
Preparation and electrochemical studies of electrospun TiO2 nanofibers and molten salt method...
9
Electrochimica Acta 55 (2010) 3109–3117 Contents lists available at ScienceDirect Electrochimica Acta journal homepage: www.elsevier.com/locate/electacta Preparation and electrochemical studies of electrospun TiO 2 nanofibers and molten salt method nanoparticles M.V. Reddy a , R. Jose b , T.H. Teng b , B.V.R. Chowdari a,∗ , S. Ramakrishna b,∗ a Department of Physics, National University of Singapore, Singapore 117542, Singapore b Nanoscience and Nanotechnology Initiative, National University of Singapore, Singapore 117576, Singapore article info Article history: Received 7 September 2009 Received in revised form 10 December 2009 Accepted 23 December 2009 Available online 11 January 2010 Keywords: Titanium dioxide Nanofibers Nanoparticles Lithium batteries Electrospunning Molten salt method Electrochemical properties abstract The TiO 2 nanofibers and nanoparticles are prepared by electrospinning and molten salt method, respec- tively. The materials are characterized by X-ray diffraction scanning electron microscopy (SEM), high resolution transmission electron microscopy (HRTEM) and a thermal analysis. The SEM and TEM stud- ies showed that fibers were of average diameter ∼100 nm and composed of nanocrystallites of size 10–20 nm. Electrochemical properties of the materials are evaluated using cyclic voltammetry, galvanos- tatic cycling and electrochemical impedance spectroscopy. Cyclic voltammetric studies show a hysteresis (V) between the cathodic and the anodic peak potentials for TiO 2 nanofibers and nanoparticles (sizes ∼15–30 nm) are in the range, 0.23–0.30 V and a redox couple Ti 4+/3+ around ∼1.74/2.0 V. Electrochem- ical cycling results revealed that the TiO 2 nanofibers have lower capacity fading compared to that of the nanoparticles. The capacity fading for 2–50 cycles was ∼23% for nanofibers, which was nearly one- third of that of corresponding nanoparticles (∼63%). We discussed the effect of particle size on hysteresis and cycling performance of TiO 2 nanoparticles. Impedance analysis of TiO 2 nanofibers and nanoparticles during first discharge cycle is analyzed and interpreted. © 2010 Elsevier Ltd. All rights reserved. 1. Introduction Nanostructured materials of variable morphologies and aspect ratios gained increasing attention in recent years. Among them one-dimensional (1D) nanostructures such as wires, rods, belts, fibers, and tubes are attractive in view of their dependence of electrical properties on directionality [1–3]. The 1D nanostruc- tures on a laboratory scale have been synthesized by lithographic [4] and wet chemical techniques [5,6]. However, finite lengths of the nanostructures through these routes are limited to sev- eral microns. Recently fabrication of metal oxides as continuos nanofibers through electrospinning is getting increased attention [7–10]. In the electrospinning process, a polymeric solution is allowed to pass through an electric field. When the applied electric field overcomes the surface tension of the liquid, a continuous jet is ejected which upon subsequent solvent evaporation and bending produces nanofibers on a collector surface. The fiber morphology such as random, aligned, core/shell, bundles, and mats could be produced by merely changing the collection or injection strategy. If the polymer solution contains metal ions for forming metal oxide, appropriate post-electrospinning heat treatment yields continuous ∗ Corresponding author. Tel.: +65 65162605; fax: +65 67776126. E-mail addresses: [email protected] (B.V.R. Chowdari), [email protected] (S. Ramakrishna). nanofibers of the corresponding material. Interest in electrospin- ning stems from several reasons (i) the electrospun nanofibers have high specific surface area, interesting pore distribution, and are characterized by interesting physical properties due to a diam- eter dependent strain [11], (ii) the electrospinning technique is relatively simple and cost effective method of producing 1D nanos- tructures and (iii) it is scalable to produce nanostructures at an industrial level. Molten salt method (MSM) is one of the simple and versatile method to obtain high purity simple and mixed nano, submi- cron/micron sized layered oxide materials [12–15]. Advantages of MSM are (i) enhanced diffusivity due to the molten reaction media and (ii) the synthetic procedure does not involve mechanical mix- ing, nor repeated grinding, and long term heating of initial reactants [12]. The discovery of photocatalytic splitting of water by a TiO 2 [16] electrode under ultraviolet (UV) light [17] opened up enor- mous research in this material and has led to many promising applications in areas ranging from photovoltaics [18,19], pho- tocatalysis [20,21] and photo- and electrochromics [22,23] and electrode material for lithium batteries [24–27]. Several groups reported synthesis of TiO 2 nanofibers by electrospinning [11,28] and characterized for applications in excitonic solar cells [29–31] and catalysis [21,32]. Electrospun TiO 2 nanofibers were used to understand some key controlling factors that determine current density in dye-sensitized solar cells [33]. Hierarchical 1D structure 0013-4686/$ – see front matter © 2010 Elsevier Ltd. All rights reserved. doi:10.1016/j.electacta.2009.12.095
-
Upload
independent -
Category
Documents
-
view
5 -
download
0
Transcript of Preparation and electrochemical studies of electrospun TiO2 nanofibers and molten salt method...
Pa
Ma
b
a
ARR1AA
KTNNLEME
1
rofiet[oen[afiepspIa
(
0d
Electrochimica Acta 55 (2010) 3109–3117
Contents lists available at ScienceDirect
Electrochimica Acta
journa l homepage: www.e lsev ier .com/ locate /e lec tac ta
reparation and electrochemical studies of electrospun TiO2 nanofibersnd molten salt method nanoparticles
.V. Reddya, R. Joseb, T.H. Tengb, B.V.R. Chowdaria,∗, S. Ramakrishnab,∗
Department of Physics, National University of Singapore, Singapore 117542, SingaporeNanoscience and Nanotechnology Initiative, National University of Singapore, Singapore 117576, Singapore
r t i c l e i n f o
rticle history:eceived 7 September 2009eceived in revised form0 December 2009ccepted 23 December 2009vailable online 11 January 2010
a b s t r a c t
The TiO2 nanofibers and nanoparticles are prepared by electrospinning and molten salt method, respec-tively. The materials are characterized by X-ray diffraction scanning electron microscopy (SEM), highresolution transmission electron microscopy (HRTEM) and a thermal analysis. The SEM and TEM stud-ies showed that fibers were of average diameter ∼100 nm and composed of nanocrystallites of size10–20 nm. Electrochemical properties of the materials are evaluated using cyclic voltammetry, galvanos-tatic cycling and electrochemical impedance spectroscopy. Cyclic voltammetric studies show a hysteresis(�V) between the cathodic and the anodic peak potentials for TiO nanofibers and nanoparticles (sizes
eywords:itanium dioxideanofibersanoparticlesithium batterieslectrospunning
2
∼15–30 nm) are in the range, 0.23–0.30 V and a redox couple Ti4+/3+ around ∼1.74/2.0 V. Electrochem-ical cycling results revealed that the TiO2 nanofibers have lower capacity fading compared to that ofthe nanoparticles. The capacity fading for 2–50 cycles was ∼23% for nanofibers, which was nearly one-third of that of corresponding nanoparticles (∼63%). We discussed the effect of particle size on hysteresisand cycling performance of TiO2 nanoparticles. Impedance analysis of TiO2 nanofibers and nanoparticles
le is a
olten salt methodlectrochemical propertiesduring first discharge cyc
. Introduction
Nanostructured materials of variable morphologies and aspectatios gained increasing attention in recent years. Among themne-dimensional (1D) nanostructures such as wires, rods, belts,bers, and tubes are attractive in view of their dependence oflectrical properties on directionality [1–3]. The 1D nanostruc-ures on a laboratory scale have been synthesized by lithographic4] and wet chemical techniques [5,6]. However, finite lengthsf the nanostructures through these routes are limited to sev-ral microns. Recently fabrication of metal oxides as continuosanofibers through electrospinning is getting increased attention7–10]. In the electrospinning process, a polymeric solution isllowed to pass through an electric field. When the applied electriceld overcomes the surface tension of the liquid, a continuous jet isjected which upon subsequent solvent evaporation and bendingroduces nanofibers on a collector surface. The fiber morphology
uch as random, aligned, core/shell, bundles, and mats could beroduced by merely changing the collection or injection strategy.f the polymer solution contains metal ions for forming metal oxide,ppropriate post-electrospinning heat treatment yields continuous
∗ Corresponding author. Tel.: +65 65162605; fax: +65 67776126.E-mail addresses: [email protected] (B.V.R. Chowdari), [email protected]
S. Ramakrishna).
013-4686/$ – see front matter © 2010 Elsevier Ltd. All rights reserved.oi:10.1016/j.electacta.2009.12.095
nalyzed and interpreted.© 2010 Elsevier Ltd. All rights reserved.
nanofibers of the corresponding material. Interest in electrospin-ning stems from several reasons (i) the electrospun nanofibers havehigh specific surface area, interesting pore distribution, and arecharacterized by interesting physical properties due to a diam-eter dependent strain [11], (ii) the electrospinning technique isrelatively simple and cost effective method of producing 1D nanos-tructures and (iii) it is scalable to produce nanostructures at anindustrial level.
Molten salt method (MSM) is one of the simple and versatilemethod to obtain high purity simple and mixed nano, submi-cron/micron sized layered oxide materials [12–15]. Advantages ofMSM are (i) enhanced diffusivity due to the molten reaction mediaand (ii) the synthetic procedure does not involve mechanical mix-ing, nor repeated grinding, and long term heating of initial reactants[12].
The discovery of photocatalytic splitting of water by a TiO2[16] electrode under ultraviolet (UV) light [17] opened up enor-mous research in this material and has led to many promisingapplications in areas ranging from photovoltaics [18,19], pho-tocatalysis [20,21] and photo- and electrochromics [22,23] andelectrode material for lithium batteries [24–27]. Several groups
reported synthesis of TiO2 nanofibers by electrospinning [11,28]and characterized for applications in excitonic solar cells [29–31]and catalysis [21,32]. Electrospun TiO2 nanofibers were used tounderstand some key controlling factors that determine currentdensity in dye-sensitized solar cells [33]. Hierarchical 1D structure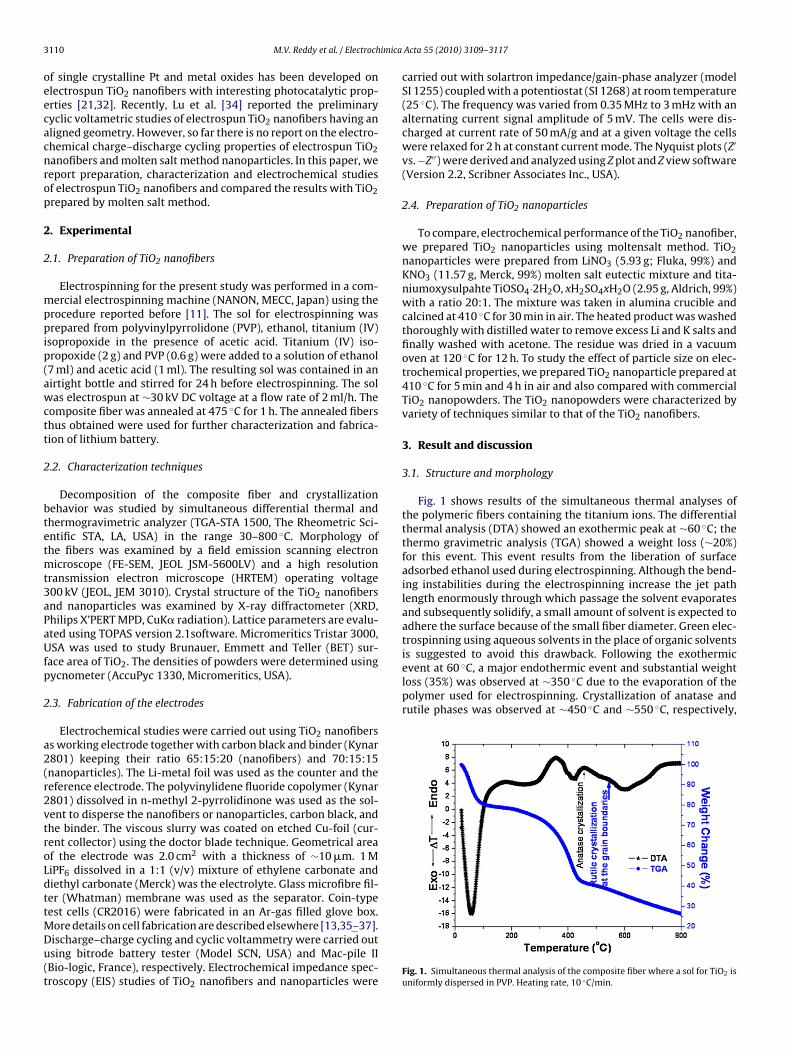
3 imica
oeecacnrop
2
2
mppip(awctt
2
btetmt3aPaUfp
2
a2(r2vtroLdttMDu(t
is suggested to avoid this drawback. Following the exothermicevent at 60 ◦C, a major endothermic event and substantial weightloss (35%) was observed at ∼350 ◦C due to the evaporation of thepolymer used for electrospinning. Crystallization of anatase andrutile phases was observed at ∼450 ◦C and ∼550 ◦C, respectively,
110 M.V. Reddy et al. / Electroch
f single crystalline Pt and metal oxides has been developed onlectrospun TiO2 nanofibers with interesting photocatalytic prop-rties [21,32]. Recently, Lu et al. [34] reported the preliminaryyclic voltametric studies of electrospun TiO2 nanofibers having anligned geometry. However, so far there is no report on the electro-hemical charge–discharge cycling properties of electrospun TiO2anofibers and molten salt method nanoparticles. In this paper, weeport preparation, characterization and electrochemical studiesf electrospun TiO2 nanofibers and compared the results with TiO2repared by molten salt method.
. Experimental
.1. Preparation of TiO2 nanofibers
Electrospinning for the present study was performed in a com-ercial electrospinning machine (NANON, MECC, Japan) using the
rocedure reported before [11]. The sol for electrospinning wasrepared from polyvinylpyrrolidone (PVP), ethanol, titanium (IV)
sopropoxide in the presence of acetic acid. Titanium (IV) iso-ropoxide (2 g) and PVP (0.6 g) were added to a solution of ethanol7 ml) and acetic acid (1 ml). The resulting sol was contained in anirtight bottle and stirred for 24 h before electrospinning. The solas electrospun at ∼30 kV DC voltage at a flow rate of 2 ml/h. The
omposite fiber was annealed at 475 ◦C for 1 h. The annealed fibershus obtained were used for further characterization and fabrica-ion of lithium battery.
.2. Characterization techniques
Decomposition of the composite fiber and crystallizationehavior was studied by simultaneous differential thermal andhermogravimetric analyzer (TGA-STA 1500, The Rheometric Sci-ntific STA, LA, USA) in the range 30–800 ◦C. Morphology ofhe fibers was examined by a field emission scanning electron
icroscope (FE-SEM, JEOL JSM-5600LV) and a high resolutionransmission electron microscope (HRTEM) operating voltage00 kV (JEOL, JEM 3010). Crystal structure of the TiO2 nanofibersnd nanoparticles was examined by X-ray diffractometer (XRD,hilips X’PERT MPD, CuK� radiation). Lattice parameters are evalu-ted using TOPAS version 2.1software. Micromeritics Tristar 3000,SA was used to study Brunauer, Emmett and Teller (BET) sur-
ace area of TiO2. The densities of powders were determined usingycnometer (AccuPyc 1330, Micromeritics, USA).
.3. Fabrication of the electrodes
Electrochemical studies were carried out using TiO2 nanofiberss working electrode together with carbon black and binder (Kynar801) keeping their ratio 65:15:20 (nanofibers) and 70:15:15nanoparticles). The Li-metal foil was used as the counter and theeference electrode. The polyvinylidene fluoride copolymer (Kynar801) dissolved in n-methyl 2-pyrrolidinone was used as the sol-ent to disperse the nanofibers or nanoparticles, carbon black, andhe binder. The viscous slurry was coated on etched Cu-foil (cur-ent collector) using the doctor blade technique. Geometrical areaf the electrode was 2.0 cm2 with a thickness of ∼10 �m. 1 MiPF6 dissolved in a 1:1 (v/v) mixture of ethylene carbonate andiethyl carbonate (Merck) was the electrolyte. Glass microfibre fil-er (Whatman) membrane was used as the separator. Coin-typeest cells (CR2016) were fabricated in an Ar-gas filled glove box.
ore details on cell fabrication are described elsewhere [13,35–37].ischarge–charge cycling and cyclic voltammetry were carried outsing bitrode battery tester (Model SCN, USA) and Mac-pile IIBio-logic, France), respectively. Electrochemical impedance spec-roscopy (EIS) studies of TiO2 nanofibers and nanoparticles were
Acta 55 (2010) 3109–3117
carried out with solartron impedance/gain-phase analyzer (modelSI 1255) coupled with a potentiostat (SI 1268) at room temperature(25 ◦C). The frequency was varied from 0.35 MHz to 3 mHz with analternating current signal amplitude of 5 mV. The cells were dis-charged at current rate of 50 mA/g and at a given voltage the cellswere relaxed for 2 h at constant current mode. The Nyquist plots (Z′
vs. −Z′′) were derived and analyzed using Z plot and Z view software(Version 2.2, Scribner Associates Inc., USA).
2.4. Preparation of TiO2 nanoparticles
To compare, electrochemical performance of the TiO2 nanofiber,we prepared TiO2 nanoparticles using moltensalt method. TiO2nanoparticles were prepared from LiNO3 (5.93 g; Fluka, 99%) andKNO3 (11.57 g, Merck, 99%) molten salt eutectic mixture and tita-niumoxysulpahte TiOSO4·2H2O, xH2SO4xH2O (2.95 g, Aldrich, 99%)with a ratio 20:1. The mixture was taken in alumina crucible andcalcined at 410 ◦C for 30 min in air. The heated product was washedthoroughly with distilled water to remove excess Li and K salts andfinally washed with acetone. The residue was dried in a vacuumoven at 120 ◦C for 12 h. To study the effect of particle size on elec-trochemical properties, we prepared TiO2 nanoparticle prepared at410 ◦C for 5 min and 4 h in air and also compared with commercialTiO2 nanopowders. The TiO2 nanopowders were characterized byvariety of techniques similar to that of the TiO2 nanofibers.
3. Result and discussion
3.1. Structure and morphology
Fig. 1 shows results of the simultaneous thermal analyses ofthe polymeric fibers containing the titanium ions. The differentialthermal analysis (DTA) showed an exothermic peak at ∼60 ◦C; thethermo gravimetric analysis (TGA) showed a weight loss (∼20%)for this event. This event results from the liberation of surfaceadsorbed ethanol used during electrospinning. Although the bend-ing instabilities during the electrospinning increase the jet pathlength enormously through which passage the solvent evaporatesand subsequently solidify, a small amount of solvent is expected toadhere the surface because of the small fiber diameter. Green elec-trospinning using aqueous solvents in the place of organic solvents
Fig. 1. Simultaneous thermal analysis of the composite fiber where a sol for TiO2 isuniformly dispersed in PVP. Heating rate, 10 ◦C/min.

M.V. Reddy et al. / Electrochimica Acta 55 (2010) 3109–3117 3111
F . (d) Ap anata
wnr
Et
Fi
ig. 2. SEM images of the (a) as-spun composite fibers, (b) and (c) after sinteringattern of the fiber showing the polycrystalline ring pattern which was indexed for
hich is clearly reflected in the XRD pattern of annealed TiO2
anofibers (Fig. 6a). The crystallization event of the anatase andutile phases was overlapped in the thermal analysis curve.Fig. 2 shows morphology of the as-spun and TiO2 nanofibers.ach individual nanofibers maintained cross-sectional uniformityhroughout the length indicating a smooth injection of fine TiO2
ig. 3. (a) SEM images of the TiO2 nanoparticles synthesized through the molten salt methomage showing typical particle agglomerates, bar scale: 50 nm and (c) HRTEM image show
bright-field TEM image of the sintered nanofibers, (e) a selected area diffractionse structure, and (f) a HRTEM image of the typical portion of the fiber.
sol dispersed in the polymer matrix during electrospinning using
the commercial electrospinning set up. The annealed fibers have asmooth surface and an average diameter of ∼60 nm. The HRTEMstudies reveal that the fibers were polycrystalline anatase and con-sist of uniform grains of size ∼10 nm. The grains were denselypacked along the fiber length. Figs. 3 and 4 show SEM images ofd prepared at 410 ◦C, 30 min in air; bar scale: 100 nm (5 keV × 50 K) (b) a bright-fielding a typical powder particle of size ∼20 nm.

3112 M.V. Reddy et al. / Electrochimica Acta 55 (2010) 3109–3117
Fig. 4. SEM images of the TiO2 nanoparticles synthesized through the molten salt method prepared at 410 ◦C, in air during (a) 5 min; bar scale: 100 nm (5 keV × 50 k), (b)5 min; bar scale: 100 nm (5 keV × 160 k), (c) 4 h; bar scale: 100 nm (5 keV × 50 k) and (d) commercial TiO2 nanoparticles; bar scale: 100 nm (5 keV × 30 k).
Fig. 5. Transmission electron micrographs of the TiO2 nanoparticles synthesized through the molten salt method, (a) 5 min; bar scale: 50 nm, (b) high resolution TEM imageof (a) (5 min); bar scale: 5 nm, and (c) 4 h; bar scale: 50 nm.

M.V. Reddy et al. / Electrochimica Acta 55 (2010) 3109–3117 3113
Fig. 6. X-ray diffraction pattern TiO2 electrospun nanofibers heated at (a) 475 ◦C, (b)550 ◦C and 650 ◦C and (c) TiO2 nanoparticles synthesized through the molten saltsot(
TfS2da3rTsocp
waa(stTauaTTw
n
Fig. 7. X-ray diffraction pattern TiO2 nanoparticles prepared through molten salt
ynthesis at 410 ◦C, for 30 min in air. The circles and continuous line represent thebserved and calculated patterns. Bottom continuous line is the difference betweenhe experimental and simulated spectra. The vertical lines show the peak positionsh k l lines) of the anatase phase.
iO2 nanoparticles prepared using the molten salt method at 410 ◦Cor durations of 5 min, 30 min, and 4 h and commercial TiO2. TheEM images of TiO2 nanoparticles show uniform particles of size0 (±5) nm with a porous morphology. SEM images clearly showifferences in size of the nanoparticles with calcination time, thegglomerated particles with the size is of the order 15(±5) nm,0 (±5) nm and 120 (±10) nm for 5 min, 4 h and commercial TiO2,espectively. Fig. 3b and c and Fig. 5, show the HRTEM images ofiO2 nanoparticles prepared for 5 min, 30 min and 4 h by the moltenalt method. The TEM images reveal that particles (30 min) weref ∼40 nm aggregates composing crystallites of size ∼20 nm andrystallites of size ∼5–10 nm and ∼30 nm crystallites for the TiO2repared during 5 min and 4 h, respectively.
Crystal structure of the fibers as well as that of the particlesere further studied by XRD. The XRD patterns of TiO2 nanofibers
nd nanoparticles are shown Fig. 6. The patterns were indexeds anatase phase. The lattice parameters of the TiO2 nanofibersFig. 6a) are a = 3.789(4) Å, c = 9.497(1) Å. The average crystalliteize (Lorentzian) of nanofibers determined from the XRD pat-ern was 15 (±2) nm, similar to the size determined from TEM.he lattice parameters of TiO2 nanoparticles (30 min) (Fig. 6b) are= 3.788(6) Å, c = 9.491(2) Å and observed lattice parameter val-es compare well with the reported literature (JCPDS 84-1286;= 3.785 Å, c = 9.502 Å). The average crystallite size (Lorentzian) of
iO2 nanoparticles was 22 nm, which is also in agreement with theEM results. BET surface area of the TiO2 nanofibers and particlesere 54 and 113 (±0.5) m2/g, respectively.Fig. 7 shows the size dependent XRD patterns of TiO2anoparticles. The obtained lattice parameters of TiO2 nanopar-
method at 410 ◦C, in air for (a) 5 min, (b) 4 h and (c) commercial TiO2 (Aldrich). Thecircles and continuous line represent the observed and calculated patterns. Bottomcontinuous line is the difference between the experimental and simulated spectra.The vertical lines show the peak positions (h k l) lines of the anatase phase.
ticles prepared at (i) 410 ◦C for 5 min (Fig. 7a): a = 3.791(2) Å,c = 9.501(6) Å, (ii) 4 h (Fig. 7b): a = 3.788(1) Å, c = 9.494(3) Å and (iii)commercial TiO2 powder (Fig. 7c) a = 3.784 Å, c = 9.512 Å compareswell with reported literature (JCPDS 84-1286). The average crys-tallite size (Lorentzian) obtained from the TOPAS software are10, 31 and 143 (±2) nm for 5 min and 4 h and commercial TiO2,respectively. The Brunauer, Emmett and Teller surface area of TiO2nanoparticles prepared at 5 min, 4 h and commercial power are 140(±0.6) m2/g, 74 (±0.6) m2/g and 10.7 (±0.2) m2/g, respectively. Themeasured densities of the powders are 3.688 g/cm3, 3.714 g/cm3,4.349 g/cm3, 4.2571 g/cm3 for the compound prepared at 5 min,30 min and 4 h and commercial power, respectively.
3.2. Electrochemical studies
3.2.1. Cyclic voltammetryFig. 8 shows the cyclic voltammograms (CVs) of TiO2 nanofibers
and nanoparticles, CVs are recorded at a scan rate of 0.058 mV s−1,at room temperature. Fabricated TiO2 cells show an open cir-cuit voltage of 2.6 (±1) V. The voltammograms of TiO2 nanofibers(Fig. 8) show a peak at ∼1.72 V during the cathodic scan, while
anodic scan, shows a minor reversible peak at 2.0 V. For TiO2particles of size ∼20 nm, the main cathodic and anodic peakswere found to be at 2.02 V and 1.73 V, respectively. The hysteresis(�V) between main cathodic and anodic peak potentials of TiO2nanofibers and nanoparticles were ∼0.28 V. For comparison the
3114 M.V. Reddy et al. / Electrochimica Acta 55 (2010) 3109–3117
Fig. 8. Cyclic voltammograms of (a) TiO2 nanofibers and (b) TiO2 nanoparticles prepared by MSM at 410 ◦C, for 30 min in air. Recorded at a scan rate of 0.058 mV s−1, cycledat room temperature, voltage range: 1.0–2.5 V or 2.8 V. Differential capacity vs. voltage plots of (c) TiO2 nanofibers, (d) TiO2 nanoparticles (30 min), extracted from Fig. 10aand b.
Fig. 9. Cyclic voltammograms of TiO2 nanoparticles prepared by MSM at 410 ◦C, in air (a) 5 min, (b) 4 h, (c) commercial TiO2. Only second cycle is shown for clarity. CVrecorded at a scan rate, 0.058 mV s−1, cycled at room temperature. Li metal was the counter and reference electrode. Potential window: 1.0–2.6 V. Geometrical area of theelectrode: 2.0 cm2.

imica
caccoasbioit∼p5sratT
3
aapT∼pLsfi(mT2
Fcw
M.V. Reddy et al. / Electroch
yclic voltammograms of TiO2 prepared at 410 ◦C, for 5 min and 4 hnd commercial TiO2. CVs recorded at a scan rate of 0.058 mV s−1,orresponding voltammograms are shown in Fig. 9. The fabricatedells show an open circuit voltage of ∼2.6 V. The voltammogramsf TiO2 (5 min, Fig. 9a), during cathodic scan show a reduction peakt ∼1.71 V with a minor peak at 1.5 V, 1.55 V, while during anodiccan show a minor reversible peak at 1.5 V, 1.55 V, 1.7 V fallowedy main peak at 1.94 V. The observed minor peaks in CV during Li-
ntercalation/de-intercalation is due to a broad energy distributionf material or it may two sites with overlapping energies whichs characteristic of amorphous regions in the material. Where ashe CV of TiO2 4 h duration showed a reversible peaks at ∼1.7 V,2.0 V. The hysteresis (�V) between main cathodic and anodic peakotential are; 0.23 V, 0.30 V and 0.41 V for TiO2 prepared by MSS atmin, 4 h and commercial TiO2 powder, respectively. The hystere-
is values vary depending on the particle size, morphology and scanate (common for all insertion electrodes) [26,38–43]. The cathodicnd anodic peak voltages correspond to insertion/extraction of Lio/from the anatase lattice and the reaction can be represented asiO2 + xLi+ + xe− → LixTiO2 (intercalation).
.2.2. Galvanostatic cyclingGalvanostatic discharge–charge cycling plots of TiO2 nanofibers
nd particles at a current density of 150 mA g−1 (0.45 C rate,ssuming 1 C = 335 mA h g−1) are shown in Fig. 10. Cycled in theotential range, 1.0–2.6 V vs. Li. During the first discharge, bothiO2 nanoparticles and nanofibers show a reduction plateau at1.75 V (Fig. 8c and d) [26] and during charge cycle a oxidationlateau was ∼1.8–2.0 V. The different plateaus are observed duringi-intercalation/de-intercalation in to TiO2 with different particleizes were discussed later section. The specific capacities during
rst discharge and charge cycle for TiO2 nanofibers were 175; 120±3) mA h g−1, respectively, which corresponds to 0.52 and 0.36oles of lithium per mole of TiO2 during discharge–charge cycle.he specific capacities for TiO2 nanoparticles were higher, i.e., 270;25 (±3) mA h g−1, which corresponds to 0.80 and 0.67 moles of
ig. 10. Galvanostatic discharge–charge cycling curves (voltage vs. capacity profiles) ofapacity vs. cycle number of (c) TiO2 nanofibers, (d) TiO2 nanoparticles. Current rate: 15indow: 1.0–2.6 V. Active material loading was 0.5 mg/cm2.
Acta 55 (2010) 3109–3117 3115
lithium per mole of TiO2 during discharge–charge cycle. Lower dis-charge capacity of TiO2 nanofibers is most likely due to crystallinityof fibers compared to that of the particles. The crystallinity of TiO2nanofibers results in an enhanced density of surface defects andtherefore, results in poor electrical conductivity and lower diffusionof Li-ions. Interestingly, the capacity fading for 2–50 cycles (Fig. 10)was ∼23% for nanofibers which is nearly half of that of corre-sponding nanoparticles (∼63%). The reduced capacity fading couldhave resulted from the peculiar porous structure of the electrospunTiO2 nanofibers. The porous structure as shown in the SEM imagesin Fig. 2 is expected to help the de-intercalation/intercalation oflithium during cycling. On the other hand, a denser packing in theparticles results in the partial loss of lithium ions that result in afaster capacity fading. These results demonstrate the advantagesof TiO2 nanofibers for lithium battery applications. The electro-chemical studies with TiO2 nanofibers different diameters andcrystallinity and the effect of conductive coating on TiO2 nanofibersare in progress in our laboratory and will be reported elsewhere.
In order to explain the effect TiO2 nanoparticle size on elec-trochemical properties, we studied preliminary discharge–chargecycling studies TiO2 prepared at 410 ◦C for 5 min, 30 min and 4 h,and commercial sample at a current rate of 50 mA g−1 (0.15 C rate,assuming 1 C = 335 mA h g−1) are shown in Fig. 11. For clarity we arediscussing TiO2 nanoparticles prepared during 30 min (Fig. 11b).During discharge we can see four regions, in the region “a” voltagedecreased from 2.6 V to 1.76 V deliver a capacity of ∼34 mA h g−1
(0.10 moles Li), the voltage plateaus varies depending on parti-cle size (Fig. 11a) [26]. The second region “b” shows a two phaseregion around ∼1.75 V vs. Li (capacity around ∼180 mA h g−1, 0.54moles of Li) (it contains both Li-rich and poor phase) [26], on fur-ther Li-insertion region “c” (1.72–1.50 V vs. Li) and “d” (1.50–1.0 V
vs. Li) are seen (Fig. 11b). During charge cycle the reversible regions“c′” (1.0–1.5 V vs. Li) and “d
′” (1.50–1.85 V) and “b
′” (1.88 V) are
clearly seen in (Fig. 11b). The electrochemical studies on commer-cial TiO2 sample with particle size 140 nm shows the absence ofregion ‘c”, higher hysteresis and lower capacity when compared
(a) TiO2 nanofibers, (b) TiO2 nanoparticles, number indicates cycle number and0 mA g−1 (0.45 C rate). Li metal was the counter and reference electrode. Potential

3116 M.V. Reddy et al. / Electrochimica Acta 55 (2010) 3109–3117
Fig. 11. Galvanostatic discharge–charge cycling curves (first cycle) of TiO2 nanopar-ticles prepared by MSM (a) at 410 ◦C, in air for 5 min, 30 min and 4 h and commercialT4at
tftsi(d0daenfit
3
ttp[nsuat
′ ′′
iO2 (Aldrich), current rate: 50 mA g−1(0.15 C rate). (b) For clarity TiO2 prepared at10 ◦C for 30 min, first cycle discharge–charge curves at current rate of 50 mA g−1
nd 150 mA g−1 are shown. Li metal was the counter and reference electrode. Poten-ial window: 1.0–2.75 V. Active material loading was ∼0.5–1.0 mg/cm2.
o molten salt method prepared TiO2 nanoparticles. It is clearrom above discharge–charge studies peak plateaus are sensitiveo particle size, and hysteresis values (�V) varies with the particleize (Fig. 11a) and current rate (Fig. 11b). The observed capac-ty values during first discharge cycle are: 150, 230, 250 and 328±3) mA h g−1 for commercial TiO2, TiO2 nanoparticles prepareduring 5 min, 4 h and 30 min, respectively and it corresponds to.45, 0.68, 0.75 and 0.98 moles lithium per mole of TiO2 inserteduring discharge cycle. Cycling results shows, the TiO2 preparedt 30 min show a highest electrochemical performance and lowerlectrode polarization compared to commercial TiO2 and otheranoparticles. Our and literature studies on TiO2 show a slight dif-
erences in electrochemical performances is due to the differencesn preparation conditions like preparation method, calcinationemperature, particle size and morphology [26,27,40–42].
.2.3. Electrochemical impedance spectroscopyElectrochemical impedance spectroscopy (EIS) is a well suited
echnique to study the electrode kinetics of electrode materials dueo its non-destructive nature and its ability to distinguish varioushenomena taking place in an electrode at different time scales13,35,36,44,45]. Nyquist (Z
′vs. −Z
′′) plots of TiO2 nanofibers and
anoparticles (prepared at 30 min) during first discharge cycle arehown in Fig. 12a and b. The impedance spectrum was fitted bysing the equivalent circuit reported in the literature [13,35]. Forll the discharge voltages (2.0 V, 1.8 V, 1.4 V, 1.2 V) impedance spec-ra are fitted using the combination of R(sf+ct) and CPE(sf+dl) with
Fig. 12. Nyquist plots (Z vs. −Z ) of during first discharge cycle. (a) TiO2 nanofibersand (b) TiO2 nanoparticles (410 ◦C, 30 min). Symbols present experimental spec-tra and continuous lines represent fitted data using equivalent electrical circuit.Geometrical area of the composite electrode: 2.0 cm2.
a Warburg resistance and interclation capacitance. Rsf is the sur-face film resistance, Rct is charge transfer resistance and CPE(sf+dl)is surface film and double layer capacitance. At the end of dis-charge at 1.0 V impedance spectra was fitted with combination ofthe R(sf+ct)//CPE(sf+dl) and Rb//CPEb, where Rb is bulk resistance andCPEb is bulk capacitance. More details on equivalent circuit nota-tions are discussed in our previous studies [13,35]. The fresh cellof TiO2 nanofibers and particles shows a single semicircle with asurface film resistance Rsf values of 128 and 335 (±5) � and CPEsfvalues are 36 and 40 (±3) �F for nanofibers and nanoparticles,respectively. The fitted impedance values during first dischargecycle: for (i) TiO2 nanofibers at a voltage, 1.8 V, 1.6 V, 1.4 V and1.2 V, the resistance (R(sf+ct)) and the capacitance CPE(sf+dl) valuesare 89, 94, 96 and 101 (±3) � and 43, 38, 74, 50 (±3) �F respectively.For (ii) TiO2 nanoparticles at a voltage, 2.0 V, 1.8 V, 1.6 V and 1.4 V,the resistance (R(sf+ct)) and the capacitance CPE(sf+dl) values are 124,129, 115 and 132 (±3) � and 43, 38, 74, 50 (±3) �F, respectively.At the end of first discharge cycle (1.0 V) the contribution frombulk resistance (Rb) is seen in addition to surface film and chargetransfer resistance. The Rb arises due to combination of electronicresistivity of active material and ionic conductivity of electrolytefilled by the pores of the composite electrode (active material, con-ducting carbon and binder) [13,35]. The fitted impedance values at1.0 V for TiO2 nanofibers are: R(sf+ct) = 104 (±3) �, Rb = 112 (±3) �and CPE(sf+dl) = 50 (±3) �F, CPEb = 5 (±0.2) mF and for TiO2 nanopar-ticles are: R(sf+ct) = 164 (±3) �, Rb = 149 (±3) � and CPE(sf+dl) = 37(±3) �F, CPEb = 4 (±0.2) mF. The intercalation capacitance values
during discharge cycle of TiO2 nanofibers and particles are in range0.03–0.8 F. Impedance studies of TiO2 nanofiber electrode on freshand at various discharge voltages, show a lower impedance valueswhen compared to TiO2 nanoparticles which indicates the smoothintercalation of lithium ions in the TiO2 nanofiber electrodes.
imica
4
aracarosfH0fntnTomd
A
NNS
R
[
[
[
[
[
[
[[[[
[
[
[
[
[[
[
[[[[[
[[
[[
[
[
[
[
[
[
[
[43] M.V. Reddy, B. Pecquenard, P. Vinatier, A. Levasseur, Electrochemistry Commu-
M.V. Reddy et al. / Electroch
. Conclusions
In summary, we prepared single phase anatase TiO2 nanofibersnd nanoparticles by electrospinning and molten salt method,espectively, and characterized by TGA/DTA, XRD, SEM, HRTEMnd BET surface area methods, and studied their electrochemi-al properties for the first time. Differences in the crystallinitynd BET surface area of the materials prepared through the twooutes resulted in an appreciable difference in the specific capacityf the lithium ion battery. The TiO2 nanoparticles (size, ∼20 nm,urface area, 114 m2/g) prepared by molten salt method at 410 ◦C,or 30 min showed higher specific capacity compared to the other.owever, the electrochemical cycling stability (current rate of.45 C) was better for electrospun TiO2 nanofibers. The capacityading for 2–50 cycles was ∼23% for nanofibers which for theanoparticles was ∼63%. The electrochemical impedance spec-roscopic studies reveals lower impedance parameters for theanofiber based batteries compared to that of TiO2 nanoparticles.he observed lower impedance indicates a smooth intercalationf lithium ions in the nanofiber based TiO2 electrodes. An opti-ized performance is still lacking with TiO2 nanofibers of different
iameters, specific surface area, and crystallinity.
cknowledgements
Part of this project is financially supported by theational Research Foundation (grants NRF-CRP4-2008-03 andRF2007EWT-CERP01-0531), Singapore. Authors thank Prof. G.V.ubbaRao, Department of Physics, NUS, for his helpful discussions.
eferences
[1] Y.N. Xia, P.D. Yang, Y.G. Sun, Y.Y. Wu, B. Mayers, B. Gates, Y.D. Yin, F. Kim, Y.Q.Yan, Advanced Materials 15 (2003) 353.
[2] C.N.R. Rao, F.L. Deepak, G. Gundiah, A. Govindaraj, Progress in Solid State Chem-istry 31 (2003) 5.
[3] J.T. Hu, T.W. Odom, C.M. Lieber, Accounts of Chemical Research 32 (1999) 435.[4] S. Hong, J. Zhu, C.A. Mirkin, Science 286 (1999) 523.[5] T.N. Sandeep Kumar, Small 2 (2006) 316.[6] Y.J. Xiong, Y.N. Xia, Advanced Materials 19 (2007) 3385.[7] A. Greiner, J.H. Wendorff, Angewandte Chemie International Edition 46 (2007)
5670.[8] R. Ramaseshan, S. Sundarrajan, R. Jose, S. Ramakrishna, Journal of Applied
Physics 102 (2007) 111101/1.[9] D. Li, Y.N. Xia, Advanced Materials 16 (2004) 1151.10] W. Sigmund, J. Yuh, H. Park, V. Maneeratana, G. Pyrgiotakis, A. Daga, J. Taylor,
J.C. Nino, Journal of American Ceramic Society 89 (2006) 395.11] A. Kumar, R. Jose, K. Fujihara, J. Wang, S. Ramakrishna, Chemistry of Materials
19 (2007) 6536.
[
[
Acta 55 (2010) 3109–3117 3117
12] K.S. Tan, M.V. Reddy, G.V. Subba Rao, B. Chowdari, Journal of Power Sources147 (2005) 241.
13] M.V. Reddy, G.V. Subba Rao, B.V.R. Chowdari, Journal of Physical Chemistry C111 (2007) 11712.
14] M.V. Reddy, G.V. Subba Rao, B.V.R. Chowdari, Journal of Power Sources 160(2006) 1369.
15] M.V. Reddy, G.V. Subba Rao, B.V.R. Chowdari, Journal of Power Sources 159(2005) 263.
16] X. Chen, S.S. Mao, Chemical Reviews 107 (2007) 2891.17] A. Fujishima, K. Honda, Nature 238 (1972) 37.18] M. Grätzel, Inorganic Chemistry 44 (2005) 6841.19] R. Jose, V. Thavasi, S. Ramakrishna, Journal of American Ceramic Society 92
(2009) 289.20] X.J. Feng, K. Shankar, O.K. Varghese, M. Paulose, T.J. Latempa, C.A. Grimes, Nano
Letters 8 (2008) 3781.21] E. Formo, Z.M. Peng, E. Lee, X.M. Lu, H. Yang, Y.N. Xia, Journal of Physical Chem-
istry C 112 (2008) 9970.22] G. Campet, J. Verniolle, J.P. Doumerc, J. Claverie, Materials Research Bulletin 15
(1980) 1135.23] Z. Tebby, O. Babot, T. Toupance, D.H. Park, G. Campet, M.H. Delville, Chemistry
of Materials 20 (2008) 7260.24] M. Wagemaker, A.P.M. Kentgens, F.M. Mulder, Nature 418 (2002) 397.25] H. Qiao, Y.W. Wang, L.F. Xiao, L.Z. Zhang, Electrochemistry Communications 10
(2008) 1280.26] G. Sudant, E. Baudrin, D. Larcher, J.M. Tarascon, Journal of Materials Chemistry
15 (2005) 1263.27] Y.G. Guo, Y.S. Hu, W. Sigle, J. Maier, Advanced Materials 19 (2007) 2087.28] D. Li, Y.N. Xia, Nano Letters 3 (2003) 555.29] S. Chuangchote, T. Sagawa, S. Yoshikawa, Applied Physics Letters 93 (2008) 3.30] R. Jose, A. Kumar, V. Thavasi, S. Ramakrishna, Nanotechnology 19 (2008) 42.31] K. Fujihara, A. Kumar, R. Jose, S. Ramakrishna, S. Uchida, Nanotechnology 18
(2007) 365709.32] E. Formo, E. Lee, D. Campbell, Y.N. Xia, Nano Letters 8 (2008) 668.33] R. Jose, A. Kumar, V. Thavasi, K. Fujihara, S. Uchida, S. Ramakrishna, Applied
Physics Letters 93 (2008).34] H.-W. Lu, W. Zeng, Y.-S. Li, Z.-W. Fu, Journal of Power Sources 164 (2007) 874.35] M.V. Reddy, S. Madhavi, G.V. SubbaRao, B.V.R. Chowdari, Journal of Power
Sources 162 (2006) 1312.36] B. Das, M.V. Reddy, C. Krishnamoorthi, S. Tripathy, R. Mahendiran, G.V. Subba
Rao, B.V.R. Chowdari, Electrochimica Acta 54 (2009) 3360.37] M.V. Reddy, G.V. SubbaRao, B.V.R. Chowdari, Electrochimica Acta 50 (2005)
3375.38] V. Subramanian, A. Karki, K.I. Gnanasekar, F.P. Eddy, B. Rambabu, Journal of
Power Sources 159 (2006) 186.39] L. Kavan, A. Attia, F. Lenzmann, S.H. Elder, M. Gratzel, Journal of Electrochemical
Society 147 (2000) 2897.40] A.R. Armstrong, G. Armstrong, J. Canales, R. Garcia, P.G. Bruce, Advanced Mate-
rials 17 (2005) 862.41] S.K. Cheah, E. Perre, M. Rooth, M. Fondell, A. Harsta, L. Nyholm, M. Boman, T.
Gustafsson, J. Lu, P. Simon, K. Edstrom, Nano Letters 9 (2009) 3230.42] G.F. Ortiz, I. Hanzu, T. Djenizian, P. Lavela, J.L. Tirado, P. Knauth, Chemistry of
Materials 21 (2009) 63.
nications 9 (2007) 409.44] M.V. Reddy, T. Yu, C.H. Sow, Z.X. Shen, C.T. Lim, G.V. Subba Rao, B.V.R. Chowdari,
Advanced Functional Materials 17 (2007) 2792.45] A.V. Murugan, M.V. Reddy, G. Campet, K. Vijayamohanan, Journal of Electroan-
alytical Chemistry 603 (2007) 287.