Optical and Chemical Properties of Molten Salt Mixtures for ...
107
Optical and Chemical Properties of Molten Salt Mixtures for Use in High Temperature Power Systems by Stefano Passerini B.S., Energy Engineering (2005) - M.S., Nuclear Engineering (2008) Politecnico di Milano, Italy Submitted to the Department of Nuclear Science and Engineering in partial fulfillment of the requirements for the Degree of MASTER of SCIENCE IN NUCLEAR SCIENCE and ENGINEERING at the MASSACHUSETTS INSTITUTE OF TECHNOLOGY May 2010 Copyright @ 2010 Massachusetts Institute of Technology All rights reserved MASSACHUSETTS INSTITUTE OF TECHNOLOGY DEC 0 9 2010 LIBRARIES ARCHIVES Signature of the Author: ~1 J/YZ4f% Department z ,oo of Nuclear Science and Engineering May 7, 2010 Certified by: {Thomas J. McKrell Research Scientist Thesis Supervisor Certified by: Soderberg Professor of Power gineering and A sociate Professor Jacopo Buongiorno of Nuclear Science and Engineering Thesis Co-Supervisor 11 Accepted by:. Jacquelyn C. Yanch Professor of Nuclear Science and Engineering Chair, Department Committee on Graduate Students
-
Upload
khangminh22 -
Category
Documents
-
view
5 -
download
0
Transcript of Optical and Chemical Properties of Molten Salt Mixtures for ...

Optical and Chemical Properties of Molten Salt Mixtures for Use inHigh Temperature Power Systems
by
Stefano PasseriniB.S., Energy Engineering (2005) - M.S., Nuclear Engineering (2008)
Politecnico di Milano, Italy
Submitted to the Department of Nuclear Science and Engineering in partial fulfillment of therequirements for the Degree of
MASTER of SCIENCE IN NUCLEAR SCIENCE and ENGINEERINGat the
MASSACHUSETTS INSTITUTE OF TECHNOLOGY
May 2010
Copyright @ 2010 Massachusetts Institute of TechnologyAll rights reserved
MASSACHUSETTS INSTITUTEOF TECHNOLOGY
DEC 0 9 2010
LIBRARIES
ARCHIVES
Signature of the Author:
~1 J/YZ4f%
Department
z ,oo
of Nuclear Science and EngineeringMay 7, 2010
Certified by: {Thomas J. McKrellResearch ScientistThesis Supervisor
Certified by:
Soderberg Professor of Power gineering and A sociate ProfessorJacopo Buongiorno
of Nuclear Science and EngineeringThesis Co-Supervisor
11Accepted by:.
Jacquelyn C. YanchProfessor of Nuclear Science and Engineering
Chair, Department Committee on Graduate Students

This Page Intentionally Left Blank

Optical and Chemical Properties of Molten Salt Mixturesfor Use in High Temperature Power Systems
By Stefano PasseriniB.S., Energy Engineering (2005) - M.S., Nuclear Engineering (2008)
Politecnico di Milano, ItalySubmitted to the Department of Nuclear Science and Engineering in partial fulfillment of the
requirements for the Degree ofMaster of Science in Nuclear Science and Engineering - MIT, May 2010
AbstractA future, robust energy portfolio will include, together with fossil fuel technologies and nuclear
systems, a mix of renewable energy systems. Within each type of system there will also be variants usedto strengthen a nation's baseload and/or peak power requirements. Among renewable energies, solarthermal systems are particularly promising in terms of their capability of contributing to the base-loadpower generation by providing enough thermal storage for continuous operation. In particular, directvolumetric absorption of the solar heat into molten salts seems to be a promising technology, in termsof efficiency and greenhouse gases emission reduction, which combines the good properties of moltensalts as heat storage media with high operating temperatures. Accordingly, the selection of molten saltsfor this application required knowledge of the salts chemical behavior as well as optical properties. Themolten salt selection and characterization was the objective of this Thesis.
The light attenuation coefficient of two reagent grade molten salt mixtures (KNO 3 - NaNO 3 , 40-60 wt% and NaCI-KCI, 50-50 wt%) was measured and characterized over the wavelength range 400nm-800nm and for different operating temperature ranges: 250*C-5000C for the nitrate mixture and 700*C-8000C for the chloride mixture. The measurements were performed using a unique custom builtexperimental apparatus based on the transmission technique which combines high accuracy andflexibility in terms of experimental conditions and temperatures with simple layout, use of common labmaterials and low cost. The experimental apparatus was validated using published data for both a roomtemperature fluid (water) as well as a high temperature fluid (a nitrate/nitrate mixture presenting a wellknown absorption edge shifting with temperature). No previous experimental works characterizedmolten salts in terms of light attenuation coefficient as a function of temperature and wavelength andunder this point of view the obtained results represent unique and direct optical measurement for sucha class of fluids. Furthermore, the obtained results are coherent to general theory on molten salts,described as semi-transparent liquids in the visible range and characterized by absorption edges in theultra-violet and far-infrared regions. About 90% of the solar light emitted in the wavelength range400nm-800nm is attenuated by 2m of nitrate salt, while about 80% of the solar light emitted in thewavelength range 400nm-800nm is attenuated by 2m of chloride salt.
In addition, the chemical stability and material compatibility of molten salt mixtures (includingnitrate/nitrite, chloride and carbonate salt mixtures) with common materials of interests were assessedpartially through dedicated material compatibility tests and more extensively using a thermodynamicchemistry software, able to predict the equilibrium composition of systems of specified composition atdifferent temperatures. The preliminary melting and material compatibility tests resulted in some of thepreviously identified salt mixture candidates to be discarded because of undesirable reactions withstructural materials or air that made them not suitable for the CSPonD design project.
Thesis Supervisor Thomas J McKrell, PhDTitle Research Scientist, Department of Nuclear Science and Engineering
Thesis Co-Supervisor Jacopo Buongiorno, PhDTitle Soderberg Professor of Power Engineering, Associate Professor of Nuclear Science and Engineering

Acknowledgments
I would like to express my gratitude to Dr. Thomas J. McKrell for his guidance, help and support
during my first two years here at MIT. I am equally grateful to Professor Jacopo Buongiorno for the
opportunity of working on this project and for all the suggestions and encouragements I received from
him.
I am thankful to the Chesonis Family Foundation, and in particular to Arunas Chesonis, for the
financial support I received.
I also thank prof. Charles Forsberg for his suggestions and help with the salt selection process
and salt chemistry, prof. Alex Slocum who provided the funds for the experimental apparatus and prof.
Ballinger for letting us use the fume hood in the Blue Lab.
Many people made these first two years unforgettable and the U.S. a second home. I want to
thank in particular all the friends of the glorious '22.101 Study Group'. The Sunday afternoons spent
together in Building 24 dealing with quantum mechanics and donuts were the best way of introducing
me to this country.

Table of Contents
1. Introduction 12
1.1 The CSPonD Project 14
1.2 Thesis Objective 16
2. Background 18
2.1 Molten Salt Mixtures 18
2.2 Theoretical Optical Properties of Semi-Transparent Media 20
2.3 Previous Experimental Work 24
3. Experimental Approach 28
3.1 General Description of the Experimental Apparatus Components 32
3.2 Validation Tests 41
3.3 Capabilities and Limitations 45
4. Results and Discussion 47
4.1 Salt Selection Process 47
4.1.1 Chloride Mixtures 48
4.1.2 Nitrate and Nitrite Mixtures 54
4.1.3 Carbonate Mixtures 55
4.2 Molten Salt Mixtures Chemical Compatibility 65
4.2.1 FactSage: a Thermodynamic Chemistry Software 66
4.2.2 Chemical Systems and Results 67
4.2.2.1 Binary Chloride Mixture, NaCl-KCI, (50-50 wt%) 67
4.2.2.2 Ternary Chloride Mixture, NaCl-KCl-MgC 2 (30-20-50 mole %) 73
4.2.2.3 Ternary Carbonate Salt, Li2CO3-Na2CO3-K2CO3 (32.1-33.4-34.5 wt%) 73
4.2.2.4 Ternary Nitrite/Nitrate Salt, KNO 3-NaNO 2-NaNO 3 (53-40-7 wt%) 74

4.3 Light Attenuation Coefficient Measurements 77
4.3.1 Binary Chloride Mixture NaCl-KCI, 50-50 wt% 77
4.3.2 Binary Nitrate Mixture KNO3-NaNO3, 40-60 wt% 79
4.3.3 Ternary Carbonate Mixture Li2CO3-Na2CO3-K2 CO3 (32.1-33.4-34.5 wt%) 81
4.3.4 Experimental Results 81
4.3.4.1 Binary Nitrate Mixture KNo3-NaNo3, 40-60 wt% 81
4.3.4.2 Binary Chloride Mixture NaCl-KCI, 50-50 wt% 85
4.3.5 Uncertainty Analysis 87
4.3.6 Comparison with Theoretical Predictions 88
5. Summary and Conclusions 89
5.1 Future Work 90
6. References 92
Appendix A: Experimental Data in Tabular Form 95
Appendix B: The Solar Spectrum 99
Appendix C: Application of the Results to the Solar Spectrum 102

List of Figures
Figure 3.1 The MIT molten-salt light-absorption facility 28
Figure 3.2 The Two Concentric Cuvettes Inside the Furnace 29
Figure 3.3 Cuvettes, Furnace and Screw Driven Precision Slide 31
Figure 3.4 Disassembled Lab Furnace 32
Figure 3.5 Heating Elements Extracted from the Furnace 33
Figure 3.6 Electric Connections at the Top of the Furnace 33
Figure 3.7 Furnace Sitting in the Fume Hood 34
Figure 3.8 Insulated Furnace Sitting on Refractory Bricks 34
Figure 3.9 Top of Furnace at 1100*C 35
Figure 3.10 Furnace Temperature 11000C 35
Figure 3.11 Furnace After Partial Replacement of the Heating Elements 36
Figure 3.12 StellarNet Blue Wave UVN-100 Spectrometer 37
Figure 3.13 StellarNet IC2 Integrating Sphere 38
Figure 3.14 Typical Spectrum for Chloride Mixture at 850C (blue line) and
Chopped Background Radiation (red line) 40
Figure 3.15: Typical Light Source Spectrum 41
Figure 3.16: Light Transmission through 2 cm of pure water, measured vs. published data 42
Figure 3.17 Light Transmission through 2 cm of pure water, measured vs. published data 43
Figure 3.18 Molten Salt Spectra Showing the Absorption Edge Shifting with Temperature around 400nm 44
Figure 3.19 Light Transmission through 2 cm of pure water, measured vs. published data 45
Figure 4.1.1 MgC 2-H20 Phase Diagram 51
Figure 4.1.2 Lid with Dark Signs 57
Figure 4.1.3 Crucible and Salt 57
Figure 4.1.4 Melting Salt 58

Figure 4.1.5 Salt Completely Melted and Transparent 58
Figure 4.1.6 Salt While Bubbling 59
Figure 4.1.7 Quartz and Sapphire Optical Windows 60
Figure 4.1.8 Quartz and Sapphire Optical Windows 60
Figure 4.1.9 Quartz Optical Windows Attacked by Carbonate Salts Vapors 61
Figure 4.1.10 Dissolution of Quartz in different Salt Baths 62
Figure 4.1.11 Comparison between a New Sapphire Optical Window and the Tested One 62
Figure 4.2.1 Partial pressure of HCI generated by the reaction between 1 kg of molten salt and 1m3 of air
as a function of temperature and air humidity at 250C 68
Figure 4.2.2 Partial pressure of HCI generated by the reaction between 1 kg of molten salt and 1m3 of air
as a function of temperature and air humidity at 25'C - 1% of NaOH added to the salt 69
Figure 4.2.3 Partial pressure of HCI generated by the reaction between 1 kg of molten salt and 1m3 of air
as a function of temperature and air humidity at 251C - 0.1% of NaOH added to the salt 70
Figure 4.2.4 Partial pressure of HCI generated by the reaction between 1 kg of molten salt and 1m3 of air
as a function of temperature and air humidity at 25'C - 0.01% of NaOH added to the salt 71
Figure 4.3.1 Furnace and Salt Sample Before the Test 77
Figure 4.3.2 Check of the Optical Alignment Using a Metallic Net Placed Over the Inner Cuvette 78
Figure 4.3.3 Inside of the Furnace During the Test at 8000C 78
Figure 4.3.4 Molten Salt NaNO3-KNO3 Commercial Mixture at 3000C 80
Figure 4.3.5 Broken Quartz Crucible After Exposure to Ternary Carbonate Eutectic Mixture 81
Figure 4.3.6 Two Typical Signal Spectra Acquired in Sequence 83
Figure 4.3.7 Sequence of Signal Spectra Characterized by Different Optical Path Length 83
Figure 4.3.8 Attenuation Coefficient Average Values and +/- Standard Deviation vs. Wavelength
at 450*C for the Binary Nitrate Salt 84
Figure 4.3.9 Attenuation Coefficient Average Values as function of Wavelength and Temperature
for the Binary Nitrate Salt 84

Figure 4.3.10 Attenuation Coefficient Average Values and +/- Standard Deviation vs. Wavelength
at 7500C for the Binary Chloride Mixture 86
Figure 4.3.11 Attenuation Coefficient Average Values as function of Wavelength and Temperature
for the Binary Chloride Mixture 86
Figure 4.3.12 From Equation 4.1, I/lo vs. Nitrate Mixture Molten Salt Thickness at 350"C and
600nm The Exponential Interpolation Gives the Value of the Light Attenuation Coefficient 88
Figure B1 Standard Solar Irradiance Spectra 100
Figure C1 Solar Irradiance Attenuation as a function of Wavelength and Salt Depth at 3500C
for the Binary Nitrate Salt 102
Figure C2 Solar Irradiance Attenuation as a function of Wavelength and Salt Depth at 350*C
for the Binary Nitrate Salt 103
Figure C3 Solar Irradiance Attenuation as a function of Wavelength and Salt Depthat 750*C
for the Binary Chloride Mixture 105
Figure C4 Solar Irradiance Attenuation as a function of Wavelength and Salt Depthat 7500C
for the Binary Chloride Mixture 105

List of Tables
Table 4.1 Physical Properties of Molten Salt Candidates 48
Table 4.2 Partial pressure of HCI generated by the reaction between 1 kg of molten salt and 1m3 of air
as a function of temperature and air humidity at 25'C 68
Table 4.3 Partial pressure of HCI generated by the reaction between 1 kg of molten salt and 1m3 of air
as a function of temperature and air humidity at 25'C - 1% of NaOH added to the salt 69
Table 4.4 Partial pressure of HCI generated by the reaction between 1 kg of molten salt and 1m3 of air
as a function of temperature and air humidity at 250C - 0.1% of NaOH added to the salt 70
Table 4.5 Partial pressure of HCI generated by the reaction between 1 kg of molten salt and 1m3 of air
as a function of temperature and air humidity at 25*C - 0.01% of NaOH added to the salt 71
Table 4.6 HC Reduction Factor for the system 1 kg of molten salt and 1m3 of air
as a function of temperature and air humidity at 250C - 1% of NaOH added to the salt 72
Table 4.7 HCl Reduction Factor for the system 1 kg of molten salt and 1m3 of air
as a function of temperature and air humidity at 25*C - 0.1% of NaOH added to the salt 72
Table 4.8 HCI Reduction Factor for the system 1 kg of molten salt and 1m3of air
as a function of temperature and air humidity at 25*C - 0.01% of NaOH added to the salt 72
Table C1 Relative Attenuation and Transmission Percentages as a function of Salt Depth
for the Binary Nitrate Salt 103
Table C2 Total Attenuation and Transmission Percentages as a function of Salt Depth
for the Binary Nitrate Mixture 104
Table C3 Integral Attenuation and Transmission Percentages as a function of Salt Depth
for the Binary Nitrate Salt 104
Table C4 Relative Attenuation and Transmission Percentages as a function of Salt Depth
for the Binary Chloride Mixture 106

Table C5 Total Attenuation and Transmission Percentages as a function of Salt Depth
for the Binary Chloride Mixture 106
Table C6 Integral Attenuation and Transmission Percentages as a function of Salt Depth
for the Binary Chloride Mixture 107

1. Introduction
A future, robust energy portfolio will include, together with fossil fuel technologies and nuclear
systems, a mix of renewable energy systems. Within each type of system there will also be variants used
to strengthen a nation's baseload and/or peak power requirements. Among renewable energies, solar
thermal systems are particularly promising in terms of their capability of contributing to the base-load
power generation, provided enough thermal storage for continuous operation also overnight. In
particular, direct volumetric absorption of the solar heat into molten salts seems to be a promising
technology, in terms of efficiency and greenhouse gases emission reduction, which combines the good
properties of molten salts as heat storage media with high operating temperatures.
Power towers use heliostats in a field to focus sunlight on a receiver placed atop a tower to
reduce heliostat shadowing, to increase optical efficiency and to achieve very high solar flux
concentration and steam plant efficiency. Historically, one of the main limitations associated with
concentrated solar towers for the production of electricity has been the economy of the system,
penalized by multiple inefficiencies. In a concentrated solar power tower, a set of collecting mirrors
reflects sunlight onto a solar boiler mounted on the top of a large tower. Light is absorbed by the boiler
tubes, and the heat raises the temperature of a salt mixture (or water) coolant inside the tubes. The hot
coolant then transfers heat to a steam cycle or other power cycle or is sent to a large insulated storage
tank. When the sun does not shine, hot salt from the storage tank is used to provide heat to the power
cycle. The boiler tubes are outside and exposed to the air with no insulation. Consequently, there are
high heat losses by radiation from hot surfaces and by air convection. In addition, the salt has to be
pumped up to the high elevation of the boiler, which requires significant pumping power. The heavy
boiler also implies a well-built solar power tower with high capital costs. Although many studies point to

central receivers as ultimately being the key to economic Concentrated Solar Power (CSP) [], production
and operating costs have yet to signal that current designs are anywhere near optimal. A variation on
the power tower design was developed in 1978 by Ari Rabl of Argonne National Laboratory who
proposed a beam-down tower with a ground-based receiver [1]. In 1997, Amnon Yogev of the
Weizmann Institute proposed a beam-down Power Tower where the light was to be beamed directly
into a molten salt/metal filled container [2]. The Weizmann Institute has done significant experimental
work with beam-down towers and ground receivers, especially for reforming materials [3].
A ground based system is the Odeillo solar furnace facility in the French Pyrenees [4] which uses
a large north facing parabola focused on a target built into one wall of a building that holds offices and
laboratories. In front of it, on the mountainside, 63 south-facing flat mirror heliostats track the sun's
movement and focus it on the north facing parabola. About 70% of the cost of the installation was
devoted to the 5.5-by-7.0-meter heliostats which can withstand 100 km/h winds. Temperatures as high
as 3,8000C were quoted as being obtainable with some targets. NREL also has a high-flux solar furnace
system where heliostats aim light towards a ground-based secondary reflector system that redirects and
concentrates the sunlight to a small aperture receiver. Another approach is direct absorption of
sunlight by several cm thick salt waterfalls, but the cost of pumps, manifold and piping pre-heaters, and
the effects of fluid flow as a function of varying solar flux, limited the practicality of such systems [5].
With regard to the material compatibility and more generally chemical properties of molten
salts for industrial applications, it is interesting to point out that the use of high-temperature salts were
investigated as coolants for use in nuclear reactors-specifically the molten salt reactor [6]. This was a
large reactor program in the 1950s and 1960s with two test reactors built and successfully operated. The
first large-scale high-temperature industrial salt application was the use of fluoride salts in the
production of aluminum. For over a century the standard production method for aluminum is

electrolysis where aluminum oxide is dissolved in cryolite, a mixture of aluminum and sodium fluoride at
about 10000C in a graphite-lined bath. Several high-temperature chloride (MgC 2, NaCl and KC or LiCI,
NaCl, and KCI) and carbonate (Li2CO3, K2CO3, Na2CO3) salt mixtures are also used for heat treating of
steel where there are open salt baths used to heat or cool down steel components. These systems
provide operational experience with these salts under a wide variety of conditions. But existing
industrial applications do not provide experience in keeping the salt pond optically clear, in performing
daily thermal cycles characterized by hundreds of degrees of thermal excursions and in heat transfer by
radiation; all these aspects have to be considered on the critical path for the CSPonD project, which is
described in the next section. Molten salts are also taken into considerations for the development of
high temperature nuclear systems [7]. This interest is a consequence of new applications for high-
temperature heat including hydrogen production, oil refining and recovery. In particular, the increasing
demands for high-temperature heat, the ability to convert such heat efficiently to electricity, and the
interest in advanced reactors and alternative nuclear fuel cycles are creating the incentives to develop
this family of technologies, opening several new frontiers for nuclear energy.
This thesis is undertaken with the support from the CSPonD project and concept. As such, the
focus of the thesis is on the solar applications of high-temperature molten salts. However, a large
fraction of the results are relevant and applicable also to the aforementioned nuclear technologies.
1.1 The CSPonD Project
The CSPonD project (Concentrated Solar Power on Demand, developed and currently under
investigation at the Massachusetts Institute of Technology) aims at improving both the economy and the
autonomy of concentrated solar power plants by replacing the solar boiler and the associated heat

storage tank with a high temperature molten salt pond and by providing heliostats on a hillside that
beam light directly into a small aperture container of molten salt. An aperture in the receiving pond
located near the base of the hill and at the focus of the heliostats lets the sunlight in, and then it
diverges to illuminate a volumetric absorption receiver. The light would penetrate the surface of the
large molten high temperature salt pond. The system can thus simultaneously collect sunlight while also
acting as the beam-down optic thereby reducing overall system complexity and cost. The use of a
hillside eliminates the need for large, secondary beam-down mirrors and compound parabolic
concentrators (CPC) that would otherwise need to be placed over a ground based system to illuminate a
large open molten salt tank. The thermal inertia of the molten salt pond, based on the design
constraints and desired operational features, can be large enough so that process heat can be extracted
also during night or when the sun is not shining. The CSPonD system can therefore effectively store the
solar energy and provide continuous operation for baseload power needs.
There are numerous candidate salts for volumetric absorption receivers: mixtures of nitrates,
carbonates, and chlorides which can be selected based on operating temperatures, durability, thermal
and light absorption properties, materials compatibility and cost. These salt candidates are fully
analyzed in Chapter 4, which presents the salt selection process for the CSPond project. As a near term
solution, a sodium-potassium nitrate salt (e.g., Hitec* solar salt: 60/40 wt% NaNO 3-KNO 3) which is
already widely used and has a low melting point of 2220 C was proposed; however, above 5930 C, the salt
decomposes and becomes very corrosive and dangerous. The advantage of using this salt is that systems
have currently been engineered to pump it between hot and cold storage tanks and a steam generator
[8]. Cost-savings have also been shown with single tank systems relying on temperature stratification
[9]. Volumetric absorption allows the bulk of the salt to run closer to its decomposition temperature, as
opposed to conventional boiler tubes filled with nitrate salts, whereby irradiance transients and higher

surface absorption of tubes in localized areas can exceed nitrate salt peak allowable temperatures or
burn out tubes. This salt could be safely used if great care was taken to ensure that no hot spots were
created that might lead to localized overheating of the salt. Higher temperature options (greater than
600'C) include chloride and/or carbonate salts. With these salts, the temperature limits are removed
and salt can collect energy and store energy at temperatures significantly beyond where we have
materials of construction for power cycles. The preferred high temperature salt is sodium chloride and
potassium chloride (50/50 wt% NaCl-KCI), which has a eutectic melting point of about 670'C and a
boiling point of 1350'C. This low-cost salt is extremely robust and essentially cannot be damaged. Heat
from the salt pond is continuously drawn through a heat exchanger and converted into electricity by a
dedicated power cycle.
The CSPonD system will thus fill a critical need in solar power, that of energy storage which is
required if solar energy is to satisfy baseload needs. CSPonD provides 24/7 power without either
extensive combustion of fossil-fuel backup, or very high cost and not yet existent battery storage. As
such, CSPonD offers substantial installed capacity for utilities and not simply energy savings: it will be a
feasible strategy that is amenable to most high beam irradiation locales and could change the face and
perceived feasibility of high grid impact solar power generation.
1.2 Thesis Objective
The main objective of this thesis is the identification and selection of suitable salt candidates for the
CSPonD system and their characterization and testing in terms of light attenuation properties and
material compatibility. The thesis objectives were addressed with experimental research supported by

background research of existing literature and the use of thermodynamic equilibrium software.
Background research included looking into theoretical models describing the light propagation in
semitransparent media in order to be able to provide an estimate of the fraction of the light absorbed
and scattered by the salt samples. Also, the background research included finding existing results for
light attenuation of salts for validation of the custom built experimental apparatus by benchmarking.
The optical properties of the selected salt affect the design of the entire system, according to the
capability of the salt to absorb, reflect and scatter the incident solar radiation. In addition, the chemical
stability and compatibility with surrounding materials determine the layout and the technical solutions
to be adopted inside and outside the pond itself to meet the desired design requirements.
On a more fundamental level, the light attenuation properties of molten salts have not been
investigated in depth and it is very difficult to find any reliable source of data or extensive studies
covering the entire wavelength range of interest for solar applications. In literature, molten salts are
generally described as 'transparent' in the visible range and 'highly absorbing' in the infrared region.
However there is no report of a precise quantification of transparency and absorbance in terms of
extinction (or attenuation) coefficient, nor was it possible to find in the literature specific data regarding
the scattering vs. absorption, both of which contribute to light attenuation. The most relevant study
regarding molten salts as a direct heat storage media was performed in the 70s mainly at Sandia
National Laboratories in the context of the Direct Absorption Receiver project (DAR) [10]. In this study,
nitrite/nitrate mixtures to be used in the DAR concept were partially characterized in terms of optical
properties, and in particular light absorption, by Drotning et al. [11]. The main, intrinsic limitation
associated with the use of nitrites/nitrates mixtures is represented by the decomposition of these salts
into brown nitrogen-oxide fumes above 5500C.

2. Background
Before presenting and describing the experimental campaign and the literature survey performed
and the related results, it is necessary to introduce and contextualize the theoretical background
supporting the idea of molten salts as heat absorption, storage and transfer media. Literature on molten
salts is not extremely wide; however, given the relative importance of molten salts in electrochemical
and thermal processes, several salt systems have been characterized in the past, including a specific
theoretical background supporting the main experimental evidences [12] [13]. The most relevant
literature study on molten salts was done by George Janz, who published a 'Molten Salts Handbook'
[14], which includes experimental data on molten salts properties as well as useful correlations and on
which also the NIST (National Institute of Standards and Technologies) properties of molten salt
database (currently discontinued) was based. A very large number of salt systems and mixtures have
been listed, even if only a few of them have been extensively studied. The most common and also
commercially used systems are carbonates, chlorides, nitrates and nitrites systems which were all taken
into consideration during the salt selection process for the CSPonD project (see Chapter 4). A brief
description of molten salts, applicable to all salts considered in this thesis, follows.
2.1 Molten Salt Mixtures
The development of conventional and industrial chemistry has been historically influenced very
strongly by the abundance of water [15]. The same could also be said for heat transfer engineering and
in general for many conventional industrial processes. Thus the evolution of many chemical and
industrial manufacturing processes has been controlled by this view and further investigations have
18

often been directed to improving these processes rather than to the discovery from first principles of
better ones. This approach of pursuing incremental, instead of radical, technological innovation has
represented a partial limitation to further progresses in many engineering fields. In actual facts, for
example, molten salts are often much better and more versatile solvents than water and other room
temperature liquids. On the heat transfer engineering side, the wide variety of operating temperature
ranges combined with low vapor pressures (compared to water) make molten salt mixtures potentially
good heat transfer fluids for several applications, including nuclear reactor coolants [22].
Molten salts have in general non-electrolyte properties similar in magnitude to those of room
temperature liquids, in spite of the obvious temperature differences. Thus molten alkali halides are
visually clear water-like liquids that have comparable refractive index, viscosity, surface tension and only
a slightly higher thermal conductivity than water itself. The vast difference in cohesive forces between
the two classes of liquids is thus compensated to a large extent by the different temperature ranges of
existence. The different types of cohesive forces for the two classes of liquids lead, however, to very
different temperature range of stability. Molten sodium chloride, for example, with its strong electrical
forces between the two ions at approximately close packed distances has a normal liquid range of about
600*C, compared with 100"C for water at ambient pressure with its weaker dipolar forces (hydrogen
bonding). As far as electrical conductance is concerned, molten salts have values that are far in excess of
those for room temperature liquids (although much less compared to a typical well conducting metal
such as copper or molten sodium). Molten salts are, in addition, by far the best class of ionic conductors,
presenting specific conductance about one order of magnitude larger than the corresponding aqueous
solutions.
Considering the solar heat absorption and storage and high temperature applications in general, the
optical properties of molten salts are obviously extremely relevant. Historically, studies of optical

properties of liquids have long been one of the most important physical methods for gaining structural
information on such systems [15]. The next section will present and describe the theoretical background
necessary to understand and validate the experimental studies previously done and the objectives of
the experimental activity presented in this Thesis.
2.2 Theoretical Optical Properties of Semi-Transparent Media
Any solid or liquid that allows electromagnetic waves to penetrate an appreciable distance into it is
known as a semitransparent liquid. This is a qualitative definition and what constitutes an 'appreciable
distance' depends, of course, on the physical system under consideration. Generally speaking, pure
solids with perfect crystalline or very regular amorphous structures, as well as pure liquids, gradually
absorb radiation as it travels through the medium, but they do not scatter it appreciably within that part
of the spectrum that is usually of interest to the most common heat transfer applications (UV-VIS-IR,
namely from 200nm to about 3000nm). A number of theoretical models exist, able to predict the
absorption and scattering characteristics of semitransparent media. As for opaque surfaces, the
applicability of such theories is limited and they must therefore be used in conjunction with
experimental data [16].
The interaction between photons, or electromagnetic waves, and small particles (impurities, always
present to a certain extent in every environment) is somewhat different from that with a homogeneous
gas, liquid, or solid. As for a homogeneous medium, radiation travelling through a particle cloud may be
transmitted, reflected or absorbed. In addition, however, interaction with a particle may change the
direction in which a photon travels. This can occur by one of three different mechanisms:

- The path of a photon may be altered, without ever colliding with the particle, by diffraction;
- A photon may change its direction by reflection from the particle;
- The photon may penetrate into the particle, changing its direction because of refraction;
All the three phenomena together are known as scattering of radiation. Absorption takes place as
the electromagnetic wave penetrates into the particle. In literature one of the most recurring physical
quantities describing these phenomena is the attenuation coefficient which can be defined in terms of
absorption and scattering coefficients as:
attenuation (2, T) = absorption (2, T) + scattering (A, T) (2.1)
All three coefficients are meant to physically represent the inverse of exponential characteristic lengths
and have therefore the dimensions of [length-]. The attenuation coefficient describes the mono-
directional penetration of the light inside the medium, while absorption and scattering coefficients are
used to distinguish between the two physical phenomena causing the light attenuation. For the system
of interest, both attenuation and absorption coefficients (and, therefore, also scattering which is linearly
related to the other two coefficients) are important to be able to estimate how far can the light
penetrate into the salt pond and how much of the solar light can be absorbed by the salt itself.
However, as is widely reported in literature and as will be shown in the following chapters, the
distinction between scattering and absorption is not trivial under an experimental point of view, while
the measurement of the combined effects into the attenuation coefficient results easier.

Therefore, in presence of scattering, the equation for transmissivity t (defined as the transmitted
intensity of radiation over the incident one, usually function of several variables among which radiation
wavelength and medium temperature) of a material layer becomes:
T = e-(-+s)X = e-#x (2.2)
where a; is known as scattering coefficient, K as the absorption coefficient and # = K + cr; as the
extinction (or attenuation) coefficient. If the radiative properties of a medium are to be theoretically
evaluated from electromagnetic wave theory, the complex index of refraction, m = n - ik (where n is the
refractive index and k the absorptive index) or, equivalently, the complex dielectric function e= e + iV',
must be known over the spectral range of interest. The two sets of parameters are in fact related [17]
and the refractive index and the absorptive index can be expressed as:
n 2 = (E' + E'2 +E"2) (2.3)
k 2 = (-E' + V' + E"2) (2.4)
The complex dielectric function can be evaluated through a number of classical and quantum
mechanical dispersion theories which have been developed to predict the value of this
phenomenological coefficient. Those models are however not extremely reliable over large wavelength
ranges and therefore empirical correlation are needed to be able to estimate it.
Generally speaking, any material may absorb or emit radiative energy at many different
wavelengths as a result of impurities (presence of foreign atoms or particles) and imperfections in the
ionic crystal lattice. However, a number of global phenomena tend to dominate the optical behavior of a
substance. In the frequency range of interest to the heat transfer engineer (ultraviolet to infrared),
electromagnetic waves are primarily absorbed by free and bound electrons or by change in the energy
level of lattice vibration (conversion of a photon into a phonon).

The principal theory describing these phenomena in a classical way assumes that electrons and ions
are harmonic oscillators subjected to forces from interacting electromagnetic waves [17]. All solids and
liquids may absorb photons whose energy content matches the energy difference between filled and
empty electron energy levels on separate bands. Since such transitions require a substantial amount of
energy, they generally occur in the ultraviolet (i.e. at high frequency). A near-continuum of electron
energy levels results in an extensive region of strong absorption (and often many overlapping bands). It
takes considerably less energy to excite the vibrational modes of a crystal lattice, resulting in absorption
bands in the infrared. Since generally few different vibrational modes exist in an isotropic lattice, such
transitions can often be modeled with a single band. In the case of electrical conductors photon may
also be absorbed to raise the energy levels of free electrons and of bound electrons within partially filled
or partially overlapping electron bands. The former, because of the nearly arbitrary energy levels that a
free electron may assume, results in a single large band in the far infrared; the latter leads to narrower
band in the ultraviolet to infrared.
The absorption behavior of ionic crystals can be rather successfully modeled by the Lorentz model
[18]. The Lorentz theory predicts the existence of Reststrahlen bands, related to the photon excitation of
lattice vibrations, in the mid and far infrared (wavelength > 5 tm).The wavelength at which the highly
absorbing region begins is also called 'long wavelength absorption edge'. The Lorentz model also
predicts that the excitation of valence band electrons, across the band gap into the conduction band,
results in several absorption bands at short wavelength (usually around the ultraviolet). So materials
that are essentially opaque in the ultraviolet become highly transparent in the visible and beyond. Pure
solids are generally highly transparent between the two absorption edges; if large amounts of localized
lattice defects and/or dopants are present, electronic excitations may occur at other wavelengths in
between. A number of detailed models can predict the absorption characteristics of such defects [18].

In general, the absorption properties of semi-transparent liquids are quite similar to those of solids,
while they also display some behavior similar to molecular gases. Remnants of intermolecular
interactions are observed in many liquids, as are remnants of electronic band gap transitions in the
ultraviolet. In the wavelengths in between, molecular vibration bands are observed for molecules with
permanent dipole moments, similar to the vibration-rotation bands of gases. Because of its abundance
in the world around us, the absorption properties of water are by far the most studied [19][18]. Natural
waters generally contain significant amount of particulates (small organisms, detritus) and gas bubbles,
which tend to increase the absorption rate as well as to scatter radiation. While a number of
measurements have been made on varieties of natural waters, the results are difficult to correlate since
the composition of natural waters varies greatly [19]. Since Reststrahlen bands tend to widen with
increasing temperature, the long wavelength absorption edge moves usually towards shorter
wavelengths, while the short wavelength one moves usually towards longer wavelengths for increasing
temperature [18].
2.3 Previous Experimental Work
The spectral absorption coefficient of a semitransparent solid or liquid can be measured in several
ways. The simplest and most common method is to measure the transmissivity of a sample of known
thickness (this technique requires also an estimate of the scattering contribution). Since solids and
liquids reflect energy at their interfaces, the transmissivity is often determined by forming a ration
between transmitted signals from two samples of different thickness. However, the transmission
method is affected by large errors when used to measure very small or very large absorption
coefficients: for samples with large transmissivity, small errors in the determination of the transmissivity

may lead to very large error for the absorption coefficient (due to the logarithmic dependence). On the
other hand, for a material with large attenuation, only extremely thin samples can be used; the
preparation of those samples can lead to different composition compared to the parent material [16].
The absorption coefficient may also be determined through a number of different reflection techniques.
The reflectivity of an optically-smooth interface of a semitransparent medium depends, through the
complex index of refraction, on the refractive index as well as the absorptive index [18]. Due to the
directional dependence of reflectivity, at least two different angles are required to estimate the
absorption properties of the medium with reflection techniques. It is also possible to measure the
reflectivity at a single angle using parallel and perpendicular polarized light, known as ellipsometric
technique [20].
Measurements of physical and optical properties at high temperatures is always difficult, and this
turns out to be particularly true for semitransparent media since at least two properties are needed to
characterized them completely (absorption coefficient as well as interface reflectivity or attenuation
coefficient as well as scattering contribution). Measurements of the optical properties of a high
temperature liquid are even more challenging. High temperature liquids are in fact often highly reactive,
making more difficult an inert confinement of the liquid in a sample holder. For what regards molten
salts, the measurement of these properties has been object of previous experimental works [11] mainly
focused on nitrates/nitrites mixtures or on single chloride/carbonate salts close to melting points. No
extensive studies on chloride/carbonates mixture at high temperatures (relatively to the respective
melting points) were performed in the past. As a general consideration, molten salts are reported in
literature [15] to be transparent or semitransparent in the visible wavelength range and absorbing or
highly absorbing in the infra-red wavelength range [18]. However, the experimental conditions and the

applications of previous studies make the quantification of the transparency and absorbance of molten
salts and the extensions of the obtained results to different systems particularly challenging.
One of the most relevant experimental works described in literature was done by Drotning et al.
[11], in the context of the Sandia National Laboratories Direct Absorption Receiver Project [10]. In his
work, Drotning partially characterized a ternary mixture (made of sodium nitrate, potassium nitrate and
sodium nitrite, 53 wt% KNO3, 40 wt% NaNO2 and 7 wt% NaNO3, with a melting point of 1420C) and a
binary mixture (made of sodium nitrate and potassium nitrate, 58 wt% KNO3, 42 wt% NaNO3, whose
melting point is 222*C). Drotning adopted both transmission and reflection techniques to estimate the
light absorption of the molten salt mixtures. Other than characterizing a peculiar behavior of the ternary
mixture (an absorption edge around 400nm which shows a shifting with temperature, as fully discussed
in Chapter 4), Drotning generally described the two salts as 'transparent' over the remainder of the
visible spectrum without discussing the actual experimental values. From his work it can also be inferred
that the experimental errors involved with the small salt thicknesses investigated could not allow a clear
quantification of small values of attenuation coefficient, typical of semi-transparent liquids. The actual
main objective of his work was in fact to show the effect of absorbing oxide particles suspended in the
molten salt for direct absorption of the solar light. He proved that particles can increase the volumetric
absorption of light by an order of magnitude and also concluded that the biggest challenge is the
stability and the dispersion without agglomeration and sedimentation of the particles suspended into
the salt [11].
Makino and other Japanese researchers also investigated the thermal radiation properties of single
molten salts including nitrates and chlorides [21]. Using a reflectance technique they were able to
experimentally measure the refractive index and the absorption coefficient of single salts at
temperatures slightly above (about 30K) the respective melting point. By so doing, they also verified the

error given by the extrapolation of suitable dispersion relations available for some wavelength ranges.
Most of their spectral characterization was focused on wavelengths longer than 1gm, which means
outside the visible range (390nm-750nm). Again, the use of relatively small salt thicknesses (on the
order of mm), the lack of experimental points in the visible range and also the arbitrariness in defining
the 'transparency' of the salts over certain wavelength ranges makes any practical extension of their
results to real engineering applications difficult.
The lack of direct light attenuation data in the visible range as a function of wavelength and
temperature is often mentioned in literature as one of the potential unknowns and main sources of
uncertainties for engineering application of molten salts (especially molten salt systems and mixtures)
for heat storage and solar power systems [21]. However, no systematic, extensive and quantitative
characterization of the most common salt systems can be found in recent literature. On the other hand,
works described in less recent literature are affected by common sources of uncertainty (like
measurements performed on thin layer of salts) and limitations associated with the use of molten salt
and common structural materials (i.e. corrosion and salt contamination issues). As a result, literature on
optical properties of molten salts is highly qualitative instead of quantitative. Clearly theoretical models
are not able to provide sufficiently accurate estimates of those properties and therefore the need of a
dedicated experimental activity that aims at those properties is clear, and its relevance not limited only
to the context of the CSPonD project.

3. Experimental Approach
Given the fact that reliable theoretical models for the estimation of optical properties of molten salt
systems and specific experimental campaigns over the wavelength range of interests were not found
(see Chapter 2), an experimental approach was considered a promising way to characterize the molten
salt mixture (as shown in Chapter 4). For what regards the possible experimental techniques presented
in Chapter 2, it was decided to adopt the transmission technique, mainly because of its simplicity and
relatively low cost [12] compared to reflection or ellipsometric ones.
A unique furnace based apparatus to melt salts and measure their attenuation coefficient at various
temperatures and wavelengths was therefore designed and built. The apparatus is shown in Figure 3.1
and has been used to measure optical properties of a number of candidate molten salts (see Chapter 4,
Section 3 for the experimental results). It is capable of operating from room temperature up to 1,1000 C.
Lig ht Source Patch-Cord-and Collimating Lense
Furnace Wall- -- -Inner Quartz Cuvette
Outer Quartz Cuvette
Molten Salt Sample -
Alumina Support Tube-
Supporting Refractory BricksIntegrating Sphere andSpectrometer Patch-Cord
Figure 3.1 The MIT Molten-Salt Light-Absorption Facility

The apparatus consisted of a vertically oriented and electrically heated split tube furnace. Two
concentric and coaxial right cylinder GE124 quartz cuvettes, with inner diameters of 42 mm and 22 mm,
were vertically oriented in the furnace (Figure 3.2)
Figure 3.2 The Two Concentric Cuvettes Inside the Furnace
The salt, however, was added to only the outer cuvette. The outer cuvette was fixed and the
inner cuvette was attached to a screw driven precision slide (Figure 3.3) that provided for its vertical
motion. Movement of the inner cuvette allowed for fast measurement of transmitted light intensity, I,
with depth. A 300 W tungsten filament halogen bulb served as the light source and was powered by a
direct current power supply. The light was captured by a collimating lens that was attached to a fiber
optic cable. The fiber optic cable carried the light to the top of the furnace where a second collimating
lens was mounted to the same structure as the inner cuvette slide. In this manner a collimated light
I -n::: -..............- - ... - - -: - : - - I I - . - - : : 0 0 " . - - - - -- , MNMMMMW

beam shined through the furnace cavity, inner cuvette, salt, and outer cuvette before being gathered by
an integrating sphere (IC2, StellarNet Inc) with a 90 degree fiber optic port. A second fiber then carried
the light from the integrating sphere to a spectrometer (Blue Wave UVN-100 Spectrometer, StellarNet
Inc), which had a bandwidth of 250 to 1100 nm and a resolution of 3.2 nm. The temperature was
measured by inserting a sheathed K-type thermocouple into the furnace through a radial hole at the mid
height of the furnace. This experimental apparatus measures the combined effect of absorption and
scattering, and therefore is designed to provide the attenuation coefficient as defined in Chapter 2.
Keeping all the optical components far from the furnace and at low temperature (<50 0C) was
advantageous in terms of experimental layout, simplicity, costs, and materials selection. However, the
greater the distance between the top collimating lens and integrating sphere the greater the effect of
spurious factors such as vibrations induced by the fume hood where the furnace is situated, the optical
quality of the quartz cuvettes, optical misalignment, and the radiation emitted by the furnace above
700*C. To counter these effects the cuvettes were custom made with flat distortion free bottoms, the
beam was collimated to a 2 mm diameter beam, and an integrating sphere employed.
Additionally, the two cuvette design eliminated vibration issues by removing the liquid free
surface from the beam path and reducing the time between depth measurements. It was found (see
Chapter 4) that at high temperatures the quartz would become hazed. Reducing the time between
depth measurements and making the measurements relative to the smallest salt thickness measured (/,)
prevented hazing of the cuvettes from affecting the measured attenuation coefficient. That is, any
surface and interface effects, which are not dependent on the actual salt thickness, would affect all
measurements equally, and thus cancel. Additionally, the double cuvette design allowed for repeated
depth measurements at various temperatures on a single salt charge. The success of this apparatus

then relied on the fact that all optical components are located outside of the furnace, where the
temperature is low (<50*C), and the ability to insure that 10 is constant for each scan of I with depth.
Figure 3.3 Cuvettes, Furnace and Screw Driven Precision Slide

3.1 General Description of the Experimental Apparatus Components
The first piece of equipment needed to perform the preliminary chemical stability and material
compatibility experiments with the molten salt mixtures for the CSPonD project was a furnace. The main
requirement posed on it was the temperature, which should at least go up to 10000C, the highest
operating temperature of the molten salt pond according to the preliminary project design. An existing
furnace shown in Figure 3.4, already part of the available lab equipment, was reported to be able to
reach 1200*C. Therefore, instead of directly buying a new one, it was decided to try to first determine if
the existing furnace could be readapted to the specific needs of the CSPonD project. This allowed, once
satisfied all the basic requirements, to have a higher flexibility compared to a commercial product, and
therefore to be able to cover with the same apparatus as many experimental conditions as possible
without incurring in design limitations.
Figure 3.4 Disassembled Lab Furnace
The furnace was disassembled and the central heating elements (consisting of two semi-
cylindrical blocks, showed in Figure 3.4 and Figure 3.5) were extracted to be used as a new furnace. By
doing this, it was also necessary to estimate correctly the electric parameters of both the old and the

new furnace configuration and to check the compatibility with the lab power supply capabilities. In
addition, also some wiring work was required to re-connect the heating elements wires to a new power
supply source.
Figure 3.5 Heating Elements Extracted from the Furnace
By connecting the two central blocks in parallel and reducing the voltage to 120V, we were able to
supply to the furnace in the new configuration the same power previously given just to the central part
in the old furnace. The 120V is directly available in the lab fume hood, where the furnace was set for the
experiments described in Chapter 4.
Figure 3.6 Electric Connections at the Top of the Furnace

The new-configured furnace was placed in the fume hood (Figure 3.7), using some refractory bricks as a
lower support. The dimensions of the tube furnace are: height 30.5 cm, inner diameter 8.3 cm, outer
diameter 10.2 cm. The furnace was then externally insulated (Figure 3.8) using an alumina silica ceramic
fiber for a total radial insulating thickness of about 6.5 cm. Additional temporary insulation was provided
also to cover the top of the furnace; this was useful in reducing the heating time when high
temperatures are needed (improving the insulation reduces the heat losses).
Figure 3.7 Furnace Sitting in the Fume Hood
Figure 3.8 Insulated Furnace Sitting on Refractory Bricks

A first test of the furnace consisted in heating the furnace up to 1100*C, 100*C beyond the design
temperature for the hottest of the salt baths designed for the CSPonD project. The test was successful
(Figures 3.9 and 3.10), the furnace did not show any problem during the experiment, and the insulation
provided was good enough to allow hand contact at an acceptable temperature (less than 50*C) with
the exterior surface of the whole setup. Furnace temperature was measured (Figure 10) at the central
axial location by means of a K-Thermocouple inserted radially through an existing hole for temperature
control instrumentation.
Figure 3.9 Top oT Furnace at 1100'C
Figure 3.10 Furnace Temperature 1100*C

The above described furnace configuration was kept basically the same for all experimental
runs. The coupling between the furnace and the optical equipment required some layout changes (see
also Figures 3.1, 3.2 and 3.3) and the presence of other structures, but the furnace parameters and
conditions were kept the same. During the experimental campaign one of the two semi-cylindrical
heating elements failed due to the corrosion of the electric wire probably enhanced by salt vapors and
salt deposition on it. However, it was possible to purchase from Watlow a semi-cylindrical heating
element fitting the original one both for what regards dimensions and also for the electrical
characteristics. No changes of the power cables or power supply were therefore required after this
partial replacement. Figure 3.11 shows the most recent layout of the furnace.
Figure 3.11 Furnace After Partial Replacement of the Heating Elements
The other two main components of the experimental apparatus for the optical measurements
are the integrating sphere collecting the light after having passed through the sample and the
spectrometer which analyzes and characterizes the transmitted spectra in terms of intensity vs.
wavelength. Both the integrating sphere and the spectrometer were purchased from Stellarnet
(www.stellarnet-inc.com/), which also provided the light acquisition and data analysis software.

Figure 3.12 StellarNet Blue Wave UVN-100 Spectrometer
The StellarNet Blue Wave UVN-100 Spectrometer (Figure 3.12) is a fiber optic coupled
instrument for measurements in 200-1150nm wavelength ranges. The unit contains a USB interface with
a snap shot memory to provide instantaneous spectral image from a highly sensitive Charge Coupled
Device (CCD). Improved electronics with a high speed 16-bit digitizer allows for fast data acquisition and
a signal to noise of 1000:1. Additionally the spectrometers can be powered directly from a PC USB-2
port. A single strand fiber optic cable or probe assembly delivers input via standard SMA 905 fiber optic
connector with a fiber optic cable. The spectrograph optics is also referred to be robust in a vibration
tolerant modular design, with no moving parts. The SpectraWiz* 32 bit spectrometer software is
compatible with every StellarNet spectrometer instrument and may be used to measure wavelength
emissions, reflectance, transmission, absorption, concentrations, and absolute intensities when properly
calibrated. In addition to real-time spectroscopy, SpectraWiz* has built-in applications for
SpectroRadiometry, SpectroColorimetry, ChemWiz chemistry lab concentration analyzer, and UV level
monitors. The detachable spectrograph assembly and control electronics are protected inside a rugged
metal enclosure, suitable for portable, process, and lab applications. Several units (up to eight) may be
_ : ... ....................... ...... ..

daisy-chained using a standard USB hub allowing simple configurations for dual and multi-beam
applications in chemistry and spectroradiometry.
Figure 3.13 StellarNet IC2 Integrating Sphere
Integrating Spheres are usually used to measure light emissions including radiant or luminous flux or
light reflectance from sample surfaces. Integrating spheres are particularly useful because they are able
to collect light with a 180* field of view and can also be calibrated for irradiance measurements
(measuring energy as a function of wavelength instead of simple photon counts).
In our case, as the alignment between the optical equipment, the sample holder and the light beam
was absolutely critical, the use of an integrating sphere able to smear the light signal over a larger solid
angle helped to eliminate the effect of small misalignment and keep the light signal steady during the
measurements. The IC2 Integrating Sphere, shown in Figure 3.13, is a 2" cube with a 5/8" input port and
SMA fiber optic output. A second SMA input can be used for reflectance illumination but was
nonessential for our optical measurements.

Once the experimental apparatus was operational and validated it, the next logical step in order to
perform optical measurements was the definition of a proper experimental procedure. After several
refinements and small changes aimed at sensibly improving the quality of the obtained measurements,
the following experimental protocol was fixed and adopted. The experimental procedure for the
characterization of the light attenuation of the molten salt candidates first required the alignment the
light path with the cuvettes and integrating sphere, which was proven to be particularly important, as a
first step. The outer cuvette is then charged and the furnace slowly brought to the temperature of
interest. Once the temperature and the measured light intensity are stable and the inner cuvette is at
its highest position of approximately 8 or 10 cm of salt thickness, the light beam is chopped by placing
an obstruction between the bulb and first collimator and this background spectrum recorded. An
integration time of 300 ms and two sets of five spectral scans each are averaged for each spectrum
acquired at each depth. The obstruction is removed and this spectrum recorded. The chopped spectrum
(shown in Figure 3.14) is then subtracted from the unobstructed spectrum and this spectrum is used for
all subsequent attenuation coefficient calculations (see Chapter 3 for extensive details on the
experimental apparatus).
The inner cuvette is then lowered in 1 or 2 cm increments and the spectrum acquisition procedure
repeated. Once the measurement for the minimum salt thickness of about 2cm is obtained, the cuvette
is raised in 1 or 2 cm increments and the spectral data acquired at each increment until the inner
cuvette returned to its initial highest position. Scanning the depth range twice in this manner requires a
total of approximately 30 minutes, and allows for verification of the repeatability of the attenuation vs.
depth data. Since the alignment of the optical components is critical and the final position of the light
spot is related to the relative orientation of the interposed surfaces, it is necessary to check that it is
possible to keep a good alignment over the desired excursion range. Several tests were preliminary
performed acquiring the light signal with the outer cuvette empty at different relative positions of the

inner cuvette with respect to the outer one. No changes in the light signal intensities (which means light
source spectra perfectly overlapping) were observed up to 10cm of path length, but, to be conservative,
the maximum excursion range for the measurements was fixed to 8cm. Further extension of the light
path will require further refinement of the experimental apparatus and in particular of the light
collimation (the smaller the beam size, the less sensitive the measurement will be to the alignment
provided that the light beam is entirely collected by the integrating sphere).
.1012dFP Setup View AVpp Db H.lp Sco Ah Trac Id
3370 i
IM.pS0C
3 00 4 00 000W 700 sm 00 1000
S000. w4.sx.73u..0.0 V.a 2520.565T.3o0. ANs sc3 sco T.-.T 00:3 aad
Figure 3.14 Typical Spectrum for Chloride Mixture at 850C (blue line)and Chopped Background Radiation (red line)
Using the experimental apparatus and the experimental procedure above described, we performed
light attenuation coefficient measurements on two molten salt candidates: a binary chloride mixture
and a binary nitrate mixture. We tested also a ternary carbonate mixture which looked promising, but
which was also found to be non compatible with quartz (see Chapter 4 and Appendix A,B,C)

3.2 Validation Tests
Once the experimental apparatus was assembled and the stability of the light source verified (Figure
3.15 shows a typical light source spectrum), the next logical step was the evaluation of the apparatus
capabilities and the validation using literature and published data. To validate the apparatus, two fluids
of known optical properties were selected: water and the so-called Hitec salt, the nitrite/nitrate mixture
(53wt% KNO 3, 40wt% NaNO 2, 7wt% NaNO 3) previously investigated at Sandia as described in Chapter 2.
The choice of those two fluids followed the logic of incremental challenges associated with optical
measurements of semi-transparent media at different temperatures and aimed at covering directly the
temperature range of the low-temperature salts part of the CSPonD design (in particular nitrate and
nitrite/nitrate mixtures).
_P & Wp Ia. &1 D's U* S. s Tan Vad
C0
T
11
-7-
00
SCOPE- W:5:73- P:Tigure 3.15: Tyi al Light Sorc Spe
Figure 3.15: Typical Light Source Spectrum
-4n4. __ - NWHO.M-W ......... ..... . .....
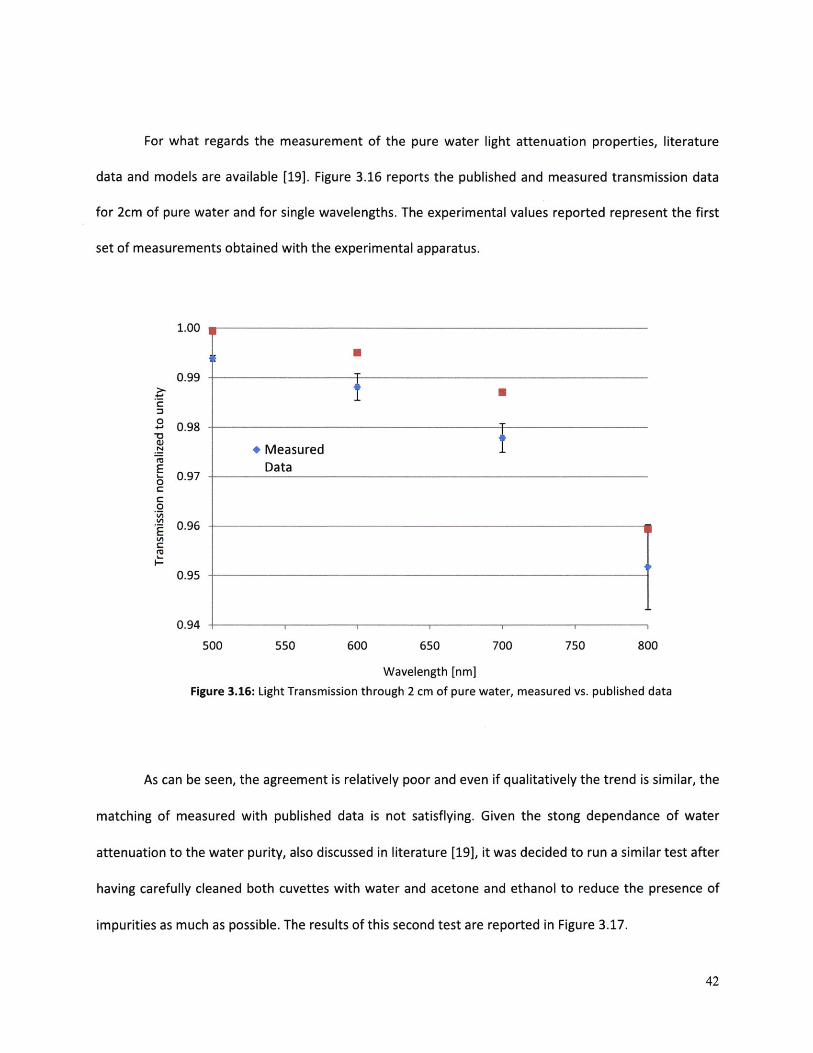
For what regards the measurement of the pure water light attenuation properties, literature
data and models are available [19]. Figure 3.16 reports the published and measured transmission data
for 2cm of pure water and for single wavelengths. The experimental values reported represent the first
set of measurements obtained with the experimental apparatus.
1.00
U
0.99
C
+- 0.98
+ MeasuredE Data" 0.97
0
0
0.96
0.95
0.94
500 550 600 650 700 750 800
Wavelength [nm]Figure 3.16: Light Transmission through 2 cm of pure water, measured vs. published data
As can be seen, the agreement is relatively poor and even if qualitatively the trend is similar, the
matching of measured with published data is not satisflying. Given the stong dependance of water
attenuation to the water purity, also discussed in literature [19], it was decided to run a similar test after
having carefully cleaned both cuvettes with water and acetone and ethanol to reduce the presence of
impurities as much as possible. The results of this second test are reported in Figure 3.17.

1.00
0.99
0.98
0.97
0.96
0.95
0.94
500 550 600 650 700 750 800
Wavelength [nm]
Figure 3.17 Light Transmission through 2 cm of pure water, measured vs. published data
As can be clearly seen, the agreement is much better and in particular the published data are
included in the experimental error bars. This test proved the concept and confirmed the accuracy and
sensitivity of the experimental setup for room temperature measurements. The error bars reported in
Figure 3.16 and 3.17 represent the standard deviation of the data acquired for different path lengths
and then normalized to a conventional 2 cm equivalent thickness. The larger absolute error at longer
wavelength is caused by the tungsten light source intensity which decays rapidly for wavelengths longer
than 600nm with the consequent increase of the noise to signal ratio. In addition, no oscillations or
signal fluctuations were observed during the experiment (reference light intensity remained constant)
................................. ...........................................
+ Measured Data
* Published Data

As discussed in Chapter 2, some data for Hitec salt have been published [11]. In particular, this
salt presents an absorption edge around 400 nm which shifts to longer wavelength with increasing
temperature (Figure 3.18). Both the identification of the absorption edge and its shift with temperature
were observed during our measurements in good agreement with previous work, as shown in Figure
3.19. This demonstrated that the apparatus works properly not only at room conditions but also at
higher temperatures.
FieSe A5 w Ap Dik c Abs Tral trad
26144
C0U
NTS
8715
400 420 440 460 480 500 520W 22Wh in Hnometers
0CXlOi-. W-v650.73.. Pi1050 V.L384.047 Time:2iM Agil S1 S0 TnnY Xt Cb:1
Figure 3.18 Molten Salt Spectra Showing the Absorption Edge Shifting with Temperature around 400nm(Red Line corresponds to Lower Temperature, Blue Line to Higher Temperature)

800
750 + Published DataExperimental Data
700
650
6004-1
550
M 500
450
400
350
300200 250 300 350 400 450 500
Temperature [C]
Figure 3.19 Light Transmission through 2 cm of pure water, measured vs. published data
3.3 Capabilities and Limitations
The experimental apparatus built to perform preliminary melting and optical measurements on
molten salts were proven to be reliable and able to perform measurements at room conditions as well
as at higher temperatures. Combining the characteristics of the furnace with the ones of the optical
equipment we can list the operative capabilities of our apparatus in terms of temperature, wavelength
and sample thicknesses as follow:
- Temperature Range: 20*C - 1000*C;
- Wavelength Range: 250nm - 1100nm;
- Sample Thickness: 1cm - 10cm;

Even if potentially accessible, not the entire ranges were practically exploited during the
experimental campaign, as will be also shown and discussed in detail in Chapter 4. This is because the
experimental error associated with the measurements was found to be a function also of the
experimental conditions which may or may not introduce variables which might significantly affect the
collected data. The two most relevant factors affecting the data were found to be the operating
temperature (because of the radiation emitted by the heated structural materials which is additive to
the ight source signal) and the light source spectrum (which is not constant in intensity over the
spectrometer wavelength range). For what regards the wavelength range of interest for the CSPonD
project (namely the solar irradiance spectrum, extending mainly between 250nm and 2500nm), our
apparatus is currently able to cover nominally only 50% of it, but not the entire detecting range of the
spectrometer can provide reliable data, as will be shown in the next Chapter. There is, in other words,
room for further improvement of the apparatus and in particular, as will be discussed also in Chapter 5,
the extension of the detecting capabilities further in the IR range (wavelength longer than 800nm)
should be considered a priority.
Even so, the current apparatus represents a relatively inexpensive way of evaluating light
attenuation properties of semi-transparent media based on the transmission technique. The two unique
features compared to previous works are represented by the high temperature capabilities as well as
the sensible increase in the sample thicknesses than can be measured, partially overcoming the intrinsic
limitations of the transmission techniques already outlined in Chapter 2.

4 Results and Discussion
4.1 Salt Selection Process
The salt selection is a crucial task for the CSPonD. The different characteristics to be investigated
included physical and chemical compatibilities with other materials present in the system (discussed
also in Section 4.2) and the optical properties that are particularly important (see Chapters 2 and 3 for
more details). In fact, the salt performance in terms of acting as a solar heat storage medium and the
global system design will strictly depend on the salts capability of acting as a semi transparent and
diffuse absorbing medium. Generally speaking, the desirable attributes of a direct absorption and
energy-storage fluid for solar power applications are:
* Semi-transparency over the range of wavelengths relevant to the solar spectrum (namely the
range 250nm - 2500nm );
e Chemical compatibility with surrounding materials at the operating temperatures envisioned for
advanced CSP systems (from 250'C up to 1000'C, depending on the chosen salt mixture);
e Low melting point, high boiling point, high specific heat, chemical stability;
* Low toxicity;
* Low cost;
Four different molten salt systems were taking into consideration during the salt selection process: a
carbonate, chloride, nitrate and nitrite-nitrate mixture. Table 4.1 summarizes some physical properties
of the promising candidates, which will be separately discussed in the rest of the chapter.

NaCI-KCI at 800*C Li2CO3-Na2CO3-K2CO3 at 800*C KNO 3-NaNO 2-NaNO 3 at 3500CDensity 1520 kg/m 3 1902 kg/m 3 1850 kg/m 3
Viscosity 1.2 mPa-s 4.3 mPa-s 2.360 mPa-s
Thermal conductivity 0.45 W/m-K 0.822 W/m-K 0.61 W/m-K
Specific heat 1090 J/kg-K 1560 J/kg-K 1560 J/kg-K
Table 4.1 Physical Properties of Molten Salt Candidates [14]
To gain experience withmolten salts, and to start testing and improving the experimental apparatus
(whose final design is fully described in Chapter 3), it was decided to perform some preliminary melting
experiments of the most promising salt mixture identified in literature [14]. We also aimed at analyzing
the molten salts behavior and in particular the salt behavior at high temperatures where the potential
for production of acid gases exists. In parallel, these preliminary experiments were also used to test
some material compatibility (salt-crucibles interactions and structural materials including quartz,
alumina, zirconia).
4.1.1 Chloride Mixtures
As a first reference salt for the chloride mixture category, a ternary mixture, in particular NaCI-KCI-
MgCl 2 (30-20-50 mol %) was chosen. This salt was already investigated at MIT by the Nuclear Science
and Engineering Department for nuclear reactor applications [22]. In the related study it was concluded
that NaCI-KCI-MgCI 2 (30-20-50 mol%) ternary chloride salt is the most promising candidate for molten
salt cooled fast reactor due to a number of favorable properties among which: small thermal expansion
coefficient, reasonably low viscosity and low melting point (396*C). Since many of the thermal
challenges associated with these systems (nuclear and solar) are common, also the first baseline mixture
for the CSPonD project was chosen to be the NaCI-KCI-MgCI 2 (30-20-50 mol%). The salt components

were purchased separately from Alpha Aesar (Stock Numbers #12314, #11595, #36226) and a number of
salt eutectic samples were prepared to be melted in a tube furnace (described in Chapter 3).
During the very first preliminary experiment, the production of an acid gas (tested with wetted pH
papers) was observed starting around 3000C. Around 2000C the formation of a liquid phase was also
observed, due to the melting of the magnesium chloride hexa-hydrate (Alfa Aesar, ACS product, stock
number 36226) which has a melting point around 180"C. This formation of HCI at relatively low
temperature is due to the fact of having chosen a Magnesium Chloride hexa-hydrate as a salt
component, with a consequent increase in the water present in the salt. The production of the acid gas
(identified as HCI as described later in this paragraph) and the consequent loss of salt components (Cl)
would result in changes in the stoichiometry of the salt mixture, shifting it from the eutectic composition
to a sensibly higher melting point (around 550*C compared to the expected 4000C). Above 6000C the
production of HCI becomes again important, leading to a further change in the salt stoichiometry and
mass. The post-test analysis showed the presence of insoluble powder and an overall visually apparent
reduction in the salt mixture left in the crucible. The crucible itself suffered from the exposure to the
acid environment and the inner surfaces were attacked (especially above the liquid surface that were
directly exposed to the salt vapors), all that resulting in the loss of the original transparency of the
crucible.
A second melting was performed using again a quartz crucible, but with magnesium chloride
anhydrous (Alfa Aesar, stock number 12315) instead of the hexa-hydrate one as a ternary salt
component. The objective was, in that case, to observe the differences in the HCI production, having
reduced the water inventory in the system by using an anhydrous salt. Around 300*C no HCI formation
was observed. However, around 4400C the salt started bubbling gas without evidence of global melting;
by using pH papers it was possible to detect the presence of an acid gas. This caused again a

considerable shifting of the melting point towards higher temperatures (again around 600"C). It was also
possible to observe the formation of a crusty deposit on the salt surface, corresponding to the bubble
formation. Also on the upper quartz optical window closing the tube furnace the presence of a deposit
was observed, and the transparency seemed to be reduced during the cooling down part of the
experiment. However, after the test, it was possible to clean it completely using some paper wipers,
without any residuals on the surface. The same cannot be said for what regards the crucible: again the
inner surface was attacked and made opaque by the acid gas. Also during additional tests performed
using different crucible materials and slightly different experimental procedure (in particular following a
smoother heating curve) bubbling and acid gas formation were observed. To understand better this
recurrent phenomenon, we looked for related information in literature and found out that Magnesium
Chloride was the cause of the acid gas production.
Magnesium Chloride (MgCl 2) is widely reported to be highly hygroscopic; the available methods for
removal of the water present in it are non-trivial [23], particularly if the production of MgO, HCI and Cl2
has to be avoided. Pure Magnesium Chloride is also a big industrial chemical produced on large scale.
Among the others, the use of MgCl 2 with water present as an impurity is considered harmful for
electrochemical systems because of the annexed production of hydrogen chloride gas and various
insoluble magnesium oxy-compounds with increasing temperature. The hydration (or dehydration) of
magnesium chloride is quite a complicated process, due to the high number of existing hydrate
compounds; Figure 4.1.1 reports the phase diagram of the magnesium chloride - water system.

300
200-
0OD-
-100o 10 20 30 40 so
MQIe % Mg0 -
Figure 4.1.1 MgCI 2-H20 Phase Diagram
At room temperature the most fully hydrated form of magnesium chloride is the hexa-hydrate one; its
dehydration is reported to proceed by the following reactions, starting over the temperature range
250C-120 0C where the solid hexa-hydrate is stable:
MgCl 2 - 6H20(,) = MgCl 2 -4H 2 0(s) + 2H 2 0(l)
MgCl2 - 4H20(s) = MgC 2 -2H20(s) + 2H20(v)
MgC 2 -2H20(s) = MgCI 2 -H2 0(s) + H2 0(v)
The dehydration of the hexa-hydrate magnesium chloride can also proceed by hydrolysis, usually
inhibited by the greater vapor pressure of water generated in the other dehydration reaction which
occurs simultaneously:
MgCI2 - 2H2 0(s) = MgOHCI(s) + HCI(g) + H2 0(V)
The final stage is to remove the last water from the solid monohydrate by the reaction:
4,
4,I
4,
Af
-

MgCI2 - H2 0(s) = MgCI2 + H2 0(v)
Again, we can have also a hydrolysis reaction leading to:
MgCI 2 -H2O(s) = MgOHC(s) + HCI(g)
By calculating the respective vapor pressures [23], it can be seen that unless precautions are taken, this
last hydrolysis reaction will proceed preferentially with respect to the dehydration reaction. While the
first stages of the dehydration can be followed without precautions (provided that no liquid phase is
present), a certain amount of HCI will be produced during the last dehydration stage. It has been
reported [23] that the entire dehydration sequence starting from hexa-hydrate can be conducted under
HCI atmosphere, averting in that way the hydrolysis reaction. A final note regards the stability of the
oxy-chloride MgOHCI, which can also decompose entirely above 5550C according to the reaction:
MgOHCI(s) = MgOs) + HCI(g)
The acid gas production was observed during the previously described tests: in particular the
acid gas strongly attacked quartz and at the same time the surface of the salt was never observed clear
because of the suspension of a white, solid deposit on the salt surface. The same behavior, even if with
different magnitudes, was observed using both magnesium chloride hexa-hydrate and anhydrous. As a
general rule, the dehydration of the magnesium hexa-hydrate should not be performed with the
presence of liquid phase, as it was during the first experiment where we melted the magnesium chloride
hexa-hydrate before having dried it, with a consequent large production of HCL. In addition, with regard
to the use of the magnesium chloride anhydrous, the water has still to be considered present as an
impurity, resulting from the exposure of the sample to the air and from the preparation of the sample

itself. Therefore, also in this case the dehydration of the salt is important and should be performed
possibly at low temperatures, avoiding rapid heating of the sample.
It can be inferred that, without an inert atmosphere, it is impossible to avoid some HCI
production, due to the hydrolysis reaction occurring during the last part of the dehydration process. This
is in agreement with the observed HCI production also using the anhydrous magnesium chloride. In this
case, it is reasonable to assume that the water causing the hydration and then the HCI production
comes partly from the moisture in the air and partly from the salt itself. However, by proceeding with
the experiment, the residual amount of water in the salt is expected to decrease and therefore the
residual HCI production should be mainly caused by the superficial hydration/dehydration of the salt
itself resulting from contact with the moisture present in the air. This could also explain the formation of
crusty deposit on the salt surface, presumably magnesium oxy-compounds resulting from the residual
dehydration. From all the evidence here reported about the melting experiments performed, it is clear
the need for an inert atmosphere apparatus, to be able to properly assess the salt compatibility. In fact,
even if reduced, the HCI formation cannot be avoided under air conditions, with consequences which
affect all the measures and the results, from the sample mass losses to the salt superficial crusty deposit
and the quartz crucible loss of transparency. Anyway, since the molten salt pond is designed to operate
in an open environment in contact with air and the design of a closed environment for the CSPonD
project is considered economically unfeasible, the above described ternary chloride mixture was
discarded from the salt candidate lists.
Instead we explored a binary chloride mixture: an eutectic of sodium chloride and potassium
chloride (NaCl-KCI, 50-50 wt%), which has potentially favorable characteristics. Molten NaCI-KCI eutectic
is actually a well known fluid, used extensively in heat treatment of metals [24]. The first drawback of
having chosen a binary instead of a ternary mixture is that the melting point for the binary mixture is

sensibly higher than for the ternary (6700C vs. 4000C). Consequently, the NaCI-KCI eutectic has to be
considered a salt candidate only for the very high temperature version of the CSPonD project, operating
between 7000C and 10000C. On the other hand, this binary mixture showed good visual transparency
once melted, no bubbling up to 1000*C and a relatively modest evaporation rate in the temperature
range considered (estimated at 800*C around 0.2 kg/(m2hr), in agreement with literature data) [25].
Preliminary melting tests of this mixture confirmed the good behavior of the salt (including a very low
release of acid gas, as discussed in Section 4.2), with the exception of a loss of clarity of quartz when
exposed to the salt melt. This phenomenon is also known and reported in literature to be caused by
physical diffusion of the alkali ions into the silica matrix [12]. This issue and its implications on the
related characterization of the salt optical properties are addressed in Section 4.3.
4.1.2 Nitrate and Nitrite Mixtures
Nitrates and Nitrites mixtures, other than being extensively used in low temperature heat
treatment of metals processes [24], were also considered as a working fluid for the first generation of
Concentrated Solar Power (CSP) technologies [26], also called solar (or power) towers [1]. In particular,
Sandia National Laboratories in the context of several projects focused on CSP solutions [26]
investigated the potential use of these mixtures also for direct absorption and storage of solar heat [10].
The primary molten salt used in this study was the eutectic mixture of water-soluble, inorganic salts
KNO 3, NaNO 2 and NaNO 3, in proportions 53-40-7 wt%. HITEC, the Coastal Chemical's name of this
mixture [27], was chosen because of its low melting point (142*C), high heat transfer coefficient,
thermal stability, and low cost [11]. Common applications of HITEC salt include uses in process
operations, such as industrial reactor temperature maintenance, high-temperature distillation, reactant

preheating, rubber curing, and rotational molding. Because of long-term decomposition of nitrite to
nitrate in the HITEC melt at elevated temperatures (see Chapter 4), a commercial [27] binary eutectic
nitrate salt was also considered as salt candidate for the CSPonD application. The composition is NaNO 3,
KNO 3 in proportions 60-40 wt%; the melting point of this binary mixture is 222*C [11].
The main limitation associated with nitrate/nitrite mixtures is that the operating temperature
range of these salts is limited to 550"C-600*C due to decomposition reaction and the consequent release
of nitrogen oxides in the gaseous form. Therefore these salts have to be considered candidates for the
lower temperature version (compared to the 10000C temperature goal) of the CSPonD concept. Due to
the lower temperatures involved and the information found in literature about these mixtures, no ad
hoc preliminary melting experiments were run. The assessment of chemical compatibility was assessed
using the software FACTsage (section 4.2), while the optical properties were investigated using the
experimental apparatus described in Chapter 3; the related results are reported in section 4.3.
4.1.3 Carbonate Mixtures
Together with chloride mixtures (see Section 4.1.1) and nitrate/nitrite mixtures (see Section 4.1.2),
another salt was identified as a candidate for the CSPonD system. This salt, called CARTECSAL (an almost
equal mixture of sodium, potassium and lithium carbonates), is currently used in salt bath heat treating
industries and is generically reported as neutral and stable in a wide temperature range. Park
Metallurgical Corporation sells this salt together with others, prevalently chloride mixtures [28]. Two
different literature documents mentioning Cartecsal salt were found and analyzed. In a Brookhaven
National Lab report [29], at page 7, it is mentioned as "Carbonate Eutectic Salt" composed by Lithium,
Sodium and Potassium carbonate. This salt was developed to be used as a cleaning fluid for nuclear

piping and waste treatment plants. In a less recent paper [30] an eutectic of these three salts with a
melting point around 4000C is presented. The paper analyses its properties for a latent heat storage
medium, however on the second page it is said that "[...] the ternary carbonate eutectic mixture has also
excellent thermo-physical properties for sensible heat storage applications such as central receiver
systems {...]". No information regarding potential reactions with air or material compatibilities were
reported.
Eutectic salt samples composed of Lithium, Sodium and Potassium Carbonate to be preliminary melted
and tested were prepared starting from the single salt components. All the three carbonate salts were
therefore separately purchased (selecting the ACS, American Chemical Society, labeled products which
report a complete analysis of the present impurities) from Alfa Aesar (Stock Numbers #36225, #11552,
#12609). The composition of the eutectic was the one suggested in [30] with Li2CO3-K2CO3-Na2CO3 [32.1
- 34.5 - 33.4, wt%]. The melting point of this mixture is reported to be around 430*C. The salt was
placed in a quartz crucible (Figure 4.1.2), in order to be able to test directly and visually its transparency
once melted. For this reason, under the crucible, a small alumina lid signed with a dark, high
temperature marker (Figure 4.1.3) was placed. By using an optical quartz window placed on the top of
the tube furnace (see Chapter 3 for extensive details on the experimental apparatus), it was possible to
have a continuous visual access to the crucible and the salt. By periodically using pH papers it was also
possible to check for presence and production of acid gases (also observed during experiments with
chloride salt mixtures containing magnesium chloride) during the salt heating and melting. The
experiment was intended to get an estimate of the melting point of the salt and to test its compatibility
under air conditions with quartz and its eventual reactions or decomposition up to 1000*C. Once the
maximum temperature (1000 0C) was reached, the system was kept steady for one hour before shutting
down the furnace and proceeding with natural cooling of the sample.

Figure 4.1.2 Lid with Dark Signs Figure 4.1.3 Crucible and Salt
During the experiment, the following main events were observed and documented:
- Relatively low melting point (<450*C);
- Bubbling starting around 750'C-800*C during heating;
- Bubbling stopped after 800*C;
- Good transparency once completely melted and before/after bubbling;
- No bubbling observed during cooling;
Figures 4.1.4, 4.1.5, 4.1.6 show the different phases experienced by the salt during the experiment.
. .........

Figure 4.1.4 Melting Salt
Figure 4.1.5 Salt Completely Melted and Transparent

Figure 4.1.6 Salt While Bubbling
This first melting experiment showed interesting results (relatively low melting point, apparently no
chemical reactions or salt decomposition up to 8000C, good transparency). After the experiment, the
crucible in the furnace was found broken with pieces of solidified salt around it, suggesting potential
chemical incompatibility between quartz and salt. In addition, the quartz optical window resulted
seriously attacked by salt vapor. At last, it was possible to test the salt solubility in water, trying to solve
small pieces of solidified salt scrapped from the broken crucible. The salt was soluble in water, even if
less effectively than the chloride mixture (it took a few hours to dissolve small pieces, compared to the
very fast dissolution observed for chloride and nitrate/nitrite mixtures). The moderate water solubility is
likely given by lithium carbonate, which is reported to be poorly soluble in water [14]; while potassium
and, even more, sodium carbonate are reported to be hygroscopic and well soluble in water [14].
A second testing experiment was then performed to clarify some of the aspects emerged during the first
melting. The salt was melted in an alumina crucible, in order to avoid the failure of the crucible itself, as
happened during the cooling phase of the first melting. The furnace operated under normal air
conditions.
...............

Figure 4.1.7 Quartz and Sapphire Optical Windows Figure 4.1.8 Quartz and Sapphire Optical Windows
In order to determine the material compatibility, together with the salt, one small quartz optical window
and one small sapphire optical window were inserted in the crucible (Figure 4.1.7 and Figure 4.1.8). The
two optical windows have a diameter of about 10mm and a weight around 0.14g (sapphire one) and
0.32g (quartz one, which is thicker of the two). The experimental procedure comprised the heating of
the salt up to 1000*C, then steady state for one hour at that temperature, and then the cooling under
natural convection.
The observed melting point was well comparable to the one observed the previous time (around 450*C),
and once completely melted the salt was found to be transparent as observed during the previous
melting. However, during the rest of the experiment, some relevant differences with respect to the first
melting test were observed: the bubbling of the salt seemed to start at a lower temperature (around
7500C instead of 800*C) and did not stop completely above 900*C nor during the first part of the cooling.
In addition, during the cooling, a crusty deposit was observed on the surface of the melted salt, which,
apparently, seemed to solidify at higher temperature than the expected freezing point. However, by
displacing the crusty deposit on the surface using steel tongs, the salt was found still melted at around
4500C as expected. The quartz optical window, at the same time, showed again a serious attack on its
surface, confirming the aggressive nature of the salt vapors towards quartz (Figure 4.1.9).

Figure 4.1.9 Quartz Optical Windows Attacked by Carbonate Salts Vapors
The post test analysis performed aimed at identifying the conditions of the sapphire and quartz optical
windows after one hour at 1000'C immersion into the molten salt. In order to do that, the salt solidified
in the crucible was dissolved using water; no attack was observed on the alumina crucible. As a result,
however, only the sapphire optical window was found inside the crucible, while the quartz one was
apparently dissolved by the salt. This fact could also explain the deposit on the surface of the salt bath
observed during the cooling of the sample, under the hypothesis of formation of insoluble compounds
as a result of the quartz dissolution into the carbonate salts mixture (see Section 4.2). A literature review
aimed at identifying some references about quartz dissolution and corrosion revealed that in fact "[ ...]
quartz glass rapidly dissolves in molten sodium sulfate and also in molten sodium carbonate [...]" [31].
Figure 4.1.10 shows that sodium carbonate (Na2CO3) strongly attacks and dissolves quartz at high
temperatures:

0.14
0.12
2
0.1 -
0.08
0.06
0.04
0.02
50 -
Time, h
Addition of 1 g melt
Dissolution behavior of quartz rods in melts at 1,473 K (1,200-C)Na2SO4 (0.3 g dissolved after 2 h)NaF (0.3 g dissolved after 1 h)Na2CO1 (0.3 g dissolved after 10 min)NaGIVO4k
Figure 4.1.10 Dissolution of Quartz in different Salt Baths [31]
Figure 4.1.11 Comparison between a Fresh Sapphire Optical Windowand One Exposed to Cartecsal
- 111

The sapphire optical window lost its clarity (Figure 4.1.11). A similar behavior was observed
previously on quartz optical windows immerged in chloride molten salts and reported in literature as
alkali metal ions diffusion into the silica matrix.
Furthermore, a rough estimate of the evaporation rate was possible, taking into consideration
the presence of the optical windows inside the crucible at the beginning of the experiment. The global
loss of weight registered during this experiment was about 14% of the initial salt charge (5g). However,
looking at the absolute quantities of evaporated salt (0.7 g) and considering also the melting point, it is
possible to compare, at least qualitatively, the evaporation rate of CARTECSAL with the chloride mixture
NaCI-KCI (50%-50% wt) one, estimated around 0.2 kg/(m 2hr) and found coherent to literature data [25].
In that case, the total, absolute evaporation was about 0.34g, but the melting point of the binary
chloride mixture is much higher than the CARTECSAL one (about 700*C vs. about 460*C). We estimated
that, due to the experimental procedure followed (in particular looking at the heating and cooling
curves), the period of time spent by the carbonate salts mixture above the melting point was about
twice than the corresponding period of time for the chloride mixture. So, even if at a first
approximation, (which means not taking into account the variations of the evaporation rate with
temperature and the geometric differences between the alumina and quartz crucibles) the evaporation
rate of the carbonate mixture can be consider of the same order of magnitude as that of the binary
chloride salt.
This statement, which will have to be better proven with further tests, could potentially bring to
a similar loading strategy for the salt level in the pond considering the binary chlorides mixture and the
ternary carbonates mixture as two possible salt candidates.

Summarizing the experimental evidence collected, the preliminary melting tests of CARTECSAL
showed the highly corrosive nature of this salt towards amorphous materials such as quartz and
sapphire. This corrosive nature, which was further characterized using the software FACTsage (see
Section 4.2), could have serious implications on the design of the pond system, especially on the design
of the upper part of the pond itself and the design option of an optical window, an inert atmosphere
above the salt pond, a gas window or a covering lid.
Similar testing and compatibility analyses, due to time and budget constraints, were not
performed on metallic materials of interest, to see if there are some corrosion-resistant alloys which
could be used and in case be exposed to the salt bath and vapors itself. In the technical sheet of the
commercial CARTECSAL sold by Park Metallurgical Corporation it is in fact said that "[...] due to the
alkaline nature of this salt mixture it is recommended that heat resisting metal alloy pots be used to
contain this salt; however, it is understood that in some instances industry has used ceramic pots in
various applications of this carbonate bath, but normally it is not recommended [...]".
The chemical compatibility of this carbonate mixture with structural materials of interests was
preliminary assessed using the software FACTsage and not through extensive experimental campaign.
Chapter 4, Section 2 of this thesis fully describes the capabilities of the software as well as the main
results obtained.

4.2 Molten Salt Mixtures Chemical Compatibility
As widely discussed in literature [15], molten salt chemistry is particularly relevant for molten salt
applications not only because of the ionic nature of salts but also because of the relatively high
temperatures needed to keep the salts molten, which also imply a faster kinetics of the potentially
occurring chemical reactions compared to room conditions. As described in Section 4.1, some
preliminary tests were run during the salt selection process. Such tests were not sufficient to properly
assess chemical compatibility between the identified salts and materials commonly used in optics and
optical measurements like quartz and sapphire, metallic alloys (such as steels and nickel alloys) and
some common refractory materials like graphite and alumina. The tests, in fact, assessed only a
preliminary compatibility: they were of the order of about 6 hours long, a period of time insufficient to
analyze in depth the potential reactions occurring between the salt and the tested materials as well as
their kinetics. Since the main goal of this work was meant to be the characterization of molten salts light
attenuation and short term chemical stability and compatibility exposure tests, an ad hoc apparatus for
long term material compatibility experiments was not designed and built. But given also the importance
for the CSPonD project on molten salt chemical stability and compatibility with most common structural
materials, this task was approached under a computational point of view.
The chemical compatibility between the molten salts and a wide ensemble of materials, including
iron, carbon, chromium, nickel, molybdenum, manganese, water, oxygen, nitrogen, silica and alumina
was assessed using a chemical thermodynamic software, FACTsage [32]. This software was selected and
purchased specifically for this task as it contains the relevant databases. This computational tool was
able to provide insightful information about molten salt chemistry; however, for the most relevant
materials under the optical and structural point of view compatibility experiments will be needed in the
future to fully assess the necessary compatibility under all operating conditions.

4.2.1 FACTsage: a Thermodynamic Chemistry Software
FactSage@, one of the largest fully integrated database computing systems in chemical
thermodynamics in the world, was introduced in 2001 and is the fusion of the FACT-Win/F*A*C*T and
ChemSage/SOLGASMIX- thermochemical packages. FactSage is the result of over 20 years of
collaborative efforts between Thermfact/CRCT (Centre de Recherche en Calcul Thermochimique,
Montreal, Canada) and GTT-Technologies (Aachen, Germany). The FactSage package consists of a series
of information, database, calculation and manipulation modules that access various pure substances
and solution databases. FactSage has nowadays several hundred industrial, governmental and academic
users in materials science, pyrometallurgy, hydrometallurgy, electrometallurgy, corrosion, glass
technology, combustion, ceramics, and geology. It is also used internationally in graduate and
undergraduate teaching and research. Users have access to databases of thermodynamic data for
thousands of compounds as well as to evaluated and optimized databases for hundreds of solutions of
metals, liquid and solid oxide solutions, mattes, molten and solid salt solutions and aqueous solutions.
The FactSage software automatically accesses these databases. The evaluated databases for oxides,
slags, mattes, salt systems, etc, have been developed by optimization of literature data using advanced
modeling techniques, several of which have been developed at the CRCT. FactSage can also access the
databases for alloy solutions developed by the international SGTE Group (Scientific Group Thermodata
Europe), and the databases for steels, light metal alloys and other alloy systems developed by The
Spencer Group, GTT-Technologies and the CRCT. With FactSage it is possible to calculate the conditions
for multiphase, multicomponent equilibria, with a wide variety of tabular and graphical output modes,
under a large range of constraints. In particular, many molten salt systems have been optimized and are
tabulated in FactSage which can therefore provide important information about the thermodynamic
chemistry of those systems and the reactivity with other compounds or elements.

4.2.2 Chemical Systems and Results
The possibility of adverse chemical reactions of the selected salt mixtures with various materials
relevant to the CSP application was investigated using the thermodynamic chemical database FactSage,
presented in the previous section. Several classes of materials were considered: constituents of
structural materials such as stainless steels and high-temperature alloys (Fe, Ni, Cr, Mo, Mn),
refractories (such as alumina, silica and graphite) and air. FactSage lets the user specify the initial
elements present in the system and the system temperature; based on that input, it automatically
searches for all the possible reactions that can take place among those elements, and yields the most
probable equilibrium conditions for the system at the specified temperature. As a remark about the
calculations performed, it should be noted that FactSage only calculates the equilibrium composition of
a system given the initial reagents and the final system temperature. Nothing can be directly inferred
about kinetics, diffusive processed at high temperatures, and timescale of the involved reactions.
4.2.2.1 Binary Chloride Mixture NaCl-KCI, 50-50 wt%
As will be shown, NaCI-KCI has benign chemical characteristics, as it is not expected to react with
the most common structural and optical materials as long as they are completely submerged into the
salt, and only mildly with water, in the temperature range 700 to 1000'C. For our system, in fact, the
code predicted that no reaction between NaCI-KCI and Fe, Ni, Cr, Mo, Mn, A1203, SiO 2 and C would occur
in the range 700-10000C. On the other hand, some oxidation of the salt would occur if air was present,
but the equilibrium concentration of the resulting oxides (Na20 and K20) would be very low, between
10~6 and 10w4 wt% in the temperature range 700-1000*C. These findings were anecdotally confirmed by
discussions with engineers at the Metallurgical Solution Inc. heat treatment facility in Providence, Rhode
Island. In their plant, molten NaCI-KCI does not attack carbon steel, stainless steel or silica-alumina

bricks at temperatures as high as 1100*C; also, no significant signs of salt oxidation are observed at
these temperatures. If humidity is present in the air, it reacts with NaCl-KCI to form hydrogen chloride
(HCI) gas. The partial pressure of HCI above a NaCI-KCI bath is shown in Figure 4.2.1 and Table 4.2 as a
function of the salt temperature and relative humidity (specified at 250C) in the air. The HCI partial
pressures are low at all temperatures; however, given the corrosive and toxic nature of HCI, it may be
desirable to capture it during operation of the CSP system; alternatively, a dry air "curtain" over the salt
bath may prevent HCI formation altogether. As a consequence of the release of HCI, the salt loses some
of the Cl and there is the formation of sodium and potassium hydro-oxides in small quantities.
2.50E-04
2.OOE-04
1.50E-04
1.00E-04
5.OOE-05
0.00E+00 '700 750 800 850 900 950 1000
Temperature [C]
Figure 4.2.1 Partial pressure of HCI generated by the reaction between 1 kg of molten salt and im3 of air as afunction of temperature and air humidity at 25'C
Partial Pressure [atm] Partial Pressure [atm] Partial Pressure [atm]Temperature [C] 10% Humidity 50% Humidity 100% Humidity
700 9.14E-06 1.92E-05 2.64E-05750 1.31E-05 2.84E-05 3.94E-05800 1.87E-05 4.11E-05 5.73E-05850 2.71E-05 5.89E-05 8.18E-05900 3.86E-05 8.24E-05 1.14E-04950 5.44E-05 1.14E-04 1.56E-041000 7.59E-05 1.55E-04 2.10E-04
1m3of air as a functionTable 4.2 Partial pressure of HCI generated by the reaction between 1 kg of molten salt andof temperature and air humidity at 250C

FACTsage calculations showed that the HCI generation is coupled with the formation in the salt
of sodium and potassium hydroxides. Prof. Charles Forsberg (MIT) suggested adding some sodium
hydroxide to the system to partially suppress the HCI generation. In particular, so far three NaOH
concentrations were investigated: 0.01% - 0.1% - 1% (wt%) referred to the total salt mass. It turns out
that the HCI partial pressure effectively decreases on average by a factor of 2 - 10 - 50 respectively.
These are temperature averaged values. At lower temperatures (700*C) the reduction is larger (up to a
factor of 200) while at high temperatures (10000C) the addition NaOH results less effective (in the worst
case just by a factor of 1.1). Hereunder the detailed results are reported:
2.50E-05
2.OOE-05
1.50E-05
1.OOE-05
5.OOE-06
0.00E+00
- 10% Humidity
- 50% Humidity
100% Humidity
700 750 800 850 900 950
Temperature [C}
Figure 4.2.2 Partial pressure of HCI generated by the reaction between 1 kg of molten salt and:function of temperature and air humidity at 25*C - 1% of NaOH added to the salt
1000
1M3 of air as a
Temperature [C Partial Pressure [atm] Partial Pressure [atm] Partial Pressure [atm]10% Humidity 50% Humidity 100% Humidity
700 4.25E-08 9.60E-08 1.56E-07750 1.25E-07 2.63E-07 4.12E-07800 3.33E-07 6.69E-07 1.02E-06850 8.15E-07 1.58E-06 2.35E-06900 1.85E-06 3.51E-06 8.79E-06

950 I 3.92E-06 7.28E-06 1.05E-05 I1000 7.77E-06 1.42E-05 2.02E-05
Table 4.3 Partial pressure of HCI generated by the reaction between 1 kg of molten salt and 1m3of air as a functionof temperature and air humidity at 254C - 1% of NaOH added to the salt
9.OOE-05
8.OOE-05
7.OOE-05
6.OOE-05
5.OOE-05
4.OOE-05
3.OOE-05
2.OOE-05
1.OOE-05
0.OOE+00
10% Humidity
-50% Humidity
100% Humidity
100% Humidit
'0000/
700 750 800 850 900 950 1000
Temperature [C]
Figure 4.2.3 Partial pressure of HCI generated by the reaction between 1 kg of molten salt and Im3 of air as afunction of temperature and air humidity at 250C - 0.1% of NaOH added to the salt
Partial Pressure [atm] Partial Pressure [atm] Partial Pressure [atm]Temperature [ 10% Humidity 10% Humidity 10% Humidity
700 1.60E-07 6.10E-07 1.18E-06
750 4.26E-07 1.51E-06 2.79E-06
800 1.05E-06 3.46E-06 6.21E-06
850 2.44E-06 7.48E-06 1.30E-05
900 5.29E-06 1.53E-05 2.57E-05
950 1.08E-05 2.95E-05 4.80E-05
1000 2.07E-05 5.36E-05 8.43E-05
Table 4.4 Partial pressure of HCI generated by the reaction between 1 kg of molten salt and m3 of air as a
function of temperature and air humidity at 250C - 0.1% of NaOH added to the salt

2.OOE-04
1.80E-04
1.60E-04
1.40E-04
1.20E-04
1.OOE-04
8.OOE-05
6.OOE-05
4.OOE-05
2.OOE-05
0.OOE+00
- 10% Humidity
- 50% Humidity
100% Humidity
700 750 800 850 900 950 1000
Temperature [C]
Figure 4.2.4 Partial pressure of HCI generated by the reaction between 1 kg of molten salt and 1m3 of air as afunction of temperature and air humidity at 250C - 0.01% of NaOH added to the salt
Temperature [C] Partial Pressure [atm] Partial Pressure [atm] Partial Pressure [atm]10% Humidity 50% Humidity 100% Humidity
700 1.32E-06 5.55E-06 1.OOE-05750 2.70E-06 1.13E-05 1.97E-05800 5.87E-06 2.13E-05 3.52E-05850 1.16E-05 3.69E-05 5.79E-05900 2.11E-05 5.91E-05 8.91E-05950 3.57E-05 8.98E-05 1.31E-041000 5.69E-05 1.31E-04 1.85E-04
Table 4.5 Partial pressure of HCI generated by the reaction between 1 kg of molten salt and 1m3 of air as a functionof temperature and air humidity at 250C - 0.01% of NaOH added to the salt
Tables 4.6, 4.7 and 4.8 report the same results expressed in terms of HCI Reduction Factor,
defined as the ratio between the HCI partial pressure for the reference system over the HCI partial
pressure in presence of a specified mass fraction of sodium hydroxide.
.. .......... .. ... .......................... .... ..... .. ............................................

Temperature (C] HCI Reduction Factor HCI Reduction Factor HCI Reduction Factor10% Humidity 50% Humidity 100% Humidity
700 210.42 197.08 166.92750 103.76 106.91 94.93800 56.06 61.18 56.18850 33.08 36.99 34.69900 20.76 23.41 22.24950 13.83 15.53 14.86
1000 9.73 10.81 10.35
Table 4.6 HCI Reduction Factor for the system 1 kg of molten salt and m3 of air as aair humidity at 25*C - 1% of NaOH added to the salt
function of temperature and
Temperature [C] HCI Reduction Factor HCI Reduction Factor HCI Reduction Factor10% Humidity 50% Humidity 100% Humidity
700 55.75 30.99 22.22750 30.39 18.62 14.03800 17.70 11.83 9.18850 11.06 7.83 6.25900 7.26 5.37 4.41950 5.02 3.84 3.241000 3.66 2.87 2.48
Table 4.7 HCI Reduction Factor for the system 1 kg of molten salt and 1m3 of air as a function of temperature andair humidity at 250C - 0.1% of NaOH added to the salt
Temperature [C] HCI Reduction Factor HCI Reduction Factor HCI Reduction Factor10% Humidity 50% Humidity 100% Humidity
700 6.78 3.41 2.61750 4.78 2.49 1.99800 3.18 1.92 1.62850 2.33 1.59 1.41900 1.82 1.39 1.27950 1.52 1.26 1.191000 1.33 1.18 1.13
Table 4.8 HCI Reduction Factor for the system 1 kg of molten salt and 1m3 of air as a function of temperature andair humidity at 250C - 0.01% of NaOH added to the salt

4.2.2.2 Ternary Chloride Mixture, NaCl-KCI-MgC2 (30-20-50 mole %)
As already discussed in Section 4.1, the ternary chloride mixture, containing magnesium chloride
as one of the salt system components, was discarded because of the production and release of HCI in
large quantities. The reaction chains reported in Section 4.1 about the de-hydration process of
magnesium chloride and the relationship between the HCI production and release and the highly
hygroscopic behavior of magnesium chloride were obtained and identified in previous works using
FactSage [32]. The matching of the experimental evidence with the theoretical prediction offered by the
software represented a good validation test for the software capabilities, on which, as already
discussed, the material compatibility assessment was based.
4.2.2.3 Ternary Carbonate Salt, Li2CO3-Na2CO3-K2CO3 (32.1-33.4-34.5 wt%)
For our system, the code predicted that no reaction between Li2CO3-Na2CO3-K2CO3 and Fe, Ni,
and C would occur in the range 500-10000 C. On the other hand, some oxidation of the salt would occur
if air were present, but the equilibrium concentration of the resulting oxides (Na20, K20 and Li20) would
be very low, below 10~5 wt% in the temperature range 500-10000C. However, the salt mixture was found
to be strongly reactive with Mo, Mn, Cr, SiO 2, A1203. The following reactions at 8000C between the salt
and the reagents were identified by FACTsage:
imol CARTECSAL + imol Cr 4 0.31539 mol (Na20)(Cr 2O3) + 0.24869 mol K2CO3 + 0.18461 mol Cr203
+ 0.43461 mol Li20
1mol CARTECSAL + 1mol Mo 4 0.37500 mol Mo2C+ 0.25000 mol (Na20)(MoO 3) + 0.12500 mol Li20 +
+ 0.62497 mol (35.573 wt.% Li2CO3)(10.770wt.% Na2CO3)(53.656wt.% K2CO3)

Imol CARTECSAL + 1mol Mo - 1 mol MnO + 0.48427 mol C + 0.43477 mol Li20 +
+ 0.51110 mol (3.3845wt.% Li2CO3)(49.545wt.% Na2CO3)(47.071wt.% K2CO3)
1mol CARTECSAL + 1mol Si02 4 1 mol CO2 + 0.43477 mol Li2SiO 3 + 0.24977 mol K2SiO 3 +
+0.31539 mol Na2SiO 3 Equation 4.1
1mol CARTECSAL + imol A1203 4 1 mol CO2 + 0.86955 mol LiAIO 2 + 0.49960 mol KAIO 2 +
+ 0.63077 mol NaAIO 2
These findings were also partly and qualitatively confirmed by literature review regarding studies on
carbonate salts corrosion effects on metals and steel components [33].
If humidity is present in the air, it reacts with CARTECSAL to form lithium, potassium and sodium
hydroxides. No acid production takes place. The hydroxide equilibrium concentration depends on the
temperature of the system, but can be estimated on the order of about 3% wt in the range 500-10000C.
The strong reactivity between carbonate salts and silica (equation 4.1) was also experimentally observed
(as mentioned in Section 4.3) and made effectively impossible performing any measurements on this
ternary mixture using the experimental apparatus and the related materials described in Chapter 3.
4.2.2.4 Ternary Nitrite/Nitrate Salt, KNO3-NaNO2-NaNO3 (53-40-7 wt%)
The first interesting feature outlined by FACTsage, coherently to what was found in literature
[11], is that this ternary mixture is not a stable one. In fact, sodium nitrite spontaneously becomes
sodium nitrate following the reaction:
4 mol NaNO 2 4 2 mol NaNO 3 + 1 mol Na20 2 + 1 mol N2

The kinetics of this reaction is reported to be very slow [11], but as a thermodynamic software,
FactSage does not provide any information about the timescale of the reactions involved. In other
words, the sodium nitrite present in the system is converted immediately and completely by the
software into sodium nitrate, sodium peroxide and nitrogen. Therefore, for the FACTsage calculations
we referred to a different nitrates mixture, similar to the one used as a back-up salt for the DAR project
[11]. This mixture composition is KNO 3 -NaNO 3, 40-60 wt% with a melting point of about 2220C. For our
system, the code predicted that no reaction between KNO 3-NaNO 3 and 02, N2, and NiO would occur in
the range 200-500*C. However, the salt mixture was found to be reactive with Fe, Ni, Cr, Mo, Mn, C,
SiO 2, A120 3. The following reactions between the salt and the reagents were identified by FACTsage at
400*C:
1mol (KNO 3-NaNO 3)+ 1mol Fe 4 0.31 mol N2 + 0.27 mol (Na20)(Fe 2O3) + 0.38644 mol KNO 3 +
+ 0.22939 mol Fe20 3 + 6744E-02 mol K202
1mol (KNO 3-NaNO 3)+ 1mol Ni 4 0.25 mol N2 + 0.50702 mol (wt.% NaNO 3) (wt.% KNO3) +
+ 1.0000 mol NiO + 0.25000 mol Na202
1mol (KNO 3-NaNO 3)+ 1mol Cr - 0.63465 mol N2 + 0.22996 mol K2CrO 4 +
+ 0.27355 mol Na2CrO 4 + 0.24825 mol Cr203
1mol (KNO 3-NaNO 3)+ 1mol Mo 4 0.50351 mol N2 + 0.48245 mol MoO 2 +
+ 0.27355 mol (Na20)(MoO 3) + 0.24400 mol MoO 3 + 0.22996 mol K20
1mol KNO 3-NaNO 3 + 1mol Mn 4 0.27262 mol N2 + 0.46179 mol KNO 3 +
+ 0.27385 mol Mn 30 4 + 0.27262 mol Na20 + 8.9229E-02 mol Mn 203

1mol (KNO 3-NaNO 3) + 1mol C 4 0.25176 mol N2 + 0.25176 mol CO2 + 0.25176 mol 02 +
+ 0.22996 mol K2CO3 + + 0.27355 mol Na2CO3
1mol (KNO 3-NaNO 3) + 1mol Si02 4 0.52869 mol N2 + 1.23361 mol 02 +
+ 0.22996 mol K2Si2O5 + 0.26653 mol Na2Si2O5
imol (KNO 3-NaNO 3) + 1mol A1203 4 0.383 mol N2 + 0.893 mol 02 + 0.47487 mol NaAIO 2
+ 0.27797 mol (22.787 wt.% NaNO 3)(77.213 wt.% KNO 3) + 0.12709 mol K2Al120 19
If humidity is present in the air, it reacts with KNO 3-NaNO 3 with the consequent formation of
sodium and potassium hydroxides and the release of gases like oxygen and nitrogen. The equilibrium
concentration of the hydroxides calculated by FACTsage results very large and basically the nitrates salt
shifts towards an hydroxides salt presenting small concentrations (10-2 % wt) of the original salt
components.
The presented simulation results on the compatibility of the salts analyzed with candidate
structural material show that the reactions between the salts and many constitutive elements of metal
alloys will presumably require the presence of a protective oxide layer as a diffusion barrier for the salt.
Future computational and experimental work should be therefore focused on the characterization of
the oxide layer behavior exposed to molten salt at different temperatures and in presence of dissolved
oxygen, with particular attention to the free surface region, particularly susceptible to localized
corrosion [25][28].

4.3 Light Attenuation Coefficient Measurements
4.3.1 Binary Chloride Mixture NaCl-KCI, 50-50 wt%
First of all the alignment of the two cuvettes and the integrating sphere with the light beam was set
and checked repeating the overlapping of the light source spectra. Then, with all the optical components
ready and the cuvettes in place in the furnace, the salt (binary chloride mixture NaCl-KCI, 50-50 wt%)
was charged into the outer cuvette, trying not to touch the inner cuvette and to load the mixture as
homogeneously as possible. A total mass of about 300g of salt mixture was loaded. Figure 4.3.1 shows
the sample in place right before closing and insulating the furnace.
Figure 4.3.1 Furnace and Salt Sample Before the Test
Once having charged the salt into the outer cuvette, the integrating sphere is basically blinded
by the solid salt which is not transparent. The alignment has therefore to be checked from the top, and
77
.. ..........

in particular observing the light beam position inside the inner cuvette. As shown in Figure 4.3.2, thanks
to a small metallic net, it is possible to identify the light beam and its position inside the inner cuvette
also during the experiment. Figure 4.3.3 shows the inside of the furnace during the experiment at 800*C:
it can be noted the oxidation of the clamp and the loss of pigment experienced by the fiber glass tongs
due to the high temperature (about 400*C at the tong).
Figure 4.3.2 Check of the Optical Alignment Using a Metallic Net Placed Over the Inner Cuvette
Figure 4.3.3 Inside of the Furnace During the Test at 8000C

4.3.2 Binary Nitrate Mixture KNO3-NaNO3, 40-60 wt%
The first melting experiment was performed on the commercial (Coastal Solar Salt) grade nitrite
mixture (60 wt% NaNO3, 40 wt% KNO3). We charged 300g of salt mixture in the outer cuvette and heat
it up to 5500C to perform the optical measurements at different temperatures and for different path
lengths. After the salt was completely melted (above about 250 0C), the measured light signal was still
much lower than expected (about one order of magnitude lower). Visually, intense salt bubbling was
observed and this phenomenon decrease but did not stop during the experiment while the light signal
kept being one order of magnitude off of the usual counts range. In order to have a better
understanding on the phenomena taking place, we decided to slightly separate the two furnace heating
elements and to take pictures of the molten salt during the experiment.
By looking at the salt, we observed a relevant presence of impurities which resulted in deposition on
the bottom of the outer cuvette and in particles suspension. Both clearly affect the attenuation
properties of the mixture. In particular, while the deposition on the bottom can be considered a surface
effect which is not expected to affect excessively the volumetric attenuation, the particle suspension
clearly gives a relevant contribution to the total light attenuation. The impurity deposition resulted in a
pinkish powder observed also after the experiment on the bottom of the solidified salt sample. Given
the low signal intensity, it was not possible to acquire spectra having a sufficient intensity to produce
reliable data. Figure 4.3.4 shows what we observed at about 3000C.
Given such a lower than usual spectral intensity, no repeatable quantitative data can be obtained
using the current apparatus and such a low purity salt and therefore we decided to proceed with the
measurements of the lab reagent grade mixture (ACS single salt components purchased from Alfa
Aesar). The experimental procedure and setup matched the one presented for the binary chloride
mixture.

Bubbles on the bottom ofthe inner cuvette
Figure 4.3.4 Molten Salt NaNO3-KNO3 Commercial Mixture at 300'C

4.3.3 Ternary Carbonate Mixture, L12CO3-Na2CO3-K2CO3 (32.1-33.4-34.5 wt%)
No measurements were performed on the ternary carbonate mixture (CARTECSAL) listed among the
promising salt candidates because of its reactivity with quartz which caused, as already described in
Section 4.1, a strong loss of clarity up to complete dissolution of quartz exposed to the salt. Figure 4.3.5
shows a quartz crucible found broken after exposure to this mixture. The dissolution of quartz is so fast
at the operating conditions of the furnace to be incompatible with the amount of time required for the
optical measurements. As will be discussed in Chapter 5, further improvement of the experimental
apparatus aiming at characterizing carbonate mixtures will require changing the materials of the high
temperature optical cell.
Figure 4.3.5 Broken Quartz Crucible After Exposure to Ternary Carbonate Eutectic Mixture
4.3.4 Experimental Results
4.3.4.1 Binary Nitrate Salt, KNO3- NaNO3 (40-60 wt%)
For each of the two tests run with this salt, spectra were acquired between 250*C and 500*C with
500C temperature steps. For each temperature (excluding the 2500C and 500*C for which it was not
81

always possible to obtain complete sets of data due to unexpected freezing or bubbling of the salt), six
1cm path length steps were covered and each sequence was repeated twice (up-down and down-up
sequences, starting with the inner cuvette completely extracted). For each point along the path length,
two signal spectra and two background spectra were acquired (see Figure 4.3.6: each of them covers the
wavelength range 250nm-1100nm with 0.5nm steps and each spectrum is the average of five such
spectral sweeps). The average of the two signal spectra subtracted by the average of the two
background spectra represents a single measurement point for a given salt depth. A total of 12
measurement depths/points per temperature were therefore collected. Figure 4.3.7 shows a sequence
of spectra acquired for different salt thicknesses; the behavior is exponential, even if it might not look
intuitive, given the small absolute light attenuation (molten salts are semi-transparent fluids). Each salt
depth and the corresponding 1/1, value for all wavelengths measured were used to determine the
attenuation coefficient. These attenuation coefficient values were then averaged over all depths for a
given temperature. Via this approach average attenuation coefficient values and associated standard
deviations of the experimental data as a function of wavelength could be plotted as shown in Figure
4.3.8). By so doing, we were able to obtain 0.5nm of wavelength resolution also when estimating the
attenuation coefficient.
Due to the light source's intensity distribution, reliable data were obtained between 400nm and
800nm, while for shorter and larger wavelengths the signal to noise ratio drops significantly, making
impossible any quantitative evaluation of the attenuation coefficients (Figure 4.3.8). Figure 4.3.9 shows
the attenuation coefficient as a function of wavelength for different temperatures (in this last figure the
standard deviations of the single curves were not reported, but can be found in in Appendix A). As
expected [18], there is a shifting to longer wavelength of the short-wavelength absorption region with
increasing temperature. However, above 450nm there is no evident temperature effect.

09kooo 93 WA.8807 3808 v&| 286r0. 8
5 i953T!30
NTs
Wavel.ngth in Xa... er
Figure 4.3.6 Two Typical Signal Spectra Acquired in Sequence
3W 4% SW m0 I0w8o% 2
FCPigre 'J3.7equence fig0al Sp474c4tTra Chra Str eb TDifrn Otica1l Pat -e
Figure 4.3.7 Sequence of Signal Spectra Characterized by Different Optical Path Length

0.4
0.3
0.2 -
0.1
4010 500 600 700 800 0 1000
'*r -0.1 :
M
-0.2
-0.3
-20.
-Wavelength [nm]
Figure 4.3.8 Attenuation Coefficient Average Values and +/- Standard Deviation vs. Wavelength at 450Cfor the Binary Nitrate Salt
0.2
0.18 +250C,
E0.16 *-30
- - 350C *d,0.14C X 400C
.! 0.12u - 450C.
0.0800
00.028
40
400 500 600 700 800 900 1000Wavelength [nm]
Figure 4.3.9 Attenuation Coefficient Average Values as function of Wavelength and Temperaturefor the Binary Nitrate Salt

4.3.4.2 Binary Chloride Mixture NaCl-KC, 50-50 wt%
The tests run using the binary chloride mixture followed an experimental and data reduction
procedure similar to the one already presented for the nitrate mixture (section 4.3.4.1). In general the
measurements on the chlorides were, however, much more challenging because of the higher
temperature, which results in a larger IR radiation coming from the furnace (which represents a noise
source), and the loss of clarity of quartz exposed to the binary chloride over time. This explains the
larger experimental error collected for the chlorides than for the nitrates, especially at larger
wavelengths, as shown in Figure 4.3.10 and as reported in tabular form in Appendix A.
Again, due to the light source intensity distribution, reliable data were obtained between 400nm
and 800nm, while for shorter and larger wavelength the signal to noise ratio drops significantly, making
any quantitative evaluation of the attenuation coefficients (Figure 4.3.10) impossible. Figure 4.3.11
shows the attenuation coefficient as a function of wavelength for different temperatures.
Similarly to Figure 4.3.9, also in Figure 4.3.11 the standard deviation for the single temperature
curves was not reported, and can be found in tabular form in Appendix A. In this case, we were able to
reliably test only the temperatures 700*C - 750*C - 800*C (the melting point of the mixture is 670*C and
starting around 850'C the radiation coming from the furnace overwhelms the light source, as can be
seen in Figure 3.14). No evident temperature effects were identified (even if 800*C data appears to have
a slightly larger attenuation coefficient at shorter wavelengths) and the attenuation coefficient values
appear smoother and slightly smaller compared to the nitrate mixture in the same wavelength range.

0.2
0.1
0
-0.1
-0.2
-0.3
-0.4
Wavelength [nm]
Figure 4.3.10 Attenuation Coefficient Average Values and +/- Standard Deviation vs. Wavelength at 750*for the Binary Chloride Mixture
0.2
0.18
0.16
0.14
0.12
0.1
0.08
0.06
0.04
0.02
0
+ 800 C
750C
700 C
400 450 500 550 600 650 700 750 800
Wavelength [nm]
Figure 4.3.11 Attenuation Coefficient Average Values as function of Wavelength and Temperaturefor the Binary Chloride Mixture

4.3.5 Uncertainty Analysis
The extrapolation of the attenuation coefficient from the collected data in terms of intensity
(counts) as a function of wavelength implies finding the analytical solution Sof the equation:
I = Io ' e-~~ (4.1)
For every couple of experimental points (corresponding to two spectra acquired at two different
axial positions of the inner cuvette) a single solution for 6can be obtained. By averaging the different
values of dobtained for each temperature step, the average light attenuation coefficient as a function of
wavelength was obtained (see Figure 4.3.12). The data acquisition software already averages the output
every five scans, providing extremely stable spectra which, combined with good optical alignment and
high signal to noise ratio, make the single signal fluctuation irrelevant for the uncertainty analysis. The
experimental standard deviation is therefore the only contributor considered in the data analysis and
includes several single contributors to the total uncertainty like positioning uncertainty, non-uniformity
of light source emissivity, interface effects, small angle perturbations. The error introduced by the
experimental apparatus itself (accuracy of the single components, in particular the spectrometer) is in
fact much smaller (around 0.1% assuming a Poisson distribution for the photon counts on the detector)
compared to the observed standard deviation (which is around 20% on average, as can be estimated
from the data reported in Appendix A) and can therefore be neglected. This also suggests that there is
room for further improvement of the experimental apparatus, as discussed in Chapter 5.
The variation in the absolute and relative error as a function of wavelength and temperature is mainly
given by the non uniform intensity of the light source over the wavelength range considered as well as
the radiation emitted by the furnace at high temperatures. Further improvement of the experimental
apparatus will need to address those issues to be able to extend the wavelength range over which the
collected data can be considered reliable. [341 [35].

4.3.6 Comparison with Theoretical Predictions
The agreement of the collected experimental evidence with the related expected trends
presented in Chapter 2 is generally good, considering also the lack of predictive models for optical
properties of high temperature semi-transparent fluids. For both the nitrate and the chloride mixtures it
was possible to identify an increasing absorbing region in the ultra-violet followed by a semi-transparent
region extending from the visible to the near infrared. Also the expected shifting with temperature of
the ultra violet absorbing region for the nitrate mixture was caught by our experimental apparatus,
whereas for the chloride mixture the reduced temperature range made more difficult its identification.
Other than being qualitatively as predicted by literature, the collected data represent have a unique and
quantitative value which make them reliable for engineering purposes and not only useful for a general
description of the phenomenology characterizing the light attenuation in high temperature semi-
transparent liquids.
1 -
0.95 y
R2 = 0.998- 0.9
0.8
.8
C
40
= 0.85 -
.2 0.8
0.75
0 1 2 3 4 5 6 7 8Light Pathlength, Nitrate Molten Salt Mixture [cm]
Figure 4.3.12 From Equation 4.1, /lo vs. Nitrate Mixture Molten Salt Thickness at 350*C and 600nm.
The Exponential Interpolation Gives the Value of the Light Attenuation Coefficient
........ ... ...

5. Summary and Conclusions
The light attenuation coefficient of two reagent grade molten salt mixtures (KNO 3 - NaNO 3, 40-
60 wt% and NaCI-KCI, 50-50 wt%) was measured and characterized over the wavelength range 400nm-
800nm and for different operating temperature ranges: 250"C-500"C for the nitrate mixture (reference
salt for the lower temperature CSPonD design) and 700"C-800*C for the chloride mixture (reference salt
for the higher temperature CSPonD design). The measurements were performed using a unique custom
built experimental apparatus based on the transmission technique which combines high accuracy and
flexibility in terms of experimental conditions and temperatures with simple layout, use of common lab
materials and low cost. The experimental apparatus was validated using published data for both a room
temperature fluid (water) as well as a high temperature fluid (a nitrate/nitrate mixture presenting a well
known absorption edge shifting with temperature). No previous experimental works characterized
molten salts in terms of light attenuation coefficient as a function of temperature and wavelength and
under this point of view the obtained results represent unique and direct optical measurement for such
a class of fluids. Furthermore, the obtained results are consistent with the general trends expected from
theory for molten salts, described as semi-transparent liquids in the visible range and characterized by
absorption edges in the ultra-violet and far-infrared regions.
In addition, the chemical compatibility of a few molten salt mixtures (including nitrate/nitrite,
chloride and carbonate salt mixtures) with common materials of interests was assessed partially through
dedicated material compatibility tests and more extensively using a thermodynamic chemistry software,
able to predict the equilibrium composition of systems of specified composition at different
temperatures. The preliminary melting and material compatibility tests brought some of the salt mixture
candidates to be discarded because of undesirable reactions with structural materials or air that made
them not suitable for the CSPonD design project.

5.1 Future Work
Despite the success of the experimental campaign and the reliability of the attenuation data
collected for two molten salt mixtures over the visible wavelength range relevant for solar energy
storage applications, the capabilities of the experimental apparatus were not fully exploited and further
modification may bring to sensible improvement of its performances. The data generated in this project
can be considered reliable in a limited wavelength range (400 to 800nm) and wavelength range (up to
800C), beyond which the radiation emitted by the furnace interferes with the optical measurements.
With regard to the limitation on the wavelength range, it would be ideal to extend it to cover
the entire range characteristic of the solar light (250nm-2500nm). This would, however, require light
sources able to span different portions of the spectrum and at the same time having comparable and
uniform (as much as possible) intensity. While specific light source for the ultra-violet range can be
easily found and purchased, an IR source, being related to the temperature, is more difficult to be
achieved. Also the spectrometer, which actually covers the range 250nm-1100nm should be coupled
with a new one able to measure light intensity in the infra red. Commercial products are in this case
available, but at much higher costs (up to 5 times higher) compared to the current piece of equipment.
The radiation emitted by the furnace is unavoidable for temperatures higher than about 700*C
and above 800*C the furnace IR contribution becomes not negligible and affects the data for
wavelengths longer than 750nm. Since the emitted radiation is collected by the integrating sphere like
the actual light source signal, the shielding of the integrating sphere should reduce the spurious signals
collected. By improving the collimation of the light beam, however, it could be possible to increase the
distance between the collimator and the integrating sphere which would therefore be placed further

from the furnace. By so doing, the solid angle under which the furnace radiation can penetrate into the
integrating sphere detection port would be reduced as well as the spurious signal.
Other than improving the optics of the apparatus, also changes in the materials of the hot cell
might result beneficial and increase the number of salt candidates suitable for an improved version of
the experimental apparatus. In particular, carbonate salts attack quartz and therefore cannot be melted
using the current experimental setup which uses two concentric quartz cuvettes. More expensive
materials like sapphire or diamond are expected to perform better under corrosion as well as under ions
diffusion processes. However, being significantly more expensive than quartz, a computational and
experimental assessment of their behavior under molten salt exposure at high temperature should be
performed before re-designing the optical cell.

6. References
[1] A. Rabl, Tower reflector for solar power plant, Solar Energy, Vol. 18, pp 269-271
[2] A. Yogev US Patent 5,685,289, Heat Storage Device, Oct. 4, 1994
[3] A. Yogev, A. Kribus, M. Epstein, A. Kogan, Solar Tower Reflector Systems: A New Approach For
High-Temperature Solar Plants, ht. J. Hydrogen Energy, Vol. 23, No. 4, pp. 239-245, 1998
[4] Felix Trombe, Albert Le Phat Vinh, Thousand kW Solar Furnace, Built By The National Center Of
Scientific Research In Odeillo (France), Solar Energy, 1973, Vol. 15, pp. 57-61
[5] A. Segal, M., Epstein, Solar Ground Reformer, Solar Energy 75 (2003) 479-490
[6] Charles W. Forsberg et al. - Liquid Salt Applications and Molten Salt Reactors - ICAPP 2007,
Proceedings
[7] C. W. Forsberg, C. Renault, C. LeBrun, E. Merlet-Lucotte, and V. Ignatiev, Liquid Salt Applications
and Molten Salt Reactors (Les applications des sels liquides et les reacteurs a sels fondues), RGN:
Revue Generale Nucleaire, No. 4, pp. 63-71, July-August 2007
[8] U. Herrmann, B. Kelly, and H. Price, Two-Tank Molten Salt Storage for Parabolic Solar Power
Plants, Energy 29 (2004) 883-893
[9] J. E. Pacheco, S. K. Showalter, and W. J. Kolb, Development of a Molten-Salt Thermocline
Thermal Storage System for Parabolic Trough Plants, Journal of Solar Energy Engineering, 124
(2002) 153-159
[10] Bohn, Green, Heat Transfer in Molten Salt Direct Absorption Receivers, Solar Energy 4, 2-1, 1989
[11] W.D. Drotning, Optical Properties of a Solar-Absorbing Molten Salt Heat Transfer Fluid,
SAND770938, June 1977

[12] Jianzhong Li and Purnendu K. Dasgupta - A simple instrument for ultraviolet-visible absorption
spectrophotometry in high temperature molten salt media - Review of Scientific Instruments
Volume 71, Number 6, June 2000
[13] William D. Drotning - Optical Properties Of Solar-Absorbing Oxide Articles Suspended In a
Molten Salt Heat Transfer Fluid - Solar Energy, Vol. 20, pp. 313-319, 1978
[14] G.J. Janz, Molten Salt Handbook, Academic Press, NY 1967
[15] Bloom, The Chemistry of Molten Salts, Benjamin, New York, 1967
[16] R. Siegel and J. Howell - Thermal Radiation Heat Transfer - Taylor and Francis, 2002
[17] James D. Livingston, Electronic Properties of Engineering Materials, John Wiley and Sons, 1999
[18] Michael F. Modest, Radiative Heat Transfer, Second Edition, Academic Press, 2003
[19] Smith, Baker, Optical Properties of the Clearest Natural Waters, Applied Optics, 1981
[20] Sawyer, Alanson, Experimental Spectroscopy, Prentice Hall, New York, 1951
[21] Makino et al. - Thermal Radiation Properties of Molten Salts (properties of alkali metal chlorides
and conductive-radiative heat transfer in the salt) - Heat Transfer Japanese Research - 1991
[22] CANES - MIT, Flexible Conversion Ratio Fast Reactor Systems Evaluation, Final Report, 2008
[23] Georges J. Kipouros and Donald R. Sadoway, A thermochemical analysis of the production of
anhydrous MgCl2, Journal of Light Metals, 2001
[24] Q. D. Mehrkam, An Introduction to Salt Bath Heat Treatment, Tooling and Production Magazine,
June and July, 1967
[25] ASM Handbook on metals, vol.4, 1991
[26] A.C. Skinrood et. al, Status Report On a High Temperature Solar Energy System, SAND74-8017,
Sept. 1974
[27] www.coastalchem.com

[28] www.heatbath.com/
[29] P.R. Lageraaen, B.R. Patel, P. D. Kalb, J. W. Adams, Treatability Studies for Polyethylene
Encapsulation of Inel Low-Level Mixed Wastes, Brookhaven National Laboratory, Final Report,
1995
[30] Byung Chul Shin, Sang Done Kim, Ternary Carbonate Eutectic (Lithium, Sodium and Potassium
Carbonates) for Latent Heat Storage Medium, Solar Energy Materials, 1990
[31] Corrosion Handbook Online, 2008
[32] http://www.factsage.com, Thermodynamic Database, 2009
[33] E. R. Hwang, S. G. Kang, Intergranular Corrosion of Stainless Steels in Molten Carbonate Salt,
Journal of Materials Science Letters, 1997
[34] Michael Grabe, Measurement Uncertainties in Science and Technology, Springer, 2005
[35] Semyon G. Rabinovich, Measurement Error and Uncertainties, Springer, 2000
[36] www.astm.org/Standards/G173.htm

Appendix A: Experimental Data in Tabular Form
BINARY NITRATE MIXTURE KNO3-NaNO3, 40-60 wt%
Wavelength Light Attenuation Standard[nm] Coefficient AVG [1/cm] Deviation [1/cm]
400 0.1041 0.0373
420 0.0390 0.0123
440 0.0264 0.0118
460 0.0238 0.0071
480 0.0198 0.0038
500 0.0195 0.0017
520 0.0181 0.0031
540 0.0165 0.0017
560 0.0160 0.0007
580 0.0149 0.0005
600 0.0143 0.0009
620 0.0144 0.0016
640 0.0132 0.0015
660 0.0124 0.0013
680 0.0126 0.0024
700 0.0115 0.0022
720 0.0111 0.0029
740 0.0113 0.0045
760 0.0145 0.0076_
780 0.0069 0.0105
800 0.0092 0.0063Binary Nitrate Mixture Data - 250'C
Wavelength Light Attenuation Standard[nm] Coefficient AVG [1/cm] Deviation [1/cm]
400 0.2566 0.0845
420 0.0747 0.0141
440 0.0322 0.0059
460 0.0238 0.0037
480 0.0214 0.0025
500 0.0188 0.0022
520 0.0177 0.0014
540 0.0163 0.0012
Wavelength Light Attenuation Standard[nm] Coefficient AVG [1/cm] Deviation [1/cm]
400 0.2366 0.0646
420 0.0645 0.0136
440 0.0299 0.0092
460 0.0222 0.0024
480 0.0196 0.0020
500 0.0181 0.0023
520 0.0168 0.0015
540 0.0159 0.0021
560 0.0153 0.0016
580 0.0148 0.0020
600 0.0140 0.0017
620 0.0136 0.0022
640 0.0124 0.0023
660 0.0120 0.0016
680 0.0109 0.0017
700 0.0107 0.0020
720 0.0099 0.0047
740 0.0090 0.0034
760 0.0089 0.0079
780 0.0085 0.0094
800 0.0092 0.0107Binary Nitrate Mixture Data - 300*C
Wavelength Light Attenuation Standard[nm] Coefficient AVG [1/cm] Deviation [1/cm]
400 0.2852 0.0826
420 0.0917 0.0178
440 0.0367 0.0102
460 0.0238 0.0048
480 0.0201 0.0042
500 0.0193 0.0027
520 0.0179 0.0029
540 0.0166 0.0019

560 0.0158 0.0012
580 0.0147 0.0015
600 0.0138 0.0017
620 0.0135 0.0023
640 0.0127 0.0017
660 0.0122 0.0014
680 0.0114 0.0012
700 0.0107 0.0029
720 0.0106 0.0021
740 0.0103 0.0043
760 0.0111 0.0096
780 0.0099 0.0041
800 0.0070 0.0055Binary Nitrate Mixture Data - 350*C
Wavelength Light Attenuation Standard[nm] Coefficient AVG [1/cm] Deviation [1/cm]
400 0.3031 0.1362
420 0.1315 0.0343
440 0.0449 0.0095
460 0.0247 0.0083
480 0.0208 0.0042
500 0.0182 0.0028
520 0.0166 0.0023
540 0.0158 0.0020
560 0.0148 0.0018
580 0.0140 0.0022
600 0.0132 0.0025
620 0.0122 0.0019
640 0.0116 0.0018
660 0.0115 0.0022
680 0.0103 0.0024
700 0.0102 0.0025
720 0.0102 0.0037
740 0.0086 0.0033
760 0.0068 0.0095
780 0.0084 0.0091
800 0.0079 0.0066Binary Nitrate Mixture Data - 450*C
560 0.0157 0.0023
580 0.0149 0.0027
600 0.0138 0.0029
620 0.0135 0.0025
640 0.0122 0.0020
660 0.0118 0.0032
680 0.0115 0.0025
700 0.0110 0.0039
720 0.0101 0.0059
740 0.0097 0.0088
760 0.0079 0.0133
780 0.0057 0.0095
800 0.0078 0.0121Binary Nitrate Mixture Data - 400*C
Wavelength Light Attenuation Standard[nm] Coefficient AVG [1/cm] Deviation [1/cm]
400 0.2976 0.3310
420 0.1828 0.0598440 0.0600 0.0106
460 0.0295 0.0121
480 0.0210 0.0064
500 0.0186 0.0089520 0.0173 0.0058540 0.0158 0.0075560 0.0150 0.0075580 0.0146 0.0079
600 0.0139 0.0096
620 0.0133 0.0087640 0.0122 0.0101660 0.0121 0.0067
680 0.0123 0.0079
700 0.0110 0.0078
720 0.0100 0.0080
740 0.0098 0.0112
760 0.0102 0.0069
780 0.0084 0.0110
800 0.0102 0.0086Binary Nitrate Mixture Data - 5000C

BINARY CHLORIDE MIXTURE NaCl-KCl, 50-50 wt%
Wavelength Light Attenuation Standard[nm] Coefficient AVG [1/cm] Deviation [1/cm]
400 0.0369 0.0229
420 0.0300 0.0096
440 0.0235 0.0068
460 0.0200 0.0076
480 0.0190 0.0030
500 0.0171 0.0029
520 0.0156 0.0029
540 0.0146 0.0020
560 0.0136 0.0031
580 0.0129 0.0012
600 0.0121 0.0010
620 0.0110 0.0032
640 0.0105 0.0022
660 0.0102 0.0040
680 0.0100 0.0055
700 0.0088 0.0031
720 0.0090 0.0051
740 0.0088 0.0115
760 0.0090 0.0204
780 0.0068 0.0126
800 0.0061 0.0145Binary Chloride Mixture Data - 7000C
Wavelength Light Attenuation Standard[nm] Coefficient AVG [1/cm] Deviation [1/cm]
400 0.0372 0.0118
420 0.0297 0.0072
440 0.0233 0.0094
460 0.0224 0.0094
480 0.0187 0.0016
500 0.0181 0.0023
520 0.0164 0.0041
540 0.0150 0.0020
560 0.0149 0.0019
580 0.0139 0.0011
600 0.0126 0.0013
620 0.0119 0.0020
640 0.0114 0.0013
660 0.0113 0.0019
680 0.0100 0.0029
700 0.0102 0.0027
720 0.0090 0.0040
740 0.0091 0.0099
760 0.0127 0.0237
780 0.0093 0.0186
800 0.0072 0.0116Binary Chloride Mixture Data - 7500C
Wavelength Light Attenuation Standard[nm] Coefficient AVG [1/cm] Deviation [1/cm]
400 0.0415 0.0325
420 0.0402 0.0193
440 0.0324 0.0218
460 0.0254 0.0126
480 0.0243 0.0150
500 0.0205 0.0121
520 0.0188 0.0102
540 0.0166 0.0077
560 0.0144 0.0071
580 0.0130 0.0048
600 0.0117 0.0041

620 0.0110 0.0059
640 0.0097 0.0043
660 0.0097 0.0042
680 0.0085 0.0041
700 0.0077 0.0050
720 0.0072 0.0064
740 0.0057 0.0082
760 0.0022 0.0163
780 0.0038 0.0288
800 0.0018 0.0233Binary Chloride Mixture Data - 800"C

Appendix B: The Solar Spectrum
Sunlight, in the broad sense, is the total frequency spectrum of electromagnetic radiation given off
by the Sun. The spectrum of the Sun's solar radiation is close to that of a black body with a temperature
of about 5,800 K. About half that energy lies in the visible short-wave part of the electromagnetic
spectrum and the other half mostly in the near-infrared part. Some also lies in the ultraviolet part of the
spectrum. More specifically, the spectrum of electromagnetic radiation striking the Earth's atmosphere
is 100 to 106 nanometers (nm). This can be divided into five regions in increasing order of wavelengths:
e Ultraviolet C or (UVC) range, which spans a range of 100 to 280 nm. The term ultraviolet refers
to the fact that the radiation is at higher frequency than violet light (and, hence also invisible to
the human eye). Owing to absorption by the atmosphere very little reaches the Earth's surface
(Lithosphere).
" Ultraviolet B or (UVB) range spans 280 to 315 nm. It is also greatly absorbed by the atmosphere,
and along with UVC is responsible for the photochemical reaction leading to the production of
the Ozone layer.
* Ultraviolet A or (UVA) spans 315 to 400 nm.
" Visible range or light spans 400 to 700 nm. This is the range that is visible to the naked eye.
e Infrared range that spans 700 nm to 106 nm [1 (mm)]. It is responsible for an important part of
the electromagnetic radiation that reaches the Earth. It is also commonly divided into three
types on the basis of wavelength:
o Infrared-A, or Near Infrared: 700 nm to 1,400 nm
o Infrared-B, or Medium Infrared: 1,400 nm to 3,000 nm
o Infrared-C, or Far Infrared: 3,000 nm to 1 mm.

2.00
'; 1.75E
1.50E
E 1.25U
.2 1.00
S0.75
0.50
0.25
ASTM G173-03 Reference Spectra
- Etr W*m-2*nm-1
---- -- Globaltilt W*m-2*nm-1
- Direct+circumsolar W*m-2*nm-1
--
u.U I I I I I I I I I
250 500 750 1000 1250 1500 1750 2000 2250 2500 2750 3000 3250 3500 3750 4000Wavelength nm
Figure B1 Standard Solar Irradiance Spectra
The solar irradiance spectra (radiation intensity as a function of wavelength) are standardized
according to several local and global parameters, including altitude and air composition and density.
Figure B1 shows the solar irradiance spectra given by the ASTM G173-03 standards [36]. These are solar
spectral irradiance distributions for use in terrestrial applications that require a standard reference
spectral irradiance for hemispherical solar irradiance (consisting of both direct and diffuse components)
incident on a sun-facing, 37* tilted surface or the direct normal spectral irradiance. The data contained
reflect reference spectra with uniform wavelength interval. The ASTM G173 spectra represent terrestrial
solar spectral irradiance on a surface of specified orientation under one and only one set of specified
atmospheric conditions. These distributions of power (watts per square meter per nanometer of
bandwidth) as a function of wavelength provide a single common reference for evaluating, for example,
spectrally selective photovoltaic (PV) materials with respect to performance measured under varying
natural and artificial sources of light with various spectral distributions. The conditions selected were
100

considered to be a reasonable average for the 48 contiguous states of the United States of America
(U.S.A.) over a period of one year. The tilt angle selected is approximately the average latitude for the
considered geographical regions. The extraterrestrial spectrum (Etr), even if resembling the blackbody
radiation, does not take into account the selective absorption due to the atmosphere. Accordingly, the
two remaining spectra in Figure B1 represent suitable distributions of the solar irradiance at sea level.
The two spectra define a standard direct normal spectral irradiance and a standard total (global,
hemispherical, within 2-pi steradian field of view of the tilted plane) spectral irradiance. The direct
normal spectrum is the direct component contributing to the total global (hemispherical) spectrum and
was chosen in this discussion of results to represent the solar light reference spectrum for the data
analysis calculation and the representation of the light attenuation properties of molten salt mixtures in
terms of solar light attenuated per depth instead of in terms of the light attenuation coefficient (see
Appendix C).
101

Appendix C: Application of the Results to the CSPonD Project
In this Appendix, we present an application of the experimental results presented in Section
4.3.4 and Appendix A. In particular, the light attenuation coefficient as a function of wavelength will be
applied in to the solar spectrum presented in Appendix B. Given the small dependence of the
attenuation coefficient with temperature, the results can be easily extended also to other operative
conditions.
Using experimentally determined attenuations coefficient, Figure C1 and Figure C2 report the
actual attenuation of the solar light for different molten salt depths in the range of 400nm-800nm,
where the data are considered reliable. Outside this range, in the two figures above reported, the
attenuation coefficient was initially assumed to be zero. The salt temperature for this calculation was
assumed uniform and equal to 3500C and only average values were considered.
I Experimental Range1
0.9
0.8
0.7
0.6
0.5
0.4
0.3
0.2
0.1
0
- Reference
-0.25m Salt Depth
- 0.75m Salt Depth
- 1m Salt Depth
2m Salt Depth
- -- 3m Salt Depth
-L
300 600 900 1200 1500 1800 2100
Wavelength [nm]
Figure C1 Solar Irradiance Attenuation as a function of Wavelength and Salt Depth at 350*Cfor the Binary Nitrate Salt
2400
102

- Reference - 0.25m Salt Depth - 0.75m Salt Depth
- 1m Salt Depth - 2m Salt Depth - 3m Salt Depth
400 500 600Wavelength [nm]
Figure C2 Solar Irradiance Attenuation as a function of Wavelengthfor the Binary Nitrate Salt
700
and Salt Depth at 350*C
Table C1 summarizes the results showing the attenuation and transmission percentages in the
wavelength range 400nm-800nm. However, this wavelength range includes 55% of the solar total
irradiance that is emitted and reaches the earth's surface (excluding wavelength shorted than 400nm for
which we assume the corresponding irradiance to be entirely attenuated given the behavior shown in
Figure 4.3.8 and Figure 4.3.9).
Salt Depth [m] 0.25 0.75 1m 2m 3m 4m Sm
% Relative Attenuation in the34.38 67.64 76.81 93.36 97.92 99.30 99.75
400nm-800nm Range
% Relative Transmission in the65.62 32.36 23.19 6.64 2.08 0.70 0.25
400nm-800nm Range
Table C1 Relative Attenuation and Transmission Percentages as a function of Salt Depthfor the Binary Nitrate Salt
103
800

If we refer to the total irradiation instead of the partial irradiation in the wavelength range we
obtain:
Salt Depth [m] 0.25 0.75 1m 2m 3m 4m 5m
% Total Attenuation19.92 39.19 44.51 54.10 56.73 57.54 57.80
of Solar Irradiance
% Total Transmission80.08 60.81 55.49 45.90 43.27 42.46 42.20
of Solar Irradiance
Table C2 Total Attenuation and Transmission Percentages as a function of Salt Depthfor the Binary Nitrate Mixture
The hypothesis of zero attenuation outside the wavelength range considered is however clearly
not correct, having shown that the attenuation coefficient has continuous values as a function of
wavelength. Considering the decreasing trend with increasing wavelengths shown in Figure 4.3.8 and
4.3.9, we can average the values reported in Table C1 and C2 to get a better estimate of the integral
behavior of the salt (this corresponds to a first order, linear extrapolation). This has to be considered a
first order approximation, which does not take into account the presence of other highly absorbing
regions farther in the infrared. As discussed in the background chapter, those regions are expected from
theory, but they are likely to occur for longer wavelengths than 2.5gm, where the solar irradiance
expires.
Salt Depth [m] 0.25 0.75 1m 2m 3m 4m 5m
% Total Attenuation in the27.150 53.416 60.657 73.730 77.325 78.419 78.776
400nm-800nm Range
% Total Transmission in the72.85 46.58 39.34 26.27 22.67 21.58 21.22
400nm-800nm Range
Table C3 Integral Attenuation and Transmission Percentages as a function of Salt Depthfor the Binary Nitrate Salt
104

Experimental Range--_- Reference
- 0.25m Salt Depth
1
0.9
0.8
E0.7
0.6
0.5
.0.4'U
i 0.3
0.2
0.1
0
600
-- 1m Salt Dept
- 2m Salt Depti
- 3m Salt Depti
900 1200 1500Wavelength [nm]
1800 2100 2400
Figure C3 Solar Irradiance Attenuation as a function of Wavelength and Saltfor the Binary Chloride Mixture
- Reference
- 1m Salt Depth
Depthat 7500C
- 0.25m Salt Depth - 0.75m Salt Depth
- 2m Salt Depth - 3m Salt Depth
400 500 600 700Wavelength [nm]
Figure C4 Solar Irradiance Attenuation as a function of Wavelength and Salt Depthat 7500Cfor the Binary Chloride Mixture
I1 -- 0.75mn Salt Depth
300
800
105
h

Using experimentally determined attenuation coefficients, Figure C3 and Figure C4 report the
actual attenuation of the solar light for different molten salt depths in the range of 400nm-800nm,
where the data are considered reliable. Outside this range the attenuation coefficient was assumed to
be zero. The salt temperature for this calculation was assumed uniform and equal to 750*C and only
average values were considered.
Salt Depth [m] 0.25 0.75 1m 2m 3m 4m 5m
% Relative Attenuation in the21.31 49.26 58.57 79.99 89.29 93.75 96.06
400nm-800nm Range
% Relative Transmission in the78.69 50.74 41.43 20.01 10.71 6.25 3.94
400nm-800nm Range
Table C4 Relative Attenuation and Transmission Percentages as a function of Salt Depthfor the Binary Chloride Mixture
Table C4 summarizes the results showing the attenuation and transmission percentages in the
wavelength range 400nm-800nm. However, this range includes 55% of the solar total irradiance that is
emitted and reaches the earth's surface (excluding wavelength shorted than 400nm for which we
assume to the corresponding irradiance to be entirely attenuated, expecting a behavior similar to the
nitrate ones in that region). If we refer to the total irradiation instead of to the reference irradiation in
the wavelength range we obtain:
Salt Depth [m] 0.25 0.75 1m 2m 3m 4m Sm
% Total Attenuation in the12.35 28.54 33.94 46.35 51.73 54.32 55.66
400nm-800nm Range
% Total Transmission in the87.65 71.46 66.06 53.65 48.27 45.68 44.34
400nm-800nm Range
Table CS Total Attenuation and Transmission Percentages as a function of Salt Depthfor the Binary Chloride Mixture
106

The hypothesis of zero attenuation outside the wavelength range considered is however clearly
not correct, having shown that the attenuation coefficient has continuous values as a function of
wavelength. Considering the decreasing with increasing wavelengths shown in Figure 4.3.10 and Figure
3.4.11, we can average the values reported in Table C4 and Table C5 to get a better estimate of the total
integral behavior of the salt (again, this corresponds to a first order, linear extrapolation). This has to be
considered a first order approximation, which does not take into account the presence of other highly
absorbing regions far in the infrared. As discussed in the background section, those regions are expected
from theory, but they are likely to occur for longer wavelengths than 2.5gm, where basically the solar
irradiance expires.
Salt Depth [m] 0.25 0.75 1m 2m 3m 4m Sm
% Total Attenuation in the16.828 38.898 46.252 63.170 70.510 74.036 75.857
400nm-800nm Range
% Total Transmission in the83.17 61.10 53.75 36.83 29.49 25.96 24.14
400nm-800nm Range
Table C6 Integral Attenuation and Transmission Percentages as a function of Salt Depthfor the Binary Chloride Mixture
107
......................