Algorithm for Estimating Suspended Sediment Concentrations in Coastal Waters of India Using Remotely...
10
Int. J. Environ. Res., 7(4):841-850,Autumn 2013 ISSN: 1735-6865 *Corresponding author E-mail:[email protected] 841 An Algorithm for Estimating Suspended Sediment Concentrations in the Coastal Waters of India using Remotely Sensed Reflectance and its Application to Coastal Environments Sravanthi, N. 1 , Ramana, I. V. 2 , Yunus Ali, P. 1, 4 , Ashraf, M. 3 , Ali, M. M. 2 and Narayana, A.C. 1* 1 Centre for Earth & Space Sciences, University of Hyderabad, Hyderabad, India – 500 046 2 National Remote Sensing Centre, Hyderabad, India– 500037 3 Central Institute of Fisheries Technology, Cochin, India 4 Centre for Spatial Information Science, Dept. of Natural Environment Studies, University of Tokyo, Japan ABSTRACT: This study presents an empirical relationship of suspended sediment concentrations (SSCs) in the coastal waters, which is derived from the conventional methods, to radiometer remote sensing reflectance values (R rs ) and satellite data in coastal waters of Kerala. An algorithm is then developed to utilize both in situ SSCs measured from conventional methods and R rs values. This algorithm is validated with the SSCs retrieved from Oceansat-2 Ocean Colour Monitor (OCM) data. A significant coefficient of determination (R 2 =0.62) is observed between the SSCs measured in situ and satellite derived SSCs. Reflectance values from more than two spectral wavelength bands are also employed to test the accuracy of results. Satellite derived SSCs range from 1- 40 mg/L in the coastal waters off Cochin, southwest India. The regional algorithm developed for the study area gives better results than Tassan’s algorithm, and this algorithm can be used in estimation of SSC for coastal waters of western India. Key words: Suspended particulate matter, Oceansat-2, Ocean Colour Monitor, West coast of India, Validation of suspended sediment concentrations INTRODUCTION Estimating suspended sediment concentration (SSC) over large oceanic areas using in-situ sampling is a lengthy, expensive, and time-consuming process. By contrast, remotely sensed spectral radiant energy measured by satellite sensors can provide an alternate, synoptic, speedy, and economic approach for assessing the SSCs in oceans, lakes, rivers and coastal waters (McKim et al., 1984; Curran and Wilkinson, 1985). However, robust algorithms are required to convert radiance or reflectance values into estimates of water constituents. In sediment dominated coastal waters, refined algorithms are particularly needed to estimate accurately the suspended particulate concentrations from remotely sensed ocean color data (Robinson et al., 1998; Moore et al., 1999). Empirical algorithms can be used to derive information about water constituents (optical properties, particulate concentrations) from the estimated radiance from the water surface. Such information is useful for the management of water quality, monitoring of water pollution, modeling of sediment distribution and transportation, and sediment budgeting in coastal environments.Algorithms designed to estimate SSCs in open ocean waters as a function of chlorophyll (CHL) concentration in the deep sea rely mainly on concentrations of plankton and associated organic detrital matter (Morel, 1980; Viollier and Sturm, 1984). The commonly adopted algorithms for CHL and SSC are the reflectance band ratios, characterizing the high absorption of CHL around 440 nm and low absorption at 550 nm. However, CHL and SSC do not co-vary in coastal waters because of the presence of particles that form from re- suspension, shore erosion, or river discharge. Therefore, the algorithm derived from blue: green band Received 30 July 2012; Revised 24 May 2013; Accepted 27 May 2013
Transcript of Algorithm for Estimating Suspended Sediment Concentrations in Coastal Waters of India Using Remotely...

Int. J. Environ. Res., 7(4):841-850,Autumn 2013ISSN: 1735-6865
*Corresponding author E-mail:[email protected]
841
An Algorithm for Estimating Suspended Sediment Concentrations in theCoastal Waters of India using Remotely Sensed Reflectance and its
Application to Coastal Environments
Sravanthi, N. 1, Ramana, I. V. 2, Yunus Ali, P. 1, 4, Ashraf, M.3, Ali, M. M.2 and Narayana, A.C.1*
1Centre for Earth & Space Sciences, University of Hyderabad, Hyderabad, India – 500 0462National Remote Sensing Centre, Hyderabad, India– 500037
3Central Institute of Fisheries Technology, Cochin, India4Centre for Spatial Information Science, Dept. of Natural Environment Studies,
University of Tokyo, Japan
ABSTRACT: This study presents an empirical relationship of suspended sediment concentrations (SSCs) inthe coastal waters, which is derived from the conventional methods, to radiometer remote sensing reflectancevalues (Rrs) and satellite data in coastal waters of Kerala. An algorithm is then developed to utilize both in situSSCs measured from conventional methods and Rrs values. This algorithm is validated with the SSCs retrievedfrom Oceansat-2 Ocean Colour Monitor (OCM) data. A significant coefficient of determination (R2=0.62) isobserved between the SSCs measured in situ and satellite derived SSCs. Reflectance values from more than twospectral wavelength bands are also employed to test the accuracy of results. Satellite derived SSCs range from1- 40 mg/L in the coastal waters off Cochin, southwest India. The regional algorithm developed for the studyarea gives better results than Tassan’s algorithm, and this algorithm can be used in estimation of SSC for coastalwaters of western India.
Key words: Suspended particulate matter, Oceansat-2, Ocean Colour Monitor, West coast of India, Validation of suspended sediment concentrations
INTRODUCTIONEstimating suspended sediment concentration
(SSC) over large oceanic areas using in-situ samplingis a lengthy, expensive, and time-consuming process.By contrast, remotely sensed spectral radiant energymeasured by satellite sensors can provide an alternate,synoptic, speedy, and economic approach for assessingthe SSCs in oceans, lakes, rivers and coastal waters(McKim et al., 1984; Curran and Wilkinson, 1985).However, robust algorithms are required to convertradiance or reflectance values into estimates of waterconstituents. In sediment dominated coastal waters,refined algorithms are particularly needed to estimateaccurately the suspended particulate concentrationsfrom remotely sensed ocean color data (Robinson etal., 1998; Moore et al., 1999). Empirical algorithms canbe used to derive information about water constituents(optical properties, particulate concentrations) from the
estimated radiance from the water surface. Suchinformation is useful for the management of waterquality, monitoring of water pollution, modeling ofsediment distribution and transportation, and sedimentbudgeting in coastal environments.Algorithmsdesigned to estimate SSCs in open ocean waters as afunction of chlorophyll (CHL) concentration in thedeep sea rely mainly on concentrations of planktonand associated organic detrital matter (Morel, 1980;Viollier and Sturm, 1984). The commonly adoptedalgorithms for CHL and SSC are the reflectance bandratios, characterizing the high absorption of CHLaround 440 nm and low absorption at 550 nm. However,CHL and SSC do not co-vary in coastal waters becauseof the presence of particles that form from re-suspension, shore erosion, or river discharge.Therefore, the algorithm derived from blue: green band
Received 30 July 2012; Revised 24 May 2013; Accepted 27 May 2013
842
Sravanthi, N. et al.
ratio is considered as unsuitable for SSC retrieval(Tassan, 1993).
Several researchers have attempted to estimate theSSCs in the coastal waters based on the remote sensingreflectance, absorption, and scattering of light by water(Tassan and Strum, 1986; Tassan, 1994; Green andSosik, 2004; Pradhan et al., 2005; Wang et al., 2010;Chauhan et al., 2012; Avinash et al., 2012). Earlierstudies on the relationship between SSC andreflectance values in coastal waters suggest thatalgorithms derived from single band reflectance valuesmay be adopted, where the SSCs increase withincreasing reflectance (Curran et al., 1987; Novo et al.,1989). Empirical calibration of different data sets werecarried out using different combinations of wavelengthbands for laboratory measured total suspended matter,in situ reflectance data, and satellite-derived reflectancedata (Chen et al., 1991; Forget and Ouillon, 1998; Hu etal., 2004; Vilamaliz and Fernando, 2009). The reflectancemodel of Gordon et al. (1988), used for open oceanwater and validated for inland turbid waters by Dekkeret al. (1997), has been extensively used to retrieve SSCsin estuarine waters (Stumpf and Pennock, 1989), and incoastal and deep ocean waters (Van Der Woerd andPasterkamp, 2004; Eleveld et al., 2008). Doxaran et al.(2002, 2003, 2005) used the near-infrared (NIR) bandratio (850 and 550 nm) model to remove the effects ofparticle size distribution and the bidirectional variationof the remotely sensed reflectance for sedimentdominated coastal waters. Some researchers haveadopted analytical approaches to solve the reflectancemodel and considered water constituents as theunknown parameterization of specific inherent opticalproperties (Forget et al., 1999; Haltrin and Arnone,2003). Nechand et al. (2010) propose a single bandalgorithm for total suspended matter retrieval basedon reflectance model and calibrated the results usingthe seaborne reflectance and total suspended mattermeasurements of the southern North Sea.
In general, the optics of water–sediment mixturesis highly nonlinear, and many factors such assuspended particle size, shape, and colour caninfluence the water–sediment optics (Baker andLavelle, 1984; Curran and Novo, 1988; Stumpf andPennock, 1989; Sydor and Arnone, 1997). Because ofthese optical complexities, it is difficult to propose anuniversal algorithm for estimation SSCs. Further,various other parameters such as coastalgeomorphology, river input, local coastal circulationinfluence the SSCs and hence the algorithm developedfor one region may not be applicable to another region.Against this background, we have attempted todevelop a regional algorithm for coastal waters ofsouthwest coast of India, using combinations of linear
reflectance bands 490, 555 and 620 nm and in situ SSCsmeasured by the conventional methods. The presentstudy is carried out with an objective of developing aregional algorithm for estimation of SSCs using in situreflectance values and in situ measured SSCs in thecoastal waters of southwest coast of India. Further,satellite derived SSCs are validated using in situ SSCsand checked for the robustness of the regionalalgorithm developed in the present study.
MATERIALS & METHODSField measurements of in situ SSCs and reflectance
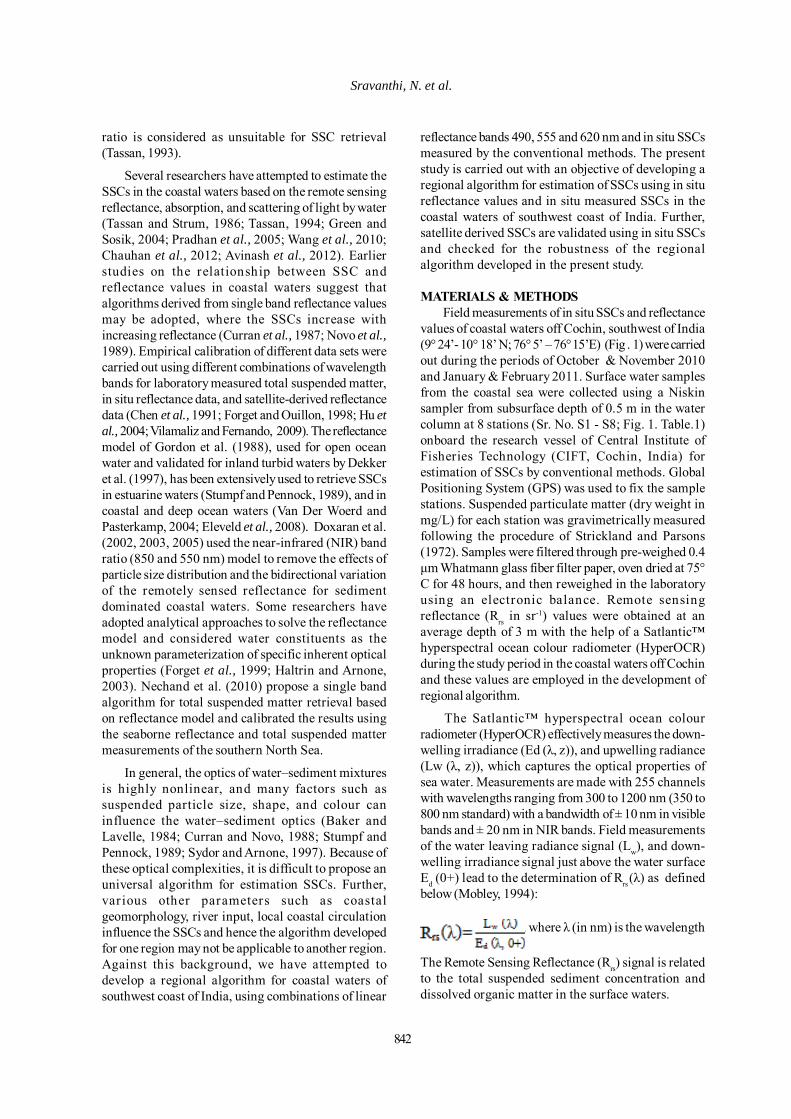
values of coastal waters off Cochin, southwest of India(9° 24’- 10° 18’ N; 76° 5’ – 76° 15’E) (Fig . 1) were carriedout during the periods of October & November 2010and January & February 2011. Surface water samplesfrom the coastal sea were collected using a Niskinsampler from subsurface depth of 0.5 m in the watercolumn at 8 stations (Sr. No. S1 - S8; Fig. 1. Table.1)onboard the research vessel of Central Institute ofFisheries Technology (CIFT, Cochin, India) forestimation of SSCs by conventional methods. GlobalPositioning System (GPS) was used to fix the samplestations. Suspended particulate matter (dry weight inmg/L) for each station was gravimetrically measuredfollowing the procedure of Strickland and Parsons(1972). Samples were filtered through pre-weighed 0.4µm Whatmann glass fiber filter paper, oven dried at 75°C for 48 hours, and then reweighed in the laboratoryusing an electronic balance. Remote sensingreflectance (Rrs in sr-1) values were obtained at anaverage depth of 3 m with the help of a Satlantic™hyperspectral ocean colour radiometer (HyperOCR)during the study period in the coastal waters off Cochinand these values are employed in the development ofregional algorithm.
The Satlantic™ hyperspectral ocean colourradiometer (HyperOCR) effectively measures the down-welling irradiance (Ed (λ, z)), and upwelling radiance(Lw (λ, z)), which captures the optical properties ofsea water. Measurements are made with 255 channelswith wavelengths ranging from 300 to 1200 nm (350 to800 nm standard) with a bandwidth of ± 10 nm in visiblebands and ± 20 nm in NIR bands. Field measurementsof the water leaving radiance signal (Lw), and down-welling irradiance signal just above the water surfaceEd (0+) lead to the determination of Rrs (λ) as definedbelow (Mobley, 1994):
, where λ (in nm) is the wavelength
The Remote Sensing Reflectance (Rrs) signal is relatedto the total suspended sediment concentration anddissolved organic matter in the surface waters.
Int. J. Environ. Res., 7(4):841-850,Autumn 2013
843
Fig. 1. Map showing the study area off Cochin, southwest coast of India. Sample stations for in situ suspendedsediment concentrations (SSCs) and reflectance measurements are also shown. (Referred in Materials and
Methods Section, Line number 77; 80 Pl delete this
Table 1. Field measurements of in situ suspended sediment concentrations (SSCs) along the Cochin coast,India. Locations of sample stations and suspended sediment concentrations in surface waters during the field
season are given. (Referred in Materials and Methods Section, Line number 80) Please delete these words
In situ SSC values (mg/L) measured during sampling days
Station. No
Lat (N) Long (E)
17 Oct 2010
21 Nov 2010 21 Jan 2011
22 Feb 2011
Remarks
S1 9° 58’ 16” 76° 15’ 32”
23.28 14.6 29.5 32.82
S2 9° 54’ 34” 76° 12’ 47”
19.06 15.93 18.4 17.79
S3 9° 54’ 28” 76° 09’ 40”
16.12 14.27 14.78 16.35
S4 9° 57’ 40” 76° 10’ 10”
19.17 20.56 22 21.58
S5 10° 00’ 02” 76° 06’ 05”
16.62 10.61 8.56 12.66
S6 10° 02’ 37” 76° 05’58”
15.59 10.11 8.1 13.61
S7 10° 02’ 58” 76° 09’ 15”
16.8 9.2 7.05 5.4
S8 9° 59’ 57” 76° 09’ 15”
28.13 12.72 14.14 13.53
Cloud sky was observed on 17 October & 21st
November 2010.
Clear sky was observed on 21 January & 22
February 2011.
844
Algorithm for suspended sediments estimation
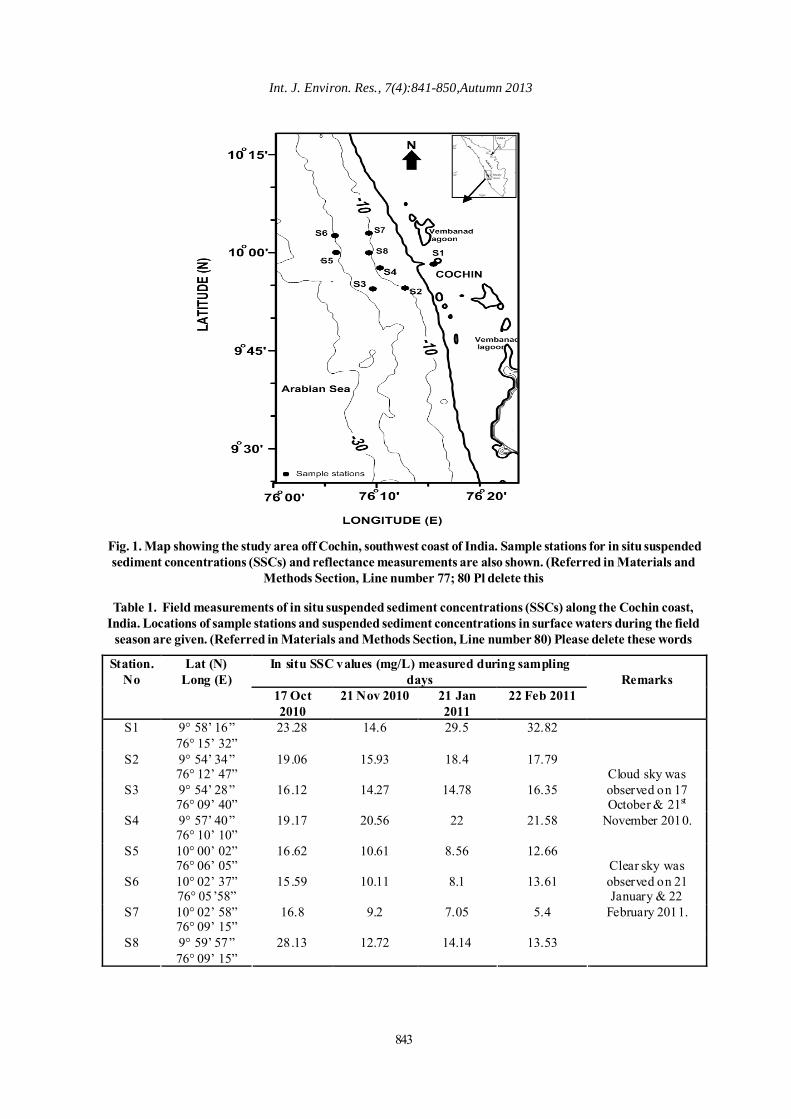
The Rrs values recorded from radiometers atdifferent stations and their respective wave lengthsfor different SSC values are shown in Fig. 2. Aprogressive increase in reflectance can be seen in thevisible region as sediment concentrations increase.Measured reflectance values, at different wavelength
0
0.01
0.02
0.03
0.04
350 450 550 650W avelength (nm)
Rrs
(sr-1
)
29.5
18.4
16.35
14.78
13.53
12.72
9.2
5.4
bands 490, 555, 620 nm, in coastal waters of the studyarea are presented in Table 2. In this study, we haveanalyzed the relationship between in situ SSCs and Rrsvalues derived from single wavelengths and fromcombinations of different wavelength bands viz., 490,555 and 620 nm (Fig. 3 & 4; Table 3).
740 nm
y = -40.872x + 17.74R2 = 0.0796
0
10
20
30
40
0 0.05 0.1 0.15 0.2 0.25Axis Title
In si
tu S
SC(m
g/l)
841 nm
y = -5.7125x + 17.161R2 = 0.0232
0
10
20
30
40
0 0.2 0.4 0.6 0.8 1
Rrs(sr-1)
in si
tu S
SC (m
g/l)
Fig. 3. Remote sensing reflectance (Rrs) values at different wavelength bands 555, 620, 740 and 841 nm plotted againstin situ suspended sediment concentration (SSC). The coefficients of determination (R2) values for respective spectral
bands are 0.074, 0.353, 0.018, and 0.023. (Referred in Materials and Methods Section, Line number 104)Pl delete
620 n m
y = 565.61x + 11.32R2 = 0.3533
0
10
20
30
40
0 0.01 0.02 0.03
Rrs (s r-1)
In si
tu S
SC (m
g/l)
555 nm
y = 208.31x + 13.088R2 = 0.0747
0
10
20
30
40
0 0.01 0.02 0.03 0.04Rrs (sr-1)
in si
tu S
SC (m
g/l)
Fig. 2. Measured remote sensing reflectance (Rrs) spectra for different suspended sediment concentrations(SSCs): (a) 5.4 mg/L; (b) 9.2 mg/L; (c) 12.72 mg/L; (d) 13.53 mg/L; (e) 14.78 mg/L; (f) 16.35 mg/L, (g) 18.4mg/L; (h) 29.5 mg/L. (Referred in Materials and Methods Section, Line number 100) Pl delete these words,
and see original figure and mark a, b, c, d, e, f on the corresponding spectral lines
845
Int. J. Environ. Res., 7(4):841-850,Autumn 2013
(Rrs490+Rrs555) nm
0
10
20
30
40
0 0.02 0.04 0.06 0.08Rrs (sr-1)
In si
tu S
SC (m
g/l)
(Rrs555+Rrs620) nm
0
10
20
30
40
0 0.02 0.04 0.06Rrs (sr-1)
In si
tu S
SC(m
g/l)
(Rrs 620/Rrs 555) nm
0
10
20
30
40
0 0.2 0.4 0.6 0.8 1 1.2Axis Title
In si
tu S
SC (m
g/l)
(Rrs 620/Rrs 490) nm
0
10
20
30
40
0 0.2 0.4 0.6 0.8 1 1.2 1.4Rrs (sr-1)
in si
tu S
SC(m
g/l)
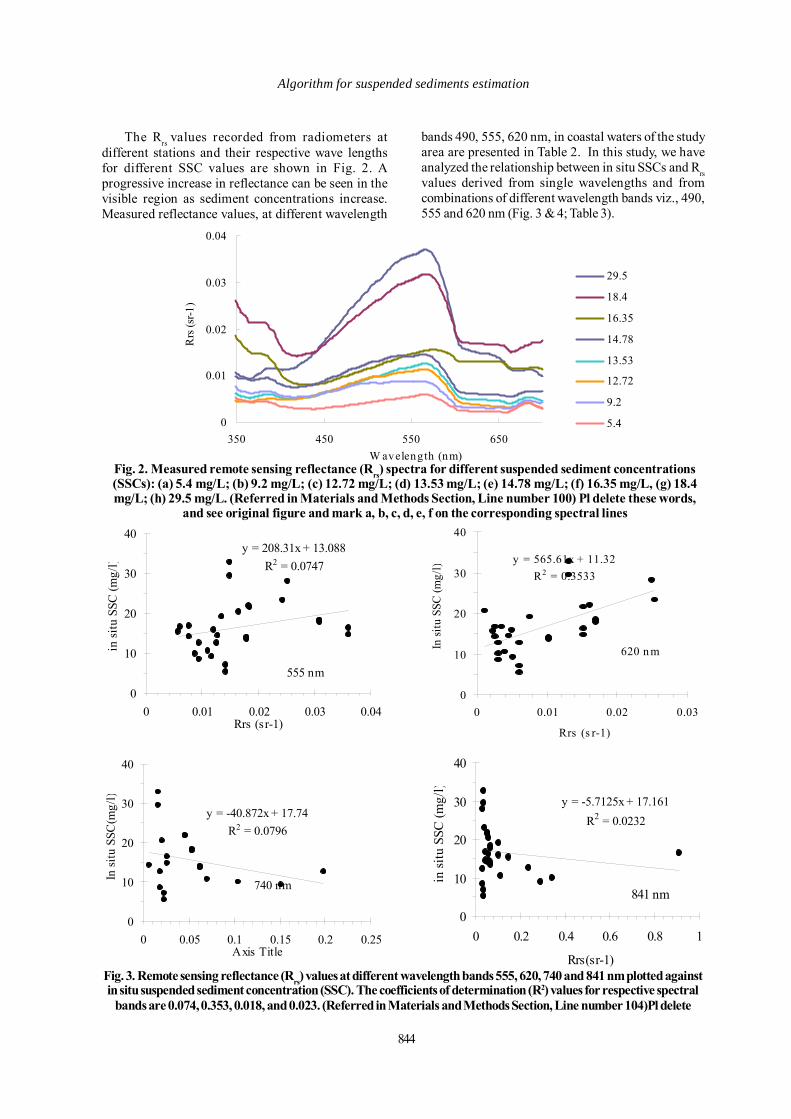
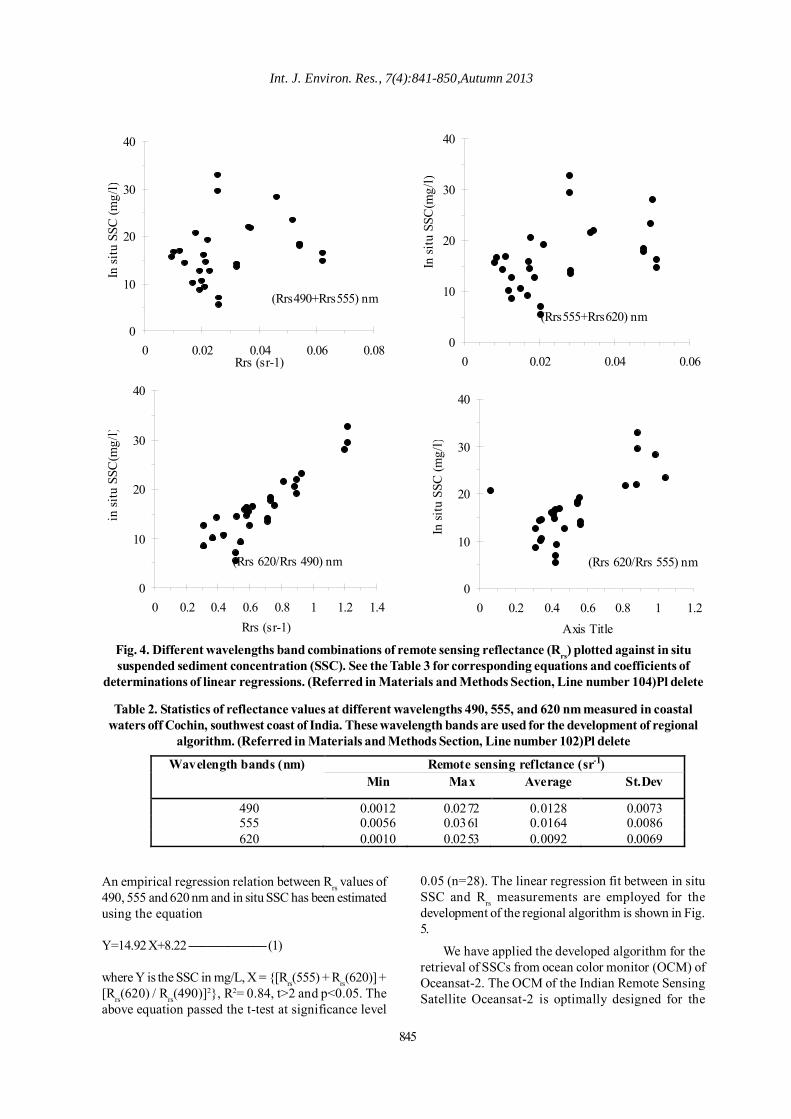
Fig. 4. Different wavelengths band combinations of remote sensing reflectance (Rrs) plotted against in sitususpended sediment concentration (SSC). See the Table 3 for corresponding equations and coefficients of
determinations of linear regressions. (Referred in Materials and Methods Section, Line number 104)Pl delete
Table 2. Statistics of reflectance values at different wavelengths 490, 555, and 620 nm measured in coastalwaters off Cochin, southwest coast of India. These wavelength bands are used for the development of regional
algorithm. (Referred in Materials and Methods Section, Line number 102)Pl delete
Remote sensing reflctance (sr-1) Wavelength bands (nm) Min Max Average St.Dev
490 0.0012 0.0272 0.0128 0.0073 555 0.0056 0.0361 0.0164 0.0086 620 0.0010 0.0253 0.0092 0.0069
An empirical regression relation between Rrs values of490, 555 and 620 nm and in situ SSC has been estimatedusing the equation
Y=14.92 X+8.22 —————— (1)
where Y is the SSC in mg/L, X = {[Rrs(555) + Rrs(620)] +[Rrs(620) / Rrs(490)]2}, R2= 0.84, t>2 and p<0.05. Theabove equation passed the t-test at significance level
0.05 (n=28). The linear regression fit between in situSSC and Rrs measurements are employed for thedevelopment of the regional algorithm is shown in Fig.5.
We have applied the developed algorithm for theretrieval of SSCs from ocean color monitor (OCM) ofOceansat-2. The OCM of the Indian Remote SensingSatellite Oceansat-2 is optimally designed for the

846
Sravanthi, N. et al.
Table 3. Coefficient of determination (R2) and Root Mean Square Error (RMSE) of different regressions forvarious combinations of the wavelength bands. The highest coefficient of determination values (>0.60) are
shown in bold. (Referred in Materials and Methods Section, Line number 104; 151)Pl delete
Developed algorithm
y = 14.929x + 8.2246R2 = 0.842
0
5
10
15
20
25
30
35
0 0.2 0.4 0.6 0.8 1 1.2 1.4 1.6
Rrs(555+620)+ Rrs (620/Rrs490)
In si
tu S
SC (m
g/l)
Fig. 5. Linear regression fit between in situ suspended sediment concentration (SSC) and remote sensingreflectance (Rrs) measurements used for the development of the regional algorithm. (Referred in Materials and
Methods Section, Line number 111)Pl delete
estimation of SSC. The high resolution OCM sensor isa push broom linear charge coupled device with eightspectral bands in visible and NIR region (with centralwavelength bands of 412, 443, 490, 510, 555, 620, 740,865 nm). The OCM provides an instantaneousGeometric Field of View of 360 m, radiometric resolutionof 12 bits, and swath of 1420 Km, and repeats at two-day time interval for any given area. Oceansat-2 OCMdata covering the coastal regions off Cochin (path 10and row 14) were used to derive suspended sedimentsconcentration. The derivation of ocean colorparameters for estimating SSC in the near-shore waterinvolves three major steps - (i) the application of anatmospheric correction of visible channels to obtain
normalized water leaving radiances (nLw), (ii) thecalculation of remote sensing reflectance Rrs (λ), and(iii) the retrieval of SSC. The satellite sensors capturethe reflected energy from the sea surface waterconstituents. Depending upon the constituents of theatmosphere layers, the energy may also be reflected orrefracted by the objects in the atmosphere. Thus, theenergy absorbed by sensor may not accuratelyrepresent the reflectance characteristics of thesuspended matter in the ocean. Therefore, the OCMdata needs to be corrected for atmospheric effects ofRaleigh and aerosol scattering. The algorithmdeveloped by Ramana et al. (2000) for case-II water(inner shelf) is used in the present study for carrying
Remote sensing reflectance (R rs (λ))
Regression equation R 2 RM SE t P
555 Y= 2 03 X+13.08 0.074 6.19 1.45 0.159 620 Y=56 5.6 X+11 .32 0.353 5.18 3.77 0.0009 740 Y= -10.07 X+17.15 0.018 6.38 -0.69 0.494 841 Y= -5.71 X+ 17.16 0.023 6.36 -0.78 0.438
490+555 Y=110.45 X+13.28 0.068 6.21 1.38 0.1787 555+620 Y=198.04 X+11.44 0.194 5.78 2.51 0.0187
(555+6 20) /(555+490) Y=48.35 X-25.04 0.779 3.02 9.57 5 .1E-10 620/490 Y=23.26 X+ 0.61 0.81 2.77 10.69 5 .2E-11 620/555 Y=19.95 X+6.08 0.507 4.52 5.17 2.16E-05 840/490 Y =-0.095 X+17.5 0.037 6.43 -0.98 0.3332 840/555 Y= -0.24 8 X+18.3 0.119 6.40 -1.83 0.0777 840 -740 Y= -5.90 6 X+16.8 0.007 6.35 -0.43 0.6727
(620/490)2 Y =15.15X+8.48 0.839 2.58 11.67 7 .8E-12
847
Int. J. Environ. Res., 7(4):841-850,Autumn 2013
out atmospheric correction. Aerosol scattering iscomputed using a long wavelength atmosphericcorrection method. SSCs in the study area have beenderived using water-leaving radiance at spectral bands490, 555, and 620 nm. The regional algorithm that hasbeen used to compute SSCs from OCM data is givenabove in equation 1. Geometric correction for thesatellite data are carried out with help of ERDASImagine 9.1 software.
RESULTS & DISCUSSIONIn this study, we have developed an empirical
algorithm based on a statistical relation between SSCand Rrs to estimate SSCs from spectral reflectance,and we also improved it using a combination of visibleand near IR bands, as the combination of these bandsgives better accuracy of estimated SSCs (Doxaran etal., 2002; Ma and Dai, 2005). Wang et al. (2010) haveobserved a significant improvement in the relationshipbetween in situ SSCs and the difference in spectralvalues of wavelength bands 2 and 5 of MODIS dataover the relationship between the in situ SSCs andsingle band spectral values. Further, combination ofin situ reflectance wavelength bands employed inglobal Tassan’s (1994) algorithm (Log10S=1.83+1.26Log10Xs; where S is the SSC in mg/L and Xs ={[Rrs(555)+Rrs(620)] x [(Rrs(555)/Rrs(490)-1.2]}), has beentested with in situ SSC data acquired in this study.However, no significant relation (R2=0.16) is observedbetween the results derived from Tassan’s algorithmand in situ SSC measured by conventional methodsin our study area.
Our results suggest a weak correlation betweensingle wavelength band Rrs values and in situ SSCs.However, a strong correlation is observed between thesquare of ratio of Rrs(620) and Rrs(490) and in situSSCs, but only a weak correlation between the ratio ofRrs(841) and Rrs(555) and in situ SSC values obtainedby conventional methods. Further, a robust linearrelationship is observed between in situ SSC and thecombination of wavelength bands {[Rrs(555) + Rrs(620)]+ [Rrs(620)/ Rrs(490)]2}, much more robust than therelationship between single wavelength band and insitu SSC. We have tried to derive relationships withother wavelength bands as shown in Table 3, but nosignificant relationship was observed.
Doxaran et al. (2005) have established a linearrelationship between the band ratios of reflectance inthe near IR (e.g.850 nm) and visible wavelength (e.g.550 nm) bands, and their relationship follows a powerlaw in the sediment dominated coastal waters (D’Saand Miller, 2003). Avinash et al. (2012) modifiedTassan’s algorithm with regression coefficients, inwhich these authors replaced global coefficients of
Tassan’s algorithm for estimation of SSCs in the coastalwaters of west coast of India. These authors haverecorded low values with the application of Tassan’salgorithm, and hence, they have employed thealgorithm developed by SAC (2004).
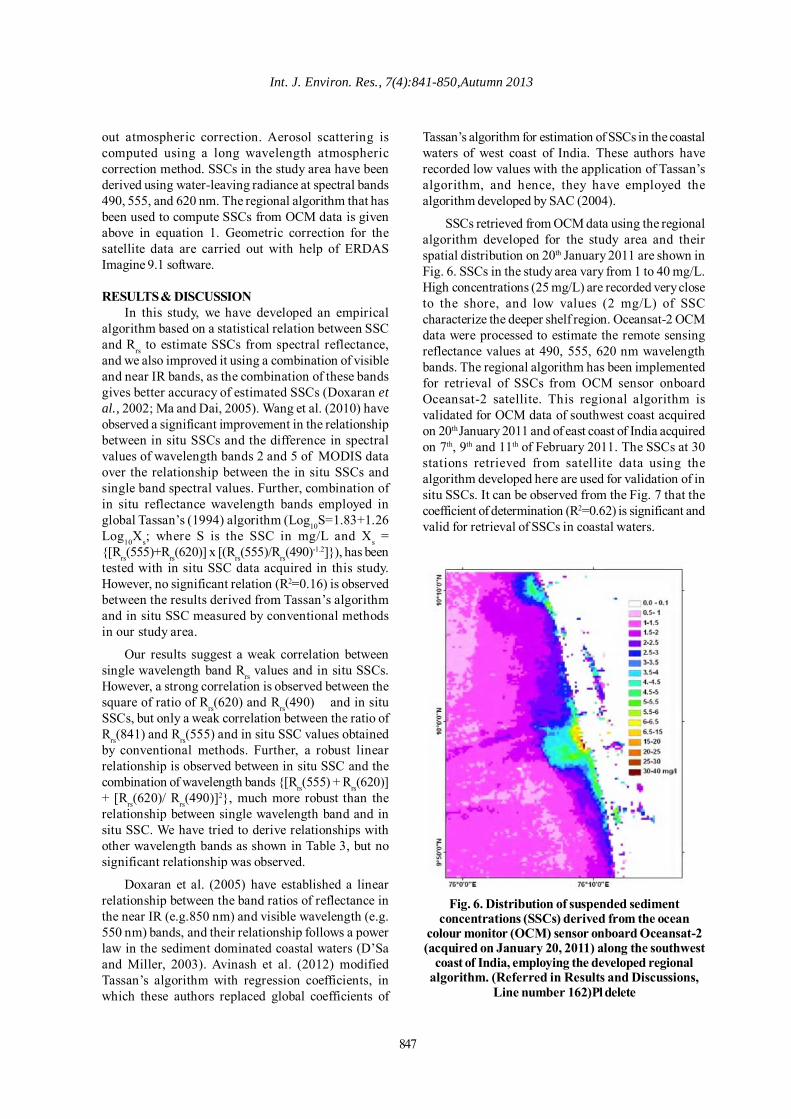
SSCs retrieved from OCM data using the regionalalgorithm developed for the study area and theirspatial distribution on 20th January 2011 are shown inFig. 6. SSCs in the study area vary from 1 to 40 mg/L.High concentrations (25 mg/L) are recorded very closeto the shore, and low values (2 mg/L) of SSCcharacterize the deeper shelf region. Oceansat-2 OCMdata were processed to estimate the remote sensingreflectance values at 490, 555, 620 nm wavelengthbands. The regional algorithm has been implementedfor retrieval of SSCs from OCM sensor onboardOceansat-2 satellite. This regional algorithm isvalidated for OCM data of southwest coast acquiredon 20th January 2011 and of east coast of India acquiredon 7th, 9th and 11th of February 2011. The SSCs at 30stations retrieved from satellite data using thealgorithm developed here are used for validation of insitu SSCs. It can be observed from the Fig. 7 that thecoefficient of determination (R2=0.62) is significant andvalid for retrieval of SSCs in coastal waters.
Fig. 6. Distribution of suspended sedimentconcentrations (SSCs) derived from the ocean
colour monitor (OCM) sensor onboard Oceansat-2(acquired on January 20, 2011) along the southwest
coast of India, employing the developed regionalalgorithm. (Referred in Results and Discussions,
Line number 162)Pl delete
848
Algorithm for suspended sediments estimation
y = 15.058Ln(x) - 25.402R2 = 0.1954
0
10
20
30
40
0 5 10 15 20 25 30In situ SSC (mg/l)
Tass
an a
lgor
ithm
SSC
s
y = 10.314Ln(x) - 21.417R2 = 0.6232
0
5
10
15
0 10 20 30In situ SSC (mg/l)
SSC
s der
ived
from
regi
onal
alg
orith
m
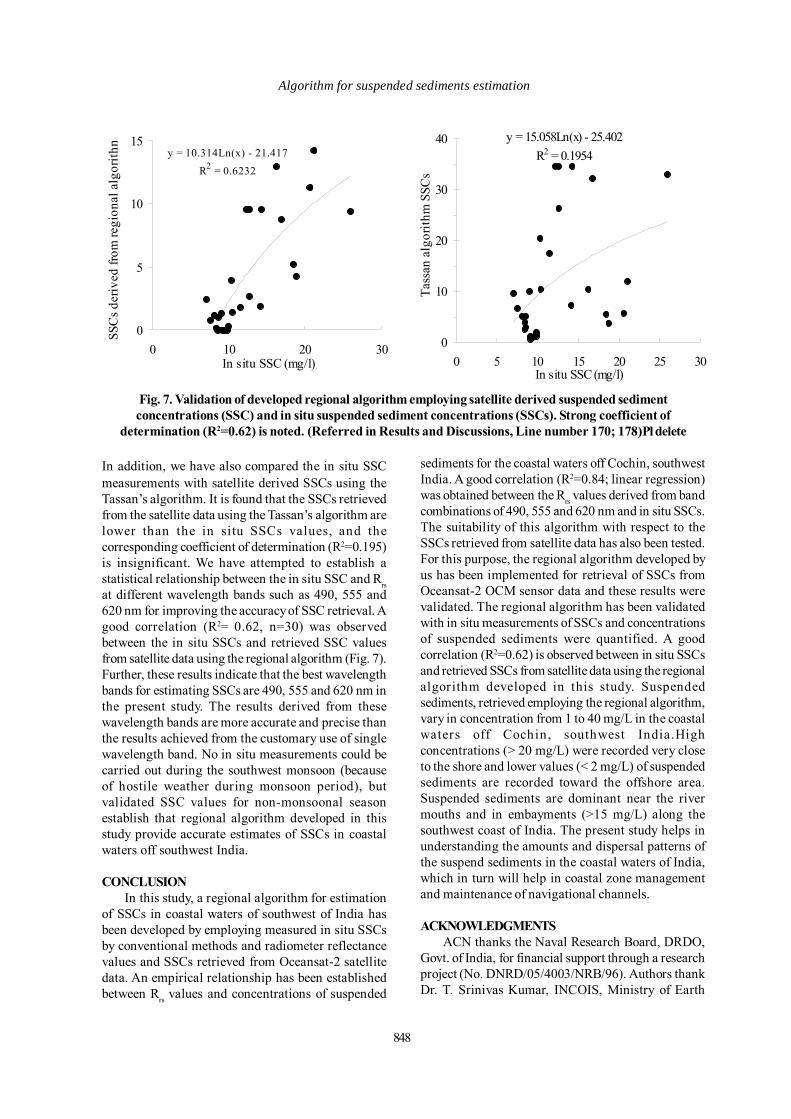
Fig. 7. Validation of developed regional algorithm employing satellite derived suspended sedimentconcentrations (SSC) and in situ suspended sediment concentrations (SSCs). Strong coefficient of
determination (R2=0.62) is noted. (Referred in Results and Discussions, Line number 170; 178)Pl delete
In addition, we have also compared the in situ SSCmeasurements with satellite derived SSCs using theTassan’s algorithm. It is found that the SSCs retrievedfrom the satellite data using the Tassan’s algorithm arelower than the in situ SSCs values, and thecorresponding coefficient of determination (R2=0.195)is insignificant. We have attempted to establish astatistical relationship between the in situ SSC and Rrsat different wavelength bands such as 490, 555 and620 nm for improving the accuracy of SSC retrieval. Agood correlation (R2= 0.62, n=30) was observedbetween the in situ SSCs and retrieved SSC valuesfrom satellite data using the regional algorithm (Fig. 7).Further, these results indicate that the best wavelengthbands for estimating SSCs are 490, 555 and 620 nm inthe present study. The results derived from thesewavelength bands are more accurate and precise thanthe results achieved from the customary use of singlewavelength band. No in situ measurements could becarried out during the southwest monsoon (becauseof hostile weather during monsoon period), butvalidated SSC values for non-monsoonal seasonestablish that regional algorithm developed in thisstudy provide accurate estimates of SSCs in coastalwaters off southwest India.
CONCLUSIONIn this study, a regional algorithm for estimation
of SSCs in coastal waters of southwest of India hasbeen developed by employing measured in situ SSCsby conventional methods and radiometer reflectancevalues and SSCs retrieved from Oceansat-2 satellitedata. An empirical relationship has been establishedbetween Rrs values and concentrations of suspended
sediments for the coastal waters off Cochin, southwestIndia. A good correlation (R2=0.84; linear regression)was obtained between the Rrs values derived from bandcombinations of 490, 555 and 620 nm and in situ SSCs.The suitability of this algorithm with respect to theSSCs retrieved from satellite data has also been tested.For this purpose, the regional algorithm developed byus has been implemented for retrieval of SSCs fromOceansat-2 OCM sensor data and these results werevalidated. The regional algorithm has been validatedwith in situ measurements of SSCs and concentrationsof suspended sediments were quantified. A goodcorrelation (R2=0.62) is observed between in situ SSCsand retrieved SSCs from satellite data using the regionalalgorithm developed in this study. Suspendedsediments, retrieved employing the regional algorithm,vary in concentration from 1 to 40 mg/L in the coastalwaters off Cochin, southwest India.Highconcentrations (> 20 mg/L) were recorded very closeto the shore and lower values (< 2 mg/L) of suspendedsediments are recorded toward the offshore area.Suspended sediments are dominant near the rivermouths and in embayments (>15 mg/L) along thesouthwest coast of India. The present study helps inunderstanding the amounts and dispersal patterns ofthe suspend sediments in the coastal waters of India,which in turn will help in coastal zone managementand maintenance of navigational channels.
ACKNOWLEDGMENTSACN thanks the Naval Research Board, DRDO,
Govt. of India, for financial support through a researchproject (No. DNRD/05/4003/NRB/96). Authors thankDr. T. Srinivas Kumar, INCOIS, Ministry of Earth
849
Int. J. Environ. Res., 7(4):841-850,Autumn 2013
Sciences, Hyderabad, for his support and helpextended during the study. Authors thank Prof. PeterMolnar, University of Colorado, Boulder, for his helpin improving the English language.
REFERENCESAvinash, K., Babula Jena., Vinaya, M. S., Jayappa, K. S.,Narayana, A. C. and Gangadhara Bhat, H. (2012). Regionallytuned algorithm to study the seasonal variation of suspendedsediment concentration using IRS-P4 Ocean Colour Monitordata. Egypt J. Remote. Sens. and Space Sci., 15, 67-81.
Baker, E. T. and Lavelle, J. W. (1984). The effect of particlesize on the light attenuation coefficient of naturalsuspensions. J. Geophys. Res., 89, 8197–8203.
Chauhan, O. S., Raghavan, B. R., Khushvir Singh., Rajawat,A. S., Ajai Kader, U. S. A. and Nayak, S. (2011). Influenceof orographically enhanced SW monsoon flux on coastalprocesses along the SE Arabian Sea. J. Geophys. Res., 116,C12037, doi: 10.1029/2011JC007454.
Chen, Z., Hanson, J. D. and Curran, P. J. (1991). The formof the relationship between suspended sedimentconcentration and the spectral reflectance: its implicationsfor the use of daedalus 1268 data. Int. J. Remote Sens., 12(1), 215-222.
Curran, P. J. and Wilkinson, H. D. (1985). Mapping theconcentration and dispersal pattern of dye from a long seaoutfall using digitized aerial photography, I. J. Remote Sens.,6, 17-31.
Curran, P. J. and Novo, E. M. M. (1988). The relationshipbetween suspended sediment concentration and remotelysensed spectral radiance: a review. J. Coast. Res., 4(3), 351–368.
Curran, P. J., Hansom, J. D., Plummer, S. E. and Pedley, M.I. (1987). Multispectral remote sensing of near shoresuspended sediments: A pilot study. Int. J. Remote Sens., 8(1), 103-112.
D’sa, E. J. and Miller, R. L. (2003). Bio-optical propertiesin waters influenced by the Mississippi River during lowflow conditions. Remote Sens. Environ., 84, 538-549.
Dekker, A. G., Hoogenboom, H. J., Goddijn, L. M. andMalthus, T. J. M. (1997). The relation between inherentoptical properties and reflectance spectra in turbid inlandwaters. Remote Sens. Reviews, 15, 59-74.
Doxaran, D., Froidefond, J. and Castaing, P. A. (2002). Areflectance band ratio used to estimate suspended matterconcentrations in sediment-dominated coastal waters. Int.J. Remote Sens., 23, 5079–5085.
Doxaran, D., Froidefond, J. M. and Castaing, P. (2003).Remote-sensing reflectance of turbid sediment-dominatedwaters. Reduction of sediment type variations and changingillumination conditions effects by use of reflectance ratios.Appl. Optics, 42, 2623-2634.
Doxaran, D., Cherukuru, R. C. N. and Lavender, S. J. (2005).Use of reflectance band ratios to estimate suspended and
dissolved matter concentrations in estuarine waters. Int. J.Remote Sens., 26, 1763-1769.
Eleveld,M. A., Pasterkamp, R., Van Derwoerd, H. J. andPietrzak, J. D. (2008). Remotely Sensed seasonality in thespatial distribution of sea-surface suspended particulatematter in the southern North Sea. Estuarine, Coastal andShelf Science, 80 (1), 103-113.
Forget, P. and Ouillon, S. (1998). Surface suspended matteroff the Rhone river from visible satellite imagery.Oceanologica Acta, 21, 739-749.
Forget, P., Quillon, S., Lahet, F. and Broche, P. (1999).Inversion of reflectance spectra of non chlorophyllous turbidcoastal waters. Remote Sens. Environ., 68, 264-272.
Gordon, H. R., Brown, O. B., Evans, R. H., Brown, J. W.,Smith, R. C. and Baker, K. S. (1988). A semi analyticalradiance model of ocean color. J. Geophys. Res., 93, 10909-10924.
Green, R. E. and Sosik, H. M. (2004). Analysis of apparentoptical properties and ocean color models usingmeasurements of seawater constituents in New Englandcontinental shelf surface waters. J. Geophys. Res., 109 (C3).
Haltrin, V. I. and Arnone, R. A. (2003). An algorithm toestimate concentrations of suspended particles in seawaterfrom satellite optical images. Paper presented at the 2nd Int.Confer. Current Problems in Optics of Natural Waters. Eds.,St. Petersburg, Russia.
Hu, C., Chen, Z., Clayton, T. D., Swarzenski, P., Brock, J.C. and Muller- Karger F. E. (2004). Assessment of estuarinewater-quality indicators using MODIS medium-resolutionbands: initial results from Tampa Bay. Remote Sens.Environ., 93, 423-44.
Ma, R. and Dai, J. (2005). Investigation of chlorophyll-aand total suspended matter concentrations using LandsatETM and field spectral measurements in Taihu Lake, China.Int. J. Remote Sens., 26. 2779-2787.
Mckim, H. L., Merry, C. J. and Layman, R. W. (1984).Water quality monitoring using an airborne spectroradiometer.Photogrammetric Engineering and Remote Sens., 50, 353-360.
Mobley, C. D. (1994). Light and water: Radiative Transferin Natural Waters, San Diego, CA: Academic Press.
Morel, A. (1980). In-water and remote measurements ofocean color. Boundary Layer Meteorology, 18, 177-201.
Moore, G. F., Aiken, J. and Lavender, S. J. (1999). TheAtmospheric correction of water colour and the quantitativeretrieval of suspended particulate matter in case 2 waters:application to MERIS. I. J. Remote Sens., 20, 1713–1733.
Nechad, B., Ruddick, K. G. and Pary, Y. (2010). Calibrationand validation of a generic multisensory algorithm formapping of total suspended matter in turbid waters. RemoteSens. Environ., 114, 854-866.
Novo, E. M. M., Hansom, J. D. and Curran, P. J. (1989).The Effect of viewing geometry and wavelength on the
850
Sravanthi, N. et al.
relationship between reflectance and suspended sedimentconcentration. Int. J. Remote Sens., 10 (8), 1357-1372.
Pradhan, Y., Thomaskutty, A. V., Rajawat, A.S. and Nayak,S. R. (2005). Improved regional algorithm to retrieve totalsuspended particulate matter using IRS-P4 ocean ColourMonitor data. J. Opt. A: Pure Appl. Opt., 7, 343–349.
Ramana, I. V., Rao, K. H., Rao, M. V., Choudhury, S. B. andBhan, S. K. (2000). Data processing scheme for the retrievalof oceanic parameters using IRS- P4 OCM data. In:Proceedings of the 5th PORSEC 2000 (Goa, India), pp.765–769.
Robinson, M. C., Morris, K. P. and Dyer, K. R. (1998).Deriving fluxes of suspended particulate matter in theHumber estuary, UK, using airborne remote sensing. Mar.Pollut. Bulle., 37, 155–163.
SAC, (2004). Atmospheric corrections, bio-optical algorithmdevelopment and validation of IRS-P4 OCM data (IRS-P4OCM Utilisation/ SATCORE project report), Sci. Rep.SATCORE/SAC/RESA/MWRG/SC/ 01/02, 98 pp., SpaceAppl. Cent., Ahmedabad, India.
Strickland, J. D. H. and Parsons T. R. (1972). A practicalhandbook of sea water analysis. Bull J. Fishe. Res., Boardof Canada., 167, 185-203.
Stumpf, R. P. and Pennock, J. R. (1989). Calibration of ageneral optical equation for remote sensing of suspendedsediments in a moderately turbid estuary. J. Geophys. Res.,94, 14363– 14371.
Sydor, M. and Arnone, R. A. (1997). Effect of suspendedparticulate and dissolved organic matter on remote sensingof coastal and riverine waters. Appl. Optics, 36, 6905–6912.
Tassan, S. (1993). An improved in-water algorithm for thedetermination of chlorophyll and suspended sedimentconcentration from Thematic Mapper data in coastal waters.Int. J. Remote Sens., 14, 1221-122.
Tassan, S. (1994). Local algorithm using SeaWiFS data forretrieval of phytoplankton pigment, suspended sedimentsand yellow substance in coastal waters. Appl. Optics, 12,2369-2378.
Tassan, S. and Strum, B. (1986). An algorithm for the retrievalof sediment in turbid coastal waters from CZCS data. Int. J.Remote Sens., 7, 643–655.
Van Der Woerd, H. and Pasterkamp, R. (2004). Mapping ofthe North Sea turbid coastal waters using SeaWiFS data.Canadian J. Remote Sens., 30, 44-53.
Vilmaliz, R. and Fernando, G. (2009). Using MODIS 250 mimagery to estimate total suspended sediment in a Tropicalopen Bay. Int. J . Systems Appli. Engineering andDevelopment, 3, 36-44.
Viollier, M. and Sturm, B. (1984). CZCS data analysis inturbid coastal waters. J. Geophys. Res., 89 (D4), 4977-4985.
Wang, J. J., Lu, X. X., Liew, S. C. and Zhou, Y. (2010).Remote sensing of suspended sediment concentrations oflarge rivers using multi-temporal MODIS images: an examplein the Middle and Lower Yangtze River, China. Int. J. RemoteSens., 31, 1103-1111.