Assessment of land-cover change using GIS and remotely-sensed data: A case study in Ain Snoussi area...
8
This article was downloaded by: [Korea University] On: 26 May 2012, At: 05:35 Publisher: Taylor & Francis Informa Ltd Registered in England and Wales Registered Number: 1072954 Registered office: Mortimer House, 37-41 Mortimer Street, London W1T 3JH, UK Forest Science and Technology Publication details, including instructions for authors and subscription information: http://www.tandfonline.com/loi/tfst20 Assessment of land-cover change using GIS and remotely-sensed data: A case study in Ain Snoussi area of northern Tunisia Taejin Park a , Woo-Kyun Lee a , Su-Young Woo b , Seongjin Yoo a , Doo-Ahn Kwak a , Boutheina Stiti c , Abdelhamid Khaldi c , Xu Zhen a & Tae-Hyub Kwon a a Department of Environmental Science and Ecological Engineering, Korea University, Seoul, 136-713, Korea b Department of Environmental Horticulture, University of Seoul, Seoul, 130-743, Korea c National Research Institutes of Rural, Water and Forests (INRGREF), Tunis, 2080, Tunisia Available online: 10 May 2011 To cite this article: Taejin Park, Woo-Kyun Lee, Su-Young Woo, Seongjin Yoo, Doo-Ahn Kwak, Boutheina Stiti, Abdelhamid Khaldi, Xu Zhen & Tae-Hyub Kwon (2011): Assessment of land-cover change using GIS and remotely-sensed data: A case study in Ain Snoussi area of northern Tunisia, Forest Science and Technology, 7:2, 75-81 To link to this article: http://dx.doi.org/10.1080/21580103.2011.573951 PLEASE SCROLL DOWN FOR ARTICLE Full terms and conditions of use: http://www.tandfonline.com/page/terms-and-conditions This article may be used for research, teaching, and private study purposes. Any substantial or systematic reproduction, redistribution, reselling, loan, sub-licensing, systematic supply, or distribution in any form to anyone is expressly forbidden. The publisher does not give any warranty express or implied or make any representation that the contents will be complete or accurate or up to date. The accuracy of any instructions, formulae, and drug doses should be independently verified with primary sources. The publisher shall not be liable for any loss, actions, claims, proceedings, demand, or costs or damages whatsoever or howsoever caused arising directly or indirectly in connection with or arising out of the use of this material.
Transcript of Assessment of land-cover change using GIS and remotely-sensed data: A case study in Ain Snoussi area...

This article was downloaded by: [Korea University]On: 26 May 2012, At: 05:35Publisher: Taylor & FrancisInforma Ltd Registered in England and Wales Registered Number: 1072954 Registered office: MortimerHouse, 37-41 Mortimer Street, London W1T 3JH, UK
Forest Science and TechnologyPublication details, including instructions for authors and subscription information:http://www.tandfonline.com/loi/tfst20
Assessment of land-cover change using GIS andremotely-sensed data: A case study in Ain Snoussiarea of northern TunisiaTaejin Park a , Woo-Kyun Lee a , Su-Young Woo b , Seongjin Yoo a , Doo-Ahn Kwak a ,Boutheina Stiti c , Abdelhamid Khaldi c , Xu Zhen a & Tae-Hyub Kwon aa Department of Environmental Science and Ecological Engineering, Korea University,Seoul, 136-713, Koreab Department of Environmental Horticulture, University of Seoul, Seoul, 130-743, Koreac National Research Institutes of Rural, Water and Forests (INRGREF), Tunis, 2080, Tunisia
Available online: 10 May 2011
To cite this article: Taejin Park, Woo-Kyun Lee, Su-Young Woo, Seongjin Yoo, Doo-Ahn Kwak, Boutheina Stiti, AbdelhamidKhaldi, Xu Zhen & Tae-Hyub Kwon (2011): Assessment of land-cover change using GIS and remotely-sensed data: A casestudy in Ain Snoussi area of northern Tunisia, Forest Science and Technology, 7:2, 75-81
To link to this article: http://dx.doi.org/10.1080/21580103.2011.573951
PLEASE SCROLL DOWN FOR ARTICLE
Full terms and conditions of use: http://www.tandfonline.com/page/terms-and-conditions
This article may be used for research, teaching, and private study purposes. Any substantial or systematicreproduction, redistribution, reselling, loan, sub-licensing, systematic supply, or distribution in any form toanyone is expressly forbidden.
The publisher does not give any warranty express or implied or make any representation that the contentswill be complete or accurate or up to date. The accuracy of any instructions, formulae, and drug dosesshould be independently verified with primary sources. The publisher shall not be liable for any loss, actions,claims, proceedings, demand, or costs or damages whatsoever or howsoever caused arising directly orindirectly in connection with or arising out of the use of this material.
Assessment of land-cover change using GIS and remotely-sensed data:
A case study in Ain Snoussi area of northern Tunisia
Taejin Parka, Woo-Kyun Leea*, Su-Young Woob, Seongjin Yooa, Doo-Ahn Kwaka, Boutheina Stitic,Abdelhamid Khaldic, Xu Zhena and Tae-Hyub Kwona
aDepartment of Environmental Science and Ecological Engineering, Korea University, Seoul 136-713, Korea; bDepartment ofEnvironmental Horticulture, University of Seoul, Seoul 130-743, Korea; cNational Research Institutes of Rural, Water and Forests(INRGREF), Tunis 2080, Tunisia
(Received 23 December 2010; Accepted 18 March 2011)
Understanding the patterns of land-cover change for biodiversity and ecology system function has been important inlandscape ecology. The objective of this study was to analyze land-cover change in the Ain Snoussi area of northernTunisia. Landsat MSS/4 and SPOT HRV/3 images were used for the analysis. To classify land-cover type into forestand non-forest area, pixel-based classification and maximum likelihood algorithm were applied to two imageriesusing supervised classification algorithm. After classification of images, each changed area was calculated. Thereby,analysis of distance roads and topographic factors such as elevation, slope, aspect, and Topographic Wetness Index(TWI) were performed. The results showed that the area changed into non-forest was slightly larger than that intoforest. Moreover, most of the changed areas, approximately half of the total changed area, were distributed near theroads. In addition, the change from forest to non-forest area tends to have a negative and positive relationshiprespectively with elevation and slope. On the other hand, the change from non-forest to forest area showed thetendency to be negative in elevation, slope, and TWI. However, the slope aspect of study area did not have anyparticular relationship with change tendency. In conclusion, spatial pattern of land-cover change was influenced bythe distance from roads and topographic characteristics of target area.
Keywords: Digital Elevation Model; distance from roads; land-cover change; topographic factors; TopographicWetness Index; Tunisia
Introduction
For detecting rapid land-cover changes over broad areas,remote sensing is an essential technique in the field offorest condition monitoring. It is hard to carry out fieldmeasurement in inaccessible forest areas and extensiveland areas. Initiatives to monitor land-cover and land-use change are increasingly reliant on informationderived from remotely sensed data. Such informationprovides the data linkage to other techniques designed tounderstand the human processes behind deforestation(Lambin 1994; Rindfuss and Stern 1998). The remotelysensed data are used to detect changes with repetitivelyacquired imageries (Collins and Woodcock 1996). Theymake it possible to determine the types and scale ofchanges in the environment (Singh 1989). Changedetection has been developed using image overlay,differencing and rationing, principal component analysis(PCA), spectral/temporal classification, and post-classi-fication comparison (Nelson 1983; Jensen 2005). Inparticular, techniques such as image differencing,rationing, and principal components analysis includetransformations of the original spectral bands toenhance the land-cover changes (Fung 1990).
Meanwhile, the Cork oak (Quercus suber L.) is animportant evergreen tree for both the ecological and
economic value of cork in the Mediterranean area.Cork oak forests are distributed only in the Mediter-ranean climate zones of Western Europe (Italy, France,Spain, and Portugal) and in North Africa (Morocco,Algeria, and Tunisia); in total, they cover 2,275,000 ha(37% in Africa and 63% in Europe) (Campos et al.2008). Most of them are distributed in a narrow sitewhen compared with the other Mediterranean ever-green oak species, such as Q. calliprinos (holly oak) andQ. ilex (holm oak) (Lumaret et al. 2005). In northernAfrica, cork oak only grows in the limited upperreaches of the high elevation areas on the borderbetween Tunisia and Algeria; its distribution is limitedto the northern part of Tunisia. Cork oak forestsrepresent 10% of the total forest area in Tunisia and4.3% of the world’s cork oak forest area. However, itssurface area has decreased dramatically, from148,000 ha to 70,000 ha, between 1920 and 2005 (Selmi2006). The cause of cork oak forest decline is unknownbecause the concept of a forest is a complicated dynamicstructure of vegetation. Although this phenomenon wasrecognized seriously, it has not been studied for thedecreasing cause of cork oak forest area.
Therefore, in this study, we tried to approach twoways for understanding land-cover change in Ain
*Corresponding author. Email: [email protected]
Forest Science and TechnologyVol. 7, No. 2, June 2011, 75–81
ISSN 2158-0103 print/ISSN 2158-0715 online
� 2011 Korean Forest Society
DOI: 10.1080/21580103.2011.573951
http://www.informaworld.com
Dow
nloa
ded
by [
Kor
ea U
nive
rsity
] at
05:
35 2
6 M
ay 2
012
Snoussi area of northern Tunisia. Firstly, we detectedland-cover change using remotely sensed data. Sec-ondly, the relationship between topographic, artificialfeatures, and land-cover change was analyzed based onextracted area.
Materials and methods
Study area
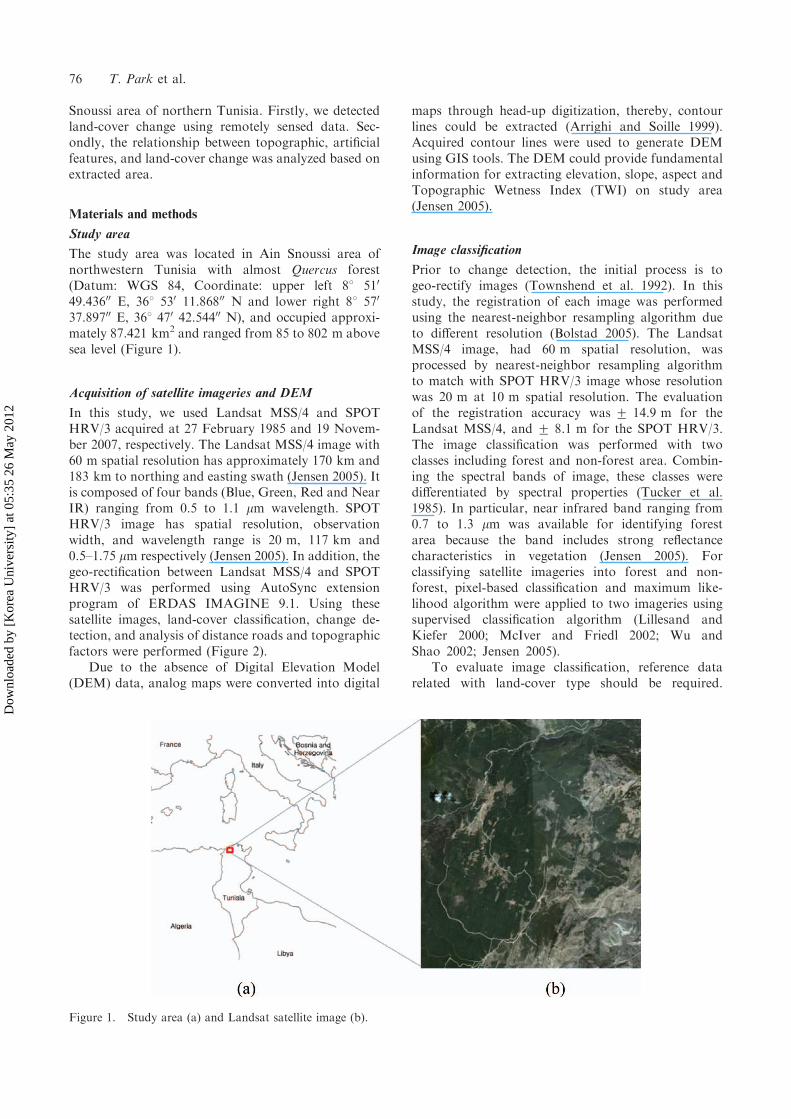
The study area was located in Ain Snoussi area ofnorthwestern Tunisia with almost Quercus forest(Datum: WGS 84, Coordinate: upper left 88 510
49.43600 E, 368 530 11.86800 N and lower right 88 570
37.89700 E, 368 470 42.54400 N), and occupied approxi-mately 87.421 km2 and ranged from 85 to 802 m abovesea level (Figure 1).
Acquisition of satellite imageries and DEM
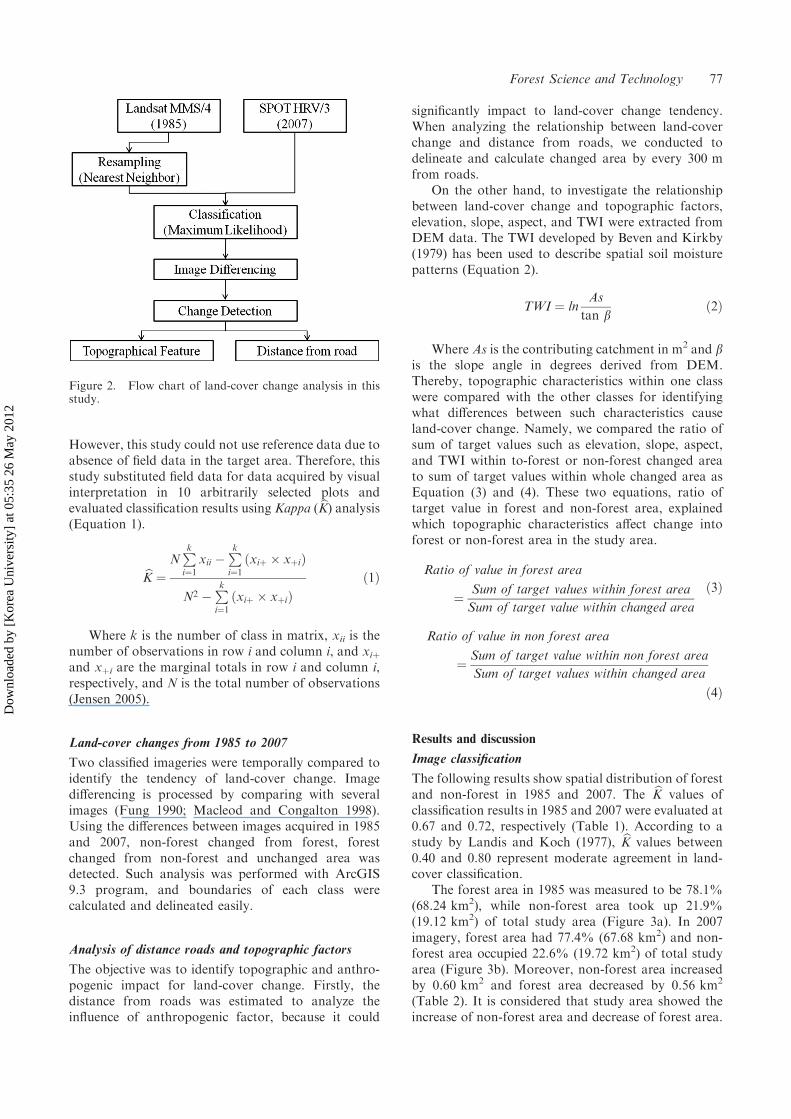
In this study, we used Landsat MSS/4 and SPOTHRV/3 acquired at 27 February 1985 and 19 Novem-ber 2007, respectively. The Landsat MSS/4 image with60 m spatial resolution has approximately 170 km and183 km to northing and easting swath (Jensen 2005). Itis composed of four bands (Blue, Green, Red and NearIR) ranging from 0.5 to 1.1 mm wavelength. SPOTHRV/3 image has spatial resolution, observationwidth, and wavelength range is 20 m, 117 km and0.5–1.75 mm respectively (Jensen 2005). In addition, thegeo-rectification between Landsat MSS/4 and SPOTHRV/3 was performed using AutoSync extensionprogram of ERDAS IMAGINE 9.1. Using thesesatellite images, land-cover classification, change de-tection, and analysis of distance roads and topographicfactors were performed (Figure 2).
Due to the absence of Digital Elevation Model(DEM) data, analog maps were converted into digital
maps through head-up digitization, thereby, contourlines could be extracted (Arrighi and Soille 1999).Acquired contour lines were used to generate DEMusing GIS tools. The DEM could provide fundamentalinformation for extracting elevation, slope, aspect andTopographic Wetness Index (TWI) on study area(Jensen 2005).
Image classification
Prior to change detection, the initial process is togeo-rectify images (Townshend et al. 1992). In thisstudy, the registration of each image was performedusing the nearest-neighbor resampling algorithm dueto different resolution (Bolstad 2005). The LandsatMSS/4 image, had 60 m spatial resolution, wasprocessed by nearest-neighbor resampling algorithmto match with SPOT HRV/3 image whose resolutionwas 20 m at 10 m spatial resolution. The evaluationof the registration accuracy was + 14.9 m for theLandsat MSS/4, and + 8.1 m for the SPOT HRV/3.The image classification was performed with twoclasses including forest and non-forest area. Combin-ing the spectral bands of image, these classes weredifferentiated by spectral properties (Tucker et al.1985). In particular, near infrared band ranging from0.7 to 1.3 mm was available for identifying forestarea because the band includes strong reflectancecharacteristics in vegetation (Jensen 2005). Forclassifying satellite imageries into forest and non-forest, pixel-based classification and maximum like-lihood algorithm were applied to two imageries usingsupervised classification algorithm (Lillesand andKiefer 2000; McIver and Friedl 2002; Wu andShao 2002; Jensen 2005).
To evaluate image classification, reference datarelated with land-cover type should be required.
Figure 1. Study area (a) and Landsat satellite image (b).
76 T. Park et al.
Dow
nloa
ded
by [
Kor
ea U
nive
rsity
] at
05:
35 2
6 M
ay 2
012
However, this study could not use reference data due toabsence of field data in the target area. Therefore, thisstudy substituted field data for data acquired by visualinterpretation in 10 arbitrarily selected plots andevaluated classification results using Kappa ( bK) analysis(Equation 1).
bK ¼NPki¼1
xii �Pki¼1
xiþ � xþið Þ
N2 �Pki¼1
xiþ � xþið Þð1Þ
Where k is the number of class in matrix, xii is thenumber of observations in row i and column i, and xiþand xþi are the marginal totals in row i and column i,respectively, and N is the total number of observations(Jensen 2005).
Land-cover changes from 1985 to 2007
Two classified imageries were temporally compared toidentify the tendency of land-cover change. Imagedifferencing is processed by comparing with severalimages (Fung 1990; Macleod and Congalton 1998).Using the differences between images acquired in 1985and 2007, non-forest changed from forest, forestchanged from non-forest and unchanged area wasdetected. Such analysis was performed with ArcGIS9.3 program, and boundaries of each class werecalculated and delineated easily.
Analysis of distance roads and topographic factors
The objective was to identify topographic and anthro-pogenic impact for land-cover change. Firstly, thedistance from roads was estimated to analyze theinfluence of anthropogenic factor, because it could
significantly impact to land-cover change tendency.When analyzing the relationship between land-coverchange and distance from roads, we conducted todelineate and calculate changed area by every 300 mfrom roads.
On the other hand, to investigate the relationshipbetween land-cover change and topographic factors,elevation, slope, aspect, and TWI were extracted fromDEM data. The TWI developed by Beven and Kirkby(1979) has been used to describe spatial soil moisturepatterns (Equation 2).
TWI ¼ lnAs
tan bð2Þ
Where As is the contributing catchment in m2 and bis the slope angle in degrees derived from DEM.Thereby, topographic characteristics within one classwere compared with the other classes for identifyingwhat differences between such characteristics causeland-cover change. Namely, we compared the ratio ofsum of target values such as elevation, slope, aspect,and TWI within to-forest or non-forest changed areato sum of target values within whole changed area asEquation (3) and (4). These two equations, ratio oftarget value in forest and non-forest area, explainedwhich topographic characteristics affect change intoforest or non-forest area in the study area.
Ratio of value in forest area
¼ Sum of target values within forest area
Sum of target value within changed area
ð3Þ
Ratio of value in non forest area
¼ Sum of target value within non forest area
Sum of target values within changed area
ð4Þ
Results and discussion
Image classification
The following results show spatial distribution of forestand non-forest in 1985 and 2007. The bK values ofclassification results in 1985 and 2007 were evaluated at0.67 and 0.72, respectively (Table 1). According to astudy by Landis and Koch (1977), bK values between0.40 and 0.80 represent moderate agreement in land-cover classification.
The forest area in 1985 was measured to be 78.1%(68.24 km2), while non-forest area took up 21.9%(19.12 km2) of total study area (Figure 3a). In 2007imagery, forest area had 77.4% (67.68 km2) and non-forest area occupied 22.6% (19.72 km2) of total studyarea (Figure 3b). Moreover, non-forest area increasedby 0.60 km2 and forest area decreased by 0.56 km2
(Table 2). It is considered that study area showed theincrease of non-forest area and decrease of forest area.
Figure 2. Flow chart of land-cover change analysis in thisstudy.
Forest Science and Technology 77
Dow
nloa
ded
by [
Kor
ea U
nive
rsity
] at
05:
35 2
6 M
ay 2
012

Namely, the tendency of land-cover change wasrepresented with changing forest into non-forest area.However, we could not be certain of land-cover changetendency, because the difference of increase anddecrease was very small.
Land-cover changes from 1985 to 2007
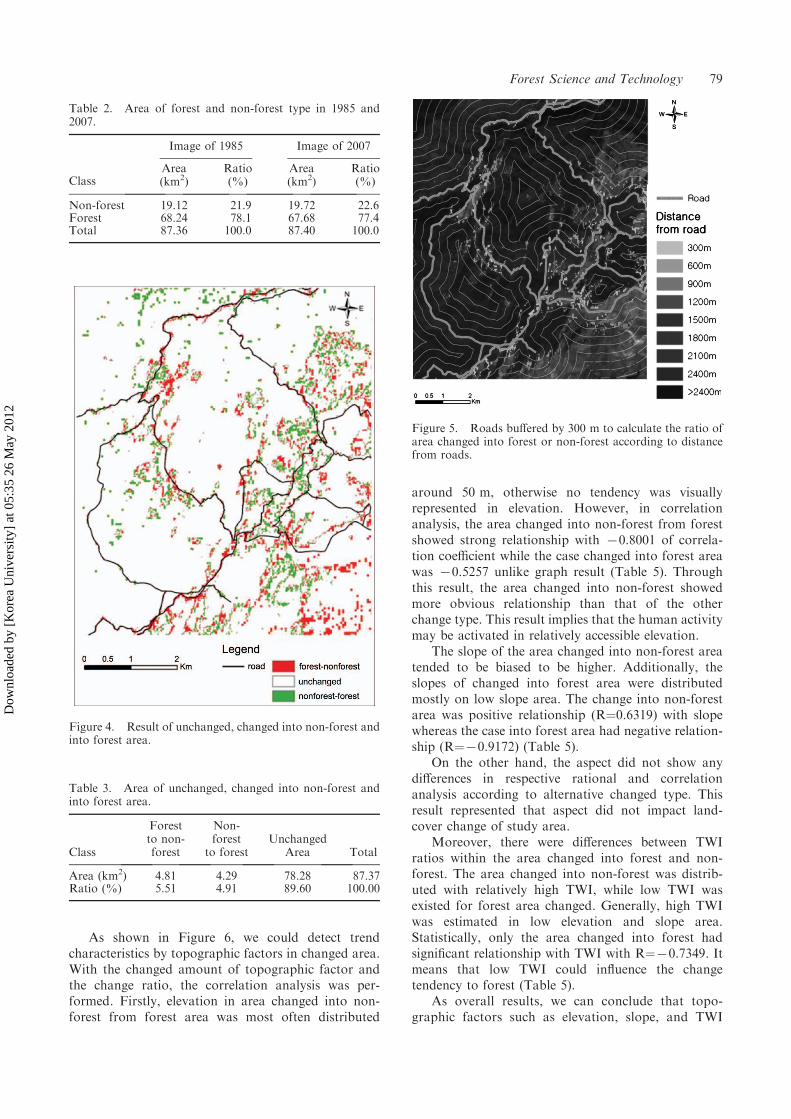
The area changed into non-forest from forest wasestimated at about 4.81 km2 (5.51%) (Figure 4,Table 3), whereas the area changed into forest fromnon-forest was about 4.29 km2 (4.91%). In results, non-forest area in 2007 has been expanded when comparedwith the non-forest area in 1985. The expanded areashows the tendency to be distributed near non-forestarea. It thus appears that the area transformed intonon-forest from forest was generated by humandevelopment activity (Meyer and Turner 1992).
Analysis of distance and topographic factors
Distance from roads
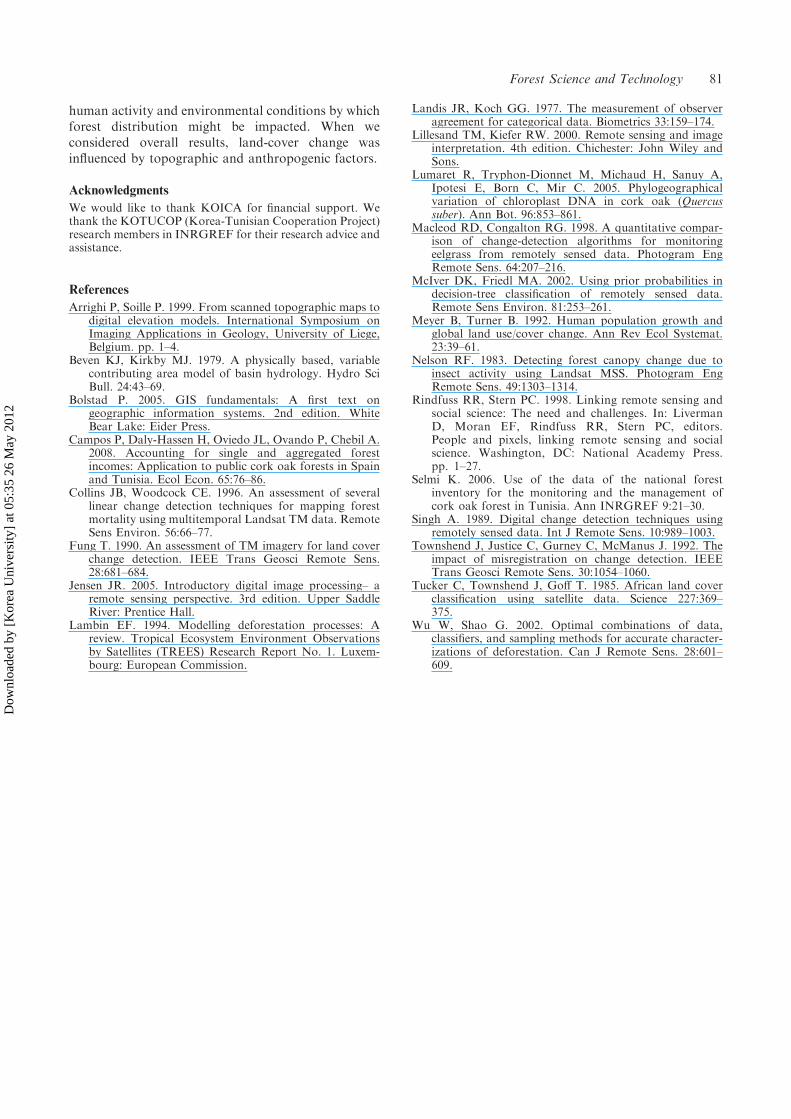
Analysis of distance from roads as an anthropogenicfactor was performed to consider its impacts for thespatial tendency of land-cover change by distance(Figure 5, Table 4). In the result of the area changedinto non-forest area from forest, within 300 m areafrom roads occupied 2.49 km2 (51.78%) of total areachanged into non-forest. The area changed into forestarea within same distance was 1.76 km2 (41.90%).Such results could show that the area changed intonon-forest tend to be distributed within roads 300 mfrom roads.
However, when distance was more than 300 m, theratio of the area changed into forest increased morethan when changed into non-forest. Most of totalchanged area, including all the areas changed intoforest and non-forest, were distributed to be 47.12%within 300 m from roads. In addition, 74.49% of totalchanged area was located within 900 m. Therefore,such tendencies within 900 m were attributed to theimpacts by human activity within a certain extent fromroads. However, we could not clarify whether roads asan anthropogenic factor influences alternative changeinto forest or non-forest area.
Topographic factors
In the case of aspect analysis, the southern area was thelowest at 9.93%, and the highest at 15.05% innorthwest. The TWI for study area was mostlydistributed with value 4 being 29.45% whereas value24, 25, 27 and 28 were the lowest.
Table 1. Error matrix and bK values derived from classifica-tion of 1985 and 2007.
ImageForest(Pixel)
Non-forest(Pixel)
Total(Pixel)
bKvalue
1985Forest (Pixel) 41,737 3602 45,339 0.67Non-forest(Pixel)
1625 6859 8484
Total (Pixel) 43,362 10,461 53,8232007Forest (Pixel) 41,498 2104 43,602 0.72Non-forest(Pixel)
2431 7790 10,221
Total (Pixel) 43,929 9894 53,823
Figure 3. Results of classification in 1985 (a) and 2007 (b).
78 T. Park et al.
Dow
nloa
ded
by [
Kor
ea U
nive
rsity
] at
05:
35 2
6 M
ay 2
012
As shown in Figure 6, we could detect trendcharacteristics by topographic factors in changed area.With the changed amount of topographic factor andthe change ratio, the correlation analysis was per-formed. Firstly, elevation in area changed into non-forest from forest area was most often distributed
around 50 m, otherwise no tendency was visuallyrepresented in elevation. However, in correlationanalysis, the area changed into non-forest from forestshowed strong relationship with 70.8001 of correla-tion coefficient while the case changed into forest areawas 70.5257 unlike graph result (Table 5). Throughthis result, the area changed into non-forest showedmore obvious relationship than that of the otherchange type. This result implies that the human activitymay be activated in relatively accessible elevation.
The slope of the area changed into non-forest areatended to be biased to be higher. Additionally, theslopes of changed into forest area were distributedmostly on low slope area. The change into non-forestarea was positive relationship (R¼0.6319) with slopewhereas the case into forest area had negative relation-ship (R¼70.9172) (Table 5).
On the other hand, the aspect did not show anydifferences in respective rational and correlationanalysis according to alternative changed type. Thisresult represented that aspect did not impact land-cover change of study area.
Moreover, there were differences between TWIratios within the area changed into forest and non-forest. The area changed into non-forest was distrib-uted with relatively high TWI, while low TWI wasexisted for forest area changed. Generally, high TWIwas estimated in low elevation and slope area.Statistically, only the area changed into forest hadsignificant relationship with TWI with R¼70.7349. Itmeans that low TWI could influence the changetendency to forest (Table 5).
As overall results, we can conclude that topo-graphic factors such as elevation, slope, and TWI
Table 3. Area of unchanged, changed into non-forest andinto forest area.
Class
Forestto non-forest
Non-forest
to forestUnchanged
Area Total
Area (km2) 4.81 4.29 78.28 87.37Ratio (%) 5.51 4.91 89.60 100.00
Table 2. Area of forest and non-forest type in 1985 and2007.
Class
Image of 1985 Image of 2007
Area(km2)
Ratio(%)
Area(km2)
Ratio(%)
Non-forest 19.12 21.9 19.72 22.6Forest 68.24 78.1 67.68 77.4Total 87.36 100.0 87.40 100.0
Figure 4. Result of unchanged, changed into non-forest andinto forest area.
Figure 5. Roads buffered by 300 m to calculate the ratio ofarea changed into forest or non-forest according to distancefrom roads.
Forest Science and Technology 79
Dow
nloa
ded
by [
Kor
ea U
nive
rsity
] at
05:
35 2
6 M
ay 2
012

cause land-cover change. However, the aspectshowed any particular relationship with the changetendency.
Conclusion
In this study, we tried to find the land-cover changetendency in Ain Snoussi of Tunisia through classifyingand analyzing changed area with topographic factorsand an anthropogenic factor. In results, the most areachanged into forest and non-forest was distributedwithin 300 m from roads. As a result, land-coverchange was influenced by human activity. In the case oftopographic factors, the area changed into non-forestfrom forest was slightly larger than that to forest area.In addition, the change to non-forest area tended to bedistributed in high elevation, slope, and TWI. On theother hand, the change to forest area occurred in lowelevation, slope, and TWI. However, we could not findany particular characteristics for the aspect influence ineach changed type. These tendencies were caused by
Table 4. Area by distance from roads according to changed type.
Distance from roads (m) 300 600 900 1200 1500 1800 2100 2400 42400 Total
Forest to non-forestArea (km2) 2.49 0.82 0.43 0.35 0.18 0.16 0.19 0.13 0.06 4.81Ratio (%) 51.78 16.96 9.04 7.34 3.69 3.32 4.00 2.68 1.19 100.00
Non-forest to forestArea (km2) 1.76 0.80 0.69 0.51 0.23 0.15 0.03 0.03 0.00 4.21Ratio (%) 41.90 19.05 16.47 12.05 5.45 3.67 0.67 0.71 0.03 100.00
Total changed areaArea (km2) 4.25 1.62 1.12 0.86 0.41 0.31 0.22 0.16 0.06 9.02Ratio (%) 47.12 17.96 12.42 9.53 4.55 3.44 2.44 1.77 0.67 100.00
Table 5. Result of correlation analysis between changedarea and topographic factors.
Feature StatisticsNon-forestto forest
Forest tonon-forest
Elevation Correlation coefficient 70.5257 70.8001P value 0.0365 0.0002
Slope Correlation coefficient 70.9172 0.6319P value 50.0001 50.0001
Aspect Correlation coefficient 0.4409 70.3230P value 0.2349 0.3966
TWI Correlation coefficient 70.7349 0.1319P value 50.0001 0.5034
Figure 6. Respective comparison of elevation (a), slope (b), aspect (c), and TWI (d) according to Equation (1) and (2) in changedarea.
80 T. Park et al.
Dow
nloa
ded
by [
Kor
ea U
nive
rsity
] at
05:
35 2
6 M
ay 2
012
human activity and environmental conditions by whichforest distribution might be impacted. When weconsidered overall results, land-cover change wasinfluenced by topographic and anthropogenic factors.
Acknowledgments
We would like to thank KOICA for financial support. Wethank the KOTUCOP (Korea-Tunisian Cooperation Project)research members in INRGREF for their research advice andassistance.
References
Arrighi P, Soille P. 1999. From scanned topographic maps todigital elevation models. International Symposium onImaging Applications in Geology, University of Liege,Belgium. pp. 1–4.
Beven KJ, Kirkby MJ. 1979. A physically based, variablecontributing area model of basin hydrology. Hydro SciBull. 24:43–69.
Bolstad P. 2005. GIS fundamentals: A first text ongeographic information systems. 2nd edition. WhiteBear Lake: Eider Press.
Campos P, Daly-Hassen H, Oviedo JL, Ovando P, Chebil A.2008. Accounting for single and aggregated forestincomes: Application to public cork oak forests in Spainand Tunisia. Ecol Econ. 65:76–86.
Collins JB, Woodcock CE. 1996. An assessment of severallinear change detection techniques for mapping forestmortality using multitemporal Landsat TM data. RemoteSens Environ. 56:66–77.
Fung T. 1990. An assessment of TM imagery for land coverchange detection. IEEE Trans Geosci Remote Sens.28:681–684.
Jensen JR. 2005. Introductory digital image processing– aremote sensing perspective. 3rd edition. Upper SaddleRiver: Prentice Hall.
Lambin EF. 1994. Modelling deforestation processes: Areview. Tropical Ecosystem Environment Observationsby Satellites (TREES) Research Report No. 1. Luxem-bourg: European Commission.
Landis JR, Koch GG. 1977. The measurement of observeragreement for categorical data. Biometrics 33:159–174.
Lillesand TM, Kiefer RW. 2000. Remote sensing and imageinterpretation. 4th edition. Chichester: John Wiley andSons.
Lumaret R, Tryphon-Dionnet M, Michaud H, Sanuy A,Ipotesi E, Born C, Mir C. 2005. Phylogeographicalvariation of chloroplast DNA in cork oak (Quercussuber). Ann Bot. 96:853–861.
Macleod RD, Congalton RG. 1998. A quantitative compar-ison of change-detection algorithms for monitoringeelgrass from remotely sensed data. Photogram EngRemote Sens. 64:207–216.
McIver DK, Friedl MA. 2002. Using prior probabilities indecision-tree classification of remotely sensed data.Remote Sens Environ. 81:253–261.
Meyer B, Turner B. 1992. Human population growth andglobal land use/cover change. Ann Rev Ecol Systemat.23:39–61.
Nelson RF. 1983. Detecting forest canopy change due toinsect activity using Landsat MSS. Photogram EngRemote Sens. 49:1303–1314.
Rindfuss RR, Stern PC. 1998. Linking remote sensing andsocial science: The need and challenges. In: LivermanD, Moran EF, Rindfuss RR, Stern PC, editors.People and pixels, linking remote sensing and socialscience. Washington, DC: National Academy Press.pp. 1–27.
Selmi K. 2006. Use of the data of the national forestinventory for the monitoring and the management ofcork oak forest in Tunisia. Ann INRGREF 9:21–30.
Singh A. 1989. Digital change detection techniques usingremotely sensed data. Int J Remote Sens. 10:989–1003.
Townshend J, Justice C, Gurney C, McManus J. 1992. Theimpact of misregistration on change detection. IEEETrans Geosci Remote Sens. 30:1054–1060.
Tucker C, Townshend J, Goff T. 1985. African land coverclassification using satellite data. Science 227:369–375.
Wu W, Shao G. 2002. Optimal combinations of data,classifiers, and sampling methods for accurate character-izations of deforestation. Can J Remote Sens. 28:601–609.
Forest Science and Technology 81
Dow
nloa
ded
by [
Kor
ea U
nive
rsity
] at
05:
35 2
6 M
ay 2
012