
Application of Remotely-sensed Data for Modeling Malaria Infection in Lokoja, Nigeria

Spatio-temporal Analysis of Urban and Population Growths in Tripoli using Remotely Sensed Data and GIS
Abubakr A. A. Al-sharif, Biswajeet Pradhan*, Helmi Zulhaidi Mohd Shafri and Shattri Mansor
Department of Civil Engineering, Faculty of Engineering University Putra Malaysia, 43400, UPM, Serdang; [email protected]; [email protected]; [email protected]; [email protected]
Abstract The remote sensing data and GIS have been used widely to analyse and study the patterns of urban expansions. The capital of Libya, Tripoli was selected to perform this study and to examine its urban growth. Four satellite imageries and popula-tion censuses of the study area for the time period 1984 to 2010 were used in this work. The objectives of this paper are identifying and analysing the urban sprawl of Tripoli as a pattern and as process. Also to understand and assess the inter-changeable relationship of urban growth and population growth of study area. Urban area extents in different time periods were extracted by supervised classification method of the satellite imageries. Then, the population data and urban extents data were coupled to perform the analysis. Additionally, Shannon’s entropy technique was used for further assessment of urban growth. The study findings demonstrate that Tripoli had sprawled urban growth during the period 1984 to 2010. Moreover, during the above mentioned period, the urban expansion dispersion rate has shown in an ascending mode. Consequently, this uncontrolled dispersed urban development had resulted in high consumption land rate per capita de-spite of decrement in population growth rate.
Keywords: Urban Sprawl, Shannon’s Entropy, Population Growth, Remote Sensing, GIS, Tripoli.
*Corresponding author:Biswajeet Pradhan ([email protected])
Indian Journal of Science and Technology
1. IntroductionDeveloping countries have higher uncontrolled rapid urbanization process than developed countries [1]. This uncontrolled rapid urban expansion causes remarkable changes in the landscape as a result of rapid economic devel-opments in those parts of the world [2, 3, 4]. Unrestrained change in landscape increases loss of green cover and for-ests, loss of fertile lands, environment degradation, ugliness of urban areas, and many more [5, 2, 6, 7, 8, 9, 10, 11, 12]. Urbanization process (urban sprawl) is one of major signif-icant drivers of land cover/use change, and it is associated with growth of populations [13, 14]. However, it is very dif-ficult to present a specific acceptable definition of urban sprawl that satisfy whole urban planning research commu-nity. Nonetheless, the simple definition is that, the urban sprawl is the amount of built up area and its dispersion
level in the landscape [15]. In addition, the urban sprawl level in the landscape in specific time represents the urban sprawl as a pattern, whereas the change of urban sprawl patterns in a landscape in different time periods represents the urban sprawl as a process [16]. However, both defini-tions of urban sprawl pattern and urban sprawl process can be included in one term ‘‘urban sprawl’’ [8].
Furthermore, the uncontrolled population growth is considered as the main factor of urban sprawl and urban spatial problems [17, 18, 19, 8].
Sandhya et al. [20] reported that the rapid population increase is due to urbanization, economy flourishing, and industrialization processes which increase the pressure on land use planning. Urban sprawl has a direct relationship with socio economic information and population figures, i.e. unexpected population growth associated with unplanned developmental activities will result in uncontrolled urban

Abubakr A. A. Al-sharif, Biswajeet Pradhan, Helmi Zulhaidi Mohd Shafri and Shattri Mansor 5135
Indian Journal of Science and Technology | Print ISSN: 0974-6846 | Online ISSN: 0974-5645www.indjst.org | Vol 6 (8) | August 2013
sprawl with poor infrastructure facilities and poor economic performance [21, 22, 23]. Additionally, urbanized land cover class changes considerably in short time as compared to other land covers classes [22]. As well, it was demonstrated that the unplanned development and urban sprawl are char-acterised by percentage of built up area growth higher than percentage of population increase [24, 25, 26]. Thus, pop-ulation in an area should be used as one of the important metrics to measure urban sprawl process. The good simple acceptable measure to identify and quantify urban sprawl is that the proportion of total built-up area to the proportion of total population [20, 27, 28]. However, urbanization process is not a preventable process. But managing, controlling, and guiding urban growth process can be achieved by using suit-able ways of urban land use analysis, and planning, so as to avoid aforementioned side effects of sprawled urbanization [26]. Subsequently, precise mapping of urbanized lands and monitoring urban expansion is very important for accurate analysis and planning [29, 5]. The use of conventional urban analysis techniques are really difficult, time consuming, and expensive. However, the urban expansion can be measured easily by calculating the percentage of areas covered by con-crete and asphalt, i.e. impervious surfaces. Additionally, those areas which is occupied by impervious surfaces are detectable and interpretable using remote sensing technique [5, 24, 28, 30]. Hence statistical methods along with GIS and remotely sensed data can be used as efficient and cost effective option for urban growth analysis and detecting urban sprawl [31, 32, 23, 1, 4, 33].
The main objective of this paper is to analyze urban growth process and it is spatial patterns in Tripoli, Libya, from 1984 to 2010, by employing GIS and remote sensing technologies. Particularly, this study identifies and assesses the urban sprawl occurrence in Tripoli, based on analysis of interchangeable relationship between urban growth and population growth.
2. Study AreaTripoli, the capital of the state of Libya, more than 2500 years old was selected as study area in this study. It is the main political, economical, commercial, financial and business centre of Libya. Tripoli is located at (N 32o 53′ and E 13o 10′) along the Mediterranean coast in the north western part of Libyan state. The Tripoli urban agglomera-tion, covers about 1143.73km2 with population more than 1.3 million individuals. It is divided into nine districts namely: Central Tripoli, Suq Aljumma, Hey Alandalus,
Abuslim, Tajoura, Ainzara, Janzour, Kaser Ben Ghashir, and Alswany as shown in Figure 1. The grow rate of the city had increased continuously in last decades, and resulted in rapid uncontrolled urban expansion.
3. Methodology and Data UsedFour remotely sensed images were classified to determine the built-up area of Tripoli metropolitan area. The details of the remote sensing data are listed in Table 1.
Table 1. List of used satellite imageries
Sensor type Acquisition year Spatial resolution
LANDSAT– TM 1984 30mLANDSAT– TM 1996 30mSPOT 5 2002 2.5mSPOT 5 2010 5m
Figure 1. Study area location map.

Spatio-temporal Analysis of Urban and Population Growths in Tripoli using Remotely Sensed Data and GIS5136
Indian Journal of Science and Technology | Print ISSN: 0974-6846 | Online ISSN: 0974-5645www.indjst.org | Vol 6 (8) | August 2013
Additional data such as populations data, and topographic map, were used further for analysis and for ref-erencing data purposes. The used imageries have different spatial resolutions. A simple technique to solve this trouble is resampling the imageries which have large resolution, so that their spatial resolution equals the smallest resolu-tion imagery. However, images resampling using bi-cubic or bi-linear resampling methods will change pixels values, i.e. average the adjacent pixel values and resampling using nearest neighbour method will results in pixel dropout or pixel duplication. For that, imageries were used without any altering of the pixel size.
Consequently, vector map of the Tripoli metropolitan area was used for clipping imageries. Thereafter, a super-vised maximum likelihood method was used to classify all clipped images to extract the built-up areas. Since in this study only urban growth is assessed, for this reason only two classes were considered, namely: urban class and non-urban class.
Amount of the built-up lands for districts in the four time instants were obtained by clipping the final classi-fied imageries using the provided vector map of districts. Subsequently the quantity of pixels in every district was multiplied by the grid size. The imaging time of some imag-eries deviated from the populations census dates (1984, 1995, and 2006). Thus, to solve this difficulty, the popu-lation data was interpolated. As a result the population data dates matched the remote sensing data dates. In the case of 2010 populations, it was assumed that the annual rate of population growth per year remains same as the population increase rate from 1995 to 2006. Hence 2010
population was computed based on 2006 population. Table 2 shows observed and interpolated population figures of Tripoli. The built-up area data and population data were used to assess and investigate the urban sprawl process and its spatial patterns. The relationships among built up area, population and the urban sprawl were analysed further to provide clear understanding about the urbanization in study area. Lastly, absolute, and relative Shannon’s entropy method were calculated to identify the urban growth pat-terns in study area. Moreover, the change rate of Shannon’s entropy values was computed to conclude the urban sprawl process.
4. Results and Discussion
4.1 Urban Growth and Built Up AreaThe four temporal satellite imageries were classified into built up and non-built up area as shown in Figure 2. The classified maps were assessed using confusion matrix approach. For accuracy assessment real ground reference polygons were compared with the classified output maps. An overall accuracy values of 91%, 93.2, 95.7%, 94% and Kappa coefficients values of 0.89, 0.93, 0.94, 0.93 were achieved for the classified maps of the year’s 1984, 1996, 2002 and 2010, respectively. The classification outcomes presented clear summary and simplified visual maps of studied area, which acted as significant indication of urban growth pattern and urban extent. By primary analysis of the classified imageries that illustrated in Figure 2, the urban growth pattern of each district, the dispersion of
Table 2. Total population and total area in (km2) of Tripoli districts
Year
1984 1996 2002 2010 District area
District
Central Tripoli 132505 128270 129130 130354 16.62Suq Aljumma 81378 103207 118124 131650 44.03Tajoura 59575 93852 110281 133677 82.93AinZara 145562 184619 206501 237662 256.03Kasr Ben Ghashir 49348 66782 76829 83137 274.62AbuSlim 201886 212156 221280 234273 137.53Hey Alandlus 218317 240051 240454 241029 68.91Janzour 87331 126593 144369 169681 109.20Alswani 13340 17396 19842 23324 153.86Total 989242 1172928 1266810 1384787 1143.73

Abubakr A. A. Al-sharif, Biswajeet Pradhan, Helmi Zulhaidi Mohd Shafri and Shattri Mansor 5137
Indian Journal of Science and Technology | Print ISSN: 0974-6846 | Online ISSN: 0974-5645www.indjst.org | Vol 6 (8) | August 2013
urban growth, the infill of the non-urban areas between previously urbanized areas, the extent of built up regions, and so on, can be noticed and determined easily.
Nevertheless, to illustrate those various spatial patterns wisely, to realize how they transform over time, to com-pare every district with other districts, and to describe the differences amongst those spatial patterns statistically, quantitative measures were used. The amount of impervi-ous surfaces like concrete and asphalt and built-up areas was used in the analysis as a direct indicator of urban development.
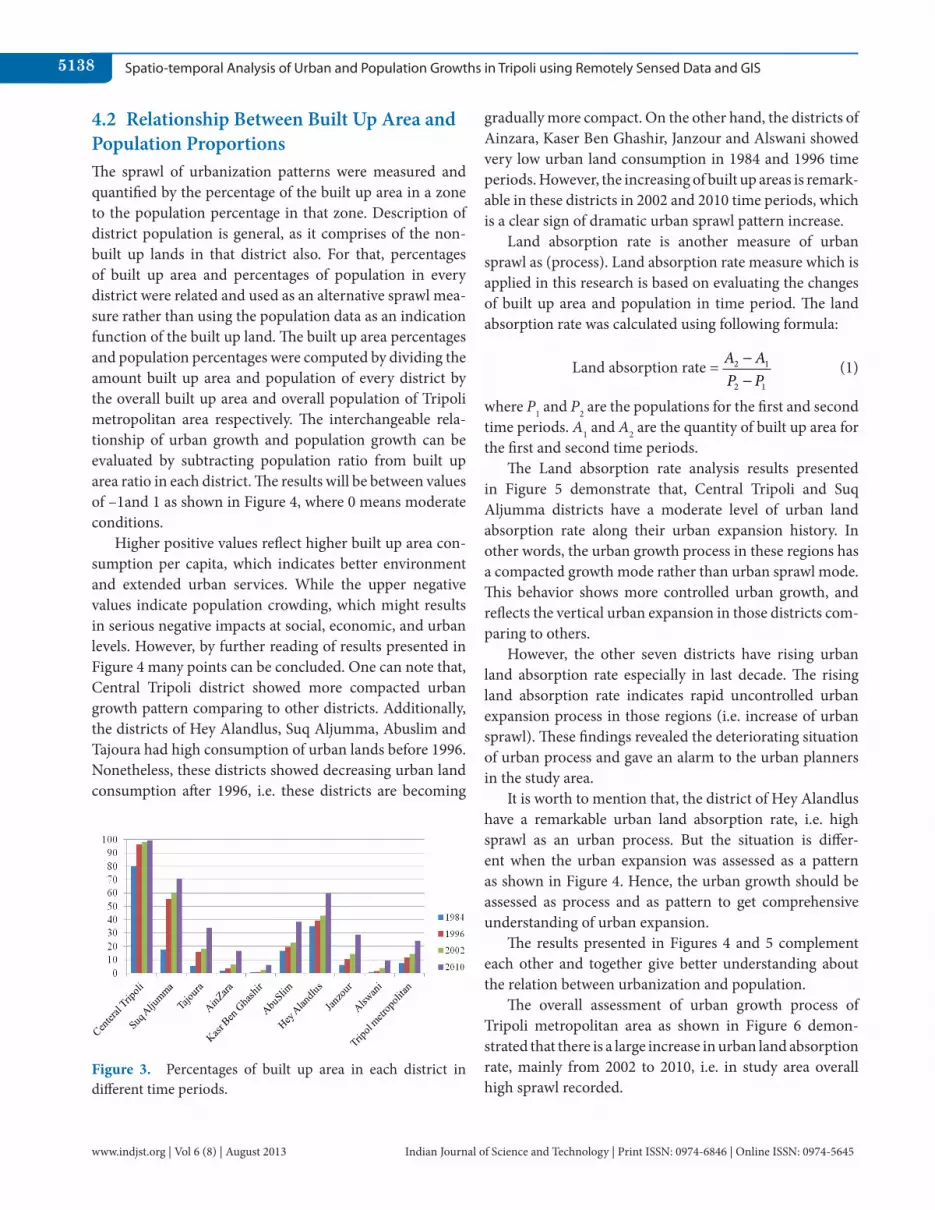
Percentages of built up areas were computed for each district and for each classified imagery and presented in Figure 3. The results presented in Figure 3 show the concentration percentages of built up area in each dis-trict. Additionally, the results demonstrate that there is a noticeable large concentration rate of built-up lands in the districts of Central Tripoli, Suq Aljumma, Hey Alandlus, and Abuslim. This concentration became extremely high in Central Tripoli district and adjacent zones. Furthermore,
the urban growth rate in these districts is lower than other districts because of built up area saturation, and may reflects more controlled urban growth.
However, the percentages of built up area in the dis-tricts of Tajoura, Janzour, Ainzara, Kaser Ben Ghashir, and Alswany are lower than 20% in 1984, 1996, and 2002, but these districts had high urban growth ratio especially from 2002 to 2010. The percentages of urban area in these districts are still lower than 50%, which means higher availability of urban growth rather than other districts. Moreover, the urban expansion rates in these districts almost doubled in 2010, this result is highly alarming because of high urban growth ratio and clear dispersion growth patterns. The overall urban expansion rate of the study area has continuously increased, especially in last decade where the growth rate had exceeded 40% of urban extent in 2002. These findings revealed an urgent need to control the dispersed urban sprawl by applying suitable urban plan and wise urban policy; otherwise the situation would be worse in future.
Figure 2. Built up area extent in different years (a) in 1984 (b) in 1996 (c) in 2002 (d) in 2010.
(c)
(d)
(a)
(b)
Spatio-temporal Analysis of Urban and Population Growths in Tripoli using Remotely Sensed Data and GIS5138
Indian Journal of Science and Technology | Print ISSN: 0974-6846 | Online ISSN: 0974-5645www.indjst.org | Vol 6 (8) | August 2013
4.2 Relationship Between Built Up Area and Population Proportions The sprawl of urbanization patterns were measured and quantified by the percentage of the built up area in a zone to the population percentage in that zone. Description of district population is general, as it comprises of the non-built up lands in that district also. For that, percentages of built up area and percentages of population in every district were related and used as an alternative sprawl mea-sure rather than using the population data as an indication function of the built up land. The built up area percentages and population percentages were computed by dividing the amount built up area and population of every district by the overall built up area and overall population of Tripoli metropolitan area respectively. The interchangeable rela-tionship of urban growth and population growth can be evaluated by subtracting population ratio from built up area ratio in each district. The results will be between values of –1and 1 as shown in Figure 4, where 0 means moderate conditions.
Higher positive values reflect higher built up area con-sumption per capita, which indicates better environment and extended urban services. While the upper negative values indicate population crowding, which might results in serious negative impacts at social, economic, and urban levels. However, by further reading of results presented in Figure 4 many points can be concluded. One can note that, Central Tripoli district showed more compacted urban growth pattern comparing to other districts. Additionally, the districts of Hey Alandlus, Suq Aljumma, Abuslim and Tajoura had high consumption of urban lands before 1996. Nonetheless, these districts showed decreasing urban land consumption after 1996, i.e. these districts are becoming
gradually more compact. On the other hand, the districts of Ainzara, Kaser Ben Ghashir, Janzour and Alswani showed very low urban land consumption in 1984 and 1996 time periods. However, the increasing of built up areas is remark-able in these districts in 2002 and 2010 time periods, which is a clear sign of dramatic urban sprawl pattern increase.
Land absorption rate is another measure of urban sprawl as (process). Land absorption rate measure which is applied in this research is based on evaluating the changes of built up area and population in time period. The land absorption rate was calculated using following formula:
Land absorption rate = A AP P
2 1
2 1
−−
(1)
where P1 and P2 are the populations for the first and second time periods. A1 and A2 are the quantity of built up area for the first and second time periods.
The Land absorption rate analysis results presented in Figure 5 demonstrate that, Central Tripoli and Suq Aljumma districts have a moderate level of urban land absorption rate along their urban expansion history. In other words, the urban growth process in these regions has a compacted growth mode rather than urban sprawl mode. This behavior shows more controlled urban growth, and reflects the vertical urban expansion in those districts com-paring to others.
However, the other seven districts have rising urban land absorption rate especially in last decade. The rising land absorption rate indicates rapid uncontrolled urban expansion process in those regions (i.e. increase of urban sprawl). These findings revealed the deteriorating situation of urban process and gave an alarm to the urban planners in the study area.
It is worth to mention that, the district of Hey Alandlus have a remarkable urban land absorption rate, i.e. high sprawl as an urban process. But the situation is differ-ent when the urban expansion was assessed as a pattern as shown in Figure 4. Hence, the urban growth should be assessed as process and as pattern to get comprehensive understanding of urban expansion.
The results presented in Figures 4 and 5 complement each other and together give better understanding about the relation between urbanization and population.
The overall assessment of urban growth process of Tripoli metropolitan area as shown in Figure 6 demon-strated that there is a large increase in urban land absorption rate, mainly from 2002 to 2010, i.e. in study area overall high sprawl recorded.
Figure 3. Percentages of built up area in each district in different time periods.

Abubakr A. A. Al-sharif, Biswajeet Pradhan, Helmi Zulhaidi Mohd Shafri and Shattri Mansor 5139
Indian Journal of Science and Technology | Print ISSN: 0974-6846 | Online ISSN: 0974-5645www.indjst.org | Vol 6 (8) | August 2013
4.3 Population and Built Up Area Growth RatesPopulation increase induces the built up area to spread out. The expansion rate of built up area is interrelated to popu-lation increase rate. Hence urban sprawl can be specified by assessment of population increase with built up area growth rates.
Figure 7 demonstrates the growth ratio of built up area and increase ratio of population in three periods.
Additionally, Figure 7 shows that the built up areas expan-sion rate was all the time larger than the population increase rate. It was extremely high through last decade.
This result disagree the conclusion of Acioly and Davidson (1996) that cities in developing parts of the world are becoming considerably more compact despite decreasing population growth [38]. In the case of Tripoli, despite the area of study showed a tendency to compact-ness during time period of 1996 to 2002, nevertheless, the general and recent tendency is towards high dispersion, i.e. sign of urban sprawl.
4.4 Shannon’s Entropy and Built Up AreasShannon’s entropy technique is popular and powerful for identifying the compactness of urban sprawl and disper-sion of urban growth [34, 16, 25, 35, 8, 20, 23, 36, 1]. The Shannon’s entropy method was applied for identifying, quantifying and measure the occurrence of urban sprawl in the study area.
The values of absolute Shannon’s entropy Hn were deter-mined by the following equation:
H P Pn i i
i
n= − ( )∑
=ln
1 (2)
where Pi is the percentage of the variable in the ith district, i.e. the percentage of built up lands in each district, com-puted by: built-up lands proportion in ith district / total proportions of built up areas in all districts. n is the districts number = 9.
The Shannon’s entropy values varies between 0 and ln(n) (i.e. 2.197). Zero entropy value indicates that built up areas have very concentrated distribution, i.e. extremely compact, whereas value of entropy nearer to ln(n) indicate that the very high dispersion of urban areas. Larger values of entropy reveal sprawl occurrence.
Figure 4. Percentage of built up area vs. percentage of population of the districts.
Figure 5. Land absorption rate in each district.
Figure 6. Overall land absorption rate of study area. Figure 7. Growth ratios of population and built up area.

Spatio-temporal Analysis of Urban and Population Growths in Tripoli using Remotely Sensed Data and GIS5140
Indian Journal of Science and Technology | Print ISSN: 0974-6846 | Online ISSN: 0974-5645www.indjst.org | Vol 6 (8) | August 2013
However, by dividing calculated absolute Shannon’s entropy by ln(n), one can get the relative Shannon’s entropy. The relative Shannon’s entropy always varying between 0 to 1 values which gives clearer understanding about the sprawl [20, 37, 4].
Analysis results presented in Table 3 and Figure 8 illus-trate that the values of entropy are always higher than the middle point of ln(n), i.e. 1.099. The entropy value became very high in 2010.
These findings demonstrate that Tripoli metropolitan has overall high dispersed urban expansion. Additionally, in spite of the decreasing population growth rate the urban sprawl is increasing upward.
The applied absolute and relative Shannon’s entropy measures evaluated the urban sprawl as a pattern. To evalu-ate the urban sprawl as a process the change rate of urban dispersion (change in sprawl) between two time periods was calculated as shown in Figure 9. The following formula was used for this purpose:
∆ = ( ) − ( )H H t H tn n n2 1 (3)
where ∆Hn is the variation in the values of entropy between time periods, H tn 1( ) is the value of relative Shannon’s entropy at time(t1), and H tn 2( ) is the value of relative Shannon’s entropy at time (t2).
Figure 9 illustrates that the study area has progressing urban sprawl process. The positive change of ∆Hn indicates uncontrolled dispersal pattern of urbanization process. However, these findings highlight the urgent needs of sustainable urban growth control and planned urban man-agement.
5. ConclusionsThis research has focussed on the patterns and extents of change in urban growth of Tripoli metropolitan area from 1984 to 2010, which can be useful in terms of directing prospect urban plans and urbanization policies for Tripoli. The analysis results demonstrated that there is an obvious indication of urban dispersion and urban sprawl for the metropolitan of Tripoli city, i.e. sprawl is increasing with time. Consequently, it is not a rule that cities in developing parts of the world become more compact with decreasing population growth rate.
The most important issues for urban planners are measuring of urban growth; and determining the urban requirements that must be accomplished earlier to get ready for future urban demands, rather than waiting for urban expansion will occur or not.
The models presented and used in this study can be employed to give some guidance to identify and measure the change likely to happen if the tendency of urban his-tory persists. However, the used models can be applied to each district as well (for more specific level research). All
Figure 8. Absolute and relative Shannon’s entropy values in different time periods.
Table 3. Shannon’s entropy values for different time periods
1984 1996 2002 2010 ln(n) ln(n)/2
Absolute entropy value
1.478 1.628 1.737 1.936 2.197 1.099
Relative entropy value
0.673 0.741 0.791 0.881 – –
Figure 9. Shannon’s entropy change rate values.
Table 4. Shannon’s entropy change values for different time periods
1984 to 1996 1996 to 2002 2002 to 2010∆(Hn) 0.847 1.112 1.436

Abubakr A. A. Al-sharif, Biswajeet Pradhan, Helmi Zulhaidi Mohd Shafri and Shattri Mansor 5141
Indian Journal of Science and Technology | Print ISSN: 0974-6846 | Online ISSN: 0974-5645www.indjst.org | Vol 6 (8) | August 2013
districts have different intensity of compactness, this results in different urban growth patterns. Hence, one policy for the whole metropolitan area will not work with the same degrees of efficiencies for all districts.
To make Tripoli metropolitan area more compact, it is necessary to minimize the quantity of lands for absorb-ing the alarming increase rate of population, i.e. applying urban policies that restrict urban expansion wisely and stop its dispersion pattern.
In conclusion, the past and the present of Tripoli urban behaviour and associated population growth have been studied using remotely sensed data and GIS tech-nique. By applying popular Shannon’s entropy model and using built up area data and population data the urban sprawl was identified and assessed. The used methods in this research work insist the advantages and signifi-cance of analytical models for urban growth assessment. Moreover, the use of population data combined with built-up area data can be considered as a very good tech-nique to measure the urban sprawl as process and as a pattern. Furthermore, integration of Shannon’s entropy method with the previous analysis technique has resulted in powerful methodology for urban sprawl analysis. However, Tripoli metropolis city as fresh case study requires more intensive research work to develop reliable predictive urban growth models. For instance, spatial statistical techniques, empirical methods and cellular automata model can be used to examine and predict the possible growth scenarios in future. Consequently, sev-eral factors that effect and drive the urbanization process should be included in those models, for further analysis and to understand their roles and their interchangeable relationships with urban expansion.
6. References 1. Kumar J A V, Pathan S ewt al. (2007). Spatio-temporal anal-
ysis for monitoring urban growth–a case study of Indore city, Journal of the Indian Society of Remote Sensing, vol 35(1), 11–20.
2. Deka J, Tripathi O P et al. (2010). Urban growth trend analysis using Shannon Entropy approach–a case study in North-East India, International Journal of Geomatics and Geosciences, vol 2(4), 1072–1078.
3. Wu K-y, Ye X-y et al. (2013). Impacts of land use/land cover change and socioeconomic development on regional ecosystem services: The case of fast-growing Hangzhou met-ropolitan area, China, Cities, vol 31, 276–284, doi: 10.1016/j.cities.2012.08.003.
4. Yeh A G-O, and Xia L (2001). Measurement and monitoring of urban sprawl in a rapidly growing region using entropy, Photogrammetric Engineering and Remote Sensing, vol 67(1), 83–90.
5. Al-shalabi M, Pradhan B et al. (2012). Manifestation of remote sensing data in modeling urban sprawl using the SLEUTH model and brute force calibration: a case study of Sana’a city, Yemen, Journal of the Indian Society of Remote Sensing, 1–12. doi: 10.1007/s12524-012-0215-6.
6. Pathan S, Jothimahi P et al. (1989). Urban land use mapping and zoning of Bombay Metropolitan Region using Remote Sensing data, Journal of the Indian Society of Remote Sensing, vol 17(3), 11–22.
7. Pathan S, Shukla V et al. (1991). Urban land use mapping: a case study of ahmedabad city and its environs, Journal of the Indian Society of Remote Sensing, vol 19(2), 95–112.
8. Sarvestani M S, Ibrahim A L et al. (2011). Three decades of urban growth in the city of Shiraz, Iran: a remote sensing and geographic information systems application, Cities, vol 28(4), 320–329, doi: 10.1016/j.cities.2011.03.002.
9. Salvati L, Sateriano A et al. (2013). To grow or to sprawl? Land cover relationships in a mediterranean city region and implications for land use management, Cities, vol 30, 113–121, doi: 10.1016/j.cities.2012.01.007.
10. Schmidt C W (2004). Sprawl: the new manifest destiny?, Environmental Health Perspectives, vol 112(11), 620–627.
11. Tole L (2008). Changes in the built vs. non-built envi-ronment in a rapidly urbanizing region: a case study of the Greater Toronto Area, Computers, Environment and Urban Systems, vol 32(5), 355–364. doi: 10.1016/j.compenvurbsys.2008.08.002.
12. Xu H, Wang X et al. (2000). A remote sensing and GIS inte-grated study on urbanization with its impact on arable lands: Fuqing City, Fujian Province, China, Land Degradation & Development, vol 11(4), 301–314.
13. Barredo J I, and Demicheli L (2003). Urban sustainability in developing countries’ megacities: modelling and predicting future urban growth in Lagos, Cities, vol 20(5), 297–310, doi: 10.1016/S0264-2751(03)00047-7.
14. Weng Q (2001). A remote sensing? GIS evaluation of urban expansion and its impact on surface temperature in the Zhujiang Delta, China, International Journal of Remote Sensing, vol 22(10), 1999–2014.
15. Jaeger J A G, Bertiller R et al. (2010). Suitability criteria for measures of urban sprawl, Ecological Indicators, vol 10(2), 397–406, doi: 10.1016/j.ecolind.2009.07.007.
16. Bhatta B, Saraswati S et al. (2010). Quantifying the degree-of-freedom, degree-of-sprawl, and degree-of-goodness of urban growth from remote sensing data, Applied Geography, vol 30(1), 96–111, doi: 10.1016/j.apgeog.2009.08.001.
17. Aljoufie M, Zuidgeest M et al. (2013). Spatial–temporal analysis of urban growth and transportation in Jeddah

Spatio-temporal Analysis of Urban and Population Growths in Tripoli using Remotely Sensed Data and GIS5142
Indian Journal of Science and Technology | Print ISSN: 0974-6846 | Online ISSN: 0974-5645www.indjst.org | Vol 6 (8) | August 2013
City, Saudi Arabia, Cities, vol 31, 57–68. doi: 10.1016/j.cities.2012.04.008.
18. Bhatta, B. (2009). Analysis of urban growth pattern using remote sensing and GIS: a case study of Kolkata, India. International Journal of Remote Sensing, 30(18), 4733–4746, doi: 10.1080/01431160802651967.
19. Maktav D, and Erbek F (2005). Analysis of urban growth using multi-temporal satellite data in Istanbul, Turkey, International Journal of Remote Sensing, vol 26(4), 797–810.
20. Kiran G S, and Joshi U B (2012). Estimation of variables explaining urbanization concomitant with land-use change: a spatial approach, International Journal of Remote Sensing, vol 34(3), 824–847. doi: 10.1080/01431161.2012.720738.
21. Sarvestani M S, Ibrahim A L et al. (2011). Three decades of urban growth in the city of Shiraz, Iran: a remote sensing and geographic information systems application, Cities, vol 28(4), 320–329, doi: 10.1016/j.cities.2011.03.002.
22. Jieli C, Manchun L et al. (2010). Extract residential areas automatically by new built-up index, 2010 18th International Conference on Geoinformatics, 1–5.
23. Kiran G S, and Joshi U B (2012). Estimation of variables explaining urbanization concomitant with land-use change: a spatial approach, International Journal of Remote Sensing, vol 34(3), 824–847. doi: 10.1080/01431161.2012.720738.
24. Barnes K B, Morgan III J M et al. (2001). Sprawl develop-ment: its patterns, consequences, and measurement, Towson University, Towson, 1–24.
25. Jat M K, Garg P et al. (2008). Modelling of urban growth using spatial analysis techniques: a case study of Ajmer city (India), International Journal of Remote Sensing, vol 29(2), 543–567.
26. Soffianian A, Nadoushan M A et al. (2010). Mapping and analyzing urban expansion using remotely sensed imagery in Isfahan, Iran, World Applied Sciences Journal, vol 9(12), 1370–1378.
27. Sharma L, Pandey P C et al. (2012). Assessment of land consumption rate with urban dynamics change using geo-spatial techniques, Journal of Land Use Science, vol 7(2), 135–148.
28. Sudhira H, Ramachandra T et al. (2003). Urban growth anal-ysis using spatial and temporal data, Journal of the Indian Society of Remote Sensing, vol 31(4), 299–311.
29. Al-shalabi M, Billa L et al. (2012). Modelling urban growth evolution and land-use changes using GIS based cellular automata and SLEUTH models: the case of Sana’a metropol-itan city, Yemen, Environmental Earth Sciences, 1–13, doi: 10.1007/s12665-012-2137-6.
30. Tehrany M S, Pradhan B et al. (2013). remote sensing data reveals eco-environmental changes in urban areas of Klang Valley, Malaysia: contribution from object based analysis, Journal of the Indian Society of Remote Sensing, vol 1–11. doi: 10.1007/s12524-013-0289-9.
31. Al Fugara A M, Pradhan B et al. (2009). Improvement of land-use classification using object-oriented and fuzzy logic approach, Applied Geomatics, vol 1(4), 111–120, doi: 10.1007/s12518-009-0011-3.
32. Punia M, and Singh L (2011). Entropy approach for assessment of urban growth: a case study of Jaipur, India, Journal of the Indian Society of Remote Sensing, vol 40(2), 231–244.
33. Youssef A M, Pradhan B et al. (2011). Integrated evaluation of urban development suitability based on remote sensing and GIS techniques: contribution from the analytic hier-archy process, Arabian Journal of Geosciences, vol 4(3–4), 463–473, doi: 10.1007/s12517-009-0118-1.
34. Araya Y H, and Cabral P (2010). Analysis and modeling of urban land cover change in Setubal and Sesimbra, Portugal. Remote Sensing, vol 2(6), 1549–1563.
35. Lata K M, Prasad V K et al. (2001). Measuring urban sprawl: a case study of Hyderabad, GIS Development, vol 12(5), 26–29.
36. Tewolde M G, and Cabral P (2011). Urban sprawl analysis and modeling in Asmara, Eritrea, Remote Sensing, vol 3(10), 2148–2165.
37. Sun H, Forsythe W et al. (2007). Modeling urban land use change and urban sprawl: Calgary, Alberta, Canada, Networks and Spatial Economics, vol 7(4), 353–376.
38. Acioly C, and Davidson F (1996). Density in Urban Development. Building issues, Lund Centre for Habitat Studies, Lund University, vol 8(3), 3–25.
Copyright © 2022 FDOKUMEN


![Travels of Ali Bey [pseud.] in Morocco, Tripoli, Cyprus, Egypt ...](https://static.fdokumen.com/doc/165x107/6333e93b3108fad7760f46d2/travels-of-ali-bey-pseud-in-morocco-tripoli-cyprus-egypt-.jpg)