Rice-acreage estimation for Orrisa using remotely sensed data
Upload
independentCategory
view
3download
0
_________________________________________________________________________
*Corresponding author: Email: [email protected];
International Journal of TROPICAL DISEASE& Health
4(6): 634-644, 2014
SCIENCEDOMAIN internationalwww.sciencedomain.org
Application of Remotely-sensed Data forModeling Malaria Infection in Lokoja, Nigeria
Olarewaju Oluseyi Ifatimehin1 and Fanan Ujoh2*
1Department of Geography and Planning, Kogi State University, Anyigba, Nigeria.2Department of Urban and Regional Planning, Benue State University, Makurdi, Nigeria.
Authors’ contributions
Author OOI designed the study, conducted the initial analyses of the study and wrote theprotocol. Author FU wrote the first draft of the manuscript, managed the analyses of thestudy and the literature searches. Both authors read and approved the final manuscript.
Received 3rd October 2013Accepted 18th February 2014
Published 18th March 2014
ABSTRACT
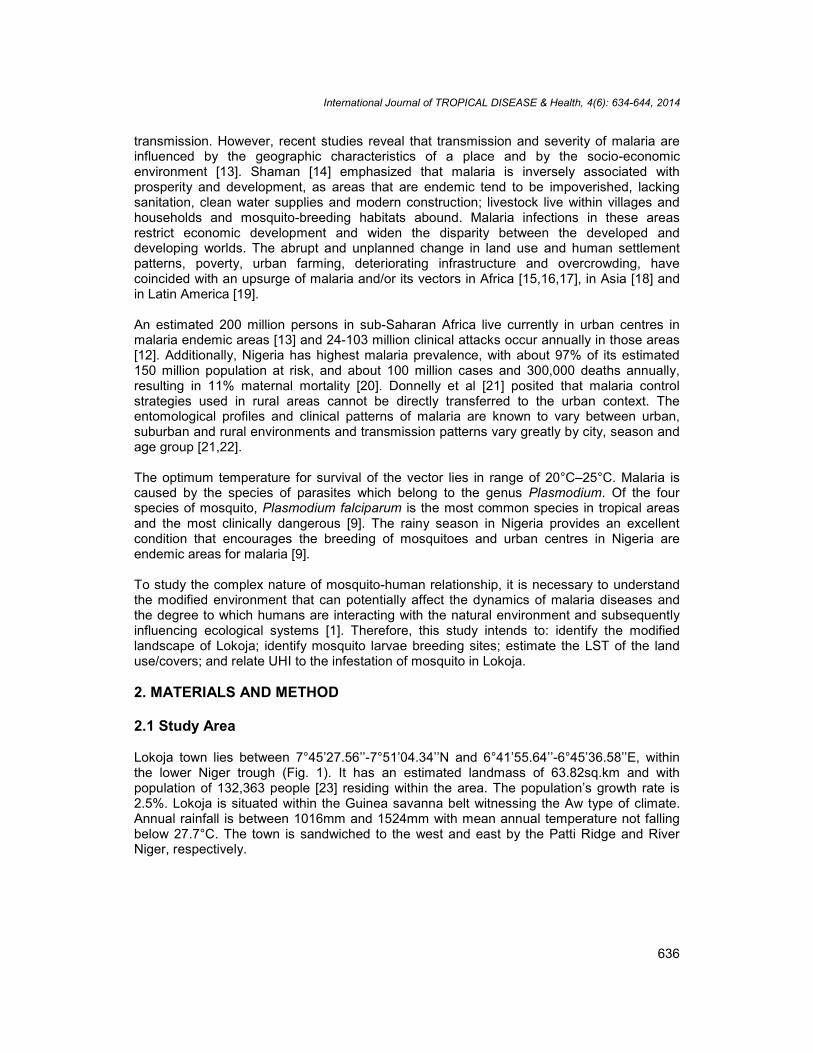
Aims: To estimate incidences of malaria infection in an urban setting using Remotelysensed data and matching same with hospital records to validate the use of Remotesensing data as a methodology for studying the prevalence of malaria.Study Design: Analyses of 2006 Nigeriasat-1 and Land sat ETM+satellite data formodeling malaria infection.Place and Duration of Study: Lokoja, Capital city of Kogi State in Central Nigeria,between March 2012 and January 2013.Methodology: Extraction of land use types, NDVI and LST maps using ILWIS 3.3 andIdrisi software. Cross tabulation of extracted maps to carry out correlational analyseswhile buffer analysis was conducted to ascertain risk zones of malaria infection in thetown. The clinical data was used in determining the recorded incidence of malaria in thestudy area.Results: Built-up area, sand bars and vacant land occupy least land cover (i.e. 28.31%)while urban agricultural land, vegetation and water bodies covered 344.33km2 (59.72%),41.98km2 (7.28%) and 18.51km2 (3.21%), respectively. The LSE value ranges from 0.92to 0.989 with an average of 0.955 whereas the highest emissivity is recorded wherevegetation is very dense and the lowest recorded for Sand bars. The LST for sand bars,vacant land and built-up area recorded the highest average temperatures of 41.13°C,
Original Research Article
International Journal of TROPICAL DISEASE & Health, 4(6): 634-644, 2014
635
35.66°C and 34.56°C, respectively. The highest negative correlation was found invegetation (-0.96) with other negative values recorded for urban agricultural land andwater bodies. The lowest correlation (0.65) was recorded from areas covered with sandbars. The UHI map shows that temperatures at the periphery are lower (about 18°C) buthigher at the core (from 26°C to 40°C).Conclusion: The interplay of NDVI, LST and land use/cover types of Lokoja provides theimpetus for the rising incidence of malaria in Lokoja town. Proper urban planning whichwill support sufficient drainages, effective waste removal, sanitary landfill sites, vegetationcontrol, fumigation, etc. can boost sanitary conditions whilst minimizing the availability ofbreeding sites for mosquito larvae. At the household levels, extensive use of bed nets andperiodic fumigation appear to be the most appropriate short-term measures for curtailingthe incidences of malaria at the study area.
Keywords: Satellite data; land use/cover; NDVI; LST; mosquito larvae; malaria; Lokoja.
1. INTRODUCTION
The rapid, unplanned urbanization observed in many parts of Africa is changing the contextfor human population and natural systems interaction [1]. The reduced vegetation cover,increased impervious surface area and the morphology of buildings in the urban centres,combines to lower evaporative cooling by storing heat during the day and releasing suchduring the night to warm the surface air [2]. A build-up of ambient land surface temperature(LST) in urban centres of 2°–3° higher than that recorded at the surrounding suburbanenvironment are witnessed in areas with greater vegetation cover, cultivated lands and aswell as greater areas of wet soils [3,4]. Urban topography, surface roughness, morphology ofbuildings and anthropogenic activities contribute to reducing outgoing long wave radiation,hinder sensible heat loss, hinder distribution of heat and generate heat [2,5,6]. The increasein sensible heat flux at the expense of latent heat flux is an occurring phenomenon in urbancentres and poses a great challenge to the environment and the health of the humanpopulation.
Additionally, urbanization has led to a significant alteration of local climate, and in particularcreates significant heat island [7]. The urban heat island (UHI) is associated with thetemperatures of central urban location rising with several degrees higher than those ofnearby rural areas of similar elevation [6,8]. Hence, different anthropogenic activities are fastbecoming primary drivers of ranges of infectious diseases outbreaks and modifiers of thetransmission and spatial distribution of endemic infections affecting human health [9].
An important impact of climate change encompasses induction of vector-borne, air–borneand marine-borne diseases. Diseases that are spread by mosquitoes and other insects arebecoming more prevalent with warmer temperatures. Such vector borne diseases includemalaria, dengue fever, yellow fever among others. The sensitivity of these vector-bornediseases to climate change depends on preceding and coexistent circumstances, such associo-economic development, local environmental conditions, human behaviour andimmunity, and the effectiveness of control measures adopted.
Rapid urbanization alters the frequency and transmission dynamics of malaria, withsignificant effects on the disease associated morbidity and mortality, which in turn hasimportant implications for control [10,11]. Keiser et al. [12] reported that until recently, urbandevelopment was generally believed to reduce the risk of vector breeding, and thus malaria
International Journal of TROPICAL DISEASE & Health, 4(6): 634-644, 2014
636
transmission. However, recent studies reveal that transmission and severity of malaria areinfluenced by the geographic characteristics of a place and by the socio-economicenvironment [13]. Shaman [14] emphasized that malaria is inversely associated withprosperity and development, as areas that are endemic tend to be impoverished, lackingsanitation, clean water supplies and modern construction; livestock live within villages andhouseholds and mosquito-breeding habitats abound. Malaria infections in these areasrestrict economic development and widen the disparity between the developed anddeveloping worlds. The abrupt and unplanned change in land use and human settlementpatterns, poverty, urban farming, deteriorating infrastructure and overcrowding, havecoincided with an upsurge of malaria and/or its vectors in Africa [15,16,17], in Asia [18] andin Latin America [19].
An estimated 200 million persons in sub-Saharan Africa live currently in urban centres inmalaria endemic areas [13] and 24-103 million clinical attacks occur annually in those areas[12]. Additionally, Nigeria has highest malaria prevalence, with about 97% of its estimated150 million population at risk, and about 100 million cases and 300,000 deaths annually,resulting in 11% maternal mortality [20]. Donnelly et al [21] posited that malaria controlstrategies used in rural areas cannot be directly transferred to the urban context. Theentomological profiles and clinical patterns of malaria are known to vary between urban,suburban and rural environments and transmission patterns vary greatly by city, season andage group [21,22].
The optimum temperature for survival of the vector lies in range of 20°C–25°C. Malaria iscaused by the species of parasites which belong to the genus Plasmodium. Of the fourspecies of mosquito, Plasmodium falciparum is the most common species in tropical areasand the most clinically dangerous [9]. The rainy season in Nigeria provides an excellentcondition that encourages the breeding of mosquitoes and urban centres in Nigeria areendemic areas for malaria [9].
To study the complex nature of mosquito-human relationship, it is necessary to understandthe modified environment that can potentially affect the dynamics of malaria diseases andthe degree to which humans are interacting with the natural environment and subsequentlyinfluencing ecological systems [1]. Therefore, this study intends to: identify the modifiedlandscape of Lokoja; identify mosquito larvae breeding sites; estimate the LST of the landuse/covers; and relate UHI to the infestation of mosquito in Lokoja.
2. MATERIALS AND METHOD
2.1 Study Area
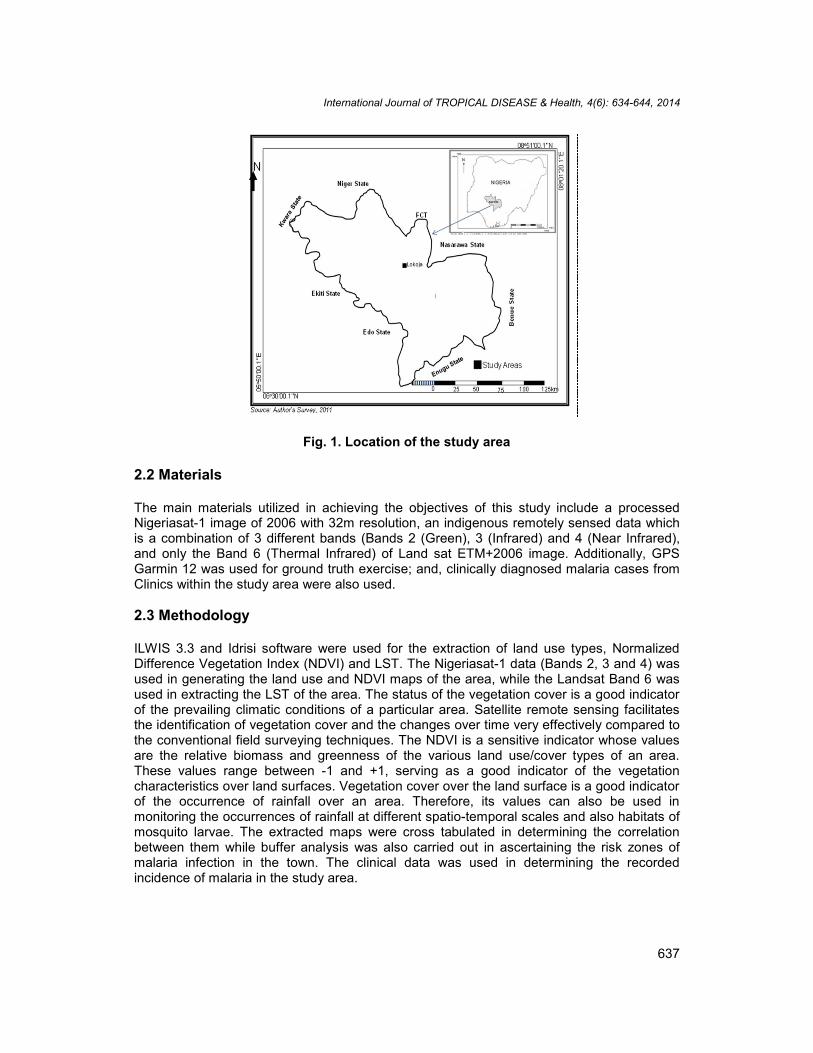
Lokoja town lies between 7°45’27.56’’-7°51’04.34’’N and 6°41’55.64’’-6°45’36.58’’E, withinthe lower Niger trough (Fig. 1). It has an estimated landmass of 63.82sq.km and withpopulation of 132,363 people [23] residing within the area. The population’s growth rate is2.5%. Lokoja is situated within the Guinea savanna belt witnessing the Aw type of climate.Annual rainfall is between 1016mm and 1524mm with mean annual temperature not fallingbelow 27.7°C. The town is sandwiched to the west and east by the Patti Ridge and RiverNiger, respectively.
International Journal of TROPICAL DISEASE & Health, 4(6): 634-644, 2014
637
Fig. 1. Location of the study area
2.2 Materials
The main materials utilized in achieving the objectives of this study include a processedNigeriasat-1 image of 2006 with 32m resolution, an indigenous remotely sensed data whichis a combination of 3 different bands (Bands 2 (Green), 3 (Infrared) and 4 (Near Infrared),and only the Band 6 (Thermal Infrared) of Land sat ETM+2006 image. Additionally, GPSGarmin 12 was used for ground truth exercise; and, clinically diagnosed malaria cases fromClinics within the study area were also used.
2.3 Methodology
ILWIS 3.3 and Idrisi software were used for the extraction of land use types, NormalizedDifference Vegetation Index (NDVI) and LST. The Nigeriasat-1 data (Bands 2, 3 and 4) wasused in generating the land use and NDVI maps of the area, while the Landsat Band 6 wasused in extracting the LST of the area. The status of the vegetation cover is a good indicatorof the prevailing climatic conditions of a particular area. Satellite remote sensing facilitatesthe identification of vegetation cover and the changes over time very effectively compared tothe conventional field surveying techniques. The NDVI is a sensitive indicator whose valuesare the relative biomass and greenness of the various land use/cover types of an area.These values range between -1 and +1, serving as a good indicator of the vegetationcharacteristics over land surfaces. Vegetation cover over the land surface is a good indicatorof the occurrence of rainfall over an area. Therefore, its values can also be used inmonitoring the occurrences of rainfall at different spatio-temporal scales and also habitats ofmosquito larvae. The extracted maps were cross tabulated in determining the correlationbetween them while buffer analysis was also carried out in ascertaining the risk zones ofmalaria infection in the town. The clinical data was used in determining the recordedincidence of malaria in the study area.
International Journal of TROPICAL DISEASE & Health, 4(6): 634-644, 2014
638
3. RESULTS AND DISCUSSION
3.1 Land Use Types and Quantification
Table 1 show that the classified image of the study area has 6 distinct land uses. The tablealso provides detailed information on the quantification of the 6 land use types identified.Urban agricultural land covered more than half of the study. The initial implication of therecorded land cover (higher urban agricultural land, vegetation and water bodies) is thatthere is a large expanse of potential mosquito larvae breeding habitat. Mosquito larvae caneffectively thrive in these land uses and their adults invade the built-up area to feed and aswell cause malaria infection.
Table 1. Lokoja under different land use/cover types in 2006
Land Use/Cover Type 2006Area (km2) %
Built-up Areas 163.2 28.3Sand Bars 3.7 0.6Urban Agricultural Land 344.3 59.7Vacant Land 4.8 0.8Vegetation 42 7.3Water Bodies 18.5 3.2Total 576.5 100
Source: Classified Nigeriasat-1 image of 2006
3.2 NDVI, LSE and LST of Lokoja
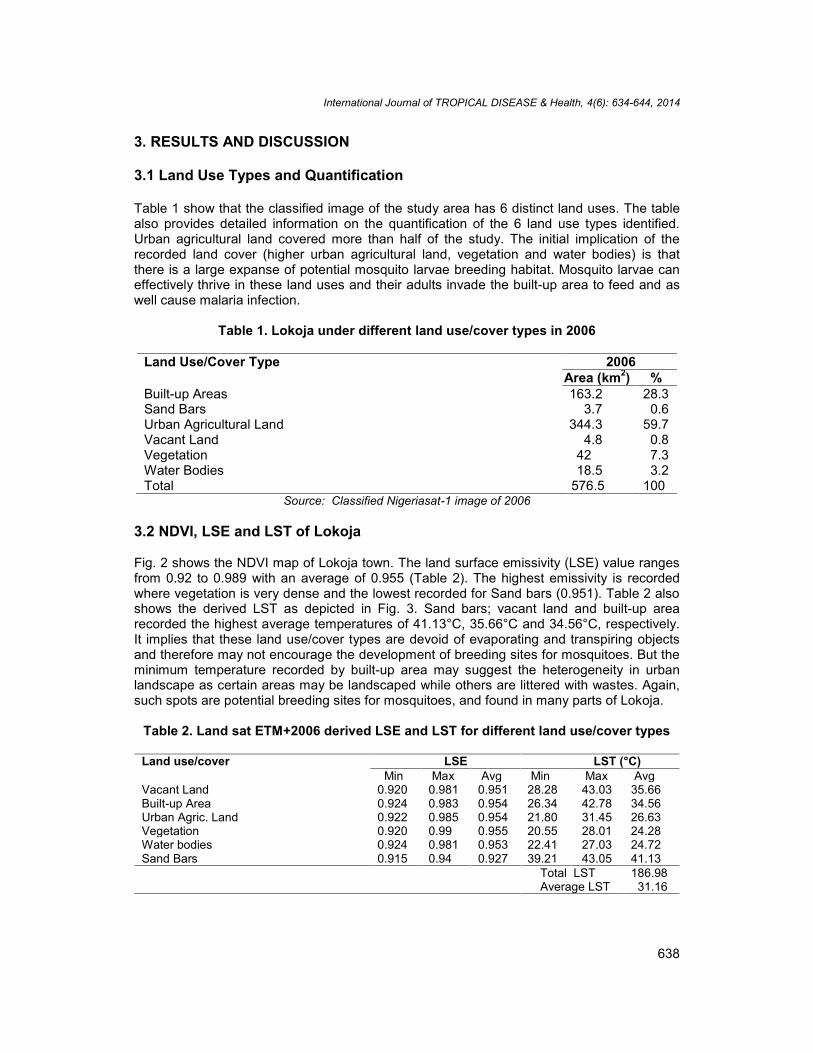
Fig. 2 shows the NDVI map of Lokoja town. The land surface emissivity (LSE) value rangesfrom 0.92 to 0.989 with an average of 0.955 (Table 2). The highest emissivity is recordedwhere vegetation is very dense and the lowest recorded for Sand bars (0.951). Table 2 alsoshows the derived LST as depicted in Fig. 3. Sand bars; vacant land and built-up arearecorded the highest average temperatures of 41.13°C, 35.66°C and 34.56°C, respectively.It implies that these land use/cover types are devoid of evaporating and transpiring objectsand therefore may not encourage the development of breeding sites for mosquitoes. But theminimum temperature recorded by built-up area may suggest the heterogeneity in urbanlandscape as certain areas may be landscaped while others are littered with wastes. Again,such spots are potential breeding sites for mosquitoes, and found in many parts of Lokoja.
Table 2. Land sat ETM+2006 derived LSE and LST for different land use/cover types
Land use/cover LSE LST (°C)Min Max Avg Min Max Avg
Vacant Land 0.920 0.981 0.951 28.28 43.03 35.66Built-up Area 0.924 0.983 0.954 26.34 42.78 34.56Urban Agric. Land 0.922 0.985 0.954 21.80 31.45 26.63Vegetation 0.920 0.99 0.955 20.55 28.01 24.28Water bodies 0.924 0.981 0.953 22.41 27.03 24.72Sand Bars 0.915 0.94 0.927 39.21 43.05 41.13
Total LST 186.98Average LST 31.16
International Journal of TROPICAL DISEASE & Health, 4(6): 634-644, 2014
639
Fig. 2. NDVI Map of Lokoja Fig. 3. LST Map of Lokoja
Vegetation, water bodies and urban agricultural land use/cover types have the least averageLST (24.28°C, 24.72°C and 26.63°C, respectively). This is as a result of the evaporating andtranspiring potentials of the components of these land use/cover types and their trappedmoisture content which collectively and ultimately facilitates the development of mosquitohabitats. Therefore, vegetation cover and water bodies have a strong affinity to attractinsects, especially mosquitoes. This is a major characteristic exhibited by the peripheralareas outside the core of urban centres as confirmed by [24].
3.3 Correlational Analyses
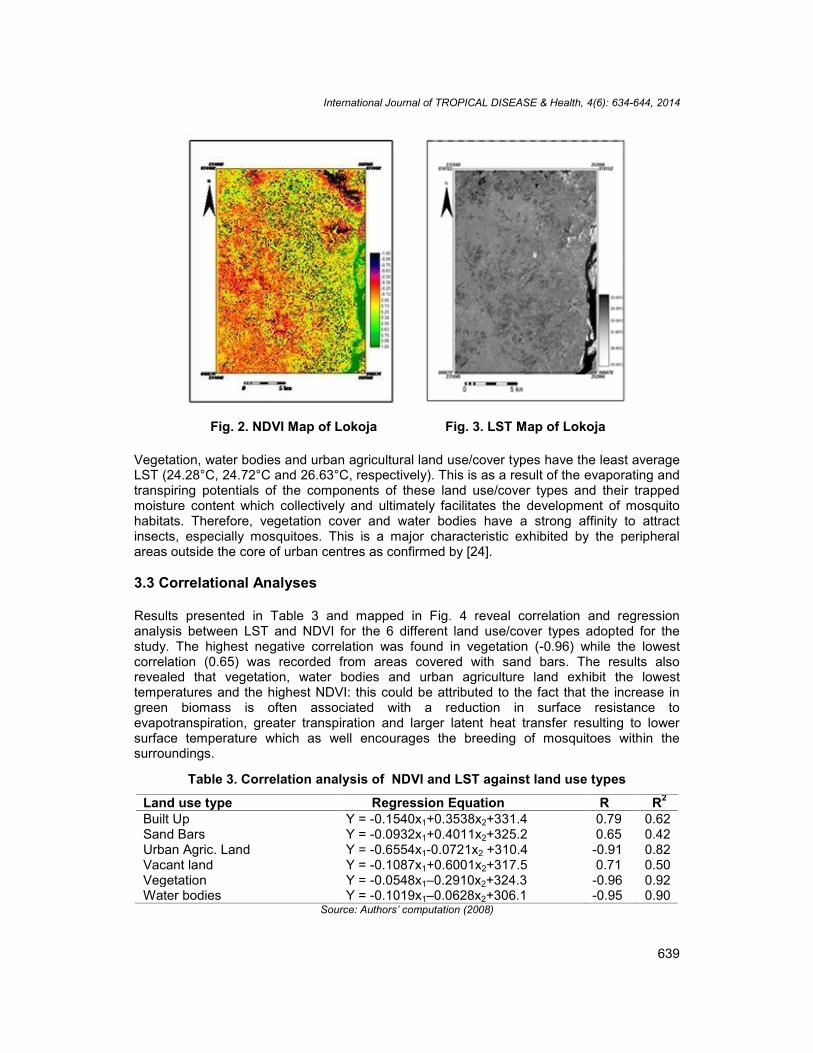
Results presented in Table 3 and mapped in Fig. 4 reveal correlation and regressionanalysis between LST and NDVI for the 6 different land use/cover types adopted for thestudy. The highest negative correlation was found in vegetation (-0.96) while the lowestcorrelation (0.65) was recorded from areas covered with sand bars. The results alsorevealed that vegetation, water bodies and urban agriculture land exhibit the lowesttemperatures and the highest NDVI: this could be attributed to the fact that the increase ingreen biomass is often associated with a reduction in surface resistance toevapotranspiration, greater transpiration and larger latent heat transfer resulting to lowersurface temperature which as well encourages the breeding of mosquitoes within thesurroundings.
Table 3. Correlation analysis of NDVI and LST against land use types
Land use type Regression Equation R R2
Built Up Y = -0.1540x1+0.3538x2+331.4 0.79 0.62Sand Bars Y = -0.0932x1+0.4011x2+325.2 0.65 0.42Urban Agric. Land Y = -0.6554x1-0.0721x2 +310.4 -0.91 0.82Vacant land Y = -0.1087x1+0.6001x2+317.5 0.71 0.50Vegetation Y = -0.0548x1–0.2910x2+324.3 -0.96 0.92Water bodies Y = -0.1019x1–0.0628x2+306.1 -0.95 0.90
Source: Authors’ computation (2008)
International Journal of TROPICAL DISEASE & Health, 4(6): 634-644, 2014
640
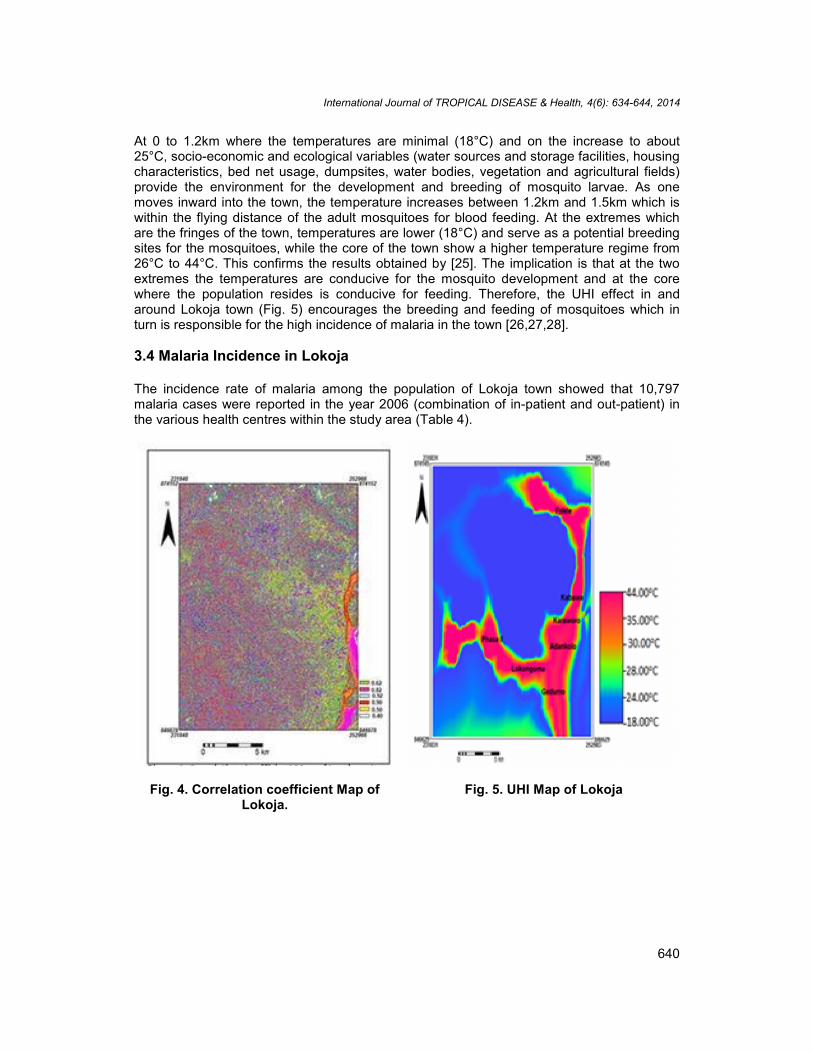
At 0 to 1.2km where the temperatures are minimal (18°C) and on the increase to about25°C, socio-economic and ecological variables (water sources and storage facilities, housingcharacteristics, bed net usage, dumpsites, water bodies, vegetation and agricultural fields)provide the environment for the development and breeding of mosquito larvae. As onemoves inward into the town, the temperature increases between 1.2km and 1.5km which iswithin the flying distance of the adult mosquitoes for blood feeding. At the extremes whichare the fringes of the town, temperatures are lower (18°C) and serve as a potential breedingsites for the mosquitoes, while the core of the town show a higher temperature regime from26°C to 44°C. This confirms the results obtained by [25]. The implication is that at the twoextremes the temperatures are conducive for the mosquito development and at the corewhere the population resides is conducive for feeding. Therefore, the UHI effect in andaround Lokoja town (Fig. 5) encourages the breeding and feeding of mosquitoes which inturn is responsible for the high incidence of malaria in the town [26,27,28].
3.4 Malaria Incidence in Lokoja
The incidence rate of malaria among the population of Lokoja town showed that 10,797malaria cases were reported in the year 2006 (combination of in-patient and out-patient) inthe various health centres within the study area (Table 4).
Fig. 4. Correlation coefficient Map ofLokoja.
Fig. 5. UHI Map of Lokoja
International Journal of TROPICAL DISEASE & Health, 4(6): 634-644, 2014
641
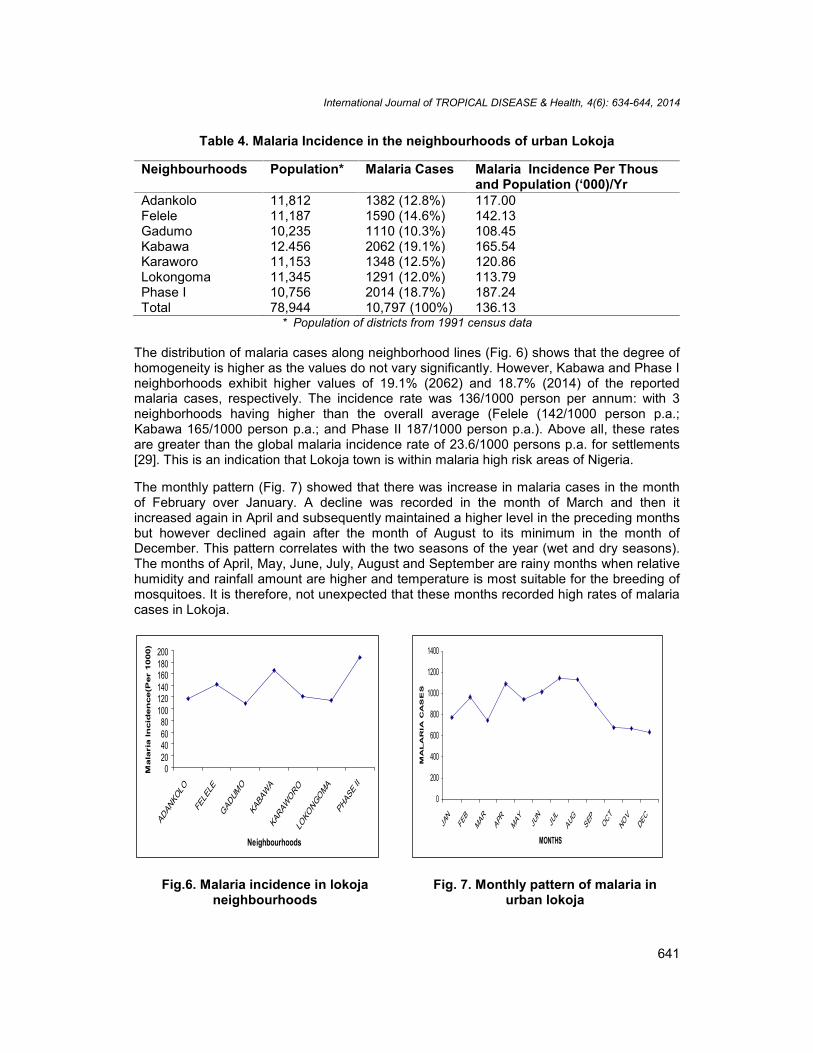
Table 4. Malaria Incidence in the neighbourhoods of urban Lokoja
Neighbourhoods Population* Malaria Cases Malaria Incidence Per Thousand Population (‘000)/Yr
Adankolo 11,812 1382 (12.8%) 117.00Felele 11,187 1590 (14.6%) 142.13Gadumo 10,235 1110 (10.3%) 108.45Kabawa 12.456 2062 (19.1%) 165.54Karaworo 11,153 1348 (12.5%) 120.86Lokongoma 11,345 1291 (12.0%) 113.79Phase I 10,756 2014 (18.7%) 187.24Total 78,944 10,797 (100%) 136.13
* Population of districts from 1991 census data
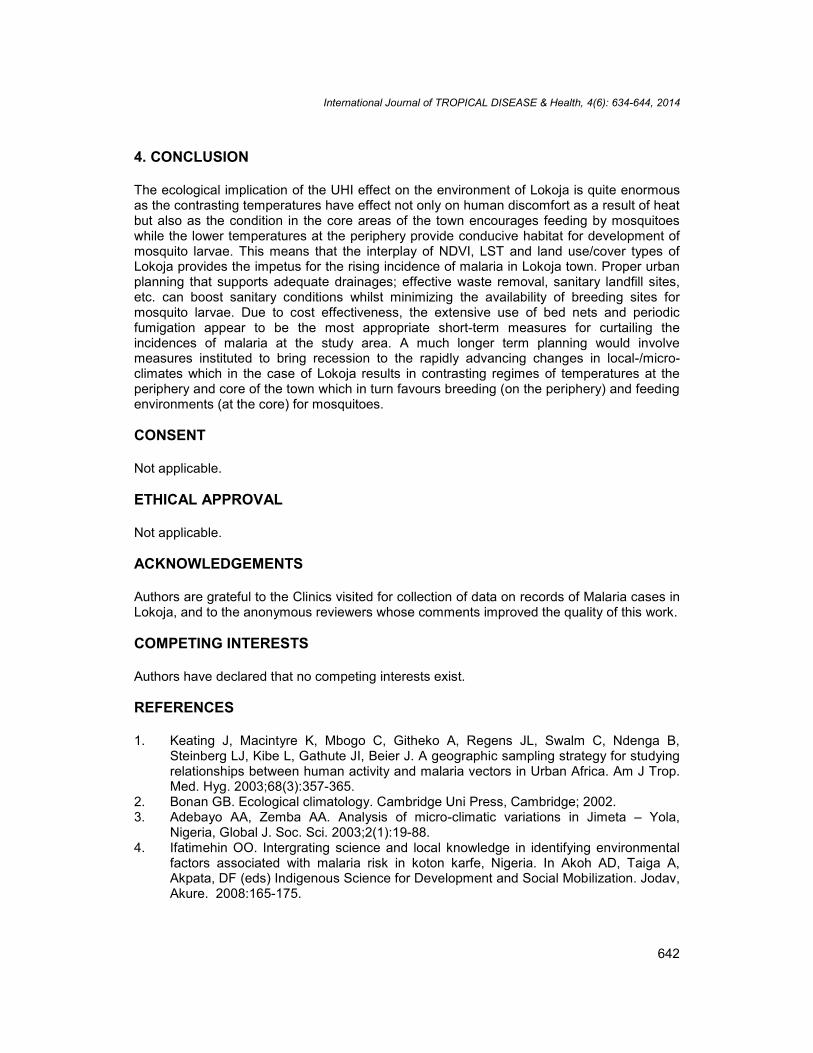
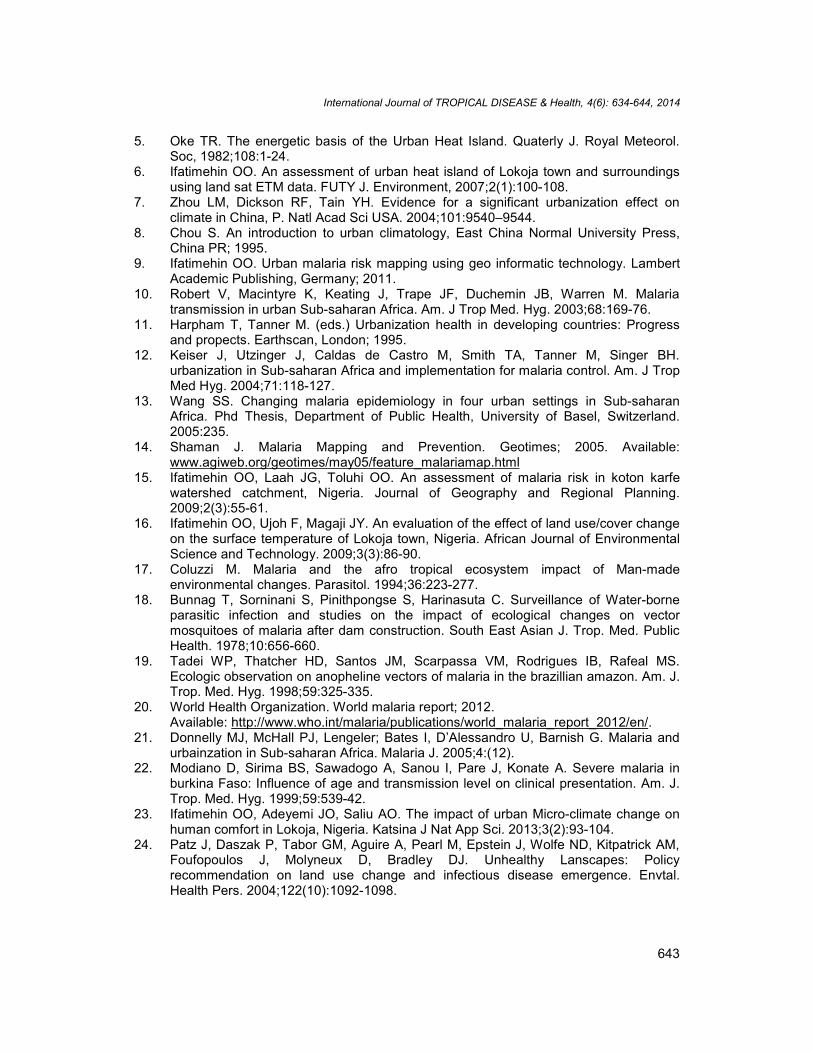
The distribution of malaria cases along neighborhood lines (Fig. 6) shows that the degree ofhomogeneity is higher as the values do not vary significantly. However, Kabawa and Phase Ineighborhoods exhibit higher values of 19.1% (2062) and 18.7% (2014) of the reportedmalaria cases, respectively. The incidence rate was 136/1000 person per annum: with 3neighborhoods having higher than the overall average (Felele (142/1000 person p.a.;Kabawa 165/1000 person p.a.; and Phase II 187/1000 person p.a.). Above all, these ratesare greater than the global malaria incidence rate of 23.6/1000 persons p.a. for settlements[29]. This is an indication that Lokoja town is within malaria high risk areas of Nigeria.
The monthly pattern (Fig. 7) showed that there was increase in malaria cases in the monthof February over January. A decline was recorded in the month of March and then itincreased again in April and subsequently maintained a higher level in the preceding monthsbut however declined again after the month of August to its minimum in the month ofDecember. This pattern correlates with the two seasons of the year (wet and dry seasons).The months of April, May, June, July, August and September are rainy months when relativehumidity and rainfall amount are higher and temperature is most suitable for the breeding ofmosquitoes. It is therefore, not unexpected that these months recorded high rates of malariacases in Lokoja.
020406080
100120140160180200
ADAN
KOLO
FELE
LE
GADUM
O
KABA
WA
KARA
WORO
LOKO
NGOMA
PHAS
E II
Neighbourhoods
Mala
ria In
cid
en
ce(P
er
1000)
0
200
400
600
800
1000
1200
1400
JAN
FEB
MAR AP
RMAY JU
NJU
LAU
GSE
POC
TNO
VDE
C
MONTHS
MA
LA
RIA
CA
SE
S
Fig.6. Malaria incidence in lokojaneighbourhoods
Fig. 7. Monthly pattern of malaria inurban lokoja
International Journal of TROPICAL DISEASE & Health, 4(6): 634-644, 2014
642
4. CONCLUSION
The ecological implication of the UHI effect on the environment of Lokoja is quite enormousas the contrasting temperatures have effect not only on human discomfort as a result of heatbut also as the condition in the core areas of the town encourages feeding by mosquitoeswhile the lower temperatures at the periphery provide conducive habitat for development ofmosquito larvae. This means that the interplay of NDVI, LST and land use/cover types ofLokoja provides the impetus for the rising incidence of malaria in Lokoja town. Proper urbanplanning that supports adequate drainages; effective waste removal, sanitary landfill sites,etc. can boost sanitary conditions whilst minimizing the availability of breeding sites formosquito larvae. Due to cost effectiveness, the extensive use of bed nets and periodicfumigation appear to be the most appropriate short-term measures for curtailing theincidences of malaria at the study area. A much longer term planning would involvemeasures instituted to bring recession to the rapidly advancing changes in local-/micro-climates which in the case of Lokoja results in contrasting regimes of temperatures at theperiphery and core of the town which in turn favours breeding (on the periphery) and feedingenvironments (at the core) for mosquitoes.
CONSENT
Not applicable.
ETHICAL APPROVAL
Not applicable.
ACKNOWLEDGEMENTS
Authors are grateful to the Clinics visited for collection of data on records of Malaria cases inLokoja, and to the anonymous reviewers whose comments improved the quality of this work.
COMPETING INTERESTS
Authors have declared that no competing interests exist.
REFERENCES
1. Keating J, Macintyre K, Mbogo C, Githeko A, Regens JL, Swalm C, Ndenga B,Steinberg LJ, Kibe L, Gathute JI, Beier J. A geographic sampling strategy for studyingrelationships between human activity and malaria vectors in Urban Africa. Am J Trop.Med. Hyg. 2003;68(3):357-365.
2. Bonan GB. Ecological climatology. Cambridge Uni Press, Cambridge; 2002.3. Adebayo AA, Zemba AA. Analysis of micro-climatic variations in Jimeta – Yola,
Nigeria, Global J. Soc. Sci. 2003;2(1):19-88.4. Ifatimehin OO. Intergrating science and local knowledge in identifying environmental
factors associated with malaria risk in koton karfe, Nigeria. In Akoh AD, Taiga A,Akpata, DF (eds) Indigenous Science for Development and Social Mobilization. Jodav,Akure. 2008:165-175.
International Journal of TROPICAL DISEASE & Health, 4(6): 634-644, 2014
643
5. Oke TR. The energetic basis of the Urban Heat Island. Quaterly J. Royal Meteorol.Soc, 1982;108:1-24.
6. Ifatimehin OO. An assessment of urban heat island of Lokoja town and surroundingsusing land sat ETM data. FUTY J. Environment, 2007;2(1):100-108.
7. Zhou LM, Dickson RF, Tain YH. Evidence for a significant urbanization effect onclimate in China, P. Natl Acad Sci USA. 2004;101:9540–9544.
8. Chou S. An introduction to urban climatology, East China Normal University Press,China PR; 1995.
9. Ifatimehin OO. Urban malaria risk mapping using geo informatic technology. LambertAcademic Publishing, Germany; 2011.
10. Robert V, Macintyre K, Keating J, Trape JF, Duchemin JB, Warren M. Malariatransmission in urban Sub-saharan Africa. Am. J Trop Med. Hyg. 2003;68:169-76.
11. Harpham T, Tanner M. (eds.) Urbanization health in developing countries: Progressand propects. Earthscan, London; 1995.
12. Keiser J, Utzinger J, Caldas de Castro M, Smith TA, Tanner M, Singer BH.urbanization in Sub-saharan Africa and implementation for malaria control. Am. J TropMed Hyg. 2004;71:118-127.
13. Wang SS. Changing malaria epidemiology in four urban settings in Sub-saharanAfrica. Phd Thesis, Department of Public Health, University of Basel, Switzerland.2005:235.
14. Shaman J. Malaria Mapping and Prevention. Geotimes; 2005. Available:www.agiweb.org/geotimes/may05/feature_malariamap.html
15. Ifatimehin OO, Laah JG, Toluhi OO. An assessment of malaria risk in koton karfewatershed catchment, Nigeria. Journal of Geography and Regional Planning.2009;2(3):55-61.
16. Ifatimehin OO, Ujoh F, Magaji JY. An evaluation of the effect of land use/cover changeon the surface temperature of Lokoja town, Nigeria. African Journal of EnvironmentalScience and Technology. 2009;3(3):86-90.
17. Coluzzi M. Malaria and the afro tropical ecosystem impact of Man-madeenvironmental changes. Parasitol. 1994;36:223-277.
18. Bunnag T, Sorninani S, Pinithpongse S, Harinasuta C. Surveillance of Water-borneparasitic infection and studies on the impact of ecological changes on vectormosquitoes of malaria after dam construction. South East Asian J. Trop. Med. PublicHealth. 1978;10:656-660.
19. Tadei WP, Thatcher HD, Santos JM, Scarpassa VM, Rodrigues IB, Rafeal MS.Ecologic observation on anopheline vectors of malaria in the brazillian amazon. Am. J.Trop. Med. Hyg. 1998;59:325-335.
20. World Health Organization. World malaria report; 2012.Available: http://www.who.int/malaria/publications/world_malaria_report_2012/en/.
21. Donnelly MJ, McHall PJ, Lengeler; Bates I, D’Alessandro U, Barnish G. Malaria andurbainzation in Sub-saharan Africa. Malaria J. 2005;4:(12).
22. Modiano D, Sirima BS, Sawadogo A, Sanou I, Pare J, Konate A. Severe malaria inburkina Faso: Influence of age and transmission level on clinical presentation. Am. J.Trop. Med. Hyg. 1999;59:539-42.
23. Ifatimehin OO, Adeyemi JO, Saliu AO. The impact of urban Micro-climate change onhuman comfort in Lokoja, Nigeria. Katsina J Nat App Sci. 2013;3(2):93-104.
24. Patz J, Daszak P, Tabor GM, Aguire A, Pearl M, Epstein J, Wolfe ND, Kitpatrick AM,Foufopoulos J, Molyneux D, Bradley DJ. Unhealthy Lanscapes: Policyrecommendation on land use change and infectious disease emergence. Envtal.Health Pers. 2004;122(10):1092-1098.
International Journal of TROPICAL DISEASE & Health, 4(6): 634-644, 2014
644
25. Sattler MA, Mtasiwa D, Kiama M, Premji Z, Tanner M, Killeen GF. Habitatcharacterization and spatial distribution of anopheles sp. Mosquito larvae in Dar esSalaam (Tanzania) during an extended dry period. Malaria J. 2005;4(4).
26. Afrane YA, Klinkenberg E, Drechsel P, Owusu-Daaku K, Garms R, Kruppa T. Doesirrigated urban agriculture influence the transmission of malaria in the city of Kumasi,Ghana? Acta Trop. 2004;89:125-34.
27. Awolola TS, Okwa O, Hunt RH, Ogunrinade AF, Coetzee M. Dynamics of the Malaria-vector populations in coastal Lagos, South-Western Nigeria. Ann, Trop. Med.Parasitol. 2002;96:75-82.
28. Ademowo OG, Falusi AG, Mewoyeka OO. Prevalence of asyptomatic parasitaemia inan urban and rural community in South Western Nigeria. Cent. Afr. J. Med.1995;41:18-21.
29. Caldas de Castro M, Yamaguta Y, Mtasiwaa D, Tanner M, Utzinger J. Integratedurban malaria control: A case study in Dar es Salaam, Tanzania. Am. J. Trop MedHyg. 2004;71:103-117.
© 2014 Ifatimehin & Ujoh; This is an Open Access article distributed under the terms of the Creative CommonsAttribution License (http://creativecommons.org/licenses/by/3.0), which permits unrestricted use, distribution, andreproduction in any medium, provided the original work is properly cited.
Peer-review history:The peer review history for this paper can be accessed here:
http://www.sciencedomain.org/review-history.php?iid=465&id=19&aid=4019
Copyright © 2022 FDOKUMEN