
Modelling of storm wash-off of suspended solids from impervious surfaces
22
This article was downloaded by: [Narodna Biblioteka Srbije] On: 01 June 2015, At: 05:40 Publisher: Taylor & Francis Informa Ltd Registered in England and Wales Registered Number: 1072954 Registered office: Mortimer House, 37-41 Mortimer Street, London W1T 3JH, UK Journal of Hydraulic Research Publication details, including instructions for authors and subscription information: http://www.tandfonline.com/loi/tjhr20 Modelling of storm wash-off of suspended solids from impervious surfaces Ana Deletic a , [Cbreve]edo Maksimovic b & Marko Ivetic b a Department of Engineering , University of Aberdeen , Fraser Noble Building, Aberdeen, AB9 2UE, Scotland, UK b Faculty of Civil Engineering , University of Belgrade , P.O.Box 895, 1100, Belgrade, Yugoslavia Published online: 13 Jan 2010. To cite this article: Ana Deletic , [Cbreve]edo Maksimovic & Marko Ivetic (1997) Modelling of storm wash-off of suspended solids from impervious surfaces, Journal of Hydraulic Research, 35:1, 99-118, DOI: 10.1080/00221689709498646 To link to this article: http://dx.doi.org/10.1080/00221689709498646 PLEASE SCROLL DOWN FOR ARTICLE Taylor & Francis makes every effort to ensure the accuracy of all the information (the “Content”) contained in the publications on our platform. However, Taylor & Francis, our agents, and our licensors make no representations or warranties whatsoever as to the accuracy, completeness, or suitability for any purpose of the Content. Any opinions and views expressed in this publication are the opinions and views of the authors, and are not the views of or endorsed by Taylor & Francis. The accuracy of the Content should not be relied upon and should be independently verified with primary sources of information. Taylor and Francis shall not be liable for any losses, actions, claims, proceedings, demands, costs, expenses, damages, and other liabilities whatsoever or howsoever caused arising directly or indirectly in connection with, in relation to or arising out of the use of the Content. This article may be used for research, teaching, and private study purposes. Any substantial or systematic reproduction, redistribution, reselling, loan, sub-licensing, systematic supply, or distribution in any form to anyone is expressly forbidden. Terms
Transcript of Modelling of storm wash-off of suspended solids from impervious surfaces

This article was downloaded by: [Narodna Biblioteka Srbije]On: 01 June 2015, At: 05:40Publisher: Taylor & FrancisInforma Ltd Registered in England and Wales Registered Number: 1072954Registered office: Mortimer House, 37-41 Mortimer Street, London W1T 3JH, UK
Journal of Hydraulic ResearchPublication details, including instructions for authors andsubscription information:http://www.tandfonline.com/loi/tjhr20
Modelling of storm wash-off ofsuspended solids from impervioussurfacesAna Deletic a , [Cbreve]edo Maksimovic b & Marko Ivetic ba Department of Engineering , University of Aberdeen , FraserNoble Building, Aberdeen, AB9 2UE, Scotland, UKb Faculty of Civil Engineering , University of Belgrade , P.O.Box895, 1100, Belgrade, YugoslaviaPublished online: 13 Jan 2010.
To cite this article: Ana Deletic , [Cbreve]edo Maksimovic & Marko Ivetic (1997) Modelling ofstorm wash-off of suspended solids from impervious surfaces, Journal of Hydraulic Research,35:1, 99-118, DOI: 10.1080/00221689709498646
To link to this article: http://dx.doi.org/10.1080/00221689709498646
PLEASE SCROLL DOWN FOR ARTICLE
Taylor & Francis makes every effort to ensure the accuracy of all the information (the“Content”) contained in the publications on our platform. However, Taylor & Francis,our agents, and our licensors make no representations or warranties whatsoeveras to the accuracy, completeness, or suitability for any purpose of the Content. Anyopinions and views expressed in this publication are the opinions and views of theauthors, and are not the views of or endorsed by Taylor & Francis. The accuracyof the Content should not be relied upon and should be independently verifiedwith primary sources of information. Taylor and Francis shall not be liable for anylosses, actions, claims, proceedings, demands, costs, expenses, damages, and otherliabilities whatsoever or howsoever caused arising directly or indirectly in connectionwith, in relation to or arising out of the use of the Content.
This article may be used for research, teaching, and private study purposes. Anysubstantial or systematic reproduction, redistribution, reselling, loan, sub-licensing,systematic supply, or distribution in any form to anyone is expressly forbidden. Terms

& Conditions of access and use can be found at http://www.tandfonline.com/page/terms-and-conditions
Dow
nloa
ded
by [
Nar
odna
Bib
liote
ka S
rbije
] at
05:
40 0
1 Ju
ne 2
015
Modelling of storm wash-off of suspended solids from impervious surfaces Modélisation du ruissellement et du transport solide en suspension sur des surfaces imperméables
ANA DELETIC, Lecturer in Environmental Engineering, Department of Engineering, University of Aberdeen, Frase r Noble Building, Aberdeen, AB9 2UE, Scotland, UK
CEDO MAKSIMOVIC, Professor and Director of IRTCUW, Faculty of Civil Engineering, University of Belgrade .P.O.Box 895, 1100 Belgrade, Yugoslavia
MARKO IVETIC, Associated Professor, Faculty of Civil Engineering, University of Belgrade, P.O.Box 895, 1100 Belgrade, Yugoslavia
ABSTRACT A mathematical model of suspended solids discharge from impervious surfaces during storm events has been developed. The model continuously simulates two major processes of different time scales; solids build-up at impervious surfaces between two storm events, and solids wash-off from the surfaces during storm events. Buildup is modelled using the Sartor and Boyd equation (21) in which the amount of' solids available on the surface is an exponential function of antecedent dry weather period duration. The spatial distribution of solid particles over the street surface is also modelled, which is an innovation. The wash-off process is divided into three sub-processes that are modelled consecutively. A kinematic wave model is used for overland flow modelling. The particle entrainment into suspension is estimated by two methods. In one, the rainfall and overland flow effects are not separated and the total shear stress is used to predict entrainment. In the other, the rainfall and overland flow effects are treated separately and then summed. An original equation was developed for this method. The model is applied on two small experimental catchments, one at Miljakovac-Belgrade, Yugoslavia and the other in Lund, Sweden. The description and verification of the model are presented and discussed in the paper.
RÉSUMÉ Un modèle mathématique a été développé pour determiner le debit solide en suspension sur des surfaces imperméables suite a de violentes precipitations. On peut simuler par ce modèle deux processus principaux a différentes echelles de temps: ('accumulation de particules solides sur des surfaces imperméables entre deux épisodes pluvieux, et l'entrainement de la phase solide ensuite. L'accumulation est décrite par l'équation de Sartor et Boyd, supposant que la quantité de particules solides dépend de la période sèche antécédente, selon une fonction exponentielle. La distribution en espace des particules solides sur la surface de la rue est également modélisée, ce qui est une innovation. Le processus de ruissellement est divisé en trois étapes qui sont modélisées successivement. Un modèle d'onde cinématique est utilise pour modéliser le ruissellement. L'entraïnement des particules en suspension est estimé par deux methodes: (i) les effets de la pluie et du ruissellement ne sont pas séparés; ils sont décrits par une tension de cisaillement globale, (ii) les effets de la pluie et du ruissellement sont séparés et additionnés ultérieurement. Une equation originale a été développée pour cette seconde methode. Le modèle est appliqué sur des résultats des mesures, réalisées sur deux bassins expéri-mentaux, l'un a Belgrade (Yougoslavie), et l'autre a Lund (Suède). L'application du modèle sur les deux bassins expérimentaux et les résultats obtenus, sont présentés et discutés.
Introduction
One of the major problems of urban areas is the pollution of atmosphere, soil and water. Non-point runoff washes and cleanses air and the land surface and then transports a variety of materials, such as sediments and heavy metals, to the nearest receiving water body. The pollution load associated
Revision received September 30, 1996. Open for discussion till August 31, 1997.
JOURNAL OF HYDRAULIC RFSEARCH, VOL. 35, 1997. NO. 1 99
Dow
nloa
ded
by [
Nar
odna
Bib
liote
ka S
rbije
] at
05:
40 0
1 Ju
ne 2
015
with storm runoff can be significantly higher than that from secondary domestic sewage effluent (2, 5). It can therefore cause degradation of surface and ground water bodies, and can also cause serious problems in drainage systems and traditional treatment facilities. It is becoming increasingly evident that the established water-quality goals cannot be attained without controlling urban storm runoff pollution (1). The pollution generation in storm runoff is a very complex process which includes a large number of relevant factors. The key factors that affect pollution build-up at a surface are: dust fallout, human activities, traffic, wind, and erosion from unpaved areas. Pollution wash-off' from a surface is caused by rainfall and runoff. These phases take place above the ground. Subsequently, the polluted water goes into a drainage system where the following transformations of pollutants occur: deposition and flushing in catch-basins (gullypots), deposition and resuspension in drainage pipes, and processes in drainage structures. These processes take place in storm drainage systems. Ultimately, the storm runoff runs into streams, rivers or lakes producing various acute or accumulative pollution effects. The process described above has not been well understood which explains why existing water quality models have in general failed to predict storm runoff pollution reliably (2, 15, 24). The models used in engineering practice address the problem from three different standpoints: deterministic, conceptual or probabilistic (24). It is an accepted view that there is no true deterministic model (2). However, there are a few models which use physically based equations to model some of the phases identified above (MOSQITO, 15). Conceptual storm water quality models, such as SWMM (7), FLUPOL (15), NPS (11), and STORM (27) are used generally in everyday practice. They take into account the phases listed above (sometimes lumping some of them), but they use relatively simple equations which contain a large number of calibration parameters. Their accuracy is low, they need a lot of field data for calibration and verification, and for certain catchments they are not applicable at all. However, they are the best models that are available today. There are also the models which consider the whole process of pollution generation as a black box. They use simple regressions based on statistical analysis of collected data, ranging from local sites to nation-wide analysis (6). Statistical models are not able to generate pollutographs during storm events, but do assess event mean and sometimes event maximum concentrations. They cannot readily be adjusted for proposed changes in the basin for which they were established, and therefore are of limited value in development planning The lack of reliable field water quality data is the main reason for the general unreliability of storm water quality models. The data related specifically to each of the phases of the pollution generation process are limited, because measurements are usually carried out at the out-fall end of drainage systems. As a result, it is difficult to single out the contribution of each successive phase of the process which, would be the best way to understand the complex mechanism of pollution generation. An investigation program of the first two phases of the process (pollution build-up, and surface wash-off) was set up by the Technical University in Lund, Sweden and the Civil Engineering Faculty of the University of Belgrade, Yugoslavia. Two small experimental urban catchments were formed, one in Lund (270m2 asphalt surface of a parking lot) and the other at Miljakovac, Belgrade (211m2 of an asphalt street). At the Miljakovac catchment, it was assured that there was no inflow from the surrounding catchments. This made possible the study of the processes that occur only at the asphalt surface. However, it was subsequently found that the catchment in Lund was not always entirely protected from the inflow from a nearby grassed area. Although, the original intention was to investigate build-up and wash-off separately, various problems frustrated this intention. Measurements of solids accumulation on the surface were attempted
100 JOURNAL DE RECHERCHES HYDRAULIQUES. VOL. 35. 1997. NO. I
Dow
nloa
ded
by [
Nar
odna
Bib
liote
ka S
rbije
] at
05:
40 0
1 Ju
ne 2
015
in Lund by regular vacuum-cleaning of marked areas (22). Dust fall-out was also measured in several buckets placed at 2 m above the surface. No correlation was found between measured masses of accumulated solids and dust fall-out, nor between measured masses of accumulated and wash-off solids. It also became apparent that the vacuum-cleaner is not able to collect fine solid particles, which are predominant in the storm runoff from paved surface. Therefore, the combined effect of both processes was studied using data on overland flow collected in urban drainage inlets (still, the processes above the surface were studied separately from the processes which occur in drainage systems). Besides rainfall intensity, the following characteristics of surface runoff were measured continuously: overland flow rate, suspended solids concentration (by an opto-electronic method), conductivity, pH and temperature. The water was collected at the storm water inlets before the reached the catch-basin (gullypot). The same type of equipment was used at both sites. The data were recorded during each observed event at 10 second intervals. Only data considered to have been reliably recorded were used for statistical analysis (25, 26) which was undertaken to reveal the most relevant factors in the process of solids build-up and wash-off. It was found that the rainfall intensity and overland flow rate are particularly important in the wash-off process. However, the amount of solids available on the surface has its own role in suspended solids generation, especially during large and intense events. A detailed description of the measurements and the results of statistical analysis is presented elsewhere (25, 26). The description of the model which was developed on the basis of these findings and its verification is presented in this paper.
Basic Equations
The model contains two major blocks: (1) the model of solids build-up at an impervious surface, and (2) the model of suspended solids wash-off from an impervious surface. The amount of solids on the surface and the suspended solids loading rate are simulated continuously for a series of rainfall events.
Solids Build-up at Impervious Surfaces
Sartor and Boyd (20, 21) suggested an exponential relationship between the amount of solids available on the surface, M, and the duration of antecedent dry weather period, /,,,.,.. This approach has been accepted by other authors (2, 8) and is generally used in everyday practice (SWMM and FLUPOL). The measurements in Lund and Miljakovac indicated that the amount of sediment available on the surface slightly affects suspended solids loading of storm runoff (25, 26), but a new build-up equation was not established. Hence, the Sartor and Boyd equation was adopted in the model. It was written for a series of rainfall events, as (Fig. 1):
M{T) = M0{\-ikUd"+,)) (1)
where M [g/m2] is the amount of solids available on the surface, T [day] is the time elapsed from the start of the first rainfall in the series, tdry [day] is the duration of antecedent dry weather period, and f [day] is the virtual time. The virtual time is calculated by assuming that deposition is zero at t' days before the start of the antecedent rainfall, as indicated in Fig. 1 (f' is used only to assist in the application of the exponential relationship for a rainfall series). There are two calibration parameters in Eq. I to be determined for each particular catchment; M0 [g/m2] which is the maximum amount of solids expected at the surface, and k [day1] which is the accumulation constant.
JOURNAL OF HYDRAULIC RESEARCH. VOL. 35. 1997. NO. I 101
Dow
nloa
ded
by [
Nar
odna
Bib
liote
ka S
rbije
] at
05:
40 0
1 Ju
ne 2
015

Fig. 1. Solids build-up at the surface.
The particle size of solids found at an impervious surface has ranged from very fine to coarse and the median particle size varied from 200 to 500 pirn (8, 16, 21). This determination of size depends on type and condition of the surface, but also on the method of sample collection (vacuum-cleaning or wet method). However, rainfall and overland flow are able to lift into suspension only fine particles. It was observed by Chebbo (3) that the median diameter of suspended solids in overland flow, d50, (before it enters a drainage system) is about 80-100 |jm. Therefore, it was concluded that the build-up equation (Eq. 1) is to asses the amount of solids on surface with the median diameter equal to d50 found in overland flow. For the estimation of d50, it is the best to obtain samples by means of an automatic sampler placed inside a street inlet (runoff should be collected before deposition in catch-basins). If it is not feasible, the value from the literature could be adopted (d50 = 80-100 mm), since it was shown that d50 takes very similar values for different urban catchments (3, 29). Solids are not uniformly distributed over the street surface. On the contrary, almost all sediment is situated within 50 cm from street curbs. A spatial distribution of solids is modelled, based on records from the literature (8, 16, 19, 20, 21), a difference from prior models, which all assume that sediment is distributed evenly over the street surface. It was assumed that a road surface contains only 10 % of the total road deposition, a gutter (which is defined as a 50 cm wide strip of a road surface located near a curb) contains 90 % of the total road deposition, and that a sidewalk has twice the deposition rate of the road. The deposition calculated by Eq 1 is distributed across the street surface according to this pattern.
Suspended Solids Wash-off from Impervious Surfaces
Solids wash-off is caused by rainfall and overland flow. Therefore, the model contains the following sub-blocks: 1. overland flow; 2. solids entrainment; 3. suspended solids transport by overland flow. The street surface was divided into two areas, and one dimensional equations were written for each; (i) a road surface where water flows in the direction of its natural slope (it is a combination of the transversal and longitudinal slope); (ii) a gutter where water flows along the sidewalk curb (the longitudinal street slope).
Overland Flow
For a unit width of the road surface (Fig. 2.a) the continuity equation, Eq. 2, and the full momentum equation, Eq. 3, were written as:
102 JOURNAL DE RECHERCHES HYDRAULIQUES. VOL. 35, 1997, NO. 1
Dow
nloa
ded
by [
Nar
odna
Bib
liote
ka S
rbije
] at
05:
40 0
1 Ju
ne 2
015
dq + d(q-/h) dl dx
+ gh— - shS. + - U 6 dx p
(3)
I
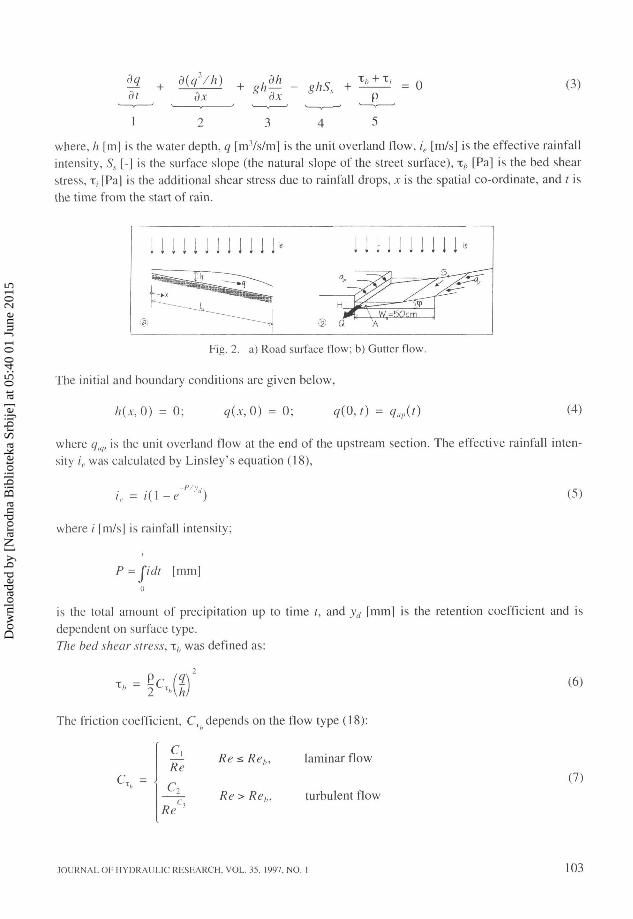
where, h [m] is the water depth, q [m-Vs/m] is the unit overland flow, ie [m/s] is the effective rainfall intensity, Ss [-] is the surface slope (the natural slope of the street surface), xb [Pa] is the bed shear stress, x, [Pa] is the additional shear stress due to rainfall drops, x is the spatial co-ordinate, and t is the time from the start of rain.
i l l J I I I I I I
® a ^ \
Fig. 2. a) Road surface flow; b) Gutter flow.
The initial and boundary conditions are given below,
ft(x,0) = 0; q(x,0) = 0; q(0, t) = qup(t) (4)
where qup is the unit overland flow at the end of the upstream section. The effective rainfall intensity ie was calculated by Linsley's equation (18),
, = ' ( 1 ^ " / V " )
where /' [m/s| is rainfall intensity;
(5)
P - fidt [mm] (i
is the total amount of precipitation up to time t, and yd [mm] is the retention coefficient and is dependent on surface type. The bed shear stress, xh was defined as:
* - lc-(! (6)
The friction coefficient, CT depends on the flow type (18):
CT =
- i Res, Re„ Re
laminar flow
C,
ReCl
(!) Re > Reh, turbulent flow
JOURNAL OF HYDRAULIC RESEARCH. VOL. 35, 1997, NO. 1 103
Dow
nloa
ded
by [
Nar
odna
Bib
liote
ka S
rbije
] at
05:
40 0
1 Ju
ne 2
015
where Re = q/v is the Reynolds number and n is the water kinematic viscosity. Ch C2, and C3 are constants that depend on surface type, and Reh is the critical Reynolds number between laminar and turbulent flow. The effect of rain drops was modelled by an additional shear stress, x, which is difficult to define separately. Therefore, the total shear stress, written as,
x, = x,, + x, (8)
was used. The coefficient of the total shear stress is given as (13),
Re s Reh, laminar flow (9)
Re > Reh, turbulent flow
where Du D2, and D3 are the constants associated with rain drop effect. The constants used in Eq. 7 and Eq. 9 depend on the surface type, and for asphalt surfaces they take values shown in Table 1 (13).
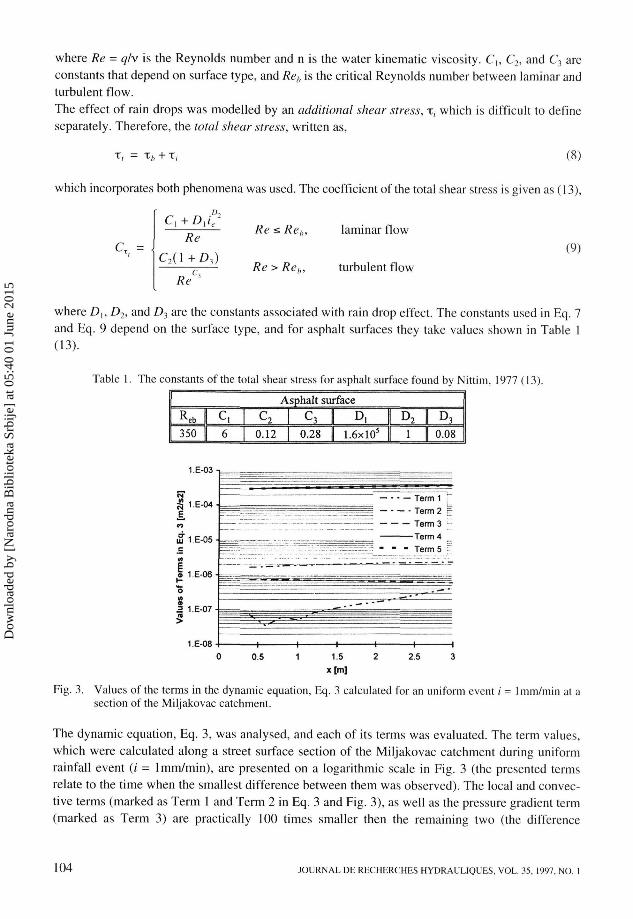
Table 1. The constants of the total shear stress for asphalt surface found by Nittim, 1977 (13). Asphalt surface
Reb 1 C, 350 f 6
C2
0.12 c3
0.28 | D,
1.6xl05 D2
1 D3
0.08
1.E-03
fi "504
n
[Ï1.E-05 c
I 1.E-06 I -"o H 9 = 1.E-07 n
1.E-08 0 0.5 1 15 2 2.5 3
x[m]
Fig. 3. Values of the terms in the dynamic equation, Eq. 3 calculated for an uniform event i = l mm/min at a section of the Miljakovac catchment.
The dynamic equation, Eq. 3, was analysed, and each of its terms was evaluated. The term values, which were calculated along a street surface section of the Miljakovac catchment during uniform rainfall event (/ = 1 mm/min), are presented on a logarithmic scale in Fig. 3 (the presented terms relate to the time when the smallest difference between them was observed). The local and convec-tive terms (marked as Term 1 and Term 2 in Eq. 3 and Fig. 3), as well as the pressure gradient term (marked as Term 3) are practically 100 times smaller then the remaining two (the difference
which incorporates both phenomena
Ct.
■ D2 C, +Dtie
Re C2(l+D3)
c, Re
Term 4
104 JOURNAL DE RECHERCHES HYDRAULIQUES, VOL. 35. 1997, NO. 1
Dow
nloa
ded
by [
Nar
odna
Bib
liote
ka S
rbije
] at
05:
40 0
1 Ju
ne 2
015
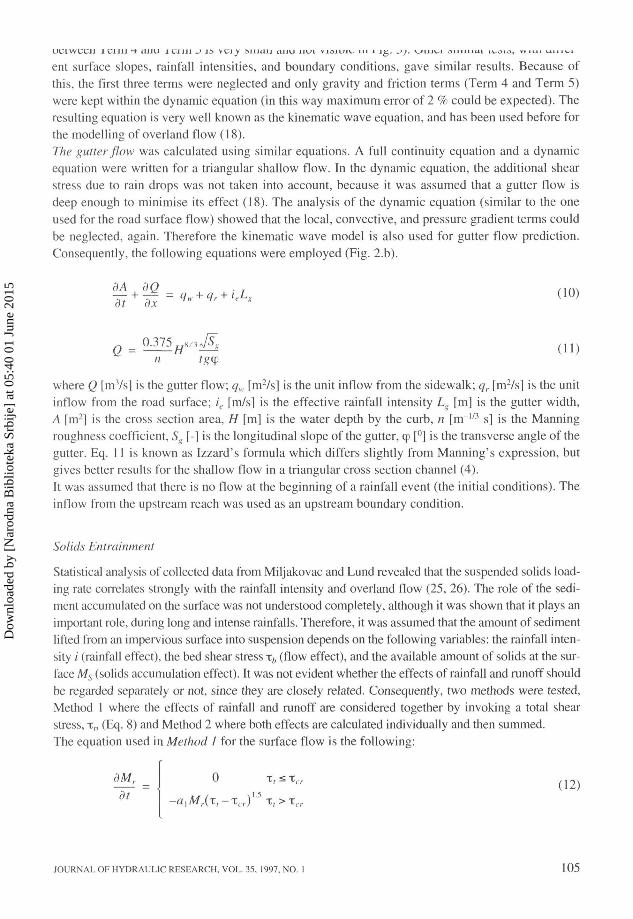
uciwccii i ci in t anu i ei in j ia vci y .Miian anu nwi visiuit m i 15. _»/. ^ u i n aiuiutu i^^u, m u i «xnwi ent surface slopes, rainfall intensities, and boundary conditions, gave similar results. Because of this, the first three terms were neglected and only gravity and friction terms (Term 4 and Term 5) were kept within the dynamic equation (in this way maximum error of 2 % could be expected). The resulting equation is very well known as the kinematic wave equation, and has been used before for the modelling of overland flow (18). The gutter flow was calculated using similar equations. A full continuity equation and a dynamic equation were written for a triangular shallow flow. In the dynamic equation, the additional shear stress due to rain drops was not taken into account, because it was assumed that a gutter flow is deep enough to minimise its effect (18). The analysis of the dynamic equation (similar to the one used for the road surface flow) showed that the local, convective, and pressure gradient terms could be neglected, again. Therefore the kinematic wave model is also used for gutter flow prediction. Consequently, the following equations were employed (Fig. 2.b).
<)A dQ ■ , /m\ — + — = q* + q, ■ + itL. (10) dt dx H" H' g
0 3 7 5 ^ 8 / 3 ^ ( U ) n rgcp
where Q [mVsj is the gutter flow; q„ [m2/s] is the unit inflow from the sidewalk; qr [m2/s] is the unit inflow from the road surface; ie [m/s] is the effective rainfall intensity Lg [m] is the gutter width, A [m2] is the cross section area, H [m] is the water depth by the curb, n [m~l/3 s] is the Manning roughness coefficient, Sg [-] is the longitudinal slope of the gutter, qp [°] is the transverse angle of the gutter. Eq. 11 is known as Izzard's formula which differs slightly from Manning's expression, but gives better results for the shallow flow in a triangular cross section channel (4). It was assumed that there is no flow at the beginning of a rainfall event (the initial conditions). The inflow from the upstream reach was used as an upstream boundary condition.
Solids Entrainment
Statistical analysis of collected data from Miljakovac and Lund revealed that the suspended solids loading rate correlates strongly with the rainfall intensity and overland flow (25, 26). The role of the sediment accumulated on the surface was not understood completely, although it was shown that it plays an important role, during long and intense rainfalls. Therefore, it was assumed that the amount of sediment lifted from an impervious surface into suspension depends on the following variables: the rainfall intensity i (rainfall effect), the bed shear stress xb (flow effect), and the available amount of solids at the surface Ms (solids accumulation effect). It was not evident whether the effects of rainfall and runoff should be regarded separately or not, since they are closely related. Consequently, two methods were tested, Method 1 where the effects of rainfall and runoff are considered together by invoking a total shear stress, Tp (Eq. 8) and Method 2 where both effects are calculated individually and then summed. The equation used in Method 1 for the surface flow is the following:
BMr 0 T,*T„ ( 1 2 )
-a,Afr(x( — xcr)' x,>xcr
JOURNAL OF HYDRAULIC RESEARCH, VOL. 35, 1997, NO. I 105
Dow
nloa
ded
by [
Nar
odna
Bib
liote
ka S
rbije
] at
05:
40 0
1 Ju
ne 2
015
where Mr [g/m2] is the available amount of material on the road surface, t, [Pa] is the total shear stress (Eq. 8 and Eq. 9), xcr [Pa] is the critical shear stress; a, [ms/kg] is calibration parameter. The critical shear stress, xcn is calculated from the Shields diagram (using t, and d50). For suspension initiation in the gutter, an equation very similar to Eq. 12 was applied, but the bed shear xh stress was used, instead of x,. A similar approach has been used for sediment entrainment from bare soil (10).
Method 2 considers rainfall effect by means of the kinetic energy of rain drops, Ek, which is a function of rainfall intensity (23),
Ek = 5 . 8 6 J T Y 1 5 6 (13)
where, Ek in [J/(m2s)], and i in [mm/h]. The effect of rain drops is damped by the depth of the overland flow, but it is also determined by the penetration depth of rain drops, hp, which could be calculated as (23), hp = 0.69JC('° I S 2 (/ in [mm/h], and hp in [m]). The effect of surface flow is expressed through the bed shear stress xh as in Method 1. Both effects were summed as,
-Mrb2{xb-Tc,y\ xb>xcr
The critical shear stress, x„, was calculated from the Shields diagram. This, the simplest approach, was regarded as appropriate until the real mechanism of particle entrainment from asphalt depressions is better known. There are two calibration coefficients in this method: £>, [m2/J] and b2 [ms/kg]. A similar expression to Eq. 14 was used for solids entrainment in the gutter (the water depth h is replaced by average cross section depth Ti). Equation 14 is an original equation developed for this model. Initial conditions for both methods were written assuming that the available amount of sediments is known at the beginning of each rainfall event (it is calculated by the build-up model).
Suspended Solids Transport by Overland Flow
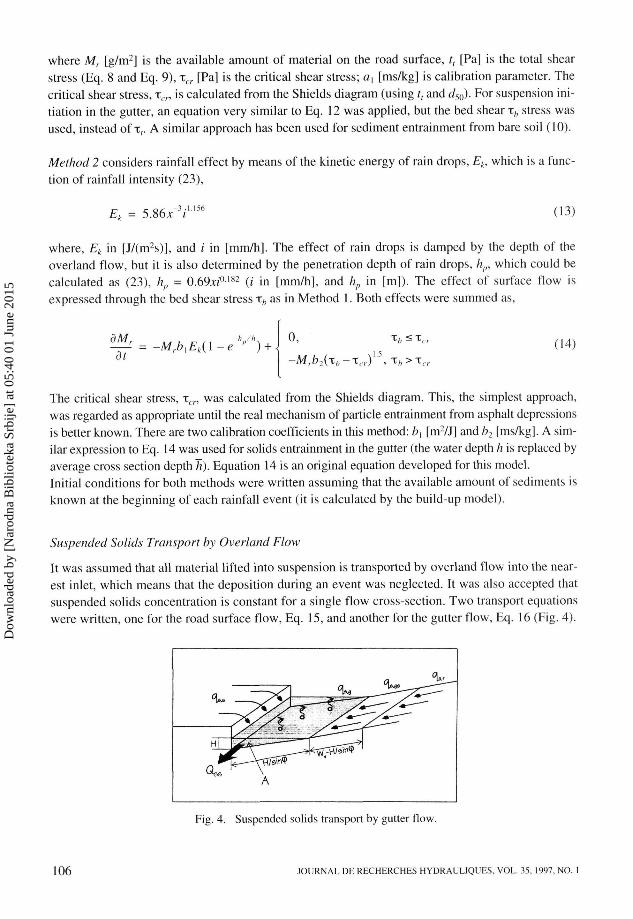
It was assumed that all material lifted into suspension is transported by overland flow into the nearest inlet, which means that the deposition during an event was neglected. It was also accepted that suspended solids concentration is constant for a single flow cross-section. Two transport equations were written, one for the road surface flow, Eq. 15, and another for the gutter flow, Eq. 16 (Fig. 4).
Fig. 4. Suspended solids transport by gutter flow.
1 0 6 JOURNAL DE RECHERCHES HYDRAULIQUES. VOL. 35, 1997, NO. 1
d Mr
~dt~ -Mrb]Et(\ e ' ) + i
Dow
nloa
ded
by [
Nar
odna
Bib
liote
ka S
rbije
] at
05:
40 0
1 Ju
ne 2
015
&{hqs/q) dqs b\hqs/q) h —— = Dis. h q
ót dx dx2
(15)
HAQSS/Q)+ iïQss m dx
Dis, d'(AQss/Q)
dx2 + qs.g + eis.g* + <is.p + <i'. (16)
I
where qi [g/s/m] is the unit suspended solids loading rate of the road surface flow; Dis, [m2/s] is the dispersion coefficient of the road surface flow; qsrs - -dM/dt [g/m2/s] is the rate of solids entrainment from the road surface; Qss [g/s] is the suspended solids loading rate of the gutter flow; Disg [m2/s| is the dispersion coefficient of the gutter flow; q [g/m/s] is the rate of solids entrainment in the gutter by the gutter flow; qsf,s [g/m/s] is the rate of solids entrainment in the gutter by the surface flow; qss [g/s/m] is the unit suspended solids inflow from the sidewalk; qsr [g/s/m] is the unit suspended solids inflow from the road surface. At the beginning of an event, the suspended solids loading rate is zero (the initial conditions). Boundary conditions were written for both the upstream and the downstream end of the reach. For suspended solids transport by road surface flow they were written as:
0.(0, f) = qs,„„(t). dx
= 0 (17)
where qsuj, is the suspended solids loading rate at the end of the upstream reach, and Ls is the length of the observed section. The downstream boundary condition is artificial, but frequently used since it permits a solution of the partial equation, Eq. 15. The boundary conditions were written for the transport by gutter flow using the same approach.
1.E-01 t
1.E-06 10
Time [mln]
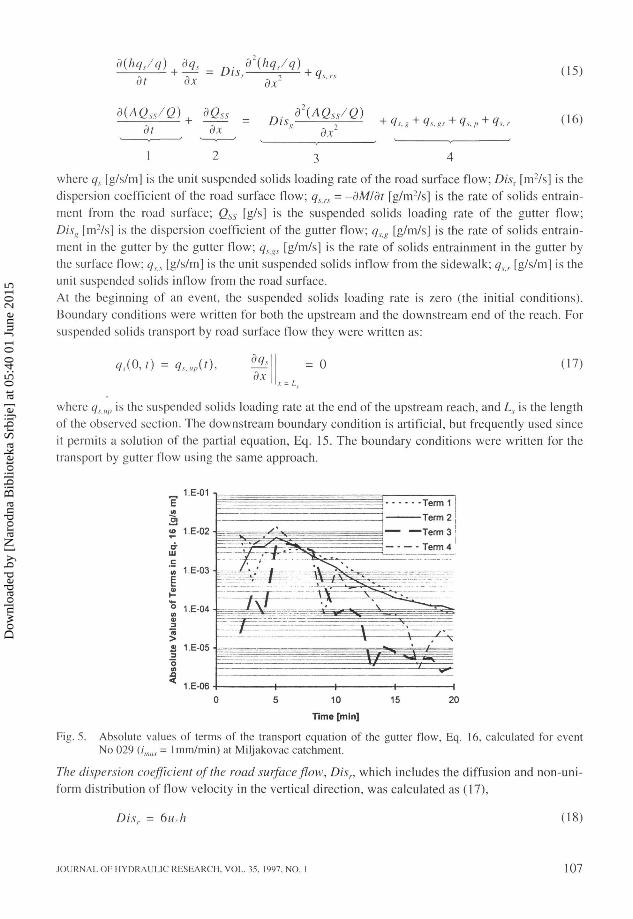
Fig. 5. Absolute values of terms of the transport equation of the gutter flow, Eq. 16, calculated for event No 029 (/,„„, = lmm/min) at Miljakovac catchment.
The dispersion coefficient of the road surface flow, Disn which includes the diffusion and non-uniform distribution of flow velocity in the vertical direction, was calculated as (17),
Dis, = bu,h (18)
JOURNAL OF HYDRAULIC RESEARCH. VOL. 35, 1997. NO. I 107
Dow
nloa
ded
by [
Nar
odna
Bib
liote
ka S
rbije
] at
05:
40 0
1 Ju
ne 2
015

{u, is the frictional velocity; u, = Jx,/p). The dispersion coefficient of gutter flow, Disv comprises the non-uniform distribution of velocity in the gutter cross section and diffusion. It was calculated using the assumptions presented in the paper by Radojkovic, 1989, (17) as:
Disg = 8.238x1 0"2 - ^ s 3H23/h (19)
It was shown that, for the same flow conditions (equal slopes, average flow depth, and roughness) the dispersion coefficient of the gutter flow is at least 1000 times larger than the dispersion coefficient of the surface flow, when calculated by Eq. 18 and Eq. 19. A sensitivity analysis was performed of the transport equations, Eq. 15 and Eq. 16. The terms of both equations were calculated for one of the most intense rainfalls recorded at Miljakovac (event No 029 with maximum rainfall intensity, imax = lmm/min). During maximum overland flow rates, which were recorded between 5 and 10 minutes after the rain start (Fig 5), the dispersion term (Term 3 in Eq. 16) was of the same order as the other terms (Term 1 is the local term, Term 2 is the convection, and Term 4 is the source term). For less intense rainfalls (event No 004 with imux = 0.5mm/min was also used in the analysis) this term was around 100 times less than others. Accordingly, it was concluded that the dispersion term could not be neglected in the transport equation of the gutter flow. This is attributable to non-uniformly distributed velocity across the triangular cross-section of the gutter which causes large dispersion coefficients during large flow rates. However, the dispersion term in the transport equation of the surface flow, Eq. 15, was at least 100 times smaller than other terms in the same equation, for all tested rainfalls. Therefore, it was concluded that the dispersion of road surface flow, which is caused only by diffusion and vertical non-uniform distribution of velocity, can be neglected.
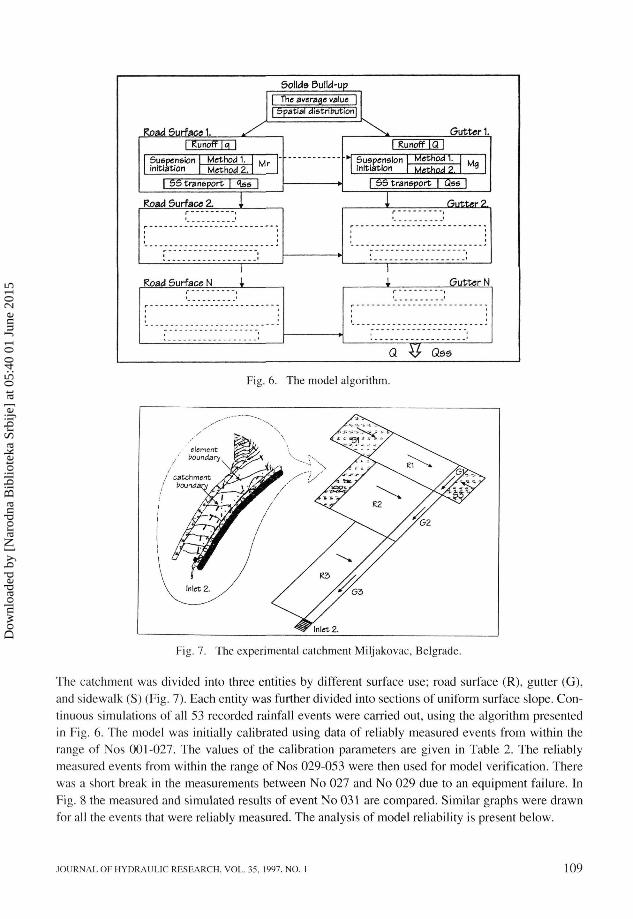
Numerical Scheme and Model Algorithm
The equations of the kinematic wave model (Eq. 2 and Eq. 3) were solved by Preiss-mann's four point implicit method. The method has been recognised as reliable and has already been used in storm runoff modelling practice (18). The transport equation, Eq. 15 and Eq. 16, were solved by a strongly implicit finite difference method (9). The model algorithm is presented in Fig. 6.
Application to the Miljakovac Catchment
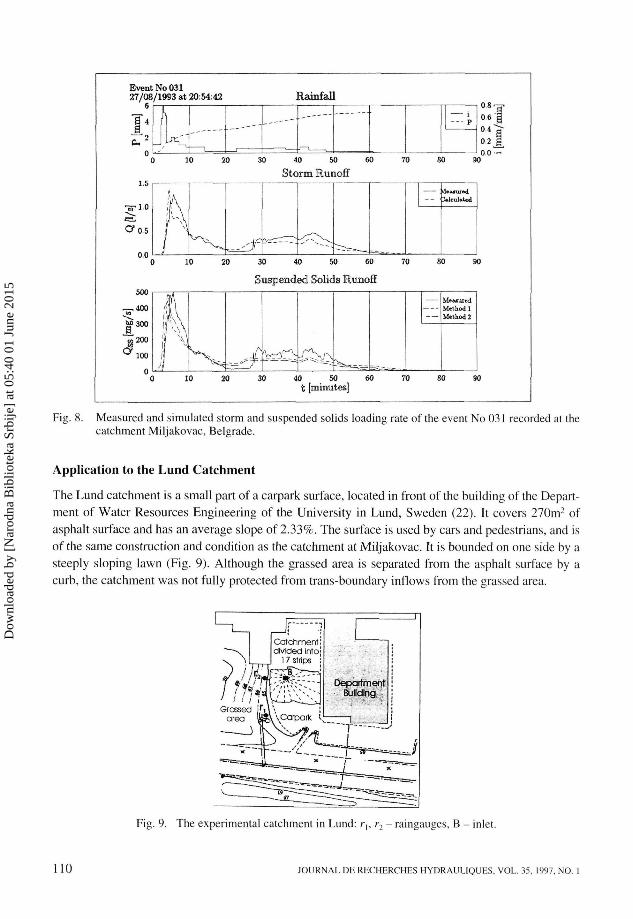
The Miljakovac catchment is located in a residential suburb of Belgrade. It covers 220m2 of an asphalt street, that is a medium traffic arterial. The slope ranges from 1.2 to 15.4 %. Watershed lines were located by levelling and by the use of tracer during one storm event. Both methods showed that no storm runoff reaches the observed asphalt surface from a nearby grassed area (Fig. 7). The storm water was collected in inlet 2 (Fig. 7) where measuring sensors and other equipment were mounted. Measurements of suspended solids loading rate in storm runoff were carried out continuously from May to November 1993. In total, 53 storm events were recorded, 23 of which have been further statistically analysed (25, 26). A large number of events had to be discarded due to low total precipitation and or measuring errors (the measuring installation was clogged occasionally, or the instruments malfunctioned). The dx was adopted from literature, as dx = 100u.(the instrumentation for this measurements was not available).
108 JOURNAL DE RECHERCHES HYDRAULIQUES, VOL. 35. 1997. NO. 1
Dow
nloa
ded
by [
Nar
odna
Bib
liote
ka S
rbije
] at
05:
40 0
1 Ju
ne 2
015
Solids Build-up
[ The average value | | Spatial distribution]
Road Surface 1. | Runoff | q~
Suspension initiation
Method 1. Method 2.
Mr
| 5 5 transport | "fes
Gutter 1. I Runoff |Q I
* Suspension initiation
Method 1. Method 2.
Mg
| 55 transport | Qss
Road Surface 2. Gut te r 2.
Road Surface N P u t t e r N
Q ^ Qss
Fig. 6. The model algorithm.
Inlet 2.
Fig. 7. The experimental catchment Miljakovac, Belgrade.
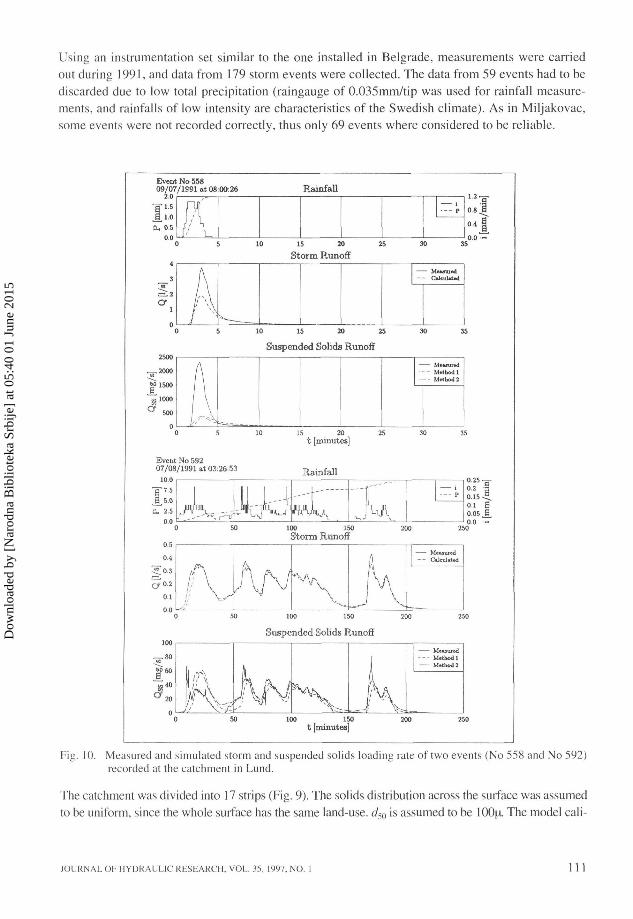
The catchment was divided into three entities by different surface use; road surface (R), gutter (G), and sidewalk (S) (Fig. 7). Each entity was further divided into sections of uniform surface slope. Continuous simulations of all 53 recorded rainfall events were carried out, using the algorithm presented in Fig. 6. The model was initially calibrated using data of reliably measured events from within the range of Nos 001-027. The values of the calibration parameters are given in Table 2. The reliably measured events from within the range of Nos 029-053 were then used for model verification. There was a short break in the measurements between No 027 and No 029 due to an equipment failure. In Fig. 8 the measured and simulated results of event No 031 are compared. Similar graphs were drawn for all the events that were reliably measured. The analysis of model reliability is present below.
JOURNAL OF HYDRAULIC RRSLARCH. VOL. 35, 1997, NO. I 109
Dow
nloa
ded
by [
Nar
odna
Bib
liote
ka S
rbije
] at
05:
40 0
1 Ju
ne 2
015
KventNoOSl 27/08/1993 at 20:54:42 Rainfall
30 40 50 Storm Runoff
0.8 ^ 0 . 6 1 0.4 "> 0 2 M. 0 0 —
bl«a«urad 2»lcuUted
20 30 40 50 60 70
Suspended Solids Runoff
■ M
V-5~
Measured Method 1 Mrthod 2
40 50 60 t [minutes]
Fig. 8. Measured and simulated storm and suspended solids loading rate of the event No 031 recorded at the catchment Miljakovac, Belgrade.
Application to the Lund Catchment
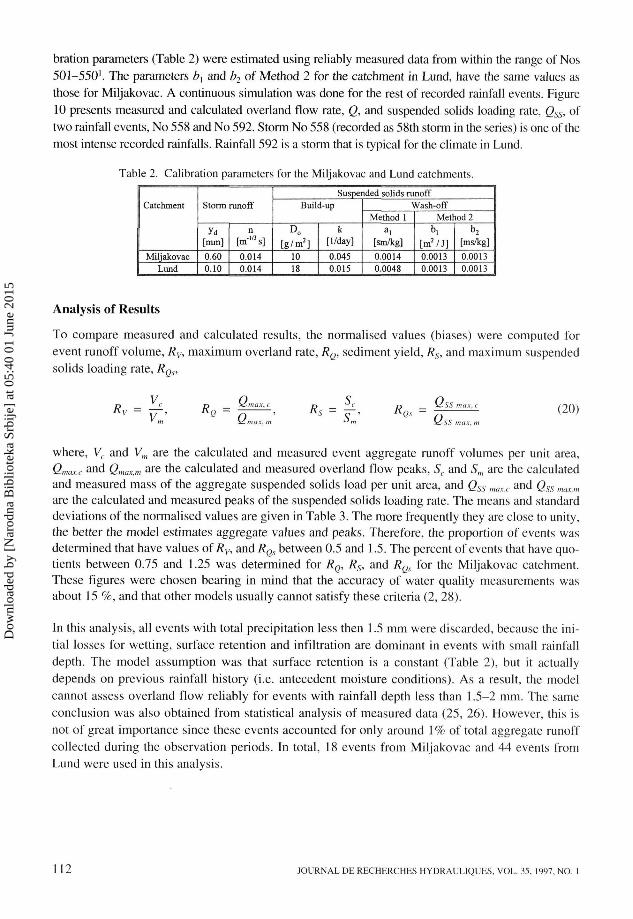
The Lund catchment is a small part of a carpark surface, located in front of the building of the Department of Water Resources Engineering of the University in Lund, Sweden (22). It covers 270m2 of asphalt surface and has an average slope of 2.33%. The surface is used by cars and pedestrians, and is of the same construction and condition as the catchment at Miljakovac. It is bounded on one side by a steeply sloping lawn (Fig. 9). Although the grassed area is separated from the asphalt surface by a curb, the catchment was not fully protected from trans-boundary inflows from the grassed area.
Fig. 9. The experimental catchment in Lund: rh r2 - raingauges, B - inlet.
110 JOURNAL DE RECHERCHES HYDRAULIQUES, VOL. 35. 1997. NO. I
Dow
nloa
ded
by [
Nar
odna
Bib
liote
ka S
rbije
] at
05:
40 0
1 Ju
ne 2
015
Using an instrumentation set similar to the one installed in Belgrade, measurements were carried out during 1991, and data from 179 storm events were collected. The data from 59 events had to be discarded due to low total precipitation (raingauge of 0.035mm/tip was used for rainfall measurements, and rainfalls of low intensity are characteristics of the Swedish climate). As in Miljakovac, some events were not recorded correctly, thus only 69 events where considered to be reliable.
Event No 558 09/07/1991 at 08:00:26 Rainfall
> 2
>
A ) 10 15 20 25
Storm Runoff 30 3.
M«*0ared Calculated
10 15 20 25
Suspended Solids Runoff
— Method 1 — - Method 2
Event No 592 07/08/1991 at 03:26:53
t [minutes]
Rainfall
li 05 JL 0 —
100 150
Suspended Solids Runoff
a ,
■ Meuuied Method 1 Method!
100 150
t [minutes]
Fig. 10. Measured and simulated storm and suspended solids loading rate of two events (No 558 and No 592) recorded at the catchment in Lund.
The catchment was divided into 17 strips (Fig. 9). The solids distribution across the surface was assumed to be uniform, since the whole surface has the same land-use. d50 is assumed to be 100|x The model cali-
JOURNAL OF HYDRAULIC RESEARCH. VOL. 35, 1997. NO. 1 111
Dow
nloa
ded
by [
Nar
odna
Bib
liote
ka S
rbije
] at
05:
40 0
1 Ju
ne 2
015
bration parameters (Table 2) were estimated using reliably measured data from within the range of Nos 501-550'. The parameters è, and b2 of Method 2 for the catchment in Lund, have the same values as those for Miljakovac. A continuous simulation was done for the rest of recorded rainfall events. Figure 10 presents measured and calculated overland flow rate, Q, and suspended solids loading rate, Qss, of two rainfall events, No 558 and No 592. Storm No 558 (recorded as 58th storm in the series) is one of the most intense recorded rainfalls. Rainfall 592 is a storm that is typical for the climate in Lund.
Table 2. Calibration parameters for the Miljakovac and Lund catchments.
Catchment
Miljakovac Lund
Storm runoff
Yd [mm] 0.60 0.10
[■A] 0.014 0.014
Suspended solids runoff Build-up
Do [g/m 2]
10 18
k [1/day]
0.045 0.015
Wash-off Method 1
a i [sm/kg] 0.0014 0.0048
Method 2 b,
[m 2 / J ] 0.0013 0.0013
b2 [ms/kg] 0.0013 0.0013
Analysis of Results
To compare measured and calculated results, the normalised values (biases) were computed for event runoff volume, Rv, maximum overland rate, RQ, sediment yield, Rs, and maximum suspended solids loading rate, RQs,
Rv - y~, RQ - jj , Rs ~ 7T, RQS = rz (20) vm \ómax,m J m Sc-SS max, m
where, Vc and Vm are the calculated and measured event aggregate runoff volumes per unit area, Qnmxc and QmaXim are the calculated and measured overland flow peaks, Sc and S„, are the calculated and measured mass of the aggregate suspended solids load per unit area, and Qss maxc and Qss majm are the calculated and measured peaks of the suspended solids loading rate. The means and standard deviations of the normalised values are given in Table 3. The more frequently they are close to unity, the better the model estimates aggregate values and peaks. Therefore, the proportion of events was determined that have values of Rv, and RQs between 0.5 and 1.5. The percent of events that have quotients between 0.75 and 1.25 was determined for RQ, Rs, and RQs for the Miljakovac catchment. These figures were chosen bearing in mind that the accuracy of water quality measurements was about 15 %, and that other models usually cannot satisfy these criteria (2, 28).
In this analysis, all events with total precipitation less then 1.5 mm were discarded, because the initial losses for wetting, surface retention and infiltration are dominant in events with small rainfall depth. The model assumption was that surface retention is a constant (Table 2), but it actually depends on previous rainfall history (i.e. antecedent moisture conditions). As a result, the model cannot assess overland flow reliably for events with rainfall depth less than 1.5-2 mm. The same conclusion was also obtained from statistical analysis of measured data (25, 26). However, this is not of great importance since these events accounted for only around 1 % of total aggregate runoff collected during the observation periods. In total, 18 events from Miljakovac and 44 events from Lund were used in this analysis.
112 JOURNAL DE RECHERCHES HYDRAUL1QUES, VOL. 35, 1997, NO. 1
Dow
nloa
ded
by [
Nar
odna
Bib
liote
ka S
rbije
] at
05:
40 0
1 Ju
ne 2
015
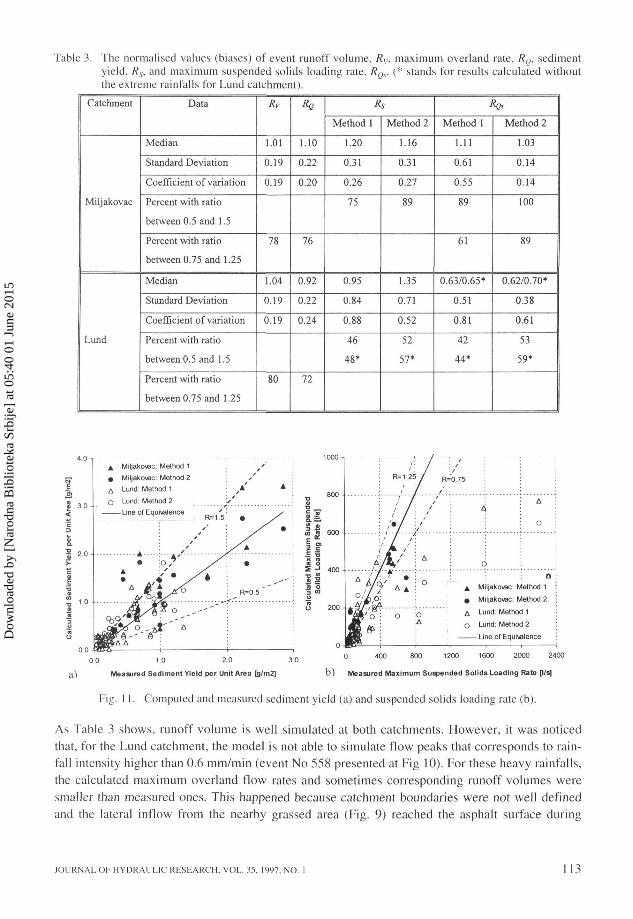
Table 3. The normalised values (biases) of event runoff volume, Rv, maximum overland rate, RQ, sediment yield, Rs, and maximum suspended solids loading rate. RQs. (* stands for results calculated without the extreme rainfalls for Lund catchment).
Catchment
Miljakovac
Lund
Data
Median
Standard Deviation
Coefficient of variation
Percent with ratio
between 0.5 and 1.5
Percent with ratio
between 0.75 and 1.25
Median
Standard Deviation
Coefficient of variation
Percent with ratio
between 0.5 and 1.5
Percent with ratio
between 0.75 and 1.25
Rv
1.01
0.19
0.19
78
1.04
0.19
0.19
80
RQ
1.10
0.22
0.20
76
0.92
0.22
0.24
72
Rs
Method 1
1.20
0.31
0.26
75
0.95
0.84
0.88
46
48*
Method 2
1.16
0.31
0.27
89
1.35
0.71
0.52
52
57*
RQS
Method 1
1.11
0.61
0.55
89
61
0.63/0.65*
0.51
0.81
42
44*
Method 2
1.03
0.14
0.14
100
89
0.62/0.70*
0.38
0.61
53
59*
^ Miljakowc: Method 1
t Miljakovac: Method 2
A Lund: Method 1
O Lund: Method 2
Line of Equi\alence
w | 600
I f ,
: R=1.25/ R=
/ / /' 1 /' f
l i ' '
: / • / : /
t^r/iA m£/>/o : o a
0.75
A 4 : : o
o : Q
^ Miljako\sc: Method 1 :
e Miljakovac: Method 2
A Lund: Method 1
O Lund: Method 2
Line of Equivalence
0.0 1 0 2.0 3.0
a ) Measured Sediment Yield per Unit Area [g/m2]
0 400 800 1200 1600 2000 2400
b ) Measured Max imum Suspended Sol ids Loading Rate [l/s]
Fig. I 1. Computed and measured sediment yield (a) and suspended solids loading rate (b).
As Table 3 shows, runoff volume is well simulated at both catchments. However, it was noticed that, for the Lund catchment, the model is not able to simulate flow peaks that corresponds to rainfall intensity higher than 0.6 mm/min (event No 558 presented at Fig 10). For these heavy rainfalls, the calculated maximum overland flow rates and sometimes corresponding runoff volumes were smaller than measured ones. This happened because catchment boundaries were not well defined and the lateral inflow from the nearby grassed area (Fig. 9) reached the asphalt surface during
JOURNAL 01- HYDRAULIC RESEARCH. VOL. 35. 1997. NO. 1 113
Dow
nloa
ded
by [
Nar
odna
Bib
liote
ka S
rbije
] at
05:
40 0
1 Ju
ne 2
015
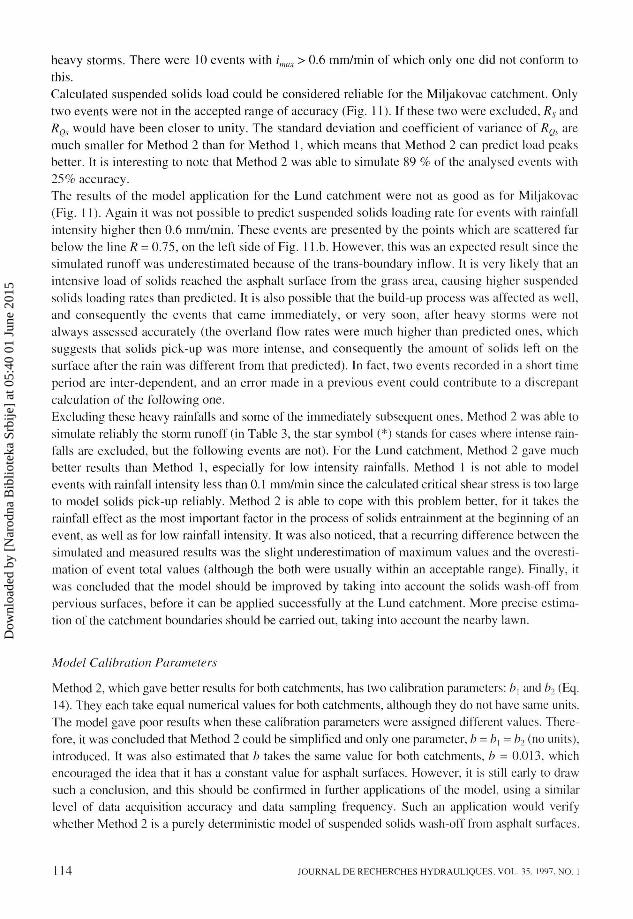
heavy storms. There were 10 events with imax > 0.6 mm/min of which only one did not conform to this. Calculated suspended solids load could be considered reliable for the Miljakovac catchment. Only two events were not in the accepted range of accuracy (Fig. 11). If these two were excluded, Rs and RQS would have been closer to unity. The standard deviation and coefficient of variance of R0x are much smaller for Method 2 than for Method 1, which means that Method 2 can predict load peaks better. It is interesting to note that Method 2 was able to simulate 89 % of the analysed events with 25% accuracy. The results of the model application for the Lund catchment were not as good as for Miljakovac (Fig. 11). Again it was not possible to predict suspended solids loading rate for events with rainfall intensity higher then 0.6 mm/min. These events are presented by the points which are scattered far below the line R = 0.75, on the left side of Fig. 1 l.b. However, this was an expected result since the simulated runoff was underestimated because of the trans-boundary inflow. It is very likely that an intensive load of solids reached the asphalt surface from the grass area, causing higher suspended solids loading rates than predicted. It is also possible that the build-up process was affected as well, and consequently the events that came immediately, or very soon, after heavy storms were not always assessed accurately (the overland flow rates were much higher than predicted ones, which suggests that solids pick-up was more intense, and consequently the amount of solids left on the surface after the rain was different from that predicted). In fact, two events recorded in a short time period are inter-dependent, and an error made in a previous event could contribute to a discrepant calculation of the following one. Excluding these heavy rainfalls and some of the immediately subsequent ones, Method 2 was able to simulate reliably the storm runoff (in Table 3, the star symbol (*) stands for cases where intense rainfalls are excluded, but the following events are not). For the Lund catchment, Method 2 gave much better results than Method 1, especially for low intensity rainfalls. Method 1 is not able to model events with rainfall intensity less than 0.1 mm/min since the calculated critical shear stress is too large to model solids pick-up reliably. Method 2 is able to cope with this problem better, for it takes the rainfall effect as the most important factor in the process of solids entrainment at the beginning of an event, as well as for low rainfall intensity. It was also noticed, that a recurring difference between the simulated and measured results was the slight underestimation of maximum values and the overesti-mation of event total values (although the both were usually within an acceptable range). Finally, it was concluded that the model should be improved by taking into account the solids wash-off from pervious surfaces, before it can be applied successfully at the Lund catchment. More precise estimation of the catchment boundaries should be carried out, taking into account the nearby lawn.
Model Calibration Parameters
Method 2, which gave better results for both catchments, has two calibration parameters: /?, and b2 (Eq. 14). They each take equal numerical values for both catchments, although they do not have same units. The model gave poor results when these calibration parameters were assigned different values. Therefore, it was concluded that Method 2 could be simplified and only one parameter, b = bt= b2 (no units), introduced. It was also estimated that b takes the same value for both catchments, b = 0.013, which encouraged the idea that it has a constant value for asphalt surfaces. However, it is still early to draw such a conclusion, and this should be confirmed in further applications of the model, using a similar level of data acquisition accuracy and data sampling frequency. Such an application would verify whether Method 2 is a purely deterministic model of suspended solids wash-off from asphalt surfaces.
114 JOURNAL DB RECHERCHES HYDRAUL1QUES. VOL. 35, 1997. NO. 1
Dow
nloa
ded
by [
Nar
odna
Bib
liote
ka S
rbije
] at
05:
40 0
1 Ju
ne 2
015
Such a claim cannot be made for Method 1, since its calibration parameter, ax, (Eq. 12) takes different values for the examined catchments. Bearing in mind that these catchments are paved by asphalt of similar construction and condition, the difference in «, values could not be explained physically. The build-up of solids at the surface is modelled using the conceptual equation, Eq. 1, and it is not likely that a deterministic approach could be applied to this process. There are too many factors that affect solids accumulation. It is believed that, land use, which was different at the examined catchments, determined the different values of the accumulation coefficient kt. This coefficient was larger for the busy asphalt street at Miljakovac (Table 2) than for the carpark in Lund. On the other hand, the removal of the solids by passing cars was greater at the Miljakovac catchment, and it did not allow sediment to settle on the surface above a certain level. This may be why the maximum amount of solids accumulated at the surface, D0, is greater in Lund than at Miljakovac. Further investigation of the build-up process should be carried out in order to reveal the relationship between the calibration parameters and factors involved in the build-up process.
Summary and Conclusion
A description has been presented of a new mathematical model of suspended solids runoff from urban asphalt surfaces. The model may be regarded as an improvement on existing practice, since it takes into account non-uniform distribution of solids over the street surface and uses an improved entrainment equation (Method 2) in which the rainfall and runoff effects are treated separately. Method 2 gave acceptable results for two small catchments, but was particularly reliable for the Miljakovac catchment. The borders of this catchment were well defined and only storm runoff from a uniform asphalt street surface was measured. Method 2 gave less satisfactory results for the Lund catchment, partially because this catchment was not fully protected from the trans-boundary inflow from a nearby lawn. An other entrainment equation was also tested (Method 1), where rainfall and runoff effects are modelled in combination as a function of total shear stress. Although Method 1 appeared satisfactory in application to the to Miljakovac catchment, it did not give satisfactory results for the Lund catchment. It was noticed that Method 2 is able to simulate reliably very low intensity rainfall events (/' < 0.1 mm/min), but that Method 1 is not. The number of calibration parameters in Method 2 could be reduced to one, because bx and b2 have equal numerical values at both catchments, although they have different units. A new calibration parameter b could be applied instead of these two, b = b, = b2 (no units). We estimate that, b = 0.013 for both catchments. If this calibration value could be shown to apply to other uniform asphalt catchments, Method 2 could be regarded as a pure deterministic model of suspended solids wash-off. This will also mean, that only two calibration parameters (for a build-up equation) will be required for the modelling of the processes that occur above the ground (the models currently in use require at least three calibration parameters). The model uses a very simple conceptual equation to assess the solids build-up at the surface. However, it assess uneven sediment distribution over the asphalt surface. Further investigation of the build-up process, or simply, further calibrations of the presented model for other catchments (using Method 2) could help in the development of rules for an effective assessment of the build-up calibration parameter. The model should be improved further, by incorporating procedures to account for wash-off from pervious areas. Such a model could be verified for the Lund catchment first, and than used for more
JOURNAL OF HYDRAULIC RESEARCH. VOL. 35. 1997. NO. 1 115
Dow
nloa
ded
by [
Nar
odna
Bib
liote
ka S
rbije
] at
05:
40 0
1 Ju
ne 2
015
complex urban catchments. With this further development the model could be useful in practice for estimating the suspended solids input into a drainage system.
Acknowledgements
This study was supported by the Swedish Building Research Council (BFR). We are particularly indebted to Dr Janusz Niemczynovwicz and Mr. Ake Spongberg from the University of Lund, Sweden. We thank kindly Professor Brian Willetts from the University of Aberdeen, UK for his great help in writing this paper.
References
1. A Guide to Surface Water Best Management Practice, 1995, Forth River Purification Board, Edinburg, 2. BERTRAND-KRAJEWSKI J. L„ SCRIVENER O., BRIAT P.. 1993, Sewer Sediment Production and Transport
Modelling: A Literature Review, Journal of' Hydraulic Research, Vol. 31 (4), pp. 435-460 3. CHEBBO G., MUSQUERE P., BACHOC A., 1990, Solids Transferred into Sewers, Proc. of' the Fifth Interna
tional Conference on Urban Storm Drainage, Osaka, July 1990 4. Clarhe W. P., STRODS P. J., ARGUE J. R.. 1981, Gutter/Pavement Flow Relationships for Roadway Chan
nels of Moderate or Steep Grade, First National Local Government Eng. Conference, Adelaide 5. CORDERY I., 1977, Quality Characteristics of Urban Storm Water in Sydney, Australia, Water Resource
Research, Vol. 13(1), pp. 197-202 6. DRIVER N. E., 1990, Summary of Nationwide Analyses of Storm-Runoff' Quality and Quantity in Urban
Watersheds, Proc. of the Fifth International Conference on Urban Storm Drainage, Osaka, July 1990 7. HUBER W. C. DlCENSON R. E., 1988, Storm Water Management Model, SWMM, Version 4, User's Man
ual, US EPA, Athens, Georgia 30613 8. GROTTKER M., 1987, Runoff Quality from a Street with Medium Traffic Loading, Journal of' the Science
of the Total Environment, Vol. 59, pp. 457—466 9. FERZIGER J. H., 1981, Numerical Methods for Engineering Application, John Wiley, New York 10. Li R. M., SHEIN H. W„ SIMONS D. B.. 1973, Mechanics of Soil Erosion by Overland Flow, XV Congress
of IARH, Istanbul, 1973 11. LITWIN Y. J. and DONIGIAN A. S., 1978, Continuous simulation of nonpoint pollution, J of Water Pollu
tion Control Federation, Vol. 50, pp. 2348-2361 12." MUSKATIROVIC D., 1976, River Regulation (in Serbian), Faculty of Civil Engineering, University of Bel
grade 13. NlTTIM R., 1977, Overland Flow in Impervious Surface, Water Research Laboratory, University of New
South Wales, Report No 151. 14. OSBORN M. P., HUTCHINGS C. J., 1990, Data Requirements for Urban Water Quality Modeling and Limi
tation of the Existing UK Database, Proc. of the Fifth International Conference on Urban Storm Drainage, Osaka, July 1990
15. PHAN L„ HERREMANS L., DELAPLACE D., BLANC D., 1994, Modelling Urban Stormwater Pollution: a Comparison Between British (MOSQITO) and French (FLUPOL) Approaches, The First International Conference on Hydroinformatics, Delft. Netherlands, September 1994.
16. PITT R., 1979, Demonstration of Nonpoint Pollution Abatement Through Improved Street Cleaning Practical, U.S.A. Environ. Prot. Agen. Rep., EPA-600/2-79-161.
17. RADOJKOVIC, M., 1989, The Mathematical Model Parameters of Linear Dispersion in Open Channel (in Serbian), VIII Conference of JDHI (Yugoslav Society of Hydraulic Research), Portoro, 1982
18. RADOJKOVIC M„ OBRADOVIC D. and MAKSIMOVIC, 1989, Computers in Urban Hydraulic Engineering, (in Serbian), Gradjevinska knjiga
19. REINERTSENT. R., 1981, Quality of Stormwater Runoff'from the Streets, Proc. of the Second International Conference on Urban Storm Drainage, Univ. of Illinois, Urbana, June 1981
20. SATOR J. D„ BOYD G. B„ AGARDY F.J., 1974, Water Pollution Aspects of Street Surface Contaminants, Journal WPCF, Vol. 46, No. 3, pp 458-467
21. SARTOR J. D., BOYD G. B., 1972, Water Pollution Aspects of Street Surface Contaminants, USA. EPA Report, EPA-R2-72-081.
116 JOURNAL DE RECHERCHES HYDRAULIQUES. VOL. 35, 1997, NO. 1
Dow
nloa
ded
by [
Nar
odna
Bib
liote
ka S
rbije
] at
05:
40 0
1 Ju
ne 2
015

22. SPONGBERG A. and NiEMCZYNOVWicz J., 1993 Measurements of Wash-off from an Asphalt Surface, Sixth International Conference on Urban Storm Drainage, September 1993
23. TAN S. K., 1989, Erosion of Clays by Rainfall, XXIII Congress of 1AHR, Ottawa, Canada, August 1989 24. TOMANOVIC A., 1990, Urban Storm Water Quality - Literature study, Lund Institute of Technology, Lund
University, Lund, Sweden 25. TOMANOVIC A., MAKSIMOVIC. C, 1994. Statistical Analysis of Water Quality Data of Storm Surface
Discharge from Asphalt Areas (in Serbian), Water Protection '94, Igalo, Yugoslavia. May 1994 26. TOMANOVIC A., 1994. Modelling of Surface Runoff Water Quality Based on the Field Measurements (in
Serbian). MSc Thesis, Civil Engineering Faculty, University of Belgrade 27. WARWICK .1. J. and WILSON J. S., 1990, Estimating uncertainty of stormwater runoff computations. J. of
Water Resources Planning and Management. Vol., 116 (2), pp. 187-204 28. Wu T. H., HALL ,1. A. and BONTA J. V., 1993, Evaluation of Runoff and Erosion Models. J. of Irigation
and Drainage. Vol. 1 19(4), pp. 364-382 29. XANTHOPOULOS C. HAHN H„ 1993, Anthropogenic Pollutants Wash-off from Street Surface, Proc. of the
Sixth International Conference on Urban Storm Drainage, Niagara Falls, Canada, September 1993
Notations
The following symbols are used in this paper: A cross-section area «i calibration parameter of Method 1 b, b,, b2 calibration parameters of Method 2 Clh coefficient of bed shear stress C„ coefficient of total shear stress C*|, C2, C3 bed sear stress constants D|, D2, D3 total shear stress constants d50 median solids particle size found in overland flow Disg dispersion coefficient in gutter flow Dis, dispersion coefficient in road surface flow Ek kinetic energy of rain drops per unit of cross-section and time g gravity acceleration i rainfall intensity ie effective rainfall intensity H depth of gutter flow by the curb /? depth of overland flow h average cross section depth of gutter flow ftp penetration depth of rain drops k accumulation constant WK gutter width L? section length Lsu upstream section length M amount of solids on the surface A/„ maximum amount of solids expected on the surface Mr amount of solids on the road surface Mv amount of solids on the gutter surface ;; Manning roughness coefficient P rainfall depth Q gutter (low Qss suspended solids loading rate
JOURNAL OF HYDRAULIC RESEARCH. VOL. 35, 1997. NO. 1 117
Dow
nloa
ded
by [
Nar
odna
Bib
liote
ka S
rbije
] at
05:
40 0
1 Ju
ne 2
015

'1 qw
UT
Is «M Hs,g&
<}s,,
Hs, rs
<z« sg ss Re Reb
T t t' tdry
yd X
<t> P * i
"^cr T, T,
unit overland flow unit inflow from sidewalk unit inflow from road surface unit suspended solids discharge rate of solids lifted in the gutter by gutter flow rate of solids lifted in the gutter by surface flow unit suspended solids inflow from the road surface rate of solids lifted from road surface unit suspended solids inflow from the sidewalk gutter longitudinal slope surface slope Reynolds number critical Reynolds number the time elapsed from the start of the first rainfall in the series
time elapsed from the rainfall start virtual time duration of antecedent dry weather period retention coefficient spatial co-ordinate transversal angle of gutter cross-section water density bed shear stress critical shear stress (from Shields diagram) additional shear stress due to rain drops effect total shear stress
118 JOURNAL DE RECHERCHES HYDRAULIQUES, VOL. 35. 1997. NO. 1
Dow
nloa
ded
by [
Nar
odna
Bib
liote
ka S
rbije
] at
05:
40 0
1 Ju
ne 2
015