Rainfall infiltration: infinite slope model for landslides triggering by rainstorm

This article appeared in a journal published by Elsevier. The attachedcopy is furnished to the author for internal non-commercial researchand education use, including for instruction at the authors institution
and sharing with colleagues.
Other uses, including reproduction and distribution, or selling orlicensing copies, or posting to personal, institutional or third party
websites are prohibited.
In most cases authors are permitted to post their version of thearticle (e.g. in Word or Tex form) to their personal website orinstitutional repository. Authors requiring further information
regarding Elsevier’s archiving and manuscript policies areencouraged to visit:
http://www.elsevier.com/copyright

Author's personal copy
Triggering threshold precipitation and soil hydrological characteristics of shallowlandslides in granitic landscapes
V. Ruiz-Villanueva a,⁎, J.M. Bodoque b, A. Díez-Herrero a, C. Calvo c
a Research and Geoscientific Prospective Department, Geological Survey of Spain (IGME), Madrid 28003, Spainb Mining and Geological Engineering Department, University of Castilla-La Mancha, Campus Fábrica de Armas, Toledo, Spainc Geofísica Consultores, Torrelodones, Madrid, Spain
a b s t r a c ta r t i c l e i n f o
Article history:Received 30 October 2009Received in revised form 27 July 2010Accepted 24 May 2011Available online 28 June 2011
Keywords:Rainfall ID-thresholdCritical rainfall intensityTDRSeismic refraction tomographySpanish Central System
Sierra deGredos, amountain range in Central Spain, is prone to the occurrence of shallow landslides, which cantransform into sediment laden flows as demonstrated by geomorphologic evidence. The analyses of thesecomplex processes require reliable design tools for predicting thresholds of triggering precipitation in order toassess the susceptibility characteristics. In the Sierra de Gredos there is a lack of knowledge concerning howweathering mantle properties vary spatially, and what effects these spatial patterns have on infiltration,surface runoff and shallow subsurface flow. In this context, this paper is focused on the hydrogeomorphiccharacterization of a shallow landslide that occurred on December 17, 1997. The Generalized Quasi-DynamicModel (GQDM) was implemented to approach the critical rainfall intensity set for different durations and toestablish the intensity–duration (ID) threshold. To this purpose, field and laboratorymethods, such as: SeismicRefraction Tomography (SRT), Time Domain Reflectometry (TDR), and geotechnical tests were applied. Theuse of these field investigations and their combination with the GQDM have allowed us to provide a detaileddescription of the behavior of the catchment, and reproduce the pattern of instability generated by an intensestormwhich triggered the 1997 shallow landslide. Furthermore, this threshold can be used as a predictive toolfor hazard prevention.
© 2011 Elsevier B.V. All rights reserved.
1. Introduction
Shallow landsliding is a major landform-shaping process in manymountain areas (Acharya et al., 2006). Landslides can transform intodebris flows or hyperconcentrated flows under specific conditions(Iverson et al., 1997). Due to their high density and mobility, flowsinduced by shallow landslides are much more dangerous than thoseresulting from continuous erosive processes (Malet et al., 2005).
At the level of current knowledge, it seems clear that factors such asmaximum hourly intensity, storm duration, storm rainfall amount andantecedent precipitation, play major roles in identifying and character-izing rainfall thresholds (D'Odorico et al., 2005). The development ofstatistically-based relationships between storm characteristics andlandslide occurrence has prompted the establishment of thresholdrainfall values for landslide hazard assessment, prediction and warningsystems (Dhakal and Sidle, 2004). This approach is based ondetermining the existence of a direct relationship between theoccurrence of a landslide and several variables, which enable thecharacterization of a rainfall event in terms of intensity and duration.Alongwith these two variables, the antecedent rainfall to the triggering
event has to be taken into account. However, this approach has a majorshortcoming, as these thresholds may be difficult to transpose todifferent landscapes from where they have been quantified. This isbecause of the importance of the antecedent rainfall prior to triggeringshallow landslides, which may vary depending on local site conditions(Wieczorek, 1987). The soil thickness is particularly important aswell asmechanical and hydrogeological properties related to it (e.g., hydraulicconductivity, transmissivity, angle of internal friction). Likewise, they donot provide a theoretical frame that enables us to understand all thephysical processes involved in shallow landsliding (Iverson, 2000).
The use of spatially distributed and physically based models poses aversatile and alternative approach that can be used in determiningwhichareas are prone to shallow landslides, and consequently in helpingplanners and decisionmakers to choose strategies thatminimize hazardsassociated to this process. Many of these models and methodologicalapproaches are based on the physically-based model developed byMontgomery andDietrich (1994) inwhich a slope stabilitymethod and atopographically based groundwater flow model are coupled. The slopestability approach is based on an infinite slope form of the Mohr–Coulomb failure law. Concerning the hydrologic model, a steady stateshallow subsurface flow based on the work by O'Loughlin (1986) hasbeen usually considered. This is only valid if recharge to a perchedwatertable occurs at every point along the hillslope, reaching subsurfacedrainage equilibrium and experiencing drainage from its entire upslope
Geomorphology 133 (2011) 178–189
⁎ Corresponding author.E-mail address: [email protected] (V. Ruiz-Villanueva).
0169-555X/$ – see front matter © 2011 Elsevier B.V. All rights reserved.doi:10.1016/j.geomorph.2011.05.018
Contents lists available at ScienceDirect
Geomorphology
j ourna l homepage: www.e lsev ie r.com/ locate /geomorph

Author's personal copy
contributing area (Barling et al., 1994). Nevertheless, shallow landslidingis a process complicated by the interaction between static and dynamicenvironmental factors. For this reason, dynamic models of the hydro-logical response at the watershed scale have been developed, linkingtopography and rainfall variability, providing a way to capture bothtopographic and climatic forcing. Borga et al. (2002a) and Tarolli et al.(2008) developed a slope-stability model, called ‘Generalised Quasi-Dynamic Model’ (GQDM hereafter), which takes transient movement ofsoil water into account. This model offers considerable improvementover the steady state model in predicting existing landslides for hazardassessment, and reproducing the patterns of instability events throughthe diagnostic mode. In this work the GQDMmodel is applied in order toanalyze the triggering precipitation of a shallow landslide in CentralSpain. As a summary, the aims of this paper are: (i) to understand thetriggering conditions of a shallow landslide in the Sierra de Gredos(Central Spain), to this purpose, field and laboratory surveys wereapplied to obtain the input parameters for the slope-stability GQDMmodel; and (ii) the estimation of the critical rainfall intensity and theassessment of rainfall Intensity–Duration threshold for the initiation ofthe landslide.
2. Regional setting
2.1. The Arroyo Cabrera catchment
The study site is located in the Arroyo Cabrera catchment. TheArroyo Cabrera is a torrent tributary of the Alberche River in the TagusBasin. It is located on the northern slopes of the Sierra del Valle
(Venero Claro), in the Sierra de Gredos (Spanish Central System)(Fig. 1).
Sierra deGredos is themain range of the Spanish Central System andextends 140 km, from east to west. The bedrock consists of biotitegranites and granodiorites from intrusions during the Variscan orogeny.The northern side of the Sierra de Gredos consists of hills that rise to1900 m a.s.l. the landscape is characterized by common granitic forms.Mantled pediments carry an in situ regolith veneer. The block orboulder-strewn slope irregularities are due to the partial breakdownbeneath the surface of sheet structures. Small, steep-sided castle kopjesare developed by pronounced marginal weathering along verticalfractures and in the subsurface. Alternatively, the presence of strongly-developed near-vertical fractures and the pronounced Pleistocene frostaction have resulted in the development of the actual block deposits.
Superficial Quaternary formations aremade up of gravels, sands andsilts. These cover the slopes, the valley bottom and endorreic de-pressions known as navas. A complete description of the geomorphiccontext of this region and the characteristics of the weathering mantlecan be found in Díez-Herrero (2003), and Palacios et al. (2003).
The climate of the study area is Continental Mediterranean, which istypical of interior Spanish mountain ranges. There are very fewmeteorological stations in the area, and the existing ones are locatedat low elevations, which limit the understanding of the orographiccomponent of precipitation. The climate of these mountains isdetermined by the frequent arrival of Atlantic depressions from theSW during the autumn, winter and spring and by the predominantAzores anticyclone causing very dry summers (only 10% of the annualprecipitation). On the northern slope, mean annual precipitation is
Fig. 1. Location of the study site. The catchment of Arroyo Cabrera is located on the northern slopes of Sierra de Gredos in the Venero Claro reach (Spanish Central System).
179V. Ruiz-Villanueva et al. / Geomorphology 133 (2011) 178–189

Author's personal copy
554 mm at 1007 m a.s.l., 1704 mm at 1200 m a.s.l., and is estimatedaround 2000 mmat 2000 ma.s.l., of which 77% falls as snow (Palacioset al., 2011).
The vegetation is made up of 43% Pinus pinaster, 40% Provencebroom (Cytisus oromediterraneus), and, to a lesser extent, Quercuspyrenaica, Pinus sylvestris and Alnus glutinosa.
Torrential rainfall events that usually occur in autumn and wintercan facilitate the triggering of shallow landslides. The local type of
landslides can transform into complex sediment laden flows (includ-ing debris flows as described in Palacios et al., 2003), that can reachtorrent channels and travel long distances evolving to flash floodsdownstream, as in this case (Ballesteros et al., 2011).
Several factors determine the occurrence of flash floods in theArroyo Cabrera basin, such as: the high drainage density; the almostcircular morphology of its headwaters (Fig. 2); and the small area(15.5 km2; 1923 m a.s.l. and 735 m a.s.l. in altitude for a length of
Fig. 2. Geomorphic mapping of the catchment of Arroyo Cabrera and Venero Claro reach, representing all forms related to granite landscape and the torrential activity of the area(levees, channels, alluvial filling). The detailed study site is marked by the black square.
180 V. Ruiz-Villanueva et al. / Geomorphology 133 (2011) 178–189
Author's personal copy
5.56 km, with an average slope of 21.6%). Furthermore, the headwaterhas average slopes of 50%, although at some locations these slopes caneasily reach 100%. As a consequence, threshold runoff and time ofconcentration of the basin are decreased; and the high average slopeof the main channel makes possible a fast flood wave routing.
2.2. Meteorological and hydrodynamic conditions of the 1997 event
On December 17, 1997 a shallow landslide occurred in the upperpart of the catchment (about 1800 m a.s.l) that was triggered by aheavy rainfall event. It evolved to a hyperconcentrated flow and aflash flood downstream (Fig. 3) which caused infrastructure damagesand economic losses.
Previously, during the months of November and December of1997, the cumulated rainfall on this region, according to the availabledata was: 821 mm recorded in the daily rain gage located in LosSerranillos (1230 m a.s.l); 617 mm recorded in the daily rain gagelocated in El Burguillo (750 m a.s.l); and, 489 mm in La Adrada (720 ma.s.l). The cumulated rainfall of the 17th of December was 141 mm,87 mm and 87 mm in last mentioned stations. These daily rain gagesare located at 25, 12 and 7 km respectively from the study area;although they are not very far away from the study site, they are inlower ranges of altitude in the Sierra de Gredos.
There is no subdaily rainfall data available for this event. Neverthe-less, some witnesses stated that the heavy storm had a durationbetween 3 and 6 h, before the shallow landslide took place, but thiscould not be confirmed. Furthermore, someweeks before the event, thetemperature rise triggereda rapid snowmelt. These conditions triggered
a shallow landslide, which evolved in a sediment laden flow, leavingdeposits of debris flow in the upslopes and hyperconcentrated and flowdeposits downslope (Fig. 3C). An avulsion phenomenon took place, andit was manifested as large-scale switching of primary channel flowprovided by the deposition of levees in themain channel sides (Fig. 3D).Another related processwas the accumulation of large woody debris, asit is shown in Fig. 3E. The bridge shown in the picture was blocked andoverflooded increasing the risk upstream this bridge,where a children'ssummer camp is located (white building). During this event othershallow landslides were triggered in nearwatersheds, nevertheless, theVenero Claro event was the most severe.
Since 2004 the Arroyo Cabrera catchment has been instrumentedintensively as part of an ongoing research program. There are 6raingauges uniformly distributed in height, one flow gage (other onewas destroyed during an ordinary flash flood), and three TDR probes.The location of this hydrometeorological instrumental can be found inFig. 1.
3. Methodology
We focused on describing how regolith properties vary spatiallyand what effects these spatial patterns have on infiltration, surfacerunoff and shallow subsurface flow, field and laboratory surveys werecarried out providing a description of hydraulic and geotechnicalproperties of the regolith.
The first point of the methodology explains the analysis of thevariability of the weathering mantle depth. It was undertaken usingseismic refraction tomography (SRT). Furthermore, the geotechnical
Fig. 3. (A) Catchment of Arroyo Cabrera and Venero Claro reach, the white line is the hyperconcentrated flow trace. (B) Scar of shallow landslide, which triggered thehyperconcentrated flow down slope. (C) Detail of deposits. (D) Avulsion phenomena associate to the hyperconcentrated flow. (E) Infrastructure damages in a bridge locateddownstream. Pictures took on December of 1997, few days after the event.
181V. Ruiz-Villanueva et al. / Geomorphology 133 (2011) 178–189

Author's personal copy
tests applied are reviewed here. The second point deals with the Ks(saturated hydraulic conductivity); time domain reflectometry (TDR)was used to study the water content variability and to calculatevertical Ks in order to estimate the lateral Ks. And, finally, the thirdpart is the application of the model, the estimation of the criticalrainfall intensity, and the assessment of rainfall Intensity–Durationthreshold for the initiation of the landslide in 1997.
3.1. Analysis of the regolith variability
The distribution of weathering mantle depth has been obtainedusing near-surface SRT. Near-surface SRT is a geophysical inversiontechnique designed for subsurface investigations where the numberof units of interest is small and seismic propagation velocity increaseswith depth (Baker, 2002). The output of SRT analysis is a model of thedistribution of seismic velocities in the subsurface; thus, additionalinterpretation must occur to generate a geologic model (i.e., determi-nation of what the velocities represent). Themeasurement of the traveltime of seismic waves refracted at the interfaces between subsurfacelayers of different velocity is recorded. First arrivals in the seismic signalsare inverted to get an image of the P-wave velocity distribution in theground. Seismic energywas provided by a source located on the surfaceusing a hammer and a plate. The traveltime is measured for the firstarrivals, including direct, refracted and diffracted wave phases andprovides information on the depth profile of the refractor and it isrelated to the stratigraphy. For a detailed description of these methodsee Hoffmann and Schrott (2003), and Schrott and Sass (2008); and, fora review of geophysical methods applied to slope stability analysis seeHack (2000).
DMT Summit Compact equipment with 24 geophones was used,and a two-dimensional (2D) surface SRT survey in the study site along108 m was carried out.
A 5-kg sledgehammer was used for seismic source. Data wererecorded on a seismograph and downloaded to computer for analysisof the first-arrival times to the geophones from each shot position.Picking traveltimes from shot gathers is the first and most importantstep of the SRT. By this way, depth profiles for each refractor areproduced by an analytical procedure based on consideration of shotand receiver geometry and the measured travel-times and calculatedvelocities using Rayfract software. The tomographic algorithm isbased on applying the eikonal equation to observed phase traveltime(Schuster and Quintus-Bosz, 1993) and is suited for processing ofseismic profiles and interpretation of P-waves. Rayfract performs thewavefront method as an optimized version of the generalizedreciprocal method, with laterally varying and automatically estimatedreceiver separation.
This is an iterative process that usually converges within 10iterations if the subsurface is not too complex. The process isperformed by determining the travel time from each source to eachreceiver along the profile (Fig. 4), comparing this result to the realtravel times, and updating themodel. The density of ray path coveragethrough a particular point in the subsurface is directly related to theaccuracy of the predicted velocity; thus, the bottom and edges of aparticular velocity model are generally the least accurate. In additionto a qualitative examination of the “fit” by comparing the modeled tothe real data a quantitative standard deviation value relating themodeled travel times to the real travel times is calculated.
In order to evaluate the main properties of the weathering mantle,disturbed and undisturbed samples were collected close to the scararea during the summer of 2008. To this purpose, geotechnical testingunder standardized conditions was accomplished, that enabled tocharacterize the following parameters: (i) specific weight; (ii) naturalmoisture; (iii) porosity; (iv) granulometry; (v) angle of internalfriction; and (vi) cohesion. Estimation of the parameters (i), (ii) and(iii) was obtained based on the analysis of undisturbed samples,whereas for the remaining parameters disturbed samples were used.
The natural moisture was calculated following the standard test tooven dry the sample to constant weight at 105 °C. The standardmethod of measuring soil moisture content is the thermogravimetricmethod. This approach is time consuming and destructive to thesampled soil, meaning that it cannot be used for repetitive measure-ments at the same location. However, it is indispensable as a standardmethod for calibration and evaluation purposes. The bulk density testwas carried out using a Helio picnometre. Particle size distributionanalyses were carried out using the sieving and hydrometer sedimen-tation,with samples previously submitted tomechanical disintegration.
Finally the shear parameters were derived from the standard testmethod for direct shear test of soils under consolidated drainedconditions. Several specimens (three in our case) are tested at varyingconfining stresses to determine the shear strength parameters, thesoil cohesion (c) and the angle of internal friction (φ). The results ofthe tests on each specimen are plotted on a graph with the peak (orresidual) stress on the x-axis and the confining stress on the y-axis.The y-intercept of the curve which fits the test results is the cohesion,and the slope of the line or curve is the friction angle. To carry out thedirect shear test the particles bigger than 2.5 mm have to be removed.
3.2. Analysis of the hydraulic conductivity
Volumetric water content data were obtained from the TDR IMKOTrime EZ model. It was installed in the upper part of the catchment in2007–2008, and it was located about 400 m from the shallow landslide.The TDR has three probes placed in the soil at different depths.
Furthermore, we observed the relation between the volumetricwater content data and the precipitation data. Since 2004, there is aHobo data logger model raingauge installed near where the TDR islocated. It records the rainfall with 0.5 seconds interval, and themaximum capacity is 2000 pulses (each pulse is equivalent to 0.2 mmof precipitation).We used the software Box Car Pro 4.3 to download thedata, analyze it and to obtain hyetographs in order to compare thesetime series with the one derived from moisture response in the soil.
The TDR technique depends on the change in apparent permeabilityof the soil trough the measurement of the travel time of an electronicpulse through a wave guide installed in the soil (the propagationvelocity depends on the permeability). Topp et al. (1980) and otherearly researchers (Baker and Allmaras, 1990; Heimovaara and Bouten,1990) found polynomial functions that describe the relationshipbetween permeability and volumetric water content. A review of thismethod and its applications can be found in Cerny (2009).
Volumetric water content can be related to the unsaturatedhydraulic conductivity (Van Genuchten, 1980). In this regard, thesimplified model derived from the Mualem-van Genuchten wasapplied to obtain the unsaturated hydraulic conductivity, and then theKs was derived using the Campbell model (Campbell, 1985).
Prior to the installation of the probes in the field, the calibration ofTDR device was done under controlled conditions: dry soil (cleansand) as well as clean water was used to this end. Furthermore, thenatural moisture of the soil was calculated in the laboratory, and thisvalue was used for calibration as well.
Three probes were installed in a profile of 1.5 m in depth as follows:the sensor 1 closest to the surface (−44 cm); the sensor 2 in themiddle(−74 cm); and, the sensor3, thedeepest, is installed at 121 cmfrom thesurface during 2008. During this period four important water-contentincrease events were recorded. The increment of volumetric watercontent (result of the maximum and residual values); response time(time taken to increase 50% of maximum value); depths (depthbetween two probes); velocity of propagation (relation between thedepths between two probes and response times for these probes); andflow (relation between the propagation and increment in watercontent) have been checked. We assumed these measurements inorder to analyze the unsaturated hydraulic conductivity and estimatedthe vertical saturated conductivity.
182 V. Ruiz-Villanueva et al. / Geomorphology 133 (2011) 178–189

Author's personal copy
3.3. Critical rainfall intensity: a generalized quasi-dynamic slope stabilitymodel
The GQDMmodel is built upon a theory of coupled dynamic shallowsubsurfaceflowand landslidingwhichuses the spatial distributionof soilsaturation in response to a rainfall of specified duration on varioussurface types, including soil-mantled elements. In the GQDM for eachelement and for auser-specifieddrainageperiod, a set of pointupslopeofthat element which contributes flow within the specified drainageperiod is computed using a quasi-dynamic wetness index. This yields asimple model capable of incorporating the combined effect of stormdurationand intensity in the triggeringmechanismof shallow landslides.A thorough review of the basis of this model and its applications can beconsulted in Tarolli et al. (2008). The model was applied in the upperslopes of the catchment, in the headwater of Arroyo Cabrera torrent(Fig. 5); this area is the steepest slope area in the entire catchment, and itis the area where the 1997 shallow landslide took place.
This subbasin comprises an area of 3.95 km2 from the 15 km2 of thewhole catchment, themain slope is 30°, and the altitude ranges between1952 and 1056 m a.s.l. Three different surfaces can bedistinguished: thebedrock outcrops, the block deposits and the area where the regolith isdeveloping (Fig. 5). The area where the 1997 shallow landslide tookplace is this last one, where the regolith is developing. Moreover, it isclose to the unconsolidated block deposits caused by freeze–thawactivity, which could contribute to the instability. Regarding to thegeneralized quasi-dynamic wetness index and the slope terms werecomputed by using a 10-m grid-based digital terrain model (DTM),restricted by data availability.
The GQDMmodel was designed to incorporate the spatial variabilityof intensity–duration–frequency (IDF) relationship across the land-scape. Climatic control (further than topographic control) on shallowlandsliding analysis was included in this way. It is possible to relate thecritical rainfall intensity for a set of rainfall duration, establishing athreshold. Intensity–duration (ID) thresholds are the most common
type of thresholds proposed in the literature (Guzzetti et al., 2007). IDthresholds have the general form:
I = c + α·Dβ
Where I is rainfall intensity, D is rainfall duration, and c=0, α , andβ are parameters.
4. Results
4.1. Weathering mantle
Seismic images for profiles 1 and 2 (SP1 and SP2) are given inFig. 6c and d, respectively. The NE-SW trending profiles SP1 and SP2display a depth range of 24 m maximum and 108 m length in total(SP1: 24 m depth and 72 length; SP2: 13 m depth and 36 length).Profiles are well correlated, and the resulting velocity tomographiesindicate a four-layered velocity distribution along the two profiles.
The analysis of the p-wave velocity models and field analysesallowed obtaining the general stratigraphy of soil and bedrock (Fig. 7).The distribution of layers is as follows: (i) a layer of low velocity(lower than 500 m s−1, 1 in Figs. 6 and 7), where the isolines areirregular and non parallel, corresponding to the weathering mantlecomposed mainly of gravels, sands and silts; (ii) a relatively higher-velocity layer (500–2000 m s−1, 2 and 3 in Figs. 6 and 7) representinga fractured granite zone; (iii) a layer characterized by the velocities inthe range of 2000–3500 m s−1 (4 in Figs. 6 and 7) and the transitionzone to the fresh granite rock; (iv) a layer with the highest velocity,corresponding to the fresh rock (5 in Figs. 6 and 7).
The thickness of the weathering mantle ranges between 3 mmaximum (based on SPs) in those areas where the weathering ishighly developed, normally in topographic hollows and 0.3 m in thenoses. Based on these results and the field work (observations carried
Fig. 4. An example of a single raw record of the receiver responses from single source for the weathering mantle in profile 1, in the study area.
183V. Ruiz-Villanueva et al. / Geomorphology 133 (2011) 178–189

Author's personal copy
out mainly in scars, or soil outcrops) an average depth of 2 m wereestablished for the study area.
The result of the geotechnical tests showed that the averagenatural moisture content of the material is 13%, the soil density was
2.68 g cm−3, and the porosity is 43%. As a result of the particle sizedistribution analyses we found an average of 84% sand, 12% silt and 4%clay. The soil type is SW (well graded sand) according to the UnifiedSoil Classification System (type A-1, sands and gravels, following the
Fig. 5. Upper slopes of the Arroyo Cabrera catchment.
Fig. 6. SRT results: comparison between observed and calculated traveltimes, ray coverage plot and velocity models for the profiles 1 and 2.
184 V. Ruiz-Villanueva et al. / Geomorphology 133 (2011) 178–189
Author's personal copy
American Association of State Highway Officials; and loamy-sandfollowing the classification of the United States Department ofAgriculture). Following the proposal of Blijenberg (1995, 2007) andthe results derived from the laboratory tests we established a value of39° of internal friction (Blijenberg gave a range between 31° and 43°of internal friction for similar types of soils).
Furthermore, the role played by vegetation in improving slopestability is well recognized, and comprehensive reviews may befound in the literature (Morgan and Rickson, 1995). Root systemscontribute to soil strength by providing an additional cohesioncomponent (Sidle et al., 2000). While this parameter is quantifiable(Gray and Sotir, 1996), its determination is not always possible(Dietrich andMontgomery, 1998). In the studied area the vegetationis mainly represented by broom. The root system is presented in thefirst 20–30 cm of the soil mantle. It canmean a value of root cohesionof 500 Pa (Miller, 2010). The value for the soil cohesion wasestablished as 1500 Pa, so that the total cohesion used in the modelwas 2000 Pa.
4.2. Weathering mantle moisture variability
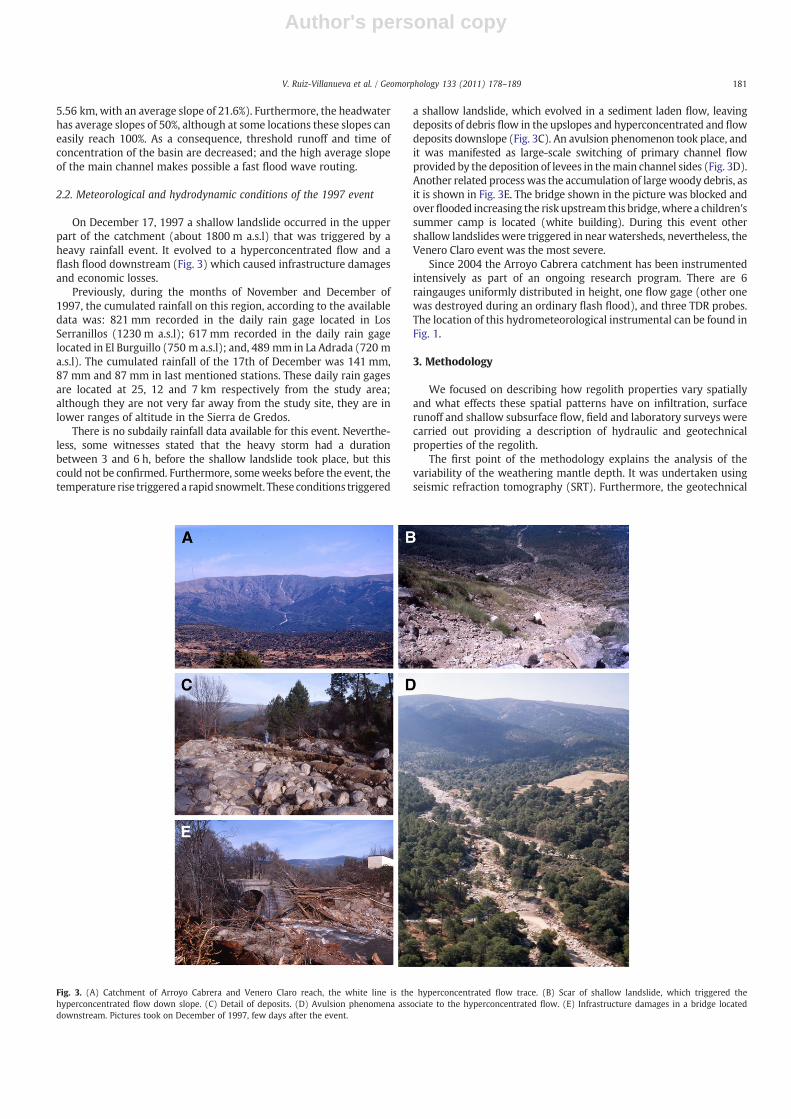
The TDR signals allowed the recording of the temporal and spatialvariability of the volumetric water content (cm3 cm−3) in the weath-ering mantle. This variability was related to the rainfall (mm h−1) dataseries recorded in the raingauge, and the response to this parametercould be observed (Fig. 8).
Fig. 8 shows the variation of average soil moisture in the top 155 cmof soilmeasuredusing theTDRprobesduring2008andalso is shown thehourly rainfall. The peak moisture content was 0.25 cm3 cm−3 duringheavy rainfall. The minimum moisture content is approximately0.1 cm3 cm−3. When the rain stopped soil moisture decreased quickly.
The Sensor 1 is the probe installed closest to the surface (−44 cm),and as Fig. 8 shows, is theprobe that recorded the lowest values ofwatercontent (close to 0.1 cm3 cm−3). The Sensor 2 is the probe located in themiddle (−74 cm), and it recorded the highest values, near to0.25 cm3 cm−3. Finally, the Sensor 3 is installed at 121 cm from thesurface, and it recorded intermediate values (close to 0.2 cm3 cm−3).
Following themethods described before, we calculated the vertical Ksfor this profile of soil, and the result for this parameter was 6.07 m d−1.
4.3. Critical rainfall intensity
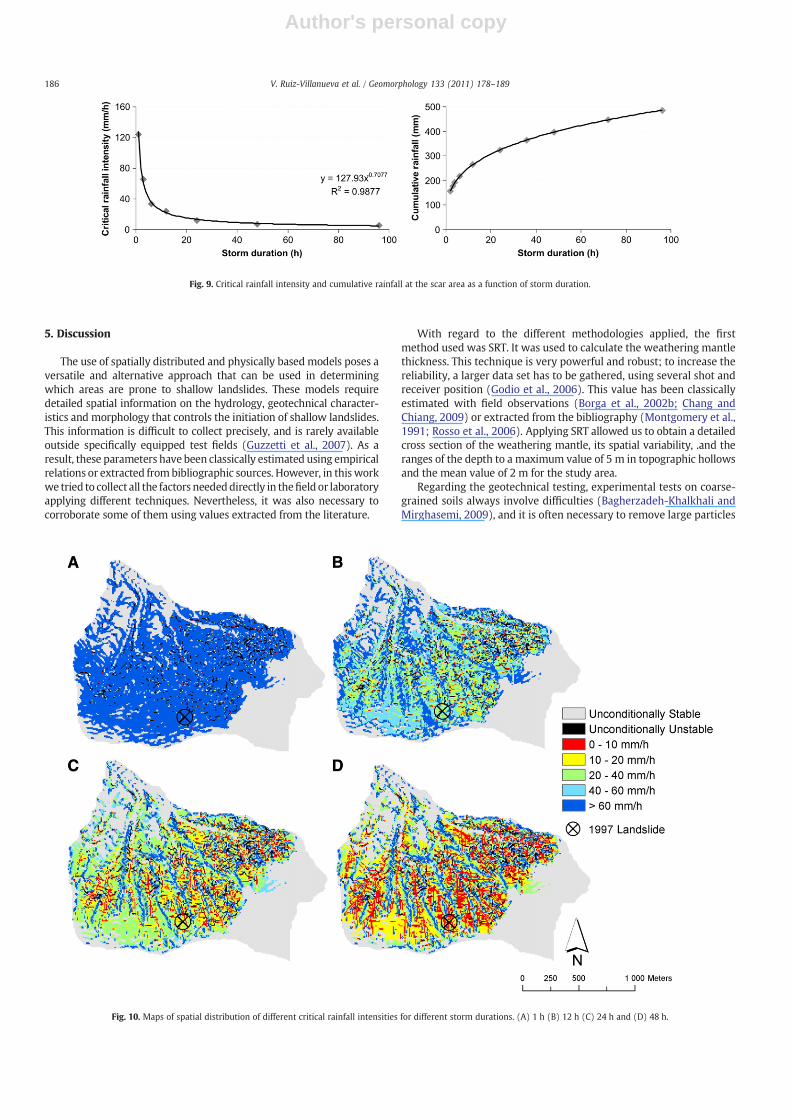
The application of the physically based model and all the above-mentioned techniques allowed us to calculate the critical rainfallintensity for a set of different durations and calculate the ID-threshold.Based on this distribution of these critical rainfall intensities wechecked the values in the 1997 landslide area (Fig. 9), and we foundthe ID-threshold of:
I = 127:93·D−0:7077
The average values across this portion of the catchment used in themodel are: 39° of angle of internal friction, 2000 Pa of total cohesionthe ratio of wet soil bulk density to water density is 1.8, the slopeparallel Ks is 61 m d−1, and the drainable porosity 0.35 m3 m−3.
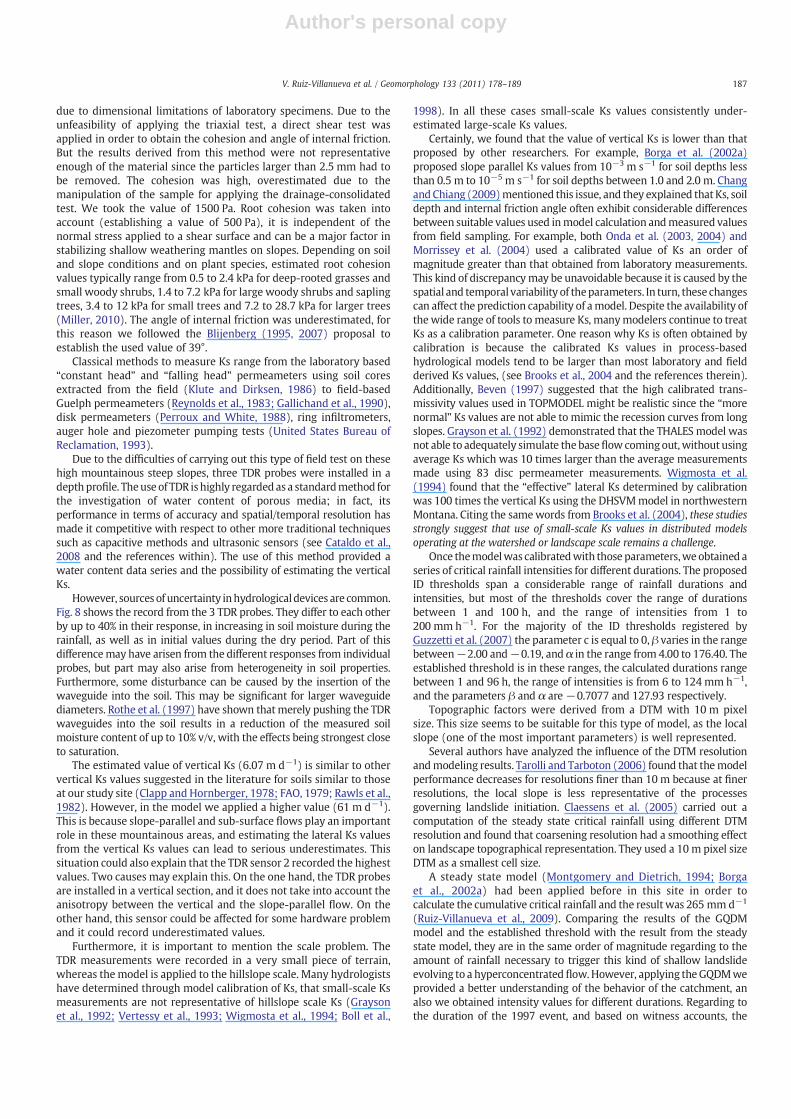
Fig. 10 shows the spatial distribution over the catchment ofdifferent critical rainfall intensities and for different storm durations.This allows understanding how the soil becomes saturated over time,based on the effective drainage area.
Fig. 7. Generalized stratigraphic section of the study site.
Fig. 8. Volumetric water content variability and rainfall data for the studied period.
185V. Ruiz-Villanueva et al. / Geomorphology 133 (2011) 178–189
Author's personal copy
5. Discussion
The use of spatially distributed and physically based models poses aversatile and alternative approach that can be used in determiningwhich areas are prone to shallow landslides. These models requiredetailed spatial information on the hydrology, geotechnical character-istics and morphology that controls the initiation of shallow landslides.This information is difficult to collect precisely, and is rarely availableoutside specifically equipped test fields (Guzzetti et al., 2007). As aresult, these parameters have been classically estimated using empiricalrelations or extracted frombibliographic sources. However, in thisworkwe tried to collect all the factors neededdirectly in thefield or laboratoryapplying different techniques. Nevertheless, it was also necessary tocorroborate some of them using values extracted from the literature.
With regard to the different methodologies applied, the firstmethod used was SRT. It was used to calculate the weathering mantlethickness. This technique is very powerful and robust; to increase thereliability, a larger data set has to be gathered, using several shot andreceiver position (Godio et al., 2006). This value has been classicallyestimated with field observations (Borga et al., 2002b; Chang andChiang, 2009) or extracted from the bibliography (Montgomery et al.,1991; Rosso et al., 2006). Applying SRT allowed us to obtain a detailedcross section of the weathering mantle, its spatial variability, .and theranges of the depth to a maximum value of 5 m in topographic hollowsand the mean value of 2 m for the study area.
Regarding the geotechnical testing, experimental tests on coarse-grained soils always involve difficulties (Bagherzadeh-Khalkhali andMirghasemi, 2009), and it is often necessary to remove large particles
Fig. 9. Critical rainfall intensity and cumulative rainfall at the scar area as a function of storm duration.
Fig. 10. Maps of spatial distribution of different critical rainfall intensities for different storm durations. (A) 1 h (B) 12 h (C) 24 h and (D) 48 h.
186 V. Ruiz-Villanueva et al. / Geomorphology 133 (2011) 178–189
Author's personal copy
due to dimensional limitations of laboratory specimens. Due to theunfeasibility of applying the triaxial test, a direct shear test wasapplied in order to obtain the cohesion and angle of internal friction.But the results derived from this method were not representativeenough of the material since the particles larger than 2.5 mm had tobe removed. The cohesion was high, overestimated due to themanipulation of the sample for applying the drainage-consolidatedtest. We took the value of 1500 Pa. Root cohesion was taken intoaccount (establishing a value of 500 Pa), it is independent of thenormal stress applied to a shear surface and can be a major factor instabilizing shallow weathering mantles on slopes. Depending on soiland slope conditions and on plant species, estimated root cohesionvalues typically range from 0.5 to 2.4 kPa for deep-rooted grasses andsmall woody shrubs, 1.4 to 7.2 kPa for large woody shrubs and saplingtrees, 3.4 to 12 kPa for small trees and 7.2 to 28.7 kPa for larger trees(Miller, 2010). The angle of internal friction was underestimated, forthis reason we followed the Blijenberg (1995, 2007) proposal toestablish the used value of 39°.
Classical methods to measure Ks range from the laboratory based“constant head” and “falling head” permeameters using soil coresextracted from the field (Klute and Dirksen, 1986) to field-basedGuelph permeameters (Reynolds et al., 1983; Gallichand et al., 1990),disk permeameters (Perroux and White, 1988), ring infiltrometers,auger hole and piezometer pumping tests (United States Bureau ofReclamation, 1993).
Due to the difficulties of carrying out this type of field test on thesehigh mountainous steep slopes, three TDR probes were installed in adepthprofile. Theuse of TDR ishighly regarded as a standardmethod forthe investigation of water content of porous media; in fact, itsperformance in terms of accuracy and spatial/temporal resolution hasmade it competitive with respect to other more traditional techniquessuch as capacitive methods and ultrasonic sensors (see Cataldo et al.,2008 and the references within). The use of this method provided awater content data series and the possibility of estimating the verticalKs.
However, sourcesof uncertainty inhydrologicaldevices are common.Fig. 8 shows the record from the 3 TDR probes. They differ to each otherby up to 40% in their response, in increasing in soil moisture during therainfall, as well as in initial values during the dry period. Part of thisdifferencemay have arisen from the different responses from individualprobes, but part may also arise from heterogeneity in soil properties.Furthermore, some disturbance can be caused by the insertion of thewaveguide into the soil. This may be significant for larger waveguidediameters. Rothe et al. (1997) have shown thatmerely pushing the TDRwaveguides into the soil results in a reduction of the measured soilmoisture content of up to 10% v/v, with the effects being strongest closeto saturation.
The estimated value of vertical Ks (6.07 m d−1) is similar to othervertical Ks values suggested in the literature for soils similar to thoseat our study site (Clapp and Hornberger, 1978; FAO, 1979; Rawls et al.,1982). However, in the model we applied a higher value (61 m d−1).This is because slope-parallel and sub-surface flows play an importantrole in these mountainous areas, and estimating the lateral Ks valuesfrom the vertical Ks values can lead to serious underestimates. Thissituation could also explain that the TDR sensor 2 recorded the highestvalues. Two causes may explain this. On the one hand, the TDR probesare installed in a vertical section, and it does not take into account theanisotropy between the vertical and the slope-parallel flow. On theother hand, this sensor could be affected for some hardware problemand it could record underestimated values.
Furthermore, it is important to mention the scale problem. TheTDR measurements were recorded in a very small piece of terrain,whereas the model is applied to the hillslope scale. Many hydrologistshave determined through model calibration of Ks, that small-scale Ksmeasurements are not representative of hillslope scale Ks (Graysonet al., 1992; Vertessy et al., 1993; Wigmosta et al., 1994; Boll et al.,
1998). In all these cases small-scale Ks values consistently under-estimated large-scale Ks values.
Certainly, we found that the value of vertical Ks is lower than thatproposed by other researchers. For example, Borga et al. (2002a)proposed slope parallel Ks values from 10−3 m s−1 for soil depths lessthan 0.5 m to 10−5 m s−1 for soil depths between 1.0 and 2.0 m. ChangandChiang (2009)mentioned this issue, and they explained that Ks, soildepth and internal friction angle often exhibit considerable differencesbetween suitable values used inmodel calculation andmeasured valuesfrom field sampling. For example, both Onda et al. (2003, 2004) andMorrissey et al. (2004) used a calibrated value of Ks an order ofmagnitude greater than that obtained from laboratory measurements.This kind of discrepancymay be unavoidable because it is caused by thespatial and temporal variability of theparameters. In turn, these changescan affect the prediction capability of amodel. Despite the availability ofthe wide range of tools to measure Ks, manymodelers continue to treatKs as a calibration parameter. One reason why Ks is often obtained bycalibration is because the calibrated Ks values in process-basedhydrological models tend to be larger than most laboratory and fieldderived Ks values, (see Brooks et al., 2004 and the references therein).Additionally, Beven (1997) suggested that the high calibrated trans-missivity values used in TOPMODEL might be realistic since the “morenormal” Ks values are not able to mimic the recession curves from longslopes. Grayson et al. (1992) demonstrated that the THALES model wasnot able to adequately simulate the baseflow comingout,without usingaverage Ks which was 10 times larger than the average measurementsmade using 83 disc permeameter measurements. Wigmosta et al.(1994) found that the “effective” lateral Ks determined by calibrationwas 100 times the vertical Ks using the DHSVMmodel in northwesternMontana. Citing the samewords from Brooks et al. (2004), these studiesstrongly suggest that use of small-scale Ks values in distributed modelsoperating at the watershed or landscape scale remains a challenge.
Once themodelwas calibratedwith those parameters,we obtained aseries of critical rainfall intensities for different durations. The proposedID thresholds span a considerable range of rainfall durations andintensities, but most of the thresholds cover the range of durationsbetween 1 and 100 h, and the range of intensities from 1 to200 mm h−1. For the majority of the ID thresholds registered byGuzzetti et al. (2007) the parameter c is equal to 0, β varies in the rangebetween−2.00 and−0.19, and α in the range from 4.00 to 176.40. Theestablished threshold is in these ranges, the calculated durations rangebetween 1 and 96 h, the range of intensities is from 6 to 124 mm h−1,and the parameters β and α are −0.7077 and 127.93 respectively.
Topographic factors were derived from a DTM with 10 m pixelsize. This size seems to be suitable for this type of model, as the localslope (one of the most important parameters) is well represented.
Several authors have analyzed the influence of the DTM resolutionandmodeling results. Tarolli and Tarboton (2006) found that themodelperformance decreases for resolutions finer than 10 m because at finerresolutions, the local slope is less representative of the processesgoverning landslide initiation. Claessens et al. (2005) carried out acomputation of the steady state critical rainfall using different DTMresolution and found that coarsening resolution had a smoothing effecton landscape topographical representation. They used a 10 m pixel sizeDTM as a smallest cell size.
A steady state model (Montgomery and Dietrich, 1994; Borgaet al., 2002a) had been applied before in this site in order tocalculate the cumulative critical rainfall and the resultwas 265 mm d−1
(Ruiz-Villanueva et al., 2009). Comparing the results of the GQDMmodel and the established threshold with the result from the steadystate model, they are in the same order of magnitude regarding to theamount of rainfall necessary to trigger this kind of shallow landslideevolving to a hyperconcentratedflow.However, applying theGQDMweprovided a better understanding of the behavior of the catchment, analso we obtained intensity values for different durations. Regarding tothe duration of the 1997 event, and based on witness accounts, the
187V. Ruiz-Villanueva et al. / Geomorphology 133 (2011) 178–189

Author's personal copy
maximum rainfall intensity appears to have had a duration of 3–6 h. Ifthe storm had this duration, and based on our threshold, the cumulatedcritical rainfall ranged between 176 and 215 mm.
In December of 1997, only three raingauges were recording data inthe nearby area. The rainfall cumulated in the three previous days isshown in Table 1. Since these daily stations are located at loweraltitudes than the study area, the data approximate the regionalrainfall, but probably underestimate the real totals for the study areaitself.
These raingauges are located in lower parts of the region (1230, 750and 720 m a.s.l), comparing with the scar area of the 1997 landslide, at1800 m a.s.l. We analyzed the data series of the Serranillos station, thehighest, from 1931 to 2009, and applying a SQRT-ETmax distribution inorder to find the frequency function.We used this function to estimate areturn period for the 1997 event. We found that for the cumulatedrainfall for durations from 3 to 6 h, the return period is approximatelyfrom 9 to 20 years respectively.
Due to the limited recording of subdaily rainfall amounts in Spainand the short record lengths in some cases the assessment ofintensity–duration–frequency (IDF) relations can be difficult. Salasand Fernandez (2007) provided an approach based on SQRT-ETmaxdistribution to carry out a regional analysis for estimation of the IDFcurves for Spain. If we compare our results with; this work we canrelate a return period to the critical rainfall intensity between 100 and200 years. This regional setting was carried out with data fromsubdaily stations, most of them in very low areas, so we think thatthese values are not representative of real rainfall in the study site.
Six subdaily raingauges have been installed in the study catchmentsince 2004. However, the data series is too short to establish local IDFcurves, but research is on going on this issue. Combining the regionalIDF curves derived from Salas and Fernandez (2007) and theserecords could possibly improve the IDF law for this region.
These stations are uniformly distributed in height, the two highestare located at 1800 and 1600 m a.s.l, called Peña Parda and La Atalayastations, and they were installed in 2005 and 2006 respectively. Inthese 5 years, these raingauges have recorded 3 events higher than100 mm in 24 h (108 mm on 28th October 2005, 106 mm on 24thNovember 2006, and 109 mm on 21th November 2007). These valuesare characteristic of normal winter events.
In Spain a similar ID-threshold was established by Corominas andMoya (1999), however that study was carried out in a differentgeologic, hydrologic and meteorological context in the Pyrenees, forlonger durations.
6. Conclusions
It is demonstrated that the variability of the weathering mantle ingranitic landscapes controls the stability of these areas. These localtypes of landslides can transform into complex sediment laden flowsand flash floods, and because of their devastating consequences,analytical tools for predicting thresholds of triggering precipitationare required in order to assess hazards resulting from these processes.
The use of the GQDM is a very effective tool, and the parameterisa-tion based on different field and laboratory methods is essential for itsimplementation.
The estimation of the critical rainfall intensity allowed the assess-ment of rainfall Intensity–Duration threshold (I=127.93·D−0.7077) for
shallow landslide in this area. This is the first time that an ID-thresholdhas been established for this region of the Spanish Central System.
Acknowledgments
The authors want to express their gratitude to the Ministry ofScience and Innovation, for financial support. This work was fundedby CICYT, Dendro-Avenidas project (CGL2007-62063) and for theGeological Survey of Spain. We are grateful to the Tagus WaterAuthority, Environment Department of Castilla y León in Ávila, andNavaluenga Council for their collaboration. We want to address ourspecial thanks to forester José Luis Galán for his assistance in the field.Furthermore we would like to acknowledge the contributions of theSoil Mechanics Laboratory of the Geological Survey of Spain (AnaGimeno and Amelia Rubio) and Paloma Fernández (UniversityComplutense of Madrid). Last but not least, we offer our gratitudeto Paolo Tarolli for discussions and suggestions, Marco Borga, TomVeldkamp, Karl Chang and Adrian Harvey for their reviews whichsignificantly improved and refine this paper.
References
Acharya, G., De Smedt, F., Long, N.T., 2006. Assessing landslide hazard in GIS: a casestudy from Rasuwa, Nepal. Bulletin of Engineering Geology and the Environment65, 99–107.
Bagherzadeh-Khalkhali, A., Mirghasemi, A.A., 2009. Numerical and experimental directshear tests for coarse-grained soils. Particuology 7, 83–91.
Baker, S.B., 2002. Near Surface Seismic Refraction Tomography Tutorial, SupplementaryReport. UB Geophysics.
Baker, J.M., Allmaras, R.R., 1990. System for automating and multiplexing soil-moisturemeasurement by time-domain reflectometry. Soil Science Society of AmericaJournal 54, 1–6.
Ballesteros-Cánovas, J.A., Eguibar, M., Bodoque, J.M., Díez-Herrero, A., Stoffel, M.,Gutiérrez-Pérez, I., 2011. Estimating flash flood discharge in an ungaugedmountaincatchment with 2D hydraulic models and dendrogeomorphic paleostage indicator.Hydrological Processes 25, 970–979.
Barling, D.B., Moore, I.D., Grayson, R.B., 1994. A quasi-dynamic wetness index forcharacterising the spatial distribution of zones of surface saturation and soil watercontent. Water Resources Research 30, 1029–1044.
Beven, K., 1997. TOPMODEL: a critique. Hydrological Processes 11, 1069–1085.Blijenberg, H.M., 1995. In-situ strength tests of coarse, cohesionless debris on scree
slopes. Engineering Geology 39, 137–146.Blijenberg, H.M., 2007. Application of physical modelling of debris flow triggering to
field conditions: limitations posed by boundary conditions. Engineering Geology91, 25–33.
Boll, J., Brooks, E.S., Campbell, C.R., Stockle, C.O., Young, S.K., Hammel, J.E., McDaniel,P.A., 1998. Progress toward development of a GIS based water quality managementtool for small rural watersheds: modification and application of a distributedmodel. Annual InternationalMeeting. American Society of Agricultural Engineers,Orlando.
Borga, M., Fontana, G.D., Gregoretti, C., Marchi, L., 2002a. Assessment of shallowlandsliding by using a physically based model of hillslope satability. HydrologicalProcesses 16, 1833–2851.
Borga, M., Fontana, G.D., Cazorzi, F., 2002b. Analysis of topographic and climatic controlon rainfall-triggered shallow landsliding using a quasy-dynamic wetness index.Journal of Hydrolgy 265, 56–71.
Brooks, S.M., Crozier, M.J., Glade, T.W., Anderson, M.J., 2004. Towards establishingclimatic thresholds for slope instability: use of a physically-based combined soilhydrology-slope stability model. Pure and Applied Geophysics 161, 881–905.
Campbell, G.S., 1985. Soil Physics with BASIC. Elsevier, New York.Cataldo, A., Tarricone, L., Vallone, M., Attivissimo, F., Trotta, A., 2008. Uncertainty
estimation in simultaneous measurements of levels and permittivities of liquidsusing TDR technique. Transactions on Instrumentation and Measurement, IEEE 57,454–466.
Cerny, R., 2009. Time-domain reflectometry method and its application for measuringmoisture content in porous materials: a review. Measurements 42, 329–336.
Chang, K.T., Chiang, S.H., 2009. An integrated model for predicting rainfall-inducedlandslides. Geomorphology 105, 366–373.
Claessens, L., Heuvelink, G.B.M., Schoorl, J.M., Veldkamp, A., 2005. DEM resolutioneffects on shallow landslide hazard and soil redistribution modelling. Earth SurfaceProcesses and Landforms 30, 461–477.
Clapp, R.B., Hornberger, G.M., 1978. Empirical equations for some soil hydraulic-properties. Water Resources Research 14, 601–604.
Corominas, J., Moya, J., 1999. Reconstructing recent landslide activity in relation torainfall in the Llobregat River basin, Eastern Pyrenees, Spain. Geomorphology 30,79–93.
D'Odorico, P., Fagherazzi, S., Rigon, R., 2005. Potential for landsliding: dependence onhyetograph characteristics. Journal of Geophysical Research-Earth Surface 110.
Dhakal, A.S., Sidle, R.C., 2004. Distributed simulations of landslides for different rainfallconditions. Hydrological Processes 18, 757–776.
Table 1Cumulated rainfall in the three previous days (16, 17 and 18 of December 1997), andtotal rainfall in these days, in the three raingauges located near the catchment.
16Dec 17Dec 18Dec Total
Serranillos 95 141.6 57 244.1Burguillo 13.4 87.9 10.6 111.9Adrada 54.5 87 28.5 170
188 V. Ruiz-Villanueva et al. / Geomorphology 133 (2011) 178–189

Author's personal copy
Dietrich, W.E., Montgomery, D.R., 1998. SHALSTAB: a digital terrain model for mappingshallow landslide potential. National Council of the Paper Industry for Air andStream Improvement.
Díez-Herrero, A., 2003. Geomorfología e Hidrología fluvial del río Alberche. Modelos ySIG para la gestión de riberas. Serie Tesis Doctorales 2. Publicaciones del InstitutoGeológico y Minero de España (Ministerio de Ciencia y Tecnología, Madrid. 587 pp.
FAO, 1979. Soil survey investigation for irrigation. FAO Soils Bulletin 42.Gallichand, J., Madramootoo, C.A., Enright, P., Barrington, S.F., 1990. An evaluation of the
Guelph permeameter for measuring saturated hydraulic conductivity. AmericanSociety of Agricultural Engineers 33, 1179–1184.
Godio, A., Strobbia, C., De Bacco, G., 2006. Geophysical characterisation of a rockslide inan alpine region. Engineering Geology 83, 273–286.
Gray, D.H., Sotir, R.B., 1996. Biotechnical and Soil Bioengineering Slope Stabilization.Wiley, New York. 378 pp.
Grayson, R.B., Moore, I.D., McMahon, T.A., 1992. Physically based hydrologic modeling:1. A terrain-based model for investigative purposes. Water Resources Research 28,2639–2658.
Guzzetti, F., Peruccacci, S., Rossi, M., Stark, C.P., 2007. Rainfall thresholds for theinitiation of landslides in central and southern Europe. Meterology and Atmo-spheric Physics 98, 239–267.
Hack, R., 2000. Geophysics for slope stability. Survey in Geophysics 21, 423–448.Heimovaara, T.J., Bouten, W., 1990. A computer-controlled 36-channel time domain
reflectometry system for monitoring soil-water contents. Water ResourcesResearch 26, 2311–2316.
Hoffmann, T., Schrott, L., 2003. Determining sediment thickness of talus slopes andvalley fill deposits using seismic refraction: a comparison of 2D interpretation tools.Zeitschrift für Geomorphologie 132, 71–87.
Iverson, R.M., 2000. Landslide triggering by rain infiltration. Water Resources Research36, 1897–1910.
Iverson, R.M., Reid, M.E., Lahusen, R.G., 1997. Debris-flow mobilization from landslides.Annual Review of Earth and Planetary Sciences 25, 85–136.
Klute, A., Dirksen, C., 1986. Hydraulic conductivity and diffusivity: laboratory methods.In: Klute, A. (Ed.), Methods of Soil Analysis, Part 1, Physical and MineralogicalMethods: Soil Science Society of America and American Society of Agronomy, 9,pp. 687–734.
Malet, J.P., Laigle, D., Remaˆıtre, A., Maquaire, O., 2005. Triggering conditions of debris-flows associated to complex earthflows. The case of the Super-Sauze earthflow(South Alps, France). Geomorphology 66, 215–235.
Miller, S.M., 2010. Getting to the root of erosion control, vegetation's influence on slopestability. Storm Water Solutions 4–3.
Montgomery, D.R., Dietrich, W.E., 1994. A physically based model for the topographiccontrol on shallow landsliding. Water Resources Research 30, 1153–1171.
Montgomery, D.R., Wright, R.H., Booth, T., 1991. Debris flow hazard mitigation forcolluvium-filled swales. Bulletin of the Association of Engineering Geologists 28,303–323.
Morgan, R.P.C., Rickson, R.J., 1995. Slope Stabilization and Erosion Control. E&FN SPONChapmann and Hall, London, Glasgow, Weinheim, New York, Tokyo, Melbourne,Madras. 274 pp.
Morrissey, M.M., Wieczorek, G.F., Morgan, B.A., 2004. Transient hazard model usingradar data for predicting debris flows in Madison County, Virginia. Environmentaland Engineering Geoscience 10, 285–296.
O’Loughlin, E.M., 1986. Prediction of surface saturation zones in natural catchments bytopographic analysis. Water Resources Research 22, 794–804.
Onda, Y., Mizuyama, T., Kato, Y., 2003. Judging the time of rainfall-triggered debris flowsby monitoring runoff. Proceedings of the Third International Conference on Debris-Flow Hazard Mitigation, pp. 147–153. Davos Switzerland.
Onda, Y., Tsujimura, M., Tabuchi, H., 2004. The role of subsurface water flow paths onhillslope hydrological processes, landslides and landform development in steepmountains of Japan. Hydrological Processes 18, 637–650.
Palacios, D., Garcia, R., Rubio, V., Vigil, R., 2003. Debris flows in a weathered graniticmassif: Sierra de Gredos, Spain. Catena 51, 115–140.
Palacios, D., Marcos, J., Vázquez-Selem, L., 2011. Last glacial maximum and deglaciation ofSierra de Gredos, Central Iberian Peninsula. Quaternary Internacional 233, 16–26.
Perroux, K.M., White, I., 1988. Designs for disc permeameters. Soil Science Society ofAmerica Journal 52, 1205–1215.
Rawls, W.J., Brakensiek, D.L., Saxton, K.E., 1982. Estimation of soil water properties.Transactions American Society of Agricultural Engineers 108, 1316–1329.
United States Bureau of Reclamation, 1993. Drainage Manual. United StatesGovernment Printing Office, Washington, D. C, pp. 61–119.
Reynolds, W.D., Elrick, D.E., Topp, G.C., 1983. A reexamination of the constant head wellpermeameter method for measuring saturated hydraulic conductivity above thewater table. Soil Science 136, 250–286.
Rosso, R., Rulli, M.C., Vannucchi, G., 2006. A physically based model for the hydrologiccontrol on shallow landsliding. Water Resources Research 42, W06410.
Rothe, A., Weis, W., Kreutzer, K., Matthies, D., Hess, U., Ansorge, B., 1997. Changes in soilstructure caused by the installation of time domain reflectometry probes and theirinfluence on the measurement of soil moisture. Water Resources Research 33,1585–1593.
Ruiz-Villanueva, V., Bodoque, J.M., Fernández-García, P., Díez-Herrero, A., Calvo-Martínez, C.M., 2009. Rainfall triggered hyperconcentrated flow in the CabreraStream catchment (Spanish Central System) in December 1997. Abstracts of thecontributions of the European Geosciences Union General Assembly 2009.Geophysical Research Abstracts 11 EGU2009-5730-3.
Salas, L., Fernandez, T., 2007. “In-site” regionalization to estimate an intensity–duration–frequency law: a solution to scarce spatial data in Spain. HidrologicalProcesses 21, 3507–3513.
Schrott, L., Sass, O., 2008. Application of field geophysics in geomorphology: advancesand limitations exemplified by case studies. Geomorphology 93, 55–73.
Schuster, G.T., Quintus-Bosz, A., 1993. Wavepath eikonal traveltime inversion. TheoryGeophysics 58, 1314–1323.
Sidle, R.C., Tsuboyama, Y., Noguchi, S., Hosoda, I., Fujieda, M., Shimizu, T., 2000.Stormflow generation in steep forested headwaters: a linked hydrogeomorphicparadigm. Hydrological Processes 14, 369–385.
Tarolli, P., Tarboton, D.G., 2006. A new method for determination of most likelylandslide initiation points and the evaluation of digital terrain model scale interrain stability mapping. Hydrology and Earth System Sciences 10, 663–677.
Tarolli, P., Borga, M., Dalla Fontana, G., 2008. Analysing the influence of upslope bedrockoutcrops on shallow landsliding. Geomorphology 93, 186–200.
Topp, G.G., Davis, J.L., Annan, A.P., 1980. Electromagnetic determinationof soilwater content:measurement in coaxial tranmission lines. Water Resources Research 16, 574–582.
Van Genuchten, M.T., 1980. A clossed form equation for predicting the hydraulicconductivity of unsaturated soils. Soil Science Society of America Journal. 44,892–898.
Vertessy, R.A., Hatton, T.J., O'Shaughnessy, P.J., Jayasuriya, M.D.A., 1993. Predictingwater yield from a mountain ash forest catchment using a terrain analysis basedcatchment model. Journal of Hydrology 150, 665–700.
Wieczorek, G.F., 1987. Effect of rainfall intensity and duration on debris flows in thecentral Santa Cruz Mountains, California. In: Costa, J.E., Wieczorek, G.F. (Eds.),Debris Flows/Avalanches: Process, Recognition, and Mitigation. Geological Societyof America, Boulder, CO, pp. 93–104.
Wigmosta, M.S., Vail, L.W., Lettenmaier, D.P., 1994. A distributed hydrology-vegetationmodel for complex terrain. Water Resources Research 30, 1642–1665.
189V. Ruiz-Villanueva et al. / Geomorphology 133 (2011) 178–189
Copyright © 2022 FDOKUMEN