Susceptibility and triggering scenarios at a regional scale for shallow landslides
21
This article appeared in a journal published by Elsevier. The attached copy is furnished to the author for internal non-commercial research and education use, including for instruction at the authors institution and sharing with colleagues. Other uses, including reproduction and distribution, or selling or licensing copies, or posting to personal, institutional or third party websites are prohibited. In most cases authors are permitted to post their version of the article (e.g. in Word or Tex form) to their personal website or institutional repository. Authors requiring further information regarding Elsevier’s archiving and manuscript policies are encouraged to visit: http://www.elsevier.com/copyright
-
Upload
independent -
Category
Documents
-
view
1 -
download
0
Transcript of Susceptibility and triggering scenarios at a regional scale for shallow landslides

This article appeared in a journal published by Elsevier. The attachedcopy is furnished to the author for internal non-commercial researchand education use, including for instruction at the authors institution
and sharing with colleagues.
Other uses, including reproduction and distribution, or selling orlicensing copies, or posting to personal, institutional or third party
websites are prohibited.
In most cases authors are permitted to post their version of thearticle (e.g. in Word or Tex form) to their personal website orinstitutional repository. Authors requiring further information
regarding Elsevier’s archiving and manuscript policies areencouraged to visit:
http://www.elsevier.com/copyright

Author's personal copy
Susceptibility and triggering scenarios at a regional scale forshallow landslides
G. Gullà, L. Antronico ⁎, P. Iaquinta, O. Terranova
National Research Council, Research Institute for Geo-Hydrologic Protection, Via Cavour 4-6, 87036 Rende, Italy
Received 23 May 2007; received in revised form 9 October 2007; accepted 10 October 2007Available online 23 October 2007
Abstract
The work aims at identifying susceptible areas and pluviometric triggering scenarios at a regional scale in Calabria (Italy), with reference toshallow landsliding events. The proposed methodology follows a statistical approach and uses a database linked to a GIS that has been created tosupport the various steps of spatial data management and manipulation. The shallow landslide predisposing factors taken into account are derivedfrom (i) the 40-m digital terrain model of the region, an ∼15,075 km2 extension; (ii) outcropping lithology; (iii) soils; and (iv) land use. Moreprecisely, a map of the slopes has been drawn from the digital terrain model. Two kinds of covers [prevalently coarse-grained (CG cover) or fine-grained (FG cover)] were identified, referring to the geotechnical characteristics of geomaterial covers and to the lithology map; soilscapes weredrawn from soil maps; and finally, the land use map was employed without any prior processing.
Subsequently, the inventory maps of some shallow landsliding events, totaling more than 30,000 instabilities of the past and detected by fieldsurveys and photo aerial restitution, were employed to calibrate the relative importance of these predisposing factors.
The use of single factors (first level analysis) therefore provides three different susceptibility maps. Second level analysis, however, enablesbetter location of areas susceptible to shallow landsliding events by crossing the single susceptibility maps.
On the basis of the susceptibility map obtained by the second level analysis, five different classes of susceptibility to shallow landsliding eventshave been outlined over the regional territory: 8.9% of the regional territory shows very high susceptibility, 14.3% high susceptibility, 15%moderate susceptibility, 3.6% low susceptibility, and finally, about 58% very low susceptibility.
Finally, the maps of two significant shallow landsliding events of the past and their related rainfalls have been utilized to identify the relevantpluviometric triggering scenarios. By using 205 daily rainfall series, different triggering pluviometric scenarios have been identified with referenceto CG and FG covers: a value of 365 mm of the total rainfall of the event and/or 170 mm/d of the rainfall maximum intensity and a value of325 mm of the total rainfall of the event and/or 158 mm/d of the rainfall maximum intensity are able to trigger shallow landsliding events for CGand FG covers, respectively.
The results obtained from this study can help administrative authorities to plan future development activities and mitigation measures inshallow landslide-prone areas. In addition, the proposed methodology can be useful in managing emergency situations at a regional scale forshallow landsliding events triggered by intense rainfalls; through this approach, the susceptibility and the pluviometric triggering scenario mapswill be improved by means of finer calibration of the involved factors.© 2007 Elsevier B.V. All rights reserved.
Keywords: Shallow landslide; Susceptibility; Rainfall; GIS; Calabria
1. Introduction
Shallow landslides are common in almost every area of theworld and affect different geoenvironmental contexts in termsof climate, lithology, soil cover, slope morphology, vegetation,etc. The dangerousness of these phenomena, because of theirrapid kinematic evolution and large areal diffusion, has beenfrequently pointed out in the literature. Rainfall is their main
Available online at www.sciencedirect.com
Geomorphology 99 (2008) 39–58www.elsevier.com/locate/geomorph
⁎ Corresponding author. Tel.: +39 984 835478; fax: +39 984 835319.E-mail addresses: [email protected] (G. Gullà),
[email protected] (L. Antronico), [email protected](P. Iaquinta), [email protected] (O. Terranova).
0169-555X/$ - see front matter © 2007 Elsevier B.V. All rights reserved.doi:10.1016/j.geomorph.2007.10.005
Author's personal copy
triggering cause. Frequently, a number of shallow landslides areobserved during a single rainy season in the same area. Amongthe predisposing factors, a key role is played by the morpho-logical characteristics of the slope, by the geotechnical charac-teristics of the geomaterials where shallow landslides develop,as well as by the impact of anthropic activities on a given area.As far as soils are concerned, these phenomena have beenobserved to specifically affect eluvial and/or colluvial deposits;degraded and/or weathered sedimentary and crystalline–metamorphic rocks; as well as glacial, fluvial and glacial, andpyroclastic deposits (Govi and Mortara, 1981; Moser andHohensinn, 1983/84; Loye-Pilot, 1984; Ogura and Filho, 1991;Van Asch and Sukmantalya Kesumajaya, 1993; Aleotti et al.,1996; Wieczorek et al., 2001; D'Amato Avanzi et al., 2004).
The triggering mechanisms of landsliding phenomena andtheir evolution cause severe risk for a number of vulnerableelements (houses and buildings, roads, railway infrastructures,telecommunication systems, etc.). In order to be effective, riskmitigation measures should focus on the identification andaccurate definition of areas susceptible to shallow landslides. Inthe literature, several methods are proposed to evaluate thelandsliding susceptibility of an area, such as landslide inven-tories, heuristic approaches, statistical analyses, and determi-nistic approaches (Soeters and van Westen, 1996; Aleotti andChowhury, 1999; Ermini et al., 2005). Surveys and observationsthat are subject to individual interpretation are the basis of thefirst two approaches; the third approach can be better employedin homogeneous zones or in areas with only a few types of slopeinstability processes (Ermini et al., 2005). The latter isessentially a geotechnical approach; therefore, data relevant tothe geometry of involved slopes are needed, along with datarelated to the critical condition of pore-water pressure and to thephysical and mechanical characteristics of involved geomater-ials. The Artificial Neural Networks, the Fuzzy logic approach,and Logistic Regression Analyses can be encompassed withinthe framework of statistical approaches (Carrara and Guzzetti,1995; Soeters and van Westen, 1996; Aleotti and Chowhury,1999; Casagli et al., 1999; Clerici et al., 2002; Sorriso-Valvo,2002; Pike et al., 2003; Ercanoglu and Gokceoglu, 2004; Erminiet al., 2005; Greco et al., 2007). Important contributions by Canet al. (2005), Gomez and Kavzoglu (2005), Guinau et al. (2005),and Guzzetti et al. (2006) are specifically useful for thestatistical approach and, in particular, in relation to the problemof shallow landslides.
Calabria (southern Italy) is affected by superficial land-sliding phenomena triggered by intense precipitation, thatinvolves almost all outcropped lithologies. Research carried outover different areas and sites in Calabria (Antronico and Gullà,2000; Antronico et al., 2002, 2004; Sorriso-Valvo et al., 2004)have produced results that are the basic elements of this study,i.e., susceptibility to shallow landsliding and triggeringscenarios at a regional scale.
After describing the predisposing factors and the triggeringcauses of observed phenomena, the study focuses on knowledgenecessary to develop the methodology used to identify areassusceptible to superficial landsliding on natural slopes and theirpotential triggering scenarios. The discussion of the results
obtained provides useful information for the systematic use ofthe proposed methodology and its improvement.
2. Geoenvironmental features
2.1. Geological and geomorphological sketches
The geological complexity of Calabria is the result of thetectonic history of the region during its formation. Almost theentire region is made up of crystalline–metamorphic nappeunits, defined as Calabrian Arc (Amodio-Morelli et al., 1976;Tortorici, 1982). The Calabrian Arc is an arcuate portion of thesouthern Apennine–Maghrebian orogenic belt (trending NW–SE and E–W, respectively). It is considered a fragment of aEurope-vergent Alpine range, overthrust as a unit during theLower Miocene on the African-vergent Apennine–Maghrebianrange during its formation (Amodio-Morelli et al., 1976;Bonardi et al., 1982; Tortorici, 1982). Its formation is alsorelated to the opening of the Tyrrhenian Sea.
During the Late Pliocene–Early Quaternary times, theCalabrian Arc has been dissected by several normal faultsegments, both longitudinally (from NE–SW to NNW–SSE)and transversally (from E–W to WNW–ESE) with respect tothe trend of the arc (Ghisetti, 1979; Monaco and Tortorici, 2000;Tortorici et al., 2002). These structures caused the fragmenta-tion of the Calabrian Arc into sedimentary basins (Crati basin,Catanzaro basin, Mesima–Gioia Tauro basin) where continentaland marine sediments settled; fragmentation also caused theformation of structural highs (Coastal Range, Sila Massif, CapoVaticano high, Aspromonte–Serre Massif).
Since the Middle Pleistocene, the whole Calabrian Arc wasaffected by a strong regional phase of extension, together withan intense regional uplifting (Tortorici et al., 1995; Monacoet al., 1996). This rapid Quaternary uplift of Calabria, combinedwith the eustatic absolute sea level changes, generated severalorders of marine terraces evident along the coasts and in thetectonic valleys. Tectonic uplifting is still an ongoing process,witnessed by the intense seismic activity of the region(Westaway, 1993; Tortorici et al., 2002).
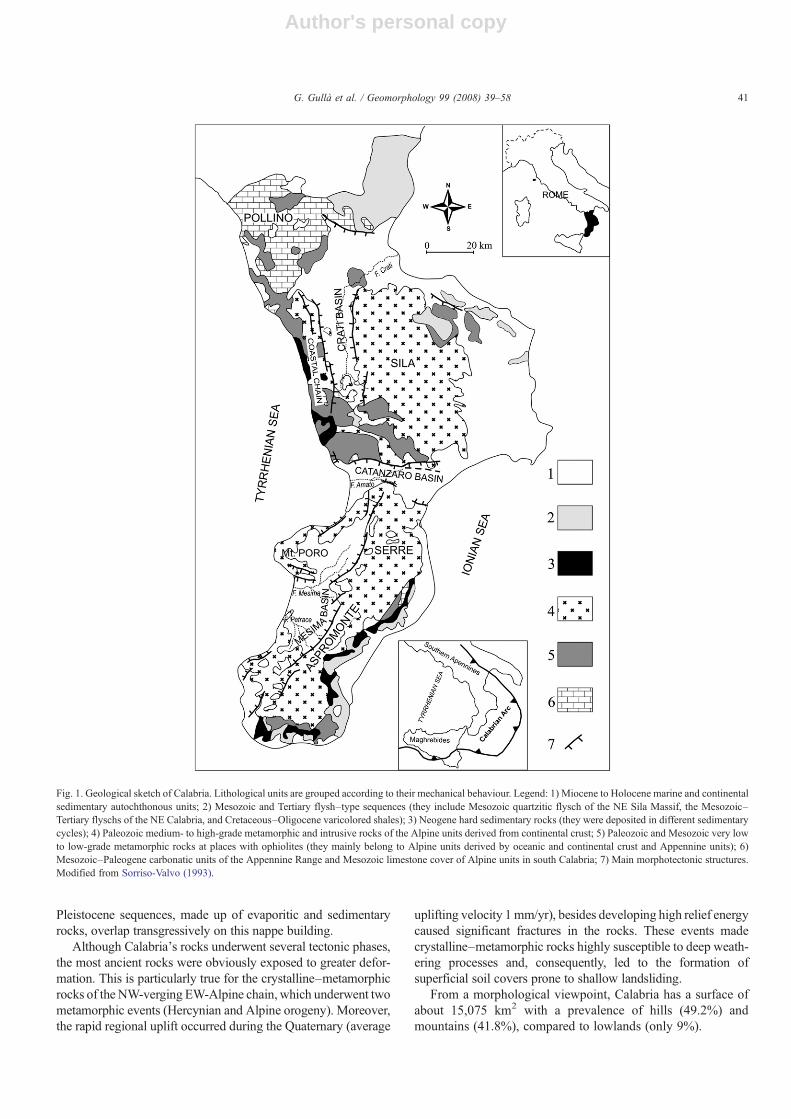
From a geological point of view and considering its structuralhighs and subsiding basins originated since the Pliocene,Calabria could be divided into two different sectors (Fig. 1).
The first sector in the north is formed by nappe units made upof granite rocks and by high- and low-grade metamorphic andophiolitic rocks (Coastal Chain and the Sila Massif). Thesenappe are laid on carbonatic units belonging to the AppenineChain; and the carbonatic units outcrop in the Pollino Massifand in the Coastal Chain. Marine and continental deposits,dating back to the Early Tortonian–Early Pliocene and to theMiddle–Upper Pliocene–Pleistocene, are laid transgressivelyon these nappe units.
The southern sector, which includes the Serre and theAspromonte Massifs, is formed by a series of nappes made upof granitic and metamorphic rocks, as well as by a sequence ofarenaceous–conglomeratic and arenaceous–pelitic turbidites andvaricoloured scaly clays, marls, limestones and sandstones withchaotic structure. Tortonian, Early Pliocene, and Upper Pliocene–
40 G. Gullà et al. / Geomorphology 99 (2008) 39–58
Author's personal copy
Pleistocene sequences, made up of evaporitic and sedimentaryrocks, overlap transgressively on this nappe building.
Although Calabria's rocks underwent several tectonic phases,the most ancient rocks were obviously exposed to greater defor-mation. This is particularly true for the crystalline–metamorphicrocks of the NW-verging EW-Alpine chain, which underwent twometamorphic events (Hercynian and Alpine orogeny). Moreover,the rapid regional uplift occurred during the Quaternary (average
uplifting velocity 1mm/yr), besides developing high relief energycaused significant fractures in the rocks. These events madecrystalline–metamorphic rocks highly susceptible to deep weath-ering processes and, consequently, led to the formation ofsuperficial soil covers prone to shallow landsliding.
From a morphological viewpoint, Calabria has a surface ofabout 15,075 km2 with a prevalence of hills (49.2%) andmountains (41.8%), compared to lowlands (only 9%).
Fig. 1. Geological sketch of Calabria. Lithological units are grouped according to their mechanical behaviour. Legend: 1) Miocene to Holocene marine and continentalsedimentary autochthonous units; 2) Mesozoic and Tertiary flysh–type sequences (they include Mesozoic quartzitic flysch of the NE Sila Massif, the Mesozoic–Tertiary flyschs of the NE Calabria, and Cretaceous–Oligocene varicolored shales); 3) Neogene hard sedimentary rocks (they were deposited in different sedimentarycycles); 4) Paleozoic medium- to high-grade metamorphic and intrusive rocks of the Alpine units derived from continental crust; 5) Paleozoic and Mesozoic very lowto low-grade metamorphic rocks at places with ophiolites (they mainly belong to Alpine units derived by oceanic and continental crust and Appennine units); 6)Mesozoic–Paleogene carbonatic units of the Appennine Range and Mesozoic limestone cover of Alpine units in south Calabria; 7) Main morphotectonic structures.Modified from Sorriso-Valvo (1993).
41G. Gullà et al. / Geomorphology 99 (2008) 39–58

Author's personal copy
The lowland area is mainly represented by coastal plains;with the exception of the three major coastal plains of the mainstream channels – in terms of length and discharge (Crati,Amato, Mesima and Petrace Rivers) – the majority of theseplains lie parallel to the coast and are not very extended. Theseareas are characterized by clayey and silty–sandy deposits(Holocene–Pleistocene).
A substantial part of the territory is made up of hills, mainlydeveloped on sedimentary deposits of the Upper Miocene–Pliocene and characterized by an overall gentle landscape,which however can be very rough because of the tendency ofsome terrains to develop badlands morphology. In general, themain processes of these areas are characterized by both shallowlandslides and larger size landslides, as well as by erosion.
The mountainous part of the territory, characterized by steepacclivity and peaks over 1500 m asl, is represented by thePollino Massif, the Coastal Chain, the Sila Massif, and theSerre–Aspromonte system (from north to south). These areasare essentially characterized by crystalline–metamorphic rockswhere the weathering grade varies according to the outcroppinglithotypes. The most widespread phenomena in this part of theterritory are often large-sized landslides and deep-seatedgravitational slope deformation (DGSD) (Sorriso-Valvo andTansi, 1996).
Because of the orographic characteristics of the region (itselongated shape and the short distance between the mainmountain systems and the sea), the hydrography (controlled bythe major tectonic structures) displays a large number of basinsof limited extension. Watercourses, generally developed oversteep slopes and flowing on plains for very limited stretches,exert continuous erosion and undercutting of the slopes.
In general, the complex geological characteristics of theregion, along with the strong seasonal contrast from a climaticviewpoint (Mediterranean climate) and the intense seismic andanthropic activity, all play a key role in making slopes prone toinstability. In fact, landslides of small and large size as well aserosion processes are very common in this region. Recentunpublished studies carried out on wide sample areas allow us
to estimate that about 20% of the regional territory is affected bylandslide incidence; in regard to water soil erosion, about 2 mm/yr on average was estimated by ARSSA (2005).
2.2. Climate
Calabrian climate is Csa in Köppen's (1948) classification,with dry and hot summers and low average temperatures. Thestrong seasonal contrast is enhanced by rapid climate changesfrom one season to the other. In the dry season (April to Septem-ber), rainfall represents 20–30% of the yearly total precipitation,about 1150 mm. The mean annual temperature ranges from 5 °Con the Pollino Range, with 10 °C on the mountain slopes to 18 °Calong the coast. The average temperature in July is over 22 °C andrainfall may be 0. The maximum daily temperature may exceed40 °C on some days in July and August. The average temperaturein January is about 10 °C along the coasts and 4 °C in themountains; above 1500 and 1700 m asl on the Sila andAspromonte Massifs, respectively, the average temperature mayfrequently be below 0 °C. In summer, the temperature is moreevenly distributed with values around 24 °C. All over Calabria,the temperature is linearly correlated with elevation, with anaverage gradient of −0.748 °C/hm on the Ionian side and−0.610 °C/hm on the Tyrrhenian side (Catani et al., 1995).
The precipitation regime is strongly influenced by theorography (Bellecci et al., 2002) from fronts transversallyapproaching the Calabrian peninsula and convective cellsclimbing up the steep seaside slopes of the mountain chains.In all seasons, low-pressure conditions cause intensive andlong-lasting storms brought by warm air fronts approachingfrom the SE. In winter, extremely intense rainfalls are caused bycold air fronts approaching Calabria from the NW; in the shortspring, the weather is highly unstable with lower rainfall; insummer, strong convective storms are frequent; and in autumn,intense precipitations are caused by cold air fronts that mayapproach from the NE.
In Fig. 2, the pattern of the pluviometric Angot coefficient(Pinna, 1977) is shown for the rain gauge stations in Calabria. The
Fig. 2. Average values of the Angot's coefficients (q=m / (P⁎n /365), where m=monthly rainfall, P=the annual rainfall and n=N° of days in a month), and standarddeviations of the monthly rainfall relevant to the 313 rain gauge stations distributed in the Calabrian regional territory. The yearly rainfall, averaged and weighted overthe regional territory and along the observation periods, is about 1076 mm.
42 G. Gullà et al. / Geomorphology 99 (2008) 39–58

Author's personal copy
Angot coefficient is defined asm / (P ·n / 365), wherem=monthlyrainfall, P=yearly rainfall, and n=number of days in a month.
Yearly average rainfall is indeed N2000 mm on the CoastalChain and the Aspromonte, whereas precipitation on the Ionianmountain slopes is between 600 and 1000 mm/yr, with valuesb500 mm/yr along the coastal plains.
Territorial distribution of the average annual rainfall, theaverage number of annual rainy days, and a “normal rainy day”i.e., the ratio between the two previous value, (Terranova,2004a) is shown in Fig. 3.
A general frame of storm conditions in Calabria is providedby Versace et al. (1989) in order to define homogeneous zonesand subzones of Calabria with regard to annual maxima of high-intensity and short-duration rainfalls [for a review see Terranova(2004b)]. Terranova (2004b) showed how events exceedinghigh thresholds, in terms of “normal rainy day,” are morefrequent on the Ionian side of Calabria.
3. Methodology
A high number of shallow landslides are triggered simulta-neously, mostly by intense and short rainfall events. Consideringthe homogeneous distribution of pluviometric conditions overthe territory, the occurrence of shallow landsliding phenomenaon the same area largely depends on outcropping lithology.Susceptibility to shallow landslides on the same type of lithologydepends on the presence of thicknesses (in some cases limited)of fresh or weak rocks (from very to intensely fractured) and/orsoil covers of various origin (colluvium, residual soils, saproliticsoils, completely degraded/weathered rocks, etc.). The limitedthickness of involved geomaterials (which is typical of thephenomena dealt with in this study) implies that modest volumesof geomaterials are involved in single shallow landslides, whilerock volumes globally involved by shallow landslides as a wholeand mobilized by a single rainfall event are often very large.
This study focuses on shallow landslides affecting differentsoil covers present on the various types of outcropped lithologyin Calabria, which very often develop into fast mass move-ments, i.e., fast, shallow slide-flow instabilities. These phenom-ena involve limited soil cover thicknesses (∼0.2 to 3.0 m).From a geometrical point of view, the phenomena are from 3 to10 m wide and their total length depends on their evolution:once the event is triggered, it could either stop or develop into adebris flow or mud flow (Fig. 4).
Shallow instabilities as a whole, which are triggered by aspecific rainfall event and that might develop into fast flow, arereferred to in this paper as “shallow landsliding event.” Therainfall event definition considered valid and used afterwards is“a sequence of rainy days preceded by and followed by at leastone non-rainy day.”
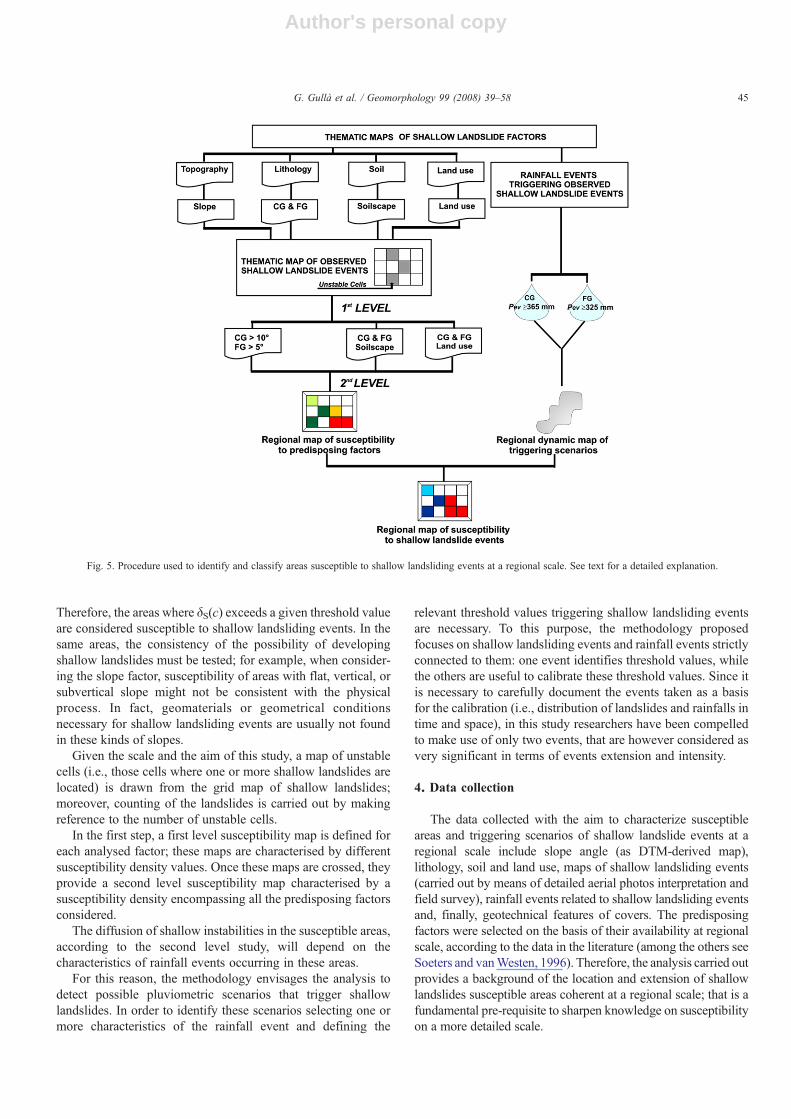
The methodology we propose aims at identifying susceptibleareas and triggering scenarios of shallow landsliding events at aregional scale (Fig. 5). A database linked to a GIS has beencreated to support the proposed methodology in its varioussteps; the GIS are implemented by means of ArcGIS 9.0package (ESRI, 2004). In particular, used informative layersrefer to a digital terrain model, outcropping lithology, soils andland use, the maps of some significant shallow landslides of thepast, and finally, rainfall related to these phenomena. Moreover,geotechnical characteristics of outcropping geomaterials havebeen carefully considered during the selection and calibration ofpredisposing factors.
In the first step, the distribution of predisposing factors ofshallow instabilities has been evaluated at a regional scale. Tothis purpose, a map of the slopes has been drawn from thedigital terrain model; two kinds of covers, prevalently coarse-grained (CG cover) or fine-grained (FG cover), have beenidentified, referring to the physical and mechanical character-istics of geomaterials and of the lithology map; soilscapes havebeen drawn from soil maps; and finally, the land use map has
Fig. 3. Isocurves of the average annual rainfall, average number of rainy days, and of the normal rainy day for the Calabrian regional territory.
43G. Gullà et al. / Geomorphology 99 (2008) 39–58

Author's personal copy
been employed without any prior processing. Similarly,possible pluviometric triggering scenarios have been identifiedby jointly using the distribution over the territory of the factorscharacterizing rainfall events – such as maximum intensity and/or total rainfall and/or duration – and of shallow instabilities.
A statistical approach has been selected for this studybecause its focus was a specific type of landslide; this was alsonecessary to avoid using subjective criteria in evaluating theimportance of the various predisposing factors from the scale ofthe study area as well as the type and quantity of available data.In particular, a simple multivariate statistical analysis method(Clerici et al., 2006), defined “Conditional Analysis Method,”has been adopted. This approach enables us to evaluate
susceptibility to shallow landsliding events according to thedensity of shallow instabilities and the various combinations ofpredisposing factors. Therefore, the importance of singlepredisposing factors for the susceptibility to shallow landslidingevents is determined by this statistical approach, according to anobjective criterion. In fact, the influence of predisposing factorsis evaluated by overlapping the data contained in the maps ofpredisposing factors with the distribution of shallow landslidescontained in the relevant informative layer. For example, bymaking reference to slope factor S, a number (NcS) of shallowlandslides falling into a given slope class (cS) and correspondingto the area A(cS) is calculated; this enables us to obtain thesusceptibility density by means of the relation δS(c)=NcS /A(cS).
Fig. 4. Some typical shallow instabilities triggered by November 2004 meteorological event in central Calabria (A and B), and September 2000 meteorological event insouthern Ionian Calabria (C and D).
44 G. Gullà et al. / Geomorphology 99 (2008) 39–58
Author's personal copy
Therefore, the areas where δS(c) exceeds a given threshold valueare considered susceptible to shallow landsliding events. In thesame areas, the consistency of the possibility of developingshallow landslides must be tested; for example, when consider-ing the slope factor, susceptibility of areas with flat, vertical, orsubvertical slope might not be consistent with the physicalprocess. In fact, geomaterials or geometrical conditionsnecessary for shallow landsliding events are usually not foundin these kinds of slopes.
Given the scale and the aim of this study, a map of unstablecells (i.e., those cells where one or more shallow landslides arelocated) is drawn from the grid map of shallow landslides;moreover, counting of the landslides is carried out by makingreference to the number of unstable cells.
In the first step, a first level susceptibility map is defined foreach analysed factor; these maps are characterised by differentsusceptibility density values. Once these maps are crossed, theyprovide a second level susceptibility map characterised by asusceptibility density encompassing all the predisposing factorsconsidered.
The diffusion of shallow instabilities in the susceptible areas,according to the second level study, will depend on thecharacteristics of rainfall events occurring in these areas.
For this reason, the methodology envisages the analysis todetect possible pluviometric scenarios that trigger shallowlandslides. In order to identify these scenarios selecting one ormore characteristics of the rainfall event and defining the
relevant threshold values triggering shallow landsliding eventsare necessary. To this purpose, the methodology proposedfocuses on shallow landsliding events and rainfall events strictlyconnected to them: one event identifies threshold values, whilethe others are useful to calibrate these threshold values. Since itis necessary to carefully document the events taken as a basisfor the calibration (i.e., distribution of landslides and rainfalls intime and space), in this study researchers have been compelledto make use of only two events, that are however considered asvery significant in terms of events extension and intensity.
4. Data collection
The data collected with the aim to characterize susceptibleareas and triggering scenarios of shallow landslide events at aregional scale include slope angle (as DTM-derived map),lithology, soil and land use, maps of shallow landsliding events(carried out by means of detailed aerial photos interpretation andfield survey), rainfall events related to shallow landsliding eventsand, finally, geotechnical features of covers. The predisposingfactors were selected on the basis of their availability at regionalscale, according to the data in the literature (among the others seeSoeters and vanWesten, 1996). Therefore, the analysis carried outprovides a background of the location and extension of shallowlandslides susceptible areas coherent at a regional scale; that is afundamental pre-requisite to sharpen knowledge on susceptibilityon a more detailed scale.
Fig. 5. Procedure used to identify and classify areas susceptible to shallow landsliding events at a regional scale. See text for a detailed explanation.
45G. Gullà et al. / Geomorphology 99 (2008) 39–58
Author's personal copy
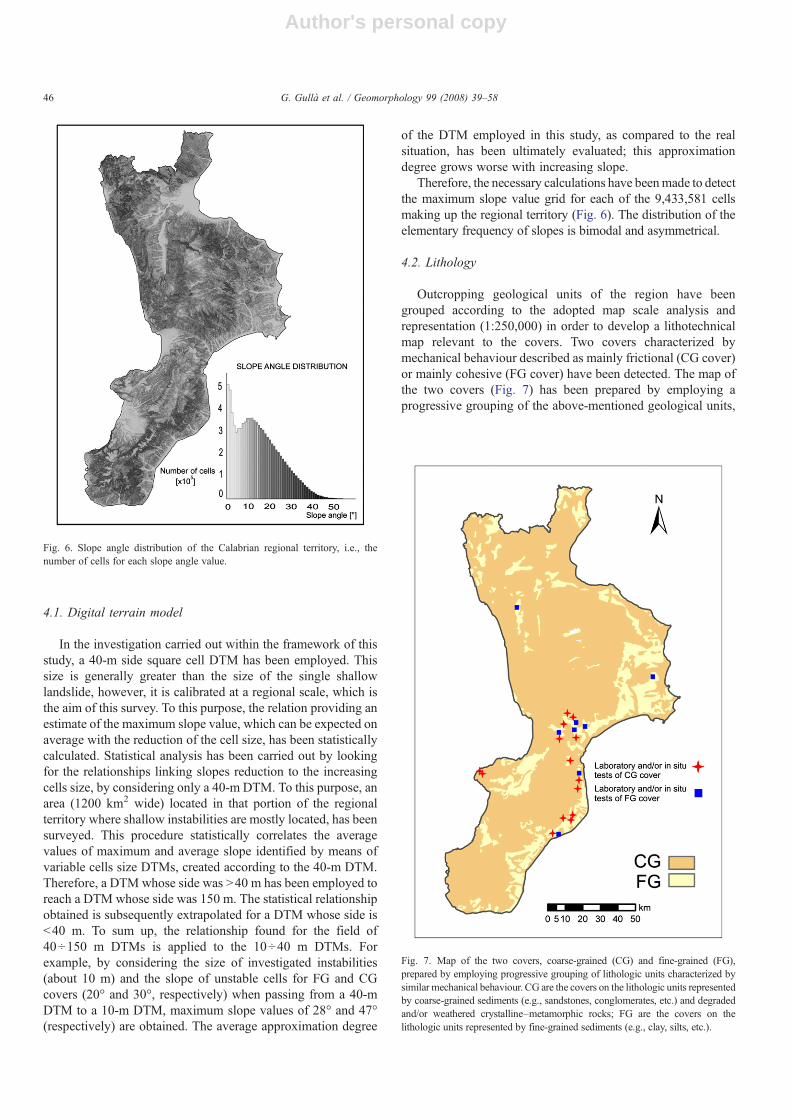
4.1. Digital terrain model
In the investigation carried out within the framework of thisstudy, a 40-m side square cell DTM has been employed. Thissize is generally greater than the size of the single shallowlandslide, however, it is calibrated at a regional scale, which isthe aim of this survey. To this purpose, the relation providing anestimate of the maximum slope value, which can be expected onaverage with the reduction of the cell size, has been statisticallycalculated. Statistical analysis has been carried out by lookingfor the relationships linking slopes reduction to the increasingcells size, by considering only a 40-m DTM. To this purpose, anarea (1200 km2 wide) located in that portion of the regionalterritory where shallow instabilities are mostly located, has beensurveyed. This procedure statistically correlates the averagevalues of maximum and average slope identified by means ofvariable cells size DTMs, created according to the 40-m DTM.Therefore, a DTM whose side was N40 m has been employed toreach a DTM whose side was 150 m. The statistical relationshipobtained is subsequently extrapolated for a DTM whose side isb40 m. To sum up, the relationship found for the field of40÷150 m DTMs is applied to the 10÷40 m DTMs. Forexample, by considering the size of investigated instabilities(about 10 m) and the slope of unstable cells for FG and CGcovers (20° and 30°, respectively) when passing from a 40-mDTM to a 10-m DTM, maximum slope values of 28° and 47°(respectively) are obtained. The average approximation degree
of the DTM employed in this study, as compared to the realsituation, has been ultimately evaluated; this approximationdegree grows worse with increasing slope.
Therefore, the necessary calculations have beenmade to detectthe maximum slope value grid for each of the 9,433,581 cellsmaking up the regional territory (Fig. 6). The distribution of theelementary frequency of slopes is bimodal and asymmetrical.
4.2. Lithology
Outcropping geological units of the region have beengrouped according to the adopted map scale analysis andrepresentation (1:250,000) in order to develop a lithotechnicalmap relevant to the covers. Two covers characterized bymechanical behaviour described as mainly frictional (CG cover)or mainly cohesive (FG cover) have been detected. The map ofthe two covers (Fig. 7) has been prepared by employing aprogressive grouping of the above-mentioned geological units,
Fig. 6. Slope angle distribution of the Calabrian regional territory, i.e., thenumber of cells for each slope angle value.
Fig. 7. Map of the two covers, coarse-grained (CG) and fine-grained (FG),prepared by employing progressive grouping of lithologic units characterized bysimilar mechanical behaviour. CG are the covers on the lithologic units representedby coarse-grained sediments (e.g., sandstones, conglomerates, etc.) and degradedand/or weathered crystalline–metamorphic rocks; FG are the covers on thelithologic units represented by fine-grained sediments (e.g., clay, silts, etc.).
46 G. Gullà et al. / Geomorphology 99 (2008) 39–58

Author's personal copy
according to observations and studies carried out in differentareas of Calabria affected by shallow landsliding phenomena(Antronico et al., 2002, 2004). A clear prevalence of CG covers(about 82% of the regional territory) compared to FG covers(about 18%) was ultimately detected.
By crossing the CG and FG cover maps and the slopes map,the percentage distribution of the slopes relevant to CG and FGcovers (Fig. 8) has been calculated. Slope distribution on CGcovers is obviously very similar to the distribution over thewhole regional territory, while slope distribution of areas withFG cover is more irregular. Moreover, elementary probabilitydistribution frequency, which is not reported in Fig. 8, ischaracterised by two peaks.
4.3. Soil and land use
The great difference and spatial distribution of soil types inCalabria are a consequence of the mixed morphology of theterritory, of its extremely complex geology producing a varietyof lithological substrata (parent material), as well as of climatevariability. As far as soils are concerned, a soil map of Calabria(scale 1:250,000) including 160 soilscapes, has been taken intoaccount (ARSSA, 2003). The legend of the map lists thefollowing: (i) for each soilscape, their inclusion in the SoilRegion, the Soil Subregion, and the Great Soilscapes; (ii) thedescription of the soils constituting the association in a singlemap unit; (iii) the taxonomical classifications; (iv) the list oflandscape elements (i.e., morphology, altitude, and slope); and(v) land capability maps (i.e., soil depth, texture, rockiness,drainage, etc.).
For this study, the research carried out also considers currentland use (i.e., farmland, forestry use, etc.). Therefore, theCalabrian “land use map” has been derived from the processingof data inferred from the project Corine Land Cover (APAT,2005) on a scale of 1:100,000, and whose legend includes 35different land uses on three levels. The vast majority of theregional territory (56.1%) is represented by agricultural areas(olive groves and arable land), forests (broad-leaved andconiferous forests), and seminatural areas (transitional wood-lands-shrub areas, as well as natural grassland) cover 33.8% and7.6% of the regional territory, respectively.
Artificial surface and water bodies account for 2.4% and0.1%, respectively, of the whole surface. Woodlands are verywidespread and mostly present on mountains. Hills and plainsare mainly used for agricultural purposes; cereals, and wine-and olive-growing are located on moderately steep slopesabove all; and, valley bottoms are very often used for intensivefarming.
4.4. Shallow landsliding events
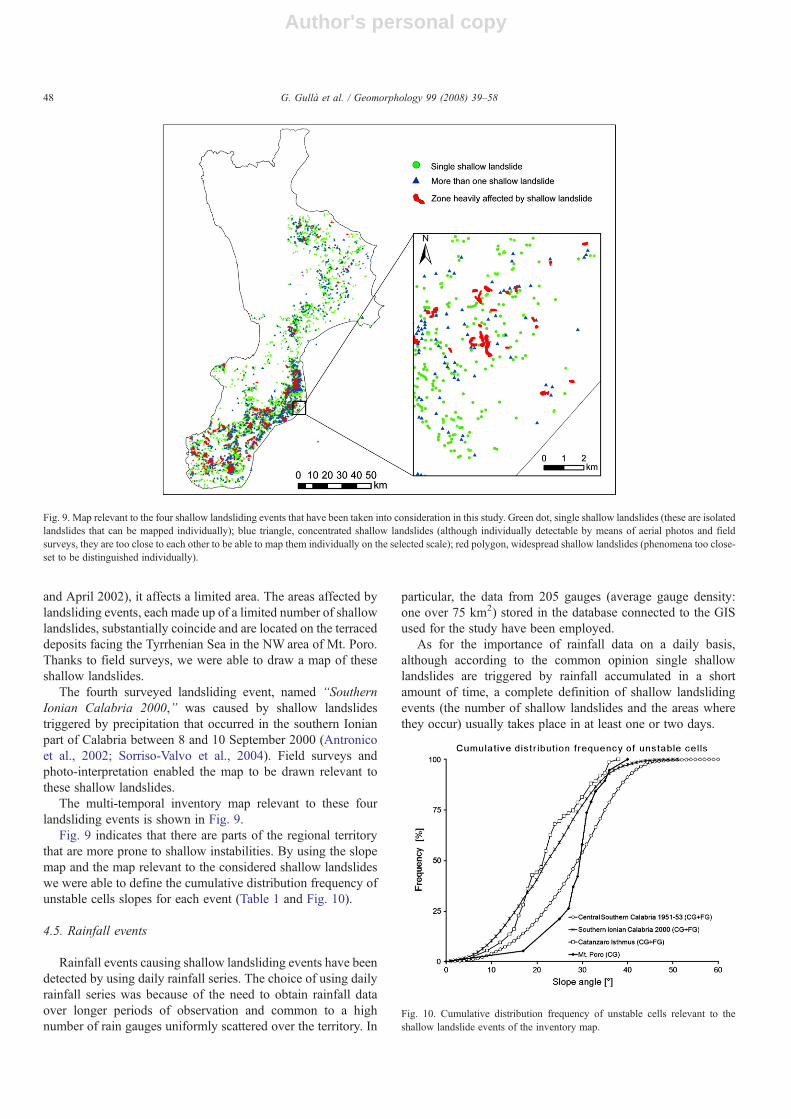
Several shallow landsliding events have occurred in Calabriaover the last 50 years. Table 1 summarizes some of the eventsthat have been taken into consideration in this study.
The shallow landsliding event known as “Central SouthernCalabria 1951–1953” and affecting a large part of the regionalterritory has been investigated by means of IGMI aerial photosdating back to 1954–1955. This event encompasses all theshallow landslides triggered by pluviometric events that hitcentral and southern Calabria in October and December 1951and in October 1953 (Caloiero and Mercuri, 1980).
A second important landsliding event, named “CatanzaroIsthmus 1985… 2004,” includes shallow landslides triggered byheavy rainfalls affecting limited portions of the area of theCatanzaro Isthmus (central Calabria) in the periods indicatedin Table 1 (Fig. 1). Also, this event encompasses a variety oflandsliding events, and a map has been drawn after fieldsurveys.
Although the landsliding event “Mt. Poro 1998–1999–2002” was the result of different landsliding events (triggeredby rainfall events that occurred in December 1998, March 1999,
Table 1Shallow landsliding events employed to make the inventory map
Fig. 8. Cumulative distribution function of the slope angles of the Calabrianregion, relevant to all the cells and just to the unstable cells of the whole territory,the CG cover, and the FG cover.
47G. Gullà et al. / Geomorphology 99 (2008) 39–58
Author's personal copy
and April 2002), it affects a limited area. The areas affected bylandsliding events, each made up of a limited number of shallowlandslides, substantially coincide and are located on the terraceddeposits facing the Tyrrhenian Sea in the NW area of Mt. Poro.Thanks to field surveys, we were able to draw a map of theseshallow landslides.
The fourth surveyed landsliding event, named “SouthernIonian Calabria 2000,” was caused by shallow landslidestriggered by precipitation that occurred in the southern Ionianpart of Calabria between 8 and 10 September 2000 (Antronicoet al., 2002; Sorriso-Valvo et al., 2004). Field surveys andphoto-interpretation enabled the map to be drawn relevant tothese shallow landslides.
The multi-temporal inventory map relevant to these fourlandsliding events is shown in Fig. 9.
Fig. 9 indicates that there are parts of the regional territorythat are more prone to shallow instabilities. By using the slopemap and the map relevant to the considered shallow landslideswe were able to define the cumulative distribution frequency ofunstable cells slopes for each event (Table 1 and Fig. 10).
4.5. Rainfall events
Rainfall events causing shallow landsliding events have beendetected by using daily rainfall series. The choice of using dailyrainfall series was because of the need to obtain rainfall dataover longer periods of observation and common to a highnumber of rain gauges uniformly scattered over the territory. In
particular, the data from 205 gauges (average gauge density:one over 75 km2) stored in the database connected to the GISused for the study have been employed.
As for the importance of rainfall data on a daily basis,although according to the common opinion single shallowlandslides are triggered by rainfall accumulated in a shortamount of time, a complete definition of shallow landslidingevents (the number of shallow landslides and the areas wherethey occur) usually takes place in at least one or two days.
Fig. 9. Map relevant to the four shallow landsliding events that have been taken into consideration in this study. Green dot, single shallow landslides (these are isolatedlandslides that can be mapped individually); blue triangle, concentrated shallow landslides (although individually detectable by means of aerial photos and fieldsurveys, they are too close to each other to be able to map them individually on the selected scale); red polygon, widespread shallow landslides (phenomena too close-set to be distinguished individually).
Fig. 10. Cumulative distribution frequency of unstable cells relevant to theshallow landslide events of the inventory map.
48 G. Gullà et al. / Geomorphology 99 (2008) 39–58

Author's personal copy
Among the typical features of a generic rainfall event,maximum intensity Imax i.e., the ratio between the peak rainfalland its duration, and total precipitation Pev play a key role forthe purpose of this study (Terranova and Gullà, 2004; Sorriso-Valvo et al., 2004; Terranova et al., 2007). By observing rainfallevents in Calabria, we inferred that the values Imax and Pev veryfrequently present similar areal distribution and, therefore, theirsimultaneous use is necessary only in a limited number of cases.
A hydrological survey has been carried out over the areasand dates of the shallow landsliding events listed in Table 1. Foreach considered landsliding event, the values of Imax and Pev
have been selected for each rain gauge. Iso-Imax and iso-Pev
maps at a regional scale have subsequently been created on thebasis of these data by using kriging contouring procedures;these maps define rainfall events related to each consideredshallow landslide event. The relevant maps represent otherknowledge layers of analysis for subsequent observations.
4.6. Geotechnical features of covers
The geotechnical features of covers involved in shallowlandslides affect two major aspects connected to landslides-triggering mechanisms and their evolution, i.e., (i) pore-waterpressure and (ii) shear strength. To this purpose, geomaterialspresent in the areas affected by shallow landsliding pheno-mena have been tested in the laboratory and/or in situ (Fig. 7)(Cascini and Gullà, 1993; Gullà and Sorbino, 1994; Aceto et al.,1996; Antronico and Terranova, 1999; Antronico and Gullà,2000; Antronico et al., 2002, 2004; Gullà et al., 2004a, 2006;Cascini et al., 2006). The reference framework of thephysical and mechanical properties of geomaterials for FGand CG covers taken at a depth of 3 m or lower, is subsequentlydescribed.
Fig. 11 shows the envelopes containing the grain sizedistribution curves of FG and CG samples: 157 FG coversamples are taken from 8 sites and 84 CG cover samples aretaken from 14 sites. Grain size distribution envelopes of the twocovers are well differentiated; and in particular, FG covers aredelimited by clay with silt and by slightly gravelly clayey siltwith sand; CG covers are characterised by clayey sand with siltand by gravel with sand. As shown in Fig. 12, geomaterials inFG covers can be classified according to the Unified SoilClassification System (USCS) as inorganic clays of medium-
high plasticity characterized by medium and/or high plasticityand ranging from inactive to normally active (CL-CH).
By analyzing some of the main index properties, we mayinfer what has been indicated in Fig. 13, i.e., that the differencesbetween FG and CG covers are significantly lower than that ofthe relevant grain size distribution envelopes. The amount ofavailable experimental data is relevant (about 200 for FG and100 for CG covers), and therefore, representative variationranges for the considered properties can be identified.
As for geomaterials of FG covers, the following data havebeen found: the unit weight of solid particles varies from25.7 kN/m3 to 27.6 kN/m3 (average value 26.6 kN/m3); theunit weight of dry soil is included between 7.6 kN/m3 and17.2 kN/m3 (average value 14.7 kN/m3); the unit weight ofnatural soil varies from 10.0 kN/m3 to 20.5 kN/m3 (averagevalue 18.3 kN/m3); the unit weight of saturated soil varies from14.7 kN/m3 to 21.0 kN/m3 (average value 19.3 kN/m3); andfinally, the void ratio varies from 0.54 to 2.06 (average value0.84).
Fig. 11. Grain size distribution envelopes of fine-grained cover (FG) and coarse-grained cover (CG).
Fig. 12. Plasticity and activity charts of fine-grained cover (FG).
Fig. 13. Index property values of fine-grained cover (FG) and coarse-grainedcover (CG): γs=unit weight of solid particles; γd=unit weight of dry soil;γ=unit weight of natural soil; γsat=unit weight of saturated soil; e=void ratio.
49G. Gullà et al. / Geomorphology 99 (2008) 39–58
Author's personal copy
As for geomaterials of CG cover, the following has beenfound: the unit weight of solid particles varies from 25.6 kN/m3
to 27.9 kN/m3 (average value 26.2 kN/m3); the unit weight ofdry soil is included between 10.5 kN/m3 and 18.5 kN/m3
(average value 16.3 kN/m3); the unit weight of natural soil variesfrom 10.8 kN/m3 to 21.3 kN/m3 (average value 18.1 kN/m3); theunit weight of saturated soil is included between 16.4 kN/m3 and21.3 kN/m3 (average value 20.0 kN/m3); and finally, the voidratio varies from 0.40 to 1.51 (average value 0.62).
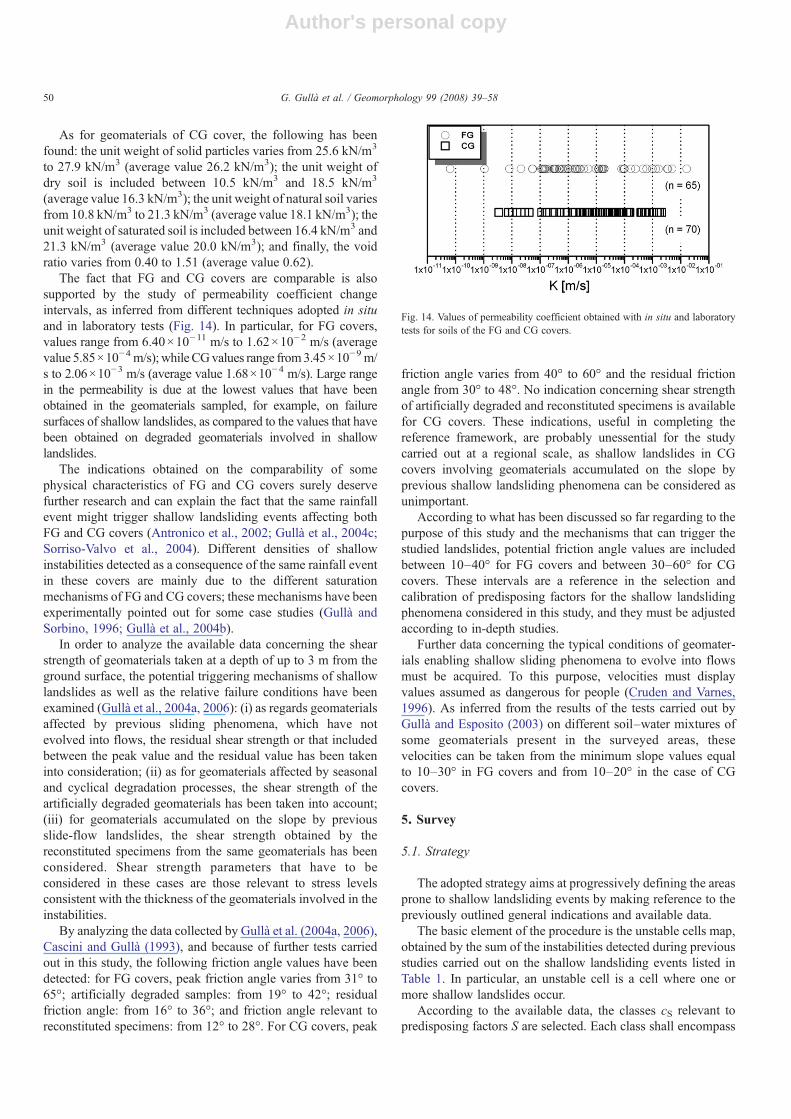
The fact that FG and CG covers are comparable is alsosupported by the study of permeability coefficient changeintervals, as inferred from different techniques adopted in situand in laboratory tests (Fig. 14). In particular, for FG covers,values range from 6.40×10⁻¹¹ m/s to 1.62×10⁻² m/s (averagevalue 5.85×10⁻⁴ m/s); whileCGvalues range from3.45×10−9 m/s to 2.06×10⁻³ m/s (average value 1.68×10⁻⁴ m/s). Large rangein the permeability is due at the lowest values that have beenobtained in the geomaterials sampled, for example, on failuresurfaces of shallow landslides, as compared to the values that havebeen obtained on degraded geomaterials involved in shallowlandslides.
The indications obtained on the comparability of somephysical characteristics of FG and CG covers surely deservefurther research and can explain the fact that the same rainfallevent might trigger shallow landsliding events affecting bothFG and CG covers (Antronico et al., 2002; Gullà et al., 2004c;Sorriso-Valvo et al., 2004). Different densities of shallowinstabilities detected as a consequence of the same rainfall eventin these covers are mainly due to the different saturationmechanisms of FG and CG covers; these mechanisms have beenexperimentally pointed out for some case studies (Gullà andSorbino, 1996; Gullà et al., 2004b).
In order to analyze the available data concerning the shearstrength of geomaterials taken at a depth of up to 3 m from theground surface, the potential triggering mechanisms of shallowlandslides as well as the relative failure conditions have beenexamined (Gullà et al., 2004a, 2006): (i) as regards geomaterialsaffected by previous sliding phenomena, which have notevolved into flows, the residual shear strength or that includedbetween the peak value and the residual value has been takeninto consideration; (ii) as for geomaterials affected by seasonaland cyclical degradation processes, the shear strength of theartificially degraded geomaterials has been taken into account;(iii) for geomaterials accumulated on the slope by previousslide-flow landslides, the shear strength obtained by thereconstituted specimens from the same geomaterials has beenconsidered. Shear strength parameters that have to beconsidered in these cases are those relevant to stress levelsconsistent with the thickness of the geomaterials involved in theinstabilities.
By analyzing the data collected by Gullà et al. (2004a, 2006),Cascini and Gullà (1993), and because of further tests carriedout in this study, the following friction angle values have beendetected: for FG covers, peak friction angle varies from 31° to65°; artificially degraded samples: from 19° to 42°; residualfriction angle: from 16° to 36°; and friction angle relevant toreconstituted specimens: from 12° to 28°. For CG covers, peak
friction angle varies from 40° to 60° and the residual frictionangle from 30° to 48°. No indication concerning shear strengthof artificially degraded and reconstituted specimens is availablefor CG covers. These indications, useful in completing thereference framework, are probably unessential for the studycarried out at a regional scale, as shallow landslides in CGcovers involving geomaterials accumulated on the slope byprevious shallow landsliding phenomena can be considered asunimportant.
According to what has been discussed so far regarding to thepurpose of this study and the mechanisms that can trigger thestudied landslides, potential friction angle values are includedbetween 10–40° for FG covers and between 30–60° for CGcovers. These intervals are a reference in the selection andcalibration of predisposing factors for the shallow landslidingphenomena considered in this study, and they must be adjustedaccording to in-depth studies.
Further data concerning the typical conditions of geomater-ials enabling shallow sliding phenomena to evolve into flowsmust be acquired. To this purpose, velocities must displayvalues assumed as dangerous for people (Cruden and Varnes,1996). As inferred from the results of the tests carried out byGullà and Esposito (2003) on different soil–water mixtures ofsome geomaterials present in the surveyed areas, thesevelocities can be taken from the minimum slope values equalto 10–30° in FG covers and from 10–20° in the case of CGcovers.
5. Survey
5.1. Strategy
The adopted strategy aims at progressively defining the areasprone to shallow landsliding events by making reference to thepreviously outlined general indications and available data.
The basic element of the procedure is the unstable cells map,obtained by the sum of the instabilities detected during previousstudies carried out on the shallow landsliding events listed inTable 1. In particular, an unstable cell is a cell where one ormore shallow landslides occur.
According to the available data, the classes cS relevant topredisposing factors S are selected. Each class shall encompass
Fig. 14. Values of permeability coefficient obtained with in situ and laboratorytests for soils of the FG and CG covers.
50 G. Gullà et al. / Geomorphology 99 (2008) 39–58
Author's personal copy
an area, A(cS), where a number of unstable cells, NUNSCe, arelocated. This area shall be defined on the basis of the unstablecells map. By using the previously outlined general definition,the density (δ) of unstable cells for each class of predisposingfactor shall be calculated:
d ¼ NUNSCe=A cSð Þ:
This ratio, which is always indicated for each class ofpredisposing factor, has been separately calculated for CG andFG covers.
By using this method, the importance of the classes ofselected factors, thereby evaluating their efficacy, so as to definethe susceptible area better, was detected.
5.2. Identification of susceptible areas
5.2.1. First level analysisTo define the areas susceptible to shallow landsliding events,
cell minimum slope value (necessary for triggering shallowlandslides) has been used as a first predisposing factor.
To choose reference values of cell slopes, the distribution ofall cells and of unstable cell slopes has been compared at aregional scale and for the same area (Fig. 8), after they had beendifferentiated according to CG and FG covers.
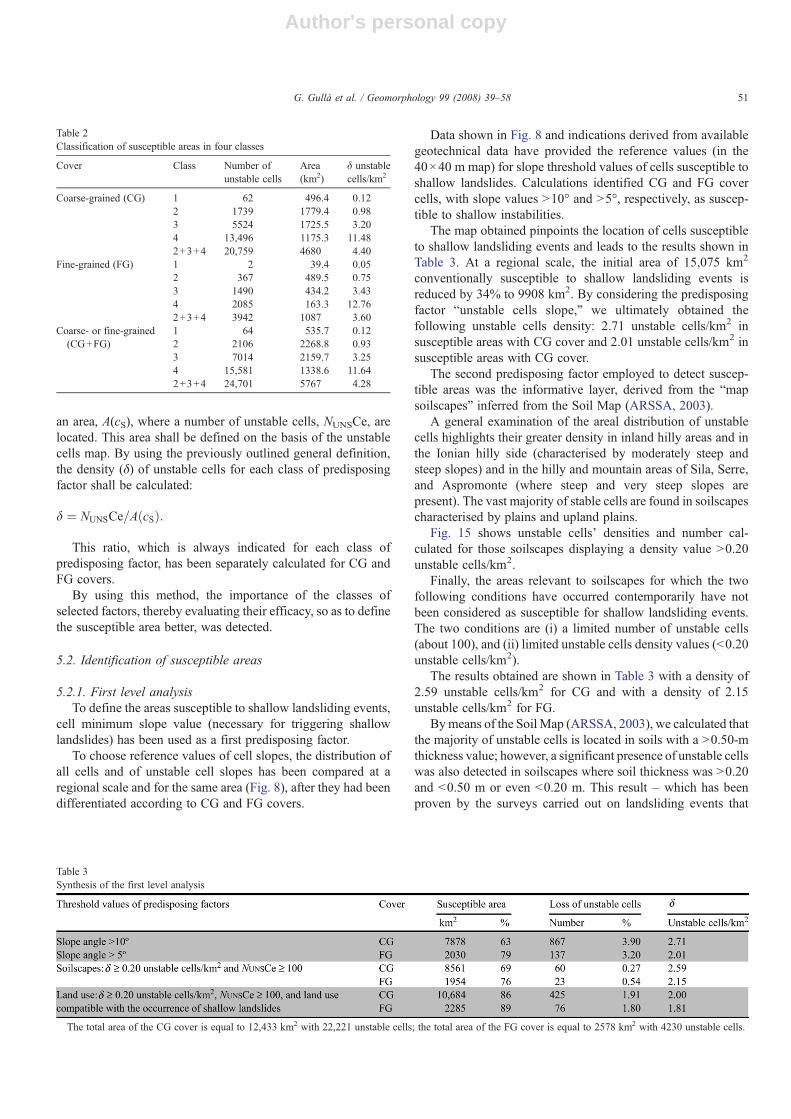
Data shown in Fig. 8 and indications derived from availablegeotechnical data have provided the reference values (in the40×40 m map) for slope threshold values of cells susceptible toshallow landslides. Calculations identified CG and FG covercells, with slope values N10° and N5°, respectively, as suscep-tible to shallow instabilities.
The map obtained pinpoints the location of cells susceptibleto shallow landsliding events and leads to the results shown inTable 3. At a regional scale, the initial area of 15,075 km2
conventionally susceptible to shallow landsliding events isreduced by 34% to 9908 km2. By considering the predisposingfactor “unstable cells slope,” we ultimately obtained thefollowing unstable cells density: 2.71 unstable cells/km2 insusceptible areas with CG cover and 2.01 unstable cells/km2 insusceptible areas with CG cover.
The second predisposing factor employed to detect suscep-tible areas was the informative layer, derived from the “mapsoilscapes” inferred from the Soil Map (ARSSA, 2003).
A general examination of the areal distribution of unstablecells highlights their greater density in inland hilly areas and inthe Ionian hilly side (characterised by moderately steep andsteep slopes) and in the hilly and mountain areas of Sila, Serre,and Aspromonte (where steep and very steep slopes arepresent). The vast majority of stable cells are found in soilscapescharacterised by plains and upland plains.
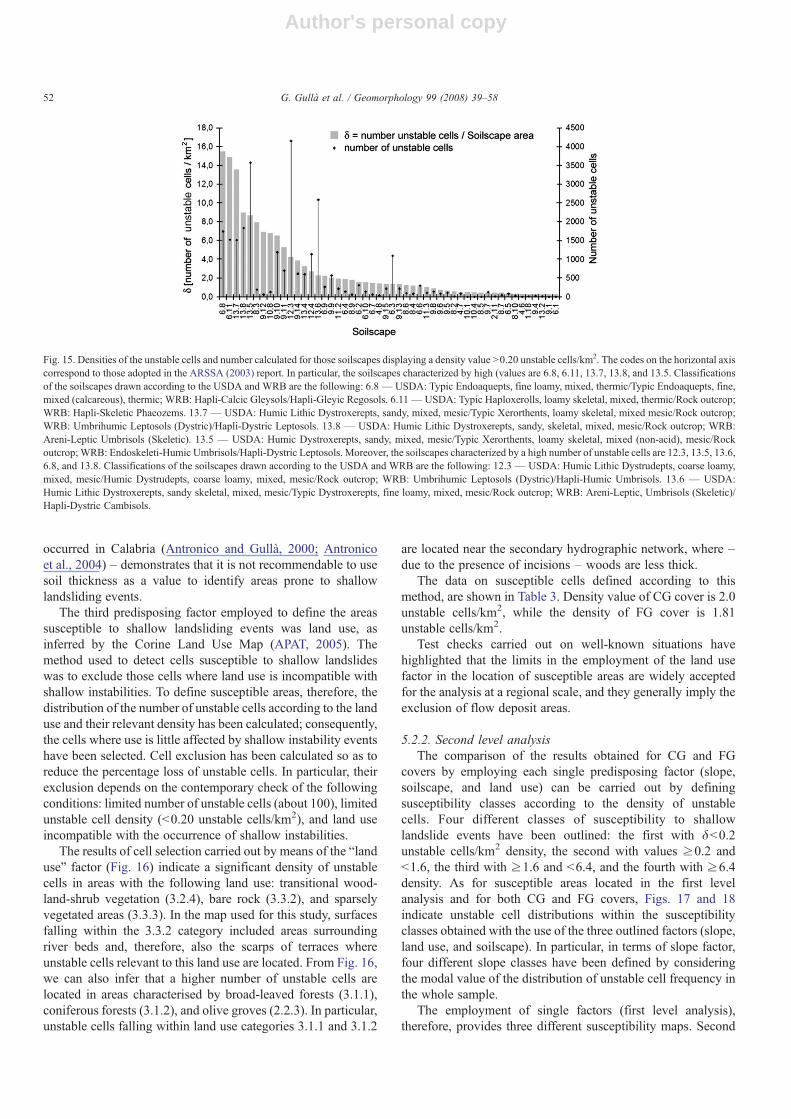
Fig. 15 shows unstable cells' densities and number cal-culated for those soilscapes displaying a density value N0.20unstable cells/km2.
Finally, the areas relevant to soilscapes for which the twofollowing conditions have occurred contemporarily have notbeen considered as susceptible for shallow landsliding events.The two conditions are (i) a limited number of unstable cells(about 100), and (ii) limited unstable cells density values (b0.20unstable cells/km2).
The results obtained are shown in Table 3 with a density of2.59 unstable cells/km2 for CG and with a density of 2.15unstable cells/km2 for FG.
Bymeans of the Soil Map (ARSSA, 2003), we calculated thatthe majority of unstable cells is located in soils with a N0.50-mthickness value; however, a significant presence of unstable cellswas also detected in soilscapes where soil thickness was N0.20and b0.50 m or even b0.20 m. This result – which has beenproven by the surveys carried out on landsliding events that
Table 2Classification of susceptible areas in four classes
Cover Class Number ofunstable cells
Area(km2)
δ unstablecells/km2
Coarse-grained (CG) 1 62 496.4 0.122 1739 1779.4 0.983 5524 1725.5 3.204 13,496 1175.3 11.482+3+4 20,759 4680 4.40
Fine-grained (FG) 1 2 39.4 0.052 367 489.5 0.753 1490 434.2 3.434 2085 163.3 12.762+3+4 3942 1087 3.60
Coarse- or fine-grained(CG+FG)
1 64 535.7 0.122 2106 2268.8 0.933 7014 2159.7 3.254 15,581 1338.6 11.642+3+4 24,701 5767 4.28
Table 3Synthesis of the first level analysis
The total area of the CG cover is equal to 12,433 km2 with 22,221 unstable cells; the total area of the FG cover is equal to 2578 km2 with 4230 unstable cells.
51G. Gullà et al. / Geomorphology 99 (2008) 39–58
Author's personal copy
occurred in Calabria (Antronico and Gullà, 2000; Antronicoet al., 2004) – demonstrates that it is not recommendable to usesoil thickness as a value to identify areas prone to shallowlandsliding events.
The third predisposing factor employed to define the areassusceptible to shallow landsliding events was land use, asinferred by the Corine Land Use Map (APAT, 2005). Themethod used to detect cells susceptible to shallow landslideswas to exclude those cells where land use is incompatible withshallow instabilities. To define susceptible areas, therefore, thedistribution of the number of unstable cells according to the landuse and their relevant density has been calculated; consequently,the cells where use is little affected by shallow instability eventshave been selected. Cell exclusion has been calculated so as toreduce the percentage loss of unstable cells. In particular, theirexclusion depends on the contemporary check of the followingconditions: limited number of unstable cells (about 100), limitedunstable cell density (b0.20 unstable cells/km2), and land useincompatible with the occurrence of shallow instabilities.
The results of cell selection carried out by means of the “landuse” factor (Fig. 16) indicate a significant density of unstablecells in areas with the following land use: transitional wood-land-shrub vegetation (3.2.4), bare rock (3.3.2), and sparselyvegetated areas (3.3.3). In the map used for this study, surfacesfalling within the 3.3.2 category included areas surroundingriver beds and, therefore, also the scarps of terraces whereunstable cells relevant to this land use are located. From Fig. 16,we can also infer that a higher number of unstable cells arelocated in areas characterised by broad-leaved forests (3.1.1),coniferous forests (3.1.2), and olive groves (2.2.3). In particular,unstable cells falling within land use categories 3.1.1 and 3.1.2
are located near the secondary hydrographic network, where –due to the presence of incisions – woods are less thick.
The data on susceptible cells defined according to thismethod, are shown in Table 3. Density value of CG cover is 2.0unstable cells/km2, while the density of FG cover is 1.81unstable cells/km2.
Test checks carried out on well-known situations havehighlighted that the limits in the employment of the land usefactor in the location of susceptible areas are widely acceptedfor the analysis at a regional scale, and they generally imply theexclusion of flow deposit areas.
5.2.2. Second level analysisThe comparison of the results obtained for CG and FG
covers by employing each single predisposing factor (slope,soilscape, and land use) can be carried out by definingsusceptibility classes according to the density of unstablecells. Four different classes of susceptibility to shallowlandslide events have been outlined: the first with δb0.2unstable cells/km2 density, the second with values ≥0.2 andb1.6, the third with ≥1.6 and b6.4, and the fourth with ≥6.4density. As for susceptible areas located in the first levelanalysis and for both CG and FG covers, Figs. 17 and 18indicate unstable cell distributions within the susceptibilityclasses obtained with the use of the three outlined factors (slope,land use, and soilscape). In particular, in terms of slope factor,four different slope classes have been defined by consideringthe modal value of the distribution of unstable cell frequency inthe whole sample.
The employment of single factors (first level analysis),therefore, provides three different susceptibility maps. Second
Fig. 15. Densities of the unstable cells and number calculated for those soilscapes displaying a density value N0.20 unstable cells/km2. The codes on the horizontal axiscorrespond to those adopted in the ARSSA (2003) report. In particular, the soilscapes characterized by high (values are 6.8, 6.11, 13.7, 13.8, and 13.5. Classificationsof the soilscapes drawn according to the USDA and WRB are the following: 6.8— USDA: Typic Endoaquepts, fine loamy, mixed, thermic/Typic Endoaquepts, fine,mixed (calcareous), thermic; WRB: Hapli-Calcic Gleysols/Hapli-Gleyic Regosols. 6.11— USDA: Typic Haploxerolls, loamy skeletal, mixed, thermic/Rock outcrop;WRB: Hapli-Skeletic Phaeozems. 13.7 — USDA: Humic Lithic Dystroxerepts, sandy, mixed, mesic/Typic Xerorthents, loamy skeletal, mixed mesic/Rock outcrop;WRB: Umbrihumic Leptosols (Dystric)/Hapli-Dystric Leptosols. 13.8 — USDA: Humic Lithic Dystroxerepts, sandy, skeletal, mixed, mesic/Rock outcrop; WRB:Areni-Leptic Umbrisols (Skeletic). 13.5 — USDA: Humic Dystroxerepts, sandy, mixed, mesic/Typic Xerorthents, loamy skeletal, mixed (non-acid), mesic/Rockoutcrop; WRB: Endoskeleti-Humic Umbrisols/Hapli-Dystric Leptosols. Moreover, the soilscapes characterized by a high number of unstable cells are 12.3, 13.5, 13.6,6.8, and 13.8. Classifications of the soilscapes drawn according to the USDA and WRB are the following: 12.3 — USDA: Humic Lithic Dystrudepts, coarse loamy,mixed, mesic/Humic Dystrudepts, coarse loamy, mixed, mesic/Rock outcrop; WRB: Umbrihumic Leptosols (Dystric)/Hapli-Humic Umbrisols. 13.6 — USDA:Humic Lithic Dystroxerepts, sandy skeletal, mixed, mesic/Typic Dystroxerepts, fine loamy, mixed, mesic/Rock outcrop; WRB: Areni-Leptic, Umbrisols (Skeletic)/Hapli-Dystric Cambisols.
52 G. Gullà et al. / Geomorphology 99 (2008) 39–58

Author's personal copy
level analysis, however, enables better location of areassusceptible to shallow landsliding events by means of thecrossing of the three susceptibility maps.
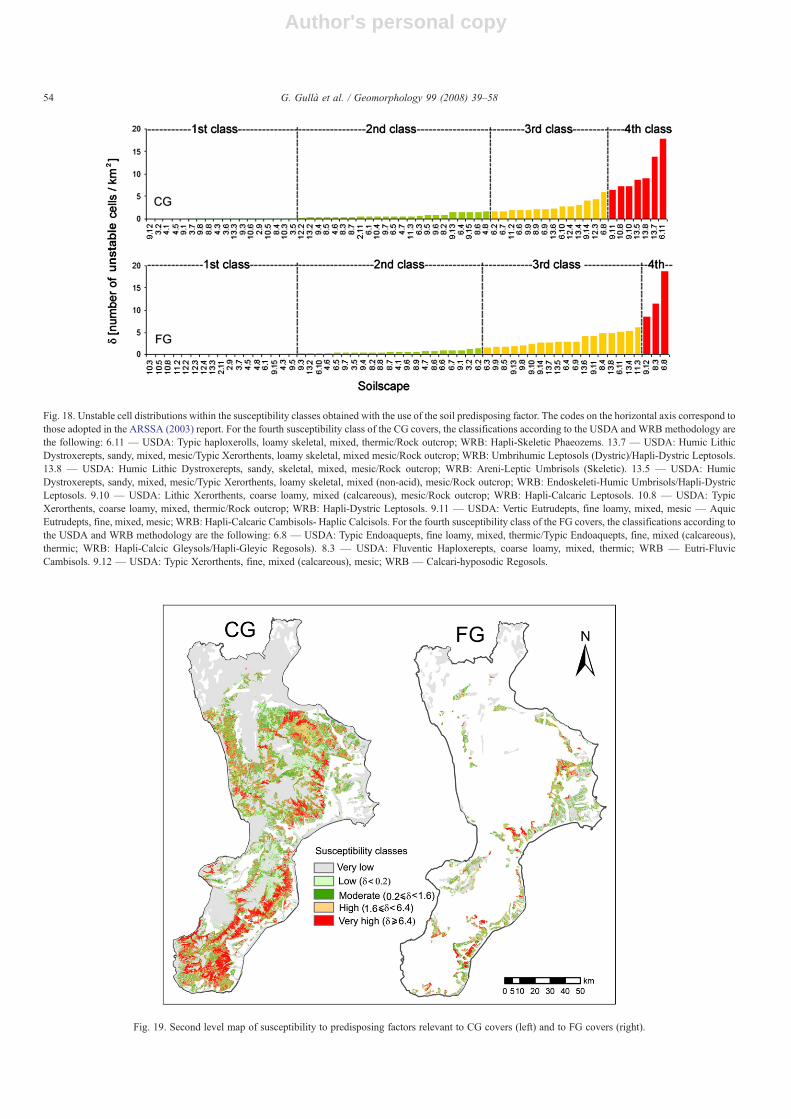
In such a map, we were able to calculate the density ofunstable cells in each crossing area and to assign a relevantsusceptibility class to each cell (Fig. 19). Second level analysispinpoints a total area of 6303 km2 with various susceptibilityclasses to shallow landsliding events, where 24,765 unstablecells are located (20,821 unstable cells in 5176 km2 with CGcover and 3944 unstable cells in 1126 km2 with FG cover). Theemployed procedure therefore excludes an area of 8714 km2 at aregional scale; 55% of this area corresponds to CG covers, and45% corresponds to FG covers. A very low level of suscep-tibility to shallow landsliding events is calculated to the ex-cluded area; however, susceptibility is not zero because nodensity values or shallow landslides number exceeding a certainthreshold are attributed to the three predisposing factors con-sidered simultaneously.
In the area encompassing the three highest susceptibilityclasses (classes 2, 3, and 4), the data summed up in Table 2highlight that a value δ=4.4 unstable cells/km2 for CG cover,compared to an initial value of 1.79 unstable cells/km2 for thewhole regional CG area, and a value δ=3.6 unstable cells/km2
for FG covers, compared to an initial value of 1.64 unstablecells/km2, are present. Finally, if we consider the whole regionalterritory and the highest susceptibility class, an area of1339 km2 is identified with δ=11.64 unstable cells/km2.
5.3. Identification of triggering scenarios
In the area described as susceptible to shallow landslidingevents, the size of the areas that could be affected by thesephenomena will depend on the characteristics of rainfall events.To this purpose, an analysis has been carried out to selectrainfall scenarios able to trigger shallow landsliding events.Daily rainfall series, relevant to the 205 rain gauges scattered
over the regional territory, have therefore been employed; oneor more characteristics of rainfall events have been selected.
According to what has been previously stated about theshallow landsliding events and the relevant rainfall events, twomain characteristics of the rainfall event have been chosen:rainfall maximum intensity, Imax, and total rainfall, Pev. Theanalyses carried out in previous studies in Calabria (Antronicoet al., 2002; Sorriso-Valvo et al., 2004; Terranova et al., 2007)have highlighted that Imax and Pev are the two triggering factorsthat mostly contribute to shallow landsliding events.
The first step of the analysis, separately carried out for CGand FG covers, is aimed at selecting the threshold values forImax or Pev typical of a rainfall event able to trigger shallow
Fig. 17. Unstable cell distributions within the susceptibility classes obtainedwith the use of the slope and land use parameters. With reference to land use, thecodes on the horizontal axis correspond to those adopted in the Corine LandCover Report (APAT, 2005).
Fig. 16. Densities of the unstable cells and number calculated for those land use map units displaying a density value N0.20 unstable cells/km2. The codes on thehorizontal axis correspond to those adopted in the Corine Land Cover Report (APAT, 2005).
53G. Gullà et al. / Geomorphology 99 (2008) 39–58
Author's personal copy
Fig. 19. Second level map of susceptibility to predisposing factors relevant to CG covers (left) and to FG covers (right).
Fig. 18. Unstable cell distributions within the susceptibility classes obtained with the use of the soil predisposing factor. The codes on the horizontal axis correspond tothose adopted in the ARSSA (2003) report. For the fourth susceptibility class of the CG covers, the classifications according to the USDA and WRB methodology arethe following: 6.11 — USDA: Typic haploxerolls, loamy skeletal, mixed, thermic/Rock outcrop; WRB: Hapli-Skeletic Phaeozems. 13.7 — USDA: Humic LithicDystroxerepts, sandy, mixed, mesic/Typic Xerorthents, loamy skeletal, mixed mesic/Rock outcrop; WRB: Umbrihumic Leptosols (Dystric)/Hapli-Dystric Leptosols.13.8 — USDA: Humic Lithic Dystroxerepts, sandy, skeletal, mixed, mesic/Rock outcrop; WRB: Areni-Leptic Umbrisols (Skeletic). 13.5 — USDA: HumicDystroxerepts, sandy, mixed, mesic/Typic Xerorthents, loamy skeletal, mixed (non-acid), mesic/Rock outcrop; WRB: Endoskeleti-Humic Umbrisols/Hapli-DystricLeptosols. 9.10 — USDA: Lithic Xerorthents, coarse loamy, mixed (calcareous), mesic/Rock outcrop; WRB: Hapli-Calcaric Leptosols. 10.8 — USDA: TypicXerorthents, coarse loamy, mixed, thermic/Rock outcrop; WRB: Hapli-Dystric Leptosols. 9.11 — USDA: Vertic Eutrudepts, fine loamy, mixed, mesic — AquicEutrudepts, fine, mixed, mesic; WRB: Hapli-Calcaric Cambisols- Haplic Calcisols. For the fourth susceptibility class of the FG covers, the classifications according tothe USDA and WRB methodology are the following: 6.8 — USDA: Typic Endoaquepts, fine loamy, mixed, thermic/Typic Endoaquepts, fine, mixed (calcareous),thermic; WRB: Hapli-Calcic Gleysols/Hapli-Gleyic Regosols). 8.3 — USDA: Fluventic Haploxerepts, coarse loamy, mixed, thermic; WRB — Eutri-FluvicCambisols. 9.12 — USDA: Typic Xerorthents, fine, mixed (calcareous), mesic; WRB — Calcari-hyposodic Regosols.
54 G. Gullà et al. / Geomorphology 99 (2008) 39–58

Author's personal copy
landslides. To this purpose, the rainfall event related to theshallow landsliding event defined as “Southern Ionian Calabria2000” has been selected for the following reasons: (i) there is abetter relation between shallow landsliding event and rainfallevent; (ii) the shallow landsliding event is better characterised interms of number of shallow landslides and their location; and(iii) CG and FG covers in the area, as well as the interval of theslopes affected by shallow instabilities, are well represented.
According to the procedure, once the rainfall event has beenselected, the isocurve of a generic function of Imax or Pev,including a high percentage of unstable cells of the relevantshallow landsliding event, must be selected.
Rainfall events pointed out by means of this method can becompared to other known and well-documented landslidingevents along with their relevant rainfall events. In case thesetests do not produce satisfactory results, the procedure continueswith a different threshold value.
In this study, tests have been carried out defining the areasaffected by the five rainfall events triggering the shallowlandsliding events named “Central Southern Calabria 1951–1953”.
Table 4 indicates the threshold values of Pev and Imax – forboth CG and FG values – obtained by the relevant isocurves,including 95% of the unstable cells of the “Southern IonianCalabria 2000” shallow landsliding event. Table 4 also reportsthe percentage of unstable cells of the event “Central SouthernCalabria 1951–53,” delineated by using three rainfall eventsout of five (15 October 1951, 30 December 1951, 20 October1953) exceeding the threshold values. Fig. 20A shows the mapof the areas (differentiated according to the CG and FG covers)relevant to Pev threshold values and encompassing about 95%of the unstable cells of the event “Southern Ionian Calabria2000.” By employing pre-set threshold values (Pev=365 mmfor CG and 325 mm for FG), the map was drawn (Fig. 20B)
Fig. 20. Pluviometric scenarios triggering the shallow landsliding events occurred in southern Ionian Calabria in September 2000 (A) and in central southern Calabriain 1951 and 1953 (B).
Table 4Rainfall thresholds determination to delineate the pluviometric scenarios on the CG and FG covers
Southern Ionian Calabria 2000 Central Southern Calabria 1951–53
Rainfall threshold based on 95% of unstable cells enveloped % of unstable cells enveloped
15 October 1951 30 December 1951 20 October 1953
Pev(CG) (mm) 365 78 0 79.5Pev(FG) (mm) 325 78.7 0 89.3Imax(CG) (mm/d) 170 71 0 34Imax(FG) (mm/d) 158 79 0.3 62
55G. Gullà et al. / Geomorphology 99 (2008) 39–58
Author's personal copy
relevant to the event named “Central Southern Calabria 1951–53,” encompassing over 78% of unstable cells.
The study carried out shows that (at a regional scale) rainfallevents able to trigger shallow landsliding events are assessed byusing the following values: Pev≥365 mm for CG covers andPev≥325 mm for FG covers. These rainfall scenarios arefurther defined by jointly using the values Imax≥170 mm forCG and Imax≥158 mm for FG covers.
6. Discussion
Second level analysis enabled us to identify and classifyareas susceptible to shallow landsliding events at a regionalscale (Fig. 19).
For a given rainfall event, by using the threshold valuesidentified for Pev and Imax, the relevant pluviometric scenariocan be delineated; and therefore, the area (at a regional scale)where the shallow landsliding event related to rainfall will mostlikely occur can be defined.
What we have described so far concerns (i) a precipitationevent of the past characterized by Pev and/or Imax values ofgiven probability, to which no shallow landsliding event isrelated; (ii) a rainfall event where connection with a shallowlandsliding event is well documented; and (iii) an ongoingrainfall event that could become highly critical for a shallowlandsliding event.
The results obtained in the first case (area considered assusceptible to a potential shallow event at a regional scale) canalso be employed to carry out historical surveys with the aim ofdocumenting shallow landsliding events unknown so far.According to the results of the historical survey, the modelcan be adjusted by means of the analysis carried out in this studyfor better identification of susceptible areas at a regional scaleand by means of the relevant rainfall scenario. For example,over the 50 year period running from 1951 to 2000, 42 rainfallevents with PevN325 mm (and with various territorial exten-sions) as well as 40 rainfall events with PevN365 mm have beendetected; therefore, targeted historical surveys can be carried outfocusing on the previously mentioned dates.
Analyses that can be carried out in the second and thirdmentioned cases may test the coherence of the results obtainedby the a posteriori simulation, or the forecasting simulation,thanks to different approaches. Simulation results can beconsidered coherent when the area considered as susceptibleencompasses a number of unstable cells for pre-set Pev and/orImax values higher than the threshold values applied to thesimulation. If, during the simulation of a given rainfall event,statistically significant incoherent results are obtained, themodel must be adjusted according to the following procedure:(i) no shallow instabilities are found in a susceptible cell locatedin the triggering scenario area→ the importance of predisposingfactors shall be increased and/or threshold values for Pev and/orImax shall be reduced; (ii) shallow instabilities are detected in asusceptible cell located outside the triggering scenario area →Pev and/or Imax threshold values shall be reduced; (iii) shallowinstabilities are detected in a non-susceptible cell within theboundaries of the triggering scenario area → the importance of
the predisposing factors shall be increased; and (iv) shallowinstabilities are detected in a non-susceptible cell locatedoutside the triggering scenario area → the importance ofpredisposing factors and/or Pev and/or Imax threshold valuesshall be reduced.
7. Conclusion
The work carried out so far enabled us to pinpoint differentsusceptible areas to shallow landsliding events on natural slopesat a regional scale. Moreover, daily rainfall threshold values(Pev and/or Imax) have been detected and may be helpful inidentifying the relevant triggering scenario for potential shallowlandsliding events for a given rainfall occurrence.
Obtained results can be employed to manage emergencysituations at a regional scale for shallow landsliding eventstriggered by intense rainfalls, thereby defining different alertlevels. Data collected systematically in the management ofemergency situations and employed in the procedure describedso far will enable us to detect the susceptible areas and toimprove the reliability of intense rainfall scenarios.
A definition of the areas at a regional level, classifiedaccording to the different susceptibility classes, enabledresearchers to select suitable areas and sites to study triggeringmechanisms of shallow instabilities and their evolution. Thanksto the data acquired, we were able to detect shallow instabilitiesin geologically homogenous areas (shallow landslides in fine-grained, in coarse-grained, and in weathered soils, etc.). To thispurpose, it would be useful to have better areal or time dataconcerning rainfall or its integration with data on positive andnegative pore pressure in those areas where shallow landslidingphenomena are more frequent (Gullà and Sorbino, 1996; Gullàet al., 2004b).
The methodology we propose in this study aims at riskmitigation and prevention actions in a specific area. Moreover,by integrating the analyses carried out and the detailed surveyson single areas affected by shallow landslides, further progressis expected to develop more efficient methodologies to plan andimplement measures for risk mitigations and reduction, which –as everybody knows – are normally extremely complex andexpensive.
Acknowledgments
The authors are very grateful to the anonymous referees andto the editor for their constructive comments. The authorsexpress their gratitude to Luigi Borrelli (CNR-IRPI) for hisvaluable assistance in the analysis of geological data.
References
Aceto, L., Gullà, G., Sorbino, G., 1996. Caratterizzazione geotecnica delle argilleaffioranti nel bacino del Torrente Turbolo (Calabria settentrionale) (ProgressReport 1). Tecnical Report, vol. 478. CNR IRPI, Cosenza, Italy. 30 pp.
Aleotti, P., Chowdhury, R., 1999. Landslide hazard assessment: summaryreview and new perspectives. Bulletin of Engineering Geology and theEnvironment 58, 21–44.
56 G. Gullà et al. / Geomorphology 99 (2008) 39–58
Author's personal copy
Aleotti, P., Baldelli, P., Polloni, G., 1996. Landsliding and flooding event triggeredby heavy rains in the Tanaro Basin (Italy). Proceedings of the InternationalSymposium Interpraevent, 24–28 June 1996, Garmisch-Partenkirchen,Germany. Bayerisches Landesamt für Wasserwirtschaft, pp. 377–386. D.
Amodio-Morelli, L., Bonardi, G., Colonna, V., Dietrich, D., Giunta, G., Ippolito,F., Liguori, V., Lorenzoni, S., Paglionico, A., Perrone, V., Piccarreta, G.,Russo, M., Scandone, P., Zanettin-Lorenzoni, E., Zuppetta, A., 1976.L'Arco Calabro Peloritano nell'Orogene Appenninico-Magrebide. Memoriedella Società Geologica Italiana 17, 1–60.
Antronico, L., Gullà, G., 2000. Slopes affected by soil slips: validation of anevolutive model. Proceedings of the VIII International Symposium onLandslides — Landslide in Research, Theory and Practice, 26–30 June2000, Cardiff, Wales. Thomas Telford, London, UK, pp. 77–84.
Antronico, L., Terranova, O., 1999. Indagine sull'erosione e sulla capacitàd'infiltrazione mediante piogge simulate. GEAM. Geoingegneria Ambien-tale e Mineraria 23, 135–141.
Antronico, L., Gullà, G., Terranova, O., 2002. L’evento pluviometrico dell’8-10settembre 2000 nella Calabria Ionica meridionale: dissesti sui versanti eprocessi in alveo. Proceedings of the Conference Il Dissesto Idrogeologico:Inventario e Prospettive, 5 June 2001, Rome, Italy. Accademia Nazionale deiLincei, Rome, Italy, pp. 67–79.
Antronico, L., Gullà, G., Borrelli, L., 2004. Shallow instabilities for slidingflow: regional influence and area affects. Proceedings of the IX InternationalSymposium on Landslides, 28 June-7 July 2004, Rio de Janeiro, Brasil. A.A.Balkema, Rotterdam, The Netherlands, pp. 1381–1387.
APAT, 2005. Project: Corine Land Cover 2000 Italy. Report 36/2005, Agenziaper la Protezione dell'Ambiente e per i Servizi Tecnici. 86 pp.
ARSSA, 2003. I suoli della Calabria - Carta dei suoli in scala 1:250,000 dellaRegione Calabria. ARSSA, Agenzia Regionale per lo Sviluppo e per iServizi in Agricoltura, Settore Servizi Tecnici di Supporto, ServizioAgropedologia, Monografia divulgativa. Rubbettino Publisher, SoveriaMannelli, Italy, 387 pp.
ARSSA, 2005. Carta del rischio di erosione attuale e potenziale della regioneCalabria. Scala 1:250,000. ARSSA, Agenzia Regionale per lo Sviluppo eper i Servizi in Agricoltura, Settore Servizi Tecnici di Supporto, ServizioAgropedologia, Monografia divulgativa. Editrice Cerbone, Napoli, Italy,107 pp.
Bellecci, C., Federico, S., Casella, G., Avolio, E., Lo Feudo, T., Sisca, M., 2002.Intense Precipitation in southern Italy. In: Gaudio, R. (Ed.), New Trends inHydrology. Editoriale BIOS, Cosenza, Italy, pp. 57–74.
Bonardi, G., De Vivo, B., Giunta, G., Lima, A., Perrone, V., Zuppetta, A., 1982.Mineralizzazioni dell'Arco Calabro-Peloritano. Ipotesi genetiche e quadroevolutivo. Bollettino della Società Geologica Italiana 101, 141–155.
Caloiero, D., Mercuri, T., 1980. Le alluvioni in Calabria dal 1921 al 1970.Geodata, vol. 7. CNR IRPI, Cosenza, Italy. 161 pp.
Can, T., Nefeslioglu, H.A., Gokceoglu, C., Sonmez, H., Duman, T.Y., 2005.Susceptibility assessments of shallow earthflows triggered by heavy rain-fall at three catchments by logistic regression. Geomorphology 72 (1–4),250–271.
Carrara, A., Guzzetti, F., 1995. Geographical Information Systems in AssessingNatural Hazards. Kluwer Academic Publishers, Dordrecht, The Netherlands.353 pp.
Casagli, N., Rinaldi, M., Gargini, A., Curini, A., 1999. Pore water pressure andstreambank stability: results from a monitoring site on the Sieve River, Italy.Earth Surface Processes and Landforms 24, 1095–1114.
Cascini, L., Gullà, G., 1993. Caratterizzazione fisico-meccanica dei terreniprodotti dall'alterazione di rocce gneissiche. Rivista Italiana di Geotecnica27 (2), 125–147.
Cascini, L., Gullà, G., Sorbino, G., 2006. Groundwater modelling of a weatheredgneissic cover. Canadian Geotechnical Journal 43 (11), 1153–1166.
Catani, R., Fabbri, P., Priante, M., Suppo, M., 1995. Caratteri climatici dellaCalabria. Utilizzazione del coefficiente di variazione per l'individuazione diaree pluviometriche omogenee. Idrotecnica 6, 341–352.
Clerici, A., Perego, S., Tellini, C., Vescovi, P., 2002. A procedure for landslidesusceptibility zonation by the conditional analysis method. Geomorphology48, 349–364.
Clerici, A., Perego, S., Tellini, C., Vescovi, P., 2006. A GIS-based automatedprocedure for landslide susceptibility mapping by the Conditional Analysis
method: the Baganza valley case study (Italian Northern Apennines).Environmental Geology 50 (7), 941–961.
Cruden, D.M., Varnes,D.J., 1996. LandslideTypes and Processes. In: Turner,A.K.,Schuster, R.L. (Eds.), Landslides: Investigation andMitigation. Special Report247, Transportation Research Board, National Research Council. NationalAcademy Press, Washington, D.C., pp. 36–75.
D'Amato Avanzi, G., Giannecchini, R., Puccinelli, A., 2004. The influence ofthe geological and geomorphological settings on shallow landslides. Anexample in a temperate climate environment: the June 19, 1996 event innorthwestern Tuscany (Italy). Engineering Geology 73, 215–228.
Ercanoglu, M., Gokceoglu, C., 2004. Use of fuzzy relations to produce landslidesusceptibility map of a landslide prone area (West Black Sea Region,Turkey). Engineering Geology 75 (3–4), 229–250.
Ermini, L., Catani, F., Casagli, N., 2005. Artificial neural networks applied tolandslide susceptibility assessment. Geomorphology 66, 327–343.
ESRI, 2004. ArcGIS 9.0th edition. ESRI, Redlands, CA.Ghisetti, F., 1979. Relazioni tra strutture e fasi trascorrenti e distensive lungo i
sistemi Messina-Fiumefreddo, Tindari-Letojanni e Alia-Malvagna (Sicilianord-orientale): uno studio microtettonico. Geologica Romana 18, 23–58.
Gomez, H., Kavzoglu, T., 2005. Assessment of shallow landslide susceptibilityusing artificial neural network in Jabonosa River basin, Venezuela.Engineering Geology 78, 11–27.
Govi, M., Mortara, G., 1981. I dissesti prodotti dal nubifragio del 10 luglio 1972nella bassa Valle Seriana. Bollettino Associazione Mineraria Subalpina 18(1–2), 87–118.
Greco, R., Sorriso-Valvo, M., Catalano, E., 2007. Logistic regression analysis inthe evaluation of mass movements susceptibility: the Aspromonte casestudy, Calabria, Italy. Engineering Geology 89, 47–66.
Guinau, M., Pallas, R., Vilaplana, J.M., 2005. A feasible methodologyfor landslide susceptibility assessment in developing countries: a case-study of NW Nicaragua after Hurricane Mitch. Engineering Geology 80,316–327.
Gullà, G., Esposito, D., 2003. Caratterizzazione geotecnica di “slurries”: risultatipreliminari. Tecnical Report, vol. 613. CNR IRPI, Cosenza, Italy. 20 pp.
Gullà, G., Sorbino, G., 1994. Considerazioni sulla permeabilità satura deimateriali di alterazione di origine gneissica. Proceedings of the SymposiumIl Ruolo dei Fluidi nei Problemi di Ingegneria Geotecnica. CNR-GruppoNazionale di Coordinamento per gli Studi di Ingegneria Geotecnica, 6–7September 1994, Mondovì, Cuneo, Italy, pp. 85–99.
Gullà, G., Sorbino, G., 1996. Soil suction measurements in a landslide involvingweathered gneiss. Proceedings of the VII International Symposium onLandslides, 17–21 June 1996, Trondheim, Norway. A.A. Balkema,Rotterdam, The Netherlands, pp. 749–754.
Gullà, G., Aceto, L., Niceforo, D., 2004a. Geotechnical characterisation of fine-grained soils affected by soil slips. Proceedings of the IX InternationalSymposium on Landslides, 28 June–7 July 2004, Rio de Janeiro, Brasil. A.A.Balkema, Rotterdam, The Netherlands, pp. 663–668.
Gullà, G., Niceforo, D., Ferraina, G., Aceto, L., Antronico, L., 2004b.Monitoring station of soil slips in a representative area of Calabria (Italy).Proceedings of the IX International Symposium on Landslides, 28 June–7July 2004, Rio de Janeiro, Brasil. A.A. Balkema, Rotterdam, TheNetherlands, pp. 591–596.
Gullà, G., Mandaglio, M.C., Moraci, N., Sorriso-Valvo, M., 2004c. Definizionedegli elementi generali di modelli geotecnici per l'analisi delle instabilitàsuperficiali per scorrimento-colata in Calabria jonica. Proceedings ofthe XXII Convegno Nazionale di Geotecnica, 22–24 September 2004,Palermo, Italy. Associazione Geotecnica Italiana, Patron Editore, Bologna,pp. 127–134.
Gullà, G., Mandaglio, M.C., Moraci, N., 2006. Effect of weathering on thecompressibility and shear strength of a natural clay. Canadian GeotechnicalJournal 43 (6), 618–625.
Guzzetti, F., Reichenbach, P., Ardizzone, F., Cardinali, M., Galli, M., 2006.Estimating the quality of landslide susceptibility models. Geomorphology81 (1–2), 166–184.
Köppen, W., 1948. Climatologia, con un estudio de los climas de la tierra. Fondode Cultura Economica, Mexico, Buenos Aires. 479 pp.
Loye-Pilot, M.D., 1984. Coulées boueuses et laves torrentielles en Corse:exemple de mouvements de terrain en pays méditerranéen montagnard.
57G. Gullà et al. / Geomorphology 99 (2008) 39–58
Author's personal copy
Mouvements de Terrain, Série Documents du Bureau de RechercheGéologique et Minière, Orléans, France, pp. 23–28.
Monaco, C., Tortorici, L., 2000. Active faulting in the Calabrian Arc and easternSicily. Journal of Geodynamics 29, 407–424.
Monaco, C., Tortorici, L., Nicolich, R., Cernobori, L., Costa, M., 1996. Fromcollisional to rifted basins: an example from the southern Calabrian arc(Italy). Tectonophysics 266, 233–249.
Moser, M., Hohensinn, F., 1983/84. Geotechnical aspects of soil slips in Alpineregions. Engineering Geology 19, 185–211.
Ogura, A.T., Filho, O.A., 1991. The Morin Debris-flow Disaster at PetropolisCity, Rio de Janeiro State, Brazil. Landslide News 5, 22–24.
Pike, R.J., Howell, D.G., Graymer, R.W., 2003. Landslides and cities — anunwanted partnership. In: Heiken, G., Fakundiny, R., Sutter, J.F. (Eds.),Earth Science in the City — A Reader. American Geophysical Union,Special Publication, vol. 56, pp. 187–254.
Pinna, M., 1977. Climatologia. UTET, Torino, Italy. 442 pp.Soeters, R., van Westen, C.J., 1996. Slope instability recognition analysis and
zonation. In: Turner, A.K., Schuster, R.L. (Eds.), Landslide Investigation andMitigation.National ResearchCouncil, Transportation ResearchBoard SpecialReport, vol. 247. National Academy Press, Washington, D.C., pp. 129–177.
Sorriso-Valvo, M., 1993. The geomorphology of Calabria. A Sketch. GeografiaFisica e Dinamica Quaternaria 16, 75–80.
Sorriso-Valvo, M., 2002. Landslides: from inventory to risk. In: Rybàř, J.,Stemnerk, J., Wagner, P. (Eds.), Landslides, Proceedings of the I EuropeanConference on Landslide, June 24–26 Prague, Cz. Rep. Balkema, Nether-land, pp. 79–93.
Sorriso-Valvo, M., Tansi, C., 1996. Grandi frane e deformazioni gravitativeprofonde di versante della Calabria-Note illustrative per la carta al 250.000.Geografia Fisica e Dinamica Quaternaria 19, 395–408.
Sorriso-Valvo, M., Antronico, L., Gaudio, R., Gullà, G., Iovine, G., Merenda,L., Minervino, I., Nicoletti, P.G., Petrucci, O., Terranova, O., 2004. Carta deidissesti causati in Calabria meridionale dall'evento meteorologico dell'8–10settembre 2000. CNR-GNDCI Pubblication, vol. 2859. RubbettinoPublisher, Soveria Mannelli, Italy.
Terranova, O., 2004a. Regional analysis of superficial slope instability risk inCalabria (Italy) through a pluviometrical approach. In: Brebbia, C.A. (Ed.),Risk Analysis IV. WIT Press, Southampton, Boston, pp. 257–266.
Terranova, O., 2004b. Caratteristiche degli eventi pluviometrici a scalagiornaliera in Calabria. Proceedings of the XXIX Convegno di Idraulica eCostruzioni Idrauliche, 7–10 September 2004, Trento, Italy. BIOSPublisher, Cosenza, Italy, pp. 343–350.
Terranova, O., Gullà, G., 2004. Hydrological characterisation of pos-sibile triggering scenarios in slope instability. In: Martin-Duque, J.F.,Brebbia, C.A., Godfrey, A.E., Diaz de Teran, J.R. (Eds.), Geo-Environment.WIT Press, Southampton, Boston, pp. 123–132.
Terranova, O., Antronico, L., Gullà, G., 2007. Landslide triggering scenarios inhomogeneous geological contexts: The area surrounding Acri (Calabria,Italy). Geomorphology 87, 250–267.
Tortorici, L., 1982. Analisi delle deformazioni fragili dei sedimenti postorogenidella Calabria settentrionale. Bollettino Società Geologica Italiana 100,291–308.
Tortorici, L., Monaco, C., Tansi, C., Cocina, O., 1995. Recent and activetectonics of the Calabrian Arc (Southern Italy). Tectonophysics 243, 37–55.
Tortorici, G., Bianca, M., Monaco, M., Tortorici, L., Tansi, C., De Guidi, G.,Catalano, S., 2002. Quaternary normal faulting and marine terracing in thearea of Capo Vaticano and S. Eufemia Plain (southern Calabria, Italy). StudiGeologici Camerti 2, 1–16.
Van Asch, Th.W.J., Sukmantalya Kesumajaya, I.N., 1993. The modelling of soilslip erosion in the upper Komering area, South Sumatra Province, Indonesia.Geografia Fisica e Dinamica Quaternaria 16, 81–86.
Versace, P., Ferrari, E., Gabriele, S., Rossi, F., 1989. Valutazione delle piene inCalabria. Geodata, vol. 30. CNR IRPI-GNDCI, Cosenza, Italy. 220 pp.
Westaway, R., 1993. Quaternary uplift of Southern Italy. Journal of GeophysicalResearch 98, 21741–21772.
Wieczorek, G.F., Larsen, M.C., Eaton, L.S., Morgan, B.A., Blair, J.L., 2001.Debris-flow and flooding hazards associated with the December 1999 stormin coastal Venezuela and strategies for mitigation. U.S. Geological Survey,Open File Report 01-144. 40 pp.
58 G. Gullà et al. / Geomorphology 99 (2008) 39–58