
The Storegga slide: evaluation of triggering sources and slide mechanics
12
The Storegga slide: evaluation of triggering sources and slide mechanics Tore J. Kvalstad a, * , Lars Andresen a , Carl F. Forsberg a , Kjell Berg b , Petter Bryn b , Magnus Wangen c a Norwegian Geotechnical Institute, P.O. Box 3930, Ullevaal Stadion, N-0806 Oslo, Norway b Norsk Hydro, N-0246 Oslo, Norway c Institute for Energy Technology, P.O. Box 40, N-2027, Kjeller, Norway Received 2 December 2003; received in revised form 15 June 2004; accepted 15 October 2004 Abstract The Storegga slide occurred about 8200 years ago. The enormous slide was released in an area where the average slope inclination is in the order of 0.6–0.78. Slide mechanisms and possible triggering sources that can cause large scale slide events at such low inclinations have been studied. The morphology of the upper part of the slide scar shows lateral spreads along marine clay layers indicating a retrogressive slide mechanism. Mechanical models of this slide mechanism have been developed considering the stain softening behaviour typical for marine clays. Numerical modelling of the rapid sedimentation during glacial periods and field measurements show that excess pore pressure existed, and still exists in areas adjacent to the slide. The three factors; slide mechanism, excess pore pressure and strain softening, have been incorporated in a retrogressive slide model, which demonstrates that large scale slide processes are possible, even at the low slope gradients in the Storegga area. q 2005 Elsevier Ltd. All rights reserved. Keywords: Slope stability; Soil strength; Pore pressure; Gravity; Strain softening 1. Introduction The Storegga slide is located in the Norwegian Sea 70– 150 km off the West coast of Norway (Fig. 1). The slide mass involved was about 3000 km 3 and affected an area of 90,000 km 2 . The upper headwall has a length of about 300 km and the NW boundary of the deposition zone extends about 800 km towards NW (Berg et al., 2005; Bryn et al., 2005). The slide area has been extensively mapped and investigated in connection with petroleum exploration and especially in connection with the slide risk evaluations for the Ormen Lange gas field. The slide base has an average inclination less than 18 and in the deepest part sliding along soil layers more than 700 m below the present seabed can be seen on seismic profiles. The slide left a deep slide scar and headwalls with gradients in the range 20–308 and locally even steeper. The headwalls have been stable since the slide event about 8200 years ago, and the present stability of the steep headwalls and the risk associated with slope failure have been evaluated (Kvalstad et al., 2005; Nadim et al., 2005). This required also understanding of possible triggering sources and slide mechanisms involved in the Storegga slide and a methodology for evaluation of the possibility of renewed large scale sliding in the Ormen Lange area. The main objective of this paper is to present results from this work. 2. Bathymetry and slide scar morphology As can be seen from the bathymetry (Fig. 2), the slide scar consists of large, slightly inclined terraces forming steps up the slide scar over a series of steeper scarps. These scarps or headwalls have heights in the range 50–350 m and the distance between the scarps in downslope direction varies from 5 to 10 km along the Northern Flank to more than 50 km in the central deep part of the slide (Fig. 3). 0264-8172/$ - see front matter q 2005 Elsevier Ltd. All rights reserved. doi:10.1016/j.marpetgeo.2004.10.019 Marine and Petroleum Geology 22 (2005) 245–256 www.elsevier.com/locate/marpetgeo * Corresponding author. E-mail address: [email protected] (T.J. Kvalstad).
-
Upload
independent -
Category
Documents
-
view
0 -
download
0
Transcript of The Storegga slide: evaluation of triggering sources and slide mechanics

The Storegga slide: evaluation of triggering sources and slide mechanics
Tore J. Kvalstada,*, Lars Andresena, Carl F. Forsberga, Kjell Bergb,Petter Brynb, Magnus Wangenc
aNorwegian Geotechnical Institute, P.O. Box 3930, Ullevaal Stadion, N-0806 Oslo, NorwaybNorsk Hydro, N-0246 Oslo, Norway
cInstitute for Energy Technology, P.O. Box 40, N-2027, Kjeller, Norway
Received 2 December 2003; received in revised form 15 June 2004; accepted 15 October 2004
Abstract
The Storegga slide occurred about 8200 years ago. The enormous slide was released in an area where the average slope inclination is in the
order of 0.6–0.78. Slide mechanisms and possible triggering sources that can cause large scale slide events at such low inclinations have been
studied. The morphology of the upper part of the slide scar shows lateral spreads along marine clay layers indicating a retrogressive slide
mechanism. Mechanical models of this slide mechanism have been developed considering the stain softening behaviour typical for marine
clays. Numerical modelling of the rapid sedimentation during glacial periods and field measurements show that excess pore pressure existed,
and still exists in areas adjacent to the slide. The three factors; slide mechanism, excess pore pressure and strain softening, have been
incorporated in a retrogressive slide model, which demonstrates that large scale slide processes are possible, even at the low slope gradients
in the Storegga area.
q 2005 Elsevier Ltd. All rights reserved.
Keywords: Slope stability; Soil strength; Pore pressure; Gravity; Strain softening
1. Introduction
The Storegga slide is located in the Norwegian Sea 70–
150 km off the West coast of Norway (Fig. 1). The slide
mass involved was about 3000 km3 and affected an area of
90,000 km2. The upper headwall has a length of about
300 km and the NW boundary of the deposition zone
extends about 800 km towards NW (Berg et al., 2005; Bryn
et al., 2005).
The slide area has been extensively mapped and
investigated in connection with petroleum exploration and
especially in connection with the slide risk evaluations for
the Ormen Lange gas field. The slide base has an average
inclination less than 18 and in the deepest part sliding along
soil layers more than 700 m below the present seabed can be
seen on seismic profiles. The slide left a deep slide scar and
headwalls with gradients in the range 20–308 and locally
even steeper. The headwalls have been stable since the slide
0264-8172/$ - see front matter q 2005 Elsevier Ltd. All rights reserved.
doi:10.1016/j.marpetgeo.2004.10.019
* Corresponding author.
E-mail address: [email protected] (T.J. Kvalstad).
event about 8200 years ago, and the present stability of the
steep headwalls and the risk associated with slope failure
have been evaluated (Kvalstad et al., 2005; Nadim et al.,
2005). This required also understanding of possible
triggering sources and slide mechanisms involved in the
Storegga slide and a methodology for evaluation of the
possibility of renewed large scale sliding in the Ormen
Lange area. The main objective of this paper is to present
results from this work.
2. Bathymetry and slide scar morphology
As can be seen from the bathymetry (Fig. 2), the slide
scar consists of large, slightly inclined terraces forming
steps up the slide scar over a series of steeper scarps. These
scarps or headwalls have heights in the range 50–350 m and
the distance between the scarps in downslope direction
varies from 5 to 10 km along the Northern Flank to more
than 50 km in the central deep part of the slide (Fig. 3).
Marine and Petroleum Geology 22 (2005) 245–256
www.elsevier.com/locate/marpetgeo

Fig. 1. Location of the Storegga slide.
T.J. Kvalstad et al. / Marine and Petroleum Geology 22 (2005) 245–256246
The distance between the upper and the lower headwall in
the Ormen Lange area varies between 15 and 25 km.
The slide scar is typically draped with debris flow
material and large areas are covered with slide blocks.
Locally, windows in the debris can be seen where the slide
base is covered only by a thin drape of post-slide Holocene
sediments (Fig. 4). The average slope inclination from the
shelf edge at 250–350 m water depth to the Møre Basin at
2800–3200 m depth is in the order of 0.6–0.78. Along the
Northern Flank and in the lower part towards the basin
somewhat steeper areas are found with inclinations in the
range 1–28, but in large parts of the slide gradients are less
than 0.48. The major headwalls have inclinations typically
in the range 10–308.
Enormous amounts of debris have passed through the
lower part of the slide scar and left little evidence of the
slide mechanism. However, along the upper headwall and in
the vicinity of the Ormen Lange field, the debris material
has not been overrun by slide material, and the slide pattern
is well preserved (Fig. 4).
In the shallow part of the slide, at Storneset to the north
of the Ormen Lange field, the slide material seems to have
undergone limited downslope displacement. Ice berg
plough-marks can be traced from the shelf into the slide
area, which demonstrates that surficial material has not been
Fig. 2. The Storegga slide area showing locations of the Ormen Lange field, the bath
the profile (6) applied in simulations of excess pore pressure in the North Sea Fa
lost. The lowering of the surface in the slide area is solely
due to lateral spreading.
The zone at the interface between the shallow and the
deep part of the slide shows a similar pattern. A series of
graben structures and ridges can be seen and the lateral
spread pattern in the shallow slide zone is well preserved in
the graben structures as shown in Fig. 4. Again no direct loss
in material occurred, but a further lowering of the seabed
was caused by lateral spreading along a deeper slide base.
Sections of seismic profiles crossing the upper part of the
slide reveal a pattern of nearly intact triangular ridges and
graben structures (Fig. 5). The reflection is severely affected
by the rugged seabed leading to spreading and attenuation
and hence loss in resolution and clarity.
Based on morphology and seismic data, the slide
mechanism was interpreted to be retrogressive sliding
over a sensitive base layer, where the slide activity
generates progressive softening of the sensitive base layer
as the slide retrogressively spreads upslope and also
laterally.
3. Modelling of progressive failure and retrogressiveslide mechanisms
Analytical and numerical methods for analysis of
retrogressive slide mechanisms were sought in an early
phase of the project. However, no such tools were found to
exist, and a stepwise development of methodology was
carried out during the project.
3.1. The infinite slope model—slab slides
The explanation of large-scale slab slides in slopes with
slope angles in the order of 0.5–28 requires a very low
resistance. For the soils investigated in the Ormen
Lange/Storegga area the undrained and drained strength is
much too high. Fig. 6 shows the relationship between the
safety factor against undrained sliding, slope inclination and
excess pore pressure ratio ruZDu/g 0z, where Du is the
excess pore pressure above hydrostatic pressure relative to
ymetric profiles (1, 2 and 3) in Fig. 3, the seismic profiles (4, 5) in Fig. 5 and
n area.

Fig. 3. Bathymetric profiles through the slide area (location; see Fig. 2).
T.J. Kvalstad et al. / Marine and Petroleum Geology 22 (2005) 245–256 247
seabed, g 0 is the submerged unit weight of the soil and z is
depth below seabed. A normalised strength ratio between
the undrained direct simple shear (DSS) strength, suDSS, and
effective consolidation stress, s 0vc, of 0.2 is applied.
As can be seen, excess pore pressure ratios of about 0.9
and a corresponding reduction in shear strength is required
to bring the factor of safety below 1.0 at slope angles of
interest. This means that only 10% of the overburden stress
is left, and either an extremely high initial pore pressure
must exist or collapsible of a highly sensitive soil layer must
be triggered. Potential sources for excess pore pressure were
investigated;
–
Fig
diff
earthquake induced shear strains generating excess pore
pressure
. 4. Bathymetric views of the upper part of the Storegga slide at the intersectio
ers from Fig. 2; red about 300 m to blue about 1000 m).
–
n b
melting of gas hydrates releasing methane gas and water
–
shear strain induced contraction with pore pressuregeneration and softening during the slide process causing
progressive failure and retrogressive sliding
–
rapid depositionThe materials investigated do not exhibit highly brittle
behaviour, and extreme earthquake loading with very long
duration (Lindholm et al., this issue; Bungum et al., this
issue) would be required to remould the material comple-
tely. It was considered unlikely that this process could take
place simultaneously over thousands of square kilometres.
Infinite slope response analyses carried out with 0.3 g peak
ground acceleration (PGA) earthquakes and cyclic soil
models, showed very little accumulation of strains and pore
etween the deep part and the shallower part at Storneset. (Colour scale

Fig. 5. Bathymetry and seismic profiles 4 and 5 in the upper headwall in the Ormen Lange area. Interpreted morphology of slide block/debris is indicated with
black lines.
T.J. Kvalstad et al. / Marine and Petroleum Geology 22 (2005) 245–256248
pressure generation. However, more severe earthquake
loading than a 0.3 g PGA earthquake is considered a
potential trigger source for initiating a retrogressive slide
process in locally steeper areas, especially when combined
with existence of excess pore pressure/underconsolidation
as discussed later.
Also gas hydrate melting was dismissed as a major
contributor. Although bottom simulation reflectors (BSRs)
are observed in some areas adjacent to the slide scar, no
signs of gas hydrate have been found in the geoborings in
the area. When subjected to temperature increase and/or
pressure reduction, gas hydrates may dissociate and release
gas and water with an increase in volume, a reduction in soil
strength and a potential reduction of the stability of a slope.
Temperature changes in the seabed caused by warm bottom
water influx after the last deglaciation may have triggered
dissociation, but were limited to water depths shallower
than about 700 m and could only have affected a small part
of the slide area. The water pressure increase caused by the
rising sea level following deglaciation has further counter-
acted the dissociation process. The distribution of gas
hydrate is non-uniform and the potential melting front along
the base of the gas hydrate stability zone does not follow the
stratigraphy and hence not the observed slip surfaces. Gas
hydrate melting could locally have weakened the soils in the
upper part of the slide area and contributed to the extension
of the slide, however, the possible spreading and extension
of the melting zone is not consistent with the observed slide
morphology.
The two latter sources for pore pressure generation,
contractive soils with strain softening causing retrogressive
sliding and rapid deposition, were considered to have higher
potential.
Fig. 6. Infinite slope analysis, (a) geometry and stresses, (b) factor of safety
vs. base inclination angle and excess pore pressure ratio, ru.
3.2. The retrogressive slide model
The slide scar and the debris formations seem to have
similarities with a retrogressive quick-clay slide. However,
the sensitivity (i.e. the ratio denoted St between the intact
and the remoulded strength) of the clays investigated is
considerably lower than typical quick clays found onshore
in Scandinavia and Canada. A model for evaluation of
retrogressive sliding was developed (Fig. 7) and can be
described as follows:
–
an initial slide is developed in the lower and possiblysteeper part of a slope, and the mobility of the slide

Fig. 7. Retrogressive slide model.
T.J. Kvalstad et al. / Marine and Petroleum Geology 22 (2005) 245–256 249
material is sufficient to more or less completely unload
the earth pressure against the initially developed head-
wall (Fig. 7a)
–
the unloading of the headwall causes undrained lateralexpansion of the soil and strain concentrations develop in
the toe area of the headwall
–
the large shear strain in the strain concentration zonescauses strain softening, primarily in the marine clay base
layer, and progressive failure develops along this layer
–
the factor of safety decreases below unity and the failingsoil mass (Fig. 7b) starts to accelerate downslope. A
triangular front wedge is formed, being pushed along the
slide base by a gradually distorted rhomb and triangular
wedge creating a graben behind the front wedge, and in
this way forming a new headwall (Fig. 7c)
–
the released potential energy is partly consumed asfriction along the base and circumference of the slide
mass, and partly in remoulding of the slide material along
the slide base and internally in the distorted slide mass
–
excess potential energy is transformed to kinetic energyaccelerating the slide mass further downslope
–
the reduction in strength gives sufficient mobility tounload the next headwall and the process repeats itself
(Fig. 7d) until soil strength, layering or geometry change
sufficiently to reduce mobility and decelerate the sliding
process
–
if the mobility is too low, the slide mass will blockfurther retrogression along the base layer and the process
will, if possible, continue along shallower marine clay
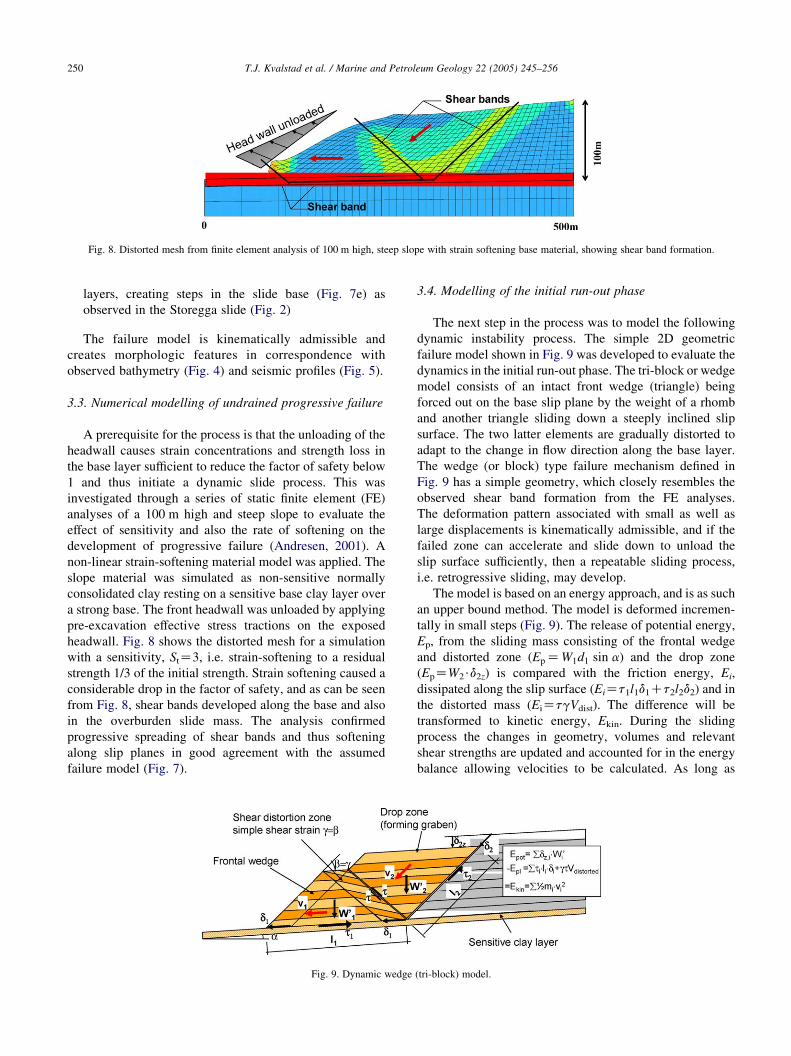
Fig. 8. Distorted mesh from finite element analysis of 100 m high, steep slope with strain softening base material, showing shear band formation.
T.J. Kvalstad et al. / Marine and Petroleum Geology 22 (2005) 245–256250
layers, creating steps in the slide base (Fig. 7e) as
observed in the Storegga slide (Fig. 2)
The failure model is kinematically admissible and
creates morphologic features in correspondence with
observed bathymetry (Fig. 4) and seismic profiles (Fig. 5).
3.3. Numerical modelling of undrained progressive failure
A prerequisite for the process is that the unloading of the
headwall causes strain concentrations and strength loss in
the base layer sufficient to reduce the factor of safety below
1 and thus initiate a dynamic slide process. This was
investigated through a series of static finite element (FE)
analyses of a 100 m high and steep slope to evaluate the
effect of sensitivity and also the rate of softening on the
development of progressive failure (Andresen, 2001). A
non-linear strain-softening material model was applied. The
slope material was simulated as non-sensitive normally
consolidated clay resting on a sensitive base clay layer over
a strong base. The front headwall was unloaded by applying
pre-excavation effective stress tractions on the exposed
headwall. Fig. 8 shows the distorted mesh for a simulation
with a sensitivity, StZ3, i.e. strain-softening to a residual
strength 1/3 of the initial strength. Strain softening caused a
considerable drop in the factor of safety, and as can be seen
from Fig. 8, shear bands developed along the base and also
in the overburden slide mass. The analysis confirmed
progressive spreading of shear bands and thus softening
along slip planes in good agreement with the assumed
failure model (Fig. 7).
Fig. 9. Dynamic wedge
3.4. Modelling of the initial run-out phase
The next step in the process was to model the following
dynamic instability process. The simple 2D geometric
failure model shown in Fig. 9 was developed to evaluate the
dynamics in the initial run-out phase. The tri-block or wedge
model consists of an intact front wedge (triangle) being
forced out on the base slip plane by the weight of a rhomb
and another triangle sliding down a steeply inclined slip
surface. The two latter elements are gradually distorted to
adapt to the change in flow direction along the base layer.
The wedge (or block) type failure mechanism defined in
Fig. 9 has a simple geometry, which closely resembles the
observed shear band formation from the FE analyses.
The deformation pattern associated with small as well as
large displacements is kinematically admissible, and if the
failed zone can accelerate and slide down to unload the
slip surface sufficiently, then a repeatable sliding process,
i.e. retrogressive sliding, may develop.
The model is based on an energy approach, and is as such
an upper bound method. The model is deformed incremen-
tally in small steps (Fig. 9). The release of potential energy,
Ep, from the sliding mass consisting of the frontal wedge
and distorted zone ðEpZW1d1 sin aÞ and the drop zone
(EpZW2$d2z) is compared with the friction energy, Ei,
dissipated along the slip surface (EiZt1l1d1Ct2l2d2) and in
the distorted mass (EiZtgVdist). The difference will be
transformed to kinetic energy, Ekin. During the sliding
process the changes in geometry, volumes and relevant
shear strengths are updated and accounted for in the energy
balance allowing velocities to be calculated. As long as
(tri-block) model.

T.J. Kvalstad et al. / Marine and Petroleum Geology 22 (2005) 245–256 251
excess kinetic energy is produced the slide mass will
accelerate, otherwise retardation will take place. The motion
will continue until the consumed energy equals the released
potential energy.
The run-out distance is strongly dependent on the
remoulded strength of the material in the slip surface.
High velocities might lead to a high frontal water pressures
and intrusion of water or remoulded soft material from the
previous slide block into the slide base causing further
reduction of the shear strength. With increasing travel
distance the soil mass will pass major steps in the slip
surfaces and break-up of slide blocks and intermixing with
water may take place. These processes are not well
understood, but might help explain excessive run-out on
low inclination slide bases.
Fig. 10 shows development of velocity, run-out distance
and geometry vs. time for an example run. The model
assumes instant application of remoulded strength at the
base slip surface and will thus overestimate the acceleration
in the initial phase. The displacement of water caused by the
sliding mass will generate a surface wave (tsunami), which
will contribute to consumption of slide energy and reduce
the initial acceleration as well as the average velocity and
the run-out. The effect on the initial acceleration can be
modelled by introduction of added water mass. Applying an
added water mass equal to 1–2 times the volume of the
slide mass leads to a reduction of the initial acceleration of
about 15–25%, but has little effect on average velocity and
run-out.
The fraction of slide energy transformed to wave energy
during the slide event depends primarily on the thickness of
Fig. 10. Example of front velocity and travel distance vs. time (upper figures) and
black, final configuration in red.
the slide mass relative to the water depth and the slide
velocity. In the distal parts of the Storegga slide with large
water depths, the effect is considered small (!10%), while
in the shelf edge area, the effect will increase and may
introduce considerable interaction between slide mass and
water.
3.5. Modelling of retrogressive spreading
The single 2D tri-block model described above was
extended to a large number of tri-blocks. In this model a
predetermined final shape controlled by the drop height, Dh,
and the inclination, b, of the frontal wedge, is applied to all
tri-blocks as shown in Fig. 11.
In the same way as above, released potential energy and
consumed energy along slip surfaces and in distorted
volumes are calculated. The number of tri-blocks is
increased until consumed energy exceeds released energy.
The number of tri-blocks and the predetermined geometry
determines the run-out length and the cut-back length of the
slide and also allows assessment of average slide mass
velocity from start to end.
In order to evaluate the volume, which is a central
parameter in tsunami analysis, an assumption regarding the
width of the slide front has to be made. Karlsrud and
Lillevik (1984) presented data from a large number of slides
showing the width to cut-back length ratio being less than 2
for nearly all cases evaluated. This applies also to the overall
Storegga slide as well as for local embayments in the upper
headwall, and a value of 2 was applied in the estimates of
slide mass geometry at different time steps (lower figure). Initial shape in
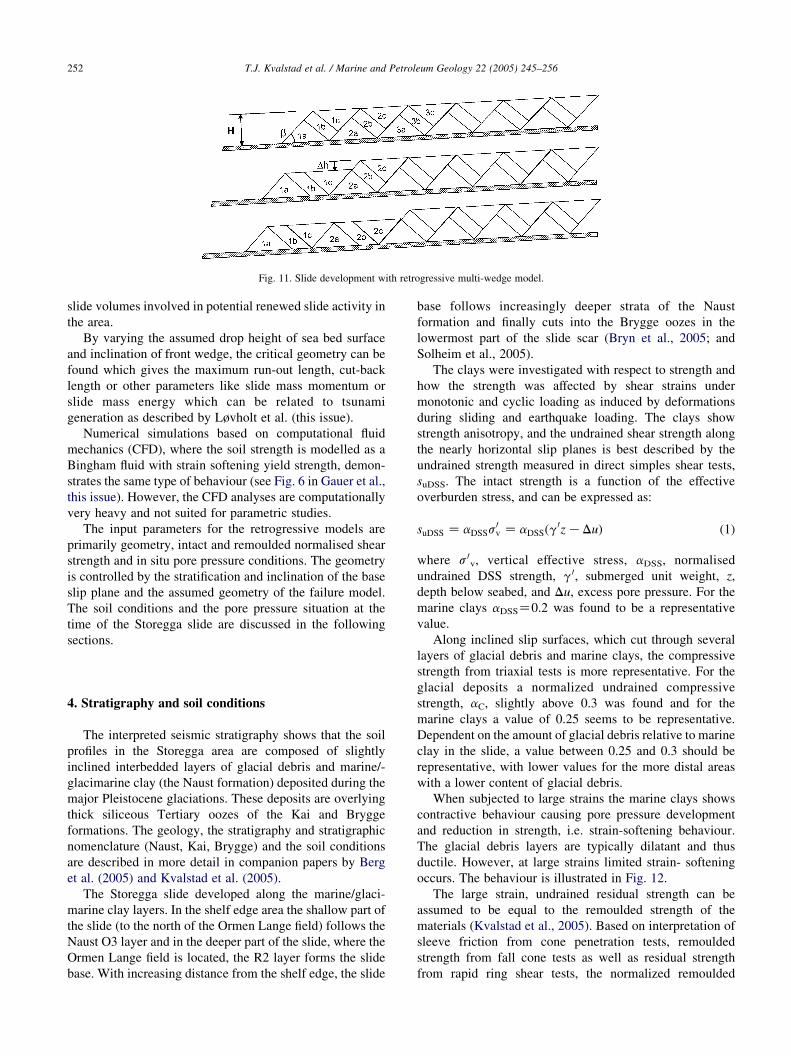
Fig. 11. Slide development with retrogressive multi-wedge model.
T.J. Kvalstad et al. / Marine and Petroleum Geology 22 (2005) 245–256252
slide volumes involved in potential renewed slide activity in
the area.
By varying the assumed drop height of sea bed surface
and inclination of front wedge, the critical geometry can be
found which gives the maximum run-out length, cut-back
length or other parameters like slide mass momentum or
slide mass energy which can be related to tsunami
generation as described by Løvholt et al. (this issue).
Numerical simulations based on computational fluid
mechanics (CFD), where the soil strength is modelled as a
Bingham fluid with strain softening yield strength, demon-
strates the same type of behaviour (see Fig. 6 in Gauer et al.,
this issue). However, the CFD analyses are computationally
very heavy and not suited for parametric studies.
The input parameters for the retrogressive models are
primarily geometry, intact and remoulded normalised shear
strength and in situ pore pressure conditions. The geometry
is controlled by the stratification and inclination of the base
slip plane and the assumed geometry of the failure model.
The soil conditions and the pore pressure situation at the
time of the Storegga slide are discussed in the following
sections.
4. Stratigraphy and soil conditions
The interpreted seismic stratigraphy shows that the soil
profiles in the Storegga area are composed of slightly
inclined interbedded layers of glacial debris and marine/-
glacimarine clay (the Naust formation) deposited during the
major Pleistocene glaciations. These deposits are overlying
thick siliceous Tertiary oozes of the Kai and Brygge
formations. The geology, the stratigraphy and stratigraphic
nomenclature (Naust, Kai, Brygge) and the soil conditions
are described in more detail in companion papers by Berg
et al. (2005) and Kvalstad et al. (2005).
The Storegga slide developed along the marine/glaci-
marine clay layers. In the shelf edge area the shallow part of
the slide (to the north of the Ormen Lange field) follows the
Naust O3 layer and in the deeper part of the slide, where the
Ormen Lange field is located, the R2 layer forms the slide
base. With increasing distance from the shelf edge, the slide
base follows increasingly deeper strata of the Naust
formation and finally cuts into the Brygge oozes in the
lowermost part of the slide scar (Bryn et al., 2005; and
Solheim et al., 2005).
The clays were investigated with respect to strength and
how the strength was affected by shear strains under
monotonic and cyclic loading as induced by deformations
during sliding and earthquake loading. The clays show
strength anisotropy, and the undrained shear strength along
the nearly horizontal slip planes is best described by the
undrained strength measured in direct simples shear tests,
suDSS. The intact strength is a function of the effective
overburden stress, and can be expressed as:
suDSS Z aDSSs0v Z aDSSðg
0z KDuÞ (1)
where s 0v, vertical effective stress, aDSS, normalised
undrained DSS strength, g 0, submerged unit weight, z,
depth below seabed, and Du, excess pore pressure. For the
marine clays aDSSZ0.2 was found to be a representative
value.
Along inclined slip surfaces, which cut through several
layers of glacial debris and marine clays, the compressive
strength from triaxial tests is more representative. For the
glacial deposits a normalized undrained compressive
strength, aC, slightly above 0.3 was found and for the
marine clays a value of 0.25 seems to be representative.
Dependent on the amount of glacial debris relative to marine
clay in the slide, a value between 0.25 and 0.3 should be
representative, with lower values for the more distal areas
with a lower content of glacial debris.
When subjected to large strains the marine clays shows
contractive behaviour causing pore pressure development
and reduction in strength, i.e. strain-softening behaviour.
The glacial debris layers are typically dilatant and thus
ductile. However, at large strains limited strain- softening
occurs. The behaviour is illustrated in Fig. 12.
The large strain, undrained residual strength can be
assumed to be equal to the remoulded strength of the
materials (Kvalstad et al., 2005). Based on interpretation of
sleeve friction from cone penetration tests, remoulded
strength from fall cone tests as well as residual strength
from rapid ring shear tests, the normalized remoulded

Fig. 12. Typical stress–strain development for marine clay and glacial
debris showing strain-softening from peak shear strength, tp, towards
residual shear strength, tres, with increasing shear strain.
T.J. Kvalstad et al. / Marine and Petroleum Geology 22 (2005) 245–256 253
strength, (surem/s 0v) was found to be in the order of 0.04–
0.10, increasing with depth for the marine clays and 0.10–
0.20 for the glacial clays. The ratio between peak strength
and remoulded strength is denoted sensitivity. If the intact
strength from triaxial compression is used as reference, the
sensitivity of the marine clays will be in the range 3–6,
while the glacial clays typically fall in the range 1.5–3.
Using DSS strength as reference will give somewhat lower
sensitivities.
Fig. 13. Parameters applied in simulation of pore pressure development
under rapid deposition. (a) Void ratio vs. effective overburden stress, (b)
permeability vs. void ratio. (the ‘modified glacial’ curve was applied in the
North Sea Fan simulations).
5. Overburden stress and pore pressure conditions
The submerged unit weight of the marine clays is in the
order of 6–7 kN/m3 in the upper metres, increasing towards
9 kN/m3 at larger depths below seabed due to increasing
compaction. The glacial debris has lower clay content,
resulting in higher density and shows typically submerged
unit weight in the range 10–12 kN/m3.
Deposition rates derived from the thickness, density
and age of the different strata showed rapid deposition in
the Ormen Lange area during glacial periods, and
especially in the adjacent North Sea Fan (Berg et al.,
2005; Nygard et al., 2005; Rise et al., 2005), and excess
pore pressure was suspected to exist in large parts of the
area.
Prediction of excess pore pressure requires information
about the compressibility and permeability of the sediments
and how these parameters change with increasing over-
burden stress and compaction. A large number of oedometer
compression tests were performed on material from the
different strata and again the materials could roughly be
divided in three groups, marine clays and glacial deposits of
the Naust formation and oozes of the Kai and Brygge
formations (Berg et al., 2005). Average relationships
between effective overburden stress, void ratio and
permeability were established (Fig. 13) and applied in the
sedimentation simulations.
The deposition rate was estimated for two different
profiles. One profile crosses the shelf edge in the Ormen
Lange area and another crossing from the depocentre in
the North Sea Fan into the lower part of the Storegga slide
(Fig. 2). Fig. 14 shows the reconstructed stratigraphy and
the estimated ages of the seismic stratigraphy considered for
the latter profile.
5.1. Modelling techniques for pore pressures caused
by rapid sedimentation
A 1D model was used at NGI for prediction of excess
pore pressure in the shelf edge area. This model does not

Fig. 14. Reconstructed stratigraphy of profile from North Sea Fan into the Storegga slide. The location of the profile is shown in Fig. 2.
T.J. Kvalstad et al. / Marine and Petroleum Geology 22 (2005) 245–256254
consider lateral flow, and is suitable for areas where lateral
flow is of little importance. In areas with varying thickness
and permeability, lateral flow processes may affect the flow
field significantly, and a 2D basin simulator model BAS
(Wangen, 1993) was applied for modelling the profile from
the North Sea Fan into the Storegga slide.
The 1D-analyses indicated excess pore pressure ratios,
ru, in the order of 0.2–0.3 in the shelf edge area at the time of
the Storegga slide, which is in reasonable correspondence
with the measured excess pore pressure of 100–110 kPa at
65 m depth below seabed in a location 2 km behind the shelf
edge (Strout and Tjelta, 2005). A series of simulations were
run for the NSF profile, varying the vertical and lateral
permeability distribution. At the time of the Storegga slide
(and also today) high excess pore pressure ratios were
Fig. 15. Examples of results from BAS simulations in Profile 6 from the North Sea
excess pore pressure ratio, ru, at the time of the Storegga slide. (a) Best estimate ve
with low permeability marine clay over high permeability Brygge ooze.
predicted in the North Sea Fan (NSF) and in the adjacent
area towards the Storegga slide (Fig. 15).
The BAS basin simulator does not allow expansion (or
swelling) caused by reduction in effective stress. In a
profile with large differences in deposition rate, the pore
pressure increase in a section with low deposition rate, as
in the toe area of the NSF, can be higher than the increase
in overburden stress. This will result in unloading and
swelling. The swelling requires an influx of pore water
and will introduce a delay in pore pressure response and
may explain that the most critical conditions may develop
with a considerable time lag compared with the deposition
history. This effect was demonstrated numerically with
FE analyses of an idealised fan structure, and indicated
that thousands of years may have passed from end of
Fan to the toe area of the Storegga slide (see Fig. 2) showing distribution of
rtical permeabilities with 10 times higher horizontal permeability, (b) Case

Fig. 16. Examples of retrogressive slide analyses of the Storegga slide showing slide velocity and kinetic energy vs. frontal run-out distance. (PJZ1015J). (a)
Case in the vicinity of the North Sea Fan with 500 m deep slip surface and 60% excess pore pressure gradient. (b) Case in the upper part of the deep slide area
with 250 m deep slip surface and 30% excess pore pressure.
T.J. Kvalstad et al. / Marine and Petroleum Geology 22 (2005) 245–256 255
rapid deposition in the depocentre at the top of the fan,
till maximum excess pore pressure is generated in the
toe area.
Table 1
Parameters applied in example cases
Parameters Case A Case B
Geometry
Initial slope height (H) (m) 500 250
Height reduction (Dh) (m) 250 125
Frontal wedge angle (b) (8) 35 35
Slope angle (a) (8) 0.6 1.2
Excess pore pressure ratio 0.6 0.3
Slide mass properties
Avg. subm. unit weight (g 0) (kN/m3) 9 9
Normalised shear strength (aC) 0.3 0.3
Sensitivity St relative to suC 2 2
Slide base properties
Normalised shear strength aDSS 0.2 0.2
Strength anisotropy suDSS/suC 0.8 0.8
Sensitivity St relative to suC 5 5
6. Example cases
Two example cases of the retrogressive slide model
applied for simulation of the Storegga slide are presented
below. Slide velocity vs. run-out distance and kinetic energy
vs. run-out distance are shown in Fig. 16. (The latter
parameter is essential for tsunami evaluations). Soil
parameters were chosen within the ranges obtained from
the soil investigations and excess pore pressure ratios
considered realistic for conditions at the time of the slide
event were applied (Table 1).
In Case A the slope inclination was set to aZ0.58, the
thickness of the slide mass, HZ500 m and the excess pore
pressure gradientZ60% to simulate the observed deep
seated sliding on very gentle base layer inclinations in the
vicinity of the North Sea Fan. The retrogressive slide model
predicts run-out distances in the order of 35 km. The
associated cut-back from the starting point is of the same
size giving a slide length of about 70 km with a slide scar
width of 70 km. The analysis shows that extensive slide
masses could be mobilised.
Case B was run with aZ1.28, HZ250 m, and a pore
pressure gradient of 30%, simulating the Storegga slide
conditions in the Ormen Lange area between the upper and
lower headwall. The resulting slide run-out is about 8 km
and thus the total slide length (run-outCcut-back) is about
16 km corresponding reasonably well with the distance
between the upper and the lower headwall.
The predicted run-out distances are sufficiently long to
push large slide masses over the major steps in the slip
surfaces. This will cause high speed impact at the base of
these steep slopes. Most likely this will lead to break-up of
the slide blocks and mixing in of seawater into the debris
material, which will reduce the average strength of the slide
mass as well as in the slip surface and allow transport of
debris over long distances.

T.J. Kvalstad et al. / Marine and Petroleum Geology 22 (2005) 245–256256
7. Conclusion
Site investigations have revealed moderately sensitive
clays and identified the marine clay layers which form
the main slip surfaces of the Storegga slide. The
morphology and seismic profiles from the upper (and
most intact) part of the slide area show clear pictures of
lateral extension indicating retrogressive upslope spreading
of the slide. Based on this interpretation mechanical models
for retrogressive failure were developed, for single step
slide release and for a continuous series of retrogressive
slide steps. The models are kinematically admissible and
based on an upper bound energy approach and reproduces
slide morphology in reasonable agreement with obser-
vations. A basic assumption and requisite is that the soil is
moderately sensitive and that the unloading caused by one
step in the slide process is sufficient to generate progressive
spreading of shear bands with strain softening causing
initiation of the next step. This was confirmed by FE
analyses for a single step slide and by CFD analyses for
continuous retrogression.
Simulations of excess pore pressure caused by the rapid
deposition during glacial periods showed that high excess
pore pressure ratios were likely to develop in the North Sea
Fan and adjacent areas during the last glaciations with more
moderate development in the Ormen Lange area. Pore
pressure measurements behind the shelf edge show values in
reasonable correspondence with the simulations.
Applying soil strength parameters from the site investi-
gations with excess pore pressure ratios from simulations,
the mechanical models for retrogressive sliding demonstrate
that retrogressive failure is a possible and likely slide
mechanism for failure along slightly inclined sensitive soil
layers. The retrogressive slide analyses show that extensive
areas may fail in a lateral extension/retrogressive failure
mode. The predicted run-out distances are sufficiently long
to push large slide masses over the observed major steps in
the slip surface. This would drastically increase the kinetic
energy of the slide masses and cause high speed impact at
the base of these steep slopes with break-up of the slide
blocks and mixing in of seawater into the debris material.
The resulting heavy slurry could well be capable of
transporting blocky material over long distances.
Retrogressive failure requires triggering of an initial slide
in the toe area. The initial triggering of the Storegga slide is
believed to be caused by the high excess pore pressure
caused by rapid deposition in the North Sea Fan combined
with earthquake loading in a locally steeper slope in the
lower part of the slide area. In these areas enormous
amounts of debris have passed, and little evidence of the
initial slide mechanism is available.
Acknowledgements
The work presented was carried out under the Ormen
Lange project. The authors would like to thank Norsk Hydro
and the Ormen Lange partners (BP, ExxonMobile, Petoro,
Shell and Statoil), for permission to publish the results. This
is publication number 46 of the International Centre for
Geohazards (ICG).
References
Andresen, L. (2001), Effect of strain softening on stability analyses.
Analysis of retrogressive sliding due to strain softening—Ormen Lange
case study. NGI report No. 521001-10, 29.03.2001.
Berg, K., Solheim, A., Bryn, P., 2005. The Pleistocene to recent geological
development of the Ormen Lange area. Marine and Petroleum Geology,
this issue, doi. 10.1016/j.marpetgeo.2004.10.009.
Bryn, P., Berg, K., Forsberg, C.F., Solheim, A., Kvalstad, T.J., 2005.
Explaining the holocene Storegga slide. Marine and Petroleum
Geology, this issue, doi. 10.1016/j.marpetgeo.2004.12.003.
Bungum, H., Lindholm, C., Faleide, J.I., 2005. Postglacial seismicity
offshore mid-Norway with emphasis on. Marine and Petroleum
Geology, this issue, doi. 10.1016/j.marpetgeo.2004.10.007.
Gauer, P., Kvalstad, T.J., Forsberg, C.F., Bryn, P., Berg, K., 2005. The last
phase of the Storegga slide: simulation of retrogressive slide dynamics
and comparison with slide-scar morphology. Marine and Petroleum
Geology
Karlsrud, K., Lillevik, S.G., 1984. Sammenstilling av leirskred behandlet
av NGI i perioden 1969–1984 (Compilation of clay slides evaluated by
NGI in the period 1969–1984, in Norwegian). NGI internal report
50904-1, December 1984.
Kvalstad, T.J., Nadim, F., Kaynia, A.M., Mokkelbost, K.H., Bryn, P., 2005. Soil
conditions and slope stability in the Ormen Lange area. Marine and Petroleum
Geology, this issue, doi. 10.1016/j.marpetgeo.2004.10.021.
Lindholm, C., Roth, M., Bungum, H., Faleide, J.I., 2005. Probabilistic and
deterministic seismic hazard results and influence of the sedimentary
Møre Basin, NE Atlantic. Marine and Petroleum Geology, this issue,
doi. 10.1016/j.marpetgeo.2004.10.006.
Nadim, F., Kvalstad, T.J., Guttormsen, T., 2005. Quantification of risks
associated with seabed instability at Ormen Lange. Marine and
Petroleum Geology, this issue, doi. 10.1016/j.marpetgeo.2004.10.022.
Nygard, A., Sejrup, H.P., Haflidason, H., King, E.L., 2005. Spatio-
temporal-magnitudal variations. Marine and Petroleum Geology, this
issue, doi. 10.1016/j.marpetgeo.2004.12.001.
Rise, L., Ottesen, D., Berg, K., Lundin, E., 2005. Large-scale
development of the mid-Norwegian shelf and margin during the
last 3million years. Marine and Petroleum Geology, this issue, doi.
10.1016/j.marpetgeo.2004.10.010.
Strout, J.M., Tjelta, T.I., 2005. In situ pore pressures: What is their
significance and how can they be reliably measured?. Marine and
Petroleum Geology, this issue, doi. 10.1016/j.marpetgeo.2004.10.024.
Wangen, M., 1993. A finite element formulation in Lagrangian coordinates
for heat and fluid flow in compacting sedimentary basins. International
Journal for numerical and Analytical Methods in Geomechanics 15,
705–733.