Cooling and exhumation of the Rieserferner Pluton (Eastern Alps, Italy/Austria

R.T. RANGANAI 273
Introduction The Archaean granite-greenstone terranes of Zimbabwecomprise type examples cited in the world-wide debateon greenstone belt formation and subsequentdeformation and provide evidence of deformation bygranite diapirism (e.g., Wilson, 1990; Bickle and Nisbet,1993; Jelsma et al., 1993; Bickle et al., 1994; Wilson et al.,1995; Blenkinsop et al., 1997; Chardon et al., 1998).Evidence for granite diapirism has been derived mainlyfrom geological and structural mapping combined withgeochronological data (e.g., Ramsay, 1989; Jelsma et al.,1993, 1996; Becker et al., 2000; Jelsma and Dirks, 2000),without input from geophysical modelling of the 3Dgeometry of the units (e.g., Stettler et al., 1997; Wellman,2000; McLean and Betts, 2003; Peschler et al., 2004).
Ranganai et al. (2008) have recently presented aregional gravity study of the south-central part of the
Zimbabwe craton, including the Fort Rixon-Shangani(FRSh) granite-greenstone terrain, which is the subject ofthe present detailed study. The Fort Rixon (FR)greenstone belt (Figure 1) is one of the smallest belts ofthe Zimbabwe craton, with an exposed maximum lengthof ~30 km and a maximum width of ~20 km. Accordingto Harrison (1969), it can be imagined that successiveperiods of intrusion and granitisation have encroachedupon the belt, causing a progressive decrease in its size.The belt is also thought to be originally part of the Bubi-Bulawayo-Filabusi (BBF) greenstone belt to the west,southwest and south respectively, but was separated bya ~2.7 Ga Sesombi Suite granite intrusion (SSg, Figure 1;Stowe, 1980; Wilson, 1990; Wilson et al., 1995). This interpretation could be of significance to theinterpretation of general granite-greenstone relationships(Campbell et al., 1991; Treloar and Blenkinsop, 1995;
STRUCTURAL AND SUBSURFACE RELATIONSHIPS BETWEEN THE FORT RIXON-SHANGANI GREENSTONE BELT AND THENALATALE PLUTON, ZIMBABWE CRATON, AS DERIVED FROMGRAVITY AND AEROMAGNETIC DATA
R.T. RANGANAIDepartment of Physics, University of Botswana, P. Bag UB0704, Gaborone, Botswanae-mail: [email protected]
© 2013 December Geological Society of South Africa
ABSTRACT
The geology, structure and subsurface mass distribution in the Fort Rixon-Shangani (FRSh) granite-greenstone terrain, Zimbabwe
craton, has been investigated using regional aeromagnetic and gravity data, as well as density-constrained gravity modelling along
four traverses/profiles. Processed aeromagnetic data reveal sets of north-northwest-trending dykes and faults, west-northwest-
trending faults and a major north-northeast-trending shear zone bounding the FRSh greenstone belt in the southeast.
The distribution of dykes is more widespread and continuous than previously recognised, while concealed mafic and ultramafic
horizons or extensions are revealed. Cross-cutting relationships and magnetic anomaly displacements provide relative age
constraints for the various dykes and associated faults in the area, with the north-northwest-trending dyke set being the youngest
and the north-northeast-trending set the oldest. There has been repeated movement along the faults over time.
The regional Bouguer gravity anomaly map shows that the Fort Rixon (FR) greenstone belt is marked by a 30 mGal positive
anomaly, relative to a background of -120 mGal over the surrounding tonalitic gneisses. Both the Bouguer anomaly and first vertical
gravity gradient maps suggest a smaller body than the current known outcrop, and this is confirmed by gravity modelling which
shows a reduced extent of the greenstone belt lithologies with depth. The maximum anomaly appears to be significantly offset to
the southwest, suggesting continuation of greenstone belt lithologies beyond surface exposures in to the southwest. The porphyritic
Nalatale granite intrudes and bisects the FRSh greenstone belt, and is associated with a gravity low (~7 mGal amplitude), which
appreciably reduces the FR greenstone belt positive anomaly in the northeast. The regional setting suggests a western granite-
greenstone contact that may be explained by doming, an eastern contact that is marked by the Irisvale-Lancaster strike-slip shear
zone, and a northern contact with an intrusive and post-tectonic granite.
Interpretation of the gravity data by 2½D modelling along three profiles shows that the FR greenstone belt has a boat or v shape
and a depth extent of 3.0 to 4.0 km. The thinnest part of the greenstone belt occurs in the northeast near the Nalatale granite,
suggesting that the pluton underlies much of the greenstone belt in the area. The Nalatale pluton is on average 2.5 km thick under
the greenstone belt but includes a root up to 4.5 km thick, and a steep contact with the tonalitic gneisses to the east. It is probably
a wedge-shaped pluton that was emplaced along steeply oriented fractures in the brittle crust.
The models show that the Nalatale pluton has a shallow outward dip with steep contacts at depth. These results, together with
the surface and subsurface disposition of the various geological units, suggest that the greenstone belt underwent deformation by
granite intrusion through diapiric-type geotectonic processes.
SOUTH AFRICAN JOURNAL OF GEOLOGY, 2013, VOLUME 116.2 PAGE 273-296
doi:10.2113/gssajg.116.2.273

Blenkinsop et al., 1997; Jelsma and Dirks, 2000, 2002).According to Ridley et al. (1997), many of the late- to post-tectonic granitoids in parts of the Zimbabwecraton have contacts which are grossly discordant to the greenstones sequences, as exemplified by theShangani monzo granite (i.e., Nalatale granite, Ng, Figure 1), a subject of this study. This post-volcanicgranite pluton almost bisects the FRSh greenstone beltinto the Fort Rixon and Shangani sections which aretreated as separate greenstone belts in current literature (e.g., Blenkinsop et al., 1997). In contrast, syntectonicconcordant plutons that have deformed the greenstonebelt lithologies are found at deeper crustal levelscompared to the late-tectonic to post-tectonic cross-cutting plutons and show different emplacement styles.These observations suggest the possibility that a plutonmay emplace itself by magmatic stoping and partly byforcible intrusion. The granites intruded the greenstonebelts and, in the process, the greenstones weredismembered, fragmented, partly assimilated, migmatized,and complexly folded (Minnit and Anhaeusser, 1992).
The current study expands on the work by Ranganai(1995, 2001) and Ranganai et al. (2008), and involvedthe collection of additional gravity data mainly over theNalatale granite pluton adjacent to the FR greenstonebelt in order to investigate their subsurface relationship.The Shangani section of the FRSh greenstone belt is notconsidered in detail here. The main objectives of thispaper are: i. to present both qualitative and quantitative
interpretation of potential field geophysical data fromthe FR greenstone belt and the adjacent Nalatalegranite through the processing and enhancement ofpre-existing aeromagnetic data to investigate thestructural relationships between the greenstone beltand the adjacent granites,
ii. to investigate the subsurface extent of the Nalatalepluton and the subsurface configuration of thegreenstone belt through 2½D modelling of recentlycollected gravity data that is constrained by surfacegeology and density measurements.
Despite the inherent problem of non-uniqueness, gravityanomalies give meaningful information about thepresent subsurface configuration of greenstone belts andgranitoid plutons and, at the very least, can be used to rule out certain mass distributions and theaccompanying hypotheses for emplacement (e.g., Guptaet al., 1982; Ameglio et al., 1997; McLean and Betts,2003; Peschler et al., 2004). The surface and subsurfacerelationship between the FR greenstone belt and the adjacent granitoid plutons provides insight into theattendant greenstone belt deformation observedthroughout the Zimbabwe craton and other Archaeanterrains world-wide (e.g., Jelsma et al., 1993; Kisters andAnhaeusser, 1995; Treloar and Blenkinsop, 1995; Ridleyet al., 1997; Chardon et al., 1998; Jelsma and Dirks, 2000;Bleeker, 2002; Van Kranendonk, 2004, 2011).
Geological and structural setting The Fort Rixon greenstone belt is one of the smallestbelts of the Zimbabwe craton, measuring only about 400 km2. Mineralization in this belt is poor whencompared with other greenstone belts in Zimbabwe(e.g., Bartholomew, 1990; Campbell and Pitfield, 1994),with a few gold mines mainly concentrated along theeastern margin where shearing and schist developmenthas been more intense (Campbell and Pitfield, 1994).This has contributed to the lack of interest ingeologically remapping the area, although a regionalstructural framework based on remote sensing andlimited ground truthing has been carried out (Campbellet al., 1991; Campbell and Pitfield, 1994). The FR belt isnormally described together with the Shanganigreenstone belt to the north, although the two arealmost completely separated by the intrusive Nalatalegranite (Harrison, 1969; Blenkinsop et al., 1997; Figure 1). The FRSh greenstone belt is dominated by avariety of lithologies, including massive and pillowedmetabasaltic lavas, amphibolites and hornblendesemischists, metagabbro-dolerites and felsic (quartz-sericite) meta-tuffs (Campbell and Pitfield, 1994). The meta-igneous rocks comprise fine-grained, extrusivebasaltic types, or coarse-grained, intrusive doleritic orgabbroic types; the latter occupying most of the centralportion of the belt (Harrison, 1969). With the exceptionof ultramafic intrusions along the eastern edge of thebelt, all the greenstone lithologies have been assigned tothe Upper Greenstone and are ~2.7 Ga in age (Wilson,1990; Wilson et al., 1995). Variably serpentinised-komatiitic lavas with interbedded banded iron formation(BIF) units occur along the eastern margin of the belt(Harrison, 1969; Campbell and Pitfield, 1994). By analogy with the Shangani greenstone belt to thenorth, the ultramafic rocks form part of the UpperGreenstones (i.e., Reliance Formation equivalents) andare also ~2.7 Ga in age. However, along the easternmargin of the belt, felsic volcanics have been describedthat may correlate with the (~2.8 Ga) Upper GreenstonesLower Bulawayan volcanics in the Shangani and Filabusi greenstone belts (e.g., Prendergast, 2004). Minorclastic sedimentary rocks also occur within thegreenstone belt.
A variety of granitic rocks surround the FR greenstone belt. To the east and southeast, the greenstone belt is mainly in contact with poorlyexposed ~2.9 to 2.8 Ga granitoid gneisses (Campbelland Pitfield, 1994; Jelsma et al., 2004). There is evidenceof recrystallization and mobilization of the gneisseswhich form embayments into the belt and there arebodies of sheared porphyritic granite in the southeast ofthe belt (Harrison, 1969). The ca. 2.6 Ga ChillimanziSuite monzogranitic plutons intrude the gneisses andinclude the Nalatale granite which bisects the Fort Rixonand Shangani sections of the FRSh greenstone belt (Figure 1). The area to the west of the FRSh greenstoneis underlain by plutonic complexes that separate theFRSh belt from the Bubi-Bulawayo greenstone belt
SOUTH AFRICAN JOURNAL OF GEOLOGY
STRUCTURAL AND SUBSURFACE RELATIONSHIPS BETWEEN THE FORT RIXON-SHANGANI GREENSTONE BELT
AND THE NALATALE PLUTON
274

R.T. RANGANAI
SOUTH AFRICAN JOURNAL OF GEOLOGY
275
Figure 1. Simplified Regional Geological map of the Fort Rixon-Shangani (FRSh) greenstone belt and surrounding areas (modified after ZGS,
1994). Labelled settlements and/or greenstone belts are: B = Bubi; Byo = Bulawayo; Fl = Filabusi; FR = Fort Rixon; Gw = Gwanda;
Mb = Mberengwa; Sh = Shangani. Note the large syn-volcanic granite (SSg) between the greenstone belts and discussed in text. Other
geological features labelled: ILSZ = Irisvale-Lancaster shear zone, JF = Jenya fault; Mbg = Mbalabala granite pluton; MF = Mchingwe fault;
Nf = Ngomi fault; Ng = Nalatale granite pluton; Sd = Sebanga dyke; SR = Shamba range; UD = Umvimeela dyke. Box shows main study area
covered by geophysical maps.
~35 km to the west. These complexes have beencorrelated with the ~2.7 Ga Sesombi Suite of tonalite-trondjhemite-granodiorite (TTG) granitoids (Wilson,1990; Wilson et al., 1995; SSg in Figure 1).
Dolerite dykes intrude both the greenstone belt andthe granitic rocks. They are poorly exposed, and occuras small swarms and discontinuous outcrops. The mainswarm occurs to the west and southwest of the belt (Figure 1), trending north-northwest to south-southeast. The Shangani Batholith to the east of theFRSh greenstone belt is dissected by the quartz gabroicUmvimeela dyke (UD), the western satellite of the GreatDyke which occurs farther east (Figure 1). There arethree shear zones/faults of regional extent; the IrisvaleLancaster Shear Zone (ILSZ), the Mchingwe Fault System(MF), and the Ngomi Fault (Nf) (Figure 1), all are eitherassociated with dolerite dykes or quartz veins. The wideILSZ shear zone defines the eastern margin of the FRShbelt and is intruded by porphyritic granite lenses inplaces. It extends to the south to the Filabusi belt whereit has a sinistral sense of movement (Campbell andPitfield, 1994) and was previously partly mapped fromfield observations, air photos and Landsat MSS data(Stowe, 1980; Wilson, 1990; Campbell et al., 1991). Majorfaults in the area parallel the west-northwest-trendingMchingwe fault (MF, Figure 1), but others trendnorthwest, some associated with mafic dykes and/orquartz veins (Harrison, 1969; Campbell and Pitfield 1994).The Mchingwe fault is a major brittle-ductile to brittlefault zone which can be traced for ~125 km, transectingthe FR greenstone belt but terminating at the westernmargin of the belt (Campbell and Pitfield, 1994; Figure 1). This shear zone has a long history of repeatedreactivation. Towards its eastern end it crosscuts theUmvimeela dyke, the Great Dyke and the Mberengwagreenstone belt and continues farther east-southeast(Figure 1). Displacement across the FR greenstone belt is ~2.2 km with a dextral shear sense, but the displacement increases further to the east-southeast where it offsets the Umvimeela dyke by 3.4 km (Campbell and Pitfield, 1994). It crosscuts theintensely sheared granitoids related to the ILSZ along the east-southeast margin of the greenstone belt,providing important relative age constraints. The Ngomifault (Nf, Figure 1) is related to the Mchingwe fault andhas a similar dextral shear sense and a displacement of~0.6 to 1.0 km (Campbell and Pitfield, 1994). For part of its strike, the fault trends parallel to the contact of theNalatale granite pluton and the greenstone belt (Figure 1), although no genetic relationship has beendemonstrated between them.
The structure of the belt is a synform complicated bytight isoclinal folding along the southeast margin, withthe BIF units emphasizing the structure of the belt.Along the Insiza River along the west side of the belt near Fort Rixon, banded amphibolites occur that dipat moderate angle (63 to 66º) to the east (Campbell andPitfield, 1994). The granite-greenstone structural, surfaceand subsurface (contact) relationships within the study
area are investigated using potential field geophysicaldata and related to geotectonic processes.
Aeromagnetic data The aeromagnetic data used in this study were obtainedfrom the Zimbabwe Geological Survey (ZGS). The aeromagnetic survey was flown in 1983 at 1 kmspaced flight lines with 305 m constant mean terrainclearance. Geometrics proton precession magnetometerswith a resolution of 0.1 nT were used. Flight directionswere east-west, approximately perpendicular to thedominant regional geological trends. North-south tie-lines were flown 14 km apart and the data werediurnally corrected and flight line-levelled using acombined computer-manual method. The levelled flightline data were first gridded in the UTM co-ordinatesystem at 250 m cell size using a bilinear algorithm(Smith and Wessel 1990), and then reduced to the pole(RTP) to correct for the effect of the magnetic inclination(-60 in the study area). For purely inducedmagnetisation, or minimal remanent magnetisation, theRTP process shifts the anomalies to lie directly over thesources, thus producing anomaly maps that can be morereadily correlated to the surface geology (e.g., Blakely,1995). The RTP grid was then analysed by furtherapplication of various digital filter operators andenhancement techniques, such as pseudo shading,apparent susceptibility calculations, analytic signal andderivatives (see Blakely, 1995), that are important forlithological and structural mapping.
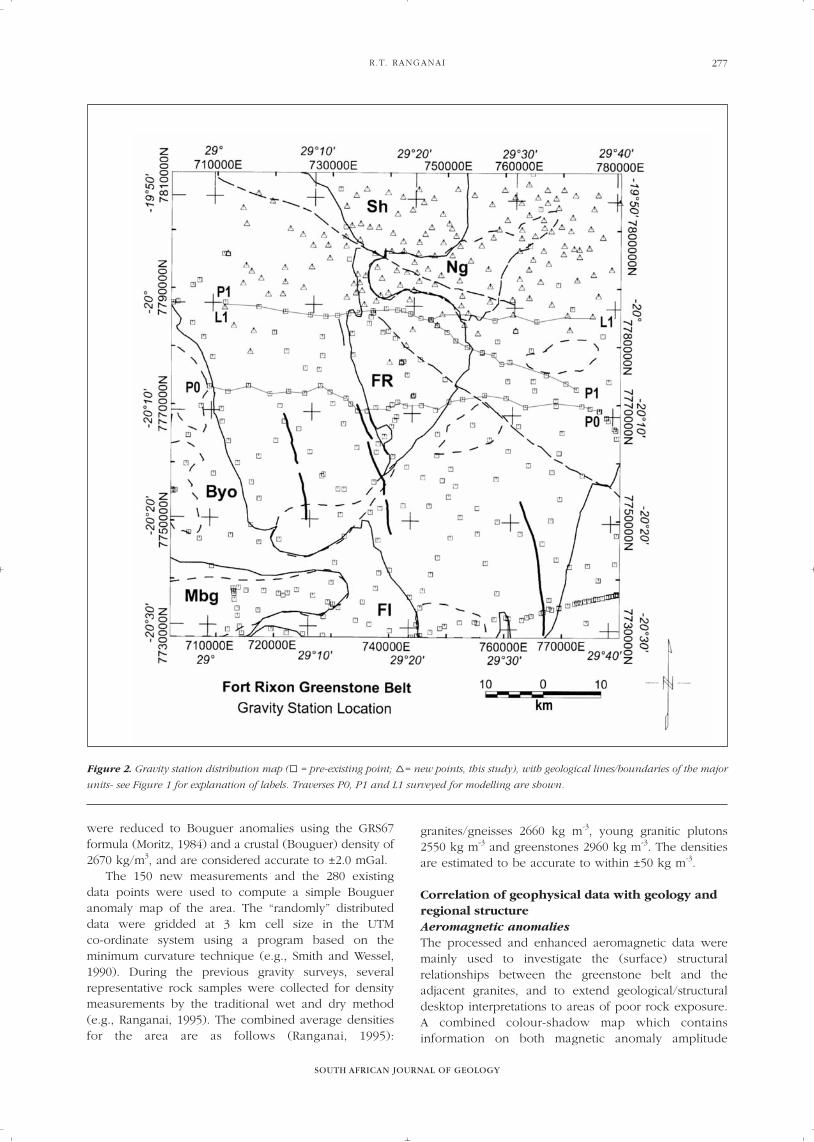
Gravity data The existing regional gravity data sets from earlierprojects (e.g., Ranganai, 1995) were consideredinadequate for a study of the configuration of thegeological units, thus a fieldwork programme wasundertaken in 1998 to establish detailed gravity traversesat 1 to 3 km spacing across the FR greenstone belt andthe adjacent Nalatale pluton. In addition a regionalnetwork (3 to 6 km spacing) of gravity stations over theShangani greenstone belt and other surroundinggranitoids was acquired in order to improve the generaldata distribution and better define the regional gravityfield (Figure 2). Gravity data were collected using aLaCoste and Romberg geodetic gravimeter along roadsand motorable tracks in the area, and it was possible tofix the lateral station position to ±50 m from 1:50 000topographic maps. In exceptional cases, it was necessaryto employ autonomous GPS positioning techniques.Station elevations were determined by barometric leap-frogging, controlled by trigonometric beacons, benchmarks and differential GPS points at approximately 10 km intervals. The traverses from barometric levellingwere joined to make a network of closed loops whosemisclosures were adjusted by a least squares program,with the GPS stations, bench marks and trigonometricbeacons as control points. Tidal and instrument drift,latitude, and elevation corrections were applied to theobserved gravity readings. The observed gravity values
SOUTH AFRICAN JOURNAL OF GEOLOGY
STRUCTURAL AND SUBSURFACE RELATIONSHIPS BETWEEN THE FORT RIXON-SHANGANI GREENSTONE BELT
AND THE NALATALE PLUTON
276
R.T. RANGANAI
SOUTH AFRICAN JOURNAL OF GEOLOGY
277
were reduced to Bouguer anomalies using the GRS67formula (Moritz, 1984) and a crustal (Bouguer) density of2670 kg/m3, and are considered accurate to ±2.0 mGal.
The 150 new measurements and the 280 existingdata points were used to compute a simple Bougueranomaly map of the area. The “randomly” distributeddata were gridded at 3 km cell size in the UTM co-ordinate system using a program based on theminimum curvature technique (e.g., Smith and Wessel,1990). During the previous gravity surveys, severalrepresentative rock samples were collected for densitymeasurements by the traditional wet and dry method(e.g., Ranganai, 1995). The combined average densitiesfor the area are as follows (Ranganai, 1995):
granites/gneisses 2660 kg m-3, young granitic plutons2550 kg m-3 and greenstones 2960 kg m-3. The densitiesare estimated to be accurate to within ±50 kg m-3.
Correlation of geophysical data with geology andregional structure Aeromagnetic anomalies The processed and enhanced aeromagnetic data weremainly used to investigate the (surface) structuralrelationships between the greenstone belt and theadjacent granites, and to extend geological/structuraldesktop interpretations to areas of poor rock exposure.A combined colour-shadow map which containsinformation on both magnetic anomaly amplitude
Figure 2. Gravity station distribution map (® = pre-existing point; Í= new points, this study), with geological lines/boundaries of the major
units- see Figure 1 for explanation of labels. Traverses P0, P1 and L1 surveyed for modelling are shown.

(colour) and anomaly gradient (relief) is presented inFigure 3. These features are important as they are relatedto lithology and depth of burial of the causative unitsand structures, respectively (e.g., Jaques et al., 1997;Betts et al., 2003; 2007). The map shows generallysmooth magnetic signatures over the dominantly basalticlavas and several areas of magnetic highs mainly overgneisses and granites, particularly east of the belt (H1 toH4, Figure 3). No direct correlations were made ofmagnetic anomalies with some of lithological units and
boundaries were often difficult to determine asanomalies encompass different units, particularly in thegranitic areas, probably due to metamorphic influence.The magnetic anomaly highs over the greenstone beltare due to intrusive dolerites and gabbros in the centralportion of the belt. The magnetic anomaly highs in thegranite areas, on the other hand could be related tocompositional variations of the Sesombi and Chilimanzisuites, the latter being biotite rich, or different phases ofintrusion of the same body. However, the anomaly high
SOUTH AFRICAN JOURNAL OF GEOLOGY
STRUCTURAL AND SUBSURFACE RELATIONSHIPS BETWEEN THE FORT RIXON-SHANGANI GREENSTONE BELT
AND THE NALATALE PLUTON
278
Figure 3. RTP residual aeromagnetic colour-shadow map of the Fort Rixon greenstone belt area. Grid cell size = 250 m, Illumination
angle = 30º and declination = 45º. Outlines of major geological units are shown. SRe = Shamba Range extension, D1 and D2 refer to dykes,
Magnetic highs labelled H1 to H4; other labels as in Figure 1.

R.T. RANGANAI
SOUTH AFRICAN JOURNAL OF GEOLOGY
279
that occurs to the south-southeast of the greenstone belt(H4), may have been accentuated by the presence ofultramafic remnants as suggested by the northwardextension of the Shamba Ultramafic Range (SRe) andmafic dolerite sills mapped in the Filabusi area to the south (Baglow, 1989). Anomaly H2 southeast of theShangani belt is shown as part of the Nalatale pluton,but the magnetic response suggests either that there areultramafic lithologies present at depth or the presence ofa Chilimanzi type granite. On the eastern edge of the
greenstone belt, intense aeromagnetic anomalies withamplitudes up to hundreds of nanoTesla are observedover the ultramafic-BIF horizons.
The volcanic rocks appear to be bounded to the westand east by linear magnetic highs due to mafic dykesand ultramafic horizons respectively, and to thesoutheast by a linear magnetic low over the Irisvale-Lancaster shear zone, ILSZ (Figures 3 and 4). The >3 kmwide magnetic low coincides with a “break” in verticalgravity gradient contours between the Bulawayo and
Figure 4. Aeromagnetic horizontal derivative map of the Fort Rixon and Filabusi greenstone belts. Note the continuity of the north-northwest-
trending dykes in the area (D1 to D3). Other symbols as in Figures 1 and 3. Box indicates study area as represented/covered in all other
geophysical maps.
Filabusi greenstone belts (Ranganai 1995, 2001;Ranganai et al., 2008; this paper). Another new featureinferred using this association is the observation that the Shamba Ultramafic Range (SR) extends in a north-westerly direction, before swinging north to north-northeast some 10 km to the east of the FRSh belt at or near the shear zone (SRe, Figures 3 and 4). This extension is only identified as a system of fractureson the geological map of the area (Baglow, 1989;Campbell et al., 1991).
There is a marked correlation between known faults(e.g., Mchingwe Fault-MF) and linear magnetic lows/zones, and mapped dykes (e.g., D1, Umvumeela-UD)with linear magnetic highs. Most of the faults are quartz-filled (non-magnetic) and can be traced for severalkilometres, although a few are associated with dolerite.The Mchingwe fault (MF) appears to extend northwestof the greenstone belt to link with the Ngomi fault in thewest; the latter may be a right-stepping segment of the former (H. Jelsma, personal communication, 2012).In general, dykes appear as linear magnetic highs whilefaults are low magnetic zones, and therefore thesesignatures can be used to map new dykes and faults.The shaded relief and derivative maps (e.g., Figure 4)are useful for the accurate delineation of the dykes (e.g., D1 to D3) and faults. Pseudoshading treatsmagnetic anomalies as topography illuminated fromdifferent directions, thus highlighting some of the finerdetails perpendicular to the illumination direction (e.g., Jaques et al., 1997). In particular, the north-northwest - south-southeast Proterozoic dykes to thewest of the greenstone belt (Figure 1) have clearsignatures and appear more continuous than mapped onthe surface, extending south to, and beyond, the Filabusibelt (e.g., D2 and D3; Figure 4). These dykes appear tocut across the shear zone (ILSZ) and the Umvimeeladyke (UD). One long dyke mapped east of Fort Rixon(D1, Figure 4) is cut by the Mchingwe fault (MF) butwithout any obvious displacement and this may providean age constraint for all the associated north-northwest-trending dykes. Farther east, northeast of the Mberengwabelt, this contrasts with the >2 km movement seen onthe Sebanga dyke (Sd, Figure 1) and caused bydisplacements along the Jenya fault (JF, Figure 1), acorrelate of the Mchingwe fault. The former isconsidered to be the main member of the north-northwest-trending dykes (Wilson et al., 1987; Wilson1990). Implications of these observations are consideredin more detail later in the discussion section.
Gravity anomaliesThe gravity anomaly map and its derivatives (Figures 5and 6) provide a comprehensive view of the areal extentof the major geological units in the area. The positiveand negative anomaly axes coincide with the inferredsynformal and antiformal axes within the greenstonebelt and granite-gneiss, respectively (cf. Subrahamanyamand Verma, 1982), typical of some Archaean granite-greenstone terrains (e.g., Gupta et al., 1982; Kehlenbeck
and Cheadle, 1990; Stettler et al., 1997; Wellman, 2000;Peschler et al., 2004). The FRSh greenstone belt ischaracterised by two well defined gravity and derivativehighs (FR and Sh) separated by a large low (Ng) over theNalatale granite pluton (Figures 5 and 6). A secondgravity low (Pl, Figure 5) is observed over the graniteterrain west of the Shangani section. A conspicuousrelative high occurs in the southwestern part of the area(Figure 5) trending roughly northwest-southeast,encompassing granitic terrain and corresponding to theBulawayo/Filabusi greenstone belt, but this is not wellconstrained in the extreme southwest over theMbalabala granite (Mbg). Many isolated shortwavelength anomalies are under sampled, and could bepartly due to the gridding process on unevenly spaceddata, as evidenced by a comparison of the mappedgeology and station locations (Figures 1 and 2). A smallgravity high (B, Figure 5) appears in the northwesternpart of the area and related to the Bubi greenstone belt(B, Figure 1) and is better revealed on the derivativemap (B, Figure 6) and regional data sets (Fisk andHawadi, 1996).
The FR greenstone belt has a ~30 mGal positiveanomaly, relative to a background of -120 mGal over thesurrounding granite-gneiss terrain (sensulato). The smallamplitude of the anomaly (cf. ~70 mGal for Mberengwa;Ranganai, 1995; Ranganai et al., 2008) probably impliesshallow depth extent for the greenstones. The positionof the anomaly does not correlate well with the mappedgeology, particularly in the east and northeast (Figure 5).The gravity anomaly indicates a smaller body than the mapped outcrop, and the maximum appears to be significantly offset to the southwest, implyingcontinuation of volcanics beyond surface exposures inthat direction. However, this asymmetry could beexaggerated due to the possible effect of the intrusivelow density Nalatale granite (Ng, Figures 1 and 5) to the northeast of the belt. The gravity low associated with the porphyritic granite appreciably reduces thegreenstone belt anomaly in the northeast. The plutonmay itself be more extensive than presently mapped assuggested by the well constrained large gravity low inthe east. In general, the extrema of the gravity anomaliesare interpreted to coincide with the axes of the beltsand/or plutons, where the units probably attainconsiderable thickness.
Another gravity low (Pl, Figure 5) is observed overthe granite terrain to the west of the Shangani sectionand associated with a positive magnetic response (H1, Figure 3). Although data distribution is rather poor,the anomaly is considered realistic based on the regionalgravity map (Fisk and Hawadi, 1996). It has beensuggested by Wilson (1990) that an intrusive granite ofthe ~2.7 Ga Sesombi suite occurs over a large area westof the FRSh greenstone belt (SSg, Figure 1), and the anomaly was expected to extend south-eastwards tothe southern end of the belt. However, the SesombiSuite plutons appear to have similar densities to theolder ‘basement’ gneisses and tonalites (Ranganai, 1995),
SOUTH AFRICAN JOURNAL OF GEOLOGY
STRUCTURAL AND SUBSURFACE RELATIONSHIPS BETWEEN THE FORT RIXON-SHANGANI GREENSTONE BELT
AND THE NALATALE PLUTON
280

R.T. RANGANAI
SOUTH AFRICAN JOURNAL OF GEOLOGY
281
which have similar compositions (Wilson et al., 1995)and the density contrast may be too small to differentiatethe extent of the intrusion. Thus the northern part of themassive granite (SSg) is mapped as a Sesombi suitepluton but the gravity and magnetic data suggests aChilimanzi suite type of pluton. Lateral density changeswithin one body cannot account for the observed gravitylow (Pl, Figure 5). Conversely, the Mbalabala granitepluton (Mbg, Figures 5 and 6) correlated with the Chilimanzi Suite has no related gravity low relative
to the background tonalite/gneiss (i.e. it is notdifferentiated by gravity), and could be of Sesombi suitetype. However, both plutons have associated magnetichighs implying they are rich in magnetic minerals,supporting the Chilimanzi suite grouping. Several smallmapped pluton outcrops (Figure 1) are too small to bereflected on the gravity anomaly map at the currentgravity station spacing.
The boundaries between greenstone belts andplutons are emphasized on the derivative map
Figure 5. Bouguer gravity anomaly map with gravity station distribution and outlines of major geological units (see Figures 1 and 2).
Positions of modelled profiles L0, L1 and L2 are shown. Traverse P0 refers to the previous profile of Ranganai et al. (2008) as discussed in
text. B = Bubi greenstone belt gravity high, Pl = granite pluton gravity low.

(Figure 6), where they are characterised by steepgradients. The increased resolution stems from the lackof, or minimal, anomaly overlapping effects; anomalydecay with distance is more rapid with derivative andhence less overlap (e.g., Boschetti, 2005). The Shanganisection gravity derivative highs (as well as Filabusi in thesouth) coincide reasonably well with the mappedoutcrop boundaries but there is a clear mismatch on theFort Rixon section, particularly on the eastern andwestern sides, confirming the southwesterly shift of thebody suggested by the Bouguer gravity anomaly map.
The relatively steep gradients indicate steeply dippingcontacts for the anomalous bodies that, in turn, suggestan intrusive relationship between the granites andgreenstones (e.g., Wellman 2000), a hypothesis which istested by forward modelling below. Most local (isolated)vertical gravity gradient highs correlate with gravitystations positioned over either subcropping ultramaficremnants or dolerite intrusions interpreted fromaeromagnetic data. The ILSZ is marked by a linear zoneof low vertical gravity gradients along the south-easternmargin of the greenstone belt, continuing southwest
SOUTH AFRICAN JOURNAL OF GEOLOGY
STRUCTURAL AND SUBSURFACE RELATIONSHIPS BETWEEN THE FORT RIXON-SHANGANI GREENSTONE BELT
AND THE NALATALE PLUTON
282
Figure 6. Vertical gravity gradient anomaly map with gravity station distribution and outlines of major geological units (see Figure 1).
B = Bubi greenstone belt high, Pl = granite pluton low. Note the association of the ILSZ with vertical gravity gradient lows.

R.T. RANGANAI
SOUTH AFRICAN JOURNAL OF GEOLOGY
283
via an incomplete ‘break’ on the Bulawayo/Filabusi belt boundary (Figure 6). It is worth noting that the shearzone is associated with sheared porphyritic granite lenses.
2½D Gravity modellingTwo detailed traverses (1 to 3 km station spacing; P0 and P1) were previously surveyed across thegreenstone belt for the purpose of 2½D forwardmodelling, and additional gravity stations were added
to extend the coverage for the northern profile P1 toinclude the adjacent pluton (L1, Figures 2 and 5). The guiding principle in selecting the traverses and thestation spacing were: 1) they intersect most of the mapped geological contacts at right angles (i.e., perpendicular to the geological strike of the greenstone belt), 2) closely spaced points over thegreenstone belt and plutonic phases, as well as theircontact areas, based on the mapped width of units,
Figure 7. (a) Bouguer gravity as extracted from grid along profile approximating ‘original’ station positionsalong traverse P0 (Figures 2
and 5); (b) Geological cross-section at surface, Bouguer anomaly along original traverse and 2½D density model for profile P0, Fort Rixon
greenstone belt. Numbers refer to densities in kg/m3. VE = Vertical Exaggeration (2). The surface of the model relates to the topography
(After Ranganai et al. (2008)). The large difference between the surface geology and the model with regard to the contact between the
volcanics and the granite is due to the intrusion of the pluton modelled in figure 8 below.

and 3) long enough to define the regional field andgeometries, and positioned in such a way as to minimiseinfluence from neighbouring units (at least in the strikedirection). Unfortunately, the traverses are locatedtowards the edges of the greenstone belt and the plutondue to access problems (Figure 2), and this iscompounded by the asymmetry of the Bouguer anomalytowards the southwest (Figure 5). However, goodcoverage was obtained across parts of the FRShgreenstone belt and Nalatale granite. Profile P0 waspreviously discussed by Ranganai et al. (2008) and themodel is presented in Figure 7, while P1 is described byRanganai (1995). In this study, two profiles (L1 and L2)were extracted from the Bouguer anomaly grid (Figure 5), with L1 partly along P1 and the gravity fieldas well controlled as possible by the original stationvalues; the profile represents the best straight linenear/along the original traverse. The southern profile(L2) was selected over the peak gravity anomaly (Figure 5), and thus the thickest part of the greenstonebelt, but has a few gravity stations for control. A thirdprofile from the Fort Rixon section in the south, throughand perpendicular to the Nalatale pluton in the middle, to the Shangani section in the north (L0, Figure 5)was also extracted from the gridded data to investigate the pluton.
An interactive program was used to calculate thegravity model responses along the profiles. The programis based on the polygon method for 2½D bodies andmakes use of algorithms described by Won and Bevis(1987). A 2½D designation comes from the ability touniquely define the strike length into and out of thecross-sectional plane of each polygon in the model, aslong as the profile is reasonably perpendicular to strike.In order to obtain more reliable results, informationconcerning mapped dips, contact locations andmeasured densities of different rock units (Table 1) areused to constrain the modelling. As granitoidscompletely surround the greenstone belt, a simplifyingassumption was made that the belt is everywhere floored
by granite gneiss of average density 2670 kg m-3. The regional gravity field has thus been modelled ascaused by granite-gneiss lithologies of dominantlygranitic composition, surrounding greenstone beltlithologies of dominantly basaltic composition rocks. A constant regional was fixed for each profile bymatching the observed and calculated curves at aselected point defining the regional. Another factorconsidered is that the predominantly basalts haverelatively uniform density and therefore the greenstonebelt has initially been modelled with a single averagedensity of 2960 50 kg/m3 (Ranganai et al., 2008; Table 1).A lower limit of 2900 kg/m3 was then considered,corresponding to the maximum depth extent for thevolcanics; this is consistent with observations in othergreenstone belts in the region (e.g., Gwavava andRanganai, 2009). The granite pluton has also beenmodelled with two densities; the area average of 2550 50kg/m3 (Ranganai, 1995) and a regional average of 2600kg/m3 (Gwavava and Ranganai, 2009). Altogether eightmodels were obtained for different densities but onlythree representative/best models are presented here(Figures 7 to 9; Table 2).
No attempt was made to reproduce every detail ofthe observed anomalies and the models are probably the simplest that broadly satisfy the surface geology, the density measurements and the gravity field. For example, isolated and relatively small units at profileedges were not included in the models. Conclusionsregarding the broad-scale structure of the geologicalunits are not significantly affected by theselimitations/assumptions. However, for each model somepetrophysical and/or geometrical sensitivity analyses(e.g., McLean and Betts, 2003) were conducted.Sensitivity analysis is a process of varying modelparameters over a reasonable range and observingrelative changes in model responses. For example, here, the main task of the sensitivity analysis is to definesensitivities of the depth extent to density (contrast)changes. Thus, densities were varied within the
SOUTH AFRICAN JOURNAL OF GEOLOGY
STRUCTURAL AND SUBSURFACE RELATIONSHIPS BETWEEN THE FORT RIXON-SHANGANI GREENSTONE BELT
AND THE NALATALE PLUTON
284
Table 1. Densities of major rock types of the granite-greenstone terrain, south-central Archaean Zimbabwe Craton.
Rock Unit and/or Rock Type Total Samples Range of (kg/m3) Mean (kg/m3) Std. Dev.
Granites/Gneisses 46 2500-2750 2630 32
Basalts/Volcanics 57 2760-3098 2976 54
Ultramafics/Schists 19 2725-2940 2840 20
Dolerites/diorites 15 2876-3064 3000 19
Sandstone/siltstones 13 2150-2670 2520 40
Table 2. Summary of the Depth Extent for the Greenstones and the Nalatale Pluton for various combinations of densities for the rock types:
Fort Rixon-Shangani (FRSh) granite-greenstone terrain.
Densities (kg/m3) Line 1: Unit thickness (km) Line 2 (km)
Crust (granite-gneiss) Pluton Volcanics Greenstones Pluton Greenstone
2670 2550 2960 2.7 4.0 2.6
2670 2550 2900 3.5 4.5 3.5
2670 2600 2960 3.0 9.8 2.6
2670 2600 2900 4.0 9.8 3.5

R.T. RANGANAI
SOUTH AFRICAN JOURNAL OF GEOLOGY
285
Figure 8. (a) Bouguer gravity and station elevation profiles along profile L2; (b) Geological cross-sectionat sea level(i.e. 0 km depth),
Bouguergravity anomaly and 2½D density model for profile L2, Fort Rixon greenstone belt. Numbers refer to densities in kg/m3.
VE = Vertical Exaggeration (4). The surface of the model relates to the topography while the model cross-section is at sea-level.
FR = Fort Rixon greenstone belt

standard deviation to further investigate the influencethat small changes in body density have on the depth tothe base of the body required to satisfy the gravityanomaly (Tables 1 and 2). Further, Ranganai et al. (2008)noted that differences in density contrast change thethickness of the various bodies by approximately ±200 m (or ~10%), but this does not affect the overallstructural concept of the cross-sections. They areconsidered to be the most likely interpretation of thesubsurface geometry of the units because they satisfydifferent constraints.
Fort Rixon greenstone belt models (i) Profile P0: model FR (Figure 7) The location of this traverse is shown in Figures 2 and 5, while the Bouguer gravity profiles and resultinggravity model are presented in Figure 7. Figure 7a is theBouguer gravity as extracted from the grid (Figure 5)along a profile approximating ‘original’ station positions,and shows some ‘smoothing’ as a result of the griddingprocess. A detailed discussion of Figure 7b is given byRanganai et al. (2008) and only a summary is presentedhere. The traverse is located towards the southern edgeof the greenstone belt and the Bouguer anomaly peak,with a small amplitude of ~25 mGal, is not coincidentwith the centre of the outcropping greenstones. The model indicates that the thickness of the belt at thisposition is limited to the range: 3.0 to 3.5 km. The thickest part of the body in the subsurface has beenshifted westward by ~4 km with respect to thegreenstone belt centre and suggests presence of graniticmaterial beneath the greenstone belt outcrop. The western contact is domal in shape, consistent withan intrusive relationship, while in the east the contact issub-vertical. It is noted that asyn- to post-volcanicgranite pluton intrusion is postulated (on field evidence)to underlie much of the area west of the greenstone belt(SSg, Figure 1; Wilson et al., 1995), separating this belt from the main Bulawayo/Filabusi greenstone belt(Wilson, 1990). Based on remote sensing, field mapping(Stowe, 1980; Wilson, 1990; Wilson et al., 1995) and thegeophysical data, the steeper eastern flank is consideredto be a shear or detachment zone along which theBulawayo/Filabusi-Fort Rixon belt separation waseffected (ILSZ, Figures 1, 4 and 6). This issue isconsidered further in the discussion.
(ii) Profile L2: model FR2 (Figure 8) Figure 8a is a plot of the Bouguer gravity and elevationalong profile L2 about 5 km north of traverse P0 (Figure 5), and also shows that the centre of theoutcropping greenstones is not coincident with the peakBouguer gravity anomaly and shifted approximately 4 km westward. However, due to the asymmetry of theBouguer anomaly towards the southwest discussedearlier, this profile crosses the peak anomaly, and hencethe thickest part of the belt. The granitic gneiss areassurrounding the greenstone belt are considerably lowerin elevation, and have an average background gravity of
-123 mGal. When seen from the west in the field, the greenstone hills are a prominent landmark and,because of their relatively steep western face, give theappearance of a scarp rising from low-lying granite(Harrison, 1969). Note that in the east, the backgroundgravity levels are lower and the anomaly fall-off sharperthan in the west. This may be caused by a north-south-striking narrow tongue of sheared porphyritic granitethat occurs between greenstone lithologies and isassociated with the Irisvale-Lancaster shear zone(Harrison, 1969). Figure 8b shows the geological sectionand the gravity model obtained along the profile. The Bouguer anomaly is approximately symmetric andhas an amplitude approaching 30 mGal, slightly largerthan for profile P0 further south. However, despite theanomaly symmetry, a good fit between the observed andcalculated Bouguer gravity values is only obtained byextending (in the subsurface) a thin layer of thevolcanics westward well beyond the mapped exposure.A smaller layer of volcanics is required in the east butunder the outcrop, giving a rather symmetric bodyhaving shallow domal contacts with tonalite/gneiss,particularly in the west (Figure 8b). This configurationcould be a result of the intrusion and granitisation of thebelt by the intrusive Nalatale and Sesombi suite granite(SSg), respectively (Figures 1, 2 and 5), as elaborated inthe following model and the discussion. For a volcanicdensity of 2900 kg/m3, the thickest part of the beltextends to just under 3.5 km as before, but slightly westof the peak anomaly, giving a slightly asymmetricgreenstone belt geometry v-shape. The regional averagedensity of 2960 kg/m3 for the volcanics yields a depthextent of only 2.6 km for the greenstone belt. A summary of the results is presented in Table 2.
(iii) Profile L1: model FR1 (Figure 9) Figure 9a is a plot of the Bouguer gravity and elevationalong profile L1 located on the northern part of the beltand near the southern edge of the Nalatale pluton(Figures 2, 5 and 6). The figure clearly shows that thecentre of the greenstone belt at surface is not coincidentwith the peak gravity anomaly and shifted westward asbefore, in this case by a larger distance of ~8 km.Similarly, the granitic gneiss areas surrounding thegreenstone belt are considerably lower in elevation, andhave an average (flat?) background gravity of -125 mGal,particularly in the west, with a low >-135 mGal in theeast. The gravity profile is asymmetric and shows a smallpositive Bouguer anomaly that peaks to about 20 mGalon the western half of the greenstone outcrop, with agradual fall eastwards. However towards the boundary,the anomaly falls sharply at the greenstone margin, tothe background level of about -130 mGal over the granites. The profile is within 2 km distance of thesouthern edge of the intrusive Nalatale granite plutonthat almost separates the Fort Rixon section from theShangani section of the greenstone belt in the north (see Figures 2, 5 and 6). It is highly probable that thisgranite underlies much of the eastern parts of the
SOUTH AFRICAN JOURNAL OF GEOLOGY
STRUCTURAL AND SUBSURFACE RELATIONSHIPS BETWEEN THE FORT RIXON-SHANGANI GREENSTONE BELT
AND THE NALATALE PLUTON
286

R.T. RANGANAI
SOUTH AFRICAN JOURNAL OF GEOLOGY
287
Figure 9. (a) Bouguer gravity and station elevation profiles along profile L1; (b) Geological cross-section at sea level (i.e. 0 km depth),
Bouguergravity anomaly and 2½D density model for profile L1, Fort Rixon greenstone belt and Nalatale pluton. Numbers refer to densities
in kg/m3. VE = Vertical Exaggeration (4). The surface of the model relates to the topography while the model cross-section is at sea-level.
FR = Fort Rixon greenstone belt; Ng = Nalatale granite pluton.
SOUTH AFRICAN JOURNAL OF GEOLOGY
STRUCTURAL AND SUBSURFACE RELATIONSHIPS BETWEEN THE FORT RIXON-SHANGANI GREENSTONE BELT
AND THE NALATALE PLUTON
288
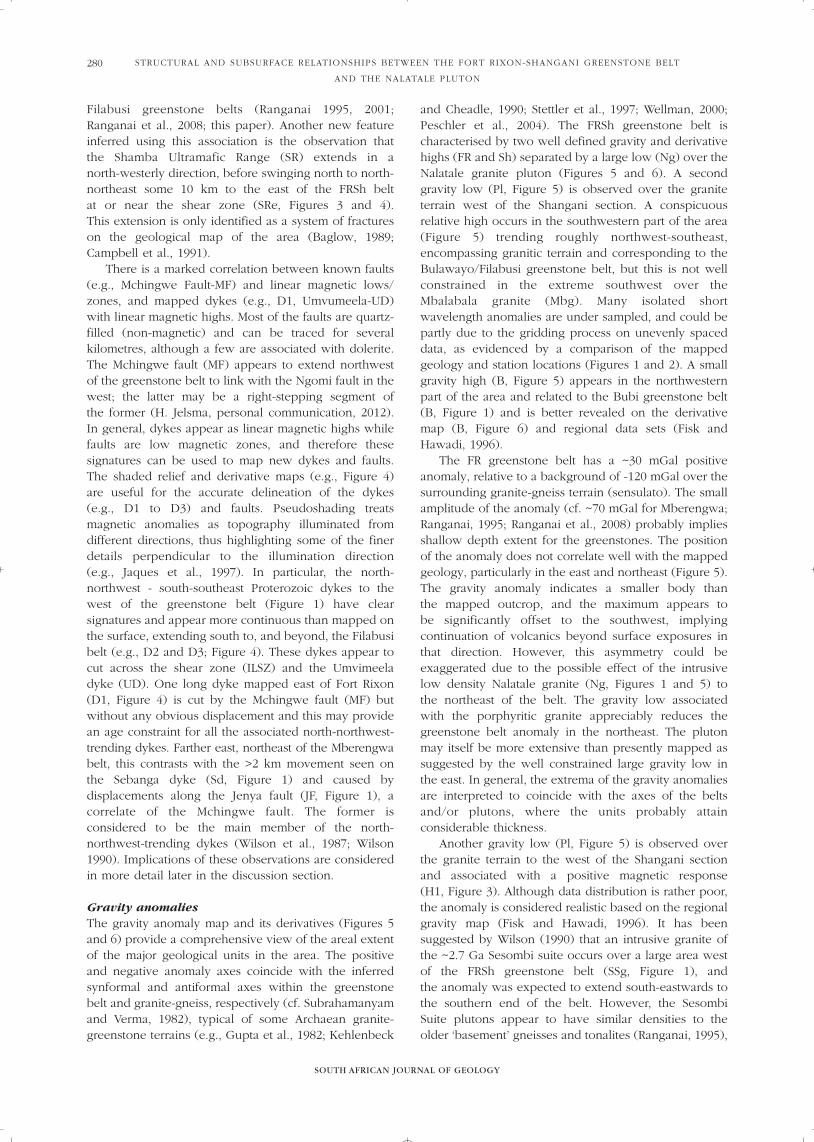
Figure 10. (a) Bouguer gravity and station elevation profiles along profile L0; (b) Geological cross-section at sea level (i.e. 0 km depth),
Bouguergravity anomaly and 2½D density model for profile L0, Fort Rixon belt-Nalatale pluton-Shangani belt. Numbers refer to densities in
kg/m3. VE = Vertical Exaggeration (2). The surface of the model relates to the topography while the model cross-section is at sea-level.
FR = Fort Rixon greenstone belt; Sh = Shangani greenstone belt; Ng = Nalatale granite pluton.

R.T. RANGANAI
SOUTH AFRICAN JOURNAL OF GEOLOGY
289
FR greenstone belt. The pluton itself shows a negativeanomaly of about -7 mGals.
The greenstone belt has therefore been modelledwith a direct shallow contact to the pluton in the eastand an ~45° south-easterly dipping contact with gneissesin the west (Figure 9b). Again, in order to obtain a goodfit between the observed and calculated Bouguer gravityvalues, a thin layer of the volcanics has been extendedwestward well beyond the mapped exposure and justbelow surface. The shallow eastern contact is somewhatdomal in shape but steep at depth, consistent with anintrusive relationship between greenstones and theadjacent subsurface granite. The belt is about 3.5 kmthick at the centre, under the Bouguer anomaly peak,with approximately 0.5 to 1.0 km of volcanics in theeastern half. The resultant inverted but ‘crunched’triangular configuration of the volcanics (Figure 9b) isinterpreted as the result of the intrusion and granitisationof the greenstone belt by the Nalatale pluton (cf. Guptaet al., 1982; Stettler et al., 1997). The granite pluton is onaverage 1.5 km thick under the greenstone belt butincludes a root up to 4.5 km thick under the outcrop andanomaly peak, and a steep contact with thetonalite/gneiss in the east. Misfits at both ends of the profile are easily accounted for by a pluton in thewest and a mafic/ultramafic intrusion in the east, assuggested by the gravity and aeromagnetic data,respectively. A model for pluton and greenstonedensities of 2600 and 2900 kg/m3 corresponds topossible maximum depths extent of 9.8 and 4.0 km,respectively, but is not presented. A summary of theresults for various density combinations is given in Table 2. The pluton fits a wedge-shaped model(Ameglio et al., 1997) with a relatively flat and thin roofregion and steep root zone extending to 5 km. This is atypical geometry for post kinematic granites (Ridley et al., 1997). The results may be similar to those of Dehlset al., (1998) for the model of the Ulu pluton, SlaveProvince, Canada that extends to ~2 km and terminatesin several plug-like roots extending to 7 km that mayhave fed the relatively thin tabular body.
Nalatale Pluton model (Figure 10) A profile from the Fort Rixon section in the souththrough the Nalatale pluton to the Shangani section inthe north was also extracted from the gridded data toconsider an alternative model of the pluton. The profile(L0) is approximately perpendicular to the pluton thatseparates the two greenstone sections. Despite theminimal gravity station control and the likely problemsof profile length versus background field overgreenstones, such a profile could be considered valuableand the resulting model informative; it constitutes the‘traditional’ 2D model across strike of the pluton.
Figure 10a is a plot of the Bouguer gravity andelevation along the profile. The area occupied by theNalatale pluton has a higher elevation compared to the adjacent greenstones, unlike in the previous twoprofiles. There is therefore an interesting inverse relation
between the two plots, as the pluton is associated witha gravity low and the lower greenstones produce agravity high. No shift is apparent in mapped boundariesand the gravity anomalies, with a fairly good agreementof the vertical gravity gradient and the mapped surfacecontacts along the profile (Figure 6). The correspondinggravity model is presented in Figure 10b. Granite-greenstone contacts have been modelled as intrusive(i.e. with the greenstone belt dipping inwards andgranite pluton dipping outwards) as per geologicalevidence and the previous model (Figure 9b). On average, the two greenstone belts are depicted asshallow (<6 km) volcanic piles while the pluton is anarrow body 7 km wide and about 12 km thick,resulting in an approximate symmetry about the pluton.In this model, the pluton appears like a typical diapirwith thickness greater than width; T>W (Petford andClemens, 2000). There is a possibility that the greenstonethickness (and possibly pluton as well) is exaggerated asthe profile is along strike of the greenstone belts anddoes not end in background tonalite/gneiss. The highervolcanic density of 2960 kg/m3 results in a depth extentof 4.5 km for the greenstones and produces a smallchange in pluton thickness to 11.7 km. The results bearresemblance to those of Brisbin and Green (1980) forthe model of the Aulneau batholith, Ontario, Canadathat extends to ~7 km and terminates in several plug-likeroots extending up to 12 km, while the adjacentgreenstones do not exceed 3 km in thickness. The pluton density of 2600 50 kg/m3 does not yieldfeasible/realistic models, requiring >25 km for thepluton and 9.0 km of volcanics.
DiscussionThe geophysical data are informative as they outline thegross aspects of the major geological units and reflectthe crustal structure of the area. The data sets tracedense and/or magnetic rock units beneath coveredareas, to reveal the shape of subsurface bodies, andpermit extrapolation of lithotectonic features fromknown outcrops. Magnetic and derivative maps indicatenew dykes and ultramafic horizons, as well asextensions to others (e.g., SRe, Figures 4 and 11) andsome faults. Figure 12 is a regional interpretation mapwith a desktop structural interpretation largely based onthe magnetic data (Figures 4 and 11) and previousmapping, while the gravity data provides a first order approximation of the extent of greenstones andplutons as well as other mafic/ultramafic intrusions. The geotectonic and/or geostructural evolution of thegreenstone belt and the pluton based on the granite-greenstone relationships derived from the potential fielddata and other geological and structural information areconsidered in some detail below.
Separation of the BBF and FRSh greenstone belts:the ILSZ connection? Some of the features described above are important forassessing the postulated detachment of the FRSh

greenstone belt from the BBF (Bubi-Bulawayo-Filabusi)greenstone belt, possibly accompanying the intrusion ofa large Sesombi suite granite pluton (SSg) west andsouthwest of Fort Rixon (Figure 1; Stowe, 1980; Wilson,1990; Wilson et al., 1995). Movement is envisaged tohave been along the Irisvale-Lancaster shear zone (ILSZ,Figure 1). The geophysical data confirm the shear zone(ILSZ, Figures 4, 6, 11) as a wide zone of low magneticresponse and low vertical gravity gradients. Secondly,due to similar densities between the Sesombi plutonsand the older tonalites/gneisses (Ranganai, 1995), thegravity data cannot map the suspected pluton, but doesnot rule out its existence. The domal shape of thegreenstones in the west from the gravity models is
consistent with the presence of an adjacent intrusiveyounger granite. Further, there is some indication ofmagnetic correlation of units across the shear zone,albeit laterally displaced (e.g., Figure 3), particularly ofthe strongly magnetic ultramafic complexes at Fort Rixonand Filabusi (FRUC, FUC, Figure 11), and possibly atShangani and Bubi (ShUC, BUC, Figures 1 and 11;Ranganai, 1995). Interestingly, attempts to relate the FRSh belt to the BBF belt to the southwest would be consistent with the identification in theFilabusiarea to the south of an extension of the Shambarange (SR) ultramafic in a northerly direction (SRe,Figures 3, 4 and 11; Ranganai, 1995). The change indirection of the extension from north-northwest (SR)
SOUTH AFRICAN JOURNAL OF GEOLOGY
STRUCTURAL AND SUBSURFACE RELATIONSHIPS BETWEEN THE FORT RIXON-SHANGANI GREENSTONE BELT
AND THE NALATALE PLUTON
290
Figure 11. Hanning filtered (10 passes) first vertical derivative of aeromagnetic data showing major structural trends (north-northeast,
north-northwest, west-northwest and northwest) in the study area as defined by dykes and faults. Features discussed in text are labelled.
Restoration of the FRSh greenstone belt to the BBF belt (by removal of granite suite SSg) would approximately re-align the ultramafic
complexes/horizons (FUC, FRUC, ShUC and BUC) in the various belts.
R.T. RANGANAI
SOUTH AFRICAN JOURNAL OF GEOLOGY
291
to north-northeast (SRe) (Figures 3, 4 and 11) at and/or near the shear zone thus follows the movement direction.
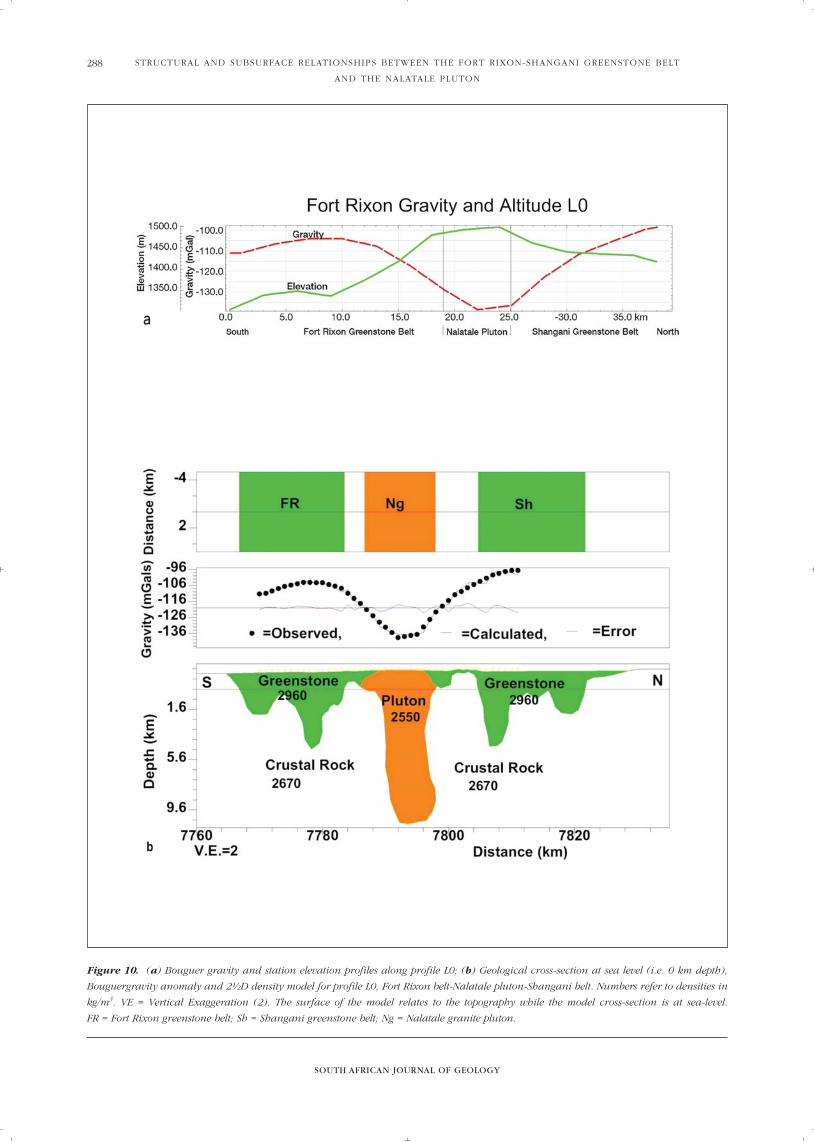
Fort Rixon dykes (FRD) and the Sebanga dykeFour main (regional) structural directions can beidentified in the study area: north-northwest,represented by the dykes, D1, D2, D3, etc. (FRD);northwest, represented by the Mchingwe fault; west-northwest, represented by the Ngomi fault; and north-northeast, represented by the Umvimeela dyke (and theILSZ), all cutting across the study area (Figures 1, 4 and11). These trends are present throughout the south-
central part of the Zimbabwe craton (e.g., Wilson, 1990;Campbell et al., 1992; Ranganai, 1995, 1999; Ranganaiand Ebinger, 2008). Cross-cutting relationships andmagnetic anomaly displacements provide ageconstraints for the various dykes and associated faults inthe area. In general, the FRD are not affected by the ILSZand cut across it, consistent with a younger age, thoughsome appear to break at the shear zone (e.g., D3,Figures 4 and 11). Most are also cut by the Mchingwefault (MF) but not by its correlate the Ngomi fault (Nf),which is not clearly/fully mapped magnetically (e.g., D1,Figure 11). Significantly, Euler deconvolution of thegravity data also shows that the Mchingwe fault extends
Figure 12. Geological interpretation map showing (major) new features, extensions, improved contacts, and regional structures identified
in this study. Features: D- dolerite dykes; DS- dolerite sill; FRGB- Fort Rixon Greenstone Belt; ILSZ- Irisvale Lancaster Shear Zone; Pl- pluton;
SRe- Shamba Range extension (Ultramafic); Other units included for reference purposes only.

across the Fort Rixon belt and cuts the north-northwest-trending FRD dykes without any sign of displacement(Ranganai, 1995, 1999). The lack of dextral movementon the north-northwest-trending dykes in the area, asopposed to the >2 km movement seen farther east(Figure 1), suggests that the FRD may be younger thanthe Sebanga dyke (Sd, Figure 1) swarm, with which theyhave been previously associated (e.g., Wilson et al.,1987; Mushayandebvu et al., 1995). Alternatively, it maybe that movement (reactivation?) on the fault was
restricted or confined to the east. Wilson (1990) relatesthe extensional dyke trends to southeast-trending dextralfaults (e.g., Mchingwe), sinistral reactivations of thenorth-northeast-trending Great Dyke-Popoteke fault set,and large-scale dextral reactivations of shear zones inthe Limpopo orogenic belt. On a regional scale, the FRDextend farther south into the LB (Ranganai, 1995, 1999;Ranganai and Ebinger, 2008). According to Söderlund et al. (2010), three samples of west-northwest to north-northwest-trending dykes of the Sebanga swarm yielded
SOUTH AFRICAN JOURNAL OF GEOLOGY
STRUCTURAL AND SUBSURFACE RELATIONSHIPS BETWEEN THE FORT RIXON-SHANGANI GREENSTONE BELT
AND THE NALATALE PLUTON
292
Figure 13. Greenstone belt deformation/granitisation due to pluton emplacement as revealed by gravity modelling (comparison of profiles
L1 and L2). (a) Bouguer gravity anomalies with geology outlines and profile locations. FR = Fort Rixon greenstone belt; Ng = Nalatale granite
pluton; Sh = Shangani greenstone belt. (b) Gravity model for L1 near pluton showing reduced size of greenstone belt due to pluton
emplacement. (c) Gravity model for L2 away from pluton showing full structure of the greenstone belt.

R.T. RANGANAI
SOUTH AFRICAN JOURNAL OF GEOLOGY
293
ages of 2512.3 ± 1.8 Ma, 2470.0 ± 1.2 Ma and 2408.3 ±2.0 Ma, the latter of which dates the SebangaPoort Dykeof this swarm.
Granite-greenstone spatial relationships: tectonicimplications The area of study is relatively small, thus a completediscussion of regional crustal structure is not feasible butthe gravity field and models are however informativeregarding the subsurface distribution of the geologicalmasses. In Figures 5 and 6, a pronounced gravity high and steep gradients correspond with the mappedmargins of the greenstone belt, with a suggestion oflateral continuation of volcanics under cover in thesouthwest. The alternating gravity highs and lows overgreenstones and granites, respectively, is a common andcharacteristic feature of many Archaean granite-greenstone terrains (e.g., Gupta et al., 1982;Subrahmanyam and Verma, 1982; Kehlenbeck andCheadle, 1990; Wellman, 2000; Peschler et al., 2004). The observed steep gradients indicate steeply dippingcontacts for the anomalous bodies that, in turn, suggestan intrusive relationship between the greenstones and the plutons. Anomaly asymmetry is mainly due tothe effect of granitisation and/or deformation asdemonstrated in Figure 9 (see also Figure 13).
According to Ridley et al. (1997), intrusive contacts ofgranitoid into greenstone are recognized where: (1) there is truncation of greenstone stratigraphy (at depth, through younger granite annihilation ortectonic means (Stettler et al., 1997)); (2) dykes andveins of granitoid occur in the marginal zones of thegreenstone belt, and; (3) angular greenstone enclavesoccur in the marginal zones of the granitoid. At the sametime, some of the granitoid-greenstone relations thatsuggest that doming or diapirism were importantmechanisms of intrusion include: (1) the broad domalshapes of many individual plutons or compositebatholiths at the present level of exposure, and (2) theoutcropping of the majority of granitoids in the cores ofanticlines or anticlinal domes, with contacts typicallysub-concordant with and close to the known base of the greenstone stratigraphy (although almostinvariably with local or low-angle stratigraphictruncation). These features are all present in the studyarea and are discussed further below.
Greenstone belt and pluton geotectonic models The derived models (Figures 7b, 8b and 9b) attribute thesmall positive Bouguer anomalies to moderately steep-sided (at least at depth and in the east) greenstonebodies surrounded by granitic crust. The domal contactin the west is consistent with “slow” granite intrusion,typical of the late syn-volcanic 2.7 Ga Sesombi suite;which form massive granodiorite to granite suites(Wilson et al., 1995; Ridley et al., 1997). This contrastswith the “rapid”, forceful emplacement of the 2.6 Chilimanzi suite represented by the Nalatale plutonnortheast of the greenstone belt; these tend to form
stocks and small batholiths cross-cutting greenstonestructures (Ridley et al., 1997). The regional geologicalmap and Bouguer gravity data indicate several Chilimanzisuite granite intrusions have a spatial association withmajor fault and/or shear zones, suggesting local fault-controlled emplacement (Figures 1 and 6; cf. McLeanand Betts, 2003). The gravity model in Figure 9b showsan ~2 km thick tabular body with an ~5km deep rootzone, while that of Figure 10b shows a diapir structure7 km wide and up to 12 km thick for the pluton. These differences could be explained by the location ofthe profiles, which are mutually perpendicular (Figures 2 and 5) with different background lithologies.
The gravity models do not support a deep crustalroot of any width for the greenstone bodies, which havea depth extent of 3.0 to 6.0 km. Both the intrusion andgranitisation of the greenstones at depth are amplydemonstrated by the differences in the two derivedgravity models, one from a profile close to the pluton (Figure 9b) and the other away from the pluton (Figure 8b) and summarised in Figure 13. On surface,the Nalatale granite almost bisects the FRSh greenstonebelt into the Fort Rixon and Shangani sections (Figure 1), in the process ‘remobilized’ or granitizedalarge part of the belt and leaving only a narrow piececonnecting/linking the two sections. Along profile L1 close to the pluton, the gravity model (Figure 9b)indicates that a major part of the eastern area of the FR belt is underlain by the pluton. This effectivelyreduces the Bouguer anomaly of the FR belt in that areaand partly accounts for the asymmetry noted earlier forthis profile (Figure 9). Considering the ‘base or root’ ofthe greenstone models at depth, the v-shape of modelFR2 far from the pluton has been modified by graniteintrusion (Figure 13), with part of the volcanics replacedby granite (assimilation or granitisation?). This basinalshape could be a function of infolding of the greenstonesuccession as a result of doming, while depth extent isa function of both deformation and erosion.Identification of small isolated pluton outcrops in theeastern parts (Figure 1) supports the possibility of largersubcropping plutons. Overall, it is clear from variouslines of evidence that the intrusion of granitoids had asignificant influence on the geotectonic evolution of thegreenstone belt. The intrusion of granitoids was eitherthe dominant cause of greenstone deformation, or,because they intruded during regional deformation,caused significant modification of regional structuralpatterns (Ridley et al., 1997).
Finally, the present results are compared to the twogroups of greenstone belt models as proposed byPeschler et al. (2004) in relation to Archaean tectonics ingeneral: (i) diapirism-type geotectonic process prior to~2.8 Ga, and (ii) plate tectonic-like processes thereafter.This translates to autochthonous vs allochthonoussettings for greenstone belts and/or diapirism vs dykingfor granite pluton emplacement. Alternatively,greenstones and granite plutons generally have the samerelatively large depth extent (~10 km) in the diapirism-

type model, while plutons are thinner in the plate-tectonic model (~3 km), and have predominantly tabularshapes (Peschler et al., 2004). The gravity models(Figures 7 to 10 and Table 2) show that the greenstonekeel (<4.0 km) is much smaller than the pluton root (~12 km), contrary to their plate-tectonic model. Further, the geometry of the pluton is not a sheet; andthus is not consistent with tabular intrusion or dyking(cf. Jelsma and Dirks, 2002). The results, together withgeochronological and structural evidence, as well asother Zimbabwe craton greenstone belt gravity models (e.g., Gwavava and Ranganai, 2009), seem not tosupport the proposed change in tectonic style with age.Many workers have advocated horizontal tectonics priorto vertical tectonics (see Benn et al., 2006 and referencestherein); in this case greenstone lithologies have beendisplaced and later infolded as a result of verticaltectonics (H.Jelsma, personal communication, 2012).
Conclusions The conclusions regarding the structural setting,subsurface configuration and geotectonic evolution ofthe Fort Rixon-Shangani (FRSh) greenstone belt and theNalatale pluton are the following: 1. The FRSh greenstone belt is mainly comprised of
~2.7 Ga basaltic volcanics that are characterised bylow, fairly flat magnetic signatures and positiveBouguer gravity anomalies up to 35 mGal amplitude.Intense aeromagnetic anomalies with amplitudes upto hundreds of nanoTesla occur over ultramafic andiron formation horizons on the eastern edge of thegreenstone belt.
2. The aeromagnetic data have allowed mapping to beextended to areas of poor rock exposure, and fourmain structural trends are identified: north-northwest,northwest, west-northwest and north-northeast.Several north-northwest-trending dykes and a majorshear zone have been revealed and/or confirmed.The magnetic lineament pattern in the area is notinfluenced by the presence of the greenstone belt.Trends of magnetic lithologies are generallyconsistent with the theory that the FRSh belt wasdetached from the Bubi-Bulawayo-Filabusi (BBF)greenstone belt along the ILSZ. However, we note thataeromagnetics could be mapping more recent events.
3. The gravity data show that the FR greenstone belt isslightly smaller than expected with the main bodysignificantly shifted to the southwest. There is astrong possibility that the intrusive post-volcanicNalatale granite continues under the belt in thenortheast. The data have not been able to reveal the presence of a suspected intrusive Sesombi suitegranite between the Fort Rixon and Bulawayogreenstone belts in the west. Although clearlygeologically distinct from the gneisses and tonalites,these late syn-volcanic granites are not separable onthe basis of their density. Identifying geophysicalfeatures of the (Chilimanzi-type) porphyritic,monzogranites and Sesombi-type TTG suites are: low
Bouguer gravity and high magnetic values versusintermediate to low magnetic values and no gravityanomaly, respectively.
4. The most realistic two and half dimensional gravitymodel of the FR greenstone belt yields a shallowbasin or boat shaped volcanic body with a thicknessof only 3.5 km. The equivalent Nalatale pluton modelindicates a typical configuration consisting of a roofregion with shallow dips and root zone walls withfairly steep outward dips, and a most probablethickness of 4.5 km. An alternative (low confidence)model representing a maximum thickness scenariofor both units depicts the FRSh greenstone belt as a6.0 km volcanic pile while the pluton is a narrowdiapir 7.0 km wide and about 12.0 km thick bisecting the greenstone belt. These features areconsistent with intrusive relationship with theyounger granite pluton.
5. The intrusion of granitoids as magmatic or solid-statedomes, or diapir-like structures had a fundamentalinfluence on the geometry of the greenstone belt.The disposition of surface lithologies and the gravitymodels show that the intrusion of the Nalatalegranite ‘remobilized’ a large part of the FRShgreenstone belt leaving only a narrow part/sectionconnecting the FR and Sh sections. Truncation ofvolcanics at depth occurs through younger graniteannihilation (granitisation) or some other tectono-magmatic processes. These findings and observationssupport the geological theory that most late graniteplutons were derived from partial melting of non-homogeneous crust and forcibly emplaced bydiapiric or ballooning processes (e.g., Minnit andAnhaeusser, 1992; Jelsma et al., 1993; Collins et al.,1998; Becker et al., 2000; Van Kranendonk, 2011),thereby deforming the greenstones.
Acknowledgements The Zimbabwe Geological Survey provided theaeromagnetic data used in this study and gavepermission for the data to be published. Additional(new) gravity data were collected through a Universityof Zimbabwe Research Board grant RB/108/96. The cooperation of the Geophysics Unit of theZimbabwe Geological Survey is greatly appreciated.Gratitude is extended to the late Samson Takaedza forassistance in the field. O. T. Okatswa is thanked for thegeology graphics. Comments by Read Mapeo and MartinMushayandebvu as well as the reviewers are greatlyappreciated. I am indebted to the critical comments and constructive suggestions by H Jelsma that greatlyimproved the paper. The editor’s comments were also valuable.
References Ameglio, L., Vigneresse, J.L. and Bouchez, J.L., 1997. Granite pluton
geometry and emplacement mode inferred from combined fabric and
gravity data. In: J.L. Bouchez, D.H.W. Hutton and W.E. Stephens (Editors),
Granite: From Segregation of Melt to Emplacement Fabrics, Kluwer
Academic Publishers, Dordrecht, the Netherlands, 199-214.
SOUTH AFRICAN JOURNAL OF GEOLOGY
STRUCTURAL AND SUBSURFACE RELATIONSHIPS BETWEEN THE FORT RIXON-SHANGANI GREENSTONE BELT
AND THE NALATALE PLUTON
294

R.T. RANGANAI
SOUTH AFRICAN JOURNAL OF GEOLOGY
295
Baglow, N., 1989. Filabusi 1: 100 000 geological map. Zimbabwe Geological
Survey.
Bartholomew, D.S., 1990. Base Metal and Industrial Mineral Deposits of
Zimbabwe; Gold Deposits of Zimbabwe. Zimbabwe Geological Survey
Mineral Resources Series No. 22 and 23, Harare.
Becker, J.K., Siegesmund, S. and Jelsma, H.A., 2000. The Chinamora
batholith, Zimbabwe: structure and emplacement-related magnetic rock
fabric, Journal of Structural Geology, 22, 1837-1853.
Benn, K., Mareschal, J-C. and Condie, K.C. (Editors) (2006). Archean
geodynamics and environments, Geophysical Monograph 164, American
Geophysical Union, 320pp.
Betts, P.G., Valenta, R. and Finlay, J., 2003. Evolution of the Mount Woods
Inlier, northern Gawler Craton, Southern Australia: an integrated structural
and aeromagnetic analysis, Tectonophysics, 366, 83-111.
Betts, P.G., Williams, H., Stewart, J. and Ailleres, L., 2007. Kinematic analysis
of aeromagnetic data: looking at geophysical data in a structural context,
Gondwana Research, 11, 582-583.
Bickle, M.J. and Nisbet, E.G. (Editors), 1993. The geology of the Belingwe
greenstone belt, Zimbabwe: A study of the evolution of Archaean
continental crust, Geological Society of Zimbabwe Special Publication 2,
A.A. Balkema, Rotterdam, the Netherlands, 239pp.
Bickle, M.J., Nisbet, E.G. and Martin, A., 1994. Archean Greenstone Belts are
not Oceanic Crust, The Journal of Geology,102, 121-138.
Blakely, R.J., 1995. Potential Theory in Gravity and Magnetic Applications,
Cambridge University Press, U.K. 441pp.
Bleeker, W., 2002. Archean tectonics: a review, with illustration from the
Slave craton. In: C.M.R. Fowler, C.J. Ebinger and C.J. Hawkesworth
(Editors), The Early Earth: Physical, Chemical and Biological
Development, Geological Society of London Special Publication,
199, 151-181.
Blenkinsop, T.G., Martin, A., Jelsma, H.A. and Vinyu, M.L., 1997. The
Zimbabwe Craton. In: M.J. de Wit and L.D. Ashwal (Editors), Greenstone
Belts. Oxford monograph on geology and geophysics, Clarendon Press,
Oxford, U.K., 567-580.
Boschetti, F., 2005. Improved edge detection and noise removal in gravity
maps via the use of gravity gradients, Journal of Applied Geophysics,
57, 213-225.
Brisbin, W.C. and Green, A.G., 1980. Gravity model of the Aulneau batholith,
northwestern Ontario, Canadian Journal of Earth Sciences, 17, 968-977.
Broome, H.J., 1990. Generation and interpretation of geophysical images
with examples from the Rae Province, northwestern Canada Shield,
Geophysics, 55, 977-997.
Campbell, S.D.G., Baglow, N. and Pitfield, P.E.J., 1991. The structural
framework of the Filabusi greenstone belt, and its relevance to gold
mineralization, Annals of the Zimbabwe Geological Survey, Volume XV
(1990), 29-38
Campbell, S.D.G., Oesterlen, P.M., Blenkinsop, T.G., Pitfield, P.E.J. and
Munyanyiwa, H., 1992. A Provisional 1:2 500 000 scale Tectonic map and
the tectonic evolution of Zimbabwe. Annals of the Zimbabwe Geological
Survey, Volume XVI (1991), 31-50.
Campbell, S.D.G. and Pitfield, P.E.J., 1994. Structural controls of gold
mineralization in the Zimbabwe Craton- Exploration Guidelines,
Zimbabwe Geological Survey Bulletin, 101, 270pp.
Chardon, D., Choukroune, P. and Jayananda, M., 1998. Sinking of the
Dharwar basin (South India): implications for Archaean tectonics,
Precambrian Research, 91, 15-39.
Collins, W.J., Van Kranendonk, M.J. and Teyssier, C., 1998. Partial convective
overturn of Archean crust in the East Pilbara craton, Western Australia-
driving mechanisms and tectonic implications, Journal of Structural
Geology, 20, 1405-1424.
Dehls, J.F., Cruden, A.R. and Vigneresse, J-L., 1998. Fracture control of late
Archean pluton emplacement in the northern Slave Province, Canada,
Journal of Structural Geology, 20, 1145-1154.
Fisk, K. and Hawadi, M.T., 1996. The National Gravity Dataset of Zimbabwe,
Zimbabwe Geological Survey Bulletin No. 103, 39pp.
Gupta, V.K., Thurston, P.C. and Dusanowskj, T.H., 1982. Constraints upon
models of greenstone belt evolution by gravity modeling, Birch-Uchi
greenstones belt, Northern Ontario, Precambrian Research, 16, 233-255.
Gwavava, O. and Ranganai, R.T., 2009. The geology and structure of the
Masvingo greenstone belt and adjacent granite plutons from geophysical
data, Zimbabwe craton, South African Journal of Geology, 112, 277-290.
doi:10.2113/gssajg.112.3-4.277
Harrison, N.M., 1969. The geology of the country around Fort Rixon and
Shangani, Rhodesia Geological Survey Bulletin 61, 152pp.
Jaques, A.L., Wellman, P., Whitaker, A. and Wyborn, D., 1997. High-
resolution geophysics in modern geological mapping, AGSO Journal of
Australian Geology and Geophysics, 17, 159-173.
Jelsma, H.A. and Dirks, P.H.G.M., 2000. Tectonic evolution of a greenstone
sequence in northern Zimbabwe: sequential early stacking and pluton
diapirism, Tectonics, 19, 135-152.
Jelsma, H.A. and Dirks, P.H.G.M., 2002. Neoarchaean tectonic evolution of
the Zimbabwe Craton. In: C.M.R. Fowler, C.J. Ebinger and C.J.
Hawkesworth (Editors), The Early Earth: Physical, Chemical and
Biological Development, Geological Society of London Special
Publication, 199, 183-211.
Jelsma, H.A., Kröner A., Bozhko, N. and Stowe, C., 2004. Single zircon ages
for two Archean banded migmatitic gneisses from central Zimbabwe,
South African Journal of Geology, 107, 577-586.
Jelsma, H.A., van der Beek, P.A. and Vinyu, M.L. (1993). Tectonic evolution
of the Bindura-Shamva greenstone belt (northern Zimbabwe): progressive
deformation around diapiric batholiths, Journal of Structural Geology,
15, 163-176.
Jelsma, H.A., Vinyu, M.L., Valbracht, P.J., Davies, G.R., Wijbrans, J.R. and
Verdurmen, E.A.T., 1996. Constraints on Archaean crustal evolution of the
Zimbabwe craton: a U-Pb zircon, Sm-Nd and Pb-Pb whole-rock isotope
study, Contributions Mineralogy Petrology, 124, 55-70.
Kehlenbeck, M.M. and Cheadle, S.P., 1990. Structural cross sections based on
a gravity survey of parts of the Quetico and Wawa subprovinces near
Thunder Bay, Ontario, Canadian Journal of Earth Sciences, 27, 187-199.
Kisters, A.F.M. and Anhaeusser, C.R., 1995. Emplacement features of
Archaean TTG plutons along the southern margin of the Barberton
greenstone belt, South Africa, Precambrian Research, 75, 1-15.
McLean, M.A. and Betts, P.G., 2003. Geophysical constraints of shear zones
and geometry of the Hiltaba Suite granites in the western Gawler Craton,
Australia, Australian Journal of Earth Sciences, 50, 525-541.
Minnitt, R.C.A. and Anhaeusser, C.R., 1992. Gravitational and diapiric
structural history of the eastern portion of the Archean Murchison
greenstone belt, South Africa, Journal of African Earth Sciences,
15, 429-440.
Moritz, H., 1984. Geodetic Reference System 1980, Bulletin of Geodesy,
58, 388-398.
Mushayandebvu, M.F., Jones, D.L., Briden, J.C., 1995. Palaeomagnetic and
geochronological results from Proterozoic mafic intrusions in southern
Zimbabwe. In: G. Baer and A. Heimann, (Editors), Physics and Chemistry
of Dykes. Balkema, Rotterdam, the Netherlands, 293-303.
Peschler, A.P., Benn, K. and Roest, W.R., 2004. Insights on Archean
continental geodynamics from gravity modelling of granite–greenstone
terranes, Journal of Geodynamics, 38, 185-207.
Petford, N. and Clemens, J.D., 2000. Granites are not diapiric, Geology
Today, September-October, 180-184
Prendergast, M.D., 2004. The Bulawayan Supergroup: a late Archaean
passive margin-related large igneous province in the Zimbabwe craton,
Journal of the Geological Society, 161, 431-445.
Ramsay, J.G., 1989. Emplacement kinematics of a granite diapir: the
Chindamora batholith, Zimbabwe, Journal of Structural Geology,
11, 191-209.
Ranganai, R.T., 1995. Geophysical Investigations of the Granite-Greenstone
Terrain in the South-Central Zimbabwe Archaean Craton, Unpublished
PhD Thesis, University of Leeds, U.K., 288pp.
Ranganai, R.T., 1999. Structure and Depth Mapping in the south-central
Zimbabwe Craton using 3D Euler Deconvolution and Spectral Analysis of
Regional Aeromagnetic Data, Journal of African Earth Sciences, 28, 67-68.
Ranganai, R. T., 2001. Structural and Subsurface Relationships between the
Fort Rixon Greenstone Belt and the Nalatale Granite Pluton, Zimbabwe,
as derived from Gravity and Aeromgnetic Data, Geophysical Odyssey
2001: 7th SAGA Biennial Technical Meeting and Exhibition, 9-12 October
2001, Drakensburg, South Africa, Extended Abstracts CD-Rom. 4pp.
Ranganai, R.T. and Ebinger, C.J., 2008. Aeromagnetic and LANDSAT TM
Structural Interpretation for Identifying Regional Groundwater Exploration
Targets, South-Central Zimbabwe Craton, Journal of Applied Geophysics,
65, 73-83.

Ranganai, R.T., Whaler, K.A. and Ebinger, C.E., 2008. Gravity anomaly
patterns in the south-central Zimbabwe Archaean craton and their
geological interpretation, Journal of African Earth Sciences, 51, 257-276.
Ridley, J.R., Vearncombe, J.R. and Jelsma, H.A., 1997. Relations between
greenstone belts and associated granitoids. In: M.J. de Wit and L.D.
Ashwal (Editors), Greenstone Belts, Clarendon Press, Oxford, U.K.,
376-397.
Smith, W.H.F. and Wessel, P., 1990. Gridding with continuous curvature
splines in tension, Geophysics, 16, 222-227.
Söderlund, U., Hofmann, A., Klausen, M.B., Olsson, J.R., Ernst, R.E. and
Persson, P., 2010. Towards a complete magmatic barcode for the
Zimbabwe craton: BaddeleyiteU-Pb dating of regional dolerite dyke
swarms and sill complexes, Precambrian Research, 183, 388-398.
Stettler, E.H., de Beer, J.H., Eberle, D., Ludden, J. and Mareschal, M., 1997.
Geophysics and Deep Structures. In: M.J. de Wit and L.D. Ashwal
(Editors), Greenstone Belts, Oxford Monograph on Geology and
Geophysics, Clarendon Press, Oxford, U.K., 339-375.
Stowe, C.W., 1980. Wrench tectonics in the Archaean Rhodesian craton,
Transactions of the Geological Society of South Africa, 83, 193-205.
Subrahmanyam, C. and Verma, R.K., 1982. Gravity interpretation of the
Dharwar greenstone-gneiss-granite terrain in the southern Indian Shield
and its geological implications, Tectonophysics, 84, 225-245.
Treloar, P.J. and Blenkinsop, T.G., 1995. Archaean deformation patterns in
Zimbabwe: true indicators of Tibetan-style crustal extrusion or not?
In: M.P. Coward and A.C. Ries (Editors), Early Precambrian Processes,
Geological Society Special Publication, 95, 87-108.
Van Kranendonk, M.J., 2004. Archaean Tectonics 2004: a review,
Precambrian Research, 131, 143-151.
Van Kranendonk, M.J., 2011. Cool greenstone drips and the role of partial
convective overturn in Barberton greenstone belt evolution, Journal of
African Earth Sciences, 60, 346-352
Wellman, P., 2000. Upper crust of the Pilbara Craton, Australia: 3D geometry
of a granite/greenstone terrain, Precambrian Research, 104, 175-186.
Wilson, J.F., 1990. A craton and its cracks: some of the behaviour of the
Zimbabwe block from the Late Archaean to the Mesozoic in response to
horizontal movements, and the significance of some of its mafic dyke
fracture patterns, Journal of African Earth Sciences, 10, 483-501.
Wilson, J.F., Jones, D.L. and Kramers, J.D., 1987. Mafic dyke swarms in
Zimbabwe. In: H.C. Halls and W.F. Fahrig (Editors), Mafic Dyke Swarms,
Geological Association of Canada Special Paper, 34, 433-444.
Wilson, J.F., Nesbitt, R.W. and Fanning, C.M., 1995. Zircon geochronology
of Archaean felsic sequences in the Zimbabwe craton: a revision of
greenstone stratigraphy and a model for crustal growth. In: M.P. Coward
and A.C. Ries (Editors), Early Precambrian Processes, Geological Society
Special Publication, 95, 109-126.
Won, I.J. and Bevis, M., 1987. Computing the gravitational and magnetic
anomalies due to a polygon: algorithms and FORTRAN subroutines,
Geophysics, 52, 232-238.
ZGS, 1994. Zimbabwe Geological Survey, Zimbabwe Geological 1: 1000000,
7th edition, Harare. Zimbabwe.
Editorial handling: R. Durrheim.
SOUTH AFRICAN JOURNAL OF GEOLOGY
STRUCTURAL AND SUBSURFACE RELATIONSHIPS BETWEEN THE FORT RIXON-SHANGANI GREENSTONE BELT
AND THE NALATALE PLUTON
296
Copyright © 2022 FDOKUMEN