Paleointensity in Hawaiian Scientific Drilling Project Hole (HSDP2): Results from submarine basaltic...
18
Paleointensity in Hawaiian Scientific Drilling Project Hole (HSDP2): Results from submarine basaltic glass Lisa Tauxe Scripps Institution of Oceanography, University of California, San Diego, La Jolla, California 92093, USA ([email protected]) Jeffrey J. Love U. S. Geological Survey, Golden, Box 25046, MS966, DFC, Denver, Colorado 80225, USA ( [email protected]) [1] Paleointensity estimates based on the high quality Thellier-Thellier data from the early Brunhes (420– 780 ka) are rare (only 30 in the published literature). The Second Hawaiian Scientific Drilling Project (HSDP2) drill hole recovered submarine volcanics spanning the approximate time period of 420–550 ka. These are of particular interest for absolute paleointensity studies owing to the abundance of fresh submarine basaltic glass, which can preserve an excellent record of ancient geomagnetic field intensity. We present here new results of Thellier-Thellier paleointensity experiments that nearly double the number of reliable paleointensity data available for the early Brunhes. We also show that the magnetizations of the associated submarine basalts are dominated by viscous magnetizations and therefore do not reflect the true ancient geomagnetic field intensity at the time of extrusion. The viscous contamination is particularly severe because of a combination of low blocking temperatures in the basalts and relatively high temperatures in the deeper parts of the drill core. Our new data, when placed on the approximate timescale available for HSDP and HSDP2, are at odds with other contemporaneous paleointensity data. The discrepancy can be reconciled by adjusting the HSDP timescales to be younger by about 35 kyr. Components: 7257 words, 13 figures, 5 Auxiliary material. Keywords: Paleointensity; thellier technique; submarine basaltic glass. Index Terms: 1521 Geomagnetism and Paleomagnetism: Paleointensity; 1560 Geomagnetism and Paleomagnetism: Time variations—secular and long term; 1594 Geomagnetism and Paleomagnetism: Instruments and techniques; 1540 Geomagnetism and Paleomagnetism: Rock and mineral magnetism. Received 15 November 2001; Revised 12 June 2002; Accepted 13 September 2002; Published 15 February 2003. Tauxe, L., and J. J. Love, Paleointensity in Hawaiian Scientific Drilling Project Hole (HSDP2): Results from submarine basaltic glass, Geochem. Geophys. Geosyst., 4(2), 8702, doi:10.1029/2001GC000276, 2003. ———————————— Theme: Hawaii Scientific Drilling Project Guest Editors: Don DePaolo, Ed Stolper, and Don Thomas 1. Introduction [2] Information about past variations in the strength of the geomagnetic field can be derived from records of two fundamentally different types: abso- lute paleointensity estimates based on thermally blocked remanences and relative paleointensity estimates based on normalized records of sediments G 3 G 3 Geochemistry Geophysics Geosystems Published by AGU and the Geochemical Society AN ELECTRONIC JOURNAL OF THE EARTH SCIENCES Geochemistry Geophysics Geosystems Article Volume 4, Number 2 15 February 2003 8702, doi:10.1029/2001GC000276 ISSN: 1525-2027 Copyright 2003 by the American Geophysical Union 1 of 18
-
Upload
independent -
Category
Documents
-
view
1 -
download
0
Transcript of Paleointensity in Hawaiian Scientific Drilling Project Hole (HSDP2): Results from submarine basaltic...

Paleointensity in Hawaiian Scientific Drilling Project Hole(HSDP2): Results from submarine basaltic glass
Lisa TauxeScripps Institution of Oceanography, University of California, San Diego, La Jolla, California 92093, USA([email protected])
Jeffrey J. LoveU. S. Geological Survey, Golden, Box 25046, MS966, DFC, Denver, Colorado 80225, USA ( [email protected])
[1] Paleointensity estimates based on the high quality Thellier-Thellier data from the early Brunhes (420–
780 ka) are rare (only 30 in the published literature). The Second Hawaiian Scientific Drilling Project
(HSDP2) drill hole recovered submarine volcanics spanning the approximate time period of 420–550 ka.
These are of particular interest for absolute paleointensity studies owing to the abundance of fresh
submarine basaltic glass, which can preserve an excellent record of ancient geomagnetic field intensity. We
present here new results of Thellier-Thellier paleointensity experiments that nearly double the number of
reliable paleointensity data available for the early Brunhes. We also show that the magnetizations of the
associated submarine basalts are dominated by viscous magnetizations and therefore do not reflect the true
ancient geomagnetic field intensity at the time of extrusion. The viscous contamination is particularly
severe because of a combination of low blocking temperatures in the basalts and relatively high
temperatures in the deeper parts of the drill core. Our new data, when placed on the approximate timescale
available for HSDP and HSDP2, are at odds with other contemporaneous paleointensity data. The
discrepancy can be reconciled by adjusting the HSDP timescales to be younger by about 35 kyr.
Components: 7257 words, 13 figures, 5 Auxiliary material.
Keywords: Paleointensity; thellier technique; submarine basaltic glass.
Index Terms: 1521 Geomagnetism and Paleomagnetism: Paleointensity; 1560 Geomagnetism and Paleomagnetism: Time
variations—secular and long term; 1594 Geomagnetism and Paleomagnetism: Instruments and techniques; 1540
Geomagnetism and Paleomagnetism: Rock and mineral magnetism.
Received 15 November 2001; Revised 12 June 2002; Accepted 13 September 2002; Published 15 February 2003.
Tauxe, L., and J. J. Love, Paleointensity in Hawaiian Scientific Drilling Project Hole (HSDP2): Results from submarine
basaltic glass, Geochem. Geophys. Geosyst., 4(2), 8702, doi:10.1029/2001GC000276, 2003.
————————————
Theme: Hawaii Scientific Drilling Project Guest Editors: Don DePaolo, Ed Stolper, and Don Thomas
1. Introduction
[2] Information about past variations in the strength
of the geomagnetic field can be derived from
records of two fundamentally different types: abso-
lute paleointensity estimates based on thermally
blocked remanences and relative paleointensity
estimates based on normalized records of sediments
G3G3GeochemistryGeophysics
Geosystems
Published by AGU and the Geochemical Society
AN ELECTRONIC JOURNAL OF THE EARTH SCIENCES
GeochemistryGeophysics
Geosystems
Article
Volume 4, Number 2
15 February 2003
8702, doi:10.1029/2001GC000276
ISSN: 1525-2027
Copyright 2003 by the American Geophysical Union 1 of 18

[see, e.g., Tauxe, 1993] or marine magnetic anoma-
lies [Gee et al., 1996]. Despite major effort, the
average geomagnetic field intensity during the early
Brunhes Chron remains poorly constrained. The
Hawaiian Scientific Drilling Project (HSDP) pene-
trated several kilometers of submarine extrusives
and hyaloclastites which are thought to be of early
Brunhes age. Of particular interest is the recovery
of abundant fresh submarine basaltic glass, a mate-
rial that often retains an excellent record of paleo-
field strength [see, e.g., Pick and Tauxe, 1993]. In
this paper, we review the available data for the
Brunhes Chron and present the results of paleoin-
tensity experiments on submarine basaltic glass
samples obtained from the HSDP2 drill core.
2. Published Brunhes Paleointensity
[3] A compilation of absolute paleointensity data is
described by Perrin et al. [1998] and is available on
line: http://www.ngdc.noaa.gov/seg/potfld/paleo.
html. We have updated the so-called PINT00 data-
base with absolute paleointensities based on the
Thellier-Thellier technique [Thellier and Thellier,
1959] that have been published since 1996. A list of
all data from the Brunhes Chron (<780 kyr) and the
references are listed in the auxiliary material (appen-
dix 1 and appendix 2). We have checked the data in
the data base against the original publication and
corrected information as appropriate. The ages used
here correspond to ages implied or stated in the
original references. In many cases, these are nomi-
nal ages based on interpolation or correlation. In
such cases, we have assigned uncertainty to zero.
We have (re)calculated the virtual axial dipole
moment (VADM) based on the latitudes and paleo-
field information included in the data table.
[4] Databases are intended to be inclusive so each
investigator must decide on a set of criteria that
will exclude data likely to be erroneous. In
Figure 1a we plot the VADMs from the data in
auxiliary material (appendix 1) that were based on
at least three specimens per cooling unit with a
standard deviation of less than 15% of the mean
value. (Please note that we use units of ZAm2
where one Zetta (Z) is 1021. These are therefore a
factor of ten larger than the usual units of
1022Am2). Of the 295 paleointensity estimates
published for the Brunhes that meet these minimal
reliability criteria, only 30 are older than 420 kyr.
In Figure 1b we plot the record of relative paleo-
intensity obtained by Guyodo and Valet [1999] by
stacking many individual sedimentary paleointen-
sity records placed on the astronomical timescale
(SINT800). These data, while likely to represent
variations in paleofield strength, are inherently
relative. They were calibrated to approximate
VADM by comparison with absolute data over
the recent past.
[5] We re-normalized the stack derived from deep-
towed magnetic anomaly profiles Gee et al. [2000]
to have the same mean as the calibrated SINT800
record and plot them in Figure 1b for comparison.
The correspondence between the independent two
relative paleointensity records is remarkably good.
We have numbered several prominant paleointen-
sity lows (PLs) and lettered several paleointensity
highs (PHs) for easy reference. PLs are often
referred to by the names of geomagnetic excursions
defined by directional aberrations observed else-
where [see, e.g., Valet and Meynadier, 1993]. For
example, PL1 is thought to be correlative to the
Laschamp Excursion. Given the difficulty of the
absolute age assignments in many of the excur-
sional records [see, e.g., Kent et al., 2002], it is
premature to make a definitive correlation of each
PL with an associated excursion.
[6] The absolute paleointensity data are less con-
tinuous than the relative paleointensity data and are
likely to have larger uncertainties in age assign-
ment. It appears that in time periods of dense
smapling, however, the absolute paleointensity
data record some of the prominant features in the
relative paleointensity records (e.g., PHa and PL1).
Nonetheless a direct comparison between the abso-
lute and relative paleointensity records for the
entire Brunhes must await more and better dated
absolute paleointensity data.
[7] There are very few absolute paleointensity data
points prior to 420 ka, hence more data from the
early Brunhes are especially needed. The second
Hawaii Scientific Drilling Project has recently
completed drilling a hole (HSDP2) at 19�420N
GeochemistryGeophysicsGeosystems G3G3
tauxe and love: paleointensity in hsdp2 10.1029/2001GC000276
2 of 18

and 155�30W. HSDP2 recovered several thousand
meters of submarine basaltic lavas and hyaloclas-
tites [DePaolo et al., 2001] including significant
amounts of fresh submarine basaltic glass that
range in age from about 420 to 550 kyr [DePaolo
and Stolper, 1996; W. Sharp, personal communi-
cation, 2002].
[8] Submarine basaltic glass is well suited for pa-
leointensity measurements [see, e.g., Selkin and
Tauxe, 2000] for a recent compilation). The mag-
netic remanence is carried by single-domain (tita-
no)magnetite often with excellent rock magnetic
behavior during the paleointensity experiment.
The NRM was acquired during initial quenching
of the glass, hence the cooling rate can be approxi-
mated to within an order of magnitude in the
laboratory. Finally, magnetite encased in glass can
avoid pervasive alteration for very long periods of
time [see, e.g., Zhou et al., 1997, 1999a, 1999b; Xu
et al., 1997a, 1997b]. In this study we seized the
opportunity to augment the early Brunhes geomag-
netic field intensity variations by exploiting the
unaltered submarine basaltic glasses recovered from
HSDP2.
3. Thellier-Thellier Experiment
[9] The most common method for obtaining esti-
mates of paleofield strength from thermally blocked
a)
b)
SINT 800
Gee et al. (2000)
1 23
45
a
b c d ef
Figure 1. (a) Previously published data from Thellier-Thellier experiments (with pTRM checks) meeting minimumcriteria for reliability (see text). Open circles with dots are from HSDP1 [Laj and Kissel, 1999]. The solid line is thepresent field dipole moment and the dashed line is the 5 Myr average of Selkin and Tauxe [2000]. (b) Relativepaleointensity stacks for the Brunhes Chron. Thin line is an inversion from a deep-tow magnetic anomaly stack ofGee et al. [2000] from the East Pacific Rise. Heavy line is the SINT800 stack from relative paleointensity records ofGuyodo and Valet [1999]. The anomaly inversion was normalized to have a common mean to the SINT800 stack.Prominent paleointensity highs are lettered a–f and lows are numbered 1–5.
GeochemistryGeophysicsGeosystems G3G3 10.1029/2001GC000276tauxe and love: paleointensity in hsdp2 10.1029/2001GC000276
3 of 18

remanences is the so-called ‘‘Thellier-Thellier tech-
nique’’ [Thellier and Thellier, 1959]. Thellier-Thel-
lier experiments rely on several implicit assumptions
including:
1. The thermal remanence (TRM) acquired is
linearly related to the field in which the rock cools.
2. The pTRM acquired during laboratory heating
is equivalent to the pTRM acquired during initial
cooling.
3. A partial thermal remanence (pTRM) acquired
by cooling in an applied field from a given
temperature is entirely removed by reheating to
the same temperature in a null field.
[10] There is a great variety in approaches to pa-
leointensity determination. This derives to some
extent from the fact that the original Thellier and
Thellier [1959] article contained a description of
several different experimental protocols. The pro-
tocol used in this study is based on the ‘‘Coe
variant’’ described by Coe [1967]. We heat a
specimen to a temperature Ti and cool it in a null
magnetic field (the ‘‘first zero field step’’). After
measuring the natural magnetic remanence (NRM)
the specimen is re-heated to the same temperature
and cooled in a controlled magnetic field (the ‘‘first
in-field step’’). After the first zero field step we can
repeat an in-field step at a lower temperature to
determine if the capacity to acquire pTRM has
changed (the ‘‘pTRM check’’). In addition to the
standard pTRM check, we can conduct a second
test. After the first in-field step, the specimen is
heated again to Ti and cooled in zero magnetic
field. This measurement checks whether all the
pTRM acquired in the intervening in-field step
was removed by re-heating to the same temperature
and cooling in zero field. This procedure is briefly
described by Dunlop and Ozdemir [1994] and in
more detail by Riisager and Riisager [2001].
Because a difference in blocking and unblocking
temperature (the latter being higher) is character-
istic of multi-domain pTRM, we call this the ‘‘MD
check’’.
[11] Ideally, the assumptions inherent in the Thel-
lier-Thellier technique would be verified by the
experimental protocol. The assumption that the
natural remanence is a linear function of the ancient
field strength is almost certainly true for thermal
remanence magnetizations in fields less than about
100 mT. The validity of this assumption in a par-
ticular paleomagnetic specimen would be compro-
mised if the magnetization was not in fact an
original TRM, but some other magnetization
acquired later in the history of the sample (for
example a viscous remanence, VRM, or chemical
remanence, CRM). To verify the origin of rema-
nence, some investigators demand that the portion
of the NRM used in the Thellier-Thellier paleofield
calculation trend to the origin. This ‘‘origin test’’ is
necessary but not sufficient to establish the applic-
ability of assumption 1. We calculate the scatter of
the NRM measurements about the best fit line
(MAD ofKirschvink [1980]) and the deviation from
the origin of this direction (a of Selkin and Tauxe
[2000]).
[12] The assumption that a given laboratory pTRM
accurately reproduces the original pTRM acquired
between two temperatures can be erroneous for
several reasons. First, if the cooling rate in the
laboratory is different from the original cooling
rate this assumption is demonstrably false [e.g.,
Aitken et al., 1981; Dodson and McClelland-
Brown, 1980; Halgedahl et al., 1980] Furthermore,
if the rock undergoes chemical alteration during
laboratory heating the laboratory pTRM will also
differ from the original pTRM. Compensating for
differences in cooling rate is relatively straight
forward if the original cooling rate is well known
and the samples behave according to single domain
theory (see, e.g., Selkin and Tauxe [2000] for a
simple graphical correction method). Recognizing
changes in mineralogy can be accomplished using
the pTRM checks, monitoring susceptibility, etc.
We use the difference ratio or DRAT parameter
which is the ratio of the difference between repeat
in field steps normalized by the length of selected
line used in the paleofield calculation [see Selkin
and Tauxe, 2000]. The pTRM checks are quite
powerful, but also must be considered necessary
but not sufficient tests for the validity of assump-
tion 2 (see below).
[13] The assumption that the blocking and un-
blocking temperatures for a given pTRM are equi-
valent may not always be true for multi-domain
GeochemistryGeophysicsGeosystems G3G3
tauxe and love: paleointensity in hsdp2 10.1029/2001GC000276
4 of 18

(MD) remanences [e.g., Levi, 1977; Bol’shakov and
Shcherbakova, 1979; Dunlop and Xu, 1994].
Because the blocking temperature Tb of MD rema-
nence is lower than the unblocking temperature
Tub, the plots of remanence remaining versus
pTRM gained (‘‘Arai diagrams’’ [Nagata et al.,
1963]) are not linear, but are concave upward.
Removal of a viscous remanence also leads to
non-linear Arai diagrams. For these reasons we
use two criteria. The b parameter (b = s/jbj where sis the standard error of the slope and jbj is its
absolute value) ensures linearity of the NRM/
pTRM data. The MD check tests the equivalence
of the blocking and unblocking temperatures in the
specimen.
[14] Our experimental protocol will detect most
errors caused by secondary remanences, MD rema-
nences and alteration of the magnetic mineralogy
during the experiment. There are several patholog-
ical cases, however, that will generate erroneous
results that are not explicitly anticipated by the
protocol. Let us consider three scenarios of alter-
ation and the consequences to the Thellier-Thellier
experiment. The first scenario is that a magnetic
mineral produced has a discrete blocking temper-
ature Tb > Ta (sketched in Figure 2a). The second is
that a magnetic mineral is produced with a distri-
bution of blocking temperatures all above Ta(sketched in Figure 2b). The third scenario is the
more usual one in which a magnetic mineral is
produced with a broad distribution of blocking
temperatures that includes Ta and the lower temper-
ature of the pTRM check Tp (sketched in Figure
2c). In all of these scenarios we assume that Tb =
Tub rendering the MD test blind to the alteration.
[15] A flow chart of an experiment in which the
first scenario occurs is sketched in Figure 3.
Several double heating steps occur, including one
at Tp at which we plan to do a pTRM check
eventually. At temperature Ta a secondary magnetic
mineral is produced with a blocking temperature
Tb > Ta. No erroneous pTRM will be acquired until
the temperature Ta is reached for the first in-field
step. The first zero field step is always done at a
higher temperature than the previous in-field step,
hence the NRM will never be affected. The erro-
neous pTRM will appear in the Arai plot as a
discrete offset at Ta, followed by ‘‘normal’’ NRM/
pTRM behavior as shown in Figure 2d. Such a plot
would fail the b criterion if the temperature steps
included Ta. Otherwise, the estimated paleofield
would in fact be correct.
[16] In the second scenario depicted in Figure 2b,
there are a range of blocking temperatures in the
new magnetic phase, all above Ta. In such a case,
there would be a continuous increase in the erro-
neous pTRM acquired, yet both pTRM (triangles)
and MD (squares) checks would pass. Nonetheless,
these data would fail the b test for linearity.
[17] The third, less worrisome scenario, is depicted
in Figure 2c whereby the blocking temperature
spectrum of the new mineral is quite broad and
includes Tp. In this case the pTRM checks would
fail as well as the test for linearity.
[18] In summary, while not infallible, the basic Coe
[1967] experimental protocol, with the addition of
the MAD, origin and MD checks that have been
added over the years, is quite robust. Most sources
of error can be detected. Other sources of error, for
example, large and variable local magnetic anoma-
lies near the specimen as it cools [see Carlut and
Kent, 2002], can be detected by also demanding
that replicate measurements be made on several
specimens from the same cooling unit.
[19] In the following section, we describe our ex-
perimental efforts on samples of submarine basaltic
glass recovered from the Hawaiian Scientific Drill-
ing Project core, HSDP2. We start with a descrip-
tion of the lithologic log, including downhole
temperature and an age model. We will then dis-
cuss the effect of elevated temperature on the
paleomagnetic behavior of the specimens. Finally,
we will present results from our Thellier-Thellier
experiments and discuss the implications of our
data on the age model and for the paleointensity
behavior of the early Brunhes.
4. Paleomagnetic Data From HSDP2
[20] Figure 4 shows the lithologic log of HSDP2,
sampling levels for the present study, temperature
versus depth and an age model. A list of the sample
names used here and the Box/Run/Unit informa-
GeochemistryGeophysicsGeosystems G3G3
tauxe and love: paleointensity in hsdp2 10.1029/2001GC000276
5 of 18

tion for each sample is in appendix 3 of the
auxiliary material. The lithologic log and temper-
ature profile are redrawn from DePaolo et al.
[2001] and the age model is from DePaolo and
Stolper [1996]. This age model is consistent with
age information from HSDP2 itself (W. Sharp,
personal communication, 2002). The dashed line
is the best-fitting quadratic relating age and depth
by the equation Age (ka) = 367 + 0.0746D �0.00000462D2 where D is depth in meters below
sea level (mbsl). We sampled submarine basaltic
glass within the lower part of the section (see
Figure 4). Sample depths have been converted to
nominal ages using the age model in Figure 4 of
DePaolo and Stolper [1996] for consistency with
other research efforts on HSDP2. According to this
Ta
Tb
Tp
pTRM
NRM
Ta
Tb1
Tb2
Tp
Tp
NRM
Blocking Temperature Spectrum
Tb
TaTp
TaTp
Temperature
Scenario1
Scenario2
Tb1 Tb2
Ta
Tb1
NRM
TaTp
Scenario3
Tb1 Tb2
a)
b)
c)
d)
e)
f)
Figure 2. (a–c) Three scenarios for hypothetical distribution of blocking termperatures of a new magnetic mineralproduced at Ta (see text). (d–f ) Arai plots for the three scenarios shown in a–c. The filled symbols are the NRM/p-TRM pairs, triangles are ‘‘p-TRM checks’’ and the squares are the ‘‘MD checks’’. While only Scenario 3 generatesfailures in the pTRM checks, all three fail the linearity constraint imposed by the b criterion.
GeochemistryGeophysicsGeosystems G3G3
tauxe and love: paleointensity in hsdp2 10.1029/2001GC000276
6 of 18

age model, our samples range from approximately
420 ka to 550 ka.
4.1. Rock Magnetic Considerations
4.1.1. Viscous Remanence
[21] Because the samples from HSDP2 have been
at elevated temperature for an extended period of
time (see Figure 4), it is necessary to consider what
viscous remanence (VRM) may have been
acquired and what laboratory blocking temperature
would be expected for such a component. At the
bottom of the hole, the samples are some 550 kawith
an in situ temperature of�40�C.According to singledomain theory developed byPullaiah et al. [1975], a
VRM acquired over a half a million years at 40�Cwould not be removed in the laboratory until approx-
imately 220�C. Therefore, the maximum blocking
temperature of theNRMcomponent used to estimate
paleofield strength must be higher than that. Above
about 1500 mbsl, the temperatures in the drill hole
have been lower, so the blocking temperature
1st zero field step @ Tp
NRM remaining New mineralwith Tb >Ta
1st infield step@Tp
1st infield step@ T > Tb
pTRM gained
2nd zero field step@ Tp
2nd zero field step@ T > Tb
2nd infield step@ Tp
(pTRM check)
erroneous pTRMin new material
MD - Check passesbecause pTRM is lost
pTRM check passes
MD check passes
1st zero field step@ T > Tb
continue several steps until suddenly material is made at Ta
et cetera
Primary minerals
(MD check)
perform several double heating steps
Figure 3. Flow chart of the Thellier-Thellier experiment under the scenario that a mineral is made by heating thesample to temperature Ta which has a blocking temperature Tb > Ta. All pTRM and MD checks pass, but there is anerroneous pTRM acquired at temperature Ta.
GeochemistryGeophysicsGeosystems G3G3
tauxe and love: paleointensity in hsdp2 10.1029/2001GC000276
7 of 18

required to remove a VRMwould be approximately
125�C.
4.1.2. Magnetic Mineralogy and GrainSize: Transects From Pillow MarginToward Interior
[22] Another rock magnetic concern is the variabil-
ity in grain size and magnetic mineralogy as a
function of distance from the glassy margin. Carlut
and Kent [2002] have examined this issue by
performing Thellier-Thellier experiments on trans-
ects of samples from the glassy margins of submar-
ine basaltic pillows inward toward the increasingly
coarse grained basaltic interiors. They demonstrated
a profound dependence of the estimated paleointen-
sity on the position of the sample with respect to the
glassy margin. As this was done on very recent
MORB pillow fragments, the actual paleofield was
Figure 4. (a) Lithologic cross section of the HSDP2 hole. The upper 1100 meters are the subaerial sequence. Belowthat is the submarine section. Hyaloclastites are orange, massive flows are in green and pillow lavas are in grey.Sampling levels for the present study are shown as dots to the right of the lithologic log. (b) The temperature profileof DePaolo et al. [2001]. (c)The age model in the inset is that of DePaolo and Stolper [1996].
GeochemistryGeophysicsGeosystems G3G3
tauxe and love: paleointensity in hsdp2 10.1029/2001GC000276
8 of 18

known. The glassy sub-samples reproduced this
field very well, while data from the pillow interiors
overestimated the paleofield. To understand the
origin of this overestimate, they performed a test
whereby the pTRM acquired at a given temperature
step was demagnetized in several successive zero
field steps with increasing temperature. They dem-
onstrated that pTRMs in their pillow interiors failed
to be demagnetized at the temperatures in which the
magnetization was acquired. This is a characteristic
of MD remanences as discussed previously. The
cause of the overestimate was therefore attributed to
both differences in cooling rate and the failure of
pTRM independence in the coarser grained material
(an MD effect).
[23] The methodology Carlut and Kent [2002]
provides a useful means for interpreting paleointen-
sity data from basalts. In the case of the HSDP2
material, we have performed a similar experiment
on a pillow margin. We chose a fragment near the
bottom of HSDP2 as a ‘‘worst case’’ scenario. We
sliced the pillow fragment shown in Figure 5 into 5
mm sub-samples from the glass rim toward the
center into several transects. One transect was sub-
jected to hysteresis analysis; another was subjected
to Thellier-Thellier paleointensity experiments.
[24] We consider first the results of the Thellier-
Thellier experiments. Specimens from the pillow
margin transect were fixed into non-magnetic glass
tubes. The sample tubes were then subjected to the
Thellier-Thellier experiment as described earlier.
Our results are in some respects similar to those of
Carlut and Kent [2002] but differ in significant
ways owing to the elevated temperatures in the
Hawaiian crust. Thellier-Thellier experiments on
specimens a–d from the HSDP2 pillow margin
transect specimens are shown in Figure 6. The
results of specimens ‘‘e–j’’ are virtually identical
to specimen ‘‘d’’. Experimental results were eval-
uated using the criteria of Selkin and Tauxe [2000]
and assigned a grade of ‘‘A’’ through ‘‘F’’ depend-
ing on the number of criteria failed. Grade ‘‘A’’
specimens met all of the criteria (DRAT � 10%,
b � 0.1, a � 15�, MAD � 15�, and the Coe [1967]‘‘quality index’’ Q > 1). All of the interpretations
shown in Figure 6 are grade ‘‘A’’. However, speci-
mens ‘‘c–e’’ have no blocking temperatures above
about 200�C and the remanence removed during
the Thellier-Thellier experiment is therefore entirely
viscous in origin.
4.1.3. Hysteresis Behavior
[25] In order to investigate the cause(s) of the
differences in the Thellier-Thellier experiment
between the glassy margin and the pillow interior,
we performed hysteresis measurements on speci-
mens from the parallel transect. Representative
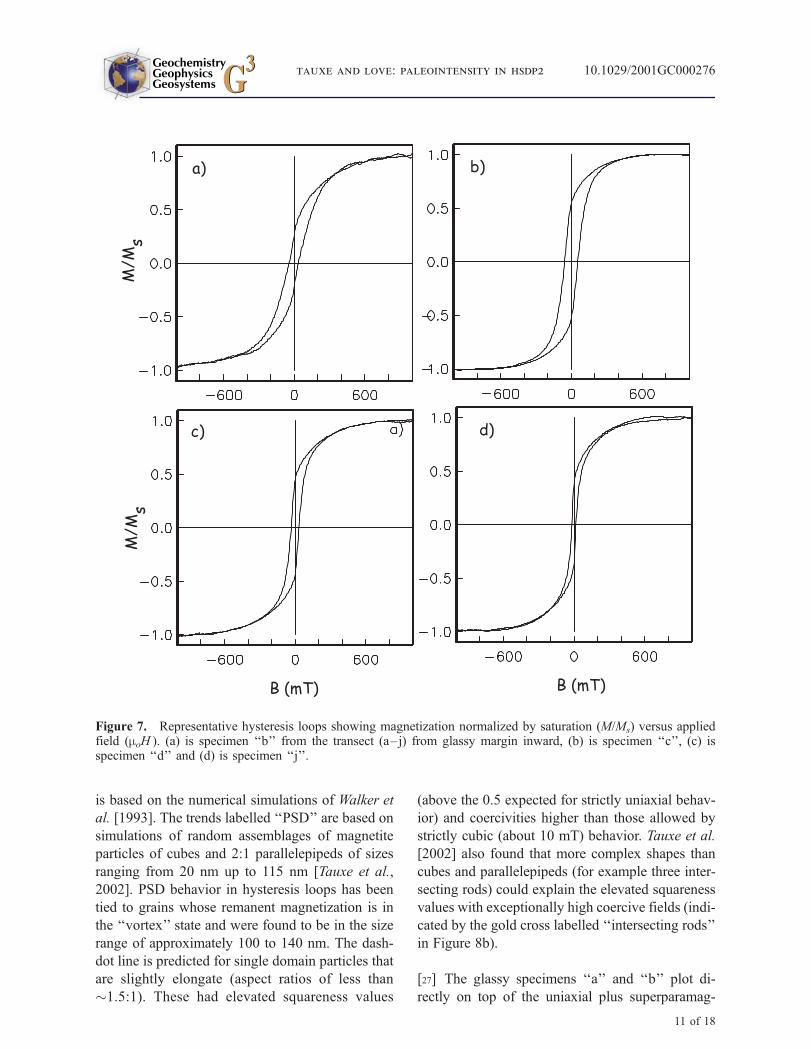
hysteresis behavior is plotted in Figure 7. Speci-
men ‘‘b’’ (Figure 7a) demonstrates a slightly
‘‘wasp-waisted’’ effect characteristic of many glass
samples. This is thought to be the result of a strong
superparamagnetic (SP) contribution combined
with an essentially single domain population domi-
nated by uniaxial anisotropy [Pick and Tauxe 1993,
1994; Tauxe et al., 1996]. The hysteresis behavior
of the specimen just inside the basalt glass margin
a
b
c
d
e
f
g
h
i
j
glassy margin
Figure 5. Transect from glassy margin of pillow.Specimens a–j taken at 5 mm intervals from margininward. Specimen ‘‘a’’ is glass, ‘‘b’’ has a glassy portionand the rest (c–j) are fine grained basalt with increasinggrain size.
GeochemistryGeophysicsGeosystems G3G3
tauxe and love: paleointensity in hsdp2 10.1029/2001GC000276
9 of 18

(specimen ‘‘c’’ in Figure 7b) exhibits the enhanced
saturation remanence to saturation magnetization
rato (here called squareness) and high coercive
fields noted by Gee and Kent [1995]. Moving
away from the glassy margin, the hysteresis loops
of the basalt chips have the lower squareness and
coercivity characteristic of so-called ‘‘pseudo-sin-
gle domain’’ type behavior [e.g., Day et al., 1977].
[26] To summarize the hysteresis behavior of the
specimens from the pillow margin transect, we plot
the squareness versus coercive field data in Figure
8a for the specimens in the transect. These data trace
out a large loop with the largest squareness-coercive
field behavior belonging to specimen ‘‘c’’, just
inside the glassy margin. In order to help understand
these data, we employ the squareness-coercive field
diagram of Tauxe et al. [2002] in Figure 8b. This
diagram shows the interpretations of squareness-
coercive field space based on micromagnetic mod-
elling of magnetite assemblages of grains with
various sizes and shapes. The heavy solid line with
an arrow pointing to the right (labelled ‘‘uniaxial
single domain’’) is the trend expected for uniaxial
particles with increasing aspect ratios [Stoner and
Wohlfarth, 1948] starting with an aspect ratio of
approximately 1.5:1 and increasing to the right (to a
maximum of about 300 mT at infinite aspect ratio).
The point labelled ‘‘cubic single domain’’ is based
on the theoretical predictions of Joffe and Heu-
berger [1974]. The solid arrow originating in the
uniaxial field and trending toward the origin
(labelled ‘‘uniaxial + SP’’) is based on the numerical
simulations of Tauxe et al. [1996]. The dotted curve
originating in the cubic single domain field and
trending toward the origin (labelled ‘‘cubic + SP’’)
a)
NRM(nAm2)
c) d)
NRM(100nA
m2)
NRM(100nA
m2)
pTRM (100 nAm2)pTRM (100 nAm2)
pTRM (nAm2)
NRM(10nA
m2)
pTRM (10 nAm2)
b)
Figure 6. Arai plots for specimens through transect from pillow margin to interior. (a) is outermost specimen; (b–d)is 0.5 cm intervals inward. The solid symbols are those used in the ‘‘paleointensity’’ determination. Triangles arepTRM checks and squares are MD checks (see text). The insets are orthogonal projections of the zero fieldremanence directions during demagnetization. Solid (open) symbols are the ‘‘unoriented’’ X,Y (X,Z) specimencoordinates.
GeochemistryGeophysicsGeosystems G3G3
tauxe and love: paleointensity in hsdp2 10.1029/2001GC000276
10 of 18
is based on the numerical simulations of Walker et
al. [1993]. The trends labelled ‘‘PSD’’ are based on
simulations of random assemblages of magnetite
particles of cubes and 2:1 parallelepipeds of sizes
ranging from 20 nm up to 115 nm [Tauxe et al.,
2002]. PSD behavior in hysteresis loops has been
tied to grains whose remanent magnetization is in
the ‘‘vortex’’ state and were found to be in the size
range of approximately 100 to 140 nm. The dash-
dot line is predicted for single domain particles that
are slightly elongate (aspect ratios of less than
�1.5:1). These had elevated squareness values
(above the 0.5 expected for strictly uniaxial behav-
ior) and coercivities higher than those allowed by
strictly cubic (about 10 mT) behavior. Tauxe et al.
[2002] also found that more complex shapes than
cubes and parallelepipeds (for example three inter-
secting rods) could explain the elevated squareness
values with exceptionally high coercive fields (indi-
cated by the gold cross labelled ‘‘intersecting rods’’
in Figure 8b).
[27] The glassy specimens ‘‘a’’ and ‘‘b’’ plot di-
rectly on top of the uniaxial plus superparamag-
a) b)
c) d)
B (mT)B (mT)
M/Ms
M/Ms
Figure 7. Representative hysteresis loops showing magnetization normalized by saturation (M/Ms) versus appliedfield (moH ). (a) is specimen ‘‘b’’ from the transect (a–j) from glassy margin inward, (b) is specimen ‘‘c’’, (c) isspecimen ‘‘d’’ and (d) is specimen ‘‘j’’.
GeochemistryGeophysicsGeosystems G3G3
tauxe and love: paleointensity in hsdp2 10.1029/2001GC000276
11 of 18

Squarene
ss
a)
MD
cubic singledomain
uniaxialsingle domain
increasingaspect ratio
b)
uniaxial+SP
cubic
+SP
c
d
j
intersectingrods
a,b
PSD
Coercive field (mT) Coercive field (mT)
increasi
ngwid
th
Figure 8. (a) Squareness-coercive field plot from hysteresis loops for specimens ‘‘a–j’’. Squareness is the ratio ofsaturation remanence and saturation magnetization. Track toward pillow interior shown by arrows. (b) Results ofnumerical simulations redrawn from Tauxe et al. [2002]. The pillow transect data are consistent with increasing grainsize of complex shapes (e.g., skeletal grains) up to a size of about 100 nm.
a
bj
M/M
o
Temperature (oC)
a b c d e f g h i j
gla
ssy
crys
talli
ne
"Banc"
(µT)
a) b)
specimen
Figure 9. (a) Blocking temperature spectra for specimens ‘‘a–j’’ from transect through the glassy margin into thepillow interior. ‘‘a’’ is the outermost specimen. Data are the intensities of the NRM remaining after the first zero fieldstep in the Thellier-Thellier experiment. (b) Estimated ‘‘Banc’’ from the Thellier-Thellier experiments as a function ofdistance from the margin.
GeochemistryGeophysicsGeosystems G3G3
tauxe and love: paleointensity in hsdp2 10.1029/2001GC000276
12 of 18

netic (SP) trend, consistent with the slightly wasp-
waisted hysteresis loops (Figure 7a). Specimens
‘‘c–j’’ fall on a trajectory starting with quite high
squareness (above the 0.5 expected for uniaxial
behavior) and high coercivities (much higher than
those allowed for cubic anisotropy) and trending in
a curve through the field labelled ‘‘PSD’’ toward
the expected MD point (essentially, the origin).
Thus the trend from specimens ‘‘c’’ to ‘‘j’’ is
consistent with increasing grain sizes of popula-
tions of either slightly elongate particles or more
complex shapes (e.g., skeletal titanomagnetites). A
thin section of the pillow margin revealed no
visible grains under an optical microscope, so the
magnetic crystals in all of these specimens are
probably sub-micron in size.
[28] Blocking temperature spectra from the zero
field steps in the Thellier-Thellier experiments for
the specimens from the pillow margin transect are
plotted in Figure 9a. The blocking temperatures
change dramatically from a maximum of over
400�C in the glassy part (a,b) to less than 200� inthe pillow interior (d–j). This behavior is most
likely the result of a change in titanium substitution
from quite low in the glassy portion to TM60 in the
pillow interior [see, e.g., Zhou et al., 1997].
Because of the relatively high ambient temperature
in the lower part of the drill core (see Figure 4) and
the relatively low blocking temperatures in the
basalts, the ancient geomagnetic field estimates
Banc derived from the pillow margin transect are
a strong function of distance from the pillow
margin. We plot the estimated ‘‘Banc’’ for the
pillow transect in Figure 9b and show the strong
over-estimate of the paleofield from the pillow
interiors.
[29] As already mentioned, paleofield estimates
can be in error for a variety of reasons, including
differences in cooling rate, multi-domain behav-
ior, alteration during the experiment, and over-
printing by viscous (or chemical) remanences.
The pillow interior specimens (‘‘c–j’’) studied
2765 m 3084 m
NRM
(nAm2)
NRM
(nAm2)
pTRM (nAm2) pTRM (nAm2)
c) d)
a) 1118.9 m b) 1127.8 m
Figure 10. Representative results from class ‘‘A’’ Thellier-Thellier experiments. Symbols same as in Figure 6.
GeochemistryGeophysicsGeosystems G3G3
tauxe and love: paleointensity in hsdp2 10.1029/2001GC000276
13 of 18

here are from within a few centimeters of the
pillow margin, so differences in cooling rate
cannot account for the factor of two change in
paleofield estimate. The specimens do not exhibit
any indication for MD behavior, either in the MD-
checks (shown as squares in Figure 6) or in the
hysteresis loops (see Figure 7), so multi-domain
behavior is unlikely to be responsible for the
behavior shown in Figure 9b. Instead, because
of the very low blocking temperatures of the
pillow interiors and the high ambient temperatures
of the drill core at that depth, we suspect that the
pillow interiors in our transect are dominated by
viscous remanence and have no relationship to the
geomagnetic field at the time of formation. This is
a different mechanism than that inferred for the
zero age pillow studied by Carlut and Kent
[2002] who found a significant MD signature in
their results.
[30] In the following section we will present results
from the rest of the samples of submarine basaltic
glasses from HSDP2. These were obtained from
pillow rinds and from hyaloclastites from the
sampling levels shown in Figure 4.
4.2. Results
[31] Three to five specimens from each sampling
horizon from HSDP2 (see Figure 4) were pre-
pared for a Thellier-Thellier experiment. Small
glassy chips were broken from the sample, soaked
in dilute HCl and examined under the microscope
for evidence of alteration. Unaltered specimens
with magnetic moments of at least 0.1 nAm2 were
placed in non-magnetic glass tubes. These then
were subjected to the Thellier-Thellier experiment
as described before with the exception that not all
the experiments on glassy specimens included the
"High" Tmean = 30.4
σ = 7.7 "Low" Tmean = 41.1
σ = 8.5
"Paleofield strength" (mT)
Cum
ulativeDistributionFunction
Figure 11. Cumulative distribution function of low temperature (maximum unblocking temperature �200�C)estimates (thin line) and high temperature (maximum unblocking temperature �300�) estimates. The probability thatthe two distributions were drawn from the same population is �2 � 10�19.
GeochemistryGeophysicsGeosystems G3G3
tauxe and love: paleointensity in hsdp2 10.1029/2001GC000276
14 of 18

MD-checks. Examples of representative grade
‘‘A’’ results are shown in Figure 10. We list all
of the results from this study in appendix 4 of the
auxiliary material.
[32] Many specimens yielded Grade ‘‘A’’ results
with maximum blocking temperatures of 225�C or
less. We have argued that these paleointensity
estimates, while appearing to be of ‘‘high quality’’,
are actually dominated by viscous contamination.
In order to underscore the effect these low temper-
ature estimates would have on estimates of the
average geomagnetic field, we have calculated
paleointensity estimates for the components iso-
lated between 100 and 225�C as well. The grade
‘‘A’’ estimates calculated in this way have the
cumulative distribution function shown as the thin
line in Figure 11. The cumulative distribution
function of the grade ‘‘A’’ data having a maximum
blocking temperature of at least 300�C is shown as
the heavy line. These two data sets are significantly
different, based on a Kolmogorov-Smirnov test, at
well above the 99.9% level of confidence. There-
fore, in addition to the usual criteria, we have added
the criterion that the maximum blocking temper-
ature of acceptable results had to be at least 300�C.
a)
b)
Figure 12. Published data are as in Figure 1. New data meeting the minimum acceptance criteria are shown astriangles. (a) Data plotted on the age model shown in Figure 4. (b) A portion of the data from (a). Data from HSDP[Laj et al., 1999] and HSDP2 (this paper) plotted with an age model that is 35 kyr younger.
GeochemistryGeophysicsGeosystems G3G3
tauxe and love: paleointensity in hsdp2 10.1029/2001GC000276
15 of 18

Finally, we have calculated average paleointensity
data for sampling horizons that had at least three
specimens meeting our minimum criteria. These are
listed in appendix 5 in the auxiliary material. Those
samples having standard deviations of less than or
equal to 15% are plotted as triangles in Figure 12.
5. Discussion
[33] The new data shown in Figure 12 nearly
double the absolute paleointensity data available
for the early Brunhes that meet minimum selection
criteria. The magnetic anomaly inversion of Gee et
al. [2000] is shown as the thin line. It appears that
the new data are quite a bit higher than other data
from the same age, in particular, both the data from
HSDP2 (triangles) and HSDP (dots within circles
[Laj et al., 1999]) appear to be offset from the
relative paleointensity stack. In Figure 12b we
replot the HSDP and HSDP2 data using an age
model that is offset to younger ages by 35 kyr. This
offset brings the data into better agreement with the
relative paleointensity pattern, yet is consistent with
the age constraints available for HSDP2 (W. Sharp,
personal communication, 2002). Moreover, the cal-
ibration of the relative paleointensity data to
approximate VADM appears to be consistent with
our data. The data from the basalts from the sub-
aerial section (HSDP [Laj et al., 1999]) are much
higher than the calibrated anomaly inversion stack.
[34] Juarez and Tauxe [2000] compiled paleointen-
sity data spanning the last 5 million years and
concluded that the average dipole moment was
approximately 55 ZAm2. They excluded the period
of time 0–0.3 Ma from the average because they
suspected that the geomagnetic field was unusually
strong during that interval and the overwhelming
early Brunhesmean = 65.2 ZAm2
σ = 20.9N = 82
late Brunhesmean = 80.2 ZAm2
σ = 26.7N = 232
VADM (ZAm2)
Cum
ulativeDistributionFunction
Figure 13. Cumulative distribution function of data from the early Brunhes (heavy line) and the late Brunhes (thinline). The early Brunhes data are those from 0.4–0.78 Ma and the late Brunhes are from 0–0.4 Ma). The probabilitythat the two distributions were drawn from the same population is �4 � 10�8.
GeochemistryGeophysicsGeosystems G3G3
tauxe and love: paleointensity in hsdp2 10.1029/2001GC000276
16 of 18

majority of data points come from that period;
hence the average value would be heavily biassed
toward a potentially unusual field state. We see
from Figure 12a that, while there is no abrupt jump
from low to high values of the field during the
Brunhes, the latter half does appear to be stronger
on average than the early half. To quantify this, we
divide the data into ‘‘early Brunhes’’ (0.4–0.78 Ma)
and ‘‘late Brunhes’’ (0–0.4 Ma). Cumulative dis-
tribution functions for both data sets are shown in
Figure 13 illustrating that the two are indeed differ-
ent at above the 99.9% level of confidence. The late
Brunhes average is virtually identical to the present
field (�80 ZAm2) and the early Brunhes (65 ± 21
ZAm2) is compatible with the five million year
average of Juarez and Tauxe [2000].
6. Conclusions
[35] The data presented in this paper support the
following conclusions:
1. Submarine basaltic glass appears to give high
quality estimates of the ancient geomagnetic field
strength in the Hawaiian submarine section of the
HSDP2 drill core.
2. Submarine basalts from the hole appear to
give estimates that are too high and are contami-
nated by a strong viscous remanence acquired by
low blocking temperature magnetic phases sub-
jected to elevated temperatures over a significant
period of time. The submarine basalts from HSDP2
cannot be used for paleointensity studies.
3. The average paleointensity for Hawaii over
the time interval 420 to 550 ka is in broad
agreement with the calibrated relative paleointen-
sity records, but agreement improves significantly
by adjusting the age model to be younger by 35 kyr.
4. In order to estimate the average geomagnetic
field intensity, one must avoid sampling bias of
anomalous states of the geomagnetic field. The
preponderance of data from the latter half of the
Brunhes is a likely source of bias in average
paleofield estimates.
Acknowledgments
[36] We are indebted to Carlo Laj for original inspiration for
this work and help in sampling. We also would like to thank
Joe Kirschvink for help at CalTech, Jeff Gee, Julie Bowles,
Peter Selkin and Agnes Genevey for helpful discussions, and
Steve Didonna and Winter Miller for making most of the
measurements. Julie Carlut and two anonymous reviewers
made numerous constructive suggestions. This work was
partially supported by an NSF grant to LT.
References
Aitken, M., P. Alcock, B. G.D., and C. Shaw, Archaeomag-
netic determination of the past geomagnetic intensity using
ancient ceramics: Allowance for anisotropy, Archaeometry,
23, 53–64, 1981.
Bol’shakov, A., and V. Shcherbakova, A thermomagnetic cri-
terion for determining the domain structure of ferrimag-
netics, Izv. Phys. Solid Earth, 15, 111–117, 1979.
Carlut, J., and D. Kent, Paleointensity record in zero-age
submarine basalt glass: Testing a new dating technique for
recent MORBS, Earth Planet. Sci. Lett., 183, 389–401,
2002.
Coe, R. S., The determination of paleo-intensities of the
Earth’s magnetic field with emphasis on mechanisms which
could cause non-ideal behavior in Thellier’s method, J. Geo-
mag. Geoelectr., 19, 157–178, 1967.
Day, R., M. D. Fuller, and V. A. Schmidt, Hysteresis properties
of titanomagnetites: Grain size and composition dependence,
Phys. Earth Planet. Inter., 13, 260–266, 1977.
Depaolo, D. J., and E. M. Stolper, Models of Hawaiian Volca-
no growth and plume structure: Implications of results from
the Hawaii Scientific Drilling Project, J. Geophys. Res., 101,
11,643–11,654, 1996.
DePaolo, D., E. Stolper, and D. Thomas, Deep drilling into a
Hawaiian volcano, Eos. Trans. AGU, 82, 149, 2001.
Dodson, M., and E. McClelland-Brown, Magnetic blocking
temperatures of single-domain grains during slow cooling,
J. Geophys. Res., 85, 2625–2637, 1980.
Dunlop, D. J., and O. Ozdemir, Rock Magnetism: Fundamen-
tals and Frontiers, Cambridge Studies in Magnetism, Cam-
bridge Univ. Press, New York, 1994.
Dunlop, D. J., and S. Xu, Theory of partial thermoremanent
magnetization in multidomain grains, 1, Repeated identical
barriers to wall motion (single microcoercivity), J. Geophys.
Res., 99, 9005–9023, 1994.
Gee, J. S., and D. V. Kent, Magnetic hysteresis in young mid-
ocean ridge basalts: Dominant cubic anisotropy?, Geophys.
Res. Lett., 22, 551–554, 1995.
Gee, J., D. A. Schneider, and D. B. Kent, Marine magnetic
anomalies as recorders of geomagnetic intensity variations,
Earth Planet. Sci. Lett., 144, 327–335, 1996.
Gee, J., S. Cande, J. Hildebrand, K. Donnelly, and R. Parker,
Geomagnetic intensity variations over the past 780 kyr ob-
tained from near-seafloor magnetic anomalies, Nature, 408,
827–832, 2000.
Guyodo, Y., and J. P. Valet, Global changes in intensity of the
Earth’s magnetic field during the past 800 kyr, Nature, 399,
249–252, 1999.
Halgedahl, S., R. Day, and M. Fuller, The effect of cooling rate
on the intensity of weak-field TRM in single-domain mag-
netite, J. Geophys. Res., 95, 3690–3698, 1980.
GeochemistryGeophysicsGeosystems G3G3
tauxe and love: paleointensity in hsdp2 10.1029/2001GC000276
17 of 18

Joffe, I., and R. Heuberger, Hysteresis properties of distribu-
tions of cubic single-domain ferromagnetic particles, Philos.
Mag., 314, 1051–1059, 1974.
Juarez, M. T., and L. Tauxe, The intensity of the time averaged
geomagnetic field: The last 5 m.y., Earth Plent. Sci. Lett.,
175, 169–180, 2000.
Kent, D., S. Hemming, and B. Turrin, Laschamp excursion at
Mono Lake?, Earth Planet. Sci. Lett., 197, 151–164, 2002.
Kirschvink, The least-squares line and plane and the analysis
of paleomagnetic data, Geophys. J. R. Astron. Soc., 62, 699–
718, 1980.
Levi, S., The effect of magnetite particle size on paleointensity
determinations of the geomagnetic field, Phys. Earth Planet.
Int., 13, 245–259, 1977.
Nagata, T., Y. Arai, and K. Momose, Secular variation of the
geomagnetic total force during the last 5000 years, J. Geo-
phys. Res., 68, 5277–5282, 1963.
Perrin, M., E. Schnepp, and V. Shcherbakov, Paleointensity
database updated, EOS. Trans. AGU, 79, 198, 1998.
Pick, T., and L. Tauxe, Holocene paleointensities: Thellier
experiments on submarine basaltic glass from the East Paci-
fic Rise, J. Geophys. Res., 98, 17,949–17,964, 1993.
Pick, T., and L. Tauxe, Characteristics of magnetite in submar-
ine basaltic glass, Geophys. J. Int., 119, 116–128, 1994.
Pullaiah, G., E. Irving, K. Buchan, and D. Dunlop, Magnetiza-
tion changes caused by burial and uplift, Earth Planet. Sci.
Lett., 28, 133–143, 1975.
Riisager, P., and J. Riisager, Detecting multidomain magnetic
grains in Thellier paleointensity experiments, Phys. Earth
Planet. Int., 125, 111–117, 2001.
Selkin, P., and L. Tauxe, Long-term variations in paleointensity,
Philos. Trans. R. Astron. Soc., 358, 1065–1088, 2000.
Stoner, E. C., and E. P. Wohlfarth, A mechanism of magnetic
hysteresis in heterogeneous alloys, Philos. Trans. R. Soc.
London Ser. A, 240, 599–642, 1948.
Tauxe, L., Sedimentary records of relative paleointensity of the
geomagnetic field: Theory and practice, Rev. Geophys., 31,
319–354, 1993.
Tauxe, L., T. A. T. Mullender, and T. Pick, Potbellies, wasp-
waists, and superparamagnetism in magnetic hysteresis,
J.Geophys.Res., 101, 571–583, 1996.
Tauxe, L., H. Bertram, and C. Seberino, Physical interpretation
of hysteresis loops: Micromagnetic modelling of fine particle
magnetite, Geochem. Geophys. Geosyst., 3(10), 1055,
doi:10.1029/2001GC000241, 2002.
Thellier, E., and O. Thellier, Sur l’intensite du champ magne-
tique terrestre dans le passe historique et geologique, Ann.
Geophys., 15, 285–378, 1959.
Valet, J. P., and L. Meynadier, Geomagnetic field intensity and
reversals during the past four million years, Nature, 366,
234–238, 1993.
Walker, M., P. I. Mayo, K. O. Grady, S. W. Charles, and R. W.
Chantrell, The magnetic properties of single-domain parti-
cles with cubic anisotropy, 1, Hysteresis loops, J. Phys. Con-
dens. Matter, 5, 2779–2792, 1993.
Xu, W. X., D. R. Peacor, W. A. Dollase, R. VanDerVoo, and
R. Beaubouef, Transformation of titanomagnetite to titanoma-
ghemite: A slow, two-step, oxidation-ordering process in
MORB, Am. Mineral., 82, 1101–1110, 1997a.
Xu, W. X., R. Van der Voo, D. R. Peacor, and R. T. Beaubouef,
Alteration and dissolution of fine-grained magnetite and its
effects on magnetization of the ocean floor, Earth Planet.
Sci. Lett., 151, 279–288, 1997b.
Zhou, W., R. Van der Voo, and D. Peacor, Single-domain and
superparamagnetic titanomagnetite with variable Ti content
in young ocean floor basalts: No evidence for rapid altera-
tion, Earth Planet. Sci. Lett., 150, 353–362, 1997.
Zhou, W. M., D. R. Peacor, R. Van der Voo, and J. F. Mans-
field, Determination of lattice parameter, oxidation state, and
composition of individual titanomagnetite/titanomaghemite
grains by transmission electron microscopy, J. Geophys.
Res., 104, 17,689–17,702, 1999a.
Zhou, W. M., R. Van der Voo, and D. R. Peacor, Preservation
of pristine titanomagnetite in older ocean-floor basalts and its
significance for paleointensity studies, Geology, 27, 1043–
1046, 1999b.
GeochemistryGeophysicsGeosystems G3G3
tauxe and love: paleointensity in hsdp2 10.1029/2001GC000276
18 of 18