lntergrated Hydrological Monitoring and Forecasting System ...
Upload
khangminh22Category
view
1download
0
Trends and Sustainability of Groundwater in Highly Stressed Aquifers (Proc. of Symposium JS.2 at the Joint IAHS & IAH Convention, Hyderabad, India, September 2009). IAHS Publ. 329, 2009.
157
Hydrological investigations of surface water–groundwater interactions in a sub-catchment in the Namoi Valley, NSW, Australia ANDREW M. McCALLUM1, MARTIN S. ANDERSEN1, BRYCE F. J. KELLY2, BEATRICE GIAMBASTIANI2 & R. IAN ACWORTH1
1 Water Research Laboratory, School of Civil and Environmental Engineering, University of New South Wales, Australia [email protected]
2 School of Biological, Earth and Environmental Sciences, University of New South Wales, Australia Abstract In catchments with multiple inputs and outputs of water it can be difficult to reconcile why various reaches of a river are gaining or losing water. If rivers and adjacent aquifers are to be managed sustainably, while balancing environmental, economic and social goals, it is important that the link between the river and the aquifer is correctly characterised. This paper demonstrates how the joint analysis of rainfall, streamflow and borehole hydrograph data can contribute to elucidating the hydrological processes occurring in the catchment and hence understanding these links. In particular, the impact of the groundwater abstractions are examined by analysing the hydrological data over large time scales (decades) which span the pre- and post-irrigation development periods as well as short time scales (weeks) during pumping and flooding events. Key words surface water; groundwater; connectivity; losing and gaining rivers; catchment hydrology; correlation analysis INTRODUCTION
Management decisions concerning the allocation of water resources in environments where surface water and groundwater are linked are very difficult. Part of this difficulty lies in the lack of data and lack of knowledge about the processes controlling the exchange of water between aquifers and rivers. Without this data and process understanding it is impossible to adequately manage the qual-ity and quantity of groundwater resources, or to allocate it in a sustainable way. Conflicts between users and stress to the resource inevitably result (Winter et al., 1998; Fullagar et al., 2006). Various methods of investigating stream–aquifer interactions are discussed in the literature (e.g. Sophocleous 2002; Kalbus et al., 2006). Within the Namoi Valley itself, various approaches have been adopted, such as relating interactions to geomorphology (Braaten & Gates, 2003) and daily percentiles of streamflow and rainfall (Brodie et al., 2007). Other studies take a bigger picture approach, such as that by Ivokovic (2009) who utilised GIS, stream hydrograph and flow duration data in combination with nested piezometers and pairs of river and groundwater hydrographs to map gaining, losing and variably gaining-losing reaches within the valley. It is within this context of the necessity of good management practice in areas where surface water and groundwater are connected, and the variety of investigative methods available, that a research project is being undertaken to investigate the spatial and temporal variability in stream–aquifer interactions in a sub-catchment of the Namoi Valley. In this paper one aspect of this research is addressed. Comparison of river gauging stations on the Namoi River indicates that the river reach within the sub-catchment is predominantly losing water. However, the general groundwater gradient in the sub-catchment would lead one to expect that the reach should be gaining water. What possible mechanism is driving this apparent discrepancy has been investigated. CATCHMENT DESCRIPTION
Maules Creek catchment (surface area of approximately 1100 km2) is located in the semi-arid region of northwestern New South Wales, Australia, and is a sub-catchment of the much larger Namoi Valley (Fig. 1). The Namoi Valley has one of the highest groundwater abstraction levels in Australia (CSIRO, 2007) and has been the focus of a variety of research projects.
Copyright © 2009 IAHS Press

Andrew M. McCallum et al.
158
Fig. 1 Location of Maules Creek Catchment.
The hydrogeology of the region has been discussed by Gates (1980), Williams (1986), Lavitt (1999), Young et al. (2002) and McLean (2003). Their work is summarised below. The unconsolidated sediments in the region have been divided into two alluvial formations: the Narrabri Formation overlying the Gunnedah Formation. The Narrabri Formation consists of extensive overbank clays with some channel sands and gravel deposited by levied meandering streams. The clay dominated formation contains high-salinity, low yielding aquifers. The Gunnedah Formation consists of sands and gravel with interbedded clays deposited by braided streams. The sand and gravel dominated formation contains lower-salinity, high-yielding aquifers. This formation predominantly fills the older palaeochannels, with the highest yielding aquifers being in deep palaeochannels containing coarse sediments deposited by high energy streams. The alluvial and colluvial plains of the Maules Creek catchment are 200 to 250 m above sea level. To the north and east is the Nandewar Range, which has peaks rising to 1000 m in the immediate vicinity. The Namoi River runs south to north along the western side of the catchment and is gauged at Boggabri in the south and Turrawan in the north. The main tributary to the river is Maules Creek which has perennial flow at Elfin Crossing and ephemeral flow higher in the catchment and at the junction with the Namoi River. Within the catchment, below and to the east of the Namoi River is a large (approx. 4 km wide and over 100 m deep) palaeochannel filled with clay, sands and gravels. Groundwater from the sand and gravel units within this palaeochannel is abstracted predominantly for flood irrigation farming of cotton, sorghum and wheat on the alluvial flood plains, as well as minor abstractions for stock and domestic use. Some surface water is also diverted for irrigation purposes. METHODOLOGY
Three sets of existing data were analysed: rainfall (4 locations), streamflow (2 locations) and borehole hydrographs (53 piezometers), obtained from the Bureau of Meteorology, State Water and the Department of Water and Energy, NSW (refer to Fig. 2 for locations). The rainfall data spanned a period of 80 years from 1928 to 2007. The streamflow and borehole hydrograph data spanned the period 1973 to 2007. This period was subdivided into “Predevelopment” (1973–1984) and “Post-development” (1985–2007), reflecting the onset of groundwater pumping within the catchment. The demarcation between these two periods was identified by looking for the reflection of seasonal groundwater pumping in the groundwater hydrographs.

Hydrological investigations of surface water–groundwater interactions in a sub-catchment in Australia
159
Fig. 2 Maules Creek Catchment and location of recording points for rainfall, streamflow and groundwater data used in the analysis.
The rainfall data was first analysed for basic statistics (sample size, mean, median, minimum, maximum, standard deviation and variance). Next the data was plotted in terms of the Cumulative Rainfall Departure (CRD). The CRD is a concept used to characterise rainfall trends. It is calculated by determining the mean of the rainfall for the period in question, subtracting the mean from each data point to determine the departure from the mean, and accumulating the resulting departures (Weber & Stewart, 2004). Streamflow data were also analysed for the same basic statistics as the rainfall data set, considering the pre-development and post-development periods. For each period the Flow Duration Curve (FDC) of the two gauging stations was also created. The FDC is a plot of streamflow (log scale) vs the percentage of time the flow is exceeded. The slope of the curve (computed between 20 and 80%) was calculated for each gauging station for the pre-development and post-development periods. Unregulated streams that receive a significant input from baseflow will have significant periods of time with low flow conditions and therefore the slope of the FDC curve will be flatter. Conversely, a steep slope indicates a variable and/or low baseflow condition (Ivokovic, 2009). In regulated streams, the FDC curve will also reflect the effects of flow due to the pattern of water release into the stream. The streamflow data was also used to investigate the losses from, and gains to, the river. The daily difference between flows at Turrawan and Boggabri (normalised by dividing by the flow at Boggabri) was computed on a daily basis. This data was then smoothed by taking the median from a 90-day filtering window. The resulting plot shows periods when more water left the catchment than entered (i.e. positive results, indicating gaining periods) and periods when less water left the catchment (i.e. negative results, indicating losing periods). For each monitoring borehole hydrograph, for both Pre-development and Post-development periods, the slope of the groundwater level trend was determined by linear regression. This slope corresponds to the average change in hydraulic head for the period under consideration. In turn these values were then plotted in plan view to show the spatial distribution of head change. The final analysis undertaken on the existing data sets was the correlation between the rainfall data and the groundwater levels. The correlation between the CRD and borehole hydrographs for the pre- and post-development periods was implemented using Matlab.
Andrew M. McCallum et al.
160
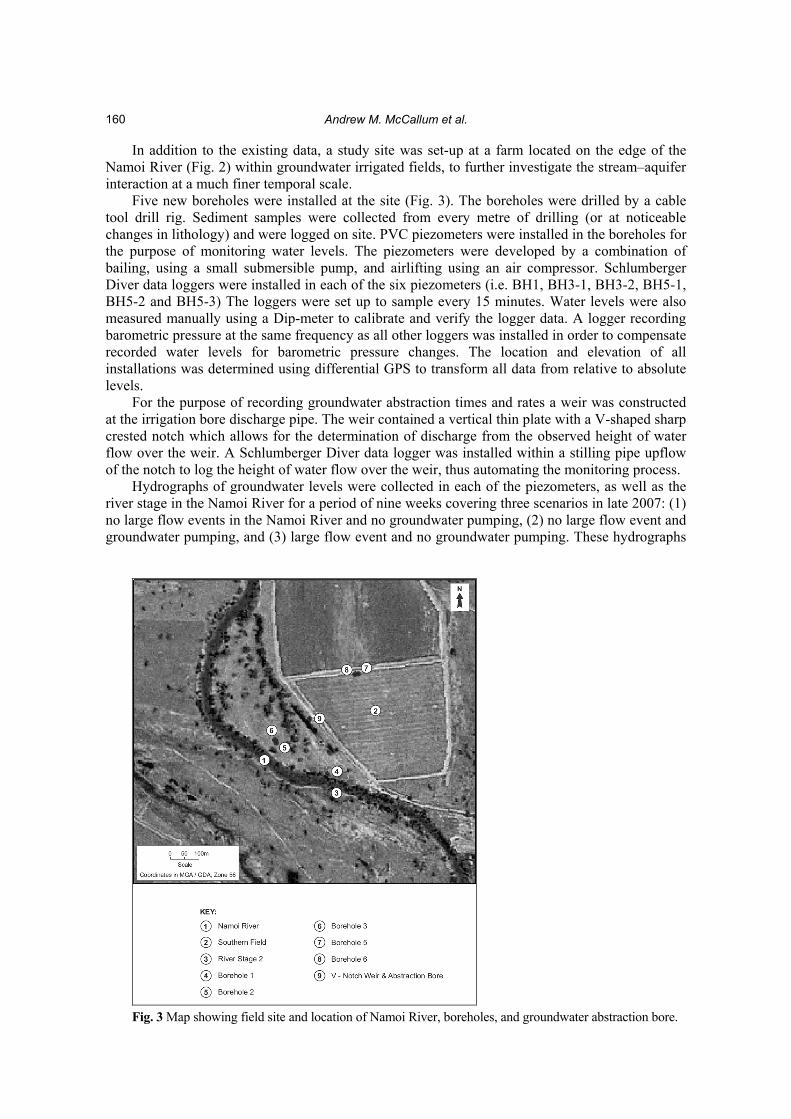
In addition to the existing data, a study site was set-up at a farm located on the edge of the Namoi River (Fig. 2) within groundwater irrigated fields, to further investigate the stream–aquifer interaction at a much finer temporal scale. Five new boreholes were installed at the site (Fig. 3). The boreholes were drilled by a cable tool drill rig. Sediment samples were collected from every metre of drilling (or at noticeable changes in lithology) and were logged on site. PVC piezometers were installed in the boreholes for the purpose of monitoring water levels. The piezometers were developed by a combination of bailing, using a small submersible pump, and airlifting using an air compressor. Schlumberger Diver data loggers were installed in each of the six piezometers (i.e. BH1, BH3-1, BH3-2, BH5-1, BH5-2 and BH5-3) The loggers were set up to sample every 15 minutes. Water levels were also measured manually using a Dip-meter to calibrate and verify the logger data. A logger recording barometric pressure at the same frequency as all other loggers was installed in order to compensate recorded water levels for barometric pressure changes. The location and elevation of all installations was determined using differential GPS to transform all data from relative to absolute levels. For the purpose of recording groundwater abstraction times and rates a weir was constructed at the irrigation bore discharge pipe. The weir contained a vertical thin plate with a V-shaped sharp crested notch which allows for the determination of discharge from the observed height of water flow over the weir. A Schlumberger Diver data logger was installed within a stilling pipe upflow of the notch to log the height of water flow over the weir, thus automating the monitoring process. Hydrographs of groundwater levels were collected in each of the piezometers, as well as the river stage in the Namoi River for a period of nine weeks covering three scenarios in late 2007: (1) no large flow events in the Namoi River and no groundwater pumping, (2) no large flow event and groundwater pumping, and (3) large flow event and no groundwater pumping. These hydrographs
Fig. 3 Map showing field site and location of Namoi River, boreholes, and groundwater abstraction bore.
Hydrological investigations of surface water–groundwater interactions in a sub-catchment in Australia
161
were used to calculate the difference in hydraulic head between the river and aquifer, thus showing the potential for gaining and losing conditions. RESULTS AND DISCUSSION
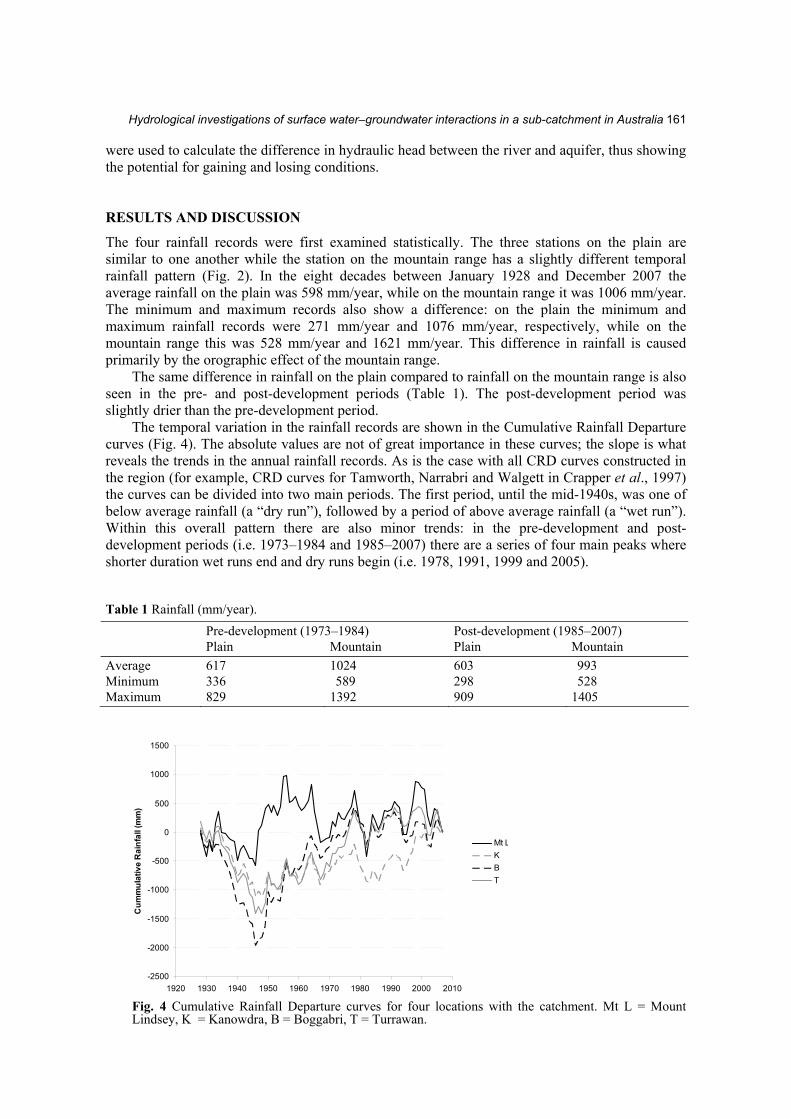
The four rainfall records were first examined statistically. The three stations on the plain are similar to one another while the station on the mountain range has a slightly different temporal rainfall pattern (Fig. 2). In the eight decades between January 1928 and December 2007 the average rainfall on the plain was 598 mm/year, while on the mountain range it was 1006 mm/year. The minimum and maximum records also show a difference: on the plain the minimum and maximum rainfall records were 271 mm/year and 1076 mm/year, respectively, while on the mountain range this was 528 mm/year and 1621 mm/year. This difference in rainfall is caused primarily by the orographic effect of the mountain range. The same difference in rainfall on the plain compared to rainfall on the mountain range is also seen in the pre- and post-development periods (Table 1). The post-development period was slightly drier than the pre-development period. The temporal variation in the rainfall records are shown in the Cumulative Rainfall Departure curves (Fig. 4). The absolute values are not of great importance in these curves; the slope is what reveals the trends in the annual rainfall records. As is the case with all CRD curves constructed in the region (for example, CRD curves for Tamworth, Narrabri and Walgett in Crapper et al., 1997) the curves can be divided into two main periods. The first period, until the mid-1940s, was one of below average rainfall (a “dry run”), followed by a period of above average rainfall (a “wet run”). Within this overall pattern there are also minor trends: in the pre-development and post-development periods (i.e. 1973–1984 and 1985–2007) there are a series of four main peaks where shorter duration wet runs end and dry runs begin (i.e. 1978, 1991, 1999 and 2005). Table 1 Rainfall (mm/year). Pre-development (1973–1984) Post-development (1985–2007) Plain Mountain Plain Mountain Average 617 1024 603 993 Minimum 336 589 298 528 Maximum 829 1392 909 1405
-2500
-2000
-1500
-1000
-500
0
500
1000
1500
1920 1930 1940 1950 1960 1970 1980 1990 2000 2010
Cum
mul
ativ
e R
ainf
all (
mm
)
Mt LKBT
Fig. 4 Cumulative Rainfall Departure curves for four locations with the catchment. Mt L = Mount Lindsey, K = Kanowdra, B = Boggabri, T = Turrawan.

Andrew M. McCallum et al.
162
During the pre-development period the average streamflow at Boggabri and Turrawan stream gauging stations were 2657 ML/day and 2434 ML/day respectively. During the post-development period these figures reduced to 1653 ML/day and 1555 ML/day. These reductions in average daily flow are due to changes further up the Namoi Valley which has caused an overall reduction in streamflow in the Namoi River within the Maules Creek catchment. The slopes of the FDC curves (calculated between 20 and 80%) at Boggabri and Turrawan were –74 and –77 for the pre-development period. During the post-development period both had slopes of –45. Again, this reflects changes further up the Namoi Valley which caused the reach of the Namoi River within the Maules Creek catchment to have a more evenly distributed flow regime. Figure 5 shows the trend in gaining/losing situations over time. Between the early 1970s and the late 1980s, generally more water discharged (typically up to 20% more) at Turrawan than entered at Boggabri. This must be due to contributions to the streamflow from the aquifer as baseflow or from catchment surface water runoff. It is likely that during this pre-development period there was more reliance on surface water diversions for farming within the catchment. Without these diversions the percentage of water leaving the catchment would be even higher. In the post-development period the general trend is reversed. This could possibly be due to interception of potential baseflow by groundwater abstraction wells, induced recharge from the river due to lowered hydraulic heads in the aquifer, and reduced runoff due to changes in land management.
-1
-0.8
-0.6
-0.4
-0.2
0
0.2
0.4
0.6
0.8
1
1970 1975 1980 1985 1990 1995 2000 2005 2010
Nor
mal
ised
and
Filt
ered
Flo
w D
iffer
ence
Fig. 5 Flow difference between Turrawan and Boggabri gauging stations. Positive values indicate more water entering the catchment at Boggabri than leaving at Turrawan, and vice versa. The missing portion of the curve from the late 1980s to the mid 1990s is due to lack of available data at one or both gauging stations during this period.
A contrast between pre-development and post-development periods is also seen in the groundwater hydrograph data. In the pre-development period the average groundwater head decline was 0.08 m/year, and ranged from –0.04 (i.e. head rise) to 0.22 m/year. In the post-development period the decline increased to 0.2 m/year, and ranged from 0.01 to 0.48 m/year. Figure 6 shows the spatial distribution of the rate of decline. The post-development pattern of drawdown appears to follow the geology with the greatest drawdown located within the palaeochannel located beneath and to the east of the Namoi River. This palaeochannel, being the main aquifer, is also the location of the majority of irrigation abstraction wells. The palaeochannel contains sediments of higher conductivity and groundwater levels therefore respond rapidly to abstraction.

Hydrological investigations of surface water–groundwater interactions in a sub-catchment in Australia
163
Maules
Creek
500 m
N
Pre development rates of decline
Maules
Creek
500 m
N
Post development rates of decline
Fig. 6 Average decline in hydraulic head per year for the pre-development and post-development periods.
Maules
Creek
500 m
N
Pre development correlations
Maules
Creek
500 m
N
Post development correlations
Fig. 7 Correlation between rainfall CRD and groundwater standing water levels.
When plotted against the CRD curves, it is evident that groundwater head levels are related to rainfall, with the peaks in the CRD curves (i.e. 1978, 1991, 1999 and 2005) roughly corresponding to peaks in the groundwater levels. This is not surprising as there is a connection between rainfall and groundwater heads via recharge.

Andrew M. McCallum et al.
164
To explore this further it is possible to do correlation analyses. In the pre-development period there was very good correlation between rainfall and groundwater levels, as shown on the left in Fig. 7. Overall the degree of correlation is reduced during the post-development period (on the right in Fig. 7) indicating that there is an additional influence on the groundwater system during this period, most likely groundwater abstraction for irrigation purposes. More sophisticated analyses would consider the correlation at various lags, but that has not been undertaken here where the purpose is to simply show how well the rainfall and groundwater data sets are correlated pre- and post-development. In addition to conclusions being drawn from the existing rainfall, streamflow and groundwater head data, it is also possible to gain insight into processes occurring in the catchment from the data collected at the field site. From the drilling logs, the site geology essentially consists of a low conductivity unit of less than 10 m thickness, which is not water-bearing (mainly silt and clay soils with some clayey sand and clayey gravel layers) overlying a unit of alluvial sediments of about 40 m thickness which is water-bearing (sands, gravels, and cobbles with some clayey layers) overlying the bedrock unit. Figure 8 shows the hydrographs for the Namoi River, BH1 (situated within the upper unit) and BH3-1 (situated in the alluvial unit) for a 9-week period. Also shown are the three periods when groundwater abstraction was occurring in the nearby pumping well. During the seventh week a large flow event occurred in the Namoi River.
218.0
219.0
220.0
221.0
222.0
223.0
26/10 9/11 23/11 7/12 21/12
Wat
er L
evel
Ele
vatio
n (m
AH
D)
0
2
4
6
8
10
12
14
16
18
20
Pum
p Fl
ow R
ate
(l/s)
RiverBH1BH3-1Pump
Fig. 8 Hydrographs for the River, BH1 and BH3-1 for a 9-week period in 2007.
-4
-3
-2
-1
0
1
26/10 9/11 23/11 7/12 21/12
Hea
d D
iffer
ence
(m)
0
2
4
6
8
10
12
14
16
18
20
Pum
p Fl
ow R
ate
(l/s)
River - BH1River - BH3-1Pump
Fig. 9 Head difference between River and BH1 and BH3-1 for a 9-week period in 2007, where a positive head difference indicates a possible gaining reach and a negative head difference a losing reach.

Hydrological investigations of surface water–groundwater interactions in a sub-catchment in Australia
165
In Fig. 9 this same data has been plotted as differences in hydraulic head between the river and the groundwater piezometers. In this plot a positive head difference indicates that there is potential for flow from the aquifer to the river (i.e. gaining conditions) and a negative head difference indicates the reverse (i.e. losing conditions). It should be noted that this plot only shows the magnitude and direction of the head difference and not the actual magnitude of flux. From Fig. 9 it can be concluded that typically neutral or slightly gaining conditions are the norm, but that under large flow and irrigation events losing conditions prevail. It is probable that this pattern is applicable to other sites along the Namoi River. However, caution should be exercised in drawing general conclusions from this data. It should be expected that the alluvial sediments along the river are heterogeneous with variable hydraulic properties. This makes it impossible to up-scale measurements at one location to the entire river reach. The results can only be used as indicative of what could be occurring within the catchment. In the rainfall, streamflow and groundwater head data, there is a contrast between the pre-development period of 1973 to 1984 and the post-development period of 1985 to 2007. In the case of rainfall, the post-development period was slightly drier. Average streamflows in the Namoi River declined and became more uniform with less extreme events in the post-development period compared to the pre-development period. Also, the overall water balance of streamflow entering at Boggabri and leaving at Turrawan changed markedly between the two periods. An additional stress was added to the groundwater system in the post-development period in the form of groundwater abstraction for irrigation. The groundwater head data show that the rate of decline is much greater during the post-development period. As the correlation coefficients between the rainfall data and groundwater levels reduced overall between the pre- and post-development periods, this increased rate of groundwater decline cannot be explained solely in terms of the slightly drier climate during the post-development period. Data collected from the field site over a 9-week period provide a closer look at what is occurring. The stream–aquifer system appears to be finely balanced. During non-pumping times the Namoi River within the catchment is a neutral or slightly gaining reach. However, during pumping periods the river becomes a losing reach. This mechanism could be applicable to the pre-development and post-development periods. Pre-development the river would thus be mostly neutral or slightly gaining, whereas post-development the river would be affected by substantial periods of losing conditions. The general groundwater gradient in the catchment is from east to west (from the Nandewar range to the Namoi River) which would lead one to expect that the river should be gaining water by baseflow. However, it appears that much of this baseflow is now captured by groundwater abstraction from the palaeochannel to the east of the river. As a consequence this anthropogenic influence has caused the Namoi River in the Maules Creek catchment to lose more. In that case the groundwater abstraction is not only removing water from aquifer storage, but is also changing the stream–aquifer interaction balance and streamflow patterns in the river. This reinforces the conclusions made by previous researchers in the catchment (Andersen & Acworth 2007; Andersen et al., 2008). The conclusions reached in this study are basically of a qualitative nature. A more quantitative assessment should be undertaken to demonstrate the magnitude of this impact more thoroughly. To do this, further data would be required such as spatial and temporal data on groundwater abstraction and streamflow diversion quantities. Further, as the Namoi River is regulated information about the timing of controlled dam releases would also be helpful in interpreting the streamflow data. CONCLUSION
The analysis of rainfall, streamflow and groundwater head data, in combination with higher resolution data from a field site, demonstrate that abstraction of groundwater for irrigation purposes is having a significant impact on the groundwater system itself, and how it is connected to the Namoi River. In particular, the abstraction of groundwater for irrigation has altered the
Andrew M. McCallum et al.
166
groundwater gradients such that, while one would expect the Namoi River reach in the Maules Creek catchment should be gaining water by baseflow, the river has lost more water with time. These conclusions have been made using a variety of simple analyses. These analyses are indicative only and do not quantify the actual changes in flux which have occurred. As a consequence the long-term impacts are currently unknown. The analysis should be taken to the next level of quantification as this will help to better unravel the surface and groundwater links within the catchment. It will also allow for better management decisions concerning the allocation of water resources. When the development of the groundwater resource approaches or exceeds the limits of sustainability as appears to be the case for this catchment, the need for further analysis and better management is imperative. Acknowledgements This study was funded largely by the Cotton Catchment Community CRC. Ken and Sue Crawford of Gowrie farm in Boggabri provided accommodation, meals and stimulating conversation while the field study was undertaken. REFERENCES Andersen, M. S. & Acworth, R. I. (2007) Hydrochemical investigations of surface water groundwater interactions in a sub-
catchment in the Namoi Valley, NSW, Australia. In: Groundwater and Ecosystems (ed. by L. Ribeiro, A. Chambel & M. T. Condesso de Melo). Proceedings of the XXXV IAH Congress, Lisbon. September, 2007.
Andersen, M. S., Meredith, K., Timms, W. & Acworth, R. I. (2008) Investigation of δ18O and δ2H in the Namoi River catchment – elucidating recharge sources and the extent of surface water/groundwater interaction. In: XXXVI IAH Congress (Toyama, Japan 26 October–1 November 2008).
Braaten, R. & Gates, G. (2003) Groundwater–surface water interaction in inland New South Wales, a scoping study. Water Sci. Technol. 48(7), 215–224.
Brodie, R. S., Hostetler, S. & Slatter, E.. (2007) Comparison of daily percentiles of streamflow and rainfall to investigate stream-aquifer connectivity. J. Hydrol. 349, 56–67.
Crapper, P. F., Beavis, S. G. & Zhang, L. (1997) Climate and Hydrology in the Namoi Catchment. International Congress on Modelling and Simulation Proceedings, Volume 1, December 1997, Hobart, 300–305.
CSIRO (2007) Water availability in the Namoi – A report to the Australian Government from the CSIRO Murray-Darling Basin Sustainable Yields Project. CSIRO: 168 pp. (Available from http://www.csiro.au/files/files/phzr.pdf, Access verified 20 Feb. 2009).
Fullagar, I., Brodie, R., Sundaram, B., Hostetler, S. & Baker, P. (2006) Managing Connected Surface Water and Groundwater Resources. Bureau of Rural Sciences, Canberra, Australia. www.brs.gov.au.
Gates, G. W. B. (1980), The hydrogeology of the unconsolidated sediments in the Mooki Valley, New South Wales. MSc Thesis, The University of New South Wales, Australia.
Ivkovic, K. M. (2009) A top-down approach to characterise aquifer–river interaction processes. J. Hydrol. 365, 145–155. Kalbus, E., Reinstorf, F. & Schirmer, M.. (2006) Measuring methods for groundwater–surface water interactions: a review.
Hydrol. Earth System Sci. 10(6), 873–887. Lavitt, N. (1999) Integrated approach to geology, hydrogeology and hydrochemistry in the Lower Mooki River Catchment.
PhD Thesis, The University of New South Wales, Australia. McLean, W. (2003) Hydrogeochemical evolution and variability in a stressed alluvial aquifer system: Lower Namoi River
Catchment, NSW. PhD Thesis, School of Biological, Earth and Environmental Science, University of New South Wales, Australia.
NSWDMR (2002) Geology – Integration and upgrade; NSW Western Regional Assessments – Brigalow Belt South Bioregion (Stage 2). NSW Department of Mineral Resources, Geological Survey of New South Wales: 156 pp.
Sophocleous, M. (2002) Interactions between groundwater and surface water: the state of the science. Hydrogeol. J. 10, 52–67. Webber, K. & Stewart M. (2004), A critical analysis of the cumulative rainfall departure concept. Ground Water 42(6/7),
935–938. William, R. M. (1986), The Cainozoic geology, hydrogeology and hydrochemistry of the unconsolidated sediments associated
with the Namoi River in the Lower Namoi valley, NSW. Department of Water Resources, Hydrogeology Report 1986/4. Winter, T. C., Harvey, J. W., Franke, O. L. & Alley, W. M. (1998) Ground water and surface water: a single resource. USGS
Circular 1139, Denver, Colorado, USA. Young, R. W., Young, A. R. M., Price, D. M. & Wray, R. A. L. (2002) Geomorphology of the Namoi alluvial plain,
northwestern New South Wales. Australian J. Earth Sci. 49, 509–523.
Copyright © 2022 FDOKUMEN