Delineation of groundwater potential zones and electrical resistivity studies for groundwater...
14
Hydrological Sciences–Journal–des Sciences Hydrologiques, 48(5) October 2003 Open for discussion until 1 April 2004 821 Delineation of groundwater potential zones and zones of groundwater quality suitable for domestic purposes using remote sensing and GIS Y. SRINIVASA RAO Department of Geology, Sri Venkateswara University, Tirupati 517 502, Andhra Pradesh, India [email protected] D. K. JUGRAN Geoscience Division, Indian Institute of Remote Sensing, 4 Kalidas Road, Dehradun 248 001, Uttaranchal State, India Abstract The exploration for groundwater in hard rock terrains is a complex task. To overcome this complexity, the integrated approach based on advanced applications of remote sensing and geographical information systems (GIS) lends itself as an efficient and effective result-oriented method for studying the development and management of water resources. Chittoor area, comprised of a hard rock terrain, is located in the drought-prone Rayalaseema region of Andhra Pradesh, India. Using remote sensing and GIS technology, groundwater potential zones, along with zones of water quality suitable for domestic purposes, were delineated and classified. Results indicated that, for the town of Chittoor, 1.64% of the area was classified to have very high groundwater poten- tial, with groundwater quality suitable or moderately suitable for domestic purposes; and 31.68% of the area was classified as high potential, with over 31% being suitable or moderately suitable. Most (62.05%) of the area is of moderate groundwater potential, with groundwater quality mostly suitable or moderately suitable for domestic purposes. Key words groundwater potential zones; groundwater quality; remote sensing; GIS; Andhra Pradesh, India Délimitation par télédétection et SIG de zones où l’eau souterraine est exploitable à des fins d’alimentation domestique Résumé La recherche d’eaux souterraines dans des sites à roches dures est une tâche complexe. Face à cette complexité, l’approche intégrée basée sur des applications avancées de télédétection et de système d’information géographique (SIG) permet de proposer une méthode efficace et efficiente pour étudier le développement et la gestion des ressources en eau. La zone de Chittoor, présentant un substrat de roches dures, se situe dans la région sensible aux sécheresses de Rayalaseema en Andhra Pradesh, en Inde. Les zones de potentiel en eaux souterraines ainsi que les zones où la qualité d’eau est compatible avec les usages domestiques ont été délimitées et classifiées en utilisant la télédétection et la technologie SIG. Les résultats indiquent que, pour la ville de Chittoor, un peu moins de 2% de la zone ont été classifiés avec un très fort potentiel en eaux souterraines, bien que moins de 1% seulement soit valable ou presque valable pour les usages domestiques; et que 31.68% de la zone aient été classifiés avec un fort potentiel, avec plus de 31% valables ou presque valables. La plupart (62.05%) de la zone présente un potentiel en eaux souterraines modéré, avec une qualité d’eau essentiellement valable et modérément valable pour les usages domestiques. Mots clefs zones de potentiel en eaux souterraines; qualité d’eaux souterraines; télédétection; SIG; Andhra Pradesh, Inde INTRODUCTION Increasing population and modern industrial and agricultural activities are not only creating more demand for groundwater resources due to the inadequate availability of surface water resources, but are also polluting groundwater resources by releasing
-
Upload
independent -
Category
Documents
-
view
1 -
download
0
Transcript of Delineation of groundwater potential zones and electrical resistivity studies for groundwater...
Hydrological Sciences–Journal–des Sciences Hydrologiques, 48(5) October 2003
Open for discussion until 1 April 2004
821
Delineation of groundwater potential zones and zones of groundwater quality suitable for domestic purposes using remote sensing and GIS
Y. SRINIVASA RAO Department of Geology, Sri Venkateswara University, Tirupati 517 502, Andhra Pradesh, India [email protected]
D. K. JUGRAN Geoscience Division, Indian Institute of Remote Sensing, 4 Kalidas Road, Dehradun 248 001, Uttaranchal State, India
Abstract The exploration for groundwater in hard rock terrains is a complex task. To overcome this complexity, the integrated approach based on advanced applications of remote sensing and geographical information systems (GIS) lends itself as an efficient and effective result-oriented method for studying the development and management of water resources. Chittoor area, comprised of a hard rock terrain, is located in the drought-prone Rayalaseema region of Andhra Pradesh, India. Using remote sensing and GIS technology, groundwater potential zones, along with zones of water quality suitable for domestic purposes, were delineated and classified. Results indicated that, for the town of Chittoor, 1.64% of the area was classified to have very high groundwater poten-tial, with groundwater quality suitable or moderately suitable for domestic purposes; and 31.68% of the area was classified as high potential, with over 31% being suitable or moderately suitable. Most (62.05%) of the area is of moderate groundwater potential, with groundwater quality mostly suitable or moderately suitable for domestic purposes. Key words groundwater potential zones; groundwater quality; remote sensing; GIS; Andhra Pradesh, India
Délimitation par télédétection et SIG de zones où l’eau souterraine est exploitable à des fins d’alimentation domestique Résumé La recherche d’eaux souterraines dans des sites à roches dures est une tâche complexe. Face à cette complexité, l’approche intégrée basée sur des applications avancées de télédétection et de système d’information géographique (SIG) permet de proposer une méthode efficace et efficiente pour étudier le développement et la gestion des ressources en eau. La zone de Chittoor, présentant un substrat de roches dures, se situe dans la région sensible aux sécheresses de Rayalaseema en Andhra Pradesh, en Inde. Les zones de potentiel en eaux souterraines ainsi que les zones où la qualité d’eau est compatible avec les usages domestiques ont été délimitées et classifiées en utilisant la télédétection et la technologie SIG. Les résultats indiquent que, pour la ville de Chittoor, un peu moins de 2% de la zone ont été classifiés avec un très fort potentiel en eaux souterraines, bien que moins de 1% seulement soit valable ou presque valable pour les usages domestiques; et que 31.68% de la zone aient été classifiés avec un fort potentiel, avec plus de 31% valables ou presque valables. La plupart (62.05%) de la zone présente un potentiel en eaux souterraines modéré, avec une qualité d’eau essentiellement valable et modérément valable pour les usages domestiques. Mots clefs zones de potentiel en eaux souterraines; qualité d’eaux souterraines; télédétection; SIG; Andhra Pradesh, Inde
INTRODUCTION
Increasing population and modern industrial and agricultural activities are not only creating more demand for groundwater resources due to the inadequate availability of surface water resources, but are also polluting groundwater resources by releasing
Y. Srinivasa Rao & D. K. Jugran 822
untreated wastes. Consequently, these activities have resulted in an increase of research, not only with regard to groundwater resources, but also with an emphasis on locating groundwater of good quality for human consumption. Integrated studies using conventional surveys along with satellite image data interpretation techniques, and geographical information systems (GIS) technology, are useful, not only to increase the accuracy of results, but also to reduce the bias on any single theme. Karanth & Seshu babu (1978), Moore (1978), Raju et al. (1985), Palanivel et al. (1996), Sree devi et al (2001) and Sankar (2002) applied remote sensing techniques in the delineation of groundwater potential zones. Many researchers (Saraf & Jain, 1994; Krishnamurthy & Srinivas, 1995; Kamaraju et al, 1996; Krishnamurthy et al., 1996; Khan Subhan & Asif Mohd, 1997; Ravindran, 1997; Saraf & Choudary, 1998; Ashok Kumar, 1999; Krishnamurthy et al, 2000; Murthy, 2000; Srivastava & Bhattacharya, 2000; Shahid et al., 2000; Khan & Moharana, 2002) have applied remote sensing techniques and GIS applications in delineation studies of groundwater resources and potential zones. Saraf et al. (1994) used GIS technology for processing and interpretation of groundwater quality data. The study area Chittoor lies between 13°10′00′′–13°15′00′′Ν and 79°04′00′′–79°09′00′′E with an area of 83.7 km2 (Fig. 1). It lies in the drought-prone and econo-mically backward Rayalaseema region of Andhra Pradesh, India. The ephemeral Niva River flows through the centre of the study area. The drainage pattern is dendritic to sub-dendritic. Geologically, the study area is underlain by unnamed granitic gneisses of Archaean age. A sugar factory, distillery, dairy, and an industrial estate are present in the study area. All of these prevailing natural and anthropogenic conditions are in turn reflected in the hydrological and groundwater quality conditions of the area. In some places, groundwater availability is a problem, while at others, where ground-water is available, its quality is questionable. This study was undertaken to delineate both groundwater potential zones and zones of groundwater quality suitable for domestic purposes in the Chittoor area, using remote sensing techniques and the application of GIS technology.
DATA USED AND METHODOLOGY
Survey of India (SOI) topographic sheet (no. 57 O/4, 1:50 000) was used to prepare base, contour, drainage and slope percent maps. Remotely sensed image data from IRS ID (LISS III) (false colour composite (FCC) of bands 321 (rgb), acquired January 1998) and Landsat 5 TM (Thematic Mapper) (false colour composite (FCC) of bands 457 (rgb), acquired February 1989) were visually interpreted for tone, texture, size, shape, relief, drainage pattern, vegetation association, and other factors. Field studies were conducted and corrections were made accordingly to maps of geology, lineaments, and hydromorphogeology. Well inventory, well yield, water table level, and groundwater samples were collected during field study. The locations of the collected groundwater samples are shown in Fig. 1. The groundwater samples were analysed for various ions (AWWA, 1950; Rainwater & Thatcher, 1960; Brown et al., 1973) and interpreted using standard methods (WHO, 1984; ISI, 1983).
Using Integrated Land and Water Information System (ILWIS) software, thematic maps of slope percent, geology and lineament, hydromorphogeology, water-table, iso-yield, iso-weathered zone thickness, lineament distance, drainage channel distance,

Delineation of groundwater potential zones and zones of suitable groundwater quality 823
Fig. 1 Location map of Chittoor area, Chittoor district, Andhra Pradesh, India.
tank distance, and groundwater quality maps of Total Dissolved Solids (TDS), Total Hardness (TH), incrustation problem, and magnesium concentration were prepared and classified for spatial analysis. Lineament distance, drainage distance, and tank distance maps were prepared by considering the well yield vs distance from lineament, drainage channel and tank, respectively (i.e. as the distance from lineament/drainage channel/ tank increases the well yield decreases). Different classes in each thematic map were assigned a knowledge-based hierarchy of weights. For groundwater potential, these weights ranged from 1 to 7. For groundwater quality and suitability of use, the weights ranged from 1 to 4, according to World Health Organization (WHO) and Indian Standards Institution (ISI) guidelines. In each thematic map, highest weight is given to the class that is most favourable, either to potential, or to quality and suitability of use, and lowest weight is given to the class

Fig. 2 Flow chart of methodology used in the study.
Classification of groundwater potential zones Classification of groundwater quality suitable for domestic purposes
(c) Fieldwork & groundwater sample collectionWell inventory; well yield data; water table levels
Contour map Drainage map
Slope percent Drainage distance map Tank distance map
Geology & lineament hydromorphogeology map
Lineament distance map
Weathered zone thickness map Iso-yield map Water table contour map
(d) Laboratory workTotal dissolved solids Total hardness Incrustation problem Magnesium concentration
(a) Topographic Map Survey of India: 57 O/4
(b) Remote sensing dataFCC –Landsat 5 FCC – IRS 1D (LISS III)
Classification of groundwater potential and groundwater quality suitable for domestic purposes
824 Y. Srinivasa R
ao & D
. K. Jugran
Delineation of groundwater potential zones and zones of suitable groundwater quality 825
that is least favourable. All the thematic maps related to groundwater potential zones were integrated and classified depending on the added weight factors determined in the analysis. In the same way, all thematic maps of groundwater quality were also integrated and classified. Finally, by integrating the groundwater potential zone classes with the groundwater quality and suitability classes, areas of both groundwater poten-tial and groundwater quality and suitability were delineated. The processing flow chart of methodology is shown in Fig. 2.
RESULTS AND DISCUSSION
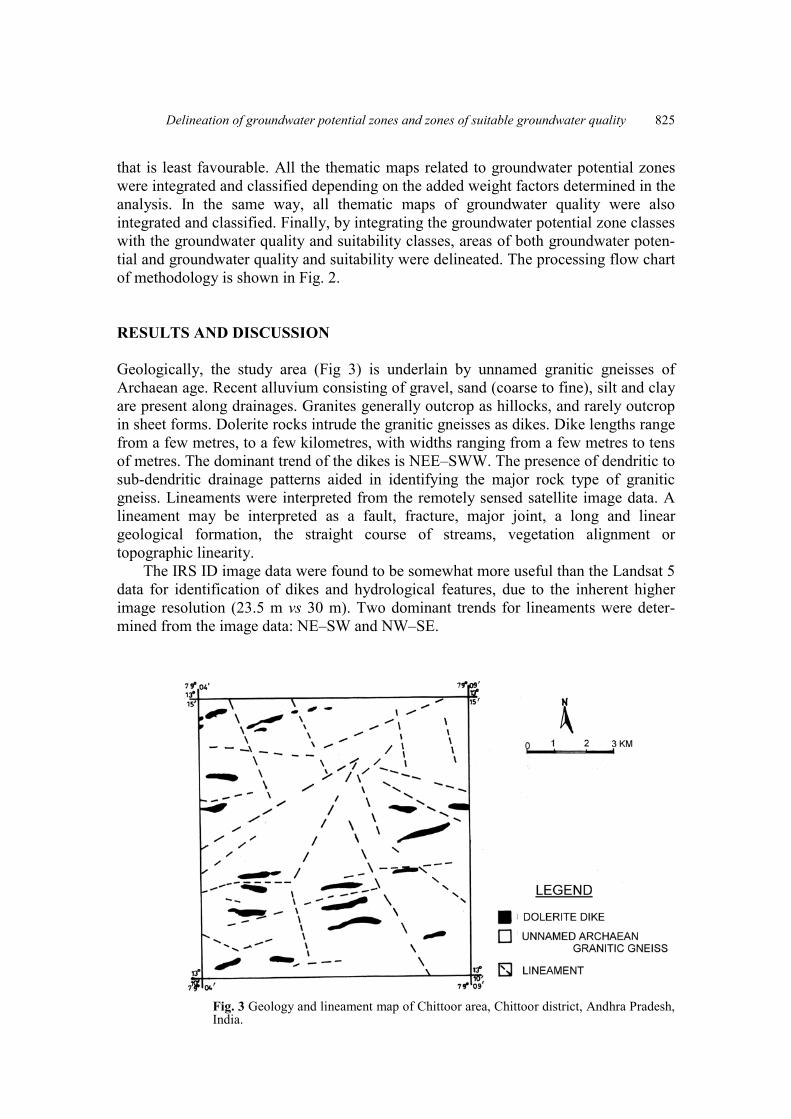
Geologically, the study area (Fig 3) is underlain by unnamed granitic gneisses of Archaean age. Recent alluvium consisting of gravel, sand (coarse to fine), silt and clay are present along drainages. Granites generally outcrop as hillocks, and rarely outcrop in sheet forms. Dolerite rocks intrude the granitic gneisses as dikes. Dike lengths range from a few metres, to a few kilometres, with widths ranging from a few metres to tens of metres. The dominant trend of the dikes is NEE–SWW. The presence of dendritic to sub-dendritic drainage patterns aided in identifying the major rock type of granitic gneiss. Lineaments were interpreted from the remotely sensed satellite image data. A lineament may be interpreted as a fault, fracture, major joint, a long and linear geological formation, the straight course of streams, vegetation alignment or topographic linearity. The IRS ID image data were found to be somewhat more useful than the Landsat 5 data for identification of dikes and hydrological features, due to the inherent higher image resolution (23.5 m vs 30 m). Two dominant trends for lineaments were deter-mined from the image data: NE–SW and NW–SE.
Fig. 3 Geology and lineament map of Chittoor area, Chittoor district, Andhra Pradesh, India.

Y. Srinivasa Rao & D. K. Jugran 826
Table 1 Classification of various themes for delineation of groundwater potential zones.
Class Criterion Percentage of study area Area (km2)Slope (%): Nearly level <1% 31.36 26.248 Very gentle 1–3% 27.33 22.875 Gentle 3–5% 6.15 5.147 Moderate 5–10% 13.85 11.592 Strong 10–15% 5.15 4.311 Moderately steep to steep 15–35% 11.98 10.027 Very steep >35% 4.18 3.499 Geology:Dolerite dike 2.99 2.503 Unnamed Archaean granitic gneiss 97.01 81.197 Hydromorphogeology:Alluvium 5.84 4.888 Moderately weathered pediplain 19.84 16.606 Shallow weathered pediplain 47.79 40.000 Pediment 2.17 1.816 Inselberg 0.12 0.100 Residual hill 12.19 10.203 Denudational hill 9.40 7.868 Drainage channel distance (m):Very near <30 11.61 9.717 Near 30–70 13.41 11.224 Far 70–120 15.44 12.923 Moderately far 120–140 5.55 4.645 Very far 140–180 10.44 8.738 Extremely far 180–210 6.46 5.407 Farthest >210 37.09 31.044 Tank distance (m):Very near <50 6.08 5.089 Near 50–140 6.62 5.541 Far 140–190 4.69 3.925 Moderately far 190–220 2.91 2.436 Very far 220–340 13.53 11.325 Extremely far 340–460 14.13 11.827 Farthest >460 52.04 43.557 Lineament distance (m): Very near <30 4.64 3.884 Near 30–120 15.86 13.275 Far 120–180 10.24 8.571 Moderately far 180–210 4.87 4.076 Very far 210–320 16.52 13.827 Farthest >320 47.87 40.067 Depth to water table (m): Very shallow <1 0.09 0.075 Shallow 1–2.8 30.58 25.595 Moderately shallow 2.8–7.5 50.47 42.244 Deep 7.5–11 14.64 12.254 Very deep >11 4.22 3.532 Weathered zone thickness (m): Very shallow <3 0.15 0.126 Shallow 3–6 24.87 20.816 Moderate 6–8 70.73 59.200 Deep 8–10 3.83 3.206 Very deep >10 0.42 0.352 Well yield (l min-1): Very low <30 0.02 0.017 Low 30–80 5.24 4.386 Moderate 80–150 38.81 32.484 High 150-300 47.94 40.126 Very high >300 7.99 6.687

Delineation of groundwater potential zones and zones of suitable groundwater quality 827
The topographic slope of the area has its own importance in affecting the runoff, recharge and movement of surface water. From a slope percent analysis, topographic slopes within the study area were classified as nearly level, very gentle, gentle, moderate, strong, moderately steep to steep, and very steep (Table 1). About 58% of the study area was classified as nearly level to very gentle slope. Numerous low relief pediments are present in the very gentle, gentle, and moderate slope classes. Moderate relief hills are present in strong, moderately steep to steep, and very steep slope classes. Hydromorphogeological maps depict important geomorphic units, landforms and underlying geology so as to provide an understanding of the processes, materials/ lithology, structures, and geologic controls relating to groundwater occurrence as well as to groundwater prospects. Such maps depicting prospective zones for groundwater targeting are essential as a basis for planning and execution of groundwater explora-tion. Hydromorphogeologically, the study area has been classified as: denudational hill, residual hill, inselberg, moderately weathered pediplain (>5 m weathered zone thickness), shallow weathered pediplain (<5 m weathered zone thickness), pediment, or alluvium. Their characteristics and groundwater prospects are given in Table 2. Nearly 70% of the study area is covered by pediplains. The hills within the region comprise a total area of 21.71%. All of these hills are classified as residual hills, except for one denudational hill in the southeastern portion and one inselberg in the central part of the study area. Dolerite rocks intrude these hills at various locations and stand as ridges since they are more resistant than surrounding granitic gneisses. Pediments cover nearly 2.17% of the study area in the northwestern and SSW portions. Groundwater occurs under unconfined conditions in shallow, moderately weathered zones of the pediplain and in semi-confined conditions in joints, fissures, and fractures that extend beyond the weathered zones. The crystalline granites and gneisses of the region lack primary porosity. As such, secondary porosity (joints,
Table 2 Hydromorphogeological characteristics in Chittoor area, Chittoor district, AP, India.
Unit Characteristics Groundwater prospects
Alluvium Nearly level surface along the river courses with gravel, coarse-fine sand, clay etc., at various locations coconut gardens and plantations are present.
Very good to excellent
Moderately weathered pediplain
Away from hills; gentle slopes with more vegetation. Weathered zones thickness ranges from 5 to 15 m. Along fractures, weathered zone thickness is more than 15 m.
Good to very good Very good
Shallow weathered pediplain (PPS)
Gentle to moderate slope with sparse vegetation. Weathered zone thickness is less than 5 m. Along fractures weathered zone thickness is greater than 5 m.
Moderate
Moderate to good
Pediment Moderate slopes with a veneer of detritus and broad undulating rock floor. Dike exposures are seen at some places. Along fractures potential is poor.
Poor to negligible
Inselberg Steep slopes occupying lesser dimensions. Nil Residual hill Group of massive hills occupying relatively small area
present with dike intrusive. Nil
Denudational hill A group of massive hills with resistant rock bodies, with medium to high relief.
Nil

Y. Srinivasa Rao & D. K. Jugran 828
lineaments and the weathered zone) is the main source for groundwater occurrence, movement and transmission. In the majority of the region (70.73%), the weathered zone is between 6 and 8 m thick. In 25.02% of the study area, the weathered zone is less than 6 m thick. A weathered zone thickness between 8 and 10 m occurs in 3.83% of the study area. A weathered zone thickness greater than 10 m is present in only 0.42% of the region. The weathered zone attains a maximum thickness of 18 m in the northeast and south-central portions of the study area. In general, groundwater is present at relatively shallow depths in the southeastern portion and at deeper levels in the southwestern and central portions of the study area. Nearly 50.47% of the study area has groundwater at moderately shallow depth (below 7.5 m) while less than 0.1% of the area has the water table at very shallow depths (Table 1). Well yields within the region range from 30 to 560 l min-1. Very high well yields (>300 l min-1) are present in 7.99% of the area and high yields (150–300 l min-1)are present in 47.94% of the study area (Table 1).
Groundwater potential zones
By integration of all the maps (classified maps of slope percent, geology, lineament, hydromorphogeology, iso-yield, iso-weathered zone thickness, water table, tank distance, drainage channel distance and lineament distance), groundwater potential zones were delineated and classified as: very high potential, high potential, moderate potential, low potential and very low potential (Table 3). Only 1.64% (1.373 km2) of the study area (83.7 km2) was classified as having very high potential at few locations (southeast, southwest and central regions), 31.68% (26.516 km2) was of high potential (southwest, southeast, northeast and central regions) and 62.05% (51.936 km2) was classified as having moderate potential (Table 3). Hence, a total of 95.37% of the area (79.825 km2) can be classified as moderate to very high potential. Very high groundwater potential zones cover an area of only 1.373 km2, as pockets where nearly level slopes, very near distance to drainage channel, very near distance to lineament and tank, very shallow water table levels (<1 m), very deep weathered zone thickness (>10 m) and very high well yields (>300 l min-1) are present in alluvium zones. High groundwater potential zones cover an area of 26.516 km2, where very gentle to gentle slopes, near distance to drainage channel, near distance to lineament and tank, deep weathered zone thickness (8–10 m), high well yields (150–300 l min-1)and shallow water table levels (1–2.8 m) are present in alluvium to moderately weathered pediplains. Moderate groundwater potential zones cover an area of 51.936 km2, where very gentle to gentle slopes, near to moderately far distance to drainage, lineament and tank, moderate to deep weathered zone thickness
Table 3 Classification of groundwater potential zones (after integration all thematic maps).
Class Percentage of the area Area (km2)Very low potential 0.03 0.025 Low potential 4.60 3.850 Moderate potential 62.05 51.936 High potential 31.68 26.516 Very high potential 1.64 1.373

Delineation of groundwater potential zones and zones of suitable groundwater quality 829
(6–10 m), moderately shallow water table levels (2.8–7.5 m), and moderate well yields (80–150 l min-1) are present in moderately weathered pediplain to shallow weathered pediplains. Low groundwater potential zones cover an area of 3.850 km2 where moderate to steep slope, extremely far to farthest distances to drainage, lineament and tank, deep to very deep water table levels, shallow to very shallow weathered zone thickness, and low to very low well yields are present as pockets spread over the whole study area. Very low groundwater potential zones are present in the northwestern corner of the study area and comprise an area of 0.025 km2.
Quality of groundwater
The chemical quality of the groundwater largely depends on the nature of rock formations, physiography, soil environment, recharge, and draft conditions in which it occurs. The chemical composition of water is an important factor to be considered before it is used for domestic, irrigation or industrial purposes (Suresh et al., 1991). Magnesium ion concentration, incrustation, total hardness (TH) and total dissolved solids (TDS) are considered criteria for classification of groundwater for domestic purposes (Table 4). According to WHO (1984) standards for suitable drinking water, magnesium ion should be below 30 mg l-1 when sulphate is more than 250 mg l-1, and if magnesium is more than 150 mg l-1 then sulphate should be below 250 mg l-1. Based on this, groundwater beneath nearly 25% of the study area (21.042 km2) is unsuitable for drinking purposes (Table 4).
Table 4 Classification of various aspects of groundwater quality for domestic purposes.
Class Criteria Percentage of study area
Area (km2)
Bicarbonate and sulphate (mg l-1):No incrustation HCO3 <400 mg l-1 and SO4 <100 mg l-1 31.08 26.014 Soft incrustation HCO3 >400 mg l-1 62.56 52.363 Hard incrustation SO4 >100 mg l-1 6.36 5.323 Magnesium (mg l-1):
Suitable SO4 >250 mg l-1 and Mg <30 mg l-1
orSO4 <250 mg l-1 and Mg <150 mg l-1
74.86 62.658
Unsuitable Otherwise 25.14 21.042 Total dissolved solids (mg l-1):Very low <250 0 0 Low 250–500 16.07 13.451 Moderate 500–750 18.12 15.166 High 750–1000 14.92 12.488 Very high >1000 50.89 42.595 Total hardness (mg l-1):Soft water <75 0 0 Moderately hard water 75–150 0.02 0.017 Hard water 50–300 15.31 12.814 Very hard water >300 84.67 70.869

Y. Srinivasa Rao & D. K. Jugran 830
Most of the tube/filtered/bore wells fail due to incrustation and corrosion problems caused by poor water quality. Incrustation results from clogging of the aquifer around the well and the openings of the well screen causing a decrease in well capacity. Incrustation reduces the well yield and increases the pumping cost. Hard incrustation forms due to sulphates and silicates of calcium and magnesium. Most of the cases are due to deposition of CaCO3, which is usually the basic binder and causes the chief trouble. Calcium carbonate is easily removed by acid treatment. However, Ca, Mg and Al sulphates and silicates are insoluble in acids or other chemicals. According to Raghunath (1983), if the HCO3 concentration is greater than 400 mg l-1, soft incrustation will form; however, if the SO4 concentration is higher than 100 mg l-1,hard incrustation will form. In the greater part of the study area, bore-well suction pipes and water-supply lines are facing incrustation problems. Therefore, based on water quality, the study area has been classified as comprising regions of: soft incrustation, hard incrustation or no incrustation. Approximately 6.36% of the study area (5.323 km2) can be classified as subject to hard incrustation problems and 62.56% of the area (52.363 km2) subject to soft incrustation problems. Hardness of water affects its reaction with soap and causes scale and incrustation accumulation in containers and conduits where the water is heated or transported. According to the standards of Sawyer & McCarty (1967), 84.67% of the study area contains very hard water (>300mg l-1 TH) and 15.31% of the area contains hard water (150–300 mg l-1 TH). Only 0.02% of the area contains moderately hard water (75– 150 mg l-1 TH). As a whole, the entire study area contains very hard water except within the northeastern, northwestern and southwestern portions which contain hard to moderately hard water at two or three point locations. Based on TDS standards (Anonymous, 1946; AWWA, 1950; Robinov et al., 1958; Davis & DeWiest, 1967), nearly 51% of the study area (42.595 km2) contains very high concentrations of total dissolved solids (in excess of 1000 mg l-1). By integrating the thematic maps of magnesium, incrustation problem, TH and TDS, a map of suitable groundwater quality for domestic purposes was prepared. Water quality on this map was classified as: suitable, moderately suitable and un-suitable (Table 5). Groundwater of suitable quality for domestic purposes is available in the northeastern, southern, southwestern, southeastern and northwestern portions, comprising 30.06% of the study area. In general, the entire central portion (67.45%) of the study area, where Chittoor town is present, is moderately suitable. Regions with unsuitable quality of groundwater (2.49%) are present at the northeastern portion as a NW–SE trending strip, where sugar factory effluents and industrial estate effluents are released into the streams. These effluents subsequently seep into the groundwater system and pollute the groundwater.
To identify the zones of suitable quality specifically in the potential zones, the map of groundwater potential zones, and the map of groundwater quality suitable for
Table 5 Classification of zones of groundwater quality suitable for domestic purpose (after integrating all aspects).
Class Percentage of study area Area (km2)Suitable 30.06 24.160 Moderately suitable 67.45 56.456 Unsuitable 2.49 2.084

Delineation of groundwater potential zones and zones of suitable groundwater quality 831
Fig. 4 Classification of groundwater potential zones and zones of groundwater quality suitable for domestic purposes.
Table 6 Classification of groundwater potential zones and zones of groundwater quality suitable for domestic purposes (after integration of respective maps).
Class Percentage of study area
Area (km2)
Very high groundwater potential with suitable quality 0.65 0.544 Very high groundwater potential with moderately suitable quality 0.99 0.829 High groundwater potential with suitable quality 7.53 6.304 High groundwater potential with moderate suitable quality 23.57 19.728 High groundwater potential with unsuitable quality 0.58 0.485 Moderate groundwater potential with suitable quality 20.38 17.058 Moderate groundwater potential with moderately suitable quality 39.97 33.455 Moderate groundwater potential with unsuitable quality 1.70 1.423 Low groundwater potential with suitable quality 1.47 1.231 Low groundwater potential with moderate suitable quality 2.92 2.442 Low groundwater potential with unsuitable quality 0.21 0.176 Very low groundwater potential with suitable quality 0.03 0.025
domestic purposes were integrated and classified (Fig. 4; Table 6). Although 1.64% of the study area can be classified as having very high groundwater potential (Table 3), only 0.65% is suitable and 0.99% is moderately suitable for domestic purposes. A total of 31.68% of the study area can be classified as having high potential; however, only 7.53% can be classified as suitable, with 23.57% moderately suitable, and 0.58% unsuitable. Although 62.05% of the study area was classified as having moderate groundwater potential, 20.38% is suitable, 39.97% is moderately suitable, and 1.70% is unsuitable. 4.60% of the study area can be classified as having low groundwater potential, with 1.47% being suitable, 2.92% moderately suitable, and 0.21% unsuitable

Y. Srinivasa Rao & D. K. Jugran 832
for domestic purposes. The remaining 0.03% of the study area can be classified as having very low potential with suitable quality for domestic purposes.
CONCLUSIONS
Remotely sensed satellite image data from IRS ID and Landsat 5 provided information used to identify and outline geology, lineament features, geomorphological and hydro-morphogeological conditions. These features served as either direct, or indirect indica-tors of groundwater occurrence. The comprehensive use of GIS resulted in the development of an efficient and effective methodology of spatial data management and manipulation. The integration and analyses of various thematic maps and image data proved useful for the delineation of zones of groundwater potential and zones of groundwater quality suitable for domestic purposes. Zones with moderate to very high groundwater potential, which are present in the southeastern, southwestern, northeastern and central portions of the study area, are being polluted by insufficiently treated industrial effluents and municipal sewages. These zones are gradually becoming unsuitable to moderately suitable for domestic purposes. To help to overcome this situation, remedial measures have to be imple-mented by imposing restrictions on industries and municipalities for proper treatment of effluents and wastes as per the WHO and ISI standards for mitigating the sources of the pollution. Measures to be taken could include the construction of water-harvesting structures for augmentation of groundwater resources and also through the implementation of proper BMPs (best management practices) for watersheds throughout the region. Groundwater quality monitoring studies could also be conducted to monitor both new occurrences, and remediation of, particular pollutants affecting the available groundwater resources.
Acknowledgements Y. S. Rao is highly grateful to the Indian Institute of Remote Sensing (IIRS), Dehradun, India for providing the opportunity to learn the GIS applications in geosciences and also to its faculty members who helped with the project work. Thanks are due to the University Grants Commission (UGC) for providing Dr Rao with a Research Associateship during 1995–2000 and to the Department of Science and Technology (SR/FTP/ES-64/2000), Government of India for sanctioning financial assistance under the Fast Track Young Scientist programme. The author also thanks the anonymous reviewers for giving valuable suggestions for improving the quality of the paper.
REFERENCES
American Water Works Association (AWWA)(1950) Water Quality and Treatment, second edn. AWWA, New York, USA.
Anonymous (1946) Drinking water standards. J. Am. Water Works Assoc. 38, 361–370. Ashok Kumar (1999) Sustainable utilization of water resources in watershed perspective—a case study in Alaunja
watershed, Hazaribagh, Bihar. J. Indian Soc. Remote Sensing 27(1), 13–22. Brown, E., Skougstand, M. W. & Fishman M. J. (1973) Methods for collection and analyses of water samples for
dissolved minerals and gases. US Geol. Survey Techniques of Water Resources Investigation 5.Davis, S. N. & DeWiest, R. J. M. (1967) Hydrogeology. John Wiley & Sons Inc., New York, USA. ISI (Indian Standards Institution) (1983) Indian Standard Specification for Drinking Water, IS 10500.

Delineation of groundwater potential zones and zones of suitable groundwater quality 833
Kamaraju, M. V. V., Bhattacharya, A., Srinivasa Reddy, G., Chandrasekhar Rao, G., Murthy, G. S. & Malleswara Rao, T. C. H. (1996) Groundwater potential evaluation of west Godavari district, A.P., India—a GIS approach. Groundwater34(2), 318–325.
Karanth, K. R. & Seshu babu, K. (1978) Identification of major lineaments on satellite imagery and on aerial photographs for delineation for possible potential groundwater zones in Penukonda and Dharmavaram taluks of Anantapur district. In: Proc. Joint Indo-US Workshop on Remote Sensing of Water Resources (NRSA, Hyderabad), 188–197. Indian Society of Remote Sensing (ISRS) National Natural Resources Management System (NNRMS), Ahmedabad, India
Khan, M. A. & Moharana, P. C. (2002) Use of remote sensing and GIS in the delineation and characterization of groundwater prospect zones. J. Indian Soc. Remote Sensing 30(3), 131–141.
Khan Subhan & Asif Mohd (1997) GIS approach for water resource assessment in parts of Rajastan and Haryana using remote sensing techniques. In: Proc. Nat. Symp. on Remote Sensing for Natural Resources (Pune, India, 4–6 December 1996), 75–82. Indian Society of Remote Sensing (ISRS) National Natural Resources Management System (NNRMS), Ahmedabad, India.
Krishnamurthy, J. & Srinivas, G. (1995) Role of geological and geomorphological factors in groundwater exploration: a study using IRS LISS data. Int. J. Remote Sensing 16(14), 2595–2618.
Krishnamurthy, J., Venkatesa Kumar, N., Jayaraman, V. & Manivel, M. (1996) An approach to demarcate groundwater potential zones through remote sensing and GIS. Int. J. Remote Sensing 17(10), 1867–1884.
Krishnamurthy, J., Mani, A., Jayaraman, V. & Manivel, M. (2000) Groundwater resources development in hard rock terrain—an approach using remote sensing and GIS techniques. Int. J. Appl. Earth Observ. and Geoinf. 2(3/4), 204–215.
Moore, G. K. (1978) The role of remote sensing in groundwater exploration. In: Proc. Joint Indo-US Workshop on Remote Sensing of Water Resources, 22–40. National Remote Sensing Agency (NRSA), Hyderabad, India.
Murthy, K. S. R. (2000) Groundwater potential in a semi-arid region of Andhra Pradesh—a GIS approach. Int. J. Remote Sensing 21(9), 1867–1884.
Palanivel, S., Ganesh, A. & Vasantha Kumaran, T. (1996) Geohydrological evaluation of Upper Agniar and Vellar basins, Tamil Nadu. An integrated approach using Remote sensing, Geophysical and well inventory data. J. Indian Soc. Remote Sensing. 24(3), 153–168.
Raghunath, H. M. (1983) Groundwater. Wiley Eastern, New Delhi, India. Rainwater, F. H. & Thatcher, I. (1960) Methods for collection and analysis of water samples. US Geol. Survey Water
Supply Paper 1454.Raju, K. C. B., Rao, G. V. K. & Kumar, B. J. (1985) Analytical aspects of remote sensing techniques for groundwater
prospecting in hard rocks. In: Proc Sixth Asian Conf. on Remote Sensing, 127–132. National Remote Sensing Agency (NRSA), Hyderabad, India.
Ravindran, K. V. (1997) Drainage morphometry analysis and its correlation with geology, geomorphology and groundwater prospects in Zuvari basin, South Goa—using RS & GIS. In: Proc. Nat. Symp. Remote Sensing for Natural Resources with Special Emphasis on Water Management (Pune, India, 4–6 December 1996), 270–296. Indian Society of Remote Sensing (ISRS) National Natural Resources Management System (NNRMS), Ahmedabad, India.
Robinov, C. J., Langford, R. H. & Brookhart, J. W. (1958) Saline-water resources of North Dakota. US Geol. Survey Water Supply Paper 1428.
Sankar, K. (2002) Evaluation of groundwater potential zones using remote sensing data in upper Vaigai river basin, Tamilnadu, India, J. Indian Soc. Remote Sensing 30(3), 119–130.
Saraf, A. K. & Choudary, P. R. (1998) Integrated remote sensing and GIS for groundwater exploration and identification of artificial recharge sites. Int. J. Remote Sensing 19(10), 1825–1841.
Saraf, A. K. & Jain, S. K. (1994) Integrated use of remote sensing and geographical information system methods for groundwater exploration in parts of Lalitpur district, UP. In: Int. Conf. on Hydrology and Water Resources (New Delhi, 20–22 December 1993) Kluwer Academic Publishers, Dordrecht, The Netherlands.
Saraf, A. K., Gupta, R. P., Jain, S. K. & Srivatsava, N. K. (1994) GIS based processing and interpretation of ground water quality data. In: Proc. Regional Workshop on Environmental Aspects of Ground Water Development (Kurukshetra, Haryana, India), II-9–II-14.
Sawyer, C. N. & McCarty, P. L. (1967) Chemistry for Sanitary Engineers, second edn. McGraw-Hill, New York, USA. Shahid, S., Nath, S. K. & Ray, J. (2000) Groundwater potential modeling in soft rock using a GIS. Int. J. Remote Sensing
21(9), 1919–1924. Sree devi, P. D., Srinivasulu, S. & Raju, K. K. (2001) Hydrogeomorphological and groundwater prospects of the Pageru
river basin by using remote sensing data. Environ. Geol. 40, 1088–1094. Srivastava, P. K. & Bhattacharya, A. K. (2000) Delineation of groundwater potential zones in a hard rock terrain of
Bargarh district, Orissa—using IRS data. J. Indian Soc. Remote Sensing 28(2&3), 129–140. Suresh, T. S., Naganna, C. & Srinivas, G. (1991). Study of water quality for agricultural use in Hemavathy river
(Karnataka). Hydrology J. (Indian Assoc. of Hydrologists) 14(4), 247–254. WHO (World Health Organization) (1984) Guidelines for Drinking Water Quality, vol. I, Recommendations. World
Health Organization, Geneva, Switzerland.
Received 22 July 2002; accepted 28 May 2003