Integration of Electrical Resistivity and Modified DRASTIC ...
18
Citation: Bernardo, B.; Candeias, C.; Rocha, F. Integration of Electrical Resistivity and Modified DRASTIC Model to Assess Groundwater Vulnerability in the Surrounding Area of Hulene-B Waste Dump, Maputo, Mozambique. Water 2022, 14, 1746. https://doi.org/10.3390/ w14111746 Academic Editor: Lluís Rivero Received: 24 April 2022 Accepted: 26 May 2022 Published: 29 May 2022 Publisher’s Note: MDPI stays neutral with regard to jurisdictional claims in published maps and institutional affil- iations. Copyright: © 2022 by the authors. Licensee MDPI, Basel, Switzerland. This article is an open access article distributed under the terms and conditions of the Creative Commons Attribution (CC BY) license (https:// creativecommons.org/licenses/by/ 4.0/). water Article Integration of Electrical Resistivity and Modified DRASTIC Model to Assess Groundwater Vulnerability in the Surrounding Area of Hulene-B Waste Dump, Maputo, Mozambique Bernardino Bernardo 1,2 , Carla Candeias 1 and Fernando Rocha 1, * 1 GeoBioTec Research Centre, Department of Geosciences, University of Aveiro, 3810-193 Aveiro, Portugal; [email protected] (B.B.); [email protected] (C.C.) 2 Faculty of Earth Sciences and Environment, Pedagogic University of Maputo, Av. do Trabalho, Maputo 2482, Mozambique * Correspondence: [email protected] Abstract: In this study, electrical resistivity was applied in six 400 m profiles around the Hulene-B waste dump (Mozambique). Afterwards, an inversion was performed by RES2Dinv. The use of the electrical resistivity method allowed us to characterize in detail some underlying aspects of the DRASTIC index by identifying anomalous zones considered to be permeable and prone to leachate migration. The modified DRASTIC index revealed high values in areas near contaminated surface groundwater and surface layers of the vadose zone, characterized by low resistivities. Areas with lower index results were characterized by high resistivity on surface layers and high depth at which groundwater was detected. The overall modified DRASTIC index result revealed medium vulnera- bility. However, high vulnerability index values were detected in areas with higher surface elevation, suggesting groundwater contamination by horizontal dilution of leachates from the surrounding area of the Hulene-B waste dump. Keywords: resistivity; anomalous zones; modified DRASTIC model; groundwater vulnerability 1. Introduction Urban areas are characterized by excessive production of solid waste [1], which is often deposited in areas not prepared for disposal or treatment, thus posing a risk of envi- ronmental contamination [2]. Soils and groundwater are described as extremely vulnerable to pollution [3]. The concept of groundwater vulnerability was first described in the early 1960s, aiming to identify areas prone to contamination [4]. Groundwater vulnerability depends not only on its flow system properties but also on contaminant sources’ proximity, and contaminant characteristics, among other factors. These can promote potential contam- inants to reach groundwater resources [5]. In urban areas, one of the main groundwater contamination sources is leachates, resulting from the decomposition of solid urban waste deposited without treatment in unplanned locations [6]. Several non-invasive models have been developed to assess groundwater vulnerability, of which geophysics, in particular electrical resistivity, and the DRASTIC hydrogeological model are pointed as the most relevant [7]. The electrical resistivity method has been used for locating hazardous waste in depth, and to identify different sources of contamination in subsurface environments [8,9]. Has been widely used to detect areas with heavy metal contamination plumes [10], groundwater [7] and lithological variations [11]. The DRASTIC model was defined by Aller, [12]. Seven hydrogeological parameters are included, being acronyms of the term “DRASTIC”, Depth of water table, net area Recharge, Aquifer media, Soil media, Topography vadose zone impact, and hydraulic Conductivity. This model has been applied to assess groundwater vulnerability in relatively large urban areas (>40 ha) [13,14]. Shah et al. [15], Arowoogun et al. [16], Dhakate et al. [17] and Water 2022, 14, 1746. https://doi.org/10.3390/w14111746 https://www.mdpi.com/journal/water
-
Upload
khangminh22 -
Category
Documents
-
view
4 -
download
0
Transcript of Integration of Electrical Resistivity and Modified DRASTIC ...
Citation: Bernardo, B.; Candeias, C.;
Rocha, F. Integration of Electrical
Resistivity and Modified DRASTIC
Model to Assess Groundwater
Vulnerability in the Surrounding
Area of Hulene-B Waste Dump,
Maputo, Mozambique. Water 2022,
14, 1746. https://doi.org/10.3390/
w14111746
Academic Editor: Lluís Rivero
Received: 24 April 2022
Accepted: 26 May 2022
Published: 29 May 2022
Publisher’s Note: MDPI stays neutral
with regard to jurisdictional claims in
published maps and institutional affil-
iations.
Copyright: © 2022 by the authors.
Licensee MDPI, Basel, Switzerland.
This article is an open access article
distributed under the terms and
conditions of the Creative Commons
Attribution (CC BY) license (https://
creativecommons.org/licenses/by/
4.0/).
water
Article
Integration of Electrical Resistivity and Modified DRASTICModel to Assess Groundwater Vulnerability in the SurroundingArea of Hulene-B Waste Dump, Maputo, MozambiqueBernardino Bernardo 1,2 , Carla Candeias 1 and Fernando Rocha 1,*
1 GeoBioTec Research Centre, Department of Geosciences, University of Aveiro, 3810-193 Aveiro, Portugal;[email protected] (B.B.); [email protected] (C.C.)
2 Faculty of Earth Sciences and Environment, Pedagogic University of Maputo, Av. do Trabalho,Maputo 2482, Mozambique
* Correspondence: [email protected]
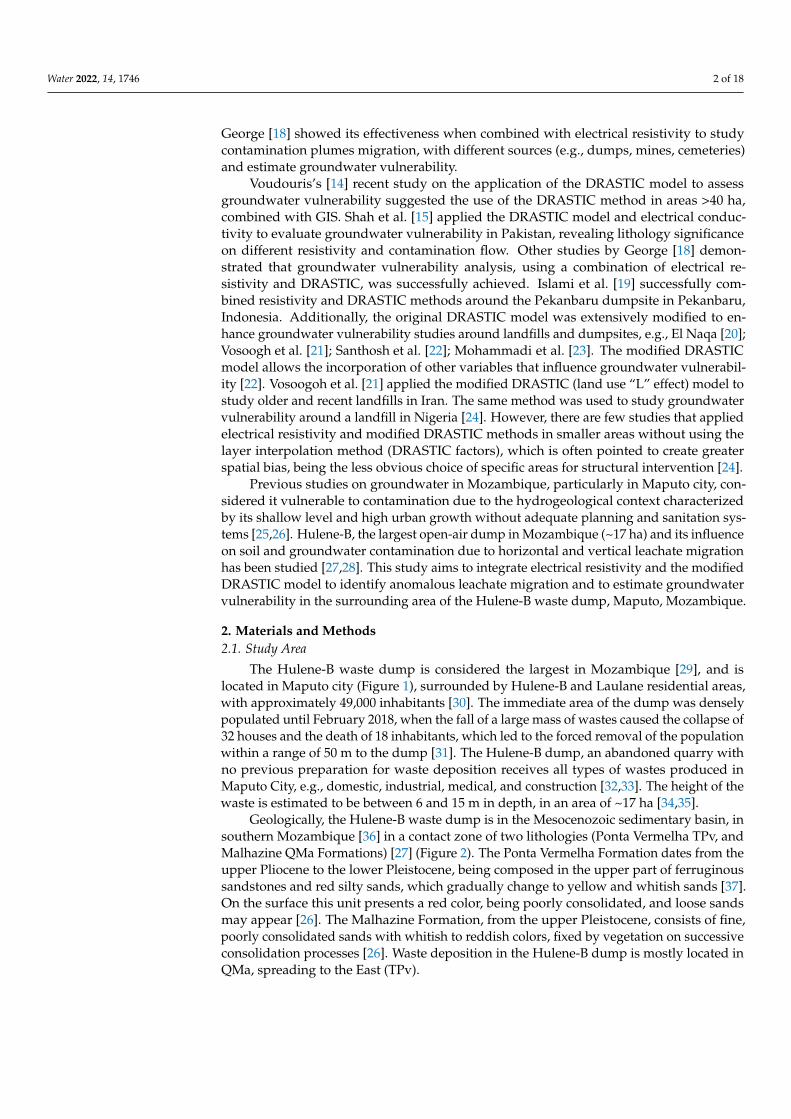
Abstract: In this study, electrical resistivity was applied in six 400 m profiles around the Hulene-Bwaste dump (Mozambique). Afterwards, an inversion was performed by RES2Dinv. The use ofthe electrical resistivity method allowed us to characterize in detail some underlying aspects of theDRASTIC index by identifying anomalous zones considered to be permeable and prone to leachatemigration. The modified DRASTIC index revealed high values in areas near contaminated surfacegroundwater and surface layers of the vadose zone, characterized by low resistivities. Areas withlower index results were characterized by high resistivity on surface layers and high depth at whichgroundwater was detected. The overall modified DRASTIC index result revealed medium vulnera-bility. However, high vulnerability index values were detected in areas with higher surface elevation,suggesting groundwater contamination by horizontal dilution of leachates from the surrounding areaof the Hulene-B waste dump.
Keywords: resistivity; anomalous zones; modified DRASTIC model; groundwater vulnerability
1. Introduction
Urban areas are characterized by excessive production of solid waste [1], which isoften deposited in areas not prepared for disposal or treatment, thus posing a risk of envi-ronmental contamination [2]. Soils and groundwater are described as extremely vulnerableto pollution [3]. The concept of groundwater vulnerability was first described in the early1960s, aiming to identify areas prone to contamination [4]. Groundwater vulnerabilitydepends not only on its flow system properties but also on contaminant sources’ proximity,and contaminant characteristics, among other factors. These can promote potential contam-inants to reach groundwater resources [5]. In urban areas, one of the main groundwatercontamination sources is leachates, resulting from the decomposition of solid urban wastedeposited without treatment in unplanned locations [6].
Several non-invasive models have been developed to assess groundwater vulnerability,of which geophysics, in particular electrical resistivity, and the DRASTIC hydrogeologicalmodel are pointed as the most relevant [7]. The electrical resistivity method has been usedfor locating hazardous waste in depth, and to identify different sources of contaminationin subsurface environments [8,9]. Has been widely used to detect areas with heavy metalcontamination plumes [10], groundwater [7] and lithological variations [11].
The DRASTIC model was defined by Aller, [12]. Seven hydrogeological parameters areincluded, being acronyms of the term “DRASTIC”, Depth of water table, net area Recharge,Aquifer media, Soil media, Topography vadose zone impact, and hydraulic Conductivity.This model has been applied to assess groundwater vulnerability in relatively large urbanareas (>40 ha) [13,14]. Shah et al. [15], Arowoogun et al. [16], Dhakate et al. [17] and
Water 2022, 14, 1746. https://doi.org/10.3390/w14111746 https://www.mdpi.com/journal/water
Water 2022, 14, 1746 2 of 18
George [18] showed its effectiveness when combined with electrical resistivity to studycontamination plumes migration, with different sources (e.g., dumps, mines, cemeteries)and estimate groundwater vulnerability.
Voudouris’s [14] recent study on the application of the DRASTIC model to assessgroundwater vulnerability suggested the use of the DRASTIC method in areas >40 ha,combined with GIS. Shah et al. [15] applied the DRASTIC model and electrical conduc-tivity to evaluate groundwater vulnerability in Pakistan, revealing lithology significanceon different resistivity and contamination flow. Other studies by George [18] demon-strated that groundwater vulnerability analysis, using a combination of electrical re-sistivity and DRASTIC, was successfully achieved. Islami et al. [19] successfully com-bined resistivity and DRASTIC methods around the Pekanbaru dumpsite in Pekanbaru,Indonesia. Additionally, the original DRASTIC model was extensively modified to en-hance groundwater vulnerability studies around landfills and dumpsites, e.g., El Naqa [20];Vosoogh et al. [21]; Santhosh et al. [22]; Mohammadi et al. [23]. The modified DRASTICmodel allows the incorporation of other variables that influence groundwater vulnerabil-ity [22]. Vosoogoh et al. [21] applied the modified DRASTIC (land use “L” effect) model tostudy older and recent landfills in Iran. The same method was used to study groundwatervulnerability around a landfill in Nigeria [24]. However, there are few studies that appliedelectrical resistivity and modified DRASTIC methods in smaller areas without using thelayer interpolation method (DRASTIC factors), which is often pointed to create greaterspatial bias, being the less obvious choice of specific areas for structural intervention [24].
Previous studies on groundwater in Mozambique, particularly in Maputo city, con-sidered it vulnerable to contamination due to the hydrogeological context characterizedby its shallow level and high urban growth without adequate planning and sanitation sys-tems [25,26]. Hulene-B, the largest open-air dump in Mozambique (~17 ha) and its influenceon soil and groundwater contamination due to horizontal and vertical leachate migrationhas been studied [27,28]. This study aims to integrate electrical resistivity and the modifiedDRASTIC model to identify anomalous leachate migration and to estimate groundwatervulnerability in the surrounding area of the Hulene-B waste dump, Maputo, Mozambique.
2. Materials and Methods2.1. Study Area
The Hulene-B waste dump is considered the largest in Mozambique [29], and islocated in Maputo city (Figure 1), surrounded by Hulene-B and Laulane residential areas,with approximately 49,000 inhabitants [30]. The immediate area of the dump was denselypopulated until February 2018, when the fall of a large mass of wastes caused the collapse of32 houses and the death of 18 inhabitants, which led to the forced removal of the populationwithin a range of 50 m to the dump [31]. The Hulene-B dump, an abandoned quarry withno previous preparation for waste deposition receives all types of wastes produced inMaputo City, e.g., domestic, industrial, medical, and construction [32,33]. The height of thewaste is estimated to be between 6 and 15 m in depth, in an area of ~17 ha [34,35].
Geologically, the Hulene-B waste dump is in the Mesocenozoic sedimentary basin, insouthern Mozambique [36] in a contact zone of two lithologies (Ponta Vermelha TPv, andMalhazine QMa Formations) [27] (Figure 2). The Ponta Vermelha Formation dates from theupper Pliocene to the lower Pleistocene, being composed in the upper part of ferruginoussandstones and red silty sands, which gradually change to yellow and whitish sands [37].On the surface this unit presents a red color, being poorly consolidated, and loose sandsmay appear [26]. The Malhazine Formation, from the upper Pleistocene, consists of fine,poorly consolidated sands with whitish to reddish colors, fixed by vegetation on successiveconsolidation processes [26]. Waste deposition in the Hulene-B dump is mostly located inQMa, spreading to the East (TPv).

Water 2022, 14, 1746 3 of 18Water 2022, 14, x FOR PEER REVIEW 3 of 19
Figure 1. Study Area (a) intra dune depression; and (b) Hulene‐B waste dump.
Geologically, the Hulene‐B waste dump is in the Mesocenozoic sedimentary basin,
in southern Mozambique [36] in a contact zone of two lithologies (Ponta Vermelha TPv,
and Malhazine QMa Formations) [27] (Figure 2). The Ponta Vermelha Formation dates
from the upper Pliocene to the lower Pleistocene, being composed in the upper part of
ferruginous sandstones and red silty sands, which gradually change to yellow and
whitish sands [37]. On the surface this unit presents a red color, being poorly consoli‐
dated, and loose sands may appear [26]. The Malhazine Formation, from the upper
Pleistocene, consists of fine, poorly consolidated sands with whitish to reddish colors,
fixed by vegetation on successive consolidation processes [26]. Waste deposition in the
Hulene‐B dump is mostly located in QMa, spreading to the East (TPv).
The eastern dump boundary corresponds to small slopes ranging from 52 to 54 m,
while the western boundary presents smaller slopes, ranging 32 to 34 m (Figure 2b).
Momade et al. [38] performed drillings L16 and L125 (Figure 2a) in two geological for‐
mations around the dump, showing that TPv formation underlain QMa, and TSa (Mio‐
cene‐Pliocene) is composed of clayey, calcareous sandstone with Ostrea cullata in its up‐
per part.
Figure 1. Study Area (a) intra dune depression; and (b) Hulene-B waste dump.
The eastern dump boundary corresponds to small slopes ranging from 52 to 54 m,while the western boundary presents smaller slopes, ranging 32 to 34 m (Figure 2b).Momade et al. [38] performed drillings L16 and L125 (Figure 2a) in two geological forma-tions around the dump, showing that TPv formation underlain QMa, and TSa (Miocene-Pliocene) is composed of clayey, calcareous sandstone with Ostrea cullata in its upper part.
Water 2022, 14, x FOR PEER REVIEW 3 of 19
Figure 1. Study Area (a) intra dune depression; and (b) Hulene‐B waste dump.
Geologically, the Hulene‐B waste dump is in the Mesocenozoic sedimentary basin,
in southern Mozambique [36] in a contact zone of two lithologies (Ponta Vermelha TPv,
and Malhazine QMa Formations) [27] (Figure 2). The Ponta Vermelha Formation dates
from the upper Pliocene to the lower Pleistocene, being composed in the upper part of
ferruginous sandstones and red silty sands, which gradually change to yellow and
whitish sands [37]. On the surface this unit presents a red color, being poorly consoli‐
dated, and loose sands may appear [26]. The Malhazine Formation, from the upper
Pleistocene, consists of fine, poorly consolidated sands with whitish to reddish colors,
fixed by vegetation on successive consolidation processes [26]. Waste deposition in the
Hulene‐B dump is mostly located in QMa, spreading to the East (TPv).
The eastern dump boundary corresponds to small slopes ranging from 52 to 54 m,
while the western boundary presents smaller slopes, ranging 32 to 34 m (Figure 2b).
Momade et al. [38] performed drillings L16 and L125 (Figure 2a) in two geological for‐
mations around the dump, showing that TPv formation underlain QMa, and TSa (Mio‐
cene‐Pliocene) is composed of clayey, calcareous sandstone with Ostrea cullata in its up‐
per part.
Figure 2. (a) Geological features; (b) study area topography; and (c) Hulene-B waste dump (adapt.Momade et al. [38]).
The Hulene-B dump hydrogeological system is in the Tertiary-Quaternary aquifersystem [26]. The aquifer substrate is formed by a layer of clayey marl to grey clay [38].The localized presence of the semi-impermeable layer (clayey sands), between fine andcoarse sand and sandstones, in the surroundings of the Hulene-B dump, causes watercirculation in these two sectors [28]. Coarse sands lie directly on top of the clay layer, insome sections, promoting semi-confined conditions [25]. The water level on local wellsvaries between 1.5 and 9.3 m in depth, with an average of 3.8 m [38]. Bernardo et al. [27]used electrical resistivity profiles in 2020 and 2021, suggesting that groundwater in thewestern boundary of the Hulene-B dump was at variable depths and with a potential

Water 2022, 14, 1746 4 of 18
risk of being contaminated by leachate plumes resulting from vertical and horizontalmigration, which, in the subsurface environment, were assigned d values 4.26 to 8.5 Ω.m.The hydraulic conductivity was estimated to be 1 to 5 m/d on the surroundings of theHulene-B dump [28].
The predominant local climate is subtropical, with mean annual precipitation of~789 mm, with two climatic seasons: (a) hot (mean 25 C) rainy period from December toMarch, representing >60% of the annual precipitation, with its peak in January (~125 mm);and (b) dry and cold season, from April to September, with lower temperatures in June andJuly (mean 21 C), and scarce precipitation, whose minimum values recorded in August(~12 mm) [39]. The prevailing winds are SE [40].
2.2. Electrical Resistivity
Electrical resistivity studies are based on electric current injected into the groundthrough a pair of electrodes (A and B—current electrodes), and the resulting potentialdifference between another pair of electrodes (M and N—potential electrodes) [41]. Groundresistivity is calculated by distances between electrodes, applied current and measuredpotential difference, based on the Law of Ohm [42].
The soil’s electrical resistivity is a characteristic closely linked to the type, nature,and state of alteration of geological formations [8]. In areas with potential groundwatercontamination, it has been used for determining the depth of the groundwater table [43](Akhtar et al., 2021), determining the distribution of contamination areas and the directionof migration of pollutants, assessing the thickness of wastes deposited in a landfill, andidentifying possible leachate plumes [41,44,45]. Soil apparent resistivity (ρa) can be deter-mined based on the known difference between electric field potential (∆V), the current (I),and the distance between electrodes [41], given by the equation:
ρa = k ∆V/I (1)
where ρa is apparent resistivity, I the intensity of current applied to the soil by electrodesA and B (mA), ∆V the differential potential between electrodes M and N (mV), and k thegeometrical coefficient of electrode positioning (m). The geometrical factor k is dependenton the distribution geometry of the electrodes, as follows:
k =2π(
1AM
− 1BM
− 1AN
+ 1BN
) (2)
where AM, BM, AN and BN represent the geometrical distance between electrodes A andM, B and M, A and N, and B and N, respectively.
In this study, 6 electrical resistivity profiles were performed in May 2021, of which,4 were on the western border of the dump and 2 profiles were on the southern and northernborders (Figure 3). Profile 3, on the north of the dump, was applied to understand thepossible migration of contaminants to areas further away from the dump (reference profile).
ABEM SAS 4000 was used for resistor data acquisition, including 4 rollers of 100 mcables with 21 outlets connected to the same number of electrodes. The layout producedby this sequence of cables corresponds to the standard of the reading program hosted bythe resistivimeter LUND Imaging System. Data acquisition employed a 50 Hz currentfrequency, using GRAD4LX8 multigradient protocol, once provides dense coverage nearbysurface and adopts the Wenner–Schlumberger protocol (ABEM, 2018). The electrode spac-ing for data acquisition was 5 m. All electrode take-outs were connected in the GRAD4S8protocol. The resistivimeter automatically switches electrodes to serve as current or poten-tial pairs. After the readings, data was transferred to the resistivimeter, which then takes3 to 6 readings to obtain the smallest error average between readings. The inversion ofthe electrical resistivity data obtained in the 6 lines was performed based on standards de-fined in software RES2DINV3.59.106, namely, the application of the smoothness constraintmethod in the resistivity values of the final model, calculation of the Jacobian matrix in

Water 2022, 14, 1746 5 of 18
each iteration, standard Gauss–Newton optimization method [46]. Profiles interpretationwas based on the direction of each profile over the entire length (400 m).
Water 2022, 14, x FOR PEER REVIEW 5 of 19
Figure 3. Electrical resistivity profiles and northern (WN) and southern (WS) wells studied, in the
surroundings of the Hulene‐B waste dump.
ABEM SAS 4000 was used for resistor data acquisition, including 4 rollers of 100 m
cables with 21 outlets connected to the same number of electrodes. The layout produced
by this sequence of cables corresponds to the standard of the reading program hosted by
the resistivimeter LUND Imaging System. Data acquisition employed a 50 Hz current
frequency, using GRAD4LX8 multigradient protocol, once provides dense coverage
nearby surface and adopts the Wenner–Schlumberger protocol (ABEM, 2018). The elec‐
trode spacing for data acquisition was 5 m. All electrode take‐outs were connected in the
GRAD4S8 protocol. The resistivimeter automatically switches electrodes to serve as cur‐
rent or potential pairs. After the readings, data was transferred to the resistivimeter,
which then takes 3 to 6 readings to obtain the smallest error average between readings.
The inversion of the electrical resistivity data obtained in the 6 lines was performed based
on standards defined in software RES2DINV3.59.106, namely, the application of the
smoothness constraint method in the resistivity values of the final model, calculation of
the Jacobian matrix in each iteration, standard Gauss–Newton optimization method [46].
Profiles interpretation was based on the direction of each profile over the entire length
(400 m).
2.3. Modified DRASTIC Groundwater Vulnerability
The DRASTIC model has been commonly used in areas where geographical, and
hydrogeological information is available and has been successfully applied in different
regions [15,47,48]. The word DRASTIC is an abbreviation of the initial letter of different
parameters such as ‘D’ to depth to water; ‘R’ to net recharge, ‘A’ to aquifer media, ‘S’ to
Figure 3. Electrical resistivity profiles and northern (WN) and southern (WS) wells studied, in thesurroundings of the Hulene-B waste dump.
2.3. Modified DRASTIC Groundwater Vulnerability
The DRASTIC model has been commonly used in areas where geographical, andhydrogeological information is available and has been successfully applied in differentregions [15,47,48]. The word DRASTIC is an abbreviation of the initial letter of differentparameters such as ‘D’ to depth to water; ‘R’ to net recharge, ‘A’ to aquifer media, ‘S’to soil media, ‘T’ to topography, ‘I’ the impact of the vadose zone media, and ‘C’ to thehydraulic conductivity of the aquifer intrinsic vulnerability of groundwater is evaluated bythe DRASTIC index formula which is given below:
DRASTIC Index = DrDw + RrRw + ArAw + SrSw + TrTw +IrIw + CrCw (3)
where “r” is the rating value, and “w” is the weight assigned to each parameter. Eachfactor is assigned a relative weight ranging from 1 to 5 (Table 1). Each DRASTIC factoris divided into ranges that affect the contaminant potential. The range for each factorlies from 1 to 10. The DRASTIC model depends on seven boundaries or layers, whichare used as input boundaries for modeling. Thus, the interpretation of the index followsthree categories: (i) indices <135 denote low vulnerability; (ii) indices between 135 and

Water 2022, 14, 1746 6 of 18
150 represent medium vulnerability; and (iii) indices >150 suggest a high vulnerability togroundwater-related environmental impacts [6,12].
Table 1. DRASTIC parameters.
Factor Interval/Characteristics Value (r) Weight (w)
(D)Groundwater depth (m)
0–1.5 10
5
1.5–4.6 9
4.6–9.3 7
9.3–15 5
15–23 3
23–30 2
>30 1
(R)Net recharge rate (mm/year)
0–50 1
4
50–100 3
100–175 6
175–250 8
>250 9
(A)Aquifer media Sand 7 3
(S)Distance between the anomalous
surface layer and groundwater
0–1.5 10
2
1.5–4.6 9
4.6–9.3 7
9.3–15 5
15–23 3
23–30 2
>30 1
(T)Terrain slope (%)
0–2 10
1
2–6 9
6–12 5
12–18 3
>18 1
(I)Vadose Zone
Sandstones 4–8
5
Limestones,sandstones, and shales 4–8
Sands and gravelswith significant silt
and clay content4–8
Sands 8
(C)Hydraulic conductivity (m/day)
1–4.1 1
3
4.1–12.2 2
12.2–28.5 4
28.5–40.7 6
40.7–81.5 8
>81.5 10

Water 2022, 14, 1746 7 of 18
In this study we applied the modified DRASTIC model combined with electrical resis-tivity data. This allows a specific assessment of the vulnerability of the dump surroundingarea, based on the distance between anomalous surface layer (low resistivity; leachateinfluenced) and groundwater. The soil variable was replaced since soils around the landfillwere classified as sandy, which is characteristic of the whole surroundings [38]. Thus, ‘S’corresponds to the distance between the superficial anomalous layer and groundwater.Values and weights of the variables were kept the same as for soil, given processes similarity,controlled by these factors (migration and attenuation of leachate). Layers spatial distri-bution was not made, given detailed description for each factor in depth and superficialslight change, as well as study area size [49,50].
For resistivity models and groundwater vulnerability validation, groundwater depth,pH and sulphates (PO4
3−) were measured in two wells in the surroundings of the dump(Figures 3 and S1). Chemical analysis of total phosphate was performed with an HI96713,with a resolution level of 0.01 mg/L (Figure S1).
3. Results3.1. Resistivity Models and Potential Contamination Risk
For the analysis of the profiles, the resistivity values of the profiles were adjustedto the same scale so that each color of the contour in the resistivity model implies thesame resistivity value (Figure 4). In this study, the electrical resistivity models wereanalyzed to identify the possible influence of leachate on groundwater contamination.Thus, anomalous zones that may reflect the leachate migration and contamination processwere identified: (i) leachate generation and migration areas (7.99–16.8 Ω.m); (ii) saturatedzones contaminated by leachate (4.96–7.99 Ω.m); (iii) groundwater and surface watercontaminated by leachate (1.535–7.99 Ω.m); (iv) waste and lithologies local (>16.8 Ω.m).
Water 2022, 14, x FOR PEER REVIEW 7 of 19
In this study we applied the modified DRASTIC model combined with electrical re‐
sistivity data. This allows a specific assessment of the vulnerability of the dump sur‐
rounding area, based on the distance between anomalous surface layer (low resistivity;
leachate influenced) and groundwater. The soil variable was replaced since soils around
the landfill were classified as sandy, which is characteristic of the whole surroundings
[38]. Thus, ‘S’ corresponds to the distance between the superficial anomalous layer and
groundwater. Values and weights of the variables were kept the same as for soil, given
processes similarity, controlled by these factors (migration and attenuation of leachate).
Layers spatial distribution was not made, given detailed description for each factor in
depth and superficial slight change, as well as study area size [49,50].
For resistivity models and groundwater vulnerability validation, groundwater
depth, pH and sulphates (PO43−) were measured in two wells in the surroundings of the
dump (Figures 3 and S1). Chemical analysis of total phosphate was performed with an
HI96713, with a resolution level of 0.01 mg/l (Figure S1).
3. Results
3.1. Resistivity Models and Potential Contamination Risk
For the analysis of the profiles, the resistivity values of the profiles were adjusted to
the same scale so that each color of the contour in the resistivity model implies the same
resistivity value (Figure 4). In this study, the electrical resistivity models were analyzed
to identify the possible influence of leachate on groundwater contamination. Thus,
anomalous zones that may reflect the leachate migration and contamination process were
identified: (i) leachate generation and migration areas (7.99–16.8 Ω.m); (ii) saturated
zones contaminated by leachate (4.96–7.99 Ω.m); (iii) groundwater and surface water
contaminated by leachate (1.535–7.99 Ω.m); (iv) waste and lithologies local (>16.8 Ω.m).
Figure 4. Calibrated color scale showing the resistivity range of materials and their characteristics.
Profile 1, from south to north of the dump (Figure 5a), is superficially characterized
by high resistivity associated with rubble, house debris and compacted waste in non‐wet
environments from 0 to 35 m. From 240 to 280 m there were zones with a rather hetero‐
geneous anomalous resistivity, which were considered leachate generation and migra‐
tion zones, (7.99–16.8 Ω.m) given the strong accumulation of surface leachates resulting
from the E‐W movement (profile 2) that are diluted with the surface waters, causing
possible contamination (280 to 400 m) (1.535–7.99 Ω.m). At medium depths 30–56.5 we
note the predominance of a vast layer throughout the length of the profile that we inter‐
pret as TPv lithologies, less resistive (12.9–16.8 Ω.m) given the possible influence of hor‐
izontal migration at depth described in profile 2. At deeper levels between 47 and 56.5 m,
anomalous zones are observed, which were considered as lithologies influenced by hor‐
izontal leachate migration and possible contaminated groundwater (>45 m depth)
(1.535–7.99 Ω.m).
Figure 4. Calibrated color scale showing the resistivity range of materials and their characteristics.
Profile 1, from south to north of the dump (Figure 5a), is superficially characterizedby high resistivity associated with rubble, house debris and compacted waste in non-wetenvironments from 0 to 35 m. From 240 to 280 m there were zones with a rather hetero-geneous anomalous resistivity, which were considered leachate generation and migrationzones, (7.99–16.8 Ω.m) given the strong accumulation of surface leachates resulting fromthe E-W movement (profile 2) that are diluted with the surface waters, causing possiblecontamination (280 to 400 m) (1.535–7.99 Ω.m). At medium depths 30–56.5 we note thepredominance of a vast layer throughout the length of the profile that we interpret as TPvlithologies, less resistive (12.9–16.8 Ω.m) given the possible influence of horizontal migra-tion at depth described in profile 2. At deeper levels between 47 and 56.5 m, anomalouszones are observed, which were considered as lithologies influenced by horizontal leachatemigration and possible contaminated groundwater (>45 m depth) (1.535–7.99 Ω.m).
Profile 2, along the W-E direction (Figure 5b), is quite heterogeneous, with high surfaceresistivities from 0 to 140 m, which represents rubble, old house debris, and waste buried ina non-wet environment west of the dump, followed, from 140 to 160 m, by a zone of possiblemigration of surface leachate into the subsurface environment, causing an extensive zoneof subsurface anomalies, which were considered as lithologies contaminated by stronghorizontal migration of leachate with E-W direction (7.99–16.8 Ω.m) and saturated zone ofcontaminated groundwater (1.535–7.99 Ω.m), differentiated levels of semi-confinement of

Water 2022, 14, 1746 8 of 18
aquifers. From 245 to 400 m depths, there were local anomalies and lithologies with higherresistivities, corresponding to highly compacted waste with diverse contents. At depthsranging from 30 to 160 m, semi-confined anomalies (<8.35 m depth) and aquifers (>10 mdepth) separated by semi-saturated layers were noted, demonstrating the existence of apossible continuous connection between the two. These characteristics were described asconducive to groundwater contamination at various depths, mainly in the surroundingsof the Hulene-B waste dump, where surface leachate flows were noted with successiveenrichment of lithological layers (7.99–16.8 Ω.m).
1
Figure 5. Profiles of the variation of the electrical resistivity in the study area.
Profile 3 (Figure 5c) north of the dump in the S-N direction, to study possible dynamicsof groundwater contamination, ~300 m away from the dump. The profile at the surface levelexhibited generally high resistivities, alternating between rubble and highly compactedsoils. At the deeper level (>40 m) in the southern end, an anomalous zone was found andconsidered as contaminated lithologies (7.99–16.8 Ω.m). This anomaly was associated withthe horizontal and vertical migration of leachate described in profile 2.
Profile 4, in the NE-SW direction (Figure 5d), from the starting point to 150 m, showedgenerally high resistivities associated with compacted residues and rubble of old houses.From 150 m depth to the end of the profile, a continuous decrease in resistivity was

Water 2022, 14, 1746 9 of 18
observed, which can be associated with saturated and wet areas with origin in a naturalreceiving basin where new waste deposits were observed, a localized source of dilution,and vertical migration of leachate and groundwater contamination (<7.99 Ω.m).
Between 300 and 310 m, relatively high resistivities were found, associated with wastedeposited in the intra dune depression with low surface moisture level. From 320 m to theend of the profile, a shallow aquifer was evident (<7.99 Ω.m), as this area corresponds to theend of the depression (SW) with a surface covered by humid soils, evidenced by low surfaceresistivities. Between 6 and 56 m in depth, was noticed a large anomaly (16.3–7.99 Ω.m)related to surface influence by leachates propagated to greater depths (>37.4 m) causingpossible groundwater contamination (<7.99 Ω.m).
Profile 5, with a west-east orientation, was at the southern end of the dump (Figure 5e).The electrical resistivity results did not display significant changes at surface level andshowed higher resistivities associated with compacted soils and rubble (including roadasphalt where the profile was executed). This road, besides being in the southern boundaryof the dump, is an access route to the interior of the Hulene-B neighborhood. Between130 and 145 m (>40 m depth) extended a resistive zone of low anomalous values, whichwere interpreted as lithologies that might influence leachate migration (7.99–16.8 Ω.m Ω.m)and possible water contamination by the vertical movement of leachates (1.535–7.99 Ω.m).
Profile 6, this profile was taken at the eastern limit of the dump, along the S-N direction,between the dump and Julius Nyerere Avenue (Figure 5f). From the starting point to 200 m,there were resistivities with average profile values (12.9–33.4 Ω.m). These resistivitiessuggested soils with different levels of compaction and surface moisture that may beassociated with various activities south of the dump. The resistivity of 33.4–53.8 Ω.mcorresponding to a superficial but thick layer, between 160 and 200 m, indicated compactedsoils at the entrance of the dump. From 8.6 m depth, higher resistivity values (>70.3 Ω.m)were noted which may be related to the sandstone stratum with different levels of alteration,typical of the TPv formation [25]. Onwards, in the northern direction, resistivity starts todecrease successively (<27.05 Ω.m) along thick layers with moisture levels that increaseuntil to groundwater (<10.44 Ω.m).
The saturated area occupied a large space, revealing the existence of an E-W ground-water flow parallel, to the dune slope where the leachate is located. The groundwatercontamination process at this point may be occurring horizontally due to leachate diffusion,causing localized anomalous resistivities (<10.445 Ω.m) close to the groundwater resistivity(<7.99 Ω.m). From 240 m, resistivity begins to decrease, generating localized anomalouszones in the subsurface, which are associated with vertical leachate migration, pointing tothe occurrence of two isolated “hot spots”. Between 240 and 280 m, below the first “hotspots”, there was a tendency for a significant increase in resistivity, which may correspondto less saturated layers up to the least conductive stratum (>33.4 Ω.m). Profile data showedthe existence of two mechanisms of possible saturated zone and groundwater contamina-tion which were, horizontal dilution in the south and center of the profile, and verticalmigration (<16.8 Ω.m) and retention of leachate in localized “hot spots”.
3.2. Modified DRASTIC Index3.2.1. Depth to Water Table (D)
Aller et al. [12] refer that the depth of the water table determines the depth throughwhich a contaminant moves before reaching the aquifer and determines the contact timewith the surrounding media. Thus, a greater possibility of contamination mitigation occurswhen the depth of the water table is greater because a deeper water table implies moretravel time and less vulnerability to contamination [13]. Thus, the deeper the phreatictable implies more travel time and less vulnerability to contamination [13,47]. On theeastern, southwestern and northern boundary of the dump (area covered by profiles6, 4, 2 and 1), subsurface waters and groundwater were detected between 1.5 and 4.6 m,and on the southern, northern and western boundary at depths >30 m (area covered byprofiles 5 and 3). Results for the eastern border southwest and northwest were similar to

Water 2022, 14, 1746 10 of 18
those published by [28], who classified the predominant aquifers in Maputo city as shallowand phreatic aquifers, estimating their average depth between 1.5 and 9.3 m. DRASTICparameters of 9 and 1, respectively, were assigned, and D = 5 (Tables 1 and 2).
Table 2. Parameter values considered in the DRASTIC Index.
Characteristics of the Surroundings of theWaste Dump P1 P2 P3 P4 P5 P6 Mean
Depth of groundwater level 45 45 5 45 5 45 31.6
Recharge capacity 32 32 32 32 32 32 32
Sands 21 21 21 21 21 21 21
Distance of anomalous surface layerand groundwater 20 20 2 20 2 20 14
Plan, soft dune and interdune depression 10 5 10 10 5 10 8.3
Sands 40 40 20 40 20 40 33.3
Hydraulic conductivity 6 6 6 6 6 6 6
DRASTIC index: 174 169 96 174 91 174 146.3
P—Profile.
3.2.2. Net Recharge (R)
Net recharge is the amount of surface water that infiltrated the underground andreaches groundwater [6], indicating the amount of water from precipitation that wasavailable for vertical transport, dispersion, and dilution of pollutants from a given applica-tion point [5,12]. Recharge water in the dump’s surroundings is a source of contaminanttransport within the vadose zone to the aquifer [19]. The greater the recharge, the morevulnerable the groundwater [51]. Given the small area analyzed in this study, data used ac-cording to Momade et al. [38] and Vicente [36] estimates the value of groundwater rechargein Maputo city between 165 and 185 mm/year for the entire Hulene-B dump surroundingarea. A value of 8 was assigned to the area and R = 4 (Tables 1 and 2).
3.2.3. Aquifer Media (A)
Aquifer media refers to a rock in the ground that serves as water storage [52]. Itindicates material property that controls pollutant attenuation processes based on thepermeability of each layer [53]. The attenuation characteristic of the aquifer material isreflected by the mobility of contaminants through aquifer media [47]. In the surroundingsof the Hulene-B dump, two types of semi-confined (west of profile area, 2) and shallow(south-west of profile area 1, 4 and area covered by profile 6) aquifers were assumed toexist, which have been described by Momade et al. [38], Vicente [36], and Cendon et al. [26],composed of inland dune sands and semi-permeable sands, and recharge occurs mainly byprecipitation given the permeable surfaces such as dune sands. The value of 7 was assignedto the area around the Hulene-B dump and A = 3 (Tables 1 and 2).
3.2.4. Distance of the Anomalous Surface Layer and Groundwater (S)
The distance between anomalous surface layer (low resistivities) generally representssurfaces contaminated by leachates in areas close to landfills [42]. Anomalous surface togroundwater band areas were characterized by intense leachate migration, which wasevidenced by transected profiles 2 (<10.445 Ω.m) and 6 (<16.8 Ω.m). The area north ofprofile 1 and southwest of profile 4 show intense anomalies that we interpret as a shallowaquifer (4) and surface soils enriched by leachates (1) that accumulate successively to thewest that can easily migrate into the confined aquifer described in (2). However, otherprofiles did not show bands with the continuous connection of anomalies and groundwater.The area covered by profiles 1, 2, 4 and 6 was assigned the value 10 and other areas value 1,and S = 2 (Tables 1 and 2).

Water 2022, 14, 1746 11 of 18
3.2.5. Topography (T)
Topography refers to the slope of an area [47]. It controls the probability of a pollutantbeing transported by runoff or remaining in the soil where it may be infiltrated [12]. Thesofter the slope (slope of 0–2%), the higher the water and/or pollutant holding capacity,while in slopes >10%, lower water and/or pollutant holding capacity occurs [12]. In thesurroundings of the dump, the relief is heterogeneous (Figure 2). The area covered byprofiles 1, 3, 4 and 6 did not present slopes. However, the area covered by profiles 2 and5 has sloped >10%. Thus, the area covered by profiles 2 and 5 was assigned the value 5 andthe other areas were assigned the value is 10, and T = 1 (Tables 1 and 2).
3.2.6. Vadose (I)
The vadose zone is the unsaturated zone that lies below the soil horizon and above thewater table [47]. It determines the attenuation characteristics of the contaminants [12]. Themovement of contaminants into the saturated zone is controlled by this parameter. Alleret al. [12] and Asfaw et al. [47] refer that if the flood zone consists of sand, the potential riskof contamination of the aquifer is very high. The surrounding soils of the Hulene-B dumpare dune sands. However, the combination of electrical resistivity data showed specificcharacteristics, which allowed us to classify in detail the environment of the dump. Thearea covered by profiles 3 and 5 was characterized by having very resistive surface layers,showing a low infiltration rate, so a value of 4 was assigned. Profile 1 was heterogeneous,with half of the area covered being very resistive(south) and with very low resistivities, theassigned value was 8. Profiles 2, 4 and 6 had a lower resistivity, showing higher infiltration,which is typical of sandy soils, so a value of 8 was assigned, and I = 5 (Tables 1 and 2).
3.2.7. Hydraulic Conductivity (C)
Hydraulic conductivity is described as the ability of materials to transmit water toaquifers, in turn controlling the rate of groundwater and contaminant material flow undera given hydraulic gradient [13]. It controls contaminant migration and dispersion from theinjection point within the saturated zone [47]. In the surroundings of the Hulene-B wastedump, the hydraulic conductivity was estimated by Momade et al. [38] as 1–5 m/d. Forthe whole studied area, a value of 2 was assigned, and C = 3 (Tables 1 and 2).
3.3. Descriptive Statistics of Electrical Resistivity and DRASTIC Index
The electrical resistivity values of the areas covered by the profiles were projected withthe vulnerability index values (Table 3). In general, the areas covered by profiles 2, 4 and6 were classified as having a high DRASTIC index. The profile areas 2 and 4, with meanresistivity values of 20.22 and 18.1 Ω.m, respectively, suggested the predominance of lowerresistivity across the profile surface area which extends into the groundwater, suggestingsuccessive leachate migration.
Table 3. Mean, maximum, minimum, standard deviation of resistivity values (Ω.m) and DRASTIC index.
ID Min Max Mean SD Modified DRASTIC
P1 8.64 42.36 20.78 5.72 174
P2 5.37 119.1 20.22 9.31 169
P3 10.12 50.8 31.01 7.3 96
P4 6.98 41.19 18.1 4.64 174
P5 1.04 477.1 37.35 31.86 91
P6 3.06 207 49.2 32.78 174SD—standard deviation.
The area covered by profile 6 had an average of 49.2 Ω.m, a minimum of 3.06 Ω.mand a maximum of 207 Ω.m. The average resistivity value was relatively higher but

Water 2022, 14, 1746 12 of 18
showed a much higher standard deviation (32.78 Ω.m), revealing resistivity heterogeneity,marked by the existence of surface anomalous bands that connect with the groundwaterat various points, which may be associated with a greater migration of leachates andgroundwater contamination.
Areas covered by profiles 3 and 5 revealed a low DRASTIC index and heterogeneouselectrical resistivity. Thus, the area covered by profile 1 showed heterogeneity in surfaceand subsurface anomalies that may be associated with vertical and horizontal migration ofcontaminants with minimum resistivity values of (1.535–7.99 Ω.m) revealing a higher riskof contamination of the semi-confined aquifers described in profile 2. However, the greaterdepth at which the groundwater was detected reveals a natural attenuation mechanismof contamination by the underlying lithologies. The area covered by profile 3 showed anaverage resistivity of 31.01 Ω.m, ranging from 10.12 to 50.8 Ω.m. These results suggest thepredominance of high resistivity values, which is translated by a reduced predominanceof resistive surfaces that were interpreted as less permeable and less contaminated sub-strates. The minimum resistivity at great depths (7.99–10.12 Ω.m) may be associated with asaturated area or localized influence of horizontal migration of contaminants, describedin profile 2. The area covered by profile 5, presented an average resistivity of 37.35 Ω.m,ranging from 1.04 to 477.1 Ω.m. Groundwater was detected at depths >40 m, with less riskof contamination by vertical migration.
The low DRASTIC values in areas covered by profiles 3, and 5 resulted from thecombination of two factors, high resistivities prevailing in the surface lithologies suggestinglow infiltration, which greatly reduces the risk of vertical migration of leachate to deeplayers, and greater depth at which, resistivities interpreted as groundwater, were found.In general, data showed areas covered by profiles, with high average resistivity, withlower DRASTIC index (profiles 3 and 5) (Figure 6). Exceptionally, the area covered byprofile 6 showed a high DRASTIC index with relatively high mean resistivity values dueto its higher standard deviation and predominance of resistivities <10.445 Ω.m in a largesurface strip that was associated with leachate migration to groundwater at low depththan in all profiles. However, in the area covered by profiles 1, 2 and 4, the presence ofresistive anomalies was considered as semi-confined and shallow aquifers and surfaceanomalies that are conducive to contaminant migration were determining factors for highDRASTIC index.
Water 2022, 14, x FOR PEER REVIEW 13 of 19
tivity, with lower DRASTIC index (profiles 3 and 5) (Figure 6). Exceptionally, the area
covered by profile 6 showed a high DRASTIC index with relatively high mean resistivity
values due to its higher standard deviation and predominance of resistivities <10.445
Ω.m in a large surface strip that was associated with leachate migration to groundwater
at low depth than in all profiles. However, in the area covered by profiles 1, 2 and 4, the
presence of resistive anomalies was considered as semi‐confined and shallow aquifers
and surface anomalies that are conducive to contaminant migration were determining
factors for high DRASTIC index.
Figure 6. Electrical resistivity values (minimum, maximum, mean, standard deviation Ω.m) and
modified DRASTIC Index. Maximum value of profile 5 (477.1 Ω.m) was set to (200) to maintain
the scale within the limits of the perceived index.
4. Data Integration
The resistivity data of the areas covered by the profiles 1, 2, 4 and 6, with a pre‐
dominance of surface and groundwater resistivity anomalies, was described in other
studies suggesting leachate migration [54], and groundwater contamination [7], mainly
in areas surrounding non‐isolated dumps where leachate can freely circulate through
adjacent lithologies and subsequently affecting the vadose zone and groundwater [55].
Surface circulation and leachate infiltration are well evidenced in profiles 1, 2, 4 and 6, by
surface and subsurface resistive anomalies, indicative of contamination [56].
In the area covered by profiles 1 (in the north), 2 and 4, continuous anomalies from
surface to groundwater were noted, described as lithological migration bands of leachate
to groundwater [57,58]. The area transacted by profile 6, besides showing an extensive
layer with low resistivities (<10.445 Ω.m), has been considered in similar studies as a
saturated zone and groundwater under leachate influence [45,59]. In the north of the
dump, two localized points of resistive anomalies were identified as “hot spots” [60,61]
resulting from vertical migration and localized accumulation of contaminants Feng et al.
[62], and may be associated with the confined aquifer system, described in this zone as
quite vulnerable to contamination given its proximity to the surface and sandy charac‐
teristics of the vadose zone [26].
The electrical resistivity data of the areas covered by profiles 3 and 5 were charac‐
terized by high resistivities, and associated with low contaminant infiltration capacity
[13], given high surface compaction [63]. The area transacted by profile 3 is located far
from the waste dump (>350 m), revealing that contaminants may not be reaching this
area. Morita et al. [64] and Touzani et al. [9] demonstrated that a resistivity increase away
from dumpsites represents a significant decrease in contamination due to the attenuating
role of soils and groundwater. Groundwater at great depths in the area covered by pro‐
files 1, 3 and 5 has been described in similar studies as a determinant of low contamina‐
Figure 6. Electrical resistivity values (minimum, maximum, mean, standard deviation Ω.m) andmodified DRASTIC Index. Maximum value of profile 5 (477.1 Ω.m) was set to (200) to maintain thescale within the limits of the perceived index.
4. Data Integration
The resistivity data of the areas covered by the profiles 1, 2, 4 and 6, with a predom-inance of surface and groundwater resistivity anomalies, was described in other studiessuggesting leachate migration [54], and groundwater contamination [7], mainly in areassurrounding non-isolated dumps where leachate can freely circulate through adjacentlithologies and subsequently affecting the vadose zone and groundwater [55]. Surface

Water 2022, 14, 1746 13 of 18
circulation and leachate infiltration are well evidenced in profiles 1, 2, 4 and 6, by surfaceand subsurface resistive anomalies, indicative of contamination [56].
In the area covered by profiles 1 (in the north), 2 and 4, continuous anomalies fromsurface to groundwater were noted, described as lithological migration bands of leachate togroundwater [57,58]. The area transacted by profile 6, besides showing an extensive layerwith low resistivities (<10.445 Ω.m), has been considered in similar studies as a saturatedzone and groundwater under leachate influence [45,59]. In the north of the dump, twolocalized points of resistive anomalies were identified as “hot spots” [60,61] resulting fromvertical migration and localized accumulation of contaminants Feng et al. [62], and may beassociated with the confined aquifer system, described in this zone as quite vulnerable tocontamination given its proximity to the surface and sandy characteristics of the vadosezone [26].
The electrical resistivity data of the areas covered by profiles 3 and 5 were character-ized by high resistivities, and associated with low contaminant infiltration capacity [13],given high surface compaction [63]. The area transacted by profile 3 is located far fromthe waste dump (>350 m), revealing that contaminants may not be reaching this area.Morita et al. [64] and Touzani et al. [9] demonstrated that a resistivity increase away fromdumpsites represents a significant decrease in contamination due to the attenuating roleof soils and groundwater. Groundwater at great depths in the area covered by profiles1, 3 and 5 has been described in similar studies as a determinant of low contaminationrisk [18,65], which partly explains the low DRASTIC index in these areas. Paul et al. [53]and Boumaiza et al. [66] mentioned that the depth of groundwater and the characteristicsof the infiltration zone are the most important factors determining the DRASTIC risk.
Gemail et al. [13], Shah et al. [15] and Nasri et al. [67] integrated electrical conduc-tivity and DRASTIC data and concluded that areas with the highest DRASTIC indexaround dumps, generally exhibit low electrical resistivity associated with the migration ofcontamination through adjacent lithologies that may subsequently reach groundwater.
The spatial projection of the Vulnerability Index in the surroundings of the Hulene-B dump was revealed to be higher to the east, southwest and northwest of the dump,with high and transient relief, and lower to the south and west of the dump with lowelevation, except for the southern area which is transient (Figure 7). Tan et al. [68] andBlarasin et al. [69] have reported that contamination of the upper levels of water tablesleads to the dispersion of contaminants to larger areas.
Water 2022, 14, x FOR PEER REVIEW 14 of 19
tion risk [18,65], which partly explains the low DRASTIC index in these areas. Paul et al.
[53] and Boumaiza et al. [66] mentioned that the depth of groundwater and the charac‐
teristics of the infiltration zone are the most important factors determining the DRASTIC
risk.
Gemail et al. [13], Shah et al. [15] and Nasri et al. [67] integrated electrical conduc‐
tivity and DRASTIC data and concluded that areas with the highest DRASTIC index
around dumps, generally exhibit low electrical resistivity associated with the migration
of contamination through adjacent lithologies that may subsequently reach groundwater.
The spatial projection of the Vulnerability Index in the surroundings of the Hulene‐B
dump was revealed to be higher to the east, southwest and northwest of the dump, with
high and transient relief, and lower to the south and west of the dump with low eleva‐
tion, except for the southern area which is transient (Figure 7). Tan et al. [68] and Blarasin
et al. [69] have reported that contamination of the upper levels of water tables leads to the
dispersion of contaminants to larger areas.
Figure 7. Spatial projection of the modified DRASTIC in surroundings of the Hulene‐B dump:
dashed in white represents low vulnerability and in black high vulnerability.
The combination of electrical resistivity data for the assessment of groundwater
vulnerability indices is an important tool for DRASTIC factors assessment, such as:
groundwater depth, and intrinsic characteristics of the vadose zone. The modification of
the “soil” factor in the original DRASTIC by the “distance between the anomalous sur‐
face layer and groundwater” is important in areas with potential contaminant migration
to groundwater, as well as in studies aiming to outline remediation measures in areas of
groundwater contamination flow.
Measured groundwater depth in the northern well (WN) was 6.5 m, and the south‐
ern well (WS) was 5.1 m similar to the electrical resistivity model (Table 4). However, The
WS location was further south of the profile 4 area and results showed that groundwater
levels tended to be more at the surface when approaching intradunar depression.
Groundwater pH and PO43− was 6.1, 1.33 mg/l in WS and, 8.4 and 0.43 mg/l, respectively.
Phosphate results were above the natural groundwater reference value of 0.005 to 0.05
mg/l [70]. Previous studies suggested that active waste dumps have a phosphate pro‐
duction of 1–100 mg/l, which can be incorporated into groundwater by leaching [71,72].
The prolonged consumption of water contaminated with high levels of phosphates can
Figure 7. Spatial projection of the modified DRASTIC in surroundings of the Hulene-B dump: dashedin white represents low vulnerability and in black high vulnerability.

Water 2022, 14, 1746 14 of 18
The combination of electrical resistivity data for the assessment of groundwater vulner-ability indices is an important tool for DRASTIC factors assessment, such as: groundwaterdepth, and intrinsic characteristics of the vadose zone. The modification of the “soil”factor in the original DRASTIC by the “distance between the anomalous surface layer andgroundwater” is important in areas with potential contaminant migration to groundwater,as well as in studies aiming to outline remediation measures in areas of groundwatercontamination flow.
Measured groundwater depth in the northern well (WN) was 6.5 m, and the southernwell (WS) was 5.1 m similar to the electrical resistivity model (Table 4). However, The WSlocation was further south of the profile 4 area and results showed that groundwater levelstended to be more at the surface when approaching intradunar depression. GroundwaterpH and PO4
3− was 6.1, 1.33 mg/L in WS and, 8.4 and 0.43 mg/L, respectively. Phosphateresults were above the natural groundwater reference value of 0.005 to 0.05 mg/L [70].Previous studies suggested that active waste dumps have a phosphate production of1–100 mg/L, which can be incorporated into groundwater by leaching [71,72]. The pro-longed consumption of water contaminated with high levels of phosphates can damageblood vessels, damage kidneys, cause osteoporosis and induce aging processes [73].
Table 4. Data validation of electrical resistivity and modified DRASTIC.
ID Depth pH RfD [70] PO43− RfD [70]
WS 5.1 m 6.16.5–8.5
1.33 mg/L0.005–0.05 mg/L
WN 6.5 m 8.4 0.43 mg/LRfD—Natural reference value.
5. Conclusions
In this study, the combination of electrical resistivity and modified DRASTIC modelswas effective in describing the hydrogeological particularities, estimating in detail ground-water vulnerability, and identifying areas of possible leachate migration into groundwaterin the surroundings of the Hulene-B dump. Areas covered by profiles 1 (north), 2, 4 and6 showed strong indications of possible groundwater contamination, with a modifiedDRASTIC index which was very high (169–174) due to the proximity of groundwater to thecontaminating surface (dump) and the connection of continuous anomalous layers fromthe surface to the aquifers. In the area of profiles 3 and 5 the index was low (91–96) due tothe strong resistivity of the surface layers and the high depth at which groundwater wasdetected (>40 m).
The overall value of the DRASTIC modified index for the surrounding area wasestimated at 146 representing a medium overall vulnerability. However, a higher vul-nerability index in areas covered by profiles 1, 2, 4 and 6, given their relatively higheraltitude (2 and 6), suggested groundwater contamination by horizontal dilution. Studieswere underway to assess areas of suspected vertical migration of leachate by chemicalanalysis as well as groundwater. Groundwater depth local validation data was similar tothe electrical resistivity model. Groundwater contamination risk identified by the modifiedDRASTIC vulnerability index was confirmed by high levels of phosphates in groundwatersamples studied.
Several challenges remain for further studies, such as quantitative studies to validateareas of leachate migration that continuously connect to groundwater in areas coveredby profiles 2, 4 and 6 and chemical analysis of surrounding wells water, and contamina-tion studies of surrounding soils at different depths, especially in areas with suspectedcontaminant migration.
Supplementary Materials: The following supporting information can be downloaded at: https://www.mdpi.com/article/10.3390/w14111746/s1, Figure S1: Sampling and chemical analysis of wellwater (a) Water collection—South well (b) Result of phosphate analysis —North well; (c) Chemicalanalysis process (d) South well.

Water 2022, 14, 1746 15 of 18
Author Contributions: Methodology, B.B. and F.R.; validation, B.B., C.C. and F.R.; formal analysis,C.C. and F.R.; writing—original draft pr appendix eparation, B.B.; writing—review and editing, B.B.,C.C. and F.R.; supervision, F.R. and C.C. All authors have read and agreed to the published versionof the manuscript.
Funding: This work was supported by GeoBioTec (UIDB/04035/2020) Research Center, funded byFEDER funds through the Operational Program Competitiveness Factors COMPETE and by Nationalfunds through FCT. First author acknowledges grants from the Portuguese Institute Camões and FNI(Investigation National Fund—Mozambique).
Data Availability Statement: Not applicable.
Conflicts of Interest: The authors declare no conflict of interest.
References1. González-Arqueros, M.L.; Domínguez-Vázquez, G.; Alfaro-Cuevas-Villanueva, R.; Israde-Alcántara, I.; Buenrostro-Delgado, O.
Hazardous solid waste confined in closed dump of Morelia: An urgent environmental liability to attend in developing countries.Sustainability 2021, 13, 2557. [CrossRef]
2. Rathi, B.S.; Kumar, P.S. Critical review on hazardous pollutants in water environment: Occurrence, monitoring, fate, removaltechnologies and risk assessment. Sci. Total Environ. 2021, 797, 149134. [CrossRef] [PubMed]
3. Boufekane, A.; Yahiaoui, S.; Meddi, H.; Meddi, M.; Busico, G. Modified DRASTIC index model for groundwater vulnerabilitymapping using geostatistic methods and GIS in the Mitidja plain area (Algeria). Environ. Forensics 2021, 1–18. [CrossRef]
4. Saranya, T.; Saravanan, S. A comparative analysis on groundwater vulnerability models—Fuzzy DRASTIC and fuzzy DRASTIC-L.Environ. Sci. Pollut. Res. 2021, 1–15. [CrossRef] [PubMed]
5. Sresto, M.A.; Siddika, S.; Haque, M.N.; Saroar, M. Groundwater vulnerability assessment in Khulna district of Bangladesh byintegrating fuzzy algorithm and DRASTIC (DRASTIC-L) model. Model. Earth Syst. Environ. 2021, 1–15. [CrossRef]
6. Ghosh, R.; Sutradhar, S.; Mondal, P.; Das, N. Application of DRASTIC model for assessing groundwater vulnerability: A study onBirbhum district, West Bengal, India. Model. Earth Syst. Environ. 2021, 7, 1225–1239. [CrossRef]
7. El Mouine, Y.; El Hamdi, A.; Morarech, M.; Kacimi, I.; Touzani, M.; Mohsine, I.; Tiouiouine, A.; Ouardi, J.; Zouahri, A.;Yachou, H.; et al. Landfill pollution plume survey in the Moroccan Tadla using spontaneous potential. Water 2021, 13, 910.[CrossRef]
8. Kayode, J.S.; Arifin, M.H.; Nawawi, M. Characterization of a proposed quarry site using multi-electrode electrical resistivitytomography. Sains Malays. 2019, 48, 945–963. [CrossRef]
9. Touzani, M.; Mohsine, I.; Ouardi, J.; Kacimi, I.; Morarech, M.; El Bahajji, M.H.; Bouramtane, T.; Tiouiouine, A.; Yameogo, S.;El Mahrad, B. Mapping the pollution plume using the self-potential geophysical method: Case of Oum Azza Landfill, Rabat,Morocco. Water 2021, 13, 961. [CrossRef]
10. Zhang, J.; Zhang, J.; Xing, B.; Liu, G.D.; Liang, Y. Study on the effect of municipal solid landfills on groundwater by combining themodels of variable leakage rate, leachate concentration, and contaminant solute transport. J. Environ. Manag. 2021, 292, 112815.[CrossRef]
11. Mepaiyeda, S.; Madi, K.; Gwavava, O.; Baiyegunhi, C. Geological and geophysical assessment of groundwater contamination atthe Roundhill landfill site, Berlin, Eastern Cape, South Africa. Heliyon 2020, 6, e04249. [CrossRef] [PubMed]
12. Aller, G.; Bennett, L.; Lehr, T.; Petty, J.H.; Hackett, R.J. DRASTIC: A Standardized Method for Evaluating Ground Water PollutionPotential Using Hydrogeologic Settings; USEPA Report 600/2-87/035; U.S. Environmental Protection Agency: Washington, DC,USA, 1987.
13. Gemail, K.S.; El Alfy, M.; Ghoneim, M.F.; Shishtawy, A.M.; El-Bary, M.A. Comparison of DRASTIC and DC resistivity modelingfor assessing aquifer vulnerability in the central Nile Delta, Egypt. Environ. Earth Sci. 2017, 76, 350. [CrossRef]
14. Voudouris, K.; Kazakis, N. Groundwater quality and groundwater vulnerability assessment. Environments 2021, 8, 100. [CrossRef]15. Shah, S.H.I.A.; Yan, J.; Ullah, I.; Aslam, B.; Tariq, A.; Zhang, L.; Mumtaz, F. Classification of aquifer vulnerability by using the
DRASTIC index and geo-electrical techniques. Water 2021, 13, 2144. [CrossRef]16. Arowoogun, K.I.; Osinowo, O.O. 3D resistivity model of 1D vertical electrical sounding (VES) data for groundwater potential and
aquifer protective capacity assessment: A case study. Model. Earth Syst. Environ. 2021, 8, 2615–2626. [CrossRef]17. Dhakate, R.; Mogali, N.J.; Modi, D. Characterization of proposed waste disposal site of granite quarry pits near Hyderabad using
hydro-geophysical and groundwater modeling studies. Environ. Earth Sci. 2021, 80, 516. [CrossRef]18. George, N.J. Geo-electrically and hydrogeologically derived vulnerability assessments of aquifer resources in the hinterland of
parts of Akwa Ibom State, Nigeria. Solid Earth Sci. 2021, 6, 70–79. [CrossRef]19. Islami, N.; Irianti, M.; Fakhruddin, F.; Azhar, A.; Nor, M. Application of geoelectrical resistivity method for the assessment of
shallow aquifer quality in landfill areas. Environ. Monit. Assess. 2020, 192, 606. [CrossRef]20. El Naqa, A. Aquifer vulnerability assessment using the DRASTIC model at Russeifa landfill, northeast Jordan. Environ. Geol.
2004, 47, 51–62. [CrossRef]

Water 2022, 14, 1746 16 of 18
21. Vosoogh, A.; Baghvand, A.; Karbassi, A.; Nasrabadi, T. Landfill site selection using pollution potential zoning of aquifers bymodified DRASTIC method: Case study in Northeast Iran. Iran. J. Sci. Technol. Trans. Civ. Eng. 2017, 41, 229–239. [CrossRef]
22. Santhosh, L.G.; Sivakumar Babu, G.L. Landfill site selection based on reliability concepts using the DRASTIC method and AHPintegrated with GIS—A case study of Bengaluru city, India. Georisk 2018, 9518, 234–252. [CrossRef]
23. Abad, P.M.S.; Pazira, E.; Abadi, M.H.M. Application AHP-PROMETHEE technic for landfill site selection on based assessment ofaquifers vulnerability to pollution. Iran. J. Sci. Technol. Trans. Civ. Eng. 2021, 45, 1011. [CrossRef]
24. Majolagbe, A.O.; Adeyi, A.A.; Osibanjo, O. Vulnerability assessment of groundwater pollution in the vicinity of an activedumpsite (Olusosun), Lagos, Nigeria. Chem. Int. 2016, 2, 232–241.
25. Nogueira, G.; Stigter, T.Y.; Zhou, Y.; Mussa, F.; Juizo, D. Understanding groundwater salinization mechanisms to secure freshwaterresources in the water-scarce city of Maputo, Mozambique. Sci. Total Environ. 2019, 661, 723–736. [CrossRef] [PubMed]
26. Cendón, D.I.; Haldorsen, S.; Chen, J.; Hankin, S.; Nogueira, G.; Momade, F.; Achimo, M.; Muiuane, E.; Mugabe, J.; Stigter, T.Y.Hydrogeochemical aquifer characterization and its implication for groundwater development in the Maputo district, Mozambique.Quat. Int. 2019, 547, 113–126. [CrossRef]
27. Bernardo, B.; Candeias, C.; Rocha, F. Characterization of the dynamics of leachate contamination plumes in the surroundings ofthe Hulene-B waste dump in Maputo, Mozambique. Environments 2022, 9, 19. [CrossRef]
28. Muchimbane, A.B.D. Estudo dos Indicadores da Contaminação das Aguas Subterrâneas por Sistemas de Saneamento in Situ–Distrito Urbano 4, Cidade de Maputo, Moçambique. Master’s Thesis, University of São Paulo, Instituto de Geociências, SãoPaulo, Brasil, 2010. [CrossRef]
29. Serra, C. Da Problemática Ambiental à Mudança: Rumo à Um Mundo Melhor; Editora Escolar: Maputo, Mozambique, 2012;ISBN 9789896700300.
30. INE (Instituto Nacional de Estatistica). Boletim de Estatísticas Demográficas e Sociais, Maputo Cidade 2019. Available online:http://www.ine.gov.mz/estatisticas/estatisticas-demograficas-e-indicadores-sociais/boletim-de-indicadores-demograficos-22-de-julho-de-2020.pdf/at_download/file (accessed on 10 January 2022).
31. VOA. Desabamento de Lixeira Deixa 17 Mortos em Maputo. Voice of America News. Available online: https://www.voaportugues.com/a/desabamento-lixeira-17-mortos-maputo/4260624.html (accessed on 30 September 2021).
32. Ferrão, D.A.G. Evaluation of Removal and Disposal of Solid Waste in Maputo City, Mozambique. Master’s Thesis, University ofCape Town, Cape Town, South Africa, 2006. Available online: http://hdl.handle.net/11427/4851 (accessed on 10 August 2021).
33. Sarmento, L.; Tokai, A.; Hanashima, A. Analyzing the structure of barriers to municipal solid waste management policy planningin Maputo city, Mozambique. Environ. Dev. 2015, 16, 76–89. [CrossRef]
34. Matsinhe, F.O.; Paulo, M. Estudo etnográfico sobre os catadores de lixo da lixeira de hulene (Maputo). Cad. Afr. Contemp. 2020, 3.35. Palalane, J.; Segala, I.; Opressa, I. Urbanização e Desenvolvimento Municipal em Moçambique: Gestão de Resíduos Sólidos; Instituto
Brasileiro de Administração Municipal, Área de Desenvolvimento Urbano e Meio Ambiente: Rio de Janeiro, RJ, Brazil, 2008; p. 12.Available online: https://www.scribd.com/document/419123335/Gestao-de-Residuos-Solidos-Em-Mocambique (accessed on7 August 2021).
36. Vicente, E.M. Aspects of the Enginering Geologic of Maputo City. Ph.D. Thesis, School of Agricultural, Earth and EnvironmentalSciences, Pietermaritzburg. Soth Africa, 2011; pp. 22–38. Available online: http://hdl.handle.net/10413/8078 (accessed on10 January 2022).
37. Vicente, E.M.; Jermy, C.A.; Schreiner, H.D. Urban geology of Maputo, Mocambique. Geol. Soc. 2006, 338, 1–13. Available online:https://citeseerx.ist.psu.edu/viewdoc/download?doi=10.1.1.606.7220&rep=rep1&type=pdf (accessed on 3 January 2022).
38. Momade, J.T.; Ferrara, F.J.; Oliveira, M. Notícia Explicativa da Carta Geológica 2532 Maputo; Escala: Maputo, Mozambique, 1996.(In Portuguese)
39. CIAT. Climate-Smart Agriculture in Mozambique; International Center for Tropical Agriculture: Cali, Colombia, 2017; pp. 1–25.40. Dos Muchangos, A. Paisagens e Regiões Naturais, Maputo; Editora Escolar: Lisboa, Maputo, 1999; pp. 5–163. (In Portuguese)41. Koda, E.; Tkaczyk, A.; Lech, M.; Osinski, P. Application of electrical resistivity data sets for the evaluation of the pollution
concentration level within landfill subsoil. Appl. Sci. 2017, 7, 262. [CrossRef]42. Lau, A.M.P.; Ferreira, F.J.F.; Stevanato, R.; da Rosa Filho, E.F. Geophysical and physicochemical investigations of an area
contaminated by tannery waste: A case study from southern Brazil. Environ. Earth Sci. 2019, 78, 517. [CrossRef]43. Akhtar, J.; Sana, A.; Tauseef, S.M.; Chellaiah, G.; Kaliyaperumal, P.; Sarkar, H.; Ayyamperumal, R. Evaluating the groundwater
potential of Wadi Al-Jizi, Sultanate of Oman, by integrating remote sensing and GIS techniques. Environ. Sci. Pollut. Res. 2022,1–12. [CrossRef] [PubMed]
44. Bernardo, B.; Candeias, C.; Rocha, F. Application of geophysics in geo-environmental diagnosis on the surroundings of thehulene-b waste dump, Maputo, Mozambique. J. Afr. Earth Sci. 2022, 185, 104415. [CrossRef]
45. Adamo, N.; Al-Ansari, N.; Sissakian, V.; Laue, J.; Knutsson, S. Geophysical methods and their applications in dam safetymonitoring. J. Earth Sci. Geotech. Eng. 2020, 11, 291–345. [CrossRef]
46. Geotomo. RES2DINV ver. 3.59—Rapid 2-D Resistivity & IP Inversion using the Least-Squares Method Wenner, Dipole-Dipole, Inline Pole-Pole, Pole-Dipole, Equatorial Dipole-Dipole, Offset Pole-Dipole, Wenner-Schlumberger, Gradient and Non-Conventional Arrays, 2010, 1–148. Available online: http://epsc.wustl.edu/~epsc454/instruction-sheets/Res2dinv03.59.pdf(accessed on 10 January 2022).

Water 2022, 14, 1746 17 of 18
47. Asfaw, D.; Mengistu, D. Modeling megech watershed aquifer vulnerability to pollution using modified DRASTIC model forsustainable groundwater management, Northwestern Ethiopia. Groundw. Sustain. Dev. 2020, 11, 100375. [CrossRef]
48. Anshumala, K.; Shukla, J.P.; Patel, S.S.; Singh, A. Assessment of groundwater vulnerability zone in mandideep industrial areausing DRASTIC model. J. Geol. Soc. India 2021, 97, 1080–1086. [CrossRef]
49. Hosseini, M.; Saremi, A. Assessment and estimating groundwater vulnerability to pollution using a modified DRASTIC andGODS models (Case study: Malayer plain of Iran). Civ. Eng. J. 2018, 4, 433. [CrossRef]
50. Kozłowski, M.; Sojka, M. Applying a modified DRASTIC model to assess groundwater vulnerability to pollution: A case study inCentral Poland. Pol. J. Environ. Stud. 2019, 28, 1223–1231. [CrossRef]
51. Hasan, M.A.; Ahmad, S.; Mohammed, T. Groundwater contamination by hazardous wastes. Arab. J. Sci. Eng. 2021, 46, 4191–4212.[CrossRef]
52. Ersoy, A.; Gültekin, F. DRASTIC-based methodology for assessing groundwater vulnerability in the Gümüshacıköy and Merzifonbasin (Amasya, Turkey). Earth Sci. Res. J. 2013, 17, 33–40. Available online: https://www.scielo.org.co/scielo.php?pid=S1794-61902013000100006&script=sci_arttext&tlng=en (accessed on 15 January 2022).
53. Paul, S.; Surabhi, C. An investigation of groundwater vulnerability in the North 24 parganas district using DRASTIC andhybrid-DRASTIC models: A case study. Environ. Adv. 2021, 5, 100093. [CrossRef]
54. Parvin, F.; Tareq, S.M. Impact of landfill leachate contamination on surface and groundwater of Bangladesh: A systematic reviewand possible public health risks assessment. Appl. Water Sci. 2021, 11, 100. [CrossRef] [PubMed]
55. Wysocka, M.E.; Zabielska-Adamska, K. Impact of Protective Barriers on Groundwater Quality. In Proceedings of the 10thInternational Conference: Environmental Engineering, Vilnius, Lithuania, 27–28 April 2017. [CrossRef]
56. Netto, L.G.; Filho, W.M.; Moreira, C.A.; di Donato, F.T.; Helene, L.P.I. Delineation of necroleachate pathways using electricalresistivity tomography (ERT): Case study on a cemetery in Brazil. Environ. Chall. 2021, 5, 100344. [CrossRef]
57. Yap, C.K.; Chew, W.; Al-Mutairi, K.A.; Nulit, R.; Ibrahim, M.H.; Wong, K.W.; Bakhtiari, A.R.; Sharifinia, M.; Ismail, M.S.; Leong,W.J.; et al. Assessments of the ecological and health risks of potentially toxic metals in the topsoils of different land uses: A casestudy in Peninsular Malaysia. Biology 2022, 11, 2. [CrossRef]
58. Chetri, J.K.; Reddy, K.R. Advancements in municipal solid waste landfill cover system: A review. J. Indian Inst. Sci. 2021, 1,557–588. [CrossRef]
59. Brahmi, S.; Baali, F.; Hadji, R.; Brahmi, S.; Hamad, A.; Rahal, O.; Zerrouki, H.; Saadali, B.; Hamed, Y. Assessment of groundwaterand soil pollution by leachate using electrical resistivity and induced polarization imaging survey, case of Tebessa municipallandfill, NE Algeria. Arab. J. Geosci. 2021, 14, 249. [CrossRef]
60. Ololade, O.O.; Mavimbela, S.; Oke, S.A.; Makhadi, R. Impact of leachate from northern landfill site in bloemfontein on water andsoil quality: Implications for water and food security. Sustainability 2019, 11, 4238. [CrossRef]
61. Marques, T.; Matias, M.S.; Silva, E.F.D.; Durães, N.; Patinha, C. Temporal and spatial groundwater contamination assessmentusing geophysical and hydrochemical methods: The industrial chemical complex of Estarreja (Portugal) case study. Appl. Sci.2021, 11, 6732. [CrossRef]
62. Feng, S.J.; Wu, S.J.; Fu, W.D.; Zheng, Q.T.; Zhang, X.L. Slope stability analysis of a landfill subjected to leachate recirculation andaeration considering bio-hydro coupled processes. Geoenvironment. Disasters 2021, 8, 29. [CrossRef]
63. Udosen, N.I. Geo-electrical modeling of leachate contamination at a major waste disposal site in south-eastern Nigeria. ModelEarth Syst. Environ. 2022, 8, 847–856. [CrossRef]
64. Morita, A.K.M.; Ibelli-Biancoa, C.; Jamil, A.A.; Jaqueline, A.; Pelinson, C.N.; Nobrega, J.; Rosalema, L.M.P.; Leitea, C.M.C.;Niviadonski, L.M.; Manastella, C.; et al. Pollution threat to water and soil quality by dumpsites and non-sanitary landfills inBrazil: A review. Waste Manag. 2021, 131, 163–176. [CrossRef] [PubMed]
65. Oke, S.A. Regional aquifer vulnerability and pollution sensitivity analysis of drastic application to Dahomey basin of Nigeria. Int.J. Environ. Res. Public Health 2020, 17, 2609. [CrossRef] [PubMed]
66. Boumaiza, L.; Walter, J.; Chesnaux, R.; Brindha, K.; Elango, L. An operational methodology for determining relevant DRASTICfactors and their relative weights in the assessment of aquifer vulnerability to contamination. Environ. Earth Sci. 2021, 80, 281.[CrossRef]
67. Nasri, G.; Hajji, S.; Aydi, W.; Boughariou, E.; Allouche, N.; Bouri, S. Water vulnerability of coastal aquifers using AHP andparametric models: Methodological overview and a case study assessment. Arab. J. Geosci. 2021, 14, 59. [CrossRef]
68. Tan, M.; Wang, K.; Xu, Z.; Li, H.; Qu, J. Study on heavy metal contamination in high water table coal mining subsidence pondsthat use different resource reutilization methods. Water 2020, 12, 3348. [CrossRef]
69. Blarasin, M.; Matiatos, I.; Cabrera, A.; Lutri, V.; Giacobone, D.; Quinodoz, F.B. Characterization of groundwater dynamics andcontamination in an unconfined aquifer using isotope techniques to evaluate domestic supply in an urban area. J. S. Am. EarthSci. 2021, 110, 103360. [CrossRef]
70. WHO. Guidelines for Drinking-Water Quality, 4th ed.; Incorporating the First Addendum; WHO: Geneva, Switzerland, 2017;ISBN 978-92-4-154995-0.
71. Akinbile, C.O.; Yusoff, M.S. Environmental impact of leachate pollution on groundwater supplies in Akure, Nigeria. Int. J.Environ. Sci. Dev. 2011, 2, 81–86. [CrossRef]

Water 2022, 14, 1746 18 of 18
72. Pan, S.; Dixon, K.L.; Nawaz, T.; Rahman, A.; Selvaratnam, T. Evaluation of galdieria sulphuraria for nitrogen removal andbiomass production from raw landfill leachate. Algal Res 2021, 54, 102183. [CrossRef]
73. Isiuku, B.O.; Enyoh, C.E. Pollution and health risks assessment of nitrate and phosphate concentrations in water bodies in SouthEastern, Nigeria. Environ. Adv. 2020, 2, 100018. [CrossRef]