Conditioning DRASTIC model to simulate nitrate pollution case study: Hamadan–Bahar plain
13
ORIGINAL ARTICLE Conditioning DRASTIC model to simulate nitrate pollution case study: Hamadan–Bahar plain Samira Akhavan • Sayed-Farhad Mousavi • Jahangir Abedi-Koupai • Karim C. Abbaspour Received: 26 May 2009 / Accepted: 4 October 2010 / Published online: 20 October 2010 Ó Springer-Verlag 2010 Abstract One of the major causes of groundwater pol- lution in Hamadan–Bahar aquifer in western Iran is a non- point source pollution resulting from agricultural activities. Withdrawal of over 88% of drinking water from ground- water resources, adds urgency to the studies leading to a better management of water supplies in this region. In this study, the DRASTIC model was used to construct groundwater vulnerability maps based on the ‘‘intrinsic’’ (natural conditions) and ‘‘specific’’ (including manage- ment) concepts. As DRASTIC has drawbacks to simulate specific contaminants, we conditioned the rates on mea- sured nitrate data and optimized the weights of the specific model to obtain a nitrate vulnerability map for the region. The performance of the conditioned DRASTIC model improved significantly (R 2 = 0.52) over the intrinsic (R 2 = 0.12) and specific (R 2 = 0.19) models in predicting the groundwater nitrate concentration. Our study suggests that a locally conditioned DRASTIC model is an effective tool for predicting the region’s vulnerability to nitrate pollution. In addition, comparison of groundwater tables between two periods 30 years apart indicated a drawdown of around 50 m in the central plain of the Hamadan–Bahar region. Our interpretation of the vulnerability maps for the two periods showed a polluted zone developing in the central valley requiring careful evaluation and monitoring. Keywords Groundwater vulnerability SUFI2 Conditioning Optimization Indexing method Iran Introduction Groundwater is the most important water resource on earth (Villeneuve et al. 1990). This is especially true in arid and semi-arid areas. In most regions of Iran, groundwater is almost the only source of water supply for drinking and agricultural activities. In Hamadan, western Iran (Fig. 1), intensive agriculture, traditional methods of handling sewage, slaughterhouses, and animal farming are principal causes of water pollution on a regional scale. Increasing population has caused agriculture to greatly rely on N-fertilizers to increase crop yield. About 90% of the croplands are used to grow two main crops of the region: wheat and potato. These lands are located in the vicinity of drinking water wells. In the past 30 years, the water table in Bahar plain (in the vicinity of Hamadan) has dropped by 50 m. This decrease in water table is accompanied by an increase in the application of fertilizers. As reported by previous studies (Rahmani 2003; Jalali 2005; Nadafian 2007), nitrate is the main groundwater pollutant in this region. As drinking water supply comes mainly from groundwater sources, this adds urgency to the study of ways to protect public water supplies of the region. Groundwater vulnerability mapping is based on the idea that some land areas are more vulnerable to groundwater contamination than others (Gogu and Dassargues 2000). This provides useful information to protect groundwater resources and to evaluate the potential for water quality improvement with changes in agricultural practices and landuse applications (Almasri 2008). Vulnerability is usually considered as an intrinsic property of a groundwater system that depends on its S. Akhavan S.-F. Mousavi J. Abedi-Koupai Department of Water Engineering, Isfahan University of Technology, College of Agriculture, 84156-83111 Isfahan, Iran K. C. Abbaspour (&) Eawag, Swiss Federal Institute of Aquatic Science and Technology, 8600 Du ¨bendorf, Switzerland e-mail: [email protected] 123 Environ Earth Sci (2011) 63:1155–1167 DOI 10.1007/s12665-010-0790-1
-
Upload
independent -
Category
Documents
-
view
5 -
download
0
Transcript of Conditioning DRASTIC model to simulate nitrate pollution case study: Hamadan–Bahar plain
ORIGINAL ARTICLE
Conditioning DRASTIC model to simulate nitrate pollution casestudy: Hamadan–Bahar plain
Samira Akhavan • Sayed-Farhad Mousavi •
Jahangir Abedi-Koupai • Karim C. Abbaspour
Received: 26 May 2009 / Accepted: 4 October 2010 / Published online: 20 October 2010
� Springer-Verlag 2010
Abstract One of the major causes of groundwater pol-
lution in Hamadan–Bahar aquifer in western Iran is a non-
point source pollution resulting from agricultural activities.
Withdrawal of over 88% of drinking water from ground-
water resources, adds urgency to the studies leading to a
better management of water supplies in this region. In this
study, the DRASTIC model was used to construct
groundwater vulnerability maps based on the ‘‘intrinsic’’
(natural conditions) and ‘‘specific’’ (including manage-
ment) concepts. As DRASTIC has drawbacks to simulate
specific contaminants, we conditioned the rates on mea-
sured nitrate data and optimized the weights of the specific
model to obtain a nitrate vulnerability map for the region.
The performance of the conditioned DRASTIC model
improved significantly (R2 = 0.52) over the intrinsic
(R2 = 0.12) and specific (R2 = 0.19) models in predicting
the groundwater nitrate concentration. Our study suggests
that a locally conditioned DRASTIC model is an effective
tool for predicting the region’s vulnerability to nitrate
pollution. In addition, comparison of groundwater tables
between two periods 30 years apart indicated a drawdown
of around 50 m in the central plain of the Hamadan–Bahar
region. Our interpretation of the vulnerability maps for the
two periods showed a polluted zone developing in the
central valley requiring careful evaluation and monitoring.
Keywords Groundwater vulnerability � SUFI2 �Conditioning � Optimization � Indexing method � Iran
Introduction
Groundwater is the most important water resource on earth
(Villeneuve et al. 1990). This is especially true in arid and
semi-arid areas. In most regions of Iran, groundwater is
almost the only source of water supply for drinking and
agricultural activities. In Hamadan, western Iran (Fig. 1),
intensive agriculture, traditional methods of handling sewage,
slaughterhouses, and animal farming are principal causes of
water pollution on a regional scale. Increasing population has
caused agriculture to greatly rely on N-fertilizers to increase
crop yield. About 90% of the croplands are used to grow two
main crops of the region: wheat and potato. These lands are
located in the vicinity of drinking water wells. In the past
30 years, the water table in Bahar plain (in the vicinity of
Hamadan) has dropped by 50 m. This decrease in water table
is accompanied by an increase in the application of fertilizers.
As reported by previous studies (Rahmani 2003; Jalali 2005;
Nadafian 2007), nitrate is the main groundwater pollutant in
this region. As drinking water supply comes mainly from
groundwater sources, this adds urgency to the study of ways
to protect public water supplies of the region.
Groundwater vulnerability mapping is based on the idea
that some land areas are more vulnerable to groundwater
contamination than others (Gogu and Dassargues 2000).
This provides useful information to protect groundwater
resources and to evaluate the potential for water quality
improvement with changes in agricultural practices and
landuse applications (Almasri 2008).
Vulnerability is usually considered as an intrinsic
property of a groundwater system that depends on its
S. Akhavan � S.-F. Mousavi � J. Abedi-Koupai
Department of Water Engineering,
Isfahan University of Technology,
College of Agriculture, 84156-83111 Isfahan, Iran
K. C. Abbaspour (&)
Eawag, Swiss Federal Institute of Aquatic Science
and Technology, 8600 Dubendorf, Switzerland
e-mail: [email protected]
123
Environ Earth Sci (2011) 63:1155–1167
DOI 10.1007/s12665-010-0790-1
sensitivity to natural impacts. Specific or integrated vul-
nerability, on the other hand, combines intrinsic vulnera-
bility with the risk of the groundwater being exposed to the
loading of pollutants from certain man-made sources (Vrba
and Zaporozec 1994; Babiker et al. 2005). Groundwater
models often have data requirements that cannot be satis-
fied in many parts of the world (Al-Adamat et al. 2003).
The attraction of the vulnerability concept is that it is
implemented by classifying a geographical area with
regard to its susceptibility to groundwater contamination.
Various techniques and methodologies have been devel-
oped to evaluate environmental impacts associated with
groundwater pollution, and the concept of aquifer vulner-
ability is one of them.
DRASTIC (Aller et al. 1987) is a model often used to
assess groundwater vulnerability to a wide range of
potential contaminants (Al-Adamat et al. 2003; Almasri
2008; Rahman 2008). The model uses seven intrinsic
parameter of the natural system, which are rated from 1 to
10. Each parameter is then weighted from 1 to 5. The rates
and weights are multiplied for each parameters and added
together to produce a so-called ‘‘intrinsic’’ vulnerability
index. These parameters include depth to groundwater (D),
net recharge potential (R), aquifer media (A), soil media
Razan
Hamedan
Malayer
Bahar
Kabodar_ahang
Nahavand
Toyserkan
Asad_abad
50°0'0"E49°30'0"E49°0'0"E
49°0'0"E
48°30'0"E
48°30'0"E
48°0'0"E
48°0'0"E47°30'0"E
35°30'0"N35°30'0"N
35°0'0"N35°0'0"N
34°30'0"N34°30'0"N
34°0'0"N
Hamadan Province Map
0 30 60 90 12015km
48°50'0"E
48°50'0"E
48°40'0"E
48°40'0"E
48°30'0"E
48°30'0"E
48°20'0"E
48°20'0"E
48°10'0"E
48°10'0"E48°0'0"E47°50'0"E
35°10'0"N35°10'0"N
35°0'0"N35°0'0"N
34°50'0"N34°50'0"N
34°40'0"N34°40'0"N
34°30'0"N
Hamadan- Bahar Watershed Map
LegendRiver
Aquifer
Not irrigatted filed crops
Irrigated field crops
Lake
Rang 1
Rang 2
Bulit-Up Area
Airport
Industries
Orchards
Potato
High : 3520
Low : 16720 10 20 30 405
km
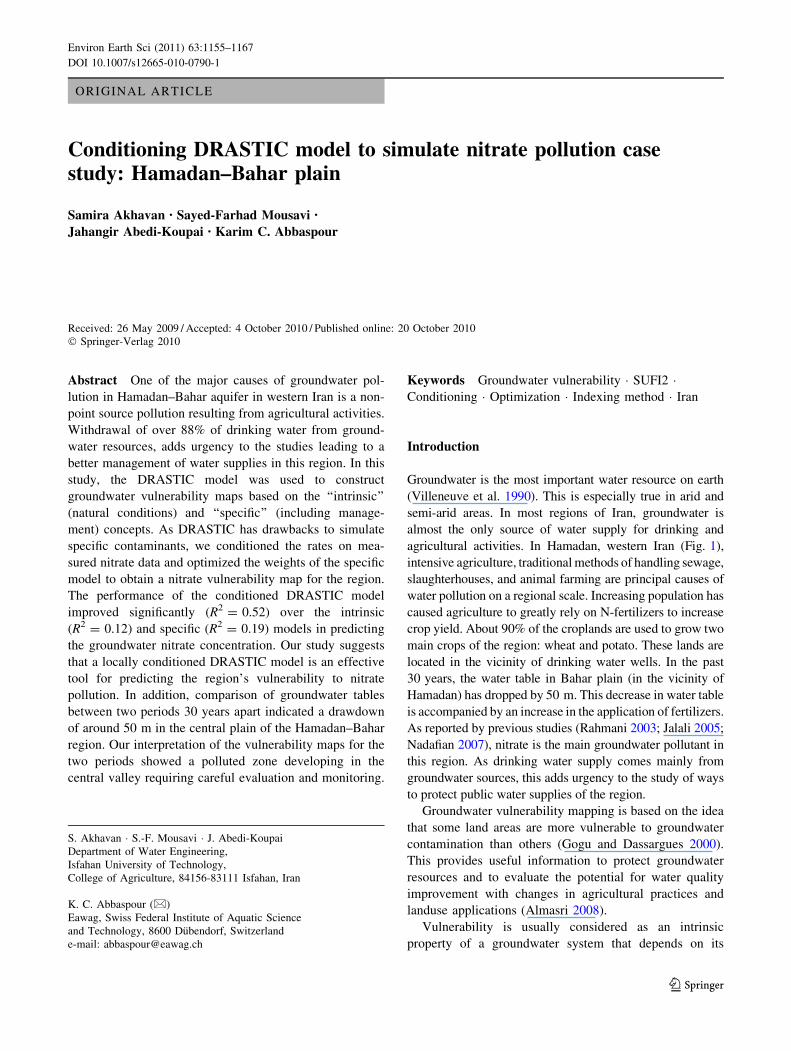
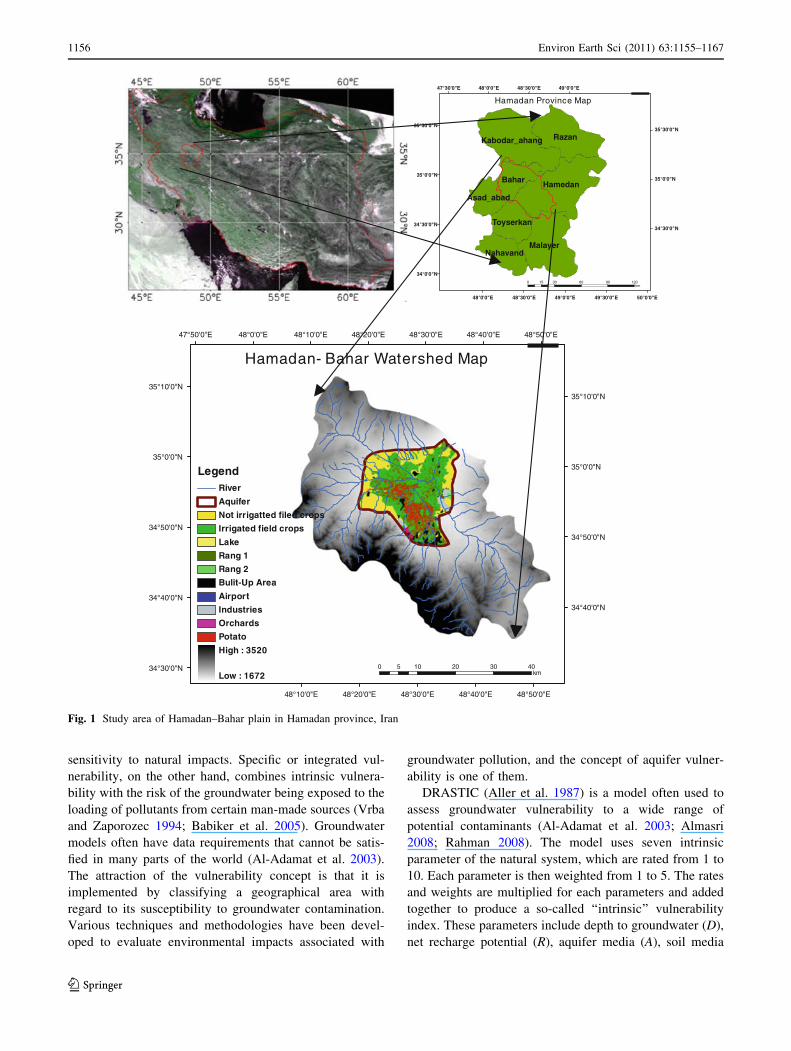
Fig. 1 Study area of Hamadan–Bahar plain in Hamadan province, Iran
1156 Environ Earth Sci (2011) 63:1155–1167
123
(S), topography (T), impact of vadose zone (I), and
hydraulic conductivity (C) of the aquifer. Landuse was
added to the above system by Secunda et al. (1998) to
produce the so-called ‘‘specific’’ vulnerability index.
Advantage of the DRASTIC model is that it uses a rela-
tively small number of parameters to compute the vulner-
ability index, which ensures the best representation of the
hydrogeological setting. This makes the model suitable for
producing comparable vulnerability maps on a regional
scale (Babiker et al. 2005).
Panagopoulos et al. (2006) investigated several studies
using the DARSTIC model and reported on some perceived
disadvantages such as many variables being factored into
one final index (Vrba and Zaporozec 1994; Merchant 1994),
qualitative judgment of the selected variables (Garrett et al.
1989), exclusion of many important scientifically defined
factors such as sorption capacity, travel time and dilution,
and general difficulty of testing the model (Rosen 1994).
Despite these criticisms, many advantages of the
DRASTIC model have also been recognized including: the
method’s low cost of application (Aller et al. 1987), and
relative accuracy of model results for extensive regions with
a complex geological structure (Kalinski et al. 1994; McLay
et al. 2001). In fact, information gained by modeling at
different levels of complexities can complement each other
and lead to a better understanding of the system under study.
DRASTIC has been applied to many regions around the
world, including Tehran–Karaj aquifer, located in central
Iran, to classify aquifer vulnerability using fuzzy system
(Mohammadi et al. 2008), Kherran plain in Khuzestan
(south west of Iran), to construct a groundwater vulnerability
map (Chitsazan and Akhtari 2008), Metline-Ras Jebel-Raf
Raf aquifer, north east of Tunisia, to classify DRASTIC
aquifer vulnerability maps (Hamza et al. 2007), and Kaka-
migahara Heights, Gifu Prefecture, Central Japan, to esti-
mate aquifer vulnerability and demonstrate the combined
use of the DRASTIC and GIS (Babiker et al. 2005).
Few attempts have been made to validate and verify the
performance of a DRASTIC model as it is usually applied to
areas of no data availability. An exception is the study of
Panagopoulos et al. (2006) who modified the rates and opti-
mized the weights of a DRASTIC model based on the corre-
lation of each parameter with measured nitrates concentration
in groundwater. But there is an intrinsically high degree of
uncertainty in this type of evaluation because pollutant loads
are the consequence of complex interactions between envi-
ronmental, landscape, and anthropogenic factors.
The objectives of this study are to determine the vul-
nerability of aquifers in Hamadan–Bahar plain with the
intrinsic and specific DRASTIC models and to show a
simple procedure for training the model on a certain con-
taminant, in this case nitrate. The training is performed by
conditioning the rates and optimizing the weights of the
DRASTIC model on measured nitrate concentrations.
ArcGIS (Ver. 9.2) was used to facilitate the analysis and
Sequential Uncertainty FItting (SUFI2, Ver. 2) (Abbaspour
et al. 2007) was applied for optimization of the weights.
Materials and methods
Description of the study area
Hamadan–Bahar aquifer is located in Hamadan province,
Iran (Fig. 1). The study area lies between longitudes 48�170Eand 48�330E and latitudes 34�490N and 35�020N. The total
area of Hamadan–Bahar aquifer is 480 km2 and the aquifer is
unconfined. Geologically, Hamadan–Bahar aquifer is loca-
ted on Sanandaj–Sirjan metamorphic zone (Hamadan
Regional Water Authority, HRWA). The parent rocks are
mainly limestone, calcareous shale and granitic material.
The oldest deposits contain slate and schist from Jurassic age
that outcrop in the eastern and southern parts of the basin.
The Cretaceous deposits consist of the carbonate series. The
main portion of the study area is covered by Quaternary
sediments and consists mainly of recent alluvium and con-
glomerate. Hamedan–Bahar alluvial aquifers consist mainly
of gravel, sand, silt and clay. The alluvial sediment thickness
varies from 25 m in the sides to 75 m in the center of the
plain. The transmissivity of the Hamadan–Bahar ranges
from 100 to 1,750 m2 day-1, while the specific yield of the
aquifer is about 5–10%. Groundwater supplies approxi-
mately 88% of the water consumed in Hamadan. The region
has a cold semi-arid climate with an average annual pre-
cipitation of 325 mm and mean annual temperature of 11�C.
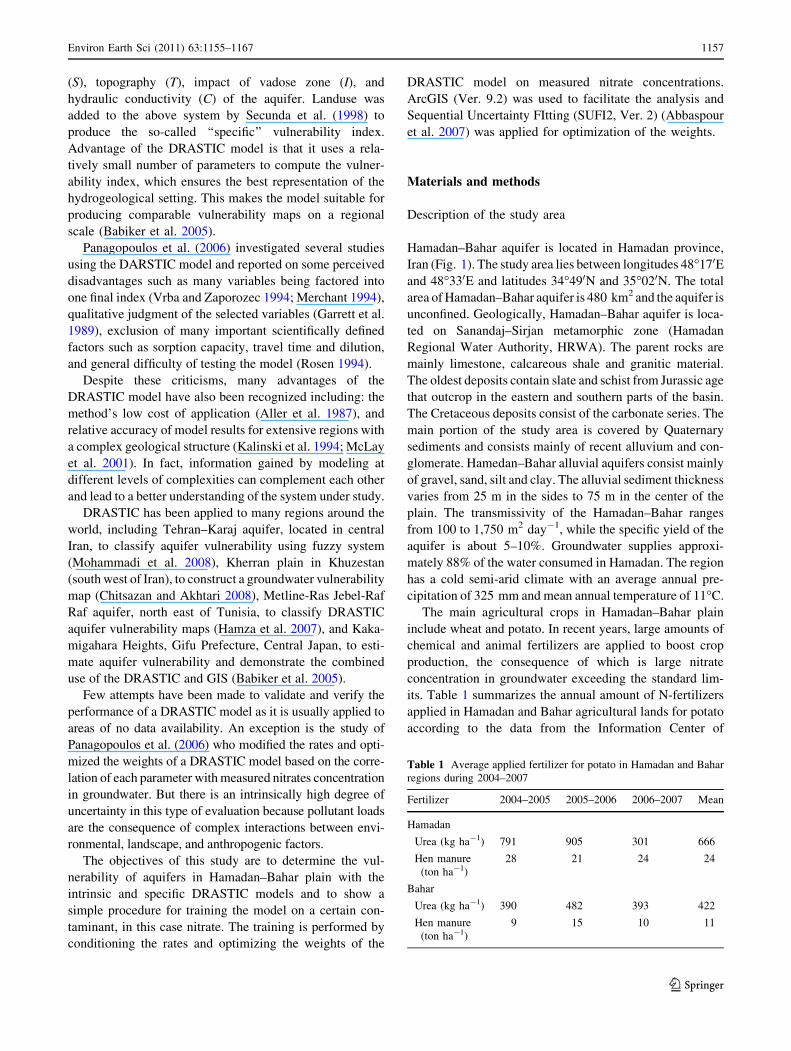
The main agricultural crops in Hamadan–Bahar plain
include wheat and potato. In recent years, large amounts of
chemical and animal fertilizers are applied to boost crop
production, the consequence of which is large nitrate
concentration in groundwater exceeding the standard lim-
its. Table 1 summarizes the annual amount of N-fertilizers
applied in Hamadan and Bahar agricultural lands for potato
according to the data from the Information Center of
Table 1 Average applied fertilizer for potato in Hamadan and Bahar
regions during 2004–2007
Fertilizer 2004–2005 2005–2006 2006–2007 Mean
Hamadan
Urea (kg ha-1) 791 905 301 666
Hen manure
(ton ha-1)
28 21 24 24
Bahar
Urea (kg ha-1) 390 482 393 422
Hen manure
(ton ha-1)
9 15 10 11
Environ Earth Sci (2011) 63:1155–1167 1157
123
Ministry of Jahade-Agriculture of Hamadan. For wheat, an
average of 150 kg ha-1 urea is applied in these regions.
DRASTIC model and model calibration
DRASTIC is an overlay-and-index method that was
developed for the US Environmental Protection Agency by
the American Water Well Association (Aller et al. 1987).
But it has since became a widely used model around the
world. DRASTIC is a conceptual model defined as a
composite description of the most important geological and
hydrological factors that could potentially affect ground-
water pollution. The model yields a numerical index that is
derived from ratings and weights assigned to the seven
model parameters expressed as follows:
Vintrinsic ¼ DrDw þ RrRw þ ArAw þ SrSw
þ TrTw þ IrIw þ CrCw ð1Þ
where Vintrinsic is the intrinsic vulnerability, D, R, A, S, T, I,
and C are the seven parameters defined in Table 2, and the
subscripts r and w stand for rate and weight, respectively.
The intrinsic DRASTIC method gives the vulnerability
of groundwater against any pollution of surface origin,
independent of the landuse or any actual occurrence of
pollutants. In a modification, Secunda et al. (1998) added
landuse to the model and estimated the specific vulnera-
bility as follows:
Vspecific ¼ Vintrinsic þ LrLw ð2Þ
where Vspecific is the specific vulnerability, and Lr and Lw
are landuse rate and weight, respectively.
The recharge rates and weights used here were based on
those proposed by Piscopo (2001) and the landuse rates and
weights were based on those published by Secunda et al.
(1998). The remaining parameter weights and rates were
based on those suggested by Aller et al. (1987). The
DRASTIC parameters were manipulated as raster maps in
an ArcGIS environment (Ver. 9.2).
For the purposes of this research, the intrinsic and spe-
cific vulnerability indices were conditioned on observed
nitrate concentrations of the aquifers in the region of study.
To do this, both rates and weights were redefined. For new
rates of categorical variables, first the average nitrate
concentration was calculated for each category and then
used in the following equation:
rðvÞj ¼½NO3
��avg; j
½NO3��avg
� 10� MAXj¼1;J
½NO3��avg; j
½NO3��avg
" #( )�1
ð3Þ
where r(v)j is modified rate for the jth category (j = 1,…, J),
½NO3��avg;j is the average of nitrate concentration for the jth
category, ½NO3��avg is the average nitrate concentration over
all categories (mg l-1), and MAX is the maximum of½NO3
��avg;j
½NO3��avg
ratio for all j 2 J. The multiplier 10, simply scales
r(v)j to a maximum value of 10. For nominal variables such
as depth and hydraulic conductivity, they were first
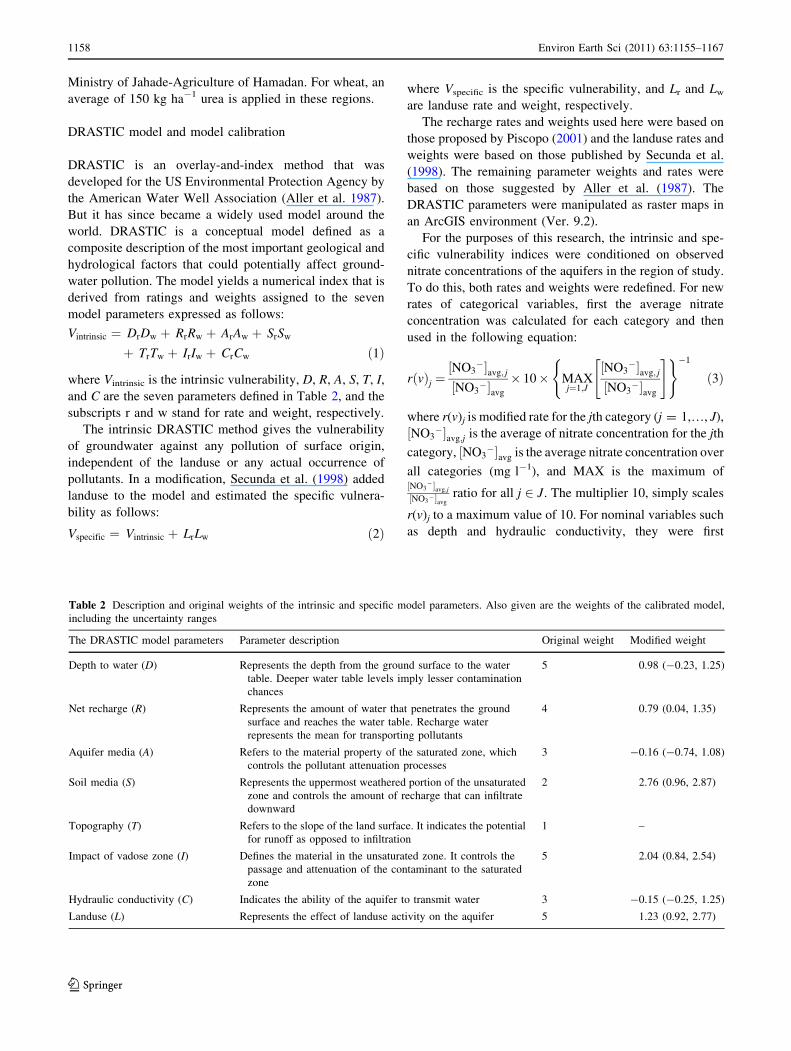
Table 2 Description and original weights of the intrinsic and specific model parameters. Also given are the weights of the calibrated model,
including the uncertainty ranges
The DRASTIC model parameters Parameter description Original weight Modified weight
Depth to water (D) Represents the depth from the ground surface to the water
table. Deeper water table levels imply lesser contamination
chances
5 0.98 (-0.23, 1.25)
Net recharge (R) Represents the amount of water that penetrates the ground
surface and reaches the water table. Recharge water
represents the mean for transporting pollutants
4 0.79 (0.04, 1.35)
Aquifer media (A) Refers to the material property of the saturated zone, which
controls the pollutant attenuation processes
3 -0.16 (-0.74, 1.08)
Soil media (S) Represents the uppermost weathered portion of the unsaturated
zone and controls the amount of recharge that can infiltrate
downward
2 2.76 (0.96, 2.87)
Topography (T) Refers to the slope of the land surface. It indicates the potential
for runoff as opposed to infiltration
1 –
Impact of vadose zone (I) Defines the material in the unsaturated zone. It controls the
passage and attenuation of the contaminant to the saturated
zone
5 2.04 (0.84, 2.54)
Hydraulic conductivity (C) Indicates the ability of the aquifer to transmit water 3 -0.15 (-0.25, 1.25)
Landuse (L) Represents the effect of landuse activity on the aquifer 5 1.23 (0.92, 2.77)
1158 Environ Earth Sci (2011) 63:1155–1167
123

classified into several categories (based on Aller et al. 1987)
and then the above equation was applied.
After rescaling the rates, the weights were optimized
using the SUFI2 (Abbaspour et al. 2007) program of Soil
Water Assessment Tool (SWAT)-CUP (Abbaspour 2007).
SWAT-CUP was redesigned to run for DRASTIC. This
program uses several methods to optimize a given objec-
tive function and it is available for use by other DRASTIC
users upon request. SUFI2 performs model uncertainty and
parameter sensitivity analysis as well as optimization. The
objective function for optimization was defined as:
OF ¼Xn
i¼1
V � ½NO3��ð Þ2 ð4Þ
where OF is the objective function, V is the vulnerability
value (intrinsic or specific) (mg l-1), [NO3-] is the mea-
sured nitrate concentration in groundwater (mg l-1), and
n is the number of measured data. In SUFI2, weights were
initially assigned a range of (0, 2). These ranges were then
modified by the program by performing 500 simulations
using Latin-hypercube sampling (McKay et al. 1979).
Upon completion of the simulations, new parameter ranges
were calculated (Abbaspour et al. 2007) and the process
was repeated until no further improvement could be made
to the objective function. As SUFI2 is a stochastic pro-
gram, the final result is shown as 95% prediction uncer-
tainty (95PPU). The goodness of calibration/uncertainty
analysis is quantified by two parameters: P-factor and
R-factor. P-factor quantifies the percentage of measured
data bracketed by the 95PPU and has a maximum value of
1. R-factor quantifies the thickness of the 95PPU band with
an ideal value approaching zero. The SUFI2 procedure tries
to bracket most of the data within a narrow uncertainty
band.
After each iteration, parameter sensitivities were deter-
mined by calculating the following multiple regression
system, which regressed the Latin-hypercube-generated
parameters against the objective function values:
g ¼ aþXm
i¼1
bibi ð5Þ
where a is the intercept, bi is slope of the parameter bi, and
m is the number of parameters. A t test was then used to
identify the relative significance of each parameter.
Model parameterization
A short description of DRSATIC parameters is provided in
Table 2. The basic database used to develop the model is as
follows:
1. Depth to water table was obtained using data from 28
piezometers provided by HRWA. The water table
levels were subtracted from the elevation of the
piezometer wells and averaged over a 6-year period
(2001–2006). The depth to water table was then
classified into ranges as defined by the DRASTIC
model and assigned rates ranging from 1 (minimum
impact on vulnerability) to 10 (maximum impact on
vulnerability). The deeper the groundwater table, the
smaller the rate. The water table layer was converted to
raster format with 100-m cell size (Fig. 2a).
2. The net recharge layer was constructed using Piscopo
method (Piscopo 2001):
Recharge Index ¼ Slope Indexþ Rainfall Index
þ Soil permeability Index: ð6Þ
First, a regional digital elevation model (DEM), pro-
vided by the National Cartographic Center of Iran, was
generated with a spatial resolution of 20 m. After
deriving the slopes, the slope was reclassified accord-
ing to the criteria given in Table 3. Rainfall, perme-
ability, and the resulting recharge indices were also
calculated as specified in Table 3. Figure 2b shows the
recharge map of the region.
3. Aquifer media information was obtained from the bore
logs obtained from HRWA and the depth to water
table. The raster map is shown in Fig. 2c. Aquifer
media layer shows that most parts of the study area
have the rating value equal to six (sand with silt and
clay).
4. Soil map of the study area (1:50,000) was obtained
from Hamadan Agricultural and Natural Resources
Research Center. The soil classes of the study area
were arranged based on the classes proposed by the
DRASTIC method. As illustrated in Fig. 2d, most
parts of the study area have rating value equal to four
(silty loam).
5. The slope was calculated as stated in (2) above and
classified based on Aller et al. (1987). This variable
was removed from the calibration analysis as it was
quite uniform for most of the region (Fig. 2e).
6. Impact of vadose zone layer (Fig. 2f) was constructed
from the lithological cross-sections obtained from the
geophysical data, bore logs and depth to water table
data provided by HRWA.
7. To obtain the aquifer hydraulic conductivity map,
transmissivity map was constructed using pumping test
results provided by HRWA. The transmissivity values
were converted to hydraulic conductivity using the
aquifer thickness map obtained from HRWA. Fig-
ure 2g shows that most parts of the study area have
hydraulic conductivity values ranging from 4 to
12 m day-1.
Environ Earth Sci (2011) 63:1155–1167 1159
123
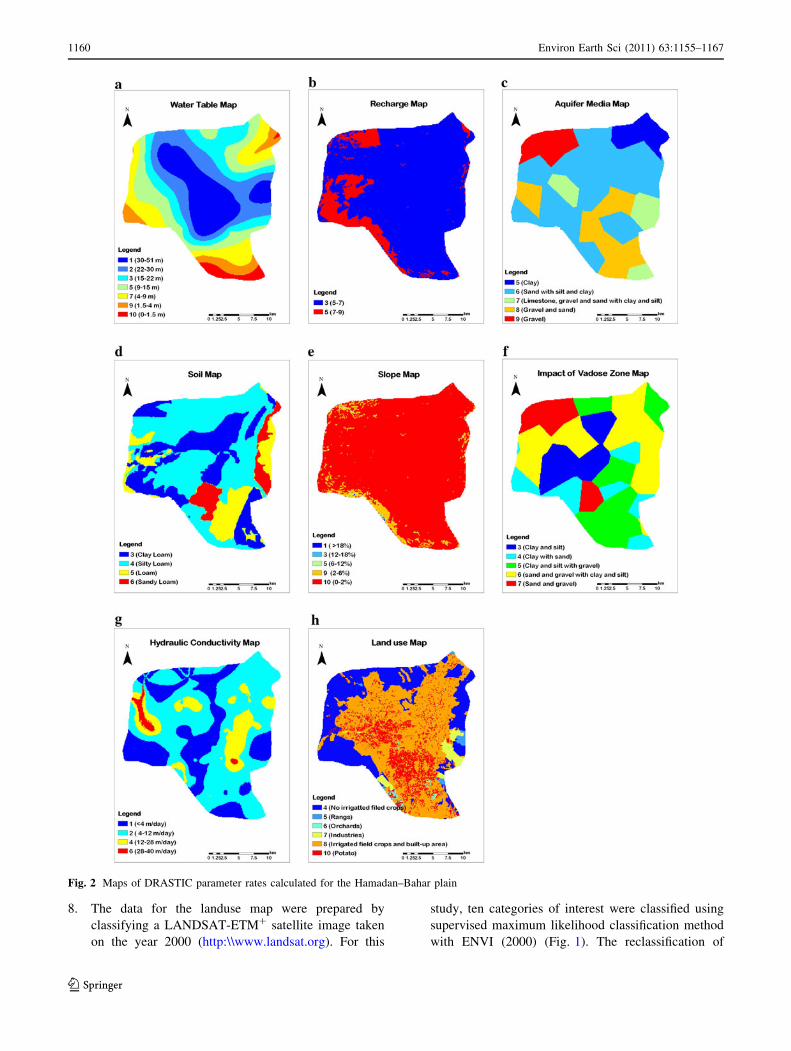
8. The data for the landuse map were prepared by
classifying a LANDSAT-ETM? satellite image taken
on the year 2000 (http:\\www.landsat.org). For this
study, ten categories of interest were classified using
supervised maximum likelihood classification method
with ENVI (2000) (Fig. 1). The reclassification of
Fig. 2 Maps of DRASTIC parameter rates calculated for the Hamadan–Bahar plain
1160 Environ Earth Sci (2011) 63:1155–1167
123

landuse for DRASTIC, however, resulted in six classes
based on the procedure of Secunda et al. (1998)
(Fig. 2h). For example, in this procedure ‘‘irrigated
field crops’’ and ‘‘buildup area’’ fall in the same class.
Finally, groundwater samples were collected monthly in
37 wells across the region of study during fall 2007 to fall
2008. The monthly variations of nitrate concentration were
quite small for the sampling period. Almost all ranges of
Table 3 Description of slope, rainfall, and soil permeability indices used in the calculation of the recharge rates based on Piscopo (2001) method
Slope Rainfall Soil permeability Recharge value
Slope (%) Index Rainfall (mm year-1) Index Range Index Range Index
\2 4 [850 4 High 5 11–13 10
2–10 3 700–850 3 Moderate to high 4 9–11 8
10–33 2 500–700 2 Moderate 3 7–9 5
[33 1 \500 1 Low 2 5–7 3
Very low 1 3–5 1
Table 4 Original and modified rates of the specific vulnerability parameters
Depth to water (D) Aquifer media (A)
Range
(m)
Original
rating
Mean NO3-
(mg/l)
Conditioned
rating
Aquifer type Original
rating
Mean NO3-
(mg/l)
Conditioned
rating
0–1.5 10 59.17 9 Clay 5 26.47 5
1.5–4 9 60.11 9 Sand with silt and clay 6 42.41 7
4–9 7 64.37 10 Limestone, gravel, sand with clay 7 35.035 6
9–15 5 55.52 9 Gravel and sand 8 58.25 10
15–23 3 27.23 4 Gravel 9 33.71 6
23–30 2 37.14 6
30–50 1 37.88 6
Soil media (S) Impact of vadose zone (I)
Soil type Original
rating
Mean NO3-
(mg/l)
Conditioned
rating
Impact of vadose zone type Original
rating
Mean NO3-
(mg/l)
Conditioned
rating
Clay loam 3 27.37 4 Clay and silt 3 41.35 6
Silty loam 4 40.12 5 Clay and sand 4 40.33 6
Loam 5 76.79 10 Clay, silt, with gravel 5 64.10 10
Sandy loam 6 54.42 7 Sand, gravel with clay and silt 6 52.02 8
Sand and gravel 7 24.26 4
Hydraulic conductivity of the aquifer (C) Landuse (L)
Range
(m/day)
Original
rating
Mean NO3-
(mg/l)
Conditioned
rating
Land use class Original
rating
Mean NO3-
(mg/l)
Conditioned
rating
\4 1 39.77 8 Non-irrigated field crops 4 37.2 5
4–12 2 50.74 10 Ranges 5 – 5
12–28 4 31.25 6 Orchards 6 61.4 8
28–40 6 – 6 Industries 7 25.01 3
Irrigated field crops 8 44.91 6
Built-up areas 8 41.06 6
Potato 10 73.52 10
Environ Earth Sci (2011) 63:1155–1167 1161
123
DRASTIC parameters were covered by the sampling
points. Plastic bottles were filled with the groundwater
sample and the samples were analyzed for NO3- by using a
DR/4000 Hach spectrophotometer. An independent nitrate
dataset containing measurements from a different set of 15
wells was obtained from Rahmani (2003) and used for
validation.
Results and discussion
In the first phase of the analysis, the DRASTIC intrinsic and
specific vulnerability indices were calculated. Table 4
shows the rates for all parameters. The weights are reported
in Table 2. An interesting observation with DRASTIC’s
specification of rates is the case of aquifer hydraulic con-
ductivity. It is seen in Table 4 that as conductivity increases,
rates also increase. Whereas one would expect that as con-
ductivity increases, the potential for local contamination
should decrease due to a faster moving groundwater and
increased dilution.
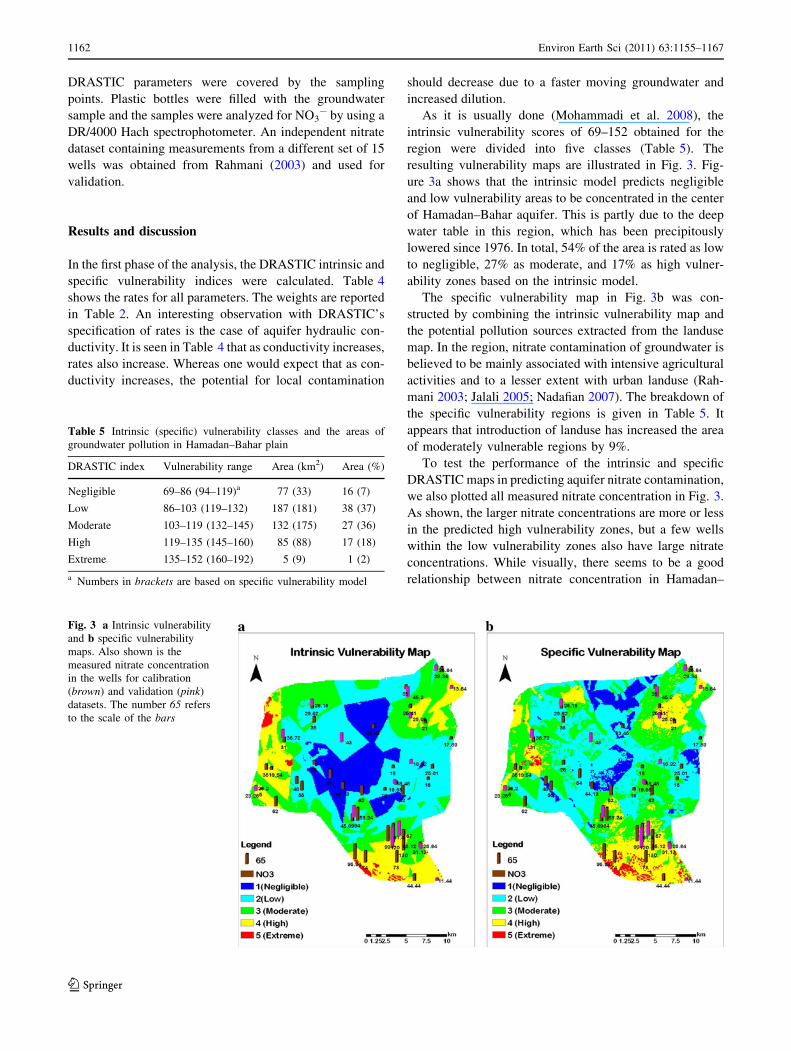
As it is usually done (Mohammadi et al. 2008), the
intrinsic vulnerability scores of 69–152 obtained for the
region were divided into five classes (Table 5). The
resulting vulnerability maps are illustrated in Fig. 3. Fig-
ure 3a shows that the intrinsic model predicts negligible
and low vulnerability areas to be concentrated in the center
of Hamadan–Bahar aquifer. This is partly due to the deep
water table in this region, which has been precipitously
lowered since 1976. In total, 54% of the area is rated as low
to negligible, 27% as moderate, and 17% as high vulner-
ability zones based on the intrinsic model.
The specific vulnerability map in Fig. 3b was con-
structed by combining the intrinsic vulnerability map and
the potential pollution sources extracted from the landuse
map. In the region, nitrate contamination of groundwater is
believed to be mainly associated with intensive agricultural
activities and to a lesser extent with urban landuse (Rah-
mani 2003; Jalali 2005; Nadafian 2007). The breakdown of
the specific vulnerability regions is given in Table 5. It
appears that introduction of landuse has increased the area
of moderately vulnerable regions by 9%.
To test the performance of the intrinsic and specific
DRASTIC maps in predicting aquifer nitrate contamination,
we also plotted all measured nitrate concentration in Fig. 3.
As shown, the larger nitrate concentrations are more or less
in the predicted high vulnerability zones, but a few wells
within the low vulnerability zones also have large nitrate
concentrations. While visually, there seems to be a good
relationship between nitrate concentration in Hamadan–
Table 5 Intrinsic (specific) vulnerability classes and the areas of
groundwater pollution in Hamadan–Bahar plain
DRASTIC index Vulnerability range Area (km2) Area (%)
Negligible 69–86 (94–119)a 77 (33) 16 (7)
Low 86–103 (119–132) 187 (181) 38 (37)
Moderate 103–119 (132–145) 132 (175) 27 (36)
High 119–135 (145–160) 85 (88) 17 (18)
Extreme 135–152 (160–192) 5 (9) 1 (2)
a Numbers in brackets are based on specific vulnerability model
Fig. 3 a Intrinsic vulnerability
and b specific vulnerability
maps. Also shown is the
measured nitrate concentration
in the wells for calibration
(brown) and validation (pink)
datasets. The number 65 refers
to the scale of the bars
1162 Environ Earth Sci (2011) 63:1155–1167
123
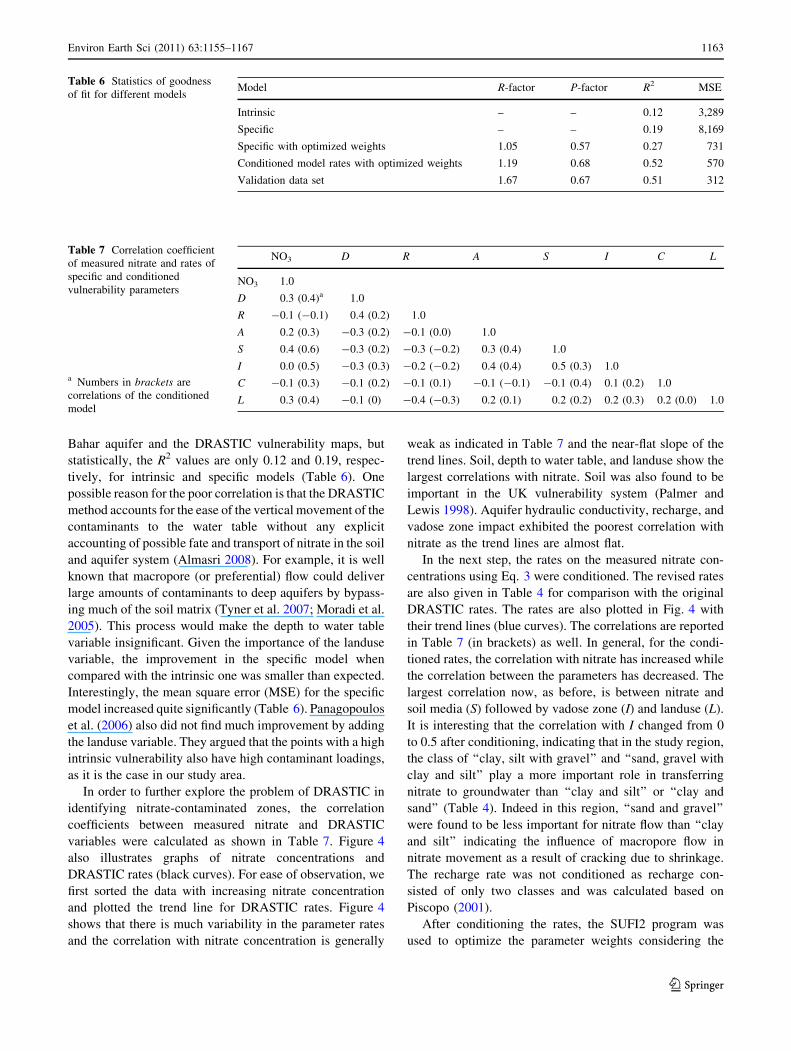
Bahar aquifer and the DRASTIC vulnerability maps, but
statistically, the R2 values are only 0.12 and 0.19, respec-
tively, for intrinsic and specific models (Table 6). One
possible reason for the poor correlation is that the DRASTIC
method accounts for the ease of the vertical movement of the
contaminants to the water table without any explicit
accounting of possible fate and transport of nitrate in the soil
and aquifer system (Almasri 2008). For example, it is well
known that macropore (or preferential) flow could deliver
large amounts of contaminants to deep aquifers by bypass-
ing much of the soil matrix (Tyner et al. 2007; Moradi et al.
2005). This process would make the depth to water table
variable insignificant. Given the importance of the landuse
variable, the improvement in the specific model when
compared with the intrinsic one was smaller than expected.
Interestingly, the mean square error (MSE) for the specific
model increased quite significantly (Table 6). Panagopoulos
et al. (2006) also did not find much improvement by adding
the landuse variable. They argued that the points with a high
intrinsic vulnerability also have high contaminant loadings,
as it is the case in our study area.
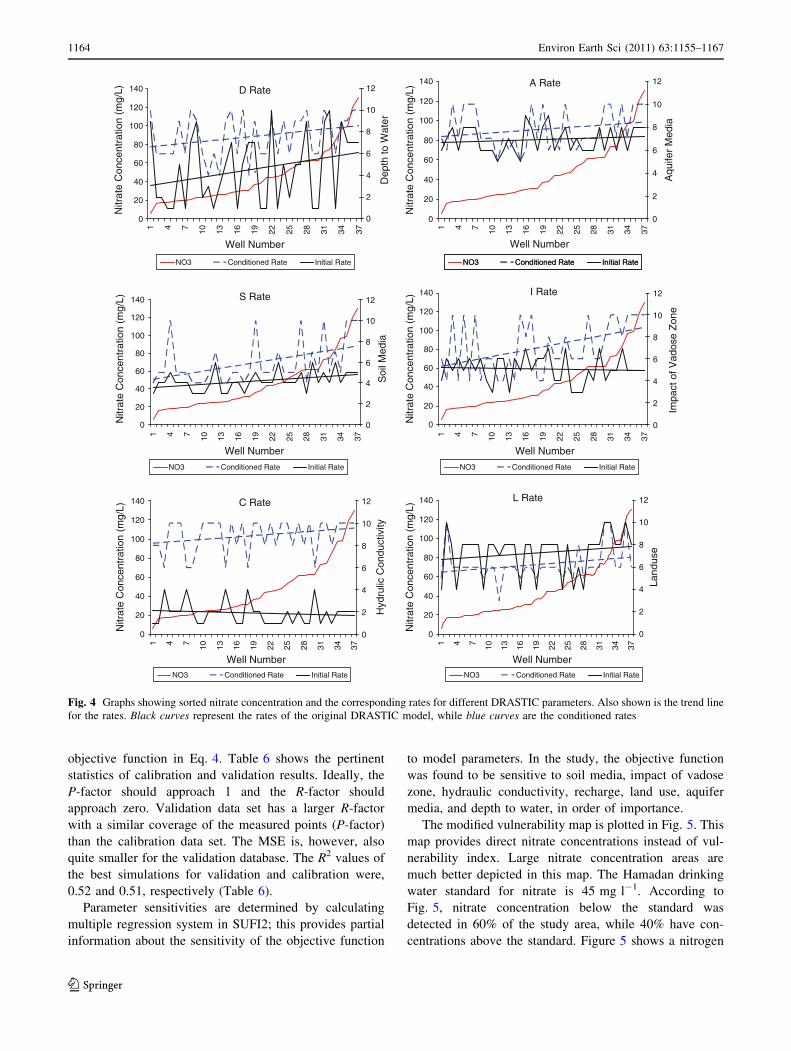
In order to further explore the problem of DRASTIC in
identifying nitrate-contaminated zones, the correlation
coefficients between measured nitrate and DRASTIC
variables were calculated as shown in Table 7. Figure 4
also illustrates graphs of nitrate concentrations and
DRASTIC rates (black curves). For ease of observation, we
first sorted the data with increasing nitrate concentration
and plotted the trend line for DRASTIC rates. Figure 4
shows that there is much variability in the parameter rates
and the correlation with nitrate concentration is generally
weak as indicated in Table 7 and the near-flat slope of the
trend lines. Soil, depth to water table, and landuse show the
largest correlations with nitrate. Soil was also found to be
important in the UK vulnerability system (Palmer and
Lewis 1998). Aquifer hydraulic conductivity, recharge, and
vadose zone impact exhibited the poorest correlation with
nitrate as the trend lines are almost flat.
In the next step, the rates on the measured nitrate con-
centrations using Eq. 3 were conditioned. The revised rates
are also given in Table 4 for comparison with the original
DRASTIC rates. The rates are also plotted in Fig. 4 with
their trend lines (blue curves). The correlations are reported
in Table 7 (in brackets) as well. In general, for the condi-
tioned rates, the correlation with nitrate has increased while
the correlation between the parameters has decreased. The
largest correlation now, as before, is between nitrate and
soil media (S) followed by vadose zone (I) and landuse (L).
It is interesting that the correlation with I changed from 0
to 0.5 after conditioning, indicating that in the study region,
the class of ‘‘clay, silt with gravel’’ and ‘‘sand, gravel with
clay and silt’’ play a more important role in transferring
nitrate to groundwater than ‘‘clay and silt’’ or ‘‘clay and
sand’’ (Table 4). Indeed in this region, ‘‘sand and gravel’’
were found to be less important for nitrate flow than ‘‘clay
and silt’’ indicating the influence of macropore flow in
nitrate movement as a result of cracking due to shrinkage.
The recharge rate was not conditioned as recharge con-
sisted of only two classes and was calculated based on
Piscopo (2001).
After conditioning the rates, the SUFI2 program was
used to optimize the parameter weights considering the
Table 6 Statistics of goodness
of fit for different modelsModel R-factor P-factor R2 MSE
Intrinsic – – 0.12 3,289
Specific – – 0.19 8,169
Specific with optimized weights 1.05 0.57 0.27 731
Conditioned model rates with optimized weights 1.19 0.68 0.52 570
Validation data set 1.67 0.67 0.51 312
Table 7 Correlation coefficient
of measured nitrate and rates of
specific and conditioned
vulnerability parameters
a Numbers in brackets are
correlations of the conditioned
model
NO3 D R A S I C L
NO3 1.0
D 0.3 (0.4)a 1.0
R -0.1 (-0.1) 0.4 (0.2) 1.0
A 0.2 (0.3) -0.3 (0.2) -0.1 (0.0) 1.0
S 0.4 (0.6) -0.3 (0.2) -0.3 (-0.2) 0.3 (0.4) 1.0
I 0.0 (0.5) -0.3 (0.3) -0.2 (-0.2) 0.4 (0.4) 0.5 (0.3) 1.0
C -0.1 (0.3) -0.1 (0.2) -0.1 (0.1) -0.1 (-0.1) -0.1 (0.4) 0.1 (0.2) 1.0
L 0.3 (0.4) -0.1 (0) -0.4 (-0.3) 0.2 (0.1) 0.2 (0.2) 0.2 (0.3) 0.2 (0.0) 1.0
Environ Earth Sci (2011) 63:1155–1167 1163
123
objective function in Eq. 4. Table 6 shows the pertinent
statistics of calibration and validation results. Ideally, the
P-factor should approach 1 and the R-factor should
approach zero. Validation data set has a larger R-factor
with a similar coverage of the measured points (P-factor)
than the calibration data set. The MSE is, however, also
quite smaller for the validation database. The R2 values of
the best simulations for validation and calibration were,
0.52 and 0.51, respectively (Table 6).
Parameter sensitivities are determined by calculating
multiple regression system in SUFI2; this provides partial
information about the sensitivity of the objective function
to model parameters. In the study, the objective function
was found to be sensitive to soil media, impact of vadose
zone, hydraulic conductivity, recharge, land use, aquifer
media, and depth to water, in order of importance.
The modified vulnerability map is plotted in Fig. 5. This
map provides direct nitrate concentrations instead of vul-
nerability index. Large nitrate concentration areas are
much better depicted in this map. The Hamadan drinking
water standard for nitrate is 45 mg l-1. According to
Fig. 5, nitrate concentration below the standard was
detected in 60% of the study area, while 40% have con-
centrations above the standard. Figure 5 shows a nitrogen
NO3 Conditioned Rate Initial Rate
D Rate
0
20
40
60
80
100
120
140
1 4 7 10 13 16 19 22 25 28 31 34 37
Well Number
Nitr
ate
Con
cent
ratio
n (m
g/L)
0
2
4
6
8
10
12
Dep
th to
Wat
er
NO3 Conditioned Rate Initial Rate
1
A Rate
0
20
40
60
80
100
120
140
1 4 7 10 13 16 19 22 25 28 31 34 37
Well Number
Nitr
ate
Con
cent
ratio
n (m
g/L)
0
2
4
6
8
10
12
Aqu
ifer
Med
ia
S Rate
0
20
40
60
80
100
120
140
1 4 7 10 13 16 19 22 25 28 31 34 37
Well Number
Nitr
ate
Con
cent
ratio
n (m
g/L)
0
2
4
6
8
10
12
Soi
l Med
ia
I Rate
0
20
40
60
80
100
120
140
1 4 7 10 13 16 19 22 25 28 31 34 37
Well Number
Nitr
ate
Con
cent
ratio
n (m
g/L)
0
2
4
6
8
10
12
Impa
ct o
f Vad
ose
Zon
e
C Rate
0
20
40
60
80
100
120
140
1 4 7 10 13 16 19 22 25 28 31 34 37
Well Number
Nitr
ate
Con
cent
ratio
n (m
g/L)
0
2
4
6
8
10
12
Hyd
rulic
Con
duct
ivity
L Rate
0
20
40
60
80
100
120
140
1 4 7 10 13 16 19 22 25 28 31 34 37
Well Number
Nitr
ate
Con
cent
ratio
n (m
g/L)
0
2
4
6
8
10
12
Land
use
NO3 Conditioned Rate Initial Rate
NO3 Conditioned Rate Initial Rate NO3 Conditioned Rate Initial Rate
NO3 Conditioned Rate Initial Rate NO3 Conditioned Rate Initial Rate
Fig. 4 Graphs showing sorted nitrate concentration and the corresponding rates for different DRASTIC parameters. Also shown is the trend line
for the rates. Black curves represent the rates of the original DRASTIC model, while blue curves are the conditioned rates
1164 Environ Earth Sci (2011) 63:1155–1167
123

plume stretching from south to north in the eastern part of
the study area following the direction of groundwater flow
from the southern highlands to the flat northern regions.
There appears to be another plume developing from the
west toward north-east following the regional topography,
which is also an indication of the groundwater flow
direction. A denser set of groundwater measurement points
could more clearly outline the nitrate plume stretching
from south-west and western part of the region to the north
and north-east.
Undoubtedly, the main source of nitrogen in the region
is the N-fertilizer and hen manure in the intensively agri-
cultural areas. But vulnerability of the groundwater to
contamination is strongly correlated to natural conditions
such as soil, vadose zone, and aquifer conditions. Another
important source of nitrate pollution is the sewage of Ha-
madan city, which is directly released into the rivers and
enters the region from the south. More studies are needed
to determine the share of each source in contaminating the
groundwater system.
Based on the existing reports, groundwater discharges
and the evolving number of wells in the region are
presented in Table 8. Figure 6 shows the water table
status in 1976 and the one averaged over a 6-year period
in 2001–2006. There has been a tremendous rise in the
number of wells withdrawing water from the aquifers
and a drastic drop in the water table in the central plain
of Hamadan–Bahar. This has undoubtedly created a
complex regional flow system. The DRASTIC models
show small vulnerability in the central plain mainly
because the groundwater table is quite deep. But in
reality, the vulnerability of this region should be quite
large because groundwater gradient should now be
directed towards the central valley bringing in polluted
water from all sides. More groundwater samples in the
central plain may, therefore, reveal a different contami-
nation picture.
For a comparison with the present condition, in Fig. 7
the intrinsic vulnerability map of 1976 was plotted. All
DRASTIC parameters between the past and the present
should have remained fairly constant, except for the depth
to water table. The greatest change between the two peri-
ods is in the central part of the plain, spatially from south-
west to north-east. The water table in the central region was
quite high in 1976; hence DRASTIC calculates a larger
vulnerability. In 1976, about 39% of the region was pre-
dicted to have a high intrinsic vulnerability, while the
current prediction puts this number at around 17%. This
reduction is entirely due to declining water table in the
central valley. But in reality, macropore flow can more than
compensate for the lowering of water table in delivering
contaminants to groundwater.
As groundwater table is higher in the regions sur-
rounding the valley than in the middle of the Hamadan–
Bahar plain, a reversal of flow gradient towards the center
is expected, which will bring in polluted groundwater
from the north, south, and west. The central valley is,
hence, a danger zone, which needs to be carefully
monitored.
Fig. 5 The vulnerability map for the conditioned model. Also shown
is the measured nitrate concentration in the wells for calibration
(brown) and validation (pink) datasets
Table 8 Temporal changes in the number of wells and groundwater discharge in Hamadan–Bahar aquifer
Year Deep wells Semi-deep wells Qanats Springs Total discharge
(MCM)Number Discharge
(MCM)
Number Discharge
(MCM)
Number Discharge
(MCM)
Number Discharge
(MCM)
1976 9 4 692 97 43 29 – – 130
1991 991 248 1,287 66 107 19 121 13 346
2003 1,024 228 1,250 71 111 31 327 8 339
MCM million cubic meters
Environ Earth Sci (2011) 63:1155–1167 1165
123

Conclusions
This study confirmed that training of DRASTIC model
rates based on measured nitrate concentrations significantly
improves model’s ability to delineate vulnerable sites.
Although the number of measured data in the calibration
data set was small, but the favorable results of the inde-
pendent validation dataset did not show severe over fitting
of the parameters. In a following study, we will consider
modeling the region with SWAT (Arnold et al. 1998)
hydrologic simulator and implementation of alternative
BMPs to alleviate the aquifer nitrate problems.
Acknowledgments The authors wish to acknowledge Hamadan
Regional Water Authority, Water and Wastewater Co. of Hamadan,
Isfahan University of Technology, and the Swiss Federal Institute for
Aquatic science and Technology, Eawag, for providing assistance to
conduct this study.
References
Abbaspour KC (2007) User manual for SWAT-CUP, SWAT
calibration and uncertainty analysis programs. Swiss Federal
Institute of Aquatic Science and Technology, Eawag, Duben-
dorf, Switzerland. http://www.eawag.ch/organisation/
abteilungen/siam/software/swat/index_EN. Accessed Aug 2009
Abbaspour KC, Yang J, Maximov I, Siber R, Bogner K, Mieleitner J,
Zobrist J, Srinivasan R (2007) Modelling hydrology and water
quality in the pre alpine/alpine Thur watershed using SWAT.
J Hydrol 333:413–430
Al-Adamat RAN, Foster IDL, Baban SMJ (2003) Groundwater
vulnerability and risk mapping for the Basaltic aquifer of the
Azraq basin of Jordan using GIS, remote sensing and DRASTIC.
Appl Geogr 23:303–324
Aller L, Bennett T, Lehr JH, Petty RJ, Hackett G (1987) DRASTIC: a
standardized system for evaluating ground water pollution
potential using hydrogeologic settings. EPA-600/2-87-035,
EPA, Washington
Almasri MN (2008) Assessment of intrinsic vulnerability to contam-
ination for Gaza coastal aquifer, Palestine. J Environ Manage
88(4):577–593
Arnold JG, Srinivasan R, Muttiah RS, Williams JR (1998) Large area
hydrologic modeling and assessment—Part 1: model develop-
ment. J Am Water Resour Assoc 34:73–89
Fig. 6 The map of depth to
groundwater table in a 1976 and
b averaged over 2001–2006
Fig. 7 DRASTIC vulnerability map based on the 1976 groundwater
depth data
1166 Environ Earth Sci (2011) 63:1155–1167
123
Babiker IS, Mohamed AAM, Hiyama T, Kato K (2005) A GIS based
DRASTIC model for assessing aquifer vulnerability in Kakami-
gahara Heights, Gifu Prefecture, Central Japan. Sci Total
Environ 345(1–3):127–140
Chitsazan M, Akhtari Y (2008) A GIS-based DRASTIC model for
assessing aquifer vulnerability in Kherran plain, Khuzestan, Iran.
Water Resour Manage. doi:10.1007/s11269-008-9319-8
Garrett P, Williams JS, Rossoll CF, Tolman AL (1989) Are ground
water vulnerability classification systems workable? In: Pro-
ceedings of FOCUS conference on eastern regional ground water
issues, Kitchener, Ontario, Canada, National Water Well Asso-
ciation, Dublin, Ohio, 17–19 October, pp 329–343
Gogu RC, Dassargues A (2000) Current trends and future challenges
in groundwater vulnerability assessment using overlay and index
methods. Environ Geol Environ Geol 39(6):549–559
Hamza MH, Added A, Rodriguez R, Abdeljaoueda S, Ben Mammou
A (2007) A GIS-based DRASTIC vulnerability and net recharge
reassessment in an aquifer of a semi-arid region (Metline-Ras
Jebel-Raf Raf aquifer, Northern Tunisia). J Environ Manage
84:12–19
Jalali M (2005) Nitrates leaching from agricultural land in Hamadan,
western Iran. Agric Ecosyst Environ 110:210–218
Kalinski RJ, Kelly WE, Bogardi I, Ehrman RL, Yamamoto PO (1994)
Correlation between DRASTIC vulnerabilities and incidents of
VOC contamination of municipal wells in Nebraska. Ground
Water 32(1):31–34
McKay MD, Beckman RJ, Conover WJ (1979) A comparison of three
methods for selecting values of input variables in the analysis of
output from a computer code. Technometrics 21:239–245
McLay CDA, Dragden R, Sparling G, Selvarajah N (2001) Predicting
groundwater nitrate concentrations in a region of mixed
agricultural land use: a comparison of three approaches. Environ
Pollut 115:191–204
Merchant J (1994) GIS-based groundwater pollution hazard assess-
ment: a critical review of the DRASTIC model. Photogramm
Eng Remote Sens 60(9):1117–1127
Mohammadi K, Niknam R, Majd VJ (2008) Aquifer vulnerability
assessment using GIS and fuzzy system: a case study in Tehran–
Karaj aquifer, Iran. Environ Geol. doi:10.1007/s00254-008-1514-7
Moradi A, Abbaspour KC, Afyuni M (2005) Modelling field-scale
cadmium transport below the root zone of a sewage sludge
amended soil in an arid region in Central Iran. J Contam Hydrol
79(3–4):187–206
Nadafian H (2007) Simulation of groundwater pollution around
drinking water wells in Hamadan city. M.Sc. dissertation, Shahid
Beheshti University, Tehran, Iran
Palmer RC, Lewis MA (1998) Assessment of groundwater vulner-
ability in England and Wales. In: Robins NS (ed) Groundwater
pollution, aquifer recharge and vulnerability, special publica-
tions vol 130. Geological Society, London, pp 191–198
Panagopoulos GP, Antonakos AK, Lambrakis NJ (2006) Optimiza-
tion of DRASTIC model for groundwater vulnerability assess-
ment, by the use of simple statistical methods and GIS.
Hydrogeol J 14:894–911
Piscopo G (2001) In: Groundwater vulnerability map, explanatory notes,
Castlereagh Catchment, NSW. Department of Land and Water
Conservation, Australia. http://www.dwe.nsw.gov.au/water/pdf/
quality_groundwater_castlereagh_map_notes.pdf. Accessed Aug
2008
Rahman A (2008) A GIS-based DRASTIC model for assessing
groundwater vulnerability in shallow aquifer in Aligarh, India.
Appl Geogr 28:32–53
Rahmani A (2003) Study and investigation of pollution in ground-
water of Hamadan-Bahar plain. Environmental Organization of
Hamadan, Iran
Rosen L (1994) A study of the DRASTIC methodology with
emphasis on Swedish conditions. Ground Water 32:278–285
Secunda S, Collin M, Melloul AJ (1998) Groundwater vulnerability
assessment using a composite model combining DRASTIC with
extensive land use in Israel’s Sharon region. J Environ Manage
54:39–57
Tyner JS, Wright WC, Yoder RE (2007) Identifying long-term
preferential and matrix flow recharge at the field scale. T ASABE
50(6):2001–2006
Villeneuve JP, Banton O, Lafrance P (1990) A probabilistic approach
for the groundwater vulnerability to contamination by pesticides:
the VULPEST model. Ecol Model 51:47–58
Vrba J, Zaporozec A (1994) Guidebook on mapping groundwater
vulnerability, vol 16. International Association of Hydrogeolo-
gists, Heise
Environ Earth Sci (2011) 63:1155–1167 1167
123