Extending the persistent primary variable algorithm to simulate ...
Upload
independentCategory
view
6download
0
i n t e r n a t i o n a l j o u r n a l o f h y d r o g e n en e r g y 3 5 ( 2 0 1 0 ) 1 2 3 8 1e1 2 3 9 0
Avai lab le a t www.sc iencedi rec t .com
journa l homepage : www.e lsev ier . com/ loca te /he
An inter-comparison exercise on CFD model capabilitiesto simulate hydrogen deflagrations with pressure relief vents
D. Baraldi a,*, A. Kotchourko b, A. Lelyakin b, J. Yanez b, A. Gavrikov c, A. Efimenko c,F. Verbecke d, D. Makarov d, V. Molkov d, A. Teodorczyk e
a Joint Research Centre (JRC), Westerduingweg, 3 Pb2, 1755 ZG Petten, The NetherlandsbResearch Center Karlsruhe (FZK), Postfach 3640 76021 Karlsruhe, GermanycResearch Centre Kurchatov Institute (KI), Moscow 123182, Russian FederationdHySAFER Centre, University of Ulster (UU), Shore Road, Newtownabbey, Co.Antrim BT370QB, UKeWarsaw University of Technology (WUT), ITC, Nowowiejska 21/25, 00-665 Warszawa, Poland
a r t i c l e i n f o
Article history:
Received 25 May 2010
Received in revised form
24 August 2010
Accepted 25 August 2010
Available online 17 September 2010
Keywords:
CFD
Vented combustion
Hydrogen safety
* Corresponding author. Tel.: þ31(0)22456514E-mail address: [email protected] (D.
0360-3199/$ e see front matter ª 2010 Profedoi:10.1016/j.ijhydene.2010.08.106
a b s t r a c t
The comparison between experimental data and simulation results of hydrogen explosions
in a vented vessel is described in the paper. The validation exercise was performed in the
frame of the European Commission co-funded Network of Excellence HySafe (Hydrogen
Safety as an Energy Carrier) that has the objective to facilitate the safe introduction of
hydrogen technologies. The mitigation effect of vents on the strength of hydrogen explo-
sions is a relevant issue in hydrogen safety. Experiments on stoichiometric hydrogen
deflagrations in a 0.95 m3 vessel with vents of different size (0.2 m2 and 0.3 m2) have been
selected in the available scientific literature in order to assess the accuracy of computa-
tional tools and models in reproducing experimental data in vented explosions. Five
organizations with experience in numerical modelling of gas explosions have participated
to the code benchmarking activities with four CFD codes (COM3D, REACFLOW, b0b and
FLUENT) and one code based on a mathematical two-zone model (VEX). The numerical
features of the different codes and the simulations results are described and compared
with the experimental measurements. The agreement between simulations and experi-
ments can be considered satisfactory for the maximum overpressure while correctly
capturing some relevant parameters related to the dynamics of the phenomena such as the
pressure rise rate and its maximum has been shown to be still an open issue.
ª 2010 Professor T. Nejat Veziroglu. Published by Elsevier Ltd. All rights reserved.
1. Introduction selected dispersion and explosion experiments with critical
Within the European co-funded HySafe Network of Excellence
(Hydrogen Safety as Energy Carrier) [1], an extensive pro-
gramme of benchmarks of Computational Fluid Dynamics
codes/models against experimental data has been performed.
The validation programme aimed at assessing the accuracy of
the numerical models and codes in correctly reproducing
0; fax: þ31(0)224565623.Baraldi).ssor T. Nejat Veziroglu. P
conditions for hydrogen deflagrations.
Some of the results that were generated during the HySafe
CFD validation programme on hydrogen accidental release
and explosions have been already published such as the
results on hydrogen release and mixing in a private garage
[2,3] and in a confined environment [4], hydrogen jet release in
a vented enclosurewith obstacles [5], hydrogen deflagration in
ublished by Elsevier Ltd. All rights reserved.
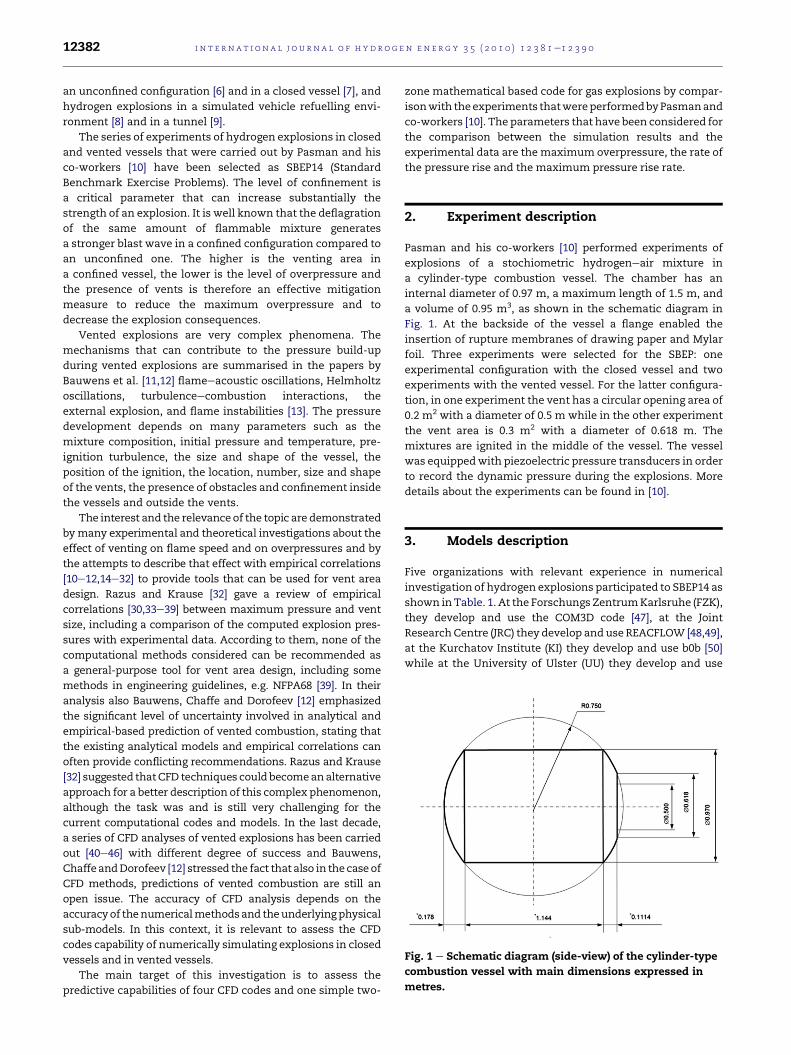
Fig. 1 e Schematic diagram (side-view) of the cylinder-type
combustion vessel with main dimensions expressed in
metres.
i n t e rn a t i o n a l j o u r n a l o f h y d r o g e n en e r g y 3 5 ( 2 0 1 0 ) 1 2 3 8 1e1 2 3 9 012382
an unconfined configuration [6] and in a closed vessel [7], and
hydrogen explosions in a simulated vehicle refuelling envi-
ronment [8] and in a tunnel [9].
The series of experiments of hydrogen explosions in closed
and vented vessels that were carried out by Pasman and his
co-workers [10] have been selected as SBEP14 (Standard
Benchmark Exercise Problems). The level of confinement is
a critical parameter that can increase substantially the
strength of an explosion. It is well known that the deflagration
of the same amount of flammable mixture generates
a stronger blast wave in a confined configuration compared to
an unconfined one. The higher is the venting area in
a confined vessel, the lower is the level of overpressure and
the presence of vents is therefore an effective mitigation
measure to reduce the maximum overpressure and to
decrease the explosion consequences.
Vented explosions are very complex phenomena. The
mechanisms that can contribute to the pressure build-up
during vented explosions are summarised in the papers by
Bauwens et al. [11,12] flameeacoustic oscillations, Helmholtz
oscillations, turbulenceecombustion interactions, the
external explosion, and flame instabilities [13]. The pressure
development depends on many parameters such as the
mixture composition, initial pressure and temperature, pre-
ignition turbulence, the size and shape of the vessel, the
position of the ignition, the location, number, size and shape
of the vents, the presence of obstacles and confinement inside
the vessels and outside the vents.
The interest and the relevance of the topic are demonstrated
bymany experimental and theoretical investigations about the
effect of venting on flame speed and on overpressures and by
the attempts to describe that effect with empirical correlations
[10e12,14e32] to provide tools that can be used for vent area
design. Razus and Krause [32] gave a review of empirical
correlations [30,33e39] between maximum pressure and vent
size, including a comparison of the computed explosion pres-
sures with experimental data. According to them, none of the
computational methods considered can be recommended as
a general-purpose tool for vent area design, including some
methods in engineering guidelines, e.g. NFPA68 [39]. In their
analysis also Bauwens, Chaffe and Dorofeev [12] emphasized
the significant level of uncertainty involved in analytical and
empirical-based prediction of vented combustion, stating that
the existing analytical models and empirical correlations can
often provide conflicting recommendations. Razus and Krause
[32] suggested thatCFD techniques could becomeanalternative
approach for a better description of this complex phenomenon,
although the task was and is still very challenging for the
current computational codes and models. In the last decade,
a series of CFD analyses of vented explosions has been carried
out [40e46] with different degree of success and Bauwens,
ChaffeandDorofeev [12] stressed the fact that also in the case of
CFD methods, predictions of vented combustion are still an
open issue. The accuracy of CFD analysis depends on the
accuracyof thenumericalmethodsand theunderlyingphysical
sub-models. In this context, it is relevant to assess the CFD
codes capability of numerically simulating explosions in closed
vessels and in vented vessels.
The main target of this investigation is to assess the
predictive capabilities of four CFD codes and one simple two-
zone mathematical based code for gas explosions by compar-
isonwith theexperiments thatwereperformedbyPasmanand
co-workers [10]. The parameters that have been considered for
the comparison between the simulation results and the
experimental data are the maximum overpressure, the rate of
the pressure rise and the maximum pressure rise rate.
2. Experiment description
Pasman and his co-workers [10] performed experiments of
explosions of a stochiometric hydrogeneair mixture in
a cylinder-type combustion vessel. The chamber has an
internal diameter of 0.97 m, a maximum length of 1.5 m, and
a volume of 0.95 m3, as shown in the schematic diagram in
Fig. 1. At the backside of the vessel a flange enabled the
insertion of rupture membranes of drawing paper and Mylar
foil. Three experiments were selected for the SBEP: one
experimental configuration with the closed vessel and two
experiments with the vented vessel. For the latter configura-
tion, in one experiment the vent has a circular opening area of
0.2 m2 with a diameter of 0.5 m while in the other experiment
the vent area is 0.3 m2 with a diameter of 0.618 m. The
mixtures are ignited in the middle of the vessel. The vessel
was equippedwith piezoelectric pressure transducers in order
to record the dynamic pressure during the explosions. More
details about the experiments can be found in [10].
3. Models description
Five organizations with relevant experience in numerical
investigation of hydrogen explosions participated to SBEP14 as
shown inTable. 1. At the Forschungs ZentrumKarlsruhe (FZK),
they develop and use the COM3D code [47], at the Joint
ResearchCentre (JRC) they develop and use REACFLOW [48,49],
at the Kurchatov Institute (KI) they develop and use b0b [50]
while at the University of Ulster (UU) they develop and use
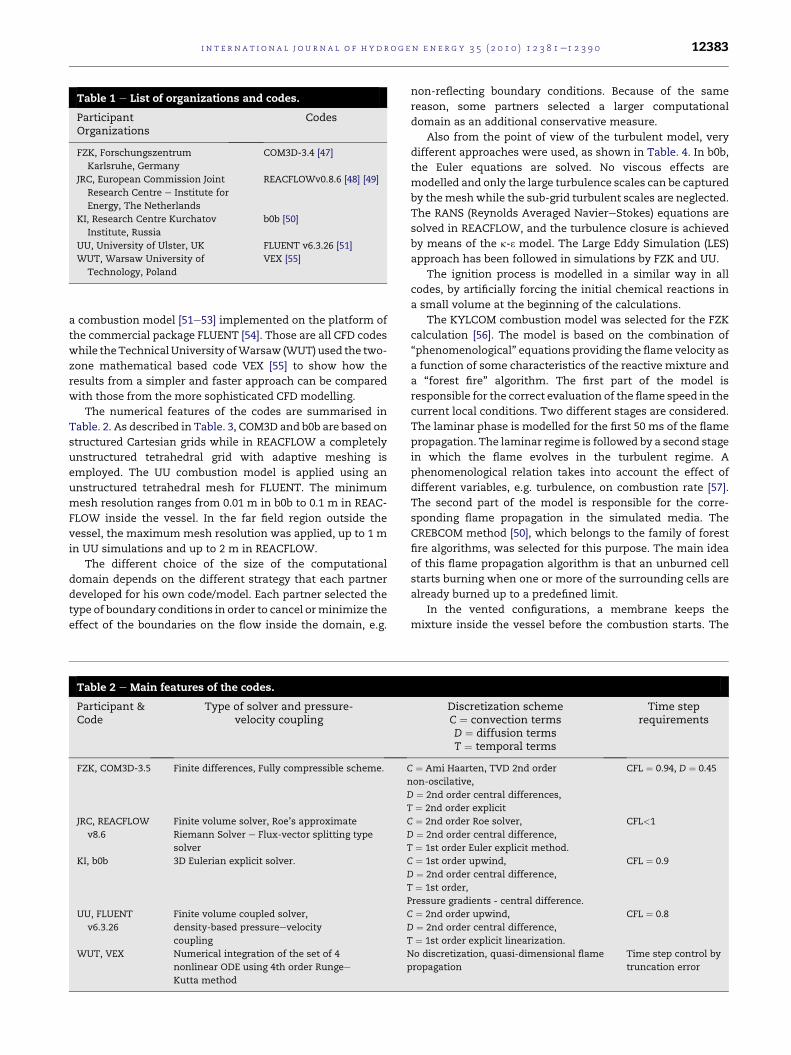
Table 1 e List of organizations and codes.
ParticipantOrganizations
Codes
FZK, Forschungszentrum
Karlsruhe, Germany
COM3D-3.4 [47]
JRC, European Commission Joint
Research Centre e Institute for
Energy, The Netherlands
REACFLOWv0.8.6 [48] [49]
KI, Research Centre Kurchatov
Institute, Russia
b0b [50]
UU, University of Ulster, UK FLUENT v6.3.26 [51]
WUT, Warsaw University of
Technology, Poland
VEX [55]
i n t e r n a t i o n a l j o u r n a l o f h y d r o g e n en e r g y 3 5 ( 2 0 1 0 ) 1 2 3 8 1e1 2 3 9 0 12383
a combustion model [51e53] implemented on the platform of
the commercial package FLUENT [54]. Those are all CFD codes
while theTechnicalUniversity ofWarsaw (WUT)used the two-
zone mathematical based code VEX [55] to show how the
results from a simpler and faster approach can be compared
with those from the more sophisticated CFD modelling.
The numerical features of the codes are summarised in
Table. 2. As described in Table. 3, COM3D and b0b are based on
structured Cartesian grids while in REACFLOW a completely
unstructured tetrahedral grid with adaptive meshing is
employed. The UU combustion model is applied using an
unstructured tetrahedral mesh for FLUENT. The minimum
mesh resolution ranges from 0.01 m in b0b to 0.1 m in REAC-
FLOW inside the vessel. In the far field region outside the
vessel, the maximum mesh resolution was applied, up to 1 m
in UU simulations and up to 2 m in REACFLOW.
The different choice of the size of the computational
domain depends on the different strategy that each partner
developed for his own code/model. Each partner selected the
type of boundary conditions in order to cancel orminimize the
effect of the boundaries on the flow inside the domain, e.g.
Table 2 e Main features of the codes.
Participant &Code
Type of solver and pressure-velocity coupling
FZK, COM3D-3.5 Finite differences, Fully compressible scheme. C
n
D
T
JRC, REACFLOW
v8.6
Finite volume solver, Roe’s approximate
Riemann Solver e Flux-vector splitting type
solver
C
D
T
KI, b0b 3D Eulerian explicit solver. C
D
T
P
UU, FLUENT
v6.3.26
Finite volume coupled solver,
density-based pressureevelocity
coupling
C
D
T
WUT, VEX Numerical integration of the set of 4
nonlinear ODE using 4th order Rungee
Kutta method
N
p
non-reflecting boundary conditions. Because of the same
reason, some partners selected a larger computational
domain as an additional conservative measure.
Also from the point of view of the turbulent model, very
different approaches were used, as shown in Table. 4. In b0b,
the Euler equations are solved. No viscous effects are
modelled and only the large turbulence scales can be captured
by themesh while the sub-grid turbulent scales are neglected.
The RANS (Reynolds Averaged NaviereStokes) equations are
solved in REACFLOW, and the turbulence closure is achieved
by means of the k-3 model. The Large Eddy Simulation (LES)
approach has been followed in simulations by FZK and UU.
The ignition process is modelled in a similar way in all
codes, by artificially forcing the initial chemical reactions in
a small volume at the beginning of the calculations.
The KYLCOM combustion model was selected for the FZK
calculation [56]. The model is based on the combination of
“phenomenological” equations providing the flame velocity as
a function of some characteristics of the reactive mixture and
a “forest fire” algorithm. The first part of the model is
responsible for the correct evaluation of the flame speed in the
current local conditions. Two different stages are considered.
The laminar phase is modelled for the first 50 ms of the flame
propagation. The laminar regime is followed by a second stage
in which the flame evolves in the turbulent regime. A
phenomenological relation takes into account the effect of
different variables, e.g. turbulence, on combustion rate [57].
The second part of the model is responsible for the corre-
sponding flame propagation in the simulated media. The
CREBCOM method [50], which belongs to the family of forest
fire algorithms, was selected for this purpose. The main idea
of this flame propagation algorithm is that an unburned cell
starts burning when one or more of the surrounding cells are
already burned up to a predefined limit.
In the vented configurations, a membrane keeps the
mixture inside the vessel before the combustion starts. The
Discretization schemeC ¼ convection termsD ¼ diffusion termsT ¼ temporal terms
Time steprequirements
¼ Ami Haarten, TVD 2nd order
on-oscilative,
¼ 2nd order central differences,
¼ 2nd order explicit
CFL ¼ 0.94, D ¼ 0.45
¼ 2nd order Roe solver,
¼ 2nd order central difference,
¼ 1st order Euler explicit method.
CFL<1
¼ 1st order upwind,
¼ 2nd order central difference,
¼ 1st order,
ressure gradients - central difference.
CFL ¼ 0.9
¼ 2nd order upwind,
¼ 2nd order central difference,
¼ 1st order explicit linearization.
CFL ¼ 0.8
o discretization, quasi-dimensional flame
ropagation
Time step control by
truncation error
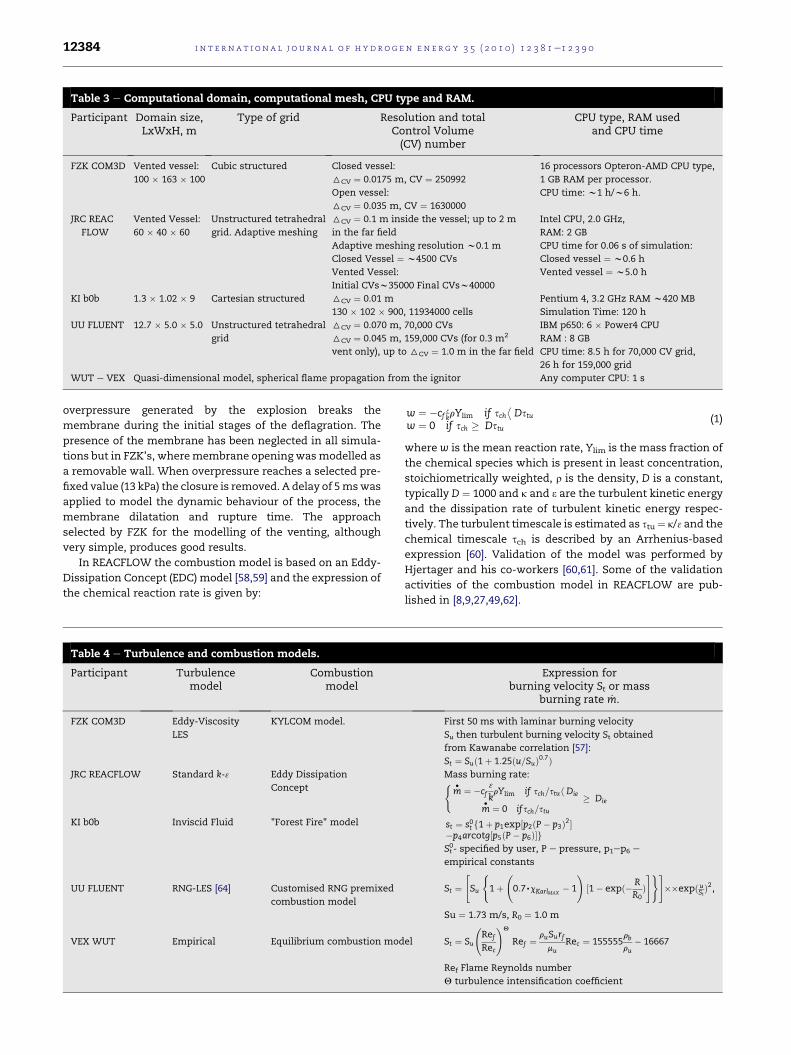
Table 3 e Computational domain, computational mesh, CPU type and RAM.
Participant Domain size,LxWxH, m
Type of grid Resolution and totalControl Volume(CV) number
CPU type, RAM usedand CPU time
FZK COM3D Vented vessel:
100 � 163 � 100
Cubic structured Closed vessel:
6CV ¼ 0.0175 m, CV ¼ 250992
Open vessel:
6CV ¼ 0.035 m, CV ¼ 1630000
16 processors Opteron-AMD CPU type,
1 GB RAM per processor.
CPU time: w1 h/w6 h.
JRC REAC
FLOW
Vented Vessel:
60 � 40 � 60
Unstructured tetrahedral
grid. Adaptive meshing
6CV ¼ 0.1 m inside the vessel; up to 2 m
in the far field
Adaptive meshing resolution w0.1 m
Closed Vessel ¼ w4500 CVs
Vented Vessel:
Initial CVsw35000 Final CVsw40000
Intel CPU, 2.0 GHz,
RAM: 2 GB
CPU time for 0.06 s of simulation:
Closed vessel ¼ w0.6 h
Vented vessel ¼ w5.0 h
KI b0b 1.3 � 1.02 � 9 Cartesian structured 6CV ¼ 0.01 m
130 � 102 � 900, 11934000 cells
Pentium 4, 3.2 GHz RAM w420 MB
Simulation Time: 120 h
UU FLUENT 12.7 � 5.0 � 5.0 Unstructured tetrahedral
grid
6CV ¼ 0.070 m, 70,000 CVs
6CV ¼ 0.045 m, 159,000 CVs (for 0.3 m2
vent only), up to 6CV ¼ 1.0 m in the far field
IBM p650: 6 � Power4 CPU
RAM : 8 GB
CPU time: 8.5 h for 70,000 CV grid,
26 h for 159,000 grid
WUT e VEX Quasi-dimensional model, spherical flame propagation from the ignitor Any computer CPU: 1 s
i n t e rn a t i o n a l j o u r n a l o f h y d r o g e n en e r g y 3 5 ( 2 0 1 0 ) 1 2 3 8 1e1 2 3 9 012384
overpressure generated by the explosion breaks the
membrane during the initial stages of the deflagration. The
presence of the membrane has been neglected in all simula-
tions but in FZK’s, wheremembrane opening wasmodelled as
a removable wall. When overpressure reaches a selected pre-
fixed value (13 kPa) the closure is removed. A delay of 5mswas
applied to model the dynamic behaviour of the process, the
membrane dilatation and rupture time. The approach
selected by FZK for the modelling of the venting, although
very simple, produces good results.
In REACFLOW the combustion model is based on an Eddy-
Dissipation Concept (EDC) model [58,59] and the expression of
the chemical reaction rate is given by:
Table 4 e Turbulence and combustion models.
Participant Turbulencemodel
Combustionmodel
FZK COM3D Eddy-Viscosity
LES
KYLCOM model.
JRC REACFLOW Standard k-3 Eddy Dissipation
Concept
KI b0b Inviscid Fluid "Forest Fire" model
UU FLUENT RNG-LES [64] Customised RNG premixed
combustion model
VEX WUT Empirical Equilibrium combustion mod
w ¼ �cf 3krYlim if sch�Dstu
w ¼ 0 if sch � Dstu(1)
where w is the mean reaction rate, Ylim is the mass fraction of
the chemical species which is present in least concentration,
stoichiometrically weighted, r is the density, D is a constant,
typically D ¼ 1000 and k and 3 are the turbulent kinetic energy
and the dissipation rate of turbulent kinetic energy respec-
tively. The turbulent timescale is estimated as stu¼ k/3 and the
chemical timescale sch is described by an Arrhenius-based
expression [60]. Validation of the model was performed by
Hjertager and his co-workers [60,61]. Some of the validation
activities of the combustion model in REACFLOW are pub-
lished in [8,9,27,49,62].
Expression forburning velocity St or mass
burning rate _m.
First 50 ms with laminar burning velocity
Su then turbulent burning velocity St obtained
from Kawanabe correlation [57]:
St ¼ Suð1þ 1:25ðu=SuÞ0:7ÞMass burning rate:(m� ¼ �cf
3
krYlim if sch=stuh Die
m� ¼ 0 ifsch=stu
� Die
st ¼ s0t f1þ p1exp½p2ðP� p3Þ2��p4arcotg½p5ðP� p6Þ�gSt0- specified by user, P e pressure, p1ep6 e
empirical constants
St ¼"Su
(1þ
0:7,cKarlMAX
� 1
!½1� expð� R
R0Þ#)#
��expðuStÞ2,
Su ¼ 1.73 m/s, R0 ¼ 1.0 m
el St ¼ Su
RefRec
!Q
Ref ¼ruSurfmu
Rec ¼ 155555rb
ru� 16667
Ref Flame Reynolds number
Q turbulence intensification coefficient
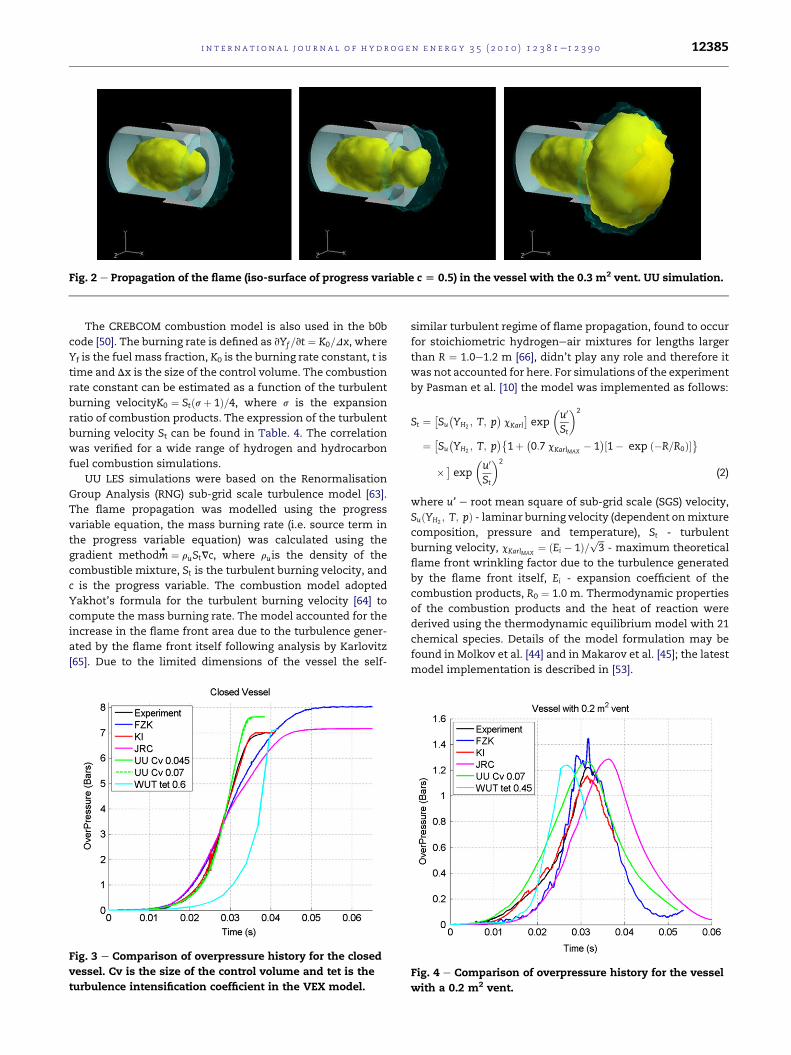
Fig. 2 e Propagation of the flame (iso-surface of progress variable c [ 0.5) in the vessel with the 0.3 m2 vent. UU simulation.
i n t e r n a t i o n a l j o u r n a l o f h y d r o g e n en e r g y 3 5 ( 2 0 1 0 ) 1 2 3 8 1e1 2 3 9 0 12385
The CREBCOM combustion model is also used in the b0b
code [50]. The burning rate is defined as vYf=vt ¼ K0=Dx, where
Yf is the fuel mass fraction, K0 is the burning rate constant, t is
time and Dx is the size of the control volume. The combustion
rate constant can be estimated as a function of the turbulent
burning velocityK0 ¼ Stðsþ 1Þ=4, where s is the expansion
ratio of combustion products. The expression of the turbulent
burning velocity St can be found in Table. 4. The correlation
was verified for a wide range of hydrogen and hydrocarbon
fuel combustion simulations.
UU LES simulations were based on the Renormalisation
Group Analysis (RNG) sub-grid scale turbulence model [63].
The flame propagation was modelled using the progress
variable equation, the mass burning rate (i.e. source term in
the progress variable equation) was calculated using the
gradient methodm� ¼ ruStVc, where ruis the density of the
combustible mixture, St is the turbulent burning velocity, and
c is the progress variable. The combustion model adopted
Yakhot’s formula for the turbulent burning velocity [64] to
compute the mass burning rate. The model accounted for the
increase in the flame front area due to the turbulence gener-
ated by the flame front itself following analysis by Karlovitz
[65]. Due to the limited dimensions of the vessel the self-
Fig. 3 e Comparison of overpressure history for the closed
vessel. Cv is the size of the control volume and tet is the
turbulence intensification coefficient in the VEX model.
similar turbulent regime of flame propagation, found to occur
for stoichiometric hydrogeneair mixtures for lengths larger
than R ¼ 1.0e1.2 m [66], didn’t play any role and therefore it
was not accounted for here. For simulations of the experiment
by Pasman et al. [10] the model was implemented as follows:
St ¼�Su
�YH2
; T; p�cKarl
�exp
�u0
St
�2
¼ �Su
�YH2
; T; p�
1þ �0:7 cKarlMAX� 1�½1� exp ð�R=R0Þ�
� � exp �u0
St
�2
(2)
where u’ e root mean square of sub-grid scale (SGS) velocity,
SuðYH2; T; pÞ - laminar burning velocity (dependent onmixture
composition, pressure and temperature), St - turbulent
burning velocity, cKarlMAX¼ ðEi � 1Þ= ffiffiffi
3p
- maximum theoretical
flame front wrinkling factor due to the turbulence generated
by the flame front itself, Ei - expansion coefficient of the
combustion products, R0 ¼ 1.0 m. Thermodynamic properties
of the combustion products and the heat of reaction were
derived using the thermodynamic equilibrium model with 21
chemical species. Details of the model formulation may be
found in Molkov et al. [44] and in Makarov et al. [45]; the latest
model implementation is described in [53].
Fig. 4 e Comparison of overpressure history for the vessel
with a 0.2 m2 vent.
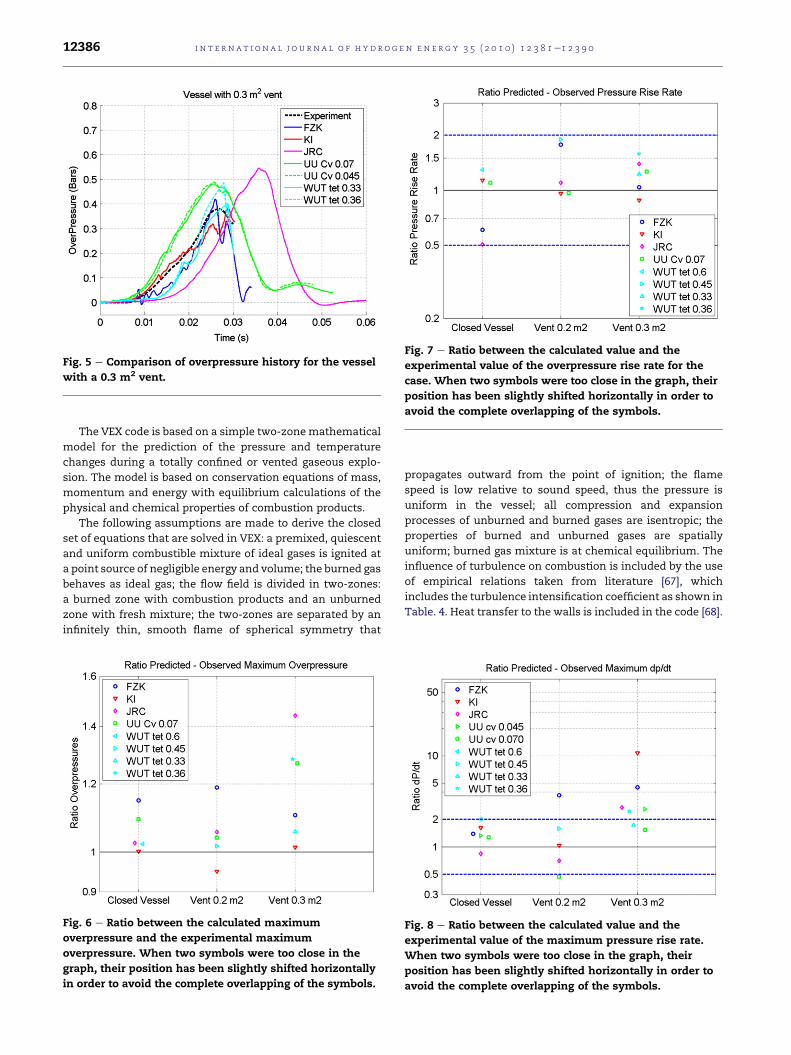
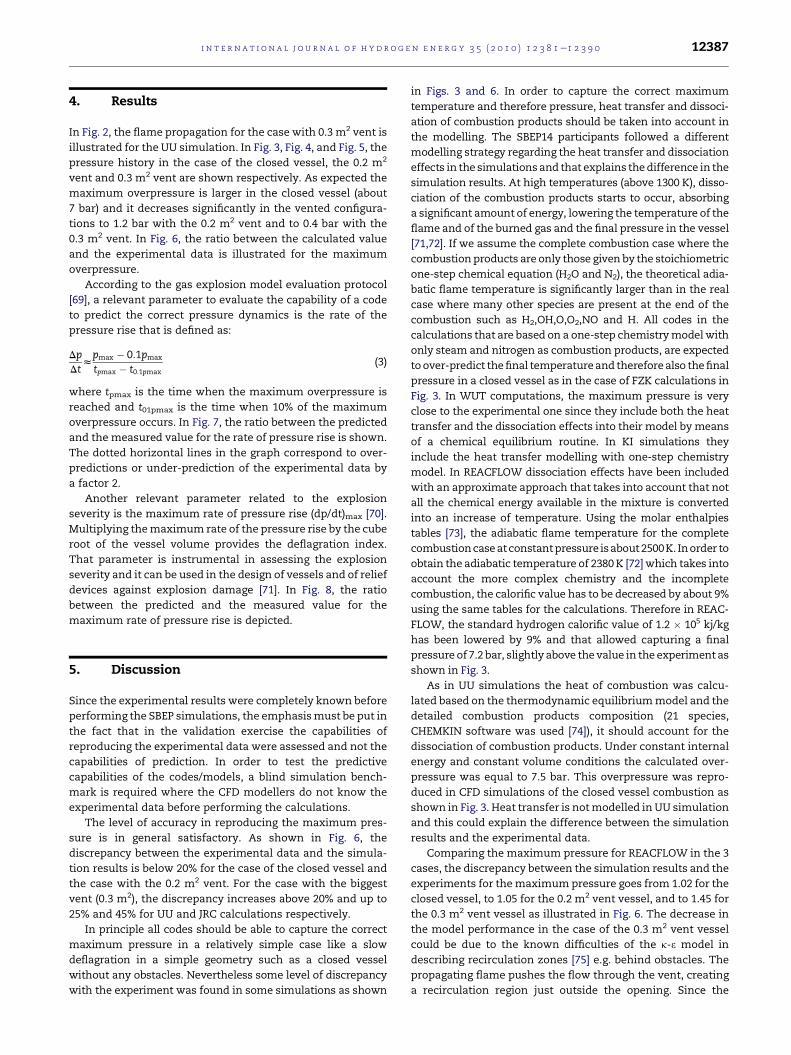
Fig. 5 e Comparison of overpressure history for the vessel
with a 0.3 m2 vent.
Fig. 7 e Ratio between the calculated value and the
experimental value of the overpressure rise rate for the
case. When two symbols were too close in the graph, their
position has been slightly shifted horizontally in order to
avoid the complete overlapping of the symbols.
i n t e rn a t i o n a l j o u r n a l o f h y d r o g e n en e r g y 3 5 ( 2 0 1 0 ) 1 2 3 8 1e1 2 3 9 012386
The VEX code is based on a simple two-zonemathematical
model for the prediction of the pressure and temperature
changes during a totally confined or vented gaseous explo-
sion. The model is based on conservation equations of mass,
momentum and energy with equilibrium calculations of the
physical and chemical properties of combustion products.
The following assumptions are made to derive the closed
set of equations that are solved in VEX: a premixed, quiescent
and uniform combustible mixture of ideal gases is ignited at
a point source of negligible energy and volume; the burned gas
behaves as ideal gas; the flow field is divided in two-zones:
a burned zone with combustion products and an unburned
zone with fresh mixture; the two-zones are separated by an
infinitely thin, smooth flame of spherical symmetry that
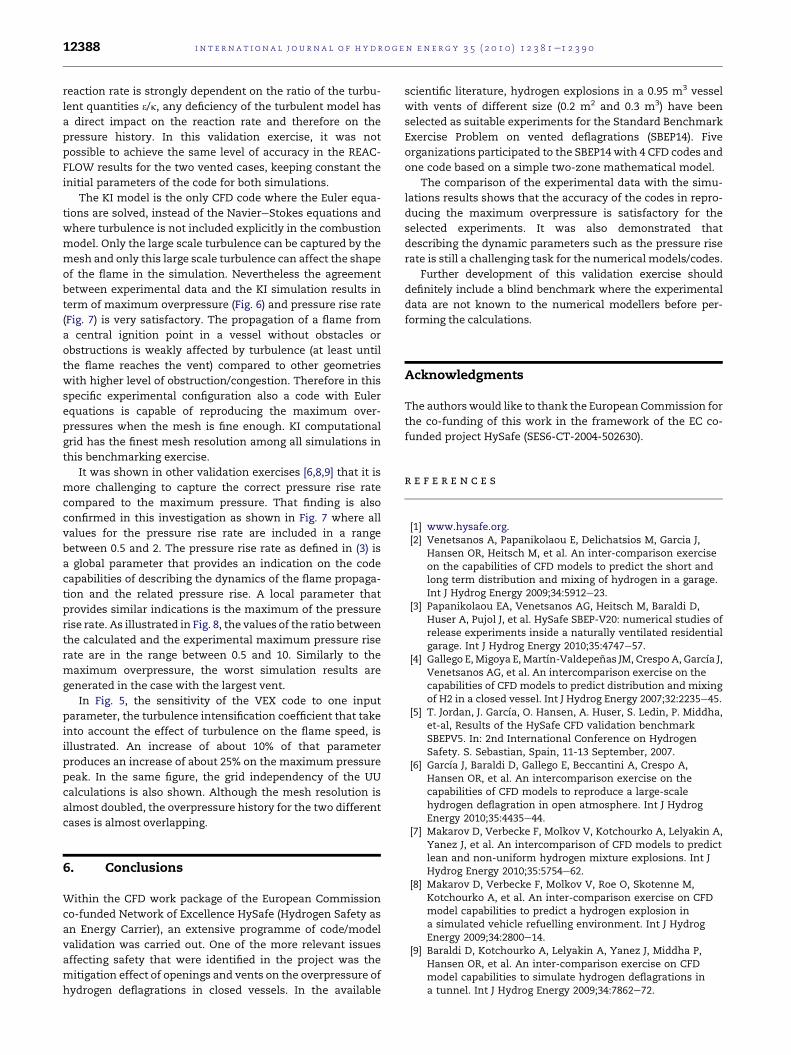
Fig. 6 e Ratio between the calculated maximum
overpressure and the experimental maximum
overpressure. When two symbols were too close in the
graph, their position has been slightly shifted horizontally
in order to avoid the complete overlapping of the symbols.
propagates outward from the point of ignition; the flame
speed is low relative to sound speed, thus the pressure is
uniform in the vessel; all compression and expansion
processes of unburned and burned gases are isentropic; the
properties of burned and unburned gases are spatially
uniform; burned gas mixture is at chemical equilibrium. The
influence of turbulence on combustion is included by the use
of empirical relations taken from literature [67], which
includes the turbulence intensification coefficient as shown in
Table. 4. Heat transfer to the walls is included in the code [68].
Fig. 8 e Ratio between the calculated value and the
experimental value of the maximum pressure rise rate.
When two symbols were too close in the graph, their
position has been slightly shifted horizontally in order to
avoid the complete overlapping of the symbols.
i n t e r n a t i o n a l j o u r n a l o f h y d r o g e n en e r g y 3 5 ( 2 0 1 0 ) 1 2 3 8 1e1 2 3 9 0 12387
4. Results
In Fig. 2, the flame propagation for the case with 0.3 m2 vent is
illustrated for the UU simulation. In Fig. 3, Fig. 4, and Fig. 5, the
pressure history in the case of the closed vessel, the 0.2 m2
vent and 0.3 m2 vent are shown respectively. As expected the
maximum overpressure is larger in the closed vessel (about
7 bar) and it decreases significantly in the vented configura-
tions to 1.2 bar with the 0.2 m2 vent and to 0.4 bar with the
0.3 m2 vent. In Fig. 6, the ratio between the calculated value
and the experimental data is illustrated for the maximum
overpressure.
According to the gas explosion model evaluation protocol
[69], a relevant parameter to evaluate the capability of a code
to predict the correct pressure dynamics is the rate of the
pressure rise that is defined as:
DpDt
zpmax � 0:1pmax
tpmax � t0:1pmax(3)
where tpmax is the time when the maximum overpressure is
reached and t01pmax is the time when 10% of the maximum
overpressure occurs. In Fig. 7, the ratio between the predicted
and the measured value for the rate of pressure rise is shown.
The dotted horizontal lines in the graph correspond to over-
predictions or under-prediction of the experimental data by
a factor 2.
Another relevant parameter related to the explosion
severity is the maximum rate of pressure rise (dp/dt)max [70].
Multiplying themaximum rate of the pressure rise by the cube
root of the vessel volume provides the deflagration index.
That parameter is instrumental in assessing the explosion
severity and it can be used in the design of vessels and of relief
devices against explosion damage [71]. In Fig. 8, the ratio
between the predicted and the measured value for the
maximum rate of pressure rise is depicted.
5. Discussion
Since the experimental results were completely known before
performing the SBEP simulations, the emphasismust be put in
the fact that in the validation exercise the capabilities of
reproducing the experimental data were assessed and not the
capabilities of prediction. In order to test the predictive
capabilities of the codes/models, a blind simulation bench-
mark is required where the CFD modellers do not know the
experimental data before performing the calculations.
The level of accuracy in reproducing the maximum pres-
sure is in general satisfactory. As shown in Fig. 6, the
discrepancy between the experimental data and the simula-
tion results is below 20% for the case of the closed vessel and
the case with the 0.2 m2 vent. For the case with the biggest
vent (0.3 m2), the discrepancy increases above 20% and up to
25% and 45% for UU and JRC calculations respectively.
In principle all codes should be able to capture the correct
maximum pressure in a relatively simple case like a slow
deflagration in a simple geometry such as a closed vessel
without any obstacles. Nevertheless some level of discrepancy
with the experiment was found in some simulations as shown
in Figs. 3 and 6. In order to capture the correct maximum
temperature and therefore pressure, heat transfer and dissoci-
ation of combustion products should be taken into account in
the modelling. The SBEP14 participants followed a different
modelling strategy regarding the heat transfer and dissociation
effects in the simulationsand that explains thedifference in the
simulation results. At high temperatures (above 1300 K), disso-
ciation of the combustion products starts to occur, absorbing
a significant amount of energy, lowering the temperature of the
flame and of the burned gas and the final pressure in the vessel
[71,72]. If we assume the complete combustion case where the
combustionproducts are only those given by the stoichiometric
one-step chemical equation (H2O and N2), the theoretical adia-
batic flame temperature is significantly larger than in the real
case where many other species are present at the end of the
combustion such as H2,OH,O,O2,NO and H. All codes in the
calculations that are based on a one-step chemistrymodelwith
only steam and nitrogen as combustion products, are expected
toover-predict thefinal temperatureand thereforealso thefinal
pressure in a closed vessel as in the case of FZK calculations in
Fig. 3. In WUT computations, the maximum pressure is very
close to the experimental one since they include both the heat
transfer and the dissociation effects into their model bymeans
of a chemical equilibrium routine. In KI simulations they
include the heat transfer modelling with one-step chemistry
model. In REACFLOW dissociation effects have been included
with an approximate approach that takes into account that not
all the chemical energy available in the mixture is converted
into an increase of temperature. Using the molar enthalpies
tables [73], the adiabatic flame temperature for the complete
combustioncaseatconstantpressure isabout2500K. Inorder to
obtain the adiabatic temperature of 2380K [72]which takes into
account the more complex chemistry and the incomplete
combustion, the calorific value has to be decreased by about 9%
using the same tables for the calculations. Therefore in REAC-
FLOW, the standard hydrogen calorific value of 1.2 � 105 kj/kg
has been lowered by 9% and that allowed capturing a final
pressure of 7.2 bar, slightly above the value in the experiment as
shown in Fig. 3.
As in UU simulations the heat of combustion was calcu-
lated based on the thermodynamic equilibriummodel and the
detailed combustion products composition (21 species,
CHEMKIN software was used [74]), it should account for the
dissociation of combustion products. Under constant internal
energy and constant volume conditions the calculated over-
pressure was equal to 7.5 bar. This overpressure was repro-
duced in CFD simulations of the closed vessel combustion as
shown in Fig. 3. Heat transfer is notmodelled in UU simulation
and this could explain the difference between the simulation
results and the experimental data.
Comparing the maximum pressure for REACFLOW in the 3
cases, the discrepancy between the simulation results and the
experiments for themaximumpressure goes from 1.02 for the
closed vessel, to 1.05 for the 0.2 m2 vent vessel, and to 1.45 for
the 0.3 m2 vent vessel as illustrated in Fig. 6. The decrease in
the model performance in the case of the 0.3 m2 vent vessel
could be due to the known difficulties of the k-3 model in
describing recirculation zones [75] e.g. behind obstacles. The
propagating flame pushes the flow through the vent, creating
a recirculation region just outside the opening. Since the
i n t e rn a t i o n a l j o u r n a l o f h y d r o g e n en e r g y 3 5 ( 2 0 1 0 ) 1 2 3 8 1e1 2 3 9 012388
reaction rate is strongly dependent on the ratio of the turbu-
lent quantities 3/k, any deficiency of the turbulent model has
a direct impact on the reaction rate and therefore on the
pressure history. In this validation exercise, it was not
possible to achieve the same level of accuracy in the REAC-
FLOW results for the two vented cases, keeping constant the
initial parameters of the code for both simulations.
The KI model is the only CFD code where the Euler equa-
tions are solved, instead of the NaviereStokes equations and
where turbulence is not included explicitly in the combustion
model. Only the large scale turbulence can be captured by the
mesh and only this large scale turbulence can affect the shape
of the flame in the simulation. Nevertheless the agreement
between experimental data and the KI simulation results in
term of maximum overpressure (Fig. 6) and pressure rise rate
(Fig. 7) is very satisfactory. The propagation of a flame from
a central ignition point in a vessel without obstacles or
obstructions is weakly affected by turbulence (at least until
the flame reaches the vent) compared to other geometries
with higher level of obstruction/congestion. Therefore in this
specific experimental configuration also a code with Euler
equations is capable of reproducing the maximum over-
pressures when the mesh is fine enough. KI computational
grid has the finest mesh resolution among all simulations in
this benchmarking exercise.
It was shown in other validation exercises [6,8,9] that it is
more challenging to capture the correct pressure rise rate
compared to the maximum pressure. That finding is also
confirmed in this investigation as shown in Fig. 7 where all
values for the pressure rise rate are included in a range
between 0.5 and 2. The pressure rise rate as defined in (3) is
a global parameter that provides an indication on the code
capabilities of describing the dynamics of the flame propaga-
tion and the related pressure rise. A local parameter that
provides similar indications is the maximum of the pressure
rise rate. As illustrated in Fig. 8, the values of the ratio between
the calculated and the experimental maximum pressure rise
rate are in the range between 0.5 and 10. Similarly to the
maximum overpressure, the worst simulation results are
generated in the case with the largest vent.
In Fig. 5, the sensitivity of the VEX code to one input
parameter, the turbulence intensification coefficient that take
into account the effect of turbulence on the flame speed, is
illustrated. An increase of about 10% of that parameter
produces an increase of about 25% on the maximum pressure
peak. In the same figure, the grid independency of the UU
calculations is also shown. Although the mesh resolution is
almost doubled, the overpressure history for the two different
cases is almost overlapping.
6. Conclusions
Within the CFD work package of the European Commission
co-funded Network of Excellence HySafe (Hydrogen Safety as
an Energy Carrier), an extensive programme of code/model
validation was carried out. One of the more relevant issues
affecting safety that were identified in the project was the
mitigation effect of openings and vents on the overpressure of
hydrogen deflagrations in closed vessels. In the available
scientific literature, hydrogen explosions in a 0.95 m3 vessel
with vents of different size (0.2 m2 and 0.3 m3) have been
selected as suitable experiments for the Standard Benchmark
Exercise Problem on vented deflagrations (SBEP14). Five
organizations participated to the SBEP14with 4 CFD codes and
one code based on a simple two-zone mathematical model.
The comparison of the experimental data with the simu-
lations results shows that the accuracy of the codes in repro-
ducing the maximum overpressure is satisfactory for the
selected experiments. It was also demonstrated that
describing the dynamic parameters such as the pressure rise
rate is still a challenging task for the numerical models/codes.
Further development of this validation exercise should
definitely include a blind benchmark where the experimental
data are not known to the numerical modellers before per-
forming the calculations.
Acknowledgments
The authorswould like to thank the European Commission for
the co-funding of this work in the framework of the EC co-
funded project HySafe (SES6-CT-2004-502630).
r e f e r e n c e s
[1] www.hysafe.org.[2] Venetsanos A, Papanikolaou E, Delichatsios M, Garcia J,
Hansen OR, Heitsch M, et al. An inter-comparison exerciseon the capabilities of CFD models to predict the short andlong term distribution and mixing of hydrogen in a garage.Int J Hydrog Energy 2009;34:5912e23.
[3] Papanikolaou EA, Venetsanos AG, Heitsch M, Baraldi D,Huser A, Pujol J, et al. HySafe SBEP-V20: numerical studies ofrelease experiments inside a naturally ventilated residentialgarage. Int J Hydrog Energy 2010;35:4747e57.
[4] Gallego E,Migoya E, Martın-Valdepenas JM, Crespo A, Garcıa J,Venetsanos AG, et al. An intercomparison exercise on thecapabilities of CFD models to predict distribution and mixingof H2 in a closed vessel. Int J Hydrog Energy 2007;32:2235e45.
[5] T. Jordan, J. Garcıa, O. Hansen, A. Huser, S. Ledin, P. Middha,et-al, Results of the HySafe CFD validation benchmarkSBEPV5. In: 2nd International Conference on HydrogenSafety. S. Sebastian, Spain, 11-13 September, 2007.
[6] Garcıa J, Baraldi D, Gallego E, Beccantini A, Crespo A,Hansen OR, et al. An intercomparison exercise on thecapabilities of CFD models to reproduce a large-scalehydrogen deflagration in open atmosphere. Int J HydrogEnergy 2010;35:4435e44.
[7] Makarov D, Verbecke F, Molkov V, Kotchourko A, Lelyakin A,Yanez J, et al. An intercomparison of CFD models to predictlean and non-uniform hydrogen mixture explosions. Int JHydrog Energy 2010;35:5754e62.
[8] Makarov D, Verbecke F, Molkov V, Roe O, Skotenne M,Kotchourko A, et al. An inter-comparison exercise on CFDmodel capabilities to predict a hydrogen explosion ina simulated vehicle refuelling environment. Int J HydrogEnergy 2009;34:2800e14.
[9] Baraldi D, Kotchourko A, Lelyakin A, Yanez J, Middha P,Hansen OR, et al. An inter-comparison exercise on CFDmodel capabilities to simulate hydrogen deflagrations ina tunnel. Int J Hydrog Energy 2009;34:7862e72.
i n t e r n a t i o n a l j o u r n a l o f h y d r o g e n en e r g y 3 5 ( 2 0 1 0 ) 1 2 3 8 1e1 2 3 9 0 12389
[10] Pasman HJ, Groothuisen ThM, Gooijer PH. Design of pressurerelief vents. In: Buschman CH, editor. "Loss prevention andsafety promotion in the process Indies". New-York: Elsevier;1974. p. 185e9.
[11] Bauwens CR, Chaffee J, Dorofeev S. Experimental andnumerical study of hydrogen-air deflagrations in a ventedenclosure. 7th International Symposium on Hazard,Prevention and Mitigation of Industrial Explosions: 13thInternational Colloquium on Dust Explosions & 8thColloquium on Gas, Vapour, Liquid, and Hybrid Explosions,St. Petersburg, Russia 7e11 July 2008.
[12] Bauwens CR, Chaffee J, Dorofeev S. Vented explosionoverpressure from combustion of hydrogen andhydrocarbon mixtures. 3rd International Conference onHydrogen Safety. Ajaccio, France. 16e18 September 2009.
[13] Bychkov VV, Liberman MA. Dynamics and stability ofpremixed flames. Phys Rep 2000;325:115e237.
[14] Bradley D, Mitchenson A. The venting of gaseous explosionin spherical vessels. Combust Flame 1978;32:221e55.
[15] Solberg DM, Pappas JA, Skramstad E. Observations of flameinstabilities in large scale vented gas explosions. Inter SympCombust 1981;18:1607e14.
[16] Cooper MG, Fairweather M, Tite JP. On the mechanisms ofpressure generation in vented explosions. Combust Flame1986;65:1e14.
[17] Kumar RK, Skraba T, Greig DR. Vented combustion ofhydrogeneair mixtures in large volumes. Nucl Eng Design1987;99:305e15.
[18] Harrison AJ, Eyre JA. External explosions as a result ofexplosion venting. Combust Sci.and Tech 1987;52:91e106.
[19] Van Wingerden CJM, Mercx WPM, Pasman HJ. Venting ofgaseous explosions. Process Saf Prog 1993;12:40e6.
[20] Carcassi MN, Fineschi F. A theoretical and experimentalstudy on the hydrogen vented deflagration. Nucl Eng Design1993;145:355e64.
[21] Dorofeev SB, Bezmelnitsin AV, Sidorov VP. Transition todetonation in vented hydrogen-air mixtures. Combust Flame1995;103:243e6.
[22] Chow SK, Cleaver RP, Fairweather M, Walker DG. Anexperimental study of vented explosions in a 3:1 aspect ratiocylindrical vessel. Process Saf Environ Prot 2000;78:425e33.
[23] Alekseev VI, Kuznetsov MS, Yankin YG, Dorofeev SB.Experimental study of flame acceleration and thedeflagration-to-detonation transition under conditions oftransverse venting. J Loss Prev Process Ind 2001;14:591e6.
[24] Tamanini F. Scaling parameters for vented gas and dustexplosions. J Loss Prev Process Ind 2001;14:455e61.
[25] Jiang X, Fan B, Ye J, Dong G. Experimental investigations onthe external pressure during venting. J Loss Prev Process Ind2004;18:21e6.
[26] Carcassi MN, Fineschi F. Deflagrations of H2eair andCH4eair lean mixtures in a vented multi-compartmentenvironment. Energy 2005;30:1439e51.
[27] Breitung W, Dorofeev S, Kotchourko A, Redlinger R,Scholtyssek W, Bentaib A, et al. Integral large scaleexperiments on hydrogen combustion for severe accidentcode validation-HYCOM. Nucl Eng Design 2005;235:253e70.
[28] Chen Z, Fan B, Jiang X, Ye J. Investigations of secondaryexplosions induced by venting. Process Saf Prog 2006;25:255e61.
[29] Molkov VV, Dobashi R, Suzuki M, Hirano T. Modelling ofvented hydrogeneair deflagrations and correlations for ventsizing. J Loss Prev Process Ind 1999;12:147e56.
[30] Molkov VV, Dobashi R, Suzuki M, Hirano T. Venting ofdeflagrations: hydrocarboneair and hydrogen-air systems.J Loss Prev Process Ind 2000;13:397e409.
[31] Molkov VV. Unified correlations for vent sizing of enclosuresat atmospheric and elevated pressure. J Loss Prev Process Ind2001;14:567e74.
[32] Razus DM, Krause U. Comparison of empirical and semi-empirical calculation methods for venting of gas explosions.Fire Saf J 2001;36:1e23.
[33] Yao C. Explosion venting of low-strength equipment andstructures. J Loss Prev Process Ind 1974;8:1e9.
[34] Simpson LL. Equations for the VDI and bartknechtnomograms. Plant/Oper Prog 1986;5:49e51.
[35] Runes E. Explosion venting. J Loss Prev Process Ind 1972;6:63e7.
[36] Cubbage PA, Simmonds WA. An investigation of explosionreliefs for industrial drying ovens. Trans Inst Gas Eng 1955;105:470e5.
[37] Rasbash D. The relief of gas and vapour explosions indomestic structures. Fire Res Note No. 1969;759.
[38] Molkov VV, Korolchenko A, Alexandrov S. Venting ofdeflagrationsinbuildingsandequipment:universalcorrelation.Proceedings of 5th International Symposium on Fire SafetyScience, Melbourne, Australia, March (1997) 1249e60.
[39] NFPA 68. Guide for venting deflagrations. Natl Fire ProtAssoc; 1998.
[40] Patel SNDH, Ibrahim SS, Yehia MA. Flamelet surface densitymodelling of turbulent deflagrating flames in ventedexplosions. J Loss Prev Process Ind 2003;16:451e5.
[41] Ferrara G, Di Benedetto A, Salzano E, Russo G. CFD analysis ofgas explosions vented through relief pipes. J Hazard Mater2006;A137:654e65.
[42] Karnesky J, Chatterje P, Tamanini F, Dorofeev S. Anapplication of 3D gasdynamic modeling for the prediction ofoverpressures in vented enclosures. J Loss Prev Process Ind2007;20:447e54.
[43] Molkov V, Makarov D, Puttock J. The nature and large eddysimulation of coherent deflagrations in a vented enclosure-atmosphere system. J Loss Prev Process Ind 2006;19:121e9.
[44] Molkov V, Makarov D, Verbecke F, et al. LES Model of VentedExplosion: HydrogeneAir Mixtures, In: Proceedings of 5th Int.Seminar on Fire and Explosion Hazards, Edinburgh, UK, April2007, 23e27.
[45] Makarov D, Verbecke F, Molkov V. Numerical analysis ofhydrogen deflagration mitigation by venting through a duct. JLoss Prev Process Ind 2007;20:433e8.
[46] Di Sarli V, Benedetto A, Russo G. Using large eddy simulationfor understanding vented gas explosions in the presence ofobstacles. J Hazard Mater 2009;169:435e42.
[47] Kotchourko A, Breitung W, Veser A, 1999. Reactive FlowSimulations in Complex 3D Geometries Using The COM3DCode, Proceedings ’Jahrestagung Kerntechnik’ 99,Kerntechnische Gesellschaft e.V., Deutsches Atomforum e.V.Annual Meeting on Nuclear Technology’99, ISSN 0720e9207,Karlsruhe, 18e20 Mai, 1999, p. 173.
[48] Troyer C, Baraldi D, Kranzlmueller D, Wilkening H, Volkert J.Parallel grid adaptation and dynamic load balancing for a CFDSolver. In: Martino B, Kranzlmueller D, Dongarra J, editors.Recent Advances in Parallel Virtual Machine and MessagePassing Interface, Lecture Notes in Computer Science, 3666.Berlin: Springer-Verlag Publishers; 2005. p. 493e501.
[49] Wilkening H, Huld T. An adaptive 3D CFD solver formodelling explosions on large industrial environmentalscales. Combust Sci Tech 1999;149:361e87.
[50] Efimenko AA, Dorofeev SB. CREBCOM code system fordescription of gaseous combustion. J Loss Prev Process Ind2001;14:575e81.
[51] Molkov VV, Makarov DV, Schneider H. Hydrogeneairdeflagrations in open atmosphere: large eddy simulationanalysis of experimental data. Int J Hydrog Energy 2007;32:2198e205.
[52] Molkov V, Verbecke F, Makarov D. LES of hydrogen-airdeflagrations in a 78.5 m tunnel. Combust Sci Technol 2008;180:1e13.
i n t e rn a t i o n a l j o u r n a l o f h y d r o g e n en e r g y 3 5 ( 2 0 1 0 ) 1 2 3 8 1e1 2 3 9 012390
[53] Verbecke F, Molkov V, Makarov D. VLES of lean hydrogen-airdeflagrations in a closed 5.7 m height vessel, 6thMediterranean Combustion Symposium, Ajaccio, France,7e11 June 2009.
[54] http://www.fluent.com/software/fluent/index.htm.[55] Rychter T, Teodorczyk A. Engineering Calculations of Gas
Explosion Parameters in Closed and Vented Vessels,Proceedings of the V Seminar "New Trends in Research ofEnergetic Materials", Pardubice 2002, 281e292.
[56] Yanez J, Kotchourko A, Lelyakin A. KYLCOM model for thecalculation of under resolved hydrogen combustionproblems. 6th International Seminar on Fire and ExplosionsHazards. Leeds, UK, 11e16 April 2010.
[57] Kawanabe H, Shioji M, Tsunooka T, Ali Y. CFD simulation forpredicting combustion and Pollutant Formation ina Homogeneous-Charge Sparkeignition Engine. COMODIA98Tokyo: JSME; 1998:287e92.
[58] Hjertager BH. Simulation of transient compressible turbulentreactive flows. Comb Sci Technol 1982;41:159e70.
[59] Hjertager BH. Simulation of gas explosions. Modell. IdentificControl 1989;10:227e47.
[60] Hjertager BH. Computer modeling of turbulent gasexplosions in complex 2D and 3D geometries. J Hazard Mater1993;34:173e97.
[61] Hjertager BH, Solberg T. A review of computational fluiddynamics (CFD) modelling of gas explosions. In: Zarko VE,Weiser V, Eisenreich N, Vasilev AA, editors. Prevention ofHazardous Fires and Explosions. The transfer to civilapplications of military Experience. Dordrecht, TheNetherlands: Kluwer Academic Publishers; 1999. p. 77e91.
[62] Bielert U, Breitung W, Kotchourko A, Royl P, Scholtyssek W,Veser A, et al. Multi-dimensional simulation of hydrogendistribution and turbulent combustion in severe accidents.Nucl Eng Design 2001;209:165e72.
[63] Yakhot V, Orszag S. Renormalization group analysis ofturbulence. I. Basic theory. J Sci Comput 1986;1:3e8.
[64] Yakhot V. Propagation velocity of premixed turbulent flames.Combust Sci Technol 1988;60:191.
[65] Karlovitz B, Denniston Jr DW, Wells FE. Investigation ofturbulent flames. J Chem Phys 1951;19:541e7.
[66] Gostintsev YuA, Istratov AG, Shulenin YuV. Self-similarpropagation of a free turbulent flame in mixed gas mixtures.Combust. Explos Shock Waves 1988;24:63e70.
[67] Maisey HR. Gaseous and dust explosion venting. ChemProcess Eng 1965;46:527e35.
[68] Tanaka Y. Three-dimensional flame development in a closedvessel: comparison between measured and theoreticalresults. Bull JSME; 1986. 29 Dec.
[69] Gas Explosion Model Evaluation Protocol, ModelEvaluation Group, European Communities, Directorate-General XII, Science Research and Development,January 1996.
[70] Tang C, Huang Z, Jin C, He J, Wang J, Wang X, et al. Explosioncharacteristics of hydrogenenitrogeneair mixtures atelevated pressures and temperatures. Int J Hydrog Energy2009;34:554e61.
[71] Lees FP. Loss Prevention in the process industry. Hazardidentification, assessment and control. 2nd ed. Oxford:Butterworth-Heinemann. Reed Educational and ProfessionalPublishing Ltd; 1996. 16/24.
[72] Advances in Heat Transfer. Heat transfer in nuclear reactorsafety. In: Irvine, Thomas F, Hartnett, James P, editors.Harcourt Publishers Ltd, A subsidiary of HarcourtInternational Ltd; June 1997. Vol. 29,Editor:PublishedISBN0120200295.
[73] Haywood R.W. Thermodynamic tables in SI (metric) Units.Cambridge University Press.
[74] Kee RJ, Rupley FM,Miller JA, ColtrinME, Grcar JF,Meeks E, et-al,Release 3.6, Reaction Design, Inc., San Diego, CA, 2000.
[75] Hirsch C, Tartinville B. Reynolds-Averaged Navier-Stokesmodeling for industrial applications and some challengingissues. Int J Comput Fluid Dyn 2009;23:295e303.
Copyright © 2022 FDOKUMEN