CFD Analysis and Wind Tunnel Experiment on a Typical Launch Vehicle Model
7
CFD Analysis and Wind Tunnel Experiment on a Typical Launch Vehicle Model Selvi Rajan. S 1 *, Santhoshkumar. M 2 , Lakshmanan. N 3 , Nadaraja Pillai. S 4 and Paramasivam. M 5 1 Scientist, Structural Engineering Research Centre, CSIR Campus, Taramani, Chennai – 600 113, Tamil Nadu, India 2 Structural Engineer, Vibromech Engineers & Services ltd., Chennai, Tamil Nadu, India 3 Director, Structural Engineering Research Centre, CSIR Campus, Taramani, Chennai – 600 113, Tamil Nadu, India 4 PhD Research Scholar, Wind Engineering Research Centre, Tokyo Polytechnic University, Japan 243-0297 5 PDF Research Scholar, Wind Engineering Research Centre, Tokyo Polytechnic University, Japan 243-0297 Abstract In order to understand the physical phenomena of the wind flow over the typical launch vehicle, the flow was simulated using both Wind tunnel and Computational Fluid Dynamics (CFD). In the present study, tests were conducted on a 1:50 scaled model of a launch vehicle. The model was subjected to two wind conditions, wind flow normal to the shorter plan dimension q =0°, where the three main cylinders of the model were one behind the other and wind flow normal to the longer plan dimension, q = 90°, where all the three main cylinders of the vehicle are subjected to direct wind pressure in the windward direction. Based on the CFD studies, the flow pattern and the force coefficients were derived. To validate these results, wind tunnel tests were carried out on a 1:50 scaled rigid and light-weight models respectively, for obtaining path lines and force coefficients. Results on streamlines obtained based on CFD simulation and wind tunnel experiments compared very well. The force coefficients in both directions were evaluated from CFD results showed good agreement with the corresponding measured values based on wind tunnel experiment. Key Words: CFD Simulation, Boundary Layer Wind Tunnel, Launch Vehicle, Flow Visualization 1. Introduction There are many simulation methods and different models are available to access the application of CFD [1,2] in the field of aerodynamics and wind Engineering. Murakami et al. [1,3] show such a simulation over the surface mounted cubic model with the k-e and LES mo- dels. Many studies show that the critical shapes can have significant unsteady effects. Different shapes can cause sudden changes in the size and structure of the wake and corresponding large changes in drag. In current competi- tive environment there is a need to design the satellite launch vehicles which will be capable of launching even under some unforeseen changes in the atmospheric con- ditions. One such situation was aroused when PSLV-C5 launched at the time of heavy rain from Sriharikota, In- dia in Oct. 2003 [4]. There is always a possibility of storms, cyclones and tornados near the launching station during the designed period of launch. Before launching, the Mobile Service Tower (MST) is taken away from the launch pad. The Umbilical tower that is fully exposed to atmospheric wind supports the launch vehicle. It be- Tamkang Journal of Science and Engineering, Vol. 12, No. 3, pp. 223-229 (2009) 223 *Corresponding author. E-mail: [email protected]
Transcript of CFD Analysis and Wind Tunnel Experiment on a Typical Launch Vehicle Model

CFD Analysis and Wind Tunnel Experiment on a
Typical Launch Vehicle Model
Selvi Rajan. S1*, Santhoshkumar. M2, Lakshmanan. N3,
Nadaraja Pillai. S4 and Paramasivam. M5
1Scientist, Structural Engineering Research Centre, CSIR Campus,
Taramani, Chennai – 600 113, Tamil Nadu, India2Structural Engineer, Vibromech Engineers & Services ltd.,
Chennai, Tamil Nadu, India3Director, Structural Engineering Research Centre, CSIR Campus,
Taramani, Chennai – 600 113, Tamil Nadu, India4PhD Research Scholar, Wind Engineering Research Centre, Tokyo Polytechnic University,
Japan 243-02975PDF Research Scholar, Wind Engineering Research Centre, Tokyo Polytechnic University,
Japan 243-0297
Abstract
In order to understand the physical phenomena of the wind flow over the typical launch vehicle,
the flow was simulated using both Wind tunnel and Computational Fluid Dynamics (CFD). In the
present study, tests were conducted on a 1:50 scaled model of a launch vehicle. The model was
subjected to two wind conditions, wind flow normal to the shorter plan dimension � = 0�, where the
three main cylinders of the model were one behind the other and wind flow normal to the longer plan
dimension, � = 90�, where all the three main cylinders of the vehicle are subjected to direct wind
pressure in the windward direction. Based on the CFD studies, the flow pattern and the force
coefficients were derived. To validate these results, wind tunnel tests were carried out on a 1:50 scaled
rigid and light-weight models respectively, for obtaining path lines and force coefficients. Results on
streamlines obtained based on CFD simulation and wind tunnel experiments compared very well. The
force coefficients in both directions were evaluated from CFD results showed good agreement with the
corresponding measured values based on wind tunnel experiment.
Key Words: CFD Simulation, Boundary Layer Wind Tunnel, Launch Vehicle, Flow Visualization
1. Introduction
There are many simulation methods and different
models are available to access the application of CFD
[1,2] in the field of aerodynamics and wind Engineering.
Murakami et al. [1,3] show such a simulation over the
surface mounted cubic model with the k-� and LES mo-
dels. Many studies show that the critical shapes can have
significant unsteady effects. Different shapes can cause
sudden changes in the size and structure of the wake and
corresponding large changes in drag. In current competi-
tive environment there is a need to design the satellite
launch vehicles which will be capable of launching even
under some unforeseen changes in the atmospheric con-
ditions. One such situation was aroused when PSLV-C5
launched at the time of heavy rain from Sriharikota, In-
dia in Oct. 2003 [4]. There is always a possibility of
storms, cyclones and tornados near the launching station
during the designed period of launch. Before launching,
the Mobile Service Tower (MST) is taken away from the
launch pad. The Umbilical tower that is fully exposed to
atmospheric wind supports the launch vehicle. It be-
Tamkang Journal of Science and Engineering, Vol. 12, No. 3, pp. 223�229 (2009) 223
*Corresponding author. E-mail: [email protected]

comes necessary to test the launch vehicles to atmo-
spheric wind loads under simulated Atmospheric Boun-
dary Layer (ABL) flow. Although sufficient studies on
the flow over some critical bodies are available, there are
not many studies on the physical phenomena of flow
around a launch vehicle for the problem of wind in hori-
zontal direction. Airflow around the launch vehicle mo-
del is complicated since the Boosters, Strapons are clo-
sely packed with main stage. The cross-section looks like
compound.
Atypical launch vehicle model of scale 1:50 as shown
in Figure 1, was considered for the present study. Prior to
wind tunnel testing a detailed understanding on the flow
behaviour around the launch vehicle was thought to be
essential for proper instrumentation and collection of
data. There was no sufficient literature available for flow
over compound cylinder like structures. In order to have
some preliminary ideas about the flow behaviour, a CFD
analysis was done as a pre-experimental study using test
section inlet conditions. Through flow visualisation, flow
aspects relating to points of separation, re-attachment
and wake flow can be studied besides knowing how the
air moves around an object and/or what forces it exerts
on the object. Flow visualisation techniques on models
in the low speed wind tunnel are mostly based on smoke,
powders and tufts. Force data may be taken simulta-
neously with each of these flow visualisation techniques
[5]. Weinstein [6] used flow visualisation technique to
examine rocket sled flow fields and to obtain the aerody-
namic flow field around aircraft in flight. Kompenhans
et al. [7] have used Particle image velocimetry (PIV) to
record the complete flow velocity field in a plane of the
flow to obtain information about unsteady flow fields.
Based on the literature [5], dry ice with hot water based
mixture was tried initially to visualise the flow pattern. It
was observed that when dry ice came in contact with hot
water, the generated smoke was dense and it settled to
the floor of the wind tunnel instead of getting transported
by the flow. Subsequently, a mixture of glycerin and dis-
tilled water had been tried as the source material. The
main advantage of the CFD predictions and its validation
using wind tunnel experiments are discussed in this paper.
2. Numerical Simulations
The computational domain is shown in Figure 2.
There are possibilities for the wind to approach from all
the four directions. Since the model is symmetric, the
computations were done only for two cases. Case_1:
Wind approaching from west direction, i.e., wind flow
normal to the shorter plan dimension � = 0�, where the
three main cylinders are one behind the other. Case_2:
Wind approaching from south direction, i.e., wind flow
normal to the longer plan dimension, � = 90�, where all
the three main cylinders are subjected to direct wind pres-
sure in the windward direction. The computational do-
main was meshed with special meshing feature called
“embedded grids” to increase the cell density near the
model cross-section. Figure 3 shows embedded mesh re-
224 Selvi Rajan. S et al.
Figure 2. Computational domain.Figure 1. Typical launch vehicle model.
gion near the model. There were about 32,000 hexahe-
dral cells in the each computation domain. The numeri-
cal analysis used mass and momentum conservation equ-
ations in two dimensions for steady state, incompressible
flow. A third order QUICK scheme used for modeling
the convective terms of the momentum equations. For
the present study a k-� turbulence model with logarith-
mic turbulent wall functions available in commercial
CFD package STAR-CD was employed [8]. It contains a
full description of the equations in the code, its numeri-
cal methodology and capabilities. The k-� turbulence
model available in STAR-CD was validated by many au-
thors [8]. Mean velocity and pressure distributions were
further obtained based on the CFD computation.
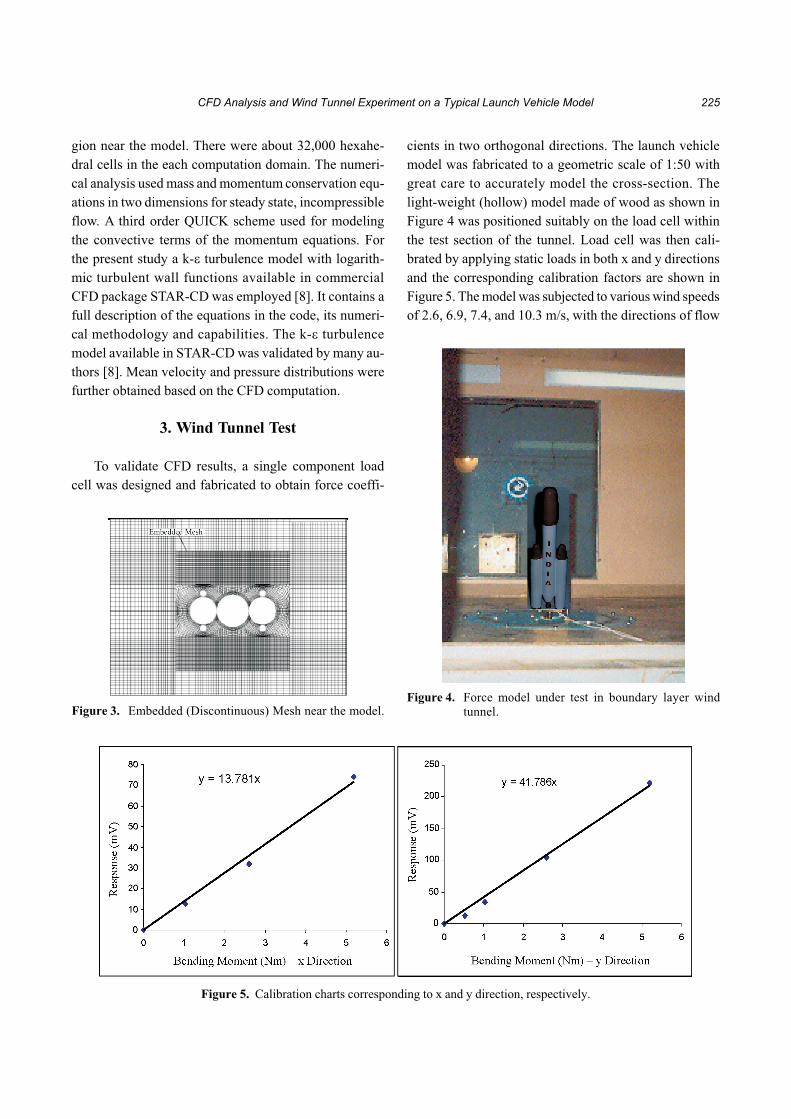
3. Wind Tunnel Test
To validate CFD results, a single component load
cell was designed and fabricated to obtain force coeffi-
cients in two orthogonal directions. The launch vehicle
model was fabricated to a geometric scale of 1:50 with
great care to accurately model the cross-section. The
light-weight (hollow) model made of wood as shown in
Figure 4 was positioned suitably on the load cell within
the test section of the tunnel. Load cell was then cali-
brated by applying static loads in both x and y directions
and the corresponding calibration factors are shown in
Figure 5. The model was subjected to various wind speeds
of 2.6, 6.9, 7.4, and 10.3 m/s, with the directions of flow
CFD Analysis and Wind Tunnel Experiment on a Typical Launch Vehicle Model 225
Figure 3. Embedded (Discontinuous) Mesh near the model.Figure 4. Force model under test in boundary layer wind
tunnel.
Figure 5. Calibration charts corresponding to x and y direction, respectively.

kept normal to the two orthogonal axes of the launch ve-
hicle. Corresponding to each of the directions, mean va-
lues of force coefficients were derived. Reference area,
A = �D2/4 (m2)
where D = effective diameter
Reference dynamic pressure = ½� U2 (Pascals)
where � = density of air, 1.2 kg/m3
and U = mean wind velocity (m/s)
Mean wind force per meter, in each direction = Cf � Vf
where CN is the calibration factor corresponding to the
direction (from Figure 5)
and VN is the output of the strain gauge
Coefficient of force = (Cf � Vf) / [(½� U2) � A] (1)
Similarly, the force coefficient for the other direction
was determined. In addition, a rigid model made of
solid stainless steel was fabricated and positioned in the
downstream side of the test section of the wind tunnel to
investigate the flow behaviour around the model. The
model was subjected to a low wind speed of 1.2 m/s, to
enable to capture the flow images. The flow lines were
visualized using glycerin mixture and were captured us-
ing a CCD camera.
4. Results and Discussions
Pressure data and the force data are expressed in
terms of dimensionless coefficients for the purpose of
comparison. As per Bernoulli’s equation the surface pres-
sure on the body is usually expressed in the form of non-
dimensional pressure coefficient as:
(2)
where, P is the pressure at required point and P0 is the ref-
erence pressure, � is the density of air and U is the free
stream velocity. The pressure coefficients are resolved
and algebraically added to the corresponding direction to
obtain force coefficient. Results on pressure distribution
as obtained from CFD study on the model were further
analysed to obtain force coefficients for both the test
cases of wind flow normal to the shorter plan dimension
0� (case 1) and wind flow normal to the longer plan di-
mension, 90� (case 2) and these values were found to be
0.23 and 1.18. The force coefficients using wind tunnel
were derived based on force measurement and were
computed as 0.25 and 1.2 respectively.
The aim of the present study was to predict the quali-
tative as well as quantitative information on velocity,
pressure, turbulence parameters like turbulence kinetic
energy, turbulence energy dissipation and wake. Figure
6 shows the mean velocity distributions for case 1 and
case 2 respectively. Figures 7 and 8 show the instanta-
neous streamline pattern for both the cases based on CFD
simulation in comparison with flow visualization con-
ducted experimentally on the rigid model of the launch
vehicle using wind tunnel. The results imply that the vor-
tex wake developing behind a group of cylinders is, to
some extent, similar to that of a single bluff body. The
same has been observed by different author [9]. Hence,
the value of force coefficient for case 2, is almost same as
the value of drag coefficient for a single cylinder, namely
1.2. The value of force coefficient in the other direction
was compared with the available literature on similar
226 Selvi Rajan. S et al.
Figure 6. Mean velocity distribution for case 1 & case 2.

type of study to further validate the results [10,11]. The
values were respectively reported as 0.38 and 0.30 as
base drag coefficients under subsonic wind, which can
be compared with the value as obtained from the wind
tunnel test as 0.25.
The figures shown below give the clear idea about
free shear and recirculation regions. Also one can realise
the free shear in the corner regions during experimenta-
tion because of the some inadequacies, hence it is quite
tedious to measure the data at more points. However it
shows the sufficient information for the free shear visu-
ally. Flow visualization studies conducted using wind
tunnel, were also shown for comparison in Figures 7 and
8. The wake survey was done for a distance of 10 D be-
hind the model at 12 stations for both the cases. The ve-
locity was non-dimensionalised and is shown in Figure 9
for case 1 and case 2, respectively. The static pressures
were computed over 280 pressure locations over the mo-
del and presented in terms of non-dimensionalised pres-
sure coefficients, Cp in Figure 10. This pressure distribu-
tion provides the critical regions of pressure and helps to
fix up the locations for pressure measurement.
5. Conclusion
CFD simulation was conducted on a 1:50 scaled
model of a rocket launching vehicle for two cases of � =
0� and � = 90�. Based on the CFD studies, the flow pat-
tern and the force coefficients were derived. To validate
these results, wind tunnel tests were carried out using
1:50 scaled rigid and light-weight models respectively,
for obtaining flow lines and force coefficients. Follow-
ing are the conclusions derived:
� The force coefficients for both the test cases of
wind flow normal to the longer plan dimension � =
0� and wind flow normal to the shorter plan dimen-
sion, � = 90� were found to be 0.23 and 1.18. Cor-
responding to each of the directions, the force co-
efficients were derived based on force measure-
ment using wind tunnel and were found to be 0.25
CFD Analysis and Wind Tunnel Experiment on a Typical Launch Vehicle Model 227
Figure 7. Instantaneous streamlines for case 1.
Figure 8. Instantaneous streamlines for case 2.

and 1.2 respectively. These values were further
compared well with the values available in the li-
terature.
� The predicted flow field around the model was
examined using CFD as well as based on wind
tunnel experiment. There was a very good com-
parison, as can be seen from Figures 7 and 8.
� The CFD predictions provide good aid for fixing
up the measurement points for velocity pressure
measurement in all the directions besides provid-
ing better understanding on the flow pattern.
� Such pre-experimental CFD study helps in reduc-
ing the number of repetitive experiments in the
collection of data besides reducing the cost and
time considerably when compared to the tradi-
tional approach of wind tunnel experiments, for
certain type of typical selected studies. In the case,
where the levels of turbulence intensities are of
228 Selvi Rajan. S et al.
Figure 9. Mean velocity defect profiles on wake centerline corresponding to case1 and case2.
Figure 10. Pressure distribution over the model.

high importance, it is imperative to resort to wind
tunnel experiments.
References
[1] Murakami, S., Mochida, A. and Hayashi, Y., “Examin-
ing the k-� Model by Means of a Wind Tunnel Test and
Large Eddy Simulation of the Turbulence Structure
around a Cube,” J. Wind Eng. Ind. Aerodyn., Vol. 35,
pp. 87�100 (1990).
[2] Tamura, T., “Numerical Study of Aerodynamic Be-
havior of a Square Cylinder,” J. Wind Eng. Ind. Ae-
rodyn., Vol. 33, pp. 161�170 (1990).
[3] Murakami, S., “Numerical Simulation of Turbulent
Flow Filed around Cubic Model Current Statues and
Applications of k-� Model and LES,” J. Wind Eng.
Ind. Aerodyn., Vol. 33, pp. 139�152 (1990).
[4] Mukesh Kumar, Geospatial Evaluation of Biodiversity
Pattern in Mining Landscape of Northern Chattisgarh,
M. Tech Thesis, Remote Sensing and Geographic
Information System Andhra University, Feb. India
(2005).
[5] Merzkirch, W., Flow Visualisation, Ed., 2nd ed., Aca-
demic Press, New York (1987).
[6] Weinstein, L. M., “Large-Field Schlieren Visualisation
from Wind Tunnel to Flight,” Journal of Visualisation,
Vol. 2, pp. 321�330 (2000).
[7] Kompenhans, J., Raffel, M., Dieterle, L., Dewhirst, T.,
Vollmers, H., Ehrenfried, K., Willert, C., Pengel, K.,
Kahler, C., Schroder, A. and Ronneberger, O., “Parti-
cle Image Velocimetry in Aerodynamics: Technology
and Applications in Wind Tunnels,” Journal of Visual-
ization, Vol. 2, pp. 229�244 (2000).
[8] STAR-CD version 3.15A manuals, Computational
Dynamics Limited (2002).
[9] David Sumner, “Closely Spaced Circular Cylinders in
Cross-Flow and a Universal Wake Number,” Journal
of Fluids Engineering, Vol. 126, pp. 245�249 (2004).
[10] Ioannis Kitsios and John Lygeros, Computation for a
Personnel Launch Vehicle Using Reachability, Ame-
rican Institute of Aeronautics and Astronautics Launch-
pad Abort Flight Envelope, HYCON-publications.
[11] Experiment on Reducing Drag on an Aerospace Launch
Vehicle, Dryden Flight Research Center, Edwards,
California.
Manuscript Received: Jul. 16, 2008
Accepted: Jun. 10, 2009
CFD Analysis and Wind Tunnel Experiment on a Typical Launch Vehicle Model 229