Horizontal Launch - NASA Technical Reports Server
154
-
Upload
khangminh22 -
Category
Documents
-
view
2 -
download
0
Transcript of Horizontal Launch - NASA Technical Reports Server


Report of the NASA-DARPA Horizontal Launch Study
Horizontal Launch:A Versatile Concept for
Assured Space Access

ii H o r i zo n ta l l au n c H
Horizontal Launch: A Versatile Concept for Assured Space Access
approved for public release; distribution is unlimited according to the national aeronautical and Space administration (Sti case 4418) and the Defense advanced research Projects agency (DiStar case 18287).
Library of Congress Cataloging-in-Publication Data
Horizontal launch: a versatile concept for assured space access / Paul a. Bartolotta, Elizabeth Buchen, Walter c. Engelund, lawrence D. Huebner, Paul l. Moses, Mark Schaffer, randall t. Voland, David F. Voracek, alan W. Wilhite
iSBn 978-0-9798095-4-5
1. Horizontal launch 2. assured space access3. Future space capable vehicles
naSa SP 2011-215994
Printed in the united States of americaDecember 2011

iiia V E r S at i l E co n c E P t F o r a S S u r E D S Pac E acc E S S
Table of Contents
Foreword ..............................................................................................................................................................................................v
Preface..................................................................................................................................................................................................vii
Executive Summary .........................................................................................................................................................................xi
chapter 1. introduction ...................................................................................................................................................................1Study approach................................................................................................................................................................................................1Selection and Definition of Figures of Merit ........................................................................................................................................2Selection of common requirements ......................................................................................................................................................3Survey of Horizontal launch System concepts ...................................................................................................................................4
chapter 2. Prescreening ..................................................................................................................................................................5Weighting the FoMs .....................................................................................................................................................................................11analyzing Economic Feasibility .............................................................................................................................................................. 13choosing a carrier aircraft ....................................................................................................................................................................... 15choosing a launch Vehicle configuration ......................................................................................................................................... 16results of the Prescreening analysis ......................................................................................................................................................17
chapter 3. Screening ......................................................................................................................................................................19Methodologies for concept Screening ............................................................................................................................................... 19analysis of carrier aircraft alternatives ............................................................................................................................................... 20analysis of launch Vehicle alternatives .............................................................................................................................................. 23results of the Screening analysis ........................................................................................................................................................... 24
chapter 4. Point Designs ...............................................................................................................................................................27Methodologies for Point Designs .......................................................................................................................................................... 27Point Design Definitions ........................................................................................................................................................................... 28Weight Breakdown comparisons ........................................................................................................................................................... 28reliability comparisons.............................................................................................................................................................................. 36costs comparisons ....................................................................................................................................................................................... 36Summary of Point Design System concepts ..................................................................................................................................... 37
chapter 5. technology trades.....................................................................................................................................................41Methodologies .............................................................................................................................................................................................. 41Selection of included technologies ..................................................................................................................................................... 42Structures ......................................................................................................................................................................................................... 42Subsystem—Shape Memory alloy actuators .................................................................................................................................. 43Propulsion........................................................................................................................................................................................................44Manufacturing ............................................................................................................................................................................................... 45operations .......................................................................................................................................................................................................46Summary of technology trade results ............................................................................................................................................... 47
chapter 6. Flight test System concepts ..................................................................................................................................53Flight test System concept configurations ....................................................................................................................................... 53Weight Breakdown analyses .................................................................................................................................................................... 58trajectory and Separation analyses ...................................................................................................................................................... 59reliability comparisons.............................................................................................................................................................................. 59cost analyses..................................................................................................................................................................................................60Summary of Flight test System concepts...........................................................................................................................................60

iv H o r i zo n ta l l au n c H
chapter 7. Summary of results .................................................................................................................................................. 63cost per Pound of Payload........................................................................................................................................................................64technology Block upgrades .................................................................................................................................................................... 65Decision Making............................................................................................................................................................................................ 65Flight testing ..................................................................................................................................................................................................66
chapter 8. Future system concept studies ........................................................................................................................... 69technology Demonstrations .................................................................................................................................................................. 69alternate capabilities for Horizontal launch Systems................................................................................................................... 70
appendices
appendix a. Figures of Merit.......................................................................................................................................................75
appendix B. Payload Market and commercial Viability analysis ................................................................................. 78
appendix c. Study Survey ........................................................................................................................................................... 80
appendix D. technology readiness levels .......................................................................................................................... 93
appendix E. Supersonic and Hypersonic carrier aircraft technologies ................................................................... 94
appendix F. Fidelity of analysis ................................................................................................................................................. 99
appendix G. assumptions and Methodologies ................................................................................................................ 102
appendix H. Details of the aerodynamic and trajectory analyses ...........................................................................109
appendix i. Ground crew requirements ............................................................................................................................ 121
team Members .............................................................................................................................................................................. 125
External contributors .................................................................................................................................................................. 127
review team Biographies.......................................................................................................................................................... 128
Bibliography ................................................................................................................................................................................... 130
Glossary (acronyms and abbreviations)...................................................................................................................................137
Table of C ontent s

vA v e r s At i l e co n c e p t f o r A s s u r e d s pAc e Acc e s s
Foreword Fully reusable horizontal takeoff and landing single-stage-to-orbit (SSTO) launch vehicle systems have long been viewed by many countries, organizations, and individuals as the ultimate answer for providing low-cost, flexible, and assured access to space. As early as 1952, Wernher von Braun envisioned a reusable shuttle-type logistics vehicle to supply a space station. In the 1960s, the Air Force Aerospaceplane design study proposed scramjet propulsion and liquid oxygen supplied by an in-flight air collection and enrichment system, setting a goal to develop and prove these and other technologies that would be required to make such a system a reality.
In the late 1960s, a two-stage reusable—airbreathing and rocket—horizontal launch system was a proposed design option for the Space Shuttle. During this period, there was an intense debate about which shuttle design would provide the best combination of lifecycle costs and capability. The technologies needed for a fully-reusable system were found to be immature and too expen-sive to develop, and in 1972, the Space Shuttle design was fixed as a vertically-launched rocket-powered system with only partial reusability.
In the early 1980s, while expendable vertical launch vehicles were in wide use for military and commercial payloads, various studies continued to investigate horizontal launch opportuni-ties, including the Reusable Aerodynamic Space Vehicle (RASV), Trans-Atmospheric Vehicle (TAV), Advanced Manned Spaceflight Capability (AMSC), and Advanced Manned Launch Systems studies. These efforts looked at airbreathing and rocket propulsion, at SSTO and multistage-to-orbit systems, and at sled-launch and air-launch.
Beginning in 1984, the $2 billion DoD-NASA National Aero-Space Plane (NASP) program was initi-ated to develop an airbreathing SSTO system similar to those studied in the 1960s. The program was cancelled in 1994, as the necessary technologies—while much more advanced than 20 years previous to this—were not sufficiently mature. The projected costs and cost uncertainties were too great.
Several new concepts for horizontal launch system were introduced in the 1980s and 1990s. A British program investigated the single-stage-to-orbit Horizontal Takeoff and Landing (HOTOL) concept using air-breathing rockets fed by pre-cooled air to reach Mach 5. A German program proposed the Sänger reusable two-stage system with a turboramjet-powered first stage to reach Mach 6 and a rocket-propelled orbiter stage. American efforts leveraged the NASA High-Speed Civil Transport (HSCT) program by adding high-efficiency turbojets to the carrier aircraft. These programs were terminated because the amortized design, development, test, and evaluation (DDT&E) costs overcame any return on investment when compared to long-range subsonic aircraft.
From the early 1990s through the mid-2000s, NASA investigated several next-generation space access candidates, including horizontal and vertical launch configurations, both airbreathing and rocket-powered. Payload classes of primary interest were initially comparable to the Space Shuttle—50,000 lb or less. By 2005, however, payload requirements to support the human space exploration program were increased to greater than 200,000 lb, with large volumes. This scenario overwhelmingly favored large vertical, rocket-powered launch systems.

vi H o r i zo n ta l l au n c H
Foreword
In late 2010, the NASA-DARPA Horizontal Launch Study (HLS) was initiated. The HLS examined a wide range of horizontal takeoff space launch system concepts for military and civil applications. This report documents the results of the study.
With an intensive effort, outstanding contributions from a select group of experts, and an excellent support staff, the study team prepared the following report and recommendations. We commend the HLS study team for its thorough efforts.
The HLS conclusions were different than many prior studies that assumed high launch rates and therefore recommended advanced fully- and partially-reusable launch systems. In contrast, the HLS results documented the operational benefits, even with very low projected annual launch rates, of developing a new horizontal take-off space launch system using a modified existing carrier aircraft and launch vehicle system utilizing state-of-the-art systems and technologies. The significant benefits of aerial fueling of the carrier aircraft were also documented. Finally, the study team crafted a low-cost flight demonstration program centered around the existing NASA 747-100 Shuttle Carrier Aircraft (SCA).
While access to space has been a part of American life for decades, it remains a complex endeavor. In this report, we lay out the landscape with the hope that policymakers in the Department of Defense, the Congress, and the Administration will find this information useful as they develop options to ensure continuous and straightforward access to space. We also hope that the informa-tion contained herein will help scientists and engineers seeking to implement innovative ideas, and will inspire future generations to exceed the expectations that limit us today.
Vince RauschOctober 2011

viiA v e r s At i l e co n c e p t f o r A s s u r e d s pAc e Acc e s s
PrefaceIn August 2010, a team was assembled with the charge to assess horizontal launch concepts for military and civilian applications, to recommend system concepts for subsonic and supersonic carrier aircraft options, to identify technology gaps for potential investments, and to identify a near-term horizontal launch demonstration. The core team members were:
¡ David F. Voracek, Project Manager, NASA ¡ Paul A. Bartolotta, Principal Investigator, NASA ¡ Alan W. Wilhite, Analysis Lead, Georgia Institute of Technology ¡ Paul L. Moses, Technology Lead, NASA ¡ Ramon Chase, Booz Allen Hamilton ¡ Walter C. Engelund, NASA ¡ Lawrence D. Huebner, NASA ¡ Roger A. Lepsch , NASA ¡ Unmeel B. Mehta, NASA ¡ Daniel Tejtel, Air Force Research Laboratory ¡ Randall T. Voland, ACEnT Laboratories LLC
Study Background
At its first meeting, the team began to develop standard figures of merit intended to facilitate an objective comparison of some widely varying approaches to the horizontal launch of payload to orbit. The team then undertook a comprehensive survey of previously published and unpublished studies of horizontal launch systems as well as systems currently proposed by government and industry organizations. During a series of teleconferences and face-to-face meetings, the results of each study were then evaluated using the figures of merit. Each concept was categorized by the time needed to develop it and the potential payload capability delivered to low Earth orbit.
In December 2010, the team briefed both the external review team and the study sponsors on its process and progress. The resulting guidance was then applied to the second phase of the team’s analysis.
The team was charged with determining the payload that could be placed in low Earth orbit using currently available subsonic carrier aircraft with either solid- or liquid-fueled launch vehicles. A notional target of 15,000 lb of payload to low Earth orbit was established.
The following constraints were also applied: ¡ The cost per pound of payload should be the primary figure of merit. ¡ Annual launch rates should be consistent with current and projected global manifests. ¡ Gross weight limitations should be based on taking off from existing runways using
currently available launch support infrastructure.

viii H o r i zo n ta l l au n c H
Pref ace
The team was also encouraged to use, where possible, existing or modified systems, subsystems, and components to minimize cost, time, and risk. An evolutionary path to a fully reusable system should be identified based on block improvements, and no technologies should be considered that had not been validated in a relevant use environment. Finally, the team was asked to iden-tify potential system, subsystem, and component ground and flight testing or demonstration options that would decrease uncertainties, increase payload weight, decrease launch costs, and increase reliability.
The team carried out this analysis during the next few months and presented interim results in April 2011. The findings and conclusions were then refined and the team’s work was concluded with this final report.
Acknowledgements
Many individuals and organizations made important contributions to the study team’s process and to this report. The team wishes to thank these individuals, but recognizes that attempts to identify all and acknowledge each contribution would require more space than is available in this brief section. To begin, the team would like to thank the sponsors of this report. Funds for the team’s work were provided by the Defense Advanced Research Projects Agency and the National Aeronautics and Space Administration.
The team gratefully acknowledges the contributions of several organizations and individuals who provided valuable data and analysis to support its work. Specific thanks go to SpaceWorks Enterprises, Inc., McKinney Associates, and Analytical Mechanics Associates for insightful and comprehensive contributions to the analysis. Many individuals also contributed their knowledge to the study as part of the core, analysis, technology, or report teams. These individuals and their affiliations are included on page 125.
As part of its work, the team received written submissions and presentations from many orga-nizations. These helped the team understand the options and potential for horizontal launch systems and the perspectives of many stakeholder organizations. A list of these organizations is provided on page 127. The team is grateful for the time, effort, and valuable information provided by all of these dedicated individuals and organizations.
Finally, the team thanks the individuals who assisted in its work by reviewing the process and its outcomes. This study methodology and progress, as well as the interim and final reports, have been reviewed by five individuals chosen for their technical expertise and diverse perspectives. These individuals provided thorough, reasoned, and critical comments that ensured the objec-tivity of the analysis, integrity of the process, and responsiveness to the sponsor direction. The HLS team thanks the following external review team for their contributions to this report:
¡ Vincent Rausch, Private Consultant; ¡ William Heiser, Professor Emeritus, U.S. Air Force Academy; ¡ Douglas O. Stanley, Georgia Institute of Technology, National Institute of Aerospace; ¡ Uwe Hueter, SAIC; and ¡ Jay Penn, Aerospace Corporation.

ixA v e r s At i l e co n c e p t f o r A s s u r e d s pAc e Acc e s s

E xecut ive Summar y
x H o r i zo n ta l l au n c H
xiA v e r s At i l e co n c e p t f o r A s s u r e d s pAc e Acc e s s
Executive SummaryThe vision of horizontal launch is the capability to provide a “mobile launch pad” that can use existing aircraft runways, cruise above weather, loiter for mission instructions, and provide precise placement for orbital intercept, rendezvous, or reconnaissance. This study identifies a viable path forward to make the vision of a robust and resilient horizontal launch capability a reality.
This report, jointly sponsored by the Defense Advanced Research Projects Agency (DARPA) and the National Aeronautics and Space Administration (NASA), is the result of a comprehensive study to explore the trade space of horizontal take-off space launch system concepts. The Horizontal Launch Study (HLS) team identified potential near- and mid-term concepts capable of delivering 15,000 lb payloads, on a trajectory from Kennedy Space Center (28.5 degrees due East), to a 100 nautical-mile (low-Earth) circular orbit. The team produced a set of system concepts that meet this criterion. Results are presented for a range of near-term system concepts selected for their availability and relatively low design, development, test, and evaluation (DDT&E) costs.
This report describes the study background and assumptions, figures of merit, point design system concepts, and flight test system concepts. It also addresses details of the study processes, including the full trade space matrix encompassing concepts at both low and high speed regimes and various operational parameters. Also discussed are the benefits of targeted technology investments and of maintaining a horizontal launch flight capability.
The HLS team carried out a progressive analysis that began with developing a systematic, normal-ized basis to compare a variety of approaches. The next step was prescreening of representative system concepts gleaned from the breadth of past studies on horizontal launch. Finally, selected system concepts were screened to identify useful point designs. A thorough investigation of these point designs was performed to demonstrate feasibility. The process provided the basis for two proposed flight demonstration system concepts defined to mitigate risk and cost.
A number of assumptions and constraints were used to guide the study process. These included the limits of existing runways, current and projected launch rates in various payload classes, and the performance parameters of existing technologies and existing designs.
After considering an array of existing and near-term subsonic carrier aircraft, the HLS team determined a practical upper limit of payload mass to low Earth orbit of 50,000 lb. This would require development of a new, large subsonic carrier aircraft and a liquid hydrogen (LH2) fueled launch vehicle. The DDT&E costs for such a horizontal take-off space launch system were esti-mated, using traditional aerospace practices, to be between $4.8 billion and $7.2 billion.
For a more modest investment, a modified existing subsonic carrier aircraft with a liquid-propellant launch vehicle could carry an estimated payload up to 20,000 lb with lifecycle costs of $8,860 per pound. The DDT&E cost for this system, including modifying an existing carrier aircraft and assembling a conventional LH2-fueled launch vehicle, was estimated at less than $2 billion. This initial analysis established the potential to launch militarily-relevant payloads to low-Earth orbit with current, commercially-available carrier aircraft and available launch vehicle technology.

E xecut ive Summar y
xii H o r i zo n ta l l au n c H
With a focus on achieving the reference payload of 15,000 lb to orbit, the HLS team next devel-oped three reference point design system concepts. One near-term system was a two-stage launch vehicle with an RP-1 kerosene (RP) fueled first stage and an LH2 fueled second stage, both carried to a launch point at 25,000 ft of altitude by a modified Boeing 747-400F carrier aircraft. The nonrecurring costs for this point design system concept were estimated at $940 million, and a recurring cost of approximately $9,600 per pound of payload to orbit. Aerial fueling of the carrier aircraft could provide further performance and cost benefits by allowing a larger launch vehicle and payload weight while meeting the carrier aircraft’s maximum take-off weight. The study team found that existing technologies were sufficient to immediately begin design of a subsonic carrier aircraft-based space launch system.
The HLS team also identified a flight technology demonstration concept using existing propulsion subsystems and technologies. This system concept consisted of the NASA Shuttle Carrier Aircraft (a modified Boeing 747-100) with either a solid or liquid propellant launch vehicle mounted on top. It was estimated that this demonstration program would cost less than $350 million over three to four years and would achieve two demonstration flights with up to 5,000 lb of payload to low Earth orbit. The flight demonstration would generate experience and understanding to reduce and mitigate risks. Most important among these are the ability for in-flight command and control of the launch vehicle and the aerodynamic parameters for separation of the carrier aircraft and launch vehicle.

1A v e r s At i l e co n c e p t f o r A s s u r e d s pAc e Acc e s s
IntroductionThe vision of horizontal launch is the capability to provide a “mobile launch pad” that can use existing aircraft runways, cruise above weather, loiter for mission instructions, and achieve precise placement for orbital intercept, rendezvous, or reconnaissance. Another compelling benefit of horizontal launch is that today’s ground-based vertical launch pads are a single earth-quake, hurricane, or terrorist attack away from disruption of critical U.S. launch capabilities.
The study did not attempt to design a new system concept for horizontal launch, but rather focused on the refinement of many previously-studied horizontal launch concepts. Because of the large number of past horizontal launch studies, a process was developed to narrow the number of concepts through prescreening, screening, and evaluation of point designs. The refinement process was not intended to select the “best” concept, but rather to establish the feasibility of hori-zontal launch from a balanced assessment of figures of merit and to identify potential concepts that warrant further exploration.
Study Approach
The HLS team began its work by determining an appropriate set of figures of merit (FOMs) in four categories: safety and mission success, effectiveness and performance, programmatic factors, and affordability, as shown in Table 1. The two discriminating factors identified were pounds and cost per pound of payload delivered to orbit. Common requirements were also established, including projected annual launch rates and gross weight runway limits.
Once the FOMs were established, the team under took a survey of unclassified horizontal launch concepts from the broad range of designs, studies, and demonstrations that have been developed over the past six decades. A database of concepts was developed from the published literature and unpublished NASA and DoD horizontal launch studies. These were analyzed using the analyt-ical hierarchy process (AHP) to identify 18 representative concepts. These 18 concepts were put through a prescreening process using analysis of alternatives and weighted figures of merit. The concepts were compared to present launch capabilities and projected payload markets to further narrow the field to four concepts that fit the study’s common requirements.
These four concepts were next expanded in a morphological matrix to thousands of possible configurations, with varying numbers of stages, engines, propulsion systems, propellants, and other features. These configurations were put through a screening process in an integrated, para-metric engineering environment to level the concepts to the same level of analysis fidelity in order to compute performance metrics and figures of merit. From these results, the team selected three distinct configurations for higher fidelity analysis. These were intended to establish the feasibility of a generic mission that would be useful for both commercial and government launch customers.
Three point designs were generated using higher fidelity engineering methods than were used for screening. The point design results were used to identify DDT&E feasibility and risk factors. Performance was computed using analysis tools with mid-level fidelity. FOMs were computed for
cH a P t E r 1

Chapter 1
2 H o r i zo n ta l l au n c H
minimum turn-around time, workforce, and cost of operations; dynamic fault trees were used to calculate the probabilities of loss of vehicle and loss of mission; and the NASA/Air Force cost model (NAFCOM) was used to determine DDT&E and production costs.
To further assess the potential for horizontal launch systems, the team then examined the impact of several advanced technologies on the three point design baselines. Structures, materials, propulsion, propellants, instrumentation, and sensors were evaluated in a low-fidelity design environment in which the FOMs were corrected to match the point design parameters. The overall cost savings were compared to the estimated cost to mature each technology to achieve demonstration of a subsystem model or prototype. This step was intended to identify gains from key technology advances and to guide potential technology investments.
The team then specified two flight test system concepts focused on very near-term and low-cost subsystems with the goal of demonstrating the system performance and mitigating the highest risk factors. Finally, the HLS team assessed potential additional uses for a horizontal launch flight test capability.
These processes were used to progressively narrow the range of potential concepts considered, reserving higher-fidelity engineering analysis for a subset of the most promising concepts. This narrowing process is shown in Figure 1.
Selection and Definition of Figures of Merit
The team began the study process by developing a set of FOMs to characterize potential hori-zontal launch concepts. The FOMs were used as decision criteria at each level of analysis in the
Study stageStudy stage
Determine figures of merit and common requirements
Survey existing concept studies
Prescreen studies to identify representative concepts
Screen sized concepts using common requirements to downselect
Develop point designs to determine value and risks
Determine impacts of inserting new technologies
Propose flight tests to mitigate risks and refinerequirements
Focus on near-term, 15,000 lb payload
Figure 1 Graphic depiction of the study process, showing the narrowed focus as the analysis progressed.
Introduc t ion
3A v e r s At i l e co n c e p t f o r A s s u r e d s pAc e Acc e s s
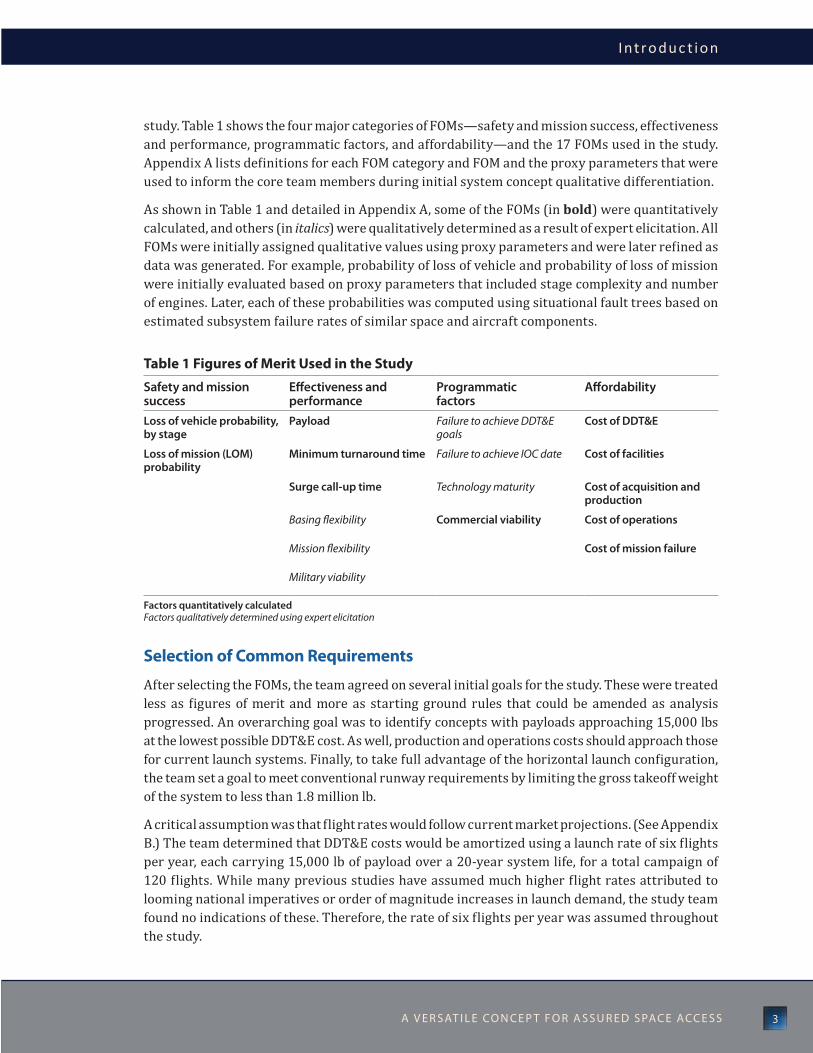
study. Table 1 shows the four major categories of FOMs—safety and mission success, effectiveness and performance, programmatic factors, and affordability—and the 17 FOMs used in the study. Appendix A lists definitions for each FOM category and FOM and the proxy parameters that were used to inform the core team members during initial system concept qualitative differentiation.
As shown in Table 1 and detailed in Appendix A, some of the FOMs (in bold) were quantitatively calculated, and others (in italics) were qualitatively determined as a result of expert elicitation. All FOMs were initially assigned qualitative values using proxy parameters and were later refined as data was generated. For example, probability of loss of vehicle and probability of loss of mission were initially evaluated based on proxy parameters that included stage complexity and number of engines. Later, each of these probabilities was computed using situational fault trees based on estimated subsystem failure rates of similar space and aircraft components.
Selection of Common Requirements
After selecting the FOMs, the team agreed on several initial goals for the study. These were treated less as figures of merit and more as starting ground rules that could be amended as analysis progressed. An overarching goal was to identify concepts with payloads approaching 15,000 lbs at the lowest possible DDT&E cost. As well, production and operations costs should approach those for current launch systems. Finally, to take full advantage of the horizontal launch configuration, the team set a goal to meet conventional runway requirements by limiting the gross takeoff weight of the system to less than 1.8 million lb.
A critical assumption was that flight rates would follow current market projections. (See Appendix B.) The team determined that DDT&E costs would be amortized using a launch rate of six flights per year, each carrying 15,000 lb of payload over a 20-year system life, for a total campaign of 120 flights. While many previous studies have assumed much higher flight rates attributed to looming national imperatives or order of magnitude increases in launch demand, the study team found no indications of these. Therefore, the rate of six flights per year was assumed throughout the study.
Table 1 Figures of Merit Used in the Study
Safety and mission success
Effectiveness and performance
Programmatic factors
Affordability
Loss of vehicle probability, by stage
Payload Failure to achieve DDT&E goals
Cost of DDT&E
Loss of mission (LOM) probability
Minimum turnaround time Failure to achieve IOC date Cost of facilities
Surge call-up time Technology maturity Cost of acquisition and production
Basing flexibility Commercial viability Cost of operations
Mission flexibility Cost of mission failure
Military viability
Factors quantitatively calculatedFactors qualitatively determined using expert elicitation

Chapter 1
4 H o r i zo n ta l l au n c H
Survey of Horizontal Launch System Concepts
The promise of horizontal take-off space launch systems has inspired many studies over the past 60 years—spanning airbreathing and rocket propulsion, expendable and reusable launch vehi-cles, and various assisted launch concepts, such as ground sleds or rail-launch with magnetic levitation. These various studies proved difficult to compare, as each used its own, sometimes unique, ground rules, assumptions, and figures of merit. Most studies focused on narrow mission requirements, such as a single payload class, market, maximum gross take-off weight, or staging Mach number. Only a few included the process for and costs of design, development, testing, production, ground operations, and mission operations.1
Rather than designing a new horizontal launch concept, this study built on the understanding resulting from those many previous designs. Data was collated from 136 published and unpub-lished unclassified sources in order to assess each design against the figures of merit selected for this study. (See Appendix C.) A variety of factors were considered across these existing studies, from the concepts of operations (CONOPs) to technologies and system integration schemes.
Examples of the variables that were collected began with size, weight, and payload capability and extended to takeoff options, such as intact, sled assist, sled crossfeed, or towed. The staging options included the number of stages, staging speeds, and whether or not a drop tank was used. Integration options included internally contained launch vehicles, embedded launch vehicles, or various attachment methods, such as inline, top, or bottom. Additional data collected included reusability approaches, whether stages were expendable, fully reusable, partially reusable, or in combination. Propulsion options included solid, liquid, airbreathing, or integrated combina-tions. Two options for aerial fueling were subsonic tanker assist and air collection and enrich-ment (ACES). This depth and breadth of the body of knowledge served to reinforce the validity of the team’s approach.
1 The Next Generation Launch Technology study was one that estimated many relevant figures of merit for a range of horizontal launch rocket and airbreathing vehicle concepts, and this study adopted many of these.

Prescreening
5A v e r s At i l e co n c e p t f o r A s s u r e d s pAc e Acc e s s
PrescreeningRather than carry the complete range of possible concepts and technologies throughout the study for quantitative analysis, a prescreening process was used to focus the team’s efforts. Aspects that were considered and compared in this stage of the analysis included CONOPs, technologies, level of fidelity, and design maturity.
The HLS team began the process by applying expert judgment to categorize each design concept. The team labeled each concept according to three payload classes: less than 500 lb, 500 to 10,000 lb, and more than 10,000 lb; and according to three technology development timeframes: 0 to 3 years (near term), 4 to 9 years (mid term), and more than 10 years (far term).
At the end of the exercise, the following eighteen concepts represented the range of options deemed available for a future horizontal launch system.
1. Fighter Jet + Multistage Solid Rocketcarrier aircraft Modified Existing Supersonic Fighter Jet aircraft
launch vehicle Small Expendable Multistage Solid rocket
technology advancement none
Supersonic Staging
Payload class less than 500 lb
timeframe near-term
concept of operation Fighter jet aircraft carries small multistage rocket to supersonic release condition. Multistage rocket delivers payload to low-Earth orbit (lEo).
Specific example nanolauncher Black
2. Commercial Jet + Multistage Solid Rocketcarrier aircraft Modified Existing Subsonic commercial Jet aircraft
launch vehicle Expendable Multistage Solid rocket
technology advancement none
Subsonic Staging
Payload class 500 to 10,000 lb
timeframe near-term
concept of operation commercial jet carries multistage rocket to subsonic release condition. Multistage rocket delivers payload to lEo.
Specific example Boeing airlaunch concept
cH a P t E r 2

Chapter 2
6 H o r i zo n ta l l au n c H
3. Commercial Jet + Multistage Liquid Rocketcarrier aircraft Modified Existing Subsonic commercial Jet aircraft
launch vehicle Expendable Multistage liquid rocket
technology advancement none
Subsonic Staging
Payload class 500 to 10,000 lb
timeframe near-term
concept of operation commercial jet carries multistage rocket to subsonic release condition. Multistage rocket delivers payload to lEo. Specific example Quickreach
4. Ground Sled + Multistage Liquid RocketGround stage Ground sled
launch vehicle Expendable Multistage liquid rocket
technology advancement Ground sled
Subsonic Staging
Payload class More than 10,000 lb
timeframe near-term
concept of operation Ground sled accelerates multistage rocket to subsonic velocities. Multistage rocket delivers payload to lEo.
Specific example reusable aerospace Vehicle (raSV) (two stage to orbit (tSto) version)
5. New Custom Subsonic Carrier + Multistage Liquid Rocketcarrier aircraft new Specially Designed large Subsonic carrier aircraft
launch vehicle Expendable Multistage liquid rocket
technology advancement none
Subsonic Staging
Payload class More than 10,000 lb
timeframe near-term
concept of operation Subsonic aircraft carries multistage rocket to subsonic release condition. Multistage rocket delivers payload to lEo.
Specific example Dual-fuselage c-5

Prescreening
7A v e r s At i l e co n c e p t f o r A s s u r e d s pAc e Acc e s s
6. Advanced Fighter Jet + Multistage Liquid Rocketcarrier aircraft Enhanced Supersonic Fighter Jet aircraft with Mass injection Pre-compressor cooling (MiPcc)
launch vehicle Small Expendable Multistage liquid rocket
technology advancement MiPcc
Supersonic Staging
Payload class less than 500 lb
timeframe Mid-term
concept of operation Fighter jet carries small multistage rocket to supersonic release condition. Multistage rocket delivers payload to lEo.
Specific example DarPa raScal
7. Commercial Jet + Reusable All-Rocket Vehicle with Drop Tankscarrier aircraft Modified Existing Subsonic commercial aircraft
launch vehicle reusable liquid rocket Vehicle with Drop tanks
technology advancement none
Subsonic Staging
Payload class 500 to 10,000 lb
timeframe Mid-term
concept of operation commercial carries reusable rocket vehicle to subsonic release condition. reusable all-rocket upperstage vehicle delivers payload to lEo.
Specific example aMSc 1.5 Stage
8. New Subsonic Carrier with Air Collection and Enrichment System (ACES) + Reusable All-Rocket Vehicle
carrier aircraft reusable turbofan and liquid rocket aircraft with acES
launch vehicle reusable liquid rocket Vehicle
technology advancement acES
Supersonic Staging
Payload class More than 10,000 lb
timeframe Mid-term
concept of operation reusable booster vehicle uses turbofan to takeoff and climb to subsonic cruise, where acES system to fill oxidizer tanks. once tanks are full, booster engages rocket propulsion and accelerations to a supersonic staging condition. reusable all-rocket upperstage vehicle carries payload to lEo.
Specific example Gryphon
Chapter 2
8 H o r i zo n ta l l au n c H
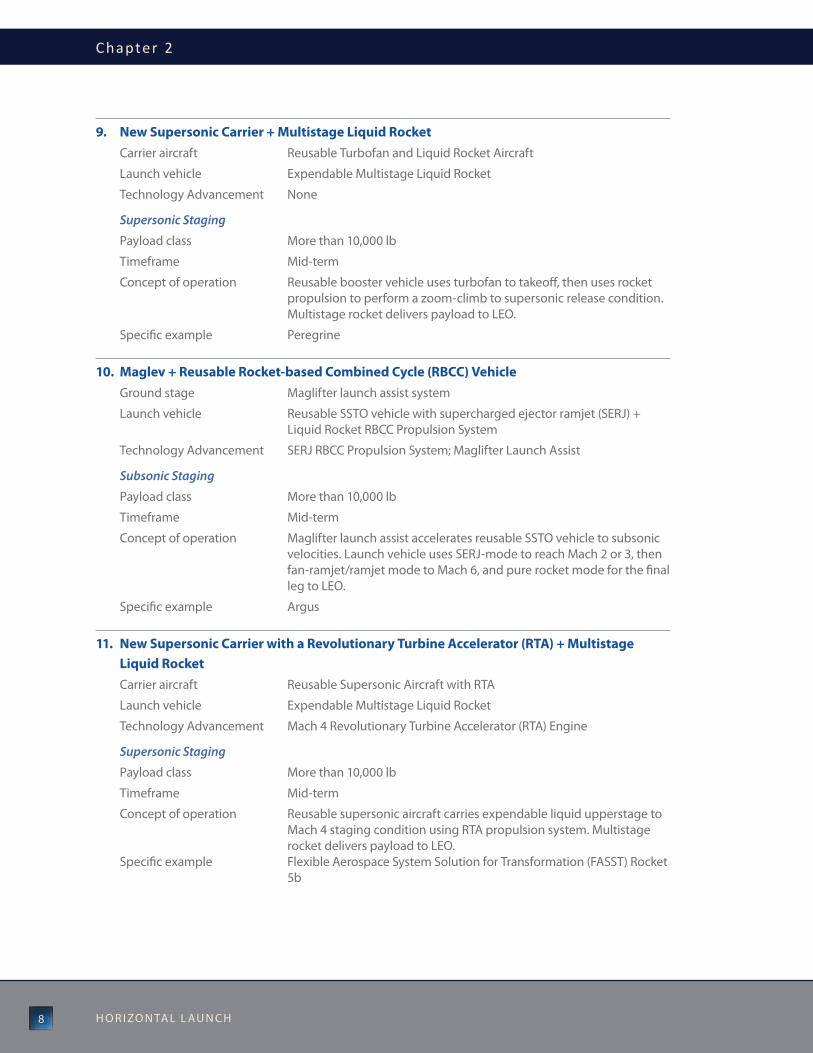
9. New Supersonic Carrier + Multistage Liquid Rocketcarrier aircraft reusable turbofan and liquid rocket aircraft
launch vehicle Expendable Multistage liquid rocket
technology advancement none
Supersonic Staging
Payload class More than 10,000 lb
timeframe Mid-term
concept of operation reusable booster vehicle uses turbofan to takeoff, then uses rocket propulsion to perform a zoom-climb to supersonic release condition. Multistage rocket delivers payload to lEo.
Specific example Peregrine
10. Maglev + Reusable Rocket-based Combined Cycle (RBCC) VehicleGround stage Maglifter launch assist system
launch vehicle reusable SSto vehicle with supercharged ejector ramjet (SErJ) + liquid rocket rBcc Propulsion System
technology advancement SErJ rBcc Propulsion System; Maglifter launch assist
Subsonic Staging
Payload class More than 10,000 lb
timeframe Mid-term
concept of operation Maglifter launch assist accelerates reusable SSto vehicle to subsonic velocities. launch vehicle uses SErJ-mode to reach Mach 2 or 3, then fan-ramjet/ramjet mode to Mach 6, and pure rocket mode for the final leg to lEo.
Specific example argus
11. New Supersonic Carrier with a Revolutionary Turbine Accelerator (RTA) + Multistage Liquid Rocket
carrier aircraft reusable Supersonic aircraft with rta
launch vehicle Expendable Multistage liquid rocket
technology advancement Mach 4 revolutionary turbine accelerator (rta) Engine
Supersonic Staging
Payload class More than 10,000 lb
timeframe Mid-term
concept of operation reusable supersonic aircraft carries expendable liquid upperstage to Mach 4 staging condition using rta propulsion system. Multistage rocket delivers payload to lEo. Specific example Flexible aerospace System Solution for transformation (FaSSt) rocket 5b

Prescreening
9A v e r s At i l e co n c e p t f o r A s s u r e d s pAc e Acc e s s
12. New Supersonic Carrier with Turbo-Ramjet + Reusable All-Rocket Vehiclecarrier aircraft reusable Supersonic aircraft with turbo-ramjet and liquid rocket Propulsion
launch vehicle reusable liquid rocket Vehicle
technology advancement turbo-ramjet Proplusion System
Supersonic Staging
Payload class More than 10,000 lb
timeframe Mid-term
concept of operation reusable supersonic aircraft uses turbo-ramjet to reach Mach 4 or 4.5, then rocket propulsion to reach Mach 6 staging condition. reusable all-rocket vehicle delivers payload to lEo.
Specific example Sänger ii
13. Commerical Jet + Reusable Turbine-based Combined Cycle (TBCC) Vehicle + Reusable All-Rocket Vehicle
carrier aircraft Modified Existing Subsonic commercial aircraft
launch vehicle reusable ramjet/Scramjet Vehicle Second Stage; reusable all-rocket Vehicle 3rd Stage
technology advancement Dual-Mode ramjet/Scramjet Propulsion System
Subsonic, Hypersonic Staging
Payload class 500 to 10,000 lb
timeframe Far-term
concept of operation commercial jet carries system to subsonic release condition. reusable second stage uses ramjet and scramjet propulsion to achieve hypersonic staging condition. reusable all-rocket third stage delivers payload to lEo.
Specific example Mustang
14. TBCC Vehicle + Reusable All-Rocket VehicleBooster stage reusable Hypersonic aircraft with tBcc Propulsion
launch vehicle reusable liquid rocket Vehicle
technology advancement Dual-Mode ramjet/Scramjet Propulsion System
Hypersonic Staging
Payload class More than 10,000 lb
timeframe Far-term
concept of operation reusable tBcc vehicle carries all-rocket reusable upperstage to hypersonic staging condition using turbine mode into supersonic speeds, then ramjet/scramjet mode to the hypersonic staging condition. reusable all-rocket upperstage delivers payload to lEo.
Specific example integrated concept model (icM)-2 tBcc

Chapter 2
10 H o r i zo n ta l l au n c H
15. RBCC Vehicle + Reusable All-Rocket VehicleBooster stage reusable Hypersonic aircraft with rBcc Propulsion
launch vehicle reusable liquid rocket Vehicle
technology advancement rBcc Propulsion System
Hypersonic Staging
Payload class More than 10,000 lb
timeframe Far-term
concept of operation reusable rBcc vehicle carries all-rocket reusable upperstage to hypersonic staging condition using ejector mode into supersonic speeds, then ramjet/scramjet mode to the hypersonic staging condition. reusable all-rocket upperstage delivers payload to lEo.
Specific example icM-3 rBcc
16. Hypersonic Vehicle with Liquid Air Combustion Engine (LACE) and Scramjet + Expendable Rocket
Booster stage reusable Hypersonic aircraft with Scramjet, lacE, and tail rockets
launch vehicle Expendable liquid or Solid rocket
technology advancement lacE; Scramjet Propulsion System
Hypersonic Staging
Payload class More than 10,000 lb
timeframe Far-term
concept of operation reusable hypersonic vehicle carries all-rocket reusable upperstage to hypersonic staging condition using lacE mode to hypersonic velocity, then scramjet mode, and rocket mode to achieve suborbital staging condition. Expendable single stage rocket delivers payload to lEo.
Specific example icM-5 - air breathing launch vehicle (aBlV) 4a (tSto implementation)
17. New Supersonic Carrier with RTA + Reusable RBCC VehicleBooster stage reusable Supersonic aircraft with rta
launch vehicle reusable rBcc Vehicle
technology advancement revolutionary turbine accelerator (rta) Engine; rBcc Propulsion System
Supersonic Staging
Payload class More than 10,000 lb
timeframe Far-term
concept of operation reusable supersonic aircraft carries expendable liquid upperstage to Mach 4 staging condition using rta propulsion. upperstage uses air-breathing propulsion to achieve hypersonic velocity, then transitions to rocket mode to reach orbit.
Specific example FaSSt 1 / icM-4
Prescreening
11A v e r s At i l e co n c e p t f o r A s s u r e d s pAc e Acc e s s
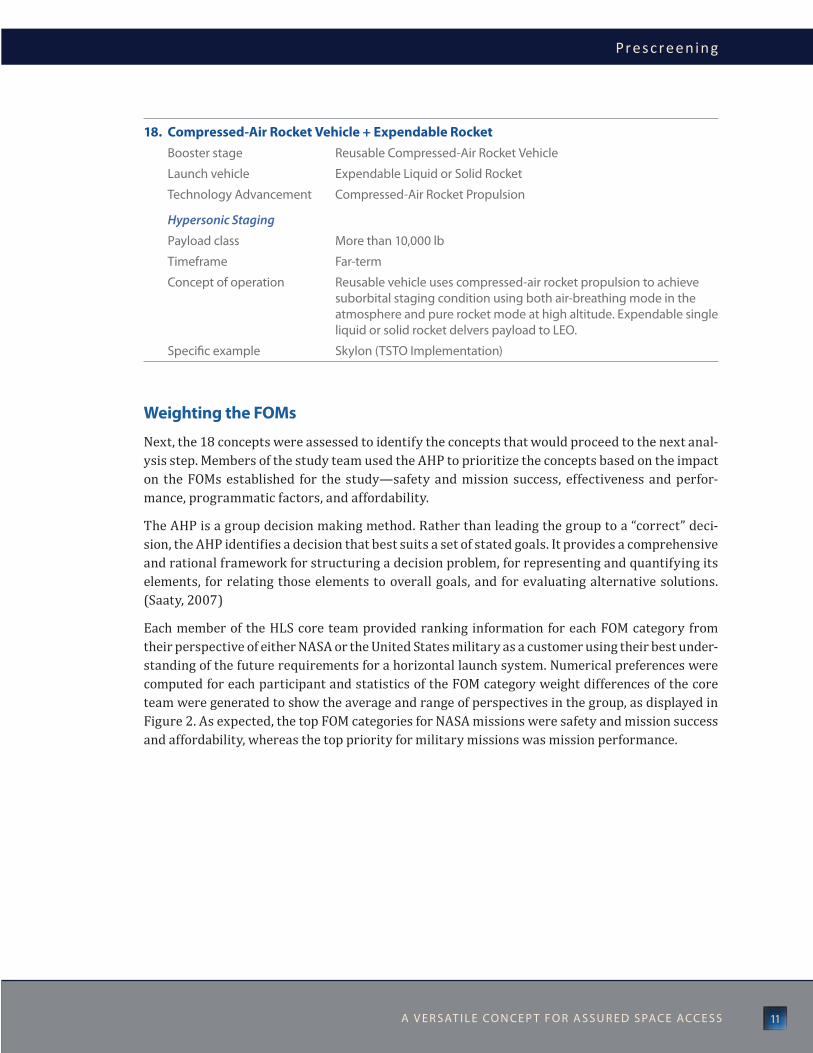
18. Compressed-Air Rocket Vehicle + Expendable RocketBooster stage reusable compressed-air rocket Vehicle
launch vehicle Expendable liquid or Solid rocket
technology advancement compressed-air rocket Propulsion
Hypersonic Staging
Payload class More than 10,000 lb
timeframe Far-term
concept of operation reusable vehicle uses compressed-air rocket propulsion to achieve suborbital staging condition using both air-breathing mode in the atmosphere and pure rocket mode at high altitude. Expendable single liquid or solid rocket delvers payload to lEo.
Specific example Skylon (tSto implementation)
Weighting the FOMs
Next, the 18 concepts were assessed to identify the concepts that would proceed to the next anal-ysis step. Members of the study team used the AHP to prioritize the concepts based on the impact on the FOMs established for the study—safety and mission success, effectiveness and perfor-mance, programmatic factors, and affordability.
The AHP is a group decision making method. Rather than leading the group to a “correct” deci-sion, the AHP identifies a decision that best suits a set of stated goals. It provides a comprehensive and rational framework for structuring a decision problem, for representing and quantifying its elements, for relating those elements to overall goals, and for evaluating alternative solutions. (Saaty, 2007)
Each member of the HLS core team provided ranking information for each FOM category from their perspective of either NASA or the United States military as a customer using their best under-standing of the future requirements for a horizontal launch system. Numerical preferences were computed for each participant and statistics of the FOM category weight differences of the core team were generated to show the average and range of perspectives in the group, as displayed in Figure 2. As expected, the top FOM categories for NASA missions were safety and mission success and affordability, whereas the top priority for military missions was mission performance.

Chapter 2
12 H o r i zo n ta l l au n c H
For the near term timeframe (1 through 5), the concepts were ranked as follows:
(2) Commercial Jet + Multistage Solid Rocket(5) New Custom Subsonic Carrier + Multistage Liquid Rocket(1) Fighter Jet + Multistage Solid Rocket(3) Commercial Jet + Multistage Liquid Rocket(4) Ground Sled + Multistage Liquid Rocket
These rankings were identical for civilian and military perspectives. The sled launch concept ranked lowest even though it was judged to carry a large payload. It was considered to have more costs and risks owing to the development costs of a new sled system, and a sled also limits launch site mobility.
For the mid-term timeframe (6 through 12), the concepts were ranked as follows:
(7) Commercial Jet + Reusable All-Rocket Vehicle with Drop Tanks(6) Advanced Fighter Jet + Multistage Liquid Rocket(12) New Supersonic Carrier w/Turbo-Ramjet + Reusable All-Rocket Vehicle(9) New Supersonic Carrier + Multistage Liquid Rocket(11) New Supersonic Carrier w/RTA + Multistage Liquid Rocket(8) New Subsonic Carrier w/ACES + Reusable All-Rocket Vehicle(10) Maglev + Reusable RBCC Vehicle
Figure 2 Example of the FOM weighting by the HLS core team. The blue bars represent average values, and the white lines indicate the maximum range of the expert opinions.
0.70.7
Blue bars = average values Lines = maximum rangesBlue bars = average values Lines = maximum ranges
0.80.8
1.01.0
0.90.9
0.60.6
0.40.4
0.50.5
0.20.2
0.30.3
0.10.1
00
0.70.7
0.80.8
1.01.0
0.90.9
0.60.6
0.40.4
0.50.5
0.20.2
0.30.3
0.10.1
00
NASA priorities Military priorities
Safety and
Mission SuccessSafety and
Mission Success
Mission Performance
Mission Performance
Affordability
Affordability
Programmatic Factors
Programmatic Factors
Safety and
Mission SuccessSafety and
Mission Success
Mission Performance
Mission Performance
Affordability
Affordability
Programmatic Factors
Programmatic Factors

Prescreening
13A v e r s At i l e co n c e p t f o r A s s u r e d s pAc e Acc e s s
The subsonic commercial carrier aircraft with a reusable rocket launch vehicle was ranked highest, followed by four concepts with almost equal priority. The system incorporating ACES ranked lower, owing to development risk. As was observed in the near-term options, the sled concept ranked lowest.
For the far-term timeframe (13 through 18), the concepts were ranked as follows:
(14) TBCC Vehicle + Reusable All-Rocket Vehicle(17) New Supersonic Carrier w/RTA + Reusable RBCC Vehicle(13) Commerical Jet + TBCC Vehicle + Reusable All-Rocket Vehicle(15) RBCC Vehicle + Reusable All-Rocket Vehicle(18) Compressed-Air Rocket Vehicle + Expendable Rocket(16) Hypersonic Vehicle w/LACE and Scramjet + Expendable Rocket
A carrier concept with a TBCC propulsion system was ranked highest. This was followed by a FASST-like Mach 4 turbojet with a RBCC powered launch vehicle and a subsonic carrier aircraft with a reusable RBCC powered launch vehicle. A Skylon-like air-breathing rocket and a dual mode scramjet with LACE, both with a liquid propellant launch vehicle, were the lowest ranked concepts.
Analyzing Economic Feasibility
The team next conducted a simple economic feasibility analysis to better understand the viability of competing systems. This analysis began by extracting cost data from a wide range of past and present launch systems. Nonrecurring costs included ground facilities costs and DDT&E costs, including purchase and modifications to the carrier aircraft. This assessment did not include technology maturation costs estimated to bring any subsystems or components to a technology readiness level (TRL) of 6. As described in Appendix D, this meant that all specified components were assumed to have achieved a system or subsystem model or prototyping demonstration in a relevant end-to-end environment, either on the ground or in space.
Recurring costs included production and acquisition of expendable elements. It also included operations costs such as fuel and ground crew, and the cost of doing business—overhead, general and administrative costs, and profit. Nonrecurring and recurring costs were added to determine the lifecycle cost, which was then amortized over the number of flights or over the pounds of payload delivered to orbit.
Figure 3 shows a spectrum of the price per pound of payload for U.S. launch vehicles. The curve reflects the overall trend in industry pricing, but of course does not necessarily scale directly to cost. The highest price per pound of payload on this graph is attributed to Pegasus, the only currently available horizontal launch system. Pegasus is a bottom-mounted launch vehicle with a two-stage solid rocket released from a modified L-1011 aircraft. It can deliver 950 lb of payload to orbit at a price of over $30,000 per pound.
The team also analyzed trends in DDT&E costs. As seen in Figure 4, DDT&E tends to increase with the inert weight of a system. The box at the top, right hand corner of Figure 4 represents the required inert weight range—100,000 lb or more—of a carrier aircraft needed to deliver

Chapter 2
14 H o r i zo n ta l l au n c H
15,000 lb to orbit. As observed in the study survey, variations in cost for a given inert weight could be attributed to system complexity, system maturity, customer requirements, or testing requirements.
Figure 4 plots a mix of concept aircraft, such as the XB series, and more fully-detailed aircraft intended for commercial production. Average DDT&E costs for a new Earth-to-orbit technology demonstrator aircraft were estimated to be $10 billion (in 2010 dollars) for a new subsonic carrier aircraft, and as high as $17 billion for a new supersonic and $25 billion for a new hyper-sonic carrier aircraft.
When amortized, these DDT&E costs can add $6,000 to $13,000 to each pound of payload to orbit and can easily overwhelm operations costs. This analysis found that a new aircraft developed solely for a new horizontal launch system presented a substantial risk to commercial viability.
A number of external factors may mitigate this outcome. For example, a government agency could fund the DDT&E costs of the new system to meet a national imperative for a mobile launch capa-bility. Other scenarios exist that could escalate the flight rate more quickly, thereby reducing the amortized cost significantly. Production may incorporate adaptive and open manufacturing processes, which can reduce development costs by as much as an order of magnitude.
Figure 3 Price per pound of payload for existing U.S. launch vehicles. The price trend line is empirically fitted to existing price data.
00 10,00010,000 20,00020,000 30,00030,000 40,00040,000 50,00050,000 60,00060,000 70,00070,000
2525
3030
3535
4040
2020
1515
1010
55
00
Pric
e pe
r pou
nd o
f pay
load
(thou
sand
s of
dol
lars
per
pou
nd)
Pric
e pe
r pou
nd o
f pay
load
(thou
sand
s of
dol
lars
per
pou
nd)
Payload, lbsPayload, lbs
Pegasus, currently theonly operating horizontallaunch system
Atlas VDelta IIDelta IV
SOURCES: Various, compiled and vetted by the HLS Analysis Team
Pegasus XL
Athena I
MinotaurTaurus XL
Athena II
Falcon 9

Prescreening
15A v e r s At i l e co n c e p t f o r A s s u r e d s pAc e Acc e s s
Figure 4 DDT&E costs for inert system weight for existing carrier aircraft. The box (upper right) highlights the range of inert system weight sufficient for horizontal launch.
100100 1,0001,000 10,00010,000 100,000100,000 1,000,0001,000,000
100.000100.000
10.00010.000
1.0001.000
0.1000.100
0.0100.010
0.0010.001
Cost
of D
DT&
E (2
010
dolla
rs, i
n bi
llion
s)Co
st o
f DD
T&E
(201
0 do
llars
, in
billi
ons)
Inert system weight (lbs)Inert system weight (lbs)
AD-1AD-1
X-45AX-45A
CL-84CL-84
X-31X-31
DM20DM20
T-39T-39
X-36 (2 aircraft)X-36 (2 aircraft)
HIMAT (2 aircraft)HIMAT (2 aircraft)
X-48B (estimate only)X-48B (estimate only)
RSRARSRA
XB-51XB-51
XB-45XB-45 XB-47XB-47
YC-14YC-14
XB-52XB-52
ConcordeConcordeSR-71SR-71 B777B777
XB70XB70
A380A380C-17C-17 HSR M2.4HSR M2.4
B747B747
X-30X-30
DO-31DO-31
XC-142XC-142
HypersonicHypersonic
Sufficient inert weightfor horizontal launch
Sufficient inert weightfor horizontal launch
SubsonicSubsonic
SupersonicSupersonic
SOURCES: Various, including published data on existing aircraft, projected data from High-Speed Civil Transport studies, and other data from Morris R Betry, "The History of Technology Viability, Technology Demonstrator and Operational Concept Prototype Program Costs," Air Force Directorate of Science and Technology, July 1994. Assembled and vetted by the HLS analysis team.
SubsonicSupersonicHypersonic
Choosing a Carrier Aircraft
The analysis parameters in the study were selected to enable valid comparisons among the various representative concepts. The outcomes of this comparison served to narrow the focus of the study.
Small supersonic carrier aircraft (e.g., fighters) were found to have very small payload capacity, up to perhaps one hundred pounds. These aircraft had low market potential and high projected costs. Larger existing supersonic aircraft, such as the B-1 Lancer, a variable-sweep wing stra-tegic bomber with supersonic capabilities, were found to have sufficient capability to support a 75,000 lb launch vehicle and could launch payloads up to 5,000 lb. However, the B-1 does not have adequate internal volume for internal carriage of a launch vehicle, nor does it have the needed transonic thrust-minus-drag performance to enable external carriage.
Several new supersonic and hypersonic aircraft were evaluated representing a range of staging Mach numbers and technologies with the potential for larger payloads. Uncertainty in develop-ment costs and in operations costs persists across these concepts, driven by varying assump-tions in launch rate, reliability, and maintenance requirements. The team found that many of these system concepts could be very competitive if launch rates increased over current market

Chapter 2
16 H o r i zo n ta l l au n c H
projections of six flights per year. Toward this day, an assessment of the development needs for super- and hypersonic carrier aircraft is provided in Appendix E.
The remaining aircraft considered were existing subsonic carriers. The most widely available option was the Boeing 747-400F, the cargo version of the commercial airliner that entered into service in 1993. It can be modified to carry an external payload of 308,000 lb. A very similar option was the Airbus A380-800F was another commercially available airliner, a wide-body aircraft with an upper deck that extends along the entire length of the fuselage. It can be modified to carry an external payload of 320,000 lb.
Several unique carrier aircraft options were also analyzed. The Antonov An-225 Mriya was a Ukranian-built strategic airlift cargo aircraft designed in the 1980s to ferry the Soviet Buran orbiter. It was the world’s heaviest aircraft with a maximum external payload of 440,000 lb. Two Boeing 747 NASA Shuttle Carrier Aircraft, SCA-905 and SCA-911, used for piggy-back ferrying of the Space Shuttle orbiter, were added to the mix. These were purpose-modified Boeing 747-100s with a maximum external payload of 192,000 and 240,000 lb, respectively.
Significantly modified carrier aircraft were also considered, such as a dual-fuselage variant of the C-5 Galaxy strategic airlift aircraft with a maximum payload of 771,000 lb. Note that a runway wider than 300 feet is required for the breath of the landing gear on the two fuselages which would restrict launch mobility.
Two additional derived designs were the White Knight X and White Knight XX, enlarged dual-fuselage variants based on the Scaled Composites White Knight Two. The White Knight X was conceived to carry roughly 5 times more payload than the White Knight Two, approximately 176,000 lb. The White Knight XX was conceived as a commercial variant of the dual-fuselage C-5, targeting 750,000 lb payload and using the same development and production methods as the existing White Knight aircraft. The White Knight XX had landing gear wider than 175 feet and would not easily take off from a standard runway.
Choosing a Launch Vehicle Configuration
One of the main decisions driving the design on a horizontal launch system is the placement of the launch vehicle relative to the carrier aircraft. A range of configuration options were considered. The launch vehicle may be carried externally on the top of or on the bottom of the carrier aircraft, stored internally, or towed. All have advantages and disadvantages, as follows:
Internally stowed launch vehicles could have the highest altitude and fastest staging condition for a given carrier aircraft; however, the size of the launch vehicle was limited by the internal payload config-uration of the carrier aircraft. The launch vehicle could also need deployable aerodynamic surfaces.
Towed launch vehicles had the fewest modifications to the carrier aircraft and the least constrained separation conditions, but required launch vehicle attachments and wings designed for takeoff, attachments for the dropped takeoff gear, and must be designed for the dynamic loads from the tow line. Towing offered larger payloads than internal stowing, and could achieve the goal of 15,000 lb of payload to orbit in some configurations.
Top-mounted launch vehicles on new, large carrier aircraft could carry up to 50,000 lb of payload to 100 nm due-east orbit.

Prescreening
17A v e r s At i l e co n c e p t f o r A s s u r e d s pAc e Acc e s s
Bottom-mounted launch vehicles such as the Pegasus rocket on the single-fuselage Lockheed L-1011 Stargazer, were limited by ground clearance that restricts the diameter and length of the launch vehicle. Significant payload performance gains were possible with high-wing, dual-fuselage designs, such as a dual-fuselage C-5 or White Knight-derived carrier aircraft, which could carry a launch vehicle bottom-mounted on the center wing. This configuration could be tailored to meet almost any payload requirement, and enabled a wide range of launch trajectories. However, these advantages were offset by the need to develop and operate a one-of-a-kind carrier aircraft, and the wingspan and associated takeoff and landing gear that limited basing flexibility.
Results of the Prescreening Analysis
A number of configuration decisions were made as a result of the prescreening process. A difficult deci-sion was the elimination of supersonic and hypersonic carrier aircraft. A launch vehicle in this speed regime for a moderate payload of 15,000 lb would require an entirely new aircraft, and cost projec-tions for any new aircraft were prohibitive when amortized over 6 flights per year. The study therefore focused primarily on existing aircraft with modifications to accommodate the launch vehicle.
The next decision was to eliminate towed concepts that require the development of a winged cradle for launch vehicle takeoff, and internally-loaded concepts that are volume constrained and can’t accommodate moderate payloads to orbit. Existing bottom-mount concepts were eliminated because the carrier landing gear length constrained the launch vehicle size and system payload. Top separa-tion has been demonstrated with the Space Shuttle orbiter, and bottom-mount separation from a dual-fuselage aircraft may be the easiest to accomplish.
Another decision was to eliminate sled- or rail-based system concepts. Sled-based launch concepts were generally inconsistent with the desire for a completely mobile capability and the ability to use existing runways. For some sled concepts, the sled could double as takeoff and landing gear resulting in weight savings and reduced complexity. However, the sled- and rail-launched systems did not have the ability for launch offset, loiter, or crossrange performance.
Based on these results, the following four system concepts were carried forward. These options were selected to span the lowest cost and highest payload opportunities among the near-term options.
Commercial Jet + Multistage Solid Rocketcarrier aircraft Modified Existing Subsonic commercial Jet aircraft launch vehicle Expendable Multistage Solid rocket
Commercial Jet + Multistage Liquid Rocketcarrier aircraft Modified Existing Subsonic commercial Jet aircraft launch vehicle Expendable Multistage liquid rocket (rP fuel)
Commercial Jet + Reusable Liquid Rocket with Drop Tankscarrier aircraft Modified Existing Subsonic commercial Jet aircraft launch vehicle reusable liquid rocket (lH2 fuel) with Drop tanks
New Custom Subsonic Carrier + Multistage Liquid Rocketcarrier aircraft new Specially Designed (Bottom carry) large Subsonic carrier aircraft launch vehicle Expendable Multistage liquid rocket

Chapter 3
18 H o r i zo n ta l l au n c H

19A v e r s At i l e co n c e p t f o r A s s u r e d s pAc e Acc e s s
ScreeningThe team next evaluated the range of possible configurations of the set of four representative concepts that survived prescreening. To do this, each concept was expanded to many concept configurations by combining the various stage and technology options in a morphological matrix. This allowed the team to evaluate and screen many configurations in an integrated, parametric, low-fidelity, engineering environment, similar to that used to compute the FOMs.
Methodologies for Concept Screening
The concept trade space consisted of a morphological matrix with the following elements: seven carrier aircraft, three types of propellants, and the number of stages, propulsion mode, propel-lants, and reusability. As shown in Figure 5, each launch vehicle could have one, two, or three stages, and the first stage could be either expendable or reusable, and could be configured with or without a drop tank.
The integration framework used to trade the payloads, costs, and loss of mission probabilities was known as Reduced Order Simulation for Evaluation of Technologies and Transportation Architectures (ROSETTA). (Crocker, 2001) ROSETTA was a design simulation tool that utilizes a multidisciplinary process that was intended to simulate design optimization. The fidelity level of the analysis carried out in ROSETTA was low—0 or 1 according to the definitions presented in Appendix F.
The payload and corresponding launch vehicle were sized to meet the maximum payload weight of the carrier aircraft while satisfying major constraints such as stage mass ratio, stage thrust-to-weight ratio, and wing loading for separation. Geometry as well as propellant tanks were sized to meet the mass ratio, wings were sized for wing loading, and engine thrust and engine mass were sized for thrust-to-weight ratio. Because all of these parameters were mutually dependent, ROSETTA iterated using feedforward and feedback loops to determine the maximum payload.
This sizing approach allowed ROSETTA to generate the parameters for an idealized system where the system and all subsystems and components were sized precisely to meet mission requirements. Such concepts were referred to as “rubberized”, reflecting the way components
Figure 5 Elements used in the morphological matrix.
Carrier aircraft
747 SCA747-400F
A380An-225
White Knight XWhite Knight XX
Dual C-5
No. of Stages
11.5 (drop tank)
23
No. of Enginesper Stage
123
Type of Propellant
RPLH2
Solid
Stage 1Reuseable
YesNo
cH a P t E r 3

Chapter 3
20 H o r i zo n ta l l au n c H
were stretched to create an idealized system. Once the maximum payload was determined, engi-neering parameters for cost and reliability were computed based on subsystem and component size, system performance, and CONOPs.
ROSETTA significantly reduced the time to achieve design convergence over a broad analysis of alternatives by approximating results for each discipline using response surfaces rather than running detailed discipline codes for each instance. These response surfaces were generated using a design of experiments method to guide the range of inputs to the various analysis tools.
This conceptual framework was used to specify the design of each propulsion system to meet all thrust constraints across 1,365 different configurations. Launch vehicles were optimized within size and gross weight constraints depending on the carrier aircraft, but were not constrained to previously-developed engines and solid motors. All launch vehicles, at this step in the anal-ysis, were considered new developments rather than existing designs, and therefore required similar development and acquisition costs for a new system. DDT&E costs were amortized over a campaign of 120 flights.
A detailed list of the assumptions and methodologies used in ROSETTA is provided in Appendix G.
Analysis of Carrier Aircraft Alternatives
The initial results of the analysis of alternatives are shown in Figure 6. Out of the 1,365 combina-tions, 1,296 feasible solutions were generated.
As was observed, the majority of the cases analyzed could carry more payload than the industry price trend line (as determined in Figure 3), but at a higher cost. The maximum payload ranged from 11,180 to 52,290 lb, which varied as the external weight capacity for each carrier aircraft. (See Table 2.)
The launch vehicles with the most promising characteristics for each carrier aircraft are shown in Table 3. The highlighted values represent the best results for each category—payload, recurring costs per flight, and lifecycle cost per pound of payload. The lowest costs of the 1,365 possibilities were either the two- or three-stage solid propellant stage concepts for all of the carrier aircraft.
Table 2 System Concept Configurations
Carrier aircraft External weight capacity (lb)
Maximum payload to LEO (lb)
White Knight X 176,000 11,180
747-100 Sca-911 240,000 15,440
a380-800F 264,550 17,090
747-400F 308,000 20,000
an-225 Mriya 440,930 30,380
White Knight XX 750,000 49,940
Dual-fuselage c-5 771,620 52,290

S creening
21A v e r s At i l e co n c e p t f o r A s s u r e d s pAc e Acc e s s
Figure 6 Results of the initial analysis of lifecycle cost and payload capability for 1,296 cases. The line is the industry price trend line originally plotted in Figure 3.
00 10,00010,000 20,00020,000 30,00030,000 40,00040,000 50,00050,000 70,00070,00060,00060,000
1212
1414
1616
1818
2020
88
1010
66
44
22
00
Life
Cyc
le C
ost P
er P
ound
of P
aylo
ad (t
hous
and
$ FY
10)
Life
Cyc
le C
ost P
er P
ound
of P
aylo
ad (t
hous
and
$ FY
10)
Payload, lbsPayload, lbs
White Knight X747-100 SCA747-400FA380-800FAn-225WhiteKnight XXDual C-5
Industry Price Trend Line
Among the existing carrier aircraft—the A380-800F, 747-400F, 747-100 SCA, An-225 Mriya—the highest payload capability results from a configuration with a single stage, drop tank, and LH2 fuel. Two-stage LH2 concepts were found to carry less payload than the drop tank concept primarily because the length of the launch vehicle was constrained to fit on top of the carrier aircraft. These length constraints produced concepts with low fineness ratios and reduced the propellant mass fractions from 0.91 to 0.84, 0.82, and 0.67 for each stage in the three-stage concept, thus reducing the maximum payload achievable. For the very large An-225, the launch vehicle length constraints were not a limiting factor, resulting in the best two-stage LH2 concept.
DDT&E cost values for the 747-100 SCA, 747-400F, and A380-800F were relatively low, owing to the assumption to acquire used aircraft. The three dual-fuselage aircraft were all treated as new acquisitions. The dual-fuselage C-5 development costs were based on the assumption that modi-fications would be extensive on an airplane of this vintage. On the other hand, optimistic devel-opment assumptions were made for the White Knight configurations based on the aggressive development history at Scaled Composites. The DDT&E costs for the White Knight XX were lower than for the dual-fuselage C-5, in spite of the fact that the C-5 is an existing production aircraft.

Chapter 3
22 H o r i zo n ta l l au n c H
Table 3 Concepts with the Most Promising Characteristics ($ in millions, all costs in 2010 dollars)
Stage 1
Stage2
Stage3
Payload(lb)
Recurring cost/flight
Lifecyclecost/lb
Total Facilities
TotalDDT&E
TotalProduction
Total Operations
TotalLifecycle
Probability of LOM
White Knight X
Drop tank/lH2 lH2 11,180 $113 $11,540 $91 $1,470 $12,430 $1,460 $15,460 1.9%
Solid Solid 4,040 $21 $7,360 $77 $660 $2,270 $550 $3,560 2.1%
Solid Solid Solid 5,330 $27 $6,490 $89 $760 $2,620 $680 $4,150 2.4%
747-100 SCA-911
Drop tank/lH2 lH2 15,450 $136 $9,860 $110 $1,550 $14,790 $1,800 $18,250 2.6%
Solid Solid 5,550 $24 $5,880 $94 $640 $2,490 $690 $3,910 2.7%
Solid Solid Solid 7,300 $31 $5,240 $110 $760 $2,870 $840 $4,590 3.1%
747-400F
Drop tank/lH2 lH2 20,000 $157 $8,860 $129 $1,860 $17,140 $2,090 $21,230 2.8%
Solid Solid 7,150 $26 $5,320 $112 $860 $2,800 $770 $4,550 2.9%
Solid Solid Solid 9,390 $34 $4,730 $132 $1,000 $3,230 $950 $5,310 3.3%
A380-800F
Drop tank/lH2 lH2 17,090 $144 $9,630 $117 $1,630 $15,980 $1,920 $19,650 3.0%
Solid Solid 6,120 $25 $6,130 $101 $680 $2,930 $730 $4,440 3.1%
Solid Solid Solid 8,060 $32 $5,400 $118 $810 $3,330 $890 $5,150 3.5%
An-225 Mriya
lH2 lH2 30,390 $347 $12,910 $284 $3,590 $40,260 $2,730 $46,860 2.7%
Solid Solid 10,300 $31 $5,130 $146 $870 $4,120 $1,040 $6,170 2.7%
Solid Solid Solid 13,500 $40 $4,480 $172 $1,040 $4,600 $1,270 $7,080 3.1%
White Knight XX
Drop tank/lH2 lH2 49,950 $266 $5,950 $240 $2,940 $28,670 $3,770 $35,610 2.0%
Solid Solid 17,650 $39 $3,330 $217 $1,560 $3,920 $1,340 $7,030 2.1%
Solid Solid Solid 23,060 $50 $2,980 $257 $1,780 $4,500 $1,670 $8,220 2.5%
Dual C-5
lH2 lH2 52,290 $478 $10,560 $388 $6,880 $54,980 $3,810 $66,060 2.1%
Solid Solid 18,170 $39 $4,600 $222 $3,550 $4,790 $1,330 $9,900 2.1%
Solid Solid Solid 23,730 $50 $3,940 $263 $3,780 $5,380 $1,670 $11,100 2.5%

S creening
23A v e r s At i l e co n c e p t f o r A s s u r e d s pAc e Acc e s s
The White Knight X had the lowest payload capability and the highest recurring costs per pound of payload, leading to the observation that a concept sized between the White Knight X and XX may have struck a better balance between mobility and payload. The dual-fuselage C-5 had the largest external payload capability and the highest delivered payload in a two-stage LH2 configuration.
The FOMs other than payload and cost did not provide many discriminators. The solid propel-lant stage concepts were assumed to have less restrictive handling and propellant storage requirements as compared to liquid engines. Although much lower in cost and with less propel-lant infrastructure than liquid stage concepts, they had the lowest payload capability—approxi-mately half that of the LH2 concepts owing to the differences in specific impulse. Finally, the probability of loss of mission for all cases ranged from 1.9 to 3.5 percent. In this low-fidelity screening analysis, this variation was considered insignificant.
While all the carrier aircraft analyzed could arguably meet the goals established in the study, each had their own strengths and weaknesses in the FOMs analysis. The White Knight X had the lowest payload capability compared to other existing commercial aircraft, with no compen-sating advantages. The White Knight XX and dual-fuselage C-5 both displayed wild uncertainty in performance. The capability of A380-800F aircraft essentially duplicated the 747 capabili-ties, and it was found to be more expensive to acquire. Finally, only one An-225 Mriya aircraft exists currently and the team considered the risks of purchasing and maintaining such a unique specimen very high.
Based on these results, only the 747-400F was carried forward for further analysis. The 747-400F is widely available as a used aircraft and is well characterized in many discipline models. For these reasons, it was judged by the study team as having the greatest potential to demonstrate overall feasibility.
Analysis of Launch Vehicle Alternatives
Various launch vehicle configurations also had different strengths and weaknesses. The system concepts with two- and three-stage solid rockets generally had the lowest costs and the lowest payload capability. At the other end of the spectrum, the three-stage LH2 system concept had the highest lifecycle costs, but not always the highest payload. The one-stage LH2 concept with drop tank generally had the best payload capability. The low-density and high-volume of the two-stage LH2 systems required a very low fineness ratio, and the multiple stages and engine nozzle lengths required long interstage adapters. For example, the two-stage and three-stage LH2 concepts had less payload than the drop tank concept on the 747-400F because the launch vehicle length was constrained to 127 ft.
The results plotted in Figure 7 reveal the potential to meet the HLS goals with the 747-400F carrier aircraft. The payload capability estimates for a 747-400F ranged from 7,150 lb with solid rockets to 20,000 lb with liquid engines. Of specific interest is two-stage RP launch vehicle, which delivered more than 10,000 lb of payload in this configuration while avoiding the opera-tional complexities of storage and handling of liquid hydrogen.
Figure 7 Comparison of costs and payload for the 747-400F carrier aircraft and several launch vehicle configurations. The cost per flight is shown in the bars on the left, and the correspond-ing payload capability is shown by the green line.

Chapter 3
24 H o r i zo n ta l l au n c H
Results of the Screening Analysis
This analysis of horizontal launch concepts showed their competitiveness as compared to the industry price trend line in Figure 3. It is difficult, however, to project better performance than the advertised price of modern vertical launch systems such as the Falcon 9 two-stage RP system or the Taurus II RP+solid (plus optional hypergol third stage). While the cost of the two- and three-stage solids could be in range considering the conservative assumptions of this model, the costs of the liquid rocket system concepts were substantially larger.
The team selected three configurations the next round of higher fidelity analysis. Based on the screening results, a low cost solid concept, a high payload two-stage LH2 concept, and a compro-mise RP+LH2 vehicle were chosen. The drop tank concept, while promising, did not have a detailed model available to fully compare this configuration. The study team recommends further consid-eration of this potentially competitive concept.
Figure 7 Comparison of costs and payload for the 747-400F carrier aircraft and several launch vehicle configurations. The cost per flight is shown in the bars on the left, and the corresponding payload capability is shown by the green line.
3-stageLH2
3-stageLH2
2-stageLH2
2-stageLH2
2-stageRP+LH22-stageRP+LH2
2-stageRP
2-stageRP
Drop tank/LH2
Drop tank/LH2
Drop tank/RP
Drop tank/RP
3-stagesolid
3-stagesolid
2-stagesolid
2-stagesolid
3-stageRP
3-stageRP
ReuseableRP+LH2
ReuseableRP+LH2
300300
400400
500500
200200
100100
00 00
22
44
66
88
1010
1212
1414
1616
1818
2020
Life
cycl
e co
st p
er fl
ight
(mill
ions
$)
Life
cycl
e co
st p
er fl
ight
(mill
ions
$) Pounds of payload per flight (lbs)
Pounds of payload per flight (lbs)
13,520
16,600 16,210
12,430
13,960
10,860
20,000
9,290 9,390
7,150
ProductionDDT&E
Operations

S creening
25A v e r s At i l e co n c e p t f o r A s s u r e d s pAc e Acc e s s

Chapter 4
26 H o r i zo n ta l l au n c H

27A v e r s At i l e co n c e p t f o r A s s u r e d s pAc e Acc e s s
Point DesignsThe three selected concepts that emerged from the screening exercise were further refined to determine development feasibility and risk at a higher level of fidelity. These concepts were developed into point design system concepts (PDs), intended to represent the expected range of performance, reliability, cost, and risk for a class of horizontal launch concepts.
The analyses optimized the various design parameters in order to maximize the payload deliv-ered to orbit, and determined the best existing rocket motor or engine and other critical subsys-tems to reduce the development risk and uncertainty of system weight and cost predictions.
Methodologies for Point Designs
The FOMs for each point design were determined using a mix of low- and mid-level fidelity tools, and system performance was calculated using level 1 fidelity tools. The methodology centered on dynamic fault trees for probability of loss of vehicle and probability of loss of mission and NAFCOM for DDT&E and production costs. As for the screening process, Appendix F contains details on the assumptions and methodologies used.
Major aspects of the point design methodology include the following: ¡ The launch vehicle gross weight was sized to meet the maximum carrying capacity of the
carrier aircraft. ¡ The performance and costs were calculated based on the properties of existing engines
rather than rubberized engines. ¡ The technical discipline tools (e.g., trajectory, aerodynamics, propulsion, mass proper-
ties), rather than response surfaces, were used. ¡ The NAFCOM cost model was used (rather than TRANSCOST) because NAFCOM computes
DDT&E and theoretical first unit cost at the subsystem level.
The goals for the vehicle concept exploration were to identify concepts with useful payloads approaching 15,000 lbs due east to a 100-nautical mile, low Earth orbit with low development costs and with production and operations costs approaching those of current launch systems. To ensure military and commercial usefulness, the concepts were constrained to existing runways with a gross takeoff weight less than 1.8 million lb.
Flight rates were set at current market projections of 6 flights per year. This nominal 60 days between flights was used to size the operations crew needed for the campaign. The crew size was also used to determine surge call-up time and minimum turn around time.
To select the best existing engines and other subsystems while optimizing the payload of the system, an array of analysis tools were integrated into a framework to link control variables. A parametric geometry model scaled the wing geometry based on wing loading constraints, stage length and diameter based on propellant requirements and carrier aircraft constraints. Aerodynamics, rocket performance, and system weight were communicated to the Program to
cH a P t E r 4
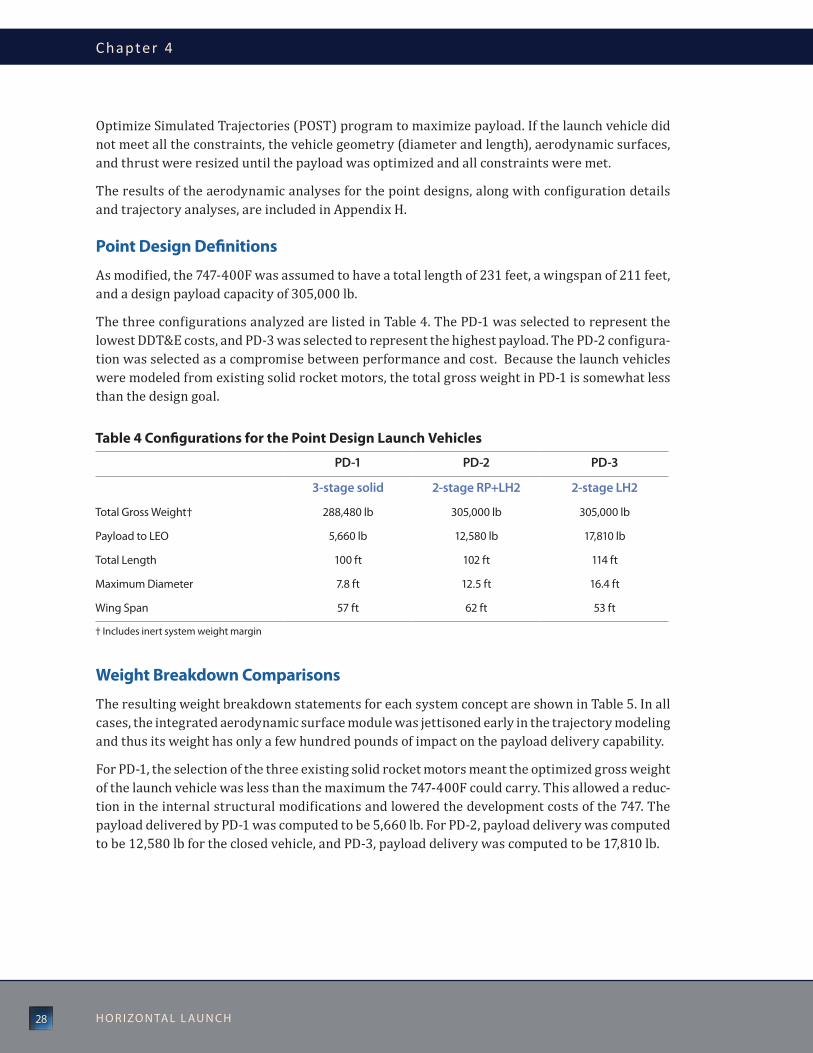
Chapter 4
28 H o r i zo n ta l l au n c H
Optimize Simulated Trajectories (POST) program to maximize payload. If the launch vehicle did not meet all the constraints, the vehicle geometry (diameter and length), aerodynamic surfaces, and thrust were resized until the payload was optimized and all constraints were met.
The results of the aerodynamic analyses for the point designs, along with configuration details and trajectory analyses, are included in Appendix H.
Point Design Definitions
As modified, the 747-400F was assumed to have a total length of 231 feet, a wingspan of 211 feet, and a design payload capacity of 305,000 lb.
The three configurations analyzed are listed in Table 4. The PD-1 was selected to represent the lowest DDT&E costs, and PD-3 was selected to represent the highest payload. The PD-2 configura-tion was selected as a compromise between performance and cost. Because the launch vehicles were modeled from existing solid rocket motors, the total gross weight in PD-1 is somewhat less than the design goal.
Weight Breakdown Comparisons
The resulting weight breakdown statements for each system concept are shown in Table 5. In all cases, the integrated aerodynamic surface module was jettisoned early in the trajectory modeling and thus its weight has only a few hundred pounds of impact on the payload delivery capability.
For PD-1, the selection of the three existing solid rocket motors meant the optimized gross weight of the launch vehicle was less than the maximum the 747-400F could carry. This allowed a reduc-tion in the internal structural modifications and lowered the development costs of the 747. The payload delivered by PD-1 was computed to be 5,660 lb. For PD-2, payload delivery was computed to be 12,580 lb for the closed vehicle, and PD-3, payload delivery was computed to be 17,810 lb.
Table 4 Configurations for the Point Design Launch Vehicles
PD-1 PD-2 PD-3
3-stage solid 2-stage RP+LH2 2-stage LH2
total Gross Weight† 288,480 lb 305,000 lb 305,000 lb
Payload to lEo 5,660 lb 12,580 lb 17,810 lb
total length 100 ft 102 ft 114 ft
Maximum Diameter 7.8 ft 12.5 ft 16.4 ft
Wing Span 57 ft 62 ft 53 ft
† includes inert system weight margin

Point Des igns
29A v e r s At i l e co n c e p t f o r A s s u r e d s pAc e Acc e s s
Tabl
e 5
Wei
ght B
reak
dow
n St
atem
ent f
or P
oint
Des
ign
Syst
em C
once
pts (
all w
eigh
ts in
lb)
Stag
e 1
PD
-1St
age
1PD
-2PD
-3M
otor
8,
980
Stru
ctur
e
8,97
0 16
,610
Subs
yste
ms
250
Prop
ulsi
on
9,19
0 11
,490
inte
rsta
ge
750
ther
mal
con
trol
330
520
Prop
ella
nt
108,
040
Pow
er
16
016
0Lo
aded
11
8,01
0 av
ioni
cs
4646
Stag
e 2
Iner
t18
,700
28
,830
Mot
or
8,98
0 co
nsum
able
s 1,
940
1,82
0Su
bsys
tem
s 35
0 M
ain
prop
ella
nts
193,
440
179,
160
inte
rsta
ge
640
Star
t-up
loss
es
58
054
0Pr
opel
lant
10
8,04
0 Fu
eled
214,
670
210,
350
Load
ed
118,
000
Stag
e 2
Stag
e 3
Stru
ctur
e
6,11
0 7,
340
Mot
or
2,70
0 Pr
opul
sion
2,
140
2,17
0Su
bsys
tem
s 13
0 th
erm
al c
ontr
ol
280
180
Prop
ella
nt
28,3
00
Pow
er
160
160
Load
ed
31,13
0 av
ioni
cs
480
480
Cont
rol M
odul
eIn
ert
9,19
0 10
,340
Stru
ctur
es, t
anks
47
0 co
nsum
able
s
810
770
Subs
yste
ms
260
reac
tion
prop
ella
nts
440
570
reac
tion
cont
rol
210
Mai
n pr
opel
lant
s 53
,390
50
,310
Pr
opel
lant
93
0 St
art-
up lo
sses
16
0 15
0 Lo
aded
1,
860
Fuel
ed64
,000
62
,130
Aer
osur
face
Mod
ule
Aer
osur
face
Mod
ule
Win
g
6,83
0 W
ing
6,86
0 6,
090
Fins
2,
030
Fins
1,
650
2,45
0 ac
tuat
ors
1,28
0 ac
tuat
ors
1,
040
1,54
0 St
rong
back
2,
260
Stro
ngba
ck
2,13
0 2,
250
12
,400
11
,680
12
,310
Fa
iring
and
ada
pter
1,
420
Fairi
ng a
nd a
dapt
er2,
090
2,40
0 Pa
yloa
d 5,
660
Payl
oad
12,5
80
17,8
10
Tota
l 28
8,49
030
5,00
030
5,00
0

30 H o r i zo n ta l l au n c H
CASTOR 120Solid rocket motor
(ATK)
CASTOR 30Solid rocket motor
(ATK)
EMPENNAGE
MAIN WING
Existing ComponentsNew Components
ATTITUDE CONTROL MODULESimilar to Athena orbital adjustment module
PAYLOAD (notional)
PAYLOAD FAIRING
STRONGBACK STRUCTURE
INTERSTAGE
Point Design 1

31A v e r s At i l e co n c e p t f o r A s s u r e d s pAc e Acc e s s
PD-1 consisted of the 747-400F carrier
aircraft and a three-stage solid
rocket launch vehicle. the solid rocket motors were
selected for the maximum payload—two castor 120
motors for stages one and two and a castor 30 motor
for stage three. the wing and empennage were
attached to the first stage with a winged “strong-
back”, a nonintegral structural interface connecting
the aerodynamic surfaces to the launch vehicle. the
intertanks, interstages, and aerodynamic surfaces
were made with graphite-epoxy composite mate-
rials. Power and attitude control subsystems were
based on the lockheed athena orbit adjust module.
PROPELLANTHTBP (Castor 120: TP-H1246, Castor 30: TP-H8299Solid motor propellant loads taken from published data
WINGS AND TAILSAll wings and tails are graphite/epoxy composite materialWings designed with load factor of 2.5 and safety factor of 1.5
STRUCTURESAll interstages are graphite/epoxy compositematerial
ATTITUDE CONTROLBased on LockheedAthena orbital adjustment module
POWERPower system based on Lockheed Athena orbital adjustment module
(Li-ion batteries)
PAYLOADDeliver payload to target circular LEO at 100 nmi altitude and 28.5° inclination
Performance data is shown for due East launch from 28.5° latitude
747-400F carrier aircraft / 3-stage solid rocket launch vehicle

32 H o r i zo n ta l l au n c H
MERLIN 1C (x3)Liquid rocket engine
(SpaceX)
RP STAGESimilar to Atlas V core stage
12.5 ft diameter
RL 10A-4-2 (x3)Liquid rocket engine
(PWR)
EMPENNAGE
MAIN WING
Existing ComponentsNew Components
LH 2 STAGE
PAYLOAD(notional)
PAYLOAD FAIRING
STRONGBACK STRUCTURE
Point Design 2

33A v e r s At i l e co n c e p t f o r A s s u r e d s pAc e Acc e s s
BODY STRUCTURESAll interstages are graphite/epoxy composite material
WINGS AND TAILSAll wings and tails are graphite/epoxy composite materialWings designed with load factor of 2.5 and safety factor of 1.5
ATTITUDE CONTROLBipropellant ACS for roll controlEngine gimbal for pitch and yaw
POWERLi-ion batteries
PAYLOADDeliver payload to target circular LEO at 100 nmi altitude and 28.5° inclination
Launch is due East from 28.5° latitude
2ND STAGE PROPELLANT TANKSAluminum, integral
1ST STAGEPROPELLANT TANKS
Aluminum, integral
2ND STAGE MAIN PROPULSIONNot sized for engine-out capability
1ST STAGE MAINPROPULSION
Not sized for engine-out capability
PD-2 consisted of the 747-400F carrier aircraft and a two-stage launch
vehicle with an rP first stage and an lH2 second stage. the first stage was made up of three rP Merlin 1c engines from SpaceX. the second stage had three rl10a-4-2 lH2 engines from Pratt&Whitney rocketdyne. the wing and empennage were attached to the first stage with a strongback. all interstages, fairings and aerodynamic surface were graphite-epoxy composite materials. the selection of the liquid engines brings the system to the maximum external payload limit of the 747-400F. the gross weight of the launch vehicle equals 305,000 lbs which was the maximum external payload limit of the 747-400F.
747-400F carrier aircraft / 2-stage RP+LH2 launch vehicle

34 H o r i zo n ta l l au n c H
RS-25ELiquid rocket engine
(PWR)
LH2 STAGESimilar to Delta IV core stage
16.4 ft diameter
RL 10A-4-2 (x3)Liquid rocket engine
(PWR)
EMPENNAGE
MAIN WING
LH2 STAGESimilar to Delta IV upper stage
PAYLOAD(notional)
PAYLOAD FAIRING
STRONGBACK STRUCTURE
Existing ComponentsNew Components
Point Design 3

35A v e r s At i l e co n c e p t f o r A s s u r e d s pAc e Acc e s s
BODY STRUCTURESAll interstages are graphite/epoxy composite material
WINGS AND TAILSAll wings and tails are graphite/epoxy composite materialWings designed with load factor of 2.5 and safety factor of 1.5
ATTITUDE CONTROLBipropellant system for roll controlEngine gimbal for pitch and yaw
POWERLi-ion batteries
PAYLOADDeliver payload to target circular LEO at 100 nmi altitude and 28.5° inclination
Launch is due East from 28.5° latitude
2ND STAGE PROPELLANT TANKSAluminum, integral
1ST STAGEPROPELLANT TANKS
Aluminum, integral
2ND STAGE MAIN PROPULSIONNo engine-out capability
1ST STAGE MAINPROPULSION
PD-3 consisted of the 747-400F carrier aircraft and a two-stage lH2
launch vehicle. owing to the large diameter of this launch vehicle, lateral directional stability and dynamic loads from buffet will require more in-depth analyses. the first stage had one rS-25E, an air-start, expendable Space Shuttle Main Engine. the second stage had three rl10a-4-2 lH2 engines. the wing and empennage were attached to the first stage with a strongback. all interstages, fairings and aerodynamic surface were graphite-epoxy composite materials. the gross weight of the launch vehicle equals 305,000 lbs which was the maximum external payload limit of the 747-400F.
747-400F carrier aircraft / 2-stage LH2 launch vehicle

Chapter 4
36 H o r i zo n ta l l au n c H
Reliability Comparisons
Using failure rates of existing systems and the reliability exponential growth history of past systems, the loss of mission (LOM) probabilities are shown in Table 6. Analysis of the most impor-tant elements revealed no dominating unreliable components.
Costs Comparisons
Program costs, listed in Table 7, were estimated using a number of assumptions. Chief among these was the acquisition and modification of a used 747-400F for $86 million, and the subse-quent DDT&E of $122 million for this aircraft. These estimates were based on past Boeing AirLaunch studies, using current year dollars. DDT&E costs of the strongback aerosurface modification were based on traditional aerospace practices modeled with the NAFCOM model. In addition, the typical government oversight for the program was based on previous manned system development, and government facilities (and their associated costs) were used for testing and demonstration.
¡ For PD-1, market price was used for the solid rocket stages. The recurring costs per pound of payload were calculated to be $51 million, or $8,930 per pound of payload.
¡ For PD-2, the Merlin 1C costs were calculated in NAFCOM based on the advertised price of the SpaceX Falcon 1 and Falcon 9. The recurring costs per pound of payload were esti-mated at $120 million, or $9,560 per pound of payload.
¡ For PD-3, the RS-25E costs were estimated using NAFCOM. Note that the RS-25E tech-nology development costs (primarily for air-start capability) have not been added to DDT&E estimates. The recurring costs per pound of payload were $130 million, or $7,300 per pound of payload.
Table 6 Reliability Assessment for Point Design System Concepts
PD-1 PD-2 PD-3
Probability (Mean flights before failure)
4th Flight loss of 747-400F 0.006% (17,241) 0.006% (17,241) 0.006% (17,241)
Failed separation 1.0% (101) 1.0% (101) 1.0% (101)
loss of Stage 1 2.07% (48) 1.72% (58) 1.95% (50)
loss of Stage 2 1.35% (74) 2.37% (42) 2.36% (41)
loss of Stage 3 2.09% (48)
16th Flight loss of 747-400F 0.001% (71,428) 0.001% (71,428) 0.001% (71,428)
Failed separation 0.24% (419) 0.24% (419) 0.24% (419)
loss of Stage 1 0.50% (199) 0.47% (212) 0.47% (212)
loss of Stage 2 0.32% (300) 0.56% (178) 0.56% (178)
loss of Stage 3 0.24% (419)

Point Des igns
37A v e r s At i l e co n c e p t f o r A s s u r e d s pAc e Acc e s s
Summary of Point Design System Concepts
The summary figures of merit for each system concept are shown in Table 8. Expanded defini-tions and proxy parameters for each FOM are listed in Appendix A.
The results of the analysis show that even within the constraint of using existing engines, the resulting systems still produced good payload performance, cost, and reliability. The three-stage solid, PD-1, had the lowest DDT&E costs. The two-stage LH2 PD-3 had the highest payload delivery and the lowest lifecycle cost per pound of payload.
Table 7 Projected Costs for the Point Design System ConceptsFY10 Dollars, assuming 6 Flights Per Year
PD-1 PD-2 PD-3DDt&E and Facilities costs
747-400F $122 M $122 M $122 M
Stage 1 $48 M $272 M $1,780 M
Stage 2 $48 M $305 M $295 M
Stage 3 $13 M
aerosurfaces $104 M $103 M $106 M
attitude control system and fairing $31 M included included
Facilities and ground service equipment $109 M $134 M $132 M
Subtotal for DDT&E and facilities $475 M $940 M $2,440 M
Acquisition and Production Costs
747-400F acquisition and modifications $86 M $86 M $86 M
Stage 1 $13 M $34 M $51 M
Stage 2 $13 M $67 M $58 M
Stage 3 $2 M $11 M na
aerosurfaces $10 M $11 M $12 M
attitude control and fairing $3 M included included
Subtotal expendable average production $41 M $112M $120 M
total recurring costs per pound of payload $8,930 / lb $9,560 / lb $7,300 / lb
Total recurring costs $52 M / flight $120 M / flight $130 M / flight
Operations Burden
turn-around time 43 hours 68 hours 57 hours
call-up time 3.8 hours 5.9 hours 7.2 hours

Chapter 4
38 H o r i zo n ta l l au n c H
Table 8 Figures of Merit for each Point Design
PD-1 PD-2 PD-3
Carrier aircraft 747-400F 747-400F 747-400F
Launch vehicle 3-stage Solid rP+lH2 2-stage lH2
Safety and Mission Success (16th flight)
Loss of mission probability – contribution from Stage 1 0.50% 0.41% 0.47%
Loss of mission probability – contribution from Stage 2 0.32% 0.57% 0.56%
Loss of mission probability – contribution from Stage 3 0.50% - -
Loss of mission probability – contribution from takeoff through lV release 0.24% 0.24% 0.24%
Total loss of mission probability at 16th flight 1.56% 1.22% 1.27%
Effectiveness and Performance
Payload to LEO 5,660 lb 12,580 lb 17,810 lb
Minimum turnaround time 36 hrs 68 hrs 57 hrs
Surge call-up time 3.8 hrs 5.9 hrs 7.2 hrs
Basing flexibility high moderate moderate
Mission flexibility high high high
Military viability moderate moderate moderate
Programmatic risk
Failure to achieve DDT&E goals low moderate high
Failure to achieve IOC date low low low
Technology maturity trl 6+ trl 6+ trl 6+
Commercial viability -15% -37% -45%
affordability (FY2010 dollars; total over campaign of 120 flights)
Cost of DDT&E (total) $0.37 B $0.80 B $2.31 B
Cost of Acquisition and Production (total over campaign) $5.10 B $13.4 B $14.5 B
Cost of Facilities and Ground Support Equipment (total) $0.11 B $0.14 B $0.13 B
Cost of Operations (total over campaign) $1.06 B $1.09 B $1.16 B
Cost of Mission Failure (total over campaign) $0.14 B $0.16 B $0.18 B
Factors quantitatively calculatedFactors qualitatively determined using expert elicitation

Point Des igns
39A v e r s At i l e co n c e p t f o r A s s u r e d s pAc e Acc e s s
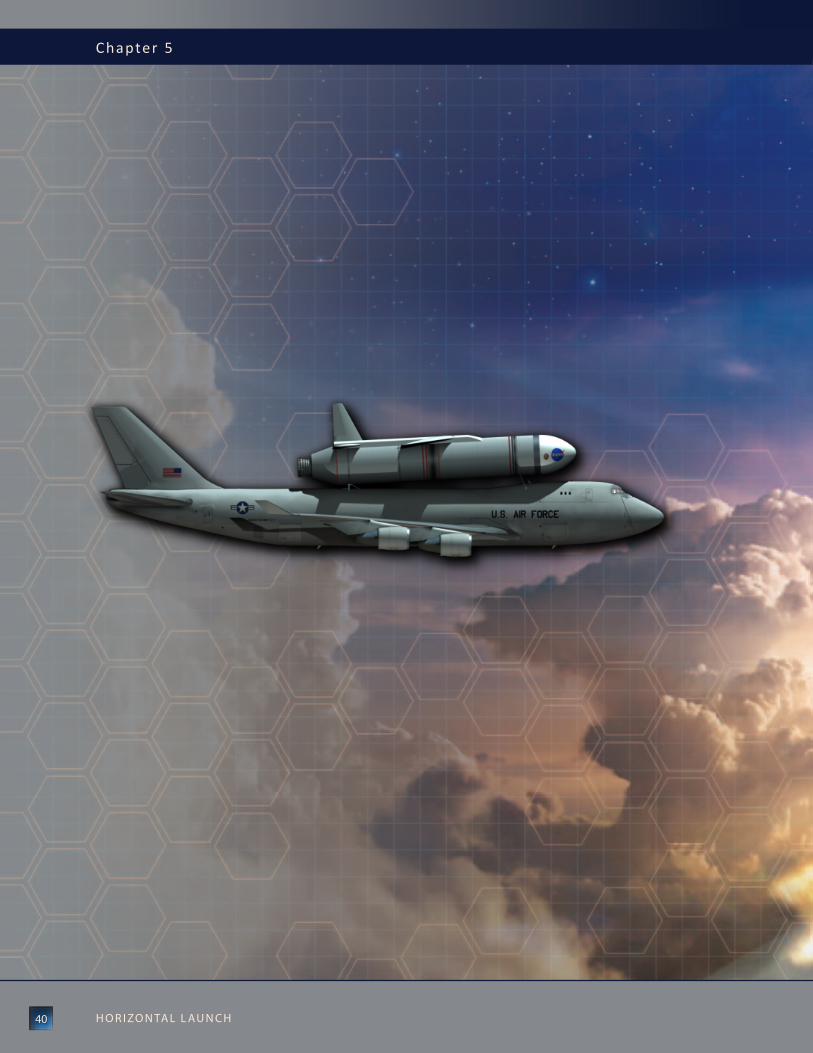
Chapter 5
40 H o r i zo n ta l l au n c H

41A v e r s At i l e co n c e p t f o r A s s u r e d s pAc e Acc e s s
Technology TradesOnce the feasibility of the three point designs was established, the potential for block upgrades and technology development was evaluated to guide potential technology investment strate-gies. The study team identified a number of promising technologies that could, with appropriate investment, improve payload-to-orbit performance, reduce costs, improve reliability, or add to military utility of horizontal launch systems. These were “traded” into each point design system concept to understand the impact of the upgrade.
ROSETTA was used with models anchored to the point designs to assess the impacts of struc-tures, materials, propulsion, propellants, instrumentation, sensors, and operations technology trades on the system concepts. This arrangement produced results with high confidence and allowed for rapid execution.
Methodologies
The methodology for the technology trade analysis was developed to take advantage of the speed of ROSETTA while improving its accuracy for the specific concepts represented by the point designs. Specific ROSETTA models were developed for each point design that aligned specific technical performance metrics between the model and the point design system concept. This anchored the model to produce results that matched point design results at each specific design point. Remaining performance metrics were varied to model the technology being traded.
Each technology trade analysis was run individually in each point-design ROSETTA model. In each analysis, a single existing technology was exchanged for an improved technology. The trade involved determination of a set of multipliers, referred to as knockdown, or “k”-factors, that were applied against appropriate performance metrics. These metrics were physical parameters, such as thrust-to-weight ratio, component weight, component reliability, or compo-nent costs. The k-factors for each technology trade were determined through a combination of existing data and expert opinion.
For each trade, a set of k-factors was put into the model which was then run to closure for a fixed gross takeoff weight, while the payload was allowed to vary. In some cases, a technology was applied to all appropriate stages of the launch vehicle for a single trade.
While many of the technologies were well-developed, some of those considered currently exist at a low TRL. To create a consistent basis, each trade excluded technology maturation costs required to bring the technology to TRL 6. Estimates of readiness and maturation costs were highly uncer-tain, generally far smaller than DDT&E costs, and their inclusion could have clouded results. Traditionally, technology maturation costs were paid by a technology maturation program and were not accounted in lifecycle cost calculations.
All other costs driven by use of a particular technology were captured in the lifecycle cost anal-ysis. This was important because, design, development, test, evaluation, acquisition, and other
cH a P t E r 5

Chapter 5
42 H o r i zo n ta l l au n c H
factors increase as the complexity of operations increases. This approach allowed the results of each trade to be compared in a consistent manner.
Technologies were grouped into the following areas: structures, subsystems, propulsion, propel-lants, manufacturing, and operations. As expected, technologies applied to different system configurations yielded different results.
Selection of Included Technologies
The technology content in previous horizontal launch studies showed a varied list of technolo-gies employed in launch vehicles and carrier aircraft. Technology readiness crossed the spec-trum from TRL of 1 (theory) to a TRL of 9 (state-of-the-art production). Some of the older studies assumed relatively low TRLs for technologies that have now matured, such as composite materials for primary airframe structures. Other studies proposed advanced technologies that still remain at low or medium TRL, such as combined cycle propulsion systems with high Mach turbines and dual-mode ramjets.
The full-scale development timeframe for each point design was limited to one to three years of maturation for near-term technologies and 4 to 9 years of maturation for mid-term technologies. This constraint eliminated many promising technologies from consideration, including many technologies related to supersonic and hypersonic carrier aircraft and reusable airbreathing and rocket launch vehicles.2
The scope of this study focused on near-term launch market projections. While the HLS team recognized that many advanced technologies could demonstrate advantages with larger payloads and more launches, the payload market projections limited the systems studied to expendable launch vehicles. Reusable systems, where higher DDT&E and nonrecurring costs can be spread over many flights, were not feasible at the launch rates considered in this study.
Because the technology content of the 747-400F was well defined, only technologies that would improve the performance, improve the reliability, or reduce the costs of the launch vehicles or to increase efficiency of system operations were included in the analysis.
Structures
Because the historical studies used for concept screening were generated over decades, some technologies were found to have matured to state-of-the-art over time. In the point design anal-yses, composite materials were baselined for airframe primary structure and aluminum alloys were baselined for liquid propellant tanks, including cryogenics. For the solid propellant rocket motors, the case material was as supplied by the manufacturer, and the motor case mass was included in the inert weight of the rocket motor.
A great deal of research and development has been carried out on composite tanks for RP, LH2, and LOX (liquid oxygen) propellants. Experimental tanks have been built and tested, and signifi-cant weight reductions have been demonstrated. More may be possible as compared to aluminum alloys with design methods specific to composites.
2 A discussion of some potential areas for investment in technologies that were eliminated from consideration is included in Appendix E.

Technolog y Trades
43A v e r s At i l e co n c e p t f o r A s s u r e d s pAc e Acc e s s
Three general challenges were met through research and development. The first was size; large tanks required in current and future rocket vehicles were limited by production methods, and this has been addressed by out-of-autoclave fabrication and progress in joining tank sections. The second challenge was material compatibility with the propellants; this has been success-fully tested for all liquid propellants without undue hazards. The third challenge was material porosity and leakage; while leakage at the molecular level cannot be eliminated, porosity has been reduced to the point where propellant leakage can be managed. The goal was to achieve leak rates so small that explosive mixtures cannot be formed in the confined spaces of the vehicle during the mission. If this result was not achievable, then leak rates must be managed through the use of purge systems, with the accompanying penalty to vehicle performance.
Relatively conservative weight reduction factors were selected to use in the structural trades for these tanks. A 27 percent weight reduction was used for RP and LH2 composite tanks, and 20 percent for LOX tanks. Although composites tanks may eventually cost less than aluminum, cost was not reduced in this trade owing to the added complexity of baffles, internal plumbing, and penetrations for feed, fill, and drain lines.
Aluminum-lithium alloys Al 2195 and Al 2050 were traded against conventional aluminum alloy (Al 2219) for all tanks on the vehicle. Aluminum-lithium alloy was a relatively straightforward substitute for conventional aluminum alloys.
The use of Al 2195 for the Space Shuttle external tank reduced its weight by 7,500 lbs, or approxi-mately 11 percent. More complex manufacturing processes such as friction stir welding were needed to manufacture aluminum-lithium tanks, leading to higher production costs for large structures. Less complex tanks, as envisioned here, will likely be less expensive, but the present study did not take advantage of projected cost reductions. Even so, the Al 2195 trade was positive for increased payload and reduced cost per pound.
Al 2050 was a commercially available aluminum-lithium alloy that has comparable mechanical properties to Al 2195, but was available at thicknesses up to five inches. This allows deeper inte-grally machined stiffeners and an additional 10 to 12 percent weight reduction over Al 2195. As for the Al 2195 trade, potential reduced costs were possible, but not accounted.
If Al 2050 alloy performs as expected at cryogenic temperature, Al 2050 could approach the effectiveness of graphite-epoxy composites.
Subsystem—Shape Memory Alloy Actuators
An actuator system built using shape memory alloys was traded against a conventional hydraulic actuator system. A shape memory alloy, such as nickel-titanium (NiTi), was one that will deform under application of either electrical or thermal input in a controlled manner. This action can be mechanically utilized to move a control surface or other component. Given their high energy density and low form factor, shape memory alloys were an enabling technology for many adap-tive structures. When heat was applied, either externally or through direct resistance via elec-trical current, shape memory alloys can respond with sufficient force and a large stroke to

Chapter 5
44 H o r i zo n ta l l au n c H
actuate mechanisms. A shape memory alloy rotary actuator weighing one pound can replace a 41-pound torque motor and gear box as well as eliminating extraneous hydraulic and pneumatic systems. (Padula, 2010)
The shape memory actuators offer very slightly improved payload, but marginally increased costs per pound. These results affected the baseline so slightly that they were likely inside the margin of error, making this technology an unlikely choice to be pursued in this application.
Propulsion
Advanced or improved rocket engines were traded against the current production rocket engines. The improved RS-25E, with 15 percent higher thrust-to-weight ratio, was traded against the current RS-25E design performance. An advanced RP engine, with vacuum specific impulse (Isp) increased from 304 seconds (s) to 332 s, and thrust-to-weight ratio increased from 92 to 154, was traded against the SpaceX Merlin 1C engine.
The RL 10A-4-3 engine was traded against the RL 10A-4-2. The RL 10A-4-3 was a proposed upgrade that substitutes nozzle components from the RL 10B-2 version of the engine to increase area ratio and increase vacuum Isp from 450 s to 452 s, at the expense of the thrust-to-weight ratio, which decreased from 61 to 57.
A single MB-60 engine was traded against the three RL 10A-4-2 engines. The MB-60 was a 60,000 lb-thrust-class engine. The engine utilize an expander cycle and improved technology in many areas. Where key components of the engine have been demonstrated through ground testing, full scale development has not yet taken place. The original engine design has an area ratio of 300, but this was reduced to 100 to allow easier integration with the vehicle stages. This trade increased the vacuum Isp from 450 s to 455 s and decreased the thrust-to-weight ratio from 61 to 46.
An air augmented rocket (AAR) was traded against the baseline three Merlin 1C engines. An air augmented rocket is a RBCC engine operated at low speed (less than Mach 2) with the dual-mode ramjet/scramjet inlet doors open while the integrated rockets are on; the rockets create a suction effect, sucking in additional air to combust in parallel with the burning rockets. The weight of the AAR shroud was estimated at 3,500 lb and was added to the first stage inert system weight. First stage vacuum Isp was improved by 10 percent. The complexity of the engine was not altered for cost purposes; instead the cost of the AAR shroud was estimated separately. The mating complexity of the first stage was also increased by 5 percent in the operations model and the failure rate of the engines was increased by a factor of 1.125.
These technology trades yielded a mixed set of results. The advanced RP engine and the AAR improved payload, but their costs increased such that resulting costs per pound of payload were significantly increased. The remaining trades produced about the same payload, but costs were also somewhat increased.
Advanced propellants were traded against conventional propellants. Advanced solid monopro-pellants were simpler to handle than traditional bipropellants with a 5.5 percent reduction in propellant density and a 3 percent improvement in vacuum Isp over traditional solids. These

Technolog y Trades
45A v e r s At i l e co n c e p t f o r A s s u r e d s pAc e Acc e s s
monopropellants can reduce the overall gross weight by reducing booster length—making them more compact or, alternatively for the same booster length, increase payload carrying capability. These two parameters can be optimized to allow the designer more packaging options that can lead to more efficient launch vehicle design concepts.
A three-stage hydroxyl-terminated polybutadiene (HTPB) hybrid rocket (solid fuel with liquid oxidizer) was traded against a three-stage solid rocket. The solid rocket mass and sizing model was used to size the solid portion of the hybrid motor, while the LOX tanks, skirts, intertank structures, feed systems, and pumps were sized using the liquid rocket mass and sizing models. The volume of the solid and LOX portions were based on the propellant mass required and oxidizer-to-fuel ratio of 2.0. The vacuum Isp for stage 1 and 2 was 314 s, and was 335 s for stage 3. The structures and mechanisms were sized based on volume. Standard procedures were used to cost the tanks, feed systems, and pumps in the same manner as the liquid rockets.
An improved hydrocarbon fuel, quadricyclane, was traded against the baseline RP fuel. The improved fuel was representative of a class of alternative high-energy-density fuels of interest for aerospace applications. The primary advantage of quadricyclane was an increase in vacuum Isp from 304 s to 356 s, but disadvantages were high production costs and complex handling operations.
Cryogenic propellants that were sub-cooled below their normal boiling point temperatures to increase density were traded against the baseline normal boiling point propellants. Densified propellants have been studied extensively for launch system applications and the technology was relatively mature. Density increases assumed for LH2 and LOX were approximately 7 and 10 percent, respectively.
Trades for solid propellants yielded significant payload increases on a percentage basis, but the cost results were mixed. Life cycle costs increased in proportion to payload and recurring cost per pound went down, but nonrecurring costs went up substantially due to the increased effort to design, develop, test, and evaluate motors using such new propellants.
The two liquid engine technologies produced very different results. Use of improved hydro-carbon fuel increased payload nearly 40 percent, but the cost per pound of payload increased as well. Densified cryogenic propellants made no practical difference in payload and costs were increased to a small degree in all costs per pound of payload.
Manufacturing
Advanced manufacturing processes can involve advanced technology or simply be a new or different way of processing the vehicle and components. These technologies were not found to increase payload, but they did reduce costs of fabrication and added flexibility, yielding modest reductions in costs per pound of payload.
New processes for assembling and curing composite materials without use of an autoclave were traded against conventional autoclave processing. This process allows for more flexibility in how work flows within a plant and encourages co-curing of larger integrated assemblies. (Gardiner, 2011) A 10 percent cost reduction was predicted for this technology over traditional autoclaved production.

Chapter 5
46 H o r i zo n ta l l au n c H
Simplification and cost reduction for adaptive manufacturing methods were traded against traditional manufacturing processes. Adaptive manufacturing employs high-level verification and validation methodologies to test and troubleshoot system integration during the design phase. This enables minimum processing steps, moveable tooling, and reduced handling of materials and components as compared to traditional manufacturing facilities with widely-separated fabrication steps, fixed tooling in every setting, and repeated movements of materials and components. A 15 percent reduction of production costs was predicted for adaptive manu-facturing over traditional manufacturing.
Operations
The following trades were a combination of added systems technology for the carrier aircraft and changes to baseline CONOPs. Neither technology trade was performed for PD-1, but the HLS team recognized that aerial fueling of the carrier aircraft could improve overall system performance for this system as well.
The launch vehicle was allowed to grow until either the maximum aircraft weight or the maximum allowable rocket length of 127 ft was reached. The total system weight of the aircraft was not allowed to exceed the maximum published gross takeoff weight of 910,000 lb at any point during the flight, which was a significantly conservative assumption.
A CONOPs was evaluated that allows taking off with lower fuel quantity on the carrier aircraft and then fueling in flight. This allows a larger gross weight launch vehicle to be carried aloft. The costs and benefits of this practice were traded against the standard CONOPS where the launch vehicle was weight-limited by the fully fueled take-off weight of the carrier aircraft.
A CONOPs was evaluated that includes an ACES on the carrier aircraft to produce liquid oxygen from atmospheric air and then transfer it to the launch vehicle. This allows a larger, higher gross weight vehicle to be carried aloft as compared to the standard CONOPs.
The ACES trade provides additional mass to the system in flight to offset fuel used by the carrier aircraft during takeoff. The system timing was critical so as not to exceed the carrier aircraft maximum weight limit. While cruising to the launch point, ACES generates liquid oxygen by sepa-rating it from the nitrogen in atmospheric air through a series of heat exchangers and a rota-tional fractional distillation unit. The resulting LOX was then pumped from the ACES system on the carrier aircraft into the LOX tanks on the launch vehicle during flight. The LOX tanks on the launch vehicle can be partially empty at takeoff. This allows a larger rocket and larger payload to be carried on a given carrier aircraft. The tank for converting the captured oxygen into a liquid was sized based on the volume of LH2 required by the system. Additional mass was added to account for the modifications to the 747-400F required to house the ACES system.3
3 The ACES system model was developed based in part on nonproprietary information provided to the HLS team from Andrews Space, Inc.

Technolog y Trades
47A v e r s At i l e co n c e p t f o r A s s u r e d s pAc e Acc e s s
Summary of Technology Trade Results
Results of the trades showed mixed results. As shown in Tables 9 through 11, certain tech-nology insertions could achieve increased payloads without significant cost increases; or conversely, costs could decrease without a decrease in payload. Benefits of varying degrees were predicted for aerial fueling, ACES, aluminum-lithium tank materials (Al 2195 and Al 2050), composite tank materials and out-of-autoclave fabrication, shape memory actuators, and adap-tive manufacturing. The remaining technologies were not strong drivers of increased payload within the constraints of this study and drive up overall lifecycle costs in almost all circum-stances. Many of these technologies will certainly be valuable in other applications, but this set of constraints—specifically, a campaign of 120 total flights—limits their cost effectiveness for horizontal launch.
With the exception of aerial fueling and ACES, all of the technologies traded in the current study were as applicable to vertical launch and other aerospace systems as they were to horizontal launch. Aerial fueling and ACES were specific to horizontal launch and have the potential to yield substantial payload increases at lower costs per pound of payload. Aerial fueling was especially powerful because there was little added cost to employ the technique in any hori-zontal launch operation.
The technology for ACES promises an effective increase in payload, although at higher cost and greater technical risk as compared to aerial fueling. Implementation of ACES will require design changes on both the carrier aircraft and the launch vehicle, while aerial fueling of the carrier aircraft could be included in a baseline vehicle concept immediately. Either or both technologies could be added as block upgrades with only moderate impact to an operational system.
Because low launch rates forced the use of expendable launch vehicles in this study, it was diffi-cult to find many technologies that could “buy their way” into the point designs. Some tech-nologies that were expected to have significant advantages did not demonstrate improvements in this analysis. Among these were improved rocket engines, other advanced propulsion tech-nologies, and improved propellants. Although the model predicted increased payloads for these technologies, the model also predicted very high costs.

Chapter 5
48 H o r i zo n ta l l au n c H
Table 9 Technology Trade Results as Applied to PD-1—Solid rocket system(Each trade made separately against the system baseline)
Payload (lb) life cycle costs ($/lb of payload)
recurring costs ($/lb of payload)
non-recurring costs ($/lb of payload)
Baseline System 5,660 $10,310 $9,270 $1,040
Structures
aluminum alloy primary structure 5,060 $11,770 $10,600 $1,170
Subsystems
Shape memory alloy actuators 5,700 10,420 9,370 1,050
Propellants
improved Solid Fuels 6,670 10,640 7,900 2,740
Hybrid rockets 7,560 14,150 11,360 2,790
Manufacturing
out-of-autoclave fabrication 5,660 10,070 9,050 1,020
adaptive manufacturing 5,660 9,950 8,940 1,010
250%250% 200%200% 150%150% 100%100% 50%50% 0.0%0.0% -50%-50%
Improved solidfuels
Improved solidfuels
Hybrid rocketsHybrid rockets
Shape memoryalloy actuatorsShape memoryalloy actuators
Out of autoclavecomposite
manufacturing
Out of autoclavecomposite
manufacturing
Adaptivemanufacturing
Adaptivemanufacturing
Incr
easi
ng c
ost b
enef
itIn
crea
sing
cos
t ben
efit
Lifecycle return on investmentLifecycle return on investment Increasing payload benefitIncreasing payload benefit
0.0%0.0% 10%10% 20%20% 30%30%
Nonrecurring costRecurring cost

Technolog y Trades
49A v e r s At i l e co n c e p t f o r A s s u r e d s pAc e Acc e s s
Table 10 Technology Trade Results as Applied to PD-2—RP/LH2 system (Each trade made separately against the system baseline)
Payload (lb) life cycle costs ($/lb payload)
recurring costs ($/lb payload)
non-recurring costs ($/lb payload)
Baseline System 12,600 $10,130 $9,360 $770Structures
aluminum alloy primary 10,400 $12,290 $11,360 $930composite tanks, rP 12,660 10,050 9,290 770composite tanks, loX 12,780 9,940 9,180 760composite tanks, lH2 12,980 9,790 9,050 750aluminum-lithium tanks; al 2195 12,910 10,070 9,310 760aluminum-lithium tanks; al 2050 13,170 9,930 9,180 750
SubsystemsShape memory alloy actuators 12,750 10,080 9,310 770
Propulsion systemadvanced rP Engine (iHPrPt P2) 15,670 11,290 8,560 2,730rl 10a-4-3 Engine 12,480 10,240 9,460 780MB-60 Engine 12,750 11,190 9,640 1,550air-augmented rocket 14,930 11,380 10,530 850
Propellantsimproved hydrocarbon fuel 17,460 13,530 11,350 2,180Densified cryogenic propellants 12,790 10,340 9,510 830
Manufacturingout-of-autoclave fabrication 12,600 9,920 9,160 760adaptive manufacturing 12,600 9,650 8,910 740
Operationsaerial fueling of carrier aircraft 17,140 8,100 7,450 650acES 17,020 8,430 7,700 740
250%250% 200%200% 150%150% 100%100% 50%50% 0.0%0.0% -50%-50%
Improved Hydrocarbon FuelImproved Hydrocarbon Fuel
Densified Cryo PropellantsDensified Cryo Propellants
Advanced RP EngineAdvanced RP Engine
RL 10A-4-3 EngineRL 10A-4-3 Engine
MB-60 EngineMB-60 Engine
Air Augmented RocketAir Augmented Rocket
AI-Li Tanks (AI 2195)AI-Li Tanks (AI 2195)
AI-Li Tanks (AI 2050)AI-Li Tanks (AI 2050)
Composite Tanks (RP)Composite Tanks (RP)
Composite Tanks (H2)Composite Tanks (H2)
Composite Tanks (LOX)Composite Tanks (LOX)
Shape Memory ActuatorsShape Memory Actuators
OoA Composite MfgOoA Composite Mfg
Adaptive ManufacturingAdaptive Manufacturing
Aerial FuelingAerial Fueling
ACESACES
Lifecycle return on investmentLifecycle return on investment Increasing payload benefitIncreasing payload benefit0.0%0.0% 10%10% 20%20% 30%30% 40%40%
Incr
easi
ng c
ost b
enef
itIn
crea
sing
cos
t ben
efit
Nonrecurring costRecurring cost
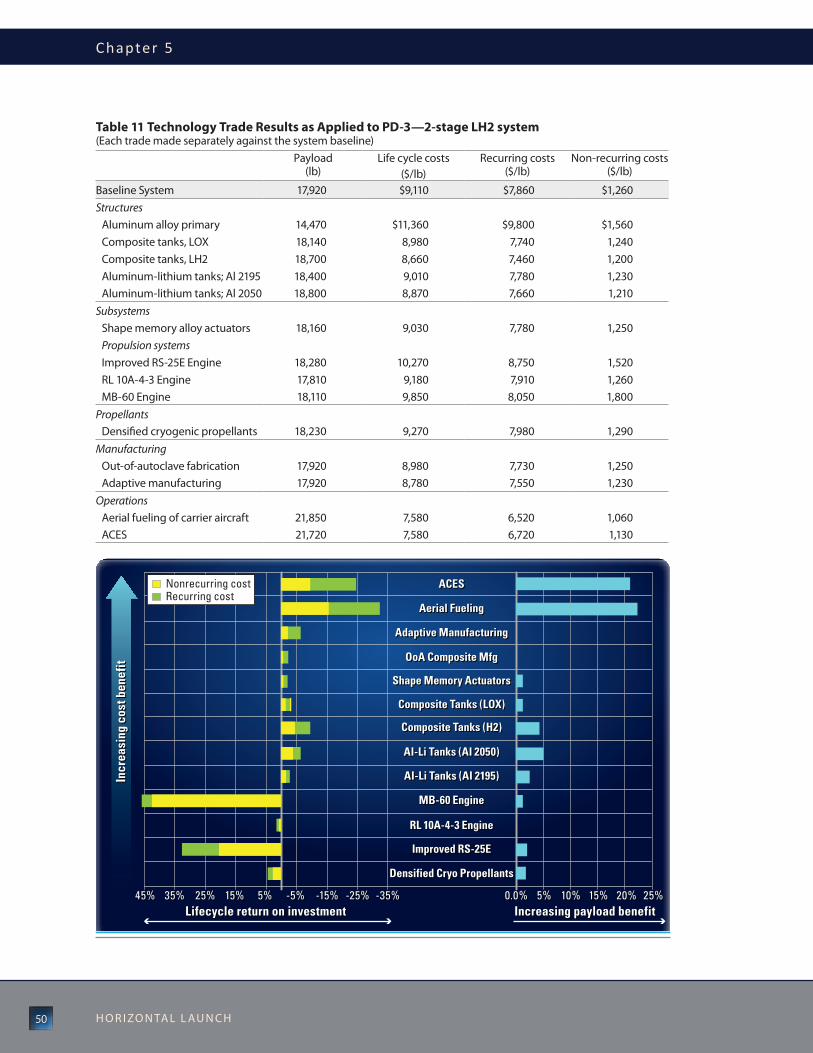
Chapter 5
50 H o r i zo n ta l l au n c H
Table 11 Technology Trade Results as Applied to PD-3—2-stage LH2 system (Each trade made separately against the system baseline)
Payload (lb)
life cycle costs ($/lb)
recurring costs ($/lb)
non-recurring costs ($/lb)
Baseline System 17,920 $9,110 $7,860 $1,260Structures
aluminum alloy primary 14,470 $11,360 $9,800 $1,560composite tanks, loX 18,140 8,980 7,740 1,240composite tanks, lH2 18,700 8,660 7,460 1,200aluminum-lithium tanks; al 2195 18,400 9,010 7,780 1,230aluminum-lithium tanks; al 2050 18,800 8,870 7,660 1,210
SubsystemsShape memory alloy actuators 18,160 9,030 7,780 1,250Propulsion systemsimproved rS-25E Engine 18,280 10,270 8,750 1,520rl 10a-4-3 Engine 17,810 9,180 7,910 1,260MB-60 Engine 18,110 9,850 8,050 1,800
PropellantsDensified cryogenic propellants 18,230 9,270 7,980 1,290
Manufacturingout-of-autoclave fabrication 17,920 8,980 7,730 1,250adaptive manufacturing 17,920 8,780 7,550 1,230
Operationsaerial fueling of carrier aircraft 21,850 7,580 6,520 1,060acES 21,720 7,580 6,720 1,130
25%25%35%35%45%45% 15%15% 5%5% -5%-5% -15%-15% -25%-25% -35%-35%
Densified Cryo PropellantsDensified Cryo Propellants
Improved RS-25EImproved RS-25E
RL 10A-4-3 EngineRL 10A-4-3 Engine
MB-60 EngineMB-60 Engine
AI-Li Tanks (AI 2195)AI-Li Tanks (AI 2195)
AI-Li Tanks (AI 2050)AI-Li Tanks (AI 2050)
Composite Tanks (H2)Composite Tanks (H2)
Composite Tanks (LOX)Composite Tanks (LOX)
Shape Memory ActuatorsShape Memory Actuators
OoA Composite MfgOoA Composite Mfg
Adaptive ManufacturingAdaptive Manufacturing
Aerial FuelingAerial Fueling
ACESACES
Incr
easi
ng c
ost b
enef
itIn
crea
sing
cos
t ben
efit
Lifecycle return on investmentLifecycle return on investment Increasing payload benefitIncreasing payload benefit0.0%0.0% 5%5% 10%10% 15%15% 25%25%20%20%
Nonrecurring costRecurring cost

Technolog y Trades
51A v e r s At i l e co n c e p t f o r A s s u r e d s pAc e Acc e s s

Chapter 6
52 H o r i zo n ta l l au n c H

53A v e r s At i l e co n c e p t f o r A s s u r e d s pAc e Acc e s s
Flight Test System ConceptsThe study team determined the critical development risks for the proposed system concepts and identified flight demonstrations as mitigation strategies. Two flight test system concepts (FTs) were developed to define design requirements and program costs. The results of this exercise serve to quantify the next steps required for the development of a national horizontal launch capability.
Flight Test System Concept Configurations
The flight test concepts were derived by modifying existing expendable, vertical launch vehicles to produce horizontal launch vehicles. Two existing launch vehicles were used as baselines, and modified for horizontal launch. (See Table 12.) The carrier aircraft for both was the 747-100 SCA-905. As modified, this aircraft was assumed to have a total length of 231 ft, a wingspan of 196 ft, and a design payload capacity of 192,000 lb.
The analysis followed the same methods as for the point designs to determine weight, develop-ment costs, and reliability. Flight test costs were based on current production costs, operations costs, and an estimate of government and contractor flight test support requirements based on past programs.
cH a P t E r 6
Table 12 Summary of Flight Test System Concepts
FT-1 FT-2air-launch vehicle modified taurus Xl modified Falcon 1e
total gross weight 179,470 lb† 81,990 lb†
Payload to lEo 4,560 lb 2,750 lb
total length 99 ft 81 ft
Maximum fuselage diameter 7.8 ft 5.5 ft
Wing span 47 ft 26 ft
† Includes inert mass margin

54 H o r i zo n ta l l au n c H
EMPENNAGE
INTERSTAGE
MAIN WING
STRONGBACK STRUCTURE
CASTOR 120Solid Rocket Motor
(ATK)
ORION 50S XLGSolid Rocket Motor
(ATK)
ORION 50XLSolid Rocket Motor
(ATK)
PAYLOAD(notional)
ORION 38Solid Rocket Motor
(ATK)
ATTITUDE CONTROL MODULE
PAYLOAD ADAPTOR
PAYLOAD FAIRING
Existing ComponentsNew Components
Flight Test Demonstrator 1

55A v e r s At i l e co n c e p t f o r A s s u r e d s pAc e Acc e s s
WINGS AND TAILSAll wings and tails are graphite/epoxy composite materialWings designed with load factor of 2.5 and safety factor of 1.5
STRUCTURESAll interstages are graphite/epoxy composite material
ATTITUDE CONTROLACS based on OSC Taurus
PAYLOADDeliver payload to target circular LEO at 100 nmi altitude and 28.5° inclination
Performance data is shown for due East launch from 28.5° latitude
PROPELLANTHTBP (all motors)
Solid motor propellant loads taken from published data
POWERPower system based on OSC Taurus
Ft-1 consisted of the 747-100 Sca-905 carrier aircraft and a multistage solid launch
vehicle. this approach was selected to minimize DDt&E costs. the launch vehicle configuration was a taurus Xl rocket modified for the demonstration vehicle. it consisted of a castor 120 stage, an orion 50S XlG stage, an orion 50Xl stage, and an orion 38 kick stage, for a total of four stages. the wing and empennage were attached to the first stage with a strongback. Structural modifications are required to adapt the exisitng attachment hardware, designed specifically for the Space Shuttle orbiter, to the demonstration vehicle. all interstages, fairings and aerodynamic surfaces were composite materials. Power and attitude control subsystems were based on existing systems.
747-100 SCA-905 carrier aircraft / 4-stage solid launch vehicle

56 H o r i zo n ta l l au n c H
FALCON 1E UPPER STAGESpaceX
FALCON 1E FIRST STAGESpaceX
MERLIN 1C ENGINESpaceX
KESTREL ENGINESpaceX
EMPENNAGE
INTERSTAGE
MAIN WING
PAYLOAD(notional)
PAYLOAD FAIRING
STRONGBACK STRUCTUREExisting ComponentsNew Components
Flight Test Demonstrator 2

57A v e r s At i l e co n c e p t f o r A s s u r e d s pAc e Acc e s s
TANK STRUCTURESAluminumStiffness increased for new bending loads (mass mods)
WINGS AND TAILSAll wings and tails are graphite/epoxy composite materialWings designed with load factor of 2.5 and safety factor of 1.5
INTERSTAGE STRUCTUREGraphite/epoxy compositeStiffness increased for new bendingloads (mass mods)
POWERSpaceX Falcon 1e
PAYLOADDeliver payload to target circular LEO at 100 nmi altitude and 28.5° inclination
Performance data is shown for due East launch from 28.5° latitude
PROPELLANTLiquid oxygen and rocket propellant (kerosene)
Propellant loads consistent with SpaceX web data
Ft-2 consisted of the 747-100 Sca-905 carrier aircraft and a two-stage launch
vehicle with rP+lH2 propulsion. the Falcon 1e launch vehicle, modified for the demonstration concept, was selected as a convenient example of a low-cost, low-risk system concept. the first stage was equipped with a rP Merlin 1c engine and the second stage with a Kestrel engine, both developed by SpaceX. Structural modifications are required to adapt the existing attachment hard-ware, designed specifically for the Space Shuttle orbiter, to the demonstration vehicle. in particular, because the vehicle was substantially shorter than the shuttle, the attachment points may have to be moved and an active separation mechanism may have to be added.
747-100 SCA-905 carrier aircraft / 2-stage RP+LH2 launch vehicle

Chapter 6
58 H o r i zo n ta l l au n c H
Weight Breakdown Analyses
The resulting weight statements for the Flight Test System Concepts are shown in Table 13.
Note that the aerodynamic surfaces were jettisoned early in the trajectory and thus have a relatively small impact on the payload.
Table 13 Weight Breakdown Statement for FT System Concepts (in lb)
FT-1 Stage 1 FT-2 Stage 1
Motor 8,980 Structure 2,030
Subsystems 220 Propulsion 1,520
interstage 1,360 thermal control 34
Propellant 108,040 Power 42
Loaded 118,590 avionics 20
Stage 2 Inert 3,650
Motor 2,600 consumables 230
Subsystems 72 Main propellants 61,010
interstage 200 Start-up losses 180
Propellant 33,100 Fueled 65,080
Loaded 35,980 Stage 2
Stage 3 Structure 570
Motor 870 Propulsion 240
Subsystems 67 thermal control 16
interstage 150 Power 190
Propellant 8,650 avionics 140
Loaded 9,740 Inert 1,160
Stage 4 consumables 140
Motor 270 reaction propellants 13
Subsystems 13 Main propellants 8,950
Propellant 1,700 Start-up losses 27
Loaded 1,980 Fueled 10,280
aerosurface Module
Wing 4,780 1,700
Fins and actuators 1,130 1,220
Strongback 1,320 650
7,220 3,580
attitude control module and power 610 --
Fairing and adapter 800 310
Payload 4,560 2,750
Total 179,470 81,990

Fl ight Tes t Sys tem C oncept s
59A v e r s At i l e co n c e p t f o r A s s u r e d s pAc e Acc e s s
Trajectory and Separation Analyses
Using the thrust patterns and launch vehicle aerodynamics, the resulting trajectories were calcu-lated using POST using assumptions tabulated in Appendix G. Once the launch vehicle attained a typical vertical flight profile, the aerodynamic surfaces were jettisoned.
In FT-1, the launch vehicle reaches a maximum dynamic pressure (q) of 2,248 psf which was very aggressive compared with a nominal launch vehicle maximum q of approximately 800 psf. The team considered, however, that the X-43A airframe-integrated scramjet vehicle was designed to an upper limit greater than 2,000 psf during its ascent to the test point on a modified Pegasus booster. (Joyce, 1998) The payload performance versus constrained maximum q was not studied in this analysis, but the possibility exists that this state could negatively impact the payload capa-bility—perhaps by requiring a stiffer outer structure. The nonconstrained trajectory payload delivery was computed to be 4,560 lb.
For FT-2, the launch vehicle reaches a maximum q of 980 psf. The nonconstrained trajectory payload delivery was computed to be 2,750 lb.
Preliminary separation analysis indicates that these separation scenarios were adequate, but further detailed analysis must be conducted for verification. Further details of the configuration, aerodynamics, and trajectory analyses for the two FTs are provided in Appendix H.
Reliability Comparisons
Using failure rates of existing systems, the success probabilities are shown in Table 14.
For FT-1, the fairing separation has been determined based on two recent consecutive Taurus rocket fairing failures. As shown in the rankings of failures, the fairing separation was an order of magnitude higher than all other propulsion and human error events. The predicted reliability improves with each flight based on historical reliability growth curves for past systems. Because these issues were expected to be resolved for the Taurus rocket for future missions, the reliability predictions presented here may be considered very conservative.
For FT-2, the Falcon 1e has had similar flight test performance as previous liquid rocket systems. The probability of success was therefore somewhat higher than the four-stage solid case.
FT-1 FT-2Probability
Demonstrated average historical reliability of each lV 67% 60%
Predicted reliability—First test 78% 83%
Predicted reliability—Second test 80% 85%
Biggest risk factor Fairing separation
off nominal payload insertion
Table 14 Reliability Assessment for FT System Concepts

Chapter 6
60 H o r i zo n ta l l au n c H
Cost Analyses
Program costs, shown in Table 15, were estimated assuming that the 747 SCA-905 would be avail-able at the current funding levels for two demonstration flights over 3.5 years. Component costs were calculated using NAFCOM which was anchored to the prices for components and systems advertised by the manufacturers—e.g., Orbital Sciences and SpaceX. The costs of government oversight and insight into the program and government facilities (and their associated costs) for testing and demonstration were determined through expert elicitation.
Table 15 Program Cost Summary for Flight Test System Concepts (FY2010 dollars)
FT-1 FT-2Development phase costs $91 M $85 M
test program phase costs $109 M $52 M
total government team and program management $67 M $67 M
total contingency (20%) $53 M $41 M
total test program costs $320 M $245 M
Summary of Flight Test System Concepts
The four-stage solid FT-1 has an estimated higher payload but also higher development costs compared to FT-2. Based on the assumption that the two-stage liquid FT-2 can be developed at the same cost as the SpaceX Falcon family of launch vehicles, total cost favors the two-stage liquid FT-2. The failure risk for the solid FT-1 was higher but was based on the recent history of payload separation failures of the Taurus launch vehicle. If these problems were solved and typical failure rates prevail, the risks were similar for the two configurations.
The FT-2 two-stage liquid has a number of advantages for a demonstration. This option would demonstrate all the necessary operational needs including LOX logistics, storage on ground, and storage in flight. In addition, it was anticipated that the configuration would allow the payload to be increased by lengthening the stages (within the limits determined by a structural bending loads analysis).

Fl ight Tes t Sys tem C oncept s
61A v e r s At i l e co n c e p t f o r A s s u r e d s pAc e Acc e s s

Chapter 7
62 H o r i zo n ta l l au n c H

63A v e r s At i l e co n c e p t f o r A s s u r e d s pAc e Acc e s s
Summary of ResultsThe design reference mission (DRM) used in this study was overly generic—to show that a subsonic carrier aircraft can be economically developed and utilized to deliver a 15,000 lb payload. But without a true DRM, it was impossible to state that this was “the best” launch option. Suitability depends entirely on the mission, and missions were each unique to the end user. One size will never fit all.
Launch system performance such as payload volume and weight, orbital inclination and alti-tude, and other factors were also highly dependent on the mission. All these factors affected recurring costs and lifecycle costs. Completing the cycle, higher annual launch rates or the ability to combine multiple payloads into a single launch was a direct function of payload capability; both had the potential to significantly reduce recurring costs. Development of a horizontal launch system will require specific DRMs to define design requirements. While the results from this study can be used as guidance for these future developments, it does not represent a definitive solution.
To define a DRM for a future horizontal launch vehicle system, several tradeoffs must be mutu-ally understood by the designer and stakeholder early in the design cycle. The most important trades have to do with the characteristics of the payload. These include total volume, total mass, center of gravity, mass distribution, and maximum diameter and length. Payload char-acteristics directly affect recurring costs by allowing a wider range of launch market oppor-tunities for different payload types, thereby increasing launch rates and decreasing costs. No other design factor (i.e., component reusability, advanced technologies, efficient opera-tions, etc.) has a greater significance in lowering lifecycle cost than flight rate.
This study used estimated launch system costs as a figure of merit. Recurring costs, DDT&E costs, and lifecycle costs (LCC) were all considered. The assumptions that go into a lifecycle cost analysis include projected annual flight rates, program duration, estimated decreased production costs over time, anticipated maintenance schedules for reusable systems, and increased operational efficiencies over time. Using only LCC without considering the cost breakdown can be misleading if highly optimistic launch rates were used. This was the case for the NASA Shuttle program, where a 440-launch design life was projected with a minimum of 28 launches per year (and as high as 55 launches per year). During its best year in 1985, the Shuttle launched 9 times and the program totaled just 135 launches overall.
The realities of flight rate are shown in Table 16 for the Space Shuttle, where the launch rate ranged from a high of 9 to a low of zero launches per year. Amortizing the $5.1 billion (1970 dollars) over 440 launches resulted in DDT&E costs of a seemingly-affordable $12 million per launch. In reality, the Shuttle’s DDT&E costs consumed over 50 percent of NASA’s annual budget for six years. For these reasons, a conservative and realistic launch rate was assumed in this study.
cH a P t E r 7

Chapter 7
64 H o r i zo n ta l l au n c H
Table 16 Space Shuttle Cost Analysis
Operations function Total cost (M$) Percent
Hardware acquisition, integration, turnaround 9%
Element receipt and acceptance 1.4
landing and recovery 19.6
Vehicle assembly and integration 27.1
launch 51.5
offline payload and crew 75.9
turnaround 112.3
indirect system support 22%
Vehicle depot maintenance 237.5
traffic and flight control 199.4
operations support infrastructure 318.6
Management support 69%
concept-unique logistics 842.7
operations planning and management 1,477.4
Total 3,363.4 100%
Source: Study on Access to Space, 1994. Figures in 1994 dollars.
Concerns about DDT&E costs drove the selection of a subsonic carrier aircraft over supersonic and hypersonic carrier concepts. An existing subsonic carrier vehicle, the 747-400F, was also selected over a new subsonic carrier. With total DDT&E costs of less than $2 billion for the entire system, the 747-400F provided the payload capability at a fraction of the DDT&E costs of a new subsonic carrier alone.
No existing supersonic or hypersonic vehicle can carry a launch vehicle capable of delivering a 15,000 lbs payload to LEO. While these would have the potential for larger payloads and lower operations costs over the subsonic concepts, the DDT&E costs estimated in this study— $17 billion to develop a new supersonic carrier and $25 billion to develop a new hypersonic carrier—would challenge any budget justification. Because the common requirements used in this study did not have a DRM that required a high speed carrier aircraft, the wide variation in DDT&E costs made this a decisive discriminator among carrier aircraft options.
Cost per Pound of Payload
Traditionally, launch costs have been compared by cost per pound of payload. The HLS team observed from the start of the study that horizontal launch will never trade off well with heavy lift vertical launch systems based on this metric. While the launch vehicle used in vertical or horizontal launch may be similar, when used for horizontal launch the launch vehicle must have

Summar y of Resul t s
65A v e r s At i l e co n c e p t f o r A s s u r e d s pAc e Acc e s s
additional subsystems such as aerodynamic surfaces and other reinforcing structures to enable carrying, separation, and pull-up maneuvers. These additions, along with the maintenance and launch costs of the carrier aircraft, will almost invariably make horizontal launch a more expen-sive option when compared to vertical launch systems.
Any DRM, however, depends on more than a single metric such as cost per pound of payload. Horizontal launch provides the potential for improved basing flexibility, covert launch, weather avoidance, and offset launch for orbital intercept and reconnaissance. These benefits may outweigh any increased cost. A more useful comparison may be to look at recurring costs on a per launch basis instead of a per pound basis. This was an especially useful metric for military utility, where horizontal launch can provide for many small covert payloads launched within hours or days rather than larger payloads launched within months or years.
Technology Block Upgrades
The use of advanced technologies applied to any new system should be limited prior to achieving the initial operational capability (IOC). This was a lesson learned from many major defense acquisitions, and of specific interest to this study, the NASA X-vehicle programs. All of these have found that the utilization of multiple advanced technologies significantly increases and compli-cates the risk of success. For this reason, this study assumed all major components intended for initial use have a TRL 6 or higher prior to program start. In today’s environment, a program manager can no longer wait on the maturation of a new technology to enable a major component capability. The DDT&E schedule for a new launch vehicle was expected to be less than 5 years.
Today’s design engineers need to plan for design versatility and modularity to enable easy tech-nology insertion and component modifications. The use of “block upgrades” has been preva-lent in civilian aircraft and automotive industries, and their use in major defense systems was growing rapidly. For these reasons, this study assumed that promising advanced technologies will be inserted as they become available after initial operating capability was established.
Decision Making
The method to choose the best option for a specific DRM depends on the perspective of the stakeholder or decision maker. Historically, stakeholders have used different tools to aid in this process. These include AHP, Multi-Attribute Utility Theory (MAUT), Kepner-Tregoe, Quality Function Deployment (QFD), Value Engineering, and many other decision methods. All of these start with a well-defined set of system level requirements and figures of merit that relate directly to the stakeholder’s DRM. These requirements must address the salient characteristics of the launch vehicle such as the payload class, insertion orbit, fuels, or infrastructure, as well as risk tolerance, DDT&E budgets, schedules, and availability of critical technologies.
For close to 40 years, many DoD decision makers have used what is called Heilmeier’s Catechism to aid in their decision process. George Heilmeier was the director of DARPA in the mid 1970s. Heilmeier would use a standard set of questions to decide which research proposal to invest in, as follows:
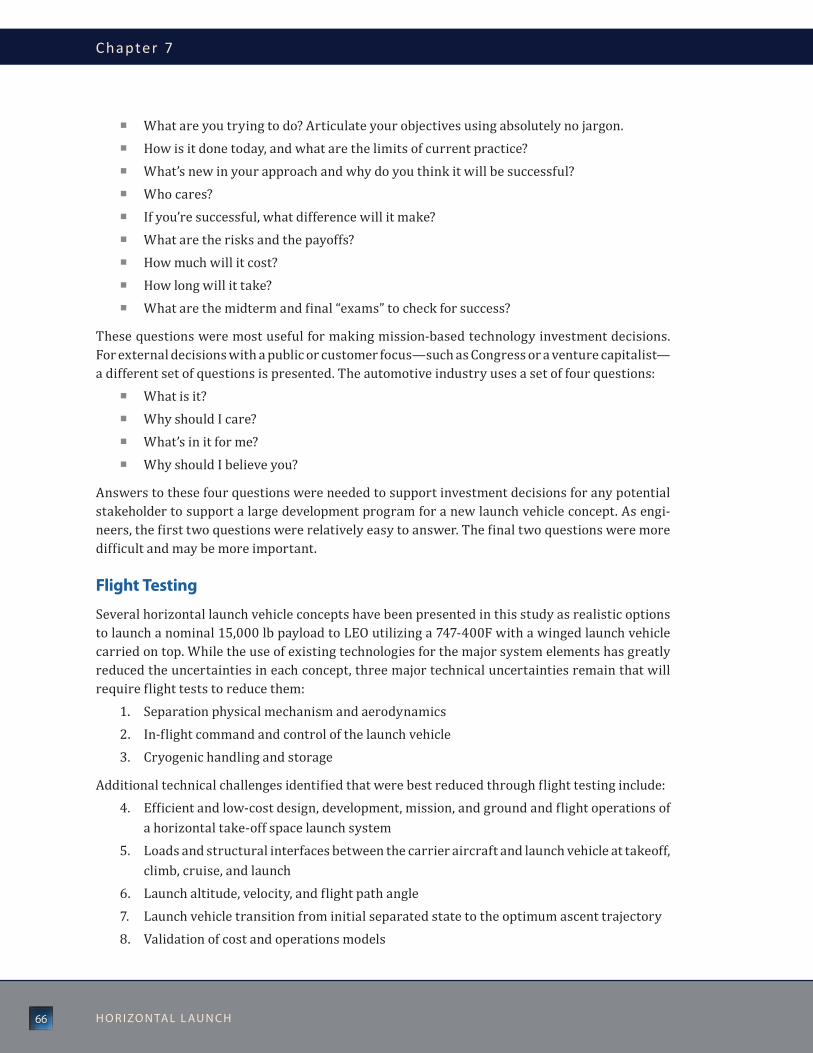
Chapter 7
66 H o r i zo n ta l l au n c H
¡ What are you trying to do? Articulate your objectives using absolutely no jargon. ¡ How is it done today, and what are the limits of current practice? ¡ What’s new in your approach and why do you think it will be successful? ¡ Who cares? ¡ If you’re successful, what difference will it make? ¡ What are the risks and the payoffs? ¡ How much will it cost? ¡ How long will it take? ¡ What are the midterm and final “exams” to check for success?
These questions were most useful for making mission-based technology investment decisions. For external decisions with a public or customer focus—such as Congress or a venture capitalist—a different set of questions is presented. The automotive industry uses a set of four questions:
¡ What is it? ¡ Why should I care? ¡ What’s in it for me? ¡ Why should I believe you?
Answers to these four questions were needed to support investment decisions for any potential stakeholder to support a large development program for a new launch vehicle concept. As engi-neers, the first two questions were relatively easy to answer. The final two questions were more difficult and may be more important.
Flight Testing
Several horizontal launch vehicle concepts have been presented in this study as realistic options to launch a nominal 15,000 lb payload to LEO utilizing a 747-400F with a winged launch vehicle carried on top. While the use of existing technologies for the major system elements has greatly reduced the uncertainties in each concept, three major technical uncertainties remain that will require flight tests to reduce them:
1. Separation physical mechanism and aerodynamics2. In-flight command and control of the launch vehicle3. Cryogenic handling and storage
Additional technical challenges identified that were best reduced through flight testing include:4. Efficient and low-cost design, development, mission, and ground and flight operations of
a horizontal take-off space launch system5. Loads and structural interfaces between the carrier aircraft and launch vehicle at takeoff,
climb, cruise, and launch6. Launch altitude, velocity, and flight path angle7. Launch vehicle transition from initial separated state to the optimum ascent trajectory8. Validation of cost and operations models

Summar y of Resul t s
67A v e r s At i l e co n c e p t f o r A s s u r e d s pAc e Acc e s s
The first major uncertainty was launch vehicle separation. This could be reduced to a limited extent by modeling and wind tunnel tests. Accurate characterization of the aerodynamic inter-actions between the carrier aircraft and launch vehicle would, however, require flight tests. These tests would also include inert separation flights to validate separation simulations utilizing a dummy launch vehicle identical in size and mass distribution. This would be used to calibrate separation analysis to ensure a clean separation prior to launching a fully fueled launch vehicle.
The second major uncertainty was in-flight command and control. The most important benefit of horizontal launch was the ability to launch a payload from anywhere in the world without significant ground support infrastructure. This would require an in-flight command center that was capable of observing and predicting downrange weather conditions, winds aloft, and air traffic. This system was not only necessary for the structural integrity of the launch vehicle but was critical to assure accurate orbit insertion for mission success.
The third major uncertainty was cryogenic handling and storage. The complexity of the fuel transfer arrangement creates the potential for boil-off and leakage through normal operation, with a heightened risk from human error of equipment failure. Such a system requires intensive monitoring and control during storage and transfer. Reliable structures for containment tanks are critical, as are all materials at cryogenic temperatures.
In addition to addressing these three major uncertainties, well-designed flight testing would also validate and optimize the models used for aerodynamics, carrier aircraft and launch vehicle control, structural loads, and overall system performance. It would be critical to carry out this validation prior to beginning a significant design and development program.
Flight tests were also critical to demonstrate operability factors including turnaround time, crew size, launch vehicle integration, ground and in-flight cryohandling, in-air propulsion start, and on-board mission and flight control. Current launch costs (assuming the full payload capa-bility was used for each) range from $30,000 per pound for the Pegasus, to $5,000 to $8,000 per pound for evolved expendable launch vehicles, and to $2,500 per pound for a Falcon 9. The factors that drive this large range include approaches to hardware acquisition, system integra-tion, test and evaluation, and mission planning. A solid understanding of all of these factors would be needed to respond to the requirements of a new DRM.
The recurring launch costs for the Space Shuttle—an average of $13,000 per pound of payload—reveal an opportunity: only 9 percent of the cost was accounted in hardware acquisition, inte-gration, and system turnaround, and only 22 percent was in indirect system support. The majority, almost 70 percent, was attributed to management support. Thus, a key driver for any planned flight test was to demonstrate a change to the traditional processes that contrib-uted to the staggering overhead burden. These will include changes not only to management oversight methods, but to quality control, logistics support, traffic and flight control approaches, and launch and support infrastructure.

Chapter 8
68 H o r i zo n ta l l au n c H

69A v e r s At i l e co n c e p t f o r A s s u r e d s pAc e Acc e s s
Future system concept studies This study was intended to provide the foundation, both through the historical review and the integrated analysis, to aid in defining requirements for any future horizontal launch vehicle system development program. A number of design decisions can be informed by this analysis, including launch rate, separation speed of the carrier aircraft, and technology development. Other factors, such as orbit altitude, launch location, and carrying crews to orbit warrant more attention than has been provided here.
The most important factor affecting recurring costs was launch rate, and cost remains the biggest challenge to widespread adoption of horizontal launch. This HLS team, therefore, believes this will drive a concept with the versatility to accommodate many different missions. A successful horizontal launch enterprise should encompass both military and commercial users across a wide range of payloads.
A successful enterprise may also be designed to span inclinations and altitudes from low to geosynchronous orbits. The reference mission systems used in this study, a capability to launch 15,000 lb to LEO at 100 nautical miles, will not be able to launch the same payload mass to geosyn-chronous orbit (GEO) at over 22,000 nautical miles. The same system may, however, be capable of launching a smaller payload, roughly one third the size, to GEO.
The ability to launch from a number of global launch sites will clearly be one of the most impor-tant factors from the perspective of both commercial and military users. However, by over-spec-ifying payloads, fuels, orbit inclinations, altitudes, abort scenarios, or airspace restrictions, users could unnecessarily limit the development of a launch system concept.
The opportunity for the horizontal launch of crews or tourists to orbit also warrants consider-ation. This study showed a horizontal launch system concept with ideal subsystem sizing could launch a 20,000 lb payload to LEO. It remains a subject for future studies as to what decrease a human-rated horizontal launch system would take compared to the baseline.
Perhaps the most important factor in any system development was choosing the right technology availability date for critical subsystems and component technologies. Many design and devel-opment programs in the past have failed to meet operational requirements because they were overly optimistic on the availability of new technologies. It was extremely important to confirm and demonstrate the technology readiness when selecting and specifying technologies. It was also critical to make the needed technology investments in a timely manner once an implementa-tion was planned.
Technology Demonstrations
Advanced technologies that increase system level performance, decrease maintenance down time, and reduce costs will have to “buy their way in” after initial operations of the horizontal launch system. To do this, these technologies will have to be validated at operating conditions for the application (as specified to achieve TRL 6). Those technologies with potential for improved
cH a P t E r 8

Chapter 8
70 H o r i zo n ta l l au n c H
operations, increased system level performance, or lower costs would go through a rigorous ground test validation prior to incorporation into a flight test evaluation program.
Flight test validation could be accomplished on the actual operating system but that would increase the risk of grounding the operational system. A better way may be to continue to operate the flight test demonstrator as a flying test bed. While the flight test demonstrators identified in this study do not satisfy the 15,000 lb payload goal, they should be effective in reducing major uncertainties and risks associated with horizontal launch. If a candidate technology was deemed through systems analysis to be low risk, it may make sense to launch as a nonprimary system on an operational vehicle. Once the technology passes through all of these gates, the design engineer can use it in a scheduled block upgrade of the horizontal launch system.
The list of conceivable technologies considered was limited in this study. It was not the intent of this study to include every potential technology improvement, but to identify the value of technol-ogies to upgrade the expendable horizontal launch vehicle system concept. The HLS team consid-ered the full impact of a given technology for this particular set of requirements—including payload performance, ground and flight operations, reliability, and costs. When subjected to this broad analysis, it became apparent that some initially attractive technology benefits did not warrant investment at this time. Many of these technologies may offer value in other instances, in particular for horizontal launch applications that employ reusable hardware, or if they provide benefits to multiple systems.
Alternate Capabilities for Horizontal Launch Systems
In addition to the traditional payload launch capability to low Earth orbit missions that hori-zontal launch systems can provide, a number of other suborbital, largely NASA and DoD unique, technology demonstration or potentially operational capabilities may be enabled or strongly enhanced by these types of systems. As examples, NASA’s Office of the Chief Technologist has recently sponsored the development of a series of Space Technology Roadmaps, which define new and innovative technology capabilities and investment recommendations spanning a 20-year development cycle.4
For example, hypersonic airbreathing propulsion technology, while not currently mature enough for use in near term horizontal launch systems was a key element of the Launch Propulsion Space Technology Roadmap and has many elements that will require maturation through flight testing. The technologies included in the roadmap include Mach 4+ turbines for TBCC, long-duration Mach 7+ scramjet operation, stable mode transitions of RBCC and TBCC vehicles, ACES, and detonation wave engine operation. Each of these component level technologies will require extensive ground tests and certification at the component level, and will ultimately require flight testing and quali-fication of these systems at or near full scale.
4 A total of 15 draft technical area (TA) roadmaps cover a broad range of technology disciplines and capabilities. The TA-01 “Launch Propulsion Systems” and TA-09 “Entry, Descent, and Landing” roadmaps explicitly call out the need for advanced flight test capabilities to develop new and innovative technologies to transform our space transportation infrastructure. Available at: http://www.nasa.gov/offices/oct/home/roadmaps/index.html

Future Sys tem C oncept Studies
71A v e r s At i l e co n c e p t f o r A s s u r e d s pAc e Acc e s s
The availability of a horizontal launch platform to deliver large scale advanced air breathing propulsion technology demonstration elements to high energy (i.e., high Mach, high q) suborbital test conditions could result in greatly enhanced flight test capabilities. Much like the modified the Pegasus launch vehicle did for the subscale X-43A scramjet vehicle flight test, such a capability could enable qualification of engine and vehicle system technologies at much lower cost and risk.
The current fleet of suborbital sounding rockets was performance limited in the volume and scale of their payloads and only have limited capabilities for payload delivery in suppressed altitude trajectory flight tests. The rocket launch systems evaluated in this study—Falcon or Taurus—could be modified to perform the suborbital suppressed trajectory missions required. However, they were not currently designed to carry large horizontal launch loads, and signifi-cant requalification would be required. An air-launched horizontal launch system, designed to accommodate these types of trajectories and loads, would require only straightforward modifi-cations to support these flight test missions.
With current component-level engine ground test articles and X-43A and X-51 flight demon-strations defined as “1x scale”, the hypersonics project in NASA’s Aeronautics Research Mission Directorate, calls for a 10x and ultimately a 100x scale engine and vehicle systems technologies that will need to be flight qualified. The horizontal launch systems described here would likely be capable of testing support to the 10x level system scale in a manner similar to how Pegasus supported testing X-43A at the 1x scale.
By allowing the new engine component technologies to be boosted and flight tested as indi-vidual elements to their requisite test conditions on a standalone carrier vehicle, the need for a full-scale integrated flight system development testing using an airbreathing propelled test vehicle with low-speed and high-speed propulsion cycles may not be necessary. This could allow for multiple advanced high speed propulsion system technology developments to occur in parallel, or staggered over a period of years and development cycles, and then removed indi-vidually from the critical path in an airbreathing flight vehicle system. The technologies could be developed and qualified individually, and only after qualified and flight proven at the compo-nent or subsystem level would they be integrated on a dedicated airbreathing launch vehicle flight system. A number of other advanced launch system technologies, not directly propulsion system related, could be tested at or near full scale including boundary layer and turbulent tran-sition experiments, warm and hot structure, actively and passively cooled, thermal protection systems, and so on.
In addition to hypersonic airbreathing propulsion, flight test demonstrations and launch capa-bilities were needed that exceed today’s state of the art with sounding rockets and balloon launch rocket assist systems. These include multiple technologies, ranging from hypersonic and supersonic inflatable aerodynamic decelerators, rigid and flexible deployable aerodynamic decelerator systems, new slender body entry aeroshells with high performance maneuvering capabilities, to supersonic retro-propulsion for large mass payload descent systems at Mars. For many of the human scale entry, descent, and landing (EDL) systems, and even some of the large robotic EDL technologies, the mass and volume requirements far exceed capabilities that exist with suborbital test platforms today. All of these will ultimately require flight testing at or near full scale.

Chapter 8
72 H o r i zo n ta l l au n c H
In order to fully qualify these systems, they must be tested in a relevant environment at or near full scale. In the late 1960s and early 1970s, NASA developed a supersonic parachute technology for the Mars Viking mission. In order to test the Viking parachutes at relevant Mars conditions, a flight test capability was developed that utilized high altitude balloons that carried a rocket propelled launch systems to altitudes of approximately 100,000 feet. The payload was severed from the balloon at altitude and rocket propelled to supersonic conditions. While this type of capability can still be utilized, it was severely limited in mass and volume capabilities, and would not be capable of delivering the large scale human class or robotic precursor decelerator system technologies to the high altitude high Mach number conditions require for full or near full scale qualification and flight certification. Notional examples of several of these advanced EDL system technologies are shown in Figure 8.
Figure 8 A flight test demonstrator can provide suborbital depressed trajectory launch capability for unique high q/high Mach systems technology demonstrations.
Payload Delivery

Future Sys tem C oncept Studies
73A v e r s At i l e co n c e p t f o r A s s u r e d s pAc e Acc e s s

74 H o r i zo n ta l l au n c H
Appendices

75A v e r s At i l e co n c e p t f o r A s s u r e d s pAc e Acc e s s
Figures of Merita PPE n D i X a
Figure of Merit Definition Measures Proxy Parameters
Safety and mission success
Loss of vehicle probability, by stage
Probability of a critical failure occurring resulting in loss of stage
P(loss of Vehicle) number of engines; inherent reliability and redundancy strategy of engines and other subsystems; stage complexity; emergency stage separation complexity; number of stage return options
Loss of mission probability
Probability of a critical failure occurring resulting in loss of one or more major mission objectives
P(loss of Mission).
number and type of system risks and mission hazards; subsystem inherent reliability; system/subsystem functional redundancy (e.g., engine-out capability); number and complexity of stages; number of engines and stages; total mission duration.
Effectiveness and performance
Payload compatibility of payload accommodations for commercial and military missions
Payload weight delivered to lEo; payload volume; payload services
none
Minimum turnaround time
Minimum time needed between mission completion and mission ready
operational readiness after mission completion
System complexity; mean time between maintenance; Stage integration complexity; Propellant safeing
Surge call-up time time between the announcement of a surge mission need and launch
time to launch after operational readiness
complexity of payload integration; time to fill tanks; launch checkout time; mission software load time
Basing flexibility the ability to launch from various launch sites and airports
System on-ground safety, takeoff and landing requirements
Propellant type, system and subsystem maturity, wing loading.
Mission flexibility the ability to adapt to mission requirements.
Mission flexibility (crossrange, downrange, loiter time, cruise margin, payload weight and volume)
aspect ratio, specific fuel consumption, mass ratio, propellant type
Military viability unique mission capability for investment cost
Qualitative assessment of military viability
DDt&E costs; fixed and variable recurring cost; flight rate; payload capability uniqueness; system launch mobility; system launch availability; system turnaround time
Factors quantitatively calculatedFactors qualitatively determined using expert elicitation
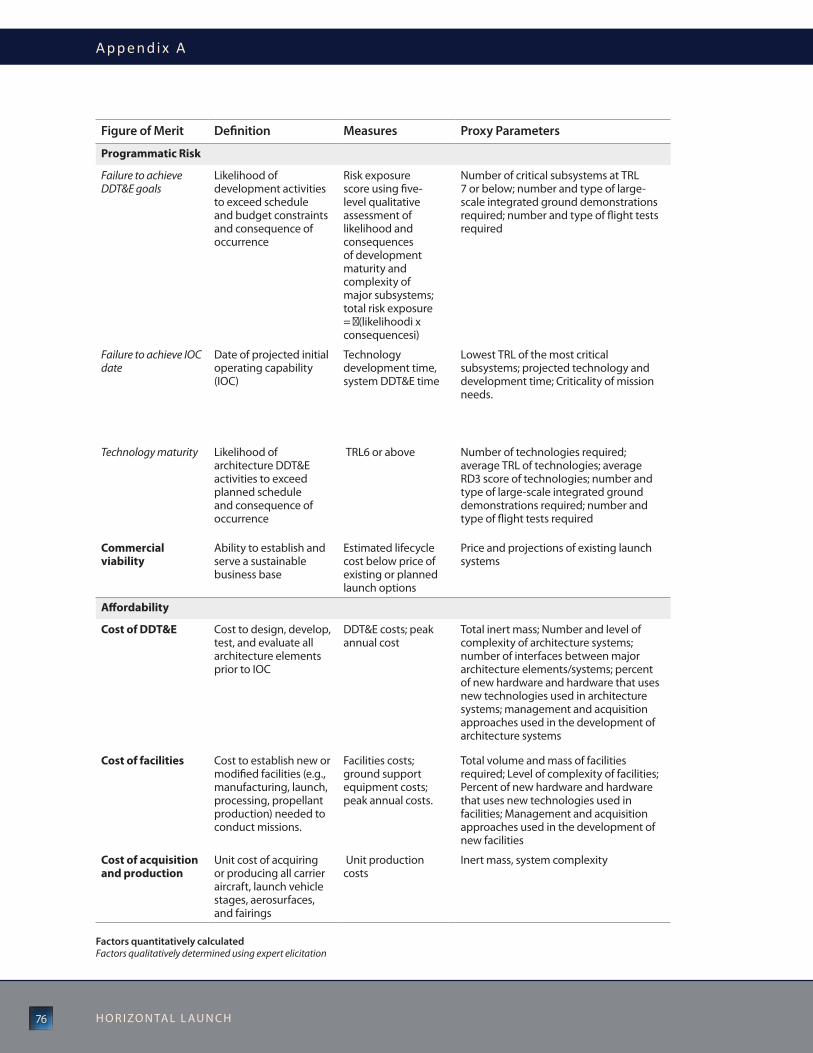
Appendix A
76 H o r i zo n ta l l au n c H
Figure of Merit Definition Measures Proxy Parameters
Programmatic Risk
Failure to achieve DDT&E goals
likelihood of development activities to exceed schedule and budget constraints and consequence of occurrence
risk exposure score using five-level qualitative assessment of likelihood and consequences of development maturity and complexity of major subsystems; total risk exposure = (likelihoodi x consequencesi)
number of critical subsystems at trl 7 or below; number and type of large-scale integrated ground demonstrations required; number and type of flight tests required
Failure to achieve IOC date
Date of projected initial operating capability (ioc)
technology development time, system DDt&E time
lowest trl of the most critical subsystems; projected technology and development time; criticality of mission needs.
Technology maturity likelihood of architecture DDt&E activities to exceed planned schedule and consequence of occurrence
trl6 or above number of technologies required; average trl of technologies; average rD3 score of technologies; number and type of large-scale integrated ground demonstrations required; number and type of flight tests required
Commercial viability
ability to establish and serve a sustainable business base
Estimated lifecycle cost below price of existing or planned launch options
Price and projections of existing launch systems
Affordability
Cost of DDT&E cost to design, develop, test, and evaluate all architecture elements prior to ioc
DDt&E costs; peak annual cost
total inert mass; number and level of complexity of architecture systems; number of interfaces between major architecture elements/systems; percent of new hardware and hardware that uses new technologies used in architecture systems; management and acquisition approaches used in the development of architecture systems
Cost of facilities cost to establish new or modified facilities (e.g., manufacturing, launch, processing, propellant production) needed to conduct missions.
Facilities costs; ground support equipment costs; peak annual costs.
total volume and mass of facilities required; level of complexity of facilities; Percent of new hardware and hardware that uses new technologies used in facilities; Management and acquisition approaches used in the development of new facilities
Cost of acquisition and production
unit cost of acquiring or producing all carrier aircraft, launch vehicle stages, aerosurfaces, and fairings
unit production costs
inert mass, system complexity
Factors quantitatively calculatedFactors qualitatively determined using expert elicitation

F igures of Mer i t
77A v e r s At i l e co n c e p t f o r A s s u r e d s pAc e Acc e s s
Figure of Merit Definition Measures Proxy Parameters
Cost of operations average annual integration and maintenance costs after ioc (fixed and variable)
average annual costs annual and per-mission System mass; level of communications and navigation infrastructure required; number and complexity of major architecture elements/systems; level of autonomy (for ground and flight operations) of architecture systems; maintainability/life of architecture systems; level of reusability of architecture systems
Cost of mission failure
average cost of failure occurring during a mission, including all direct and indirect return-to-flight costs.
average cost of mission failure; time to return to flight after mission failure
number and type of alternate launch systems; level of commonality and modularity between systems; system production costs; recurring cost per flight
Factors quantitatively calculatedFactors qualitatively determined using expert elicitation

Appendix B
78 H o r i zo n ta l l au n c H
Payload Market and Commercial Viability AnalysisA realistic payload demand forecast underpins the commercial viability analysis performed in this study. The market forecast was derived by projecting future launch demand forward from the last ten years of satellite launch history. Sources of data included the Union for Concerned Scientists, the NASA National Space Science Data Center (NSSDC), AMSAT, and other indepen-dently verified sources. The demand forecast was calibrated with near-term forecasts published by industry monitoring organizations such as Teal Group, Euroconsult, and the Commercial Space Transportation Advisory Committee (COMSTAC). A Gompertz curve (an S-curve function commonly used for economic applications) was employed as the forecast model. The shape of this curve was determined by solving for the inflection point and growth parameter that best fit the historical data as well as near-term growth estimates. Market demand was projected for the period of 2010 to 2060. All historical data was normalized to low-Earth orbit equivalent delivered payload in order to represent the total demand to all orbital destinations.
In order to produce meaningful demand predictions across the broad range of vehicle payload capabilities examined, the market forecast was stratified into payload classes (by mass). To account for the fact that the payload capability of an available launch vehicle would likely influence the design mass of real world payloads, the payload classes were binned according to a span of plus or minus 20 percent from the target payload mass. Thus, multiple forecast curves were produced representing the forecast with error bands of plus or minus 20 percent of payload masses. Competition in the marketplace would prevent a launch vehicle from capturing the entirety of the forecasted demand, so a market capture percentage is applied to the overall demand forecast.
The potential for dual manifesting was accounted for by summing the market forecast at the target payload together with half the market forecast of the payload class that is half the mass of the target payload.
Examples of the binned market demand are shown on page 79 in the growth of market demand over time. In the detailed analysis, payloads were binned at a higher fidelity.
Commercial viability was assessed for all concepts considered in the screening process, as well as for the three point designs. The commercial viability margin was defined as the difference of the breakeven price from the market price, divided by the breakeven price.
Commercial Viability Margin = (Market Price – Breakeven Price) / Breakeven Price
A positive value represented commercial viability, meaning the breakeven price is lower than the market, and the concept could generate profit. A negative value indicated that the market price was lower than the breakeven price, and the concept would not be profitable over the campaign.
a PPE n D i X B

Pay load Market and C ommerc ia l V iab i l i t y Analys is
79A v e r s At i l e co n c e p t f o r A s s u r e d s pAc e Acc e s s
5,0005,000 10,00010,000 15,00015,000 30,00030,000 35,00035,000 40,00040,00020,00020,000 25,00025,000
1010
1212
88
44
1414
66
22
00
Mar
ket D
eman
d(n
umbe
r of l
aunc
hes)
Mar
ket D
eman
d(n
umbe
r of l
aunc
hes)
LEO Equivalent Payload (lbs)LEO Equivalent Payload (lbs)
20202015
Global Market Demand for Commercial Launches

Appendix C
80 H o r i zo n ta l l au n c H
Stu
dy
Sur
vey
Conc
ept
Nam
eG
over
nmen
t/A
genc
yPe
rfor
mer
Last
Ye
arD
esig
n Pa
yloa
d (lb
s)D
esig
n M
atur
ity
Tech
nolo
gy
Tim
efra
me
Syst
em D
escr
iptio
n
aBlV
-02
uS/
na
Saa
stro
x20
0125
,000
lb
1-lo
w3-
Far
air
brea
thin
g la
unch
veh
icle
with
var
ious
low
spee
d op
erat
ing
syst
em e
ngin
e co
ncep
ts a
ccel
erat
ing
vehi
cle
to D
MrS
J ta
keov
er a
t M3+
, fol
low
ed b
y va
rious
met
hods
of t
rans
ition
ing
to ro
cket
pro
puls
ion
(Hun
t , 2
001)
aBlV
-04
(lac
E)u
S/n
aSa
lang
ley
rese
arch
ce
nter
2001
25,0
00
1-lo
w3-
Far
air
brea
thin
g la
unch
veh
icle
with
var
ious
low
spee
d op
erat
ing
syst
em e
ngin
e co
ncep
ts a
ccel
erat
ing
vehi
cle
to D
MrS
J ta
keov
er a
t M3+
, fol
low
ed b
y va
rious
met
hods
of t
rans
ition
ing
to ro
cket
pro
puls
ion
(Hun
t , 2
001)
aBlV
-04a
(lo
X)u
S/n
aSa
lang
ley
rese
arch
ce
nter
2001
25,0
00
1-lo
w3-
Far
air
brea
thin
g la
unch
veh
icle
with
var
ious
low
spee
d op
erat
ing
syst
em e
ngin
e co
ncep
ts a
ccel
erat
ing
vehi
cle
to D
MrS
J ta
keov
er a
t M3+
, fol
low
ed b
y va
rious
met
hods
of t
rans
ition
ing
to ro
cket
pro
puls
ion
(Hun
t , 2
001)
aBlV
-04b
(ace
tr)
uS/
na
Sala
ngle
y re
sear
ch
cent
er
2001
25,0
00
1-lo
w3-
Far
air
brea
thin
g la
unch
veh
icle
with
var
ious
low
spee
d op
erat
ing
syst
em e
ngin
e co
ncep
ts a
ccel
erat
ing
vehi
cle
to D
MrS
J ta
keov
er a
t M3+
, fol
low
ed b
y va
rious
met
hods
of t
rans
ition
ing
to ro
cket
pro
puls
ion
(Hun
t , 2
001)
aBlV
-04c
(aBt
J)u
S/n
aSa
lang
ley
rese
arch
ce
nter
2001
25,0
00
1-lo
w3-
Far
air
brea
thin
g la
unch
veh
icle
with
var
ious
low
spee
d op
erat
ing
syst
em e
ngin
e co
ncep
ts a
ccel
erat
ing
vehi
cle
to D
MrS
J ta
keov
er a
t M3+
, fol
low
ed b
y va
rious
met
hods
of t
rans
ition
ing
to ro
cket
pro
puls
ion
(Hun
t , 2
001)
aBlV
-04e
(aBt
J)u
S/n
aSa
lang
ley
rese
arch
ce
nter
2003
25,0
00
1-lo
w3-
Far
air
brea
thin
g la
unch
veh
icle
with
var
ious
low
spee
d op
erat
ing
syst
em e
ngin
e co
ncep
ts a
ccel
erat
ing
vehi
cle
to D
MrS
J ta
keov
er a
t M3+
, fol
low
ed b
y va
rious
met
hods
of t
rans
ition
ing
to ro
cket
pro
puls
ion
(Hun
t , 2
001)
aBlV
-05
uS/
na
SaPr
att a
nd
Whi
tney
2001
25,0
00
1-lo
w3-
Far
air
brea
thin
g la
unch
veh
icle
with
var
ious
low
spee
d op
erat
ing
syst
em e
ngin
e co
ncep
ts a
ccel
erat
ing
vehi
cle
to D
MrS
J ta
keov
er a
t M3+
, fol
low
ed b
y va
rious
met
hods
of t
rans
ition
ing
to ro
cket
pro
puls
ion
(Hun
t , 2
001)
aBlV
-06
(rBc
c ro
cket
dyne
)u
S/n
aSa
Boei
ng,
aero
jet,
McK
inne
y a
ssoc
iate
s
2001
25,0
00
1-lo
w3-
Far
air
brea
thin
g la
unch
veh
icle
with
rBc
c in
air-
augm
ente
d ro
cket
mod
e to
DM
SJ ta
keov
er a
t M2.
5+, f
ollo
wed
by
tran
sitio
n to
rock
et p
ropu
lsio
n (M
oses
, 19
99)
aP
PEn
DiX
c

Study Sur vey
81A v e r s At i l e co n c e p t f o r A s s u r e d s pAc e Acc e s s
Conc
ept
Nam
eG
over
nmen
t/A
genc
yPe
rfor
mer
Last
Ye
arD
esig
n Pa
yloa
d (lb
s)D
esig
n M
atur
ity
Tech
nolo
gy
Tim
efra
me
Syst
em D
escr
iptio
n
aBlV
-07a
(rBc
c ae
roje
t)u
S/n
aSa
Boei
ng,
aero
jet,
McK
inne
y a
ssoc
iate
s
2001
25,0
00
1-lo
w3-
Far
air
brea
thin
g la
unch
veh
icle
with
rBc
c in
air-
augm
ente
d ro
cket
mod
e to
DM
SJ ta
keov
er a
t M2.
5+, f
ollo
wed
by
tran
sitio
n to
rock
et p
ropu
lsio
n (M
oses
, 19
99)
aBlV
-07c
(rBc
c ae
roje
t)u
S/n
aSa
Boei
ng,
aero
jet,
McK
inne
y a
ssoc
iate
s
2001
25,0
00 lb
2-M
ed3-
Far
air
brea
thin
g la
unch
veh
icle
with
rBc
c in
air-
augm
ente
d ro
cket
mod
e to
DM
SJ ta
keov
er a
t M2.
5+, f
ollo
wed
by
tran
sitio
n to
rock
et p
ropu
lsio
n (M
oses
, 19
99)
aBlV
-07c
-la
unch
ass
ist (
rBcc
ae
roje
t)
uS/
na
SaBo
eing
, ae
roje
t, M
cKin
ney
ass
ocia
tes
2001
25,0
00
2-M
ed3-
Far
air
brea
thin
g la
unch
veh
icle
with
laun
ch a
ssis
st w
ith r
Bcc
in a
ir-au
gmen
ted
rock
et m
ode
to D
MSJ
take
over
at M
2.5+
, fo
llow
ed b
y tr
ansi
tion
to ro
cket
pro
puls
ion
(Mos
es ,
1999
)
aBlV
-08
(PD
E G
E)u
S/n
aSa
lock
heed
2001
25,0
00
1-lo
w3-
Far
air
brea
thin
g la
unch
veh
icle
with
PD
E lo
w sp
eed
oper
atin
g sy
stem
DM
SJ ta
keov
er a
t M3+
, fol
low
ed b
y tr
ansi
tion
to ro
cket
pr
opul
sion
(Mos
es ,
1999
)
aBlV
-09
(ace
tr /
atSD
)u
S/n
aSa
Boei
ng
com
pany
2001
25,0
00
1-lo
w3-
Far
air
brea
thin
g la
unch
veh
icle
with
var
ious
low
spee
d op
erat
ing
syst
ems e
ngin
e co
ncep
ts a
ccel
erat
ing
vehi
cle
to D
MrS
J ta
keov
er a
t M3+
, fol
low
ed b
y va
rious
met
hods
of t
rans
ition
ing
to ro
cket
pro
puls
ion
(Mos
es ,
1999
)aB
lV-1
0u
S/n
aSa
Boei
ng
com
pany
2001
25,0
00
1-lo
w3-
Far
air
brea
thin
g la
unch
veh
icle
with
var
ious
low
spee
d op
erat
ing
syst
ems e
ngin
e co
ncep
ts a
ccel
erat
ing
vehi
cle
to D
MrS
J ta
keov
er a
t M3+
, fol
low
ed b
y va
rious
met
hods
of t
rans
ition
ing
to ro
cket
pro
puls
ion
(Mos
es ,
1999
)aB
lV-G
tu
S/n
aSa
aero
jet,
Geo
rgia
te
ch
2000
25,0
00
1-lo
w3-
Far
aBl
V-G
t ac
cele
rate
s with
aer
ospi
ke ta
il ro
cket
and
turb
oram
jet
to M
ach
3. F
rom
Mac
h 3-
18 th
e ve
hicl
e us
es D
MSJ
and
ae
rosp
ike
rock
et. F
rom
Mac
h 18
to o
rbit,
thru
st is
pro
vide
d by
th
e ro
cket
exc
lusi
vely
. (Br
adfo
rd, 2
000)
aBlV
-VtH
lu
S/n
aSa
Boei
ng,
aero
jet,
McK
inne
y a
ssoc
iate
s
2000
25,0
00
1-lo
w3-
Far
Sam
e as
aBl
V-07
c, e
xcep
t for
Vto
(con
figur
atio
n as
sum
ed
com
patib
le w
ith V
to, n
ot te
chni
cally
cor
rect
) - a
naly
sis d
one
sole
ly a
s “w
hat i
f?” t
rade
(Mos
es, 1
999)
adva
nced
reu
sabl
e Sm
all l
aunc
h Sy
stem
uS/
na
Sala
ngle
y re
sear
ch
cent
er
1999
2,00
0 1-
low
3-Fa
ra
ir-la
unch
ed fr
om a
n-22
5 (M
oses
, 199
9)
airb
ourn
e M
icrol
aunc
her “
Mla
”n
aD
assa
ult
2008
154
1-lo
w1-
nea
rtw
o st
age
solid
/liqu
id u
pper
sta
ge a
ir-la
unch
ed fr
om r
afal
e fig
hter
(Das
saul
t, 20
08)

Appendix C
82 H o r i zo n ta l l au n c H
Conc
ept
Nam
eG
over
nmen
t/A
genc
yPe
rfor
mer
Last
Ye
arD
esig
n Pa
yloa
d (lb
s)D
esig
n M
atur
ity
Tech
nolo
gy
Tim
efra
me
Syst
em D
escr
iptio
n
air-
laun
ched
SS-
520
Japa
niH
i ae
rosp
ace
na
37
1-lo
w1-
nea
rSS
-520
sou
ndin
g ro
cket
air-
drop
ped
from
a c
-130
(HlS
tea
m,
2011
)
alS
- Boe
ing
airl
aunc
h w
ith 7
47
(Fus
elag
e)
uS/
air
Forc
eBo
eing
co
mpa
ny19
997,
500
lb2-
Med
1-n
ear
Mod
ified
Boe
ing
747
carr
ier a
ircra
ft a
ir-la
unch
es a
thre
e-st
age,
w
inge
d up
per s
tage
. upp
erst
age
is b
asic
ally
an
athe
na ro
cket
w
ith w
ings
. (Bo
eing
, 200
0)
alS
- Boe
ing
airl
aunc
h w
ith 7
47
(und
erw
ing)
uS/
air
Forc
eBo
eing
co
mpa
ny20
007,
500
1-lo
w1-
nea
rM
odifi
ed B
oein
g 74
7 ca
rrie
r airc
raft
air-
laun
ches
a th
ree-
stag
e,
win
ged
uppe
r sta
ge. u
pper
sta
ge is
bas
ical
ly a
n at
hena
rock
et
with
win
gs. (
Boei
ng, 2
000)
alSV
- a
ir la
unch
ed
Sort
ie V
ehic
leu
S/a
ir Fo
rce
Boei
ng
com
pany
1981
3,00
0 1-
low
1-n
ear
Mod
ified
Boe
ing
747
(att
achm
ent h
ardw
are,
dew
ar, t
ail r
ocke
t)
carr
ies a
n al
l-roc
ket o
rbite
r and
cyl
indr
ical
dro
p ta
nk to
alti
tude
fo
r air
laun
ch. (
Day
, 201
0)
alSV
- a
ir la
unch
ed
Sort
ie V
ehic
leu
S/a
ir Fo
rce
Gen
eral
D
ynam
ics
1981
5,00
0 1-
low
1-n
ear
Mod
ified
Boe
ing
747
(new
H-t
ail,
atta
chm
ent h
ardw
are)
car
ries
an a
ll-ro
cket
orb
iter a
nd V
-sha
ped
drop
tank
to a
ltitu
de fo
r air
laun
ch. (
Day
, 201
0)
alSV
- a
ir la
unch
ed
Sort
ie V
ehic
leu
S/a
ir Fo
rce
rock
wel
l in
tern
atio
nal
1981
3,00
0 1-
low
1-n
ear
Mod
ified
Boe
ing
747
(new
V-t
ail,
atta
chm
ent h
ardw
are)
car
ries
an a
ll-ro
cket
orb
iter a
nd d
rop
tank
to a
ltitu
de fo
r air
laun
ch.
(Day
, 201
0)
aMSc
- tr
ans-
at
mos
pher
ic
Vehi
cle
(747
- la
unch
ed 1
.5 S
tage
)
uS/
air
Forc
ero
ckw
ell
1984
10,0
00
1-lo
w2-
Mid
Mod
ified
Boe
ing
747
air-
laun
ches
reus
able
orb
iter a
nd d
rop
tank
s. o
rbite
r acc
eler
ates
to o
rbit
usin
g ro
cket
pro
puls
ion.
(S
anbo
rn, 1
984)
aM
Sc -
tran
s-at
mos
pher
ic
Vehi
cle
(GEM
-la
unch
ed S
Sto
)
uS/
air
Forc
ero
ckw
ell
1984
10,0
00
1-lo
w3-
Far
Gro
und
effec
t mac
hine
(GEM
) lau
nch
assi
st is
use
d to
ac
cele
rate
a re
usab
le d
elta
-win
ged
orbi
ter t
o ta
keoff
vel
ocity
. o
rbite
r con
tinue
s to
acce
lera
te u
sing
rock
et th
rust
. (Sa
nbor
n,
1984
)ar
tSir
aDSp
aceW
orks
, G
ray
rese
arch
2003
40,0
00
1-lo
w3-
Far
Mag
lev
laun
ch a
ssis
t acc
eler
ates
veh
icle
to M
ach
~0.
8. D
ual-
fuel
, all-
rock
et p
ropu
lsio
n us
ed d
urin
g re
mai
ned
of m
issi
on.
Vehi
cle
is re
usab
le. (
Wal
lace
, 200
3)
ast
rolin
erir
aDKe
lly
aero
spac
e19
9310
,030
1-
low
2-M
ida
stro
liner
tow
ed to
alti
tude
by
747.
use
d lo
X/Ke
rose
ne ro
cket
en
gine
s to
acce
lera
te to
Mac
h 6.
5 st
agin
g po
int.
rele
ased
up
per s
tage
. (Sa
rigul
-Klij
n, 2
001)

Study Sur vey
83A v e r s At i l e co n c e p t f o r A s s u r e d s pAc e Acc e s s
Conc
ept
Nam
eG
over
nmen
t/A
genc
yPe
rfor
mer
Last
Ye
arD
esig
n Pa
yloa
d (lb
s)D
esig
n M
atur
ity
Tech
nolo
gy
Tim
efra
me
Syst
em D
escr
iptio
n
athe
nau
S/n
aSa
uni
vers
ity
of M
ichi
gan
1994
3,77
3 1-
low
1-n
ear
thre
e st
age
liqui
d ro
cket
air-
drop
ped
from
c-5
B ca
rrie
r airc
raft
. ro
cket
car
ried
in c
-5B
carg
o ba
y. (B
ooke
r, 19
94)
atS
opt
ion
3 SS
to
(aB/
r)u
S/n
aSa
lang
ley
rese
arch
ce
nter
1993
25,0
00 lb
2-M
ed3-
Far
Vehi
cle
take
s off
unde
r low
-spe
ed a
irbre
athi
ng p
lus r
ocke
t m
ode.
tra
nsiti
on to
ram
jet m
ode
occu
rs a
t Mac
h 3,
follo
wed
by
tran
sitio
n to
scr
amje
t mod
e at
Mac
h 6.
roc
ket m
ode
acce
lera
tes t
he v
ehic
le fr
om M
ach
15 to
orb
it. (n
aSa
, 199
4)at
S o
ptio
n 3
tSto
(a
B/r)
uS/
na
Saa
mes
re
sear
ch
cent
er
1994
25,0
00
2-M
ed3-
Far
Vehi
cle
take
s off
unde
r tur
bo-r
amje
t thr
ust.
Stag
ing
betw
een
the
boos
ter a
nd o
rbite
r occ
urs a
t Mac
h 5.
(na
Sa, 1
994)
aVat
arin
dia
DrD
o20
012,
500
1-lo
w3-
Far
aVat
ar
take
s off
horiz
onta
lly u
sing
turb
o-ra
mje
t eng
ines
. Sc
ram
jet m
ode
is th
en u
sed
from
Mac
h 4
to 8
. Dur
ing
this
ph
ase,
air
is c
olle
cted
and
liqu
id o
xyge
n is
sto
red.
a ro
cket
m
ode
is th
en u
sed
to c
ompl
ete
the
asce
nt to
orb
it. (H
lS t
eam
, 20
11)
B-52
H r
espo
nsiv
e a
ir la
unch
uS/
Dar
Pao
rbita
l Sc
ienc
es,
Scha
fer
2004
500
2-M
ed1-
nea
rth
ree-
stag
e ro
cket
air-
laun
ched
from
B-5
2. (F
rick,
200
4)
Bant
am-X
arg
usu
S/n
aSa
Geo
rgia
te
ch19
9930
0 1-
low
3-Fa
rG
roun
d la
unch
ass
ist s
yste
m p
rovi
des 8
00 ft
/s in
itial
vel
ocity
. Ve
hicl
e ac
cele
rate
s with
supe
rson
ic e
ject
or ra
mje
t (SE
rJ) i
n ej
ecto
r mod
e, tr
ansi
tions
to ra
mje
t mod
e at
Mac
h 3,
tran
sitio
n fr
om ra
mje
t to
rock
et p
rimar
y at
Mac
h 6
and
cont
inue
s to
orbi
t. (S
t. G
erm
ain,
199
9)Ba
ntam
-X K
lin
a
rgus
uS/
na
SaG
eorg
ia
tech
1999
20,0
00
1-lo
w3-
Far
Gro
und
laun
ch a
ssis
t sys
tem
pro
vide
s 800
ft/s
initi
al v
eloc
ity.
Dee
ply
cool
ed tu
rboj
et o
pera
te to
geth
er u
p to
Mac
h 1.
5, D
ctJ
al
one
prov
ides
thru
st to
Mac
h 4,
rock
ets t
hrot
tled
back
up
betw
een
Mac
h 4
and
6, fi
nal t
rans
ition
to ro
cket
mod
e at
Mac
h 6
and
abov
e (S
t. G
erm
ain,
199
9)Ba
ntam
-X P
DrE
a
rgus
uS/
na
SaG
eorg
ia
tech
1999
20,0
00
1-lo
w3-
Far
Gro
und
laun
ch a
ssis
t sys
tem
pro
vide
s 800
ft/s
initi
al v
eloc
ity.
PDrE
pro
vide
s all
thru
st u
ntil
Mac
h 2,
ram
jets
use
d fr
om M
ach
2 to
6, a
nd th
en P
DrE
s pro
pel v
ehic
le to
orb
it (S
t. G
erm
ain,
19
99)
Bant
am-X
Sta
rgaz
eru
S/n
aSa
Geo
rgia
te
ch19
9930
0 1-
low
3-Fa
rVe
hicl
e ac
cele
rate
s in
ejec
tor m
ode
from
lift
off to
Mac
h 3,
dua
l-m
ode
ram
jet/
scra
mje
ts a
ccel
erat
e to
Mac
h 10
, tra
nsiti
on to
ro
cket
mod
e fr
om M
ach
10 to
Mac
h 14
sta
ging
poi
nt. r
ocke
t up
per s
tage
con
tinue
s to
orbi
t. (o
lds,
1999
b)

Appendix C
84 H o r i zo n ta l l au n c H
Conc
ept
Nam
eG
over
nmen
t/A
genc
yPe
rfor
mer
Last
Ye
arD
esig
n Pa
yloa
d (lb
s)D
esig
n M
atur
ity
Tech
nolo
gy
Tim
efra
me
Syst
em D
escr
iptio
n
Bant
am-X
Sta
rsab
eru
S/n
aSa
Geo
rgia
te
ch20
0130
0 1-
low
2-M
idVe
hicl
e ac
cele
rate
s in
ejec
tor m
ode
until
Mac
h 3.
5, u
tiliz
es
ram
jet m
ode
from
Mac
h 3.
5 to
5.5
, and
then
rock
et m
ode
from
M
ach
5.5
to s
tagi
ng a
t Mac
h 10
. roc
ket u
pper
sta
ge c
ontin
ues
to o
rbit
(St.
Ger
mai
n, 2
001)
Beta
uS/
na
SaBo
eing
co
mpa
ny19
9150
,000
1-
low
3-Fa
rFu
lly re
usab
le s
yste
m w
ith c
ombi
ned
air-
brea
thin
g an
d ro
cket
pr
opul
sion
on
the
boos
ter,
and
rock
et p
ropu
lsio
n on
the
orbi
ter.
Stag
ing
at M
ach
8. (n
adel
l, 19
92)
Beta
iiu
S/n
aSa
larc
, Bo
eing
1992
17,5
00 lb
1-lo
w3-
Far
Fully
reus
able
sys
tem
with
air-
brea
thin
g bo
oste
r and
rock
et
orbi
ter.
Mac
h 6.
5 st
agin
g po
int.
(nad
ell,
1992
)Bl
ack
colt
uS/
air
Forc
eM
artin
M
arie
tta
1994
1,00
0 2-
Med
2-M
idBl
ack
colt
take
s off
unde
r tur
boje
t pow
er, c
limbs
, and
re
ndez
vous
with
tank
er. t
anke
r tra
nsfe
rs li
quid
oxy
gen
enab
ling
Blac
k co
lt to
acc
eler
ate
to a
Mac
h 12
sta
ging
co
nditi
on. F
rom
ther
e, S
tar-
48 m
otor
acc
eler
ates
pay
load
to
orbi
t. (z
ubrin
, 199
5)Bl
ack
Hor
seir
aDPi
onee
r as
trona
utic
s20
001,
000
1-lo
w2-
Mid
Blac
k H
orse
take
s off
unde
r tur
boje
t pow
er, c
limbs
to a
ltitu
de,
and
rend
ezvo
us w
ith ta
nker
. tan
ker t
rans
fers
liqu
id o
xyge
n en
ablin
g Bl
ack
Hor
se to
acc
eler
ate
to o
rbit
usin
g a
tail-
mou
nted
rock
et. (
zubr
in, 1
995)
Blad
erun
ner
uS/
air
Forc
eSM
c20
042,
000
1-lo
w2-
Mid
Blad
erun
ner c
an b
e ai
r-dr
oppe
d fr
om a
c-1
7a a
t Mac
h 0.
8, 4
0 kf
t. Sy
stem
acc
eler
ates
to M
ach
11 u
nder
rock
et p
ower
. Sta
ging
oc
curs
and
upp
er s
tage
pro
ceed
s to
orbi
t. Bo
oste
r is r
e-us
ed.
(Ham
pste
n, 2
004)
Boei
ng F
-15
Glo
bal
Strik
e Ea
gle
(F-1
5 G
SE)
iraD
Boei
ng
com
pany
2006
600
2-M
ed1-
nea
rM
odifi
ed F
-15
airc
raft
car
ries t
wo-
stag
e ro
cket
upp
er s
tage
on
top
of fu
sela
ge. S
tagi
ng is
supe
rson
ic. (
chen
, 20
06)
cros
sbow
iraD
tele
dyne
Br
own
2010
na
1-lo
w2-
Mid
Spec
ializ
ed, a
ll-ne
w c
arrie
r airc
raft
is u
sed
to d
eplo
y a
two-
stag
e liq
uid
rock
et a
t hig
h ga
mm
a. (S
oren
sen,
200
4)
Ded
alus
air
laun
ch
conc
ept
Fran
cecn
ES,
on
Era
na
330
1-lo
w1-
nea
ra
ir-la
unch
from
new
car
rier a
ircra
ft a
t Mac
h 0.
7. a
thre
e-st
age
solid
upp
er s
tage
car
ries t
he p
aylo
ad to
orb
it. (t
albo
t, 20
08)
DF-
09 r
Bcc
uS/
air
Forc
eBo
eing
co
mpa
ny19
985,
000
1-lo
w3-
Far
Vehi
cle
uses
rBc
c pr
opul
sion
. Sta
ging
poi
nt is
Mac
h 10
. (S
cude
ri, 1
998)
DF-
09 t
Bcc
uS/
air
Forc
eBo
eing
co
mpa
ny19
985,
000
1-lo
w3-
Far
tBcc
DF-
9 ta
kes o
ff un
der t
urbo
-ram
jet t
hrus
t and
tran
sitio
ns
to ra
mje
t-sc
ram
jet o
pera
tion
star
ting
at M
ach
4. t
he v
ehic
le
uses
a li
near
rock
et s
yste
m to
pro
vide
thru
st d
urin
g a
pop-
up
man
euve
r. (S
cude
ri, 1
998)

Study Sur vey
85A v e r s At i l e co n c e p t f o r A s s u r e d s pAc e Acc e s s
Conc
ept
Nam
eG
over
nmen
t/A
genc
yPe
rfor
mer
Last
Ye
arD
esig
n Pa
yloa
d (lb
s)D
esig
n M
atur
ity
Tech
nolo
gy
Tim
efra
me
Syst
em D
escr
iptio
n
DF-
10 t
Bcc
uS/
air
Forc
eBo
eing
co
mpa
ny19
9610
,000
2-
Med
2-M
idSt
udy
prod
uced
a q
uick
-rea
ctio
n, g
loba
l rea
ch iS
r M
ach
10
airc
raft
cap
able
of d
eliv
erin
g a
10 k
lb p
aylo
ad g
loba
lly a
nd
retu
rnin
g to
co
nu
S (S
cude
ri, 1
998)
Drl
Vis
rael
isra
el in
st.
tech
.20
0816
5 1-
low
1-n
ear
F-15
i car
rier a
ircra
ft d
eplo
ys 2
-sta
ge s
olid
rock
et. (
HlS
tea
m,
2011
)F-
15 M
icro
sate
llite
la
unch
Veh
icle
uS/
air
Forc
eBo
eing
co
mpa
ny20
0344
0 2-
Med
1-n
ear
Solid
rock
et u
pper
sta
ge c
arrie
d on
cen
terli
ne b
enea
th F
-15
fight
er. (
HlS
tea
m, 2
011)
Falc
on
Qui
ck
reac
hu
S/D
arPa
airl
aunc
h ll
c20
041,
000
lb2-
Med
1-n
ear
Qui
ck r
each
is a
ir-dr
oppe
d fr
om a
c-1
7 an
d us
es 2
liqu
id s
tage
s to
put
its p
aylo
ad in
lEo
. (a
irlau
nch,
200
7)
Freq
uent
Fly
er (D
an
Del
ong)
iraD
tele
dyne
Br
own
na
1,00
0 1-
low
2-M
idFr
eque
nt F
lyer
is b
oost
ed b
y an
exp
enda
ble
rock
et fi
rst
stag
e. a
fter
firs
t sta
ge b
urno
ut, a
win
ged-
body
sec
ond
stag
e pr
ocee
ds to
a s
econ
d st
agin
g po
int.
a ro
cket
upp
er s
tage
ac
cele
rate
s th
e pa
yloa
d to
orb
it un
der r
ocke
t thr
ust.
(Xco
r,
2011
)G
loba
l ran
ge t
aVir
aDan
SEr,
M
cKin
ney
ass
ocia
tes
2009
20,0
00
3-H
igh
1-n
ear
all-
rock
et v
ehic
le d
eriv
ed fr
om r
aSV
dat
abas
e, w
ith d
etai
led
scal
ing
algo
rithm
s. (H
lS t
eam
, 201
1)
Ho
tol
uK
Briti
sh
aero
spac
e19
8217
,600
1-
low
2-M
idH
oto
l ta
kes o
ff us
ing
a ro
cket
-pro
pelle
d sl
ed. t
he v
ehic
le
then
use
s a n
ovel
rB5
45 a
ir/lH
2/lo
X ro
cket
eng
ine
to
acce
lera
te to
Mac
h 5.
Fro
m M
ach
5 to
orb
it th
e ve
hicl
e us
es
pure
rock
et p
ropu
lsio
n. (S
arig
ul-K
lijn,
200
1)H
oto
l - i
nter
im
with
an-
225
uK
Briti
sh
aero
spac
e19
91n
a1-
low
3-Fa
ra
ir-la
unch
ed fr
om a
ukr
aini
an a
n-22
5 M
riya
airc
raft
. int
erim
H
oto
l w
ould
sep
arat
e fr
om th
e ca
rrie
r airc
raft
at s
ubso
nic
spee
ds, a
nd w
ould
then
pul
l up
for t
he a
scen
t to
orbi
t. it
wou
ld re
turn
via
a g
lidin
g re
-ent
ry a
nd la
ndin
g on
gea
r on
a co
nven
tiona
l run
way
. (n
eila
nd, 1
991)
HrS
t a
rgus
uS/
na
SaG
eorg
ia
tech
1998
20,0
00
1-lo
w3-
Far
arg
us u
tiliz
es M
aglif
ter l
aunc
h as
sist
to re
ach
800
ft/s
at l
aunc
h.
Mai
n en
gine
s are
initi
ally
in su
perc
harg
ed e
ject
or m
ode
and
tran
sitio
ns to
fan-
ram
jet m
ode
betw
een
Mac
h 2
and
3. a
rgus
fli
es in
fan-
ram
jet/
ram
jet m
ode
until
Mac
h 6,
at w
hich
poi
nt it
tr
ansi
tions
to ro
cket
mod
e fo
r the
fina
l leg
to o
rbit.
(old
s, 19
98)
HrS
t at
S w
ith M
HD
uS/
na
Salo
ckhe
ed,
aero
jet,
anSE
r,
McK
inne
y a
ssoc
iate
s
1998
25,0
00
1-lo
w3-
Far
lock
heed
HrS
t co
ncep
t use
d th
e n
aSa
atS
con
figur
atio
n w
ith
a M
HD
Ene
rgy
By-P
ass e
ngin
e sy
stem
to “s
hift
” the
aer
ojet
St
rutJ
et e
ngin
e pe
rfor
man
ce b
ack
up a
long
the
Mac
h ax
is.
(HlS
tea
m, 2
011)
HrS
t Er
J / l
acE
SSto
uS/
na
Sala
ngle
y re
sear
ch
cent
er
1998
52,8
00
1-lo
w3-
Far
Vehi
cle
uses
lac
E Ej
ecto
r ram
jet (
ErJ)
rBc
c pr
opul
sion
. (H
lS
team
, 201
1)

Appendix C
86 H o r i zo n ta l l au n c H
Conc
ept
Nam
eG
over
nmen
t/A
genc
yPe
rfor
mer
Last
Ye
arD
esig
n Pa
yloa
d (lb
s)D
esig
n M
atur
ity
Tech
nolo
gy
Tim
efra
me
Syst
em D
escr
iptio
n
HrS
t H
yper
ion
uS/
na
SaG
eorg
ia
tech
1998
20,0
00
1-lo
w3-
Far
Hyp
erio
n us
es it
s rBc
c en
gine
s in
ejec
tor m
ode
durin
g ta
ke-o
ff an
d up
to M
ach
3. B
etw
een
Mac
h 3
and
Mac
h 5.
5 th
e ve
hicl
e us
es ra
mje
t mod
e, a
nd fr
om M
ach
5.5
to M
ach
10
scra
mje
t mod
e is
use
d. M
ach
10 to
orb
it is
acc
ompl
ishe
d us
ing
rock
et th
rust
. (o
lds,1
999a
)H
rSt
Spac
e a
mer
ica
conc
ept
uS/
na
SaSp
ace
am
eric
a19
9825
,000
1-
low
3-Fa
rSS
to a
ll-ro
cket
veh
icle
with
laun
ch a
ssis
t. li
mite
d de
finiti
on
avai
labl
e. (n
aSa
, 199
8)
HrS
t SS
to
Wav
erid
eru
S/n
aSa
rock
wel
l19
9820
,000
lb1-
low
3-Fa
rW
aver
ider
con
figur
atio
n (le
ngth
/dia
met
er=5
). u
ses m
agle
v la
unch
ass
ist f
or ta
ke-o
ff an
d 8
turb
ojet
s for
low
-spe
ed
prop
ulsi
on. H
igh
spee
d pr
opul
sion
is r
Bcc.
(na
Sa, 1
998)
HSD
tVin
dia
DrD
o20
07n
a1-
low
3-Fa
rVe
hicl
e us
es s
cram
jet a
nd ro
cket
pro
puls
ion
mod
es. S
tagi
ng
poin
t is a
t Mac
h 6.
5. (H
lS t
eam
, 201
1)
HtS
-1 t
urbi
nes (
+ ta
il ro
cket
) / r
ocke
tu
S/n
aSa
Boei
ng
com
pany
2000
25,0
00
1-lo
w3-
Far
Vehi
cle
uses
turb
ines
plu
s tai
l roc
kets
on
the
boos
ter,
and
rock
et p
ropu
lsio
n on
the
uppe
r sta
ge. (
HlS
tea
m, 2
011)
HtS
-2 r
Bcc
/ roc
ket
uS/
na
SaBo
eing
co
mpa
ny20
0025
,000
1-
low
3-Fa
rVe
hicl
e us
es r
Bcc
prop
ulsi
on o
n th
e bo
oste
r and
rock
ets o
n th
e up
per s
tage
. (H
lS t
eam
, 201
1)
HtS
-3 t
Bcc:
tu
rbin
es/r
J/SJ
(+
tail
rock
et) /
roc
ket
uS/
na
SaBo
eing
co
mpa
ny20
0025
,000
1-
low
3-Fa
rVe
hicl
e us
es t
Bcc
and
tail
rock
ets o
n th
e bo
oste
r and
rock
ets
on th
e up
per s
tage
. (H
lS t
eam
, 201
1)
HtS
-4 a
cES/
rBcc
/ ro
cket
uS/
na
SaBo
eing
co
mpa
ny20
0025
,000
1-
low
3-Fa
rVe
hicl
es u
ses r
Bcc
prop
ulsi
on w
ith a
cES
on th
e bo
oste
r and
ro
cket
s on
the
uppe
r sta
ge. (
HlS
tea
m, 2
011)
HtS
-5 t
urbi
nes (
+ ta
il ro
cket
) / r
Bcc
uS/
na
SaBo
eing
co
mpa
ny20
0025
,000
1-
low
3-Fa
rVe
hicl
e us
es tu
rbin
es a
nd ta
il ro
cket
s on
the
boos
ter a
nd r
Bcc
on th
e up
per s
tage
. (H
lS t
eam
, 201
1)
HtS
-6 t
Bcc:
tu
rbin
es/r
J/SJ
(+
tail
rock
et) /
rBc
c
uS/
na
SaBo
eing
co
mpa
ny20
0025
,000
1-
low
3-Fa
rVe
hicl
e us
es t
Bcc
prop
ulsi
on o
n th
e bo
oste
r and
rBc
c on
the
uppe
r sta
ge. (
HlS
tea
m, 2
011)
HtS
-7 t
urbi
nes (
+ ta
il ro
cket
) w/ 2
nd
stag
e ro
cket
uS/
na
SaBo
eing
co
mpa
ny20
0025
,000
1-
low
3-Fa
rVe
hicl
e us
es tu
rbin
es a
nd ta
il ro
cket
s on
the
boos
ter a
nd
rock
ets a
lone
on
the
uppe
r sta
ge. (
HlS
tea
m, 2
011)
JSS
- ral
V-B
uS/
na
Sala
ngle
y re
sear
ch
cent
er
2010
20,0
00
2-M
ed3-
Far
tBcc
boo
ster
sta
ge. (
na
Sa, 2
010)
laun
cher
one
(W
K2 +
upp
er st
age)
iraD
Scal
ed
com
posi
tes
2010
440
2-M
ed1-
nea
rW
hite
Kni
ght 2
car
ries t
hree
-sta
ge u
pper
sta
ge. (
am
os, 2
009)
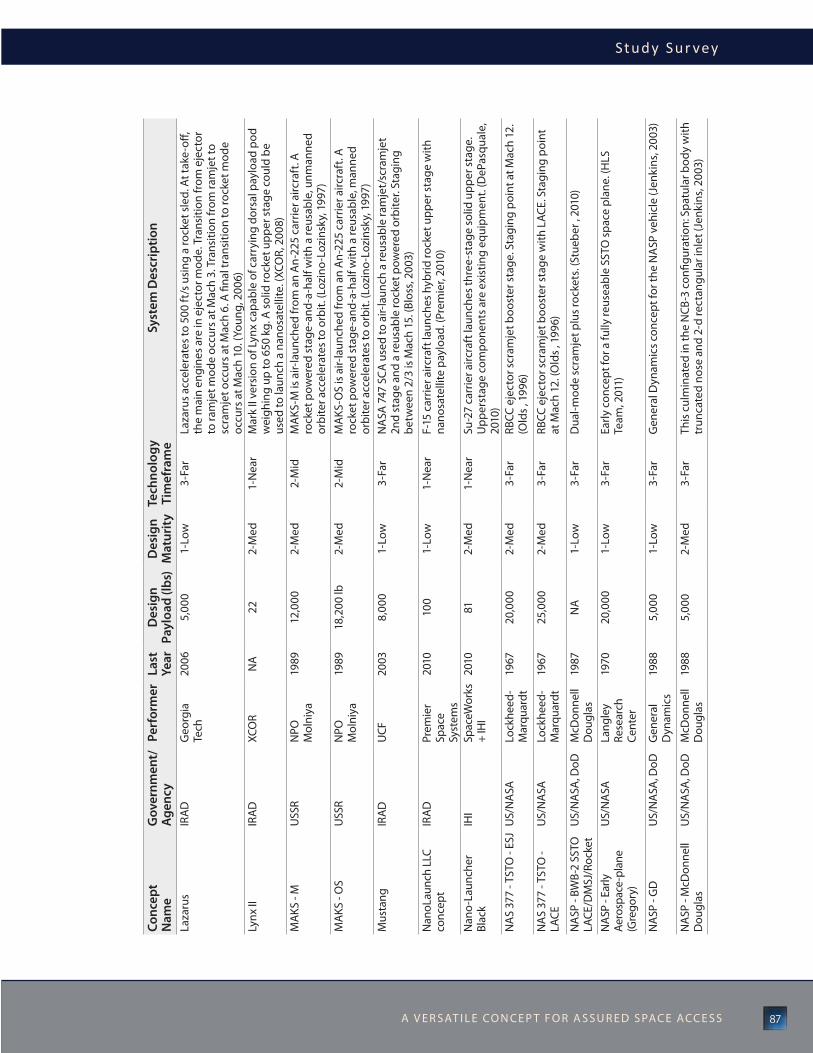
Study Sur vey
87A v e r s At i l e co n c e p t f o r A s s u r e d s pAc e Acc e s s
Conc
ept
Nam
eG
over
nmen
t/A
genc
yPe
rfor
mer
Last
Ye
arD
esig
n Pa
yloa
d (lb
s)D
esig
n M
atur
ity
Tech
nolo
gy
Tim
efra
me
Syst
em D
escr
iptio
n
laza
rus
iraD
Geo
rgia
te
ch20
065,
000
1-lo
w3-
Far
laza
rus a
ccel
erat
es to
500
ft/s
usi
ng a
rock
et sl
ed. a
t tak
e-off
, th
e m
ain
engi
nes a
re in
eje
ctor
mod
e. t
rans
ition
from
eje
ctor
to
ram
jet m
ode
occu
rs a
t Mac
h 3.
tra
nsiti
on fr
om ra
mje
t to
scra
mje
t occ
urs a
t Mac
h 6.
a fi
nal t
rans
ition
to ro
cket
mod
e oc
curs
at M
ach
10. (
Youn
g, 2
006)
lynx
iiir
aDXc
or
na
22
2-M
ed1-
nea
rM
ark
ii ve
rsio
n of
lyn
x ca
pabl
e of
car
ryin
g do
rsal
pay
load
pod
w
eigh
ing
up to
650
kg.
a s
olid
rock
et u
pper
sta
ge c
ould
be
used
to la
unch
a n
anos
atel
lite.
(Xco
r, 2
008)
MaK
S - M
uSS
rn
Po
Mol
niya
1989
12,0
00
2-M
ed2-
Mid
Ma
KS-M
is a
ir-la
unch
ed fr
om a
n a
n-22
5 ca
rrie
r airc
raft
. a
rock
et p
ower
ed s
tage
-and
-a-h
alf w
ith a
reus
able
, unm
anne
d or
bite
r acc
eler
ates
to o
rbit.
(loz
ino-
lozi
nsky
, 199
7)M
aKS
- oS
uSS
rn
Po
Mol
niya
1989
18,2
00 lb
2-M
ed2-
Mid
Ma
KS-o
S is
air-
laun
ched
from
an
an-
225
carr
ier a
ircra
ft. a
ro
cket
pow
ered
sta
ge-a
nd-a
-hal
f with
a re
usab
le, m
anne
d or
bite
r acc
eler
ates
to o
rbit.
(loz
ino-
lozi
nsky
, 199
7)M
usta
ngir
aDu
cF20
038,
000
1-lo
w3-
Far
na
Sa 7
47 S
ca u
sed
to a
ir-la
unch
a re
usab
le ra
mje
t/sc
ram
jet
2nd
stag
e an
d a
reus
able
rock
et p
ower
ed o
rbite
r. St
agin
g be
twee
n 2/
3 is
Mac
h 15
. (Bl
oss,
2003
)
nan
olau
nch
llc
conc
ept
ira
DPr
emie
r Sp
ace
Syst
ems
2010
100
1-lo
w1-
nea
rF-
15 c
arrie
r airc
raft
laun
ches
hyb
rid ro
cket
upp
er s
tage
with
na
nosa
telli
te p
aylo
ad. (
Prem
ier,
2010
)
nan
o-la
unch
er
Blac
kiH
iSp
aceW
orks
+
iHi
2010
81
2-M
ed1-
nea
rSu
-27
carr
ier a
ircra
ft la
unch
es th
ree-
stag
e so
lid u
pper
sta
ge.
upp
erst
age
com
pone
nts a
re e
xist
ing
equi
pmen
t. (D
ePas
qual
e,
2010
)n
aS
377
- tSt
o -
ESJ
uS/
na
Salo
ckhe
ed-
Mar
quar
dt
1967
20,0
00
2-M
ed3-
Far
rBcc
eje
ctor
scr
amje
t boo
ster
sta
ge. S
tagi
ng p
oint
at M
ach
12.
(old
s , 1
996)
na
S 37
7 - t
Sto
- la
cEu
S/n
aSa
lock
heed
-M
arqu
ardt
19
6725
,000
2-
Med
3-Fa
rrB
cc e
ject
or s
cram
jet b
oost
er s
tage
with
lac
E. S
tagi
ng p
oint
at
Mac
h 12
. (o
lds ,
199
6)
na
SP -
BWB-
2 SS
to
lacE
/DM
SJ/r
ocke
tu
S/n
aSa
, DoD
McD
onne
ll D
ougl
as19
87n
a1-
low
3-Fa
rD
ual-m
ode
scra
mje
t plu
s roc
kets
. (St
uebe
r , 2
010)
na
SP -
Early
ae
rosp
ace-
plan
e
(Gre
gory
)
uS/
na
Sala
ngle
y re
sear
ch
cent
er
1970
20,0
00
1-lo
w3-
Far
Early
con
cept
for a
fully
reus
eabl
e SS
to sp
ace
plan
e. (H
lS
team
, 201
1)
na
SP -
GD
uS/
na
Sa, D
oDG
ener
al
Dyn
amic
s19
885,
000
1-lo
w3-
Far
Gen
eral
Dyn
amic
s con
cept
for t
he n
aSP
veh
icle
(Jen
kins
, 200
3)
na
SP -
McD
onne
ll D
ougl
asu
S/n
aSa
, DoD
McD
onne
ll D
ougl
as19
885,
000
2-M
ed3-
Far
this
cul
min
ated
in th
e n
cB-3
con
figur
atio
n: S
patu
lar b
ody
with
tr
unca
ted
nose
and
2-d
rect
angu
lar i
nlet
(Jen
kins
, 200
3)

Appendix C
88 H o r i zo n ta l l au n c H
Conc
ept
Nam
eG
over
nmen
t/A
genc
yPe
rfor
mer
Last
Ye
arD
esig
n Pa
yloa
d (lb
s)D
esig
n M
atur
ity
Tech
nolo
gy
Tim
efra
me
Syst
em D
escr
iptio
n
na
SP -
ncB
-3 S
Sto
la
cE/D
MSJ
/roc
ket
uS/
na
Sa, D
oDM
cDon
nell
Dou
glas
1987
5,00
0 1-
low
3-Fa
rFi
nal c
onfig
urat
ion
for a
ircra
ft c
once
pt re
view
(acr
) in
aug
1987
and
subs
eque
nt d
own-
sele
ct: S
patu
lar b
ody
with
tr
unca
ted
nose
, 2-d
rect
angu
lar i
nlet
. Bec
ame
new
“Gov
’t Ba
selin
e” a
s nat
iona
l tea
m/J
Po e
stab
lishe
d (l
au, 2
008)
na
SP -
rock
wel
lu
S/n
aSa
, DoD
rock
wel
l19
885,
000
1-lo
w3-
Far
this
was
“the
Gov
ernm
ent B
asel
ine”
con
cept
: a c
onic
al b
ody,
w
ith s
emic
ircul
ar “s
mile
” inl
et -
low
per
form
ance
at h
ighe
r M
ach
num
bers
led
to d
evel
opm
ent o
f ncB
fam
ily o
f con
cept
s w
ith “s
patu
lar”
nos
e/fo
rebo
dies
and
2-d
inle
ts (J
enki
ns, 2
003)
na
SP D
eriv
ed
Vehi
cle
uS/
na
SaM
cDon
nell
Dou
glas
1991
30,0
00
1-lo
w3-
Far
an
oper
atio
nal v
ersi
on o
f the
McD
onne
ll D
ougl
as X
-30
/ ncB
-3
vehi
cle
(Jen
kins
, 200
3)n
Glt
- Fa
SSt
uS/
na
SaBo
eing
co
mpa
ny20
0320
,000
lb2-
Med
3-Fa
ra
uni
que
conc
ept f
or n
Glt
: Hc
Mac
h 4
first
sta
ge u
sing
Mac
h 4.
2 rt
a t
Js, “
shoe
horn
ed” u
nder
neat
h a
larg
er M
ach
4-14
lo
X/lH
2 rB
cc/r
ocke
t 2nd
sta
ge (B
radl
ey, 2
003)
nG
lt -
Gry
phon
uS/
na
Saa
ndre
ws
Spac
e20
0318
,900
2-
Med
2-M
idu
ses a
ir co
llect
ion
& En
richm
ent S
yste
m (a
cES)
in la
rge,
lo
iterin
g ca
rrie
r airc
raft
to fi
ll up
rock
et v
ehic
le p
rope
llant
tank
s (a
ndre
ws,
2003
)
nG
lt -
icM
-2 t
Sto
H
tHl
tBcc
/roc
ket
uS/
na
SaSa
ic,
McK
inne
y a
ssoc
iate
s
2003
20,0
00
2-M
ed3-
Far
Mac
h 8
tBcc
boo
ster
with
lo
X/lH
2 ro
cket
2nd
sta
ge (S
aic
, 20
03)
nG
lt -
icM
-3 t
Sto
H
tHl
rBcc
/roc
ket
uS/
na
SaSa
ic,
McK
inne
y a
ssoc
iate
s
2003
20,0
00
2-M
ed3-
Far
Mac
h 8
rBcc
boo
ster
with
lo
X/lH
2 ro
cket
2nd
sta
ge (S
aic
, 20
03)
nG
lt -
icM
-4 t
Sto
H
tHl
turb
ine/
rBcc
/ roc
ket
uS/
na
SaSa
ic,
McK
inne
y a
ssoc
iate
s
2003
20,0
00
2-M
ed3-
Far
a u
niqu
e co
ncep
t for
nG
lt: H
c M
ach
4 fir
st s
tage
usi
ng M
ach
4.2
rta
tJs
, “sh
oeho
rned
” und
erne
ath
a la
rger
Mac
h 4-
14 l
oX/
lH2
rBcc
/roc
ket 2
nd s
tage
(Sa
ic, 2
003)
nG
lt -
icM
-5 S
Sto
H
tHl
tBcc
/roc
ket
uS/
na
SaSa
ic,
McK
inne
y a
ssoc
iate
s
2003
20,0
00
2-M
ed3-
Far
aBl
V-4e
sca
led
dow
n to
20
klb
due
east
from
25
klb
to iS
S
orbi
t (Sa
ic, 2
003)
nG
lt -
Spac
elin
er
100
uS/
na
SaM
arsh
all
Spac
e Fl
ight
ce
nter
1999
20,0
00
1-lo
w3-
Far
rBcc
SSt
o c
once
pt w
ith la
unch
ass
ist.
(Dan
khoff
, 200
0)
nG
lt -
SSto
tBc
c/ro
cket
with
MH
D
uS/
na
Saan
SEr,
lo
ckhe
ed,
McK
inne
y a
ssoc
1998
20,0
00
1-lo
w3-
Far
aBl
V-4c
sca
led
dow
n to
20
klb
due
east
from
25
klb
to iS
S
orbi
t (H
lS t
eam
, 201
1)

Study Sur vey
89A v e r s At i l e co n c e p t f o r A s s u r e d s pAc e Acc e s s
Conc
ept
Nam
eG
over
nmen
t/A
genc
yPe
rfor
mer
Last
Ye
arD
esig
n Pa
yloa
d (lb
s)D
esig
n M
atur
ity
Tech
nolo
gy
Tim
efra
me
Syst
em D
escr
iptio
n
Path
finde
rir
aDPi
onee
r ro
cket
-pl
ane
1998
5,07
0 2-
Med
2-M
idre
usab
le w
inge
d-bo
dy b
oost
er s
tage
take
s off
unde
r tur
boje
t th
rust
and
rend
ezvo
us w
ith a
tank
er a
ircra
ft. a
fter
taki
ng o
n lo
X, v
ehic
le a
ccel
erat
es to
Mac
h 15
sta
ging
poi
nt a
nd re
leas
es
rock
et u
pper
sta
ge. (
Sarig
ul-K
lijn,
200
1)Pe
gasu
sir
aDo
rbita
l Sc
ienc
es
corp
2010
1,00
0 3-
Hig
h1-
nea
rth
ree-
stag
e so
lid ro
cket
upp
er s
tage
is c
arrie
d to
an
air-
drop
po
int b
y a
mod
ified
l-10
11 a
ircra
ft. (
orb
ital,
2011
)
Pere
grin
eir
aDa
ndre
ws
Spac
e20
0415
,000
1-
low
2-M
idre
usab
le, a
irpla
ne-li
ke fi
rst s
tage
use
s tur
boje
ts a
nd a
tail
rock
et to
take
off, c
limb,
and
acc
eler
ate.
a m
ultis
tage
sol
id
rock
et u
pper
sta
ge c
arrie
s the
pay
load
to o
rbit.
(and
rew
s,
2008
)Po
lyut
russ
iaa
ir la
unch
Sy
stem
, inc
.n
a6,
600
1-lo
w2-
Mid
thre
e st
age
liqui
d ro
cket
upp
er s
tage
air-
drop
ped
from
an-
124
(HlS
tea
m, 2
011)
rafa
el l
ight
air
laun
ch (l
al)
isra
elra
fael
2006
100
lb1-
low
1-n
ear
an
uppe
r sta
ge b
ased
on
rafa
el’s
“B” m
issi
le is
car
ried
alof
t by
an
F-15
i figh
ter p
lane
. the
upp
er s
tage
rele
ase
occu
rs a
t su
pers
onic
spee
d. (H
lS t
eam
, 201
1)ra
Scal
- co
lem
anu
S/D
arPa
cole
man
2003
165
2-M
ed2-
Mid
Da
rPa
pro
gram
to d
esig
n an
d de
velo
p lo
w-c
ost o
rbita
l in
sert
ion
capa
bilit
y fo
r ded
icat
ed m
icro
-siz
e sa
telli
te p
aylo
ads.
th
e co
ncep
t is t
o de
velo
p a
resp
onsi
ve, r
outin
e, sm
all p
aylo
ad
deliv
ery
syst
em c
apab
le o
f pro
vidi
ng fl
exib
le a
cces
s to
spac
e us
ing
a co
mbi
natio
n of
reus
able
and
low
-cos
t exp
enda
ble
vehi
cle
elem
ents
. (Y
oung
, 200
5)ra
Scal
- Del
ta
Velo
city
uS/
Dar
PaD
elta
Ve
loci
ty20
0316
5 2-
Med
2-M
idD
arP
a p
rogr
am to
des
ign
and
deve
lop
low
-cos
t orb
ital
inse
rtio
n ca
pabi
lity
for d
edic
ated
mic
ro-s
ize
sate
llite
pay
load
s.
the
conc
ept i
s to
deve
lop
a re
spon
sive
, rou
tine,
smal
l pay
load
de
liver
y sy
stem
cap
able
of p
rovi
ding
flex
ible
acc
ess t
o sp
ace
usin
g a
com
bina
tion
of re
usab
le a
nd lo
w-c
ost e
xpen
dabl
e ve
hicl
e el
emen
ts. (
Youn
g, 2
005)
raSc
al -
Gt
iraD
Geo
rgia
te
ch20
0516
5 1-
low
2-M
idD
arP
a p
rogr
am to
des
ign
and
deve
lop
low
-cos
t orb
ital
inse
rtio
n ca
pabi
lity
for d
edic
ated
mic
ro-s
ize
sate
llite
pay
load
s.
the
conc
ept i
s to
deve
lop
a re
spon
sive
, rou
tine,
smal
l pay
load
de
liver
y sy
stem
cap
able
of p
rovi
ding
flex
ible
acc
ess t
o sp
ace
usin
g a
com
bina
tion
of re
usab
le a
nd lo
w-c
ost e
xpen
dabl
e ve
hicl
e el
emen
ts. (
Youn
g, 2
005)
raSc
al -
nor
thro
p G
rum
man
uS/
Dar
Pan
orth
rop
Gru
mm
an20
0316
5 2-
Med
2-M
idD
arP
a p
rogr
am to
des
ign
and
deve
lop
low
-cos
t orb
ital
inse
rtio
n ca
pabi
lity
for d
edic
ated
mic
ro-s
ize
sate
llite
pay
load
s.
the
conc
ept i
s to
deve
lop
a re
spon
sive
, rou
tine,
smal
l pay
load
de
liver
y sy
stem
cap
able
of p
rovi
ding
flex
ible
acc
ess t
o sp
ace
usin
g a
com
bina
tion
of re
usab
le a
nd lo
w-c
ost e
xpen
dabl
e ve
hicl
e el
emen
ts. (
Youn
g, 2
005)

Appendix C
90 H o r i zo n ta l l au n c H
Conc
ept
Nam
eG
over
nmen
t/A
genc
yPe
rfor
mer
Last
Ye
arD
esig
n Pa
yloa
d (lb
s)D
esig
n M
atur
ity
Tech
nolo
gy
Tim
efra
me
Syst
em D
escr
iptio
n
raSc
al- P
ione
er
rock
etpl
ane
uS/
Dar
PaPi
onee
r ro
cket
-pl
ane
2003
165
2-M
ed2-
Mid
Da
rPa
pro
gram
to d
esig
n an
d de
velo
p lo
w-c
ost o
rbita
l in
sert
ion
capa
bilit
y fo
r ded
icat
ed m
icro
-siz
e sa
telli
te p
aylo
ads.
th
e co
ncep
t is t
o de
velo
p a
resp
onsi
ve, r
outin
e, sm
all p
aylo
ad
deliv
ery
syst
em c
apab
le o
f pro
vidi
ng fl
exib
le a
cces
s to
spac
e us
ing
a co
mbi
natio
n of
reus
able
and
low
-cos
t exp
enda
ble
vehi
cle
elem
ents
. (Yo
ung,
200
5)ra
Scal
- Sp
ace
acce
ss l
lcu
S/D
arPa
Spac
e ac
cess
llc
2003
165
2-M
ed2-
Mid
Da
rPa
pro
gram
to d
esig
n an
d de
velo
p lo
w-c
ost o
rbita
l in
sert
ion
capa
bilit
y fo
r ded
icat
ed m
icro
-siz
e sa
telli
te p
aylo
ads.
th
e co
ncep
t is t
o de
velo
p a
resp
onsi
ve, r
outin
e, sm
all p
aylo
ad
deliv
ery
syst
em c
apab
le o
f pro
vidi
ng fl
exib
le a
cces
s to
spac
e us
ing
a co
mbi
natio
n of
reus
able
and
low
-cos
t exp
enda
ble
vehi
cle
elem
ents
. (Yo
ung,
200
5)ra
Scal
- Spa
ce
laun
ch c
orp.
uS/
Dar
PaSp
ace
laun
ch
corp
.
2003
165
lb2-
Med
2-M
idD
arP
a p
rogr
am to
des
ign
and
deve
lop
low
-cos
t orb
ital
inse
rtio
n ca
pabi
lity
for d
edic
ated
mic
ro-s
ize
sate
llite
pay
load
s.
the
conc
ept i
s to
deve
lop
a re
spon
sive
, rou
tine,
smal
l pay
load
de
liver
y sy
stem
cap
able
of p
rovi
ding
flex
ible
acc
ess t
o sp
ace
usin
g a
com
bina
tion
of re
usab
le a
nd lo
w-c
ost e
xpen
dabl
e ve
hicl
e el
emen
ts. (
Youn
g, 2
005)
raSV
SSt
o H
tHl
rock
etir
aDBo
eing
co
mpa
ny19
7610
,000
2-
Med
1-n
ear
raSV
take
s off
usin
g a
600
ft/s
gro
und
acce
lera
tor.
the
vehi
cle
then
asc
ends
to o
rbit
unde
r pur
e ro
cket
pow
er su
pplie
d by
2
SSM
Es. (
Boei
ng, 1
976)
reus
able
orb
ital
carr
ier
uS/
na
Salo
ckhe
ed19
6425
,000
1-
low
2-M
idtu
rboj
et a
nd ro
cket
pro
puls
ion.
(HlS
tea
m, 2
011)
reus
able
orb
ital
carr
ier
uS/
na
Saro
ckw
ell
1964
25,0
00
1-lo
w2-
Mid
rock
wel
l con
cept
for t
he r
oc
vehi
cle.
(HlS
tea
m, 2
011)
robu
st S
cram
jet -
Q
uick
sat
uS/
air
Forc
eSp
ace-
Wor
ks20
0413
,090
1-
low
3-Fa
rtB
cc b
oost
er s
tage
with
tail
rock
ets.
all-
rock
et u
pper
sta
ge.
Stag
ing
poin
t is a
t Mac
h 9.
(Bra
dfor
d, 2
006)
robu
st S
cram
jet -
Sp
iral-2
uS/
air
Forc
eSp
ace-
Wor
ks20
0615
,000
1-
low
3-Fa
rtB
cc b
oost
er s
tage
with
tail
rock
ets.
all-
rock
et u
pper
sta
ge.
Stag
ing
poin
t is a
t Mac
h 9.
(Bra
dfor
d, 2
006)
Sa-1
iraD
Spac
e ac
cess
llc
, M
cKin
ney
ass
ocia
tes
1999
20,0
00
1-lo
w3-
Far
the
Sa-1
is a
747
-siz
e sp
acep
lane
that
take
s off
unde
r eje
ctor
ra
mje
t mod
e. r
amje
t-sc
ram
jet m
ode
is th
en u
sed
to M
ach
8 at
w
hich
poi
nt p
ure
rock
ets t
ake
over
. (Fa
a, 2
001)
Säng
er 2
Ger
man
yM
BB19
9120
,000
1-
low
2-M
idSä
nger
2 u
ses t
urbo
-ram
jet p
ropu
lsio
n to
acc
eler
ate
to M
ach
4.4.
the
veh
icle
then
use
s roc
ket t
hrus
t to
reac
h a
Mac
h 6
stag
ing
poin
t for
upp
er s
tage
rele
ase.
(HlS
tea
m, 2
011)

Study Sur vey
91A v e r s At i l e co n c e p t f o r A s s u r e d s pAc e Acc e s s
Conc
ept
Nam
eG
over
nmen
t/A
genc
yPe
rfor
mer
Last
Ye
arD
esig
n Pa
yloa
d (lb
s)D
esig
n M
atur
ity
Tech
nolo
gy
Tim
efra
me
Syst
em D
escr
iptio
n
Salk
eld
c-5
(und
erw
ing)
iraD
Syst
em
Dev
elop
-m
ent c
orp.
1970
5,50
0 1-
low
1-n
ear
orb
iter w
ith d
rop
tank
s air-
drop
ped
from
und
er w
ing
of c
-5a
ca
rrie
r airc
raft
. (Sa
lkel
d, 1
978)
Salk
eld
Dua
l c-5
(u
nder
win
g)ir
aDSy
stem
D
evel
op-
men
t cor
p.
1970
12,0
00
1-lo
w2-
Mid
Win
ged
orbi
ter a
nd d
rop
tank
s air-
drop
ped
from
dua
l c-5
a
carr
ier a
ircra
ft. (
Salk
eld,
197
8)
Sea
arg
usir
aDSp
ace-
Wor
ks20
041,
000
1-lo
w2-
Mid
nex
t-ge
nera
tion
tSto
sys
tem
with
ele
ctro
mag
netic
laun
ch
assi
st h
oriz
onta
l tak
eoff
from
airc
raft
car
rier.
reus
able
boo
ster
st
age
with
com
bine
d-cy
cle
prop
ulsi
on, e
xpen
dabl
e ro
cket
up
per s
tage
(Spa
cew
orks
, 200
4)Sh
enlo
ngch
ina
chin
a20
0711
0 1-
low
1-n
ear
Shen
long
is a
ir-la
unch
ed fr
om a
n H
-6 B
adge
r (tu
-16)
bom
ber.
a th
ree-
stag
e so
lid u
pper
sta
ge c
arrie
s a sm
all p
aylo
ad to
lEo
. (H
lS t
eam
, 201
1)Sk
ylon
na
reac
tion
Engi
nes
ltd.
2010
26,0
00
1-lo
w3-
Far
Skyl
on u
ses t
wo
Sabr
e rB
cc e
ngin
es in
air/
lH2
mod
e to
ac
cele
rate
to M
ach
5.5,
and
then
use
s pur
e ro
cket
mod
e to
as
cend
to o
rbit.
(rea
ctio
n, 2
010)
Spac
e cl
ippe
rru
ssia
Yuzh
noye
s SD
on
a1,
100
lb1-
low
1-n
ear
two
stag
e so
lid u
pper
sta
ge a
ir-dr
oppe
d fr
om a
n-1
24 (H
lS
team
, 201
1)
Spac
e o
pera
tions
Ve
hicl
eu
S/a
ir Fo
rce
Faul
kner
co
nsul
ting,
M
cKin
ney
ass
ocia
tes
2004
12,0
00
3-H
igh
2-M
idtS
to, V
tHl,
hyd
roca
rbon
-fue
led,
rBc
c su
bson
ic-c
ombu
stio
n fo
r rel
iabl
e, ra
pid
mili
tary
spac
e ac
cess
, lau
nche
d fr
om K
Sc in
to
pola
r and
28-
deg
118
x 56
nm
i orb
its. t
hree
pay
load
s: SM
V,
caV,
MiS
(Bra
dley
, 200
3)Sp
acep
lane
(Dan
D
elon
g)ir
aDte
ledy
ne
Brow
nn
a12
,000
1-
low
2-M
idW
inge
d-bo
dy, r
ocke
t pow
ered
orb
iter a
ir-la
unch
ed fr
om
mod
ified
Boe
ing
747.
(Xco
r, 2
011)
Spira
l 50-
50u
SSr
nPo
M
olni
ya19
6522
,000
2-
Med
3-Fa
rlH
2 fu
eled
turb
ojet
s acc
eler
ate
vehi
cle
to M
ach
6 st
agin
g po
int.
rock
et u
pper
sta
ge b
oost
s reu
sabl
e or
bite
r. (B
iltge
n,
2004
)St
arru
nner
iraD
Geo
rgia
te
ch20
0425
,000
1-
low
3-Fa
rtB
cc w
ith a
cES
SSto
con
cept
. (Bi
ltgen
, 200
4)
Supe
rlac
E / a
cES
aero
spac
e-pl
ane
na
Gen
eral
D
ynam
ics
1962
35,0
00
1-lo
w3-
Far
SSto
aer
ospa
ce p
lane
con
cept
usi
ng l
acE
in a
ir-br
eath
ing
mod
e an
d ac
ES in
rock
et m
ode
asce
nt to
orb
it.
(Hep
penh
eim
er, 2
007)
Sviti
azu
krai
nen
atio
nal
Spac
e ag
ency
2005
14,5
00
1-lo
w1-
nea
rze
nit r
ocke
t air-
laun
ched
from
the
top
of a
n a
n-22
5. (H
lS
team
, 201
1)
Swift
laun
ch
iraD
uni
vers
ity
of
calif
orni
a,
Dav
is
2001
1,80
0 1-
low
2-M
idc-
5 or
an-
124
carr
ier a
ircra
ft is
use
d to
air-
drop
a n
ovel
orb
iter-
aft,
1.5
stag
e sy
stem
with
dro
p ta
nks.
(Sar
igul
-Klij
n, 2
001)

Appendix C
92 H o r i zo n ta l l au n c H
Conc
ept
Nam
eG
over
nmen
t/A
genc
yPe
rfor
mer
Last
Ye
arD
esig
n Pa
yloa
d (lb
s)D
esig
n M
atur
ity
Tech
nolo
gy
Tim
efra
me
Syst
em D
escr
iptio
n
taV
Scie
nce
Daw
n
reus
able
aer
o-dy
nam
ics
Spac
e Ve
hicl
e (r
aSV
)
uS/
air
Forc
eBo
eing
co
mpa
ny19
9010
,000
3-
Hig
h1-
nea
rSl
ed-la
unch
ed a
ll-ro
cket
spac
epla
ne (S
anbo
rn, 1
984)
taV
Scie
nce
Daw
n zE
lu
S/a
ir Fo
rce
lock
heed
1990
10,0
00
1-lo
w3-
Far
zEl
uses
1.5
Mlb
thru
st b
oost
er s
tage
to li
ft-o
ff fr
om a
30
deg
nose
-up
star
ting
posi
tion.
reu
sabl
e w
inge
d zE
l ac
cele
rate
s to
orbi
t und
er a
ll-ro
cket
thru
st. (
Sanb
orn,
198
4)
tele
maq
ueFr
ance
cnES
na
550
1-lo
w1-
nea
rli
quid
/sol
id/li
quid
upp
er s
tage
s lau
nche
d fr
om th
e to
p of
an
airb
us a
330.
(tal
bot,
2008
)u
rEti
azt
ecu
S/n
aSa
Geo
rgia
te
ch20
0420
,000
1-
low
3-Fa
rtB
cc b
oost
er s
tage
with
HED
M. S
tagi
ng p
oint
at M
ach
8.2.
(K
okan
, 200
4)u
S Sp
acep
lane
iraD
uS
Spac
epla
ne
Sys.
2010
15,0
00
1-lo
w3-
Far
tBcc
boo
ster
sta
ge w
ith a
ll-ro
cket
upp
er s
tage
. Sta
ging
poi
nt
at M
ach
6. (u
S Sp
acep
lane
, 200
6)
Vozd
ushn
y St
art
russ
iaEn
ergi
a20
006,
600
1-lo
w1-
nea
rSo
lid u
pper
sta
ge a
ir-dr
oppe
d fr
om a
n-12
4 (H
lS t
eam
, 201
1)
X-34
Bir
aDo
rbita
l Sc
ienc
es
corp
2000
880
lb2-
Med
2-M
idX-
34B
was
to b
e ai
r-la
unch
ed fr
om th
e 74
7 ca
rrie
r airc
raft
at
Mac
h ~
0.8.
the
X-3
4B u
sed
rock
et m
ain
prop
ulsi
on, a
s did
its
smal
l upp
er s
tage
. (H
lS t
eam
, 201
1)
Yako
vlev
Hig
h a
ltitu
de a
eria
l la
unch
(Ha
al)
russ
iaYa
kovl
ev19
942,
500
1-lo
w2-
Mid
icBM
-bas
ed u
pper
sta
ge a
ir-la
unch
ed fr
om t
u-16
0 ca
rrie
r ai
rcra
ft. (
Sarig
ul-K
lijn,
200
1)

93A v e r s At i l e co n c e p t f o r A s s u r e d s pAc e Acc e s s
Technology Readiness LevelsTRL 1 Basic principles observed and reported: transition from scientific research to applied
research. Essential characteristics and behaviors of systems and architectures. Descriptive tools are mathematical formulations or algorithms.
TRL 2 technology concept and/or application formulated: applied research. theory and scientific principles are focused on specific application area to define the concept. characteristics of the application are described. analytical tools are developed for simulation or analysis of the application.
TRL 3 analytical and experimental critical function and/or characteristic proof-of concept: Proof of concept validation. active research and Development (r&D) is initiated with analytical and laboratory studies. Demonstration of technical feasibility using breadboard or brassboard implementations that are exercised with representative data.
TRL 4 component/subsystem validation in laboratory environment: Standalone prototyping implementation and test. integration of technology elements. Experiments with full-scale problems or data sets.
TRL 5 System/subsystem/component validation in relevant environment: thorough testing of prototyping in representative environment. Basic technology elements integrated with reasonably realistic supporting elements. Prototyping implementations conform to target environment and interfaces.
TRL 6 System/subsystem model or prototyping demonstration in a relevant end-to-end environment (ground or space): Prototyping implementations on full-scale realistic problems. Partially integrated with existing systems. limited documentation available. Engineering feasibility fully demonstrated in actual system application.
TRL 7 System prototyping demonstration in an operational environment (ground or space): System prototyping demonstration in operational environment. System is at or near scale of the operational system, with most functions available for demonstration and test. Well integrated with collateral and ancillary systems. limited documentation available.
TRL 8 actual system completed and “mission qualified” through test and demonstration in an operational environment (ground or space): End of system development. Fully integrated with operational hardware and software systems. Most user documentation, training documentation, and maintenance documentation completed. all functionality tested in simulated and operational scenarios. Verification and Validation (V&V) completed.
TRL 9 actual system “mission proven” through successful mission operations (ground or space): Fully integrated with operational hardware/software systems. actual system has been thoroughly demonstrated and tested in its operational environment. all documentation completed. Successful operational experience. Sustaining engineering support in place.
a PPE n D i X D

94 H o r i zo n ta l l au n c H
Supersonic and Hypersonic Carrier Aircraft TechnologiesA major finding of this study was the overwhelming effect of the cost of design, development, test, and evaluation (DDT&E) of new supersonic and hypersonic carrier aircraft technologies. This appendix summarizes some of the fundamental and critical technologies that will drive these costs prior to integration of a supersonic or hypersonic carrier aircraft into a horizontal launch system.
The main benefit of maximizing the separation Mach number was to lower the V required by the launch vehicle to attain orbital velocity, thus allowing potentially greater payload mass to orbit. This advantage could also be used for additional structural margin to increase reliability and system robustness or to add systems that allow a fully reusable launch vehicle. (Bilardo, 2003) Numerous studies in the past ten years have identified technologies needed to realize a supersonic or hypersonic carrier aircraft for horizontal launch options.
Supersonic Carrier Aircraft
Many of the technologies used in existing supersonic aircraft can be utilized for horizontal launch but will need larger airframes to increase payload capability. The study team found that the small size of existing supersonic aircraft limited the size of payloads that could be launched. The internal dimensions limit the size of a launch vehicle carried internally, and external carriage of a launch vehicle on a supersonic aircraft was currently impractical without very large excess thrust to overcome the transonic drag.
Novel aircraft configurations may increase the payload capability of supersonic aircraft. Examples include a modified structural design to maximize internal volume or a radical airframe design that aims to solve the transonic pinch point problem. Promising propulsion technologies include larger-scale supersonic turbojet engines or efficient aerodynamic and thermal integra-tion of clustered turbojets to increase thrust to levels. Additionally, several specific propulsion integration technologies could enhance supersonic staging horizontal launch, including variable cycle turbo accelerator engines,5 tail rockets, (Andrews, 2005) the use of mass injection pre-compressor cooling, (Carter, 2003) or the use of liquid oxygen in turbojet afterburners. (Balepin, 2008) Alone or in combination, these would allow a significant transonic thrust margin and an acceleration-climb maneuver to enable a more optimal launch of the rocket powered launch vehicle with a high flight path angle and low dynamic pressure.
Hypersonic Carrier Aircraft
Hypersonic staging horizontal takeoff and landing carrier aircraft concepts have been proposed in many studies with a variety of different propulsion system and vehicle architectures. (Boeing,
5 Such as the Revolutionary Turbine Accelerator (RTA).
a PPE n D i X E

Super sonic and Hyper sonic C arr ier A i rc raf t Technologies
95A v e r s At i l e co n c e p t f o r A s s u r e d s pAc e Acc e s s
2005; McClinton, 2004; 2008; CPIAC, 2001; Stanley, 2010; NRC 2004) Several enabling technolo-gies described in these studies that will require development or demonstration investments to achieve TRL 6 are summarized here. This list was not intended to be all-inclusive or comprehen-sively detailed, but only to provide a summary perspective on major areas of technology develop-ment requirements.
The hypersonic carrier aircraft included here were assumed to deploy the launch vehicle between Mach 6 and 10. For a higher Mach number, carrier aircraft or a single-stage-to-orbit vehicle, TRLs were likely to be lower in almost every subsystem than supersonic systems.
Specific technologies that need to be addressed were partly configuration dependent. That is, some technologies will require early attention during conceptual design of a hypersonic carrier aircraft depending on specific attributes to be utilized or traded. Where TRLs were identified in previous studies, they were specifically referenced. Further, where technologies can also be linked to the following NASA Space Technology Roadmaps, they were shown by technology area number after each technology.6
Vehicle-Level System Design1. Develop and verify multidisciplinary design optimization (MDO) tools to include the
ability to enhance existing scaling laws and related analysis tools to properly design carrier aircraft of sufficient size to carry launch vehicles of sufficient size; to perform vehicle geometry parameterization to efficiently explore the vehicle design space; to generate automated external and internal grid surfaces to expedite analysis of computa-tional fluid dynamics (CFD); to perform trajectory optimization for an accelerator carrier aircraft to maximize performance and operability of the airbreathing engines across the speed regime; to improve discipline-level analysis tool fidelity; to improve modeling and analysis of aerodynamic heating, engine heating, and thermal management; and to include cost and safety analyses in all phases of system design. [TRL 3-4; TRL 2-5] [Roadmap sections TA01 1.3.8; TA11 2.2.2.4; TA12 2.5.3]
2. Develop methods to efficiently design for vehicle stability and control across the speed regime is needed to address the aeropropulsive effects on vehicle trim and their sensi-tivity to Mach number and engine throttle setting. [TRL 3-4] [Roadmap section TA01 1.3.5]
3. Develop verified methods to predict transonic propulsion integrated with airframe performance and operability is needed to achieve a solution to the transonic pinch-point problem. [TRL 2-3]
4. Develop methods to efficiently incorporate uncertainty into analysis and design methods using probabilistic analyses. [TRL 2-3] [Roadmap sections TA12 2.2.2 and 2.3.6]
6 NASA Space Technology Roadmaps. Available at http://www.nasa.gov/offices/oct/home/roadmaps/index.html

Appendix E
96 H o r i zo n ta l l au n c H
5. Verify understanding of effects of critical data and communications transmission through shock layers and/or ionized flowfields.
6. Assess the potential uses of magnetohydrodynamics for drag reduction, vehicle and flow-path flow control, and combustion enhancement. [TRL 1-2]
Propulsion and Propellants1. Revive efforts on a revolutionary turbine accelerator to determine upper speed limit
capability (with a goal of at least Mach 4) and develop a flight-weight version engine. [TRL 4-6] [Roadmap section TA01 1.3.1]
2. Revive RBCC development efforts with emphasis on inlet/isolator/rocket performance and compatibility, augmentation/air capture requirements at subsonic speeds, trading inlet starting Mach number with high speed capture requirements, and long life high performance thrust chamber development. [TRL 4] [Roadmap section TA01 1.3.2]
3. Exercise and determine the low-speed limit of the dual-mode scramjet with reasonable performance and operability via inlet bleed systems, a cold-start system, and improve-ments to flameholding. [TRL 3] [Roadmap section TA01 1.3.5]
4. Experimentally demonstrate mode transition from a low-speed engine (such as a turbojet) to a high-speed engine (ramjet/scramjet) and the effect on overall vehicle performance and engine operability. [Roadmap section TA01 1.3.1]
5. Address options for integration of multiple engine systems, including turbojet cocooning, air augmentation, inlet systems, and nozzle systems. [TRL 3-4] [Roadmap section TA01 1.3.1]
6. Assess possible solutions for transonic thrust (e.g., external burning or tail rockets). [TRL 3-4]
7. Develop variable geometry and multiple fueling location options for improved high-speed engine multiMach number performance. [TRL 4-6] [Roadmap section TA01 1.3.1]
8. Develop system (hardware and software) to control propulsion performance and oper-ability. [TRL 4-6]
9. Renew efforts to determine performance, durability, and integration of linear aerospike tail rockets. [TRL 4-5]
10. Continue to understand hypersonic propulsion physics challenges via “unit” experiments in such areas as natural and forced boundary-layer transition; boundary layer turbu-lence; separation caused by shock-boundary layer interaction; shock-shock interaction heating; inlet-isolator shock trains; cold-wall heat transfer; fuel injection, penetration and mixing; finite rate chemical kinetics; turbulence-chemistry interaction; boundary layer relaminarization; recombination chemistry; and catalytic wall effects. [Roadmap section TA01 1.3.5]
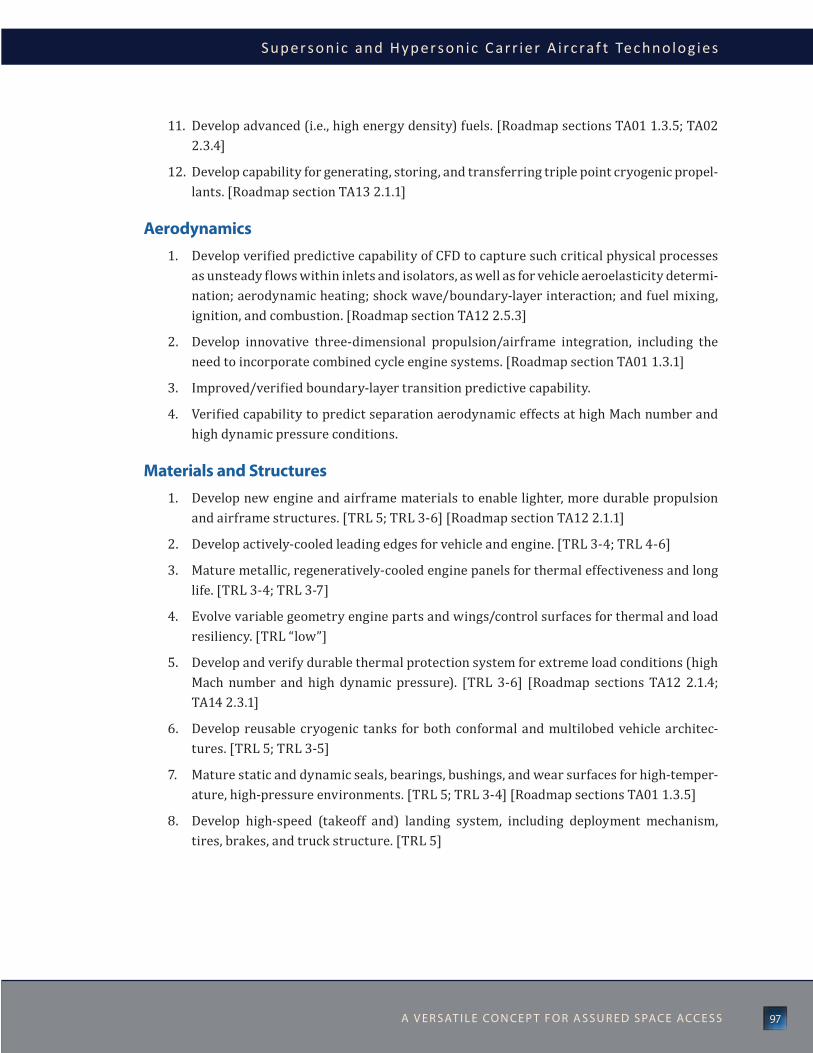
Super sonic and Hyper sonic C arr ier A i rc raf t Technologies
97A v e r s At i l e co n c e p t f o r A s s u r e d s pAc e Acc e s s
11. Develop advanced (i.e., high energy density) fuels. [Roadmap sections TA01 1.3.5; TA02 2.3.4]
12. Develop capability for generating, storing, and transferring triple point cryogenic propel-lants. [Roadmap section TA13 2.1.1]
Aerodynamics1. Develop verified predictive capability of CFD to capture such critical physical processes
as unsteady flows within inlets and isolators, as well as for vehicle aeroelasticity determi-nation; aerodynamic heating; shock wave/boundary-layer interaction; and fuel mixing, ignition, and combustion. [Roadmap section TA12 2.5.3]
2. Develop innovative three-dimensional propulsion/airframe integration, including the need to incorporate combined cycle engine systems. [Roadmap section TA01 1.3.1]
3. Improved/verified boundary-layer transition predictive capability.
4. Verified capability to predict separation aerodynamic effects at high Mach number and high dynamic pressure conditions.
Materials and Structures1. Develop new engine and airframe materials to enable lighter, more durable propulsion
and airframe structures. [TRL 5; TRL 3-6] [Roadmap section TA12 2.1.1]
2. Develop actively-cooled leading edges for vehicle and engine. [TRL 3-4; TRL 4-6]
3. Mature metallic, regeneratively-cooled engine panels for thermal effectiveness and long life. [TRL 3-4; TRL 3-7]
4. Evolve variable geometry engine parts and wings/control surfaces for thermal and load resiliency. [TRL “low”]
5. Develop and verify durable thermal protection system for extreme load conditions (high Mach number and high dynamic pressure). [TRL 3-6] [Roadmap sections TA12 2.1.4; TA14 2.3.1]
6. Develop reusable cryogenic tanks for both conformal and multilobed vehicle architec-tures. [TRL 5; TRL 3-5]
7. Mature static and dynamic seals, bearings, bushings, and wear surfaces for high-temper-ature, high-pressure environments. [TRL 5; TRL 3-4] [Roadmap sections TA01 1.3.5]
8. Develop high-speed (takeoff and) landing system, including deployment mechanism, tires, brakes, and truck structure. [TRL 5]

Appendix E
98 H o r i zo n ta l l au n c H
Thermal Management1. Verify closed-loop engine regenerative cooling and fuel conditioning tools. [TRL 3]
[Roadmap section TA01 1.3.8]
2. Develop verified shock interaction heating prediction and mitigation.
3. Develop innovative, robust, low subsystem impact cooling concepts for highly-loaded airframe and propulsion structures (e.g., film cooling and transpiration cooling).
Ground Test Technologies and Flight Operations1. Develop methodology for test and evaluation of larger-scale systems (e.g., engines,
thermal panels, structural components) and mode transition.
2. Verify fundamental physics understanding through well designed “unit” experiments for tool validation.
3. Develop diagnostic capabilities for acquiring additional types and amounts of data from ground and flight tests. [Roadmap section TA13 2.1.3]
4. Develop capability for faster turnaround time through highly automated vehicle opera-tions, where the vehicle itself will report to the ground personnel what maintenance it needs via Integrated Vehicle Health Management. [TRL 2-3] [Roadmap sections TA04 2.1.5; TA09 1.1.5; TA11 2.2.2.2; TA12 2.2.3 and 2.3.5; TA13 2.3.3 through 2.3.6]
5. Develop new range operations to minimize ground-based personnel needed for a given mission.
6. Develop launch vehicle processing methods to integrate the launch vehicle and the carrier aircraft with minimum crew and turnaround times.
7. Address launch-assist options such as magnetic levitation or electromagnetic rails. [Roadmap section TA13 2.3.1]

99A v e r s At i l e co n c e p t f o r A s s u r e d s pAc e Acc e s s
Fidelity of AnalysisThe analysis requirements and methodology differs for performance-related disciplines at various levels of analytical fidelity. The levels zero through four are described here for eight cate-gories of analysis.
Configuration, geometry and packaging
0 Parametric, empirical or analytical geometry model
1 External and major internal components modeled such as propellant tanks; payload bay, propulsion, etc., modeled for volume, area, and key linear dimensions
2 all components modeled, packaged, and analyzed for geometric properties including center of gravity; geometry redrawn and packaged to match closure model
3 all components modeled, packaged, and analyzed for geometric properties including center of gravity and inertia characteristics; geometry redrawn and packaged to match closure model
4 all components modeled, packaged, and analyzed for geometric properties including center of gravity and inertia characteristics; geometry re-drawn and packaged to match closure model
Structures and materials
0 Parametric or historical equation adjusted to level 1 or higher for similar technology and vehicle configuration
1 one-dimensional bending loads analysis based on structural theory of beams, shell, etc. with nonoptimums based on level 2 or higher results
2 limited three-dimensional finite element analysis (less than 20,000 nodes) for all major load cases, structure sized to allowables, nonoptimums determined empirically or analytically
3 three-dimensional finite element analysis (more than 20,000 nodes) for all major load cases, structure sized to allowables, nonoptimums determined empirically or analytically; dynamic frequencies estimated.
4 three-dimensional finite element analysis (more than 100,000 nodes) for all major load cases, structure sized to allowables, nonoptimums determined empirically or analytically. Dynamic frequencies estimated.
Sizing and closure
0 Weight and volume closure with consistent bookkeeping of all propellants and fluids based on commensurate fidelity level inputs from other disciplines; as-flown vehicle photographic scale factor less than +/- 15% from as-drawn
1 Weight and volume closure with consistent bookkeeping of all propellants and fluids based on commensurate fidelity level inputs from other disciplines; as-flown vehicle photographic scale factor less than +/- 10% from as-drawn
2 Weight and volume closure with consistent bookkeeping of all propellants and fluids based on commensurate fidelity level inputs from other disciplines; as-flown vehicle photographic scale factor less than +/- 5% from as-drawn
3 Weight and volume closure with consistent bookkeeping of all propellants and fluids based on commensurate fidelity level inputs from other disciplines; as-flown vehicle photographic scale factor less than +/- 3% from as-drawn
4 Weight and volume closure with consistent bookkeeping of all propellants and fluids based on commensurate fidelity level inputs from other disciplines; as-flown vehicle photographic scale factor less than +/- 1% from as-drawn
a PPE n D i X F
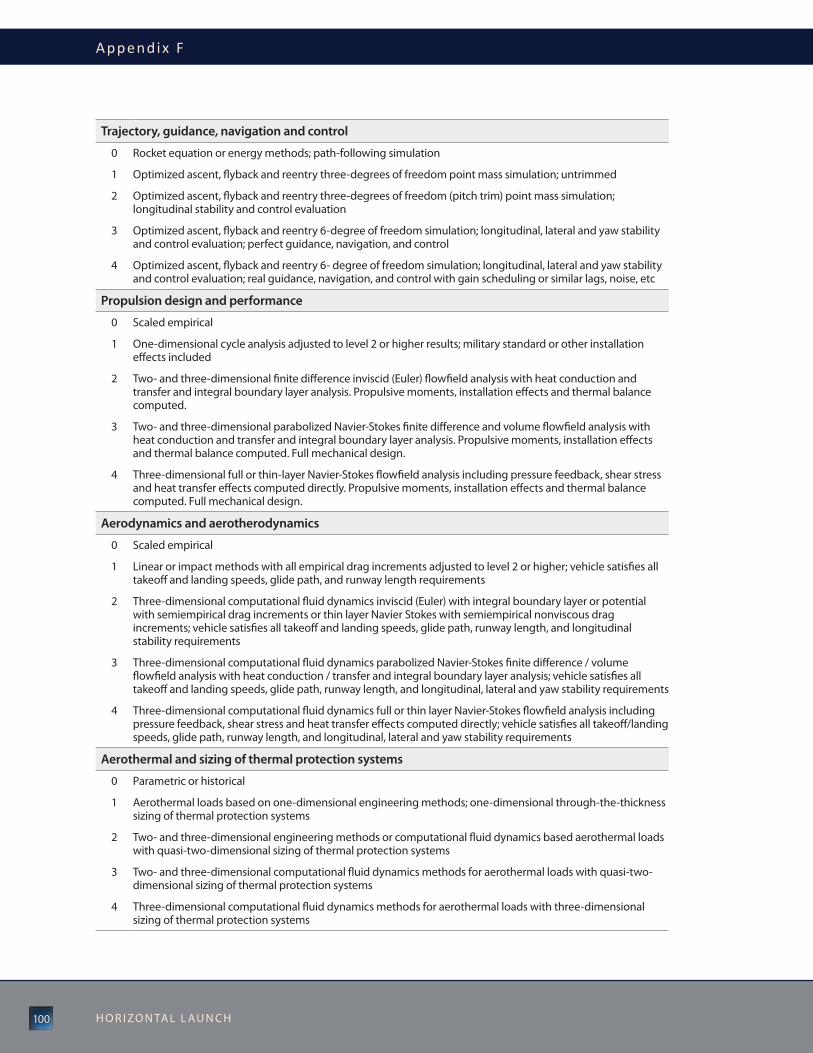
Appendix F
100 H o r i zo n ta l l au n c H
Trajectory, guidance, navigation and control
0 rocket equation or energy methods; path-following simulation
1 optimized ascent, flyback and reentry three-degrees of freedom point mass simulation; untrimmed
2 optimized ascent, flyback and reentry three-degrees of freedom (pitch trim) point mass simulation; longitudinal stability and control evaluation
3 optimized ascent, flyback and reentry 6-degree of freedom simulation; longitudinal, lateral and yaw stability and control evaluation; perfect guidance, navigation, and control
4 optimized ascent, flyback and reentry 6- degree of freedom simulation; longitudinal, lateral and yaw stability and control evaluation; real guidance, navigation, and control with gain scheduling or similar lags, noise, etc
Propulsion design and performance
0 Scaled empirical
1 one-dimensional cycle analysis adjusted to level 2 or higher results; military standard or other installation effects included
2 two- and three-dimensional finite difference inviscid (Euler) flowfield analysis with heat conduction and transfer and integral boundary layer analysis. Propulsive moments, installation effects and thermal balance computed.
3 two- and three-dimensional parabolized navier-Stokes finite difference and volume flowfield analysis with heat conduction and transfer and integral boundary layer analysis. Propulsive moments, installation effects and thermal balance computed. Full mechanical design.
4 three-dimensional full or thin-layer navier-Stokes flowfield analysis including pressure feedback, shear stress and heat transfer effects computed directly. Propulsive moments, installation effects and thermal balance computed. Full mechanical design.
Aerodynamics and aerotherodynamics
0 Scaled empirical
1 linear or impact methods with all empirical drag increments adjusted to level 2 or higher; vehicle satisfies all takeoff and landing speeds, glide path, and runway length requirements
2 three-dimensional computational fluid dynamics inviscid (Euler) with integral boundary layer or potential with semiempirical drag increments or thin layer navier Stokes with semiempirical nonviscous drag increments; vehicle satisfies all takeoff and landing speeds, glide path, runway length, and longitudinal stability requirements
3 three-dimensional computational fluid dynamics parabolized navier-Stokes finite difference / volume flowfield analysis with heat conduction / transfer and integral boundary layer analysis; vehicle satisfies all takeoff and landing speeds, glide path, runway length, and longitudinal, lateral and yaw stability requirements
4 three-dimensional computational fluid dynamics full or thin layer navier-Stokes flowfield analysis including pressure feedback, shear stress and heat transfer effects computed directly; vehicle satisfies all takeoff/landing speeds, glide path, runway length, and longitudinal, lateral and yaw stability requirements
Aerothermal and sizing of thermal protection systems
0 Parametric or historical
1 aerothermal loads based on one-dimensional engineering methods; one-dimensional through-the-thickness sizing of thermal protection systems
2 two- and three-dimensional engineering methods or computational fluid dynamics based aerothermal loads with quasi-two-dimensional sizing of thermal protection systems
3 two- and three-dimensional computational fluid dynamics methods for aerothermal loads with quasi-two-dimensional sizing of thermal protection systems
4 three-dimensional computational fluid dynamics methods for aerothermal loads with three-dimensional sizing of thermal protection systems

F idel i t y of Analys is
101A v e r s At i l e co n c e p t f o r A s s u r e d s pAc e Acc e s s
Airframe and engine subsystems
0 Parametric or historical
1 Functional definition and evaluation or one-dimensional or generic modeling of subsystem
2 Quantitative thermal and fluid analysis of subsystem; component weights estimated with empirical, historical or analytical data or analysis
3 Quantitative thermal and fluid analysis of subsystem; component weights estimated with empirical, historical or analytical data or analysis
4 Quantitative thermal and fluid analysis of subsystem; component weights estimated with empirical, historical or analytical data or analysis

Appendix G
102 H o r i zo n ta l l au n c H
Scre
enin
g Pr
oces
s (F
idel
ity L
evel
0)
Tech
Tra
des
(Fid
elity
Lev
el 0
)Po
int D
esig
ns
(Fid
elity
Lev
el 1
)Fl
ight
Tes
ts
(Fid
elity
Lev
el 1
)Fi
scal
yea
r for
cos
t dat
aFY
10
FY10
FY
10
FY10
Wei
ghts
and
siz
ing
Mod
el /
met
hodo
logy
com
pila
tion
of m
ass
estim
atin
g re
latio
nshi
ps fr
om
the
Stag
eSiz
er m
odel
, pre
viou
s st
udie
s, an
d ot
her r
efer
ence
s
com
pila
tion
of m
ass
estim
atin
g re
latio
nshi
ps fr
om
the
Stag
eSiz
er m
odel
, pre
viou
s st
udie
s, an
d ot
her r
efer
ence
s
com
pila
tion
of m
ass
estim
atin
g re
latio
nshi
ps fr
om
the
Stag
eSiz
er m
odel
, pre
viou
s st
udie
s, an
d ot
her r
efer
ence
s
com
pila
tion
of m
ass
estim
atin
g re
latio
nshi
ps fr
om
the
Stag
eSiz
er m
odel
, pre
viou
s st
udie
s, an
d ot
her r
efer
ence
s
Stag
e si
zing
phi
loso
phy
all
stag
es w
ere
fully
pa
ram
etric
; no
exis
ting
hard
war
e as
sum
ed
use
d ex
istin
g la
unch
veh
icle
st
ages
with
fixe
d th
rust
an
d w
eigh
t; al
l oth
er st
age
com
pone
nts f
ully
par
amet
ric
use
d ex
istin
g la
unch
veh
icle
st
ages
with
fixe
d th
rust
an
d w
eigh
t; al
l oth
er st
age
com
pone
nts f
ully
par
amet
ric
use
d ex
istin
g ha
rdw
are
for p
ropu
lsio
n an
d st
ages
; in
ters
tage
s, ae
rosu
rfac
es, a
nd
atta
chm
ent h
ardw
are
size
d pa
ram
etric
ally
Stag
e th
rust
-to-
wei
ght r
atio
at
igni
tion
for s
izin
g1s
t Sta
ge =
1.2
0; 2
nd S
tage
=
1.15;
3rd
Sta
ge =
1.10
num
ber o
f eng
ines
sele
cted
to
prov
ide
suffi
cien
t thr
ust b
ased
on
traj
ecto
ry si
mul
atio
n
num
ber o
f eng
ines
sele
cted
to
prov
ide
suffi
cien
t thr
ust b
ased
on
traj
ecto
ry si
mul
atio
n
num
ber o
f eng
ines
sele
cted
to
prov
ide
suffi
cien
t thr
ust b
ased
on
traj
ecto
ry si
mul
atio
n
Solid
mot
or p
rope
llant
mas
s fr
actio
n 0.
93Ba
sed
on e
xist
ing
solid
stag
esBa
sed
on e
xist
ing
solid
stag
esBa
sed
on e
xist
ing
solid
stag
es
liqu
id p
rope
llant
tank
uni
t w
eigh
t (fu
el a
nd o
xidi
zer)
0.8
lb/f
t3 Fu
nctio
n of
max
imum
load
, se
gmen
t len
gth,
and
tank
vo
lum
e
Func
tion
of m
axim
um lo
ad,
segm
ent l
engt
h, a
nd ta
nk
volu
me
not
app
licab
le -
all e
xist
ing
stag
es w
ith fi
xed
stag
e w
eigh
ts
Win
g un
it w
eigh
t5.
0 lb
/ft2
Func
tion
of w
ing
surf
ace
area
an
d as
pect
ratio
Func
tion
of w
ing
surf
ace
area
an
d as
pect
ratio
Func
tion
of w
ing
surf
ace
area
an
d as
pect
ratio
Payl
oad
dens
ity
8.0
lb/f
t3 7.
0 lb
/ft3
7.0
lb/f
t3n
a - e
xist
ing
payl
oad
fairi
ng
with
fixe
d di
men
sion
s and
w
eigh
t
Payl
oad
fairi
ng u
nit w
eigh
t 2.
75 lb
/ft2
2.5
lb/f
t2 2.
5 lb
/ft2
na
- exi
stin
g pa
yloa
d fa
iring
w
ith fi
xed
dim
ensi
ons a
nd
wei
ght
inte
rsta
ge/in
tert
ank
unit
wei
ght
4.3
lb/f
t2 Fu
nctio
n of
max
imum
load
an
d se
gmen
t len
gth
Func
tion
of m
axim
um lo
ad
and
segm
ent l
engt
hFu
nctio
n of
max
imum
load
an
d se
gmen
t len
gth
Prop
ella
nt re
serv
es, r
esid
uals
, an
d st
art-
up lo
sses
1.
8% o
f ide
al p
rope
llant
mas
s 1.
8% o
f ide
al p
rope
llant
mas
s 1.
8% o
f ide
al p
rope
llant
mas
s 1.
8% o
f ide
al p
rope
llant
mas
s
Ass
um
ptio
ns
an
d M
eth
od
olo
gie
sa
PP
EnD
iX G

A s sumptions and Methodologies
103A v e r s At i l e co n c e p t f o r A s s u r e d s pAc e Acc e s s
Scre
enin
g Pr
oces
s (F
idel
ity L
evel
0)
Tech
Tra
des
(Fid
elity
Lev
el 0
)Po
int D
esig
ns
(Fid
elity
Lev
el 1
)Fl
ight
Tes
ts
(Fid
elity
Lev
el 1
)Pr
opel
lant
ulla
ge
2.0%
of r
equi
red
prop
ella
nt
volu
me
2.0%
of r
equi
red
prop
ella
nt
volu
me
2.0%
of r
equi
red
prop
ella
nt
volu
me
2.0%
of r
equi
red
prop
ella
nt
volu
me
iner
t sys
tem
wei
ght g
row
th
mar
gin
15%
15%
for n
ew c
ompo
nent
s; 5%
fo
r exi
stin
g co
mpo
nent
s15
% fo
r new
com
pone
nts;
5%
for e
xist
ing
com
pone
nts
15%
for n
ew c
ompo
nent
s; 5%
fo
r exi
stin
g co
mpo
nent
sca
rrie
r airc
raft
pay
load
ca
rryi
ng c
apac
ityW
hite
Kni
ght X
: 176
,000
lb
74
7-10
0 Sc
a-9
11: 2
40,0
00 lb
747-
100
Sca
-905
: 192
,000
lb
a38
0-80
0: 2
64,5
50 lb
747-
400F
: 308
,000
lb74
7-40
0F: 3
05,0
00 lb
747-
400F
: 305
,000
lb
a
n-22
5: 4
40,9
25 lb
Whi
te K
nigh
t XX:
750
,000
lb
D
ual c
-5: 7
71,6
18 lb
Prop
ulsi
on
Prop
ulsi
on si
zing
phi
loso
phy
no
exis
ting
hard
war
e as
sum
ed
(all
engi
nes/
rock
ets w
ere
fully
pa
ram
etric
)
Exis
ting
engi
nes/
rock
ets
Exis
ting
engi
nes/
rock
ets
Exis
ting
engi
nes/
rock
ets
Perf
orm
ance
Solid
rock
et m
otor
: 290
s (1s
t st
ages
) 29
2s (2
nd/3
rd st
ages
)
rP e
ngin
e: 3
46s (
1st s
tage
s)
354s
(2nd
/3rd
stag
es)
rP e
ngin
e: t
/W =
100
lH2
engi
ne: 4
50s (
1st s
tage
s)
460s
(2nd
/3rd
stag
es)
lH2
engi
ne: t
/W =
55
cast
or 1
20: 2
79s
cast
or 3
0: 2
95s
Mer
lin 1
c: 3
04s
Mer
lin 1
c Va
cuum
: thr
ust=
13
8,40
0 lb
f, t/
W =
92
rS-2
5E: 4
53s
rS-2
5E: V
acuu
m t
hrus
t =
490,
850
lbf,
t/W
= 7
3
rl 1
0a-4
-2: 4
50s
rl 1
0a-4
-2: V
acuu
m t
hrus
t =
22,2
89 lb
f, t/
W =
61
cast
or 1
20: 2
79s
cast
or 3
0: 2
95s
Mer
lin 1
c: 3
04s
Mer
lin 1
c Va
cuum
: thr
ust=
13
8,40
0 lb
f, t/
W =
92
rS-2
5E: 4
53s
rS-2
5E: V
acuu
m t
hrus
t =
490,
850
lbf,
t/W
= 7
3
rl 1
0a-4
-2: 4
50s
rl 1
0a-4
-2: V
acuu
m t
hrus
t =
22,2
89 lb
f, t/
W =
61
Ft-1
: ca
stor
120
: 279
s o
rion
50S
XlG
: 287
s o
rion
50Xl
: 291
s o
rion
38: 2
89s
Solid
rock
et m
otor
thru
st
trac
es ta
ken
from
atK
Spa
ce
Prop
ulsi
on P
rodu
cts c
atal
og
Ft-2
M
erlin
1c:
304
s Ke
stre
l: 32
5s
Mer
lin 1
c: 1
38,4
00 lb
f Ke
stre
l: 6,
245
lbf
Traj
ecto
ry
Mod
el /
Met
hodo
logy
app
licat
ion
of ro
cket
equ
atio
n w
ith a
ssum
ed to
tal Δ
V an
d lo
sses
bas
ed o
n Po
St i
sim
ulat
ion
app
licat
ion
of ro
cket
equ
atio
n w
ith a
ssum
ed to
tal Δ
V an
d lo
sses
bas
ed o
n Po
St i
sim
ulat
ion
PoSt
i si
mul
atio
n - 3
deg
rees
of
free
dom
opt
imiz
ed u
ntrim
med
tr
ajec
tory
with
con
stra
ints
PoSt
i si
mul
atio
n - 3
deg
rees
of
free
dom
opt
imiz
ed u
ntrim
med
tr
ajec
tory
with
con
stra
ints
carr
ier a
ircra
ft re
leas
e co
nditi
ons
alti
tude
: 35,
000
fta
ltitu
de: 2
5,00
0 ft
alti
tude
: 25,
000
fta
ltitu
de: 2
5,00
0 ft
M
ach
num
ber:
0.75
M
ach
num
ber:
0.7
Mac
h nu
mbe
r: 0.
7M
ach
num
ber:
0.7

Appendix G
104 H o r i zo n ta l l au n c H
Scre
enin
g Pr
oces
s (F
idel
ity L
evel
0)
Tech
Tra
des
(Fid
elity
Lev
el 0
)Po
int D
esig
ns
(Fid
elity
Lev
el 1
)Fl
ight
Tes
ts
(Fid
elity
Lev
el 1
)Si
mul
atio
n co
nstr
aint
sM
axim
um q
: les
s tha
n 1,
000
psf
Max
imum
q: l
ess t
han
1,00
0 ps
f M
axim
um q
: les
s tha
n 1,
000
psf
Max
imum
q: l
ess t
han
1,00
0 ps
f
M
axim
um q
-alp
ha: l
ess t
han
5,00
0 ps
f-deg
rees
M
axim
um q
-alp
ha: l
ess t
han
5,00
0 ps
f-deg
rees
M
axim
um q
-alp
ha: l
ess t
han
5,00
0 ps
f-deg
rees
M
axim
um q
-alp
ha: l
ess t
han
5,00
0 ps
f-deg
rees
acce
lera
tion
cons
trai
nts
Max
imum
win
g no
rmal
fact
or:
less
than
1.5
gM
axim
um w
ing
norm
al fa
ctor
: le
ss th
an 1
.5g
Max
imum
win
g no
rmal
fact
or:
less
than
1.5
gM
axim
um w
ing
norm
al fa
ctor
: le
ss th
an 1
.5g
M
axim
um a
ccel
erat
ion:
les
s th
an 5
.0 g
M
axim
um a
ccel
erat
ion:
les
s th
an 5
.0 g
M
axim
um a
ccel
erat
ion:
les
s th
an 5
.0 g
M
axim
um a
ccel
erat
ion:
les
s th
an 5
.0 g
Sepa
ratio
n tim
ing
10s d
elay
aft
er se
para
tion
befo
re e
ngin
e ig
nitio
n10
s del
ay a
fter
sepa
ratio
n be
fore
eng
ine
igni
tion
10s d
elay
aft
er se
para
tion
befo
re e
ngin
e ig
nitio
n10
s del
ay a
fter
sepa
ratio
n be
fore
eng
ine
igni
tion
M
inim
um o
f a tw
o se
cond
de
lay
afte
r roc
ket s
tagi
ng
even
t bef
ore
igni
tion
of n
ext
stag
e en
gine
Min
imum
of a
two
seco
nd
dela
y af
ter r
ocke
t sta
ging
ev
ent b
efor
e ig
nitio
n of
nex
t st
age
engi
ne
Min
imum
of a
two
seco
nd
dela
y af
ter r
ocke
t sta
ging
ev
ent b
efor
e ig
nitio
n of
nex
t st
age
engi
ne
Min
imum
of a
two
seco
nd
dela
y af
ter r
ocke
t sta
ging
ev
ent b
efor
e ig
nitio
n of
nex
t st
age
engi
ne
W
ing
and
tails
dro
pped
tim
e ch
osen
by
optim
izer
, mus
t be
befo
re fi
rst s
tage
bur
nout
and
se
para
tion
Win
g an
d ta
ils d
ropp
ed ti
me
chos
en b
y op
timiz
er, m
ust b
e be
fore
firs
t sta
ge b
urno
ut a
nd
sepa
ratio
n
Win
g an
d ta
ils d
ropp
ed ti
me
chos
en b
y op
timiz
er, m
ust b
e be
fore
firs
t sta
ge b
urno
ut a
nd
sepa
ratio
n
Win
g an
d ta
ils d
ropp
ed ti
me
chos
en b
y op
timiz
er, m
ust b
e be
fore
firs
t sta
ge b
urno
ut a
nd
sepa
ratio
n
Pa
yloa
d fa
iring
rele
ase
whe
n dy
nam
ic p
ress
ure
falls
bel
ow
0.1
psf
Payl
oad
fairi
ng re
leas
e w
hen
dyna
mic
pre
ssur
e fa
lls b
elow
0.
1 ps
f
Payl
oad
fairi
ng re
leas
e w
hen
dyna
mic
pre
ssur
e fa
lls b
elow
0.
1 ps
f
Payl
oad
fairi
ng re
leas
e w
hen
dyna
mic
pre
ssur
e fa
lls b
elow
0.
1 ps
f
orb
itta
rget
ed d
irect
inje
ctio
n in
to
100
nmi c
ircul
ar d
ue e
ast o
rbit
from
a la
titud
e of
28.
5 de
gree
s
targ
eted
dire
ct in
ject
ion
into
10
0 nm
i circ
ular
due
eas
t orb
it fr
om a
latit
ude
of 2
8.5
degr
ees
targ
eted
dire
ct in
ject
ion
into
10
0 nm
i circ
ular
due
eas
t orb
it fr
om a
latit
ude
of 2
8.5
degr
ees
targ
eted
dire
ct in
ject
ion
into
10
0 nm
i circ
ular
due
eas
t orb
it fr
om a
latit
ude
of 2
8.5
degr
ees
Aer
odyn
amic
s
Mod
el /
Met
hodo
logy
Base
d on
Miss
ile D
atco
M
anal
ysis
, with
gra
dien
t-ba
sed
optim
izat
ion
to re
ach
sizi
ng
goal
s
Base
d on
Miss
ile D
atco
M
anal
ysis
, with
gra
dien
t-ba
sed
optim
izat
ion
to re
ach
sizi
ng
goal
s
Base
d on
Miss
ile D
atco
M
anal
ysis
, with
gra
dien
t-ba
sed
optim
izat
ion
to re
ach
sizi
ng
goal
s
Base
d on
Mis
sile
Dat
coM
an
alys
is, w
ith g
radi
ent-
base
d op
timiz
atio
n to
reac
h si
zing
go
als
Sim
ulat
ion
para
met
ers
alp
ha ra
nge:
-20
to 2
0 de
gree
sa
lpha
rang
e: -2
0 to
20
degr
ees
alp
ha ra
nge:
-20
to 2
0 de
gree
sa
lpha
rang
e: -2
0 to
20
degr
ees
M
ach
rang
e: 0
.75
to 3
0 M
ach
rang
e: 0
.5 to
30
Mac
h ra
nge:
0.5
to 3
0 M
ach
rang
e: 0
.5 to
30
Win
g si
zing
bas
is30
0 lb
/ft2
(gro
ss w
eigh
t win
g ar
ea)
Func
tion
of w
ing
surf
ace
area
an
d as
pect
ratio
Func
tion
of w
ing
surf
ace
area
an
d as
pect
ratio
Func
tion
of w
ing
surf
ace
area
an
d as
pect
ratio

A s sumptions and Methodologies
105A v e r s At i l e co n c e p t f o r A s s u r e d s pAc e Acc e s s
Scre
enin
g Pr
oces
s (F
idel
ity L
evel
0)
Tech
Tra
des
(Fid
elity
Lev
el 0
)Po
int D
esig
ns
(Fid
elity
Lev
el 1
)Fl
ight
Tes
ts
(Fid
elity
Lev
el 1
)co
nfigu
ratio
nW
ing
mou
nted
at 5
° inc
iden
ce
to ro
cket
bod
y X-
axis
Win
g m
ount
ed a
t 5° i
ncid
ence
to
rock
et b
ody
X-ax
isW
ing
mou
nted
at 5
° inc
iden
ce
to ro
cket
bod
y X-
axis
Win
g m
ount
ed a
t 5° i
ncid
ence
to
rock
et b
ody
X-ax
is
H
oriz
onta
l tai
l con
trol
surf
ace
set t
o 50
% o
f cho
rdH
oriz
onta
l and
ver
tical
tails
si
zed
to a
chie
ve in
-flig
ht st
atic
st
abili
ty
Hor
izon
tal a
nd v
ertic
al ta
ils
size
d to
ach
ieve
in-fl
ight
stat
ic
stab
ility
Hor
izon
tal a
nd v
ertic
al ta
ils
size
d to
ach
ieve
in-fl
ight
stat
ic
stab
ility
Ve
rtic
al ta
il ar
ea a
nd p
lanf
orm
sa
me
as h
oriz
onta
l tai
lsVe
rtic
al ta
il ar
ea a
nd p
lanf
orm
sa
me
as h
oriz
onta
l tai
lsVe
rtic
al ta
il ar
ea a
nd p
lanf
orm
sa
me
as h
oriz
onta
l tai
lsVe
rtic
al ta
il ar
ea a
nd p
lanf
orm
sa
me
as h
oriz
onta
l tai
ls
Cam
paig
n
Dur
atio
n20
yea
rs20
yea
rs20
yea
rs3.
5 ye
ars
Flig
ht r
ate
6 an
d 12
flig
hts p
er y
ear
6 fli
ghts
per
yea
r6
fligh
ts p
er y
ear
2 fli
ghts
Dev
elop
men
t an
d U
nit C
osts
Mod
els /
met
hods
em
ploy
edD
evel
opm
ent a
nd te
st
hard
war
e es
timat
ed u
sing
cu
stom
impl
emen
tatio
n of
tra
nSc
oSt
v.8
.0, a
nd
hist
oric
al d
ata;
Fa
cilit
ies c
ost d
eriv
ed fr
om
Faci
lity
and
Gro
und
Supp
ort
Equi
pmen
t ope
ratio
ns a
naly
sis
(FG
oa)
Mod
el
Dev
elop
men
t and
test
ha
rdw
are
estim
ated
usi
ng
subs
yste
m-le
vel r
espo
nse
surf
ace
equa
tions
of n
aFco
M
2007
supp
lem
ente
d by
tr
anSc
oSt
v.8
.0 a
nd h
isto
rical
da
ta;
Faci
litie
s cos
t der
ived
from
Fa
cilit
y an
d G
roun
d Su
ppor
t Eq
uipm
ent o
pera
tions
ana
lysis
(F
Go
a) M
odel
Dev
elop
men
t and
test
ha
rdw
are
estim
ated
usi
ng
naF
coM
200
7, a
nd h
isto
rical
da
ta;
Faci
litie
s cos
t der
ived
from
Fa
cilit
y an
d G
roun
d Su
ppor
t Eq
uipm
ent o
pera
tions
ana
lysis
(F
Go
a) M
odel
Dev
elop
men
t and
test
ha
rdw
are
estim
ated
usi
ng
naF
coM
200
7
indu
stry
stan
dard
wra
psco
ntra
ctor
fee:
10%
cont
ract
or fe
e: 1
0%co
ntra
ctor
fee:
10%
cont
ract
or fe
e: 1
0%
Pr
ogra
m su
ppor
t: 11
%Pr
ogra
m su
ppor
t: 11
%Pr
ogra
m su
ppor
t: 11
%Pr
ogra
m su
ppor
t: co
sts
incl
ude
36 g
over
nmen
t tea
m
pers
onne
l and
supp
ortin
g co
ntra
ctor
s for
4 y
ears
co
ntin
genc
y: 2
0%co
ntin
genc
y: 2
0%co
ntin
genc
y: 2
0%co
ntin
genc
y: 2
0%
Ve
hicl
e in
tegr
atio
n: 4
%
Vehi
cle
inte
grat
ion:
4%
Ve
hicl
e in
tegr
atio
n: 4
%
Vehi
cle
inte
grat
ion:
4%
DD
t&E
base
line
DD
t&E
cost
s ass
ume
prev
ious
m
atur
atio
n to
trl
6+D
Dt&
E co
sts a
ssum
e pr
evio
us
mat
urat
ion
to t
rl6+
DD
t&E
cost
s ass
ume
prev
ious
m
atur
atio
n to
trl
6+D
Dt&
E co
sts a
ssum
e pr
evio
us
mat
urat
ion
to t
rl6+
airc
raft
DD
t&E
cost
s74
7-10
0 Sc
a: $
10M
747-
100
Sca
-905
: $0M
74
7-40
0F: $
144M
747-
400F
: $12
2M74
7-40
0F: $
122M
a
n-22
5: $
20M
W
hite
Kni
ght X
: $12
5M
D
ual-f
usel
age
c-5:
$2.
38B
W
hite
Kni
ght X
X: $
400M

Appendix G
106 H o r i zo n ta l l au n c H
Scre
enin
g Pr
oces
s (F
idel
ity L
evel
0)
Tech
Tra
des
(Fid
elity
Lev
el 0
)Po
int D
esig
ns
(Fid
elity
Lev
el 1
)Fl
ight
Tes
ts
(Fid
elity
Lev
el 1
)a
ircra
ft a
cqui
sitio
n co
st
747-
100
Sca
: $0M
747-
100
Sca
-905
: $0M
74
7-40
0F: $
30M
747-
400F
: $30
M74
7-40
0F: $
30M
a
n-22
5: $
1.03
B
airc
raft
mod
ifica
tion
cost
74
7-10
0 Sc
a: $
5M
Ft
-1: 7
47-1
00 S
ca-9
05: $
10M
Ft
-2: 7
47-1
00 S
ca-9
05: $
12M
747-
400F
: $62
M 7
47-4
00F:
$56
M 7
47-4
00F:
$56
M
an-
225:
$10
M
airc
raft
pro
duct
ion
cost
Whi
te K
nigh
t X: $
50M
tau
rus u
nit c
ost:
$33.
5M
Falc
on u
nit c
ost:
$11M
D
ual-f
usel
age
c-5:
$1.
02B
Whi
te K
nigh
t XX:
$18
0M
non
-rec
urrin
g en
gine
/roc
ket
cost
sEn
gine
DD
t&E
calc
ulat
ed in
m
odel
rS-2
5E D
Dt&
E co
st: $
750M
(d
oes n
ot in
clud
e sy
stem
in
tegr
atio
n or
wra
ps)
rS-2
5E D
Dt&
E co
st: $
750M
(d
oes n
ot in
clud
e sy
stem
in
tegr
atio
n or
wra
ps)
Exis
ting
engi
ne u
nit c
osts
cast
or 1
20 u
nit c
ost:
$8.7
Mca
stor
120
uni
t cos
t: $8
.7 M
ca
stor
30
unit
cost
: $1.
6 M
cast
or 3
0 un
it co
st: $
1.6
M
M
erlin
i-c
unit
cost
: $2.
8M (u
nit
cost
at b
egin
ning
of c
ampa
ign)
Mer
lin i-
c un
it co
st: $
2.8M
(uni
t co
st a
t beg
inni
ng o
f cam
paig
n)
rl
10a
-4-2
uni
t cos
t: $1
0.9M
(u
nit c
ost a
t beg
inni
ng o
f ca
mpa
ign)
rl 1
0a-4
-2 u
nit c
ost:
$10.
9M
(uni
t cos
t at b
egin
ning
of
cam
paig
n)
rS
-25E
uni
t cos
t: $3
1.4M
(uni
t co
st a
t beg
inni
ng o
f cam
paig
n)rS
-25E
uni
t cos
t: $3
1.4M
(uni
t co
st a
t beg
inni
ng o
f cam
paig
n)
Prod
uctio
n le
arni
ng c
urve
95%
rl 1
0a-4
-2 a
nd M
erlin
i-c:
95%
rS
-25E
: 90%
o
ther
new
subs
yste
ms:
90%
rl 1
0a-4
-2 a
nd M
erlin
i-c:
95%
rS
-25E
: 90%
o
ther
new
subs
yste
ms:
90%
Ope
rati
ons
Mod
els /
met
hods
em
ploy
edH
ardw
are
cost
s est
imat
ed
usin
g cu
stom
mod
el b
ased
on
tran
Sco
St v
.8.0
and
his
toric
al
data
; o
pera
tions
cos
t est
imat
ed
usin
g cu
stom
impl
emen
tatio
n of
tra
nSc
oSt
v.8
.0;
ope
ratio
ns c
ost a
nd ti
me
met
rics d
eriv
ed fr
om
tran
Sco
St v
.8.0
and
his
toric
al
data
with
mul
tiplie
rs
Har
dwar
e co
sts e
stim
ated
us
ing
subs
yste
m-le
vel
resp
onse
surf
ace
equa
tions
of
naF
coM
200
7 su
pple
men
ted
by t
ran
Sco
St v
.8.0
and
hi
stor
ical
dat
a;
ope
ratio
ns c
ost a
nd ti
me
met
rics d
eriv
ed fr
om
tran
Sco
St v
.8.0
and
his
toric
al
data
Har
dwar
e co
sts e
stim
ated
us
ing
naF
coM
200
7 an
d hi
stor
ical
dat
a;
ope
ratio
ns c
ost a
nd ti
me
met
rics d
eriv
ed fr
om
tran
Sco
St v
.8.0
and
his
toric
al
data
Gro
und
and
fligh
t ope
ratio
ns
estim
ated
usi
ng a
com
posi
te
of H
yper
port
, com
et o
cM a
nd
D4o
ps

A s sumptions and Methodologies
107A v e r s At i l e co n c e p t f o r A s s u r e d s pAc e Acc e s s
Scre
enin
g Pr
oces
s (F
idel
ity L
evel
0)
Tech
Tra
des
(Fid
elity
Lev
el 0
)Po
int D
esig
ns
(Fid
elity
Lev
el 1
)Fl
ight
Tes
ts
(Fid
elity
Lev
el 1
)Su
rge
call-
up ti
me
ass
umes
all
syst
ems i
n ne
ar-
read
y st
ate;
incl
udes
fuel
ing
of c
arrie
r airc
raft
, acc
eler
ated
fin
al a
ssem
bly,
fuel
ing
of u
pper
st
ages
ass
umes
all
syst
ems i
n ne
ar-
read
y st
ate;
incl
udes
fuel
ing
of c
arrie
r airc
raft
, acc
eler
ated
fin
al a
ssem
bly,
fuel
ing
of u
pper
st
ages
ass
umes
all
syst
ems i
n ne
ar-
read
y st
ate;
incl
udes
fuel
ing
of c
arrie
r airc
raft
, acc
eler
ated
fin
al a
ssem
bly,
fuel
ing
of u
pper
st
ages
Min
imum
turn
arou
nd ti
me
incl
udes
car
rier a
ircra
ft
prep
arat
ion,
rock
et st
age
asse
mbl
y an
d in
tegr
atio
n, a
nd
final
ass
embl
y
incl
udes
car
rier a
ircra
ft
prep
arat
ion,
rock
et st
age
asse
mbl
y an
d in
tegr
atio
n, a
nd
final
ass
embl
y
incl
udes
car
rier a
ircra
ft
prep
arat
ion,
rock
et st
age
asse
mbl
y an
d in
tegr
atio
n, a
nd
final
ass
embl
y
recu
rrin
g op
erat
ions
incl
udes
ope
ratio
nal c
osts
of
747
carr
ier a
ircra
ft, s
uppo
rt
staff
for 7
47 te
chni
cian
te
am, r
ocke
t sta
ge a
nd
vehi
cle
asse
mbl
y/in
tegr
atio
n te
chni
cian
s, su
ppor
t sta
ff fo
r as
sem
bly/
inte
grat
ion
team
, pr
opel
lant
s
incl
udes
ope
ratio
nal c
osts
of
747
carr
ier a
ircra
ft, s
uppo
rt
staff
for 7
47 te
chni
cian
te
am, r
ocke
t sta
ge a
nd
vehi
cle
asse
mbl
y/in
tegr
atio
n te
chni
cian
s, su
ppor
t sta
ff fo
r as
sem
bly/
inte
grat
ion
team
, pr
opel
lant
s
incl
udes
ope
ratio
nal c
osts
of
747
carr
ier a
ircra
ft, s
uppo
rt
staff
for 7
47 te
chni
cian
te
am, r
ocke
t sta
ge a
nd
vehi
cle
asse
mbl
y/in
tegr
atio
n te
chni
cian
s, su
ppor
t sta
ff fo
r as
sem
bly/
inte
grat
ion
team
, pr
opel
lant
s
incl
udes
ope
ratio
nal c
osts
of
747
carr
ier a
ircra
ft, s
uppo
rt
staff
for 7
47 te
chni
cian
te
am, r
ocke
t sta
ge a
nd
vehi
cle
asse
mbl
y/in
tegr
atio
n te
chni
cian
s, su
ppor
t sta
ff fo
r as
sem
bly/
inte
grat
ion
team
, pr
opel
lant
s
recu
rrin
g op
erat
ions
cos
t co
ntin
genc
y 1
5%
20%
20%
20%
recu
rrin
g op
erat
ions
pro
gram
m
anag
emen
t wra
p 2
0%
calc
ulat
ed d
irect
ly in
mod
elca
lcul
ated
dire
ctly
in m
odel
calc
ulat
ed d
irect
ly in
mod
el
Relia
bilit
y
Mod
els /
met
hods
em
ploy
edEx
cel-b
ased
Eve
nt S
eque
nce
Dia
gram
supp
orte
d by
Fau
lt tr
ees;
failu
re ra
tes d
eriv
ed fr
om
hist
oric
al d
ata
Exce
l rep
licat
ion
of r
elex
-ba
sed
Even
t tre
e su
ppor
ted
by F
ault
tree
s; fa
ilure
rate
s de
rived
from
his
toric
al d
ata
rele
x-ba
sed
Even
t tre
e D
iagr
am su
ppor
ted
by F
ault
tree
s; fa
ilure
rate
s der
ived
from
hi
stor
ical
dat
as
rele
x-ba
sed
Even
t tre
e D
iagr
am su
ppor
ted
by F
ault
tree
s; fa
ilure
rate
s der
ived
from
hi
stor
ical
dat
a
Failu
re ra
te: b
oost
er
sepa
ratio
n fr
om a
ircra
ft74
7-10
0 Sc
a: 1
in 1
00 fl
ight
s
74
7-10
0 Sc
a: 1
in 1
00 fl
ight
s
74
7-40
0F: 1
in 1
00 fl
ight
s 74
7-40
0F: 1
in 1
00 fl
ight
s 74
7-40
0F: 1
in 1
00 fl
ight
s
a
n-22
5: 1
in 1
25 fl
ight
s
W
hite
Kni
ght X
: 1 in
100
0 fli
ghts
D
ual-f
usel
age
c-5:
1 in
667
fli
ghts
W
hite
Kni
ght X
X: 1
in 6
67
fligh
ts

Appendix G
108 H o r i zo n ta l l au n c H
Scre
enin
g Pr
oces
s (F
idel
ity L
evel
0)
Tech
Tra
des
(Fid
elity
Lev
el 0
)Po
int D
esig
ns
(Fid
elity
Lev
el 1
)Fl
ight
Tes
ts
(Fid
elity
Lev
el 1
)Fa
ilure
rate
: sta
ge se
para
tion
even
t 1
in 1
07 fl
ight
s 1
in 4
29 fl
ight
s1
in 4
29 fl
ight
s1
in 4
29 fl
ight
s
Engi
ne o
ut c
apab
ility
all
engi
nes r
equi
red
for a
ll ph
ases
of fl
ight
all
engi
nes r
equi
red
for a
ll ph
ases
of fl
ight
all
engi
nes r
equi
red
for a
ll ph
ases
of fl
ight
all
engi
nes r
equi
red
for a
ll ph
ases
of fl
ight
Com
mer
cial
Via
bilit
y
Mod
els /
met
hods
em
ploy
edD
isco
unte
d ca
sh fl
ow a
naly
sis
supp
orte
d by
cus
tom
co
mm
erci
al a
nd m
ilita
ry
laun
ch d
eman
d m
odel
Dis
coun
ted
cash
flow
ana
lysis
su
ppor
ted
by c
usto
m
com
mer
cial
and
mili
tary
la
unch
dem
and
mod
el
Dis
coun
ted
cash
flow
ana
lysis
su
ppor
ted
by c
usto
m
com
mer
cial
and
mili
tary
la
unch
dem
and
mod
el
Gov
ernm
ent c
ontr
ibut
ion
to
DD
t&E
cost
$400
M$4
00 M
$400
M
laun
ch M
arke
tco
mm
erci
al +
Mili
tary
com
mer
cial
+ M
ilita
ryco
mm
erci
al +
Mili
tary
ant
icip
ated
infla
tion
rate
2.1%
2.1%
2.1%
tax
rate
30%
30%
30%
Flig
ht ra
te fo
r com
mer
cial
vi
abili
ty a
naly
sisca
lcul
ated
acc
ordi
ng to
mar
ket
dem
and
and
capt
ure.
ran
ges
betw
een
~3 to
~7
fligh
ts p
er
year
bas
ed o
n pa
yloa
d cl
ass.
calc
ulat
ed a
ccor
ding
to m
arke
t de
man
d an
d ca
ptur
e. r
ange
s be
twee
n ~3
to ~
7 fli
ghts
per
ye
ar b
ased
on
payl
oad
clas
s.
calc
ulat
ed a
ccor
ding
to m
arke
t de
man
d an
d ca
ptur
e. r
ange
s be
twee
n ~3
to ~
7 fli
ghts
per
ye
ar b
ased
on
payl
oad
clas
s.

109A v e r s At i l e co n c e p t f o r A s s u r e d s pAc e Acc e s s
Details of the Aerodynamic and Trajectory AnalysesDimensions Used in Aerodynamic Analysis for the Point Design System Concepts
Parameter PD-1 PD-2 PD-3
Wing
aspect ratio 3.5 4.1 3.5
taper ratio 0.17 0.09 0.2
lE Sweep angle 38.5° 38.3° 36.4°
Platform area 923 ft2 940 ft2 803 ft2
thickness-to-chord ratio 0.1 0.1 0.1
loading at 1 g 310 lb/ft2 320 lb/ft2 380 lb/ft2
incidence angle 5° 5° 5°
Tails (Horizontal and Vertical)
aspect ratio 4.0 4.0 4.0
taper ratio 0.43 0.34 0.36
lE Sweep angle 21.8° 26.2° 25.4°
Platform area 120 ft2 97 ft2 145 ft2
thickness-to-chord ratio 0.1 0.1 0.1
Dimensions Used in Aerodynamic Analysis for the Flight Test System Concepts
Parameter Ft-1 Ft-2
Wing
aspect ratio 3.8 3.5
taper ratio 0.15 0.19
lE Sweep angle 37.5° 37.3°
Platform area 598 ft2 193 ft2
thickness-to-chord ratio 0.1 0.1
incidence angle 0° 5°
Tails Horizontal Vertical Horizontal Vertical
aspect ratio 4.6 3.7 5.0 3.8
taper ratio 0.30 0.35 0.30 0.30
lE Sweep angle 25.0° 40.0° 23.1° 40.0°
Platform area 51.2 ft2 51.2 ft2 35.5 ft2 35.2 ft2
thickness-to-chord ratio 0.1 0.1 0.1 0.1
a PPE n D i X H

Appendix H
110 H o r i zo n ta l l au n c H
00 22 44 66 88 1010 1212 1414 161600
0.50.5
11
1.51.5
22
2.52.5
Lift
Coe
ffic
ient
Lift
Coe
ffic
ient
Lift
to D
rag
Ratio
Lift
to D
rag
Ratio
CL versus Alpha at Constant Mach NumberCL versus Alpha at Constant Mach Number
L/D versus Alpha at Constant Mach NumberL/D versus Alpha at Constant Mach Number
Alpha (deg)Alpha (deg)
00 22 44 66 88 1010 1212 1414 1616Alpha (deg)Alpha (deg)
Mach 0.7Mach 0.7Mach 0.9Mach 0.9Mach 1.1Mach 1.1
Mach 0.7Mach 0.7Mach 0.9Mach 0.9Mach 1.1Mach 1.1
Mach 0.7Mach 0.7
5 deg5 deg10 deg10 deg
0 deg0 degMach 0.9Mach 0.9Mach 1.1Mach 1.1
Mach 0.7Mach 0.7
00112233445566778899
1010
00 0.50.5 11 1.51.5 22 2.52.5
0.80.80.70.7
0.60.60.50.50.40.40.30.30.20.20.10.1
00
Dra
g Co
effic
ient
Dra
g Co
effic
ient
Pitc
hing
Mom
ent C
oeff
icie
ntPi
tchi
ng M
omen
t Coe
ffic
ient
Drag Polar at Constant Mach NumberDrag Polar at Constant Mach Number
CM versus Alpha at Constant Deflection AngleCM versus Alpha at Constant Deflection Angle
Lift CoefficientLift Coefficient
00 22 44 66 88 1010 1212 1414 1616
Sref=851 ft2Sref=851 ft2
Lref=95.0 ft2Lref=95.0 ft2
Alpha (deg)Alpha (deg)
-0.06-0.06
-0.04-0.04
-0.02-0.02
0.000.00
0.020.02
0.040.04
0.060.06
45.2 ft 27.8 ft10.6 ft 10.9 ft
57.0 ft61.4 ft 31.0 ft
Approximate CG
Schematic used in aerodynamic analysis
44.1 ft 25.3 ft10.8 ft 12.5 ft
53.0 ft68.4 ft33.9 ft
Approximate CG
Point Design 1
Aerodynamic results

Detai l s of the Aerodynamic and Trajec tor y Analyses
111A v e r s At i l e co n c e p t f o r A s s u r e d s pAc e Acc e s s
iD Event time(s)
Weight (lb)
altitude(ft)
relative Velocity (f/s)
Mach number
Dynamic Pressure (psf)
Gamma (deg)
alpha(deg)
1 aircraft separation
0 288,490 25,000 711 0.7 270 5.0 8.0
2 Stage 1 ignition 10 288,490 25,244 674 0.7 240 -1.4 8.0
3 Maximum dynamic pressure
38 248,198 33,459 1,460 1.5 835 32.7 6.0
4 aerosurface jettison
47 234,596 41,864 1,668 1.7 747 39.0 6.0
5 Stage 1 burnout and separation
89 168,166 90,407 3,298 3.3 283 21.1 11.8
6 Stage 2 ignition 92 158,077 93,288 3,297 3.3 247 20.1 12.1
7 Stage 2 burnout and separation
171 50,117 263,736 12,606 13.6 2.7 16.5 6.3
8 Fairing jettison 190 40,073 327,786 12,446 13.9 0.1 14.7 3.9
9 Stage 3 ignition 235 38,650 446,839 12,162 13.6 0.0 10.1 -1.4
10 Stage 3 burnout and separation
376 10,396 605,877 24,189 27.0 0.0 0.0 -10.5
Alti
tude
(tho
usan
ds fe
et)
Alti
tude
(tho
usan
ds fe
et) A
ltitude (thousands feet)A
ltitude (thousands feet)
00 55 1010 1515 2020 2525 3030 3535 4040 4545 5050Downrange (nmi)Downrange (nmi)
00
2525
5050
7575
100100
125125150150
00 100100 200200 300300 400400 500500 600600 700700Downrange (nmi)Downrange (nmi)
00
100100
200200
300300
400400
500500
600600
700700
11
22 33
55
66
4477
88
99 1010
STAGE 1STAGE 1 STAGE 2STAGE 2 STAGE 3STAGE 3
Trajectory Analysis for the Point Design 1

Appendix H
112 H o r i zo n ta l l au n c H
44.1 ft 25.3 ft10.8 ft 12.5 ft
53.0 ft68.4 ft33.9 ft
Approximate CG
Aerodynamic results
00 22 44 66 88 1010 1212 1414 161600
0.50.5
11
1.51.5
22
2.52.5
Lift
Coe
ffic
ient
Lift
Coe
ffic
ient
Lift
to D
rag
Ratio
Lift
to D
rag
Ratio
CL versus Alpha at Constant Mach NumberCL versus Alpha at Constant Mach Number
L/D versus Alpha at Constant Mach NumberL/D versus Alpha at Constant Mach Number
Alpha (deg)Alpha (deg)
00 22 44 66 88 1010 1212 1414 1616Alpha (deg)Alpha (deg)
Mach 0.7Mach 0.7Mach 0.9Mach 0.9Mach 1.1Mach 1.1
Mach 0.7Mach 0.7Mach 0.9Mach 0.9Mach 1.1Mach 1.1
Mach 0.7Mach 0.7
5 deg5 deg10 deg10 deg
0 deg0 degMach 0.9Mach 0.9Mach 1.1Mach 1.1
Mach 0.7Mach 0.7
00112233445566778899
1010
00 0.50.5 11 1.51.5 22 2.52.5
0.90.90.80.80.70.70.60.60.50.50.40.40.30.30.20.20.10.1
00
Dra
g Co
effic
ient
Dra
g Co
effic
ient
Pitc
hing
Mom
ent C
oeff
icie
ntPi
tchi
ng M
omen
t Coe
ffic
ient
Drag Polar at Constant Mach NumberDrag Polar at Constant Mach Number
CM versus Alpha at Constant Deflection AngleCM versus Alpha at Constant Deflection Angle
Lift CoefficientLift Coefficient
00 22 44 66 88 1010 1212 1414 1616
Sref=851 ft2Sref=851 ft2
Lref=95.0 ft2Lref=95.0 ft2
Alpha (deg)Alpha (deg)
-0.03-0.03-0.02-0.02
-0.01-0.010.000.000.010.010.020.020.030.03
0.040.04
Point Design 247.9 ft 27.8 ft
8.8 ft 10.4 ft
62.1 ft
72.1 ft
27.9 ft
Approximate CG
Schematic used in aerodynamic analysis

Detai l s of the Aerodynamic and Trajec tor y Analyses
113A v e r s At i l e co n c e p t f o r A s s u r e d s pAc e Acc e s s
Alti
tude
(tho
usan
ds fe
et)
Alti
tude
(tho
usan
ds fe
et) A
ltitude (thousands feet)A
ltitude (thousands feet)
00 55 1010 1515 2020 2525 3030 3535 4040 4545 5050Downrange (nmi)Downrange (nmi)
00
2525
5050
7575
100100
125125
150150
175175
00 100100 200200 300300 400400 500500 600600 700700 800800 900900Downrange (nmi)Downrange (nmi)
00
100100
200200
300300
400400
500500
600600
700700
11
22 33
4455
66
77
88
STAGE 1STAGE 1 STAGE 2STAGE 2
Trajectory Analysis for the Point Design 2
iD Event time(s)
Weight (lb)
altitude(ft)
relative Velocity (ft/s)
Mach number
Dynamic Pressure (psf)
Gamma (deg)
alpha(deg)
1 aircraft separation
0 305,000 25,000 711 0.7 270 5.0 8.0
2 Stage 1 ignition 10 305,000 25,243 673 0.7 239 -1.5 8.0
3 Maximum dynamic pressure
33 273,006 30,176 1,271 1.3 715 30.6 6.7
4 aerosurface jettison
46 255,852 40,848 1,461 1.5 602 44.4 6.7
5 Stage 1 main engine cut off and separation
152 99,303 223,283 8,251 8.4 7.2 20.8 9.0
6 Stage 2 ignition 154 78,657 229,081 8,229 8.4 5.6 20.4 8.9
7 Fairing jettison 185 73,836 312,473 8,791 9.8 0.1 16.2 12.1
8 Stage 2 main engine cut off
513 22,969 606,934 24,189 27 0.0 0.0 2.5

Appendix H
114 H o r i zo n ta l l au n c H
44.1 ft 25.3 ft10.8 ft 12.5 ft
53.0 ft68.4 ft33.9 ft
Approximate CG
44.1 ft 25.3 ft10.8 ft 12.5 ft
53.0 ft68.4 ft33.9 ft
Approximate CG
Schematic used in aerodynamics analysis
Point Design 3
Aerodynamic results
00 22 44 66 88 1010 1212 1414 161600
0.50.5
11
1.51.5
22
2.52.5
Lift
Coe
ffic
ient
Lift
Coe
ffic
ient
Lift
to D
rag
Ratio
Lift
to D
rag
Ratio
CL versus Alpha at Constant Mach NumberCL versus Alpha at Constant Mach Number
L/D versus Alpha at Constant Mach NumberL/D versus Alpha at Constant Mach Number
Alpha (deg)Alpha (deg)
00 22 44 66 88 1010 1212 1414 1616Alpha (deg)Alpha (deg)
Mach 0.7Mach 0.7Mach 0.9Mach 0.9Mach 1.1Mach 1.1
Mach 0.7Mach 0.7Mach 0.9Mach 0.9Mach 1.1Mach 1.1
Mach 0.7Mach 0.7
.5 deg.5 deg
.10 deg.10 deg
0 deg0 degMach 0.9Mach 0.9Mach 1.1Mach 1.1
Mach 0.7Mach 0.7
00112233445566778899
1010
00 0.50.5 11 1.51.5 22 2.52.5 3.03.0
1.21.2
11
0.80.8
0.60.6
0.40.4
0.20.2
00
Dra
g Co
effic
ient
Dra
g Co
effic
ient
Pitc
hing
Mom
ent C
oeff
icie
ntPi
tchi
ng M
omen
t Coe
ffic
ient
Drag Polar at Constant Mach NumberDrag Polar at Constant Mach Number
CM versus Alpha at Constant Deflection AngleCM versus Alpha at Constant Deflection Angle
Lift CoefficientLift Coefficient
00 22 44 66 88 1010 1212 1414 1616
Sref=716 ft2Sref=716 ft2
Lref=98.7 ft2Lref=98.7 ft2
Alpha (deg)Alpha (deg)
-0.04-0.04-0.02-0.02
0.000.000.020.020.040.040.060.060.080.08
0.100.10

Detai l s of the Aerodynamic and Trajec tor y Analyses
115A v e r s At i l e co n c e p t f o r A s s u r e d s pAc e Acc e s s
Alti
tude
(tho
usan
ds fe
et)
Alti
tude
(tho
usan
ds fe
et) A
ltitude (thousands feet)A
ltitude (thousands feet)
00 55 1010 1515 2020 2525 3030 3535 4040 4545 5050Downrange (nmi)Downrange (nmi)
002020404060608080
100100120120140140160160
00 200200 400400 600600 800800 10001000
STAGE 1STAGE 1 STAGE 2STAGE 2Downrange (nmi)Downrange (nmi)
00
100100
200200
300300
400400
500500
600600
700700
11
22 33
4455
66
77
88
Trajectory Analysis for the Point Design 3
iD Event time(s)
Weight (lb)
altitude(ft)
relative Velocity (ft/s)
Mach number
Dynamic Pressure (psf)
Gamma (deg)
alpha(deg)
1 aircraft separation
0 305,000 25,000 711 0.7 270 5.0 8.0
2 Stage 1 ignition 10 305,000 25,238 670 0.7 237 -1.6 8.0
3 Maximum dynamic pressure
35 277,274 31,292 1,368 1.4 794 28.4 6.1
4 aerosurface jettison
48 251,295 41,676 1,594 1.6 688 37.9 6.8
5 Stage 1 main engine cut off and separation
175 112,991 266,870 10,749 11.7 1.7 15.7 6.3
6 Stage 2 ignition 177 82,339 272,644 10,732 11.8 1.3 15.5 6.2
7 Fairing jettison 195 77,169 320,843 11,060 12.4 0.1 13.6 7.8
8 Stage 2 main engine cut off
516 29,437 607,161 24,118 27.0 0.0 0.0 2.5

Appendix H
116 H o r i zo n ta l l au n c H
Flight Test Demonstrator 1
00 22 44 66 88 1010 1212 1414 161600
0.50.5
11
1.51.5
22
2.52.5
Lift
Coe
ffic
ient
Lift
Coe
ffic
ient
Lift
to D
rag
Ratio
Lift
to D
rag
Ratio
CL versus Alpha at Constant Mach NumberCL versus Alpha at Constant Mach Number
L/D versus Alpha at Constant Mach NumberL/D versus Alpha at Constant Mach Number
Alpha (deg)Alpha (deg)
00 22 44 66 88 1010 1212 1414 1616Alpha (deg)Alpha (deg)
Mach 0.7Mach 0.7Mach 0.9Mach 0.9Mach 1.1Mach 1.1
Mach 0.7Mach 0.7Mach 0.9Mach 0.9Mach 1.1Mach 1.1
Mach 0.7Mach 0.7
5 deg5 deg10 deg10 deg
0 deg0 degMach 0.9Mach 0.9Mach 1.1Mach 1.1
Mach 0.7Mach 0.7
00112233445566778899
1010
00 0.50.5 11 1.51.5 22 2.52.5
0.70.7
0.60.6
0.50.5
0.40.4
0.30.3
0.20.20.10.1
00
Dra
g Co
effic
ient
Dra
g Co
effic
ient
Pitc
hing
Mom
ent C
oeff
icie
ntPi
tchi
ng M
omen
t Coe
ffic
ient
Drag Polar at Constant Mach NumberDrag Polar at Constant Mach Number
CM versus Alpha at Constant Deflection AngleCM versus Alpha at Constant Deflection Angle
Lift CoefficientLift Coefficient
00 22 44 66 88 1010 1212 1414 1616
Sref=530 ft2Sref=530 ft2
Lref=94.0 ft2Lref=94.0 ft2
Alpha (deg)Alpha (deg)
-0.03-0.03-0.02-0.02
-0.01-0.010.000.000.010.010.020.020.030.03
0.040.04
Aerodynamic results
53.1 ft 20.4 ft14.0 ft 6.5 ft
47.4 ft
65.8 ft
21.6 ft
Approximate CG
Schematic used in aerodynamics analysis
44.1 ft 25.3 ft10.8 ft 12.5 ft
53.0 ft68.4 ft33.9 ft
Approximate CG

Detai l s of the Aerodynamic and Trajec tor y Analyses
117A v e r s At i l e co n c e p t f o r A s s u r e d s pAc e Acc e s s
Alti
tude
(tho
usan
ds fe
et)
Alti
tude
(tho
usan
ds fe
et) A
ltitude (thousands feet)A
ltitude (thousands feet)
00 55 1010 1515 2020 2525 3030 3535 4040 4545 5050Downrange (nmi)Downrange (nmi)
00
2525
5050
7575
100100
125125
00 200200 400400 600600 800800 1,0001,000 1,2001,200 1,4001,400 1,6001,600Downrange (nmi)Downrange (nmi)
00
100100
200200
300300
400400
500500
600600
700700
11
22
33
55
44
66
88
77 1010
1212
99
1111
STAGE 3STAGE 3 STAGE 4STAGE 4STAGE 1STAGE 1 STAGE 2STAGE 2
Trajectory Analysis Data Summary for the Flight Test 1
iD Eventtime
(s)Weight
(lb)altitude
(ft)
relative Velocity
(ft/s)Mach
numberDynamic
Pressure (psf)Gamma
(deg)alpha(deg)
1 aircraft separation 0 179469 25,000 711 0.7 270 5.0 8.0
2 Stage 1 ignition 10 179468 25,322 657 0.6 228 -0.4 8.0
3aerosurface jettison 50 121005 47,690 3,314 3.4 2,232 19.0 2.2
4 Maximum dynamic pressure 53 109764 50,736 3,577 3.7 2,248 18.3 2.2
5 Stage 1 burnout and separation 90 64215 102,540 7,715 7.8 877 12.6 4.1
6 Stage 2 ignition 92 53666 105,871 7,687 7.7 745 12.3 4.3
7 Stage 2 burnout and separation 159 20561 215,168 16,106 16.1 38.0 6.7 1.8
8 Stage 3 ignition 161 17691 218,903 16,098 16.2 32.6 6.6 1.6
9 Stage 3 burnout and separation 229 9083 335,239 22,128 24.7 0.2 4.5 0.4
10 Fairing jettison 236 7950 347,474 22,111 24.7 0.1 4.4 0.2
11 Stage 4 ignition 462 7150 593,720 21,768 24.3 0.0 1.2 -7.5
12 Stage 4 burnout and separation 528 5460 607,444 24,187 27.0 0.0 0.0 -6.5

Appendix H
118 H o r i zo n ta l l au n c H
46.6 ft 11.2 ft11.7 ft 5.1 ft
26.0 ft
53.4 ft
18.8 ft
Approximate CG
Schematic used in aerodynamics analysis
Flight Test Demonstrator 2
00 22 44 66 88 1010 1212 1414 161600
0.50.5
11
1.51.5
22
2.52.5
Lift
Coe
ffic
ient
Lift
Coe
ffic
ient
Lift
to D
rag
Ratio
Lift
to D
rag
Ratio
CL versus Alpha at Constant Mach NumberCL versus Alpha at Constant Mach Number
L/D versus Alpha at Constant Mach NumberL/D versus Alpha at Constant Mach Number
Alpha (deg)Alpha (deg)
00 22 44 66 88 1010 1212 1414 1616Alpha (deg)Alpha (deg)
Mach 0.7Mach 0.7Mach 0.9Mach 0.9Mach 1.1Mach 1.1
Mach 0.7Mach 0.7Mach 0.9Mach 0.9Mach 1.1Mach 1.1
Mach 0.7Mach 0.7
5 deg5 deg10 deg10 deg
0 deg0 degMach 0.9Mach 0.9Mach 1.1Mach 1.1
Mach 0.7Mach 0.7
00112233445566778899
1010
00 0.50.5 11 1.51.5 22 2.52.5
0.70.7
0.60.6
0.50.5
0.40.4
0.30.3
0.20.2
0.10.100
Dra
g Co
effic
ient
Dra
g Co
effic
ient
Pitc
hing
Mom
ent C
oeff
icie
ntPi
tchi
ng M
omen
t Coe
ffic
ient
Drag Polar at Constant Mach NumberDrag Polar at Constant Mach Number
CM versus Alpha at Constant Deflection AngleCM versus Alpha at Constant Deflection Angle
Lift CoefficientLift Coefficient
00 22 44 66 88 1010 1212 1414 1616
Sref=159 ft2Sref=159 ft2
Lref=74.6 ft2Lref=74.6 ft2
Alpha (deg)Alpha (deg)
-0.03-0.03-0.02-0.02
-0.01-0.010.000.000.010.010.020.020.030.03
0.040.04
Aerodynamic results

Detai l s of the Aerodynamic and Trajec tor y Analyses
119A v e r s At i l e co n c e p t f o r A s s u r e d s pAc e Acc e s s
Trajectory Analysis Data Summary for the Flight Test 2
Alti
tude
(tho
usan
ds fe
et)
Alti
tude
(tho
usan
ds fe
et) A
ltitude (thousands feet)A
ltitude (thousands feet)
00 55 1010 1515 2020 2525 3030 3535 4040 4545 5050Downrange (nmi)Downrange (nmi)
00
2525
5050
7575
100100
125125
150150
00 200200 400400 1,0001,000600600 800800 1,2001,200Downrange (nmi)Downrange (nmi)
00
100100
200200
300300
400400
500500
600600
700700
11
2233
44 55
66
77
88
STAGE 1STAGE 1 STAGE 2STAGE 2
iD Event time(s)
Weight (lb)
altitude(ft)
Velocity (ft/s)
Mach number
Dynamic Pressure (psf)
Gamma (deg)
alpha(deg)
1 aircraft separation 0 81,914 25,000 711 0.7 270 5.0 8.0
2 Stage 1 ignition 10 81,914 25,250 665 0.7 233 -1.5 8.0
3 aerosurface jettison 40 68,249 37,264 1,703 1.8 970 35.1 5.1
4 Maximum dynamic pressure
44 62,673 41,662 1,902 2.0 980 32.7 5.1
5 Stage 1 main engine cut off and separation
144 17,141 228,996 13,125 13.5 14.2 15.5 5.2
6 Stage 2 ignition 146 13,259 235,960 13,108 13.6 10.5 15.3 5.2
7 Fairing jettison 175 12,676 329,295 13,333 14.9 0.1 12.9 7.2
8 Stage 2 main engine cut off and separation
612 3,980 606,306 24,189 27.0 0.0 0.0 10.8

Appendix H
120 H o r i zo n ta l l au n c H
Time: 0.0 secondsSeparation: 0.0 feet
Time: 0.0 secondsSeparation: 0.0 feet
Time: 0.5 secondsSeparation: 0.3 feet
Time: 0.5 secondsSeparation: 0.3 feet
Time: 1.5 secondsSeparation: 18.2 feet
Time: 1.5 secondsSeparation: 18.2 feet
Time: 2.5 secondsSeparation: 56.9 feet
Time: 2.5 secondsSeparation: 56.9 feet
Separation simulation snapshots for a Flight Test Demonstrator

121A v e r s At i l e co n c e p t f o r A s s u r e d s pAc e Acc e s s
Ground Crew RequirementsSurge call-up time and minimum turn around time (TAT) were calculated for the three point designs. Minor variations in the necessary crew sizes were calculated, which can be attributed to factors such as smaller LOX tanks that take less time to fuel or an increased diameter which allows more technicians to work on integration. If staff sizes are assumed to be the same, turn-around times would generally equalize for these vehicles.
The following figures show the results of the operational analysis using current integration and checkout practices for launch vehicles.
a PPE n D i X i
00 88 1616 2424 3232 4040 4848
Carrier aircraft preparationCarrier aircraft preparation
Stage 1,2 alignmentand assembly
Stage 1,2 alignmentand assembly
Stage 1,2 mate andinterfaces
Stage 1,2 mate andinterfaces
Stage 2,3 alignmentand assembly
Stage 2,3 alignmentand assembly
Stage 2,3 mate andinterfaces
Stage 2,3 mate andinterfaces
Carrier aircraft fuelingCarrier aircraft fueling
Integrate launch vehiclewith aircraft
Integrate launch vehiclewith aircraft
Margin (20%)Margin (20%)
Time Elapsed (hrs)Time Elapsed (hrs)
Full turnaround activities
MarginCall-up activities (also in TAT)
Results of the operational analysis for Point Design 1.

Appendix I
122 H o r i zo n ta l l au n c H
00 88 1616 2424 3232 4040 4848 5656 6464
Carrier aircraft preparationCarrier aircraft preparation
Stage 1,2 alignmentand assembly
Stage 1,2 alignmentand assembly
Stage 1,2 mate andinterfaces
Stage 1,2 mate andinterfaces
Carrier aircraft fuelingCarrier aircraft fueling
Integrate launch vehiclewith aircraft
Integrate launch vehiclewith aircraft
Liquid Propellant LoadingLiquid Propellant Loading
Margin (20%)Margin (20%)
Time Elapsed (hrs)Time Elapsed (hrs)
Full turnaround activities
MarginCall-up activities (also in TAT)
00 88 1616 2424 3232 4040 4848 5656 6464 7272
Carrier aircraft preparationCarrier aircraft preparation
Stage 1,2 alignmentand assembly
Stage 1,2 alignmentand assembly
Stage 1,2 mate andinterfaces
Stage 1,2 mate andinterfaces
Carrier aircraft fuelingCarrier aircraft fueling
Integrate launch vehiclewith aircraft
Integrate launch vehiclewith aircraft
Liquid Propellant LoadingLiquid Propellant Loading
Margin (20%)Margin (20%)
Time Elapsed (hrs)Time Elapsed (hrs)
Full turnaround activities
MarginCall-up activities (also in TAT)
Results of the operational analysis for Point Design 2.
Results of the operational analysis for Point Design 3.

Ground Crew Requirement s
123A v e r s At i l e co n c e p t f o r A s s u r e d s pAc e Acc e s s

124 H o r i zo n ta l l au n c H

125A v e r s At i l e co n c e p t f o r A s s u r e d s pAc e Acc e s s
Team Members
Core Team
David F. Voracek, Project Manager, NASA Paul A. Bartolotta, Principal Investigator, NASA Alan W. Wilhite, Analysis Lead, Georgia Institute of Technology Paul L. Moses, Technology Lead, NASA Ramon Chase, Booz Allen Hamilton Walter C. Engelund, NASALawrence D. Huebner, NASA Roger A. Lepsch, NASA Unmeel B. Mehta, NASA Daniel Tejtel, Air Force Research Laboratory Randall T. Voland, ACEnT Laboratories LLC
Analysis Team
Analytical Mechanics AssociatesScott AngsterMatt Toniolo
Georgia Institute of TechnologyPatrick ChaiMatthew Fischer
McKinney Associates Leon McKinney
NASAJeffrey Bowles Veronica HawkeLoc HuynhJames KlessKurt J. KloeselSyri J. KoelfgenJohn MeltonShishir PandyaJeffrey S. RobinsonPaul Tartabini
126 H o r i zo n ta l l au n c H
Team Member s
Analysis Team (continued)
SpaceWorks Enterprises, Inc.John BradfordElizabeth BuchenA.C. CharaniaDominic DePasqualeKevin FeldMichael KellyJohn OldsBrad St. GermainJon WallaceAndrew Willis
Technology Gap Team
Analytical Mechanics Associates Scott Faatz Charles SchaferMichael SealKen Smith
Gloyer-Taylor Laboratories, LLCPaul Gloyer
NASAJohn G. Martin
SpaceWorks Enterprises, Inc. A.J. PiplicaMark Schaffer
Report Team
SpaceWorks Enterprises, Inc.Mark ElwoodAlan Mackey
Strategic Analysis, Inc.Becky Bortnick AferganGreg ByerlyToni Marechaux

127A v e r s At i l e co n c e p t f o r A s s u r e d s pAc e Acc e s s
External ContributorsThe following organizations provided written submissions and presentations to the study:
¡ Aerospace Solutions LLC ¡ AirLaunch LLC ¡ Andrews Space Inc ¡ ATK / Alliant Techsystems Inc ¡ Boeing Company ¡ CFD Research Corporation ¡ Holder Aerospace ¡ Ingenia Engineering ¡ NASA’s John F. Kennedy Space Center ¡ L-3 Communications Corporation ¡ Lockheed Martin Corporation ¡ Northrop Grumman Corporation ¡ Princeton Satellite Systems, Inc. ¡ Pratt & Whitney Rocketdyne ¡ Rocket Planes Corporation ¡ Sierra Nevada Corporation ¡ Special Aerospace Services LLC ¡ Strategic Space Services LLC ¡ Triton Systems, Inc ¡ XCOR Aerospace

128 H o r i zo n ta l l au n c H
Review Team BiographiesVincent Rausch, Chair, served as the Program Manager of the NASA Hyper-X/X-43A program from 1996 through 2004 at the NASA Langley Research Center. In 2004, this program successfully flight-demonstrated two scramjet-powered X-43A research vehicles, at Mach 7 and at Mach 10. In the early 1980s he served as the director for concepts and innovation in the Aeronautical Systems Division, Wright-Patterson AFB, Ohio, where he led the Transatmospheric Vehicle (TAV) system studies, transitioned the DARPA/USAF Teal Dawn project into the Advanced Cruise Missile, led classified studies and analyses, and served as the DARPA agent for Copper Canyon. In 1985, he set up the National Aero-Space Plane (NASP) Program Office and served as its director of operations, and in 1988, he transferred to the Pentagon to establish and lead the joint Air Force, Navy, and NASA NASP Interagency Office. In 1991, he was selected for the position of Assistant Director for Aeronautics (High-Performance Aircraft) at NASA Headquarters. After successful X-43 flights, he led the preliminary design of the Ares 1-X first stage prototype and design concept demonstrator in the Ares I program. He spent 25 years in the USAF, retiring as a colonel in 1991. He currently serves on the flight test review team of the Air Force X-51A.
William H. Heiser is professor emeritus of aeronautics at the United States Air Force Academy, and has served as a visiting professor at Cambridge University and at the University of California, Davis, and began his academic career as an assistant professor at the Massachusetts Institute of Technology. His industrial experience includes serving as head of turbine technology at Pratt and Whitney Aircraft, manager of advanced technology at the General Electric Aircraft Engine Group, and vice president of research at Aerojet General Corporation. He also served as chief scientist at the Air Force Aero Propulsion Laboratory and the Air Force Arnold Engineering Development Center. Dr Heiser is an Honorary Fellow of the American Institute of Aeronautics and Astronautics, a Fellow of the American Association for the Advancement of Science, and a Life Fellow of the American Society of Mechanical Engineers. He has a B.S. degree from Cooper Union, a M.S. degree from the California Institute of Technology, was a Fulbright Exchange Student at the Braunschweig Technische Hochschule, Germany, and holds a Ph.D. degree in mechanical engineering from the Massachusetts Institute of Technology. He currently chairs the technology review for the Air Force high mach number expendable turbine engine and serves on the flight test review team for the X-51A.
Uwe Hueter is a senior engineer in the Missile Defense and Space Operations at Science Applications International Corporation (SAIC) located in Huntsville, Alabama. Uwe has 48 years of experience in aerospace of which the first 42 years were at the NASA’s Marshall Space Flight Center in Huntsville, AL. His experience includes 20 years in flight hardware development and 28 years in launch vehicle design supporting many NASA programs, such as Saturn, Skylab, Spacelab, and Space Station, as well as various advanced space transportation initiatives and the Constellation program. After retiring from NASA in 2004, Uwe joined SAIC in Huntsville

129A v e r s At i l e co n c e p t f o r A s s u r e d s pAc e Acc e s s
Rev iew Team Biographies
where he has been supporting NASA in the earth-to-orbit transportation systems under the exploration initiative activities and supporting DoD for reusable access-to-space and high-speed air responsive vehicle technologies. Uwe has authored 35 technical papers and received many NASA awards including the Silver Snoopy Award, Exceptional Service Medal, and Exceptional Achievement Medal.
Jay P. Penn is a distinguished engineer with over 31 years of experience in the aerospace industry and currently heads the Reusable Launch Vehicle Office at the Aerospace Corporation. He began his career as a flight control engineer at the NASA Johnson Space Center and has supported numerous defense and commercial space launch customers around the world as an expert in space systems, technologies, planning, and program management. He has experience across the acquisition, development, test and operations phases of expendable and reusable space launch systems and architectures as well as satellite and constellation design and orbit transfer. Recent projects include the Joint NASA/DARPA Manned Geosynchronous Servicing study, the DARPA F6 Fractionated Satellite Program, and DARPA’s FAST High Performance Solar Array develop-ment efforts; some of his many past projects include the Reusable Booster System, the Evolved Expendable Launch Vehicle, the Military Spaceplane, Space Maneuver Vehicle roadmap planning activities, SLI Gen 2 and 3 activities, DC-X /XA, and the X-30. Mr Penn participated in an inde-pendent assessment of the X-33 and X-37 programs, provided technical support to the National Reconnaissance Office in advanced spacelift planning, requirements definition, and studies, led Aerospace Corporation’s support to the successful DARPA Orbital Express Advanced Technology Demonstration and their Space Solar Power system engineering activities. He has published extensively on related topics. Mr Penn received a B.S. degree in mechanical engineering from Rutgers University.
Douglas O. Stanley is a principal research engineer on the aerospace engineering faculty of the Georgia Institute of Technology and a visiting professor in residence at the National Institute of Aerospace. He is an internationally recognized expert with over 25 years of experi-ence leading the systems engineering and analysis of advanced space transportation systems in government, industry, and academia. He has also developed and implemented many state-of-the-art tools and methods for the assessment and selection of advanced technologies for aero-space systems. He has authored over 60 peer-reviewed publications and conference papers in the space transportation field, and led a NASA study on exploration systems architecture. Prior to joining academia, Dr. Stanley served as program director for advanced flight systems at Orbital Sciences Corporation where he led engineering efforts in support of NASA’s Exploration Systems Program, Orbital Space Plane Program, Space Launch Initiative, and the Space Transportation Architecture Studies. At NASA, he served as the technical lead for the Reusable Launch Vehicle Program, which included the X-33 and X-34 flight demonstration vehicles. He received a Ph.D. degree in systems engineering and a masters degree in astronautical engineering from George Washington University, and has received numerous awards, including the NASA Distinguished Public Service Medal.

130 H o r i zo n ta l l au n c H
BibliographyAdler, M., M. Wright, W. Engeleund, C. Campbell, T. Rivellini, and I. Clark, “NASA DRAFT Entry,
Descent, and Landing Roadmap,” Technology Area 09, NASA Headquarters, November 2010.
AirLaunch, “LLC QuickReach Small Launch Vehicle,” December 2007. Accessed October 2011: www.airlaunchllc.com/AirLaunch%20QuickReach%20Fact%20Sheet%20-%20Updated.pdf
Ambrose, R., B. Wilcox, B. Reed, L. Matthies, D. Lavery, and D. Korsmeyer. “NASA DRAFT Robotics, Tele-Robotics and Autonomous Systems Roadmap,” Technology Area 04, November 2010.
Amos, Jonathan, “LauncherOne: Virgin Galactic’s other project.” BBC News. 10 November 2009. Accessed on 1 November 2011: http://www.bbc.co.uk/blogs/thereporters/jonathanamos/2009/11/launcherone-virgins-galactics.shtml
Andrews, Dana and Andy Crocker, “Near-Term Transformational HTHL Architecture for 2nd and 3rd Gen RLV Programs,” Andrews Space, Inc. Technology Briefing at RLV/SOV Air Frame Conference on 27 February 2003.
Andrews, J., M. Wolfert, E. Lund, and D. Andrews, “Comparison of Vertical and Horizontal Takeoff Hybrid Launch Systems to Address Responsive Space Needs”, AIAA-2005-6683, August 2005.
Andrews Space, Inc., “Operationally Responsive Spacelift,” 2008. Accessed October 2011: www.andrews-space.com/content-main.php?subsection=MTA4
Balepin, V., High Speed Propulsion Cycles. In Advances on Propulsion Technology for High-Speed Aircraft (Paper 2, pp. 1-32). Educational Notes RTO-EN-AVT-150. Neuilly-sur-Seine, France: RTO, 2008. Available at http://www.rto.nato.int
Bilardo, V., J. Robinson, D. Komar, W. Taylor, N. Lovell, and G. Magio, “NGLT Systems Tiger Team Study Results: Implications for space launch architectures and technologies,” American Institute of Aeronautics and Astronautics, AIAA-2003-5263, presented at the 39th AIAA/ASME/SAE/ASEE Joint Propulsion Conference, Huntsville, Alabama, July 20–23, 2003.
Bilardo, V.J., J.L. Hunt, N.T. Lovell, G. Maggio, A.W. Wilhite, and L.E. McKinney. “The Benefits of Hypersonic Airbreathing Launch Systems for Access to Space,” American Institute of Aeronautics and Astronautics, AIAA-2003-5265, presented at the 39th AIAA/ASME/SAE/ASEE Joint Propulsion Conference, Huntsville, Alabama, July 20–23, 2003.
Biltgen, Patrick, Jarret Lafleur, Josh Loughman, Robert Martin, Kevin Flaherty, Min Cho, Keith Becker, Chester Ong, and John R. Olds, “StarRunner: A single-stage-to-orbit, airbreathing, hypersonic propulsion system,” American Institute of Aeronautics and Astronautics, AIAA-2004-3729. 2004.
Bloss, Bryan E., “MUSTANG: A Near-term solution for aircraft-like space operations,” briefing slides, University of Central Florida, Orlando, Florida. December 2003.
Boeing Company, “Boeing Studying Air-Launched Addition to Launch Vehicle Family,” Seal Beach, California, 2 March 2000. Accessed October 2011: www.boeing.com/news/releases/2000/news_release_000302s.html
Boeing Company, Final Report on Feasibility Study of Reusable Aerodynamic Space Vehicle, vol. 1, Executive Summary. Kent, Washington: Boeing Aerospace Company, November 1976.
131A v e r s At i l e co n c e p t f o r A s s u r e d s pAc e Acc e s s
Bib l iography
Boeing Company, “NIA Hypersonics Report,” Contract No. 2900-HY04, NA-05-1079, February 18, 2005.
Booker, Corey G., John Ziemer, John Plonka, Scott Henderson, Paul Copioli, Charles Reese, Christopher Ullman, Jeremy Frank, Alan Breslauer, and Hristos Patonis, Athena: Advanced air launch space booster.” NASA-CR-197148, June 1994. 291 pages.
Bradford, J. E., Olds, J. R., and J.G. Wallace, “A Two-Stage Spacelift Concept Using Air-Breathing Propulsion and Falcon-Derived Hardware,” 54th Joint Army-Navy-NASA-Air Force (JANNAF) Propulsion Meeting (JPM) and 5th Modeling and Simulation / 3rd Liquid Propulsion/2nd Spacecraft Propulsion Joint Subcommittee Meeting, Denver, Colorado, 14018 May 14–18 2007.
Bradford, J., A. Charania, J. Olds, and J. Wallace, “Innovative Concept Development of Reusable Launch Vehicles Using Combined-Cycle Propulsion for Military Applications,” AFRL-IF-WP-TR-2006, SpaceWorks Engineering, Inc., Atlanta Georgia, July 2006.
Bradford, J., J. Olds, and J. Wallace, “A Two-Stage Spacelift Concept Using Air-Breathing Propulsion and Falcon-Derived Hardware,” 54th Joint Army-Navy-NASA-Air Force (JANNAF) Propulsion Meeting (JPM) and 5th Modeling and Simulation/3rd Liquid Propulsion/2nd Spacecraft Propulsion Joint Subcommittee Meeting, Denver, Colorado, 14–18 May 2007.
Bradley, M.K., J. D. Embler, D. J. McCormick, and J. J. Miller, “Air breathing SOV Configuration Study.” AFRL-VA-WP-TR-2003, Boeing Company, Huntington Beach, California, March 2003.
Carter, P., O. Brown, and T. Rice, “DARPA’s Rapid Access Small Cargo Affordable Launch (RASCAL) Program”, AIAA-2003-8004, April 2003.
Chemical Propulsion Information Analysis Center. “National Hypersonic Science and Technology Planning Report,” CPIAC Publication 717, October 2001.
Chen, Timothy T., Preston W. Ferguson, David A. Deamer, and John Hensley, “Responsive Air Launch Using F-15 Global Strike Eagle,” American Institute of Aeronautics and Astronautics, RS4-2006-2001. Presented at the 4th Responsive Space Conference, Los Angeles, California, 24–27 April 2006.
Clements, G., B. Brown, M. Fawcett, B. Underwood, N. Zeitlin, and S. Schaefer. “NASA DRAFT Ground and Launch Systems Processing Roadmap,” Technology Area 13, November 2010.
Crocker, A., A. Charania, and J. Olds, “An Introduction to the ROSETTA Modeling Process for Advanced Space Transportation Technology Investment,” AIAA-2001-4625, August 2001.
Crocker, A., A.M. Wuerl, J.E. Andrews, and D.G. Andrews, Progress on Alchemist ACES: Technology for next generation space transportation”, AIAA-2003-4890, July, 2003.
Dankhoff, W., K. Dayton, D. Levack, P. Odom, R. Rhodes and J. Robinson, “A NASA Spaceliner 100 Propulsion Oriented Technology Assessment,” American Institute of Aeronautics and Astronautics, AIAA-2000-3603, presented at the 36th AIAA/ASME/SAFJASEE Joint Propulsion Conference, Huntsville, Alabama, 17-19 2000.
Dassault Aviation, “Rafale, satellite launcher study,” Web. Issue No. 3, 23 October 2008.
Day, Dwayne. “Fire in the sky: the air launched sortie vehicle of the early 1980s (part 2).” The Space Review, 8 March 2010. Accessed October 2011: www.thespacereview.com/article/1580/1

132 H o r i zo n ta l l au n c H
Bib l iography
Day, Dwayne. “Fire in the sky: the air launched sortie vehicle of the 1980s (part 3).” The Space Review, 22 March 2010. Accessed October 2011: www.thespacereview.com/article/1591/1
DePasquale, Dominic, A.C. Charania, Seiji Matsuda, and Hideki Kanayama, “NanoLauncher: An affordable and dedicated air-launch transportation service for nanosatellites,” Institute of Aeronautics and Astronautics, AIAA-2010-8629, presented at the AIAA Space 2010 Conference and Exposition, Anaheim, California, 30 August–2 September 2010.
Federal Aviation Administration, Reusable Launch Vehicles and Spaceports: Programs and Concepts for 2011, Associate Administrator for Commercial Space Transportation, January 2001. 41 pages.
Frick, Warren, Joseph Guerci, and Brian Horais, “Responsive Air Launch,” American Institute of Aeronautics and Astronautics, AIAA-2004-8003, presented at the 2nd Responsive Space Conference, Los Angeles, California, 19–22 April 2004.
Gardiner, G., “Out-of-autoclave prepregs: Hype or revolution?” High Performance Composites, January 1, 2011. Available at Accessed November 2011: http://www.compositesworld.com/articles/out-of-autoclave-prepregs-hype-or-revolution
Gentry, G., D. Smyth, and W. Oliver, “The Mark IV Supersonic-Hypersonic Arbitrary-Body Program,” AFFDL-TR-73-159, Vols I-III, Nov. 1973.
Hampsten, Kenneth R., “BladeRunner and Airborne Missile Silo”, concept briefing, 25 June 2004.
Heppenheimer, T.A., Facing the Heat Barrier: A history of hypersonics. The NASA History Series. Washington, D.C.: National Aeronautics and Space Administration, 2007.
Hill, S., C. Kostyk, B. Motil, T. Swanson, S. Rickman, and R. Notardonato, “NASA DRAFT Thermal Management Systems Roadmap,” Technology Area 14, November 2010.
HLS Analysis Team, Expert knowledge and analysis from various sources, 2011.
Hunt J.L., D.H. Petley, P.L. Moses, J.G. Martin, S.M. Ferlemann, C.P. Leonard, R.J. Pegg, J.S. Robinson, L.W. Taylor III, R.F. Vause, S.Z. Pinckney, and K.A. Bouchard, “Airbreathing Launch Vehicle Study,” 50th JANNAF Propulsion Meeting, Salt Lake City, Utah, 11–13 July 2001.
Isakowitz, S.J., J.B. Hopkins, and J.P. Hopkins, Jr., International Reference Guide to Space Launch Systems, 4th edition, American Institute of Aeronautics and Astronautics, 2004. pp 51–53.
Jenkins, Dennis R., Tony Landis, and Jay Miller, “American X-Vehicles: An Inventory – X-1 to X-50, Centennial of Flight Edition.” Monographs in Aerospace History No. 31, SP-2003-4531, June 2003.
Joyce, P., M. Pudoka, V. Allen, and J. Pomroy, “Flight Test Design Considerations for Rocket-Boosted Hypersonic Flight Research”, JANNAF 35th Combustion Subcommittee/Propulsion Systems Hazards Subcommittee/and Airbreathing Propulsion Subcommittee Joint Meetings, December 1998.
Ko, Andy, L.T. Leifsson, J.A. Schetz, W.H. Mason, B. Grossman, and R.T. Haftka, “MDO of a Blended-Wing-Body Transport Aircraft with Distributed Propulsion,” American Institute of Aeronautics and Astronautics, AIAA-2003-6732, presented at the AIAA 3rd Annual Aviation Technology, Integration, and Operations (ATIO) Technical Forum, Denver, Colorado, 17–19 November 2003.

133A v e r s At i l e co n c e p t f o r A s s u r e d s pAc e Acc e s s
Bib l iography
Kokan, T., J.R. Olds, V. Hutchinson, and J.D. Reeves, “Aztec: A TSTO hypersonic vehicle concept utilizing TBCC and HEDM propulsion,” American Institute of Aeronautics and Astronautics. AIAA-2004-3728, presented at the 40th AIAA/ASME/SAE/ASEE Joint Propulsion Conference and Exhibit, Fort Lauderdale, Florida, 11–14 July 2004.
Lau, Kei Y., “Hypersonic Boundary-Layer Transition: Application to high-speed vehicle design,” Journal of Spacecraft and Rockets, Vol. 45, No. 2, March–April 2008, pp. 176–183.
Lozino-Lozinsky G.E., and A.G. Bratukhin, eds. Aerospace Systems: Book of technical papers. Moscow, Russia: Moscow Aviation Institute, 1997.
McClinton, C.R., “High Speed/Hypersonic Aircraft Propulsion Technology Development,” in Advances on Propulsion Technology for High-Speed Aircraft (Paper 1, pp. 1–32). Educational Notes RTO-EN-AVT-150. Neuilly-sur-Seine, France, 2008.
McClinton, C.R., et al., “Hyper-X: Foundation for future hypersonic launch vehicle,” IAC-04-V.8.08, presented at the 55th International Astronautical Congress, Vancouver, Canada, October 2004.
McConnaughey, P.K., M.G. Femminineo, S.J. Koelfgen, R.A. Lepsch, R.M. Ryan, and S.A. Taylor, “NASA DRAFT Launch Propulsion Systems Roadmap,” Technology Area 01, November 2010.
Messinger, R., Boeing Company. “Evaluation of Advanced Composite Structures Technologies for Application to NASA’s Vision for Space Exploration,” NASA Contractor Report NASA/CR-2008-215120, July 2008.
Meyer, M, L. Johnson, D. Goebel, H. White, D. Coote, and B. Palaszewski, “NASA DRAFT In-Space Propulsion Systems Roadmap,” Technology Area 02, November 2010.
Moses, P.L., S. M. Ferlemann, C. P. Leonard, K. A. Bouchard, R. F. Vause, S. Z. Pinckney, L. W. Taylor III, J. S. Robinson, J. G. Martin, D. H. Petley, and J. L. Hunt, “Design and Development of an Airbreathing Launch Vehicle with Turbine-Based Low-Speed Propulsion and Dual Mode Ramjet/Scramjet High-Speed Propulsion,” 1999 JANNAF CS/PSHS/APS Joint Meeting, Cocoa Beach, Florida, 18–22 October 1999.
Nadell, Shari-Beth, William J. Baumgarten, and Stephen W. Alexander, “Mission and sizing analysis for the Beta II two-stage-to-orbit vehicle,” American Institute of Aeronautics and Astronautics, AIAA-1992-1264, presented at the Aerospace Design Conference, Irvine, CA, 3–6 February 1992. 14 pages.
National Aeronautics and Space Administration, Access to Space Study Summary Report. Office of Space Systems Development, January 1994.
National Aeronautics and Space Administration, “An Operational Assessment of Concepts and Technologies for Highly Reusable Space Transportation,” report of the Integration Task Force, Operations, of the Highly Reusable Transportation Study. November, 1998. Accessed October 2011: science.ksc.nasa.gov/shuttle/nexgen/Nexgen_Downloads/HRSTOpsIntRepor.pdf
National Aeronautics and Space Administration, “Commercial Market Assessment for Crew and Cargo Systems,” Pursuant to Section 403 of the NASA Authorization Act of 2010 (Public Law 111-267). April 27, 2011. Appendix B, p. 40.
National Aeronautics and Space Administration, NASA Facing the Heat Barrier: A history of hypersonics, pp. 118–221. Accessed October 2011: history.nasa.gov/sp4232-part2.pdf

134 H o r i zo n ta l l au n c H
Bib l iography
National Aeronautics and Space Administration, NASA Space Exploration Systems Architecture Study, NASA TM 2005-214062, November 2005.
National Research Council, Evaluation of the National Aerospace Initiative, National Academies Press, 2004.
Neiland, V. I. and R.C. Parkinson, “The An-225/Interim Hotol Launch Vehicle,” IAF, International Astronautical Congress, 42nd, Montreal, Canada, 5–11 October 1991. 8 pages.
Olds, John R., John Bradford, Ashraf Charania, Laura Ledsinger, David McCormick, and Kirk Sorensen, “Hyperion: An SSTO Vision Vehicle Concept Utilizing Rocket-Based Combined Cycle Propulsion,” American Institute of Aeronautics and Astronautics, AIAA-99-4944, presented at the 9th International Space Planes and Hypersonic Systems and Technology Conference and 3rd Weekly Ionized Gases Workshop, Norfolk, Virginia, 1–5 November 1999a.
Olds, John R., Laura Ledsinger, John Bradford, Ashraf Charania, David McCormick, and D.R. Komar, “Stargazer: A TSTO Bantum-X Vehicle Concept Utilizing Rocket-Based Combined Cycle Propulsion,” American Institute of Aeronautics and Astronautics, AIAA-99-4888, presented at the 9th International Space Planes and Hypersonic Systems and Technology Conference and 3rd Weekly Ionized Gases Workshop, Norfolk, Virginia, 1–5 November 1999b.
Olds, John R., “Options for Flight Testing Rocket-Based Combined Cycle (RBCC) Engines,” Institute of Aeronautics and Astronautics, AIAA-96-2688, presented at the 32nd AIAA/ASME/SAE/ASEE Joint Propulsion Conference, Lake Buena Vista, Florida, 1–3 July 1996.
Olds, John R. and Peter X. Bellini, “Argus: A Highly Reusable SSTO Rocket-Based Combined Cycle Launch Vehicle with Maglifter Launch Assist,” American Institute of Aeronautics and Astronautics, AIAA-1998-1557, presented at the AIAA 8th International Space Planes and Hypersonic Systems and Technology Conference, Norfolk, Virginia, 27–30 April 1998.
Orbital Sciences Corporation, Pegasus. Accessed October 2011: www.orbital.com/spacelaunch/pegasus/
Padula, S., “Shape Memory Alloy Program Review,” NASA Glenn Research Center, 7 May 2010.
Palaszewski, B., L.S. Ianovski, and P. Carrick. “Propellant Technologies: A Persuasive Wave of Future Propulsion Benefits.” NASA TM-97-206228, December 1997.
Peebles, C., “Air-Launched Shuttle Concepts”. Journal of the British Interplanetary Society (1983) Vol. 36, p. 153
Premier Space Systems, Inc., “NanoLaunch, LLC,” Briefing slides, Siskiyou County, California, 13 July 2010.
Reaction Engines, Ltd, “SKYLON - The Vehicle, 2010.” Accessed October 2011: www.reactionengines.co.uk/skylon_vehicle.html
Saaty, Thomas L., and Kirty Peniwati. Group Decision Making: Drawing out and reconciling differences. Pittsburgh, Penn.: RWS Publications, 2007.
Salkeld, Robert, “Tripropellant RLVs 1965-1978,” 1978. Accessed October 2011: www.pmview.com/spaceodysseytwo/spacelvs/sld039.htm

135A v e r s At i l e co n c e p t f o r A s s u r e d s pAc e Acc e s s
Bib l iography
Sanborn, M. W., R.J. Budica, C.F. Ehrlich, and R. T. Cervisi, “Overview of Transatmospheric Vehicle Systems,” Rockwell International Concept Briefing to USAF/SAB, Washington, D.C., 4 October 1984.
Sarigul-Klijn, Marti and Nesrin Sarigul-Klijn, “A Study of Air Launch Methods for RLVs,” American Institute of Aeronautics and Astronautics, AIAA-2001-4619. 2001. 16 pages.
Science Applications International Corporation, “Integrated Concept Model 2 (ICM-2): A two-stage-to-orbit turbine based combination cycle concept,” ASAP Team Final Report, 21 February 2003.
Scuderi, Lee F., George F. Orton, and James L. Hunt, “MACH 10 Cruise/Space Access Vehicle Study,” American Institute of Aeronautics and Astronautics, AIAA-1998-1584, presented at the AIAA International Space Planes and Hypersonic Systems and Technologies Conference 8th, Norfolk, Virginia, 27–30 April 1998.
Shafto, M., M. Conroy, J. LeMoigne, R. Doyle, E. Glaessgen, L. Wang, and C. Kemp, “NASA DRAFT Modeling, Simulation, Information Technology & Processing Roadmap,” Technology Area 11, November 2010
Smart, C., “NAFCOM Cost Risk Module,” The NASA Engineering Cost Group and Science Application International Corporation, Huntsville, Alabama, 2004. pp 2–8.
Snyder, Christopher, J. Robinson, and S Ferlemann, “TBCC TSTO Design for the NASA-AFRL Joint System Study,” Presented at the Turbine Engine Technology Symposium, Dayton, Ohio, 16 September 2010. Accessed October 2011: www-psao.grc.nasa.gov/publications/TETS-2010_TBCC-JSS.pdf
Sorensen, Kirk, “ALTO/Crossbow -— A Transformational Air and Space Concept,” briefing slides: Huntsville, Alabama, February, 2003.
Spaceworks Engineering, Inc., “Transformational Carrier-Launch Capabilities: space access and hypersonic transport using electromagnetic launch assist,” June 2004.
St. Germain, Brad and John R. Olds, “An Evaluation of Two Alternate Propulsion Concepts for Bantam-Argus: Deeply cooled turbojet + rocket + pulsed detonation rocket + ramjet,” American Institute of Aeronautics and Astronautics, AIAA-1999-2354, presented at the AIAA/ASME/SAE/ASEE Joint Propulsion Conference and Exhibit, 35th, Los Angeles, California, 20–24 June 1999.
St. Germain, Brad, John R. Olds, Laura Ledsinger, James McIntire, Douglas Nelson, and John Weglian, “Starsaber: A small payload class TSTO vehicle concept utilizing rocket based combined cycle propulsion,” American Institute of Aeronautics and Astronautics, AIAA-2001-3516, presented at the 37th AIAA/ASME/SAE/ASEE Joint Propulsion Concept and Exhibit, Salt Lake City, Utah, 8–11 July 2001.
Stanley, D.O., and J. Olds, “Hypersonic Technology Assessment Study-FY10 Final Report,” Lunar Campaign Assessment Support, Task Order NNL09AB62T, Subtask 3.8, National Institute of Aerospace, October 26, 2010.
Stueber, Thomas J., Daniel R. Vrnak, Dzu K. Le, and Peter J. Ouzts, “Control Activity in Support of NASA Turbine Based Combined Cycle (TBCC) Research.” NASA/TM-2010-216109, March 2010. Accessed October 2011: gltrs.grc.nasa.gov/reports/2010/TM-2010-216109.pdf
136 H o r i zo n ta l l au n c H
Bib l iography
Talbot, C. and C. Bonnal, “Air Launch Solutions for Microsatellites,” Centre National d’Etudes Spatiales (CNES) briefing slides, presented to Surrey University, Surrey, United Kingdom, 9 September 2008.
US Spaceplane Systems, “Two Stage To Orbit: What is wrong with single stage vehicles.” Accessed October 2011: us-spaceplanesystems.com/twostage.asp
Vickers, J., R. Piascik, S. Scotti, D. Lowry, J. Stewart, and A. Calomino. “NASA DRAFT Materials, Structures, Mechanical Systems, and Manufacturing Roadmap,” Technology Area 12, November 2010.
Wagner, J., R. Hafley, and M. Domack.”Al-Li Alloy 2050 for Launch Vehicle Applications,” July 2009.
Wallace, Jon, John Olds, A.C. Charania, and Gordon Woodcock, “A Study of ARTS: A dual-fuel reusable launch vehicle with launch assist,” American Institute of Aeronautics and Astronautics, AIAA-2003-5269, presented at the 39th AIAA/ASME/SAE/ASEE Joint Propulsion Conference and Exhibit, Huntsville, Alabama, 20–23 July 2003.
XCOR Aerospace, “Previous Vehicle Design by Dan DeLong,” Accessed October 2011: www.xcor.com/products/vehicles/frequent_flyer_and_teledyne_brown_spaceplane.html
XCOR Aerospace, Press Release, “XCOR Aerospace Suborbital Vehicle to Fly within Two Years: New vehicle called the Lynx,” March 26, 2008. Accessed October 2011: www.xcor.com/press-releases/2008/08-03-26_Lynx_suborbital_vehicle.html
Young, David A. and John R. Olds, “Responsive Access Small Cargo Affordable Launch (RASCAL) Independent Performance Evaluation,” American Institute of Aeronautics and Astronautics, AIAA-2005-3241. 2005. 23 pages.
Young, David A., Timothy Kokan, Ian Clark, Christopher Tanner, and Alan Wilhite, “Lazarus: A SSTO hypersonic vehicle concept utilizing RBCC and HEDM propulsion technologies,” Institute of Aeronautics and Astronautics, AIAA-2006-8099, presented at the 14th AIAA/AHI Space Planes and Hypersonic Systems and Technologies Conference, Canberra, Australia, November 2006.
Zubrin, Robert M. and Mitchell Burnside Clapp: “Black Horse: One stop to orbit.” Analog Magazine. June 1995.

137A v e r s At i l e co n c e p t f o r A s s u r e d s pAc e Acc e s s
Glossary (Acronyms and Abbreviations)
aar air-augmented rocket
aBlV air breathing launch vehicle
acES air collection and enrichment system
aHP analytical hierarchy process
aiaa american institute of aeronautics and astronautics
aMSc advanced Manned Spaceflight capability
atK alliant techsystems
atS access to space
aVatar aerobic vehicle for hypersonic aerospace transportation
caV common aero vehicle
cFD computational fluid dynamics
conoP concept of operation
conuS continental united States
DarPa Defense advanced research Projects agency
DctJ deeply cooled turbojet
DDt&E design, development, test, and evaluation
DMrSJ dual-mode ramjet/scramjet
DrM design reference mission
EDl entry, descent, and landing
FaSSt flexible aerospace system solution for transformation
FoM figure of merit
Ft flight test system concept
FY fiscal year
GEM ground effect machine
GEo geosynchronous orbit
HEDM high-energy density material (propellant)
HlS Horizontal launch Study
Hotol horizontal takeoff and landing
HrSt highly reusable space transportation
HSct High-Speed civil transport
HSDtV hypersonic technology demonstrator vehicle
HtHl horizontal take-off, horizontal landing
HtPB hydroxyl-terminated polybutadiene
icBM intercontinental ballistic missile
icM integrated concept model
iHPrPt integrated high payoff rocket propulsion technology
ioc initial operational capability
iraD industrial research and development
iSr intelligence, surveillance, and reconnaissance
JSS Joint System Study
lacE liquid air cycle engine

138 H o r i zo n ta l l au n c H
Glossar y
lb pound
lcc lifecycle cost
lE leading edge
lEo low Earth orbit
lH2 liquid hydrogen
loM loss of mission
loX liquid oxygen
lSoS low-speed operating system
MaKS multipurpose aerospace system
Maut multi-attribute utility theory
MDo multidisciplinary optimization
MHD magnetohydrodynamics
MiPcc Mass injection Pre-compressor cooling
MiS modular insertion stage
naSa national aeronautics and Space administration
naSP national aero-Space Plane
nGlt next Generation launch technology program
oSc orbital Sciences corporation
PD point design system concept
PDE pulse detonation engine
PDrE pulse detonation rocket engine
PoSt program to optimize simulated trajectories
psf pounds per square foot
PWr Pratt Whitney rocketdyne
q dynamic pressure
QFD Quality Function Deployment
raScal rapid access small cargo affordable launch
raSV reusable aerodynamic space vehicle
rBcc rocket based combined cycle
roSEtta reduced order simulation for evaluating technologies and transportation architectures
rP rocket propellant
rta revolutionary turbine accelerator
Sca shuttle carrier aircraft
SErJ supercharged ejector ramjet
SMV space maneuver vehicle
SSto single stage to orbit
taV trans-atmospheric Vehicle
tBcc turbine based combined cycle
tM technical memorandum
trl technology readiness level
tSto two stage to orbit
V velocity
Vto vertical takeoff
VtoHl vertical takeoff horizontal landing
X experimental