2014_Final.pdf - NASA
287
-
Upload
khangminh22 -
Category
Documents
-
view
5 -
download
0
Transcript of 2014_Final.pdf - NASA


Cover image:This cover illustrates key components of the Johnson Space Center’s strategic implementation plan referred to as JSC 2.0. JSC is leading the human exploration of space by exploiting the International Space Station as a cornerstone of exploration, enabling the commercialization of low-earth orbit, and extending human exploration beyond low-Earth orbit by leading the development of space exploration systems and vehicles, as well as leading the maturation of the technologies needed for future human space exploration missions.
Acknowledgements:The University Collaboration and Partnership Office collaborated with the JSC Strategic Opportunities and Partnership Office (SOPD) to produce and publish this report. Support from SOPD is appreciated.
Research and Technology Development Report 2014 NASA Report TM-2013-217382Published by the Johnson Space Center External Relations Office Michael Kincaid, DirectorDeborah Conder, Deputy Director Kamlesh Lulla, Project Manager and Executive Editor Jeffrey Bye, Project Lead and Editor

Contents
ForewordEllen Ochoa ....................................................................................................................................................................... 1
Introduction Kamlesh Lulla .................................................................................................................................................................... 2
Strategic Opportunities and Partnership Development OfficeYolanda Marshall, Douglas A. Terrier, Steven Gonzalez ................................................................................................... 3
Technology and Innovation: Investing in the Future at Johnson Space CenterDouglas A. Terrier .............................................................................................................................................................. 5
The Human Health and Performance Directorate: A Comparative Analysis of Innovation Within an OrganizationJeffrey R. Davis, Kathryn E. Keeton, Elizabeth E. Mary C. McFather ............................................................................... 8
Human Health, Life Support and Habitation Systems, and Space Medicine
Advancing No-Drill Dentistry - Treatment of Human CarriesGeorge D. Arndt, Diane Byerly, Marguerite A. Sognier, John Dusl, Ivan Stangel ........................................................... 11
Microwave Energy Countermeasure for Skin DisordersDiane Byerly, George D. Arndt, John Dusl, Marguerite Sognier ..................................................................................... 13
A Potential Path to Understanding Vision Changes During SpaceflightScott M. Smith, Sara R. Zwart ..........................................................................................................................................15
Human Research Program William Paloski, Barbara Corbin ...................................................................................................................................... 17
Magnet Architectures and Active Radiation Shielding StudyKenneth Bollweg, Shayne C. Westover, Steve Blattnig, Robert Singleterry, Rainer B. Meinke, Scott A. Washburn, William J. Burger, Steve Van Sciver, Roberto Battiston ................................................................................................................ 19
Use of Gas Chromatograph-Differential Mobility Spectrometer for Volatile Organic Compound Monitoring on the International Space StationJohn T. James, Thomas F. Limero, Eric S. Reese, William T. Wallace, Patti F. Cheng, John B. Trowbridge .................. 22
Organ Dose Projection and Acute Radiation Sickness AssessmentFrancis A. Cucinotta, Myung-Hee Y. Kim, Shaowen Hu, Hatem N. Nounu ..................................................................... 25
NASA Space Cancer Risk Assessment 2012Francis Cucinotta, Patrick O’Neill, Myung-Hee Y. Kim, Lori Chappell, Shaowen Hu, Ianik Plante, Hatem N. Nounu...... 27
Pharmaceutical Product Development:Intranasal Scopolamine (INSCOP) Metered Dose SprayLakshmi Putcha, Vernie R. Daniels ................................................................................................................................. 29
Comparative Benchmark Dose Modeling as a Tool to Make the First Estimate of Safe Human Exposure Levels to Lunar DustJohn T. James, Robert R. Scully, Chiu-wing Lam ............................................................................................................. 31
Lower Body Gradient Compression Garments Protect Against Orthostatic Intolerance After Bed RestSteven H. Platts, Michael C. Willig, Rob Ploutz-Snyder, Michael B. Stenger, Stuart M. C. Lee, L. Christine Ribeiro,Tiffany R. Phillips ............................................................................................................................................................. 33
Contentscontinued
A Novel Noninvasive Technology to Estimate Peripheral Venous PressureAlan H. Feiveson, Steven H. Platts, David S. Martin, Michael B. Stenger, Stuart M. C. Lee, Tim Caine, Sydney P. Stein,Tim Matz .......................................................................................................................................................................... 35
Improved Efficiency With a Suite of Custom Ultrasound Analysis ProgramsSteven H. Platts, Natalia M. Arzeno, L. Christine Ribeiro, Timothy L. Caine, David S. Martin, Michael B. Stenger, Stuart M. C. Lee ......................................................................................................................................................................... 38
Novel Assessment of Dynamic Muscle Function Using UltrasoundNatalia Arzeno, David Martin, Tim Caine, Kyle Hackney, Lori Ploutz-Snyder, Jessica Scott ........................................... 41
Improving Human Research and Astronaut Care with NASA Life Sciences Data Ken Jenks, Kathy Johnson-Throop, Binaifer Kadwa, Mary Van Baalen, Stacie Ray, Diedre Thomas, Jacque Havelka, Sara Mason, Adriana Babiak-Vazquez, Jacqueline Charvat, Lesley Lee, Mary Wear ............................................................. 43
Improving Balance Function Following Long-Duration Spaceflight by Enhancing Signal Information from the Inner EarMillard Reschke, Scott Wood, Jacob Bloomberg, Ajitkumar Mulavara, Matthew Fiedler, Igor Kofman, Yiri E. De Dios, Chris Miller, Rachel Brady, Brian Peters, Raquel Galvan, Helen Cohen .................................................................................. 46
Human Exploration Systems, Technologies for Extravehicular Activity and Harsh EnvironmentsSpacesuit Evaporator-Absorber-Radiator (SEAR)Grant C. Bue, Mike Izenson, Weibo Chen, Ed Hodgson ................................................................................................. 49
Reduced Volume Prototype Spacesuit Water Membrane EvaporatorJanice V. Makinen, Grant C. Bue, Colin Campbell, Aaron Colunga ................................................................................ 52
Environmental Technologies Leadership in Energy and Environmental Design at Johnson Space CenterSteve Farley .................................................................................................................................................................... 56
Materials, Structures, Development and Testing Ablative Thermal Protection System ModelingAdam Amar, Benjamin Kirk, A. Brandon Oliver ............................................................................................................... 60
Monopropellant (AF-M315E) Product CharacterizationBenjamin Greene, Mark B. McClure, Dion J. Mast ......................................................................................................... 63
Correlation and Improvement of Modeling of Hypervelocity Impact, Micrometeoroid and Orbital Debris Impacts onto Spacecraft WindowsJohn Alred, Larry Vuong .................................................................................................................................................. 65
Inflatable Habitat DevelopmentMolly Selig, Gerard Valle ................................................................................................................................................. 67
Contentscontinued
Analysis of Material Specimens on the Komplast Experiment After Long-term Exposure on the International Space StationJohn Alred, Julie Henkener, John Golden, Michael Kravchenko ..................................................................................... 69
Improved Measurement of Ejection Velocities from Craters Formed in SandMark J. Cintala, Terry Byers, Francisco Cardenas, Roland Montes, Elliot E. Potter ........................................................ 71
Shell/NASA Vibration-Based Damage CharacterizationJohn Michael Rollins ........................................................................................................................................................ 73
Advancements in Capsule Parachute AnalysisDavid Bretz ...................................................................................................................................................................... 75
NASGRO - Fracture Mechanics and Fatigue Crack Growth Analysis SoftwareJoachim Beek, Royce Forman ......................................................................................................................................... 77
Crew Perspective on Time Delayed Voice CommunicationsMarcum L. Reagan, Stanley G. Love ............................................................................................................................... 79
Solving Problems for Spacewalking Astronauts from Small Micrometeoroid and Orbital Debris ImpactsE.L. Christiansen, D.M. Lear ............................................................................................................................................ 81
Stiffness Characteristics of Foams for Applications Requiring Exposure to Harsh Space EnvironmentsGabriel Ortiz-Sanchez, Erica S. Worthy ........................................................................................................................... 83
Sub-Scale Re-entry Capsule Drop Test via High-Altitude BalloonRon Sostaric, Nicole Dawkins .......................................................................................................................................... 86
Development Testing of the Capsule Parachute Assembly System (CPAS)Christopher Johnson, Ricardo Machin, Michele Parker, Rilla Wolf .................................................................................. 89
Developing Rotary Blade Landing TechnologyJeffrey D. Hagen, Brent A. Evernden ............................................................................................................................ 92
Correlation of Direct Localized Resistivity Measurements with Fiber Damage in Bare IM7 Carbon Fiber TowsNathanael Greene, Daniel Wentzel, Regor Saulsberry, Igor Sevostianov .................................................................... 95
Space Power, Energy Storage, and PropulsionFuel Cell Mass Trade for LOX/Methane LanderAbigail C. Ryan .............................................................................................................................................................. 98
Battery Development for Spaceflight ProjectsJudith A. Jeevarajan, Elvia Garcia, Gilbert Varela, Martin Martinez .............................................................................. 100
Advanced Battery Technology Programs and TestingJudith A. Jeevarajan, Bruce Duffield .............................................................................................................................. 102
Magnetic Nozzle Effects on Plasma PlumesFrans H. Ebersohn, John V. Shebalin ............................................................................................................................ 104

Contentscontinued
Robotics, Tele-Robotics, Autonomous Systems, and Software
Core Flight Software Reuse in Human-Rated SystemsLorraine Williams, Steve Duran ..................................................................................................................................... 106
Project Morpheus Lander Software: Built upon Reusable Software ArchitecturesLorraine Williams, Robert O. Shelton, Robert L. Hirsh .................................................................................................. 108
Software-Based Graphical Processor Unit for Use Beyond Low-Earth OrbitGlen Steele, Jairo Sanchez, Lee Morin, George Salazar, Joel Busa, Patrick Laport, Tim Verborgh ............................ 111
Autonomous Landing and Hazard Avoidance Technology (ALHAT) Field TestingDavid K. Rutishauser, Chirold D. Epp, Edward A. Robertson ........................................................................................ 114
Morpheus Engine Calibration Using Image Processing and Parameter EstimationWyatt Johnson ............................................................................................................................................................... 117
Tool for Rapid Analysis of Monte Carlo Simulations (TRAM)Carolina Restrepo, Kurt E. McCall, John E. Hurtado .................................................................................................... 120
Telepresence for Deep Space MissionsOron Schmidt, Levi Dexter, Brian Greenly, Blake Hubbard ........................................................................................... 122
Multi-Purpose Crew Vehicle Guidance, Navigation, and Control Model-Based Development of Flight SoftwareJoel R. Henry, Mark C. Jackson .................................................................................................................................... 124
Failure Modes and Effects Analysis (FMEA) Assistant ToolMelissa D. Flores, Jane T. Malin, Land D. Fleming ....................................................................................................... 126
Development of a Flight Debris Monitoring ToolMike Bernatovich, Jeff Fox, Matthew Hart, Don Reed, Kristin Bledsoe, Patrick Laport ..................................................128
Exploration, Planetary Science, and Sensor SystemsOrion Multi-Purpose Crew VehicleOrion Team .................................................................................................................................................................... 132
NASA’s Commercial Crew ProgramTrent M. Smith, Steven P. Siceloff ................................................................................................................................. 134
Flight Deck of the FutureMary McCabe, Christie Sauers ...................................................................................................................................... 137
Reconfigurable Electronic Textile GarmentsCory Simon .................................................................................................................................................................... 140
Designing a Food System for a Mars Habitat MissionGrace Douglas, Maya Cooper ....................................................................................................................................... 142
Contentscontinued
Nanophase Iron-Induced Reactivity of Ground Lunar SoilAntony S. Jeevarajan, William T. Wallace ..................................................................................................................... 144
Third International In-Situ Resource Utilization Analog Field TestGerald B. Sanders, Dean Eppler, William E. Larson, Jackie Quinn .............................................................................. 147
NASA’s Extreme Environment Mission Operations - Science Operations Development for Human ExplorationMary Sue Bell ................................................................................................................................................................. 149
Small-Scale Impact Processes on Stony AsteroidsMark J. Cintala, David W. Mittlefehldt, Friedrich Hörz, Francisco Cardenas ................................................................. 151
Shock Effects on Cometary - Dust SimulantsMark J. Cintala, Lindsay P. Keller, Diane H. Wooden, Keiko Nakamura-Messenger, Francisco Cardenas, Roland Montes, Susan M. Lederer, Elizabeth Jensen, Sean S. Lindsay, Douglas H. Smith ................................................................... 153
Early Life on Earth and the Search for Extraterrestrial BiosignaturesDorothy Z. Oehler, Christopher House........................................................................................................................... 155
The Water Content of Earth’s Continental Mantle is Controlled by the Circulation of Fluids or MeltsAnne Peslier, Alan B. Woodland, David R. Bell, Marina Lazarov, Thomas J. Lapen ..................................................... 156
Magnetohydrodynamic Turbulence and the GeodynamoJohn V. Shebalin ............................................................................................................................................................ 158
Helping the Next Generation Space Vehicles Be Safe and SuccessfulAlison J. Dinsel, Adam L. Gilmore .................................................................................................................................. 159
Dividing the Concentrator Target from the Genesis MissionH.V. Lauer Jr., P.J. Burkett, S.J. Clemett, C.P. Gonzales, K. Nakamura-Messenger, M.C. Rodriguez, T.H. See, B. Sutter ........................................................................................................................................................................ 160
A New Martian Meteorite Found is One of the Most Oxidized to DateAnne Peslier, Thomas J. Lapen, John T. Shafer, Alan D. Brandon, Hejiu Hui, Anthony J. Irving .................................. 162
Water in the Oldest Lunar Rocks: The Moon is ‘Wetter’ Than Previously ThoughtAnne Peslier, Hejiu Hui, Clive Neal, Youxue Zhang ...................................................................................................... 163
Constraining Early Planetary Differentiation: The Link Between Chondrites and Achondrites Revealed from theStudy of Aubrite MeteoritesAnne Peslier, Alan D. Brandon, MunirHumayun, David van Acken ............................................................................... 165
Standards-Based Wireless Sensor Networks and Modular Instrumentation for Spaceflight ApplicationsRichard J. Barton, Patrick W. Fink, Raymond S. Wagner ............................................................................................... 166
2012 Analog Mission OverviewBarbara A. Janoiko, Marcum L. Reagan, James E. Johnson ........................................................................................ 168
Geolab: A Geological Workstation for Future MissionsCynthia Evans, Michael Calaway, Mary Sue Bell, Zheng. Li, Shuo Tong, Ye Zhong, Ravi Dahiwala ............................ 171
The 2012 Moon and Mars Analog MissionLee Graham ....................................................................................................................................................................174

Contentscontinued
NEEMO 16: Evaluation of Techniques and Equipment for Human Exploration of Near-Earth AsteroidsMarcum L. Reagan, Michael L. Gernhardt, Steven P. Chappell, Andrew F. Abercromby, William L. Todd .................... 176
NASA Research and Technology Studies (RATS) 2012: Evaluation of Human and Robotic Systems for Exploration of Near-Earth AsteroidsMarcum L. Reagan, James E. Johnson, Barbara A. Janoiko, Michael L. Gernhardt, Andrew F. J. Abercromby, Steven P. Chappell, Harry L. Litaker .............................................................................................................................................. 178
Rewriting the Landform History of one of Africa’s Three Largest BasinsM.J. Wilkinson ................................................................................................................................................................ 181
Flammability and Explosive Technologies Burning of Commercially Pure Titanium in Oxygen-Enriched AtmospheresJoel Stoltzfus, Nathan Jeffers, Timothy D. Gallus ......................................................................................................... 185
Titanium Ignition Temperature Measurement TechniquesJoel Stoltzfus, Timothy D. Gallus ................................................................................................................................... 188
Space and Ground Operations Space Station Visiting Spacecraft Communication System Multipath Environment During RendezvousCindy Jih, Mark Chavez, Shian Hwu, Kanishka deSilva, Matthew Upanavage ............................................................ 192
Radio Frequency Exposure Analysis for Multiple Wi-Fi Devices in an Enclosed EnvironmentJames R. Keiser, Catherine Sham, Shian Hwu, Bryan A. Rhodes, Alan H. Chu, Kanishka deSilva ............................. 194
Refined Leak Test Methods for Payloads Pressure Integrity VerificationOleg M. Lvovsky ............................................................................................................................................................ 197
Augmenting Spacecraft Viewing With Virtual WindowsMax Haddock, Helen Neighbors .................................................................................................................................... 200
Technical Standards for Liquid Propellant CharacterizationBenjamin Greene, Regor L. Saulsberry, Mark B. McClure ............................................................................................ 203
Discovery and Identification of Dimethylsilanediol as a Contaminant in International Space Station Potable WaterJ. Torin McCoy, Jeffrey A. Rutz, John R. Schultz, C. Mike Kuo ..................................................................................... 205
Impact of Time Delay to Crew and Ground Workload and CoordinationKara Pohlkamp, Jeff Mauldin, Lui Wang, Lee Morin, Jeremy Frank, Rob McCann ....................................................... 208
Using Mathematical Optimization to Improve Extravehicular Activity PlanningPaul Felker, Javier Salmeron ......................................................................................................................................... 211
Portable Simulator for On-Board International Space Station Emergency TrainingMichael Root, Lucia McCullough, Scott Segadi, Clinton Balmain, Kathy Bolt, Harold Brian ......................................... 213
Rigorous Antenna Noise Temperature Analysis for International Space Station Visiting SpacecraftsCindy Jih, Mark Chavez, Timothy Early, Catherine Sham, Shian Hwu, Kanishka deSilva ............................................ 216

Contentscontinued
Modular Instrumentation SystemPaul Delaune, Hester Yim, Richard Barton, Raymond Wagner .................................................................................... 218
Terahertz Signal Propagation Characteristics for Spacecraft ApplicationsCindy Jih, Catherine Sham, James R. Keiser, Shian Hwu, Kanishka deSilva ............................................................... 220
International Space Station Designing Lithium-ion Batteries for Electric Power SystemEugene Schwanbeck, Penni Dalton .............................................................................................................................. 223
Foot Pedals for Spacecraft Manual ControlStanley G. Love, Lee M. Morin, Mary E. McCabe .......................................................................................................... 224
Development and Execution of Autonomous Procedures Onboard the International Space Station to Support the Next Phase of Human Space ExplorationSusan Beisert, Michael Rodriggs, Francisco Moreno, Stanley Love, David Korth, Stephen Gibson, Young H. Lee, Donald E. Eagles ....................................................................................................................................................................... 226
Virtual Guidance: Just-in-Time Training for Ophthalmic UltrasoundSteven H. Platts, Sydney P. Stein, Timothy P. Matz, David S. Martin, Timothy L. Caine, Michael B. Stenger, Stuart M. C. Lee ................................................................................................................................................................................ 228
Space Habitability Operation Reporting Tool: Development, Testing and Transition to Operations PlanM. Whitmore, S. S. Thaxton, H. L. Litaker ..................................................................................................................... 230
International Space Station Virtual Reality TrainerBrian Mader, Evelyn Miralles, Brad Bell, Jeff Hoblit ....................................................................................................... 233 The Value of Human-in-the-Loop Testing in Designing Human-Rated SpacecraftNathan R. Moore, Robert L. Howard, Harry L. Litaker Jr., Maijinn Chen, Bryan A. Cloyd, Carl S. Conlee, Evan S. Twyford .......................................................................................................................................................................... 235
Speech Intelligibility Studies on the Vocera Communication Badge and the Apple iPADCory Simon, Andy Romero, Haifa Moses, Harry L. Litaker Jr., Shao-Sheng R. Chu, Ronald D. Archer ....................... 237
Toughened Thermal Blankets for Micrometeoroid and Orbital Debris ProtectionEric Christiansen, Dana Lear ......................................................................................................................................... 239
The International Space Station: A Unique Platform for Remote Sensing of Natural DisastersWilliam L. Stefanov, Cynthia A. Evans ........................................................................................................................... 241
Core Operations, Mission Planning, and Analysis Spacecraft Simulation (COMPASS) ProjectChris Glenn, Bryan Evans, Marc Abadie ........................................................................................................................ 243
The Apollo Lunar Sample Image Collection: Digital Archiving and Online AccessNancy S. Todd, William L. Stefanov, Gary E. Lofgren, Patricia A. Garcia ...................................................................... 245
Ultra-Wideband Time-Difference-of-Arrival High Resolution 3-D Proximity Tracking SystemDickey Arndt, Phong Ngo, Chau Phan, Kent Dekome, Jianjun Ni, John Dusl ............................................................... 247
A Demonstration of an Autonomous Micro Spacecraft for the Return of Scientific Samples from Exploration MissionsCarlos R. Ortiz-Longo .................................................................................................................................................... 249

Contentscontinued
Satellite Deployment from the International Space StationOscar J. Guzman, Matthew P. Hershey ......................................................................................................................... 251
Characterizing Electrospray Ionization for Potential In-flight Water MonitoringAriel V. Macatangay, Thomas F. Limero, William T. Wallace, Daniel B. Gazda ............................................................. 252
Electro-Thermal Vaporizer Direct Analysis in Real Time-Mass Spectrometry for Sensitive and High Throughput Water Contaminant AnalysisAriel V. Macatangay, Thomas F. Limero, William T. Wallace, Daniel B. Gazda, Facundo M. Fernández, Prabha Dwivedi .......................................................................................................................................................................... 255
Software Toolkit for Ethernet Lab-Like Architecture (STELLA)Michael J. Coats, Amanda Rice ..................................................................................................................................... 258
International Space Station High-Rate Communications UpgradesPenny Roberts, Gary Cox, Sundeep Kwatra ................................................................................................................. 260
Effectiveness of Satellite Postmission Disposal to Limit the Orbital Debris Population Growth in Low Earth OrbitJ.-C. Liou ....................................................................................................................................................................... 262
Rudimentary Cleaning Compared to Level 300AChristina Y. Piña Arpin, Joel Stoltzfus ............................................................................................................................ 264
Colorimetric Detection and Decontamination of Ionic Monopropellants Benjamin Greene, Mark B. McClure, Claudia J. Galvan ............................................................................................... 266
Inspiring Future Generations: Education and Outreach The Human Health and Performance Directorate/NASA Science & Technology Institute - Innovation & InclusionPamela Denkins, Karla S. Marriott, Alamelu Sundaresan, Jinghe Mao, Shakhawat Bhuiyan, Jacqueline Madry-Taylor 269
NASA Human Health and Performance Center Collaboration SuccessesJeffrey R. Davis, Carissa J. Callini, Elizabeth E. Richard, MaGee Johnson ................................................................. 272
Seeing Earth from the Eyes of an AstronautMelissa Dawson ............................................................................................................................................................ 274
Education and Public Outreach (EPO) at NASA’s Analog Missions in 2011 and 2012 Barbara Janoiko, Wendy Watkins .................................................................................................................................. 275

Foreword
Ellen OchoaDirector, Johnson Space Center
At NASA Johnson Space Center (JSC), we are focused on advancing human spaceflight. We have just marked the 15th anniversary of the International Space Station (ISS), counted from the first element launch, and 13 years of continuous habitation by international crews. Today we make full use of ISS as a national laboratory open to researchers from the international community to conduct science in microgravity, and as a test bed for exploration technologies and concepts. JSC is also developing the Orion Multi-Purpose Crew Vehicle for exploration beyond the low-Earth orbit, helping enable the successful development of commercial space transportation systems, and leading innovation in developing space technologies that will blaze the trail for future missions. Our talented engineers and scientists are conducting research and developing technologies that will allow humans to explore farther reaches of our universe. New technologies and new scientific understanding remain the foundations for expanding our reach into deep space for exploration.
The Research and Technology Development Report 2014 highlights JSC’s scientific and technological research, engineering innovations and the technology investments in support of NASA’s exploration roadmap. I believe this information will spark new ideas and encourage research and scientific communities from universities, industry, nonprofit organizations and federal agencies to engage in discussions with us for future collaborations and partnerships. I encourage you to contact Kamlesh Lulla at Kamlesh.p.lulla@ nasa.gov for opportunities to collaborate with us.
Strong and long-term relationships with universities, industry and diverse research and engineering organizations will enable us to meet the nation’s goals in space exploration. I invite you to join us as we craft our future.
1

Introduction
The core mission of the NASA Johnson Space Center (JSC) is human spaceflight and human space exploration. For the past five decades, JSC has focused on human spaceflight, making great strides in engineering, science and technology innovations and developments. As we look to the future, we are leading the way by investing in new innovations and technologies to pursue bold missions that will include sending humans to deep space to compelling destinations such as near-Earth asteroids and Mars. JSC’s talented scientists and engineers bridge the boundary between conceptual laboratory and basic research and technology development, and the real-life spaceflight applications. These research and technology developments have matured and evolved over the years.
Each year our engineers and scientists innovate, collaborate and share knowledge with our cohorts in the U.S. government, aerospace companies, universities, industry and various institutes to meet the new technological challenges. NASA’s rigorous engineering and scientific demands to accomplish its mission result in either creating new technologies or improving and customizing the ones already available. Once proven, these technologies have the potential to be utilized in a multitude of commercial products and markets in society.
The Research and Technology Development Report 2014 highlights diverse technical, scientific and engineering research and technology developments currently underway at JSC. Our technology roadmaps, technical challenges and mission operation considerations are the main drivers of the efforts. You will find more than 125 reports in this volume that encompass a broad range of engineering, as well as and human performance and research related topics, including advanced battery technologies, robotics, non-destructive testing, telepresence for deep space, no-drill dentistry, designing a food system for a Mars habitat mission and many more. Our planetary scientists have reported results from studies such as a small-scale impact process on stony asteroids to early life on Earth and the search for extraterrestrial biosignatures. Other reports, such as the moon Mars analog mission and evaluation of human and robotic systems for exploration of near-Earth asteroids, are also noteworthy. All reports are clustered in sections that cover a broad theme for related technologies to make this volume user friendly.
JSC-developed technologies, expertise and facilities are valuable national assets. Our investment in new technologies is an investment in our nation’s future. We want to engage the public, academic and commercial sectors in our research and technology needs leading to
collaborations of mutual interest, both with commercial and academic research groups. Recent successes of some commercial companies are indicators of burgeoning commercial space enterprises. We welcome these accomplishments and look forward to collaboration in the areas of mutual interest.
Collaborating with Johnson Space Center
NASA and JSC have a long history of working with universities, industry, federal laboratories and other research and technology development organizations. In addition to the conventional funding mechanisms for collaboration such as grants, cooperative agreements and procurement opportunities, reimbursable and non-reimbursable Space Act Agreements can be used to provide mutual leveraging of government, university and industry resources in the cooperative pursuit of joint-interest research and technology development efforts. JSC has a strong interest in developing long-term collaborations with diverse research and technology institutions.
We look forward to working with both the commercial and academic groups interested in partnering with JSC.
Kamlesh LullaDirector, University Collaboration and Partnership Office
2

Strategic Opportunities and Partnership Development
Yolanda Marshall, Johnson Space Center Douglas A. Terrier, Johnson Space Center
Steven Gonzalez, Johnson Space Center
Building Alliances to Shape Our Future In 2011, Johnson Space Center (JSC) leadership placed an emphasis on partnerships by creating the Strategic Opportunities and Partnership Development Office (SOPDO). For decades, the space agency has generated U.S. innovations and inventions while nurturing partnerships to facilitate the transfer of NASA-developed technologies to the private marketplace. JSC is now positioned to establish partnerships that drive innovation and foster collaboration, in addition to conducting traditional technology transfer efforts. SOPDO provides a clear entry point for external aerospace and non-aerospace entities interested in partnering with JSC and seeks to establish new partnerships and integrate partnership efforts across JSC’s directorates.
At JSC, we leverage technology, expertise, facilities and funding to solve numerous technical challenges for NASA. We have a record of success working with aerospace and non-aerospace industries, government agencies and academia to solve technical problems and transfer technologies to the commercial sector for further development. We pursue partnerships that enable our exploration goals and contribute to the advancement of science and technology for societal and economic benefits. NASA has many capabilities and assets that are applicable to other industries. We have learned that our capabilities, such as living and working in extreme environments; design, development, testing and operation of complex systems; human health and performance; and safety and risk analysis are transferable to other industries, including energy, health care and manufacturing. We have entered into partnerships focused on development of advanced materials for structures and high-performance textiles, development and testing of fiber-optic monitoring systems for oil rig platforms and pharmaceuticals that benefit astronauts and the public.
Recently, JSC began establishing strategic partnerships with consortiums to increase the potential for technology development internally and externally. In 2012, JSC entered into an agreement with the Houston Technology Center (HTC), a non-profit technology incubator and accelerator that assists entrepreneurs with technology commercialization projects. The partnership enables HTC to connect their clients directly with JSC technologists and technologies that have commercialization potential. Currently, HTC is working with 18 teams in the incubator at JSC, and four small businesses are in the process of formalizing partnership agreements with JSC.
These diverse partnerships not only advance technology but provide a gateway for public and private entities to interact with NASA.
Technology Transfer and Intellectual Property Portfolio Management The founders of the U.S. space program, through the Space Act Agreement of 1958, required NASA to transfer its technologies to the marketplace so that the U.S. taxpayers can benefit from our advancements. As a part of NASA’s statutory charter, the SOPDO facilitates the transfer and commercialization of NASA-sponsored research and technology development, including industrial use of unique NASA capabilities and facilities. This includes managing JSC’s Intellectual Property Portfolio from new technology reporting, to licensing patented JSC technologies, to public outreach, to educating the American taxpayers about the benefits of space. Since January 2012, JSC has applied for 26 patents and has been issued 16 new patents now available for licensing. During the same timeframe, JSC licensed 10 technologies and issued 225 software-usage agreements. In order to increase visibility of licensing opportunities, JSC has begun using new methods of communicating technology transfer opportunities. We are currently working with four university business schools to develop business cases for NASA technologies that help companies understand how a technology may have potential commercial applications. Additionally, JSC is exploring the use of social media and webinars as methods to reach a broader audience.
In early 2013, JSC’s director was recognized as the 2013 Laboratory Director of the Year by the National Federal Laboratories Consortium. More recently, R&D Magazine selected a JSC’s Robo-Glove technology as a recipient of a 2013 R&D 100 Award. This places Robo-Glove technology among the 100 most significant technologies introduced in the past year. This recognition serves as an indicator that we are making notable strides in our efforts to advance technology development and enable the commercialization of technologies that have real-world application. For more information about JSC’s Technology Transfer and Commercialization office, visit: http://technology.jsc.nasa.gov
Strategic Technology Investments The SOPDO oversees the Small Business Innovative Research/Small Business Technology Transfer (SBIR/ STTR) programs at JSC.
3

The SBIR/STTR programs, established by law, exist to stimulate technological innovation in the private sector by increasing participation by small businesses in federal research and technology development. A competitive proposal process is launched annually via a solicitation of proposals, with the focus of the NASA technology program needs coupled with the potential for commercialization. Since January 2012, JSC’s SBIR/STTR awards have totaled 79 with a value of $29 million. For more information on the SBIR/STTR programs, visit: http://www.sbir.nasa.gov
By successfully pursuing opportunities that develop and advance key competencies and technologies required for future space exploration, JSC bolsters its role as a global innovation leader in human space exploration. For more information about JSC’s technologies, capabilities and partnership opportunities, visit: http://www.nasa.gov/jscpartnerships
4

Technology and Innovation: Investing in the Future at Johnson Space CenterDouglas Terrier, Johnson Space Center
At Johnson Space Center, we are continuing to focus on the importance of leveraging technology, expertise, facilities and funding to solve numerous technical challenges for NASA. We successfully work in partnership and collaboration with aerospace and non-aerospace industries, government agencies and academia to solve extremely difficult problems, and strive to transfer technology into the commercial sector.
To determine the appropriate focus areas, the NASA Office of the Chief Technologist (OCT) and Center Chief Technologists (CCT) developed NASA’s integrated technology roadmap to illustrate how these technologies directly link or contribute to NASA’s missions and significant national needs (Figure 1). The effective and coordinated management of technology development and innovation, from NASA Headquarters through each NASA field center, result in leading-edge missions for the future. Centers are charged with providing technologies to support both national needs and human space exploration. In cooperation with the Space Technology Mission Directorate (STMD), OCT offices are responsible for overseeing the development of cross-cutting, pioneering new technologies and capabilities for the agency to achieve its current and future missions. Collaborations and partnerships in research and development help provide those technologies that benefit and support space exploration and meet additional needs by leveraging knowledge, resources and funding. They are the keys to advancing research and development at NASA. We welcome opportunities to partner, both internally and externally, to explore common interests, develop new relationships, share information and gain proficiency and capabilities.
The CCT at JSC works closely with the center’s senior scientists, technologists and managers to optimize available resources, select appropriate technologies and manage a portfolio of innovation and technology projects. Center technology portfolio management efforts are coordinated to a strategy for center innovation and technology that is based on the following innovation and technology strategic themes: 1. Develop the human spaceflight workforce of
tomorrow. 2. Invest and nurture core capabilities needed for the
future.3. Establish a consistent approach to guide future
commitments. 4. Foster “integrative thinking.”
The JSC CTO has established a set of initiatives that represent JSC’s commitment to develop new technologies related to NASA Strategic Goals with the strategic themes in mind. These initiatives include research and development awards and innovative facilities or infrastructure, including creative spaces to encourage innovation throughout the workforce.
The CCT technology and innovation awards include the center-level and directorate-level Independent Research and Development (IR&D) projects, as well as Innovation Charge Account (ICA) opportunities. More than 150 research and development projects have been supported through the JSC CCT office in Fiscal Year (FY) 2012 and FY 2013.
5

TA01 • Launch ProPuLsion
systems
Solid Rocket PRoPulSion SyStemS • Propellants• case materials• nozzle systems• hybrid rocket Propulsion
systems• Fundamental solid Propul-
sion technologiesliquid Rocket PRoPul-Sion SyStemS• Lh2/LoX Based• rP/LoX Based• ch4/LoX Based• Detonation Wave engines
(closed cycle)• Propellants• Fundamental Liquid
Propulsion technologiesAiR BReAthing PRoPulSion SyStemS• tBcc• rBcc• Detonation Wave engines
(open cycle)• turbine Based Jet engines
(Flyback Boosters)• ramjet/scramjet engines
(accelerators) • Deeply-cooled air cycles• air collection &
enrichment system• Fundamental air Breathing
Propulsion technologiesAncillARy PRoPulSion SyStemS• auxiliary control systems• main Propulsion systems
(excluding engines)• Launch abort systems• thrust Vector control
systems• health management &
sensors• Pyro & separation systems• Fundamental ancillary
Propulsion technologiesunconventionAl / otheR PRoPulSion SyStemS• Ground Launch assist• air Launch / Drop systems• space tether assist• Beamed energy / energy
addition• nuclear• high energy Density
materials/Propellants
chemicAl PRoPulSion• Liquid storable • Liquid cryogenic • Gels • solid • hybrid • cold Gas/Warm Gas • micro-propulsion non-chemicAl PRoPulSion• electric Propulsion • solar sail Propulsion • thermal Propulsion • tether Propulsion AdvAnced (tRl <3) PRoPulSion technologieS • Beamed energy Propulsion • electric sail Propulsion • Fusion Propulsion • high energy Density
materials • antimatter Propulsion • advanced Fission • Breakthrough Propulsion SuPPoRting technologieS • Propellant storage &
transfer
TA02 • in-sPace ProPuLsion
technoLoGies
TA03 • sPace PoWer &
enerGy storaGe
PoweR geneRAtion• energy harvesting • chemical (Fuel cells, heat
engines) • solar (Photo-Voltaic &
thermal) • radioisotope• Fission• FusioneneRgy StoRAge• Batteries• Flywheels• regenerative Fuel cellsPoweR mAnAgement & diStRiBution• FDir• management & control • Distribution & transmission• Wireless Power
transmission• conversion & regulationcRoSS cutting technology• analytical tools• Green energy impact• multi-functional structures• alternative Fuels
TA04 • roBotics, teLe-
roBotics & autonomous systems
TA05 • communication & naViGation
TA06 • human heaLth, LiFe suPPort &
haBitation systems
TA07 • human eXPLoration
Destination systems
TA08 • science instruments,
oBserVatories & sensor systems
SenSing & PeRcePtion• 3-D Perception• relative Position & Velocity
estimation• terrain mapping,
classification & characterization
• natural & man-made object recognition
• sensor Fusion for sampling & manipulation
• onboard science Data analysis
moBility• extreme terrain mobility• Below-surface mobility• above-surface mobility• small Body/microgravity
mobilitymAniPulAtion• robot arms • Dexterous manipulators• modeling of contact
Dynamics• mobile manipulation• collaborative manipulation• robotic Drilling & sample
ProcessinghumAn-SyStemS integRAtion• multi-modal human-
systems interaction• supervisory control• robot-to-suit interfaces• intent recognition &
reaction• Distributed collaboration• common human-systems
interfaces• safety, trust, &
interfacing of robotic/ human Proximity operations
Autonomy• Vehicle systems
management & FDir• Dynamic Planning &
sequencing tools• autonomous Guidance &
control• multi-agent coordination• adjustable autonomy• terrain relative navigation• Path & motion Planning
with uncertaintyAutonomouS RendezvouS & docking• relative navigation sensors
(long-, mid-, near-range)• Guidance algorithms• Docking & capture
mechanisms/interfaces• mission/system managers
for autonomy/automationRtA SyStemS engineeRing• modularity/commonality• Verification & Validation of
complex adaptive systems• onboard computing
oPticAl comm. & nAvigAtion• Detector Development• Large apertures• Lasers• acquisition & tracking• atmospheric mitigationRAdio FRequency communicAtionS• spectrum efficient technologies• Power efficient technologies• Propagation• Flight & Ground systems• earth Launch & reentry comm.• AntennasinteRnetwoRking• Disruptive tolerant networking• adaptive network topology• information assurance• integrated network managementPoSition, nAvigAtion, And timing• timekeeping & time Distribution• onboard auto navigation &
maneuver• sensors & Vision Processing systems• relative & Proximity navigation• auto Precision Formation Flying• auto approach & LandingintegRAted technologieS• radio systems• ultra Wideband• cognitive networks• science from the comm. system• hybrid optical comm. &
navigation sensors• rF/optical hybrid technologyRevolutionARy concePtS• X-ray navigation• X-ray communications• neutrino-Based nav. & tracking• Quantum Key Distribution• Quantum communications• sQiF microwave amplifier• reconfigurable Large apertures
using nanosat constellations
enviRonmentAl contRol & liFe SuPPoRt SyStemS & hABitAtion SyStemS• air revitalization• Water recovery & management• Waste management• habitationextRAvehiculAR Activity SyStemS• Pressure Garment• Portable Life support system• Power, avionics & softwarehumAn heAlth & PeRFoRmAnce• medical Diagnosis / Prognosis• Long-Duration health• Behavioral health• human FactorsenviRonmentAl monitoRing, SAFety & emeRgency ReSPonSe• sensors: air, Water, microbial, etc.• Fire: Detection, suppression, recovery• Protective clothing / Breathing• remediationRAdiAtion• risk assessment modeling• radiation mitigation• Protection systems• radiation prediction• monitoring technology
in-Situ ReSouRce utilizAtion • Destination reconnaissance,
Prospecting, & mapping • resource acquisition • consumables Production • manufacturing Products
& infrastructure emplacement SuStAinABility & SuPPoRtABility • autonomous Logistics
management • maintenance systems • repair systems• Food Production, Processing,
& Preservation “AdvAnced” humAn moBility SyStemS • eVa mobility • surface mobility • off-surface mobility “AdvAnced” hABitAt SyStemS • integrated habitat systems • habitat evolution• “smart” habitats• artificial Gravity miSSion oPeRAtionS & SAFety • crew training • Planetary safety• integrated Flight operations
systems• integrated risk assessment tools cRoSS-cutting SyStemS • construction & assembly • Particulate contamination
Prevention & mitigation
Remote SenSing inStRumentS/SenSoRS• Detectors & Focal Planes• electronics• optical components• microwave / radio• Lasers• cryogenic / thermaloBSeRvAtoRieS• mirror systems• structures & antennas• Distributed aperturein-Situ inStRumentS/SenSoR• Particles: charged & neutral• Fields & Waves• in-situ
TA01 TA02 TA03
TA04 TA05 TA06
TA07 TA08
TA09 TA10
note: only Jsc core competencies are highlighted.
Figure 1: NASA Technology Roadmaps
6

TA09 • entry, Descent &
LanDinG systems
TA10 • nano- technoLoGy
TA11 • moDeLinG, simuLation,
inFormation technoLoGy & ProcessinG
TA12 • materiaLs, structures,
mechanicaL systems & manuFacturinG
TA13 • GrounD & Launch
systems ProcessinGTA15 • aeronau-
tics
TA14 • thermaL manaGe-
ment systems
AeRoASSiSt & AtmoSPheRic entRy• rigid thermal Protection
systems• Flexible thermal Protection
systems• rigid hypersonic Decelerators• Deployable hypersonic
DeceleratorsdeScent• attached Deployable Decel-
erators• trailing Deployable Decelera-
tors• supersonic retropropulsionlAnding• touchdown systems• egress & Deployment systems• Propulsion systems• small Body systemsvehicle SyStemS technology• separation systems• system integration and
analyses• atmosphere & surface
characterization• modeling and simulation• instrumentation and health
monitoring• Gn&c sensors and systems
engineeRed mAteRiAlS & StRuctuReS • Lightweight structures • Damage tolerant systems• coatings• adhesives• thermal Protection & controleneRgy geneRAtion & StoRAge • energy storage• energy GenerationPRoPulSion • Propellants• Propulsion components• in-space PropulsionSenSoRS, electRonicS & deviceS • sensors & actuators• nanoelectronics• miniature instruments
comPuting• Flight computing• Ground computingmodeling• software modeling & model-
checking• integrated hardware & software
modeling• human-system Performance model-
ing• science modeling• Frameworks, Languages, tools &
standardsSimulAtion• Distributed simulation• integrated system Lifecycle simula-
tion• simulation-Based systems engineer-
ing• simulation-Based training &
Decision support systemsinFoRmAtion PRoceSSing• science, engineering & mission Data
Lifecycle• intelligent Data understanding• semantic technologies• collaborative science & engineering• advanced mission systems
mAteRiAlS• Lightweight structure• computational Design• Flexible material systems• environment• special materialsStRuctuReS• Lightweight concepts• Design & certification methods• reliability & sustainment• test tools & methods• innovative, multifunctional
conceptsmechAnicAl SyStemS• Deployables, Docking and inter-
faces• mechanism Life extension systems• electro-mechanical, mechanical &
micromechanisms• Design & analysis tools and
methods• reliability / Life assessment /
health monitoring
• certification methodsmAnuFActuRing• manufacturing Processes• intelligent integrated manufactur-
ing and cyber Physical systems• electronics & optics manufactur-
ing Process• sustainable manufacturingcRoSS-cutting• nondestructive evaluation• model-Based certification &
sustainment methods• Loads and environments
technologieS to oPtimize the oPeRAtionAl liFe-cycle• storage, Distribution &
conservation of Fluids• automated alignment,
coupling, & assembly systems
• autonomous command & control for Ground and integrated Vehicle / Ground systems
enviRonmentAl And gReen technologieS• corrosion Prevention,
Detection, & mitigation• environmental remedia-
tion & site restoration
• Preservation of natural ecosystems
• alternate energy PrototypestechnologieS to incReASe Reli-ABility And miSSion AvAilABility• advanced Launch technolo-
gies• environment-hardened
materials and structures• inspection, anomaly Detec-
tion & identification
• Fault isolation and Diag-nostics
• Prognostics technologies• repair, mitigation, and
recovery technologies• communications, network-
ing, timing & telemetrytechnologieS to imPRove miSSion SAFety/miSSion RiSk• range tracking, surveillance
& Flight safety technologies• Landing & recovery systems
& components• Weather Prediction and
mitigation• robotics / telerobotics• safety systems
AeRoScienceS• Propulsion airframe integra-
tion• Drag reduction• novel configurations• Propulsion airframe aero-
acoustics• computational methods• robust aero• Formation Flight• Wake Vortex• VstoL/estoL• reduce/mitigate sonic Boom• multidisciplinary Design &
analysis tools• efficient hypersonic aeroPRoPulSion And PoweR• Quiet Propulsion• ultraclean Propulsion &
alternative Fuels• Fuel efficiency• Propulsion for stoL/VtoL• supersonic Propulsion• combined cycle hypersonic• aero-Propulsion-servo-
elasticity• robust Propulsion• hybrid Propulsion and Power• Variable cycle• advanced concepts/
alternative engine cycles• intelligent engine • integrated Power manage-
mentdynAmicS, contRol, nAvigAtion, guidAnce, And AvionicS• advanced Guidance• Distributed Decision,
uncertainty, &Flight Path• Distributed Flow control of
Vehicle Dynamics• intelligent & adaptive
control• Fault-tolerant iVhm• on-Board Weather• Pilot Vehicle integration• synthetic & enhanced Vision• uaV in the nas• advanced V&V techniques• Load, Vibration & stability
control• advanced communicationsintelligent & humAn integRAted SyStemS, oPS, deci-Sion mAking & netwoRking• complex interactive systems• separation assurance• Wake Vortex systems• architecture Vulnerabil-
ity analysis for air traffic control
• adaptive air traffic control for adverse Weather
• collaborative Decision systems
• operational maintenance Data
• task & attention manage-ment
• environmentally Friendly aviation
• super Density operations
cRyogenic SyStemS • Passive thermal control• active thermal control• integration & modelingtheRmAl contRol SyStemS• heat acquisition• heat transfer• heat rejection & energy
storagetheRmAl PRotection SyStemS• entry / ascent tPs• Plume shielding (convective
& radiative)• sensor systems & measure-
ment technologies
TA16 • orBitaL DeBris
anD hyPerVeLocity imPact
oRBitAl deBRiS • modeling• monitoring• mitigation• remediationhyPeRvelocity imPAct• material composition• experimental investiga-
tions
TA17 • emerGinG technoLoGies
TA11 TA12
TA13 TA14
Figure 1: NASA Technology Roadmaps (continued)
7
The Human Health and Performance Directorate:
Jeffrey R. Davis, Johnson Space Center Kathryn E. Keeton, Wyle Science, Technology, and Engineering Elizabeth E. Richard, Wyle Science, Technology, and Engineering
A Comparative Analysis of Innovation Within an Organization
Mary C. McFather, Wyle Science, Technology, and Engineering
IntroductionA benchmarking effort was conducted in 2012 to evaluate innovation efforts within the Human Health and Performance (HH&P) Directorate at Johnson Space Center in comparison to other governmental agencies, as well as private and public organizations across the United States. The HH&P Directorate comprises human health and countermeasures research, medical operations, habitability and environmental factor activities and directorate management functions that support current spaceflight. Over the past five years, a concerted effort within the HH&P Directorate has been focused on testing, evaluating and implementing new business models and innovative approaches to problem solving. A number of different innovative problem-solving methods have been tested and evaluated, including external crowdsourcing, consortium and partnership building, as well as internal crowdsourcing within NASA.
Given its successful experience with these new methods, HH&P recognized the need for a formal framework that would use existing and new methods of problem solving that harness collaborative innovation. A benchmark evaluation was conducted to understand how other organizations have implemented new process models of innovation, what barriers they encountered, what strategies they employed to address these barriers and how they evaluate the success of using these platforms. A benchmark evaluation allowed for a true comparison of what other companies and organizations had implemented to develop a new business model that includes novel methods of innovation. Two specific objectives were identified: 1) to determine improvements needed for the current implementation path, and 2) to analyze how other organizations have achieved their high-performance levels so this information could be used to evaluate success in future innovation implementations.
Analysis Approach To conduct this benchmarking effort, a diverse range of organizations were identified based on their current work with innovation initiatives and included representatives from the public, private and government sectors, both small and large entities and innovation model type (organizations that provide innovation services), those that
Specific themes emerged from each of the five main sections of the structured interview.
• Approach to Innovation Implementation
Findings/Results: The results suggest that creating a culture change is imperative when implementing innovation within an organization. Interviewees most frequently discussed bottom-up approaches to implementing innovation and aligning with the culture of the organization in order to be successful. However, a top-down implementation was also frequently discussed, suggesting that successful innovation implementations require both a bottom-up and top-down approach within the organization. A designated team was also cited as an important component of a successful innovation process implementation. Organizations often employed more than one strategy, and many interviewees suggested that approaching innovation process implementation from a multi-modal approach was ultimately more effective and successful.
• Key Barriers to Implementing Innovation Processes
Barriers are an important consideration when developing a strategy to implement innovation processes, or simply supporting more innovative practices within an organization. These results suggest that the most prominent barriers include the difficulty in providing a compelling case for the need to use innovation practices. Closely related to demonstrating a clear need for new innovation processes is the difficulty in obtaining permanent funding for such opportunities. Identifying an appropriate market base was also discussed by many of the interviewees, which ties closely to the need for aligning the services that innovation platforms, practices, etc., provide with the specific needs of the organization.
• Overcoming Barriers
Many effective strategies to overcome barriers were suggested. Specifically, using communication and support mechanisms as critical tools in this process will facilitate the success of an innovation initiative. Additionally, cultural changes must take place within organizations
8

so that employees are less averse to trying new things and more open to failing, and are open to training and working with a diverse group of individuals. Interviewees also suggested that an organization should be able to make a pivot, or a change, without a downside. By identifying and addressing multiple ways to overcome these barriers, organizations can become more nimble and successful in implementing innovation strategies and processes.
• Critical Benefits to Implementing Innovation Processes
Critical benefits of innovation must be understood to establish metrics that demonstrate these outcomes. The results suggest that revealing unknowns, increasing the expanse of education and understanding and creating a paradigm shift of cultural behavior are all critical benefits of innovation implementation. As such, it is equally critical that the organization acknowledge, understand and effectively use these benefits to further improve efforts of implementing these initiatives within the organizational context.
• Evaluation of Innovation Process Effectiveness and Utility
Across most interviewees, evaluation proved to be one of the weakest components of establishing a strong innovation implementation strategy. Indeed, data indicated that organizations across the board struggle with demonstrating the true value of implementing innovation initiatives or ongoing innovative practices and strategies. While numerous examples of subjective and, in some instances, objective measures were provided, no real metric provided direct evidence to a financial incentive and/or benefit when considering organizational investment. Advancements must be made in the direct and indirect measurement of the value of innovation initiatives and novel problem-solving techniques, and efforts focused to successfully establish a direct value metric of utilizing innovation methods for the organization. Indeed, it is imperative to identify metrics for evaluation purposes to definitively establish best practices (i.e., innovation process models, practices, tools, etc., empirically demonstrate a positive organizational impact) in order to continue and increase their use and implementation across organizations. This benchmarking effort was highly successful in establishing specific guidelines and identifying best practices to employ when considering the development, implementation and evaluation of innovation processes and initiatives.
A few key concepts emerged across all discussion questions that are critical to the success of implementing innovation efforts within an organization:
• Dual Approach (top-down and bottom-up): Critical to gain top management buy-in, and buy-in from employees
• Commitment: Leader commitment is essential, but need commitment from both the upper management and employees (this includes middle management)
• Communication: Must be multi-modal, consistent and started early in the development process (must engage employees early and provide them with the opportunity to participate so that they may feel empowered)
• Infrastructure/Support: Establish a support system with personnel that can help ensure the effort succeeds
Focusing on the results of this effort and applying them to each step of an innovation initiative (design, development, implementation and, most importantly, evaluation) will help ensure true value is realized. For example, one project currently in work within the HH&P Directorate is the Solution Mechanism Guide (SMG). Ultimately, the SMG will serve as a guide and resource for those within the directorate interested in learning more about problem-solving methods that are available to use, including innovation platforms. The purpose of the SMG aligns with the results of the efforts of this benchmarking effort: improve communication, reduce barriers and provide the support employees need to ensure innovative initiatives succeed. The HH&P Directorate will continue to support tools and processes that are developed with these key concepts to ensure the success of ongoing innovative efforts.
9

Human Health, Life Support and Habitation Systems, and Space Medicine
10

Advancing No-Drill Dentistry - Treatment of Human Caries
Beginning in 2008, the Engineering Directorate at the Johnson Space Center (JSC) in collaboration with the Human Health and Performance Directorate and Biomat Sciences, Inc., organized a Biomedical Engineering Technology Team (BETT). The objective of this collaboration was to create new approaches and technologies capable of providing dental care for astronauts during all phases of a NASA mission - a NASA Directive that remains challenging due to the availability of limited treatment options. Simplifying and improving dental care as well as emergency dental treatments for astronauts is a major goal for BETT. The collaboration led to the development of a lightweight, portable handheld microwave system with a sharply focused antenna suitable for dental applications. BETT used this device to perform a series of small-animal studies to determine the effects of microwave energy on the pulp cells (cells in the internal organ of teeth) of rat incisors and surrounding tissues. After exposure to microwave energy, rats were sacrificed and histological examination of the tissues was performed using adjacent, untreated incisors as controls. The results of these studies showed no harmful effects on the pulp cells of the incisors, and established the feasibility of using focused microwave energy for dental applications.
To further develop this microwave energy-based technology for future human use both in space and on earth, objectives achieved by BETT over the past year included: 1) development of new, improved hardware; and 2) assessment of the efficacy of this treatment on bacteria in actual human caries.
The previous prototype that was developed delivered duration-specific microwaves at specified power levels. This was achieved using high-output frequency amplifiers, i.e., Gallium-Arsenide (GaAs)-based devices. However, GaAs is a power-inefficient technology (typically <5 percent) and costly to implement. The design of the new system maintains the stringent power requirements while reducing the size and weight of the device. A new technology, based on Gallium Nitride (GaN), was selected for use in the new prototype under development. This resulted in significant increases (4X) in efficiency in power, as well as decreased size and heat transfer.
George D. Arndt, Johnson Space CenterDiane Byerly, Johnson Space CenterMarguerite A. Sognier, Universities Space Research Association
John Dusl, Jacobs TechnologyIvan Stangel, Biomat Sciences
A series of experiments were performed using unique, customized test beds and caries (tooth bacteria/cavity) isolated from extracted human teeth. The BETT studies established that an isolated caries-causing strain of bacteria, Streptococcus mutans, could be effectively eradicated using microwave energy. However, human caries are more complex, containing multiple strains of bacteria, as well as the breakdown products of caries (proteins, demineralized tooth structure). Accordingly, the next step was to establish the ability of this technology to eradicate caries-causing bacteria contained in human caries.
Human caries were directly exposed to focused microwave energy, and bacterial survival following exposure was compared to equivalent, untreated controls. Sample data from this work is shown in in Table 1 below.
Table 1.
Example agar plates containing colonies of the control and microwave-treated bacteria are shown in Figure 1. These studies showed that bacteria were effectively eradicated with a short, direct exposure of microwave energy.
Figure 1. Photo of colony assay with control (left) and microwave esposed (right) samples.
11

Subsequently, more rigorous testing was performed by placing caries inside a drilled-out human tooth, followed by exposure to microwave energy. The results of these studies showed that caries could be effectively killed even when contained within the tooth structure.
Parallel studies were performed to determine if microwave exposures, required to kill caries, would affect tooth structure. Equivalently sized tooth sections were embedded in epoxy and exposed to microwave energy. These samples were then evaluated microscopically and spectroscopically, as well as submitted to microhardness testing to determine the microwave effects on the mechanical properties of the teeth. No differences were noted in the protein structure of microwave-exposed and non-exposed teeth when examined at ultra-high magnification using field emission microscopy. Spectroscopically, microwave-exposed teeth showed some increase in free carbonate, a component of the mineralized phase of teeth. However, this change was negligible. The microhardness of both exposed and non-exposed teeth exhibited no statistical differences. Thus, microwave exposure had no effect on the mechanical behavior of teeth, to the extent ascertainable by this type of test. Additional studies determined if any significant temperature increase would be observed in human teeth exposed to microwave energy. For these experiments, human teeth were maintained at body temperature and perfused with water while temperature within the tooth was monitored internally using a thermocouple. These studies showed that there was no more than a two-degree increase in temperature with exposure. Previous research has shown that this is within a level that is well tolerated by pulp cells.
Upon completion of these studies, this technology will require further development involving the production of a final hardware prototype, followed by the completion of human clinical trials before its subsequent application on Earth and in space. Upon implementation, this new technology will revolutionize dental practices by simplifying treatments and reducing discomfort. Treatments will become less invasive by reducing or eliminating the need for drilling. The technology should be widely applicable due to the portability of the system, low cost and ease of usage.
12

Microwave Energy Countermeasure for Skin DisordersDiane Byerly, Johnson Space CenterGeorge D. Arndt, Johnson Space Center
John Dusl, Jacobs TechnologyMarguerite Sognier, Universities Space Research Association
Skin infections occur frequently in astronauts on the International Space Station (ISS) and are expected to occur on future exploration missions. Currently, a variety of ointments, creams, and antibiotics are used to treat these infections. Due to the increased virulence of microbes in microgravity, decreased immune response of astronauts in space and reduced upmass requirements, there is a critical need for a noninvasive, nonchemical-based countermeasure.
In 2011, the Biomedical Engineering Technology Team, an inter-directorate collaboration between the Human Health and Performance and Engineering Directorates, devised a novel approach for addressing this medical issue. The long-term objective of these studies is to create an effective microwave energy based treatment for skin disorders/infections that could significantly reduce or eliminate the need for antibiotics and/or ointments on ISS and on future exploration missions. This would decrease the incidence of medical infections, thereby improving mission safety. This project represents an initial first step in applying focused microwave energy to control and eradicate highly resistant and difficult to treat skin disorders caused by bacteria and fungi.
The hardware used for this application consisted of a microwave generator set to specific Ka-band frequencies, fed through preamplifier and power amplifier stages (as shown in Figure 1) before being emitted from the antenna The signal could either be applied through a general directional horn antenna for larger exposure areas or a smaller, loaded antenna to pinpoint more diminutive areas.
Figure 1. Hardware test configuration.
To establish initial proof of concept, several bacterial strains were directly exposed to microwave energy for four different time intervals and bacterial survival determined using a standard colony-forming assay (colony-forming units). Representative data is shown in Table 1.
Table 1. Bacterial survival test data.
These studies were repeated multiple times and demonstrated that bacteria can be effectively killed using specific frequencies of microwave energy.
For this approach to be an effective countermeasure, however, the treatment must not only kill the infecting bacteria, but also not harm surrounding skin cells. Accordingly, a unique test bed was developed to simulate a bacterial skin infection while enabling both bacteria and skin cells to be simultaneously exposed. For this experiment, the bacteria Staphlococcus epidermidis was selected since it is commonly found in skin and is a leading cause of infections. All samples were exposed to focused microwave energy for 30 seconds. Bacterial survival was determined using a standard survival assay (colony-forming units), while the viability of fibroblasts was assessed using Trypan blue dye exclusion.
The diagram in FIgure 2 shows the positions of cells and bacteria during microwave exposure. Samples were three-eighths inches apart, measured center to center. Bacteria was placed in positions “C” and “S,” while fibroblasts were in positions “1” and “2.” Representative data is summarized in Table 2.
Figure 2. Experimental setup.
13

Table 2. Survival data based on position.
In some experiments, fibroblasts were placed in position “S,” and no decrease in viability of fibroblasts compared to controls was observed (data not shown).
These experiments demonstrated that a 30-second exposure killed 98 to 100 percent bacteria (S. epidermidis, simulating skin infection) without decreasing the viability of cells (mouse/human fibroblasts, simulating skin cells).
The illustration in Figure 3 shows the overall concept for this application.
Figure 3. Overall cocept of treatment of skin disorders with microwaves.
In summary, these initial studies show the feasibility of using focused microwave energy as a potential countermeasure for the treatment of skin disorders. The next steps in development will include additional testing with other bacterial strains and fungi, as well as advanced, miniaturized prototype hardware development before considering commercialization and future clinical studies. Once fully developed, due to the lightweight and portability of the equipment, this technology should be widely applicable for both space and Earth-based usage (i.e., military, isolated areas, veterinary).
14

A Potential Path to Understanding Vision Changes During SpaceflightScott M. Smith, Johnson Space Center Sara R. Zwart, Universities Space Research Association
Vision changes in astronauts represent one of the most significant risks to human health on the International Space Station (ISS) and potential exploration missions. These ophthalmic issues were identified in recent years, and research is underway to better understand how they occur and to define and develop a way to counteract the changes. A primary hypothesis to explain the ophthalmic changes is that they are caused by an increase in intracranial pressure that results from fluid shifts and/or cardiovascular changes, both of which are thought to be associated with weightlessness. Factors that may impinge upon fluid shifts during weightlessness have been identified and are subject to scrutiny. They include carbon dioxide, resistance exercise and a high dietary intake of sodium-- all of which have the potential to increase circulatory volume and intracranial pressure. What remains perplexing is that on any given mission, with the same exposure to microgravity, food system, exercise and cabin environment, one crew member may develop vision issues, and another may not.
These results were from the Nutritional Status Assessment project, a project led by the Human Health and Performance Directorate’s Nutritional Biochemistry Laboratory. This effort was funded by the NASA Human Research Project (HRP) Human Health and Performance element, and was initiated in 2006. Inflight collections commenced with crew members on Expedition 14 and have continued through into 2013, where the last participating crew member flew on Expedition 34/35. The JSC Nutritional Biochemistry Laboratory was involved with coordination and implementation of the science, while the HRP International Space Station (ISS) Medical Project Experiment Support personnel managed the integration and implementation within the flow of spaceflight experiments. While too numerous to mention each by name, many, many people are responsible for the success of this project overall, and these data in particular.
For the Nutritional Status Assessment experiment, blood and urine samples are collected from astronauts before, during and after flight. These samples are analyzed for a wide-ranging set of chemicals and biochemicals that are related to nutrition and health and include minerals and vitamins. In reviewing the data from the first 20 crew members who participated in the experiment, five of whom had vision changes, the investigator team identified a significant relationship between changes in vision and changes in biochemicals related to a common metabolic pathway.
The so called “one-carbon metabolism” pathway transfers single carbon units from one chemical to another. This transfer is accomplished by several enzymes, along with several vitamin cofactors, including folate, vitamin B6, vitamin B12 and biotin. The one-carbon pathway is critical for many functions in the body, including DNA synthesis, amino acid production and more.
What was identified in this ISS experiment is that four of the key metabolites in the one-carbon pathway occurred in higher concentrations in blood samples from crew members who had vision issues than in samples from those who did not. Strikingly, the concentrations of these metabolites were higher before, during and after flight. Additionally, serum levels of the vitamin folate were lower in crew members who had vision issues than in those who did not.
Two possible situations could prevent the one-carbon pathway from functioning at 100 percent of its capacity, resulting in elevated blood concentrations of the four key one-carbon metabolites. The first is a vitamin deficiency of one of the vitamins that act as cofactors of the enzymes in the pathway. This was ruled out by analysis of other biochemical and dietary intake data. The other potential situation is the existence of minute changes in the genetic blueprint for the enzymes, changes that occur commonly across the population. These changes are called polymorphisms (that is, multiple forms) of genes. Blood type is a common example of a polymorphism. Multiple polymorphisms that affect the one-carbon pathway can occur, and one such polymorphism is found in about 15 to 20 percent of the population. These polymorphisms are associated with increased concentrations of certain biochemicals in the pathway, and with levels of serum folate that are lower than normal.
Thus, the biochemical differences observed in space crew members who have vision issues strongly suggest that their one-carbon metabolism was affected before, during and after flight. The observation that differences existed before flight suggests that genetic differences in this pathway may exist among astronauts and may interact with some aspect of microgravity to cause the vision changes. The fact that not all crew members on the same flight have vision issues suggests that some form of individual response occurs that could easily be explained by genetics rather than environmental factors.
15

These results were published in the Journal of Nutrition in 2012 and led to a follow-on proposal and project to further evaluate the one-carbon metabolic pathway, and genetic polymorphisms affecting it, in ISS crew members. The follow-on study was initiated in 2012 and will conclude in 2013. As exciting as these preliminary results are, they are essentially circumstantial evidence, and the results from the ongoing follow-on study will be needed to determine whether a) genetic polymorphisms in the one-carbon metabolic pathway are a key factor in spaceflight-related vision changes, b) polymorphisms in this pathway are a minor element in spaceflight-related vision changes, or c) these results are coincidental, and only reflect other factors in a larger issue. Regardless of which outcome they support, the results of this ongoing study will be an important step in evaluating the biochemical data further. If it turns out that the one-carbon metabolic pathway is related to the vision issues of ISS residents, the results may have significant implications for NASA and future astronauts, and for the general population as well.
16

Human Research ProgramWilliam Paloski, Johnson Space Center Barbara Corbin, Johnson Space Center
Crew health and performance is critical to successful human exploration beyond low-Earth orbit. Risks to crew health include physiologic effects from radiation, hypo-gravity and planetary environments, as well as unique challenges in medical treatment, human factors and behavioral health support. The goal of the Human Research Program (HRP) is to provide human health and performance countermeasures, knowledge, technologies and tools to enable safe, reliable and productive human space exploration. In its eight years of operation, the HRP continues to manage its architecture of evidence, risks, gaps, tasks and deliverables for each identified risk to crew health. Products are delivered to support the design of future exploration such as the Orion Multi-Purpose Crew Vehicle and advanced capabilities required to support long duration mission exploration. Experiments continue on the International Space Station (ISS), on the ground in analog environments that have features similar to those of space flight and in laboratory environments. Data from these experiments further NASA’s understanding of how the space environment affects the human system. These research results contribute to scientific knowledge and technology developments that address the human health and performance risks.
ObjectivesThe specific objectives of the HRP are:
1. Develop capabilities, necessary countermeasures and technologies in support of human space exploration, focusing on mitigating the highest risks to crew health and performance. Enable the definition and improvement of human spaceflight medical, environmental and human factors standards.
2. Develop technologies that serve to reduce medical and environmental risks, to reduce human systems resource requirements (mass, volume, power, data, etc.) and to ensure effective human-system integration across exploration mission systems.
3. Ensure maintenance of agency core competencies necessary to enable risk reduction in the following areas: space medicine; physiological and behavioral effects of long-duration spaceflight on the human body; and space environmental effects, including radiation, on human health and performance and space human factors.
The HRP is comprised of six major elements that are focused to accomplish specific goals for investigating and mitigating the highest risks to astronaut health and performance.
These six elements are: ISS Medical Projects, Space Radiation, Human Health Countermeasures, Exploration Medical Capability, Space Human Factors and Habitability (SHFH) and Behavioral Health and Performance (BHP). These elements provide the program’s knowledge and capabilities to conduct research to address the human health and performance risks as well as advance the readiness levels of technology and countermeasures to the point of transfer to the customer programs and organizations.
To learn more about the HRP, please visit: http://www.nasa.gov/exploration/humanresearch/index.html.
Partnerships and CollaborationsThe HRP works with universities, hospitals, and federal and international agencies for the purpose of sharing research facilities and multiuser hardware, and for collaboration on research tasks of mutual interest. The HRP uses bed rest facilities at the University of Texas Medical Branch in Galveston, Texas, to study changes in physiologic function associated with weightlessness. Many of these changes occur in people subjected to bed rest with the head tilted downward at a 6-degree angle.
The NASA Space Radiation Laboratory at the Department of Energy’s Brookhaven National Laboratory in Upton, New York, is used to conduct research using accelerator-based simulation of space radiation.
In 2013, the HRP acquired the Human Exploration Research Analog (HERA) facility located at the Johnson Space Center in Houston, Texas. The HERA, which enables research across HRP, especially for the BHP and SHFH elements, is an analog test-bed for long duration crew habitation that can simulate transit or exploration-class missions.
The National Space Biomedical Research Institute (NSBRI) — an academic institute funded by the HRP— investigates the physical and psychological challenges of long-duration human space flight. Founded in 1997 through a NASA competition, the NSBRI is a nonprofit research consortium that connects the research, technical and clinical expertise of the biomedical community with the scientific, engineering and operational expertise of NASA. Additional information about the NSBRI can be found at: www.nsbri.org.
The HRP also maintains collaborative relationships with the ISS International Partners through various working groups. These relationships enhance the research capabilities of all partners and provide synergism of research efforts.
17

Some of the working groups in which the HRP participates include:
• International Space Life Sciences Working Group (Canada, Japan, Germany, Ukraine, France and the
• European Space Agency) http://www.nasa.gov/exploration/about/islswg.html
• U.S.-Russian Joint Working Group• European Union in Radiobiology Research Program• International Council of Radiation Protection
The HRP organizes and participates in international collaborative meetings and coordinates research and technology workshops. The workshops are conducted to inform researchers outside of NASA about the HRP’s research and to obtain information about research going on outside of NASA. Some of the workshops include:
• Human Research Program Investigators’ Workshop http://www.hrpiws2013.com/workshops.php
• International Astronautical Congress http://www.iafastro.com/?title=IAC2013/
• Annual NASA Space Radiation Research Investigators’ Workshop, http://www.dsls.usra.edu/meetings/radiation2012/
• International Academy of Astronautics Humans in Space Symposium, http://www.his2013.com
HRP International Science OfficeIn early 2012, HRP was asked by the ISS Expert Working Group (IEWG) to lead its Team 5, the IEWG Human Health Management Team, the multi-national ISS management effort of coordinating human research across the ISS partners, with particular emphasis on research requiring ISS resources. The International Science Office (ISO) was established within the HRP in September 2012 to coordinate and oversee the execution of the activities as outlined in the Team 5 strategy white paper “Enhancing ISS Human Research: An International Strategy of Risk Reduction for Exploration”. With the determination that it would continue to function after the IEWG was to be dissolved, Team 5 was re-designated the Multilateral Human Research Panel for Exploration (MHRPE).
ISO is responsible for integrating HRP and other ISS Partner assets into an international research portfolio coordinated to the fullest extent possible. Additionally, ISO works with multilateral and bilateral implementation groups identified in the strategy white paper to coordinate their individual documents and processes that support MHRPE objectives and also produces and manages integrated documents and processes that cross these implementation groups.
In addition, as directed by the October 4, 2012, memorandum from the Human Exploration and Operations Mission Directorate Associate Administrator, NASA and Roscosmos will perform a one year expedition of a US and a Russian crewmember on the ISS from 2015 to 2016. It is expected that a joint US-Russian human research program, with participation by other ISS Partners, will be planned and executed to maximize the scientific return of this flight, oriented toward next generation exploration risk. ISO will oversee the HRP and NASA implementation of this human research program based on integrated inputs from all partners and participants.
It is the responsibility of the ISO to maximize the value of the international human research effort for exploration to the goals and objectives of the NASA Human Research Program.
Education and OutreachThe HRP Education and Outreach Project is committed to using NASA’s space research and exploration to educate the nation in science, technology, engineering and mathematics. Project activities and materials target educational communities, the general public, policymakers and the media using formal and informal venues. The project has made notable strides in their K-12 programs and outreach efforts. The primary grade programs include the 21st Century Explorer, Fit Explorer, and Sports and Exploration, while the secondary programs include Math and Science at Work and Exploring Space through Math.
Another key HRP Education and Outreach activity is Mission X (MX), a multi-year international fitness challenge project involving children 8-12 years old from over 22 countries (and growing). The goal of MX is to help children improve their level of daily physical activity, live a healthier lifestyle, and expand their awareness of human space exploration. The MX Project and 18 activity modules are available in 15 languages on the website http://trainlikeanastronaut.org/. The MX Challenge happens each year from mid-January to mid-March and in 2013 is supported by 11 space agencies.
Each year, the HRP compiles and publishes an annual report highlighting major programmatic and technical accomplishments. These reports can be found at: http:/ /www.nasa.gov/explorat ion/humanresearch/research_info/overview/program_docs_detail.html
To learn more about the Human Research Program Education and Outreach Project, please visit:http:/ /www.nasa.gov/explorat ion/humanresearch/education/index.html
18

Magnet Architectures and Active Radiation Shielding StudyKenneth Bollweg, Johnson Space CenterShayne C. Westover, Johnson Space Center Steve Blattnig, Langley Research Center Robert Singleterry, Langley Research Center
Rainer B. Meinke, Advanced Magnet Lab, Inc.Scott A. Washburn, University of Colorado, BoulderWilliam J. Burger, University of Perugia, ItalySteven Van Sciver, Florida State UniversityRoberto Battiston, University of Trento
NIAC Phase 2 is a two-year study in progress to roadmap technologies and further evaluate the shielding concept. Benefitting from the low temperature and high-vacuum environment of deep space, existing high-temperature superconductors make such radiation shields realistic, near-term technical developments.
Active Shielding Background and ApproachThe magnetosphere’s extensive field, as well as the planet’s atmosphere, both provide Earth with protection from the space environment. Surrounding a spaceship with large volumes of magnetic field (a modest eight-meter diameter field in this study) can accordingly protect the habitat of a spaceship and enable extended missions of human beings for the exploration of the solar system and in the far future of intergalactic space.
The bending strength of a magnetic field on charged particles depends on the product of field strength, i.e., flux density measured in Tesla, and the path length of particles in the field. It is therefore equivalent to use shielding magnets with very large volumes filled with a relative low flux density or smaller-field volumes, but filled with a high flux density. As long as the product of flux density and path length is the same, both approaches deliver the same bending strength. This offers two possibilities for efficient shielding, and deciding between them is an important step in the development of a feasible solution. The performed analysis identified clear advantages for large volumes and low flux densities, since the Lorentz forces acting in coils increase quadratically with flux density. Using a novel concept of lightweight, expandable coils based on-high temperature superconductors enables magnets with unprecedented large volumes.
Volume and flux density are not the only parameters that need to be considered in the realization of magnets for a practical radiation shield. Several other issues related to the realization of magnets with sufficiently large products of flux density and path length, seen by the traversing particles, have to be taken into account. Large magnets, in most cases, have extended-fringe magnetic fields that intrude into the spaceship habitat, where flux densities of more than a few Gauss would lead to difficult or even unacceptable conditions.
IntroductionProtecting humans from space radiation is a major hurdle for human exploration of the solar system and beyond. Large magnetic fields surrounding a spaceship would deflect charged particles away from the habitat region and reduce the radiation dose to acceptable limits. Led out of the Johnson Space Center Propulsion and Power Division within the Engineering Directorate, the objective of this NASA Innovative Advanced Concepts (NIAC) study is to determine the feasibility of active magnetic shielding based on state-of-the-art high temperature superconductors to protect crew from space radiation exposure on long-duration missions beyond low-Earth orbit. Phase 1 was a one-year study completed in 2012 that evaluated magnet architecture concepts and technologies to deflect high-energy galactic cosmic radiation and solar particles. Several designs were reviewed during the study, and the multiple parameters that should be evaluated for magnetic shielding were considered. Mass, power and shielding efficiency were computed and compared with current passive shielding capabilities. The study team eventually down-selected the concepts to a scalable, lightweight solenoid architecture that is launchable and deployable using magnetic pressure to expand large diameter coils, as seen in Figure 1.
Figure 1. An 8-Tesla-meter, 6+1 expandable active radiation shielding architecture with a two-launch assembly approach developed in a NIAC phase 1 study.
19

Surrounding the habitat with an additional superconducting coil allows it to completely compensate and eliminate any fringe magnetic field inside of the habitat. Additionally, this coil acts as an effective thermal shield, which intercepts thermal radiation from the habitat, the largest heat source in interplanetary space. Furthermore, the fringe fields of magnets surrounding a spaceship lead to large forces acting between the individual magnets, which reach levels of several 106 Newton. In the case of solenoid coils that all have the same field direction, these coils repel each other, and no forces act on the spaceship habitat. Many other issues in the realization of the active magnetic radiation shielding need to be considered, but it is important to mention that even the difficulties in manufacturing superconducting magnets with the necessary features and performance are an important parameter to decide on a concept. This is of particular importance, since lightweight coils that can expand are necessary for the radiation space shield.
Finally, it needs to be pointed out that the study for good reasons only considers superconducting magnets. The flux density needed to bend particles with momenta in the range of 1 GeV/c (gigaelectron volts divided by the speed of light) and higher, requires flux densities in the Tesla range for coils of realistic dimensions. Figure 2 depicts the bending of 2.2 GeV protons with a 1 Tesla, 8 meter diameter coil array, graphically representing a subset of ray traces of this energy spectrum approaching the center of the habitat. Substantial current levels, typically in the kilo-amp range, are therefore necessary to produce such flux densities. The ohmic losses and related power requirements for normal conducting magnets operating at the required currents are unmanageable for space applications.
Superconducting magnets, in contrast, can operate in a persistent mode (i.e., no power supply is needed once the coil has been excited to the operational current level).
In the case of persistent-mode operation, the magnets can be charged with superconducting flux pumps (i.e., small devices that can reach very high current levels). Furthermore, normal conducting magnets typically contain large amounts of iron, which would make such magnets too heavy for space launch. Superconducting magnets, on the contrary, can produce the required flux densities without any iron enhancement by currents only, and coils similar to blimps become realistic.
In the NIAC study, six eight-meter diameter solenoidal electromagnets are assembled around a habitat as seen in Figure 1. The end caps are left open (i.e., no magnet coils) to allow for infrastructure such as interplanetary propulsion systems and docking systems.
With sufficient advances in high-temperature superconductor technology and a solar heat shield, no active cooling system will be required for the six large superconducting coils surrounding the habitat. The high-vacuum and low-temperature environment of deep space and appropriate solar shadowing will allow keeping the coils at an operational temperature below about 50 Kelvin. The compensation coil, which closely surrounds the habitat, can be cooled with cryocoolers located inside the habitat. Vehicle operations may require an active cooling system based on gaseous helium to be employed to sustain the required operational temperature of the outer six coils. However, the concept of expandable, superconducting magnets seems to violate all experience with existing superconducting magnets used for research and medical applications. Such magnets require support structures to avoid even microscopic movements of the superconductor, which are known to initiate quenching of the superconductor (i.e., transitions from the superconducting to the normal conducting state). Since Lorentz forces acting on the conductors in high-field magnets lead to a large ”magnetic pressure” similar to forces acting in conventional pressure vessels, support structures of utmost stability are required for these magnets.
High-temperature superconductors like yttrium barium copper oxide (YBCO), however, have much larger operational margins than the low-temperature conductors used in most existing superconducting magnets, and mechanical movements of the conductor should not initiate quenching. Experiments recently performed by NASA personnel and the Advanced Magnet Lab have verified that superconducting coils based on an existing YBCO conductor can undergo large and rapid shape changes without causing any quenching. These successful tests have led to a paradigm shift in superconducting magnet technology and established the feasibility of the assumed concept of expandable, lightweight superconducting coils.Figure 2. An 8-Tesla-meter, 6+1 expandable active
radiation shield turning 2.2 GeV protons.20

The final step of demonstrating that such coils can expand under the influence of Lorentz forces and remain operational is in work, as seen in Figures 3 and 4. The structural design of such a coil system to manage magnetic loads around a habitat is also part of the phase 2 study. In addition to design and testing efforts, a software trade tool is in development to assist in scaling such a magnetic shield sized for mission duration as it applies to the human dose allowable.
Figure 3. High Temperature Superconductor testing at the Energy Systems test area, Johnson Space Center.
Figure 4. HTS Coil Expandability Test conducted by Advanced Magnet Lab at National High Magnetic Field Lab.
21

Use of Gas Chromatograph-Differential Mobility Spectrometer for Volatile Organic Compound Monitoring on the International Space StationJohn T. James, Johnson Space CenterThomas F. Limero, Wyle Science, Technology, and EngineeringEric S. Reese, Wyle Science, Technology, and Engineering
William T. Wallace, Wyle Science, Technology, and EngineeringPatti F. Cheng, Wyle Science, Technology, and EngineeringJohn B. Trowbridge, Wyle Science, Technology, and Engineering
The environment of the International Space Station (ISS) is a semi-closed system. Although the crew lives in this atmosphere for 24 hours a day, archival air samples are returned only once every three or four months. These samples are used to determine the acceptability of air quality aboard the ISS (in particular, the presence of volatile organic compounds [VOCs]), but the long intervals between returned samples could compromise the value of identifying pollutants and responding to a slowly degrading ISS atmosphere. Additionally, contingency events (for example, overheated components/wiring or strong odors) demand a more immediate analysis that only real-time monitors can provide.
A potential, real-time VOC monitor that warranted testing was a commercial, off-the-shelf instrument based on gas chromatography-differential mobility spectrometry (GC/DMS). This instrument, the Air Quality Monitor (AQM), possessed a number of advantages compared to previous air-monitoring instruments, with the most important advantage being a vastly reduced size and mass. The AQM was sent to the ISS as an experiment in 2009, supported by the ISS Program Office and the Johnson Space Center Human Health and Performance Directorate, to determine if the excellent ground-based performance observed before and during flight preparation could be maintained in the more-challenging ISS environment. Although mixtures used to assess the AQM’s readiness for flight mimic the ISS atmosphere, it is impossible to duplicate the exact composition or the small changes that occur in the closed ISS environment. For the experiment, a set of compounds were chosen for the AQM target list (Table 1) that are representative of the more extensive list expected for operational hardware.
Table 1. AQM target compound list. The established air quality limit for each compound, referred to as Spacecraft Maximum Allowable Concentration (SMAC), is provided in the last column.
A block diagram (Figure 1) of the AQM highlights the essential components of the instrument. A sample pump acquires an air sample that flows through a preconcentrator sorbent bed. Following sampling, the preconcentrator is rapidly heated to desorb the VOCs trapped from the air sample. The trapped VOCs are then transferred from the preconcentrator to the gas chromatograph (GC) column by carrier gas flow. As the analytes elute from the GC column, a 63Ni ionization source produces reactant ions that transfer charge to the analytes. The detector monitors two important parameters for detection and identification of each analyte: the GC retention time and the compensation voltage (Vc). During their transit through the DMS, the ions are subjected to cycles of an asymmetric radio frequency voltage field that displace most ions perpendicular to the gas flow. In order for the gas flow to deliver an ion to the detector (and achieve selectivity), the Vc (a small direct current voltage) must be applied.
Figure 1. Block diagram of GC/DMS techonology.22

Historically, air-quality instruments used for measuring trace VOCs have been evaluated by comparing the instrument’s results to those from returned archival samples (Grab Sample Containers [GSCs]), where the GSC sample was acquired close to the device and within one to two hours of the instrument’s sample session. The archival samplers are returned to the ground and analyzed in the JSC Toxicology Laboratory. Sampling typically occurs once per month, but ISS logistics can interfere with the simultaneous archive sampling and instrument operation.
The first AQM unit (unit 40) to be deployed was located on the Crew Health Care System rack located in the center of the LAB module. The AQM remained in this location until late August 2009, at which time the AQM was relocated to Node 2 near the end of the LAB module (Figure 2). The AQM has remained near this location since August 2009. Unit 40 showed excellent reproducibility in GC retention times during the first year of operation on ISS, maintaining a relative standard deviation of < 1 percent.
Figure 2. AQM unit 40 (inside red box) shown in ISS at its long term position at the Node 2/LAB junction.
In the first year of the AQM operation, there were 10 GSCs acquired at times and positions that allowed them to be used to evaluate the performance of unit 40. During this time, the AQM detected 12 of 16 target compounds, most at concentrations near the detection limit. Two compounds, dichloromethane (DCM) and octamethylcyclotetrasiloxane (OMCTS), were not detected because of a contaminant (carbon dioxide) that affected formation of negative ions. After switching to positive mode, OMCTS was subsequently detected and has been detected in most runs since July 2010. The issue with DCM was also resolved, and it has been detected by ground-based analysis of AQM data since July 2011. Overall, unit 40 results (qualitative and quantitative) matched closely with the GSCs except for benzene, 2-butanone, and, occasionally, ethyl acetate. The reasons for the discrepancies compared to the GSCs were two contaminants in the ISS atmosphere.
Although large concentrations of benzene and 2-butanone were detected by unit 40, one look at the overlaid chromatograms (Figure 3) from flight and preflight calibration shows unidentified peaks eluting close to the target compound peaks, resulting in interference. The peak interfering with 2-butanone and ethyl acetate was trimethysilanol, but the peak interfering with benzene has yet to be identified. Starting with unit 36, quantification of these compounds has been improved, although some require ground-based analysis of the flight data. This co-elution issue observed during the experiment demonstrated the need for a second unit with a different GC column.
Figure 3. Chromatograms from the AQM unit 40 calibration (black/brown) and from operations on ISS (red).
The overall performance of AQM unit 40 was considered very good and led to a decision to build an operational AQM. In addition to the agreement with archive samples, there were other data that supported the confidence in the AQM technology; namely, the consistency of results, which corresponded to historical ISS data showing a rather stable contaminant load. Also, the AQM demonstrated the capability to follow changes in the target compound concentrations several times in the past three years (for example, when Node 2/cupola was attached to the ISS in February 2010).
The experimental AQMs operated on the ISS for approximately four years and, during that time, three different instruments were employed (units 40, 39 and 36). The objectives of the experiment were to assess the technology’s capability and to identify hardware or procedural modifications that would be required to enable this type of monitor to function as an operational air quality monitor on the ISS. Although several compounds were difficult for the experimental AQM to accurately quantify, the overall performance of the device was sufficient to warrant building operational units.
23

The inclusion of a second operational AQM unit, with a different GC column, has enabled the enhanced detection of several compounds and has further reduced the potential for misidentification due to co-elution of non-target air contaminants. Additionally, the addition of the second operational AQM has allowed for an expansion of the target compound list, which will consist of 22 compounds for the first flight and will undoubtedly expand in future years.
The operational AQMs were delivered to ISS in March of 2013 and are currently undergoing validation of their performance. Upon their successful validation, the AQMs are expected to provide real-time VOC monitoring for up to three years, at which point another set of units will be prepared and delivered to the ISS. The successful implementation of this technology will reduce the need for archival sampling, thereby reducing crew time expenditure, and will allow for near real-time responses to events that could affect air quality.
24

Organ Dose Projection and Acute Radiation Sickness AssessmentFrancis A. Cucinotta, Johnson Space CenterMyung-Hee Y. Kim, Universities Space Research Association
Shaowen Hu, Universities Space Research AssociationHatem N. Nounu, Universities Space Research Association
A goal of Space Radiation Program Element (SRPE) in the Human Health and Performance Directorate at Johnson Space Center is developing scientifically based integrated risk assessment tools to enable safe, reliable and productive human space exploration. SRPE developed the probabilistic risk assessment of acute radiation sickness (ARS) using an improved organ dose projection model from the exposure to Solar Particle Events (SPEs). SPEs occur quite often over the approximately 11-year solar cycle, but are highly episodic and almost unpredictable. They represent an important threat to crews of space exploration missions. During such events, the flux of protons with energy greater than 10 MeV may increase over background by four to five orders of magnitude for a period of several hours to a few days. Blood-forming organ (BFO) doses during extravehicular activities, or spacewalks, are estimated from the exposure to historical SPEs in figure 1. The hazards of exposure to these large doses have to be evaluated in the context of the high-competing risks of vehicle or life support system failures. In addition to the risk of cancer and other late effects such as the neuronal and heart disease risks and cataracts, the appraisal of ARS assumes prime importance because it can impair the performance capabilities of crew members, and thereby threaten mission success.
SRPE has integrated SPE models and organ dose evaluation models using the Baryon transport code (BRYNTRN) with an output data processing code of SUMDOSE, and a probabilistic model of Acute Radiation Risk (ARR). The risk projection models of organ doses and ARR take the output from BRYNTRN, whose operation requires extensive input preparation.
With a graphical user interface (GUI) to handle input and outputs of organ dose projections, the prodromal response models can be connected easily and correctly in friendly way. A GUI for the ARR and BRYNTRN organ dose projection code (ARRBOD) version 1 in 2009 has provided seamless integration of input and output manipulations required for operations of the ARRBOD modules.
In 2012 and 2013, the improved spectral fit of SPEs has been made over all energies; the analysis of any SPE at a certain proton fluence is made based on the distribution of total fluence of the recorded SPEs to fulfill National Research Council recommendations from 2008 on development of probabilistic approach to SPEs, Managing Space Radiation Risk in the New
Era of Space Exploration; and sophisticated non-linear kinetics models of bone marrow stem cells and various blood system components are developed to describe and provide accurate descriptions of human and other species responses to acute and chronic irradiation. They are incorporated with the knowledge of dose-rate effects for solar protons as the ARRBOD version 2.0 Web server.
In the future, investigations are planned for skin damage, resulting changes in immune system and any impacts on other ARS components by using multi-scale modeling framework for new data from the National Space Biomedical Research Institute Acute Radiation Team. Radiobiology data will be considered to introduce a track-structure-related relative biological effectiveness (RBE), which is important for secondary radiation from protons and SPEs with large helium components. The resultant RBEs will replace the International Commission on Radiological Protection RBEs.
Figure 1. BFO dose estimation with 90 percent tolerance limits during spacewalk from exposure to historical SPEs with proton fluence at energy > 30 MeV (top) and 100 MeV (bottom). The BFO dose limit (250 mGy-Eq) is shown as dotted line.
25

The ARRBOD version 2.0 Web server (figure 2) is the risk-assessment tool for organ dose projection, physical linear energy transfer (LET) analysis and ARR assessment from SPE, or beam, exposure. It is developed in support of mission design, operational planning and shielding optimization for future human space exploration missions. Dose-rate analysis and detailed shield files of various spacecraft support spacecraft design and operational planning to avoid ARR and stay within the current NASA dose limits. Organ doses and ARR severity assessments with 95 percent confidence levels guide alternative solutions for the determined objectives set by mission planners. Blood cell kinetics simulation serve as biodosimetric tools with clinical hematologic data of acute and protracted exposures. To comply with NASA’s renewed commitment to excellence for models and simulations, NASA-STD-7009 and Class D software are fully implemented for ARRBOD software safety compliance.
Figure 2. ARRBOD version 2.0 (http://spaceradiation.usra.edu).
26

NASA Space Cancer Risk Assessment 2012Francis A. Cucinotta, Johnson Space CenterPatrick O’Neill, Johnson Space CenterMyung-Hee Y. Kim, Universities Space Research Association
Lori Chappell, Universities Space Research AssociationShaowen Hu, Universities Space Research AssociationIanik Plante, Universities Space Research AssociationHatem N. Nounu, Universities Space Research Association
planning for future missions to the moon, near-Earth objects or Mars. The NSCR 2012 version 1 Web server evaluates mission/individual specific organ exposures behind spacecraft shielding. It employs the multiple parallel processing method to improve run time by the user. An overview of the functional control is provided as a flow chart in figure 1, and the user-friendly interface for those controls is shown in figure 2 for the input of mission and environment parameters. Seamless integration of an enormous quantity of research knowledge is provided to users to evaluate potential cancer risks to individuals. A large number of shielding materials can be considered by the user, including liquid hydrogen, methane and polyethylene.
Exposures to astronauts from galactic cosmic rays that are made up of high-energy protons, high-energy and charge (HZE) nuclei and solar particle events (SPEs) that are comprised largely of low- to medium-energy protons, are a critical challenge for space exploration. Experi¬mental studies have shown that HZE nuclei produce both qualitative and quantitative differences in biological effects compared to terrestrial radiation, leading to large uncertainties in predicting exposure outcomes to humans. NASA limits astronaut exposures to a 3 percent risk of exposure-induced death (REID) and protects against uncertainties in risk projections using an assessment of 95 percent confidence intervals in the projection model.
The Space Radiation Program Element in the Human Health and Performance Directorate at NASA Johnson Space Center has developed a cancer risk projection code, which evaluates the level of uncertainty of each factor (parameters) in the risk model and determines the overall uncertainty in risk estimates. The model originated from recommendations of the National Council on Radiation Protection and Measurements. The model was reviewed by the National Research Council in 2012 and approved for use at NASA by the Chief Health and Medical Officer in August 2012.
The major features of the NASA Space Cancer Risk (NSCR) 2012 model include NASA-defined radiation quality factors (QFs), which for the first time are based on microscopic energy deposition and the most recent research results on HZE particle cancer risks. NASA-defined radiation QFs are distinct for leukemia and solid cancer risk estimates. NSCR 2012 makes age and gender-specific risk predictions for the U.S. average population, and for the first time estimates for a population of never-smokers are made. State-of-the-art GCR and SPE environmental models developed at NASA are used, including the Baryon transport code (BRYNTRN) and the high-energy and charge nuclei transport code (HZETRN) with the Quantum Multiple Scattering Model of Fragmentation (QMSFRG) database. The NASA-defined QFs are integrated with the latest analysis of human radio-epidemiology data as the NSCR 2012 version 1 Web server.
The purpose of the NSCR 2012 version 1 Web server is to provide seamless integration of input and output manipulations, which are required for operation of the sub-modules: BRYNTRN, SUMSHIELD and the cancer probabilistic response models. The main applications envisioned are International Space Station missions and
Figure 1. Flow chart of functional control for the user input.
Figure 2. User interface of mission and environment parameters of NSCR 2012 version 1.
27

Output data files on particle spectra for fluence, dose and tissue organ doses, and dose equivalents for solid cancers and leukemia, are generated by parallel processing for different shielding depths, and the outputs are viewed in chart and in data. For the overall histograms and statistics of cancer risks, parallel processing of Monte-Carlo trials are executed with the selection of astronaut and demographics by user. The user interface of input parameters for cancer risk projection code and the probability of REID result are shown in figures 3 and 4, respectively. To comply with NASA’s renewed commitment to excellence for models and simulations, NASA-STD-7009 and Class D software are fully implemented for the NSCR software safety compliance. The NSCR software also evaluates cancer risks from diagnostic radiation exposures, and new modules for cancer risks from aviation and secondary cancers during treatment with proton and carbon beams (Hadron therapy) are under development.
Figure 3. User interface of astronaut and demographics of NSCR 2012 version 1.
Figure 4. Probability of REID result of NSCR 2012 version 1.
28

Pharmaceutical Product Development: Intranasal Scopolamine (INSCOP) Metered Dose Spray Lakshmi Putcha, Johnson Space Center Vernie R. Daniels, Wyle Science, Technology and
Engineering
technology (see Figure 2). The new formulation offers consistent doseuniformity, enhanced user satisfaction and palatability,and is aimed at rapid absorption to ensure a fast onsetof action. A preliminary report on the absorption and side-effects profile of the INSCOP spray will be presented at the Aerospace Medical Association 2013 annual meeting. These preliminary results indicate that the formulation will provide precise dosing option with rapid onset of effect.
Motion sickness has been a problem associated with spaceflight, the modern military and commercial air and water transportation for many years. Clinical studies have shown that scopolamine is the most effective medication for the prevention of motion sickness. However, the two most common methods of scopolamine administration (transdermal and oral) have performance limitations that compromise its utility. Intranasal administration offers a noninvasive treatment modality and has been shown to alleviate many of the problems associated with oral and transdermal administration. With the elimination of the first pass effect by the liver, intranasal deliveryachieves higher and more reliable bioavailability than an equivalent oral dose (see Figure 1). This promotes enhanced efficacy at a reduced dose, thus minimizing untoward side effects.
An aqueous intranasal scopolamine formulation has been developed and evaluated by researchers within the Human Health and Performance Directorate at the Johnson Space Center (JSC) as a Food and Drug Administration (FDA) Investigational New Drug (IND) intended for the treatment of motion sickness. Subsequently, a gel formulation of this IND formulation, INSCOP, was custom manufactured and tested for bioavailability, toxicity and efficacy in four FDA-approved clinical trials. Clinical trials of bioavailability were conducted at a commercial clinical research organization, MDS Pharma Services, Inc., in Lincoln, Neb., and the efficacy trial was conducted at the Naval Aerospace Medical Research Laboratory in Pensacola, Fla., under a Space Act Agreement between the two organizations. Results from clinical trials of bioavailability indicated rapid absorption after INSCOP administration, as shown by maximum plasma concentrations reached within one hour after dosing. Results from the efficacy trial indicated that INSCOP is a fast-acting and reliable way to prevent and treat motion sickness at lower than currently used doses for treatment (0.2 mg versus 0.4 and 0.8 mg), as indicated by significantly increased mean number of head movements tolerated in motion-susceptible subjects after INSCOP treatment and no significant cognitive side effects were reported. Based on these results that confirm INSCOP is efficacious for the treatment of motion sickness in susceptible individuals with no significant cognitive or sedative effects, the gel formulation was subsequently modified as an aqueous formulation with an aim to enhance suitability for rescue treatment and to alleviate problems associated with dose uniformity of the gel formulation. As a result, an aqueous formulation was developed fordispensing as a micro spray with the precise, metereddose delivery capabilities of a commercial, off-the-shelf
Figure 1. Plasma concentration-time profiles of scopolamine.
At present, recent reports of new therapeutic indications for scopolamine rekindled a widespread interest in new scopolamine dosage forms. This novel dosage form and delivery system of INSCOP spray, in addition to its proven potential for fast and efficacious treatment for motion sickness for the armed forces, spaceflight, and commercial sea, air and space travel markets, has a tremendous psychotherapy potential for mental and emotional disorders and degenerative neurocognitive diseases. Further studies to characterize the therapeutic index of INSCOP spray for motion sickness are planned at the Naval Medical Research Unit in Dayton, Ohio, funded by the commercial partner, Epiomed Therapeutics, Inc. (a small pharmaceutical business partner with special interest in product development for the treatment of emesis in all clinical paradigms). To initiate this joint venture, JSC and Epiomed Therapeutics, Inc., of Irvine, Calif., entered into a Space Act Agreement to test, optimize therapeutic index and market INSCOP spray for acute and chronic treatment of motion sickness.
29

Figure 2. New markets for INSCOP.
In compliance with the goals of this agreement, NASA transferred FDA IND sponsorship of INSCOP to Epiomed on Nov. 30, 2012, to facilitate production and commercial development. Epiomed plans to continue to work closely with NASA to optimize therapeutic efficiency as a rescue treatment for motion sickness, in addition to the current target market for acute and chronic treatment. Epiomed agrees to provide the formulation for use by NASA, the Department of Defense, and continue investigations aimed at marketing for commercial travel use.
30

Comparative Benchmark Dose Modeling as a Tool to Make the First Estimate of Safe Human Exposure Levels to Lunar DustJohn T. James, Johnson Space CenterChiu-wing Lam, Wyle Science, Technology & Engineering Group
Robert R. Scully, Wyle Science, Technology & Engineering Group
BackgroundBrief exposures of Apollo astronauts to lunar dust (Figure 1) occasionally elicited upper respiratory irritation; however, no limits were ever set for prolonged exposure to lunar dust. The United States and other spacefaring nations intend to return to the moon for extensive exploration within a few decades. In the meantime, habitats for that exploration, whether mobile or fixed, must be designed to limit human exposure to lunar dust to safe levels.
Using the best fit profile, the user can select a level of risk of occurrence of an adverse event associated with the curve. The default measure of 1 standard deviation from the mean of the air-exposed control group was used.
Experimental ProcedureThree respirable-sized (~2 micrometer (μm) mass median diameter) lunar dusts (two ground and one unground) and two standard dusts of widely different toxicities (quartz (QZ) and Titanium Dioxide (TiO2)) were instilled into the respiratory system of rats. Rats in groups of six were given 0, 1, 2.5 or 7.5 mg of the test dust in a saline-surfactant vehicle, and biochemical and cellular biomarkers of toxicity in lung lavage fluid were assayed one week and one month after instillation.
Benchmark Dose ModelingA biomarker was deemed “sensitive” if the response to quartz, a highly toxic dust, was at least 10-fold higher than the response to TiO2 (low-toxicity dust). In addition, the benchmark fit to the data had to meet acceptability criteria. By comparing the BMDs from the dose-response curves of sensitive biomarkers, safe exposure levels were estimated for astronauts (example in Figure 3). BMD comparisons were made to Permissible Exposure Levels (PELs) that are known (QZ and TiO2) and to be estimated (lunar dusts A, C, and E) on a log-log plot.
Figure 1. Astronaut Gene Cernan wearing suit covered with lunar dust.
Scientists within the Human Health and Performance Directorate at Johnson Space Center have conducted research to estimate safe human exposure limits to lunar dust. Lunar dust collected during the Apollo 14 mission Comparative Benchmark Dose Modeling (CBMDM) was used to conduct the research. The U.S. Environmental Protection Agency provides software to perform benchmark dose (BMD) modeling. The goal of that modeling is to find a best fit to the dose-response profile for specific toxicological endpoints (Figure 2).
Figure 2. BMD curve that produced the best fit to data on monocyte chemotactic protein-1 a week after unground lunar dust was instilled into rat lungs. The BMD is approximately 2.8 milligrams (mg).
31
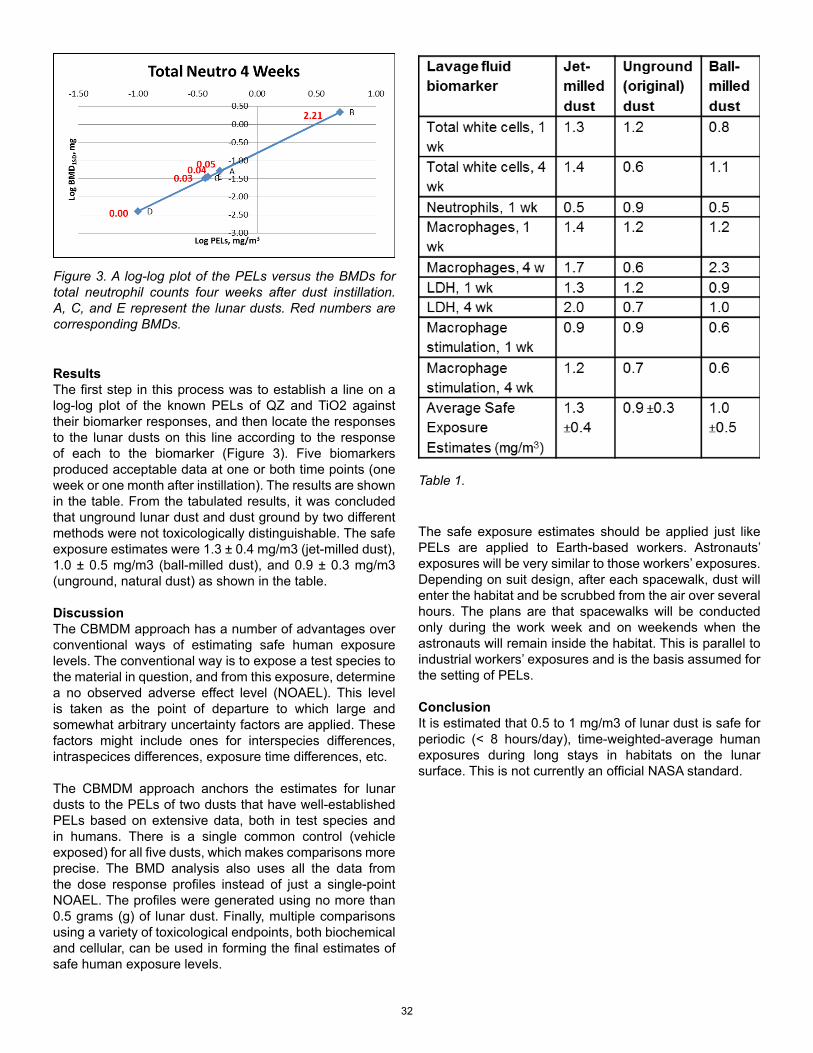
Figure 3. A log-log plot of the PELs versus the BMDs for total neutrophil counts four weeks after dust instillation. A, C, and E represent the lunar dusts. Red numbers are corresponding BMDs.
Results The first step in this process was to establish a line on a log-log plot of the known PELs of QZ and TiO2 against their biomarker responses, and then locate the responses to the lunar dusts on this line according to the response of each to the biomarker (Figure 3). Five biomarkers produced acceptable data at one or both time points (one week or one month after instillation). The results are shown in the table. From the tabulated results, it was concluded that unground lunar dust and dust ground by two different methods were not toxicologically distinguishable. The safe exposure estimates were 1.3 ± 0.4 mg/m3 (jet-milled dust), 1.0 ± 0.5 mg/m3 (ball-milled dust), and 0.9 ± 0.3 mg/m3 (unground, natural dust) as shown in the table.
DiscussionThe CBMDM approach has a number of advantages over conventional ways of estimating safe human exposure levels. The conventional way is to expose a test species to the material in question, and from this exposure, determine a no observed adverse effect level (NOAEL). This level is taken as the point of departure to which large and somewhat arbitrary uncertainty factors are applied. These factors might include ones for interspecies differences, intraspecices differences, exposure time differences, etc.
The CBMDM approach anchors the estimates for lunar dusts to the PELs of two dusts that have well-established PELs based on extensive data, both in test species and in humans. There is a single common control (vehicle exposed) for all five dusts, which makes comparisons more precise. The BMD analysis also uses all the data from the dose response profiles instead of just a single-point NOAEL. The profiles were generated using no more than 0.5 grams (g) of lunar dust. Finally, multiple comparisons using a variety of toxicological endpoints, both biochemical and cellular, can be used in forming the final estimates of safe human exposure levels.
Table 1.
The safe exposure estimates should be applied just like PELs are applied to Earth-based workers. Astronauts’ exposures will be very similar to those workers’ exposures. Depending on suit design, after each spacewalk, dust will enter the habitat and be scrubbed from the air over several hours. The plans are that spacewalks will be conducted only during the work week and on weekends when the astronauts will remain inside the habitat. This is parallel to industrial workers’ exposures and is the basis assumed for the setting of PELs.
ConclusionIt is estimated that 0.5 to 1 mg/m3 of lunar dust is safe for periodic (< 8 hours/day), time-weighted-average human exposures during long stays in habitats on the lunar surface. This is not currently an official NASA standard.
32

Lower Body Gradient Compression Garments Protect Against
Steven H. Platts, Johnson Space CenterMichael C. Willig, JES TechRob Ploutz-Snyder, Universities Space Research AssociationMichael B. Stenger, Wyle Science, Technology and Engineering
IntroductionSpaceflight-induced orthostatic intolerance is a health and safety concern for astronauts during landing and in the hours immediately after landing. In some individuals, it may persist for several days thereafter. Upon return to Earth, astronauts may be expected to extract themselves from the space vehicle in the event of an emergency, or fend for themselves when support personnel are not available immediately after an off-nominal landing. Under nominal conditions, orthostatic intolerance can interfere with an astronaut’s ability to return to activities of daily living without supervision, and may limit participation in reconditioning activities intended to assist in the recovery process. Similar impairments might be a concern for astronauts upon arrival at Mars after a six-month flight in microgravity, although spaceflight-induced cardiovascular deconditioning might have a smaller effect on the astronaut’s function in a lower-gravity environment.
Orthostatic Intolerance After Bed Rest
Stuart M. C. Lee, Wyle Science, Technology and EngineeringL. Christine Ribeiro, Wyle Science, Technology and EngineeringTiffany R. Phillips, Wyle Science, Technology and Engineering
To protect against post-spaceflight orthostatic intolerance, astronauts commonly wear lower-body compression garments designed to assist blood return from the legs and lower abdomen to the heart. This improvement in venous return counters the effects of spaceflight-induced reductions in blood and plasma volume; prevents large drops in stroke volume, cardiac output and blood pressure when seated or standing; and assists in the maintenance of cerebral blood perfusion. During the Space Shuttle Program, NASA employed an inflatable lower-body compression garment, the Anti-Gravity Suit (AGS), which was effective during re-entry and landing, but loses pressure after detaching from its compressed gas source in the vehicle and impairs emergency egress. The AGS was removed by the crew surgeons and suit technicians in the Crew Transport Vehicle soon after landing, and it was not intended to be used in the hours and days after the mission ended. Cosmonauts and astronauts returning from the International Space Station in the Soyuz capsule wear an elastic compression garment, the Kentavr, which is adjusted to provide its highest level of compression on landing day and is worn during the first few days of recovery when lower levels of compression are achieved by adjusting the lacing on the sides of the garment. Unfortunately, the level of compression provided by the
Kentavr cannot be quantified, the garment can only be adjusted by the crew surgeon or other highly trained individuals and uncomfortable swelling can develop in the feet and knees, which are not covered by the Kentavr.
In preparation for exploration missions and commercial crew applications, different garment configurations and magnitudes of compression of commercially available and custom-designed compression garments have been investigated for their ability to reduce the incidence of orthostatic intolerance after spaceflight and in hypovolemic subjects. Through the combination of previous experiences with compression garments, peer-reviewed research and consultation with a commercial provider, a three-piece, lower-body gradient compression garment (GCG) was designed (Figure 1) and demonstrated to be
Figure 1. Three-piece lower body compression garment used to protect against spaceflight- and bed rest-induced orthostatic intolerance.
effective during short-stand tests performed on landing day after space shuttle missions. However, no astronaut volunteers for that study wore the GCG after the immediate post-landing timeframe to determine its long-term effectiveness or comfort. These factors were evaluated in normal healthy subjects after bed rest, as this model
33
MethodsStudy ProtocolEight control and eight treatment subjects volunteered to participate in a 14-day 6° head-down bed rest (HDBR) study at the General Clinical Research Center Satellite Flight Analogs Research Unit at the University of Texas Medical Branch in Galveston, Texas. Test subjects were admitted to the bed rest facility 13 days prior to the start of HDBR, and standard conditions (diet, wake/sleep time, time allowed in sunlight) were maintained across all subjects throughout the study.
Five days prior to the start of HDBR (BR-5), plasma volume was measured, and cardiovascular responses to a 15-minute 80° head-up tilt test were assessed. The tilt test consisted of a 5-minute resting baseline period followed by 80° head-up tilt for 15 minutes, or until presyncopal symptoms intervened (e.g., systolic blood pressure of <70 mmHg, lightheadedness, nausea), or if the subject requested that the test be terminated. Heart rate, blood pressure, stroke volume and cardiac output were measured during the test. These tests were repeated immediately following the conclusion of bed rest (BR+0), one day after bed rest (BR+1) and three days after bed rest (BR+3). Plasma volume only was measured two days after bed rest (BR+2). Testing occurred at the same time of day for each test day.
Compression GarmentsBoth the control and treatment groups donned the custom-fitted GCG upon waking on BR+0. Control subjects removed the GCG following the completion of testing on BR+0, whereas treatment subjects wore this garment through bedtime. The GCG consisted of a combination of a custom-fitted thigh-high stocking with custom-fitted “biker-style” shorts that provide a continuous gradient compression from the foot to the abdomen. The GCG was constructed to produce a pressure of 55 mm Hg at theankle, decreasing linearly to approximately 35 mm Hg
at the knee and 18 mm Hg at the thigh. The pressure in the abdominal region was ~16 mm Hg. On days BR+1 and BR+2, subjects in the treatment group wore off-the-shelf thigh-high stockings all day. On BR+1, the thigh-high garment provided 30 to 40 mm Hg of compression at the ankle, decreasing in the compression level up the leg to 10 mm Hg at the top of the thigh. On BR+2, the thigh-high garment provided 10 to 20 mm Hg of compression at the ankle, decreasing up the leg to 5 mm Hg at the top of the thigh.
Subjects reported scores of garment comfort while wearing the garments on BR+0 through BR+2. Subjects scored the garment fit and comfort of the shorts and thigh stockings separately on a scale of 1 to 5, with 1 being “very comfortable” and 5 being “very uncomfortable.” A score of 3 was considered to be “neutral.”
ResultsAlthough plasma volume was reduced in both groups after bed rest, no subject experienced symptoms of presyncope on BR+0. Orthostatic intolerance is normally increased after bed rest, but the GCG effectively prevented this. In fact, the heart rate response to tilt was lower on BR+0 compared to BR-5, and the decrease in stroke volume normally seen with head-up tilt (or standing) was also smaller on BR+0 than on BR-5. Elevated heart rate and low stroke volume with tilt or standing are common observations after bed rest and spaceflight without effective countermeasures. When subjects were tested on BR+3, both groups had recovered plasma volume and responses to head-up tilt to similar levels. Wearing the lower-compression thigh-high garments did not appear to have affected recovery in the treatment group.
Both the control and the treatment subjects generally considered the GCG to be within comfort tolerance on BR+0. Comfort scores among the treatment subjects wearing the lower compression thigh-high garments on BR+1 and BR+2 were consistently scored as “1” (very comfortable) or “2” (comfortable).
ConclusionsThe three-piece, abdomen-high compression garments are comfortable to wear and effectively prevent the signs and symptoms of orthostatic intolerance that are normally seen after 14 days of HDBR, an accepted model of spaceflight. Additionally, wearing garments that decrease in levels of compression each day during recovery from bed rest does not prevent the restoration of plasma volume and cardiovascular responses to head-up tilt by BR+3. Wearing these garments during re-adaptation to Earth gravity potentially will benefit astronauts who participate in short-duration spaceflight (such as commercial space flyers) and those who participate as long-duration astronauts on exploration-class missions to the moon, near-Earth asteroids and Mars. Also, wearing the GCG may be beneficial in the treatment of patients who are hypotensive and/or regularly suffer from episodes of orthostatic intolerance.
produces cardiovascular effects similar to spaceflight. The objectives of the current investigations were a) to confirm the effectiveness of the GCG after 14 days of bed rest during a longer orthostatic stress (15 minutes of head-up tilt) than was employed in the study of shuttle astronauts, b) to determine whether compression garments in the days after bed rest prevented recovery of orthostatic tolerance and plasma volume, and c) to measure the comfort of wearing compression garments during recovery from bed rest. This investigation was performed by the Johnson Space Center Cardiovascular Laboratory within the Biomedical Research and Environmental Sciences Division of the Health and Human Performance Directorate. This work was a continuation of previous efforts to develop compression garments for astronauts after spaceflight, with the study initiation in May 2011, completion of data collection in February 2012 and final data analysis conducted and reporting to NASA completed in October 2012.
34

A Novel Noninvasive Technology to Estimate Peripheral Venous PressureAlan H. Feiveson, Johnson Space CenterSteven H. Platts, Johnson Space CenterDavid S. Martin, Wyle Science, Technology and EngineeringMichael B. Stenger, Wyle Science, Technology and Engineering
IntroductionGreater than 30 percent of American astronauts have developed permanent changes in visual acuity after long-duration spaceflight. While short-duration spaceflight is often characterized by vision disturbances, these are generally transient and do not have lasting impacts on the structure or function of the eye. These changes in vision may be related to spaceflight-induced cephalad fluid shifts, elevated intracranial and intraocular pressures and, perhaps, elevations in central venous pressure (CVP). Elevated CVP may inhibit drainage of cerebral spinal and lymphatic fluids from the skull and thus increase intracranial pressure.
Stuart M. C. Lee, Wyle Science, Technology and EngineeringTim Caine, Wyle Science, Technology and EngineeringSydney P. Stein, MEI TechnologiesTim Matz, MEI Technologies
Direct, invasive measures of CVP have been obtained in a small number of astronauts who were instrumented with an intravascular pressure transducer before and for up to two days of microgravity. No data currently exists beyond this point, and the little data available from postflight measurements are inconclusive. Direct measurements of CVP are not without risk due to the invasive nature of catheter insertion; therefore, an alternative is to estimate CVP from a noninvasive measure of peripheral venous pressure (PVP). A novel technique to estimate PVP has been developed using a pressure transducer in conjunction with ultrasound imaging of the desired vein. There has been strong correlation between PVP determined by this noninvasive measurement and invasive validation. Researchers also found agreement between PVP and CVP measurements in patients in intensive care and demonstrated potential clinical applications in other diseased populations.
with an in-line pressure transducer. This study was performed by the Johnson Space Center Cardiovascular Laboratory in the Biomedical Research and Environmental Sciences Division of the Health and Human Performance Directorate from June to December 2012.
MethodsTen volunteers participated in testing on four separate days. PVP measures were obtained in four veins: cephalic vein (forearm), greater saphenous vein (lower leg), internal jugular vein (neck) and the supratrochlear vein (forehead). For the greater saphenous and cephalic veins, PVP (noninvasive and invasive) was measured at baseline, followed by partial occlusion of venous flow with a blood pressure cuff located proximal to the measurement site and inflated to 30 and 60 mmHg. For the jugular and supratrochlear veins, PVP (noninvasive only) was measured while supine and at 10º and 20º head-down tilt. Following each change in condition, there was a stabilization period of two minutes, during which no measurements were taken.
Noninvasive PVP measures were obtained by two sonographers in a randomized but balanced order for each vein in each of the three conditions. Each sonographer obtained five PVP measurements for each vein under each condition while blinded to their own results and those obtained by the other sonographer. Distance from the scanning site to an anatomical landmark was kept constant for each vein across days to ensure data collection consistency.
The overall objective of this study was to determine the feasibility of obtaining a noninvasive measure of PVP using a novel device and a technique called compression sonography in four different veins as a potential alternative to invasively measuring CVP. This addresses a gap in noninvasive diagnostic imaging capability and techniques to diagnose conditions on the Space Medicine Exploration Medical Condition List. The veins examined were chosen based upon their accessibility for measurement in the laboratory and during spaceflight. Additionally, the validity of compression sonography was determined by comparing the noninvasive measures of PVP in two veins to invasive measures obtained from a venous catheter
Noninvasive Peripheral Venous PressureNoninvasive PVP measures were obtained using a custom-made device (VeinPress 2010, Switzerland, shown in Figure 1) consisting of a commercially available pressure transducer attached to a bladder filled with a mixture of water and glycerin. The bladder was attached to the head of a 12-5 megahertz (MHz) linear array probe on commercially available ultrasound equipment (GE Vivid Q, GE Healthcare, Milwaukee), as shown in Figure 2. The sonographer placed the bladder against the skin overlying the vein of interest and applied pressure until the vein was compressed to the point of closure, verified by ultrasound imaging. The pressure applied by the bladder on the skin that was necessary to compress the
35

vein was assumed to equal the pressure within the vein. The pressure in the bladder was displayed digitally to an operator. Figure 3 shows an ultrasound image of a vein uncompressed, partially compressed, and fully compressed.
Figure 1. VeinPress device by itself.
Figure 2. VeinPress device positioned as it was used on the head of the ultrasound probe.
Figure 3. An uncompressed vein is shown in the top image (a). The middle image (b) shows a partially compressed vein. The bottom image (c) displays a fully compressed vein.
Invasive Peripheral Venous PressureInvasive PVP measures in the cephalic and greater saphenous veins were obtained with a Draeger Infinity Delta XL (Draeger Medical Systems, Inc., Danvers, Mass.) for comparison to noninvasive measurements from a point just distal to the noninvasive PVP measurement site. Invasive PVP measures were taken immediately before and after noninvasive measures during baseline rest with the blood pressure cuff proximal to the imaging site, inflated to 30 and 60 mmHg.
Results/DiscussionPreliminary analyses have revealed four important findings. First, with the noninvasive PVP device, the sonographers were able to detect increases in PVP in all veins from the baseline condition with either venous occlusion or head-down tilt. Venous pressure in the greater saphenous and cephalic veins increased due to the partial occlusion of venous flow as the inflation of the blood pressure cuff located proximal to the measurement site increased. Noninvasive PV measurements increased in the jugular and supratrochlear veins as the head-down tilt angle increased. The jugular vein was more readily visualized, which led to more consistent PVP measurements in relation to subject tilt angle. Thus, the jugular vein may be a preferred location for noninvasive PVP measures pending future validations.
Second, while noninvasive PVP measures increase concomitantly with invasive measures in the greater saphenous and cephalic veins, the noninvasive and invasive measures were statistically different. Improvements in the device or application of an appropriate correction factor for noninvasive PVP obtained through statistically modeling might yield values that might more closely match invasive measurement.
36
Finally, it was observed that imaging through the bladder of the VeinPress causes some degradation of the ultrasound image that, especially for smaller veins, increases the difficulty of reliably judging when the vessel is fully compressed. Thus, the image degradation impacts the quality of the PVP measurements. The jugular vein was larger than the other veins imaged in this study and thus was less technically challenging. In contrast, the supratrochlear vein was the smallest vein imaged, and the variability in the PVP measures for this vessel was the highest.
Further analysis of the data, including the development of an objective measure of statistical outliers, will be necessary to determine the VeinPress’ ability to provide statistically useful results in small subject populations, such as those typical for spaceflight research.
ConclusionsWhile the prototype VeinPress device is potentially useful for the measurement of peripheral venous pressure, improvements in the design of the device, particularly in the bladder, might yield more accurate measurements by improving the ability to visualize when the vein has been compressed to the point of closure. This may be especially important in the study of smaller veins, for which clear images are more difficult to obtain. However, the ability to noninvasively detect changes in the jugular vein due to its larger size is promising. It is hoped that the determination of jugular venous pressure with the VeinPress on the International Space Station will provide valuable information into the cause of cerebral venous congestion, and the potential resulting increase of intracranial pressure as a contributor to the Visual Impairment and Intracranial Pressure syndrome.
Third, the noninvasive measurements obtained by different sonographers may be different from each other. Due to the subjective nature of determining when a vein is compressed, it may be preferable for a single sonographer to perform all measurements in a longitudinal study, but this may not be logistically feasible. Improvements in the device or the measurement technique should be addressed to decrease the inter-operator variability.
37

Improved Efficiency With a Suite of Custom Ultrasound Analysis ProgramsSteven H. Platts, Johnson Space CenterNatalia M. Arzeno, Wyle Science, Technology and EngineeringL. Christine Ribeiro, Wyle Science, Technology and Engineering Timothy L. Caine, Wyle Science, Technology and Engineering
BackgroundThe Johnson Space Center Cardiovascular Laboratory (CVL) in the Biomedical Research and Environmental Sciences Division of the Health and Human Performance Directorate routinely performs ultrasound studies to study the effects of spaceflight, spaceflight analogs (e.g., head-down bed rest) and countermeasures to deconditioning. Ultrasound images were previously analyzed using vendor-provided analysis packages, but these have not always been sufficient for the needs of the laboratory. Most recently, the CVL analyzed ultrasound data using ProSolv®CardioVascular (Fujifilm USA, Indianapolis). Though ProSolv® is customizable and can interact with Microsoft Access, the customization process can be complex and time consuming.
As the CVL expanded the complexity of ultrasound measures and began to use ultrasound in other applications beyond cardiac and vascular studies, theProSolv® software was no longer adequate. While other software packages were considered, it soon became clear that laboratory’s needs might be better met with in-house software development specialized to the CVL’s applications and sufficiently flexible to adapt to requirements of future work. To address the NASA’s Human Research Program goals, the CVL developed a customized suite of analysis programs using MATLAB® (MathWorks, Natick, Mass.), a commercially available programming package.The initial development of the custom ultrasound analysis programs began in 2011, with full implementation and refinement of the programs during 2012. Additional program customizations continued in 2013 as efficiencies were realized and innovations in the process were implemented. This suite of custom programs has allowed the CVL to analyze more types of ultrasound data, conduct analyses more efficiently and address a wider variety of Human Research Program risks and gaps. The customizability of the analysis programs promotes cost savings by resulting in decreased analysis times and allowing a variety of analyses that would require several commercial software packages to accomplish otherwise.
David S. Martin, Wyle Science, Technology and EngineeringMichael B. Stenger, Wyle Science, Technology and EngineeringStuart M. C. Lee, Wyle Science, Technology and Engineering
Custom AnalysisProgramsCalculation of Vessel DiameterThe deconditioning effects of spaceflight and an astronaut’s exposure to increased levels of oxidative stress have the potential to negatively affect vascular structure and function, which are precursors to the development of atherosclerosis. The CVL is currently studying this, and one of the prime measurements is arterial diameter. At the time this work began, the commercially available software only allowed point-to-point distances to be calculated, requiring the selection of one point on each vessel wall to calculate vessel diameter. Furthermore, the angle of the vessel had to be estimated such that the line connecting the two points would appear to be perpendicular to the vessel walls.The combination of the visual estimation of these points and the large number of possible places where this measurement could be made introduces a high degree of variability. The custom program (Figure 1) reduces the variability of the measurements by automatically correcting the angle of the vessel on the image, such that distances are always measured perpendicular to the anterior wall, and averaging the distances between the manually traced vessel walls at each pixel. Thus, the resulting vessel diameter calculation is an average of over 100 points and can better capture global changes in the imaged vessel’s diameter.
This work has directly impacted ongoing research directed towards an improved understanding of spaceflight induced adaptations and countermeasures to maintain cardiovascular and musculoskeletal health.
38

Figure 1. Custom program for vessel diameter measurement. The line in the middle of the vessel was automatically added to the image after first analysis to specify the region of the vessel to be measured for subsequent analyses.
Measurement of Muscle Cross-Sectional AreaSpaceflight-induced loss of muscle mass and volume is a common observation after spaceflight, but until recently there was no imaging capability on-orbit that could be used to monitor changes during a mission. Ultrasound is currently being used for this purpose, and bed rest studies are underway to validate these measures against magnetic resonance imaging (MRI). Like with MRI, muscle volume can be computed from a series of muscle cross-sectional area (CSA) measures obtained from ultrasound images at regular intervals along the length of the muscle. The calculation of muscle CSA at each interval is based on the manual tracing of the muscle performed by the investigator.
Although commercial software was available to make these muscle CSA measurements, the tracing of the muscle had to be completed in one attempt and could not be altered, since the commercial ultrasound analysis software miscalculated the CSA if any of the points in the tracing were moved. Thus, if the tracing was not performed perfectly on the first attempt, the tracing process had to be restarted, resulting in an increase in analysis time. The custom program (Figure 2) allows for rearrangement of the traced points along the border of the muscle until the user directs the program to calculate the CSA.
Figure 2. Custom program for muscle volume calculation. Points have been selected to specify the border of the muscle to be measured. The progress graphs below the image track the measurements that have been completed.
Echocardiogram and Stroke Volume AnalysisCardiac structure and function after spaceflight and spaceflight analogs are among the most common measurements obtained by the CVL and other laboratories. The CVL initially developed customized MATLAB programs to perform specialized calculations that were more robust than the commercially available software. However, the increased efficiency attained by using the custom programs in completing these analyses led the CVL to develop similar programs for routine data analysis that was previously completed using commercial software. The custom programs for echocardiogram and stroke volume analysis allow for a variety of calculations based on distances, slopes or areas, where the type of calculation is automatically detected from the name of the measured variable.
A particularly attractive feature of these custom programs is the ability to designate which variables should be calculated. There is a large amount of data that can be generated from cardiac imaging, but not all variables, are of interest in each of the studies conducted by the CVL. Thus, the echocardiogram analysis program allows the user to select whether a comprehensive list of measurements should be available on the user interface or just the subset that is typically measured in all protocols. This customization of measurements per protocol increases efficiency of data analysis since the analyzer does not need to memorize the required measurements for each study.
39

Increases in Efficiency and AccuracyAnalysis of ultrasound data requires that a sonographer or other expert trace an outline (e.g., cardiac and muscle) or place points on the image (e.g., heart rate, vessel diameter). To control for any potential biases that the exact point placement might produce, each ultrasound measurement is performed independently by at least two trained experts and their results compared. To ensure cohesion between the multiple analyses, descriptors such as image name, quality and measurement location identification used to be manually entered in separate documents. In addition to providing the means to perform specialized analyses, the analysis programs developed by the CVL personnel have consolidated all of the information that used to be stored in several files into one Excel file per test, where the descriptors are automatically added from within the user interface.
Time and cost savings are mainly achieved by 1) the aforementioned inclusion of all necessary information into one file that communicates with the custom program, and 2) automatic file selection and measurement location identification for the second and third analyses. Once the first analysis is completed, new images are created with a particular file name such that those performing second and third analysis do not need to spend time linking an image with a particular measurement. Instead, when the new image is loaded, it automatically detects and specifies the measurement that should be performed. These new images also indicate what area of the image should be analyzed (e.g., if an image contains multiple beats, it will specify which beat should be used for analysis), where this indication is automatically added based on the measurement performed by the first expert, and an element of randomness in the exact indicator location preserves the integrity of subsequent measurements.
Future DirectionsThe CVL will continue to develop customized analysis packages to study and better understand the physiological adaptations to spaceflight and to aid in the development of targeted countermeasures. For example, to better understand muscle contraction during and after spaceflight, the CVL has been developing a program that implements image and video processing algorithms to track specific points on the muscle border during a contraction. The CVL also intends to develop programs to track the curvature of the eye while studying spaceflight-induced vision changes and to calculate such parameters as the pulsatility index in the investigation of adaptations in the vascular system. Development of programs such as tracking the muscle contraction or measuring changes in eye curvature exploit the computational capabilities of MATLAB, since implementation of such mathematically complex measurements would otherwise require the purchase of specialized software that could require further customization.
SummaryThe CVL has developed a suite of custom programs for ultrasound analysis that have allowed an increase in the number of measures that can be made and augmented the types of investigations that can be conducted. These custom programs improve efficiency and accuracy during analysis, resulting in significant time and cost savings. As testing protocols evolve, the development of custom programs will allow the CVL to continue exploring variables of interest without the limitations that can be encountered when using only commercial software. The innovations implemented through the use of these custom analysis programs has directly impacted health and human research supporting the International Space Station and will assist in preparations for future space exploration missions.
40

Novel Assessment of Dynamic Muscle Function Using UltrasoundNatalia Arzeno, Wyle Science, Technology and EngineeringDavid Martin, Wyle Science, Technology and EngineeringTim Caine, Wyle Science, Technology and Engineering
The last 40 years of space research have clearly shownthat lower limb skeletal muscle is particularly susceptibleto microgravity-induced deterioration. To ensure that essential operational tasks can be successfully completed during long-duration missions to Mars or near- Earth objects, it is vitally important to monitor the health status of the musculoskeletal system. Researchers from the Human Adaptation and Countermeasures Division within the Human Health and Performance (HHP) Directorate at the Johnson Space Center have developed an ultrasound protocol to assess muscle cross-sectional area (CSA) in flight. This protocol provides important information regarding changes in muscle size; however, does not assess muscle contractile performance. Understanding disuse-induced loss of muscle contractile function is crucial to minimizing the risks of impaired performance due to reduced muscle strength and endurance in astronauts who embark on exploration missions beyond low-Earth orbit.
Continuous measurement of muscle contractile performance has traditionally been achieved using animal preparations in which the muscle tissue is exposed. More modern methods, e.g., sonomicroscopy, where a piezoelectric ultrasound transmitter and receiver are surgically implanted into both ends of a muscle, are still invasive. Recent research has demonstrated that ultrasound can measure continuous changes in human muscle contractile function. Tracking cardiac tissue motion with post-processing software has become a well established technique to assess indices of cardiac performance, such as left ventricular strain and torsion. However, tracking skeletal muscle is a relatively new technique that requires users to manually identify of points of interest frame-by-frame – an exceptionally time-consuming process. The goal for this investigation was to advance current ultrasound capabilities to: 1) evaluate the feasibility of acquiring ultrasound images of contracting skeletal muscle; and 2) develop a Matlab program that automatically tracks and quantifies contracting skeletal muscle.
Figure 1. Acquisition of dynamic muscle movement with ultrasound.
Kyle Hackney, Wyle Science, Technology and EngineeringLori Ploutz-Snyder, Universities Space Research AssociationJessica Scott, Universities Space Research Association
MethodsIn June 2012, researchers from HHP received a NASA Innovation Award to pilot ultrasound acquisition of dynamic skeletal muscle and develop a custom Matlab program to track contracting skeletal muscle.
Acquisition of Dynamic Muscle with Ultrasound Five subjects were positioned in a Biodex dynamometer (Biodex Medical Systems, Shirley, N.Y.) (Figure 1). To standardize image acquisition within and across subjects, a scout ultrasound scan was conducted to determine the mid belly of each muscle. At this position, a customized template developed and validated by our laboratory secured the probe in place to acquire ultrasound images during muscular contractions. Participants performed six contractions on the right leg: maximal isometric contraction; isotonic contraction at 60 percent of maximal contraction; passive contraction at 90 and 150 °/second; isokinetic contraction at 90 and 150 °/second. At each test velocity, a series of warm-up contractions at about 50 percent effort were performed to familiarize the subjects to the test velocity and movement. A two-minute rest period occurred between each test velocity. Ultrasound images were obtained with a commercially available system (Philips iE33; Philips Medical Systems, Bothell, Wash.) with a 17.5 megahertz (MHz) sector transducer. An ultrasound movie file containing a sequence of image frames was recorded and saved digitally for subsequent offline analysis (Matlab, The MathWorks Inc., Natick, Mass.).
41

Tracking Algorithms in Matlab ProgramUltrasound images of tissue consist of a set of intensity forming “speckles” that create patterns. If the ultrasound probe remains in the same position during a movement, the changes in the speckle patterns represent movements in the tissue. These movements can be directly and actively followed using speckle-tracking algorithms. Movements of the tissue over the course of an image sequence can then be quantified by monitoring changes in the position of the speckles. Five muscle-tracking algorithms were tested, with each algorithm outputting muscle strain throughout contractions.
Analysis of Ultrasound Images with Matlab ProgramOn a typical ultrasound image (Figure 2), the CSA of the muscle (rectus femoris) appears in the center of the image. Visual inspection confirmed that relative motion between the edges can be used to estimate the changes in length and thickness of the muscle. The muscle tracking algorithms automatically tracked the change in position of each marker (points in Figure 2) from the initial frame to subsequent frames for the duration of the contraction.
ResultsFive subjects performed various passive and active contractions while ultrasound images of the rectus femoris were obtained. The investigation demonstrated that acquisition of contracting muscle is obtainable using a high-frequency ultrasound probe and that the contracting muscle can be tracked with various algorithms using a custom Matlab program. This work was completed in September 2012. Further investigations are needed to determine the most valid algorithm for tracking muscle, to assess the reliability of the muscle-tracking technique and to ascertain the association between torque and skeletal muscle strain.
SummaryGiven that future missions will be of considerably longer duration than the current six-month stays on the International Space Station, information characterizing skeletal muscle contraction is of fundamental importance for sustaining human presence in space and extending the exploration of our solar system. Speckle-tracking, a new non-invasive ultrasound imaging technique, could allow for an objective and quantitative evaluation of global and regional muscle function. Greater understanding of muscle atrophy acquired through a combination of the use of speckle tracking and a customized analysis program could provide knowledge that would enhance a crew’s ability to effectively, reliably and safely complete long-duration mission tasks.
An additional, potential ground-based benefit of this technique is its application to the understanding of muscle dysfunction in numerous populations. Muscle wasting and decreases in muscle strength and function significantly impact millions of Americans. After age 50, the muscle mass declines by one to two percent annually, and muscle strength decreases by about 1.5 percent. This age-related muscle loss, termed sarcopenia, affects approximately 10 percent of elderly individuals ages 60 to 70 years. After the age of 80, up to 50 percent of people can be affected. Muscle wasting is not only a problem in the elderly, but also a consequence of chronic diseases such as cancer, heart failure and chronic obstructive pulmonary disease. In the United States alone, there are approximately 12 million cancer patients, 5.7 million heart failure patients and 15 million chronic obstructive pulmonary disease patients. The assessment of muscle contractile performance with ultrasound could therefore aid in the diagnosis and management of individuals with muscle-related disorders.
Figure 2. Typical ultrasound image of muscle CSA.
ResultsFive subjects performed various passive and active contractions while ultrasound images of the rectus femoris were obtained. We demonstrated that acquisition of contracting muscle is obtainable using a high-frequency ultrasound probe, and that the contracting muscle can be tracked with various algorithms using a custom Matlab program. This work was completed in September 2012. Further investigations are needed to determine the most
valid algorithm for tracking muscle, to assess the reliability of the muscle-tracking technique and to ascertain the association between torque and skeletal muscle strain.
42
Improving Human Research and Astronaut Care with NASA Life Sciences DataKen Jenks, Johnson Space CenterKathy Johnson-Throop, Johnson Space CenterBinaifer Kadwa, Johnson Space CenterMary Van Baalen, Johnson Space CenterStacie Ray, Lockheed MartinDiedre Thomas, Lockheed MartinJacque Havelka, Lockheed MartinSara Mason, MEI Technologies
Adriana Babiak-Vazquez, Wyle Science, Technology & Engineering Group Jacqueline Charvat, Wyle Science, Technology & Engineering Group Lesley Lee, Wyle Science, Technology & Engineering Group Mary Wear, Wyle Science, Technology & Engineering Group
IntroductionSince the beginning of the US space program, the human element has been critical to the successful completion of NASA mission objectives. Human exploration of space has enabled the accomplishment of certain mission objectives not possible with robotic missions, and with the accumulation of U.S. spaceflight experience, many aspects of the effects of spaceflight on humans have been determined. However, with exploration class and one-year missions on the horizon, there is a continuing need to better understand both immediate and long-term risks to astronauts.
The Human Health and Performance Directorate (HH&P) at Johnson Space Center (JSC) has been charged with optimizing astronaut crew health and performance, and mitigating spaceflight risks through countermeasures, habitability, environmental factors research, medical operations and directorate support functions that enable mission success. The HH&P houses over 50 years of records, archives, and databases of NASA’s human spaceflight experience. Until very recently only a subset of this data was available so HH&P implemented a data sharing policy for release of NASA protected health and research information. This policy allows researchers internal and external to NASA to use archived data for new analyses and ensures “the integrity and protection of these data while also clarifying the process for those who request data access to further understand and mitigate the risks of human spaceflight on behalf of NASA and/or the benefit of the U.S. population.” Two groups within HH&P, the Lifetime Surveillance of Astronaut Health (LSAH) program, and the Life Sciences Data Archive (LSDA), are working together to implement processes outlined in the HH&P Data Sharing Policy and have made great strides in sharing astronaut data with the spaceflight operational, clinical, and research communities in fiscal year (FY) 12/FY13. Background Medical and research life sciences data at JSC are housed in two separate systems: LSAH and LSDA. The LSAH data system holds all ground and flight medical data for astronauts, vehicle environmental data and data from non-
flight assignable retirees who return to JSC annually for occupational health surveillance monitoring. Data in this system is managed according to NASA’s Health Information Management System Federal System of Records. The LSDA holds all research data collected as part of NASA-funded life sciences investigations. The LSDA holdings include data collected on astronauts, control and ground analog subjects and plants and animals. LSDA is managed according to NASA’s Human Experimental and Research Data Records Federal System of Records. The data held in both systems are subject to the Privacy Act of 1974, as Amended (5 United States Code (USC), Part 552a), and the agency also voluntarily adheres to the guidelines of the Health Insurance Portability and Accountability Act of 1996 (45 CFR Part 160 and Part 164, Subparts A and E).
Management of LSAH and LSDA data holdings prior to 2010 was predominantly separate, with little or no crossover of goals, objectives or strategy. To assure the integrity and protection of personally identifiable information while improving accessibility to both the medical and research communities, a joint management structure of this ‘evidence base’ was established. This integration is intended to ensure that the widest scope of relevant data is being applied to the understanding of space physiology and development of countermeasures and other mitigation strategies. Data from both LSAH and LSDA systems are now accessible by a single, integrated, web-based request process. Incoming data requests are then facilitated by a joint LSAH and LSDA team called the evidence base working group (EBWG). The EBWG’s data handling and release policies are managed by the LSAH advisory board (LSAH AB). The LSAH AB is a cross-cutting board chaired by the Chief of Space and Clinical Operations Division with permanent membership held by those who are knowledgeable of HH&P operations and policies. The Board’s responsibilities include establishing policies and allocating resources pertaining to data handling and release, and to disposition requests for uses of data that can be attributed to an individual human subject.
Collaborations and PartnershipsThe JSC Flight Medicine Clinic, where active astronauts
43

receive medical care from selection to training to spaceflight and after spaceflight, is the source for much of the data in LSAH. In turn, the LSAH database is queried at the request of flight surgeons and clinic physicians to provide information to support clinical care of the astronaut patients.
The Human Space Flight Operations Branch may require directed analyses using astronaut or other test subject data in LSAH and LSDA to address specific NASA programmatic or decision support needs. These types of data analyses may provide indirect benefit to current or future astronauts, particularly if the analyses result in risk mitigation activities.
The Astronaut Occupational Health Program (AOHP) is a comprehensive occupational health strategy for NASA’s human spaceflight population. Occupational surveillance, as directed by AOHP, is largely carried out by LSAH personnel, and external subject matter experts are involved as needed.
EBWG personnel work closely with NASA’s institutional review board (IRB) to assure research is conducted in an ethical and safe manner. Although the necessary dataset may be created while a researcher is waiting for IRB approval, the data is not released until the EBWG ensures the research has been approved and proper consent has been obtained. Much of the data archived in the LSDA is research funded by the Human Research Program (HRP). HRP researchers are interested in existing data available through LSAH and LSDA to enhance their efforts. As such, the EBWG is working with HRP during its evaluation and funding process for future research to better anticipate requests coming from HRP researchers. Within HRP, the International Space Station Medical Project (ISSMP) is responsible for the integration of all flight research activities aboard the International Space Station (ISS). The ISSMP and LSDA partner to ensure the data are delivered to the principle investigator and after analysis, archived in the LSDA. The EBWG is also working closely with ISSMP to better integrate informed consent processes to minimize the time needed by the astronauts to be properly informed of research protocols and goals and to provide their consent. The Human Performance Data Project (HPDP) is a new collaboration between the established life sciences data repositories, the Space Human Factors Engineering, and the Behavioral Health and Performance research disciplines. The HPDP will collect and archive performance metrics associated with human activities during spaceflight operations and make this data available to operations personnel and research communities. The HRP and HH&P are interested in integrating this new project into the existing infrastructure of human data archives. The EBWG data handling process will guide the development of this project,
leveraging the established capabilities of LSAH/LSDA to provide a common access point for relevant human data. Fulfilling Data NeedsSince 2009, both archives have worked with HRP to conduct yearly surveys to gain insight into what data researchers need and how data is used so the needs of the research and operational communities can be better addressed. The survey results have generated several new processes to address data accessibility, including an improved data fulfillment process (shown in Figure 1). The data request process begins with a new and efficient automated web portal, resulting in immediate notification that the request was received by the EBWG. The brown boxes indicate regular communications with the requester to discuss data request specifics, inform the requester on request progress, and any actions required by the requester, such as establishing scientific merit or obtaining IRB approval. In addition to checking on the availability of data, EBWG regularly works with investigators to understand study objectives. This helps the EBWG team best fulfill requests for data to ensure research goals are met to the greatest extent possible.
Figure 1. Data request fulfillment.
The access point for all data is through the public website at lsda.jsc.nasa.gov. Information for current and completed research, a listing of the medical requirements, and a data request page for datasets not available on the website can be accessed here. Please visit the website for more information.
Requests for human data that are publicly available, grouped, or completely de-identified can be more easily shared, but due to the small numbers of the astronaut population, the majority of requests would produce data that are easy to attribute to specific individuals. Releasing this data would require obtaining informed consent from the individuals per IRB guidelines, which can be a lengthy and resource-intensive process when completed on a case-by-case basis. To streamline this task, the LSAH and LSDA
44

Repositories were established. Astronaut participation in either of the repositories is voluntary and requires informed consent. Astronauts can choose which of their data stored in the repositories may be made available for release to current and future research studies. The use of these data repositories will further improve dissemination of and access to NASA life sciences data and information.
Another improvement recently implemented is the use of a Data Use Agreement (DUA) document with all releases of attributable data. The DUA formalizes the expectations of HH&P and the requester regarding how the data will be used and/or published, who will have access to any parts of the data, how the requester will protect the data, and how data will be destroyed once analysis has been completed. The DUA is an important tool used to reinforce the data protection policies of NASA. These new tools are expected to improve efficiency of access to NASA’s life sciences data while providing sufficient protection of sensitive personal information.
Examples of Successful Use of Life Sciences Data When efforts to improve data accessibility were initiated in 2009, approximately 50 data requests were fulfilled during that fiscal year. In FY11 and FY12, LSAH and LSDA responded to nearly 150 requests for data and information each year. The number of requests for data is expected to increase in the future and with these established teams and processes, NASA is well poised to meet this demand. 190 total requests were processed in the first half of FY13 alone which demonstrates the growing success of the effort as described here.
A few examples of recent publications resulting from access to LSAH/LSDA data are listed below: Risk of Spaceflight-Induced Intracranial Hypertension and Vision Alterations http://humanresearchroadmap.nasa.gov/evidence/reports/VIIP.pdf Are Medications Involved in Vision and Intracranial Pressure Changes Seen in Spaceflight?http://hrpiws2013.com/abstractPDF/HRPWOtringVIIPabs.pdf Evaluation of Crew Exposure to Mild Hypobaric Hypoxia in a Microgravity Environmenthttp://hrpiws2013.com/abstractPDF/HRP_Abstract_Exploration_Atmospheres_Final.pdf Longitudinal Study of Relationship of Exposure to Space Radiation and Risk of Lens Opacityhttp://www.rrjournal.org/doi/abs/10.1667/RR2876.1
Optimizing Medical Resources for Spaceflight Using the Integrated Medical Modelh t t p : / / i n g e n t a c o n n e c t . c o m / c o n t e n t / a s m a /asem/2011/00000082/00000009/art00006
Risk of Herniated Nucleus Pulposus Among U.S. Astronautsh t t p : / / i n g e n t a c o n n e c t . c o m / c o n t e n t / a s m a /asem/2010/00000081/00000006/art00006
45

Improving Balance Function Following Long-Duration Spaceflight by Enhancing Signal Information from the Inner EarMillard Reschke, Johnson Space CenterScott Wood, Johnson Space CenterJacob Bloomberg, Johnson Space CenterAjitkumar Mulavara, Universities Space Research AssociationMatthew Fiedler, Wyle Science, Technology and Engineering
Igor Kofman, Wyle Science, Technology and EngineeringYiri E. De Dios, Wyle Science, Technology and EngineeringChris Miller, Wyle Science, Technology and EngineeringRachel Brady, Wyle Science, Technology and EngineeringBrian Peters, Wyle Science, Technology and EngineeringRaquel Galvan, Massachusetts Institute of TechnologyHelen Cohen, Baylor College of Medicine
Crew members returning from long-duration spaceflight face significant challenges due to the microgravity- induced inappropriate adaptations in sensorimotor function (e.g., balance control, mobility). Crew members adapted to the microgravity state may need to egress the vehicle within a few minutes for safety and operational reasons after g-transitions. During exploration-class missions, the interactions between a debilitated crew member during re-adaptation to gravity and the prevailing environmental conditions imposed during gravitational transitions may lead to further disruptions in the ability to perform functional egress tasks. At present, no operational countermeasure has been implemented to mitigate this risk.
The Neuroscience Laboratory at Johnson Space Center in the Biomedical Research and Environmental Sciences Division of the Human Health and Performance Directorate is developing a method based on stochastic resonance to enhance the brain’s ability to detect signals from the balance organs, especially when combined with balance-training exercises for rapid improvement in functional skill for standing and mobility. This method involves a stimulus delivery system that is wearable/portable, providing electrical stimulation imperceptible to the balance organs of the human body. Such a countermeasure based on stochastic resonance (SR) will thus enhance sensorimotor capabilities with the aim of facilitating rapid adaptation during gravitational transitions following long-duration spaceflight.
SR is a mechanism whereby noise can assist and improve the response of neural systems by enhancing information transfer by the detection of relevant sensory signals. This project specifically used low, imperceptible levels of white-noise-based binaural bipolar electrical stimulation of the vestibular system (stochastic vestibular stimulation, or SVS) as the proposed countermeasure to improve postflight balance and locomotor disturbances. The project has conducted a series of studies to document the efficacy of SVS stimulation on physiological and perceptual responses during performance of balance/locomotion tasks on unstable surfaces and motion-tracking tasks during
intra-vestibular system conflicts. In an initial study (Fiscal Year 2009/Fiscal Year 2010), the SVS was evaluated to determine if this stimulus improved overall balance performance while standing on an unstable surface. Results from these studies showed that SVS improved overall balance performance. The amplitude of optimal stimulus for improving balance performance was predominantly in the range of 30-210 microamperes (μA) root mean square (RMS). These results indicate that SVS may be sufficient to provide a comprehensive countermeasure approach for improving postural stability.
In a second study (Fiscal Year 2012/Fiscal Year 2013), SVS was evaluated during locomotion on a treadmill mounted on an oscillating platform. Results from these studies showed that SVS improved locomotor performance consistent with the SR phenomenon in normal, healthy subjects in the stimulus amplitude range of 30-210 µA RMS. These results indicate that SVS may also be used to maximize locomotor performance during walking in unstable environments.
In a third study (Fiscal Year 2012/Fiscal Year 2013), SVS was evaluated during an otolith-canal conflict scenario in a variable radius centrifuge at low frequency of oscillation (0.1 hertz) on both eye movements and perceptual responses (using a joystick) to track-imposed oscillations. The variable radius centrifuge provides a selective tilting sensation that is detectable only by the otolith organs, providing conflicting information from the canal organs of the vestibular system (intra-vestibular conflict). Results show that SVS significantly reduced the timing difference between both the eye movement responses, as well as the perceptual tracking responses with respect to the imposed tilt sensations. These results indicate that SVS can improve performance in sensory conflict scenarios as experienced during spaceflight.
The transition from one sensorimotor-adapted state to another consists of two main mechanisms: strategic and adaptive. Strategic modification represents immediate and transitory modifications in control that are employed to deal with short-term changes in the prevailing environment.
46

If these changes are prolonged, then plastic adaptive changes are evoked that modify central nervous system function to automate new behavioral responses. Previous studies from the laboratory that assessed the effects of long-duration spaceflight on mobility showed that astronauts’ overall recovery after long-duration spaceflight is composed of both strategic and adaptive motor-learning processes. The adaptive process took on an average 15 days post landing to recover to preflight levels of performance. More importantly, this longer-term adaptive recovery mechanism was significantly associated with their strategic ability to recover on each day of testing. The techniques for improving signal detection using SVS may thus provide additional information to improve such strategic abilities and help in significantly reducing the number of days required to recover functional performance to preflight levels after long-duration space flight. This countermeasure may also be fielded as a training modality to enhance adaptability, or skill acquisition, during rehabilitation, or as a miniature patch-type stimulator that may be worn by people with disabilities due to aging or disease, improving posture and locomotion function. Such populations may include older adults; patients with diabetic neuropathy, stroke or Parkinson’s disease; or injured war fighters treated in military-support hospitals to return to their pre-injury assignments or similar positions quickly while still facilitating maximum rehabilitative potential. The data obtained in this project will aid in the design of a countermeasure system used for improving functional tasks during and after g-transitions. Future work on this technology could be to make available an operational version of this countermeasure, such as a skin patch vestibular prosthesis, that will further act synergistically with the pre- and in-flight adaptability training on the International Space Station, as well as postflight. This will provide an integrated, multi-disciplinary countermeasure capable of fulfilling multiple requirements, making it a comprehensive and cost-effective countermeasure approach.
47

Human Exploration Systems, Technologies for Extravehicular Activity and Harsh Environments
48

Spacesuit Evaporator-Absorber-Radiator (SEAR) Grant C. Bue, Johnson Space CenterMike Izenson, Creare Inc.
SummaryA system for non-venting thermal control for spacesuits was built by integrating two previously developed technologies, namely NASA’s Spacesuit Water Membrane Evaporator (SWME), and Creare’s flexible version of the Lithium Chloride Absorber Radiator (LCAR). A subscale Space Evaporator-Absorber-Radiator (SEAR) system was tested in relevant thermal vacuum conditions. These tests showed that a full-scale, 1 m2 radiator having about three times as much absorption media as in the test article would be sufficient to support a 7-hour spacewalk. The tests also pointed the way to improvements in the internal flow arrangement of the flexible LCAR for more efficient venting of Non-Condensable Gas (NCG). A different LCAR packaging arrangement was conceived that would provide a multifunctional structure for the Portable Life Support System (PLSS) housing of a spacesuit. The multifunctional LCAR would be made from a high-strength carbon fiber composite honeycomb, the cells of which would be filled with the chemical absorption media. This new packaging reduces the mass and volume impact of the SEAR on the PLSS compared to the flexible design. A 0.2 m2 panel with flight-like honeycomb geometry is being constructed and will be tested in thermal and thermal vacuum conditions. Design analyses forecast improved system performance and NCG control. A flight-like regeneration system is also being built and tested. Design analyses for the structurally integrated prototype as well as the earlier test data show that SEAR is not only practical for spacesuits, it also has useful applications in spacecraft thermal control.
Weibo Chen, Creare Inc.Ed Hodgson, UTAS
Since America’s first spacewalks, extravehicular activity (EVA) thermal control has challenged spacesuit system developers. The heavily insulated suits required to protect spacewalking astronauts from the extreme thermal environments of outer space and the surrounding vacuum severely limit opportunities to reject the waste heat generated by hardworking astronauts and by the equipment that keeps them productive and alive. Limited power availability to support heat transport in practical spacesuit systems and human thermoregulatory responses that demand lower skin temperatures as heat loads increase compound the challenge. Despite continuing research and development efforts, no satisfactory alternative to the thermal control approaches applied in the Apollo program spacesuits has been developed for autonomous EVA life support during the past half century. State-of-the-art spacesuits still rely on heat collection and transport using a liquid cooling garment and heat rejection by vaporizing water into the surrounding space vacuum.
The SEAR ConceptNASA’s recent development of the Spacesuit Water Membrane Evaporator (SWME, Figure 1), and a desiccant absorption heat-pump radiator, the Lithium Chloride Absorber Radiator (LCAR, Figure 1) developed by Creare, Inc., are combined to achieve robust, non-venting, EVA heat rejection that eliminates water loss due to EVA thermal control over a wide range of operating conditions. This effort was led by the Crew and Thermal Systems Division of the Engineering Directorate.
Figure 1. (Top) Spacesuit Water Membrane Evaporator (SWME). (Bottom) Lithium Chloride Absorber Radiator (LCAR).
The current embodiment of the absorption heat pump radiator, uses a flexible panel design. While enabling conformal mounting of the system on the Portable Life Support System (PLSS) housing, this approach also adds bulk and complicates suit operations. Furthermore, the flexible design called for a network of
49

Because the desiccant absorbs water during the course of an EVA mission, the modules must be regenerated prior to the next mission by heating to moderate temperatures (120°C (248°F)) to dry out the desiccant and recover the water. This can be easily achieved in space by embedding electrical heaters in the LCAR or by passing heated air from a simple regeneration system through the absorber modules.
A similar absorber module could be coupled to an external radiator through a heat exchanger would be useful in providing a non-venting topping function for orbiting spacecraft during low lunar orbit where both heat rejection requirements and 290 K peak sink temperature are relatively high. Regeneration could be conducted during colder parts of the orbit where there is more available cooling for a condensing heat exchanger.
LCARThe Lithium Chloride Absorber Radiator (LCAR) contains a powerful lithium chloride (LiCl) desiccant that enables the Spacesuit Water Membrane Evaporator (SWME) to generate cooling without venting water from the PLSS. The desiccant can effectively absorb water vapor produced by the SWME while operating at a temperature more than 30°C higher than the SWME. High temperatures result from heat released by the absorbed water vapor and enable heat rejection by radiation at a heat flux on the order of 50% greater than possible at normal suit temperatures. Since the heat of absorption is no more than 20% greater than the heat removed from the SWME by the vapor, there is a significant net gain in heat rejection capacity that enables the system to use a relatively small radiator. Under normal operating conditions, the LCAR cools the spacesuit without venting water. However, if the heat load is unusually high and/or the heat sink is unusually hot, then radiation alone may not be able to reject enough heat to absorb all the water vapor generated by the SWME. In this case, the system can be designed to vent the excess steam to space. A LCAR that operates this way will lose a small amount of water during periods when it is overloaded, but will be much smaller than a LCAR designed to absorb all water vapor under all conceivable heat loads and environmental conditions.
Since LCAR operation does not require flow of the liquid solution, the LCAR is designed to ensure that the solution remains captured by the porous hydrophilic sponge elements during both heat rejection and regeneration modes of operation. These porous elements are designed with enough void volume to hold all the LiCl-water solution at the end of normal operating process. The need to keep the LiCl solution inside the LCAR places constraints on the regeneration process.
Integrated Thermal Vacuum PerformanceThe SEAR flexible prototype hardware was tested in thermal vacuum conditions in Chamber N at JSC in May 2012 for a nominal EVA environment. Figure 3 shows the SWME power, LCAR radiator power, and water accumulation as a function of time. Three independent measures of water accumulation, namely SWME evaporation, load cell, and water from apparent radiation, track well with each other until the Exit Valve is closed. The SWME power shows that greater than 120 Watts (W) were rejected during the absorption run. These results suggest that a full-scale, 1 m2 radiator having about three times as much absorption media as in the test article would be sufficient to support a 7-hour spacewalk.
axial and transverse channels to distribute the water vapor to the cylindrical stacks of desiccant storage media. This led to performance inefficiencies and intermittent buildup of non-condensable gas (NCG) in communicating channels that hindered absorption. Both storage bulkiness and NCG build-up problems could be elegantly solved by replacing the PLSS housing with a carbon fiber composite honeycomb, with the honeycomb cells packed with the stacks of desiccant sponges and grafoil interleaves (see Figure 2). The entire stack would have a depth of approximately 12 mm, and include the storage stack honeycomb of approximately 8 mm in depth, internal vapor manifolds to distribute vapor and to vent NCG, and an external radiator face sheet. In this way, the housing multi-functionally provides the necessary protective structure, desiccant storage capacity, and radiator surface to reject the heat. The 8-mm depth of storage media suggests more efficient absorption resulting in a potential radiator temperature of 330 Kelvin (K).
Figure 2. Modified radiator with PLSS housing replaced with a carbon fiber composite honeycomb.
50

Testing of the SEAR prototype has identified that the storage bulkiness, condensation, and NCG build-up observed with the flexible panel LCAR would be solved by replacing the PLSS housing with a carbon fiber fcomposite honeycomb, with the honeycomb cells packed with the stacks of desiccant sponges and grafoil interleaves. A machined carbon composite plate is currently being fabricated to simulate the honeycomb structure, to be assembled in August 2013. The 11.4-mm (0.45-in.)- thick plate with overall dimensions of 30.5 x 50 cm (12.0 x 19.5 in.) will be machined with a 14 x 11 array of 1-inch cylindrical holes, each of which can accommodate four absorber sponges. Each face of the plate will also be machined with an array of passages for water vapor (inward-facing side) and non-condensable gas (radiatingside). This design enables the panel to be tested in eithera continuous capillary venting or intermittent venting model. A thin sheet of conductive graphite will be bondedover each face to seal the internal volume and to spreadheat over the radiating surface.
The system can be implemented within expected PLSS volume constraints, adds very little to the PLSS power requirement (less than 1 W average for added sensors and control valve actuation), and imposes modest on-back mass penalties, but results in dramatic consumablemass savings for long duration missions requiring multiple EVA’s. Testing of the flat-panel coupon will be completed in September 2013. More efficient flight-like designs are planned for the coming year. The goal is to test a full-scale system in an test on ISS and ultimately be implemented through the Advanced Exploration Systems (AES) program into the Advanced EVA Mobility Unit (EMU) project.
Figure 3. SWME power, LCAR radiator power, and water accumulation as a function of time.
51

Reduced Volume Prototype Spacesuit Water Membrane EvaporatorJanice V. Makinen, Johnson Space Center Grant C. Bue, Johnson Space Center
Development of the Advanced Extravehicular Mobility Unit (AEMU) portable life support subsystem (PLSS) is currently under way at NASA Johnson Space Center. The AEMU PLSS features a new evaporative cooling system, the reduced volume prototype (RVP) spacesuit water membrane evaporator (SWME). The RVP SWME is the third generation of hollow fiber SWME hardware. The SWME offers several advantages when compared with prior crewmember cooling technologies, including the ability to reject heat at increased atmospheric pressures, reduced loop infrastructure, and higher tolerance to fouling. Like its predecessors, RVP SWME provides nominal crew member and electronics cooling by flowing water through porous hollow fibers. Water vapor escapes through the hollow fiber pores, thereby cooling the liquid water that remains inside of the fibers. This cooled water is then recirculated to remove heat from the crew member and PLSS electronics. Major design improvements, including a 36% reduction in volume, reduced weight, and a more flight-like backpressure valve, facilitate the packaging of RVP SWME in the AEMU PLSS envelope. The development of these evaporative cooling systems will contribute to a more robust and comprehensive AEMU PLSS.
NASA is currently developing an AEMU spacesuit PLSS technology unit that is human-rated for long-duration microgravity or planetary missions, and vacuum or low-pressure environments. This AEMU development is a NASA Advanced Exploration System (AES) project hosted at JSC and led by the Crew and Thermal Systems Division of the Engineering Directorate. A critical component of extravehicular activity (EVA) suits is heat rejection, which cools the crew member and electrical components in the PLSS. The current PLSS uses a sublimator for heat rejection. Whereas the current PLSS sublimator can effectively cool the crew member and electronics, it has a number of limitations including sensitivity to contaminants and the need for a separate feedwater supply. Because of these limitations, the current PLSS sublimator is certified for only 25 EVAs—critically limiting current EVA capability. Additionally, sublimators do not have the capability of rejecting heat in pressure environments that are above the triple point of water, such as the atmospheric conditions of Mars.
Colin Campbell, Johnson Space CenterAaron Colunga, Jacobs Engineering
The hollow-fiber (HoFi) SWME has been selected as the heat-rejection technology in the next generation of spacesuits. The HoFi SWME cools circulating water (which acts as the coolant in the system) through in-line evaporation. The water is then circulated through the liquid cooling garment and also to PLSS components. The SWME takes advantage of recent advances in micropore membrane technology to provide robust heat rejection with a high tolerance to contamination. HoFis are thin-walled, porous tubes made from polypropylene that are approximately 300 microns in diameter. This HoFi membrane technology yields a low mass and volume system that is durable and reliable. The HoFi geometry allows a high-membrane surface area to be contained in a compact module; therefore, large volumes can be filtered with low power consumption while using minimal space. The current SWME design has about 14,900 tubes providing approximately 0.6 m2 of open pore area, which contributes to SWME’s resistance to coolant loop contaminants that will accumulate over the planned 800-hour operational life.
The first sheet membrane SWME prototype, which wasdesigned and tested at NASA Johnson Space Center in 1999, showed promise for the next-generation heat-rejection subsystem. In 2009, a full-scale version of the sheet membrane prototype was built, together with two full-scale HoFi prototypes; one with spacers for venting and one without spacers for venting. These three prototypes underwent a series of tests to characterize membrane performance, including determination of the cooling water heat-rejection rate, backpressure results, and contamination sensitivity. In 2010, a new prototype SWME, called Gen2 SWME, was created. The Gen2 SWME design incorporates lessons learned from the HoFi prototypes. Additionally, the Gen2 SWME incorporates the use of lighter-weight, plastic materials and has a flight-like backpressure valve built into the housing. After a year of both standalone and integrated PLSS testing, development of a 3rd generation SWME—the RVP SWME began.
52

A number of sizing analyses were performed based on Gen2 SWME testing results: 1. Fiber CountDuring Gen2 SWME testing, the team assessed the heat rejection of two different cartridges. A five-layer, 30-chevron (14,900 fibers total) Gen2 SWME produced 700W of heat rejection at 91 kilograms per hour (kg/hr) with a 10°C outlet, whereas a six-layer, 30-chevron (17,900 fibers total) Gen2 SWME produced 892W of heat rejection at 91 kg/hr with a 10°C outlet. Based on this improved performance with increased fibers, a six-layer hollow fiber chevron configuration was selected for the RVP SWME.2. Fiber LengthThe Gen2 SWME had a total exposed fiber length of 6.5 inches. Based on the RVP SWME heat rejection requirement of 700W at 91kg/hr with a 10°C outlet, it was determined that a six-layer, 30-chevron RVP SWME would only require a total exposed fiber length of 5.1 inches.3. Vapor Flow Gap SizingThe Gen2 SWME had a 15.88 mm vapor flow gap around the perimeter of the hollow fiber cartridge to facilitate efficient vapor escape from the Gen2 SWME housing. Circumferential vapor flow pressure drop calculations for RVP SWME indicated a 9 mm vapor flow gap would be sufficient to ensure efficient vapor escape and a vapor pressure differential between the outside and inside of the housing that amounted to less than 10% of the total vapor backpressure.4. Cage-less designThe team elected to stay with the same general design concepts of the Gen2 SWME: a cylindrical envelope with a poppet backpressure valve. Several RVP SWME design elements were novel, including a hollow fiber cartridge bonded directly to the housing with no cage, and the elimination of all tool-less manifolds, see Figure 1.
Reduced Volume Prototype Design and DevelopmentIn 2010, the Gen2 SWME was successfully demonstrated in the AEMU PLSS 1.0 Breadboard. The focus of this test was to investigate the performance and capability of all technology development hardware that will be incorporated in the AEMU PLSS: the SWME, the primary and secondary oxygen regulators, the Rapid Cycle Amine Swingbed, and the ventilation loop fan. While this test incorporated all technology development hardware, these hardware elements were intentionally not packaged in a PLSS-like volume—all hardware was erected on a large rig to facilitate service and to incorporate additional sensors. Following successful demonstration of the PLSS 1.0 Breadboard, planning for a fully packaged, volumetrically accurate PLSS 2.0 began.
Figure 1. Cage-less design.To maximize PLSS packaging efficiency, the SWME team began design of a more compact test article. The main goals of the RVP SWME included reducing volume of the test article by 20% without significantly impacting heat rejection performance. The heat rejection requirement for the RVP SWME was set as 700 Watts (W).
The design was completed in May 2012. The new fabrication and packaging techniques for RVP SWME provided a 36% reduction in volume compared to Gen2 SWME. The reduced volume of the RVP relative to the Gen2 SWME is shown in an inset in Figure 2 by rendering the RVP in red wireframe inside the Gen2 SWME model. The RVP SWME manufacturing and assembly was completed by October 2012 and was integrated into the packaged AEMU PLSS 2.0 test article in March 2013, see Figure 3. During the AEMU PLSS 2.0 testing, the SWME will undergo rigorous testing that will simulate actual EVA use, as well as contingency situations. Interaction and behavior of RVP SWME with other AEMU PLSS components will be assessed. PLSS 2.0 testing is expected to be finished in December 2013.
Figure 2. The reduced volume of the RVP relative to the Gen2 SWME.
53

Beyond RVP SWMEDuring the AEMU PLSS 2.0 packaging exercise, the RVP SWME team noted volumetric inefficiencies of the RVP SWME. Due to the circular shape of the RVP SWME, a significant volume of free space around the test article cannot be utilized for other PLSS components. To maximize packaging efficiency, the team is investigating the fabrication of a Rectangular SWME for AEMU PLSS 2.5 testing. The Rectangular SWME (Gen4 SWME) would provide the same amount of heat rejection as the RVP SWME. The major design changes of the Rectangular RVP SWME will be: 1) Rectangular shape: to improve overall AEMU packaging efficiency; 2) New fiber bundle orientation: the chevron pattern used in prior SWMEs will not be conducive to a rectangular shape. Instead, the team will most likely utilize equal sized fiber bundles layered in a parallel fashion; 3) Integration of a gate backpressure valve: using a gate valve that opens via sliding across a backpressure orifice on the RVP SWME housing will greatly reduce the volume occupied by the RVP SWME in the AEMU PLSS package. Currently, the poppet valve extends 4 inches from the RVP SWME housing.
Design work for the Rectangular RVP SWME began in February 2013. Manufacturing began in October 2013.
Figure 3. RVP SWME manufacturing and assembly integrated into the packaged AEMU PLSS 2.0 test article.
54

Environmental Technologies
55

Leadership in Energy and Environmental Design at Johnson Space CenterSteve Farley, Johnson Space Center
The Center Operations Directorate (COD) at Johnson Space Center (JSC) is responsible for leading the design and construction of all new facilities and major renovations at JSC to ensure these facilities meet the Leadership in Energy and Environmental Design (LEED) criteria. This criterion ensures energy and material efficiency and sustainability are inherent in all new construction.
To make certain JSC meets NASA Headquarters’ minimal LEED Gold requirements, the architect-engineer firm performing the design, project manager and project team perform a LEED design charette at the pre-design stage of each project. This charette calls for an item-by-item review of the U.S. Green Building Council’s LEED Project Scorecard to determine which LEED points are reasonable to accomplish within the scope of a project, and which are open possibilities.
As a project progresses through its 30-, 60- and 90-percent design review, the scorecard is reexamined to determine which points must be dropped out or may be added due to the latest engineering design data. At the 30-percent stage, the design concept proposed by the architect-engineer is justified by a lifecycle cost analysis. This analysis is adjusted and refined as the project progresses to its final design stage.
This process has enabled JSC to design, construct and certify the following LEED buildings over the past eight years:
LEED certified Building 27: The Astronaut Quarantine Facility (March 2008)LEED Silver certifiedBuilding 207A: Gilruth Recreation Center facility addition (July 2009)Building 29: Avionics Integration Laboratory (March 2012)LEED Gold certifiedBuilding 2 North: Office of Communications and Public Affairs (August 2010)Building 26: The Center for Human Space Flight Performance and Research (September 2010)Building 265: Source Evaluation Board office additions (April 2010)Building 12: Administrative Support Building (will be submitted for LEED Gold certification in early 2013)LEED Platinum certifiedBuilding 20: The new office building (September 2010)Building 12: Administrative Support Building
Building DescriptionJSC’s newest facility, Building 12, one of JSC’s oldest original permanent buildings, underwent a complete refurbishment to modernize it to help serve JSC well into the 21st century. Building 12 is a two-story, 67,348-square-foot office building that houses JSC accounting, administrative and training groups, and is located on the historic central mall of campus. Sustainability has been at the forefront of the design process since project inception, and as such, features are integrated into the building – not an afterthought. Most existing inherent obstacles present in the building presenting challenges to the refurbishment program and to sustainability goals were creatively overcome and, in some cases, turned into assets. The project posed the daunting task of complete renovation and upgrade to meet current applicable codes and standards, including life safety, environmental, energy, mechanical/electrical/plumbing engineering and structural. Two of the largest existing building systems by weight and volume, however, were retained, with new engineering analysis and upgrades in the refurbished design (these being the iconic JSC white-quartz-faced precast concrete exterior wall panels and the building’s steel framing and concrete foundations). The vast majority of all materials removed and demolished were accounted for and sent to recycling entities, or in the case of hazardous materials, to environmentally certified disposal. Project design started in 2008, and construction was completed in 2012. Building 12 is using LEED for New Construction (LEED-NC) version 2.2 to track the sustainability aspects of the project. Building 12 is currently projecting a LEED Gold rating.
Features Included in the ProjectThe refurbishment effort included all parts of the building, including interiors, exterior skin and the roof. The interiors use low-odor materials, including paints and coatings; adhesives and sealants; composite wood; and carpet systems. Offices are located toward the central core of the building to enhance daylight and views to the outside (Figure 1).
56

Figure 1. New interior of refurbished Building 12.
Certified wood and durable materials were used as well. New lighting was installed to provide greater control to the occupants and reduce energy use. Lighting control features include occupancy sensors, daylight sensors and low-voltage relays. Low-flow plumbing fixtures were installed throughout the building, with a projected water use savings of 43 percent. The building uses JSC’s existing central utility plant, but multiple strategies have been used to reduce energy use.
Such items include:• Under-floor air distribution system that also increases
building use flexibility• Variable speed drives on mechanical equipment• Daylight harvesting and occupancy sensors reduce
lighting costs • Photovoltaics (PVs) will be integrated into the shading
devices• Four highly efficient vertical axis wind turbines are
being placed on the roof (Figure 2) • The building is estimated to be 34 percent energy
efficient without PVs and wind turbines versus American Society of Heating, Refrigeration and Air-Conditioning (ASHRAE) 90.1-2004
• Strategically engineered sun-shading devices tailored to maximum solar efficiency while enhancing indirect natural day lighting inside the space (Figure 3)
Figure 2. Wind turbines located on the roof of Building 12.
Figure 3. Building 12 sun-shading devices maximize solar efficiency and enhance natural lighting inside.
57

The exterior of the building includes a new curtain wall system with dual-glazed low-emissivity windows, premium exterior envelope insulation and sun shades. Such features reduce the heat glare and heat gain into the building, which improves occupant comfort and reduces energy use. A vegetated roof was used, which helps reduce the heat-island effect for the building and site and mitigates storm-water runoff (along with the site landscaping) (Figure 4). Efforts are being made to promote alternative transportation at JSC; therefore, bicycle storage and shower facilities are provided in the building. Parking spaces are also being set aside for fuel-efficient and carpool vehicles.
Figure 4. Building 12 vegetated roof.
Sustainable strategies employed during construction include:
• Reusing the building• Diverting at least 95 percent of the construction waste
from landfills• Using building materials with at least 12 percent
recycled material• Construction methodologies to reduce dust and dirt
during construction to help ensure a healthier indoor air environment
The resulting completed project is a unique example at JSC of the successful dichotomy of retaining the best of the NASA historic heritage meshed with the cutting edge sustainable engineering of the future. The “new” Building 12 is an excellent example of how sustainability is fully integrated into existing buildings to maximize employee comfort, enhance productivity and improve design aesthetics in a value-added and cost-effective manner.
58

Materials, Structures, Development and Testing
59
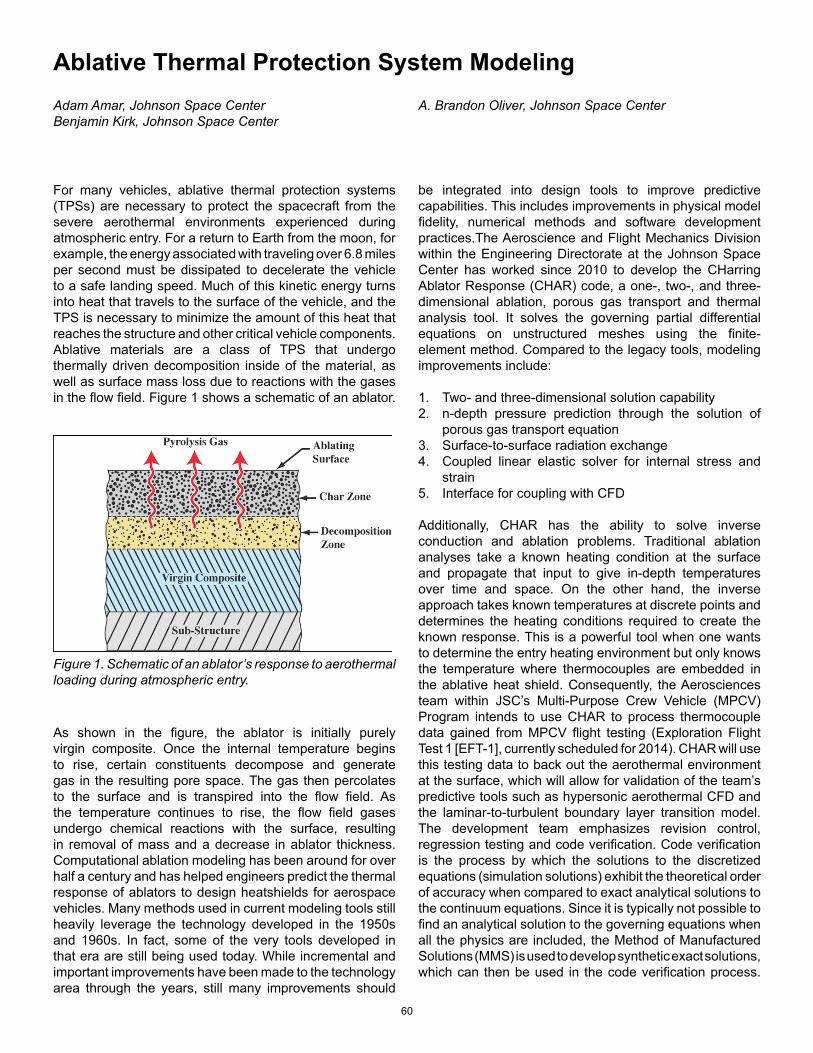
Ablative Thermal Protection System ModelingAdam Amar, Johnson Space CenterBenjamin Kirk, Johnson Space Center
A. Brandon Oliver, Johnson Space Center
For many vehicles, ablative thermal protection systems (TPSs) are necessary to protect the spacecraft from the severe aerothermal environments experienced during atmospheric entry. For a return to Earth from the moon, for example, the energy associated with traveling over 6.8 miles per second must be dissipated to decelerate the vehicle to a safe landing speed. Much of this kinetic energy turns into heat that travels to the surface of the vehicle, and the TPS is necessary to minimize the amount of this heat that reaches the structure and other critical vehicle components. Ablative materials are a class of TPS that undergo thermally driven decomposition inside of the material, as well as surface mass loss due to reactions with the gases in the flow field. Figure 1 shows a schematic of an ablator.
be integrated into design tools to improve predictive capabilities. This includes improvements in physical model fidelity, numerical methods and software development practices.The Aeroscience and Flight Mechanics Division within the Engineering Directorate at the Johnson Space Center has worked since 2010 to develop the CHarring Ablator Response (CHAR) code, a one-, two-, and three-dimensional ablation, porous gas transport and thermal analysis tool. It solves the governing partial differential equations on unstructured meshes using the finite-element method. Compared to the legacy tools, modeling improvements include:
1. Two- and three-dimensional solution capability2. n-depth pressure prediction through the solution of
porous gas transport equation3. Surface-to-surface radiation exchange4. Coupled linear elastic solver for internal stress and
strain5. Interface for coupling with CFD
Additionally, CHAR has the ability to solve inverse conduction and ablation problems. Traditional ablation analyses take a known heating condition at the surface and propagate that input to give in-depth temperatures over time and space. On the other hand, the inverse approach takes known temperatures at discrete points and determines the heating conditions required to create the known response. This is a powerful tool when one wants to determine the entry heating environment but only knows the temperature where thermocouples are embedded in the ablative heat shield. Consequently, the Aerosciences team within JSC’s Multi-Purpose Crew Vehicle (MPCV) Program intends to use CHAR to process thermocouple data gained from MPCV flight testing (Exploration Flight Test 1 [EFT-1], currently scheduled for 2014). CHAR will use this testing data to back out the aerothermal environment at the surface, which will allow for validation of the team’s predictive tools such as hypersonic aerothermal CFD and the laminar-to-turbulent boundary layer transition model.The development team emphasizes revision control, regression testing and code verification. Code verification is the process by which the solutions to the discretized equations (simulation solutions) exhibit the theoretical order of accuracy when compared to exact analytical solutions to the continuum equations. Since it is typically not possible to find an analytical solution to the governing equations when all the physics are included, the Method of Manufactured Solutions (MMS) is used to develop synthetic exact solutions, which can then be used in the code verification process.
Figure 1. Schematic of an ablator’s response to aerothermal loading during atmospheric entry.
As shown in the figure, the ablator is initially purely virgin composite. Once the internal temperature begins to rise, certain constituents decompose and generate gas in the resulting pore space. The gas then percolates to the surface and is transpired into the flow field. As the temperature continues to rise, the flow field gases undergo chemical reactions with the surface, resulting in removal of mass and a decrease in ablator thickness.Computational ablation modeling has been around for over half a century and has helped engineers predict the thermal response of ablators to design heatshields for aerospace vehicles. Many methods used in current modeling tools still heavily leverage the technology developed in the 1950s and 1960s. In fact, some of the very tools developed in that era are still being used today. While incremental and important improvements have been made to the technology area through the years, still many improvements should
60
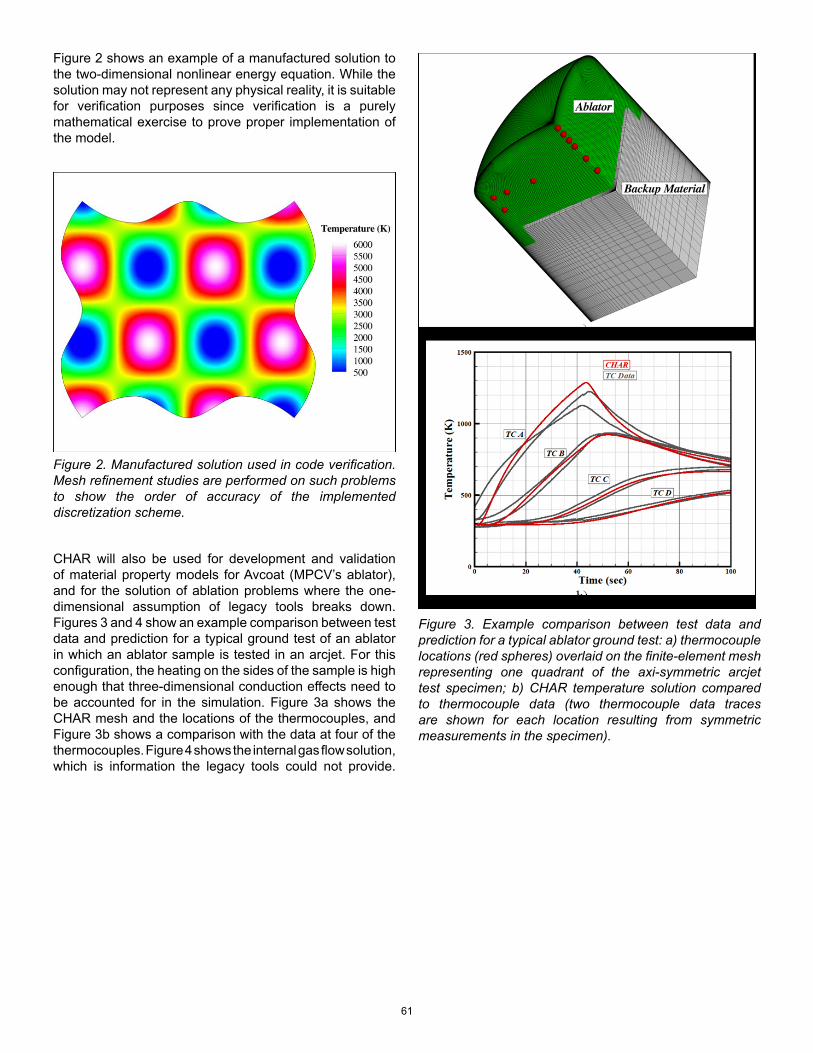
Figure 2 shows an example of a manufactured solution to the two-dimensional nonlinear energy equation. While the solution may not represent any physical reality, it is suitable for verification purposes since verification is a purely mathematical exercise to prove proper implementation of the model.
Figure 2. Manufactured solution used in code verification. Mesh refinement studies are performed on such problems to show the order of accuracy of the implemented discretization scheme.
CHAR will also be used for development and validation of material property models for Avcoat (MPCV’s ablator), and for the solution of ablation problems where the one-dimensional assumption of legacy tools breaks down. Figures 3 and 4 show an example comparison between test data and prediction for a typical ground test of an ablator in which an ablator sample is tested in an arcjet. For this configuration, the heating on the sides of the sample is high enough that three-dimensional conduction effects need to be accounted for in the simulation. Figure 3a shows the CHAR mesh and the locations of the thermocouples, and Figure 3b shows a comparison with the data at four of the thermocouples. Figure 4 shows the internal gas flow solution, which is information the legacy tools could not provide.
Figure 3. Example comparison between test data and prediction for a typical ablator ground test: a) thermocouple locations (red spheres) overlaid on the finite-element mesh representing one quadrant of the axi-symmetric arcjet test specimen; b) CHAR temperature solution compared to thermocouple data (two thermocouple data traces are shown for each location resulting from symmetric measurements in the specimen).
61

Figure 4. Example cross-section of CHAR internal gas flow solution in ablator material from a typical ablator ground test.
These types of tests and simulations help designers gain enough confidence in their models to apply them in the flight environment.
CHAR is still in active development. The team plans to add higher-fidelity physical models, validate these models, further develop the inverse capability, and implement improved mesh motion capability. The ultimate goal is to develop a tool with a hierarchy of modeling fidelity to give users flexibility based on the application, desired speed and required fidelity.
62
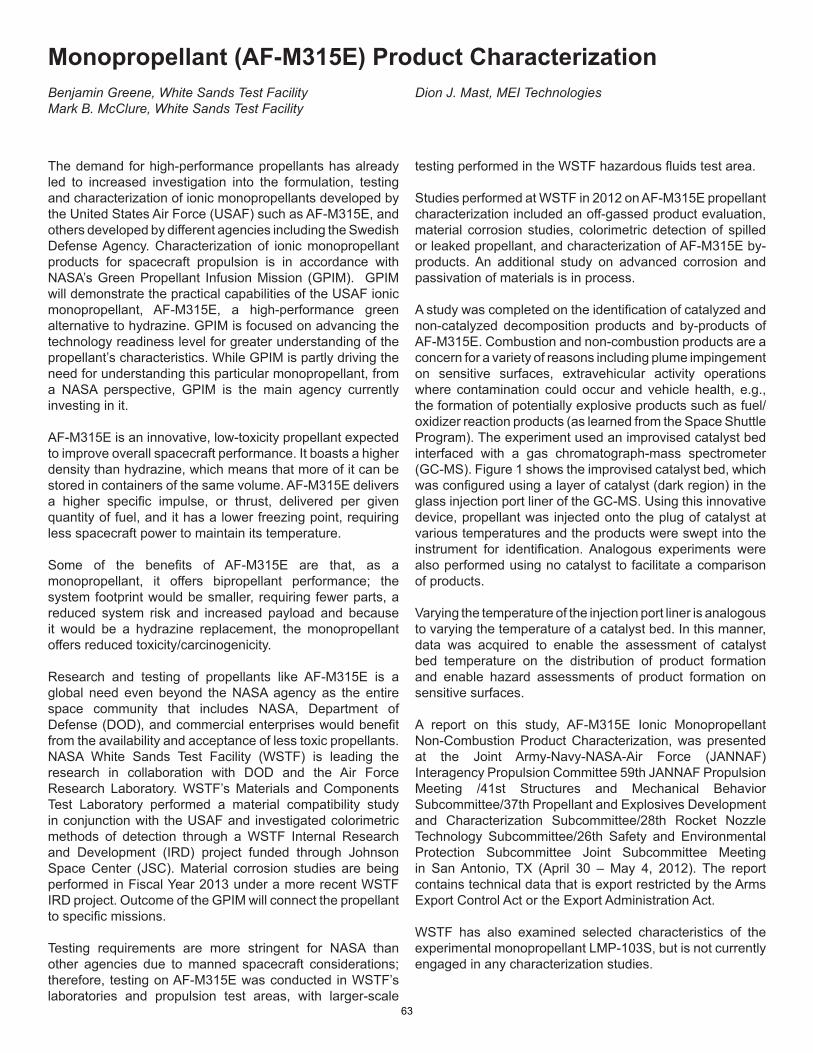
Monopropellant (AF-M315E) Product Characterization
The demand for high-performance propellants has already led to increased investigation into the formulation, testing and characterization of ionic monopropellants developed by the United States Air Force (USAF) such as AF-M315E, and others developed by different agencies including the Swedish Defense Agency. Characterization of ionic monopropellant products for spacecraft propulsion is in accordance with NASA’s Green Propellant Infusion Mission (GPIM). GPIM will demonstrate the practical capabilities of the USAF ionic monopropellant, AF-M315E, a high-performance green alternative to hydrazine. GPIM is focused on advancing the technology readiness level for greater understanding of the propellant’s characteristics. While GPIM is partly driving the need for understanding this particular monopropellant, from a NASA perspective, GPIM is the main agency currently investing in it.
AF-M315E is an innovative, low-toxicity propellant expected to improve overall spacecraft performance. It boasts a higher density than hydrazine, which means that more of it can be stored in containers of the same volume. AF-M315E delivers a higher specific impulse, or thrust, delivered per given quantity of fuel, and it has a lower freezing point, requiring less spacecraft power to maintain its temperature.
Some of the benefits of AF-M315E are that, as a monopropellant, it offers bipropellant performance; the system footprint would be smaller, requiring fewer parts, a reduced system risk and increased payload and because it would be a hydrazine replacement, the monopropellant offers reduced toxicity/carcinogenicity.
Research and testing of propellants like AF-M315E is a global need even beyond the NASA agency as the entire space community that includes NASA, Department of Defense (DOD), and commercial enterprises would benefit from the availability and acceptance of less toxic propellants. NASA White Sands Test Facility (WSTF) is leading the research in collaboration with DOD and the Air Force Research Laboratory. WSTF’s Materials and Components Test Laboratory performed a material compatibility study in conjunction with the USAF and investigated colorimetric methods of detection through a WSTF Internal Research and Development (IRD) project funded through Johnson Space Center (JSC). Material corrosion studies are being performed in Fiscal Year 2013 under a more recent WSTF IRD project. Outcome of the GPIM will connect the propellant to specific missions.
Testing requirements are more stringent for NASA than other agencies due to manned spacecraft considerations; therefore, testing on AF-M315E was conducted in WSTF’s laboratories and propulsion test areas, with larger-scale
testing performed in the WSTF hazardous fluids test area. Studies performed at WSTF in 2012 on AF-M315E propellant characterization included an off-gassed product evaluation, material corrosion studies, colorimetric detection of spilled or leaked propellant, and characterization of AF-M315E by-products. An additional study on advanced corrosion and passivation of materials is in process.
A study was completed on the identification of catalyzed and non-catalyzed decomposition products and by-products of AF-M315E. Combustion and non-combustion products are a concern for a variety of reasons including plume impingement on sensitive surfaces, extravehicular activity operations where contamination could occur and vehicle health, e.g., the formation of potentially explosive products such as fuel/oxidizer reaction products (as learned from the Space Shuttle Program). The experiment used an improvised catalyst bed interfaced with a gas chromatograph-mass spectrometer (GC-MS). Figure 1 shows the improvised catalyst bed, which was configured using a layer of catalyst (dark region) in the glass injection port liner of the GC-MS. Using this innovative device, propellant was injected onto the plug of catalyst at various temperatures and the products were swept into the instrument for identification. Analogous experiments were also performed using no catalyst to facilitate a comparison of products.
Varying the temperature of the injection port liner is analogous to varying the temperature of a catalyst bed. In this manner, data was acquired to enable the assessment of catalyst bed temperature on the distribution of product formation and enable hazard assessments of product formation on sensitive surfaces.
A report on this study, AF-M315E Ionic Monopropellant Non-Combustion Product Characterization, was presented at the Joint Army-Navy-NASA-Air Force (JANNAF) Interagency Propulsion Committee 59th JANNAF Propulsion Meeting /41st Structures and Mechanical Behavior Subcommittee/37th Propellant and Explosives Development and Characterization Subcommittee/28th Rocket Nozzle Technology Subcommittee/26th Safety and Environmental Protection Subcommittee Joint Subcommittee Meeting in San Antonio, TX (April 30 – May 4, 2012). The report contains technical data that is export restricted by the Arms Export Control Act or the Export Administration Act.
WSTF has also examined selected characteristics of the experimental monopropellant LMP-103S, but is not currently engaged in any characterization studies.
Benjamin Greene, White Sands Test FacilityMark B. McClure, White Sands Test Facility
Dion J. Mast, MEI Technologies
63

Figure 1. Improvised catalyst bed configured using a layer of catalyst (dark region) in the glass injection port liner.
64

Correlation and Improvement of Modeling of Hypervelocity Impact, Micrometeoroid and Orbital Debris Impacts onto Spacecraft WindowsJohn Alred, Johnson Space Center Larry Vuong, Universities Space Research Association
AbstractHypervelocity impacts (HVIs) caused by micrometeoroid and orbital debris (MMOD) onto spacecraft windows is explored using SPHINX, a numerical simulator utilizing smooth particle hydrodynamics (SPH). Analysis of the impact is modeled utilizing the Mie-Grϋneisen equation of state (EOS) and elastic perfectly plastic strength model. The predictive reliability of SPHINX is determined by damage comparisons with historical data. An experimental program of HVI ground testing is proposed to further refine the SPHINX simulation capability.
IntroductionIn the Earth’s space environment, millions of naturally occurring micrometeoroids and man-made debris moves at hypervelocity speed that averages ten kilometers per second. These particles can collide with spacecraft windows and damage in the form of a crater and sub-surface cracks. A recent example of such an impact was seen on one of the cupola’s windows on the International Space Station (ISS), as shown in Figure 1. These damages pose a risk to failure of equipments and life of crew members working in space.
The JSC Structural Engineering Division within the Engineering Directorate performed an analysis of impacts on fused silica in order to develop a quick-look criterion of the state of an impacted window for the ISS. For the analysis of the impacts, computer simulations were developed using SPHINX, an SPH numerical code developed by the Los Alamos National Laboratory. SPH is a grid-less, Lagrangian hydrodynamic method that uses fluid elements to represent its mass points according to fluid motion equations. An example of a SPHINX output is shown in Figure 2.
Figure 1. MMOD impact on ISS cupola window.
Fused silica (SiO2) has been the primary material used for windows because of its optical clarity, smooth surface, low coefficient of thermal expansion, and high resistance to thermal and mechanical shocks.
Figure 2. SPHINX two-dimensional HVI model of aluminum oxide at 4.0 kilometers per second on 0.56 inches in thick fused silica 0.84 millimeters. The axis are in SPHINX are in centimeters.
High energy impacts were computed using the SPHINX model, which provides crater depth and diameter as well as spalling. Results are compared with historical data for fused silica from testing facilities, CTH numerical models, and in-space hypervelocity impacts. The objective of the analysis is to characterize the post-impact shape and to show that the calculation reproduce similar features of craters in historical HVI data on fused silica by using SPHINX shown in Table 1.
65

Table 1. Historical data for HVI comparisons on fused silica.
Table 2. SPHINX HVI results on fused silica.
Equation of State and Strength ModelThe Mie-Grϋneisen equation of state was used to model fused silica[1]. A rough estimate of the Grϋneisen parameter was determined from the knowledge of the linear thermal expansion, the bulk speed of sound, and the specific heat. Given the thermal expansion of fused silica, the Grϋneisen parameter was found. For material strength, the elastic perfectly plastic model is used, in which the yield stress and shear modulus are constants. The shear modulus was found to be 28.9 gigpascals with the yield stress estimated at its tensile stress of 150 megapascals. The tensile stress varies as its strength depends on the condition of the glass surface.
Results/DiscussionTwo SPHINX calculations of the impact of a 1.0 millimeter aluminum oxide (Al2O3) and a 0.28 millimeter soda lime glass projectile were performed on a 0.56 inch thick fused silica plate, shown in Table 2, and compared with historical data in Table 1. The analysis did not follow the historical data closely especially against a commercial finite element model developed by Sandia National Laboratories, called CTH. In comparing Figures 2 and 3, the SPHINX and CTH HVI results show that more damage is observed in SPHINX analysis. SPHINX results compared to CTH can be seen on Tables 1 and 2 where SPHINX has a damage depth of 0.84 millimeter, which is more than five times the damage depth found using CTH as well as the historical trend for the given parameters seen in Figure 3. For higher energy impacts, the accuracy of the SPHINX model improves when compared against the historical data from the Southwest Research Institute (SwRI). Data from SwRI, shown in Table 1, suggest that there are many variations that cause the large range of damage to occur.
Errors when dealing with soda lime glass projectile may contribute to the variation in the results due to thermal expansion and internal voids. The SPHINX results falls within the range of the SwRI results with a less than ten percent difference in damage depth between two results seen in Table 1.
Figure 3. CTH HVI results compared with historical trends.
ConclusionSPHINX analysis cannot be used to accurately model hypervelocity impacts on fused silica until furtherhistorical data is compared to determine its accuracy. In comparable cases, SPHINX calculations compare more favorably with higher energy impacts than lower energy impacts. However, improvements in the model can be made to increase SPHINX’s accuracy for impacts on glass. A series of hypervelocity impact tests onto glass and other brittle samples is underway at the NASA White Sands Test Facility to provide data by which the SPHINX model may be updated for such materials. Also a strength model specified for glass to accurately reflect the equation of state of glass during impacting is under development.
66

Inflatable Habitat DevelopmentMolly Selig, Johnson Space Center Gerard Valle, Johnson Space Center
Inflatable Habitats are critical technology as NASA prepares to send humans beyond low-Earth orbit. Large volumes are required for vehicles that must support humans for long duration missions with limited or nonexistent resupply capability. Inflatable modules can be designed to fit into the available space in a launch vehicle, and then be expanded to a larger volume when deployed. An architecture including inflatable structures will require fewer launches than an architecture consisting of only traditional aluminum modules, lowering the overall cost.
The Structural Engineering Division within the Engineering Directorate is leading the inflatable habitat development work for the Johnson Space Center (JSC). One of the key inflatable habitat technical issues that JSC is currently studying is damage tolerance. Damage tolerance is the ability of the structure to withstand micrometeoroid impacts, or other in-orbit damage, as well as assessing the effects of damage to the life of the structure.
In July 2012, a damage tolerance test was performed at the NASA White Sands Test Facility. An 88-inch-diameter Kevlar test article was pressurized to 49 psig (one-fourth of the burst pressure), and several of the 1 inch wide woven structural restraint layer straps were severed with linear shape charge cutters (see Figure 1). Four straps were cut on one side of the article (two axial straps and two hoop straps) sequentially, opening up a gap in the restraint layer of approximately 3.5 inches by 2 inches in size. Four separate straps were cut on the other side simultaneously, opening up a second gap, approximately 3.5 inches by 2 inches in size (see Figure 2). Strain in the straps was measured using photogrammetry.
Figure 2. 2012 damage tolerance test articl, sequential cut side, post cut (webbing tails removed).
Figure 1. 2012 damage tolerance test article with sequential cutters installed.
After each set of cuts, the module stayed intact at pressure, and loads from the cut straps were redistributed to surrounding straps.
The 2012 damage tolerance test is a follow-up from a 2008 damage tolerance test of the same 88-inch-diameter Kevlar module. In the 2008 test, the module was pressurized to 45 psig and one strap was severed with a linear shape charge cutter. Not only did the module remain intact after the strap cut, but no measurable reduction in strain was seen at the bulkhead strain gages. This result demonstrated that the woven webbing structure is capable of redistributing the load of a damaged structure, even within severed elements. The 2012 test showed that even when a larger gap is created, the damage remains a local effect.
Additional damage tolerance testing was conducted in 2011 when strap samples that had been intentionally damaged in hypervelocity impact testing were pulled to failure in an Instron tensile testing machine. A sample restraint layer
67

with MMOD damage is shown in Figure 3. The breaking strength of the damaged straps was compared to the breaking strength of pristine straps. The extent of damage on the straps varied. The breaking strength of the damaged straps ranged from 14 percent of ultimate tensile strength to more than 100 percent of ultimate tensile strength. Before strength testing, a qualitative assessment of the damage to the strap provided a prediction of the breaking strength; however, the accuracy of the predictions is subjective.
Figure 3. Front view of damage on test sample 4 (with inset close-up view)
Another area of inflatable habitat development being studied is the dynamic response of the module when attached to other modules in space. In 2011, a modal test was conducted with an 88-inch-diameter Kevlar test article (see Figure 4). The test article had a metal bulkhead on each end, but no central core connecting the two bulkheads. The module was pressurized to 14.7 psig, and positioned on end, with the bottom bulkhead fixed to a ballast plate, and the top bulkhead free. The top bulkhead was actuated, and accelerometers attached to the restraint layer straps recorded the article dynamic response. Results were correlated with NASTRAN and LS-DYNA models. Similar modeling will be used to evaluate the Bigelow Expandable Activity Module dynamic response when attached to the International Space Station.
Figure 4. 2012 modal test article.
The main focus of study for inflatable habitat development in 2013 is creep. Creep is a time-dependent failure mode that affects inflatable habitat materials that are under continuous loading for years at a time, and is a significant factor in assessing the life of an inflatable structure.
Two creep burst tests are being planned at JSC for 2013. In the first test, an 88-inch-diameter Kevlar test article will be pressurized to approximately 76 percent of the module burst pressure, and held at pressure until burst. Photogrammetry will be used to collect strap strain measurements throughout the test, and high speed video will capture the burst. In the second test, an 88-inch-diameter Vectran test article will be pressurized to approximately 60 percent of the module burst pressure, and held at pressure until burst. NASA Langely Research Center (LaRC) is performing strap level, real-time and accelerated creep testing of the same webbing materials, both Kevlar and Vectran, under various loads. Results of the JSC testing will be compared with strap level data from LaRC to predict the life of inflatable habitat structures. This type of testing and analysis is essential to support certification of large scale, long-term mission inflatable modules where fleet leader life testing is not practical.
68

Analysis of Material Specimens on the Komplast Experiment After Long-term Exposure on the International Space StationJohn Alred, Johnson Space CenterJulie Henkener, Johnson Space Center
John Golden, BoeingMichael Kravchenko, Boeing
AbstractKomplast is a space environmental effects experiment that exposes samples of Functional Cargo Block (FGB) module materials of construction to space and provides some determination of the nature of the space environment (sensors). Komplast is similar to the Materials International Space Station Experiment and the Russian Material Experiments conducted by the Russian Space Corporation-Energia. Material samples on the Komplast experiment, launched with the FGB, were examined for effects after 12 years exposure to the space environment.
IntroductionThe Komplast materials experiment was designed by the Khrunichev State Research and Production Space Center (KhSC) together with other Russian scientific institutes, and has been carried out by Mission Control Moscow since 1998. Komplast panels fitted with material samples and sensors were located on the International Space Station (ISS) FGB module exterior surface. Within the framework of this experiment, the purpose was to study the effect of the low-Earth orbit (LEO) environment on exposed samples of various materials.
The panels were sent into orbit with the FGB when it launched on November 20, 1998. Panels 2 and 10 were retrieved during a Russian spacewalk in February 2011 and sealed within cases to temporarily protect the samples from exposure to air until they could be studied on the ground. Panel 2 contained an experiment to detect micrometeoroid and orbital debris impacts; radiation and ultraviolet sensors; several pieces of electrical cable; and samples made from elastomeric and fluoroplastic materials. Panel 10 contained a temperature sensor and both carbon composite and adhesive-bonded samples. Figure 1 shows the location of panels 2 and 10 on the FGB module aft endcone. The panels were subsequently returned to Earth by Space Shuttle Discovery on the STS-133/ULF-5 mission after 12 years of LEO exposure, and opened in an argon chamber at the Institute of Nuclear Physics at Moscow State University in July 2011 (see Figure 2).
Figure 1. Komplast Panels on FGB.
Figure 2. Komplast panel opening in argon chamber.
Results/DiscussionThis report summarizes the findings of the analyses conducted by Johnson Space Center’s Structural Engineering Division with Russian colleagues in Fiscal Year (FY) 2012 and FY 2013. Based on the results of analyzing the readings from sensors located on Komplast panels and in studying material samples from the panels, the comprehensive effect of spaceflight factors on the FGB (at the locations of panels 2 and 10) was evaluated. Total solar exposure was determined to be 960±200 kilojoules (kJ)/cm2, or 21,000 equivalent solar hours. Because of location of these two panels and the ISS flight attitude, atomic oxygen (AO) influence was relatively low for such a long-duration exposure, approximately 1.5x10²¹ oxygen atoms/cm2.
69
Most of the AO influence occurred during the early phase of ISS assembly. Temperatures ranged from a maximum of 107°C to a minimum of -80°C.
Contamination observations were also made through the evaluation of optical properties on thermal control coatings and by examination of visible deposits located near several samples on the panels, primarily from elastomeric samples. These elastomer samples were extensively investigated for their physical property changes and sealing capability. In addition, 16 samples of adhesive-bonded joints using three types of epoxy adhesive were evaluated, studying fracture toughness, failure surface and adhesive-volume properties. Both rubber and adhesive-bonded specimens also underwent additional (postflight) ground-based exposures to simulate a total 30 years in LEO prior to their evaluation. The adhesive specimens research carried out made it clear that all types of adhesive-bonded joints remained serviceable as components of FGB module construction for 30 years from the date of beginning their service under space conditions.
Panel 2 also contained a micrometeoroid experiment shown in Figure 3. The micrometeoroid/orbital debris environment was determined, as is shown in Figure 4. Interestingly, the distribution of craters and low-velocity impact particles observed in the 5-50 micrometers (μm) size range was ~2-3 orders of magnitude higher than that predicted by the Orbital Debris Model (ORDEM2000) of natural and artificial origin microparticles in the ISS orbit. The difference between the Komplast microparticle results and the current ORDEM2000 model for particles smaller than 50 μm is still under investigation.
Figure 3. Micrometeoroid Sensor on Panel 2.
ConclusionOverall, results indicate that space environmental effects will not adversely impact the service life of the FGB through 2028. Additional Komplast panels remain in orbit and have the potential to yield similar results as presented here. While no plans presently exist within the ISS Program to retrieve these remaining panels, the NASA, Boeing and KhSC investigators have prioritized a list of the these panels with respect to potential for the highest return of scientific and engineering data. The investigation of the two returned Komplast panels is being completed, with a summary of the results obtained from this unique long-duration exposure experiment to be presented to the ISS Program within this year.
Figure 4. HVI results compared with historical trends.
70

Improved Measurement of Ejection Velocities from Craters Formed in SandMark J. Cintala, Johnson Space CenterTerry Byers, Jacobs TechnologyFrancisco Cardenas, Jacobs Technology
A typical impact crater is formed by two major processes: compression of the target (essentially equivalent to footprint in soil) and ejection of material. The Ejection-Velocity Measurement System (EVMS) in the Experimental Impact Laboratory (EIL) has been used to study ejection velocities from impact craters formed in sand since the late 1990’s. The EVMS is operated by scientists within the Astromaterials Research and Exploration Science Directorate at the Johnson Space Center (JSC). The original system used an early-generation charge-coupled device (CCD) camera; custom-written software; and a complex, multicomponent optical system to direct laser light for illumination. Unfortunately, the electronic equipment was overtaken by age and the software became obsolete in light of improving computer hardware.
Roland Montes, Jacobs TechnologyElliot E. Potter, Jacobs Technology
Figure 1. EVMS schematic diagram
When the button to fire the vertical gun is pressed, a signal is sent to a computer that acts as a controller. The computer sends a signal to a digital camera, which opens its shutter. After a short delay to allow the shutter to open completely, the computer sends a signal to the firing circuit. Gunpowder is ignited, sending the projectile
(typically a sphere between 3 and 5 mm in diameter) toward the target. When the projectile interrupts a separate laser that is trained just across and above the target’s surface (not shown in Figure 1 for simplicity), a detector sends a signal to the illumination laser, turning it on. The illumination laser is programmed to flash at a specific rate; in some cases, a series of different illumination segments is programmed. This permits different lighting sequences to be used at different times during the crater’s growth, which is very rapid initially but much slower toward the end. The camera’s shutter remains open while the laser completes its programmed sequence, taking a time exposure. Each photograph thus includes information from every flash of the laser during the experiment.
An example of the kind of image that can be acquired by this system is shown in Figure 2, which was recorded during the impact of a 4.76-mm stainless-steel sphere into 0.5-1-mm sand at a speed of 1.65 km/s. It would have been very difficult, if not impossible, to image such fine-grained sand with the original EVMS. The first segment of the illumination sequence shown from right to left in Figure 2 turned the laser on once per millisecond; that rate was constant through the first segment. The yellow arrows point to the illuminated profile of the ejecta plume as it grew. Because the illumination sequence was constant, the distance between the successive images of the plume’s profile is directly proportional to the speed with which the plume expanded. It is readily apparent that the plume (and the crater itself) grew very rapidly just after the impact when the impact-generated stresses in the target were highest. As time passed, however, the shock wave that initiated the ejection process expanded into the target, losing intensity in the process, much as light will decrease in intensity as the distance to its source increases. As the strength of the shock dropped, then, so too did the motion that it imparted to the sand. Ultimately, the shock decayed to a sound wave, it became too weak to set the sand into motion, and crater growth stopped. This process is reflected in the continually decreasing gaps between the images of the plume (from right to left), until the plume was expanding so slowly that it is difficult to distinguish between the later, successive images.
Experience obtained from years of operating the EVMS has resulted in the design of a new, simplified and streamlined version. By 2012, most of the equipment was upgraded, commercially available LabVIEW software has taken the place of the custom computer code, and EVMS v.2 is now up and running. It is a much more robust system, having all of the major components integrated into a single, modular assembly, a straightforward change that greatly improves the process of aligning the optics and camera. A schematic design of the system is shown in Figure 1, which illustrates the main components.
71
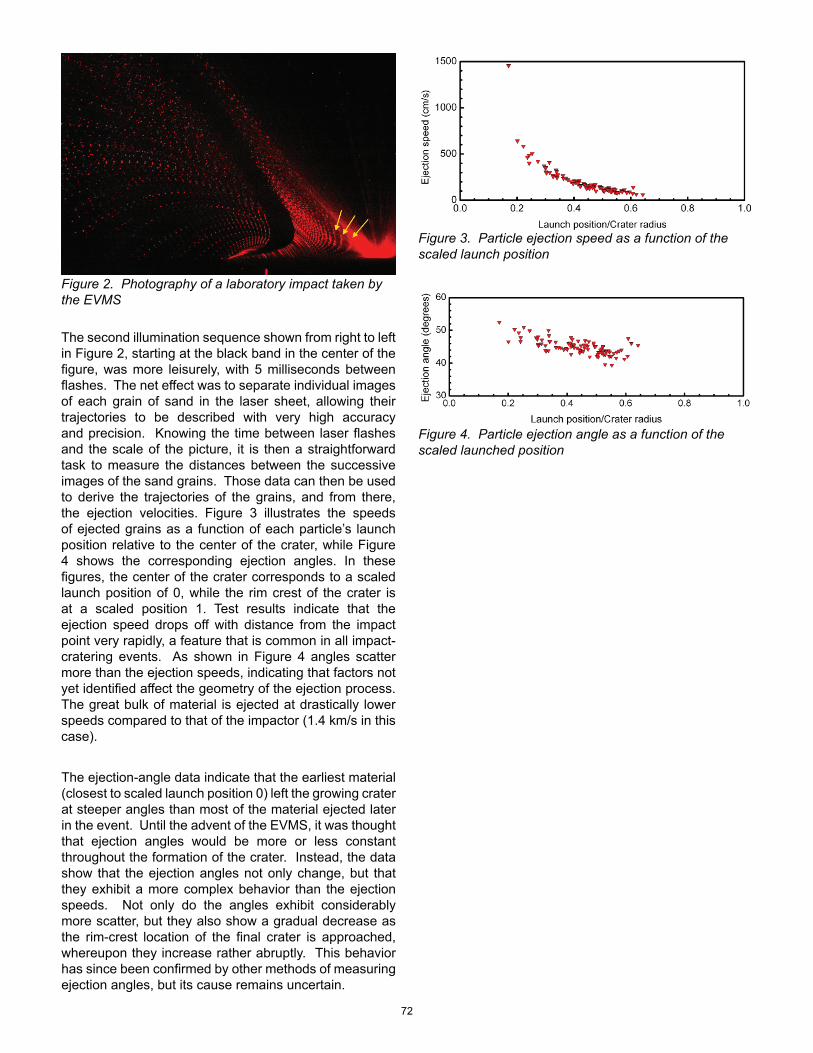
Figure 2. Photography of a laboratory impact taken by the EVMS
The second illumination sequence shown from right to left in Figure 2, starting at the black band in the center of the figure, was more leisurely, with 5 milliseconds between flashes. The net effect was to separate individual images of each grain of sand in the laser sheet, allowing their trajectories to be described with very high accuracy and precision. Knowing the time between laser flashes and the scale of the picture, it is then a straightforward task to measure the distances between the successive images of the sand grains. Those data can then be used to derive the trajectories of the grains, and from there, the ejection velocities. Figure 3 illustrates the speeds of ejected grains as a function of each particle’s launch position relative to the center of the crater, while Figure 4 shows the corresponding ejection angles. In these figures, the center of the crater corresponds to a scaled launch position of 0, while the rim crest of the crater is at a scaled position 1. Test results indicate that the ejection speed drops off with distance from the impact point very rapidly, a feature that is common in all impact-cratering events. As shown in Figure 4 angles scatter more than the ejection speeds, indicating that factors not yet identified affect the geometry of the ejection process. The great bulk of material is ejected at drastically lower speeds compared to that of the impactor (1.4 km/s in this case).
The ejection-angle data indicate that the earliest material (closest to scaled launch position 0) left the growing crater at steeper angles than most of the material ejected later in the event. Until the advent of the EVMS, it was thought that ejection angles would be more or less constant throughout the formation of the crater. Instead, the data show that the ejection angles not only change, but that they exhibit a more complex behavior than the ejection speeds. Not only do the angles exhibit considerably more scatter, but they also show a gradual decrease as the rim-crest location of the final crater is approached, whereupon they increase rather abruptly. This behavior has since been confirmed by other methods of measuring ejection angles, but its cause remains uncertain.
Figure 3. Particle ejection speed as a function of the scaled launch position
Figure 4. Particle ejection angle as a function of the scaled launched position
72
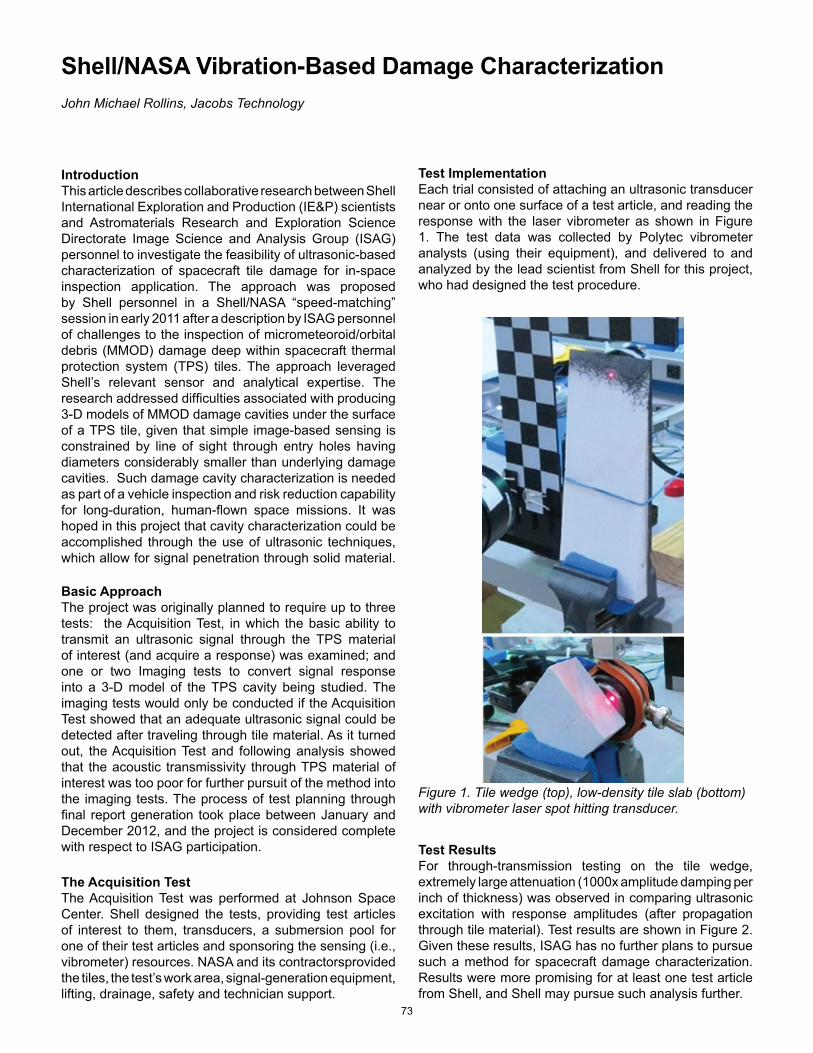
Shell/NASA Vibration-Based Damage CharacterizationJohn Michael Rollins, Jacobs Technology
IntroductionThis article describes collaborative research between Shell International Exploration and Production (IE&P) scientists and Astromaterials Research and Exploration Science Directorate Image Science and Analysis Group (ISAG) personnel to investigate the feasibility of ultrasonic-based characterization of spacecraft tile damage for in-space inspection application. The approach was proposed by Shell personnel in a Shell/NASA “speed-matching” session in early 2011 after a description by ISAG personnel of challenges to the inspection of micrometeoroid/orbital debris (MMOD) damage deep within spacecraft thermal protection system (TPS) tiles. The approach leveraged Shell’s relevant sensor and analytical expertise. The research addressed difficulties associated with producing 3-D models of MMOD damage cavities under the surface of a TPS tile, given that simple image-based sensing is constrained by line of sight through entry holes having diameters considerably smaller than underlying damage cavities. Such damage cavity characterization is needed as part of a vehicle inspection and risk reduction capability for long-duration, human-flown space missions. It was hoped in this project that cavity characterization could be accomplished through the use of ultrasonic techniques, which allow for signal penetration through solid material.
Basic ApproachThe project was originally planned to require up to three tests: the Acquisition Test, in which the basic ability to transmit an ultrasonic signal through the TPS material of interest (and acquire a response) was examined; and one or two Imaging tests to convert signal response into a 3-D model of the TPS cavity being studied. The imaging tests would only be conducted if the Acquisition Test showed that an adequate ultrasonic signal could be detected after traveling through tile material. As it turned out, the Acquisition Test and following analysis showed that the acoustic transmissivity through TPS material of interest was too poor for further pursuit of the method into the imaging tests. The process of test planning through final report generation took place between January and December 2012, and the project is considered complete with respect to ISAG participation.
Test ImplementationEach trial consisted of attaching an ultrasonic transducer near or onto one surface of a test article, and reading the response with the laser vibrometer as shown in Figure 1. The test data was collected by Polytec vibrometer analysts (using their equipment), and delivered to and analyzed by the lead scientist from Shell for this project, who had designed the test procedure.
Figure 1. Tile wedge (top), low-density tile slab (bottom) with vibrometer laser spot hitting transducer.
The Acquisition TestThe Acquisition Test was performed at Johnson Space Center. Shell designed the tests, providing test articles of interest to them, transducers, a submersion pool for one of their test articles and sponsoring the sensing (i.e., vibrometer) resources. NASA and its contractorsprovided the tiles, the test’s work area, signal-generation equipment, lifting, drainage, safety and technician support.
Test ResultsFor through-transmission testing on the tile wedge, extremely large attenuation (1000x amplitude damping per inch of thickness) was observed in comparing ultrasonic excitation with response amplitudes (after propagation through tile material). Test results are shown in Figure 2. Given these results, ISAG has no further plans to pursue such a method for spacecraft damage characterization. Results were more promising for at least one test article from Shell, and Shell may pursue such analysis further.
73

Figure 2. Plots showing relative amplitude of ultrasonic signal propagating through the tile wedge after transmission through (left to right) 0.16 inches, 0.40 inches and 0.87 inches of thickness, respectively. Note that the amplitude is practically in the noise after traveling through less than an inch of tile thickness.
74

Advancements in Capsule Parachute AnalysisDavid Bretz, Jacobs Technology
The Image Science and Analysis Group (IS&AG),a subgroup within the Johnson Space Center (JSC) Astromaterials Research and Exploration Science Directorate, has provided image analysis support of the Crew Exploration Vehicle Parachute Assembly System (CPAS) testing being conducted at the Yuma Proving Grounds by the JSC Engineering Directorate. The work by IS&AG is a continuation of photogrammetric analysis that began in 2010, and continues to take place through 2013 and 2014 during the development and analysis of parachutes for the Multi-Purpose Crew Vehicle (MPCV) being developed at JSC.
The cameras installed on these vehicles have been upgraded from early testing and expanded the role of photogrammetry. They now provide 60 frames per second (progressive) high-definition quality (1280 x 720 pixel) imagery of the main parachute during all phases of activity, as well as 300 frames per second high-speed imagery of very dynamic events such as the drogue mortar deployment, drogue inflation, main parachute deployment and main parachute reefing stages. Characterization of the optical properties of these cameras, such as focal length, lens distortions and the fine tuning of the exposure settings, have been important aspects of IS&AG support during this period.
At the request of the engineers, IS&AG developed methods for converting video imagery into parachute flight performance parameters, such as fly-out angles, parachute skirt diameters and drogue mortar deployment speeds. This information (along with many other parameters measured with a variety of instruments) is used by engineers to understand and accurately model parachute behavior, drag coefficient and rate of descent. Having good models will improve the fidelity of MPCV simulations of roll control and splashdown impacts.
In the last two years, the tests have evolved to use more realistic drop test vehicles, such as the Parachute Compartment Drop Test Vehicle (PCDTV), which has a realistic parachute compartment. But, with a long body and dart-shaped nose, the Parachute Test Vehicle (PTV) has a capsule shape to mimic the dynamics of the true MPCV (Figure 1).
Figure 1. Images showing the PCDTV on topand the PTV on bottom.
The methods of photogrammetric analysis have also evolved both in technique and in the variety of the investigations. Determination of the fly-out angles (angle between parachute center and centroid of the parachute cluster) and the skirt diameters of the main parachutes have been improved. Previous methods used features at the top of the canopy to provide direct scaling of image features. And, while they included lens distortion corrections, they did not account for image distortions caused by a changing perspective as the parachutes fly out from the center of the cluster, tilting to the side in the wide field of view. A new method was developed to account for this wide perspective while still using only a single camera for analysis. The method assumes the parachutes move on the surface of a sphere of constant radius surrounding the camera because they are tethered to the vehicle (Figure 2).
Figure 2. Diagram illustrating how points on the main parachute skirts can be assumed to lie on the surface of a sphere centered on the vehicle. LR and LS are the lengths of the parachute riser line and suspension lines, respectively, which define the radius of the sphere when an average skirt diameter is assumed.
75

The points on the video image that track the edge of the parachute are used to define vectors in space, which intersect this sphere. This allows the points on the actual skirt to be located in 3-D space relative to the camera, and these points can then be analyzed to determine the inlet area and diameter of each parachute canopy over time (Figure 3).
Figure 3. Parachute diameters versus time for CDT-3-5.
A high-speed camera with a view of one of the two drogue mortars on each test has allowed a measurement of the velocity of the drogue mortar as it exits and travels away from the camera. Figure 4 shows the early moments in the deploy sequence.
The deployment bag containing the parachute is fixed to a rigid and circular mortar lidat the front. (A circular-shaped sabot attached to the back of the bag falls away soon after ejection.) Points on the front lid are tracked, and the apparent diameter of the lid is calculated. Knowing the diameter of the lid and the camera’s focal length allows a distance to the deployment bag to be calculated. The measurement method was verified by recording and analyzing similar images during a ground test at General Dynamics in early 2012. Table 1 shows the mortar speeds measured for five tests.
Figure 4. High-speed camera images showing drogue mortar deploy on Cluster Development Test 3-1). The rigid lid affixed to the front of the drogue deployment bag is used for measuring distance, while the sabot (back-facing lid) comes free and falls to the right.
Table 1. Mortar speeds calculated from high-speed imagery during drogue parachute deploy.
Current and future parachute tests through 2014 will involve an analysis of parachute fly-out angles and diameters. Additional analysis is being done on the dynamics of the main parachute bag deployment.
76

NASGRO - Fracture Mechanics and Fatigue Crack Growth Analysis SoftwareJoachim Beek, Johnson Space CenterRoyce Forman, Johnson Space Center
Structural failure due to the consequences of naturally occurring and service-induced flaws, damage or cracks in a part or structure is the primary threat to the integrity, safety and performance of nearly all highly stressed mechanical structures. Consequences of such failures include serious injury or loss of life, severe environmental damage and substantial economic loss. One such example is the well-known crash of United Airlines flight 232 in Sioux City in 1989, in which the fan disk in the tail-mounted engine ruptured catastrophically at 37,000 feet. The cause was found to be a manufacturing defect in the Titanium disk, which caused a fatigue (see Figure 1) crack to form and grow over a number of flights; this was compounded by maintenance procedures failing to detect the damage.
Under continued active development for over 25 years, NASGRO use has evolved from fracture control implementation on space shuttle primary structure to all critical spacecraft hardware. However, it is developments in recent years that have made NASGRO so powerful and versatile that it is now used in the worldwide aerospace industry, as well as in areas as varied as railroad and ship building. It has received the prestigious NASA “Software of the Year” Award and R&D Magazine’s “R&D100” Award.
Figure 1. Catastrophic failure of United Airlines flight 232’s tail-mounted engine’s fan disk. Crack is visible from top center to lower right.
The NASA-developed NASGRO® fracture mechanics analysis computer program is the standard software tool used by NASA and its contractors for fracture analysis of space hardware and safety-critical ground systems. The importance to NASA is the ready availability of an accepted, accurate and reliable, state-of-the-art code with unmatched analytic capabilities.
Features that make NASGRO unique among fracture mechanics analysis tools include:• a large library of more than 70 crack and damage
models• a database containing fracture properties for
hundreds of metallic materials• a unique crack-growth equation (and seven legacy
equations) able to model onset of growth, small-crack behavior, crack growth-retardation effects and instability
• capabilities to model elastic-plastic loading, failure of glass or glass-like materials under constant loading and critical crack size
NASGRO development continues to be driven by the needs of new aerospace vehicles seeking improved reliability and reduced mass, such as new commercial airliners and NASA’s Multi-Purpose Crew Vehicle (MPCV) by making use of evolving technologies and advanced materials.
Advanced failure criteria are needed to properly address failure mechanisms in applications with short, high-amplitude fatigue loads such as pressure vessels and landing gear. Current models treat the effects of material yielding and crack instability as independent failure mechanisms, but experimental evidence shows these to be synergistic, as well as dependent on geometry thickness. A research program was undertaken in March of 2013 by Johnson Space Center’s (JSC’s) Structural Engineering Division to characterize this relationship and incorporate improved failure models in NASGRO. This program is expected to be completed in 2015.
77

At the opposite end of the fatigue crack-growth spectrum, the fatigue crack-growth threshold (or onset of crack growth) is important in applications subject to many millions of low-amplitude fatigue load cycles, such as helicopters or spacecraft during launch. Improvements to modeling threshold behavior can lead to reduced mass in primary structures, which is critical to spacecraft such as the MPCV. A research program was started in 2012 by JSC’s Structural Engineering Division to answer a question that has recently generated heated debate in the research community: are variations in measured threshold values an artifact of the test methods and environment, or are they indications of intrinsic microstructural events? This research will examine threshold behavior for a number of common aerospace alloys by measuring threshold, examining fracture surfaces with scanning electron microscopes to determine fracture mechanisms and performing analyses to predict the amount of plastic deformation generated during crack growth. This program is anticipated to be completed in 2014.
Many aerospace vehicles are increasingly designed to be constructed from advanced composite materials. These materials offer tailored composition to address specific structural performance needs (such as increased stiffness in one direction over another) while offering operators reduced maintenance costs. One of the important damage mechanisms in composite structure is delamination, or separation of the layers of fibers and binding matrix. Typically, composite structures are certified by resource-intensive and expensive testing of small material coupons and small-scale test articles, leading up to testing of full-scale structure. A development program will be started by JSC’s Structural Engineering Division in 2013 to assess the feasibility of modeling damage such as delaminations by implementing a virtual crack closure technique in a 2-D, anisotropic, layered Boundary Element Analysis method. If successful, such an analysis capability would be incorporated into the NASGRO package and could become a useful and less costly alternative to damage tolerance verification of composite structures.
78

Crew Perspective on Time Delayed Voice CommunicationsMarcum L. Reagan, Johnson Space Center Stanley G. Love, Johnson Space Center
Human exploration of deep space will involve significant speed-of-light delays for radio transmissions between crews in space and flight controllers on Earth. Although command and telemetry delays of minutes to hours are routinely tolerated in the operation of unpiloted spacecraft, NASA has only recently begun to investigate the much less mature field of delayed voice communication between people.
In the last few years, the Engineering Directorate at the Johnson Space Center (JSC) has led investigations of delayed voice communication in high-fidelity simulations of future space exploration missions. These spaceflight “analog” tests are often conducted at remote field sites. They typically include fully staffed control centers, astronauts serving as crew, realistic mission timelines lasting one to two weeks and prototype exploration vehicles and habitats. Analogs have field-tested dozens of emerging technologies, including countermeasures for delayed communication. Analogs that have investigated delayed voice communication include NASA Extreme Environment Mission Operations (NEEMO), Research and Technology Studies (RATS), the Pavilion Lake Research Project and Autonomous Mission Operations. The analogs tested communication using one-way delays of 50, 300, 600 and 1200 seconds, with 50 second (representing a near-Earth asteroid) a common value used by all five.
Consensus reports from the crews of RATS and NEEMO, rated voice communication with a 50-second one-way delay as “borderline acceptable” to “unacceptable.” Ordinary spacecraft communication with a delay of one second or less rates as “totally acceptable.”
Specific challenges with delayed voice can be divided into eight categories: confusion of sequence, when messages “cross in the mail;” interrupted calls, when an incoming message interferes with an outgoing call in progress; time wasted waiting for signals to pass to a remote partner and back; reduced ability of each partner to maintain an accurate mental model of what the other knows and needs to know; loss of awareness, of which transmitted messages have arrived at the remote station; the perception that a conversation partner who does not respond promptly does not care; slow response of the ground team to rapidly changing situations aboard the spacecraft; and generally reduced awareness of the remote party’s situation.
Field testing has identified at least ten suggestions for meeting the challenges imposed by delayed communications. Some of those suggestions include the simple solutions of announcing incoming calls, warning crews if they will need to write down numbers or data, using a common reference time such as Greenwich Mean Time, and adhering to classic radio communications protocols of marking the end of a transmission with “out” or saying “over” if a response is requested.
Finally, in dynamic situations, keeping track of the remote party’s status demands considerable attention. Lapses can have serious consequences, as illustrated in the NEEMO 16 mission, which simulated a medical emergency scenario (a severe allergic reaction) with a 300-second one-way communication delay (see Figure 1). As the case evolved, the crew erroneously deviated from the ground’s unheard instructions. The eventual result was an incorrect simulated medical response in the habitat and a loss of situational awareness in the control center. This scenario demonstrated that in a real emergency, instructions from a disconnected ground team could make the situation on board worse than a crew working alone, and much worse than today’s effective cooperation between the crew and ground. It also shows that proper training and tools will be critical to successfully manage real emergencies in the face of communication delays.
Figure 1. NEEMO 16 medical emergency simulation under a 300-second one-way communication delay.
79

Several analog missions used text messaging along with voice for delayed communication (see Figure 2). Text messaging proved to be a natural and intuitive complement to voice calls that mitigates many of the challenges of delayed communication. Numerous comments were collected from operators involved in field testing with some of the key findings suggesting that text is a preferred method of communicating non-time-critical information and that rapport between the crew and ground teams can also be developed effectively with text.
Extensive ground simulations have uncovered many challenges with delayed voice communication, and also provided opportunities to develop new techniques to meet those challenges. Text messaging, which functions well in everyday life with moderate delays and provides a record of what was said, emerged as an excellent supplement for delayed voice. Future mission simulations will continue to investigate the problems of voice communication over great distances. JSC is also preparing to test delayed voice and texting aboard the International Space Station (ISS), in preparation for future simulations of deep space exploration missions to be carried out aboard the orbiting outpost. Text messaging capability between ISS crews and ground controllers is expected to come online in the summer of 2013, with delayed voice channels to follow.
Figure 2. “SciCom” Dean Eppler communicating with the crew via text during RATS 2012.
Although field testing has identified many benefits associated with the use of text messaging along with voice for delayed communications, text messaging can distract people from other, more critical tasks. “Don’t text and drive” will apply in space as well as on Earth. For critical operations, crews recommended assigning one person to act as a filter for both voice and text communication, passing on information to his or her nearby crewmates as needed.
Features that were suggested for a space-to-ground operational text messaging application include multiple single-topic “chat rooms,” time stamps and read receipts, an actively updated indication of a live link and a new-message notification feature that can be turned off if necessary.
Even with best practices for voice calls, plus the capability for text messaging, crews and controllers in delayed-voice tests found communication challenging. Their recommendations for tools and techniques to further improve delayed voice communication included keeping meticulous records of the time at which every call was made, implementing instant-playback capability or automatic text transcription for all communication, and starting a timer whenever a message is transmitted.
80

Solving Problems for Spacewalking Astronauts from Small Micrometeoroid and Orbital Debris ImpactsE.L. Christiansen, Johnson Space Center D.M. Lear, Johnson Space Center
The external handrails used by the International Space Station (ISS) crew during an extravehicular activity (EVA) are exposed to micrometeoroid and orbital debris (MMOD) impacts that cause craters that have raised edges, called “crater lips” (Figure 1). These crater lips are often very sharp and represent an EVA cut-glove hazard. There have been several cases of craters reported on ISS handrails. For instance, the Johnson Space Center (JSC) Astromaterials Research and Exploration Science (ARES) Directorate Hypervelocity Impact Technology (HVIT) group identified six craters on a single 13.7-inch-long handrail from an ISS pump module (PM) returned on the last space shuttle mission, STS-135. This PM handrail was exposed to MMOD impacts for 8.7 years. The largest crater on the PM handrail measured 1.85mm diameter (outside), with a 0.33mm lip height (Figure 2). The size of the other five craters ranged from 0.12mm to 0.56mm in diameter, with crater lips that ranged from 0.01mm to 0.08mm high. Other MMOD craters have been observed on ISS handrails and EVA tools (Figure 3).
Figure 1. MMOD impact craters into metals typically exhibit raised, sharp-edged “crater lips.”
Figure 2. Six craters were found by the JSC Hypervelocity Impact Technology Group on one handrail removed from the ISS Pump Module Integrated Assembly (PMIA) and returned on STS-135. Largest crater found on the PMIA handrail (#38 in overview) was 1.85mm diameter with 0.33mm-high crater lips.
Figure 3. Nearly 5mm-diameter crater found by ISS crew on the EVA D-handle tool stored externally on ISS, prior to STS-123 EVA. Note that the detached spall from the side opposite the MMOD impact crater also has sharp edges. The D-handle is made from similar materials as typical ISS dog-bone handrails.
81

If the crater lips from hypervelocity impacts are large enough, they can tear or cut into the materials used in the EVA gloves. Crater lip heights of 0.01 inch (0.25mm) were found to be sufficient enough to cut EVA glove materials in ground experiments coordinated by the NASA EVA Engineering community. These experiments were performed after there were several incidents of cut gloves reported for EVAs during STS-109, STS-110, STS-116, STS-118, STS-120, STS-125 and other missions. Some of these glove cuts were large enough to result in early termination of the EVA. For instance, on STS-118 during a routine glove inspection, one of the EVA crew members noticed a possible tear on the thumb of his left glove. To be safe, EVA managers decided to end the spacewalk after about 5.5 hours, and examination and photography of the glove performed during suit removal revealed the extent of the glove tear (Figure 4). A similar incident occurred during the third EVA of STS-120. MMOD craters are not the only possible cause for these glove damages, but are one of the leading possible causes.
The JSC ARES Directorate’s HVIT group in the Human Exploration Science Office and the Engineering Directorate’s Crew and Thermal Systems Division, under the leadership of the EVA Project Office, worked together from 2008 to 2012 to assess the risk of cut gloves from MMOD craters on handrails and develop methods to identify and repair craters on handrails.The HVIT provided assessments of the frequency of craters with lip heights that could result in glove damage and worked with the NASA White Sands Test Facility (WSTF) to provide samples of realistic hypervelocity impact damage to handrails to help support development of the tools and procedures used to find and repair damage to handrails. HVIT/WSTF impact tests in 2011-2012 on handrails were used to provide samples of impact damage on handrails to certify handrail covers that EVA crew members fit over impact damages as they are located, which prevent gloves from being torn by the MMOD craters.
Figure 4. Damage to the left glove of one of the EVA crew members after STS-118 EVA #3.
This effort culminated in a number of changes to EVA hardware and proceduresto minimize the risk from sharp edges that could cut the EVA gloves, including:
1. Toughening the gloves by adding additional materials to areas sensitive to cuts.
2. Monitoring the status of the handrails for MMOD impacts via photographs and maintaining a database of potential sharp edges on handrails for EVA planning purposes, referred to as the ISS Imagery Inspection Management System (IIIMS). HVIT and Image Science and Analysis Laboratory personnel jointly review photographs of ISS handrails and other surfaces to identify MMOD damage that is documented in the IIIMS database and used to inform EVA crews of potential sharp edges during EVA planning. Currently, the IIIMS contains more than 200 records of MMOD impacts to handrails and other areas that could be contacted during EVA.
3. Developing EVA procedures and tools to detect and repair or cover sharp edges from MMOD impacts on handrails.
4. Since the above changes have been incorporated in EVA hardware and procedures, incidents of cut gloves have been greatly reduced.
82

Stiffness Characteristics of Foams for Applications Requiring Exposure to Harsh Space EnvironmentsGabriel Ortiz-Sanchez, Johnson Space Center Erica S. Worthy, Johnson Space Center
The Structural Engineering Division within the Engineering Directorate at the Johnson Space Center has been supporting the evaluation of several commercial-off-the-shelf foams. The selected foam will be certified and incorporated into the Japanese Experimental Module (JEM) On-orbit Replaceable Unit (ORU) Transfer Interface hardware, better known as JOTI (see Figure 1).
Several foams for the side cushions used in the JOTI design were evaluated from February 2012 to July 2013. The selection criteria for the foam material were flammability, thermal-vacuum stability and environmental stability. The latter refers to material characteristics such as resistance to moisture, humidity, fungus, radiation and immunity to attack by LEO reactive constituents such as atomic oxygen. Since the JOTI will be inside JEM, toxicity and odor are additional material concerns. Requirements such as operational temperatures, foam density, dimensional stability and cushion performance for the design were also considered. A review of technical reports to use various open-celled foam materials for space applications and the Material and Processes Technology Information System were used to identify potential candidates. The foams evaluated are shown in Table 1.
Figure 1. Japanese Exploration Agency (JAXA) slide table, JOTI hardware and foam location.
The JOTI is a mechanical interface to the existing slide-table located in the JEM Pressurized Module Airlock and is designed to provide the International Space Station (ISS) a way to transfer internally stored Canadian Robotic Arm-compatible ORUs outside the ISS. The hardware is intended to be delivered to ISS during the summer of 2013. JOTI is a stroke-controlled clamping system, meaning that the final force applied to the ORU is based primarily on clamping stroke, areas of contact and the stiffness of the foam. The purpose of the foam is to prevent damage to sensitive payload surfaces and provide load compliance as the JOTI wall travels a set stroke against the payload.
The foam will be covered with beta cloth material to protect it from space environmental effects such as atomic oxygen, plasma and radiation. The materials and processes selected for the JOTI design must be suitable for use in the terrestrial and low-Earth orbit (LEO) environment and must not pose an external contamination threat to the ISS. Materials with a proven space pedigree were selected to the greatest extent practicable. This approach reduces the risk of failure due to material degradation.
Table 1. Description of foams evaluated.
83

Several factors affect the foam stiffness. The primary on-orbit environment is thermal exposure, combined with cyclic compressive loading conditions. Pressure and humidity have been taken into consideration. The down-selection of the foam was separated into the following phases: inspection by density and manufacturer-provided properties, compression tests at room temperature, evaluation by humidity exposure, lifecycle testing, geometry effects and vacuum exposure.
Soft foam is required to limit the clamping forces transmitted to the payload. By inspection, Densified® HT, Basotect® G+ and Crest® 5250 were eliminated due to their higher stiffness at room temperature in comparison to the other candidates. ASTM D3574 was tailored to better represent the application. Compression tests were performed on samples of Bisco® BF-2000 and BF-1000. Both these specimens were eliminated due to their relatively high stiffness. From the compression tests at low humidity, Pyrell® foam showed a significant stiffness increase from ambient when exposed to -100˚F. For a stroke of 0.125 inches, an output reading of 270 pounds-force (lbf) was obtained. Cryogenic tests demonstrated a glass transition temperature for Pyrell® at approximately -20˚F. Interestingly, the foam returned to its normal condition at room temperature. Solimide® AC-530 and Willtec® melamine foam were the two best candidates, as both had the lowest stiffness increase at cryogenic exposure.
Solimide® AC-530 and Willtec® melamine foams were tested for repeated loading performance. The test configuration (see Figure 2) helped to understand geometry effects from surrounding material to the compression area and surface stiffness from the beta cloth wrapper. Solimide® AC-530 presented higher stiffness over the entire stroke during the first compression cycle, but a significant reduction over subsequent compressions. Willtec® also resulted in the first compression cycle having a higher stiffness. Peak loads with this configuration increased by a factor of two when compared with previous tests.
Figure 2. Lifecycle test configuration with Solimide® AC-530 specimen.
The vacuum exposure test consisted of a specimen pre-compressed at ambient pressure to a solid height of 0.5 inches and then exposed to vacuum while reading expansion force. During both the de-pressurization and re-pressurization phases, a ±0.25 lbf load change was seen in both samples. When compared with baseline data, it was concluded that the delta load was likely be induced by the instrumentation. No evident change in volume was observed on the specimens. Willtec® foam has a history of off-gassing concerns and was eliminated as a candidate.
From the foams evaluated, Solimide® AC-530 was selected for this particular application due to its superior performance during the down-selection process. The final test program of the selected foam was separated into the following phases: a) engineering evaluation - sample cyclic loading compression test and full-size foam wrapper compression test; b) certification - sample size foam vacuum test and sample size thermal/cyclic loading foam compression test.
For the engineering evaluation cyclic test, a new specimen of Solimide® AC-530 presented, once again, a higher stiffness over the entire stroke for the first compression cycle, but at cycle number five, the test data showed more stable. The beta cloth surface tension did not present a major impact in load readings when compared against geometry effects (perimeter of foam versus compression area).
Per certification testing, the life of foam is shown to be good for 64 uses assuming a compression stroke per foam wall of no more than 0.25 inches. No data is available for compression strokes above 0.25 inches considering the flight foam batch with the corresponding pre-conditioning on it. Pre-conditioning resulted in a linear behavior for the foam under the tested stroke of 0.25in at +75°F and +135°F. Data demonstrated that the foam has a non-linear behavior at -135°F up to the 0.2-inch stroke. Foam showed to be predictable for the entire 132 loading cycles as tested. During the evaluation process, it was concluded that the likelihood of high humidity trapped inside the foam while in space is remote due to the high vacuum. Humidity effects at cold temperature were subsequently invalidated as a test case for this application.
As part of the vacuum performance test (test configuration shown in Figure 3), it was learned that the open-cell foam and beta cloth evaluated is not directly affected by a stable pressure environment. No evident change in volume was observed on the specimens.
84

Figure 3. Test fixture configuration and specimen for vacuum test.
The development and qualification test program for the JOTI application and representative test data are provided as guidelines for future foam applications.
85

Sub-Scale Re-entry Capsule Drop Test via High-Altitude BalloonRon Sostaric, Johnson Space Center Nicole Dawkins, Kennedy Space Center
High-altitude balloon flights are an inexpensive method used to lift payloads to high altitudes. Federal Aviation Administration (FAA) regulations permit payloads of up to 6 pounds without requiring any waivers or special permissions. Using such a balloon flight capability, the Rocket University program at Kennedy Space Center (KSC) collaborated with the Aeroscience and Flight Mechanics Division within the Engineering Directorate at Johnson Space Center to perform test flights of a sub-scale version of the Maraia Entry Capsule. The Maraia Capsule is envisioned as an entry technology testbed that could be adapted to return small payloads (10s to 100s of kg) from the International Space Station (ISS) or other beyond low-Earth orbit (LEO) destinations.
The main test objective is to gain insight into the aerodynamic and dynamic properties of the capsule in the subsonic regime. The capsule has been scaled accordingly, resulting in a test article 10 inches in diameter by approximately 6.5 inches tall at the 6-pound weight limit. Secondary test objectives include testing subsystems (e.g., avionics; parachutes; and guidance, navigation and control [GN&C] subsystems) planned for use in future larger-scale flights, as well as training and gaining overall experience in all aspects of designing, developing and testing spaceflight systems. JSC is serving as the principal investigator (PI) for this work, and is also responsible for parachutes, GN&C, aerodynamics and detailed simulation analysis. KSC is providing the flight platform, avionics, software, manufacturing, communications, operations planning and execution.
Figure 1 shows the drop-test concept of operations. A priori winds and trajectory predictions are used to determine a launch location so that the trajectory and predicted landing location is desirable for safety and recovery purposes. The balloon is filled on the ground, and payload lines are laid along the predominant ground wind direction. The system is launched from a large open area to minimize the risk of entanglement and jerking of the lines and payloads.
Figure 1. Concept of operations.
The balloon ascends for one to two hours, depending upon payload mass and fill volume. Once above an altitude of 70,000 feet (ft), a release command is issued when trajectory predictions show that the capsule (aeroshell) will land within the landing zone (or when they are closest to the zone, based on real-time trends). The capsule descends in free fall to 50,000 ft, at which point an autonomous command is sent to deploy the parachute. (The ground operator may also manually issue a parachute deploy command at any time.) The capsule then descends and lands, with an approximate terminal velocity of 38 ft/second.
A separate release command is issued for the Rocket University payload, which contains its own avionics, when landing predictions are such that it is desirable for the payload to separate from the balloon and land. (Note: On Flight 1, this command was issued simultaneously for both payloads. Future flights will permit separate commands for better control of payload landing locations.) The parachute system for the Rocket University payload is an inline, pre-deployed system that inflates as the payload descends. The balloon then ascends (now more quickly, with less payload attached) and bursts at (very approximately) 115,000 ft, and is not recovered.
86
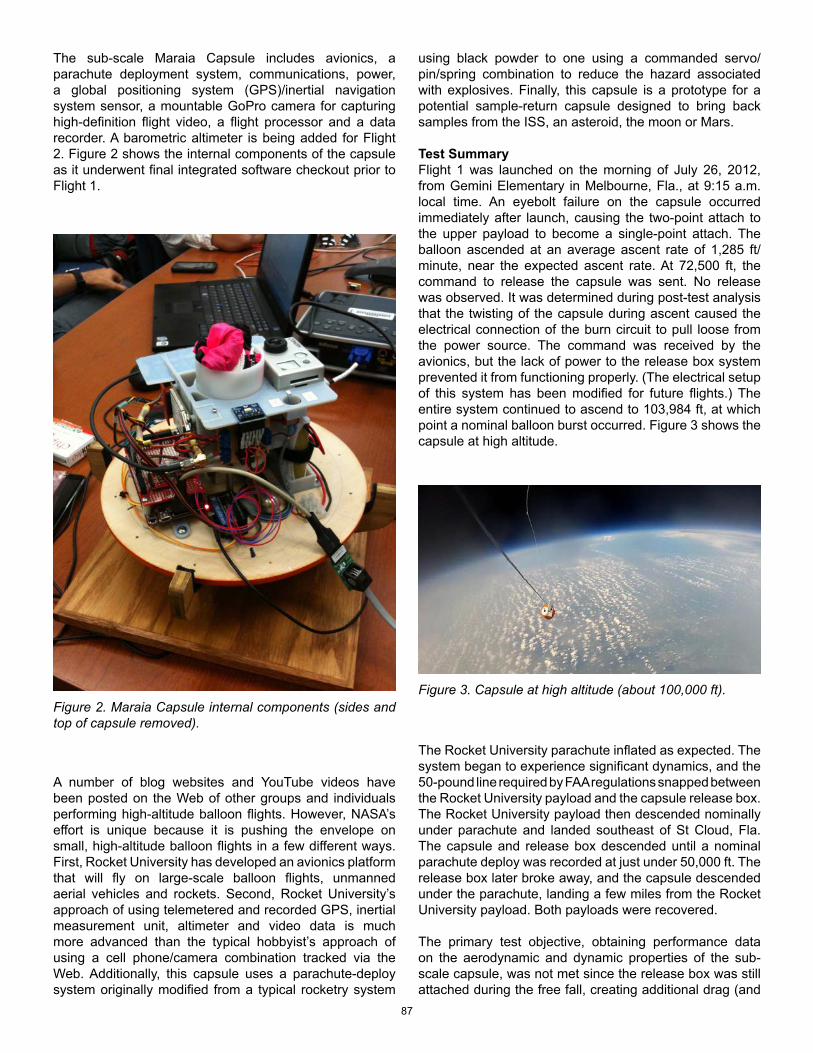
The sub-scale Maraia Capsule includes avionics, a parachute deployment system, communications, power, a global positioning system (GPS)/inertial navigation system sensor, a mountable GoPro camera for capturing high-definition flight video, a flight processor and a data recorder. A barometric altimeter is being added for Flight 2. Figure 2 shows the internal components of the capsule as it underwent final integrated software checkout prior to Flight 1.
Figure 2. Maraia Capsule internal components (sides and top of capsule removed).
A number of blog websites and YouTube videos have been posted on the Web of other groups and individuals performing high-altitude balloon flights. However, NASA’s effort is unique because it is pushing the envelope on small, high-altitude balloon flights in a few different ways. First, Rocket University has developed an avionics platform that will fly on large-scale balloon flights, unmanned aerial vehicles and rockets. Second, Rocket University’s approach of using telemetered and recorded GPS, inertial measurement unit, altimeter and video data is much more advanced than the typical hobbyist’s approach of using a cell phone/camera combination tracked via the Web. Additionally, this capsule uses a parachute-deploy system originally modified from a typical rocketry system
using black powder to one using a commanded servo/pin/spring combination to reduce the hazard associated with explosives. Finally, this capsule is a prototype for a potential sample-return capsule designed to bring back samples from the ISS, an asteroid, the moon or Mars.
Test SummaryFlight 1 was launched on the morning of July 26, 2012, from Gemini Elementary in Melbourne, Fla., at 9:15 a.m. local time. An eyebolt failure on the capsule occurred immediately after launch, causing the two-point attach to the upper payload to become a single-point attach. The balloon ascended at an average ascent rate of 1,285 ft/minute, near the expected ascent rate. At 72,500 ft, the command to release the capsule was sent. No release was observed. It was determined during post-test analysis that the twisting of the capsule during ascent caused the electrical connection of the burn circuit to pull loose from the power source. The command was received by the avionics, but the lack of power to the release box system prevented it from functioning properly. (The electrical setup of this system has been modified for future flights.) The entire system continued to ascend to 103,984 ft, at which point a nominal balloon burst occurred. Figure 3 shows the capsule at high altitude.
Figure 3. Capsule at high altitude (about 100,000 ft).
The Rocket University parachute inflated as expected. The system began to experience significant dynamics, and the 50-pound line required by FAA regulations snapped between the Rocket University payload and the capsule release box. The Rocket University payload then descended nominally under parachute and landed southeast of St Cloud, Fla. The capsule and release box descended until a nominal parachute deploy was recorded at just under 50,000 ft. The release box later broke away, and the capsule descended under the parachute, landing a few miles from the Rocket University payload. Both payloads were recovered.
The primary test objective, obtaining performance data on the aerodynamic and dynamic properties of the sub-scale capsule, was not met since the release box was still attached during the free fall, creating additional drag (and
87

stability). However, all secondary test objectives were met, including successful autonomous parachute deployment, demonstration of avionics and GN&C in flight, execution of ground commands in flight and observation of system response and recovery of both payloads.
Flight 2 was launched on April 24, 2013, from WW James Park in Titusville, Fla., at 10 a.m. local time. A severe dynamic event occurred at 65,000 ft during the ascent, causing the tether line to break and the capsule to separate prematurely. A clean capsule free fall was not achieved, as the release box stayed attached to the capsule. Both payloads were recovered in the water near the target landing zone, southeast of Jetty Park (near Port Canaveral). Intended capabilities added from the first flight to the second included 1) separate control over the release timing of each payload (not demonstrated successfully), and 2) real-time video downlink via S-band transponder on the Rocket University payload to permit remote monitoring via the Web (which did work). Upgraded avionics and software (to be used on the subsequent full-scale balloon flight) were successfully verified.
A full-scale (150-pound) Maraia Capsule high-altitude balloon drop test is planned for August 2013 near Ft. Sumner, N.M. This series of flights, along with other ongoing ground-based development activities, will hopefully lead to full development of an entry technology testbed version of the Maraia Capsule. The objective of this testbed is to test entry, descent and landing technologies needed for future missions through the entire flight regime, from LEO to touchdown.
Rocket University is continuing to fly high-altitude balloon flights, but intends to successfully demonstrate the release system before resuming further payload flights.
88

Development Testing of the Capsule Parachute Assembly System (CPAS)
Christopher Johnson, Johnson Space CenterRicardo Machin, Johnson Space Center
Michele Parker, Johnson Space CenterRilla Wolf, S&K Global Solutions
The Capsule Parachute Assembly System (CPAS) for NASA’s new Multi-Purpose Crew Vehicle (MPCV) spacecraft will be the largest human-rated parachute system ever designed by the United States or any other country. Johnson Space Center’s Engineering Directorate is leading the development of this system through the CPAS project.
The CPAS consists of four types of parachutes: forward bay cover parachutes, drogues, pilots and mains, as shown in Figure 1.
Figure 1. Capsule Parachute Assembly System.
The first parachutes to appear are the three forward bay cover (FBC) parachutes that help pull off the FBC safely, uncovering the remainder of the parachute system. Approximately two seconds later, mortars deploy two 23-ft-diameter drogue parachutes to stabilize and decelerate the spacecraft from initial deploy conditions to the proper state vector for hand-off to the next parachutes. The drogues inflate in stages to control loads and are held full-open until the vehicle reaches the appropriate altitude for main parachute deployment. Next to deploy, also by individual mortars, are three 9.8-foot-diameter pilot parachutes, which each quickly extract one of the three large main parachutes. The main parachutes, each 116 feet in diameter, also inflate in stages to control the loads. The
mains then remain with the capsule until splashdown, at which point they are released by the spacecraft avionics.
A Challenging EndeavorThere are many challenges associated with the MPCV parachute system. For example, the system must use materials that can handle the extreme demands of space flight. It must assemble itself in mid-air and perform across a broad range of flight conditions. The system must also be fault-tolerant, able to successfully perform even if a part of the system, such as a main parachute, fails. Additionally, the entire system must adhere to strict weight requirements while safely landing the more-than-20,000-pound capsule with only one drogue and two main parachutes.
Verifying the DesignParachutes have aspects that are predictable, such as how the spacecraft will hand off to the parachutes: Mach number, altitude, etc. They also have aspects that are unpredictable, such as the actual parachute extraction from a confined space and parachute inflation: how the pressure distribution spreads the canopy apart.
Verification of the unpredictable design aspects relies on past experience and system demonstration via airdrop tests. Regarding the more predictable variables, the parachute system must successfully perform throughout a broad range of deployment conditions such as various altitudes, attitudes and rates, dynamic pressures, and Mach numbers. However, because of the randomness of parachute performance, showing that the CPAS works for the maximum or minimum value of each variable does not validate that it will work for all dispersed combinations. Thus, a key component of design verification depends on mathematical modeling anchored to testing.
Full-scale testing is performed to gather data on a vast quantity of system factors. Then engineers reconstruct the test data to create models that will describe the critical elements of parachute performance. The models then allow the CPAS team to extrapolate system performance for the extensive range of deployment conditions associated with human spaceflight. More than 90 percent of the CPAS requirements will be verified via mathematical models anchored to system development and qualification testing.
89

Figure 2. Sequence of test vehicle extraction and separation.
Air Drop Testing The CPAS team has developed innovative test techniques to make air drop tests more affordable while accommodating full-scale spacecraft size and mass constraints.
The Apollo program conducted air drop tests of boilerplate capsules – simulators of the size and mass characteristics of the Apollo Command Module – employing a dedicated C-133 aircraft modified to drop the capsules directly from the belly of the aircraft, an expensive endeavor.
In more recent testing series, readily available techniques use helicopters to lift spacecraft articles for system-level testing. However, because of the MPCV capsule’s mass – 30 percent heavier than the SpaceX Dragon capsule – and because model validation cannot be accomplished with the data that would be generated from using helicopters (sufficient velocity cannot be attained) CPAS full-scale testing cannot use this technique.
Thus, the CPAS team invented new test techniques utilizing available, unmodified US Air Force aircraft to conduct full-scale system testing at desired altitudes and environments.In the CPAS-invented technique (see Figure 2), a test
vehicle is mated to the CPAS Pallet Separation System (CPSS) and loaded into a C-130 or a C-17 aircraft. Once the aircraft reaches the appropriate altitude, two extraction parachutes pull the combined pallet system and test vehicle out the rear of the aircraft. Using avionics that measure the mated vehicle extraction performance, the test vehicle is separated from the CPSS at the optimum point to safely deploy the test vehicle programmer parachutes. While the CPSS pallet system descends to the ground on its own recovery parachutes, the programmer parachutes are deployed to deliver the test vehicle to proper position and test flight conditions (e.g., attitude and rate of descent). The programmers are then cutaway and the CPAS deployment sequence begins.
Test Vehicles and EquipmentTwo different test vehicle shapes, shown in Figure 3, are used to create test conditions that cannot be tested simultaneously (i.e., with the same test vehicle).
Figure 3. Capsule- and dart-shaped test vehicles.
A capsule-shaped vehicle creates proper air recirculation (wake) behind the spacecraft required to assess drogue parachute performance; however, this vehicle shape cannot descend quickly enough to represent specific flight dynamic pressures. A dart-shaped vehicle can create high dynamic pressures; however, the wake created by the dart does not allow proper drogue assessment.
90

Thus, using the two vehicles in different tests allows modeling to confidently represent the full range of flight conditions.
Using innovation to improve affordability, the CPAS Project also uses CPAS flight components in place of other parachutes required for the test technique where feasible, such as using CPAS parachutes as test vehicle programmers and CPSS recovery parachutes as shown in Figure 4. These serve as opportunities to evaluate design changes before incorporating them into the Engineering Development Unit (EDU) CPAS parachutes.
Figure 4. CPAS components used as programmer and recovery parachutes.
Testing Success Using these innovative test techniques, the CPAS Project has performed 10 successful EDU air drop tests as of July 2013. To attain human-rating certification for the MPCV CPAS, the project team will complete 15 additional development and qualification airdrop tests for a total of 25 system-level tests prior to the first manned mission.
91

Developing Rotary Blade Landing Technology
Jeffrey D. Hagen, Johnson Space Center Brent A. Evernden, Johnson Space Center
A team from across the Johnson Space Center (JSC) Engineering Directorate, led by the Structural Engineering Division along with university collaborators, have been developing and demonstrating rotary wing-based, rigid, deployable and aerodynamic decelerator technology for potential use in future spacecraft descent and landing applications. While the International Space Station (ISS) has expressed interest in being an early adopter of the technology for its sample return efforts, new entry decelerator technology is seen as potentially applicable to any launch or reentry system required to perform survivable landings on bodies with sensible atmospheres. Current research is focused on six primary areas: in-flight rotor spin-up; rotor counter torque control; auto rotation landing; rotary wing flight of reentry capsule configurations; rotor blade deployment; and rotor blade telescoping.
1) Deployable rotary wing systems use the entry vehicle’s kinetic energy of descending flight to aerodynamically energize the rotor system from a zero rotational energy state to sufficient rotational speed to maintain controlled flight. Because the bulk of traditional rotary wing flight experience has been with systems that energize the rotor wing prior to initiating flight, the team conducted very low cost preliminary investigation of in-flight rotor spin-up. A small scaled experimental test article (shown in Figure 1), constructed using rapid prototyping techniques and commercial parts, was drop tested in an indoor nine-floor test facility at JSC during 2011.
Figure 1. Small rotary wing test article.
By forgoing expensive flight control systems, a tensioned guide wire and external recovery system enabled initial testing to quickly focus on the rotor system spin-up without the cost and complexity of controlled flight and landing. Local access to a nine-story drop space enabled rapid development and validation of the test articles, but this limited drop height and restricted the available flight time and scope of investigation. Accordingly, during 2012, the guide wire and recovery system were duplicated in the Vehicle Assembly Building (VAB) at KSC (Kennedy Space Center), greatly expanding the available flight time and experimental opportunity. Valuable insights were gained into the relationship between blade pitch angles, rotational acceleration and velocity, as well as validating this ultra-low-cost test methodology and setup. Test-article modifications were made to more accurately represent potential relative rotor system and capsule geometry at the moment of initial spin-up, but remain untested at this time.
2) Use of conventional rotorcraft counter-torque systems in typical spacecraft applications is both undesirable and unnecessary due to mass, deployment complexity issues and because autorotation systems traditionally require an engine to apply torque to the vehicle to counteract a limited amount of torque reaction due to rotor bearing and control system friction. Preliminary investigations conducted in 2012 of a passive control vane system for management of such residual rotor torque indicated that it would be suitable for a spacecraft-type deployable rotor system. A small, very low-cost, scaled demonstrator was developed by modifying an inexpensive hobby helicopter kit with additional commercial and rapid prototype parts (shown in Figure 2).
Figure 2. Small-scaled remote-controlled demonstrator.
92

Proof-of-concept testing was conducted by again using the JSC Building 49 drop test facility initially, and then expanded to the KSC VAB drop test facility. The testing successfully demonstrated the viability of a control vane concept to manage the counter-torque issue, as well as demonstrated the adaptability of the drop test methodology for low-cost investigation of additional aspects of deployable rotor-landing technology development. This testing also yielded valuable insight into effective control vane design and operation.
3) Auto rotation landing systems have the potential to achieve fully decelerated landings using stored rotational energy of the rotor system without the need for external energy input prior to landing, which may be suitable for some spacecraft applications. Accordingly, the small-scale commercial-off-the-shelf-based test article described above was also designed to demonstrate this passive landing capability during the same drop testing. Control of the landing terminal deceleration was achieved with manual activation via radio command link, with some success achieved in these initial demonstrations, as well as gaining significant understanding necessary for expanded testing. A larger-scale free flight auto rotation landing demonstrator is in work, but has not yet reached full testing of unpowered landings.
4) Some basic flight performance testing of rotary wing systems integrated with reentry capsule shapes is known to have occurred in the past, but to date, little of the testing experience is presently accessible. Starting in 2011, a small-scale, remote-controlled free-flight demonstrator was constructed using consumer hobby components and rapid prototyping. For expediency and reduced testing cost, this article was designed with a test configuration unique, self-powered capability for independently reaching auto-rotation test initiation altitudes. In order to achieve the self-powered phase of flight without a conventional rotorcraft counter torque system, the test article was also designed with a test-unique active counter torque system, which consisted of consumer hobby-ducted fans in place of the passive control vane system discussed earlier. The ultimate intent of the test article is to demonstrate and understand auto rotation flight and unpowered landing of a capsule configuration vehicle, which required adding a bi-directional capability to the counter torque fan system. During 2012, considerable difficulty was encountered when modifying the consumer hardware for bidirectional control and achieving sufficient counter-torque thrust due to shortfalls in claimed consumer hardware performance. However, these problems were eventually overcome, allowing for demonstration of powered free flight in the preliminary configuration and to commence auto-rotation attempts. Full autorotation demonstration, as well as installation of the capsule aero shell simulator, remains in work.
5) Starting in 2011, student design teams from Rice University began developing a prototype rotor deployment
ground test article. The initial test article configuration was designed for measurement of aerodynamic loads on the blades set to varying angles of deployment from the capsule body during simulated airflow testing behind an airboat. Preliminary results from testing in 2012 appeared to follow expectations from initial Computational Fluid Dynamics (CFD) analysis at notional full scale from 2011. Subsequently, the test article was redesigned by the next Rice student class and upgraded for aerodynamically driven deployment of the blades, as well as more robust testing and richer data collection. During initial testing in the spring of 2013, an airboat was again used as a simulated wind source for test article development and proof of concept. This was followed by actual wind-tunnel testing conducted in cooperation with Texas A&M University in their Low Speed Wind Tunnel facility (see Figure 3) to measure aerodynamic forces during initial deployment and demonstrate aerodynamically driven deployment in a scaled configuration (though at lower speeds than actual flight conditions).
Figure 3. Low-speed wind tunnel testing.
Initial results uncovered non-obvious and non-trivial aerodynamic details of importance to rotor deployment, confirmed expectations from the prior CFD analysis, as well as provided initial confirmation of feasibility and provided a necessary basis of understanding of deployment aerodynamic issues needed for future design iterations.
6) Detailed design and analysis of a blade telescoping ground demonstrator test article and test facility was also conducted during 2012. Design and analysis of an initial, notional telescoping blade structure and bearing system concept showed promise for overcoming the issues of load transfer and friction while remaining compatible with system packaging requirements. Understanding was gained of the unique requirements for designing an airfoil structure suitable for telescoping packaging and in-flight deployment, and preliminary design concepts were developed. Detailed design and analysis of a ground test stand and rotor hub system, with telescoping deployment actuation and control systems, were conducted in 2012.
93

These items were tailored for testing of the initial telescoping rotor blade concept, but were designed with a generic capability for testing of future telescoping blade concepts as well. These test article (shown in Figure 4) and test rig elements were approaching readiness for manufacturing in 2012-2013 for use in future test and evaluation phases.
Figure 4. Ground demonstration test article.
These demonstration and test activities undertaken and continued into early 2013 successfully addressed the highest-priority technology-risk items identified as key to enabling development of deployable rotor systems as a spacecraft recovery method. No insurmountable obstacles or surprises have been encountered to date, and results so far appear promising for future development. When brought to a sufficient level of technical maturity, deployable rotor landing technology is potentially applicable to most conventional reentry capsule and recoverable rocket stage configurations. Awareness of the benefits and status of the technology will enable such projects to position for potential future design upgrades to incorporate rotor landing, which has the potential to offer game-changing improvements to safety and economy of operation of space transportation systems. Concerted investment could advance the technology to readiness for operational applicability in the 5- to 10-year time frame. In the near term, this is an area where the JSC Engineering Directorate is interested in discussing and exploring partnering opportunities to continue this effort.
94

Correlation of Direct Localized Resistivity Measurements with Fiber Damage in Bare IM7 Carbon Fiber TowsNathanael Greene, NASA Johnson Space CenterDaniel Wentzel, NASA White Sands Test Facility
Regor Saulsberry, NASA White Sands Test FacilityIgor Sevostianov, New Mexico State University
Nondestructive evaluation (NDE) and nondestructive testing (NDT) are used thoughout industry and government to evaluate the integrity of materials, components, and systems and accomplish physical property characterizations. These techniques are invaluable because of their unique ability to screen for defects and accomplish other material characterizations without damage. One category of components that has received extensive attention is carbon composite overwrapped pressure vessels (COPVs) using epoxy matrix. These vessels provide a significant weight savings over even the higher performing metal vessels. The vessels can, however, experience a phenomenon know as stress rupture when they fail below the normal rated burst pressure after being left pressurized at high stress ratios for extended periods. The COPV technical community has sought to understand and predict stress rupture, but despite years of effort, damage accumulation resulting in the failure mode is still difficult to evaluate.
In the search for a viable NDE technique to understand and predict stress rupture of COPVs, NASA has employed many different techniques including acoustic emission (AE), ultrasonic testing (UT), eddy current, X-ray, fiber Bragg grating (FBG), and a host of other NDE methods. The success of these various techniques has been mixed, and a reliable method to characterize damage progression in COPVs is still needed. One method under evaluation is direct measurement of the materials’ electrical resistance. This method has proven successful in characterizing homogeneities in metals, and because of carbon’s electrical conductive properties, it has been hypothesized that similar analysis could also prove successful. In addition, previous work in composites has been able to correlate resistivity measurements to damage in carbon/epoxy composites. This research effort was carried out from August 2012 to February 2013 at both the Department of Mechanical Engineering at New Mexico State University and NASA Johnson Space Center (JSC) White Sands Test Facility’s (WSTF) Materials and Components Laboratories. It demonstrated the feasibility of performing resistance measurements in bare carbon fiber tows and identified a relationship between the percentage of surviving filaments and localized resistivity. More testing is needed to further validate the results and establish usable techniques.
By monitoring the resistance measurements of bare HexTow® IM7 (Hexcel Corporation, Stamford, CT) carbon fiber tows as the sample is under load it is possible to gain insight into changes in the material as the sample progresses to failure. Micro-mechanical changes relating
to mechanical properties are observed based on cross-property correlations and macro scale changes are observed based on the number of surviving filaments.
Locations of high resistivity were correlated visually with damage sites (Figure 1), and areas of localized damage were detected based on an increase in localized resistance. In addition, a theoretical model based on the cross-sectional area was developed that shows how the resistance of a 1 cm segment of tow changes as filaments are broken (Figure 2).
Figure 1. Visible damage in top half of strand and significant damage at 6 cm where the highest resistance was measured.
95

Figure 2. Progression of resistance measurements to failure (266.9 Newtons [N]) of two strands and the theoretical breaking point (3.18 ohms).
As seen in Figure 2, it appears possible to correlate to the number of remaining continuous filaments based on the resistance measurement and breaking force.
Many opportunities exist for future work. This analysis needs to be expanded to include additional samples of bare IM7 tows to make the data statistical significant. In addition, epoxy impregnated tows need to be tested in a similar manner to see how this method of determining damage would work with a composite material. This research is scheduled for completion in fall 2013.
Another area of future effort is application of this technique to different kinds of specimens and damage types. If it is going to be useful for COPVs, this method needs to be used on more complicated geometries such as carbon fiber/epoxy coupons, laminates, etc. After starting with the simplest case to refine the methodology, the method can now be applied to more complicated systems and refined further. In addition, it would be useful for the resistivity measurement findings to be corroborated using various other NDE techniques. Two NDE techniques that have potential to corroborate the resistivity measurements are AE, because of its source location ability and its capability to distinguish between damage mechanisms, and eddy current, because carbon’s conductive flaws can be discerned. Both of these techniques are currently being investigated.
96

Space Power, Energy Storage, and Propulsion
97

Fuel Cell Mass Trade for LOX/Methane LanderAbigail C. Ryan, Johnson Space Center
The fuel cell development program at NASA Johnson Space Center (JSC) within the Propulsion and Power Division of the Engineering Directorate has largely focused on proton exchange membrane fuel cells (PEMFC) for the last decade, as they offer a low temperature and more robust alternative to the alkaline fuel cells used during the Apollo and Space Shuttle programs. JSC has led multiple Small Business Innovative Research (SBIRs) relating to “non-flow through” PEMFC development and has remained the agency leader in fuel cell environmental testing and system integration. JSC has completed several analog demonstrations with PEMFC technology, most recently by providing three kilowatts of power to the Multi Mission Space Exploration Vehicle (MMSEV), a prototype for crewed explorations developed under the Agency’s Advanced Exploration Systems program, during the Research and Analog Test Sites (RATS) 2012 analog test activity.
PEM technology for space applications has improved significantly since NASA began this work, but PEMFC technology has some limitations: 1) They require pure oxygen and hydrogen as reactant, and 2) The waste heat created in the exothermic system must be rejected at a low temperature with a large radiator and is equal to almost two-thirds of the produced power.
To augment NASA’s fuel cell technology portfolio, the Propulsion and Power Division has recently begun researching solid oxide fuel cells (SOFCs) as an alternative to PEMFCs in certain applications. For instance, after showing the volumetric and mass savings of liquid oxygen (LOX) – methane (CH4) lander vs. a traditional LOX – liquid hydrogen (LH2) lander (Fig 1), the Morpheus lander was proposed, designed and built to research LOX/CH4 propulsion. Morpheus is a prototype lander designed and built at JSC under the Advanced Exploration Systems program for conducting future space exploration. The advent of LOX/CH4 as propellant for the Morpheus lander allows NASA to explore the option of using SOFCs, since, unlike PEMFCs, these high-temperature fuel cells can run on “dirty” reactants like hydrocarbon propellant boil-off and residuals. By scavenging leftover and wasted propellant, the fuel cell power system can provide power, independent of the sun, for as long as reactant exists (unlike a battery, which grows in size based on the lengths between recharges, only a fuel cell’s reactant supply need grow for a fuel cell to continue to provide power – Fig 2). In fact, within this study, the fuel cell team quantified that the mass of a battery will surpass the mass of an SOFC at about 40 kilowatt-hour of use – that is, at a 3 kilowatt load, a battery must be recharged at least every 13.5 hours or it will outweigh a 3 kilowatt fuel cell.
Figure 1. LOX-CH4 vs. LOX-CH2 lander comparison.
Figure 2. SOFC vs. battery comparison.
98

Solid oxide fuel cell technology also has a natural fit within the Mars In-Situ Resource Utilization (ISRU) architecture, since the “dirty” reactants created via soil and atmospheric processing can be used in an SOFC system with little ill effect. Further, in a hostile environment like Mars, where sunlight is not always guaranteed (cloud cover, dust storms, etc), a fuel cell as primary power or backup would allow the reactant scavenging operation to continue even when batteries cannot be recharged by the sun. Further, solid oxide technology can be applied to electrolysis as well and aid ISRU missions in creating oxygen out of carbon-dioxide (CO2).
In order to illustrate the mass savings of using an SOFC instead of a PEMFC on a LOX/CH4 lander, a weight trade was performed during the fall of 2012 to compare the size of a PEMFC system and an SOFC system for a three kilowatt, fourteen day mission (Table 1).
Table 1. Mass summary.
In performing this exercise, a few broad takeaways became evident: first, though high temperature operations are often a drawback on earth, the mass difference in needing an active cooling system for the PEMFC versus requiring only a small (one centimeter by one centimeter) radiator for an SOFC system was quite striking when quantified. PEMFCs need to reject waste heat equal to nearly two-thirds of the power they create (in this case, 1780 watts of waste heat for a 3 kilowatt system) due to the waste heat being of low quality (low temperature) and thus not easily useable in other applications. Simple radiation of this waste heat would require a radiator size of about one meter by one meter. A SFOC system, however, creates waste heat at a much higher quality than a PEMFC (about 900-degrees C versus 80-degrees C) and can thus provide this heat for other applications (heating up liquid propellants on their way to the fuel cell, for example). In fact, once the energy of heating the reactants is taken
out, the SOFC still has over 600 watts of heat that could be used elsewhere or radiated out of the small radiator mentioned above. Further, the SOFC system can act as a heat source for other active thermal loops in the Morpheus vehicle. This particular trade study did not quantify the amount of system integration that could occur between power; life support; and thermal, but further studies will undoubtedly show still greater mass savings when an SOFC system, instead of a PEMFC system, is used.
Second, during this weight trade study, the fuel cell team learned that, though using a partial oxidation (PROX) reformer would yield a smaller system mass than using a steam reformer (due to the ability to discard the fuel cell product rather than scrub it of CO2 and recirculate it back into a steam reformer), the oxygen savings when using a steam reformer were beneficial enough to warrant a down-select to the steam reformer. PROX reformers waste about a quarter of the oxygen they intake as a way of turning methane into hydrogen. Steam reformers, however, can theoretically utilize almost all of the oxygen available while only discarding a small amount of CO2. The amount of oxygen saved via steam reforming creates a higher mass savings than a smaller fuel cell system involving a PROX reformer.
For either a PEMFC or an SOFC, it was determined by the team that the structural and volumetric impact to the propellant tanks to account for extra reactant above the residual amount would be minimal: the methane tank total growth would be equal to 0.4 meters cubed, or about 400 liters, while the oxygen tank total growth would be about 0.3 meters cubed, or 300 liters.
Though this weight trade was very successful in teaching the fuel cell team about the mass and volume advantages of using an SOFC on a LOX/CH4 lander, the performance advantages or disadvantages have yet to be quantified. Though collaboration between NASA and the Office of Naval Research, JSC has acquired a one kilowatt solid oxide fuel cell stack to test beginning summer 2013. It is the hope of the fuel cell team that this testing will shine light on the SOFC’s ability to handle frequent load jumps as well as determine the impacts of multiple on-off cycles. Through testing with a space power profile, NASA can create the complete story on SOFCs and begin work on analyzing its integration potential with other on-board systems.
99

Battery Development for Spaceflight ProjectsJudith A. Jeevarajan, Johnson Space CenterElvia Garcia, Johnson Space Center
Gilbert Varela, Johnson Space CenterMartin Martinez, Johnson Space Center
The battery group within the Energy Systems Division of the Engineering Directorate at the Johnson Space Center (JSC) provides extensive support to projects that require batteries or battery chargers. Government furnished equipment (GFE) projects are funded by NASA programs and the hardware is owned by NASA, at least during the design and manufacturing stage. This paper will only address projects that involved heavy participation from members of the battery group and were initiated since 2011.
Low Voltage Lithium-ion Battery for ISS InventoryA 3.7 volt (V) 5.0 amp-hour (Ah) Lithium-ion (Li-ion) battery (see Figure 1) with 2 LG 2.8 Ah cells in parallel,(1) was fabricated with the intention of providing power hardware on the International Space Station (ISS). The cells used in this battery had been previously tested under the ISS Li-ion cell surveillance program. The battery, fabricated by Space Information Labs, is fitted with a circuit board that has the charger logic as well as monitoring and control for safety. The batteries can be tested using test equipment and charged using the Universal Serial Bus (USB) port. Several of these units can be tied in series or parallel to provide higher voltages (up to 20 V) and capacities as needed by the application. This allows hardware owners to use a battery that is in the ISS inventory and will not require the detailed testing to confirm the safety of the battery design. The ISS battery will however still require that the batteries be tested for each application for both performance and safety.
Figure 1. Low-voltage 5.0 Ah Lithium-ion battery for ISS inventory.
Radiation Environment Monitor (REM)Technical guidance was provided in the fabrication of a primary Lithium (LiFeS2) battery for this device. The battery is designed with 2 cells in series (string) and two such strings in parallel to give 3.0 V and 5.8 Ah. A fifth cell provides power independently to a clock. Although all five cells are placed in close proximity, only 4 of those are electrically connected to provide the main power for the REM (Figure 2). The battery has protection for external shorts and overdischarge into reversal.
There is no charging source, so inadvertent charge is not a concern. Internal short hazards are mitigated by performing a vibration screening test to levels higher than the workmanship vibration required for flight batteries. The REM is scheduled to fly in 2014 as a payload on the first Engineering Flight Test-1 (EFT-1) of NASA’s Multi-Purpose Crew Vehicle being developed by JSC (Figure 3).
Figure 2. Photo of the assembled REM primary Lithium battery.
Figure 3. Concept Schematic of the REM showing the primary Lithium battery installed.
100

Lithium-ion Battery Operations Terminal (LBOT)The purpose of the LBOT team is to design, build, test, certify and deliver a new EVA battery charging system for ISS. The project was initiated as a result of the aging chargers on ISS and also with the emerging needs for safe battery charging. The current Battery Charger Module (BCM), the primary mechanism for charging and maintaining EVA batteries on ISS will reach its end of life in 2016. The existing EVA batteries are expected to be transitioned to lithium-ion chemistry in the near future and the need for cell bank monitoring and tighter tolerances on capacity measurements accelerated the need for a new charger (LBOT). The LBOT is expected to be the charging and conditioning station for the EVA Li-ion batteries on ISS until 2028. This will replace the current Battery Charger Assembly / Battery Stowage Assembly (BCA/BSA) in the ISS Joint Airlock avionics rack. The LBOT (Figure 4) will be able to charge all NASA EVA batteries including the Long Life Li-ion Batteries (LLB), the Li-ion Rechargeable Battery Assembly (LREBA) and the Li-ion Pistol Grip Tool (LPGT) to maintain them for EVA readiness. Up to fifteen (15) total EVA batteries will be stowed within LBOT, connected to the battery charger. Upon command from the crew, the charger will control voltage and current to maintain a charge/discharge profile as dictated by the battery owners. Battery operations will be monitored from the ground through telemetry, from which go/no-go for EVA decisions for the batteries will be made.
Figure 4. Concept of LBOT Station.
101

Advanced Battery Technology Programs and TestingJudith A. Jeevarajan, Johnson Space Center Bruce Duffield, Jacobs Technology
The advanced battery technology program is led by the Battery Group within the Propulsion and Power Division of the Engineering Directorate at the Johnson Space Center (JSC). The program includes research and testing of state-of-the-art commercial-off-the-shelf (COTS) cells for inclusion into the existing NASA-JSC cell database. The presence of a cell test database allows for the ease of selection and use of cells for quick development of power sources for government furnished equipment (GFE) as well as payload hardware. The funding for this work was provided by the International Space Station Program (ISS) and The NASA Engineering and Safety Committee (NESC). This paper will only address the significant results of each test program since more detailed information can be obtained from the referenced conference proceedings or by contacting the authors.
LG Lithium-ion (Li-ion) 18650 cellsThe studies on LG 2.8 Ah (Ampere hours) Lithium-ion (Li-ion) 18650 cells included performance and safety tests including overcharge and external short tests on 10-cell series strings (10S). The rate capability tests with charge and discharge rates ranging from C/10 to 1C (C-rates are the rate of discharge or charge of a battery compared to the capacity of the battery) for 200 cycles showed that the capacity degradation varied from 6% to 9% with the discharge at C/10 displaying the least and that at 1C rate displaying the highest loss. For reference a 1C discharge is the current that would seemingly be provided by a battery per its ampere-hour rating in an hour. The LG Li-ion cells when overcharged as single cells display activation of the current interrupt device (CID) as expected, but go into a thermal runaway condition when they are overcharged in a 10-cell series (10S)configuration (Figure 1).
The external short test on the 10S string did not show anomalous behavior and it was observed that one cell PTC remained in the activated state for the entire two-hour period during which the short was held.
Li-ion Cells in Pouch FormatStudies on Li-ion cells in the pouch format included testing of SKC 15 Ah, Tenergy 6 Ah, Wanma 5 Ah, Altairnano 13 Ah. The SKC and Altairnano cells were of high-rate capability, with the latter manufactured with a nanotitanate anode that reduces the nominal voltage of the cell to 2.3 volt (V). The SKC cells performed extremely well under different rates, with the maximum capacity loss of less than 4 percent occurring at 1C discharge rate for the 500 cycles tested. Only swelling was observed under off-nominal safety tests, except for the heat-to-vent test that showed complete charring due to pouch opening and burning of electrolyte.
The Altairnano cells performed extremely well, exhibiting 14 Ah capacity (8 percent higher than rated) at a 1C discharge rate, and the rated capacity of 13 Ah at 5C discharge rate with no degradation of capacity for a cycle life of 100 and 200, respectively. The capacities obtained at the 10C rate of discharge was about 72 percent of the capacity obtained at a 1C discharge rate, but the loss in capacity for 25 cycles was negligible. The Tenergy Li-ion pouch cells displayed a maximum of 3 percent capacity loss for the 300 cycles studied. The Wanma Li-ion pouch cells displayed a capacity loss from 8 to 18 percent, the highest loss observed at a 1C rate of discharge for 300 cycles. An interesting observation with both the Tenergy and the Wanma cells was that the cells did not have a tolerance to 1C and 0.5C overcharges, even at the single cell level, but displayed tolerance at the C/5 rate of overcharge. The two cell designs also exhibited burning of positive tabs with no other events or failures under external short conditions in the single cell, as well as multi-cell, configurations.
Tolerance of Li-ion pouch cells to varied pressure environmentsThe Li-ion pouch cells were also tested under vacuum (~0.1 psi [pounds per square inch]), reduced pressure (8 to 10 psi) and, in some cases, deep-vacuum conditions (10-4 to 10-5 Torr). As the number of portable applications using Li-ion pouch cells increased, and as the vacuum exposure test is used as a leak check on all flight batteries, it was imperative to carry out a test program to determine the tolerance of these pouch cell designs to varied pressure conditions. The tests included continuous cycling under vacuum conditions, as well as variations in periods of storage. Figure 1. Overcharge test of 10S string of LG 2.8 Ah Li-
ion 18650 cells.
102

The cells did not display weight changes before and after the test, although significant capacity degradation was observed with some of the cell designs. The cell design that exhibited the worst case performance under varied pressure environments were the Wanma cells. The cross sections of the pouches using scanning electron microscopy, and the analysis of the materials using energy dispersive spectroscopy and chemical methods, indicated similar material composition, though the thickness of the layers varied from cell to cell. The internal construction of the cells was also analyzed. It was concluded that the tolerance of a cell design to low pressure and vacuum conditions depended on the internal construction of the electrode stack and how well it held together. Although the composition of the pouch did not have any effect, the thickness of the pouch may have played a role in the robustness of the pouch.
Li-ion CapacitorsLi-ion capacitors (LIC) from JSR Micro, Inc., are asymmetric capacitors with activated carbon forming the positive electrode and a lithium-doped carbon forming the negative electrode, with an organic carbonate electrolyte as in Li-ion batteries. The LIC does not undergo a full intercalation process that occurs in a Li-ion cell design (Figure 2), making it a lot safer.
Figure 2. Schematic of Li-ion Supercapacitor from JSR Micro, Inc.
The LIC with a capacitance of 3300 F (Farad) had a nominal voltage range of 2.2 to 3.8 V, capacity rated at 1 Ah and an internal resistance of 0.7 milliohm. The 1 Ah LIC can accept up to 140 A (Ampere) of charge. The performance of these at different temperatures showed that 1 Ah capacity was obtained at -30 °C, and up to 1.5 Ah was obtained from 40 to 70 °C. Self-discharge tests were carried out with storage at different voltages. At the highest stored voltage of 4.2 V, the capacity retained was 1.72 Ah, even though the voltage fell by about 7.4 percent to 3.8 V. The safety tests indicated that the LICs swell under overcharge and overdischarge conditions, but are not affected by an external short. Simulated internal shorts and very high temperatures cause thermal runaway.
MicroStrain Gages for SafetyMicrostrain gages studies were started at NASA JSC in 2006, but did not get completed until 2012 due to the extensive program carried out. This program was carried out to study their characteristics under nominal and off-nominal conditions when placed on Li-ion cells (Figure 3)
of different formats (cylindrical 18650, 26650, prismatic metal can and prismatic pouch). It was observed that the resistance change during normal charge is insignificant (0.1 to 0.2 ohm), compared to the change (1 ohm) that occurs before a cell displays high temperature due to an overcharge condition. This indicated that the microstrain gage is more representative of the internal temperature of the cell than the thermocouple, making this a very promising device for safety control in Li-ion battery designs. The activation of the protective mixed oxide semiconductor field effect transistor switches to changes in straingage resistance was demonstrated by designing it into a protective circuit board.
Figure 3. Photo showing microstrain gages on a Li-ion cylindrical 18650 cell.
Li-ion Spinel Cell LimitationsStudies in the past have demonstrated that cell internal protective devices do not necessarily protect as intended in large, multi-cell configurations, and this was studied in spinel cells that have only a CID. Cells in various multi-cell (4S, 4P, 10S, 10P) configurations were tested under off-nominal conditions and confirmed that the CID that protects in single cell devices does not protect in multi-cell configurations.
SummaryThe research carried out under the advanced technology programs have benefited both NASA and the space industry, both government and commercial. Projects that have a quick turnaround time have benefited by the baseline studies carried out in this program that shortens or gives a head-start on the choice of cell designs for their hardware. The battery group will continue to carry out the research in the area of cells, batteries and accessories that lead to a safer battery design.
103

Magnetic Nozzle Effects on Plasma PlumesFrans H. Ebersohn, NASA Space Technology Research Fellow
John V. Shebalin, Planetary Scientist, Astromaterials Research Office
The principal effort in this project is the computational research and development work being done by a doctoral student funded by the NASA Space Technology Research Fellowship Program and hosted by the Astromaterials Research and Exploration Science (ARES) Office. An ARES astrophysicist serves as research mentor, collaborator and theoretical advisor for the Fellow, whose Fellowship began in August 2011 and ends in August 2015, when the work will be completed. The work is specifically aimed at advancing the state-of-the-art in Magnetoplasmadynamic (MPD) Thruster and Variable Specific Impulse Magnetoplasma Rocket (VASIMR) technologies for in-space propulsion systems. The goals of this research are to understand the underlying physics of plasma flow through a magnetic nozzle, as well as its later detachment from a plasma engine, and to use this knowledge to optimize the design of both MPD rockets and VASIMR, technologies that may well prove essential for a viable program of future, long-duration solar system exploration.
Crucial aspects of MPD thruster and VASIMR performance that need to be understood are (1) how magnetic nozzle design affects an emerging plasma jet; (2) how design can be optimized to ensure plasma jet detachment of with minimal plume divergence; and (3) how, at the same time, thrust and specific impulse can be optimally balanced. Research is proceeding theoretically, as well as through numerical simulation of plasma flow in a magnetic nozzle, allowing a study of magnetic nozzle performance in both the single and dual jet configurations of an MPD thruster or VASIMR. This work will produce a robust design tool that could help enable long-duration space missions.
In numerical simulations performed during Fiscal Years 2012 and 2013, model inviscid jet expansion simulations have been seen to agree with theoretical predictions of near vacuum jet expansion and under-expanded jet dynamics. Significant progress has also been made in modeling resistive plasma jets, and preliminary magnetic nozzle configurations have been tested, as well. An example of results for a case utilizing a steady state axisymmetric numerical plasma flow solver is shown in Figure 1, where x is distance along the central plume axis and r is distance perpendicular to the central axis. Inflow parameters similar to those of the VASIMR engine were used in this case. The top contour shows the velocity magnitude while the bottom shows the density. The jet inlet is located at x = 0 and has a radius ro of half a meter. A number of boundary and initial conditions for fluid properties such as velocity, density, and pressure were tested to determine which would produce the best combination of physically accurate and numerically feasible results for future magnetic
nozzle test cases. Boundary and initial conditions for the diverging applied magnetic field of a magnetic nozzle were incorporated and preliminary test cases with low magnetic field strength were studied.
Preliminary studies of the so-called ‘theta-pinch’ problem were also conducted. Theta-pinches are characterized by a strong axial magnetic field which confines a flowing plasma. This is intended to serve as an intermediate case between the vacuum expansion and the magnetic nozzle expansion of a plasma jet. Studies of theta-pinch and resistive magnetic nozzle plasma jet expansions will continue and results will be compared to experiments, which will, in turn, guide the evolution of the computational method. The effect of the Hall and electron pressure terms in the Generalized Ohm’s Law will also be studied and these terms will be incorporated as necessary in the computer program. Furthermore, the need for subgrid scale magnetohydrodynamic turbulence models will be evaluated. Periodic assessments of numerical robustness are, of course, an ongoing activity.
Figure 1. (a) Velocity and (b) density contours for jet expansion with parameters near the regimes of VASIMR. No magnetic field is applied.
104

Robotics, Tele-Robotics, Autonomous Systems, and Software
105

Core Flight Software Reuse in Human-Rated SystemsLorraine Williams, Johnson Space Center Steve Duran, Johnson Space Center
The cost of developing flight software for human-ratable spacecraft is usually high and steadily increasing with complexity over time. In order to reduce the cost, shorten schedule and improve maturity, software reuse may be explored. A reusable spacecraft flight software framework and library has been developed by Goddard Space Flight Center (GSFC) called the Core Flight Software (CFS) system. This framework has been successfully deployed in several uncrewed flight and technology projects and has become a NASA asset for flight software reuse. Recent experience with CFS within the Engineering Directorate at the Johnson Space Center (JSC) has proven successful for several projects, including the Morpheus lander. Given the potential cost, schedule and maintainability gains in safety-critical software development, the benefits of using CFS in human-rated systems are being explored. In order to investigate, asses and adapt the CFS system to human-ratable architectures, and to prepare for reuse of this system in manned space missions, an Advanced Exploration Systems (AES) Program Core Flight Software project was formed in 2013, led by the JSC Engineering Directorate. This project has determined the CFS framework viable for use and extensibility into fault-tolerant architectures typical of human missions, and has progressed on a path to produce human-ratable instantiations of the CFS on existing human spaceflight architectures.
Goddard Core Flight Software Architecture OverviewThe development of a productized and configurable set of flight software grew out of the necessity to produce flight software simultaneous projects with similar needs, but was produced intentionally for reuse. The architecture of this framework is layered, each layer with its own application program interface, abstracting the layers below to enable portability across differing underlying hardware and software operating systems. The framework allows for the configuration of common software elements and functions across a spacecraft and provides an extensible and component-based architecture-integrating infrastructure common to real-time space missions. The four-layered architecture is shown in Figure 1. The top-layer application provides software components built to use the core Flight Executive (cFE) system services. Applications are typically separate cyclic processes that follow an input-process-output execution paradigm. A rich set of reusable CFS configurable applications exist and continues to grow; but where needed, mission-specific applications must be written for specialized project functionality and to access unique hardware. The cFE layer is an Application Programming Interface (API) performing common system services. Services include a publish-subscribe communication message bus, table services for configuration, event processing and time services, among others.
The Operating System Abstraction Layer (OSAL) is an API that maps common operating system calls onto different operating systems/platforms for portability. Support for several operating systems exists. The platform-specific package layer (PSP) provides functions to access processor hardware such as timers and particular memory regions.
Figure 1. Core Flight Software System architectural layers.
Componentized Application Software DesignBy utilizing the CFS architecture, applications can be built as individual components working together to form a system. Figure 2 shows a typical CFS application software architecture. Core services and inter-task message communication are provided by the framework. A set of configurable and reusable applications may be used as needed by the project. Mission-specific software is added for specialized project functionality and to access unique hardware. A template for CFS applications is available with the framework and promotes reuse of CFS applications across different hardware or operating systems. Using a common template, the number of available components for reuse should increase with number of users.
106

Figure 2. Application software architecture within CFS.
Core Flight Analysis Within Fault-Tolerant ArchitecturesIn order to assess the feasibility of this framework within hardware architectures typically used to support human-rated missions, the CFS framework was adapted for use on both ARINC-653 partitioned and replicated voting platforms. The goal of the assessment was to see of the CFS design would withstand this type of extensibility not originally planned without having to re-engineer the API or layers while still maintaining the benefits of the system. A diagram of the adaptation of CFS within these architectures is shown in Figure 3. The original CFS, typically deployed on a single processor system without software partitioning, is shown on the left. In the center block, new OSAL and PSP layers were created to effectively allow multiple virtual machines or “partitions” running CFS (or non-CFS) on the same computer. This allows for a form of intra-machine fault isolation. For example, if one partition were to fail, another critical partition would continue to execute unaffected. Similarly, this architecture was extended with an instantiation of the OSAL and PSP layers over a both a triplex and a quad-redundant set of voting machines, shown on the right. Replicating computer hardware with voting is a form of fault management that allows operations to continue in the event of processor hardware failures. In this architecture, both a software and hardware voting system originally developed for the X-38 project called “Fault-Tolerant System Services” was layered under the OSAL and PSP layers. The result was voted input/out and a highly fault-tolerant system. Additionally, in each case, the application software running at the top layer of the architecture was unaffected, required no changes, and agnostic as to the level of fault tolerance employed below. This effort showed viability of the CFS within systems built for human rating.
Figure 3. Core flight software adaptaion for fault tolerance.
Core Flight Software Adaptations for Human RatabilityAfter determining that the CFS architecture was adaptable to typical human spaceflight architectures, the next step is to extend CFS productization toward achieving Class A safety-critical certification. The goal is that when a program uses the CFS, an instantiation of it tested for the particular platform, complete with all necessary artifacts to aid in human certification, would be already available. This will reduce overall software development, test and certification costs for the program. While the GSFC CFS system that was developed as Class B software has been fully tested for particular spaceflight missions and is already at Test Readiness Level 9, additional effort to achieve general product-line Class A certification of the CFS is needed. Under the AES Core Flight Software project, this effort is underway. The AES CFS project is in the process of producing several instantiations of the CFS, one of which is a human-ratable version targeted for the Orion platform. Other instantiations in development include a quad-redundant voting system, a distributed architecture instantiation, a version of CFS embedded with Trick simulation support and a version of CFS targeted toward education/outreach.
107

Project Morpheus Lander Software: Built upon Reusable Software ArchitecturesLorraine E. P. Williams, Johnson Space CenterRobert L. Hirsh, Johnson Space Center
Robert O. Shelton, Johnson Space Center
Project Morpheus is a terrestrial lander used as a vertical test bed platform for developing technology and proving hardware and software systems for use in space exploration. Originally conceived in late 2009 by Johnson Space Center’s Engineering Directorate as “Project M,” a project to land a humanoid robot on the moon in 1,000 days, this lander is a result of that effort, and the project seeks to maintain resolvability to a future space mission. As of 2012, this project became one of the agency’s new Advanced Exploration Systems (AES) technology development projects and is actively conducting flight tests. In line with the vision of future space missions, one of the guiding philosophies of Morpheus development has been to maintain an aggressive schedule and low budget while not deviating from a spaceflight-ready architecture.
These goals posed a great challenge to software development that was met through effective reuse and rapid development with open tools.
Morpheus Software Components OverviewMorpheus software consists of three main components: flight software, ground software and simulation software. While the emphasis in spacecraft development typically tends to be on the flight software – that software residing and running on the actual vehicle – both ground and simulation software components are equally essential in developing, testing and operating the craft. One of the key features of Morpheus software as colored green in Figure 1 is the elements of reuse employed as the core architectural building blocks of the system.
Figure 1. Morpheus software components.
108

Morpheus Flight SoftwareMorpheus flight software was built upon a core set of configurable flight-qualified software herein called Core Flight Software (CFS) developed by Goddard Space Flight Center (GSFC). This flight software allowed reuse of necessary common components for spaceflight while providing an operating system abstraction layer and facilities supporting rapid development of project-specific applications. Per figure 2, the green and blue “bubbles” are those CFS core applications that were either used as-is or configured for use. The configured applications include the ability to command, provide telemetry, schedule applications, log data, monitor limits and provide sequencing. The CFS also provides an operating system abstraction Application Program Interface (API) for services relating to time, communication, asynchronous events, table-driven configuration and task execution.
The “software bus” message-passing facility is a key element of this architecture that provides a publish-subscribe communication mechanism between applications. The yellow and pink “bubbles” are specific to the Morpheus project and were new development. The yellow applications, primarily consisting of guidance, navigation, control and propulsion functions, were able to be written and tested within simulation independent of the target hardware. The pink “bubbles” represent those functions that provide access to sensor data and vehicle-specific actuator hardware. This architecture allowed a clear division of development responsibilities, identification of clear interfaces and rapid development since the team was able to concentrate on mission specifics and build upon a reliable and existing core.
Figure 2. Morpheus flight software architecture.
109

Morpheus Ground Software ArchitectureThe Morpheus ground software was also built upon a system developed and productized by GSFC called Integrated Test and Operations System (ITOS). This system provides telemetry decommutating, commanding, data distribution, data reconfiguration and display capabilities used for controlling the vehicle. A unique feature of the ITOS is that it provides a scalable “test like you fly” environment, allowing use on personal development computers during flight software development, as well as scalable to an entire control room. Figure 3 shows ITOS displays in the Morpheus control room.
Figure 3. Morpheus control room using ITOS.
Morpheus Simulation Software ArchitectureThe simulation system built for Morpheus used a system called “Trick,” a product developed and productized at Johnson Space Center. Trick is a real-time modeling and simulation framework for quickly building, integrating, testing and controlling the behavior of complex vehicle, environment and dynamic models. The simulation environment, like the CFS and ITOS, supports use throughout the development, test and operations software lifecycle by providing a single simulation supporting multiple test configurations such as single-computer embedded simulation, distributed simulation, hardware-in-the-loop simulation and operator training. Figure 4 shows a screenshot of the Trick simulation environment running embedded CFS flight software, a dynamic simulation of the vehicle in flight, as well as driving a graphical display.
Figure 4. Morpheus trick-based simulation.
Software Development ToolsIn order to facilitate rapid and low-cost development, the project Morpheus software team employed use of popular open software tools as much as possible. This tool chain includes Eclipse as the development environment and Subversion for configuration management. A tool called Hudson was used for build checking. Redmine was used for bug, issue, feature and release tracking. In addition to these open distribution tools, government tools CFS, ITOS and Trick were used to facilitate development as described above. The Windriver Workbench product suite was used to develop, build and analyze code on targets running the VxWorks operating system.
110
Software-Based Graphical Processor Unit for Use Beyond Low-Earth OrbitGlen Steele, Johnson Space CenterJairo Sanchez, Johnson Space CenterLee Morin, Johnson Space CenterGeorge Salazar, Johnson Space Center
Joel Busa, Helios Solutions, LLCPatrick Laport, Aerospace Applications North AmericaTim Verborgh, Aerospace Applications North America
The ProblemVisualization of spacecraft specific telemetry is an essential safety critical component to an astronaut crew’s ability to interface with their spacecraft. The preferred approach would be to use a modern Graphics Processor Unit (GPU) to make the presentation of such telemetry possible. Typically, the GPU drives the display of the telemetry out to specialized computer monitors that have been adapted to the operational rigors of a spacecraft. The benefits of such a system stem from their ability to redefine and manipulate the presented information based on mission context and effective re-use of the limited viewing space available in the cockpit environment. The situational experience aboard a spacecraft may mirror modern technologies similar to what might be found in the commercial aviation field. Unfortunately, the GPU available from commercial aviation glass cockpit display systems, or even the GPU found in your desktop personal computer (PC), face a number of environmental factors that make their direct use unsuitable for incorporation into a spacecraft that is expected to travel beyond low-Earth orbit.
The principle factors working against direct application of commercial GPU-based systems are the radiation environment experienced by spacecraft while traveling beyond low-Earth orbit and the need for cockpit display systems to be safety certified. Commercial, off-the-shelf GPUs are primarily comprised of a small number of dedicated silicon, large-scale Integrated Circuit (IC) devices (integrated into a GPU function). Its development has been driven by enormous market forces associated with the commercial PC, of which considerations of radiation tolerance or use in safety-critical systems has not been paramount.
Currently, the human space program has had a very limited choice of cockpit display systems from aerospace companies. Moreover, the associated total projected lifetime cost for the display hardware and generation of displayable content have been a concern. The cost associated with such systems is not just the cost to procure and install hardware on a spacecraft, but also includes the lifetime display modification and update cost to generate and certify the graphical contents used to convey the spacecraft’s telemetry to the crew.
Most current solutions use manufacturer-specific proprietary software specifically linking the aerospace vendor’s GPU hardware to the generation of graphical display content, which provides little room for commonality or competition that would be advantageous to NASA in its quest to build future spacecraft for a reasonable cost. The SolutionBeginning in the spring of 2012, the Avionic Systems Division within the Engineering Directorate at the Johnson Space Center (JSC), together with the Astronaut Office within the Flight Crew Operations Directorate, began a collaborative exploration of alternative software based approaches to the use of the traditional dedicated silicon based GPU for use in spacecraft. Originally, investigation of this alternative approach was driven by JSC to explore methods of controlling cost associated with the development of crew interface display systems for the Multi-Purpose Crew Vehicle (MPCV) Program. The high costs associated with methods used to develop MPCV crew displays were due to the required use of proprietary GPU hardware and the required use of proprietary tools for the development of display content. In addition, development of any crew display content required a substantive costly hand coding effort that significantly impacted schedules even for minor modifications.
The collaborative efforts are directed at demonstration of the technical feasibility of an alternative GPU approach based on software while at the same time enhancing competitive solutions that might be utilized by providers of such systems. By increasing the viability of competitive solutions that may be applied to providing a GPU function, NASA will be enhancing competitive avenues among aerospace contractors that could potentially supply similar software based GPU systems for future manned spacecraft. In addition, the Software Graphics Processor project is exploring technologies drawn from the commercial market and blending them in a way to achieve a GPU design suitable for safety critical display of spacecraft telemetry while also meeting required radiation tolerance levels and helping to lower subsystem Size, Weight, Power (SWaP) and cost.
111

The Software Graphics Processor project explores the spacecraft GPU issue in a way that does not use specialized, dedicated silicon IC devices as devised by the commercial GPU market. Instead, it leverages three separate commercial efforts together to produce the functionality of a GPU that has a certifiable path for use in safety-critical systems, while at the same time exhibiting sufficient radiation tolerance suitable for use beyond low-Earth orbit. Specifically, the software GPU project capitalizes on the availability of vendor-provided, radiation-tolerant Single Board Computer (SBC) and field programmable gate array (FPGA) devices; availability of vendor-provided safety-critical subset of the open source open graphics language software libraries; and the availability of commercially available safety critical operating systems (Figure 1). This solution provides a GPU function capable of operating in the radiation environment found beyond a low-Earth orbit, while at the same time decoupling the proprietary relationship between the providers of the GPU’s hardware and the providers of displayable graphical content. The software component running on the radiation-tolerant SBC renders the contents of a graphical display with associated telemetry into a low level, rasterized format suitable for display upon an output display device such as a Liquid Crystal Display (LCD) monitor. A bus interface transfers the rendered image to a radiation-tolerant FPGA and supporting electronics. The FPGA reconciles differences between the rate the SBC renders display contents into the low level, rasterized format, and the required isochronous transfer of data to the output display device.
Advantages to this approach are principally twofold. First, radiation-tolerant SBCs are commercially available and could even be common to other SBC units that are used within a spacecraft. This could have implications associated with long-term missions, where it might be possible to swap around components to achieve sparing goals.
Figure 1. Software GPU comunent diagram.
Second, methods used to describe displayable contents derive from a subset of open source graphical routines, and thus removes the proprietary relationship between the methods used to describe a display and the GPU’s hardware. The subset of routines available for this task have been specifically reengineered in an implementation to meet software safety-critical criteria. Using a familiar set of graphical library routines that are well understood to those who design graphical display content breaks the relationship previously held by the providers of the GPU hardware (one of the large contributing factors to lifetime costs), thus enhancing options that may be employed by the competitive environment.
Current ResultsThe initial implementation of the software-based GPU has been completed, and benchmark performance metrics are being compiled. Preliminary results indicate the SBC is capable of rendering the stylized graphical displays typically used for safety critical displays. However, preliminary results have also confirmed suspected system bottlenecks to reaching overall performance goals. For example, initial selection of a SBC was geared for low-power performance, and thus uses a slow-performing Peripheral Component Interconnect (PCI) bus to transfer the rasterized data to the FPGA (See Figure 1). Initial benchmarks for this preliminary system show that the slow PCI bus is the dominant bottleneck to achieving acceptable spacecraft telemetry and vehicle status frame rates. At the same time, preliminary benchmark performance focusing on aspects of converting displays along with their associated telemetry into a rasterized format internal to the SBC allude to the feasibility of reaching display render rates that will grow to targeted rates (somewhere in the neighborhood between 20 to 40 frames per second).
112

Future WorkCurrently, the FPGA and associated electronics (see Figure 1) are represented in the development effort with an off-the-shelf FPGA card and a small, custom-developed printed circuit board. Components that make up this portion of the system have yet to be vetted for their radiation tolerance and represent an area of future work. The team believes it is possible to achieve radiation-tolerance behavior for this portion of the system based on prior examples of FPGA development for projects that have already been used beyond low-Earth orbit. However, exploration of this aspect of the system definitely bears more discussion and practical testing to show the feasibility of using a radiation-tolerant FPGA along with supporting display electronics.
In the foreseeable future, the software GPU team is embarking on an effort to use a new, higher-performing SBC to directly achieve performance goals of 20 to 40 rendered frames per second. This new SBC uses eight lanes of Peripheral Component Interconnect Express bus and represents an enormous improvement over the transfer rates experienced with initial SBC’s single PCI bus. Additionally, the team plans to continue to explore means to effectively increase the transfer rate of rendered frames between the SBC and the FPGA by working with the display software vendor to improve efficiency of safety-critical graphical libraries. One of the approaches the team has been pursuing is to reduce the overall amount of data that must be pushed across the SBC’s bus through a modified approach to using the safety-critical graphics-rendering libraries. Thus, it is anticipated that through use of software-optimization techniques and increased SBC processor performance, the software GPU will reach rates acceptable for the display of safety-critical displays, while at the same time exhibiting radiation-tolerant behavior suitable for use beyond low-Earth orbit.
113

Autonomous Landing and Hazard Avoidance Technology (ALHAT) Field TestingDavid K. Rutishauser, Johnson Space CenterChirold D. Epp, Johnson Space Center
Edward A. Robertson, Johnson Space Center
Challenges encountered during Apollo lunar landings evidenced a need for a system to identify safe landing locations and precisely guide a vehicle to a selected location. Concepts to include such a system had been considered for Apollo but were not implemented, and a thread of interest and international investment in the capability has continued since that time. In 2005, when NASA goals focused on returning to the moon by 2020, this enabling technology became a top priority; and, in 2012, NASA’s Space Technology Roadmap reiterated it as a top priority.
The Autonomous Landing and Hazard Avoidance Technology (ALHAT) project is managed in the Aeroscience and Flight Mechanics Division within the Engineering Directorate at Johnson Space Center. The project was started in 2006 with the goal to progress technologies and techniques for hazard detection and precision landing. Reaching a technology readiness level (TRL) 6 – creation of a model or prototype demonstration in a relevant environment (ground or space) – by the end of government Fiscal Year (FY) 2012 was set at the beginning of that FY.
This aggressive timeline is consistent with the lean engineering culture becoming prevalent throughout NASA,
which prioritizes early prototype development and testing early and often to drive out design issues, operational concepts and requirements.
Morpheus, a prototype robotic planetary lander developed at JSC that serves as a Vertical Test Bed (VTB) for advanced spacecraft technologies, provides the relevant environment for an ALHAT TRL-6 demonstration. The findings of the ALHAT project will then feed into additional prototyping design cycles and eventually into a baseline design suitable for a spaceflight mission.
The ALHAT uses Guidance, Navigation and Control (GN&C), terrain sensing and hazard-recognition functions to identify and avoid surface hazards so crewed, cargo and robotic vehicles can safely land under any lighting conditions on planetary surfaces within tens of meters of designated and certified landing sites. As illustrated in Figure 1, the ALHAT uses three operational modes during descent: 1) Terrain Relative Navigation (TRN) to compare sensor data with onboard map data for global precision navigation; 2) Hazard Detection and Avoidance (HDA) to scan the intended area to determine safe landing locations; and 3) Hazard Relative Navigation (HRN) to navigate to the chosen safe site.
Figure 1. ALHAT operational modes for lunar descent and landing trajectory profile.
114

Aggressive test campaigns were planned and executed to meet the ALHAT and Morpheus project goals for government FY 2012. To accomplish the integration of the ALHAT subsystems being developed on opposite coasts of the United States and to find as many issues as possible prior to attempting VTB integration, an ALHAT ground test campaign was performed at the NASA Langley Research Center (LaRC) Long Distance Test Range (LDTR).
The LDTR features a long, straight track, which provides distances similar to the VTB trajectory, and a shed at one end on which landing targets were placed for imaging purposes. The Charles Stark Draper Laboratory Guidance Embedded Navigator Integration Environment was a surrogate system for the VTB, since Morpheus hardware was not available to support this test campaign. The ALHAT system was placed on a truck with a window in the front of the cargo area for sensors to “see” through, and the truck was driven from the far end of the track toward the shed while the ALHAT system operated.
A test campaign was also executed at JSC that included static and dynamic tests, and concluded with a series of tethered flight tests (Figure 2). At this point, the ALHAT system was integrated into the full Morpheus vehicle. This set of tests was performed to 1) verify the static and dynamic end-to-end pointing accuracy of the Hazard Detection System (HDS) using the Morpheus navigation inputs (critical to HRN), 2) execute a static and dynamic mosaic scan (critical to HDA), and 3) conduct initial testing of navigation sensors (Doppler Light Detection and Ranging [LIDAR] and laser altimeter) in the flight environment. The overall goal was to expose as many issues in the range test configuration as possible.
Figure 2. ALHAT/Morpheus testing at NASA JSC: A) crane test of navigation sensors; B) tethered pointing test.
The loss of the Morpheus vehicle during initial free flight tests at Kennedy Space Center (KSC) in August of 2012 created the opportunity for a integrated ALHAT/Morpheus helicopter test campaign. This campaign represented the first opportunity to evaluate the performance of ALHAT integrated with Morpheus avionics and GN&C systems under realistic flight conditions and simulated planetary terrain. The systems integration and test terrain are shown in Figure 3.
Figure 3. Helicopter test configuration: a) ALHAT/Morpheus systems integrated with the LaRC UH-1H helicopter testbed; b) ALHAT scan of simulated planetary terrain and a photograph of the actual terrain.
The campaign was very successful in providing critical performance data and identifying issues not possible with the fidelity of previous field testing. All system modes were exercised with good results, providing confidence that the advertised ALHAT capability could be demonstrated on Morpheus.
115

Autonomous navigation, both open- and closed-loop with the ALHAT system, is planned during free-flight tests at KSC. These tests, of which the flight profile is shown in Figure 4, will demonstrate free-flight capability, expand the envelope of the free-flight trajectory and fly Hazard Detection Phase (HDP) free flights and trajectories with the ALHAT system operating closed-loop with respect to vehicle GN&C.
This KSC flight campaign will mark the first time autonomous hazard detection and precision landing has been demonstrated during a high-energy landing trajectory on a rocket-powered testbed, and will represent a major step towards enabling safe, precision landing for future planetary exploration missions.
Figure 4. ALHAT/Morpheus HDP flight profile.
Based on the experience gained during the government FY 2011 to FY 2012 development cycle, the ALHAT team has developed a plan to incrementally reduce the size, weight and power of the ALHAT system. A series of design refinements will facilitate these reductions and will lead to a more spaceflight-capable ALHAT system that could be ready to test on a VTB in government FY 2014. These improvements include new active LIDAR sensor and beam-steering technologies that can potentially greatly reduce laser power and eliminate the gimbal. Additionally, custom printed circuit boards would reduce the number of processor/input cards, consolidate HDS functions and provide efficient thermal control to reduce the weight and power required for fans and thermoelectric coolers currently embedded within ALHAT components. This next-generation ALHAT system would likely have a total mass of less than 75 kg and would facilitate infusion of ALHAT technologies into a future planetary exploration mission.
116
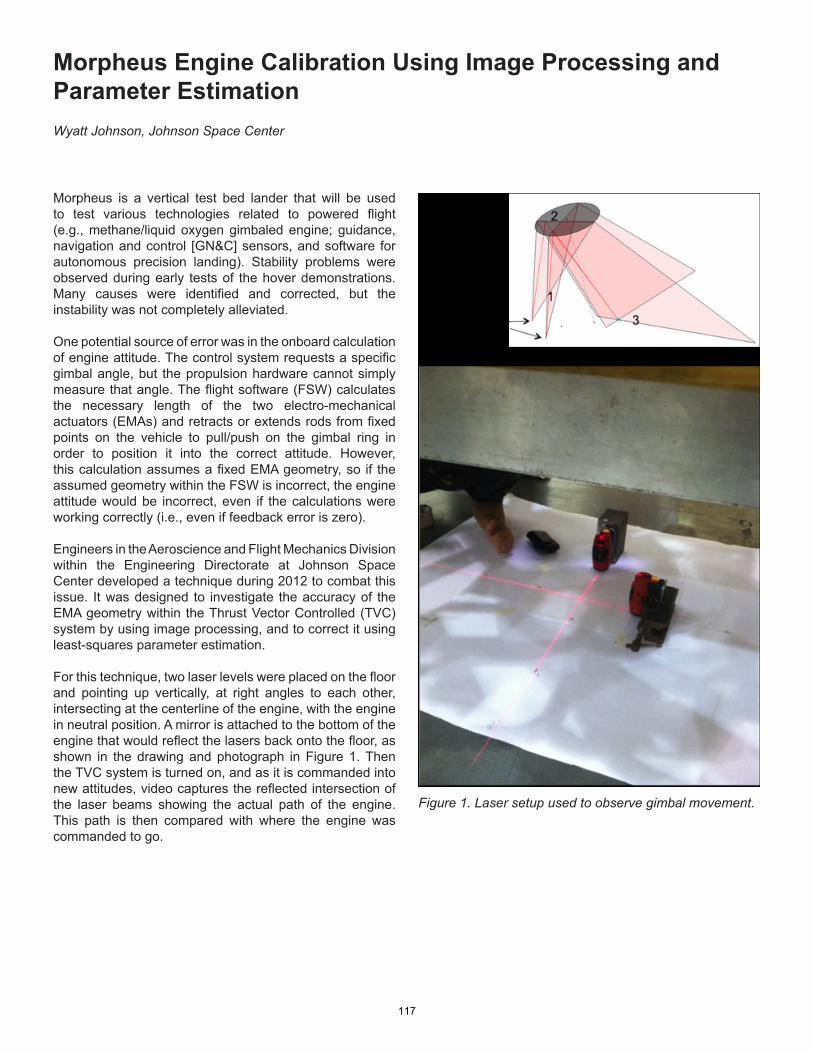
Morpheus Engine Calibration Using Image Processing and Parameter EstimationWyatt Johnson, Johnson Space Center
Morpheus is a vertical test bed lander that will be used to test various technologies related to powered flight (e.g., methane/liquid oxygen gimbaled engine; guidance, navigation and control [GN&C] sensors, and software for autonomous precision landing). Stability problems were observed during early tests of the hover demonstrations. Many causes were identified and corrected, but the instability was not completely alleviated.
One potential source of error was in the onboard calculation of engine attitude. The control system requests a specific gimbal angle, but the propulsion hardware cannot simply measure that angle. The flight software (FSW) calculates the necessary length of the two electro-mechanical actuators (EMAs) and retracts or extends rods from fixed points on the vehicle to pull/push on the gimbal ring in order to position it into the correct attitude. However, this calculation assumes a fixed EMA geometry, so if the assumed geometry within the FSW is incorrect, the engine attitude would be incorrect, even if the calculations were working correctly (i.e., even if feedback error is zero).
Engineers in the Aeroscience and Flight Mechanics Division within the Engineering Directorate at Johnson Space Center developed a technique during 2012 to combat this issue. It was designed to investigate the accuracy of the EMA geometry within the Thrust Vector Controlled (TVC) system by using image processing, and to correct it using least-squares parameter estimation.
For this technique, two laser levels were placed on the floor and pointing up vertically, at right angles to each other, intersecting at the centerline of the engine, with the engine in neutral position. A mirror is attached to the bottom of the engine that would reflect the lasers back onto the floor, as shown in the drawing and photograph in Figure 1. Then the TVC system is turned on, and as it is commanded into new attitudes, video captures the reflected intersection of the laser beams showing the actual path of the engine. This path is then compared with where the engine was commanded to go.
Figure 1. Laser setup used to observe gimbal movement.
117

Two tests were conducted to plot actual engine movement under different commands. For the first test, the engine was commanded to move in a series of circles (circular sweep) with increasing radius (commanded pitch angle from vertical). The expected outcome was concentric circles with radii proportional to the commanded pitch angle (from 0.5 to 4.5 degrees). The second test used discrete points in the commanded engine space, with the expected result being a grid with appropriate scaling. The actual results from each test, neither of which matched expected results, are shown in Figure 2.
Figure 2. Geometry accuracy test results: a) series of circles (circle sweep) with increasing radii; and b) discrete points.
The results from the second test provided the necessary clue to the root cause of the error. The grid spacing of the diagonal lines appeared sinusoidal. When this sinusoidal error was injected into the EMA commands in a laboratory mathematical model, both scan patterns (Figure 2) could be recreated.
The source of the error was traced back to the EMA position feedback sensors, which were operating within specifications but were still creating noticeable errors in engine pointing. Because the GNC system is so sensitive, this small error was causing problems when commanding the engine to maintain a precise Morpheus hover.
To begin image processing, the laser lights had to be isolated. In order to do this, once the laser emitters were in place (as shown in Figure 1) for the test runs, a calibrated test grid on paper was placed on the ground underneath the engine. It was very important that the test grid 1) be done in a color scheme that highly contrasts with the (red) laser light and the ambient light, and 2) provide a calibrated length scale that can be used to map camera pixel locations into coordinates in the vehicle’s body frame. An example of a sufficient test grid is a dark green and dark blue checkerboard. After the test, everything is removed from the image except the laser lines. One way to do this is to subtract the background (the test grid) from the image by way of median frame filtering. A threshold operation is then applied to remove any low-level noise, which results in a binary image of just the lasers to be used in the next step.
This next step uses the locations of the laser pixels to determine the equations of the two lines that best match the actual photo. The intersection point of these two lines is then computed.
The final step in the image-processing sequence is to map the previously identified points from the camera frame into the body frame. This is done using a projective transform, which geometrically describes the projection of an n-dimensional vector across an n+1-dimensional space onto another n-dimensional surface. In this context, the test pattern and laser intersection measurements are 2-D and are projected across 3-D space, and into the 2-D viewport of the camera.
For the 2-D case, there are eight unknowns. Since each laser intersection point provides two pieces of information, four points are required to uniquely determine a mapping. In practice, however, picking four points will not yield a great solution due to imprecision in picking the “right” points, as well as imperfections in the test surface. So, multiple points can be used to form a least-squares fit, in minimized linearized form.
Typical precisions range from 0.2-0.5 mm/pixel, depending on whether the pixel was in the foreground or background. Precision improves as the camera moves to a more overhead view.
Parameter estimation can be viewed as a special case of Kalman filtering. A batch series of measured outputs and expected outputs are fed into the filter, which then produces the parameter vector that minimizes the observed error in a least-squares sense. This process is repeated until the filter converges. Convergence would require exactly one
118

iteration if the measurement function be linear with respect to the parameter vector. The parameter estimation process is illustrated in Figure 3.
Figure 3. Parameter estimation process flow.
Each input command and output measurement is put through this process to generate an error; then the errors are processed in a batch filter update, and the process is repeated until convergence occurs. In order to implement the parameter filter, the partials of the measurement vector (the laser intersection), with respect to the parameter vector, are needed.
A zoomed-in result of the post-parameter-filter circle sweep is shown in blue in Figure 4. The red line indicates the desired (commanded) performance.
Figure 4. Gimbal circle sweep after applying the results of the parameter filter to the FSW.
This is a huge improvement over the original circle sweep (Figure 2a), though is not yet perfect. Some causes for the remaining inaccuracies include imprecision of the original laser and test pattern alignment, which could be mitigated by accounting for them in the analytic geometry and then estimating them in the filter.
A zoomed-in result of the post-parameter-filter circle sweep is shown in blue in Figure 4. The red line indicates the desired (commanded) performance. The perspective transformation to the body frame is required for the Kalman filter. The same coordinate system (and sigma +/-) must be used when comparing the mathematical model (where it was commanded to go) to the observation (where it actually went). Since the mathematical model produces numbers in the body frame (independent of camera location since the math model has no camera), the camera observations must be transformed into body coordinates so the comparison can be executed accurately.
119

Tool for Rapid Analysis of Monte Carlo Simulations (TRAM)Carolina Restrepo, Johnson Space CenterKurt E. McCall, Johnson Space Center
John E. Hurtado, Texas A&M University
Designing any complex engineering system requires extensive simulation and analysis work. Monte Carlo simulations are often used to generate thousands of simulated scenarios of a flight design. Until a few years ago, this analysis was done by performing multiple sets of Monte Carlo runs and then having engineers manually analyzing the data sets. This manual work was an overwhelming undertaking from the viewpoint of time required, and also created a possible risk of overlooking potentially critical problems in the design.
So, when the Aeroscience and Flight Mechanics Division within the Engineering Directorate at the Johnson Space Center (JSC) started producing large amounts of data that needed to be analyzed, they began leading the effort to develop a generic analysis tool with more capabilities that could analyze the data much more efficiently.
This tool can quickly sort through large data sets and point an analyst to areas in a data set that are most likely to cause specific types of failures in a design. The first version of this tool, a MATLAB program created in 2011 as a team co-op’s PhD thesis at Texas A&M, proved that it is possible to automate the analysis of Monte Carlo data. However, running the tool in MATLAB still took a significant amount of time.
This new version of the tool, called TRAM, was developed in 2012 and uses the same algorithms as did the original version, but has greatly increased speed. TRAM uses parallel code that runs on a graphical processing unit (GPU), which is a massively parallel coprocessor based on computer graphics technology, capable of performing many types of general-purpose computations. It automatically ranks individual design variables and combinations of variables according to how useful they are in differentiating the simulation runs that meet requirements from those that do not. This is done by highlighting the differences between successful and failed simulation runs in a given Monte Carlo set. A single, statistically-significant set is enough for TRAM to run a productive analysis. TRAM also has a much-improved analysis capability in that it can work with much larger and more complex data sets.
Two well-known pattern recognition methods, kernel density estimation (KDE) and k-nearest neighbors (KNN), were combined into a stand-alone analysis tool that can identify both single variables and combinations of variables that affect a system failures specified by an analyst. A simplified chart of TRAM’s layout is shown in Figure 1.
Figure 1. TRAM process flow.
The two main codes are located on a Linux server that hosts the GPU, and the graphical user interface is a MATLAB program that allows the user to interface with the server in a seamless way, and to subsequently plot and save the data in a simple format.
The KDE algorithm was implemented using two parts: KDE for original variables (supplied by the Monte Carlo simulation), and KDE for compound variables (formed from the difference or quotient of two original variables). The two types of analysis are performed separately but the ranked results can be combined. The GPU code, or kernel as it is called, divides the work into thousands of individual lines of computation, called threads. The threads are grouped into independent units, called blocks. The first kernel computes partial probability densities for all blocks, each of which is responsible for a portion of the data. A second kernel then sums the densities computed for each block, and a third kernel computes the rankings of the variables.
The KNN algorithm, on the other hand, deals with scatter plots of the Monte Carlo data, where each axis corresponds to either an original or a compound variable. Each point on the plot is classified as “pass” or “fail” according to the failure specifications supplied by the user, and the plots with greatest separation between passing and failing data points are ranked highest.
120

As an example of its application, TRAM analyzed Monte Carlo simulation data to identify the driving design parameters of NASA JSC’s Multi-Purpose Crew Vehicle that needed to be examined in more detail. The vehicle is required to provide full abort coverage throughout the ascent phase of flight. The aerodynamic characteristics of the vehicle and its launch abort system are known to be major drivers for the Guidance, Navigation and Control algorithm design. TRAM was used to quickly identify the most influential aerodynamic parameters allowing engineers to focus their efforts on future design cycles.
Prior to TRAM, identifying the problematic aerodynamic variables involved running several Monte Carlo simulations and manually looking at this data. For this Orion example, each data set contained approximately 400 dispersed variables and 2,000 simulation runs. Each Monte Carlo set took over two hours to run. TRAM was able to identify the same driving design parameters by analyzing a single data set. The first version of this tool, which ran entirely on MATLAB, was able to accomplish this task in approximately two minutes for the analysis of individual variables, and a few hours for the analysis of a small set of compound variables. The current version of TRAM that runs on the GPU can analyze the same set of data in just a few seconds for the individual variables and a few minutes for a large number of compound variables.
Figure 2 displays the relative influence of each dispersed variable on a specific type of system failure. Specifically, in this example, a failed case is defined as a simulation run that failed to perform a controlled reorientation maneuver during an abort. Out of over 400 variables dispersed for an ascent abort Monte Carlo simulation, only six variables are significant in comparison to the rest.
Figure 2. MPCV ascent abort performance relative influence of dispersed variables.
In general, TRAM is now a practical tool for the analysis of large Monte Carlo data sets. The GPU version has significantly improved computation times making it possible to analyze variable combinations in a timely manner. TRAM is currently a generic tool, and therefore also applicable to non-aerospace data sets.
121

Telepresence for Deep Space MissionsOron Schmidt, Johnson Space CenterLevi Dexter, South Dakota School of Mines and Technology
Brian Greenly, Florida Institute of TechnologyBlake Hubbard, Friendswood High School
NASA’s Grand ChallengeThis research is being performed in response to NASA’s grand challenge for telepresence in space to “create seamless, user-friendly virtual telepresence environments allowing people to have real-time, remote interactive participation in space research and exploration.”Conversely, the crew on a long-duration exploration mission can benefit from immersive telepresence sessions from Earth that stimulate the body’s sensors for sight, hearing, smell and touch. Time is also a key factor for psychological health and elevates the importance of feeling connected. The research described in this report deals with bringing Earth-based sensations to the crew to help them cope with the mental changes resulting from the transition from living on Earth to living on a spacecraft on a long-duration mission.
What is Telepresence?High-quality video conferencing on Earth is mature and sometimes referred to as “telepresence video conferencing.” However, terrestrial video conferencing falls short of the true telepresence definition: “A collection of technologies that enable people to feel or appear as if they are present in a location which they are not physically in.” The crew on a long-duration space mission could experience events that occurred recently on Earth with enough sensual information to make them feel as though they were there. Conversely, crew activities and vehicle health information could be brought to flight controllers, family and friends on Earth with more immersiveness and fidelity than ever before.
Research Objectives and ProductsTelepresence sessions between the crew, family membersand medical doctors require visual and acoustic privacy.This environment is best achieved in individual crewquarters. Prototype Deep Space Habitat (DSH) crew quarters (see Figure 1) were developed and built in support of the Advanced Exploration Systems Program during the summer and fall of 2012, which provided both privacy and a safe haven from which to conduct operational activities during solar-radiation events. Development of the prototype was led by the Avionic Systems Division within the Engineering Directorate at the Johnson Space Center. The high school and college intern students that participated in the design and construction of the crew quarters are cited at the beginning of this document. Three-dimension video displays and multi-dimension audio systems provided a realistic recreation of Earth events. Indirect Light Emitting Diode lighting simulated a 24-hour circadian rhythm cycle.
Figure 1. Exterior view of the prototype crew quarters showing the interor control console.
Relevance and Value to NASAAdvancing the technology for the crew’s use of virtual telepresence aboard a deep space habitat and used by Earth-bound flight controllers, the crew’s family, friends and payload investigators will likely enhance mission capabilities, human performance efficiency and improve the crew’s psychological health. This research demonstrated the capability of determining the crew’s medical and psychological health through the transmission of 3-D video accompanied by high-quality multi-channel audio. The crew’s emotional and general well-being can be transmitted to the ground subconsciously via their body language. Eye contact with a 3-D camera and tone of voice provided vital information. This finding suggests more research should be conducted to determine how non-invasive telepresence sensors can be used to collect and transfer crew health information to their doctors on Earth.
3-D Display Research FindingsLarge 3-D High-Definition Televisions (HDTVs) with active frame switching provided high-quality, immersive 3-D imagery. The viewing angles were very wide and allowed multiple viewers. The active switching glasses had a battery life that varied from one to three hours. The viewing glasses were not interchangeable between the various manufacturer’s monitors. Viewing multiple monitors with one pair of active switching glasses did not work because the 3-D right and left channel-switching signals transmitted from the monitors were not synchronized. For these reasons, active switching 3-D monitors were not used in the prototype crew quarters.
122

Passive 3-D displays did not require synchronization with their polarized viewing glasses, so one pair of glasses could be used to view multiple displays simultaneously. The glasses were inexpensive and did not require batteries. The right and left video channels were displayed via interleaved horizontal lines, so the vertical resolution for each channel was reduced from 1024 lines to 512 lines. The vertical viewing angle was constrained to be only 10 or 15 degrees up or down from perpendicular to observe the full 3-D effect with good depth perception. Three passive 3-D displays were installed in the crew quarters to view three 3-D video streams simultaneously (see Figure 2). Eye contact is inhibited by the dark lenses in the glasses, so the best -3D display would be autostereoscopic and would not require glasses. Large autostereoscopic displays (greater than 10 inches) are still very expensive, but should see cost reductions through future mass production.
Figure 2. Three passive 3-D monitors with speakers behind perforated aluminum walls.
SoundHuman ears can determine the direction that sound is coming from by detecting the phase difference of the acoustic wave front between our two ears. Many consumer grade and professional 3-D cameras have the necessary five microphones built in to capture 5.1 surround sound. A five channel sound system was installed in the prototype crew quarters, which provided realistic reproduction of multi-directional sound with 3-D video.
Follow-on ResearchTo fully realize the potential benefits and limitations of the telepresence technologies, research will continue beyond Fiscal Year 2014. Data compression and delay-tolerant networking techniques will be applied to cope with the long link propagation times measured in minutes instead of seconds. Telepresence systems should stimulate the senses of not only sight and hearing, but also touch and smell as a minimum. Generating familiar smells can stimulate vivid memory recall for the crew. Research is continuing to find a way to generate, distribute and extinguish fragrances without the use of high heat or an open flame. Actuators and pressure sensors will be embedded in clothing to support haptic communications and stimulate the sense of touch.
123

Multi-Purpose Crew Vehicle Guidance, Navigation, and Control Model-Based Development of Flight SoftwareJoel R. Henry, Johnson Space Center Mark C. Jackson, Charles Stark Draper Laboratory
The Multi-Purpose Crew Vehicle (MPCV) Guidance Navigation and Control (GN&C) team is charged with developing GN&C algorithms for the exploration flight test one (EFT-1) vehicle. The GN&C team is a joint team consisting primarily of prime contractor (Lockheed Martin) and personnel and contractors from the Aeroscience and Flight Mechanics division within the Engineering Directorate at Johnson Space Center.
The flight software (FSW) must be able to operate in manual and automated modes, handling commands from both the crew and the ground, and must execute complex guidance and navigation algorithms while controlling highly dynamic configurations during entry, ascent abort and orbital maneuvers. The breadth of algorithm types required to meet these needs drives a multi-rate architecture to meet central processing unit usage allocations.
Early in the EFT-1 FSW design process, the team focused on generating and validating GN&C requirements and decided to move toward a model-based development (MBD) approach, implementing the plan by developing the tools and processes of Figure 1.
Figure 1. MPCV GN&C MBD Tools.
The team selected MATLAB/Simulink as the tool for developing GN&C algorithms, and Mathworks autocode tools as the means for converting GN&C algorithms to FSW. This MBD process was fairly new to NASA, so many practices and tools were created during software development to adapt MBD to MPCV needs. The use of MBD has never been applied to a human-rated spacecraft of this scale.
First, algorithms were developed as Simulink diagrams, often based on pre-existing algorithms already implemented as prototype C-code. These algorithms were then integrated into a Simulink framework that allowed execution within a six-degrees-of-freedom simulation. The Simulink framework was essentially a wrapper around the GN&C algorithms that provided execution, mode-ing and debugging in the native Simulink environment. Dubbed the “Rapid Algorithm MATLAB/Simulink® Engineering Simulation (RAMSES),” this wrapper eventually housed all GN&C algorithms and provided models of non-GN&C FSW required for GN&C execution.
The team then used the MBD process to produce preliminary versions of the GN&C computer software units (CSUs) in Simulink. Figure 2 shows a Simulink diagram of a typical GN&C CSU.
Figure 2. Typical Simulink GN&C CSU.
124
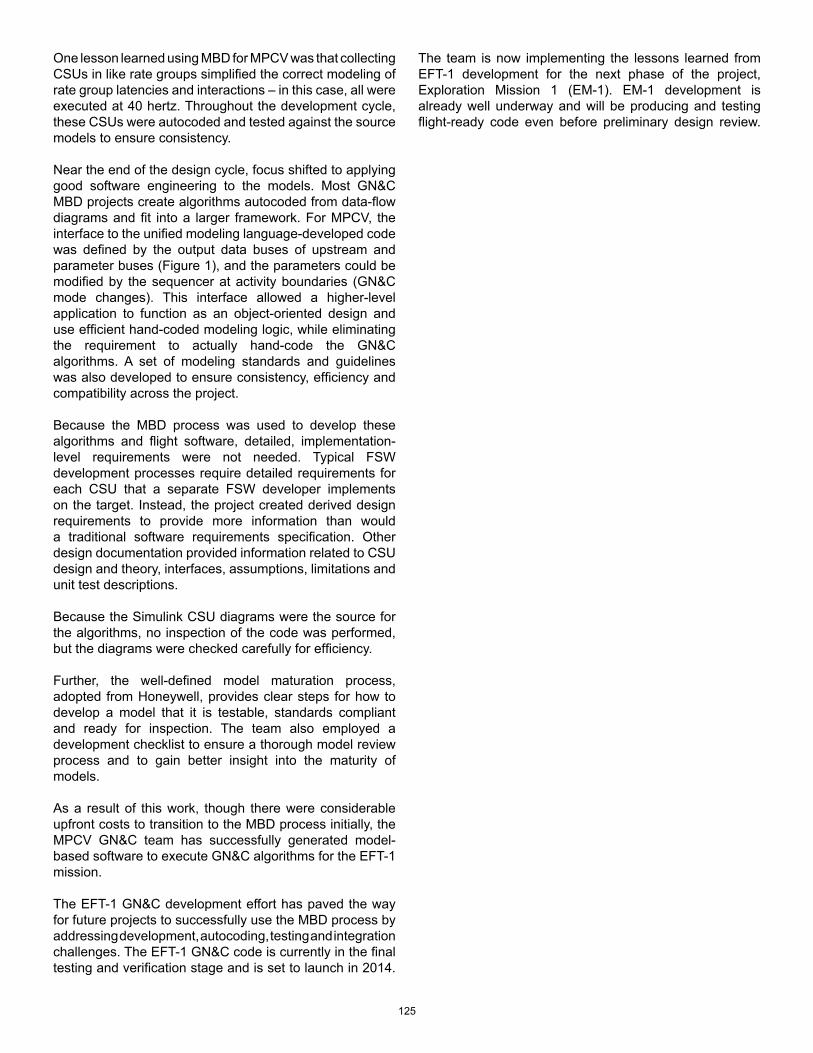
One lesson learned using MBD for MPCV was that collecting CSUs in like rate groups simplified the correct modeling of rate group latencies and interactions – in this case, all were executed at 40 hertz. Throughout the development cycle, these CSUs were autocoded and tested against the source models to ensure consistency.
Near the end of the design cycle, focus shifted to applying good software engineering to the models. Most GN&C MBD projects create algorithms autocoded from data-flow diagrams and fit into a larger framework. For MPCV, the interface to the unified modeling language-developed code was defined by the output data buses of upstream and parameter buses (Figure 1), and the parameters could be modified by the sequencer at activity boundaries (GN&C mode changes). This interface allowed a higher-level application to function as an object-oriented design and use efficient hand-coded modeling logic, while eliminating the requirement to actually hand-code the GN&C algorithms. A set of modeling standards and guidelines was also developed to ensure consistency, efficiency and compatibility across the project.
Because the MBD process was used to develop these algorithms and flight software, detailed, implementation-level requirements were not needed. Typical FSW development processes require detailed requirements for each CSU that a separate FSW developer implements on the target. Instead, the project created derived design requirements to provide more information than would a traditional software requirements specification. Other design documentation provided information related to CSU design and theory, interfaces, assumptions, limitations and unit test descriptions.
Because the Simulink CSU diagrams were the source for the algorithms, no inspection of the code was performed, but the diagrams were checked carefully for efficiency.
Further, the well-defined model maturation process, adopted from Honeywell, provides clear steps for how to develop a model that it is testable, standards compliant and ready for inspection. The team also employed a development checklist to ensure a thorough model review process and to gain better insight into the maturity of models.
As a result of this work, though there were considerable upfront costs to transition to the MBD process initially, the MPCV GN&C team has successfully generated model-based software to execute GN&C algorithms for the EFT-1 mission.
The EFT-1 GN&C development effort has paved the way for future projects to successfully use the MBD process by addressing development, autocoding, testing and integration challenges. The EFT-1 GN&C code is currently in the final testing and verification stage and is set to launch in 2014.
The team is now implementing the lessons learned from EFT-1 development for the next phase of the project, Exploration Mission 1 (EM-1). EM-1 development is already well underway and will be producing and testing flight-ready code even before preliminary design review.
125

Failure Modes and Effects Analysis (FMEA) Assistant ToolMelissa D. Flores, Johnson Space CenterJane T. Malin, Johnson Space Center
Land D. Fleming, MEI Technologies
In order for NASA to meet ambitious goals in space exploration using increasingly complex system designs, safety should be considered as early as possible in the design process. Program managers, design engineers and systems safety and reliability practitioners recognize the need to identify risk early, thus reducing lifecycle cost. However, current safety analysis methods are challenging to perform quickly enough to affect design, particularly when assessing rapidly occurring changes and large, complex systems. Hardware criticality, which can drive cost and schedule due to testing and certification requirements, can be quickly and systematically identified. Undesirable consequences across subsystem interfaces can be mitigated or eliminated.
Failure Modes and Effects Analysis (FMEA) starts at the component level and evaluates what can go wrong and how it can affect the system. It is a bottom-up, systematic method that is mostly qualitative. It is used to identify design strategies to prevent failures and improve reliability. The FMEA, therefore, provides input to risk-assessment activities, assists in assessing compliance to safety requirements (e.g., identifying single-point failures) and is used to compare the benefits of competing designs. FMEAs are required for a wide range of products designed and built by NASA.
In prior NASA programs, free text fields provided for database entry led to inconsistent failure mode identification. For example, to identify the mode where a valve “Fails to close,” some analysts would enter a failure mode of “Fails open,” while others wrote “Fails to close.” A later search of problem reports for occurrences of this failure mode would miss occurrences that were identified differently. For this reason, a standard list of about 100 Common Failure Modes (CFMs) was developed as selections for use in a database. However, in practice, it was observed that such a long list was unwieldy, and analysts too frequently chose convenient general failure descriptions (e.g., “fails to function”). The more specific type of failure mode would be identified in the free text field. This negates the benefit of a CFM list. Also, general failure modes are rarely adequate for FMEA worksheet development and subsequent systems and safety analysis.
To investigate how to solve these problems, the Safety and Mission Assurance Directorate at Johnson Space Center (JSC) initiated the FMEA Assistant Tool project in September 2011 to investigate collaboratively with the JSC Engineering Directorate the feasibility of developing a software tool to assist in FMEA.
The FMEA Assistant uses a standardized, systematic approach to failure analysis to achieve four goals: 1) make it easy and fast, while increasing attention to relevant factors and CFMs; 2) reduce errors and increase specificity; 3) output a draft worksheet; and 4) capture reusable model information that can help bridge the gap between system engineering and safety. The tool accomplishes these goals by guiding the analyst through a set of questions about component attributes. The chosen attributes narrow down the number of possible choices of failure modes that make sense for that component. The analyst need only consider a few small sets from the full list of CFMs to find the appropriate ones.
Architecture Model GenerationThe tool generates a system model visualization to organize review, based on the Hazard Identification Tool prototype, developed in collaboration between JSC’s Safety and Mission Assurance and Engineering Directorates. This tool uses semantic text analysis and extraction technology to automatically create system models from requirements, FMEAs and hazard reports. The model shows components, connections, redundancy and links to FMEAs. The visualizations of system architecture aid review of completeness, correctness and consistency of the analyses. Reachability analysis also permits inspection of flow paths and redundancy from the visual model. This technology was extended to generate the basis of a reliability block diagram model from the master equipment list (MEL). The FMEA Assistant Tool models a system’s components and their connective relationships, assists the design engineer or safety analyst in FMEA and, finally, links the FMEA data back to the model for further analysis and review. An initial model is generated from the MEL, and the analyst arranges the components and creates the connections to complete a model.
FMEA Worksheet GenerationDialogue pages help the analyst build a draft FMEA worksheet for the selected component. The analyst considers and selects failure modes from the CFM lists. Pick lists help narrow down to small sets of relevant candidate failure modes based on subsystem type, component functions, types of resources and outputs, state sets and hazard types. The dialogue is dynamic so that the choices of failure modes presented change if the analyst changes the attribute selections. The analyst can try out alternate selections to enhance analysis and decision making. For the selected failure modes, other dialogue pages help the analyst select types of failure mode causes and effects.
126
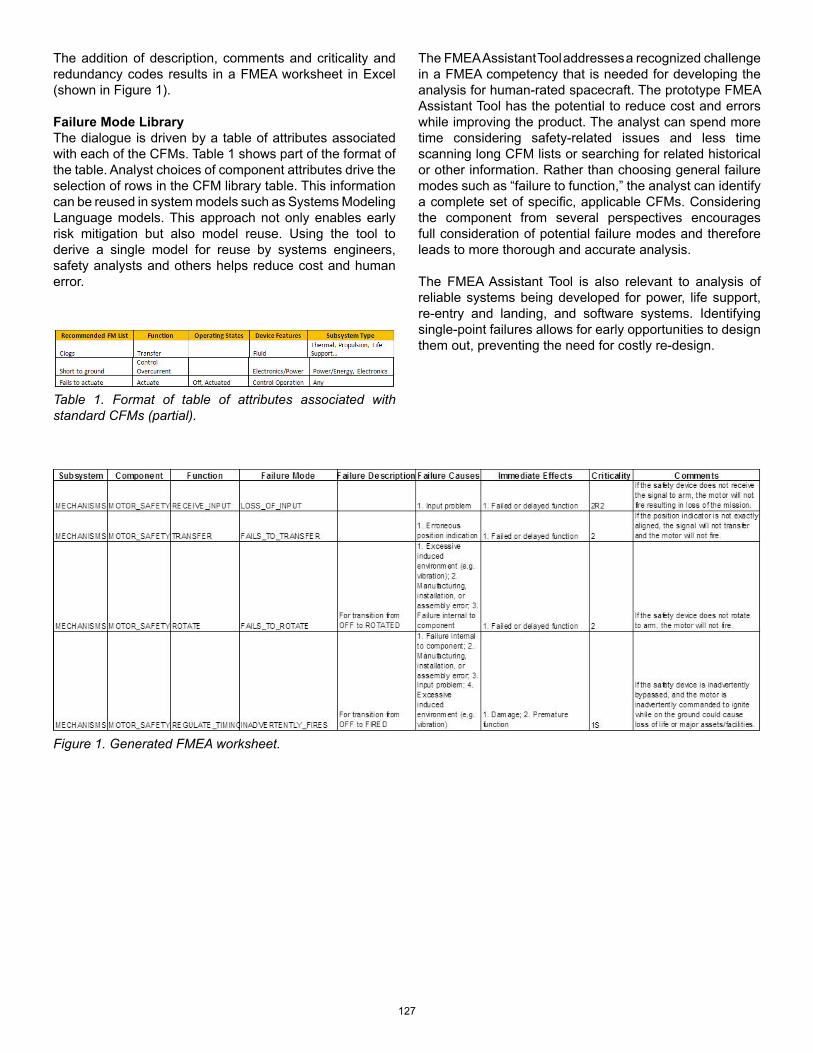
The addition of description, comments and criticality and redundancy codes results in a FMEA worksheet in Excel (shown in Figure 1).
Failure Mode LibraryThe dialogue is driven by a table of attributes associated with each of the CFMs. Table 1 shows part of the format of the table. Analyst choices of component attributes drive the selection of rows in the CFM library table. This information can be reused in system models such as Systems Modeling Language models. This approach not only enables early risk mitigation but also model reuse. Using the tool to derive a single model for reuse by systems engineers, safety analysts and others helps reduce cost and human error.
Figure 1. Generated FMEA worksheet.
Table 1. Format of table of attributes associated with standard CFMs (partial).
The FMEA Assistant Tool addresses a recognized challenge in a FMEA competency that is needed for developing the analysis for human-rated spacecraft. The prototype FMEA Assistant Tool has the potential to reduce cost and errors while improving the product. The analyst can spend more time considering safety-related issues and less time scanning long CFM lists or searching for related historical or other information. Rather than choosing general failure modes such as “failure to function,” the analyst can identify a complete set of specific, applicable CFMs. Considering the component from several perspectives encourages full consideration of potential failure modes and therefore leads to more thorough and accurate analysis.
The FMEA Assistant Tool is also relevant to analysis of reliable systems being developed for power, life support, re-entry and landing, and software systems. Identifying single-point failures allows for early opportunities to design them out, preventing the need for costly re-design.
127

Development of a Flight Debris Monitoring ToolMike Bernatovich, Johnson Space CenterJeff Fox, Johnson Space CenterMatthew Hart, Jet Propulsion Laboratory
Don Reed, Johnson Space CenterKristin Bledsoe, Jacobs TechnologyPatrick Laport, Aerospace Applications North America
IntroductionThe Multi Purpose Crew Vehicle (MPCV) Capsule Parachute Assembly System (CPAS) test program comprises a series of full scale capsule parachute drops (see Figure 1) to human rate the recovery system. This testing began in the fall of 2012 and is performed at the Yuma Army Proving Grounds in Yuma, AZ. During these tests, the capsule is dropped from a C-17 (or C-130) aircraft from approximately 25,000 ft. During the complex parachute deployment sequence, upwards of 23 separate items are ejected and either parachute or fall to the ground at varying times in the test sequence. Many of the items are too small to see with the naked eye. At approximately 10,000 ft. an Army UH-1 (Huey) helicopter (see Figure 2) orbits and gathers key photo & video documentation to aid in the engineering assessment of the vehicle’s performance during the flight.
All falling debris is a hazard to the safety of the UH-1 flight crew and must be avoided. At the same time, the UH-1 needs to be positioned close enough to gather the needed data. The baseline method of avoiding debris is through traditional planning of a very conservative keep out zone, a map, a stopwatch, and a small handheld global positioning system (GPS). A secondary situational awareness tool was needed that could provide a 2-D (two dimensional) moving map of the range with the predicted positions of the debris superimposed along with the real time position of the UH-1. This would provide a secondary visual aid during the complex CPAS flight operation allowing the helicopter to approach as close as safely possible to get the best photo and video while ensuring the crew can more easily see and avoid the myriad of debris keep out zones.
Development and Operational UseThe tool is comprised of three main elements, 1) A ruggedized laptop (see Figure 3), 2) A Windows Based software (s/w) 2-D Moving Map and 3) A Baro/Altimeter & GPS Sensor suite (see Figure 4).
Figure 1. MPCV Capsule Test Article / Parachute system descending to the landing area.
Figure 2. Army UH-1 Video Chase Helicopter.
Figure 3. Ruggedized Laptop.128

Figure 4. Baro/Altimeter & GPS Sensor.
The MPCV Vehicle Integration Office organized and led the effort to develop the tool. Having unique flight test background and organizational relationships with key technical groups, the office coordinated with the MPCV Flight Test Office, Rapid Prototyping Lab to develop the core software (s/w) ,United Space Alliance to build the sensor, and the CPAS wind / debris prediction team to provide data for the tool.
The s/w superimposes a map of the drop test area in the Yuma Proving Ground range on the laptop display. Known predictions of the debris horizontal & vertical velocity are pre-programmed into the tool. On flight day, balloon wind data is loaded into the s/w which when coupled with the debris data creates a series of polygon projections for each debris item on the display.
Next, these debris polygons need to be positioned relative to the helicopter position. This is accomplished through use of a Baro/Altimeter & GPS sensor which establishes the position and altitude of the helicopter. When fed to the laptop, the s/w can then plot the position of the helicopter on the display. In this way, the helicopter’s position can be determined relative to the debris items. Two sensors are flown, the primary Baro/Altimeter & GPS sensor and a backup sensor with GPS only. Each system was custom built with low cost, readily available commercial off the shelf (COTS) hardware.
In addition to the debris polygon keep out zones, there is additional situational awareness through the use of color. When the debris is at a pre-programmed altitude above the helicopter the polygons are yellow in color, as they near the helicopter’s altitude the turn red for a period until safely passing the helicopter, and when below the helicopter they turn green. Finally, when the debris is on the ground it turns blue in color.
The debris polygon and color scheme greatly increase the situational awareness of the flight crew during high workload periods of the flight test enabling them to vector safely away from any debris while allowing the video and still photo team to capture the data needed from the test. Additional features of the tool include clock and elevation angle for each debris item (see Figure 5) which aids the flight crew in finding items such as smaller parachutes when they are still drifting to the ground.
Figure 5. Moving Map S/W, Polygons, Clock & Elevation Data.
Post flight, each debris polygon can be isolated one at a time on the map making it easy to identify the search area. As the helicopter scans the area a breadcrumb track feature on the display helps vector the flight crew. A waypoint can be captured when an item is found. Figure 6 shows the laptop in the flight rack on board the UH-1.
Figure 6. Close-up View of Laptop in Flight Rack.
129

Completion of the primary development and testing phase took place in 2012. The tool has successfully supported each of ten flight test thus far. It will continue supporting testing through 2014.
VerificationSeveral aspects of the s/w were verified to ensure accuracy of the displayed data. Both the primary & backup altitude / position sensors were checked against the helicopter altimeter, then checked against a precision GPS logging instrument flown aboard the helicopter. The altitudes and lat / lon all compared favorably. An additional check was performed to ensure the 2-D moving map was accurately anchored to the proper lat / lon. This was performed with a simple cross check against a handheld Garmin GPS by placing both the handheld and laptop / sensor combo next to each other at a known map intersection then comparing the differences of the sensor output and map location. Again, both compared favorably with each other and well within a small error band confirming accuracy of the system and its use in an operational environment.
Future 3-D Software DevelopmentThe 2-D moving map s/w is also capable of a 3-D (three dimensional) “out-the-window” projection. Work continues to fine tune the elevation model with the overlaying imagery, calibrate the image with a live sensor and develop a roll / pitch / yaw sensor which will align the live sensor with the synthetic scene. Once complete, an additional situational awareness “out-the-window” point of view will be possible.
Conclusion The Debris Tool has become integral to mission success and safety for the CPAS drop tests where flying a helicopter in close proximity to the test vehicle with 23 separate items falling out of the sky presents a unique challenge. It adds a level of situational awareness and operational efficiency far above any other parachute testing seen at NASA.
Navy personnel have seen the tool in action and were also impressed with it. They are exploring the option of flying the tool on their SH-60 Seahawk helicopters during the recovery of the MPCV flight test article scheduled for testing in the fall of 2014.
The tool has been improved to the point where it is relied upon to keep the helicopter out of harm’s way, while improving the efficiency of the recovery operation.
One of the most unique features of this system is how it was developed. JSC was heavily promoting innovation at the time the Constellation program was canceled and there was a period when the MPCV program was charting a new course and management encouraged folks to find innovative ways to help the program. A small team of personnel with unique and diverse skills came together from across the center and identified an area where they could help. This was a true innovation effort with folks volunteering their time and pursuing their passions.
130

Exploration, Planetary Science, and Sensor Systems
131

Orion Multi-Purpose Crew VehicleOrion Team, Johnson Space Center
In 2012, NASA’s new Orion spacecraft continued to take shape, with parts coming together from suppliers and manufacturers across the country, in preparation for the 2014 flight test that will send it farther than any vehicle designed for humans has been in more than 40 years.
The year got off to a running start in January, when technicians installed the Exploration Flight Test-1 (EFT-1) vehicle backbone that will distribute the intense loads the vehicle will see during landing, and the crew module barrel, one of the primary pieces of the pressure vessel. For EFT-1, an uncrewed Orion will launch from Kennedy Space Center and travel 3,600 miles into orbit, allowing engineers to gather valuable data about key Orion systems functions and capabilities. By June, the entire pressure vessel structure of the spacecraft was complete and on its way to Kennedy Space Center in Florida, marking a major milestone along the road to EFT-1.
The team wasted no time resting on its laurels, however. Installation of subsystems and components in the crew module at the Operations and Checkout Facility (see Figure 1)—Kennedy’s spacecraft factory—began in July, and it underwent its first round of proof-pressure testing in October. Kennedy also began work on the 1,300 thermal protection system tiles that will cover the vehicle’s back shell and provide protection from the extreme heat of re-entry.
Meanwhile, at Lockheed Martin in Denver, work began on Orion’s composite heat shield, the largest ever built, which will provide the lion’s share of thermal protection during re-entry. The 176 titanium stringers that form the interior structure of the flight heat shield were delivered and joined with the heat shield skin in October. Once a layer of Avcoat (see Figure 2) has been added, the heat shield will be complete and ready for Orion’s return to Earth.
Figure 1. The Exploration Flight Test-1 crew module is removed from the static loads test fixture at the Operations and Checkout building at KSC. During testing, the loads on the vehicle ranged from 14,000 pounds to 240,000 pounds with more than 1,600 strain gauges recording the vehicle’s response.
Figure 2. Technicians at Textron Defense Systems in Massachusetts apply Avcoat ablative thermal protection material to the composite honeycomb on top of the Orion heat shield carrier structure.
As the vehicle comes together, its design continues to be tested across the country on land, in the air and on (simulated) seas. Its parachutes were tested with five deployments from 25,000 feet above the Arizona desert this past year (see Figure 3). The tests were part of the human-rating process for Orion vehicles to come, and looked at the expected parachute performance, as well as potential malfunctions, ensuring that even if everything doesn’t go as planned, Orion’s future crews will land safely.
132
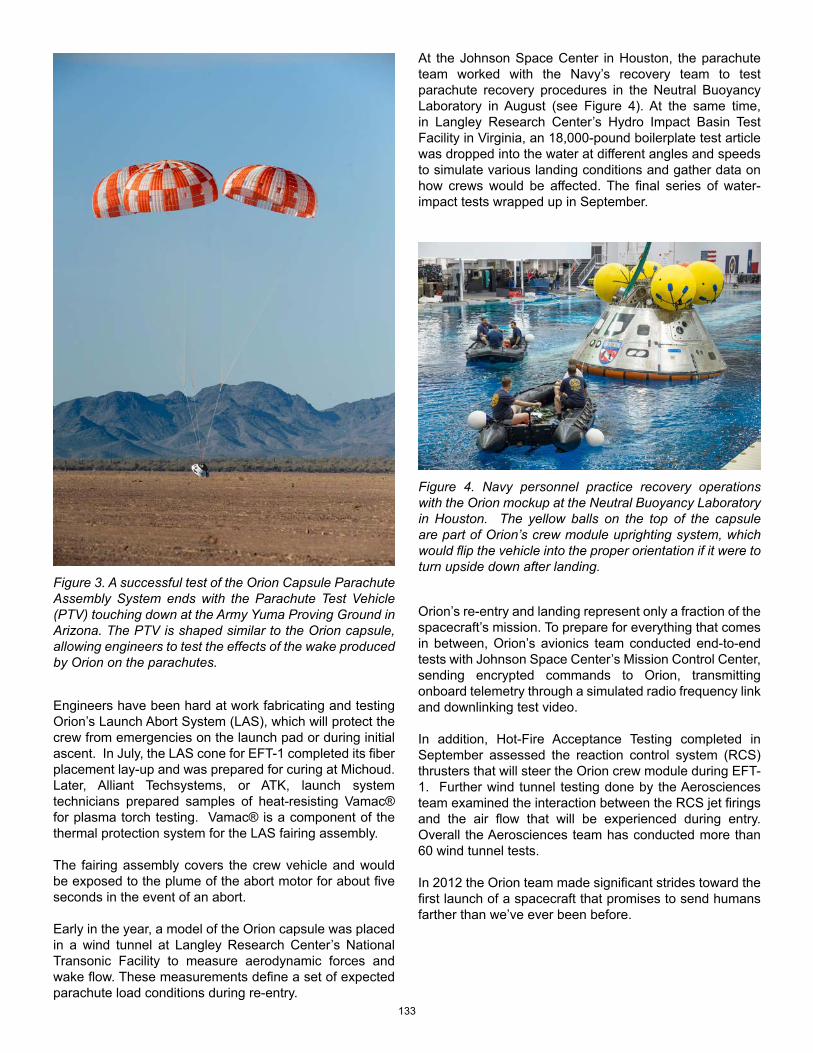
Figure 3. A successful test of the Orion Capsule Parachute Assembly System ends with the Parachute Test Vehicle (PTV) touching down at the Army Yuma Proving Ground in Arizona. The PTV is shaped similar to the Orion capsule, allowing engineers to test the effects of the wake produced by Orion on the parachutes.
Engineers have been hard at work fabricating and testing Orion’s Launch Abort System (LAS), which will protect the crew from emergencies on the launch pad or during initial ascent. In July, the LAS cone for EFT-1 completed its fiber placement lay-up and was prepared for curing at Michoud. Later, Alliant Techsystems, or ATK, launch system technicians prepared samples of heat-resisting Vamac® for plasma torch testing. Vamac® is a component of the thermal protection system for the LAS fairing assembly. The fairing assembly covers the crew vehicle and would be exposed to the plume of the abort motor for about five seconds in the event of an abort.
Early in the year, a model of the Orion capsule was placed in a wind tunnel at Langley Research Center’s National Transonic Facility to measure aerodynamic forces and wake flow. These measurements define a set of expected parachute load conditions during re-entry.
At the Johnson Space Center in Houston, the parachute team worked with the Navy’s recovery team to test parachute recovery procedures in the Neutral Buoyancy Laboratory in August (see Figure 4). At the same time, in Langley Research Center’s Hydro Impact Basin Test Facility in Virginia, an 18,000-pound boilerplate test article was dropped into the water at different angles and speeds to simulate various landing conditions and gather data on how crews would be affected. The final series of water-impact tests wrapped up in September.
Figure 4. Navy personnel practice recovery operations with the Orion mockup at the Neutral Buoyancy Laboratory in Houston. The yellow balls on the top of the capsule are part of Orion’s crew module uprighting system, which would flip the vehicle into the proper orientation if it were to turn upside down after landing.
Orion’s re-entry and landing represent only a fraction of the spacecraft’s mission. To prepare for everything that comes in between, Orion’s avionics team conducted end-to-end tests with Johnson Space Center’s Mission Control Center, sending encrypted commands to Orion, transmitting onboard telemetry through a simulated radio frequency link and downlinking test video.
In addition, Hot-Fire Acceptance Testing completed in September assessed the reaction control system (RCS) thrusters that will steer the Orion crew module during EFT-1. Further wind tunnel testing done by the Aerosciences team examined the interaction between the RCS jet firings and the air flow that will be experienced during entry. Overall the Aerosciences team has conducted more than 60 wind tunnel tests.
In 2012 the Orion team made significant strides toward the first launch of a spacecraft that promises to send humans farther than we’ve ever been before.
133

NASA’s Commercial Crew ProgramTrent M. Smith, Kennedy Space Center Steven P. Siceloff, Abacus Technology
A new approach to transporting astronauts safely into space and back is paying off for NASA and private companies as they work together to launch humans aboard American spacecraft from American launch sites to the International Space Station (ISS) later this decade. There are numerous key items to making this approach work, including developing new technologies and improving or adapting existing ones to better fit the unique needs of crews, the station and the companies.
Under NASA’s Commercial Crew Program (CCP) led by the Kennedy Space Center (KSC) and the Johnson Space Center (JSC), engineers, designers and scientists are applying their hard-earned knowledge of spaceflight to the challenges partner companies are facing as they develop their own rockets and spacecraft.
NASA is overseeing a progression of technological achievements as well as the development of a competitive marketplace for space transportation in its work with multiple aerospace companies.
Each of the companies is producing a spacecraft or rocket or both and is overcoming broad challenges, ranging from propulsion and re-entry to the detailed needs of fine tuning navigation instruments, refining life support systems and developing launch abort systems that safely lift astronauts away from danger.
The agency’s goals for the effort call on companies to produce a spacecraft and rocket combination that can carry four astronauts and equipment to the ISS, with the spacecraft serving as a safe haven on the ISS in an emergency and remains docked at the orbiting laboratory for up to 210 days. The companies also are required to provide an abort system to return astronauts safely in a launch emergency.
Three phases of development agreements were awarded by NASA to identify and develop concepts into designs for the mission. Each phase narrowed the technological requirements and called for reviews to refine the needs to continue development.
The current phase, called the Commercial Crew Integrated Capability, or CCiCap, is aimed at producing an integrated system consisting of spacecraft, rocket, ground support and mission operations that can make a first flight around 2017. During CCiCap the Boeing Company, Sierra Nevada Corporation (SNC), and Space Exploration Technologies (SpaceX), are pursuing unique paths to space, and are partnered with NASA to make their push toward flight. The CCiCap partner integrated systems are shown in Figure 1.
Figure 1. An artist’s depiction of NASA’s partners in its Commercial Crew Integrated Capability Initiative showing their crew transportation designs. The Boeing Company, Sierra Nevada Corp., and Space Exploration Technologies are advancing integrated crew transportation systems for Low-Earth Orbit and transportation to the International Space Station.
Boeing – CST-100/Atlas V In 2010, Boeing and NASA partnered for the first phase of development of the CST-100, short for Crew Space Transportation-100. The capsule-shaped CST-100 is bigger than an Apollo spacecraft and is designed to take seven people, or a combination of crew and cargo, to the International Space Station and other locations in low-Earth orbit.
The company’s spacecraft design has progressed steadily through each new phase of development, meeting precise criteria along the way to continue toward a flight test in the middle of this decade.
The CST-100 spacecraft would launch atop an Atlas V rocket provided by United Launch Alliance. A service module would fly with the crewed section of the spacecraft. The design takes advantage of Boeing’s extensive aerospace history with NASA, which goes back to the Apollo spacecraft and extends through the Space Shuttle and Space Station Programs.
The company is developing numerous technologies that will be tested extensively as design and engineering continues. Boeing completed important engineering reviews, including in August 2012, an Integrated Systems Review that established a baseline for the CST-100.
The technological advances also include making changes to the reliable satellite-launching Atlas V rocket so it can safely boost humans.
134

Modifications include incorporating sensors and other hardware that will monitor the rocket’s health during the climb into orbit. If the sensors pick up a problem, the system will alert the astronauts on board in case an abort needs to take place to save the crew.
The reviews have not been limited to the spacecraft and rocket. In October 2012, Boeing completed its Production Design Review milestone that inspected plans for the infrastructure and equipment needed on the ground to manufacture the spacecraft and test it successfully.
Among the technologies developed for the Atlas V is a newly developed liquid oxygen feed line duct that will transfer the super-cold propellant from its onboard liquid oxygen tank to its dual-engine Centaur configuration. The Centaur is the rocket component that will propel the spacecraft to its intended orbit.
A separate review held in January 2013 covered the software that will guide the spacecraft. Working with a detailed computer arrangement at the Avionics Software Integration Lab, the computer coding for the Boeing spacecraft faced the demands of launch and spaceflight and succeeded in its mission. The computers that will operate the CST-100 are significantly more advanced than the punch-card-programmed models that Apollo spacecraft used, and are much more powerful than the space shuttle’s general purpose computers.
SpaceX - Dragon/Falcon 9SpaceX has made enormous strides in the development of a Dragon capsule capable of carrying astronauts safely to the International Space Station. The company has developed and flown a cargo-carrying version of its spacecraft that successfully docked with the station on repeated occasions. The spacecraft flew atop a rocket called Falcon 9 that also was developed by the Hawthorne, Calif.-based company.
With successful flights of its rocket and capsule configuration behind it, SpaceX has focused on evolving the Dragon capsule to host a crew. The developments include incorporating a life support system and the control systems an astronaut would need to manually pilot the spacecraft.
The company is working closely with NASA on a series of engineering and development reviews. The Integrated System Requirements Review held October 2012 detailed plans for the spacecraft, launch vehicle and ground and mission operations systems needed to achieve a successful mission.
A Ground Systems and Ascent Preliminary Design Review held December 2012 recently covered ground systems, including vehicle processing and launch pad operations as well as the Falcon 9 launch vehicle and the Dragon spacecraft, focusing on the ascent and abort flight regimes.
SNC - Dream Chaser/Atlas VSNC’s Dream Chaser looks like a space plane and is designed to carry up to seven astronauts and their equipment to the space station. The company is preparing for some of its most stringent testing so far to prove the design of its vehicle will work safely.
The Engineering Test Article, a full-size mock-up of the Dream Chaser, has been through a ground resonance test in the company’s facilities and wind tunnel testing is coming up.
In August 2012 SNC completed a Program Implementation Plan Review that detailed the design, development, system testing, evaluation, risk reduction activities and flight testing of all its Dream Chaser systems during the Commercial Crew Integrated Capability (CCiCap) phase. SNC is developing plans for further testing, certification and crewed orbital demonstration flight.
An Integrated System Baseline Review was conducted in October 2012 to show that the Dream Chaser design meets SNC system requirements with acceptable risk and within schedule constraints. It will establish the basis for proceeding with a detailed design. It will show that design options have been selected that meet SNC requirements, interfaces have been identified, and verification methods have been described.
A major campaign of drop-tests using a full-sized model are expected in 2013 to show that the spacecraft will glide to a landing to end a mission, just as the space shuttle did for 30 years. The company made several preparatory flights ahead of the drop test using a helicopter equipped with a long cable and special sling holding a Dream Chaser. The flight tests will take place at NASA’s Dryden Flight Research Center in California.
Although each spacecraft is unique from its competitors in a number of ways, all three designs are incorporating new technologies to provide a launch abort system, a major requirement for the spacecraft NASA wants to safely carry astronauts to the space station.
Launch Abort SystemThe three companies developing spacecraft in collaboration with NASA’s Commercial Crew Program are taking a new approach to the question of the best way to whisk a crew out of danger during a launch countdown or during the climb into space.
Previously, NASA counted on either a small rocket atop a capsule that would pull a spacecraft and astronauts away from danger, or ejection seats to save astronauts. But the advent of stronger thrusters, new propellants and computer controls have made it possible for spacecraft designers to incorporate a launch abort system, or LAS, that ignites and pushes the spacecraft and its crew out of harm’s way.
135

Boeing’s CST-100 will use four RS-88 “Bantam” engines on the base of the CST-100’s service module to lift the capsule and crew away from a failing rocket during launch. The Bantam design, which burns ethanol and liquid oxygen, is undergoing more qualification tests to show it will work as a reliable escape system motor. A hot-fire test of a RS-88 “Bantam” engine is shown in Figure 2.
Figure 2. Pratt & Whitney Rocketdyne hot-fires a launch abort engine for The Boeing Co., which is developing its CST-100 spacecraft for NASA’s Commercial Crew Program.
SpaceX has run numerous tests on its escape rocket system, too. Called SuperDraco, the engines are designed to be mounted on the sidewalls of the Dragon spacecraft. Eight of the thrusters will fire to lift a Dragon capsule in an emergency. The SuperDraco thrusters burn a hypergolic combination of propellants that immediately ignite when they come in contact with each other. A SuperDraco engine test is shown in Figure 3.
SNC is counting on a revolutionary “green” propellant to power the hybrid rocket motor that would push the Dream Chaser spaceplane and its crew to safety in a launch abort. Unlike traditional solid-fueled engines, the hybrid under development by SNC can be throttled and shut off and restarted repeatedly. A SNC hybrid rocket motor test is shown in Figure 4.
Figure 3. Superdraco rocket engine fires at SpaceX’s facility in Texas.
Figure 4. A rocket motor under development by Sierra Nevada Corp. Space Systems for its Dream Chaser spacecraft successfully fires at the company’s rocket test facility located near San Diego.
CCP continues deep involvement with these three American companies as they continue to develop integrated transportation systems capable of safely flying astronauts to the International Space Station from American soil.
136

Flight Deck of the FutureMary McCabe, Johnson Space Center Christie Sauers, Johnson Space Center
For the past 55 years, NASA has been focused on designing spacecraft for highly trained astronauts and, primarily, for a cockpit environment. However, future missions will likely shift this paradigm to longer-duration missions that have months, or even years, between ground-based training and flight use. Add to this the explosion in use of smartphones, tablets and gaming controllers, and the expectations the average human has for their Computer-Human Interface (CHI) devices is far beyond the typical aeronautic cockpit.
The Flight Deck of the Future (F.F) at the Johnson Space Center is focused on meeting the challenges of an evolving human space program and satisfying the techno-geek of the 21st century. The F.F was established from within the Engineering Directorate by the Avionic Systems Division and the Systems Architecture and Integration Office in 2011 to engage a multidisciplinary team to develop and integrate innovative human interfaces for future human spacecraft. By incorporating the expertise of all domains within Human Systems Integration (HSI), from the very formation of a project through operation, costly operational workarounds can be avoided. At JSC, these domains include: crew, traditional engineering disciplines, Human Health and Performance, operations and training, and safety.
Human interfaces incorporate a wide range of areas. The F.F is pursuing advanced technologies in audio, video, control-input devices, displays, lighting, human factors evaluations and metrics.
ObjectivesThere are two main objectives of the F.F. The first objective is to demonstrate the benefit of infusing HSI methodology into the NASA systems engineering process at the earliest design phase. In order to reach this goal, the F.F has engaged HSI disciplines across JSC and NASA to facilitate technical communication and collaboration.
Second, the F.F strives to develop the next generation of human interfaces for human spaceflight missions based on the latest, most innovative technologies. This objective cannot be achieved without creating partnerships with other government agencies and industry leaders, as well as engaging academia by partnering with students in technology development and education outreach.
CapabilitiesSeveral capabilities exist within the F.F to facilitate meeting the objectives of infusing HSI methodology into spacecraft systems and advancing our human interfaces for spaceflight. Three stationary, physical mock-up areas were created to allow for technology integration into a more authentic environment for Human-in-the-Loop (HITL) testing.
First, a reconfigurable habitat mock-up, designed and built by students at Kansas State University, provides a partial curved wall environment that can be set up in multiple vertical and horizontal configurations. Second, a single crew quarters mock-up, designed and built by students at Texas Tech University, offers a one-fourth cylinder area for evaluating technologies in a small, personal space for crew members within a habitat. Third, a cockpit mock-up, shown in Figure 1, provides the constrained physical space and a fully reclined orientation for evaluating dynamic flight vehicles.
Figure 1. Cockput mock-up.
Additional, more portable mock-up environments were also included to add testing flexibility within F.F. These include an HSI workstation and a 180-degree immersive visual environment. The HSI workstation can be configured for telerobotic applications, telepresence interactions, traditional vehicle health monitoring and control, and even crew entertainment. The 180-degree immersive visual environment, shown in Figure 2, is a setup of several large panel screens that can give the user the sense of being inside a virtual world without requiring wearable visual displays. Additional, more portable mock-up environments were also included to add testing flexibility within F.F. These include an HSI workstation and a 180-degree immersive visual environment. The HSI workstation can be configured for telerobotic applications, telepresence interactions, traditional vehicle health monitoring and control, and even crew entertainment. The 180-degree immersive visual environment, shown in Figure 2, is a setup of several large panel screens that can give the user the sense of being inside a virtual world without requiring wearable visual displays.
137

Figure 2. This is the 180-degree immersive visual environment.
Along with the180-degree immersive visual environment, a fully immersive visual environment, shown in Figure 3, is currently being configured. This is a full, spherical dome that will allow full immersion into a visual setting and allow the user some degree of freedom of movement.
Figure 3. Fully immersive visual environment.
The most unique capability of the F.F is due to its inclusion within the integrated Power, Avionics and Software (iPAS) facility, as shown in Figure 4. As the human interface component of iPAS, the F.F has the ability to interface innovative, low Technology Readiness Level (TRL) technologies with actual path-to-flight hardware and systems at a very early design stage. This allows a much higher-fidelity product much earlier in the design process.
Figure 4. The iPAS facility, including the Flight Deck of the Future.
In addition to the physical capabilities of F.F, there is also a focus on providing a collaborative environment to bring together the multiple disciplines of HSI that have traditionally been primarily isolated. To this end, the F.F has created a repository of HSI community activities/projects across JSC and has begun expanding this to the greater NASA community. There is also an effort to integrate lessons learned from previous programs/project into future designs.
Once a technology has been introduced into the F.F, human factors evaluations are applied to help direct the research and design activities. Because of the inclusion of the Human Health and Performance community, research and development projects, as well as larger, established projects, can utilize the F.F channels to perform HITL evaluations at a much earlier design phase.
Partnerships and CollaborationsThe F.F team has engaged various organizations across JSC, other NASA centers and other government agencies in all aspects of the F.F. The collaboration efforts have identified and developed technologies to mature to higher TRLs, built our core set of testing services, infused HSI methodology into existing and new projects and developed the mock-up environments available for HITL testing of technologies.
138

In addition to the student partnerships mentioned supporting mock-ups development, several other partnerships have been developed. F.F and the crew office are working together to provide a test environment for a new, feet-only control device, using hardware, software and support from the crew office’s displays and controls Rapid Prototyping Lab. F.F is partnering with the Avionics Systems Division on a number of technology development projects, such as wearable electronics, virtual windows and telepresence. The Human Health and Performance Division is partnering with F.F on technology development, such as robot control methods and avatar systems, and providing testing services, such as test plan development and test conduction. Ames Research Center is collaborating with F.F to jointly mature collaboration tools such as large-screen, multi-touch devices. Numerous other organizations are also partnering with F.F in areas such as Systems Architecture and Integration, Operations, Robotics, Orion Program and Safety.
Education and OutreachThe F.F partnerships with students include both on-site personnel through the Pathways Intern Program, and projects at the universities, such as Capstone Senior Design Projects. Students are mentored through the NASA design process for one to two semesters, with typical engineering design reviews, and have opportunities to see NASA activities and facilities in person during visits to JSC. In turn, the students share their NASA partnership with local communities across the country, spreading their knowledge and excitement to others.
While senior design projects developed and delivered mock-ups of large space structures, several of the smaller F.F environments and lab infrastructure were provided by the on-site interns. In particular, student intern projects designed and built the HSI workstation, developed voice control software and designed and built the reconfigurable display mounting for the cockpit mock-up. Student involvement has been instrumental to the success of the F.F.
SummaryThe F.F laboratory is the place at JSC to test and integrate human interfaces at all stages of the design process. This unique, collaborative environment brings together all the disciplines required to develop cost-effective, user friendly human-computer interfaces. By focusing on HSI and bringing those concepts and methodologies to the forefront of design, the F.F is bringing innovative, cutting-edge technologies to the next generation of human spaceflight.
139
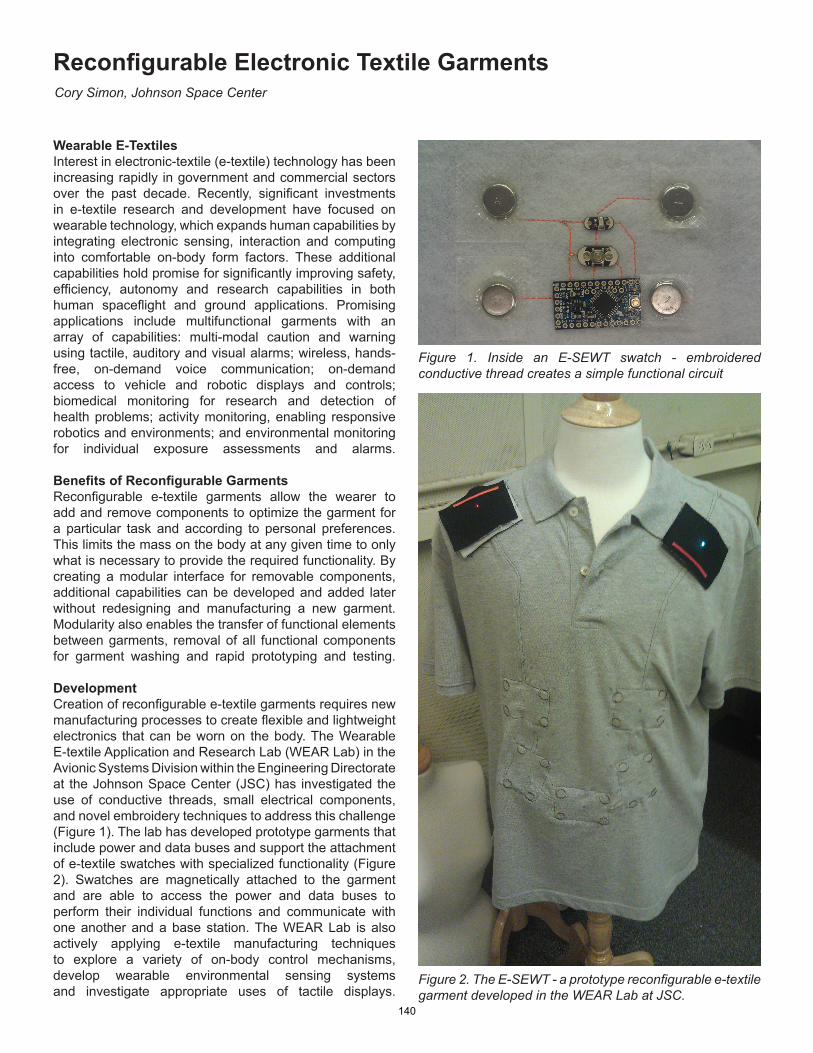
Reconfigurable Electronic Textile GarmentsCory Simon, Johnson Space Center
Wearable E-TextilesInterest in electronic-textile (e-textile) technology has been increasing rapidly in government and commercial sectors over the past decade. Recently, significant investments in e-textile research and development have focused on wearable technology, which expands human capabilities by integrating electronic sensing, interaction and computing into comfortable on-body form factors. These additional capabilities hold promise for significantly improving safety, efficiency, autonomy and research capabilities in both human spaceflight and ground applications. Promising applications include multifunctional garments with an array of capabilities: multi-modal caution and warning using tactile, auditory and visual alarms; wireless, hands-free, on-demand voice communication; on-demand access to vehicle and robotic displays and controls; biomedical monitoring for research and detection of health problems; activity monitoring, enabling responsive robotics and environments; and environmental monitoring for individual exposure assessments and alarms.
Benefits of Reconfigurable GarmentsReconfigurable e-textile garments allow the wearer to add and remove components to optimize the garment for a particular task and according to personal preferences. This limits the mass on the body at any given time to only what is necessary to provide the required functionality. By creating a modular interface for removable components, additional capabilities can be developed and added later without redesigning and manufacturing a new garment. Modularity also enables the transfer of functional elements between garments, removal of all functional components for garment washing and rapid prototyping and testing.
DevelopmentCreation of reconfigurable e-textile garments requires new manufacturing processes to create flexible and lightweight electronics that can be worn on the body. The Wearable E-textile Application and Research Lab (WEAR Lab) in the Avionic Systems Division within the Engineering Directorate at the Johnson Space Center (JSC) has investigated the use of conductive threads, small electrical components, and novel embroidery techniques to address this challenge (Figure 1). The lab has developed prototype garments that include power and data buses and support the attachment of e-textile swatches with specialized functionality (Figure 2). Swatches are magnetically attached to the garment and are able to access the power and data buses to perform their individual functions and communicate with one another and a base station. The WEAR Lab is also actively applying e-textile manufacturing techniques to explore a variety of on-body control mechanisms, develop wearable environmental sensing systems and investigate appropriate uses of tactile displays.
Figure 1. Inside an E-SEWT swatch - embroidered conductive thread creates a simple functional circuit
Figure 2. The E-SEWT - a prototype reconfigurable e-textile garment developed in the WEAR Lab at JSC.
140

CollaborationWearable technology and e-textiles are relatively new fields of research that require highly diverse and traditionally separate skills. Through partnerships with respected university researchers and their students, JSC personnel are collaborating with apparel designers, industrial designers, textile experts and human computer interaction specialists. Figure 3 shows prototype garments developed by apparel design students at the University of Minnesota in 2012. The student teams sought to demonstrate new implementations of astronaut cooling garments and investigate where traditional electronic devices might be mounted on astronaut’s body. In the spring of 2013, nearly 50 students from the University of Minnesota, Georgia Tech and Virginia Tech investigated additional challenges related to e-textiles and wearable technology faced by JSC engineers. The students were able to leverage their unique skills and the perspective of their professors and NASA mentors to explore novel ideas and address focused challenges.
Figure 3. University of Minnesota student prototypes that address space suit cooling and electronic component placement.
Future WorkThe WEAR Lab continues to develop and prototype wearable technologies for use in human spaceflight. Future work will include improvements in the e-textile manufacturing process through continued refinement and new partnerships with flexible electronics researchers. Current reconfigurable e-textile garments will be updated to improve wearer comfort and durability while also adding new functions. The technologies developed are expected to provide revolutionary capabilities, both in human spaceflight and Earth applications.
141

Designing a Food System for a Mars Habitat MissionGrace Douglas, Johnson Space Center Maya Cooper, Lockheed Martin
NASA is working to achieve human spaceflights to the Mars surface by 2035 and to build a sustainable, long-term human presence on the planet. The NASA Human Research Program (HRP) has an identified risk for such missions—that an inadequate food system could cause loss of life or degradation of performance for the crew. A mitigation of the risk could require that a portion of the diet is grown, processed and prepared in the space habitat. The extent of that diet portion has not been determined. Feeding the crew member with traditional, shelf-stable, fully cooked food items has high food security, but will require heavy stowage loads and limit the diet options, while complete dependence on habitat grown crops will require extensive crew time, power, mass and volume commitments in the habitat.
From October 2009 to September 2012, the HRP Advanced Food Technology team of the Human Systems Engineering and Development Division within the Human Health and Performance Directorate at Johnson Space Center conducted a trade study that compared the resource utilization of processing baseline crops into edible ingredients to the resource utilization of the existing prepackaged food system for a Mars habitat scenario. Five food systems were developed for evaluation based on three 10-day cycle menus for a 600-day surface mission. The first food system consisted of meals derived from crops potentially grown at the Martian habitat, with minor dry ingredient additions such as spices and dried egg powder. The second food system used the same meals as the first, but the ingredient sourcing changed; meals were derived from a smaller number of crops potentially grown at the Martian habitat, stable bulk commodities (rice, beans, wheat) shipped from Earth and minor dry ingredient additions. The third and fourth food systems mirror the first and second system food sources, respectively, except both the third and fourth systems were supplemented with prepackaged meat products. The final food system was based solely on the existing International Space Station (ISS) menu items in 2010.
The assessment of the systems included mass, volume, power, cooling and crew time utilization as prescribed by equivalent system mass (ESM) principles. ESM is a metric that allows standardization (through mass equivalency factors) of several parameters to result in a single quantity (mass penalty) that represents the launch cost of a given life support system.
An extensive supply of prepackaged food is required to support six crew members for 600 days. The introduction of habitat-processed food allows a significant decrease in the quantity of required stowed consumables. Table 1 provides the quantity of food that must be shipped to the deep space habitat and the amount of produce that must be grown in a habitat greenhouse for each potential food system.
Table 1. Food mass requirements for proposed food systems.
The masses of the food were summed according to the amount of each ingredient required to produce each recipe, the frequency of the recipe in the menu cycle and, as necessary, the amount of raw produce required to produce the ingredient. Contingency food amounts, in case of emergency, were not included. Along with the food masses, equipment mass was also considered. The total mass of food equipment used in all four food systems with food-processing components ranges from 180.7 to 185.7 kilograms, dependent upon the level of peanut and wheat ingredient-processing required. The equipment mass is in stark contrast to the equipment mass postulated by other researchers, whose evaluations estimated 718 kilograms of equipment, though researchers did note that some of the equipment may have been oversized for a crew of six. The mass differences between the two studies are largely driven by the selection of smaller-scale configurations for the mill, refrigerator, ice cream maker, convection oven and concentrator equipment, as well as the elimination of the tortilla press.
The volume required for the prepackaged food system was more than two times the volume required to support any other food system. The food volume was calculated using the same densities for powder, leafy, granule, legumes/liquids and resupply pasta.
142

The prepackaged food volumes were taken from dimensional measurements of current ISS food product. The equipment volumes were determined from dimensional measurements of the equipment used in simulations.
The power requirements were derived from the summation of power usage of the appliances and remains the same for systems 1 through 4. Additionally, the cooling requirement is equal to the power requirement of the system. Thus, the power and cooling requirements are 11.534 kW. The power and cooling requirement for system 5 is 0.960 kW per shuttle operations.
Under the proposed bioregenerative system, all of the food items are produced from crop or commodity ingredients. The processes are more complex than the simple rehydration and heating involved in preparing meals for the ISS. Consequently, the time required to cook food is much more time than is required currently on the ISS, or even in most modern kitchens. Almost all meals from food systems 1 and 2 required at least two hours of dedicated crew time, a 1,200-percent increase over the time required to actively prepare meals on ISS. The daily active time for food preparation for food systems 1 and 2 averaged 450 minutes; and the active time for food systems 3 and 4 averaged 379 minutes.
Food system 3, a food system dependent upon significant crop growth and prepackaged meats, had the lowest ESM of the food systems assessed. Bulk ingredients are not included within the system design, which reduces the required amount of shipped food. The addition of prepackaged meats reduces the crew time in food systems 3 and 4 as compared to the first 2 food systems. Table 2 provides the categorical summations input into the ESM metric.
Table 2. Compilation of the ESM Values for food-processing trade study.
The trade study answers the key question to which it was targeted—is it better to take the food to Mars or grow the food on the surface—with the ambiguous “yes.” While the advantages of growing the food at the surface involve a tremendous upmass savings and menu personalization (thus potentially higher acceptability and more menu variety), it cannot be discounted that even a small addition of prepackaged food prompted a significant decrease in crew time utilization and decreased the likelihood of food scarcity. The results indicate the food system design should focus on a solution that is mixed with food sources, leveraging the advantages of both farming crops and stowing the food supply.
The results of this study should be placed in the context of the resource utilization by other subsystems and the overall mission goals. While growing the majority of food at the habitat is advantageous for the food-processing subsystem, the biomass demand will require significant square meters of farming area, along with the lighting, airflow and water resources that support greenhouse production. Additionally, the bioregenerative food systems require significant crew-time utilization that could preclude crewmember dedication to science and exploratory objectives. The allowable amount of crew time spent on food production tasks or the galley allotment within the habitat should correlate to the stated mission goals—a test of habitability or scientific discovery. The food system requirements will ultimately be formulated within the confines of that guiderail. As the goal shifts, the food system will shift.
This work was funded by HRP and supports the Risk of Inadequate Food System, answering, “What technologies can be developed that will efficiently balance appropriate vehicle resources such as mass, volume and crew time?” The study results offered significant insight into resource utilization balance for the food subsystem and influenced the prioritization of future tasks to reduce risk of inadequate nutrition.
143

Nanophase Iron-Induced Reactivity of Ground Lunar SoilAntony S. Jeevarajan, Johnson Space Center William T. Wallace, Wyle Science, Technology, and
Engineering
Several nations are planning to send robotic and manned missions to the moon in the current decade, and this has led to a renewed interest in studying the properties of the lunar regolith, the broken, shattered and pulverized rock, mineral and glass materials that blanket the entire surface of the moon. Much of this interest is related to mission operations, as lunar soil was found to cause problems with mechanical systems during the Apollo missions, and there is concern that lunar dust could potentially cause health problems. However, the lunar regolith also presents opportunities for the in-situ resource utilization of the soils as a source of important materials for a lunar base.
Lunar dust is generally described as that portion of the lunar regolith with a mean grain diameter of less than 20 micrometers. The composition of the dust depends on its age and its origin on the lunar surface. A significant difference in the types of dust is that highland dusts have considerably lower iron contents than that of mare dusts, ~5 percent ferrous oxide (FeO) versus 15 percent, respectively.Some of this iron content is in the form of fully-reduced iron particles (Fe0) with diameters on the orders of tens of nanometers, referred to as nanophase iron (np-Fe). Due to the fact that these iron particles are a function of space weathering, their concentration can provide a relative age, allowing one to designate “mature” and “immature” dusts, due to their “exposure ages” on the lunar surface.
Lunar dust is produced over millennia by different forms of space weathering. Meteorites and micrometeorites (<1 mm) impact the lunar surface, 1) pulverizing the larger pieces of regolith (a process known as comminution), 2) melting portions of the soil that quenches and produces aggregates of mineral, rock and glass fragments termed agglutinates, and 3) vaporizing components of the melted soil, which condenses and deposits of the surfaces of the individual soil grains. Virtually all soil/dust particles are coated with silica-rich glass containing huge quantities of nano-sized metallic Fe grains suspended within this glass. Continued comminution of soil/dust particles chips these glass rims of the particles, thereby increasing the amount of fine-grained glass containing np-Fe (i.e., the dust). In addition, the solar-wind hydrogen impregnated in the surfaces of soil particles may reduce the FeO component of the melt, also producing additional metallic Fe. Comminution can also lead to changes on the surfaces of the particles, creating an “active” surface full of broken silicon-oxygen bonds. These active sites give rise to the potential for chemical reactivity with respiratory tissue in humans.
In the years since the Apollo missions, it is likely that much of the reactivity of the returned lunar dust has been lost due to exposure to trace amounts of oxygen and water vapor. In an effort to recreate some of the lunar soil reactivity that astronauts may encounter on the moon, members of the Human Health and Performance Directorate at the Johnson Space Center initiated studies in 2006 to determine the effects of grinding lunar highland soil, and the measured reactivity was compared with that of lunar dust simulant, JSC-1A-vf, quartz, and the unground parent materials, as grinding can serve as a first approximation of micrometeorite bombardment. Using a method developed at JSC that allowed for the quantification of the production of hydroxyl radicals produced by dust in solution by measuring a change in fluorescence, it was determined that grinding of the lunar dust produced approximately a 10-fold increase in radical production over the unground soil. Grinding of quartz and lunar dust simulant also produced an increase in radical production, but much less than that of the lunar soil. The radical production of the ground lunar soil was approximately 10-fold and 3-fold greater than ground quartz and JSC-1A-vf, respectively. The increased reactivity produced for the quartz by grinding was attributed to the presence of silicon- or oxygen-based radicals on the surface. While these radicals may also play a part in the reactivity of the lunar soil and lunar simulant, other factors would seem to be required to account for the greatly increased reactivity of the lunar soil.
The Apollo lunar soil sample used in the previous studies contained minerals known to produce reactive species upon grinding in amounts similar to that of JSC-1A-vf, so the tremendous increase in reactivity seen upon grinding must have arisen from another source, especially considering the fact that the unground lunar dust was no more reactive than the unground lunar simulant. This increased reactivity was tentatively attributed to the presence of np-Fe present in the Apollo sample. Defective surfaces are known to be more reactive, and grinding of the lunar soil exposes defective iron surfaces. Upon grinding and placement in solution, the exposed iron oxidizes, producing Fe (II), and initiates a chain reaction (Fenton reaction) that produces hydroxyl radicals.
A sample of synthesized np-Fe in amorphous silica was ground and tested for hydroxyl radical production. Figure 1 shows the results of this trial in comparison to the pure amorphous silica matrix, containing no np-Fe, and lunar dust simulant (JSC-1A-vf) containing no np-Fe.
144

Figure 1. Reactivity of ground “Yang nanophase-Fe simulant”, lunar simulant, and amorphous silica.
Table 1.
Figure 2. Reactivity of immature and mature mare and highland lunar soils. Numbers indicate the maturity.
Further testing of other lunar soils led to similar results. In Figure 3, the reactivities of eight samples are shown with respect to their maturities. For both the mare and highland soils, similar trends are seen as the reactivity of a particular ground soil is correlated to its maturity. Additionally, it was found that mare soils are generally more reactive than highland soils, regardless of maturity. This fact can be traced to the total amount of FeO content in the sample. In these studies, the FeO contents of the mare soils are ~3- to 4-fold that of the highland soils. Since the total amount of np-Fe in a sample is normalized to the total iron, expressed as FeO, a mare soil will have much more np-Fe than a highland soil of the same maturity and will, therefore, be much more reactive.
Studies continued on ground Apollo soils of various maturities and sites (highland versus mare), and their relative abilities to produce hydroxyl radicals in solution, were measured. The results of these tests are shown in Figure 2 and show that mare soil is more reactive after grinding for both mature and immature soils. Plotted for comparison, quartz displays much less reactivity. Based on these tests, the mature mare and highland soils are approximately 1.5- to 2-fold more reactive after grinding than their immature counterparts.
The bulk chemistry of these simulants is shown in Table 1, along with the chemistry of an Apollo 14 soil. The reactivity of the sample containing np-Fe is much greater than that of the other samples and is more in line with the intensity seen for lunar dust. It seems clear that the np-Fe is the cause of the high reactivity of lunar dust in comparison to simulants.
Figure 3. Reactivity of various ground mare and highland soils with respect to their maturity (Is/FeO).
Rea
ctiv
ity (a
rb. u
nits
)
Maturity Level
145

In summary, the production of hydroxyl radicals in solution by lunar soils was measured. The reactivity after grinding is correlated with the maturity of the soil, which is a function of the amount of np-Fe present in the sample. Mare soils are also found to be more reactive than highland soils, a fact that is consistent with a np-Fe concentration dependence. As opposed to reactivity arising simply from broken bonds on the surface, the reactivity of ground lunar soil can be attributed to the np-Fe. While these results indicate that lunar dust can be highly reactive, the effect of this reactivity on astronauts or mechanical equipment is still unclear. Studies are underway to determine if this reactivity will impact the design requirements for astronauts or equipment used during lunar missions.
146
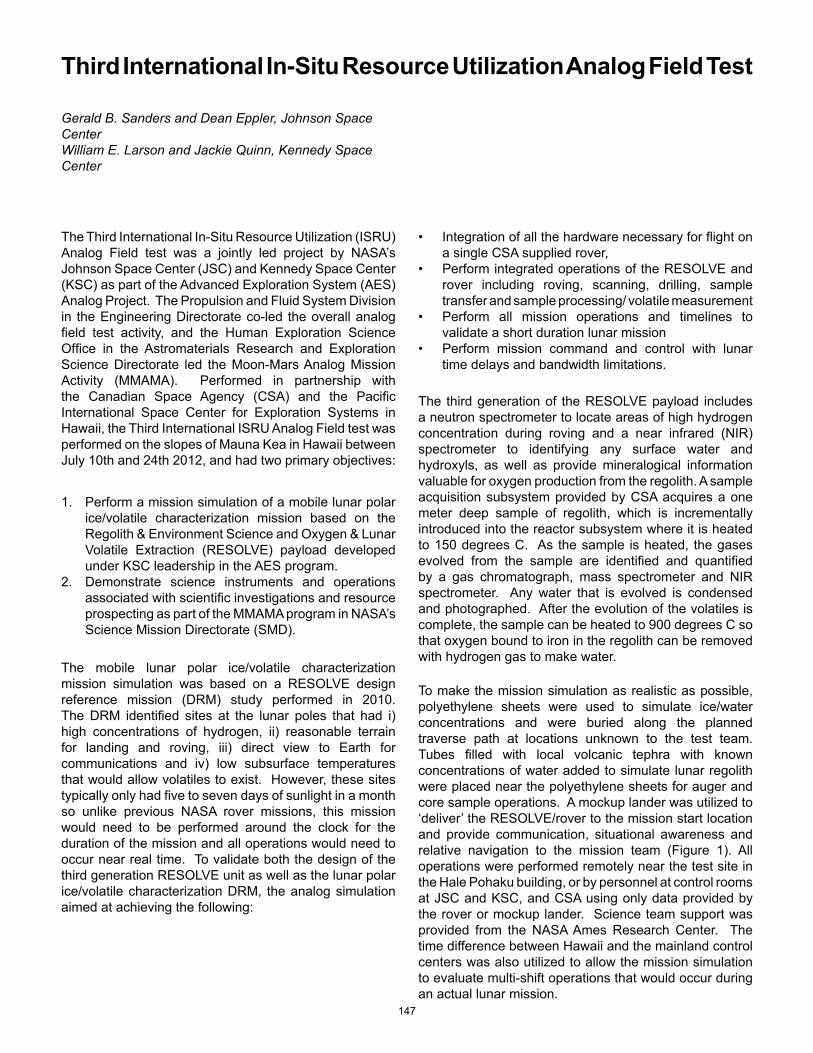
Third International In-Situ Resource Utilization Analog Field Test
Gerald B. Sanders and Dean Eppler, Johnson Space Center William E. Larson and Jackie Quinn, Kennedy Space Center
The Third International In-Situ Resource Utilization (ISRU) Analog Field test was a jointly led project by NASA’s Johnson Space Center (JSC) and Kennedy Space Center (KSC) as part of the Advanced Exploration System (AES) Analog Project. The Propulsion and Fluid System Division in the Engineering Directorate co-led the overall analog field test activity, and the Human Exploration Science Office in the Astromaterials Research and Exploration Science Directorate led the Moon-Mars Analog Mission Activity (MMAMA). Performed in partnership with the Canadian Space Agency (CSA) and the Pacific International Space Center for Exploration Systems in Hawaii, the Third International ISRU Analog Field test was performed on the slopes of Mauna Kea in Hawaii between July 10th and 24th 2012, and had two primary objectives:
1. Perform a mission simulation of a mobile lunar polar ice/volatile characterization mission based on the Regolith & Environment Science and Oxygen & Lunar Volatile Extraction (RESOLVE) payload developed under KSC leadership in the AES program.
2. Demonstrate science instruments and operations associated with scientific investigations and resource prospecting as part of the MMAMA program in NASA’s Science Mission Directorate (SMD).
The mobile lunar polar ice/volatile characterization mission simulation was based on a RESOLVE design reference mission (DRM) study performed in 2010. The DRM identified sites at the lunar poles that had i) high concentrations of hydrogen, ii) reasonable terrain for landing and roving, iii) direct view to Earth for communications and iv) low subsurface temperatures that would allow volatiles to exist. However, these sites typically only had five to seven days of sunlight in a month so unlike previous NASA rover missions, this mission would need to be performed around the clock for the duration of the mission and all operations would need to occur near real time. To validate both the design of the third generation RESOLVE unit as well as the lunar polar ice/volatile characterization DRM, the analog simulation aimed at achieving the following:
• Integration of all the hardware necessary for flight on a single CSA supplied rover,
• Perform integrated operations of the RESOLVE and rover including roving, scanning, drilling, sample transfer and sample processing/ volatile measurement
• Perform all mission operations and timelines to validate a short duration lunar mission
• Perform mission command and control with lunar time delays and bandwidth limitations.
The third generation of the RESOLVE payload includes a neutron spectrometer to locate areas of high hydrogen concentration during roving and a near infrared (NIR) spectrometer to identifying any surface water and hydroxyls, as well as provide mineralogical information valuable for oxygen production from the regolith. A sample acquisition subsystem provided by CSA acquires a one meter deep sample of regolith, which is incrementally introduced into the reactor subsystem where it is heated to 150 degrees C. As the sample is heated, the gases evolved from the sample are identified and quantified by a gas chromatograph, mass spectrometer and NIR spectrometer. Any water that is evolved is condensed and photographed. After the evolution of the volatiles is complete, the sample can be heated to 900 degrees C so that oxygen bound to iron in the regolith can be removed with hydrogen gas to make water.
To make the mission simulation as realistic as possible, polyethylene sheets were used to simulate ice/water concentrations and were buried along the planned traverse path at locations unknown to the test team. Tubes filled with local volcanic tephra with known concentrations of water added to simulate lunar regolith were placed near the polyethylene sheets for auger and core sample operations. A mockup lander was utilized to ‘deliver’ the RESOLVE/rover to the mission start location and provide communication, situational awareness and relative navigation to the mission team (Figure 1). All operations were performed remotely near the test site in the Hale Pohaku building, or by personnel at control rooms at JSC and KSC, and CSA using only data provided by the rover or mockup lander. Science team support was provided from the NASA Ames Research Center. The time difference between Hawaii and the mainland control centers was also utilized to allow the mission simulation to evaluate multi-shift operations that would occur during an actual lunar mission.
147

Successful operations over the six day mission simulation included traversing 1140 meters, successfully finding and characterizing 9 of 12 ‘hot spots’ (3 were missed due to the rover deviating from the planned traverse), performing 4 auger operations (3 in native material/1 in drill tube), 4 core sample collections (3 in drill tubes and 1 in native material) and 4 core segments processed and evaluated.
Figure 1. Mockup lander with RESOLVE rover.
The purpose of SMD’s MMAMA program is to allow individuals and small groups of instrument projects to test and evaluate operations and instruments in simulated mission environments to help NASA understand new exploration techniques and define requirements for navigation, mobility, communications, sample processing and curation and other critical mission elements that could be used in future exploration missions. For this field test, the MMAMA instrument evaluation and mission simulation objectives included the following:
• Evaluate operation concepts and instrument effectiveness in characterizing geologic context and history, site terrain and physical/ mineralogical properties of potential resources
• Evaluate the performance and effectiveness of science instruments that could complement those already integrated into the RESOLVE payload
The MMAMA mission simulation was performed over three days in a geologically diverse location on Mauna Kea at about 11,500 feet. The mission simulation conducted science operations with a ground penetrating radar, magnetic susceptibility sensor, and combined Mossbauer/X-Ray Fluorescence instrument mounted on a second rover provided by CSA. Line-of-site and panoramic cameras and both global positioning systems and inertial navigation sensors were also mounted on the rover (Figure 2). Two instruments that could not be transported to the analog test site, the mechanized sample processing and handling system (MeSH) and the volatile analysis by pyrolysis of regolith (VAPoR) were tested at the Hale Pohaku building near the test site. During field test operations, geologists were present with hand held instruments (that could not be mounted on the rover), as well as test personnel wearing video and communication
Figure 2. MMAMA mission simulation instrumentation mounted on rover.
gear that could simulate an astronaut on a planetary surface. Samples were also taken from the field, at the direction of remote mission controllers at Hale Pohaku, to be ground into powder using the MeSH instrument and have their constituents analyzed using the VAPoR instrument mass spectrometer.
The MMAMA mission simulation achieved significant science return. Pre-mission traverse plans using the type of images available prior to ‘landing’ were evaluated. Although many legs of the planned traverses were not executable, the planned traverses provided a framework to vary from, and maximized the efficiency in the field when rapid replanning was required. Analysis and subsequent replanning of traverses was performed exceedingly well, especially since many members of the science team had not worked in that kind of environment previously. A robust “plan-operate-evaluate-replan” operation was carried out very successful, particularly in light of the difficult terrain. It was concluded that the sum of the activity was far greater than what would have been achieved for each individual instrument test. During the science mission simulation, the Science Team continued to refine initial evaluation of geologic context and history of the ‘landing site’, and hypotheses will continue to be tested downstream of the test. The simulation also integrated video into the tactical process of mission planning and operations, and data acquisition over the duration of the mission simulation exceeded two to three times the planned amount. In the end the rover traversed over 9 km at the test site, and performed over 5 km of test traverses and instrument evaluation before the 3 day mission simulation.
At the conclusion of the analog field test, both primary objectives were successfully met. The RESOLVE-based lunar polar ice/volatile mission simulation demonstrated that the resource prospecting and extraction objectives can be met in a very short five to seven day mission. Lessons learned will be applied to both developing the mission concept of operations and science procedures for the actual missions. Lessons learned from the MMAMA instrument and operation tests will be used in subsequent analog field tests involving planning and remote control and operations of science equipment.
148

NASA’s Extreme Environment Mission Operations - Science
Mary Sue Bell, Jacobs Technology
The purpose of NASA Extreme Environment Mission Operations (NEEMO) mission 16 was to systematically evaluate and compare the performance of a defined series of representative near-Earth asteroid (NEA) extravehicular activity (EVA) tasks under a variety of different conditions, with each condition representing one possible combination of work systems, constraints and assumptions being considered for future human NEA exploration missions. During NASA’s Desert Research and Technology Studies 2011, the primary focus of the test was on understanding the implications of communication latency, crew size and work system combinations with respect to scientific data quality, data management, crew workload and crew/mission control interactions, but the 1-gravity environment precluded meaningful evaluation of NEA EVA translation, worksite stabilization, sampling or instrument deployment techniques. Thus, NEEMO missions were designed to provide an opportunity to perform a preliminary evaluation of these important factors for each of the conditions being considered. NEEMO 15 took place in 2011 and provided a first look at many of the factors, but the mission was cut short due to a hurricane threat before all objectives were completed. NEEMO 16 took place in 2012 and took into account the lessons learned from NEEMO 15. Astromaterials Research and Exploration Science (ARES) Directorate personnel consulted with Johnson Space Center (JSC) engineers to ensure that high-fidelity planetary science protocols were incorporated into NEEMO mission architectures. ARES has been collaborating with NEEMO mission planners since NEEMO 9 in 2006, successively building upon previous developments to refine science operations concepts within engineering constraints, and is expected to continue the collaboration as NASA’s future human exploration mission destinations evolve.
Operations Development for Human Exploration
The Importance of Planetary Sample ReturnsPlanetary science has seen a tremendous growth in new knowledge as a result of recent NASA robotic missions that have detected deposits of water-ice at the moon’s poles and potential conditions under which life could have flourished on Mars.
While some sophisticated data can be derived from “in situ” measurements taken by rovers and satellites, returned planetary samples allow scientists on Earth to use latest technologies available to maximize the scientific return. The science community has recently seen compelling sample returns, including solar wind particles (NASA’s Genesis),
comet particles (NASA’s Stardust), asteroid particles (Japanese Space Agency’s Hayabusa) and Antarctic meteorites, which scientists collect each Austral summer.
The National Research Council Decadal Study of 2011 recommended that NASA’s chief scientific goal should be to return samples from Mars by 2023. Measurements taken by the Mars Exploration Rovers, Spirit and Opportunity, indicate that Mars had a warmer and wetter climate early in Mars history—conditions in which scientists believe life could have formed on early Mars. But chemical evidence of life in materials like the rocky regolith of Mars can be quite small and difficult for robotic geologists to detect and measure.
Figure 1. Clamshell sample collection device in use during NEEMO 16.
The ARES Directorate at JSC curates all of NASA’s “extraterrestrial” samples. The ARES Directorate mission is to protect, preserve and distribute samples for study from the moon, Mars and interplanetary space in support of solar system exploration. These sample collections include lunar rocks and regolith returned by the Apollo missions.
Samples from Mars will require special handling protocols from the time the sample collection site is chosen through documentation, encapsulation and transport to Earth and to NASA’s curation facility for allocation to scientists for analysis and study. Because scientists don’t yet know how to differentiate an Earth-derived sample of life from a Mars-derived sample of life, scientists are eager to develop protocols that will protect Mars samples from Earth contamination. Testing of sample collection devices and techniques performed during NEEMO 15 and NEEMO 16 is shown in Figure 1, Figure 2, and Figure 3. Landers, collection tools and sample containers could all carry trace amounts of Earthly biology, so they must be equipped with decontamination materials and procedures to protect the precious samples.
149

How Do NASA’s Analog Missions, Like NEEMO, Help Scientists Develop Special Sample Handling Techniques for Their Exploration Programs?Planetary environments are considered extreme for both robotic and human exploration. Apollo astronauts experienced lower gravity on the moon than on Earth and a very thin atmosphere that required them to wear a spacesuit with life protection and support systems. When they collected moon rocks, the astronauts didn’t know if they were exposing themselves to health hazards, so they wore large bulky gloves and used special sample collection tools and containers. These protective materials and special sample devices were developed in laboratories at JSC and then tested in the field by geologists. After the sampling tools and techniques were sufficiently refined, Apollo astronauts were trained to use the techniques developed by the scientists.
Figure 3. A NEEMO 15 aquanaut tests sample-collectiontools.
Figure 4. Aquanauts test and develop surface operations in the reduced-gravity underwater environment.
facility that allows humans to experience reduced gravity due to the buoyancy provided by water in an environment requiring life support for breathing air. During NEEMO 16, NASA refined sample-collection techniques in an extreme environment and trained astronauts to use tools and procedures developed for those unique conditions.
NASA develops tools and techniques during analog missions to ensure the scientific integrity of samples returned from a variety of planetary surfaces both by robots and by human explorers. NASA’s returned samples will help scientists understand the formation and evolution of the solar system and determine if life or the conditions for life existed on other planetary bodies. These returned samples will be curated for future generations and allow them to employ advanced techniques not yet available to scientific researchers.
Figure 2. NEEMO aquanauts collect and document samples.
Today, ARES scientists are developing tools and techniques for use on planetary surfaces with the same life-support requirements and gravity conditions for human exploration as on the moon or Mars, but also lower-gravity environments like NEAs as well (see Figure 4). Low-gravity environments present special obstacles for collecting and containing geologic materials because loose material can drift away and an astronaut can be propelled away from a planetary surface just by hitting a rock with a hammer. NEEMO is an undersea research
How Does This Analog Activity Fit With NASA’s Current Mission Plans?NASA is actively planning to expand the horizons of human space exploration, and with the Space Launch System and the Multi-Purpose Crew Vehicle, humans will soon have the ability to travel beyond low-Earth orbit. That opens up a solar system of possibilities, and NASA’s goal is to send humans to explore an asteroid by 2025. Other destinations may include the moon or Mars and its moons. Regardless of the destination, the work must start now. NASA is developing the technologies and systems to transport explorers to multiple destinations, each with its own unique—and extreme—space environment. Because sample return requirements are mission specific, the handling protocols are designed specifically for the types of questions the scientific community hopes to answer using samples from a particular planetary destination. ARES curation scientists are in collaboration with the mission architecture engineers to develop mission goals that are aligned with science goals. ARES scientists participate in analog missions for protocol development and science operations development from mission conception to execution, and sample return to ensure that the requirements of the scientific community will be met and the scientific return to the public will be maximized.
150

Small-Scale Impact Processes on Stony AsteroidsMark J. Cintala, Johnson Space CenterDavid W. Mittlefehldt, Johnson Space Center
Asteroids are a very diverse group of small objects (when compared to the much larger planets) orbiting the sun. Most known asteroids are located between the orbits of Mars and Jupiter (in the “asteroid belt”), but large numbers are in orbits that cross that of the Earth. While scientific curiosity historically has driven investigations of asteroids, it is becoming intensely apparent that detailed information about asteroids could be critical someday in dealing with a potential disaster-causing impact. Among the various asteroid types are those that are believed to be the sources of one of the most common types of meteorite, the “ordinary chondrites.” In fact, the large meteoroid that exploded over Chelyabinsk in Russia in February 2013 was an ordinary chondrite, and evidence suggests that ordinary chondritic asteroids constitute a large fraction of the “Earth crossers.”
Friedrich Hörz, Jacobs TechnologyFrancisco Cardenas, Jacobs Technology
Earth-based astronomical observations have long inferred and recent spacecraft missions have shown that even small asteroids (Figure 1) are covered with unconsolidated debris (as is the moon), which is generically termed “regolith.”
Figure 1. The asteroid Itokawa, as photographed by the Japanese Aerospace Exploration Agency’s Hayabusa spacecraft in 2005.
The regolith on any typical airless body in the solar system is generated primarily through the breaking up, or “comminution,” of surface rock by impacting meteoroids. This is a process that, while not capable of being exactly duplicated on Earth for a variety of reasons, is amenable to simulation in the laboratory. All that is needed is an accelerator that can launch projectiles accurately at speeds of at least 2 km/s, a vacuum chamber, a piece of ordinary chondrite, a container to keep it confined and people obsessed enough to shoot it 59 separate times, sieving it after every few shots and removing samples for later analysis. Actually, the ordinary chondrite was a piece from a larger meteorite that was found in Antarctica in1985.
Amazingly, all of those requirements can be found in one place: the Experimental Impact Laboratory (EIL). The Astromaterials Research and Exploration Sciences (ARES) Directorate at Johnson Space Center (JSC) is the home of the EIL. The EIL includes three accelerators that permit researchers to study a wide variety of phenomena associated with the effects of high-velocity impacts into geologic materials. By studying these processes, scientists can learn about the histories and evolution of planetary bodies and the solar system as a whole.
ARES scientists are continuing the study that was initiated in 1995 of the chondrite found in Antarctica. The 464-gram meteorite has been subjected to 2 km/s impacts in the EIL with 3.2-mm (1/8 inch) ceramic spheres. The largest fragment remaining after each shot was used as the target for the next impact, until the biggest surviving fragment was less than half the weight of the impacted piece. The meteorite required nine separate shots before it met that criterion, which means that it was a surprisingly tough rock. By comparison, similar experiments using terrestrial gabbro targets (a coarse-grained, strong, igneous rock fairly common on Earth and the moon) required only about half of that energy to reach the same level of destruction. Given this, it is possible that, had the Chelyabinsk meteoroid been a large block of gabbro instead of ordinary chondrite, might well have broken up at a higher altitude, doing less damage on the ground.
All of the debris from those nine shots was collected, put in a container and impacted repeatedly. Regular breaks were taken to sieve the results, which allowed the “evolution” of this artificial regolith to be followed. Identical experiments using gabbro and basalt (a very fine-grained equivalent of the gabbro) were also performed, but they were stopped at 25 shots, by which time enough information was in hand for comparison (Figure 2). The larger pieces of the chondrite again, surprisingly, disrupted sooner than those of the gabbro and basalt, but when the pieces of the chondrite broke apart, they did so more thoroughly. It is entirely possible that, when the meteorite was being disrupted initially, it suffered more internal fracturing than was apparent. Upon additional, repeated impact in the combined debris, those fractures were activated and finally disaggregated the larger chunks.
151
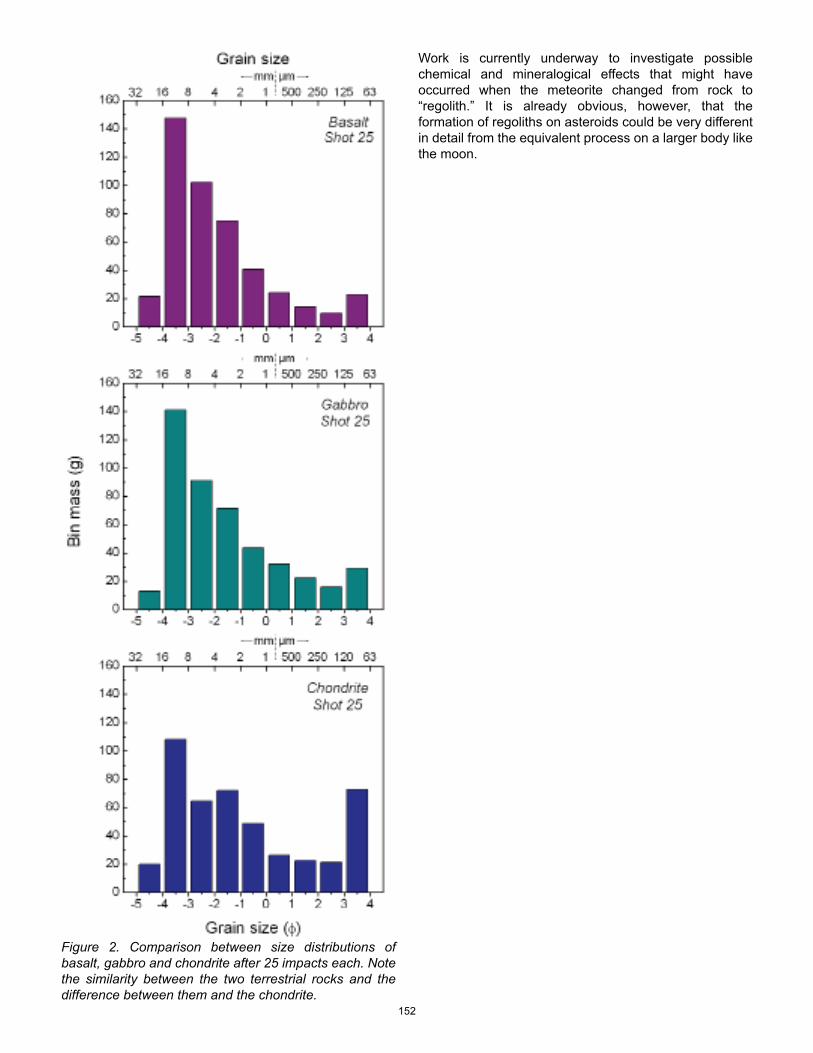
Figure 2. Comparison between size distributions of basalt, gabbro and chondrite after 25 impacts each. Note the similarity between the two terrestrial rocks and the difference between them and the chondrite.
Work is currently underway to investigate possible chemical and mineralogical effects that might have occurred when the meteorite changed from rock to “regolith.” It is already obvious, however, that the formation of regoliths on asteroids could be very different in detail from the equivalent process on a larger body like the moon.
152

Shock Effects on Cometary - Dust SimulantsMark J. Cintala, Johnson Space CenterLindsay P. Keller, Johnson Space CenterDiane H. Wooden, Ames Research Center Keiko Nakamura-Messenger, Jacobs TechnologyFrancisco Cardenas, Jacobs Technology
While comets are perhaps best known for their ability to put on spectacular celestial light shows, they are much more than that. Composed of an assortment of frozen gases mixed with a collection of dust and minerals, comets are considered to be very primitive bodies and, as such, it is thought that they hold key information about the earliest chapters in the history of the solar system. (The dust and mineral grains are usually called the “refractory” component, indicating that they can survive much higher temperatures than the ices.) It has long been thought, and spacecraft photography has confirmed (Figure 1), that comets suffer the effects of impacts, as does every other solar system body. Comets spend most of their lifetimes in the Kuiper Belt, a region of the solar system between 30 and 50 times Earth’s average distance from the sun, or the Oort Cloud, which extends to ~1 light year from the sun. Those distances are so far from the sun that water ice is the equivalent of “rock,” melting or vaporizing only through the action of strong, impact-generated shock waves.
Roland Montes, Jacobs TechnologySusan M. Lederer, Planetary Science InstituteElizabeth Jensen, Planetary Science InstituteSean S. Lindsay, New Mexico State UniversityDouglas H. Smith, California State University
High-velocity impacts not only create craters such as those in Figure 1, but the shock waves they generate also affect the refractory components of the comets’ nuclei and, by inference, those of any other ice-rock body in the Kuiper Belt or Oort Cloud. With typical impact speeds of “only” around 3 km/s (~ 2 miles/sec), the overall effects on the refractory components are not completely clear. It is known, however, that infrared (IR) spectra of dust in comets’ tails are similar to IR spectra of various well-studied silicates, such as olivines and pyroxenes, but the matches are far from perfect. Furthermore, dust samples from Comet Wild 2 (Figure 2) show damage to crystal structures that can be explained easily by impact-generated shock. Seeing macroscopic evidence for impact in the photography and microscopic evidence for impact in the samples, it is only natural to question what other effects impact can have on comets and their constituent materials. An aspect of this problem that can be attacked immediately is to characterize the effects noted above that relatively low-velocity impacts can have on some of the more common refractory components of comets, which is the focus of this research.
Figure 1. The nucleus of Comet Tempel 1, which was the target of the Deep Impact mission in 2005. Craters, presumably of impact origin, are visible in a wide range of preservation states. Each of the two crisp, similar-sized craters on the bottom half of this picture has a diameter very similar to that of the Astrodome, around 220 meters.
Figure 2. The nucleus of Comet Wild 2 (about 5 km in diameter) as photographed by the Stardust spacecraft, which collected dust particles as it flew past the comet.
153

With this in mind, scientists within the Astromaterials Research and Exploration Science (ARES) Directorate are midway through a four-year grant to investigate these effects, which addresses the fundamental quest NASA has to understand planetary geophysical processes on solar system bodies. Using the vertical gun in the ARES Experimental Impact Laboratory, 3.2-mm ceramic spheres are launched at olivine and pyroxene crystals (Figure 3), and the resulting fragments are recovered and analyzed with a Fourier-transform IR spectrometer and a transmission electron microscope (TEM). Aluminum-oxide ceramic was chosen as a projectile material because it has a density and shock behavior similar to that of rock, and so provides a good simulation of rocky meteorites. While collisions among comets will most commonly involve ice-rock mixtures into ice-rock mixtures, these early experiments modeled rock into ice-rock targets because such a combination would result in the greatest likelihood of damage to the rock component. Should effects be observed with the “rocky” projectiles, it would be a simple matter to use lower- density impactors to simulate ice. Pieces of pyroxene and olivine, versions of which have been found in samples from the Stardust mission and are commonly detected in spectra of comet dust, were used as targets. They were placed in a container filled with granular potassium bromide (KBr; see Figure 3), which acted to absorb the residual momentum of the projectile after it collided with the target mineral. KBr has the added benefit of being soluble in water, so the shocked material could be collected after the impact and the KBr dissolved away in water, leaving the shocked mineral behind.
Figure 3. An enstatite (a form of pyroxene) crystal before (left) and after (right) being pulverized by a ceramic projectile. The inside diameter of the target container is 34 mm (about 1.5 inches).
In this way, mineral grains were shocked at speeds up to 2.8 km/s, retrieved and analyzed. Figure 4 shows IR spectra of shocked and unshocked forsterite grains (the gem peridot is high-quality forsterite). Note that the peaks change not only their amplitudes, but their maxima occur at shorter wavelengths than that of the unshocked sample. Measurements of this sort provide the first indications as to why the spectra of dusty comet tails do not match the spectra of pristine minerals. Furthermore, early examination of the shocked forsterite grains with the TEM shows damage to the mineral’s crystal structure that are very similar to some observed in Stardust particles. This work is continuing and will soon involve targets cooled to very low (liquid-nitrogen) temperatures, further increasing the fidelity of the experiments.
Figure 4. Comparison of IR spectra from unshocked (black) and three samples of forsterite shocked in an impact at 2.45 km s-1. The spectra of the shocked sample differ because the fragments were probably not subjected to the same shock level - a spherical projectile generates the highest shock pressure at the point of contact; the shock felt by the target at any other point depends on its location relative to the impact point.
154

Early Life on Earth and the Search for Extraterrestrial BiosignaturesDorothy Z. Oehler, Penn State University Christopher House
An understanding of earliest terrestrial life is of astrobiological importance, as knowledge of early evolutionary processes on Earth can provide insight to development of life on other planets. In the last two years, scientists within the Astromaterials Research and Exploration Science (ARES) Directorate at the Johnson Space Center (JSC) have applied the technology of Secondary Ion Mass Spectrometry (SIMS) to individual organic structures preserved in Archean (~3 billion years old) sediments on Earth. These organic structures are among the oldest on Earth that may be microfossils – that is structurally preserved remnants of ancient microbes. ARES applied the SIMS technology to the samples to determine their stable carbon isotopic composition. This is the first time that such ancient, potential microfossils have been successfully analyzed individually for carbon composition. Photomicrographs of the preserved organic structures are shown in Figure 1 and Figure 2. Results of the analysis performed by ARES support the interpretation that these structures are remnants of early life on Earth, and further that they may represent planktonic organisms that were widely distributed in the Earth’s earliest oceans. This study has been accepted for publication in the journal Geology.
Figure 1. Optical photomicrographs of clusters of approximately 3 billion year old, spheroidal structures from the Farrel Quartzite of Australia, as seen in petrographic thin section. (A) and (C) are in transmitted light. (B) and (D) show the same structures in a combination of transmitted and reflected light with the locations of SIMS analyses and the SIMS-measured stable isotope compositions superimposed, expressed as parts per thousand (‰) differences from a standard.
Figure 2. Optical photomicrographs of approximately 3 billion year old, spindle-like microstructures from the Farrel Quartzite of Australia, as seen in petrographic thin section. (A, C, and E) are in transmitted light. (B, D, and F) show the same structures in a combination of transmitted and reflected light, with the locations of SIMS analyses and the SIMS-measured stable isotope compositions superimposed, expressed as parts per thousand (‰) differences from a standard.
Christopher House, Penn State University Christopher House
155

The Water Content of Earth’s Continental Mantle is Controlled by the Circulation of Fluids or MeltsAnne Peslier, Jacobs TechnologyAlan B. Woodland, University of FrankfurtDavid R. Bell, Arizona State University
A key mission of the Astromaterials Research and Exploration Science (ARES) directorate at Johnson Space Center is to constrain the formation and geological history of terrestrial planets. A crucial parameter to be measured is water, with the aim to determine its amount and distribution in the interior of Earth, Mars and the moon. Most of that “water” is not liquid water, per say but rather hydrogen dissolved as a trace element in the minerals of the rocks at depth. Even so, the middle layer of differentiated planets, the mantle, occupies such a large volume and mass of each planet that when added at the planetary scale, oceans worth of water could be stored in their interior. The mantle is where magmas originate. Moreover, in Earth, the mantle is where the boundary between tectonic plates and the underlying asthenosphere is located. Even if mantle rocks in Earth typically contain less than 200 parts per million H2O, such small quantities still have tremendous influence on how easily they melt (i.e., the more water, the more magma produced) and deform (the more water, the less viscous they are). These two properties alone emphasize that to understand the distribution of volcanism and the mechanism of plate tectonics, we need to determine how much water is present in the mantle, that of Earth being a template to which all other terrestrial planets can be compared to.
With that goal in mind, scientists within ARES have been working since 2007 on the mantle beneath the oldest continents. These are called cratons, and are underlain by a mantle keel of very old mantle rocks that have not participated in the general mantle convection, i.e. the engine for plate tectonics, for more than 3 billion years (Figure 1). Using Fourier transform infrared spectrometry in 2011-2012 at ARES, the water content in minerals from the Kaapvaal craton (southern Africa, Figure 2) has been measured and combined with other chemical tracers of mantle processes. The study shows that water in mantle rocks was brought by fluids and melts circulating through the craton keel (Figure 3). The distribution of water in the continental mantle is thus heterogeneous, depending on the nature and water content of the fluid or melt and the path of the latter in the mantle. It is likely that these fluids or melts are related to subduction events in the Archean and Proterozoic, i.e., more than 500 million years ago. The study is being expanded, with ongoing similar projects on the mantles beneath the Siberian craton and the southwestern United States.
Figure 1. Sketch of the cross-section of a craton, showing the path of melts, or fluids, of various chemical compositions and water contents (colors) through the cratonic mantle and the corresponding xenolith locations at the surface (triangles). Purple arrows in the asthenosphere indicate mantle convection responsible for plate tectonics, from which cratonic keels appear isolated.
Marina Lazarov, University of HannoverThomas J. Lapen, University of Houston
Figure 2: Location of the Kaapvaal craton. Finsch, Kimberley, Lesotho sites, and Jagersfontein are diamond mines. The magma that brings up diamonds, called kimberlite, also brings up pieces of the mantle (from 100 to 200 km depth) as it passes through on its way to the surface. These pieces of mantle, called xenoliths, have been analyzed for water in the present study.
156
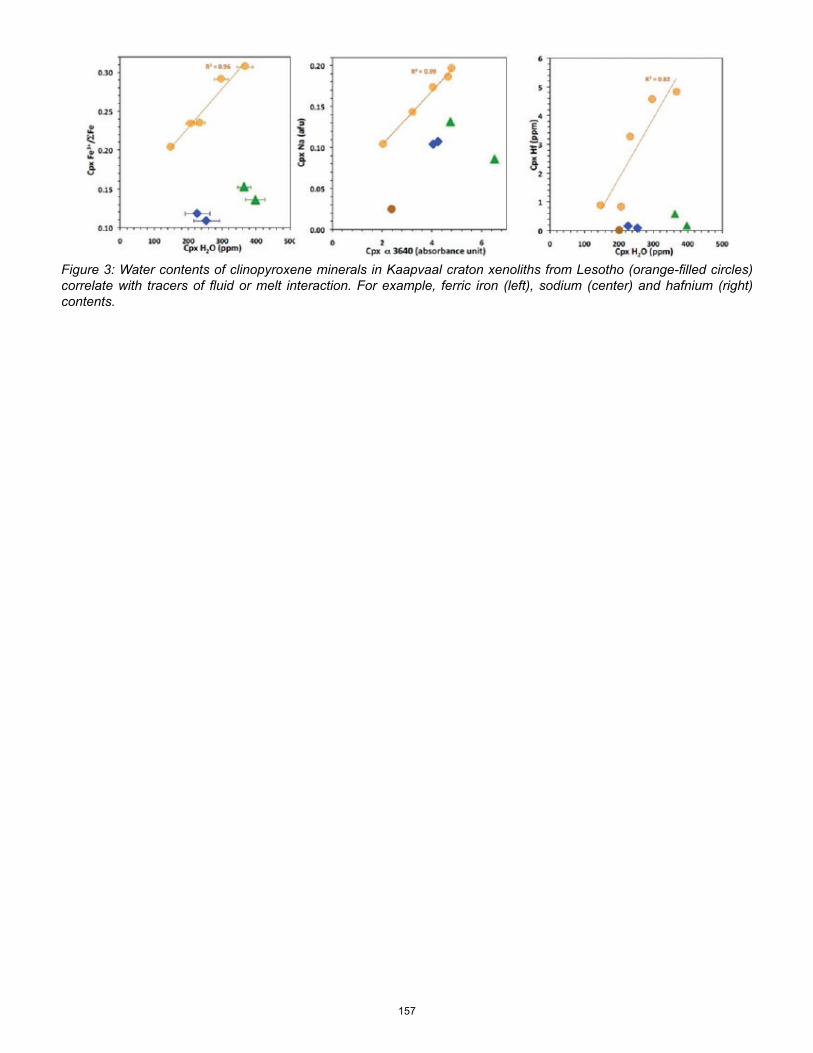
Figure 3: Water contents of clinopyroxene minerals in Kaapvaal craton xenoliths from Lesotho (orange-filled circles) correlate with tracers of fluid or melt interaction. For example, ferric iron (left), sodium (center) and hafnium (right) contents.
157

Magnetohydrodynamic Turbulence and the GeodynamoJohn V. Shebalin, Johnson Space Center
The Johnson Space Center (JSC) Astromaterials Research and Exploration Science Directorate has been conducting research since 2007 to understand the physical processes that create planetary magnetic fields through dynamo action. The “dynamo problem” has existed since 1600, when William Gilbert, physician to Queen Elizabeth I, recognized that the Earth was a giant magnet. In 1919, Joseph Larmor proposed that solar (and by implication, planetary) magnetism was due to magnetohydrodynamics (MHD), but full acceptance did not occur until Glatzmaier and Roberts solved the MHD equations numerically and simulated a geomagnetic reversal in 1995. JSC research produced a unique theoretical model in 2012 that provided a novel explanation of these physical observations and computational results as an essential manifestation of broken ergodicity in MHD turbulence. Research is ongoing, and future work is aimed at understanding quantitative details of magnetic dipole alignment in the Earth, as well as in Mercury, Jupiter and its moon Ganymede, Saturn, Uranus and Neptune, and also in the sun and other stars. Current computational research results are given in Figure 1 below, showing effective dipole angle with respect to normalized rotation vector o. (The dotted line is what would be expected if
o = 0. Also, note that saturation occurs.)
Earth would probably look like Mars: dry, barren and lifeless. However, the geomagnetic dipole field is not static, arising as it does from deep MHD flows, but changes over time: it has weakened about 10 percent since 1850, and its direction wanders (see Figure 2) or even reverses (on the average every 100,000 years). The geomagnetic field is intimately connected to the existence and location of the radiation belts, and its multipole components cause such features as the South Atlantic Anomaly that adversely affects low-Earth-orbit spacecraft such as the International Space Station. A detailed knowledge of the geomagnetic field and how it changes in the short and long term is very important for understanding and predicting changes in the atmosphere (weather and climate) and for planning future near-Earth missions. Similar effects and concerns will occur in space missions that explore other planets in the solar system.
Figure 1. Dipole angle with respect to rotation rate in a model geodynamo.
Figure 2. Observed north dipoles during 1831 to 2007. Image Credit: Arnaud Chulliat, Institut de Physique du Globe de Paris
Earth is the planet we observe most closely and for which we have the best data, so current work focuses on it. The geomagnetic field is of utmost importance to the growth and survival of life on Earth, because it serves as a “magnetic bumper” that protects us from the solar wind, coronal mass ejections and cosmic rays. The geomagnetic field is a primarily dipole field that allows for the existence of a stable atmosphere, without which the
Understanding planetary magnetism is clearly important, and JSC research indicates that MHD turbulence plays a critical role. MHD processes underlie planetary magnetism and also appear in the interior and exhaust plumes of plasma rocket engines, so that gaining an understanding in one area informs our efforts in the other. There is much that is still unknown, and ongoing research is expected to lead to important applications of knowledge to the planning and operation of future space missions and to a greater and more fundamental understanding of the origins, evolution, effects and interactions of global magnetic fields generated within the Earth, other planets and the sun.
158

Helping the Next Generation Space Vehicles Be Safe and SuccessfulAlison J. Dinsel, Johnson Space Center Adam L. Gilmore, Johnson Space Center
Following the retirement of the Space Shuttle Program, many engineering resources at Johnson Space Center (JSC) have been redirected to focus on two major development programs: Multi-Purpose Crew Vehicle (MPCV) and Commercial Crew (CC). MPCV plans to send humans beyond low-Earth orbit (LEO) through the development of an exploration vehicle. CC is partnering with private American companies to develop the capability for transporting crew to and from LEO and the International Space Station (ISS). The key difference in the two programs is ownership of the respective vehicles once they become operational. NASA will own and operate the MPCV exploration spacecraft, while private companies will own and operate CC transportation spacecraft, with NASA contracting for the crew transfer services.
With a wealth of experience in previous development projects and programs at NASA, the Mechanical Design and Analysis Branch (MDAB) within the JSC Engineering Directorate Structural Engineering Division has recognized the importance of co-locating engineers at contractor facilities. For MPCV, this is at the Lockheed Martin facility in Denver. Initially motivated to expedite communication during mechanism development testing, the role has evolved into a coordination role to resolve requirements conflicts; a planning role to better execute on-schedule, verification testing; and an expeditor role to better align the NASA and contractor team priorities. The benefits of collocation are not for NASA alone, as Lockheed has also benefitted by gaining better access to lessons learned from previous programs, limiting churn caused by conflicting requirements and accommodating activity surges with in-line support. NASA has benefitted by addressing the causes of schedule slips during previous testing, creating leadership opportunities, providing technical development and building design confidence earlier by having deeper insight into the day-to-day operations.
The CC Program is using a different engagement strategy than NASA has previously used for many of its programs. While the strategy is very beneficial for many reasons, the level of knowledge required is reduced from the traditional oversight approach currently used with MPCV and in other past NASA programs. Part of gaining additional insight, beyond the agreed upon products, is demonstrating that specific engineering expertise at NASA has relevance and value to the corresponding challenges that our partners are experiencing. Within the MDAB, there have been multiple instances of specific expertise shared with
our commercial partners. For example, MDAB hosted a landing gear summit to share decades of lessons learned in landing systems across NASA programs. Led by one of the most experienced landing system experts in the agency, a wide range of specific high-risk areas were showcased, along with analysis and test mitigations used to reduce those risks in NASA’s previous programs. Another example is sharing the expertise from developing and managing specific mechanical systems onboard the ISS with at least one of the commercial partners. While most required information can be theoretically gleaned from product specifications, it was the education on some of the intricacies and subtle behavioral characteristics of the hardware that is most valuable to the commercial partners. For both of these examples, it was clear that the collocation and sharing of experience and expertise paves the way for a value-added relationship that benefits both NASA and each our commercial partners.
159

Dividing the Concentrator Target from the Genesis MissionH.V. Lauer Jr., Jacobs TechnologyP.J. Burkett, Jacobs TechnologyS.J. Clemett, Jacobs TechnologyC.P. Gonzales, Jacobs Technology
The Genesis spacecraft, launched in 2001, traveled to a Lagrangian point between the Earth and sun to collect particles from the solar wind and return them to Earth. However, during the return of the spacecraft in 2004, the parachute failed to open during descent, and the Genesis spacecraft crashed into the Utah desert. Many of the precious cargo of solar wind collectors were broken into smaller pieces. The field team rapidly collected the capsule and collector pieces for later assessment. Each day, for the next few days, the team discovered that various collectors survived intact, including three of four concentrator targets. Within one month, the team had imaged over 10,000 fragments and packed them for transport to Johnson Space Center’s Astromaterials Acquisition and Curation Office within the Astromaterials Research and Exploration Science (ARES) Directorate. Currently the Genesis samples are curated along with the other extraterrestrial sample collections within ARES.
The Genesis curator determined that using laser scribing techniques to “cut” a precise line and subsequent sample cleaving (a controlled breaking the sample along that line) was the best method for accomplishing the sample subdivision. However, laser scribing is not risk free. The possible risks include excess heating of the sample, which could initiate loss of some the implanted solar wind via thermal diffusion. Accidental breaking the sample during the handling and cleaving process is an additional risk. Early in Fiscal Year 2013, to address this delicate, complicated task, the ARES office assembled a team of their top scientists to develop a cutting plan that would ensure success when applied to the actual concentrator target wafer, i.e., produce approximately a 1 cm2 piece from the actual requested area of the wafer. The team, subsequently referred to as the JSC Genesis Tiger Team, spent months researching and testing parameters and techniques related to scribing, cleaving, transporting, handling and holding (mounting) the precious specimen. The investigation required considerable amounts of “thinking outside of the box” and many, many trials using non-flight wafer analogs.
K. Nakamura-Messenger, Jacobs TechnologyM.C. Rodriguez, Jacobs TechnologyT.H. See, Jacobs TechnologyB. Sutter, Jacobs Technology
Although broken and dirty, the Genesis solar wind collectors still offered the science community the opportunity to better understand our sun and the solar system as a whole. One of the more highly prized concentrator collectors survived the crash almost completely intact (Figure 1).
The Genesis concentrator was designed to concentrate the solar wind by a factor of at least 20 so that measurements could be made of solar oxygen and nitrogen isotopes. One of these materials was the Diamond-on-Silicon (DoS) concentrator target. Unfortunately, however, the DoS concentrator broke on impact (Figure 1). Nevertheless, the scientific value of the DoS concentrator target was high. The Genesis Allocation Committee received a request for ~ 1 cm2 of the DoS specimen, taken near the focal point of the concentrator, for the analysis of solar wind nitrogen isotopes. The largest fragment, Genesis sample 60000, was designated for this allocation and needed to be precisely cut. The requirement was to subdivide the designated sample in a manner that prevented contamination of the sample and minimized the risk of losing or breaking the precious requested sample fragment.
Figure 1. Genesis concentrator target (top), and the recovered DoS fragments (bottom).
As a result of all of the preliminary testing, the following method was adopted as the final cutting plan. It was used on two final end-to-end practice runs and then on the actual flight target wafer. The wafer was oriented on the laser-cutting stage with the 100 and the 010 directions of the wafer parallel to the corresponding X and Y directions of the cutting stage.
160

The laser was programmed to scribe 31 lines of the appropriate length along the Y stage direction. The programmed scribe lines were separated by 5 micrometers in the X direction. The laser parameters were set as follows. 1) The laser power was 0.5 watts. 2) Each line consisted of 50 passes, with the Z position being advanced 5 micrometers per pass. 3) There was a built-in wait time of 30 seconds before scribing the next line to allow for wafer cool down from any possible heating via the laser.
The ablated material that “stuck” in the “scribe-cut” was removed from the “cut” using an ultrasonic micro-tool. After all of the ablated silicon was removed from the wafer, the wafer was then repositioned in exactly the same orientation on the laser stage. The laser was focused using the bottom of the wafer channel and the 31-line scribing pattern described above, and reprogrammed using the Z position of groove bottom as the starting Z value instead of the top wafer surface as used previously. Upon completion of the second set of scribes, the ultrasonic micro-tool again was used to clean out the “cut.” The wafer was once again remounted on the stage using exactly the same orientation as before. As previously, the laser was focused on the bottom of the groove. This time, however, the laser was programmed to scribe only one line down the exact center of the channel. The final scribe line consisted of 100 passes with a Z advance of 5 micrometers per pass and with the laser power set at 0.5 watts. As mentioned above, the adopted final cutting plan was practiced on two end-to-end dress rehearsal trials using non-flight silicon triangular-shaped wafers of similar size and orientation to the actual DOS 60000 target sample before it was cut. The actual scribing of the triangular-shaped wafers required scribing two lines and subsequent cleaving (i.e., scribe-cleave then scribe-cleave) in order to obtain the requested allocation piece.
Early in December 2012, after many months of experiments practicing and perfecting the techniques and procedures, the team successfully subdivided the Genesis DoS 60000 target sample, one of the most scientifically important samples from the Genesis mission (Figure 2). On Dec. 17, 2012, the allocated piece of concentrator target sample was delivered to the requesting principal investigator.
Figure 2. (top) Image of backside of DoS 60000 wafer, with the location of the two proposed scribing lines projected on to the surface. (bottom) The actual flight specimen following the successful processing by the JSC Genesis Tiger Team.
The cutting plan developed for the subdivision of this sample will be used as the model for subdividing future requested Genesis flight wafers (appropriately modified for different wafer types).
161

A New Martian Meteorite Found is One of the Most Oxidized to DateAnne Peslier, Jacobs TechnologyThomas J. Lapen, University of HoustonJohn T. Shafer, University of Houston
As of 2013, about 60 meteorites from Mars have been found and are being studied. Each time a new Martian meteorite is found, a wealth of new information comes forward about the red planet. The most abundant type of Martian meteorites is called shergottite, and their lithologies are broadly similar to Earth basalts and gabbros, i.e., crustal igneous rocks. The entire suite of shergottites is characterized by a range of trace elements, isotopic ratio and oxygen fugacity values that mainly reflect compositional variations of the Martian mantle these magmas came from.
Alan D. Brandon, University of HoustonHejiu Hui, University of Notre DameAnthony J. Irving, University of Washington
A newly found shergottite, NWA 5298 (North West Africa), was the focus of a study performed by scientists within the Astromaterials Research and Exploration Science (ARES) Directorate at Johnson Space Center (JSC) and completed in 2012. This sample was found in Morocco in 2008 (Figure 1).
Figure 1: Top figure is a photograph of the NWA 5298 meteorite showing its exterior. The bottom figure is a thin section of NWA 5298 as seen under a microscope. The main minerals are pyroxene (Px) and plagioclase (Pl).
Major element analyses were performed in the ARES Electron Microprobe laboratory at JSC, while the trace elements were measured at the University of Houston by laser-inductively-coupled mass spectrometry. A detailed description and analysis of this stone revealed that this meteorite is a crystallized magma that comes from the enriched end of the shergottite spectrum, i.e., trace-element enriched and oxidized (Figure 2). Its oxidation comes in part from that of its mantle source and from oxidation during the magma ascent. Moreover, it represents a pristine magma that has not been mixed with any other magma or seen crystal accumulation (or crustal contamination) on its way up to the Martian surface. NWA 5298 is therefore a direct, albeit evolved, melt from the Martian mantle. Its lithology (basaltic shergottite) represents the oxidized end of the shergottite suite. It is thus a unique sample that has provided an end-member composition for Martian magmas.
Figure 2: Trace element (ratio of Lanthanum (La) overYtterbium (Yb)) versus oxygen fugacity characteristics ofNWA 5298 compared to those of other shergottites.NWA 5298 is enriched in trace elements and the mostoxidized basaltic shergottite found to date.
162

Water in the Oldest Lunar Rocks: The Moon is ‘Wetter’ Than Previously ThoughtAnne Peslier, Jacobs TechnologyHejiu Hui, University of Notre Dame
The recent detection of water in Mare basaltic glass beads and on the lunar surface has revolutionized our knowledge and understanding of the moon. Up to now, the moon was thought to have lost its volatiles during the cataclysmic two proto-planet collision that is believed to have led to its creation and during the evolution of a lunar magma ocean.
Clive Neal, University of Notre DameYouxue Zhang, University of Michigan
Scientists within the Astromaterials Research and Exploration Science (ARES) Directorate at Johnson Space Center (JSC) completed in 2012 an analysis of the water in the oldest rocks from the moon that are from the collection of samples collected during the Apollo Program. The rocks analyzed at JSC, brought back by astronauts during the Apollo 15 and 16 missions (Figure 1), are pieces of the moon’s oldest crust (>4.4 x 10⁹ years old) and are called ferroananorthosites. These are thought to have crystallized from a moon-wide magma ocean at the beginning of its history. They are mainly composed of the mineral plagioclase, which was analyzed for water by Fourier Transform Infrared (FTIR) spectrometry. These measurements were challenging because of the fragility of the samples (Figure 2), the fact that they are very precious and that the water contents measured were low.
Figure 1. Sample 15415 before it was sampled by the Apollo 15 astronauts on the lunar surface. This ferroananorthosite is one of the best-known rocks of the Apollo collection, and is popularly called the “Genesis Rock” because the astronauts thought they had a piece of the moon’s primordial crust.
Figure 2. A photo of a plagioclase grain analyzed for water in this study.
Analysis of the ferroananorthosites found about 6 part per million (ppm) H2O in the plagioclases (Figure 3). Analysis also found up to 2 ppm H2O in the plagioclases of another type of moon rock, called troctolite, that is thought to be pieces of the old lunar crust. Although these may seem like trivial amounts, finding water in rocks from the oldest lunar crustal rocks has profound implications. For example, there is a debate on whether the origin of the water measured in moon rocks so far was brought later by impacts (comets, for example), or was present all along from the beginning of the moon’s history. Results from ARES analysis support the latter hypothesis. Moreover, knowing the amount of water in the earliest moon rocks has implications on the modeling of the moon formation event. Finally, part of the water measured by spacecraft orbiting the moon may be from indigenous water in crustal rocks, such as analyzed in this study.
163

Figure 3. Example of FTIR spectra of lunar plagioclases in the water-band region. The “bump” in the spectrum above the dotted line (the baseline) is due to absorption of the infrared light by O-H bonds in the plagioclase.
164

Constraining Early Planetary Differentiation: The Link Between Chondrites and Achondrites Revealed from the Study of Aubrite MeteoritesAnne Peslier, Jacobs TechnologyAlan D. Brandon, University of HoustonMunirHumayun, Florida State University David van Acken, University of Bonn
Meteorites fall into two broad categories: chondrites, the almost-pristine pieces of the early solar system before planets formed; and achondrites, which come from differentiated bodies, i.e., planets or asteroids with layers of core, mantle and crust. One type of meteorite, called aubrite or enstatiteachondrite, is fascinating because it may represent a link between chondrites and achondrites. Moreover, enstatiteachondrites formed very early in solar system history. They therefore provide insight into early planetary formation.
The focus of a study completed in 2012 by scientists within the Astromaterials Research and Exploration Science Directorate at Johnson Space Center (JSC) was to determine the amount of platinum group elements (PGE) in the abundant metal and sulfides of several well-known enstatiteachondrites. Sample aliquots were first characterized in the electron microprobe laboratory at JSC (Figure 1), while the PGE were measured at Florida State University by laser inductively coupled mass spectrometry.
PGE measurements made are consistent with each sample originating from a different parent body, with each having a complex history of melt extraction and differentiation, asteroid break-up and re-accretion, and infiltration by impact melts. However, the PGE patterns measured as part of this study in the enstatiteachondrites are similar to those of enstatitechondrites (Figure 2), favoring a common origin for the two types of meteorites (i.e., the origin of enstatiteachondrites could be from the differentiation of enstatitechondrites).
Figure 1. Electron back-scattered maps of the aubrite thin sections showing targeted area for PGE analysis. Brightest phases are metals and sulfides. A) Mt Egerton. B) Cumberland. C) Shallowater.
Figure 2. PGE contents in an enstatiteachondrite (Mt Egerton in black) are similar to those of enstatiteachondrites (EL in grey).
165

Standards-Based Wireless Sensor Networks and Modular Instrumentation for Spaceflight ApplicationsRichard J. Barton, Johnson Space CenterPatrick W. Fink, Johnson Space Center
Raymond S. Wagner, Jacobs Technology
Recent years have seen a wealth of low-cost, low-power wireless radio technologies emerge. These are enabling the networked connectivity of an increasing number of devices on the eventual path to an “internet of things”. Remote monitoring and control of both home and industrial devices will become increasingly affordable, eventually reaching a granularity where networking inexpensive appliances becomes commonplace.
Deployment of wireless networking on orbit has not kept pace with this incredible terrestrial proliferation, and thus NASA has a unique opportunity to spin in a host of proven, standards-based, commercial-off-the-shelf (COTS) technologies, increasing capabilities at a very low cost and risk compared to many other spaceflight technology development efforts. The benefits of such a transition can be substantial. Wireless technologies can allow for the removal of wire harnesses and connectors in new vehicles, resulting in decreased launch weight and, therefore, increased payload capacity. Existing vehicles, such as the International Space Station (ISS), can also benefit from retrofit with new technologies using wireless connections, removing the often show-stopping requirement of installing new cable drags as systems are added.
A critical step in the eventual deployment of these technologies is understanding how each behaves in relevant spaceflight environments, illuminating the trade-offs between competing alternatives. Indeed, a variety of standards-based, COTS wireless technologies can now be found, covering a range of data-rates, costs and power requirements. These range from very simple, low-power wireless sensor network radios to more complex, power-hungry solutions like Wi-Fi. And even within families of solutions, alternatives with fairly different behaviors exist.As an example, the trade space of low-power, low-data rate wireless sensor network (WSN) technologies centers around the Institute of Electrical and Electronics Engineers (IEEE) 802.15.4 standard, which provides basic features necessary for building more complete WSN solutions. Two major standards provide upper layers to form distributed, multi-hop mesh networks using the IEEE 802.15.4 services. These are ZigBee, which is targeted primarily at home automation, and the International Society of Automation (ISA) standard ISA100.11a, which is targeted at industrial automation. The former provides an inexpensive, lightweight and completely ad-hoc solution, though it does not contend well with radio-frequency interference in its operating channel. The latter provides a more costly, centrally managed solution which provides
quality-of-service guarantees not found in ZigBee that are necessary for critical industrial process monitoring and control deployments.
A comparison of the relative performance of the two using production hardware had not been found in the literature, so to evaluate the trade-offs, in 2011, the Avionic Systems Division at Johnson Space Center (JSC) devised a series of tests using the JSC Wireless Habitat Testbed (Figure 1), an ISS module-sized testbed used for studying the co-existence of multiple candidate wireless systems for manned spaceflight. Of chief concern was evaluating whether the more costly frequency-hopping ISA100.11a solution could provide some benefit over the single-frequency ZigBee protocol in the presence of Wi-Fi (IEEE 802.11g) interference. The results, published in 2012, provide the first known documented comparison between the two leading low-power, low-datarate WSN standards using laboratory test data.
Figure 1. NASA JSC wireless habitat testbed.
Designing these experiments to give a meaningful comparison between the two protocols involved building hardware and software configurations to hold everything constant across trials, except the choice of wireless protocol. Test applications, generating specific traffic patterns, had to operate the same regardless of which underlying protocol was used to transport the data in experiments. This experience, in part, inspired the design in 2011 of a second generation of hardware, dubbed the Modular Instrumentation System (MIS).
166

MIS segregates the various tasks of embedded monitoring and control – power, processing, communication and sensing – into separate hardware modules which can be interchanged to achieve alternate configurations of the same basic design. This enables true apples-to-apples comparisons of competing wireless technologies. Test software, exercising a particular protocol feature under comparison, resides a microcontroller on the processor board. The test program is loaded onto the processor board together with a device driver for the protocol to be investigated, and this is interfaced with a board containing the COTS radio implementing the protocol. Drivers are written to expose a common set of calls independent of the details of the application programming interface for a particular COTS radio, allowing the same application-level test software to run with various protocols. A common power supply is interfaced with all nodes, and sensor packages can also be added to extend MIS utility past laboratory trials with synthetic data to field trials generating actual sensor readings. In this configuration, MIS has been used to evaluate the ISA100.11a WSN protocol in both the Habitat Demonstration Unit – Deep Space Habitat project in the 2011 Desert Research and Technology Studies field trials and in ongoing work in the JSC Integrated Avionics, Power, and Software testbed. Figure 2 shows an example of a MIS stack, complete with a sensor interface.
In addition to providing guidance to NASA-internal development activities, the results of MIS WSN trials have been fed into the Consultative Committee for Space Data Systems (CCSDS) through JSC Avionics Systems Division personnel. CCSDS member agencies, including NASA and the European Space Agency (ESA), provide representatives to the Wireless Working Group (WWG), which is responsible for writing recommended practices for deployment of wireless networking technologies in and around spacecraft. From 2011-2012, NASA and ESA representatives to the CCDSDS WWG sketched out a joint technology maturation effort called the Smart Sensor Inter-Agency Reference Testbench (SSIART), which is designed to spread the work of evaluating standards-based wireless technologies across both agencies. The details of this proposed collaboration appeared in a publication in 2013. When implemented, SSIART will involve the exchange of reference hardware and software designs between NASA and ESA to enable joint testing and trial deployment of candidate wireless protocols in the various unique test environments operated by each agency. MIS offers an example of a possible configuration of a SSIART test article. In 2012, the SSIART partnership received the approval of the U.S. Department of State to move ahead with the exchange of hardware drawings and code, and it will be proceeding in 2013 as resources allow.
Figure 2. Modular instrumentation system (MIS) unit.
167

2012 Analog Mission OverviewBarbara A. Janoiko, Johnson Space CenterMarcum L. Reagan, Johnson Space CenterJames E. Johnson, Johnson Space Center
Steven P. Chappell, Wyle Science, Technology & Engineering Andrew F. Abercromby, Wyle Science, Technology & Engineering
What is an Analog Mission?An analog mission is an activity that utilizes integrated operations to provide data that influences the development of mission architectures and technology critical to future human spaceflight. These missions are typically conducted in extreme, remote and isolated environments to adequately represent the logistical challenges associated with human spaceflight and may also be conducted in actual or simulated microgravity or by using high-fidelity computer simulations.
Each analog mission drives innovation through the collaboration of game-changing and cross-cutting technologies and mission operations scenarios utilizing partnerships across the Agency, other government institutions, academia, private enterprise and international partners. Analogs also improve affordability of human exploration by utilizing a “build-a-little, test-a-little” approach that uncovers technical deficiencies and provides operational lessons learned early in development to reduce long-term operational cost.
BackgroundNASA’s Analog Missions are led out of the Engineering Directorate at the Johnson Space Center (JSC) under NASA’s Advanced Exploration Systems (AES) program and draws on resources from across the Agency. In 2012, AES funded four analog missions: NASA Extreme Environment Mission Operations (NEEMO), Research and Technology Studies (RATS), In-situ Resource Utilization (ISRU) and International Space Station (ISS) Testbed for Analog Research (ISTAR). NEEMO and RATS were primarily focused on the challenge of conducting exploration operations on a near-Earth asteroid (NEA). ISRU was focused on the operations and technology needed to identify and ground truth locations with high water (ice) content in lunar soil. ISTAR was focused on operational techniques for mitigating long communications delays and on-board procedures that promote crew autonomy.
A key part of the Analog Missions Project is the Exploration Analogs Mission Development (EAMD) team. This team ensures that a consistent and rigorous approach is applied to the operational products, tools, methods and metrics used across all NASA analog activities to enable iterative development, testing, analysis and validation of evolving exploration ops concepts.
EAMD builds a test study design that enables quantitative evaluation of operational and technological capabilities that helps inform cost-effective mission and hardware design and development, and it ensures the data collected before, during and after analog tests is usable and relevant to NASA’s exploration architecture and technology development priorities.
NEEMO 16Since 2001, NEEMO missions have utilized the world’s only operational undersea research habitat, Aquarius, off the coast of Key Largo, Florida. Aquarius is similar in size to the U.S. Laboratory module on the ISS and sits in water about 60 feet deep with an entrance level at about 50 feet. Aquanauts in the habitat are living under elevated pressure and must undergo a lengthy decompression schedule before surfacing to avoid serious injury, which provides a similarly extreme environment as living in space.
The 16th NEEMO mission was a 12-day mission conducted June 11-22, 2012 with six crew-members from NASA, Japanese Aerospace Exploration Agency, European Space Agency, Cornell University and Aquarius Reef Base professional aquanauts and habitat technicians. The mission built upon the NEA exploration studies started during the NEEMO 15 mission in October 2011 and investigated the combination of exploration systems (Multi-Mission Space Exploration Vehicles (MMSEVs), Deep Space Habitat, extravehicular activity (EVA) as shown in Figure 1, and robotic systems) and operational practices (sample collection, communication and navigation, etc.) most effective for human exploration of a NEA. Additionally, the entire mission was conducted under a 50 second, one-way communications delay (representative of NEA exploration mission) affecting voice, text, video, file transfer and internet use to evaluate mitigation tools and techniques.
The article titled “NEEMO 16: Evaluation of Techniques & Equipment for Human Exploration of Near-Earth Asteroids” in this biennial report provides more detail on the NEEMO 16 analog mission.
168
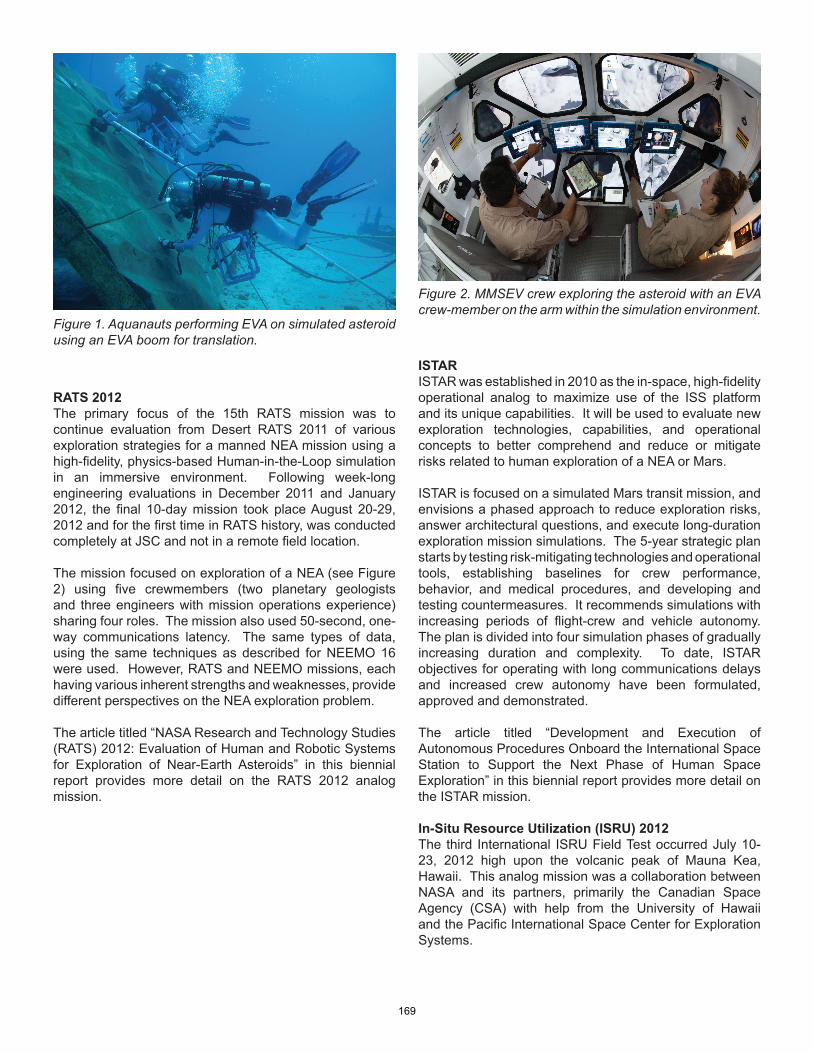
Figure 1. Aquanauts performing EVA on simulated asteroid using an EVA boom for translation.
RATS 2012The primary focus of the 15th RATS mission was to continue evaluation from Desert RATS 2011 of various exploration strategies for a manned NEA mission using a high-fidelity, physics-based Human-in-the-Loop simulation in an immersive environment. Following week-long engineering evaluations in December 2011 and January 2012, the final 10-day mission took place August 20-29, 2012 and for the first time in RATS history, was conducted completely at JSC and not in a remote field location.
The mission focused on exploration of a NEA (see Figure 2) using five crewmembers (two planetary geologists and three engineers with mission operations experience) sharing four roles. The mission also used 50-second, one-way communications latency. The same types of data, using the same techniques as described for NEEMO 16 were used. However, RATS and NEEMO missions, each having various inherent strengths and weaknesses, provide different perspectives on the NEA exploration problem.
The article titled “NASA Research and Technology Studies (RATS) 2012: Evaluation of Human and Robotic Systems for Exploration of Near-Earth Asteroids” in this biennial report provides more detail on the RATS 2012 analog mission.
Figure 2. MMSEV crew exploring the asteroid with an EVA crew-member on the arm within the simulation environment.
ISTARISTAR was established in 2010 as the in-space, high-fidelity operational analog to maximize use of the ISS platform and its unique capabilities. It will be used to evaluate new exploration technologies, capabilities, and operational concepts to better comprehend and reduce or mitigate risks related to human exploration of a NEA or Mars.
ISTAR is focused on a simulated Mars transit mission, and envisions a phased approach to reduce exploration risks, answer architectural questions, and execute long-duration exploration mission simulations. The 5-year strategic plan starts by testing risk-mitigating technologies and operational tools, establishing baselines for crew performance, behavior, and medical procedures, and developing and testing countermeasures. It recommends simulations with increasing periods of flight-crew and vehicle autonomy. The plan is divided into four simulation phases of gradually increasing duration and complexity. To date, ISTAR objectives for operating with long communications delays and increased crew autonomy have been formulated, approved and demonstrated.
The article titled “Development and Execution of Autonomous Procedures Onboard the International Space Station to Support the Next Phase of Human Space Exploration” in this biennial report provides more detail on the ISTAR mission.
In-Situ Resource Utilization (ISRU) 2012The third International ISRU Field Test occurred July 10-23, 2012 high upon the volcanic peak of Mauna Kea, Hawaii. This analog mission was a collaboration between NASA and its partners, primarily the Canadian Space Agency (CSA) with help from the University of Hawaii and the Pacific International Space Center for Exploration Systems.
169

The primary objective of the mission was to demonstrate the integrated mobility platform and the science payload for a lunar polar ice or volatile mission. To reach this objective, the Regolith and Environment Science and Oxygen and Lunar Volatile Extraction payload, mounted on the CSA Artemis Jr. rover (see Figure 3), had to demonstrate the ability to locate, characterize, and map water ice and other volatiles akin to what may be present at the lunar poles.
Another suite of experiments that occurred during the ISRU test was the Moon Mars Analog Mission Activities Science/Resource Prospecting Mission, where a second CSA rover, Juno II, used Ground Penetrating Radar and a Mössbauer spectrometer to collect data.
The article titled “Third International In-Situ Resource Utilization Analog Field Test” in this biennial report provides more detail on the ISRU field test.
Figure 3. RESOLVE drill operations on Artemis Jr. rover.
ConclusionData collected from NEEMO 16 and RATS 2012, as well as previous Desert RATS and NEEMO missions, have given NASA a very complete picture of the architectural elements required, operational concepts and special tools and techniques needed to explore a NEA. It also gives us a richer base of experience for performing human operations with a significant (50 second one-way) communications delay.
Some initial communications delay and crew autonomy tests have already been conducted with ISTAR. Planning is currently underway to use the long duration and micro-gravity environment offered on ISS to simulate multiple features of a future Mars mission. Results from the ground-based analogs will be incorporated into these simulations.
The ISRU mission was a great success in several areas. It demonstrated hardware robustness in a challenging operational environment, it allowed us to verify that we have a solid operational concept for operating the multiple instruments and rovers involved, and we were able to collect more data than we had anticipated going into the test. The ISRU hardware is now one step closer to the thermal and vacuum chamber tests that are needed to ultimately certify it for spaceflight, targeted for 2017.
170

Geolab: A Geological Workstation for Future MissionsCynthia Evans, Johnson Space CenterMichael Calaway, Johnson Space CenterMary Sue Bell, Johnson Space Center
Zheng. Li, University of BridgeportShuo Tong, University of BridgeportYe Zhong, University of BridgeportRavi Dahiwala, University of Bridgeport
The GeoLab glovebox was, until November 2012, fully integrated into NASA’s Deep Space Habitat (DSH) Analog Testbed (Figure 1).
Figure 1. GeoLab glovebox (top) inside NASA’s Deep Space Habitat (bottom).
The conceptual design for GeoLab came from several sources, including current research instruments used on the International Space Station (Microgravity Science Glovebox), existing Astromaterials Curation Laboratory hardware and clean room procedures, and mission scenarios developed for earlier programs.
Since 2009, when the GeoLab design and construction started, the GeoLab team (a group of scientists from the Astromaterials Acquisition and Curation Office within the Astromaterials Research and Exploration Science Directorate at the Johnson Space Center) progressively developed and reconfigured the GeoLab hardware and software interfaces and evolved test objectives. GeoLab tests addressed the following goals: 1) determine requirements and strategies for sample handling and prioritization for geological operations on other planetary surfaces; 2) assess the scientific contribution of selective in-situ sample characterization for mission planning, operations, and sample prioritization; 3) evaluate analytical instruments and tools for providing efficient and meaningful data in advance of sample return and 4) identify science operations that leverage human presence with robotic tools.
GeoLab allowed NASA scientists to test science operations related to contained sample examination during simulated exploration missions. The team demonstrated science operations that enhance the early scientific returns from future missions and ensure that the best samples are selected for Earth return. The facility was also designed to foster the development of instrument technology.
In the first year of tests (2010), GeoLab examined basic glovebox operations with one and two crewmembers, and science operations with a remote science team. The 2010 tests also examined the efficacy of basic sample characterization (descriptions, microscopic imagery, X-ray Fluoresence (XRF) analyses) and feedback to the science team. In year 2 (2011), the GeoLab team tested enhanced software and interfaces for the crew and science team (including web-based and mobile device displays) and demonstrated lab configurability with new diagnostic instruments (Multispectral Microscopic Imager from the Jet Propulsion Lab and Arizona State University). In year 3 (2012), the GeoLab team installed and tested a robotic sample manipulator and evaluated robotic-human interfaces for science operations.
171

GeoLab Robotic Sample Manipulator. Sample return missions have strict protocols to reduce potential contamination of samples, and sample handling in microgravity presents special challenges. To begin to address these challenges in the GeoLab, scientists at the Johnson Space Center partnered with engineering students from the University of Bridgeport, in Bridgeport Connecticut. The students were awarded one of the 2012 National Space Grant Foundation Exploration Habitat (XHab) Academic Challenges to develop an engineering design for tools to handle geological samples for analysis in a microgravity glovebox environment (see http://www.nasa.gov/exploration/technology/deep_space_habitat/xhab/xhab-2012-progress.html). The Bridgeport XHab team designed and built a robotic arm system with a three-finger gripper that could manipulate geologic samples within the existing GeoLab glove-box (Figure 2). An innovation developed by the Bridgeport team was the large curvature of each finger, a design that reduced contact with the irregular surfaces of a rock sample, thus minimizing contamination risk while still allowing a significant capture force to be applied to uneven surfaces of a rock (Figure 3).
Figure 2. GeoLab Robotic Sample Manipulator CAD design and CAD rendering of robotic arm inside glovebox, created by U. Bridgeport XHab 2012 team.
Figure 3. Views of the robotic sample manipulator three-fingered end effector holding and positioning rock samples.
The robotic manipulator was required to be able to capture and release samples, translate the full volume of the glovebox, and precisely manipulate samples for imaging, microscopic examination and positioning for XRF analyses. The full range of motion (translation in X, Y and Z direction; pivot up, down and rotating end effector) were accomplished with a linear slide for the length of the glovebox (X-direction), and precision linear stages or motion along the Y and Z axes. The Z-axis linear stage was mounted on a motorized rotary stage. All four (X, Y, Z, and rotation) stages were enabled by a motion controller. The robotic arm pitch used a series of enclosed gears attached to a motor. The three-fingered grasper enabled 360 degree rotation with two additional motors; all three motors were controlled by one controller. Both controllers were Ethernet enabled and connected to the DSH avionics network switches. A software interface for the controllers was designed by the DSH software team and was hosted on the GeoLab computer using touch screen technology above the glovebox.
The tests of the robotic arm provided insight into technologies that will be required for higher readiness levels.
172

The ultimate goal is to build a robotic system that could autonomously conduct the preliminary examination of returned samples and downlink this data to Earth-based mission scientists. The team’s current goal for sample science in the context of planetary exploration is to have autonomous robotic systems, assisted by human crew members when required that can 1) collect and stow samples in an archival manner, 2) conduct preliminary examination of samples, 3) downlink the data to mission scientists for sample return prioritization and 4) maintain rigorous curation protocols that preserve the scientific integrity of the samples.
Three Years of GeoLab Tests. Over 3 years that GeoLab was integrated into the DSH, GeoLab participated in 19 days of simulated mission testing in full analog settings, and monitored operations with 18 different test subjects. The GeoLab team also conducted stand-alone tests with nearly 20 other operators. While complete compilation and assessment of test results is still underway, the GeoLab team can confidently report the following:
1. The GeoLab design supports autonomous crew operations of the basic glovebox functions. The trained crew enhances science returns by providing spontaneous observations; this is especially important when time delays preclude real-time science team involvement.
2. Good sample imagery is key for preliminary characterization. Imagery collected at a range of scales forms the basis for additional characterization. The earliest tests indicated that basic microscopy provided invaluable data for rapid assessment of samples.
3. Robotic assists for sample handling are critical in microgravity. Robotics aid crew and enable precision sample handling for data collection. The 2012 tests validated the quantity and quality of microscopy that could be achieved with a robotic sample holder. The sample holder made possible one-person operations (crew efficiency), provided flexibility in sample positioning (see Figure 3), enabled systematic sample positioning, allowing for mapping of the sample for future analyses. Finally, proper robotic sample handling can result in less sample handling, and therefore present less risk of damaging or compromising a sample.
4. A combination of imaging tools and robotic tools provides significant flexibility for designing facilities and operations related to sample characterization and sample handling. Progressive tests using robotic interfaces will help develop requirements, instruments and procedures for different exploration scenarios.
5. Preliminary sample characterization provides data that supports smart decisions during mis-sion operations. Data supports sample prioritization, enables a better understanding of the regional geology being explored, highlights details on samples and is useful for future exploration plans. The types of data that were collected in the GeoLab during the analog tests allow for wide dissemination and broad participation by scientists and students on Earth.
173

The 2012 Moon and Mars Analog MissionLee Graham, Johnson Space Center
The 2012 Moon and Mars Analog Mission Activities (MMAMA) scientific investigations were completed on the Mauna Kea volcano in Hawaii in July 2012. The investigations were conducted on the southeast flank of the Mauna Kea volcano at an elevation of approximately 11,500 feet. This area is known as “Apollo Valley” and is in an adjacent valley to the Very Large Baseline Array (VLBA) dish antenna. Two of the four MMAMA investigations selected were led by scientists within the Astromaterials Research and Exploration Systems Directorate at Johnson Space Center (JSC). These included the Increasing Robotic Science proposal and the Mossbauer/X-Ray fluorescence spectrometer (MIMOS II/MIMOS IIA). The original robotic investigation proposal called for a human versus robot comparative study of the JSC C2 rover and, potentially, the C2 rover with a Robonaut torso mounted on it, often called a “Centaur.” (A Robonaut is a dexterous humanoid robot designed and built at JSC.) However, last-minute travel restrictions eliminated this capability from the test.
Working with the NASA Regolith and Environment Science and Oxygen and Lunar Volatile Extraction project, a NASA Advanced Exploration System Program project hosted at Kennedy Space Center, the MMAMA team was able to identify a replacement rover, the JUNO II (shown in Figure 1), provided by the Canadian Space Agency. In addition, as planning progressed for the 2012 tests on Mauna Kea, an opportunity presented itself to move the MMAMA test site to a more geologically challenging location. This did, however, also reduce the test time from the original two weeks to only three days. The primary focus of the investigation was to determine the valley formation process(es). The instruments used in the test were selected based on several considerations. The major criteria included: 1) applicability to the scientific investigation of the valley; 2) mobility; 3) availability; 4) remote control capability; and 5) weatherproofing capability. The MMAMA robotic investigation involved the use of six scientific- and engineering-related instruments. They included a ground penetrating radar (GPR), a second-generation Mossbauer/X-ray fluorescence spectrometer, a panoramic video camera, a magnetic susceptibility meter, a global positioning sensor receiver and a three-axis accelerometer.
Figure 1.
During operation in the field, a successful attempt was made to simulate a remote-controlled planetary science mission by minimizing the number of times the rover was physically touched by an operator. The only exception to this was the GPR data collection, where the operator had to activate the system that was mounted on the rover each time it was used (several times each day). To accomplish the remote operation, a combination wireless and hardwired onboard instrument suite was developed. During the test, control of the instruments was accomplished by four operators remotely controlling specific instruments and the rover itself (see Figure 2).
Figure 2.
174

Google Earth images were used as an analog to the orbital images available prior to a planetary “landing” in order to create notional traverses prior to the mission. Although there were many legs of the planned traverses that were not executable (given the difficult trafficability of the surface), the planned traverses provided a framework to vary from and maximized the team’s efficiency in the field, where rapid re-planning was required (see Figure 3).
Figure 3.
The science instrumentation provided a range of geological context and geophysical and geochemical information about the test site. This initial evaluation of the geologic context and history of the Apollo Valley (or “landing site”) was continually refined by this integrated investigation. For example, the hypothesis that a large, higher-albedo mound was part of a burst glacial dam was confirmed only by walking the formation. As another example, though the orbital data and the video pans showed possible channels or valleys on either side of this structure, it was only on the ground that it was clear that the west valley was the location of the glacial dam breach, and the eastern portion of the valley was on a sloping area. This, combined with our ability to determine the shape of the mound (steeper slope on the west side than the east) and the morphology to the north of it, led the team to conjecture that the ice dam hypothesis was possible. Further research and investigation are necessary; however, to definitively state that an ice dam burst formed the valley.
The 2012 MMAMA science activity allowed for a small team to perform significant science over the three main days of testing. All personnel meshed and worked well, even though each major instrument set started out as a separate proposal (see Figure 4).
Figure 4.
175

NEEMO 16: Evaluation of Techniques and Equipment for Human Exploration of Near-Earth AsteroidsMarcum L. Reagan, Johnson Space CenterMichael L. Gernhardt, Johnson Space CenterSteven P. Chappell, Wyle Science, Technology & Engineering
Andrew F. Abercromby, Wyle Science, Technology & EngineeringWilliam L. Todd, Universities Space Research Association
IntroductionNASA Extreme Environment Mission Operations (NEEMO) is an underwater spaceflight analog that allows a mission-like operational environment and uses buoyancy effects and added weight to simulate different gravity levels. The NEEMO 16 mission was performed at the Aquarius undersea research habitat (Figure 1) from June 11 to 22, 2013.
MethodsFour subjects were weighed out to simulate zero gravity and evaluated different techniques and tools to perform an NEA exploration circuit on the sea floor outside Aquarius. Subjects completed tasks that included float sampling, rock chip sampling, core sampling, soil sampling, geophysical array deployment and large instrument deployment (Figure 3). Lessons learned from previous analog tests were incorporated.
Figure 1. The Aquarius undersea habitat (background) and Deep Worker submersibles (foreground with crew) used during the NEEMO 16 mission.
The mission focused on near-Earth asteroid (NEA) exploration techniques to provide key input to NASA’s Capability Driven Framework, including evaluation of different combinations of vehicles, crew members, tools and equipment that could be used to perform exploration tasks on an NEA surface (Figure 2).
The effects of representative communication latencies associated with NEA missions were also studied during the mission.
Figure 2. Depiction of an MMSEV with a crew member performing an extravehicular activity (EVA) in a foot restraint on an astronaut positioning system near an NEA.
Figure 3. EVA crew member in an NEA exploration circuit working with sample/tool bags while attached to translation lines.
176

Tasks were completed using translation lines, a rotational/translational boom, EVA jetpack and a foot restraint on a Deep Worker submersible representative of the Multi-Mission Space Exploration Vehicle (MMSEV). The MMSEV is a NASA Johnson Space Center-led project to develop an exploration vehicle with variants that could support both zero gravity and surface-exploration activities, enabling EVA as well as robotic exploration.
A one-way communication latency of 50 seconds between an NEA and mission control was simulated throughout the mission. Subjective data included acceptability, simulation quality, capability assessment ratings and comments. Photo and video were also collected.
ResultsThe only method rated as totally acceptable for performing all the NEA exploration tasks was using a foot restraint on an MMSEV (Figure 4). EVA jetpacks and methods that used anchoring to the NEA surface (boom and translation lines) were found to be acceptable for a limited set of tasks. Technology development should include a vehicle with an astronaut positioning system and EVA foot restraints, EVA jet-packs and, possibly, an EVA boom that could be anchored to an MMSEV or the surface. Follow-on unsuited testing was performed on the Active Response Gravity Offload System at Johnson Space Center during NASA’s Research and Technology Studies 2012. Further insight may be gained with additional testing of NEA exploration techniques in a reduced gravity analog with spacesuits, increased-fidelity vehicles and equipment. Also, communication tool and just-in-time training improvements were also identified to better handle both nominal and contingency operations with NEA-like communication latency.
Figure 4. EVA crew member hammering geophysical array anchor while attached to a foot restraint on the Deep Worker submersible (MMSEV analog).
This work was led by the Human Health and Performance and Engineering Directorates at the Johnson Space Center in support of NASA’s Advanced Exploration Systems Program.
177

NASA Research and Technology Studies (RATS) 2012: Evaluation of Human and Robotic Systems for Exploration of Near-Earth AsteroidsMarcum L. Reagan, Johnson Space CenterJames E. Johnson, Johnson Space CenterBarbara A. Janoiko, Johnson Space CenterMichael L. Gernhardt, Johnson Space Center
Andrew F. J. Abercromby, Wyle Science, Technology and EngineeringSteven P. Chappell, Wyle Science, Technology and EngineeringHarry L. Litaker, Lockheed Martin
IntroductionFundamental to the development of NASA’s Capability Driven Framework is identifying the exploration systems that are required for the range of destinations being considered and finding safe, affordable, and effective ways to develop and operate those systems. Design reference missions (DRMs) currently being considered by NASA for human exploration of near-Earth asteroids (NEAs) include stays in the proximity of the target NEA of between 14 and 56 days during which time the Earth-NEA transit vehicle, Deep Space Habitat (DSH), and multi-purpose crew vehicle (MPCV, used for crew launch and re-entry) would remain between 500 meters and 2 km away from the NEA to minimize the possibility of collision. Exploration and sampling of the NEA surface would be conducted by crewmembers leaving the DSH in extravehicular activity (EVA) suits with appropriately sized EVA jetpacks to enable brief sorties to the NEA surface and/or by using a Multi-Mission Space Exploration Vehicle (MMSEV), which is a small pressurized spacecraft with rapid EVA capability enabling multi-day exploration sorties away from the DSH.
RATS 2012 was the 15th mission to date and for the first time in RATS history, was conducted completely at Johnson Space Center and not in a remote field location. Following week-long engineering evaluations in December 2011 and January 2012, the final integrated test took place Aug. 16-30, 2012, and was led by the Systems Architecture and Integration Office within the Engineering Directorate.
MethodsThe RATS 2012 test focused on optimizing utilization of a four-person crew, DSH, MMSEV, EVA jetpacks, and Mission Control Center operating with 50 seconds each-way communication latency, during exploration within an immersive virtual-reality physics-based simulation of the NEA Itokawa (Figure 1).
Figure 1. Screenshot of MMSEV NEA simulation showing MMSEV with one EVA crewmember attached to an astronaut positioning system (APS) and a second free-flying using an EVA jetpack.
The experimental design for RATS 2012 was based on the results of the Desert RATS (DRATS) 2011 field test, which have been published in a peer-reviewed journal. The RATS 2012 crew consisted of two planetary geologists and three engineers with mission operations experience rotating across the four mission roles. High-resolution imagery from the Japanese Space Agency’s (JAXA) Hayabusa mission was integrated into the simulation and models of three-dimensional boulders of representative sizes, shapes, and distributions were added at specific locations based on inputs from a scientist with expert knowledge of Itokawa. Traverse plans were prepared based on the Hayabusa imagery and using assumptions for sampling and instrument deployment methods and durations based on data from complementary JSC-led testing in reduced gravity environments, results of which have also been published in peer-reviewed journals and conference proceedings. Traverses were planned to include variation in terrain, illumination, and centripetal acceleration within each traverse while maintaining consistency among test conditions.
178

The Gen 2A MMSEV is the third prototype vehicle developed by the MMSEV project. The MMSEV project is a NASA Advanced Exploration Systems (AES) technology development project hosted at JSC. Habitability and human factors evaluation of the Gen 2A MMSEV while being operated within a high fidelity operational environment was also included in RATS 2012. The Gen 2A MMSEV was located within the JSC Building 9 hi-bay throughout the RATS 2012 test and was surrounded by high-resolution video walls displaying video generated by the MMSEV NEA Simulation (Figure 2).
Figure 2. Gen 2A MMSEV prototype with cockpit windows surrounded by video walls.
Test subjects inside the MMSEV used the displays, controls, and views of the video walls through the windows to operate the MMSEV and interact with the immersive simulation environment throughout the 10-day test (Figure 3).
Figure 3. Test subject inside the Gen 2A MMSEV. Video walls displaying the NEA simulation can be seen through the windows.
Test subjects moved to the nearby virtual reality (VR) Laboratory to conduct simulated EVAs, where head-mounted displays, instrumented gloves, and an EVA jetpack control module allowed crewmembers to operate within the MMSEV NEA simulation environment. During test conditions in which the MMSEV was anchored to the NEA, one test subject would perform EVA tasks from the VR lab using a simulated jetpack while a second crewmember performed anchored EVA tasks using the Active Response Gravity Offload System (ARGOS) to simulate microgravity (Figure 4).
Figure 4. Test subject performing exploration EVA tasks in simulated microgravity using ARGOS (left) and the VR laboratory (right).
This test did not attempt to evaluate specific NEA anchoring technologies due to the immaturity of those technologies and the inability to meaningfully test them within the existing software simulation. Instead, a consistent approach was used in which MMSEV pilots manually performed 10 minutes of a precision station-keeping flying task to approximate the increased workload and propellant that would likely be required to perform an anchoring. The number of anchorings was recorded to enable post-test parametric analysis of the effect of anchoring duration on productivity and propellant usage for different exploration techniques.
Simulation telemetry and consensus subjective ratings were used to assess exploration productivity, propellant usage, workload, and acceptability during exploration traverses in test conditions incorporating different combinations of extravehicular and intravehicular crewmembers; anchored vs. free-flying operations; EVA jetpacks vs. astronaut positioning system (APS) attached to the MMSEV; and NEA size and spin rates. Human factors of the Generation 2A MMSEV prototype were evaluated by two separate two-person crews, each inhabiting the MMSEV for 3 days and 2 nights.
179

Other Test ObjectivesOutside of the primary test objectives, RATS testing provides opportunities for integrated and/or standalone technology demonstrations to advance those systems towards flight readiness, as well as Education and Public Outreach (EPO) activies to inform, educate, inspire, and engage the public in future exploration. During this test, a 3 kilowatt (kW) regenerative fuel cell was intermittently used to power the Gen 2A MMSEV cabin, and the product water from the fuel cell was then used to assist in the evaluation of a prototype exploration electrolyzer. In addition to live outreach events on NASA TV and through Challenger Learning Centers, one day of the test was dedicated to media and VIP tours and inter-views.
Results For the operations tested, the recommended distribution of crewmembers is two in the DSH, one in the MMSEV, and one EVA. Crewmembers rated this condition as overall acceptable and experienced lower workload and greater situational awareness vs. conditions involving two EVA crewmembers. Free-flying modes were preferred vs. anchoring the MMSEV to the NEA because of decreased overhead and increased situational awareness, although propellant savings of 30% were measured with anchoring. Alternating between APS and jetpack (vs. APS only) did not improve acceptability but decreased propellant usage. Human factors of the Gen 2A MMSEV were rated acceptable overall. Detailed results of the RATS 2012 test were presented at the 2013 International Conference on Environmental Systems and will be published in the conference proceedings.
180

Rewriting the Landform History of one of Africa’s Three Largest BasinsM.J. Wilkinson, Jacobs Technology
BackgroundBasic geomorphic (landform) research of the Earth is being conducted by scientists within the Astromaterials Research and Exploration Science (ARES) Directorate at the Johnson Space Center (JSC). The research provides for the examination of Earth observations from several imagery sources, including photographs taken by astronauts from on-board the Space Shuttle during its many years of operation, and the International Space Station (ISS), for understanding of a class of large but under-appreciated geological feature known as a megafan (very large alluvial fan). Megafans have significance to oil exploration and planetary geology. The research is a world survey of megafans which are river-made features. The research that has been ongoing since the Space Shuttle era when the wide distribution of these features was first detected.
The geomorphic research of the Earth is being published progressively on a variety of topics since the megafan has numerous unexpected applications, including biodiversity applications. In 2012 and 2013 research on two topics has been completed, namely description of megafans in the Kalahari Basin in southern Africa, and the connection between megafans and bird diversity in Amazonia, with publications expected in 2013. Applications of the research to Mars fluvial geology are being prepared for a NASA Mars Data Analysis funding proposal to be submitted in late 2013.
Research FindingsThe Kalahari Basin in southern Africa—one of the largest in Africa, with the Congo and Chad basins—has attracted attention since David Livingstone traveled through the area in the 1840’s, as a semiarid desert with a large freshwater wetland, known as the Okavango Swamp (150 km radius). This prominent megafan has been well photographed by astronauts over the years, with its fingers of dark green forests projecting into the dun colors of the dunes of the Kalahari semi desert (Figure 1).
The unexpected result of the research effort is the sheer number of large fans on the planet’s surface—the full implication of the astronaut photography becoming apparent in the mid-1990s. It was realised that these features are widespread on Earth, rather than being occasional freaks of geology.
The study area in the northern Kalahari basin is centered on the Okavango megafan of northwest Botswana has become well known as an African wild life preserve of importance to conservation and tourism alike.
Figure 1. Northern Kalahari Desert megafans. Top: Fingers of riverine forest of the Okavango megafan, 150 km radius (lower half of image). ISS image (ISS30-E-198442) taken from the cupola 03-31-2012. Bottom: Vertically exaggerated oblique view of the Cubango megafan, the largest in the study area: the cone stretches 310 km from the apex (image top center) to the Etosha dry lake depression (blue area, foreground).
181

As one of the few easy-to-see megafans on the planet, the Okavango megafan has become important in geological literature, as the example of an unusually large alluvial fan. It is one of only three major, well-known megafans in all of Africa. Megafans are still generally thought to be rare on the planet. However, research has now documented fully 68 megafans in Africa alone, many much larger than the 150 km-long Okavango feature (Figure 2). Eleven, plus two more possible fans, are mapped in the area immediately surrounding the Okavango feature. Megafan cones occupy at least 200,000 km2 in the northern Kalahari Desert, twice the size of Cuba—or 300,000 km2 if the inferred megafans prove to be real, equaling the size of Italy.
Figure 2. Outlines of northern Kalahari Desert megafans.
The Okavango River is unusual in having built not one but two megafans along its course, the abovementioned Okavango megafan and the Cubango megafan.
It is still unappreciated by geologists that megafans produce the flattest and smoothest terrains on Earth—on new roughness maps of Earth these stand out as the darkest areas (Figure 3).
The new roughness map is based on an algorithm used first on Mars to quantify topographic roughness. The map allows direct comparisons of topographic roughness between the two planets. Research on Earth’s flattest terrains is just beginning with the aid of such maps—and now appears to provide analogs for the flattest regions of Mars.
Figure 3. Northern Kalahari Desert megafan roughness map. Most of the darkest zones represent smooth surfaces of large fluvial fan cones formed by the named rivers of the region. Brighter tones are river canyons, eroded uplands and dunefields.
Research Implications1. These perspectives were successfully applied to
identify the largest megafan in the group which had been unknown to local geologists in Namibia—because patterns of dunes, vegetation, and dry lakes obscured it from being detected remotely.
2. Such understanding can probably be applied on Mars, where Earth systems and martian fluvial similarities to Earth suggest that megafans ought to exist.
3. “Sweep angles” of rivers on megafans drastically change the hydrology in some subbasins (Figure. 4): when the Cubango and Kunene rivers were oriented toward the Etosha Pan (a dry lake today) it was probably a semi-permanent body of fresh water for many millions of years. With these rivers oriented away from the basin, fully 93% of the discharge of the basin is now oriented away from the dry lake.
4. Biological contact between major river systems was probably controlled by megafans situated on divides between major river systems: various fish species that originated in the Congo basin are now found in the Upper Zambezi River, and vice versa — apparently because of river switching behavior on the Cassai megafan (region 6 in Figure 4) that has allowed migrations in both directions. This unappreciated characteristic of megafan location appears to explain many interbasin aquatic species distributions
182

Figure 4. Northern Kalahari Desert megafan roughness map. Most of the darkest zones represent smooth surfaces of large fluvial fan cones formed by the named rivers of the region. Brighter tones are river canyons, eroded uplands and dunefields.
183

Flammability and Explosive Technologies
184

Burning of Commercially Pure Titanium in Oxygen-Enriched AtmospheresJoel Stoltzfus, White Sands Test FacilityNathan Jeffers, Jacobs Technology
Timothy D. Gallus, MEI Technologies
Even though titanium and its alloys are known to be easily ignited and, once ignited, burn vigorously in oxygen-enriched atmospheres, parts made from these materials are sometimes exposed to these environments. For example, titanium alloy blades are used in turbine engines which, by virtue of their high pressures, could be considered oxygen enriched. Because of the use of titanium-based alloys in oxygen-enriched atmospheres, there is a significant need to understand their flammability as a function of oxygen concentration and pressure.
In 2012, a fire occurred in a bi-propellant rocket motor injector plate made from titanium at the NASA Johnson Space Center White Sands Test Facility (WSTF). To support the failure analysis, the WSTF Oxygen Group was asked to determine the flammability of commercially pure (CP) titanium as a function of test sample diameter, test gas pressure and oxygen concentration. During 2012 and 2013, test samples of varying diameters were ignited at the bottom and burned upward in 70 percent oxygen (O2)/balance nitrogen gas (N2) and in 99.5+ percent O2 at various pressures. The burning rate of each ignited sample was determined by observing the apparent regression rate of the melting interface (RRMI) of the burning samples. The burning rate, or RRMI, increased with decreasing test sample diameter and with increasing test gas pressure and oxygen concentration. The oxygen concentration had a much more marked effect on the burning rate than oxygen pressure.
Test SamplesThe test material was CP titanium (Grade 2), UNS R50400. Test samples were configured as 6.0-inch (in.) long rods having diameters of 1/32 in., 1/16 in., 1/8 in., 3/16 in. and 1/4 in. With the exception of the 1/32 and 1/16-in. diameter wires, the samples were prepared for test by machining a 0.030-in. wide slot through the bottom end to pass the igniter wire through to ensure ignition (Figure 1).
Figure 1. CP titanium samples prior to test and sample with ignition promoter installed.
185

Ignition PromotersCP titanium (Grade 2) wire was used as the ignition promoter. This wire was wrapped around the bottom end of each test sample and resistively heated to induce melting and subsequent ignition of the igniter wire. The burning igniter wire heated, melted and ignited the sample to which it was attached.
Test ApparatusThe tests were conducted in the WSTF High Pressure Promoted Combustion Test Facility. It was comprised of a test chamber (Figure 2), a 3,000-pound-per-square-inch (psi) mixed gas supply system, pressure recording equipment, and a 200-frame-per-second high-speed digital camera. The digital camera was used to record test sample burning by observing the RRMI as it progressed up the test sample after ignition. The video images were recorded through a 2-in. diameter sapphire sight glass located adjacent to the bottom end of the test sample.
Figure 2. Schematic of WSTF 757 in3 promoted combustion test chamber.
Test ProcedureThe samples were washed, blown dry and individually sealed in clean polyethylene bags. The sample was mounted vertically in the chamber and secured at the top. The igniter leads were connected and the chamber was sealed. The chamber was purged three times and vented to ambient pressure. The test chamber was pressurized to the test pressure and the igniter was initiated by applying power. The test results were observed and recorded. The burn rates (RRMI) were calculated using measurements taken from the digital video recordings.
Test ConditionsTests were conducted in ambient conditions on samples of each test diameter at 25 and 200 pounds per square inch absolute (psia) in 70 percent O2/balance N2. In addition, tests were conducted using 1/8 in. diameter samples in 99.5+ percent O2 at 12.4, 25, 50, 100, and 200 psia.
ResultsTests in 70 percent O2/balance N2 at 25 psiaTest samples with diameters ranging from 1/32 to 3/16 in. supported burning in 70 percent O2/balance N2 at 25 psia. The RRMI decreased with increasing test sample diameter. The 1/4-in.-diameter sample ignited but did not support self-sustained burning in all nine tests conducted. In all other cases, the samples burned completely once ignited.
When the cross-sectional area of the test sample was less than 0.0123 in2, or the diameter of the test sample was less than 1/8 in., the burning rate increased dramatically.
Tests in 70 percent O2/balance N2 at 200 psiaAll the test samples supported burning and burned completely in 70 percent O2/balance N2 at 200 psia. The RRMI decreased with increasing test sample diameter. Similar to the 25 psia data, when the cross-sectional area of the test sample was less than 0.0123 in2 , or the diameter of the test sample was less than 1/8 in., the burning rate increased dramatically.
Tests in 99.5+ percent O2The test results of 1/8-in.-diameter CP titanium (Grade 2) rods in 99.5+ percent O2 as a function of test gas pressure showed that every sample burned completely once ignited and, as expected, the RRMI increased with increasing pressure.
DiscussionIt is clear that CP titanium will undergo complete, self-sustained burning if ignited in 70 percent O2/balance N2. In addition, it is evident that the burning rate, as indicated by the RRMI, increases as the cross-sectional area decreases. In test gas pressures of 25 and 200 psia, the burning rate increased dramatically when the cross-sectional area was less than 0.0123 in2.
Effect of Test Gas Pressure (70 percent O2/balance N2)When test gas pressure was increased, the burning rate increased for all diameters of CP titanium tested. The magnitude of the increase ranged from 4.8 times for the 1/8-in.-diameter samples to 3.3 times for the 3/16-in.- diameter samples. A comparison of the burning rates in 70 percent O2/balance N2 is shown in Figure 3.
186

Figure 3. Burning rates comparison of CP titanium rods in 70 percent O2/balance N2 as a function of test gas pressure.
Effect of Oxygen ConcentrationThe effect of oxygen concentration on the burning rate of 1/8-in.-diameter rods of CP titanium is shown in Figure 4. At 25 psia, the rods tested in 99.5+ percent O2 burned ~5 times the rate of samples tested in 70 percent O2/balance N2. At 50 psia, the rods tested in 99.5+ percent O2 burned ~12.5 times the rate of samples tested in 70 percent O2/balance N2. At 100 and 200 psia, the rods tested in 99.5+ percent O2 burned ~15 times the rate of samples tested in 70 percent O2/balance N2.
Figure 4. Comparison of burning rates of 1/8 in. diameter CP titanium in pure oxygen versus mixed gas.
The burning rate in 200 psia of 99.5+ percent O2 was 6.6 times greater than the burning rate in 25 psia of 99.5+ percent O2. In contrast, the burning rate in 200 psia of 70 percent O2/balance N2 was only 3.3 times greater than the burning rate in 25 psia of 70 percent O2/balance N2. It is probable that this was due to the presence of the 30 percent N2 in the mixed gas test atmosphere. It is surmised that the N2 significantly increased the heat transfer from the burning test sample at elevated pressure, reducing the effect of the greater quantity of oxygen available at that pressure.
Direct comparison to previous flammability studies of titanium and titanium alloys in oxygen-enriched atmospheres is not possible because in those studies burning rates were not measured. They presented threshold pressures (the minimum pressure required to support self-sustained burning), but did not record RRMI.
ConclusionCP titanium (Grade 2) is flammable in 70 percent O2/balance N2 pressures as low as 25 psia up to 3/16 in. diameter. At 200 psia, test samples with diameters up to 1/4 in. supported self-sustained burning. The burning rate increased as cross-sectional area decreased. For all diameters of CP titanium and oxygen concentrations tested, the burning rate increased as the test gas pressure was increased. In 70 percent O2/balance N2, the magnitude of the increase ranged from 3.3 to 4.8 times for the various diameter samples. In 95.5+ percent O2, the burning rate of test samples with 1/8-in. diameters increased over an order of magnitude when the test gas pressure was increased from 12.4 to 200 psia. The oxygen concentration had a much more marked effect on the burning rate of CP titanium wire and rods than did oxygen pressure.
As a result of this work, NASA is able to understand the fire potential of titanium in oxygen-enriched atmospheres and have a test technique to investigate the effect of varying oxygen concentration and pressure on the flammability of titanium and titanium alloys.
187

Titanium Ignition Temperature Measurement TechniquesJoel Stoltzfus, White Sands Test Facility Timothy D. Gallus, MEI Technologies, Inc.
A fire occurred in the injector plate of a bi-propellant thruster during tests at NASA Johnson Space Center’s White Sands Test Facility (WSTF) in 2012. The injector plate, fabricated from commercially pure (CP) titanium (Grade 1), was consumed in the fire. The open literature indicated melting temperatures in the range of 1660 °C and ignition temperatures ranging from 250 to 1627 °C for titanium powder and solid titanium, respectively. During 2012 and 2013, the WSTF Oxygen Group assisted in the failure analysis by investigating the ignition temperature of titanium and titanium alloys in oxygen-enriched atmospheres to validate or modify the available literature values.
To determine the ignition temperature of CP titanium in oxygen-enriched atmospheres, vertically mounted test samples of varying diameters were ignited by induction heating in 66 percent oxygen (O2)/balance nitrogen (N2) and in 99.5+ percent O2 at 1000 pounds per square inch absolute (psia). Ignition tests were performed on CP titanium (Grade 2) and Ti-6Al-4V in 66 percent O2/balance N2 and 99.5+ percent O2. The CP titanium samples were configured as 10 cm long rods with a nominal diameter of 3.2 mm. The surfaces of the CP titanium samples were nitrided, natural, sanded, and etched. The Ti-6Al-4V rods were threaded with a 6 32 thread pattern.
Ignition was measured by either a two-color pyrometer, or a Type S (platinum/platinum-rhodium) thermocouple comprised of wire leads welded to the samples. The ignition temperatures in 66 percent O2 and 99.5+ percent O2, with various surface treatments and configurations, were in the range from 1623 to 1659 °C (Table 1).
The tests were conducted in the WSTF High Pressure Promoted Combustion test facility. It was comprised of a 12.4 Liter (L) test chamber, a 6000 psi oxygen supply system, a 3000 psi mixed gas supply system, pressure recording equipment, and high-speed digital camera. The digital camera was used to record the test sample ignition process. The video images were recorded through a 5.1 cm diameter sapphire sight glass located adjacent to the bottom end of the test sample. The configuration of the test chamber was modified to accommodate the ignition of titanium samples using induction power (Figure 1). Test samples were suspended vertically and ignited at the center by the application of induction energy focused by an hourglass-shaped induction coil.
Table 1. Comparison of Ignition Temperature Results
Figure 1. Promoted Combustion Test Chamber as Modified to Determine Autoignition Temperature of Titanium Rods.
All tests were recorded using a Phantom Model V7.1 high-speed video camera. It was set to record at 2000 frames per second with an exposure time of 40 microseconds (μs). A 0.9 optical density neutral density filter (with transmittance of 12.5 percent) was added to a Nikon 105-mm micro lens, which was focused at ~12 in. The F-stop was set at 32. The camera was mounted external to the test chamber and set to view the ignition event through the sapphire window of the chamber. A remotely operated trigger was used to initiate storage of the video recording data for several seconds before and after the trigger was activated.
188

Figure 2. Typical Smooth Test Sample with Welded Thermocouple Wires.
Two two-color pyrometers made by Process Sensors Corporation were used for temperature measurements. Both pyrometers view the light emitted from the test samples in the 0.9 and 1.6 µm wavelengths. The ratio of the values of those wavelengths determined the temperature of the viewed object. Using a two-color pyrometer, the temperature of gray bodies with the same emissivity at both wavelengths is measured without knowledge of the emissivity value. This feature automatically adjusts for dust, smoke, or a dirty viewing window between the pyrometer and the test sample. During Tests 7481 through 7483, a Metis Model MQ11 two-color pyrometer with a laser aiming light was added. In Tests 7481 through 7485, the laser was aimed at a spot size ~1.27 mm. The spot was focused on the test sample at a distance of ~25 cm as shown in Figure 3a. From Test 7484 onward, the thermocouple was omitted and only pyrometer and video camera trigger trace were recorded and keyed to the video recording.
From Test 7493 onward, the pyrometer was changed to the second Metis MQ11 two-color pyrometer with a through-lens sighting feature. In Tests 7486 through 7508 the spot size was about 1.65 mm and was focused on the test sample at a distance of ~25 cm as shown in Figure 3b.
The pyrometer and the high-speed camera were arranged outside the test chamber and aimed to view the test sample through the sapphire window. The high-speed camera was positioned to view directly through the window and the pyrometer was arranged at a 90-degree angle from the camera to view the test sample via a first surface mirror. The arrangement of the camera, pyrometer, mirror, and test chamber is shown in Figure 4.
Figure 3. Temperature Sensing Spot Size and Location of First Pyrometer (a) and Second Pyrometer (b).
Figure 4 . Arrangement of Camera, Pyrometer, Mirror and Test Chamber.
Temperature measurements were made using two techniques: thermocouples and two-color pyrometers. A Type S (platinum/platinum-rhodium) bare wire thermocouple was used in Tests 7453 through 7483 with 0.05 mm and 0.076 mm diameter leads of the thermocouple welded to the test sample (Figure 2). The effective area of measurement of this configuration is the test sample material between the thermocouple wire weld points. The response time is infinitely fast because the test sample itself is included as the junction between the individual thermocouple leads. Configured in this manner, the thermocouple reading will reflect the average temperature of the test sample between the attachment points of the lead wires. For Tests 7453 through 7480, the thermocouple reading and the video camera trigger trace were recorded digitally at 2000 hertz. The video camera image was recorded at 2000 hertz and keyed to the digital thermocouple readings via the video camera trigger trace.
The test gas pressure in the chamber was measured using a Teledyne Tabor, Model 710A pressure indicator with a range of 0 to 15,000 psi. This Bourdon-tube type device measured pressure with an accuracy of ± 0.025 percent full scale. A time stamp was recorded with each measurement.
189

The ignition temperature was established by comparing the video images with the thermocouple and pyrometer readings. The ignition event was determined by the appearance of a luminosity increase on the surface of the test sample that was significantly greater than the background luminosity that occurred due to the sample being heated by the induction power. The time at which the brightness arrived at the location of the thermocouple or the pyrometer sensing spot was correlated with the temperature data to determine the ignition temperature.
In all cases, the test samples ignited and burned completely from the bottom end of the sample, which was located inside the induction coil, to the copper sample holder. In tests conducted in 66 percent O2/balance N2, the burning of the test sample was quenched at the copper sample holder. In the nine tests conducted in 99.5+ percent O2, the samples did not quench at the sample holder, but burned to completion.
No effect on the ignition temperature as a function of surface treatment, rod configuration, or oxygen concentration was observed. The ignition temperature for Test 7471 in 99.5+ percent O2 was 1647 °C compared to ignition temperatures for tests conducted in 66 percent O2, which ranged from 1623 to 1659 °C. This may indicate that the ignition process is not wholly controlled by events occurring on the surface of the sample, but that some subsurface event, such as melting of the sample, may be controlling the ignition process.
In this work, two techniques of measuring ignition temperature were employed: 1) Type S thermocouple wire welded to the sample, and 2) a quick-response, two-color pyrometer. These measurement techniques produced similar results. The results of this work confirm that bulk titanium ignites slightly below its melting temperature. These results also enabled the thruster failure analysis team to verify the root cause and progress of the fire event. These measurement techniques can be used in future work, with confidence, to study the effect of various parameters on the ignition of titanium and other metals and alloys in oxygen-enriched environments.
190

Space and Ground Operations
191

Space Station Visiting Spacecraft Communication System Multipath Environment During RendezvousCindy Jih, Johnson Space CenterMark Chavez, Johnson Space CenterShian Hwu, Barrios Technology
Kanishka deSilva, Jacobs TechnologyMatthew Upanavage, ERC Inc.
In 2012 the Avionic Systems Division within the Engineering Directorate at the Johnson Space Center (JSC) initiated and performed a study to analyze and verify the communication system performance for International Space Station (ISS) visiting vehicles during rendezvous in a multipath environment. The study was referred to as the ISS Common Communications for Visiting Vehicles (C2V2) study.
The ISS is a very large and complex space vehicle. The communications and tracking (C&T) system antennas are surrounded by many large metallic structures such as various solar panels, thermal radiators, modules and many attached payloads. The solar panels and thermal radiators are rotated dynamically to maintain preferential orientation with respect to the sun. The C&T antennas have to transmit and receive Radio Frequency (RF) signals in wide field of view regions and may encounter multipath interference. There are concerns about the multipath effects (signal interference due to reflections and diffractions) of the surrounding structure on the C&T system performance.
The ISS RF environment for the RF systems includes multipath propagation, shadowing effects and RF interference. The multipath consists of different replicas of the original signal caused by reflections, diffractions or diffusions generated when the signal encounters surrounding ISS structures such as solar panels, thermal radiators and modules, as shown in Figure 1.
These replicas are attenuated versions of the original signal; they have different phases, and different arrival times. At the receiver they combine and produce a distorted version of the transmitted signal, as shown in Figure 2.
Figure 1. The multipath consists of different replicas of the original signal when the RF signal encounters surrounding ISS structures.
Figure 2. The multipath signals could cause signal delay and distortion.
The shadowing effect mainly attenuates the direct signal. This attenuation could be very severe when the signal must wrap around and pass through metallic objects.
In this study, the multipath channel characteristics are computed for a visiting spacecraft communication system in the ISS environment. The visiting spacecraft can be a commercial crew or cargo spacecraft. The rigorous computational electromagnetic modeling technique is applied to compute the multipath signal strength and time delay, which are required to determine the multipath effects at various locations along the visiting vehicle rendezvous trajectory. Careful planning and quantitative assessment for a visiting vehicle communication system operation in the space station multipath environments are necessary for successful system operations and mission safety. Computational investigations are performed using the electromagnetic modeling technique-the Uniform Geometrical Theory of Diffraction (UTD). The channel response is modeled as the vector sum of all the signal components arriving at the visiting spacecraft receiving antenna.
192

Different space station structural elements cause multipath at different range distances along the trajectory. Each structure element, depending on its position and orientation, contributes to multipath only at certain range segment along the rendezvous trajectory. When the solar panel is rotated at different angle, the multipath affective area may change to a different region. Thus, the space station multipath environment for a visiting vehicle is a dynamic problem.
When the visiting vehicle is at a close range from the space station, the multipath signal ray tracing plot is shown in Figure 3.
Figure 3. The total received signal is the sum of the direct signal, the reflected signals and the diffracted signals.
The reflections off a flat panel are typically stronger than off a curved surface such as the ISS Destiny module (U.S. lab) due to the energy spreading off a curved surface. Thus, a structure element with a large flat surface, such as solar panels, thermal radiators and truss segment faces, is more of a concern than cylindrical structures, such as the modules. Figure 4 shows the power spectrum vs. time delay plot at a location along the visiting vehicle rendezvous trajectory.
Figure 4. The multipath signal components relative power vs. time delay plot at a location along the simulated visiting vehicle rendezvous trajectory.
At this location, there are some strong multipath signals at about -95 dBm. The multipath signals are at comparable power level as the direct signal. The multipath effects could be significant when the visiting vehicle is at this location.Ray tracing and geometrical theory of diffraction have been applied to model the multipath in the space station environment for a visiting space vehicle. The multipath was analyzed for the visiting vehicle travel along the rendezvous trajectory. Results reveal that multipath could be significant while the visiting vehicle is within the reflection zone of large space station objects such as solar panels and flat surfaces on the truss segment. This fact is due to the strong specular reflections off a large flat surface. The results from this study point out the influence of the space station solar panel and thermal radiator positions and orientations during rendezvous and docking, and are useful for the visiting vehicle mission planning. The multipath risk for the visiting vehicle could be minimized at specific positions along the rendezvous trajectory. To minimize the multipath from the reflections off the solar panels, it is possible to eliminate the strong reflections by temporally parking the solar panels at positions so that the panels do not cause specular reflections to the visiting vehicle at specific locations during rendezvous.
AppendixThe mathematical model of the multipath can be presented using the method of the impulse response. At the receiver, due to the presence of the multiple signals ray paths, multiple signal components will be received, and each one of them will arrive at different times. In fact, since the RF signals travel at the speed of light, and since every path has a geometrical length possibly different from that of the other ones, there are different air travelling times (in free space, the light takes 3 ns to travel 1 m distance). Thus, the received signal will be expressed by
where N is the number of RF signal paths (rays), an represent the complex amplitude (i.e., magnitude and phase) of the nth multipath component, and tn is the time delay of the nth multipath component.
193

Radio Frequency Exposure Analysis for Multiple Wi-Fi Devices in an Enclosed EnvironmentJames R. Keiser, Johnson Space CenterCatherine Sham, Johnson Space CenterShian Hwu, Barrios Technology
Bryan A. Rhodes, Jacobs TechnologyAlan H. Chu, Jacobs TechnologyKanishka deSilva, Jacobs Technology
IntroductionSpace is an extremely stressful and hostile environment for the human body, which makes long-duration spaceflight especially challenging. With an environment characterized by extreme variations in temperature, the absence of atmospheric pressure, solar and galactic cosmic radiation, and zero-gravity, astronauts must confront a host of unique physiological issues to allow for sustainable human exploration. In 2012 the Avionic Systems Division within the Engineering Directorate at the Johnson Space Center (JSC) initiated and conducted a study to explore the methods to reduce the Radio-Frequency (RF) exposures to astronauts in a spacecraft environment. This study was conducted at the request of the Radiation Health Office within the Human Health and Performance Directorate. The study results were provided to NASA flight surgeons for astronaut health and wellness considerations for long-duration human spaceflight missions.
The use of Wi-Fi devices such as notebook computers, tablets, Personal Digital Assistants (PDAs) and smartphones has seen rapid growth in recent years. At the same time, concern of the RF radiation effects on human health due to the Wi-Fi devices by the consumer has also increased. RF safety is an important issue for Wi-Fi device manufacturers, consumers and government regulators.
The RF exposure standards on the permissible radiation levels of consumer Wi-Fi devices are regulated by the Institute of Electrical and Electronics Engineers C95.1 standard for Safety Levels with Respect to Human Exposure to Radio Frequency Electromagnetic Fields. The Wi-Fi devices must be designed as such that the radiated field strength from the Wi-Fi transmitter is within the permissible exposure limits. These permissible exposure limit standards are based on the thermal effects of the RF energy in the human body.
Wi-Fi devices operated inside a metallic enclosure have been investigation in the recent years. A motivation for this study is to analyze wave propagation inside an enclosed environment such as elevator, car, aircraft or spacecraft. The health risk could be higher for the RF transmitters such as Wi-Fi devices used in a confined environment. This concern is based on the fact that the RF energy will not have any escape route, and all the energy emitted by the RF emitters will be absorbed by the occupants. Figure 1 depicts occupants on board the International Space Station working with in a confined environment. In an enclosed environment, the transmit power of some advanced smart
Wi-Fi devices could automatically increase to compensate for a weak received signal.
Because of the wave reflections, electric field in enclosed environment could be very complicated with constructive and destructive interferences. The constructive interference could intensify with multiple reflections. There has been concern that a metallic enclosure could potentially act like an imperfect resonant cavity, leading to RF hot spots, where the electromagnetic fields are enhanced. This could increase the severity of the RF exposure for the Wi-Fi device users in such an environment.The distribution of the electric field from the multiple Wi-Fi transmitters is calculated using rigorous computational electromagnetics. The method of moments (MoM) was used to model the mutual coupling among antennas. The geometrical theory of diffraction was applied for the multiple reflections off the floor and walls. The RF Keep Out Zone, where the calculated electric field strength exceeds the permissible RF exposure limit, could be determined to assess the RF human exposure compliance.
Figure 1. The International Space Station consists of many enclosed metallic modules.
Simulation ResultsThe enclosed indoor environment is modeled as a metallic box sized 2 meters (m) by 2 m by 2 m. A deterministic ray tracing algorithm, the geometrical theory of diffraction is used for the field interactions, including multiple reflections from the floor and walls. The multiple Wi-Fi devices were modeled as half-wavelength dipole antennas placed at various separation distances from each other. The transmit power is assumed to be 0.25 watts (W), or 24 dBm (dBm is an abbreviation for the power ratio in decibels (db) of
194

the measured power referenced to one milliwatt), which is typical for consumer Wi-Fi devices. The industrial, scientific and medical (ISM) radio frequency band at 2.4 gigahertz (GHz) is assumed. The antennas were modeled using the rigorous MoM. The antenna mutual coupling effects were taken into account.
A. Confined SpaceFigure 2 shows the field intensity for a Wi-Fi antenna a) placed in an opened space (on the left) and b) placed in a confined metallic (perfectly reflective) room sized of 2 m by 2 m by 2 m (on the right). Figure 3 shows the field intensity for two Wi-Fi antennas a) placed in an opened space (on the left) and b) placed in a confined room sized of 2 m by 2 m by 2 m (on the right). The spacing between the Wi-Fi antennas is two wavelengths.
The differences in the electric fields between in the confined space and in free space were computed. It can be observed that the field strengths could increase significantly for Wi-Fi device operated in a confined room than in an opened space. The total signal increases due to constructive interference, where the direct signal and the reflected signals are in phase. A smaller room could have a more pronounced effect than a larger room.
Figure 2. Electric field distributions for one Wi-Fi device in free space (left) and in a confined space (right).
B. Spacing Between Wi-Fi Devices The field intensity for two Wi-Fi antennas placed 1 wavelength and 1.5 wavelenth apart in a closed room sized 2 m by 2 m by 2 m were computed and compared. The field intensity for three Wi-Fi antennas placed 1 wavelenth and 1.5 wavelenth apart were computed and compared. It can be observed that the field distributions are very different with different spacing among the Wi-Fi devices. The mutual coupling effects are determined by the antenna spacing. The RF energy radiation patterns (i.e., stronger in some directions) can be changed by varying the antenna spacing. Thus, the Wi-Fi device spacing has a large influence on the field distributions.
C. Number of Wi-Fi DevicesThe electric field distributions for one and two Wi-Fi devices placed near the upper-right corner of a closed room were computed and compared. It can be observed that the field strength increases significantly by adding multiple Wi-Fi devices. The differences in electric field with two and four Wi-Fi devices were analyzed. At some locations, the fields are reduced because of destructive interferences among the different electric field components with significant phase difference.
D. Locations of Wi-Fi Devices The Wi-Fi device locations can have a large influence on the field distributions. As shown in Figure 4, four Wi-Fi devices are placed near the center. The field distributions are obviously very different from that placed at the corners of the room.
Figure 3. Electric field distributions for two Wi-Fi devices in free space (left) and in a confined environment (right).
Figure 4. Electric field distributions for four Wi-Fi devices placed in free space (left) and placed in a confined environment (right) near the center.
195

ConclusionA numerical study on RF radiation of multiple Wi-Fi devices inside a confined space is presented in this paper. The effects of number of Wi-Fi devices and their positions inside the room on the electric field intensities and distributions were investigated. Results have shown that the electric field could be significantly affected by the location of placement and the number of the Wi-Fi devices. The electric fields are enhanced due to mutual coupling among the Wi-Fi devices and the multiple reflections from the ground and walls. No cavity or resonance effects were observed for the 2.4 GHz Industrial, Scientific, Medical (ISM) band devices in the room modeled and the number of devices and locations investigated. The resonance effects likely require smaller enclosed spaces with lower frequencies. As shown in this study, it’s possible to maximize or minimize field intensity in a specific area by arranging the Wi-Fi devices in a planned placement and spacing since the radiation is maximal in the plane perpendicular to the dipole antenna and minimum in the direction along the antenna axis. The antenna coupling effects could be reduced if the antennas are note placed in the same plane. The results of this study were provided to the flight surgeons for astronaut health and wellness considerations for long-duration human spaceflight missions.
196

Refined Leak Test Methods for Payloads Pressure Integrity VerificationOleg M. Lvovsky, ARES Technical Services
Payloads pressurized with working fluid (gas or liquid) and sealed payloads can leak on orbit. Although a leak is an undesired escape or passage of contents through a material or orifice, a certain amount of leakage can be tolerated commensurate with the effect of the leak. When dealing with toxic or hazardous materials, however, requirements for fluid and gas leakage rates have to be properly established and, most importantly, reliably verified. This verification can be achieved through application of various leak test methods, in which different tracing agents and characteristics determine one method to be more appropriate than another method. It is imperative for payloads onboard manned spacecraft, designed by a government agency or commercially, to employ suitable means of leakage rate verification.
Led by the Vehicle Office within the International Space Station (ISS) Program Office and the ISS Vehicle Integration & Assurance Branch within the Safety & Mission Assurance (S&MA) Directorate at the Johnson Space Center, test engineers from ARES Technical Services, in cooperation with Boeing in Huntsville, Ala., refined 15 leak test methods and prepared the Guidelines for Payload Leak Testing that were included in the Pressurized Payloads Interface Requirements Document, Space Station Program (SSP) 57000. This work was initiated on Dec. 24, 2012, and completed on May 9, 2013.
Generally, payload developers should plan to perform multiple leak tests during the course of the payload building process. The test method to be employed shall have sensitivity and be accuracy consistent with the specified Maximum Allowable Leakage Rate (MALR) for every unique payload. Recommended MALRs are shown in Table 1, and leak test methods that can be used to verify it are shown in Table 2.
Table 1. Recommended Maximum Allowable Leakage Rates *scc/sec stands for one cubic centimeter of gas per second at a pressure differential of one standard atmosphere (760 torr at 0 degrees centigrade)
Table 2. Leak test methods to be employed to verify payload pressure integrity and pinpoint local leaks.
The following leak test methods will be recommended for payloads pressurized with working fluid (gas or liquid): Methods I, II, Va, VII, VIII, IX, X, XI, XII, XIII, or XIV, as appropriate.
The following leak test methods will be recommended for sealed payloads: Methods III, IV, Vb , VI, or XV, as appropriate.
If the payload has redundant seals, each seal pressure integrity should be verified independently. One of the possible ways to do verification is to use the very first portion of the test (e.g., the first 30 to 120 seconds depending on seal design, material and size) to check whether the mass spectrometer leak detector response is greater than 10-7 scc/sec of Helium (proposed by S. Underwood/Boeing). In all cases, leak testing must be conducted after the payload proof pressure test if they are not performed together.
When temperature potentially affects the sealing materials or surfaces, an evaluation of hardware design and operational characteristics should be performed. If technically warranted, the leak test should be conducted at the minimum and maximum qualification temperature limits.
197

A leak test at temperature limits is warranted on a payload of a given level of assembly due solely to one or more lower-tier payloads comprising the assembly. If it can be shown that all of those lower-tier payloads receive an appropriate leak test at temperature limits as part of a lower-level qualification test, then the higher level of assembly does not require leak testing at temperature limits.
Helium mass spectrometer or other leak detectors may be used for detecting leakage rates starting from 10-9 scc/sec and higher. Leak detection and measurement procedures may require vacuum chambers, bagging of the entire payload or other special techniques to achieve the required accuracy.Many previously known methods were refined and developmentally tested prior to including them into NASA documentation. The major improvement for all the tracer gas methods (I, VI, VIII, XII) was an introduction of procedural steps for stabilization of the leak detector output. These steps, once implemented, should guarantee that the assessment of the existing leaks would be done in a very conservative manner with no escapes. Improvements also include the requirement that the leak test method employed should be demonstrated to have a sensitivity to detect leakage rate of at least half of the specified pass/fail leakage rate allowable [e.g., if the MALR is less than 10-4 scc/sec, the method (“end-to-end” test setup) used should be demonstrated by use of a standard leak source to be capable of detecting at least 5.0x10⁻⁵ scc/sec].Description of some improved and thus strongly recommended leak test methods is grouped by two for both pressurized and sealed payloads, the first of which shown is for total leakage rate verification, and the second is for pinpointing local leaks (Table 3).
Table 3. Recommended leak test methods. Note: Improvements are highlighted. Table 3. Recommended leak test methods (continued).
198

ConclusionThe payload organizations will be able to use these guidelines to assure that each level of containment of the pressurized payload will not leak. This improved leak testing methodology will reduce the safety hazard of the payloads with hazardous gases and fluids to allow safe completion of scientific research aboard the ISS. Refined leak test methods were incorporated as guidelines into SSP 57000 “Pressurized Payloads Interface Requirements Document.” That should provide guidance and visibility to the entire ISS Program and International Partner community, including European Space Agency safety experts who had previously noted concerns with the lack of concise guidelines within existing and maintained ISS standards and specifications. JSC will continue to pursue and develop leak test methodology improvements.
References1. SSP 57000, “Pressurized Payloads Interface
Requirements Document, Space Station Program.”2. PIRN 57000-NA-0373B, Add Appendix G “Guidelines
for Payload Leak Testing During Qualification and Acceptance Environmental Testing.”
199

Augmenting Spacecraft Viewing With Virtual WindowsMax Haddock, Johnson Space Center Helen Neighbors, Johnson Space Center
SummaryThe Avionic Systems Division within the Engineering Directorate at the Johnson Space Center (JSC) is leading a research and development project referred to as “Virtual Windows”. The Virtual Windows project was initiated in 2011 in response to a request from the Engineering Directorate’s Structural Engineering Division, and consists of a multi-faceted effort to employ video camera, processing, and display technologies to augment crewmember viewing from the available windows in future spacecraft designs, when and where appropriate. Spacecraft window assemblies are critical for some mission objectives and support psychological health, but they are of relatively high mass, create structural stress points and cabin air leak path concerns, and when used beyond low earth orbit they heighten the concern for radiation impacts on crew health and internal spacecraft systems. These limitations, concerns and challenges associated with actual windows incorporated in the design of a human-rated spacecraft may be addressed by the implementation of technologies that augment viewing. The key to success for any viewing augmentation system is to provide the crew with a viewing experience that approaches the use of an actual window or exceeds what an actual window can provide.
To this end, two concepts have been developed and evaluated to date: 1) field of view control using a viewer’s relative position, and 2) developing a software application which allows a tablet computer user to automatically select and control relevant video cameras through the use of onboard sensors -effectively offering a portable window. Evaluation feedback has shown these concepts have potential for future application and the critical engineering and user feedback has been incorporated into a development roadmap to help guide subsequent efforts.
Other aspects of the development roadmap which are in work or planned for the near future include: live video scene stitching across multiple cameras to enable large scene panoramic viewing and/or perspective changes to see around occlusions, coupling user relative motion and scene stitching concepts with 3 dimensional (3D) technology to produce the experience in 3D and investigation of the latest wide field of view lenses and de-warping software coupled with user position sensing and/or tablet orientation sensing. The Virtual Windows project will also investigate incorporation of non-standard sensors that can support live imaging needs (laser, thermal, etc.) as well as anticipated surface conforming or flexible displays.
Because the virtual window is an electronic display device, it can be multi-purposed to provide additional functions such as vehicle health status, caution & warning alarms, environmental panel illumination, reflective mirror, and/or personal entertainment. Additionally, as embedded sensor technologies continue to be integrated in display devices, the virtual window can also serve as a control device using touch screen and/or gesture controlled interfaces. These factors, when combined with the fact that typical window assemblies are of relatively high mass, point to the ability to achieve the critical size, weight and power (SWAP) savings necessary for exploration spacecraft design.
Field of View (FOV) Control using Viewer Relative PositionTo emulate the experience of looking through a window, the user must be able to achieve changes in the view relative to their head/eye position. There are several internet examples that demonstrate how viewers can use their body positions to change their perspectives in a scene provided by computer generated graphics or a video file. JSC identified the Rational Craft/Winscape system as one which most closely reflected our goal for near term evaluation. Early in this project, JSC was able to collaborate with the developers to modify their commercial product, Winscape, to accept live video (versus recorded video). The Winscape product utilizes a Kinect sensor to determine a viewer’s relative position, which is then used by the application software to determine the portion of the available FOV to be displayed. The Kinect sensor is a motion tracking device for the Xbox 360 video game console and computers using the Windows operating system.
An engineering evaluation was conducted using the modified Winscape system (see Figure 1). Evaluators felt that a system using relative position to interact with their view held a lot of possibilities for future spacecraft habitats. The Virtual Windows project was encouraged to refine this capability with emphasis on the following areas.
To enable the user to pan about a large FOV without a loss in image resolution, one needs to have a very large resolution image frame to work from. This has driven efforts to achieve a low latency solution for stitching live video together from multiple cameras, which can be positioned at aligned locations. This is a complex task but once accomplished could provide the framework for stitching images from a spacecraft’s exterior cameras together to achieve large contiguous views and make them available in a seamless interface.
200

Evaluators also felt the ability to visually estimate perspective distances to objects and between objects was an important goal to achieve if a virtual window was to be used for operational tasks. Practically speaking, this will require integration of a method for changing the user’s point of view (not field of view) and a multi-camera solution is required to achieve this as well. This task will naturally and necessarily follow the aforementioned live video scene stitching development.
Portable Virtual PortholeWith the ever-increasing performance of wireless communications and prevalence of wireless computing devices, it is expected that the next generation spacecraft will rely on wireless solutions for a significant number of operational needs. This, coupled with video encoding efficiencies, make wireless video solutions a real possibility for next generation spacecraft. When considering the image resolutions available on current tablet computers and the embedded sensor packages which can determine orientation (among other things), it became practical to consider that the future crew should have the ability to carry their window with them. As such, JSC has developed an application referred to as the Portable Virtual Porthole (PVP) for test and evaluation.
The idea behind the PVP is that the crew should be able to quickly (i.e., by the touch of an icon) launch an application that automatically provides a view from a camera of interest with little or no application interaction required. The user can pan the tablet around and the application will automatically provide the camera view that is consistent with the orientation of the tablet (see Figure 2). The determination of the camera view displayed is based on the embedded gyroscope sensor/functionality of the device. The option does exist to select camera views via an additional icon touch as well.
Figure 2. Figure 2: PVP application view of live camera feed. User has option to select cameras by natural tablet orientation or icon touch.
During demonstration and evaluations, this system clearly illustrated that future spacecraft crews will no longer be required to translate to a specific workstation in order to see exterior video. It also illustrates that there are prospects for using orientation of the tablet to intuitively and automatically select camera views. This capability was evaluated in simulated habitat and rover environments, and clearly is best suited for a habitat environment where the crew is mobile within the spacecraft and will be moving from one worksite to the next with the occasional need/desire to get external views. Other applications could include use of the system to display internal (to the spacecraft) camera views, e.g. to preclude the need to translate from one segment of a spacecraft to another in order to check on an experiment, or to view an image generated from a camera in a relatively inaccessible area such as behind an equipment rack.
Evaluation feedback was positive for this system with most emphasis placed on including in future implementations pan, tilt and zoom capabilities for the cameras involved so that you can not only select the camera to view but you also are able to control its view through tablet position and/or touch controls. There was also an interest in having the camera views sweep in and out of the tablet view in a contiguous fashion as the user pans. The utility of this feature is dependent on enough cameras being available such that there are not big gaps in the scene or by leveraging the aforementioned scene stitching. Both of these areas of feedback are under investigation.
Figure 1: User evaluating virtual window interaction and comparing experience to a real spacecraft window assembly. Note the FOV changes on the virtual window between the top and bottom images.
201

Forward WorkThe JSC Engineering Human Interface Branch will continue the Virtual Windows technology development effort for the foreseeable future. The effort has already involved collaboration with the private sector, academia and educational outreach as well as peer organizations and projects at JSC. There are several other technical challenges beyond those mentioned here but progress is being made for this technology roadmap. In addition to solving the key technical problems, the project looks forward to showing how this capability can be fully integrated with candidate spacecraft architectures to demonstrate SWAP savings and support crew functions.
202

Technical Standards for Liquid Propellant CharacterizationBenjamin Greene, White Sands Test FacilityRegor L. Saulsberry, White Sands Test Facility
Mark B. McClure, White Sands Test Facility
Technical standards are widely used in characterizing liquid propellants. Expertise in characterizing liquid propellants is one of White Sands Test Facility’s (WSTF’s) core capabilities, and the use of technical standards in liquid propellant characterization is vital and enabling; however, no formal protocol exists to fully characterize the complete suite of properties of liquid propellants. Therefore, innovation is required in the selection and application of appropriate technical standards for liquid propellant characterization. To connect gaps in standards for liquid propellant characterization with available methods that may not be standardized or that people may not be aware of, in Fiscal Year 2012, WSTF researched and analyzed existing methods and presented a report detailing the research to the Joint Army-Navy-NASA-Air Force (JANNAF). The presentation garnered interest among JANNAF Liquid Propellant Panel members who have initiated efforts to revive relevant but discontinued standards and to propose a contiguous set of consensus standards that are necessary to provide liquid propellant characterization data for future testing.
WSTF’s Materials and Components Laboratories perform liquid propellant characterization and leads the effort relative to Johnson Space Center primarily in the areas of liquid propellant and material compatibility test method development, implementation and standardization. Overall programmatic requirements previously driven by the space shuttle are currently driven by the International Space Station and commercial spaceflight companies. As new propellants are developed, the need for standardization of test methods is becoming more and more important. WSTF’s work was intended to provide an awareness of the importance of standardization, and standards that are needed to provide complete information necessary for full characterization as they apply to program requirements.
Military and NASA specifications and their referenced standards, American Society for Testing and Materials International, the Chemical Propulsion Information Analysis Center, the International Organization for Standardization, the Society of Automotive Engineers International, North Atlantic Treaty Organization Standardization Agreements, the Compressed Gas Association and others are some of the many sources of technical standards used for liquid propellant characterization.
The NASA Technical Standards Program, sponsored by the Office of the NASA Chief Engineer, enhances NASA’s technical capabilities by providing technical standards required to meet NASA’s needs.
This program supports the development of non-government standards, develops NASA standards when needed and, in addition, provides a single-point access for NASA and its contractors to technical standards, as well as to tools and best practices needed to achieve technical excellence and to further mission success.
Technical standards pertaining to liquid propellant specification analyses; chemical, physical and thermodynamic properties; NASA materials and processes requirements and testing; test methods for fluid and material compatibility and permeation resistance of materials exposed to liquid propellants (Figure 1); hazard potential of liquid propellants; sensitivity, stability and explosive testing (Figure 2); material specifications and test methods; and environmental, occupational health and safety aspects of liquid propellants are also important to liquid propellant characterization.
Figure 1. A propellant permeation test assembly.203

The following must at least be considered to characterize a liquid propellant:
• Specification limits and analyses• Material and fluid compatibility • Physical, chemical, thermodynamic and kinetic
properties• Fluid stability and storability, including thermal
stability and catalytic decomposition (accelerated rate calorimetry), minimum ignition energy, microcalorimetry and adiabatic compression sensitivity
• Aging and decomposition kinetics• Corrosivity and corrosivity characteristics and their
change with time• Additives and their effects• Life expectancy and additive evaluation• Design and performance of catalyst and non-catalyst
ignition systems• Effect of fluid on catalytic ignition systems, catalyst
poisoning and means to prevent catalyst poisoning• Propellant waste decomposition• Methods of detection and vapor characterization• Environmental, occupational health and safety
Many of the technical standards used for liquid propellant characterization are found via NASA’s Standards and Technical Assistance Resource Tool, which is found at: https://standards.nasa.gov/
Registration (at no cost to NASA and most NASA support contractors) allows access to IHS (formerly Information Handling Services) Standards Expert, a document service that provides intelligent search functions and access to the products of 46 standards development organizations. Numerous standards relevant to liquid propellant characterization are available at no cost to the user.
Figure 3. Large-scale test of the reactivity of propellants using rapid mixing.
204

Discovery and Identification of Dimethylsilanediol as a Contaminant in International Space Station Potable WaterJ. Torin McCoy, Johnson Space CenterJeffrey A. Rutz, Wyle Science, Technology & Engineering
John R. Schultz, Wyle Science, Technology & Engineering C. Mike Kuo, Wyle Science, Technology & Engineering
Discovery of an Unknown CompoundWhile analyzing the archive water samples for ethylene glycol and propylene glycol, a persistent interference was observed. The analysis was being performed using gas chromatography/mass spectrometry (GC/MS), using selected ion monitoring (SIM). Figure 1 shows a comparison of the chromatogram from a water sample containing the unknown and a standard containing 4 ppm ethylene glycol (EG). The black (middle) trace is a plot of the detector response for an ionic mass of 31 daltons (Da). The chromatogram of the water sample shows a peak with an ionic mass equal to 31 at a retention time of 4.50 minutes. This peak is very close to the expected retention time of EG, 4.601 minutes, and could have easily been mistaken for EG. Fortunately, the compound that produced the peak also contained an ion at mass 45, which is not a characteristic ion for EG. The upper (red) trace in both chromatograms is the detector response at ionic mass 45. Comparing the traces, it is obvious that the peak in the water sample contains a substantial fraction of ionic mass 45, whereas EG contains virtually none. Based on these findings, additional work was initiated to identify the unknown contaminant.
The US Water Processor Assembly (WPA) processes a mixture of atmospheric moisture and urine distillate into clean, potable water that is used by crews on the International Space Station (ISS). Between April and September of 2010, the Total Organic Carbon (TOC) concentration in the product water from the WPA exhibited a sharp increase. TOC concentrations measured with the onboard Total Organic Carbon Analyzer (TOCA) steadily rose from undetectable levels to about 2 mg/L. The maximum allowable TOC concentration in the WPA product water is 3.0 mg/L. This increasing TOC trend indicated that organic compounds were breaking through the WPA. The two most likely causes of the breakthrough were either a large increase in the concentration of an existing environmental contaminant or the introduction of a new contaminant in the ISS atmosphere. Currently, there is no capability to monitor specific organic compounds in water samples on the ISS. In an effort to identify the source of the detected TOC, several archive water samples were returned on Soyuz 22 for ground-based analysis in the Human Health and Performance Directorate’s Water and Food Analytical Laboratory at NASA’s Johnson Space Center (JSC). The project was initiated upon receipt of the samples, September 30, 2010.
Figure 1. GC/MS of ISS humidity condensate above, glycols standard below.
205

Characterization and IdentificationThe first step in the identification was to generate a mass spectrum of the unknown compound using GC/MS in scanning mode. Scanning mode is much less sensitive than SIM mode, but it provides a full mass spectrum which can be compared to spectra in established databases, much like a fingerprint. Because scanning mode is much less sensitive than SIM mode, water samples containing the unknown contaminant were concentrated prior to analysis.
In the initial GC/MS analysis, the unknown compound eluted very close to EG, which boils at 197-degrees C. While multiple factors affect retention times in gas chromatography, it is possible to infer relative boiling points among analyses based on their elution order. It appeared likely that its boiling point was greater than 100-degrees C, and could therefore be concentrated without loss by evaporation. This was accomplished by heating a sample of ISS potable water at 55 C in a heating block while purging with a slow stream of ultrapure helium. This continued until the sample volume was reduced to one-thirteenth of the original volume.
The 13 times concentrate was then re-analyzed by GC/MS to check for degradation of the unknown contaminant. Using the same SIM conditions as the original analysis, a similar peak was observed with approximately 10-fold greater amplitude.
A GC/MS method using scanning mode was then set up with the same temperature profile used in the glycols analysis. The MS detector was scanned from 29 to 284 mass to charge ratio (m/z). This generated a mass spectrum that was searched against the mass spectral database in the instrument software, the Wiley Registry 7N Edition. Unfortunately, none of the mass spectra in the database yielded a suitable match.
Colleagues at Boeing Analytical Services Laboratory in Huntsville, Alabama, used a different database (NIST08) to search for the masses observed in scanning mode analysis. This search generated a very close match for dimethylsilanediol (DMSD). Figure 2 displays the mass spectrum of the unknown contaminant next to the mass spectrum of DMSD.
Figure 2. Mass spectrum of unknown (top graph) compared to best spectral match (bottom graph) in database
206

In an attempt to confirm the preliminary identification, water samples containing the unknown compound were analyzed for silicon content by inductively coupled plasma mass spectrometry. The obtained silicon concentrations confirmed the presence of a silicon containing compound and showed excellent correlation with estimated concentrations of the unknown.
The concentrated potable water sample was also analyzed by direct infusion into a quadruple time-of-flight mass spectrometer (QqTOF, a “QStar Elite” from AB Sciex) using both atmospheric pressure chemical ionization and electrospray sources. This was done to accurately determine the molecular weight of the unknown and check for the presence of fragments or product ions. Researchers from the University of the Pacific were also requested to conduct time-of-flight mass spectrometry (TOFMS) analysis of the potable water concentrate using direct analysis in real time. The results of these analyses confirmed the identification of the unknown as DMSD.
Development of a Quantitative Method for DMSDOnce the unknown was confirmed to be DMSD, it was necessary to develop a calibration curve to quantify the amount of DMSD in the samples. However, no commercial suppliers of DMSD could be located and no custom synthesis service would agree to synthesize a neat standard DMSD because this compound is unstable at high concentrations and a mixture of oligomeric forms would likely result. In order to verify the presence of DMSD and quantify the compound in water samples, a standard of DMSD was needed. Eventually, a DMSD standard was synthesized in-house using a published procedure for the synthesis of 14C – labeled DMSD. This procedure was based on the hydrolysis of dimethoxydimethylsilane to form DMSD and methanol. Using the procedure, a 100 mg/L non-isotopically labeled standard of DMSD was prepared. The resulting standard was analyzed for methanol to calculate the efficiency of the synthesis. The 100 mg/L standard was diluted to 10 mg/L and analyzed using the GC/MS SIM method for glycols where the unknown was initially observed. A similarly sharp peak with the same retention time as the unknown was obtained. The standard solution was then analyzed in scanning mode and the mass spectrum was an excellent match for DMSD in the NIST08 database.
Several attempts were then made to modify the glycols GC/MS method to optimize the detection of DMSD. Unfortunately, these efforts were plagued by severe carryover between injections. After analyzing several water samples containing DMSD, DMSD was detected in ultrapure water samples that were run subsequently. It is believed that the silicon-based materials used throughout the gas chromatograph adsorbed the compound within the instrument, causing carryover into subsequent samples and limiting the accuracy of the method.
To solve the difficulties encountered with the GC/MS method, two high performance liquid chromatography (HPLC) methods were developed for DMSD. One of these employs a refractive index detector (RI) and the other uses tandem mass spectrometry (or LC/MS/MS). Neither of these methods had issues with carryover that were observed with the GC/MS. DMSD is now routinely quantified in water samples from ISS using the RI method. DMSD continues to be detected in water samples returned from the ISS, at low insignificant levels, but the source of the compound has not definitively been determined to date.
The identification of DMSD as a contaminant in the product water from the U.S. ISS Water Processor Assembly has triggered numerous further studies evaluating the impact of this compound. The response factor of the TOCA hardware to the chemical (in terms of percent recovery) has been addressed, as well as the efficiency of the hardware to flush the compound from itself. The effect of DMSD on the ISS Oxygen Generation System has been addressed. Research was begun screening adsorbent resins capable of removing the compound using the ISS WPA multifiltration beds. The ability of the ISS WPA catalytic reactor to remove DMSD has been evaluated by Environmental Control and Life Support System engineers. Because the source of DMSD onboard ISS is not known, its concentration plot is being correlated with air quality siloxane levels, various dockings, equipment change-outs, and other events in an attempt to isolate the source.
207

Impact of Time Delay to Crew and Ground Workload and CoordinationKara Pohlkamp, Johnson Space CenterJeff Mauldin, Johnson Space CenterLui Wang, Johnson Space Center
Lee Morin, Johnson Space CenterJeremy Frank , Ames Research CenterRob McCann, Ames Research Center
IntroductionFuture human spaceflight missions beyond low earth orbit will have to operate more autonomously due to communication delays with Earth representing a fundamental change to current mission operations. To help define requirements for future operational protocols and support tools, NASA’s Autonomous Missions Operations (AMO) project conducted a series of 24 simulations of quiescent spacecraft operations under varying time delay and operational conditions in 2012. This was the first test of its kind to utilize a fully modeled ground team staffed by experienced flight controllers, allowing the complete interaction between the crew and ground teams to be analyzed at higher fidelity than previous analog experiments. This experiment was led at Johnson Space Center (JSC) by the Space Transportation Vehicle Division within the Missions Operations Directorate beginning in 2011.
This study was also conducted on shorter timescales (hours) than previous studies (days or weeks), allowing more systematic manipulation of simulation conditions. Two-hour simulations were conducted at one of three one-way time delays: 1.2 seconds (Lunar), 50 seconds (near-Earth object), or 300 seconds (5 minutes, en-route to Mars).
Except for two control runs, each test scenario also included a systems failure or a crew medical emergency.
Twelve “baseline” tests were conducted utilizing tools and protocols representative of current International Space Station (ISS) operations. The set was then repeated in a “mitigation” configuration utilizing a suite of advanced automation tools and protocols designed to mitigate the impact of time delay:
• Texting tools (commercial, off-the-shelf software) allowed the time-delayed exchange of information between crew and ground without voice communication.
• A NASA-developed Advanced Caution and Warning System (ACAWS) that automatically isolated faults and recommended troubleshooting procedures to the crew based upon vehicle configuration. In some cases, this allowed crews to begin troubleshooting before the flight control team in the Mission Control Center (MCC) even saw the failure due to time delay.
• A NASA developed electronic procedure interface (WebPD) that allowed flight controllers to track time-delayed procedure execution statuses (steps completed, active and completed procedures) without having to communicate with the crew.
During each simulation, a crew of four (comprising one previously-flown astronaut as commander and three flight controllers or trainers) was stationed in the Deep Space Habitat (DSH) facility, and an eight-member Flight Control Team (FCT) were stationed in a mock MCC.
Finding HighlightsTask CompletionThe team hypothesized the number of completed tasks in the timeline would decrease with increasing time delay. On average, only one fewer task was completed between the 50 and 300 second delay cases and there was no influence from other simulation configuration parameters. This is likely due to the crew’s ability to multi-task while waiting for MCC responses. However, this multi-tasking had an impact upon crew workload.
Crew WorkloadCrew and FCT members rated their workload after each two-hour run using the Bedford Workload Scale [1]. Ratings of less than or equal to three fall within the “green zone” (workload satisfactory without reduction), whereas ratings of four to six fall in the “yellow zone” (workload unsatisfactory without reduction). Figure 1 shows the average workload ratings of crewmembers as a function of time delay and operational configuration (error bars indicate standard deviation). As shown by the error bars, most ratings fell in a range between two and six, with three of the four averages straddling the border between “green” and “yellow”.
208

Figure 1. Crew workload and highest four flight controller’s workload, averaged across the five runs at 50 and 300 seconds.
The figure also shows the baseline average was just above the “satisfactory without reduction” (3.25) range at the 50 second delay and increased to the “unsatisfactory without reduction” range (4.1) at 300 seconds. In mitigation, by contrast, the average rating decreased between 50 and 300 seconds, almost reaching the desirable “green” zone. This is an unexpected and interesting pattern. A three-way analysis of variance (ANOVA) with crew, time delay and operational configuration (baseline versus mitigation) as factors revealed a statistically significant interaction between configuration and time delay. Individual comparisons revealed that the difference in workload between 50 and 300 seconds was significant in the baseline configuration but not the mitigation configuration.
Flight Control Team WorkloadOverall, workload ratings were considerably lower among the FCT than crewmembers, likely because in this scenario, the FCT were not the primary procedure executers. As with real operations, some console positions were busier than others due to system failures and task distribution. A rank ordering of the average Bedford workload ratings in the baseline configuration by FCT position revealed that the ratings for four consoles fell in the green zone. In an attempt to eliminate possible floor effects and increase the sensitivity of statistical testing, only the data for the four highest workload positions were subjected to statistical analyses (this group did include the Flight Director (FLIGHT) and the Capsule Communicator (CAPCOM)). The average workload ratings of these highest-workload positions are plotted in Figure 3.
Figure 3 reveals FCT workload, unlike crewmembers, was consistently higher in baseline than mitigation and higher under 300 seconds of time delay than 50 seconds for both configurations. An ANOVA with crew, time delay and configuration revealed marginally significant effects of both configuration and time delay, and no hint of an interaction. Thus, overall, the tool suite (especially texting and WebPD) reduced the FCT workload.
Team Coordination Participants were not provided any guidance concerning what features of the environment they should consider when determining workload ratings. Thus, it was interesting to note several crewmembers and FCT participants identified crew-ground coordination issues as contributing factors.
As part of the questionnaire immediately following each run, both crew and flight controllers were asked to rate the difficulty of coordinating with the other group with 1 being not at all difficult and 5 being quite difficult. Figure 2 shows the average and standard deviation of the crew’s ranking of the difficulty of coordination with the FCT along with the equivalent rankings for the highest workload FCT positions.
209

Figure 2. Crew and highest four flight controllers’ rating of coordination difficulty, averaged across the 5 runs at 50 and 300 seconds.
Coordination difficulty increased with time delay for both groups and coordination was easier in the mitigation configuration. An ANOVA on crew ratings including crew, configuration, and time delay shows the main effects of configuration and time delay were significant. For FCT members, the corresponding tests for configuration and time delay were also significant.
Crewmember and FCT comments indicated texting greatly reduced coordination difficulty (and possibly crew workload). However, FCT members commented texting increased workload because it created another information source to monitor. During the experiment the ISS as a Testbed for Analog Research (ISTAR) texting protocol was followed: ground never sent crew a text message unprompted without also sending a voice call. Thus, crew did not have to monitor the text window while ground did.
Overall, the amount of voice communication (number of calls and total talk time) was less in mitigation than in the baseline configuration while workload and communication difficulty also decreased in mitigation. This shows the tool suite was a more effective means of transferring information under time delay than voice communication alone. This experiment shows that even quiescent operations become more difficult with time delay, but these difficulties can be mitigated using advanced tools and operations protocols.
Future WorkAMO’s 2012 experiment showed advanced caution and warning software can help crews become more autonomous and the need for autonomy increase as communication delays extend. To further development of this technology and operational concept, the project is planning a crew-autonomy experiment onboard ISS in late 2013-2014. The onboard crew will assume responsibility for managing the Total Organic Carbon Analyzer (TOCA) which is used to evaluate the level of organic carbon in reclaimed water. The crew will be responsible for providing MCC with the list of TOCA activities required for each seven-day planning cycle, evaluating the data from each water quality analysis for TOCA performance and organic carbon trends, and providing recommendations for the recovery of faults. The experiment hypothesizes the crew can assume these responsibilities when aided by software without increasing pre-flight training.
210

Using Mathematical Optimization to Improve Extravehicular Activity PlanningPaul Felker, Johnson Space Center Javier Salmeron, Naval Postgraduate School
Performing an extravehicular activity (EVA) involves substantial preparatory costs in terms of severely limited resources and astronaut crew time. EVA operations also place the participants in extreme danger from a multitude of sources. As a result, EVA plans must be highly choreographed to achieve the maximum value from each operation. Since the advent of EVA capability in the mid-1960s, NASA has used teams of extensively-trained and experienced subject matter experts to carefully plan these activities. They undertake an elaborate and iterative process to transform raw requirements from the program customer (currently, the International Space Station) into highly efficient, executable EVA timelines.
Given the evolutionary development process and repeated reworking of the timeline required throughout the planning phase (Figure 1), tools that can assist the planning experts may result in significant savings and/or enhanced plan quality. The EVA planning model (EPM) was developed during 2012 as a linear, mixed-integer program intended as a proof-of-concept demonstration for employing formal mathematical optimization to EVA planning.
The goal of the EPM is to create the optimum EVA plan, which to the first order, is the one that maximizes the priority of scheduled tasks within the allowable time.
The EVA planning problem has three major sub-parts: selecting which of the available tasks will be placed into the timeline, assigning those tasks to one of the crew members and ordering the tasks. Clearly, these three sub-problems cannot be addressed individually in series because each one must be considered with respect to the other two. It must also be understood that priority alone does not dominate the decision making in EVA planning. It coexists with efficiency which can be conceptualized in pseudo units of priority per time unit per task.
Solving the problem of translating customer requirements (in the form of tasks and relevant task data) into the best possible EVA timeline can be informed by utilizing aspects of and concepts from several classical combinatorial optimization problems in the operations research literature. The EPM mixed-integer linear program is a hybrid of several of these problems, including the knapsack problem, traveling salesman problem and job shop problem. The EPM accepts input data from the user in the form of tasks and task attributes and outputs an overview timeline for a single EVA that can serve as a basis for evaluation by an expert planner. Creation of this timeline necessitates that the model selects tasks from the provided list and orders them in such a way as to maximize the priority value of the EVA.
Figure 1. Simplified EVA planning flowchart.
211

The goal of the EPM is to create the optimum EVA plan, which to the first order, is the one that maximizes the priority of scheduled tasks within the allowable time. The EVA planning problem has three major sub-parts: selecting which of the available tasks will be placed into the timeline, assigning those tasks to one of the crew members and ordering the tasks. Clearly, these three sub-problems cannot be addressed individually in series because each one must be considered with respect to the other two. It must also be understood that priority alone does not dominate the decision making in EVA planning. It coexists with efficiency which can be conceptualized in pseudo units of priority per time unit per task.
Solving the problem of translating customer requirements (in the form of tasks and relevant task data) into the best possible EVA timeline can be informed by utilizing aspects of and concepts from several classical combinatorial optimization problems in the operations research literature. The EPM mixed-integer linear program is a hybrid of several of these problems, including the knapsack problem, traveling salesman problem and job shop problem. The EPM accepts input data from the user in the form of tasks and task attributes and outputs an overview timeline for a single EVA that can serve as a basis for evaluation by an expert planner. Creation of this timeline necessitates that the model selects tasks from the provided list and orders them in such a way as to maximize the priority value of the EVA.
The nature of EVA planning presents a difficult challenge in terms of proving model functionality and quality. This was addressed partly by introducing a methodical and thorough testing regimen derived from the field of software engineering and adapted to the mathematical model. Initial proof-of-concept culminated with the use of EPM to build EVA plans using actual planning data provided by subject matter experts. Expert opinion surveys were conducted to obtain an evaluation of the concept and output of the EPM, its usefulness, strengths and weaknesses. EVA timelines created by the model showed that it is capable of omitting lower priority or “expensive” tasks when EVA time is limited and that it is highly efficient at task ordering and the elimination or consolidation of crew idle time. It also demonstrated usefulness in allowing expert planners to “game plan” for the impact of late-breaking constraints such as those caused by orbital day-night phasing or changes in customer needs.
Assessment of EPM output and the subject matter expert survey results suggest that EPM establishes the basis for a formal mathematical optimization that can be used to aid subject matter experts in EVA development and planning. EPM creates credible EVA timelines that match or exceed the effectiveness of human built solutions, and allows for tradeoff evaluation and “what if” scenario analysis that can be valuable to the planning community in a variety of ways.
The EPM, as developed in this research, has some limitations that could be addressed with continued development. Among them are (1) a primitive user interface, (2) a lack of functionality in several important areas (i.e., robotic arm integration and tool constraints) and (3) highly variable model performance in terms of solution times. These shortcomings would have to be addressed before use of the tool could progress beyond the experimental stage into operational use. Recalling that the purpose of the research was simply to demonstrate that mathematical optimization techniques could be used to facilitate the planning process, the EPM was a success. Future development of the ideas into a more operationally usable tool is still under consideration by the planning experts from the Mission Operations Directorate’s EVA, Robotics, and Crew Systems Operations Division.
212
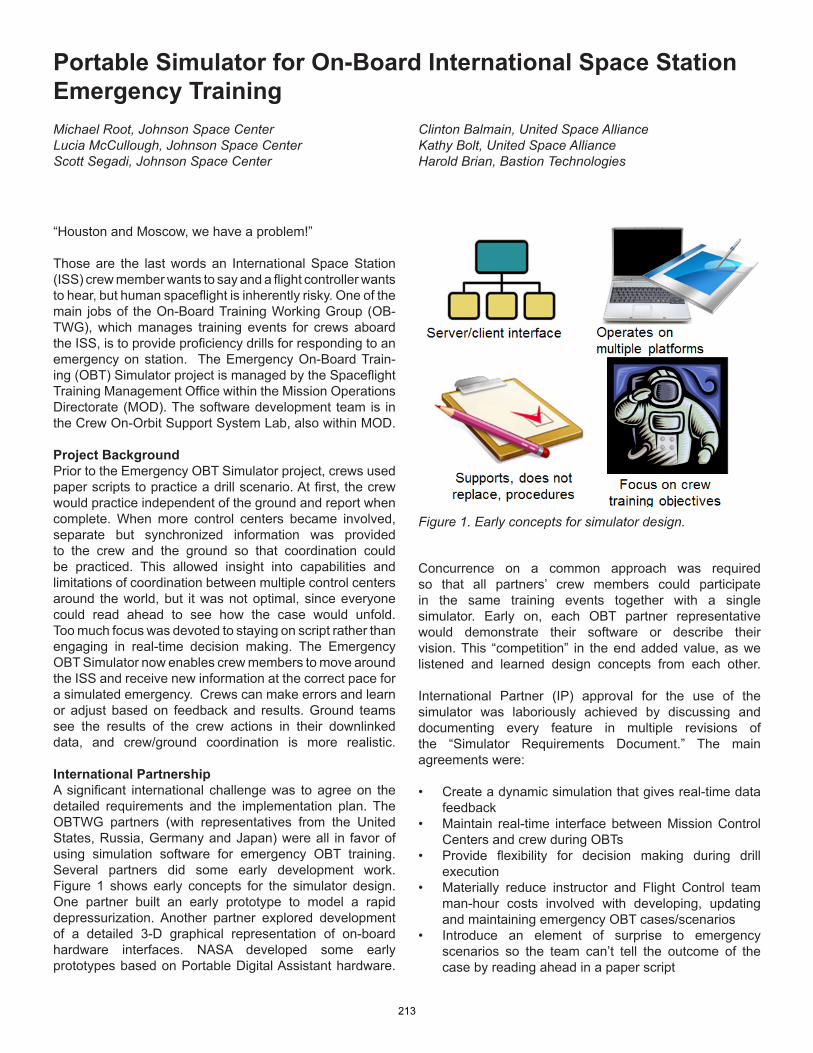
Portable Simulator for On-Board International Space Station Emergency TrainingMichael Root, Johnson Space CenterLucia McCullough, Johnson Space CenterScott Segadi, Johnson Space Center
Clinton Balmain, United Space AllianceKathy Bolt, United Space AllianceHarold Brian, Bastion Technologies
Figure 1. Early concepts for simulator design.
“Houston and Moscow, we have a problem!”
Those are the last words an International Space Station (ISS) crew member wants to say and a flight controller wants to hear, but human spaceflight is inherently risky. One of the main jobs of the On-Board Training Working Group (OB-TWG), which manages training events for crews aboard the ISS, is to provide proficiency drills for responding to an emergency on station. The Emergency On-Board Train-ing (OBT) Simulator project is managed by the Spaceflight Training Management Office within the Mission Operations Directorate (MOD). The software development team is in the Crew On-Orbit Support System Lab, also within MOD.
Project BackgroundPrior to the Emergency OBT Simulator project, crews used paper scripts to practice a drill scenario. At first, the crew would practice independent of the ground and report when complete. When more control centers became involved, separate but synchronized information was provided to the crew and the ground so that coordination could be practiced. This allowed insight into capabilities and limitations of coordination between multiple control centers around the world, but it was not optimal, since everyone could read ahead to see how the case would unfold. Too much focus was devoted to staying on script rather than engaging in real-time decision making. The Emergency OBT Simulator now enables crew members to move around the ISS and receive new information at the correct pace for a simulated emergency. Crews can make errors and learn or adjust based on feedback and results. Ground teams see the results of the crew actions in their downlinked data, and crew/ground coordination is more realistic.
International PartnershipA significant international challenge was to agree on the detailed requirements and the implementation plan. The OBTWG partners (with representatives from the United States, Russia, Germany and Japan) were all in favor of using simulation software for emergency OBT training. Several partners did some early development work. Figure 1 shows early concepts for the simulator design. One partner built an early prototype to model a rapid depressurization. Another partner explored development of a detailed 3-D graphical representation of on-board hardware interfaces. NASA developed some early prototypes based on Portable Digital Assistant hardware.
Concurrence on a common approach was required so that all partners’ crew members could participate in the same training events together with a single simulator. Early on, each OBT partner representative would demonstrate their software or describe their vision. This “competition” in the end added value, as we listened and learned design concepts from each other.
International Partner (IP) approval for the use of the simulator was laboriously achieved by discussing and documenting every feature in multiple revisions of the “Simulator Requirements Document.” The main agreements were:
• Create a dynamic simulation that gives real-time data feedback
• Maintain real-time interface between Mission Control Centers and crew during OBTs
• Provide flexibility for decision making during drill execution
• Materially reduce instructor and Flight Control team man-hour costs involved with developing, updating and maintaining emergency OBT cases/scenarios
• Introduce an element of surprise to emergency scenarios so the team can’t tell the outcome of the case by reading ahead in a paper script
213
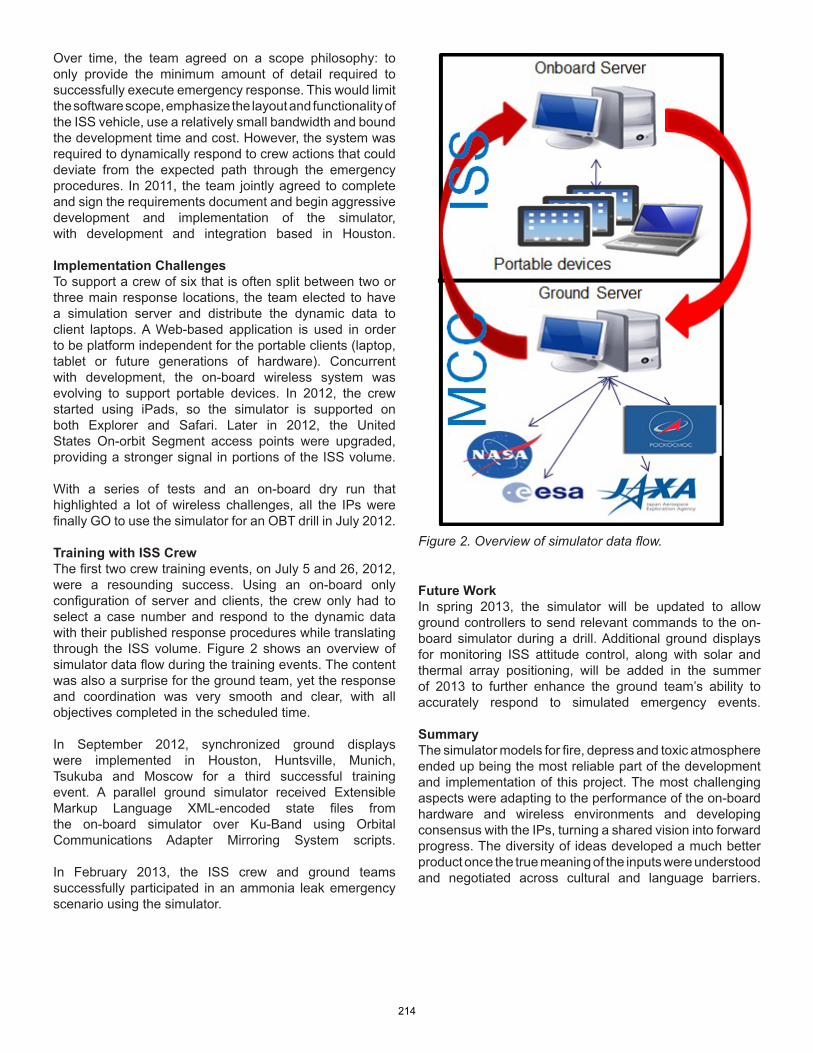
Over time, the team agreed on a scope philosophy: to only provide the minimum amount of detail required to successfully execute emergency response. This would limit the software scope, emphasize the layout and functionality of the ISS vehicle, use a relatively small bandwidth and bound the development time and cost. However, the system was required to dynamically respond to crew actions that could deviate from the expected path through the emergency procedures. In 2011, the team jointly agreed to complete and sign the requirements document and begin aggressive development and implementation of the simulator, with development and integration based in Houston. Implementation ChallengesTo support a crew of six that is often split between two or three main response locations, the team elected to have a simulation server and distribute the dynamic data to client laptops. A Web-based application is used in order to be platform independent for the portable clients (laptop, tablet or future generations of hardware). Concurrent with development, the on-board wireless system was evolving to support portable devices. In 2012, the crew started using iPads, so the simulator is supported on both Explorer and Safari. Later in 2012, the United States On-orbit Segment access points were upgraded, providing a stronger signal in portions of the ISS volume. With a series of tests and an on-board dry run that highlighted a lot of wireless challenges, all the IPs were finally GO to use the simulator for an OBT drill in July 2012. Training with ISS CrewThe first two crew training events, on July 5 and 26, 2012, were a resounding success. Using an on-board only configuration of server and clients, the crew only had to select a case number and respond to the dynamic data with their published response procedures while translating through the ISS volume. Figure 2 shows an overview of simulator data flow during the training events. The content was also a surprise for the ground team, yet the response and coordination was very smooth and clear, with all objectives completed in the scheduled time.
In September 2012, synchronized ground displays were implemented in Houston, Huntsville, Munich, Tsukuba and Moscow for a third successful training event. A parallel ground simulator received Extensible Markup Language XML-encoded state files from the on-board simulator over Ku-Band using Orbital Communications Adapter Mirroring System scripts.
In February 2013, the ISS crew and ground teams successfully participated in an ammonia leak emergency scenario using the simulator.
Figure 2. Overview of simulator data flow.
Future WorkIn spring 2013, the simulator will be updated to allow ground controllers to send relevant commands to the on-board simulator during a drill. Additional ground displays for monitoring ISS attitude control, along with solar and thermal array positioning, will be added in the summer of 2013 to further enhance the ground team’s ability to accurately respond to simulated emergency events.
SummaryThe simulator models for fire, depress and toxic atmosphere ended up being the most reliable part of the development and implementation of this project. The most challenging aspects were adapting to the performance of the on-board hardware and wireless environments and developing consensus with the IPs, turning a shared vision into forward progress. The diversity of ideas developed a much better product once the true meaning of the inputs were understood and negotiated across cultural and language barriers.
214

The OBT emergency simulator project adds value to JSC’s mission:
• Crew safety is paramount to the JSC mission. With the Emergency OBT simulator now in use, the crew can be much better prepared for an emergency event.
• Since the simulator generates synchronized data on-board and on the ground, flight control teams around the world can concurrently share a realistic perspective of how a true emergency would unfold. They can monitor realistic data and practice international coordination of their roles.
• The Emergency OBT Simulator performance gives astronauts, cosmonauts and IPs a productive and efficient way to face very complex situations and continually refine their response strategy and execution. Figure 3 shows a sample crew display
• provided by the training simulator during an emergency• depress scenario on board ISS• Astronauts, cosmonauts and Flight Control teams in
the International Control Centers are very pleased with the results of the OBT emergency simulator.
The Emergency OBT Simulator project success is applicable to other NASA environments and non-NASA environments. The simulator is available for participants at any NASA or ISS IP control center to observe and practice response to an unfolding ISS emergency for broad understanding. The format and concept of the software application would be useful for future long-duration flights. The on-board component can be used in a standalone mode or with parallel support from ground teams. Data is modified to suit the perspective of the participant, for both language (English or Russian) and role (crew roles, instructor role or flight controller positions).
Figure 3. Sample of crew display during depress emergency case.
215
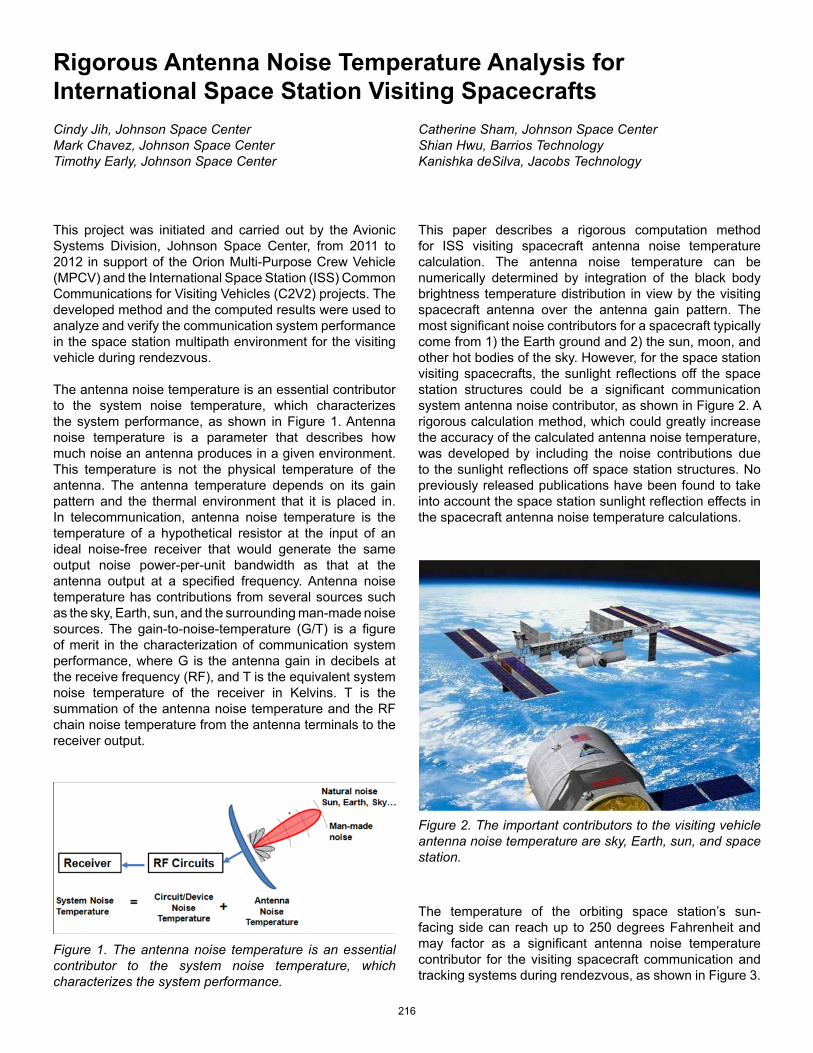
Rigorous Antenna Noise Temperature Analysis for International Space Station Visiting SpacecraftsCindy Jih, Johnson Space CenterMark Chavez, Johnson Space CenterTimothy Early, Johnson Space Center
Catherine Sham, Johnson Space CenterShian Hwu, Barrios TechnologyKanishka deSilva, Jacobs Technology
This project was initiated and carried out by the Avionic Systems Division, Johnson Space Center, from 2011 to 2012 in support of the Orion Multi-Purpose Crew Vehicle (MPCV) and the International Space Station (ISS) Common Communications for Visiting Vehicles (C2V2) projects. The developed method and the computed results were used to analyze and verify the communication system performance in the space station multipath environment for the visiting vehicle during rendezvous.
The antenna noise temperature is an essential contributor to the system noise temperature, which characterizes the system performance, as shown in Figure 1. Antenna noise temperature is a parameter that describes how much noise an antenna produces in a given environment. This temperature is not the physical temperature of the antenna. The antenna temperature depends on its gain pattern and the thermal environment that it is placed in. In telecommunication, antenna noise temperature is the temperature of a hypothetical resistor at the input of an ideal noise-free receiver that would generate the same output noise power-per-unit bandwidth as that at the antenna output at a specified frequency. Antenna noise temperature has contributions from several sources such as the sky, Earth, sun, and the surrounding man-made noise sources. The gain-to-noise-temperature (G/T) is a figure of merit in the characterization of communication system performance, where G is the antenna gain in decibels at the receive frequency (RF), and T is the equivalent system noise temperature of the receiver in Kelvins. T is the summation of the antenna noise temperature and the RF chain noise temperature from the antenna terminals to the receiver output.
Figure 1. The antenna noise temperature is an essential contributor to the system noise temperature, which characterizes the system performance.
This paper describes a rigorous computation method for ISS visiting spacecraft antenna noise temperature calculation. The antenna noise temperature can be numerically determined by integration of the black body brightness temperature distribution in view by the visiting spacecraft antenna over the antenna gain pattern. The most significant noise contributors for a spacecraft typically come from 1) the Earth ground and 2) the sun, moon, and other hot bodies of the sky. However, for the space station visiting spacecrafts, the sunlight reflections off the space station structures could be a significant communication system antenna noise contributor, as shown in Figure 2. A rigorous calculation method, which could greatly increase the accuracy of the calculated antenna noise temperature, was developed by including the noise contributions due to the sunlight reflections off space station structures. No previously released publications have been found to take into account the space station sunlight reflection effects in the spacecraft antenna noise temperature calculations.
Figure 2. The important contributors to the visiting vehicle antenna noise temperature are sky, Earth, sun, and space station.
The temperature of the orbiting space station’s sun-facing side can reach up to 250 degrees Fahrenheit and may factor as a significant antenna noise temperature contributor for the visiting spacecraft communication and tracking systems during rendezvous, as shown in Figure 3.
216

The conventional antenna noise temperature calculation does not take into account the space station reflection effects and results in an underestimated antenna and system noise temperature. Thus, the visiting spacecraft communication and tracking system performance during rendezvous could be overestimated.
A rigorous antenna noise temperature calculation procedure for the visiting spacecrafts was developed as follows: 1) Compute the antenna gain pattern, including the electromagnetic wave interactions (reflections and diffractions) from the visiting spacecraft using the rigorous computational electromagnetic techniques such as the hybrid Geometrical Theory of Diffraction (GTD) and the Method of Moment (MOM) approach. 2) Calculate the antenna noise temperature contribution from the black bodies such as the Earth, sun, moon and galaxy by integrating the black body temperatures over the visiting spacecraft antenna gain pattern. 3) If the space station is illuminated by the sun, calculate the antenna noise temperature contribution from the sun-illuminated space station by the integration of space station structures and temperature contributions over the visiting spacecraft antenna gain pattern. Figure 4 shows the space station structure could be a significant contributor to the visiting spacecraft at a location 50 meters underneath the ISS during rendezvous. The space station is in the antenna pattern high gain area, as shown in orange color. The contributions in the antenna pattern high gain area will have higher weighting in the antenna noise temperature calculations. The visiting spacecraft antenna noise temperature is the sum of the results from performing the second and third steps of the temperature calculation procedure described above.
Figure 3. The temperature of the orbiting space station’s sun-facing side could be up to 250 degrees Fahrenheit and could be a significant antenna noise temperature contributor.
Figure 4. The dark areas are the space station structures in the field of view of the visiting spacecraft communication system antenna at 50 meters underneath the ISS.
The developed method and the computed results in this paper were used to analyze and verify the visiting spacecraft communication system performance in the space station multipath environment for visiting vehicle during rendezvous.
217

Modular Instrumentation SystemPaul Delaune, Johnson Space CenterHester Yim, Johnson Space Center
Richard Barton, Johnson Space CenterRaymond Wagner, Jacobs Technology
NASA uses computer systems in all phases of its mission. Each application has different requirements for performance, size, weight and power. In the past, custom hardware was designed for each application to minimize size, weight and power. This is a very expensive and time-consuming method, and it also was very difficult to upgrade when requirements changed. Industry standard form factors have emerged as a solution in many cases. Commercial companies are designing within these form factors to meet or exceed the environmental requirements of spaceflight. Versa Module Eurocard, Compac Peripheral Component Interconnect and Personal Computer 104 are examples of form factor standards that are currently being used on spacecraft avionics designs. These form factors are answers to the requirements for large- to medium-size performance applications. A gap remains, however, in the small size/microcontroller application arena, where there are no real ruggidized, modular or scalable commercial standards.
To address this gap, NASA’s Johnson Space Center/Avionics System Division within the Engineering Directorate conceived and designed a system in the small size/microcontroller area. The Modular Instrumentation System (MIS) is a compact, space-related computer system that is modular, scalable and reconfigurable (see Figure 1). MIS has a flexible design so that as subsets of requirements are changed, the need for new designs is minimized and the reusability of the hardware and software modules is maximized. The result is a flexible, affordable and small computer system that can be adapted to uses in space environment instrumentation and control. This project was started in December 2011.
Using the experience gained in building small controllers and instrumentation, it was decided to slice the modules into similar functional areas. The common modules are power, Microcontroller/Central Processing Unit (CPU), communication and application modules. The application modules perform tasks such as data acquisition, power switching, motor control and more, and multiple application modules can be added to a stack. The mechanical design is a stacking system where the interface between modules is a pair of surface mount connectors located 90 degrees from one another in one of the corners, which allows horizontal expansion of each board as necessary. One connector is dedicated to power, with conductor pins dedicated to ground, a range of standard Direct Current voltages for current CPUs and communication/application modules, and raw 28 Volts. Each module uses only the power conductors required by its components. The second connector is much more loosely defined. It is used for serial data, analog signals and small data busses. Four mechanical stand-offs are used to stabilize the stack, one at each of the corners.
The software is similarly designed in a modular fashion. Software changes to a MIS design derived from a previous MIS application will mainly involve compiler directive changes reflecting the use of new hardware stack modules and any application-specific parameters and operation scenarios.
An example of the advantages of this system can be found in accelerometer applications. Several customers are interested in collecting accelerometer data on their systems. The first application requires an interface to 28 Volts direct current (Vdc) power and has an Ethernet interface for communication and data retrieval. Figure 2 shows a dual Ethernet configuration of the MIS. The second application requires battery operation and a Wi-Fi communication interface. The changes necessary to move from option one to option two involve swapping the 28 Vdc power supply board for a battery board, changing the communication board from an Ethernet board to a Wi-Fi board and changing the software from an Ethernet module driver to a Wi-Fi module driver. All of the identified boards are included in a standard capabilities list and have been designed beforehand. There are no dedicated hardware design costs, so only software changes, testing and integration must be priced. The real cost savings is reflected in the reduced time to market for the second application.
Figure 1. Typical MIS stack.218

Figure 2. Dual Ethernet configuration of the MIS.
The value of the MIS system is in its reusability. The cost of development for many common modules (see Figure 3) has been paid for. Replicating the modules is fairly inexpensive. The system can be flown in space as is. Or, if absolute smallest size, weight and power are required, the MIS can be used to prototype the systems, and then the circuits redesigned to reduce size, weight and power. This method eliminates one iteration of detail design, thereby saving time and budget. The system is valuable to payloads for its capability to monitor the payload and environment, and it can also be used to control the payload and communicate the data back to the ground.
Figure 3. Common Avionics Enabler version of the MIS for the Multi-Mission Space Exploration Vehicle.
Current applications include habitat system instrumentation and control (2012- 2013), dynamic flight instrumentation in rugged environments (2012-2013) and in-vehicle communication protocol converters and remote control unit for thruster jets (2012-). More MIS modules are currently in development to support several space flight opportunities. The system is being targeted for the embedded controller for 1) a high0voltage controller for a dust mitigation experiment on International Space Station (ISS) (estimated flight in 2014), 2) an external high-definition camera system on ISS (delivery end of 2014) and 3) a data acquisition system to characterize the flight environment on a sub-orbital flight such as Virgin Galactic’s SpaceShipTwo (estimate flight in 2014).
219

Terahertz Signal Propagation Characteristics for Spacecraft ApplicationsCindy Jih, Johnson Space CenterCatherine Sham, Johnson Space CenterJames R. Keiser, Johnson Space Center
Shian Hwu, Barrios TechnologyKanishka deSilva, Aerodyne Industries
IntroductionRecent research and development activities in Terahertz (THz) frequency technologies are expanding into broad applications such as security screening, medical imaging, and wireless sensors and communications. Previously, THz technology has been driven by applications in astronomy. NASA has been leading the THz frequency technology development for the sensors and instruments in astronomy for the past 20 years.
Due to the vast availability of multiple gigahertz (GHz) bandwidths, gigabit data rate wireless transmission is possible with THz frequency radios. Multi-gigabit per second (MGbps) broadband wireless access based on THz transmission frequencies is closer to becoming a reality. Atmospheric attenuation of THz signals could significantly decrease the communication ranges and transmittable data rates for ground-based systems. Contrary to the THz applications on the ground, the performance of space applications of the technology would not be impacted due to atmospheric attenuation. The manufacturing technologies for the THz frequency electronic components are advancing and maturing. There is great potential for NASA to benefit from THz technology-based wireless systems in space applications typically challenged with difficult cabling and size/weight constraints. In 2012 the Avionic Systems Division within the Engineering Directorate at the Johnson Space Center (JSC) initiated and conducted a study to fully assess the performance of THz frequency wireless systems in potential space applications.
There is no limit on the demand for the data rates and capacity of wireless communications for today’s broadband applications. New technologies for spectral efficient schemes and the interference mitigation were developed to achieve the growth of data rates in recent years. To meet the demand, new technologies are needed to offer data capacity and reduce energy consumption requirements in future wireless networks. One development is the expansion of new frequency spectrum for radio systems. In the THz range of the frequency spectrum (from 300 GHz to 3000 GHz), multiple GHz channel bandwidths are available. This provides the possibility to transmit MGbps data rates with less power consumption and higher channel capacity of the network.
THz-band wireless systems have some desired advantages over currently available wireless systems. Much higher bandwidths are available than the conventional microwave
and millimeter wave systems.
The THz system efficiency is higher than laser systems. The THz-band signals have smaller attenuations than the optical/laser signals. The capability of transmission and reflection off the dielectric materials could be useful in many non line-of-sight indoor applications for THz waves.
An important advantage of the THz wireless system is the potential low-complexity system design with the simplest modulation schemes, coupled with the multiple GHz channel bandwidth to achieve the multi-gigabit throughput performance. This simple system architecture could have a comparative advantage to the traditional spacecraft S-band, Ku-band and Ka-band systems that use high complexity radio architectures to achieve high data rate due to limited available channel bandwidth. The small form factor and lightweight nature of the THz radio and antenna could be attractive to NASA human space exploration applications.
The spacecraft Radio Frequency Interference (RFI) could be a challenge for spaceflight missions involving multiple spacecraft such as the future commercial spaceflights to the International Space Station. The THz system could be used to mitigate the potential RFI for multiple spacecraft operations. Operation in THz spectrum, with very few existing space systems, could minimize operational constraints due to RFI. The THz spectrum property provides inherent isolation from terrestrial RF systems (through atmospheric attenuation), thus eliminating the potential RFI from the ground systems.
Spacecraft Wireless Local Area Network (WLAN) ApplicationsWireless communication is an enabling technology for both human and robotic spacecraft. It enables un-tethered mobility of crew and instruments, increasing safety and science return, and decreases mass and maintenance costs by eliminating cabling.
Current WLAN systems are migrating from traditional 2.4 and 5.8 GHz microwave bands toward 60 GHz millimeter wave frequency. Future systems are expected to work at even higher carrier frequencies in the THz band beyond 300 GHz. Although the channel signal propagation characteristics have been thoroughly studied at microwave frequencies, there are much fewer studies in the millimeter and THz frequency bands.
220

Figure 1. Interior WLAN applications inside a spacecraft module.
The pass loss was computed at different frequencies of 2.4, 5.5, 60 and 300 GHz. It’s observed that the diffractions for the 60 GHz millimeter wave and 300 GHz THz signals are much weaker than the conventional microwave at 2.4 and 5.5 GHz. The path loss and signal attenuation at 300 GHz of THz band is 40 to 60 Decibels higher than the microwave at 2.4 or 5.5 GHz.
A person blocking the direct path could also cause a significant drop of the received power and leads to a jump in the bit error rates for the THz wireless system due to the shadowing effects. The capability of the THz signal reflection off a thin sheet of dielectric materials could be useful in such Non Line of Sight (NLOS) indoor applications, as shown in Figure 2. The reflected THz signal strengths could be much higher than the diffracted signals in the shadow regions, where the directed signals are not available. The other option would be to use adaptive scanning antenna to ensure reliable data communication in the presence of moving people.
Figure 2. A thin sheet of dielectric materials could be used as a THz signal reflector to overcome NLOS communications.
The path loss in the X-Y plane inside the module with and without the walls painted or covered with reflecting materials at 300 GHz were computed and compared. Figure 3 shows the path loss in the X-Y plane inside the module with a blockage plate at the middle of the room at 300 GHz. Figure 4 shows the path loss in the X-Y plane inside the module with a blockage plate at the middle of the room with the walls painted or covered with reflecting materials at 300 GHz. The high path loss areas in the NLOS shadow regions are much reduced as compared to Figure 3, with no reflections off the walls. The reflected signals off the walls increase the signals in the NLOS shadow regions. The RF coverage in the NLOS shadow regions is significantly improved with the reflections off the walls. The signal strengths could increase by 30 Decibels in the NLOS shadow regions with the walls painted or covered with reflecting materials.
Figure 3. The path loss in the X-Y plane inside the module with a blockage plate at the middle of the room at 300 GHz.
Figure 4. The path loss in the X-Y plane inside the module with a blockage plate at the middle of the room with the walls painted or covered with reflecting materials at 300 GHz.
A THz wireless system could provide Gigabits per second high data rate WLAN services to the crew modules of the spacecraft, as shown in Figure 1. A typical spacecraft module with a size of 6 meters (m) X 2.5 m X 2.5 m is modeled for analyzing signal propagation characteristics at THz frequency.
221

ConclusionA THz wireless system for the potential future spacecraft WLAN applications was investigated. The THz signal propagation characteristics inside a spacecraft module were analyzed. The results indicated that the THz signals will be very weak in the NLOS shadow regions due to much weaker diffracted fields than the microwave signals. The capability of the THz signal reflection off a thin sheet of dielectric materials could be useful in such NLOS indoor applications. The computed results indicate that the signal strengths could increase 30 Decibels with the reflections in the NLOS regions. A prototype THz system demonstration test inside a spacecraft module mock-up would be a next step to further advance the Technology Readiness Level for future THz flight hardware and system development.
222

International Space Station Designing Lithium-ion Batteries for Electric Power SystemEugene Schwanbeck, Johnson Space Center Penni Dalton, Glenn Research Center
Currently, the International Space Station (ISS) electric power system (EPS) utilizes Nickel-Hydrogen (NiH2) batteries to store electrical energy for the EPS. The batteries provide power for the ISS and are charged during insolation and discharged during eclipse. The NiH2 batteries are designed to operate at a 35 percent depth of discharge (DOD) maximum during normal low-Earth orbit (LEO) operation. As these batteries age, they will be replaced by a newly-designed Lithium-ion (Li-ion) battery. The Development Projects Office (DPO) within the ISS Program is in charge of managing the development of this complex battery project.
Each existing NiH2 battery consists of two series connected orbital replacement units (ORU). Post-assembly complete, the ISS EPS has a total of 24 batteries (48 ORUs) in orbit. One new Li-ion battery will replace two NiH2 ORUs, with double the power capability of the old batteries. One Li-ion battery will directly replace one of the NiH2 ORUs; the second NiH2 ORU will be replaced using an adapter plate (AP). The AP provides micrometeoroid orbital debris protection and thermal shielding for the exposed battery slot on the integrated equipment assembly (IEA), serves as a power jumper for the ORU series connection and data, and functions as a structure for storage of a non-functional NiH2 ORU (See figure 1, Li-Ion battery and adapter plate ORUs). The combined total launch weight of a Li-ion battery and AP will be over 30 percent less than two NiH2 ORUs.
Figure 1. Li-Ion battery and adapter plate ORUs.
• 10-year design life (58,000 charge/discharge cycles)• 134-Ampere-hour (Ah) nameplate capacity (30 series
connected Li-ion cells)• 15 kilowatt-hours power• Contingency orbit capability consisting of one additional
orbit at reduced power after a 20 percent DOD without recharge
• Easy in-orbit replacement, utilizing the robotic arm and extravehicular activity
The cells selected for use in the ISS Li-ion battery ORU are 134 Ah cells, and use an elliptically wound lithium cobalt oxide (Li-CoO2) cathode and a graphite anode stack. Since Li-ion cells can cause a self sustaining thermal event if not controlled properly, the ISS team has designed in a minimum of two fault tolerance for protection of the battery system. Each cell in the battery has two sensors for both voltage and temperature. Overcharge, over discharge and over temperature are controlled by both software and hardware inhibits. Where two fault tolerances cannot be achieved (cell internal short circuits) design for minimum risk (DFMR) is utilized. Manufacturing process controls and individual cell screening along with other physical ORU controls help reduce the risk of internal shorts.
These new Li-ion batteries will be integrated into the existing ISS EPS and photovoltaic thermal control system (PVTCS), which created several challenges to the design. The Li-ion battery operates at a higher temperature (about 20-degrees C) than the NiH2 battery (about 1-degree C) and the PVTCS must support the new batteries integrated with the baseline EPS hardware. These factors have necessitated the development of a new PVTCS thermal control algorithm to incorporate the fixed configuration of the fluid lines, coldplates, and radiator with the Li-ion thermal characteristics.
In the new system, the required battery temperature range is warmer than the maximum pump outlet temperature. The resulting integrated design provides shorter Li-ion baseplate fins, as well as an updated thermal control algorithm. The algorithm senses battery temperature and pump flow control subassembly (PFCS) outlet temperature and commands the flow control valve (FCV) to preset positions in order to maintain the batteries and pump outlet temperatures within limits.
The first set of six batteries and their adapter plates are scheduled for an early 2017 launch via the Japanese H-II transfer vehicle. Web addresses: https://iss-www.jsc.nasa.gov/nwo/dpo/pg1/web/li-ion.shtmlEach Li-ion battery is designed to meet the following
requirements:223
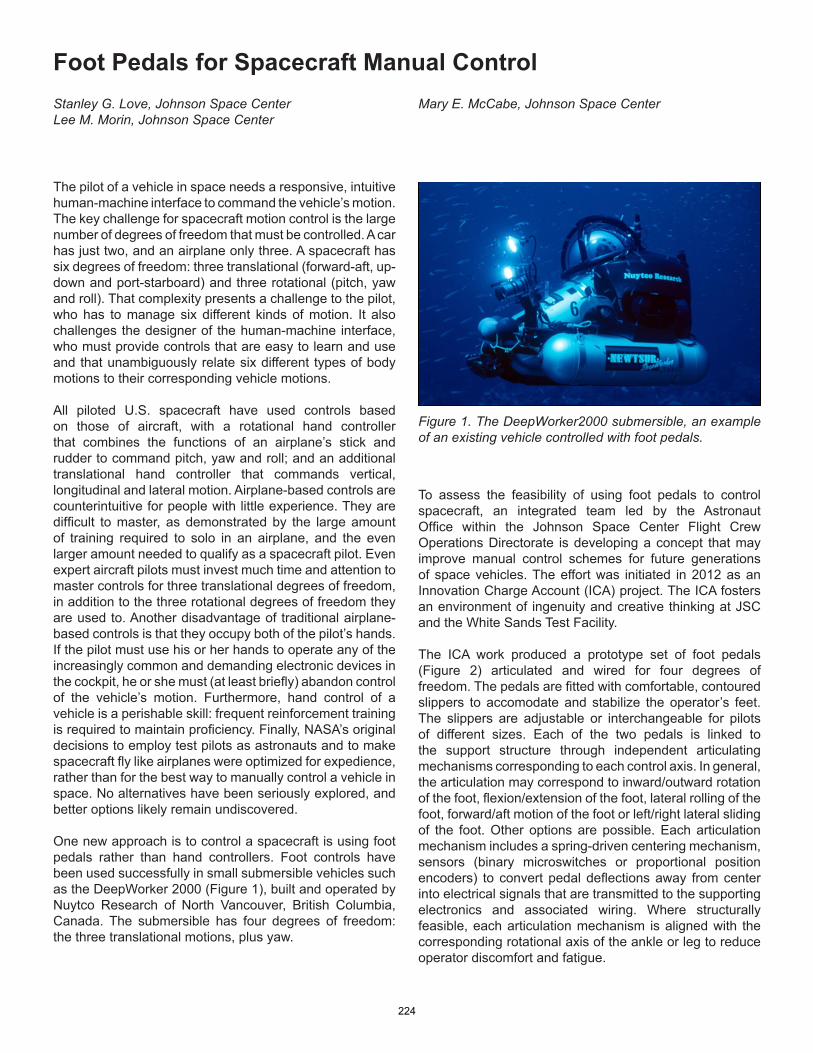
Foot Pedals for Spacecraft Manual ControlStanley G. Love, Johnson Space CenterLee M. Morin, Johnson Space Center
Mary E. McCabe, Johnson Space Center
The pilot of a vehicle in space needs a responsive, intuitive human-machine interface to command the vehicle’s motion. The key challenge for spacecraft motion control is the large number of degrees of freedom that must be controlled. A car has just two, and an airplane only three. A spacecraft has six degrees of freedom: three translational (forward-aft, up-down and port-starboard) and three rotational (pitch, yaw and roll). That complexity presents a challenge to the pilot, who has to manage six different kinds of motion. It also challenges the designer of the human-machine interface, who must provide controls that are easy to learn and use and that unambiguously relate six different types of body motions to their corresponding vehicle motions.
All piloted U.S. spacecraft have used controls based on those of aircraft, with a rotational hand controller that combines the functions of an airplane’s stick and rudder to command pitch, yaw and roll; and an additional translational hand controller that commands vertical, longitudinal and lateral motion. Airplane-based controls are counterintuitive for people with little experience. They are difficult to master, as demonstrated by the large amount of training required to solo in an airplane, and the even larger amount needed to qualify as a spacecraft pilot. Even expert aircraft pilots must invest much time and attention to master controls for three translational degrees of freedom, in addition to the three rotational degrees of freedom they are used to. Another disadvantage of traditional airplane-based controls is that they occupy both of the pilot’s hands. If the pilot must use his or her hands to operate any of the increasingly common and demanding electronic devices in the cockpit, he or she must (at least briefly) abandon control of the vehicle’s motion. Furthermore, hand control of a vehicle is a perishable skill: frequent reinforcement training is required to maintain proficiency. Finally, NASA’s original decisions to employ test pilots as astronauts and to make spacecraft fly like airplanes were optimized for expedience, rather than for the best way to manually control a vehicle in space. No alternatives have been seriously explored, and better options likely remain undiscovered.
One new approach is to control a spacecraft is using foot pedals rather than hand controllers. Foot controls have been used successfully in small submersible vehicles such as the DeepWorker 2000 (Figure 1), built and operated by Nuytco Research of North Vancouver, British Columbia, Canada. The submersible has four degrees of freedom: the three translational motions, plus yaw.
Figure 1. The DeepWorker2000 submersible, an example of an existing vehicle controlled with foot pedals.
To assess the feasibility of using foot pedals to control spacecraft, an integrated team led by the Astronaut Office within the Johnson Space Center Flight Crew Operations Directorate is developing a concept that may improve manual control schemes for future generations of space vehicles. The effort was initiated in 2012 as an Innovation Charge Account (ICA) project. The ICA fosters an environment of ingenuity and creative thinking at JSC and the White Sands Test Facility.
The ICA work produced a prototype set of foot pedals (Figure 2) articulated and wired for four degrees of freedom. The pedals are fitted with comfortable, contoured slippers to accomodate and stabilize the operator’s feet. The slippers are adjustable or interchangeable for pilots of different sizes. Each of the two pedals is linked to the support structure through independent articulating mechanisms corresponding to each control axis. In general, the articulation may correspond to inward/outward rotation of the foot, flexion/extension of the foot, lateral rolling of the foot, forward/aft motion of the foot or left/right lateral sliding of the foot. Other options are possible. Each articulation mechanism includes a spring-driven centering mechanism, sensors (binary microswitches or proportional position encoders) to convert pedal deflections away from center into electrical signals that are transmitted to the supporting electronics and associated wiring. Where structurally feasible, each articulation mechanism is aligned with the corresponding rotational axis of the ankle or leg to reduce operator discomfort and fatigue.
224

The range of motion in all articulation axes is within the comfortable range of motion of the operator’s foot, and deflection forces are set low enough to be applied without strain, but high enough to minimize inadvertent control inputs. With all the articulations centered, no commands are sent and the operator’s foot is in a neutral position. The supporting electronics are comparable to those used in traditional hand controllers, and serve as an electrical and signal interface between the sensors in the pedals and the spacecraft’s, or simulator’s, motion control system.
Figure 2. A working four-axis prototype of foot-pedal controls for spacecraft. The prototype has been used to “fly” a computer-based spacecraft simulator.
To operate the pedals, the spacecraft pilot sits as the controls and places his or her feet in the slippers. He or she deflects the pedals to send corresponding commands to the vehicle’s motion control system. One possible mapping of foot motion to spacecraft motion is as follows:
Left FootToes down: spacecraft translation vertical down (+Z)Toes up: spacecraft translation vertical up (-Z)Toes left: spacecraft translation lateral port (-Y)Toes right: spacecraft translation lateral starboard (+Y)Foot slide forward: spacecraft translation forward (+X)Foot slide aft: spacecraft translation aft (-X)
Right FootToes down: spacecraft pitch down (- Pitch)Toes up: spacecraft pitch up (+ Pitch)Toes left: spacecraft yaw left (- Yaw)Toes right: spacecraft yaw right (+ Yaw)Foot slide left: spacecraft roll left (- Roll)Foot slide right: spacecraft roll right (+ Roll)
Foot controls have the same minor reliability concerns as traditional hand controls. One additional maintenance issue for foot controls is their location in the foot well of a vehicle’s cockpit, which makes them more difficult to reach than more conveniently placed hand controls. The same safety concerns (most commonly from inadvertent commands or “stick bumps”) apply to foot controls and traditional hand controls, but the out-of-the way placement of foot controls that makes them harder to reach for maintenance also makes them harder to actuate unintentionally.
The main advantage of foot pedal controls is that they are very easy to learn. The DeepWorker 2000, with four-axis foot controls, can be safely soloed after only a few hours of training, compared to months for an aircraft with three-axis hand controls. A second benefit of foot controls is that they leave the operator’s hands free for other tasks in the cockpit. Third, anecdotal evidence supports better retention of foot-control proficiency in comparison with hand controls. After a two-year hiatus, operation of the DeepWorker is not noticeably impaired, while operating an airplane after two years out of the pilot’s seat requires formal retraining and a recurrency check ride.
The working four-axis prototype shown in Figure 2 has been successfully used to “fly” spacecraft simulators on laptop computers and in and the Liquid Galaxy flight deck environment at JSC. It was demonstrated at JSC’s Innovation Day event in May 2012 and highlighted at the Innovation Conference and Showcase in downtown Houston in October 2012. One of JSC’s Advanced Exploration Systems projects, the Multi-Mission Space Exploration Vehicle (MMSEV), which builds full-size instrumented cabins and cockpits to inform the design of future spacecraft, may include foot controllers as part of its cockpit development effort. Following a presentation of the project for the New Technology Evaluation panel, JSC is initiating work to patent and license the technology.
Funding for further development of foot-pedal controllers is being sought. In addition to the possible MMSEV application, there is interest in evaluating the ergonomics of the foot pedals aboard the reduced-gravity aircraft and in developing foot pedal controls for a future Extravehicular Activity jetpack. Other possible applications include video games and control of cars or other machines by people with upper-limb disabilities.
225

Development and Execution of Autonomous Procedures Onboard the International Space Station to Support the Next Phase of Human Space ExplorationSusan Beisert, Johnson Space CenterMichael Rodriggs, Johnson Space CenterFrancisco Moreno, Johnson Space CenterStanley Love, Johnson Space Center
David Korth, Johnson Space CenterStephen Gibson, Johnson Space CenterYoung H. Lee, Jet Propulsion Laboratory Donald E. Eagles, California Institute of Technology
Now that major assembly of the International Space Station (ISS) is complete, NASA’s focus has turned to using this high-fidelity in-space research testbed not only to advance fundamental science research, but also to demonstrate and mature the needed technologies and develop the operational concepts that will enable future human exploration missions beyond low-Earth orbit.
One of these focus areas is the development and execution of ISS Testbed for Analog Research (ISTAR) autonomous flight crew procedures that are intended to increase crew autonomy that will be required for long-duration human-exploration missions. Due to increased communications delays and reduced logistics resupply, autonomous procedures are expected to help reduce crew reliance on the ground flight control team, increase crew performance and enable the crew to become more subject-matter experts on both the exploration space vehicle systems and the scientific investigation operations that will be conducted on a long-duration human-space exploration mission. ISTAR tests are sponsored by the Human Exploration Development Support Office at the Johnson Space Center (JSC), and are supported by JSC’s Mission Operations Directorate. The focus for ISTAR is to identify candidate investigations to be performed on ISS as Exploration Development Test Objectives (xDTOs). These investigations will mitigate exploration mission human and architectural risks and develop the concept of operations for a Mars or Near Earth Asteroid mission. ISTAR will be the highest fidelity exploration analog working in conjunction with other Earth based analogs such as the NASA Extreme Environment Mission Operations (NEEMO), and Desert Research and Technogy Studies (DRATS) to develop and mature exploration technology and operational concepts.
Since the latter half of 2012, selected non-critical ISS systems crew procedures have been used to develop techniques for building ISTAR autonomous procedures, and ISS flight crews have successfully executed them without flight controller involvement. Although the main focus has been preparing for exploration, the ISS has been a beneficiary of this synergistic effort in many cases and is considering modifying additional standard ISS procedures that may improve crew efficiency, reduce operational costs and increase the amount of crew time available for scientific research.
To date, twelve activities have been performed using ISTAR autonomous procedures. These procedures were selected based upon their opportunities to test various aspects of autonomy, such as commanding, off-nominal condition response, analysis of results to determine subsequent actions and use of just-in-time training. The crew and flight controllers have completed questionnaires indicating which changes they found to be beneficial for autonomy.
The ISTAR tests have helped procedure developers determine the information needed by the flight crew to autonomously execute procedures that have normally either been performed by the ground or by coordinating with ground controllers. Flight crews have also provided a greater understanding of what is involved in making procedures more autonomous. Figure 1 and Figure 2 show flight crewmembers on board ISS performing ISTAR tests. Some of their lessons learned are:
• Providing explanations and “big picture” information in the procedures gives the flight crew a better understanding of how to work through problems.
• Videos and pictures allow the crew to better understand techniques and system performance. Videos also help avoid ambiguous or subjective terminology, such as “a little wiggle.”
• Troubleshooting steps allow the crew to “safe” equipment and regain equipment functionality.
• It is important to indicate constraints, such as “Fan can only be off for 3 hours,” wait constraints, expected time needed for troubleshooting steps, etc.
• The crew needs to know what information to provide to the ground.
• Nominal and alternate stowage locations should be included for equipment that might be needed for nominal execution as well as troubleshooting.
It is expected that the next phase of autonomous procedure development will include payload science and human research investigations. Additionally, ISS International Partners have expressed interest in participating in this effort. The recently approved one year crew expedition starting in 2015, consisting of one Russian and one U.S. On-Orbit Segment crew member, will be used not only for long duration human research investigations but also for the testing of exploration operations concepts, including crew autonomy.
226

Figure 1. Canadian Space Agency astronaut Chris Hadfield installs Ultrasonic Background Noise Tests sensors behind a rack in the Destiny laboratory using ISTAR procedures. These sensors detect high-frequency noise levels generated by station hardware and equipment operating within Destiny.
Figure 2. European Space Agency astronaut Andre Kuipers holds the Velocicalc meter used to measure air velocity to perform an ISTAR procedure.
227

Virtual Guidance: Just-in-Time Training for Ophthalmic Ultrasound
Steven H. Platts, Johnson Space Center Sydney P. Stein, MEI TechnologiesTimothy P. Matz, MEI TechnologiesDavid S. Martin, Wyle Science, Technology and Engineering
Introduction With the goal of space travel beyond low-Earth orbit comes the need for astronauts to autonomously diagnose and treat medical conditions in the absence of an immediately available physician and advanced medical equipment. Ultrasound, due to its low cost, portability and capability to safely image virtually any part of the body, is an ideal medical diagnostic modality in remote or isolated environments. However, without years of specific training, knowledge of relevant anatomy and experience with ultrasound, it will be difficult for an astronaut to produce high-quality images for medical diagnostic or research purposes across the wide range of potential applications.
Due to the volume of training required to prepare for a spaceflight mission, astronauts cannot devote a sufficient amount of time to train in all the potential ultrasound applications. Currently, this limitation has been overcome by having experts on the ground remotely guide astronauts through an ultrasound examination. Remote guidance requires real-time video downlink from the International Space Station (ISS), along with two-way audio communication between the astronaut in space and the ultrasound expert in the Tele-Science Center at Johnson Space Center, allowing for immediate feedback on equipment settings, image quality and scan technique. However, when future missions involving a greater distance to Earth lead to greater communication delays, this method will be inadequate, and astronauts must perform scans without real-time assistance. Therefore, a method of just-in-time training called Virtual Guidance was devised that allows untrained operators to perform ultrasound scans independently to meet the need for autonomous training and ultrasound imaging for future exploration missions. The JSC Cardiovascular Laboratory in the Biomedical Research and Environmental Sciences Division of the Health and Human Performance Directorate developed the Virtual Guidance tutorial from January to December 2011.
Virtual Guidance is a detailed audio/video tutorial that guides an untrained scanner step by step through the acquisition of an ultrasound study. Using this form of just-in-time training, it is believed that astronauts will require minimal amounts of training and practice before embarking on an exploration mission. The feasibility of using Virtual Guidance to acquire diagnostically adequate images of the carotid artery and intima-media thickness has been previously reported. In response to the concern for inflight and postflight visual and anatomical changes in the eye, a Virtual Guidance module for ocular ultrasound was developed and tested to demonstrate the efficacy of obtaining diagnostically adequate images of the optic nerve, the optic nerve sheath and the anterior chamber of the eye, including the retina.
MethodsVirtual Guidance is a form of just-in-time training that uses a comprehensive audio and video tutorial specifically designed to allow an untrained operator to perform an ultrasound scan autonomously. The tutorial presents key factors for the successful acquisition of ocular ultrasound images in a step-by-step fashion, beginning with equipment setup, ergonomics, subject positioning, examination protocol and scanning technique. For each required image a photograph is shown in the tutorial depicting probe placement, and a representative ultrasound image is displayed. Because inexperienced scanners initially will acquire less-than-adequate images, examples of poor image quality also are included in the tutorial with descriptions on how to improve the image. The untrained operator views the tutorial through video glasses with audio (Vuzix Wrap 310XL, New York, N.Y.), allowing for hands-free viewing of the tutorial played on a portable media device as shown in Figure 1 (32 GB iPod Touch, Apple, Inc.). The glasses sit high on the nose, allowing for clear viewing of the subject and ultrasound equipment so as not to interfere with scanning, yet easily allow the untrained operator to view the tutorial as shown in Figure 2.
Timothy L. Caine, Wyle Science, Technology and Engineering Michael B. Stenger, Wyle Science Technology and Engineering Stuart M. C. Lee, Wyle Science, Technology and Engineering
228

Figure 1. Virtual Guidance glasses and iPod.
Figure 2. Untrained operator performing opthalmic examination using the Virtual Guidance tutorial.
images acquired by an inexperienced scanner using the Virtual Guidance tutorial. As is now the practice, it is likely that astronauts participating in exploration missions will receive basic ultrasound training before launch. Therefore, one might expect an even higher success rate, and perhaps the capability for completing more complex imaging protocols, when astronauts use Virtual Guidance during the course of their mission.
Ten test subjects with no previous ultrasound experience were recruited to perform ophthalmic ultrasound examinations using only the Virtual Guidance tutorial as a guide. Instructions were provided regarding operation of the media device and audio/video glasses, but no other training was received. With the guidance of the tutorial, subjects acquired and stored images of the optic nerve, the nerve sheath and the anterior chamber of the eye for later evaluation by blinded, independent experts. Acquisition of the images by untrained operators using the Virtual Guidance tutorial required no more than 30minutes per study. Ultrasound was performed using unmodified, commercially available ultrasound equipment (Philips CX50, Philips Medical, Andover, Mass.).
ConclusionsThis project demonstrated that Virtual Guidance is a successful method for untrained operators to acquire ultrasound images of the eye for clinical evaluation. Virtual Guidance fills a performance or training gap by facilitating autonomous astronaut performance of ultrasound examinations when real-time Remote Guidance is not feasible due to the prolonged time delay in communication expected on exploration missions. Virtual Guidance can also be used on the ISS, when real-time two-way audio and video communication is not available due to loss of signal with Mission Control, or in locations where this capability is not currently supported, such as the Extravehicular Activity airlock. Further, Virtual Guidance can be used to acquire ultrasound images in remote locations on Earth, where the appropriate medical experts are unavailable.Further refinements to the tutorials based on feedback from untrained scanners who participated in these studies will lead to a greater success rate when using the current Virtual Guidance modules and aid in the successful development of future Virtual Guidance applications. Future work may include demonstration of the Virtual Guidance capabilities in exploration mission analog environments and on the ISS. This work addresses Human Research Program risks and gaps, with specific reference to the medical diagnosis and care of astronauts during future exploration missions. Virtual Guidance allows astronauts without significant training to take advantage of ultrasound as a versatile imaging tool with a wide range of clinical and research applications.
Results/DiscussionIndependent experts in interpreting ultrasound images evaluated and scored 18 images. An equipment failure unrelated to the performance of the study resulted in one subject acquiring unusable images. Of these 18 images, 17 were scored as diagnostically adequate. The high success rate among these untrained operators is remarkable and is encouraging for the successful autonomous acquisition of ultrasound images during exploration missions. Figure 3 shows ultrasound images of the anterior chamber and optic nerve and nerve sheath, respectively, acquired by a registered sonographer compared to
Figure 3. Ultrasound images of the anterior chamber and optic nerve and nerve sheath, respectively. Images A and B acquired by a registered sonographer. Images C and D acquired by an inexperienced scanner using the Virtual Guidance tutorial.
229

Space Habitability Operation Reporting Tool: Development, Testing and Transition to Operations PlanM. Whitmore, Johnson Space CenterS. S. Thaxton, Lockheed Martin
H. L. Litaker, Lockheed Martin
IntroductionThe design of space vehicles and crew habitats can greatly affect habitability in terms of physical and psychological needs and comfort, particularly during long-duration spaceflight. Currently, official human factors and habitability data collection during space operations is limited to post-mission debriefs, which often occur at least one month after the end of a mission. The long gap between observation and reporting may cause a decrease in the quality of data collected, pointing to the benefits of near real-time data collection.
The Human Factors and Habitability Assessment Tool Directed Research Project (Hab DRP), led by personnel within the Human Health and Performance Directorate at the Johnson Space Center, aims to develop tools to assist in assessing vehicle habitability. To date this has included the development of an application to provide near real-time data collection capabilities and an assessment of targeted use of video as a data collection tool. Future plans also include assessment of utilization of space within vehicles and habitats. The focus of this report is on the development, testing and transition to operations plans for the Space Habitability Observation Reporting Tool (iSHORT), an iPad-based application that allows crewmembers to document observations about their surroundings near real-time using text, photographs, video and audio recordings.
iSHORT DevelopmentiSHORT was developed beginning in 2011 and continuing through 2013 using an iterative process including user testing in the laboratory and testing during an analog mission. This iPad-based application allows crewmembers to document near real-time observations about their surroundings using text, photographs, video and audio recordings. The iSHORT interface, shown in Figure 1, allows users to create these reports in a simple integrated environment and to submit quickly and easily.
Figure 1. iSHORT interface collects text, photo, video, and/or audio data.
Analog Mission TestingData CollectionNASA Extreme Environments Mission Operations (NEEMO) provides an opportunity for researchers to work with crewmembers participating in analog missions in the Aquarius habitat, which is located on the ocean floor off of the coast of Key Largo, FL (see Figure 2). During NEEMO 16 in June 2012, each of the four crewmembers was scheduled to use iSHORT once daily throughout their 12-day mission. At the end of the mission, crewmembers completed a questionnaire regarding iSHORT, and three of the four crewmembers also participated in post-mission debriefs with the Hab DRP team.
230
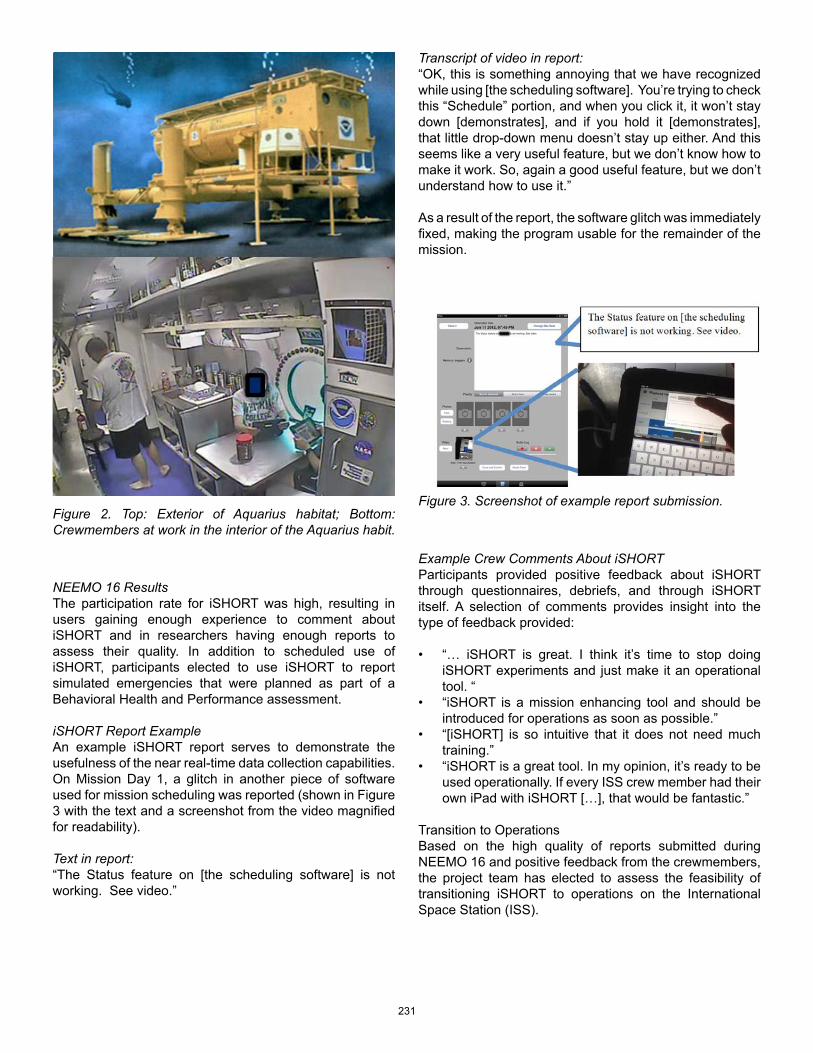
NEEMO 16 ResultsThe participation rate for iSHORT was high, resulting in users gaining enough experience to comment about iSHORT and in researchers having enough reports to assess their quality. In addition to scheduled use of iSHORT, participants elected to use iSHORT to report simulated emergencies that were planned as part of a Behavioral Health and Performance assessment.
iSHORT Report ExampleAn example iSHORT report serves to demonstrate the usefulness of the near real-time data collection capabilities. On Mission Day 1, a glitch in another piece of software used for mission scheduling was reported (shown in Figure 3 with the text and a screenshot from the video magnified for readability).
Text in report:“The Status feature on [the scheduling software] is not working. See video.”
Figure 2. Top: Exterior of Aquarius habitat; Bottom: Crewmembers at work in the interior of the Aquarius habit.
Transcript of video in report:“OK, this is something annoying that we have recognized while using [the scheduling software]. You’re trying to check this “Schedule” portion, and when you click it, it won’t stay down [demonstrates], and if you hold it [demonstrates], that little drop-down menu doesn’t stay up either. And this seems like a very useful feature, but we don’t know how to make it work. So, again a good useful feature, but we don’t understand how to use it.”
As a result of the report, the software glitch was immediately fixed, making the program usable for the remainder of the mission.
Figure 3. Screenshot of example report submission.
Example Crew Comments About iSHORTParticipants provided positive feedback about iSHORT through questionnaires, debriefs, and through iSHORT itself. A selection of comments provides insight into the type of feedback provided:
• “… iSHORT is great. I think it’s time to stop doing iSHORT experiments and just make it an operational tool. “
• “iSHORT is a mission enhancing tool and should be introduced for operations as soon as possible.”
• “[iSHORT] is so intuitive that it does not need much training.”
• “iSHORT is a great tool. In my opinion, it’s ready to be used operationally. If every ISS crew member had their own iPad with iSHORT […], that would be fantastic.”
Transition to OperationsBased on the high quality of reports submitted during NEEMO 16 and positive feedback from the crewmembers, the project team has elected to assess the feasibility of transitioning iSHORT to operations on the International Space Station (ISS).
231

Major potential roles for iSHORT on ISS include:• As-needed use at discretion of crewmembers• Stakeholders who would like to specifically request
feedback, such as experiment investigators and payload/hardware owners (requires software modifications)
• Data collection tool for in-orbit crew debriefs
Data from iSHORT could be used to contribute to the database for the Human Performance Data Project; to supplement the ISS crew comments database, which houses post-mission debrief comments; and to compile lessons learned to apply to next generation vehicle designs.
The specific aims of the Hab DRP’s iSHORT transition to operations for ISS are:1. Establish relationships with potential stakeholders for
data collected using iSHORT2. Determine software requirements, processes, and
documentation based on discussions with operations and other appropriate groups
3. Develop a plan for distributing, archiving, and analyzing data received through iSHORT
4. Propose a plan for ISS operations including considerations such as training and scheduling
5. If appropriate, pursue implementation of ISS operations plan
In addition to ISS transition to operations, the Hab DRP team will pursue opportunities to make iSHORT available as a data collection tool for activities such as ground-based flight analog missions.
Forward work for iSHORT includes coordination efforts with stakeholders and operations personnel as well as updates to the software. Updates include changes to data handling to integrate more smoothly with existing systems and databases, and also enhanced features such as the capability for crewmembers to flag reports as private, enabling the use of iSHORT for collecting sensitive data and cloud computing capabilities. The use of iSHORT as a data collection tool for selected HRP experiments on ISS is tentatively planned beginning in 2015.
232
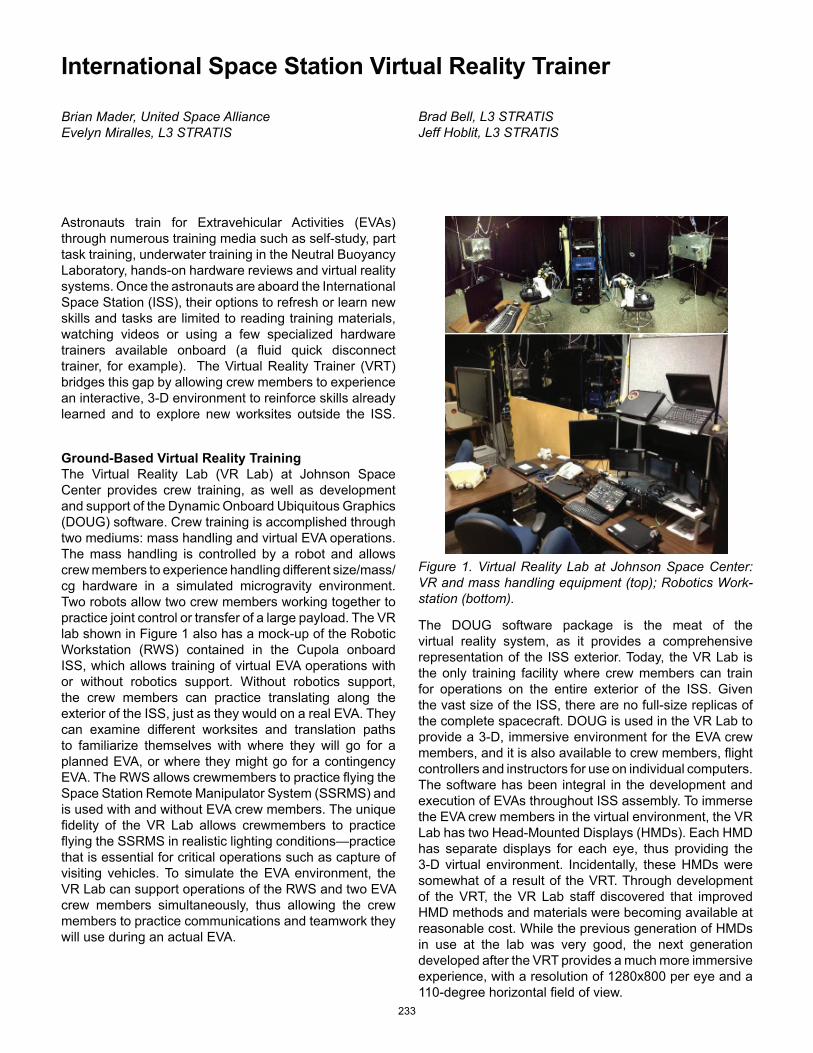
International Space Station Virtual Reality Trainer
Brian Mader, United Space AllianceEvelyn Miralles, L3 STRATIS
Astronauts train for Extravehicular Activities (EVAs) through numerous training media such as self-study, part task training, underwater training in the Neutral Buoyancy Laboratory, hands-on hardware reviews and virtual reality systems. Once the astronauts are aboard the International Space Station (ISS), their options to refresh or learn new skills and tasks are limited to reading training materials, watching videos or using a few specialized hardware trainers available onboard (a fluid quick disconnect trainer, for example). The Virtual Reality Trainer (VRT) bridges this gap by allowing crew members to experience an interactive, 3-D environment to reinforce skills already learned and to explore new worksites outside the ISS.
Ground-Based Virtual Reality TrainingThe Virtual Reality Lab (VR Lab) at Johnson Space Center provides crew training, as well as development and support of the Dynamic Onboard Ubiquitous Graphics (DOUG) software. Crew training is accomplished through two mediums: mass handling and virtual EVA operations. The mass handling is controlled by a robot and allows crew members to experience handling different size/mass/cg hardware in a simulated microgravity environment. Two robots allow two crew members working together to practice joint control or transfer of a large payload. The VR lab shown in Figure 1 also has a mock-up of the Robotic Workstation (RWS) contained in the Cupola onboard ISS, which allows training of virtual EVA operations with or without robotics support. Without robotics support, the crew members can practice translating along the exterior of the ISS, just as they would on a real EVA. They can examine different worksites and translation paths to familiarize themselves with where they will go for a planned EVA, or where they might go for a contingency EVA. The RWS allows crewmembers to practice flying the Space Station Remote Manipulator System (SSRMS) and is used with and without EVA crew members. The unique fidelity of the VR Lab allows crewmembers to practice flying the SSRMS in realistic lighting conditions—practice that is essential for critical operations such as capture of visiting vehicles. To simulate the EVA environment, the VR Lab can support operations of the RWS and two EVA crew members simultaneously, thus allowing the crew members to practice communications and teamwork they will use during an actual EVA.
The DOUG software package is the meat of the virtual reality system, as it provides a comprehensive representation of the ISS exterior. Today, the VR Lab is the only training facility where crew members can train for operations on the entire exterior of the ISS. Given the vast size of the ISS, there are no full-size replicas of the complete spacecraft. DOUG is used in the VR Lab to provide a 3-D, immersive environment for the EVA crew members, and it is also available to crew members, flight controllers and instructors for use on individual computers. The software has been integral in the development and execution of EVAs throughout ISS assembly. To immerse the EVA crew members in the virtual environment, the VR Lab has two Head-Mounted Displays (HMDs). Each HMD has separate displays for each eye, thus providing the 3-D virtual environment. Incidentally, these HMDs were somewhat of a result of the VRT. Through development of the VRT, the VR Lab staff discovered that improved HMD methods and materials were becoming available at reasonable cost. While the previous generation of HMDs in use at the lab was very good, the next generation developed after the VRT provides a much more immersive experience, with a resolution of 1280x800 per eye and a 110-degree horizontal field of view.
Figure 1. Virtual Reality Lab at Johnson Space Center: VR and mass handling equipment (top); Robotics Work-station (bottom).
Brad Bell, L3 STRATIS Jeff Hoblit, L3 STRATIS
233

Bringing VR Aboard the ISSIn today’s spaceflight environment, the main ISS assembly is complete, and the purpose of EVAs has shifted from ISS assembly to smaller, less frequent maintenance and repair tasks. As such, the crews that perform these EVAs might not have the luxury of training the tasks on the ground prior to their flight. Virtual reality provides the clear advantage of “seeing” and training tasks before they must be performed. In a critical contingency EVA scenario, where hardware must be repaired or replaced in a short timeframe, the desire to have a virtual reality lab aboard the ISS became clear. But, how do you replicate a complicated facility, which uses electromagnetic-based motion tracking, extensive computational resources and several operators to keep everything running? Personnel in the EVA, Robotics and Crew Systems Division and the Software, Robotics and Simulation Division performed trade studies to survey current commercial VR glasses, but even with recent advances in technology, none of the systems provided the desired capability; most notably, a wide field of view. The VR Lab staff went back to the drawing board to see what materials were already available for use on the ISS.
With the visual scene taken care of, the next issue became control. As mentioned above, the VR Lab uses a professional motion-tracking system, as well as custom gloves to track the location of the crew members’ heads and hands to provide feedback in the virtual environment. Launching such a system to the ISS was simply not an option due to cost, spatial constraints and more. Again, turning to the equipment already available onboard, the VR Lab staff decided to use a webcam attached to the back of the laptop screen to provide head tracking. Software embedded within the DOUG package then tracks the optical flow of the scene via the webcam to adjust the visuals as the user moves his/his head. Another item already onboard, the Simplified Aid For EVA Rescue (SAFER) hand controller, was chosen to maneuver through the visual scene. The SAFER is the “jet pack” used by EVA crew members for emergency rescue, if they were to float off of structure untethered.
Figure 2. VRT Prototype in use.
Inspiration came in an unexpected form: a laptop screen. A prototype VRT shown in Figure 2 was designed and built, looking deceptively simple. The VRT consists of a hood that attaches to the laptop screen, with an integral optics assembly. The user simply straps the laptop to their head—a method only suited for the microgravity environment on the ISS. The existing DOUG software provides the visuals, with some tweaks to split the laptop screen into left and right eye images. The optics assembly provides the lenses required to allow the user to focus on and converge the two images, thus providing a 3-D environment with a resolution of 960x1200 per eye and a 90-degree horizontal field of view.
Onboard TrainingThe initial uses of the VRT include procedure review and familiarization, in addition to SAFER proficiency training prior to EVAs. Astronauts have been using the DOUG software package onboard for EVA and robotics support throughout assembly of the ISS; the VRT takes the capability to the next level by providing an immersive environment. The VRT configuration for training on board ISS is shown in Figure 3 and Figure 4. Some ideas for future training using the VRT include integrated EVA/robotics training through networkedlaptops onboard and potential augmented reality solutions. By making use of existing ISS hardware (laptop, webcam, hand controller, DOUG software), the certification process to fly the hardware was simplified and expedited. The VRT hardware is manifested to launch on ATV4 (scheduled for June 2013), and will likely be put to use quickly by the ISS crew prior to a set of EVAs scheduled for July 2013.
Figure 3. VRT in launch/stowage configuration (above).
Figure 4. VRT in assembled configuration, attached to laptop (above).
234

The Value of Human-in-the-Loop Testing in Designing Human-Rated Spacecraft
Since 2008, the Multi-Mission Space Exploration Vehicle (MMSEV) project has incorporated a robust human centered designed philosophy. By undergoing a rigorous human-in-the-loop (HITL) testing program, each of vehicle generation’s integrated functional prototypes have provided data to answer key questions associated with that vehicle’s generation and provides design guidance for the next generation. Over these past six years, Johnson Space Center’s Habitability and Human Factors Branch within the Human Health and Performance Directorate (specifically the Usability Testing and Analysis Facility and Habitat Design Center), there have been more than 1,412 hours of HITL testing conducted on the Space Exploration Vehicle prototypes, with 1,273 design elements studied, 149 different data points collected and 1,544 hours of test video recorded.
Nathan R. Moore, Johnson Space CenterRobert L. Howard, Johnson Space Center Harry L. Litaker Jr., Lockheed MartinMaijinn Chen, Lockheed Martin
BackgroundStarting in late 2007 with a low-fidelity wooden mock-up based on a Computer Aided Design model, the MMSEV project conducted an initial functional volume HITL evaluation of 16 dynamic tasks, baselined by the project, helping participants to visualize the volume and interface with the required hardware (Figure 1).
Figure 2. Top: 2008 GEN 1A cockpit with the touch screen displays on adjustable arms. Bottom: Redesigned 2009 GEN 1B cockpit with edge keys replacing touch screens and a more robust attachment system.
Using lessons learned from the low-fidelity mockups, mission tasks and crew expectations were refined and the design cycles advanced to the first generation (GEN 1) medium-fidelity vehicle prototype. These GEN 1 designs have undergone four Desert Research and Technology Studies (DRATS) in Arizona. Crews worked and lived in the first-generation cabins for three days in 2008 and 14 days in 2009. HITL data gathered during these field trials proved to be invaluable to vehicledesigners in areas such as the cockpit with displays and controls (Figure 2), in addition to stowage.
Figure 1. Top: Second iteration low-fidelity wooden mock-up used for early HITL testing. Bottom: Medium-fidelity GEN 1 MMSEV prototype vehicle.
For example, in 2009, HITL data collected presented stowage reconfiguration for Extravehicular Activity (EVA) as a major issue affecting mission time. It was calculated to require 20 minutes per day, per crew member, just to reconfigure the stowage for an EVA, and was a significant impact to crew time for a 14-day mission. Information of this caliber was used by vehicle
Bryan A. Cloyd, MEI TechnologiesCarl S. Conlee, MEI TechnologiesEvan S. Twyford, MEI Technologies
235

test time were recorded for both tests. Analysis showed two major HITL issues: improved situational awareness (SA) around the vehicle, and design impacts affecting crew sleep in the sleep station (Figure 4). The A-pillar, center nose structure and displays caused major SA issues when confirming the vehicle’s orientation and proximity to the surface of the asteroid, especially in a nose down flight configuration. Vehicle and human factors engineers will need to investigate SA aids such as additional video cameras, radar and window hash marks. HITL data also indicated that a sleep bunk dimension for a sleeping crew member was miscalculated, built as less than the Constellation Program 70024 Revision D Human System Integration Requirements stature requirement 4.1.1.1 [HS2001V] for the largest male, causing a major redesign of the seat and bunk area. In 2013, the vehicle team started testing the GEN 2B’s internal volume in NASA’s Neutral Buoyance Laboratory under EVA suit conditions using two different gravity environments of microgravity (0-g) and a moon’s gravity (1/6-g). Preliminary findings indicated crews were able to sit in the cockpit area suited; however, they indicated more elbow and foot room were needed to make operation optimal. Using this opportunity to examine other aspects of the vehicle’s interior, the team was enlightened by the test crews that more soft mobility aids were needed to assist with translation in and out of the side hatch. Field-of-view was also tested with the crew, indicating the lower windows were vital for landing operations, while the upper windows were best for flight operations. Such timeliness of these design lessons from robust HITL data has reduced costlymodifications to the current GEN 2B vehicle design, which is scheduled for a 14-day habitability test in late 2014.
Figure 3. Top: crowded 2009 GEN 1B side hatch stowage. Bottom: 2011 GEN 2A side hatch stowage. Reconfiguration time was eliminated.
designers and human factors engineers to completely redesign the entire stowage system from a Crew Transfer Bag system to a more form-follows-function design (Figure 3). The 2010 and 2011 trials introduced crews with a significant anthropometric range and included the first female crew member. The HITL data collected enhanced the knowledge of the functional volume and the vehicle’s design to accommodate a range of human sizes while advancing system configuration knowledge. With knowledge gained from these iterative desert testing missions, the vehicle design team was able to make large numbers of important and thoughtful design decisions in an efficient manner regarding cost and time, which built a confidence level for pushing forward to develop a higher-fidelity second generation vehicle (GEN 2).
Current WorkToday, a GEN 2A prototype vehicle is the first in a series of prototypes that will get the team closer to a flight vehicle, with later versions being able to handle pressure differentials. Two HITL tests using the GEN 2A prototype took place in the fall of 2012. During these tests, four two-person crews lived and worked in the vehicle for three days. Unlike the earlier DRATS testing with the vehicle on more planetary missions, the GEN 2 vehicles are designed for deep space Near-Earth Asteroid missions. Crews performed simulated planned flight/EVA missions around the asteroid using the Reconfigurable Operational Cockpit Facility’s asteroid simulations and standard testing protocols developed by the Exploration and Analog Mission Directorate. More than 113 hours of crew mission
Figure. 4. Within the GEN 2A vehicle, the top photo shows the crew having difficulty with their SA confirming the vehicle’s orientation, while the bottom photo shows the sleep bunk length issue.
236

Speech Intelligibility Studies on the Vocera Communication
Cory Simon, Johnson Space CenterAndy Romero, Johnson Space CenterHaifa Moses, Johnson Space Center
In a speech communication system, speech intelligibility is a measure of the extent to which listeners can identify words or phrases spoken by trained talkers and transmitted by the system. However, noise is frequently an unwanted factor inherent in many environments and communication systems. On the International Space Station (ISS), crews depends on communication with the ground via telecommunication systems, with fellow crew members in other parts of the ISS via intercom systems and with fellow crew members in the same module of the ISS via face-to-face communication. The noisy environment on ISS causes comprehension problems and impacts crew time by requiring crew members to repeat messages, travel closer to other crewmembers to be heard or travel to the audio terminal units (ATUs). Therefore, the Human Systems Engineering and Development Division within the Human Health and Performance Directorate, in association with the Avionic Systems Division within the Engineering Directorate at Johnson Space Center, are currently investigating commercial-off-the-shelf (COTS) alternatives to the current ISS ATUs to provide a wireless communication system that would improve the efficiency of communication.
For both studies, three noise environments were tested: 1) A baseline environment within a noise-controlled acoustical chamber with minimal noise (sound level of approximately 20 dBA); 2) The U.S. Lab module (noise level of 58.0 dBA); and 3) The Russian Mini-Research Module 2 (noise level of 70.6 dBA). A decibel (dB) is a measure of sound level. The dB is logarithmic unit used to describe a ratio which in this case is sound pressure. Sounded measured as a decibel with an A weight, or dBA, is where a sound-level filter using the A scale is used. The A scale corresponds to the inverse of the 40 dB equal-loudness curve. By using this filter, sound meter readings are less sensitive to very high and very low frequencies. The representative noise samplings of the U.S. Lab and Russian modules were obtained by the Acoustics Office’s Noise Survey of the ISS conducted in January 2012. Investigators adopted the Orion Program’s intelligibility score requirement of at least 70 percent accuracy within the simulated ISS noise environments. The investigators employed the American National Standards Institute standard for statistical measure of speech intelligibility over communication systems: the Modified Rhyme Test (MRT), which consists of 50 six-word rhyming monosyllable word sets. The listener was shown a six-word list, and upon hearing the carrier sentence of “Please mark <test word> now” presented by the speaker, was asked to identify which of the six was uttered. Listener responses were scored as the number of words identified correctly and the number of words identified incorrectly.
Badge and the Apple iPAD
Harry L. Litaker, Jr., Lockheed MartinShao-Sheng R. Chu, Lockheed MartinRonald D. Archer, Lockheed Martin
In April and May of 2012, two studies were conducted to test the Vocera© communication system and the Apple iPAD© with headsets (Figure 1).
Figure 1. The left photo shows a user wearing the Vocera badge. The photo on the right shows the user using the iPAD with earbuds.
The first study examined the placement of the Vocera communication badge for best speech intelligibility. The listener and the talker wore the badge in one of three body locations: chest, upper arm and shoulder. The team also measured the sound level at 3.3 feet (1 meter) from the talker so that each MRT word set would be at the same sound level for both listener and talker. The order for badge locations and test noise environments were randomly assigned. The results show that the shoulder and chest locations produced higher speech intelligibility scores regardless of the noise environment. Participants indicated that even though they liked the chest location, having the Vocera badge at the shoulder location was the easiest to hear the communication, that being closest to the ear. Among the noise environments, the Russian environment led to the lowest intelligibility scores for all badge locations (Figure 2).
237

Furthermore, to evaluate overall performance with the badge, the team also collected the accuracy in which the badge recognized the human voice for all body locations and noise environments. The team concluded that the chest location was the best for accurate voice recognition. The U.S. and baseline noise levels resulted in similar accuracy levels, while the Russian noise environment resulted in decreased accuracy levels. Based on these findings, even though the shoulder was a more preferred location for users due to badge proximity to ears, the intelligibility and voice recognition data demonstrated the best overall performance with the badge at the chest location. Findings were presented to the ISS Program’s Avionics and Software Office for consideration of employing the Vocera system aboard ISS.
Figure 2. The top chart shows the speech intelligibility scores as a function of body position. The bottom chart shows the overall speech intelligibility for the body positions as a function of noise environment.
were the iPAD internal microphone/speaker, COTS iPAD earbuds and a Jawbone ERA© Bluetooth headset. Results indicated that the speech intelligibility accuracy with the iPAD internal microphone/speaker was the poorest. Accuracy results with the iPAD earbuds and Jawbone headset were similar, with the earbuds leading to somewhat better, but statistically not significant.
Even though participants indicated having stereo input with the iPAD earbuds as beneficial, the noise-cancelling feature of the Jawbone headset’s microphone, along with the wireless connection to the iPAD, made the Jawbone headset more desirable for space applications (Figure 3). The method used for these speech intelligibility studies is considered standard. To improve the ease of use of the method, an electronic version of the method was developed. The software provided the ability to quickly randomize the MRT word sets and to administer the test electronically, thus resulting in a more efficient and quicker data collection and analysis. This tool and its application are assisting NASA investigators and management in quickly assessing the speech accuracy while providing well-informed system knowledge to make “go/no go” decisions about any wireless COTS communication systems for ISS and future space missions.
Figure 3. The top chart shows the speech intelligibility scores as a function of configuration. The bottom chart shows the overall speech intelligibility scores as a function of configuration and noise environment.
Crews aboard ISS use Apple iPADs. Since there are many communication applications for the iPAD, and wireless communications show promise, the team decided to investigate the feasibility of using the iPAD as a possible wireless communication solution. Using the same method for assessing speech intelligibility as in the Vocera badge study, investigators tested three microphone/headset configurations and the iPAD with the Vocera application installed in the three ISS noise environments (baseline, U.S. and Russian). The three headset configurations
238
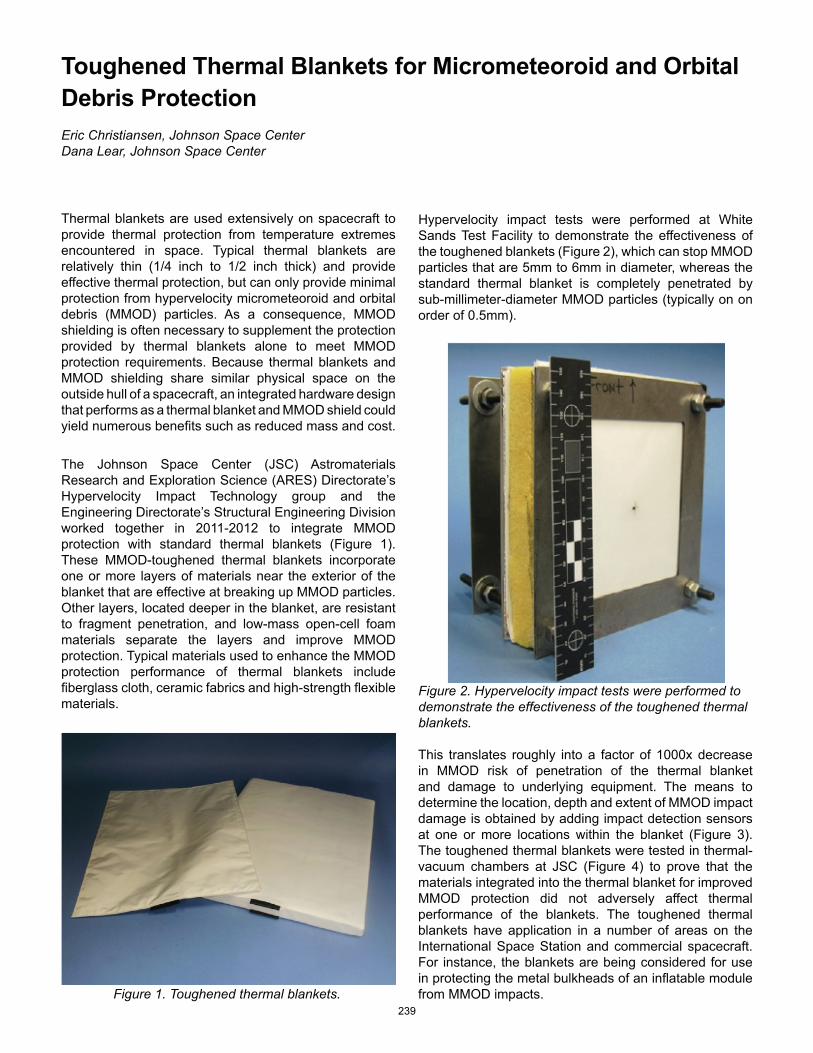
Toughened Thermal Blankets for Micrometeoroid and Orbital Debris ProtectionEric Christiansen, Johnson Space CenterDana Lear, Johnson Space Center
Thermal blankets are used extensively on spacecraft to provide thermal protection from temperature extremes encountered in space. Typical thermal blankets are relatively thin (1/4 inch to 1/2 inch thick) and provide effective thermal protection, but can only provide minimal protection from hypervelocity micrometeoroid and orbital debris (MMOD) particles. As a consequence, MMOD shielding is often necessary to supplement the protection provided by thermal blankets alone to meet MMOD protection requirements. Because thermal blankets and MMOD shielding share similar physical space on the outside hull of a spacecraft, an integrated hardware design that performs as a thermal blanket and MMOD shield could yield numerous benefits such as reduced mass and cost.
The Johnson Space Center (JSC) Astromaterials Research and Exploration Science (ARES) Directorate’s Hypervelocity Impact Technology group and the Engineering Directorate’s Structural Engineering Division worked together in 2011-2012 to integrate MMOD protection with standard thermal blankets (Figure 1). These MMOD-toughened thermal blankets incorporate one or more layers of materials near the exterior of the blanket that are effective at breaking up MMOD particles. Other layers, located deeper in the blanket, are resistant to fragment penetration, and low-mass open-cell foam materials separate the layers and improve MMOD protection. Typical materials used to enhance the MMOD protection performance of thermal blankets include fiberglass cloth, ceramic fabrics and high-strength flexible materials.
Figure 1. Toughened thermal blankets.
This translates roughly into a factor of 1000x decrease in MMOD risk of penetration of the thermal blanket and damage to underlying equipment. The means to determine the location, depth and extent of MMOD impact damage is obtained by adding impact detection sensors at one or more locations within the blanket (Figure 3). The toughened thermal blankets were tested in thermal-vacuum chambers at JSC (Figure 4) to prove that the materials integrated into the thermal blanket for improved MMOD protection did not adversely affect thermal performance of the blankets. The toughened thermal blankets have application in a number of areas on the International Space Station and commercial spacecraft. For instance, the blankets are being considered for use in protecting the metal bulkheads of an inflatable module from MMOD impacts.
Hypervelocity impact tests were performed at White Sands Test Facility to demonstrate the effectiveness of the toughened blankets (Figure 2), which can stop MMOD particles that are 5mm to 6mm in diameter, whereas the standard thermal blanket is completely penetrated by sub-millimeter-diameter MMOD particles (typically on on order of 0.5mm).
Figure 2. Hypervelocity impact tests were performed to demonstrate the effectiveness of the toughened thermal blankets.
239

Figure 3. Impact sensor film.
Figure 4. Thermal vacuum tests of toughened thermal blankets.
240

The International Space Station: A Unique Platform for Remote Sensing of Natural DisastersWilliam L. Stefanov, Johnson Space CenterCynthia A. Evans, Johnson Space Center
Assembly of the International Space Station (ISS) was completed in 2012, and it is now fully operational as a platform for remote-sensing instruments tasked with collecting scientific data about the Earth system. Remote- sensing systems are mounted inside the ISS, primarily in the U.S. Destiny Module Window Observational Research Facility (WORF), or are located on the outside of the ISS on any of several attachment points.
An immediate application of ISS remote-sensing systems is for data collection in response to natural disasters as a means of providing information for humanitarian aid to stricken countries. This activity contributes directly to the station’s “benefits to humanity” mission.
While NASA and other space agencies have had remote-sensing systems orbiting Earth and collecting publically available data since the early 1970s, these sensors are carried aboard free-flying, unmanned satellites. These satellites are traditionally placed into sun-synchronous polar orbits that allow for repeat imaging of the entire surface of the Earth with approximately the same sun illumination (typically local solar noon) over specific areas, with set revisit times. (This allows for uniform data to be taken over long time periods and enables straightforward analysis of change over time.)
In contrast, the ISS has an inclined, sun-asynchronous orbit (the solar illumination for data collections over any location changes as the orbit precesses) that carries it over locations on the Earth between approximately 52 degrees north and 52 degree south latitudes (Figure 1). The ISS is also unique among NASA orbital platforms in that it has a human crew. The presence of a crew provides options not available to robotic sensors and platforms, such as the ability to collect unscheduled data of an unfolding event using handheld digital cameras as part of the Crew Earth Observations facility and on-the-fly assessment of whether environmental conditions such as cloud cover are favorable for data collection. The crew can also swap out internal sensor systems installed in the WORF on an as-needed basis.
The ISS orbit covers over 90 percent of the inhabited surface of the Earth and allows for the ISS to pass over ground locations at different times of the day and night. This is important for two main reasons: 1) certain surface processes occur at times other than local solar noon (for example, development of coastal fog banks), making relevant data difficult to collect from traditional satellite platforms; and 2) it provides opportunities for the ISS to collect data for short-duration events, such as natural disasters, that polar-orbiting satellites may miss due to their orbital dynamics. In essence, the ISS can be “in the right place and at the right time” to collect data.
Figure 1. Representation of polar, sun-synchronous orbits (e.g., Landsat 7) and the inclined equatorial, sun-asynchronous orbit of the ISS (image center).
The International Charter, Space and Major Disasters (also known as the “International Disaster Charter,” or IDC) is an agreement between agencies of several countries to provide, on a best-effort basis, remotely sensed data of natural disasters to requesting countries in support of disaster response. In the United States, the lead agency for interaction with the IDC is the United States Geological Survey (USGS). When an IDC request, or “activation,” is received, the USGS notifies the science teams for NASA instruments with targeting information for data collection. In the case of the ISS, earth scientists in the Johnson Space Center Astromaterials Research and Exploration Science Directorate, in association with the ISS Program Science Office, coordinate targeting and data collection with the USGS. If data is collected, it is passed back to the USGS for posting on their Hazards Data Distribution System and made available for download.
241

The ISS was added to the USGS list of NASA remote-sensing assets that could respond to IDC activations in May 2012. The initial NASA ISS sensor systems available to respond to IDC activations included the ISS Agricultural Camera (ISSAC), an internal multispectral visible near-infrared wavelength system mounted in the WORF; Crew Earth Observations (CEO), where the crew collects imagery through station windows using off-the-shelf handheld digital visible-wavelength cameras; and the Hyperspectral Imager for the Coastal Oceans (HICO), a visible to near-infrared system mounted externally on the Japan Experiment Module Exposed Facility. Since May 2012 and as of this report, there have been 37 IDC activations, and ISS sensor systems have collected data for ten of these events (Figure 2).
Figure 2. Three IDC flooding events as seen from sensors on the ISS. Top left: ISSAC, flooding in Pakistan acquired Sept. 9, 2012 (scale bar is 10 km). Lower left: CEO, flooding in Krymsk, Russia, acquired July 10, 2012 (scale bar is 5 km). Right: HICO, flooding in Mozambique acquired Feb. 3, 2013 (scale bar is 20 km). Pointers indicate north for each image.
The ISSAC completed its prime mission at the end of 2012, and has been replaced in the WORF with the automated ISS SERVIR Environmental Research and Visualization System, or ISERV Pathfinder. The ISERV Pathfinder is a pointable, high spatial resolution (~ 3 meters/pixel) camera and telescope system designed primarily as a technology demonstration. Its prime mission is to provide imagery to developing nations as part of the NASA and U.S. agency for International Development SERVIR (Spanish for “to serve”) program, but can also respond to IDC activations.
The ISS is intended to be a test bed for multiple users over its lifetime, which means that no single remote-sensing system has a permanent internal or external berth. This scheduled turnover provides for development of new remote sensing capabilities relevant to both research and applied science, including disaster response, and represents a significant contribution to continuance and enhancement of the NASA mission to investigate changes on our home planet.
242
Core Operations, Mission Planning, and Analysis Spacecraft Simulation (COMPASS) ProjectChris Glenn, Johnson Space CenterBryan Evans, Johnson Space CenterMarc Abadie, Johnson Space Center
OverviewThe main objective of the Core Operations, Mission Planning and Analysis Spacecraft Simulation (COMPASS) project is to provide the Johnson Space Center (JSC) Mission Operations Directorate (MOD), Flight Dynamics Division, with 6-degree-of-freedom (DOF) trajectory simulation software that is capable of reliably and accurately simulating launch vehicles and spacecraft in the context of trajectory analysis, mission design and operations tasks. It is a next-generation tool suited for use with America’s complex space vehicles (e.g., International Space Station [ISS], Multi-Purpose Crew Vehicle [MPCV], Space Launch System), and can be extended to support other vehicles and mission classes as required.
perform their work. Inputs, outputs and functions of the simulation components can be directly accessed by the Python scripting interface, and new capability can be imported into the simulation environment at run-time, etc.
MotivationPrevious MOD simulation software used to perform similar tasks had a number of limitations, including, but not limited to: • designedtofocusononeflightphase(e.g.,ascent,
orbit or descent),• designed to focus on a particular vehicle, making it
difficulttoextendtootherscenarios,and• coded in previous-generation programming
languages that are increasing sustaining costs.
COMPASS is being designed to address these limitations through a hybrid architecture that will enable the modeling of America’s numerous future launch vehicles andspacecraft,whosefinalspecificationsarenotknown.Therefore, COMPASS must be flexible and able toaccommodate a wide variety of potential scenarios.
Design: Collaboration with the Jet Propulsion Laboratory on a Hybrid SimulationThe architecture is a so-called hybrid simulation that includes both compiled code in the C++ programming language, and interpreted code in the Python scripting language. Using Python instead of a “run-deck” or “input-deck” consisting of a specialized simulation language as the communication interface between the engineer and the simulation provides the user with a dynamic programming interface to the core simulation capabilities. This interface yields an unprecedented ability to interact withandreconfigurethesimulationasnecessaryto
Per a JSC MOD internal trade study, the way to provide the best overall value in terms of development cost, sustaining cost and capabilities to be delivered to the users was to blend a simulation framework developed by the Jet Propulsion Laboratory (JPL) with new content developed at JSC.Specifically, theCOMPASS solutionleverages the Dynamics and Real-Time Simulation (DARTS) dynamics engine and Dshell simulation framework developed by JPL. JPL’s need to support multiple missions, the same motivation that MOD shares today, drove the development of a flexible, extensiblesolution. Since the 1990s, DARTS/Dshell has been used successfully on a number of JPL-led unmanned space missions,includingMarsPathfinder,Cassini,GalileoandStardust.
In addition to leveraging the DARTS/Dshell framework to the greatest extent possible, COMPASS includes additional development required to tailor COMPASS for the types of crewed American missions that MOD will support in the future and to meet other MOD-unique needs.
Accomplishments to DateSince beginning in Fiscal Year (FY) 2011, the COMPASS projecthascompletedasoftwarerequirementsdefinitionactivity that resulted in more than 1,800 Level C (detailed) simulation requirements. The project has also completed initial proof-of-concept demonstrations of generic ascent, orbit and entry space vehicles, and more detailed 3-DOF and 6-DOF comparisons against readily available data generated by other trajectory simulations. In FY 2012 and FY 2013, preliminary versions of COMPASS were releasedwithcapabilitiesusedbyMODforascentflightphase analysis tasks, including initial design of range safety trajectories for the MPCV Ascent Abort #2 (AA-2) mission.
243

Later in FY 2013, the project will be releasing functionality to be used in support of MOD’s analysis of 6-DOF trajectories associated with items jettisoned or released from the ISS. At the end of FY 2013, legacy ISS simulation software tools will be retired, and a reduction in future sustaining costs will be realized.
Collaboration DividendsTheCOMPASSteamhascontributedsignificantlytothedevelopment of Dshell Common, which is a redesign and refactoring of JPL’s high-level simulation infrastructure. A description of the key elements in the COMPASS projectCollaboration with JPL is provided in Figure 1. The Dshell Common effort, led by JPL, is a repository of common models and functionality available for all DARTS/Dshell simulations at JPL and JSC. Dshell Common incorporates a variety of improvements over earlier versions of the DARTS/Dshell framework, including the ability to handle multiple vehicles and multiple planetary bodies in the same simulation, improved parameter handling (including units conversion) and an improved ability to handle a rangeofmethodstospecifyrun-timeconfigurations.
In addition to these specifics, MOD and JPL teamscontinue to work toward shared goals of producing a more sustainable software footprint from the agency perspective through activities such as model reuse/sharing, technology collaboration and lessons-learned discussions.
Figure 1. Description of key elements in COMPASS project collaboration with JPL.
244
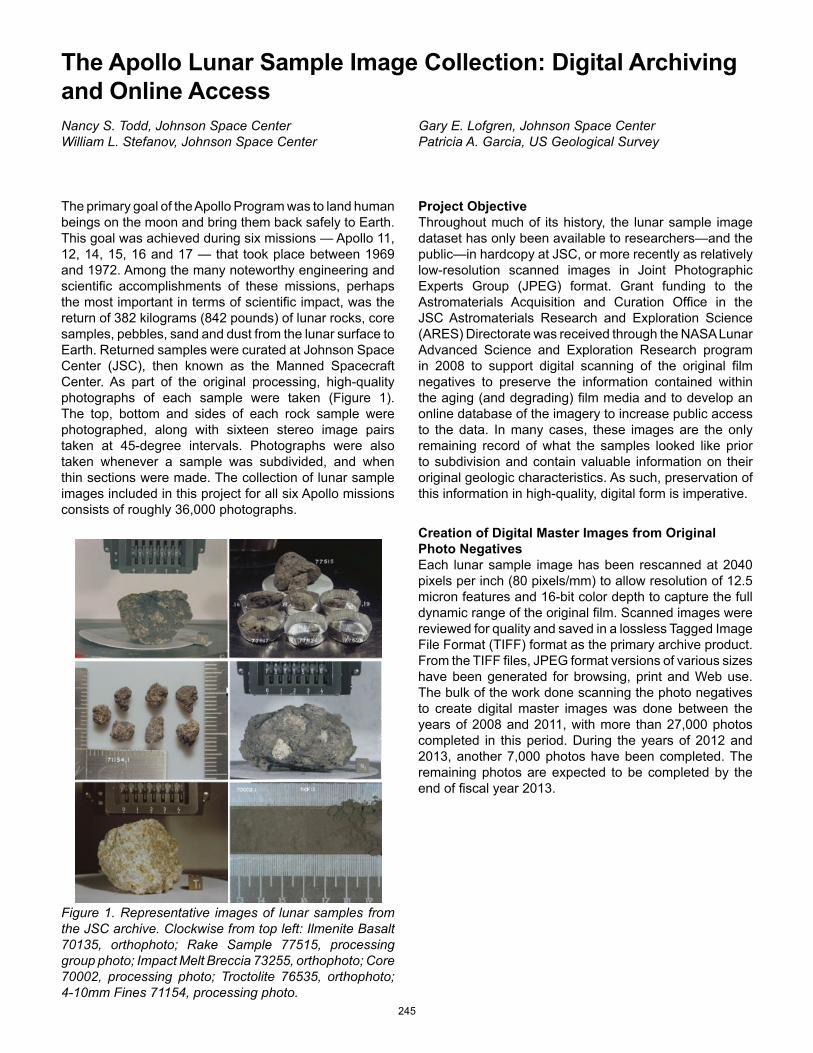
The Apollo Lunar Sample Image Collection: Digital Archiving and Online AccessNancy S. Todd, Johnson Space CenterWilliam L. Stefanov, Johnson Space Center
The primary goal of the Apollo Program was to land human beings on the moon and bring them back safely to Earth. This goal was achieved during six missions — Apollo 11, 12, 14, 15, 16 and 17 — that took place between 1969 and 1972. Among the many noteworthy engineering and scientific accomplishments of these missions, perhaps the most important in terms of scientific impact, was the return of 382 kilograms (842 pounds) of lunar rocks, core samples, pebbles, sand and dust from the lunar surface to Earth. Returned samples were curated at Johnson Space Center (JSC), then known as the Manned Spacecraft Center. As part of the original processing, high-quality photographs of each sample were taken (Figure 1). The top, bottom and sides of each rock sample were photographed, along with sixteen stereo image pairs taken at 45-degree intervals. Photographs were also taken whenever a sample was subdivided, and when thin sections were made. The collection of lunar sample images included in this project for all six Apollo missions consists of roughly 36,000 photographs.
Gary E. Lofgren, Johnson Space CenterPatricia A. Garcia, US Geological Survey
Project ObjectiveThroughout much of its history, the lunar sample image dataset has only been available to researchers—and the public—in hardcopy at JSC, or more recently as relatively low-resolution scanned images in Joint Photographic Experts Group (JPEG) format. Grant funding to the Astromaterials Acquisition and Curation Office in the JSC Astromaterials Research and Exploration Science (ARES) Directorate was received through the NASA Lunar Advanced Science and Exploration Research program in 2008 to support digital scanning of the original film negatives to preserve the information contained within the aging (and degrading) film media and to develop an online database of the imagery to increase public access to the data. In many cases, these images are the only remaining record of what the samples looked like prior to subdivision and contain valuable information on their original geologic characteristics. As such, preservation of this information in high-quality, digital form is imperative.
Figure 1. Representative images of lunar samples from the JSC archive. Clockwise from top left: Ilmenite Basalt 70135, orthophoto; Rake Sample 77515, processing group photo; Impact Melt Breccia 73255, orthophoto; Core 70002, processing photo; Troctolite 76535, orthophoto; 4-10mm Fines 71154, processing photo.
Creation of Digital Master Images from Original Photo Negatives Each lunar sample image has been rescanned at 2040 pixels per inch (80 pixels/mm) to allow resolution of 12.5 micron features and 16-bit color depth to capture the full dynamic range of the original film. Scanned images were reviewed for quality and saved in a lossless Tagged Image File Format (TIFF) format as the primary archive product. From the TIFF files, JPEG format versions of various sizes have been generated for browsing, print and Web use. The bulk of the work done scanning the photo negatives to create digital master images was done between the years of 2008 and 2011, with more than 27,000 photos completed in this period. During the years of 2012 and 2013, another 7,000 photos have been completed. The remaining photos are expected to be completed by the end of fiscal year 2013.
245

Online Access to Lunar Sample Data conducts restoration work related to past NASA missions to migrate data from outdated media or mission-specific formats to current archive media and formats. The Apollo 17 lunar sample archive structure was developed during 2012-2013 by both JSC ARES and NASA PDS personnel, and the final version released by PDS in March 2013. The archives for Apollo 11 and 12 are in the final development stages and will be released over the remainder of 2013.
The Lunar Sample Catalog and Photo Database (http://curator.jsc.nasa.gov/lunar/samplecatalog/) first published to the JSC ARES Astromaterials Curation website in November 2010, and has been extensively reworked in the past couple of years to improve and extend its functionality. A completely updated interface, which incorporates additional search options, expanded references and user-requested enhancements, was launched in the spring of 2012 and announced during the 43rd Lunar and Planetary Conference. The searchable database interface provides the ability to search for lunar sample information using a variety of criteria: sample generic number; mission; collection station or landmark; rock classification; and public displays that include the sample. Query results (Figure 2) include sample details, photographs, listings of all reference catalogs that include the sample and, where available, links to the petrographic and geochemical data for the sample in the Lunar Sample Compendium. Users may also search for sample images using photo numbers, type of photo and related sample information. Image query results can be displayed in tabular or gallery format and can be downloaded as print-quality high-resolution JPEG files.
Figure 2. Screen capture of the Lunar Sample Catalog and Photo Database interface.
For the Apollo mission archives, each sample image (full resolution TIFF) has a corresponding data product label. The data product label contains extensive metadata to allow for ingestion into databases and query searches by sample number; mission; rock type; descriptive mineralogical and petrographic terms; and cross-mission searches by lunar landmark or collection station. Scan parameters for each image are also included in the metadata. Ancillary information included with each mission archive include a mission summary, references relevant to the photographs themselves (film type, photographic technique and more) and Lunar Sample Catalogs corresponding to the sample images.
Each archive is organized according to the geologic classification and sub-classification of the samples, as well as by photo type (Figure 3). An “Extras” subdirectory contains JPEG images generated from each primary TIFF file, and a “Document” subdirectory contains the sample catalogs and other reference material.
Figure 3. Partial file directory for the Apollo 17 archive available from the NASA PDS (http://pdsimage.wr.usgs.gov/Missions/Apollo/Rock_Sample_Images/).
Future PlansCompletion of film-negative scanning is anticipated by the end of fiscal year 2013. The remaining photos will be available in the online JSC Lunar Sample Catalog and Photo Database by spring 2014. The archives of the lunar rock sample images associated with Apollo 14, 15 and 16 will be generated and delivered to the NASA PDS during the same period. Together, these efforts will preserve the unique photographic record of the original rock samples returned from the moon and provide greater access to the images – resulting in both increased scientific use and stimulation of public awareness of the Apollo missions’ legacies.
Digital Archiving of the Lunar Sample Images In concert with the development of the online database, the lunar sample image collection is being archived within the NASA Planetary Data System (PDS) (http://pds.nasa.gov/). The PDS archives and distributes scientific data from NASA planetary missions, astronomical observations and laboratory measurements. The PDS also periodically
246

Ultra-Wideband Time-Difference-of-Arrival High Resolution 3-D Proximity Tracking SystemDickey Arndt, Johnson Space CenterPhong Ngo, Johnson Space Center Chau Phan, Johnson Space Center
IntroductionA few prototype ultra-wideband (UWB) tracking systems are currently under development at Johnson Space Center (JSC). The Avionics Systems Division within the Engineering Directorate leads this effort at JSC. These systems are being studied for use in tracking of lunar/Mars rovers and astronauts during early exploration missions when satellite navigation systems (such as global positioning system) are not available. UWB technology is exploited to implement the tracking system due to its fine time resolution, which is on the order of picoseconds; its low power spectral density, which allows the system to coexist with other communication systems; and its resistance to multipath interference. The tracking algorithms such as Time-Difference-of-Arrival (TDOA) and Angle-of-Arrival (AOA) are used by these systems for various space applications, such as long-range tracking, proximity high-resolution tracking and tracking-data-aided docking. Some analysis and design efforts have been made to demonstrate the feasibility of UWB tracking systems and improve the tracking accuracy. In this report, we document a research and development effort that extends the tracking capability of the UWB TDOA proximity high-resolution tracking system from a two-dimensional (2-D) space to a three-dimensional (3-D) space. This 3-D tracking system is developed for a robotic control system in a facility called “Moonyard” at Honeywell Defense and System in Arizona under a Space Act Agreement.
Kent Dekome, Johnson Space Center Jianjun Ni, Jacobs TechnologyJohn Dusl, Jacobs Technology
Since electromagnetic waves travel with constant velocity in free space, the distance between the transmitter and the receiver is directly proportional to the propagation time of the signal. The TDOA approach determines the possible position of the transmitter by examining the difference in time at which the same signal arrives at multiple receivers. Each TDOA measurement determines that the transmitter must lie on a hyperboloid with constant range difference between the two receivers. At least three receivers are needed for a 2-D location estimation, and four receivers for a 3-D location estimation. The intersection of hyperboloids provides the location of the transmitter.
Generally, the transmitter location is determined by finding a least-squares solution to linearized versions of the TDOA equations. A Two-Stage Weighted Least Square Solution algorithm can eliminate the initialization and convergence problems. This method linearizes the TDOA equations by adding a dummy variable. The original non-linear TDOA equations are transformed into a set of linear equations with an extra variable, which requires one more receiver or sensor. Since this algorithm nearly achieves the Cramer-Rao lower bound for Gaussian TDOA noise at low noise levels, it corresponds to a nearly optimal estimator for this problem.
System DesignMany technologies have been applied to estimate the location of a radio source, such as AOA, TDOA, relative signal strength and various hybrids of them. For close-in applications, the TDOA approach has been chosen as the tracking method in this research effort since it does not require synchronization between the transmitter and receiver. Furthermore, the extremely high fidelity of the UWB timing circuitry permits very high accuracy of propagation time measurements while transmitting data. This fine time resolution feature of UWB can provide the accurate TDOA estimates required for reliable tracking system performance. The TDOA technique is discussed briefly below.
The configuration of the UWB TDOA High-Resolution 3-D Proximity Tracking System is described here. On the transmitting side, one UWB radio with an omni antenna is mounted on the top of the target; on the receiving side, a one-radio-five-antenna configuration is chosen to eliminate the synchronization issue among receivers. Five receiving antennas are connected to one UWB radio through a power combiner. The optimum antenna location configuration “twisted square” is chosen based on the previous study results. One antenna is set up at the origin of the coordinates system, while other four antennas are located on the circle of a predefined radius. This configuration places two antennas in the x-z plane and two antennas in the y-z plane. Each antenna is at a 45-degree angle in their respective planes so that they are an equal distance from each axis.
247

Field TestThe field test of the UWB TDOA High-Resolution 3-D Proximity Tracking System was conducted at Honeywell’s “Moonyard” robotic control test facility in Greendale, Ariz., in 2009. The tests setup is shown in Figure 1. One receiving antenna is located at the “origin” of the “Moonyard,” while other four are located on a circle of a radius of 20 feet. The center antenna is set at height of four feet. Among other four antennas, two are set low at a height of two feet, while two are set high at a height of six feet. The span of Z-dimension is about four feet. Figure 2 shows the target climbing up to a mound that is one terrestrial feature of this 3-D “Moonyard.”
Figure 1. UWB TDOA 3-D proximity tracking system setup at “Moonyard.”
Figure 2. The target tracked by UWB 3-D tracking system.
The UWB signals received through five receiving antennas from the transmitting antenna on the target are shown in Figure 3. The tracking algorithm uses the TDOA information generated from the receiving signal to determine the location of the target. The tracking accuracy is tested. The test data shows that the average tracking accuracy is less than one inch in the X-axis, and the Y-axis and is about two inches in the Z-axis. The tracking accuracy degradation in the Z-axis is due to the limited span of Z-dimension. Real-time trajectory runs are also tested. One of the trajectories recorded by the UWB tracking system graphic user interface is shown in Figure 4. The update rate of the tracking data is about 1 hertz (Hz).
Figure 3. UWB signals received through five receiving antennas.
Figure 4. The tracked trajectory of the target.
ConclusionA prototype UWB TDOA High Resolution 3-D Proximity Tracking System has been designed, implemented, tested and proven feasible for providing positioning-awareness information in a 3-D space to a robotic control system. Future work includes developing a scheme to enlarge the span of the Z-dimension for Z-axis tracking data accuracy improvement, expanding the tracking area through automatic gain control and using advanced synchronization techniques.
248

A Demonstration of an Autonomous Micro Spacecraft for the Return of Scientific Samples from Exploration MissionsCarlos R. Ortiz-Longo, Johnson Space Center
On the advent of exploration missions, the question of how to return scientific samples from deep-space exploration missions for laboratory analyses on Earth, is one of great importance.
Led by the Structural Engineering Division; with participation from the Aeroscience and Flight Mechanics Division; the Energy Systems Division; the Software, Robotics, and Simulation Division and the Avionics Systems Division, one of the concepts being evaluated in the Engineering Directorate is that of a small autonomous spacecraft or probe, which is released from a mother ship. Containing specific material samples, it would find its way back to a pre-determined landing site, at a pre-determined time, on the surface of the earth for recovery. Samples would be retrieved, and transported to laboratories for evaluation.
An autonomous micro spacecraft requires all of the subsystems present in all spacecraft, but to a smaller scale. Computers, software, guidance-navigation and control, thermal protection, thermal control, propulsion, robust and thermally controlled payload return canister, and deceleration and landing systems are all required for the successful and safe return of samples. All of these subsystems packaged on a spacecraft weighing no more than 100 kilograms (kg), present the engineering challenge at hand.
As an initial demonstration of this concept, the Maraia Return Capsule team at the Engineering Directorate (named posthumously for Robert J. Maraia, an engineer and mentor at the Structural Engineering Division), is developing the technology and engineering test demonstration articles necessary for eventually demonstrating a micro-spacecraft return from the International Space Station (ISS).
The concept micro spacecraft is shown in Figure 1; a graphical representation of the placement of subsystems. Visible are the propulsion tanks, payload compartment, computer and parachute compartments. It would be protected from the atmospheric re-entry environments with a thermal protection heat shield.
The concept of operations for the Maraia Re-entry Capsule demonstration mission requires the micro spacecraft to be taken to the ISS on board one of the ISS resupply spacecraft. It would, then, be prepared for release from the ISS, by placing the micro spacecraft on a release table mounted in the Japanese Experiment Module (JEM) Airlock.
Using one of the robotic arms, the release table and capsule would be oriented in a way where the capsule can be pushed away from the ISS, by using internally-stored spring energy.
The Maraia capsule would then perform guidance, navigation and control maneuvers; a de-orbit burn and find its way to the landing site where scientific samples would be recovered.
To date, the engineering teams have completed the development of the JEM airlock release table (called Cyclops). The Cyclops table is shown in Figure 2.
The Cyclops table is scheduled to be launched to the ISS in 2014. Originally thought around the Maraia Capsule mission only, the release table has been made generic as to allow release of any shape or size payloads (that fit through the JEM airlock volume) that does not fit the current JEM-Small Satellite Orbital Deployer (J-SSOD) system. The J-SSOD system only allows cube-sat configurations. Customers from the Department of Defense (DOD), Texas A&M University and The University of Texas have already signed up to have scientific payloads be released from ISS through the JEM airlock with the use of the Cyclops release table.
Figure 1. Maraia re-entry capsule.
249

Figure 2. Cyclops JEM airlock release table.
The Maraia Capsule Team has performed parachute testing at the Naval Air Warfare Center, China Lake, CA, performed small scale balloon drops from target altitudes of 100,000 feet, performed avionics, and software development, non-toxic propulsion development and is working towards a 120,000 feet, full scale capsule balloon release by the end of 2013.
The China Lake parachute tests allowed the team to down select various configurations of commercially available parachutes of the size required for the recovery of less than 100 kg payloads.
Small scale Maraia capsule shapes, equipped with instrumentation, video, and parachute recovery systems have been dropped from 73,000 feet and 105,000 feet (See Figure 3). These tests were designed to measure the basic aerodynamics of the capsule shape, and successfully tested the novel “residual gas” parachute deployment system. The parachute deployment system utilizes residual propulsion cold gases to eject the drogue parachute, which, in turn, deploys the main parachute.
Figure 3. Small-scale Maraia capsule, 105,000 foot falloon release.
The team is currently preparing two additional test articles for testing in 2013. The first is a drop test article, which will measure the maximum parachute opening dynamic pressures. This test article will be released from an aircraft or helicopter from lower altitudes in order to expose the main parachute canopy to maximum opening loads.
The other is a full-scale Maraia test article for release from 120,000 feet. This test article will have fully integrated subsystems, and parachute deployment system. It is scheduled to be tested by the end of 2013.
The Maraia Re-entry Capsule Team is laying out the technology path required for the development of micro spacecraft. These spacecraft are intended to be the foundation of a concept to utilize probes that could be released from mother exploration ships, and if returned to a low earth orbit, they can fly back to the surface of the earth with samples.
The Maraia Capsule subsystems are being integrated in an interchangeable “chassis” architecture, where the subsystems could then be used on other, more advanced aerodynamic shapes, like inflatable or mid Lift to Drag Ratio (L/D) aeroshells (See Figure 4).
Figure 4. Inflatable and Mid L/D Re-Entry Concept Vehicles.
The demonstration of the initial Maraia concept, by utilizing the ISS as a test bed, will allow for the refinement of the sample re-entry spacecraft that will support future exploration initiatives.
250

Satellite Deployment from the International Space StationOscar J. Guzman, Johnson Space Center Matthew P. Hershey, Johnson Space Center
The Space Station Integrated Kinetic Launcher for Orbital Payload Systems (SSIKLOPS) is an in-orbit, small satellite deployment system that will be used to safely deploy experiments and satellites away from the International Space Station (ISS). The SSIKLOPS project management, design and hardware development was led through the Structures Division within the Engineering Directorate. The primary advantage of using SSIKLOPS over a launch deployment system is that SSIKLOPS will enable small satellite teams to develop hardware without requiring hard launch support equipment. Launching satellites soft-stowed allows satellite providers to reduce structural complexity. In order to gain a basic understanding of the hardware, the concept of operations, description of the hardware subsystems and finally the development program will be discussed.
The SSIKLOPS system will be transferred between the pressurized, intravehicular environment and unpressurized, extravehicular environment of the ISS through the Japanese Experimental Module (JEM) airlock, located in the JEM Pressurized Module (JPM). A satellite or deployable experiment can be attached to SSIKLOPS inside the JPM by the crew and then moved to the extravehicular environment via the JEM Airlock slide table, at which point either the JEM Small Fine Arm or the Special Purpose Dexterous Manipulator transfers SSIKLOPS with its payload from the JEM to a predetermined deployment position. After payload deployment, SSIKLOPS is returned to the JEM Airlock Slide Table and transferred back inside the pressured volume of ISS.
The system is comprised of various structural and mechanical subsystems (see Figure 1), which together allow SSIKLOPS to interface with the intravehicular activity crew, JEM airlock hardware, robotic arm systems and also retain, release and launch a deployable experiment. In addition, there will be extravehicular activity (EVA)-compatible features to accommodate hazard controls of ISS hardware that allow for EVA operations.
The hardware development program was split into two phases. In the first phase, an Engineering Development Unit (EDU) was designed, built, assembled and tested. The EDU was tested in three environments: Thermal, Vibration and finally cyclic loading. Interfaces to Japan Aerospace Exploration Agency (JAXA) hardware were also successfully verified in Tsukuba, Japan in early 2013. In the second phase a Proto-flight and Qualification unit is under development with plans to apply the lessons learned from the EDU testing and refine testing for both the Proto-flight and Qualification article.
During and after hardware development a systems requirements review and preliminary design review were the major design milestones. The proto-flight article will undergo thermal and vibration testing, and the qualification unit will be subjected to cyclic operation. Like the EDU, the interfaces based on the second phase design were verified with JAXA hardware in Tsukuba, Japan.
Once it is delivered to the ISS in 2014, SSIKLOPS will provide NASA with the capability to service customers, including the Department of Defense Space Test Program, academia research projects such as the LoneStar satellite out of the Texas and Texas A&M Universities, flight experiments from Tohoku University (Japan) as well as several satellite and reentry research projects from the Johnson Space Center Engineering Directorate and other NASA centers.
Figure 1. SSIKLOPS hardware.
251

Characterizing Electrospray Ionization for Potential In-flight Water MonitoringAriel V. Macatangay, Johnson Space CenterThomas F. Limero, Wyle Science, Technology, and Engineering
William T. Wallace, Wyle Science, Technology, and Engineering Daniel B. Gazda, Wyle Science, Technology, and Engineering
Maintaining a safe, respirable atmosphere and an adequate supply of potable water are critical to ensuring astronaut health during spaceflight. To date, the majority of the air and water quality data collected during human spaceflight missions was obtained by ground analysis of archive samples. However, as mission durations and distance from Earth increase, the inherent limitation of archival sampling becomes apparent. With the retirement of the Space Shuttle, the number of opportunities to return samples from the International Space Station (ISS) has decreased dramatically. This increases the time lag between sample collection and analysis and delays implementation of corrective actions when results do not meet specifications. The situation is complicated further because the overall number of environmental samples returned had decreased due to the volume restrictions of the Russian Soyuz capsules. In order to provide air and water quality information in a time-efficient manner, it is imperative that real-time monitoring becomes more prevalent.
Ground-based analyses for volatile organic compounds (VOCs) in air and water samples often use similar instrumentation and target many of the same compounds. Therefore, it seems logical to develop a single instrument in to monitor both air and water quality during human spaceflight. A survey of the current monitors on board ISS shows that air monitors have progressed further towards providing compound-specific information inflight. As such, an alternative to building a new water monitor would be to modify air monitoring technology to analyze both air and water samples. This approach necessitates the design of an inlet system that will allow VOCs in the water to be ionized prior to entering the air analyzer.
One technique that has found wide use (in both commercial and research settings) in the past decades for ionizing macromolecules in solution is electrospray ionization (ESI). In a typical ESI source, the solution to be analyzed flows through a needle or capillary held at high voltage. As charged droplets exit the needle into a bath gas, they are attracted to a grounded counter electrode. Charge repulsion leads to a breakup of the droplets as they move towards the counter electrode until all that remains are ionized analyte molecules. A diagram of the ESI process is shown in Figure 1.
The work described in this report and performed by members of the Human Health and Performance Directorate at the Johnson Space Center focused on assembly of an ESI source and use of photography and video to determine the effects of flow rate, applied voltage and solution composition on spray formation.
Initial work on the electrospray system in January of 2012 focused on the effects different parameters have on the formation of a consistent spray under controlled conditions. For this study, a mixture of a weak acid, water and methanol was used. At lower voltages, large droplets form at the end of the needle. Once these droplets break free from the needle, they are drawn towards the collector plate due to the charge buildup on the droplet surface. As the voltage is increased incrementally, the solution at the needle orifice forms a hemisphere and small droplets are pulled from needle towards the collector plate. With a further increase in voltage, however, a cone shape can be seen emitting from the needle with a jet of liquid at the end. The jet emanating from the cone is indicative of electrospray formation. As the voltage is increased further, little change in the shape of the spray is seen until a point at which it appears that the electrospray formation degrades, presumably due to preferential discharge due to the high applied voltage. The results from these experiments are depicted in Figure 2.
Figure 1. Electrospray ionization process.
252

In order to be useful for spaceflight applications, an instrument must be low power. Therefore, while it is important to know the voltage required to form a spray, it is also important to know if other parameters can be manipulated to reduce the voltage requirements and, thereby, the power draw of the instrument. Several parameters were tested in order to assess their impact on electrospray formation. The first parameter tested was the surface tension of the test solution. Electrospray is formed when the electrostatic forces applied to the liquid via the needle overcome the surface tension of the solution. To determine the effect of surface tension on the required voltages, test mixtures with varying surface tension were prepared and their electrospray onset measured under identical conditions. Figure 3 shows the measured electrospray onset voltages plotted as a function of surface tension values. In this data, a general trend towards increased voltage requirements with increasing surface tension is clearly evident.
Figure 3. Effect of surface tension on electrospray onset voltage.
In most published electrospray research, the emitter is a fused silica capillary of very small inner diameter (I.D.). These capillaries are not ideal for spaceflight because they are very fragile. It was decided to use a stainless steel hypodermic needle that was cut to a flat end. Larger needles are stronger, mitigating the risk of breakage, but they may not provide sufficient voltage per unit area to produce an electrospray. Needles of various I.D. were tested to determine the voltage required to form an electrospray. As the I.D. increased past around 600 micrometers (µm), the voltage required to form a spray increased. However, it was unclear if decreasing the needle I.D. below 300 µm would result in a lower voltage requirement. Studies suggest that smaller needles require less voltage. To mitigate their potential for breakage in the cabin, however, a more robust engineering solution will be required.
In conventional electrospray sources, the flow rates used to introduce the test solution are generally less than 20 microliters/minute (µL/min). Figure 4 shows the effects of solution flow rate on the required electrospray onset voltage for two test solutions. As the flow rate decreased, the voltage requirement increased. In fact, in the case of water at the lowest flow rate, a true electrospray did not form even at the highest voltage provided by the power supply, suggesting that power requirements of the ESI system could be lowered by increasing the flow rate. The benefits of increased flow rate versus power requirements and instrument complexity will need to be weighed in order to determine an ideal set of ESI parameters for a flight instrument.
Figure 2. Production of electrospray.
253

In the present work, a number of experimental parameters relating to the production of ESI have been tested. It was found that ESI was possible for a variety of solutions, including pure water, if all parameters were optimized. The surface tension of the test solutions was found to play the largest role in the production of ESI. Future work will focus on producing ESI with solutions that mimic those on ISS and interfacing the ESI source with a flight-like detector. This testing would allow for a baseline understanding of the ability of ESI to ionize ISS water samples, with a long-term goal of producing a flight-ready prototype to understand the true effects of microgravity on the ESI process.
Figure 4. Effect of solution flow rate on electrospray onset voltage.
254
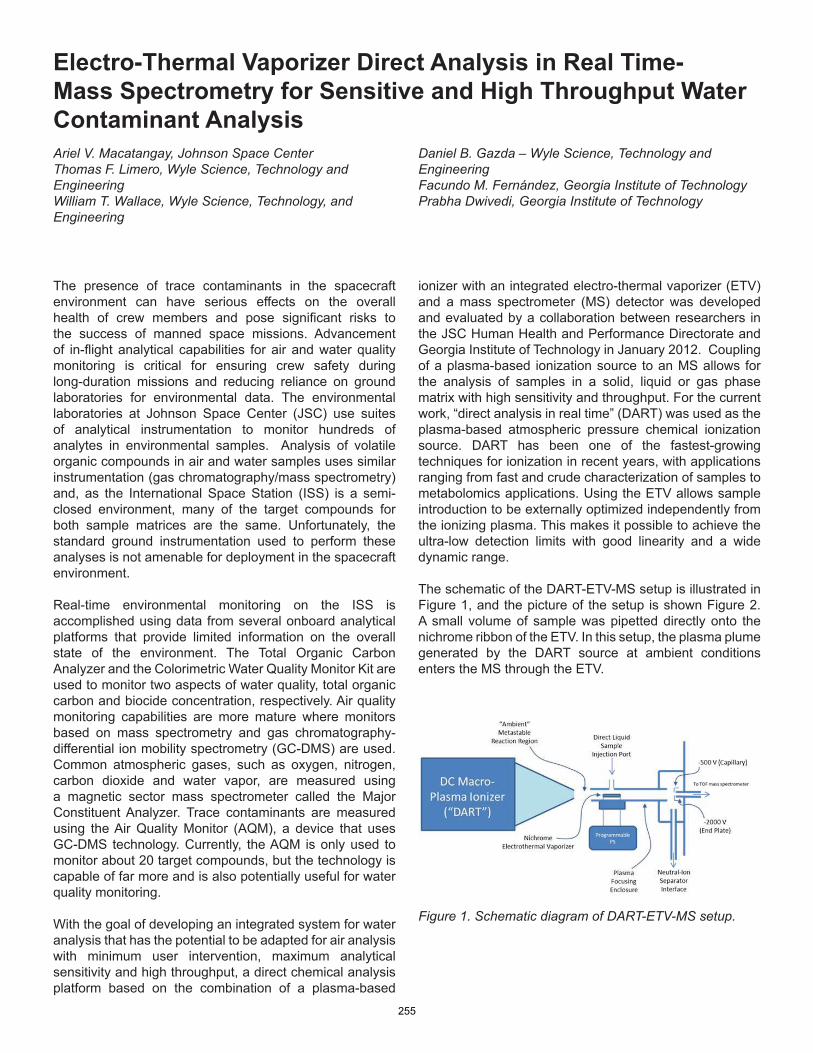
Electro-Thermal Vaporizer Direct Analysis in Real Time-Mass Spectrometry for Sensitive and High Throughput Water Contaminant AnalysisAriel V. Macatangay, Johnson Space CenterThomas F. Limero, Wyle Science, Technology and Engineering William T. Wallace, Wyle Science, Technology, and Engineering
Daniel B. Gazda – Wyle Science, Technology and Engineering Facundo M. Fernández, Georgia Institute of TechnologyPrabha Dwivedi, Georgia Institute of Technology
The presence of trace contaminants in the spacecraft environment can have serious effects on the overall health of crew members and pose significant risks to the success of manned space missions. Advancement of in-flight analytical capabilities for air and water quality monitoring is critical for ensuring crew safety during long-duration missions and reducing reliance on ground laboratories for environmental data. The environmental laboratories at Johnson Space Center (JSC) use suites of analytical instrumentation to monitor hundreds of analytes in environmental samples. Analysis of volatile organic compounds in air and water samples uses similar instrumentation (gas chromatography/mass spectrometry) and, as the International Space Station (ISS) is a semi-closed environment, many of the target compounds for both sample matrices are the same. Unfortunately, the standard ground instrumentation used to perform these analyses is not amenable for deployment in the spacecraft environment. Real-time environmental monitoring on the ISS is accomplished using data from several onboard analytical platforms that provide limited information on the overall state of the environment. The Total Organic Carbon Analyzer and the Colorimetric Water Quality Monitor Kit are used to monitor two aspects of water quality, total organic carbon and biocide concentration, respectively. Air quality monitoring capabilities are more mature where monitors based on mass spectrometry and gas chromatography-differential ion mobility spectrometry (GC-DMS) are used. Common atmospheric gases, such as oxygen, nitrogen, carbon dioxide and water vapor, are measured using a magnetic sector mass spectrometer called the Major Constituent Analyzer. Trace contaminants are measured using the Air Quality Monitor (AQM), a device that uses GC-DMS technology. Currently, the AQM is only used to monitor about 20 target compounds, but the technology is capable of far more and is also potentially useful for water quality monitoring. With the goal of developing an integrated system for water analysis that has the potential to be adapted for air analysis with minimum user intervention, maximum analytical sensitivity and high throughput, a direct chemical analysis platform based on the combination of a plasma-based
ionizer with an integrated electro-thermal vaporizer (ETV) and a mass spectrometer (MS) detector was developed and evaluated by a collaboration between researchers in the JSC Human Health and Performance Directorate and Georgia Institute of Technology in January 2012. Coupling of a plasma-based ionization source to an MS allows for the analysis of samples in a solid, liquid or gas phase matrix with high sensitivity and throughput. For the current work, “direct analysis in real time” (DART) was used as the plasma-based atmospheric pressure chemical ionization source. DART has been one of the fastest-growing techniques for ionization in recent years, with applications ranging from fast and crude characterization of samples to metabolomics applications. Using the ETV allows sample introduction to be externally optimized independently from the ionizing plasma. This makes it possible to achieve the ultra-low detection limits with good linearity and a wide dynamic range. The schematic of the DART-ETV-MS setup is illustrated in Figure 1, and the picture of the setup is shown Figure 2. A small volume of sample was pipetted directly onto the nichrome ribbon of the ETV. In this setup, the plasma plume generated by the DART source at ambient conditions enters the MS through the ETV.
Figure 1. Schematic diagram of DART-ETV-MS setup.
255

This vaporizer can be heated in a controlled manner through the programmable power supply that generates pulses with a short duration. During each pulse the water is vaporized, and target analytes are volatilized and exposed to the plasma ionizing stream, generating an ionic signal pulse with amplitude proportional to the deposited analyte amount. The gas flow of the DART source and the vacuum provided by the inlet of the MS serve to transmit the ions into the MS for detection and identification. Typical DART-ETV-MS spectra of a blank and acetaminophen, in both positive and negative ion detection mode, are depicted in Figure 3.
Figure 2. Picture of the DART-ETV-MS setup (left). An enlarged picture of the ETV is shown on the right.
Figure 3. Mass spectra of background and acetaminophen ions in both positive and negative mode.
During the acetaminophen measurement, the programmable power supply to the ETV was programmed to ramp the current output in three stages. This current profile was selected to facilitate desolvation, vaporization of the analyte and decontamination of the sample spot. This final decontamination step is important to ensure that no cross contamination occurs between samples. The temperature and duration of heating can be varied for specific applications depending on the analyte of interest. For a spaceflight application, these parameters could be set to accommodate a wide range of compounds rather than being optimized for a specific analyte.
The applicability and potential of DART-ETV-MS for water analysis was investigated using a number of target compounds diluted in water. Here, the focus is on methylethyl ketone (MEK), which is occasionally found at trace amounts in ISS air and is routinely detected in ISS condensate and wastewater. Figure 4 shows a typical MS spectrum and the extracted ion chromatograms of each tentatively identified response ion. The background spectrum is shown in A, the background-subtracted spectrum of MEK (100 millimolar (mM) solution in water) is shown in B, and C shows the extracted ion chronograms of prominent MEK response ions at mass-to-charge ratio (m/z) values of 57.03, 73.06, 90.09, 145.12 and 127.11 dalton (Da). Proposed formulas that correspond with the masses of the identified ions are also shown in C.
256

Using MEK as a test compound, it has been shown that using ETV as a sampling system for the analysis of water by DART-MS is possible. The use of ETV to transfer liquid and solid phase samples into the gas phase, and permit gas-phase ionization by ambient-pressure ionization sources, expands the usage of plasma-based sources such as DART to environmental applications and has illustrated the potential applications in spaceflight. Although adapting ETV for spaceflight will require miniaturization of the plasma source, thereby making it currently unfeasible for ISS, the development of this type of source will potentially expand analytical capability available for manned spaceflight beyond environmental monitoring. Miniaturizing the plasma source would also reduce the flow of carrier gas, which will minimize the use of consumables in flight. A mini-plasma ionization source, coupled to an ETV, can lead to a true matrix-independent analyzer capable of analyzing any solid, liquid or gas.
Figure 4. (A) Background. B) MS spectrum of methyl ethyl ketone (MEK). (C) Ion chromatograms of MEK ions.
257

Software Toolkit for Ethernet Lab-Like Architecture (STELLA)Michael J. Coats, Johnson Space Center Amanda Rice, Boeing
The International Space Station (ISS) is a remarkable achievement recognized the world over. As a National Laboratory facility, the ISS is providing new opportunities for government agencies, academia, commercial companies and our international partners to pursue breakthrough discoveries in the areas of biology, human health, physical science/materials, Earth sciences, and space exploration. To this end, the Software Toolkit for Ethernet Lab-Like Architecture (STELLA) was developed to create an innovative software application that would transform the way researchers communicate with their payloads on the International Space Station.
The STELLA software development project, jointly led by the NASA ISS Avionics and Software and the Research Integration Offices, has been supported by personnel from The Boeing Company and Barrios Technology, Inc. The team’s innovation, technical skill and commitment led to the successful release of STELLA 1.0 and its subsequent flight demonstration on board the ISS in May of 2010. NASA, along with Boeing, continues to support internal development efforts aimed at enhancing and expanding STELLA’s performance. Due to the success of STELLA 1.0 and its broad researcher appeal, NASA now provides STELLA as a standard software interface.
The majority of ISS research is conducted in payloads residing in one of the eight Expedite the Processing of Experiments to the Space Station (EXPRESS) payload racks. Each rack provides foundational resources and services to the payload, such as power, data, and communication interfaces. In the past, Payload developers were faced with the complex task of compliance to the command and data handling (C&DH) interfaces/protocols between experiment, rack, station, and ground subsystems in order to successfully execute science. For schedule and cost-constrained organizations, these efforts were complex, time-consuming, costly, and typically beyond their core expertise. With STELLA, the payload developer can now focus their expertise on conducting research while operating in an environment equivalent to their terrestrial-based facilities.
STELLA has effectively “opened the box” to non-NASA researchers who are typically unfamiliar with the complexity of the ISS C&DH infrastructure and the associated communication protocols required for successful uplink and downlink computer-based communications. A prominent commercial payload developer estimated that a “from scratch” payload software development effort could cost from $500,000 to $2 million dollars. The simplicity of STELLA integration mitigates this cost and allows focused
attention on the payload and its scientific objective thereby increasing the potential research return. Streamlining the connection to the ISS command and data handling environment facilitates this focus.
The STELLA software has become a core capability by integrating common and general-purpose software tools, and providing both the on-orbit and ground services to easily interface with ISS C&DH systems. All services are server-based and use well known industry standard communication protocols. Software servers handle communication to-and-from the ISS payload (such as command file uplinks, telemetry, health and status, and file downlinks). The payload developer simply develops applications that communicate via these standard protocols that interface to STELLA servers. The basic philosophy of the STELLA architecture has been, “If a payload developer can communicate and control a payload via standard protocols in a terrestrial laboratory, STELLA’s servers will bridge the gap between the developer’s ground and on-orbit segments with the complexities of the ISS C&DH system.”
STELLA’s value is best summarized by the researchers at the University of Tennessee who report that STELLA has logically made the ISS computer and the ground-based lab computer the same computer as far as communication is concerned. Additionally, when the lab program on ISS writes data files (or any other kind of file), the lab computer on the ground can see the file directory and open those files on the ground computer. The STELLA interface, which is totally transparent to the end user, allows the researcher to focus on what they know well, and allows them to do this quite distant experimentation using tools with which they are already familiar.”
STELLA 1.0 completed its final testing in the early spring of 2012 and was approved for use as a NASA supported Space Station application in December of 2012. NASA supports not only our domestic payload developers but our international partners as well. As of May 2013, just six months after being put on contract to integrate STELLA users, Boeing has ten committed STELLA users (shown below) and is consulting with six evaluation users for future integration. Boeing is currently under contract to NASA to integrate STELLA users through 2015. Without question – the STELLA software has achieved the goal of making payload software integration easier, simpler, and less costly – returning the researcher’s focus to new discoveries and cost-efficient utilization of the ISS as a true National Laboratory facility.
258
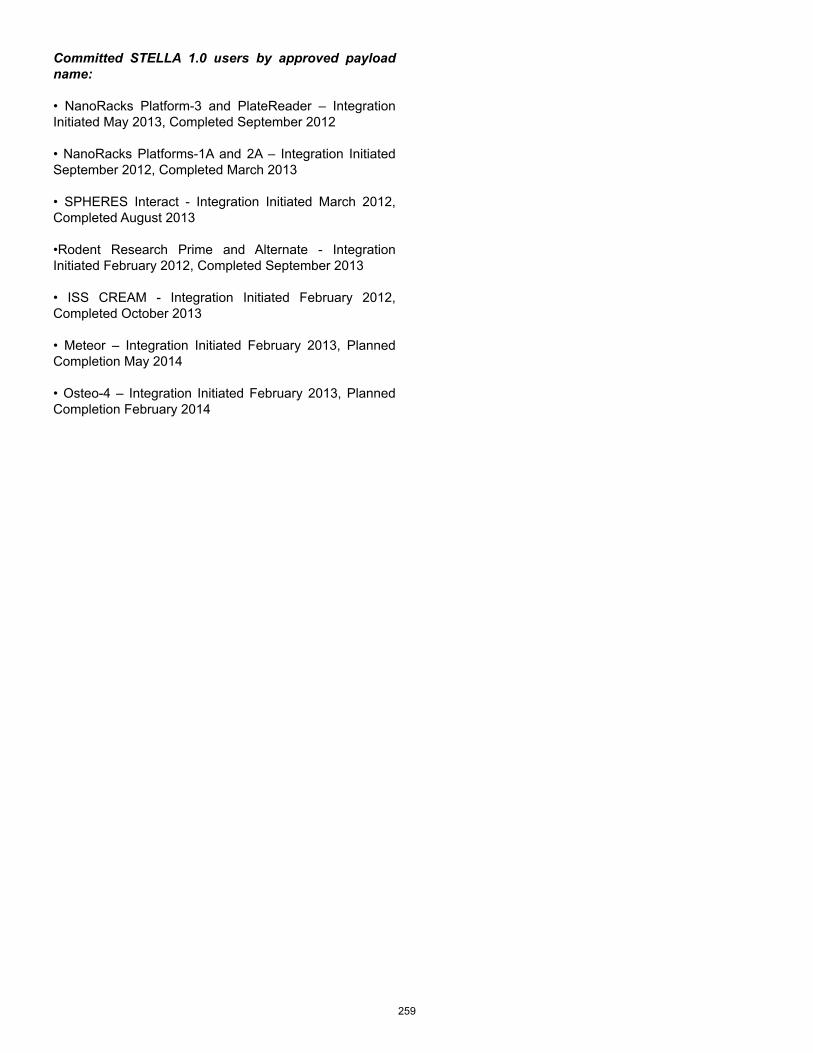
Committed STELLA 1.0 users by approved payload name:
• NanoRacks Platform-3 and PlateReader – Integration Initiated May 2013, Completed September 2012
• NanoRacks Platforms-1A and 2A – Integration Initiated September 2012, Completed March 2013
• SPHERES Interact - Integration Initiated March 2012, Completed August 2013
•Rodent Research Prime and Alternate - Integration Initiated February 2012, Completed September 2013
• ISS CREAM - Integration Initiated February 2012, Completed October 2013
• Meteor – Integration Initiated February 2013, Planned Completion May 2014
• Osteo-4 – Integration Initiated February 2013, Planned Completion February 2014
259

International Space Station High-Rate Communications Upgrades
Penny Roberts, Johnson Space CenterGary Cox, Johnson Space Center
Sundeep Kwatra, Johnson Space Center
The International Space Station (ISS) has greatly enhanced its communication and data distribution system to provide a first-class payload data handling system. These enhancements, led by the ISS Avionics and Software Office, use state-of-the-art technology, including on-orbit field programmable gate arrays (FPGAs), commercial standards for audio and video encoding and common internet protocols. As a result, the ISS has further opened its doors to its principal users, the payload and science community, while simultaneously improving communications capabilities for the onboard crew and operators. This article describes two of these enhancements and the doors they opened.
Integrated Communications UnitThe Integrated Communications Unit (ICU) upgrade, installed on April 2, 2013, is central to the payload communications link. It provides the path for all payload data to the ground and now provides multiple paths for two-way communications between the payload researcher on the ground and the crew members and the onboard payload. The ICU also provides state-of-the-art video encoding and more video channels for simultaneous viewing of multiple payload operations. The overall improvements to ISS provided by the ICU upgrade are listed in Table 1.
The ICU is a powerhouse of electronics. It contains 1) a reprogrammable, high-speed digital modem that supports two-way high-rate communications (300 megabits per second [Mbps] downlink, 25 Mbps uplink) between the ISS and the ground via the Tracking and Data Relay Satellite System; 2) over 300 Gigabytes of solid state, nonvolatile memory with simultaneous read and write access speed exceeding 500 Mbps for capturing data and recording video during communications outages; 3) multiple channels of audio and video using commercial standard codecs running on in-situ, reprogrammable FPGAs; 4) a gigabit Ethernet network card for receiving data from the many ISS experiments and internally routing it to the modem; and 5) five 1 gigahertz (GHz) single board computers that are used to control the data flow, multiplex and demultiplex data to and from the more than 100 different ISS sources and destinations, format the data for transmission and control the configurations of each of the functions within the box.
Table 1. Overall ICU improvements to ISS.
Open communications are critical to the success of any human endeavor. The ICU upgrade has made “phone” calls easier between the experiment investigators and the crew members onboard the ISS. The ICU provides two more space-to-ground audio channels, which enable the crew members to talk with investigators on the ground without interfering with the day-to-day communications between the control centers and the crew.
260

April 12, 2013, marked a first in human spaceflight: four different experimenters on the ground simultaneously talked with four crew members onboard over four different audio channels at the same time.
Additionally, the increased forward and return link data rates and streamlined data-handling techniques improved Internet phone calls between the crewmembers and their families and co-workers on the ground.
ICU, combined with numerous ground-based upgrades, enabled many leaps forward in the video world. Video is the experimenter’s eyes into the onboard operations. Three of these leaps are tied to the existing video systems onboard the vehicle: 1) more simultaneous video channels to ground (from 4 to 6); 2) H.264/MPEG-4 video compression with MPEG-2 Transport Stream video formatting providing higher resolution video while consuming less bandwidth; and 3) high-speed downlink of recorded video from the ISS to the ground users. These new video capabilities make it possible for more simultaneous, video-based payload operations.
The video and audio compression algorithms are all resident within a fully on-orbit programmable FPGA. The same holds true for the forward and return link modulation schemes in the modem. This allows for upgrades to more efficient algorithms, potentially leading to higher quality audio/video and higher data rates without changing hardware. When the payload data communications demand grows, the ICU can grow with it without taking down the payload data link.
Expansion of the ISS’s Ethernet communications was critical for enabling future payloads to use readily available technology. The ICU incorporates Gigabit Ethernet interfaces to both automated payload switches and provides an additional station Local Area Network (LAN) channel for future payload data communications.
The upgraded Ku-Band architecture incorporated additional robustness to ensure payload data and video requirements could be met if failures of any component along the path were to occur. An additional string of external hardware was integrated into the vehicle, which interfaces to two independent ICUs. Additionally, the ICU internal design separates each unique function and allows for each of these functions to operate independently.
This adds to the system robustness in case there is a failure of any one of these functions. Finally, the ICU design supports on-orbit card-level replacement and programming. Future upgrades and repairs are possible through replacement of a card (versus the entire unit) and via reprogramming.
Improved Payload Ethernet Hub Gateway The improved Payload Ethernet Hub Gateway (iPEHG) is an upgrade to the existing PEHG, which serves as hubs for payload traffic on the ISS. The PEHG is used to for two primary purposes in the ISS data architecture: 1) provide Ethernet connectivity for payloads; and 2) provide a gateway for payload data downlink.
The new iPEHG, installed on May 1, 2013, updates the Ethernet interface for the payloads from 10 to 100 Mbps and extends this improvement through to the fiber gateway interface. It also changes the basic design from a hub to a switch-based design, effectively eliminating the all the previous bottlenecks. In addition, with the new iPEHG and updated cabling, more Ethernet ports (up to 23, versus previously 13 to 20) are made available.
The new iPEGH is designed around a newer switch-fabric technology. The switch fabric allows for full-duplex operation and virtually eliminates any collisions and re-transmissions. In addition, the new iPEHG supports 100 Mbps Ethernet connections. These changes also span to the gateway function, which now supports the full 100 Mbps bandwidth of the fiber optic connection. The result is a more than a tenfold increase in data throughput for payloads. Finally, the new iPEGH/ICU combination adds an enhanced capability for the payloads and their operators. A new forward link access capability to the payloads has been added, allowing the payload scientists more direct control over their experiments.
SummaryThese new changes to the ISS high-rate communications system have opened up the possibilities for new and existing payloads. Higher data throughput, audio and video have all enhanced the ISS and its place as an orbiting scientific laboratory. These new additions use today’s technology to meet the demands of current and future payload operations.
261
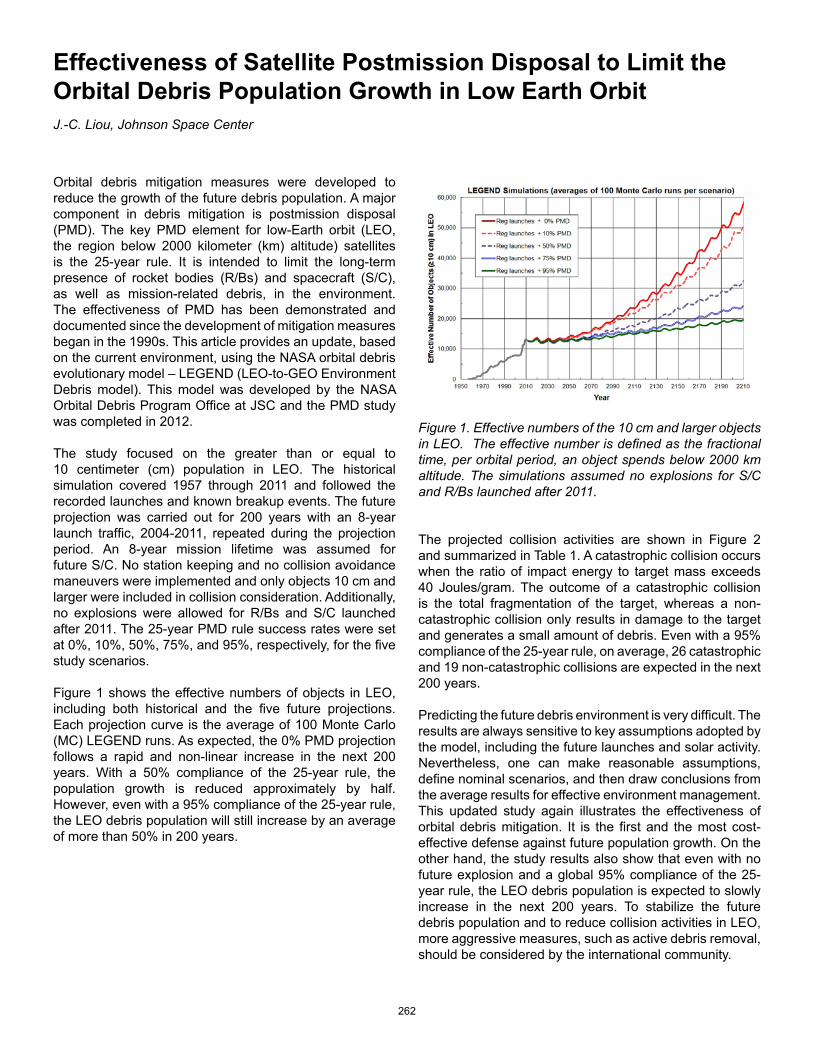
Effectiveness of Satellite Postmission Disposal to Limit the Orbital Debris Population Growth in Low Earth OrbitJ.-C. Liou, Johnson Space Center
Orbital debris mitigation measures were developed to reduce the growth of the future debris population. A major component in debris mitigation is postmission disposal (PMD). The key PMD element for low-Earth orbit (LEO, the region below 2000 kilometer (km) altitude) satellites is the 25-year rule. It is intended to limit the long-term presence of rocket bodies (R/Bs) and spacecraft (S/C), as well as mission-related debris, in the environment. The effectiveness of PMD has been demonstrated and documented since the development of mitigation measures began in the 1990s. This article provides an update, based on the current environment, using the NASA orbital debris evolutionary model – LEGEND (LEO-to-GEO Environment Debris model). This model was developed by the NASA Orbital Debris Program Office at JSC and the PMD study was completed in 2012.
The study focused on the greater than or equal to 10 centimeter (cm) population in LEO. The historical simulation covered 1957 through 2011 and followed the recorded launches and known breakup events. The future projection was carried out for 200 years with an 8-year launch traffic, 2004-2011, repeated during the projection period. An 8-year mission lifetime was assumed for future S/C. No station keeping and no collision avoidance maneuvers were implemented and only objects 10 cm and larger were included in collision consideration. Additionally, no explosions were allowed for R/Bs and S/C launched after 2011. The 25-year PMD rule success rates were set at 0%, 10%, 50%, 75%, and 95%, respectively, for the five study scenarios.
Figure 1 shows the effective numbers of objects in LEO, including both historical and the five future projections. Each projection curve is the average of 100 Monte Carlo (MC) LEGEND runs. As expected, the 0% PMD projection follows a rapid and non-linear increase in the next 200 years. With a 50% compliance of the 25-year rule, the population growth is reduced approximately by half. However, even with a 95% compliance of the 25-year rule, the LEO debris population will still increase by an average of more than 50% in 200 years.
The projected collision activities are shown in Figure 2 and summarized in Table 1. A catastrophic collision occurs when the ratio of impact energy to target mass exceeds 40 Joules/gram. The outcome of a catastrophic collision is the total fragmentation of the target, whereas a non-catastrophic collision only results in damage to the target and generates a small amount of debris. Even with a 95% compliance of the 25-year rule, on average, 26 catastrophic and 19 non-catastrophic collisions are expected in the next 200 years.
Predicting the future debris environment is very difficult. The results are always sensitive to key assumptions adopted by the model, including the future launches and solar activity. Nevertheless, one can make reasonable assumptions, define nominal scenarios, and then draw conclusions from the average results for effective environment management. This updated study again illustrates the effectiveness of orbital debris mitigation. It is the first and the most cost-effective defense against future population growth. On the other hand, the study results also show that even with no future explosion and a global 95% compliance of the 25-year rule, the LEO debris population is expected to slowly increase in the next 200 years. To stabilize the future debris population and to reduce collision activities in LEO, more aggressive measures, such as active debris removal, should be considered by the international community.
Figure 1. Effective numbers of the 10 cm and larger objects in LEO. The effective number is defined as the fractional time, per orbital period, an object spends below 2000 km altitude. The simulations assumed no explosions for S/C and R/Bs launched after 2011.
262

Figure 2. Cumulative numbers of catastrophic collisions predicted by the 5 projection scenario. Each curve represents the average of 100 MC runs.
Table 1. Projected collision activities for the next 200 years in LEO. All collisions are for 10 cm and larger objects. The numbers are averages of 100 MC runs.
263

Rudimentary Cleaning Compared to Level 300AChristina Y. Piña Arpin, White Sands Test FacilityJoel Stoltzfus, White Sands Test Facility
Contamination in oxygen-enriched environments can act as both a fuel and/or an ignition source. To mitigate risks associated with oxygen systems, contamination control is necessary. One form of contamination control is precision cleaning, in which a value for the level of cleanliness is assigned to specific hardware. In aerospace use, a risk assessment is typically performed to determine the level of cleanliness required to operate a system or hardware safely. Aerospace operations are typically able to clean and assemble hardware in a certified clean room; however, some situations such as field operations require maintaining and cleaning oxygen system hardware to prevent fire hazards, without the availability of a precision cleaning facility.
unit to maintain cleanliness. A third party, trained to detect any hardware anomalies, verifies the cleanliness of the hardware using an otoscope and a magnifying fluorescent inspection lamp with a 5-diopter lens. To pass visual inspection, no particles or fibers can be visible, no signs of previous contamination can be detected, and no signs of rust, discoloration, or water spots can be seen.
Precision CleaningPrecision cleaning is a three-part process typically performed by WSTF in compliance with NASA JPR 5322.1G and American Society for Testing and Materials (ASTM) G93, Standard Practice for Cleaning Methods and Cleanliness Levels for Material and Equipment Used in Oxygen-Enriched Environments. The first part of the process is pre-cleaning, followed by visual inspection, and ending with cleanliness verification. Pre-cleaning is a detailed cleaning performed in a controlled shop environment and utilizes a series of ultrasonic baths that create implosions and agitating contaminants while the hardware is immersed. Each bath contains either a surfactant, mild alkaline, or acid solution. The type of solution used depends on its compatibility with the hardware. Between baths a technician manually agitates and provides mechanical cleaning assistance of the contaminants on the hardware. Once the hardware is cleaned, rinsed, and dried using a nitrogen-purged oven, it is passed on to another individual for visual inspection. The hardware in the visual inspection area is kept under a high-efficiency particulate air (HEPA) filtered downflow
While developing rudimentary cleaning procedures that could be used in the field, two important questions came up: What effect does the personnel cleaning the equipment have on the hardware’s end cleanliness level, and what level of cleanliness could be realistically achieved? A study performed by the Technical Services Section at NASA White Sands Test Facility (WSTF) characterized the cleanliness level achievable when using a basic cleaning process, and compared results to NASA Johnson Space Center (JSC) Procedural Requirements (JPR) 5322.1G, Contamination Control Requirements Manual, Level 300A.
Once the hardware passes visual inspection, it is sent to the ISO (International Organization for Standardization) Class 5 clean room for final cleaning and cleanliness verification. This area requires personnel to wear full clean room garments to be worn over street clothes consisting of coveralls, hood head cover, boot covers, and gloves. Final cleaning is performed by rinsing the hardware with a solvent. To verify cleanliness of the hardware, a measured amount of the rinse solvent is captured for analysis in accordance with ASTM G93-03 Type II Quantitative Tests (Solvent Extraction Tests 1 and 2). The rinse solvent is passed through a membrane filter, which is used to perform the particle count in accordance with ASTM F312-08, Standard Test Methods for Microscopical Sizing and Counting Particles from Aerospace Fluids on Membrane Filters. The solvent is evaporated and the remaining nonvolatile residue (NVR), which commonly consists of residual oils or greases, is gravimetrically measured in accordance with ASTM F331-05, Standard Test Method for Nonvolatile Residue of Solvent Extract from Aerospace Components (Using Flash Evaporator). Precision cleanliness levels are a quantitative measurement, where the count and size of particles are indicated by a number (the smaller the number the cleaner the part) and the amount of NVR per square meter of hardware is indicated by a letter (e.g., “A” is cleaner than “B”). The chart in Table 1 describes the cleanliness levels as specified in NASA JPR 5322.1G.
Table 1. Cleanliness Levels (per NASA JPR 5322.1G).
264

This study, which began in 2010, measured the effectiveness of basic shop cleaning. The study concluded in 2012 with analysis of data by the Component Services Section and the Oxygen Group at WSTF. Results from the study were published by ASTM in September 2012.
To determine the effectiveness of basic shop cleaning, three items representing parts of an oxygen system with maximum operating pressure of 2000 psi were contaminated: a metal plate, valve body, and metal oxygen bottle. The contaminants chosen were representative of materials that could contaminate the system during normal use: oil, lubricant, metal shavings/powder, sand, fingerprints, tape, lip balm, and hand lotion. The cleaning process used hot water, soap, various brushes, gaseous nitrogen, a water nozzle, plastic trays, scouring pads, and a controlled shop environment.
Test ArticlesThree identical sets of hardware were assembled, each containing three items chosen to represent parts of a typical oxygen system: an aluminum plate 6 x 6 x 0.125 in. (15 x 15 x 0.3 cm), a cast stainless steel 0.25-in. (0.6-cm) ball valve body, and small oxygen storage bottle (Figure 1).
ContaminantsThe contaminants chosen represented materials that could contaminate the system during use or be found in a field shop: oil, lubricant, metal shavings/powder, sand, fingerprints, tape, lip balm, and hand lotion (Figure 2).
following the recommended cleaning process and using only the supplied set of tools (Figure 3). Once the individual declared their test articles to be cleaned, the test articles were sampled by a WSTF clean room technician (not in a test group) to measure the amount of particulate and NVR.
ConclusionTest results indicated that the achievable cleanliness level was independent of the technical knowledge or proficiency of the personnel cleaning the items. Each of the groups achieved similar success rates. This suggested the results were not dependent on experience, technical training, or prior knowledge of oxygen hazards, that the instructions were adequate to produce a consistent result, and that special training did not produce improved cleaning results.
Results also showed that achieving a Level 300 particle count was more difficult than achieving a Level A amount of NVR. With proper cleaning procedures that incorporate contamination control principles, a cleanliness level of 300A is possible to quantitatively achieve in a field shop environment; however, the consistency of cleanliness parameters met cannot compare to those achieved in a production precision cleaning facility. With joint understanding of both oxygen and contamination control, it can be determined if field cleaning meets the requirements to maintain a safe oxygen system.
Figure 1: Typical oxygen system components.
Test subjects were classified into three groups: engineers from the WSTF Oxygen Team with technical knowledge of oxygen hazards and the importance of using clean hardware in oxygen systems; professional clean room technicians with significant precision cleaning experience; and a group with no previous knowledge of oxygen or precision cleaning. The three individuals in each test group were provided with a set of identical cleaning supplies, a cleaning procedure, and a set of contaminated test articles. Each individual cleaned their three items
Figure 2: Typical sources of oxygen system contamination.
Figure 3: Oxygen system cleaning tools.
265

Colorimetric Detection and Decontamination of Ionic MonopropellantsBenjamin Greene, White Sands Test FacilityMark B. McClure, White Sands Test FacilityClaudia J. Galvan, New Mexico State University
NASA White Sands Test Facility (WSTF), other NASA centers, the United States Air Force (USAF), Department of Defense (DOD), and commercial industries work with candidate spacecraft ionic monopropellants that have potential for improved performance and reduced toxicity over traditional hypergolic propellants. Fluids and residues resulting from spills or leaks of liquid propellants require fast and easy detection and decontamination methods both for personal safety and to protect the environment. In 2012, visual colorimetric methods for the detection of new candidate spacecraft ionic monopropellants were investigated by the WSTF Materials and Components Laboratories through a Johnson Space Center (JSC) Internal Research and Development (IRD) project.
The means of detection were rapid and used either common commercially available off-the-shelf (COTS) test strips and kits or easily prepared chemical reagents. Specific ion test strips, pH test strips, simple chemical solutions used for qualitative chemical determinations, and explosives test kits were used to obtain color indications.
Propellants were first obtained from the manufacturers, and were managed in accordance with NASA-STD-8719.12, Safety Standard for Explosives, Propellants, and Pyrotechnics, due to explosive classification. Diluted solutions of propellant were used to remove the explosive classification and avoid further complications from working with explosives in the laboratory.
A literature survey was first performed, but no remarkable literature outside of common chemistry principles was found relative to the detection and decomposition of the propellant blend. Known propellant ingredients were examined and suitable color-forming reactions were identified. Commercially available test strips and kits were identified to test for those species. Most of the test strips and kits are well characterized and widely used for the detection and quantitation of the species of interest. The COTS explosives test kits, for example, are recognized by the National Institute of Justice and are used for field and security testing.
Two COTS explosives test kits were evaluated: one using aerosols and the other using liquids applied as drops to swabbed substrates. In Figure 1, the response of a commercial explosive detection test strip to a propellant is shown on top right. The strip on the bottom right was
for a different class of explosive and gave a negative response. The test strips on the left were exposed to water and gave negative results.
Figure 1. The response of a commercial explosive detection test strip to a propellant is shown on top right. The strip on the bottom right was for a different class of explosive and gave a negative response. The test strips on the left were exposed to water and gave negative results.
In some cases, color-forming reagents made in the laboratory gave predictable as well as unpredictable results. A few drops of diluted propellant were first applied to an inert substrate, and then test strips were wetted with water and applied to the “contaminated” zone. Color indications were observed and photographed alongside “control” samples, which consisted of the corresponding substrates but without propellant.
Figures 2 and 3 depict the response of commercial test strips. Figure 2 shows the response of a test strip (right center) to a chemical species on a propellant-wetted surface (right top). The test strip (right bottom) gave a negative response to a potentially interfering species. The strips and wetted surface on the right are blanks, wetted with water only, for comparison. Figure 3 shows the response of pH paper to a propellant. The pH paper on the left gave a color change compared to a water blank on the right.
266

Figure 2. The response of a test strip (right center) to a chemical species on a propellant-wetted surface (right top). The test strip (right bottom) gave a negative response to a potentially interfering species. The strips and wetted surface on the right are blanks, wetted with water only, for comparison.
Figure 3. The response of pH paper to a propellant. The pH paper on the left gave a color change compared to a water blank on the right.
Figure 4 indicates the results when exposed to a laboratory solution. Color change is observed when a propellant-wetted surface is exposed to a test solution. The color change is a positive detection of the propellant. A positive response in some cases, where the color-forming chemistry was known to result in decomposition of the active chemical species, suggests a means of contamination mitigation.
Figure 4. The results when exposed to a laboratory solution.
Methods of decontaminating and remediating propellant leaks or spills were discussed and found unremarkable, suggesting standard but appropriate liquid chemical spill procedures and referencing the Department of Transportation Emergency Response Guide procedures for the appropriate explosive class. Verification of decontamination seems likely and sometimes unique using several of the methods that were evaluated in this work.
Results of this investigation have been presented to the Joint Army-Navy-NASA-Air Force (JANNAF) InteragencyPropulsion Committee.
267

Inspiring Future Generations: Education and Outreach
268
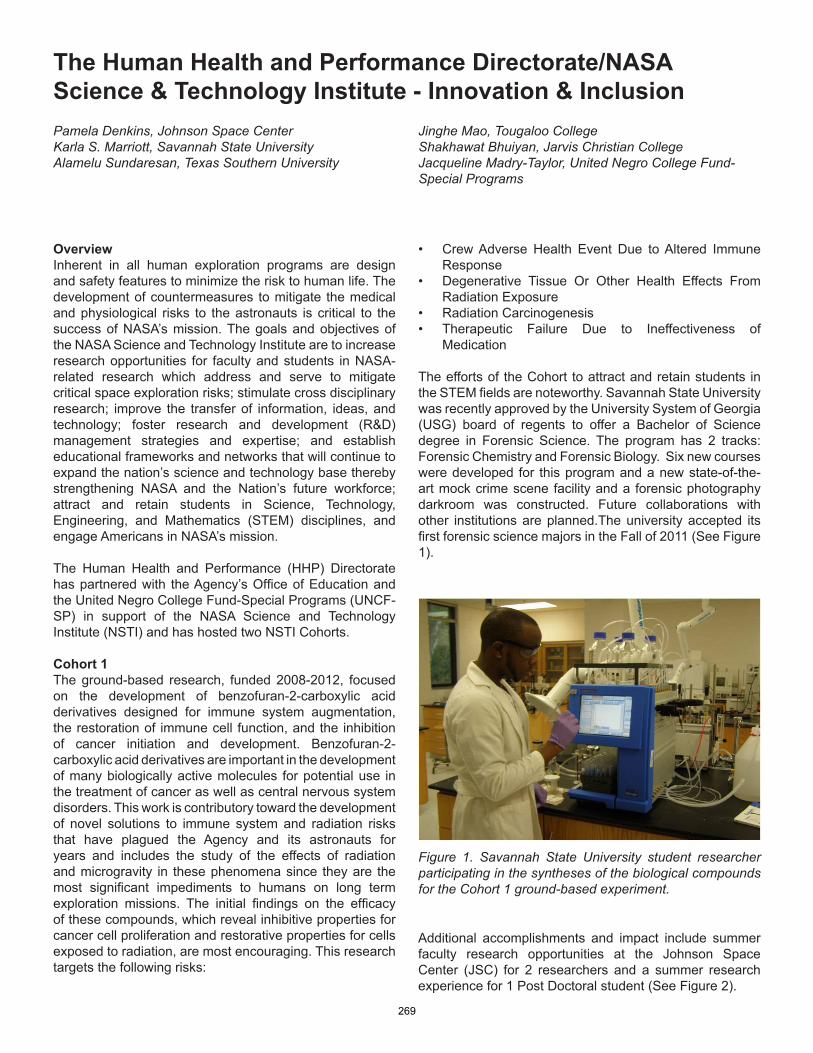
The Human Health and Performance Directorate/NASA Science & Technology Institute - Innovation & InclusionPamela Denkins, Johnson Space CenterKarla S. Marriott, Savannah State UniversityAlamelu Sundaresan, Texas Southern University
Jinghe Mao, Tougaloo CollegeShakhawat Bhuiyan, Jarvis Christian College Jacqueline Madry-Taylor, United Negro College Fund-Special Programs
• CrewAdverse Health Event Due toAltered ImmuneResponse
• Degenerative Tissue Or Other Health Effects FromRadiationExposure
• RadiationCarcinogenesis• Therapeutic Failure Due to Ineffectiveness of
Medication
Theeffortsof theCohort toattractandretainstudents intheSTEMfieldsarenoteworthy.SavannahStateUniversitywasrecentlyapprovedbytheUniversitySystemofGeorgia(USG) board of regents to offer a Bachelor of Sciencedegree in Forensic Science. The program has 2 tracks:ForensicChemistryandForensicBiology.Sixnewcoursesweredeveloped for thisprogramandanewstate-of-the-artmockcrimescenefacilityanda forensicphotographydarkroom was constructed. Future collaborations withother institutionsareplanned.Theuniversityaccepted itsfirstforensicsciencemajorsintheFallof2011(SeeFigure1).
OverviewInherent in all human exploration programs are designandsafetyfeaturestominimizetherisktohumanlife.Thedevelopmentofcountermeasures tomitigate themedicalandphysiological risks to theastronauts iscritical to thesuccessofNASA’smission.ThegoalsandobjectivesoftheNASAScienceandTechnologyInstitutearetoincreaseresearchopportunities for facultyandstudents inNASA-related research which address and serve to mitigatecriticalspaceexplorationrisks;stimulatecrossdisciplinaryresearch; improve the transferof information, ideas,andtechnology; foster research and development (R&D)management strategies and expertise; and establisheducationalframeworksandnetworksthatwillcontinuetoexpandthenation’sscienceandtechnologybasetherebystrengthening NASA and the Nation’s future workforce;attract and retain students in Science, Technology,Engineering, and Mathematics (STEM) disciplines, andengageAmericansinNASA’smission.
The Human Health and Performance (HHP) Directoratehaspartneredwith theAgency’sOfficeofEducationandtheUnitedNegroCollegeFund-SpecialPrograms(UNCF-SP) in support of the NASA Science and TechnologyInstitute(NSTI)andhashostedtwoNSTICohorts.
Cohort 1 Theground-based research, funded2008-2012, focusedon the development of benzofuran-2-carboxylic acidderivatives designed for immune system augmentation,therestorationof immunecell function,andthe inhibitionof cancer initiation and development. Benzofuran-2-carboxylicacidderivativesareimportantinthedevelopmentofmanybiologicallyactivemolecules forpotentialuse inthetreatmentofcanceraswellascentralnervoussystemdisorders.Thisworkiscontributorytowardthedevelopmentof novel solutions to immune system and radiation risksthat have plagued the Agency and its astronauts foryears and includes the study of the effects of radiationandmicrogravity in thesephenomenasince theyare themost significant impediments to humans on long termexploration missions. The initial findings on the efficacyofthesecompounds,whichrevealinhibitivepropertiesforcancercellproliferationandrestorativepropertiesforcellsexposedtoradiation,aremostencouraging.Thisresearchtargetsthefollowingrisks:
Figure 1. Savannah State University student researcher participating in the syntheses of the biological compounds for the Cohort 1 ground-based experiment.
Additional accomplishments and impact include summerfaculty research opportunities at the Johnson SpaceCenter (JSC) for 2 researchers and a summer researchexperiencefor1PostDoctoralstudent(SeeFigure2).
269

Figure 2. Professional development experience in the Radiation Biology Lab at NASA Johnson Space Center.
Fourteenundergraduatestudentshaveparticipatedintheresearch,ofwhich,2studentshaveservedas internsatJSCduringthesummer2011(SeeFigure3).
Figure 3. Undergraduate students worked on UNIMET project at Tougaloo College.
More than 13 papers have been generated; numerousconferences attended including four internationalconferences (Japan, China, Germany, and the UnitedKingdom); and over 200 students mentored throughoutreach activities. Two researchers have receivedadditional fundingtoexpandtheir research(NSTICohort2 and the NASA Experimental Program for StimulatingCompetitiveResearch(EPSCoR)).
Further,theresearchofCohort1istobeconductedontheInternationalSpaceStation(ISS)underthesponsorshipoftheISSUniversityResearchInitiativefor.Tier2andTier3ResearchInstitutionsFY13–FY15.
TheuniversitiesrepresentedareSavannahStateUniversity(Georgia),TugalooCollege (Mississippi),JarvisChristianCollege(Texas),andTexasSouthernUniversity(Texas).
Cohort 2 The Cohort, with the research focus entitled “TheDevelopment of Technologies for Elucidation andMitigationofBoneLossinMicrogravity,Osteoporosis,andInflammatory Disease in Space Environments”, beganits first year as a research cluster October 2011. Thisresearchtargetstherisks1:
• EarlyOnsetOsteoporosisDueToSpaceflight• BoneFracture• CrewAdverse Health Event Due toAltered Immune
Response
Radiationisincludedtoassessthepossibilityofsynergismand exacerbation of bone loss with space radiation.Specificallytargetedarethefollowingrisks:
• Degenerative Tissue Or Other Health Effects FromRadiationExposure
• Whataretheeffectsofradiationonbone?
Thisstudywillaid infindingappropriatepharmacologicalagents which may minimize/decrease the bone lossduring extended exposure tomicrogravity environments.Modeling radiation impactswillprovideacomprehensivepicture of the space radiation effects and increasedosteoclastogenesisandaidinthedevelopmentofoptimaldosagestocombatthisphenomenon.Ten students participated in summer 2012 researchexperiencesat JSCand5will participate in thesummer2013. This Cohort has partnered with the University ofNorwayandwillhost twoNorwegianDoctorofMedicine/Doctor of Philosophy (MD/PhD) students during thesummer2013(SeeFigure4).
Figure 4. Cohort 2 Student Interns – JSC, Summer 2012, along with NASA mentors.
270

The faculty and students are required to engage in aneducation & outreach activity during the summer whichmay include speaking to elementary, middle school, orhighschoolstudentsregardingtheirinterestinSTEM,theirexperience in theNASA Internship,and/orassistingwithon-goingeducationandoutreach taskswhileat aNASACenter.Approximately330Educatorsandstudentshavebeen impacted by the institutions through their outreachefforts.
TheuniversitiesrepresentedareTexasSouthernUniversityandPrairieViewA&MUniversity,bothlocatedinTexas.
271

NASA Human Health and Performance Center Collaboration SuccessesJeffrey R. Davis, Johnson Space CenterCarissa J. Callini, Wyle Science, Technology & Engineering
Elizabeth E. Richard, Wyle Science, Technology & Engineering MaGee Johnson, Wyle Science, Technology & Engineering
The NASA Human Health and Performance Center (NHHPC) is a global convener of government, industry, academic and non-profit organizations to support the advancement of human health and performance innovations to enable space exploration and benefit life on Earth. Over the past two years, the NHHPC has enhanced opportunities for collaboration by providing a platform for best practice sharing, collaboration opportunities and conducting forums for open innovation methodology discussion. Not only has the NHHPC enhanced communication within the membership, it has also allowed for more communication of NASA needs and research to the public and a gateway to promote projects to help solve those needs. The NHHPC is a JSC Human Health and Performance Directorate initiative led by Dr. Jeffrey R. Davis, director.
Events and Connection ActivitiesWith more than 125 member organizations to date, the NHHPC has held several events to keep members involved and collaborating. These include successful workshops targeted at strategies and best practices for collaborative innovation and connecting through collaboration. In June 2012, the NHHPC hosted mHealth - Smart Media and Health: Applications Benefitting Life in Space and on Earth for its membership in Washington, D.C., in conjunction with D.C. Health Data and Innovation Week. The workshop program included keynote speakers U.S. Chief Technology Officer Todd Park (see Figure 1) and Executive Vice President and Chief Information Officer at Kaiser Permanente Philip Fasano, followed by a panel focused on mobile health applications for Earth and space. Panelists from The National Science Biomedical Research Institute, Near Eye Tool for Refractive Assessment - Massachusetts Institute of Technology Media Lab, the U.S. Food and Drug Administration and more also took part. Mobiquity, Inc. and Rock Health also presented the impacts of mobile technology in the health care industry. More information can be found on the NHHPC mHealth Workshop Web page.
In addition to face-to-face workshops, the NHHPC hosted Member to Member Connect webcasts, giving members the opportunity to create a dialogue around a new technology or collaboration opportunity. Members including IBM (February 2012) and Doximity (August 2012) have discussed advances in analytics technologies and medical error prevention.
Additionally, the NHHPC coordinates and distributes a quarterly electronic newsletter to its members and posts it to the NHHPC website. In this publication, members contribute their collaboration project opportunities, news updates, accomplishments and upcoming events.
Figure 1. U.S. Chief Technology Officer Todd Park talking to mHealth participants.
Collaborative Projects and OpportunitiesSeveral collaborative projects have emerged among NHHPC member organizations. These include medical guidelines for spaceflight from a NASA, University of Texas Medical Branch and Federal Aviation Administration collaboration (June 2012), and air-quality monitoring between NASA and the U.S. Navy. Additionally, NASA and General Electric (GE) are engaged in a project to investigate various options to enhance water analysis capabilities for human spaceflight in a cost-effective manner. Originally designed for offline, routine testing of water in industrial settings, preliminary testing of the GE TrueSense Personal Water Analytics for use in space has just recently been completed.
272

Education and outreach has been a big success within the NHHPC. Twelve NHHPC partners in the Education Community of Practice developed and conducted a successful pilot education competition designed to promote careers in science, technology, engineering and math in May 2012. Middle school students from around the country researched the human challenges of a manned mission to an asteroid, elaborated on issues and proposed possible solutions for the NHHPC Middle School Asteroid Contest. Students were recognized with Web presence for their work, as well as certificates from NASA and Clemson University. A second contest is currently being conducted where 6th- to 8th-grade students have been invited to outline their mission plans for a human crew to travel to an asteroid, including: Which asteroid should we visit? What is the mission goal? What challenges will you need to identify? And how will you solve the challenge?
The NHHPC website and Twitter feeds have been a growing place for members to share and promote the collaboration opportunities they have available to the membership and the general public. Opportunities have included technical challenges from Procter & Gamble and NASA, funding opportunities from NSBRI, as well as other innovation programs offered by the membership.
The Path ForwardThe NHHPC is now looking to expand its successful The NHHPC is now looking to expand its successful collaborative model by including member organizations with disciplines in addition to human health and performance to advanced innovations that benefit life in space and on Earth. Additionally, the NHHPC hopes to enhance international partner relations and increase international membership to leverage expertise worldwide. Figure 2 and Figure 3 show the NHHPC at the International Astronautical Congress. With these goals, the NHHPC will be used as a platform to conduct an accelerated innovation pilot program. This pilot will foster disruptive research and technology innovations in human health and performance by accelerating advanced capabilities that enable exploration-class missions. In addition, this pilot could also help address global concerns on Earth in the areas of human and environmental health.
Figure 2. NHHPC at the International Astronautical Congress – Panel discussion.
Figure 3. NHHPC at the International Astronautical Congress.
273

Seeing Earth from the Eyes of an AstronautMelissa Dawson, Jacobs Technology
The Human Exploration Science office within the Astromaterials Research and Exploration Science (ARES) Directorate has undertaken a new class of handheld camera photographic observations of the Earth, as seen from the International Space Station (ISS). For years, astronauts have attempted to describe their experience in space and how they see the Earth roll by below their spacecraft. Thousands of crew photographs have documented natural features as diverse as the dramatic clay colors of the African coastline, the deep blues of the Earth’s oceans or the swirling Aurora Borealis or Australis in the upper atmosphere. Dramatic recent improvements in handheld digital single lens reflex (DSLR) camera capabilities are now allowing a new field of crew photography: night time-lapse imagery.
During Expedition 28 in 2011, NASA astronauts Mike Fossum and Ron Garan began experimenting with the automated functions of their onboard DSLR cameras. The intent was to take low-light, long-exposure images of the dark side of the Earth to document not only nighttime activity of our civilization, but also provide a profound new insight into humanity’s presence and effect on our planet. The astronauts utilized a bogen arm in the Cupola of the ISS to stabilize the camera. The camera was set to take an image every three seconds for several minutes. The motion of the ISS then allowed those still images to be assembled into dramatic movies, providing spectacular new views of the planet never seen before by the general public. The downlinked still images were processed by the ARES Crew Earth Observations (CEO) Office to assemble the final videos (Figure 1).
Figure 1: Time-lapsed astronaut photograph of western Europe (ISS030-E-185649, March 28, 2012, 28mm), which is part of the video entitled “Aurora Borealis over Western Europe.”
As educational supplements to these videos, CEO has also created:• Annotated time-lapse videos, highlighting city and
place names,• Time-lapse video alongside a Google Earth tour,
which plays simultaneously so the user may see both geographical and geological feature names that can be found in the video, and
• Narrated time-lapse videos where features in the video are described for the viewer
The videos can be accessed in varying resolutions, from 640x426 to 1980x1080 HD within the CEO website at:
Figure 2: Time-Lapsed image of Florida and the southeastern United States at night (ISS030-E-6082, Nov. 24, 2011, 19mm), which is part of the video entitled “Mexico and the Eastern United States.”
http://eol.jsc.nasa.gov/Videos/CrewEarthObservationsVideos/
Users may also download the original still images to create their own movies. The public and media response to this new class of imagery has been dramatic. The videos have been highlighted by numerous publications (e.g., Chicago Tribune, USA Today, etc.), websites (e.g., SpaceflightNow.com, Space.com, NASA.gov, YouTube, etc.) and TV broadcasts on most major networks, such as The Discovery Channel and the Public Broadcasting System. The public outreach benefit to Johnson Space Center and NASA as a whole is significant. This imagery has excited the public again about the power of spaceflight to not only inspire our children to study things like math and science, but also to highlight how humanity is indeed one species, populating the same planet floating in the dark, cold void of space.
274
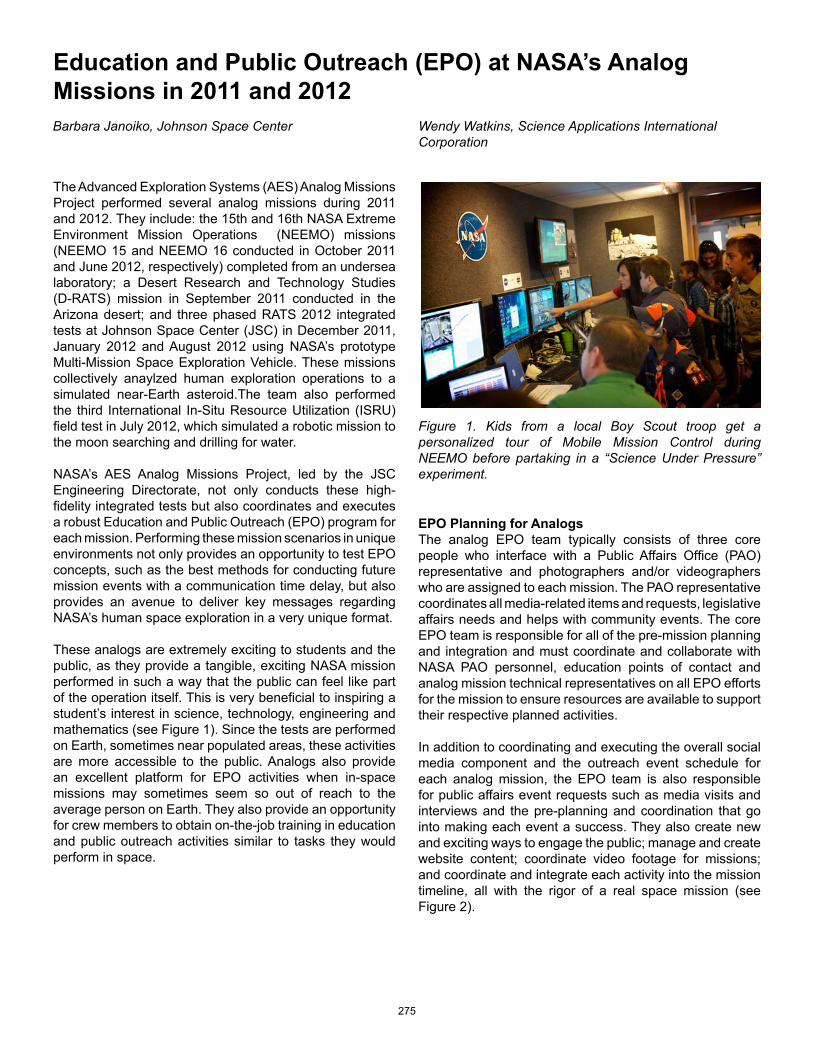
Education and Public Outreach (EPO) at NASA’s Analog Missions in 2011 and 2012Barbara Janoiko, Johnson Space Center Wendy Watkins, Science Applications International
Corporation
The Advanced Exploration Systems (AES) Analog Missions Project performed several analog missions during 2011 and 2012. They include: the 15th and 16th NASA Extreme Environment Mission Operations (NEEMO) missions (NEEMO 15 and NEEMO 16 conducted in October 2011 and June 2012, respectively) completed from an undersea laboratory; a Desert Research and Technology Studies (D-RATS) mission in September 2011 conducted in the Arizona desert; and three phased RATS 2012 integrated tests at Johnson Space Center (JSC) in December 2011, January 2012 and August 2012 using NASA’s prototype Multi-Mission Space Exploration Vehicle. These missions collectively anaylzed human exploration operations to a simulated near-Earth asteroid.The team also performed the third International In-Situ Resource Utilization (ISRU) field test in July 2012, which simulated a robotic mission to the moon searching and drilling for water.
NASA’s AES Analog Missions Project, led by the JSC Engineering Directorate, not only conducts these high-fidelity integrated tests but also coordinates and executes a robust Education and Public Outreach (EPO) program for each mission. Performing these mission scenarios in unique environments not only provides an opportunity to test EPO concepts, such as the best methods for conducting future mission events with a communication time delay, but also provides an avenue to deliver key messages regarding NASA’s human space exploration in a very unique format.
These analogs are extremely exciting to students and the public, as they provide a tangible, exciting NASA mission performed in such a way that the public can feel like part of the operation itself. This is very beneficial to inspiring a student’s interest in science, technology, engineering and mathematics (see Figure 1). Since the tests are performed on Earth, sometimes near populated areas, these activities are more accessible to the public. Analogs also provide an excellent platform for EPO activities when in-space missions may sometimes seem so out of reach to the average person on Earth. They also provide an opportunity for crew members to obtain on-the-job training in education and public outreach activities similar to tasks they would perform in space.
Figure 1. Kids from a local Boy Scout troop get a personalized tour of Mobile Mission Control during NEEMO before partaking in a “Science Under Pressure” experiment.
EPO Planning for AnalogsThe analog EPO team typically consists of three core people who interface with a Public Affairs Office (PAO) representative and photographers and/or videographers who are assigned to each mission. The PAO representative coordinates all media-related items and requests, legislative affairs needs and helps with community events. The core EPO team is responsible for all of the pre-mission planning and integration and must coordinate and collaborate with NASA PAO personnel, education points of contact and analog mission technical representatives on all EPO efforts for the mission to ensure resources are available to support their respective planned activities.
In addition to coordinating and executing the overall social media component and the outreach event schedule for each analog mission, the EPO team is also responsible for public affairs event requests such as media visits and interviews and the pre-planning and coordination that go into making each event a success. They also create new and exciting ways to engage the public; manage and create website content; coordinate video footage for missions; and coordinate and integrate each activity into the mission timeline, all with the rigor of a real space mission (see Figure 2).
275

Figure 2. A RATS crew member performs a live Web stream outreach event through the Digital Learning Network at JSC. The Challenger Learning Center connects with analogs whenever possible.
Dedicated public web pages for each analog mission are located at: http://www.nasa.gov/exploration/analogs/index.html. Typically, the websites are updated with current mission information, and the past data is archived. Followers and fans can find links to every related social media account on the analog home pages.
During the NEEMO 16 mission, the EPO team collaborated with the European Space Agency (ESA), Japan Aerospace Exploration Agency (JAXA), NASA Teaching from Space group and other agencies to conduct a fun, engaging activity involving topside team members and crew in the habitat. For one week during the mission, the crew conducted experiments proposed by educators and scientists from NASA, ESA and JAXA. These experiments demonstrated how science experiments yielded different results at different atmospheric pressures. The topside team conducted an experiment and then posed questions to the public, soliciting their thoughts on the outcome. The experiment was performed in the Aquarius Habitat, which maintains an atmospheric pressure approximately 2.5 times surface pressure. The activity was aptly named “Science Under Pressure” and gained quite a following.
NEEMO social media fans were invited to predict the outcome of each experiment, and correct responses received a digital certificate to display on their own social media page or print as a keepsake. Videos from the Science Under Pressure activity received more than 22,078 views during the two-week NEEMO mission.
Other exciting outreach events have included on-site visits by the public during NEEMO, D-RATS and ISRU missions. Many spectators touring the Space Vehicle Mockup Facility while on the Space Center Houston tram tour were able to view the 2012 RATS testing in progress. Space Flight Awareness honorees, media, congressional visitors and even the entertainer Yanni have witnessed various analog missions and received printed literature.
During ISRU, the team worked with a local astronomy center for a dynamic community event with over 475 visitors who were invited to operate remote-controlled rovers and interact with team members for live demonstrations of hardware and software used during the mission.
Occasionally during the missions, EPO team members would conduct on-the-fly connections with classrooms using an informal format with an iPad and Skype. Each analog mission presents a different set of connection challenges for EPO, but the Aquarius Habitat used for NEEMO has a built-in infrastructure (see Figure 3).
Figure 3. Crew members connect with a classroom from 50 feet below the surface.
Special event opportunities were always a welcome possibility, such as the video call from the NASA Administrator Charles Bolden to two crew members of NEEMO 16: NASA astronaut Dorothy “Dottie” Metcalf-Lindenburger and ESA astronaut Timothy Peake, who were fully suited and in the water for a simulated Extravehicular Activity (EVA). The video of the live call is located on the analog YouTube channel, and the live video had more than 1,969 viewers while on the air.
276

Table 1.
The EPO team coordinated and performed the following live education and public outreach events during the analog missions in 2011 and 2012:
Desert RATS 2011• Sixteen live EPO events during mission and two at the
JSC rock yard during dry runs• RATS Phase 1A and 1B• Three live International Space Station (ISS) Update
interviews performed by PAO• RATS 2012• Seven live EPO events and two live ISS Update
interviews performed by PAO• NEEMO 15• Twelve live interviews with entire crew during a one-
hour media “live-shot” event (coordinated by PAO) and 12 live EPO events
• NEEMO 16• Seventeen live EPO events, six ISS Update interviews
performed by PAO, Science Under Pressure activities, and the EPO team conducted two communications delay interview simulations for comparison
• ISRU 2012• Four live EPO events back to the mainland, conducted
a robust community event at the Imiloa Astronomy Center in Hilo, Hawaii, with more than 475 visitors
EPO Post-Mission ActivitiesThe EPO team is responsible for gathering all post-mission metrics and lessons-learned documentation related to public and educational outreach. The summary metrics for the NEEMO, ISRU and RATS missions during 2011 and 2012 (see Table 1) were very impressive and show that analogs do not go unnoticed by the general public. In fact, there are many individuals who inquire regularly about the missions, and some school science clubs and groups base their activities around analog operations.
Analog EPO SummaryIn support of the space agency’s strategic goal to share NASA with the public and provide opportunities for participation, the Analogs EPO team leverages each unique mission to provide a wide variety of opportunities for the general public, educators and students to participate in real NASA activities. With the new tools and technologies available for worldwide connection and collaboration, the team has inspired thousands of individuals throughout the missions and, in many cases, continually throughout the year via social media connections.
277