·_·11 - NASA Technical Reports Server
130
, .- , " . . ,- • ' . .. '. ",: ,. , . . . ' ''-, ", '(:"-.' . .. ., _. ,/ . -.:.. - INITIAL TECHNICAL ,. , '. ..- - ,. \ :C: ' i", Pc ... . -'-. "", .. '" AND ECONOMIC EVALUATIOr'fOF"- : , . . ':' '," .". . . " SPACE SOLAR POWE.RCONCEPTS 1 ,- VOLUME I - SUMMARY .. CF SCi; } 1: ( .. H .. • .. ' _1 '::;;;':L AUGUST 31, 1976 , , . '-' I - , -. .:- t '- ' -; ••' .. -. ':I;, . . -,
-
Upload
khangminh22 -
Category
Documents
-
view
1 -
download
0
Transcript of ·_·11 - NASA Technical Reports Server

(
t I I , -
, r
f '
,
.-, "
r i I !
. . ,-
·_·11 ,I _ ~~_
• ' ... '. ·".·l~ · ",: ,. , . . . '''-, ", '(:"-.'
.~ .
.~ .. .,
_. ,/ .~; .
.:~"~, -.:.. -
INITIAL TECHNICAL ENVIRONM,ENf'~AbAi·"c_," ,. , '. ~ ..- - ,. \ :C: ' i", ,~ . Pc ... . -'-. ~,' "", .. '" ~ ~;,'
AND ECONOMIC EVALUATIOr'fOF"-: , . . ':' '," .". . .
"
SPACE SOLAR POWE.RCONCEPTS
1
,-
VOLUME I - SUMMARY ("AS..i-T~"1-/.-7 .. jr:~) l~.i.l ~dl I.c. CH~ IC.~l,
~~~~~~~d~~l~i , ~~ : cC~~C~l( £~ k lUjIl ~~ CF ~ C~~L SCi; } E~~f ~ ~ ~~Ct~I~ . V J LUj~ 1: ',J;"~j":,y ( .. .'_~,, ) 1~ " . H .. • ~7/U .. '_1 '::;;;':L 1~~
AUGUST 31, 1976
, ~.
, . '-' I
- ,
iJhc~a:s
11~22
-.
.:- t
' - '
-; •• ' .. -. ':I;, ~'" . .
q
-,

~:
f.' ,
~.
tJ , t:
~,
~ ,
;" (;; " , ,j. I' \;
f ~' ..
t ~\ ~
~ r iy ~
i· ~. r.: , , ,
~ c ~
• J ~-
(
c:
.. . .-~ - ~.
INITIAL TECHNICAL, ENVIRONt,lENTAL, AND ECONOHIC
EVALUATION OF SPACE SOLAR POWER CONCEPTS
VOLUilE I - SUMf1ARY
VOLUME II - DETAILED REPORT
-

I .-.--.-._- -. .--.- ,-~<-~,--" -'-,--"-, ..,.,.,-
~T"-'" "Y' I NJ144!1\¥1
---l
I I j ,:
(I CONTENTS
Section Page t l' I INTRODUCTIOI'< 1-1
II CONCLUSIONS II-1
~: III PROGRAM REQUIREMENTS II 1-1
r i. -,
A. Projected Energy Demand III-1 , ~'
B. Implementation Scenarios III-1 I ! IV POWER STATION IV-1 ; . • t ~" A. System Analysis IV-2 ~
1 • Efficiencies · · · IV-2 2. MPTS/MRCS Analysis · IV-2
, 3. Orbit Considerations IV-5 4. Configurations · · · IV-9
¥; 5. Mass Properties IV-11
B. Solar Energy Collection System IV-15
f 1. Solar Array · · • • · · · IV-15 " 2. Power Distribution IV-17 · · · · 3. Structure · · · · · • • · IV-18
4. Attitude and Orbit Control · · . . . . . . IV-19 5. Instrumentation, Control and Communications IV-21
)( 6. Maintenance Station · · · · IV-21 i. ... ;:, C. Microwave Power Transmission System IV-22 " r
1 • Antenna Array · · · IV-22 2. Microwave Generators IV-22
" , 3. Subarrays • · · · IV-22 4. Phase Control IV-23 5. Pointing Control • IV-23 6. Power Distribution IV-25 7. Structure • · · · IV-26 8. Rotary Joint • · •
IV-26 g. Thermal Contro] • • IV-28
D. Microwave Reception and Conversion System IV-28
l. Rectenna • · · • · · · · • · · • • IV-28 2. Grid Interface • · · · · · · · IV-29
(j iii

"
I ~ I
Section
E. Operations
F. Unit Costs
v SPS CONSTRUCTION AND MAINTENANCE SYSTEM
VI
VII
A. Systems Requirements and Analysis
B. Construction Base ••••••••
1. Constructi on and Manufacturin~ Facil i ty • 2. Orbital Construction and Support Equipment 3. Logistics Facility ••••.• 4. Integration Management Facility 5. Crew Habitability Facilities
C. Construction Operations •
SPACE TRANSPORTATION SYSTEMS
A. Systems Requirements and Analysis
B. Heavy Lift Launch Vehicle ••••
C. Personnel and Priority Cargo Launch Vehicle ••••••• 0 ••••
D. Cargo Orbital Transfer Vehicle
E. Personnel Orbital Transfer Vehicle
F. A Summary of Projected Transportation System Characteristics
INTEGRATED OPERATIONS • • •
A. Systems Requirements and Analysis
B. Program Model •••••••
C. Mission Management Concept
D. Mission Management Functions
1. Program Headquarters Mission Control 2. Launch and Recovery Control,. . . . • 3. LEO Operational Base COJltrol •... 4. GEO Operational Base Control .... 5. SPS (Individual Unit) Ground Control
iv
•
Page
IV-29
IV-31
V-l
V-l
V-5
V-6 V-8 V-8 V-8 V-9
V-9
VI-l
VI-l
VI-2
VI-8
VI-8
VI-l2
VI-17
VII-l
VII-l
VII-l
VII-3
VII-3
VII-3 VII-12 VII -13 VII-13 VII-14
-

~.
"
J I
f) L/
Section
E.
r
Key Considerations and Areas for Further Investigation. . . . ... ..
1. Prelaunch, Launch, and Recovery Operations 2. Space t1imufacturing and Construction Options 3. Operational Space Control Operations 4. Simulation and Training Operations 5. Safety in SPS Operations
VIII ENVIRONMENTAL CONSIDERATIONS
IX
X
XI
A. Methodology • . . . . . B. Environmental Questions
C. Comparisons with Conventional Systems
MANUFACTURING CAPACITY, NATURAL RESOURCES, TRANSPORTATION, AND ENERGY CONSIDERATIONS
A. Requirements . . . . B. Manufacturing Capacity
C. Natural Resources • • •
D. Surface Transportation
E. Energy Payback
PROGRAM DEVELOPMENT PLAN
A. Program Phiising •••
B. System Definition and Exploration Technology Phase
C. Technology Advancement Phase
D. System Development •
E. Program Costs •••
PROGRAM COST AND ECONOMIC ANALYSIS • •
A. Methodology
B. SPS Costs ••
v
Page
VII-14
VII-14 VII-15 VII-1S VII-15 VII-16
VI II-1
VI II-1
VlII-1
VII 1-2
IX-1
IX-1
IX-1
IX-1
I X-1
IX-3
X-1
X-1
X-1
X-6
X-7
X-7
XI-1
XI-1
XI-l
-

Section
C. Comparison with Conventional and Other Advanced Systems
D. Summary Remarks • •
vi
,- <. "~-.""''''--''-" .""~,--,~,,, -".,~,",.",.~~. ~""" _____ ""D"''''L'''",''''."'''-*~''Q.#*'!iI''
Page
XI-4
XI-lO
1 /
-

. , , .
(
Table
IV-l
IV-2
IV-3
IV-4
V-l
V-2
V-3
V-4
VI-l
VI-2
VI-3
VI-4
VI-5
VI-6
VI-7
VI-B
VI-9
VII-l
VII-2
VII-3
VII-4
TABLES
A SUMMARY OF MICROWAVE SYSTEM(S) PARAMETERS
SUMMARY OF UNIT MASSES
MASS PROPERTIES SUMMARY . COST ESTIMATING RELATIONSHIPS • • •
ORBITAL CONSTRUCTION EQUIPMENT REQUIREMENTS
COLUMN/CABLE CONFIGURATION TYPICAL MAN LOADING
TRUSS CONFIGURATION TYPICAL MAN LOADlNG (GEO CONSTRUCTION) • • • • • • • . • • • • •
TYPICAL PEAK STAFFING (LEO) rOR ANTENNA SUBARRAY FABRICATION ••• • • • .
HLLV CANDIDATE ENGINE CHARACTERISTICS
HLLV CANDIDATE CONFIGURATION CHARACTERISTICS
HLLV COST ESTIMATES • • • • • • • • • •
OTV CANDIDATE THRUSTER CHARACTERISTICS
HLLV RANGE OF PR~JECTED ESTIMATES •
PLY RANGE OF PROJECTED ESTIMATES •
COTV RANGE OF PROJECTED ESTIMATES •
POTV RANGE OF PRO,JECTED ESTIMATES • • •
RELATIVE TRANSPORTATION COSTS FOR SEVERAL SPS CONFIGURATIONS AN~ CONSTRUCTION LOCATIONS
SPS PROGRAM MODEL INPUTS, ASSUMPTIONS, AND GUIDELINES •• . • • • • • • • • • • •
PROGRAM MODEL SUMMARY FOR "COLUMN/CABLE" SPS IN GEO "...... .. .. .. .. .. " " " " "
PROGRAM MODEL SUMMARY FOR "TRUSS" SPS IN GED
PROGRAM MODEL SUMMARY FOR "TRUSS" SPS IN LEO
vii
• •
•
Page
IV-6
IV-12
IV-14
IV-32
V-ll
V-12
V-13
V-14
VI-3
VI-3
VI-6
VI-10
VI-1B
VI-1B
VI-19
VI-20
VII-4
VII-6
VII-B
VII-10
-,

r t ~ ~ ~
if t , ~
i • t, , 1
.' , I, Table ,
~ , ! VIII-l
~ , r i •
I IX-l ~ ! , ! t , ! IX-2 I t i XI-l I ! ~ I ! XI-2 ! I f I I ! I
[. i
~
~, i [" t
·1
:, . ~.l!'>_"-.=''''~
\ ..
ENVIRONMENTAL COMPARISON OF lO-GW POWERPLANT OPERATIONS 0 0 0 • 0 0 <;I 0 • • 0 • • • • • • • • • • • •
NATURAL RESOURCE DEMANDS OF A lO-GW SPS COMPARED TO NATIONAL AND WORLD DEMANDS IN THE YEAR 2000
ENERGY PAYBACK OF A lO-GW SPS
DDT&E COST ESTIMATE SUMMARY •
SUMMARY OF COST ESTIMATES AND RELEVANT PARAMETERS FOR 1 O-G\~ SPS • • " • • • • • • • • • • • • • • . . . .
viii
Page
VIII-3
IX-2
IX-2
XI-5
XI-5
'1',1 ~
-
1 ! , i l i l 1 j

r
{ Figure
1-1
III-1
IV-1
IV-2
IV-3
IV-4
IV-5
IV-6
IV-?
IV-8
IV-9
IV-10
IV-11
IV-12
IV-13
IV-14
IV-15
IV-16
IV- i 7
IV-18
FIGURES
Stuqy task structure ••••• 0 •••• 0 0 •• 0
Projections of U.S. electrical energy requirements and possible SPS implementation scenarios ••
SPS functional description • 0 ••••••••
Estimated efficiencies of the various steps in the collection, conversion, and transmission process
Output power limits • • • • • • • • •
o 0 It It
•
. .
• •
• •
Power density at rectenna • • • • o 0.. Eclipse geometry • • • • • • • • • • • 9 ... • • • •
Examr1e con.figurations (a Column/cable • (b Truss.,...
• _ • 0 •
o • • • 0 • • 0 It • 0 •
Solar power satellite total mass ••••••
• • • •
•
Solar concentrator • • O' .0. 0 ••• 0 • 0 0
Solar cell blanket •• • 0 • • • • • •
Gravity gradient torques (a) Short period • (b) Long period ••
o 0 It 0 • •• It 0 •• 0 It
o .0. • • • • o 0 • • It Counterweight location
Antenna element • • • • • • 0 • •• 0 .00
Typical antenna distribution system ••• · .' • •
Antenna primary structure •• • • • • • ••
Ball joint and drive concept. .0.0. . . . . .0. Rectenna construction • • • • • 0 • 0 0 0 0 0 0 0 • • • •
Variation in ground dc power output • • • • • • • • • • •
Photovo1taic array cost projection ••• • • 0 0 0 0 0
ix
Page
1-4
111-2
IV-1
IV-3
IV-4
IV-?
IV~8
IV-10 IV-10
IV-13
IV-16
IV-17
IV·19 IV·19
IV-20
IV-24
IV-25
IV-26
IV-2?
IV-29
IV~30
IV-33
....

i
Figure Page ~,
V-l Beam builder machine concept. • • • • • • • • • • • • V-l
V-2 Typical SPS construction sequence - column/cdble (POP) • • V-2
~ V-3 Partial constructio~ of column/cable configuration • • • • V-3
& V-4 Concept for solar cell/concentrator deployment , · • • • V-4 ~ ~ V-S Construction base concept for truss configuration -• • • V-S t,,·
V-6 Typical SPS construction sequence - truss configuration. ~ V-6 ~ " • V-7 Construction base concept for column/cable ! .. configuration • • • • • · • • • • • • • • • • • · • • • • V-7 ! ~,
~. V-8 Operational schematic of construction base , (column/cable) •• 0 • 0 0 0 •••• • 0 • • • • • • • V-1O
VI-l Modified single-stage-to-orbit launch vehicle • • • VI-4
VI-2 Two-stage winged launch vehicle • • • • • VI-S
VI-3 Two-stage winged launch vehicle • • • • • VI-7
VI-4 Personnel and priority cargo launch vehicle • • • • • • VI-1O ) "., ./
VI-S LEO-to-GEO transfer time as a function of thrust/weight . • • • • • • • • • • • • • • • • • • • · • VI-ll
VI-6 Propellant burden contribution for high-thrust 02/H2 COTV • • • • • • • • • • • · · · • • · • • • • • • • VI-13
VI-7 Cargo orbital transfer vehicle (COTVG) characteristics · • • • • • • • • • • • • • • VI-14
VI-8 Crew module concept • • • • • • • • • • • • • VI-1S
VI-9 Crew rotation passenger module • • • • • • VI-16
VI-1O Personnel orbital transfer vehicle (POTVL) charr.·cteri sti cs • • • • • • • • • • • • • • • • • • • • • VI-17
VII-l SPS mission scenario. · • • • • • • • • • • • • • VII-2
VII-2 SPS mission management concept • • • • • • • • • • • VII-12
t) , r
x
, .

Figure
X-l
X-2
X-3
X-4
X-5
XI-l
XI-2
XI-3
XI-4
XI-5
XI-6
XI-7
XI-8
XI-9
XI-10
Space solar power projected program phasi ng " •••
System definition and exploratory technology phase activities • 0 • 0 •••• 0 0 I> 0 ••• 0 ~ 0 •
• • co 0
• • • 0
The relative merits of space solar powel" and other systems - coal, nuclear, sol ar terrestr:a1 •••• • • •
Significant test activities, initial phase, July 1976 to J~ly 1978 (partial listing) •••••• • •••
Techl1ology advancement phase • • • •
Cost equations . . . • • • •
SPS cost parametrics .01> • o • 0 •••
Conventional and advanced power ger.eration system cos ts 0 • 0 • 0 • • 0 • 0 • 0 • • • • •
• • •
Terrestrial solar pm"/er • • 0 0 •• 0... •• ••
The 5-GW solar pOller tower concept with electrolysis cell/fuel cell energy storage ••••••••••
The 5-GW sular photovoltaic-fue1 cell/electrolysis cell sys tern . • 0 • • II .. • • • • • • 0 • 0
Terrestrial solar photovo1taic power cost for 5-GW plant •• D • • • • • • • • 0 • • • 0 • • •
T erres tri a 1 solar thermal po~er cost for 5-GW power tower concept , • • . . • • • • • . • • • •
Land area re(uire~nts for 5-GW plant • • • • •
Satellite cost breakdown . · . • . • • • • • • •
xi
· . . • • • •
• • 0 Go
• • •
•
• • •
Page
X-1
X-2
X-5
X-5
X-6
XI-3
XI-6
XI-7
XI-8
XI-9
XI~9
XI-10
XI-ll
XI-12
XI-13
-

f ~ , i f I
;
I ,
f . I k.c,
I
~ I I
(,
I. INTRODUCTION
The requirements for energy in the U.S. and the world will continue to increase to support a growing population and to improve the quality of life for that population. Projections indicate the II.S. requi rements will grow by il factor of 2 to 3 between now and the year 2000.
The manner in which we will meet this requirement is not clear. Oil and gas are expected to ce depleted within decades. Fuel for the present class of nuclear reactor systems will also be depleted in the same time frame. The breeder reactor system, when successfully developed, will greatly extend the natural fuel resource but presents continuing safety and environmental concerns, not the least of which is the disposal of nuclear waste as it accumulates from large-scale nuclear energy production. Fusion reactor s/stems also have potential, but these require significant scientific advances. Coal resources appear sufficient for several hundreds of years. The environmental concerns associated with mining coal, and the subsequent problems or costs in reducing air pollution to an acceptable level during its use, are well known. The logistics of a greatly expanded coal industry is also a significant although not unsolvable consideration.
In view of the problems or concerns related to obtaining the required energy from cil, gas, nuclear, and coal sources, the Nation is actively pursuing alternate sources of energy for the future. Solar energy is an obvious candidate for consideration. Solar energy is inexhaustible and clean, and the increasing costs of other sources will make solar energy more attractive in the future. The use uf solar energy collected on the Earth has several basic limitations, however, which will tend to inhibit its wiaespread use. At any given location on the Earth, a solar collector will be limited by such factors as the day-night cycle, cloud cover, and atmospheric 3ttenuation. The day-night cycle, particularly, requires the use of expensive storage capacity or limits the solar application by reQuiring additional power sources.
A concept has been presented ("Power from the Sun: Its Future," Dr. Peter E. Glaser, Amer. Assn. Advan. Sci., Vol. 162, Nov. 22, 1968, pp. 857-861) that is intended to alleviate limitations associated with the collection of solar energy on Earth. This concept involves placing large solar power satellites in geosynchronous orbit and beaming microwave energy down to collection stations on the Earth. Some of the advantages of thi s concept are that the satell ite is in near-conti nuous sunlight that is not attenuated by the atmosphere, no electrical storage facilities are required, the land use requirement is reduced by a factor of 5 to 10, ar.d the ground power output can be located near the user rather than in desert-type regions.
1-1
--

J I ,
I
,
~' , "
1
•
The space concept, while having advantages, al so introduces new requirements. These include the need for transportation of the power station into space and the transmission of power from space to Earth by microwave radiation.
Several studies conducted in the past few years have been directed toward exploring the feasibility of this concept. The results of these studies have generally been favorable, while reflecting a need for significant technological advancement if the concept is to be econ~mically competitive with ground-based systems.
Critical areas WEre identified during the course of these studies and research and development programs have begun to be formulated to investigate these areas. A particular effort was conducted at the NASA Lyndon B. Johnson Space Center (JSC) during the summer of 1975 to evaluate the need and feasibility of a Space Solar Power Development Laboratory. The study was done in support of the NASA "Outlook for Space" study and was documented in JSC-0999l. Possible requirements for a development laboratory or "pilot plant" type solar power satellite were evaluated and the technical feasibility of such a plant was established.
In view of past study results, the 6-week study, and the conclusions of the "Outlook for Space" study, it was decided to implement at JSC a more detailed study of the Space Sular Power Concept. This document (Volume I) presents a summary of the results of that study. Volume II contains the detailed studies on w~ich the summary was based. The study was conducted between SeptembE'r 1975 and June 1976, by JSC personne 1.
The general objectives of Solar Power Satellite (SPS) studies in-elude:
1. Establishment of realistic technical and economic design rriteria and requirements for a full-scale SPS.
2. Definition of technology development and flight-test programs necessary to achieve the optimum SPS design.
3. Comparison of the SPS with other energy generation options to establish the relative economic, environment"l, and social advar,tages/ disadvantages of the SPS concept.
These objectives are quite broad and definitive answers will require a number of years of study augmented by technology efforts in a number of areas. Nevertheless, the present study provides further insight into a number of aspects of the concept and provides a point of departure for further work. This summary (Vol. I) presents a number of preliminary ronclusions and a synopsis of the more detailed studies that are presented in Volume II.
1-2
...'

I
j I
I "-
~ I
~.
~
f r , t t , " "
! ~
~ ~. J\ , t f • § ~ . ,. t , f, ~ ,. r , f,
\, ::.. , l
f ~ f?
~ h .. i
.-
,
-.-" -<". -~·r'~·'·'<'~""'''''''l:''"'''''~'·'"·-·'··~ ",-""".·~~-P-~""",,'~
\ , I 1
Certain programmatic guidelines were chosen to initiate the study and bound the study effort.
1. Program plans and technology proj~ctions will be developed based on deployment of the first operational SPS as early as 1990.
2. The capability will be provided as early as 1995 to deploy two to four SPS's per year.
3. Dedicated transportation systems will be developed and optimized specifically for use in deploying and operating the SPS network.
4. Materials used in fabricating and operating an SPS will be obtained only from the Edrth.
5. The SPS will be deployed in appropriate geosynchronous orbits only.
6. The lifetime of an SPS will ~ominally be 30 years, although liberal refurbishment/replccement of parts may be assumed.
7. The SPS will be dE-signed in a manner tD optimize participation of man in its fabrication, assembly, and operation.
8. Availability of scarce resources will be a major consideration in projecting technologies to be used in fabricating the SPS network.
g. Energy as well as economic payback will be assessed in determining the SPS development strategy.
10. Aspects of social and environmental impact will be assessed. 11. Assembly fabrication strategies for SPS will be developed such
as to minimize overall costs.
The first two guidelines were modified slightly as the study progressed in that various scenarios were defined and evaluated •
Avc.ilable resources defined the scope and depth of the study. For example, the study was primarily limited to consideration of the photovoltaic concept for solar energy collection and :onversioll, although a rath'~r thorough review of past system studies involving the use of the thennal energy conversion concept was accomplished (Vol. II). Similarly, the more detailed design studies were limited to consideration of silicon solar cells. Given these restrictions, a range of power station sizes and weights was determined based on conservative and optimis.lc estimates of collection, conversion, transmission, and receiving efficiencies.
Analyses and/or design studies were conducted for each element of the systems to varying degrees. These studies included several satellite configurations, construction concepts, crew ~equirements, alternate microwave generator concepts, rotary joint design~, ?ttitude and control concepts, and structural designs.
Several program scenarios were developed that defined the number and schedule of space power satellites required to provide varying percentages of the Nation's energy needs in the 1995-2025 period.
1-3
-.

~ J
i , ::.
Satellite weights were then coupled with the number and schedules of satellitEs required to define a range of transportatio', requirements. These requirements were used to guide the study of varie'Js transportation elements and to estimate integrated tran~portation requirements such as fleet size. Transportation Elements for which specific studies were conducted included multistage winged and ballistic heavy lift launch vehicles, a variety of orbital transfer vehicle thrusters, and persor.ne1 launch and transfer veh<c1e designs.
In a similar manner, the satellite and transportation system characteristics, number, and schedule were used as a basis to estimate the cost of design, d'~ve10pment, test, and evaluation (DDT&E), total program, and mi 115 ::,~r' k i 10watt hour. Pre1 iminary estimates are a1 so provided of n~.tura1 resource requirements and pollutants emitted from processing dnd launch operations. Estimates of energy payback are also presented.
Figure 1-1 presents the task structure that was used in the study effort. The present report (Vol. I) and Volume II are also organized according to this task structure.
Collection
Transmission
Reception
Construction and maintenance
CCY!sUuction
Logistics
Habitat and command
Environment
Solar power systems in space
Requirements and gUidelines
Transportation
Cargo to LEO
Personnel to LEO
Cargo OTV
Personnel OTV
Integrated program plan
Manufacturing
Transportation
Alternate energy sources
Figure 1-1.- Study task structure.
1-4
Integrated ops
Functions
Procedures
Facilities
,
1 / /
-

• ,
, , '0
f ,
I
I j
'~'_;7""""~T' ".'""':"".~,~""", •..• _,, "'~ "'-,-,'V"'" V'~=":>'!'lI
II. CONCLUSIONS
The scope and complexity of the satellite power concept coupled with the limited depth of the present study would make it inappropriate to draw absolute conclusions. However, the SPS concept appears to be technically feasible in that no design or operational problems were encountered that did not" appear amenable to solution. The economic viability of the system appears promising but is obviously dependent upon a combination of technology advancement and/or the costs of competitive sources.
Within the limitations of the study and based on a variety of assumptions and/or estimates, the following preliminary conclusions are presented.
1. The maximum power output of an individual microwave transmission link to Earth is about 5 GW and the transmitting antenna diameter is about 1 km. based on the following assumptions;
a. 2 b.
23 mW/cm c.
resulting in a d.
~~ operating frequency of 2.45 GHz A maximum allowable power density at the ionosphere of
A maximum allowable antenna waveguide temperature of 485 K power density at the antenna of 21 kW/m2 A 10-dB Gaussian taper of the microwave beam
2. The estimated mass of a 10-GW SPS (incorporatir.g solar energy converters sufficient for two 5-GW microwave power transmission systems) is between 47 x 106 and 124 x 106 kg, based on the following assumptions:
a. Silicon cell arr"ays with an efficiency of 15 to 17 percent at 30° C 3nd a concentration ratio of 2
b. An overall system conversion and transmission efficic~cy range of 4.2 to 8.0 percent
c. A weight growth of 50 percent over present estimates
The resulting solar array areas ranged from 96 to 183 km2•
3. The silicon solar cell arrays make up well over half the weight and cost of the satellite. Consequently, additional effort on solar arrays offers the most potential for overall system improvement, particularly with respect to new approaches that could result in significant weight reduction.
4. Considerations of the stl'ucture indicatea that minimum weight can be achieved if design loads are limited to those encountered on orbit and after construction. If this is done, the structure can be held to a very small percentage (-5 percent) of the SPS weight. The major factor in design will not be weight but the development of techniqlles for automated on-orbit construction and for conducting large electrical currents.
i
-

i , ~ , , r i % i' " f I ~.
, I t ,
~- " ,
5. Development of automated construction techniques is complex and requires a great deal of further effort. A preliminary task evaluation based on a conceptual construction technique suggests that as many as 600 personnel may be required in space to construct an SPS in 1 year, with minor variations expected in personnel required dup to configuration and cor,~;truction locatIon,. Placing and supporting these personnel in orbit is t' relatively smi!ll factor in the overall transportation requirement.
6. Past studies have indicated an apparent performance advantage of ~onstructing, assembling, or deploying all or a portion of the solar arrays in low-Earth orbit and then utilizing solar energy with electric thrusters to propel the system or major elements thereof 'to geosynchronous orbit. The conclusion of the present study is that this area need~ further study with full consideration given to the following factors:
a. Degradation of the exposed solar arrays during transit b. Protection of unused arrays during transit c. Earth shadowing during portions of transit possibly re
quiring nonsolar propulsion d. Docking and assembl~' of large SPS sections at geosynchronous
orbit and resulting impact on structura~ design e. Relative simplicity of ch,?nical stages for transfer cf
"containerized" packages to geosynchronuus orbit f. Radiation conditions at geosynchronous orbit
7. The SPS in equatorial orbit will be eclipsed both by the Earth and by other satellites. These eclipses result in as many as three brief (up to 75 min) power outages per day for two 6-week periods pe~ year, although less than 1 percent of the available energy is lost. The SPS/grid system must be designed to accommodate these outages.
8. Conceptual designs and charact~ristics were developed for twostage winged and bed 1 i stic heavy 1 ift 1 aunch vehic: es of varyi ng payload capability. Although the ballistic systems are muc', smaller and lighter, recovery and reusability will be key issues in establishil1g the desired configuration.
9. Heavy liH launch vehicle design considerations established hydrocarbon tuel rather than hydrogen as the choice for first-stage propellant because of its greater energy density.
10. Considerations of Isp and confidence in technical development of c,;,ndidate electric engines indicate that the MPD arcjet engine appears to be the best choice for self-powered orbital tranfer. These engines are also suitable for subsequent use as thrusters for the SPS attitude control system.
11. The high launch rates required indicate that launch window and related operational considerations may become significant factors. Launch latitudes near the Equator greatly expand the launch window and offer performance advantages.
II-2
-
)

i ,. f,' it. z
t~:' " f ~ ~ £ , ~~
~ ;
~' " ~
t )';-
I'
f ~ , ~.
! ,.,
• ~ , ~ !
l ! , ~ , '/
~
" I ~ ; I
~ r i" • ;;
(j , , , ~ ~ , ~ ! " •• , ~;
t i ~
I ~. i i
I
- ~ "r'-'1'<;~-'''''''~''''-'~''i='.f~''_'''''''-''''''''''''''''''' .:,""" ", ,~- '"
I
12. Based on varying assumptions as to performance, construction, location, orbital transfer modes, and reusability, achievable transportation costs to geosynchronous orbit are estimated to range from $75 to $3DD/kg. The major contributor to the total transportation costs for a given program was the cost of transporting the necessary material to low-Earth orbit.
13. The cost of producing electricity from solar power satellites as described herein is estimated to be in the range of 29 to 115 mills/ kWh. This range of estimates is based on the following assumptions:
a. An implementation of 112 lD-GW satellites over a 3D-year period
b. A range of satellite weights and transportation costs as indicated earlier
c. A design, development, test, and evaluation (DDT&E) cost amortized over the 3D-year implemc~tation period
d. A space hardware repair/replacement rate of 1 percent annually
e. A plant factor of 92 percent allowing for eclipses and maintenance time
f. A return on capital investment of 15 percent
14. The cost of producing electricity with conventional (nuclear and fossil) plants is predicted to be in the range of 15 to 3D mills/kWh in the 1995 time period, depending upon the cost, fuel, and type of powerplant. The cost of producing electricity with potential ground-based powerplant concepts (ground solar, geothermal, wind) is estimated to be from 28 to 121 mills/kWh.
15. The introduction of SPS in lieu of meeting an equivalent portion of the Nation's energy needs with Ilew nuclear and coal-burning electrical powerplants will result in significant reduction in emissions (particulates, NOx' SOx' and nuclear waste).
16. The microwave power density at the edge of the rectenna (1 mW/cm2) is about one-tenth of the present U.S. standard for human exposure. The system is fail-safe in that the beam would be dispersed to harmless intensity levels should the microwave beam pointing control fai 1.
17. Implementation of SPS on a large scale would create an increased demand for resources such as aluminum and rocket propellant gases (hydrogen and argon). Also, production capacity would have to be substantially increased in the areas of solar cells and reduction of arsenic from oxides (for the manufacture of gallium arsenide diodes). However, there does not appear to be any critical shortages of resources for SPS construction based on world reserves.
II-3
i ! i I j • I ! 1 1 1 j 1 i j , J 1 1 ; oj
1 , ! ,
'"'- ,~. ".
/
-
I o~
!

, I
I ( I
I
I
--"'''''''''''''''''''''''-. "''''''<C''"'''''''''~''''''''--~'-'''''''i'''''f r-Jii" ~'''''''"'"''.,'''''-:'='
1
III. PROGRAM REQUIREMENTS
A. Projected Energy Demand
Projections of the Nation's electrical energy demand have been made by the Federal Power Commission (FPC), the Energy Research and Development Administration (ERDA), and other Federal agencies and private organizations. Figure 111-1 shows the FPC and ERDA projections for electrical energy demand through 1990 and 20GO, respectively. The FPC projection was presented in the 1970 Federal Power Survey report, Volume I. The ERDA projection (presented in ERDA-48, Volume 1, June 1975) involves six different scenarios that are encompassed by the shaded area of figure 111-1. The highest electricity generation scenario is based on intensive electrification and it has a 4.4 percent/yr growth rate in the year 2000. The lowest electricity generation scenario is based on improved efficiencies in end use and it has a 1.4 percent/yr growth rate in the year 2000. The FPC projection, which is higher than any of the ERDA projections. has an annual growth rate of 6.0 percent/yr in 1990. The FPC projection has been extrapolated to the year 2025 at the 6.0-percent growth rate in order to provide a reference for the development of solar power system implementation scenarios.
B. Implementation Scenarios
Effective use of space solar power imp1 ies an- implementation program that will produce a significant portion of the future electrical program demand. Therefore, scenarios of SPS implementation rates were developed that would provide 25 percent of the new capacity by 2015 (scenario A), 50 percent of the' new capacity by 2010 (scenario B), and all of the new capacity by 2005 (scenario C), in relation to the extrapolated FPC projection. Scenario B was used as an illustrative example by which to examine the SPS in terms of its program requirements and resulting economic analysis. This scenario results in providing a significant quantity of the total electrical energy by 2025. The SPS installed capacity by 2025 would be 1120 GW or about 30 percent of the FPC extrapolated project'ion. If the power output of each SPS is 10 GW (as described in sec. IV). implementation of Scenario B results in a total of 112 satellites in orbit by 2025. The construction rate varies from one per year initially (1995) to seven per year during the last J years of the 30-year period.
III-l
/
-
, -l J
.1

i; I I !
, y
~
f f I. i
* \ '
~~ t, ~. , , ;" :ii: ~, <.!I ( -h ~ , ,. ~ .... i .!!! ,
:::>
! E :::>
~; u r ~ -~
~ U
'" c. 3 Vl Il.. Vl
35.0 Reference:
(a) 1970 Federal Power Survey, Volume 1 Federal Power Commission
3500 I 30.0 (b) ERDA-48, Volume 1, June 1975 Energy Research and Development Administration,'
I ~ I 3000 '" CI)
I <: 25.0 .s;; I ::l: I <.!I
I 2500 .0 SPS 0 I .... scenario - 20.0 ,
c I .E .. I '" III I 2000 c , CI) en , ~ 15.0 , III ,
1500 c , til ., '" u I :5 I ~ 10.0 I
\oJ I
1000 I , , , ""
500 5.0
o oL-~ ____ L-~~~~~ ____ -L~
1975 1980 1990 2000 2010 20202025
Year
Figure 111-1.- Projections of U.S. electrical energy requirements and possible SPS implementation scenarios.
1II-2
/
-
i \
)
I I I
I ! , I
I ! , I , ! ! ~
~ , 1 I \ , 1 .. ~
" I I 1 l ~ ~
1 l

~
~ .~
~ -: t' l' ~:" l' ~-' :"
p ., ., n * ~ , ,
~ ~
R ~ i b,
~, f·'
~ l ~ i ~ l ~ I. ~. , 1; ~ ,. f) ~ ~ , , t f : ; , t
" r ~
, ~ i
t t E-
~-
IV. POWER STATION
The power station of the SPS consists of a Solar Energy Collection System (SECS), which converts solar ene,gy into electricity; a Microwave Power Transmission System (MPTS), wl,ich conve .. ts the electricity into microwave energy and transmits it to Eart;;; and a Microwave Reception and Conversion System (Mr,CS). which converts the mi crowave energy into electric i ty suitabl e for ill Lerface with a distribution grid. These elements of the pow~r station are depicted in figure IV-l.
The purpose of this part of the study was to explore the factors involved in the design of the power station. This involved evaluating the power output of individual satellites, methods and efficiencies of energy conversion and transmission, requirements and design approaches to system elements, weights of equipment and material in orbit, and the orbital characteristics of the satellites.
I'" \ Solar ( ... ' concentrator
Solar cell blanket
Antenna subarray 'I I"
I, "
',,": I.
I , • 'I '~.N------' , I"
I ::' : I: ,,:
Solar Energy Collection System
.,,--Miicrowal/e Power Transmission System
Microwave Reception and Conversion Sys'om . .-r
Figure IV-l.- SPS functional description.
IV-l
Power to grid
-

t t
__ ._,,~_, ,_"~" __ ",-,,-,"_,,,,<?_.~.,,.""""" --.r_·",~~,--·"",,,,,",,"""<';"''''''''1' ,==:-=,,,,,","'<'. '.,..., "!"'f>!,~,,:!,;~"""'''''''Ir-''''''''''''''''''''''''')'''i .,,", .i"'U"-Qi"'9t'!l!!l!ldJ~
t -
Several configuration approaches were considered and two typical examples were studied in some detail for the purpose of defining ranges of weight, cost, and construction approaches. These two examples are referred to as the "column/cable" and "truss" configurations.
A. System Analysis
1. Efficiencies
The energy collection, conversion, and transmission process involves a number of steps, each having an associated efficiency. An initial task of the study was to estimate these efficiencies. Three estimates were made of tbi~ efficiency of each step, incl uding a minimum efficiency that could be achieved with virtual certainty, a probably achievable (nominal) efficiency, and the best, or maximum, efficiency that might be achieved. These estimates are presented in figure IV-2. The estimated overall efficiencies from incident sunlight to dc output were 4.2, 5.4, and 8 percent for the "minimum," "probable," and "maximum" cases, respectively. The estimated efficiencies of the system excluding photovoltaic conversion of sunlight to electrical energy were 41, 52, and 69 percent, respectively. These estimated sfficiencies were used for collector sizing and weight estimates. Revised efficiency estimates indica~ed that the "probable" achievable (nominal) efficiency was more appropriately 58 percent than 52 percent. The efficiencies of the various steps resulting in this revised "probable" estimate are also presented in figure IV-2.
2. MPTS/MRCS Analysis
An analysis was conducted to determine the appropriate size of the power station, defined in terms of the dc output power at the rectenna and the overall microwave system(s) parameters.
Two specific constraints were identified that would limit the maximum power output. These constraints were maximum allowable power densities of 21 kW/m2 at the transmitting antenna and 23 mW/cm2 at the ionosphere. The former is the re~ult of the thermal limitations of the aluminum waveguides. The latter is the result of a theoretical analysis (ref. Meltz) which indicates that nonlinear interactions between the beam and the ionosphere will not exist below this level.
Given a system frequency (2.45 GHz) and the estimated efficiencies of steps in the trqnsmission process, the two aforementioned constraints can be related to dc output power and transmitting antenna diameter. These relationships are illustrated in figure IV-3. It can be seen from the figure that the maximum power output that does not exceed the constraints is 5 GW, achieved with a transmitt;ng antenna diameter of 1 km. Accordingly, a 5-GW dc output power at the rectenna and a l-km antenna diameter have been used as nominal, or reference, values throughout the study.
IV-2
1 /
-

~
< I
W
"''''=-,-,"l·y,., "'~""._"~'-"-"~'''''._.',.--,-~ ...
· 7'<-'~ ·-C .. '"·,'-.... --r.~'''"""'",.,"'.·_- ,;:" ... «~«-.-~-.. ' .~.'~"'."~'.~'-"-,~,-.;'"";'"'f.''''"'"~''i; •• "'"'''...",,,''''',,'''Y'',-~_'''' ... ~'''~,.,<l)'Im>?'14,.;oil,""" ;;:;:;;;0:$1 jh~f:M"M!1\ZUJtl#.o:;:H9!K. <A.9AAW ':Ah.i.Q I.; ~J ,~)If)jQA;:; L,J.;gqJ ._.t..",
<.,~.--~-.. -.-,.+, .. -. .'----,,- -,_. ----- '--'''--'-'' ---- ------~-~.-- -'~-.-.. ~ ____ -""T"'" -"r'-·'~·-''!'i
-""- / ..........
Efficiencies, percent
j
.~ /
.~ , l ,
i
~ 1
~-
Parameters Minimum Nominal Maximum
Original Revised
Photovoltaic conversion (from solar energy)
At 300 C 15 15 15 17 At 100 0 C 10.3 10.3 10.3 11 .6
SECS power distribution 85 92 92 93 Antenna powe .. distribution 94 96 98 97 dc-rf convers1on 85 87 87 94 Phase control (a) (a) (a) (a) Waveguides (I2R) 99 i 99 98 99 Mechanical alinement 97 98 98 99 Atmosphere 92 96 98 98 Energy collection 81 86 88 91 rf-dc conversion 85 87 90 94 Power interface (output power to grid) 99 99 99 99
Overall efficiency 4.2 5.4 6.0 8.0 Effi~i~~cy exc'!udil1g photovol taic conversion 41 52 58 69
L.... ----- __ 1- --_L------'--
aCombined with energy collection.
Figure IV-2.- Estimated efficiencies of the various steps in the collection, conversion, and transmission prQcess.
.'.- ,~~,,~",-, ...... ,~ .. , ......... -........,,--...-.,---, .. -.
t
,
I
~-
"
~ ]
";
~ , ,
i 1
I ~
---

oc
I l ~
i ~ t ~ 1 f , ~ [ < ~
, t r r: • , ~
, ,
I • !
L, _.<'._.
.. ""T"'" '''-''''~.'O~ ~~~'"~T'--
I l~ 4 5
6 V Power density
\ \ at transmitter 6 5 40 / 60 / 4 GW output power
\ \ / \ / \ Power density /
'" '" \ \ at ionosphere 1 / / E E \ / '- -!:! \ s: ~ \ / 10-dB taper -'"
! 30 ~ ... 40 \ \ / 2.45 GHz
~ \ / / 'E .. -" \ /
'" .. \ c '" /
~ 0 \ / c / RI .e
\ \/ ~
;;; /\ / '" ~
,/ c 'in Thermal and ionosphere limits .. c 'C .. , ill 20 'C
~ t 20 .. ~ -'" 0-
m "" Q. m Q.
10 0 .5 1.0 1.5 2.0
Transmitting antenna diameter, km
Figure IV-3.- Output power limits.
A microwave frequency of 2.45 GHz was selected for study purposes. This frequency is at the center of a 100-MHz band reserved for industrial, scientific, and medical use, so that interference with communications will be minimized. Atmospheric attenuation is also low at this frequency. A higher frequency, such as 3 GHz, offers higher gain for the same antenna diameter and should be considered, but would cause SUbstantial inter-ference with present users of this band.
The mainbeam pattern and sidelobe characteristics of the antenna will vary with the power density taper over the antenna. Increasing the amount of taper produces a lower boresight density. a wider mainlobe, and lower sidelobes. For a given rectenna radius, the collection efficiency increases with the amount of taper. A 10-dB taper has been adopted for this study. For a no-error/no-failure condition, this gives a gO-percent collection efficiency at a rectenna radius of 4300 m. An ideal continuous taper would be too complex to be practical and was replaced in this study by a 10-step approximation that gives virtually the same performaoce.
IV-4
/
-
I ) 1
I

I
i
!
I
'~=·-'N~==n>=", j\l'~"""',","";"'M£"'""'1"";;::"'''' !'lIhQ!"!Jtt!!!&t"'" .. , ''''!!J'';~''''!i'''')A'''''''i O!!!!.I(I!1!!t4IP
I t The transmitting antenna consists of a number of subarrays,
each of which is phase controlled as a unit. Increasing the size of individual subarrays reduces the number of receivers and phasing electronics required, and therefore the cost of the phasing control system. Decreasing the size of the subarrays reduces thermal distortion and the probable need for active positioning to compensate for misalinement. Subarray sizes of 4, 10, and 18 m (square) were studied. The 10-m size was selected as a reference, because it required less phase-control equipment than the 4-m size while not needing the active mechanical alinement of the 18-m size.
A summary of the microwave system{s) parameters is presented in table IV-l. These parameters were utilized in the calculation of the power density distribution across the rectenna, which is presented in figure IV-4.
Power densities of 23 mW/cm2 and 1 mW/cm2 exist at the center and edge (5 km) of the rectenna, respectively. The latter density corresponds to one-tenth of the current U.S. standard for allowable human exposure to microwave radiation.
3. Orbit Considerations
There are three orbit perturbations of importance. The Earth's equatorial ellipticity, solar and lunar gravity gradients, "d solar radiation pressure result in satellite movement that must be assessed and possibly counteracted.
The equatorial ellipticity causes a drift in longitude centered about either longitude 1200 W or 60 0 E. Such a drift is unacceptable in view of an expected large number of satellites in this orbit and the need to maintain a proper relationship between the satellite and the receiving antenna. The velocity inr.rem'ent required to counteract this drift, however, ~. less than 1 mis/yr.
Solar and lunar gravity gradients cause an initial inclination of zero to grow to about 15 0 in 27 years. Nonzero inclinations require larger rectennas (approximately '10 to 30 percent for 7.30 inclination). Zero inclination can be maintained with a velocity increment of 46 m/s/yr; this appears to be a reasonable price.
Solar radiation pressure produces an eccentricity in the orbit. To maintain the eccentricity at zero requires a velocity increment ~f a few hundred ~/s/yr. The problems associated with a slightly eccentric orbit, primarily a moderate departure from constant velocity antenna rotation and a small (on the order of +1 percent) variation in rectenna output, do not appear to war~ant the expenditure.
IV-5
/
-

; .
, ! I
, .. " '-1 .. - --.---'~---.-" ~""--.. -""«"",
I
TABLE IV-l.- A SUMMARY OF MICROWAVE SYSTEi~(S) PARAMETERS
Parameter
Output dc power at rectenna Transm'l tt i ng antenna diameter Array aperture illumination
Subarray size Nll,llber of subarrays Error budget
Total rms phase error for each subarray for the phase control system
Amplitude tolerance across subarray
Inoperative microwave generators (random distribution)
Phase control
Antenna radiators dc power distribution system,
lateral configuration Antenna mechanical alinement
requi rements for a 2-percent loss I in effective antenna gain
Rectenna dimensions at 40° latitude
Rectenna collection efficiency using tne specifie1 error budget
Power density at center of rbctenna
Power density at edge of rectenna Nominal microwave system
efficiency from dc output at rotary joint to collected dc output of rectenna
Remarks
5 GW 1 km
10-step, truncated Gaussian amplitude distribution with a 10-dB edge taper
100 m2 (approximately 10 m by 10 m) 7850
+1 dB
2 percent
Active, retrodirective array with phasing system using transmission lines combined with a subarray-tosubarray phase transfer scheme
Slotted wave!;uides 40 kV
+3 arc-minutes
lC km I::y 14 km
88 percent 2 23 mW/cm 2 1.0 mW/cm
63 percent
IV-6
/
-

1 _ J
T-l-'~-- --. . N.&W3..A?u.:;;: tAJiJtc d%AL ':GPr ."piP
I I
100
10
1
2 23 mW/cm
---.1 '-....
"'-
'" .01
NORMAL OPERATION OF PHASE CONTROL SYSTEM
100 phase error 1 dB amplitude error 2'/0 failure rate 1 km tranSl.1itter dia 10 dB taper
PARTIAL FAILURE OF PHASE CONTROL SYSTEM
1350 phase error No ampl itude error No failures 1 km transmitter dla 10 dB taper
Rectenna radius used in cost models
TOTAL FAILURf OF PHASE CONTROL
.003 -------- --------
\
.001 Io---L_....L..._"-----'_-'-_.L-_'- _-'-_-'----1'--'-'-_-'-_"-----' o 5 10
Rectenna radius, km
Figure IV-4.- Power density at rectenna.
IV-7
"
J fC$JIJj
... '

The SPS, in synchronous equatorial orbit, will be eclipsed by the Earth daily for about 43 days at the spring equinox and 44 days at the fall equinox (fig. IV-5). The maximum duration is about 75 minutes. The eclipse is total and occurs at about local midnight. Becaus; the maximum dimension of a typical SPS is 6 to 7 percent of tr.e width of the penumbra, the illumination gradient is slight. Total power loss is slightly less than 1 percent of total annual output.
The close spacing (about 0.5 0 of longitude) that results from a large number of satellites (112 located to serve the United States) will cause the satell ites to ecl ipse each other blice a day, at about 6 a.m. and 6 p.m., for about 2 weeks, at the equinoxes, This eclipse is shorter and is not total, but will cause almost complete microwave power loss for as long as 15 minutes. The penumbra is much nqrrower than the satellite di,np.nsions, so that illumination gradients are steep. Differential thermal expansion must therefore be accounted for in the system design.
r Region of SPS shadowing
6 PM
Region of Earth shadowing
Region of SPS shadowing
Figure IV-5.- Eclipse geometry.
IV-8
Sun --
-

,
(
; ,
[ .-.~.",.'.,~\ .. ""....-~,7l' ;;,"".)fN.}; .J,i~. 'l$f~
Power loss is less than 0.1 percent of ar,nua1 output; however. these eclipse conditions must be considered i~ integrating satellite-generated power with surfac~ systems.
4. Configurations
In an attempt to minimize structural weights, the concept illustrated in figure IV-6(a) (column/cable) was developed utilizing compression columns and supporting cables (see "SECS Structure," sec. IV-B-3). With this configuration, the transmitting antenna has to be mounted on the north or south end of the solar array to be able to view the Earth continuously. However, microwave recoil from the antenna (about 5 1b) causes a constant disturbing torque, and the offset in the center of mass also produces a solar radiation pressure torque. To eliminate these disturbances, the solar array area was doubled and an antenna was mounted on each end. The resulting configuration is essentially twa o-GW satellites sharing a commmon structure. For a given total power requirement. this approach has an additional advantage in that the number of satellites is halved and consequently the distanc~ between satellites doubled. This simplifies traffic control and maintenance a"lj reduces the impact of eclipse by other satellites.
This configurational approach did result in a very low structural weight, as will be seen in the subsequent presentation of mass properties; however, it should also be noted that the SECS structural weight is not a large percentage of the satellite total weight, ranging from 1 percent (minimum, column/cable) to 6 percent (maximum, truss)· for the cases considered. The column/cable configll' .tion has the poten- -. tial disadvantage of being incompatible wit a mission mode that involves construction of the satellite, or modules thereof, at low-Earth orbit, which then rrovides solar energy to propel the satellite to geosynchronous orbit.
A second configuration was also considered in some depth (fig. IV-6(b)). It is referred to as the "truss" configuration. Like the column/cable, it has two 5-GW antennas and a "double-size" solar array, although a single 5-GW system with central antenna is also possible. It is built up as a three-dimensional truss and may be easier to construct in geosynchronous orbit than the column/cable configuration. It can also be built in modules at low-Earth orbit.
Several other configurations were considered briefly; they werf' adaptations of the two concepts described previously and did not appear to offer any overriding advantages.
The sizes of the configurations as presented in figure IV-6 are related to "probable," or nominal, efficiencies of conversion and transmission as discussed in section IV-A-l. The relationship between efficiency, array size, and mass will be presented in the next section.
IV-9
1 /
-

-,,-,,-~ ..... ,-,~~ .- ,-,w, " • ",. ,.., '·"U·_''''~ ... ~, ~,"-,7>"""''""'''''''c'''''''''''''=l:', ""'"~~'""",", "'1', T"""'"","~ ... """.,. "'~ :;;;Mq:,A".4lA
7.2 km 6 krn 1+--14.4 km--+..f
14.4 km
I 5.2 km
I
1-km diameter
Counterweight
Side view
(a) Column/ cable.
1----\-------· 27.5 km ------1 -lkm
1~6km
~ ~~I~~~~~~~'~~
'--Antenna (2) 1-km diameter
(bl Truss.
Figure IV-6.- Example configurations.
IV· 10
i /
-.
/i

! , ,
i. ;
5. Mass Properties
To determine the range of weights of the satellite, the following process was used. The three estimates of system efficiencies presented in figure IV-2 were used to define the solar array area necessar,'! to provide lO-GW power output to two rectennas (5 GW "ach) for each estimate. The resulting areas were as follows.
Overall efficiency, percent 4.2 - minimum 5.4 - nominal 8.0 - maximum
Array sizea , km2
183 144
96
alncreased 4.3 percent to compensate for solar angle-ofi~cidence losses (see sec. IV-8-IV).
For each subelement of the satellite, a "minimum," "nominal," and "maximum" unit weight was estimated. In this case, the minimum and maximum terms have the inverse meaning of that applied to the efficiency estimates. For example, the minimum weight is the best that might be achieved, whereas the maximum can be achieved with virtual certair.:.y. Table IV-2 summarizes the minimum, nominal, and maximum Imit weight estimates for the various subelements of the satellite.
If the three subelement estimates are applied to each of the three array sizes and the two different configurations, a total of 18 (3 by 3 by 2) weight estimates are obtained. The resulting range, or envelope, of weights is presented in figure IV-7. The satellite mass is seen to be in a range between 47 000 and 124 000 metric tons. Note that this weight is associated with a satellite that provides 10 GW of power to two rectennas via two 1-km transmitting antennas.
A satellite weight breakdown for 6 of the 18 estimates is presented in table IV-3. The six estimates presented are identified by symbols in figure IV-7. The breakdow;lS indicate the significance of the solar cell blankets to the total weight, approaching 50 percent in all cases. The SEeS structure, on the other hand, is not a major contribution to the total, varying from 1 to 6 percent of the total for cases presented. The microwave generators contribute approximately 15 percent of the total weight. Note that the klystron was assumed for all estimates. Experience has shown that the total mass invariably grows during the course of any aerospace program, the amount depending on the degree of technology advancement involved. Fifty percent growth from the initial concept weight can reasonably be expected for a program of this nature. Accordingly, the totals obtained by summing the estimates of subelements have been increased by 50 percent. This weight growth has been included in the weights presented in figure IV-7.
IV-ll
-.

'::>0 "':0 "r:tc ~!
10
Hi ~lii
~
<: I ~
N
_ Component
Solar energy collaction system Primary structure (column/cable) Primary structure (truss) Secondary structure Mechanical systems Maintenance station Control Instrumentation/communications
Solar cell blankets
Solar concentrators
Power distribution (column/cable) Power distribution (truss)
Microwave power transmission system Primary structure Secondary structure Subarray structure Therma 1 control Mechanical systems Rotary joints Pointing control Power distribution Phase control Microwave generators Waveguides
a
- ,~, • --.~' -'C '"'''"'<-" ... -,,- """ -,p,.-,-~-,'-~"-'''' "--~''''~'''''''''''''''-''''''''-'''''''''''.~~,'f-~,",_).4i'i¥,!'''.i!'"." E.k .. ,c .... G:, _(;;;:. 4':;:;:i&Ji£i]iSf ,,3M;;;!!!
TABLE IV-2.- SUMMARY OF UNIT MASSES
Unit masses a
Minimum Nominal Maximum
Nom. -10 percent 3.08 kg/m Nom.+20 percent Nom.-10 percent 2764 Nom.+20 percent Nom.-10 percent 209 Nom.+20 percent
30 40 50 70 85 100
150 (dry) 200 (dry) 300 (dry) 3 4 5
.31 kg/m2 .40 kg/m2 .46 kg/m2
Nom. .04 kg/m2 Nom.
Full use 3886 No use of of solar 3000 solar concen-
concentrators trators
Nom. -1 0 percel'it 392 Nom.+20 percent Nom.-10 percent 518 Nom. +20 percent Nom.-10 percent 300 Nom. +20 percent Nom.-10 percent 23 Nom.+l0 percent Nom.-10 percent 30 Nom. +20 percent
363 635 907 Nom.-20 percent 100 Nom.+30 perce,t Nom.-20 percent 167 Nom.+100 percent Nom.-20 percent 358 Nom.+20 percent Nom. -20 percent 8846 Nom.+20 percent Nom.-20 percent 4002 Nom. +20 percent
'·'~·--··"2V"··':::-·~J·~~-?''''~~mfY~~r~:~-?~
Remarks
x total column length Proportional to solar 3rray area Proportional to solar array area
1000 m3 enclosed volum... Dry mass plus 1 year of propellant
x solar cell blanket area
x concentrator area
Proportional to (area)3/2
Proportional to power at rotary jOint
Proportional to power at generators
L-. t!
1 1 ., 4 ) , ,
/ ~ ..
:J J,
Quantities represent total mass of component (for reference solar array area) 1n metric tons unless otherwise noted. 1
;l,!II"o;< 'j",.. ,r~~~""'-''''''''"_'"'''''"''~'_"_,,""'r''""~_,",""'-''''"~ ...... l
,
~ f
- j
" -J

c)
f-:z 0 0 0 ~
Ul Ul
'" E fJ)
Cl. fJ)
, . I,
140
130
120
110
100
90
80
70
60
50
Truss Column/cable
/
/ /
/
/ If!
Maximum unit masses
Nominal unit masses
Minimum unit masses
40 ~ __ ~ ____ ~ ____ ~~ __ -L ____ ~ __ ~
80 100 120 140 160 180 200
Solar array area, km2
Figure IV-7.- Solar power satellite total mass.
IV-13
/
-.

· .».~ "- '"<~"""'''''''', ."'-" ~"."~~-"n'-",,v_-'_'
cc ~~'
t-<
~~ A:;)
')'''?'''~~''!''''''''''''~~'''tJtOO:>8'JI&' -~""+''f~f ."'w·· ","-,JMvI'1!J.i .8.¥?i}ifRm" .( _ a iU.JJiA4H·" .#4· ;gC.l t. 41 j
- ---" .•. ~ .. --~-.--..~..,.,. ........ "..~
1 / i 3 +- ~
J ;
.f:
c::~
§: TABLE IV-3.- MASS PROPERTIES SUMMARY
1 1
-<: I ~
.j:>
Component
Solar energy collection system Solar cell blankets Solar concentrators Structure Power distribution Other systems
Microwave power transmission system Microwave generators Waveguides Structure Power distribution Rotary joints Phase control Pointing control Other systems
Solar power satellite total
Solar power satellite (including 50 percent growth)
0 Minimum
(20914 ) 14893 3843 290
1568 320
(10625 ) 5455 3202 1089 102 363 286
80 48
31539
47309
Mass properties. metric tons
Col umn/Cabl ea Trussa
0 /::, a IT Nominal Maximum Minimum Nominal
(39171 ) (62434 ) (21443) (40869) 28677 42062 14893 28677 5735 7315 3843 5735
431 621 1793 2973 3886 11802 575 3000 442 634 339 484
(15371 ) (20424 ) (10625) ( 15371) 8846 12251 5455 8846 4002 4802 3202 4002 1210 1452 1089 1210
167 394 102 167 635 907 363 635 358 430 286 358 100 130 1 1
53 61 48 53
52542 82861 32068 56240
81813 124292 48102 84360 --- ~~--
aSymbols relate to size/efficiencies indicated by similar symbols on figure IV-7 •
. _--"'.>-
-.. -.-'
~. r" t., .. ··b '-'t:'" rt! ',-. t.!.t.i~~'-'-"""".""= . .>-,,,,",.~_ ._ .. ~,_ .... t
/5, Maximum
(60936) 42062 7315 4550 6327
682
(20427) 12251 4802 1452
394 907 430
1 61
81363
122045 I
, , ~ 1
.~- ~.
'-.
-...-
1 ., ., i J i ! 1 1
I
J i

I , J
B. Solar Energy Co11ectinn System
The SECS includes the necessary elements for the collection and conversion of sunlight to electrical power, the distribution of that power to the antenna interface, structural loads, and attitude and orbit control.
A preliminary analysis indicated that the most promising conversion systems from the standpoint of current state of development were the photovoltaic silicon solar cell and the thermodynamic Brayton cycle. It was also recognized that more efficient and advanced systems might be required to establish SPS viability. For the purpose of the immediate study, however, systems effort was concentrated on the photovoltaic silicon solar cell approach to provide a departure point for comparative evaluation with other approaches in future studies.
1. Solar Array
Silicon solar cells have been developed and utilized in spacec"aft for a number of years. More recently, under the impetus of proposed terrestrial use, an intensive effort has been initiated to improv'~ the efficiency and reduce the cost of silicon cells. Typical characteristics of space operational solar arrays and those projected to result from the present development efforts for Earth use are as follows.
Present (1976) Projected (1985)
Efficiency, percent
12 8 to 10
Thi ckness, mils
8 to 12 4 to 6
Cost, $/W
100 .50
For the purposes of the present study, it has been estimated that efficiencies of 15 to 17 percent at 300 C are achievable within the projected SPS time frame.
Cost and weight of the total solar array can be reduced by concentrating the sunlight so that the entire area need not be covered with solar cells. Accordingly, a parametric study of performance as a function of concentration ratio for both sil icon (si) and gall ium arsenide (GaAs) cells w~s performed. It was found that GaAs becomes cost competitive only above concentration ratios of 4 to 6. At these ratios, the solar array requires relatively complex structure and must be oriented toward the Sun more accurately to avoid excessive losses. Silicon cells were used, at a concentration ratio of 2, as a reference for the current study. At this ratio, a simple trough can be used (fig. IV-8). Nominal conversion efficiency, incl uding losses withi n the cell blanket, is estimated at 10.3 percent for the 1000 C cell temperature expected with 2:1 concentration. Cell degradation due to radiation damage and thermal cycling is expected to be a total of 6 percent for the first 5 years and 1 percent/yr thereafter.
IV-15
1
-
~
1 , j
i , 1 j J l
~
I

"'---",",'C7'~~"'-"~ "'-~~~·!"'I""i""~r~~
Incident solar radiation
I-------------WI------------~
WI Concentration ratio = iii
2
Figure IV-B.- Solar concentrator.
A typical solar cell blanket. used as a reference design, is shown in figure IV-9. The electrical connections between cells (copper or aluminum) are sandwiched between two layers of Kapton and welded to the cell through holes in the upper layer of Kapton. The cells are covered with a plastic such as FEP Teflon. Cell thickness is 0.1 mm (4 mil). Total blanket wei9ht is estimated at 0.31 to 0.46 kg/m2• Concentrators are 12.5 mm (0.5 mil) with a thin aluminum coating. Their weight is approximately 0.04 kg/m2•
Considerable development will be required in cell manufacture and blanket assembly. The present technique of growing a sing1ecrystal ingot about 3 in. in diameter, sawing it into disks, cutting the disks into square blanks, and lapping and polishing to make a cell, cannot hope to meet cost or quantity requirements of the program. Work has been done on growing silicon in thin sheets, but crystal defects, which reduce efficiency. are numerous.
IV-15
I /
-
·1 )

I
i i \.
I f.
(.
... , .......... " .. ".~.~~.~-.. ~.~,~"~-. '"M1' au:: £" l- 4~~$ 51 @;@h --3 1&
Kapton/ adhesive interconnect
Figure IV-9.- Solar cell blanket.
2. Power Distribution
r
A nominal operating voltage of 40 kV was selected for this study. Other studies have used 20 kV to match the operating voltage of the amplitron microwave generator. However, the higher voltage offers a significant weight advantage and can presumably be used with amplitrons in series pairs. In addition, 40 kV is compatible with the klystron, an alternative to the amplitron. Still higher voltages could be used, but arcing and voltage breakdown could require more insulation weight.
Pure aluminum was used as the conducting material in preference to copper or silver on the basis of resistivity and density. If structural properties are required, 6061 aluminum is still preferable to copper or silver. Superconductors were not seriously considered because of the weight and complexity of thf> refrigeration system.
The ideal shape of a conductor is a thin, flat sheet for optimum heat dissipation. Thus, the aluminized solar array concentrator is an interesting candidate. A thickness of 12.5 mm (0.5 mil) should provide sufficient cross-sectional area. Positive and negative conductors can be separated by the ~I/idth of the cell blanket over most of the array, but insulation would be required in some locations.
Magnetic effects between conductors have not been analyzed. It is possible that the resulting forces will distort the surface of the concentrators, causing uneven illumination of the cell blanket.
Because of the high curl'ent levels (220 000 A at the rotary joint), switching should not be done within the array distribution system. On-off switching can occur at the solar cell blanket interface with the distribution system. It is assumed that regulation to limit overvoltage will be done within this cell blanket.
IV-17
1
-.

· '-" -
The principal technology issue is the dc switching problem arising from the high voltage and current levels.
3. Structure
Operating structural loads on the SPS are very low, increasing the significance of transportation, assembly, and maintenance loads. The large scale of the SPS emphasizes the dynamic characteristics of the structure that must be addressed in design.
The primary natural load in synchronous orbit is gravity gradient torque; at low altitudes aerodynamic drag is also a consideration. Induced loads include propulsion/ReS thrust, current loop interactions with the Earth's magnetic field, microwave recoil from the antennas, and nonuniform antenna motion. Thermal transients and gradients arising from eclipses will produce differential e~pansion loads.
Two fundamentally different approaches have been considered. Two of the most efficient structural members are tension members (cables) and buckling-limited compression members. This fact is the basis of the c(llumn/cable structural concept, which consists of a small number of compression members that are held in position by a large number of cables.
An alternative approach is to maintain component alinement by providing local stiffness at the minimum level consistent with dynamic stability, such as in the truss configuration. This structure is less efficient from a weight standpoint but may offer advantages in assembly and modularization.
For either configuration, conventional aerospace structural concepts will be inadequate to achieve the low weight required. One possible approach applicable to the truss configuration is to accept occasional elastic buckling of individual members due to random loadings (e.g., docking), from which the member would recover after removal of the load (suth as deformation of a venetian blind). Following this concept, the low operational stressps make it possible to design columns with L/p = 200.
The most significant dynamic loading frequency is the 12-hour (2.3 x 10⁻⁵ Hz) gravity gradi~nt cycle. In selecting a minimum natural frequency of 2.3 x 10⁻⁴ Hz to keep the dynamic response to a reasonable level, it was found that the membrane stress in the array of the column/cable configuration should be on the order of 0.3 N/m (0.02 lb/ft), and that the minimum depth of the truss configuration should be on the order of 600 m.
IV-1B
:~ I i I
-.

I I I
I (,
I j
4. Attitude and Orbit Control
The control system must compensate for all forces acting on the SPS. both orbit perturbations and attitude disturbances. Orbit perturbations are discussed in section IV-A-3.
The predominant attitude disturbances are gravity gradient torques of two kinds: short-period (12 hour) torque about an axis perpendicular to the orbit plane, and long-period torque about an axis in the orbit plane (see fig. IV-10). Other attitude distur~ances include solar radiation pressure and microwave recoil (if not acting through the center of mass) and antenna angular accelerations (if eccentricity or inclination is not zero).
~Earth
la) Short period.
\ : _-\-H.lu:'iI+--_~r: Sun
I I Sol~ j U ~M~M
:: ~tation ;".;, -iff
Sola,' orientation torques
Ib) Long period.
Figure IV-10.- Gravity gradient torques.
IV-19
-
, ~ .J
i ,
1

. -,- -~.", ~~,,~. ~'~~"-"'''''''~''''''''''''''''>;~~' -.~'",=o.~'."'="" "~-"='-'f"""""'''''''''~'''T''''''''''''~'''''''''41'!!4''''i'i''''tc'''I'''."",-,cI!!lA$lIllflm\ll!lM!IlU!!!S. .. tU!l'.l"'fl"'l, ;~;"&.·~;,J'!!II!II;:1'I!I!4
Gravity gradient torques can be countered by a reaction control system, but at a substantial propellant cost. As an alternative, the coll .. nn/cable configuration can eliminate the short-period torque by means of about 106 kg of counterweights at the ends of the columns perpendicular to the array (fig. IV-llJ. Purely on a weight basis, the counterweights are roughly equivalent to a 3D-year prope'i1ant supply if specific impulse is about 98 000 m/s (10 000 lb-s/lb), assuming an array length/width ratio of 2. The long-period torque could be countered in a similar fashion by altering the length/width ratio, but the counterweight required is prohibitive (on the order of 7 x 10⁶ kg). Orienting the long axis of the array perpendicular to the orbit plane (POP) eliminates the long-period torque at an annual average power loss of 4 percent; the weight of additional array fequired to 'lIake up the loss is much less than the propellant required. This is the preferred approach.
Width
Counterweight
• Lengt l.l
Counterweight
Figure !V-ll.- Counterweight location.
IV-20
r
-

~ i
1', '" ~
Several electric propulsion/RCS systems were evaluated, includ-''lg electrostatic (ion) thrusters, magnetoplasmadynam;c (MPD) and thermal arc jets, and an 02H2 chemical system in which the propellant is launched as water and electrolyzed to produce the gases. The intent was not a complete survey of all possibilities, but a range of potentiai options in terms of weight, performance, and power reql;;rements, Of the systems considered, the MPD arc jet appears most attl·dctive. Although it is in an early stage of development and performanc~ projections are uncertain, its low weight, high specific impulsp and high unit thl'ust rr.ake it worth further conrideration.
All the high-performance propulsion systems require large amounts of electrical power. It would be impractical to store sufficien~ electrical energy to operate these systems during eclipse. It appears feasible, however, to inhibit propulsive or RCS maneuvers during eclipse, except for short-period gravity gradient compensation. This small requirement can be satisfied by an H202 electrolysis system that produces and stores gases in sunlight; the system can also serve as a standby propulsion system.
Development is required for the RCS. Development will also be necessary in control of very large, flexible structures, a problem that cannot be completely simulated on Earth because gravity is much greater than the forces normally acting on the structure.
5. Instrumentation, Control, and Communications
A large quantity of subsystem'status data will be required for ground monitoring and control. The depth of this study has not produced sufficiently detailed definition to permit meaningful identifica-tion of instrumentation, control, and communications requirements. However, present technology should be adequate for all foreseeable needs, and the weight impact on the SPS will be insignificant. As a consequence, this subsystem has been deferred for later study.
6. Maintenance Station
Because it would be impractical to design the SPS for a 30-year failure-free life, maintenance will inevitably be required periodically. The maintenance question has not been explored to any depth in this study, however, and the following comments represent a cursory consideration of the problem.
To minimize ~he payload of the maintenance spacecraft, as many maintenance support capabilities as possible should be incorporated into the SPS. These would include a normally unmanned, habitable control station, some repair and smal: spares storage facilities, and servicing and local transportation vehicles. All these capabilities will be similar, if not identical, to those used during construction, so that the same development program is applicable to both.
IV-2l
.....
I 1 , 1

, ,
I
~ )
)
C. Microwave Power Transmission System
The MPTS consists of microwave generators, subarray elements, a phase contro' system, power nistribution, a pointing control system,
\"otary joints, and structure.
1. Antenna Array
Tile antenna is a planar phased array with a diameter of
1 km, comprising about 7850 subarrays. Each subarray is individually
phase-controlled by reference to a "pilot" beam transmitted from the rectenna so that a narrow, coherent beam is transmitted to the ground.
Power density varies in a 10-step approximation of a 10-dB Gaussian taper to maximize the power in the main lobe of the beam.
2. Microwa;'e Generators
Microwave generators convert dc electrical power to microwave power for transmission to ground. Several types were considered,
but only two, the amp1itron and the klystron, were considered likely candidates and examined in detail.
The amp1itron's chief projected advantages are significant-
ly lower specific weight (roughly 0.4 kg/kW versus 0.7 kg/kW for the klystron) and somewhat higher efficiency (88 percent vs. 86 percent). It
uses a cold cathode, which enhances reliability, and can be passively cooled
by a pyro1ytic graphite radiator. However, it is relatively noisy and requires
an absorptive filter. Tuning is accomplished by a motor-driven pole
piece that is potentially unreliable.
The klystron is capable of ten times the power OJtput per
tube of the amp1itron. Therefore, fewer tubes are required, greatly simplifying antenna assembly. The anode voltage is twice as high, per
mitting a reduction in distribution system weight (unless the amp1itrons
are connected in series). The gain is much higher; the resulting 10w-rf
input drive power makes phase control easier. Arcing and breakdown are
prevented automatically by internal discharge.
Although the ky1stron was used for weight estimates in
this study, it is too early to make a selection, and much wvrk is needed
on both tubes before a final c~oice is possible.
3. Subarrays
The transmitting antenna includes a large number of subarrays, each of which is controlled as a unit. To minimize losses,
the subarray should be approximately square. Power density is varied
over ~he antenna by adjusting the number of microwave generators in
each subarray.
IV-22
-
J

r
! I l'l
I ,
~ )
, ,
"~-1°'-''-'-'-- "-~. no', ''''''~';'' ~""'-""-'P""=,,, ;0;,(1 •• 'TIJi.Q.".MIi!!(ifA!f'I4£lI!\/)4i!tW1 ,"'{.IO • .J4S.SD.1Ij
1 To achieve maximum uniformity of illumination of the
antenna aperture, a resonant slotted waveguide array is used. The basic antenna element is illustrated in figure IV-12. The components are an input feed guide that distributes power from the tube to the radiating waveguides, a back face that contains slots for coupling power from the feed guide to the radiating guides, vertical walls that separate the radiating guides, a front face that contains the radiating slots, and end walls. Aluminum is used because of its conductivity, density, and cost. Close tolerances (about 0.001 in.) are required in slot dimensions and location and should be a factor in planning space versus ground construction of this element.
Waveguide technology is well established. However, manufacturing and on-orbit assembly techniques will require development if the necessary production rates and efficiencies are to be achieved.
4. Phase Control
The coherence and direction of the transmitted beam a.re mainta:ned by reference to a pilot beam transmitted from the rEctenna to a reference receiver in the center of the antenna and to each subarray. Loss of phase control immediately diffuses the transmitted beam (see fig. 1 V-4), ~o that the concentrated beam cannot wander away from the rectenna. Two methods of comparing the received phasing signals appear promi sing.
The first method (the "transmission line" approach) employs a separate transmission line from the central reference receiver to each small group of subarrays. Thi, requires that transmission delay times be calibrated and maintained, requiring additional control circuitry. The second ("sequential ") method transmits the reference phase from one subarray to the next; this can result in a large buildup of phase error.
The preferred approach appears to be a combination of these, in which several sllbarrays (perhaps 8 to 16) are connected in series as a group, and each group receives the reference phase via a separate transmission line. The rf cable distribution has been used for weight estimating purposes, but a fiber optics system is potentially lighter.
Areas of concern include phase control system requirements for each tube, phase stability ~f components outside the phase control loop, and transmitter rf interference with the phase referen~e system.
5. Pointing Control
In an eccentric orbit, the antenna must vary from constant velocity in order to track the rectenna; this requires a cyclic torque with a period of 1 day to be applied to thE antenna. A more or less
-

I
" ..J. I
End wall -......
RF output to ground
" ,
, , , ,
, , , ,
-I I-4.3 cm
,
//
//
//
//
rront face
/
, /
, /
/
-Vertical walls
. IV 12 - Antenna element. Flgure - •
IV-24
Feed guide
Microwave generator input
Feed guide length
-
)

i i I
,
" cont~nuous torque is also neces%ary to ov~rcome joint friction. It ~ppears that these torques can be reacted by the structure without serlOUS overall dynamic effects. However, there may be some local dynamic response that can be identified only by analysis of detailed design. If such problems exist, they can be circumvented by isolating the antenna drive from the SPS structure, either by "shock-mounting" the antenna or by reacting the drive torques against reaction jets or momentum storage devices on the antenna. To be conservative, the latter approach has been used for sizing purposes. Reaction jets would tend to create an atmosphere and would consume large quantities of propellant. Control moment gyros (CMG's) or other momentum storage devices are attractive for cyclic torques, although rotor masses of several tons are required. Friction is counteracted within the joint and does not affect the supporting structure.
Pointing command inputs can be derived from phase differences in the pilot beam as received at a set of four selected 3ubarrays located 90° apart. A second set of subarrays is used to resolve phase ambiguities. Initial acquisition is based on the known position and attitude of the SPS, but this method is not accurate enough for antenna pointing.
The principal development required is the momentum storage device. A CMG for this application would be more than 200 times heavier (~25 000 kg) than the CMG's used on Skylab if desisned to the same stresses.
6. Power Distribution
A lateral flow distribution system was used to minimize weight (fig. IV-13). Each quadrant of the antenna is independent, with several switchgear per quadrant. Four s~itchgear per quadrant keep the current at a reasonable level (~ll 000 A) and were assumed for estimating purposes. The switchgear serve not only as distribution points, but can be used to bring power up to maximum in a controlled sequence during startup. Power is routed to distribution points (switchgear) serving from one to four subarrays, depending on the power density
SubillTay distribution palnt-_-I--.. ..
Switch gear
.L __
I
Figure IV-13.- Typical antenna distribution system.
IV-25
-.

···-·''''-'''''''''''··'I'·'~''· -~""--~-'>:""'.,..--,. .. ".--,....,~ -?",)""",.<""~=~~1"'" - ,~",,-, ",,",,"""f""""-l '" MN oct U .. M"
I 1 in that part of the antenna. Further work will be required on a control system for the switchgear and on the degree and location of power ~':pp1y regulation.
7. Structure
A compression hoop structural concept was developed in an effort to minimize structural weight. Primary structure consists of four concent.ric polygons of 6, 12, 18, and 24 sides joined by tension cables (fig. IV-14J. The polygon sides are rectangular frames 65 by 130 m. A secondary structural matrix adapts the antenna subarrays to the primary structure such that each subarray is attached at three points. Thermal distortion should be minimized in view of the radial symmetry of the structure and the power density.
Figure IV-14.- Antenna primary structure.
8. Rotary Joint
The rotary joint provides a structural connection between the SEeS and the transmitting antenna, a means of transferring electrical energy from the SEeS to the transmitting antenna, and a drive system to rotate the joint continuously about one axis and roughly 1°, oscillating daily, about a second axis.
Several approaches were identified and evaluated in general terms, and a promising concept was selected for more detailed examination. This concept, illustrated in figure IV-15, consists of a ball joint approximately 25 ft in diameter. The spherical contact surface is split into two halves. and supports structural loads and transfers electrical energy by means of sliding brushes.
IV-26
/
-

( ,
Ball joint outer race 40-ft dia
-t --1---+ Elect. wires (bare, stranded copper) r struct \ \
(truss) .--.:.----+--\-~-+-""""'-
Suspension· A-A strut (6)
I
Actuators (6),
1 A
Outer rac~j Inner race
/--~',,,,Driveshaft~4- ---.
i , '",:'"'''''': \tU~~ ~ ( \ .L ~ + \ \ ,
\~ ,:/ I, #
L Antenn;----+--I # Sliding structure contact
(brushes)
Figure IV-15.- Ball joint and drive concept.
IV-27
, U-joint
Drive motor
-

, , I i f
The joint is rotated continuously by a drive motor in the center. Tilt is accomplished by six actuators at the top. The outer ball is suspended within its cylindrical cage by many small copper wires
that resist translation but not small rotations, and also conduct electri
cal energy from the ball to the antenna. The suspension struts sense
rotation of the ball and a computer converts these signals into joint drive commands to maintain the cage/ball relative oriantation. Thus, the drive system overcomes friction but makes no other inputs.
A sUbstantial design and development program is required.
Heat rejection from the interior of the joint will be a major problem. Brush design and materials for a 3D-year life will also require research.
9. Thermal Control
Passive thermal control of the transmitting antenna ap-pears feasible, but a closely integrated design of the microwave genera
tors, waveguides, electronics, and structure will be required. Three significant design considerations are waste heat rejection, thermal dis
tortion from the daily solar orientation cycle, and thermal strain f~om
ecl i pses.
The rotary joint presents the other major heat rejection
problem. It has not been analyzed in depth, but appears to be a potential application for heat pipes.
D. Microwave Reception and Conversion System
The MRCS includes a large rectifying antenna, or rectenna,
(fig. IV-16) to convert the microwave energy to dc electrical energy, a distribution system to collect the energy, and dc-ac inverters to convert the energy to a fonm compatible with the commercial power grid.
1. Rectenna
The rectifying antenna is an integrated system for collect
ing microwave power and rectifying this power into direct current. The rectenna consists of about 15 billion elements. Each rectenna element
consists essentially of a half-wave dipole antenna and a half-wave rectifier (Schottky barrier diode). These elements are mounted on a wire
mesh ground plane and connected in series to produce the required dc output voltage. The elements would cover an elliptical area typically 10 by 14 km (at 40" latitude) to produce 5-GW dc output power.
The efficiency of the rectenna falls off rapidly at low power densities. This, together with the power density distribution in the microwave beam, may place an upper limit on practical rectenna size.
A major development item is an element that will operate efficiently at low power densities and is producible at low cost.
IV-28
/
_.,
j
I j

t I I I
t I i
I I
I i f !
i t
t [ ! l .
, (.
Figure IV-16.- Rectenna construction.
2. Grid Interface
It may be possible for the distribution grid to accommodate dc voltage directly; if not, the dc output may be inverted by either of two approaches. In the first approach, the rectenna is wired to produce 1000 V dc, which is used directly as the inverter. input. This requires a large number of inverters to minimize conductor losses and cost.
In the second approach, the rectenna is wired to produce 250 kV dc. This allows an inverter location remote from the rectenna because of lower dc transmission losses, and requires fewer inverters for the same power output. It does, however, create new insulation requirements and structural modifications to separate the wiring from ground.
E. Operations
Ideally, SPS power would remain uniform at all times. In reality, however, there will be variations from several causes as illustrated in figure IV-17.
When the solar array 1s oriented perpendicular to the orbit plane, as has been found desirable from a weight standpoint (see sec. IV-B-4), the solar energy collected varies as the cosine of the Sun's declination, producing the 6-month cycle at the top of figure IV-17. Total variation is about 450 MW.
IV-29
-

5 .3
5.0
4.7
5.3
5.0
4.7
" ;, ; .;
j .. ' !: i! ' Due to orbit :1·: l=--T -- -'t~--,-' ; '+' ~_-,-ec_~~n-.tr_ic_it_Y"-_-r-
J F M ' A M I J I J N D 5 i. •. _ .•• •. __ . ____ __ ____ •. _. _ __ ____ ..• _ .. . ___ . __ _
._- "-- ------- .... ----"'
~'J\A r. Ifll\I\I\I\I\l\l\I\I\I\I\/~\\WN tN (fA Ii I Ii ! i I I I ; I I i
I ' ,I . I
I ! i I I I
! ;. I I ; i I
: March : 1 Apnl
-'" . -" _.-.---- --.-.-._-----
_-_ !-~El;I;;;;,E"th)~j:::f,~:;~~ c
- _ r 75 minutes - (max.)
,
-7 --15 minutes 1~~-~ __ ---L---~----~~(m~a~x~.~)---L----~
I March 20 T March 21
figure IV-17.- Variation in ground de power output.
IV-30
-
I 1 i

I
I t
j
i I
,-. --""7<"-""- .--" .. - .. ~".,-=,~",--".-~,--. :'-r"'~-"''''''''''~'"~~'''''''~''';'' .",.=c<>~-,,,,·m;"=\li'I\,.a .i( )is,,, Xi? "ts:f'lW1T il.! ~ .. JJ"E,t;;"""'"i
I Orbit eccentricity will cause a cyclic fluctuation in
sate11ite-to-rectenna distance. For an expected eccentricity of 0.04, this results in a daily power output variation of about 100 MW superimposed on the 6-month variation.
Eclipses by the Earth (see sec. IV-A-3) will cause total shutdowns daily around local midnight for about 6 weeks in the spri,lg and fall. Maximum duration is about 75 minutes. Eclipses by other satellites will cause shutdowns at about 6 a.m. and 6 p.m. local time for several days in the spring and fall, with a maximum duration of about 15 minutes.
Total shutdowns will also be required at times for maintenance. Duration of shutdown is conjectured to be a few weeks, and the frequency is about once every 5 years.
The primary operational problems will arise from the eclipses. At 0.50 spacing, as many as 38 SPS's of a total of 112 will be in the Earth's shadow simultaneously, so that power sharing will be of limited usefulness. A shifting, nonequatoria1 orbit that is never eclipsed is possible but has not been examined in this study; it is expected that orbit maintenance propellant will be prohibitively heavy. No entirely satisfactory solution to the eclipse problem is apparent, and further ;tudy is required. Maintenance shutdowns will be less frequent, can be planned for off-peak conditions, and should consequently present less of an operational problem.
The daily ~nd 6-month cyclic variations in power output can be eliminated if necessary. A circular orbit avoids the daily fluctuation but at a cost in orbit maintenance propellant of some 200 metric tons/yr (I = 10 000 1b-s/1b). The 6-month cycle can be eliminated by continuouss~olar orientation instead of POP. Additionu1 reaction control propellant on the order of a few hundred tons per year would be required or, for the column/cable configuration, counterweights of some 7000 metric tons could be used (sec. IV-B-4). The system trade-offs relating to the power station have not taken into account any adverse impact of these fluctuations on the distribution grid. It is possible that inclusion of these considerations may alter the orbit and attitude control considered in this study. and further iterations of the trade-offs should be made.
F. Unit Costs
Table IV-4 shows a list of cost estimating relationships (CER's) utilized for initial SPS costing. These CER's were produced using historically derived CER's for similar space equipment. Because of the very high volume production rates required for items such as sola~ cells. Schottky diodes (rectenna elements), and microwave generators, the CER's for these devices were substantially reduced below current values for space systems. An example of this expected cost reduction is illustrated in figure IV-18 for silicon solar cells. The cost reduction is projected by ERDA as a result of a major terrestrial photovo1taic research
-

',.,.cr,·,,,,,~.~,,,,,,~,,,,I'·'- <'~, ""'f'" »'"
00 >o;l~
is 81Z ~~ €'tl
§!
...... <: • w N
.... "v·_; ___ ",.·· ·""'~'~-¥'''f<'<~r''''·~'''··'~~'"'·'~~""'-'-'''''W-'''''''''''''''"'''''~'?r<'''~~~~o.e.""'''''¥ftiJEiL,¥. C@S?,g:'iff.&K)tJ -* ~;.-: ,3;.1.. ·n Q. '#fW,'1
.. __ "_"~''''_~~ __ ~'"''_''''-.' .,."_I;'>,.,..,....-.:~~ ... ~,~_.,..-r.:"'''',...,.._._ • ......".,,..'~~' .. -''''
~I--
TABLE IV-4.- COST ESTIMATING RELATIONSHIPS
Category CER
Minillllm Nominal
Solar energy collection system: Solar cell blankets, $/kW •••••••••• 100 300
Solar concentrators. $/kW • • • • • • • • • • -- 25 Structure, $/kg • • , • • • • • • • • • • • • -- 7.00 Power distribution, $/kg •••••••••• -- 4.00 Other systems, $/kg ••••••••••••• -- 1000
~crowaye power transmission system: Microwave generator, $/unft ••••••••• -- 2000
Waveguid.s, $/kg . . . . . . . . . . . . . . -- 70
Structure, S/kg: ••••••••••••••• -- 70 Power d;stributfon, $/kg •••••••••• -- 40 Rotary joints, $/kg ••••••••••••• -- 100 Phase control, $/unft •••••••••••• -- 56 Painting control, $/kg ••••••••••• -- 1500 Other sy! terns, $/kg • • • • • • • • • • • • • -- 1000
Kicrowave receptfon and conversion system: Rectenna array (circufts)2
and diode assembly, $/m 6 8 . . . . . . . . . 2 .15 Real estate. $/m •••••••••••••• --
Site preparation, $/m2 . . . . . . . . . . . -- .40 Power distribution and control, $/m2 . . . . -- 2.50
2 Support structure, $/m ••••••• • • • • 6 10
Source/derivation
Maxillllm
500 ERDA terrestrial photo-voltaic goals
-- ($0.70/m2) -- Space equipment -- Space equfpment -- Electronic components; hfgh
reHabfl fty
-- Manufacturer projection
-- Design estimate
-- Space equipment -- Space equfpment -- Design estimate -- Design estimate -- Electronic components -- Electronic components; high
reliabflity
8 Manufacturer projection
-- ($ 650/acre)
-- ($1800/acre)
-- ($ 45/kW); switchgear and inverters
10 Design estimate
t
.
i
:i , , , ~ 'i 'i 1 , , _______ '-1
1
~--.... -
1
j ! •

,
! I
i I
1
I
·~-·---I
. I I
and development (R&D) program currently in progress. ERDA's 1985 goal is to produce solar cells in quantities of 500 MW for $500/kW peak. According to ERDA 48, Volume 2, a production capability of 50 GW (equivalent to 2.5 10-GW SPS's) should be achieved by 2000 with a market price in the range of $100 to $300/kW. While recognizing that the weight requirements for solar cells to be used in space are different from those for terrestrial use, the $100 to $500 range appears reasonable. and was used in the present study.
o
ERDA projections
I 1 I I I I I
--
1985 goal 500 wrw at $500fCW
I I
Industry accumulated volume, kW
SPS volume range ----_1_ _I I -----, 1 I I I 1 ,
2000 goal: 50 GW at $100 to 300/kW
I I
Figure IV-18.- Photovo1taic array cost projection.
IV-33
/
-.
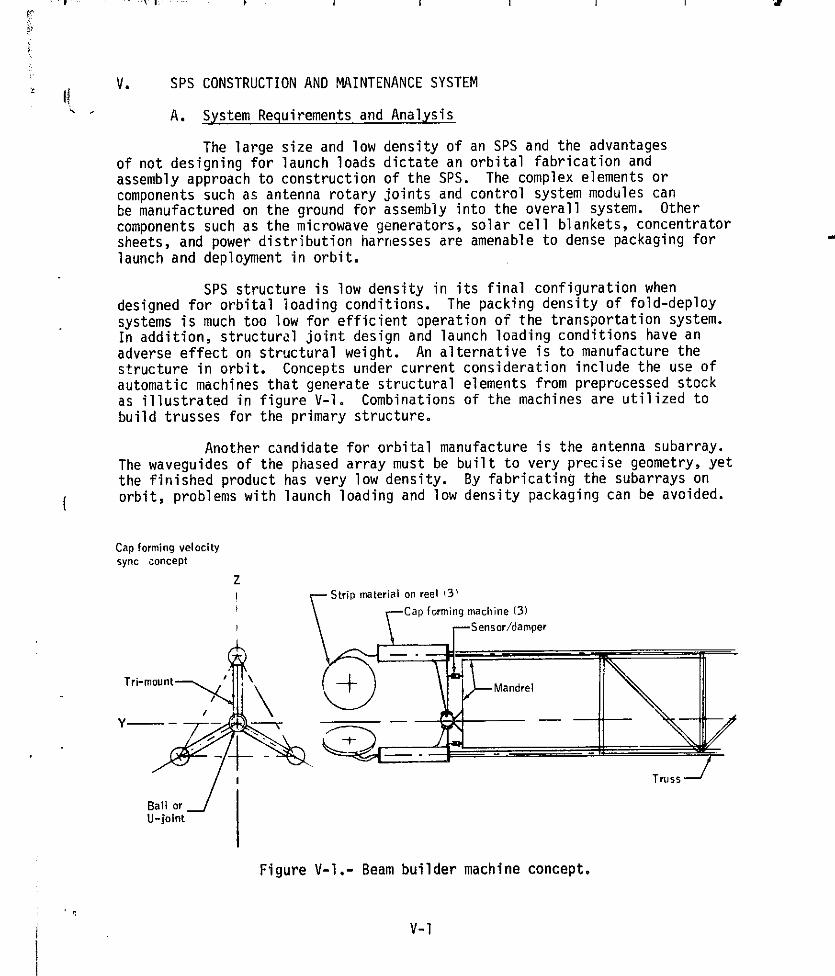
···1·
~
II
t 1
I f ! t
r I
J
V. SPS CONSTRUCTION AND MAINTENANCE SYSTEM
A. System Requirements and Analysis
The large size and low density of an SPS and the advantages of not designing for launch loads dictate an orbital fabrication and assembly approach to construction of the SPS. The complex elements or components such as antenna rotary joints and control system modules can be manufactured on the ground for assembly into the overall system. Other components such as the microwave generators, solar cell blankets, concentrator sheets, and power distribution harrlesses are amenable to dense packaging for launch and deployment in orbit.
SPS structure is low density in its final configuration when designed for orbital loading conditions. The packing density of fold-deploy systems is much too low for efficient operation of the transportation system. In addition, structurul joint design and launch loading conditions have an adverse effect on structural weight. An alternative is to manufacture the structure in orbit. Concepts under current consideration include the use of automatic machines that generate structural elements from preprDcessed stock as illustrated in figure V-l. Combinations of the machines are utilized to build trusses for the primary structure.
Another candidate for orbital manufacture is the antenna subarray. The waveguides of the phased array must be built to very precise geometry, yet the finished product has very low density. By fabricating the subarrays on orbit, problems with launch loading and low density packaging can be avoided.
Cap forming velocity sync concept
Tri-mount
y---
Ball or U-jolnt
z Strip material on reel 13'
Cap fCirming machine (3)
Sensor/damper
Mandrel
Figure V-l.- Beam builder machine concept.
V-l
-.

, i
t ~-I f
I
,
~ i )
- . . _--......... ---·-~--~·--T·-- -, , -
T _.
) \
I The large size of the SPS requires a high degree of automation to
uchieve the necessary construction rates. The construction crew can be best utilized in servicing and maintaining automated equipment, evaluating the operation and output, and performing contingency operations. The construction and support crew operate a construction base consisting of construction and manufacturing facilities, orbital construction and support equipment, logistic facilities, integration management facilities, and crew habitability facilities.
A conceptual GEO construction sequence for the column/ca~le perpendicular-to-the-orbital-plane (POP) configuration is shown in togure V-2. The schedule is phased for completion in 1 year. The construction facilities are assumed to be operational . Construction facil ities are provided at each end of the major columns (fig. V- 3). These facilitie s move out from the center of the SPS by generating structural members. Stabilizing cables are attached and deployed as the columns are extended. Packages of solar cell blankets and reflectors are attached to the column and connected to the power distribution system by construction personnel. Deployment of the collector is gradual ~s the column length increases (f -ig. V-4). Deployment is aided and mon 'i tored by personnel.
Milestones Iionth from , tar
112131415 6 " .0 n 12 1 I Attach beam -.. 11111111 1 1
. 2 primary
13 IAttach cables
!4 Iinstall solar cell hi., oJ, 1
15 I Install . sheets I 16 Iinstall power di s~ system_
17 I Attach contro l modules
18 IF. 1 , gimbal
19 I Attach ball joint
110 [In sta ll drive
11 checks !IIIIIIIII
113 11 . to ball joint
antenna power dist -FIll 116 Inst.II
L8 Fab anlenna '-LEO~ 19 III 20 1111111111 1 Not.s :
.-Figure V-2.- Typical SPS construction sequence - column/cable (POP).
V-2
1 41 . ; ~ , ~ i
--
1
J

-"T~-'- .-
l --{ I
.-",,,,<" ,,~!;<" ... ..., •• "--"~-"""-'-. ·-·,-··~·';''''"''~'~-'·'--'''''''''=7, "."'·"""'c,... .• ,..-""''''''''''~ .~~, -~' ... /'*"""8"'"~~".'"' ,.,.,"""'...,."""""""...... ~v;;ki iii &3 X4AMU -, L4.J.l q#3¥
I 1
Beam bui Iders extending columns
, ,
, ~Final array position
Interim array position
\
Antenna under con s trll c ti on
Figure V-3.- Partial construction of column/cable configuration.
Antenna construction takes place in parallel with the collector construction. Hoe antenna construction facil ities are attached to the appropriate column fabrication facilities. The antenna subarray support structure provides a construction framework for buildup of the concentric ring primary structure. As the concentric rings are completed, installation of the prefabricated antenna subarrays is performed. The antenna power distribution and phase control systems are connected. System checkout is completed and construction equipment is removed.
An alternative to the column/cable is the truss configuration. The truss configuration was conceived as an aid to on-orbit construction. With the regular geometry of the truss configuration, a construction base concept as shown in figure V-5 is possible. A large space frame supports the equipment necessary for completion of the collector array. Materials are received and distributed, trusses are manufactured with automatic machines, reflectors
V-3
SUP
-.

-·'·-·--~· l-' " . I
.• 3il r $ . a
T'
I
Conlf\101' ,ltta cli poin ts
5l .. c,
Concentrator P3cK.1qe
Figure V-4.- Concept for solar cell/con~entrator deployment.
and solar cell blankets al 'e deployed, power distribution cab1es are installed, and subsystems are checked out within the structural support of the construction base . Antenna fabrication takes place in a fashion similar to that described for the column/cable configuration . A construction sequence for the truss ~onfiguration is provided in figure V-5 .
A potential advantage of the truss configuration is the use of modular construction at a small construction base in LEO. Then a bootstrap transportation mode can be used to power the modular segn;ent to GEO with energy derived by deploytlitmt of some of the solar cell blankets. These solar cells are degraded during the traverse of the Van Allen regions, which must be considered in sizing the array.
Another principal issue with the modular approach is the docking and attachment of very large masses in GEO. The modular segments are very large and the relative motion between segments must be attenuated. A' docking system would have to be provided that achieves low distributed loads.
V-4
-

(
I
Antenna
constrllcGtt~io:n -~~~:K1\ facility-
Concentrator instal\er---~~;c,
Solar cell blanket installer
Beam builcier Logistics and integration facility
Figll~: ';-5.- Construction base concept for truss configuration.
B. Construction Base
Construction base design is sensitive to the operational concept for its intended use in support of large structure manufacturing in a remote environment. Crew size and associated support are major considerations in sizing the construction base. Specific operations such as assembly ciocking 07 transport vehicles, propellant transfer, maintenance operations, crew rescue, and radiation E'.1vironment monitoring and emergencies all contribute to design requirements. The physical configuration of the SPS will also be a determining factor in specific construction base design. The space radiation environment will be a driver in the design of manned facilities and equipment.
Five major elements of the orbital construction base are defined as follows:
1. Construction and manufacturing facility 2. Orbital construc.tion and support equipment 3. Logistics facility 4. Integration management facility 5. Crew habitability facilities
V-5
1 /
-

I r • •
r I f
! I ,
•
-r~ -r -- -~-"""'
~ i I
I I
Month~ Milestones
1 121 314 151~T~T~T~TIo -ii 12 1 .. 1 II 1 I III II ITTTTTTT
~ IF ~ array""" ~ .1 ~nstalls~ 14 . Install ~
IS ~power~ ~ 6 i Attach control 7 T
Is I System check c-rj
lci IF I support
Ei Ili ~ 112 I Install ' -~ 11" IF "-IH I Install power tjnn
~ I Install antenna li l' Remove
18 19
~ it ?ci . - LEO
=
Figure V-6.- Typical SPS construction sequence - truss configuration •
Each element contains or consists of equipment that is used to perfonn certa i n functions and tasks cOl1lT1ensurate wi th the requ ired ste" ·· uystep sequential construction operations. Figure V-7 illustrates a con;truction base concept for a column/cable configuration. It (.onsists of six construction facility sites for the solar energy cullection system (SECS) and one for each microwave power transmissio~ system (MPTS). Logistics and integration management facilities are combined at two locations. Habitability facilities are combined with each of the other facilities.
1. Construction and manufacturing facility.- The construction and manufacturing facility provides the capability for the direct construction cpe r·ations. The crew monitors automated manufacturing and construction fun tions with a crew override capability in the event of malfunction.
The facility consists of six space frames supporting the machines for fabricating the structural elements of the SPS collector system. Preprocessed stock is s~pplied to the machines ard processed into the final structural trusses. These trusses are connected to form the larger trusses of the primary struc ·, ure. Cable rigging devices are a 1 so opera ted from the fa ~ il i ty. The pa .. kages of so 1 ar ce 11 blankets
V-6
~ ,
-.

FJ" ~. ~. ~, ~, , ~{ !, W , ~'
I ~, , s-
f >,:
j, , ;. f, ~ G: " "
f "
~ ~ " ! ~ " I , , , , ; , ,
".
I f· c ~, ;::
I
J" """ . .1 ... ""., .. ,, . ,.
., .. -~ (f ,
"- ..-
I
\'
Integration management
Construction faciI ity---
C on~U'uction facility --.~
Construction facil ity
Figure V-7.- Construction base concept for column/cable configuration.
V-7
-.

and reflectors are positioned by equipment on two of the facilities sites for deployment. The construction facility provides a platform for connection and deployment of the power distribution cabling.
Two portions of the facility are devoted to antenna construction. Machines for structural fabrication and assembly will bui'ld up the primary structure and subarray support structure. Other machines will install antenna subarrays. A part of the construction facility will be devoted to manufacture of the subarrays in a pressurized environment. This is conceived of as an assembly-line operation principally in a shirtsleeve environment. Subarray manufacture could be done in low-Earth orbit (LEO) to reduce the personnel logistics requirements.
2. Orbital construction and support eguipment.- The orbital construction and support equipment is the manned equipment required to monitor the machines in the construction base, to service them, to inspect subsystem installation, and to perform contingency operations. Manned remote-control manipulators will be provided with a shirt-sleeve environment for man-machine operations. Manipulators will be used for acquiring, positioning, a1ining, holding, and assembling of subsystem components. Conceptually, there would be facility manipulators attached to the con~ struction facility and mobile manipulators able to move along the SPS structure. Extravehicular activity (EVA) capability for contingencies will be provided by EVA modules that house all of the associated EVA equipment hardware, its checkout facility, recharge, stowage and donning facilities, and an airlock to gain access to the vacuum environment. Manned maneuvering units (MMU) may be necessary to support continge~cy operations.
3. Logistics faci1ity.- The principal function of the logistics facil ity is as a "warehouse" in orbit to provide the capabil ity for receiving, storing, and distributing supplies, construction materials, fuels, spare parts, and maintenance tools. A storage and distribution capability will be needed because of the magnitude of materials traffic.
A docking port module will be an integral part of the logistics facility and will be used for loading/unloading and servicing arriving and departing orbital transfer vehicles. Materials and personnel will be transferred to other elements of the construction base by means of the attached transit system.
Maintenance, repair, refurbishment, and servicing for construction equipment and vehicle systems will be done in the docking/ servicing maintenance module. Fuel storage and fuel transfer operations will also be provided by this module.
4. Integration management' facil ity.- Because of the nU',lber of daily arriving and departing orbital transfer vehicles, the displacement of construction base elements, timing or sequence of construction operations, and communications between construction base elements, transportation vehicles, and the ground, a management facility "air traffic control center"
v-a
1 /
....

< ••
, . '.
'i. ,
"
will be needed to integrate all operations in orbit. This facility will provide a communications capability to construction base elements, other satellites, transportation systems, and major ground facilities network.
Centralization for overall mission and operations control for the construction base and its interfaces is a key element in the organization of the base. Mission and operation control will include activities such as transportation and docking control, construction activity scheduling, consumab1es management, safety operations, laser a1inement, and missior logistics. The physical combination of the management facility with tl. logistics facility i; likely.
5. Crew habitability faci1ities.- Crew habitability facilities consist of a number of elements the habitation module, subsystems module, and power module. The habitation modules will provide a shirt-sleeve environment for personnel at the eight major worksites. The subsystem modules will contain the necessary subsystems for support and operation of the construction base.
C. Construction Operations
The configuration of the SPS and the sequence of construction will generally define the requirements for the construction base. Construction operations will drive the configuration of the construction base. The financial advantages of a short construction time will interact with the launch rate to define the construction schedule and the construction facil-I. ity. Guidelines used in developing a staffing plan are as follows.
, I ,
1. Each construction base in geosynchronous Earth orbit (GEO) will have an autonomous organization unto itself.
2. All modules needed to construct an SPS will be resident and attached to the structure.
3. Nominal construction operations will consist of three shifts, 24 hours/day.
4. There will be four crews to provide for maintenance and off duty time.
5. The crew stay time on orbit will be 180 days. 6. There will be cross training. 7. Construction crews will live at their worksite.
An operational schematic for a construction base is shown in figure V-8.
From the schematic and construction sequence are developed the numbers of machines, the number of operations, and the personnel requirements. All estimates were based on the "nominal" size configuration, which has a solar array area of 142 km2 (see fig. IV-7). These estimates for a "nominal" size configuration have also been used for the "minimum" (96 km2) and "maximum" (183 km2) sized arrays in other sections of the report. Later studies will obviously have to evaluate the effect of array size on crew requirements.
-,

Materials delivery from LEO
Manufactllrlng
l / facility \ Logistics , Transporters L Delivery facility I to local
\ ( sites
Warehouse ~ storage Stor
Fabrication
(.''''M' ~ assembly deployment installation
Perform construction function
Figure V-S.- Operational schematic of construction base (column/cable).
Table V-l shows a comparison of the construction equipment requirements for the column/cable and truss configurations. Table V-2 provides an estimate of the personnel requirements for the column/cable configuration construction and support. A typical peak staffing estimate for the truss configuration is provided in table V-3. Typical staffing for manufacture of antenna subarrays in LEO is shown in table V-4.
The peak staffing needed for the typical truss construction base reflects the number and isolation of activity regions. These personnel will generally have passive functions that may be done remotely. The column/cable base activity regions are less numerous but will require greater mobility and more active crew functions. For these reasons, there is greater potential for r~duction in crew size for the truss base and less probability of growth in numbers.
V-10
-
1

( TABLE V-l.- ORBITAL CONSTRUCTION EQUIPMENT REQUIREMENTS ,,~ ~
Equipment No:/confiQuration Co 1 umn/ CaOl e Truss
SfCS 61 Beam-building machines 30
Cable-rigging devices 8 0 Solar cell blanket package installers 4 4 Reflector package installers 4 8 Power distribution harness installers 4 4 Mobile manned manipulators 8 5 Facility manned manipulators 12 2
MPTS (two antennas) 8 Subarray manufacturing (two/hour) 8
Beam-building machines 18 18 Subarray support structure
Primary structure 8 8 Cable-rigging devices 12 12
Power distribution harness installers 4 4 Subarray installers 4 4
It is expected that more personnel will be required in space for modular construction in LEO with final assembly in GEO. The same construction functions mlJst be performed in LEO; in addition. the assembly of the modules in GEO must be accomplisheJ. A summary of peak crew requirements for the two configurations and different construction locations are as follows.
Configuration Column/cable Truss Truss
Primary construction
location GEO GEO LEO
Peak personnel/SPS
GEO 474 574 200
LEO 176 176 740
Total 650 750 940
The estimated crew requirements for the truss configuration with primary construction in LEO were done in less dptail than the other two cases.
-

<: I ~
N
,-,- - r-~ -. . ,"'- ..... ~,., .. , - ~~,,-, -~-",-.,<-~~.,.'-"' ""'~"'-"'" ,. ,~ . ..-" .... g"=-:~~ .... ",~&')';<."."j'''rot'i'{~~-",,,,~!'G' _l}k ~":O;.JJW ilijjlf4V!l« UtiSPH-;gy; C;;r;z:,.I!R.t#' .'kn .@M¥.9I¥!tMMl , zr;,Q Q. ,$( j Q tg:m;"4£!4!¢4JhAjiM t IE ),'4
/ r-
TABLE V-2.- COLUMN/CABLE CONFIGURATION TYPICAL MAN LOADING
Category
1 2
Attach beam builders to hub 48 Build primary structure 48 Rig cables 24 Install solar blankets Install reflectors Install ppwer distribution
system Build antenna substructure 16 Build antenna primar'y
structure Install subarrays Systems checks Subtotal 48 88
Management 10 20 Food service 32 36 Control center 40 40 Warehouse 40 40 Motor pool 30 40 Medical 10 10 Other support 36 44
Subtotal 198 230 Total 246 318
- --- -- ------ --_L-
apeak staffing.
Estimated man 10ading/mo7~h 1 construction personnel
3 4 5 a6 7 8 9 10 11 12 asks ,
48 48 48 48 4S 48 48 I 24 24 24 24 24 24 24 48 48 48 48 48 48 48 48
48 48 48 48 48 48 48 48
16 16 16 16 16 16 16 16 16 16 16 16 16 16 16 16
16 16 16 16 16 16 16 16 16 16 16 16 16 16
8 8 152 232 232 232 232 232 232 144 72 8"
SUDDort functions 20 20 20 20 20 20 20 20 20 10 44 48 48 48 48 48 48 48 32 28 40 40 40 40 40 40 40 40 40 30 40 40 40 40 40 40 40 40 40 30 40 40 40 40 40 40 40 40 40 30 10 10 10 10 10 10 10 10 10 10 44 44 44 44 44 44 44 44 44 ~
238 242 242 242 242 242 242 242 226 74 390 474 474 474 474 474 474 386 298 182
{ ..... m'"
"-.... ".",. --~
·· __ ·.....-··~ __ ;·_ .... ,...."'~ .. .,.""""""""_..-~-""'.;-...,"""""'w""", .... o,=....v.~ ... ~.,-.....-.-..-·_·· __ • --
t '"
~
~ 1 .\ ! ~ I l 1
j 1 i I

,- ---1'- '-,- ~,- ,.---
__ ...... __ .~._ -~--, .. .,. ~v·"-~- ,...,-~. ',.,.-.- • ~'.'~ ,,-""" .... ~ ~._-~_~.
~ .. ...:.~
"."",,qr-<_"',~" ~~-<,."",-, . ~c." ,-. .---.~~,. _~~,~_r"",,,,,,,,,'''''''''''''''''~P:--'''''''''''''''''.';'_'''. ""'~"'1>"':",,""·"'nr .. qil, Mil. :; ,$l;;:::;;PIQC ,) ffiP9ll9JS'i __ Wl4L4EMjjQ!.L.:-.,:;:Jk"AU .P4..tt .4¥.tl)%t Wi! eh-MM.A4&A!!@Qj)_ 1 dd .*1
"'-~' . :~.~ .-" ..... -. -"~~-·'''~,:;.,,~,~~~~'''''~;-ipnr,,,.,~"l($~~~#!!:¥l%~~~~~it~~~~
~
~f ( •. ,.~
ii\J /
) ,
~1 ~! f3 :~ ',~
" g
TABLE V-3.- TRUSS CONFIGURATION TYPICAL MAN LOADING (GEO CONSTRUCTION)
Category
1
Beam builders 78 Solar cell blanket installers 8 Concentrator sheet installers 12 Mobile manipulators 12 Facility manipulators 20 Antenna primary structure Antenna support structure Antenna harness and array
installers <: I System checks
w Subtotal 130
Management 10 Control center 40 Warehouse 40 Motor pool 30 Medical 10 Food service 18 Other support (laundry, R&R
facility, shop, equipment issue) 32 Subtotal 180 Total 310
- -- ----- - --- - - ---
apeak staffing.
Estimated man loading/month (construction personnel)
2 3 4 5 a6 7 8 9 10 11 12 Tasks
117 156 156 156 156 156 156 156 .
32 32 32 32 32 32 32 32 32 61 64 64 64 64 64 64 64 64 64 16 16 16 16 16 16 16 16 12 40 40 40 40 40 40 40 40 21) 16 16 16 16 16 16 16 16 16 16 16 16 16 16 16 16 16 16
-16 16 16 16 16 16 16 16 16
10 10 269 356 356 356 356 356 356 356 176 74 TO
Support functions
~~ ~g ~g 20 20 20 20 20 20 15 10 : 40 40 40 40 40 40 35 30 .
40 40 40 40 40 40 40 40 40 35 30 40 40 40 40 40 40 40 40 40 35 30 , 10 10 10 10 10 10 10 10 10 10 10 ,10 28 28 28 28 28 28 28 20 15 10
40 40 40 40 40 40 40 40 36 32 28 210 218 218 218 J 218 218 218 218 206 177 148 479 574 574 574 574 574 574 574 382 251 158 ------ -~-
L.. ____ ~ ________________
t
..,.-.,... -.... -
'--
1
u , 1 ~
i iB
1 j
I ~ ~
"

1 I TABLE V-4.- TYPICAL PEAK STAFFING (LEO)
FOR ANTENNA SUBARRAY FABRICATION
Function Personnel No./shift Total
Subarray manufacture 16 64" Warehouse 4 16 Management -- 3 Medical personnel -- 4 Control center 3 12 Other support 4 16 Food service 2 8
123
Considering the current lack of task definition, the degree of automation that can be achieved, and the configuration effects, it is believed that the peak crew personnel requirement in space is between 200 and 800.
The construction study did not include a definition of the weights of the construction base. As an input to the program model, gross estimates were made for LEO and GEO bases. Those crude estimates were obtained as a percentage of the weight of the SPS as follows.
Ma~s, metric tonsxl03 Construction GEO LEO
location SPS base base GEO 81.8 ~ 1:0 GEO 84,4 7,0 1.0 LEO 84,4 1. a 8,0
It was assumed that each base would require a replacement, refurbishment, or repair mass of 1000 metric tons per year or per SPS constructed,
Maintenance operations for each SPS were estimated to require 12 man-years/year for each SPS at GEO and 0,5 man-years/year at LEO, It was further assumed that the mass to orbit associated with maintenance would be 800 to 900 metric tons per year,
Per~,onnel provisions l'equirements were estimated to be 2 Ot 3 metric tons/person/year, with the larger number being required at the primary construction location,
V-14
-

(
.---~-«"~~ -" [' , .. = .... "M_-l"'. " .,,"
I . ) ·-'f ,'-
VI. SPACE TRANSPORTATION SYSTEMS
A. Systems Requirements and Analysis
The SPS transportation system is required to transport build-ing material, subassemblies, equipment, supplies, and personnel to geosynchronous ol"bit (GEO) at a rate sufficient to establish as many as s('ven stations per year (assuming a moderate rate of bvildup, or scenario B), having masses ranging from 47 x 106 to 124 x 106 kg/station. The largest and most massive payload element is now expected to be the rotary joint between the transmitting antenna and the solar energy collection 5tructure (SECS). This rotary Joint measures up to 12 by 10 by 10 m and weighs up to 450 metric tons.
Perforw4nce and economic considerations dictate that the Earth to low-Earth orbit (LEO) transportation be accomplished by heavy lift launch vehicles (HLLV) designed for the appropriate flight rates and the loads associated with launch, atmospheric flight, reentry, and landing, whereas the LEO-to-GEO transportation vehicles (orbital transfer vehicles (OTV's)) be designed for nonatmospheric loads and high specific impulse (possibly low thrust) propulsion. A single transportation vehicle design suitable for both flight regimes would be a difficult feat with present technology and would be, at best, a compromise design that would not be cost effective compared with separate vehicles.
The alternatives open to the power satellite designers that have the largest impacts on the i.ransportation system are (1) construction of the station in GEO, (2) construction of th~ station in LEO and transporting it to GEO in modul~s for final assembly, and (3) construction of the station completely in LEO and transporting it to GEO a5 a single unit. The first alternative is considered to be required by the column/cable structure, whereas the first, second, and third are permitted by the truss configuration.
These alternatives affect the OTV design because assembly in LEO, either partial or completa, offers the possibility of using payload-supplied power for LEO-to-GEO propulsion. This is expected to reduce transportation costs because it permits effective use of :ligh-specific-impulse. low-thrust electrical propulsion systems that require relatively small quantities of propellant to be iifted from the Earth's surface. If power is not available from the payload, as in the case of the first alternative, electrical propulsion is still possible, but requires a heavy dedicated power source, the expense of which dictates round-trip flight. Under such conditions, chemical and nuclear propulsion systems become competitive.
Two cargo OTV concepts are considered. One is for the SPS configurations that involve primary construction at GEO and therefore requires independent OTV propulsion systems. The second is for SPS configurations that involve construction at LEO, either total or in modules, which can provide energy for propulsion for orbital transfer.
VI-l
i I i
;,t,k1~
-.

r , , r ~:
r'" ---L
(
,,,.0!U-lithr'; ~1 4-_.,(X
r
Crew transportati on from Earth to LEO wi 11 be accomp 1 i shed uy a personnel launch vehicle (PLV), which may be a Space Shuttle derivation, and from LEO to GEO by a chemically powered personrel OTV (POTV). The POTV is expected to incorporate ~ conventional chemical rocket, probably 02/H2' to provide a short transit time system (1 day or less). The thrust level necessary to achieve the short time of flight precludes high-specific-impulse, 10w-th\"ust electrical systems.
B. Heavy Lift Launch Vehicle
The HLLV is designed for transporting all SPS freight, except crews and high-priority cargo, from Earth to LEO. The launch site is assumed to be the NASA John F. Kennedy Space Center (KSC), and payloads are launched into an approximately 90 by 500 km, 28.5° inclination nominal insertion orbit. Payload rendezvous capability is provided by the orbital maneuvering system (OMS) to decrease second-stage velocity requirements. This imposes a weight penalty of approximately 3 percent on the payload for the OMS, including propellant, and requires a subsequent return to Earth for the OMS engines and avionics. The cost of OMS recovery has not been investigated. The HLLV will provide a payload environment, such as acceleration, shock, vibration, temperature, etc., similar to that provided STS payloads, but will provide no additional services.
The key figure of merit for the HLLV is the cost per pound of payload to LEO. Minin,izing this cost ret;uires attaining as much reusability as possible with as little refurbishment and parts replacement as can be achieved. Reuse goals of 300 and 500 flights were considered from a structural design (fracture mechanics) standpoint and are suggested as the range for launch vehicle replacement calculations and costing purposes.
No particular requirements for advanced technology were assumed in the HLLV studies. Hydrocarbon fuel engines are considered best for launch vehicle first stages because the greater fuel density relative to hydrogen allows enough decrease in structure with related cost advantages to outweigh the higher specific impulse of hydrogen fueled engines. The engines that were considered are presented in table VI-1. The HLLV candidate configurations are presented in table VI-2.
These candidates represent the range of launch vehicle concepts suggested by the section on Technology Forecast of the Outlook for Space report and by NASA and industry experts. Other candidates, such as mixed ballistic and winged systems and very large (450-ton payload) single stage to orbit (SSTO) vehicles were considered in a study contracted by Boeing (NAS 9-14710). Study analyses conducted to date did not identify the mixed systems as leading candidates, although the large SSTO was considered a close competitor to the two-stage ballistic vehicle.
The modified SSTO is an SSTr launch vehicle with a 100- to 175-metric ton payload capability. It features an expendable external hydrogen tank (hence "modified" SSTO) and uses 15 uprated (4000-psia chamber pressure)
VI-2
J ... " .. $1,; ,Z$z~ , ~ i
-.
t , .~
l .1
j
! 1
j ,

r" l J
"l
\ I ,
"T
I
TABLE VI-1.- HLLV CANDIDATE ENGINE CHARACTERISTICS
Engine Fuel
F-1 (£=lO)a RP-1 SSMEb,c H2 New RP_1 a RP-1 New RP-1 b RP-1 New Propanea C H Growth SSMEb,c
3 8 H2
aGas generator.
bStaged combustion.
Oxi-di 7.er Sea
level
°2 262
°2 363 O2 313
°2 280
°2 303 O2 -
cSSME = Space Shuttle main engine.
Isp T VAC/dry weight
Vacuum 288 93 455 74 344 90 313 107 338 100
466 75
TABLE VI-2.- HLLV CANDIDATE CONFIGURATION CHARACTERISTICS
Configuration Propellants Payload, Stage 1 Staqe 2 Metric tons
Mod ified SSTO °2/H2 - 100 to 175 Two-stage winged °2/H2 °2/H2 450
°2/RP-1 °2/H2 450 °2/propane °2/H2 450
Two-stage ballistic °2/RP-1 °2/H2 450
°2/proparoe °2/H2 450
°2/ RP-1 °2/H2 900 °2/propane °2/H2 900
VI-3
j
-

SSME's. Its payload can be a modified Orbiter (which does not require a main propulsion system) with a 45-ton payload or a personnel carrier module carried internally in the payload bay or a much larger payload in an aerodynamic shroud. The external hydrogen tank i~ separated and reentered in a remote ocean region as is the Space Shuttle external tank. The configuration and characteristics are shown in figure V1-l.
The tVlv-stage winged candidate is a 450-J11etric ton payload launch vphicle that accepts a potentially higher unit cost than wdterrecovered vehicles in order to acquire the operational advantages of airplane-like recovery. Several configurations, burn sequences, and engines were investigated and are described in Volume 110 The characteristics and configuration of a selected design using 20 LOX/propane (C3H8) enghes are shown on figuY'e VI-2, along with the characteristics
>-'
'" co
X '< c.. ~
0
'" II) ::::
0 38' " '<
'" '" ::::
1--- 99' ---I
Payload, cons, 185 x 185 km, tons Modified Orbiter I·~ert, tons Stage inert, tons Stage oxidiz,!I', tons Exter'lal tank ioert, tons Extf.fnal \~nk fuel, tons Gro~s lift-off weight, tons NVTlber of engines (uprated SSME's) Tank s:aging altitude, km Tank staqing velocity, km/sec Thrust/wei~'ht .ratio
X '< c.. ~
0 00
'" :::: 0 " >-' '< +> 00 -0 co '" PJ ;:) '<
1 0 PJ c..
I 99'
140 (shroud) - 45 (in Orbi ter) 61
166 2352
69 392
3143 15
III 7.82 1.25
Figure V1-l.- Modified single-stage-to-orbit launch vehicle o
V1-4
!
I i
-.

I -~.,.~,~.~. .'1[-. ~"""""",",,·f"'l=-~ .. ,,~. ·"""" ......... "''"lJt ... a. ... '''!!2,.Q''''_ ... 1 !!I!! ...... ,,1.2"'1'.\_"'" .lkOl!!!!,!III.UIII!II."
I 1
400
300
200
Booster"::,. _
100
/""
I \ I I \ ,- -
Payload Front view
Rear view
00
- 0 0
, /1\
, , I \
I \ - -\
.... -~-
50
c:::::::~. ~ Orbital glide' __ ----:::::JI'- -1[::::---__
Fl 0 -J-----#' .--Jc;#r:i
LH2 Bocster type
~P-l Propa~
~ayload tons, 90 x 500 km 477 477 477
Stage 1 inert I tons 1602 1331 1347 Stage 1 propellant tons 7034 9279 9580
Stage 2 inert, tons 368 432 444 Stage 2 propellant, tons 1570 1838 1891
Gross lift-off weight I tons 11,051 13,357 13,738
Number of engines, stage 1 18 22 20 Number of engines, stage 2 6 7 7
Staging altitude, km 70,83 58.4 57,2 Staging velocity I relative 2.93 2,70 2,65 Boostp.r maximum down range
Figure VI-2.- Two-stage winged 1 aunch vehicle.
VI-5
-,
j
~ 1 1 1
J
1

,- -.~ . , !
.. ,., ,,,,Ii, 1 12·;;;t jl;:;' , g*a:gmAe".A\J:~ 41;:;',,# U IA; \ ,
of LH2 and RP-l systems. The design, development, test, and evaluation (DDT&E) cost is estimated to be about $10 billion with a first unit cost of about $900 million. This is high compared to the similar prelilJ'inary estimates of two-stage ballistic system costs (see the cost summary in table VI-3), but the selection discriminator will likely be the operational costs, for which the dry-land, launch-site recovery advantages of the winged system may prevail.
( I I 1
For the two-stage ballistic configuration, in which both stages are recovered ballistically, Saturn V weight and geometry technology and aerodynamic data were used. Both 450- and 900-metric ton payload capability vehicle concepts were studied. Both LOX/RP-l and LOX/C3Ha first-stage engines were evaluated. Outline drawings of each size vehicle ana their characteristics are shown in figure VI-3 with a Saturn V for com~lrison. The DDT&E cost is estimated to be less than $5 billion with a first unit cost of less than $500 million for the smaller version, which has the same payload as the winged configuration. As mentioned before, operational co:ts will be the discriminator, and considerably mo~e study is required on the cost of vertical water landing and the resultant refurbishment costs.
Study results to date indicate that the goal expressed in the satellite power team study of $20/1b ($44/kg) to LEO is attainable for large-payload, high-launch-rate systems. It is not yet possible to determine the favored launch vehicle concept from among the modified SSTO, two-stage winged, or two-stage ballistic candidate systems studied. Operating costs must be much more carefully estimated. At this point, the two-stage ballistic vehicle is chosen to represent the minimum cost HLLV and the two-stage winged the maximum. A summary of estimated costs is shown in table VI-3. The indicated total cost per flight is preliminary and a more accurate determination will be a goal of future studies. In particular, operational costs must be determined, based on operational scenarios, including specific launch and recovery sit~3 and manpower requi rements. Thi sana lysi sis requi red to determi ne wl,ether the poss ib le lower operating costs of winged recovery and SSTO systems will outweigh the lower initial costs of ballistic systems.
TABLE VI-3.- HLLV COST ESTIMATES
Configuration Stage-l Payload, Cost, $ billion propellant metric tons DDT&E TFU Per flight
(a)
Two-stage winged °2/propane 450 10.5 0.9 0.03
Two-stage ballisdc °2/propane 450 4.2 .5
Two-stage ballistic °2/propane 900 4.8 .7 .02
aIncludes vehicles, operations, and amortized spares/refurbishment.
VI-6
-.
, ~
I 1

· ... r .... ·~ ..
'. i 110 MT payload
~--~~~~--~'I
Saturn lL
02/RP-1 Booster
payload, tons, 90 x 500 km 454 907
Stage 1 inert, tons 500 389 Stage 1 propellant, tons 4441 8236
Stage 2 inert, tons 233 400 Stage 2 propellant, tons 1937 3599
Gross lift-off weight, tons 7565 14C31
Number of engines, stage 1 12 24 Number of engines, stage 2 6 12
Staging altitude, km 43.4 43.5 Staging velocity (RELl / km/sec 1.84 1.91
Booster maximum down range 381 396
Figure VI-3.- Two-stage ballistic launch
VI·?
-.
02/Propane Booster
454 907
485 865 4410 8177
245 421 2065 3832
7659 14203
12 24 6 12
41.3 40.6 1.70 1.78
346 357
vehicle.

·r ~
I j
C. Personnel and Priority Cargo Launch Vehicle
The PLV will be utilized to transport all personnel to LEO and can, in addition, fulfill high-priority delivery functions of a modest scale. The approach taken in this study was to modify the current Space Shuttle vehicle to fulfill these requirements. Past studies have indicated that the baseline Shuttle system can be improved in both payload capability and operating cost by replacement of the two solid rocket boosters with a liquid rocket booster (LRB) utilizing oXY9~n and kerosene propellants. If available for heavy lift vehicle ~se, a new, more efficient, oxygen/hydrocarbon engine can be advantageously employed to increase the payload capability of this growth Shuttle booster or enable a decrease in propellant requirements. The LRB is a 33-ft-diameter sta~e with integral propellant mounted beneath the Shutcle external tank (ET). It uses four F-1 class engines and provides series burn opera-tion. The stage is recoverable down range following a parachute w,1ter landing.
The reference mission for the study is the Shuttle Reference Mission 1, with an Orbiter modified for a payload of up to 100 000 pounds (45 metric tons). The LRB is sized according to weight estimating relationships based on Saturn technology. The Orbiter is modified to inc1 ude the additi ona 1 st"'uctura 1 wei ght necessary to accommodate the i ncreased up payload.
Both series burn and parallel burn Shuttle/LRB configurations were studied. The ~cries burn mode achieved minimum gross lift-off weight (GLOW) in the design cases simulated and is expected to be significantly less expensive due to the smaller expendable ET. The design simulation designated EOIN0505 was chosen as the reference PLV configuration. This configuration and characteristics are shown on figure VI-4. A concept has been proposed by Rockwell International for a 68-passenger Orbiter transport vehicle. Although as many as 100 passengers may be possible for a modified Orbiter, a range of 40 to 80 passengers is assumed in the present study. The estimated cost per flight is $8 to $12 million.
D. Cargo Orbital Transfer Vehicle
The COTV is a space-based system designed for transporting from LEO to GEO all the material required for SPS construction or assembly, but does not transport personnel. Two basic COTV systems may be identified, distinguished by whether or not power is available from the payload. The first system, COTVL applies to SPS confi~urations that involve construction at LEO, either total or in modules, which can provide energy for propulsion for orbital transfer. The second system, COTVG, applies to SPS configurations that involve primary construction at GEO and consequently cannot provide ~ayload power for transfer from LEO to GEO.
VI-8
-.

.. .... r··~· . 'l
", !1':'", •• _,.",."""_"""""'., ..... ,;,.,ze""" .... "'1I"".:; ....... JI!!!!!,L""9J!!!£.''''*!!!U!!!.£A'''''f'l'. "'W""k .. -t!!l!C 1IJ!2JQ1llt91111!1 . ..
J \ I
Transport to LEO 500 km eire, 28-1/2°
Series burn GLOW, 2193 tons 69.2 m-
Parallel burn GLOW, 2032 tons 56.1 m-
T /WO 1.5
Baseline Shuttle
29.5 tons payload (ETR) "'$15M/flt
Payload, tons Pafload, passengers Orbiter, inert, tons External tank, inelt, tons External tank, propellant, tons Liquid rocket booster, inert, tons Liquid rocket booster, propellant, tons Gross lift-off weight, tons Nun,ber of engines, CF-1's) Staging altitude (booster), km Staging velocity, km/see
.............
, .'
T /WO 1.34
I ~ :: : : ! \l ':.. 4F-1
EDIN0505 Growth Shuttle
"" 36 tons payload (ETR) ""$10M/flt
36 (jnternal orbiter) 40 to 50
85 33
567 138
1325 2193
4 45.54
1.40
Figure VI-4.- Personnel and priority cargo launch vehiclp..
The characteristics of the thruster systems studied are presented in table VI-4. Attractive systems are those with the highest specific impulse, because less propellant must be transported to LEO •. However, 'these systems (ion thrusters) are extremely low thrust units and their acquisition costs cannot be quantified with the same confidence as chemical systems. The thermal and magnetoplasmadynamic (MPD) arcjets appear to enjoy relatively high specific impulse levels with significantly lower hardware weight, complexity, and cost.
Because the CaTV does not have human factors restric'ions on transit time, it is possible to use the thruster systems with high specific impulse, even if the corresponding thrust-to-weight ratio (T/W) is extremely low and
VI-9

I I r
I I
TABLE VI-4.- OTV CANDIDATE THRUSTER CHARACTERISTICS
Type Propellant Isp ' sec Thrust/ Electrical weiaht efficiency nercent
ChemicaT °2/H2 460 to 470 37 --Nuclear-thermal H2 760 to 780 3 --Resistojet H2 800 to 1 000 1 65 Therma 1 arcjet H2 2 000 to 3 000 .01 50 MPD arcjet Ar 2 000 to 10 000 .01 50 to 70 Ion Ar 5 000 to 20 000 4x10⁻⁴ 85
the trip times are measured in months. In the case of lEO assembly or partial assembly, the acceleration placed on the structure by the COTV l must be less than O.OOlg, which dictates a low T/W. The transit time variation with T/W is shovm in figure VI-5. Other implications of using a low thrust level, which results in an acceleration several orders of magnitude less than the local gravity, are: (1) continuous thrusting and acceptance of gravity losses is necessary rather than the three burn impulsive transfers normally practiced, (2) thrust may be horizontal to the ground for simplicity, because this is very close to the ideal velocity vector, and (3) the delta velocity required is approximately equal to the actual difference in the circular velocities of the original and new orbits.
A problem associated with systems using solar energy and exerting a continuous low thrust is the occultation of the Sun by the Earth. This interrupts thrusting and may require that a system reacquire solar orientation each time the satellite emerges from the shadow. Another factor affecting the photovo1taic system is that solar cells exposed during passage through the Van Allen belts will suffer a performance degradation estimated to be as high as 30 percent for the long transit times considered. This effect is reduced because the COTVl does not require that all the array be exposed during orbital transfer. These problems can be avoided if a reusable chemical propulsion system is used to take the payload to a higher orbit, perhaps as high as 5000 km; then the switch to the solar-powered system is made.
The COTVl's, using payload-supplied power, can take full advantage of the more advanced thruster concepts, such as the MPD arcjet, because they do not pay the penalty of the necessarily heavy power supplies and the round-trip mission. These systems have the advantage of low propellant requirements, thus der~easing the orbital burden factor, but must pay some economic penalty because of their long transit time. Additionally, an MPD thruster/argon-pr0pe11ant system operating from its own nuclear reactor appears to hold promise for low thrust, nuclear-electric payload transfer. Key factors, presently
VI-10
-.

I t !
I I
, , , I ~
~ "-I-
10-1 0 I I
10-2 I I I
10- 3 I I
28.5° plane [ASSUmed acceleration limit change for large structures
.-...------------ ---------I I
10-4 I I j'-H igh thrust
--------1 Typical range for electric
I - - - thrusters
10- 5 I I I
10-6 I I I
10-7 1/4
.1
(3-impulse burn)
6.8 1 10
Trip time, days
I I I I I I I
90 100
Figure VI-5.- LEO-to-GEO transfer time as a function of thrust/weight.
1000
unresolved and directly affecting the cost competitiveness of this approach, include the following.
1. Thruster efficiency and specific jet power 2. Thruster specific impulse 3. Thruster refurbishment and total operating life 4. Nuclear reactor disposal after useful life 5. Allowable orbit transfer time
The configuration and construction concept that allows the SPS to be at least partially assembled in LEO allows the COTV L to use payload-supplied power. Its structural acceleration limits are expected to be so low (O.OOlg or less) that the low thrust level orbital mechanics computations are necessary. The COTVL candidates are pdmarily defined by the characteristi cs of thei r thrusters. At this time., an MPD arcjet configuration has been identified as the "best case" option, with the electrically driven thermal arcjet as the fallback position, or "worst case" opti on.
VI-ll
I
-.

f'
I I I I , ! ~ 1
f ~, , , t , ,
The COTVG, applicable to SPS construction in GEO, need not handle payloads in as large segments or with as low acceleration limits, but it does need to supply its own 2nergy. Possibilities are solar energy collected by solar cells or thermal systems, nuclear reactors, and chemical propulsion systems. Present analyses indicate that an 02iH2 chemical COTVG may be the least expensive option.
A comparison of various stages and reusability versus expendable choices in terms of propellant-to-payload ratio versus stage mass fraction is shown on figure VI-5. It is seen that the two-stage reusable system requires more propellant than does a single-stage expendable system but it has the advantage of reusing the hardware.
Two primary 02/H2 chemical propulsion COTVG configurations have been investigated. The first is a two-stage reusable system with both stages returned to LEO. The second is a 2-1/2 stage vehicle, which is based on the assumption that an empty drop tank may be left with the SPS as parasitic weight without penalty, or perhaps even utilized in the SPS construction at GEO. The configuration and characteristics of the two and one-half stage system, as shown on figure VI-7, are represented as the "nominal" COTVG for the program model work presented in section VII.
Partial recovery concepts may be devised. One example suggested by Rockwell International may merit further consideration. In this concept, the engine (modified SSME) and avionics are returned from GEO to Earth ballistically and recovered at sea.
The propellant-to-payload weight ratio as a function of stage mass fraction for a NERVA solid core nuclear propulsion OTV 11as investigated, and its advantages in propellant weight brought to LEO over the 02/H2 system appeared to be small and may not be preserved if longer reactor life than 10 hours is specified. The reduced propellant requirement, if any, must be balanced against the greater vehicle and space operations cost of nuclear stages and the per'formance pena lty and operati ons costs associ ated with disposal of th~ reactor at the end of its usp.ful l:fe. In the Future Space Transpor~ation System Analysis Study (NAS 9-143?3), it was concluded that the solid-core nuclear OTV was a higher cost opti~n than 02/H2 stages.
E. Personnel Orbital Transfer Vehicle
The POTV will be utilized to transport all personnel from LEO to GEO and return to LEO and to transport high-priority cargo to GEO. The short trip time (less than 1 day) and small payload requirement of the POTV preclude commonality with the high-specific-impulse, low-thrust cargo OTV systems being considered. Therefore, except in the case of the independent high-thrust, chemical-propulsion cargo OTV, the POTVis considered as a spec~~l-purpose device optimized for personnel transfer between LEO and GEO.
VI-12
-

-c '" 0
! ,., ~ '" , c.
~ Co ::l , -c " , c:
~' ::l 0 , c.
! ~
~ OJ C. ~
c: ~ Qj c. 0 ~ c.
'" -c c: ::l 0
Cl..
\ } ,
5
4
3
M u I ti p I e- stag e reusable
2
.91
6V = 14200 ft/sec (4.33 km/sec) I = 460 sec sp
No down payload
S ingle-stage reusable
Two-stage reusable
.92 .93 .94 .95 .96
Stage mass fraction
Figure VI-6.- Propellant burden contribution for high-thrust 02/H2 COTV.
VI-13
1

I I----Stage 2 drop tank---+-Stage 2 core-r------Stage 1--------\
LH2 tank
2-1/2 stage L02/LH2 Life: 30 missions Payload: 250 tons "'$10M/flt
LH2 tank
Length: 48 m Diameter: 8.4 m Total weight: 510 tons Propellent weight: 475 tons
Figure VI-7.- Cargo orbital transfer vehicle (COTVG) characteristics.
The POTV LEO-to-GEO mission is assumed to be initiated at the LEO orbit transfer operation base. Modular OTV elements are docked and propellants tanks topped off. A two-burn injection places the OTV and payload on the synchronous transfer ellipse with a trip time of 8 to 9 hours. At apogee, the circularization maneuver is performed and rendezvous with the GEO SPS construction base is accomplished. GEO orbital stay for a typical mission is between 2 and 7 days. Orbital stay time can be extended for GEO refueling applications. Return to the LEO base is all-propulsive.
For the purpose of this study, the conservative choice was made to employ conventional chemical propulsion with all-propulsive return of the vehicle and crew to LEO. Single-stage, 1-1/2 stage (outbound propellant tanks expended), and common-stage configurations are all candidates for this mission. Additionally, for those cases where economic cargo transportation is available, significant advantages may accrue to the POTV by storing propellants in GEO (having previously been delivered by the cargo OTV) for the return journey.
A crew module concept layout is shown on figure VI-8. During the operational program phase, the crew module will be used as the manned control compartment for the POTV, now transporting the crew rotation passenger module, which is shown on figure VI-9. High-priority cargo may be carried as POTV payload instead of, or in additic'1 to, the cre\~ rotation pas,enger module.
VI-14
-.

J I I
r
\ Li
• i;
A
PLSS and pressure suit storage ~~;::
Galley 1/ and mess ,.r......-....
Sleeping , compartments
l----I Hygiene and toi let
PLSS and pressure suit storage
Section BB
Contra I comp-_. 1-
2.00 m (6.6 fti
4.42 m -(14.5 It)l- --Jf....:;.".~-;'l;: .. ;::::=~
I ~, ,-----r:;
Crew quarters
r~;m , ; ~~r. ;;E~~ __
Docking /'. Airlock .'L"I \, ) I B_
Hatch i---2.tl3m I 2.4Bm 1------,,(6::':'.:.,7 ft) (B • 2 ft)
4.82 m (15.8 It)
Section AA
Figure VI-8.- Crew module concept.
Results of a parametric slzlng study indicate that, although the 1-1/2 stage candidate required less LEO start-burn mass, the commonstage (two identical stages) candidate may provide more vers~ti1ity to the transportation fleet with its capabilities for operation as a single stage (each stage individually), its total reusability to LEO, GEO sortie missions operations, and GEO refueling of second stage for return to LEO. In addition, the individual stages are compatible with the Shuttle payload bay. The sizing mission for the POTV is assumed to be the GEO manned sortie mission with total reusability and turnaround at LEO.
VI-1S
-.
j 1 J •
I

, .
i
J
! , " l ~ f
, , , ,
1 ..... .
'\ ··~T~---r . (,~, ;-. "1''''='' '%""","']',,,1.1-"')! $ ..
\ ~
I I
4.4 m dia
Equipment and baggage stowage
Ladder
No. "f pas~engers
25 50 100
(for vertical entry)
I t r I
Dim "All Gross weight I
Izngth, m tons
6.51 7.54 9.29 13.28
14.85 24.28
_"AI'_
i ,J ,J
- a .89 m typ seat spacing
Seat <landing position) Seat llift-off position)
Docking assy Ityp)
life support equipment
Figure VI-9.- Crew rotation passenger module.
The common-stage concept consists of two nearly identical stages used in series to provide the rpquired mission delta velocity. The first of these stages is used to provide approximately 85 percent of the delta velocity required for ocquiring the elliptical geosynchronous transfer orbit on a crew rotation flight. The second stage provides the remainder of the transfer delta velocity as well as that required for circularization at the destination orbit and both of the return maneuvers. Following separation from stage 2, stage 1 is retrograded into the Earthcircular departure orbit. Splitting the delta velocity in the above manner results in the stages having identical propellant capacities. Subsystems design approaches are also common between the stages, includ-ing the size of the main engine.
A representative POTVL configuration and characteristics are shown on figure VI-1D, together with the crew module. The dimensions of the stages are Shuttle compatible but due to their prupellant requirements will require on-orbit fueling/refueling. A 75-man crew rotation module plus over 20 metric tons of priority cargo can be carried to GEO in the operating mode wherein stage 2 is refueled at GEO.
VI-16
r L. iL
-..

I"
, ~ i I
1 1
I Crew 1 ______ Stage 2 -----_1-_____ Stage 1 ______ _ r-module-r-
LH2 tank
Common stage LO/LH 2 Life: 30, li::5oion5
Payload: 75 passengers + 20 tons (up) 75 passengers (down) (2nd stage GEO refuel> "$12 M/llt
LH2 tank
Length: 33.28 m
Diameter: 4.42 m
Total weight: 123 tons
Propellant weight: 106 tons
Number of engines at 66720 newtons each: Stage 1: 4 engines Stage 2: 2 "'''lgines
Figure VII-10,-Personnel orbital transfer vehicle (pnTVL) characteristics.
Current cost estimates, in $ million, are a; follows.
DDT&E • • • • • • to •
Tota 1 fi rst unit •• Total operating cost/
flight, maximum •• Total operating cost/
flight, ffiinimum •
$478 $ 31
$ 20
$ 7
F. A Summary of Projected Transportation System Characteristics
The results of studies of the various transportation elements necessary to support the SPS program have been presented in the previous sections. In this section, the results are used to develop ma;dmum, nominal, and minimum estimates of characteristics for each transpor'tation element (HLLV, PLY, COTVG, COTVl' POTVG, POTVL). rhe MINIMUM estimates are the most·~ptimistic combin~tion of characteristics, whereas the MAXIMUM estimates are the most pe$simistic, with the NOMINAL e,timate lying between these extremes.
V 1-17
...

I I i I
r" . ,
---L
I I
I
The nominal estimates of tables VI-5 to VI-B were used to derive the nominal cost of transportation for implementing a nominal network of SPS units and to develop the overall program model presented in section VII. The minimum, nominal, and maximum estimates were used with SPS's of minimum, nominal, and maximum weights to develop the range of estimates of the "cost of electricity," presented in section XI.
The Ilominal estimates of tables VI-5 to VI-B were also used to derive the nominal cost of transportation for implementing nominal weight SPS's wi th di fferen t confi gurati ons and constructi on 1 oca ti ons. These res ~i cs are presented in table VI-9 and indicate the expected reduced costs of cons tructi ng the sys tem in LEO and util i zi n\1 energy from the sys tem to provi de power for orbital trans fer. The caol cul ati ons a 1 so i ndi cate .. he small percentage «5 percent) of costs involved in personnel transfe~·. It is also apparent that the cost of cargo transport to LEO dominates the space transportation cost elements.
TABLE Vf-5,- HLLV RANGE OF PROJECTED ESTIMATES
Characteristics Minimum Nominal Maximum Payload/flight, metric tons · · · 900 700 450 Flight cost:
$ million/flight • , • · , , , · 20 23 25 $/kg , . , . . . , , · · · , , · 22 33 56
Flight turnaround, days · · · · · 5 6 9
TABLE VI-6.- PLY RANGE OF PROJECTED ESTIMATES
Charactero;stics Minimum Nominal Maximum Passengers/flight , • . . • · · · · BO 50 40 Fl ight cost, $ million/flight · · · B 10 12 Flight turnaround, days · · • · · · 7 11 14
VI-1B
-

f.f"
00 "J~ ",0
§~ .0", ~P> l:;~ 2fiJ
<: 0-< I ~
<D
m, "". . .. __ J,'," "; JAU4f.4.;<4(Ac,rm,f)\i%J ...• $, .•.• .J.AGtAMGiliWCP;;;* it( •• 1
TABLE VI-7.- COTV RANGE OF PROJECTED ESTIMATES
Characteristics COTVG COTVL Minimum Nominal Maximum Minimum Nominal Maximum
Payload/flight, metric tons .. . .. .. .. . . . 250 250 250 1000 1000 1000 Total inert weight, metric tons .. . .. . . . 29 35 43 122 166 215 Expended inert weight, metric tons • • • • • 7 9 11 79 110 138 Propella ~/flight, metric tons ••••••• 453 475 494 691 800 902 Preflight propellant loss, metric tons ••• 136 143 147 207 240 271 Fligilt CJst:
$ million/flight ••••••••••••• 5 10 20 20 30 70 $/kg .. .. .. .. .. • .. .. .. • • .. .. .. • .. • .. .. 20 40 80 20 30 70
Flight turnaround, days •••••••••• 5 7 10 5 7 10 Mission life, missions ••••••••••• 50 30 20 20 10 5 -_._--- - - ---- --- -- I - - ---- -
TABLE VI-8.- POTV RANGE OF PROJECTED ESTIMATES
Characterist ics POTVG POTVL Minimum Nominal Maximum Minimum Nominal Maximum
Passengers/flight, no. . .. .. .. .. . .. . . .. a240 a230 a2l5 75 75 75 Inert weight, metric tons . .. . .. .. .. . . . 29 35 43 17 19 23 Propellant up, metric tons ••••••••• 453 475 494 93 106 126 Propellant dOwn, metric tons •••••••• -- -- -- ~7 53 63 Preflight propellant loss, metric tons ••• 136 143 147 50 58 69 Flight cost, $ million/flight . .. .. . .. .. .. 10 15 25 7 12 22 Flight turnaround, days .. .. .. .. . .. .. .. .. . 5 7 10 5 7 10
I Mission I if(~ missions ••••••••••• 50 i 30 20 50 30 20
aThe listed passenger-only capability of the POTVG (identical to COTVG) is developed from the GEO-to-LEO dowr.-payload capability of the complete second stage (drop tank and core) of the 2-1/2 stage COTVG• In actual operations, only 50 to 100 passengers might fly as part of the COTVG outbound cargo.
~
.
-------1--.
j 1
j J
~ l
Iij.;-.",,--- ---
,

r ,
~
I
TABLE VI-9.- RELATIVE TRANSPORTATION COSTS FOR SEVERAL SPS CONFIGURATIONS AND CONSTRUCTION LOCATIONS
Transportation Co~figuration and construction location vehicle Column/cable Truss Truss
GEO GEO LEO $/kW $/kg $/kW $/kg $/kW $/kg
HLLV 996 119 1076 120 661 73 PLY 26 3 30 3 37 4 COTV 345 41 373 41 273 30 POTV 6 1 7 'I 6 1
Total 1373 164 1486 165 977 108
Note: For SPS's emplaced at nominal cost and weight.
VI-20
-,
! I ~

., r H
, r
,
.n" 1''''- l" ",,'J.' " 1';
f
VII. INTEGRATED OPERATIONS
A. Systems Requirements Analysis
The capability to manufacture and construct large solar power stations in space will require a new dimension in space operations where innovative and advanced concepts can produce gains measurEd in orders of magnitude rather than percentages. The physical requirements for Solar Power Satellites (SPS) call for large microwave transmission antennas on the order of 1 km in diameter and large surfaces on the order of 100 to 200 km 2• Because of these physical requirements, the location for' the manufacture and construction of the SPS will be expanded to include both low-Earth orbital and geosynchronous orbital locations as well as ground-based factory and plant activities. Therefore, space operations will be greatly influenced by th~ manufacturing and construction concept selected, which in turn will determine requirements for construction time, space equipment, transportation sY'7~m, ground support system, and personnel and material resources.
The basic elements needed to define and develop an integrated operations and mission management concept for the man':facture, construction, quality control, checkout, operation, and maintenance of a large number ot SPS's are: the Solar Power Satellites operating at geosynchronous Earth orbit (GEO); Ooerational Bases in GEO and low-Earth orbit (LEO), consisting of constructfon" manufacturing, maintenance, and logistics facilities; a Space Transportation System to transport material, equipment, and personnel between Ect~th and the operational bases in LEO and GEO; and a Ground Support System consisting of the Communications and Data Network facilities, Launch and Recovery operation facilities, Program Headquarters Mission Control facilities, industrial and warehouse facilities, the ground transportation systems, and the SPS ground receiving stations and opprations control facilities; and the materials, equipment, supplies, and personnel ~esources. A numter of these elements ure discussed in detail in oth, ~ ctions of this report. A very general SPS operations scenario is ' .Nn in figure VII-l to describe the mission sequence and basic elem~nts of the SPS production and operation system.
B. Program Model
To develop an estimate of the overall program require-ments for ,;he creation of a Solar Power Satellite System, this study has assumed an SPS implementation rate that calls for the construction of 112 SPS units (scenario B, sec. III) producing 10 GW power each at the ground over a 3D-year time frame from 1995 to 2025. Three alternative CJnstruction and assembly concepts, involving two configurations, were evaluated during the study to identify program r'equirements. These three alternatives are defined as follows.
Concept 1: Th~ "COLUMN/CABLE" SPS configuration constructed and assembled primarily in GEO. Chemical COTV transportation from LEO to GEO.
VII-l
.k,.itX. S!Izq
... '
i .j
I j ]

l
GEO Operation.ll Base
sps Unit Production
Manufacturing and Construction Facilities
Base Support F.1cilities
Logistics F.lcililies
Maintenance SPS and Unit Refurbishment 1----+1 Operation Visits
SPS Operational Elements • Solar Power S;!tellites • Space Transportation System • LEO and GEQ Operational Bases
Cargo and Personnel Orbit Transfer Vehicles
• Ground Support System
Materia Is Equipment Supplies Propellants Personnel
LEO Operational Base
Manufacturing nod Construction Facilities
Logistics F.lcilities
Base Support Facilities
SUflPI.. , Facilities
Logistics Facilities
Cargo and Personnel Launch Vehicles
Latmch and Recovery Filcilities
ENth Operational Base Launch and Recovery Site
Figure VII-l.- SPS mission scenario.
Ground Rectenna Facility
/
/
/ /
Concept 2: The "TRUSS" SPS configuration constructed and assembled primarily in GEO. Chemical COTV transportation from LEO to GEO.
I
Concept 3: The "TRUSS" SPS configLtration constructed end partially assembled in ~EO with final assembly in GEO, Self-powered transportation from LEO to GEO.
Program models have been developed for each of the preceding concepts to identify the following program requirements for each year.
1. 2. 3. 4. 5. 6. 7.
rate to LEO
SPS units constructed Total SPS urlits on line Mass to GEO and LEO Operational base units implemented and total on line Personnel in GEO and LEO for production and maintenance New POTV, COTV, PLV, and HLLV units required Personnel and car-go launch vehicle total flights and flight
8. Personne 1 and flight rate to GEO
9. Personne 1
and cargo orbital transfer vehicle total flight
and cargo launch and orbital transfer vehicles fleet size
VI I-2
,~
I -i
j i j l 1 , :1
!

[
.""""""''''''''*'1'' AA
)
The program models utilize the results of the systems analysis of the basic SPS elements conducted during this study. The guidelines and assumptions are listed in table VII-l. For each construction and configuration concept, a "nominal" weight and size SPS (sec. IV) was used in the calculations. The resulting program models are listed in tables VII-2 to VII-4.
C. ~1'ission Manag~ment Corcept
In developing a philosophy for an overall mission management concept that can satisfy the basic system requirements and conduct the program model as presented above, the following guidelines have been identified and assumed.
1. Personnel-operated and automated machines for manufacturing and construction tasks in space
2. Operations and control authority delegated throughout the ground- and space-based facilities
3. Program and overall operations and control authority maintained on ground
4. Dedicated synchronous satellite communications relay sY5tem
In general, all past space programs and the approaching Shuttle Orbiter, Spacelab, and IUS Space Transportation System (STS) mission~ can be regarded as ground-based space operations; that is, the complement of flight systems is prepared for flight in ground-based facilities and is largely controlled in accordanc~ with plans and procedures developed and managed from ground-based facilities. The development of continously manned permanent space facilities in LEO and GEO conducting the SPS program model and detailed functions as discussed in sections IV, V, and VI requires that the authority for operations and control of daily ongoing activities must be delegated to the primary operational sites, basically the launch and recovery site, the LEO and GEO operational bases, and the SPS satellite ground rectenna sites.
The mission management concept that has been developed to incorporate this philosophy is illustrated in figure VII-2. This concept applies only t~ the prnduction/operational phase of implementin9 the 112 SPS's.
D. Mission Management Functions
The decentralization and assignment of SPS mission management functions are allocated and identified as follows from figure VII-2.
1. Progr&m Headquarters Mission Control
It is envisioned that one element of the basic Ground Support System will be a control function and facility for the overall program management, operations, administration, program planning, resource
VII-3
-.

~§
~, CJ."
~~ I-tt:; >-3 ><:CiJ
< ~
~
I ..,.
_· .. ·~.·.""""~-.~H··~_._· .. _W, ~ --".,",~n<·""",""-'-"--=<'l'""'fn"'"''''''-''''''' "'~~'.,.~~,' i,_ J. tL Ui ' . .;c. 'illY",,","_ ,N "'l"""""" ,'"\!tit" ,,_. (, -~:::n;S.u;:ii4W..;e... CD; _k 1 ANti... H _ .1 .;, } .. (4"44'1 '.
TABLE VII-1.- SPS PROGRAM MODEL INPUTS, ASSUMPTIONS, AND GUIDELINES
Characteristics
SPS characteristics
Number of SPS units, total SPS 'nominal' unit mass each, M tons X 103
SPS unit mass repair each, M tons X IC3 per year
Operational base characteristics
GEO base mass each, M tons X 103
LEO base mass each, M tons X 103 GEO and LEO base mas~ ~'epair each, M tons X 103 per year
(construction facilities only)
Personnel characteristics
24 hours!7 days/week operations 3 shifts/day, 4 orbital teams 180-day orbital tour per person
Construction, base support, and logistics operations GEO personnel, total, each new SPS unit per year LEO personnel, total, each new SPS unit per year
Maintenance operations GEO pel'sonnel, total, each operational SPS per year LEO personnpl, total, each operational SPS per year
Provisions
1. Column/cable GEO
112
83.582 a(81.8) .836
6.000 1.000
1.000 (GEO)
474 176
12 .53
GEO personnel provisions, M tons per pers~n per year 3.0
Concept
2. Truss GEO
112
90.123 a(84.4) .901
7.000 1.000
1.000 (GEO)
574 176
12 .53
3.0 ? n
3. Truss LEO
112 90.123 a(84.4)
.901
1.000 8.000
1.000 (LEO)
200 740
12 .43
2.0 LEO personnel provisions, M tons per person per year 2.0 ____ L-____ ~~-L __ 3.0
aNumbers in parentheses are final masses, but the pro~!" .... 'TJOde1 was not updated.
•
--,.j~-----
-
---~
~----
j i
"-."~' .. ,".,," ... ,-~ .. ,-~--.-,~-.-~

'-='0 @c >t:fC 8z ?:iF. @~ >;::t"::.-~ -. k" ;---. . ,
<: --I 01
Characteristics
HlLV characteristics, nominal
Two-stage ballistic: Payload, M tons Flight turnaround, days Vehicie life, missions F1ight cost, $M/flight
PLY characteristics, nominal
Mooified Shuttle: Payload, passengers Fli~ht turnaround, days Vehicle life, missions Flight cost, $M/flight
COTV characteristics, nominal
Payload, H tons Inert weight. M tons Expended inert weight, M tons Propellant/flight, M tons Propel1cult loss in LEO storage/flight,
M tons Flight duration, days Flight turnaround, days Vehicle life, missions Flight cost, $M/flight
POlY characteri~ticst nominal
Payload, passengers Inert weight, M tons Propellant weight, M tons Propellant loss in LEO storage/flight, M tons Flight turnaround, days Vehicle life, missions Flight cost, $M/flight
-:0 f~'i':" !- ~~~ .. ,~~.U_","_,,_"C,_ . __ ,.'_~'~'hU*'''~ .. '
TABLE VII-l.- Concluded
1. Column/cable GEO
700 6
300 23
50 11
100 10
(2-1/2 3tage chemical)
250 35 9
475
143 TBO
7 30 10
(passenger module for 2-1/2 stage chemical)
230 35
475 143
7 30 15
·'--~"~-'-~-·"=""~·'r'~._._. r"~_,.. '. "'1(0,,1/ CQiill ; \ .,\ ·.Lt£M '" M:;ZjAl-iZ "Sill! #2 2 $ 12-LJ£ > k: UP,
Concept
2. Truss GEO
700 6
300 23
50 11
100 10
(2-1/2 stage chemical)
250 35
9 475
143 TBO
7 30 10
(passenger module for 2-1/2 stage chemical)
230 35
475 143
7 30' 15
.
3. Truss LEO
700 6
300 23
50 11
100 10
(Electric/chemical)
1000 166 110 onn v_.
2i1~
50 7
10 30
(special purpose) 75 19
106/"p, 53/down 58 7
30 12
t
--_ .. /-_ .. ,
j
! i j
---------- J
..".". --

<: ~
~ , 0'1
Year
1995 1996 1997 1998 1999 2000 2001 2002 2003 2n~.~
2005 2006 2007 2008 2009 2010 2011 2012 2013 2014 2015 2016 2017 2018 2019 2020 2021 2022 2023 2024 2025
.......... "'-"~.:;...,""'-...... ~"'''' ... -~-'-",-- ..
SPS units
No./yr Total on line
0.5 0 .5 0
1 1 1 2 1 3 1 4 1 5 2 6 2 8 2 10 2 12 3 14 3 17 3 20 3 23 4 26 4 30 5 34 5 39 5 44 6 49 6 55 6 61 6 67 6 73 6 79 6 85 7 91 7 98 7 105
112
-"-~"--'''-'.''',"",.-~. """"·-'w"',.......~""'~~ .;; .. _ thAI .¥I$/Ol.d.Ji,.ij MOI __ ~ me i .. R a .411, FI,;. ", '*"
TABLE VIl-2.- PROGRAM MI.::L SUMMARY FOR "COLUMN/CABLE" SPS IN GEO
OPS base Total personnel in space units in LEO GEO LEO and GEO
No./yr Total Product:o" Mainten.'!n..:e Production Maintenance on line
1 1 88 237 0 0 1 88 237 0 0 1 176 1 474 12 0 1 176 1 474 24 0 1 176 2 474 36 0 1 176 2 474 48 1 1 176 3 474 60 0 2 352 3 948 72 0 2 352 4 948 96 0 2 352 5 948 120 1 2 352 6 948 144 0 3 528 7 1422 168 0 3 528 9 1422 204 0 3 528 10 1422 240 1 3 528 11 1422 276 0 4 704 13 1896 312 1 4 704 15 1896 360 0 5 880 17 2370 408 0 , 880 <0 2370 468 1 'j 880 22 2370 528 0 6 1056 24 2844 588 0 6 1056 27 2844 660 0 6 10<;6 30 2844 732 0 6 1056 33 2844 804 0 6 1056 36 2844 876 0 6 1056 39 2844 948 1 6 1056 42 2844 1020 0 7 1232 45 3318 1092 0 7 1232 49 3318 1176 0 7 1232 53 3318 1260
7 56 1344
Total/yr
325 325 663 675 688 690 703
1375 1400 1425 1450 2125 2163 2200 2237 2925 2975 3675 3738 3800 4512 4587 4662 4737 4812 4887 4962 5687 5775 5863 1400
•
Total mass to space, M tans X 1Q3/yr
LEO GEO
172 4g 151 43 305 87 308 88 311 89 314 90 323 96 621 177 627 179 634 ... 181 661 188 948 270 957 '273 966 275 996 284
1286 366 1320 376 1613 459 1628 465 1664 474 1960 558 1978 563 1996 569 2015 574 2033 579 2051 584 2091 595 ·2390 680 2411 686 2433 692
342 96
---/-.. -.,
--------.;
.~---.--
~~--~ 1 1 I
I ] ,
---...---.-- ~
~----.

~o
;;:i::>:1 ...... "Oc;:l
°2 ~~ 10 C1~
~:
<: --I .....
Year
1
1gg5 1996 1997 1998 1999 2000 2001 2002 2003 2004 2005 2006 2007 2008 2009 2010 2011 2012 2013 2014 2015 2016 2017 2018 2019 2020 2021 2022 2023 2024 2025
POTV flights to GEO Fleet New
No./yr Total size units
2 2 2 ? 2 4 2 0 4 8 2 0 4 12 2 0 4 16 2 0 4 20 2 0 5 25 2 0 9 34 2 1 9 43 2 0
10 53 2 0 10 63 2 1 l' 77 2 0 ',4 91 2 0 14 105 2 1 15 120 2 1 19 13~ 2 0 20 159 2 1 24 1B3 2 1 25 20B 2 1 26 234 2 1 30 264 2 1 31 295 2 1 32 327 2 1 32 359 2 1 33 392 2 1 34 426 2 1 34 460 2 1 39 499 2 1 39 538 2 1 40 578 2 1 12 590 2 0
.~ ..• "., "'>'W~''''m",,.~n· __ '~-_,=,...-~..., ... ,~v>c,,_,~,,,.,., .. ,,,,,,~..,...'f''~~~'_. :;:;:, )W%{I" __ """'.~" '. \(Ct.,P!. • >,t .Lt. ;!GS.PPX).; #J#wt!,4J&':;;k1¥. . it j ( i44ii
TA8LE VII-2.- Concluded
COTV flights to GEO PLV flights to LEO Fleet New Fleet
No./yr Total size units No./yr Total size
195 196 4 7 13 13 2 172 368 4 6 13 26 2 347 715 7 11 26 52 2 351 1066 7 12 27 79 2 354 1420 7 12 28 107 2 357 1777 7 12 28 135 2 3B5 2162 7 13 29 164 2 709 2B71 14 24 55 218 2 716 3587 14 24 56 275 2 722 4309 14 25 57 332 2 753 5062 14 25 5B 390 2
lOBO 6142 22 36 85 475 3 1091 7233 22 37 B7 562 3 1101 8334 22 37 88 650 3 1135 9469 22 3B 90 740 3 1465 10934 29 49 117 857 4 1503 12437 29 50 119 976 4 1B37 14274 37 62 142 1123 5 1854 1612B 37 62 150 1273 5 lB95 16023 37 64 152 1425 5 2233 20256 44 75 1Bl 1606 6 2253 22509 44 76 184 1790 6 2274 247B3 44 76 1B7 1977 6 2294 27077 45 7, 190 2167 6 2315 29392 45 78 193 2360 6 2336 31728 45 78 196 2556 6 23BO 34108 45 80 199 2756 6 2721 36829 54 91 228 2984 7 2745 39574 54 92 231 3215 7 2769 42343 54 93 235 3450 7
3B5 42728 8 13 56 3506 2
HLLV flights to LEO New Fleet
units No./yr Total size
2 245 245 4 0 216 461 4 0 435 896 8 0 440 1336 8 0 444 1780 8 0 448 2228 8 0 483 2711 8 1 B88 3599 15 0 897 4496 15 1 906 5402 15 0 946 6348 15 2 1354 7702 23 1 1367 9069 23 1 1380 10449 23 1 1423 11872 23 2 1837 13709 31 1 -1885 15594 31 2 2303 17897 39 1 2325 20222 39 1 2377 22599 39 2 2800 25399 49 2 2B26 2B225 46 2 2852 31077 46 2 2q78 33955 49 2 2"04 36B59 49 'l 2931 39790 49 2 2987 42777 49 2 3414 46191 57 2 3444 49635 57 2 3475 53110 57 0 489 53599 8
t
New units
4 0 4 0 0 0
15 0 0 0 0
23 0 0 0
31 0 8 0 0
38 0
11 0 0
38 0
19 0 0 0 I
---/----
,,"CTn ,. __ -
" J ~ , I l i I ~ ~
~

<: ~
~
I co
I Year
1995 1996 1997 1998 1399 2000 2001 2002 2003 2004 2005 2006 2007 2008 2009 2010 2011 2012 ;'013 2014 2015 2016 2017 2018 2G19 7020 2021 2022 2023 2024 2025
SPS units
~:o./yr Total on line
0.5 0 .5 0
1 1 1 2 1 3 J 4 1 5 2 6 2 8 2 10 2 12 3 14 3 17 3 20 3 23 4 26 4 30 5 34 5 39 5 44 6 49 I 6 55 6 61 6 67 6 73 6 79 6 85 7 91 7 98 7 105
112
""'~'·"'O<_'·~"-C~···~~_' ,"- y', .. -- ""'~'~-~~"'-""'-"'T"":;"""m'-·7'N'~~"''''''''W'''''''''~''''''~)*"ii''''#p """,*,"':;UW.iIl. :;" 4< 0 ,.;. P;:Si .. ; stiPP ".AgL~$, & M$. __ ,.tAM4lQ._ .. ii MAC A . £ ,
---1---,
TABLE VII-3.- PROGRAM MODEL SUMMARY FOR "TRUSS" SPS IN GEO
OPS base Total personnel in space Total mass to space, units in LEO GEO M tons X 103/yr LEO and GEO
No./yr Total Production Maintenance Production Maintenance Total/yr LEO GEO on line
1 1
I 88 0 287 0 375 187 54
0 1 88 0 287 0 375 163 47 0 1 176 1 574 12 763 329 94 0 1 176 1 574 24 775 333 95 0 1 176 2 574 36 788 336 96 0 1 176 2 574 48 790 339 97 1 1 176 3 574 60 803 366 105 0 2 352 3 1148 72 1578 672 191 0 2 352 4 1148 96 1600 678 193 0 2 352 5 1148 120 1625 685 195 1 2 352 6 1148 144 1650 715 204 0 3
I 528 7 1722 168 2425 1024 292
0 3 528 9 1722 204 2463 1034 295 0 3 528 10 1722 240 2500 1044 297 1 3 528 11 1722 276 2537 1077 307 0 4 704 13 2296 312 3325 1389 396 1 4 704 15 2296 360 3375 4175 495 0 5 880 17 2870 408 4175 1742 495 0 5 880 20 2870 468 4238 1758 500
J
1 !
_J 1 5 880 22 2870 528 4300 1799 512 0 6 1056 24 3444 588 5122 2117 602 0 6 1056 27 3444 660 5187 2136 608 0 6 1056 30 3444 732 5262 2156 614 0 6 1056 33 3444 804 5337 2176 619 0 6 1056 36 3444 876 5412 2195 624 0 6 1056 39 3444 948 5487 2215 630 ~--~-" 1 6 1056 42 3444 1020 5562 2260 543 0 7 1232 45 4018 1096 6387 2581 734 0 7 1232 49 4018 1176 6475 2603 741 0 7 1232 53 4018 1260 6563 2626 747
7 56 1344 1400 367 104
l.~---_-
~

~~ 8~ ~~ r~
;::' ~ ~,
-7
<: --I '"
Year
1995 1996 1997 1998 1999 2000 2001 2002 2003 2004 2005 2006 2007 2008 2009 2010 2011 2012 2013 2014 2015 2016 2017 2018 2019 2020 2021 2022 2023 2024 2025
POlY flights to GEO
Fleet No./yr Total sizf'
2 2 2 2 4 2 5 9 2 5 14 2 5 19 2 5 24 2 6 30 2
11 41 2 11 52 2 11 63 2 11 74 2 16 90 2 17 107 2 17 124 2 17 141 2 21 163 2 23 185 2 29 215 2 29 2'4 2 29 273 2 35 308 2 36 344 2 36 380 2 37 417 2 38 455 2 38 493 2 39 532 2 44 576 2 45 621 2 46 I 667 2 12 679 I 2
4*'- .rtN' . ? ·h ....... ~_..".,_.~_,=-> __ ".'''_~" ....... ,,;,.«
New units
2 0 0 0 0 0 1 0 0 1 0 1 0 1 1 1 1 1 1 1 1 1 1 1 1 1 1 1 1 1 1
',-._1 __ ,..T"_' .~". ,..,.-,_.-.~", .. _ .• ,_, C""'.;-_--,.._'-""""'"""''''''''~ \".; jli • ,100,0, J"w¥,<S"'''''IWl (lUI ,~ai&..,t AMP ~W:;:J ,J; .$';% ItJfW,Lii .. J W W&l ;:;::;i'kE!.IA.,e;; ... <.JI 1-"
TABLE VII-3.- Concluded
COTV flights to GEO PLY fl ights to LEO
Fleet New Fleet No./yr Total size units No./yr Tota 1 size
241 241 4 8 15 15 2 186 427 4 6
I 15 30 2
376 803 I 8 13 31 61 2 380 1183 8 13 31 92 2 383 1566 8 13 I 32 124 2 387 1953 8 13 ! 32 156 2 418 1371 8
I 14
I 33 189 2
765 3136 15 26 63 252 2 773 3909 15 26 I 64 316 2 780 4689 15
I 26 i 65 381 2
815 5504 16 28 I 66 447 2 1166 6670 ' 23 39 I 97 544 3 1177 7847 23 40 98 642 3 1188 9035 23 40 ! 100 742 4 1227 10262 24 41
I
111 854 4 1581 11844 31 53 133 987 5 1625 13469 32 55 135 1122 5 1980 15449 ," 66 167 1289 5 "' 2001 17450 39 67 ]70 1459 6 2048 19498 40 69 172 1631 6 1409 21907 47 81 205 1836 7 2432 24339 47 82 208 2044 7 2454 26793 48 82 211 2255 7 2476 29269 48 83 214 2469 7 2498 31767 49 84 217 2686 7 2521 34288 49 85 220 2906 I 7 7571 36859 50 86 223 3129 7 2937 39796 I 57 98 256 3385 . 8 2963 42759 57 99 259 3644 I 8 2989 45748 58 100 262
I 3906 8
415 46163 8 14 5e 3962 2
HLLV fli9hts to LEO New Fleet
units No./yr Total size
2 268 268 5 0 233 501 5 0 471 972 8 0 475 1447 8 1 480 1927 8 0 485 2412 8 0 524 2936 9 1 960 3896 16 0 969 4865 16 1 979 5844 16 1 1022 6866 16 2 1463 8329 25 1 1477 9809 25 2 1491 11297 25 1 1540 12837 25 2 1985 14822 33 1 2039 16861 33 1 2488 19349 42 2 2512 21861 42 1 2570 24431 42 2 3025 27456 50 2 3053 30509 50 2 3082 33591 51 2 3109 36720 51 2 312;- 39857 51 2 3165 43022 53 2 3227 46249 53 3 3687 49936 61 2 3720 53656 61 2 3753 57409 62 0 525 57934 9
-- -
!
New units
5 0 3 0 0 5 1 7 0 0
11 7 7 0 0
19 ;
16 0 0
27 17 17 0 0
29 7
25 0 0 0
----.l-<--~
------.--,j ,
---_.-
~----
.1
i ·1
1 1
I

SPS units
Year No./yr Total on line
1995 0.5 0 1996 .5 0 1997 1 1 1998 1 2 1999 1 3 2000 1 4 20e 1 5 2002 2 6
<: 2003 2 8 - 2004 2 10 -, 2005 2 12 ~
a 2006 3 14 2007 3 17 2008 3 20 2009 3 23 2010 4 26 2011 4 30 2012 5 34 2013 5 39 2014 5 44 2015 6 49 2016 6 55 2017 6 61 2018 6 67 2019 6 73 2020 6 79 2021 6 85 2022 7 91 2023 7 98 2024 7 105 2025 112
~.~-....~, . .-... ,.,,-.:~ ....... ,.,
---"~"'"""'~--~=~'-"" .0;. ., j • • Ji,MS;a ,;;;:;.d,," " • .&l_·'£'e.9'!m'I!i~f .!.'."iff!Sl<Xh?L!I-",.lbW"
----I-----~
TABLE VII-4.- PROGRAM MODEL SUMMARY FOR "TRUSS" SPS IN LEO
OPS boo. Total personnel in space units in LEO LEO and GEO
No./yr Total Production Maintenance Production on line
1 1 370 0 100 0 1 370 0 100 0 1 "10 1 200 0 1 140 1 200 0 1 740 2 200 0 1 740 2 200 1 1 740 3 200 0 2 1480 3 400 0 2 1480 4 400 0 2 1480 5 400 1 2 1480 6 400 0 3 2220 7 600 0 3 ;;220 9 600 0 3 2220 10 600 1 3 2220 11 600 0 4 2960 13 800 1 4 2960 15 800 0 5 roo 17 1000 0 5 3700 20 1000 1 5 3700 22 1000 0 6 4440 24 1200 0 6 4440 :7 1200 0 6 4440 30 1200 0 6 4440 33 1200 0 6 4440 36 1200 0 6 4440 39 1200 1 6 4440 42 1200 0 7 5180 45 1400 0 7 5180 49 1400 0 7 5180 53 1400
7 56 ------
GEO
Maintenance Total/yr
0 470 0 470
12 953 24 965 36 973 48 992 60 1003 72 1955 96 1980
120 2005 144 2030 168 2995 204 3933 240 3070 276 3107 312 4085 369 4135 408 5125 468 5188 528 5250 588 6252 660 6327 7]2 6402 804 6477 876 6552 948 6627
1020 6702 1092 7717 1176 7805 1260 7893 1344 1400
----
!
Total mass to space, M tons X 103/yr
LEO GEO
104 46 101 45 203 91 205 93 207 94 209 95 214 97 415 189 419 191 423 192 429 194 632 286 639 289 645 292 653 295 859 388 869 393
1076 487 1087 492 1099 498 1309 592 13n 598 1334 604 1347 609 1359 615 1372 621 1387 627 1597 723 1612 729 1627 735
235 ___ L 106
I l ., ~
-J 1
--=-- .... -

F""''''''''''~:''!''~'''~''''"-';IlT'''''''''''''-.r-''..",'''~ <c-""",-·"""·,,,, .. ,.~~,,,.,, .. ,,,
('
!'J '--~
:;@ "rio ~~ C"
Ei ~s
< ~
~
I ~
~
Year
1995 1996 1997 1998 1999 2000 2001 2002 2003 2004 2005 2006 2007 2008 2009 2010 2011 2012 2013 2014 2015 2016 2011 2018 2019 2020 2021 2022 2023 2024 2025
POTV flights to GEO Fleet
No./yr Total size
:1 3 2 3 6 2 5 11 2 6 11 2 6 23 2 6 29 2 7 36 2
13 49 2 14 63 2 14 77 2 15 92 2 20 112 2 21 133 2 22 155 2 23 178 2 29 207 2 31 238 2 38 276 2 39 315 2 41 356 2 48 104 2 50 454 2 52 506 2 53 559 2 55 614 2 57 671 2 59 730 2 66 796 3 68 864 3 71 935 3 36 971 3
TABLE VIl-4.- Co"e1uded
COTV flights to GEO New Fleet New
units No./yr Total size units
2 46 46 1 5 0 45 91 1 5 0 91 182 2 10 0 93 275 2 10 0 94 369 2 10 0 95 464 2 10 1 97 561 2 10 0 189 750 4 19 1 191 941 4 j9 0 192 1133 4 19 1 194 1329 4 29 0 286 1613 6 29 1 289 1902 6 29 0 292 2194 6 29 1 295 2489 6 30 1 388 2B77 8 39 1 393 3270 8 39 1 487 3757 10 49 1 492 4249 10 49 2 498 4747 10 50 2 592 5339 12 60 2 598 5937 12 60 2 604 6541 12 60 2 609 7150 12 61 2 615 7765 12 62 2 621 B386 12 62 2 627 9013 12 63 2 723 9736 14 73 2 729 0465 14 73 2 735 1200 14 74 0 106 1306 2 10
n"" ~~. '~"~. ""''''''W-6~"",-'''''''' ;"'-.. "'~"'_",",.'r>"_"""""-""",~_~""",,,,,,,,,,,, - "' "'~, ~ - .'- ''r;''''''-~
~ _._-/-.,--
PLV flights to LEO HLLV flights to LEO Fleet New Fleet New
No./yr Total size units No./yr Total size units
19 19 2 2 149 149 3 3 19 38 2 0 146 295 3 0 38 76 2 0 290 585 5 2 39 115 2 1 293 878 5 0 39 154 2 0 296 1174 5 0 40 194 2 1 299 1473 5 3 40 234 2 0 305 1778 5 0 7f!. 312 3 2 592 2370 10 7 79 391 3 0 598 2968 10 0 80 471 3 1 604 3572 10 0 81 552 ~ 0 613 4185 10 3
120 672 5 3 903 5088 16 13 121 793 5 1 912 6000 16 0 123 916 5 1 921 6921 16 0 124 1040 5 1 933 7854 16 0 163 1203 6 2 1226 9080 21 8 165 1368 6 2 1241 10321 21 13 205 1573 7 2 1537 11858 26 5 207 1780 7 2 1552 13410 ;~6 0 210 11990 7 2 1570 14980 '~6 0 250 .>240 9 3 1869 16849 ,1 13 253 <494 9 2 1887 18736 31 13 256 2149 9 2 1905 20641 ,4 8 259 3008 9 3 1923 22564 34 0 262 32i'O 9 I
2 1941 24505 34 0 265 3535 9 3 1959 26464 34 13 268 3803 9 2 1980 28444 34 13 30B 4111 11 3 2282 30726 39 13 312 4423 11 3 2303 33029 39 0 315 4738 11 3 2324 35353 39 0 56 4794 2 0 336 35689 6 0 ,
~....... -~--
, t
Wtl' ). "'ti wnw··,.,.· ;ail~"""" .. 'ii'" 1& ..... Ck< 7"- ~'~~~\.>ooil-";~'~"""';""f""'''''''''_.'''''''''';._'-,",,, ~,o.. '._._,,""~ ""''''~_''",,,,.,,~,,,,,,,~,,",=-,,,-,,,,",",~_,,,".,,",,,)~~.,."_''''''''''''''''''''''"-',-" . ..,,_.~,~~-s::;,,""'~~""->';'""""'~""""''"'"'''_''''''''''-<:''''''~"''''''''')_''''~_'''_' __ ,.''',._.,,_ .. _~._ .. ,_".Hill

Isps number l~ ____ _
Isps number 2r - - - --GEO Operational Base Control
r;M7.:a~nu"7fa:-c7'"tu-'rl~ng:--1 Base Support r-L-09-is-t-lc-s -,
Canst and Maint Ops Ops Ops
Transportation Vehicles
LEO Operational Base Control
~M~an~uf~a-'ct~ur~in-g--' r-------, Const and Maint Base Support Logistics
Ops Ops Ops
Program Headquarters Mission Control I Communications and
Data Networks Ops
Ground Transportation Ops
Material and Special Manufacturir.g Ops
SPS Resourses Managemen
Transportation Vehicles
Launch and Recovery Control
Launch and Recovery Ops
Warehouse and Inventory Ops
Vehicle Maintenance Ops
F 'gure VII-2.- SPS mi ssion management concept.
control, mission planning, etc. type of SPS activities. This control element would also manage and direct all the ground-based manufacturing
required, would obtain necessary materials for orbital construction, and
in general manage the overall ground support requil'ements for ensuring
that all the bdSic cargo elements are accounted for and in the system. This control element would also manage the ground transportation opera
tions required to transport cargo elements to the launch site. This element would also manage the overall selection, train'jng, simUlation
activities, and assignment of all personnel in their respective job functions and tasks. This element would manage the overall orbital construction and assembly operations being conducted on the ground and in
LEO and GEO on an overall project ba"ls. The coordination of the Com
munications and Data Network relay satellites and ground station would be
assigned to this element for overall SPS responsibility.
2. Launch and Recovery Control
The second major element of the SPS ground support system is the operations and control of the launch and recovery operations.
VII-12
T
i
I
1 ,
i , j , 1 '" 1
I 1 -~
l l l
I 1 1
l I
1 j
}, "
,

, r 1 1
~ t
, ,
! , [
t f, I "
!
~ I
f ,I ,
The basic function of this control element is to manage all the ground operations involved with the preparation, launch, and return of all personnel and cargo to and from the LEO operational bases and the maintenance of the cargo launch vehicles (HLLV) and the personnel launch vehicle (PLV). This element will also manage and conduct the training and simulation for all transportation vehicle flight crews.
3. LEO Operational Base Control
The LEO and GEO operational bases utilize the same basic elements for operations and control authority, with the major differences being due to the n~ture of the functions and tasks required in their respective orbital location for manufacturing and construction operations, logistics oper'ations, and base support operations. Each space operational base (LEO or GEO) is envisioned to manage its own day-to-day activities involved with manufacturing, construction, logistics, and transportation operations and its interfaces with the other major elements in the SPS system.
It is expected that the LEO operational base will be predominantly concerned with logistics and transportation operations because its position in LEO links it directly to the ground and to the ;;EO operational base. This base will be the primary "space traffic control center" handling all cargo and personnel arriving and 'Jeparting via the launch vehicles from Earth and then, in turn, acting as a warehouse in space until transferring required cargo and personnel to orbital transfer vehicles (OTV) for departure to the GEO operational base and handling arriving OTV's returning from GEO. It is therefore expected that significant authority for operations and control over all the SPS logistics and transportation operations will be dele~ated to the LEO operational base.
Because of its ongoing full range of space operation activities and its ready access to the ground, the LEO operational base is the prime candidate for implementing and conducting training and simulation for all new orbital crew personnel.
4. GEO Operational Base Control
The GEO operational base, similar to the LEO operational base, will manage its own day-to-day activities involved with manufacturing, construction, logistics and transportation operations, and its i~terface with the other major elements in the SPS system.
It is expected that the GEO operational base will be predominantly concerned with the manufacturing, construr.tion, and final checkout and operational go-ahead for each SPS satellite because its pos,tion in GEO is the resident operational location fi1r the SPS satellites. Therefore, it is expected that significant authority for operations and control over all the SPS manufacturing, construction, checkout, and maintenance will be delegated to the GEO operational base.
VII-13

The GEO operational base will also conduct the routine maintenance and "onboard" inspection of all individual SPS satellite units after they are operational by sending resident GEO base crewmembers to visit several SPS units on periodic inspection and maintenance tours. Emergency visits to any SPS unit would also be managed by the GEO base.
5. SPS (Individual Unit) Ground Control
The primary authority for operations and control of each individual SPS unit after it becomes operational will reside with a ground control facility located at the ground rectenna station. The SPS ground control elements for each of the 112 SPS units complete the basic elements comprising the ground-based support system.
It is expected that the SPS control facility will manage the power transmission from the SPS unit in orbit to the rectenna and into the interface with a ground-based utility distribution system. This control facility will monitor the performance and status of the SPS system~ and will coordinate as required with the Program Headquarters Mission Control facility for assistance and with the GEO operational base for "revisit" operations.
Position and tracking information for all 112 SPS units will be managed and coordinated by the Program Headquarters Mission Control facility. Potential conflicts or potential in-orbit collisions will be identified and the necessary operations required to correct the situation wi 11 be determined and imp1 emented by the Program Headquarters Mission Control and the respl:!ctive SPS Ground Control facilities of eacl1 involved SPS unit.
E. Key Considerations and Areas For Further Investigation
During the development of the SPS program model and the overall mission management concept for SPS operations and control, many new and challenging functions and tasks have been identified that are lacking in technology development and/or analysis in significant depth; therefore, many critical areas requiring operational and design trade-effs cannot be evaluated at this stage of our understanding. However, the following concerns have been selected as having the most significant impact on the SPS design and operations concept during this study effort.
1. Prelaunch, Launch, ann Recovery Operations
The Program Model discussed in sUbsection VII-B implies the magnitude of ground support operations involved in the daily flow of personnel and material, equipment, etc. in various packaged forms, which have to be transported from the original location by some ground transportation element to the launch site, where they are received, un-loaded, processed, and stored for assignment to a launch vehicle. (See
VIl··14
/
. 1 , !
-
--, ' i i

, ~
~ \
~ f, ! ~
~ ~ !
.~ i: ' f>.
I i
J
d"' .... j
~ ,
also fig. VII-l.) Preparations for launch commence when the launch assignment is made. Recovery operations for returning vehicles are also handled at the launch and recovery facilities. It is recognized that the personnel and facilities involved in the ground operations of the SPS system will be an important element in the operational assessment and cost of the SPS; however, no in-depth analyses of these operational elements have been conducted during this study. Significant attention needs to be devoted to this area in follow-on efforts to this study.
2. Space Manufacturing and Construction Options
This new area of technology and its operational considerations have been discussed in previous sections. However, the concepts and options selected for accomplishing the space manufacturing and construction tasks have "significant" influence on the operational requirements of the SPS system in such areas as operational base manning, crew skill mix, construction sequence and mission activity schedules, simulation and training, etc. Early design, development, test, and evaluation (DDT&E) programs must be directed at developing and demonstrating this new area of space technology.
3. Operational Space Base Control Operations
The magnitude of operational activity required in LEO and GEO to accomplish the implementation and operations of the 112 SPS systems, when considering total personnel operating on Earth and in space; multi-ple vehicles moving between, to, and from Earth, LEO, and GEO bases; the space manufacturing ~nd construction tasks; and the massive cargo requirements as discussed in previous sections, has led to a mission management concept assigning significant operations and control authority to t~e space base elements of the SPS system. The implications of basing control, operations, and management functions in space will have philosophical, programmatic, economic, and technical repercussions upon the composition of future space program concepts, particularly when examined in the context of resource requirements, costs, systems definition, and re-latable requirements for advanced technology development. In this study, the concept of in-space operational control has only been identified and further analysis is required.
4. Simulation and Training Operations
The operation of space manufacturing and construction equipment will require mdnned and automated tasks involving a broad range of skill mix activities that have not been exercised or required in past or current space programs. With the involvement of thousands of ground and orbital crew personnel in conjunction with the large and massive space structures and equipment required for SPS production and operations, the area of simulation and training operations and facilities has only been identified in this study and further analysis is required.
VII-1S
/ ,
-
; J : ~!

i J
I II.( , ~ , [ I ~ r < i ~ l r !
~ , .' I '. \j ;; " , , ! t , ~ i ~
, ~ f ~ ~ , t ~ I. ,
I ! , , I ! ! I
I I
5. Safety in SPS Operations
This study has not included a safety analysis associated with the manfacturing, construction, checkout, operations, or with the associated space logistics operations of cargo and personnel transfer, vehicle servicing, refurbishment, maintenance and operations, and propellant storage and servicing tasks. Potentially hazardous situations need to be identified and examined in depth to assess all the natural and incucsd hazards associated with all mission phases and elements of the SPS system.
VIl-16
I r
/
)
-
:I \ \ J

VIII. ENVIRONMENTAL CONSIDERATIONS
A. Methodology
An evaluation of the space solar power concept must involve an assessment of the potential impact on the environment and the people living within that environment. This impact can be either positive or negative in an absolute sense or in relation to other potential sources of energy. The present study has identified those environmental topics that must be addressed in the solar power concept assessment and has presented estimates of relative environmental impact in selected areas for the solar power concept and other sources.
B. Environmental Questions
Solar energy is considered a "clean" form of energy; however, the collection, conversion, and transmission of this energy introduce environmental questions. These questions or topics may be grouped into four categories.
Vehicle Emissions/Operations Microwave Beam Space Operational Environment Earth Activities
A detailed listing of topics related to each of these categories is presented later in the'report (fig. X-2, D.1 through D.4) in the context of. areas needing analysis and testing to provide definitive answers to environmental questions.
Considerable experience has been developed in the course of analyzing emissions from the Shuttle propulsion ~ystems and this potential impact on the environment. Reflecting Shuttle experience, SPS studies have emphasized consideration of fuels that are projected to be compatible with the natural environment. For example, launch vehicles have previously considered the use of hydrocarbon, hydrogen and oxygen propellants, whereas orbital transfer vehicle studies have considered argon in preference to mercury. SPS environmental studies must emphasize the size and quantity of vehicles and launches involved as well as the particular emissions from a given vehicle in view of the large numbers involved in a significant size commercial program. Specific topics to be considered include noise, gas cloud formation, and thermal effects in the launch area; emission effects on the stratosphere; and noise and NOX production during reentry.
Transmission of large amounts of power by microwave radiat'ion from the SPS to Earth introduces questions related to its effects. Preliminary analyses of the beam-ionosphere interaction have indicated a
VIII-1
~ j ,
I , I j
I 1

f f ~ ?, , t ~" • .;:,-:
1;' 1, t ~. ;.
k ~~
r f ,. , ~ ,
! \
! ,
! J
power density level beneath which non1;near interactions are not expected to occur. This level has been used in this and other studies as an upper limit with a resulting effect on the sizing of the microwave transmission system. Similarly, current U.S. standards have been taken into consideration in the conceptual design of the system such that power levels outside of the area of the rectenna are one-tenth or less of the existing U.S. standards. A substantial effort will be required to investigate the 10ng- and short-term effects of low-level microwave radiation on humans, plants, and animals. Studies and tests will also be required to assess the effects of the radiation on radio astronomy, communications, and electronic equipment.
Although environmental questions related to the Earth and its populations are of particular concern, questions related to operations in the space environment must also be considered. It has been estimated in earlier sections that hundreds to thousands of personnel will be required in space depending upon the scope of the commercial construction program. ~lany of these personnel may be required in geosynchronous orbit where the converging radiation environment is significantly different from that existing in low-Earth orbit. This subject is treated in some detail in Volume II. Consideration of this environment is reflected in conceptual construction concepts that em~)hasize a:Jtomated techniques with most crew activity taking place in "protected" locations.
C. Comparisons With Conventional Systems
The introduction of satellite power systems will yield environmental benefits ill the areas of air pollution caused by combustion of fossil fuels, cooling water requirements and associated thermal pollution, and nuclear waste disposal.
Table VIII-1 presents the results of a preliminary analysis and comparison of a 10-GW SPS system with coal and nuclear powerp1ants of the same capacity. The data of table VIII-1 illustrate the relatively minor quantities of air pollutants (oxides of sulfur and nitrogen and particulates) resulting f~om launch vehicle engine exnaust in comparison to o. coal-burning plant.
The air pollutants from the vehicle launches required to implement an SPS are seen to be negligible compared to the pollutants from a coal-burning plant.
VIII-2
r .
1

( )
II
I .1
I I
TABLE vIII-l.- ENVIRONMENTAL COMPARISON OF 10-GW
Parameter
Primary fuel. MT/yr • • • Waste, MT/yr • · · . • • · Airborne emissions. MT/yr
S02 • • • • • • · · · · NOX . · . . · · · · · · Particulate o 0 • • • ·
Thermal loss total, Btu/hr
La nd use. km2 Fixed • . . • · • · · · 30 years • • • • · • • ·
aLaunch year only. bControl (S02 or NOX)' cNo control. dpresent controls.
POWERPLANT OPERATIONS
Nuclear Coal
· · · 112 42 x 106
· • · 330 8 x 10⁶ ash bJ •6 x 10⁶ sludge
• • • -- cl.5 x 106
• • • b.3 x 106
· • • -- c.6 x 106
b.3 x 106
· · · -- d.8 x 106
• • · 770 x 1012 700 x 1012
• • · 40 to 50 3.5 · · · 3.9 900
VII 1-3
SPS
a3•49 x 106
a1800
al02 x uP 15 x 102
64 200
1
J 1 1
i , 1 j , 1
I .~

(
I I , I
f I ( , , ,
j t ~ , t . , .... !----~
--"'~-'-'-"- ,.,- --r .-
IX. MANUFACTURING CAPACITY, NATURAL RESOURCES, TRANSPORTATION, AND ENERGY CONSIDERATIONS
A. Re9uir~ments
The implementation of a large-scale SPS program (scenario B, sec. III) will requil-e a significant increase in industrial capacity in certain areas and require assessment of the impact on natural resources and the transportation system. In addition, a measure of the "efficiency" or desirability of the SPS concept is the length of time required for an SPS to produce an amount of energy equivalent to that required for its implementation. The results of preliminary analyses of each of these topics are presented in the following paragraphs.
B. Manufacturing Capacity
An analysis of a conceptual design of the SPS was conducted to determine the fabricated components and processed materials required. The results indicated that a "mass production" capability would have to be developed and installed to produce the apprOXimately 1 billion solar cells required. A greatly expanded processing capacity would be required for the large amounts of hydrogen, oxygen, and possibly argon needed for the transportation systems. A new industrial bas~ would be required in selected areas for the production of gallium arser,ide diodes and for the reduction of arsenic from oxides.
C. Natural Resources
Table IX-l presents an estimate of the natural resources required for the implementation of an SPS of "nominal" weight. The resources required for a program involving 112 SPS's (scenario B) will not seriously impact U.S. and/or world resources with the possible exception of aluminum. Aluminum ore (bauxite) is currently being imported for the production of nearly all U.S. aluminum. Imports would have to be expanded to meet SPS requirements. The implementation of an SPS would result in the use of approximately 3 percent of world demand in the year 2000. It should be noted that th(! conceptual design a~sumed for this analysis used aluminum as the ';UPPO\"t structure for the rectenna (224 I'equired for 112 SPS's). This use constitutes practically all of the 3 percent cited previously. Future studies should obviously consult alternates to the use of aluminum for this purpose if the amount required represents a significant problem to aluminum resources.
D. ?urface Transportation
The transportation of raw materials, fabricated components, and assemblies to the launch site must be considered. A study was conducted
IX-l
~
t 1
~ • j .; ,
/ :; .~
j ~ , , : ;, " " " 5 " ;

!Jl¥7'-",\:co_"" "'''':N.M\''l'r'''''''''''':'''''-'''~'~.I'''.''''r_!'·'-'''~ ';:~",.,_","'-"'''" '0, __ ,0 ~'-,',-' .• _ ~~_'". '~"""~~, ~"_"_""",,_,,,,-,,~,,, • < .".,., _,--"'" _,~_"y. __ "'-~- ;.~,~-...... .","7'=c-! '"....,,<0 "';'l/"--"";"'''~~'''''''''''''-::'-'"''-'''''''''''''''''''~''f':-V-~'''i''''''''rw~Jl"!'I!l'fI!
Material
Aluminum (Al) Argon (Ar) Arsenic (As)
CoWr (Cu) Ga ium (Ga) Oxygen (02) Platinum (Pt) Silicon (5i) Tungsten (W)
--.-~"---.-r-"'''1:!;;-<'Ci.;,~.~,~~~~~J;~1:;~~'r~
TABLE IX-1.- NATURAL RESOURCE DEMANDS OF A 10-GW SPS COMPARED TO NATIONAL AND WORLD DEMANDS IN THE YEAR 2000
SPS demand (t\W SPS's/yr),
Total demand, percent Conments
metric tons U.S. World
2.l4x106 7.1 2.77 94 percent of mass t~ in rectenna 2.82 16 6.57 Production capactt~ r~luired
1 ?<; 356(1) .11 Reduction of metal from oxides required 2.6x10⁴ .2 .09
116 16764(?) 5640(1) Production to date based on demand 2x10⁷ 38.6 14.4 Production capacity requ~red 8 14.8 5.17
.43x105 3714(1) (a) Production Capacity required 2500 .71 .27
- --- -- ---- ----- -------
/ ~---
'\
- aNot applicable. >< I
N
to';'=,--"""."",-,-, ,'_,,'.....,,'u,~~>l~~, .. -'-;,,'<."- ••.
TABLE IX-2.- ENERGY PAYBACK OF A 10-GW SPS --.
Item Quantity, kg Total energy to produce, kWhxl0 10
Rocket propellant and gasses 3.42xl010
Rectenna 1.12xl09
Other 5P5 materials 8.64xl08
Total ------ --
SPS electrical energy output = 8.05xl010 kWh/yr 6.7xlO 10 kWh
Payback time 8.05xl010 kWh/yr = 0.83 year
2.78 2.70 1.20
6.7
t
... ...". .... "
----

( which showed that, at peak SPS production rtlte (seven/yr, scenario B) on the order of 12 x 109 metric ton-km/yr of transport would bp. required. This compares with a total U.S. transportation projection of 5 x 10¹² metric ton-km/yr in 2000. 'iherefore, the maximum SPS impact woul d be 1 ess than 1 percent of the year 2000 total requirement. Warehousing and handling facilities at intermediate and end points should be considered in future st.'Jdies.
E. Energy Payback
A rre1iminary study was conducted to assess the, energy required for the implementation of an SPS and the time required for the SPS to generate an equiva1ant amount of energy. Table IX-2 is a list of the energyintensive materials required for the implementation of an SPS of "nominal" weight and the energy involved in its production. To process the material for an SPS, 6.7 x 10¹⁰ kWh are required. Approximately 80 percent of the total is involved in the production of the necessary propellants and aluminum for t.he rectenna. Previous comments regarding the use of aluminum for the support structure of the rectenna should be noted.
The SPS produces 8.1 x 10¹⁰ kWh/yr; consequently, the 6.7 x 10¹⁰ kWh used in implementation of the SPS would be generated or "paid back" in less than 10 months. This figure compares favorably with estimates for conventional ground systems, which range from 0.2 to 1.0 year for payback.
IX-3
, i
l -1 1 ~ , J j
I I ~
1 J 1 ~ 1
~. ~ ;1 ~ , , !
1 l , 1 ~ 1 , I
i 1
" :,
1 "
1 j
j :1
I 1 i I

,
I w
I
I ~
, \
X. PROGRAM DEVELOPMENT PLAN
A. Program Phasing
The SPS program plan has been divided into fo~r phases as illustrated in figure X-l. The four phases include an initial phase of system definition and exploratory technology followed by a technology advancement phase. These two phases would provide the information required to make a decision in the 1987 time perio~ to proceed with full-scale development of the system. Assuming a positive decision at this time, an initial system might be in operation in the 1995 time period. The subsequent and final phase would be one of commercialization involving multiple SPS's such as identified in the various scenarios described in section III.
B. System Definition and Exploratory Technology Hiase
Thi s immediate phase woul d i ncl ude imp'roved defi nition and assess-ment of satellite power system concepts; transportation, construction, and operational support systems; design, development, test and evaluation (DDT&E), and recurring costs and environmental impact. A further description of activities in these four areas is presented in figure X-2.
Phase 75 80 85 90 95 200l! 05 10 15 20 25
Major Milestones 79'\i Comm~t to te~hnolo~ adva~cemen.t ,
87 'VComm!t to system development
• System definition/exploratory technology (Estimated cost $40 to $ 50 million) ,
• Technology advancement (Estimated cost ($4 to $6 billion)
• Ground based development J • Space experiments
• Space sub-scale system evaluation
• S~,stem development (Estimated cost $39 to 52b;lIion)
• Commetcialization
• SPS production and construction
• Facility construction
Figure X-l.- Space solar power projected program phasing.
X-l
i
1 J
-,

; , ~.
SATELLITE POWER SYSTEM CONCEPTS
o DEFINITIVE COMPARATIVE ANALYSIS AND ASSESSMENT OF THE SEVERAL POWERGENERATION CONCEPTS
- SOLAR CELLS (SILICON, GALLIUM ARSENIDE) - THERMAL (8RAYTON)
o RELATIVE ~IERITS OF LOW-EARTH ORBIT AND GEOSYNCHRONOUS-ORBIT CONSTRUCTION LOCATIONS
o CONCEPTUAL DESIGN AND ANALYSIS OF A VARIETY OF CONFIGURATIONS o OETAILED STRUCTURAL, THERMAL, AND ATTITUDE STABILIZATION AND CONTROL
IINALYSES (INCLUDING MODELING AND SIMULATIONS) FOR CONSTRUCTION, ~:AINTENANCE, AND OPERATION PERIlJD~
o IN-DEPTH ANALYSIS AN ... EVALIJATION OF EACH SUBSYSTEM/MAJOR COMPONENT EFFICIENCIES
o RECTENNA ANALYSES WITH EMPHASIS ON REDUCING COSTS AND CONSTRUCTION ENERGY AND NATURAL RESOURCE REQUIREMENTS
o DEVELOPMENT AND OPTIMIZATION OF SYSTEM AND DETAILED CONCEPTS FOR SPS-POWER GRID INTERFACE AND OPERATION
B. SUPPORT SYSTEMS
C.
o CONCEIVE AND EVALUATE TECHNIQUES AND DEVICES FOR CONSTRUCTION, INSPECTION, AND MAINTENANCE OF SATELLITE POWER SYSTEMS, INCLUDING DESIG~ CHARACTERISTICS OF A CONSTRUCTION FACILITY WITH ASSOCIATED UTILITY, HABITATION, AND CONTROL FEATURES
o REFINE STUDIES OF HEAVY LIFT LAUNCH VEHICLES
- WINGED LAND LANDING VS. BALLISTIC WATER LANDING - PAYLOAD/FLEET SIZING - OPERATION COST ANALYSIS - FACILITY REQUIREMENTS - LAUNCH LOCATIONS
o EVALUATE AND ASSESS ORBITAL TRANSFER MISSION MODES, INCLUDING DESIGN, LIFE, AND COST OF ELECTRICAL, CHEMICAL. AND NUCLEAR PROPULSION SYSTEMS
DDT&E AND RECURRING COSTS
o TOTAL DDT&E COSTS HAVE NOT BEEN DERIVED IN ANY DETAIL. ROUGH ESTIMATES RANGE FROM $30 TO $70 BILLION OVER 10- TO 20-YEJlR PERIOD. PLANNED STUDIES WOULD TARGET FOR AN ESTIMATE WITH +20 PERCENT ACCURACY
o PRESENT STUDIES INDIC1i'TE AS MUCH AS A FACTOR OF 3 TO 4 (30 TO 110 MILLS/KWH) SPREAD IN ESTIMATES OF THE COST OF COMMERCIAL POWER FROM SOLAR POWER SYSTEMS
o SYSTEMS STUDIES AND OTHER ACTIVITIES .SHOULD REDUCE THIS ESTIMATE SPREAD TO APPROXIMATELY 2 (30 TO 60, 50 TO 100) IN THE NEXT ~ YEARS
Figure X-2.- System definition and exploratory technology phase activities.
X-2
, , •• ,,,
1 / /
i 1 j
~ !
-'

J
I.
, -
D. ENVIRONMENTAL IMPACT
o PRELIMINARY ASSESSMENT OF THE SYSTEM RESUL TS :.,~ MODEST IMPACTS AND/OR QUESTIONS TO BE ANSWERED
o ENVIRONMENT AREAS MAY BE GROUPED AS FOLLOWS:
- VEHICLE EMISSIONS/OPERATIONS - MICROWAVE BEAM - EARTH ACTIVITIES - SPACE OPERATIONAL EN'!!RONMENT
o WITHIN THE NEXT 2 YEARS, ANALYSES SHOULD PROVIDE INFORMATION FOR A FIRST-ORDER IMPACT ANALYSIS IN ALL AREAS. TEST DATA RELATED TO THE BIOLOGICAL EFFECTS OF THE MICROWAVE BEAM ON HUMANS ARE PROBABLY THE MOST TIME-CRITIC.~L AREA
o SUBSEQUENT FIGURES OUTLINE QUESTIONS TO BE TREATED IN EACH ENVIRONMENTAL AREA
0.1 VEHICLE EMISSIONS/OPERATIONS
l
I
o TROPOSPHERE - LAUNCH AREA GAS CLOUD, RAINOUT CONDITIONS, AND BIOLOGICAL EFFECTS
,
- METEOROLOGICAL EFFECTS AND ECOLOGICAL CONSEQUENCES
o STRATOSPHERE
o IONOSPHERE
o THERMOSPHERE/ MAGNETOSPHERE
o SONIC BOOM/ LAUNCH NOISE
o VEHICLE FAILURE EFFECTS
D.2 MICROWAVE BEAM
- PHYSICAL AND BIOMEDICAL OZONE UEPLETION EFFECTS - WEATHER MODIFICATION ASSESSMENT
- ASSESSMENT OF 'PUNCH OL~I EFFECT
- PREDICTED DISTRIBUTIONS
- PREDICTED LEVELS - POSSIBILITY OF SEISMIC E~FECTS
- ATMOSPHERE/SURFACE EFFECTS
o IONOSPHERE/BEAM INTERACTION
o EFFECTS ON HUMANS, ANIMALS, PLANTS
o EFFECTS ON ASTRONOMY, COMMUNICATIONS, ELECTRONIC EQUIPMENT
o WEATHER EFFECTS AT SURFACE AND IN TROPOSPHERE
Figure X-2.·· Continued.
X-3
,
1
-
j i
i
1 I . .l

0.3 EARTH ACnVITI ES
o RESOURCE EXTRACTION, MANUFACTURING, AND TRANSPORTATION EFFECTS
o LAND USE - RECTENNA - LAUNCH AND RECOVERY SITES
0.4 OPERATIONAL SPACE ENVIRONMENT
0 IONIZING RADIATlOI\1 BIOLOGICAL AND EQUIPMENT EFFECTS DOSAGE AND SHIELDING ASSESSMENT
0 MICROWAVE RADIATWr; REFLECTED/SCATTERED
0 MAGNETOSPHERE PLASMA SPACECRAFT CHARGING HIGH VOLTAGE - PLASMA INTERACTION
0 METEOROIDS CREW/HABITAT EQUIPMENT/SOLAR CELLS
0 SPACE "TRAFFIC" MULTIPLE SPS'S AND THEIR LOGISTICS SUPPORT OTHER SATELLITES
Figure X-2.- Concluded.
More definitive comparisions of the relative merits of space solar powe\' with other systems such as coal, nuclear, and solar terrestrial are also required in the present phase. Detailed areas in which these comparisons should be attained are presented in figure X-3.
This phase will also involve the detailed definition and cost of the subsequent technological advancement phase. Key activities to support this definition will include solar power system studies, space station analysE's as related to subscale system evaluation, technology studies, and program analyses.
A number of significant test activities are proposed to be conducted in this initial phase. A partial listing of these tests is included in figure X-4.
X-4
-

f [ ,
~
~ ~f ~,.. , ~" ,. Jr, ;:
~'. t i , , .(.".
.~
r
(
I ; ,
I . I [
REFINE PRESENT PRELIMINARY COMPARISONS IN FOLLOWING AP.EAS: o COST AND RELATED ECONOMIC CONSIDERATIONS o TECHNOLOGY REQUIREMENTS o ENVIRONMENTAL CONSIDERATIONS o SAFETY o LOGISTICS IMPLICATIONS o NATURAL RESOURCE REQUIREMENTS o ENERGY PAYBACK o INTERNATIONAL CONSIDERATIONS o REGULATORY CONSIDERATIONS o INTERFACE WITH PRESENT STRUCTURE
Figure X-3.- The relative merits of space solar power and other systems -coal, nuclear, solar terrestrial.
o MICROWAVE BEAM - IO:lflSPHERE INTERACTION TEST - ARECIBO AND POSSIBLY NEW OR MODIFIED SYSTEMS
o DEMONSTRATE PHASED-ARRAY CJNCEPT - GOLDSTONE
o COMPLETE LABORATORY r:RFORMANCE EVALUATION OF GaAs SOLAR CELLS o LABORATORY-SCALE TESTING OF IMPROVED HIGH-RATE SOLAR CELL PRODUCTION
TECHNIQUES o THERMAL-VACUUM TESTING OF ADVANCED RADIATOR CONCEPTS o DESIGN AND TESTING OF PROTOTYPE SPACE FABRICATION DEVICE o EVALUATION OF GRAPHITE EPOXY CASTINGS o TESTING AND EVALUATION OF MPD AND THERMAL ARC THRUSTERS o PRELIMINARY WIND-TUNNEL TESTING OF CONCEPTllAL LAUNCH, REENTRY, AND
LANDING CONFIGURATIONS o CO~PLETE INITIAL TESTS OF BIOLOGICAl. fFFECTS OF 'HIGH Z' RADIATION o PRELIMINARY TESTS OF MICROWAVE RADIATION ON EQUIPMENT, VEGETATION,
A~ID ANIMALS o THERMAL-VACUUM TESTING OF TYPICAL STRUCTURES o ADDITIONAL CRITICAL TEST AS IDENTIFIED IN STUDIES
Figure X-4.- Significant test activities, initial phase, July 1976 to July 1978 (partial listing).
X-5
, l I
1 J
j
1 j
1 1
I

, ;
, I
C. Technology Advancement Phase
The technology advancement phase (FY80-87) consists of three elements: ground-based developments, space experiments, and a subscale system evaluation in space. The results of these activities must also be integrated into a continuing program and system analysis and evaluation. A more detailed breakdown of activities that will be required in each of the three elements is presented i.n figure X-5.
GROUNO·BASED DEVELOPMENT
MICROWAVE POWER TRANSMISSION/ RECEIVING TECHNIQUES
MICROWAVE GENERATOR OEVELOPMENT
EFFICIENT, LIGHTWEIGHT, LOWCOST SPACE SOLAR CELLS
THERMAL CONVERSION SYSTEM, COMPONENT TECHNOLOGY
POWER PROCESSING ANO DISTRIBUTION COMPONENTS
MATERIALS INVESTIGATION
ORBITAL TRANSFER THRUSTER TECHNOL9GY
ENVIRONMENT - BIOLOGICAL EFFECTS - IONOSPHERE IMPACTS - RAOIOFREQUENCY INTERFERENCE
TYPICAL ACTIVITIES
SPACE EXPERIMENTS
STRUCTURAL ELEMENTS AND FABRICATION TECHNIQUES
ELECTRONIC/MECHANICAL COMPONENTS - ADVANCED SOLAR CELLS - MATERIALS . - MICROWAVE GENERATORS - THERMAL CONVERTER
COMPONENTS
HIGH-VOLTAGE PLASMA EFFECTS
ORBITAL TRANSFER THRUSTER FLIGHT EVAlUATlON
PROPELLANT TRANSFER
EMISSIONS - ATMOSPHERE COMPATIBILITY
SPACE SUBSCALE SYSTEM
DEVELOPMENT AND EVALUATION
CONSTRUCTION/ASSEItlLY OF lARGE SYSTEMS
LOGISTICS OF LARGE-SCALE SPACE OPERATIONS
IN-SPACE PRODUCTIVITY AND ASSEMBLY COSTS
END-TO-END POWER SYSTEM PERFORMANCE
Figure X-S.- Technology advancement phase.
Comments pertinent to the activities in this phase are presented in the following paragraphs.
Solar ener~ conversion.- The most significant contribution to technical and economlC feasibility of SPS can be obtained by increase of solar cell array power per unit mass (kilowatts/kilogram) and decrease in cost. It is also expected that solar cell life will playa key role in determining economic feasibility.
Structures.- Although structures appear to be a relatively low weight item in current SPS configurations, it is expected that significant analytical and test efforts will be required to develop and qualify these systems. The main difficulty in this area is the inability to ground test (simulate) the large, lightweight systems.
X-6
'-."',"","" ..... ~,.,~ ., .. ,
1 1 , '~
/ '~ ~ ,
t 1

, ; ~ , I [,
j t f
\ ~ t, ,
J f i , ~
Microwave conversion and control.- The satisfactory performance of dc/rf power converters is essential to the success of the SPS concept. The key performance parameters are efficiency, lifetime, and noise characteristics. Low component weight is desirable, but it is of secondary importance to conversion efficiency, which directly affects solar array size and weight.
E~vironmental impact.- The design and performance of SPS 1s directly influenced by allowable microwave radiation intensity levels on the ground and in the upper atmosphere. It is expected that a major test program will be required to resolve environmental issues and to establish practical but safe design criteria.
Space transportation.- The installed cost of SPS is strongly influenced by space transportation costs. Although the HLLV development appears to be primarily a scale-up and product improvement of existing rocket technology, such as was accomplished in the Saturn V development, significant testing and development will be required to demonstrate lowcost operations and efficient equipment reuse concepts. Devel~pment of a suitable low-cost, long-life OTV propulsion system is also mandatory regardless of SPS design configuration.
D. System Development
Detailed plans for the system development phase would be developed during the Technology Advancement pha~e of the program. The scope of the effort would e~eed tliat r.equired for the Apollo Program, particularly since a continuing commercial phase would be envisaged requiring a large industrial capacity. The ability to accomplish this in the period between 1985 and 1987 will be dependent upon the planning, organization, and long lead-time activities conducted during the preceding phase. The transportation and associated launch and recovery (or landing) facility development will constitute a particularly significant theme of the overall activities of this phase.
E. Program Costs
The program plan (fig. X-l) shows preliminary estimates of costs by major phase. The initial phase (system definition and exploratory technology) is estimated to cost between $40 and $50 million. The major elements in this estimate are as follLWS:
1.
2.
3.
4.
5.
System studies - $10 to $14 million
Environmental ana1ys~s and tests - $5 to $6 million
Microwave conversion and control - $10 to $12 million
Structure (thermal and materials) - $7 to $9 million
Orbit transfer propulsion, exploratory technology - $7 to $9 million
X-7

, , , ~ ~'
r , ~ ~ , • ~. , [;.
•
__ UU_ U·.·UUUuu -UUU"-l" .. " "/-" ~,
r
Commitrllent to the technology advancement phase would occur in 1979, assuming favorable results from the initial program phase. The technology ) advancement phase is estimated to cost $4 to $6 billion over a period of ' " about 10 years. The peak annual funding for this phase would be about $2.0 billion in the 1985-87 time frame. The major cost element of the phase would be the development of techniques and the subsequent construc-tion and evaluation of a subsca1e system in orbit.
The system development phase (initiated 1987) would involve commitment to a multibillion per year program· of 8 to 10 years' duration. The total cost is estimated to be $45 to $55 billion, with the major cost elements being development and verification of space transportation systems ($9 to $12 billion), solar power satellite systems ($19 to $22 billion) and orbital construction facilities ($16 to $19 billion).
Expenditures for the final commercialization phase would depend primarily upon SPS unit costs, space transportation costs, and rate of installation. Initial estimates of these costs are given in section XI of this report.
x-a i )
!
. , ,
-

, , ~ , ~ " ! ~ ~ , r !
~' i, t' f 1:': , 1
t , f ~ , f , ~ t , , ~ ~ [ ~ ~ ~ ~ .
! , • t t ~ ,
I f
I " g y ~ t,
V
, , ,. " , , " • l
" \C 1.' Ii ~ " .~
~ ~. , ~
~;
~. i' ~ it .' ~ I 'J'.
t
(
XI. PROGRAM COST AND ECONOMIC ANALYSIS
A. Methodology
The SPS design concepts evaluated involve improved technology in several areas as well as new and vastly expanded space activities over those which have been accomplished to jate. The economic analysis and evaluation of SPS are based on projections of capability and technology resulting from a major development program as described in section X. For analytic purposes, it was assumed that the SPS ground-receiving stations (rectennas) would be operated as baseload power sources in a large power grid. This grid would include conventional powerplants (nuclear and fossil fuel) for both baseload and peaking requirements. The general approach adopted was to derive program costs and the associated power production costs for the implementation of 112 lO-GW power stations over a period of 30 years beginning in 1995. The program costs were used to determine SPS unit costs. Annual operating and maintenance (O&M) costs were also determined as were the return rates necessary to amortize design, development, test, and evaluation (DDT&E) costs. These costs are then compared with costs of conventional baseload and other future power systems.
B. SPS Costs
The major cost elements of the SPS are as follows:
1. Power Station System - consists of capital cost of Solar Energy Collection System, Microwave Power Transmission System, and the Microwave Reception and Conversion System.
2. Space Transportation System - consists of capital cost and operation cost of HLLV's, COTV's, logistic vehicles (PLV's, POTV's) and associated launch, recovery, and refurbishment facilities.
3. Space Construction System - consists of capital costs of space facilities and equipment for construction and assembly of power station systems, including manpower requirements.
4. Operational Costs - consists of costs of manpower, transportation, consumables, and repair/replacement hardware for sustaining and maintaining operation of the power station system.
5, DDT&E Costs - consists of all nonrecurring research and development funds expended prior to initiation of commercialization (1995) •
The preceding cost elements m3Y be expressed in mills/kWh and combined to obtain a total cost of electricity (COE) at the busbar as follows:
COE (mills/kWh) = capital recovery + O&M + DDT&E
This equation with definition of all terms is shown in figure XI-l.
Capital costs.- The capital cost CC of an SPS consists of satellite hardware, satellite construction, space transportation, and ground
XI-l
, , ,
-

j f t
[l~-~I-:
I Ii' system (r&ctenna) costs. The satellite hardware costs were determined using the cost estimating relationships (CER's) and satellite weight characteristics given in section IV. A range of costs was determined based on satellite weight, satellite configuration and construction location (LEO or GEO), and unit cost of solar cells varying from $100 to $500/kW.
The cost of satellite construction was based on requirements delineated in section V. This cost item includes spacr, construction facilities and equipment and space construction personnel.
The space construction facilities are to house construction personnel and equipment and are located in LEO and GEO, as required by the particular construction location and configuration. The costs of these fac'" ities were prorated over the number of satell ites constructed because they are reusable. The facilities were estimated at the rate of $250/kg recurring hardware cost.
The space transportation costs and cost variables are discussed in detail in section VI. The transportation cost per SPS was determined by summing the total space transportation cost for 112 satellites and dividing by 112 to reflect the reusability of launch and orbit transfer vehicles.
The rectenna costs were based primarily upon the recurring costs of diodes, circuits, and the support structure. Unit costs utilized are given in section IV. As indicated in figure XI-1, a plant lifetime of 30 years was assumed in the computation of capital recovery rate. Also, a fixed rate of return of 15 percent for principal, interest, taxes, and insurance was utilized in all cases. The SPS plant factor utilized was 0.92, which is based on an average downtime of 4 weeks/yr for maintenance and repair. This downtime period would include the loss of power during the brief eclipse periods.
O&M costs.- The primary operation of SPS will be conducted from the ground receiving station. It is anticipated that routine, but infrequent, "onboard" monitoring and inspection may also be required. This may be accomplished by a crew that ser'vices several SPS's, thus reducing the costs attributable to a single SFS.
As a baseload power system, SPS will be designed to operate at full capacity year round. It is anticipated, however, that scheduled shutdowns of several days' duration will be required annually to replace or repair failed or malfunctioning components (klystron tubes, solar array blanket sections, etc.). In such cases, an HLLV and the selected COTV concept could be scheduled to deliver the hardware. Personnel and consumables would be delivered by the personnel transportation vehicles. Preliminary estimates of annual O&M costs were based on the following assumptions:
XI-2 I
j , .... 1
1

r I ~ ~ r , i
i ~
~ , , , ~ { i ,
I I
I (
i
r r I
- --"'-_~'W_ - _.- ---~--'--~-----.,. "_"'''"_""''1
Cost of electricity (mills/kWh) = Capital recovery + O&M + DDT&E
C.p;~1 '&""Y" [1-( .'h y] ( CEC ) (10001
r = rate of return, 15 percent assumed 'C plant lifetime, 30 years assumed CC = satellite materials + construction + space transportation + rectenna E = (plant capacity, kW) (plant factor> (hours/yr)
Operation and maintenance
(Manpower + materials + space transportation)/yr O&M = Annual electrica I energy, kWh/yr
Design, development, test and evaluation Total funding outlay
DO T &E = ~-':"-;;'---'-'''''''-'-'-:'--''---
(AVeri.lge no. of SPS1s) over first 30 years (E) (30)
Figure XI-1.- Cost equations.
1. Ground O&M staff 2. On-orbit. maintenance/repair 3. Repair/replacement/maintenance
48 man-yr/yr/10-GW system 12 man-yr/yr 1 percent of SPS mass/yr (per Slle. VII)
DDT&E costs.- The DDT&E cost was based on development cost estimates for the major program elements. The estimates utilized are given in table XI-1. The estimates shown are the cumulative funding requirements from the start of technology advancement through system development (1995). The amortization of these costs over the initial 30 years of SPS operation per scenaric B was accomplished using the equation shown at the bottom of figure XI-1. The numerator of the equation (total funding outlay) may include interest on capital expended during the 20-year development program. If a 9-perl'ent interest charge is used, the effect is to illcrease the actual cost by a factor of about 1.4. However, as will be shown later, ~he DDT&E amortization cost is a small fraction of the cost of electricity.
XI-3
. -
1 /
-

~ , ~. ,
t , I. ~~
, ~. y,; ~- r.\'.
;';i' , t !
~ ~, , , i , t r, i f, !
t ! , , ~ , ) S , , f , ~ , g ,. ; , r , f
~%41t"'f'..> ., -'~f,' ~O;<?~
Cost summary.- Table XI-2 shows a summary of the cost estimates
for the range of design parameters investigated. Note that the total COE ranges from 29 to 115 mills/kWh. The COE for the "nominal" system is 50 to
59 mills/kWh, which consists of 46 to 52 mills/kWh for capital recovery,
3 mills/kWh (6 percent) for O&M, and 1 mill/kWh (2 percent) for amortization
of DDT&E. The capital recovery cost breaks down to about 45 percent for
space transportation, 40 percent for satellite and construction, and 15
percent for the rectenna. In the highest cost combination (COE : 115 mills/
kWh), transportation costs increase to 60 to 70 percent. The satellite
capital recovery is 25 to 30 percent and the rectenna only 8 to 10 percent.
The SPS capital cost expressed in $/kW varies from a low of $1400/kW to a high of $5780/kW. This cost is the primary driver in establishing the cost of electricity for the SPS.
This n.~minal cost system results from an overall SPS efficiency . 2
of 5 percent, solar array welght of 0.4 kg/m , $300/kW for solar cell
blankets, and a transportation cost from Earth to GEO of $108 to $164/kg.
The construction location and satellite configuration are seen to have little effect on COE.
Figure XI-2 illustrates the range of possible cost combinations
for the SPS weight range investigated.
C. Comparison With Conventional and Other Advanced Systems
The economic viability of SPS will be dependent upon the costs
and economics of alternative conventional and other future power systems.
Figure XI-3 shows a sun~ary of typical power-generaticn costs for
baseload conventional systems and several advanced concepts receiving research and development interest (and funding) at this time. The range of
costs shown for each of the conventional systems corresponds to sitespecific variations such as local environmental constraints, local labor
and materials costs, land and site preparation costs, and fuel cost varia
The cost of coal-fired plants varies greatly depending upon the degree of stack gas scrubbing required and the type of cleanup system utilized. The conventional nuclear systems shown are light water reactors (pressurized water and boiling water). It is expected that the
fast breeder r.eactor (liquid metal cooled) will have a capital cost in the
$800 to $900/kW range.
The highest cost conventional systems are coal and nuclear, which
are becoming the major electrical power sources for the last quarter of this
century. As with SPS, the other advanced power systems shown generally have
higher capital costs ($/kW) than the conventional systems, but have zero-to
minimal fuel costs. The technical and economic feasibility of these systems
is currently being investigated by ERDA and others. Although not shown in
figure XI-3, nuclear fusion is another advanced power-generation system that
XI-4
1
-

''''''''"'''~~'''J<''''Y'T''''''<T'''''r- ,,,'t.,..,, -~,. r .. "·'·~:'~W-·'''-' '.' .... ,--".'-,-.".~ .. -,,~"" . ....-.... ,"..,.....,"",.," .... f\ ••• """'''''''~ •• =-.: ... ~""..., ,,,,~,,.o~'"·'''''-''''''''·'·'''''''·''''.'W''''''''''_~'i"'l'-'''-'--''''fFl'''·\~!'''-·''''W''' ""-..... '''''~~
~~~n;,IJ]l~!'<;~' ~'''!?$''~f.;'<N'.-:tI'''' .. ~,·(l:.~t.~~''''~1'-<-:¢:"'-':r;:.~·- .. "~.f!'·-C··~..,..I'~,.'>!'·'~)l,-, "'''''c~:!<~,~~;=1.;'!r-''I;;':'':'~-f~Il'!~~~cm:<;,,~~,-,,~''t1~'''l:~~4''~·'':7!"~"'€l'~~~'-G'~'~~~~
~,-,~~.
.. """" ...
x -, '"
~o 'J:t~ gfj .:~
l~~ fJ
6J
,-..
TABLE XI-1.- DDT&E COST ESTIMATE SUMMARY
Element Est~mated cost, hi 1 ];on
Power station systems 19.0 to 22.0 HLLV 5.0 to 10.0 COTV 1.Oto2.0 POTV 1.0 to 1. 5 PLY 0.5 to 1.1 Construction facilities
and equipment (orbital) 16.0 to 19.0 Total program 1I2.!i to SUi
-
TABLE XI-2.- SUMMARY OF COST ESTIMATES AND RELEVANT PARAMETERS FOR lO-GW SPS
Construction I-:C:-;""':--""T.=_-,--,,-.,f.~m~t_=.,...,.~== __ ,.,..,.,---..j Capi tal t,;os't ml I IS kwn
Efficiency, Weight. Transportation, cost, leonfiguration percent kgX106 $/kg $/kW
aG_CC a Construction in geosynchronous Earth orbit; column/cable construction. G-T a Construction in geosynchronous Earth orbit. truss configuration. l-T = Construction fro low-Earth orbit; truss configuration.
bNumbers in parentheses are final numbers. but cost model was not changed.
"._," .,,~.'.,'..n" ____ ---",1.,, __ .,0" ~"._~"'""'~~~""'_ .. , ..... ,.
5 5
12 12
12 9
t
29 26
2 2
1-\ I
32 29
'. / ~--
1 ! , 1
~
""!
'---~--~ , I j
g 1 J
..-_"... __ -....:1
'-.. J j ,
.JI

30
25 = ;;:
'" 20 J!!
'. 15 ;;1 0
10 <.)
5
0
Satellite and construction
'--_--.Nom inal range $300/l<W
$lOO/l<W
So\ar ceUs
50 100 150
GEO mass, 106 kg
Rectenna
satellite
80
60
= ~ ~ 40 '§
~ 0
<.)
20
0
120
$75-
I Space transportation
17""- Nominal range $108 to 164/1<g
105/1<g
50 100
GEO mass, 106 kg .. sPs
150
I t--=-OO-Nominal range
SPS cost = and + space transportation + rectenna constJUctio"
o 50 100
GEO mass, 106 kg
Figure XI-2.- SPS cost parametrics.
150
currently receives significant research and development funding; however, major technological breakthroughs are still required before total system definition may be accomplished.
The range of power-generation costs for the advanced systems is 28 to 55 mills/kWh for the ocean thermal system to 97 to 121 mills/kWh for ~r0und-based solar thermal systems. The solar thermal systems could not be strictly Classified as a baseload system because only Hmited (shortterm) energy storage is provided. The wind power-generation system cost is based on the "fuel saver" operational mode wherein the wind system operates in parallel with conventional plants when windspeeds are within a specified range, thus effecting a reduction of fuel consumption in the conventional plants. In this mode of operation, the wind plant annual capacity factor, which is a measure of equipment utilization, is very low (30 to 40 percent at best).
XI-6
, '''I '~ j ,
l i ,
'1 ;
$ '1 , U
~ 1 1 ~ ! j J ~ ; -; q , , l , ;
..... ;!
, " 1 ; 1 , ;
! ~ •
j j
1

I I. ,
1 120
-'" ;;: -" ..... ~
'5 100 ~
~ '0 " '" 80 ,... , on .... '" c! 60 ?;> 'u :5 u ., -.;
40
" ~ ~ 0 u
20 I I I I
I 0
Gas Oil Coal Nuclear Wind Ground Ground Ocean SPS thermal solar thermal solar photo-
voltaic
Conventional Advanced
Figure XI-3.- Conventional and advanced power generation system costs.
AlsQ shown in the figure is the range of costs estimated for the SPS. The possible SPS costs span the range from a low of 29 mills/kWh for the lightest weight, lowest transportation and unit cost s~'stem tr, 115 mills/kWh for the highest weight, highest transportation and unit cost system. At the low range, the SPS cost is competitive with current conventional systems, and the ri'Jhest estil'lated cost is no greater than that of other advanced systems pr",sently receiving research and development support.
Terrestrial solar power.- A brief design and evaluation study was performed to determine the relative cost of electricity for alternate terrestrial solar power concepts. Figure XI-4 illustrates a generalized energy flow diagram for a terrestrial solar power system. As two example cases, a photovoltaic and a thermal cy~le (steam Rankine) were analYlcd to determine the cost of electricity for these systems.
XI-7
.; 'i , ~ i j

I I f r ~r
J I I
The systems were sized to 5 GW to be comparable with a 5-GW SPS rectenna. In both case~, it was assumed that the plants were located in the southwestern region of the United States, where plant factors of as high as 0.16 to 0.25 may be obtainable. Figures XI-5 and XI-~ show the energy flow diagrams for hydro pumped storage and fuel cell/water electrolysis cell (hydrogen) storage terrestrial solar power systems. In the solar thermal case, a hybrid system consisting of a combination solar plant and coal-burning steam powerp1ant was analyzed. Figure' XI-7 and XI-8 show the estimated COE for these cases as a function of storage time. It was assumed that with no storage the plant factor varied from 0.16 to 0.25, which is optimistic for such systems. The ter'restria1 photovo1taic system was costed based on $300/kW solar cells operating at 11-percent efficiency.
Note on figure XI-8 that the nominal SPS cost (50 to 60 mi11s/ kWh) is lower than the solar thermal terrestrial system by a substantial margin. The hybrid solar - coal plant has about half the cost of electricity of the SPS, but it saves only 13 percent in th:!rma1 energy (coal), whereas the SPS is a 100-percent sUbstitution for the coal.
Figure XI-9 shows the estimated land requirements for the two cases mentioned above together with SPS land requirement. The terrestrial photovo1taic system requires about three times the land area of the solar thermal system because of its lower conversion efficiency.
Conversion Sola r input to Plant factor - 16 to 25 percent* Power
I electrical I energy I L_ -------
• •
Photovoltaic cells efficiency = 10 to 15 rercent
Thermal cycle efficiency - 30 to 40 percent
Hybrid
• Fossil • Nuclear
Energy storage
• Batteries • Thermal/chemical • Pumped storage • Flywheels • Water ele~trolysis/fuel cell
*Southwest locations
Figure XI-4.- Terrestrial solar power.
XI-B
grid
,
1
§ , ;
1 ,1 j J I j j

f J , k' )
~ I " ~ I , , , , , , , ~ , , ~ , ~, I: ~ , I
~ ~, ~, , W , • ~ f; , ~ , ~ i ,
t
~ , If, f (
1, '-
~
l I::~
Steam turbine/ 10 13,7 X 10¹⁰ kWh/yr generator plant 1.0 X 10 kWhe/yr
--S-ol-ar-i-np-u-t----.;~--l efficiency = 0.40
142 km2 mirror field 20 GW capacity
Fuel cell efficiency = 0.70 Electrolysis efficiency = 0.8 Storage capacity = 100 hours
E leclrolysis/ fuel cell storage
efficiency =0.56
- 4.0 X 10¹⁰
kWhe/yr
5 GW
Figure XI-5.- The 5-GW solar power tower concept with electrolysis cell/fuel cell energy stor~ge.
58 X 1010 kWh/yr Photovoltaic field 1 X 10¹⁰ kWh /yr efficiency = 11 percent e Solar input 23 GW
e capacity
465 km2 collector
10 Storage capacity = 100 hours 5.36 X 10 kWh /yr e
Eleclrolysis 3 X 10¹⁰ kWh /yr fuel cell storage e
efficiency = 0.56
4 X 10 10 kWh/yr
5 GW peak
Figure XI-6.- The 5-GW solar photovoltaic-fuel cell/electrolysis cell system.
XI-9
i 1 J • , .~ ,
/ , !

~ 1 " t~ !i
" t' ~ [ ,
~
I , ~;
t , ~ I ! ,
200
$300/kW solar cells Pumped hydro\
~
~ 150
VI
E -~ <> b u C1J C1J
.....
FC:::S 100 rp.F. = 0.16
0 .... VI 0
U 50 - - - - - - SPS nominal - - - - - - -
o 20 40 60 80 100
Storage time. hours
Figure XI-7.- Terrestrial solar photovoltaic power cost for 5-GW plant.
D. Summary Remarks
Preliminary SPS cost and economic analyses indicate the following:
1. The SPS appears to be an economically viable electrical power generation system for the early 2000 time period. The cost to produce electricity is 29 to 115 mills/kWh based on a 15-percent rate of return on capital investment and a 0.92 plant capacity factor. The COE based on nominal system characteristics (weight, efficiencies, transportation, etc.) is 50 to 60 mills/kWh. These costs are in the competitive range with the 28 to 121 mills/kWh for other advanced systems of current interest and, at the lowest values, compete with conventional coal and nuclear costs (15 to 29 mills/kWh).
XI-10
1 /
-
I --ol

I
i 200
~ 150 ~ en
z-·u 100 .b u OJ
Qj
'15 ~
en o
U 50
o
Pumped hydro storage --__ ,
P.F.=0.20
storage
r-----P.F. = 0.25 ---- - - ----S"PSnOmina'- -- ---------- -------------- ------- - -.- - - - - - .".,..., • .,.. -.,.- To:" - - - - - - - --} Fuel savings "yorIO-coal Olant --- - ---" -----"--""-'---------- only 13 percent
20 40 60 so 100
Storage time, hours
Figure XI-S.- Terrestrial solar thermal power cost for 5-GW power tower concept.
2. The highest cost component in the SPS concepts investigated is the solar cell blankets, comprising up to 81 percent of the SPS capital cost. Figure XI-10 shows this relationship together with the relative cost contribution of the other components.
3. DDT&E costs represent a substantial investment (up to $50 billion); however, when this cost is amortized over the 3D-year implementation period (112 power stations), the amortization cost is only 2 percent of the COE.
4. SPS O&M costs are 2 to 7 mills/kWh, which do not appear excessive based on initial estimates.
5". Concept 3 (truss structure, LEO construction, electric COTV) results in the lowest cost design; however, further analysis is required because of the very preliminary nature of this study.
XI-ll
I
-
j
~ j

~ i , . ..
N E
500
400
-", 300 ""C
'" ~ '5 g ~
m :0 200
""C c: '" -I
Photovoltaic
F C-EC storage
Power tower
FC-EC storage
100 ____ ------ -- - -- -----5-GWrectenna
o 20 40 60 80 100 Stc(age time, hours
Figure XI-9.- Land area requirements for 5-GW plant.
6. The assumptions used in the "nominal" cases (50 to 60 mills/ kWh) are worthy of mention because they represent a set of assumptions that are believed to be attainable and do not represent any extreme breakthroughs in technology. For instance, the silicon solar cell for this nominal design case was 10.4 percent efficient at the operating temperature of 1000 C. The cost of the array was $300/kW (ERDA goals: $500/kW in 1985 and $100 to $300/kW in the year 2000) 1 and the bas i c cell was 4 mil s thi ck. The total system endto-end efficiency was 5.4 percent, which represented a total satellite weight of 84 000 metric tons. The transportation cost used was $164/kg to GEO compared to the projected current Shuttle cost of $550/kg to LEO.
lReference ERDA 48, vol. II.
XI-12
,
1
'.1 )
"1 ,
l I ] .,
1
I 1 -, , ! 1 j
i 1 I j
J
j
1 I I
1 i

r f
, r, , , , f l
~ r • , f , , , ~ ,
, ['
f [,
I I t , ,
t
"
l l i
(
Microwave generators - 4')'.
Solar concentrators - 4')'.
Phase control - 4.4Y,
Other - 17.5'/.
Satellite cost breakdown Solar cells at $500!1<w
Microwave generators - 11,)"
Solar concentrators - 12'/,
Satellite cost breakdown Solar cells at $100!1<w
Phase control 12.5'/,
Figure XI-10.- Satellite cost breakdown.
NASA-JSC
XI-13
1 1
l
1 l I
1
1 I I 1
_.j , 1
l I ~ j
1 ~ l
1 'I I l
~ j 1
j
i 1 i