19900005178.pdf - NASA Technical Reports Server
132
! l United Technologies Research Center Report No. 87-41 q. ! = I- L t LASER VELOClMETER AND TOTAL PRESSURE MEASUREMENTS IN CIRCULAR-TO-RECTANGULAR w f & % !- | f TRANSmONDUCTS William P. Patrick and Duane C. McCormick 1 It I June 1988 Final Report Contract NAS3-24616 w I *,.,., I Prepared for NASA Lewis Research Center 2100 Brookpark Road Cleveland, OH 44135 NgO-14494 (NASA-CR-182286) LASER V_LOCIMETFR ANO Tn_T_L PREqSURF MEASUREMENTS IN CIRCdLAR-TG-RE-CTArJGULA_, TRA_='4SITIUN P, UCI_ Fin_l _epor+ (United Technologies Research _ Cenf_:r) 121 p CSCl 209 Uncl ._s G 3/.i4 0234007
-
Upload
khangminh22 -
Category
Documents
-
view
0 -
download
0
Transcript of 19900005178.pdf - NASA Technical Reports Server

!
l United Technologies Research Center
Report No. 87-41
q.
! =I-
L
t
LASER VELOClMETER AND TOTAL PRESSURE
MEASUREMENTS IN CIRCULAR-TO-RECTANGULARw
f
& %
!-|
f
TRANSmONDUCTS
William P. Patrick and Duane C. McCormick
1It
I
June 1988
Final ReportContract NAS3-24616
w
I*,.,.,
I
Prepared for
NASA Lewis Research Center
2100 Brookpark Road
Cleveland, OH 44135
NgO-14494(NASA-CR-182286) LASER V_LOCIMETFR ANO
Tn_T_L PREqSURF MEASUREMENTS INCIRCdLAR-TG-RE-CTArJGULA_, TRA_='4SITIUN P,UCI_
Fin_l _epor+ (United Technologies Research_ Cenf_:r) 121 p CSCl 209
Uncl ._s
G 3/.i4 0234007
_jd
m
m1
_w
I
am
I i _
J _ UNITEDTECHNOLOGIESRESEARCHCENTEREast HaTtford. Connecl_Cul 06108
i F
t
UTRC87-41
Laser Velocimeter and Total
Pressure Measurements in
Circular-to-Rectangular
Transition Ducts
I
i
REPORTED BY _/_
?
William P. Patrick
Duane ¢. McCormick
f
Robert W. Paterson
DATE June 1988
NO. OF PAGES 130 COPY NO.

'mUll
d
n
|
U
i
|
i
n
lUll
i
UTRC87-41
Laser Velocimeter and Total Pressure Measurements in
Circular-to-Rectangular Transition Ducts
TABLE OF COFI'EFrS
w--
J
w
LIST OF FIGURES ............................. v
LIST OF TABLES .............................. ix
NOMENCLATURE ............................... xi
SUMMARY .................................. I
CHAPTER
I. INTRODUCTION ............................. 3
2. REVIEW OF PREVIOUS INVESTIGATIONS ................... 7
3. DESCRIPTION OF THE EXPERIMENT ..................... 13
3.1 Experimental Arrangement .................... 13
3.1.1 Transition Duct Definition ................ 13
3.1.2 Description of the Test Facility ............. 14
3.2 Instrumentation ......................... 16
3.2.1 Laser Velocimeter System ................. 16
3.2.2 Pressure Measurement Instrumentation ........... 18
3.2.3 Measurement Locations .................. 19
4. RESULTS ............................... 33
4.1 Measurements in AR310 Transition Duct .............. 33
4.1.1 Inlet Plane Total Pressure Measurements ......... 33
4.1.2 Inlet Plane Laser Velocimeter Measurements ....... 35
4.1.3 Exit Plane Total Pressure Measurements .......... 35
4.1.4 Exit Plane Laser Velocimeter Measurements ........ 38
PRECEDING PAGE BLANK NOT FILMED
ill

imm
UTRC87-_l
TABLE OF CONTENTS (Cont'd)
4.2 Measurements in AR630 Transition Duct ..............
4.2.1 Inlet Plane Total Pressure Measurements .........
4.2.2 Inlet Plane Laser Veiocimeter Measurements ........
4.2.3 Exit Plane Total Pressure Measurements .........
4.2.4 Exit Plane Laser Velocimeter Measurements ......
4.3 Calculated Axial Vorticity Distribution .............
5. CONCLUSIONS ..............................
REFERENCES ................................
TABLES ..................................
APPENDIX A - AR310 TRANSITION DUCT INSPECTION ...............
APPENDIX B - ERROR ANALYSIS ........................
4O
i
mmm
W
m
m
m
m
qp
I
l
m
m
U
m
I
m
w
iv

_ UTRC87-41
LIST OF FIGURES
r
w.,-
L
r
Figure No.
I-I
2-I
2-2
3-I
3-2
3-3
3-4
3-5
3-6
3-7
3-8
3-9
3-10
3-11
3-12
4-I
4-2
4-3
Title
Calculated Stall Margin for Benchmark Transition Duct
Configurations
Schematic of Transition Duct (L/D = 2.3) Investigated by Mayer
(Ref. 4)
Secondary Flows in a Rectangular Duct (from Ref. 15)
Schematic of Transition Ducts Illustrating Coordinates and
Nomenclature
Schematic of Test Centerline Illustrating Flow Conditioning
Transition Duct Inlet Definition
AR310 Transition Duct With Constant Area Extension
AR630 Transition Duct With Constant Area Extension
Laser Velocimeter Data Acquisition System
AR310 Transition Duct With LV System
Boundary Layer Probe for Transition Duct Exit Plane
Measurements
Coordinate System Definition and Measurement Locations at Exit
of AR310 Transition Duct
Locations of Boundary Layer Traverses in AR310 Exit Plane
Coordinate System Definition and Measurement Locations for
AR630 Transition Duct
Locations of Boundary Layer Traverses in AR630 Exit Plane
Total Pressure Profiles in AR310 Inlet Plane
Wall Boundary Layer in AR310 Inlet Plane
Axial Velocity Profiles in AR310 Inlet Plane
,5
v
UTRC87-41
Figure No.
44
4-5
4-6
4-7a
4-7b
4-8a
4-8b
4-8c
4-8d
4-9
4-10a
4-10b
4-11
4-12
4-13a
4-13b
4-14
4-15
4-16
4-17
4-18
LIST or IGU s (Cout'd)
Title
Transverse Velocity Profiles in AR310 Inlet Plane
Axial Turbulence Profiles in AR310 Inlet Plane
Transverse Turbulence Profiles in AR310 Inlet Plane
Total Pressure Distribution in AR310 Exit Plane
Total Pressure Distribution in AR310 Exit Plane
Transverse Total Pressure Boundary Layers in AR310 Exit Plane
Spanwise Total Pressure Boundary Layers in AR310 Exit Plane
Corner Total Pressure Boundary Layers in AR310 Exit Plane
Boundary Layer Integral Parameters in AR310 Exit Plane
Total Pressure Boundary Layers in AR310 Exit Plane, Law of the
Wall Coordinates
Axial Velocity Distribution in AR310 Exit Plane
Axial Velocity Distribution in AR310 Exit Plane
Cross-Flow Velocity Vectors in AR310 Exit Plane
Kinetic Energy Distribution in AR310 Exit Plane
Static Pressure Distribution in AR310 Exit Plane
Static Pressure Distribution in AR310 Exit Plane
Axial Turbulence Distribution in AR310 Exit Plane
Total Pressure Profiles in AR630 Inlet Plane
Wall Boundary Layer in AR630 Inlet Plane
Axial Velocity Profiles in AR630 Inlet Plane
Transverse Velocity Profiles in AR630 Inlet Plane
n
m
v
mq
pB
JlU
i
"V
m
u
nii
u
qp
m.
i
mu
m
w
viI

UTRC8?-41
n
LIST OF FIGURES (toni'd)
Fi6ure No.
4-19
4-20
4-21a
Title
Axial Turbulence Profiles in AR630 Inlet Plane
Transverse Turbulence Profiles in AR630 Inlet Plane
Total Pressure Distribution in AR630 Exit Plane
=
4-21b
4-22a
4-22b
4-22c
4-23
4-24a
4-24b
4-25
4-26
4-27a
4-27b
4-28
4-29a
4-29b
5-1
A-1
Total Pressure Distribution in AR630 Exit Plane
Transverse Total Pressure Boundary Layers in AR630 Exit Plane
Spanwise Total Pressure Boundary Layers in AR_30 Exit Plane
Boundary Layer Integral Parameters in AR630 Exit Plane
Total Pressure Boundary Layer in AR630 Exit Plane, Law of the
Wall Coordinates
Axial Velocity in AR630 Exit Plane
Axial Velocity Distribution in AR630 Exit Plane
Cross-Flow Velocity Vectors in AR630 Exit Plane
Kinetic Energy Distribution in AR630 Exit Plane
Static Pressure Distribution in AR630 Exit Plane
Static Pressure Distribution in AR630 Exit Plane
Axial Turbulence Distribution in AR630 Exit Plane
Axial Vorticity Distribution in AR310 Exit Plane
Axial Vorticity Distribution in AR630 Exit Plane
High Aspect Ratio Duct Fluid Dynamics
Comparison of AR310 Design Cross Section to Actual Cross
Section
vfl
_um
m
IN
mmmm
U
¢mml
m
m
imp
INto
mmm
m"

_ UTRC87-41
Table No.
I
lla
lib
Ilia
lllb
IVa
IVb
LIST OF TABLES
Title
Coefficients for Superellipse Equation
AR310 Inlet Boundary Layer
AR630 Inlet Boundary Layers
AR310 Exit Plane Data
AR630 Exit Plane Data
Total Pressure Boundary Layer Surveys in AR310
Exit Plane
Total Pressure Boundary Layer Surveys in AR630
Exit Plane
Measured Cross Sections of AR310 Transition Duct
Estimated Bias Errors, Precision Errors, and
Uncertainties of LV Measurements
PRECEDING PAGE BLANK NOT FILMED
ix
i,....
mF
N
u
mw
Ill
x__
gl
D
l
IP
il
r_II
mm
m
s
II
ill
Im
m

UTRC87-41
NOMENCLATURE
=.=
m
=
AR
CfD
H
L
P
P
Q
qR
Re erady
radz
S
T
U
U +
UI
u
V
v
W
w
X
Y
Ybly+
z
69956"*
6
v
Aspect ratio
Skin friction coefficient
Inlet diameter
Half height of exit plane or boundary
layer shape factor, _*/0
Axial length
Total pressure
Static pressure
Dynamic head
Turbulent kinetic energy
Inlet radius
Reynolds number based on momentum thickness
Superellipse coefficient
Superellipse coefficient
Half-span of exit plane
Static temperature
Axial mean velocity component
Non-dimensional axial velocity component, U/U
Friction velocity
Axial fluctuating component
Spanwise mean velocity component
Spanwise fluctuating velocity component
Transverse mean velocity component
Transverse fluctuating velocity component
Axial coordinate
Spanwise coordinate
Boundary layer wall distance
Non-dimensional boundary hayer wall
distance, YblUT/vTransverse coordinate
Boundary layer thickness at 0.995 Ure f
Boundary layer displacement thickness
Superellipse exponent
Superellipse exponent
Boundary layer momentum thickness
Kinematic viscosity
Axial vorticity component
Subscript
ref Quantity measured at reference location
i Inviscid velocity
iw Inviscid velocity at the wall
PRECEDING PAGE BLANK NOT FILMED
xt
qlP
,g
I
n

m
V
4-
UTRC87-41
ORfGINAL PAGE IS
OF POOR QUALITYSOHHAR¥
Laser Velocimeter and Total Pressure Measurements in
Circular-to-Rectangular Transition Ducts
William P. Patrick and Duane C. McCormick
A comprehensive set of total pressure and three-component laser velocimetry
(LV) data has been obtained within two circular-to-rectangular transition ducts
at low subsonic speeds. This set of reference data was acquired for use in iden-
tifying secondary flow mechanisms and for assessing the accuracy of computational
procedures for calculating such flows. Data were obtained at the inlet and exit
planes of an aspect ratio three duct having a length-to-diameter ratio of one
(AR3IO) and an aspect ratio six duct having a length-to-diameter ratio of three
(AR630). Each duct was unseparated throughout its transition section. Total
pressure distributions showed the flows to be symmetric in each duct. Axial
velocity distributions in the exit plane were much flatter in the AR630 duct than
the AR310 duct indicating that the flow had not completely expanded to fill the
exit duct uniformly in the shorter AR310 duct prior to reaching the exit plane.
The continuing expansion of the flow into the exit duct caused small outward
cross flows in the exit plane of each duct. Maximum cross-flow velocities were
0.12 Ure f for the AR310 duct and 0.11Ure f for the AR630 duct.
The flow distributions differed significantly near the sidewalls of each=
duct. The sidewall boundary layers in the AR310 duct were relatively thin where-
as the AR630 duct sidewall boundary layers were thickened by an axial vortex pair
which transported low momentum fluid from the _idewalls into the core flow aloug
the duct semi-major axis. The fluid dynamics which created the sidewall vortex
pair in the high aspect ratio AR630 duct can be understood by first considering
the flow in a circular S-duct. The secondary flow pattern that exists in an S-
duct is initiated in the first bend where the higher velocity flow in the core
flow moves away from the inner wall due to centrifugal force. The resulting
pressure field creates a recirculation pattern composed of two counterrotating
vortices. In the second bend of the S-duct, the pressure forces are reversed and
the strength of the vortex pair is diminished. In the AR630 transition duct the
stream tube near the sidewall of the transition duct approximates the shape of an
S-duct. Rowever, the transition duct shape becomes nearly rectangular between
the first and second bends in the sidewall causing the vortex pair to be concen-
trated and strengthened. Further assisting the strengthening of the vortex pair
is the natural tendency of a flow in a straight rectangular duct to form corner
vortices. Flow in the lower aspect ratio AR310 duct does not have the same con-
tribution from vortex concentration and rectangular duct corner vortex develop-
ment, and, therefore, has weak corner vortices in the exit plane.
It is therefore concluded that secondary flows can play an important part in
the fluid dynamics of transition ducts and needs to be addressed in computational
analysis. The strength of the secondary flows depends on both the aspect ratio
and relative axial duct length.
w
mp
nn_
I
Im
g
mum
J
q
II
II
IV
nI
W
J
U
m
m
u

UTRC87-41
CHAPTER 1
INTRODUCTION
wm-
lm-
L
,.....,,
Advanced jet engine exhaust systems for military aircraft employ nonaxisym-
metric nozzles for supermanueverability and/or thermal plmae reduction. These
nonaxisymmetric nozzles are usually rectangular in cross section to achieve
mission requirements such as thrust vectoring and nozzle area ratio variability
within fabrication, material, and cost constraints. For certain applications
rectangular nozzles having aspect ratios greater than five have been proposed.
The transition duct which connects the axisymmetric jet engine to the
rectangular convergent-divergent nozzle should be designed to deliver uniform
subsonic flow with minimal losses to the nozzle. The practical need to minimize
the weight of the propulsion system requires that the transition to high aspect
ratio occur in the shortest possible distance. This constraint, however,
increases the probability of flow separation within the transition duct with the
associated penalties of high viscous losses and severe cooling problems
(Ref. l).
Computer codes for calculating three-dimensional viscous flows have been
developed which offer the possibility of designing short, high aspect ratio tran-
sition ducts having low loss. Critical to the implementation of such codes in
engine design systems, however, is the availability of data for assessing code
accuracy. Total pressure and three-component velocity measurements in the inlet
and exit planes of high aspect ratio transition ducts have not been previously
reported. The objective of the current program is to provide such reference data
of benchmark quality for two transition duct geometries to provide needed data
for code assessment and an understanding of the flow physics.
The two ducts tested were of the most basic design having no net diffusion,
turning, or inlet swirl. The first duct, supplied by NASA, had an aspect ratio
of three (3) and a length-to-inlet diameter ratio of unity (I.0) and was desig-
nated AR310. The second duct, supplied by UTC, had an aspect ratio of six (6)
and a length-to-inlet diameter ratio of three (3.0) and was designated AR630.
Each transition duct was constructed from superelliptic cross-sections positioned
perpendicular to the duct centerline to match the geometric input requirements of
PEPSIG, the three-dimensional subsonic viscous marching code which has been
developed under NASA-Lewis Research Center sponsorship (Ref. 2). In Figure l-l,
prepared by the Lewis-Research Center's Computational Methods Branch (Ref. 3),
the stall boundaries for constant area and accelerating transition ducts have
been calculated as a function of L/D and aspect ratio using PEPSIG. The
calculations were performed for ducts having extremely thin inlet boundary
layers. The ducts in the current study were chosen because of their proximity to
the stall boundary.
PRECEDING PAGE BLANK NOT FILMED 3

UTRC87-41
The study of the AR310 transition duct was sponsored by NASA Lewis Research
Center. Data for the AR630 transition duct were acquired under the UTRC
independent research program in gas dynamics. The authors wish to acknowledge
helpful discussions with the NASA Lewis technical monitor Mr. A. R. Bishop as
well as Mr. Bernard Anderson (NASA Lewis), Dr. Robert Paterson (UTRC), and Dr.
Michael Werle (UTRC). Appreciation is also expressed to Mr. Charles Coffin
(UTRC) for his high quai_ty w_k both in performing the LV and total pressure
measurements and in fabricating the constant area duct extension sections.
B
Im
m
q
q
l
U
4

0'011VI=I HIDN37
" i
'ii
0
87-9-19-1
5
W
g
i
M
i
gin"
ii
i
UTRC87-41
CHAPTER 2
REVIEW OF PREVIOUS INVESTIGATIONS
_mw
L
= .
Although benchmark quality flowfield data for high-aspect-ratio transition
ducts has not been reported previously, several related studies have been
performed since the initial transition duct flowfield documentation by Mayer
(Ref. 4) fifty years ago. The current program is the latest in a series of
programs sponsored by the NASA Lewis Research Center to obtain benchmark quality
experimental data sets for generic aircraft inlet and exhaust duct configurations
for the purpose of verifying three-dimensional viscous codes. The overall
program, which was reviewed in 1984 by Anderson (Ref. 2), included a series of
studies having increasing flow complexity which were performed at Imperial
College of Science and Technology in London. These tests which included flows in
90-degree bends having square (Ref. 5) and circular (Ref. 6) cross sections,
circular (Ref. 7) and square (Ref. 8) S-ducts, and a square-to-round transition
duct (Ref. 9) were documented using total pressure traverses, sidewall static
pressures, and three-component LV measurements. Recent additional programs in
the NASA Lewis sponsored series have been conducted at the University of
Tennessee Space Institute by Vakili et al (Ref. lO) to study the structure of
compressible secondary flows in an S-duct and by Crewford et al. (Ref. ll) to
obtain benchmark quality LV measurements in a 90-degree turning duct having a
square cross section with thin turbulent inlet boundary layers. In addition to
the NASA-Lewis sponsored programs, studies by Melling and Whitelaw (Ref. 12),
Rowe (Ref. 13), and Bansod and Bradshaw (Ref. 14) provide insight into the
generation of secondary flows in straight rectangular ducts, curved ducts, and S-
shaped ducts, respectively.
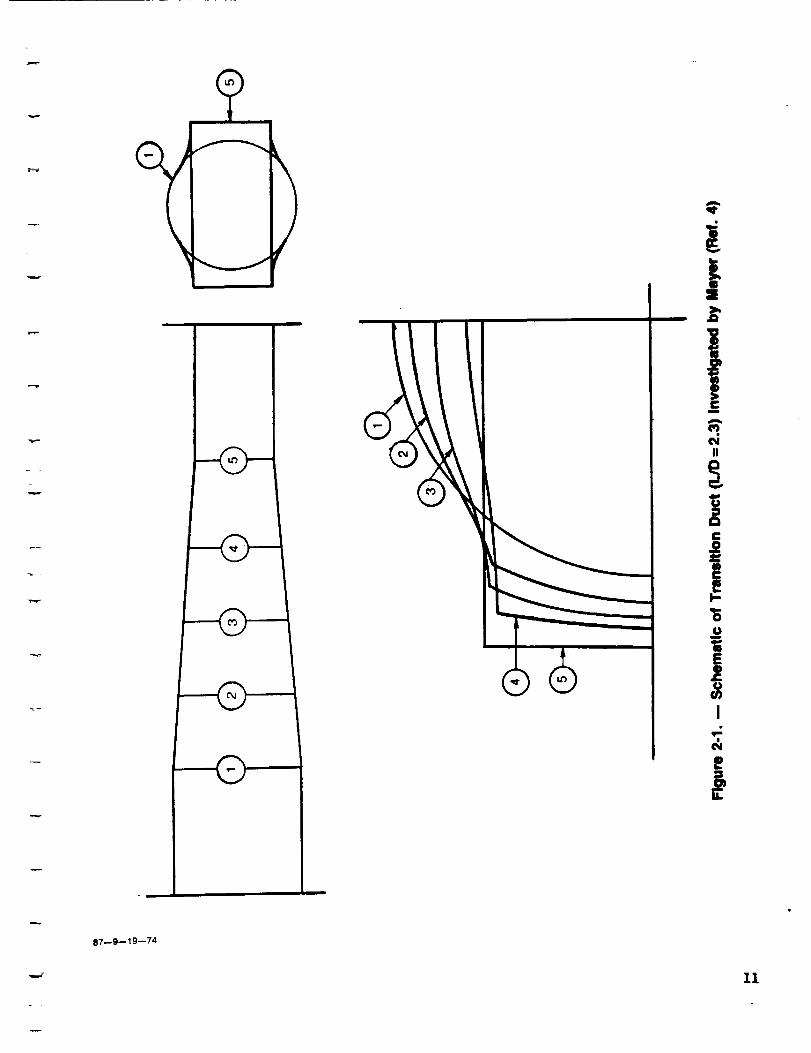
Few transition duct studies have been performed either analytically or
experimentally. Mayer (Ref. 4) performed detailed measurements with a four-hole-
probe, a pitot probe, and wall static pressure taps to obtain total pressure
contours and the three-dimensional velocity field in two constant area ducts
which transitioned from circular (D = 190 mm) to rectangular with an aspect ratio
of 2.0 (238 mm x I19 m_n) in 0.58 and 2.32 inlet diameters. The cast aluminum
alloy transition sections had no surface discontinuities in the mean flow
direction although the cross-sectional shapes were discontinuous in the
circumferential direction throughout the transition (as shown in Fig. 2-I).
Both circular-to-rectangular and rectangular-to-circular transition flows
were tested at a Reynolds number based on inlet hydraulic diameter of 192,000.
The flow throughout the test section was unseparated in each test. For each case
the inlet velocity profile was fully developed and turbulent. The cross-stream
velocities for the circular-to-rectangular tests showed maxima of 22 percent and
I0 percent of the maximum streamwise velocity for the short and long transition
PRECEDING PAGE BLANK NOT FILMED7
UTRC87-41 w
section, respectively. Secondary flows at the exit of the rectangular-to-
circular transitions were much less. Mayer noted that for the rectangular-to-
circular test cases the inlet flowfield contained significant secondary flows,
shown qualitatively in Fig. 2-2. These secondary flows typically develop in the
corners of rectangular ducts due to Reynolds stress gradients in the inlet
boundary layers (Ref. 9). This flow feature of non-circular, straight ducts has
been observed as long ago as 1926 by Prandtl (Ref. 15) from which Fig. 2-2 was
taken. For Mayer's rectangular-to-circular case, the inlet secondary flows were
attenuated in the transition section. +
Taylor et al. (Ref. 9) measured the flow through a duct which transitioned
from a 40 m square cross section to a 40 mr, diameter circular cross section in
80 mm with a resultant decrease in cross-sectional area of 21.5 percent. Each
cross section in the transition was formed by the intersection of a square and a
circle, and approximated a superellipse with a shape factor of unity to within
1.5 percent of the radius. Tests were conducted with water at a Reynolds number
based on inlet hydraulic diameter of 35,350. The inlet boundary layer thickness,
defined at 95 percent of the maximum velocity, was 13 percent of the inlet
hydraulic diameter. Secondary flows in the square inlet section were estimated
to be less than 1.5 percent of the bulk velocity because of the thin inlet
boundary layers.
LV measurements of mean velocity components, turbulence levels, and shear
stress were obtained. Maximum cross-stream velocities of 7 percent of the bulk
velocity were measured at the exit plane. Taylor et al. attributed the develop-
ment of the secondary flows to lateral pressure gradients which originated due to
differences in streamwise wall curvature in the corner fillets compared to the
symmetry planes oriented 45 degrees to the bisector of the corner fillets.
Higher pressures in the fillets relative to the region of the symmetry plane
induced the cross-stream flows.
Recently tests were performed at the NASA Langley Research Center by Burley,
Bangert, and Carlson (Ref. I) to determine the overall performance of a high-
aspect-ratio nonaxisyuxnetric nozzle and circular-to-rectangular transition ducts.
Five transition ducts were used to study the effects of duct length, wall shape_
and cross-sectional area distribution on performance. Ducts having transition
lengths equal to 0.5, 0.75, and 1.0 times the 200 wm inlet diameter were tested.
Each duct had an exit plane aspect ratio of 6.33. The duct cross sections were
developed from superelliptic shapes to provide smooth transition from the circu-
lar inlet to the rectangular exhaust. Nevertheless, for the duct lengths of 0.75
inlet diameters or less, large regions of separated flow were observed in the
transition sections for ducts having constant cross-sectional areas. Decreasing
the cross-sectional area through the transition reduced the extent of flow
separation.
m
9
W
? 9
m
l
J
q
n
U
m
=Z_ !

UTRC87-41
Fluid dynamic measurements were limited to wall static pressure measure-
ments, total-pressure profiles in the inlet and exit planes, and surface flow
visualization. Inlet and exit total-pressure profiles were integrated to deter-
mine total pressure loss through the ducts. Overall performance of the slot
nozzle determined from the discharge coefficient and thrust ratio decreased when
the transition duct length was reduced from 1.0 to 0.5 inlet diameters.
Gutmark and Schadow (Refs. 16 and 17) have studied the effect of secondary
flows generated in the conical contraction to a slot jet fuel nozzle on the
enhacement of fuel-air mixing in the combustor. Air tests were conducted on
three nozzles constructed from 15 deg half-angle cones tapering to elliptical
slot exits with aspect ratios of 2, 3, and 5. In addition, two nozzles having
7.5 deg and 30 de& contractions to an aspect ratio 3 exit were tested to study
the effect of nozzle length on performance. Hot-wire measurements were taken to
determine mean velocity contours and the distribution of turbulence intensity in
the flow exiting the nozzles. Tests were conducted at a Reynolds number of
1.6 x 10 6 based on exit equivalent diameter and jet exit velocity. Jet spreading
measurements indicated that increasing the slot aspect ratio and/or reducing the
nozzle length (i.e. steepen the contraction in the conical transition) increased
the axial vorticity in the jet exhaust.
Analytical studies of transition duct flows have been performed by Roberts
and Forester (Ref. 18), Anderson, Muramoto, and Levy (Ref. 19), Towne and Schum
(Ref. 20), and Burley, Bangert, and Carlson (Ref. 1). Roberts and Forester used
a transformed set of parabolized Navier-Stokes equations to solve three-
dimensional compressible viscous flows in ducts with arbitrary cross sections.
One set of results pertinent to transition duct studies was presented. Turbulent
flow through a duct which transitioned in two inlet diameters from a semi-
circular inlet to a semi-elliptical exit with an aspect ratio of 4 was presented.
Maximum cross-stream velocities equal to 20 percent of the streamwise velocity in
the duct exit plane were predicted.
Burley et al. used the potential flow code MCAERO to predict the sidewall
static pressure distributions measured in the transition duct tests described
previously. Agreement with experimental data was poor because of the highly
viscous nature of the flow in the ducts.
Towne and Schum used PEPSIG to compute flowfields in curved aircraft inlet
configurations which included rectangular-to-circular cross sections. Calcula-
tions were performed for turbulent flow at a Reynolds number based on diameter of
48,000 and an inlet Mach number of 0.5. Their study included variations in inlet
boundary layer thickness and Mach number. Calculations for flows having inlet
boundary layer thickness of 0.048 and 0.24 of the inlet duct half width indicated
the basic flow phenomena to be the same for each case but the thicker boundary
layer persisted through the transition section causing lower total pressure
recovery at the engine face. Calculations for Mach numbers of 0.5 and 0.01
showed minor differences in the flowfields. In addition, calculations of the
9
UTRC87-41 -
flowfield in a straight section which transitioned from a rectangular inlet with
an aspect of ratio of 2 to a circular duct over a distance of 4 exit duct
diameters showed no significant distortion in the flowfield in the elongated
transition section.
Anderson, Muramoto, and Levy used PEPSIG to calculate flowfields in
circular-to-rectangular transition ducts having short duct lengths and high
aspect ratios. Duct cross sections were defined by constant area superellipses.
Computations were performed for flows at high Reynolds number (7.3 x I05/m), with
very thin inlet boundary layers, at an inlet Mach number of 0.3. Results
presented for an aspect ratio 3 duct having a length of 1.5 inlet diameters (i.e.
AR315) revealed a three-dimensional separation midway through the transition
section followed by the generation of a strong pair of axial vorticies.
Following subsequent reattachment of the flow, the vortex pair persisted to the
duct exit inducing cross-stream velocities in excess of I0 percent of the exit
freestream velocity.
L_
N
q
U
U
m
I
T
m
m
m
10g
mm
A
8"7--9-- I g--74
11

I
J
fmm
qm
i
Figure 2-2. -- Secondary Flows In a Rectangular Duct(From Reference 15)
ql
I
m
mif
mm
g
mm
_row
.__..
elm
l
m
1287--9--19--75 "rob

UTRC87-41
CRAPTER 3
DESCRIPTION OF THE EXPERIMENT
=
3.1 Experimental Arrangement
3.1.1 Transition Duct Definition
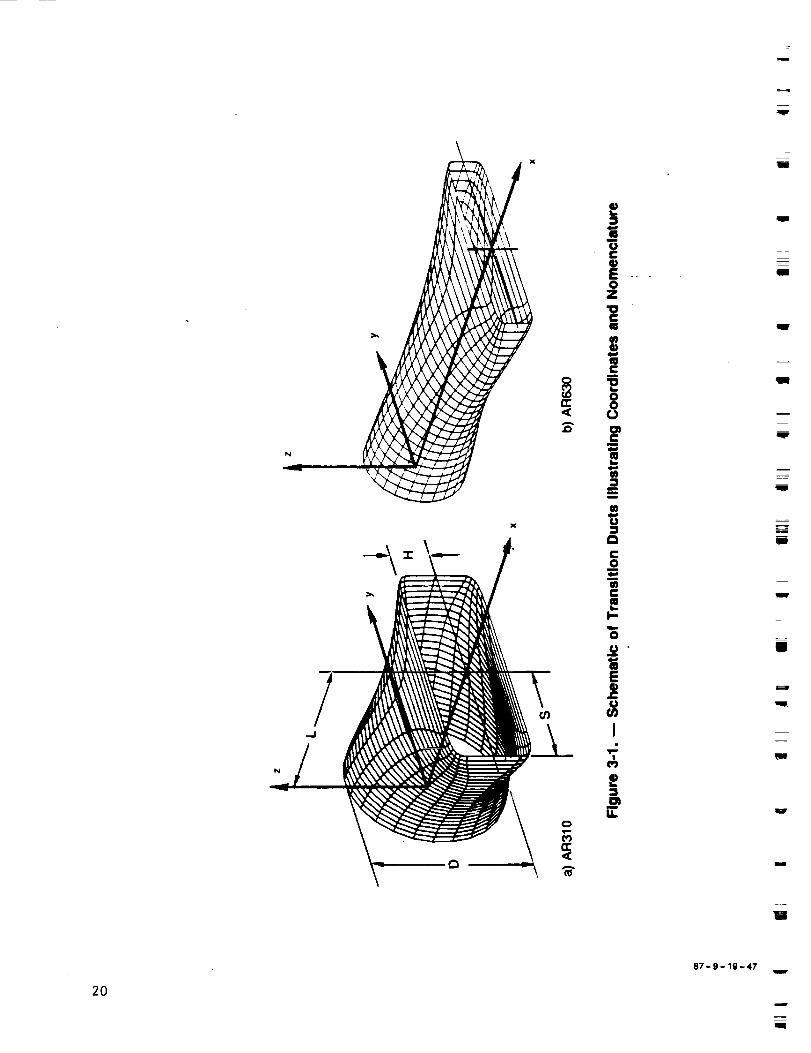
The two circular-to-rectangular transition ducts tested are shown in Fig. 3-
I. The coordinate system origin is located at the circular inlet with the x axis
in the axial direction, the y axis in the spanwise direction, and the z axis in
the transverse direction. The characteristic duct dimensions (L, D, S, and H)
are also shown in the figure. The aspect ratio, defined as AR = S/H,
characterizes the narrowness of the rectangular exit. The axial duct length is
characterized by the axial-length-to-inlet-diameter ratio, L/D. The value of
these two parameters are combined to form the duct designation. For example, in
part a) of the figure the transition duct is designated AR310 which illustrates
an aspect ratio 3 exit with an overall length of L/D = 1.0. The second duct,
show in part b) of the figure, is designated AR630 and thus has a aspect ratio 6
exit plane and an L/D of 3.0.
The cross sections of the transition ducts are composed of a series of
superelliptical shapes perpendicular to the duct centerline. The superelliptical
shapes are defined by the equation
= 1 (1-1)
where the coefficients rady, radz, n., and _z are a function the axial position.Y
The coefficients versus axial distance for the two ducts are listed in Table I at
each 4 percent of the transition duct length. Note, the axial distance (x),
rady, and radz have been normalized by the inlet radius. Since the cross
sections of the ducts are super ellipses, the exit is shaped like a rectangle
with rounded corners rather than a true rectangle.
The calculation of the superellipse coefficients is determined by pre-
scribing the inlet and exit duct walls to be tangent to the axial direction and
prescribing the cross-sectional area variation. For the AR310 transition duct,
the cross-sectional area is a constant value, equal to the inlet area. For the
AR630 transition duct, the area increases from the inlet value to a value I0
percent larger before contracting back down to the initial value (see Table I).
This area variation corresponds to that of a transition duct constructed of
13
m

UTRC87-41
flat planes and conical sections. Construction by flat planes and conical
sections is typical of manufacturing techniques and thus this duct simulates the
corresponding area distribution. However, the cross-sectional shapes are super-
ellipses (like the AR310) in order to match the geometric input requirements of
PEPSIG.
The dimensional values of the half-height, H, and half-span, S, for the
AR630 transition duct were 2.778 cm and 16.665 cm, respectively. These values
were calculated from Eq. (i-I) applied at the exit plane and were found to agree
within 1.5 percent of the actual measured values. For the AR310 transition duct
H and S were 5.776 cm and 16.768 cm, respectively. These values are from actual
measurements since the half-span was found to differ significantly from the
calculated value (17.184).
Because of the above noted discrepancy, a detailed inspection of the AR310
transition duct was conducted at several axial cross planes. The results showed
significant differences between the actual cross-sectional shapes and those
calculated by Eq. (I-I). These results are presented in Appendix A. The AR630
transition was also inspected at two axial cross planes. The results showed good
agreement with Eq. (I-I). In conclusion, Eq. (I-I) should be used to describe
the AR630 transition duct and Appendix A tabular data should be used to describe
the AR310 duct.
3.1.2 Description of the Test Facility
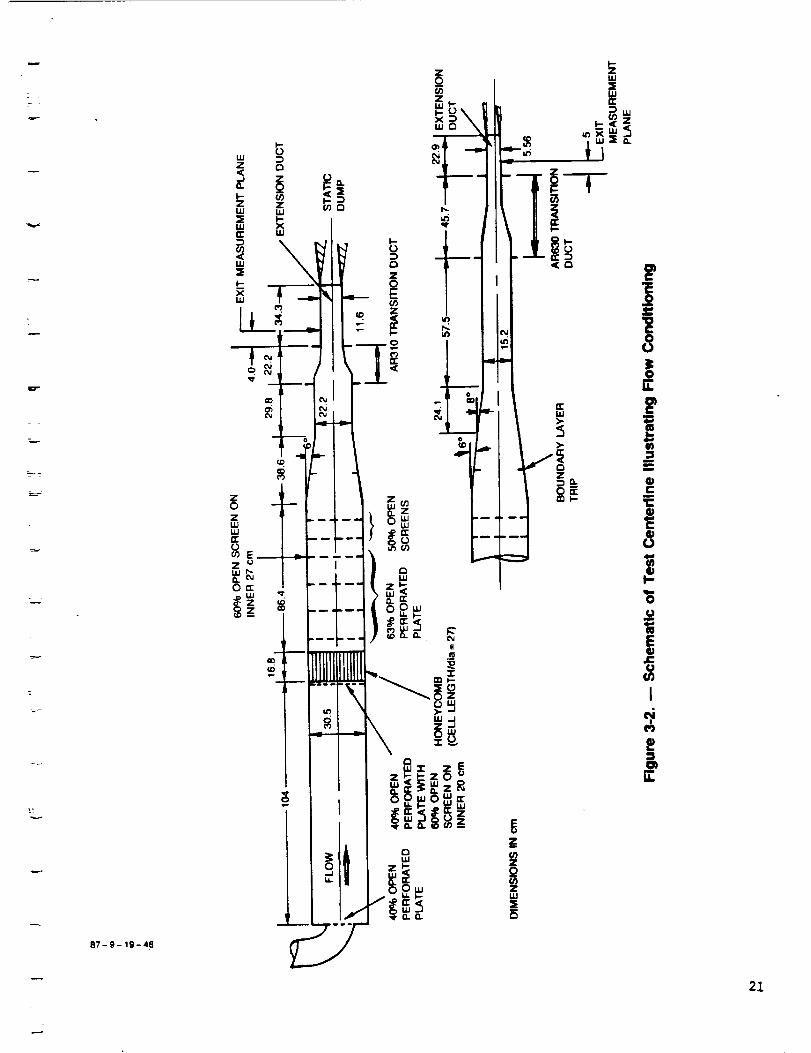
A schematic of the test centerline illustrating the flow conditioning for
the transition ducts is shown in Fig. 3-2. Regulated, dry air is introduced
through a 15 cm diameter pipe with a perforated plate exit into the 30 cm
diameter centerline/plenum. The resulting jet flow dump is allowed to spread
naturally for 3.5 diameters before encountering a series of perforated plates,
honeycomb, and screens used to provide a uniform, low turbulence, non-swirling
flow. The flow is then accelerated with a conical contraction (for AR630, two
conical contractions, see figure) to the inlet transition duct inlet diameter.
The boundary layer is tripped in this contraction in order to avoid three-
dimensional transition.
A constant diameter section is located between the contraction exit and the
transition duct inlet. This section allows boundary layer growth under near-zero
pressure gradient coonditions , thus providing a_near-equilibrium turbulent
boundary layer for the transition duct inlet. This section also yields
appropriate reference conditions for normalizing the velocity and pressure data.
Downstream of the transition duct the flow enters a constant area extension
duct having the same cross-sectional shape as the transition duct exit. For the
AR310 transition duct, the superelliptical exit plane has small corner radii and
is very nearly rectangula r shaped. For this reason it was unnecessary to match
the exact exit plane cross section with the extension duct. Instead, the
extension duct has a rectangular cross section. For the AR630, the deviation of
14
w
mm
u
m
W
D
iI
_4
I
m
u
g
l
M
I

UTRC87-41
the exit plane cross section from a rectangular shape is significant and had to
be matched by the extension duct cross section. Downstream from the extension
duct the flow is dumped into the test cell.
The purpose to the constant area extension duct is to provide a "test
section" where the transition duct exit flow characteristics can be measured. It
would be inappropriate to allow the transition duct flow to dump directly into
the test cell and to attempt to document the exit flow characteristics since the
resulting constant static pressure boundary condition would influence the flow
even upstream of the exit plane. As show in Fig. 3-2, the exit measurement plane
is 0.34 exit duct heights (4.0 cm) downstream from the exit plane for the AR310
transition duct and 0.90 exit duct heights (5.0 cm) downstream for the AR630
transition duct. It was impossible to document the flowfield at the exit plane
due to optical access requirements of the LV (laser velocimetry) system.
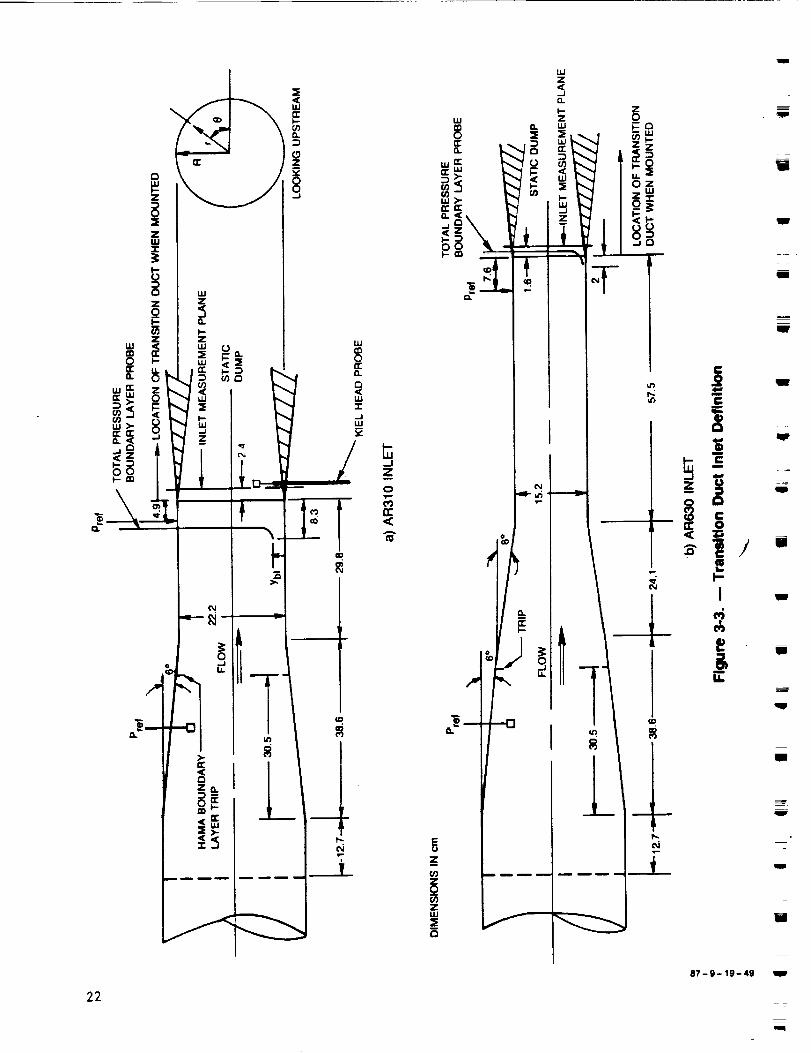
A schematic illustrating the inlet condition definition is shown in Fig. 3-3
for the two transition ducts. To document the inlet flow conditions (flow
uniformity, turbulence, zero swirl, and inlet boundary layers) the transition
ducts were removed and the flow was allowed to dump into the test cell downstream
of the constant diameter inlet duct (as shown in the figure). This approach was
selected since PEPSIG flow calculations showed transition ducts induce flow swirl
upstream of the inlet and because the desire here was to certify that the inlet
flow was uniform, low turbulence, and swirl free.
For the AR310 transition duct inlet, the flow uniformity was checked with a
keilhead total pressure probe just downstream of the flow dump (see Fig. 3-3a).
Surveys were taken along the radial direction, r, at four angular orientations,
0. Corresponding LV surveys were taken somewhat further downstream from the
exit. Mean and fluctuating velocity components in the axial, x, and transverse,
z, direction were measured to check the flow swirl, turbulence level, and flow
uniformity. Upstream of the flow dump the inlet boundary layer was measured with
a total pressure boundary layer probe. The probe is a flattened hypodermic tube
which hooks in the upstream direction to minimize the flow disturbance. The
probe dimensions are 0.305 mm height and 1 mm width (height is roughly 2 percent
of the measured boundary layer).
The inlet definition schematic for the AR630 transition duct is shown in
Fig. 3-3b. LV surveys downstream from the flow dump were taken in the same
manner as AR310. No corresponding keiihead total pressure probe surveys were
taken due to the confidence gained from the AR310 surveys and the redundancy of
the axial LV data. The boundary layer was measured with a total pressure
boundary layer probe in the same manner as AR310. An additional angular location
was taken and the surveys were taken across the entire duct diameter in order to
provide total pressure uniformity documentation (since keilhead surveys were not
done).
Figure 3-3 illustrates the details of the flow contraction and boundary layer
trip. Note that the interfaces between the straight and conical sections were
15

UTRC87-41
smoothed (not reflected in figure) to avoid inlet separations. The location of
the boundary layer trip was chosen to be upstream of the onset of natural three-
dimensional transition. A trip location was selected based on a value of
Re x = 9 x I0 _ since this Reynolds number defines the approximate location where
flat plate laminar boundary layer instabilities begin to amplify. The trip is of
the Hams type (Ref. 21) which is a line of triangular shapes in order to provide
an efficient, rapid trip. The trip thickness is .51 mm, roughly 60 percent of
the estimated boundary layer displacement thickness.
Also show in Fig. 3-3 is the location of the measured reference pressures
used to set the operating condition and to normalize the data. As shown, the
reference (inlet) static pressure is measured upstream of the constant diameter
section exit (transition duct inlet) with a wall tap. The reference total
pressure is measured further upstream in the conical section with a keilhead
probe where the dynamic head and thus probe wake is smaller. Together these
pressures were combined to calculate the reference (inlet) dynamic head and
velocity (total temperature probe upstream of the centerline flow conditioning
was also measured in order tO calculated velocity),
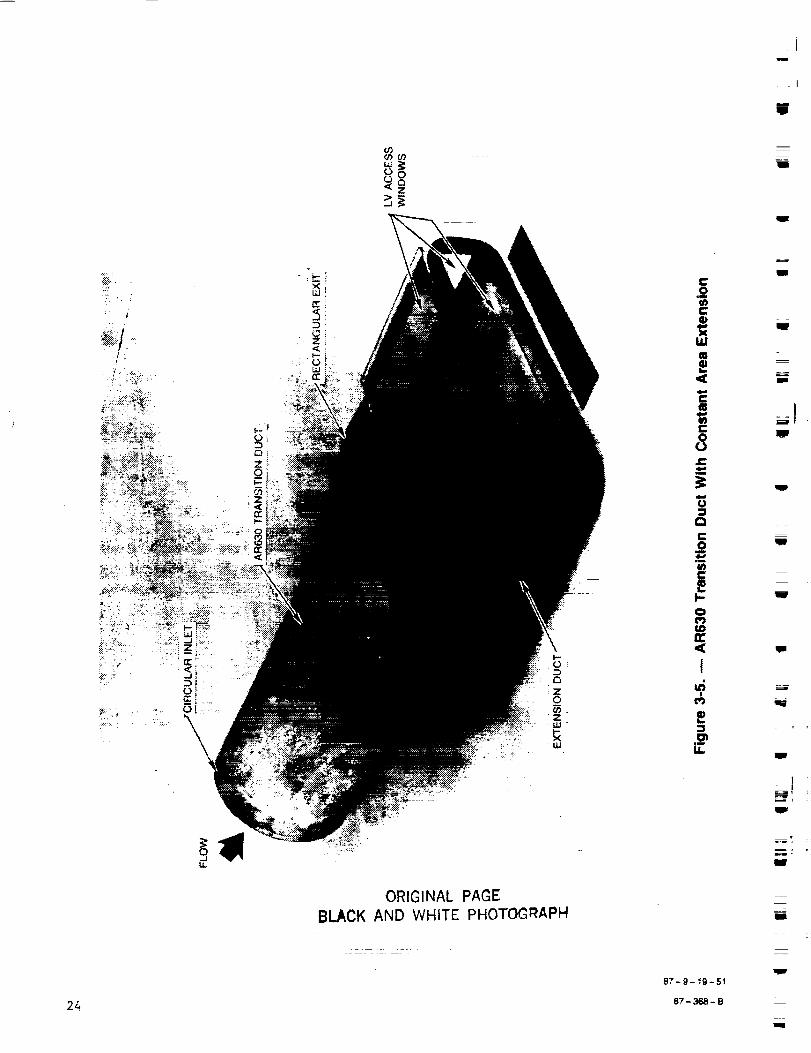
Photographs of the two transition ducts with their extension ducts installed
are shown in Figs. 3-4 and 3_5. The_310 transition duct (Fig. 3-4) was
constructed in two symmetric halves (cut along the xy plane), each half being
molded Plexiglas. The assembled transition duct is flange mounted. The exten-
sion duct is constructed with optical-quality glass for LV access. The AR630
transition duct (Fig. 3-5) was fabricated in a different manner than the AR310.
The duct was constructed in one section using a molded fiberglass. The extension
duct was fabricated in the same manner with a glass window for LV access.
B
W
W
g
3.2 Instrumentation
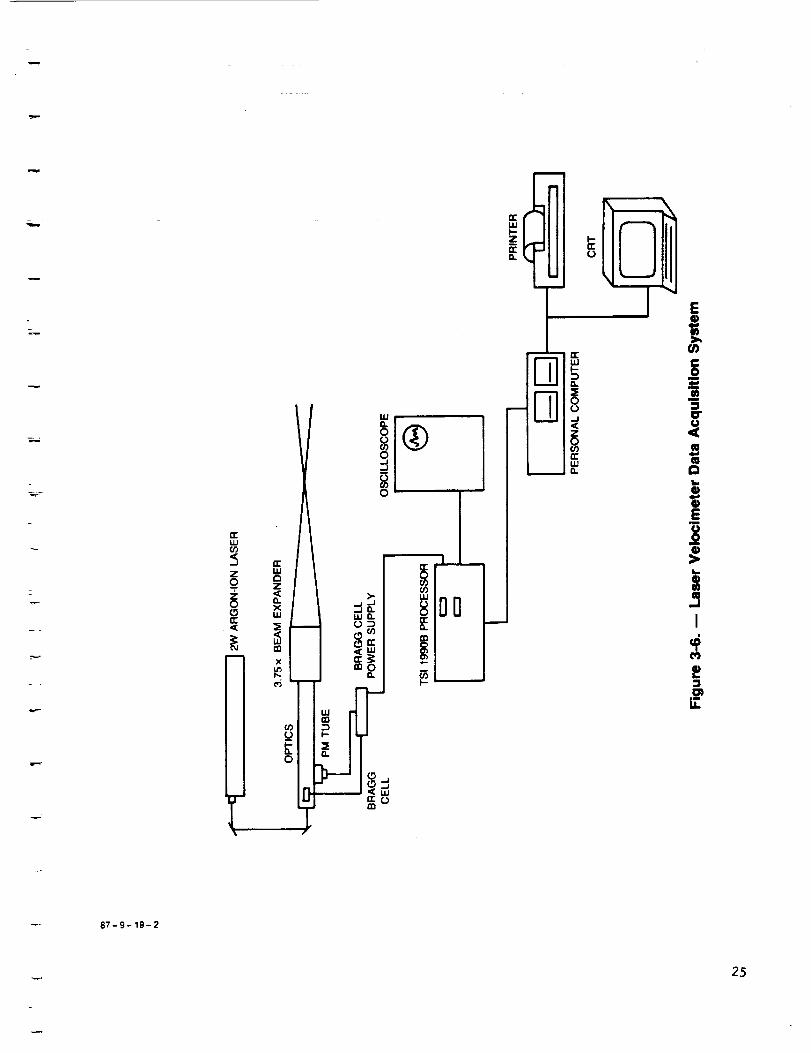
3.2.1 Laser Velocimeter STstem
The LV (Laser Velocimetry) is the primary measurement technique used in this
study. This method was desirable since it measures in a nonintrusive manner the
three components of velocity. The LV system used was essentially a TSI (Thermal
Systems Inc.) System 9100-6 and is shown schematically in Fig. 3-6. It is a
single component system which consists of a 2W argon-ion laser, backscatter
optical system, counter-type signal processor, and computer for on-line data
reduction, and a hard disk storage device for subsequent off-line data reduction.
A photograph of the LV system (transmitting optics)measuring the spanwise
velocity in the AR310 extension duct is shown in Fig. 3-7.
The LV was operated in a dual beam or "fringe" mode in which light from the
intersection of two incident beams having a wavelength of 0.5145 _m is hetero-
dyned to detect the Doppler shift from an injected seed particle, at the local,
instantaneous fluid velocity. In this mode, the LV measures the velocity
16
=
i
,qj
m
u
uI
-- UTRC87-41
k
component in the plane of the incident beams that is perpendicular to the
bisector of the beams. The effective shape of the resultant measurement volume
is an ellipsoid with major axis in the direction of the bisector of the beams.
The optical system used a 3.75X beam expander with a 762 mm focal length,
152 nzn diameter (f/stop 5) transmitting lens. The beam expander was used to
provide a smaller measurement volume, thus obtaining better resolution and high
signal-to-noise ratio. The beam spacing into the beam expander was 35 un for
most of the measurements. This results in a measurement volume size of 1.6 by
.13 mm (major and minor axis length). In order to obtain data in the corner of
the Ag630 duct, a beam spacing of 13 nn was used. The resulting measurement
volume dimensions were 4.2 by .13 mm. Bragg shifting was employed to obtain 360
degree polar response of the measurement volume. The counter-type processor, TSI
1990B, was used to interpret the Doppler signal. A counter-processor measures
the time for a particle to cross a desired number of fringes, converts the time
into digital format, and transfers this data to the computer. This measurement
represents one realization of velocity. For the current experiment 16 fringe
crossing were required for each realization and 2048 realizations were taken for
each velocity measurement. The processor was operated in the continuous mode
(i.e. multiple measurements of one particle possible) in order to offset indivi-
dual realization bias, as discussed in Ref. 22.
The computer was an IBM AT microcomputer. The acquisition software/hardware
system was a modified version of the TSI 6230 two-channel system software
(operated in one-channel mode). This system includes a TSI 6260 parallel inter-
face card which resides in the computer and connects directly to the timer module
of the processor. The modifications to the software include the addition of
traverse table control and statistical editing procedures.
The time mean velocity components were estimated by the numerical average of
all the realizations, that is
1 N
U --- _ UiN ill
(3-1)
where N is the sample size of the data point. The uncertainty in the velocity
due to this estimate and the uncertainty due to bias errors are discussed in
Appendix B. The turbulence (standard deviation) of the measured velocity was
estimated as
_. 1 N" X (ui - 0)2 (3-2)o (N-l) ill
17

UTRC87-41 qm
Each velocity sample (i.e. a set of realizations) _ was statistically edited
by AEDC criteria (described by Patrick in Ref. 22) to remove bad data points due
to noise. For the sample size of 2048, the AEDC criteria is to reject any data
points outside the acceptance band of ±3_ (calculated from the entire data
sample). In addition, some individual data samples made in the corners had to be
manually edited due to excessive noise.
The traversing of the measurement volume was accomplished with a TSI 9500
traversing table. This is a computer controlled, 3-axis traversing table. The
entire optics package and laser were mounted on the table bed. An encoder
readback system permitted highly accurate positioning. The overall uncertainty
was _0.013 mm. The table also has a manual tilt feature for measurements close
to surfaces.
The seed material was one micron diameter titanium dioxide. It was injected
using a fluidized bed seeder upstream of the flow conditioning on the tunnel
centerline. The fluidized bed seeder had a centrifugal separator to eliminate
large, agglomorated particles before injection. The measured seed size
distribution indicated a sharp peak at one micron, confirming the successful
operation of the centrifugal separator. The seed injection location was selected
upstream of the flow conditioning in order to avoid flow disturbances in the
inlet flow to the transition duct. Flow conditioning screens and perforated
plates were periodically inspected for blockage due to seed material.
3.2.2 Pressure Measurement Instrumentation
Two different types of total pressure probes were used in this investiga-
tion. For documenting the overall total pressure distribution in the exit plane,
a straight kielhead probe was employed. The probe was fabricated from a 0.159 cm
diameter aspirated kielhead tube. The kielhead probe, which has a ±30 degree
acceptance angle, was selected in order to accurately measure the total pressure
in a secondary flowfield. The probe was inserted upstream from the exit of the
extension duct to the exit measurement plane.
The other type of total pressure probe used was a boundary layer impact
probe. It is shown schematically in Fig. 3-8. This probe was used to measure
the inlet and exit boundary layers of the transition ducts. The probe was
fabricated from 0.89 mm diameter hypodermic tube that was flattened at the tip,
forming 0.30 mm x 1 _ sensing area (note the long side of the probe tip was
parallel to the wall). For the inlet measurements, the probeshaft extended in
the radial direction (of the circular inlet) and the probe end hooked in the
upstream direction to minimize probe interference. For the exit boundary layers,
the probe shaft extended upstream from the extension duct exit to the
measurement plane. The probe end was offset from the probe shaft to minimize
probe interference.
i
I
'l
W
z
U
J
U
_m
N
18
--=
u
I
.--, UTRC87-41
!
,.-.m,
t
Both types of total pressure probes were traversed within the x,y plane with
a Daedal/Compumotor positioning table system. This system is computer controlled
and has encoder feedback capability to permit high positioning accuracy
(:tO.Of3 ram).
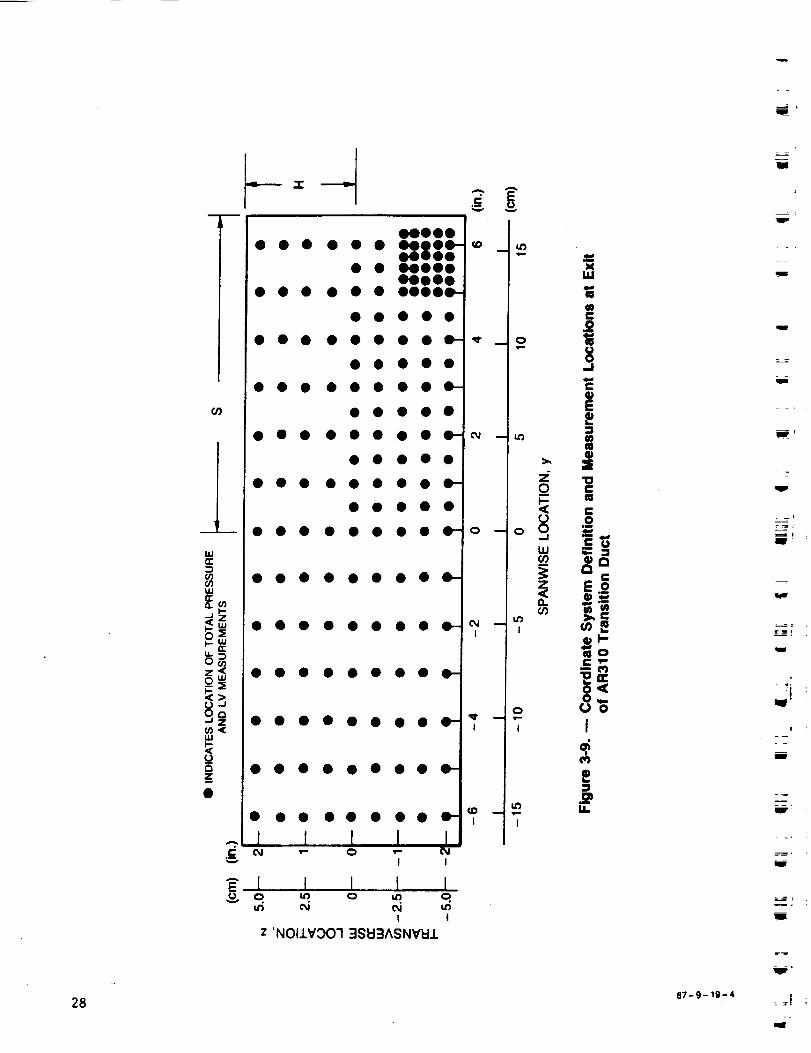
3.2.3 )leasurement locations
The locations of the exit plane LV and total pressure measurements are shown
in Fig. 3-9 for the AR310 transition duct. The LV data consists of the three
components of the velocity vector (along the reference axes shown in Fig. 3-1) at
the 168 measurement locations shown. The coarse grid spacing over the entire
exit plane was chosen to verify the flow symmetry about the y and z axes. After
flow symmetry was verified, additional measurements were made in the lower
quadrant in order to investigate the flow features in more detail.
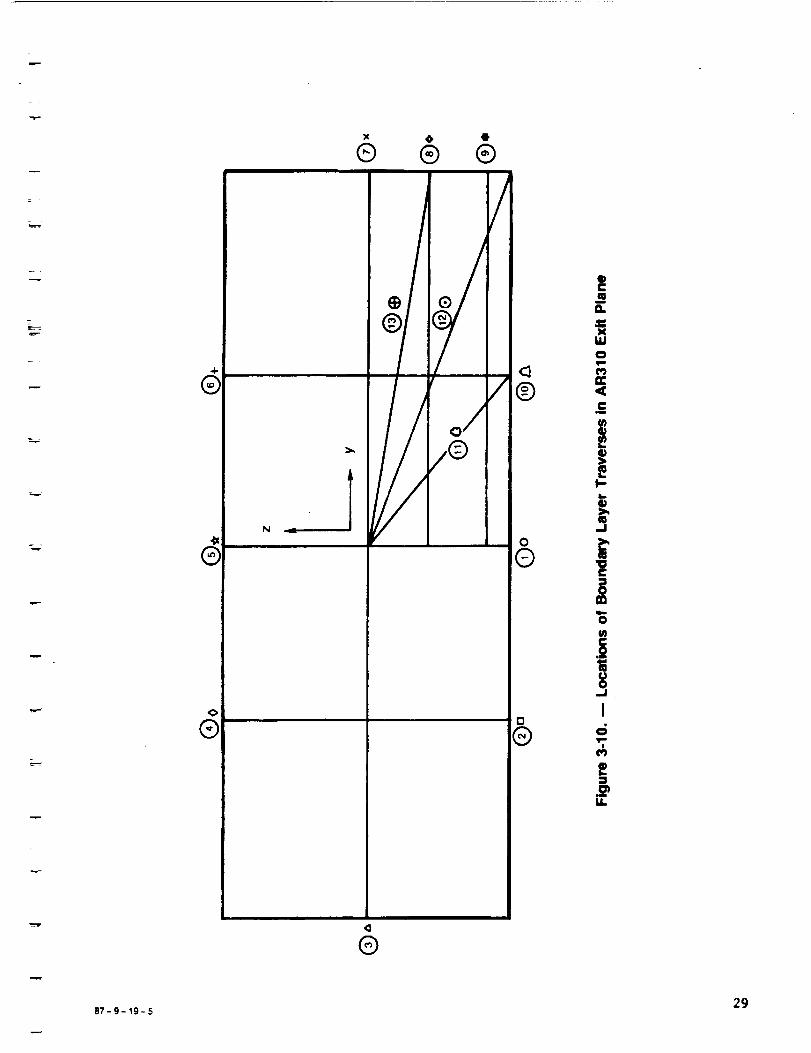
The locations of the exit plane, total-pressure boundary-layer surveys are
shown in Fig. 3-10. Each survey is identified by a number and a symbol which
will be used for ease of data presentation. As seen in the figure, surveys are
along the spanwise and transverse directions. In addition, corner surveys along
the radial direction were taken.
The corresponding measurement locations for AR630 transition duct are shown
in Figs. 3-11 and 3-12. In Fig. 3-11, the 154 measurement locations of LV and
total pressure measurements are shown. Similar to the AR310 data matrix, a
coarse grid spacing was employed to verify flow symmetry and more a detailed
spacing was then performed over a symmetric region. Due to obstructed optical
access, it was impossible to obtain LV data at some of the corner points of the
AR630 transition duct. In Fig. 3-12 the total-pressure boundary-layer survey
locations are shown. Note that no radial surveys were taken.
=
19
mm
tlW
I
g
U
W
qlW
m
mmm
R
W
_m
m
uw
imm
_I
J
2O
87-9-19-47 ,row
ml
8'7- 9- 19- 48
I-"
(D
k _pl-al_-
=, iIUJUJ
If"
° !_ I --
__ _ ....
-._
I1:
W
C_
It
i
lI
!II-
E
ffi
Ie_
I
2Z
Q,
\
=E
O _-
LU
O...J
r_
OJ
G.
EtJ
zU_
u_zUJ
tn
it)
(D
_t_
i
!°I-
Io')
U.
87-9-19-49
_m
qlm
J
mI
m
w
_W
g
I
I
I
g
g
W
22

//
/
/
/
i
==
8.¢:
3=
C0m
C¢II,=
I-0
I
f
==
o
U.
ORIG!NA[ PAGEBLACK AND WHITE PHOTOGRAPH 23
tw
_ I
nB=l!
o30"3o3
oo°"_Z
m
U
24
ORIGINAL PAGE
BLACK AND WHITE PHOTOGRAPH
Cm
e"oO
w
O:3
Cl
m
C
I.
I-,-Ot_¢,O
I=-;
8
wmLi..
w
l
!
ql_
W
I
.=_'.
q
m
w
h
uJO.r,3_
o.
I11 •O.o1,'__iicJ
DO
!i
ib,,-
i-
E
i
iJ
I
87-9-19-2
25

26
ORIGINAL PAGE
BLACK AND WHITE PHOTOGRAPH

F
I-
z
F, ii
x0 II
_. II
l_ U
87-9-19-327
U
28
Wn-
W
n"
.J<
J
z_
A
oooeo• • • • • • oo9oo-
oeooo• • 00000
ooeoo• • • • • • 00000--
o o • • o
• • o o o • o o o-
o o • • •
• • o • • • o o o-
o o • o •
o • o • • • o • 0--
o • o • o
o • o o o • • o o-
o o • • •
o • • o o o o • o-
o o • o o • o • o-
o • • • • o o • o-
o o • • o • • • o-
• • • • o o o o o-
o • • o o • o o o-
• • • • • • o o o-
I ____1 ! I/ I
I I 1 IN N m
I I
Z 'NOI.LVO0"I 3SEI:::IASNVEI.L
c f,)
m
oJ
I
q_" ,.,..q
I
I
=LIJ
E
"=z _=o
I_l'-
C,p,m
o ¢,_o
, I
m
I
87-9-19-4
W
m
tram
l
Im
q_
W
I
mmm
i
=
u
'sip'
lW
= :
--=
87-9-19-5
4-
®
1
<>
®
x o •
® ® ®
N _. J
®
f
/©
/
/
/®
O
®
D
®
[
W
iI,-II
.J
Ie_VI
29

_ !
3O
z 'NOI.LVO01 :ISEFIASNVEIJ.
•,,-_e") C'_I "" 0 I I I
I I I_ J I I I _.me_
'-_dd o l I. IIIIIIIIIIIIII
O_ < 'm
w LIJ
r.,)__0
z__z
87-9- 19-6
qW
i
m
mm
i !
J
i!
W
I
i
alam"
'l
=
,gap
W

®
®
®
X
®
N
O
®
li
®
m
°®
!
O
®
87-9-19-7
31
i
II
Im
fW
mi
lw
_)If
w
b
_tJ
mg
tI
mR
mW
!
!
uw
w
,i i
W
I
=_el
_. UTRC87-41
CHAPTER 4
RESULTS
Velocity and pressure data obtained in this study are presented in both
tabular and graphical format. Velocity data have been normalized by the free-
stream velocity, Ure f, at the tunnel reference location in the constant area
approach duct upstream of the test section inlet. Ure f was calculated from Qref,
the freestream dynamic pressure, which was determined from the freestream total
pressure, Pref' measured with the inlet kielhead probe and the reference static
pressure, Pref (see Fig. 3-3). Ure f equaled 30.48 m/set (I00 ft/sec) at nominal
tunnel operating conditions (Tre f = 15"C, 59 ° F and Pref = 760 mmHg, 14.7 psia).
Ure f was adjusted to maintain constant unit Reynolds number equal to 1.94 x 10⁵/m
at the reference location when the tunnel conditions deviated from nominal.
Static pressures are presented relative to the tunnel static pressure at the
reference location. All pressures, static and total, were normalized by Qref"
The coordinates used for the presentation of results are x, distance downstream
from the start of the test section (see Fig. 3-i), y, spanwise position relative
to the test section centerline, and z, transverse position relative to the test
section centerline. Results for the AR310 and AR630 ducts are presented
sequentially in the following sections. For each duct, flow conditions in the
inlet plane are defined by total pressure and mean velocity profiles across the
duct to determine flow uniformity, transverse velocity profiles to certify the
inlet flow to be free of swirl, law-of-the-wall velocity plots determined from
pitot measurements to characterize the turbulent inlet boundary layer, and axial
and transverse turbulence levels to provide input for computational codes.
Similar data measured in the exit plane is presented in the form of 2-D and 3-D
contour plots and vector plots of the cross-stream velocity fields. Quantities
such as kinetic energy, flowfield static pressures, and axial vorticity
distributions in the exit plane, which have been derived from these directly
measured quantities, will be presented also.
4.1 Measurements in AR310 Transition Duct
4.1.I Inlet Plane Total Pressure Measurements
4.1.1.1 Mean Flowfield Measurements
Kielhead total pressure traverses were made across the inlet duct at 45
degree azimuthal spacings. Measurements were conducted 2.4 cm downstream from
the exit plane of the AR310 inlet duct in a static dump test as shown
schematically in Fig. 3-3. The measured profiles, shown in Fig. 4-I, are flat to
within ±1.5 percent of Qref except for the outer 20 percent of the flow
influenced by the duct wall boundary layers. The inlet boundary layer thickness,
PRECEDING PAGE BLANK NOT FILMED 33
UTRC87-41 u
6995, determined from the point at which the dielhead total pressure in the
boundary layer equaled 99 percent of the freestream total pressure (i.e. the same
point at which the velocity calculated from the total pressure reached 99.5
percent of the freestream velocity) was I0 percent of the inlet diameter.
4i,1,2
Forty-polnt pitot traverses were made within the boundary layer at x = -8.3
cm in a static dump test as shown schematically in Fig. 3-3. The boundary layer
thickness, 6995, determined from the pitot measurements was 2.2 cm (0.87 in)which equaled 9.9 percent of the inlet diameter which was in agreement with the
boundary layer thickness indicated by the kielhead measurements. Integral prop-
erties calculated for the boundary layer at the AR310 inlet are tabulated below:
Displacement thickness, 6* = .179 cm
Momentum thickness, 8 = .135 cm
Shape factor, H = 1.33
Momentum thickness Reynolds no. = 3244
Reynolds no. based on inlet diameter = 5.25 x l05
m
u
J
U
The velocity profile of the inlet boundary layer is plotted in "law-of-the-wall"
(U+ vs. y+) coordinates in Fig. 4-2. To calculate the data points in Fig. 4-2
the friction velocity, U T, was chosen to minimize the least-squares fit to the
equation
U 1
U+ = m = _ in y+ + 5.0U 0.41
T
(4-1)
where y+ ffiYu_Iv as recommended by Coles (Ref. 23) over the log-linear region
of the profile (50 < y+ < 500). Then the skin friction could be calculated from
the equation
U 2
cf ffi 2 _ (4-2)
Using this equation, the value of skin friction has been calculated to be
0.00384. The strength of the boundary layer wake component, determined as the
maximum deviation, AU+, of the data from Eq. (4-I) was 1.5. This value is in
agreement with the value quoted by Coles for an equilibruim turbulent boundary
layer having the same momentum thickness Reynoids number and freestream
turbulence level.
A tabular listing of the data points in physical and "law'of-the-wall"
coordinates is given in Table fla.
34
g
U
tJ
g
l
u
w
l
=
UTRC87-41
4.1.2 Inlet Plane Laser Velocimeter Measurements
Laser velocimeter measurements were obtained in a plane located 2.4 cm
downstream from the end of the inlet duct. The four twenty-three point radial
traverses were spaced 45 degrees apart around the azimuth.
4.1.2.1 Nean Velocit_Meaaurementa
Axial velocity profiles, U/Ure f vs. r/R, are plotted in Fig. 4-3. The
profiles are flat to within ±.01Ure f over the central 80 percent of the flow-
field which was uninfluenced by the sidewall boundary layer and/or free jet shear
layer except for three data points near r/R = 0.8 on the e = 90 degree traverse.
The transverse velocity, W, was measured at the same locations as the axial
velocity component to quantify the intensity of swirl in the inlet flow. The
measured transverse velocity component, plotted as W/Ure f vs r/R in Fig. 4-4,
exceeded .01Ure f at only six points within the central 95 percent of the flow
and at those six points W/Ure f did not exceed 0.015. These values are suffi-
ciently low to certify the inlet flow to the AR310 duct to be swirl free.
4.1.2.2 Turbulence l_eaauremeuta
Profiles of axial turbulence intensity,_u2/Ure f vs. r/R, are plotted in
Fig. 4-5 for each of the four LV traverses in the inlet plane of the AR310 duct
plane. The axial turbulence had a uniform 1.8 percent turbulence intensity
throughout the freestream flow. Near the periphery of the duct the axial turbu-
lence intensity approached 0.I0 Ure f. These values are normal for near-wail
turbulence intensities within a turbulent boundary layer. Boundary layer
measurements made on a flat plate by Klebanoff (Ref. 24) indicated a maximum
turbulence intensity in the near wall region equal to 9 percent of the local
freestream velocity.
Profiles of transverse turbulence intensity,_w2/Ure f vs. r/R, are plotted
in Fig. 4-6. The transverse turbulence profiles have more data scatter than the
axial turbulence profiles but the average value of the transverse turbulence is
.018 Uref, which is equal to the axial turbulence intensity.
4.1.3 Kxit Plane Total Pressure Measurements
As noted above in Fig' 3-9: total pressure measurements were obtained at 168
locations in the exit plane of the AR310 duct. The exit plane measurement
station was located 4.0 cm downstream from the end of the transition section
within the constant area extension section. A tabular listing of the data is
given in Table Ilia in terms of (P - Pref)/Qref.
35

UTRC87-41
4.1.3.1 Mean Flowfield Meamurelentm
The measured total pressure distribution throughout the exit measurement
plane of the AR310 duct is plotted in Fig. 4-7a as contour lines of constant
(P-Pref)/Qref. Three aspects of the data presentation should be noted. First,
the frame formed by the y/S and z/H axes is drawn to scale and has the shape of
the cross section at the exit measurement plane. Second, the contours are
plotted only to the extent of the cross section over which data was taken. The
contours were not extrapolated to the wall. Third, the contour plot is presented
in an exploded format to permit an examination of the differences in the details
of the contours calculated from data obtained on the coarse, medium, and fine
grid spacings depicted in Fig. 3-9.
The largest contour plot, obtained from data taken on the coarse measurement
grid, shows that the flow is symmetric in the exit plane. A large region of
essentially inviscid flow existed in the duct core where the total pressure
exceeded 95 percent of Qref over 70 percent of the duct cross-sectional area.
Total pressure losses in excess of 0. I0 Qref were confined to the duct corners.
The contours calculated from data taken on the medium and fine measurement
grids differed only slightly from the coarse grid contours. They did not
delineate any features of the fluid physics which were not seen in the coarse
grid measurements.
A three-dimensional plot of the exit plane total pressure distribution
generated from data taken on the coarse measurement grid is shown in Fig. 4-7b.
The flat total pressure profile within the core flow and the concentration of the
losses in the duct corners are readily apparent in the 3-D graphic.
4.1.3.2 Boundar__La_,ye_r l/easurements
As noted above in Fig. 3-10, boundary layer traverses were made at thirteen
locations in the exit plane of the AR310 duct at the same axial location as the
kielhead total pressure measurements. The thirteen traverses consisted of six in
the transverse direction, four in the spanwise direction, and three radial
traverses near the duct corner.
The transverse total pressure profiles are plotted in Fig. 4-8a. The
transverse boundary layers were thin and had well-behaved turbulent profiles at
all six traverse locations. The thinnest boundary layers occurred at traverse
locations I and 5 at the midspan location along the exit plane semi-minor axis
where 8995 equaled .12H, i.e. 12 percent of the duct half-heighth. At traverselocations 2, 4, 6, and I0 located at y/S = ±.5 the boundary layer thickness was
approximately .2H.
m
J
l
w
m
g
W
u
m
36
M
I
q
UTRC87-41
T
The spanwise total pressure profiles are plotted in Fig. 4-8b. The spanwise
boundary layers were much thicker than the transverse boundary layers. The
thinnest spanwise boundary layers were measured at traverse locations 3 and 7
along the exit plane semi-major axis, where the boundary layer thickness was
approximately 0.75 H. At traverse location 8 at z/H - -0.44, the boundary layer
was thicker, 6995 ffi1.0 H, but the turbulent profiles remained well behaved.
However, at traverse location 9 an inflection point was measured in the total
pressure profile.
The location of the inflection point corresponded with the inflection point
in traverse 12 shown in Fig. 4-8c. The S-shaped profile along traverse 12 could
indicate the presence of a vortex core at Ybl/H - 0.25 (y/S = 0.92, z/H = -0.92).
Profiles 11 and 13 are sufficiently removed from the duct corner to be uninflu-
enced by the axial vortex.
Eleven of the boundary layer profiles were integrated to determine the
displacement and momentum thicknesses. Profiles at locations 8 and 9 were not
integrated since these profiles do not extend outside the boundary layer. As
will be discussed in Section 4.1.4.2 there are significant normal pressure
gradients at the exit plane that must be accounted for in the calculation, of the
displacement and momentum thicknesses. The method of Kooi (Ref. 25) which
accounts for normal pressure gradients in the calculated displacement and
momentum thicknesses was used such that
_ U dy 16 Ui
0 0
(4-3)
and
-_ dy8 = -- 1 - dy - -- - Uiw
0 Uiw Uiw
(4-4)
respectively. Here Uiw is the inviscid axial velocity at the wall calculatedfrom the local wall static pressure and inlet total pressure. The local inviscid
axial velocity, Ui, is given by
Ui - _ (P - p) - Vi2 - Wi 2(4-5)
where V i and W i are unknown but estimated by the measured LV values. Since theseterms are small, the approximation is reasonable. Eq. (4-5) assumes the boundary
layer probe is sensitive to all three components of velocity. For boundary layer
survey points between LV data points, linear interpolation was applied. Between
the LV data point closest to the wall and the wall, the tangential component of
velocity was assumed constant and the normal component was linearly interpolated
to zero. For the local static pressure, p, the values calculated in Section
37

UTRC87-41
4.1.4.2 were used. The local wall static pressure was assumed equal to the value
closest to the wall (that is, a negligible normal pressure gradient was assumed
for the inner portion of the boundary layers). Note that the first terms in Eqs.
(4-3) and (4-4) are the classic definitions of the integral parameters and the
second terms are corrections to account for the normal pressure gradients.
The results of the calculated integral parameters are shown in Fig. 4-8d in
terms of the displacement and momentum thicknesses normalized by the duct half-
height (H), and the shape factor. For the transverse surveys the displacement
thicknesses is about 2 percent of the half-height whereas the spanwise surveys
are much thicker at 6-7 percent. The shape factorsall tend to be reasonable for
turbulent boundary layers with values between 1.28-1.43 (neglecting surveys II,
12, and 13 which are not normal to the surface).
The boundary layer profiles obtained at locations I, 3, 5, and 7 along the
duct semi-major and semi-minor axes are plotted in law-of-the-wall coordinates in
Fig. 4-9. The spanwise profiles, 3 and 7, are nearly identical, and the trans-
verse profiles, 1 and 5, also differ only slightly indicating minor asymmetry
existed in the duct exit flow. However, the profiles, which appeared well
behaved when plotted in linear coordinates in Fig. 4-8, do not have the extended
log-linear regions and wake profiles characteristic of equilibrium turbulent
boundary layers.
4.1.4 Exit Plane Laser Velocimeter }4easurements
As noted above in Fig. 3-9, laser velocimeter measurements were obtained at
each of the 168 total pressure measurement locations in the exit plane of the
AR310 duct. Three mean velocity components, U, V, and W, and three components of
turbulenceS, _, and_ were determined from three 168-point traverses with
a single component LV system. These velocity measurements are given in
Table llla (normalized by Uref).
4.1.4. l _anVelo_c£_ty Heasurements
LV measurements of the axial velocity distribution in the exit plane of the
AR310 duct are shown in a 3-D plot in Fig. 4-I0a. The measured flowfield appears
to have a nearly inviscid velocity distribution relatively uninfluenced by
viscous wall boundary layers. Gradients in the mean flow exist in both the
transverse and spanwise directions. In the transverse direction, the profile is
slightly concave due to an overspeed of approximately .05 Ure f at the edges of
the top and bottom wall boundary layers. In the spanwise direction, the profile
is slightly convex with higher axial velocities in the center of the duct. A
two-dimensional representation of the axial velocity data is shown in Fig. 4-10b
where contours of U/Ore f have been plotted. The data corroborates the total
w
i
i
t
W
w
w
M
W
U
!
I
J
=2
W
38
u
-- UTRC87-41
pressure data described above which indicated that the flow field was nearly
potential with the effects of viscosity limited to thin wall boundary layers and
corner flows.
The cross-flow velocity vectors measured in the AR310 exit plane are plotted
in Fig. 4-11. Four aspects of the data shown in Fig. 4-11 should be noted.
First, the magnitude of the cross-flow does not exceed 15 percent of Ure f at any
measurement location and is typically on the order of .05 Ure f. Second, thepattern of the cross-flow vectors shows excellent flow symmetry in the exit
measurement plane. Third, the direction of the cross-flow is predominantly
outward, indicating that the mean flow is continuing to adjust toward a more
uniform profile in the constant area extension duct. Fourth, in the lower right
corner of the figure where measurements were taken on a fine grid spacing the
cross-flow vectors indicate the presence of a weak axial vortex in the corner.
The cross-flow velocity components were combined with the axial velocity
components to determine the kinetic energy distribution in the AR310 exit plane.
Contours of constant kinetic energy are plotted in Fig. 4-12. The gradients in
the kinetic energy distribution are primarily in the spanwise direction.
4.1.4.2 Calculated Exit Plane Static Pressure Distribution
With the assumption of constant density across the AR310 exit plane, the
Bernoulli equation was used to calculate the local static pressure from the
measured total pressure and the kinetic energy at each of the 168 measurement
locations in the exit plane. The calculated static pressure field plotted in
three dimensions in Fig. 4-13a is non-uniform and predominantly concave in shape.
The non-uniformity in static pressure across the exit plane was approximately
equal to .25 Qref except at local spikes near the periphery of the measurement
field. The higher static pressure along the duct sidewalls is due to the side-
wall influence in setting up the potential flow pressure pattern necessary to
turn the flow toward the axial direction in the exit duct. Contours of constant
static pressure plotted in Fig. 4-13b show that the calculated static pressure
over the central 75 percent of the exit duct is lower than the reference pressure
indicating that the core flow has been over accelerated in the transition
section.
4.1.4.3 Turbulence Measurements
Due to optical access limitations some of the LV cross-flow velocity
measurements near the duct walls were made at various known small inclination
angles. The slight misalignment of the fringe pattern in the measurement volume
relative to purely spanwise or transverse directions required the mean cross-flow
velocities to be determined trigonometrically from pairs of inclined spanwise and
transverse measurements. Spanwise and transverse turbulence components cannot be
so reconstructed from measurement pairs without knowledge of the cross stress
component.
39
u
UTRC87-41
Therefore, in this section, only axial turbulence components, which were
measured directly at all measurement locations in the exit plane, are presented
graphically. Values of transverse and spanwise turbulence components at all
measurement locations are listed in Table IIIa. Values which are considered
contaminated due to beam tilt are denoted parenthetically with the beam tilt to
the right of the measurement.
The distribution of the axial component of turbulence in the AR310 exit
plane is shown in Fig. 4-14 in which lines of constant axial turbulence level are
plotted. The turbulence level throughout the core flow is less than .02 Uref,
the same level of turbulence measured in the inlet flow (see Fig. 4-5). Regions
of higher turbulence intensity are confined to the duct corners. Overall, the
axial turbulence level distribution in the AR310 exit plane is quite symmetric.
4.2 Measurements in AR630 Transition Duct
4.2.1 Inlet Plane Total Pressure Measurements
Total pressure traverses were made across the inlet duct at 0 deg and 90 deg
azimuthal locations' Measurements were 0btalned 2_cm upstream from the exit
plane of the AR630 inlet duct in a static dump test as shown schematically in
Fig. 3.3.
4.2.1.1 Mean Flowfield Measurement
The measured total pressure profiles from the 0 deg and 90 deg azimuthal
locations have been plotted together in Fig. 4-15. The profiles are flat to
within ±I percent of Qref except for the outer 20 percent of the flow influenced
by the duct wall boundary layers.
4.2.1.2 Boundar_y_La_yer Measurement s
The boundary layer thicknesses, 6995, determined from the pitot tube
traverses were 1.524 cm (0.600 in) and 1.534 cm (0.604 in) at the 0 deg and 90
deg azimuth positions, respectively. These values equaled I0 percent of the
inlet diameter. Integral properties calculated for the boundary layers at the
AR630 inlet are tabulated below:
Displacement thickness, 6" (cm)
Momentum thickness, e (cm)
Shape factor, H
Momentum thickness Reynolds no., Re
e = 0 des e = 90 deg average
0.179 0.175 0.177
0.132 0.129 0.131
1.36 1.36 1.36
2702 2727 2715
The inlet boundary layer velocity profiles are plotted in "law-of-the-wall"
(U+ vs. y+) coordinates in Fig. 4-16. The profiles have a well-behaved
40
I
g
I
J
I
W
z
w
w
-- UTRC87-41
r
log-linear region and a wake strength, AU +, of 1.5, which equaled the value
calculated for the inlet boundary layer to the AR310 transition duct. Using Eq.
(4.2) a skin friction, Cf, value of 0.00363 has been calculated for the
boundary layers.
A tabular listing of the data points in physical and "law-of-the-wall"
coordinates is given in Table lib.
4.2.2 Inlet Plane Laser Velocimeter Measurements
Laser velocimeter measurements were taken 1.6 cm downstream from the end of
the inlet duct. Four twenty-five point radial traverses were spaced 45 degrees
apart around the azimuth.
4.2.2.1 14can Velocit_Measurements
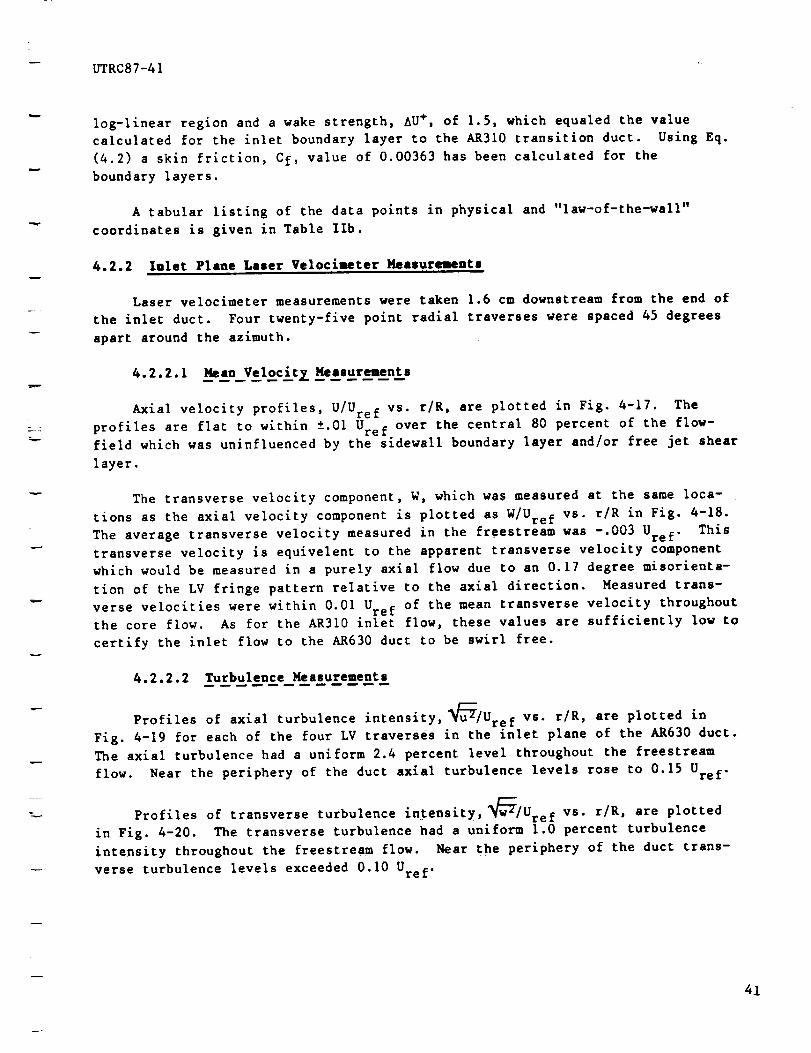
Axial velocity profiles, U/Ure f vs. r/R, are plotted in Fig. 4-17. The
profiles are flat to within ±.01Ure f over the central 80 percent of the flow-
field which was uninfluenced by the sidewall boundary layer and/or free jet shear
Iayer.
The transverse velocity component, W, which was measured at the same loca-
tions as the axial velocity component is plotted as W/Ure f vs. r/R in Fig. 4-18.
The average transverse velocity measured in the freestream was -.003 Ure f. This
transverse velocity is equivelent to the apparent transverse velocity component
which would be measured in a purely axial flow due to an 0.17 degree misorienta-
tion of the LV fringe pattern relative to the axial direction. Measured trans-
verse velocities were within 0.01Ure f of the mean transverse velocity throughout
the core flow. As for the AR310 inlet flow, these values are sufficiently low to
certify the inlet flow to the AR630 duct to be swirl free.
4.2.2.2 Turbulence Measurements
Profiles of axial turbulence intensity,_/Ure f vs. r/R, are plotted in
Fig. 4-19 for each of the four LV traverses in the inlet plane of the AR630 duct.
The axial turbulence had a uniform 2.4 percent level throughout the freestream
flow. Near the periphery of the duct axial turbulence levels rose to 0.15 Ure f.
Profiles of transverse turbulence intensity,_/Ure f vs. r/R, are plotted
in Fig. 4-20. The transverse turbulence had a uniform 1.0 percent turbulence
intensity throughout the freestream flow. Near the periphery of the duct trans-
verse turbulence levels exceeded 0.I0 Ure f.
41
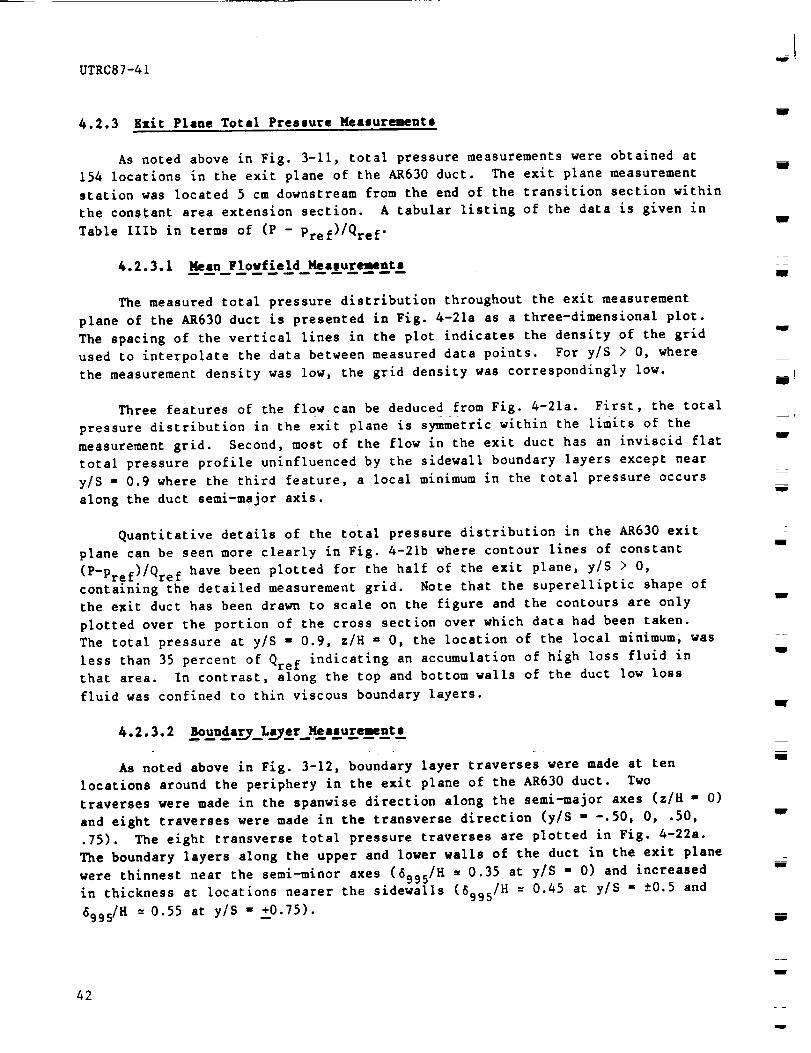
UTRC87-41
4.2.3 Exit Plane Total Pressure Measurements
As noted above in Fig. 3-11, total pressure measurements were obtained at
154 locations in the exit plane of the AR630 duct. The exit plane measurement
station was located 5 cm downstream from the end of the transition section within
the constant area extension section. A tabular listing of the data is given in
Table lllb in terms of (P - Pref)/Qref.
4.2.3.1 Mean Flowfield 14eaeur_nt_
The measured total pressure distribution throughout the exit measurement
plane of the AR630 duct is presented in Fig. 4-21a as a three-dimensional plot.
The spacing of the vertical lines in the plot indicates the density of the grid
used to interpolate the data between measured data points. For y/S > 0, where
the measurement density was low, the grid density was correspondingly low.
Three features of the flow can be deduced from Fig. 4-21a. First, the total
pressure distribution in the exit plane is symmetric within the limits of the
measurement grid. Second, most of the flow in the exit duct has an inviscid flat
total pressure profile uninfluenced by the sidewall boundary layers except near
y/S = 0.9 where the third feature, a local minimum in the total pressure occurs
along the duct semi-major axis.
Quantitative details of the total pressure distribution in the AR630 exit
plane can be seen more clearly in Fig. 4-21b where contour lines of constant
(P-Pref)/Qref have been plotted for the half of the exit plane, y/S > O,
containing the detailed measurement grid. Note that the superelliptic shape of
the exit duct has been drawn to scale on the figure and the contours are only
plotted over the portion of the cross section over which data had been taken.
The total pressure at y/S = 0.9, z/H ffi0, the location of the local minimum, was
less than 35 percent of Qref indicating an accumulation of high loss fluid in
that area. In contrast, along the top and bottom walls of the duct low loss
fluid was confined to thin viscous boundary layers.
4.2.3.2 _Bou._nd_.arT__LaTe_.r Measurements
As noted above in Fig. 3-12, boundary layer traverses were made at ten
locations around the periphery in the exit plane of the AR630 duct. Two
traverses were made in the spanwlse direction along the semi-major axes (z/H = 0)
and eight traverses were made in the transverse direction (y/S = -.50, 0, .50,
.75). The eight transverse total pressure traverses are plotted in Fig. 4-22a.
The boundary layers along the upper and lower walls of the duct in the exit plane
were thinnest near the semi-minor axes (6995/H ffi0.35 at y/S = O) and increased
in thickness at locations nearer the sidewalls (6995/H = 0.45 at y/S = ±0.5 and
699sIH = 0.55 at ylS - +_0.75).
I
i
BSEEM
I
W
m
r_
U
zg
w
w
mMM
42
l
m
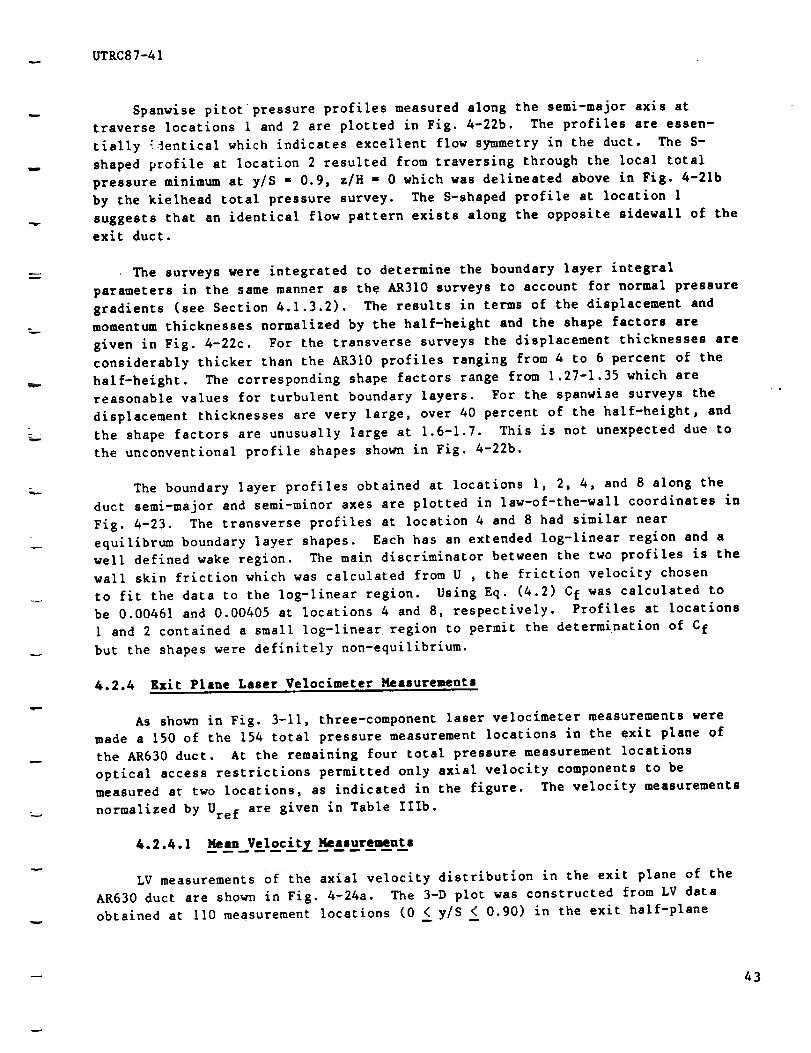
UTRC87-41
w
J
Spanwise pitot pressure profiles measured along the semi-major axis at
traverse locations 1 and 2 are plotted in Fig. 4-22b. The profiles are essen-
tially _dentical which indicates excellent flow symmetry in the duct. The S-
shaped profile at location 2 resulted from traversing through the local total
pressure minimum at y/S = 0.9, z/H = 0 which was delineated above in Fig. 4-21b
by the kielhead total pressure survey. The S-shaped profile at location I
suggests that an identical flow pattern exists along the opposite sidewall of the
exit duct.
The surveys were integrated to determine the boundary layer integral
parameters in the same manner as the AR310 surveys to account for normal pressure
gradients (see Section 4.1.3.2). The results in terms of the displacement and
momentum thicknesses normalized by the half-height and the shape factors are
given in Fig. 4-22c. For the transverse surveys the displacement thicknesses are
considerably thicker than the AR310 profiles ranging from 4 to 6 percent of the
half-height. The corresponding shape factors range from 1.27-1.35 which are
reasonable values for turbulent boundary layers. For the spanwise surveys the
displacement thicknesses are very large, over 40 percent of the half-height, and
the shape factors are unusually large at 1.6-1.7. This is not unexpected due to
the unconventional profile shapes shown in Fig. 4-22b.
The boundary layer profiles obtained at locations I, 2, 4, and 8 along the
duct semi-major and semi-minor axes are plotted in law-of-the-wall coordinates in
Fig. 4-23. The transverse profiles at location 4 and 8 had similar near
equilibrum boundary layer shapes. Each has an extended log-linear region and a
well defined wake region. The main discriminator between the two profiles is the
wall skin friction which was calculated from U , the friction velocity chosen
to fit the data to the log-linear region. Using Eq. (4.2) Cf was calculated to
be 0.00461 and 0.00405 at locations 4 and 8, respectively. Profiles at locations
I and 2 contained a small log-linear region to permit the determination of Cf
but the shapes were definitely non-equilibrium.
4.2.4 Exit Plane Laser Velocimeter Measurements
As shown in Fig. 3-11, three-component laser velocimeter measurements were
made a 150 of the 154 total pressure measurement locations in the exit plane of
the AR630 duct. At the remaining four total pressure measurement locations
optical access restrictions permitted only axial velocity components to be
measured at two locations, as indicated in the figure. The velocity measurements
normalized by Ure f are given in Table IIIb.
4.2.4.1 Mean VelocitzHeasurements
LV measurements of the axial velocity distribution in the exit plane of the
AR630 duct are shown in Fig. 4-24a. The 3-D plot was constructed from LV data
obtained at If0 measurement locations (0 < y/S < 0.90) in the exit half-plane
43
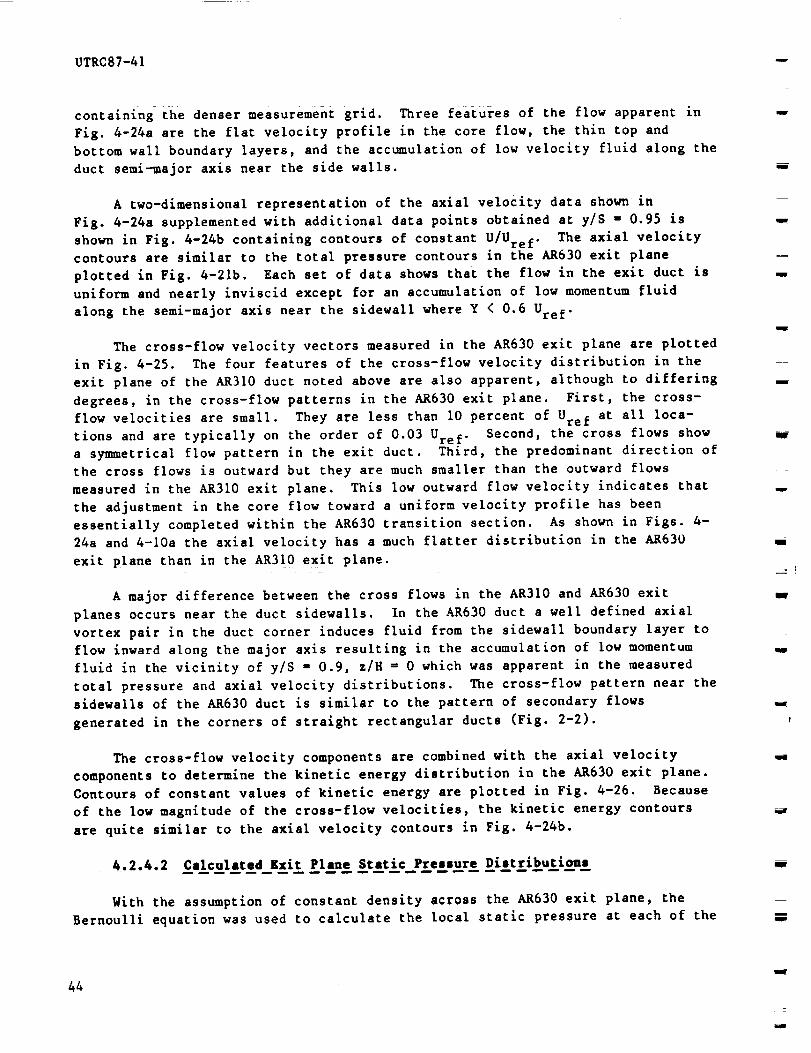
UTRCg?-41
containing the denser measurement grid. Three features of the flow apparent in
Fig. 4-24a are the flat velocity profile in the core flow, the thin top and
bottom wall boundary layers, and the accumulation of low velocity fluid along the
duct semi-major axis near the side walls.
A two-dimensional representation of the axial velocity data shown in
Fig. 4-24a supplemented with additional data points obtained at y/S = 0.95 is
shown in Fig. 4-24b containing contours of constant U/Ure f. The axial velocity
contours are similar to the total pressure contours in the AR630 exit plane
plotted in Fig. 4-21b. Each set of data shows that the flow in the exit duct is
uniform and nearly inviscid except for an accumulation of low momentum fluid
along the semi-major axis near the sidewall where Y < 0.6 Ure f.
The cross-flow velocity vectors measured in the AR630 exit plane are plotted
in Fig. 4-25. The four features of the cross-flow velocity distribution in the
exit plane of the AR310 duct noted above are also apparent, although to differing
degrees, in the cross-flow patterns in the AR630 exit plane. First, the cross-
flow velocities are small. They are less than I0 percent of Ure f at all loca-
tions and are typically on the order of 0.03 Ure f. Second, the cross flows show
a symmetrical flow pattern in the exit duct. Third, the predominant direction of
the cross flows is outward but they are much smaller than the outward flows
measured in the AR310 exit plane. This low outward flow velocity indicates that
the adjustment in the core flow toward a uniform velocity profile has been
essentially completed within the AR630 transition section. As shown in Figs. 4-
24a and 4-10a the axial velocity has a much flatter distribution in the AR630
exit plane than in the AR310 exit plane.
A major difference between the cross flows in the AR310 and AR630 exit
planes occurs near the duct sidewalls. In the AR630 duct a well defined axial
vortex pair in the duct corner induces fluid from the sidewall boundary layer to
flow inward along the major axis resulting in the accumulation of low momentum
fluid in the vicinity of y/S = 0.9, z/H = 0 which was apparent in the measured
total pressure and axial velocity distributions. The cross-flow pattern near the
sidewalls of the AR630 duct is similar to the pattern of secondary flows
generated in the corners of straight rectangular ducts (Fig. 2-2).
The cross-flow velocity components are combined with the axial velocity
components to determine the kinetic energy distribution in the AR630 exit plane.
Contours of constant values of kinetic energy are plotted in Fig. 4-26. Because
of the low magnitude of the cross-flow velocities, the kinetic energy contours
are quite similar to the axial velocity contours in Fig. 4-24b.
4.2.4.2 Calculated gxit Plane Static Preasure Distributions
With the assumption of constant density across the AR630 exit plane, the
Bernoulli equation was used to calculate the local static pressure at each of the
w
w
I
w
m
I
m
!
i
w
I
B
44
m
t
UTRC87-41
=
150 measurement locations at which total pressure and three-component LV data had
been obtained. A three-dimensional plot (Fig. 4-27a) of the calculated static
pressure field for the half-plane containing the denser measurement grid shows
the static pressure to be uniform across the exit duct except for a region of
higher static pressure near the outer 20 percent of the span near the sidewalls.
The limited region of higher static pressure along the sidewalls indicates that
the potential pressure field created by the transition duct to turn the flow
toward the axial direction successfully created a uniform axial flow pattern in
the core flow across the exit duct and minimal additional flow turning is
required downstream of the exit plane.
Contours of constant static pressure plotted in Fig. 4-27b show that the
variation in static pressure across the core flow in the AR630 exit plane is
limited to 0.i0 Qref" The static pressure at midspan was 0.15 Qref lower than
the upstream reference static pressure due to core flow acceleration in the
transition duct. The flow acceleration was caused by a reduction in the effec-
tive cross-sectional area between the inlet and exit planes because of displace-
ment thickness growth through the transition section.
4.2.4.3 Turbulence Measurements
Optical access limitations were more severe in the AR630 exit plane than the
AR310 exit plane resulting in a more limited set of non-contaminated cross-flow
turbulence measurements (see related disussion in Sec. 4.1.4.3). The cross-flow
turbulence data for the AR630 exit plane are listed in Table IIlb. Values which
are considered contaminated due to beam tilt are denoted parenthetically with the
beam tilt to the right of the measurement.
Axial turbulence measurements, however, were made at each of the 150 LV
measurement locations. The distribution of the axial component of turbulence in
the AR630 exit plane is shown in Fig. 4-28 in which lines of constant axial
turbulence level are plotted. The turbulence level throughout the core flow is
on the order of 3 to 4 percent of Ure f which is somewhat higher than the 2.4
percent turbulence level measured in the inlet plane. The highest level of axial
turbulence, .flUte f occurred at the center of the low momentum region near thesidewall.
4.3 Calculated Axial Vorticity Distribution
The axial vorticity distribution in the exit measurement plane was
determined from the transverse velocity data using the equation
aw av(4-6)
45
UTRC87-41 "_
In order to apply Eq. (4-6), linear interpolation was performed on the
measurement grid (Figs. 3.9 and 3.11) to obtain a uniform grid distribution
across the exit plane (such that the grid spacing in the y and z direction was
equal to the smallest actual spacing in the respective direction). For the AR630
duct this was only done on half of the exit plane. Also, along the periphery of
the measurement grid, an additional line of grid points was determined by
interpolating data between the measured points and the duct boundary where the
no-slip condition requiredV - W = 0 (this was done in order to evaluate _x at
the periphery). Standard central difference approximations were then applied to
the two terms on the right-hand side of Eq. (4-6).
The resulting axial vorticity distributions are presented in Figs. 4-29a and
4-29b where contours of constant axial vorticity are plotted using intervals of
lO0/sec. In the AR310 duct (Fig. 4-29a) no vortex pattern can be discerned with
the 100/sec contour spacing. Except near the edges of the measurement grid the
magnitude of the vorticity was less than lO0/sec. In the AR630 exit plane the
magnitude of the vorticity is also less than 100/sec over the central 80 percent
of the duct (Fig. 4-29b). However, a sharply defined vortex pair is delineated
near the duct sidewall at y/S ffi0.9, z/H = 0.35 where Rxmin < -400/sec (clockwise
rotation) and at y/S = 0.9, z/H = -0.30 where Rxmax > 500/sec (counterclockwise
rotation).
As shown above the effect of the vortex pair is to transport low momentum
fluid from the duct sidewall boudary layer and deposit it along the duct semi-
major axis in the exit plane. The penetration distance of the low momentum fluid
from the sidewalls into the core flow along the semi-major axis is directly
proportional to the strength of the vortex pair and the residence time of the
fluid within the vortex. Thus, the stronger vortex pattern and estimated longer
residence time in the longer AR630 duct appears to be responsible for the
observed differences in flow distribution near the sidewalls of the two ducts
tested.
I
m
I
m
l
g
W
I
m
l
J
l
I
l
46
u

L
rw
R
1.0
0.6'
0.2'
-0.2
-0.6
- 1.0
0 -- 11 =
r_ -- 56 °
z3 -- 101 °
-- 146 =
ai=
a=
a
¢L
¢=
oa0
o3
o0
=¢
_o
4=
I -v I I I I
0 0.2 0.4 0.6 0.8 1.0
(P - Pref)
Qref
Figure 4-1. -- Total Pressure Profiles in AR310 Inlet Plane
1.2
87-9-19-B
47
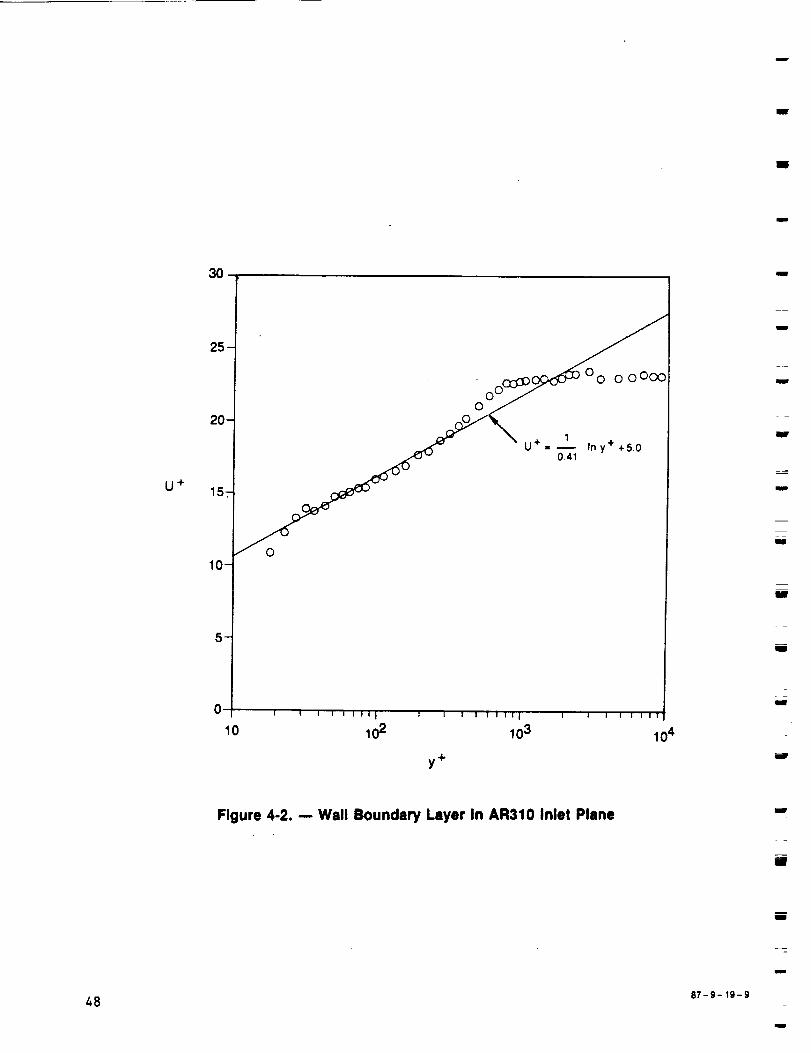
I
mI
i
U +
30
25-
20-
15-
10-
5_
U _ In y +50f 0 "
I I I I I I II I I I I I I I I I _ I I I I I I II
0 102 103 104
y+
I
I
I
w
I
mI
I
t
I
Figure 4-2. -- Wall Boundary Layer In AR310 Inlet Plane i
I
iI
87-9- 19-g
i
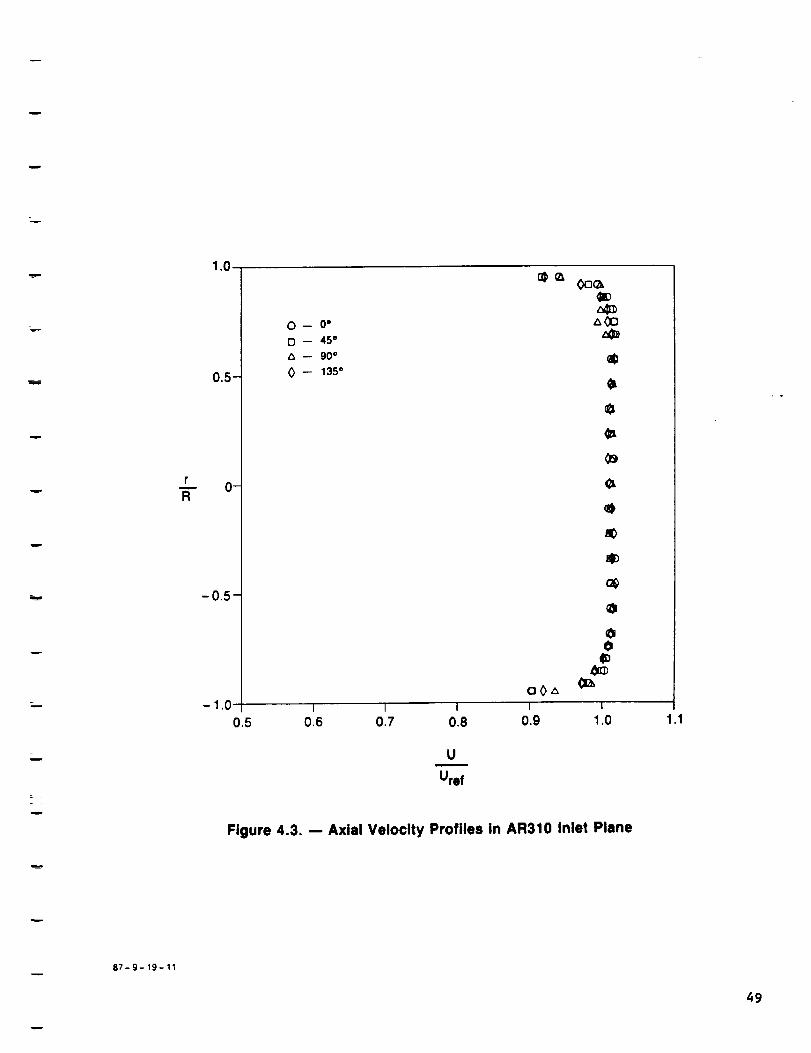
rm
R
1.0
0.5--
_
-0.5-
0 -- O°
D -- 450
-- 90 °
0 -- 135°
oOA
O(3ok
r, Oo
aD
a
c_
ca
00
B]:x)
-1.0 i i i =0.5 0.6 0.7 0.8 0.9 1.0
Um
Uref
Figure 4.3. -- Axial Velocity Profiles in AR310 Inlet Plane
.1
87-9-19- 11
49
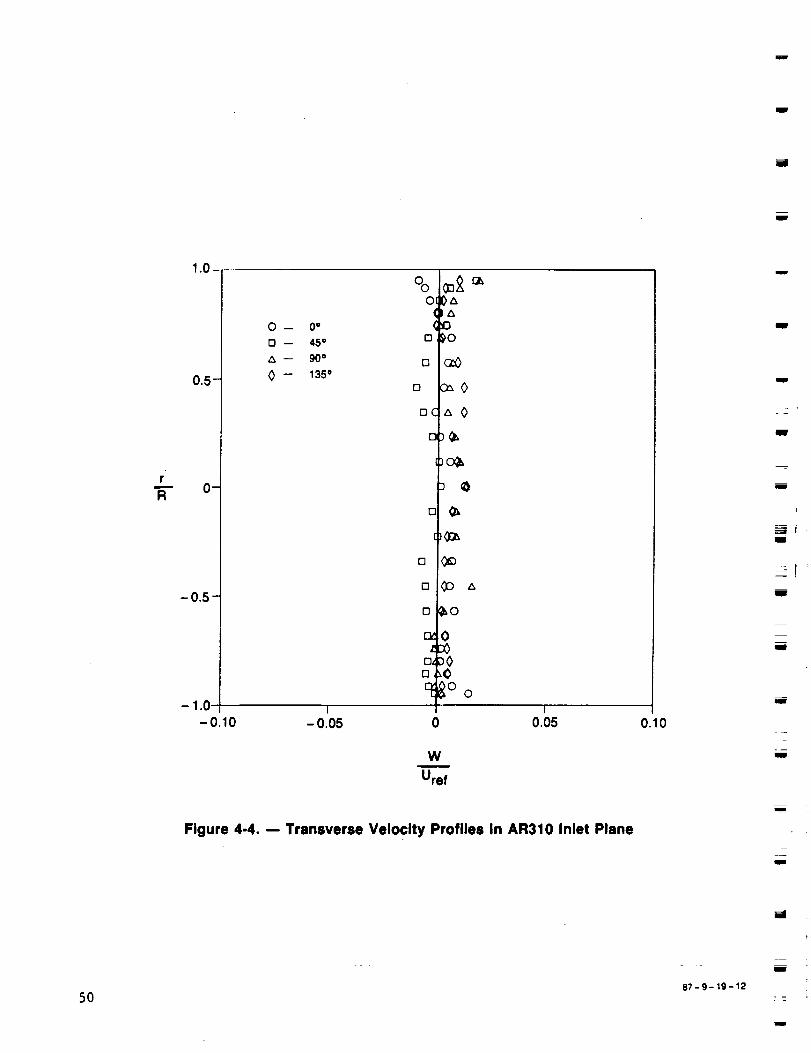
I
m
r'
R
1.0
0.5--
--
-0.5-
O -- 0 °
[] -- 45"
-- 90 °
0 -- 135a
%OI
o
[3
o
oC
[3
o
[3
D
>A
D_o
_0
_0
c_
_o
0E_
0
0
- 1.0 I J-0.10 -0.05 0.05
Wm
Uref
Figure 4-4. -- Transverse Velocity Profiles In AR310 Inlet Plane
0.10
u
UB'
J
R
m
I
IIIB
ImW
m
m
5087-9- 19-12
m
i

r
R
1.0
0.5--
0-
-0,5-
- 1.0
0
c_
OA
0
B_
0
O
¢
a
(_OLQ
0 -- 0 °
0 -- 45 °
-- 90 o
¢ -- 135°
I
0.05I
O.lO
m
Uref
I
0.15 0.20
Figure 4-5. -- Axial Turbulence Profiles In AR310 Inlet Plane
87-9-19-13
51
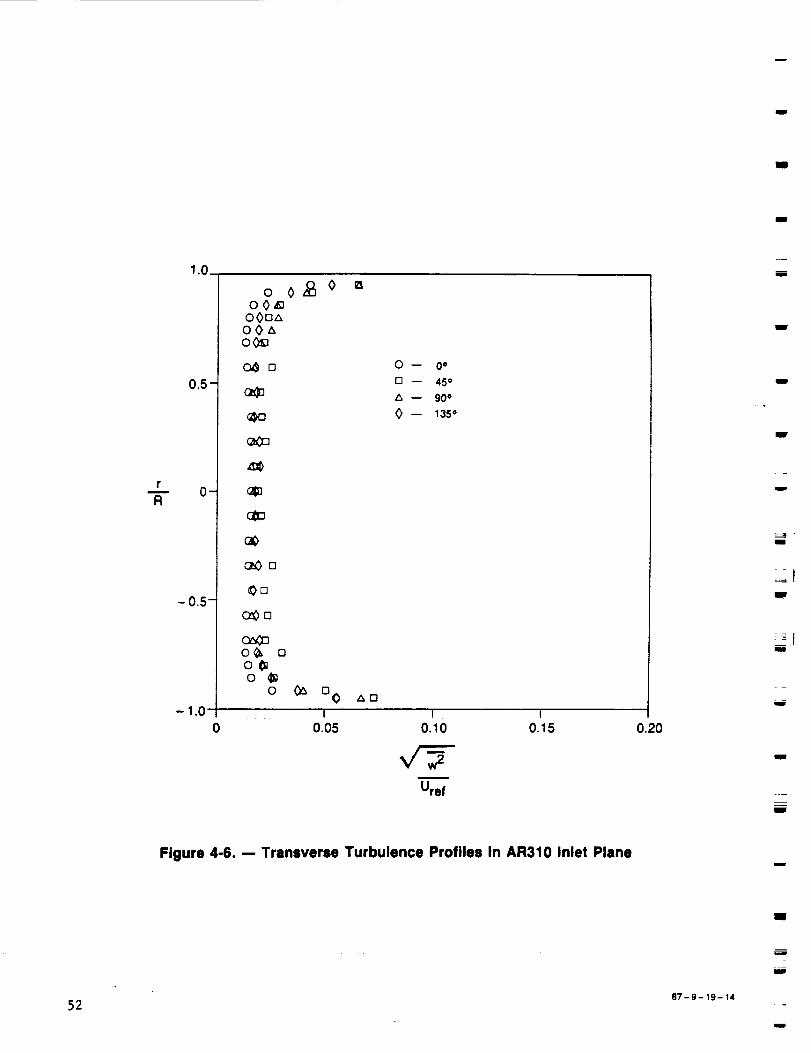
m
lib
lib
r
R
1.0
0.5--
-0.5-
o0£oo0_
o0o_OOAo0_
c_OD
_n
c:_¢n
o_
0 O_ o...V Z_D
0 -- 0 •
D -- 45 •
-- 90 o
0 -- 135o
- 1.0 I I J0 0.05 0.10 0.15
Uref
0.20
I
I
I
IIIIIr
u
I
m
w
m
I
Flgure 4-6. -- Transverse Turbulence Profiles In AR310 Inlet Plane
BB
5287-9- 19- 14
I
IBBB
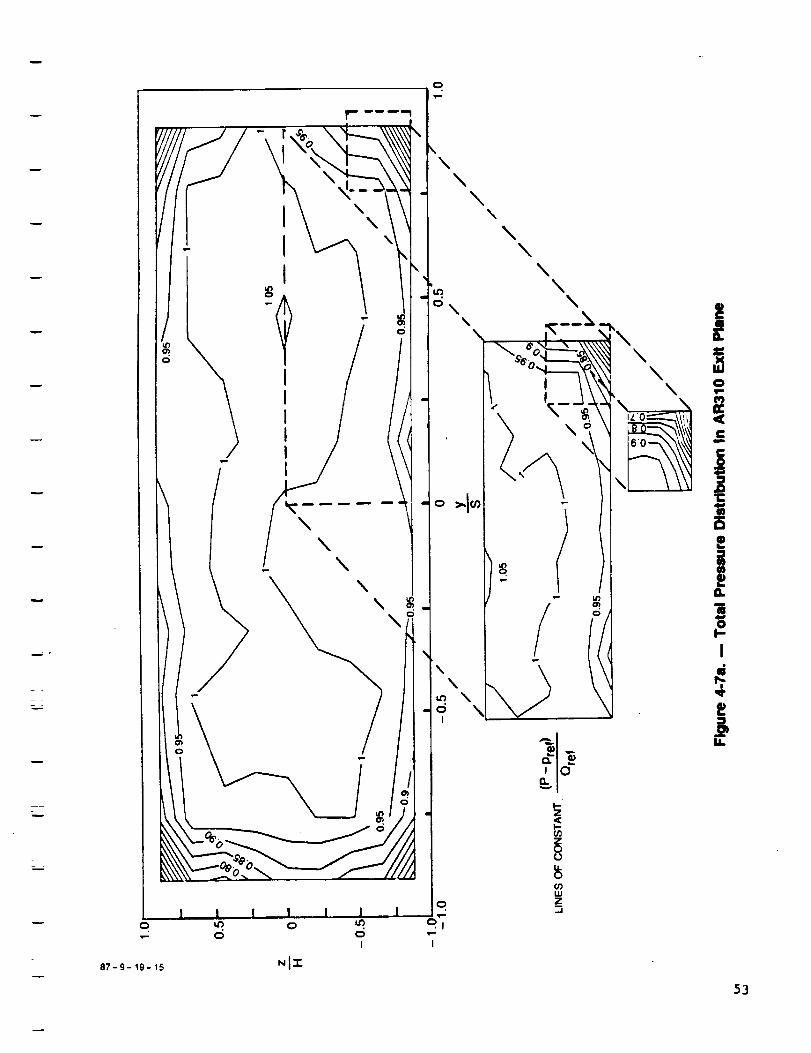
=
w
C>
87-9- 19- 15
i I I ! I I I
dI
I,-
{.)
tJ)1,1.1
o z_.J
i
"1"
53

f
lira
P - Pre!
Oref
0,8-_
0.5 _
-1
0.4_-
0,2
0.88
0
Z
H
/
i
<I
/
- 0.25
f
J
0
0.50
0.75
Figure 4.7b. -- Total Pressure Distribution In AR310 Exit Plane
im
m
mm
87_9-19-16
54
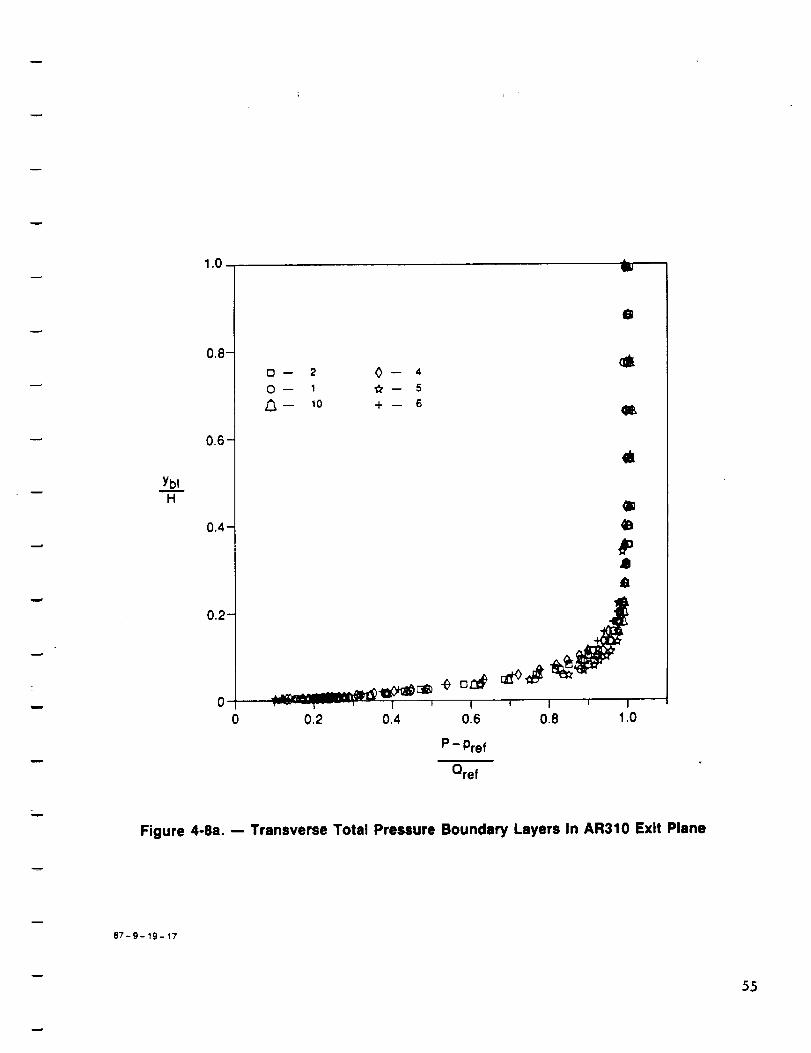
2
Ybl
H
1.0
0.8--
0.6--
0,4--
0.2-
D-- 2 _-- 4
0 -- 1 I_' -- 5
j_-- lO +- 6
a
qlm
a
4s
0 1-_ --1 --- ! I I 1 J I J I
0 0.2 0.4 0.6 0.8 1.0
P - Pref
Qref
Figure 4-8a. -- Transverse Total Pressure Boundary Layers In AR310 Exit Plane
87-g- 19- 17
55
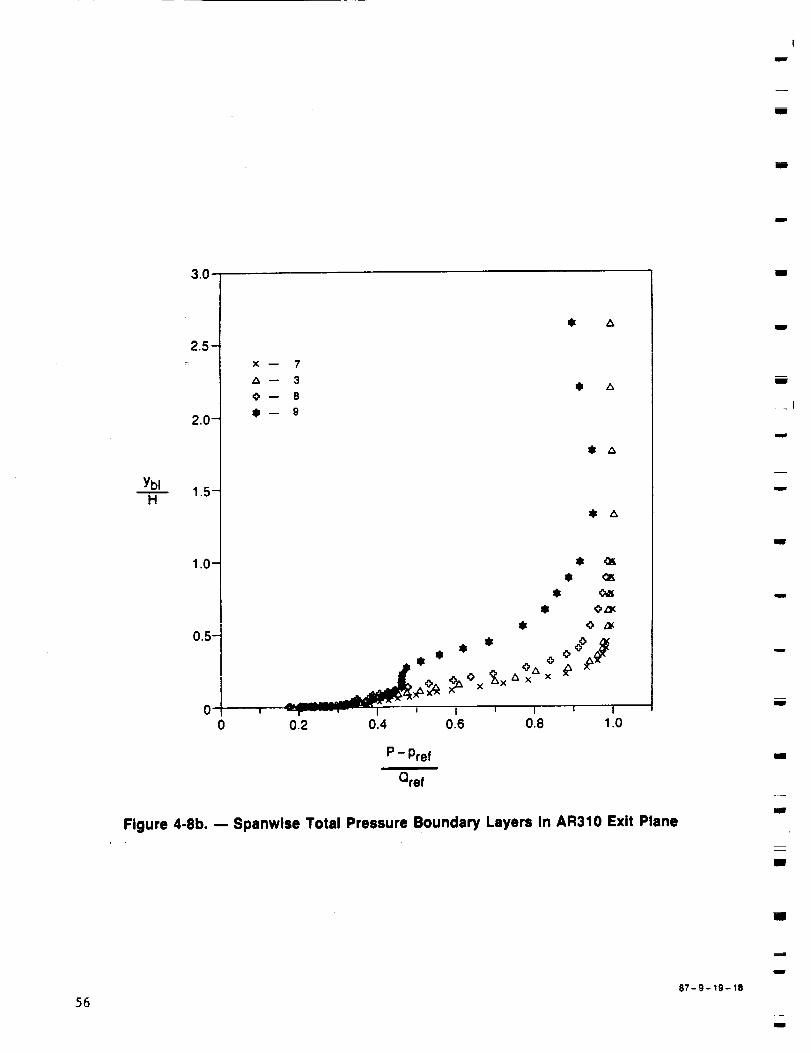
t
u
g
i
mw
3.0
YbtH
2.5--
2.0-
1.5_
1o0--
0,5_
i A
x -- 7
O -- 8
i-- 9
i 'OZ_i '0 ,_
" x0 ' "r Z-_-', - _ I _ I _ I
0 0.2 0.4 0.6 0.8 1.0
P - Pref
Qref
Figure 4-8b. -- Spanwise Total Pressure Boundary Layers In AR310 Exit Plane
i
g
m
g
m
m
g
i
=_
Rll
IB
ml
5687-9- 19- 18
i
I
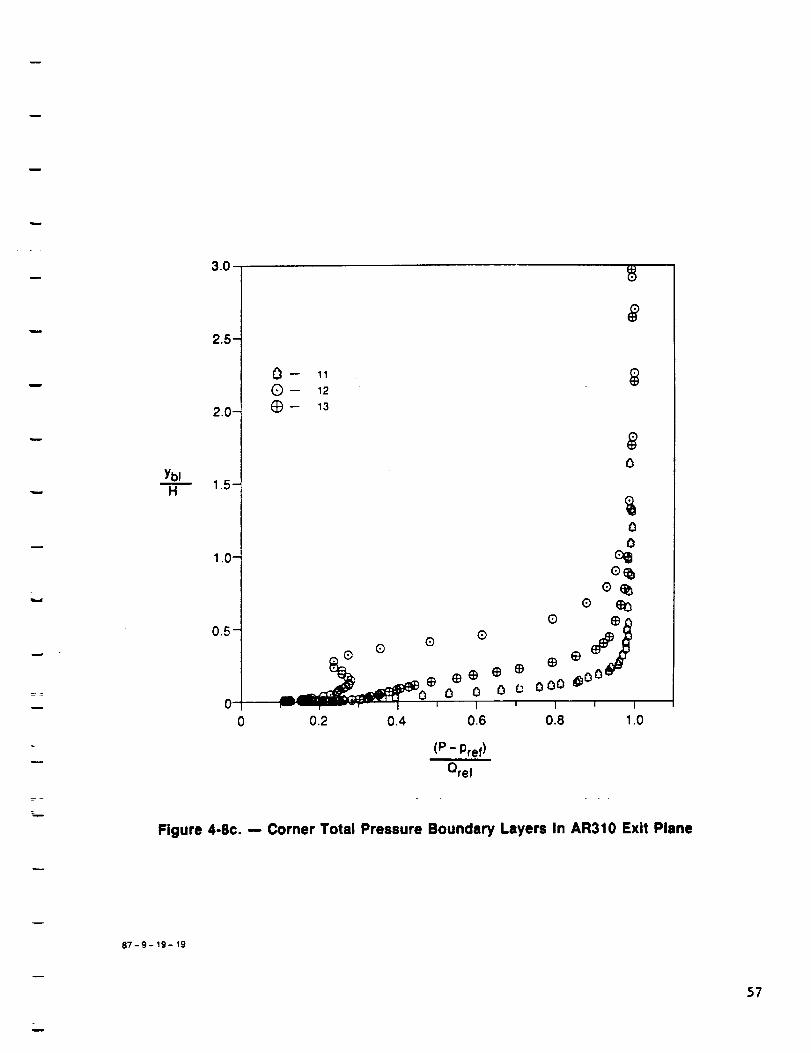
w
!
3.0
2.5--
2.0--
1.0--
0.5--
m 11
(_-- 12
(_)-- 13
Q
® Q
_ -r I _ I
0.2 0.4 0.6
0
00
e_e_
o
ooo _oo0
I _ I
0.8 1.0
(P- Pref)
Qref
Figure 4-8c. -- Corner Total Pressure Boundary Layers In AR310 Exit Plane
87- 9- 19- 19
57

!w
I
m
m
-..,.e
.l-
m
"l-
mmm
o_
co
m
p..r,,.
oo
m
cocoodo¢;>
m
.Zco
,p..
m
coco
o
om
r,.
oo
m
Z
m
co
O
m
c_Oo
m
,r-"
N
_L .Lc_J f"-u') o_o4 u_
m mmm
¢D "-
O O ¸m m
co c_o o4
m w
u')O_¢,)
oi,'°1
Olol :
|._.. x"
7<
o E
.p-ro
m
° ico
• ..Io
¢0
Q
°m
m
o I.I.O
m
,i,m
04OO
m
mm
i
m
zm
w
Im
Im
I
II
m
m
5887-9- 19-67
imm
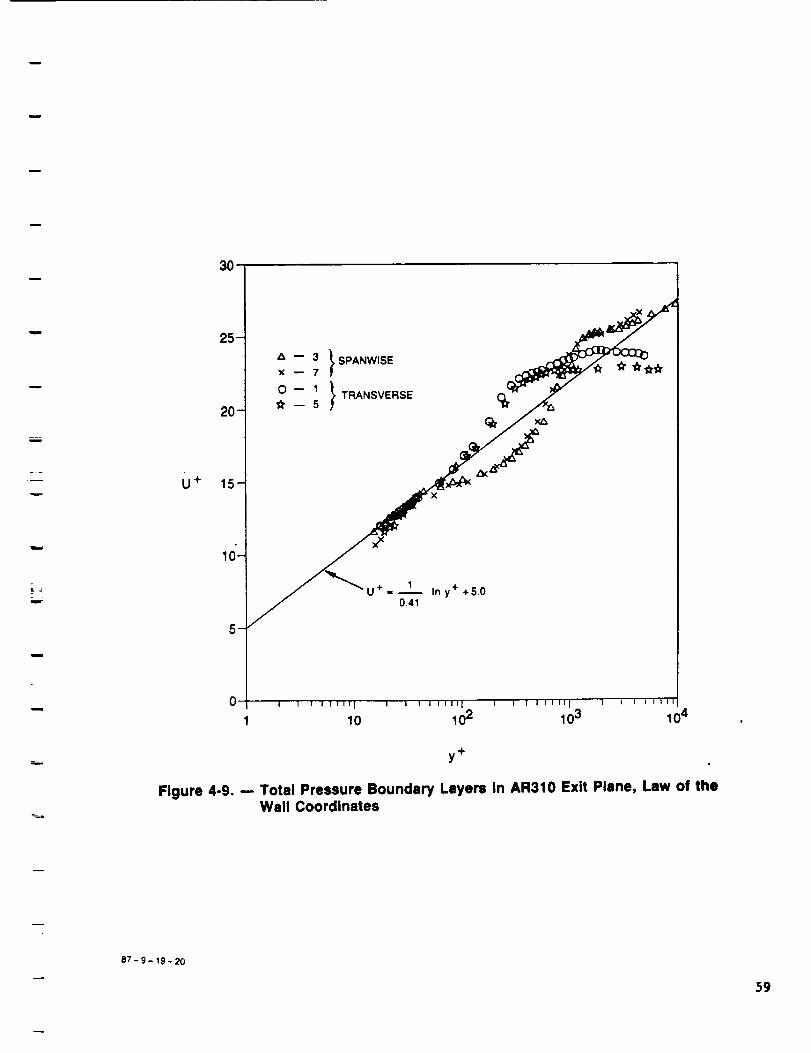
m
H
3O
U +
25-
20-
15
10-
_
U+= 1 Iny+ +5.00.41
0 I I I I lll'l i I I 'I I t111_ I I I I I III I I I I t I III
1 10 102 103 104
y+
Figure 4-9. -- Total Pressure Boundary Layers In AR310 Exit Plane, Law of theWall Coordinates
87- 9- 19- 20
59
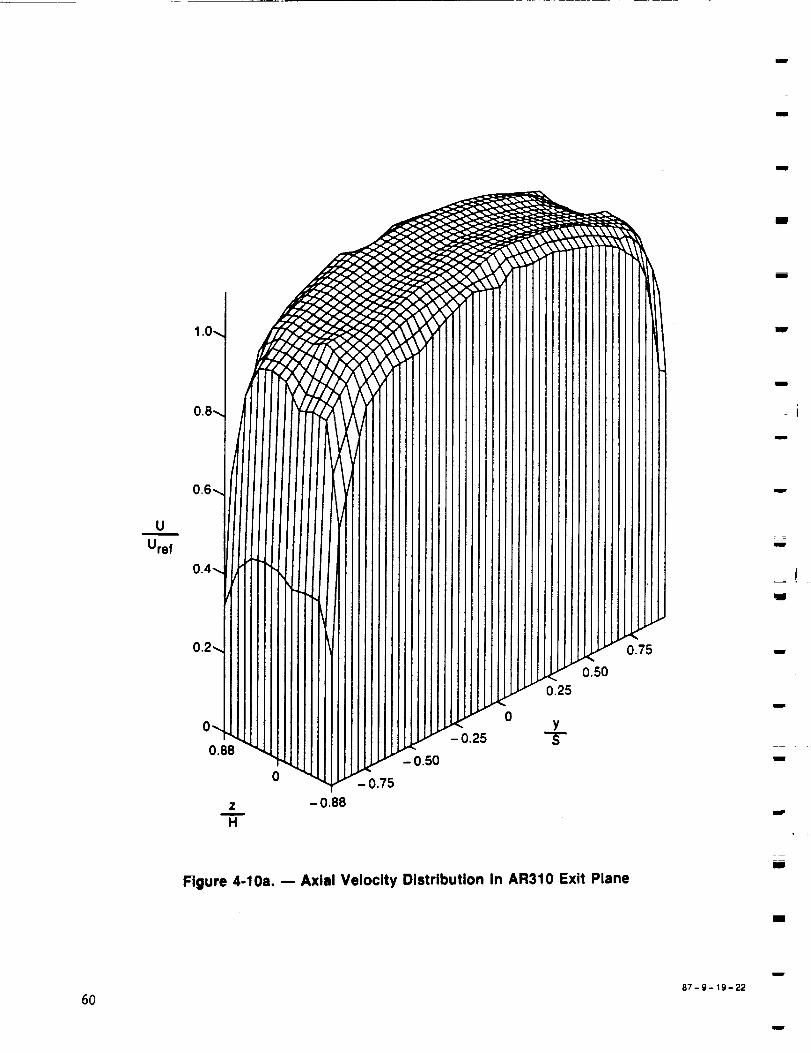
ibm
U
Uref
0.88
Zm
H
0
-0.88
0
0.25
YT
0.50
0.75
m
m
m
m
i
!
I
i
I
Figure 4-10a. -- Axial Velocity Distribution In AR310 Exit Plane
lib
mm
6O87-9- 19-22
m

m
w
w
i
L
r_-
u
87-9- 19-21
I,-Z<l--(3)
Z
0
U.
0£0UJ
z..J
0
t t t I ! I
NJ'I" I
O
O
u
io
I
i
O
ot
I
=_W
=
ii
i
61

62
o
\ \
t
t
f
A
7
t t t t
t t t t
t t t t _ tt t t t
f t t t t t
t f t t
k I..
V Ir _ _ _ I, II,
JO
¢,,J I
LIDI ! !
Nl "
o
I_tt
m
t
m
I,.
,c _..
F' _u
m
__oI
! o
I
I
0!
[
_e
>
0m
U.
IJ
I,2
ILL
87-9-19-24
m
m,
m
J_
mm
i
I
II
m
I :
1ram
g
m
BE
m
m
m,rob
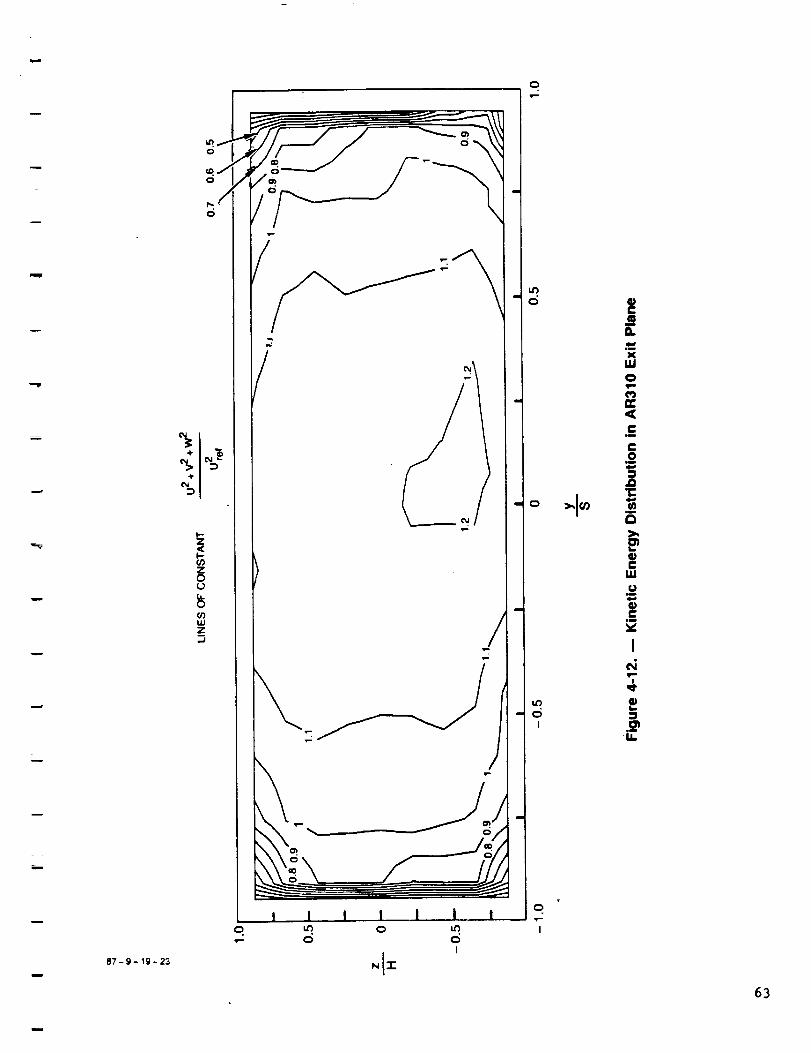
,m-
q
w
m
lira
87-9-19-23
!--
Zo
[,L0
(/)uJz_.J
/
/
o
/
/
I I I I i i t
0I
NiT
o
0
0I
0
I
mm
L
x.10
e"Jm
C
,2
m
a
e-.1
u
¢,i
Ie_
63

mE
01"_
(P- Pref)
Qref
--0.
-0._
0.88
z oH
_w t
p,
gIII
IIII
i i i
0.50
Figure 4-13a. -- Static Pressure Distribution In AR310 Exit Plane
)r
,0
I ii!!! !
I
n
1"0.75
z
P
•= ,
m
m
I
I
u
n
ml=
m
J
U
I
6487-9-19-26
I
mm
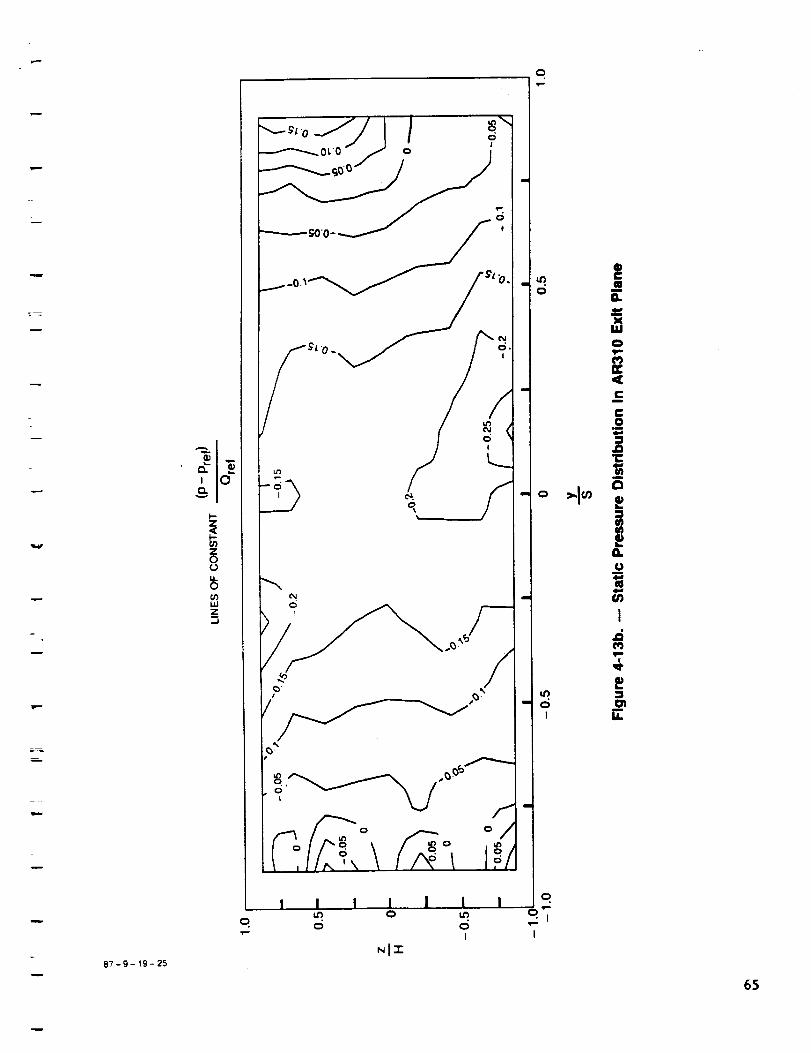
ww_
w,-
w4. 87-9_ _9- 25
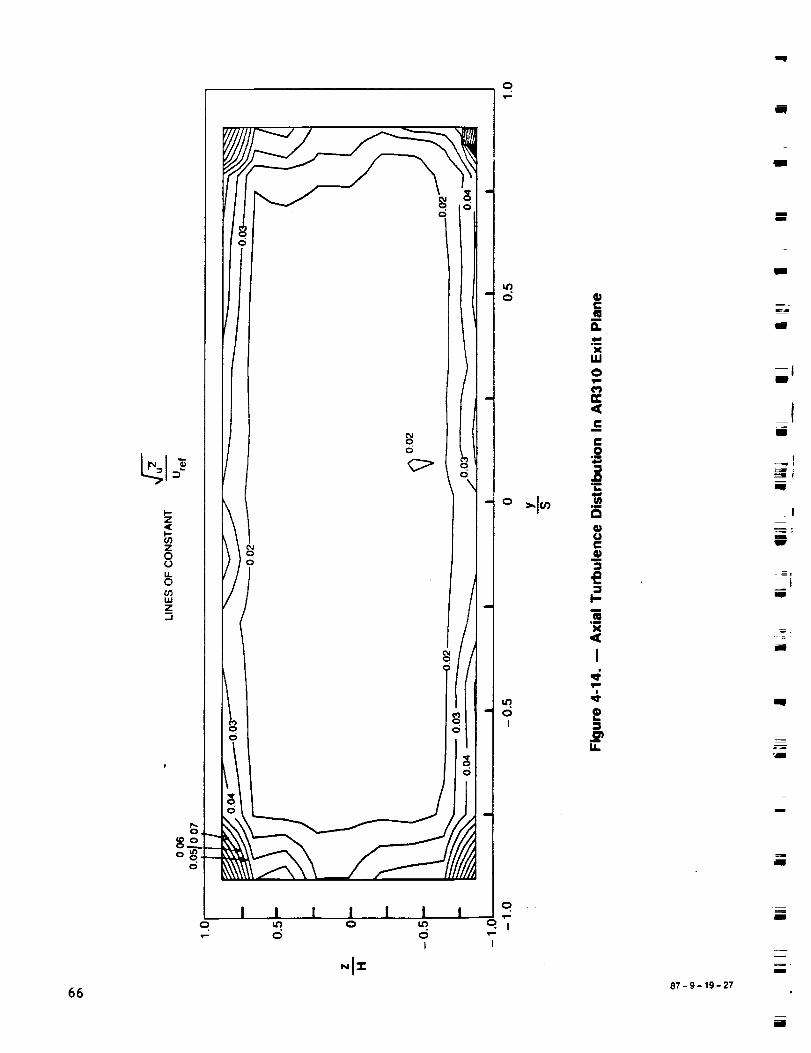
o
ml
mm
u
0CIg
m
IL
xwo
IIc<i-
m
C0
,m
'1=
tDUC
£I,-m
mimX<
I
i
IL
mm
l
I
m
im
I
w
_bm
mW
m
i
6687-9-19-27
m
mm
m
i
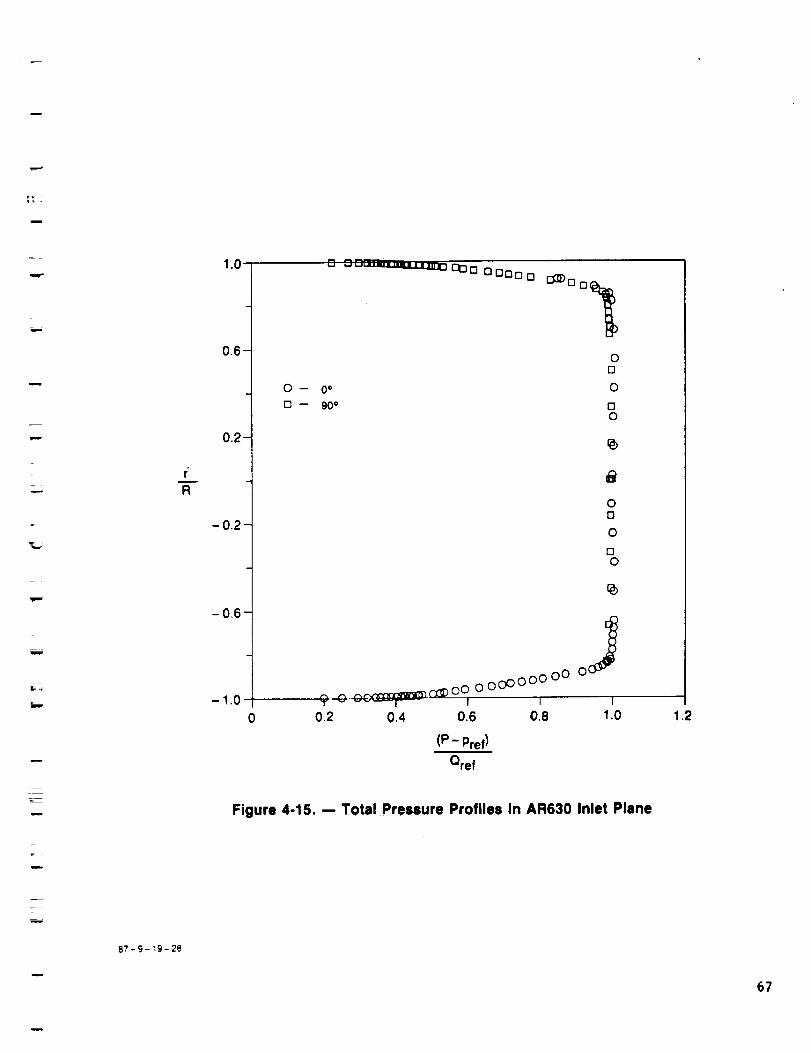
m,--
L_
r
R
1.0
0.6"
0.2"
-02
-06
-1.0
O --
D --
_ "'" '""-_JOO0 0 000130
0 o
90°
0D
0
D0
0[]
0
O0
9 o c_ c_)oO_ o ooOO oo°°_ o7,
0.2 0.4 0.6 0.8 1.0
(P - Pref)
Oref
Figure 4-15. -- Total Pressure Profiles In AR630 Inlet Plane
12
r
87-9 - Ig- 28
67
u
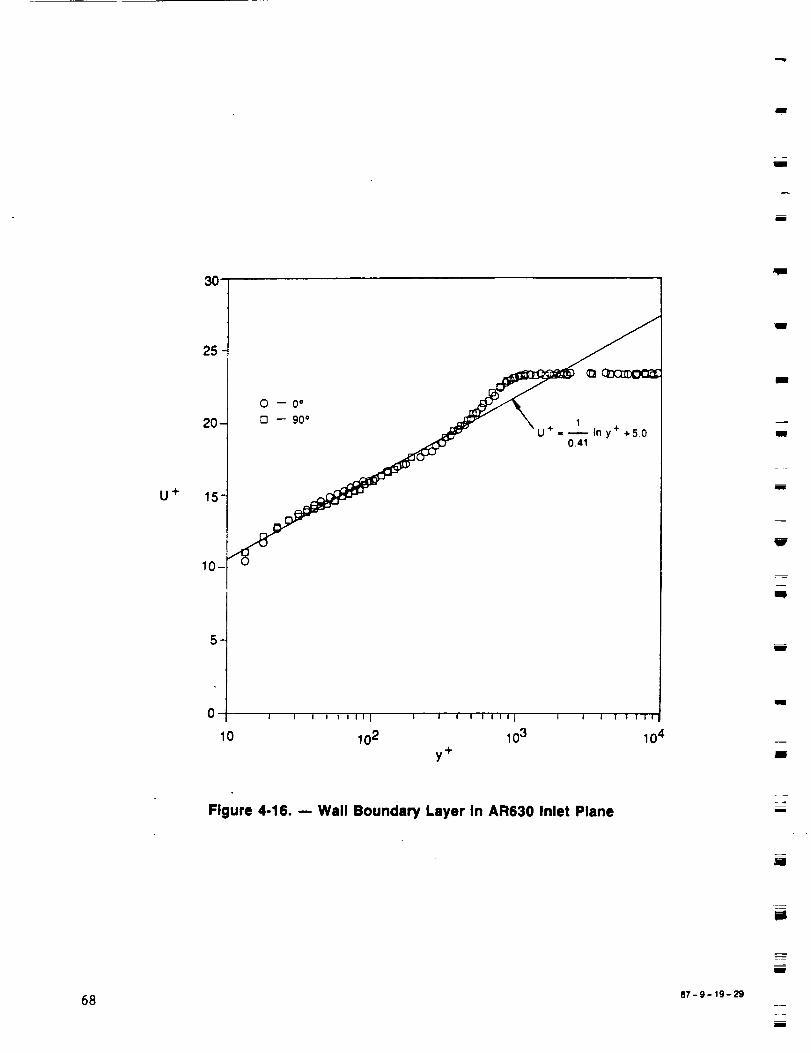
I
U
m
25-
20'
U + 15-
10-
0 -- 0 °
0 -- 90° r_ _,,+ 1 ,_ + __
I0
I I I I I II I I I 1 I I I I I I I I I I t I I I
102 103 104y+
qll
t
m
Ill
m
V
II
m
il
Figure 4-16. -- Wall Boundary Layer In AR630 Inlet Plane m
l
im
68 87-9- 19-29
L--
!
D
m
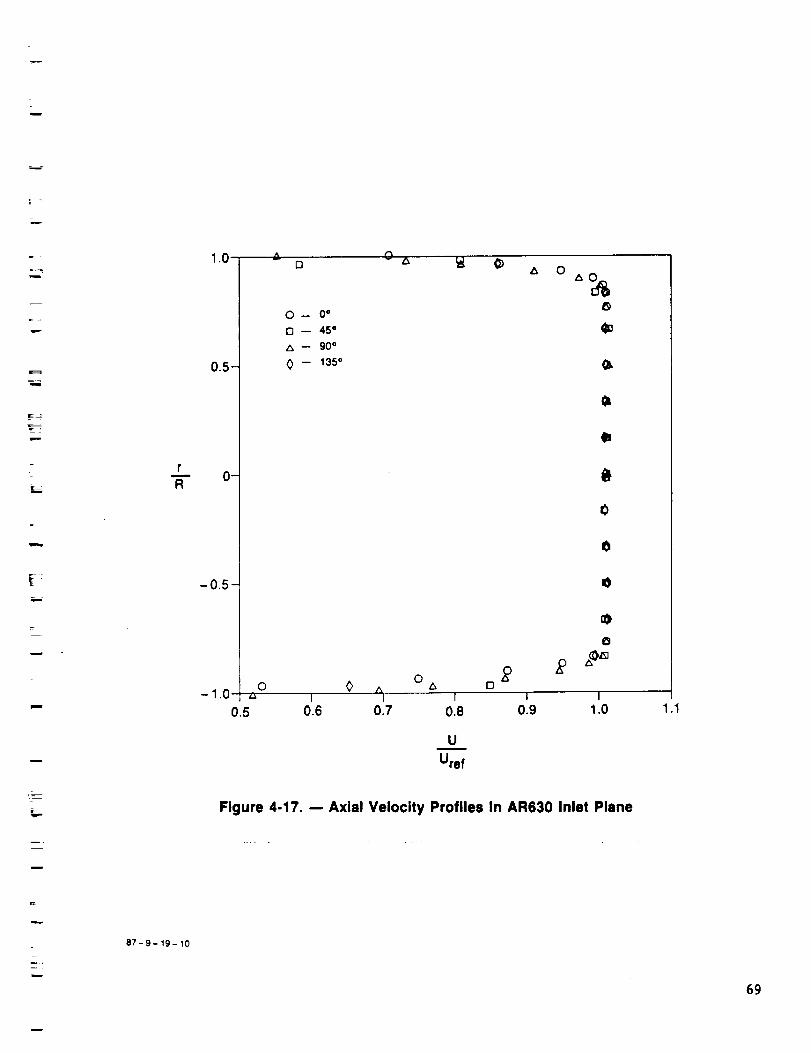
i
m,.,
,.m-,
mm
m
r
R
1.0
0.5--
--
-0.5-
-1.0
A[]
O -- 0 °
Q -- 45 °
-- 90 °
0 -- 135°
O A
o 2
0
°%
4n
8
C
0
z)
O
O
0 A•" l I I I I
0.5 0.6 0.7 0.8 0.9 1.0
U
Uref
Figure 4-17. -- Axial Velocity Profiles In AR630 Inlet Plane
1.1
87-9- 19- 10
6g

rm
R
1.0
0.5_
0_
-0.5-
-1.0
-0.10
O -- 0 e
D _ 45 °
-- 90 u
0 -- 135°
_D
A O
D o
0 Z
On
0_)
C_I_
m(
_X_
I _ _ I
- 0.05 0 0.05
A
W
Uref
0,10
Figure 4-18. -- Transverse Velocity Profiles In AR630 Inlet Plane
t4row
m
g
!
rj
HI
i-!BE'
am
i
1
tw
ii
mm
I
Im
q!F
mm
ID'
7O87-9-19-30

i
L
L
%
IP-
r
R
1.0 % o ,,4 n
0.5--
--
-0.5-
0
G_
0
02 Ao
AO0
0 -- 0 °
[] -- 45 °
-- 90 °
0 -- 135°
0
A D _'A _ ° 0-1.0 I q _ i
0 0.05 0.10 0.15
Uref
Figure 4-19. -- Axial Turbulence Profiles In AR630 Inlet Plane
0.20
=
m87-9- 19-31
71
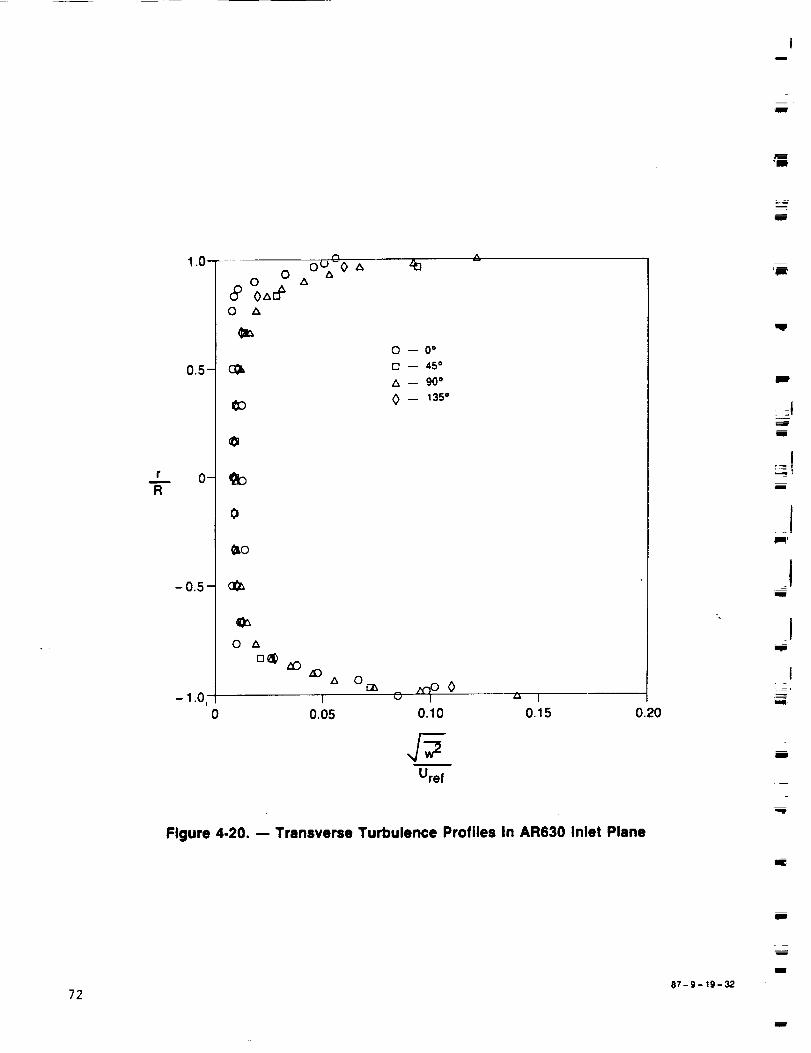
Im
m
'BIm
rm
R
1.0--
0.5--
-0.5
-1.0
_
oOo_O_
0 0 z_
0
0
0
- (_
0 A
A
0 -- 0°
[] -- 45 °
-- 90 °
0 -- 135°
,_)Or.._
I o _ 0 "" I
0 0.05 0.10 0.15
Uref
0.20
Figure 4.20. -- Transverse Turbulence Profiles In AR630 Inlet Plane
m
qF
im
:I
Ill
u
:r
tmm
IIll
I
m
I
m
7287-9-19-32
111
m
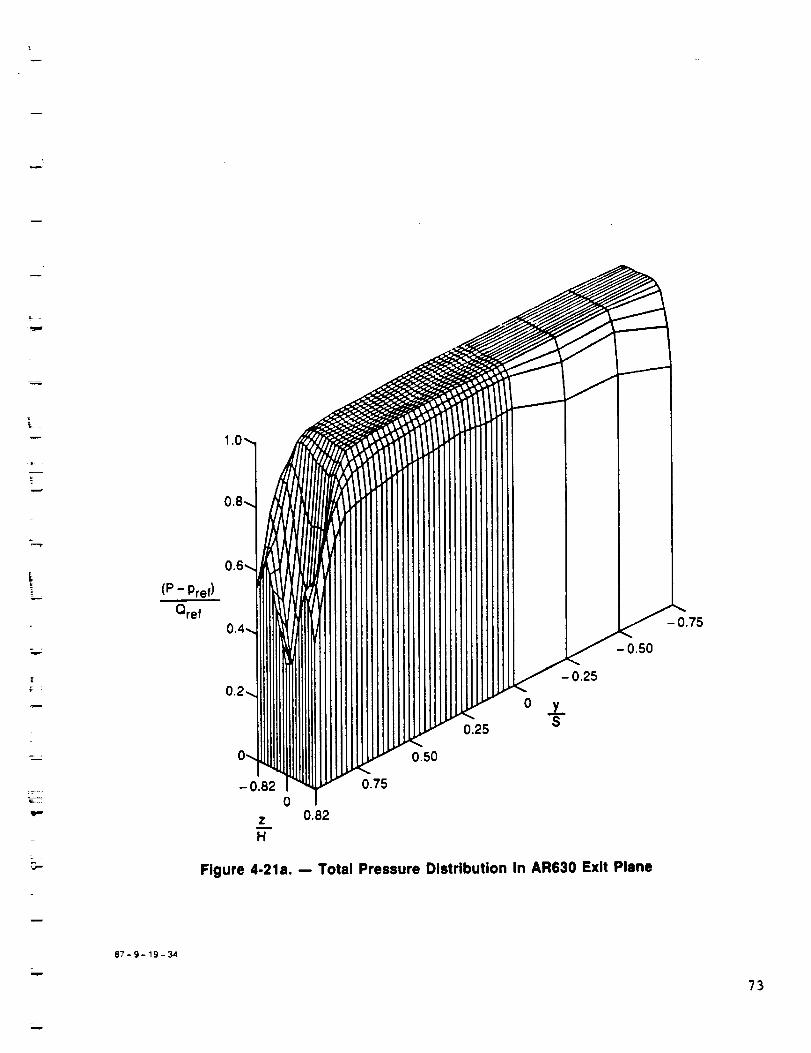
=
w
Lr---r
(P- Pref)
Qref
0z 0.82
H
0.75
0.25
0.50
0 YT
Figure 4-21s. -- Total Pressure Distribution In AR630 Exit Plane
w
87-9-19-34
73
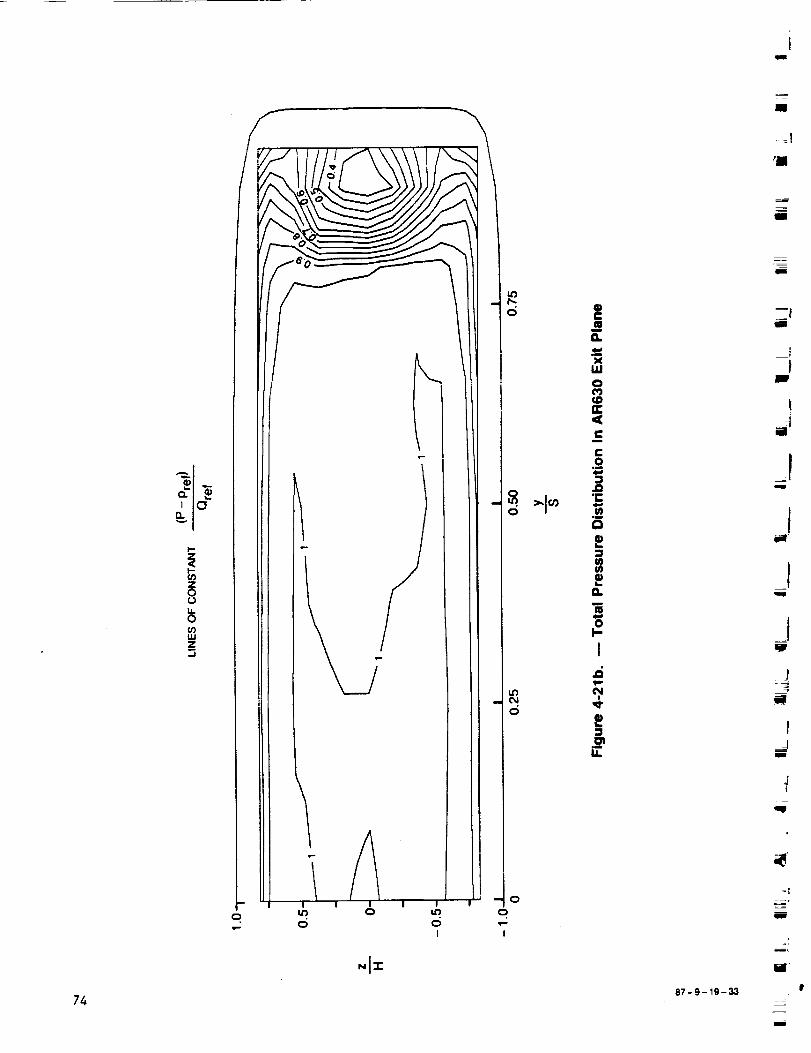
im
74
I-.Z<
u)LUz.J
-I=
u')
O
c;
u_
O
o
Q
I
mi
G.
O
(D
Cm
C._o4_
:3J:"r-4,8
0m
rl
Q)im
G.
mm
OI-
I
O_
U.
87-9- 19-_
i
ZtJw
i
J
Ji
aalB
.IIiml
qlw
a
mm
mI
i
Elm
g
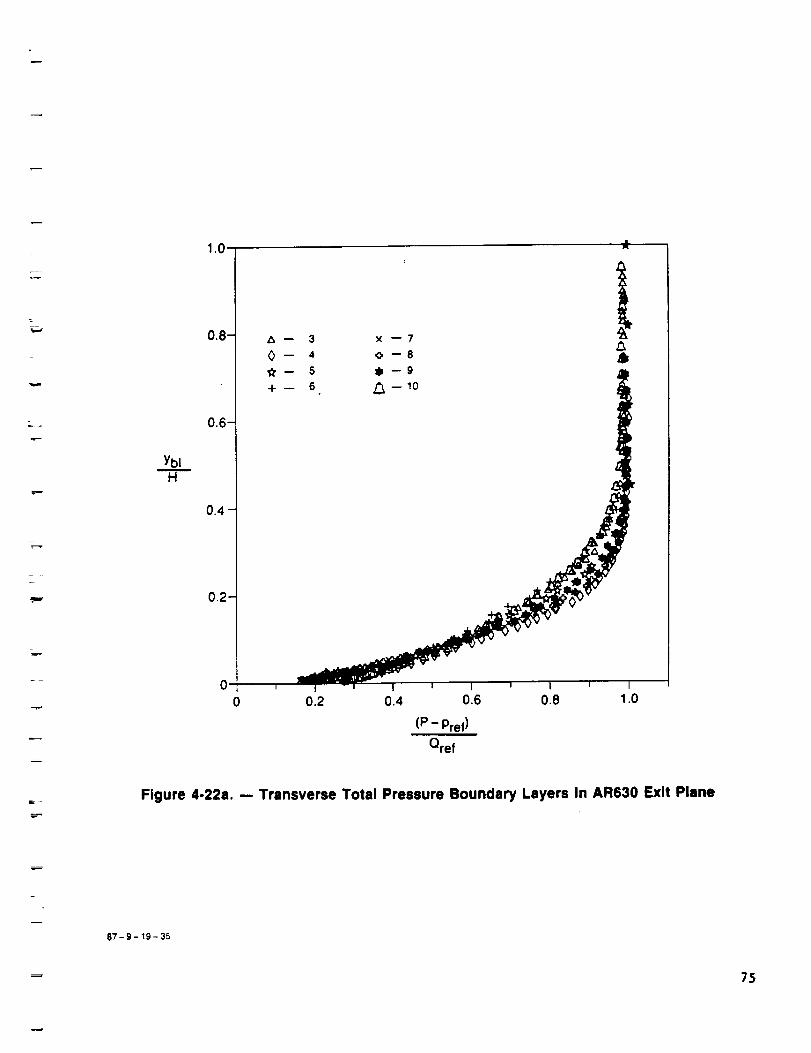
.=
w
Ybl
H
1.0
0.8-
0.6--
-- 3 x --7
O-- 4 o--e
,_.-- 5 ,--9
4- -- 6 _:_ --10
i
T TT r T_r I0 0.2 0.4 0.6 0.8 1.0
(P - Pref)
Qref
Figure 4-22a. -- Transverse Total Pressure Boundary Layers In AR630 Exit Plane
87-9-19-35
75
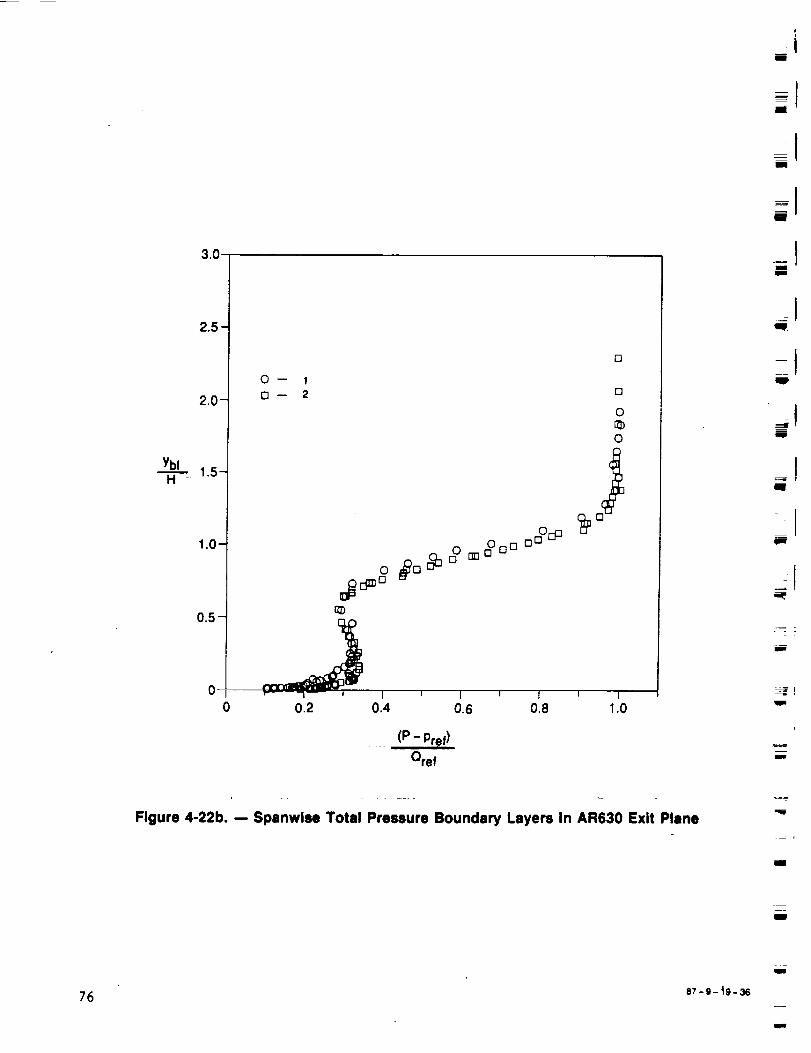
3.0
2.5--
2.0--
D
[]
0
0
1.0- o #0 _ o = o oo oo_
0.5-
o!J0 0.2 0.4 0.6 0.8 1.0
(P - Pref)
Oref
i
I
i
I
i
l
I
I
III
FmI
I
Im
mi
Figure 4-22b. -- Spanwiss Total Pressure Boundary Layers In AR630 Exit Plane'qw
im
I
76 87-9- _9-_
m

=p
_.=_
w
87-9- 19-66
m
e
I
m
-1-
m
m
r_
m
/
¢'_ I
,e.-
m
¢q
O
m
,1¢O
O
m
/
CO,i¢
('9
,p-
ro
f_
¢0 O
O
m
00¢>
,q¢O
m
_L,i¢
,r,-
¢D
U')
I_ ¢'9O
O
m
00
O
O
m
('_1
Ol
m
•I N
i:>,,
I
(_')1
,e- |
=.o
n-
C_ m
Em (D
Em
'e" m
(bm
_¢
__ "(b(D
_0 >'.
_ .J
•- _.,m
P
c_ o
¢0o IQ _o N
_t
0
0
0
0
77
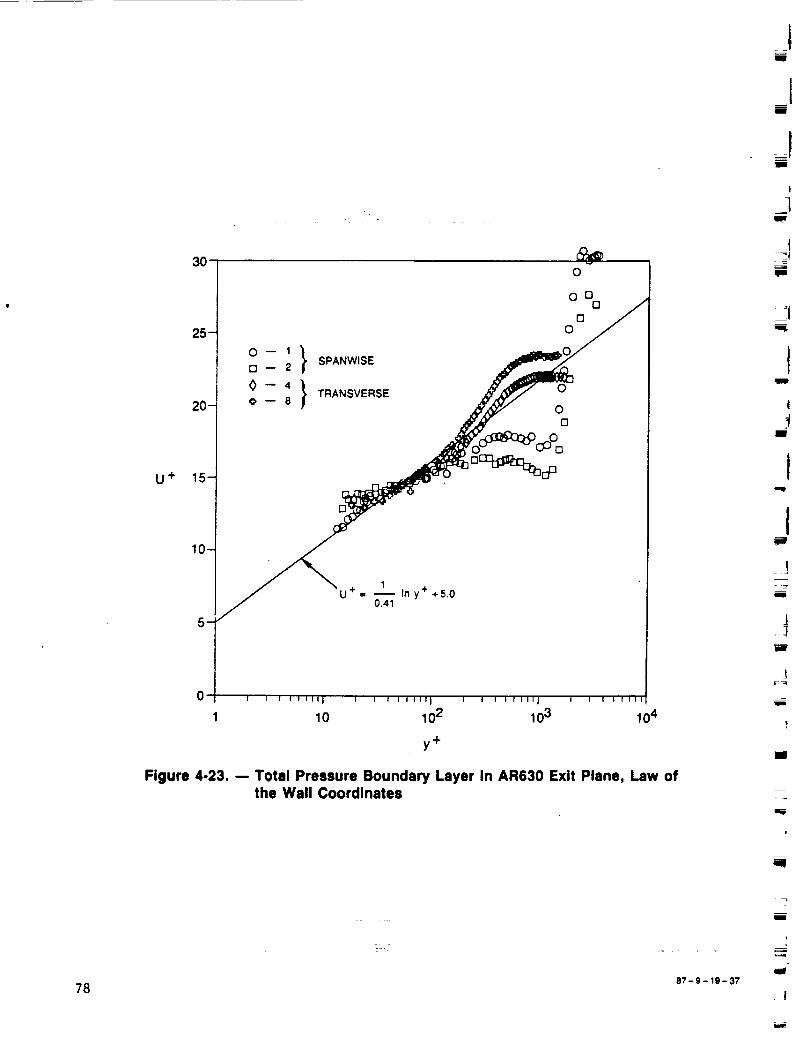
30
25-
20-
U + 15-
10-
_
°-, tQ- 2 SPANWISE
0 -- 4 } TRANSVERSEO 8
1U + = _ In y++5.0
0.41
i
I I I t I IIIj I # f I I I11_ I I I I lillJ i I I I I II1'
10 10 2 103 104
y÷
Figure 4-23. -- Total Pressure Boundary Layer In AR630 Exit Plane, Law ofthe Wall Coordinates
_1n
u
Jw
w
Zi
Im
!
lie
J,mR
!
n
J_j
t
qmm
EE
=_
ml
78
mw
v
!
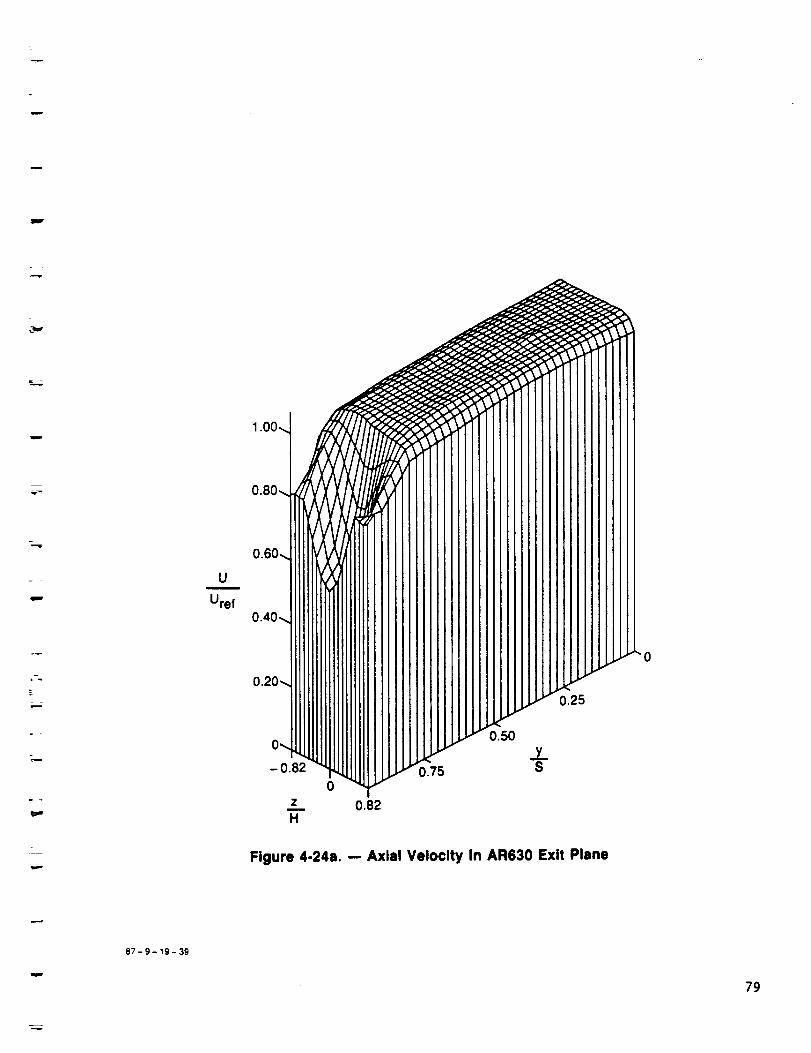
--_
U
Uref
Z
H
0
0.82
0.50
0.25
Figure 4-24a. -- Axial Velocity In AR630 Exit Plane
L
87-9- lg-3g
79

.i
Z<
c/)
u
u_iiiz
tDr,,aa.
X
0
(Drr<C
m
Co
w_
J:,m
L
$0
U0
m
C_
m
mx<
I,4
I
3,9
.I
U
g
v.i,
I
U
t
_i
.ii
I
1II
ill
i
iz
m
i
8O 87-9- 19-38
Mm
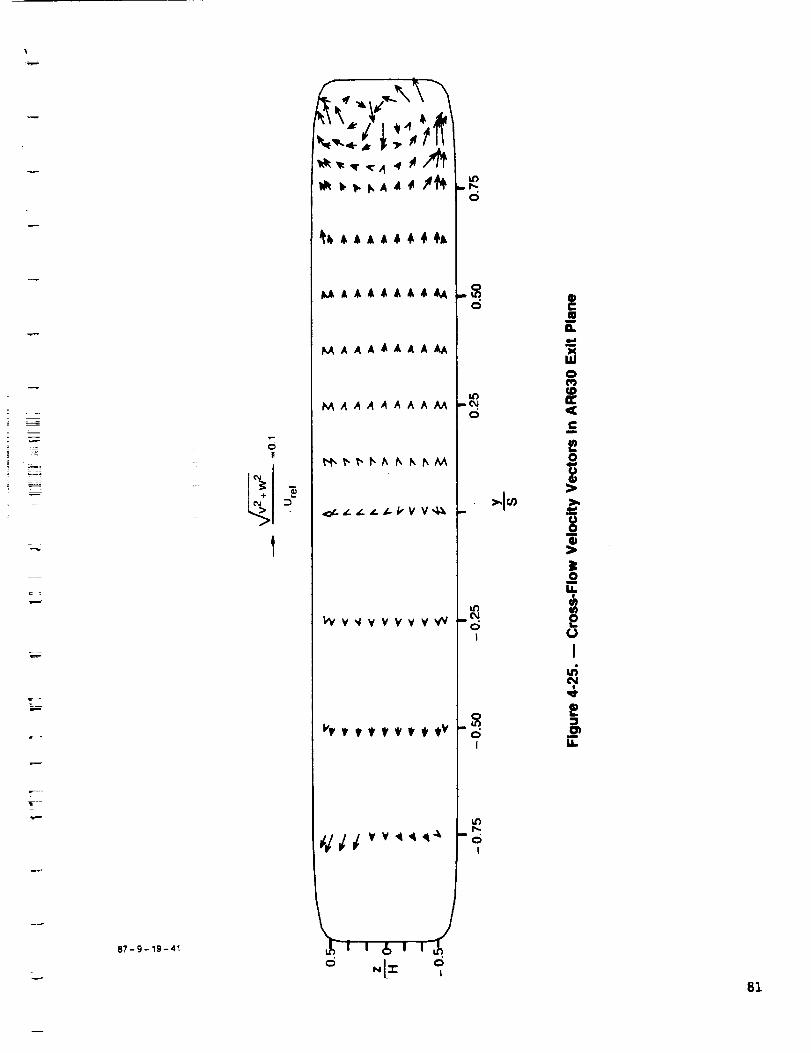
87-9-19-41
o
If
_AAA_AA_
M AAA_AAA AA
MAAAAAAA_
kVv,_ VvvvvW
_wWWWWw_ v
N I_ oL I
..5__5
,=, O,J0
tt')nod
c_I
0I
i,ni',,,,,,
I
|E=I,U
o
F,!
0
Iu,,;@4
|
n-,
81

82
_i _
I.-
Z
<I--¢/)Z
0(3
0(/)IJJ
Z
_t
q
o
II
o
o
.IT
ZI
| rm
UJ
L_
q)C : L; =
UJ _--P
u uq)C
m
U.
q
m
m
87-9-19-40
mm
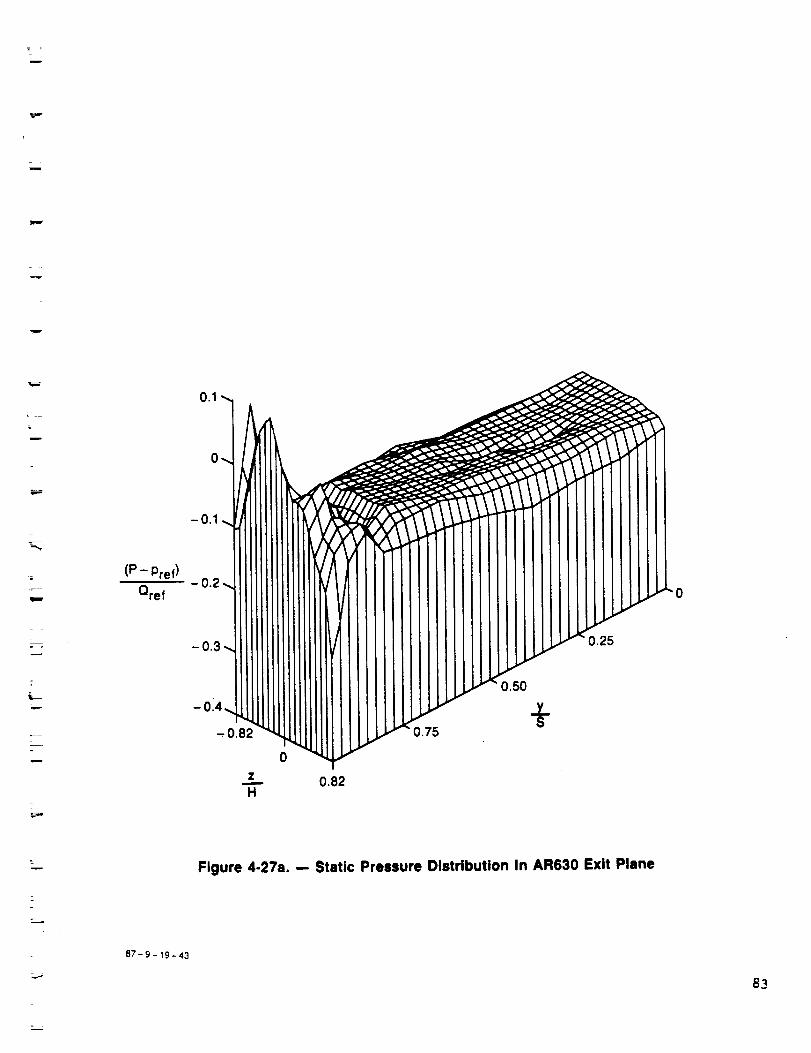
===.
m
=
r
(P - Pref)
Qref
0
0.82H
0.50
Figure 4-27a. -- Static Pressure Distribution In AR630 Exit Plane
87-9- 19-43
83

84
I..-
z<
O(nuJ
_z,_1
oI !
q
I
o
I
87-9-19-42
m
mm
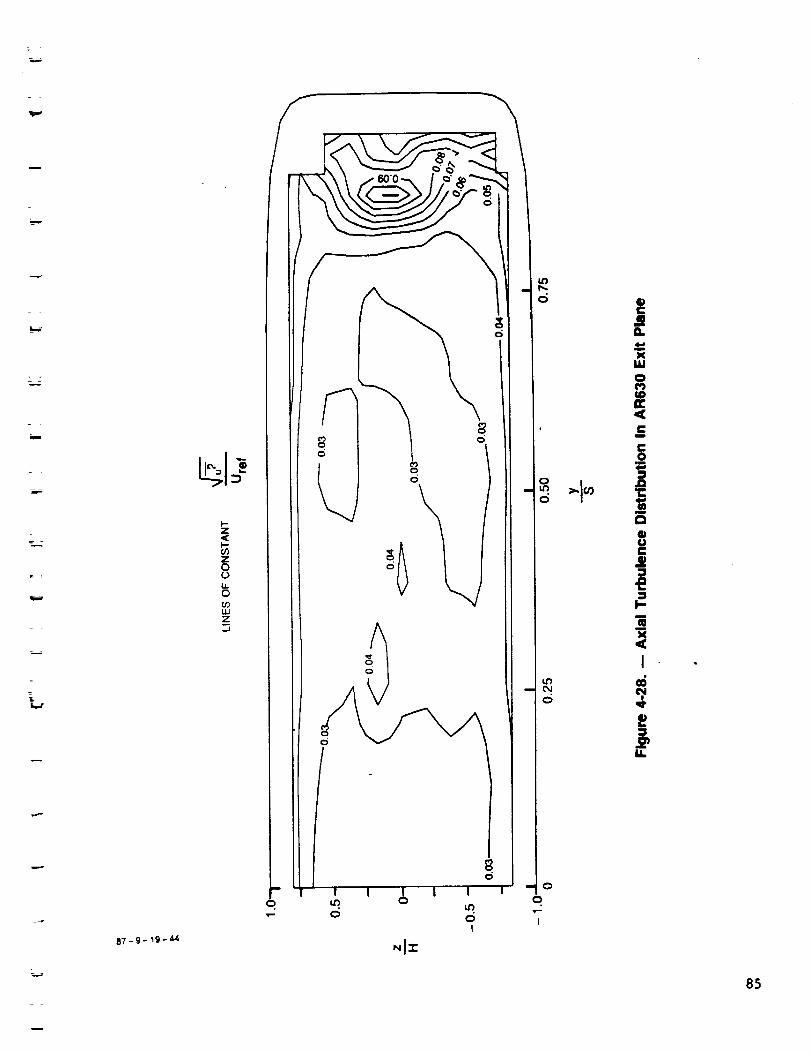
=
u
w
m
87-9-19-44
0¢,0IJJ
Z
..I
m
o
0
o
o
I
8_

86 87- 9- 19-45=--
iml

%
==_
w
=
w
b
_I
87-9- 19-46
aO
0
UJ
I
II
Z
it
0
UJ
_.g..,,I
87
1ram
m
mm
u
U
m
_f
i
_p
IID
L_imw
m
_ti
f"
J
qll
Ill
m
I

--" UTRC87-41
OtAPTER $
CONCLUSIONS
. =
w
s- :
Detailed data sets of the inlet and exit planes of two transition ducts,
designated AR310 and AR630, have been obtained at low subsonic speeds (U e f -30.5 m/set) using total pressure traverses and non-intrusive laser veloclmetry
measurements of three velocity components. The inlet flows had uniform, swirl-
free velocity profiles with thin turbulent boundary layers (6995/D = 0.I0) andturbulence levels on the order of two percent of the freestream velocity.
Surface flow visualization showed that both ducts were unseparated throughout
their transition sections.
The cross flows in the exit plane of each duct were small and were directed
predominantly outward toward the sidewall. Maximum cross-flow velocities were
0.12 Ure f for the AR310 duct and 0.11Ure f for the AR630 duct.
Total pressure distributions showed the flows to be symmetric in each duct.
Axial velocity distributions in the exit plane were much flatter in the AR630
duct than the AR310 duct indicating that the flow had not completely expanded to
fill the exit duct uniformly in the shorter AR310 duct prior to reaching the exit
plane. The continuing expansion of the flow into the exit duct caused the
outward cross flows.
The flow distributions differed significantly near the sidewalls of each
duct. The sidewall boundary layers in the AR310 duct were relatively thin
whereas the AR630 duct sidewall boundary layers were thickened by an axial vortex
pair which transported low momentum fluid from the sidewalls into the core flow
along the duct semi-major axis.
The fluid dynamics which created the sidewall vortex pair in the high
aspect ratio AR630 duct are illustrated in Fig. (5-I). As shown in the figure,
the streamtube near the sidewall of the transition duct approximates the shape of
an S-duct. Towne and Schum (Ref. 20) have shown that the secondary flow pattern
in an S-duct is initiated in the first bend where the higher velocity flow in the
core flow moves away from the inner wall due to centrifugal force. This flow
pattern results in lower static pressure along the inner wall (i.e. sidewall of
transition duct) than along the adjacent walls (i.e. top and bottom walls of
transition duct). The resulting pressure field creates a recirculation pattern
within the boundary layers along the top and bottom walls toward the sidewall.
At the inflection point of the S-duct a vortex pair has been formed. In the
second bend of the S-duct, the pressure forces are reversed and the strength of
the vortex pair may be diminished.
PRECEDING FAGE _,:_,_ _T FILMED89

UTRC87-41
In the AR630 transition duct, however, the duct shape becomes nearly
rectangular between the first and second bends in the sidewall causing the vortex
pair to be concentrated and strengthened. Further assisting the strengthening of
the vortex pair is the natural tendency of a flow in a straight rectangular duct
to form corner vortices which induce flow to move from the sidewalls toward the
core flow along the semi-major axis (Ref. 15). Each of these effects contributes
to the vortex patterns in the AR630 exit plane.
Flow in the lower aspect ratio AR310 duct does not have the same
contribution from vortex concentration and rectangular duct corner vortex
development. Thus, the reduced strength of the vortices in the AR310 exit plane
may result from the counteracting pressure forces at the second bend of the
transition duct sidewall. Detailed surveys within the transition section are
necessary to better define the secondary flow development within circular-to-
rectangular transition ducts.
It is therefore concluded that secondary flows can play an important part in
the fluid dynamics of transition ducts and needs to be addressed in computational
analysis. The strength of the secondary flows depends on both the aspect ratio
and relative axial duct length.
I
Mm
i
u
u
g
l
fq
w
m
W
U
U
90I
u
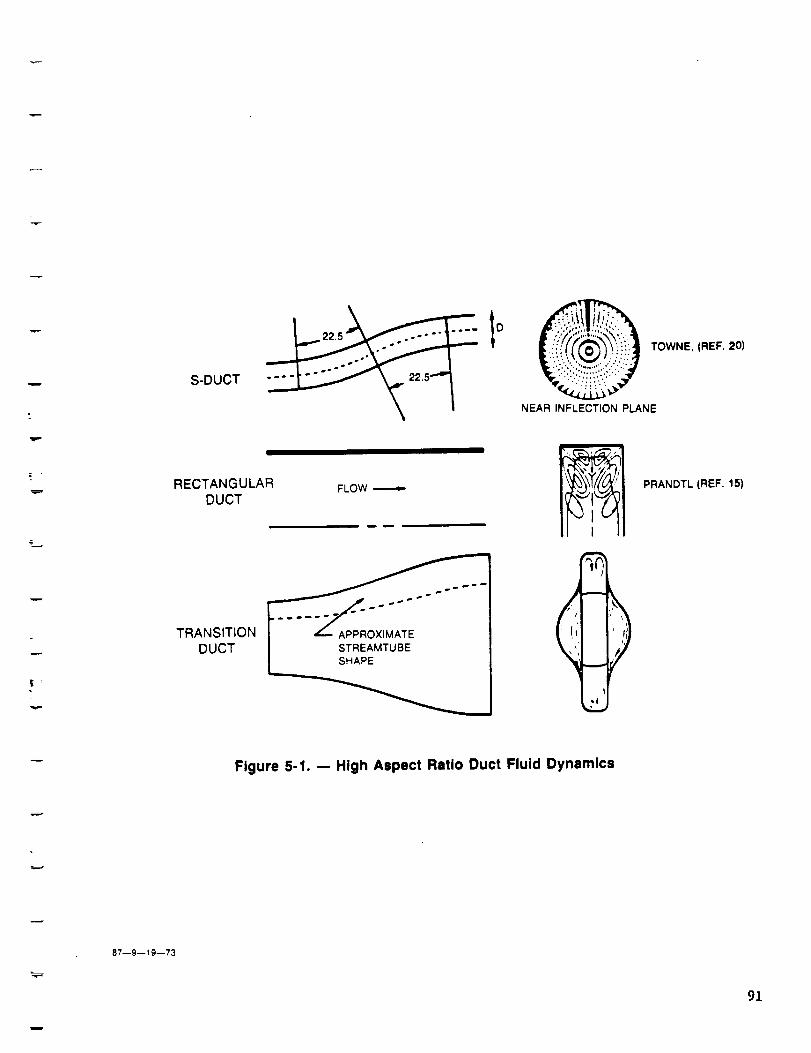
wS-DUCT
RECTANGULARDUCT
FLOW
TRANSITION .... _O)dM_:E "''° ....
DUCT
NEAR INFLECTION PLANE
TOWNE, (REF. 20)
,d
PRANDTL (REF 15)
Figure 5-1. -- High Aspect Ratio Duct Fluid Dynamics
87--9--19--73
91
_J
zl
I
w
I
I
iw
w
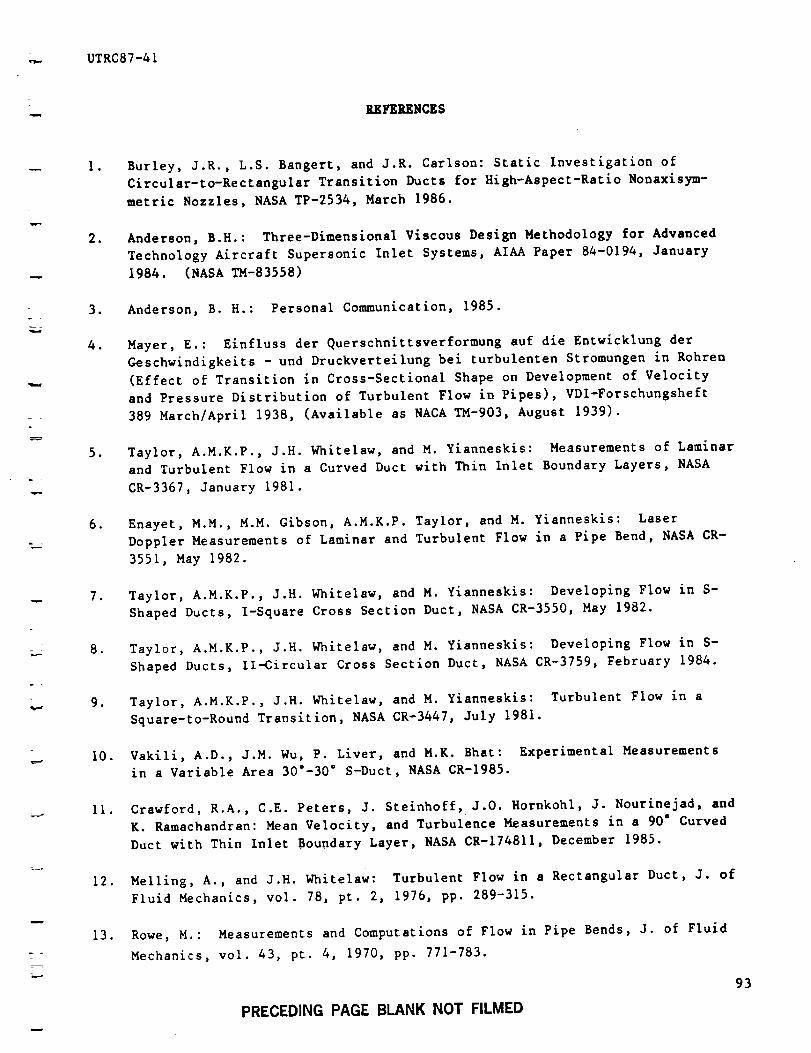
_- UTRC87-41
t k
REFERENCES
_ I.
2.
- 3.
4.
5.
r
=
.
,
8.
9.
I0.
ii.
12.
13.
Burley, J.R., L.S. Bangert, and J.R. Carlson: Static Investigation of
Circular-to-Rectangular Transition Ducts for High-Aspect-Ratio Nonaxisym-
metric Nozzles, NASA TP-2534, March 1986.
Anderson, B.H.: Three-Dimensional Viscous Design Methodology for Advanced
Technology Aircraft Supersonic Inlet Systems, AIAA Paper 84-0194, January
1984. (NASA TM-83558)
Anderson, B. H.: Personal Communication, 1985.
Mayer, E.: Einfluss der Querschnittsverformung auf die Entwicklung der
Geschwindigkeits - und Druckverteilung bei turbulenten Stromungen in Rohren
(Effect of Transition in Cross-Sectional Shape on Development of Velocity
and Pressure Distribution of Turbulent Flow in Pipes), VDI-Forschungshef_
389 March/April 1938, (Available as NACA TM-903, August 1939).
Taylor, A.M.K.P., J.H. Whitelaw, and M. Yianneskis: Measurements of Laminar
and Turbulent Flow in a Curved Duct with Thin Inlet Boundary Layers, NASA
CR-3367, January 1981.
Enayet, M.M., M.M. Gibson, A.M.K.P. Taylor, and M. Yianneskis: Laser
Doppler Measurements of Laminar and Turbulent Flow in a Pipe Bend, NASA CR-
3551, May 1982.
Taylor, A.M.K.P., J.H. Whitelaw, and M. Yianneskis: Developing Flow in S-
Shaped Ducts, 1-Square Cross Section Duct, NASA CR-3550, May 1982.
Taylor, A.M.K.P., J.H. Whitelaw, and M. Yianneskis: Developing Flow in S-
Shaped Ducts, ll-Circular Cross Section Duct, NASA CR-3759, February 1984.
Taylor, A.M.K.P., J.H. Whitelaw, and M. Yianneskis: Turbulent Flow in a
Square-to-Round Transition, NASA CR-3447, July 1981.
Vakili, A.D., J.M. Wu, P. Liver, and M.K. Bhat: Experimental Measurements
in a Variable Area 30"-30 ° S-Duct, NASA CR-1985.
Crawford, R.A., C.E. Peters, J. Steinhoff, J.O. Hornkohl, J. Nourinejad, and
K. Ramachandran: Mean Velocity, and Turbulence Measurements in a 90" Curved
Duct with Thin Inlet Boundary Layer, NASA CR-174811, December 1985.
Melling, A., and J.H. Whitelaw: Turbulent Flow in a Rectangular Duct, J. of
Fluid Mechanics, vol. 78, pt. 2, 1976, pp. 289-315.
Rowe, M.: Measurements and Computations of Flow in Pipe Bends, J. of Fluid
Mechanics, vol. 43, pt. 4, 1970, pp. 771-783.
93
PRECEDING PAGE BLANK NOT FILMED

UTRC87-41
14. Bansod, P., and P. Bradshaw: The Flow in S-Shaped Ducts, Aeronautical
Quarterly, vol. 23, May 1972, pp. 131-140.
15. Prandtl, L.: Turbulent Flow, NACA TM-435, October 1927.
16. Gutmark, E., and K.C. Schadow: Azimuthal Instabilities and Mixing Charac-
teristics of a Small Aspect Ratio Slot Jet, AIAA Paper 87-0486, January
1987.
17. Gutmark, E., K.C. Schadow, T.P. Parr, D.M.Parr, and K.J. Wilson: Combustion
Enhancement by Axial Vortices, AIAA Paper 87-1831, June 1987.
18. Roberts, D.W., and C.K. Forester: A Parabolic Computational Procedure for
Three-Dimensional Flows in Ducts with Arbitrary Cross-Sections, AIAA Paper
75-143, January 1978.
19. Anderson, B.H., K.K. Muramoto, and R. Levy: A Study of Three-Dimensional
Viscous Flow within High Aspect Ratio Transition Ducts, AIAA Paper 85-0085,
January 1985.
20. Towne, C.E., and E.F. Schum: Application of Computational Fluid Dynamics to
Complex Inlet Ducts, AIAA Paper 85-1213, July 1985.
21. Hama, F. R.: An Efficient Tripping Device, Journal of the Aeronautical
Sciences, Vol. 24, March 1957, pp. 236-237.
22. Patrick, W. P.: Error Analysis for Benchmark Fluid Dynamic Experiments,
Part I: Error Analysis Methodology and the Quantification of Laser
Velocimeter Error Sources, Report R85-151772, United Technologies Research
Center, East Hartford CT, 1985.
23. Coles, D. E.: The Turbulent Boundary Layer in a Compressible Fluid, Rand
Corp. Report R-403-PR, September 1962.
24. Klebanoff, P. S.: Characteristics of Turbulence in a Boundary Layer with
Zero Pressure Gradient, NACA Rep. No. 1247, 1955.
25. Kooi, J. W.: Influence of Free-Stream Mach Number on Transonic Shock-Wave
Boundary-Layer Interaction, Report No. NLR MP 78013 U, National Aerospace
Laboratory, Amsterdam, The Netherlands, May 23, 1978.
26. Patrick, W. P.: Flowfield Measurements in a Separated and Reattached Flat
Plate Turbulent Boundary Layer, NASA CR-4052, March 1987.
g
q
pmm
W
m
mm
94
C_-2

q_r TABLE ICOEFFICIENTS FOR SUPERELLIPSE EQUATION
AR310
x/R rady radz 17Y f/z AREA
0.00 1.0000000 1 . 0000000 2.0000000 Z. 0000000 1.00000.08 1.0024099 0.9975954 2. 0000000 2. 0000000 1.00000.16 1.0094080 0.9906801 2.0000000 2.0000000 1.00000.24 1.0206738 0.979?446 2.0000000 2.0000000 1.00000.32 1.0)593_ 0.9653125 2.0000000 2.0000000 1.00000.40 1.05&9421 0.9479194 2.0000000 2.0000000 1.00000.48 1.0774775 0.9280938 2.0000000 2.0000000 1.00000.56 1.1033373 0.9063&09 2.0000000 Z.0000000 1.00000.64 1.1320353 0.8829026 2.0027151 2. 0027151 1.00000.72 I. 161/,4,18 0.8568226 2. 0253842 2.0_38&2 1.00000.80 1.1923180 0.8294398 2. 050650& 2.059650& 1.08000.88 1.22&2432 0.8011267 2.1072369 2.1072369 1.00000.96 1.2567968 0.7722556 2.1712093 2.1712093 1.00001.04 1. 2895613 0.7631985 2.2551298 2.2551296 1.00001.12 1. 3221t/,9 0.7143273 2.3637581 2.3637581 1.00001.20 1.3540/,01 0.6860142 2.503593/, 2.503593/, 1.00001.28 1.3849163 0.6586313 2.6835108 2.6835108 1.00001.36 I .&143238 0.6325510 2.9163589 2.9163589 1.00001.I,d; I._,18';30 0.6081454 3.220_03& 3.2209034 1.00001.52 I . 4670544 0.5857365 3.6254110 3.625/,110 1.00001.60 1 ./,895382 O. 5651K,6& /,.1731195 4.1731195 1.00001.68 1.5088749 0.5486974 4. 930_76 6.930/,876 1.00001.76 1. 52_&&9 0.53&71 l& S .9920216 5.9920216 1.00001.8/, 1 . 536/,285 0.5242606 7.U,25745 7./,/,25745 1.00001.92 1.5/,38070 0.5177172 9.112/,592 9.112&592 1.00002.00 1.5_3591 0.515&53_ I0.0000000 I0.0000000 1.0000
AR630
x/R rady radz _7y _z AREA
0.00 I. 0000000 I. 0000000 2. 0000000 2. 0000000 1. 00000.24 1.0007143 0.9996173 2.0000000 2.0000000 1.00030.48 1.0053711 0.9971241 2. 0000000 2._0 1.00250.72 1.0169945 0.9909001 2.0000000 2.0000000 1.00770.96 1.0376930 0.9798167 2.0000000 2.0000000 1.01671.20 1. 0687437 0.9631907 2.0000000 2. 0000000 1.02941.44 1.1106777 0.9/,07371 2. 0000000 2. 0000000 1.0_91.68 1.1633711 0.9125222 2.0000000 2. 0000000 1.06161.92 1.2261314 0.8789169 2._ 2.0000000 1.07772.16 1.2977_8 0.8405501 2.0000000 2.0000000 1.09092.40 1 . 3767633 0.7982608 2.0000000 2. 0000000 i .09902.6/, 1.4611921 0.7530529 2.0000000 2.0000000 1.10042.M 1 . 5489798 0. 706_72 2. 0000000 2. 0000000 1.09373.12 1.63_ 13 O. 658_340 2. 0000000 2. 0000000 1.07843.36 I. 7256889 0.611/,279 2. 0000000 2. 0000000 1.05513.60 1.8101177 0.5662202 2.0800000 2.0000000 1.02493.84 1 . 8890963 0.5239310 2. 0551491 2.0551491 1.0000&.08 1.9607496 0.&855640 2.3025522 2.3025522 1.0000&.32 2.0235100 0.4519587 2.6555567 2.6555567 1.0000&.56 2.0762043 0.4237437 3.16&6576 3.1646576 1.0000&.80 2.1181374 0.4012903 3.9101000 3.9101000 1.00005.0& 2.1&91880 0.38&6_3 5. 0090160 5. 0090160 1.00005.28 2.1698866 0.3735808 6.5_)5&33 6.5?05433 1.00005.52 2.1815100 0.5673569 8.&278&31 8.&271K,31 1.00005.76 2.18616/,9 0._k_2 9.7/,14103 9.T&l&lO] 1.00006.00 2.1868830 0. _44805 9.9999752 9.9999752 1.0000
87- 9- 19- 69
95
w
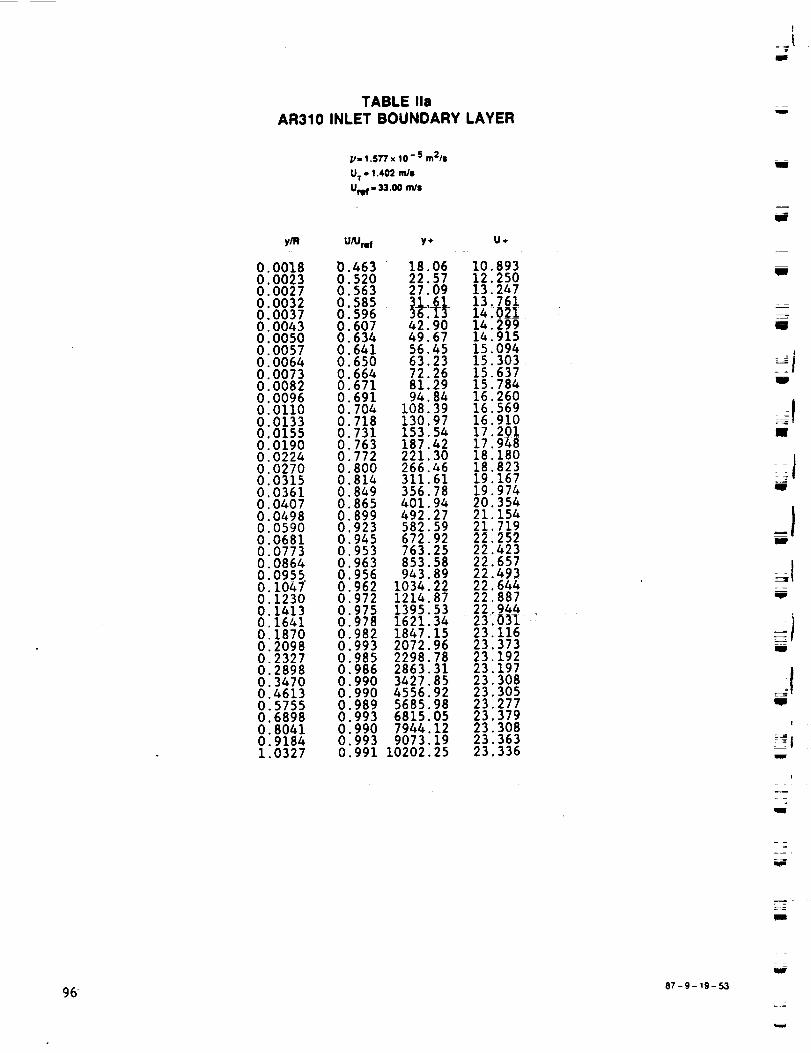
I
TABLE lla
AR310 INLET BOUNDARY LAYERg
p-1 .ST/x 10- 5 m2/s
UT - 1.402 mJs
Umf- 33.00 m/s
Y_ U_mf
0.0018 0.4630.0023 0.5200.0027 0.5630.0032 0.5850.0037 0.5960.0043 0.6070.0050 0.6340.0057 0.6410.0064 0.6500.0073 0.6640.0082 0.6710,0096 0.6910.0110 0.7040.0133 0.7180.0155 0.7310.0190 0.7630.0224 0.7720.0270 0.8000.0315 0.8140.0361 0.8490.0407 0.8650.0498 0.8990.0590 0.9230 0681 0.9450 0773 0.9530 0864 0.9630 0955 0.9560 I04_ 0.9620 1230 0.9720 1413 0.9750 1641 0.9780 1870 0.9820 2098 0.9930 2327 0.9850 2898 0.9860 3470 0.9900 4613 0.9900.5755 0.9890.6898 0.9930.8041 0.9900.9184 0.9931.0327
y÷
18.0622.5727.0931.6136.1342.9049.6756.4563.2372.2681.2994.84
108.39130.97153.54187.42221.30266.46311.61356.78401.94492.27582.59672.92763.25853.58943.89
1034.221214.871395.531621.341847.152072.962298.782863.313427.854556.925685,986815.057944.129073.19
0._91 10202.25
U+
10.89312.25013.24713.76114.02i14.29914.91515.09415.30315.63715.78416. 26016.56916.91017.20117.94818.18018.82319.16719.97420. 35421. 15421.71922.25222.42322.65722.49322,64422.88722. 94423.03i23.11623,37323.19223.19723. 30823.30523.27723.37923.30823.36323.336
i
w
=--
W
W
a
m
J
o)I
U
U
t
m
i
=, =
L-- •
W
m
9687-9-19-53

TABLE lib
AR630 INLET BOUNDARY LAYERS
Y_
O.O0200.00200.00270.00330.00400.00470.00530.00600.00670.00770 00870 00970 01070 01170 01300 01430 01570.01900,02230.02570,03230,03900,04570,05230.05900,06570.07230.07900.0857
0.09570.10570.11570.12570 13570 14570 15900 17230 18570 21900 25230.28570.31900.35230.48570.61900.75230.88571.01901.15231.28571.41901.55231.68571,81901.8523
87-9- 19-_ t
U_mf"
0.4470.4470.5000,5420.5670,5870,5980.6110.6220,6350.6440.6520.6630.6690.6810.6820 6890 7100 7240 7320 7520 7690.7950.8160.8340.8470.8650.8830.8990.9180.9330.9580.9720.9800.988-0.9930.9970.9961.0001.0001.0001.0011.0021.0011.0021.0000 9981 0001 001i 00I1 0021 0031.0020.9990.996
e-O
Y÷
13.3313,3317.7722 2226 6631 ii35 5539 9944 4451 i057.7764.4371,1077.7686.6595.54
104.43126.65148.86171.08215.52259.96304.39348.83393.27437.71482.14526.58571,02637.67704.33770.98837.64904.30970.95
1059.831148.701237.571459.761681.951904.132126.322348.503237.244125.995014.735903.476792.227680.968569.709458.45
10347.1811235.9312124.6712346,85
p- 1.411 x 10 - $ m2/|
UT - 1.:134 m/s
Ure f - :lI.N m/s
U÷
10.48210.48711.73912.72413.29013.76614.02314.34114.59614.88515.11715.29115.54815.70315.96815,98616,15116,64716.97417,16217.64718.04718.63819.13819.55919,87620.29920 71321 07721 53221 88522 46522 80322.99523.13723.29323.39523.37223.44523.45323.46623.48823.50523.48623.51223.45723.41923.45023.48623.47823.50223.53223.50823.43523.362
e-lO
Y_ . U_
0.0020 0.4730.0020 0,4720.0027 0.5190.0033 0.5470.0040 0.5680.0047 0.5780.0053 0.5910.0060 0.6010,0067 0.6090.0073 0,6140.0083 0.6240.0093 0.6380.0103 0.6470.0103 0.6430.0113 0.6530.0123 0.6560.0133 0.6710.0153 0.6820.0173 0.6970.0193 0.7070.0213 0.7150.0247 0.7300.0280 0.7530.0347 0.7670.0413 0.7860.0480 0.8100.0547 0.8290.0613 0.8450.0680 0.8610.0747 0.8800.0880 0.9100.1013 0.9420,1147 0.9600.1280 0.9780.1413 0.9860.1547 0 9910.1680 0 9930.2013 0 9940.2347 0 9950.2680 0 9950.3013 0 9970.3347 0.9960.5013 0.9990.6680 0.9980.8347 0.9981.0013 1.0001.0013 0.9991.0013 0.9961.1680 0.9971.3347 0.9971.5013 0.9981.6680 0.9951.8347 0.9921.8347 0.9941.8347 0.9911.8857 0.9751.9190 0.9211.9190 0.927
y_
13.3313.3317.7722.2226.6631.1135.5539.9944.4448.8855.5562.2168.8868,8875.5482.2188.87
102.21115.54128.87142 20164 42186 64231 07275 51319 95364 38408.82453.26497.70586.57675.44764.32853.19942.07
1030.941119.821342.001564.191786 372008 562230 743341 674452 605563 536674.466674.466674.467785.398896.31
10007.2411118.1612229.0912229.0912229.0912569.0412791.2312791.23
U÷
11.09611.07312.18012.83013.31913.56413.86614.09314.28314.40514.63714.95915.16915.09415.32715.39815.74815.99416.35716.59016.77117.11917.65617.98718.43019,00119.45019.81320.19920.64421.35422.10222.51022.93123.13525.25323.28323.31823.33523.34423.38223.357
.41423.41423.44823,42223.36523.39823.37623.40225.33823.26123.30923.25322.86721.61021.740
97

y/S
-0.908 0.879 0.3949-0.908 0.659 0.7654-0.908 0._0 0.7336-0.908 0.220 0.8222-0.998 0.000 0.8785-0.906 -0.220 0.81106-0.998 -0._0 0.8229-0.908 -0.659 0.8090-0.908 -0.879 0.5583
-0.757 0.879 0.8243-0.757 0.659 0.9865-0.757 0.&&0 0.9956-0.737 0.220 0.9687-0.757 0.000 0.9953-0.757 -0.220 1.0008-0.757 -O.U,O 1.0030-0.757 -0.659 0.9758-0.757 -0.879 0.11561
-0.606 0.879 0.87/,8-0.606 0.659 0.9924-0.606 0.&+0 1.00_-0.606 0.22O 1.0041-0.606 0.000 1.0026-0.606 -0.220 1.0036-0.6O6 -0.&_0 1.0021-0.606 -0.659 0.9962-0.6O6 -0.879 0.8987
'0.4+` o.a79 ...... o._-0.4+` 0.659 1.0008-0.4+` 0._0 1.00i7- O.&+` O. 220 I. 0049-0.6+` 0.000 1.0029-0.6+` -0.220 1.0029-0.4+` -0.k&0 1.00&0-O.&+` -0.659 1.0001-0.454 -0.879 0.9288
:oO: 0.8790.659 0.966/,-0.303 0._0 0.99?8-0.303 0.229 1.0005-0.303 0.000 1.0520-0.383 -0.220 0.9988-0._r_ -0._,0 0.9938-0.303 -0.659 0.9971-0.303 -0.879 0.9377
-0.151 0.879 0.9132-0.151 0.659 0.9937-0.151 O.l,_O 1.0038-0.151 0.220 1.0009-0.151 0.0O6 0.9980-0.151 -0.220 0.996+-0.151 -O.&&O 0.9988"0.151 -0.659 0.9952-0.131 _ = -0.8790. +9603
o.ooo o.879 0.92990.000 0.659 0.98+`0.99O 0.42,0 1.00S00.000 0.220 1.00390.000 0.000 0.99250.000 -0.22O 0.99970.000 -0.4_0 0.99820.990 -0.659 0.99'r_o.ooo -o.879 o.9491
0.076 o.ooo _ .oo+`0.076 -0.220 0.97780.076 -0._0 0.93000.076 -0.659 0.9_920.076 -0.879 0.7019
O. 151 0.879 0.97400.151 0.659 0.98960.151 0./,_0 0.99710.151 0.220 1.00230.151 0.000 1.00830.151 °0.220 1.00810.151 -0.i,J,0 0.99330.151 -0.659 0.99210.151 -0.879 0.8288
AR310
(p - I%t)_m_
-0.02760.0178
-0.1673o0.1014-0.0245
0.08530.OOO7
-0.01_0.1390
-0.0305-0.0163-0.0367-0.0330-0.0251-0.0St_-0.0145-0.0143
0.00_
-0.1232-0.0761-0.0840-0.0739-0.0730-0.O676-0.0741-0.0595-0.0735
-0.1816-0.1219-0.1294-0.1155-0.1096-0.1133-0.1282-0.1120-0.0525
-0.2693-0.19e0-0.1++7-0.1502-0.1/925-0.1m-0.1&?.4-0.1451-0.1417
-0.1707-0.1859-0.1806-0.1766-0.1722-0.1862-0.1910-0.1685-0.11163
-0.2103-0._,5-0.1886-0.181&-0.1835-0.2088-0.2061-0.2215-0.1519
-0.1802-0.2246-0.2542-O.28/,8-0.46&3
-0.14+`-0.1_-0.1879-0.1740-2.+`14-0.11_1-0.2073-0.2.38?-0.3146
TABLE IliaEXIT PLANE DATA
U/Umf
O.64090.66220.94780.95970._920.89150.90560.99140.6424
0.92150.99881.01351.008&1.00731.02711.00610.99240.9198
0.99641.03141. O,r,031 .O3621.0+`91.03251.03451.02&90.98,;1
1.03361.05821 .O6171.05671.05301.05491.06211.05240.9884
1,06501.0";'82I'07831.07171.06901.07471.98/.21.O6771.0373
1.04101.08591.08801.08&91.08151.08711.09031.07831.0702
t .O6781.09081.09251,08671.0644t.09931.09731.10311._92
1.08781.0964i .09731.11081 .O799
t .05?81.08431.08801.08_1.08301.0915i,0QS?1.10921.0_1
-0.1073 0.0150 0. l_rl; 0.0991 0.01_-0.0571 0.0297 0.0493 0.0_07 0.0420-0.0_85 0.0208 0.0587 0.0301 0.0400-0.0505 0.0068 0.0:301 0.0279 0.0351-0.045t 0.00_ 0.0304 0.0261 0.0331-0.0243 0.0031 0.0&27 0.039` 0.0291-0._55 -0.0070 0.0466 0.0331 0.0335-0.0t_3 -0.014_ 0.0&73 0.0377 0.0&&l*0.0797 0.0t47 0.1329 0.1066 0.0_1
-0.0731 *0.0059 0.0&W, 0.037/+ 0.0&t3-0.0722 -0.0006 0.0195 0.0141 0.01M-0.0700 0.0009 0.0171 0.0113 0.0140-O.O_J 0.00t0 0.0161 0.0157 0.0120-0.0728 -0.0059 0.0172 0.01&1 0.0166
-0. 7-0. 0656 -0.0036002 0.0183 0.0139 0.010/,-0.0726 0.0164 0.0118 0.0119-0.0720 0.00_ 0.0213 O.01/A 0.0187-0.0734 0.0169 0.0&83 0.0396 0.O611
-0.0719 -0.0033 0.0.T_ 0.028_ 0.0315-0.O680 -0.00_ 0.0163 0.0120 0.01&5-0.00782 -0.0077 0.0163 0.0099 0.0117-0.O656 -0.0028 0.0158 0.0131 0.0106-0.O676 0.0009 0.0170 0.0113 0.0124-0.0714 0.0057 0.0163 0.012.3 0.0095-0.0; ,9 0.0112 0.016& 0.0105 0.0109-0.0717 0.009_ 0.0187 0.0128 0.012.3- O.0730 O. 0089 O.0485 O. 0370 O. 0294
-0.0615 -0._00_- .... 0.03_ .... 0.0228 +-0.0314-0.0S+` -0.0041 0.0162 0.0108 0.016_-0.O622 -0.00&2 0.0157 0. 0093 0.0113-0.O619 -0.0028 0.0153 0.0126 0.0112-0.O607 -0.0036 0.0166 0.0124 0.0116-0.0583 0.0026 0.0158 0.01/,5 0.0103-0.O647 0.0O60 0.0160 0.0100 0.0109-0.O670 0.0055 0.017'7 0.0122 0.0124-0.0660 0.0O62 0.0519 0.0362 0.0257
-0.040_ -0.0043 0.0253 0.0174 0.0271-0.0&19 -0.00T5 0.0158 0.0100 0.0217-0.0_28 -0.0036 0.0161 0.0091 0.011/+-0.0_0 0.0020 0.0157 0.0118 0.0111.oo918 0.ooo2 o.o171 O.OllO o.o199-0..m,_53 0. 0 0.o+,69 0.01!, 0.0105oo51, oo++6 oo,+o o o.o1130o,72 0oo30 o.o19o O.OLO3o.o125o055o 0.oo32 0.0+,9 0.02++ o-0.0148 0.00_9 0.0_73 0.0286 0.0265-0.0203 0.0576 0.016_ 0.9989 0.0158-0.0251 -0.0009 0.0170 0.0087 0.0116-0.0218 -0.0016 0.0159 0.0110 0.0114-0.02_ -0.0029 0.0173 0.0096 0.0128-0.0282 0.0040 0.016/, 0.0120 0.0106-0.0303 0.0078 0.0167 0.0089 0.0116-0.0299 0.0089 0.0176 0.009_ 0.0123-0.0378 0.0038 0.021_ 0.0219, 0.0193
o.om2 -o.oo16 o.o o.oi,+ o.o+,5o.oo23 0.0t++ 0.999i 0.0199-0.0017 0.0169 0.0079 0.01200.0011 0.0076 0.0163 0.0103 0.01100.0092 0.00&6 0.0173 0.0104 0.01220.0515 0.0103 0.0i80 0.00g_ 0.0108
-0.0129 0.0099 0.0185 0.0150 0.0117-0.0094 0.0059 0.0168 0.0098 0.0t25-0.0114 0.0031 0.0288 0.0193 0.0180
0.0165 0.00_5 0.0169 0.0108 0.01280.0150 0.0091 0.0176 0.0095 0.0125
-0.0012 0.9996 0.0203 0.0137 0.01320.0012 0.0099 0.0197 0.0111 0.01550.0032 0.0058 0.0_11 0.0204 0.0237
0.020S 0.990_ 0.0+`5 0.0222 0.02060.0220 -0.0023 0.0174 0.0101 0.01250.0i87 -0.0029 0.0178 0.0085 0.01230.0197 0.0505 0.0156 0.0113 0.01160.0287 *0.0007 0.0163 0.0105 0.01&80.0273 0.0O68 0.0170 0.0101 0.01080.0124 0.0118 0.016;, 0.0138 0.01150.0173 0.0109 0.0183 0.0097 0.01600.0178 0.0122 0.0432 0.0225 0.0296
+
il
t
mm
!(5)(5) _'
lml
I(-5)(-5)
5)
(-5)(-5)
(5)
15) _imm
(-5)1ira
(5)(5)
(-5) I(-5)
(.5) ms,(5)
IIM
(-5)(_5)• --(5) _ I(5)
((-51(-5)
( 5> :1(5)
(-5) me(-5)
m
(-6)
(5) _,(5)
(-5) _.(-5)
r/-9-1g-5598w

!row
-r--,"
y/S z/H
0.227 0.0000.227 -0.2200.227 -0.4&O0.227 -0._,90.227 -0.879
0.303 0.879
00 , 0.659. 0.I_O.3O3 0.22O0.303 0.000O.3O3 -O.22O
o:N 0,,o-0.6590.3O3 -0.879
0.379 0.0O60.379 -0.2200.379 -0.4_00.3?9 -0.6590.375 -0.879
O.&S_ 0.879O.&S& 0.6590.454 0.4_00.454 0.2200.4_, 0.05O0.454, -0.2200.&54 -0._00.&54 -0.6590.4S4 -0.879
0.530 0.0000.530 -0.2200.530 -0.4_00.53O -0.6590.530 -0.879
0.606 0.8790.606 0.6590.6O6 0._.00.606 0.2200.606 0.000O.6O6 -0.2200.606 -0._,00.606 -0.6590.606 -0.879
0.681 0.0000.681 -0.2200.681 -0._00.681 -0.6590.681 -0.87Q
0.757 0.8790.757 0.6590.757 0._00.757 0.2200.757 0.6O00.757 -0.22O0.757 -O.&_O0.757 • -0.5_90.757 -0.6590.757 -0.769O.757 -0.8?9
0.795 -0._,00.795 -0.5490.795 -0.6590.795 -0.7690.795 -0.879
0.833 0.O60o.m -0.2200.833 -0._00.833 -0._90.833 -0.6590.833 -0.7690.833 -0.879
0.871 -0._00.871 -0.5/,90.871 -0.6590.871 -0.7690.871 -0.879
(P- pref)/Oref
1.00]81.01610.90430.99130.8761
0.96120.99660.99991.001&0.99741.01331.00360.99310.9232
0.90_1.00531.00440.98W,O.9387
0.91891.00181.00711.00771.00171.00981.00970.99460.9265
1.00661.00371.00640.90_0.93.6
0.90331.00321.01891.01491.00280.90751.00470.98880.9278
1.00760.99950.90440.97950.B98_
0.84691.00791.01911.01401.00250.90280.98230.96860.9_0.93680.8354
0.97260.97580.9714O.9O9?O.7877
1.00340.97780.95000.95800._920.86570.7'019
O.92300.92580.90000 73o:_o2
TABLE Ilia
AR310 EXIT PLANE DATA (CONTINUED)
(p - pref)/Oref U/Uref V/Uref W/Umf _uZ_re/
-0.1653 1.O8O6 0.0370 0.O601 0.0157-0.1764 1.9014 0.0369 O.OGt,2 0.0160-0.1959 1.0907 0.0233 0.0575 0.0168-0.2268 ,.1032 0.,16 0.0O85 0.0192-0.2633 , .0669 0.,12 0.0109 0.0_05
-0.1261 1.0A20 O.OM8 0.0015 0.0357-0.162.3 1.0759 0.0.362 -0.0018 0.0159
-0.17'00 _ O_ O. 03R3 -0.0055 0.0169-0.1513 : 0.0373 -0.0060 0.0154-0.154,1 1.0722 0.0431 -0.O672 0.0179-0.1653 1.08t,6 0.0668 0.0017 0.0164
-0.1728 _.0_ 0..32 0.O678 0.0187-0.2150 O.O&2& 0.0090 0.0182-0.2219 1 .O690 0.0478 0.0O88 0.0369
'0. t4_7 1 .O679 0.0515 -0.0066 0.0152-0.1531 1.0749 0.05_7 -0.O613 0.0152-0.1566 1.0766 O.06M 0.0039 0.0159-0.20&8 1.0916 0.0511 0.0041 0,0173-0.1803 1.0560 0.O626 0.0053 0.03g_
-0.1103 1.0130 0.0550 -0.0012" 0.04_,-0.1214 1.0587 0.06_ -0.0O63 0.0153-0.1264 1.0633 0.0530 - 0.00?S 0.0158-0.108/. 1.0551 0.0538 -0.O643 0.0158-0.1213 1.0581 0.0591 - O.O632 0.0160-0.123_ 1.O628 0.O604 0.0014 0.0149-0.1311 1 .O669 0.0503 0.00_1 0.0169-0.1764 1.0804 0.O611 0.00&l 0.0169-0.17O8 1.0450 0.0721 0.0063 0.0&34
-0.0954 1.0477 0.O655 -0.0010 0.01/,,8-0.1050 1.05O8 O. O673 O.O633 0.0154-0.1087 1.05&5 0.0556 0.0043 0.0162-0.1509 I.O680 0.O683 0.0048 0.0165-0.1384 1.0327 0.O8O8 0.0054 0.0418
-0.0697 0.9844 0.O624 0.0019 0.0474-0.0586 1.0291 0.0529 -0.0O61 0.0183-0. O698 1.0417 0.0590 -0.0037 0.0159-0.0580 1.0338 0.0645 -0.0027 0.0152-0.0731 1.03_9 0.0701 -0.0010 0.0149-0.O832 1.0371 0.0712 0.0051 0.0157-0.0625 1.0/,09 O. O602 0.0081 0.0170-0.1157 1.0&85 0.0707 0.0091 0.0190-0.1140 1.0170 0.M58 0.0O82 0.0413
-0.0_r, 1.0194 0.O698 0.003& 0.0152-0.0545 1.0243 0.0693 0.0043 0.0163-0.O670 1.0285 0.0601 O. 0056 0.0160-0.0900 1.0317 0.0709 0.0094 0.0204-0.0978 0.9042 0.0872 0.012.3 0.0_18
0.0186 0.9076 0.O668 -0.0056 0.05610.0030 1.0005 0.0624 0.0040 0.0205
• O.0393 O. 9883 O. 0546 O. 0094 O. 02350.0227 0.9927 0.0756 0.0099 0.02100.0158 0.9916 0.0585 0.0042 0 0226
-0.0335 1.0110 0.0645 0.0073 0.0162-0.0_20 1.0103 0.0590 O. 0O85 0.0178-0.0_14 1.0129 O.O628 0.0065 0.0193-0.0578 1.0107 0.O698 0.0090 0.0214-0.O6_6 0.9986 0.0777 0.0136 0.0269-0.O854 0.9552 O.OM4 0.0244 0.0473
- 0.0380 1.0037 0.0560 0.0018 0.0180-0.0349 1.00_ 0.0623 0.0022 0.0198-0.0296 0.9079 0.0715 0.O646 0.02._-0.O622 0.9824 0.O809 0.0135 0.0312-0.0924 0.9333 0.09_ 0.029O 0.0500
0.0596 0.9699 0.0550 0.0010 0.0291-0.0269 1.00O6 0.0590 0.000_ 0.0176-0.0437 0._3 0.0550 -0.0027 0.01M-0.03O2 0.902.3 0.0590 -0.0058 0.0214-0.0250 0.9843 0.0729 -0.0019 0.0259-0.O631 0.9595 0.o8g_ 0.0142 0.0397-0.0967 0.8884 0.0896 0.0371 0.O665
-0._01 0.9802 0.0465 -0.0O85 0.0242-0.0218 0.9717 0.0564 -0.0156 0.0278-0.0272 0.9600 0.0746 -0.0014 0.0335-0.0583 0.9249 0.1007 0.0059 0.0_73-0.0740 0.7762 O. I004 0.0401 0.1347
0.011/,0.01020.01690.01020.0215
O.O2340.00990.00960.01250.01200.01030.01270.0110O.O2O7
0,01160.01070.01310.01100.0227
0.03040.01050.00960.0t4_0.01150.01120.01350.01050.0258
0.01170.01090.01_.0.01170.0275
0.03140.01210.01050.01480.01260.01190.01550.01300.0274
0.01300.01260.01610.01550.0310
0.04120.01540.01640.02070.02030.01360.01&80.01780.0200O.O2O90.0358
0.01600.018/,0.01850.02390.0497
0.01890.01390.01640.02200.01960.02730.0608
0.02120.0249O. 02640.03680.0737
0.01280.01190.012:30.01610.0325 (-6)
0.OZO8 S)0.0131 _ 5)0.01t40.0tlz0.0t_0.010_0.0t150.0t27 (-5)0.0260 (-5)
0.01170.0116O.0tZ_0.01440.023/, (-6)
0.0276 5)0.0137 _ 510.01160.01060.0118O.010&0.01100.012_ (-5)0.0231 (-S)
0.01150.01110.01180.01490.0247 (-6)
0.0296 (5)O.01M (5)0.011S0.01080.01260.01060.01120.0146 (-5)0.0266 (-5)
0.01120.01130.01280.01800.0313 (-6)
0.0383 5)0.0177 _ 510.01330.01140.01260.01290.01470.01800.0191 (-5)0.02560.0367 (-5)
0.01900.02060.02130.03130.0_7 (-6)
0.01550.01900.02160.02270.02470.03910.03M (-6)
0.03390.04610.0?99 (-6)
998",'- 9 - 1g - 56

i
,m
y/S L4'I (P - pref_Oref
0.908 0.879 0.56530.908 0.659 0.91570.9O8 0.4J,0 0.93550.908 0.220 1.01190.908 0.000 0.96220.9O8 -0.22O 0.92560.908 -0.U,0 0.81400.9O8 -0.569 0.8O840.908 -0.659 0.80230.908 -0.769 0.73650.908 -0.879 0.4205
0.946 -0./,40 0.60970.946 -0.549 0.582/,0.946 -0.659 0.61920.946 -0. 769 0.6/,750.946 -0.879 0._23
TABLE Ilia
AR310 EXIT PLANE DATA (CONCLUDED)
0.1619 0.62_ 0.10_0 0.0335 0.1330 0.0906 0.07_ ( S)0.1832 0.8531 0.0601 0.0335 0.050& 0.0&06 0.0.388 ( S)0.19_ 0.8610 0.0251 0.0130 0.0548 0.0_07 0.03250.1544 0.92S2 0.0390 -0.0008 0.0361 0.0275 0.02770.0432 0.9S73 0.0503 -0.0065 0.0364 0.022a; 0.0249
-0.0016 0.9617 0.0_1 -0.0075 0.0321 0.0261 0.0302-0.0212 0.9186 0.036& -0.0069 0.0662 0.0356 0.0&19-O.01&O 0.9056 0.0451 -0.0160 O.O&S7 0.0369 0.0&33-0.0t62 0.9019 0.0681 -0.0211 0. 066& 0.0377 0.0&50 (-5)-0.0549 0.8821 0.1139 -0.0170 0.0524 0. 047.3 0.0529-0.0002 0.6379 0.1176 0.0020 O. 1/,9e 0.0821 0.08.37 (-$)
0.0752 0.7307 0.0253 -0.00&0 0.1102 0.062/, 0.06810.0392 0.736.3 0.0317 -0.0067 0.1067 0.0561 0.0667
-0.0094 0.7906 0.0565 -0.0194 0.0778 0.0_95 0,0620-0.0259 0.8136 0.1009 -0.0358 0.0633 0.0513 0.0601
0.0&02 0.62/,3 0.0963 -0.0550 0.1210 0. 0833 0.0780 (-6)
_I
mJ
i
Ul
IIW
I
aim
II
_r
CU
i
E
qll
mm
lira
I0087 - g - lg - 57 L
w
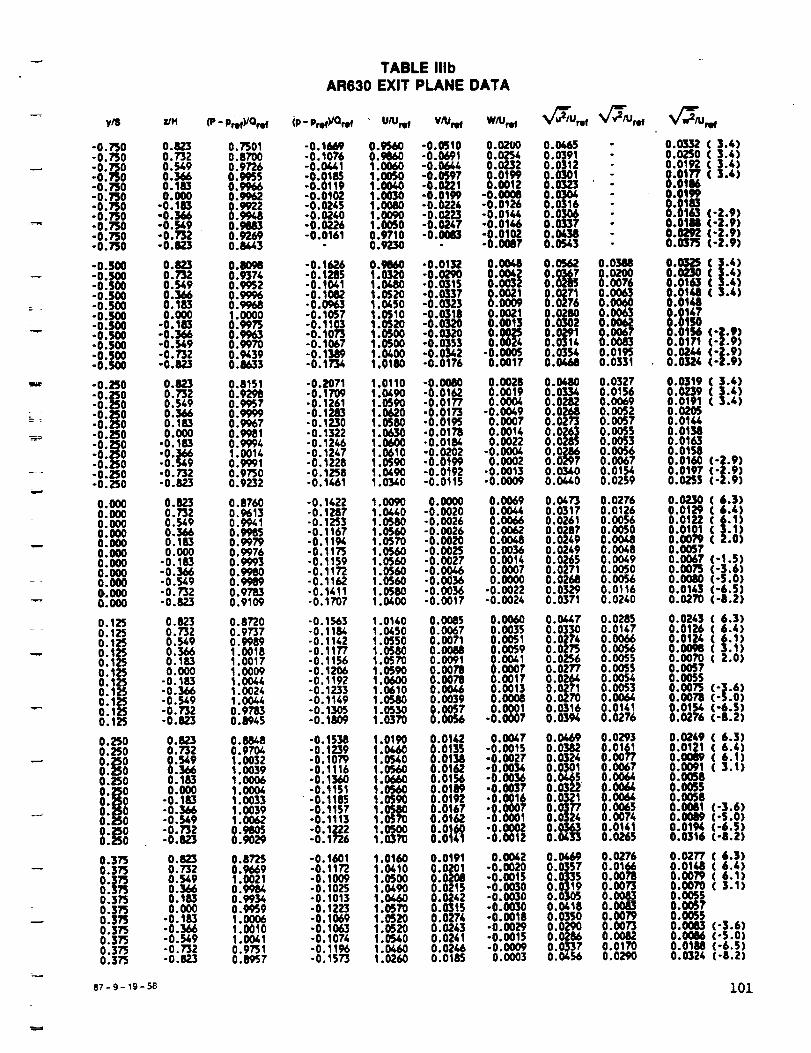
,e,-;
TABLE IIIbAR630 EXIT PLANE
y/S zJH (P - pmf)/Qref (p - pref)JOref U/Umf VAJref
-0.730 0.823 0.7301 -0.1669 0.9560 -0.0510-0.750 0.732 0.8700 -0.1076 0.9660 -0.0691-0.750 0.'`9 0.9726 -0.0_1 1.0060 -0.06_-0.750 0.366 0.9955 -0.0185 1.0050 -0.0597-0.730 0.183 0.9966 -0.0119 1.0040 -0.0221-0.?50 0.000 0.9962 -0.0102 1.0030 -0.0199*0.730 -0.183 0.9922 -0.02/,5 1.0080 -0.0224-0.730 -0.366 0.99/.8 -0.0240 1.0090 -0.0223*0.730 -0.'`9 0.9883 -0.0226 1.00S0 -0.0247-0.?50 -0.732 0.9269 -0.0161 0.9710 -0.0083-0.750 -0.823 0.8_3 0.9230
-0.500 0.823 0.8098 -0.1626 0.9860 -0.0132-0.500 0.732 0.9374 -0.1285 1.0320 -0.0290-0.500 0.549 0.9952 -0.1041 1.0480 -0.0315-0.500 0.366 0.9996 -0.1082 1.0520 -0.0337-0.500 0.183 0.9968 -0.0963 1.0450 -0.0323-0.500 0.000 1.0000 -0.1057 1.0510 -0.0318-0.$00 -0.183 0.9973 -0.1103 1.0520 -0.0320-0.500 -0.366 0.9963 -0.1073 1.0500 -0.0320-0.500 -0.549 0.9970 -0.1067 1.0500 -0.0353-0.500 -0.732 0.0439 -0.1389 1.0400 -0.0342-0.500 -0.823 0.8633 -0.173& 1.0180 -0.0176
-0.250 0.823 0.8151 -0.2071 1.0110 -0.0080-0.250 0.732 0.9298 -0.1709 1.0499 -0.0162-0.250 0.549 0.9957 -0.1261 1.0590 -0.01?7
-0. D0 0.183 0.9967 -0.1230 1.0580 -0.0195.0._ 0 0.366 0.9999 -0.1283 1.0620 -0.0173-0.250 0.000 0.9981 -0.1322 1.0630 -0.017800.250 -0.183 0.99_ -0.1246 1.0600 -0.018&-0.250 -0.366 1.0014 -0.1247 1.0610 -0.0202-0.250 -0.'`9 0.9991 -0.1228 1.0590 -0.0199-0.250 -0.732 0.9730 -0.1258 1.0490 -0.0192-0.250 -0.823 0.9232 -0.1461 1.0540 -0.0115
0.000 0.823 0.8760 -0.1422 1.0090 0.00000.000 0.732 0.9613 -0.1287 1 .GU.0 -0.00200.000 0.549 0.9941 -0.1253 1.0580 -0.00260.000 0.366 0.9985 -0.1167 1.0560 -0.00260.000 0.183 0.9979 -0.1104 1.0570 -0.00200.000 0.000 0.9976 -0.1173 1.0560 -0.00250.000 -0.183 0.9993 -0.1159 1.0560 -0.00270.000 -0.366 0.9980 -0.1172 1.0560 -0.00460.000 -0.549 0.9989 -0.1162 1.0560 -0.0036G. 000 -0.732 0.9?83 -0.1411 1.0580 °0.00360.000 -0.82.3 0.9109 -0.1707 1.0400 -0.0017
0.125 0.823 0.8?20 -0.1563 1.0140 0.00850.125 0.732 0.9737 -0.1184 1.0450 0.00670.125 0.549 0,9, 01142 1.05,0 0.00,1o:l_ o_ 1.00,0 011, 105_ 000,01, lOO,, 01,,6 1.05700.00,10125 0.o00 looo, 0 ,_ 1.05,0 000_0.125 -0.183 1.004/, -0.1192 1.0600 0.00780.125 -0.366 1.0024 -0.1233 1.0610 0.00460.125 -0.549 1.0044 -0.1149 1.0580 0.00390.125 -0.732 0.9783 -0.1305 1.0530 0.00570.125 -0.823 0.8945 -0.1809 1.0370 0.0056
0.250 0.823 0.8848 -0.15M 1.0190 0.01&20.250 0.732 O.9"r04 -0.1239 1.0_C 0.013,0.250 0.549 1.0032 -0.1079 1.05&0 0.01380.250 0.366 1.0039 -0.1116 1.0560 0.01620.250 0.183 1.0006 -0.1360 1.0060 0.01560.250 0.000 1.0004 -0.1151 1.0560 0.01890.250 -0.183 1.0033 -0.1185 1.0590 0.01920. 250 -0.366 1.0039 -0.1157 1.0580 0.0t670._0 -0.'`9 1.0062 -0.1113 1.0570 0.01620.250 -0.732 0.9605 -0.1222 1.0500 0.01600.250 *0.823 0.9029 -0.1726 1.0370 0.0141
0.375 0.823 0.ST_ -0.1601 1.0160 0.01910.375 0.732 0.9669 -0.1172 1.0410 0.02010.373 0.'`9 1.0021 -0.1009 1.0500 0.02080.373 0.366 0.99_ -0.1025 1.0490 0.02150.31'5 0.183 0.9934 -0.1013 1.0_K) 0.02420.373 0.000 0.99S9 -0.1223 1.0570 0.03130.373 -0.183 1.0006 -0.1069 1.0520 0.027&0.373 °0.366 1.0010 -0.1063 1.0520 0.02/,30.373 -0.549 1.0041 -0.1074 1.0"`0 0.02410.3?5 -0.732 0.9731 -0.1196 1.0460 0.02/,60.3?5 - 0. 823 0.895, -0.1573 1.0260 0.0185
87- 9- 19- 58
DATA
wmr_ _'2,Ur_ 'V/_'m_ _/_'_j._
0.0200 0.0465 0.0532 ( 3.4)0.02"` 0.039i 0.0250 ( 3.4)0.0232 0.0312 0.0192 ( 3.4)0.0199 0.0301 0.0t77 ( 3.4)0.0012 0.0523 0.0186
-0.0008 0.0304 0.0199-0.0126 0.0316 0.0183-0.014_ 0.0306 0.0163 (-2.9)-0.0146 0.0337 0.0188 (-2.9)
(-2.9)oo,o2 004,, o:_-0.0087 0.0"`3 (-2.9)
0.0048 0.0562 0.0388 0.0325 3.4)
0.0042 0.0367 0.02O0 0.023O _ ] 4)0.0032 0.0285 0.00'6 0.0163(:4)0.0021 0.0271 0.0063 0.0148 (3.4)0.0009 0.0276 0.0060 0.01480.002t 0.0280 0.0063 0.0t470.0013 0.0502 0.0062 O.OlSO0.0025 0.0291 0.0067 0.01S6 (-Z.9)0.0024 0.,1, 0.0083 0.0171 (-2.9)
-0.0005 0.03"` 0.01_ 0.02" (-2.9)0.0017 0.0468 0.0331 0.0324 (-2.9)
0.0028 0.0480 0.032, 0.0319 ( 3.&)o.ooloo o.o156oo.9(,.4)0.0004 0.0282 0.0069 0.0191 ( 3.4)
-0.0049 0.0268 0.0052 0.02050.000, 0.0273 0.005, 0.01_0.0014 0.0263 0.0055 0.01M0.0022 0.028, 0.0053 0.0163
-0.0004 0.0286 0.0056 0.01580.0002 0.029, 0.0067 0.0160 C-2.9)
.o.0013 o.o3_o 0.01"` 0.0197 (-z.9)
.0.000_ o.o_o 0.02,9 0.025, (-2.9)
0.0069 0.0473 0.02,6 o.ozso (6.3)0.00_ 0.031, 0.0126 0.01_ 6.4)
0.0066 0.0261 0.0056 0.0122 _ t.1)0.00620.028700_0 0.0101 1)000_ 0.02,9 ooo48 00079_:0)000_ 0.0249000_ 0.00,70.0014 0.0265 0.0049 0.0067 ('1.5)000o, 0.02710_0 00073(-36)0.0000002_ ooo56 ooo.(-so)00022 0.03290.0,16 0.01,3(,6,)-0002, 00371 0.0240 00270(-a2)0.0060 0.0_7 0.0285 0.0263 (6.3)
0.0126 6.4)
0003,o.3o 00,4,0.0051 0.0274 0.0066 1)0.0059 0.0273 0.00560.0041 0.0256 0.0055 0.0070 ( 2.0)0.0007 0.0277 0.005, 0.00570.0017 0.026/. 0.0054 0.005,0.0013 0.0271 0. 0053 0.0073 (-3.6)0.0008 0.0270 0.006& 0.007'8 (-5.0)o.00oio,16 o.o1,1 oo1,,(-6,).oo00, o.o3_ 0.0276 00276(82)0_7 00_ 0.0293 0.02,9(63)
"0.0015 0.0382 0.0161 0.0121 6.4)
o_, oo_4 ooo77 o.00-_|:1)o.00"` 003o, o_7 ooo,1, 1)-0.0036 0.0_5 0.006& 0.0058-0.0037 0.0322 0.006_ 0.005,-0.0016 0.0321 O.O06& 0.0058
'0.0001"0"0007O.v_?7 0.0074 0.0089 (-,.0)0..0'_7% 0.0065 0.0081 (-3.6)-0.0002 O. 0,363 0.0141 0.019& (-6.5)-0.0012 0.0433 0.0265 0.0516 (-8.2)
0.0042 0.0469 0.0276 0.0277 (6.3)-0.0020 0.03'7 0.0166 0.0148 6.t)
-0.001S 00 0_ 0.007'8 0.0079 _ 6.1)-0.0030 _ 0.0073 0.0070 ( 3.1)-0.0030 0 0.0083 0.0055-0.0030 0.0418 0.0083 0.0057-0.0018 0.0550 0.00?9 0.005,-0.0029 0.0290 0.0073 0.0083 (-3.6)-0.0015 0.0286 0.0082 0.0086 (-5.0)-0.000q 0.0_7 0.0170 O.01M (-6.5)
0.0003 0.0&56 0.0290 0.0324 (-8.2)
i01

y/S z/H
102
TABLE IIIb
AR630 EXIT PLANE DATA (CONTINUED)
(P - pref)/Oref (P - prefYOref U/Uref V/Umf W/UrM '_u_ref
0.500 0.823 0.8694 -0.13730.500 0.732 0.9585 -0.10740.500 0.549 1.0007 -0.08790.500 0.366 0.9979 -0.0909
o.,00 o1. o:_ -oo,,0.500 0.000 -0.0894O.SO0 -0.183 0.9966 -0.09220.500 -0.366 0.9982 -0.08440.500 -0.549 1.0O26 -0.0967O.SO0 -O.T_ 0.9793 -0.09710.500 -0.823 0.8918 -0.i369
0.6_ 0.82.3 0.8520 "0.12110._,, 0.732 0.,30 -0.0_00:_ 0.,,9 0.,, -0.0_2o._ o.,,30 -0.98130._,, 0.1, 0.'o1, -0.078T0.625 0.000 0.9923 "0.08&10._,, -0.1, 0.,93, -0.0_0._,, -0._ 1.000, -o.o,,100:_ -0.549 1.oo26 -o.o_-o.m o.,m .O.lO_o._ -o._ 0..,2 -o.1,26o._o o.m o.m, -o.11,30.750 0.732 o.9_ -o.o,1o.m 0.549 0.,.6 -0.o`190._0 0._ 0.9878 +.005,o.m 0.1, 0.,921 -0.o`50o.m 0.000 0.,73 .0.0_00.7,0 -0.1, 0.,_7 .0.07030.750 -0.3,, 0._2 -0.o,52o.m -0.549 o.,'o, -0.081,0.750 -o.m 0.,256 .0.1076o.7,o -0._ 0.,1, .0.1,,50._ 0.,, 0.,179 -0.10920.800 0.732 0.8879 "0.104.I0.,00 0.549 0.92,1 -0.0,30.,00 0._ 0.912, -0.10,,o._ o.1, o.,o7 .o.o,?70.800 0.000 0.9375 "0.1029o.,o +.1, o.,623 -o.105,o._o -o._ o.9_,, -o.o_60.,00 -0.5,9 0.,_ -0.0,,0._ -0.732 0.91,1 .0.1156o._ -o._ o.,1,3 -o.1_o.,o o.m 0.75,, -o.o,10.850 0.732 0.8256 -0.05_0.850 0.549 0.7799 -0.05990.050 0.366 0.5848 -0.1/,9e0.850 0.183 0.5738 -O.O_B50.850 0.000 0.5/,73 -0.O`620.850 -0.11L3 0.6122 -0.13280.850 -0.366 0.7563 -0.13120.050 -0.549 0.8541 -0.1077O.,SO -0.732 0.86_ -O.OU60.8S0 -0.823 0.7897 -0.1074
0.900 0.823 0.6354 -0.09"_0.900 0.752 0.7205 -O.O`_0.900 0.549 0.6295 -0.03"O0.900 0.366 0._r,55 0.00830.900 0.183 0.3279 -0.O2080.900 0.000 0.29?9 -0.04850.9oo -o.ln o._.87 -o.o9_0.900 -0,366 0.3122 -0.1701o.9oo -o.549 o.7_ -o.13s30.9oo -o.732 0.?7o2 o.u150.900 -0.823 0.6830 0.3001
0.950 o._.s o._ozo._o o._2 o.s_30.950 0.549 0.6100 -o.omo.gso o._ o.so12 -o.o2o/,0.9_ 0.183 0.3623 o0.01310 JPiJO 0.000 0.3509 0.0_+10.950 .0.lea 0.4594 0.10_0.950 -0.566 o.s6ss o.o7ta0.950 -0.549 0.6516 -0.01/,8o.95o -o.n2 o.s713o.95o -o._m 0.5476
1.00_ 0.0_2 0.00661.0320 0.02119 0.00101.0430 0.O287 -0.00081.04_0 0.O2_ -0.00O`1.04&O 0.0315 -0.00121.0&O0 0.0330 -0.00171.04_0 0.0306 -0.00111.0_00 0.030& -0.00131.G4J_O 0.0324 -0.0O201.0370 0.0323 -0.00191.01&0 0.O222 -0.0013
0.9e50 0.0330 0.010_1.0170 0.O333 0.00931.0300 0.033/, 0.00171.036O 0.0316 0.00151.0340 0.0295 0.00051.0370 0.0309 -0.00121.0_0 0.033,11 -0.00201.0_10 0.0364 -0.00291.0400 0.0398 -0.00351.0310 O.O_l& -0,00171.0030 0.0278 0.0039
0.9730 0.0292 0.017/,1.0020 0.0351 0.O2_1.O230 0.O268 0.01601.O260 0.019_ 0.01/,41.0280 0.0175 0.00621.O2"O 0.0215 -0.00211.0_.0 0.O281 -0.00801.03t0 0.0363 -0.01221.0340 0.0&76 -0.03151.0i50 O.OS_ -0.00560.9800 0.0&29 0.0026
0.9620 0.0313 0.02450.9950 0.0355 0.O2621.0050 0.0225 0.03011.00"O O. O01M 0.O2S21.01/,0 0.0039 0.01521.0200 0.0068 -0.00221.0330 0.0193 -0.0i631.0350 0.0161 -0.02211.0360 0.0555 -0.050_1.0129 0.0734 -0.01000.9890 0.0505 -0.00i3
0.9030 0.0_02 0.02610.9370 0.00/,5 0.03130.9150 0.0230 0.0&530.8560 -0.0007 0.0/,320.7880 -0.0179 0.0516O._L30 -0.0183 0.00_0.8630 0.00_ *0.01730.9410 0.0374 -0.02520.9780 0.0696 -0.O2090.9710 0.1008 -0.0009O.W, IO 0.1075 0.0100
0.1_20 0.0400 0.O2190.8820 0.0822 0.02190.8140 O.O_H_ 0.03230.6600 -0.0105 0.03520.38_0 -0.0656 0.O3O90.5820 -0.0876 0.0014o,_6o -o.o.7 -o.007_o.mo o:oo37.o.001,o.91, o.o_ 0.oo39o."`o o.o_51-o.o21,o.61, o.o_ -o.o11,
o.;15o0.;436o.;_5o o.o2o,-o.o_0.7210 "0.O221 "0.03550.6o7o o.om -0.01_.o.s_ .00_32 00._o,5_o 0.0,9o 0.0373o._m o.o,s9o.03_o.,1oo o.o,9 0.03,o0.8150
0.O468 O.03O90.03_0 0.01640.O276 O.OO830.O273 0.OO780.0375 0.00870.0327 0.0092
0.00000.OO720.O271D 0.00860.0314 0.01980.0_2 0.0313
0.0547 0.0334O. 0399 0.02020.0307 0.00890.03_. 0.00890.0291 0.00880.O2,6 0.00810.O28_ 0.00?70.029e 0.00750.0319 0.00850.0352 0.0212O. 04_. O.03&O
0.0537 0.03&50.0_34 0.07.330.03,30 0.01210.0302 0.01030.0301 0.00970.0312 0.00860.0321 O.OO830.031& 0.00810.0335 O. 011/,O. 0_03 O. 02650.0530 0.0373
0.0532 0.03520.0501 0.02610.0_,9 0.01990.0_1 0.01960.0482 0.01990.0438 0.01980.0423 0.016]O.03?7 0.01330.042& 0.01520.0476 0.02490.0569 0.038.t
0.0591 0.03480.0/,82 0.027/,O. 0309 O. 03000.07_ 0.03870.1095 0.04810.1108 0.0_95
oO:_ o.o.o0.03230.0/,69 0.026O0.0_73 0.02790.0561 0.0357
0.06&3 -+ 0.0386 ( 9)0.05O6 0.0_05 (9)0.0781 0.039e ( 9)0.0869 0.0511 (-10)0.0637 0.0554 (-10)0.0395 0.0516 (-10)0.08._. 0.0/.83 (-10)O.9833 0.0675 1-10)0.07/,8 0.0356 (-10)0.086_ 0.0_2 (-10)0,0961 0.0405 (-10)
0.06O3 1-10)0.0_33 (-10)0.0/,27 (-10)0.0486 (-10)
o.o6o20.07/,I0.0_.3O.05220.056_0.06440.05600.0595
0.0310 (6.3)0.017/, (6.4)0.00_ (6.1)0.00620.00540.00560.00560.00630.0087 (-5.0)0.0191 (-6.5)0.0333 (-8.2)
0.0330 6.3)0.O237 _ 6.310.0087 (6./,)0.00660.00560.00570.0054O.O(W,0.0090 (-5.0)0.0192 (-6.5)0.03&5 (-8.2)
0.02_ 1 6.3)0.0105 (6./,)0.00830.000.00_0.00810.01000.01"O (-5.0)0.0235 (-6.5)
0.01820.01950.0235O. 02/,90.0239 •0.0209O. 02530.027"2 (-6.5)
0.03760.04530.05010.05080.0_780.0_270.0337
0._170.06680.04470.06_60.0_70'0_310.0378
0.0366O.Gf,020.05380.05030.03610.0325O.0359
87-9- 19-59
111
IIW
I
m
!
lib
_iJ
×i
_m
i
m_
m
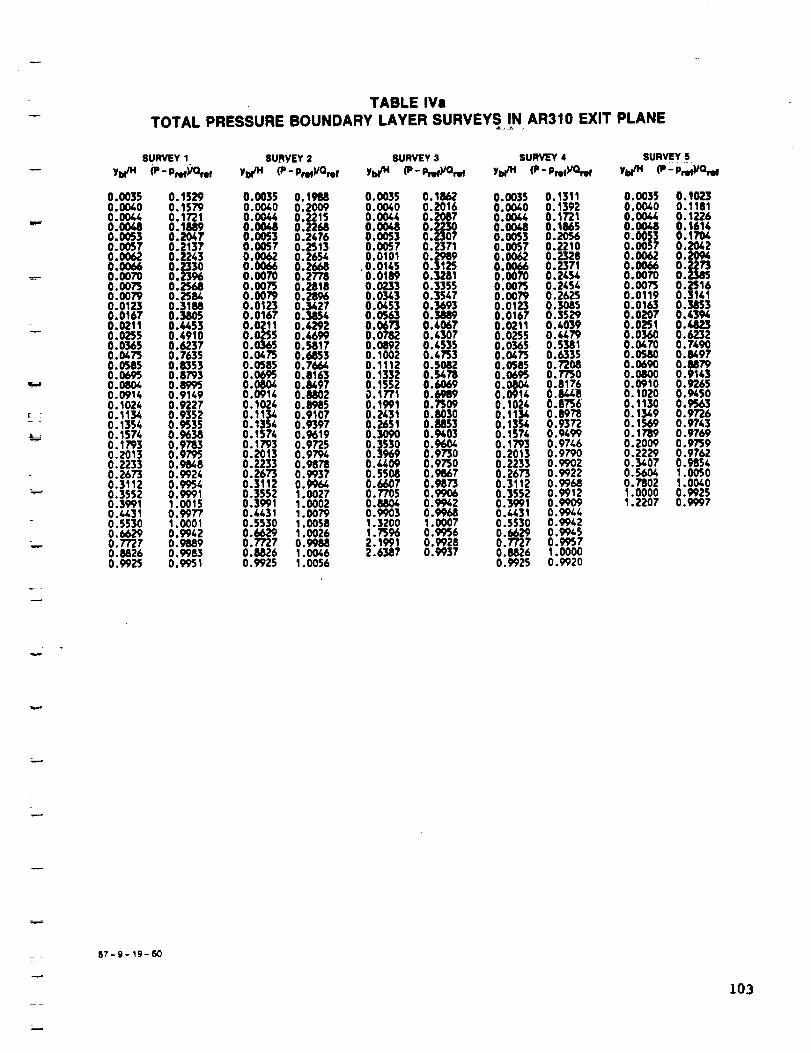
L
TABLE IVa
TOTAL PRESSURE BOUNDARY LAYER SURVEYS IN AR310 EXIT PLANE
SURVEY 1 SURVEY 2 SURVEY 3 SURVEY 4 SURVEY S
0.0035 0.1529 0.0035 0.19M 0.0035 0.1862 0.0035 0.13110.0040 0.1579 0.0040 0.2009 0.0040 0.2016 0.0040 0.13920.00_ 0.1721 0.00_ 0.2215 0.0044 0.2087 0.00_ 0.17210.00_ 0.1889 0.00_ 0.2268 0.0048 0.2230 0.00_ 0.t8650.0053 0.2047 0.0053 0.2476 0.0053 0.2307 0.0053 0.20560.0057 0.2137 0.0057 0.2513 0.0057 0.2371 0.0057 0.22100.0062 0.2243 0.0062 0.2654 0.0101 0.2989 0.0062 0.23280.00_ 0.2330 0.0066 0.2668 . 0.0145 0.3125 0.0066 0.23710.007O 0.2396 0.007O 0.2778 0.0189 0.3281 0.0070 0.24540.0075 0.2368 0.0075 0.2818 0.02.33 0.3355 0.0575 0.24540.0079 0.2584 0.0079 0.2896 0.0343 0.3547 0.0079 0.26250.0123 0.31M 0.0123 0.3427 0.0453 0.3693 0.0123 0.30850.0167 0.3805 0.0167 0.M54 0.0563 0.3889 0.0167 0.35290.0211 0.&453 0.0211 0.&292 0.0673 0.6067 0.0211 0.40390.0255 0.4910 0.0255 0.4699 0.0?82 0.4307 0.0255 0.44790.0365 0.6237 0.0365 0.5817 0.0892 0.4335 0.0365 0.55810.0475 0.7635 0.0475 0.6853 O. 1002 0.4753 0.0475 0.63350.0585 0.8353 0.0585 O.766& 0.1112 0.5082 0.0585 0.72080.0695 0.8793 0.0695 0.8163 O. 1332 0.54?8 0.0695 0.77500.0804 0.8995 0.0804 0.8497 0.1552 0.6069 0.08_ 0.81760.091/, 0.9149 0.0914 0.8802 0.1771 0.6989 0.091/, 0.84480.1026 0.9227 0.102/, 0.8985 0.1991 0.7309 0.102/, 0.87560.1134 0.9352 0.1134 0.9107 0.2431 0.8030 0.1134 0.89780.1354 0.9535 0.1354 0.9397 0.2651 0.8853 0.1354 0.93720.157/, 0.9638 0.1574 0.9619 0.3090 0.9403 0.157/, 0.9499O. 1793 0.9783 O. 1793 0.9725 0.3530 0.9604 O. 1793 0.97460.2013 0,9795 0.2013 0.9794 0.3969 0.9730 0.2013 0.97900.2233 0.9048 0.2233 0.98?8 0.4409 0.9750 0.2233 0.99020.2673 0.9924 0.2673 0.9937 0.5508 0.9667 0.2673 0.99220.3112 0.9954 0.3112 0.9964 0.6607 0.9873 0.3112 0.99680.3552 0.9991 0.3552 1.0027 0.7705 0.9906 0.3552 0.99120.3991 1.0015 0.3991 1.0002 0.8804 0.9942 0.3991 0.99090.4431 0.9977 0.4431 1.0079 0.9903 0.9968 0././,31 0.99440.5530 1.0001 0.5530 1.0058 1.3200 1.0007 0.5530 0.99420.6629 0.99/,2 0.6629 1.0026 1.7596 0.9956 0.6629 0.99450.7727 0.9889 0.7727 0.9988 2.1991 0.9928 0.7727 0.99570.8826 0.9983 0.8826 1.0046 2.6387 0.9937 0.8826 1.00000.9925 0.9951 0.9925 1.0056 0.9925 0.9920
0.0035 0.10230.0040 0.11810.00_ 0.12260.0048 0.16140.OO53 0.1704
ooo570.0062 .O.0066 0.22730.00_ 0.23850.0075 0.25160.0119 0.31410.0163 0.38530.0207 0./,3940.0251 0./,8230.0350 0.62320.047O O.749O0.0580 0.84970.0690 0.88790.6800 0.91/,30.0910 0.9265O. 1020 0.94500.1130 0.9563O. 1349 0.9726O. 1569 0.97/,3O. 1789 0.97690.2009 0.97590.2229 0.97620.3407 0.98540.5604 1.0050O. ?802 1.0040I. 0500 0.99251.2207 0.9997
r
87-9- 19-50
103
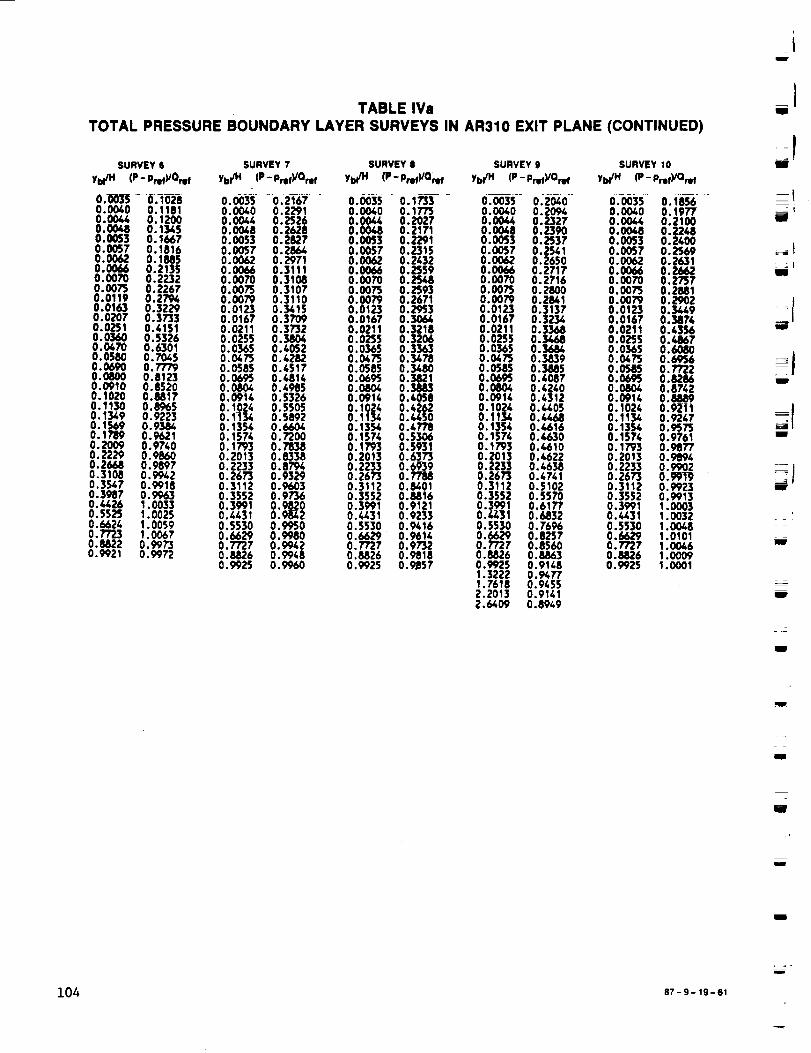
TABLE IVa
TOTAL PRESSURE BOUNDARY LAYER SURVEYS IN AR310 EXIT PLANE (CONTINUED)
SURVEY S
yU_/H (P- pret)JOref
0.0035 0.102B0.0040 0.11010.0044 0.12000.0048 0.13450.0053 0.16670.0057 0.18160.0062 0.1M50.0066 0.21350.0070 0.22320.0075 0.22670.0119 0.27940.0163 O.32290.0207 0.37330.0251 0.4151O. 0360 O. 53260.0470 0.63010. O580 0.70450.069O 0.77"_0.0800 0.81230.0910 0.85200.1020 0.88170.1130 0.89650.1349 0.9223O. 1569 0.93840. lnlq 0.96210.2OO9 0.97400.2229 0.98600.2668 0.98970.3108 0.99420.3547 0.99180.3987 0.99630.4426 I. 00330.5525 1.00250.6624 1.00590.7723 1.00670.8822 0.99730._;_21 0.9972
SURVEY 7 SURVEY $ SURVEY g
0.0035 0.21670.0040 0.22910.0044 0.25260.0O48 0.26280.0053 0.28270.0057 0.286/,0.0062 0.29710.0066 0.31110.0070 0.31080.0075 0.31070.0079 0.31100.0123 0.34150.0167 0.37O90.0211 0.37320.0255 0.38040.0365 0.40520.0473 0.42820.0585 0.45170.0695 0.48140.0804 0.49850.09i4 0.53260.1024 0. 55050.1i_ 0.58920.1354 0.66040.157/, 0.72000.1793 0.78380.2013 0.8338O. 2233 O.8794O. 2673 O.93290.3112 0.96030.3552 O.97360.3991 0.98200.4431 0._,20.5530 0.99500.6629 0.99800.7727 0.99420.8826 0.99480.9925 0.9960
0.0035 0.17330.0040 0.17750.004/, 0.20270.0048 0.21710.0053 0.22910.0057 0.23150. O062 0.24320.0066 0.25590.00?0 0.2S_0.0075 O. 25930.0079 0.26710.0123 0.29530.0167 0.30660.0211 0.32180.0255 0.32060.0365 0.33630.0475 0.3478O.0585 0.348O0.0605 0.38210.0804 O.38830.0014 0.&0580.1024 0.4262O. 1134 O. 44500.1354 0.4778O. 1574 0.5306O. 1793 0.59310.2013 O.6373O. 2233 0.69390.26t'3 0.77880.3112 0._,010.3552 0.88160.3991 0.91210.4_31 0.92330.5530 0.9/,160.6629 0.96140.7727 0.97320.8826 0.98180,9925 0.9857
0.0035 0.20400.0040 0.20940.0044 0.23270.00_ 0.239O0.0053 0.25370.OO57 0.2541O. 0062 O. 26500.00_ 0.27170.0070 0.27160.0075 0.28000.0079 0.28410.0123 0.31370.0167 0.32340.0211 0.3368O.0255 0.3468O. 0565 O.0.047'5 0.38390.0585 0.3M50.0605 0.40870.0804 0.42/.00.0014 0.4312O. 1024 0.44050.1134 0.44680.1354 0.4616O. 1574 0.4,6300.1793 0.46100.2013 0.4622O. 2233 O. 46380.2673 0.47410.3112 0.51020.3552 O.55700.3991 0.61770._3i O.6832O. 5530 O. 76960.6629 O.82570.7'727 0.85600.8826 0.88630.9925 0.91481.3222 0.94771,7618 O. 94552.2013 0.91412.6409 0.8949
suRvEYloyI_/H (P - pref)/Oref
0.oo35 o.1856O.O040 O. 19770.0O44 0.21000.0048 0.2248O. OO53 O. 24000.0057 0.2569
00o620.00660.0070 0.275?0.0073 0.28810.0079 O.29020.0123 0.34490.0167 0.38?40.021t 0.43560.0255 0.I,8670.0365 0.608O0.047'5 0.69560.0385 0.7722O.O695 0.82860.0804 0.87420.0014 0.8889O. 1024 O. 92i I0.1134 0. 92470.1354 0.9575O. 1574 0.97610.1793 0.98770.2013 0.98940.2233 0.99O20.2673 0.99T90.3112 0.99230.3552 0.99t30.3991 1.00030.4431 1.00320.5530 I .OO480.6629 1.01010.772? 1.00460.8826 1 .OOO90.9925 1.0001
w
[--- iil
i
wl
gB
I1'
W
m
w
I
W
mJ
I
104 87-9- 19-61
w

.,...
z
w
TABLE IVa
TOTAL PRESSURE BOUNDARY LAYER SURVEYS IN AR310 EXIT PLANE (CONCLUDED)
SURVEY 11 SURVEY 12 SURVEY 13
Ya_" (1'- P_)_Or_ YUTM (1'- Pr_)lO_ YU_ (P- Pr_)la_
0.0035 0.11520.0040 0.1127O.O044 0.10780.0048 0.11130.0053 0.11630.0057 0.12010.0062 0.12370.0066 0.12770.0070 0.15530.007'5 0.16650.0079 0.18170.0083 0.19710.0088 0.20930.0132 0.26320.0176 0.30980.0220 0.34130.02_. 0.36210.0308 0.39400.0418 0.&6270.0527 0.53020.0637 0.60010.0747 0.66250.0857 0.?0880.0967 0.75920.1077 0.78930.1107 0.81270.1297 0.85380.1407 0.85980.1626 0.88240.18/.6 0. (_)00.2O66 0.93520.2286 0._O90.2505 _.qSM0.2725 0.96210.3165 0.96950.36O4 0.97_0.4044 0.97790._;8_ 0._I0.4923 0.98O70.5363 0.98390.6462 0.9825O.?560 O. 9849O.8659 O. 98980.9?50 0.98321.0857 0.98881.1956 0.99331.3055 0.99271.6352 0.9868
0.0035 O. 15520.004O O. 15500.0044 0.1569O,O048 0.15500.0053 0.15940.0057 0.15480.0062 0.1S&l0.0066 0.152/*0.0070 0.15360.0075 0.15/,I0.0079 0.15190.0123 0.15300.0167 0.15690.0211 0.17130.0255 0.18020.0565 0.20970.0475 0.22770.0585 0.2/*29O. 069/* O. 2/*600.0804 0.25010.O91/* 0.262/*O. 102/* 0.26630.11_ 0.27/*70.12_ 0.27510.1_ 0.28O20. lb_. 0.27150.1903 0.25690.2123 0.25700.23_3 0.23600.2782 0.23580.3222 0.27280.3662 0.35/*30.4101 0.48060.45/.I 0.61320.564O 0.791/*0.6738 0.87710.7837 0.92800.8936 0.95071.0035 0.959/*1.3771 0.98461.8167 0.99392.2563 O. 99782.6958 0.99862.9156 0.9920
0.0035 0.172/*0.0040 0.10750.0044 0.20100.0048 0.21/,10.0053 0.22620.0057 0.23410.0062 0.23W.0.0066 0.250(;0.0070 0.25100.0075 0.26120.0079 0.25940.0123 0.28330.0167 0.30190.0211 0.32300.0255 0.32/*50.0365 0.330_0.0&75 0.35170.0585 0.35650.O694 O. 7790.0804 0.]9750.091/* 0.40520.102/* 0./,2790.1134 0.4431O. 1354 0.&8500.1574 0.55000.1793 0.591/*0.2013 0.6512O. 2233 O. 7078O.2673 0.79140.3112 0.85130.3552 0.90160.3991 0.92O90.4431 0.93570.5530 0.951/*0.6629 0._,40.7727 0.97/*70.8826 0.98230.9925 0.98191.3222 0.989/*1.7610 0.99132.2013 0.99802.6,;O9 0.99_2.9705 0.991/*
=
87-g- 1g-62
105

Lg
106
TABLE IVbTOTAL PRESSURE BOUNDARY LAYER SURVEYS IN AR630 EXIT PLANE
_URVEY1
0.0073 0.10390.0082 0.10720.0091 0.12160.0101 0.12660.0110 0.14050.0119 0.14000.0128 0.15760.0137 0.15750.0146 0.16950.0165 0,1T_0.0183 0.16330.0201 0.17700.0247 O.18550.0293 0.1987O.0339 O.20590.0384 0.20430.0476 0.2095O.0567 O.2322O.O659 0.24050.0750 0.2224O.08,;2 O.2602O.O933 0.27130.1025 0.27490.1162 0.31330.1391 0.28450.1619 0.30270.1848 0.31460.2077 0.3193O.23O6 0.32110.2534 0.31720.2763 0.32550.3220 0.31980.3678 0.31620.4t35 0.30890.4593 0.32120.5508 0.29290.6/,23 0.2_00.7338 0.32030.8253 0.40070.9167 0.52570.8710 0.46131.0082 0.67350._ 0.58/,9I .o997 0.80431.1912 0.90141.2827 0.96151.3742 0.9850I.&657 0.99401.5572 0.97971.6487 0.9884I. 7402 O.99301.8317 0.99861.9231 0.9959
SURVEY2 SURVEY3 SURVEY4 SURVEYS
Yi_ (P- Pnd)iOmt Ybl/H (P- Prel)/Omf Yb_ (P- Pref)JQmf YI_H (P- Pref)/amf
0.0073 0.19050.0078 0.22720.0082 0.21520.0091 0.21380.0101 0.23060.0110 0.22760.0119 0.21740.0128 0.232O0.0146 0.24770.0165 0.23350.0183 0.24050.0201 0.25470.0220 0.25350.0238 0.24_,O.0256 O.25&70.0302 0.2592O.O348 0.28100.0393 O.27990.0439 0.27660.O531 0.29410.0622 0.31540.0714 0.32500.0805 0.32850.0897 0.32210.0988 0.31550.1217 0.3330O.1446 O.3399O.1674 O.33940.1903 0.320t0.2132 0.32700.2560 0.3336O.2589 O.33750.2810 0.32630.3275 0.3271O.3733 0.31260.4190 0.30430._48 0.29420.5563 0.28500.6478 0.30430.7392 0.37020.8307 0.45850.9222 0.62391.1510 0.90931.3797 0,99981.6084 0.98781.8371 0.q9132 0659 0 99282.2946 0.99100.6_78 O.29740.67'O6 0.31900.6935 0.31930.7164 0.34860.7392 0.36290.7621 0.39600.785O 0.447110.8079 0.45080.8307 0.48_20.8536 0.51910.8765 0.538908994 0.57580.9222 0.63_10.9451 0.60520.9680 0.70330.9909 0.7299i,0137 0.7673i.0366 0.79_261.0595 0.827o1.0823 0.8_21.1052 o.9o691.1510 0.91601.1967 0.94751.2425 0.96861.2882 0.97_1.3339 0.97981.3797 0.9889I.4254 O.98581.47i2 0.99461.5169 0.98791.5627 0.9869
o.oo820.0091 0.21600.0101 0.19700.0110 0.20100.0119 0.21300.0165 0.21100.0210 0.25300.0256 0.31300.0233 0.28300.0279 0.32400.0325 0.35700.0371 0.37200.0416 0.3930O.6462 0.4090O.O554 0,_300.O645 0.47200.0737 0.4q400.0828 0.51700,0_65 0.35_00.1102 0.59400.1240 0.61700.1423 0.66800,1331 0.63700.1514 0.6700O.1697 O.71800.1834. 0.74600.1972 0.76700.2109 0.79500.2246 0.8190O.2383 O.836O0.2521 0.85500.2658 O.87000.2795 0.89000.2978 0.91200.$i61 0.91100.3344 0.92500.3527 0.94200.3710 0.94900.3984 0.95900.4259 0.97300.4533 0.97700.4,899 0.98200.5265 0.98300.5631 0.98200.6089 0.986O0.6546 0.98600.7O04 0.98400.7461 0.98600.7919 0.98600.8376 0.98400.8833 O.98700.9291 0.98500.9131 0.98500.8765 O.98900.8856 0.98700.8948 0.98500.8719 0.98600.8490 0.98300.8262 0.98500.8033 0.9810
o,oo730.27600.0256 0.37140.0165 0.32370,0348 0,41280.0439 0,44670.0531 0.47630.0622 0.50560.0714 0.53740.0805 0.55990.0897 0.60070.O988 0.62560.1080 0.64920.1171 0.M590.i263 0.7172O. 1354 0.74340.1446 0.76550.1537 0.79400.1674 0.81510.18_2 0.85610.1674 0.81210.1949 0.87540.2O_ 0.89660.2223 0.91360.2360 0.9239O.2498 O.93950.2635 0.94880.27'72 0.95050.2909 0.96170.3047 0.97170.3230 0.97810.3413 0.98540,3596 0.98650.377Q 0_99200,3962 0.q__70.4145 0,98730.4328 0.99320.4511 0.99600.4694 0.99560.4876 0.99370.5105 0.99710.5563 0.99340.6020 0.99860.6478 0.9975
0.0073 0.19700.0078 0.18250.0082 0.20270.0091 0.19080.0110 0.19740.0128 0.20760.0146 0.22180.0165 0.1999o.01lm 0.21870.0210 0.23040.0233 0.24_60.0256 0.27070.0279 0.25850.0302 0.30990.0348 0.3_230.0393 0.36760.0_39 0.40120.0485 0.41300.0531 0.42290.0622 0.45700.0714 0._._510.0805 0.5125O.0897 O.5399O.0988 0.59360.1080 0.58660.0988 0.55550.1171 0.6338o. 1354 0.66000.1537 0.6968o. 1720 0.76020.1903 0.78970.1720 0.75470.2086 0.81770.2269 0.86310.2452 0.8871O.2635 0.90450.2818 0.94660.4511 1.00260.6340 0.99820.8170 0.99661.oooo 0.99330.6020 0.99860.6478 0.9975
87-9-19-63
t
tim
Im
t
1
m
IBm
J
=tI
m
ml
J
i
m
|
U
I
l

v
w
w
TABLE IVb
TOTAL PRESSURE BOUNDARY LAYER SURVEYS IN AR630 EXIT PLANE (CONTINUED)
SURVEY 6
Ybl/H (P - Pref)lOref
0.O073 0.21070.0082 0.21900.0091 0.20540.0101 0.20620.0110 0.218/,0.0119 0.22110.0128 0.21520.01_S 0.21260.0165 0.21940.0183 O.222O0.0201 0.24170.0220 0.23670.0238 0.26000.0256 0,27730.0302 0.30100,0348 0,3_600.0393 0.35_0.0439 0.4333O.0/.85 0.41660.0531 0.43320.0439 0.39980.0576 0.43580.O668 0.47710.0805 0.50330.0988 0.54940.1171 0.59000.1354 0.64480.1537 0.65100.17'20 0.69280.1903 0.74730.2086 0.7668O.2269 O.79930.2452 0.8244O.2635 O.B5600.2818 0.87960.3001 0.89060.31_ 0.q0640.3367 0.92610.3550 0.93590.3733 0.94970.3916 0.96700.4511 0.99090.6340 0.99920.8170 0.9'9971.0000 0.9973
SURVEY 7
ybl/H (P - pref)/amf
O.O073 0.16180.O082 0.17'230,0091 0,17990,0101 0,18860.0110 0.18580.0128 0.19270.0101 0.16390.0137 0.19640.0174 0.22620.0210 0.25540.0247 0.2725O. 028/, O. 28740.0320 0.30420,0357 0,32150.0393 0.33530.0439 0.34980._85 0,36/,80,0531 0.38870.O622 0.43300.0714 0.46530.08O5 0.50800.0897 O.54680.0988 0.5732O. 1080 0.61690.1171 0.63940.1263 0.66910.1354 0.69360.1583 0.76310.1812 0.81870.2040 0.86O70.2269 O.09660.2498 0.91860.2726 0.94110.2955 0.95330.318z, 0.97140.3413 0.97380.3641 0.97880.3870 0.98620.4099 0.9_60.4126 0.98510.4401 0.98740.4673 0.99040.4922 0.98960.5242 0.99160.5563 0.99590.5883 O.99O90.6203 0.9946O.6569 0.9879O.6935 0.9906
SURVEY 8
Ybl/H (P - prefl/Qref
0.0073 0.17780.0256 0.22910.0439 0.3583O.0_8 0.32790.0302 0.3OO40.0485 0.37510.0576 0.41860.0531 0.39820.0622 0.43410.0714 0.46730.O8O5 0.51540.0759 0._740.0851 0.53490.0897 0.54920.0942 0.56240.0988 0.58400.1080 0.61240.1171 0.8428O. 1263 0.6747O. 1354 0.7022O. 1446 0,7298O, 1537 0,75590.1629 0.78190.1720 0.80560.1812 0.8249O. 1903 0.83230.2_0 0.S6340.2177 0.89260.2315 0.90450.2452 0.9217O. 2635 O.93900.2818 0._400.3001 0.95730.33.67 0.98060.3733 0.97880.40_;' 0.9943O. 4465 O. 98880,4831 0.99530.5197 0.99330.5563 0,9971O, 5929 O.993.80.40qq 0.99120.3916 0.99060.3733 0.98550.3550 0.98770.3367 0.97370.3184 0.97290.3001 0.96400.0348 0,31580.0325 0.30100.0302 0.30660.0279 0.21_O. 0256 O.27680.0233 0.26650.0210 0.25130.0188 0.23020.0165 0.21460.0142 0.19310.0119 0.1899O. 0096 O. 1670
- SURVEY 9
Yb_ (P- PmtYOrtt
0.0O73 0.21490.0082 0.23430.0091 0.24240.0110 0.25160.0128 0.26340.01/,6 0.27630.0165 0.2835O. 0393 O. 38360.0165 0.2787O. 0393 O. 38850.0/,16 0.39540.0439 0.3975O. 0485 0.42080.0531 0.43180.0576 0.6453O. 0622 0.46950.0714 0,50480.0805 0.53170.O897 0,56810.0988 0.38660.1125 0.63100.1263 0.66700.1400 0.71040.1537 0.7383O. 1720 0.77490.1903 0.81100.2086 0.84310.2269 0.8688O.2543 0.90120.2818 0,93150.3092 0.94570.3367 0.W>440.3641 0.97540.3916 0.98500.4190 0.986_0.4465 0.99120.4739 0.98980.5014 0.98900.5288 0.99520.5563 0._440.5929 0.9918O.6295 O.98980.6661 0.99400.7027 0.9906O. 7392 0.989/,
SURVEY lO
ybl/H (P - pref)lQmf
0.OO73 0.27800.0078 0.27700.0087 0.28200.0101 0.28900.0114 0.29400.0128 0.30000.0142 0.31900.0156 0.31600.0174 0.33200.0192 0.33100.0215 0.34500.0238 0.3500O. 0284 0.36900.0329 0.39000.0373 0.39900.0421 0,41700.O467 0.43100.0512 0.44100.0604 0 J,8000.O695 0.5O9OO. 0787 O. 54OO0.O878 0.55700.1016 0.58800,1153 0.6230O. 1290 0.64500.1491 0.66900.1629 0.70800.1812 0.74100.1995 0.76600.2177 0.80200.2360 O. 82000.2543 O. 84900.2726 0.86900.2955 0.88800.3184 0.90500._13 0.93200.3_I 0.94200.3916 0.95000,4190 0.962OO.4465 O. 96700.4922 0.97600.5380 0.97800.5837 0.98200.6295 0.98400.6752 0.98200.7667 0.98000.8582 0.98400.9497 0.98200.538O 0.98300.5563 0.98200.5746 0.98/,0O.5929 O. 98300.6112 0.98300.6295 0.98200.6661 0.98100.7027 0.98200.7392 0.9830
107
qii
!
II
I
!
I
r_Ill
III
I
I
I
iI'
II
.l
iiill
IiI
II
W
I
_IIf'

UTRC87-41
APPENDLKA
AR310 TRANSITION DUCT INSPECTION
E ,
,qs.m
Due to an obvious difference between the actual exit plane shape and the
design shape Eq. (I-i), a detailed inspection of the AR310 duct was performed.
The cross-sectional shape at 15 axial locations was defined with a Cordax 1000,
3-axis coordinate measuring machine (0.00025 cm resolution). Initial
measurements indicated that the duct was very symmetrical and that upstream of
x/R - 0.88 the duct coordinates were in close agreement with Eq. (I-I). Thus, to
define the duct shape, only one quadrant of the duct is presented from x/R - 0.88
to x/R - 2.00. The results at 8 axial stations are shown in Fig. A-I and an
entire set of inspection data is listed in Table A-I. In Fig. A-l, the design
shape is the solid line and the actual shape is the dashed line. At x/R - 0.88
the agreement between the design and actual cross-sectional shape is very good
but it degrades rapidly further downstream. At the exit plane (x/R - 2.00) the
actual duct has a more square corner and the span is 7 percent of the half-height
(H) smaller than the design.
In summary, the AR310 transition duct shows significant cross-sectional
shape variation from the design. In order to accurately describe the duct, Eq.
(I-I) should be used for x/R < 1.0 and Table A-I for x/R > 1.0.
W
PRECEDING PAGE BLANK NOT FILMF.J_
109
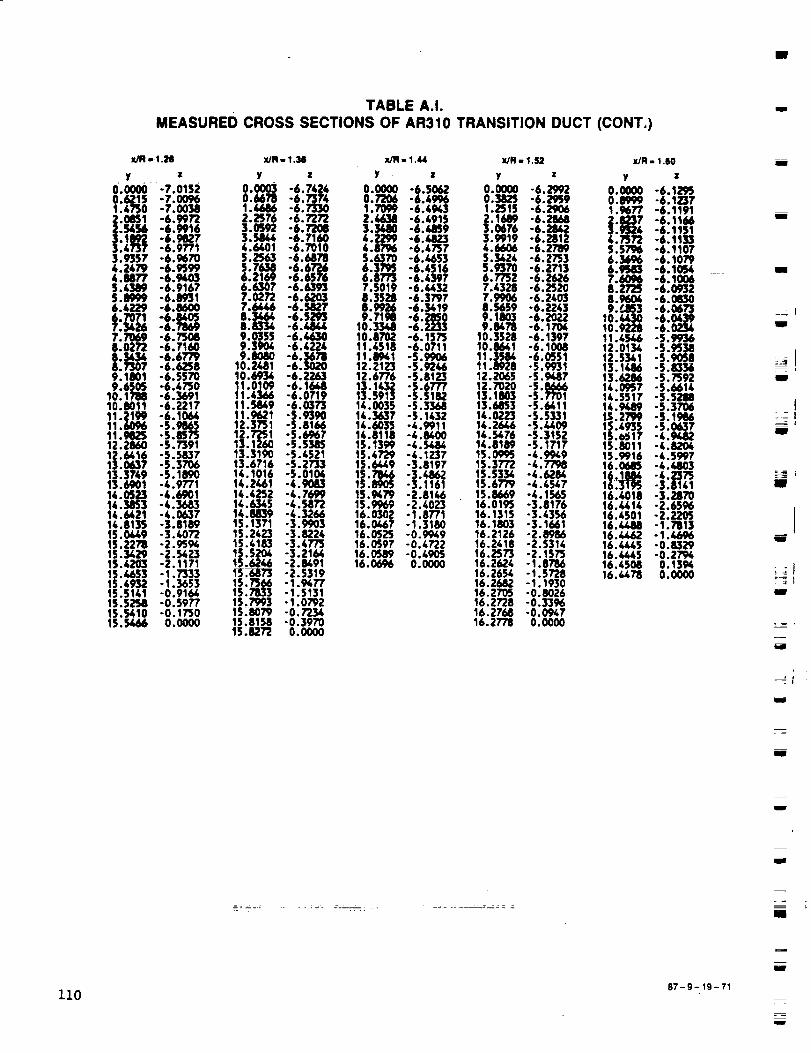
ID
TABLE A.I.
MEASURED CROSS SECTIONS OF AR310 TRANSITION DUCT (CONT.)
--1.28
y Zo.05o0 -7.o1520.6215 -7.00961.4750 -7.00M2.0851 -6.99722._56 -6.99163.1892 °6.98273.473? -6.97713.9357 -6.96704.2679 -6.93996.8877 -6.94_35.4389 -6.91675.8999 -6.89316.4229 -6.86006.7071 -6.06057.3626 -6.78697.7069 -6.75O88.0272 -6.71608.3434 -6.67798.7307 -6.62589.1801 -6.55709.6505 -6.&750
10.1788 -6.369110.80!1 -6.221711.2199 -6.106_11.6096 -5.986511.9825 -5.857512.2060 -5.739112.64t6 -5.583713.0637 -5.370613.3749 -5.189013.6901 -4.977114.0523 -4.690114.3853 -4.368314.6421 -4.063714.8135 -3.818915.0449 -3.4O7215.2278 -2.959_15.3429 -2.5_2315./.203 -2.117115./o653 - 1.733315.&932 - 1.365315.5141 -0.916415.5258 -0.597'715.5410 -0.175015.5466 0.0000
x/R- 1.M*
y z0.0003 -6.74240.6678 -6.73741.4686 -6.73302.2576 -6.72723.0592 -6.72083.5844 -6.7i604.6401 -6.70105.256,3 -6.M785.7638 -6.67266.2169 -6.65?66.6307 -6.63937.0272 -6.62037.6446 -6.58278.3666 -6.52938.8334 -6.6,0_9.0355 -6.46309.3904 -6.422&9.8080 -6.3678
10.2/.81 -6.302010.6934 -6.226311.0109 -6.i64811./.366 -6.071911.58/,9 -6.037311.9621 -5.939012.3751 -5.816612.7251 -5.696713.t260 -5.538513.3190 -5./,52113.6716 -5.27331/*. 10t6 -5.01041&.2661 -4.90831/*./.252 -4.769914.6345 -4.587214.8839 -4.326615.1371 -3.990315.2423 -3.822415.4183 -3.477515.520& -3.216415.6246 -2.84911_. 6873 -2.531915.7566 -1.947715.7833 -1.513115.7993 -1.0792i5.8079 -0.723415.8158 -0.397015,8272 0.0000
x/R - 1.44
Y •
0.0O05 -6.50620.7206 -6.49961.7099 -6./*W.32.4638 -6./.915
&3:_ -6.48594.8796 -6.47575.637O -6.46536.3795 -6./.5166.8773 -6.43977.5019 -6.44328.3528 -6.37978.9926 -6.34199.7198 -6.28S0
10.33_ -6.223310.8702 -6.157511.4518 -6.071111.8941 -5.990612.2t23 -5.924612.6776 -5.812313.1/.32 -5.677713.5913 -5.51821/*.0535 -5.33681/*.3637 -5.143214.6035 -&.991114.8118 -4.840515.1399 -/*. 548615.4729 -/*. 123715.6449 -3.819715.7846 -3._6215.8905 -3.116i15.9479 -2.814615.9969 -2.402316.0302 -1.877116.0467 -1.3lira16.0525 -0.994916.O597 -0./.72216.0589 -0.490516.0696 0.0000
x/R- 1.52
y •
0.0050 -6.29920.M25 -6.29591.2513 -6.20062.1689 -6.28683.0676 -6.28423.9919 -6.28124.6606 -6.27895.3624 -6.27535 706_/_ 2 -6.2713-6.26267./*328 -6.25207.99O6 -6.24038.5659 -6.22/*39.1803 -6.20229.8478 -6.1704
10.3528 -6.139710.8641 -6, IOM11.358_ -6.O55111.8928 -5.993112.2065 -5.948712.7020 -5.866613.1803 -5.770113.6853 -5.641114.0223 -5.533t14.2646 -5.440914.5476 -5.315214.8189 -5.171715.0995 -/*.9'K915.3772 -/*.779815.5334 -4.628&15.6779 -/*./.5/.715.8669 -4.156516.0195 -3.817616.1315 -3.435616.1803 -3.166116.2126 -2.898616.2/.18 -2.531416.2573 -2.157516.2624 -1.878616. 265/, - t. 57"2816.2682 -1.193016.2705 -0.8026t6.2728 -0.339616.2768 -0.094716.2778 0.0000
xJR - !.80
y •0.0500 -6.1_P50.8999 -6.12371.9877 -6.11912. 73._4 -6.1166-6.11514.7572 -6.11335.5796 -6.11076.3696 -6.10796.9583 -6.10547.6096 -6.10068.2725 -6.09328.96_ -6.O83O9J.M3 -6.0673
10.4430 -6.063910.9228 -6.023411.4546 °5.993612.0136 -5.95M12.5341 -5.9O5813.1486 -5.833613.6286 -5.75921/*.0957 -5.661414.5517 -5.52881&.9/*_9 -5.3706lS. 2799 -5.198615./.935 -5.063715.o_17 -/*. 9#'AJ213.8011 -4.820415.9916 -/*.599716.0685 -&.480316.1884 -/*.237316.3195 -3.$1/.i16.4018 -3.287016.4414 -2.659616.4501 -2.220516.4488 -1.781316.4#d_2 -1.d_?616._.45 - 0.8329t6.4465 -0.279416.4506 0.1394t6.4478 0.0500
m
mm
I
M
I
iiw
JI_z r
J
B
m
m
m
w
m
11087-9- lg-71
atom

TABLE A.I.
MEASURED CROSS SECTIONS OF AR310 TRANSITION DUCT
x/R. 0.88
y •
0.0000 -8.92250.2278 -8.92020.6894 -8.91031.1768 -8.89331.7620 -8.86262.2857 -8.82352.7334 -8.77953.2189 -8.72693.6373 -8.669O4.0013 -8.61214.3279 -8.55524.5926 -8.5O525.1255 -8.39245.6754 -8.25936.0787 -8.14936.4793 -8.02946.888?. -7.89487.28_0 - 7.75287.6871 -7.59498.07_ -7.43008.2949 -7.32998.5507 -7.20758.8964 -7.0310_.iS(_ -6._58 _9,5270 -6.67189.7874 -6.5082
10.2227 -6.210310.6502 -5.883910.9690 -5.613111.1964 -5.&02611.3965 -5.20751!.5352 -5.063511.6967 -&.887011.9210 -&.620512.0968 -&.395212.3355 -&.061212.5062 -3.797012.6840 -3.690712.7805 -3.308112.8925 -3.075913.0302 -2.751813.1656 -2.370813.2504 -2.081513.3436 -I .685013.4033 - 1.338613. _02 -0.879913.4940 -0.487213.516,4 -0.173713.5247 O. 0000
DIMENSIONS IN cm
x/R - 0.96
y z
0.0000 -8.50490.1308 -8.5O420.5799 -8.&9761.2035 -8.48211.9W_ -8._32.8209 -8.39223.5123 -8.32643.9353 -8.27584.3914 -8.21664.8379 -8.16655.4046 -8.0U,95.7920 -7.96626.3297 - 7.iK?.36.6708 -7.75516.98_ -7.66757.5433 -7.54337.8483 -7.39758.3287 -7.22178. ?,_,5 -7.O5469.1305 -6.88429.4348 -6.73999.6992 -6.60609.9751 -6.4574
l O.--a_ -6.27_10.5639 -6.1051IO.SAM -5.914111.0152 -5.795811.3043 -5.576611.&750 -5.&37911.T&l& -5.204511.9416 -5.016012.1361 -A.818412.2751 -4.66_12.5588 -&.333012.83_ -3.961113.1186 -3.514913.3248 -3.126713.4579 -2.829113.5989 -2.&52113.7114 -2.078513.7879 -1.750113.8206 -1.577613.8781 -1.106913.9144 -0.833613.9451 -0.441513.9591 -0.231913.9736 0.0000
x/R- 1.04
y z
0.0000 -8.00630.6165 -8.07_0.9180 -8.07491.6093 -8.05892.4953 -8.02313.1605 -7.90_73.83O8 -7.9345&.2466 -7.89415.0089 - 7.80495.6845 -7.70746.4262 -7.57487.1217 -7.A2657.5281 -7.32828.0142 -7.19718.5583 -7.03259.0630 -6.86O59.4,818 -6.70189.8862 -6.5329
10.&031 -6.290810.9212 -6.015511.2700 -5.807711.6528 -5.554211,999O -5.297912._17_ -5.155912.4363 -4.926812.7196 -4.650512.9723 -4.373_13.0980 -4.221713.2690 -4.001513.4526 -3.739413.6591 -3.4_013.8359 -3.O5_13.9484 -2.795314.O566 -2.501914.2103 -1.953514.2479 -1.775714.2855 -1.562914.3294 -1.231114.3535 -0.980&14.3703 -0.750114.4008 -0.278114.&201 -0.062714.4170 -0.0003
_R - 1.12
y •
0.0000 -7.68780.6055 - 7.6&?.21.0528 -7.67641.7056 -7.6655
.&615 -7.6_9
.3050 -7.61164.01M -7.57204.6982 -7.52205.4318 -7.45216.2593 -7.35036.8169 -7.26777.5202 -7.14358.0841 -7.02648.5659 -6.91269.0785 -6.77629.4722 -6.65919.9868 -6.4892
10.3599 -6.350810.7747 -6.180611.1730 -5.999511.6096 -5.775511.9537 -5.578112.2895 -5.362412.6190 -5.126512.8839 -4.913_13.1519 -&.671113.36/,0 -&.&58213.5471 -4.254213.7013 -4.065513.8839 -3.818614.0805 -3.51161&.2281 -3.242114.3716 -2.933214.5252 -2.51O514.6121 -2.193314.6985 -1.774_14.7460 - 1.435914.7861 -0.989314.8062 -0.6_7414.8222 -0.342414.8_02 0.0000
0.0000
1.6828 -7.3116
|._._ -7.t_n6-7 _84,1o 4.7864 -7.21495.4933 -7.16796.1359 -7.1143
-7. 5_6.7'125 -6._7.56157.9_9 -6.89O38.6233 -6.77169.2662 -6.63789.71K6 -6.5126
10.1_59 -6.&17610.4780 -6.316510.8504 -6.193111.1694 o6.081311 ..r_,84 -5.930911.7889 -5.826312.1173 -5.6?0612.3962 -5.524512.6583 -5.373_12.9685 -5.i75313.2870 -&.9_3613.5976 -4.683513.7610 -4.530113.9830 -&.296914.1788 -&.063014.37'06 -3.800614.5918 -3.437414.7688 -3.072114.9382 -2.595415.0266 -2.239615.0901 -1.889315.1501 - 1.359915.1765 -0.9S0715.19g_ -0._66615.2187 0.0000
,Lw
z
r--
87-9-19-70
IIi

TABLE A.I. r
MEASURED CROSS SECTIONS OF AR310 TRANSITION DUCT (CONCLUDED)
x/_ - 1.68
y z
0.0000 -5.99360.9710 -5.9M82.1847 -5.96533.1656 -5.M406.0183 -5.4M30
-5 o,-5.971_,6.6921 -5.9764?.7203 -5.97418.7114 -5.96909.6733 -5.9619
10.3256 -5.9540
11 -5.916/,12.39_ -5.892012.8537 -5.867913.25_2 -5.842313.6873 -5.805714.107/, -5.755614.6502 -5.654815.1427 -5.507515.4935 -5.358915.8069 -5.185915.9990 -5.051816.1061 -&.961916.3256 -4.658616._9e -4.329216.5296 -3.880416.5707 -3.334816.51K7 -2.930116.5898 -2.657316.5923 -2.291316.5882 -1.793016.584_ -1.452616.5816 -0.980216.5799 -0.646216.5796 -0.245416.5814, 0.0000
x/R - 1.76
Y •
0.0000 -5.89361.1003 -5.M851.8207 -5.M722.7874 -5.88523.6670 -5.88674.4J,09 -5.88295.1587 -5.M165.8715 -5.88096.6558 -5.87M7.2517 -5.87867.8897 -5.87818.6114 -5.87739.3711 -5.8748
10.0239 -5.872710.4795 -5.872011.151/, -5.868911.6197 -5.863812.0985 -5.856712.6215 -5.846813.0871 -5.837413.5585 -5.8_4513.823& -5.81M1/,.1689 -5.7_214.3914 -5.776214.6703 -5.745514.996& -5.694215.3388 -5.618015.5796 -5.547915.9288 -5.&l&O16.2070 -5.272316.3774 -5.133816.5037 -4.926316.5809 -4.718116.6233 -4.519416.6632 -4.131316.6779 -3.762516.6832 -3.431316.6893 -2.901416.6896 - 2.346716.6_0 -t.816416.6799 -1.454416.6774 -0.978716.6766 -0.634016.6766 -O.&IM16.6769 0.0000
x/R- 1.84
Y
"5 730.63880"0000"5_421.69_ -5.82272.8037 -5.82093.7889 -5.81945.1829 -5.81_6.3701 -5.81747.29O3 -5.81488.2603 -5.81339.0279 -5.81369.80O3 -5.8123
10.6832 -5.813011.7079 -5.812012.5i9& -5.810513.0741 -5.807513.5275 -5.8o5214.1813 -5.796014.6710 -5.777214.8689 -5.766115.1869 -5.759915.5390 -5.696715.7615 -5.658915.M08 -5.634716.0856 -5.5875t6.2936 -5.530916.4069 -5.497816.4917 -5.478516.6558 -5.184616.7132 -&. 86._316.7434 -4._9116.7/_5 -&.101116.7488 -3.7887
16.7495 -3._3_263816.7498 "i"16.7472 - .16.7437 - [email protected] - 1.675916.7383 -1.205516.7578 -0.795316.7378 -0.339916.7373 -0.020116.7376 0.0000
xIR - 1.92
y z
o.oooo0.9947 -5.78591.9715 °5.78562.9167 -5.78493.9652 -5.78335.0091 -5.7821
3.8837 - S.?_S6.7059 -5.77957.8t99 -5.77729.1_3 -5.7770
10.5207 -5.776211.7272 -5.777012.4356 -5.779312.9291 -5.778013.3W,2 -5.7780I_._. ,5.. 776514.5354 -5.776214.7759 -5.77_14.9936 -5.771915.3774 -5.766815.6614 -5.757715.8913 -5.7_.516.2420 - 5._18016.4937 -5.700816.6_56 -5.693_16.68_2 5.676616.7289 -5.625816.7480 -5.5039i6._P_ -5._16.7683 -5.176516.776/, -4.893316.7810 -&.575016.7805 -4.282716.7782 -3.838216.7772 -3.542516. 776& -3.153216.7737 -2.752916.7734 -2.381816.7709 -1.996416.7693 -1.713716.7683 -i .307616.7673 -I .069116.7678 -0.502916.76715 0.0000
x/R- 2.00
y z
0.0000 -5.7_600.5_94 -5.77601.3175 -5.7762t. 1951 -5.7760
.1M1 .S. 77604.2753 -5.77605.2972 -5.77606.0436 -5.7'7526.?966 -5.77527.4384 -5.77528.3533 -5.77579.0150 -5.77499.7439 -5.7757
10.6007 -5.775211.3911 -5.774912._W.5 -5.774912.7160 -5.775213.5_58 -5.774714.3378 -5.774914.8521 -5.774715.3726 -5.775215.8885 -5.77_16.2032 -5.764PI16.5169 -5.765516.7762 -5.679_16.7792 -5.662716.7838 -5.59_16.7965 -5.2659
-_';_716.7912 -4.167116.7919 -3.646416.7914 -2.983516.7912 -2.287016.7914 - 1.704616.7919 -1.143_16.7914 -0.618716.7912 -0.283016.7912 -0.059716.791:) 0.0000
18
_j
um
r_--1U
mulms
Ull
li
I
IIg
J
I
w
w
u
z]z 87- 9- _g- 72

Z
0x/R = 0.88
-2-
--4-
--6"
--8-
-100 ' ,_ ' _ i'2
Y20
0x/R = 1.52
_2-8-
-10-, , I ,o ,_ _ 12 li_ 2o
Y
h
w
w
0x/R = 1.04
-2-
--4-
--8-
--8"
-100 _,' 8 ' 12
Y20
,
--2-
--4-
--6"
--8"
-10
0
x/R = 1.20
tl !
I I / I I I I
4 8 • 12 16Y
2O
0
--2"
--4-
Z--6"
x/R = 1.68
S-8-
-10 , , ,0 4
0
--2-
--4"
Z
--6"
--8-
-100
12 1'6 20Y
x/R = 1.84
' 8 1'2 ' 16 '20Y
0
-10
-2-
--4-
--6-
--8-
o _
x/R = 1.36
i I
DESIGN (EQ. 1.1
.... .__'_" ACTUAL
Z
x/R = 2.000
--2-
--4-
--6"
--8-
-10
0
J'12 '1'6 20 ' _, ' 8 '12'16' 20y Y
_ Figure A.1. -- Comparison of AR310 Design Cross Section to Actual Cross Section
87-9- 19-65 113
|
i
maD
i
i
0
i
I
mini
i
] t
ui
i
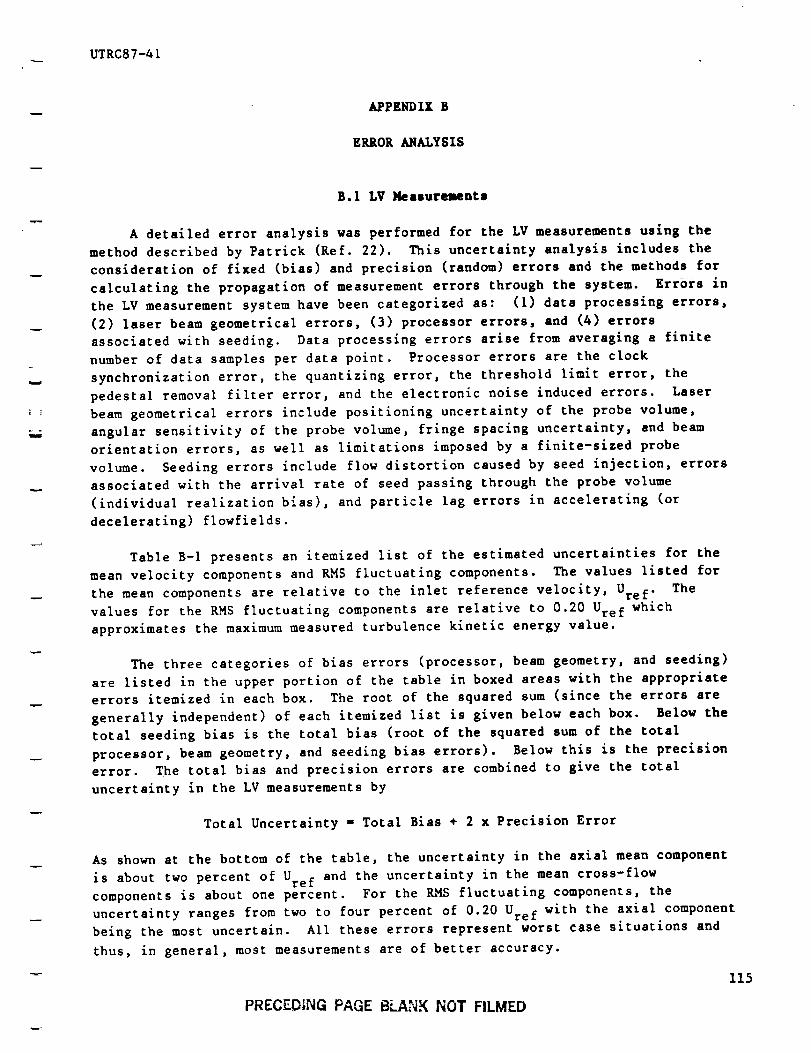
UTRC87-41
APPENDIX B
ERROR ANALYSIS
B.I LV Measurements
A detailed error analysis was performed for the LV measurements using the
method described by Patrick (Ref. 22). This uncertainty analysis includes the
consideration of fixed (bias) and precision (random) errors and the methods for
calculating the propagation of measurement errors through the system. Errors in
the LV measurement system have been categorized as: (I) data processing errors,
(2) laser beam geometrical errors, (3) processor errors, and (4) errors
associated with seeding. Data processing errors arise from averaging a finite
number of data samples per data point. Processor errors are the clock
synchronization error, the quantizing error, the threshold limit error, the
pedestal removal filter error, and the electronic noise induced errors. Laser
beam geometrical errors include positioning uncertainty of the probe volume,
angular sensitivity of the probe volume, fringe spacing uncertainty, and beam
orientation errors, as well as limitations imposed by a finite-sized probe
volume. Seeding errors include flow distortion caused by seed injection, errors
associated with the arrival rate of seed passing through the probe volume
(individual realization bias), and particle lag errors in accelerating (or
decelerating) flowfields.
Table B-I presents an itemized list of the estimated uncertainties for the
mean velocity components and RMS fluctuating components. The values listed for
the mean components are relative to the inlet reference velocity, Ure f. The
values for the RMS fluctuating components are relative to 0.20 Ure f which
approximates the maximum measured turbulence kinetic energy value.
The three categories of bias errors (processor, beam geometry, and seeding)
are listed in the upper portion of the table in boxed areas with the appropriate
errors itemized in each box. The root of the squared sum (since the errors are
generally independent) of each itemized list is given below each box. Below the
total seeding bias is the total bias (root of the squared sum of the total
processor, beam geometry, and seeding bias errors). Below this is the precision
error. The total bias and precision errors are combined to give the total
uncertainty in the LV measurements by
Total Uncertainty = Total Bias + 2 x Precision Error
As shown at the bottom of the table, the uncertainty in the axial mean component
is about two percent of Ure f and the uncertainty in the mean cross-flow
components is about one percent. For the RMS fluctuating components, the
uncertainty ranges from two to four percent of 0.20 Ure f with the axial component
being the most uncertain. All these errors represent worst case situations and
thus, in general, most measurements are of better accuracy.
115
PRECED;NG PAGE BLANK NOT FILMED

UTRC87-41
Many of the errors listed as zero in the table are inappropriate (and thus
don't exist) because of the type of processor (item 5 of processsor bias),
optical setup (item 6 of processor bias and item 7 of beam geometry bias),
processor settings (item 2 and 7 of processor bias), Bragg shifting (item 5 and 6
of beam geometry bias), or the seeding technique (item I of seeding bias). Item
i of processor bias, particle acceleration bias, is assumed to be zero since
there are no large accelerations expected in a constant area, subsonic duct flow.
Item 1 of beam geometry bias, finite probe volume bias, is zero since the
measured velocity profiles showed no shaped peaked profiles. Item 2 of seeding
bias, particle lag bias, is assumed zero for the turbulence measurements, since
small seeding particles were used. However, this type of error may contaminate
the data but it is extremely difficUit to estimate (Ref. 22)' Also note that
items 3 and 4 of seeding bias are assumed to offset each other and thus are not
independent errors (see Ref. 22).
B.2 Total Pressure Measurements
The accuracy of the t0tai pressure measurements is dependent on several
factors including the accuracy of the pressure transducers, the angular
sensitivity of the pitot probes, and the effect of turbulence on the pitot
reading. Each of these factors will be discussed below.
Pressure transducers were calibrated to an accuracy of ±0.04 Qref at the
beginning of each test day. Transducer output voltages were zeroed prior to each
traverse to compensate for thermal drift. Zeroes were also checked after each
traverse to ensure that drift during the traverse did not exceed ±0.002 Qref'
otherwise the data was retaken.
Two types of pitot probes were Used in this study: an aspirated kielhead
for the overall total pressure distribution at the duct inlet and exit planes and
a flattened hypodermic impact tube for boundary layer surveys at the inlet and
exit planes. Patrick (Ref. 26) has calibrated the angular sensitivity of these
types of probes over a range of dynamic head. For the aspirated kielhead, the
accuracy was found to be within I% Q over a range of ±30 deg angle of incidence.
The boundary layer probes were accurate within I% over ± 7 deg angle of
incidence. The maximum flow angle relative to the axial direction (the direction
in which pitot probes were oriented) was measured (from LV data) to be I0 deg in
the corners of the AR310 duct and 8.5 deg along the semi-major axis between the
vortex pair in the AR630 duct. For the kielhead probe these flow angles are well
within the I% Q angular sensitivity range. For the boundary layer probe, these
flow angles are outside the I% Q angular sensitivity range and could cause errors
in boundary layer surveys 12 for the AR310 duct and I and 2 for the AR630 duct
to be as large as 2% Q.
The effect of turbulence on pitot measurements is generally separated into
two parts. First, pitot probes respond to static pressure plus the square of the
velocity. Thus, Reynolds decomposition and time averaging yields
116
w
m
!
U
m
_Jmm
tm
lI
.1
g
I
m
m
i
I
I
mw

UTRC87-41
- --Qref / Qref +/ measured Uref
q_+ 2 (B-l)
Uref
Where q - (u2 + v 2 + w2)/2. Thus, the normalized total pressure will sense a
pressure which is high by an amount equal to the measured normalized turbulent
kinetic energy. As shown in Figs. 4-14 and 4-28 (also see Table Ill) the highest
turbulence levels occur in the corners of the AR310 duct (maximum q ffi0.018 U_e f)
and along the semi-major axis between the vortex pair for the AR630 duct (maximum
q = 0.009 U_ef). Therefore, the suspect data are the same boundary layers that
are suspect due to probe angular sensitivity. Also, the kielhead probe
measurements are suspect in these regions, reading high by possible 2 to 42
percent of Ure f.
The second effect of turbulence depends on the scale of turbulence. The
instantaneous velocity fluctuations result in instantaneous angle of incidence
fluctuations, thus a time average pitot measurement will be low if the angle
fluctuations exceed the acceptance angle of the probe. To approximate the value
of the error, integral length scale information of the turbulence is necessary.
Since this data does not exist for the current experiment, the error cannot be
estimated. Note that this error counteracts the turbulence kinetic energy
error.
In summary, the accuracy of the total pressure measurements varied
throughout the flowfield. Except in the AR310 corner and along the semi-major
axis between the vortex pair for the AR630 duct, the kielhead and boundary layer
probe measurement accuracy is reasonably estimated to be between I-2% of Qref"
For the measurements in the high turbulence, high cross-flow regions the accuracy
cannot be estimated.
117
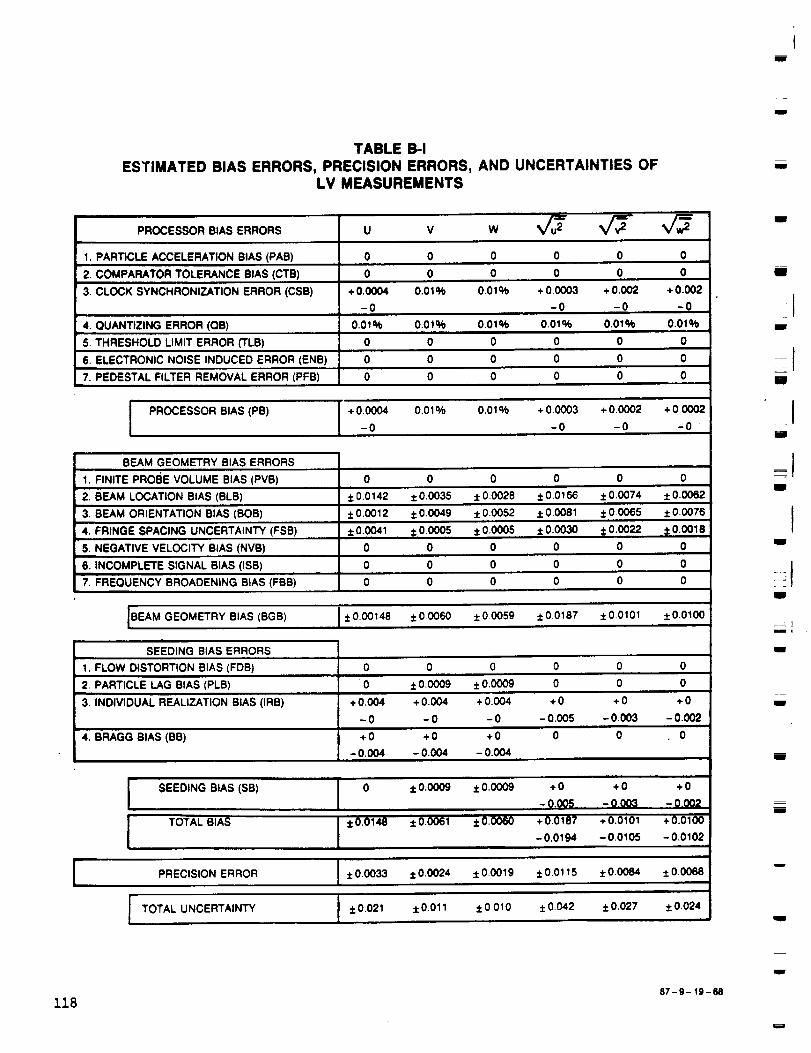
I
TABLE B-I
ESTIMATED BIAS ERRORS, PRECISION ERRORS, AND UNCERTAINTIES OFLV MEASUREMENTS
PROCESSOR BIAS ERRORS U V W
1 PARTICLE ACCELERATION BIAS (PAB) 0 0 0 0 0 0
2 COMPARATOR TOLERANCE BIAS (CTB) 0 0 0 0 0 0
3. CLOCK SYNCHRONIZATION ERROR (CSB) +0.0004 0.01% 0.01% +00003 +0.002 +0.002
-0 -0 -0 -0m,.
4. OUANTNZNNG ERROR (QB) 0.01% 0.01% 0.01% 0 .01% 0.01% 0o01_/_
,. THRESHOLD LNMNT ERROR (TLB) 0 0 0 0 0 0
8. ELECTRONIC NOmSE ,NDUCED ERROR (ENB) 0 0 0 0 0 0
7. PEDESTAL FILTER REMOVAL ERROR (PFB) 0 0 0 0 0 0
! PROCESSOR B'As (PB) I .0'0004 0"010//0 0"01% +0'0003 +0"0002 "1"0'0002--0 -0 -0 --0
BEAM GEOMETRY BIAS ERRORS
1. FINITE PROt3E VOLUME BIAS (PVB) 0 0 0 0 0 0
2. BEAM LOCATION BIAS (BLB) +0.0142 +1:0.0035 +0,0028 +0.0166 +0.0074 ±0.0062
3. BEAM ORIENTATION BIAS (BOB) +0.0012 ±0.0049 +0.0052 +0.0081 +0.0065 +0.0076
4. FRINGE SPACING UNCERTAINTY (FSB) +0.0041 +0.0005 +0.0005 +00030 +0.0022 ::1:0.0018
5. NEGATIVE VELOCITY BiAS (NVB) 0 0 0 0 0 0
6. INCOMPLETE SIGNAL BIAS (,SB) 0 0 0 0 0 0
7. FREQUENCY BROADENING BIAS (FBB) 0 0 0 0 0 0
IBEAM GEOMETRY BIAS (BGB) 1+0.001,8 ±00060 +00059 ¢0.0187 :1:0.0101 +0.0100i I
SE_:DING BIAS ERRORS
1 FLOW DISTORTION BIAS (FDB) 0 0 0 0 0 0
2 PARTICLE LAG BIAS (PLB) 0 ± 00009 ¢ 0.0009 0 0 0
3 INDIVIDUAL REALIZATION BIAS (IRB) + 0.004 + 0,004 + 0004 + 0 + 0 + 0
-0 -0 -0 - 0.005 - 0.003 -0.002
4. BRAGG BIAS (BB) + 0 + 0 + 0 0 0 0
-0._ -0.004 -0._
SEEDING BIAS (SB) 0 :t 0.0009 :1:0.0009
.
TOTAL BIAS
+0 +0 +0
mO._i - 0.003 ,- 0.0o2+0.0148 +0.0061 + 0.0060 +0.0187 +0.0101 +0.0100
-0.0194 -0.0105 - 0.0102
PRECISION ERROR ::!:0.0033 + 0.0024 ± 0.0019 +0.0115 ±0.0084 +0.0068
TOTAL UNCERTAINTY ±0.021 +0.011 ±0.010 +0._2 ±0.027 +0.024
IIII
III
iil
IIIII
FII
i
-IIll
iIII
!
III
lid
I
mW
I
11887-g- 19-88