SOUNDING SYSTEMS - NASA Technical Reports Server
451
CONT RACTOR SOUNDING _ _ Bruce Botlermann SYSTEMS AND DATA REVIEW C. - MAY 1970
-
Upload
khangminh22 -
Category
Documents
-
view
0 -
download
0
Transcript of SOUNDING SYSTEMS - NASA Technical Reports Server

CONT RACTOR
SOUNDING
_ _ Bruce Botlermann
SYSTEMS
AND DATA REVIEW
C. - MAY1970

1. Report No. 2. Government Accession No.
NASA CR-1529 (Part 2)
4. Title and Subtitle VOLUME I: A STUDY OF 30 KM TO 200 KM
METEOROLOGICAL ROCKET SOUNDING SYSTEMS
Part IL Literature and Data Review
7. Author(s)
Bruce Bollermann
9. Performing Organization Name and Address
Space Data Corporation
Phoenix, Arizona
12. Sponsoring Agency Name and Address
NASA-George C. Marshall Space Flight CenterMarshall Space Flight Center, Alabama 35812
Contract Monitor: Robert E. Turner
3. Recipient's Catalog No.
5. Report Date
May 1970
6. Performing Organization Code
8. Performing Organization Report No.
10. Work Unit No.
11. Contract or Grant No.
NAS8-20797
13. Type of Report and Period Covered
CONTRACTOR REPORT
14. Sponsoring Agency Code
15. Supplementary Notes
Distribution of this report is provided in the interest of information exchange.
Responsibility for the contents resides in the author or organization that prepared it.
16. Abstract
This report reviews the contemporary literature on meteorological rockets and
associated systems, to determine the accuracies and limitations of the current meteorological
rocket systems from available data, and to determine the adaptability of the more complex
geophysical rocket experiments to simplified, economical, routine meteorological rocket
soundings. This literature review covers the various system requirements and techniques
used in obtaining meteorological measurements of the 30 km to 200 km region of the atmo-
sphere. In addition to the detailed descriptions of the various rocket vehicles, telemetry,
sensors, decelerators and other related equipment, this review also includes a study of the
gun probe systems.
The study is presented in two books: Book 1 contains an introduction, a discussion
of systems requirements and a description of the various sensing techniques; Book 2 con-
tains details of the rocketsonde decelerator techniques, telemetry and tracking equipment,
descriptions of the rocket vehicles, gun probe systems and a summary of the report. The
two books are printed under separate cover, and are labeled Volume L
17. Key Words (Suggested by Author(s)) 18. Distribution Statement
Unclassified - Unlimited
19. Security Classif. (of this report_
Unclassified
20. Security Classif. (of this page) 21. No. of Pages
Unclassified 435
*For sale by the Clearinghouse for Federal Scientific and Technical Information
Springfield, Virginia 22151
22, Price*
$3.00
FOREWORD
Most of the material in this report has been taken directly from
the current literature; thus, to avoid frequent interruptions in the
text, references have been omitted. Instead, acknowledgements are made
preceding Book I for the primary investigators and authors whose works
have been abstracted and whose data are presented. A bibliography of
the digested literature follows the conclusion of Book 2.
This survey was made under Contract NAS8-20797 with the Aerospace
Environment Division, Aero-Astrodynamics Laboratory, Marshall Space
Flight Center. Mr. Robert E. Turner was the Contract Monitor.
ACKNOWLEDGEMENTS
Special recognition is expressed to the Meteorological Working
Group of the Inter-Range Instrumentation Group, Range Commander's
Conference, whose efforts brought about the formation of the Meteor-
ological Rocket Network, and consequently the widespread distribution
of its valuable data to the scientific community. The Network has
grown worldwide, and has directly influenced developments in rocket
meteorology.
Appreciation is expressed to Mr. Robert E. Turner and Mr. O. E.
Smith of the Aerospace Environment Division, Aero-Astrodynamics
Laboratory, NASA-Marshall Space Flight Center for their support and
guidance in presenting this study, and to Mr. Edgar Schaefer for the
many illustrations and Mr. David Gironda and staff of the Space Data
Corporation for editorial assistance.
ooo
III

TABLE OF CONTENTS
VOLUME I
BOOK 2
Chapter Page
FOREWORD "'"• • • • • • • • • • . • • • • . • • • • • • • • ill
4 ROCKETSONDE DECELERATORS
4.14.1.1
4.1.2
4.1.3
4.1.4
4.1.5
4.1.6
GENERAL ................ I
Ballistic Coefficient ........... I
Deployment Reliability .......... 7
Stability ................. 7Radar Cross-Section ........... 10
Constant Descent Rate .......... 11
Cost ........ . .......... 11
4.2
4.2.1
4.2.2
4.2.3
4.2.4
4.2.5
4.2.6
CONVENTIONAL PARACHUTESGeneral ................. 12
Design Parameters ............ 12Arcas 15' Gentex Parachute ....... 23
Loki Dart 7.6' Parachute ........ 44
NOL 6 t Square Parachute ........ 44NOL Wind Sensor Parachute . . ..... 53
4.34.3.1
4.3.2
4.3.3
4.3.4
4.3.5
PARACHUTES WITH GEOMETRY POROSITYG enera I .................. 55
Disk-Gap-Band Parachute ........ 55Cross Patch Parachute .......... 62
Annular Ring Parachute ......... 62
Miscellaneous Geometric Porosity Designs. 66
4.44.4.1
4.4.2
4.4.3
4.4.4
4.4.5
4.4.6
STROKES FLOW RIBBON MESH PARACHUTEGeneral .................. 72
Theoretical ................ 73
Proposed Parachute Design ........ 74
Proposed Performance .......... 78Test Data ................. 78
Summary ................. 83
-V-

Chapter Page
4.5
4.5.1
4.5.2
4,5,3
4.5.4
4.5.5
4.5.6
RAM-AIR DECELERATORS
OeneraJ ........ • ........
Ballute Principle ............Arcasonde Ballute ............
Datasonde Starute ...........
High Speed Ballutes ...........Biconical Decelerator ..........
8888
89
9494
98
4.6 SUMMARY 100
TELEMETRY AND TRACKING
5.1 GENERAL ................ 101
5.25.2.1
5.2.2
5.2.2.1
5.2.2.25.2.2.3
5.2.2.4
5.2.2.5
5.2.2.6
5.2.2.75.2.2.8
5.2.2.9
5.2.3
RADAR
General ................. 103
Radar Descriptions ........... 104Radar Set AN/SPS-12 .......... 104
Radar Set AN/MPS-19 ......... 104Mod II Radar ............... 108
Radar Set AN/FPS-16 ...... . . . . 108
Radar Set AN/FPQ-I I ......... 112
Radar Set AN/MPS-504 ......... 112
NASA Long-Range S-Band (Spandar) . . 121Radar Set AN/FPQ-6 .......... 121
Velocimeter, Model 10A, Doppler Radar. 125
Radar Application to Rocketsonde System . 129
5.3
5.3.15.3.2
5.3.3
5.3.4
5.3.4.15.3.4.2
5.3.4.2.1
5.3.4.2.25.3.4.2.3
5.3.4.2.4
TELEMETRYGeneral ................. 139
IRIG Telemetr 7 Systems ......... 140
DOVAP Telemetry Tracking System . . . 153
AN/GMD Telemetry and Tracking System . 159General .................. 159
Ground Station Equipment ........ 160Rawin Set AN/GMD-1 ......... 160
Rawin Set AN/GMD-2 ......... 165
Rawin Set AN/GMD--4 ......... 169
NASA Radiosonde ADP System ..... 169
- v| -

Chapter Page
5.3.4.35.3.4.3.15.3.4.3.25.3.4.3.35.3.4.3.45.3.4.45.3.55.3.5.15.3.5.25.3.5.35.3.65.3.6.15.3.6.25.3.6.3
RocketsondeInstrumentation ....... 176
Stratospheric Terhperature Sonde (STS-1) . 176Arcasonde- 1A .............. 180A N/DMQ -9 ............... 180
Datasonde ................ 192
Miscei ianeous Instruments ........ 192
AN/SMQ-1 Telemetry Systems ...... 199General .................. 199
Ground Station Equipment ........ 199Rocketsonde Instrumentation ....... 202
Advanced Concept -Motorola Study . . 209General ................. 209
Ground Equipmen t ............ 218Radiosonde ................ 223
6 ROCKET VEHICLES
6.1 G EN ERAL ................ 228
6.2 HISTORICAL REVIEW .......... 233
6.3
6.3.1
6.3.2
6.3.36.3.4
6.3.5
6.3.6
6.3.7
6.3.86.3.9
6.3.10
CURRENT VEHICLE SYSTEMS ...... 243General ................. 243
Arcas .................. 248
Loki Dart ................ 259
Skua .................. 281MT-135 ................. 282
Super Loki Chaff Dart .......... 282
Viper Dart ................ 298
Cajun Dart ................ 303Boosted Arcas ............... 311
Nike Vehicles .............. 321
6.4
6.4.16.4.2
6.4.3
6.4.4
6.4.5
6.4.6
DEVELOPMENT SYSTEMS ........ 323
General ................. 323
Improved Viper Dart ........... 323
Super Loki Instrumented Dart ...... 323Destructable Arcas ........... 324
Consumable Rocket ............ 333
Army RDT&E Rocket ........... 336
- vii -

Chapter
6.4.7
6.4.8
6.5
6.5.1
6.5.2
6.5.3
6.5.4
7 GUN PROBES
7.1
7.2
7.3
7.4
7.5
7.6
8 SUMMARY
APPENDIX A
BI BLIOGRAPHY
Pag e
Kangaroo ................. 337Destructible Dart ............. 339
DISCUSSION .............. 346
General ................. 346
Vehicle Performance ........... 346
Vehicle Impact Dispersion ........ 348
Vehicle Wind-Sensitivity ......... 348
GENERAL ................ 351
5-I NCH PROJECTILES .......... 354
7-I NCH PROJECTILES .......... 358
16-I NCH PROJECTILES .......... 360
GUN-BOOSTED ROCKETS ........ 362
METEOROLOGICAL ROCKET vs GUNPROBE COMPARISON .........
Corrections for Meteorological Rocket
Temperature Soundings on an IndividualBasis
365
369
379
381
ooo
-- Vlll --

LIST OF FIGURES
BOOK 2
Figure
4.1
4.1-I
4. I-2
4. 1-3
4.1-4
4. I-5
4.1-6
4.2-I4.2-2
4.2-3
4.2-4
4.2-7
4.2-8
4.2-9
4.2-10
4.2-I I
4.2-12
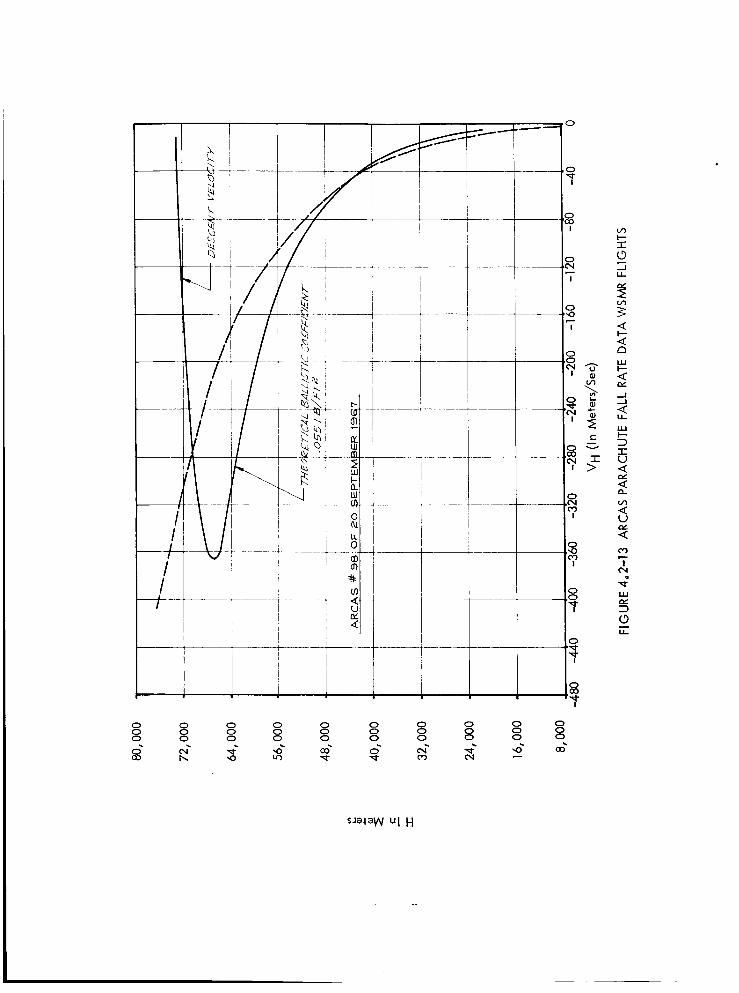
4.2-13
4.2-14
4.2-15
4.2-16
4.2-17
4.2-18
ROCKETSONDE DECELERATORS - GENERAL
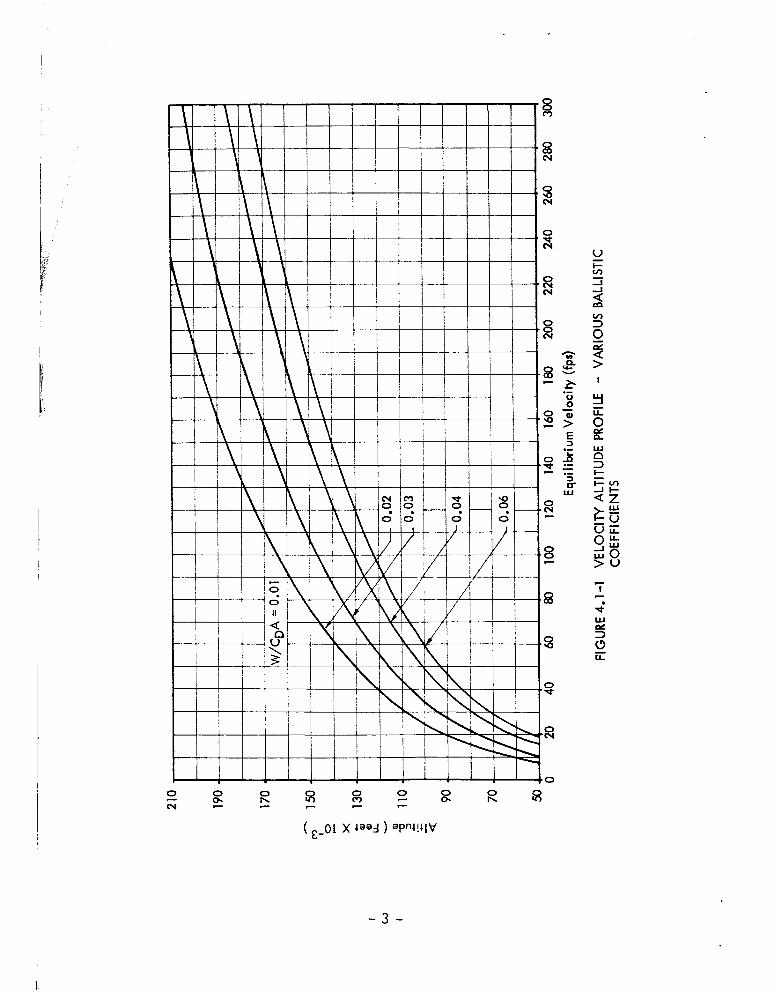
Velocity-Altitude Profile-Various BallisticCoefficients .................... 3
Drop from 245,000 Ft to 200,000 Ft. W/CDA-0.020 ...................... 4
Altitude vs Decent Rate .............. 5
Descent Curves from Various Release Altitude . . 6
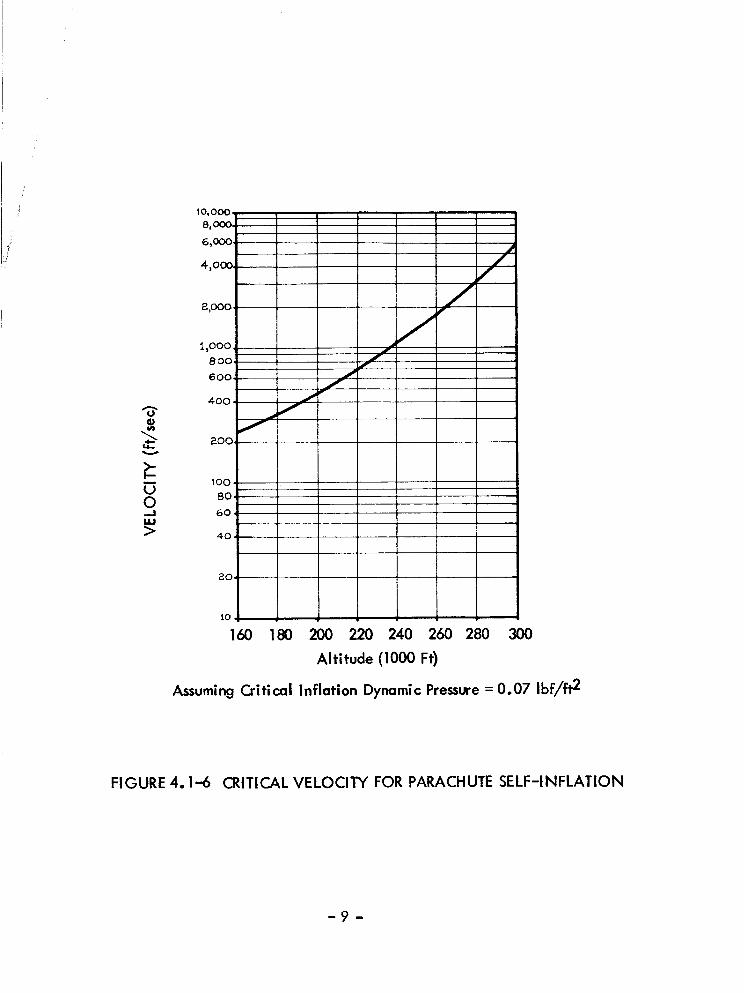
Dynamic Pressure at Apogee ............ 8Critical Velocity for Parachute Self-inflation . . 9
4.2 CONVENTIONAL PARACHUTES
Hemispherical Parachute Gliding Mode ....... 18Arcas Gentex Parachute, 15' Diameter ....... 24
Cross-Sectional Diagram of the Arcas Parachute
Assembly ...................... 26
Principle of Separation of the Arcas Payload
Assembly ...................... 26
Arcas Parachute and Payload after Expulsion . . . 27Arcas Parachute (Gentex Company) Descent Rate
Average for Standard Payload Weight ....... 29Arcas Parachute Fall Rates ............. 30
Arcas Parachute Descent Curve ........... 31
FPS-16 Radar Tracks of Arcas Flights at Pacific
Missile Range .....................
Initial Wind Response Altitude vs Apogee Altitude.Arcas Parachute Fall Rate Data-WSMR Flights//1 .
Arcas Parachute Fall Rate Data-WSMR Flight//2 .
Areas Parachute Fall Rate Data-WSMR Flight//3 .
Arcas Parachute Fall Rate Data-WSMR Flight//4.
Arcas Parachute Fall Rate Data-WSMR Flight it5.
Arcas Parachute Fall Rate Data-WSMR Flight//6.
Areas Parachute Fall Rate Data-WSMR Flight//7.
Arcas Parachute Fall Rate Data-WSMR Flight//8.
Page
34
35
36
37
38
394O
41
42
43
- ix -

Figure
4.2-19
4.2-20
4.2-21
4.2-22
4, 2-23
4.2-24
4, 2-25
4.2-26
4.2-27
4.3-I
4.3-2
4.3-3
4.3-4
4.3-5
4.3-6
4.3-7
4.3-8
4.3-9
4.4-3
4.4-4
4.4-54.4-6
4.4-7
Page
Dartsonde Instrument Package on 7.6' Chute . . . 45
Loki 7.6 Parachute-Sonde Descent Velocity . . . 47Loki 7.6 Parachute-Sonde Descent Time ...... 47
Loki #173 Launched 19 October 1967 ....... 48
Lokl 7.6 Descent Rate Profiles -WSMR FlightTest Data, #I ............. 49
Loki 7.6 Descent Rate Profiles- WSMR
Test Data, //2............. 50
Loki 7.6 Descent Rate P_ofiles- WSMR
Test Data, #3 ............. 51
Lok[ 7.6 Descent Rate Profiles-WSMR
Test Data, #4 ............. 52
NOL Wind Sensor Parachute ............ 54
• . . . • •
Flight
• • • • • •
Flight
• • . • • •
Flight
• • . . . • •
4.3 PARACHUTES WITH GEOMETRY POROSITY
Disk-Gap-Band Parachute Configuration ...... 56
Modified Deployment Bag with Packed Parachute . 60
Sequence of DGB Deployment Events ....... 61
Cross Patch Parachute ............... 63
35' Cross Patch Parachute Fall Rate Results.... 65
Drag Coefficient of Annular Plates(Rings).... 67
Annular Ring Parachute Design .......... 68
Wagon Wheel Parachute .............. 69
Ring Sail Parachute .... . ........... 70
4.4 STROKES FLOW RIBBON MESH PARACHUTE
Drag Coefficient of an Infinite Single Cylinder . . 75Drag Coefficient for a Flat Disc wlth 20%
Solidity in a Normal Flow ............. 76
The Concept of the Stokes Flow Ribbon MeshParachute ..................... 77
Descent Trajectory of the Dartsonde Parachute . . 80
Descent Trajectory of the Dartdrifter Parachute . . 81
Descent Trajectory of the Arcas Parachute .... 82Experimental Drag Coefficients for Models of 0.2,
0.1 and 0.05 Solidity as a function of Reynolds
Numbers compared with Theory .......... 85
-X-

Figure Pag____ee
4.5 RAM-AIR DECELERATORS
4.5-I4.5-2
4.5-3
4.5-4
4.5-5
4.5-6
5.2-1
5.2-2
5.2-3
5.2-4
5.2-55.2-6
5.2-7
5.3-1
5.3-2
5.3-35.3-4
5.3-5
5.3-6
5.3-7
5.3-85.3-9
5.3-10
5.3-11
5.3-12
5.3-135.3-14
5.3-15
5.3-16
Bailute Configuration (Typical) ........ . . 90Ballute Drag Force Distribution .......... 91
Typical Ballute ................... 92
Loki Dart Starute Configuration Sketch ...... 95
Typical Telemetry Records from Parachute Flightand a koki Statute Flight .............. 96NOL Biconical Decelerator ..... . ...... 99
5.2 RADAR
Radar Set AN/MPS-19, Block Diagram ....... 107Model 10A Velocimeter, Block Diagram ...... 130The Mean of 6 Cases from FPS-16 Tracks ...... 133
S-Band Radar Track of 8-Foot Parachute ...... 134
S-Band Radar Track of S-Band Chaff ........ 136X-Band Radar Track of X-Band Chaff ....... 137
Signal Strength vs Time after Expulsion of Chaff.. 138
5.3 TELEMETRY
IRIG FM/FM Telemeter Subcarrier Bands ...... 141Pulse Duration Modulation ............. 145
Missile Antenna Configurations .......... 149
PDM/FM Telemetry System, Block Diagram .... 150
F/V_/FM Telemetry System, Block Diagram ..... 151
FM/'AM Telemetry System, Block Diagram ..... 152
X-Band Telemetry Receiving System, Block Diagram. 154
Representative Dovap Telemetry Record ...... 156Shroud-Type Dovap Antenna Radiation Pattern #1 . 157Shroud-Type Dovap Antenna Radiation Pattern #2. 158
Rawin Set AN/GMD-1At Systems ......... 162
Rawin Set AN/GMD-1Bt Functional Diagram . . . 163
Block Diagram of the TMQ-5 Recorder.. ..... 166
Rawinsonde System AN/GMD-2t Block Diagram . . 168Statistical AN/GMD-2 Wind Errors vs Slant Range
for Averaging Times ...... . ......... 170
Simplified Block Diagram of AN/GMD-4 System.. 171
- xi -

Fi gur e Pag__._e
5.3-175.3-18
5.3-19
5.3-20
5.3-215.3-22
5.3-23
5.3-24
5.3-25
5.3-26
5.3-275.3-28
5.3-29
5.3-305.3-31
5.3-325.3-33
5.3-34
5,3-35
5.3-36
5.3-375.3-38
5.3-39
6.3-I6.3-2
6.3-3
6.3-4
6.3-5
6.3-6
6.3-7
6.3-8
6.3-96.3-10
6.3-I I
6.3-12
Radiosonde ADP System Simplified, Block Diagram . 174
Statospheric Temperature Sonde, STS-1 ....... 178
STS-1 Electrical Circuit Diagram .......... 179Arcasonde-lA Instrument and Nose Cone ...... 181
Arcasonde-lA Instrument Components ........ 182Arcasonde-lA, Block Diagram ............ 183
AN/DMQ-9 Rocket Instrument Package ...... 185
AN/DMQ-9 Block Diagram ............ 187AN/DMQ-9 Schematic Diagram .......... 188
Datasonde Instrument Configuration ........ 193Arcasonde-3 Instrument .............. 196
Arcasonde-3, Telemetry Block Diagram ...... 197AN/SMQ-1 Radiosonde Receptor, Block Diagram . 203Radiosonde Set WOX-1A .............. 205
WOX-1AI Block Diagram ............. 206
Advanced Sounding System, Block Diagram .... 211PN Range System .................. 216
Telemetry Modulator, Block Diagram ........ 217
Telemetry Extractor, Block Diagram ......... 220Range Signal Demodulator, Block Diagram ..... 220
64 kHz Component vs Code Correlation-Zone Loop . 222
64 kHz Component vs Code Correlation-Code Loop . 222
AMSS Radiosonde, Block Diagram ......... 225
6.3 CURRENT VEHICLE SYSTEMS
Meteorological Rocket Configurations ........ 244The Arcas Rocket .................. 249
Arcas Nose Cone .................. 251
Cross-Sectional Diagram of the Arcas Motor .... 253
The Maior Components of the Arcas Vehicle .... 256
Major Components of the Closed-Breech ArcasLauncher ....................... 257
Principle of Operation of the Arcas Closed-BreechLauncher ....................... 258
The Loki Dart Meteorological Sounding Rocket . . . 261
Loki-Dart Vehicle Configuration ........ . . 263Cross Section of the Instrumented Dart ....... 265
Photo of Instrumented Dart System ......... 267
Meteorological Probe PWN-8B, Major Dimensions . 268
- xii -

Figure Page
6.3-136.3-146.3-156.3-166.3-176.3-186.3-196.3-20
6.3-216.3-226.3-236.3-246.3-25
6.3-26
6.3-27
6.3-28
6.3-296.3-30
6.3-31
6.3-32
6.3-336.3-34
6.3-35
6.3-36
6.4-16.4-2
6.4-3
6.4.-4
6.4-5
PWN-8B System, Dart Cross Section ........ 269
Payload Expulsion Sketch ............. 271Rocket Launcher LAU-66/A 278
• • • • • . . . . . . m
Major Dimensions of Launcher LAU-66/A ..... 279Skua Performance Curves .............. 283
Super Loki Vehicle Configuration .......... 287
Super Loki Chaff Dart Vehicle Configuration .... 288
Super Loki Chaff Dart compared with Standard LokiDart Vehicle .................... 289
Cross-Section view of Super Loki Rocket Motor.. 291
Cross-Section view of Super Loki-Chaff Dart . . . 292
Super koki Launch Rail Assembly .......... 294
Typical Base for Super Loki Launch Rail ...... 295
Nominal Trajectory Summary - Super Loki Dart . . . 296Viper-Dart Vehicle Configuration ......... 299
Viper-Dart (Dart) Cross Section View ........ 300
Viper Motor and Components ............ 302
Nominal Dart Trajectory, Viper Dart ........ 306Cajun Dart Vehicle Configuration .......... 307
Cutaway View of the Cajun Dart ........... 309Cajun-Dart Altitude vs Range ............ 310
Boosted Arcas Vehicle Configuration ........ 312
Sidewinder Arcas Vehicle Configuration ...... 315
Sparrow Arcas Vehicle Configuration ........ 317Boosted Arcas Ii Vehicle Configuration ....... 319
6.4 DEVELOPMENT SYSTEMS
Super Loki Instrumented Dart Nominal Trajectory . . 325
Frangible Arcas Vehicle Configuration ....... 328
Nominal Frangible Arcas Flight Events Sequence . . 331
Consumable Meteorological Rocket OperationConcept ....................... 334
Kangaroo Dart Vehicle Configuration ........ 342
-- Xlll -

Fi gur e Pag__ee
7.1-1
7.3-1
7.4-1
7.5-I
8.1-I
8. I-2
8. 1-3
8.1-4
8. I-5
8.1-6
7.1 GUN PROBES - GENERAL
Gun Probe Performance Summary .......... 352
7.2 5-INCH GUN PROJECTILES
5-Inch Gun Projectile Configuration ........ 355
5-Inch Projectile Nominal Traiectories ....... 356
7.3 7-INCH GUN PROJECTILES
Gun Probe Loading Mechanism ........... 359
7.4 16-INCH GUN PROJECTILES
Typical Martlet-2C Payload Configurations ..... 363
7.5 GUN-BOOSTED ROCKETS
Gun Boosted Rocket Configurations .......... 363
8.1 SUMMARY
ETR- APOLLO II Launch Support Density Profile
14 July 1969 .................... 371
ETR -APOLLO II Launch Support Density Profile
16 July 1969 ......... . .......... 372
ETR -APOLLO II Launch Support Wind Profile
14 July 1969 ........... . ........ 373
ETR -APOLLO !1 Launch Support Wind Profile
16 July 1969 ....... . ............ 374
ETR -APOLLO I! Launch Support Temperature
Profile - 14 July 1969 ............... 375
ETR -APOLLO II Launch Support TemperatureProfile - 16 July 1969 ............... 376
- xiv -

LIST OF TABLES
BOOK 2
Table
4-1
4-2
4-3
4-4
4-5
4-6
4-7
4-8
4-9
4-10
4-11
5-1
5-2
5-35-4
5-5
5-65-7
5-8
5-9
5-10
5-11
5-12
5-13
5-14
5-15
Page
4. ROCKETSONDE DECELERATORS
Fall Velocities at Various Altitudes ........ 17
Arcas 15 ! Gentex Parachute ............ 25
Fall Rate Study of Arcas Parachute and SondePayload ...................... 32
Initial Wind Response Lag Data .......... 33Loki 7.6 Irvin Parachute ............. 46
Arcas Cross Patch Parachute Design Parameters.. 64
Proposed Parachute Design Parameters ....... 79
Summary of Test Results and Model Weights for
Models of Different Solidity ............ 84
Comparison of Proposed Dartdrifter Model (Theoretical)with Chamber Tests Data .............. 86
Arcasonde Ballute Specifications .......... 93
Dartsonde Starute Specifications .......... 97
5. TELEMETRY AND TRACKING
Radar Set AN/SPS-12, Technical Characteristics . . 105
Radar Set AN/MPS-19, Technical Characteristics . 106
Mod !i Radar, Technical Characteristics ...... 109Radar Set AN/FPS-16, Technical Characteristics . . 113
Radar Set AN/FPQ-11, Technical Characteristics . 117
Radar Set AN/MPS-504, Technical Characteristics . 120
SPANDAR, Technical Characteristics ........ 122
Radar Set AN/FPQ-6, Technical Characteristics . . 126
Model 10A Velocimeter, Technical Characteristics . 131Radar Characteristics ................ 132
IRIG F/Vk/FM Telemeter Subcarrier Bands. ..... 142
X-Band Telemetry System Characteristics ...... 155
AN/GMD-1 Specifications ............. 167Rocketsonde Instruments ............... 177
Arcasonde-lA Specifications ..... ....... 184
-XV-

Table Pag__ee
5-16
5-175-18
5-19
5-20
6-1
6-2
6-36-4
6-5
6-66-7
6-8
6-9
6-10
6-116-12
6-13
6-14
6-15
6-16
6-17
6-18
6-19
6-20
6-21
6-22
6-23
6-24
Arcasonde-2B Specifications ............ 195Arcasonde-3 Specifications ............. 198
Advanced System Characteristics .......... 212
AN/AMQ-9 vs AMSS Comparison .......... 213AMSS Radiosonde Characteristics .......... 226
6. ROCKET VEHICLES
Meteorological Rockets ............... 234
Summary of ARC Rocket Study ............ 239
Summary of Current Meteorological Rocket Vehicles . 245Loki Dart Vehicles ................. 246
Obsolete Vehicles ................. 247
Arcas Rocket System Dimensions ........... 252Arcas Rocket Motor Performance Characteristics . . • 255
Flight Performance Characteristics of the Arcas
System ........................ 260
Principle Characteristics of the Loki Sounding Rocket 264
Rocket Motor Major Design CharacteristicsSummary ....................... 273Hardware Design Characteristics Comparison .... 274
Rocket Motor Ballistic Performance Comparison . . . 274
Skua - General Specifications ........... 284
Japanese MT-135 vs Arcas .............. 285
Super Loki Rocket Motor Design Characteristics
Summary ....................... 290Super Loki Chaff Dart Design Characteristics .... 290
Nominal Trajectory Summary, Super Loki Dart .... 297
Viper Dart Weight Table ............... 304
Nominal Performance Summary ........... 305
Summary of Boosted Arcas Vehicles ......... 313
Summary of Nike-Boosted Vehicles ......... 322
Comparison of the Super Loki with the Current koki
Dart System ..................... 326Frangible Arcas Vehicle Dimension and Weight
Comparisons ..................... 329
Detailed Weight Breakdown of the Frangible ArcasVehicle ....................... 330
- xvi -

Table Page
6-25
6-26
6-27
6 -28
7-1
AMICOM RDT&E Rocket Design Characteristics . . 338
Kangaroo Weight Table ............... 343
Coming Glass Works Pyro Ceram Physical
Properties ...................... 344
Comparison of Wind Dispersion Effects for VariousVehicles ....................... 350
7. GUN PROBES
Meteorological Rocket vs Gun Probe Comparison . . 366
- xvll -

e
ROCKETSONDE DECELERATORS
4.1 General.
High altitude decelerators, such as parachutes or inflatable structures,have been used to conduct meteorological soundings to altitudes of at least
60 kilometers. Although many of these same data could have been obtained
as direct probe measurements, it was found to be more economical to employ
a descent vehicle and a rocketsonde payload. The instrumentation for these
payloads has been a great deal less sophisticated and less costly than would
be required for direct probing during rocket vehicle ascent• It is likely that
rocketsonde techniques will be required for gathering data to the upperaltitude limits of at least the simpler sensors to maintain a low system cost.
Therefore, the need for improved decelerators in future systems is of para-
mount importance.
The requirements for a meteorological rocketsonde decelerator can beenumerated as follows:
• Low ballistic coefficient
o Deployment reliability
. Acceptable stability
• Adequate radar cross-section
e Relatively constant descent rate
6. Low cost
Although the above factors are interdependent to some degree, each
is discussed separately in the sections which follow for ease in presentation.
4.1.1 Ballistic Coefficient•
A low ballistic coefficient (W/CDA) is the primary factor which governsthe usefulness of a high altitude meteorological decelerator system. This
characteristic determines the equilibrium or terminal fall rate of the rocketsonde
-1-

at the various altitudes as indicated in Figure 4.1-1. Also for a givenapogee or deployment altitude, the ballistic coefficient determines the
maximum dynamic overshoot velocity and the altitude at which the des-cending system reaches terminal velocity. Figure 4.1-2 presents initial
trajectory data for a typical high-altitude deployment of a descent system
with a given ballistic coefficient. The system accelerates downward past
the zero g value (where drag equals weight) and then accelerates in the
upward direction because the drag force at this point is greater than theweight. This upward acceleration continues until the vehicle slows down
to terminal velocity for the particular altitude where the drag force equals
the weight. In the meantime the descent velocity has significantly exceed-
ed or overshot the terminal velocity. At a lower altitude the descent
velocity slows up to the terminal velocity value. After this the terminal
velocity curve is followed during the remainder of the descent providedthe system remains deployed and aerodynamically stable. The net result
is that for a high altitude deployment, the descent systems fall faster thanterminal velocity for a portion of the descent. The magnitude of thisvelocity overshoot is a function of ballistic coefficients as indicated in
Figure 4.1-3. The overshoot velocity is also a function of deploymentaltitude as indicated in Figure 4.1--4.
For most meteorological measurements utilizing the rocketsondetechnique, descent velocities must be maintained at subsonic levels.
Aerodynamic heating of the sensor, stagnation pressure increase and windshear measurement error are all a function of the square of the descent
velocity and measurement errors increase drastically as fall velocity in-
creases. In addition, faster fall rates present to the sensor instrumentationa greater timewise gradient of the parameter to be measured. Most of the
inexpensive sensors and instrumentation are response time limited, and the
measurement accuracy is thereby degraded by fast fall rates. Transonic andsupersonic velocities render most of the meteorological measurements useless.
Therefore, an adequately low ballistic coefficient for the descent system isnecessary for accurate measurements. Once this ballistic coefficient is
determined, then the optimum deployment altitude can be selected. To
achieve a low ballistic coefficient the weights of the descent vehicle and
payload instrumentation must be kept to as low a value as possible. Pay-load miniaturization must be carried to the extent which is economicallyfeasible. In addition, the drag of the descent vehicle should be maximized
based upon packaging volume requirements. Generally speaking, this means
-2-
ii
\\
\//1\\\
!\I\
k
\\\
\
7, "_oU
!
! II
1 iP
i
I I
\I ,<_ /, \\_),I ,\! ',M_' /
'\_\, i
1
[o o _
1
'I
//
L0
8
0
o
Ui--'I,#"l
.,,.,.I
I,#'l
o :)oo,I 0
_ 0E _.
W '-J f'--o "_Z0 0
i U,'r"0"
8 "J_.,,0
!
ul
I "-0
,0
0 0 0 0O- h. _r)
( £_01 X _,aa..l ) apn,q,q'q
-3-

k
0
0
/ / °/
b
|
/
8 8 8 o
.0
(_OS/l-l) X-IpOlOA
I,,I-
O
I
4IdU
c)Ou-
• • i i
(44 _0l) epnJ,!41V
i | i w i ! |
_ _ o.9_
8t_
! a--!
(_oeS/.l-.I) uo!4o_leo:)V
-4-

30x|O 4
28
26
24
22
J---- Terminal Velocity Curves
W
CD S
02
//
I---
I.I_
I--
I.--..3
<
2O
18
16
14
12
I0
.10
.08 _
M=I
0 400 800 1200 1600
Descent Velocity, Ft/Sec
FIGURE 4.1-3 ALTITUDE VS. DESCENT RATE
-5-

f_
F',,!
f_
/
k
e.-\-_:
-.. "_
11"
0-co
¢'o
0
0
0
Z-
0
.N-_
',0
0
w
I--
F--,..I
w
w,..1
,,v
0
0
U-
L_
t.)F-
Z
"t
W
¢9
_q
0 0 0 0 0
(+4 i_01.) apn,l.!.l.IV
0 _') 0 bO 0
0
( W>l ) opn-I.H.IV
00,I
-6

#
that the drag coefficient per unit packaging volume should be maximized
for the flow region being considered. This indicates the use of very thin
and lightweight fabrics for canopy materials. The weight and packagingvolume requirements for shroud lines and fittings should also be minimized.
4.1.2 Deployment Reliability.
To achieve the descent rates indicated by the respective ballistic
coefficient, the decelerator must achieve full deployment upon ejection
from the rocket vehicle. Conventional silk parachutes require a dynamicpressure of at least 0.03 to 0.07 Ibs/ft 2, depending upon parachute design,
in order to inflate reliably. The dynamic pressure is a function of deploy-ment altitude and velocity. For a given rocket vehicle both of these factors
are related to launch angle. Typical examples are presented in Figure 4.1-5
which indicated marginal inflation reliability for the Arcas parachute at
launch angles above 86° and for the Loki Dart parachute at launch anglesabove 83 °. Deployment velocity vs. deployment altitude for reliable
inflation of conventionally shaped silk parachutes are presented in Figure4.1-6. These data indicate that self inflation is not practical above analtitude of about 230,000 feet. Above this altitude the critical inflation
velocity is in the transonic and supersonic flow regions.
In addition to the altitude and deployment velocity effects upon
self inflation reliability, the deployment altitude wind velocity must beconsidered. High altitude winds can be as great as typical deployment
velocities, and can either subtract from or add to the deployment velocitydepending upon wind direction.
The above factors indicate the need for positive inflation techniques
for decelerator deployment much above 180,000 feet.
4.1.3 Stability.
In order to take full advantage of the decelerator ballistic coefficient,
a reasonable degree of stability must be achieved. The drag coefficient formany decelerators is slightly greater at a small angle of attack than at zero
and does net fall off much until about 30 degrees is experienced. Therefore,
from a fall rate standpoint oscillations as great as _ 30 degrees are notobjectionable.
-7-

c_l
m
v
LI.I
V")¢/')Wev'a-
k_
<CZ>..
lo,8
6
Launch Angle (Degrees)
\
FIGURE 4.1-5 DYNAMIC PRESSURE AT APOGEE
-8-
"6"
m
uo...II.LI>
100000
6_000,
'4
P---.jO00_
I_000,
8oo,
600.
400-
_-00,
100
80
60
40
//
/
20
10
160 180 200 220 240 260 280 300
Altitude (1000 Ft)
Assuming Critical Inflation Dynamic Pressure = 0.07 Ibf/ft 2
FIGURE 4,1....6 CRITICAL VELOCITY FOR PARACHUTE SELF-INFLATION
-9-

Some authors have implied that even a mildly oscillating systemwould result in wind measurement errors because of the instantaneous hor-
izontal component of velocity established at an instantaneous angle of
attack. However, when the period of the oscillation is taken into account,it has been found that the horizontal displacement due to the oscillation
is negligible, i.e., within the random error (rms) of the typical trackingradars.
A major objection to instability of the decelerator is that relatively
severe telemetry signal dropouts occur for severely oscillating decelerators.All of the sondes flow to date have nulls in the transmitted antenna patterns
along the longitudinal axis of the sonde. At high elevation angles wherethe decelerators oscillate to the greatest extent, signal dropouts at thereceiver are most troublesome. As the sonde descends to a lower altitude
and the oscillations dampen, signal dropouts are virtually eliminated.
Very often there is a severe loss of telemetered data in the high altitudeswhere it is most needed. Therefore, stability of the decelerator within
reasonable bounds is important for high altitude data retrieval.
\
The effect of decelerator oscillations on the sensor instrumentation
has been mentioned by some authors as an important factor, however, forthe sensors flown to date the normal attitude variations of the sensors due to
decelerator oscillations have not appeared to cause any significant error inthe reduced data.
4.1.4 Radar Cross-Section.
A majority of the rocketsondes which have been flown in the past
have required radar tracking of the decelerator. The current developmenttrend is toward a telemetry instrument which incorporates slant range track-
ing in addition to azimuth and elevation angle determination. With such an
instrument the requirement for radar tracking will be eliminated and the
decelerator will not be required to present a radar target. However, if the
cost of the transponder type instrument is significantly greater than the trans-
mit-only type, the latter sonde will probably be used at launch sites where
tracking radar is available. For these systems the decelerator will be requiredto incorporate a radar target with at least a 71m 2 radar cross-section. This
is generally accomplished by coating the silk canopy material with either asilver or copper conductive finish. Canopies can also be formed with aluminized
mylar for this purpose.
- 10 -

4.1.5 Constant Descent Rate.
Since the upper altitude densities are much less than those of the
lower atmosphere, sensor response is generally a good deal slower at high
altitudes. This is not only true of sensors such as the thermistor temperaturemeasurement element but is also true of wind response of the decelerator.Most of the decelerators have a constant drag coefficient and fall fast at
high altitudes and slow at the lower altitudes. This is indirect oppositionto the sensor requirements, it would be advantageous to obtain as slow
descent velocities as possible in the upper atmosphere and to increase the
fall rates in the lower atmosphere. Although it is possible to employ reef-
ing devices to achieve a more uniform fall rate, it is probably not worththe expense to speed up the fall rate in the lower atmosphere for the sake
of saving a few moments of tracking time. Major efforts should be directed
toward obtaining the slowest high altitude descent velocities possible.
4.1.6 Cost.
Since meteorological rocketsondes are being used on a routine baslst
and a large number of them are being flown each year1 the cost of the
decelerator must be kept to a low value. One hundred dollars or so perunit seems to be a reasonable cost for such a device.
-11-
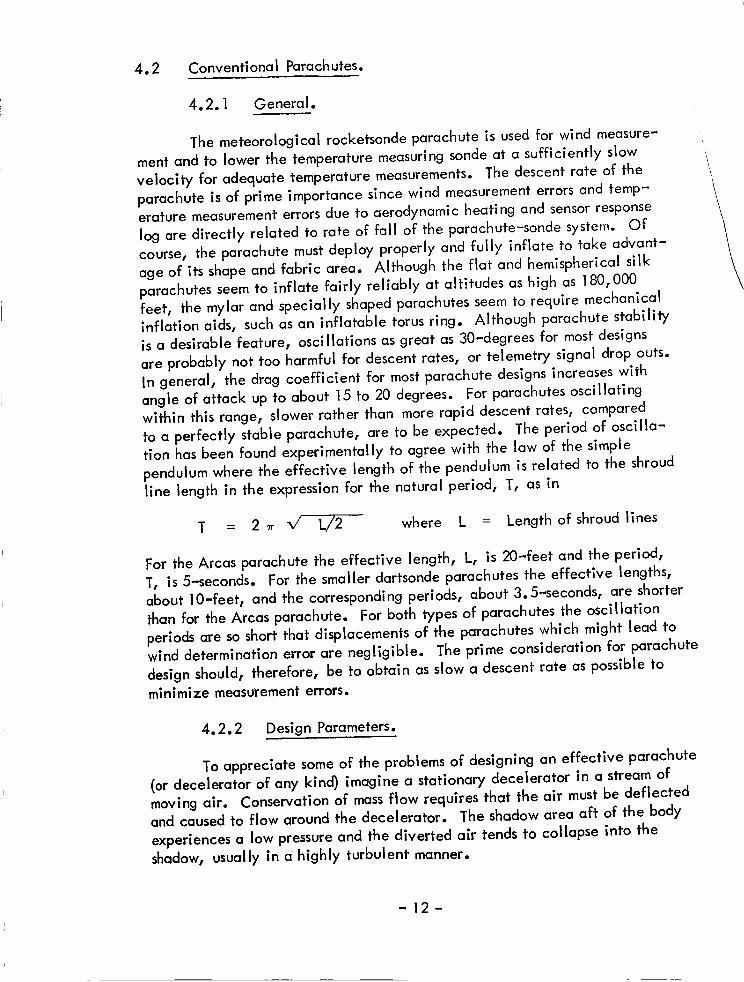
4.2 Conventional Parachutes.
4.2.1 General.
The meteorological rocketsonde parachute is used for wind measure-
ment and to lower the temperature measuring sonde at a sufficiently slowvelocity for adequate temperature measurements. The descent rate of the
parachute is of prime importance since wind measurement errors and temp-erature measurement errors due to aerodynamic heating and sensor response
log are directly related to rate of fall of the parachute-sonde system. Of
course, the parachute must deploy properly and fully inflate to take advant-age of its shape and fabric area. Although the flat and hemispherical silk
parachutes seem to inflate fairly reliably at altitudes as high as 180,000
feet, the mylar and specially shaped parachutes seem to require mechanicalinflation aids, such as an inflatable torus ring. Although parachute stability
is a desirable feature, oscillations as great as 30-degrees for most designs
are probably not too harmful for descent rates, or telemetry signal drop outs.
In general, the drag coefficient for most parachute designs increases with
angle of attack up to about 15 to 20 degrees. For parachutes oscillatingwithin this range, slower rather than more rapid descent rates, compared
to a perfectly stable parachute, are to be expected. The period of oscilla-
tion has been found experimentally to agree with the law of the simple
pendulum where the effective length of the pendulum is related to the shroud
line length in the expression for the natural period, T, as in
T : 2 _ v' L//2 where L : Length of shroud lines
For the Arcas parachute the effective length, L, is 20-feet and the period,
T, is 5-seconds. For the smaller dartsonde parachutes the effective lengths,
about 10-feet, and the corresponding periods, about 3.5-seconds, are shorter
than for the Arcas parachute. For both types of parachutes the oscillationperiods are so short that displacements of the parachutes which might lead to
wind determination error are negligible. The prime consideration for parachute
design should, therefore_ be to obtain as slow a descent rate as possible tominimize measurement errors.
4.2.2 Design Parameters.
To appreciate some of the problems of designing an effective parachute
(or decelerator of any kind) imagine a stationary decelerator in a stream of
moving air. Conservation of mass flow requires that the air must be deflectedand caused to flow around the decelerator. The shadow area aft of the body
experiences a low pressure and the diverted air tends to Collapse into the
shadow, usually in a highly turbulent manner.
\\
-12-

;/
Now, turbulence has both its good and its bad effects, it can be
shown that those shapes that create the most turbulence also offer the high-
est amount of drag or resistive force. Because turbulence represents aconsumption of energy, this correlation should not be surprising. Unfortunate-
ly, turbulence also produces undesirable instabilities.
Wind tunnel tests show that the shadow area behind the canopy tendsto be filled from two sections at opposite points on the circumference in aseesaw manner. As the collapsing airstream oscillates, so does the local
external pressure, and since the force on the canopy is governed by thedifference between internal and external pressure, a cyclical rocking moment
deveiopes. The parachute oscillates at a rate and magnitude governed by a
complex set of factors. In some cases the oscillation may cause the load toswing through an arc of 60-degrees or more.
None of the conventional parachute designs - and that includes the
hemisphere, the flat-circular, and the conical - are particularly stable in
flight. All of them allow the payload to swing beneath the canopy, part-
icularly when the air itself is turbulent, gusty and unstable. Conventionalparachutes do not open reliably at very low dynamic pressures and they
exhibit poor stability with coning angles or oscillations of about + 45o or
more at high altitudes. Experience with parachutes at dynamic pressuresbelow 1 lb/ft 2 has shown that for repeatable and immediate canopy opening,
an inflation aid must be provided.
Descent rates of current conventional parachutes are excessive foraccurate meteorological measurements above an altitude of 180,000 feet.
The ballistic coefficients of the current parachute - sonde systems aregreater than 0.05 lb/ft 2 and larger parachutes are required for the given
payload weight to reduce the fall rates. As long as metalization of the silk
canopy fabric is required for radar tracking, it appears that the conventionallyshaped parachute is limited to a ballistic coefficient of at least 0.01 ib/ft 2
by itself without any allowance for payload weight.
Fairly extensive investigations indicate that a major problem in
parachute deployment is the tangling and twisting of the parachute shroudlines and their interference with the canopy. Photography has shown that
shroud lines flung over the crown of the parachute have reduced the effective
flying area and have caused the abnormal descent rates. There have alsobeen discontinuities in the descent rates of recent conventional parachute
systems. It appears that once the parachute has been sized properly for the
-13-
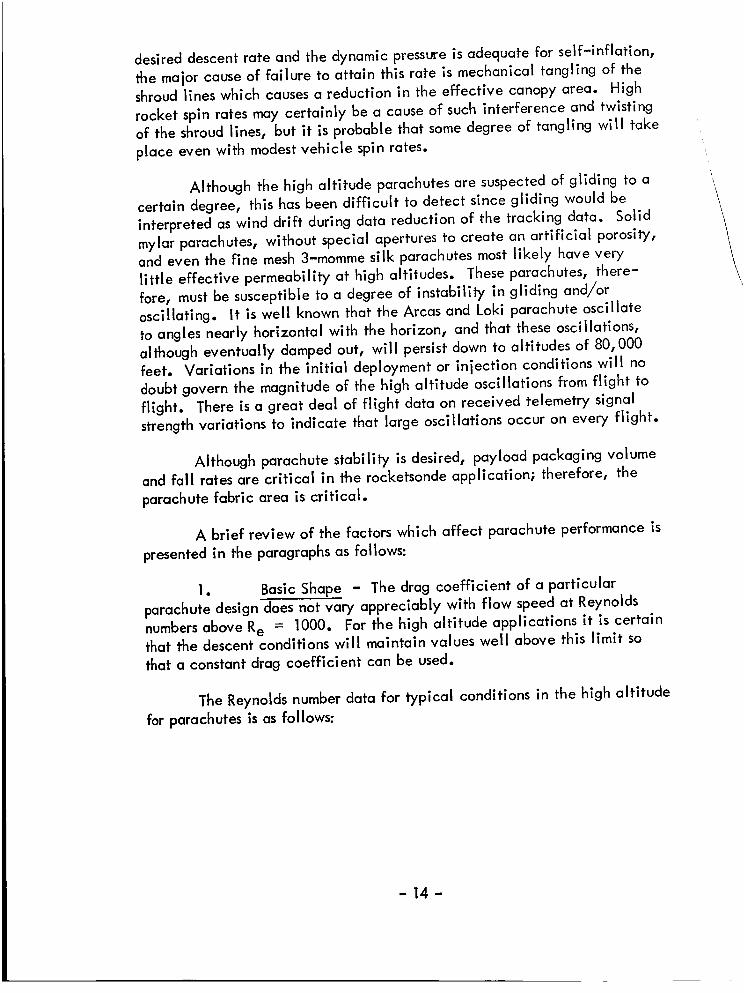
desired descent rate and the dynamic pressure is adequate for self-inflation,
the major cause of failure to attain this rate is mechanical tangling of the
shroud lines which causes a reduction in the effective canopy area. High
rocket spin rates may certainly be a cause of such interference and twisting
of the shroud lines, but it is probable that some degree of tangling will take
place even with modest vehicle spin rates.
Although the high altitude parachutes are suspected of gliding to acertain degree, this has been difficult to detect since gliding would be
interpreted as wind drift during data reduction of the tracking data. Solid
mylar parachutes, without special apertures to create an artificial porosity,
and even the fine mesh 3-moraine silk parachutes most likely have very
little effective permeability at high altitudes. These parachutes, there-fore, must be susceptible to a degree of instability in gliding and/or
oscillating. It is well known that the Arcas and Loki parachute oscillate
to angles nearly horizontal with the horizon, and that these oscillations,
although eventually damped out, will persist down to altitudes of 80,000
feet. Variations in the initial deployment or injection conditions will nodoubt govern the magnitude of the high altitude oscillations from flight to
flight. There is a great deal of flight data on received telemetry signal
strength variations to indicate that large oscillations occur on every flight.
Although parachute stability is desired, payload packaging volume
and fall rates are critical in the rocketsonde application_ therefore, the
parachute fabric area is critical.
A brief review of the factors which affect parachute performance is
presented in the paragraphs as follows:
1. Basic Shape - The drag coefficient of a particular
parachute design does not vary appreciably with flow speed at Reynolds
numbers above Re = 1000. For the high altitude applications it is certainthat the descent conditions will maintain values well above this limit so
that a constant drag coefficient can be used.
The Reynolds number data for typical conditions in the high altitude
for parachutes is as follows:
\\
- 14-

Altitude
DescentVelocity
p = 1.6929x 10-6
= 3.6816 x 10⁻⁷
170,000 feet
225 ft/sec
Ibf-sec 2 - ft'4
Ibf-sec ft 2
Parachute Flying Diameter Crown Height
Arcas 15.0 ft 7.5 ft
Dartsonde 6.0 ft 3.0 ft
Reynolds Number
8, 800
31520
Experimental evidence indicates that a maximum drag coefficient,
which is based on projected area, is obtained for a parachute with a crown
height to inflated to flying diameter ratio of one-half (0.5); that is, for a
parachute which is approximately hemispherical in shape. If designed and
joined together as flat circles, parachute canopies have inflated diameters
which are approximately two-thirds (0.66) of the laid-out fabric diameters
and are essentially hemispherical in shape. The ratio of their inflated frontalarea, SD , to that of the area of the fabric, Se , is consequently on the
order of S,, /Se = 0.45. The drag coefficient referred to canopy fabric
area is then approximately CDe = 0.45 CDa . The parachute descent vel-ocity, U, can then be calculated as either,
_ 2W _/ 2WU-- _ - or -
p CDo So p CDe So
2. Equilibrium Descent Velocity - The descent velocity of aparachute system can be given by:
-15-

(I +Z
g
where: K = C D S
2 mg
p = atmospheric density
= altitude coordinate
g = acceleration of gravity
If the second term, g, is neglected, descent velocity can be predicted within
5-percent accuracy for 2_ _< 140 m/sec, and within a 1-percent accuracy for2_ -< 63 m/sec. Table 4-1 can be used to predict descent velocities at various
altitudes for given values of K.
3. Gliding - The stable equilibrium of a nonporous hemispherical
parachute about a point 1.3 times the diameter below the canopy is at an angle
of attack of approximately 45 degrees. A hemispherical parachute which does
not oscillate may therefore maintain a steady gliding angle of 45 degrees instill air. The weight of the parachute and load is supported in this case by the
resultant aerodynamic forcer R, composed of both lift and drag as indicated in
Figure 4.2-1. The effective vertical velocity or weight coefficient, CWa ,used to calculate descent velocity may be defined as
CW a
W C R
1/2 p U2Sa sin 2
where Cwn may be as much as twice the value of C,, A gliding parachutehas a slower rate of descent than a nongliding parach_u_e I_y a factor of the
square of the sine of the angle of attack. The angle of stable gliding is also
affected by the shroud line length. For the rocketsonde application the glidingmode is to be avoided since the horizontal glide velocities will be interpretedas wind velocities in the data reduction and erroneous wind velocities will be
reported. Gliding can be reduced by increasing the porosity or permeability
of the parachute canopy•
-16-

Ev
ILlt_
I.---
I"--,--.I.<
Z)
0
.<>I---<
II
u0=-IILl>.-,I.._1.<13-
'T
ILl,=--I
I.,I.i
.--I
.<>
_J' L
ZILl
lullt_
I--.
,=.1
0 0 0 0 0 0 0 0 0 0 0 0
O- 0 0 0 8 0 0 0 0 0 0 0 00 0 0 0 0 0 0 0 0 0 0,0 0 _ CO C',I "0 0 _ _0 C'_ ,0 0
-17-

d
V
\
\
9 °,'," .3d
d = Flying Diameter R = Resultant Aerodynamic ForceV = Total Velocity R = -_/L2 + _D2u = Descent VelocityD = Drag Force 7 = Glide AngleL = Lift Force c_ = Angle of Attack
FIGURE 4o2-1 HEMISPHERICAL PARACHUTE GLIDING MODE
-18-

4. Oscillating Parachutes - Stable gliding occurs only undercertain favorable conditions. A more probable mode of motion for most
parachutes is an oscillation which is produced through dynamic interaction
between canopy forces and the suspended load. While gliding may prevail
at slow rates of descent, oscillations are predominant at speeds anticipatedfor the rocketsonde application. The drag or weight coefficients are
significantly reduced from stable conditions to the oscillating mode, and
telemetry signal strength variations (i.e., signal dropouts) at the ground-
based receiver are caused by the oscillating payload. In such a system,let _ be the angle from the vertical through which the pendulum acts.
From the previous discussiont it is seen that _ could initially have almost
any value from 0 to 180 ° depending upon the direction in which the nose
cone is pointing during separation. The dynamic behavior is then subject to
analysis as a circular pendulum for which the period, T, is defined in the
fol lowing:
T = 4
g o _/1-K 2 sin 2
where, L, is the length of the pendulum, g is the acceleration due to gravity,and, K_ is the sin ( a/2). ## is a function of _ whose maximum value is
An evaluation of one of the probable limiting cases, where a approaches
180 °, yields a period of approximately 8.0 seconds for a typical 15-,foot dia-
meter parachute for the initial condition immediately after deployment,
neglecting drag and damping, and assuming a rigid pendulum. In the otherlimiting case_ where a is a small angle, the period is approximately 5.5
seconds under the same assumptions.
5. Permeability - Permeability is a measure of the average
speed of the flow of air passing through the parachute fabric. The effective
permeability of parachute canopies can be expressed as:
Weff = Wtest '_ Ptest /
- 19 -

and the flow speedratio as
W/V = Wtest V 0.21/2 p CD_ /A Ptest
0.6
where Weff Effective permeability flow speed
Wtest test permeability flow speed
APtest test pressuredifferential
Thedrag or weight coefficien_ are reducedby permeability as indicatedin the expression,
CDa = CDn (1-W/V)COlT
where CDa is the drag coefficient for a nonporous material and CD_colT'ls
the corrected value which allows for flow through the canopy. The drag on
a parachute is reduced as the permeability increases. Permeability tendsto reduce the drag but also reduces the tendency for a parachute to oscillate
and glide. Although the effect of permeability can be predicted for low
altitude flight, there is some question as to the effect at high altitudes.The large mean-free-paths of air molecules at high altitudes significantly
affect the permeability of small-sized pores such as are found in the 3-momme
silk fabric being currently used in the fabrication of current high altitude
meteorological rocket parachutes. There are indications that at the 200,000-
foot levels these parachutes are essentially impervious to flow through the
canopy fabric. A means of increasing the permeability of such parachutes
would be by the cutting out of sufficiently large holes in the canopy material.
6. Critical Velocity - For every parachute there is a velocity,
called the "critical velocity", above which it will not inflate but insteadremain in a duffle bag or "squidded" configuration. The more porous the
fabric, the lower the critical velocity and, of course, the less useful the
parachute. Fortunately, the squidded parachute will generally introduce
-20-

sufficient drag to causethe velocity to drop below the critical velocityand to permit inflation to proceed- assumingtof courser that it doesnotstrike the ground first.
Thecritical velocity depends upon the overall porosity of the canopyand the distribution of porosity, it also depends upon the shape of the
canopy mouth opening. No precise analytical method exists for determining
the critical opening velocity but it can be estimated from assumed values ofthe critical parameters.
7. Aeroelasticity - The permeability of textile fabrics is
increased by applying tension and causing elastic deformation in the material.
Inasmuch as tension in canopies is proportional to the dynamic pressuret in
low altitudes the drag coefficient of a fabric parachute decreases as the speed
is increased. This factor may not be significant in the high altitudes for the
reasons mentioned in the previous section.
8. Parachute Size and Rigging Line Length - For a given speed
of descent the drag coefficient decreases as parachute size is increased since
rigging line tension increases as the diameter is made larger. The flying
diameter can be increased slightlyr however, by increasing the length of therigging lines.
9. Breathing - This is a dynamic phenomenon resulting in anoscillation in the diameter of the parachute. Since the breathing involves
changes in shape, it may be dependent to some extent upon the elasticity of
the parachute system. Changes in parachute diameter are necessarily attend-
ed by changes in overall length which are communicated to the suspendedload through the suspension lines_ an efficient spring mass system in itself.
The results in a spring mass system supported by an elastic envelope contain-
ing a considerable mass of circulating air, i.e.t two free masses joined byan elastic link. The forces resisting deformations of shape are apparently
negligible for the normal equilibrium condition of shape of the parachute so
that a transient disturbance is easily translated into small periodic undamped
oscillations in both the length and diameter of the system.
10. Deployment - The complete deployment of a conventionalparachute consists c_a number of steps as follows:
-21 -

a. Release or ejection from the vehicle
b, Line and canopy stretch terminated by snatch force
Co Inflation to opening shock, terminated by overinflation
do Rebound and recovery to "steady" drag condition
e. Completion of deceleration to near equilibrium velocity
f, Steady or controlled descent
11. Deployment into a Wind Field - High altitude winds have
quite frequently been found to be as great as 100 meters per second which issimilar in magnitude to the horizontal velocity of some rocket vehicles at
apogee. Experience indicates that parachute deployment and streaming
problems increase when the rocket horizontal velocity is in the same directionand of the same order of magnitude as the deployment altitude winds. Ofcourse, the effect is a reduction in the relative wind velocity with respect
to the parachute and a reduction in the available dynamic pressure. Sincehigh altitude wind reversals and wind speeds are a seasonal and geographical
phenomena, without a positive inflation aid, parachute deployment reliability
can be quite variable.
12. Deployment from a Spinning Missile - Parachute deploymentfrom a spinning missile is a fairly complex phenomena and defies a preciseanalytical treatment. The spin energy may help to open and spread out the
parachute canopy to some extent and no doubt the spin rate of the deployed
canopy is greatly reduced from its packaged condition. In general, the pay-load will not be despun during the opening process, therefore, a difference
in spin rate between the canopy and the payload will be created. This factorno doubt tends to twist and tangle the shroud lines and prevent full inflation
in many cases.
- 22 -

4.2.3 Arcas 15' Gentex Parachute.
The standard Arcas parachute as shown in Figure 4.2-2 is a pre-formed hemispherical-shaped silk parachute manufactured by the Gentex
Company. Details of this parachute are presented in Table 4-2.
The parachute is generally supplied with alternate gores metalized
far radar tracking. Twenty-two percent of the silk fabric is metalized Foruse with FPS-16 quality radar and fifty percent is metalized for use with the
lower powered radars.
The Arcas parachute assembly consists of an instrument mounting base
and a radar-reflectlve parachute (diameter 4.5 meters) packaged inside a
cylindrical parachute container. A cross-sectional diagram of the parachuteassembly is shown in Figure 4.2-3. The parachute container is a sealed unit
which is attached to the forward retaining ring of the motor case. A lanyard
connects the after-closure of the parachute container to the head-end closure
of the rocket motor. The instrument package to be used is attached to the
instrument base and inserted into the nose-cone. When the payload is
assembledt the cone is secured to the instrument base by six steel balls that
are held in place by the collar of the parachute container. The instrument
base is attached to the forward closure of the parachute container by join-
ing the stud of the parachute container closure with the stop nut mounted onthe instrument base. A cork spacer is used between the parachute container
and the instrument base to absorb some of the shock of separation. The
process for the assembly of the payload is outlined in greater detail in the
discussion of the rocket-launchlng procedure.
The principle of separation of the Arcas payload assembly is i l lustrated
in Figure 4.2--4. Pressure generated by the separation charge acts on the
afterciosure of the parachute container, and the pressure is transmitted through
the inner cylinder of the container assembly. The shear pins which secure theforward closure of the parachute container break, thus allowing the nose-cone,
instrument package and parachute pack to be ejected. The parachute and
lanyard retain the after-closure assembly of the parachute contained. When
the parachute is fully extended, the snap line attached to the crown of the
parachute breaks and the steel ball joining the instrument base and nose-conefall away thus allowing the nose-cone to separate from the instrument base
and package. Figure 4.2-5 gives the dimensions of the parachute and the con-
figuration of the parachute and payload after expulsion.
-23-

F I G U R E 4.,2-2 A R C A S G E N T E X P A R A C H U T E , 1 5 FOOT D I A M E T E R
- 24 -

TABLE4-2
ARCAS151GENTEXPARACHUTE
Design
Flying Diameter
Line Length
Number of Lines
Parachute Weight
Canopy Material
Canopy Weight
Canopy Weight Density
Weight of Shrouds and Fittings
Surface Area
Flying Cross-Section Area
Standard Payload Weight
CD
CD
Ballistic Coefficient W/CDA
Preformed H emlsphericai
15.0 ft
28.0 ft
24
2.62 Ibs
3-Momme Silk
0.865 lbs
2.43 x 10 -3 Ib/ft 2
1.75 lbs.
354 ft 2
177 ft 2
4.65 lbs
0.624
0.335
0.065 Ib/ft 2
- 25 -

!
\
i_5
\
4 6 5 10
\
2
Legend
7
I I0 9 8
1. Motor Case Retaining Ring 6. Para-_cute-Container Wall ] 1. Shock Cushion
2. Inner Split Cylinder 7. Ogive Sleeve Section 12. Forward Closure3. Packaged Parachute 8. Instrument Base 13. Parachute
4. Stud 9. Stop Nut Container5. Shear Pins 10. Steel Balls 14. After Closure
15. Cable
FIGURE 4.2-3 CROSS-SECTIONAL DIAGRAM OF THE ARCAS PARACHUTE ASSEMBLY
I
\
2
\6
Legend]. Parachute Container 4. Oglve 7. Break Line
2. After Closure 5. Arcasonde IA 8. Split Inner
3. Steel Balls 6. Parachute Cylinder
FIGURE 4.2-4 PRINCIPLE OF SEPARATION OF THE ARCAS PAYLOAD ASSEMBLY
- 26 -

E"O
_- 4.57m. =
Silk 3 Momme
\
\\\\
/
Parachute Weight
(.91 kg.)
32 Braided Nylon Shrouds
22.7 kg. Tensile Strength
FIGURE 4.2-5
Payload Weight
(I. _kg.)
ARCAS PARACHUTE AND PAYLOAD AFTER EXPULSION
- 27 -

An analysis has been made of flight test data for the Arcas Gentex
parachute. Figure 4.2-6 presents the descent rate average for hundreds of
Arcas parachute flights with a standard payload of 4.65 pounds. The
weight to effective or flying area ratio, W/S, for these flights was 0.0410Ib/ft z, and except for occasional erratic flights, the descent rate dataagrees within + 8 per cent of altitudes below 170,000 feet. Figure 4.2-7
presents descent rate data for heavier and lighter payload weights for theArcas parachute with weight to effective area ratios of 0.0459 Ib/ft 2 and
0.0334 Ib,/ft2. Descent times are presented in Figure 4.2-8 for various
Arcas payload weights. A statistical analysis of Arcas parachute descentrates has been conducted by the Air Force at Cape Kennedy. The resultsare tabulated in Table 4-3.
WSMR reports that the Areas parachute does not fully deploy for thefirst 25, 000 ft. to 35,000 ft. or 80 seconds to 90 seconds after deployment
at apogee. The fall rates are higher than expected right after apogee andthe radar signal is weak. Oscillations of +-45 ° to + 90 ° with a 5-second
period are experienced at the high altitudes, and these are damped out
with a period of 8-seconds in about 23-minutes of descent. For systems
ejected at 250,000 ft. velocities on the order of 800 to 900 ft/sec, are
attained at 230,000 feet. The lag in initial wind response at 60 Km is about
20-seconds° The wind response lag after apogee which we have studied is
presented in Table 4-4.
Figure 4.2-9 presents two typical radar plots from which these kind
of data were derived. Figure 4.2-10 presents the initial wind response
altitude against apogee altitude. Although the scatter of points on this plot
indicate that a correlation does not exist between apogee and wind sensingaltitude, the data are too few from which to draw any final conclusions.
However, it appears that some chutes respond at 2, 000 to 3,000 feet below
apogee, while others lose 20,000 to 30,000 feet before responding to thewind.
A recent study of Arcas parachute descent rates has been conducted
by the Army at WSMR. Descent velocities for the standard Arcas systemhave been plotted by the Army as shown in Figures 4.2-11 through 4.2-18.
These data indicate that the parachute becomes fully deployed and descent
rates are stabilized to the theoretical values by an altitucle of 40 km. It
appears that occasionally the parachute deploys very soon after ejection fromthe rocket vehicle and follows the theoretical descent ratio curve essentially
- 28 -

0
t:- Ol x 4:_)3Gn1111v
<
<
<r_
I.--
zi..t_1£J
l.iJ/m
>-Z<
8__.
ia
<
<z_-<<mu,,,,_,9
#
-29-

! u_
i -_- i_
0
0
00
_Ol X iI) ]GNIILIV

0
8
_1_ o
YY ,///1
/
8 lit 8
"r" a.
.mI,--
lil _'.#1.1.1
0
0
0
0
001 x l_-i - :IOClllIIV

TABLE 4-3
FALL RATE STUDY OF
ARCAS PARACHUTE AND SONDE PAYLOAD
Avg Fall No. Standard
Ht (K ft) (FPM) Samples Deviation
%
1 Dev
%
2 Dev
81-85 1891 25 62.3
86-90 2233 25 58.691-95 2674 25 72.4
96-I00 3118 25 105.3
101-105 3568 25 119.8
106-I 10 4076 25 134.0
111 -I 15 4579 25 122.0116-120 5168 25 187.2
121 - 125 5855 24 228.9
126-I 30 6543 24 150.2131 -I 35 7275 25 228.9
136-140 8120 25 225. I141-145 9118 25 316.4
146-I 50 10220 25 283. I
151 -I 55 11387 25 314.9
156-I 60 12557 24 467.2
161-165 13816 24 340.8
166-170 15113 24 482.1
171 -I 75 16677 23 468.8176-180 18117 19 554.6
181 -I 85 19857 16 430.3
186-I 90 21807 I 0 608.5
191-195 23611 6 394.2
196-200 25786 4
201-205 27902 2
Ft. 68
76
64
56
7272
6468
71
71
72
60
68
7252
67
75
75
61
7462
70
67
92
92
100100
92
92
9696
92
96
96
96
9692
100
96
92
92
10095
100
100
I00
Based on Arcasonde launches at Cape Kennedy Florida 1964-65
- 32 -

TABLE 4-4
INITIAL WIND RESPONSELAG DATA
ApogeeAltitudes Ti me
First Indication of Wind ResponseAltltudes Ti me
220 K'
212
182
188
201
213
203
213
128 Sec
128
128
128
133
128
128
128
200 K' 240 Sec
180 176
177 145
186 136
196 150
171 192
200 148
205 160
- 33 -

_IC, LIRE 4,,2.-9 FPS-16 RADAR TRACKS OF ARCAS FLIGHTS AT PACIFIC MISSILERANGE
NOTE:
XY - Plot
3' 16,°LM"/'I¢4"
6' b' /
S f 11a"
I
W
80 ''_"
4000 Yds. /
Parachute Expulsion at 128 Seconds
Z - Plot
1_8" 136"
4"
80
15 February 1960 /
NOTE: Parachute Expluslon at 128 Seconds
210,000 >
200,000c
ITI
>190,000
0<r'n
180,000r-
i
170,000 _
160,000
XY - Plot
--L._, _. _...7C,__o.,
_ee_
7 LI_"
104"
96"
S
I 4000 Yds.W
N
Z - Plot
1_8" 136"
._ i44"
104"/ - 160"
- 168"
- 176"
96'
- 184"
_t"/
80,,/ - ,4'
2 March 1960
220,000
210,000
200,000
190,000
>I--",--4
,,--4
c
rTI
>
0<I'l'l
L_I--'
I

I0
X,.i-
v
_rJ •
Z0O-U'3I.M
Z
I--
u-
u-
01.1.1
I--.=.1
220
210
180-
170-
180 190 200 210 220 230
Apogee Altitude (ft x 10-3)
FIGURE 4.2-10 INITIAL WIND RESPONSE ALTITUDE VS.APOGEE ALTITUDE
- 35 -

I
S,/
i//
/
kI
II
i
i
k,
q_
t,
"-4--J
"-4
--_-/---/
I/////
_F-
,,//
8 oo0 0
i i
i i
i0 0 0
g g 8
I
I
4 I
, iI
o 8 o0 00 0 0
h ,
i 'I
i
Fi
0
,o"
0
0
I
I
0
"T
i--
r©._.1u_
0--,-0 _
h-
123
N _ <
I-.-
0
I
I
0
I
o
©m
sJeCeW Ul H

s_4aW Ul H
iIIII
/i
i
_. ' .I/ I I! i i i
7
---- -t=-I--_-- }_- "_ -_......
r ql tu k_, •_ _e_.'_ !__. ml r_ -4-- _ -_ _-_--_,
' i u.
-U- i 4-_0_4....
i
0
0
I--
..1-(9...1u_
I
,_ ?__- .<
I.--
.<c3
.<U-
l.LI
v -r""1- t..)
> .<
.<
.<t.)
.<
"T
(5
0 0 0 0 0 0 0 0 0 0
0 0 0 0 0 0 0 _ 0 00 0 0 0 0 0 0 _ 0 0
sJa_,aW Ul H

0
0
0o4
!
0 0 0 0 0 0 0o g o 8 8 8 o o o o0 0 0 0 0 0 0 0 0
sJe_/_/ u I H

J
/ i
L //'L , i /
II -I--_.... _- _ ..... -
--i --
I
!II!
0 0 00 0 00 0 0
1
I
i II
I
, I
= !I I i n_ ! [ i
.! - __ .... f---
i !°_-, ' io_i I 11
[ _ [ <l I I
0 0 0 0 0 0Q 0 0 0 0 00 0 0 0 0 0
0
. I--
"1-
0,..JU-
o_00
.<I---
U.I
_ -J
o_
I--
"1-
.<
.<
t_
s.ie.laW Ul N

I
I
i.
1L
/!!!!/!I
//
//
/
!/
//
!/!
/i!
.J//
\
S
i -i- o.
(.,J
'_ ,,,,,o
!
T t
- 0m
_e.leW ul H
-41 -

I
\\
//////II
1I
II
I
//
/!
//
/
//
-d
It'-
Illfn
m
13.
cI1
t.Un-
Z
_.1
4*
!'
o
I
o
7
o,'..o
7
o
u
(M --i n-
>
o
I
o,',o
?
oo
"t
o
t-"1-(9._1
t_
I--
__1_J
I.U
I--
"I-U<e_
6¢v,<
!
o
8o
ooo
ooo
ooo
ooo
80
ooo
o ooo
o
Tooo
sJeJ,eW ul H

o0o
ooo
000
o0o
sJe_,eWUl H
- 43 -

from apogee. More often, however, the descentvelocities exceedthetheoretical values and showa rather erratic pattern above40 Km.
4.2.4 Loki Dart 7.6' Parachute.
A standard Loki Dart parachute as shown in Figure 4.2-19 is a cir-cular flat silk parachute which is manufactured by the Irvin Air Chute
Company. Details of this parachute are presented in Table 4-5.
This parachute is made radar-reflective by metalizing alternate gores
so that fifty percent of the area presents a target. A center or squib line isattached From the payload to the crown of the canopy, so that the crown is
drawn somewhat from the hemispherical shape. This is done to increase the
drag coefficient and to improve deployment reliability. However, a less
stable descent results as compared with the hemispherical shape. Figure 4.2-20
presents typical descent rates for the 7.6' parachute and Figure 4.2-21 presentsaltitude vs. time profiles for various ejection altitudes.
A recent study of the 7.6 _ Loki Dart parachute descent rates has beenconducted by the Army at WSMR. Flight test data from this study are plotted
in Figures 4.2-22 through 4.2-26. These data indicate that this system iscapable of achieving a ballistic coefficient better than 0.050 Ib/ft 2, but
many of the flights possess excessive fall rates above an altitude of 40 kilometers.
No doubt deployment problems are the cause of the rapid fall rates.
4.2.5 NOL 6' Square Parachute.
A standard NOL parachute is the 6-feet square silk parachute which
has been used with the Lokl Dart (Hasp) and the five-lnch gun probe projectile.This parachute consists of 71" x 71" square of 3-Momme silk and eight shroud
lines of 9-feet length. The silk canopy is metalized for radar reflection.
Each of four shroud lines is attached to a corner of the canopy, and each of
the remaining shroud lines is attached to a point slightly offset from the mid-
point of each of the four sides. The purpose of the slight offset is to inducea slow spin rate to the descending parachute to prevent gliding which might
lead to erroneous wind data. A weight breakdown for this parachute is asfollows:
Canopy 0.088 lb.
Shroud and fittings 0.100
Payload 0.750
TOTAL 0.938 lb.
-44-

FIGURE 4.2-19 DARTSONDE INSTRU/WENT PACKAGE ON 7.6 FOOT CHUTE
- 45 -

TABLE 4-5
I.OKI 7.6' IRVIN PARACHUTE
Design
Flying Diameter
Line l,ength
Number of Lines
Parachute Weight
Canopy Material
Surface Area
Flying Cross-Section Area
Fabric Diameter
Standard Payload Weight
CD a
CD®
Ballistic Coefficient
Flat Circular
5.7 Ft.
7.6 Ft.
9
0. 225 lb.
3-Momme Silk
45.5 Ft. 2
25.5 Ft. 2
7.6 Ft.
0.788 lb.
0.660
0 o370
0.060 Ib/ft 2
' - 46 -

I--uJILlIJ-
!
O
Xu.I
c_
I---.-J
<_
uJuJLL
000
X
200
180
160
140
120
100
8O
I _ I !-:allRate of a 200, ?__ _jFoot Altitude Ejectio_
--I 7-' "i;/
/'
, y
l__Fall Rate of a 250,
000 Foot Altitude
Eje ction
L0 100 200 300 400 500 600 700 800 900
Fall Rate - Feet Per Second
FIGURE 4.2-20 LOKI 7.6 PARACHUTE - SONDE DESCENT VELOCITY
250
225
2OO
175
150
125
100
75
Nom!ooc*oo !_ 250,000 Ft.
230,000 Ft.
/._---- 200,000 Ft.
175, 000 Ft.
,\\ t ,,
! : 1 I i
__ __] __ _ 2__
0 5 10 15 20 25
Ti me-Mi nutes
3O
FIGURE 4.2-21 LOKI 7.6 PARACHUTE-SONDE DESCENT TIME
- 47 -

/
0
0
I
I
t o!
' i_ oI
b
0 0 0 00 0 0 0
p,,
oI---
k.)o@,
L)_ z
_..1
"1- _v
o...1
_4
!
.g
©
S_I].I._ u! M
- 48 -

,0
_" i 1 I_" ! __/+" i i
I l_TY ! : _,,' ! i /it '. !
i ! / # ' i : i
! I I ' I ' I.
i to { i 1 ;
i: _ i,, ,k" i i i I o, --: ..........._-....-_ k '<_
I r! _, q i i i o
i, I,, i I f
........3-A-
/
t ii
,ti/
I
l I0 0 00 0 00 0 0
I i
i I ,
I
__ __1
I
i "
..A
0 0 00 0 0
0 0 0
!t
i
IiitI
OOO
I1
OOO
i O
i t
iI
000
.d
O
|
!
O
I
T
O
t_I
O
(Z3
I--
I--
"I"
O..J
d _
_ u_O
°_ I-.-
zt.)
V
O_.1
ICN
.4
oii
S_I:IIBVVu! H
- 49 -

000
CO
It
bi
i
0 00 00 0
L/
0 0 0 0 0 00 0 0 0 0 00 0 0 0 0 0
0
0
I
0CO]
o'r00
- 50 -

k
- /\/
/I
i
///iI!
/
//
j ,"'_ ff
j _/f/
r_
rn
ILl>0"7
£0
QLI.J"::£rj7
.4_J
_Jf_
0_J
0 0 0 0 0 0 0 0 0 0"_'10 0 0 0 0 0 0 0 0 00 0 0 0 0 0 0 0 0 0
I--
I,--
I.UI--
"1-
._1ii
,.-I
0C
Qw i,_
ILl1" i--v>
I--
z
LU
",0
v0_.i
I
o
I.U
L_I,J-
- 51 -

FI/I!
, /
/k
u4
\/1 ;4
\1/
-a_", _lt,,
I
f
J/
/
f
JJ
/
oo o o o o o o
b-
fJ)
111
21uo
b.0
[_.
v0-I
i o
o
!
oGo
!
oo
o
8
) o ,c
CM _
S_I=II_]Wu! H
,<I--.<
"r"o, "7
oo04 Lo, 3:
LI-
I LO
• a..
I'--"1- Z
,o
n v0..J
40
!c4
0U..
- 52 -
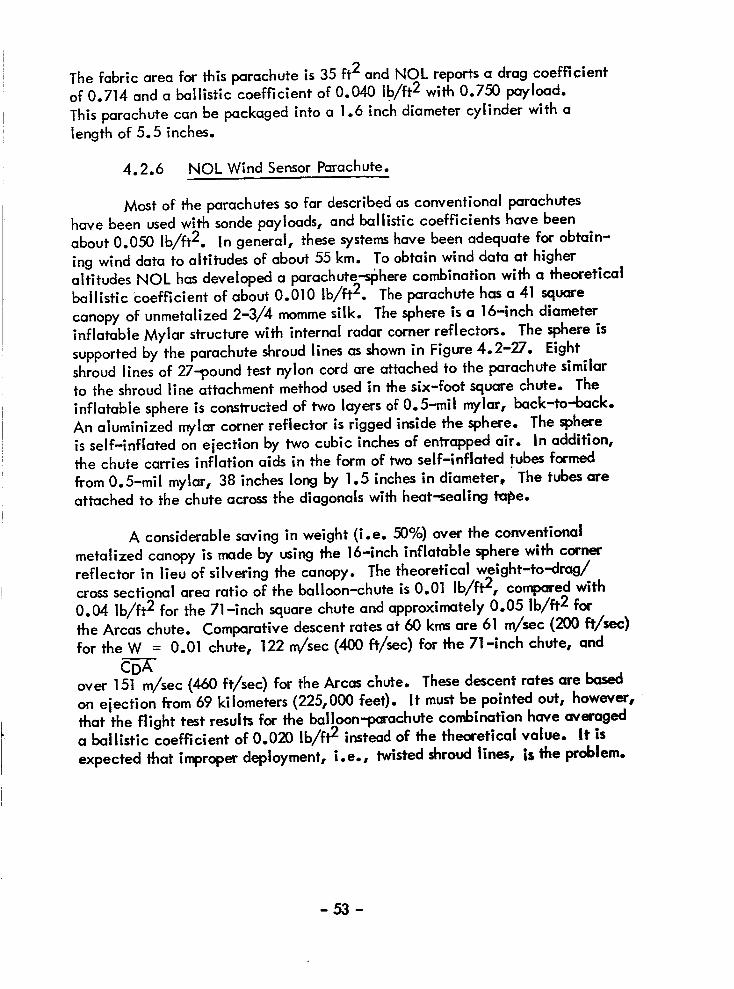
The fabric area for this parachute is 35 ft 2 and NOL reports a drag coefficient
of 0.714 and a ballistic coefficient of 0.040 ib/ft 2 with 0.750 payload.
This parachute can be packaged into a 1.6 inch diameter cylinder with alength of 5.5 inches.
4.2.6 NOL Wind Sensor Parachute.
Most of the parachutes so far described as conventional parachutes
have been used with sonde payloads, and ballistic coefficients have been
about 0.050 Ib/ft 2. In general, these systems have been adequate for obtain-
ing wind data to altitudes of about 55 kin. To obtain wind data at higher
altitudes NOL has developed a parachute--sphere combination with a theoreticalballistic _:oefficient of about 0.010 ib/ft 2. The parachute has a 41 square
canopy of unmetalized 2-3/4 momme silk. The sphere is a 16-inch diameter
inflatable Mylar structure with internal radar corner reflectors. The sphere is
supported by the parachute shroud lines as shown in Figure 4.2-27. Eight
shroud lines of 27-pound test nylon cord are attached to the parachute similar
to the shroud llne attachment method used in the six-foot square chute. Theinflatable sphere is consh'ucted of two layers of 0.5-mil mylar, back-to-back.
An aluminized mylar corner reflector is rigged inside the sphere. The sphere
is self-inflated on ejection by two cubic inches of entrapped air. in addition,the chute carries inflation aids in the form of two self-lnflated tubes formed
from 0.5-rail mylar, 38 inches long by 1.5 inches in diameter, The tubes are
attached to the chute across the diagonals with heat-sealing tape.
A considerable saving in weight (i.e. 50%) over the conventional
metalized canopy is made by using the 16-inch inflatable sphere with corner
reflector in lieu of silvering the canopy. The theoretical weight-to-drag/cross sectional area ratio of the balloon-chute is 0.01 Ib/ft 2-, compared with
0.04 Ib/ft 2 for the 71-inch square chute and approximately 0.05 Ib/ft 2 for
the Arcas chute. Comparative descent rates at 60 kms are 61 m/see (200 ft/sec)
for the W = 0.01 chute, 122 m/sec (400 ft/sec) for the 71-inch chute, and
over 151 m/sec (460 ft/sec) for the Arcas chute. These descent rates are based
on ejection from 69 kilometers (225,000 feet). It must be pointed out, however,
that the flight test results for the balloon-parachute combination have averageda ballistic coefficient of 0.020 Ib/ft 2 instead of the theoretical value, it is
expected that improper deployment, i.e., twisted shroud lines, is the problem.
-53-

Inflation Tubes/
4' Parachute
\A
/
16" Sphere withCorner Reflector
WT = 54 G MS
FIGURE 4.2-27 NOL WIND SENSOR PARACHUTE
-54-

4.3 Parachutes with Geometry Porosity.
4.3.1 General.
Most of the conventional parachutes utilize fabric canopies withthe porosity of the canopy material permitting a stabilizing flow during
descent. The pore size, however, is quite small and when it approachesthe mean free path of the molecules of air in the high altitudes, the
effective porosity of the fabric is reduced to a negligible value. Althoughthis fabric has a large degree of porosity in the lower altitudes, it is
essentially non-permeable at high altitudes. These parachutes oscillaterather severely from deployment down to about 80,000 feet where the
fabric porosity and damping become effective, in an attempt to achievemore stability in the high altitudest various experimenters have devised
parachute shapes which offer air flow through sections of the canopy thathave been cut out from the conventional shape, in general, an improve-ment in stability has resulted from these efforts1 and in some cases reduced
descent rates have been achieved. This is most likely due to more efficient
use of the canopy surfaces. A review of the designs incorporating file
canopy cut--out modifications on geometric porosityras this is calledrispresented in the next sections.
4.3.2 Disk-Gap-Band Parachute.
Various models and sizes of the Disk-Gap-Band parachute have been
developed and tested by the G. T. Schjeldahl Company for NASA LangleyResearch Center. The configuration of this parachute design is shown in
Figure 4.3-1. The geometric porosity of this design is in the formation of
a gap between the top disk and the side band positions of the canopy. Aninflatable torroidal ring is attached to the inner surface of the band for
positive deployment.
A 16.6 foot diameter DGB parachute has been designed for use withthe Arcas. This design has a total canopy area (S.) of 216 ft 2 and a drag
coefficient of 0.50 based upon total canopy area. Parachute weight is 1.7
pounds. With a payload weight of 3.30 Ibs. the ballistic coefficient is 0.050lb/ft 2. The parachute canopy is constructed of two major parts designated as
the disk and the band. The disk, which is a flat circular sheet, forms the
central part of the canopy; and the band, which is cylindrical in shape, extends
down from the outer edge of the disk and forms the lower portion or skirt of the
- 55 -

Disk
Gap
//
/
FIGURE 4o3-1 DISK-GAP-BAND PARACHUTE CONFIGURATION
-56-

canopy. The disk and the band are separated to provide a geometric open-
ing designated as the gap, The area relationships of the canopy are asfol lows:
Disk Area = 52,4% of total area
Gap Area 12.4% of total area
Band Area = 35.2% of total area
The torus inflation aid is constructed of 4-inch diameter tublar sections. Thetorus has a major diameter of 11-feet and is attached to the inside surface
of the band portion of the canopy at each of the twenty suspension line tapes.
Three (3) Saran wrapped water soaked blotters are located equally spacedinside the torus and each has sufficient water to pressurize the torus. Each
torus is pressure tested to assure leak-proof construction before installationinto the parachute canopy.
The DGB parachute systems are equipped with a miniature ballbearing swivel located between the confluence point of the parachute
suspension lines and the payload lanyard. This swivel allows for differential
rotation rate decays. Clevis type hardware is provided for attachment of the
suspension lines to the swivel and the swivel to the payload lanyard. Thelanyard is 24-inches in length.
The parachutes are provided packed in deployment bags fabricated
of cotton canvas and nylon webbings. The deployment bags are of suchsize as to fit firmly but easily into the standard Arcas rocket canister.
The deployment bag is provided with a permanently attached stripof material having elastic loops which hold the suspension lines in place
and allows the suspension lines to deploy only from the payload end of the
holding strip. This arrangement assures an orderly deployment of thesuspension lines and assists in preventing problems of line entanglement.
The parachute deployment bag is equipped with two (2) 1-3/4 inch wide
nylon webbings which retain the parachute canopy in the deployment bag
until the last loop of the suspension lines pull out and unlatches the restraint
webbings. This system assures that the suspension lines are deployed fulllength before the canopy is released.
The deployment bag attachment lanyard is provided with five sewn-lnloops to absorb the shock of stopping the bag and restrained canopy while
-57-

the suspension lines are deploying. The Arcas DGB parachute dimensionsare as follows:
Nominal Diameter 16.6 ft,
Number of suspension lines 20
Length of suspension lines 18 ft.
Torus cross section diameter 4 _n.
Torus major diameter 11 ft.
Attachment lanyard length 24 in.
Miniature swivel 1-1/2 in. long by 3,/4 in. dla.
The disk and band portions of the canopy are fabricated of a dacron-
thread reinforced metallzed mylar film material designated as G. T. Schjeidahlmaterial X-821. This mylar film is of 1,/4 mii thickness and is 100 percent
metalized for radar reflectivity. The dacron reinforcement threads carry the
stress loads and provide ripstop characteristics. The X-821 material is joined
by mylar tapes which are also reinforced by dacron threads. This same tape
is used as suspension line tape to join the band to the disk portion oF the
canopy,
The suspension lines are 85 pound test coreless nylon line. Eachsuspension line is continuous through the confluence point and is tied off at
each end to a suspension line tape at the edge of the canopy. The twenty18-foot long suspension lines are actually formed from ten lines, each 36-feetlong.
The torus is constructed of 1/2 rail clear mylar film and is joined to
the canopy by dacron reinforced mylar tapes. The attachment tapes are sewn
to the canopy in addition to being adhesive bonded.
The payload lanyard and the deployment bag_ shock-attenuating lanyard
are both constructed of 1500 lb. test nylon webbing.
- 58 -

The deployment bag is constructed of cotton canvas to reduce damage
resulting from hot sparks emitting from the separation charge. Nylon webb-
ings are used for the attachment loop and the canopy restraint straps. Nylon
tape is used to edge cover flaps of the deployment bag. Rubber bands mountedin a dacron mylar tape are used to hold the folded suspension lines in place
in the deployment bag.
A scaled-down version of the Arcas DGB parachute design has been
flight tested with the Loki Dart system. The results have been poor becauseof deployment problems which are most likely spin rate related.
In the course of the development flight tests for the DGB parachuter
it was found that the deployment from a spinning missile caused shroud line
tangling and canopy entanglement. Therefore, the parachute was packed in
a special deployment bag designed with canopy restraint straps, suspension llne
holders and a shock attenuating attachment lanyard. The most important factor
to be considered for any parachute deployment method is assurance thatsuspension lines are kept in tension at all times during line and canopy deploy-
ment. To accomplish this, the deployment bag was redesigned by placing one
and three--quarter inch wide canopy restraining straps inside the bag, and by
attaching the suspension line holding strip to the deployment bag. This
accomplished three things: 1) attaching the suspension line holding strip to
the deployment bag assured that the lines deployed from the j_ayload attach-ment end only; 2) use of the deployment of the last loop of the suspension
lines as the activating mechanism for release of the canopy assured against
premature release; and 3) restraint of the canopy until the suspension lineswere fully deployed assured that the canopy did not eject from the deploy-
ment bag until the suspension lines were stretched full length and under
tension. The modified deployment bag is shown in Figure 4.3-2 and the
sequence of deployment events is presented in Figure 4.3-3. With this
system, reliable deployment has been obtained as high as high as 232,000feet.
The above deployment technique has certainly been an improvement
in the state-of-the-art for deploying meteorological rocketsonde parachutes.
Other significant improvements developed during the DGB development program
have been the use of a positive inflation aid and on improvement in stability.
The DGB parachute system is equipped with a water vapor pressurized tarus
inflation aid, to provide instantaneous and full opening of the parachute
canopy immediately after deployment. The canopy design uses geometric porosity
-59-

/LUin
IU
o_
Q_
atll_LU
,Ti.m
ocO
Z
.ml
ill
LLI
U-
0
!
LL
- 60 -

im
ZI.l.I
:>
1.1-
0ILl
uZ
C_LLI
!O"J
ILlr_
0I.L
-61 -

as a means of achieving stability so that stability characterlstics will not
vary with the altitude of operation. Wind tunnel tests indicate that the DGB
parachute is stable at approximately 6-degrees angle of attack. Severalrocket flight tests have been conducted using on board camera and long
range ground-based cameras to check stability in actual operation at high
altitudes and indications are that inflight stability is as good or better than
predicted by the wind tunnel tests. Absence of periodic oscillation in
telemetry signal strength and radar return signal records is also an indication
of in-flight stability.
4.3°3 Cross Patch Parachute.
The cross patch or plus parachute if formed by crossing two rectangular
canopy sections in the shape of a cross and joining the intersecting areas.The shroud lines are attached to the ends of each cross member as shown in
Figure 4.3-4. NOL has fabricated and flight tested a 35-foot cross patch
parac!_te for use with the Arcas system. Design parameters for this parachute
are presented in Table 4-6.
During flight tests, this parachute exhibited a much slower descentrate than the regular Arcas 15-foot Gentex parachute. At 200,000 feet the
cross patch parachute descent velocity was 275 ft/sec, while the regular
Arcas 15 foot parachute falls at 460 ft/sec. The cross patch, however, showedan oscillation in descent velocity with a 10,000 foot period and a 25 ft/sec
amplitude at 200t000 feet. This pattern is a characteristic of breathing in-
stability. Typical fall rate results are shown in Figure 4.3-5. It appears that
an inflation aid, such as an inflatable torus would be required for high altitudeopening and breathing stabillty. Although this would detract from the
theoretical ballistic coefficient to some degree, the resulting fall rates should
still be quite good. The simplicity of design and fabrication for the cross
patch parachute should make it quite inexpensive.
4.3.4 Annular Ring Parachute.
For solid fabric parachute designs the hemispherical shape seems to
create the greatest drag per unit of projected area. Since the drag coefficient
of a circular disk, C D = 1.15, is not significantly reduced by cutting a holein its center up to a diameter ratio of twenty-five percent, it may be advisable
to consider a hemispherical design with an aperture cut in the crown to reducethe magnitude of parachute gliding and oscillating. A vent hole in the center
- 62 -

!
FIGURE 4o3-4 CROSS PATCH PARACHUTE
- 63 -

TABLE4-6
ARCASCROSSPATCHPARACHUTEDESIGN PARAMETERS
Canopymaterial 2-3,//4morainesilk
PanelLength
PanelWidth
FabricArea
Fabric Density
FabricWeight
ShroudLine and Fittings Weight
Total ParachuteWeight
PayloadWeight
Total Weight
CD (210 ft,/sec @ 180,000 ft)
CD (180 ft,/sec @ 170,000 ft)
Ballistic Coefficient
35 ft.
9 ft.
549 ft. 2
2.23 x 10⁻³ ib,/ft2
1.40 Ib
1.75 Ib
3.15 lb.
4.60 lb.
7.75 ib
0.464
0.447
0.026 Ib,/ft 2
-64-

cO0
X
p:II
I
i11El
i--
I--.-I
210
200
190
180
/
170
160
150
140
]3O
120
110
100
//
/ I
// i //I
_/" , "/// i""
. ,,_/ 0/// /11
I _ .",,"'I "o/ _l'//o_
/ /I I ,,o.
,I .I! I I [email protected] I
,' II/ ' _?/I /// _._
I I I! / _ .II II / /
I i1 I I
,,/i/ ,,//! ,;/ II! I
! ill /, /I/ i/// I"I i
I
I //Iii /
it
J
/J
3O0
Vertical Velocity - Ft.,//Sec.
FIGURE 4.3-5 35' CROSS PATCH PARACHUTE FALL RATE RESULTS
6.5 -

o$_the canopy provides a flow of air into the normally turbulent flow abovethe crown. This short circuits the collapsing air stream and increases the
parachute stability. As long as the aperture diameter is kept below 25
percent of the flying diameter, the stability of the parachute should besignificantly improved with no reduction in the drag coefficient or drag
based upon fabric area. Although the drag decreases as the diameter of
the center hole increases beyond 25 percent, the drag coefficient based uponthe area of the resulting ring, hence fabric area, increases and reaches a
theoretical limiting value of 1.98 at a diameter ratio of 1.0. Figure 4.3-6presents experimental data on the drag coefficients of annular flat plates for
increasing center hole diameter ratios.
The theoretical drag coefficient data indicates a maximum drag
coefficient based on fabric area occurs for an infinitely large inside and
outside ring diameter, i.e., a hoop with an infinitely large diameter.This design is impractical since shroud line loads would increase severely as
the diameter of the parachute increases and the chute would col lapse.
Although the center hole concept may not be considered as within the state-
of-the-art for high altitude rocketsonde parachute designs at the presenttime, it might be considered for this application after suitable flight test
results under a special parachute evaluation program.
Parachutes based upon this center hole concept as shown in Figure 4.3-7
are called annular ring parachutes. These designs are promising althoughthey would require a positive inflation aid for the rocketsonde application.
To our knowledge there has not been any meteorological flights conductedwith this design.
4.3.5 Miscellaneous Geometric Porosity Designs.
There have been various other parachute designs with geometric porosity
proposed for high altitude meteorological rockets which have not as yet been
successfully flight tested. These designs include the wagon wheel and thering-sail parachutes as shown in Figures 4.3-8 and 4.3-9. It is expected that
most of these parachutes would require an inflation aid, and the advantages
over the previously discussed designs is not obvious.
- 66 -

" I
£_
°_"-0
i
0
0Z
v
I"--
.--I
...I
ZZ.,_Ii
oI-,.-
Z
u13,..
I1-
ou
123
u_
0
"D
o
0
-6-
0
,0
0
- 67 -

FIGURE 4..3-7 ANNULAR RING PARACHUTE DESIGN
- 68 -

\
FIGURE 4,,3-8 WAGON WHEEL PARACHUTE
- 69 -
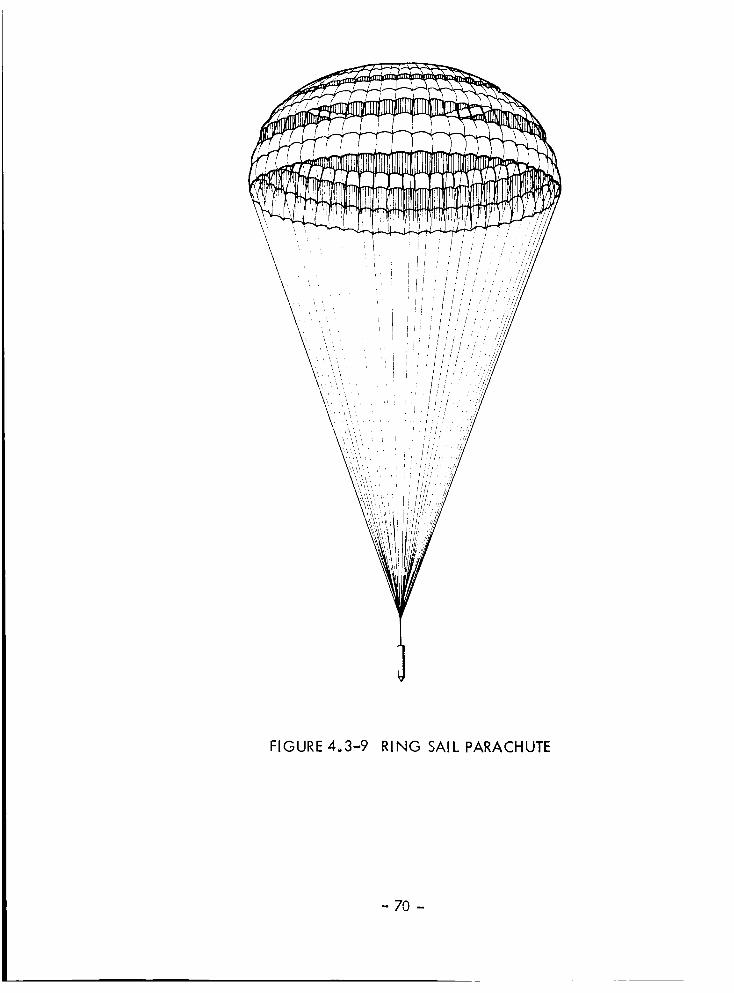
\\\\\
\
FIGURE 4.3-9 RING SAIL PARACHUTE
- 70 -

The vortex-ring parachute is based upon a rather unique concept.The drag coefficient of a conventional flat--circular parachute is about 0.75
while that of a ribbon parachute generally averages around 0.50 to 0.55.
The parachute that holds the record so far as drag coefficient is concerned
is the vartex-rlng parachute. The canopy of the vortex-ring is divided into
four separate panels which are tilted in flight in such a way that the para-chute behaves like a four-bladed propeller -- the panels deflect the air-
stream and cause the whole canopy to whirl. The turbulence that creates
drag also creates instability unless it is controlled and balanced. The
vortex--ring canopy takes advantage of this. The drag coefficient can be
as high as 2.00t and the oscillations are usually below five degrees. Itis necessary to have a precision swivel between the payload and the canopy.
The swivel and the natural, complexity of the canopy add to the cost and
weight with the result thai the vortex-ring chute is used only for specialized
applications.
Early flight tests of the Arcas rocket included some flights of thevortex-ring parachute. In all cases, the vortex-ring parachute failed to
deploy and streamed to impact. It will probably be necessary to construct
the canopy panels so that they can be inflatable structures.
- 71 -

4.4 Stokes Flow Ribbon Mesh Parachute.
4.4.1 General.
The Stokes flow ribbon mesh parachute with inflatable struts appearsto be a most promising subsonic decelerator to altitudes of 100 km. Wind
measurement analysis of this system was described in Section 3.2.9. The
canopy mesh is constructed from fine filaments or ribbons and the spacesbetween these elements creates geometric porosity which is conducive to
stability. The small filament diameter or ribbon width takes advantage of the
Stokes flow region of low Reynolds number, Re1 and creates high viscous
drag. For Re less than one1 the drag coefficient is inversely proportional
to Re; and hence, the smaller the filament diameter, the greater the dragcoefficient. Both the theory developed by Astro Research Corporationand vacuum chamber tests conducted by NASA-Langley indicate that ballisticcoefficients can be achieved which are much less than 0.010 Ib/ft 2. Theory
indicates that without a payload this design could descendas slowly as 400
meters per second at 100 km. Packaging techniques, inflatable braces, and
radar cross-section are factors which require further investigation.
The Stokes flow parachute design offers the primary advantage of a
reasonably slow descent rate for high altitudes. A secondary advantage isthat the drag coefficient decreases during descent to the lower altitudes so
that the terminal velocity does not slow down with decreasing altitude asmuch as for more conventional designs. Since there is a large amount of
geometric porosity, even for high altitude operation_ stability characteristics
are significantly improved and severe oscillating and tumbling at high
altitudes should be eliminated. Deployment of the Stokes flow design requiresinflatable struts or braces which contain an inflation medium. Since para-
chute packaging volume is the primary limiting factor for small meteorological
rockets, the drag coefficient per unit packaging volume becomes a most
important factor. The Stokes flow parachute should be superior over all otherdescent devices considered in this respect. However, shroud line tangling
may be a problem which must be solved since deployment will most likely be
from a spinning missile.
- 72 -

4.4• 2 Theoretical.
pulFor very low Reynolds number, Re = _ _t , the drag on an
object is approximately inversely proportional to the Reynolds number asindi cated by
D = ki_lu --" A p uT
k2
where C D = _ for Re < 1
R e
Symbols:
Re Reynolds Number
pul
/z
k i
CDii
A
Air density
Air viscosity
Free stream velocity
Characteristic length, i.e., length ofan object in the direction of flow
Constants related to object shape and size
Drag coefficient referenced to object iand reference area j
Area projected normal to flow.
- 73 -

For small Reynolds numbers viscous effects predominate and theresulting drag is due to the fluid deformation and friction rather than
pressure differentials. Experimental data have been taken and corrections
have been made to Stokes law by Oseen, Wieselsherger and Prandtl forthe viscous drag on an infinite single cylinder, and the resulting C D vs Re
is plotted in Figure 4.4-1.
It can be seen that extremely high drag coefficients are obtained
when Reynolds numbers become small, i.e., for small diameter fibers orthin ribbons.
When a series of single fibers or small elements are combined to
form a fish-net or grid geometry, actuator disc theory of fluid dynamics
can be used to estimate the overall drag coefficient of the network. The
network drag coefficient varies with the Reynolds number and the solidity
ratio, E, which is the ratio of the frontal area of the network, A, and
the frontal area of all the fiber, a, as E -- a/A. For a particular valueof E, the network drag coefficient approaches that of a flat plat, i.e.,
CDA = 1, as the solidity ratio is reduced. A typical plot of drag coeffic-ient vs Reynolds number is presented in Figure 4.4-2. This figure indicates
that a parachute can be constructed from small elements with an 80%
porosity (E = 0.20), and the drag coefficient is the same as for a solid
canopy for Re below 0.8. Furthermore, as this system descends to lower
altitudes, i.e., high Re values, the drag coefficient decreases so fallrates do not decrease as much as for conventional parachutes with con-
stant drag coefficients.
4.4.3 Proposed Parachute Designs.
The concept of the Stokes flow ribbon mesh parachute is shown in
Figure 4.4-3. The parachute consists of a square canopy deployed and
rigidized by an x-shaped bracing system fixed diagonally into the squarenet. There are two straight inflated thin walled brace tubes, each with
the length of a full diagonalt one fixed above the network and one below
it. The four sectional network sails between adjacent brace legs are
designed such as to provide upward bent conical surface when in operation.
The braces also provide the attachment point for the suspension lines forthe payload. The network or canopy is composed of a square angled net
made from aluminized mylar tapes approximately O. lO0-inch wide and
O.O0025-inch thick. The braces consist of O.O0025-inch thick mylar tubes,
-74-

O_een
L
,Vi ese I _ber_er/i 'randt I!
i
i
i
FIGURE4o4-1 DRAG COEFFICIENT OF AN INFINITE SINGLE CYLINDER
- 75 -

°--
--0
D
•-_ >
_ o_
U_
___0e
II0
123
I
0 1---- -
- 7'- i---
I
0
_ Q.
II
0nO
p
j' I!
II
I
II
0
,<
8
•i °(IJ
0
_3
...... t'd
014-
.,,.I
0Z.<Z
-J
0
0CM
"r
uu
I--
,<,..It.l_
<
0U-
l--
Zo...... 6) u
LL
8_ 0
.<_,, _
('M
.m !
_. 2:_
,'r"
oO
,<,,0
d 0 d0 o
_ /6 -

\\
\\
FIGURE 4°4-3 THE CONCEPT OF THE STOKES FLOW RIBBON /V_ESH PARACHUTE
- 77 -

and the suspension lines are nylon monofilaments with an 0.005-inch dia-
meter for the dart application and an 0.010-inch diameter for the Arcas
application•
Three parachute designs have been proposed by Astro Research
Corporation for application as follows:
•
2.
3.
Dartsonde Parachute
Dart Wind Drift TargetArcasonde Parachute
The main design parameters are presented in ?able 4-7.
Various methods have been proposed for pressurization of the
braces such as pressurized gas containers and liquid freon. However,we would suggest the use of isopentane alcohol as used in the Robin
inflatable sphere applications. This material is easy to seal in a closed
container and has proven to be quite reliable in numerous flight tests.
Inflatable structures with isopentane routinely collapse at about 120,000
feet altitudes. This self collapsing feature is desirable for this application
to speed descent rates at the lower altitudes.
4.4.4 Proposed Performance.
The flight performances for the three proposed parachute designs
are presented in Figures 4.4-4 through 4°4-6. The full lines represent the
descents of the fully deployed canopies• The dotted lines are estimatesof the descent rate after brace support tubes collapse. The dartdrifter
design remains subsonic almost up to 100 km (330,000 ft.)• For higher
altitude subsonic operation, thinner materials than the 0•00025-1nch mylar
are required• The total descent times for the three designs are as follows:
1• Dartsonde 34 minutes
2• Dartdrifter 93 minutes
3. Arcasonde 25 minutes
4.4.5 Test Data.
Chamber tests of the Stokes flow parachute concept have been con-
ducted by NASA-Langley by dropping models of various solidity ratios inhigh altitude simulation environments. The major chamber test variablesare listed as follows:
- 78 -

TABLE4-7
PROPOSED PARACHUTE DESIGN PARAMETERS
Application
Canopy Side Length
Brace Tube Radius
Length of Suspension
Canopy Weight
Brades Weight
Suspension Weight
Payload Weight
TOTAL WE! GHT
Operating Altitudes
Design Point
Packaging Volume
Dartsonde Dartdri ferParachute Parach ute
3.58 m 3.58 m
18.10-3 m 14.10-3m
7.6m
0.318 N 0.318 N
0.110 N 0.08 N
0.012 N
3.330 N
3.770 N 0.398 N
270 K' - 70K !
82.4 km -
21.3 km
80 fps@ 150K' -24.4 m/s @ 45.8 km
13.75 in 3 16.1 in 3
2.25 x 10⁻⁴m 3 2.64 x 10⁻⁴m 3
Arcasonde
Parachute
10.4 m
37. I 0-3m
22.1 m
2.35 N
0.58 N
0.13N
31.10 N
34.16 N
200 K' to 0
61 km toO
200 fps @ 200 K'
61 raps@61 km
182.5 in 329.8 x 10"4m 3
-79-

1000'
9,
8,
7,
6.
5,
4.
3"
li 0 2,
Era_.]S
--_ PARACHUTE
-_-1 Mylar Tapes
___ Canopy Sidelength|Area
____[Total Weight
s =0.20
L = 3.872mA 15m
W=4._NM=I
Col lapsingAltitude
0 20 40 6O 8O lO0 H [kin]
FIGURE 4.4-4 DESCENT TRAJECTORY OF THE DARTSONDE PARACHUTE
- 80 -
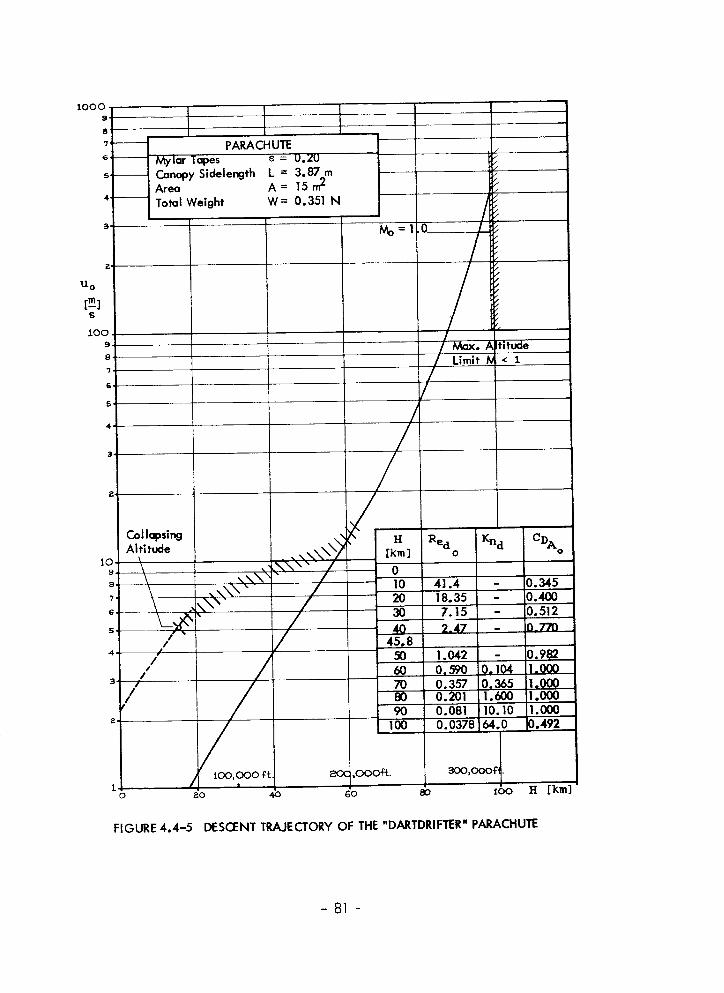
100%.
8 _
7'
4" --
B-
Z"
11 o
[,n]s
ioo,
8,
7,
g.
5'
4,
PARACHUTE....Mylar Topes e = U.ZUCanopy Sidelength L = 3.87 mArea A = 15 m2
Total Weight W = 0.351 N
Col lapsingAltitude
\
////
///
10 ./
////
/
Max. A !tltude
< 1
Red Kna C_A10 [km] o o
8, 10 41.4 - 0.3457, 20 18.35 - 0.400e 30 7.15 - 0.512
s. /, 40 2.47 - 0_7704 / 45.8
// 50 1.042 - 0.982/ 6o o,_;o o.104 !1.ooo
3 / 70 0.357 0.365 ll,000// 80 0.201 1.600 1.0(10
_. 90 0.081 10.10 1.000I00 0.037864.0 _.492
1 / • _ ,O00ff. 300,OOOF_
o 2o 40 6o 8o Ioo H [kin]
FIGURE 4.4-5 DESCENT TRAJECTORY OF THE "DARTDRIFTER" PARACHUTE
- 81

1ooo
u. 0
[_]s
I,
PARACHUTE
Mylar Tapes 6: = 0_20 .................... Canopy Sidelength L = 10o52 m.... Area A q = 111.2 m2
Total Weight W = 35.2N r
M 5i.0 .....
! Dgsi_n Point _ /
r r \../N o ,
1 i
r ' "" i_'-- - : t ,\\3; / !
Zollapsing ! ,,,,\\\ _ / l- 1
....... [kin] A o
/ /_ 0// 10 168 - O. 282
/ ___ 20 77 - 0.310_o- __ 30 30.9 - O. 362
_. I _ 40 1I. 9 - O. 44745.8
7. 50 4.96 0.104 0. 5886. ! ...... _ 61 2.59 0.118 0.6295
/ _ -- 70 1.64 0.365 0°643
80 I. 163 I .60 0.406_ I 90
100
!I '
1, I 1oo;ooo st.[ eoc ooo _t. soo,,ooo fto _o 40 6o 8o loo I-[ [l_m'
FIGURE 4°4-6 DESCENT TRAJECTORY OF THE "ARCAS" PARACHUTE
- 82 -

Simulated Altitudes 100-, 125-, 150-, 165-x 103 ft.
Solidity Ratiosr E 0.20, 0.10, 0.05
Reynolds Numbers, Re 1.6 to 18.1
Mylar Ribbon Width 0.I00 in
Mylar Ribbon Thickness 0.00025 in
Grid Spacing I, 2, 4 in.
The canopy size was a 3-foot square, and the drag reference area was
9 square feet. However, the slack ribbon mesh balloons upward and inward
between the braces during flight to reduce the projected flying area to 6.25
square feet. A summary of the test results is presented in Table 4-8. Theresulting drag coefficient data is plotted against Reynolds number in
Figure 4.4-7 and compared with the theoretical curves.
The experimental drag coefficients compare favorably with the
theoretical values, and for the lower Reynolds numbers are considerably
greater. This is most likely due to the added structural areas in the con-structed models such as the bracing struts and taped edges of the canopies.
The 0.20 solidity ratio design resulted in the greatest drag coefficient,since the other designs did not reach a Reynolds number low enough for
them to approach the flat plate drag coefficient1 C D = I. The ballistic
coefficient data, W/CDA I for these tests are presented along with theproposed Dartdrifter theoretical values in Table 4-9 for a solidity ratio of
E = 0.20. Although the experimental drag coefficient for E = 0.20
agrees extremely well with the theoretical, the ballistic coefficient is more
than twice as great. This is caused by the fabricated model having a weight-to-area ratio of 2.4 times that estimated for the proposed model. No doubt
the estimated weight is quite optimistic, but since the chamber model is a
good deal smaller in size, it no doubt suffers a relative weight penalty.
4.4.6 Summary.
The Stokes flow ribbon mesh parachute appears to offer significant
advantages over the more conventional designs, especially for high altitude
(100 km) operation. The main advantage is a much greater drag per unit
weight and per unit packaging volume. Other advantages are stability and
- 83 -

TABLE 4-8
SUMMARYOF TESTRESULTSAND MODELWEIGHTSFORMODELSOF DIFFERENTSOLIDITY
DragCoefficient
Reynolds Model Terminal EquivalentNumber Weight Velocity Altitude
(ibs.) (ft/sec) (ft)
•370
•517
•722•983
0 2 Solidity
10.41 .010715 13.65
4.73 .010715 21.052.58 .010715 28.00
1.60 .011458 35.65
99110012 , 800]45,400
163,400
0.1 Solidity
•2OO• 306
.305
.534
.736
• 733
11.68 •0095745 19.365.83 . 0095745 25.81
5.83 .0095745 25.92
2.83 .0095745 30.77
1. 69 .009 5745 37.65
1. 68 .0095745 37.88
103, 300
124,600124, 8OO
145,400
163, 400
163, 600
0.05 Solidity
.0896
.213
.210
.337
.576
18.12 .0078540 23.76
6.32 .0078540 28.006.36 .0078540 28.29
3.23 .0078540 35.12
1.76 .0078540 38.70
99, 100
124, 600
124, 800
145, 400
163, 600
-84-

,!° I.J=
Qm
"I_ C_l _ 0
0
//
//
J
/
[] /Z/
// /
/
/
!
/
/i /
!
/!
!
/f
J
'///I ,
J
/!
0 _ _0 _I" ¢_I
0o >-
rv,
_00 ,,,
c;Tl--
Z_-
_fh• I.I.I
0 _"
d_,,oo um ill
__ o-jO t'L O
-_zzz_m
o wO_ _z
,,, O0U- I--Ou<Z¢'_,,
I-- m
I_- ..1
×0
I
_ 0• I.L
((13) 1N 3131=1::!303 9V_IG
- 85 -

I.I.Je_
-1-U-I-
UI--ILl
e,1
01.1.1
1-
v
_JII1
(:30
LI- I--
c_E3ILl
00
LI_
0Z0
Q..
0U
S"
I.J.I_.1
I--
¢)"-0
..i-.°_.4,-
Z:
×CI
1,3
o
Q.
I..i.1
000
m"',0
L_
0
0
00
0
"0
c;
0
o:
0
0
0C,0
d
00
0
,._0_.00
0
",0CO
c_
EIJo-
r )
0
o:
04
0
I--.
04
0',
00
000
,,0
0
0
c_
b.o
c;
0
0
c;
00-
000
000
',0
0
000
0
P_
0
0
0
c_
0
.u_
I--
- 86 -

a variable drag coefficient which permits more rapid descent rates at thelower altitudes than constant drag coefficient systems. Smaller ribbon
widths might be utilized to obtain reduced Reynolds numbers so that flat
plate drag values may be approached with the solidity ratios below 0.20,
In this way even slower descents in the high altitudes may be possible.
- 87 -

4.5 Ram-Air Decelerators.
4.5.1 General.
The general principle of the ram-air decelerators is to capture aninflation pressure from the flowing air stream to positively and reliably inflate
the structure. An inlet is employed to achieve stagnation or total pressure
within the inflatable structure. This internal pressure is the sum of the
ambient air pressure and the dynamic pressure and is directed noi'mal to theinside surface of the structure. Although the external pressures tending to
collapse the structure are also composed of both ambient and dynamic
components, the dynamic component is generally applied obliquely overmost of the external surface of the structure, hence the internal pressure
forces will always be greater and inflation is assured. Two advantages of
this technique are that a separate self-inflation system is not required andthe ratio between internal and external pressure is more constant at the
various altitudes during descent. This permits the use of a minimum thick-
ness and weight canopy.
4,5.2 Ballute Principle.
The Goodyear Aerospace Corporation pioneered in the development
of the Ballute in a series of steps which evolved as follows:
1. During experiments to decelerate, stabilize and
recover payloads at high altitudes and supersonic
velocities, drag was attained by towing a pressurized
sphere behind the recoverable payload. Although
drag was achieved, the sphere was violently unstablein the subsonic and transonic velocity regimes.
, To stabilize the sphere an inflated torus called a
burble fence was added to ensure flow separationat a constant station. The burble fence progressed
from the original size of three percent of the sphere
diameter to about 25 percent as is employed in someof the current Ballute designs.
- 88 -

. Ram-air inflation was used instead of canned
gas pressurization.
o isotensoid theory of pressure membrane design wasemployed to permit minimum thickness films to be
used. This is made possible by designing the
structure so that membrane stresses are nearly equalin all directions over the entire Bailute surface.
A significant advantage of the Bailute is that is has relatively small inflation
inlets and takes a few seconds to inflate. Thus opening stresses for both the
structure and the payload are minimized. A typical Ballute is shown in
Figure 4.5-1. The major portion of the drag results from negative basepressure rather than from direct frontal loads. This is indicated in
Figure 4.5-2. The center of pressure is, therefore, located quite a bit
aft and stability is enhanced. Historically, the burble fence design has trans-
itioned from a toroldal type, to a hexagonal and more recently to a square
type to improve stability and fabrication simplicity. An improvement indescent rates has recently been achieved by increasing the included angle
at the leading apex of the Ballute to increase pressure drag.
4.5.3 Arcasonde Ballute.
The most recent ballute configuration tested on the Arcasonde system
has a 14-ft diameter with a 10--percent burble fence, as shown in Figure 4.5-3.
The body of the ballute is constructed of 12 gores of 1/2-roll mylar. Theseams are butt and tape construction. Six gores are aluminized to provide
the necessary radar trackability. The burble fence also is made of l/2-mil
mylar and is attached by lap seams and tape. Meridian straps that transmitdrag load to the instrument are flat woven nylon lacing stock attached to
the center of each gore with 1/2-rail mylar tape. The inlet assembly consists
of 12 beryllium-copper leaf springs mounted on a swivel plate. Specificationsfor the Arcasonde Ballute are shown in Table 4-10.
Unlike a parachute, the Ballute is an impermeable pressure vessel
with the only opening a relatively small ram-air inlet. To prevent burstingat deployment from expansion of air trapped within the packaged unit, a
perforated canister was developed for the Areas to permit bleeding
off this residual air prior to deployment. Early versions of the Arcasonde
Ballute used 1/4-mil mylar but were found to be unreliable as a majority of
- 89 -

Burble Fence
Burble-Fence Inflation Ports
AluminizedGore
iii!iiii!iiiiiiiiiiiiiiiiiiiiiiiii
G oreSeams
MeridianClear Gore
RAM-Air Inlet
(Springs and Swivel)
Meteorologi cal Instrument
FIGURE 4o5-1 BALLUTE CONFIGURATION (TYPICAL)
- 90 -

\
\
\
FIGURE 4.5-2 BALLUTE DRAG FORCE DISTRIBUTION
-91 -
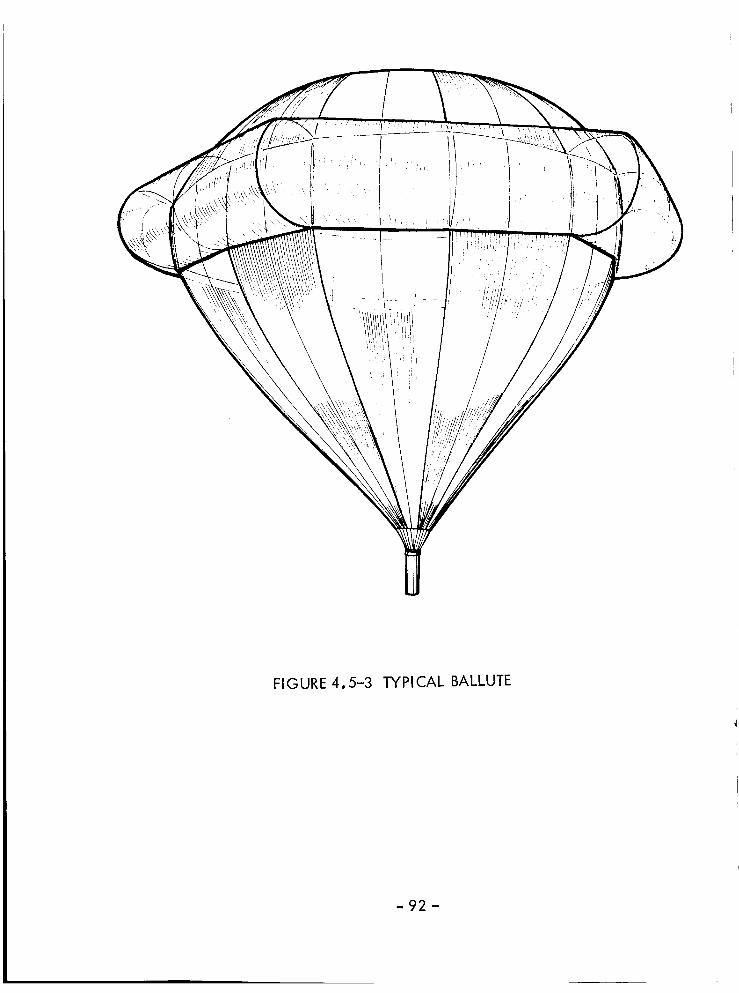
FIGURE 4.5-3 TYPICAL BALLUTE
-92 -
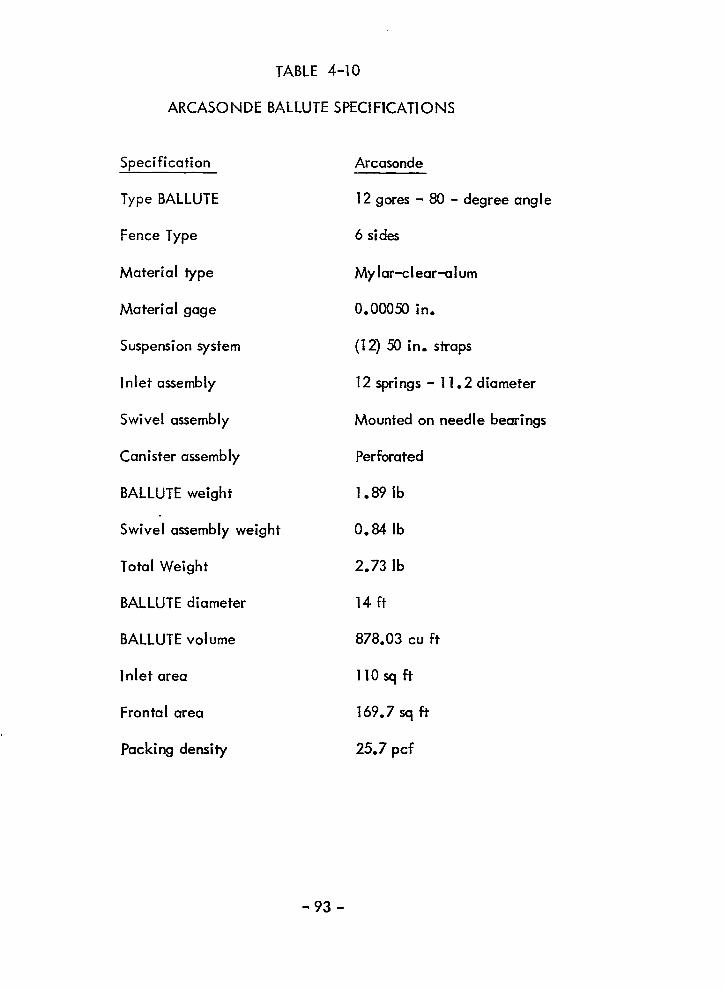
TABLE4-I0
ARCASONDEBALLUTESPECIFICATIONS
Specification
Type BALLUTE
Fence Type
Material type
Material gage
Suspension system
Inlet assembly
Swivel assembly
Canister assembly
BALLUTF weight
Swivel assembly weight
Total Weight
BALLUTE diameter
BALLUTE volume
Inlet area
Frontal area
Packing density
Arcasonde
12 gores - 80 - degree angle
6 sides
Mylar-clear--alum
0.00050 in.
(12) 50 in. straps
12 springs - 11.2 diameter
Mounted on needle bearings
Perforated
1.89 Jb
0.84 Ib
2.73 ib
14ft
878.03 cuft
110 sq ft
169.7 sq ft
25.7 pcf
- 93 -

theseunits failed structurally at deployment. Reliability wassubsequentlyimprovedby the useof the heavier 1/2-rail mylar, but descentrateswereslightly faster than the standardArcas Gentex parachute. Thecurrentunit is 14-feet in diameterand hasa ballistic coefficient of 0.060 Ib/ft 2.However, telemetry signal dropoutshave essentially beeneliminated withthis design, although descentratesare not satisfactorily slow.
4.5.4 Dartsonde Statute.
A
Loki Dart
the U. So
Ball ute.
small 7-foot Bailute-type decelerator has been developed for the
system. This decelerator has been designated as the Starute byAir Force and is essentially a scaled down version of the Arcas
However, with the lightweight Datasonde instrument as the pay-
load, the Starute shows a significant improvement in descent velocity witha ballistic coefficient of 0.030 Ib/ft 2. In addition the deployment reliability
has been excellent, and the stability has essentially eliminated all of the
telemetry signal dropouts. Figure 4.5-4 presents an illustration of the Loki
Starute. A comparison of typical telemetry records from a regular parachute
flight and a Loki Starute flight is presented in Figure 4.5-5. Loki Starute
specifications are presented in Table 4-11. A larger 12-foot Starute is
being developed under an AFCRL program to be used with the Instrumented
Super Loki Dart system to obtain even slower descent rates in the higher
altitudes to 75 km for improved rocketsonde wind and temperature measure-ments.
4.5.5 High Speed Ballutes.
Both the Arcasonde and Dartsonde Bailutes have been designed for
medium to low speed subsonic decents from altitudes of about 200,000 feetdown. The geometries of these designs will most likely have to be changed
for higher altitude and higher speed operation to obtain optimum performance.
The leading apex angle and the separation distance between payload and
Ballute become important drag determining factors in the higher speed regimes.In subsonic flow the pressures and drag coefficients decrease slightly with
increased separation distance. At supersonic speeds a discontinuous variation
in pressure profile and drag coefficient is obtained by varying the separationdistance. At close distances the Ballute causes divergence of the forebody
(payload) wake, and the resulting pressures and drags are low. As the Ballute
is moved aft, the forebody wake converges and pressures and drag increase.A separation distance of at least 4 forebody diameters is required to realize
maximum drag in the low supersonic flow regimes. Wind tunnel measurementsfrom Mach 1.57 to Mach 4.65 indicate that included apex angles should be
- 94 -
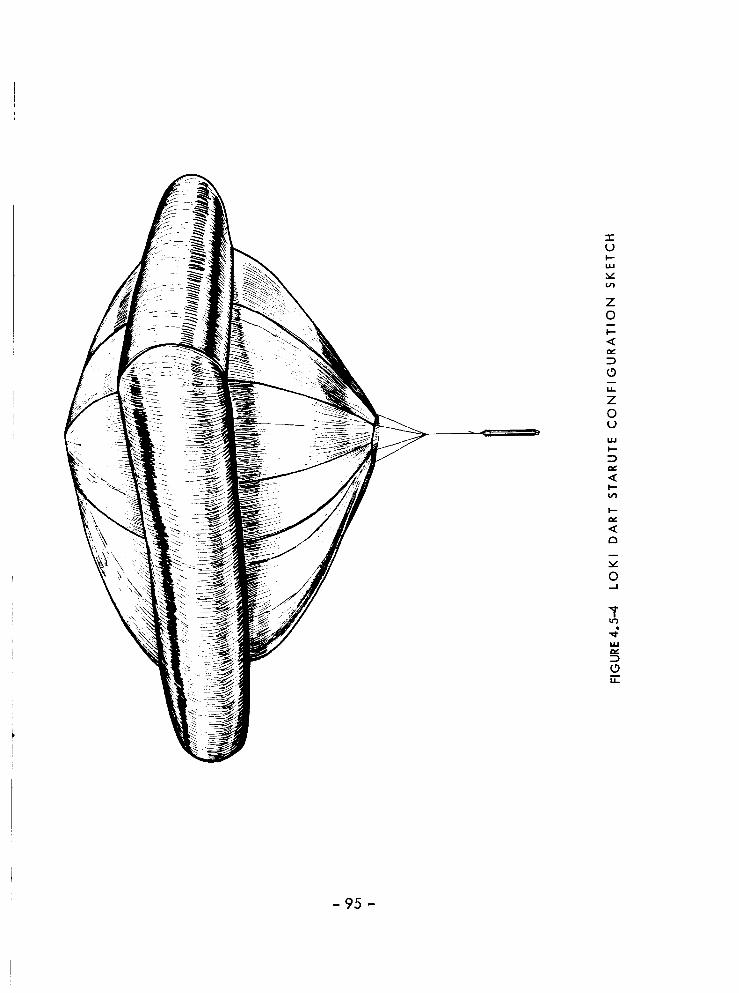
rUI--.
I=LI
,,/
z0I--
<_
om
14_
z0L.)
14.1
Im
tv'
I'--
I'--
,v
v
0.--I
_rLr)
,414.1
0n-
- 95 -

LOKI PARACHUTE FLIGHT LOKI STARUTE FLIGHT
b--_ --..-.+ _
I
--foo
FIGURE 4.5-5 TYPICAL TELEMETRY RECORDS FROM PARACHUTE FLIGHT AND ALOKI STARUTE FLIGHT
- 96 -

TABLE 4-1 !
DARTSONDE STARUTE SPECIFICATIONS
Specification
Type BALLUTE
Fence type
Material type
Material gage
BALLUTE weight
Swivel assembly weight
Total Weight
BALLUTE diameter
Flying area
Dartsonde
8 gore
4 sides
Mylar-clear-alum
0.00025 in
0.316 Ibs
0.026 Ibs
0.342 Ibs
7 ft
49 sq ft
- 97 -

_0 ° to 90 ° to achieve maximum drag, The Ballute may be useful in
meteorological rocket applications to altitudes significantly above200,000 feet, but descent velocities will most likely be in the transonic
and supersonic regimes at altitudes approaching 300,000 feet.
4.5.6 Biconical Decelerator.
The Naval Ordnance Laboratories are currently developing aram-air inflated biconical decelerator for high altitude meteorological
applications. This decelerator is in the form of two inverted truncated
cones of differing apex angles as shown in Figure 4°5-6° This designincreases the base area and hence the base drag for a given amount of
canopy material as compared with the Ballute° Since in the subsonic
flow regime a major portion of the Ballute drag is due to base pressurerthe biconical geometry capitalizes on this Fact and should be more efficient
than the Ballute. The basic shape should be inherently stable, and the
flow separation should be tripped consistently at the top edge.
- 98 -

FIGURE 4.5-6 N.OoL. BICONICAL DECELERATOR
- 99 -

4.6 Summary.
A comparison of the drag efficiency of the various decelerators
for which flight test data are available may be made by comparing the
ballistic coefficients of the decelerators alone without payloads as follows:
Decelerator
Arcas Gentex Parachute
Loki 7.6' irvin Parachute
NOL 6' Square Parachute
Arcas D-G-B Parachute
Arcas Cross Patch Parachute
Dartsonde Statute
Stokes Flow Ribbon Mesh
Parachute (Theoretical)
Bal i istic Coeffi ci ent
(lb/ft 2)
0.024
0.013
O.0O8
0.016
0.013
0.009
0.001
It appears that the only decelerator which has a chance of maintain-ing subsonic descent velocities to altitudes as high as 100 km is the Stokes
flow ribbon mesh parachute. The ram-air inflated decelerators may proveuseful to the high altitudes if transonic and supersonic velocities are
permissible with the given sensor system.
- 100 -

.
TELEMETRY AND TRACKING
5.1 General.
Telemetry and tracking have not proven to be a problem for the
60 km rocketsonde flights since the equipment in current use at almost all
of the missile ranges has been sufficiently reliable and accurate for this
application. The tracking accuracy requirements for wind and altitude
determination and the telemetry accuracy requirements for the temperature
data are not particularly stringent. The rockets.ride decelerators offer
targets of high radar cross--section and are easy to track - once acquired.
Chaff clouds offer large radar targets and are simple to acquire and track
for at least 50,000 feet of descent before they disperse into clusters andthe radar starts searching for the high spots within the cloud.
The only significant problem experienced with data acquisition from
rocketsonde flights has been an occasional late acquistion of either radar
track of the decelerator or telemetry reception of the temperature data.
The dart vehicles offer a relatively small radar target going into apogee,and radar with less capability than the AN/FPS-16 will probably lose
track until the payload deploys. Although the radar signal returns from
the deployed decelerator is very good, acquisition may be a problem, dueto the narrow beam width of tracking radars, unless an uptrack is maintained.
With experienced operators this has not been a problem, and generally only
a thousand or so feet of data are lost due to later radar acquisition. The
1680 mHz telemetry signal is generally weaker during the uptrack because
of antenna pattern nulls toward the rear of the vehicle. Sometimes the signal
is lost during uptrack, and a late acquisition of the temperature data after
deployment occurs. Most of the experienced operators acquire the GMDtrack within a few seconds after deployment. This generally does not cause
a loss of temperature data since the thermistor is still in the process of cooling
to atmospheric temperature during this time period.
For the more specialized high altitude experiments data acquisition
becomes a more significant problem. Passive falling sphere experiments requireprecision in the radar data - the equivalent of the FPS-16 quality. In fact,
- 101 -
if a morepreciseradar is used, the data accuracy would be better and thealtitude of usefuldata could be extendedupward. Also, without a radaruptrack of the vehicle, acquisition of the sphere could be a problem.Accelerometer falling spheres require rather precise telemetry accuracy,
and so far have used IRIG channels. The pitot probe requires rather precise
telemetry accuracy and tracking data. The vehicle velocity enters into
the data reduction equations as does the telemetered ram pressure information.
However, the Denpro system discussed in Section 3.5 used GMD-2 telemetry
and tracking data with reasonably good results. In this application, tele-
metry modulation rates were increased to 1,000 pps and the GMD-2 velocity
and altitude data compared favorably with FPS-16 radar data. The grenade
experiments require quite specialized ground-base data acquistion equipmentas described in Section 3.6. Many of the other high-altitude experiments
require a greater frequency response in the telemetry modulation and the
standard 20 to 200 rps AM of the GMD systems is not adequate. In these
cases FM may be used with GMD system or pulse rates may be increased.
- 102 -

5.2 Radar.
5.2.1 General.
There are a number of radars which are currently in use at the variousmissile ranges for various specialized purposes such as surveillance and rangesafety, acquisition, beacon tracking, skin tracking and deep space probetracking. These radars represent various stages in the state-of-the-art inradar development and operate in various frequency bands as shown below:
RADAR FREQUENCY BANDS
Band Center Frequency(mHz)
L 1,300
S 2,700
C 5, 500
X 9,000
The L-band systemsare generally used for surveillance and have notbeen found adequate to track meteorological rockets. The X-, S- and C-
band radars have been the most useful for meteorological rocketapplications.The X-band M-33 modified (by WSMR) is a mobile unit which has been usedto track meteorological payloads at remote sites, but is incapable of uptrack-ing the vehicles. The S-band SCR-584 Mod 2 radar has been used extensivelyand is adequate to skin track the Arcas to about 130,000 ft but cannot track
the Lokl Dart. This radar is certainly adequate to track rocketsonde payloads.The C-band FPS-16 is the most used and most desirable of the commonly availableradars. This radar is capable of tracking the Loki Dart thru apogee and theprecision is good enough to reduce passive falling sphere density data to 2%accuracy at 90 km. The FPS-16 is also capable of tracking a 2-1nch diameter50-1nch long dart (Viper Dart System) to an altitude of about 430,000 feet.
More accurate and powerful radars than the FPS-16 exist, but they are locatedat a limited number of sites and are not generally available for meteorological
- 103 -

soundings. Doppler radars have been found useful in the developmentof meteorological rocket vehicles, but the range limitations of the common
sets restrict their use from tracking the payloads.
5.2.2 Radar Descriptions.
A summary of the technical characteristics of typical radar systems
is presented as follows:
5.2.2.1 Radar Set AN/SPS-12.
Radar Set AN/SPS-12 is a medium_ange surveillance radar
equipment designed to detect aircraft and surface vessels. Target range andbearing data are obtained for presentation on associated ppi units. RadarSet AN/SPS-12 transmits and receives pulses of r-f energy in the frequency
range of 1250 to 1350 mc (L band).
Radar Set AN/SPS-12 requires three-phase, 60-cycle, 440
volt input power at approximately 6000 watts. The circuits in all units
(except the radar modulator high-voltage-supply circuit) operate from
single-phase, 60-cycle, 115-volt power supplied by the power distributiontransformer, which is connected across two lines of the three-phase 440--volt
input. The technical characteristics of Radar Set AN/SPS-12 are given inTable 5-1.
5.2.2.2 Radar Sets AN/MPS-19.
Radar Sets AN/MPS-19 are modified, mobile units used for
acquisition and weather observation. Table 5-2 lists the characteristics of
the unit used for acquisition and Figure 5.2-1 is a block diagram of the
AN/MPS-19 equipment. The AN/MPS-19 provides data outputs in the followingforms:
1. Synchro voltages representing slant range andazimuth and elevation angles.
. Potentiometer voltages representing slant rangeand sine and cosine functions of azimuth and
elevation angles.
3. Precision digital data representing slant range
and azimuth and elevation angles.
- 104 -

TransmittingSystemFrequencyTransmitterPeakr-f powerPulseratePulselengthModulator typeR-f Iines
Antenna System
TypeBeam width
Polarization
Azimuth slew rate
Range DataMaximum range
Minimum range
Range indicators
Receiving System
Antenna coupllng
I-f frequencyI-f bandwidth
Local osc freq controlReceiver mds
Sweep ranges
Data Readout
One A scope and up to six ppl
Sweep expander
1250 to 1350 mc
Tunable magnetron500 kw
300 or 600 pps variable :k5%
4 Hsec at 300 pps, 1 I_sec at 600 pps
Hydrogen-fii led thyratronWavegulde (3-1/4 by 6-1/2 inches)
Cosecant-squared reflector
3 ° horizontal; 30 ° verticalVertical
2-1/2 to 15 rpm, or manual
200 miles
400 yards
4_ 20, 80 miles at ±0.5%, 200
TR & atr cavities, crystal mixer, stc30 mc
0.5 mc at 300 ppst 2 mc at 600 ppsArc-100 dbm
400 to 8000 yards, 1 to 20 miles,
4 to 80 miles, and 4 to 200 miles
1000 yards per inch up to 80-mile range
TABLE 5-1 Radar Set AN/SPS-12, Technical Characteristics
- 105 -

Transmitting System
Frequency range
Peak power
Average power
Output power tubePulse width
Prf
Receiving System
I-f frequencyBandwidth
Oynamic range
Noise figure
Sensltlvit 7
Antenna SystemDiameterBeam width
R-f transmission llne
Power capabll ity
Antenna System (Continued)Vswr
Line loss, receiving
Azimuth coverage
Elevation coverage
Ranging System
Maximum range
Minimum rangeMaximum tracking rateMaximum slew rate
2700 to 2900 mc
500 kw
164 w (single pulse), 492 w (triple
pulse)
Magnetron0.8 IJsec
300 to 2000 cps; beacon 410 cps
30 mc
3 mc
80 db4db
108 db
8 ft (parabolic)
3° (half power)
Rectangular wavegulde500 kw
2 db
3 db
360 °
-15 ° to 89.5 °
360, 000 yards
500-1000 yards
28, 000 yards/second
25, 000 yards/second
System Facts
Accuracy
System PowerLoad
Azimuth, 1 mil
Elevation, 1 mil
3 phase, 110 volt, 12 kw (util)
3 phase, 208 volt, 10 kw (oper)
TABLE 5-2 RADAR SET AN/MPS-19, TECHNICAL CHARACTERISTICS
- 106 -

PULSE IAIR LINK TRANSMITTERSYSTEM PULSE 2 SYSTEM
CODER GATE I
MOOULATOR TRIGGER
400KYD SWEEP GATE r
32KYD. SWEEP GATE ._
AUTOMATICRANGE TRACKING
SYSTEM
R-F
SYSTEM
BEACON AFC GATE
STC GATE
RANGE INDICATINGSYSTEM
MEG VIDEO
AGC TRACKING GATES
FIXED 82KC PULSESm
PPI TRIGGER
66 USEC GATE
2 KYD BRIGHTENER
PPI TRACKING GATE
I'°cIE
F-t'_ ''_ !.....J VIDEO F_
[ MAPPING SYSTEM ] FF w
_PPI TRIGGER
RANGE RATE / RAMGE
SLANT RANGE COMPUTER
AIR LINK CONTROL PANEL
FIGURE 5.2-1 Radar Set AN/MPS-19, Block Diagram
- 107 -

5.2.2.3 Mod (11) Radar.
The Mod II Radar, is an extensively modified and rehabilitat-
ed SCR-584 Radar. Mod II is an automatic angle and range tracking radar
designed to provide the following:
1. Synchro voltages representing slant range andazimuth and elevation angles.
. Potentiometer voltages representing slant rangeand sine and cosine functions of azimuth and
elevation angles.
3. Precision digital data representing slant range
and azimuth and elevation angles.
Improvements over the SCR-584 radar include: dual local
oscillators for skin and beacon tracking, A-scope range presentation, inter-
mediate servo system for smoothing purposes, tunable S-band magnetron,
output power attenuation_ traveling wave tube r-f amplification in the
receiving system_ multipulse and coding capability, nutating antenna feedto allow vertical or horizontal polarization, waveguide transmission line,
and pulse repetition frequency selection.
In general, the Mod II provides recorded metric data for
range users, real-time position data for range safety or guidance, and target
acquisition data for other ground instrumentation equipment.
Table 5-3 list the technical characteristics of the system.
5.2.2.4 Radar Set AN/FPS-16.
The AN/FPS-16, is a C-band, high precision, monopulse
tracking radar. The accuracy of the AN/FPS-16 is such that the position data
obtained from point-source targets has azimuth and elevation angular errors
of less than 0.1 rail rms and range errors of less than 5 yards rms with a signal-to-nolse ratio of 20 db or greater. The AN/FPS-16 provides data outputs in
the following forms:
- 108 -

TABLE 5-3 MOD !1 Radar, Technical Characteristics
Transmitting System
Frequency rangeTransmitter
Peak r-f power
Average powerPulse widthPrf
Pulse shape
Modulator type
Receiving System
I-f frequency
Sensitivity
Noise figureBandwidth
Type
Antenna coupling
Antenna System
Type
Focal lengthBeam crossover
Gain
Beam widthDrive
Side lobe location
2650 - 2850 mc
Tunable magnetron250 kw
0.5kw
0.75 IJsec
205, 341, 366, 410, 467, 569, 682,
732, 852, 1024, 1280, and 1707cpsSquare
High vacuum
30 mc
-102 dbm
7.5 db
2 mc
Superheterodyne
R-f amplifier into slngle-ended crystal
10-foot parabolic35.6 inches
80% or 50%
37 db
2.5 °
2/4 hp in each axis
1st, 4.12°; 2nd, 6.22 °
-109 -

TABLE 5-3 MOD il Radar, Technical Characteristics (Continued)
Antenna System (Continued)R-f transmission line
Type of feed
Type of scan
Scan frequencyPolarization
Ranging System
Maximum range
Minimum range
Maximum tracking rateMaximum slew rate
Master oscillator frequencyRange tracking
Skin track range
Tracking gates
System Facts
Synchro inputsTracking rates
Slewing range
Range accuracy
Range indicators
0 ther presentation
System Data ReadoutTiming Box
Cursor scale camera
Rectangular waveguide with transitionto rigid 7/8-inch coaxial at azimuth
rotary jointNutatingConical
30 cpsVertical-clrcular-horizontal
768, 000 yards, beacon track
500 yards8000 yards/second (automatic)
20, 000 yards/second (manual)82 kc
Manual, rate aided, and automatic
65 statute miles, 1-square-meter target12, 0.5 mil/second
Azimuth, 1:1; elevation, 1:120°/second, azimuth; 8°/second,
elevation
20°/second, azimuth; 20°/second,elevation
20, 000 yards/second, range
:1:10 yards3 A-scopes; 2000 yards, 32, 000 yards,
full -tracked ranges
Ppi
One 35-mm camera photographs the
following: range timing, camera
pulses from radar cameras, syncpulses from programmer, and signal
tone from programmerAzimuth and elevation cursor scales on
antenna mount photographed with35-ram Mitchell camera similar to
that on MPS-19; resolution +0.2 rail
- 110 -

TABLE 5-3 MOD I! Radar, Technical Characteristics (Continued)
System Data Readout (Continued)
Scope camera
Boresight camera
Digital readout
System PowerLoad
System Data Output
Azimuth, potentiometer typeNumber of turns
Wiper resistanceBrush load required
Resistance/quadrant
Elevation, potentiometer typeNumber of turns
Wiper resistanceBrush load required
Resistance/quadrant
Range, potentiometerNumber of turns
klnearityBrush load
Resistance
Wiper resistance
2000-yard J-scope photographed with35-mm Mitchell camera
40-inch focal length (35-mm Mitchell
camera)
Azlmuth_ elevatlon_ range_ and tlmlng
recorded on 1/2-1nch magnetic tape
3 phase, 110 voib 12 kw
Sine-cosine
1
10 kilohms
0.25 m
15 kilohms
S ine-coslne1
10 kilohms
0.25 m
15 kilohms
192, 000 and 384 w000 yards10
O.O2%0.25 kilohm
20 kilohms
10 kilohms
-111 -

1. Synchro voltages representing slant rangeand azimuth and elevation angles.
. Potentlometer voltages representing slant
range and sine and cosine functions of
azimuth and elevation angles.
3. Precision digital data representing slant
range and azimuth and elevation angles.
The AN/FPS-16 radar also provides real-time, present-position analog data for range safety use.
Table 5-4 lists the technical characteristics of the system.All random errors listed in the table are referenced to beacon operations.
In skin tracking, increased angular dispersion will result from either target
glint, when the angular physical dimensions of the target exceed theresolutions of the radar, or from thermal noise at small signal-to-noise ratios.
According to the beam width of the radar, listed angle tracking performance
is expected to be maintained down to elevation angles of approximately 0.5 °.At smaller elevation angles, tracking errors of increasing magnitude willoccur and can be corrected only by means of boresight camera data.
5.2.2.5 Radar Set AN/FPQ-11.
These radars, based on the MPS-19 design, have been recon-
figured to improve and extend tracking capability by the addition of 14 ft.diameter parabolic antennas; precision torque drive pedestals; new receiving
systems; wide range gate; a selectable 0.25 us pulse; auxiliary track systemand digital data encoders and by complete replacement of the antennapositioning system.
The technical characteristics are presented in Table 5-5.
5.2.2.6 AN/MPS 504 Surveillance Radar.
This radar provides continuous surveillance to a maximum
ground range of 200,000 yards. It is used for range safety and as an aid in
recovery missions. The technical characteristics are presented in Table 5-6.
- 112-

TABLE 5-4 RadarSetAN/FPS-16, Technical Characteristics
Transmitting System
Frequency range
Peak power
Average power
Output power tubePulse widths
Prf
Frequency accuracy
Pulse shapeModulator
Normal operating power
Receiving System
Type
High power: 5480 4-30 mc
Low power: 5480 to 5825 mc1 megw (fixed)1.7kw
Magnetron
0.25, 0.5, and 1 Msec
142, 341, 394, 366, 467, 569, 682,
732, 853, 1024, 1280, and 1364 cps4-1.5 mc
Square
High-vacuum type
250 to 300 kw with tunable magnetron;
750 to 900 kw with fixed magnetron
Superheterodyne
-113-

TABLE 5-4 Radar Set AN/FPS-16, Technical Characteristics (Continued)
Receiving System (Continued)
I-f frequency
SensitivityNoise figureBandwidth
Dynamic range
I-f noise figure
Ranging System
Maximum range
Minimum rangeMaximum tracking rateMaximum slew rate
Bandwidth (maximum)Acceleration
Master oscillator frequency
Oscillator stability
Range accuracyTracking gates
Target designation
Range tracking
Tracking noise
Dispersion
Antenna System
TypeFeed
Focal lengthBeam crossoverGain
Beam width
Polarization
Tracking pointDrive
Antenna temperatureSide lobe location
Capture area
30 mc
-99 dbm
11 db
1.8 and 8 mc (narrow-wide)-93 db with stc
6 db
I, 000, 000 yards500 yards
10, 000 yards/second
40, 000 yards/second
10 cps4000 yards/second 282 kc
l in 106:1:5yards
0.5, 1, 1.5 HsecManual or automatic modes
Manual, rate aided, or automatic
Angle std deviation, O. 1 mll
Range std deviation, 1.5 yards
12-foot parabolic reflector
4-horn monopulse48.4 inches
0 db
43 db
1.2 °, r-f axis to 1/2 power point,horizontal and vertical
Vertical, horizontal, circular
Center of main lobe (no crossover point)
Azimuth: two 2-hp motors
Elevation: one 2-hp motor
40°K above 50 ° elevation (dark sky)1.72 ° (1st)
2.62 ° (2nd)
7.88 square meters
-114 -

TABLE 5-4 RadarSet AN/FPS-16, Technical Characteristics(Continued)
Antenna System (Continued)
Type of scanR-f transmission line
Line loss receiving
Line loss transmitting
System Facts
Azimuth coverage
Elevation coverage
Range accuracySerial readout rate
GranularityPulse duration
Rise time
Tracking rates
Slewing rates
Accelerations
Bearing accuracy
Range on 1 square meter
Random noise errors in outputdata
Systematic errors
System Data ReadoutData box
Range scope
Monopulse
Rectangular wavegulde1.3 db2.3 db
360 °
-10 ° to 190° (tracking -10 ° to 85 °)
:k5 yards
100 lops maximum
±1 yard
0.2 _ec minimum1.0 _ec maximum
0.1 vsec
Azimuth: 42°/secondElevation: 22.5°/second
Range: 10, 000 yards/secondAzimuth: 45°/second
Elevation: 22.5°/second
Azimuth: 45°/second
Elevation: 24°/second
Range: 40, 000 yards/secondAzimuth: 0.1 rail
Elevation: 0.1 roll
272, 000 yards
Slant range: O'R 1.5 yards
Azimuth and elevation: (TA, o"E O. 1 railZero setting errors: :bO.7 to 2.0 yards
Drift errors due to external beacon delayvariations estimated to be less than
100 feet
Total mechanical errors: 0.04 roll rms
35-rnm Mitchell camera for the follow-
ing: azimuth and elevation synchro
dials, timing lights, sync pulses,and signal tone
35-ram Mitchell camera photographsi i
- 115-

TABLE 5-4 Radar Set AN/FPS-16, Technical Characteristics (Continued)
System Data Readout (Continued)
Range scope (Continued)
Nixie readout
Pedestal cursor dial
Ungated video
Consolidated recorder
Sanborn recorder
Magnetic tape system
System PowerLoad
2000-yard segment of range and
72, 000 yards synchro35-mm pulse-operated flight research
camera: azimuth, elevation, and
range; timing; model number; and
radar mode of operation
Azimuth: 35-mm flight research cameraElevation: 35-mm flight research
camera
Boresight: 80-inch EFL lens with 35-mmresearch camera
Tektronix scope, 2000-yard segment of
range, 35-mm flight research camera
Agc, WWV, range timing, radar timing,
radar camera shutter pulse, CHUFour channels; can record any four of
the following: agc, 2000-yard range
synchro output, timing, sync pulse,
WWV, CHU, azimuth and elevation
error, and range error signals
Records binary output of range, azimuth,timing, azimuth error, and elevation
error
3 phase, 120/208 volt, 100 kva
-116-

Table 5-5 Radar Set AN/FPQ-11, Technical Characteristics
Transmitting System
FrequencyPeak Power
Normal operating power
Pulse repetition frequencyPulse width
Pulse shape
Coding capabi li b'Modulator
RF lines
Line loss
Antenna System
TypeDrive
Feed
GainPolarization
Beam width
Tracking pointSidelobes
Azimuth coverage
Elevation coverage
Angular tracking accuracySlew rates
Range System
Maximum rangeMinimum range
Skln Track range
Range accuracy
Master oscl I lator frequencyOsci I lator stability
Tracking gate
Maximum range track rate
2, 700 - 2,900 MHz tunable500 kW minimum
550 - 850 kW
Both Radar & Beacon 410, 512, 585 pps
0.25ps, 0.8ps, selectable
Square
1 to 3 pulsesSoft tube
Rectangular waveguideLess than 1 dB
Parabolic 14 ft diameter
dc torque motors
Conical scan, (30 Hz)39 dB
Vertical or horizontal, or RH circular
or LH circular (remotely selectable)
1.8 ° axis to half power points
50% or 80% (manually selected prior to test)At least 20 dB down from Main lobe
Plus or minus 360 °
-1.5 to 181.5 °
0.15 mils
Greater than 40°/sec in both axis
1,999, 500 yards, Veriort system
300 yards in narrow pulse50 nmi on 6" sphere
0.01% (same as the MPS-19 accuracy)81.946,427 kHz2.5 x 103
0.3 Ms16, 000 yd/s
-117-

Fable 5-5 Radar Set AN/FPQ-11, Technical Characteristics (contln0ed)
Range System (continued)
Range slew rate
Range tracki ng
Target acquisition
Receiving System
Frequency
Type
Antenna coupling
Noise figureMinimum discernible
signal (MDS)Bandwidth
IF
Image rejection
Range indicators
Transmitter
FrequencyPower
Pulse width
Repetition rate
Type output tube
Type modulator
Recovery ti me
Delay
40,000 yd/s/s
Manual, automatic, rate aided
MPS-19 radar, MK-51 optical tracker,
infrared tracker, CCTV and other
FPQ-11 radar°
2,650 -- 2,950 MHz
S uperh eterodyne
Parametric amplifier (1 5 MHz bandwidth)Better than 2 dB
With parametric amplifier - 115 dBm
Without parametric amplifier - 102 dBm
5o6MHz, 2,>6MHz (selectable with pulse
width)25 MHz
20 dB down or gi-eat_r by SSB mixer
Three 5 in A-scopes, single sweep, as
follows: Total range according to PRF
approximatd y 365, 000 yards, 32, 000
sentatlonr triple sweepr 2,000 yd
segment of range including target pre-
sentation, the three sweeps displaying
beacon video, radar video and summedvideo.
2700 - 2950 MHz
150 W (minimum)
0.5 plus or minus 0o1 )_s1-2000 pps
Triode cavitySolid State
Less than 50 ps
2 Hs nominal
- 118-

Table 5-5 RadarSetAN/FPQ-11, Technical Characteristics(continued)
Power Supply
Primary power source
Primary power inputInternal power source
Mechanical
Size
Form
WeightPressurization
Environmental
TemperatureVibration
Shock
Acceleration
6.9 Vdc plus or minus 10%
Approximately 9 W5 HR-1 Yardney Silvercels, life
approximately 60 min.
25.5 in3
3 & 3/4 x 3 x 2 & 1/4 in excluding
mounting flangeLess than 2 Ib
15 psi
-20 to 70 ° C
5-2000 c,/s at 10g, 3 min sweep
100g all planes
80g all planes
- 119-

Table 5-6 Radar Set AN/MPS-504, Technical Characteristics
Transmitti ng System
FrequencyPeak Power
Normal operating power
Pulse repetition frequencyPulse width
Pulse shapeModulatorRF lines
Antenna System
TypeBeam width azimuth
Beam width elevation
Range System
Maximum range
Minimum range
Range accuracy
Receiver System
Type
Minimum discernible signalBandwidth
Range indicator
Azimuth coverage
Elevation coverage
2700 - 2900 MHz
500 kW minimum
600 kW
410 pps
2 UsSquareSoft tube
Rectangular waveguide and rigidcoaxial cable
Half parabolic cylindrical reflector2°
15°
200, 000 yds
2, 000 ydsplus or minus 1,000 yds
Superheterodyne-97 dB
1.2 MHz
PPI scope, provided with 3 sweepranges, 50, 000, 100,000 and 200,000
yds.360 °
-3 to 45 ° dependent of the mechanicaltilt of the antenna
-120-
5.2.2.7 NASA Long-Range, S-Band (SPANDAR).
The NASA Long-Range, S-Bandt located on the Wallops
Mainland area directly opposite Wallops lslancb is a high-powered, conical-
scant tracking radar. The radar employs a 60-foot parabolic reflector on a
95-foot mount. Features of the radar include: at least 5 megawatts peak
powert parametric amplifier in the receiving system, a digital data system,
a doppler systemt and a 5000-mile range for beacon tracking. The estimated
skin-tracking range for a 1-square-meter target is approximately 600 statutemiles. Table 5-7 lists the technical characteristics of the radar.
The NASA Long-Range SPANDAR provides data outputs inthe following forms:
1. Synchro voltages representing slant range andazimuth and elevation angles.
. Potentiometer voltages representing slant rangeand sine and cosine functions of azimuth and
elevation angles.
3. Precision digital data representing slant range andazimuth and elevation angles.
5.2.2.8 Radar Set AN/F PQ-6.
The AN/FPQ-6 is a pulse radar capable of nonambiguous
range measurements of targets at ranges up to 32,000 nautical miles.
Features of the AN/FPQ-6 system include: built-in
acquisition features in the ranging equipment; an auxiliary nonreferenced
range system (AUXTRACK); a C-scope with video integrator to erAanee
long-range target acquisition; rapid slewing circuits with added tracking
features; and four A-scopes displaying range increments.
The transmitter is convertible to doppler measurements,
pulse compression, and other more elaborate coherent transmitter-receiver
techniques. The transmitter frequency synthesizer and multiplier may be used
with minor variations to drive r-f output stages covering other r-f frequencybands, such as kt S or X bands.
- 121 -

Transmitting System
FrequencyTransmitter
Peak r-f power
Average powerPulse rate
Pulse lengthPrf
Frequency stability
Frequency resolutionPulse shape
Antenna System
Type of reflectorFocal lengthBeam crossoverGain
Beam width
WeightDrive
2700 to 2900 mc
H igh-power kl ystron
5 megawatts10 kw
256 to 390 pps (in 4 steps)
1, 2, and 5 IJsec256, 303, 328, and 390 cps
1 part in 106 per month5 parts in 109 per day1 mc
Square
60-foot parabolic reflector
25 feet 1/2 inch1.5 clb
52.8 db
0.39 °
84 tons (antenna & tower top)
Two 32 hp in each axis
TABLE 5-7 SPANDAR, Technical Characteristics
- 122 -

TABLE 5-7 SPANDARtTechnical Characteristics(Continued)
Antenna SystemAntenna temperatureSide lobe locationSide lobe heightNull depthTypeof feedTypeof scanScan frequencyPolarizationR-f transmissioniireVswrLine loss receiving
Line loss transmitting
Receiving System
Frequency range
Receiver type
I-f frequency
Image re jection
Sens itivityNoise figureBandwidth
Low-noise device
Dynamic range
Ranging System
Maximum range
Minimum range
Maximum tracking rateMaximum slew rate
Master oscillator frequency
Range accuracy
Tracking gatesData bits
Serial readout rate
GranularityDigital "1"
Digital "0"
30°K (dark sky)1st 0.68°; 2nd 1.04 °13 clb down16.8 db
Rotating circular hornConical
30 cpsCircular, vertical, horizontal
Rectangular wavegu|de1.18
0.8 db
2 db
2600 to 2900 mc
GE FPS-6B
30 mc
18 db down PAR
-116 dbm
3 db
1.3 mc - 650 kc
Parametric
-117 db
10, 000, 000 yards1000 yards
1O, 000 yards/second
40, 000 to 500, 000 yards/second82 kc
4-25 yards
6 & 18 _ec2O
50 pulses/second
:!:10 yards-3 vdc-11 vdc
- 123 -
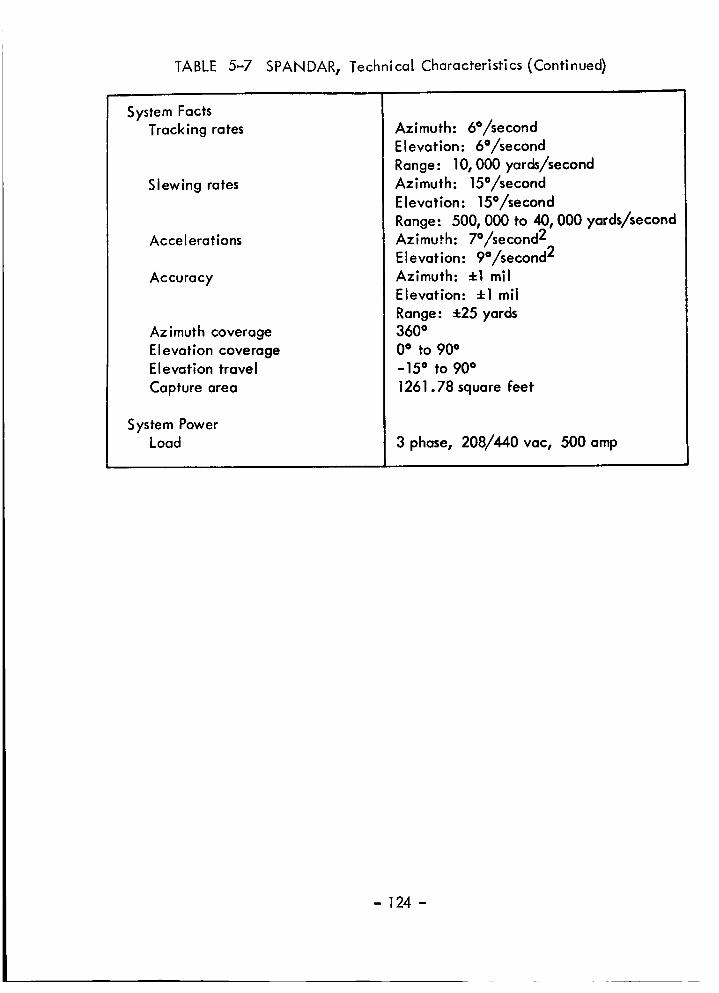
TABLE 5-7 SPANDAR, Technical Characteristics (Continued)
System FactsTracking rates
Slewing rates
Accelerations
Accuracy
Azimuth coverageElevation coverageElevation travel
Capture area
System PowerLoad
Azimuth: 6°/secondElevation: 6°/second
Range: 10, 000 yards/secondAzimuth: 15°/second
Elevation: 15°/second
Range: 500, 000 to 40, 000 yards/secondAzimuth: 7°/second 2
Elevation: 9°/second 2Azimuth: 4-1 m|l
Elevation: 4-1 mll
Range: +25 yards360 °0° to 90 °
-15 ° to 90 °
1261.78 square feet
3 phase, 208/440 vac, 500 amp
-124-

Theantennamounthasthe following capabilities: precisedata takeoffs; high and low servoresponsebandwidthcapability, with highgain acrossthe variable range; high torquesto counteract wind forcesandachieve high accelerations; hydrostatic bearing in azimuth and phasedballbearingsin elevation to provide tracking smoothnessat extremely low andhigh angular velocities; and stability with thermal changes. Table 5-8 liststhe technical characteristics of this radar system.
The AN/FPQ-6 provides data outputs in the following forms:
1. Synchro voltages representing slant rangeand azimuth and elevation angles.
. Potentiometer voltages representing slantrange and sine and cosine functions of
azimuth and elevation angles.
3. Precision digital data representing slant
range and azimuth and elevation angles.
5.2.2.9 Veloclmeter, Model 10A, Doppler Radar.
The Velocimeter, Model 10A, is a mobile doppler radarwhich generates a contlnuous-wave radio-frequency signal that is radiated
from a directional transmitting antenna. The part of this transmitted signalthat strikes a target is reflected back to a directional receiving antenna.
If the target is stationary, the frequency to the reflected signal is identical
with that of the transmitted signal. If the object is moving toward or awayfrom the antenna, the frequency of the reflected signal is increased or
decreased, respectively. The amount of the frequency shift, which isproportional to the radial speed (V) of the moving target, is known as the
doppler frequency. This mobile doppler radar has an output power of 125watts.
The Model 10A Velocimeter uses an audio beat frequency todetermine test vehicle velocity. Its average useful range is about 50 to 100
thousand feet. The audio output is recorded on magnetic tape along with the
timing and control signals. Each cycle of the audio frequency represents
0.1864 feet/second; readings are to the nearest one-fourth cycle in the data
reduction process. The radar operates at about 2640 mc and requires two
operators: one for azimuth and one for elevation control. After visual sight-ing is no longer possible, the operators use tracking radar data in a "bug-
matching" process to follow the desired target.
- 125 -

TABLE 5-8 RadarSet AN/FPQ-6, Technical Characteristics
TransmittingSystemFrequencyrangeFrequencystabil ityPeakpowerAveragepowerOutput powertubePowerprogrammingPulsewidthsPrf
Coding capabilityFrequencyresolution
Receiver System
Tuning range
I-f frequency
Image re jectlon
SensitivityNoise figureBandwidth
Dynamic range
Antenna System
TypeFocal lengthBeam crossover
GainBeam width
Drive
Antenna temperatureSide lobe height
Null depth
Capture areaElevation coverage
Gear ratioBacklash
klnearlty
5400 to 5900 mc
1 in 108/hr
2.5 to 3 megw4.8 kw
Klystron-30 db
0.25, 0.5, 1, and 2.5 i_sec
160, 640, 341, 1280, 1707,
285, and 366 cpsYes
243 kc in steps
142, 233,
5370 to 5930 mc
30 mc
40 db
-110 dbm
8 db
1.2 1.6
-110 db with programming
29-ft Cassegrainian parabola8 ft
0 db
51 db
0.4 °
Hydraulic motors (two -37.5 hp)
26 °K, dark sky20 db down
35 db (minimum)
14.88 square meters-2 ° to 182 °
720:1
0.005 mil
0.09 mil (rms)
-126-

TABLE 5-8 Radar Set AN/FPQ-6, Technical Characteristics (Continued)
I
Antenna System (Continued)
Azimuth coverageGear ratioBacklash
Slip rings
Angle noise
Feed system:Type of feed
Type of scanPolarization
R-f transmission line
Line loss receiving
Line loss transmitting
Ranging SystemMaximum range
Maximum tracking rateMaximum slew rate
Velocity memory
Velocity lagBandwidth (maximum)Acceleration
Master oscillator frequency
Oscillator stability
Acquisition data accuracy
Range accuracy
Tracking gatesData bits
Serial readout rate
GranularityDigital "1"
Digital "0"Pulse duration
Rise time
System Facts
Tracking rates
360 ° continuous
650:1
0.005 mil
Video: 16 to 60 cps to 50 mcIf: 6 to 25 mc to 50 mc
0.03 mll (rms) servo
S-horn.
MonopulseVertical or circular
Rectangular wavegulcle2.3 db
3.5 db
32, 000 nautical miles (nonambiguous)
20, 000 yards/second
240, 000 yards/second
99%/5 seconds
0..555 cps/nmi/second
19 cps100, 000 yards/second 2 (10, 000 g' s)
5 mcI in 107
:!:5 nautical miles
yards0.25, 0.5, 1, and 2.4 psec
25 binary
50 kc/second
2 yards8 _2 volts
0 volt
1 :L-O.15 pse_c
0.3 psec
Azimuth: 28°/second
Elevation: 28°/second
-127-

TABLE 5-8 Radar Set AN/FPQ-6, Technical Characteristics (_Continued)
Ranging System (Continued)
System Facts (Continued)
Slewing rates
Accelerations
Accuracy
Range on 1 square meter,
corner reflector, 1 meter
side lengthScan modes
System DataAnalog outputs
Digital outputs:Bits
Granularity
System PowerLoad
Range: 20, 000 yards/secondAzimuth: 28°/second
Elevation: 28°/second
Range: 240, 000 yards/secondAzimuth: 20°/second zElevation: 20a/second 2
Range: 10,000 g'sAzimuth: _-0.05 mll
Elevation: _-0.05 mll
Range: _ yards800 nautical miles
Circle, spiral, raster, rectangular
Same as AN/FPS-16
Azimuth: 20
Elevation: 20
Range: 25Azimuth: 0.0122 mil
Elevation: 0.0122 mll
Range: 2 yards
208 volts, industrial, 239.1 kva
208 volts, critical, 107.6 kva480 volts, industrial, 98.8 kva
480 volts, critical, 50 kva
- 128 -

Figure 5.2-2 is a block diagram of the Model 10AVeiocimeter. Table 5-9 lists the technical characteristics of the radar.
5.2.3 Radar Application to Rocketsonde Systems.
Several types of radars are used extensively for tracking meteorological
rocket systems. They are the mobile systems M-33 (X-band), Ab_/MPA-12(X-band), and AN/MPQ-18 (S-band), and the stationary system AN/FPS-16
(C-band). The major characteristics of these radar systems are given in
Table 5-10. Currently the FPS-16 radar system is the one mast suitable for
hacking meteorological rockets, in that it can skin-track the rocket duringits flight and then immediately track the payload at the time of its expulsionfrom the rocket.
Most of the high-performance range radars are fixed emplacements
and are too expensive ($1-3 million) to establish at remote meteorologicalrocket sites. To make available a low-cast mobile tracking radar for remote
sites, the Army personnel at WSMR have developed modifications to surplus
M-33 mobile gun-laying radars for tracking meteorological rocket payloads.
As the slew rate and sensitivity of this radar do not permit skin tracking of
the rocket during ascent, thses radars have been slaved to the GMD telemetry
tracking systems to aid in acquisition. Other modifications to make the M-33more suited to meteorological rocket work include the extension of the
effective plotting board range to 100,000 yards, and the installation of a10-foot parabolic reflector antenna to increase radar sensitivity over that
available with the original lens system.
A usable passive wind sensor or rocketsonde deflector must provideadequate radar signal return to be tracked with the available radar to a
slant range of at least 100,000 yards. Consequently, the parachutes are
coated with a metallic substance for radar reflectivity. As a measure of the
radar efficiency of the sensors, AGC voltages are recorded against slant
ranges. The voltages are calibrated to decibels above the minimum discern-
able signal (MDS). The results from the FPS-16 tracks of Arcas 15-footparachutes is presented in Figure 5.2-3. The efficiency of the 8-foot Loki
parachute is illustrated in Figure 5.2-4. The radars used with the Loki para-chute were MPQ-12 and MPQ-18 units from White Sands Missile Range.
For comparative purposes, the results of an S-band corner reflector track areincluded. The corner reflector track was a standard ML 307/ap aluminum
foll reflector carried aloft by a 1200 gram balloon. It is apparent that both
-129-

t-
EI-
,,,,1
_.----
.a.o:3O
Im i i
"----'-'
I° 1 °°wOoa. F-In
i u ! --_--
G.
.JbJz
Q.
o
l-zou
. m
i_ --J
r w
z w
i"_-xU 0
1
o
o "__ o,-, %_ >
J_e_
(5U.
- 130 -

TABLE 5-9 Model 10A Velocimeter, Technical Characteristics
Frequency
RangeAntenna beamwidth
Flat responsePower output
Noise figureI-f bandwidth
Doppler output
2640 mc
50, 000 to 100, 000 feet
4.5 ° between half-power points
Up to 11,000 feet/second (8000 mph)
200 watts peak, 125 nominal12 db
200 kc
3 watts into 500-ohm load
Lowest frequency, 1000 cps; velocity= 186 feet/second
Highest frequency, 60, 000 cps;
velocity = 11, 160 feet/second
- 131 -

cOU
O
I
I.IJ.-I
.<I--
c/3
X
o
!1°o
ic/3
Z.<
oo
iO"
Z.<
c-q
iC/
Z,<
.H
E
E-,
U
© o
U
© o
U
o
L_
U
© O
.<ZZ
E-.,Z<:
0N
m %
N _
0,-_
_ m UX _
•,..-I _m _ m
tfl
•,.-I _
o U O_,-_ ._ N _
O._b- 4:: u
o U
©
Z0
_._ O
u}
.H0'1 _
i
O _'O oo _ +l
O L_ o"C_ L_
>. ,
co O _ _
r._ <_ ,_ +_ ::::> ,
© o
oo 0 _ _
+, ©
o _ _::_ c; O _ I_
_-_'_ L00O _ Z_
'--_ _.-_ c._
o
o _e-t
_ t
- 132 -

AO
8
><I--UJU,lIt.
ILl
OZ<ev,
i--
Z<_J
8O
7O
6O
5O
4O
3O
2O
10
0
7O
I I i
I I I I I
60 50 40 30 20 10
DB ABOVE MDS
FIGURE 5.2-3 The mean of 6 Cases from the FPS-16 Tracks of Arcas15-foot Parachutes at Pacific Missile Range, California
- 133 -

-O
C_>..
c"
O
ks.J
©Z<_
Z..<.
9O
8O
2O
6O
5O
4O
3O
2O
I0
The efficiency of the 8-FootLoki Parachute is illustrated
here.
I I I I 1 I
S-Band Cornereflector
6O
FIGURE 5_2_4
50 40 30 20 I 0
DB above MDS
S-BAND RADAR TRACE OF 8 FOOT PARACHUTE
- 134 -

parachutes can be tracked to 100, 000 yards slant range and are adequatereflectors for the available radar. Using the above recordings and the
radar range equation it appears that the 15-foot and 8-foot parachutesprovide effective targets of 45 meters 2 and 9 meters 2 respectively.
Signal strength recordings made during chaff tracks at WSMR are
presented in Figures 5.2-5 and 5.2-6. Signal return is undoubtedly a
function of dispersion due to the additional parameters, time and windstructure, as well as slant range. To approximate the effects of time and
wind structure, the variation with slant range was removed. This was
accomplished by treating the target as a solid sphere. Although it would
be supposed that the signal level would always decrease with time, plots
of signal strength vs time contain instances of the reverse (Figure 5.2-7).
This is attributed to a probable shift of the radar to a different "patch"of chaff in the target arear that is, one with a stronger return. Another
possible explanation is a redistribution of chaff so that a greater signalreturn was evidenced for a time. However, both of these mechanisms which
serve to enhance signal return should provide only temporary stimulus.Generally, the signal should and does deteriorate with time (range being
constant). It has been the experience at WSMR that most chaff tracks
were terminated within 30 minutes after deployment due to signal deteriora-
tion resulting from chaff dispersion.
There has been some question regarding the effect of chaff wave
length and radar polarization on signal return. No presentable recordingswere made during these tests but there is definite evidence from observed
signal return at the radar that it is not necessary to match chaff dipole and
radar wave length exactly. X-band chaff can be tracked with S-band radar
with only an approximate 10-percent loss in signal return compared with
S-band chaff signal return. Similar results were obtained when X and C-band
radar were used with S-band chaff. Polarization appears interchangeablesince similar signal levels were observed on a single parcel of chaff whether
circular, horizontal, or vertical polarization was applied. It might be
inferred then, that as the chaff falls, it is randomly oriented with respectto the radar.
- 135 -

0
o0
v
0z
Z<
110
100
90
8O
7O
6O
5O
4O
Signal Strength Recordings madeduring Chaff Tracks at WSMR.
!
I I I I60 50 40 30
D B above MDS
FIGURE 5_2-5
-Z
jl
2O
S-BAND RADAR TRACK OF S-BAND CHAFF
S-Band
CornerReflector
10
- 136 -
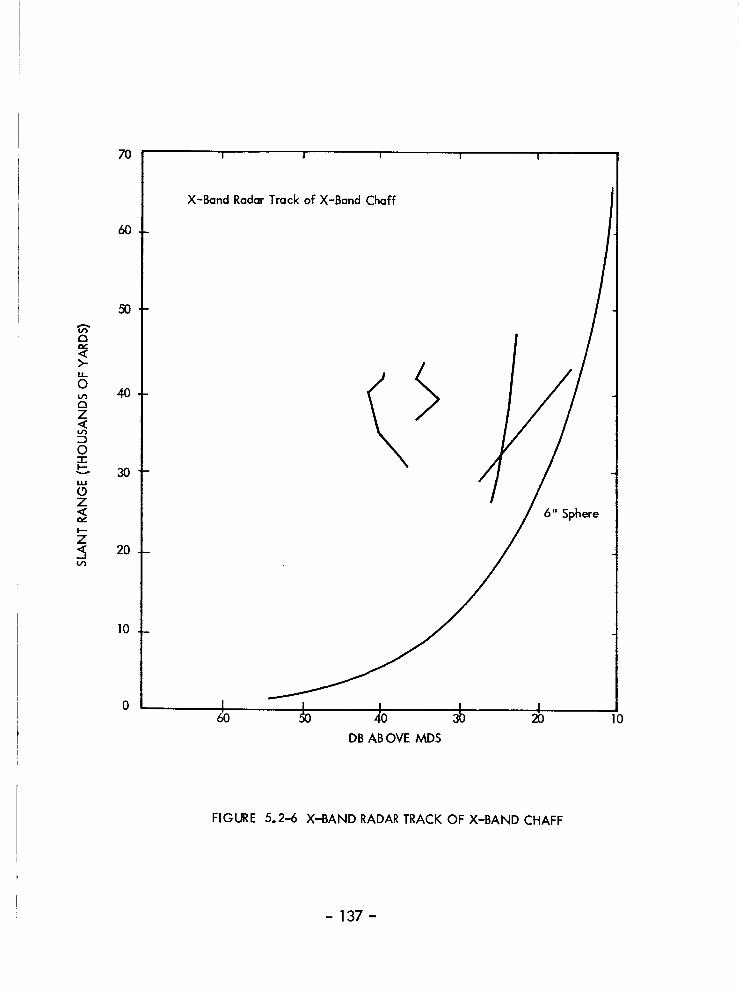
7O
6O
5O
>-U-
O40
Z_c
O--i-I----- 30ILl
OZ<_
I-,-
Z'_ 20(./3
]0
I I ! I I
X-Band Radar Track of X-Band Chaff
6O 5O
DB AB OVE MDS
6" Sphere
10
FIGURE 5.2-6 X-BAND RADAR TRACK OF X-BAND CHAFF
- 137 -

¢-
3O
25
2O
15
10
5
I
Signal Sfrength Recordings made
during Chaff Tracks at WSMR.
o I _ I+10 0 -10 -2c
Decibels
FIGURE5,2-7 SIGNAL STRENGTH VS. TIME AFTER EXPULSION OF CHAFF
- 138 -

5.3 Telemetry.
5.3.1 General.
The four basic kinds of telemetry which have been used with meteoro-
logical rocket systems have been the 216 mHz to 235 mHz standard IRIG
telemetry, the 1680 mHz AN/GMD-(x), the 403 mHz AN/SMQ - (x) and
the specialized 38 mHz DOVAP tracking telemetry. Considering present
equipment, the advantages of the IRIG telemetry over th GMD and SMQtypes is a better modulation frequency response, multichannel potential,
and an inherently stable crystal-controlled transmitter frequency. The dis-
advantages, however, far outweigh the above advantages. Current IRIG
telemetry payloads are too costly ($1,000 for a one channel sonde) for
routine use. Although the components could be miniaturized, current
components are too large for the small dart diameters. The antenna lengthsfor the 200 mHz range of transmitter frequencies are too long for small
rocket systems, and the systems are not set up for tracking the vehicle, i.e.,
radar is required. Perhaps the greatest disadvantage is that the IRIG systems
do not operate at the assigned meteorological frequencies of 403 mHz and1680 mHz. The DOVAP system offers the advantage of obtaining tracking
data, but has all of the other disadvantages discussed above.
The SMQ system offers the advantages of a small lighter weightinstrument for the rocketsonde application because the modulation duty cycle
is more efficient than for the GMD types. Also, an omnidirectional ground-based receiver is used so that a vehicle track does not have to be maintained.
The SMQ receiver is smaller, less complex and lower in cost ($3500) than
the GMD receiving system. It also requires less maintenance. However,radar is required with the SMQ system to obtain tracking data.
The GMD system is currently the most appealing among the various
telemetry systems because the instruments can be made small enough for eventhe small darts, and tracking data can be obtained with the AN/GMD- (2-4)
systems. Since the GMD operates at the meteorological frequency bands,
meteorological rocket operations can be conducted as a complete weather
station function. Since radar is not required with the GMD - (2-4) systems,
remote sites can be established with minimum cost and complexity. The cost of
the ground equipment is not prohibitive ($35,000 for GMD-1, $65,000 for
GMD-2), and the complete payload instruments should be from $200 to $400.
A GMD-2 system has been used to successfully track a pitot probe experiment
(Denpro) during vehicle ascent, and the tracking data compared favorably with
- 139 -

the FPS-16radar results. Forprobeapplications the modulationpulseratewill probably have to be increasedas it was for the abovepitot probe(from 200 ppsto 1000pps)for better data accuracy and frequencyresponseor FM modulationcan be used.
5.3.2 IRIG Telemetry Systems.
IRI G telemetry systems currently operate at carrier frequencies between
216 mHz and 235 mHz with the newer systems to operate in the 2200 mHz to2300 mHz band. In the FM-FM or FM-PM system1 various methods are used to
enable the r-f carrier to carry more than one signal. Eighteen different
channel frequencies can be applied to modulate the r-f carrier_ they may beapplied either one at a time or, under the proper circumstances, all at once.
These 18 frequencies are subordinate carrier frequencies, called subcarrier
frequencies. Subcarrier frequencies are in turn frequency-modulated by a
source of information. The width of Channel 1 as set by the standards is
30 cycles above or below the center frequency of 400 cycles. The value of30 cycles is determined by the standards, which call for a deviation of ± 7.5%
of the center frequency.
To keep the lowest signal-to-noise ratio, a modulation index (deviation
ratio) of five was chosen. This is shown in Channel 1 by dividing the 30-
cycle deviation by 5 and finding 6, which represents the frequency, in cycles
per second, at which applied information can modulate Subcarrier Channel I.A modulation index lower than Five may be used at the expense of the signal-
to-noise ratio. A modulation index of unity (1) would permit all 30 cycles
of information to be passed. However, the signal-to-noise ratio would be
low, severely handicapping the resultant output signal. In addition to possible
distortion, another difficulty with a modulation index of unity, where the fulldeviation would be used, is the probability of the information of each channel
overlapping, producing "cross talk". Figure 5.3-1 shows how the bandwidths
increase with increasing channel frequency. For full details of the completechannel frequencies, deviation limits, and standard information-carrying
capabilities of all channels, see Table 5-11. As the frequency of each succeed-
ing channel increases, the frequency by which the channel may be modulated
increases. The modulating frequency of Channel 1 is six cycles, that of
Channel 18 is 1050 cycles. Thus Channel 18 may be used to convey informationchanging at a maximum rate of 1050 cycles. Slow variations in information
are applied to the lower-frequency channels. To allow the subcarrier channel
- 140 -

Iii:.i"" T.H_E.J_OWE_RSUBCARRIEXBANDSARENARROWER
FIGURE 5.3-1 IRIG F/vV'FM Telemeter Subcarrier Bands
- 141 -

Band
TABLE 5-I I
IRIG FM/FM TELEMETER SUBCARRIER BANDS
-7.5% C enter Freq. +7.5%
I 370 400 4302 518 560 6023 675 73O 785
4 888 960 I, 0325* 1,202 11300 1,3986* 1,572 1,700 1,8287* 2r 127 2, 300 2, 4738* 2, 775 3, 000 3, 2259* 3, 607 3, 900 4, 19310 * 4,995 5,400 5, 80511 * 6,799 7,350 7,90112 * 9, 712 10,500 11,28813 * 13,412 14,500 15,58814 20,350 221000 23r 65015 27, 750 30,000 32t 25016 37, 000 40,000 43, 00017 48, 562 52, 500 56,43818 64, 750 70• 000 75• 25019 86,025 93• 000 99,97520 114• 700 124, 000 133• 30021 156• 625 165• 000 177• 375
A _
BC*DE*
FGH
NOTE:
Intelligence, cpsMI =1 MI =5
30 64O 855 1170 14
100 20125 25175 35255 45300 60400 80550 110800 160
1• 100 2201• 650 3302• 250 4503, 000 6003• 950 7905• 250 1• 0506•975 1,3959,300 1• 960
12, 375 2• 475
-15% Center Freq. +I 5%
1825344459
79105140
700 22, 000 25, 300
500 30,000 34, 500000 40• 000 46, 000620 52, 500 60• 380
,500 70, 000 80, 500
,050 93• 000 106• 950,400 124• 000 142, 600250 165, 000 189, 750
3• 300 6604• 500 9006• 000 1• 2008• 000 1• 600
10• 500 2• 10013, 950 2, 79018, 600 3• 72024, 750 4• 950
USE OF OPTIONAL BANDS
Band A may be employed by omitting Band 13, 15 and B.Band B may be employed by omitting Band 14, 15• A and C.Band C may be employed by omitting Band 15, 17• B and D.Band D may be employed by omitting Band 16• 18• C and E.
Band E may be employed by omitting Band 17• 19• D and F.Band F may be employed by omitting Band 18• 20• E and G.
Band G may be employed by omitting Band 19• 21 F and H.Band H may be employed by omitting Band 20 and G.
Bands 20• 21• G and H are to be used on 1435-1535 & 2200-2300
megacycle systems only.
- 142-

to carry higher information frequencies, the deviation limits of a subcarrier
channel may be increased. Doubling the deviation doubles the frequencyof information that can be handled by a channej_ As a result, the lastfive channels, 14 through 18, may be used witffan increased value of 15%
deviation limits. For identification, these channels are labeled A throughE.
The synchronizing information is detected on the ground and assures
that the information is recovered in the proper sequence. This means that the
pulse representing information channel No. 1 always follows the synchroniz-ing pulse and the pulse preceding the synchronizing information is the lastinformation channel.
The subcarrier oscillator is a low-frequency oscillator that conveysthe information gathered by the transducer. The frequencies vary from an
audio frequency of 400 cycles to as high as 70,000 cycles. The subcarrier
frequency is then applied to modulate a high-frequency R-F transmitter.
The IRIG subcarrier frequencies can carry varying degrees of intelligence,depending upon the frequency of the channel selected. The higher the
channel frequency the higher the frequency of the information it can carry.The information reproduced by the transducer at the point being measured
may vary from zero to a maximum of 2100 cycles. This varying informationis used to modulate the subcarrier oscillator. The type of modulation used
may be Amplitude Modulation (AM), Phase Modulation (PM), or FrequencyModulation (FM). Frequency modulation of the subcarrier oscillator is
most frequently used at present.
A subcarrier oscillator requires that the modulations vary the frequencylinearly. It must have high stability, low drift, and low distortion. Since
space and weight are important considerations, simple basic circuits are oftenused. To aid in achieving these goals, high-grade, close-tolerance com-
ponents are used throughout the equipment. Various methods may be used to
check frequency drift. The simplest is to remove, for an instant, the input
to the subcarrier oscillator. It then oscillates at a known specific frequency.Another method is to apply a calibrating voltage to the subcarrier oscillator to
produce a known specific frequency. There are three types of oscillatorcircuits in general use as subcarrier oscillators:
- 143 -

|. Inductance-capacitance
. Resistance-capacitance phase - shift
3. Multivibrator
The inductance of an L-C tank circuit is often the coil winding of
an inductive-type transducer. An R-C phase-shift oscillator may use the
varying resistance-type transducer part of the phase-shifting network.Multivibrator oscillators are generally Free-running, with their frequency
varied by variations in their bias caused by the output of a resistive-typetransducer.
The output frequency of a voltage-controlled subcarrier oscillator
may be varied so that an increase in the applied signal either causes an
increase or a decrease in the output frequency. The value of input voltagerequired to achieve _: 7.5% frequency swing, or +- 15% frequency swing,
varies with each manufacturer. An average value is from 3 to 5 volts. The
input voltage may be unipolar, such as zero to + 5 volts, or zero to -5 volts.
Or it may be bipolar, such as zero to + 2.5 volts.
In summary, the subcarrier oscillator is a self-contained oscillator
that has as its center frequency any one of the 18 IRIG standard values.The subcarrier oscillator is modulated by the varying output of a transducer,
most often by FM.
The output of the subcarrier oscillators is used to modulate the r-ftransmitter. The form of modulation used for the r-f transmitter is usually
frequency modulation or phase modulation. Crystal-control led phase
modulation is more prominent. The r-f carrier frequency used is in the 216
to 235 megacycle band assigned for telemetry use.
The PDM-FM or PDM-PM system enables the r-f signal carrier to
carry more than one information channel. This is accomplished by dividingthe time the carrier is on the air into known amounts, each amount represent-
ing a different channel of information. The information is converted to a
value of time, then the r-f carrier is turned on to transmit a pulse of energy
for the length of time representing the value of the information. As shown in
Figure 5.3-2, a pulse duration of 90 microseconds ( _ sec) represents aminimum-information reading; a pulse duration of 700 ( _ sec) represents a
-144-

:iii!iii_iiii
!!iiii_ii_i!_!ii
:i:i:i:!:_:i:i:ii:i:i:i:_:_:i:i:
iiiii!_iiiiiii!,i:i:i:i:i:i:i:i:i
iiii_ii!i_iiiiiii:iSi:i:_:i:i:!iiiii_iiiiiii!ii:
Z
o
- 145 -
maximum-information reading. For example, 90_ sec might represent aminimum-information level of the output of an instrument. The 700_ secmight represent a maximum-information level.
These pulses of information are sent in specific numbers, 900 per
second. This could represent 43 information channels sampled 20 times persecond. Two additional channels are transmitted with no information to
identify the beginning and end of each group of information.
One problem in having the output of two or more subcarrier oscillatorssimultaneously modulating the r-f transmitter is cross modulation, or cross
talk. This results essentially from harmonics of some of the lower-frequency
subcarrier oscillators missing with the primary frequencies of the high fre-
quency subcarrier oscillators. Harmonics are generated in nonlinear circuits,or circuits in which overloading causes operation in a nonlinear region. To
prevent format| on of harmonic frequencies, linear mixing networks are usedat the output of the subcarrier oscillators. These are sometimes called harmonic
suppression filters.
To keep an equal signal-to-noise ratio output for all subcarrier oscillators,the high-frequency subcarrier oscillators must deviate the transmitter more than
the lower-frequency subcarrier oscillators. The transmitter frequency deviation
of the lower-frequency subcarrier oscillators is kept to a minimum to reduce
the effects of cross talk and other porblems.
The operating range of the transmitter is to a large degree determinedby three factors_
1. Transmitter power
. Receiving and transmitting antenna gain
o Receiver sensitivi ty
The power output of a transmitter averages 3 watts, giving an approx-
imate range of 50 miles under line-of-sight conditions° To obtain higher
power, the transmitter is used to drive a high--power r-f amplifier. R-famplifiers average 40 to 50 watts of output, increasing the range of transmission.
- 146 -

The problems encountered in constructing r-f transmitters are the same as
those found in constructing all previously discussed telemetering equip-
ment; compactness, ruggedness and dependability• R-f transmitters posethe additional problem of heat generated in the transmitters. Forced-
air cooling has been used from some circuits, other immerse the entire
unit in oil for better heat dissipation. Shock is an especially serious threatof the r-f transmitter because a slight movement of some of the tuned-
circuit elements causes undesired modulation of the output, producing an
erroneous signal. Frequency drift is held to a minimum by the use ofhigh-quality components and other techniques, especially crystal control.
The transmit r-f power requires an antenna, which must be efficient
to make the most of the small power output of the transmitter. An efficient
antenna is not difficult to produce under ordinary circumstances. However,on a missile moving at supersonic speed, it is quite a problem. Since the
missile may be spinning about its longitudinal axis, the antenna must radiate
in all directions. This may also be accomplished by having more than one
antenna. In addition, the sudden acceleration and high temperatures
involved require that the antenna be of sturdy construction and correctmaterials. To keep the missile as streamlined as possible, the antenna cannot
be a bulky unit that would alter the missile's shape.
These problems often result in a compromise in the type of antennaused. The most popular types are:
• The airframe is the radiator.
• Carefully located stubs or wires are used as the radiator•
. A projecting portion of the vehicle, such as a fin, is
electrically isolated by a notch and used as a radiator.
. Slot antennas, mounted flush with the skin of the
vehicle, are used as a radiator.
o A resonant cavity is used to isolate a portion of thevehicles for excitation as a radiator.
- 147 -

Use of the entire airframe as the radiator is shown in Figure 5.3-3A.
A spike placed in the nose cone of the vehicle is a simple form of stub
antenna, Figure 5.3-3B. The length of the spike and its use are largely
determined by the length of the vehicle. A notch cut through a projecting
part of the vehicle, such as a fin, produces a surface suitable for radiation
(Figure 5.3-3C). (When necessary, the notch is filled with a solid dielectricmaterial). A slot antenna (Figure 5.3-3D) may be mounted flush with the
skin of the vehicle. The radiation pattern of this type of antenna is quite
similar to that of a dipole and reflector. A fifth method, shown in Figure5.3-3E, utilizes a resonant cavity to isolate the outer skin surface of theforward section from the rest of the rocket. The outer skin surface of the
isolated portion is utilized as a radiator.
Typical PDM/FM Telemetry:
PDM (Pulse Duration Modulation) telemetry systems are used when
a strictly time division multiplex system is capable of meeting the bulk oftelemetering requirements. Compared to the subcarrier channels system,
the PDM/FM facilities permit the use of a relatively large number of
channels, but only at lower frequencies. Figure 5.3-4 is a block diagram
of the PDM/FM system.
Typical FM/FM Telemetry:
The FM/FM telemetry system is a frequency division, multiplex
type device. Subcarriers of different frequencies modulate an r-f carrierand the subcarriers are frequency modulated by the intelligence. The
channel capabilities of the system can be increased by using the commutationmethod to modulate the carrier frequency with combinations of the sub-
carrier frequencies. Subcarrier frequencies for FM/FM telemetry are selectedfrom a chart compiled by the Inter-Range Instrumentation Group (IRIG).
Figure 5.3-5 is a block diagram of the FM/FM telemetry system.
Typical FM/AM Telemetry:
The FM/AM telemetry system is a frequency-modulated-subcarrier,
amplltude-modulated-carrier type facility. Sixteen converters, each of aspecified frequency, receive and convert data for the individual channels
of the tape recorder. Channels 1 through 14 are converted to 5 kc; channels15 and 16 are converted to 10 kc. The converted channels are then recorded
on separate tracks of tape recorder. Figure 5.3-6 is a block diagram that is
representative of FM/AM systems.
- 148 -

Theentireskinis the radiator
BA stabis the radiator
A notchedfin is the radiator
O _
A flusk-mouatedslotantenna
A cavity-isolatedportioiiof theskinusedas a radiator
FIGURE 5.3-3 Missile Antenna Configurations
- 149 -

1= tj
i,
RF.
PAN
ANTENNA
PRE AMP PDM- FM
REC.RECORDER
SCOPE DECOM COUNTER
FIGURE 5.3-4 PDM/FM Telemetry System, Block Diagram
- 150 -

PRE AMR
R.F.
PAN
II
FM - FM I
iREC.
I I00 KCREF.
AMPI VIDEO I
+ I00 KCRECORDER
COUNTERr
I I l-SCOPE SWDISC.
VIDEO
PAN
FIGURE 5.3-5 FM/FM Telemetry System, Block Diagram
- 151 -

ANT(NNA
FM -AM
RECEIVER
I
TIMING IN
25 KC REE
INTERCOM.
_EO I
I
CHANNEL
NO. t
---am- I
---D, 2
3
--.-m, 4
5
6
7
---,era B
9i
---.Ira I01
i
-_.,Im I Ii
12i
---era 131i
,-.-am 141
q
151
,GIi
ONVERTERS
97. 5 KC
I10.0 KC
119.5 KC
129.5 KC
139.5 KC
150.0 KC
160.5 KC
170.0 KC
179.5 KC
190.5 KC
199.5 KC
212.0 KC
225.0 KC
7.34,0 KC
217,0 KC
238.0 KC
5 KC
5 KC
5 KC
S KC
5 KC
5 KC
5 KC
5 KC
5 KC
5 KC
5 KC
5 KC
5 KC
5 KC
I0 KC
I0 KC
TAPE RECOROER
I
NOTE :
CHANNELS I THROUGH 14 +_2,SKC
CHANNELS 15 AND 16 _4" 5KC
FIGURE 5.3-6 FM/AM Telemetry System, Block Diagram
- 152 -

Typical X-Band Telemetry:
Figure 5.3-7 illustrates the X-band telemetry receiving system insimplified block diagram form. Table 5-12 list the characteristics of this
system.
5.3.3 DOVAP Telemetry Tracking System.
The DOVAP system functions as a combined telemetry and tracking
system. A 38.031-mc transmitter located at the launch site emits a CW
signal that is received by the rocket, and by each of four widely spread
DOVAP stations. A DOVAP transponder in the rocket doubles the frequencyof the received signal and ret_ns_ts to the DOVAP stations. At eachDOVAP station the 38.031 -mc signal from the launch site transmitter is
received, doubled in frequency, and mixed with the signal from the rocket.The frequency difference between the two signals results in an audio fre-
quency doppler signal whose frequency is proportional to the time rate
of change of the transmitter-rocket-receiver path-length. Tape recordingsof the doppler signal, along with precision timing are made at each DOVAP
station. At the DOVAP Master Station, simultaneous recordings of the
doppler signals from each DOVAP station are made, along with recordings
of DOVAP telemetry. Accurate trajectories can be obtained from thedoppler data.
The telemetry receiving stations consist of amplitude modulated
recelverss discriminators, mulfichannel magnetic oscillographs, and
magnetic tape recorders. Circularly polarized helical antennas, fixed inboth elevation and azimuth are used with the receivers.
The rocket-borne DOVAP telemetry subcarrier oscillator consists of
a single channel frequency modulated positive grid balanced multivibratorhaving a center frequency of 30 kc/s, and a frequency deviation of plus or
minus 40% of center frequency for an input signal level of from zero to plus
five volts. Negative voltage excursions of the subcarrier oscillator key the
transponder radio frequency carrier off for one half the period of the sub-
carrier frequency. The telemeter is an integral component of the DOVAPtransponder.
A representative DOVAP telemetry record is shown in Figure 5.3-8.Typical shroud-type DOVAP antenna radiation patterns, are shown in Figures
5.3-9 and 5.3-10. The nearly omnl-directional pattern in the plane of the
loop is an important feature of these antennas.
- 153 -

FIGURE5.3-7 X-Band Telemetry Receiving System, Block Diagram
SERVOCONTROLCIRCUITS
MIXER _ DETECTOR
LOCALOSCILLATOR
E
I °'TE-GENERATOR
AUTOMATIC
' ITELEMETER 1RECORDING
SYSTEM
ACQUISITION
-154-

TABLE5-12\X-Band Telemetry System Characteristics
Receiver
Frequency range
SensitivityNoise figureI-f bandwidthModulation
Recording System
Tape recorderRecorder channels
Display
Detected videoPDM raster
Single PDM channel
Antenna
Type
Radiating elementBeamwidthGain
Polarization
Azimuth scan
Elevation scan
Maximum tracking rate
8500 to 9600 mc
-95 dbm
Approximately 9 db10 mc
PDM/AM
100-kc response
PPM, PDM, azimuth angle error,
elevation angle error, AGC voltage,
timing and voice
Oscilloscope
Oscil IoscopePulse-duration (interval counter)
Metal plate lensMonopulse type, four feedhoms
Approximately 1.2 ° (6-clb points)40 db
Horizontal, vertical linear, or circular360 ° continuous
-10' to +180 °
40 ° per second (azimuth and elevation)
- 155 -

NOI-L¥_817V._ SJ-70A _"
J 3NI71V_I3d I,_13 1. _IOJ.YJ.rI_I,'W O_ ns
} ,HJ._ION
f "_VIAI
t J.SVN .4"=OVIAI
;_ H.LBON
"gVkN 0
L.22. _ _
I NOLLV_IenV_ gkTOA S OZ8,
d
-o
o_D
n,,,
>,,
Q)E_D
(!)
O..0>0
O
e-(1)
t_
I
ELI
omu..
-156-

FIGURE 5.3-9
Pattern and Polarization in Plane of Loop
SHROUD - TYPE DOVAP ANTENNA RADIATION PATTERN
- 157 -

Pattern in Plane Perpendicular to Plane of Loop Polarization in Plane of Loop
FIGURE 5.3-10 SHROUD - TYPE DOVAP ANTENNA RADIATION PATTERN
- 158 -
5.3.4 AN/GMD - (x) Telemet W and Tracking Systems.
5.3.4.1 General.
The AN/GMD - (x) ground-station equipment has been
developed and standardized for radiosonde data acquisition. The AN/GMD-1,
which is common at many of the military weather stations, not only receivesthe meteorological data but tracks the airborne transmitter in azimuth and
elevation angles. For radiosonde measurements altitude is determined from
the pressure measurement with this equipment. This technique is notaccurate enough at rocketsonde altitudes and radar must be used. The
AN/GMD-2 performs the same functions as the GMD-1 with the addition
of the capability of measuring slant range. The feature is quite importantfor the rocket use since it eliminates the need for radar tracking. The azimuth
and elevation slewing rates of these equipments are not fast enough to uptrack
the rocket systems from lift off with most of the existing missile range site
geometries. However, intercept methods of acquisition soon after lift offhave been routinely employed with a large degree of success. The AN/GMD-4
has been developed to upgrade the GMD-2 system by employing coarse rang-
ing to eliminate the slant range ambiguity problem and to provide automatic
data processing of the received meteorological data. The GMD systern._
appear to be adequate for meteorological rocket work. if a faster data trans-
mission response is required for advanced probe applications, the modulationrates can be increased or FM may be employed. Both of these techniques
have been used. The tracking accuracies appear to be adequate for most
meteorological rocket applications as a rather good agreement has beenobtained with AN/FPS-16 radar tracking data.
The design philosophy of the GMD equipment has been to
minimize the cost of the airborne instrumentation. Since approximately 400,
000 radiosondes are flown each year, it has been quite important to keep as
much of the required complexity and cost of the telemetry systems as possible
in the ground station equipment. Therefore, the airborne instruments or
sondes are fairly simple to design and mininal cost. This advantage has to
some degree been passed on to the current rocketsonde instruments for they
basically are copies of the equivalent radiosondes as far as the electronic
circuitry is concerned.
-159-
For the next few years at least the GMD system appearsto offer the greatest advantages in routine meteorological rocket applications
because the ground equipment is standard weather station equipment,telemetry is accomplished at the assigned meteorological frequencies, the
payload instrumentation is simple and low in cost and tracking data can be
obtained so that the requirement for radar tracking can be eliminated.
5.3.4.2 Ground-Station Equipment.
The GMD ground-statlon equipment consists of either the
AN/GMD-1, the AN/GMD-2 or the AN/GMD-4 as described in the
foliowi ng sections.
5.3.4.2.1 Rawin Set AN/GMD-1 •
The Rawin Set AN/GMD-1, together with its
associated equipment1 has been the standard ground equipment for trackingof balloon-borne atmospheric probes since 1949. This transportable radiodirection finder was designed to track automatically a balloon-borne radio-
sonde transmitter (frequency range 1660-1700 mc). Its major units include
a parabolic antenna with a pylon scanner assembly, a pedestal which supplies
support and rotation machinery for the antenna in elevation and azimuth, anantenna control which energizes and controls the tracking machinery, and
a receiver which detects and amplifies both the data signal and the tracking
error signal from the scanner.
No modifications of the basic AN/GMD-1 are
necessary to permit its use in tracking the Arcas-borne meteorological instru-ments in current use. At several sites receiver sensitivity has been increased
15 decibels through the use of a tunnel dlobe or parametric pre-ampllfier to
permit tracking of the dart instruments. The elevation slew rate is sufficientto follow the Arcas sounding rocket from launch to apogee when the tracking
site is located approximately one-half mile from the launching pad. The dartinstruments can likewise be tracked shortly after launch since their velocity in
the first 151000 feet is too great for tracking from the launch site.
The Recorder AN/TMQ-5 is the standard data
recording device supplied with the AN/GMD-1 system and is used for the
recording of temperature information from the rocket-borne transmitter. The
- 160 -

demodulatorstage converts the data pulse frequency (0-200 pps) to a DClevel which is recorded on 10-inch chart paper usually at a rate of one
inch per minute with an accuracy of +- . 5 cycles per second.
The GMD-l"ground equipment consists of a
tracking dish antenna and receiver unit, a control recorder unit and aTMQ-5 chart recorder as shown in Figures 5.3-11 and 5.3-1 2. Other
versions of the system contain various au_dliar._, equipment such as rangingtransmitter and various automatic data equipment.
The antenna and receiver unit consists of a
seven foot diameter dish1 mounted on a pedestal which contains the
receiver and antenna motor controls. The dish may be operated in either
automatic or manual track mode locally at the pedestal or from controls
on the recorder, which is usually remote from the pedestal. The antenna
system consists of a parabolic reflector, an eccentric cup which is rotated
by a drive motor and hollow drive shaft, a dipole antenna, and a trans-mission line. The rocketsonde transmitter transmits a pulse-modulated
radio-frequency signal (1680 Mc). The antenna lobe (received signal
intensity pattern) rotates slowly. When the rocketsonde is in line withthe electrical axis of the antenna reflector, the signal intensity of the
dipole has a constant value; when the rocketsonde drifts to a point offthe electrical axis of the antenna reflector, the intensity of the signal at
the dipole varies with the rotation of the eccentric cup. Some of theradio-frequency energy from the transmitter is received by the parabolicreflector and reflected to the dipole antenna. As a result, the amplitude
of the radio-frequency signal at the dipole takes the shape of a modulatedsinusoidal wave. The relative phase and amplitude of the sinusoidal mod-
ulation is indicative of the angular distance of the rocketsonde transmitterfrom the axis of the antenna.
In the receiving system, the modulated wave
is beat against the output of the local oscillator to produce a 30 Mc inter-
mediate frequency which retains the pulse modulation and amplitude varia-
tions. The intermediate-frequency signal is then amplified and detectedand the demodulated signal (30 cycles/sec sine wave and pulses) is passed
to the antenna positioning system and to the meteorological data transmission
system. The receiving system also contains an automatic frequency control
(AFC) circuit to maintain a constant 30 Mc intermediate frequency and aservice meter for checking various currents and voltages present in the Rawin
set.
- 161 -

I
ANTENNA (R-F)
SYSTEM
II
RECE IVING
SYSTEM
METEOROLOGICALDATA
TRANSMISSION
SYSTEM
ANTENNAPOSITIONING
SYSTEM
POSITION
INDICATINGAND
RECORDINGSYSTEM
FIGURE 5.3-11 Rawin Set AN/GMD-1A, Systems
- 162 -

BALLOON
TRANSMITTER
ANTENNA
ECCENTRIC CUP
MIXER ASSEMBLY
REFLECTOR
OSCILLATOR
Z'F SIGNAL
REFERENCE
ERROR SIGNAL
INFORMATION
ANTENNAPOSITION /
AZIMUTH UNiTAZIMUTH ORt_ E-_
ELEVATIONANGLE
AZIMUTH ANGLE
ELEVATION AND
AZIMUTH REMOTE
CONTROL
FIGURE 5.3-12 Rawin Set AN/GMD-1B, Functional Diagram
- 163 -
The antenna positioning system receives the
detected sinusoidal signal from the receiving system. It rejects the pulse
modulation and then amplifies and compares the sinusoidal content withtwo reference voltages from the reference voltage generators. These
reference voltages correspond to the elevation and azimuth components of
the position of the antenna axis. This results in two dc voltages, one for
elevation and one for azimuth. The magnitude and polarities of these
voltages are indicative of the magnitude a._d direction of the angular diff-
erence of the radiosonde with respect to the electrical axis of the antenna.The azimuth error voltage is applied to the azimuth drive to position the
antenna reflector in azimuth. The elevation error voltage is applied to the
elevation drive to position the antenna reflector in elevation. Sincethe
position of the rocketsonde is constantly changing, the azimuth and eleva-tion drives are constantly positioning the antenna reflector to track therocketsonde. Error voltages can also be introduced so as to track the rocket-
sonde manually.
The elevation and azimuth angles of the antenna
are indicated and recorded by the Rawin set and are recorded at successiveinstants of time.
The receiver covers a band from 1655 mc to
1705 mc and will operate in either AM or FM mode. AM mode is utilized by
the current dart system. The modulation type, when viewed from the carrier,
is PDM-AM in that the intelligence is impressed upon the carrier in theform of negative pulses of sufficient magnitude to exceed 100% AM and hence
terminate the carrier for the duration of each pulse. The repetition of the
carrier terminating pulses contains the data. This technique results in pulsesof carrier frequency energy of varying duration as a function of the data
transmitted. The incoming signal is mixed with the local oscillation frequency
in a wave guide, and a 30 mc IF is detected in the receiver which reconstructs
the chain of pulses originally impressed upon the carrier. These pulses arethen differentiated, and the resulting positive pulse from the trailing edge
is used to trigger a multivibrator which results in a train of pulses of very
constant amplitude and duration. These pulses are fed into a self-balancing
servosystem which positions a pen on a strip chart recorder. The recorder pin
is displaced as a function of pulse repetition frequency and can accommodate
rates up to 200 pps. Various auxiliary amplifier systems have been used toenhance the incoming signal and, of these, the parametric amplifier seems to
be the most satisfactory.
-164-

The meteorologicaldata transmission system
receives the detected signal from the receiving system. It then rejects the
sinusoidai modulation for antenna positioning, shapes and amplifies the
meteorological pulses and passes them to the meteorological recorder. The
meteorological recorder (which is not an integral part of the Rawin set) con-
verts the pulses, whose rate is determined by the sensor resistance, into a
graphical representation of sensor resistance as a function of time. Moredetailed information concerning this receiving system can be found in thetechnical manual concerning the receiver (Rawin Set AN/GMD/1A).
The meteorological recorder AN/TMQ-5 is
used in conjunction with the AN/GMD-1 and AN/GMD-2 receivers. A
block diagram of the recorder is shown in Figure 5.3-13. The variable-
rate pulses from the receiver are fed to the frequency converter of therecorder which converts them to a dc voltage. The value of the dc voltage
at any instant is proportional to the pulse frequency which created it. Thisdc voltage excites a servo system that positions a pen whose displacement
from its zero position on a calibrated chart is again proportional to the pulse
frequency which in turn was determined by the value of the temperaturesensor resistance in the rocketsonde.
Detailed information concerning the meteorological
recorder can be found in the technical manual (Radiosonde Recorder AN/TMQ-5")
concerning the recorder. Specifications for the AN/GMD-I'are presentedin Table 5-13.
5.3.4.2.2 Rawln Set AN/GMD-2.
The GMD-2 is essentially the same as the GMD-1
with the addition of a slant range determination system. In fact a number ofGMD-1 sets have been converted to GMD-2 sets by adding a 403 mHz trans-
mitter and a ranging modulation discriminator. A block diagram of the
AN/GMD-2 is presented in Figure 5.3-14. The essential difference between
this and the GMD-1 system is the addition of 403 mHz transmitted signal
containing an 81.94 kHz sine-wave modulation to the airborne instrument.The airborne instrument contains a 403 mHz receiver which accepts the ground-
station transmitted ranging signal, detects the 81.94 kHz modulation and fre-
quency modulates the airborne 1680 mHz transmitter at the 81.94 kHz rate.Thus the airborne instrument operates as a transponder in addition to a data tele-
metry transmitter. The meteorological data is AM pulse modulated as in the case
of the GMD-1 system.
- 165 -

r.m.
I JCO W
I zZ ,_
_- ow ¢-) F--
L _1 _
U.l
C3 I--._.10>
Wa.
_ F---III
--JILl, .--I
ZO
el
I
>
W
_1
m Bm q m _
W
t fiW r"_ j 11_
_ oI--Z W _
W0 a
0 tz_a:¢-)0Zl--'_0
m
>
N _ m
W
0,_rY_-
WO>
Wr_D
_S,,,o
o_
1
i W
I__
°_-O_
(5,-.00
-I
r,-,m
I_=_C.)(I
J
_s
I
I.ii-0
E,o
Qm
U0
I
- 166 -

TABLE 5-13
AN/GMD - I SPECIFICATIONS
R-F System
ScanningAntennaReflector
Spinner motor
Spinner generator
Conical
DipoleParabolic
! nduction
2 phase, self-excited; 15 volts, 30 cps
Receiving System
TypeNormal frequency
Intermediate frequencyFrequency controlLocal oscillator
Local oscillator
frequencyI nput impedanceData
ModulationBandwidth
Superheterodyne1680 mc30 mc
AFC or manual
Tube type
1650 mc
50 ohms
Error signalFM or PM0.8 mc or 2.5 mc
Antenna Positioning System
TrackingDrive motors
Tachometer generators
Automatic, local manual, remote manual
60 volts dc, 1.4 amperes, 1/20 hp at
500 rpm2.1 volts dc at 100 rpm
Position Indicating and recording S/stem
Synchro transmitters
Synchro receivers
RecordingPrinter motor
Type IV, single phase, self-synchronous;115 volts_ 60 cps
Type V_ single phase_ self-synchronous;
115 volts, 60 cps
Tape (digital imprint)
Synchronous type; 115 volts, 60 cps
- 167 -
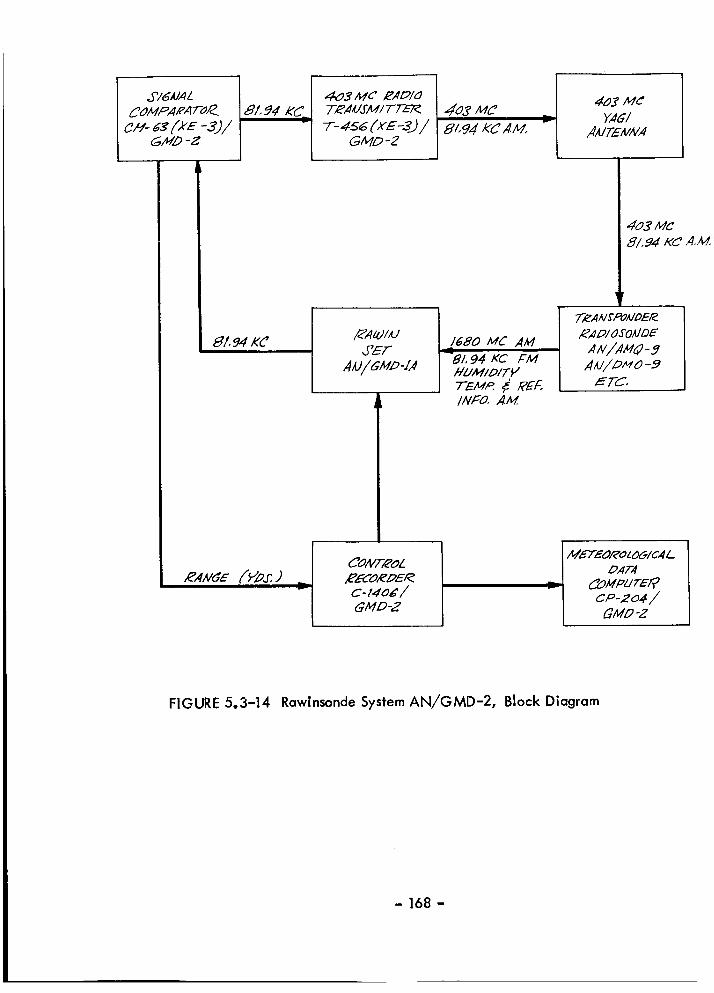
g/, 94 KC
_03 il,IO _APlOTEA/JJl_ll T TEI_
T-4s_ 6zE-32 /GMO -2
i_A _) IMJEf
168o MC AM
y'Bi. 94 KC FMI HLIM/DITVj TEMp. ,_/eEF.
INFO. AM.
¢03 MC
rAG�AAITENNA
I I
T'_AAI_PO_IDE/_
_ADI OSOtJDE
A/u/D _ O -9
E TC,
XAX_E {_'PS.gICONTROL
c-z4o$/GMD-2
IME'7"EOI_OLO_ICA/-DATA
-I c _xo+/GMO-Z
FIGURE 5.3-14 Rawinsonde System AN/GMD-2, Block Diagram
- 168 -

When the ranging signal is received at the
ground-equipment, the 81.94 kHz modulation is detected and its phase is
compared with the transmitted signal to determine the time for a round trip,i.e., from the ground station to the sonde and back to the ground station.
One complete phase shift of the ranging modulation is equivalent to 4,000
yards, therefore, a slant range of 2, 000 yards.
The GMD-2 system is currently in operation ata limited number of locations with both balloon sondes and rocket sondes.
The main disadvantage with the system is that the range data can be ambiguousif the signal is lost for an appreciable period of time. The ranging modulation
places the sonde range within a range of 2,000 yards but does not indicate
which 2,000 yard increment it is unless an accurate count of completed phaseshifts is made from a known point in space or launch. A coarse ranging pro-vision can be added to the GMD-2 as a modification. This coarse ranging
modulation determines the slant range with an accuracy sufficient to determine
the 2, 000 yard increment. The regular ranging modulation is then used todetermine the accurate slant range.
The wind error from GMD-2 data is a function
of the slant range and averaging period. Typical wind erros are presented in
Figure 5.3-15.
5.3.4.2.3 Rawin Set AN/GMD-4.
The GMD-4 is essentially the same as the GMD-2
with the addition of a coarse ranging facility and automatic data processingfor both the tracking data and the meteorological data. A simplified block
diagram is presented in Figure 5.3-16. When signal dropouts or temporaryloss of signal from the airborne instrument occur, the ranging modulation is
momentarily interrupted and then started again. The time of arrival of the
reinstated signal places the slant range data into the proper 2, 000 yardincrement and the normal 81.94 kHz modulation is used for the required
accurate determination. Range rate data recording is also improved over the
original GMD-2.
5.3.4.2.4 NASA Radiosonde ADP System.
A number of schemes for automatic and semi-
automatic processing of radiosonde data have been devised with varying degreesof success. An operational automatic data processing system was developed for
use with the AN/GMD-2 Rawln Set. This system was supplied by the Bendix
- 169 -

Z
_8>
°_m
_d
C3
Z
C3
[-
0
I
(sJ_oN_)uouu_ a_ s_u
o
v
0
0
0
0
0
O__EZ_
"_8
'7
_4
0,'r-
- 170 -

Z
_z
a
I#1 ,_ ;::3 I
r3 I _".
• I
i
_4_.1 AI
, I
_,1
I
;z,,1_ "_ I
b_
Ai
r_
0
0
0I-,,4
¢::1
0
i::1
t-,.,4o_
,,o"T
I.U,v
:30i14.
- 171 -

Friez Instrument Division to NASA/MSFC and installed at the Huntsville
facility in September 1963. The system was designed with a number of
functional systems utilizing standard "off-the-shelf" meteorological
equipment. These items required only minor modifications, in some cases,
to provide system interface. The remaining units which were wholly des-igned and fabricated at Bendix Friez include the tracking data Digitizer,the Converter-Detector and the ControI-Decommutator. The later two
units contain the logic and control circuits essential for automation of
the met data. A data processor commands a printing summary punch toproduce punch cards as desired.
The AN/AMQ-9 radiosonde unit is utilized
with the following telemetry modifications:
1. A special commutator designed to
include 1/2-second reference s_mer_t preceding each temperature andeach humidity segment. These reference identifiers clearly indicate a
change from one sensor to the next, so that close or equal signal ratios
are not confused, and that noise or signal dropouts are not mistaken forfrequency changes.
2. Since the slant range is desired in
meters, the ranging modulation frequency of the sonde is changed from
81.94 kHz. Modifications of the Rawin set transmitter and comparator
are necessary to be compatible with the frequency change, and the data
processor is used to handle the printout, the visual indication and themonitoring of slant range data obtained from the Rawin set.
The difficulty in recognizing the reference
frequency is the spread of 40 pulses per second allowed by the specificationand the fact that zero humidity can produce a pulse rate just 15 pulses per
second below the actual reference frequency. To attempt to recognize
reference as any frequency above 170 pulses per second would erroneously
detect a zero percent humidity frequency (175 pps) of a radiosonde havinga reference frequency of 190 pulses per second. To eliminate this difficulty,
the automatic data processor stores and updates the reference frequency
continuously during the flight. The reference frequency can then be automatically
detected as that frequency within 10 cycles per second of the stored reference.This scheme will be workable for all normal shifts in the radiosonde blockingoscillator.
- 172 -

The measurement of the temperature andhumidity data is made in the voltage realm with 0.905 volts correspond-
ing to 190 cycles per second. The linear conversion to voltage is
accomplished in the Converter-Detector unit. Referring to the block
diagram in Figure 5.3-17, the output of the frequency to DC voltage
converter is connected to the signal loss detector, the "reference detector,
and the A to D Converter. The A to D Converter is a digital voltmeter-ratiometer with front panel decimal display. This unit measures the
reference frequency (voltage), the temperature ratio, and the humidityratio. The "signal loss detector" will actuate if the frequency falls below
10 cps (0.047 VDC) for more than one half second. The "reference
detector" will actuate if the incoming frequency is within 10 cps of thestored reference frequency.
The tracking of the radiosonde commutator
is accomplished by a stepping switch. Each time the "reference detector"
is actuated, the stepping switch is advanced. The stepping switch "home"
position corresponds to the reference segment of the commutator with the
remaining five positions corresponding to the temperature and humidity
segments. The stepping switch therefore keeps the synchronism with theradiosonde commutator. When the "reference detector" is actuated longer
than 1.5 second (as it is during the 3.9 second reference frequency trans-
mission) the stepping switch will "home" unless it is already in the "home"
position. A word description of the sequence of events, starting with thereference frequency, will show the signal flow through the simplified block
diagram. The reference detector actuates for 3.9 seconds and immediately
advances the stepping switch to "home" from the last temperature position.After 1.5 seconds, the "home detector" generates a home command which will
reestablish synchronism if the stepping switch had fallen out of step. After
2.2 seconds total delay, a measure command is sent to the A to D Converter.
The mode command of the A to D Converter is connected through the stepping
switch to the VOLTS mode. The DC input (reference frequency) is measured;
the decimal output is converted to binary ceded decimal (BCD), and appears
at the BCD-to-Analog Converter input. Within 0.33 second after the A to DConverter receives its measure command, it generates an end-of-measure
command which goes through the "signal loss detector," the stepping switch,
the "reference quality: circuit, and the "reference detector". The commandthen causes the BCD-to-Analeg Converter to store the data appearing at its
input. The "reference quality" circuit will inhibit storage of the reference
frequency if it is more than 5 cps below the previously stored reference. This
guards against storing the reference frequency during even a slight signal
dropout.
-173-

IL
I
v_joml
aILl
O-
LLIIm
r_
ILl
Z00r_
"Tc'O
ill
c_ii
-174-

There is no reference identifier preceding
or following the reference data transmission. The stepping switch advances
to the first temperature position after 3.2 seconds total delay (by means ofa circuit not shown on the simplified block diagram). At 2.2 seconds later
than the advance of the stepping switch, a measure command is sent to theA to D Converter to measure the incoming temperature frequency (voltage).
Now the A to D Converter mode command is switched to "ratio" to measure
the DC input as a ratio of the reference voltage from the BCD to analogconverter, within 0.33 seconds after the A to D Converter receives its
measure command it generates and end of measure command which goes through
the "signal loss detector", and the stepping switch to the Temperature and
Humidity Translator Storage. The command causes the output of the A to DConverter to be stored in the temperature section of the Temperature and
Humidity Translator Storage.
The stepping switch is advanced to the next,
or humidity, position when the first reference identifier actuates the"reference detector". At 2.2 seconds after the stepping switch is advanceda measure command is sent to the A to D Converter. This time the store
command appears on the "store H" line of the Temperature and HumidityTranslator Storage unit. The stepping switch is advanced each time a ref-erence identifier is received until the long reference frequency is received
when the entire sequence described above is repeated.
In case one reference identifier is not received
due to a signal dropout the ControI-Decummutator contains an auxiliary advance
circuit which will advance the stepping switch. No measure command will be
generated since the "reference detector" will not have actuated. Synchroniza-
tion of the stepping switch with the radiosonde commutator is maintained, and
the temperature or humidity information punched out on the IBM card is the
previously stored data.
The azimuth, elevation, and slant range data
from the pedestal are in the form of synchro--signals. By means of a selectorswitch on the Control Decummutator front panel, the operator switches to the
desired pedestal and control recorder. Reed relays within the GMD Junctionbox connect the Data Processor to the synchro-signals. In the Digitizer, the
synchro signals position digital encoders and frontal panel indicators by meansof servo-motor drives. The digital outputs are stored in their respective Trans-
lator Storage units on command from the Timer. Azimuth, elevation and slant
range data are stored simultaneously to be punched out on the card identified
with the proper elapsed time.
- 175 -

The ADP system is designed to give theoperator the ability to observe the output in printed form on the IBM cards,
to observe the meteorological data on the A to D Converter, and to
observe the azimuth, elevation and slant range data. The printed card can
be compared with AN/TMQ-5 record _c ensure that the meteorological data
are being processed properly. In the event that the IBM 526 printingsummary punch would hang up due to a damaged card or some other reasont
the raw data will be available from three paper records. The azimuth
and elevation angles are printed (with time) by the C-577 Control
Recorder. The slant range and elapsed time are printed by the Auxiliary
Slant Range Printer, and the meteorological data are recorded by theAN,/TMQ-5 Meteorological Recorder.
5.3.4.3 Rocketsonde Instrumentation.
Although twenty-three rocketsonde instruments are listed
in the "Data Report, Meteorological Rocket Network Firings, World Data
Center A", (see Table 5-14), only five of these instruments are currentlyused on an operational basis. Four of these five instruments are used with
GMD equipment and are described in the following section.
5.3.4.3.1 Stratospheric Temperature Sonde (STS-1)
The STS-! instrument in Figure 5.3-1 8 has been
developed for the Arcas by Ballard, et. ai.t at WSMR as an improved versionof the Delta I for operation with the AN/GMD-1 ground-station. The
improvements have included the reduction of power in the measuring circuit,
the use of a thin-film MylQ thermistor mount and a better matching of thesensor input resistance calibration of the sonde with the thermistor calibration
to achieve better accuracy over the full temperature range. A circuit diagramof the STS-1 is presented in Figure 5.3-19. The temperature data measurement
circuit consists of a current amplifier transistor which feeds the amplifiedthermistor current into a unijunction relaxation oscillator to form data or ref-
erence pulses at a rate depending upon sensor or reference resistance. Thepulses are fed to a buffer amplified transistor which AM modulates to cut off
a standard pencil triode 1680 mHz cavity-oscillator radiosonde transmitter
tube. A solid-state switching circuit and a relay are employed to switch to
and from the temperature sensor and reference resistor.
- 176 -

TABLE 5-14
ROCKETSONDE INSTRUMENTS
I NSTRUMENT STATUS
Delta
DMQ -6
Gamma
Borg -WarnerGamma !1Arcasonde
PMR II
Arcasonde IA *
Resistance WireMetrosonde
Servo-mech Sonde (SMI)Arcasonde iI-A
DMQ-9 *
Arcasoncle ilDatasonde *
Delta (T. F.)
Stratospheric Temp. Sonde (STS)*Mini Loki (S.T.S.M.L.)EchosondeSolid State Arcasonde
Hasp WOX I-A *
Hasp WOX 3-A
ObsoleteObsolete
Obsolete
Obsolete
Obsolete
ObsoleteObsolete
Operational in Arcas (USAF)British Skua
ObsoleteObsolete
Experimental
Operational in Arcas (USAF)Obsolete
Operational in Loki Dart (USAF, USA, USN)Obsolete
Operational in Arcas (WSMR)ObsoleteObsolete
Developmental
Operational (USN)Obsolete
Note: * Operational Instruments
-177-
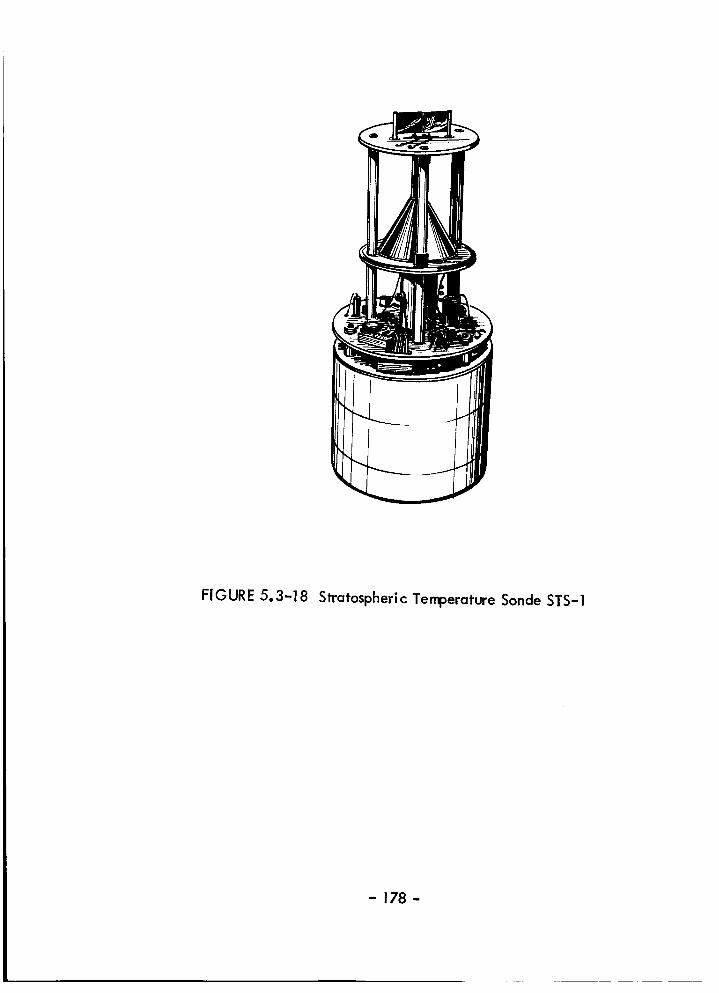
FIGURE5.3-18 Stratospheric Temperature Sonde STS-1
- 178 -

!
E,,
I'_-' -_ i_o
IPI I P2I _ - ,, POWERP,_U_
',_ 0 @
O 0 0 0
CON,,OLPLuG_II _I
R4 2.-/K
iR_4
C 9 Io_
R 13¢z_o/c
DIPOLE
ANTENNA
:12.0o
R.F. OSC. ASSY. LI
Tv_:
_.ODO
R6
_,C3
R7
R8_.oo
R9/80
_o_..z..,vz6t,6
R I0/,¢f_..
,, .,'C5/4
FLIGHT PLUG WIRING
ALL PLUGS SHOWN
FROM REAR VIEW
FIGURE 5.3-19 Stratospheric Temperature Sonde STS=I Elec_ical Circuit Diagram
- 179 -

The transmitter oscillates at a nominal fre-
quency of 1680 megacycles and generates approximately 500 milliwatts
of power at a plate voltage of 120 volts. This gives an extreme range ofapproximately 160 km for small quadrant elevation angles when the trans-
mitter is used in conjunction with the Rawin receivers AN/GMD-1 andAN/GMD-2. The antenna is a brass dipole above a copper, conically
shaped ground plane and serves to match the tube impedance to that ofthe antenna.
5.3.4.3.2 Arcasonde - 1A.
The Arcasonde-lA as shown in Figure 5.3-20
has been developed by Atlantic Research Corporation for use with the Arcas
rocket as an AN/GMD-1 type instrument. This instrument includes a thin-
film Mylar therm|stor mount, a replaceable dry-cell power pack, a block-
ing oscillator data circuit and an electronic commutator. The Arcasonde-lA
telemetry package consists of an integral-cavity-oscillator transmitter,operating in the 1660-1700 mHz band, modulated by a blocking-oscillator-
type pulse generator at rates between 10 and 205 pulses per second. An
electronic commutator provides a reference pulse rate of six seconds durationafter each 20 secnnds of thermistor dwell. The instrument is modular in
designing; complete functional units can be interchanged or replaced in thefield.
The instrument components are shown in
Figure 5.3-21 and a simplified block diagram is presented in Figure 5.3-22.
Arcasonde 1A specifications are presented in Table 5-15.
5.3.4.3.3. AN/DMQ-9.
The DMQ-9 instrument, as shown in Figure 5.3-23,
has been developed by USAF-CRL for use with the Arcas rocket as a GMD-2
type transponder instrument.
The basic instrument package is a 3.3 Ib instru-
ment which consists of a 403 megacycle self-quenching super-regenerative
receiver, a 1680 megacycle radiosonde transmitter, receiving and transmitt-
ing antenna assemblies, motor actuated sensor switches, electronic circuitry
to properly modulate the transmitted carrier and a battery power supply.
The 403 megacycle receiving antenna system is
located directly above the power supply module. Four 1/2 inch wide steel
strips making up the receiving elements are eyeleted to a glass epoxy discand retained in a folded position by the nose cone. After the nose cone is
-180-

FIGURE 5.3-20 ARCASONDE 1A Instrument & Nose Cone
- 181 -
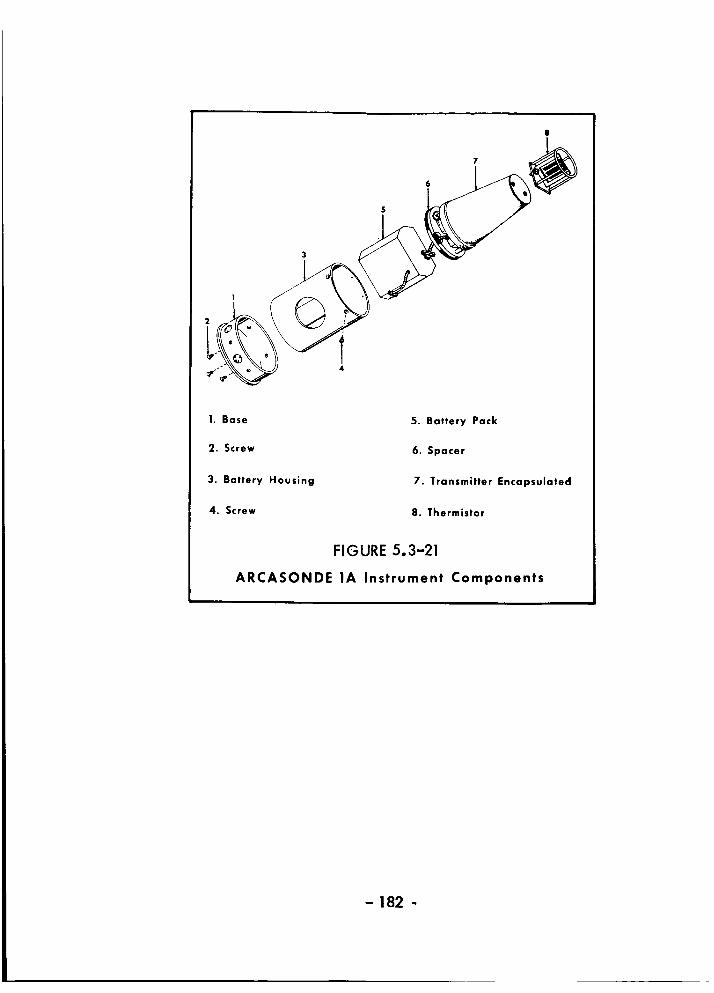
1. Base
2. Screw
3. Battery Housing
4. Screw
5. Battery Pack
6. Spacer
7. Transmitter Encapsulated
8. Thermistor
FIGURE 5.3-21
ARCASONDE 1A Instrument Components
- 182 -

N
-r
E
om
u._ I
s _Ui
_ c_ >> _
|
• __1' ._ IDGAg- _ I--_ ._
i _ _,_
_o-_I"nO I
--r--"lI
I= I
I
I
0
V
U
0
.<
Z0
u
.<
!
_du.I
0mU_
- 183 -

TABLE 5-15
ARCASONDE - 1A SPECIFICATIONS
Height
Maximum Diameter
Weight
Transmitter Type
Frequency
Modulation
Power Output
Antenna
Temperature Sensor
Power Supply
Battery Life
29.6 cm (11.66 in)
1 1.1 cm (4.38 in)
2.04 kg (4.5 Ib)
Pulse-modulated
cavity osci I lator
1660-1700 mH z
10 - 205 pps
300 mW
Helical Slot
10-mil coated bead thermistor
Dry battery pack
3 Hours (at 20o C)
-184-

SENSOR MouNTING PLATE
SENSOR SCANNIN6 UNIT
ETCHED CIRCUIT1680 MC ANTENNA
ELECTRONIC MODULES
BATTERY PACK
)OWER SUPPLY MODULE
_00 MC ANTENNAELEMENTS
FIGURE 5.3-23 AN/DMQ-9 Rocket Instrument Package
- 185 -

discarded at apogee, these elements open to a position normal to the
longitudinal axis of the package. The battery pack is clamped against
the receiving antenna deck. Access is provided to the battery area by
removing the two screws by which the battery holder is attached to andforms an integral part of the structure.
The next section of the package consists ofthree modules: the 1680 megacycle cavity oscillator (encapsulated in
foam plastic), the self-quenching super-regenerative receiver, and the
blocking oscillator and 81.94 kc slant ranging signal amplifiers. The
last two modules are shielded against r.f. interference. The lower disc
to which these modules are attached comprises the etched circuit 1680
megacycle dipole antenna.
A scanning switch subassembly, consisting
of a motor driven cam that actuates two snap-action switches, is located
immediately above the electronic modules. The motor shaft rotates at3 rpm and the four lobe cam is of such design as to alternately switch between
reference and temperature with a dwell of approximately 4.5 seconds on
either, plus and "off" time of approximately 0.5 second preceding each
switching operation.
A sensor mounting plate is located at the forward
end ot: the instrument package to accommodate a plug-in type sensorassembly.
The electronic circuitry consists of a 403 mHzself-quenching super-regeneratlve receiver which receives and detects the
81.94 kHz amplitude modulated carrier from the Rawin Set AN/GMD-2
transmitter. The 81.94 kHz signal is in turn retransmltted on a 1680 mHz
carrier (FM) to the Rawin Set where phase comparison of the outboard andincoming modulation permits direct measurement of slant range. Switch-
ing between the meteorological sensor and reference resistor is accomplished
with cam actuated snap-action switches and the signals derived therefrom
are used to frequency modulate the 1680 mHz transmitter at a rate ofapproximately 20 to 200 cycles per second. Power for the sonde is obtained
from a silver oxide-zinc battery pack in conjunction with a DC to DCconverter.
A block diagram of the circuit shown in
Figure 5.3-24. Figure 5.3-25 is a schematic diagram of all the componentsinEicated in the following detailed description.
-186-

TI 403 MC
_IIPEP-_EGENF__P-_4TIVE
RECEIVER.
@I
_ENJ_
AM PLIFIE_"
Qz, o_,o4
BL ocKIIVG
O._CI£L,4TOP_
gz /_zMoouz.ATO
Q9
I I_;80MC T
=!___Z£CILLATO_.///I
l21LVER- ZIIJC
_ATTE_YPACK
Figure 5.3-24 AN/DMQ-9, Block Diagram
- 187 -

I,
U
i*i
- ]88 -

Self-Quenching Super-regeneratlve Receiver.
The 403 mHz signal received by the sonde isinductively coupled from the antenna to the input tank of the super-reg-
enerative detector Q 1. Trimmer capacitor C2 is the only adjustment
necessary to tune the receiver to the specific operating frequency of theRawin Set transmitter. The quench voltage, a saw-tooth signal approx-
imately two to three volts in amplitude at the collector of Q 1 and havinga frequency of approximately 400 kHzt is generated within the detector
stage itself. This frequency is determined principally by C5 and the
distributed parameters of the circuit. The effect of the quench signal isto alternately drive the detector into and out of self-oscillatlon.
The initial portion of the self-oscillating
condition may be considered a sampling period at which time the amplitudeof the 81.94 kHz modulation on the 403 mHz carrier influences the per-
formance of the stage during the remainder of that particular quench cycle.Thus, over a number of quench cycles the collector current of the super-
regenerative detector consists of components at the modulation frequency(81.94 kHz), the quench frequency (400 kHz) and the carrier frequency*403 mHz). These latter two frequencies are appreciably attenuated
from the desired 81.94 kHz signal by means of components L2 and C8, andL5 and C10 respectively.
81.94 kHz Amplifiers and Modulator.
The super-regeneratlve detector is followed withan amplifier, Q2, having an output tank, C12 and L6, tuned to resonance
at 81.94 kHz. The overall gain of this stage is approximately 15. A portion
of the 81.94 kHz signal appearing across the tank is tapped off and luther
amplified by a factor of approximately 10 in Q3. No further amplificationtakes place through Q4 which serves as an impedance matching elementbetween Q3 and the _ransmitter modulator QS.
The modulator, an emitter follower is parallelwith cathode resistor R17 of the 1680 mHz cavity oscillator, changes theeffective cathode bias of the r.f. oscillator as a function of the 81.94 kHz
signal. As a resultt the oscillator produces a frequency modulated carrier
having a deviation of approximately 175 kHz for the 81.94 kHz rangingsignal at threshold 403 mHz input to the sonde receiver.
-189-

Blocking Oscillator.
The blocking oscillator, Q7, is a transistorized
(2N2905A PNP silicon epitaxial), relaxation oscillator which utilized half ofthe primary windings of transformer T1 for feedback. The other half of the
primary is connected to the 1.5 volt supply. The combination of low supplyvoltage and high reference resistance, R22, in the sensor loop, results in
a maximum power dissipation in the temperature measuring thermistor of
approximately 6 microwatts. Reference frequency is a function of the
inductance of the transformer, the reference resistor and capacitor C19.If required, padding capacitor C20 is added to give _ reference frequency
of approximately 190 cycles per second.
Buffer stage Q6, connected as an emitter
follower isolates the blocking oscillator from 1680 mHz oscillator. The out-
put of this stage, approximately 0.75 volts peak negative pulses about 85microseconds wide, is applied to the grid of the transmitter to shift the
carrier frequency at the repetition rate generated by the blocking oscillator.
1680 mHz Transmitter.
The 1680 mHz transmitter V1 is, with the
exception of a sub-minlature coax cable fitting for the antenna output jack
a standard 6562 single tuned cavity oscillator as used in other radiosondeapplications. Grid resistor R18 is selected to give a plate current of
approximately 30 ma. The transmitter is frequency modulated by both the81.94 kHz ranging signal and meteorological intelligence as described
above. To prevent environmental factors from affecting the transmitter,
such as severe frequency shifts or complete failure, the tube is potted
in a foam-in-place resin.
Power Supply.
The primary power source for the instrument consists
of four Eagle-Picher type 1515 silver oxide-zinc cells that will provide approx-
imately three hours of operation. A freshly activated battery pack has an initial
output voltage of about 7 volts which decreases to 6 volts after the first fewminutes of use. The full 6 volts potential is used for the transmitter filament,
the switching motor and as the input to a DC-DC converter. A 1.5 volt connect-
ion feeds the blocking oscillator. A two-pole, double-throw power switch is
provided.
- 190 -

The DC-DC converter suppliesthe operatingvoltages for the remainder of circuitry. Oscillation of the transistorized
converter is initiated by starting resistor R23 in the otherwise symmetrical
configuration. The frequency of oscillation is approximately 1 kHz as
transistors Q8 and Q9 alternate operation in an on-off condition. Feed-
back is provided by the base to emitter transformer windings. The squarewave voltage produced by this circuit is stepped up by the transformer and
the output is rectified by the full wave bridge consisting of CR1, CR2, CR3
and CR4. Final filtering by C25, R26 and C26 provides a substantially
rlpple-free plate supply of approximately 118 volts which is used for thetransmitter directly and also as the source from which zener diode VR 1 pro-
vides a nominal 10 volt supply for the receiver, 81.94 kHz amplifiers and
buffer stages. Filter components k7_ C28 and C29, mounted on the rear ofthe receiver case_ attenuate DC-DC converter noise on the 10 volt line.
To improve the stability of the receiver and to
assure satisfactory operation of the super-regenerative detector stage withnormal variations in circuit parameters, the supply voltage to the receiver
was increased from 6 volts to approximately 10 volts prior to the final
series of flight tests. The higher voltage was obtained with a zener diode
voltage regulator circuit operating from the nominal 115 volt B+ generatedby the DC-DC converter.
Antennas.
The receiving antenna is a configuration of
four, half wavelength elements spaced 90 degrees apart on the mounting
board. These elements feed half wavelength segments of sub-miniature
coaxial cable in such a manner as to produce the equivalent effect of
two mutually perpendicular dipole antennas.
The transmitting antenna is an etched circuit,centerfed dipole made up of two 152° segments of copper - one on each side
of the base material. A length of sub-minlature coaxial cable connects the
radiating elements to the 1680 mHz oscillator.
- 191 -

5.3,,4.3.4 Datasonde.
The Datasonde as shown in Figure 5.3-26 isa miniature 1680 mHz instrument which has been designed for the Loki Dartand is operationally used with the GMD-1.
The instrument is 13 ounces in weight, 11.1inches in length and 1o1 inch in diameter, with the antenna at the forward
end and the sensor at the aft end. The electronic system and batteries areenclosed in a thin phenollc-flberglass tube, and all voids are filled with an
encapsulation compound. The electronics are solld-state except for thestandard pencil tube triode cavity oscillator transmitter tube used for
1680 mHz radiosondes. The data modulation circuit consists of a unijunction
relaxation oscillator. The power supply consists of a rechargeable nickel-
cadmium battery and a DC-DC converter. Solid-state switching circuits
are employed for switching between data and reference channels°
The Datasonde employs the thin film mylarloop thermistor mount which has been developed by Space Data Corporation
specifically for this instrument° A rather unique feature of the Datasonde
design is that the antenna of the instrument energizes the nose tip of thedart to obtain an uptrack signal during vehicle ascent°
Flight tests of the Datasonde instrument have
been conducted by USAF-CRL to determine the telemetry accuracy. Pre-cision resistors were flown instead of the thermistor. The telemetered
resistance values were compared with the laboratory values to determine
that the telemetered accuracy was within the equivalent of +- 0°5 ° Kover approximately ten flight test units° This error estimate includes errors
in the ground-equlpment and in the reading of the AN/TMQ-5 recorderchart.
5.3.4.4 Miscellaneous Instruments.
The Arcasonde-2B transponder instrument has been devel-
oped by Atlantic Research Corporation for use with the Arcas rocket and the
GMD-2. It is essentially similar to the AN/DMQ-9 which the Air Forcehas standardized.
The Arcasonde-2B telemetry package consists of a 403 mHz
receiver to detect the AN/GMD-2 range signal and an integral-cavity-oscillator transmitter operating in the 1660-1700 mHz band. The transmitter
is modulated by a blocklng-oscillator-type pulse generator at rates from
10 to 205 pulses per second° An electronic timer alternately samples astable reference resistor and the thermistor, with dwell times of six seconds
on each° A blanking circuit prevents pulsed data from modulating the
- 192 -
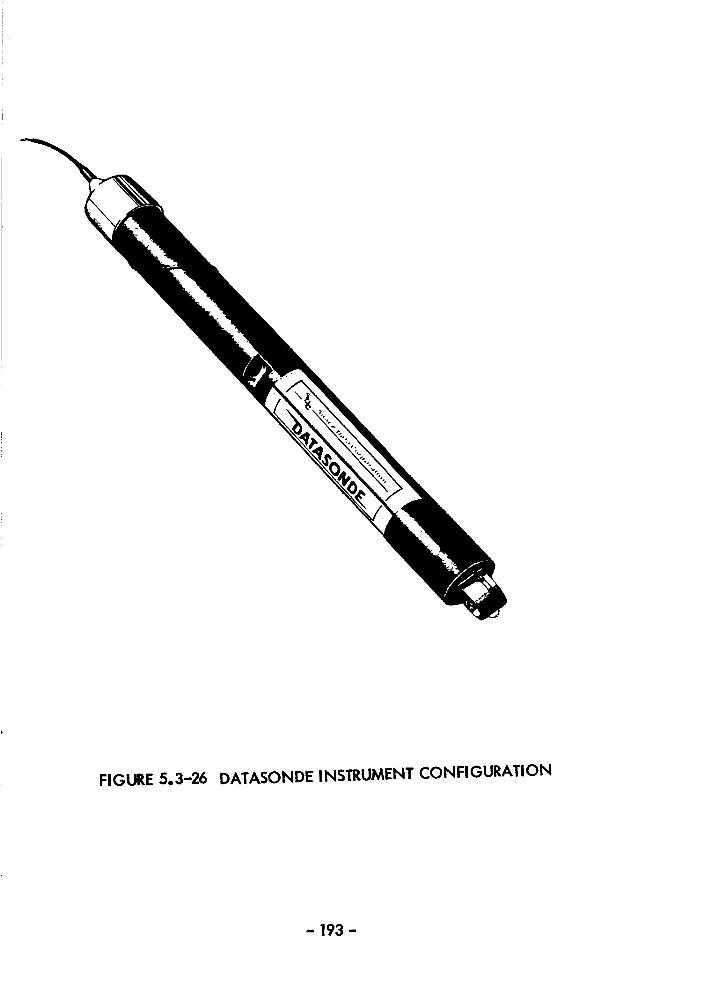
FIGURE 5.3-26 DATASONDE INSTRUMENT CONFIGURATION
- 193 -

transmitter for 0.5 seconds after each reterence or 0ata sample, permittinguse of the instrument with automatic data-handling equipment. The
instrument is modular in design; complete functional units can be inter-
changed or replaced in the field. The specifications are presented inTable 5-16.
To the best of our knowledge the Arcasonde-2B _s not
being used operationally since the Air Force has standardized and is usingthe AN/DMQ-9.
The Arcasonde 3 transponder instrument is shown in Figure
5.3-27. It was incorporated with the Denpro system to telemeter sensor
information from the ascending probe and to obtain a track without the need
for radar support. The Arcasonde 3 telemetry package is designed tofunction during the ascent of the Arcas sounding rocket vehicle. Transmitt-
ing in the 1660-1700 mHz band of the standard meteorological telemetry
receivers, the package can process input from both variable voltage and
variable resistance sensing elements. Pulse repet[tion rates from 100 to
1000 pps provide higher resolution than the standard GMD sondes in tele-
metered data. Optional features include a 403 mHz receiver for slantrange measurement with the AN/GMD-2 Rawin set and a timing unit to
allow sequential sampling of several sensors. The Arcasonde 3 package
was designed to fit into the parachute canister of the standard ARCAS rocketvehicle. Receiver antennas are stowed flush with the rocket's external
surface during the high-dray port|on of the flight and extended at a 45 °
angle in the upper atmosphere. The package is modular in design with
printed circuit intermodular connection. Complete functional units canbe interchanged or added in the field. External jacks allow use of a ground
power supply for prelaunch testing and standby. A block diagram is pre-
sented in Figure 5.3-28 and specifications in Table 5-17.
Resistance wire sondes have been flown by the British on
the Skua rocket and by the Japanese (Echo-sonde) on the MT-135 rocket.Very little information is available on these sondes except that they tele-
meter at the 1680 mHz carrier frequency and are about the size of the
Arcasonde-lA. These sondes employ resistance wire instead of a thermistor
as the temperature sensor. Since the change in resistance of the wire with
temperature is very small, rather expensive preamplifiers (by American
standards) must be employed to boost the sensor signals from the microvohregion to volts in order to modulate the telemetry transmitter.
-194-

TABLE 5-16
ARCASONDE- 2BSPECIFICATIONS
Height
MaximumDiameter
Weight
TransmitterType
Frequency
Modulation
PowerOutput
Antenna
ReceiverType
Frequency
RFSensitivity
Antenna
TemperatureSensor
PowerSupply
Battery Life
29.6 cm (1 1.66 in)
11.1 cm (4.38 in)
2.04 kg (4.5 Ib)
Frequency - modulatedcavity oscillator
1660 - 1700 mH z
10 - 205 pps
300 mW
Helical slot
Super-regenerativedetector, self quenched
400 - 406 mHz
50 mV
Dipole
10-mil coated bead thermistor
Dry battery pack
2 Hours (at 20° C)
- 195 -

I
FIGURE 5.3-27 Arcasonde 3
- 196 -

i I
CONT_OLLEO
_SCJL L,4TO__
7-0 V_LT _ POWF--_
4_,ATI_P.YPACK I ICOMVE,'_I'._7-_.
MODLIL A ro,_
FIGURE 5.3-28 Arcasonde3 Telemetry Block Diagram
- 197 -
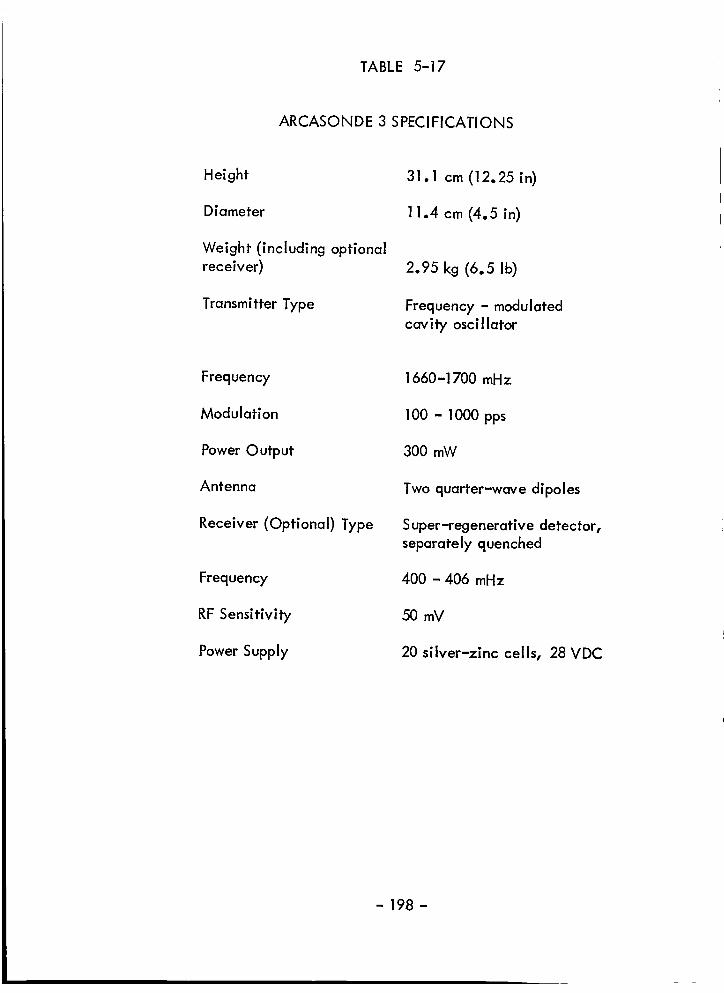
TABLE 5-17
ARCASONDE 3 SPECIFICATIONS
Height
Diameter
Weight (including optionalreceiver)
Transmitter Type
31.1 cm (12.25 in)
11.4 cm (4.5 in)
2.95 kg (6.5 Ib)
Frequency - modulated
cavity oscillator
Frequency
Modulation
Power Output
Antenna
Receiver (Optional) Type
Frequency
RF Sensitivity
Power Supply
1660-1700 mHz
100 - 1000 pps
300 mW
Two quarter-wave dipoles
Super-regenerative detector,
separately quenched
400 - 406 mHz
50 mV
20 siiver-zlnc cells, 28 VDC
- 198 -
5.3.5 AN/SMQ-1 Telemetry Systems.
5.3.5.1 General.
The AN/SMQ-1 systems operate at a carrier frequency of
403 mHz and employ pulse rate modulation as do the GMD systems.
However, instead of pulsing the transmitter off as in the GMD systems,
the modulation pulses the transmitter on through a pulse transformer thereby
eliminating the DC-DC converter of the GMD sonde systems. More important,
however, is the fact that the typical duty cycle of the pulses is from about0.2 to 2.0%. Therefore, the SMQ airborne systems are turned on and
radiating only 0.2 to 2.0% of the time while the GMD systems are turned
on and radiating about 99.8 to 98.0% of the time during the relatively long
dwells between pulses. This means that the SMQ sondes can be made smaller
and lighter than the GMD sondes. This is a distinct advantage for improving
the ballistic coefficient of the rocketsonde decelerator systems, since in
addition to a decrease in weight more payload volume is made available tothe decelerator. Another advantage is that for a given signal strength at
the receiver site and a given slant ranger the required power radiated from
the sonde is considerably less for the 403 mHz carrier than for the 1680 mHzcarrier. Also the SMQ ground-based receiver system does not require a
tracking antenna and is much simpler to maintain and is considerably lower
in cost. The only disadvantage of the SMQ systems is that they do not
track and require radar support for altitude and wind data.
5.3.5.2 Ground-Station Equipment.
The ground-station equipment consists of the Navy developedAN/SMQ-1 Radiosonde Receptor or the smaller transistorized version of this
set developed by the U. S. Weather Bureau.
Radiosonde Receptor AN/SMQ-1 is a receiving and recording
device operating in the frequency range of 390 to 410 mHz. The receptor
is employed in a HASP Iil system to receive and record upper atmospherictemperature data from the HASP Radiosonde Set WOX-1A. The components
of the receptor are the antenna, receiver, recorder, power supply, electrical
cabinet and a paper table.
The antenna is approximately 1-1/2 feet high and is designed
to operate effeclently over a frequency range of 390 to 410 mHz. One hundred
- 199 -

feet of coaxial cable is supplied with each antenna. One end of the cableis fitted with a male plug for connection to the antenna input jacks; the
other end is connected to the top rear corner of the electrical cabinet by
four type N connectors on the cabinet. PMR has developed a helical
antenna for use with rocket system for a higher antenna gain.
The receiver is designed for receiving the radiosonde pulse
modulated radio frequency signals on a continuously variable tuning rangeof 390 to 410 mHz. The receiver amplifies1 demodulates and converts the
signals to d.c. voltage. The magnitude of the d.c. voltage appearing at
the receiver output is directly proportional to, and varies in exact accordancewith, the received signal pulse repetition rate. A loudspeaker for aural
monitoring and an oscilloscope for visual monitoring are included in the
receiver circuitry. All operating controls, the loudspeaker, and the oscillo-
scope are located on the receiver front panel. A coaxial type antenna
switch is located on the back of the receiver front panel. The control for
this switch is on the front panel. It permits selection of four antenna inputs
and provides means for grounding the receiver antenna input. The d.c.
output of the receiver is fed to the recorder.
The recorder displays the data from the receiver on roll chart
paper. The voltage output from the receiver is applied to a servo-drive motorrwhich actuates an ink pen through a system of shafts, gears and a pulley wire.
The ink pen records data on moving chart paper which is driven over three
paper rolls by a chart drive motor. The chart paper is graduated in 100
divisions across the paper. Readings on the chart usually correspond to
half the pulse rate of the RF signals in pulses per second (pps) from the radio-sonde.
The power supply operates from a 115-volt, 60-cycle, a.c.source and supplies all of the voltage requirements for the receiver and
recorder. Power and heater on-off switches and associated pilot temperatureindicators and blown fuze indicators are recessed in the upper center of the
front panel.
The electrical cabinet is a shock mounted, drip proof, metal
structure provided with space heaters and sliding drawers. The top drawercontains the receiver; the middle drawer contains the recorder, and the bottom
drawer contains the power supply.
- 200 -

The radiosonde signal received by the receptor consists
of pulses of 403 mHz radio frequency energy. The frequency of repetition
of these pulses is dependent on meteorological conditions. Each pulse is
approximately 250 to 275 microseconds in duration and the pulse repetition
frequency may vary from 10 to 200 pulses per second. The received signalpulses will generally be a series of pulses at one audio rate followed by
a series at a different audio rate. Each series of pulses will cause the
receptor to print on the chart in a position determined by the audio rate of
that particular series of pulses.
The received pulsed signals are fed from an antenna through
the signal selector switch to the R.F. section which contains an R.F. amplifier,mixer and local oscillator. The oulput of the R.F. Section is fed to the I.F.
strip which consists of five stages of I.F. amplification. The second and
third stages of amplification are available to adjust receiver gain while thefifth stage acts as a first ilmlter. The I. F. output is fed to the detector
section consisting of a llmiter and a discriminator. The discriminator is
used as a slope detector and its output in the form of negative d-c pulses isfed into the audio section.
The audio section contains a pulse amplifier, clipper and
a pulse shaper. Thls section amplifies and shapes the input signal and
eliminates noise to form a strong consistent trigger pulse to the frequencymeter section which follows. In addition, the output of the pulse amplifier
is fed as the observed signal to the vertical amplifier in the video monitorcircuit.
The frequency meter section converts the pulsed signals in-to varying d.c. voltages to control the servo system in the recorder. It also
provides signals for the audio and video monitors. This section consists of
a trigger gate, a multlvlbrator, a ringing and damping circuit, a pulsegenerator, filter and attenuator in the order mentioned. As the signal pro-
gresses through the trigger gate and multivibrator, it is further stabilized.
The muitivlbrator output energizes a ringing circuit which is damped after
each first half cycle providing strong trigger pulses to the pulse generator.The pulses are accurately formed by the pulse generator and its associated
delay llne and fed into a Iowpass filter which converts them into a positive
d.c. voltage proportional to the repetliton rate. The d.c. output is fed
-201 -

into an attenuator which provides a means of accurately calibratingthe signal to the recorder.
Video and audio monitoring are provided as a means
of tuning and maintaining proper receiver gain. The audio signal is
picked up from the muitivibrator output, while video signals are obtained
from the multivibrator in the frequency meter section, and from the pulse
amplifier in the audio section.
The recorder section consists of comparator circuits, a
60 cycle servo amplifier and a pen drive servo system to which a poten-
tiometer is connected, feeding back a reference signal to the comparator.
The varying d-e output from the receiver is combined with the referencesignal from the potentiometer. The resultant is amplified and fed to the
servo motor as a directional signal moving the pen to a position proport-
ional to the pulse rate of the received signal. Limit stops prevent over-travel of the pen. A two-speed chart drive system allows a selection of
chartpaper feed.
The power supply provides the necessary voltages for allsignal and control circuits. This unit provides regulated and unregulated
6.3v a-c for filaments, +400 volt unregulated, regulated and unregulated
270v d-e, regulated +150 v d-e and -430 v. d-c unregulated supplies.In addition, all 115 v. a-c supplies are controlled by the main power switch
in the power supply. A block diagram of the AN/SMQ-1 is presented in
Figure 5.3-29.
5.3.5.3 Rocketsonde Instrumentation.
The WOX-1A has been developed and standardized by the
U. S. Navy for use with the HASP III (Loki Dart type) rocket and theAN/SMQ-1 ground-based receiver.
The radiosonde, externally is cylindrically shaped, approx-
imately 11 inches Iongt 1.4 inches in diameter and weighs 22 ounces. In
ejection, as the payload package leave the body, a spring-loaded buttonon the radiosonde body is released to start the radiosonde operation. After
ejection, the payload package opens to release the parachute by the action
of two flat springs placed between the staves and insulation strips insidethe staves. The staves, piston and closure plug separate from one another
and from the parachute-radiosonde payload, leaving the parachute free to
open with the aid of the radiosonde's weight.
- 202 -

_z___ I- -- _ --I--- - ---- -I _I-:----I '_ I I _/]
--_- I,_t ,I I i_ [ .I
_.,_ Ig:[ I_ I i i [ o i1
_=r--I I ;_-_l,7' ,,l, L .....
----- | ...... ,,,_1,,u ILl _.,' LLI LLIo,"_-I_ I_
__c.V__l__ _ _ _ -q
_,o_1 ;il,< __
T _!_ _o u_ /_1 -__ /h,
•---T--- -_ - --
_1 ®
_ a
_I_. I_I,_ I
._<_ I
_t_l% I
_'>_ I
ii[ih,.
I
_o1t-
I
J
_--iiII _zllII _ ,,' III __ I!
I I] I ,II _1
Io ,--_ - I1tu .7,_ I Iol
l_/ '_!t J
-r _ I
a "-7 i
I_I--'_' j _ p I_ I _ _ I
'_-' I_ Vq_lI
I,.} _,1
"'0
0
O_oI t_1
o_
E__'T
0,,
VCO
I.IJ
LI.
- 203 -

The radiosonde collects and transmits temperature datato a ground or shipboard Radiosonde Receptor AN/SMQ-1. The major
components of the radiosonde, shown diagrammatically in Figure 5.3-30
are a 6 volt nlckel-cadmlum battery, a temperature sensor, a transistor-ized modulating circuit and a transmitter which telemeters on a 403 mHz
frequency. The transmitter is coupled to an antenna wire which is alsoa connecting llne from the radiosonde to the non-radiating riser of the
parachute, in addition to the antenna wire itself, the steel case of the
radiosonde is used as a part of the antenna.
The battery of the radiosonde powers the radiosonde
operation. Prior to iaunchlngl the battery is slow-charged for a six-hour period. A closure plug in the forward end of the body is fitted with
a removable screw to provide access to the connector for battery charging.
The temperature sensor of the radiosonde is a bead ther-
mistor, through which a current is passed. The transmitter transmits apulse modulated radio frequency signal whose pulse rate is dependent on
the resistance of the thermistor and, therefore, the atmospheric tempera-ture.
The pulse rate transmitted depends not only on resistance
of the thermistor, but also on changes in the operation of the radiosonde
components due to atmospheric temperature and a depletion in battery
voltage. To correct for the irregularities, a reference resistor of accurate-
ly known resistance is put in the radiosonde on a circuit separate from thethermistor circuit. Signals, called reference signals, from the known
resistor circuit are transmitted for two-second intervals alternately with
temperature data signals from the thermistor circuit, which are transmittedfor four-second intervals. These alternating signals are received and
recorded on rolled chart paper by a radiosonde receptor. Combining the
two signals eliminates consideration of the adverse effects of temperature
and voltage loss.
The Radiosonde Set WOX-1A is comprised of essentially
four electronic functioning blocks; namely, a commutator, an analog to
frequency converter, a drlver-modulator stage and a UHF transmitter-antenna section. Due to the severe environments encountered during flight
and also the limited volume available for both the electronic circuitry
and the power supply, semiconductors were used for all the active circuit
components except for the transmitter. A schematic is presented in
Figure 5.3-31.
- 204 -

._.E°_
_uI--
ED
°_
v
Z
°_D
NL_
I.-- "00
4-U
I I
!
x0
w
e_
z0
0
0
!
_4
m
- 205 -

L
T_Y
koII
I
_ T _ 1 ,
E
,m
r_
0
I
Y0
-0I--
0
I
_4ID
- 206 -

The two channel commutator circuit in the WOX-1A
system is an asymmetrical flee-running multivibrator that samples the air
temperature sensor for a period of four seconds, then subsequently samples
a fixed precision reference resistor for a period of two seconds. The time
sharing sequence was selected to obtain a maximum sampling of thetemperature altitude profile with a minimum loss due to sampling thereference.
The subsequent functioning block consists of the amplify-
ing stages and transmitter modulator. The modulator is designed to
deliver 3.0 ampere pulses at 5.0 volts which represents 15.0 watts of
pulsed power. This capability required an amplifier section with a power
gain of approximately 35 db. The blocking oscillator was designed to
delivery 3.0 volts into a 2000 ohm load. The value of 2000 ohms wassufficiently high so that its reflected impedance into the blocking
oscillator circuit during the pulse did not affect the repetition rate.
The first stage, Q6, is essentially an emitter follower having a minimum
current gain of approximately 10. An output current of the order of 15 ma
is realized from an input current of 1.5 ma. The collector voltage remainsconstant at 1.5 volts during the pulse. The second amplification stage,
Q7, provides a minimum gain of 10 resulting in a base drive to themodulator, Q8 of 150 ma. The 10 ohm resistor, R18, in the collector of
the second stage limits the current below the maximum dissipation of the
2N597. The 100-ohm resistor, R17, in the base circuit of the modulator and
diode 1N93, CR4, in the emitter leg provides DC stabilization and prevents
thermal runaway. The I N93 was selected on the basis of its current carrying
capacity of 3.0 amps during the pulse. With 150 ma into the base of themodulator and a minimum beta of 20 the collector current is of the order
of 3.0 amps. During saturation the maximum voltage across the pulse trans-
former is approximately five volts; the remaining voltage is distributedacross diode CR4 and the collector to emitter junction of 2N670. Thediode in the emitter circuit of the modulator insures cutoff at high temp-
eratures thereby preventing thermal runaway. The 2N670 also has aspecially designed heat sink, which is also an aid to prevent thermal
instability.
The pulse modulating transformer, which was designed at the Naval
Ordnance Laboratory, has special characteristics that were not available
in commercial types. The magnetic core is grain oriented silicon steel
with a relatively high maximum flux density. The prirna_ and secondaryore wound on the magnetic toroid such that the leakage inductance is
extremely small. The wire size was selected so that the resistance lasses
- 207 -

are equal in each winding. The core size and the wire stacking make
maximum utilization of the geometric volume available in the package.
The inner diameter of the complete wound torold was required to acceptthe 2N670 transistor and heat sink. The tertiary winding is used to reset
the core so that the entire change in flux can be realized. This resultsin a more efficient and smaller size transformer. The current use for
resetting the core is the filament current for the transmitter tube. The
modulator stage is capable of delivering 3.0 ampere pulses of current
at 5.0 volts. The B+ pulses appearing at the plate of the transmitter arein the order of 240 volts at 40 ma.
The transmitter uses a Colpitts type oscillator capable
of delivering 3.0 watts of peak power at 403 mHz. The oscillation tube
is a UHF triode, type 5718. The oscillator circuit utilizes the inter-electrode capacity for positive feedback from plate to grid. The
oscillator frequency is adjusted by a vernier capacitor across the printed
circuit coil. The tuned inductance is a printed copper coll on Rexolite
dielectric. This material is superior for low loss qualities and is idealas a dielectric for high frequency-circuits. The oscillator is completely
shielded in a copper case which minimizes radiation other than via the
antenna. The shield also serves to "fix" the stray distributed capacitance
and inductance parameters for better frequency predictability.
The R.F. power for the triode is directly coupled to a
center-fed fullwave antenna. The antenna is asymmetrical; one-half
is a stainless steel cylinder which houses the transmitter and telemet_/circulb while the other is a thin stranded copper wire of one-half
wavelength. The thin wire also acts as a supporting cable attached at
the upper end to the parachute. This asymmetrical antenna itself is not
a simple geometric configuration, consequently the impedances and
current distributions are difficult to solve analytically. Approximationsto the exact impedance equations were made in order to obtain results
that could be used in resolving the antenna parameters and matching
network. The final antenna parameters were adjusted empirically toyield optimum R. F. power radiation in free space.
Although initial procurement quantities of the WOX-1A
were unreliable in flight performance, a change from germanium to silicon
transistors improved the conditioning temperature capability of theinstrument. Recent production units have demonstrated sufficient reliabilityto consider the system as operatlonal.
- 208 -

Design limitations of the WOX-1A have led to funding
by NOL for the development of an advanced version which is called theWOX--4A. Design goals for this new instrument are for a smaller diameter
(1.1 inches), a shorter instrument length (6 inches), a lighter weight
(6 ounces) and a thin-film mylar thermistor mount. The original WOX-1Amust be flown in a 1-5/8 inch diameter dart which does not achieve
adequate altitude. The new instrument will fit into the 1-3/8 inch dia-
meter Navy chaff darts. The shorter length of the new unit will permit
more space for the rocketsonde decelerator, and the lighter weight willimprove the ballistic coefficient of the descent system for slower fall
rates. The older WOX-1A uses a rather heavy thermistor fiber mounting
structure which voids the temperature measurements above 150, 000 feet.
The new thln-fiim mounts should upgrade the temperature measurementsto the current state-of-the-art.
5.3.6 Advanced Concept-Motorola Study.
5.3.6.1 General.
Motorola Inc., has been funded by AFCRL to conduct a
design study for an advanced meteorological telemetry and tracking system for
both radiosondes and rocketsondes. The purpose of developing an AdvancedMeteorological Sounding System (AMSS) is to update the present system
with particular emphasis on improved reliability, decreased operating casts
and increased accuracies. As opposed to the present ground based meteoro-logical tracking system, the AMSS provides a smaller and lighter radio-
sonde, improved ranging and telemetry accuracies, higher data ratesincluding a continuous data channel, unambiguous ranging to 580 kilo-
meters, digitized output data and a solid state design throughout.
The objective of the AJ_SS was to develop a ground basedmeteorological sounding system which would effectively use modern design
techniques in the gathering of accurate meteorological data. The system
evaluation did not include any study of the meteorological sensors, air-borne vehicles (balloons or rockets) or final data processing equipment.
In selecting a system configuration the following guidelines were used:
. The system design should favor techniqueswhich reduce operating complexity andminimize maintenance and technical
obsolescence. Design mechanization shouldinclude maximum utilizaffon of solid state
and integrated circuits.
- 209 -

. The design should emphasize simplifi-
cation of the flight expendable radiosonde
and make use of techniques which would
reduce cost, weight and power consumption.
. The ground equipment should be designed
with adequate performance margins to
achieve long life and maximum reliability.
. The system performance should exceed that
presently available from the existing AN/GMD-2 system.
in keeping with the program objectives a study was con-
ducted to develop a system which would reflect as many of the current designcapabilities as possible. During the initial stages of the program a number
of trade studies were made in an attempt to arrive at the optimum systemconfiguration. At the conclusion of this synthesis and analysis period
certain portions of the system were implemented. This included both the
radiosonde and ground equipment, and after a laboratory evaluation a
number of balloon borne flight tests were made. These tests were primarily
concerned with the range and telemetry functions in which overall systemperformance was demonstrated. Although a number of configurations arepossible, that which was selected is shown in a simplified block diagram
in Figure 5.3-32. Some of the more significant system characteristics are
shown in Table 5-18 and although this table may briefly describe the
proposed system, it is of interest to compare this with the systems thatare currently operating in the field. This is done in Table 5-19 in which
the AMSS is compared to the present AN/AMQ-9. These two systems
differ in a number of areas but probably the most noticeable is in the radio-sonde configuration and ranging system.
The primary measurement parameters are slant range,
antenna angle data, time and four telemetry channels. The telemetry datamay consist of temperature, humidity, pressure or whatever is desired.
From the above raw data suitable processing will allow computation of such
meteorological information as winds aloft, altitude, temperature andhumidity profiles, air densities, refraction indices and so forth.
- 210 -

i,
t
II
I
!II
II
,Ii
J
I I
m
UI l
" I
E.ao
.m
U
0
e-o_"ID
0
"100
C
U>
-0
.<C',4
!CO
@
-211 -

TABLE 5,-18
ADVANCED SYSTEM CHARACTERISTICS
Maximum Slant Range
Uplink Frequency
Uplink Power
Uplink Data
Uplink Modulation Form
Radiosonde Receiver Type
Radiosonde Output Power
Radiosonde Transmitter
Type
Downlink Data
Downlink ModulationForm
Ground Receiver Type
System Acquisition Time
Information
Range Resol ution
Ranging System
Tel emetr/Resol ution
Output Data Form
300 km
400 - 406 mHz
30 Watts
Range
FM at Index of 0.7
Superheterodyne
35 Milliwatts
Crystal Multiplier
Range and Telemetry
PM
Phase Locked
10 sec
Time
Antenna Pointing AnglesSlant Range
Telemetry - 3 Time Shared ChanI Continuous Chart
5 Ft. Unambiguous to 580 km
BI-Phase PRN
0.02% of Full Scale
Punched Tape
- 212-

I tern -
TABLE 5-19
AN/AMQ-9 VS. AMSS COMPARISON
~ Sonde Receiver Sensitivity Sonde Receiver Type Sonde Receiver Selectivity Sonde Transmit Power Sonde Trniisrntt F;qinCf
d
Sonde Frequency Stability %. Downlink Modulation Form F' Ranging System i. Allowable Range Error (sonde)
UnambCguow Runge Range Resobton
5 Rawe Extr Construction ; Telemetry Form 8 Talemetry Channels
< Frame Rate t Commutator Censtructlon
. Sonde Power Requirements i 1 1
\
Sonde Weight
1
t i
i
1
i I
AN/AMQ-9
5OcV or -73 DBM @ 50 ohms Super =regenerative 3 OB Bandwidth: 60 mHz 300 Mil l iwat ts Tux=b!t 16!5!2-!700 E!=! 2
f 4 m H z FM 81.94 ktiz Tone 560 feet 115 Milets 3 feet E lectro-MechanScal Blocking Osci Ilakv Two Time Shared
One per 20 seconds Mechanical 625 gram less Battay 7.58 Watb
-213 -
AMSS
96 DBM Superheterodyne IF Bandwidth: 300 kHz 35 Milliwatts Crystal Selection From 1668-1693 mHz ? 75 kHz PM 64 kHz@PN f 100 feet 365 Miles 5 feet E I ectronic Two Subcarrion One Continuous Three Time Shared One per second Solid State 705 grams less Battery 3.4 Watts
i

The uplink signal consists of a 403 mHz carrier whichis frequency modulated with a PRN ranging signal. The maximum transmit
power is 30 watts in which the actual level is controlled by the receiver
AGC. Such a coarse control limits the signal range over which the trans-
ponder must operate and this in turn aids in decreasing the group delay
variations within the radiosonde. The transmitter output is fed to theantenna system, which radiates the signal to the radiosonde. The trans-
ponder, operating as a superheterodyne receiver, converts the 403 mHz
received carrier to a 17 mHz IF. This is then applied to a standard dis-
criminator which detects the range signals and PM modulates the down-
link carrier. In addition to the ranging signal, two telemetry subcarriersare also modulated on the down link carrier. One of these subcarriers
is used to transmit continuous telemetry channel data while the other sub-
carrier contains time shared telemetry information. The down llnk carrieroperates at a nominal 1680 mHz and 35 miiliwattSo
At the ground terminal this signal is received and auto-
tracked by the antenna system. The sum channel signal is fed to the Phase
Locked Receiver which is a double conversion, superheterodyne receiver
with intermediate frequencies of 50 mHz and 10 mHz. The receiver thendemodulates the input signal and provides baseband range information to
the Range Extractor and subcarrier telemetry information to the TelemetryExtractor. The slant range is obtained by measuring the time delay between
the transmission of the range code and reception of this same code signal.
The elapsed time is computed in a Timer Interval Counter which allows rangeresolution measurements of 4.9 feet. The output range data is then digitally
recorded and transferred to the data processor. The telemetry informationis generated in the transponder through appropriate sensors and is received
at the ground station in the same manner as the range signal. However, in
the Telemetry Extractor the process is somewhat different in that the detector
is an FM discriminator in which the output amplitude is a measure of the
sensor condition. The analog output data is then applied to a digitalvoltmeter which converts the analog information to a digital format and
transfers this data to the Data Processor. The Data Processor then accepts,converts and stores tracking data, meteorological data and time data .obtained
during the flight of a radiosonde and produces a punched paper tape output
suitable for transmission over standard teletype lines.
in measuring slant range there are a number of methods
which will accomplish this purpose. The three outstanding systems are a
radar range measuring system, a PN (pseudo noise) ranging system and atone ranging system. All three systems have been used extensively in various
- 214 -

phasesof the space program. The advantage of the radar system is the
simplicity of the radiosonde since a passive corner reflector may besubstituted for the receiver in the radiosonde. The principal disadvantage
of such a system is the high transmit power.required at the ground stations.
If radar systems are available for such use then it is desirable to takeadvantage of this condition. However, where such is not the case a
range system using tones or PN is more desirable. For the AMSS system a
PN ranging system was selected. As opposed to the tone system an PN
ranging provides considerable jamming immunity, and far distant ranging,extremely low frequencies are not required. In reality the system selected
is a hybrid PN ranging system which utilizes a resolution range tone and
a short PN sequence for ambiguity resolution. Although the code used
here is much simpler than that used in many space programs, the operationis much the same. Far examplet referring to Figure 5.3-33 a 64 kHz
sine wave is bi-phase modulated at an 8 kiloblt rate. That is, after each
eight (8) cycles of the 64 kHz range tone a decision is made as to whether
to change the phase by 180° or leave the slnewave undisturbed. The
code format which makes such a decision is commonly a PN sequence.
That is, its spectrum resembles noise to the extent that the code lengthwill allow such a representation. Then by measuring the time delay between
the transmission and reception of the code sequence a measure of range
may be obtained. The AMSS code length is 31 bits which corresponds to
an unambiguous range of 580 kilometers and a further description of the
range extraction process is described in the subsystem section.
The telemetry requirements are to provide four channelsof data with one channel being continuous and the other three time shared.The maximum data rate on each time shared channel is one reading per
channel per second. The modulation technique is shown in Figure 5.3-34where the reference channel width is three times that of any informationchannel and the measurement data is contained in the amplitude of the
information channel relative to the reference channel. Requirements on
the subcarrier VCO_s are those of extreme llnearity (better than 0.1%),
good stability (both long and short term) and the units must be economical
throw-away components. Such units are now practical and played a key
role in establishing this method as the telemetry format.
- 215 -

f 0
I °m
--1°1"
Oz
.,,.I
Im
uJ
o0
I-"
Z
I'--
0
0
0
0
O
t,-
W
ao
W
>U.I
(3
U.I
f,-
WCZ_,-I
a,.
l---
nr
I--
J
,-I
130
Z0
I--
u
I
(.3U.I
g
U,I
0
r,-
0
O
0
=.1 m
._
_, :_z_0 _'_"
(3Z.<
Z
I
m
- 216 -

0
a-a
00
1o
!
tI
0 "-- _'_ M 'q"
lll I0
U0.J
0
0
I.-
,,,.1wI--
;gI
i11IX
m
- 217 -

5.3.6.2 Ground Equipment.
The block diagram of the proposed advanced soundingsystem, as shown in Figure 3.5-32, consists of several major elementsdescribed as follows:
1. VHF Transmitter.
The ground transmitter is a solid state unit operating
at a crystal controlled nominal frequency of 403 mHz. The output power
level varies between 5 milliwatts and 30 wafts and is controlled by thereceiver AGC. Over this output level the transmitter must demonstrateless than + 10 nanoseconds group delay variation and for overall operat-
ing conditions, the group delay stability should be better than +- 20nanoseconds. The transmitter is FM modulated with the 64 kHzO PN
ranging data and the output is supplied to the ground antenna system.
2. Ground Antenna.
The ground antenna system consists of a transmit antenna
operation at 403 mHz and a receive antenna operating at 1680 mHz. The
transmit function associated with the ground antenna does not pose any
significant design problems as the required gain is only 3 db. This isnot true in the case of the receive function where there are cl number of
conflicting requirements.
3. Auto-Track Receiver.
The ground receiver is a phase lock tracking receiver
which is used to track the downlink RF carrier and to convert the rangeand telemetry data to baseband. In addition to the abover the receiver
must also provide signals proportional to the antenna pointing error which
are in turn used to drive the antenna servo system. The receiver design to
perform these functions is a double conversion superheterodyne receiver
with 50 mHz and 10 mHz IF frequencies. The receiver will automatically
acquire the carrier signal and the acquisition will not be affected by the
presence of the telemetry sldebands. Coherent AGC is used to maintain
the IF signal to the phase detector constant so that loop bandwidth is notaffected by signal level.
- 218 -
4. Telemetry Extractor.
The purpose of the telemeff 7 extractor is to develop out-put signals which are proportional to the sensor resistance values in the
radiosonde. A block diagram of such a circuit is shown in Figure 5.3-35.
The baseband input consists of two subcarriers which have
been frequency modulated with the telemetry data. The extraction systemconsists basically of a low frequency FM receiver which detects the sub-
carrier and provides a multiplexed output signal (a cw signal in the case of
the continuous channel). This signal is applied to a phase locked loopwhich serves to detect the
sync drives logic circuitryproperly decommutate the
to calibrate the telemetry
bit sync of the multiplexed signal. This bit
to derive frame sync as well as gate signals to
multiplexed input and derive correction signalsdata.
The band pass filters have a bandwidth of 520 Hz (2 _ L)
such that the signal-to-noise input into the discriminator will be above
threshold under all expected condition and the phase lock loop band-
width used for sync purposes is 2.0 Hz (2 B L).
The telemetry extractor is completely automatic and doesnot require prior calibration of manual checks throughout a radiosonde
flight. The circuitry has been designed such that the digital circuits and
operational amplifiers are utilized wherever possible. In this way thetelemetry extractor is readily adapted to present day integrated circuits,
5. Range Extractor.
The purpose of the range extractor is to develop an out-
_ut signal which is a measure of the slant range to the transponder. Therange extractor will measure relative phase shifts between the transmitter
and received range signals with the total range being displayed as the
timer interval between a start and stop pulse. The ranging systemselected was a PN ranging system in which the Range Extractor is shownin Figure 5.3-36. The input signal is a 64 kHz sine wave which has been
bi-phase modulated with a 31 bit PN code. The bit rate is 8 kbits/sec.
Operation of the range extractor is such that after acquisition the Word
Detector provides an output pulse at some pre-set code condition. This
- 219 -

R3
8,_POD _- PASS
IER
ZERO
IE
SYNC
R1 = R2 = R3
A4 cO _ 2 5 SEC
I_ c 1 H:
L_ ,_ZERO SYNC
RETS_NC RS,RI=R6
• CHANtSYNC RS=R 9
" CHAN 7SYNC ROC;=25SECCHAN 3 SYNC
CHAN4SYNC R?
8 L 520 He
_JAS_ HAN[) INPU] C|
R6 R8 6 L fHz
8t_ ,NC
3_
8 L _ I H_
CHANIS_C
¢_A_ 1
BL • 1 H1
CHAN 2 $Y_C
_C_AN 2
B L _ 1HZ
C_AN 3 $Vhm
_C_AN 3
B L = 1HZ
FIGURE 5.3-35 TELEMETRY EXTRACTOR, BLOCK DIAGRAM
¢;4 Kilt Oi'N
• = .
64OPN
I'ODE I (X)P
fJ;4 KIll • 8 KHz
64 KHz
I
FIGURE 5.3-36 RANGE SIGNAL DEMODULATOR, BLOCK DIAGRAM
RANGE
STOP
- 220 -

is then fed to a logic function which simply creates an output pulse at thefirst 64 kHz zero crossing after reception of an input from the Word
Detector. This output is termed the stop pulse which terminates the count
in a time interval counter. Initiation of the counter is done by meansof the start pulse which is generated in an identical manner to the stop
pulse except the acquisition and tracking functions are not required. As
can be seen the demodulator consists of a code loop and a tone loop.
Operation of these two loops is as follows:
1. The ground tracking receiver locks to the
input RF carrier after which
2. The PN generator in the code loop is precessed
in time at a rate of about 10 PN bits per second.
. When the PN sequence of the demodulator approaches
that in the modulator a coherent 64 kHz signal appears
at the input to the phase detector in the tone loop.This is shown in the correlation function of Figure
5.3-37. When the tone loop locks to the 64 kHz
signal the lock indicator stops the PN precessingand indicates lock.
. The code loops which has a correlation function asshown in Figure 5.3-38 will then drive itself so
as to null out the 64 kHz component. Thus when
the code loop has driven the PN generator to thisstate the 64 kHz signal to the tone loop will bemaxi mum.
As can be seen, once the acquisition process has been
completed the operation of the system is identical to a tone ranging systemexcept that ambiguities have been resolved by means of a PN code instead
of the addition of tones. The tone loop bandwidth (2PL) is 2 Hz and acqui-
sition time of the system is based on the code search time. Since the code
is precessed at a rate of 10 bits/sec, and the code length is 31 bits, the
maximum acquisition time is 3.1 seconds. Zero setting of the range is
straight-forward. Coarse range is set in by merely establishing the worddetector input state which will allow resolution to within one bit. The
fine resolution is obtained by increasing or de_easing the delay in thestop pulse output.
- 221 -

64KHz
COMPONENT
AMPLITUDE
/I
-I BIT
- 0 DB LEVEL
f--3ODBLEVEL
I I I
-2 BIT 0 +I BIT *2 BIT '7"
LEVEL
FIGURE 5.3-37 64KHz COMPONENT VS CODE CORRELATION - TONE LOOP
-6 DB LEVEL_
/¢ PHASE
I I
-2 BITS -1 BIT
500 KHz
COMPONENT
AMPLITUDE
-3 DB LEVEl
PH SEI
\ I
0 V,1 BIT _.2 BITS ,3 BITS
FIGURE 5.3-38 64KHz COMPONENT VS CODE CORRELATION - CODE LOOP
- 222 -

6. Range Modulation Generator.
The purpose of the range modulation generator is to
generate the ranging signals which are furnished to the ground trans-
mitter and the range extractor. The ranging signal consists of a64 kHz resolution tone and ambiguity tones of 8 kHz, 1 kHz and250 kHz which ore coherent with the resolution tone or else the PN
signal to resolve the ambiguities of the 64 kHz resolution tone.
7. Timing.
The time is provided by a digital clock in the Time
Interval Counter and may be designed to furnish local or elapsed time
in digital form for use by the Range Modulation Generator. This time
data is also applied to the Data Processor for analysis and recording
purposes.
8. Data Processor and Monitor.
This contains all ground equipment controls for acquisition,
tracking, monitoring and recording the performance of the system. The
data processor provides a display of time, slant range, azimuth and eleva-tion angles and telemetry. It also provides a punched paper tape on which
all pertinent data is recorded in teletype code format.
5.3.6.3 Radlosonde.
The radiosonde is designed to perform two functions. As
a transponder, it must receive the up-llnk range signals, demodulate them,and retransmit them to enable the determination of slant range. As a
telemetry transmitter, it must accept the outputs of the meteorological sensors,condition them and transmit them along with calibration information to
the ground station.
It would be desirable to have a single transponder design
for both balloon and rocket launch applications, but the comparatively
high packaging costs which are inherent in the rocket environment ore an
unnecessary restriction on the balloon sonde and, therefore, in order to
- 223 -

reduce per unit costs of the high volume balloon application, a lessrigorous mechanical design is used for the balloon.
A block diagram of the radiosonde is shown in Figure5.3-39 and a list of performance characteristics is shown in Table 5-20.
The transponder uses a narrow band FM superheterodyne receiver and aphase modulated transmitter in which the received frequency modulatedranging information is translated to the downlink transmitted signal°The transponder signal levelsr gains and bandwidths are based on the
use of an inexpensive quartz crystal in the transponder. This quartzcrystal, located in the transmitter voltage controlled oscillator, isthe source of the receiver local oscillator signal and the transmitter downllnk
signal. The quartz crystal pays its way by permitting a reduction in thedownlink transmitter output power to only 35 milliwatts while operatingat slant ranges up to 300 kilometers_ This power level allows a substantialsavings in battery cost, weight and packaging costs. As can be seen the
functional block diagram of the radiosonde does not present any startling
or new innovations and the real significance of the design is the develop-ment of a radiosonde unit which will economically provide the requiredoutputs. Some of the more important features of the low cost design are:
1o Use of crystal oscillator as described above
2_ Use of highly accurate and economical VCO_s
for the telemetry subcarilerso See Figure5.3-34.
3_ Design of a transponder with low group delayvariations over the operating environment°
4. Use of transistorized front end to provide systemnoise figures less than 7_5 db_
Q Use of a stripline filter in the final X4 outputstage to improve reproducibility and eliminatetuning controls.
6g Use of low cost switching gates to provide thenecessary channel isolation in an accurate
PAM telemetry system_
7_ Use of foam packaging to provide a shockresistant, thermally insulated, lightweightdesign.
8. Design which will allow modular addition orelimination of functions within the radiosonde_
.- 224 -

I
I(3
N,
_ _'_ __ ,,,,t I',. t'.. _,_ _1 I
-_._._,-_
l
I
r_ _
1
- 225 -

TABLE 5-20
AMSS RADIOSONDE CHARACTERISTICS
RECEIVER
Input Frequency
TypeInput Signal LevelInput Signal Level w,/o Damage
Noise Figure
IF Bandwidth (2 flLO)
Video Bandwidth (/_LO)
TRANSMITTER
Output Frequency
Output PowerLocal Oscillator Output
Subcarrier Deviation LinearityGate Switch Impedances
Gate Oscillator Frequency
Gate Oscillator Stability
GROUP DELAY VARIATION
For a 64 kHz Tone the Maximum
Group Delay Variation within
the Radiosonde over the Operat-
ing Temperature, Signal Leveland Time
WEIGHT
Electronics
Total Package including
Battery
Modulation Type
Deviation kinearity
400-406 mHz
Superheterodyne FM Receiver-96 to-56 DBM
-6 DBM
8 DB Maximum
470 kHz125 kHz
1680 mHz Nominal1660-1700 mHz Band
35 Milliwatts
0 DBM
0.1% of Best Straight LineOn - Less than 500 ohms
Off - Greater than 500 megohms12 Hz+ 10%
+ 270 Nanoseconds
Less than 2 Ibs.
Less than 4 Ibs.
PM
+ 20% of Best Straight Time
- 226 -

TABLE 5-20 AMSSRADIOSONDECHARACTERISTICS- continued -
FREQ UE NCY STABI L! I"Y
Short Term
Long Term (8 Hours)
TELEMETRY
Channels
Frame Rate
Subcorrier FrequenciesContinuous Channel
Multiplexed ChannelSubcarrier Deviation
LIFE
Operati ng
Storage
OPERATi NG ENVIRONMENT
Temperature
HumidityAltitude
Shock (Rocket Launch)
Acceleration
1 Part in 109
6 Parts in 105
1 Continuous and 3 Time Shored
One (1) per second
10.5 kHz
7.35 kHz
+- 125 Hz Maximum
4 Hours
1 Year
-70 ° C to +70 ° C
To 100% with CondensationTo 200 Kilometers
100 G's of 11 Milliseconds
Duration in each Major Axis200 G's
- 227 -

.
ROCKET VEHICLES
6.1 General.
Of the various kinds of launch vehicles and modes of propulsion,
so far the only type which has proven to be practical for routine meteoro-logical soundings is the solid-propellant sounding rocket. Gun-launched
projectiles have successfully carried chemical trail and chaff payloads to
the higher altitudes, but their payload diameter and acceleration loadshave restricted their use to these payloads. Also the overall cost of the
gun-launched projectile firings appears not to be competitive with the
booster dart rocket vehicles. Gun-launched telemetry systems have notbeen used for meteorological applications, and in fact, their feasibility
in general has not been proven. Other methods of propulsion such as
liquid-propellant rockets, hybrid solids, ramjets and ducted rocketsappear to be too costly and complex without any significant advantage
over the solid-propellant rockets.
The solid-propellant sounding rockets for meteorological applica-tions can be categorized as either single stage, booster dart or two stage
vehicles. Each of these types has its own advantages and disadvantages.
A selection among the various vehicle types for a particular mission can
only be made after the sensor instrumentation, telemetry and measurement
altitude region have been determined.
For the larger sounding rockets which carry all kinds of large and
heavy scientific equipment payloads, some using agencies rate the vehicles
on a cost and performance index, such as vehicle cost per pound of net
payload per mile of altitude. Some have tried to apply such an index tothe meteorological rockets, where it would have no significance at all.
When considering a meteorological rocket system, the important parameters
are the meteorological measurements to be made, their range of altitudeand their cost. Thus, the first consideration should be selection of the
sensor, its accuracy and the altitude range of the measurements. Next,
one must decide upon the telemetry instrumentation to be used and whether
or not to employ a rocketsonde decelerator. Only after the payload and
- 228 -

desiredaltitude range have been determined, can a reasonable choice
of vehicle be made. The efficiency of the vehicle in carrying arbitrary
pounds of weight to arbitrary altitudes is not important. The importantfactor is the ability of the vehicle to carry the required payload to therequired altitude at the minimum cost. In addition, there are a number
of secondary factors in the choice of a vehicle for the meteorologicalrocket application. A listing of factors which might be considered in
the choice of a rocket vehicle for a typical meteorological rocket systemis as follows:
]. Performance.
The vehicle must be able to carry the requiredmeasurement payload to the required altitude or
it is worthless for the application.
2. Cost.
Since meteorological rockets are used for routine
soundings, cost is perhaps the most important factor.
1 Wind Sensitivity and Dispersion.
Since meteorological rockets are used on an
operational basis, essentially all over the world,
they must be capable of being launched under the
most severe wind conditions. Wind sensitivity and
the resulting impact dispersion must be kept to areasonable minimum so that launches will not have
to be cancelled due to weather conditions. Dis-
persion factors other than wind sensitivity are aboutthe same for the various rocket designs, and the
resulting impact dispersions (minus wind effects) are
primarily a function of apogee altitude.
. Reliability.
Reliability is a term often used to rate potentialvehicles, but is meaningless without a great deal of
flight data. What designer does not design far 100%
reliability? For vehicles which have not been
- 229 -

thorough ly fl igh t-tested, esti mates of re liabi I ity
are fictions. Many people like to assign a higherreliability to single-stage vehicles than to two-
stage vehicles on a statistical basis, yet there are
technical factors, such as aerodynamic heating,dyna mi c pressure and pi tch-rol ! resonance probl ems,
which may more severely affect the slngle-stage
vehicle. There have been many two-stage vehicleswhich have flown more reliably in a two-stage con-
figuration, i.e., Nike-Cajun, Nike-Apache,
Nike-Hydac, Nike-Tomahawk. Even with a greatdeal of flight testing and operational usage, reliability
can be a variable parameter. It took the Arcas system
about four years and three-thousand flights to achieve
a 90% reliability. Then after two years of continuedsuccess, the reliability fell to a farily low level.
Reliability is difficult, or impossible, to assess with
sufficient accuracy for a new design and has been
quite variable for the designs in use.
. Operational Capability.
A meteorological rocket should be capable of being
handled and launched by a crew of two people with-
out the necessity for elaborate handling equipment.
The system should be relatively simple to operateunder adverse weather conditions, for world-wide
launchings may be required for remote sites by relative-
ly inexperienced personnel. Conditioning temperature
limits should be as wide as possible for compatibility
with extreme geographic regions from the tropics tothe Arctic.
. F Ii ght Ch arac teri stics.
Flight characteristics such as a aerodynamic heating
vibration, acceleration, attitude stability and roll
rate have occasionally been used to rate vehicles.However, if the intended payload will adequately
function under the given level of each of these factors,
what further consideration is required.'?
- 230 -

7. Safety Characteristics.
Most of the solid propellants used in current motors
(except double base propellants) are quite safe tohandle and ship so there is little choice among them.
Payload separation device initiators are perhaps a
greater safety hazard, depending upon their design.
. Telemetry and Tracking Potential.
Rocketborne telemetry instrumentation is considered
as part of the payload for meteorological rockets and,therefore, is included in Item 1. However, if track-
ing telemetry is employed, a fast moving vehicle maybe more difficult to acquire and track than a slow one.
This is also true for radar tracking and here a small
vehicle may be more difficult to radar track than alarge one. These factors should be considered in
evaluating a new design.
. Versatility.
Vehicle or rocket motor versatility has occasionallybeen used as a rating factor for meteorological rockets
in the past. Thus, people have sought a rocket which
would perform for a 100 km requirement as well as a
60 km requirement or for a temperature measurement
and as well as an ozone measurement. In many casesthis versatility criteria is self-defeating from an
economic standpoint because it implies that the vehiclesystem or the rocket motor is overdesigned for one of
the mission requirements. Generally this is the require-ment for the greater number of flights. For instance, an
Arcas-type vehicle might be chosen because it is capable
of carrying a fairly bulky ozonesonde instrument and can
also be used for routine temperature and wind measure-
ments. However, the requirements for wind and tempera-
ture measurements might be for three thousand flights per
- 231 -

year. The Arcas-type vehicle might cost three times
as much as a dart vehicle which can only carry the
wind and temperature measuring payloads. The obvious
economic choice would be to use the larger more costlyrocket for the one hundred ozone flights and the smallerlower cost rocket for the three-thousand wind and
temperature flights. The same argument holds for altitudeversatility consideration. A much greater quantity of
60 km flights are required than 100 km flights. Therefore,
why pay a great deal more for the 60 km data by usingthe 100 km vehicle to obtain it, when the data could beobtained with a smaller lower cost vehicle?
Before a vehicle can be chosen for a meteorological rocket system
application, the payload requirements of weight, diameter and length must
be determined. Also, payload interfacing requirements, such as the need
for telemetry antennas, should be studied.
A fairly wide variety of sounding rocket vehicles are currently avail-
able for the meteorological rocket applications. In fact, additional vehicles
are being developed each year. The adaptation of these vehicles, or at
least the design concepts, to a given payload - altitude requirement can
now be a straight-forward engineering development. The development offrangible, consumable or destructable vehicles to eliminate or reduce the
falling mass hazard will at the current time require a state-of-the-artadvancement.
- 232 -

6.2 Historical Review.
Over the past eight years there have been many studies and attemptsto produce a meteorological rocket which could be used for routine soundings
to 65 km altitudes. A review of the meteorological rocket vehicle develop-
ment attempts is presented in Table 6-1. it is interesting to note that only
the Arcas and Loki-type systems are currently being used for routine sound-ings to 65 km.
The Loki type vehicles employ a high-thrust short-duration booster
rocket with a non-propulsive dart payload stage. These vehicles offer con-
siderable advantage in operational simplicity, low wind sensitivity anddispersion and low production cost. A disadvantage, however, has been a
restriction for some instrumented payloads because of the relatively high
boost accelerations and limited payload diameter and volume.
The Arcas vehicle was designed to accommodate a relatively large
payload diameter, weight and volume in a low acceleration environment.
However, because of its long burning time, the Arcas has proven to be
quite wind-sensltive. Wind-sensitivity and dispersion in combination with
a relatively high cost for Arcas have been major disadvantages for its use
in routine operations.
The past several years have seen a number of attempts to develop
more suitable meteorological vehicles, but to date, none have yielded
operational systems. The Army Ballistic Research Laboratory and the
Canadian Armament Research and Development Establishment have experi-mented with atmospheric probes launched from 5-inch, 7-inch and 16-inch
guns. The acceleration of 16,000 g and upwards associated with this
technique make difficult their use with state-of-the-art type meteorological
instruments - especially the sensors. Two Navy sponsored programs were
directed toward development of single-stage vehicles with substantial pay-load capacity which would be less wind-sensitlve and less expensive than
the Arcas. Both used relatively long burning time (9 to 12 seconds) internal
burning solld-propellant grains in an attempt to compromise between high
accelerations and low-launching velocity. One of these vehicles, the
Aeolus, has severe reliability problems and was canceled. The Raven
proved to be unstable with payloads of less than 20 pounds. This vehicle
will reach only about 160,000 feet from sea level with this minimum pay-
load weight. Both of these vehicles appear to be a move in the proper
- 233 -

o0
0o
0
7
LU.,,1
<I-.-
I--
<I--
_z
<
o l>s
iii -.I
,, ¢_<
O o
iii--I
U
.Fiii
>
.-
o o o oCO _D ,,0 0
o o o o_ _ o
g
0 0 0 I_-
o o I00 - _- I
o
I
0 t'h __
•
O
"-8EO
O
1:1.
O
I:l O O OI: ¢- I- _ -O ¢-
o o o _ _. o"-_ "_- "--_- 0 0 %=
O O O o c_ ,, - ,P O
:g o _ _ _ _ co_ _ ig I o o0 CO 0
00CO
0 1 0,Io, o I _ I I I -,
0 0 0 0 0 0 0
o Ig _ :g _ o I I I oCO .,_ cO
O0¢4 0 0 0 0 0 II O_ _ CO
v'OINI'M
v v h_ v v v v v v h_0 0 0 o 0 0 0 0 0 0
_ 0 _"
0e-U I--- I_ _ I o U
_ _ - g_•-& _ -ao
3_ oz o ® ,-(,_ *--
- 234 -

C
e-¢-O
U
Q.._
U0
8
7
,,,,,1m
I--
Ue'-
_ OD _
!-- U
I-- el
_ O
"10
Q.O
>ID
"N
(D Q) _ q) OD. O- O- D-O O O O :D-
_ _ _ - _ o> > T_-- -- > >
,', ,', _ _. ,-, ,-, o
o o, o o _ _; _o('NI _ (')
U.,I
<--
>.. o.. -
Ill ,--I
:E ..>,
.<w
l,c) I
l,Cl O0 0
('3 I'M O"}
I 0I
I I --
V v v
OO4 _I"
O
O i
O O O
o _ ,, : : oo
O O _ O O O O_ o _ _ o
O O
V _ v V V V V
o o o 8 oO O 04 O
O
ee_ b- I
>.
i I i I I G)I I I I I "_I I I I I I--
t).-r-LLI>
0c_°--
...J
•- ._ o. g o .__ 8
- 235 -

direction, but it seems that the developers underestimated the aerodynamic
design requirements. The Atmos is a third Arcas-type vehicle which has
proved to be unreliable. Two other efforts,' the AG-32 ramjet and the
Stratos solid-propellant steam-powered system, both directed toward a
low-cost vehicle_ have not proven practical.
The British, Canadians, Germans and French have all been active
in the meteorological rocket area, but the only operating vehicle designed
for the 65 kilometer range to come from these efforts to date is the British
Skua. This Arcas-type vehicle is sllghtly larger in diameter and lengththan Arcas and uses a recoverable booster to increase launching velocity.
Cost data is not available to us, but it appears to be a very expensive
system. The Japanese have developed an Arcas-t'/pe vehicle, the MT-135which is about twice the size of Arcas and reaches the same altitude.
From a survey of current vehicle programs, it appears that efforts to
compromise between Arcas and booster-dart type vehicles have not met with
significant success, in most instances, the developers appear to have under-
estimated the aerodynamic propulsion and structural design requirements forthese vehicles.
in 1965 NASA-LRC awarded a contract to North American Aviation,
Inc. to conduct a study to define a state-of-the-art rocket vehicle which is
suitable for synoptic meteorological soundings. The apogee altitude chosen
for this study was 65 km, and the various rocket vehicle design studied werea single stage, a booster dart, a dual-thrust single stage, and a two stage
configuration. All designs employed solid-propellant rocket motors. An
Arcas-type 4.5 inch diameter single stage vehicle was found to be optimumafter consideration of a number of factors such as reliability, versatility
and cost. The burning time was reduced from the Arcas value of 29 seconds
to 19 seconds to reduce the wind sensitivity. Howeverr the propellant grainweight was even less than that of the Arcas and so was the total impulse even
though quite a highvalue of specific impulse (248.5 seconds) was used in the
calculations. The trajectory calculations appear to be quite optimistic in
view of the increased drag losses due to the reduction in burning time, and
the specific impulse value appears to be higher than obtainable with currentstate-of-the-art low cost rocket motors.
A major factor in the choice of the single-stage vehicle was versatitlit_
in the payload-carrying capacity. Measurements of wind, temperature, press-ure, density and ozone concentration were cited as being desirable on a single
- 236 -

flight. This led to the assumption that it would be desirable to retain a
significant amount of instrument package installation flexibility in the
design of the payload compartment to incorporate future sensors. Modelsof existing Arcas telemetry packages, i.e., AN/DMQ-9, were also used
for payload size requirements. Aside from the problem of over-estimating
the performance of this vehicle, it now appears that the requirement for
versltility in payload volume is a false requirement for the routine meteoro-logical rocket.
In 1965 the Atlantic Research Corporation completed a study forUSAF-CRL to investigate the optimum meteorological sounding rocket
configurations from among off-the-shelf rocket motors for missions to 100 km,
150 km and 200 kin. Single stage, booster dart and two-stage vehicles
were synthesised from among sixty-five available solld-propeilant rocket
motors to determine the optimum vehicles for the missions as defined below:.
Mission Apogee
Weight Diameter Altitude
(Ibs) (in) (km)
A 15 2-5 100
B 15 2-5 150
C I 0 4.5-6 200
D 20 6 200
Although 225 vehicle combinations were found which would meet
the specific performances, these systems were further evaluated by con-sideration of the factors as follows:
ReliabilityPayload Diameter Versatility
All-Weather Launch Capability
Handling Requirements
SafetyAcceleration Loads
Aerodynamic HeatingTemperature LimitationsCost
- 237 -

The results of the study indicated that single stage vehicles are
not useful for light weight meteoroioglcal payloads such as specified for
the study. This is because fairly large motors must be used for the highaltitude performance and these large motors would require ballast in the
payload section for adequate stability. Oversize payloads or ballast
weight were not allowed under the ground rules of the study. Theserestrictions have had a significant effect on the study results. Booster
dart vehicles did not rate high in the study because of the payloaddiameter limitations imposed by the study and the value rating scheme
which was used. Although twenty-one booster dart vehicles qualified onperformance basis, they were severely down-rated on grounds of having
small available payload diameters, large motor sizes and handling. The
two-stage vehicles were scored as the first twenty desirable vehicles
for each of the four-performance classes. Thus1 the study results would
indicate that for the meteorological rocket requirements above 100 kin,two-stage vehicles are probably the best overall choice. The proposedbest choices are tabulated in Table 6-2.
It is interesting to note that the Arcas appears as the second stagefor the first four vehicles of categories A and B, and for the first nine
vehicles of category C. Loki second stages rate almost equal to Arcas
for category A and appear to also be desireable for category B requirements.The larger diameter requirement of category C dictates the use of the Hopi IV
in place of the Loki. Very few successful candidates were found for
category D (6-inch diameter minimum payload to 200 kin) and even thosefew had low value scores. These vehicles were all quite a bit large and
more expensive than the current concept of a meteorological rocket wouldallow.
As with previous studies of optimum meteorological rockets, this
ARC study has suffered from too generalized payload requirements, rather
arbitrary ground-rules_ and a quite subjective value judgement scoringsystem. A meteorological rocket which is to be used frequently should be
designed for the exact measurement instrumentation to obtain the required
data throughout the required altitude region at the lowest possible cost.
There is much too great a difference between a two-inch and five-inch
diameter payload for them to be considered in the same category. The
study ground-rules of not permitting ballast or over-slzed payloads (largerdiameter payload than the final stage rocket motor) are unrealistic limita-
tlons which arbitrarily restrict the number of possible vehicle combinations.
- 238 -

TABLE 6-2
SUMMARY OF ARC ROCKET STUDY
CLASS
PayloadP/L Dia.Altitude
15_ibs.
2to 5in.100 km
®15 ibs.
2 to 5 in.
M=3.5 at 100 (150) km
RANK ROCKETS SCORE ROC KETS SCORE
1 Judi-Arcas
2 Hasp II - Arcas3 Falcon-M58-Arcas
4 Z uni-Arcas5 Judi-Judi6 N PP Boost-Arcas
7 Judi-Hasp8 Falcon-M58-Judi
9 Hasp-Has p10 Sup. Falcon-Arcas11 Falcon M58-Hasp12 Hasp-Jucli
13 Spar. 111-6B Side 1-A14 Spar. Sus-Side 1-(:15 Falcon M58-Side 1-(3
16 Spar 111-6B-Zunl17 Zuni-Judl18 Deacon-Side I-A
19 Hopi Ill-Side 1-A20 Falcon-Gar II-SI-C25 Zuni-Side I-C
30 Judi-Hopl II40 NOTS-Boost-Arcas
FirstDart #42 Hawk-Dualt.
Sec.
Dart //48 Hopi IV
Third
Dart //58 Gar 9
LastRated _ 104 Terrier-Arcas
Vehicle Boost Boost
83.981.881.4
76.273.572.872.4
72.472.271.871.2
71.070.468.568.2
67.267. I66.7Aero66.064.663.762.0
61.8
60.5
58.0
40.2
Spar. Sust-Arcas 78.6Side 1-A Arcos 76.3
Aero i. Sled-Arcos 75.4Mauler-Arcas 72.4
Spc=r111-6B-Side 1-C 72.1Falcon Gar II-Arcas 71.4Side 1-C-Side 1-(3 69.0
Arcas Boost-Hopi IV 68.4Cherokee-Side 1-C 67.9
Spar. Sust-Jud| 66.8Hopl Ill-Side. I-C 66.4Aeron.Sled-Side 1-C 66.3
Spar. Sust-H asp 66.3Side. 1A-Judi 66.0
Hopi II-Side 1-C 65.7Hopl IV-Side 1-C 65.4Side 1A-Hasp 65.1Yuma 1 -Side 1-C 64.1
Aeroj. SlecI-Judi 63.8NPP Boost-Hopi IV 63.0AeroB. Boost-Side 1-C 61.9Deacon-Side 1-C 60.0
Upstart-Side 1A (Bo) 58.0
//62 Black Brant 10" 49.4
//67 Recruit 43.6
_68 Lance 40.3
//69 Terrier-Dart 34.7MK-I 2 Boost
- 239 -

TABLE 6-2
SUMMARY OF ARC ROCKET STUDY - continued -
CLASS
PayloadP/L Dia.Altitude
10_lbs.
4.5 to 6.0 in.
200 km
®20 Ibs.
6.0 to 12 in.
200 km
RANK ROCKETS SCORE ROCKETS SCORE
1 Spar. Sust-Arcas
2 Spar. 111-68-Arcas
3 Aeroj-Sled-Arcas4 Cherokee-Arcas
5 Mauler-Arcas
6 Vuma 1-Arcas
7 H opi II -Arcas8 Side, 1C-Arcas
9 Hopi 1--(2 Arcas
10 Spar. Sust.-Hopi IV11 Aerob Boost-Areas
12 Deacon-Arcas
13 Falcon M58-Hopi IV
14 Mauler-Hopi IV15 Genie MD-1 -Arcas
16 Cherokee-Hopi II
17 Mauler-Hopi II
18 Builpup-Arcas19 Lacrosse-Side IIC
20 Apache-Side 1-C
25 Spar. Sust-Hopi II30 Gar 9-Side 1-C
40 Bullpop-Hopi III
First
Dart _37 Tomahawk 406
Sec,
Dart #43 Black Brant (17")
Last
Rated #45 Black/Brant (10")
Vehicle (HVAR)
71.5
70.9
68.268.1
68.0
66.9
66.8
65.5
64.8
63.262.2
61.0
61.0
59.8
59.5
59.1
58.2
57.8
57.6
57.4
59.7
55.5
48.6
50.2
43.0
31.8
Javel. Ill-Viper 2B
Recruit-Viper 1BYardbird-Kiva 1
Genie MD-1-Kiva 1
Hawk Dual-Deacon
Javel. Ill-DeaconLacrosse-Kiva 1
#7 Lacrosse-Kiva 1
51.4
48.8
48.2
47.4
47.0
45.0
44.7
44.7
- 240 -

Value judgements concerning the tradeoff of merit points for such factors
as aerodynamic heating, maximum dynamic pressure, propellant safety,vehicle reliability and maximum acceleration are almost completely sub-
jective. These factors may not be at all pertinent depending in many cases
upon the specific payload. In general, vehicle reliability estimates areworthless for vehicles yet to be developed, if a particular vehicle and pay-
load can withstand a certain dynamic pressure and aerodynamic heating,there is no value advantage in reducing these factors. Either the system
performs or it does not. The validity of the final results of this study can
be questioned on the basis for determining the relative importances among
the various rating factors.
in spite of the shortcomings of the study, there is presented a gooddeal of detailed information which is quite useful for future planning of
rocket vehicles. Some of the performance data, however, are not veryaccurate and should not be considered as valid without some further check-
ing. For instance, the Viper 2B-Dart (2.0 inch diameter) is shown as
achieving an apogee of only 3.50, 000 feet, while subsequent flight testsof this same vehicle resulted in apogees as high as 435,000 feet.
The Arcas has been the primary meteorological rocket network and
60 km support vehicle for the last six years. Although the systems reliability
started out at a relatively low level, it gradually improved over the yearsto a level of about ninety percent. However, over the past year or so this
reliability level has suffered somewhat.
At the current time, it appears that the Arcas is being phased out
as the primary 60 km meteorological rocket infavor of the instrumentedLoki Dart vehicle. This Loki Dart system has been qualified and standard-
ized by the Air Force as the Meteorological Probe PWN-8B. The Lokl
Dart system with a ram-air decelerator (Starute) and a 1680 mHz temperature
measuring payload (Datasonde) currently is 42 percent of the Arcas-Arcasonde
cost and this figure has been obtained at fairly modest production rates.Increased production requirements should reduce this cost ratio to approximately
one-third. An additional advantage of the Loki system is a reduction of the
wind sensitivity from a value of 1.20 nm/knot for the Arcas to a value of0.32 nm/knot for the dart.
Lokl Dart vehicles have been used for years to dispense chaff for
routine wind data. Current Loki Dart chaff systems are routinely dispensing
chaff to altitudes of 250,000 feet from sea level launch sites and 280,000
feet from WSMR. A high energy Loki motor was developed two years ago by
- 241 -

Space Data for the Army to obtain chaff winds to 2801000 feet from sea
level sites. The Hopi Dart and Cajun Dart vehicles were developed for
NASA-MSFC to obtain winds to 90 km with chaff payloads from Cape
Kennedy in support of the Saturn. Just this year the Super koki vehicle
has been developed to obtain winds to 90 km with chaff payloads fromCape Kennedy in support of the Saturn. The Super Loki vehicle has been
developed for NASA-MSFC to replace the Hopi Dart and Cajun Dart with
a lower cost system for the high altitude chaff winds requirement. An
instrumented dart for the Super 1.oki is currently being developed to obtain
winds and temperatures to a higher altitude than the capability of thecurrent PWN-8B system.
Instrumented payloads for the higher altitude measurements have
historically been flown with the larger geophysical rockets such as the
Aerobee-1501 the Nike Cajun, the Nike Apac he and others. A significantbreak-through a few years ago was the development of the Sparrow Arcas for
soundings to about 4751000 feet with moderate size (4.5-inch diameter)
and moderate weight (16-1b) payloads. Other versions of the boosted Arcashave been developed for altitudes between 200,000 feet and 475r000 feet.
The Viper Dart has just recently been developed for carrying the
Robin passive inflatable sphere to an altitude of 125 km. Further develop-
ment efforts are currently being expended to increase the Viper Dart altitude
to 140 kin. The dart has a 2-inch diameterr weighs 29.5 pounds and has apayload volume of 46 cubic inches.
- 242 -

6.3 Current Vehicle Systems.
6.3.1 General.
Although there have been a number of attempts to develop optimized
meteorological rockets over the past few years, the only ones currently beingused on a routine, synoptic basis are the Arcas and the Loki Dart. Since
reliable instrumentation has been developed for the Loki vehicle, it is
currently replacing the more expensive and wind-sensitive Arcas for the
majority of the Meteorological Rocket Network and routine support launch-ings. Thus, the Arcas is gradually being relegated to the less frequent
research soundings where the versltility in payload diameter is required.
Until a GMD-2 transponder-type telemetry instrument is developed for
the Lokl system, however, the Arcas will still be used routinely withthe AN/DMQ-9 transponder sonde at the few locations requiring a GMD-2
track. For routine measurements above 65 km the Super Lokl and the Viper
Dart are currently being employed to measure chaff winds and falling spheredensities and winds respectively. The various boosted Arcas vehicles
available have had limited use, generally for special research payloads.
The various Nike boosted vehicles have been used for large research pay-
loads, and are too large and costly to be considered seriously for routinemeteorological sounds. The two foreign meteorological rockets, Skua 1,
(British) and MT-135 (Japanese), are basically Arcas-type vehicles which
appear to have no particular advantage over the Arcas. A summary of the
current meteorological rocket vehicles is presented in Figure 6.3-1 andTable 6-3.
Although the monthly Data Report on Meteorological Rocket Network
Firings lists twenty-six meteorological rocket types, most of these vehicles
are either obsolete or redundant. All of the Lokl typevehicles of Table 6-4are essentially the same, and the only operational version of the instrumented
Loki is the PWN-8B. The obsolete vehicles from the Data Report are listed
in Table 6-5. More detailed information on the currently active vehicles arepresented in the sections which follow.
- 243 -

180"
140'
12.0.
fO0 "
I 80'
i 60'
.40,
_0'
FIGURE6.3-1 METEOROLOGICAL ROCKET CONFIGURATIONS
-244-

uJ,,..I
u-rILl
>Im
vu0
.J
U0
I il
,o 0
J 0c_m uJ
mmm
[...
Zmira
N'
umm
0>-
:)
V
mmm
-J
O_Jm
m*l
i'--"
muJ
U"r"mmm
>
"0 ,40
® _ o >_0 U
U ',/ U -_®o .,_ .,__o":" - o _ > _ o --o_
Q._ -,m- ::)._ C _ U
_ 0 "0 -_ 0°--•1= • ".1_
® ,_ ___ -_ __
>>>>>
-oXXXXX
• C E E _ C
°_ o_ _ _ _ _ _
E_
0 _
2
\ \x_a_ ;\\ xx\xxxx_00
• eeeeee eeeeeee
_) ._ _ ll) "--"0 "0 "0 "_r"o _ _ _"
E o_
E EEEEEE
--_
EE_E EEEE__E EE
<:._ <:.--v _-,-I_ Q.._ 0"_
•oU_ .- _--r
- 245 -

TABLE 6-4
LOKI DART VEHICLES
JUDI
LOKI I
ROCKSONDE 200 (Obsolete)
HASP I
HASP II
HASP III
TALLY HI (Obsolete)
LOKI DART
PWN-8B
- 246 -

TABLE 6-5
OBSOLETEVEHICLES
LOKI I
JUDI
ROCKSONDE 200
HASP I
METROC
BOOSTED METROC
DEACON ARROW
ARCHER
RAVEN
HOPI DART
TALLY HI
HASP III
SIROCCO
CAJUN
- 247 -

6.3.2 Arcas.
Sucha great deal of information hasbeenpublishedconcerningthe Arcas, that to include a detailed description here would be painfullyredundant. Therefore, only a brief descriptionwill be given.
TheArcassoundingrocket is an unguidedvehicle with a diameterof 4.5 inches and is designed to carry payloads of 12 pounds or less toheights in excess of 200,000 feet when launched from sea level. Four
fixed fins stabilize the vehicle during flight. A pyrotechnic separationdevice is included to separate the payload from the missile at peak
altitude. The rocket is designed for launching from a specificallydesigned closed-breech launcher to reduce its inherent wind-sensitivityto a somewhat tolerable level.
A cross-section of the Arcas rocket vehicle is shown in Figure 6.3-2.
The rocket is 4.5 inches in diameter, 90.9 inches long and weighs 77 pounds
when provided with a nominal 12-pound payload. The high performance
rocket motor is powered by an end-burning solid-propellant grain, generating
a 336-pound thrust for approximately 30 seconds. The application of long-
burning propellants is advantageous because acceleration is experienced
over a long period of time, peak g-loadlng is minimized and more efficient
conversion of thrust to vehicle velocity is realized based on the greaterpercentage of thrust time in a more rarefield region of the atmosphere.
The Arcas has a cylindrical parachute container threaded to thehead cap of the motor case. The parachute is packaged in to this section
and the forward head closure of the parachute compartment is secured with
three shear pins. The barrel section of the plastic nose cone slides insidethe forward end of the parachute container. The active payload is secured
to a metal instrumentation base plate which is secured, in turn, to a center
stud bolt by means of a lock-nut. The nose cone may be secured to the
instrumentation base plate by set screws, or, if nose cone jettison is desired,
by six steel balls which fall away upon expulsion of the parachute-payloadcombination. The steel-ball separation device permits exposure of sensing
elements to the atmosphere during descent of the payload.
- 2#8 -

V
_L_
_ L_
i
r'
%i
_._/¸ _
Ii!iI
!/
Y_: ,
_5
I-,-
W
vU
0
t.)
'-r-l..,-
I
o
- 249 -

A gas-generator separation device mounted in the head cap of the
rocket motor functions at apogee, separating the parachute and instrumenta-
tion section from the rocket motor. This separation device incorporates apyrotechnic delay column which is activated at termination of the propellant
burn phase, providing a 130-second function period from rocket lift-offto payload separation. The gas-generator, acting on the after closure of
the parachute container, expels the parachute, instrumentation and nosecone from the burned-out motor by piston-type action.
The Arcas nose cone (Figure 6.3-3) provides a volume of 140 cubicinches for instrumentation. An additional 150 cubic inches of volume can
be utilized if the parachute is not required, or, for every large payloads,
as many as 127 cubic inches can be obtained by extending the parachute
cylinder or cylindrical section of the nose cone. in the nominal activepayload configuration section, the nose cone, instrumentation, base plate,
parachute container, and associated components weigh four pounds. The
parachute weighs an additional 2.3 pounds, making the gross component
weight 6.3 pounds and permitting up to 5.7 pounds active payload weightfor the nominal configuration. By use of an extended payload section and
parachute container, payloads up to 20 pounds can be accommodated.
The Arcas Robin balloon is a variation of the basic Arcas rocket
system design. The payload consists of a 1-meter-diameter mylar balloon
bearing an internal corner reflector for passive radar tracking purposes.
The balloon weighs 0.3 pound and is inflated by chemical action upon
expulsion from the rocket at apogee. In the Robin configuration, the para-
chute container is eliminated, and the nose cone is attached directly to themotor case by means of a threaded adaptor sleeve. The Robin rocket vehicle
is 80.8 inches long and the total weight is 72.5 pounds, including ballast
required to maintain vehicle stability brought about by the extremely light
balloon payload. Separation of the Robin balloon is accomplished by means
of the standard Arcas separation device.
Major Arcas parameters are listed in Table 6-6.
The rocket motor (Figure 6.3-4) contains an end-burning charge of
plastisol type solid propellant. The motor case consists of a one-plece steelouter casing with an insulator liner. The nozzle structure is a tapered
graphite insert supported by the tapered after-end of the case. A steel
retaining ring, welded to the head end of the case, is used to secure the
- 250 -

--o_ m o
e_
×_ -_
t
!
I,u
Z0U
0'7
U
?',,0
,v
0u.
- 251 -

TABLE 6--6
ARCAS
ROCKET SYSTEM DIM ENSIONS
PARAMETER
Length ( in.)Overall 90.9
Rocket motor 60.8
Parachute container 12.0
Nose cone 18.1
Diameter ( in. ) 4.5
Fin span (in.) 13.0
Fin area(4fins) (in. 2) 94
Interval volume ( in. 3 )Parachute container 140Nose cone 170
Nominal weight (Ibs.)Total vehicle 70.5Motor burnout 29.5
Nose cone 1.5
Parachute container (loaded) 4.0Rocket motor 65.0
* Does not include instrument package and instrument base, which total 4 to
6.5 Ibs. depending on the type of rocketsonde payload.
- 252 -

7
/1 NOZZLE INSERT
2 MOTOR CASE
3 INSULATING LINER
4 RETAINING RING
5 HEAD CLOSURE CONTAINING
PAYLOAD SEPARATION DEVICE
LEGEND
3
/6
4
i ,
J !
/5
6 END-BURNING PROPELLANT
CHARGE
7 IGNITER ASSEMBLY
8 FLANGE FOR LAUNCHING PISTON
ATTACHMENT
FIGURE 6.3.-4 CROSS-SECTIONAL DIAGRAM OF THE ARCAS MOTOR
- 253 -

motor head closure and also provided a threaded joint for attachment
of the payload sections. The motor is delivered completely assembled
and cannot be disassembled in the field. Nominal performance character-istics of the motor are shown in Table 6-7.
A pyrotechnic device is used for payload separation and is an
integral part of the motor head closure. This device contains a delay
column of pyrotechnic material that burns for 100 seconds. It is ignitedas combustion of the propellant nears completion after approximately 28
seconds. This delay column in turn ignites a gas-generating charge, which
separates the payload from the expended rocket motor at a relative velocityof 50 feet per second with a maximum acceleration of less than 50 g's.
The igniter is packaged separately for shipment and is installed
through the nozzle of the rocket just prior to firing. It employs an electric-
ally activated squib and five grams of pyrotechnic booster compound. Theparachute container assembly, including parachute, is provided as a sealedunit and cannot be disassembled in the field. It is coupled to the motor
case by connecting a lanyard to an attachment hole in the case headc I osure,
The major components of the Arcas are shown in Figure 6.3-5.
A closed breech launcher is normally used for launching the Arcas
rocket. The major components of the launcher as shown in Figure 6.3-6are a 20-foot tube to guide the vehicle during initial acceleration, a free-
volume cylinder to retain the exhaust gases, and a base assembly constructed
to permit azimuth and elevation angle settings. Access to the launcher for
loading is provided by a hinged breech plate on the bottom of the free-
volume cylinder. The breech plate is equipped with a connector for the
firing line and the igniter leads.
In operation as indicated in Figure 6.3-7 the free-volume cylinder
entraps the exhaust gases of the burning rocket motor. These gases exert
pressure on a piston attached to the nozzle end of the rocket vehicle,accelerating the vehicle up the launching tube. The rocket is centered and
supported in the tube during launching by four plastic spacers that fall awayfrom the rocket along with the piston as the rocket leaves the tube.
- 254 -

TABLE6.7ARCASROCKEI MOTOR PERFORMANCE CHARACTERISTICS
CHARA CTERI STI CS TEMPERATURE (o F ) NORMAL VALUE
Average thrust ( Ibs ) - 10
+70
+110
268336
385
Burning time ( se¢ ) - 10
+70
+110
35.4
29.024.8
Average pressure ( psi ) - 10+ 70
+110
_5
1020
11_
TOTAL IMPULSE (Ib - sec)9089
- 255 -

\
. _56 "

LAUNCHING-TUBE ASSEMBLY
FREE-VOLUME-CYLINDER ASSEMBLY
/ A Ux I LIARY
GAS-GENERATOR ASSEMBLY
AZ IMUTFI-TABLE ASSEMBLY
BASE ASSEM BLY
FIGURE 6.3-6 MAJOR COMPONENTS OF THE CLOSED-BREECH ARCAS LAUNCHER
- 257-

I !
FIGURE 6.3-7 PrincipLe of Operation of the Arcas Closed-Breech Launcher
- 258 -

If desired, an auxiliary gas generator which is incorporated into
the free-volume cylinder may be used. This will increase the launching
velocity over that obtainable with the basic launching system. The gasgenerator contains a propellant charge that generates additional gas
pressure into the cylinder. The generator is fired mechanically by gas
pressure from the launcher transmitted through a high temperature, high
pressure hose. The U. S. Navy at PMR has recently developed a com-
pressed air system to be used in conjunction with the Arcas launcher toaccomplish the same objective.
Utilization of the gas generator technique results in an increase
of the Arcas rocket launch velocity. In the cctse of the rocket-sonde
system the increase is from 150 feet per second to 230 feet per second.This has the effect of reducing the Arcas wind sensitivity slightly.
Typical Arcas flight performance values are shown in Table 6-8for 88° and 84° launch elevations for both the Robin and Arcasonde
configurations, with and without the launcher gas generator.
6.3.3 Loki.
The kokl meteorological rocket sounding system is designed to measure
temperature and wind velocity as functions of altitude to a height of 65 km.
A sketch of the Loki rocket system is shown in Figure 6.3-8.
The rocket is launched from a helical-railed launcher. The vehicle,
consisting of a rocket motor and payload-bearing dart_ is propelled to
a motor burnout hight of 5, 000 feet where the dart is separated from therocket motor. The dart then follows a ballistic trajectory to a peak height
where the payload is expelled from the dart. The payload consisting of
the temperature sensing device and small radio-frequency transmitter thendescends on a radar-reflective parachute or other decelerator.
Other payloads commonly employed in the koki system are radar-
reflective chaff dipoles and radar-reflective parachutes for the determination
of wind velocity while radar-reflective inflatable spheres have been utilized
for the determination of stratospheric air density and winds.
The rocket vehicle is comprised of two stages, the booster motor and
the unpowered dart which contains the payload. The Loki motor is an internal-
burning type which provides an average thrust of 890 kilograms for a period of
- 259 -

TABLE 6-8
FLIGHT PERFORMANCE CHARACTERISTICS OF THE ARCAS SYSTEMS
FOR 88° AND 84 ° LAUNCH ANGLES
STANDARD LAUNCH
Max. altitude (ft)Time to max, altitude (sec)
Max velocity (fps)Altitude at burnout (ft)
Launch velocity (fps)Acceleration at launch (g)
ROCKETSONDE (12 Ibs) ROBIN (8 Ibs)
88 ° QE 84 ° O.E 8,8° QE_ 84°QE
197,000 181,000 232,000 21 5,000124 120 135 130
3, 440 3,420 3,760 3,74051,000 50,000 56,000 54,000150 150 160 160
33 33 36 36
GAS GENERATOR LAUNCH
Max. altitude (ft)Time to max. altitude (sec)
Max. velocity (fps)Altitude at burnout (ft)
Launch velocity (fps)Acceleration at launch (g)
ROCKETSONDE (12 Ibs) ROBIN (8 Ibs)
88° qE 84° RE 88° (_E
21 O, 000 198,000 247,000 232, 000128 125 139 134
3520 3510 3860 3830
53, 000 52,000 57,000 55,000230 230 250 250
90 90 94 94
- 260 -

IMILl
vUC)
c_Z
Z
0
.-J
_J
0
Oa_
0
i.--
r_I
vC)._J
LU
-l-IB
O0I
UJ
I.L
- 261 -

2 secondsthusproducinga rocket velocity of 1500meters/secat analtitude of 1500meters. At this point the motor is separated fromthe dart which then follows a ballistic trajectory to an altitude of 65
km. At this altitude, and approximately 110 seconds after launch time,
the payload is ejected by an explosive charge, the ejection time being
determined by means of a pyro-delay fuze which is activated at the timeof rocket launch.
The dimensions of the Loki rocket system are shown in Figure 6.3-9
while Table 6-9 lists the principal physical characteristics of the rocket
and Figure 6.3-10 shows a cross-sectional view of the various components
which comprise the dart payload for the determination of temperature and
wind velocity in the stratosphere.
The balloon dart carries an inflatable plastic balloon as the sensingdevice. The balloon contains a corner-reflector radar target and is ejected
from the dart at an altitude of 65 km to form a sphere one meter in diameter.
The sphere is tracked by radar as it descends through the atmosphere. Fromthe radar determination of balloon position as a function of time, air density
and wind velocity are determined as functions of altitude. The data
reduction techniques utilized for the determination of these parameters are
contained in the bibliography of this manual.
The chaff dart carries radar-reflective dipoles as the sensing elements.
The dipoles are ejected from the chart in the neighborhood of 65 km. The
tracking of the chaff cloud by a ground-based radar system serves to determine
the position of the chaff at successive time intervals. From the radar deter-
mination of the cloud position as a function of time, stratospheric wind
velocity is determined as a function of altitude.
Two types of chaff are commonly utilized. Copper chaff 1.27 x 10⁻²cmin diameter is used for the determination of wind velocity at altitudes between
65 and 15 km. At 15 km the copper chaff fails to provide an adequate target
for the tracking radar because of the excessive dispersion of the chaff dipoles
forming the chaff cloud. Nylon chaff 8.8 x 10⁻³cm in diameter has been usedto determine wind velocities at altitudes from 85 to 60 kin.
The Meteorological Probe PWN-8B (Instrumented Loki Dart) has been
developed, qualified and successfully flight tested for final standardizationby the U. S. Air Force to make available a low cost meteorological sound-
ing rocket system for operational use. The major components of the probe
- 262 -

Z0I,.-
:::)
0I,I_
Z0U
I.I1.1...I
U
'-r
I,--
!
0..I
o..
W
::b
0I.I-
,J
- 263 -
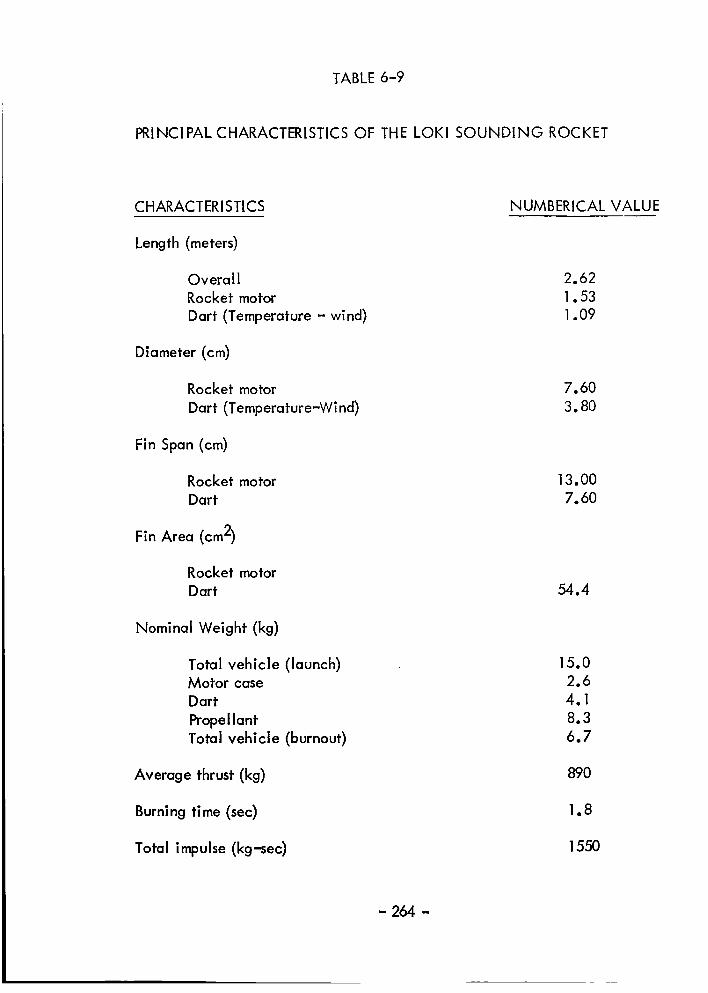
TABLE 6-9
PRINCIPAL CHARACTERISTICS OF THE LOKI SOUNDING ROCKET
CHARACTERISTICS NUMBERICAL VALUE
Length (meters)
Overall 2.62Rocket motor 1.53
Dart (Temperature - wind) 1.09
Diameter (cm)
Rocket motor 7.60
Dart (Temperature-Wind) 3.80
Fin Span (cm)
Rocket motor 13.00
Dart 7.60
Fin Area (cm 2)
Rocket motor
Dart 54.4
Nominal Weight (kg)
Total vehicle (launch) 15.0Motor case 2.6
Dart 4.1
Propel lant 8.3
Total vehicle (burnout) 6.7
Average thrust (kg) 890
Burning time (sec) 1.8
Total impulse (kg-sec) 1550
- 264 -

im
t_
r_LU
i---
ZllJ
fJ_
Z
Ill
IIB
LL
O
Z
Oim
UIll
f4_
0
_J
0
!
ILla_
LL
-- 265 -

system include a small solid-propellant rocket motor, a non-propulsivedart which contains the payload, a launcher and a ground-based test
set. The system has been designed for launches at remote sites as well
as at established missile ranges. Atmospheric temperature and wind data
are obtained with this probe to an altitude of 200,000 feet.
The major components of the Meteorological Probe PWN-8B con-
sist of the following:
Rocket Motor SR 71-AD-1 Rocket Motor
Igniter Assembly
Ogive, Instrumentation GroupA/A 37U-26
Dart BodyDart Tail
Launcher, Meteorological Probe
LAU-66/A
Launcher
Test Set, Ogive Instrumentation
Group TTU-273/E
Test Set
Each of these components has undergone environmental and performance
testing, and each component was used in the qualification flight tests.
All of these components have been designed to withstand both storageand operation temperature extremes from -40 ° F to + 140 ° F. The rocket
motor nas been qualified to MIL-R-MIL-STD-810. The test set has been
designed and qualified in accordance with MIL-21200, Class 2 andMIL-STD-108.
The design of the vehicle system incorporates an improved Lokirocket motor and a 1.437 inch diameter dart. The dart design is similar
to that which was developed under the CRL Contract No. AF 19(628)-4164
for a Loki Instrumented Dart System. Figure 6.3-11 presents a photograph
of the vehicle system. Figure 6.3-12 is a dimensioned sketch of the
vehicle config uration.
The dart system design is indicated in Figure 6.3-13. The tailassembly consists of the booster coupling receiver, tail fins, firing line
umbilical receptors1 pyrotechnic time delay and expulsion charge. The
- 266 -

FIGURE 6.3-1 1 PHOTO OF INSTRUMENTED DART SYSTEM
- 267 -

k..
0
N
0
;I
t
"7
0m
z
©
_aco
i
z
- 268 -
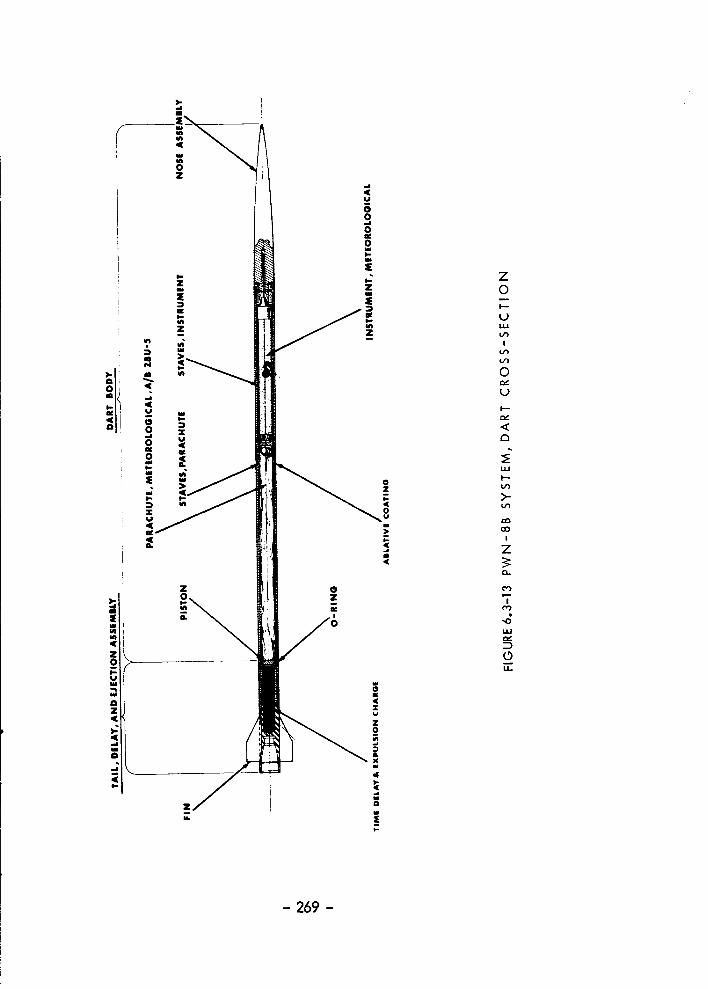
- 269 -

parachute-sonde payload resides inside two sets of split staves which
transmit the ejection piston load directly to the nose cone or ,giveduring expulsion. The staves are also used the sliding the payload
into the dart body during assembly and out from the dart body during
ejection. Both the dart body and the staves contain a payload
umbilical hole for external power and calibration. The staves arelined with an asbestos paper to reduce the heat transfer from the
dart body into the payload• The staves are split to permit deploymentof the parachute and instrument with minimum interference• The nose
cone or ,give is shear-pinned to the dart body so that during expulsion,
the ,give separates from the dartr leaving the front end of the dart
body open for payload ejection. The ,give has a drilled hole down thecenter for the sonde antenna to make contact. The ,give is isolated
from the dart body by means of an electrical insulator. Thus, the ,giveacts as an active antenna while the dart body forms the ground plane.
The operation sequence of the proposed booster-dart vehicle
system is as follows:
•
2.
3•
,
.
,
.
8.
•
Rocket motor and dart time delay ignition.
Initial vehicle motion disengages dart umbilicals.
Vehicle travels up through helical rail launcher
which imparts spin or roll to the vehicle•Vehicle exits the launcher at 180 ft./sec, with a
spin rate of 13 rps• Spin rate at launch is necessaryto reduce effects of thrust misalignment on vehicle
dispersion.Booster rocket burns out at 1.91 sec. at 4, 750 ft.
and 5, 120 ft./sec. Spin rate has decreased to
10 rps.
Dart separates, spins up to 50 rps and coasts to
apogee.Pyrotechnic delay train ignites expulsion charge.
Ejection piston transmits load through packagingstaves to ,give where retaining pins are sheared.
Ejection piston expels payload, staves and ,giveas indicated in Figure 6.3-14.
The rocket motor design is specified by USAF Drawing Number
67D57300 and is an improved version of the koki motor. The total
impulse of the present design is increased by 316 pounds-seconds by
- 270 -

NOSE ASSEMBLY #
ABLATIVE COAT_
INSTRUMENT, METEOROLOGICAL
STAVES , INSTRUMENT
STAVES , PARACHUTE
PISTON
PARACHUTE, METEOROLOGICAL,A/B 28U- .5
DART BODY
ABLATIVE COATI NG
FIGURE6.3-14 PAYLOAD EXPULSION SKETCH
- 271 -

increasing the specific impulse and weight of propellant. This has beendone to assure that the minimum apogee altitude specification at an
effective launch angle of 80 ° of 200,000 feet will be satisfied.
A summary of the major design characteristics of the SR 71-AD-1rocket motor is presented in Table 6-10 along with similar data for the
Loki II and HASP type motors. The differences in hardware design betweenthe SR 71-AD-1 and these motors is summarized in Table 6-11. These
improvements in the design and performance of the rocket motor havesignificantly improved both altitude performance and flight reliability
of the system. The rocket motor is specified by MIL-R-83064 (USAF)
Model Specification, Rocket Motor SR 71-AD-1.
The total impulse of the SR 71-AD-1 rocket motor is 4076 pound-seconds, which is significantly higher than the Loki II and HASP Mark 32
Mod O motor impulses of 3,760 pound-seconds. This has been accomplished
by increasing the propellant specific impulse from 223 seconds to 231 secondsand the propellant weight from 16.88 Ib to 18.25 lb. The increase in
propellant weight is due to a high volumetric loading rather than the use
of a higher density propellant. The port volume of the SR 71-AD-1 motoris reduced from the Mark 32 Mod O design, and the nose piece is not
loaded with propellant. The nozzle throat area is also increased to give
a higher thrust at a lower chamber pressure than the Mark 32 Mod O design.The steel ring at the nozzle end of the Mark 32 Mod O is replaced with a
rubber boot to reduce the problem of motor wall-burn throughs at the
junction of the forward end of the nozzle and the motor wall.
A comparison of the ballistic performance between the SR 71-AD-1motor and the Loki II or HASP motors is presented in Table 6-12.
Rocket Motor Hardware Design.
The SR 71-AD-1 rocket motor major hardware components consistof the forward closure, the motor tube, the nozzle assembly, the fins, theforward boot and the aft boot.
- 272 -

TABLE 6-10
ROCKETMOTORMAJOR DESIGN CHARACTERISTICSSUMMARY
Design Characteristics SR 71 -AD-I
Loki il & Mark 32
M od 0 HASP Types
Length (in) 66.06 66.06
Diameter (in) 3.126 3.126
Wall Thickness (in) 0.061 0.061
Weights:
Case (ib) 4.39 4.39Nozzle (Ib) 0.81 1.52
Liner (lb) 0.60 0.50
Propellant (lb) 18.25 16.88
Total (Ib) 24.05 23.29
Motor Mass Fraction
Burning Time (Sec.)
Action Time (Sec.)
0.76 0.73
1.86 1.86
2.04 1.97
Chamber Pressure:
Maximum (psi)
Average (psl)
1,447 1,500
979 1,340
Total Impulse at Sea Level (Ib.--sec) 4,076
Propellant Specific Impulse (sec) 231Throat Area (in 2) 1.41
3, 760223
0.983
Expansion Ratio
Grain Port Diameter (Tapered) (in)
5.44
I. 30-I .00
6.05
1.58-1.00
- 273 -

TABLE 6-I I
HARDWARE DESIGNCHARACTERISTICS COMPARISON
Hardware Design
Motor Case
Nozzle
Nozzle - Motor Case
Junction Protector
Nose Piece Loading
Forward End Seal
SR 71-AD-1
Same
Recessed 0.81 lb
"O" Ring Seal
Rubber Boot
Loki II &
Mark 32 Mod 0
Same
Not Recessed
Steel Sleeve
Steel Sleeve
None Propel lant
Rubber Boot Rubber
TABLE 6-12
ROCKET MOTOR BALLISTIC PERFORMANCE COMPARISON NOMINAL
80 ° F CONDITIONS
SR 71 -AD-1
Total I repulse (Ib.sec) 4,076
Action Time (sec) 2.04
Maximum Thrust (Ib-ft) 2,902
Average Thrust (Ib-ft) 2, 033
Speci fi c I repulse (sec) 231
Loki II & Mark 32
Mod 0 HASP Types
3,760
1.97
2, 380
2, 020
223
- 274 -

LOKI LAUNCHER
General.
Loki type vehicles have been launched utilizing several different
types of launchers such as the standard helical-rail tube, a zero-lengthlauncher, a rail launcher with no spin and a five-inch gun launcher.
Of these techniquest the most successful has been the helical-rail tube
because of its inherent capabilities to induce the spin rate to the vehicleprior to the time it is released for free flight. The helical--rail launch
tube was developed for the original Loki anti-aircraft dart system to
reduce dispersion far greater aiming accui'acy. This launch techniquehas been used for the Loki-Dart meteorological rockets for a number of
years up to the present time with excellent success in restricting dart
impacts to relatively small regions - a significant advantage of the Lokl-Dart system. The LAU-66/A launcher has been designed to a helical-
rail identical in function to the original Loki helical-rail launch tube.
Vehicle Dispersion Considerations.
During the original Loki 1 system development program at JPL,
firings were made using both spiral--rail launch tubes and straight rails.Also, long (14 feet) and a short (7 feet) spiral-rail launch tubes were
compared. The results of a number of firings with each launch system aresummarized below:.
Helical Straight Helical
Launcher Type Rails Rails Rails
Launcher Length (ft.) 14
Launch Velocity (ft/sec) 359
Launch Spin Rate (rps) 18.1
14 7362 244
0 12.7
Average Wind Effect (mil/mph) 1.3
Dispersion w/wind (5 mph) 6.6
Dispersion w/wind (5 mph) 7.3
1.3 1.0
22.8 7.2
-- 7.4
For a hlgh-acceleration, high-velocity system such as the PWN-8B
- 275 -

Probe vehicle the effect of wind at launch and during flight upon impactdispersion is relatively insignificant. This fact leaves the vehicle airframe
and, especially, thrust misalignment as the next major sources of impactdispersion. The dispersion resulting from these mlsalignment factors can
be significantly reduced by imparting spin to the vehicle, before they canalter the course of the rocket vehicle. A critical period for a vehicle
with no spin at launch is just as the vehicle leaves the constraints of the
launcher. The thrust misalignment vector operates immediately upon
launch to turn the vehicle into a new heading without the benefits of any
appreciable aerodynamic restoring forces to resist the moment generatedby the thrust misalignment. Hence, a new heading is taken before the
vehicle has a chance to build up sufficient spin, by means of canted fins,to vector out the misalignment effects.
Firings using the conventional hellcal-rails had less than one-thlrd
of the dispersion experienced with the straight no-spin rail. It was con-
cluded by JPL that the initial spin imparted to the vehicle by the helical-rail launchers strongly reduces the dispersion. The average wind effect
does not seem to be influenced significantly by either straight or spiral talldesigns or launcher length changes, at least from 7 feet to 14 feet. Dis-
persion does not seem to be particularly influenced by launcher rail lengthfor variations of the above magnitude.
Launcher Design.
General.
The LAU-66/A Launcher has been designed as a helical-rail launcher
of moderate length, i.e., 10 Feet long, to maintain trajectory and impact
dispersion at a low value. Increasing launcher length beyond 10 feet does
not significantly reduce either the average wind effect or dispersion, but
makes a more cumbersome and costly launcher. Since the basic vehicle
dispersion for the probe system is so small, i.e., 7.0 mils, accuracy inlauncher settings, launcher rigidity and launcher straightness (lack ofbowing) become limiting factors in making possible a minimum trajectory
and impact dispersion. These factors, in addition to the practical aspects
of cost, mobility and environmental fidelity, have been the main design
goals for the LAU-66/A launcher.
Requirements.
As discussed abovet it is necessary to provide a rigid structure to
support the launch tube to limit the dispersion, in addition to providing
- 276 -

the rigid structurefor the launch tube, the other design goals for thelauncher has been:
.
2.
3.
.
.
.
.
8.
.
Adjustable in elevation to :1:1/4 degree.
Adjustable in azimuth to _ 1/2 degree.
Allow the launch rails to be supported in such a
way that one man can easily elevate the rails intothe launch position or move the rails into the
horizontal position.Provide elevation and azimuth locking mechanisms
which are easily locked and unlocked.Provide a motor retainer stop which is easy toactuate and will withstand the rocket blast of the
motor at launch.Provide access for the umbilical connector to the
instrument.
Provide junction boxes for the firing lines.The basic design shall be such that it can be
assembled in the field with two people without
auxiliary lifting equipment. This has been
accomplished by using a component type construct-ion and limiting the weight of each component to
not more than 240 pounds.Azimuth and elevation indicators are an inherent
part of the launcher.
Description.
The Launcher, Meteorological Probe LAU-66/A (Figure 6.3-15)
consists of four major components: base, pedestal assembly, support assembly,and the rali assembly. The launcher base supports the pedestal assembly,
which in turn supports the support assembly to which the rail assembly is
secured. The rail assembly supports the Meteorological Probe PWN-SB
during launch operations and imparts a stabilizing spin of approximately
10 revolutions per second to the probe as it travels out of the launcherinto free flight. Launch elevation angles are set with the support assembly.
Launch azimuth angles are set with the pedestal assembly. Electrical firing
circuitry for the PWN-8B and the appropriate connectors are provided aspart of the support assembly and pedestal assembly. Major dimensions of
the launcher are presented in Figure 6.3-16.
- 277 -
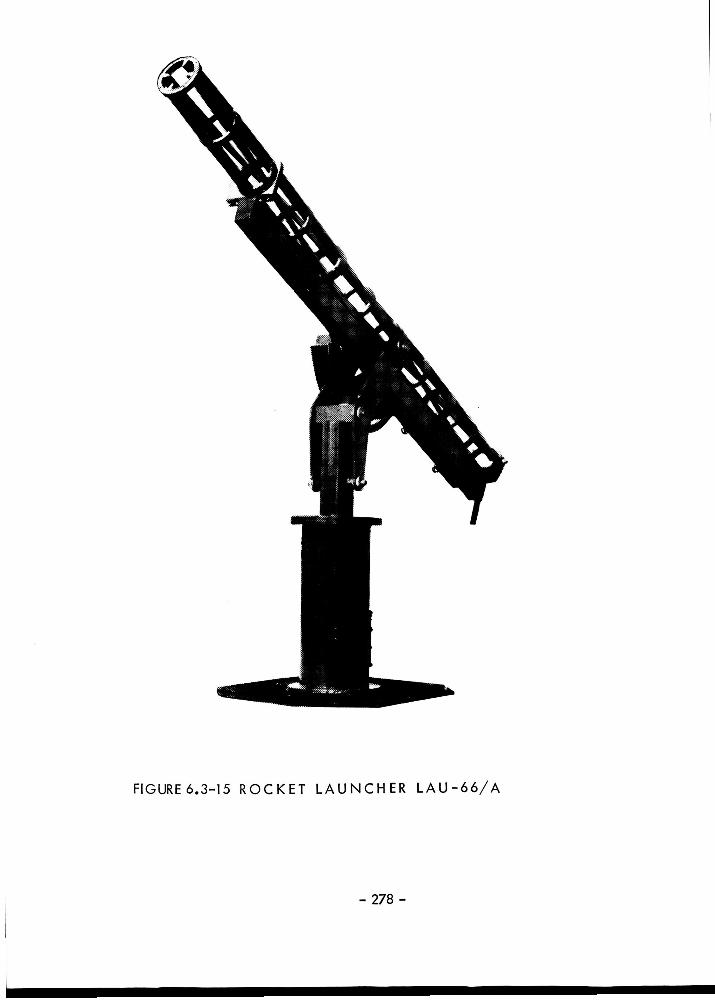
FIGURE 6.3-15 R O C K E T L A U N C H E R L A U - 6 6 / A
- 278 -

i
Ii
I I/J
/
!
m
m
L
O
Z _,,in,
_zjo _j'T
I-0Z
! .
m
,_0
',0!
Uz
.J
0
Z0
Z
r_
0
!
0IJI-
- 279 -
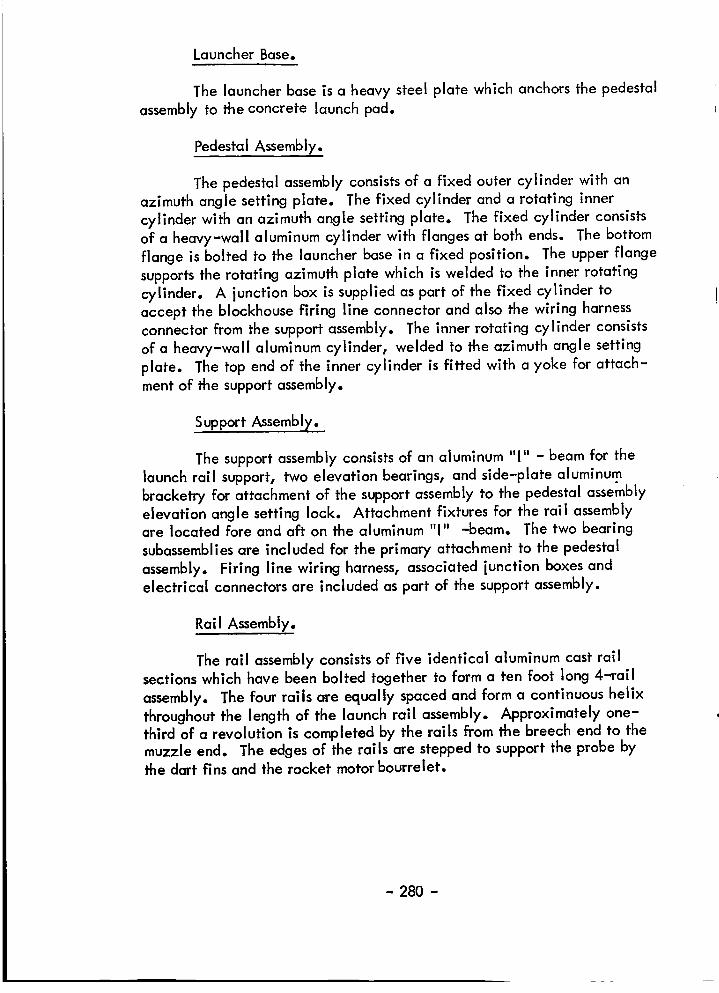
Launcher Base.
The launcher base is a heavy steel plate which anchors the pedestal
assembly to the concrete launch pad.
Pedestal Assembly.
The pedestal assembly consists of a fixed outer cylinder with anazimuth angle setting plate. The fixed cylinder and a rotating inner
cylinder with an azimuth angle setting plate. The fixed cylinder consistsof a heavy-wall aluminum cylinder with flanges at both ends. The bottom
flange is bolted to the launcher base in a fixed position. The upper flange
supports the rotating azimuth plate which is welded to the inner rotating
cylinder. A junction box is supplied as part of the fixed cylinder toaccept the blockhouse firing llne connector and also the wiring harnessconnector from the support assembly. The inner rotating cylinder consists
of a heavy-wall aluminum cylinder, welded to the azimuth angle setting
plate. The top end of the inner cylinder is fitted with a yoke for attach-
ment of the support assembly.
Support Assembly,
The support assembly consists of an aluminum "! °' - beam for the
launch rall support, two elevation bearings, and slde-plate aluminumbracketry for attachment of the support assembly to the pedestal assembly
elevation angle setting lock. Attachment fixtures for the rail assemblyare located fore and aft on the aluminum "1" -beam. The two bearing
subassemblies are included for the primary attachment to the pedestal
assembly. Firing line wiring harness, associated junction boxes andelectrical connectors are included as part of the support assembly.
Rail Assembly.
The rall assembly consists of five identical aluminum cast railsections which have been bolted together to form a ten foot long 4--rail
assembly. The four rails are equally spaced and form a continuous helix
throughout the length of the launch rall assembly. Approximately one-third of a revolution is completed by the rails from the breech end to themuzzle end. The edges of the rails are stepped to support the probe by
the dart fins and the rocket motor bourrelet.
- 28O -

6.3.4 Skua.
The Skua is 226 cm (89 in) long, 13.1 cm (5.15 in) diameter and
weighs 37.5 kg (82 1/2 Ib). The rocket motor case is manufactured from100 t/in 2 steel and is filled with a moderate specific impulse end burning
case-bonded solid propellant, The rocket is fitting with four fins and,
in the parachute role, the nose cone is made of glass fibre. Separation
of the payload compartment is obtained by means of a thermal switch which
operates at the end of motor burning and a time switch which may be pre-
set to achieve the required separation height. These switches close thefiring curcuit to another small solid propellant motor which ejects the
payload compartment clear of the rocketwith a relative velocity of14 m/sec (45 ft/sec).
The boost arrangement is recoverable. It separates from the main
rocket at an altitude of 15 m (50 it) and descends by parachute. The
boost motor can then be returned for refilling and the boost support structure
can be cleaned, inspected and re--assembled for the next firing. It hasbeen found that 85% of the boost and boost support structure can be re-
used after each firing.
A payload space of 8, 200 cu cm (500 cu in) is available and pay-loads of up to 6 kg (13 lb) may be accommodated. The standard equipment
is a British (Irving) radar reflecting parachute of 4.6 m (1 _ {t) diameter
and a sonde transmitter capable of transmitting at 28 m/cs.
Skua has operated successfully from a launch site at South Uistin the Hebrides, and it is in service with the British Meteorological Office.
Performance.
The Skua can reach an altitude of 90 km (295, 000 ft) with a pay-
load of 1.8 kg (4 lb) using a 85 ° launch. This performance is attained
using a 0.2 second boost system giving a launch velocity of 100 m/sec(328 ff/sec). Without the boost the altitude is approximately 66 km
(210,000 ft) for the same payload.
Using the standard boost and launching techniques i.e., correctionfor the ballistic winds, the dispersion of impact paints due to wind lieswithin a circle of 5.3 kilometers radius for 1 m/sec (3.3 miles for 3 ff/sec)
error in ballistic wind for a 72 km (236,000 ft) altitude.
- 281 -

The curves of Figure 6.3-17 illustrate the rocket altitude capabilitiesagainst payload, time and range. The Skua major characteristics are pre-sented in Table 6-13.
Launch System.
The high speed launch system consists basically of a 3-part 54 cm
(21 in) diameter tube mounted on an ordinary commercial vehicle for
maximum mobility. The tube is elevated hydraulically and accurate adjust-ment is carried out by a manual screw acting on the diagonal stays. Azimuth
adjustments are obtained by altering the direction in which the vehicle is
pointing and a sighting bar is placed below the driver's position. It hasbeen found that azimuth accuracies of 1/2 ° can be obtained and elevation
accuracies of 1/10 °.
Loading is carried out by lowering the tube to an angle of 15° and
inserting the complete rocket and boost assembly with the aid of specialloading rods.
6.3.5 MT-135.
The MT-135 is the Japanese version of the Arcas. The MT-135 islonger, larger in diameter and weighs almost twice as much as Arcas. The
burning time is appreciably shorter, the thrust level is greater and the
altitude performance is slightly less than that of the Arcas. A comparison
of the major characteristics is presented in Table 6-14.
6.3.6 Super Loki-Chaff Dart.
The Super koki Dart meteorological rocket system has been developed
for NASA - Marshall Space Flight Center to obtain hlgh-altltude (85 km) wind
data with a low cost rocket vehicle and a radar-reflective chaff payload.
The Super Loki Dart consists of a scale-up of the older Loki Dart system,which
has been in use for many years to gather wind data to altitudes up to 65 km.The Super Loki Dart two-stage vehicle consists of a high-impulse solid-pro-
pellant rocket motor as the first stage, and a non-propulslve dart which
contains the chaff payload as the second stage.
- 282 -

Max altitude varlal/on wilh payload
,,,_ FT[,J_ncher _ 85 ° effeclive
go
++-1.220O*
×" t
. tt 4 s o to t_ 14 _
Payload Mt/m_
(i) Standard hmmcb system with boost(2) Witlma boost
(3) _-_.e_ed
(_
FT
...L--_ !+.w
b-
_]'[-- I,-- =--o Is 3o 45KM
Traieclo_ varialiee with launch mile
(1O-lb l_ylu_l)
KM
gO
6O
3O
FT
-300.0( 0
/// '\\.,_/ \\\
tOO 2OO 300
Ti_ _sscs
Tn_mri_ _mdb_ _ SS"
FIGURE6.3-17 SKUA PERFORMANCE CURVES
- 283 -

TABLE 6-I 3
SKUA- GENERALSPECIFICATIONS
ROCKET (with parachute and sonde)
Overall length with motorDiameter
Weight including filled motor
All burnt weight
Payload weight
Payload volumePeak Altitude (for 10 Ib payload)Burn-out altitude (approximately)
Launch velocityInitial acceleration (max)
Flight acceleration (max)
Boost breakaway altitude
226 cm (89 in)
13.1 cm (5.15 in)
37.5 kg (82 I/2 Ib)14.3 kg (31 1//2 Ib)
4.5 kg (10 Ib)8,200 cu cm (500 cu in)
70 km (230,000 feet)
15 km (48, 000 feet)100 m//sec (328 ft//sec)
57 g
12g15 m (50 ft)
PAYLOAD
Parachute
(Irving Type)Transmitter
TypeFrequency
4.6 m (15 ft) diaMet Office RocketSonde Mk 1
Met 56,000
28 m/cs
LAU N CH ER
Length
Vehicle TypeWeight (vehicle and launcher)Launch tube length
Max launch angle range
6.5 m (21 ft)Bedford RL
5, 084 kg (5 ton)
9.8 m (32 ft)Unrestricted
- 284 -

TABLE6-14
JAPANESE MT-135 VS ARCAS
Total Length
Diameter
Total Weight
Payload Weight
Burn Time
Average Thrust
Max Velocity
Apogee(80 ° launch amle)
MT- 135
3.2m
13.9 cm
68 kg
10 kg
10.5 sec
825 kg
1370 m/sec
55 km
ARCAS
2.3m
11.4 cm
35 kg
5.4 kg
29 sec
155 kg
1050 m/sec
61 km
- 285 -

Altitudes as high as 125 km have been obtained with this vehicle
system during the development flight tests at White Sands Missile Range,Altitudes to 110 km were achieved for flights from sea level launch sites.
A helical-rail launcher has been developed to impart spin or roll to thevehicle prior to release in order to minimize impact dispersion and
associated range safety problems.
The basic Super Loki rocket motor can be used to propel larger
diameter instrumented dart systems to altitudes on the order of 85 km toupgrade the atmospheric temperature profile measurements currently being
conducted by the standard-size Loki.
The Super Loki Dart as shown in Figure 6.3-18 is a two-stage sound-ing vehicle consisting of a solid-propellant Super Loki rocket motor as the
first stage and a non-propulsive dart containing the payload as the secondstage. A dimensional sketch of the vehicle is shown in Figure 6.3-19.
This vehicle is essentially a scaled-up version of the standard Loki Dartvehicle as indicated in Figure 6.3-20.
The Super Loki rocket motor consists of an aluminum case with an
internal burning cast-in-the-case solid propellant. Major design character-
istics of the rocket motor are presented in Table 6-15. An aluminum inter-
stage coupling structure is located at the head end of the rocket motor,The propellant fuel is a polysulfide polymer and the oxidizer is ammonium
perchlorate. The igniter consists of two parallel 1 watt/1 ampere no-firesquibs and an appropriate ignition charge. The igniter is separable fromthe motor and is installed at the launch site. A cross-sectlon view of the
Super Loki rocket motor with the igniter installed is shown in Figure 6,3-21.
The high altitude chaff dart for the Super Lokl system consists of asteel cylindrical body with a steel ogive and an aluminum tail piece. The
cylindrical body contains the chaff payload which is packaged into split
steel staves. The ogive is retained at the forward end of body with shear-
screws which are sheared during payload expulsion out from the forward end
of the dart. The tail piece contains an electrlcally-actuated 145-second
pyrotechnic time delay and a small payload ejection charge. Four steel
fins are roll-pinned into the dart tall for flight stability. The aft end of
the dart tall is boattailed to reduce aerodynamic drag and to be used tomate the dart to the booster. A cross--section view of the chaff dart is
shown in Figure 6.3-22. Major chaff dart characteristics are presentedin Table 6-16.
The payload consists of 0.0127 mm (0.5 mil) "S"-band aluminumized-
mylar chaff.
- 286 -

FIGURE6.3-18 SUPER LOKI VEHICLE CONFIGURATION
- 287 -

100 KM HIGH ALTITUDE CHAFF DART
4.8 In2 Per Fin (4 Ea)
SUPER LOKI M
I
10.0 In2 Per Fin (4 Ea)
1
FIGURE6.3-19 SUPER LOKI CHAFF DART VEHICLE CONFIGURATION
- 288 -
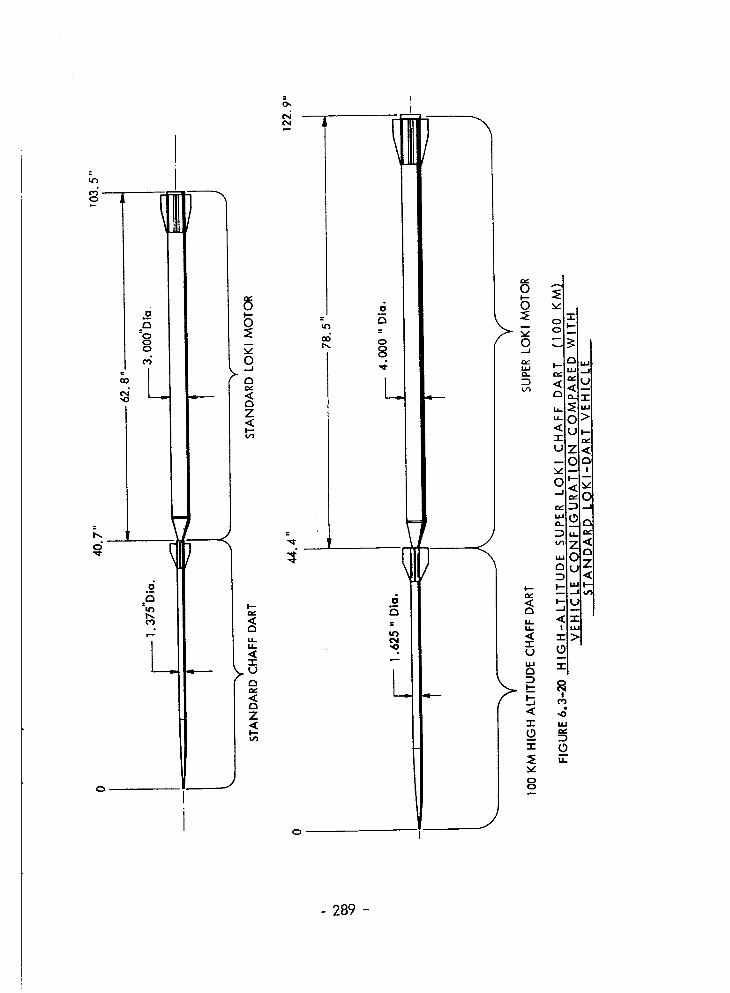
0
I--
U
z
0
o -']0 C _1
-r-U
o,u.I
w.I
I-- I---
•"r" _
i 15
v
8
I.II ..1
_-I "r"
_1_DI>
zl ,_1OI,-,i
g!"u z_.J I--
-..I ¢,¢'1
U
I
>
- 289 -

TABLE 6-15
SUPER LOKI ROCKET MOTOR
DESIGN CHARACTERISTICS SUMMARY
Length (inches)Diameter (inches)
Weights:Inert Motor With Interstage (kg)
Propel lant (kg)
Total (kg)
Motor Mass Fraction
Burning Tir,_e (seconds)
Chamber Pressure:
Maximum (Atmospheres)
Average (Atmospheres)
Thrust at Sea Level:
Maximum (kg)
Average (kg)
Total Impulse at Sea Level (nt-sec)
Specific Impulse at Sea Level
78
4
5.26 (11.6 ib)
16.87 (37.2 Ib)22.14 (48.8 ib)
0.76
2.0
I00.02 (1470 PSig)83.69 (1230 PSig)
2608.20 (5750 Ib)2018.52 (4450 Ib)
3.96 (8900 Ib-sec)
239
TABLE 6-16
SUPER LOKI CHAFF DART DESIGN CHARACTERISTICS
Length
Diameter
Weight
Payload Volume
122.33 cm (48.16 inches)
4.13 cm (1.625 inches)
6.12 kg (13.5 pounds)
491.61 cm 3 (30 inches 3)
- 290 -
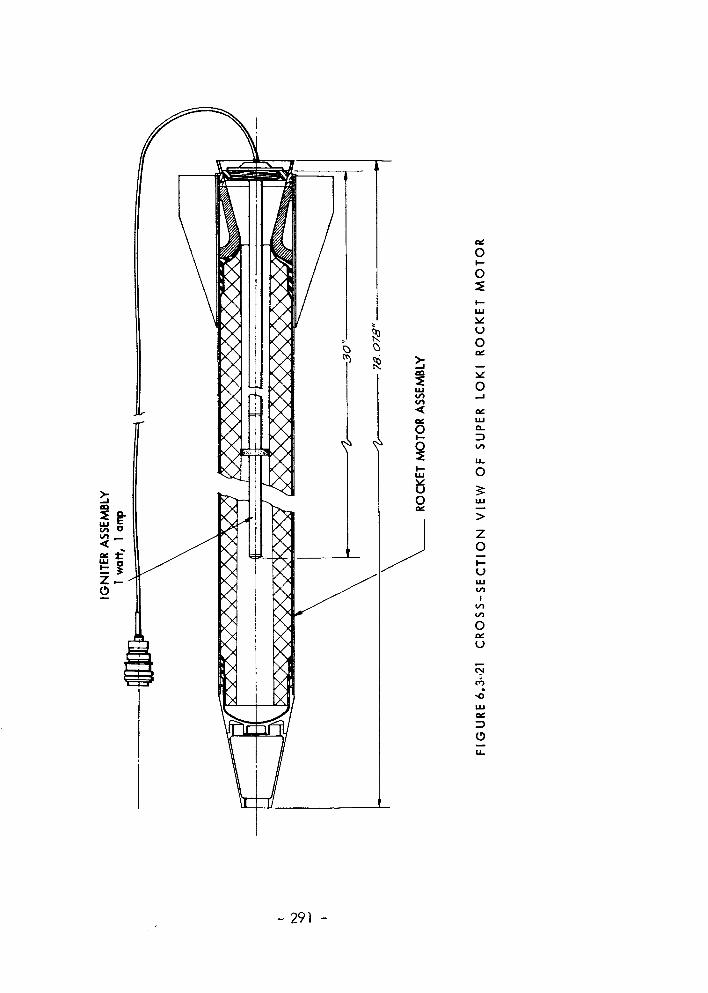
ima
Z--0
II
"ii IX
I Ix
,//
I
I
I,I.I
0
I,--W
U
0
0I--
0
I,,-
U
0
V
0..,I
0
Z0
I'--
ILl
I
0t_
u
0mI.i.
- 291 -

l--
r_
iiii
-r"U
0...I
iii
ii
0
iii
Z0I..-uI,Ll
0
u
!eo
iii
0,'T"
-- 292 -

The Super Loki Launcher consists of four helical rails which complete
approximately one-third of a revolution throughout the launch rail length.
The launch rail assembly as shown in Figure 6.3-23 consists of six castaluminum sections which are bolted together to form a continuous 4.39 m
(12 feet) length. The edges of the rails are stepped to support the vehicle
by the dart fins and the rocket motor nozzle ring. The outside diameter
of the launch tall assembly is 26.04 cm (10-1/4 inches).
The purpose of the launch rail is to impart an 8.5 rps spin to the
vehicle by constraining the dart fins to a helical path during their _ravelalong the launch rails. The aft end of the motor h'avels for 4.39 meter
(12 feet) prior to its release from the launcher.
The Super Loki Launch Rail Assembly can be mounted to any suitable
launcher base by means of forward and aft mounting brackets. A launcher
base specifically designed for this rail is shown in Figure 6.3-24.
Trajectories for the Super Loki are presented in Figure 6.3-25 forvarious launch angles from sea level. A nominal trajectory summary is
presented in Table 6-17. i
- 293 -

>-
1.1.1
.<
,<
,,1-uZ
.<,...I
v0ml
w
I
o
- 294 -

J
FIGURE6.3-24. TYPICAL BASE FOR SUPER LOKI LAUNCH RAIL
- 295 -

A/
I
///
/I/
I j/
/
/
_fJ/
J
J
K
I
%11
im
v
0
!
0im
U
Z
0Z
|
e')
,d
0
./23J'0 7/,>/- 3G/7.-//_Z 71;"
- 296 -

TABLE 6-17
NOMI NAL TRAJECTORY SUMMARY
SUPER LOKI DART, 80° Q.E. SEA LEVEL LAUNCH
Burnout Altitude (m)
Burnout Range (m)
Burnout Time (sec)
Apogee Altitude (m)
Apogee Range (m)
Apogee Time (sec)
Impact Range (m)
Impact Time (sec)
BOOSTER
1577.6 m (5,176 ft)
298.1 m (978 ft)
2.1
2318.9 m (7,608 ft)
446.2 m (1,464 ft)
6.1
462.4 m (1,517 ft)
108
DART
1577.6 m (5,176 ft)
298.1 m(978 ft)
2.1
113.4 km (372,000 ft)
41.8 km (137, 000 ft)
6.1
83.8 km (275, 000 ft)
3O9
- 297 -

6.3.7 Viper Dart.
The Viper Dart Robin Meteorological Rocket System has been
developed to obtain high altitude density and wind data by utilizing
the Robin inflatable sphere as a sensing device. The system consistsof a rocket motor, an unpowered dart and the Robin inflatable sphere.
Flight tests of the system provided density, temperature1 pressure andwind data from an altitude of about 90 kilometers to an altitude of
approximately 40 kilometers or less.
During the flight test phases of the initial development program,
reliable performance was obtained to 125 km with a slightly longer and
heavier dart than originally contemplated. This was due to the added
requirement for extra volume for a tracking aid. Although higheraltitudes were obtained for smaller and lighter weight darts1 the larger
dart design was chosen as final for the initial development program.
The 125 km Viper-Dart vehicle consists of a Viper solid-propellantrocket motor as the first stage and an inert dart as the second stage.
Figure 6.3-26 presents the vehicle configuration. The dart weight has
been optimized to produce a high ballistic coefficlent for efficient
coasting to the desired apogee altitude. The dart diameter of 2.00-inches has been chosen as a tradeoff among factors of altitude performance_
flight stability_ payload packaging and thermal protection for the pay-load. The dart employs an aft-end boattail for interstage coupling, for
housing the dart igniter leads and to reduce base drag during coasting-dart flight. The interstage has been designed as a tradeoff between
shallow angles to reduce drag and larger angles which reduce weight.
Launch lugs are located on fore and aft regions of the booster to matethe vehicle with the launch rail.
The dart design is shown in Figure 6.3-27. The dart has a relative-
ly long length-to-dlameter ratio with a high fineness-ratio ogive. A boat-
tall structure aft of the fins is employed to reduce base drag and provide a
convenient means of interstaging. The dart is designed to have a gross
weight of 29.5 Ibs. which gives reliable performance when used with the
Viper Rocket motor. The basic dart diameter is 2.000-inches and thelength is 58.0 inches.
- 298 -
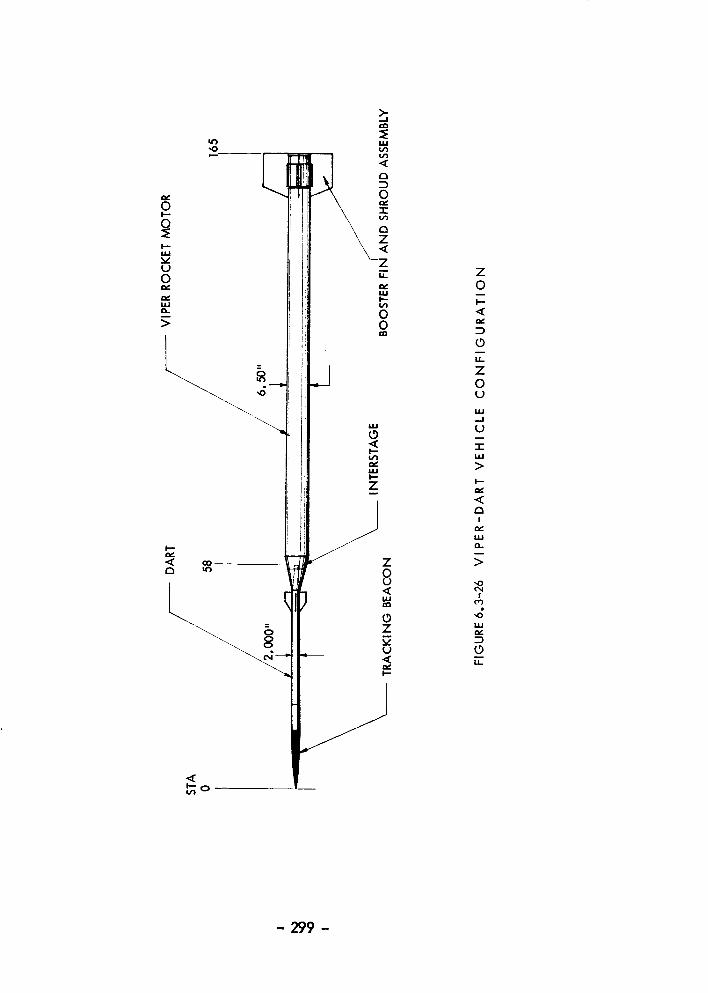
Z0
I,-,,-
0
l.l_
Z0u
l.IJ
,,..,I
1.j
-T-I,,I.I
>I,.,-
.<
I
!
0mIJ_
- 299 -

LU
>
z0
UILl
L,r}
0
L)
<v
I,--,
<
I,,,U
T,
!¢0
I,,,U
C5U-
1
- 300 -

The payload ejection system is made up of two components, i.e.,
the pyrotechnic time delay and the expulsion charge. The pyrotechnic
time delay is ignited at launch at the same time the booster motor isignited. After the time delay has burned for a specified time, ignition
from the time delay is provided to the expulsion charge. The expulsion
charge consists of 5 grams of boron potassium nitrate pellets. Upon
ignition these pellets generate a high pressure behind the piston which
forces the ejection piston forward. The first motion of the ejection pistonforces a hollow metering pin into the Robin sphere inflatable capsule.
Further forward motion picks up the outer piston, which transmits a force to
the oglve to shear the shear-screws which hold the ogive in place. In
this way, the sphere package and the ogive are ejected. At this pointin the ejection sequence, the piston is stopped at the forward end of
the dart by a swagging which prevents any of the burning boron potassiumnitrate pellets or hot exhaust gases from contacting the sphere. The
staves around the sphere are allowed to separate after ejection; thus
allowing the sphere to expand and inflate. The dart ogive contains the
tracking beacon.
The interstage is an aluminum coupling structure between thebooster and the dart, which also forms an aerodynamic fairing from the
dart diameter to the booster diameter. The interstage is connected to the
booster through a threaded connection at the forward end of the booster.
The interstage structure is thereby attached to the booster for the entireflight duration. Internal surfaces of the interstage are machined to
accept the boat-tail of the dart at a point close to the motor and at anotherpoint at the forward end of the interstage. Longitudinal force, exerted
from the dart when the system is accelerating, is absorbed at the end ofthe boat-tail and at the forward end of the booster. Because of the severe
aerodynamic heating environment during boost, the interstage is coatedwith a O.030-inch thickness of an ablative coating for thermal protection.
The rocket motor and flight hardware are shown in Figure 6.3-28.
The Viper is a 3.52 KS 8500 solld-propellant rocket motor adaptable
for sounding vehicle propulsion, sled propulsion and other uses. The motor
case is a cylindrical rolled and welded tube with hemispherical ends of
heat-treated chrome molybdenum steel, with a minimum yield point of
165,000 psi, and with nominal dimensions of 6.5 inches outside diameter
and 107-1nches in length. The nozzle is an assembly of carbon steel with
a graphite insert. The propellant is polysulphide/ammanium perchlorate,
-301 -

UlI-
n
Ill_5
LI
t9
-1
IUZ
J
Clff
0I.L
I--
Z
Z
0a..
0U
Z
0
0
W
a..
r.
ICO
0M.
- 302 -

case-bonded type.
The nominal weight of the complete rocket motor is 191.68
pounds. The nominal weight of the rocket motor components are asfoi lows:
Metal Case 31.00
Head Cap 2.13Nozzle 7.25
Liner 2.05
Insulation 0.50
Propellant 148.75
Ibs
Total 191.68 ibs.
The nominal total impulse at sea level is 31,830.3 lb/sec for a nominaltotal time of 3.52 seconds. The vehicle component weights are presented
in Table 6-18. A nominal performance summary is presented in Table
6-19 with a typical trajectory in Figure 6.3-29.
The Viper Dart Robin is currently being used for routine wind
and density measurements at Cape Kennedy, WSMR and PMR in itspresent 125 km version. At the same time a further development program
is being pursued by AFCRL to increase the altitude of this system to 140 km.
6.3.8 Cajun Dart.
The Cajun Dart vehicle was developed by Space Data Corporation
for the Aero-Astrodynamics Laboratory of George C. Marshall Space FlightCenter to measure winds in the altitude range from 70 to 90 kilometers.
The Cajun Dart chaff rocket is a two stage dart type sounding rocket
vehicle. In the launch configuration the vehicle has a gross weight of
about 200 pounds and an overall length of 13 feet. Figure 6.3-30 showsthe vehicle with the basic dimensions and weights. The first stage of the
Cajun Dart is the Cajun rocket motor, Mad III, manufactured by ThlokolChemical Corporation, Elkton, Maryland. The Cajun motor is 102 inches
long and has a principle diameter of 6.5 inches. The motor less flight
hardware weighs 168 pounds with 118.5 pounds of propellant. The nominal
burning time of 2.8 seconds, yields total impulse of 25,250 pounds seconds,
yields a burnout velocity of slightly over 5000 feet per second at an altitude
of 7, 000 feet. At Cajun burnout, separation of the Dart from the Cajun
booster is accomplished by allowing the aerodynamic drag differentialbetween the bmster and Dart to physically separate the two (2) stages.
- 303 -

TABLE 6-I 8
VIPER-DART WEIGHT TABLE
Vehicle Launch Weight
Vehicle Burnout Weight
Dart Coast Weight
Component Weight Breakdown:
Dart
InterstageBooster FinsBooster Motor
Case 31.00H ead 2.13Nozzle 7.25Miscellaneous 2.55
Propellant 148.75
234.18 lb.
85.33 lb.
29.50 lb.
29.50 Ibs.3.509.50
191.68
- 304 -

TABLE 6-19
NOMINAL PERFORMANCE SUMMARY
Vehicle Name
Booster - Stage i
Dart Weight/Diameter
Launcher Setting (Nominal)
Time Altitude Range
Event (Sec) (feet) (feet)
Viper Dart
Viper29.5 Ibs/2.00 in80.0o Q .E.
Velocity
(Ft/Second)
Stage i
Ignition 0
Burnout (Separation) 3.10
Booster Apogee 10.9
Booster Impact 178.5
Stage 2
Dart Apogee
Dart Impact
0
8,500
18,000
0
162 405, 179
323 0
0
1553
3, 500
3620
152, 547
305, 140
0
5934
22
97
950
4,600
The payload is deployed at dart apogee (162 seconds).
- 305-

\
\
I
l---
e_
>
>;e_
ol---
I,Ll
,--)
.<e_
i=-
,_i
Z
oZ
!
CO
ILl
LDI.I.,
_3S/l _J - Al I00 73A
- 306 -

0
I4.2
40.7
4S.5
o_/ve ................ 7. oo7_,'/ AJ's),.............. 2. _,_
70TAL ................. I_, Z_ L_;_.r.
_4JLIM
IpLe_l_e...........4.00,_ns ................. 7. 3ZNo#_ 14ardware ....... 49.3o
_I _ _ ....... ?_. _o
7-_/ Ve_ide WL
ISO.O
IGO.O
FIGURE 6.3-30 CAJUN DART VEHICLE CONFIGURATION
- 307 -

After separation the Dart continues to coast to payload ejection.
The Dart 1-3/4 inches in diameter, weighs 17 pounds and is
51.7 inches long. The dart is a non-thrusting stage functioning only
as a low drag payload housing. The nose of the Dart is designed to
have a hypersonic optimum shape, keeping the aerodynamic drag to aminimum. The aft end of the Dart has been boat-tailed, forming the
interstaging surfaces as well as reducing the base drag. These two (2)
factors along with the otherwise sleek shape of the Dart combine to
produce a very low drag rocket configuration. The payload housedinside the Dart is 30 cubic inches of 0.5 rail, aluminized mylar, foil
chaff cut to S-band length.
Figure 6.3.31 is a cutaway drawing of the dart showing theexternal dimensions as well as the internal configuration.
In order to make a system reliably measure winds from 90 kilo-
meters down, the nominal vehicle apogee must be above this altitude.
As shown in Figure 6.3.32, the nominal apogee point for the CajunDart is 93 kilometers altitude, 37 kilometers range at a time of 140
seconds, when fired at an 80 degree elevation angle. This will keep
the apogee of all flights above 90 kilometers even with the normal
vehicle dispersion.
When the Dart has reached its apogee, the payload is ejected.
This expulsion is accomplished by the use of 145 second pyrotechnictime delay housed in the Dart tail and initiated at launch. At 145
seconds the time delay ignites a 5 gram expulsion charge which ejects
the Dart nose cone and the chaff payload by forcing a piston the fulllength of the Dart. The chaff is then free to drift with the winds asit falls.
The Cajun Dart has been used by NASA at Cape Kennedy for
routine measurement of high altitude winds but is currently being replaced
by the lower cost Super Loki.
- 308 -
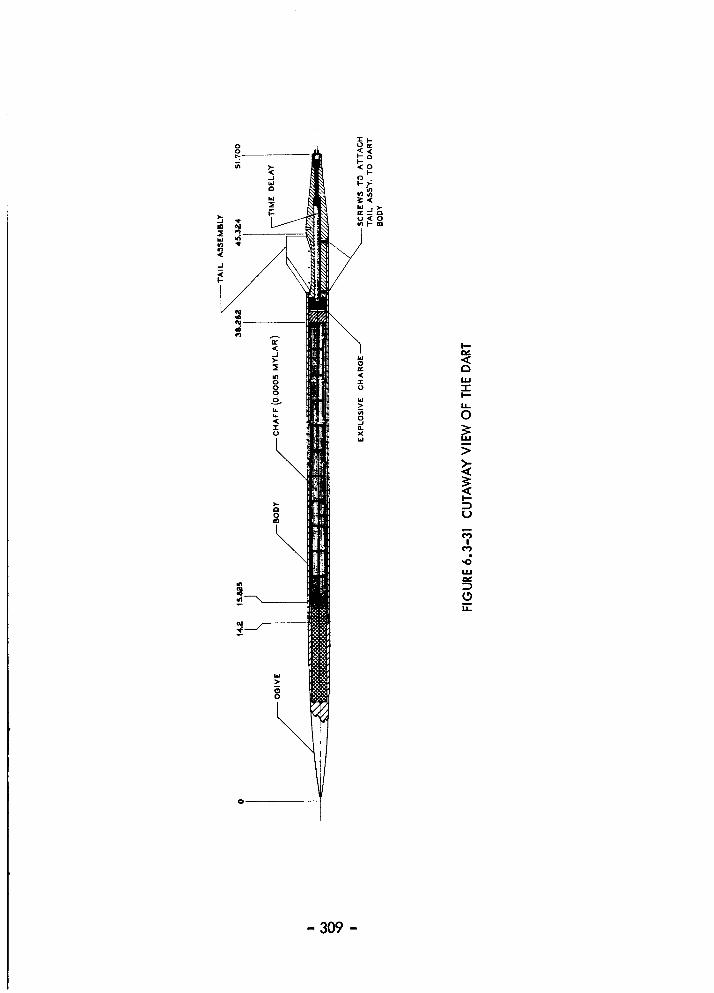
00
\
ILl
-rI--
o
I--
U
!
,d
0
- 309 -

FIGURE6.3-32 CAJUN-DART ALTITUDE VS. RANGE, 80 ° Q.E.
.,j
/_0'
/OO'
80-
60.
40 ¸-
/,80'
/O
O 2O 4O 6O
RANGE- KILOMBTEF--S
- 310 -

6.3.9 Boosted Arcas. (See Figure 6.3-33)
There are various versions of the boosted Arcas in limited use
today as indicated in Table 6-20. The Arcas is used as a second stagein these configurations and the payload capacity is as follows.
Payload Weight
Payload Diameter
Payload Length, NominalPayload Volume, Nominal
10-30 Ib
4.25 in26 in.
305 in.
The performance of the boosted Arcas vehicles depends upon thebooster used. A brief description of each of the boosted Arcas con-
figurations is presented in paragraphs which follow.
The booster is an Atlantic Research 0.8-KS-2700 rocket motor.
Power for ignition of both stages is provided by a ground source, a motion
switch firing the sustainer igniter after positive ignition. An optional
sustainer igniter incorporating a 2-second delay is also available. Fin
assemblies are preset to provide a roll rate of approximately 25 ms atburnout.
The vehicle is launched from the standard ARCAS rocket launcher
with the breech door open. Assembly and launch preparation requires no
special handling equipment and can be accomplished by a two-man crew.
VEHICLE DATA
First-State Motor
MARC 14AI
Nominal performance ratingPrincipal diameter
Overall length
Igniter: TypeRecommended firing current
0.8-KS-2700
10.2 cm (4.0 in)
71.6 cm (28.2 in)
Pyrotechnic
3.5-5 amp
-311 -

PAYLOAD
HVARCAS
46.0 CM(18.1 IN)
i29.2 CM(11..' IN)
323.1 CM(127.2 IN)
154.2 CM(60.7 iN)
11.4 CM(4.5 iN)
MARC14A1
BOOSTER
33.0 CM(13.0 IN)
10.2 CM T(4.0 IN)
71.6 CM(28.2 IN)
FIGURE6.3-33 BOOSTED ARCAS VEHICLE CONFIGURATION
- 312 -

ILl
0o_ 0
0
_ 0
_4
oo.. ".0
,0 _ -(3
o _ o ,-4 o c_ o'° o or" -'7°
!_0
14.1.,-I
"rI.Ll
r-_i,.i.i
o
il
E_ _ o o0 _ 0 o4 -0 _ 0 1"_
-313-

Second-Stage Motor
MARC 2B] ARCAS
Nominal performance rating 29-KS-324
Principal diameter 11.4 cm (4.5 in)
Overall length 154.2 cm (60.7 in)
Igniter: Type-Pyrotechnic (optional 2-second delay squib)
Recommended firing current 5 amp
Weights (less payload)
Gross launch weight
First-stage burnoutSecond-stage ignition
Second-stage burnout
46.3 kg (102.0 Ib)
41.3 kg (91.0 Ib)30.1 kg (66.4 Ib)
10.6 kg (23.3 Ib)
Sidewinder Arcas. (See Figure 6.3-34)
Originally developed by the Naval Missile Center, under the
sponsorship of Air Force Cambridge Research Laboratories, the Sidewinder-ARCAS vehicle used propulsive stages which are proven, qualified rocket
motors. Staging is accomplished by a bayonet-type interstage adapter that
provides structural rigidity during boost, but permits drag-induced stage
separation. Fin assemblies are preset to provide approximate spin ratesof 7 to 20 rps at second stage burnout.
The launch system is a 15 Foot long rail assembly designed for mount-
ing on an adjustable-boom launcher of the type available at most launch
sites. Assembly and launch preparation require no special handling equip-
ment and can be accomplished by a two-man crew.
Power for ignition of both stages is provided by a ground source,
a motion switch completing the second-stage firing circuit only after
positive booster ignition. A delay squib in the second stage igniter allows 2seconds of coasting flight between booster burnout and second stage ignition.
- 314 -

PAYLOAD
t,16.0 C.M
(18.1 IN)
29.20,t(!1.51N)
HV ARCAS 157.5 CM(62.0 IN)
II.4 CM(4.5 iN)
433 CM(170.5 IN)
12.7 CHiN)
190.5 C.M(75.0 JN)
FIGURE6.3-34
45.7 CM( 18.0 IN)
SIDEWINDER ARCAS VEHICLE CONFIGURATION
- 315 -

SIDEWINDER ARCAS
VEHICLE DATA
First-Stage Motor
MK 17 Sidewinder 1A
Nominal performance rating
Principal diameterOverall length
Igniter: TypeRecommended firing current
2.14-ES-3972
12.7 cm (5.0 in)
190.5 cm (75.0 in)
Pyrotechnic
3 amp
Second-Stage Motor
MARC 2C1 HV ARCAS
Nominal performance rating 29-KS-324
Principal diameter 11.4 cm (4.5 in)Overall length 157.5 cm (62.0 in)
Igniter: Type - Pyrotechnic (with 4-second delay squib)Recommended firing current 7 amp
Weights (less payload)
Gross launch weightFirst-stage burnout
Second-stage ignition
Second-stage burnout
75.5 kg (166.3 Ib)
55.6 kg (122.5 Ib)
30.6 kg (67.5 Ib)
11.1 kg (24.4 Ib)
Sparrow Arcas. (See Figure 6.3-35)
Developed originally For the Pacific Missile Range Density Probe
(DENPRO) program, the Sparrow-HV ARCAS uses propulsive stages which
are proven, qualified rocket motors. Staging is accomplished by a bayonet-type interstage adapter that provides structural rigidity during boost, but
permits drag-induced stage separation. Fin assemblies are preset to provide
approximate spin rate of 8 to 20 rps at second-stage burnout.
The launch system is a 15-foot long rail assembly designed for
mounting on an adjustable-boom launcher of the type available at most
launch sites. Assembly and launch preparation require no special handling
equipment and can be accomplished by a two-man crew.
- 316 -

PAYLOAD
HYARCAS
157.5 CM(62.0 IN)
384 C._(151.1 IN)
11.4 CM(4.5 iN)
SPARROWC8
20.3 CM T131.6 CM(51.8 IN)
81.3 CM(32.0 IN)
FIGURE 6.3-35 SPARROW ARCAS VEHICLE CONFIGURATION
- 317 -

Power for ignition of both stages is provided by a ground source,
a motion switch completing the second-stage firing curcuit only after
positive booster ignition. A delay squib in the second-stage igniterallows 6 seconds of coasting flight between booster burnout and second
stage ignition.
VEHICLE DATA
First-Stage Motor
MK 6 Mod 3 Sparrow C-8
Principal diameter
Overall length
Igniter: TypeRecommended firing current
20.3 cm (8.0 in)131.6 cm (51.8 in)
Glow plug
30 amp
Second-Stage Motor
MARC 2C1 HV ARCAS
Nominal performance rating 29-KS-324Principal diameter 11.4 cm (4.5 in)
Overall length 157.5 cm (62.0 in)
Igniter: Type - Pyrotechnic (with 8-second delay squib)Recommended firing current 7 amp
Weights (less payload)
Gross launch weightSecond-stage ignition
Second-stage burnout
93.5 kg (206.0 Ib)
30.6 kg (67.5 lb)
11.1 kg (24.4 Ib)
Boosted Arcas II. (See Figure 6.3-36)
The Boosted Arcas II uses a booster employing an internal burningpropellant grain and an Arcas motor case. This booster was developed by
Atlantic Research Corporation specifically for this vehicle and has had alimited flight test history.
Staging is accomplished by a bayonet-type interstage adapter that
provides a rigid structure during boost, but permits drag-lnduced stage
separation.
- 318 -

t46.O O4(18.1 IN)
_._ 04
111. SIN)
404 C3_(159.0 IN)
163.6 CM(64.4 IN)
FIGURE 6.3-36 BOOSTED ARCAS !1 VEHICLE CONFIGURATION
- 319 -

Power for ignition of both stages is provided by a ground sourceta position s_vit_h completing the second-stage ignition circuit only after
positive booster ignition. A delay squib in the second-stage igniter allows4.5 seconds of coasting flight between booster burnout and second stage
ignition.
The vehicle is designed for launching from the standard ARCAS
rocket launcher with open breech door or from a 15 foot long rail.
Assembly and launch preparation can be accomplished by a two-mancrew,
VEHICLE DATA
First-Stage Motor
MARC 42A1 Booster
Nominal performance rating
Principal diameterOverall length
Igniter: Type - Pyrogen, 1-watb 1-amp squib
Recommended firing current
3.0-KS -2740
11.4 cm (4.5 in)163.6 cm (64.4 in)
7 amp
Second-Stage Motor
MARC 2C1 HV ARCAS
Nominal performance rating 29-KS-324
Principal diameter 11.4 cm (4.5 in)
Overall length 157.5 cm (62.0 in)
Igniter: Type - Pyrotechnic (with 8.0 second delay squib)
Recommended firing current 7 amp
Weights (less payload)
Gross launch weight
First-stage burnout
Second-Stage ignition
Second-Stage burnout
61.4 kg (135.3 Ib)
45.4 kg (100.0 Ib)
30.6 kg (67.5 Ib)
11.1 kg (24.4 Ib)
- 320 -
6.3.10 NikeVehicles,
There are a number of Nike-boosted sounding rockets which are
used for geophysical research. Although these vehicles are too large
and too expensive for serious consideration as routine meteorological
rockets, they are briefly described here for sake of completeness. A
summary of the Nike-boosted vehicles is presented in Table 6-21. Thesevehicles are designed to carry large payloads (greater than 50 Ibs) toaltitudes between 100 km and 300 kin. Each uses the Nike M5 rocket
motor as the first-stage. This motor has a diameter of 16.5 inches, a
length of 135.5 inches and weighs 1342 Ibs. This motor alone requires
significant handling equipment and could hardly be considered forroutine meteorological operations.
- 321 -

uI O00 0 0 • 0
0
O4
0
"00,1
I
000
0Im
CO0 0 0 _, 0 O_
0 O_O0 ,--.
,0
I
I--
000
U
a
ooT
Z
!',0
-r-.,,U
Z
o _ o
0 0 -00
_0
v v
m v
v _ (D
Q_ °I
o o o_ o oO C3 Q- _
00
CO _,_
O0
v
a o
> >
0 0
O0COO0I
IW
0
I
O0I
0
r_
-0
00
0
8_9
g0
000
0
e-
X0
- 322 -

6.4 Development Systems.
6.4.1 General.
There are a number of meteorological rocket vehicle develop-
ment programs which are currently being pursued. These programsrange from rather modest efforts such as improving the Viper Dart per-
formance to the state-of-the-art development of fragible boosters. A
brief description of the current meteorological rocket vehicle develop-
ment programs is presented in the sections which follow.
6.4.2 Improved Viper Dart.
The Viper Dart is currently being modified to improve the
apogee altitude performance from 125 km to 140 kin. This is beingaccomplished under an &FCRL program by using a propellant with a
higher specific impulse than the standard Viper. Techniques of stabiliz-
ing the booster after burnout are also being investigated to reduce the
problem of booster impact dispersion.
6.4.3 Super Loki Instrumented Dart.
The Super Loki vehicle is being modified by incorporating a
large diameter (2.1 inch) dart to extend the standard rocketsonde temp-erature and wind measurements upward as high as 75 km. This program
is sponsored jointly by AFCR1 and NASA-MSFC. The large diameterdart will permit the incorporation of a large Starute decelerator, a
GMD-2 transponder instrument and more room for advanced sensors.The cost of this vehicle should not be significantly greater than for thestandard Lokl vehicle.
The development of a 2.1 inch diameter instrument dart for the
Super Loki system is a follow-on to the chaff dart system developmentto improve the altitude and measurement capability of current instrumented
systems. An 85 km apogee is achievable with the proposed instrumented
dart systemt and the payload volume is more than double that of the
current instrumented dart systems. This increased volume can be used for
additional sensors, a transponder/telemetry sonde, and most important, an
increased-size parachute to obtain significantly slower descent rates of thesonde during the measurement period. Temperature and wind measurement
errors of current systems are functions of the square of the descent velocltyt
- 323 -

and a significant improvement in measurement accuracy can accrue byreducing the parachute descent rate, The cost of this instrument dart
system should not be significantly greater than the current instrumenteddart systems.
The proposed Super Loki Instrumented Dart system consists oF the
Super koki rocket motor and a 2.1 inch diameter dart. The dart is des-igned to contain a maximum diameter parachute to extend the altitude
and improve the accuracy of wind and temperature measurements. Per-
formance of this system is as follows:
Launch AngleDart Weight
Apogee Altitude
Apogee Range
Apogee Time
Burnout VelocityMaximum Acceleration
85°
14 lb (6°35 kg)85 km
15 km
132 sec
Mach 5.4
102 g
A nominal trajectory is plotted in Figure 6.4-1 o
The 2.1 inch diameter instrumented dart contains a payload volume
of 55 cubic inches. This is more than twice the payload volume of the1.437 inch diameter (3°65 cm) instrumented dart which is currently being
used. Either a 1680 mc/GMD-(x) or a 403 mc/SMQ-1 sonde can be
used with the proposed dart depending upon ground-station _quipment,Descent rates of the sonde system can be slowed to 230 fps (70.1 m,/sec) at
61 km with a Super Loki system (W/CDA - 0.015 Ib/ft 2 or 0°073 kg/mAdvantages of the Super koki Instrumented Dart over the current Loki
Instrumented Dart are presented in Table 6-22°
An inflatable falling sphere payload has been procured by the Armypersonnel at White Sands Missile Range for use with the existing chaff dart
design. Since altitudes of 125 km were obtained at White Sands_ reasonably
good density data may be derived with the Robin falling sphere payload toaltitudes below 90 km with the Super Loki. Since the apogee altitude for
a sea level launch will only be about 113 km_ the falling sphere density
data may be restricted to a maximum altitude of 85 km for sea level sites,
6°4°4 Destructible Arcas.
A destructible or fragmentible Arcas has been developed under a
previous AFCRL contract by incorporating explosive charges with a fiber-
- 324 -

I_o 26
IZO
II0
Ioo
0 •
_q
_0"
50.
30
20 =
i
I
_V
2#
22.
20
16-
_q
,
1
0
18oo -
/
/
/
_E
E
160
FIGURE 6.4-I SUPER LOKI INSTRUMENTED DART NOMINAL TRAJECTORY85° SEA LEVEL LAUNCH
- 325 -

TABLE 6-22
COMPARISON OF THE SUPER IOKI
INSTRUMENTED DART SYSTEM
WITH THE CURRENT
INSTRUMENTED DART SYSTEM
Super Loki
System
Standard Loki
System
80°Q. E, Apogee Altitude
Dart Diameter
Payload Volume
Payload Volume Availablefor Parachute
Parachute-Sonde Ballistic
Coefficienb W/CdA
Descent Rate at 61 km
Dart Ablative Coating
85 km
(278.9 k ft)
5.398 cm
(2.125 in)
901.3 cm 3
(55 cu in)
612.87 cm 3
(37.4 cu in)
0.073 kg/m 2
(0.015 Ib/ft z)
70.1 m/sec(230 ft/sec)
Not Required
63 km
(206.7 k ft)
3.65 cm
(1.437 in)
3491.6 cm
(30 cu in)
262.19 cm 3
(16.0 cu in)
0. 146 kg/m 2
(0.030 Ib/ft 2)
100.6 m/sec 2
(330 ft/sec)
Required
- 326 -

glassplastic rocket motor design. Sheet explosive 0.042-inches thick
was placed around the fiber-cjlass motor throughout its length in addition
to an explosive charge located behind the payload section at the for-ward end of the rocket motor. After vehicle apogee and payload separa-
tion, the explosive charges were initiated and the remaining rocket wasfragmented into rather small pieces which had a sea level impact energies
on the order of 2.4 ff-lb (3.25 joules) maximum.
The vehicle contains an additional explosive charge between the
rocket motor head closure and payload which is initiated by a mechanical
timer unit at a timer predetermined and set prior to launch. Initiation
of this primary explosive charge subsequent to payload ejection results infragmentation of the forward section of the spent rocket motor assembly
and induces sympathetic detonation of the sheet explosive material onthe exterior of the motor case. Detonation energy of the sheet explosive
produces fragmentation of the motor case and fin assembly.
A description of the vehicle, is presented in Figure 6.4-2. Com-parison of dimensional and weight data between the Frangible Arcas and
Arcas vehicles is presented in Table 6-23. A detailed weights breakdown
of the frangible vehicle, less payload, is shown in Table 6-24.
The primary mission of the frangible vehicle is deployment of a
payload at apogee, and subsequent self-induced fragmentation of the
vehicle to particle sizes of very low impact kinetic energies. In order toensure reliable fragmentation, the vehicle incorporates two independent
initiation systems. The primary initiator is a mechanical timer unit whichis armed at lift-off and started at rocket motor burnout. This unit is
designed to initiate fragmentation twenty seconds after payload ejection.This time interval was selected to provide adequate clearance between
the payload and the spent rocket vehicle.
A redundant, pressure sensing unit is incorporated as an independentunit. This secondary initiator is armed at a nominal altitude of 24.4 km
(80, 000 it) during vehicle ascent and initiates fragmentation at a nominal
altitude of 18.3 km (60,000 ft) during vehicle descent in the event of a
failure of the primary system. The overall mission profile is illustrated in
Figure 6.4-3.
A major objective and requirement of the program was the develop-
ment of an integral explosive fragmentation system. Initial fragmentation
- 327 -

q p
_-_13/_.-_
FIGURE 6.4-2 FI_ANGIBLE ARCAS VEHICLE CONFIGURATION
- 328 -

TABLE 6-23
FRANGIBLEARCASVEHICLEDIMENSION AND WEIGHTCOMPAJ_ISONS
FrangibleArcasStandardArcas w/o Fragmenta-
tion SystemMod 0 Mod 3
cm in cm in
Frangible Arcas
with Fragmenta-
tion SystemMod 3
cm in
Dimensions
Nose Cone 45.9 18.1 45.9 18.1 45.9 18.1
Parachute Container 29.2 11.5 29.2 11.5 29.2 11.5
Rocket Mtr. Assy 154.0 60.7 164.0 64.5 176.5 69.5
Over-al I Length 229.1 90.3 239.1 94.1 251.6 99.1
Max. Body Diameter 11.4 4.5 11.9 4.7 12.2 4.8
Min. Body Diameter 11.4 4.5 11.2 4.4 11.4 4.5
Fin Span 33.0 13.0 33.0 13.0 33.0 13.0
Weights kg Ib kg Ib kg Ib
Loaded Motor Assy 30.0 66.4 28.4 62.7 31.0 68.4
Payload a 4.9 10.7 4.7 10.4 4.7 10.___4
Total Launch Wt. (Nom). 34.9 77.1 33.1 73.1 35.7 78.8
Vehicle Wt. at Mtr.
Burnout (Less PayloadWeight) 10.6 23.3 8.9 19.7 11.5 25.4
Note: a Includes parachute assembly, Arcasonde Instrument, nose cone and ballast.
- 329 -
TABLE 6-24
DETAILED WEIGHT BREAKDOWN OF THE FRANGIBLE ARCAS VEHICLE (LESS PAYLOAD)
ComponentNominal Weight Nominal Weightat Lift Off at Burnout
kg Ib kg ib
Motor Case Assembly 7.48 16.50
Fin Assembly 0.76 1.69Fin Screws 0.01 0.03
Propellant Assembly a 19.40 42.70Retaining Sleeve 0.68 1.49
Explosive Module Fwd Plate 0.14 0.32
Explosive Module Aft Plate 0.13 0.29Push Rod 0.01 0.02
Mechanical Timer Assembly 0.32 0.70Redundant Initiator 0.14 0.30
Primary Explosive Charge 0.94 2.06Sheet Explosive Charge &
Overwrap 1.04 2.30
6.89 15.20
0.76 1.69
0.01 0.03
0.45 1.000.68 1.49
0.14 0.32
0.13 0.29
0.01 O.O2
0.32 0.700.14 0.30
0.94 2.06
1.04 2.30
31.05 68.40 11.51 25.40
Note: a Includes propellant, headplatet O-ring, dimple motor and inhibitor.
- 330 -
I//J/I�� /
FIGURE 6.4-3 NOMINAL FRANGIBLE ARC.AS FLIGHT EVENTS SEQUENCE
PHASE III VEHICLE CONFIGURATION
- 331 -

tests incorporated a single modular shaped explosive charge in the for-ward end of the rocket motor. These initial tests showed adequatefragmentation of the forward and aft motor sections, but the center
portion was left intact, it was interesting to note how the spent motor
case acted as a shock tube and provided fragmentation of the nozzle/finsection while leaving most of the tube intact. Additional tests showed
that the shape given the single explosive charge had no appreciable effecton the fragmentation results. Hence, it was evident that additional
explosive material applied directly to the motor case was needed to
achieve the required degree of fragmentation.
Tests utilizing linear shaped charges also proved unsuccessful.Although the motor case was sectioned at each location of the charge, the
resulting fragments were unacceptable with regard to the maximum impact
kinetic energy requirement. This could have been overcome by increasing
the number of linear shaped charge strips, but the resulting vehicle weightwould have been prohibitive.
Subsequent tests incorporating a primary explosive charge in the
forward section of the vehicle, in combination with 1.07 mm- (0.042 in)thick sheet explosive material on the exterior of the motor case, were
successful. Fragmentation to particle sizes yielding impact kinetic energies
of 3.25 joules (2.4 ft/Ib) or less were achieved.
Only one flight test of the complete system was conducted, and
it was apparent that the destruct charges performed as a cloud of debriswas tracked by radar. The apogee altitude for this test was only about
128,000 feet and a considerably larger vehicle would be required to make
up for the addition weight and drag penalties created by the explosives
system. In spite of the low performance, the principle of the destructiblemotor case was demonstrated with this program. However, the otherproblem areas were brought to light.
The major objections to the fragmentation technique are the safety
aspects of ground-handllng a llve rocket motor which is surrounded byClass A explosives. The danger of such a device is considerably greater
than for a rocket motor alone. In addition, if the explosives initiationsystem ever failed to function, then the subsequent ground-impact would
surely cause a high-order explosion. Furthert even if the system functionedsatisfactorily, the nose cone itself presents a considerable falling mass hazard.
-332 -

In addiation, a tremendous number of full system flight tests would be
required, without a single failure, to adequately demonstrate an
order of reliability high enough for use over populated areas. For thesereasons, further efforts on this program have been terminated.
6.4.5 Consumable Rocket.
The U. S. Army Missile Command supported jointly by NASA-LRChas been investigating the development feasibility of a consumable rocket.
The falling mass hazard safety criteria of a maximum particle kinetic energy
of 1 foot-pound (1.35 joules) and a particle size limitation of 0.1 pound
(45.3 grams) were adopted for this program. The proposed concept of the
consumable rocket is shown in Figure 6.4-4. After payload separation at
apogee, the motor case material is to be ignited so that it completelyburns to ashes before reaching the ground.
in the fall of 1965, on the basis of prior feasibility studies, a
decision was made to proceed with further development of the consumable
technique. Effort was directed toward improving the characteristics of
combustible case wall composites, based upon the following general
parameters in decreasing order of priority:
(1) Completeness of neutralization
(2) Safety in manufacturing and use
(3) High strength
(4) High autoignition temperature(5) Low environmental degradation
(6) Least cost
Results of this study indicated two promising approaches to fabrica-
tion of consumable rocket cases -- use of a homogeneous composite, and
use of a sandwich composite. These composites were investigated atPicatinny Arsenal beginning February 1966. Material composities were
fabricated in 2.54 by 7.62 cm plates, 15.24 cm diameter standard test
rings, 2.54 cm diameter by 10.16 cm cylinderst 7.62 diameter by 22.86 cm
cylinders and 7.62 cm diameter by 45.72 cm pressure bottles.
The homogeneous composite structure was a fi lament-wound type,consisting of nitrocellulose fiber wound together w_ relnforc|ng Fiber in
- 333 -

%
,,4
8O
60"
4o.
o 25
gEPA _A TIOAI,*INDPAYLOAD
/ g--'.,:__
FRAGMENTATION AIVD EXPLILJTON
_',eOUl_D RAN6E _ THOUJANDJ _ OF A'/ETE-_J_
_0
FIGURE 6.4-4 CONSUMABLE METEOROLOGICAL ROCKET OPERATION CONCEPT
- 334 -

in an epoxy binder. Reinforcing fibers considered for use were E-glass,Fortisan, HM-2 rayon, nylon and polypropylene. Samples of the
homogeneous composite using from 50 to 100% nitrocellulose fiber were
prepared and ignited at a simulated 61,000 meter altitude. The only
structure of this type which was adequately destroyed was the 100%nitrocellulose/epoxy (6% of original weight). Other samples 2.54 cm
diameter by 7.62 cm long) were burned with the following percentagesof residue:
SAMPLE RESIDUE ( Wt. %)
73% NC/27% Fortisan 27
52% NC/48% Fortlsan 49
77% NC/23% Fiberglass 39
63% NC/37% Fiberglass 6O
73% NC/27% Nylon 32
40% NC/60% Nylon 56
The homogeneous composite remains a promising technique, whose
major improvement potential lies in improved tensile strength of thenitrocellulose fiber.
The sandwich composite structure utilizes a pyrotechnic core "sand-
wiched" between alternate layers of filament-wound fiberglass or anorganic fiber in an epoxy binder. These composites were prepared in flat
specimens 2.54 cm by 10.16 cm, utilizing nitrocellulose paper, PETN
paper, double base propellants and pyrotechnics as core materials laminated
between 0.05 cm thick pieces of fiberglass-epoxy. Combustion tests at61,000 meter simulated altitude showed the following results:
Nitrocellulose would ignite but would not
propagate.
PETN paper would not ignite.
Propellants lacked sufficient energy to
destroy the samples.
Pyrotechnics showed promise but needed
further development.
- 335 -

A pyrotechnic core material was then developed by PicatinnyArsenal especially for use in the sandwich composite. This core
develops about 1600 calories per gram with 5000 ° F flame temperature,
burns at 0.5 cm per second at 60,000 meters altitude, autoignites about
860°F, is insensitive to shock, and will not detonate explosively.
Pressure vessels, 7.62 cm diameter by 22.8 cm long, were fabricated inthe sandwich construction utilizing a filament wound 0.05 cm inner
layer of S-glass/epoxy, a 0. 152 cm pyrotechnic core, and a 0.05 cm
S-glass/epoxy outer layer. These vessels, with burst pressures of280 kg/cm2r were essentially reduced to small pieces of weak fibers
when burned at a simulated 36.6 km altitude. A similar configurationof Fortisan rayon with a room temperature burst pressure of 176 kg/cm 2was reduced to ash when burned at 36.6 km simulated altitude.
The new pyrotechnic core in a sandwich construction surpasses
all other concepts studied to date for neutralization of the falling mass
hazards. A continuation of the program is aimed at optimizing thesandwich construction, and designing a rocket motor case and fins for
static and flight demonstration tests.
The nozzle construction presents a special problem which must
also be included in the investigation. Data obtained in prior studies of
consumable rockets revealed that dispersion of the heat absorbed in thenozzle section during the rocket motor thrust phase constitutes a threat
to the surrounding consumable components. Any addition of insulation,
however, is detrimental to efficient neutralization. A possible solution
to this problem is the disposal of the nozzle section shortly after motorburnout. Means of accomplishing this includes (1) the use of a consuma-
ble nozzle section which is protected from erosion and heat for the
duration of thrust, but which autoignites shortly thereafter; or (2) the
use of a small detonable charge which breaks up the nozzle section with-
out damaging the motor case. Early investigation of these and possibly
other techniques is planned. Concepts will be developed and tested inrocket exhaust environment.
6.4.6 Army RDT and E Rocket.
Development efforts are currently under way on a new RDT and E
rocket by the U. S. Army Missile Command. This rocket is a single-stagevehicle of about the same size and shape as the Arcas. Burning time isreduced, however, to about ten seconds, and it is doubtful that the desired
- 336 -

apogeealtitude of 72 km will be achieved with the current design.Design characteristics are listed in Table6-25.
The rocket motor consists of a resistance welded stainless steel
tube, ARMCO 21-6-9t with a 0.055-inch _ 0.004-inch wall and a
yield stress of 150 ksl. The head closure consists of stainless steel 3011/4 H SS and is 0.109-inches thick. The nozzle retaining ring is
321 stainless steel. There is a graphite throat insert and a threaded
aluminum retaining ring. The motor insulation consists of 0.070-inch
thick RFB. The design chamber pressure of the motor is 3750 psi.
The propellant is acrylonitrlte-butadiene-sty_ene.
The vehicle fins are made from 0.063-inch thick stainless steel
and are resistance-welded to the motor case. A split parachute canister
of PUC plastic is used. This is interesting since a split parachute
canister was originally used with the Arcas. Lack of structural rigid-
ity caused vehicle breakup with the Arcas.
The design goal is for a production cost of $350 for the vehicle.
6.4.7 Kangaroo.
The Kangaroo Dart is a solid-propellant sounding rocket vehicle
which was developed by the Aeromechanics Branch of the Pacific MissileRange. The Kangaroo concept consists of retaining a non-propulsive
dart containing the payload in an insulated canister inside the rocket
motor port during the boost phase of flight. This dart is expelled from
the rocket motor at burnout by a combination of motor chamber pressure
and drag deceleration of the booster. The dart then coasts to apogee,
and the booster remains stable throughout its low altitude trajectory toimpact.
The Kangaroo Dart two--stage vehicle employed a dart payloadhousing which was submerged in the rocket motor to contain the dart
during propulsive flight. At motor burnout the dart is ejected by tail-
off chamber pressure and booster deceleration. The ejecting dart causes
the shear-pinned nose cone tip to be separated from the vehicle, and the
dart continues to eject through the aperature thus formed. The aft end of
the dart is tapered in order to receive a pick-up fins canister during dart
- 337 -

TABLE 6-25
AMICOM RDT & E ROCKET DESIGN CHARACTERISTICS (MK 4 Mod !1)
Vehicle Performance
Altitude at apogee, 80 ° Q E (ft) 246, 760
Time to apogee (sec) ,/o
Velocity at burnout (ft/sec) 4700
Mach No. at burnout 4.67
Maximum Dynamic Pressure ib/ft 2 13, 789
Vehicle Physical Characterisitcs
Diameter (in) 4.875
WeightTotal (lb) 97.83
Burned (lb) 43.05
Discharge (ib) 54.78
Static Stability calibersNosecone
Fins
1.6
4-caliber tangent ogive
(0.250" thick plastic)
Number 4
Span (in) 12.83Root 5.00
Sweep Angle (deg) 60
Dimensions and Performance Characteristics for Rocket Motor (MK 4 Mod II)
Diameter (in)
Propellant weight (Ib)
Motor weight (Ib)Action time (sec)
Specific Impulse (sec)Maximum pressure (psig)
Grain length (in)
- 338 -
4.875
54.OO
79.6910.33
231.62500
62.5

Table 6-25 AMICOM RDT & E Rocket Design Characteristics - continued -
Rocket Motor Weight Breakdown (Ib)
Motor Chamber 18° 28Nozzle End Restricter 0° 13
Insulation 4.46
Nozzle 2.82
Propel lant 54.00
Motor Weight 79.69Consumables 54.78
Burnout Weight 24.91
Vehicle Weight Breakdown (Ib)
Ogive 2.48
Sleeve (Steel) 0.36
Pedestal (Steel) 3.44
Separation Device 1.00Parachute and Canister 4.55
Payload 3.00
Fins (Steel) 3.31Motor 76.69
Vehicle launch 97.832
Discharge 54.780
Vehicle Burnout 43.052
- 339 -

Table 6-25 AMICOM RDT & E Rocket Design Characteristics - continued -
Drag Coefficient Data
Mach No,
0
0.5
!.0
1.5
2.0
2.5
3.0
4.0
0
0
.250
.290
• 275
.250
• 230
• 200
Flight Velocity Profile
FlightTime
(sec)
2.5
5.0
7.5
9.020.0
30.0
Velocity
.(ft/sec)
2250
39004600
4700
3550
3100
- 340 -

ejection. A propellant delay charge is used at the aft end of the dart
canister housing to prevent initial motor chamber pressure from eject-ing the dart at llft-off before vehicle acceleration becomes large
enough to retain the dart. A scale drawing of the vehicle assembly is
shown in Figure 6.4-5 and a vehicle weight breakdown is presented
in Table 6-26 for the Viper rocket motor configuration.
The advantages of the Kangaroo concept are the elimination ofthe aerodynamic heating of the dart and payload during the early boost
phase and a shorter vehicle length than for the more standard two-stage
booster-dart configuration. Some of the dart payloads require an
ablative coating on the dart surface to reduce the aerodynamic heating
input. Dart separation problems have occasionally occurred and have
caused low flights. These problems have been traced to large bendingmoments at the interstage coupling. The Kangaroo concept is an
attempt to avoid these problem areas.
The disadvantages of the Kangaroo concept are a severe perform-
ance penalty and high cost. The canister housing must be machined
and insulated to protect it from the motor chamber gases. In addition,
a nose cone assembly, a delay charge, a forward bulkhead and a pick-
up fin canister must be fabricated. All of these items add significantcost and weight to the regular booster dart system.
6.4.8 Destructible Dart.
A proposed solution to the falling mass hazard problem has beenthe use of a destructible dart constructed with Pyro Ceram - a Carning
Glass Works product. The proposal has been to fabricate the dart
structures with this material, use powdered lead as ballast and destruct
the entire assembly at apogee to release the payload. It is reported
that a concentrated point load will cause the Pyro Ceram material to
fracture into small granular particles no larger than 0.250-inch in
diameter. Table 6-27 presents a llst of the physical properties of thismaterial in fabricated form.
Although the Pyro Ceram material appears to be reasonably strong,fabrication into a dart structure and the mechanical fidelity during sharp-
edged booster shocks may become significant problems. The material
does not appear to be inexpensive.
- 341 -
Z
Z0
tll--
0,'7Z0U
I.U
._1
U
I
r_
r_
00
0z
M
!
-o
-:342 -

TABLE 6-26
KANGAROO WEIGHT TABLE|
Vehicle Launch Weight
Vehicle Burnout Weight
Dart Coast Weight
243.75 lb.
95.00
18.00
Component Weight Breakdown:
Dart
Head AdapterNose Cone
Dart Retaining TubeBooster Fins
Booster Motor
CaseHead
NozzleMiscelianeous
Propel lant
18.00 lb.
24.07
10.00
31.00
2.13
7.252.55
48.75
243.75 lb.
- 343 -

TABLE 6-27
CORNING GLASS WORKS PYRO CERAM PHYSICAL PROPERTIES
Density
Water Absorption
Porosi ty
Ave. Coeff. of Expansion (0-300°C)
Thermal Diffusivity (at 25°C)
Youngs Modulus
Compressive Strength
Poisson's Ratio
Shear Modulus
Bulk Modulus
Modulus of Rupture (Tumbler-Abraded)
Knoop Hardness (100 gm)
Loss Tangent (at 8.6 GHz)
Dietectric Constant (at 8.6 GHz)
Volume Resistivity (at 250 ° (2)
2.93 gm/cm 3
0.00%
0.00% Void Volume
90x 10-7,/° C
8.0xl0-3cm2/sec.
17.0x 10⁶ psi
350x103 psi
0.22
7.0x 10⁶ psl
10. lx106 psi
100x103 psi
640
7xi03
7
lx108 ohm-cm
- 344 -

The proposed system includes a booster rocket which wouldimpact within a 1-mile radius of the launch site. This is a serious
limitation for iaunchings near populated areast since 2,000 acres of
land would be required to be cleared. Also to prove the reliability of
the system would take thousands of flight tests without a single failure.
This appears to be an expensive program.
- 345 -

6o 5 Discussion°
6° 501 General.
Several topics dealing with meteorological rocket vehicles are
worthy of a brief discussion° These topics which concern vehicle per-
formance, wind-sensitlvity and impact dispersion are presented in the
fol lowing sections.
6o5°2 Vehicle Performance.
The performance of single stage vehicles is particularly sensitive
to burning time, For 65 km rockets a burning time of about 30 secondsresults in maximum altitude. For longer burning times, the vehicle
gravity turn causes the velocity vector to flatten out to a low flight
path angle and apogee altitude is reduced° For shorter burning times,higher velocities are experienced in the lower high density regions of
the atmosphere, and the resulting drag losses degrade the altitude per-formance. Thus, attempts to duplicate Arcas performance with short
burning time internal-knowlng rocket motor designs resulted in significant-
ly larger and heavier rockets than the Arcas. Since the wind-sensitivityof a vehicle is a function of the burning time, a compromise should be
made between maximum performance and wlnd-sensltivity, A single stageburning time between 10 and 20 seconds appears to be reasonable. This
range of burning time is not easy to obtain in a small diameter rocketmotor with a total impulse sufficient for the 65 km performance range.
Motor designs are quite restrictive and critical for the single stage
application.
The basic concept in the design of the booster dart vehicle is to
utilize a high performance rocket motor for the first stage and a non-
propulsive dart for the second stage to carry the meteorological payload
to apogee altitude. To take full advantage of this basic concept, it is
necessary to use a rocket motor with a relatively short burning time andhigh mass ratio. The basic technical advantage of this system occures
by obtaining a high velocity in a short period of time and separating the
dart as early in the flight as possible. Since the dart has a comparatively
high weight-to-drag ratio as compared to the booster, this early separation
minimizes the energy lost to aerodynamic drag.
- 346 -

The velocity at the end of booster burnout is dependent uponthe rocket motor mass fraction and specific impulse. However, when
allowance is made for both the dart and associated flight weight hard-
ware, the overall burnout weight of the system becomes of paramount
importance. If booster burnout time is kept to a short duration, i.e.,one or two seconds, then the accumulated velocity of impulse lost to
drag during the boost phase will be relatively small. Booster diameter
and the resulting interstage design, i.e., cone angle and weight, also
have a relatively important influence on booster drag performance,
especially which rocket motor burning times are appreciably longer than
two seconds. In a similar manner, booster fin size is relatively import-ant for relatively long burning time rocket motors. A careful trade-
off should be made between dart weight and booster fin size in order
to maintain an adequate static stability margin for the vehicle during
boost phase, and yet not penalized the booster burnout performance
wlth an excessively heavy dart.
Rocket motor design is not so critical for two-stage vehicles as it isfor either the single stage or booster dart vehicles. The booster or first-
stage need not have a particulary high value for mass fraction for it is
weighted down with the second-stage and payload anyhow. The thrust
level should be relatively high to provide an appreciable lift-offacceleration. This is to reduce wind effects. Since the interstage coast
period can be selected by the vehicle designer, the burning tlme of the
second stage is not critical. Short burning time second stages can be
ignited at a higher altitude to reduce drag losses. Thus, there is a great
deal of latitude in rocket motor design for the two-stage vehicles. Since
short burning time rocket motors are generally less expensive to fabricatethen the long burning time motors, and have higher mass fractions (less
inert weight and insulation required) the obvious choice for a two stage
meteorological rocket would be a minimum cost short burning time boiler
plate booster and an improved mass fraction short burning time secondstage motor.
Although it is expected that the booster dart vehicles will dominatethe routine meteorological rocket applications to 140 km over the next
few years (because of low cost and low wind dispersion), there probablywill be a modest requirement for a single stage vehicle to replace the
Arcas for semi-routine ozone soundings. Such a vehicle should have an
- 347 -

improved performance (carry a slightly larger diameter payload than4.5 inches to about 75 km) and should be less expensive than the
Arcas. For payloads diameters larger than about 2 inches and altitudes
above 140 km the obvious choice is a two-stage vehicle. The 140 km
Viper Dart application is probably as far as the booster dart concept
can reasonably be used.
6.5.3 Vehicle Impact Dispersion.
Vehicle impact dispersion factors can be divided into wind effectsand non-wind effect factors. The wind effects can further be sub-divided
into random error and bias components. The wind effect bias can be
significantly reduced by current wind-weighing techniques which permitoff-setting the launch angles to correct for the wind. Since this procedure
is not perfect, there is a wind measurement effort and the wind velocitychanges with time there is a random wind effect which directly causes
dispersion. The greater the wind sensitivity for a vehlcle, the greater is
the random wind effect error and resulting impact dispersion.
For most vehicles random wind effects and thrust misalignment
cause a majority of the vehicle disperslon. By reducing or eliminating
these two causes of vehicle dispersion, quite small impact patterns can
be accompllshed. Essentially all sounding rockets are caused to roll or
spin about their longitudinal axis by employing fin incidence or cant.This is done to cancel or vector out vehicle misalignment dispersions.
However, vehicle spin rates do not build up until an appreciable distance
is achieved from the launcher, and vehicle velocity has become appreciable.
In these cases the thrust mlsallgnment, just as the non-splnning vehicleleaves the constraints of the launcher, diverts the course of the missile
and a significant dispersion occurs. If the missile were pre-spun before
leaving the launcher, this element of dispersion could be eliminated.
The Loki systems accomplished this by using helical rails. This is onereason that the Loki dispersions are minlnal. To reduce the random wind
effects dispersion, the overall missile wind sensitivity must be reduced.
6°5.4 Vehicle Wind-Sensltivity.
Wind-sensltlvlty performance of the vehicle is a function of the
boost acceleration, which is related to rocket motor burning t|me, and
the relative magnitudes of the vehicle static stability margin and transverse
moment of inertia. Wind effects are slight for a very fast accelerationand short burning time rocket motor. If the vehicle static margin at llft-off,
- 348 -

and during the boost phase, is maintained at an adequately small value,and tke moment of inertia about the pitch axis is large, wind effects
are slight. Although by increasing the launch velocity of a given vehicle
a reduction in wind sensitivity can be made, such a reduction may notbe great. The total time the vehicle is under propulsion is the main factor
contributing to the wind sensitivity of a vehicle in spite of the launch
velocity. Thus, Arcas wind sensitivity is not greatly reduced by employ-
ing the gas generator charge during the launch stroke or even by employ-ing a booster rocket. Dual thrust vehicles will also be wind sensitive
as long as relatively long burning times are employed for sustained thrust
phase in spite of the increase in launch velocity. The only reallyeffective answer to reduce wind sensitivity is short burning times.
A comparison of the wind dispersion of short and long burningtime vehicles is presented in Table 6-28. it should be noted that the
wind-sensltive altitude ceiling is considerably higher for the long burn-
ing time vehicles. Since the higher altitude winds are generally muchstranger than the low altitude winds, the resultant ballistic wind will be
greater. Thus, the wind displacement differences between the short andlong burning are even greater than indicated.
- 349 -

O0C_I
I",0
iii._1eel
<I--
21
.11LI_LI_
I.L.I
Z0L,_,-,,,
1.1.1
c_Z
LL
0Z
LLI
>_.'_
Z
Z_O--_Z
7 -_
_Q I--- v
7
_- o_T O);"
t.ul _-
Z
< --....I I.--
v
ZI-LI _
U-v
0
00
dC'4
000
000
c_-0
0
00
c_-0
0 0 0 00 0 0 00 0 0 0
COC'4
0
c; c; c; c;
0-0¢M
I--
.<c3
0.._1
0CNt_
tz3
6.<
o _0
.o"
.<Ue_
:# <0 r_
r._ i.i.i
- 350 -

.
GUN PROBES
7.1 General.
Since 1961, high-performance • conventional guns have been
used to launch atmospheric probes. This development has been under-
taken by the U. S. Army Ballistic Research Laboratory (BRL) working
closely with McGill University Research Institute of Montreal, Canadaand NASA - Wallops Island, Virginia, under Project HARP (High
Altitude Research Project). Project HARP is devoted to the develop-
ment of high altitude gun launched rockets and projectilest the acquisi-
tion of engineering and scientific data on the upper atmosphere and thecritical vehicle-environment interactions. As part of this effort, 5-inch
guns have placed 25-pound projectiles at 250,000 feet, 7-inch guns have
placed 60-pound projectiles at 330,000 feet and 16-inch guns have
reached 590, 000 feet with 185-pound projectiles as indicated in
Figure 7.1-1o ChaFF, balloon, aluminized parachute and chemical
payloads have been successfully used while on-board telemetry unitsare in an advanced state of development.
Although the major structural problems of high-'g' telemetry have
been solved for the most part, the reactions to high velocities encountered
in the lower realm of the atmosphere have hindered development of
instrumented payloads. This has included the more slowly accelerated gun-boosted rocket vehicles of the 7-inch and 16-inch guns• developed to
carry payloads to extreme altitudes and possibly orbital missions.
Initial tests of a gun probe system began on the 5-inch gun at BRL
Aberdeen Proving Ground, Maryland, during June 1961. These tests,
conducted at the Edgewood Peninsula launch site were followed by the
installation of a 16-inch gun at Barbabos, W. I., and testing of the larger
gun probes began in January 1963. Since these original tests, installation
of the 5-inch gun as spread to sites at Wallops Island, Virginia; WhiteSands, New Mexico; Barbabos; Fort Greely, Alaska; Highwater, Quebec;
and Yuma, Arizona. Additional 16-inch gun installation have included
- 351 -

-I--
(_
o
vI
oe_
<
600
4OO
2OO
04OOO
W/CDA Ib/ft 2
8OOO
7000 ft/sec
6000 ft/sec
5000 ft/sec
000
Gun VelocTty Apogee Weight
5" A 5400 ft/sec 250 kft 23 Ib7" 13 5400 ft/sec 300 kft 59 Ib7" • 5900 ftJsec 330 kft 27 Ib16" O 5600 ft/sec 350 kft 185 Ib16" • 6300 ft/sec 465 kft 185 Ib16" ® 7100. t:t/sec 590 kft 185 Ib
FIGURE 7.1-1 GUN PROBE PERFORMANCE SUMMARY
- 352 -

facilities at Yuma and Highwater, the latter being a horizontal testfire installation. Testing of the 7-inch gun probe was not initiated
until May of 1964, since surplus or worn out hardware of this newgun were not available up to that time. The initial Wallops Island
Tests were followed by installation of the gun at White Sands with
additional facilities planned for other sites as the modern hardwarebecomes available.
Most of the test previously conducted have developed ballistic
and design techniques for this entirely new field of technology so that
reliable, optimum performance could be substantiated. The manyproblems encountered during the early phases of development showed
that it was a more complex undertaking than had previously been
anticipated. Significant engineering efforts solved may of the inherent
problems in gun launched probes and some scientific data have been
gathered. These successful probes are primarily wind profiles measured
by chaff, aluminized balloons and parachutes and by tri-rnethyl-aluminumtrials. A number of successful 250 mHz and 1750 mHz telemetry flights
have been made primarily with the slower, larger 16-inch projectiles
which carried various types of instrumented payloads. However, the
greatest success of gun launched projectiles has been TMA chemical
trial studies of the Sporadic E layer variations.
Generally, the gun probe may be considered in terms of two basic
vehicle classifications: the ballistic glide vehicle which receives itsthrust solely from the gun launch, and the rocket-assisted vehicle (des-
cribed in Section 7.5). In the case of ballistic glide projectiles, the
flight trajectroy is controlled by launch vector velocity and ballisticcoefficient. To obtain a high ballistic coefficient, high fineness ratiomilliles are utilized having large vehicle mass densities. To obtain a
high launch velocity, sabot launched sub-callber vehicles are used,retaining a high ballistic coefficient after sabot separation. By an
increase in barrel length equal to 75 calibers, muzzle velocity is also
increased so that maximum gun performance and propellant efficient is
achieved. A further increase in muzzle velocity is realized when the
muzzle end is sealed with a thin plastic sheet and the barrel evacuated
of air. Larger bore diameter guns would increase the weight-to-drag
ratio and decrease acceleration loads but development of a larger gun
does not seem practical at the present state of gun probe development.
- 353 -
7.2 5-Inch Gun Projectiles.
Initial development of a 5-inch HARP probe system utilizeda 120 mm, T-123 high performance tank gun, smooth-bored to 5.1inches, muzzle extended to 33 feet and mounted on a 155 mm towed
vehicle carriage. The entire system is mounted on a 30-degree
inclined ramp to allow for near vertical firing. The missile and charge
are loaded into the tube separately. To achieve proper seating and
placement of the missile in the tube, the sabot quarters are backed with
plastic and are made slightly oversize, so that a special loading fixture
and hydraulic ram force loads the projectile at a peak force of 10 tons.
The flight vehicle is a subcaliber, fln-stabillzed projectile,45-inches long, weighing 20-pounds a'nd has a maximum body diameter
of 2.6 inches as indicated in Figure 7.2-1. The fins are slightly smaller
than the gun barrel and are canted to induce a small spin rate. The
payload cavity, 1.8-inches in diameter by 7-inches deep, is locatedin the forward body of the vehicle. Muzzle velocities in excess of
5,400 feet/sec and a load equivalent of 55,000 'g' occur at launch,producing a ballistic glide to a maximum altitude of 250,000 feet.
Figure 7.2-2 illustrates the altitude vs range profile for various launchangles at 4,000 feet launch elevation.
Payloads originally consisted of chaff or meteor projectilesfollowed by testing of a 1750 mHz telemetry package with nose antenna.
These tests were unsuccessful and provided evidence of poor design, which
resulted in redesign of the entire system. This improved second generation
gun probe had increased performance and reduced aerodynamlc i nstabillty
as well as incorporated an advanced telemetry and antenna system.Refinements of the Solistron(SOLId state klySTRON) transmitter were made
to eliminate the change in frequency due to excessive launch temperatures.
This included a reduction in size to 1-1rich long by !. 125-1nches in
diameter, permitting the use of ample thermal insulation and heat sinking.
However, temperature data showed that the package experiences temp-
eratures during the glide portion of the flight in the order of 300°C, highenough to alter the electronic and mechanical characteristics of the antenna,
RF circuit and telemetry instrumentation. Changes in load impedance due
to excessive temperature caused deviations in frequency and power output.This results in weakened signal strenght, high frequency drift, additional
RF noise and eventual signal dropout. Efforts are underway to overcome
- 354 -

,,gz'l_
Z
o
oz
- 355 -

I I I I I I0 0 0 0 0 0
N m _ 0N (_ -- --
('1-I)4) 30N1117V
o
o
oo
o
N
0
Ill
0
U1.1.1
I--
,-.I
.<Z
0ZILl._J
UI.U
0
-1-
UZi
!
IC_
t4U,.I
0U-
- 356 -
i

the problems of excessive aerodynamic heat transfer and temperatureeffects.
in order to readily provide wind sensing probes for the 5-inchgun, means to prevent tearing or burning of a parachute payload were
developed. These aluminized parachute vehicles have been providing
wind data to as high as 70 kilometers on an operational basis. Several
attempts have been made to reduce production costs, ammend the current
payload volume restructions and at the same time optimize vehicle per-formance. However, a practical, improved probe system is under the
same basic physical restrictions inherent with .the gun probe techniq_se,and therefore confined to limited design innovations.
- 357 -

7.3 7-Inch Gun Projectiles.
The 7-inch system is essentially a scaled up version of the 5-inch
system with three times the payload capacity and with an altitude per-formance of 350, 000 feet. The modern 175-mm M-113 gun is smooth-
bored, extended to 50-feet and placed in a highly modified T-76 double
recoil field mount. Interior ballistics have been a major problem with
this gun. Desired velocities are not always achieved at computed pressures
and erratic pressure variations occurred with larger charges.
The basic flight vehicle is 64-inches iongt 3.6-inches in diameter
and weigh: 60-pounds. The 7-inch diameter plastic sabot is again made
oversize and force loaded at 10 to 30 tons uslng a hydraulic jack as shown
in Figure 7.3-1. The vehicle achieves a muzzle velocity of 5400-feet/sec
at 35t000 'g'. A smaller, high performance missile has been developed
to reach 400,000 feet with a much smaller payload. This missile is 55-inches long having a 3-inch diameter and weighs 40-pounds. Metal
parts behavior of this highly accelerated system have caused problems
during development.
Payloads have utilized the usual chaff and aluminized parachutesto measure winds above 210,000 feet. Available payload volume is
125-cublc inches. Chemical payloads have been successfully used,
including a package of cesium nitrate with high explosives to generatean observable cloud of electrons at 330, 000 feet. Also a Langmulr probe
instrumented payload has been tested. A full bore 7-inch rocket vehicle
has also been developed consisting of a 125 pound projectile with a fiber-
glass case and solid propellant rocket having pop-out fins. Launched atmuzzle velocities exceeding 4,000 feet//sec it should place a 20 pound
payload at 500,000 feet.
- 358 -

\I
\\
-Z
-.r-UI,LI
Z
ii1
0
Z
!
I,,L
- 359 -

7.4 16-Inch Gun Projectiles.
The 16-inch gun incoprorates the use of a Mark D barrel, smooth-bored to 16.4 inches and elaborately modified to support a barrel exten-
sion to 119-feet, 5-inches. Weighing approximately 200-tons, it can be
elevated to 85 degrees in less than 8 minutes. Subcaliber, oversizedsabot launched vehicles are rammed into seating position with a maximum
force of 50 tons. The necessity for a fast burning, high pressure yield
propellant charge lead to the development of a spaced charge, multi-
point ignition technique which provides optimum efficients of the pro-pellant charge, and is used in conjunction with the evacuated barrel
technique °
Various types of vehicles and payloads have been used fromMartlet 1 smoke and flash vehicles to Martlet 4 orbit potential rockets.
The Martley 2C, TMA loaded vehicle has been the system most utilizedbecause of it's simplicity and high performance. Details of its wind
measurement technique were discussed in Section 3.2.7.3. Weighing
185-pounds carrying a 25-pound payload, it can achieve apogees inexcess of 180 km. It is 55-inches long by 5.4 inches in diameter andis accelerated to 15,000 'g' at a launch velocity of 7, 100 ft/sec.
Typical payload configurations are illustrated in Figure 7.4-1. Other
vehicles have been used to test various systems designs and payloadconfigurations with the more recent efforts projected toward gun-boosted
rockets. Active payloads using both 250 mHz and 1750 mHz telemetryhave been carried on a number of flights. Onboard sensors have included
magnetometers, sun-seekers_ pressure gages and Langmuir electron density
probes. However, difficulties in telemetry and antenna functions have
again been a problem_ and these devices must still be considered under
development.
- 360 -

I--
0
Z
00
\
Z
Z0
0,-r"Z0U
0,=.1
U
!
!
0
- 36| --

7.5 Gun-Boosted Rockets.
Full bore gun-boosted rockets theoretically possess excellentperformance while retaining a portion of the gun's economy and low
dispersion. Optimization of the gun-boosted system involves a trade-
off between the amount of kinetic energy imparted by the launcher
and the amount of chemical energy carried aboard, considering that
as the total launch weight is increased, launch velocity decreases.
As launch weight is decreased to obtain high muzzle velocity, the
ballistic coefficient becomes the dominant factor just as with theballistic glide missile. The optimum situation has been found to exist
when relatively large rockets are matched with intermediate gun
velocities; the gun performing as a reliable, retainable first stage for
the system.
Initial development of a gun launched rocket was the Martlet
3A vehicle. A subcaliber projectile weighing 153-pounds, it contains
a 57-pound case-bonded 6-inch nitrocellulose grain motor° Delay
ignited a 14-seconds after launch, the motor burns for 7-seconds carry-ing a telemetry package weighing 50-pounds in a 46_8 cubic inch
payload section° Many problems relating to the effects of highly
accelerated motor propellants, telemetry packages and antenna designs
were studied as well as various internal ballistic concepts. Additionaltypes of vehicles were built for the 16-inch gun and one model was
built for the 7-inch gun, the Martlet 3E.
Development of a full bore 16-inch Martlet 3D vehice providea first stage for the Martlet 4 orbital vehicle which consisted of three
stages. Additional development of guidance control units and liquidupper stages have continued efforts along these lines.
A subcaliber vehicle was also developed for extreme high altitude
performance or orbital potential with reduced complexity. This two stageMartlet 2G-1 vehicle is 169-inches long by 11.4 inches in diameter and
has a total weight of 1,100 pounds.
All the gun-boosted rockets mentioned above are illustrated in
Figure 7o5-1o Additional gun launched systems, such as a Scramjet first
stage vehicle, have been proposed as further advancements of gun launch
- 362 -

/
%
7
I
=
- r----
• ill|l Ifll
!HHl illl
I IIII
z0I..-
.<
0Ez0U
ILlV
U
0
I.U
(/1
00I
z
0
"T
0
- 363 -

potentials. As further studies of high 'g' acceleration continue, utiliza-tion of the gun-boosted rocket for high altitude missions may become
possible, although they may never become really practical in this
application.
- 364 -

7.6 Meteorological Rocket vs Gun Probe Comparison.
Since the development of the gun launched projectiles has
demonstrated an additional means of gathering high atmospheric data,
comparison of this system with the meteorological rocket is necessary to
evaluate its essential performance. Table 7-1 presents a comparisonof gun-launched vehicles against operational meteorological rockets.
Another effective means of comparison would b_ to consider the major
aspects in catagorles of the advantages and disadvantages that gun
probes have in relation to rockets.
Advantages.
. Gun probes can achieve high accuracy in placing
a package at a desired point in space. This
performance can be achieved consistently withoutregard to changing weather conditions.
. Minimal wind deviation and low dispersion providedecreased range limitations and restructions. High
velocities insure accuracy of the ballistic trajectory
and decrease vehicle impact range.
. The economy of the inert payload or the first stagesubstitution of the gun launched rocket is an
important consideration. The cost of propelling a
given weight to altitude is particularly interestingfor orbital insertion vehicles, but is not really
advantageous for meteorological applications. The
economy in reduced range area is worth consideration.
. Barrel confinement provides a reliable means of stabiliza-tion and guidance through high Mach numbers, insuring
range safety at launch, and reducing complicationswhich are inherent to rocket launched vehicles.
-365-

ZO
<
Ou,,i
O
z
O
J>I--i,i
U
O
<u6O..J
O
O,,i
T
_I
<
..OO
O
O
-i-
8
O
I
O._I
_O _O _.-_ u-} L_ OOO CN
_O U'_OO OOO_O _ O _O O
O O
0 00 0
CY 0 0
_o _o _ ooo o oo_o _ _ ooo _
_O
_o _ _ oOOO- o_o o
_ 0 _"
0 00 0 CO0 _0 0
<5 _4 d
0") _ 0 _ _ u"_ 0 0 O0
_C'_ 0 O_ I'_. _ 000CO 0 00_
o'm"0
u_O0 O0 0 O0.C__0 u'_ "_- O0
CO O0 _
0 u")0Oq
oo 1 o0 0 00 -0 _t"
uu_ uuu _ EEE_ _ _ XXX
O Ooo0"ooo
ooo oo_o 00
o1oo o00 CO_" 0 -0
•7_ _o- 6
°0 _
Z o_N _-c
0 C"-0 0
04 OC_I _ C) _.-O
_.E g
.o o- _ I _-_
O O O O_ _- CO OLI.
o _ _ E.E >-__--..O O O-
O O
u u
-o-- ID°--_- O "--U -- ._-
°-- O
o _-
8 "E
c _ __ o E
S:5
-_._
c "_, -0 I
0') 0
"-- _ _0 >
_ °
4--0
Q.
E
c121
t-
_" 0_ 0
°_ _
0 _
._ u _i- -0 ¢-
t.)
- 366 -

Disadvantages.
• Only those measurements which involve apparatus
that can be made resistant to high acceleration
stresses are possible. The extreme acceleration
loads produce an inflight elastic rebound phenomenonwhich restricts the structural fabrication of utilized
hardware.
1 Payload volumes are restricted by the structural/
weight ratio required of the high density projectiles.
Additionally, high aerodynamic heating effects
limit sensors, telemetry and antenna designs and create
the greatest challenge in the development of instrumented
payloads.
• Since internal ballistics of the gun is a determining
factor of flight trajectory, its performance should
not vary from that computed for a particular launch•
However, this has not always been the case, sincevariations have occurred from erratic internal propulsion.
i.e. The powder bags used are highly sensitive to
changes of temperature and humidity. Additionally,various disturbances at the gun, such as blast, muzzle
whip and sabot separation, can impart linear and
angular momentum to the missile, causing an oscillatory
motion in the trajectory know as aerodynamic jump.
• Muzzle emergence and transition to free flight have
incurred further restrictions to vehicle design due to
the high Reynolds number, heat and drag experiencedat that time. The resultant noise intensity at firing
creates a high nuisance value for this system.
• Maintenance costs of the gun are high in comparison
to rocket launchers• Although basic propellant costs
per round are highly economical compared to rocketfuels, initial cost of the gun is high• Consideringthat the erosion ilfe of a 5-inch tube alone is limited
to 350 rounds with reboring necessary after 200 rounds,
operating costs average high per vehicle launch com-
pared with equivalent performance meteorological
rocket systems.
- 367 -

Although there has been a great deal of discussion concerning
the relative merits of gun probe systems for meteorological soundings,the gun probes appear to be more expensive and operationally more
cumbersome than for the lower cost meteorological rocket systems.
The gun probes are limited in payload diameter and volume. They
currently offer state-of-the-art development problems for sensor instru-
mentation. The gun projectiles are fairly expensive, and the overall
cost per launching does not compare favorably with the existing boosterdart vehicles when account is made for the emplacement, reboring and
launching costs. The gun probe systems may in the future be competitive
with the booster dart systems for simple payloads such as the passive
inflatable sphere if significant improvements are accomplished and alarge number of launchlngs are to be made from a given site. There
are no prevalent advantages for the gun-boosted rocket system in the
meteorological rocket field since the added complexity of firing a
rocket system from a gun is neither simple nor inexpensive°
- 368 -

o
SUMMARY
The strongest overall meteorological rocket requirements are forwind and temperature measurements throughout the rocketsonde region of
30 km to 60 km or slightly above. These measurements are currentlybeing made on a routine basis with the Arcas and the lower cost Loki
Dart rocketsonde systems. The bead thermistor measurements appear to
be adequate to 60 kmt and satisfactory soundings have been mode to
68 km by applying aerodynamic heating and radiation correction factors
to the raw temperature data. With a slower fall rate decelerator andadvanced thermistor sensor techniquest it appears that the low cost
rocketsonde technique with an immersion thermometry temperature measure-ment is possible up to an altitude of about 75 km. An additional improve-
ment in the accuracy of the conversion of the measured temperature pro-
files into pressure and density profiles through the _ocketsonde regions maybe accomplished by the incorporation of a one-polnt pressure switch inthe rocketsonde instrument package. If this switch can be mode sufficiently
accurate at a low cost to measure 28 mb (80,000 feet) within an rms error
of 0.30 mbt this technique will be more accurate than using the hypsometer
radiosonde data which may differ significantly in space and time from the
rocketsonde run. A super Loki instrumented dart system with a largedecelerator is being developed jointly by AFCRL and NASA/MSFC to
accomplish the above extension of the current rocketsonde measurements.
This appears to be the lowest cost approach for routine measurements in
this altitude region.
The second most important requirement is for density and windmeasurements from rocketsonde altitudes to 100 km. Currently the most
promising system for this application is the Viper Dart vehicle with the
Robin inflatable falling sphere. Development flight tests by AFCRL and
the initial operational flight tests at Cape Kennedy and WSMR indicatethat reasonable densities and winds can be obtained to about 90 km with
this system. An AFCRL development program is underway to increasethis altitude to 100 km in the near future. As the Viper Dart Robin system
proves to be useful, costs can be significantly reduced by developing a
lower cost booster than the Viper rocket motor or by developing a two-
stage vehicle from two small low cost motors for this payload.
- 369-

The Robin payload is quite suitable as a meteorological
sensor because of its structural simplicity, low weight and volume
characteristics, ease of deployment and compatibility with various
vehicles and payloads, reliability and measurement accuracy, andits relative economy as compared with other more complex, sophisticated
sensing systems.
A recent demonstration of the Robin sphere performance was in
support of the Apollo Ii launch at Cape Kennedy, Florida. The
support requirements of this particular mission necessitated a reliable
measurement of atmospheric parameters from surface to 90 km. As
part of this effort, the Viper Dart Robin vehicle was flown in conjunctionwith the Loki Datasonde and the respecffve Rawinsonde observations.
The resulting data produced temperature, density, pressure and wind
profiles from the surface to 90 km with excellent agreement in the
overlap regions. These atmospheric parameters have an appreciableeffect on the Saturn V vehicle guidance and control functions during
its powered flight to 90 km. Figures 8.1-1 and 8.1-2 represent the
density profiles derived from these data. Figures 8.1-3 and 8.1-4 pre-
sent the wind profiles of these observations. It is interesting to note
the overlapping of all three wind profiles in Figure 8.1-4 since theRawinsonde utilized GMD-4 tracking and the others incorporated FPS-
16 tracking. Temperature profiles are illustrated in Figures 8.1-5 and8.1-6.
The main disadvantage of the Robin passive sphere technique is
the requirement for a radar with the precision of the AN/FPS-16 orbetter. During the Sparrow-Arcas Denpro program, it was found that
the tracking accuracy of the AN/GMD-2 compared favorably with the
AN/FPS-16 radar data in the slant range parameters. No doubt thisis due to the fact that the main tracking variable during vehicle ascent
is slant range, and the GMD-2 is fairly accurate in slant range deter-
mination. Therefore, there may be a requirement for a low cost pltot
probe system utilizing GMD-2 tracking and telemetry at sites whereadequate radars are not available. The vehicle for such a system should
consist of two low cost, relatively small rocket motors configured into
a two-stage vehicle with a final stage diameter from 3.0" to 4.0". The
vehicle apogee should be about 200 km in order to maintain sufficient
velocity through 100 km to assure accurate density data to this altitude.
Such a system should cost on the order of $2, 500 if the currently available
vibrating diaphram pressure gauge is found to be adequate. If wind data
were desired from this system an inflatable sphere could be ejected near
- 370 -

ALTITUDE (KM)
..ILI_
14J
zzv
I,Lla.
<U
I
O,,".OO..
!
mLI.
O
D
2c[.
_.n
L)Z:::)<_,I
O--4
O.<
!
(W>I) 3anl117v
!
I.I,.I
om1.1_
- 371 -
-371 -

_÷ -
f t :.:i i;:
4- -!_¢i
-.t 1] !
tL ii11
• 4:}i:!- i
• ' r '
• , r
j , !7 i •
" Z,l
r !!!' , . , +
. • , L _
i', _!!''_ j!!
- 372 -

80
4O
3O
2O
I0
BO°.--.L
270 ° 3_0 °
ISo" IBO" o
\
20 4O f_O 80 I00J .L
+ + , + _+
. _ • • . , . _ _
U-
ZZW
v
+ . .
. .
180° 2.'/0" 34;0"
WIND DIRECTION
SO° 180" 0
J'l/z Y/4,/S_9RAWINSONDE- 1115Z (,)VIPER ROBIN- 1310Z (o)LOKI DATASONDE- 1431Z (x)
ZO 40 60 80 I00
WIND SPEED (M/SEC)
- 373 -

• i°180° 270 ° 360 ° 090 ° 180° 20 40 60 80 I00
90
70
&0
vv
_o:DI--
I.--.--I
.,<
4O
30
t0
u,_
>_-E3L.U
ZzLLI
v
.<M
I
O.,-OO,
,O
!
LL.
O
E3Z
I.-
2Q-
(./3
"I-U7:D.<..I
g-J
OQ_
.<I
N,I.--ILl
10
180o 270" 360 °
WIND DIRECTION090 ° 180° 0 20 40 60 80 100
I WIND SPEED(M/SEC)
"t"
I,u
o,n-
- 374 -

I0
4O
3O
I.L
ZZ
.<U!
.,00,,
>,
"_t
I
m
o
.<
I.--
I--
oo..
v_
-rUZ
ooo..
I
l.--l.u
I0
-_ -7O -50 -30
TEMPERATURE (°CELSIUS)
-IO IO
!
ILl
ONLI-
30
- 375 -

- 90 -70 -50 -30 - tO 10 30
7O
4O
2O
-so -3o
TEMPERATURE(°CELSIUS)
I0
- 376 -

the vehicle apogee, and the wind data could be retrieved with a less
precise radar than the FPS-16. If no radars were available at a particularsite, an extra large inflatable sphere could be deployed with a relative-
ly light-weight GMD-2 transponder. This system would be considerably
more expensive than the simple inflatable falling sphere experiment,
and this extra cost should be weighed against the necessity for obtaining
100 km wind and density data at sites without precision radar.
There appears to be an interest in a modest scale seml-synoptic
ozone network to an altitude of about 75 km. Typical ozone payloads
weigh about 35 pounds, and a reasonable diameter is about 5.5" to 6.5".
Although fairly large slgnal-stage vehicle has been proposed for thisappllcatlon, a better choice might be a low cost two-stage vehicle.
Currently such vehicles do not exist.
Electron density payloads are fairly small and lightweight. The
same two-stage vehicle proposed for the pitot probe system would be most
appropriate for electron density measurements to 200 km. Electron
density measurement systems should be amenable to fairly low cost
($2, 000) production.
For large numbers of launchings per year at a given site, a size-
able investment in the ground-based facilities may be justified on the
basis of reducing the expendable costs. For instance, if density is
required to 100 km at a site where there is no radar, the choice may be toeither construct an acceptable radar at the site, or to use a GMD-2
type system. With the radar, a low cost passive falling sphere system may
be used, whereas with the GMD-2, a more expensive pitot probe type
system may be required. The most economic choice would depend upon
the number of firings anticipated during the useable life (estimating
obsolescence) of the ground equipment. If the passive sphere system
should cost $1,300 and the pitot probe system cost $2, 300, then one
thousand flights would be required from the given site to amortize thecost of a $1 M radar. Thus, the establishment of a realistic requirement
for the number of flights from a given launch site per year is quiteimportant for future design efforts.
- 377 -

APPENDIX I
- 378 -

CORRECTIONS FOR METEOROLOGICAL ROCKET T_4PERATURE SOUNDINGS
ON AN INDIVIDUAL BASIS
By Robert M. Henry
NASA Langley Research Center
Langley Station, Hampton, Va.
Presented to the American Meteorological Society Conference
on High-Altitude Meteorology and Space Weather
Houston, Texas
March 29-31, 1967
- 379 -

CORRECTIONS FOR METEOROLOGICAL ROCKET TEMPERATURE SOUNDINGS
ON AN INDIVIDUAL BASIS
By Robert M. Henry
NASA Langley Research Center
ABSTRACT
Past studies have derived magnitudes of rocketsonde temperature errors from assumed atmospheric prof i les and parachute t ra jector ies ; the present paper derives corrections using the actual t ra jectory and t;Le measured temperature prof i le . radiation, infrared radiation, e lectr ical heating by the measuring current and by radio-frequency radiation, and for thermal emission by t h e thermistor and mount. such as the Arcasoncle IA sensor. large reductions i n the magnitudes of the corrections required. computing t h e ventilation velocity t o improve the accuracy of the large aero- dynamic heating correction i s presented.
Corrections are derlved for aerodynamic heatmg, thermal. lag, solar
Corrections are derived for a simple postmount and for a thin-fi lm mount It is shown t h a t the thin-film mount produces
A method of

CORRECTIONS FOR METEOROLOGICAL ROCKET T_4PERATURE SOUNDINGS
ON AN INDMDUAL BASIS
By Robert M. Henry*
INTRODUCTION
With any measuring system, there is always concern as to the measurement
errors of the system. These errors are of particular interest where meteorolog-
ical rocket systems are concerned because the errors generally increase with
altitude, and however much the systems are improved there is always a desire to
utilize data from still higher altitudes where the errors become increasingly
large.
A number of previous studies (for example, refs. i to 6) have considered
the problem of measurement errors of bead thermistors primarily by assuming
standard conditien[ and nominal trajectories and solving for the thermistor tem-
perature from an assumed atmospheric temperature profile. The present study
considers the inverse of this problem: given the time history of the thermistor
temperature, to fired the atmospheric temperature profile. This_ of course, is
uhe problem faced by the using meteorologist.
The purpose of this paper is to help extend the useful altitude range of
meteorologi:al rocket data by presenting a system of corrections based on the
actual conditions arid trajecto_, of the particular measuring system.
SYMBOLS
A
A] b.
C
C D
cp
G
h
J
area
albedo
heat capacity
drag coefficient
epeci[_ic heat of air at constant pressure
geom£trlc factor depending on shape and exposure
acceleration of gravity
coefficient of convective heat transfer for total area
solar constant
*Aerospace engineer.
- 381 -

P
k
m
r
S
T
Teff
v 7
w' vz
wt
WZ W
X
a
B c
0
P
coefficient of thermal conductivity
mass of parachute plus payload
recovery coefficient
area of parachute
temperature
effective radiatiozi t ezarature of atmosphere
ventilation velocity
vector velocity of parachute
vertical component of parachute velocity
three-dimensional vector wind velocity
electrical heating of thermistor due to measuring current and radio- i frequency radiation i
vertical wind velocity z $
weighting factor
length of lead wire
absorptivity for radiation
cross-sectional area of lead wire
thermal emissivity
Stefan-Boltzmann constant
air density
&bscripts:
atm atmosphere
f conductive thin film
z long-wave (terrestrial) radiation
m mount
8 short-wave (solar) radiation
t thenni stor
- 382 -

KEA_T-TRANSFER EQUATIONS
To determine the corrections to be applied to the temperature measurements,
it is necessary to evaluate the various heat-transfer mechanisms involved
between the environment and the measuring system and between different parts of
the measuring system.
The first relationship to be considered is the heat equation of the therm-
istor itself. This equation is a statement that the rate of increase in the
heat content of the thermistor is equal to the sum of the heat inputs:
v2= ht atm + rt --2Cp - T + astGstJ(l + Alb.) + _ztGztaTeff4
- Atetoqt 4 + W t + _-_X (Tm - Tt) (i)
The term on the left of the equation represents the net rate of addition of
heat. The first term on the right is the rate of heat transfer by conduction 3
and includes the aerodynamic heating [rtV2/2Cp). The sum of Tatm + rtV2/2c p
is called the recovery temperature, and represents the temperature of the atmo-
sphere in actual contact with the surface of the thermistor.
The remaining terms represent, respectively, solar heating, infrared
heating, thermal emission by the thermistor, electrical heating (by the measuring
current and by the radio-frequency radiation from the transmitter antenna) and
heat conduction through the lead wires from the mount.
The expression for heat conduction given here (2_k_/X) assumes a uniform
gradient of temperature along the wire. This is appropriate if the heat trans-
fer between wire and environment is small, the temperature lapse rate is not
changing rapidly, and the system has recovered from any large initial tempera-
ture differences at deployment. It is not appropriate for systems having long
lead wires, and may also be inappropriate for a short period of time immediately
after deployment if the initial temperatures of the system components are
greatly different from their respective recovery temperatures.
Heat-Transfer Equation for Thin Film
The widely used Arcasonde IA (ref. 5) and also a number of more recent
designs developed by, for example, White Sands Missile Range, Metrophysics,
Inc., and Thiokol's Astro-Met Division utilize a short lead wire plus a metal-
lic thin film deposited on a plastic thin-film substrate in the electrical path
of the measuring current. The original purpose of this arrangement was to
achieve thermal isolation of the thermistor from the telemetry package. How-
ever, it is found that the large &rea of thin film in addition to providing
- 383 -

thermal isolation serves as a very effective heat exchanger with the atmosphere.
In fact_ the heat transfer from the film, conducted through the lead wires,
dominates the transfer processes of the thermistor.
The heat-transfer equation of the thin film can be expressed by an equa-
tion similar to that for the thermistor:
Cf _ = hf atm + rf _p - T + _sfGsfJ(l + Alb. ) + _zfGzfOTeff 4
- AfcfcTf 4 + 2-_xk(Tt - Tf) (2)
which differs from equation (i) principally in the change of subscripts. The
geometric factors in the radiation terms are different 3 and there is strong
dependence on the solar angle. The electrical heating is expected to be negli-
gible and is omitted. The conduction term is the negative of the conduction
term in equation (i) with Tm = Tf.
CORRECTION EQUATIONS
Equations (i) and (2) provide a basis for not only evaluating the various
errors in the film-wire-bead system_ but also for correcting them using the con-
ditions of the actual flight rather than nominal corrections.
Correction Equation for Bead
If the temperature of the bead thermistor T t and_ consequently, its
derivative is a known function of time, equation (i) can be solved for the
atmospheric temperature Tat m by simple algebraic manipulation. The resulting
correction equation
V2 et dT tTat m = Tt - rt- + --
2Cp ht dt
Gst_stJ(l + Alb.)
_ __ AtcteTt 4Wt + _ 2k_(Tm - Tt)
ht ht Xht
Gzt_lteTeff 4
h t ht
(3)
gives the atmospheric temperature as the sum of the thermistor temperature plus
a series of correction terms which may be called, respectively, the aerodynamic
heating correction, lag correction_ solar-radiation correction, long-wave-
radiation correc_ion_ electrical heating correction, and conduction correction.
- 384 -

Actual evaluation of the corrections is complicatedby difficulties and
uncertainties in the determination of some of the correction parameters. In
the altitude range of interest, the bead experiences transition from continuum
flow to slip flow and from slip flow to free molecule flow. This affects the
determination of both the convective heat-transfer coefficient ht and the
recovery coefficient rt. The geometric factors Gst and G_t are affected
by deviations of the actual beads from the nominal diameters and from the
nominal spherical shape. The solar and long-wave absorptivities and emissivi-
ties _st and _Zt and the emissivity et may vary with age and exposure to
a contaminated atmosphere. While variations in the solar constant J may be
neglected, the value of the albedo Alb. will vary over a wide range depending
on cloud cover, snow cover, vegetation, and at costal locations, on the solar
angle. The effective radiating temperature of the atmosphere Tef f varies with
latitude and season and also with cloud cover. As a result, it will be diffi-
cult to make radiation corrections with a high percentage of accuracy and
reflective coatings or radiation shields are needed to keep the magnitude of
these corrections small.
Finally, the conduction correction requires a knowledge of the mount tem-
perature Tm which in the case of the thin-film mount is the film temperature
Tf. This can be found from the heat equation of the film, equation (2). In
order to obtain closed form solutions, it is _ecessary to make a suitable
approximation for the quadratic term AtetoTf_. This may be done by using the
first two terms of the Maclaurin series expansion of Tf 4
Tf 4 _Tt 4 + 4Tt3(T f - Tt) (4)
This linear approximation will be very accurate at the temperature encountered
by the meteorological rocket, producing an error of around 1.O percent for a
30 ° difference between Tf and Tt.
With the substitution of equation (4) into equation (3), equation (3) can
be solved for (Tf - Tt). If the resulting value is substituted into equa-
tion (2) and the result solved for the atmospheric temperature, a system cor-
rection equation results:
Tat m = Tt +
V 2 dTt _
-htrt _ + _t d--_ - GstmstJ(l + Alb.) - Gltc_itTeff - Wt + AtetoTt 4
i_(2kS/X)ht +
hf + 2kp/X + 4A_f_2t 3
hf + 2k_/X + 4AfcfoTt3 L hTrf + Cf _ - SsfmsfJ(1 + AI_.) - G_f_zfOTeff h + AfcfeT
+ (5)hf(2k_/X)
ht +
hf + 2k_/X + 4Af_foTt 5
- S_ -

in which the unknown film temperature Tf has been eliminated. The time deriv-
ative of the film temperature_ which still appears, can be assumed t0be approx-
imately equal to the derivative of the thermistor temperature except for a brief
period immediately after deployment where a step change in temperature may pro-
duce a temporarily large difference.
It can be seen from equation (5) that the expansion of the conduction term
has also changed the aerodynamic, lag_ radiation_ and emission terms. In each
case the denominator h t has been replaced by the expression
ht +
hf + 2kG/X + 4AfefoTt3
which can be regarded as a system convective heat-transfer coefficient. The
behavior of the system can be understood better by considering the corresponding
terms in the first and second fractions. It can be seen that each term -
aerodynamic heating, lag, radiation, etc. - is the sum of the term for the bead
plus the corresponding term for the film multiplied by a weighting factor
2k_/xwf = (6)
hf + 2k_/X + 4Afcf_Tt3
which is, approximately_ the ratio of the conduction 2k_/X to the total ther-
mal dissipation hf + 2k6/X + 4AfcfoTt3. The denominator - the system convec-
tive heat-transfer coefficient - is a similar weighted sum of the thermistorand film heat-transfer coefficient
hsystem = ht + wfhf (7)
Thus, equation (5) can be rewritten
Tat m = T t -
dT t dTf
+ wf_fhtr t + wfhfrf V2 Ct dt d7+
ht + wfhf 2Cp h t + wfhf
+ Gst_st + WfGsf_sf J(l + Alb.) - GZt_Zt + wfGzf_Zf Teff 4
ht + wfhf h t + wfhf
Wt Atct+_Afe f
ht + wfhf ht + wfhf_t 4 (8)
- 386 -
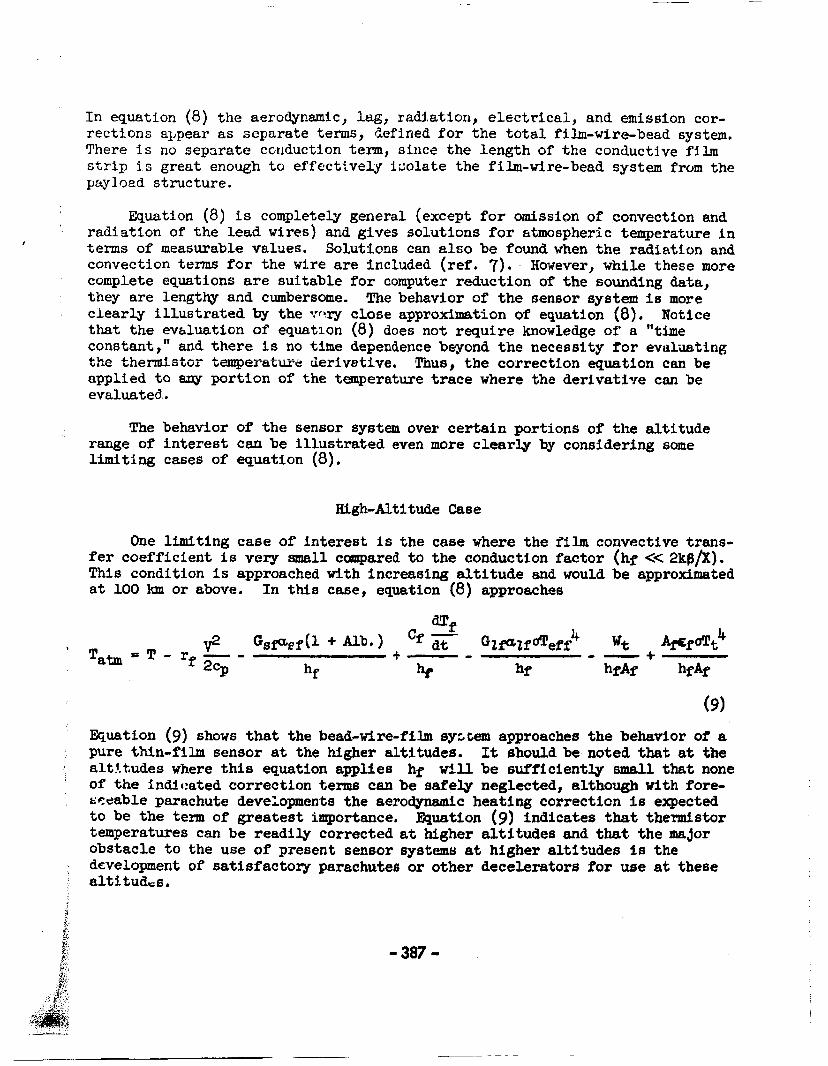
I n equation (8) the aerodynamic, lag, radiation, e lec t r ica l , and emission cor- rections q,pear as separate terms, &fined f o r the t o t a l film-wire-bead system. There i s no separate ccuduction term, since t h e length of t h e conductive film st r ip i s great enough t o effectively i x l a t e the film-wire-bead system from the paylozd structure.
Equation (8) is completely general (except f o r omission of convection and radiation of the lead wires) and gives solutions f o r Eitmospherfc temperature i n terms of measurable values. Solutions can a l so be found when the radiation and convection terms f o r the wire are included (ref. 7). However, while these more complete equations are suitable for computer reduction of the sounding data, they are lengthy and cumbersome. clearly i l lust ra ted by the ~ r y close approximation of equation ( 8 ) . Notice that the evbluation of equation (8) does not require knowledge of a "time constant," and there is no t i m e dependence beyond the necessity for eval-uating the t h e i d s t o r teiqperat-ue derivetive. applied t o any portion of the tanperature t race where the derivative can be evaluated.
I
The behavior of the aensor system i s more
Tnus, t h e correction equation can be
The behavior of the sensor system over cer ta in portions of the al t i tude range of in te res t can be i l lus t ra ted even more clearly by considering some limiting cases of equation (8).
High-Altitude Case
One limiting case of interest is the case where the film convective trans- f e r coefficient is very small compared to the conductlon factor (hf << 2kg/X). This condition is approached with increasing a l t i t ude and would be approfimated a t 100 lun or above. In this case, equation (8) approaches
( 9 )
Equation (9) shows that the bead-wire-film system approaches the behavior of a pure thin-film sensor a t the higher altitudes. It should be noted that at the alt!.tudes where t h i s equation applies hf will be sufficiently small that none of the indicated correction terms can be safely neglected, although wi th fore- seeable parachute developments the aerodynamic heating correction is expected t o be the tern of greatest importance. Equation (9 ) indicates that thermistor temperatures can be reedily corrected a t higher a l t i tudes and that the major obstacle t o the use of present sensor systemti at higher a l t i tudes is the development of sat isfactory parachutes or other decelerators for use at these alt€tud,s,
-387-

Lower Altitude Case
Another 1i.rnitir.g case of interest is the case where the conduction factor
T h i s condition is approximated at altitudes below about 70 La. is very small ccjmpared with the film convective transfer coefficient (2kp/X << hf). In this iower altitude case equation-(8) approaches :
ht + 2kf3/X ht + 2kP/X
. 4 W t 4 +
. ht +-2k$jC
In this case the system heat-transfer coefficient becomes ht + 2kP/X. that the numeretors of the lag, radiation, electrical, and emission terms are the same as in the simple thermistor correction equation (3) , that is, the eeme as for a Gimple thermally isolated thermistor. tents is substantially reduced in magnitude by the increased denominator. the 60- to 70-km range, decreases with altitude to values an order of nagnitude below %kS/X, with correepondiug reduction in the lag, radiation, electrical heating, and emission corrections. The aerodynamic heating correc- tion is reduced slightly, primarily because the film (whose recovery coeffi- cient is heavily weighted) is in the continuum flow regime at these altitudes, with e recovery coefficient. of about 0.9 compared to about 1.1 for the bead thermistor which ie in the slip-flow regime. trical heating, and atdssion corrections are on the order of tenths of a degree, the Lag correction I s on the order of a degree, and the aerodynamic heating correction is on the order of tens of degrees. a nominal traJectory, but deviations f r o m nominal always result in increases. )
Notice
As a result, each of these In
ht
As a result, the radiation, elec-
(It le about loo K at 65 lun for
Computation of Ventilation Velocity
Since it appears that the aerodynemic heating 16 the most important cor- rectian at all altitudes, it is important to determine this correction with the greatest accuracy which is feasible, In evaluating the aerodynamic heating it has frequently been aosumed that the ventilation velocity V can be approxi- mated by the magnitude of the verticalvelociQ Vz. However, this assumption is valid only if the vertical velocity approximates the terminal velocity, and previous study (ref. 8) shows that, for the range of ballistic coefficients of current parachutes, terminal velocity ie not closely approached until below 60 Irm. It is thus deslrable to obtain a better representation of the ventila- tion velocity.
The Casired ventilation velocity V is the magnitude of the vector difier- ence between the parachute velocity and the velocity of the at;mosphere 17 - $1. The equations of motion do not provide a unique solution for this
- 3 0 8 -

value from tracking data unless an assumption is made regarding one component o f t he velocity of the atmosphere. however, by neglecting the vertical wind velocity i n comparison w l t h the ver- t i c a l component of parachute velocfty. parachute (the drag equation) is given by
I A very good approximation can be found,
The equation of vert ical motion for the
If' the approximation that solved fo r the ventilation
Vz Vz - Wz i s made, then equation (11) can be velocity :
which can be evaluated from known or measured quantities. derivative of the position must be determined, precise tracking is needed; radar tape data rather than plotboard data should be used,
Since the second
The approxlmstion i n equation (12) will eenerally be very good throughout the region of the atmosphere of interest. short t i m e a f te r apogee when the parachute does not posseas appreciable verti-
It obviously wlU not apply for a
cal velocity.
Correctione t o rocketeonde temperature profiles for serodynamic heating, therms1 lag, eolar radiation, Infrared radiation, e lec t r ica l heating by the measuring current and by radio-frequency r a a t i o n , and for thennal emisaion can be made for current thin-f i lm mount designs as well as for eimple post mounting, and can be made for the 8 C t W conditions and parachute tradectory of the individual sounding.
The accuracy of' the aerodynamic heating correctlon, which is the largest correction, can be improved by using the calculated ventilation velocity instead of the vertical velocity.
The use of a thin-film mount, which serves a8 a heat exchanger between atmosphere and thermistor results i n great reductlon of all the corrections except the aerodymnlc heating correction.
The aerodynamic heating correction is reduced eomewhat by the thin-film I
I mount because tranaltlons t o s u p flow and t o free molecule flow occur st higher altitudes.
I - 389 -
I I i
2 a
f
i
5 4 i I :
I ak I I'

Because the corrections are substantial, especially at the higher alti-
tudes, the accuracy of the sounding at the higher altitudes depends strongly
on the accuracy of the corrections.
Additional research is needed to determine accurate values of the param-
eters used in the corrections, particularly the convective heat-transfer coef-
ficients and recovery coefficients over the range of atmospheric conditions
and flow regimes encountered.
R_R_NCES
i. Barr, William C.: Theoretical Considerations in the Design of Atmospheric
Temperature Sensing Elements. USASEDL Tech. Rept. 2195, April 1961.
(Available from DDC as Document No. AD 255896.)
2. Ballard, Harold N.: Response Time of and Effects of Radiation on the VECO
Bead Thermistor. Tech. Rept., Schellinger Research Lab., Texas Western
College (Contract DA-29-O40-ORD-2410), April 1961.
3. Wagner, N. K.: Theoretical Time Constant and Radiation Error of a Rocket-
sonde Thermistor. J. Meteorol., vol. 18, no. 5, Oct. 1961,
pp. 606-614.
4. Wagner, N. K.: Theoretical Accuracy of a Meteorological Rocketsonde
Thermistor. J. Appl. Meteorol., Vol. 3, No. 4, Aug. 1964, pp. 461-469.
5. Drews, William A.: A Thermistor Arrangement to Improve Temperature Meas-
urements at High Altitudes. NASA CR-533, 1966.
6. Thompson, Donald C.: The Accuracy of Miniature Bead Thermistors in the
Measurement of Upper Air Temperatures. Scientific Report No. i (Contract
No. AF 19(628)-4165), Mass. Inst. Tech., Oct. 1966. (Also AFCRL-66-775.)
7. Staffanson, Forrest L.: Mathematical Model of the Film Mounted, Rocketsonde
Thermistor. Paper presented at American Meteorology Society Conference
on High Altitude Meteorology and Space Weather. Mar. 1967.
8. Murrow, Harold N.: Parachutes for Meteorological Applications. IRIG Doc.
No. 111-64, Feb. 1965, pp. 237-245.
- 390 -

BIBLIOGRAPHY

BIBLIOGRAPHY
CHAPTER I - INTRODUCTION
1.1 GENERAL
Inter--RangeInstrumentationGroup, Meteorological Working Group,Meteorological RocketNetwork Committee, (1960): Initiation of
the Meteorological Rocket Network Report, AD 246 950.
Suomi, V. E.; Observing the Atmosphere - A Challenge: Proceedings
of the IRE, Page 2192 - 2197 - November 1962.
1.2 ATMOSPHERIC PARAMETERS
Jehn, K. H., Wagner, N. K., Gerhardt, J. R., Haragan, D. R.;
Wind and Temperature in the Atmosphere between 30 and 80 KM:3rd Quarterly Technical Report - 1 Jan 1961 thru 31 March 1961,Contract A-23--072-ORD-1564.
Clark, G. Q., Webb, W. L., Jenkins, K. R.; (1960): High Atmos-
phere Meteorological Parameters, IRE Trans. Military Electronics,
MIL-4, 238 - 243.
1.3 MEASUREMENT CONSIDERATIONS
Miers, B. T., Beyers, N. J.; Rocketsonde Wind and TemperatureMeasurements between 30 and 70 KM for selected Stations. ERDA-70,
September 1963.
1.4 MEASUREMENT SYSTEMS
Joint Scientific Advisory Group to the Meteorological Rocket Network;
An Analysis of the First Year in Operation: Journal of GeophysicalResearch, Vol 66, No. 9, Page 2821, September 1961.
- 392 -

CHAPTER 2 - SYSTEM REQUIREMENTS
2. I GENERAL
2.2 MISSILEAND SPACEVEHICLESUPPORT
Cook, G. E.; Comparisonof Air Densities obtained from Orbital
Decay and Instruments: Technical Report No. 66370, November 66.
Field, Jerome S. and Hargis, David E.; The Effects of the Accuracy of
Atmospheric Data on the Structural Design Loads of a Typical LaunchVehicle: Aerospace, Mar. 1964.
Henry, Robert M. and Cochrane, James A.; Geographical Variations
of Wind Loads on Vertically Rising Vehicles - NASA, 2-6 Mar. 64.
Moore, G. R. and Harmon, W. H.; Meteorological Data Required in
Hypersonic Glide Research Flight Test Program - The Boeing Company,Seattle, Washington .
USAF; Some Effects of the Natural Environment on Aerospace Systems:4 WG P 80-4-1, March 23, 1964.
Vaughan, William W.; Wind Profiles at Staging Altitudes (35 KM to
80 KM): NASA, 27 - 28 September 1961.
2.3 METEOROLOGICAL RESEARCH
Diamond, Marvin and Lee, Robert P.; Statistical Data on Atmospheric
Design Properties above 30 KM: ERDA-75, October 1963.
Estes, Glen, D.; Meteorological Rocket Program, Vol. III, Rev. 1,
Meteorological Research, Development, Test and Evaluation Rocket:.USAMC - AD-804817, October 1966.
Friedman, H.; Sounding Rocket Research Techniques, IQSY InstructionManual _9, iQSY Secrefariat, London - 1964 - November.
- 393 -

2.3 Meteorological Research - (continued)
Howley, D.L._ A Study to Define a State-of-the-Art Rocket Vehicle
Suitable For Synoptic Meteorological Soundings, Vol. I, NASA -CR-66002, (NAA) SID65-411, 1A, 16 June 1965 (Rev.)
Kellogg, Win. W._ Rocket Research and the Upper Atmosphere: "The
Earth", Page 157- 168.
Rosenberg, Norman W._ Dynamic Model of Ionospheric Wind Profiles:
Journal of Geophysical Research, Space Physics, Vol. 73_ No. 15,Page 4965, August 1, 1968.
Smith, L. G., Weeks, L. H. and McKinnon, P. J._ Investigation ofthe D and E Regions of the Ionosphere during the International QuietSun Year. NASA CR-391 - March 1966.
Smith, W. S._ Theon, J° S._ Swartz, P. C. and Katchen, L. B._
Temperature, Pressure, Density and Wind Measurement in the Upper
Stratosphere and Mesosphere, 1965 - NASA TR-R 263, September 67.
Webb, Willis, L°_ The Dynamic Stratosphere - ERDA-62, August 63.
- 394 -

CHAPTER 3 - ATMOSPHERIC SENSORS
3. I GENERAL
Radigan, J.(Director Internal Systems);High Altitude Sensing Tech-
niquesr Final Summary Report - NORT 65-11, January 1965.
Smith, W. S.; Temperaturet Pressuret Density and Wind Measurementsin the Upper Stratosphere and Mesosphere, NASA Technical Report,NASA TR R-263r 1965; TR R-245, 1964.
Smith, W., Theonr J., Katchen, L. and Swartz_ P.; Temperature,
Pressure, Density and Wind Measurements in the Upper Stratosphere
and Mesosphere, 1964. NASA, TR R-245 - NASA 1966.
Smith, W. S., Theon, J. S., Swartz, P. C.; Katchen, L. B._;
Temperature, Pressure_ Density and Wind Measurements in the Stratos-
phere and Mesosphere ! 1966 - NASA TR R-288, August 1968.
3.2 WIND MEASUREMENT TECHNIQUES
Avara, E. P. and Mierst B. T.; A Data Reduction Technique for Meteor-
ologlcal Wind Data above 30 Kilometers - ECOM-5168, December 67.
Ban', W. C.; Theoretical Evaluation of Cylindrical Chaff as a Wind
Sensor at High Altitudes_ USASRDL, TR 2138, AD 241876, 36.
Battan, L. J.; (1959): Use of Chaff for Wind Measurements, Bull. AMS,Vol 39, 258 - 260.
Batten, E. S.; Wind Systems in the Mesosphere and Lower Ionosphere,P-2018, NSF, 13 June 1960. (Rand Corporation)
Beaudoin, P. E.t Golombt D., Noel_ T. M., Rosenbergt N. W. and
Vickery, W. K.; Observation of Mesosphere Winds and Turbulence with
Smoke Trails: Journal of Geophysical Research_ Vol 72_ No. 1415 July 1967.
- 395 -

3.2 Wind Measurement Techniques - (continued)
Beyers, N. J. and Miers, B. T.; A Summary of Studies of Duirnal TidalMotions Near the Stratopause over White Sands Missile Range, NewMexico - June 1966.
Beyers, N. J. and Thiele, O. W. (1961): Meteorological Rocket Wind
Sensors, (Unpublished).
Beyers, N. J. and Thiele, O. W. (1961): Performance Characteristics ofSystems for High Altitude Wind and Temperature Observations, Instr. Soc.of Amer.-Amer. Meteor. Soc., 11-15, preprint 170 LA-61-1.
Beyers, N. J., Thiele, O. W., Wagner, N. K.; (1962): PerformanceCharacteristics of Meteorological Rocket Wind and Temperature Sensors,Technical Report SELWS-M-4, U. S. Army Electronics Research andDevelopment Activity, White Sands Missile Range, New Mexico.
Borden, T. R.t Jr., Hering, W. S., Muencht H. S., Ohrlng, G. (1960):
Contributions to Stratospheric Meteorology, GRD Notes, 2, GeophysicsResearch Directorate, AF Cambridge Research Laboratories, Bedford, Mass.
Bruch, A. and Morgan, G. M. Jr. (1961): Wind Variability in the Mesos-phere as Determined by the Tracking of Falling Objects, AFCRL 660,Final Repo., Contract No. AF 19(604)-6193, New York University.
Eddy, Amos, Duchon, C. E., Hasse, F. M. and Haragan, D. R.;Determination of Winds from Meteorolocjical Rocketsondes _t2 - Nov. 65.
Finger, Frederick G., Teweles, Sidney; The Mid-Winter 1963 Stratos-pheric Warming and Circulation Change: Journal of Applied MeteorologyVol. 3, No. 1, PP - 1 - 15, February 1964.
Golomb, D., Harang, O. and DelGreco, F. P.; Upper AtmosphereDensities and Temperatures at 105-165 Kilometers from Diffusion andSpectral Intensity of AIO Trails: Journal of Geophysical Research, Vol. 72,No. 9, 1 May 1967.
Hoffman, J. M., Nelson, L. S. and Smith, L. B.; Yellow-Green LuminosityAccompanying the Injection of Trlethylborane into the Upper Atmosphere:Nature, Vol. 214, _5094, pp 158 - 159, SC- R-67-1073, April 1967.
Jehn, K. H., Wagner, N. K., Gerhardt, J. R. and Haragan, D. R.; (1961):Wind and Tempe==ature in the Atmosphere between 30 and 80 kin, SecondQuarterly Report, Contract DA-23-072-ORD-1564, University of Texas,
Austin, Texas.
- 396 -
3.2 Wind Measurement Techniques - (continued)
Jenkins, K. R., Webb, W. L.; (1958): Rocket Wind Measurements tBull. AMS, Vol. 39, 436.
Jenkins, K. R., Webb, W. L.; (1958): Rocket Wind Measurements,
Tech Memo 531, USASMSA, White Sands Missile Range, New Mexico.
Jenkins, K. R., Webbt W. L. (1959): High Altitude Wind Measurements rJ. Meteorologlcalp Vol 16, 511-518.
Keegan, Thomas J.; Winds and Circulations in the Mesosphere: AFCRL-244, February 1961.
Lally, V. E. and Levi,an, R.; (1958): Accuracy of Wind Determination
from the Track of a Falling Object, AF Surveys in Geophysics, USAFCRINo. 93, AD 146858.
Paterson, Ray E., Schuetz, John, Shenk, Win. E. and Lan, Wen.;
Derivation of a Meteorological Body of Data Covering the NorthernHemisphere in the Longitude Region between 60°W and 160°W from
March 1964 through February 1965:. NASA CR-723, April 1967.
Ragsdale, George C. and Wasko, Peter E.; Wind Flow in the 80-400 km
Altitude Region of the Atmosphere: MTP-AERO-62-49t 5 June 1962.
Rapp, R. R. (1969): The Accuracy of Winds derived by the Radar Trackingof Chaff at High Altitudes, J. Meteor., Vol 17t 507-514.
Smith, Lawrence B.; Use of Chaff Rockets for Measurement of High-
Altitude Winds: Sandia Carporationt 5 - 8 December 1960.
Webb, Willis, /.; Stratospheric Tidal Circulatlon_ Reviews of Geo-physics, Vol. 4, No. 3, Page 363 - 375, August 1966.
Woodrumt Arthur and Justusr C. G.; Atmo_heric Tides in the HeightsRegion 90 to 120 Kilometers: Journal of Geophysical Research, Vol. 73,
No. 2, Page 467, 15 January 1968.
- 397 -

3.3 TEMPERATURE MEASUREMENT TECHNIQUES
Badgley, F. !.} (1957): Response of Radiosonde Thermistors, Rev. Sci.Inst., 28(12 1079 1084).
Ballard, H. N.; (1961): Response Time of and Effects of Radiation on the
VECO Bead Thermistor, inst. Soc. of Amer., Preprint No. 169-LA-61.
Ballard, J. C.; (1941): On the Interpretation of Temperature Measurementsmade at High Levels, Mon. Wea. Rev., Vo_ 69r 33-40.
Ballard, Harold N.; The Measurement of Temperature in the Stratosphereand Mesosphere, USAECOM Report//5056, May 1966.
Bailard, Harold N.; A Review of Seven Papers Concerning the Measurementof Temperature in the Stratosphere and Mesosphere: DA Task - IV650212A
27-03, ECOM-5125, May 1967.
Ban', W. C.; (1958): Heat Transter Considerations in the Design of High
Altitude Temperature Sensing Elements, Bull AMS, Vol 39, 435.
Ban', W. C.; (1961): Theoretical Considerations in the Design of Atmospheric
Temperature Sensing Elements, USASRDL, TR 2195.
Beyers, N. J-t Thiele, O. W., Wagner, N. K.; (1961): "PerformanceCharacteristic of Meteorological Rocket Wind and Temperature Sensors",
Technical Report SELWS-M-4, Missile Meteorology Division, U. S. ArmyElectronics Research and Development Activity, White Sands Missile Range,New Mexico.
Cole, Allen E.} Temperature Variations in the Tropical Stratosphere and
Mesosphere 25 to 80 Kilometers: AMS,/,_iTtkA Paper No. 66-344,28- 31 March 1966.
Daniels, Glenn E.; Errors of Radiosonde and Rocketsonde TemperatureSensors: Bulletin of the Amer. Meteorological Society, Vol. 49, No. 1,
Page 16 - 18, January 1968.
- 398 -

3.3 TemperatureMeasurementTechniques - (continued)
Daniels, Glenn E.; Measurements of Gas Temperature and the
Radiation Compensating Thermocoupie:
Diedrick, James, H and Curtis, Henry B.; Experimental Investiga-
tion of Total Emlttance and Solar Absorptance of Several Coatings
between 300 ° and 575 ° K: NASA TND-3381, April 1966.
Drews, W. A.; An Improvement of Atmospheric Temperature Measure-
ments above 30 km by Means of the Bead Thermistor Mounting Arrange-men t, NASA Contract NAS 1-1611, January 1966.
Drews, William A.; A Thermistor Arrangement to Improve TemperatureMeasurements of High Altitudes: NASA CR-533, August 1966.
Henry, Robert, M.; Corrections for Meteorological Rocket TemperatureSoundings on an Individual Basis: NASA, 29 - 31 March 1967.
Hind, A. D.; Temperature Corrections to a Bead Thermistor in the UpperAtmosphere, Weapons Research Establishment, Autrallon Defense Scientific
Service, Salisbury, South Australia, May 1966.
Neweil, H. E.; (1959): Sounding Rockets, McGraw-Hill.
Ney, E. P.; (1961): The Measurement of Atmospheric Temperatures,J. Meteor., Voi. 18, 60 -80.
Quinlan, F. T. and Crutcher, H. L.; The Comparison of Rocketsonde
and Radiosonde Temperatures in the 25 - 32 KM Layer at Cape Canaveral tFlorida between 20 May 60 and 25 April 62: NASA, MTP-AERO--63-35
15 May 1963.
Pearson, P. Q.; An Investigation into the Response and Corrections to a
Thermistor and a Platinum Wire Resistance Thermometer t Weapons ResearchEstablishment, Australian Defense Service, March 1964.
Rubio, Robert and Ballard, H. N.; Time Response and Aerodynamic Heating
of Atmospheric Temperature Sensing Elements, AMS Conference on theDynamic Structure of the Atmospheres, 8 - 10 November 1966.
- 399 -

3.3 Temperature Measurement Techniques - (continued)
Robinson, Elmer; New Meteorological Sensors to 150,000 feet, Phase I
Survey and Bibliography of Current Techniques, USASRDL, ContractNo. DA-26-039-SC-87296, SRI Project No. PAU-3692t 30 Apr. 1962.
Robinson, Elmer; New Meteorological Sensors to 150,000 feet, Phase II
Contract No. DA-36-039-SC-87296, SRI Project No. PAU-3692,
•,,s b ff 1 I_: I I llJ I_I I 1 I._L e
Servomechanisms, Inc. Research and Development Center (1963); Study
for improvements of Temperature Measurements with Thermistors in High#,ltitudes; Contract No. DA-29-040-ORD-2410, Santa Barbara Airport,
Goleta, California
Thiele, Otto, Wo and Beyers, Norman J.; Verification of Meteorological
Rocket Temperature, Density and Pressure Measurements, AMS-ATAA,28- 31 March 1966.
Thiele, Otto, W. and Beyer, Norman J.; Comparison of Rocketsonde and
Radiosonde Temperatures and an Evaluation of Computed R_ocketsonde
Pressure and Density: Journal of Geophysical Research, Vol. 72, No. 10,
15 May 1967o
Thompson, Donald, C.; The Accuracy of Miniature Bead Thermistor in the
Measurement of Upper Air Temperatures; Contract No. 6670, Task #667001,
AFCRL-66-773 Scientific Report #1, 1 October 1966.
Thompson, Donald C. and Kelly, D. P.; The Accuracy of Thermistors in
the Measurement of Upper Air Temperatures: MIT, Revised form -21 November 1966.
Wagner, Haragen, Gerhardt, (1962): Seventh Quart. Tech. Report t
Contract DA-23-072-ORD-1564, University of Texas.
Wagner, N. K., (1963): Theoretical Accuracy of the Met. Rocketsonde
.Thermistor, Repo 7-23, Contract DA-23--072-ORD-1564, ElectricalEngineering Laboratories, University of Texas.
Wagner, N. K.; Theoretical Accuracy of a Meteorological Rocketsonde
Thermistor; Journal of Applied Meteorology, Vol. 3, No. 4, Page 461-
469, August 1964.
- 400 -

3.3 Temperature Measurement Techniques - (continued)
Wagner, N. K. (1961): Theoretical Time Constant and Radiation errorof a Rocketsonde Thermistor, J. Meteor., 606-614.
Webb, Willis, L.; Detailed Acoustic Structure above the Tropopause,
USASMAS, 15 January 1962.
Wright, W. F.; (1961): "A Survey for Naval Ordnance Laboratory ofHigh Altitude Atmospheric Temperature Sensors and Associated Problems:
Final Report, Navy Contract N--60921-6136, Wright Instruments, Inc.,
Vestal, New York.
-401 -

3.4 FALLING SPHEREDENSITYMEASUREMENTTECHNIQUES
Bartman,F. L.; Falling Sphere Meathod for Upper Air Density and
Temperature, J. Atm. and Terr. Phys., Spec. Supply, Voi. I,1954.
Bartman, F. L., Chaney, L. W.r Jones, L.M., and Liu, V. C.;
Upper-Air Density and Temperature by the Falling-Sphere Meathod,
Journal of Applied Physics, Vol. 27, No. 7, 1 July 1956.
Brockman, W. E., (1963): Computer Programs in Fortran and Balgolfor Determining Winds, Density, Pressure and Temperature from the
Robin Falling Balloon. University of Dayton Research Institute Report,
Contract No. AF19 (604) 7450.
Champion, K. S. W. and Faire, A. C.; Falling Sphere Measurements
of Atmosphereic Density, Temperature and Pressure1 Up to 115 kmrEnvironmental Research Papers No. 34, 1964.
Engler, N. A.; Development of Methods to Determine Winds_ Density,
Pressure and Temperature from the Robin Falling Balloon. ContractAF 19(604) 7450, Met. Dev. Lab., AFCRL, Bedford, Massachusetts,1961.
Faire, A. C.; AFCRL Rigid Falling Sphere Program, AFCRL, HanscomField, Massachusetts, June 1963.
Faire, A. C. and Champion, K. S. W.; Falling Sphere Measurements
of Atmospheric Density, Temperature and Pressure r Up to 115 KM:AFCRL-64-554, July 1964.
Faucher, G. A., Procunier, R. W. and Stark, C. N.; Flight Information
and Experimental Results of Inflatable Falling Sphere System for Measuring
Upper Air Densi_/: AFCRL-685, August 1961.
Faucher, G. A., Procunier, R. W. and Sherman, F. S.; Upper Atmos-
phere Density obtained from Falling Sphere Drag Measurements, Space
Physics Lab., AFCRL, December 1962.
- 402 -

3.4 Falling SphereDensityMeasurementTechniques- (continued)
Faucher, G. A., Morrissey, J. F. and Stark, C. N.; Falling Sphere
Density Measurements: Journal of Geophysical Research, Vol. 72,
No. 1, Page 299 - 305, 1 January 1967.
Heinrick, Helmut, G.; Aerodynamic Drag Characteristics of SphericalBalloons (Robin) Descending from 70 km Altitude - University of
Minnesota • March 1964.
Heinrich, H. G., Haak, E. L. and Niccum• R. J. (1963): Research
and Development of Robin Meteorological Rocket Balloons, University
of Minnesota Report, Vol. II, Contract No. AF 19(604) 8034.
Jones, L. M.; Transit-time Accelerometer r Rev. Sci. Instr., 1956
Jones• L. M., Peterson, J. W., Schaeffer, E. J. and Schulte, H. F.;
Upper-Air Densities and Temperatures from Eight I GY Rocket Flightsby the Falling-Sphere Method: IGY Rocket Report Series _51 1 Dec 1959.
Leviton, R. and Palmqulst, W. E.; A Rocket Balloon Instrument,
(Abstract) Bull. AMS, Voi. 40, Page 374, 1959.
Leviton, R. and Palmquist W., Robin, A Meteorological Sensor, ARS
Meeting, Minneapolis, Minnesota, December 1960.
Leviton, R.; The Robin-Falling-Sphere, IGIG Docuemnt No. 105-60,GRD Research Note 73, AFCRL, August 1961.
Leviton, Robert and Wright, John B.; Accuracy of Density from theRobin Falling Sphere, AFCRL - 1095, December 1961.
Missile Meteorology Division; Density and Pressure Profiles Derived
from Meteorological Rocket Measurements I TR-108, USASMSA,September 1961.
Pearson, P. H. O.; An Appraisal of the Falling Sphere Method of
Density Measurements Using External Measuring Methods, AustralianDefense Scientific Service, Weapons Research Establishment• Tech
Note SAD82, October 1961.
- 403 -

3.4 Falling Sphere Density Measurement Techniques - (continued)
Peterson• J. W. and McWatters, K. D.; The Measurement of Upper-
Air Density and Temperature by Two Radar -Tracked Falling Spheres•
University of Michigan, Office of Research Administration• Tech
Report No. 03598-13-T• March 1963.
Peterson: J. W., Hansen, W. H. • McWatters, K. D. and Bonfunte• G.;
Atmospherlc Measurements Over Kwaja lein UsingFa I li ng Spheres;ORA - Project 05436, January 1965.
Schutte, H. F., Robinson, D. A. and Wagener,,,I. L.; Failing-Sphere
Experiment for Upper-Air Density: Instrumentation Developments• TheUniversity of Michigan• Office of Res. Administration• Final Report
03558-6-F, April 1962o
Scoggins, James, R.; Sphere Behavior and the Measurement of Wind
Profiles, NASA TND-3994, June 1967.
Welinskb B. R.; Robin, Meteorological Balloon Development• Final
Report• AF 19(604) 6653, Page 31, 1960.
Welinski, B. R.; Research and Development of Robin Meteorological
Rocket Balloons, G. T. Schjeldahl Company Report, Vol. I, Contract
AF 19(604)8034, 1963.
Wright Instruments, Inc.; A survey of Pressure and Density Sensors andAssociated Problems for the N.O.L. Hasp Program; NOL-N-60-21-
5603, April 1959.
Wright, John B.; The Robin Falling Sphe_re MRN, MWG, RCC Document111-64.
- 404 -

nn
3.5 PITOT PROBE DENSITY MEASUREMENTS
Ainsworth, J. E., Fox, D. F. and LaGow, H. E.: Measurement of
Upper Atmosphere Structure by Means of the Pitot-Static Tube rNASA Technical Note D-670, 1961.
Ainsworth, J. E, Fox, D. G. and LaGow, H. E.; Upper-AtmosphereStructure Measurement made with the Pitot Static Tube; Journal of
Geophysical Research, Vol. 66, No. 10, Page 3191, October 1961.
Arnold, J. W., Simmons, Harmon, L. and Miller, Wm. T.; A__.nn
Investigation ot the Aerodynamic Characteristics of a 25 ° Sphere-
Cone Including a Pressure Distribution Analysis at Angles of Attack,
and a Trajectory Analysis During a Typical Re-entry Trajectory,Ling-Temco-Vought, Inc., NASA, CR--66D37, August 1965.
Atlantic Research Corporation, Final Technical Report on the Denpro
Program for the Design, Fabrication and Flight Testing of a Meteoro-logical Rocket Probe: Contract N123(61756)32883A (PMR), April 1965.
Burcham, Frank W. Jr.; Calibration of a 40 ° Conical Pressure Probe at
Mach Numbers from 3.5 to 7.4i NASA TN-D-4678, NASA, 1968.
Coates, Edward, M. Jr.; Stagnation and Static Pressures on a Nose-
Mounted 15° Conical Probe with Various Forebody Configurations,NASA TN-D-3526, August 1966.
Horvath, J., Simmons, R., and Brace, L.; "Theory and Implementation
of the Pitot-Static Technique for Upper Atmospheric Measurements, "Space Physics Research Lab, Report NS-1, University of Michigan,March 1962.
King, J. Derwin; Technology Utilization Report; Vibrating DiaphragmPressure Tranducer, NASA SP-5020, August 1966.
Norris, John D. and Pierpont, P. Kenneth; Experimental Performance ofa Conical Pressure Probe at Mach Numbers of 3.0t 4.5 and 6.0:
NASA TND-3719, December 1966.
Project Aries - Final Report t Science Communication t Contract No.
3071(00) 1 August 1960.
- 405 -

3.5 Pitot Probe Density Measurements (continued)
Quiroz, Roderick, S._ Seasonal and Latitudinal Variations of Air
Densih/ in the Mesosphere (30 to 80 Kilometers)_ Journal oF
Geophysical Research, Voi. 66, No. 7, July 1961.
Radigan, J. (Director, Inertial Systems Section)_ Ames Pressure Trans-ducer Experimental Evaluation_ NORT 64-355, December 1964.
Schaff, S. A._ The Pitot Probe in Low - Density Flow, Report #535,
AD652-173, January 1966.
Smith, Lawrence B.i Measurement of Atmospheric Pressure Between
95 and 130 KM Using Cold-Cathode Ionization Gages; Southwest
Research I nstitute_ Vibrating Diaphragm Pressure Transducer_NASA SP-5020, August 1966.
Webb, Lannie, D._ Characteristics and Use of X-15 Air Data Sensors_
NASATND-4597, June 1968.
- 406 -

3.6 SONIC GRENADES
Nordberg, W., Stroud, W.; "Results of IGY Rocket-Grenade Ex-
periments to Measure Temperatures and Winds above the Island of
Guam, "; J. Geophys. Res. 66(2):455-464, February 1961.
Nordberg, W., and Smith, W.; "The Rocket-Grenade Experiment,"NASA Technical Note D-2107, March 1964.
Nordberg, W. and Smith, W.; The Rocket Grenade Experiment,"Sounding Rocket Research Techniques, IQSY, Instruction Manual,London, 1964.
Smith, W., Katchen, L., Sacher, P., Swartz, P., and Theon, J.;
"Temperature, Pressure, Density and Wind Measurements with the
Rocket Grenade Experiments, 1960-1963 r "NASA Technical ReportR-211, October 1964.
Stroud, W., Nordberg, W., Bandeen, W. R.t Bar, man, F. L. and
Titus, T.; "Rocket-Grenade Measurements of Temperatures and Winds
in the Mesosphere over Churchill, Canada', J. Geophys. Res.,65 (8): 2307-2323, August 1960.
- 407 -

3.7 OZONE SENSORS AND TECHNIQUES
Craig, Richard, A.; Dekuisi, John, J., Stuetzer, Irmgard; Comparisonof Chemiluminescent and Umkehr Observations of Ozone; Journal of
Geophysical Research, Vol. 72, No. 6, March 15, 1967.
Randhawa, Jagir, S.; Mesospheric Ozone Measurements during a
Solar Eclipse: Journal of Geophysical Research, Vol. 73, No. 2,January 15, 1968
Spurling, John F. (NASA) and Arizumi, Naosuke (JMA); The Japan-
United States Meteorological Rocket Project, May 1967.
Reed, Edith I.; A Night Measurement of Mesospheric Ozone byObservations of Ultraviolet Airglow: Journal of Geophysical Research,
Space Physics, Vol. 73, No. 9, May 1, 1968.
- 408 -
3.8 WATER VAPOR MEASUREMENT TECHNIQUES
- 409 -

3.9 ATMOSPHERICCOMPOSITION
Evans,W. F. J., Hunter, D. M., Llewellyn, E. J. and Jones, A.Vallance; Altitude Profile of the Infrared Atmospheric Systems of
Oxygen in the Dayglow: Journal of Geophysical Research, Space
Physics, Vol. 73, No° 9, May 1, 1968.
Hedin, A. E. and Nier, Alfred O.; A Determination of the Neutral
Composition Number Density and Temperature of the Upper Atmosphere
from 120 to 200 Kilometers with Rocket-Borne Mass Spectrometers:
Journal of Geophysical Research, Vol. 71, No. 17, September 1966.
Smith, Leslie, G., Weeks, Lawrence; Molecular Oxygen Densities;NASA CR-392, March 1966.
Weeks, L. H. and Smith, L. G.; Molecular Oxygen Concentrations
in the Upper Atmosphere by Absorption Spectroscopy; Journal ofGeophysical Research, Space Physics, Vol° 73, No° 15, August 1, 1968.
-410 -

3.10 ELECTRONDENSITY
Aiken, A. C. and Blumle, L. J.; Rocket Measurements of the E-Region
Electron Concentration Distribution in the Vicinity of the Geomagnetic
Equator; Journal of Geophysical Research, Space Physics, Vol. 73,No. 5, March 1, 1968.
Bettinger, Richard, T.; An ln-Situ Probe System for the Measurement
of Ionospheric Parameters, Vol. !!, T.R. 277, Dept. of Physics andAstronomy, University of Maryland, June 1964.
Bettinger, Richard T.; Direct Probe Measurements in the Auroral
Ionosphere; Contract AF 19(628) 2792, AFCRL 66-825, Sept. 1966.
Brooks, David R. and Hoell, James, M. Jr.; A Computerized Data-
Reduction Technique for Langmuir Probe Analysis of Electron Temp.
Variations in the Exhaust of aiMagnetoplasmad/namic Arc; NASATN-D-4220t November 1967.
Fejer, J. A., Heikkila, W. J., Holt, O.; (Principal Investigators):
Comparison of Rocket-Borne Probes for Electron Density Measurement;
Quarterly Status Report _t5, Period 1 August 1965 through 31 October
1965; (NASA Contract NSR 44-004-017)
Heikkila, W. J., Eaker, N., Fejer, J. A., Tipple, K. R., Hugiil, J.,Schnerble, D. E. and Calverb W.; Comparision of Several Probe
Techniques for Ionospheric Electron Concentration Measurements, Journalof Geophysical Research, Space Physics, Vol. 73, No. 11, June 1, 1968.
Journal of Geographical Research, Space Physics, Vol. 73, No. 11,June 1, 1968.
LeLevier, R. E., Branscomb, L.M.; Ion Chemistry Governing MesosphericElectron Concentrations: Journal of Geophysical Research, VoL. 73,
No. 1, January 1, 1968.
Monro, P. E., Mechtly, E. A. and Sastry, Reginald E; Analysis of
Ordinary Mode Standing Waves Observed by Rockets in the E. Region;Journal of Geophysical Research, Space Physics, Vol. 73, No. 13,
July 1, 1968.
-411 -

3.10 ELECTRON DENSITY - (continued)
Narcisi, R. S.; Ion Composition Measurements and Related Ionsopheric
Processes in the D and Lower E Regions_ AFCRL-66-715, EnvironmentalResearch Papers, No. 230, October 1966.
Oster, A. L., Coroniti, S. C., A Method of Measuring Electron and Ion
Densities in the Region of 4-80 Kilometers, Journal of Geophysical Research,
Space Physics, the American Geographical Union, Voi. 73, No. 13,July I, 1968.
Sonin, Ain, A.; Theory of Ion Collection by a Supersonic AtmosphericSounding Rocket: Journal of Geophysical Research, Voi. 72, No. 17,September 1, 1967.
-412 -

3.11 SOLARAND TERRESTRIALRADIATION FLUXSENSORS
Aagard, RobertL., Measurement of Infrared Radiation Divergence inthe Atmosphere with the Double-Radiometer and the Black Ball,J. Meteor. 1960.
-413 -

3.12 MISCELLANEOUSDENSITYMEASUREMENTTECHNIQUES
Thiele, Otto W.; Feasibility Experiment for Measuring Atmospheric
Density through the Altitude Range of 60 to 100 Kilometers overWhite Sands Missile Range; USAERDA, October 1964.
Weinstock, Jerome, Deducing of Magnitudes of Ionospheric, Irregular-ities from Backscatter Measurements; Journal of Geophysical Research
Vol. 73, No. 1, January 1, 1968.
-414 -

3.13 MISCELLANEOUS PRESSURE MEASUREMENT TECHNIQUES
Metro-Physics, inc; Loki-Dart Transponder Rocketsonde Advanced
Temperature Sensors and Thermoconductivity High Altitude Pressure
Gages..
Thieleg Otto, W. and Beyers, Norman J.; Upper Atmosphere Pressure
Measurements with Thermal Conductivity Gages; Journal of Atmospheric
Science, Vol. 24, No. 5, September 1967.
-415 -

CHAPTER4 - ROCKETSONDEDESCENTSYSTEMS
4.1 GENERAL
Beyers, N. J. and Thiele, O. W.; Meteorological Rocket WindSensors, Special Rep. 21, USASMSA, White Sands Missile Range,New Mexico, 1960.
Heinrich, H.. G.; Drag and Stability of Parachutes, Aero. Eng.
Rev., Voi. i5, No. 6, 73-81, 1956.
Kay, Marvin and Olsen, R. O.; Improved Technique for DerivingWind Profiles from Rocketsonde Parachutes. Journal of Geophysical
Research, Vol. 72, Number 16, 15 August 1967.
Murrow, H. N. and Dozier, C. M.; Performance Studies and Require-
ments for Parachutes Utilized for Meteorological Data gathering atAltitudes between 200,000 and 100_ 000 feet, AMA/AIAA,/Texas
Western College Conference on the Structure of the Stratosphere-
Mesosphere, EIPaso, Texas (unpublished), 1963.
Olsenr R. O. and Kaysr Marvin; Improved Rocketsonde Parachute -Derived Wind Profiles: ECOM-5086, October 1966.
-416 -

4.2 CONVENTIONAL PARACHUTES
Eckstrom, C. V.; Flight Characteristics of a New Sounding Rocket
Parachute, AMS Fifth Conference on Applied Meteorology,
Atlantic City, New Jersey, (unpublished) 1964.
Heinrich, H. G.; The Effective Porosity of Parachute Cloth Flugwiss,
II (Heft 10), 1963.
Jenkins, K. R.; Empirical Comparisons of Meteorological Rocket WindSensors, J. Appi. Meteor., Voi. I, 1962.
Law, C. Herbert; A Study of Aerodynamic Deployable Decelerators
at Hypersonic Velocities: AIAA Student Journal, Voi. 5, No. 1,February 1967.
Murrow, H. N. and Barker, L. E. Jr.; An Analytical Study of the
Wind-Following Characteristics of a Parachute at High Altitudes r ARSSemi-Annual Meeting and Astronautical Exposition, El Cortez Hotel,
San Diego, California (Unpublished) 1959.
Technical Documentary Report ASD-TDR-62-100; Stability and Drag of
Parachutes with Varying Effective Porosity, Contract AF 33(616) 8310,1962.
Whitiock, C. H. and Murrow, H. N.; Performance Characteristics of a
Preformed Elliptical Parachute at Altitudes between 200, 000 and 100r000
Feet obtained by In-Flight Photography, NASA TN D-2183, 1964.
-417 -

4.3 PARACHUTESWITH GEOMETRYPOROSITY
Eckstrom,Clinton V.; Development and Testing of the Disk-Gap-Band Parachute used for Low Dynamic Pressure Applications atEjection Altitudes at or above 200,000 Feet: NASA - Contract
NASI-3372, August 10, 1965.
-418 -

4.4 STROKESFLOWRIBBONMESHPARACHUTE
Astro ResearchCorporation, High Altitude Parachute System forMeteorological Research Sondes: ARC-P-233A, October 26, 1966.
Niederer, P. G.; Development of a High Altitude Stokes Flow
Decelerator, Final Report; Astro-Research Corporation. ContractNAS5-10168, November 1966.
Rhyme, R. H., Erskin, C. W., Tolefson, H. B.; ExperimentalInvestigation of the Drag Characteristics of Ribbon Mesh Decelerators
at Low Reynolds Number. Langley Working Paper -443, LangleyResearch Center, NASA, 17 July 1967.
Santeler, D.; Hoikeboert H.; Jones, D; and Pagano, F.; VacuumTechnology and Space Simulation, NASA SP-105, NASA, 1966.
- 419 -

4.5 RAM-AIR DECELERATORS
Jaremenko, I. M.; Ballute Characteristics in 0.1 to 10 Mach Number
Speed Regime: "J. Spacecraft, Vol. 4, No. 8, August 1967. "
Turk, Raymond, A.; Pressure Measurements on Rigid Model of BalluteDecelerator at Mach Numbers from 0.56 to 1.96. NASA TN-D
3545, August 1966.
- 420 -

CHAPTER5 - TELEMETRYAND TRACKING
5.1 GENERAL
NASA - Wallops Station Handbook, 6 April 1964.
- 421 -

5.2 RADAR
Beyers, N. J.; Preliminary Radar Performance Data on Passive
Rocketborne Wind Sensors, IRE-Tran-Actions on Military Electronics,MIL-4, No. 2-3, 1960.
Briggs, R. S. and Rotolante, R. A.; Installation of Radar Tracking
Facilities at McMurdo Station, Antarctica, (Unpublished), 1963.
- 422 -

5.3 TELEMETRY
Atlantic ResearchCorporation, Flight Testing of the Arcasonde IInstrument Package Report, (Unpublished), 1960.
Clark, G. Q.; Development of a Rocket Telemetry Package for the
Meteorological Rocket Network I Initiation of the MeteorologicalRocket Network, IRIG Document No. 105-60; Revised August 1961,AD 246950, 1961
Clark, G. Q. and McCoy, J. G.; Meteorological Rocket Thermometry,Tech. Rep. MM--460t U. S. Army Signal Support Agency, White SandsMissile Range, New Mexico, 1962.
Cline, D. E.; Double-Direction Finding Rocket Meteorological Sensin_lUSASRDL, TR 1981, AD 212-478, 1958.
Coppola, A.A.; Use of Rawin Set AN/GMD-2 with Radiosonde Set
AN/DMQ-6 r USASRDL, TR 2171, AD 251, 1961.
Coppola, A. A.; Radiosonde Set AN/DMQ--6, USA ELRDL Tech. Report2354t 1963.
Grimesey, Robert P; Meteorological Sounding Rockets and Instrumentation_6 December 1961.
Keegan, T. J.; Meteorological Rocketsonde Equipment and Techniques,Bull. AMS, Vol 42, 715-121, 1961.
Kendall, Bruce M.; Evaluation of the A-15497 1680 mHz Power Oscillator
for Meteorological Sounding Rocket Application, NASA, 14 May 1965.
Kidd, K. W.; Further Development of the AN/DMQ-9 Rocketsonde(Bendix Corporation), Contract No. AF19(628) 4045, Project No. 6682,
Task No. 668206, Final Report June 1965.
Krasin, Elvin, F. and Wood, Kenneth, J.; An Advanced MeteorologicalSounding System (Design Plan), Contract #AF19(628) 4215, Project e6670,Task _667002, Scientific Report//1, AFCRL-66-256, 30 November 1965.
- 423 -

5.3 Telemetry - (continued)
Parker, M. J.; The Loki-Hasp Rocket Sonde Meteorological Equip-ment, (Unpublished) 1961.
Poppoff, I. G.; Low-Cost Meteorological Rocket Systems, Astron-autics, 26 - 1958.
Poppoff, I. G.; Rocketsondes for High-Altitude Sounding L SR! Journal,Standford Research Institute, Vol. 3, 56-60, 1959.
Radiosonde Recorders, AN/'TMQ-5 and AN/TMQ-5A t Tech. Manual
TM11-84-36, Dept. of the Army.
Rawin Set AN/GMD-1A, Tech. Manual, TM-11-27-1A; Department
of the Army.
Roberts, W. C., Jr. and Webster, R. C.; Arcas Rocketsonde SystemDevelopment, American Rocket Soc. National Conference on the
High Atmosphere, Minneapolis, Minn., Atlantic Research Corporation,
Alexandria, Virginia (Unpublished) 1959.
Turner, Robert E. and Jendrek, Richard A.; Radiosonde Automatic Data
Processing System, NASA/MSFC, NASA TM-X-53186, December 1964.
Webb, W. L.; Dissipation of Power in the Sensor of the AN/AMT-,4,USASMSA, 1960.
Wenzel, R. F.; Air-Launched Rocketsonde Study r General Dynamics,Contract #AF19(628) 3265, Project #6020, Task #602001, AFCRL-64-
59, January 1964.
Wood, Kenneth,; The Advanced Meteorological Sounding System;Motorola Report AFCRL Contract, 1969.
- 424 -
CHAPTER6 - ROCKETVEHICLES
6. I GENERAL
Atmore, FrankR. and Billings, Gall R.; A Study to Guide Research
and Development Toward An Operational Meteorological Sounding
-Rocket System. Contract/INASW-1522, October 1966, Apri I 1967.
- 425 -

0.2 HISTORICAL REVIEW
Jenkins, K. R.; Measurements of High Altitude Winds with Loki rUSASMSA TM 544, AD 200 001, 1958.
Masterson, J. E.; The Loki Meteorological Rocket System, (Un-published), 1961.
Smith, L. B.; The Measurement of Winds between 100,000 and
_ ,_haf.-Ro,,K_ts, J. Meteor., Voi. 17, i960.300t 000 F_e+ by Use of r c -,-
Smith, L. B.; Use of Chaff-Rockets for Measurement of High-AltitudeWinds, Paper ARS, 15th Annual Meeting, Washington, 1960.
Tobin, J. E.; Flight Testing of the Rocketsonde 200-P and 200-1
Meteorological Sounding Rocket S/stem, Marquardt Corporation,Rep. S-285, 1962.
Itokawa, Hideo; Development of Sounding Rockets in Japan (Tech.Translation F-87) NASA TT F-87, March 1963.
- 426 -
6.3 CURRENT VEHICLE SYSTEMS
Atlantic Research Corporation, Arcas Rocketsonde System; HighAltitude and Meteorological Sounding Rocket, Atlantic ResearchCorporation, Alexandria, Virginia, 1960.
Bollermann, Bruce and Walker, Robert L.; Meteorological Probe
PWN-8B I Qualification Program, Contract No. AF19(628) 5921,Project No. 6682, Task No. 668206, AFCRL-68-0132, 28 Feb 1968.
Bradford, W. C.; Theoretical and Experimental Dispersions for theArcas-Robin Rocket, Tech. Doc. APGD-TDR-61-62, Air ProvingGround Center, Eglin Air Force Base, Florida, 1961.
Bradford, W. C. and Myers, P. W.; Dispersion Study for the Arcas-Robin with 230 Feet/Second Launch Velocity r APGC AIDR 62-2,
Air Proving Ground Center, Eglin Air Force Base, Florida, 1962.
Brown, J. A.; Arcas High-Altitude Meteorological Rocketsonde
System, Transactions, New York Academy of Science, Set. !1,Vol. 22, 175-183, 1960.
Clark, G. Q.; Arcas Nose Cone Alpha, Schellenger Res. Lab.,Texas Western College, EIPaso, Texas, 1959.
Cochran, V. C. and Hansen, J. K.; Theoretical Performance of the
Arcas and Boosted Arcast Tech. Rep. MM-432, U. S. Signal MissileSupport Agency, White Sands Missile Range, New Mexico, 1963.
Development and Performance of the Sparrow-HV Arcas (DEN PRO)Sounding Rocket Vehicle t Contract No. N123-(61756)32883A (PMR)August 30, 1963.
Griner, G. N. and Mahar, T. A.; Sparrow (c8)-HV Arcas DispersionAnalysi% Rep. No. ARC-FA1-2D1, Atlantic Research Corporation,Alexandria, Virginia, 1963.
Hansen, W. H. and Fischback, F. F.; The Nike-Cajun Sounding RocketProject 2453 t Contract No. AF 19(604)-1560, March 1967.
- 427 -

6.3 Current Vehicle Systems - (continued)
Hoidale, M. J.; Arcas Dispersion at White Sands Missile Range, NewMexico, 1961-1963, Internal Report, U. S. Army Electronics Research
and Development Activity, White Sands Missile Range, New Mexico,1964.
Kirchoff, G. F.; Reliability Report on the Arcas Sounding Rocket,Unnumbered Tech. Rep., Atlantic Research Corporatlon_ Alexandria,
Virginia, 1962.
Parker, M. J.; HASP, Instrumented, Status Report and Recommendationfor Termination of Development of the Head, 1.625-Inch Rocket MK-2
Mod 2, NOLTR 64-17, 17 February 1964.
Space Data Corporation; Cajun-Dart Sounding Vehicle, Contract No.NAS8-11624, SDC TM-198, January 1967o
Thiele, O. W.; Boosted Arcas and Boosted Raven Systems for HighAltitude Soundings, The Meteorological Rocket Networkt IRIG MWG,1965.
Turner, Robert E. and Gilchrist, Luke P.; Hopi-Dart and Cajun-DartRocket Wind Measuring Systems, NASA TM X-53303, 26 July 1965.
Ubico, R. E., Kirchoff, G. F. and Webster, Ro C.; Fabrication and
Delivery of Arcas Sounding Rocket Systems EX 6 Mod 0 and EX 6 Mod 1tRep. ARC-PSR1-2BI_ Atlantic Research Corporation, Alexandria, Va._1963.
Walker, R. L., Zinsli, K. R. and Watson_ C° W.; Judi-Robin Balloon
Dart Sounding Vehicle t Rocket Power, Inc., Final Report, AFCRL
64-471, Contract AF 19(628) 2805, May 1964.
Webb, W. L., Jenkins, K. R° and Clark, ca. Q o; Flight Testing of the
Arcas USASMSA, White Sands Missile Range, New Mexico, 1959.
Webster, R. C. et ai; Development of the Arcas Rocketsonde System,Final Report, NONR-2477-(00)_ Ad 235-345, 1960o
Webster, R. Co, Roberts, W. C° Jr. and Donnell, W. P°; Development
of the Arcas Rocketsonde System_ Final Report, Atlantic Research Corp.,Alexandria, Virginia, 1960.
- 428 -

6.3 Current Vehlcle Systems - (continued)
Webster, R. C., and Roberts, W. C.; Arcas, All-Purpose Soundi_Rocket r Paper, ARS, 15th Annual Meeting, Dec., Washington, D. C.,1960.
Webster, R.C., Dunfee, D. D. and Peterson, J. S.; A Closed Tube
Launched Sounding Rocket, Atlantic Research Corporation, 14 July 1964.
- 429 -

6.4 DEVELOPMENT SYSTEMS
Bollermann, Bruce and Walker, Robert L.; Design, Development and
Flight Test Viper Dart Robin Meteorological Rocket System; ContractNo. AF 19(628) 5911, Project No. 6682, Task No. 668203,30 June 1968.
Bollermann, Bruce and Walker, Robert L.; Super-Loki Dart MeteorologicalRocket System; SDC TM-310, Contract No. NAS8-20797, 30 June 1968.
- 430 -

CHAPTER7 - GUN ROBES
7. I GENERAL
Allen, E. F.; Engineering Services to Optomize the 5-inch Gun
Probe, Space Data Corporation ASL Report Contract DO7-68-C-0071, November 1968.
Borwn, J. A. and Poughkeepsie, F. H (BRL), Sioan, G. J. (NOL);High Altitude Wind Measurements Using Radar-Tracked Parachutes
Ejected from Gun Probes.
Glass, !. !.; Hypervelocity Launchers, Part i; Sample Launchers;University of Toronto, ARL-63-86, May 1963.
Harp Project, First Twelve Firings and Status as of July 30, 1963,Rep. No. 635, McGiil University, 1963.
Harp Project, Description and Status, Rep. No. 625, McGillUniversity, 1962.
MacAilister, L. C. and Bradley, J. W.; Comments on the Use of
Guns to Launch High Altitude Probes, Memo Report//1252,March 1960.
Mermagen, W. H.; Telemetry Experiments Conducted on the HarpProject at Barbados, W. i. and Wallops Island, Va. During thePeriod -January -March 1964; BRL Memo. Report No. 1578,July 1964.
Mermagen, W. H.; ,Harp 250 nc Telemetry Experiments, Jun-Oct 64",BRL Memo. Report No. 1614, November 1964.
Mermagen, W. H.; Cruickshank, W. K. and Vrataric, F.; "VHF and
VHF High-G-Telemetry Instrumentation for HARP Vehicles t BRC Memo.
Report No. 1768, May 1966.
Murphy, C. H. and Bull, G. V.; "Review of the High Altitude ResearchProgram (HARP)" BRL Report No. 1327, July 1966.
Murphy, C. H. and Bull, G. V.; "HARP 5-Inch and 16-inch Guns at
Yuma Proving Ground, Arizona", BRL Memo. Report No. 1825,February 1967.
- 431 -

7.2 5-iNCH GUN PROJECTILES
Bayer, E. D.; Five-Inch HARP Tests at Wallops Island r BRL Memo.Report No. 1532, 1963.
Bayer, E. D.; Five-Inch HARP Test at Barbados_ West Indies; Jan -Feb 66; BRL Memo. Report No. 1771, July 66.
Cruickshank, W. J.; A Feasibili_/Test of a 1750 mc/s Teleme_
and Tracking System for 5-Inch HARP Projectiles; BRL Memo. ReportNo. 1651, May 66.
Luckert, H. J.; Space Research Institute of McGill University;
Report for March 65 Test Firing Series, Project Harp, AD No. 475146.
Marks, Spence T. and Boyer, Eugene D.; A Second Test of an Upper
Atmosphere Gun Probe System: RD and E Projects #1A011001B021 and
1M010501A005, Memo Report #1464, April 1963.
Space Data Corporation, Program Plan for Engineering Services toOptimize the 5-Inch Gun Probe Vehicle; SDC TM-282, 5 Jan 1968.
Williamson, Edwin L.; Gun-Launcher Vertical Probes at White Sands
Missile Range, ASL-ECOM Report No. 5030, Feb. 1966.
- 432 -

7.3 7-1NCH GUN PROJECTILES
Boyer, E. D. and MacAllister, L. C.; Seven-Inch Harp Gun-Launched Verticle Probe System; Initial Development/ BRL
Memo. Report No. 1770, July 1966.
- 433 -

7.4 16-1NCH GUN PROJECTILES
Agard ConferenceProceedingsNo. 10, "The Fluid Dynamic Aspectsof Ballistics" September 1966.
Murphy• Charles H. (BRL)• Bull, Gerald V. and Edwards, Howard• D.;
Upper Atmosphere Winds Measured by Gun Launched Projectiles; BRLMemo. Report No. 1747, May 1966.
Murphy• Chdrles H. and Bull, Gerald V.; Ionospheric Winds over
Yum% Arizona• Measured by Gun-Launched Projectiles; Journal ofGeophysical Research• Space Physics, Vol. 73• No. 9, Pg. 3005,
May 1• 1968.
- 434 -

7.5 GUN-BOOSTEDROCKETS
Bull, G. V., Lystert D. and Parkinson_ G. V.; "Orbital andHigh Altitude Probing Potential of Gun Launched Rocket" Space
Research Institute, McGill University Reporb October 1966.
Bull, G. V and Murphyt C. H.; "Gun-Boosted Rockets for HighPerformance Sounding Missions: AIAA Technical Papers, ReportNo. A67-20550, 1967.
.._A-l.,angley, 1970 -- 20 -- 435 -