
Sonic Boom - NASA Technical Reports Server
261
NASA Conference Publication 31 73 .. High-Speed Research: Sonic Boom . . - ! T A f " y . Volume I1 atfic in Arms 7- , L ?',2f&[kid (,&j~',~ ' 'V-edids o/kronfemnce he pt- --' k Langlg. Research Center .. ..-*..*.t ....... .----- Hampton, Virginiu ... - - 1 bmCOPYJ Febmo 2S27.1992 ...... ....... . ... ..... ....... . . - , I-. , .<. . . . ........... . , , '. . - .:. ; . . ;.' , . . . . ... > ... . . - i MAR 02% i r . . -.I- . -- , b , ! ; I - '3 lly
-
Upload
khangminh22 -
Category
Documents
-
view
0 -
download
0
Transcript of Sonic Boom - NASA Technical Reports Server

NASA Conference Publication 31 73 ..
High-Speed Research: Sonic Boom
. . -!T A f " y .
Volume I1
atfic in Arms
7 - , L ?',2f&[kid ( , & j ~ ' , ~ ' 'V-edids o/kronfemnce he pt-
--'
k Langlg. Research Center
.. ..-*..*.t....... .....----- Hampton, Virginiu . . . - - 1 b m C O P Y J F e b m o 2S27.1992
. . . . . . . . . . . . . . ... . . . . . . . . . . . .
. . - , I-. , .<.
. . .
. . . . . . . . . . . . , ,, '.
. - .:. ; . . ; . ' , .
. . . . . . > ... . .
- i
MAR 0 2 %
i r . . -.I- . -- ,b, !;I- '3 l ly

NASA Conference Publication .? " 3
Hig h-Speed Research: Sonic Boom
Volume II
Compiled by Christine M . Darden
Langley Research Center Hampton, Virginia
Proceedings of a conference sponsored by the National Aeronautics and Space Administration,
Washington, D.C., and held at Langley Research Center
Harnpton, Virginia February 25-27, 1992
National Aeronautics and Space Administration
Office of Management
Scientific and Technical Information Program
1992

All copies of this document or portions thereof shall include the cover with the restriction notices clearly displayed.

Preface Volume I1
The purpose of this workshop was to provide a forum for government, industry and university 0 in the sonic boom element of NASA's High Speed Research Program to prcsent and
discuss important technology issues related to that element. The workshop sessions were divided rn atmospheric propagation, acceptability studies and configuration design and @on--the
three concurrent research areas within the sonic boom program. Attendance at the workshop was by invitation only.
This volume of the workshop proceedings includes papers on the design and analysis of low- boom configurations. Included are descriptions of low-boom configurations which have been designed using modified linear theory methods and CFD methods. Papers also include sonic boom analysis using computational methods, and other areas of concern such as proper nacelle integration and proper initialization distance for extrapolation methods using either computational input or wind tunnel input. Because of the commercial sensitivity of papers within this volume, its contents and the workshop sessions included in this area are classified as ITAR and LIMITED DISTRIBUTION.

Page intentionally left blank

VOLUME I1
CONFIGURATION DESIGN, ANALYSIS AND TESTING
b . . . . . . . . . . . . . . . . ~ ~ n o m i c Benefits of Supersonk Overland Operation 1 Munir Metwally
A practical Low-Boom Overpressure Signature Based on . . . . . . . . . . . . . . . . . . . . . . . . . . Minimum Sonic Boom Theorg 15 Robert J. Mack and George T. Haglund
supersonic Airplane Design Optimization Method for Aerodynamic . . . . . . . . . . . . . . . . . . . . . . . . performance and Low Sonic Boom 31 Samson H. Cheung and Thomas A. Edwards
. . . . . . . . . . . . . . What Gross Weight and Range for an Advanced HSCT? 45 Cornelius Driver
Low Sonic Boom Design and Performance of a Mach 2.411.8 . . . . . . . . . . . . . . . . . . . . . . . Overland High Speed Civil Transport 55
John M. Morgenstem
. . . . . . . . . . . . . . . . . . . Two HSCT Mach 1.7 Law Sonic Boom Designs 65 George T. Haglund and Steven S. Ogg
ComputationallExperimental Analysis of Three Low Sonic Boom Configurations with Design Modifications . . . . . . . . . . . . . . . . . . . . . 89 Susan E. CliEF
CFD Predictions of Near-Field Pressure Signatures of a Low-Boom Aircraft . . . . . . . . . . . . . . . . . . . . . . . . . . . . . . . 119 Kamran Fouladi and Daniel Baize
Application of Computational Fluid Dynamics and Laminar Flow Technology for Improved Performance and Sonic Boom Reduction . . . . . . . . . . 137 Percy J. Bobbitt
Sonic Boom Prediction for the Langley Mach 2 Low-Boom t
Co-tion . . . . . . . . . . . . . . . . . . . . . . . . . . . . . . . . . . 157 Michael D. Madson
Ground Signature Extrapolation of Three-Dimensional Near-Field CFD Predidions for Several aSCT Confignrations . . . . . . . . . . . . . . . . . 175 M. J. Siclari @
. . . . . . . . . . . . . Limitations on Wind-Tunnel Pressure Signature Extrapolation 201 Robert J. Mack and Chrimine M. Darden

Some Considerations on the Integration of Engine Nacelles into . . . . . . . . . . . . . . . . . . . . . . . . . . . Low-Boom Aircraft Concepts 221
Robert J . Mack
Nacelle and Forebody Considerations in Design for Reduced Sonic Boom . . ' . . . . . 237 George T . Haglund
. . . . . . . . . . . . . . . . . . . . . . . . . . . . . . . . . . . Attendees 251

ECONOMIC BENEFITS OF SUPERSONIC OVERLAND OPERATION
Muni. Metwally New Commercial Programs
McDonnell Douglas Long Beach, CA
Environmental concerns are likely to impose some resmctions on the next generation of supersonic commercial transport. There is a global concern over the effects of engine emissions on the ozone layer which protects life on Earth from ultraviolet radiation.
There is also some concern over community noise. The High Speed Civil Transport (HSCT) must meet at least the current subsonic noise certification standards to be compatible with the future subsonic fleet. Concerns over sonic boom represent another environmental and marketing challenge to the H S n program.
The most attractive feature of the supersonic transport is speed, which offers the traveling public significant time savings on long range routes.
The sonic boom issue represents a major environmental and economic challenge as well. Supersonic operation overland produces the most desirable economic results. However, unacceptable overland sonic boom raise levels may force HSCT to use subsonic speeds overland.
These environmental and economic challenges are likely to impose some' resmctions on supersonic operation, thus introducing major changes to existing route structures and future supersonic network composition. The current subsonic route structure may have to be altered for supersonic transports to avoid sensitive areas in the stratosphere or to minimize overland flight tracks. It is important to examine the alternative route structure and the impact of these resmctions on the economic viability of the overall supersonic operation.
Future market potential for H S D fleets must be large enough to enable engineand airframe manufacturers to build the plane at a cost that provides them with an attractive return on investment and to sell it at a price that allows the airlines to operate with a reasonable margin of profit.
Subsonic overland operation of a supersonic aircraft hinders its economic viability for the fallowing reasons:
Reduced time savings Unresmcted supersonic operation produces optimum economic results. Time
savings, the HS-s most attrative marketing feature, would be maximized As the percentage of subsonic overland increases, time savings decxeasc, thus eroding the unique competitive advantage of the HSCI'over subsonic aircraft. Figure 1 shows how time savings decline at different levels of mixed operation. The highest time savings of supersonic versus subsonic flight is achieved for routes that rn entirely overwater, such as between Honolulu and Sydney, whcre time savings exceed 5-112 hours. As the p e n t a g e
1

TIME PERFORMANCE
BLOCK TIME (HOURS)
AVERAGE STAGE LENGTH - 4,500 NAUTICAL MILES
10 SUBSONIC
OVERLAND OFF-DESIGN OPERATION (PERCENT)
9 - OFF-DESIGN CRUISE SPEED
8 - MACH. 0.95
7 -
Figure 1
3
'
-A A A
-0 A > W a
2 - $ u - A '?
4 J
;I Y U) Q
2 P

of restricted operation i m ~ s , time savings decline, as for example the Dallas Fort ~ ~ d - ~ r a n k f u r t route, where time savings are cut to 3 hours.
~ ~ ~ l u s i o n of some major city-pairs for ihe giobai super network. , c .
Some of the major high density routes are mostly overland. Restricted supersbnic overland will result in excluding the trans-continental U.S. routes such as New
yo&-Los Angeles. This will reduce the traffic demand base of the supersonic operation, thus having an impact on HSCT fleet size.
subsonic operation of a supers_onic configuration imposes a penalty on its operating cost.
There is a significant reduction in aircraft economic performance and productivities when a mixed mode of operation is gradually introduced. The impact of wholly supersonic versus mixed subsonic and supersonic flight on the vehicle's operating economics is illustrated in Figure 2. The data presented compares the operating profit for a vehicle with all Mach 2.2 operation versus vehicles with a mixed Mach number operation of Mach 2.2 overwater and 0.95 overland, or Mach 2.2 overwater and 1.6 overland. These comparisons are made with 10,20, and 30 percent of the operation flown at the lower Mach number. Using an all Mach 2.2 operation as baseline, at a 30:70 ratio of over land (Mach 1.6) to overwater (Mach 2.2) operation, there is a decrease of 12 percent in operating profit. When the overland portion is flown at Mach 0.95, the reduction in operating profit amounts to 20 percent.
Increase airline dependence on fare surcharge. The higher operating cost of the mixed mode of operation may force the airlines to
impose a fare premium on supersonic travelers. Higher fares will reduce the HSCL*s potential market share and fleet size. Figure 3 shows fleet projections based on traffic demands at different levels of fare premium. As fleet requirement declines, less aircraft will be produced, resulting in a higher unit price. A reduced HSCI' fleet size may make launching the program financially unattractive to airframe manufacturers.
An increase in the market potential of supersonic operation can be achieved by making progress in the following areas:
ROUTE DIVERSION
Supersonic restrictions overland and other environmental concerns require changes from current subsonic global air route systems. Supersonic network scenarios were developed to assess the impact of environmental restrictions on the HSCT's market potential and economics. Attention is focussed on reaching an optimum supersonic route structure to facilitate evaluation of different technical, operational, environmental, economic, and marketing scenarios that may ultimately influence the design of the HSCT. Until a satisfactory solution to the sonic boom problem is obtained, supersonic flight overland will be restricted. Modifications to great circle routes are required to find an alternative flight path that eliminates or minimizes overland flight to unpopulated land masses. Candidate supersonic city-pairs were each analyzed for possible diversion to eliminate or ieduce overland tracks.
The results of the route diversion analysis show that some of the routes are all overwater, with no diversion required. Others become all overwater through diversion. Still others exhibit various degrees of overland reduction through diversion. However, some are a l l overland, with no feasible diversion. These routes are strong candidates for removal from possible HSCT service.
In evaluating flight performance, the ground track prof~le beoomes important. If the overland segments of the route occur at the beginning and end of the flight, perfcmnance is

OPERATING PERFORMANCE (REVENUE - COST = PROFIT)
MACH 2.2, MACH 2.211.6, MACH 2.210.9 (PER AIRCRAFT) \
REVENUE COST PROFIT
MILLIONS OF
DOLLARS
. . MACH
2.210.9 (20%) MACH
2.211.6 (20%)
PERCENTAGE OF OVERLAND OPERATION Figure 2
HSCT FLEET PROJECTIONS BASED ON TRAFFIC DEMAND
FARE PREMIUM
LEVEL
YEAR
-3

least affected. However, if the overland segmepts happen to fall anywhere along the track after cruise speed has been reached, there would be additiond penalities. The aircraft must fly lower and slower over-the land segment, and then climb back up to higher cruise altitude. 4n example of route &version and optimization is depicted in Figure 4 for the New Yo* - Tokyo route. The Great Circle Distance between JFK Airport and Narita Airport is 5845 N.M~., with 88 percent of the ground track overland. By rerouting the flight via Seattle, distance is increased by 693 n miles, and the percentage overland declined from 88 to 35
ent as illustrated in Figure 4A. By diverting the route through the Arctic Ocean, Bering Et, and North Padfic, the percentage of overland flight was further reduced to 20 perant at a l o w Cost of 227 extra nautical miles, as shown in Figure 4B.
Few candidate global airline network scenarios for HSCT have been assen;oled. creative rerouting was conducted to minimize overland segments and to lessen the impact of the environmental resu-ictions that may be imposed on future supersonic operation. The data on these network scenarios represents an assembly of global routes from which HSm global aaffic networks can be constructed. The network scenarios provide examples on how supersonic service may bring some changes to the current global route saucture. Some of these supersonic network scenarios show good potential for capturing more than half the market share of long-range
DEDICATED CORRIDORS
Few dedicated corridors were selected for unrestricted supersonic flight between high density M i c regions. Whenever possible, supersonic flight corridors are mostly over unpopulated land or regions with very low population density. The sole purpose for selecting these comdors was to examine the impact on network productivity, with no intention of recommending their use. Figure 5 shows some of the corridors used in the analysis. In general, the introduction of corridors would add some improvement over route diversion. Comdors appear to be more effective where they serve the regional flow from Europe to the Middle and Far East, and less effective between Europe and the Americas. The Asian and Australian tracks provided about 90% reduction in the subsonic operanon as compared to 30% reduction achieved by route diversion. Figure 6 illustrates this comparison.
The Europe-Americas tracks provided about 49% reduction in the subsonic operation as compared to 71% reduction achieved by route diversion. Figure 7 illustrates the subsonic reduction between Europe and the Americas.
LOW SONIC BOOM DESIGN
The economic benefits of low sonic boom design can be attributed largely to its ability to capture a much larger market. An aircraft that can fly supersonically overland will be able to operate those high density routes that are mostly overland, such as " coast to coast" routes in North America and the routes between Europe and the Far East. The penetration of additional major aaffic markets will impact the fleet requirements, the development and production costs, the operating cost, and the profitability of both the airline and the manufacturer. It will also improve the productivity in terms of Mach speed per block hour.
MARKET CAPTURE
An H S m with amixed mode of operation will be operating in a resmcted supersonic network The criteria used for selecting city pairs for the restricted network are as follows: ,
- Route distance should be over 2,000 N MI. - Overland portion should not exceed 50% of individual route distance. - Average overland distance of total resmcted network should not exceed 25%.

8. VIA BERING STRAIT
---- GREAT CIRCLE
GREAT CIRCLE DISTANCE 5.845 N MI DIVERTED DISTANCE 6.072 N MI
FOR THIS DIVERTED ROUE: - UCTRA MILES 227 '
I OMRLAND MlES 1.190 PERCENT OVERLAND 19.61 % BLOCK TIME 55HR I
DIVERTED ROUTING - NEW YORK-TOKYO
Figure 4

POSSIBLE SUPERSONIC FLIGHT CORRIDORS
Figure 5
Comparison Asian And Australian Tracks Distance And Sub 1.18
onents
1~ Diverted I 0.901m Corridor I
Distance X Subsonic Subsonic % Reduced
Figure 6

Comparison ~ u r o p e - ~ m e r i c a s Tracks Distance And Subsonic Components
1.201
Distance % Subsonic Subsonic % Reduced
Figure 7

250 city pairs have qualified for membership in the restricted network.
G~ &e other hand, the low sonic boom design will be operating in an -stricted '
s,pas~nic network wluch w$ include all routes greater than 2,000 N MI, whether ffiey over water or overland; 91 8 city pairs have qualif~ed for membership in the unrestricted network. Figure 8 shows the relationship between the restricted and the unrestricted supersonic networks in terms of airpon pairs.
~ssuming that a mature fleet of HSCT does exist in the year 2005,975 (Mach 2.2) and 1142 (Mach 1.6) aircraft will be r e q a to serve the 918 city pairs of the unrestricted network. - For the restricted nf3'work, the 250 city pairs represent only 40% of the ASM. Therefore, the fleet requirement is estimated to be between 386 for Mach 2.2 / 0.95 and 450 for Mach 1.610.95. Figure 9 shows relative ASM for both the restricted and the unrestricted supersonic networks. Figure 10 illustrates the fleet size projection for restricted and u ~ s m c t e d networks.
HSCT FLYAWAY COSTS
Unit flyaway cost is a function of production quantity. The flyaway cost includes all design and development cost amortized over the production quantity. HSm will have higher development and production cost because of the advanced technology incorporated in its material, propulsion system, and manufacnuing techniques. A large production quantity will enable the manufacturer to recoup its higher development and production costs. It will also reduce the flyaway cost, making the market-based selling price for HSCT very attractive. Figure 11 shows the flyaway cost data as a function of production quantity. Higher fleet size for serving the unrestricted network will take advantage of rhe lower unit flyaway cost.
DIRECT OPERATING COST (DOC) , . The ownership related DOC components such as depreciation for aircraft and spares, interest, and insurance, represent the major items in DOC calculation. The higher the HSCT price, the higher will be the ownership cost. Figure 12 shows the DOC comparison between baseline M2.m.95 and low sonic boom M2.211.6 design. Due to the smaller fleet size required to serve the restricted network, the production quantity of the M2.210.95 is relatively small. The higher price of the baseline aircraft is reflected in .3 1 percent higher ownership cost. The larger fleet size of the low sonic boom Mach 2.U1.6 design that is - required for serving the unrestricted network has resulted in higher production quantity, lower unit price, and a reduction in ownership cost percentage. Overall reduction in direct operating cost amounts to 19 percent in favor of the low sonic boom Mach 2.31.6 design.
HIGHER PRODUCTIVITY MACH PER BLOCK HOUR
The weighted average network block Mach number for the restricted network is much lower for the low sonic boom unnstricted netwmk This is due to the higher percentage of overland distances flown at subsonic speeds. The unrestricted network is the more efficient supersonic network. Due to its single mode of operation, the unresmcted network shows a higher block to design mise/spted ratio.

' RESTRICTED V s UNRESTRICTED Supersonic Network .
RESTRICTED NETWORK 250
.... .-.
- . . _ . . . - ... -
. ,.. -.- .... ... . .. . -. .. - . . .. ... . . .. . ..
2 3 4 5 6 7 Range ( I 000nm)
Figure 8
Supersonic Network
---
2 3 4 5 6 7
Range (1000nm) Figure 9

FLEET SIZE PROJECTION FOR RESTRICTED AND UNRESTRICTED NETWORKS
DESIGN RANGE 5000 N.Ml. 1200 1142
# 800
UNITS
600
Unit Flyaway
Cost ($Millions)
1.610.95 2.2lO.95 M 1.6 M 2.211.6 M 2.2
RESTRICTED UNRESTRICTED
Figure 10
COMPARATIVE HSCT FLYAWAY COSTS Development Costs Included
Cum Average Basis, 1990 Dollars
Allcraft Produced
Fignre 11

DOC COMPARISON (4000N.M. TRIP)
CASH COST OWNERSHIP TOTAL COST COST
Figure 12

AIRLINE PROFITABILITY
Any rediicti~n k agentkg cost is ccmmenssxxte wi& highcr profit to the airline. Airlines may elect to reduce or eliminate fare premium, thus improving the overall commercial viability of the HSCT program.
CONCLUSION Low boom design is a high risk challenge with very rewarding payoffs. Eliminating the sonic boom problem will be difficult. However, any breakthrough will improve the efficiency of the supersonic operation and enhance the market potential for the HSCT. A reasonable reduction in sonic boom may not be good enough for completely unrestricted operation, but it can be adequate for carridor operation. In general, full supersonic operation is highly attractive to all concerned. It provides better economics for the airlines, the passengers, and the manufacauers. It is readily apparent that there are substanrial economic and marketing benefits in fuIl supersonic operation, hence the importance of achieving a low-sonic-boom configuration.

Page intentionally left blank

A practical Low-Boom Overpressure Signature Based on Minimum Sonic Boom Theory
Robert J. Mack NASA Langley Research Center
Hampton, VA
George T. Haglund Boeing Commercial Airplane Company
Seattle, WA
SUMMARY
A brief resume of sonic boom minimization methods is given to provide a background for a new, empirical modification of the Seebass and George minimum-nose-shock sonic boom F- function and signature. The new "hybrid F-function has all the inherent flexibility of application found with the Darden-modified Seebass and George F-function. In addition, it has enhanced this flexibility and applicability with neglegible increase in nose and/or tail shock strength. A description of this "hybrid" F-function and signature is provided, and the benefits of using them to design high-performance, low-boom aircraft are discussed.
INTRODUCTION
The theory of minimum sonic boom has advanced considerably since the L. B. Jones report on a lower bound to sonic boom, reference 1, in 1961. Based on the flow field of a supersonic projectile paper by G. B. Whitham, reference 2, Jones predicted that a slender body whose area growth was proportional to xl" would produce a minimum disturbance overpressure signature in the far field.
Walkden, reference 3, showed that the lift on a wing-body also contributed to the far-field overpressure because, along the longitudinal or flight direction, it generated equivalent area which was directly proportional to the product of the local lift and the Mach number parameter, P, and was inversely proportional to the cruise velocity dynamic pressure. W~th this extension to Whitham's theory, the L. B. Jones lower bound body could now represent both the volume and the lift of the aircraft. However, the nose bluntness of the lower bound body meant that aircraft it represented would be subject to a sizeable zero-lift wave drag penalty.
While evaluating the overpressures generated by large aircraft during the acceleration to

cruise velocity, reference 4, F. E. McLean noted that equivalent-area body shapes with less wave drag than the Jones lower bound body produced lower intensity shocks at distances in the mid-field range. Studies of sonic boom propagation through a standard stratified atmosphere by W. D. Hayes, reference 5, demonstrated that the shape of the pressure signature would tend to stabilize or "freeze" while the shock strengths attenuated as the disturbances travelled the'mid-field distances between the stratospheric cruise altitude and the ground. These studies changed the focus of minimization from the far-field to the mid-field.
The low boom and minimum boom signatures used today came from the mid-field studies of R. Seebass and A. R. George, reference 6, who applied minimization techniques to pressure signature shapes. They provided a means by which the overall airmaft design could be guided and controlled to reduce the shock strengths felt on the ground. These methods still led to aircraft with some low-boom-induced drag penalties although they were usually lower than previous levels found on the lower bound equivalent area body. However, with the modification to the nose- bluntness requirement introduced by C. M. Darden in reference 7, trade-offs between shock strength and aircraft drag could be conducted during the design phases that showed promise of providing aerodynamically efficient, mission-capable aircraft with acceptable sonic boom characteristics.
Another modification to the overpressure signature shape recently contributed by G. T. Haglund, reference 8, further opened the "window" of design flexibility for the aircraft designer integrating both low sonic boom and high aerodynamic efficiency characteristics into the aircraft configuration. Like the Darden nose-bluntness modification, it was suggested by a merging of experience with the Seebass and George minimum boom pressure signatures with purely practical design considerations. The purpose of this report is to show why and how this "second generation" sonic boom signature was developed and demonstrate the benefits derived from applying it to conceptual aircraft design methodology.
SYMBOLS
A, aircraft equivalent areas, ft2
B value of the F-function slope between y = 5 and y = le , ft
C value of the F-function between y = yf and y = 5, ft D discontinuous change in the F-function at y = h, ft
F(y) the Whitham F-function
h cruise altitude, ft
H value of the F-function at y = yf / 2
I(x) unit step function; I(a) equals 1.0 only for x ,T a , it is zero elsewhere

ground reflection factor, usually 1.9
effective length of the aircraft or model, ft
cruise Mach number
flow field presswe, psf
ambient pressure, psf
P - Pa 9 psf
free stream dynamic pressure, psf
beginning cruise weight, lb
longitudinal distance, ft
effective distance, ft
effective distance parameter in the F-function, F(y)
F-function "nose-bluntness" parameter, ft
effective distance along trailing F-function where tail shock conditions are met
a value of the atmospheric "advance factoi', AF(y)/Ay
ax atmospheric advance defined in reference 6, ax = C / a , ft
j3 Jizz X effective length that determines the shape of the positive portion the F-function, ft
5 effective length where ''ramp" of slope B begins, ft
4 angle whose tangent is equal to the value of B, see figure 7
DEVELOPMENT
L. B. Jones, one of the first to research minimum sonic boom body shapes, derived his lower bound body from impulse theory. It has rapid local area growth at the nose followed by smaller area growth such that the equivalent area distribution of this lower bound sonic boom body is proportional to xl" . With this F-function, an N-wave shaped far-field overpnssure signature with the lowest ground overpressurt level is obtained. However, the drag incnment associated with the local nose bluntness can be prohibitively large. Figure 1 shows the equivalent area distribution, the F-function, &d the prcssure signature of a typical Jones lower bound body.

Figure 1. Area distribution, F-function, and pressure signature of a Jones lower bound body. . . A
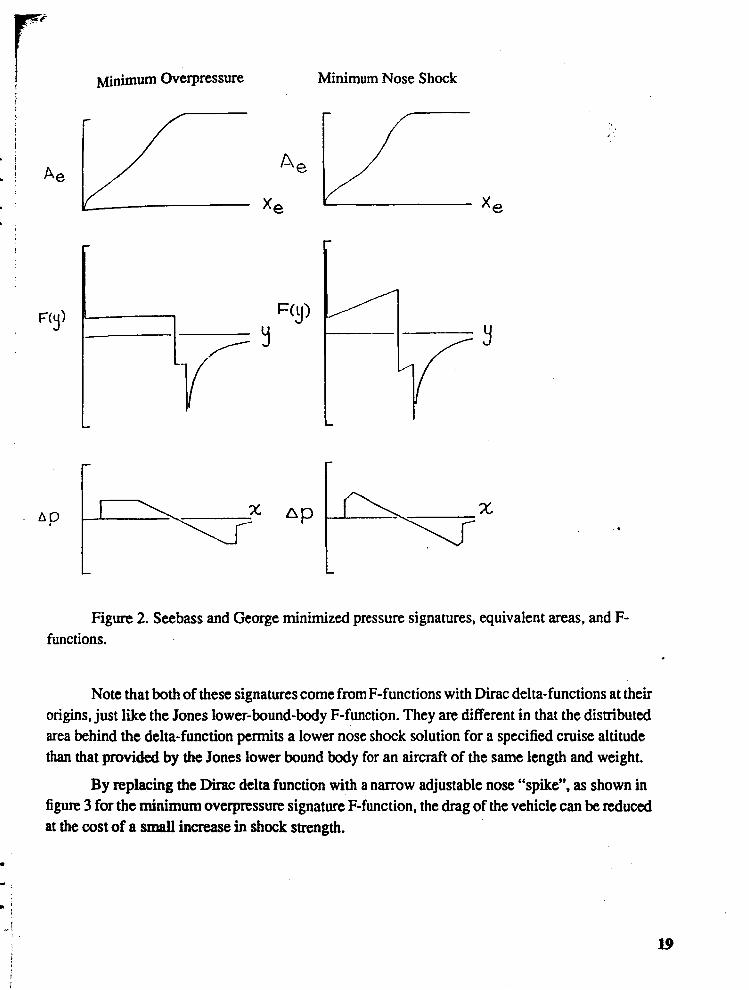
When later research and design studies indicated that supersonic-cruise aircraft would be long and slender enough so that the mid-field rather than the far-field signature would reach the ground, other types of body shapes were examined for both low boom and low wave drag characteristics. The minimization techniques used by Seebass and George provided two pressure signatures which were constrainted for either minimum nose shock or minimum peak overpressure. Both of these are shown in figure 2 as presented in their original form.
1 Minimum Overpressure !
Minimum Nose Shock !
Figure 2. Seebass and George minimized pressure signatures, equivalent areas, and F- functions.
Note that both of these signatures come from F-functions with Dirac delta-functions at their origins, just like the Jones lower-bound-body F-function. They are different in that the distributed area behind the delta-function permits a lower nose shock solution for a specified cruise altitude than that provided by the Jones lower bound body for an aircraft of the same length and weight.
By replacing the Dirac delta function with a narrow adjustable nose "spike", as shown in figure 3 for the minimum overpressure signature F-function, the drag of the vehicle can be reduced at the cost of a small increase in shock strength.

Figure 3. Nose "spike" modification to the "flat top" F-function.
With this modification, the configuration drag can be varied during the design stages. Trade-offs between drag and ground overpressure permit more flexibility in selecting and integrating aircraft components. .
Although not shown, the modified Seebass and George minimum shock or "ramp" F- function, reference 6, can be obtained by the addition of a "spike". In addition to the nose "spike" width, yf, the slope of the "ramp" length, B (see symbol list and figure 2), can also be adjusted to permit more component arrangement flexibility in the aircraft design.
Both of the minimum boom F-functions and signatures are point-design shapes with point- design limitations. The "flat-top" signature has one forward of the y =yf point on the F-function, while the "ramp" F-function and pressure signature has one on each side of the y = yf point. With the "ramp" F-function, perturbations to the ambient conditions of the standard atmosphere will change the atmospheric propagation characteristics resulting in higher overpressures. The "flat- top" F-function is somewhat less sensitive in that atmospheric perturbations in only one direction will produce higher overpressures.
These design point features indicate that the "ramp" and the "flat-top" signatures can be minimized only for a narrow range of atmospheric propagation characteristics. This poses no problem when designing research or wind tunnel models, but is a potential difficulty when designing a real supersonic cruise aircraft. Since the standard atmosphere is an averaged statistical

model, aircraft configurations designed with it and these two F-functions have limited value only an average set of flight conditions are being considered mid met.
G. ~aglund made a further practical modification to the F-function and pressure signature ,, overcome these point-design limitations. Like the nose "spike" feature which preceded it, the .. modification was empirical and increased the applicability and flexibility of the low-boom . at the potentid expense of a small increase in nose shock strength. The derivation of
areas from the F-function and a description of the F-function features are outlined . in the followhlg section.
In figure 4, this "second generation9'-modified F-function, pressure signature, and quivalent area distribution are presented.
i t -
1,
h
Figure 4. Haglund-modified equivalent areas, F-function, and pressure signature.
This F-function is no longer a true minimized F-function nor does it give a true minimized I pressure signature in the classical mathematical definition. However, for practical aerodynamic and - I acoustic reasons, it combines the best features of the Seebass and George F-functions and the nose

"spike*'(for drag- nose shock mdes), with a constant-value section between the "spike" and the "ramp". Such an F-function and its derivative signature is more accurately called aUhybrid".
The constant-value section aft of yf in the F-function permits hot-day and cold-day perturbations in the atmospheric propagation characteristics to be incorporated into the aircraft design as well as allowing additional control over aircraft length, component arrangement and integration, and area growth. With this feature on the F-function and its incorporation in the aircraft geometry, the probability that the ground shock strength would be predictable for a specified Mach number, altitude and beginning cruise weight could be greatly improved. The following paragraphs will describe these two features.
Atmospheric compensation. The method for incorporating hot-day, cold-day atmospheric . propagation variations can be explained with the use of figure 5.
A d v a n c e lines
Figure 5. Hybrid F-function showing hot-day/ cold-day compensation analysis.
For given flight conditions of cruise Mach number, altitude, ground overpressure, and weight, the atmospheric propagation advance is computed for the standard day, the hot day, and the cold day. Coldday conditions decrease the value of the atmospheric "advance factor" resulting in a "spike" length that is longer than one required for a standard day. Conversely, hot-day conditions increase the atmospheric "advance factor" value relative to that for a standard day and the "spike" length is shorter. This inverse relationship between the atmospheric "advance factor" and "spike" length is due to the definition of the "advance factor" which represents the net change in a finite- pressure signal location relative to a zero-strength acoustic signal traveling through the atmosphere.
The lower value of the advance factor could determine the location of the "nose bluntness" length, yf , while the highest value of the advance could determine the most fomard location of

be "ramp ,* starting point, 5 . With these two values in hand, the remaining signature parameters of
~ ~ , . h cruise altitude, aircraft effective length, slope of "ramp", and cruise weight would
be input the Hybrid Signature code. Computed values of Ap would be compared with desired
0verP ressure limits. Adjustments to the input, excluding yf and 5, would be tried iteratively until
- a F-function, equivalent area distribution, and signature was found with 5 no less that . set by cold-day conditions.
Usually, the "spike" length, yf , is varied to study the trade-off between shock strength and . zero-lift wave drag. It still can be used for this purpose as long as the hot-daylcold-day atmospheric compensations are not compromised. There can still be length available for a larger value
of 5 which would be useful in giving sufficient aircraft volume to meet mission requirements of fuel volume, passenger cabin room, reserve fuel, landing gear stowage, etc. Two examples are given to show the sensitivity of the method.
The first is for an aircraft which cruises at a Mach number of 3.0 :
W = 650,000 lb ,
I, = 300.0 ft ,
4 = 40.0 ft , and
For a 1962 standard atmosphere day, the value yf = 20.0 ft results in a Ap = 1.032 psf. To obtain the same value of Ap on a "hot day", yf needs to be about 18.0 ft, while for a "cold day", yf would be about 22.0 ft. So if an overpressure of 1.032 psf is an acceptable nose shock strength, then 18.0 feet value provides the necessary "cold day" compensation. The aircraft will have a bit more nose bluntness and probably a bit more drag than if it were designed for a standard day, but it will meet the desired nose shock criteria for all but the most extreme atmospheric conditions. The hot-day and the coId-day atmospheres were approximations to those defined in the 1962 standard atmosphere tables. However, the results obtained with their use indicated the probable values and the ranges in "hybrid" signature-calculation constants determined with more exact methods.
The second example is for an aircraft which cruises at a Mach number of 1.6 :
M = 1.6,
h = 45,000 ft ,
W = 650,000 Ib , le = 300.0 ft ,
6 = 40.0 ft , and
B = 0.5 a

For the standard day, yf = 20.0 f t results in ~p = 0.617 psf. For the "hot day", yf of about 19.0 ft is appropriate, while for the "cold day", yf is about 21.0 ft. The plus-and-minus differential of "hot day" minus "cold day" yf values are very small at either Mach number. Thus, only the "hot day" value is of primary importance. Most of the time, the value of 5 is greater than the yf value required for "cold day" compensation. This permits additional flexibility in adjusting the desired low boom equivalent areas for good agreement with those of the conceptual aircraft being designed.
The Ap value of 0.617 psf looks attractive but should not be taken seriously without further examination. In this example, the aircraft nose geometry which would produce such a ground nose shock strength was prohibitively slender. Thus, nose geometry as well as overpressure is a consideration in the selection of an equivalent area distribution.
Design flexibility. The advantages of using the Haglund "hybrid" F-function method during the preliminary design phases are illustrated in figure 6.
A e
400 - P
200 - Fuselage ----- -- -
0 I
Figure 6. Example of design flexibility possible using the "hybrid" F-function.
In this example, the Mach 1.6 configuration, previously mentioned, serves to demonstrate the increased design flexibility acruing from the use of the "hybrid" F-function derived equivalent area distributions. Its beginning cruise specifications are repeated for ease of referral.

A value of about 19.0 feet for yf will meet "hot day" requirements but results in an aircraft that is unusually slender. Decreasing yf to 10.0 feet while keeping the rest of the input values
,,,at makes the nose blunter and saucturally more practical. It also reduces the overpressure. However, this nose shock overpressure reduction will come with the addition of more aircraft volume, and potentially more drag, even though the weight is assumed to have remained constant.
Two pairs of lines are shown in figure 6. The upper pair is for the total equivalent area due to lift and volume, while the lower pair is for the fuselage areas. Reducing yf increases the aircraft volume. This volume increment can be added to the fuselage to permit six-abreast rather than five- abreast seating. If this is not necessary, the extra volume can be used to obtain additional wing volume for fuel. Often, drag and/or weight penalties result from increasing the volume while keeping the length constant. If the drag and weight increments from this volume increase are found to be relatively small, this new low-boom solution may be more suitable than the previous one. The equivalent area c'urves shown in figure 6 for values of yf equal to 10.0 and 19.0 feet indicate that over a range of about 220.0 feet in effective length, an increment of about 10.0 square feet in equivalent area would be required.
With the exception of the fuselage, this example is based mostly on overall equivalent areas rather than on actual geometry. If an actual conceptual aircraft were being designed, it is very possible that some of the other parameters would also have to be changed to obtain a good agreement between the aircraft and the ideal equivalent area curves. Obviously, the shape and location of the aircraft components are also changing, but by varying both the aircraft geometry and the low boom equivalent curve, the time required for convergence can be reduced. This double- effort approach assumes that a specified overpressure level is never compromised.
Assuming that the Mach number, the beginning cruise altitude, and the beginning cruise weight are fixed, the values of B and 5 remain as variables to be altered as the design matures. In contrast, the modified Seebass and George F-functions permit changes only in the value of B after fixing the size of yf and maintaining the other parameters as constants. In the next section, the derivation of the equivalent areas equation is presented and described. The conditions for determining the strength and position of the nose and trailing shocks are also described to show how they are used to determine the necessary constants and coefficients in the area equation.

DERIVATION OF THE "HYBRID" EQUIVALENT AREAS
The F-function shown in figure 4 is inverted by using Abel's integral in the form
using the same constraints as in reference 6. It is repeated as figure 7 so the various features can be explained.
Figure 7. George Haglund's "hybrid" F-function.
The equivalent area associated with this "hybrid" F-function is:
( X - Y ~ ) ~ ' ~ + I ( S ) (1n)B ( ~ - 5 ) ~ ' ~ - I (1) (514)D (x- A) 3/2 I

where I(x) is the unit step function.
. plus any equivalent area adjustments for wake, boundary layer displacement thickness, .
,gine-nacelle exit area minus intake aria increments, etc. Nose shock Ap is computed fiom the F-function parameter, C , the "advance factor", a , the altitude, h , the reflection factor, K, , and
fie of cruise altitude and ground pressures.
As it is applied in this paper
a = AF(y)/Ay
This "advance factor" should not be confused with the "advance" used in the reference 6. There, the advance is called ax , the distance that a unit disturbance would lead or follow an acoustic signal that reached the ground after propagating through the atmosphere. It would be equal
. to
The "advance factor" is the change in distance with altitude that a unit strength disturbance travels relative to an acoustic signal starting from the same point along the aircraft during cruise flight. Like the advance, the "advance factor" is calculated from the Mach number, the altitude, and the characteristics of a standard, "hot day", or "cold day" atmosphere. The "advance factor", a , relates the two F-function parameters H and C through
The triangular "spike" of magnitude H at y = yf / 2 and C at y = yf , is the modification introduced by Darden in reference 7 to reduce the nose bluntness associated with the areas derived from the Dirac-delta function on the F-functions described in reference 6. At y = 6 , the constant
- value of F(y) = C , the Haglund innovation, ends, and F(y) continues with slope B past the

discontinuity at y = C to y = le. The value of AF(y) = D at y = A , the slope B , and the aircraft or body length 1, are used to set the ratio of tail shock strength to nose shock strength. A solution for the tail shock is found from the value of F(Ie), a , and the integral of F(y) between le and an F-function area-balancing point yr which is solved iteratively through *
and
Values of yf , 1, , B , and 6 are part of the input parameter set. Other input parameters include Mach number, altitude, ground reflection factor, and ratio of tail shock strength to nose shock strength. The nose shock strength, Ap , is an output value computed from the input values and shock conditions; it.is not a specified or target input. If it is not satisfactory, some of the input lengths, the altitude, the weight, or the Mach number will have to be changed.
The code that computes the hybrid F-function, equivalent areas, and signature is meant to supplement the Seebass and George minimization code. Together, they allow the designer to obtain the possibIe minimums and then trade sonic boom and atmospheric perturbations with aircraft drag and performance to obtain a satisfactory sonic boom constrained configuration. .
CONCLUSIONS
Past experience with sonic boom minimization methods and techniques'have show? that the pure mathematical approach has produced two types of performance penalties. The first type was associated with zero-lift wave drag due to the locally severe blunting applied to the nose of the aircraft. This was found with the L.B. Jones lower bound sonic boom body and to a lesser extent, the Seebass and George set of minimum nose shock and minimum overpressure signatures. The second type of penalty was due to the point-design nature of the F-functions or the corresponding pressure signatures. Predicted overpressure signatures might be obtained for a specified standard, hot-day, or cold-day atmosphere, but all three conditions could not be satisfied simultaneously.
A set of empirical cures were found to overcome these limitations. Using a triangular ''spike" rather than a Dirac delta-function permitted drag-shock strength trade-offs to be studied

md Combining the "flat-top" and the "ramp" F-function shapes and starting the F-function with the previously-mentioned nose "spike" provided the additional flexibility ,ws,ary to meet drag constraints as well as variable atmosphere ambient conditions: l l ~ e resul"ng "hybrid" F-function and pressure signature was not a minimum in the mathemiiical
but was a practical compromise in terms of the airplane configuration itself.
Hot day-cold day conditions are small perturbations to the standard day features of the Hybrid F-function. While providing a useful limit on the nose-bluntness length, yf , they should
seriously hamper efforts at setting the "ramp" initial length, 6 , and the "ramp" slope, B, such that aircraft volume, aircraft mission performance, and low sonic boom constraints can be met.
REFERENCES
i 1. Jones, L. B. : Lower Bounds For Sonic Bangs. Journal of the Royal Aeronautical Society, vol. 65, no. 606, June 1961, pp. 433 - 436.
1 2. Whitham, G. B. : The Flow Pattern of a Supersonic Projectile. Communication on Pure 1 and Applied Mathematics, vol. V, no. 3, August 1952, pp. 301 - 348.
3. Wakden, F. : The Shock Pattern of a Wing-Body Combination, Far From the Flight Path. Aeronautical Quarterly, vol. IX, pt. 2, May 1958, pp. 164 - 194.
4. McLean, F. Edward : Some Nonasymptotic Effects On the Sonic Boom of Large Airplanes. NASA TN D-2877. 1965.
5. Hayes, Wallace D. ; Haefeli, Rudolph C. ; and Kulsrud, H. E. : Sonic Boom Propagation in a Stratified Atmosphere, With Computer Program. NASA CR - 1299, 1969.
6. Seebass, R. ; and George, A. R. : Sonic-Boom Minimization. Journal of the Acoustical Society of America, vol. 51, no. 2, pt. 3, February 1972, pp. 686 - 694.
7. Darden, Christine M. : Sonic Boom Minimization With Nose-Bluntness Relaxation. NASA TP- 1348, 1979.
8. Haglund, George T. : High Speed Civil Transport Design for Reduced Sonic Boom. Boeing Document No. D6-55430, NASA Contract No. NAS 1 - 18377,199 1.

Page intentionally left blank

Airplane Design Optimization Method for Aerodynamic Performance and Low Sonic Boom
Samson H. Cheung* and
Thomas A. Edwards**
NASA Ames Research Center
Moffett Field, CA 94035
ABSTRACT
i
i This paper presents a new methodology for the optimization of supersonic airplane designs to meet ! the dual design objectives of low sonic boom and high aerodynamic performance. Two sets of design
parameters are used on an existing High Speed Civil Transport (HSCT) configuration to maximize the
aerodynamic performance and minimize the sonic boom under the flight track. One set of the parameters
perturbs the camber line of the wing sections to maximize the lift-over-drag ratio (LID). A preliminary
optimization run yielded a 3.75% improvement in LID over a baseline low-boom configuration. The other
set of parameters modifies the fuselage area to achieve a target F-function. Starting from an initial configuration with strong bow, wing, and tail shocks, a modified design with a flat-top signature is
obtained. The methods presented can easily incorporate other design variables and objective functions.
Extensions to the present capability in progress are described.
INTRODUCTION
The sonic boom element of NASA's High Speed Research Program includes low-boom aircraft
design studies, atmospheric propagation research, and bioacoustic response studies. NASA Ames Research
- *~esearch Scientist, MCAT Institute. ** Assistant Branch Chief, RFA.

Center has been investigating the use of computational fluid dynamics (0) to and design low-
boom aircraft. Initially, validation studies were canied Out that established the requirements for
accurate sonic boom predictions using CFD. Since then, attention has turned to the pdspect of using CFD in the low-boom design process.
The need for simultaneous sonic boom and aerodynamic optimization was highlighted recently when
it became clear that airplanes designed to a strict sonic boom constraint suffer an unacceptable performance
penalty. A new proposed route structure for HSCT's incorporating supersonic corridors over land has
relaxed the sonic boom constraint somewhat. On the other hand, reducing an airfhmer's market risk for a
. low-boom airplane necessitates that its aerodynamic performance nearly match that of a conventional design.
Therefore, low-boom design studies must carefully balance the tradeoff between sonic boom loudness and
aerodynamic performance.
Because of its generality, CFD offers the designer the opportunity to address many design issues
simultaneously. An added advantage is that the geometry definition and performance data are common to
any analysis or optimization problem. This paper demonstrates how the same computational tools can be
used to optimize both sonic boom and aerodynamic efficiency. The theory and implementation of these
techniques are briefly reviewed, then the optimization capability is exercised using a recently-developed low-
boom configuration as an initial design (Ref. 1).
Several computational tools interconnect in the optimization procedure to be described. The CFD
flow solver is the 3-D parabolized Navier-Stokes code UPS3D (Ref. 2). Although the code is capable of
producing viscous flow results, it has been shown previously (Ref. 3) that inviscid analysis is sufficient for
accurate sonic boom prediction. All results in this paper are based on the Euler equations for inviscid flow.
The UPS3D code is supported by a hyperbolic grid generation scheme (Ref. 4) that is sufficiently fast and
robust to operate within an automated optimization enviroriment. The nonlinear optimizer NPSOL is based
on a sequential quadratic programming algorithm in which the search direction is the solution of a quadratic
programming subproblem (Ref. 5). The near-field pressure signal created by the airplane is extrapolated to
the ground-level sonic boom by a routine based on Whitham's F-function and the equal-area rule (Refs. 6,
7). Finally, the perceived loudness (PLdB) of the sonic boom can be determined by Stevens' Mark VII method which involves Fast Fourier Transform on the energy spectrum of the sonic boom (Ref. 8).

! r . - .
AERODYNAMIC OPTIMIZATION
'fhe Boeing low-boom model 1080-911 (Ref. 1) is used as the baseline configuration for the a e d ~ a m i c optimization studies. This configuration is 330 ft. long and is designed to cruise at Mach 1.7 at an altitude of 44,OOO ft . A schematic of this configuration is shown in Fig. 1. The objective function to be d z e d in this case is the lift-to-drag ratio, and the design parameters influenced the camber line of the wing sections. First, fine-grid CFD solutions were performed over a range of angles of attack to
the aerodynamics of this baseline configuration. These solutions indicated a maximum L/D of 18.23 at 4.0 degrees angle of attack.
Using CFD as an analysis tool for aerodynamic optimization requires that the inherent numerical enon of the solution are either negligibly small, or independent of the design perturbations. One means to insure this is to use very fine grids, which is computationally expensive. Another approach is to perform the optimization on a moderately coarse grid and then verify the end result with a fine-grid computation. This approach helps define the grid density for which the numerical errors are independent of the design perturbations. While the numerical value of L/D differs on coarse and fine grids, the increment due to design changes will be preserved when the errors on the coarse grid become independent of the design variables. In the present work, it was found that marching grid dimensions of 40 circumferential points by
b
30 radial points was not fine enough to produce reliable optimization trends, whereas furthe; resolving the surface with a 67 by 30 grid produced consistent results on successively finer grids.
Design Optimization Parameters
Given a set of design parameters and the relevant consuaints, the optimizer (NPSOL) will perturb the parameters and find the steepest gradient to search for the local minimum of the objective function. A widely used approach to aerodynamic optimization of an HSCT-type configuration is the use of shape functions (sine and exponential bumps) which are added in the airfoil sections (cf. Ref. 9). A difficulty with this approach is that the location and nature of the shape functions must be chosen carefully for each problem, and the values chosen for a particular configuration and flight condition may not be appropriate for e - a different case. .
(.
33

fi study, control points an defined on the camber line of each airfoil section as shown in Fig. 2, ~f~~ is the y-coordinate of the c0n td point, and % is one of the design parameters, the new location of that conml point is
where Tmar is the maximum thickness of the airfoil. The new airfoil is formed by splining through the us, control points with the thickness held fixed. For relatively straight camber lines, the control points are co: evenly distributed along the chord, whereas curved camber lines are defined by clustering control points in
regions of curvature.
Results
For aerodynamic optimization, the lift-to-drag ratio.was chosen as the objective function and the
design parameters are control points along the camber line of each airfoil section. The wing is defmed by
twenty-six spanwise stations as shown in Fig. 3. To reduce the design space for this problem, two sets of
five design parameters are used. The first set defines the camber line used for span stations 3 through 8 in
the high-sweep region. The second set defines the camber line for stations 9 through 26. '?he five control
points are evenly distributed along the camber line in both cases. The optimization run for this demonstration required approximately eighty flow solutions totaling four hours of Cray-YMP CPU time to
give an optimized wing-body configuration with an UD of 18.75 versus the original value of 18.03. Figure
4 compares the pressure on the lower surface of the original and optimized wing. Most of the increase in
LID results from a reduction of the wave drag, evidenced by the lower pressure on the wing leading edge.
Figure 5 compares the airfoil section 3 of the original and optimized wing. A polar plot of LID versus a for
both the original and redesigned configurations is shown in Fig. 6. The LID is uniformly higher for the
optimized wing, and the maximum WD is nearly 4% greater than the original geometry. It is interesting to
note that there are only minor changes in the lift distribution and volume, so the aerodynamic optimization
has a negligible effect on the sonic boom sign-.

LINEAR SUPERSONIC THEORY
The low-boom design process in this paper makes use of linear supersonic theory which is widely
",d to predict the sonic boom of slender wing-body configurations (Refs. 10 and 11). For the sake of
I beeeasily determined by finding the m a of the cross-section made by the cutting planes normal to the
* -
I s-wise axis (x-axis). On the other hand, the equivalent area distribution due to lift, or B-function, is
,,~leteness, this method is briefly discussed. .
Given a wing-body configuration, the equivalent area distribution due to volume, or A-function, can
1 where p= d a . In this paper, the B-function is calculated fkom the lift distribution predicted by h e
code. The total equivalent area distribution, Ae(x), is the sum of A(x) and B(x). Then the F-function can
be calculated by the Lighthill integral 00
where ~ ( t ) = e x , Act(t) is the derivative of A&), and function h is
In these expressions K1 is the modified Bessel function of the second kind, p is Heaviside's operator of
differentiation and H(z) is the Heaviside unit step function. When exvapolated to a distance r l , the F-
/ function is shifted by the factor of -rfi~, where r=(ytl)(2~3)-14t4,4. This shifted F-function is muti- valued, so the location of the shock waves in the signature is determined by applying the equal-area rule.
The pressure signal at distance rl is obtained by

~t should be noted that, by using the Abel rmnsform, the u~uivalent area distribution can be found in tern of I
'
This fann is particularly useful in the sonic boom minimization method to be described next
SONIC BOOM MINIMIZATION @
b
The sonic boom minimization method applied here is inspired by the method of Darden (Ref. 12), #
but uses CFD to provide an accurate description of the lift distribution and near-field pressure signal. First,
a baseline flow solution is obtained and the ground-level sonic boom signature is determined by '
extrapolating the near-field pressure as described in Ref. 3. The equivalent area distribution for the b
configuration is generated as described above. The next step uses the optimizer to generate an equivalent
area dismbution with improved sonic boom characteristics. This is done by using the nine F-function b
parameters in Ref. 12 as "design" variables (see Fig. 7). The objective function in this case is a weighted . combination of the sonic boom loudness (PLdB) and the deviation from the original area distribution:
I
Objective Function = (wl*PLdB + w*D) /2 . (5) \
where D is the deviation in I 2 nurm of the equivalent area distribution from the original design: I
and wl and are two weighting factors in the order of .001 and 1, respectively. Because the configuration
used for this demonstration was designed for a flat-top signature, the F-function parameters were further b
constrained to achieve this result. Once the target F-function is defined, the new equivalent area is found , i
using Eq. 4. In the present case, the equivalent area increments are applied only to the A-function. As a I result, the lift distribution remains essentially unchanged and further CFD computations are not needed. In ,
the future, the increments will be distributed between the A-function and B-function, necessitating flow j solutions to generate the new equivalent area distribution.

The ground-level sonic boom of the original wing-body configuration at 4 degrees angle of attack is shown in Fig. 8. This result was obtained by extrapolating the flow solution from a distance of 1.25 body lengths to 133 body lengths. A strong intermediate shock is evident in the signature. However, the
computational model did not include the nacelle geomeay, and their effect on the far-field sighatme is under
investigation. Figure 9 shows the equivalent area distribution of the original geometry using CFD for the lift . dismbution. The optimization routine developed a new area dismbution based on a flat-top signature and
minimal deviation from the original geometry, which is also shown in the figure. Note that, except for a
small area near the nose, the new distributioa &ids equivalent area to the configuration.
. Figure 10 compares the geometry of the original and modified configurations. The nose is visibly
sharper, and the fuselage is somewhat larger in radius near the wing leading edge. Figure 11 compares the
ground-level sonic boom for the two configurations. The modified configuration more nearly achieves the
targeted flat-top signature. However, the perceived loudness was reduced by just 1 PLdB because the front
shock was not allowed to change in this case. The lift-to-drag ratio increased by less than 1% as a result of
these changes.
SUMMARY
Analysis and optimization computer codes have been joined to address design issues for an HSCT.
Using CFD for aerodynamic analysis provides the accuracy and generality to study many different problems
with the same basic methodology. The present work has demonstrated the ability to optimize aerodynamic
efficiency and sonic boom loudness with a few simple design parameters. Applying this capability to a
baseline low-boom configuration produced a 4% improvement in lift-to-drag ratio and eliminated an
intermediate shock in a flat-top sonic boom signature with a small duct ion in the loudness.
FUTURE WORK
b
The design capability described in this paper will be advanced along two lines in the near future. First, the design capability will be generalized somewhat. As mentioned earlier, equivalent area increments

for optimization will be applied to both volume and lift distributions for increased flexibility in design. By '
monitoring the aerodynamic performance as the lift distribution is manipulated, the dual design objectives '
may be optimized simultaneously. Second, development of a new low-boom configuration will be pursued : using the complete geometry (including nacelles and empennage) of an existing low-b&m geometry. The *
goal of this effort will be to advance the performance of a low-boom HSCT in terms of sonic boom loudness . and lift-to-drag ratio as far as current technology pennits. t
REFERENCES
1. Haglund, George: Two HSCT Mach 1.7 Low Sonic Boom Designs. Invitational High-Speed Research Program Sonic Boom Workshop, NASA CP-3 173, 1992.
2. Lawrence, S., Chaussee, D., and Tamehill, J.: Application of an Upwind Algorithm to the 3-D Parabolized Navier-S tokes Equations. ALAA Paper 87- 1 1 12, 1987.
3. Cheung, S., Edwards, T., and Lawrence, S.: Application of CFD to Sonic Boom Near and Mid Flow-Field Prediction. AIAA Paper 90-3999, 1990.
4. Chan, W., and Steger, J.: A Generalized Scheme for Three-Dimension Hyperbolic Grid Generator. AiAA Paper 91-1588, 1991.
5 . Gill, P., Murray, W., Saunders, M., and Wright, M.: User's Guide for NPSOL, Technical Report SOL 86-2, Stanford University, CA 94305, 1986.
6. Whitham, G. B.: The flow Pattern of a Supersonic Projectile. Comrn. Pure & Appl. Math., Vol. V, , No. 3, 1952.
7. Lighthill, M. J.: Higher Approximation. General Theory of High Speed Aerodynamics, Vol. VI of High Speed Aerodynamics and Propulsion, Princeton University Press, 1954.
8.. Stevens, S. S.: Perceived Level of Noise by Mark VII and Decibels (E). Jour. Acoust. Soc. Am., Vol. 51(2), 1972.
9. Chang, I. C., Torres, F., and van Dam, C.: Wing Design Code using 3-D Euler Equations and Optimization. AIAA Paper 91-3190, 199 1.
10. Wallcden, F.: The Shock Pattern of a Wing-Body Combination, Far from the Flight Path. Aeronaut. Q., Vol. IX, 1958
11. Gottlieb, J., and Ritzel, D.: Analytical Study of Sonic Boom From Supersonic Projectiles. Prog. Symposium, 1989.
12. Darden, Christine: Sonic Boom Minimization with Nose-Bluntness Relaxation. NASA Technical Paper 1348,1979.
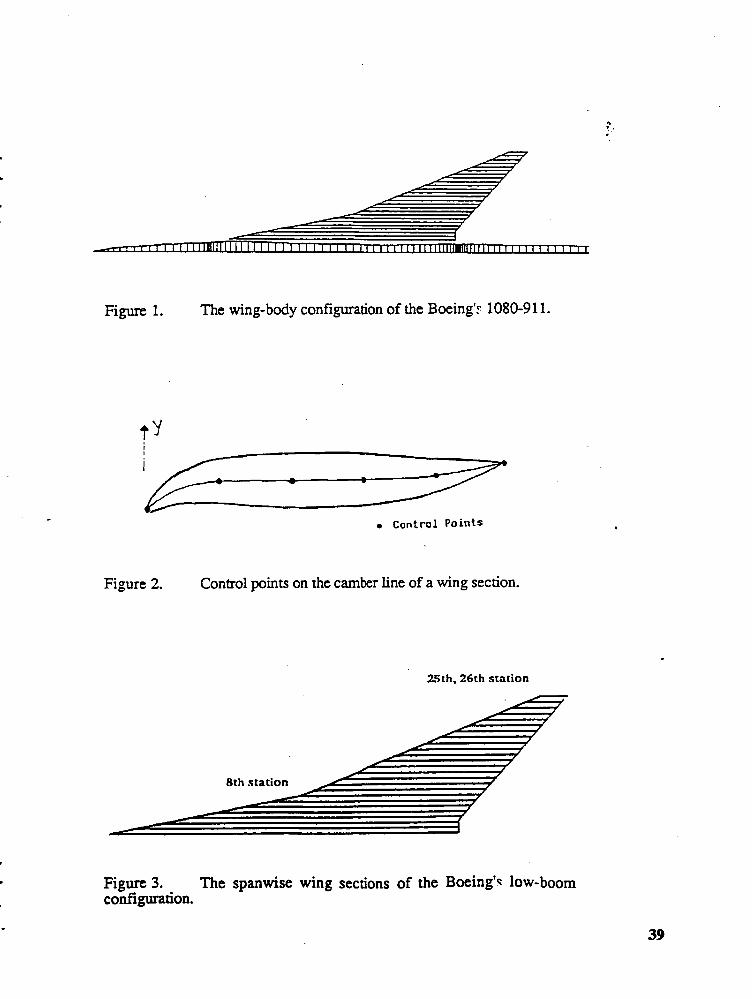
Figure 1. The wing-body configuration of the Boeing': 1080-9 1 1.
. Contro l Points
Figure 2. Control points on the camber line of a wing section.
25th. 26th stat ion
8th stat ion
Figure 3. The spanwise wing sections of the Boeing'c low-boom configuration.

Figure 4. Prcssurt contour on the lower surfaces of the original and modified configuration.
Wing Section #3
I I
0 .4 0 . 5 0.7 Chord Length
Figure 5. Airfoil section 3 of the original and up* wing.

Angle of Attack (dezree)
Figure 6. Polar plot of LID versus a for the original and redesigned configurations.
I 1 - I
0 2 Axial distance
Fi ,m 7. The F-function is characterised by the nine parameters as shown. A typical relationship among the equivalent area distribution, F- function, and pressure signal is described.

15,
1.0-
0 5 - 8
0.0--
-05-
-1.0- 0.1 0.2 0.3
Time (sec)
Figure 8. Sonic boom shape on the ground produced by the original configuration.
0.006% _ _ - - - - - _ A e
0.004-
- Original - - -. Modified
1.00 X
b
Figure 9. The difference in the equivalent area distributions between the original and the modified designs.

Figure 10. Comparison in the original and the modifled configurations.
1.5
1.0-
0.5 - 1
2 0 . 0 - 1
-0.5 - ---. Modified
- 1.0- . I - 1 -1.5-
0.1 0.2 0.3
Time (sec)
Figure 11. Comparison in the original and the modifled sonic booms.

Page intentionally left blank

WHAT GROSS WEIGHT AND RANGE FOR AN ADVANCED HSCT?
Cornelius Driver I .
Eagle Engineering, Inc. Harnpton, VA
Abstract
A review of studies conducted in 1986 indicates that a 300 passenger, 5500 nautical mile range aircraft should weigh less than 400,000 pounds. Some data from a British Aerospace SAE paper will be shown that purports to be an advanced Concorde that meets the range payload specifications at a gross weight of 360,000 pounds. Previous studies by Peter Coen of Langley Research Center support these results.
The weight of a supersonic transport is important from the point of view of how much effort should -be expended in developing lower sonic boom technologies. It is obvious that a 360,000 pound aircraft can be modified to a more acceptable boom level than a 700,000 pound one.
INTRODUrnN
The H S n System Studies have codinned a 30 to 40 percent increase in market penetration of an HSCT that can fly overland compared to one that cannot. This market size factor, like the selection of the proper range-payload and Mach number, deserves all the attention that can be generated for the vehicle to be a success. A review of the HSCT work reported over the past 5 years would suggest that inadequate resources may have contributed to the lack of use of the most advanced technologies. While this perspective may seem harsh, it is difficult to rationalize the configuration gross weights now being shown.
From a sonic boom perspective, a 700 or 800 thousand pound vehicle will be most difficult to modify in such a way as to make its overpressure level low enough to raise the possibility of being acceptable. In fact, the magnitude of this perceived problem may lead to d u c e d sonic boom research and concentration on over water configurations only. This course could turn out to be disastrous if it turns out to be incorrect.
The question is are there combinations of payload, range, and technology levels that could provide the capability to carry 250 passengers 5500 nautical miles for gross weights of about 360,000 pounds (about half the present study configuration weights). There should be no question that altering a 360,000 pound configuration to attain a specified low boom level is an

easier task than trying to achieve that level with a starting point of 700 or 800 thousand pounds. Fortunately, there are two advanced Concorde studies (Refs. 1 and 2) that support that a 360,000 pound vehicle may be able to carry 250 passengers 5500 nautical miles.
0 ! .
DISCUSSION
The results of several past studies and an array of technology improvements support the contention that present day systems studies should yield lighter weight supersonic cruise transports.
Let us start then with a review of the dollars spent in support of supersonic technologies in the United States (see fig. 1). First, a considerable amount of effort has already been paid for and should be used to the fullest extent. The SCR Program shown spent approximately 130 million dollars over 8 years at an average cost of about $30,00O/rnan-year; today, three times that amount would have to be spent to generate the man hours expended in that program. It is apparent to me that a lot more resources are required to generate a reasonable level of effort in the supersonic technology area. A major portion of the SCR funds were spent on noise reduction, advanced propulsion, titanium sandwich construction, and sonic boom. Substantial advances were made in each of these areas and should be showing up in the study configurations in terms of reduced takeoff gross weight.
Another piimary source of weight reductions is in the advanced subsonic aircraft shown on figure 2. All of these aircraft have technologies not in use when the previous SST Program ended or even when the SCR Program ended in 1980. Technologies, such as the two-man cockpit, advanced engines running at temperatures of 2600°~, carbon brakes, light weight seats and galley, the application of composites in tails and floor beams - each of these technologies have twice the gross weight reduction payoff on an SST compared to a subsonic aircraft. Have we incorporated all the weight reduction items presently in use in the subsonic aircraft in the HSCT study aircraft?
I submit that the competitor to an advanced HSCT are these two-engine, long-range subsonic airplanes that leave from any local airport and fly directly where I wish to go. If I have to fly subsonic to an airport to catch an HSCT flight, then I have forfeited a larger portion of my trip time savings before the SST flight even begins.
Since two studies have been performed applying advanced technology to the Concorde, let us begin with those studies (refs. 1 and 2). The present Concorde in commercial service was designed and prototype.. in the 1960's and entered commercial series in 1976. Since it has completed over 50,000 flight cycles in commercial service at M = 2.05 it provides a credible base or reference point (see fig. 3).
If the Olyrnpus engine on the Concorde was redesigned today, it would weigh nearly half as much as the original engine and have 1/2 the number of compressor stages and 112 the part count (see fig. 4). It would be about 1000 ?F hotter and have at least a 15 percent lower SFC.

~ o s t of these advances, including digital fuel controls are flying on advanced commercial and engines today. Coen's analysis (xf. 1) showed that similar technology improvements
reduce the gross weight 150,000 pounds if the range were held constant or the range would incre~e18W fiauiicid d e s if the gross weight welt heid constam Tnis resuit was obtained using the original Concorde weights and aerodynamics.
C Coen's paper also examined the payoff of advanced aerodynamic features such as planform, thickness, camber and twist, and paying attention to area rule principles in the layout of
. the configuration. His results were almost as dramatic as the payoffs in propulsion; at a constant range the gross weight was reduced to 280,000 pounds; at constant gross weight the range was increased 1200 nautical miles (see fig. 5).
The recent British aerospace study reported in reference 2 shows a second generation Concorde with many of the features described by Coen in his study done in 1986. The advanced Concorde is a tailless configuration and utilizes fuel transfer for cg control as in the original design. ( It uses a small canard to trim the trailing edge flap down configurations for landing and/ or takeoff.) Note that it is designed to carry 280 passengers (see fig. 6).
Note that the bars are labeled "Today's" technology, assumed for baseline aircraft, and required for viable aircraft (see fig. 7). Note, also, that they do not mention the engine weight reduction, only the SFC reduction. Finally, note that the Coen study showed larger L/D gains and today's structural weight reduction levels. This figure indicates that most of the necessary technical progress required to provide a viable configuration is already in hand. Only a small further technology increment is required and that may be partially made up by the "extra" aerodynamics available.
The message from figure 8 is that most of the technology required for an advanced SST is already in hand. The figure indicates what is needed is about 1000 miles range at a constant gross weight. From Coen's study, several answers are available. For instance, the L/D improvement of 20 percent shown in the previous chart is only 8.74, 30 percent is 9.49, and 40 percent is 10.22. Certainly 9.5 at Mach 2.05 is feasible today. While the Olympus was, and is, a great supersonic engine, it is still a 25 year old design derived from a predecessor designed in the 1950's. Digital controls and variable bypass offer the promise of at least the 10.22 percent sfc improvement desired.
When Coen (ref. 1) applied all the advances at once, he showed a gross weight of 304,000 pounds to carry 200 passengers 5500 miles. The British Aerospace study indicated 363,000 for 280 passengers 5500 miles (see fig. 9). An advanced Concorde then offers a reasonable way to apply the new technology to an advanctd configuration. Certainly we should be working on a sonic boom problem based on a 360,000 pound gross weight not 700,000 to 800,000. Since Ap overpnssure is approximately proportional to the dw this reduction in gross weight would nduce the boom by more than 40 percent. The boom reduction available by flying above 60,000 feet instead of about 50,000 feet results in another 40 percent reduction in boom level. Design . restrictions, such as NOx reduction criteria that quires reduced altitude and Mach number -

should be fuLly "n&rst& befors they commit the counw to a false course. In the competitive situation, no risk is greater than pushing a lower Mach number than the competitor.
SUMMARY C. . ~t is probably appropriate that an advanced Concorde be utilized as a reierence c~nfiguration between the Government and the contractors.
Attaining a meaningful sonic boom overpressure reduction is tough enough without starting with takeoff gross weights that may be twice as heavy as required to perform the mission.
W b l e data exists that indicates that 250 passengers can be carried 5500 nautical miles with takeoff gross weights of about 360,000 pounds.
Artificial restraints of altitude or Mach number only make the design decision tougher and may inadvertently lead to the wrong conclusions.
REFERENCES
1. Coen, I? G.: The Effect of Advanced Technology on the Second-Generation SST. NASA Langley Research Center, AIAAIAHSIASEE Air& Systems, Design and Technology Meeting, Dayton, Ohio, 1986.
2. Liddell, Peter W.: Prospects for a Second Generation Supersonic Transpod. Presented at the SAE Aerotech 199 1 Aerospace Technology Conference and Exposition, September 23-26, 1991, Long Beach, California.

YEAR
Figure 1. Funding history.
Figure 2. Subsonic aircraft competitors.

Concorde SST
Range 3500 n.m.
TOOOW. 185 Tonnes
Cruise at M = 2
LID = 7.3 . ..,
Passengers 100 first class s.f.c = 1.2 (installed)
Figure 3. The precursor - Concorde SST.

(Original figure not available at time of publication.)
.............................. 3386 kg. .............................................. Weight .......... .... - 1814 kg. ........ ..... ....................... 15.5 ........... .. ......................... ..__..... OPR ..................... 20+
.... ................................ 1350°K ..................... .................- TIT .........- 1811 . 1922OK ............................... ..... 14 ....... No. Compressor .................................... ..,.... 6
Stages
0.41 ...................................................... ho ............................................... 0.5 . 0.55 0.12 .................................................... SFC .................................................. - 0.10
Part Count ................................. - 112 of Concorde's Olympus Engines
. Figure 4. SST propulsion potential.

Concorde 1971 1977 Arrow SST SST Wing
10
8 .
Cruise LID
6
Figure 5. Effect of aerodynamic improvements on liftldrag ratio.
-
Area ruled fuselage
0 - n n 1 1 -1 4
Wing camber optimised for supersonic cruise
A / 4*1 with ejector silencer
I - I
- I
Foreplane Planform optimised for supersonic cruise 'd
Figure 6. - Advanced supersonic transport study - datum aircraft.
Gross wing Area (sq ft) Span (it) Aspect rrtio Overall length (It) Fim area (sq ft) Foreplane a m (sq ft) No. or pPssmF
A.S.T.
7,483 117
1.74 311 50s 159 280
Conwde
4,600 8.4
1.53 201 400
100

Base is Concorde
Aerodynamics MateriaW
I Cruise WD structural optimisation
Powerplant cruise SFC
C] "Todays" technology
Assumed fur baseline aircraft
Required for viable aircraft
Figure 7. Advanced supersonic transport study technology standards relative to Concorde.
Aircraft Size
Range NMLS Meets Far 36 Stage 3
' Figure 8. Advanced supersonic transport study-feasiblity of achieving AST technology standards.

Passengers
Advanced SST
200 F
150 -
50 -
0 1 2 3 4 5 6 7 8 9 1
Range (1000 n.mi.)
Figure 9. Range-payload curve ,for advanced two-engine SST.

LOW SONIC BOOM DESIGN AND PERFORMANCE OF A MACH 2.4/1.8 OVERLAND HIGH SPEED CIVIL TRANSPORT
4 7 8
John M. Morgenstern McDonnell Douglas Corporation, Douglas Aircraft Company
Long Beach, CA
INTRODUCTION
This paper describes the design features of a Douglas Mach 2.411.8 Low Sonic Boom High Speed Civil Transport (HSCI') configuration developed for NASA under government contract number NAS 1- 19345. The c ~ ~ g u r a t i o n is designed to fly over water at Mach 2.4 for highest productivity and economic worth, and fly over land at Mach 1.8 with reduced sonic boom loudness.
SONIC BOOM DESIGN GOALS
Before the design work was undertaken, a study was performed to determine the appropriate Mach number and weight for sonic boom design minimization efforts (figure 1). Based on preliminary acoustic response studies, a loudness goal of 90 PLdB was chosen. The NASA Langley (Christine Darden) SEEB computer code1 was used to quantify the maximum weight possible for a 90 PLdB waveform. A minimum shock waveform was chosen to maximize the weight allowable. A minimum weight constraint was added based on a non-low boom baseline configuration weight required to meet the mission range and payload desired. As a first order approximation, a 10% increase in weight above the baseline was chosen as an upper weight limit. In previous NASA studies, Douglas was counseled against operating in the no bow shock regime due to concerns over shockless waveforms coalescing into larger front shocks. Further, the equivalent area shapes required to eliminate bow shocks tend to allow very little volume for a practical vehicle. From the design space shown in figure 1, it was decided to pursue sonic boom minimization at Mach 1.8 with a maximum take-off gross weight (MTOGW) of 850,000 pounds.
In addition to using Mach 1.8 for sonic boom minimization, a payload of 300 passengers and range of 5,000-5,500 nautical miles were chosen to match the baseline configuration. Mach 2.4 supersonic cruise over water was chosen to reduce the risk of the low boom design: if the low boom

Sonic Boom Design Space
MTOGW
* !.
- F m t Shock Yin. Shape
- Length = 330 fl.
- Porcul = 0.5
- Yf/L r OD
Mach
Figure 1
configuration was not allowed to fly supersonic overland, it would still be capable of Mach 2.4 over water; therefore, it retains the baseline's productivity economic advantage over water (compared
. to subsonic aircraft). Further, the long lifting lengths needed for sonic boom minimization are conducive to the higher sweeps which are beneficial at Mach 2.4.
DESIGN AND ANALYSIS METHODS
Design of the configuration startedwith a SEEB equivalent area goal based on the chosen MBch number and weight. A linear wing-body-tail panel method calculates the configuration's lift in a trimmed condition. A far-field wave drag program calculates the volume pressure disturbance of the full configuration, wing-body-tails-nacelles. A linear sonic boom propagation method reads in axial lift distributions at several angles-of-attack and Mach angle cut volume distributions at several roll an les. The lift and volume are converted into an 'f function (as per the Whitham-Walkden F theory ) and propagated to the ground at several roll angles to f o m a sonic boom carpet.
Numerous configurations, their permutations and various mutations were analyzed. This study included at least 3 planforms, several twist and camber combinations, 3 horizontal tails, 4 canards, 2 vertical tails, 2 nacelles, and more than 50 fuselages. Many improvements were made in the analysis methods to handle more complex configurations, improve turn-around time, and improve techniques used for numerically calulating slopes and second derivatives as configuration complexity increased.

PBRX - 2.5 ROB- 98.4 CSEL- 104.6
MACH 1.8 GROUND WAVEFORM MACH 1.8 GROUND W A V E F O ~
.
9. '7
Figure 2 Figure 3
During the many configuation analyses and recent NASA wind tunnel test analyses,l the strong effect of nacelles on sonic boom became apparent. Figure 2 shows a comparison of the intended minimum shock waveform with the ground waveform for an earlier version of the 2.411.8 configura- tion. A large pressure spike due to the nacelles "ate up" most of the ramp waveform, creating a second shock that doubled the front waveform loudness. A two part strategy was undertaken to deal with the nacelle pressure spikes: the location of the nacelles was changed, and the accuracy of nacelle effects was increased.
First, the nacelles were moved aft so their pressure spikes would occur behind the front ramp of the waveform. This virtually eliminated the nacelle shock effect on the ground waveform, as shown
NACELLE PRESSURE CONTOURS FROMNASTD CFD SOLUTION
- Nacelle Outline
- Pressure Contours
Figure 4
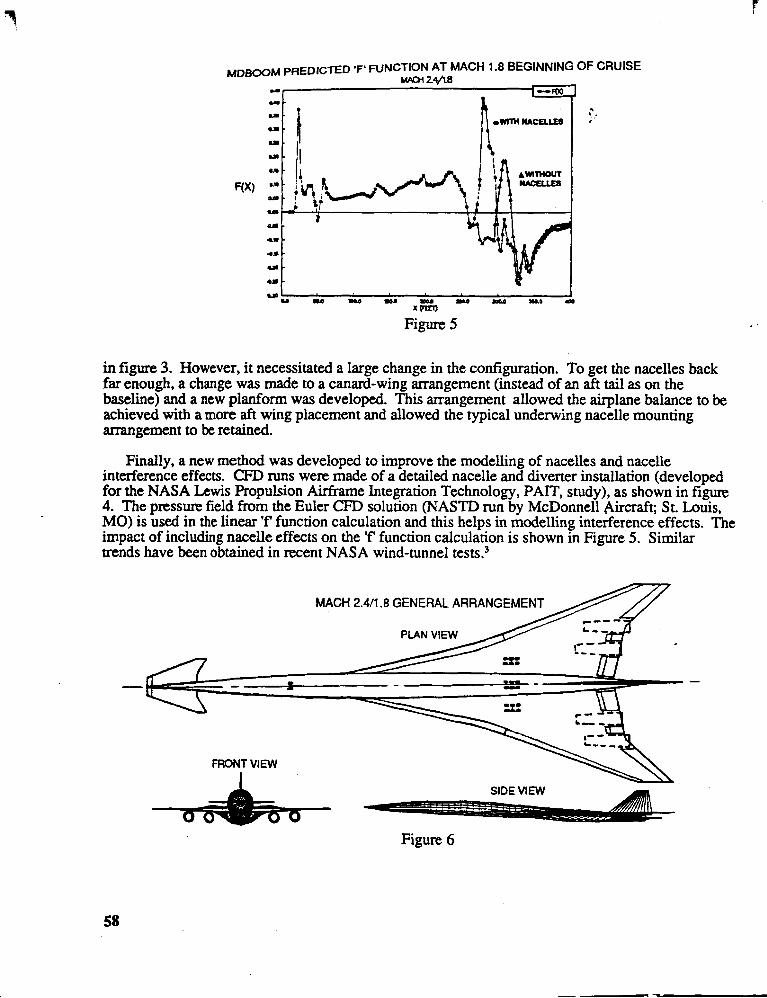
MDB~OM PREDICTED 'F' FUNCTION AT MACH 1.8 BEGINNING OF CRUISE MAoi 2-
u I - F W j
Figure 5
in figure 3. However, it necessitated a large change in the configuration. To get the nacelles back far enough, a change was made to a canard-wing arrangement (instead of an aft tail as on the baseline) and a new planform was developed. This arrangement allowed the airplane balance to be achieved with a more aft wing placement and allowed the typical underwing nacelle mounting arrangement to be retained.
Finally, a new method was developed to improve the modelling of nacelles and nacelle interference effects. CFD runs were made of a detailed nacelle and divener installation (developed for the NASA Lewis Propulsion Airframe Integration Technology, PAIT, study), as shown in figure 4. The pressure field from the Euler CFD solution (NASTD run by McDonnell Aircraft; St. Louis, MO) is used in the linear 'f function calculation and this helps in modelling interference effects. The impact of including nacelle effects on the 'f function calculation is shown in Figure 5. Similar trends have been obtained in recent NASA wind-tunnel tests.3
MACH 2.411.8 GENERAL ARRANGEMEN
FRONT V I M
Figure 6

MACH 2.411.8 GROUND UNDERTRACK WAVEFORM AT MACH 1.8 BEGINNING OF CRUISE
Z J P b.0 0.1 0.a 0.0 pp .*
3s
BACK HALF 97.5 PLdB
Figure 7
2.411.8 CONFIGURATION GENERAL ARRANGEMENT
The latest 2.411.8 configuration arrangement is shown in figure 6. As mentioned previously, it has a canard in front. In addition to acting as a trimming and control surface, the canard has a small movable surface on its zero sweep leading edge. This surface is deflected up during low boom operation at Mach 1.8 to help create an effective "nose blunmess" without a blunt area distribution. In this way, the bluntness drag need not be present during Mach 2.4 over water cruise. The wing has a 76/68 degree subsonic swept leading edge and a "gull-wing" dihedral to imppve nacelle clearance. The fuselage meets the 300 passengers in a 3-class arrangement goal.
2.411.8 CONFIGURATION BOOM LEVELS
Figure 7 shows the beginning of cruise undertrack ground waveform. While the front half of the waveform is close to the 90 PLdB goal, the aft shock brings the total to an annoying 98.2 PLdB. - The first question is, "Why did the aft shock get so loud?" The loud aft shock appeared as a result of adding the nacelle CFD pressures created under the back end of the wing. These pressures cause a steep rise in the equivalent area distribution seen as the nacelle pressure spike in the 'f function (figure 5). As previously mentioned, the effect of the spike is suppressed by the nacelle placement; however, the quick drop off in lift behind the spike causes negative pressure spikes behind the nacelles, which could not be eliminated by fuselage shaping without a large drag penalty. A more gentle drop off in lift is needed to reduce the aft shock strength.
The second question might be, "Why has the minimum shock waveform become a delayed ramp?" The front shock is a little larger than desired because the large canard at the front nose introduces some non-smoothness that is difficult to remove. Also, the design methods have trouble keeping the area distributions smooth wherever lifting surfaces begin and end. And finally, the shape of the ramp was allowed to vary a bit to smooth the fuselage for reduced wave drag.

One solution to both problems would be to add an aft horizontal tail in addition to the front canard. In an optimum supersonic trim condition, it is generally beneficial to carry some aft tail lift.
- The size of the canard could also be reduced. The problem in using this approach is that the avail- able methods are not currently capable of handling three surface configurations.
In spite of the large aft shock, it is important to hightlight how far the design has progressed toward an acceptable low boom signature. Significant attention was paid to minimizing off-track loudness during the design process. Figure 8 shows the total sonic boom carpet loudness for the beginning of cruise condition, along with waveforms at several points along the carpet. Note that a shaped waveform is retained throughout the carpet. The effect of the nacelle pressure spike is controlled at all roll angles.
In addition to looking at off-track loudness, sonic boom carpets at other than the beginning of . cruise must be considered. Figure 9 compares the Mach 1.8 beginning of cruise sonic boom carpet with the Mach 1.2 climb carpet (without acceleration effects) and the Mach 1.8 end of cruise carpet. The Mach 1.2 climb values are held to roughly the same loudness level, but the carpet is consider-

SONIC BOOM CARFET MACH 2.4/1.8
115.0 -- I , - BEGIN CRUISE Y1.8
gg: itu, 0- OuO CRUISE ~ > 6 ** CUMB M I 2
110.0 -
105.0 -
90.0 - - -
'p I
I I 1
-15.0 -10.0 -5.0 0.0 5.0 10.0 75.0 DISTANCE OFF-TRACK (FEET*10000) *lo'
Figure 9
ably more nanow. A low noise, mid-field (non N-wave) waveform at the ground is achieved by climbing in a low q (dynamic pressure) ascent tragectory similar to those shown in reference 3. The fuel burn penalty for the lower q climb is 1.5 to 2 percent. It is possible that this penalty could be . reduced by tailoring the canard lift dismbution for Mach 1.2 boom minimization in future studies.
Of paticular interest is that the Mach 1.8 end of cruise waveforms are almost identical in shape to the beginning of cruise waveforms, except they are about 6 PLdB quieter. The ground waveform from the end of cruise has the same "aged" shape as the beginning of cruise waveform, because the airplane is flying at a constant lift coefficient which means that the same p,Jp- ratio exists all along the vehicle throughout cruise. The implication is that throughout climb, cruise, and descent the "aging" of a low boom ramp waveform will be held at or below its design target, and thereby, maintain a shaped waveform (in a non-turbulent atmosphere.) In summary, altitude changes at the same Mach number do not cause low boom waveform shapes to "age" differently when using typical constant lift coefficient climb, cruise, and descent txagectories. Conversely, Mach number directly affects waveform "aging", so that at Mach 2.4 beginning of cruise the low boom 2.4/1.8 configuration produces a typical N-wave of 104.5 PLdB loudness, undertrack.

2.4/1.8 CONFIGURATION PERFORMANCE
Since ~~~h 2.4 cruise over water is more productive and 70% of the earth is covered with water, the 2.41.8 low boom airplane is likely to spend most of its time cruising at Mach 2.4. Therefore, Mach 2.4 cruise efficiency is of paramount importance. Wing leading edge sweeps were chosen with this speed in mind and the planform twist and camber distribution are optimized for it. The area disaibution is smoothed for Mach 2.4 cruise and simultaneously shaped for low boom at Mach 1.8. The Mach 2.4 roll averaged area distribution is shown in figure 10.
MACH 2.411.8 ROLL AVERAGED AREA DISTRIBUTION AT MACH 2.4
.. X STATION
Figure 10
Table 1 below gives a comparison between the 2.41.8 low boom airplane and a 2.4B.95 baseline, both sized at the same MTOGW and flying 25% over land at reduced speed. The Mach 2.4 cruise performance of the two configurations is about equal; however, the 2.411.8 configuration is significantly more efficient at Mach 1.8 over land than the 2.4B.95 baseline is at Mach 0.95 over Iand. The main penalty of the 2.411.8 configuration is the weight of the large wing, which contrib- utes most of the 18 percent increase in operator's empty weight (OEW) relative to the Baseline. This performance assessment analysis is preliminary and no changes of the Low Boom geometry were allowed during sizing.
Table 1
LOW BOOM BASELINE 2.411.8 2.410.95
WIND TUNNEL TEST AND FURTHER PLANS
* 7 9
At this point, it is desirable to fabricate and test a wind tunnel model of the 2.4/1.8 low boom . geometry. It represents many new features that have yet to be validated. Predictions indicate that a ramp front waveform should be achieved undertrack and shaped waveforms are achieved at all roll angles with ground intercepts. The strong aft shock would not make a difference with the proposed wind tunnel test methods, because the signature behind the nacelles cannot be modelled accurately due to sting interference and the lack of engine power effects (engine exhaust). Further revisions of the 2.411.8 configuration will be undertaken to reduce the aft shock and improve performance. In the meantime, the CFD predictions of the nacelle effects need to be verified along with the off-track prediction methodology. Further, a newly developed method that links full configuration CFD solutions to sonic boom predictions4 will be used on the 2.411.8 Low Boom design. The CFD is better able to account for three dimensional effects, but more complex, low boom wind tunnel test data are needed to develop experience and thereby accuracy with the method.
REFERENCES
1. Darden, Christine M.: Sonic-Boom Minimization With Nose-Bluntness Relaxation. NASA TP-1348, Jan. 1979.
2. Whitham, G. B.: The Flow Pattern of a Supersonic Projectile. Communications on Pure and Applied Mathematics, 5, 1952, pp. 30 1-348. Walkden, F.: The Shock Pattern of a Wing-Body Combination, Far From the Flight Path. Aeronautical Quarterly, lX (2), 1958, pp. 164- 194.
3. Darden, Christine M.; Mack, Robert J.; Needleman, Kathy E.; Baize, Daniel G.; Coen, Peter G.; Barger, Raymond L.; Melson, Duane N.; Adams, Mary S.; Shields, Elwood W.; and McGraw, Marvin E.: Design and Analysis of Low Boom Concepts at Langley Research Center. First Annual High-Speed Research Workshop, Vol. III, Session 5, May 1991.
4. Page, Juliet A.; Plotkin, Kenneth J.: An Efficient Method for Incorporating Computational Fluid Dynamics Into Sonic Boom Prediction. AIAA 9 1-3275, Sept. 199 1.
ACKNOWLEDGEMENT
The author would like to acknowledge the help of the Advanced Design Team of Douglas Aircraft.

Page intentionally left blank

TWO HSCT MACH 1.7 LOW SONIC BOOM DESIGNS*
C . George T. Haglund and Steven S. Ogg Boeing Commercial Airplane Group
Technology & Product Development /Aerodynamics Engineering Seattle, WA 98 124-2207
- SUMMARY
The objective of this study was to provide low sonic boom concepts, geometry, d analysis to support wind tunnel modd designs. Within guidelines provided by NASA, two High Speed Civil Transport (HSCI') configurations were defined with reduced sonic boom that have low drag, high payload, and good performance. To provide information for assessing the feasibility of reduced sonic boom operation, the two designs were analyzed in terms of their somc boom characteristics, as well as d y n a m i c s , weight and balance, and performance characteristics. Low drag and high payload were achieved, but both of the blended arrow-wing configurations have deficiencies in high lift capability, fuel volume, wing loading, balance, and takeoff gross weight. Further refinement of the designs is needed to better determine the commercial viability of low boom operation. To help in assessing low boom design technology, the two configurations were defined as wind tunnel models with altered aft-bodies for the wind tunnel sting mounting system.
The primary objective of this study was to define wind tunnel models of two configurations for sonic boom testing. The goal of the wind tunnel test is to verify experimentally the low-boom characteristics with 12-inch models that incorporate the effects of wing camber, nacelles, and fuselage area-ruling. The aft-body of the model mus$ be altered, however, to provide for the sting mounting system.
Previous NASA-sponsored studies at Boeing have included these effects (References 1 to 7), and have helped to define practical HSCT configurations with reduced sonic boom charactaistics. In the current work, two low-sonic-boom configurations were designed for overland cruise at M1.7 and overwater cruise at M2.4. The major objective was to explare the effect of sonic boom wavef- shape. One configuration was designed to the well-lmown "flat-top" waveform, while the other was designed to the "hybrid" waveform developed at Boeing (References 6 and 7). Figure 1 compares the two target low sonic boom waveforms with a conventional waveform. The hybrid waveform has desirable features &om the standpoints of configuration design, sonic boom propagation, and loudness. 'Ihe hybrid waveform was so named because it combines the features of the "flat-top" and the *'*urn-shock" waveforms of Refaence 8. The hybrid waveform
* Work done on contract NAS3-25963

deswsJ M~ smudy because it is a sif lcm devdopment toward achieving a practical low S O ~ E bm HSCT. Howevcr, since the peak prwsurc rises to about 2.0 lblfrZ, there is =me con- that this waveform would Inodtlce an unacceptable response for indoor obwncra (buildings respond primarily to the peak p s m e rather than the S t i a l shock wave intensity that is primary fa outdm observers). On the other hand, the "flat-top" wave- has a maximum overplessuTe of about 1.0 lblft2 and would be more acceptable to i n d m observers. n u s the flat-top waveform deserves study as a target and was included in this study.
Reduced sonic boom loudness is achieved by reducing the magnitude or increasing the rise time of the pressure jump across each shock wave in the sonic boom waveform. For an acceptable loudness of about 72 dB& the shock wave intensity at the ground must be approximately 0.80 1blft2. In the current study, the target sonic boom shock intensity was relaxed somewhat to about 1.0 lblft2 to demonstrate that a low sonic boom configuration can achieve low drag, high payload, and good performance. The pcrfonnance objectives of the two configurations were as follows:
Range: 5000 nm Payload: 300 tri-class passengers Cruise Lift to Drag Ratio: At least one unit higher than the baseline configuration
Since L/D alone is not a good measure of airplane performance, each airplane was evaluared in sufficient depth to dew ' , an operaring empty weight (OEW) and maximum takeoff weight (MTOW) for a 5000 n-mi. mission. This allowed a meaningful parfmmance comparison to a conventional baseline configuration, the 1080-874.
The three configurations to be discussed are as fallows:
Model Waveform Unrestricted Cruise Mach Resmcted Cruise Mach
1080-910 Hybrid 2.4 1.7
For convenience, these configurations will be referred to as the -874, -910, and -91 1.
CONFIGURATION DEVELOPMENT
This section provides a description of the configuration development and configuration characteristics such as aerodynamics, stability and control, weight and balance, performance sizing, and sonic boom.
The two desired low sonic boom waveforms are shown in Figure 1. The real constraints, however, in the Boeing low boom design method are the corresponding Whitham F-functions shown in Figure 2. 5 .
Configuration Description
The two low-boom cofigurations share some features of the baseline 1080- 874 cofiguration, including the following:
Blended wing-body philosophy Aft fuselage fuel tank 4 PWA STJ-945 engines (year 2002 turbine bypass afterburning &jet) 4-post landing gear
The baseline configuration -874 is shown in Figure 3, and the drawings of the low-boom configurations -910 and -911 are shown in Figures 4 and 5. The -91 1 has no horizontal tail and therefore the elevator and trimming functions are performed by the wing t d h g edge flaps.
High Speed Design and Analysis
The sonic boom constraint is severe and directly affects every configuration component. The low boom design method used at Boeing has been summarized recently in References 6,7, and 9. 'Ihere is a complex interplay between many design elements. The wing planfoxm must provide a gradual, smooth lift distribution and low drag. The camber and twist were designed for a Q, of about .09, with a sufficiently positive CMO, at a Mach number of 2.1. The wing thickness distribution was defined by considering landing gear requirements and rear spar depth at the outboard nacelle. The wing thickness to chord ratio values are relatively low, contributing to low wing wave drag. The nacelles and empennage contribute volume and lift and must be located and shaped appropriately. The fuselage area distribution was defined last. In practice, several iterations with the wing planfarm were required to achieve acceptable wing-body wave drag, which is important far optimum performance. 'Ihe sonic boom constraint provides an automatic area-ruling effect and low wing-body wave drag can be obtained, provided the proper wing planform is chosen.
Both of the low boom configurations have significantly reduced drag compared to the baseline configuration. The -91 1 is close to the optimum that can be obtained with ar without a sonic boom constraint, while the wave drag of the -910 could be improved somewhat by modifying the iqboard strake and farebody. .
TWO innovative concepts were i n d u c e d on the -910 configuration to obtain the dc-d low-boom Whitbarn F-function: tailoring of the nacelle forecowl shape and
I
dcflccting the leading edge flaps- Figure 6 shows the effect of these two design modifications OII the F-fundon- f .
i n e nacelle forecowl shaping is simply the reduction of initial forecowl angle to f
reduce shock strength and corresponding increase of the aft forecowl angle to retain the i
maximum nacelle diameter required for accessories. The drag penalty for this change is small. The correct shaping of the nacelle forecowls when combined with the appropriate staggering of the nacelles and careful design of the boundary layer diverters provides sigdicant flexibility in closing to the desired F-function.
Low boom configurations have required p l a n f m that provide long lifting lengths. These planform, however, have many undesirable characteristics in terms of wing weight, I .
low speed aerodynamic performance, and configuration integration. The -910 configuration employs leading edge deflections to distribute the lift in such a way that the equivalent area due to lift provides a smoothly varying equivalent area when combined with the equivalent area due to volume. The summation of the F-function due to lift and the F- function due to volume illustrates this point as shown in Figure 7.
Low Speed Design and Analysis
The low speed performance of the -910 low sonic boom codguration is based on the assumption that flap settings can be programmed to provide optimum lift-to-drag ratio (LID) for varying conditions during climbout Programmed flap climbout polars for the milless airplane (-91 1) were not produced, however, since climbout UD optimization would not reduce airplane size because it is limited by approach speed and rakeoff field length constraints.
Wing apex vortex fence deployment at landing flare was assumed on the tailless airplane, as on the baseline airplane (-874). Because utilization of a vortex fence offered no benefit to 1080-910 airplane sizing, it was removed for a weight reduction.
The procedure for calculating the lift and drag characteristics of the low sonic boom configurations consisted of adding computed increments to an established data base. The reference data base selected for low speed characteristics prediction is the estimated full scale data base for the Model 2707-300 airplane built up &om high Reynolds number testing conducted in the spring of 1970 (Reference 10). Increments due to configuration wing differences relative to the 2707-300 are determined by comparing computed characteristics. The NASA computer program, AEROZS (Reference 1 I), is used for the drag due to lift computations since it includes the effects of the leading edge separation vortex and leading edge suction limitations together with a wing potential flow solution. Additional un~ections to the Model 2707-300 data base include differences in skin friction, climination of nose cab droop, and thrust (where appropriate).
The attitude limits for the tailless airplane (-91 1) are higher to compensate for the loss in trailing edge flap lift. The tailless -91 1 required an incase in landing gear length of 54 inches to achieve the 160 KEAS approach speed limit at maximum landing weight. The lengthened gear produces an OEW increase of about 5400 Ib. Landing gear length has a significant eff' on takeoff field length and approach speed because of its effect on rotation

angle capability. An increase in wing-body incidence angle could be used to shorten the landing gear somewhat, but with a cruise drag penalty.
The lift-to&zg mios f a climbout a d approach were determined from respective polar5 for each con6iguration. Leading and trailing edge flaps vary for c l i m h t and approach to maximize L/D at each condition. Climbout points are selected for a speed (V2+10) corresponding to the lift coefficient for a second segment climb plus 10 hots. For approach, the values of L/D correspond to a gear extended speed that will result in an attitude limited touchdown after a 3% speed bleed-off. Pertinent information comparing each of the co&gura!ions at these two conditions is presented below.
Stability and Control
The horizontal tail size is determined by calculating the forward and aft center of gravity (c-g.) limits as a variation with tail size and selecting the tail size which provides the required c.g. range. This also determines the main landing gear position since the nose wheel steering criterion requires a certain distance between the aft c.g. and gear position. The forward c.g. limit is based on take-off rotation criterion and the aft c.g. is based on stall recovay.
Since the 1080-911 is a tailless configuration, the longitudinal control evaluation consisted of d e ~ ~ g whether the elevons provide adequate control and, if so, how many of the four segments per side are required and if some can be used for high lift. 'Ihe results show that only three of the four @er side) are required but there is insufficient control to permit using the unused panel for high lift. It was decided to use the three inboard panels far elevons and leave the outboard panel unused, or as a possible low-speed . aileron, because of the probable high acroelastic losses of the outboard panel.
The sized vertical tail of the -911 (528 sq. ft.) is larger than that of the -910 (464 sq. ft.) because of the mare aft wing location and more forward vertical tail location of the -911 compared to the -910.
Weight and Balance
The point design configurations were balanced by positioning the wing to achieve desired c.g. ranges. These configurations wese then analyzed to provide operating empty weights and weights scalars far a i r d sizing. Scalars were detexmhed for the change in

OEW with &l"K)W, engine airflow, and wing area. These scalars are described in more d e ~ in section 8.7.3 of Ref- 3. Ballast was required to balance all the point design
but was not included in the perfcnmmce calculations. q ,
Performance Sizing
This section presents _the aerodynamic performance results of the "Hybridw sonic boom waveform -910 and the tailless "Flat-Top" sonic boom waveform -91 1, with takeoff and climb thrust-augmented Pratt Whitney STJ945 engines. The 1989 baseline model -874 previously supplied in Reference 9 is also included for comparison.
The -874, -910 and the -91 1 configurations were sized following the same Design Requirements and Objectives (DR&O) criteria as outlined in Reference 12. These req-ents include:
Design Mach = 2.4 Design Range = 5000 nm Takeoff Held Length = 12000 ft. Approach Speed = 160 keas Transonic Climb Thrust Margin = 0.3 CNise Thrust Margin = 0.1 ClimbTime=O.75hr.
In addition to these requirements, a 20% Programmed Thrust Lapse Rate (PLR) limit was applied to reduce community noise as described in Reference 5. The 2Wo PLR is an automatic reduction in thrust initiated at 35 feet altitude which has been found empirically to reduce the "shoulder" of the 85 dBA noise footprint to that extent caused by the takeoff ground-roll. The requirement specifies that the engine maximum climb thrust minus 20% must be great enough to maintain a speed of V2+10 knots while climbing at a gradient which allows the aircraft to attain the minimum altitude for FAR cutback at a distance from brake release that permits the achievement of full spin down when the FAR specified cutback measuring station is reached.
Major charactexistics of the sized ahcraft are shown in the table below. SREF is the reference wing area in square feet and Wa is the reference engine airflow in pounds mass per second. MTOW and OEW are expressed in pounds.
1080-910 Hybrid 320 823640 362270 9.89 9957 575
A summary of the configuration and'performance results for each sized c o ~ ~ o n is given in Figure 8. The different payloads of the co&guratiom, however,

make comparisons difficult. An estimate was made using empirical rules to adjust the MTOW for a payload of 279 passengers. lie results are shown in Figure 9, with the payload to gross weight ratio of the -910 and -911 both about 10% lower than the baseljne -874 at the same payload (279 passengers). , '
- It should be noted that the sized configurations for the 1080-91 0 and 1080-91 1 were
obtained through only one airplane sizing cycle. Therefore, any performance recommendations or conclusions are prelimhary in nature. Future MTOW optimization should include additional sizing cycles to converge design objectives and performana results through refinements in available fuel volume, high lift systems, and wing camber.
Sonic Boom Charactaistics
Estimated sonic boom waveforms calculated by the method documented in References 13 and 14 are shown in Figure 10. These were calculated for the initial design conditions of Mach 1.7,44000 ft. altitude, and the design CL of about .09.
The performance sizing described previously resulted in significantly higher gross weights than were designed for. 11 compares the initial design and performance sizing conditions. An impartant consideration is whether the low boom characteristics have been lost because of thc heavy gross weight. Figure 12 shows the calculated sonic boom for the heavier start-cruise weights for the -911 configuration. The higher wing lift has produced stronger shocks, but the low boom characteristics have not been lost entirely. Another mode of operation is to fly at the design CL of the heavier gross weight, by
- reducing the cruise altitude appropriately. For the -91 1 this means reducing the i n i t s cruise altitude fiom 44000 ft. to about 39000 ft. The sonic boom waveform for this case, shown in 12, is very similar to the higher altitude case, but the pressure levels are higher because of the shartcr propagation distance to the ground. However, a structural weight penalty would be assessed for flying at this reduced altitude due to increased dynamic pressure.
WIND TUNNEL MODEL DESIGN
Aft-Body Design and Sonic Boom Characteristics
The Boeing low-boom design method is appropriate for designing an altered aft- body, in the same way it is used for designing the full configuration aft-body. The only change is to modify the target sonic boom waveform to produce an open aft-body that matches the dtsircd sting dhmetcr. .
Figure 13 shows the target sonic boom waveforms and the estimated sonic boom - waveforms for the wind tunnel model configurations. The -911 forebody was also analyzed using a CFD code called STUFF (a parabolized NavierStokes solver run in the

inviscid mode). The result shown in Figure 13 indicates a bow shock of 1.4 lblft2 instead of the desired 1.0 lblflZ predicted by linear theory methods. This inconsistency is possibly related to the forebody camber and wing body junction regions that were n@ modelled accurately by the linear theory methods. Thus, design methods based on the linear theory should be used with care, and sonic boom characteristics should be verified by CFD methods.
Aerodynamic Performance Verification
The highly-swept, lightly-loaded wings of the two low-boom cofigurations provide a significant reduction in drag. At Mach 2.4, for example, the theoretical drag of the -91 1 is 23% lower than the baseline -874. However, viscous effects can have impartant consequences on highly swept wings that can negate the theoretical drag reduction. Reference 15 provides a set of design conditions developed fiom experimental
I I
test programs. In general, attached flow must be maintained on the wing upper surface by avoiding the following flow conditions: strong spanwise flow near the wing trailing edge, extremely high leading edge suction pressures, inboard shock separation, and a strong shock near the wing trailing edge. These adverse flow conditions can affect the boundary
i layer and produce separated flow. The presence of the adverse flow conditions can be determined fiom examining calculated wing pressure distributions. For this study, TFUNAIR was used to calculate wing pressures. A check of the -91 1 sonic boom design flight condition (MI -7, CL = .090) showed no severe flow problems. I
CONCLUSIONS AND RECOMMENDATIONS
Achieving a practical HSCT low-boom configuration with low drag, high payload, and good performance is a formidable design problem. In this study, two low-boom configurations were designed to different sonic boom waveforms for overland cruise at Mach 1.7 and overwater cruise at Mach 2.4. Both configurations met the goal of at least ' 300 passengers and low drag, but suffered from the increased OEW of the arrow-wing planform and large fuselages.
The following conclusions summarize the results of this study:
1. Of the two configurations, the -910 designed to the hybrid wavefarm has fewer design problems. The -91 1 tailless configmation has the advantage of reduced drag compared to the -910, but needs considerable work to improve low speed perfarmance and a serious balance problem due to the aft location of the wing.
2. High payload (at least 300 passengers) and low drag were achieved for both configlxrations.
3. The OEW and MTOW of the low boom configurations are sigdicantly higher than the baseline for the 5000 nmi. mission. For the same payload of 279 passengers,

both the -910 and -91 1 have payload to gross weight ratios about 10% lower than the baseline -874.
4. Wind tunnel model aft-body designs were developed by using the same technique t r
as for the basic airplane design but with a modified target tail shock
- 5 . A TRANAJR analysis of the -91 1 wing-body showed well-behaved flow qualities with M e chance of flow separation at Mach 1.7.
* 6. The Linear theory low-boom design methods should be used with care and the sonic boom characteristics should be verifid by a CFD method.
During this short study, it was not possible to modify the designs to any extent. Refinements are needed to correct design deficiencies for improved performance while maintaining the low-boom characteristics. This should be done before attempting a better assessment of commercial viability. In addition, it would be desirable to modify several of the design goals.
1. Revised design goals a. Reduce the target shock wave strength to about 0.8 lb/ft2 for better
acceptability. b. Reduce the passenger count to about 280 to 290 to improve low boom
design flexiiility. c. Consider designing for a lower overwater cruise Mach number to nduce the
performance penalty for flying Mach 1.7 overland.
2. Design improvements a. Increase the available fuel volume by increasing the inboard wing th ihess
slightly (-910 and -91 I), and/or by adding fuel further outboard in the wing . to reduce required wing area and hence MTOW.
b. Change landing gear to a 3-post gear, which may provide more volume for fuel and reduced weight (-910 and -91 1).
c. Consider reducing the mid-body fuselage cross-sectional area to 4-abreast seating, for lower wave drag and more low-boom design flexibility (-910 and -911).
d. Reduce the wave drag of the -910 c ~ ~ g u r a t i o n by matching the wing planform with the optimum area-ruled fuselage, within the low-boom c0nslra.int.
e. Revise the camber and twist of the -911 configuration to obtain a better match between the lift coefficient for maximum IJD and the airplane cruise lift coefficient.
f. Revise the camber and twist of both configurations to improve the low- speed high-lift characteristics. For the -91 1 this will allow a reduction in the landing gear length that was required for an approach speed of 160 hots. A folding canard should also be considend
g. Iterate through the airplane sizing promhe and the sonic boom consmined designs to obtain a better match between optimum perfomawe and the low wing loading that low boom rtquirts.
h. Investigate ways of reducing the tail shock strength, for example, through horizontal tail loading, aft-body contouring, or secondary air exhausted from the aft-body.

I
~igh-Speed Civil Transport Studies, Task 3.2 - Special Factors ~ssessrnent, Sonic Booms. Boeing Document D6-53322-3, August 1987, Contract NAS1-18377.
Brown, J. G.; and Haglund, G. T.: Sonic Boom Loudness Study and Airplane Configuration Development. AIAA Paper 88-4467, presented at the W A S E E Aircraft Design, Systems, and Operations Conference, September 7-9,1988, Atlanta, Georgia
Highspeed Civil Transport Study, Airfixme Technology, NASA CR 181879,1989.
High-Speed Civil Transport Study, Special Factors, NASA CR 181880,1989.
High-Speed Civil Transport Study, NASA CR 4233, September 1989.
Haglund, G. T.: High Speed Civil Transport Design for Reduced Sonic Boom, Boeing Company Document D6-55430, Feb., 1991.
Haglund, G. T.: HSCT Designs for Reduced Sonic Boom, AIAA Paper 91-3103, presented at the AIAA Aircraft Design Systems and Operations Meeting, Baltimore, MD, September 23-25,1991.
Darden, Christine M.: Sonic-Boom Minimization with Nose-Bluntness Relaxation, NASA TP 1348,1979.
High Speed Civil Transport Study, Environmental Studies and Innovative Concepts, NAS CR XXXXB6,1990, contract NAS1-18377.
10. Boeing Document D6A12104-1TN: SST Model 2707-300 PPD and PT Aerodynamic ~ r i s t i c s fur Performance Calculations, SST Aerodynamic Staff, January 29, 1971.
11. Carlson H. W.; and Darden C. M.: Validation of a Pair of Computer Codes for Estimation and Optimization of Subsonic Aerodynamic Performance of Simple Hinged-Flap Systems for Thin Swept Wings, NASA Technical Paper 2828, November 1988.
12. Sweetland, P. F.; and Vachal, J. D.: High Speed Civil Transport Study, Volume 3, Aixframe Technology, Boeing Document D6-54674-3, November 1988.
13. Hayes, W. D.; Haefeli, R. C.; and Kulsud, H. E.: Sonic Boom Propagation in a Stratified Atmosphere, with Computer Pro- NASA CR 1299,1969.
14. Haglund, G. T.; and Kane, E. J.: Study Covering Calculations and Analysis of Sonic Boom During Operational Maneuvers, Vol. III, Description of Computer Program and Estimation of Limitation Near Caustics, FAA Report EQ 71-2, Feb. 1971.
15. Kulfan, R M.; and Sigalla, A,: Real Flow Limitations in Supersonic Airplane Design. AlAA Paper 78-147, presented at the AIAA 16th Aerospace Sciences Meeting, January 16-18,1978, Huntsville, Alabama.

N-g&AVE t. Cruise: Mach 2.4, 60000 ft Altitude.
4 - 2.5 pcl
t Time
"HYBRID" WAVEFORM Cruise: Mach 1.7, 44000 ft Altitude.
"FLAT-TOP" WAVEFORM Cruise: Mach 1.7. 44000 ft Altitude.
SIGNATURES AT THE GROUND SURFACE
Figure 1. Design sonic boom waveforms.

Figure 2. Design Whitham sonic boom F-functions.

MODEL 1080-874 BODY LENGTH 3729 IN WING SPAN 1438.5 IN
Figure 3. Configuration drawing of Model 1080-874 Baseline.

MODEL 1080-910 BODY LENGTH 3960 IN WING SPAN 1626.7 IN
I
I i
Figure 4. Configuration drawing of Model 1080-9 10.

MODEL 1080-91 1 BODY LENGTH 3960 IN I - WING SPAN 1626.7 IN I
Figure 5. Configuration drawing of Model 1080-9 1 1. . .

1080-910, MACH 1.7, C,=.095
DISTANCE, Y, FEET
0 50 100 150 - 200 250 300 350
DISTANCE, Y, FEET Figure 6. Effect of nacelle forecowl shape and wing leading edge flap deflection on sonic
boom F-function.

-40 0 40 80 120 160 200 240 280 320 360
DISTANCE, Y , FEET
Figure 7. F-functions due to volume, lift, and the total configuration for 1080-910.
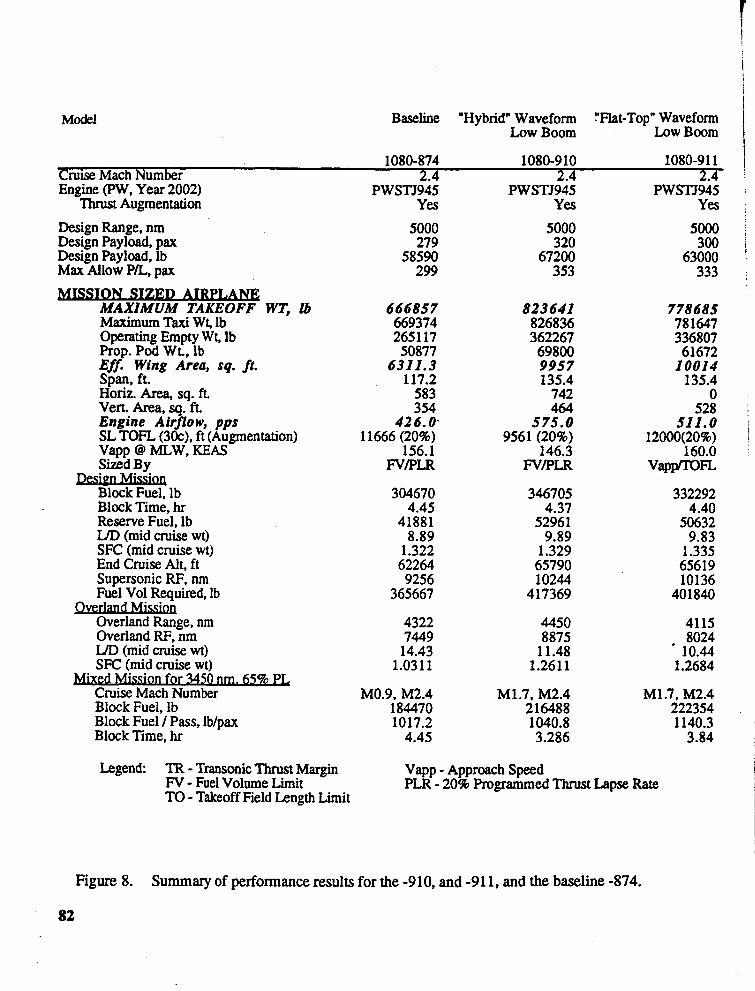
Model
Cruise Mach Number Engine (PW, Year 2002)
Thrust Augmentation
Design Range, nm Design Payload, pax Design Payload, Ib Max Allow PI'', pax
P MAXIMUM TAKEOFF WT. Ib - a --
Maximum ~ & i ~f lb- -
Operating Empty Wt, Ib Prop. Pod WL, lb Eff. Wing Area, sq. ft. Span, ft. Horiz. Area, sq. ft. Vert. Area, sq. ft. Engine Airflow, pps SL TOFL (30~). ft (Augmentation) Vapp @ MLW, KEAS Sized By
Block Fuel, lb Block Time, hr Reserve Fuel, Ib UD (mid cruise wt) SFC (mid cruise wt) End Cruise Alt, ft Supersonic RF, nm Fuel Vol Required, Ib
Overland Range, nm Overland RF, nm UD (mid cruise wt) SFC (mid cruise wt) . . ed for 345~- 65% PL Cruise Mach Number Block Fuel, Ib Block Fuel / Pass, Iblpax Block Time, hr
I
Baseline "Hybrid" Waveform !'Flat-Top" Waveform Low Boom LowBmm 1
Yes Yes Yes 1
Legend: TR - Transonic Thrust Margin Vapp - Approach Speed FV - Fuel Volume Limit PLR - 20% Programmed Thrust Lapse Rate TO - Takeoff Field Length Limit
Figure 8. Summary of performance results for the -910, and -911, and the baseline -874.
82

Phase lllA 78 dba (-859)
Phase lllB 71 dba (-881)
90 dba 78 dba
Figure 9. Performance comparison using the payload-to-MTOW ratio.

N~ch 1.7, 44000 f t Altitude, I S A , No wlnd, K,= 1.9.
T IME , SECONDS
-0.05 0.00 0.05 0.10 0.15 0.20 0.25 0.30
T I ME, SECONDS Figure 10. Calculated sonic boom waveforms at the ground surface for the -910 and -91 1
Using modified linear theory methods.

Note: Design Start - Cruise Altitude is 44000 feet
Design Condition
Initial Design
Wing Area, SREF, Ft
Start - Cruise W, Lb
Start - Cruise CL start - cruise WISREF, ~ b / ~ t ~
Sized Airplane Wing Area, SREF, Ft2
Start - Cruise W, Lb
Start - Cruise CL start - cruise WISREF, ~ b l ~ t ~
Figure 11. Comparison of the initial design condition and sized airplanes.
1080-910
9984
620000 .095
62.1
9957
767240
.I16
76.6
1080-9 1 1
10044
560000 .085
55.8
10014 720700
.lo9
72.2
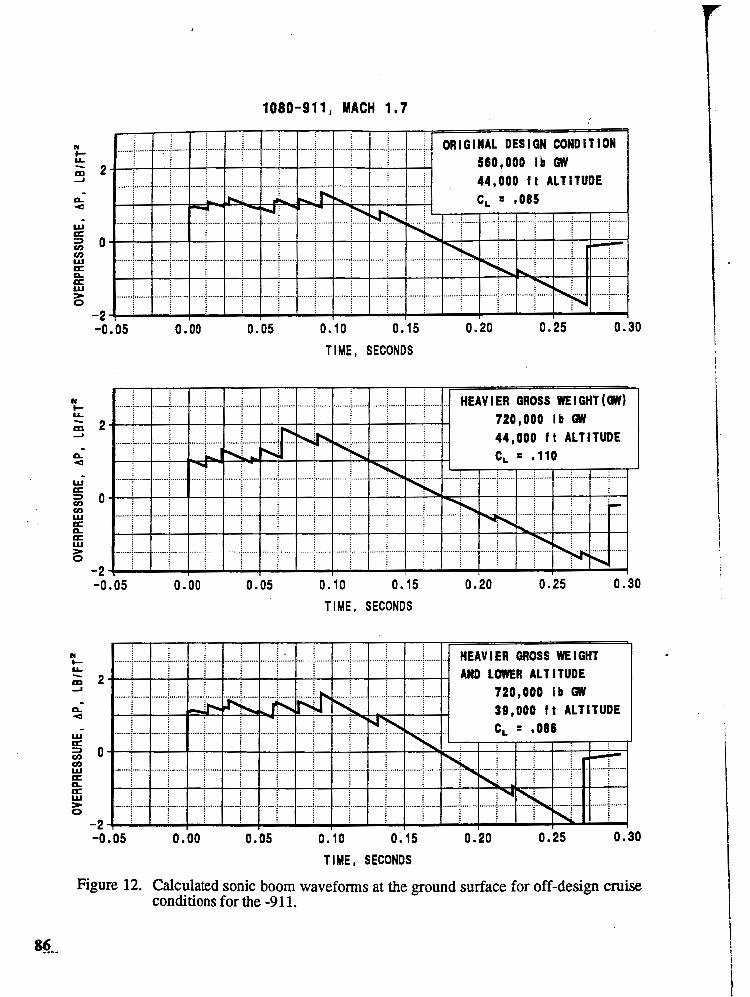
1080-911, MACH 1.7
-0.05 0.00 0.05 0.10 0.15 0.20 0.25 0.30
TI ME, SECONDS
TIME, SECONDS
-0.05 0.00 0.05 0.10 0.15 0.20 0.25 0.30
T IME , SECONDS
Figure 12. Calculated sonic boom waveforms at the ground surface for off-design cruise conditions for the -9 1 1.

Mach 1.7, 44000 f t A l t l t u d r , I S A , No W l n d , K,=l,g.
T I ME, SECONDS Figure 13. Calculated sonic boom waveforms for the -910 and -91 1 wind tunnel models.
(Full scale conditions and at the ground surface).

Page intentionally left blank

COMPUTATIONAWEXPERIMENTAL ANALYSIS OF THREE LOW SONIC BOOM CONFIGURATIONS WITH DESIGN MODIFICATIONS
Susan E.Cliff NASA Ames Research Center
Moffett Field, CA
SUMMARY
The Euler code, designated AIRPLANE, which uses an unstructured tetrahedral mesh was used to
compute near-field sonic boom pressure signatures on three modern low sonic boom configurations: the
Mach2 , Mach3, and Haglund models. The TEAM code which uses a multi-zoned structured grid was used
to calculate pressure signatures for the Mach2 model. The computational pressure signatures for the Mach2
and Mach3 models are compared with recent experimental data. The computed pressure signatures were
extracted at distances less than one body length below the configuration and extrapolated to the experimental
distance. The Mach2 model was found to have larger overpressures off-ground-track than on-ground-track
in both computational and experimental results. The correlations with the experiment were acceptable where
the signatures were not contaminated by instrumentation and model-support hardware. AIRPLANE was
used to study selected modifications to improve the overpressures of the Mach2 model. 7
INTRODUCTION
Low sonic boom levels for the next generation supersonic civil transports are necessary if supersonic
flight over populated areas is permitted. Three modern low boom configurations have been designed with
"shaped" pressure signatures. The Mach2 model (ref. 1) and the Haglund model (ref. 2) were designed to
have "flat-top" pressure signatures, whereas the Mach3 model (ref 1) was designed to have a "ramped" pressure signature on the ground. This was not achieved with the inadequate length of the ramped portion
of the area distribution. These models have been designed primarily using quasi-linear methods. The
approach of this research is to use Euler codes to predict sonic boom for comparison with experimental data.
The CFD pressure signatures are taken close to the model so that sufficient grid densities can be maintained
and then extrapolated to greater distances. Euler and Potential methods have been shown to give good
correlations with experiment for three generic configurations (refs. 3,4,5).
. - Recent Euler analyses of the Mach2 and Mach3 models by Siclari and Darden (ref. 6) have indicated
. significant off-ground-track sonic boom levels in comparison with the level on-ground-track. This was

verified experimentally in the Ames 9x7-Foot Supemonic Wind Tunnel, as well as computationally using the
AIRPLANE code. Suggested modifications to the Mach2 configuration are included in this study which
reduce the shock strengths off-ground-track without significantly changing the signatu& directly below the
model. Increasing the leading edge sweep of the outboard wing panel was found to reduce the strength of
the off-ground-track shocks without adversely affecting on-track pressures. The effects of using non-linear
dihedral, which increases towards the wing tips, were also investigated with AIRPLANE.
APPROACH
Two Euler fmite volume codes were used: AIRPLANE and Three dimensional Eulermavier-Stokes I . Aerodynamic Method (TEAM). AIRPLANE consists of two programs: MESHPLANE and FLOPLANE,
the grid generator and the flow solver, respectively. These programs were developed by Baker and I
i Jameson to model complex configurations using unstructured grids. MESHPLANE generates the tetrahedra
using a method based on Delaunay triangulation (refs. 7,8, and 9). Interior points placed approximately
normal to the surface adjacent to each surface point are triangulated along with the surface points to improve
the surface triangulation and to distinguish surface triangles from flow field triangles. The method is
constrained such that the surface is not altered when exterior points near the surface of the configuration are mangulated. The points that lie within the interior of the configuration are deleted during the volume
triangulation. The laborious procedure of blocking and gridding structured multiple-zone grids is eliminated
by AIRPLANE. The flow solver FLOPLANE uses a finite volume algorithm that computes flow variables
at the vertices of each tetrahedron (ref. 10). I 1 !
The Euler solver in TEAM is an enhanced version of Jameson's cell-centered FL057 (ref. 11). Raj
et al. added the Navier-Stokes capability, several dissipation schemes, residual smoothing, and boundary
conditions which can model specified mass flow ratios (ref. 12). TEAM has the ability to use structured
blocked grids of arbitrary topology without one-to-one grid abutments. A multiple zoned structured grid
was generated using the General Dynamics GRIDGEN programs (ref. 13). The surface grid was generated
using a CADICAM system. The flow-field grid was generated using GRIDGEN programs. The block I
structure and edge point distributions were developed using GRIDBLOCK. The faces of each block were
generated using the algebraic or elliptic solvers in GRIDGEND. The volume grid was generated by I
GRIDGEN3D using the algebraic solvers. I I
Comparisons of experimental pressure signatures with exnapolated computational near-field Euler
press= signatures for three modem low boom configurations are presented. The experimental pressure I
signatures for the Mach2 and Mach3 models were measured at distances ranging from approximately one I 1
90 I

half to two body lengths below the model. Obtaining computational data at half a body length was found to
be difficult with the current CFD methods due to the large computer resources required to maintain dense
grids away from b e M y . In zd&tiofi to density, the dissipation iqherent ir, the nr;neiicd proedte required to improve convergence causes rapid shock strength decay with increasing distance from the
configuration. To obtain accurate solutions, most CFD data used in this study were extracted at a quarter . body length and then extrapolated to the experimental distance. The extrapolation code used for this study is
* a waveform parameter method based on geometric acoustics for the wave amplitude and isentropic theory
B
for the non-linear waveform distortions (ref. 14).
A photograph of the Mach 2 model installed in the wind tunnel is shown in Figure 1. An external
strain gage is visible on the sting downstream of the model base. Fore and aft sections of the model are held
together by screws located ahead of the vertical tail. The screw holes were fdled with plaster before testing.
The nacelles were made of fiber-glass and were removable. A planform view showing the upper surface of
the Mach3 model is shown in Figure 2. Note the sharp nose of the fuselage, designed to produce a ramped
(finite rise) pressure signature. An isometric view of the Haglund model showing the computational surface
grid shaded by the surface normals is shown in Figure 3. The design goals of the Haglund model were to
have a "flat-top" pressure signature on the ground at Mach 1.7 and for a flight altitude of 44,000 feet.
MACH2 MODEL
Computational Grids - Mach2 Model
The TEAM computation for the Mach2 model with pylons, flow-through nacelles, and vertical tail at M=2.00, was obtained using a 78-zone grid The grid was swept 30' from the freestream direction to
maintain grid density and improve shock capturing in the flow-field. The upstream boundary was placed
1.5 body lengths ahead of the model, the downstream boundary was 6.0 body lengths from the nose of the
model, whereas the vertical and spanwise boundaries were 4.0 body lengths fiom the model. The block
boundaries of the computational grid on the upper surface are shown in Figure 4. The grid consisted of
1,850,084 points. Note that the abutment lines on the surface are for the most part parallel to the free-stream
direction. A grid which uses a spanwise definition is preferred when the wing sweep exceeds 45O, but in
order to model the pylons and nacelles accurately a compromise in grid quality was selected. The 2:l abutment capability in TEAM can greatly reduce the number of grid points. For example, the fuselage used
- 101 points in the seeamwise direction, while the wing had 35 points on the tip. The grid had 118 and 91 points in the vertical and spanwise directions, respectively. A view of the flow-through nacelles is shown in
91

Figure 5. Note that the chamfered faces of the nacelles are modeled and that the block faces are colored differently. The 2: 1 abutments on the wing lower surface can be seen where the green, and cyan blocks
meet and where the blue and yellow blocks abut.* A view of the block structure on the interior and exterior of the nacelles at the inlet face is shown in figure 6. The nacelles are enclosed in a rectangular grid, with the
faces of the blocks colored differently. The nacelles required approximately 40 of the 78 blocks of grid.
AIRPLANE grid I The symmetry plane of the tetrahedral mesh used with AIRPLANE is illustrated in Figures 7a-7c.
The upstream boundary was placed near the model nose since upstream influence should not exist at
supersonic Mach numbers. The staging of mesh densities through a sequence of nested lattices is evident in
these figures. Each stage represents a 2:l grid refinement. Red and green boxes enclose regions of differing grid densities and the final view shows the surface grid in the symmetry plane; note that the model
supporting sting used in experiment was included in the computations. A total of 259,121 mesh points,
1,555,988 volume tetrahedra and 13,692 surface mangles were used for the configuration with nacelles.
A partial view of the lower surface grid of the Mach2 model is shown in Figure 8. Note that nacelles
are open allowing flow to pass through. The surface grid points used with TEAM were used as input into
MESHPLANE for surface triangulation and subsequent tetrahedral volume griding. This was not ideal, but
was the only surface definition available at the time, a spanwise definition would improve the surface
triangulation, particularly along the leading edge of the wing.
Computational Results - Mach2 Model
The TEAM pressure signatures for the Mach2 model with flow through nacelles are compared with
experimental data at Mach 2.0 and an angle of attack of 0.0' in Figure 9. The TEAM pressure signature was
obtained at 0.2 body lengths from the model and extrapolated to a distance of 1.085 body lengths. Nbte that
the bow shock strength predicted by TEAM is less than experiment and smeared. This may be due to
insufficient grid density in the region of the bow shock. However, the magnitude of the flat portion of the
pressure signature is fairly accurately predicted. The strong shock due the blunt lips of the nacelles is
predicted by TEAM. The nacelles were unstarted during the wind tunnel test and would be expected to I
i produce a stronger shock than the flow through nacelles modeled in the computations. The Euler I
computations indicate that the blunt lips are primarily responsible for the large nacelle shock strength.
The AIFWLANE computation with flow-through nacelles is shown in Fig 10. The bow shock and flat top region of the signature is more accurately predicted by AIRPLANE than TEAM. The strength of the
nacelle shock is lower for AIRPLANE than TEAM; however, the actual shock strength with started nacelles
*Figures a ~ e not shown in color.
92

is unknown. The unstructured grid code is better suited to complex configurations, because regions of poor grid quality often encountered when a structured grid is used are avoided. The series of shock waves downstream of the tail shock are associated with instrumentation and model support hardware and were not included in the computations. Further discussion of this issue will be presented in the Mach3 model section
of this report.
The Mach2 model was also tested without nacelles. A comparison of an extrapolated AIRPLANE pressure signature directly below the niodel with wind tunnel data from the Ames 9x7-Foot Supersonic Wind Tunnel is shown in Fig 1 1. The correlation with experiment is good, but the bow shock is slightly smeared. In this case the aft portion of the signature which was compted by model support hardware was deleted. In addition to the on-ground-track pressure signature, a signature at an azimuthal angle of 4S0was also measured. The off-ground-track pressure spike initially predicted by Siclari and Darden was validated both computationally, with AIRPLANE, and experimentally (Fig 12). AIRPLANE again underpredicts the strength of the bow shock, but the overall shape of the signature and difference in magnitudes of the bow and outboard wing shock are well predicted by AIRPLANE.
AIRPLANE used about 10 CPU hours and 90 million words of memory on the Cray 2. TEAM used approximately 8 hours of CPU time and 8 million words of memory on the Cray Y-MP. The AIRPLANE computations for the models discussed below used approximately the same memory and CPU time per grid point as the Mach2 model.
MACH 3 MODEL
Computational Grids - Mach3 Model
AIRPLANE grid
The fuselage of the Mach3 model was defined using sections perpendicular to the free stream, resulting in a more accurate nose definition. The tail and most of the wing were defined using streamwise cross sections. The outer wing near the tip used sections parallel to the trailing edge in order to accurately model the leading edge in this region. Grids for the model were developed with and without nacelles. The pylons were not modeled since they were assumed insignificant to the sonic boom computations. The nacelles were modeled with solid faces to simulate unstart. The upstream and downstream faces were defined with a center point and two concentric circles between the center and the exterior of the nacelles.
The exterior surface of the nacelles were modeled using circular sections normal to the axis of each nacelle. B

The lower surface grid near the nacelles is shown in Figure 13. A total of 230,537 mesh points, 1,367,809
volume tetrahedra, and 12,735 surface triangles were used to compute the flow about the configuration with nacelles.
Computational Results - Mach3 Model
Computational pressure signatures for the Mach 3 model with and without nacelles were obtained
with AIRPLANE. This configuration was tested at Mach numbers of 2.50 in the Ames 9x7- and the
Langley 4x4-Foot Supersonic Wind Tunnels. The Mach 2.96 data was obtained in the Langley 4x4-Foot
Supersonic Wind Tunnel.
The pressure signatures obtained with AIRPLANE and the experimental data for Mach 2.50, h/l =
0.47, CL = 0.072 are shown in Figure 14. The computational data were obtained at a distance of 0.25 body
lengths and extrapolated to the experimental altitude. The forward portion of the signature is accurately
predicted. However, the correlation for the aft portion is poor. Schlieren photography was used to
investigate the cause of the multiple shocks in the aft portion of the experimental signature. The Mach2 and
Mach3 models were built in two pieces and attached with screws located upstream of the vertical tail
(Figures 1 and 2). The screw holes were filled with dental ph t e r during testing. The plaster was sanded,
yielding a non-smooth surface which may be responsible for the series of weak shocks shown near the
model base in figure 15. Also, an external strain gage attached to the sting downstream of the model base
generates additional shock waves. These shock waves can be seen by careful examination of the Schlieren
photography of figures 15 and 16. The adapter connecting the sting to the angle of attack mechanism
generates additional shock waves, as does the shroud covering of the strain gage wires. The angle of attack
mechanism was placed approximately one body length behind the model. The strong shocks emanating
from the angle of attack mechanism begin corrupting the signatures at distances of approximately one body
length and greater at Mach 2.50. The coalescence of shocks from the angle of attack mechanism and the
adapter can be seen in Figure 17. The experimental pressure signature at h/l = 0.94 is compared with an
AIRPLANE signature extrapolated from h/l =0.25 to 0.94 and Langley 4x4-Foot experimental data
extrapolated from h/l = 0.47 to 0.94 (Figure 18). The extrapolated experimental signature and the
extrapolated computational data do not correlate well in the region of the second expansion at h/l = 0.94. The
reason for this is not well understood at this time but may be related to three-dimensional effects which may
not be affecting the centerplane at the closer altitudes of experiment and the computations, and to shocks
emanating from the filled screw holes. The forward portion of the computational signature correlates better
with the experimental data than for an h/l of 0.47 (compare Figures 14 and 18). Note, in particular, that the
correlation for the bow shock is better at h/l = 0.94 than at h/i = 0.47, probably due to smearing of both
CFD and experiment. The strong shock at the rear of the experimental pressure signature is due to the angle
of attack mechanism. A similar cock is observed in the computations because the entire sting including the
ramped partion which joins the adapter to the angle of attack mechanism was modeled
94

The computations with blocked nacelles compared with experimental data from the 9x7-Foot
supersonic Wind Tunnel are shown in Figures 19a - 19c. The computations were extracted at an M of 0.2
and extrapolated to an h/l of 0.68. The Mach3 model was tested at Mach 2.5, the maximum Mach number ofthe 9x7-Foot Supersonic Wind Tunnel. The correlation with experiment is excellent at an h/l of 0.68. - The magnitude of the shock due to the unstarted nacelles is well predicted by AIRPLANE. The
- data downstream of the nacelle was contaminated by interference from the angle of attack ' mechanism and is not shown. The correlation at one body length is also good. Note that the computational
lift coefficient is greater than the experimental lift coefficient in figures 19a and 19b and that good m l a t i o n
is obtained. The computational lift coefficient shown in figure 19c is less than the experimental value and
the correlation with experiment is poorer. The lower angle of attack used with the inviscid Euler code to
obtain the desired lift coefficient results in weaker shocks, therefore the computational liEt coefficient must
be greater than experiment for improved signature correlation.
Pressure signatures for the Mach3 model were also computed at its design Mach number and
compared with Langley 4x4-Foot Supersonic Wind Tunnel data and with computations by Siclari and
Darden (ref. 6, Figure 20a.). The lift coeficient of the Siclari-Darden computation were not given in ref.
6, but is assumed to be less than experiment. The forward pomon of the AIRPLANE pressure signature
correlates well with the experimental data as observed in previous computations. The two Euler codes
predict similar pressure signatures with the same number of shocks and expansions. The series of weak
shoc'ks shown in the wind tunnel data is not observed in the computations because the external gages,
adapter, irregular shroud over the adapter, and angle of attack mechanism were not modeled. An
computationaVexperimental comparison at an altitude of 0.94 body lengths is shown in Figure 20b. Again,
poor correlation in the aft region of the signature is observed. Coalescence of shocks from the model
support hardware with model shocks occurs closer to the model at higher Mach numbers. The strong shock
in the aft region of the experimental signature is due to the coalescence of the model tail and the angle of
attack mechanism shocks.
HAGLUND MODEL
Computational Grids - Haglund Model
The wingibody portion of the computational Haglund model was defined by sections normal to free-
stream. This gave a more accurate triangulation of the highly swept leading edge of the wing. An i s o d c - view of the computational model showing the surface triangulation is shown in figure 21. The number of -

points for each defining section increased from the nose, defined by a single point, to the sections near the wing tip which had 136 points. The trailing edge of the wing tip is also defined with a single point The spanwise sections near the tip do not include the sting. The thin wing tip required only upper and lower
surface points to define the section at the wing tip. The configuration without nacelles was defined with two components, the winglbody and the sting. A total of 344,043 mesh points, 2,110,627 volume tetrahedra,
and 4,655 surface triangles were used to compute the flow about the configuration without nacelles.
The complete Haglund configuration with nacelles and diverters was modeled computationally. The
nacelles are in close proximity to the wing and are canted downward to minimize boundary layer interaction
with the inlet and to align the inlet with the local flow direction. A small section of the inboard nacelles near
the trailing edge of the wing protruded through the upper surface of the wing in the CAD definition,
requiring lowering of the nacelles to a allow adequate grid points on the diverter. The internal portion of the
nacelle was modeled such that the cross sectional area was held constant. This results in a blunt base on the
nacelle and was chosen to insure that the flow does not expand or compress inside the nacelle, thus
preventing a drag error. The drag due to the blunt base of the nacelle must be subtracted from the total drag.
The nacelles and diverters required very fine grid spacing in the streamwise direction which increases in
density at the rear of the diverter. The wing maintains this dense region of grid points which should ensure
shock capture for the nacelles. The nacelles and diverters were defined using streamwise cross-sections. An
isometric view of the upper surface of the configuration is shown in figure 22. A view of the lower surface
showing the nacelles and diverters is shown in figure 23. A total of 437,672 mesh points, 2,666,437
volume tetrahedra, and 27,972 surface triangles were used to compute the flow about the complete
configuration.
Computational Results - Haglund Model
The AIRPLANE pressure signatures for the Haglund Model without nacelles were computed at Mach 1.7 and a = 4S0, which produced a lift coefficient of 0.091, slightly above the cruise value of 0.085.
The computational pressure signatures at distances of 0.20 and 0.40 body lengths are shown in Fig 24.
Both signatures show rough approximations of a "flat-top" pressure signature. The signature is not as flat
as the Mach2 model signature, but the configuration is more apt to meet its mission requirements. The
highly swept, cambered and twisted arrow wing distributes the lift along the length of the configuration,
thereby separating the shock waves and reducing their magnitude so that shock coalescence is minimized
The pressure signature of the Haglund model with nacelles and diverters modeled at distances of 0.2 and 0.40 body lengths is shown in Figure 25. This solution was obtained at a lower angle of attack (a = 4'
as opposed to 4.5') than for the isolated wing case, to allow for the lift due to the nacelles. The lift due to the
nacelles was overestimated and a computational lift coefficient of 0.08 1 was obtained. The strong shock

emmating from the nacelle/diverter is clearly evident in the pressure signatures at 0.2 body lengths, but the shock is narrow and dissipates rapidly as shown in the signatures at 0.4 body lengths. The nacelles appear to a ~ ~ e irn2roved h e ~ ~ S S U E s i p a m ; the second expansion is minimized resulting in a more flat top signature. Upon extrapolation of the pressure signatures to the ground, multiple weak shocks in the "flat- . top99 region of the signature were obtained. .
DESIGN MODIFlCATIONS - MACH2 MODEL
The first design modifications appiied to the Mach2 model were to increase the leading edge sweep of the outboard pomon of the wing from 52' to 62' and then to 70' in an attempt to reduce the off-ground- track overpressures. The increase in sweep was achieved by shearing the wing sections in the streamwise
direction to maintain area and aspect ratio as nearly as possible. The original sweep of 52' resulted in a
supersonic leading edge for the outboard wing panel which was assumed to be responsible in part for the
unacceptable off-track pressures. Another attempt to alleviate the off-track pressures was to reduce the
cruise Mach number of the configuration to Mach 1.6. This was found to be unsuccessful; the large sweep
change may be responsible for the large off-track overpressures. The planforms with 62' and 70°1eading edge sweep are shown in Figures 26a and 26b, respectively. The sweep of the outboard panel began at 57.5% and 34.06% span stations for the 62' and 70" sweep configurations, respectively. The shearing of the wing at 34% span resulted in a non-linear trailing edge of the wing. The planform area of the
configuration with 70' sweep was increased slightly to maintain a bi-linear trailing edge. In addition to the
sweep modifications, a nonlinear dihedral beginning at 57.5% of span which increases towards the tip was
investigated for the Mach2 model. The dihedral near the tip was approximately 40'. The curve defining the dihedral is a monomial with an exponent of 10.0. The excessive dihedral was imposed in an attempt to
move the peak overpressure beyond cutoff (approximately So) . The results of these modifications at an
azimuthal angle of 4S0 is shown in Figure 27a. The 62' swept wing reduced the peak overpressure by
approximately 30% and the peak overpressure for the 70' swept wing was reduced by approximately 50%.
The configuration with non-linear dihedral did not significantly change the on-or off-track pressure
signatures of the original configuration. It is fortunate that the effect was small since the large dihedral would reduce the aerodynamic efficiency of the configuration. The effects of these design modifications on- I
ground-track are shown in Figure 27b. Note that there is little difference between the pressure signatures i for the original model, wings with increased sweep, and non-linear dihedral. The configuration with 70' leading edge sweep has a larger expansion than the other configurations. This may be due to the 7 .
- modification of the 70 O swept wing beginning at a more inboard station than the 62 swept wing. I . 5 . i t I I
a

CONCLUDING REMARKS
Euler CFD codes combined with extrapolation are capable of predicting pressure signatures for any
azimuthal angle from centerline to near cutoff.
Euler CFD pressure signatures extrapolated from distances of approximately one quarter body length
to experimental distances give acceptable correlations with experimental data. Good correlations also require the use of fine grids from the surface to the plane of the computational pressure signature, and reliable
experimental data that is not contaminated by instrumentation and model support hardware should be
available.
Dissipation in Euler codes used to facilitate convergence causes shocks to dissipate rapidly with
increasing distance from the surface. Very fine grids are required even if the computations are taken near the
model and extrapolated to experimental distances. The quality of the solution depends on grid density in the
important regions of the flow field and the size of the computational space; the topology of the grid is of little
importance.
The AIRPLANE unstructured grid generation program requires approximately one tenth of the time
needed to generate a structured blocked grid for a complex configuration, but control of the point
distribution is currently limited. For complete airplane configurations it is the only practical way to develop
a grid.
Good experiment/CFD correlations have been achieved by performing the computations at a larger
lift coefficient than the experimental value because of the lack of viscous decambering.
The limits on M for computing near-field pressure signatures needs further study. Dissipation, grid
density, aspect ratio, and lift coefficient are important factors in determining such limits. ,
ACKNOWLEDGEMENT t
The author would like to thank Tim Baker for his continued support and expertise in Computational P
Fluid Dynamics and grid generation, Scott Thomas for his expedient and efficient sofnvare development, I
Kurt Vaillancourt and Francis Enomoto for their CADICAM support

REFERENCES
1. Mack, Robert J., and Needleman, Kathy E.: The Design of Two Sonic Boom wind Tunnel Modeis from Conceptual Aircraft which Cruise at Mach Nlznbers of 2.0 and 3.0. AIAA paper No. 90-4026, 1990.
2. Haglund, George: HSCT Designs for Reduced Sonic Boom. AIAA paper No. 91-3103, Sept. 1991.
3. Cliff, Susan E., and Thomas, Scott D.: Euler/Experiment Correlations of Sonic Boom Pressure Signatures. AIAA -91-3276, Sept. 1991.
4. Cheung, S., Edwards, T., and Lawrence, S.: Application of CFD to Sonic Boom Near- and Mid-Field Prediction. AAIA-90-3999,1990.
5 Madson, M.D.: Sonic Boom Predictions for Three Generic Models Using a Solution-Adaptive Full- Potential Code. AIAA-91-3278, 1991.
6. Siclari, M., and Darden, C.: CFD Predictions of the Near-Field Sonic Boom Environment for Two Low Boom HSCT Configurations. AIAA -91- 163 1.
7. Baker, Timothy J.: Automatic Mesh Generation for Complex Three-Dimensional Regions Using a Constrained Delaunay Triangulation. Engineering with Computers 5, 1989, pp. 16 1- 175.
8. Baker, Timothy J.: Generation of Tetrahedral Meshes Around Complete Aircraft. 2nd international conference on numerical grid generation in computational fluid dynamics, Dec 5-8, 1988.
9. Baker, Timothy J.: Shape Reconstruction and Volume Meshing for Complex Solids. International Journal for Numerical Method in Engineering, Vol. 32, 1991, pp.665-675 . 10. Jameson, A., and Baker, T.J.: Improvements to the Aircraft Euler Method. AM-87-0452, 1987.
1 1. Jameson, A.: A Vertex Based Multigrid Algorithm for Three Dimensional Flow Calculations. proceedings on numerical methods for compressible flows-Finite Difference and Volume Techniques, edited by T. E. Tezduar, and T. J. R. Hughes, AMD-vol78, ASME, 1986, pp. 45-73.
12. Raj P., Olling, C.R., Sikora, J.S., Keen, J.M., Singer, S.W., and Brennan, J.E.: Three-dimensional Eulermavier-Stokes Aerodynamic Method ('TEAM). AFWAL-TR-87-3074, volumes 1-3, Dec., 1987.
13. Steinbrenner, John P., Chawner, John R., and Fouts, Chris L.: The Gridgen 3D Multiple Block Grid Generation System. WRDC-TR-90-3022, Volume 1, July, 1990.
14. Thomas, Charles: Extrapolation of Sonic Boom Pressure Signatures by the Waveform Parameter Method. NASA TN D-6832,1972.

Figure 1. Photograph of the Mach2 configuration.
Figure 2. Photograph of the Mach3 configuration.

Figure 3. Isomeaic view of the Haglucd Model, shaded by surface normals.
Computational grid with shaded surfaces showing the block boundaries of the multi- .blocked grid.
101

Figure 5. Lower surface view of the TEAM computational grid of the Mach2 computational grid showing' the nacelles.
*
Figure 6. TEAM computational grid of the Mach2 configurations showing the grid plane at the inlet of the , nacelle.

Figure 7. AIRPLANE unstructured grid for the Mach2 model. (a) Entire centerplane. (b) Expanded view of centerplane.
7 (c) Expanded view of centerplane.


- TEAM, CL = 0.05, data extrap. from h/i = 0.20
0 Experimental data, CL = 0.05
.10 r I
Figure 9. Pressure signatures for the Mach2 model with flow-though nacelles, M = 2.0, hP = 1.085.
- AIRPLANE, CL = 0.05, data extrap. from h/l = 0.25 0 Experimental data, CL = 0.05
Figure 10. Ressure signatures for the Mach2 model with flow-though nacelles, M =2.0, CL = 0.065, M = . 1.085-

- AIRPLANE, CL = 0.047, data extrap. from h/l = 0.25
0 Experimental data, CL = 0.044
4 7 5 0 5 1 . 0 1.5 2 0 2.5
xll
Figure 11. Pressure signatures for the Mach2 model without nacelles, M = 2.0, @ = 0.0". M = 0.66.
- AIRPLANE, CL = 0.047, data extmp. from M = 0.30 0 Experimental data, CL = 0.044
xll
Figure 12. Pressure signatures for the Mach2 model without nacelles, M = 2.0, @ = 45.0'. M = 0.66.

Figure 13. Low= surface of the Mach3 configuration with blocked nacelles.
- AIRPLANE, CL t 0.072, data extrap. from M = 0.25 0 Experimental data, CL = 0.065
Figure 14. Pressure signatures for the Mach3 model, M = 2.50, @ = O.OO, h/l = 0.47. a

Figure 15. Schlieren photograph of the Mach3 model in theAmes 9x7 Supersonic Wind Tunnel, M = 2.5, 0: = 2.0".
Figure 16. Schlieren photograph of the aft portion of the Mach3 model, sting and angle of attack mechanism in the Ames 9x7 Supersonic Wind Tunnel.
108

Figure 17. Schlienn photograph of the angle of attack mechanism in the Ames 9x7 Supersonic Wid Tunnel.
- AIRPLANE, CL = 0.072, data extrap. from M = 02.5 0 Experimental data, CL = 0.065 0 Experlmental data extrap. from hll = 0.47, CL = 0.065
Figure 18. Pressure signatures for the Mach3 model without nacelles, M = 2.50, @ = O.oO, hi1 = 0.94.
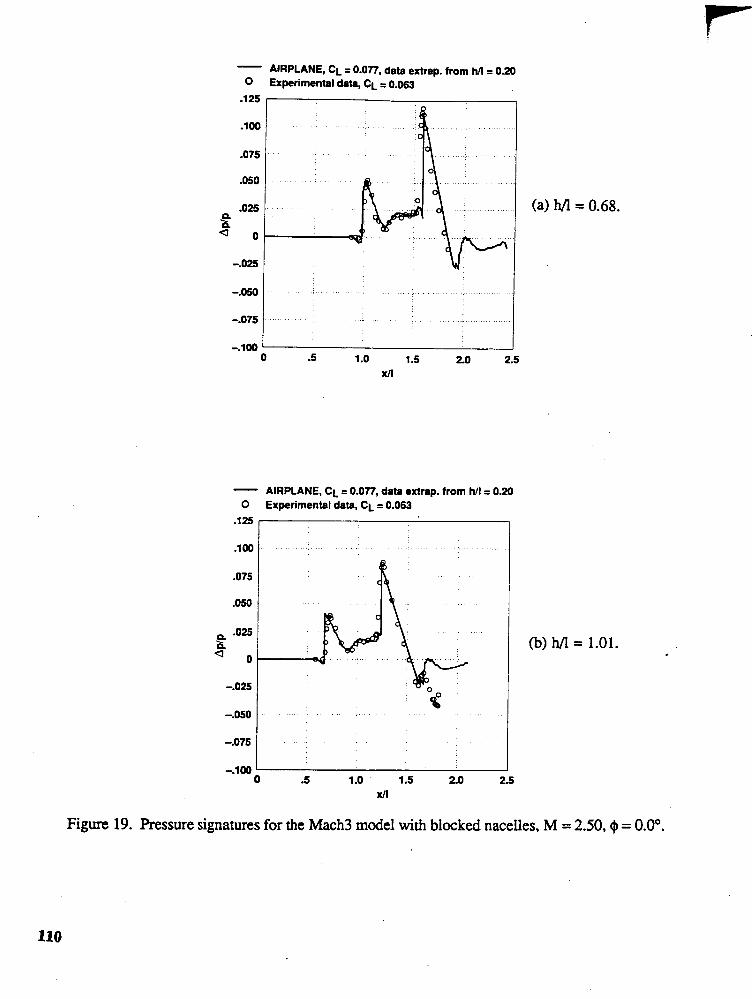
- AIRPLANE, CL = 0.077, data edrep. from hll = 0.20
0 Experimental data, CL = 0.063
- AIRPLANE, CL = 0.077, data extmp. from hll = 0.20
0 Experimental data, CL = 0.063
(b) h/l = 1.01.
Figure 19. Pressure signatures for the Mach3 model with blocked nacelles, M = 2.50, @ = 0.0'.

- AIRPLANE, CL = 0.077, data extrap. from hll = 0.20 0 Experimental data, CL = 0.08

- AIRPLANE, CL = 0.069, data extrap. from M = 0.25 0 Experimental dam, CL = 0.056 ---- SicbrCDarden Eukr Comput.tions
- AIRPLANE, CL = 0.060, data extrap. from hll .: 0.25
o Exporlmsntal data, CL = 0.056
Figure 20. Ressun signatures for the Mach3 model without nacelles, M = 2.96, + = O.OO,

Figure 21. Isomemc view of the upper surface unstructured computational grid for the Haglund model without nacelles.

Figw mode
- :1 with nacelles and diverter.
the H
Figure 23. Isomemc view of the lower surface of the unstructured computational.grid for the Haglund model with nacelles and diverter.
114

- AIRPLANE, CL = 0.091, data at Wl = 0.2 ---- AIRPLANE, CL = 0.091, data at Wl = 0.4
Figure 24. Ressure signature for the Haglund model without nacelles, M = 1.70, @ = 0.0'.
AIRPLANE, CL = 0.080, data at H/L = 0.2 - - - - - - AIRPLANE, CL = 0.080. data at H/L = 0.4
Fig. Pressure Signatures for the Haglund model with diverters and nacelles, M = 1.70, q3 = 0
* Figure 25. Pressure s ignam of the Haglund model with naceIles and diverters modeled, M = 1.70, $ = O.oO. -
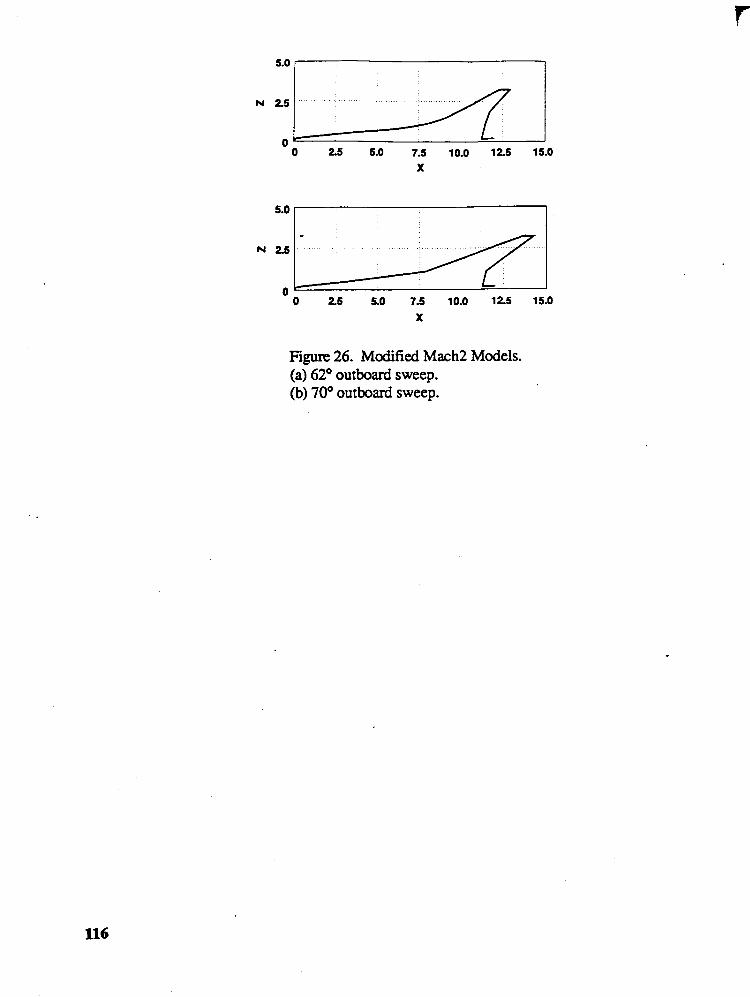
Figure 26. Modified Mach2 Models. (a) 62' outboard sweep. (b) 70' outboard sweep.

- Original wlng, AIRPLANE, CL = 0.047, data extrap. trom NI = 0.25
0 Expadmental data, CL = 0.044 - - - - 62" swept wlng, AIRPLANE, CL = 0.047, data oxtrap.
from Nl = 0.25 - 70" swept wlng. no dlhodnl AIRPLANE, CC = 0.046, data omrp. from M = 0.25
-- VarbMe dihedml. AIRPLANE. CL = 0.046. data exmp. from Nl = 0.25
- O r l g l ~ l wlng, AIRPLANE, CL = 0.047, data extmp. tromMr015
0 Exp.rknmtal data, CL = 0.044 - - - - 62" mrpt wing, AIRPLANE, CL = 0.047, data extrap.
tromM.0.25 - 70. swopt wing, no dlhednl AIRPLANE, CL = 0.046,
data oxtnp. from Nl = 0.25 -- Varbbb dlhednl, AIRPLANE, CL = 0.046, data oxtrap. trom M = 0.25
Figure 27. Rssrure signatures for the Mach2 and modified Mach2 models without nacelles, M = 2.0, + = 45.0'.

Page intentionally left blank

CFD PREDICTIONS OF NEAR-FIELD PRESSURE SIGNATURES OF A LOW-BOOM
AIRCRAFT*
Kamran Fouladi Lockheed Engineering & Sciences Company
Hampton, VA
Daniel Baize NASA Langley Research Center
Hampton, VA
SUMMARY
A three dimensional Euler marching code has been utilized to predict near-field pressure
signatures of an aircraft with low boom characteristics. Computations were extended to
approximately six body lengths aft of the aircraft in order to obtain pressure data at three body
lengths below the aircraft for a cruise Mach number of 1.6. The near-field pressure data were
extrapolated to the ground using a Whitham based method. The distance below the aircraft where
the pressure data are attained is defined in this paper as the "separation distance." The influences
of separation distance and the still highly three-dimensional flow field on the predicted ground
pressure signatures and boom loudness are presented in this paper.
INTRODUCTION
The existence of any future high speed civil transport (HSCT) aircraft will be gavemed
largely by its environmental acceptability and economic viability. A major environmental
concern of a high speed transport aircraft is the intense sonic boom it generates during
supersonic flight. This concern has lead to international laws which prohibit overland supersonic
commercial flights. However, the economic viability of proposed designs is drastically increased
when supersonic cruise is maintained throughout the majority of the mission. Therefore, HSCT
configurations with reduced sonic boom characteristics are very desirable, providing that the
existing bans of overland supersonic flight could be affected. Accurate sonic boom predictions are
* Work done on contract at Lockheed Engineering & Sciences Company, NAS1-19000.

required before these regulatory changes and economic benefits can be pursued.
Traditional sonic boom prediction methods have been based on Whitham theory (Ref. I),
and its extension to wing bodies (Ref. 2). The effects of a stratified atmosphere were added to
sonic boom predictions in Ref. 3. References 1, 2, and 3 predict sonic booms by the equivalent
area method and they are referred to as "modified linear theory" methods. These prediction
methods can be used reliably to predict sonic boom signatures on the ground h m pressure
signatures attained at a distance from the aircraft where three-dimensional and nonlinear effects
have been significantly diminished. Other means of obtaining the near-field press= signatures
are wind tunnel testing and CFD calculations. The near-field pressure data can be extrapolated to
the ground using methods such as those reported in Refs. 3-4. A sonic boom propagation method
that included three-dimensional and nonlinear effects is presented in Refs. 5-7. However,
extensive flow field data such as pressure, velocities, Mach numbers, flow angularities, etc., are
required as input for that method which is based on the Method of Characteristics.
Although wind tunnel experiments were used exclusively to obtain near-field pressure
data for Whitham based calculations in the past, recent improvements and maturation of
numerical algorithms have made CFD methods a viable complement to experimental testing. In
addition, the cost of model fabrication and wind tunnel operations continues to rise while the cost
of high speed computing has dropped and its availability has significantly increased. Additionally,
higher order CFD methods are now capable of simulating flows about complex configurations,
such as HSCTs, with a high degree of accuracy (e.g. Refs. 8-11). Such methods can provide, for
example, the extreme near-field and off-surface flow field information for aerodynamic analysis
of an aircraft. It is also possible to predict the pressure signature several body lengths away. These
signatures can then be extrapolated to the ground using modified linear theory. Off-flight track
conditions may also be extracted, since the complete three dimensional solution about the aimaft
is calculated.
In the past, it has been assumed that the loudest boom occurs on the centerline ground
flight track, and the boom gets weaker as the distance from the centerline increases (Ref. 12).
Thus, efforts concentrated on predicting and reducing the boom loudness on the flight path and
sonic boom generated to the sides of the centerline were usually ignored. With the design of more
sophisticated low boom configurations, there is a growing concern that these assumptions may no
longer be valid. For example, the three dimensional results of Siclari and Daden (Ref. 10) have
indicated that boom overpressures up to 40% greater in magnitude can be seen off-centerline for

the low boom aircraft considered in their study. This was attributed to shocks generated by
&craft's supersonic leading-edge wing crank.
Ailother issue of cancem is the effect sf "sepaiiition d i s t a n ~ " on t\e abiliq a a m m ~ l y
predict ground pressure signatures and its associated loudness. Separation distance is defined
herein as the distance below the aircraft where near-field pressure data are attained. The near-field
presswe data are then extrapolated to the ground for sonic boom prediction using twe
dimensional Whitham based methods. I€ the separation distance is too small, .a pressure signature
only in one plane may not contain all information necessary to assess the signature over the ground
path. Conversely, due to constraints on computational resources, it is desirable to determine a
minimum separation distance from the aircraft where nonlinear and three-dimensional effects are
no longer prominent. A smaller computational domain is required for a smaller distance, thus
simcant savings in both computational time and memory can be obtained.
The objective of this paper is two fold (i) predict the level of sonic boom generated both
on- and off-centerline of flight path of a low boom configuration; (ii) investigate the effects of
separation distance on the prediction of the ground sonic boom. Aerodynamic analysis and
prediction of the near-field pressure signature of a newly designed low boom aircraft are
performed using a three dimensional Euler code (Ref. 10) which has been recently modified for
this purpose.
APPROACH
MIM3DSB (Multigrid Implicit Marching-Sonic Boom) is an Euler marching code
specifically tailored for prediction of near-field pressure signatures of aircraft configurations (Ref.
10). The numerical scheme is based on a Jamson type explicit vertex based, finite volume
method. The scheme initializes the flow field by a conical flow solution at the configuration apex.
The three-dimensional solution is then computed using a hybrid implicit marching technique.
MIM3DSB utilizes a central difference finite volume method in crossflow planes, and an implicit
upwind finite difference technique in the marching direction to solve three-dimensional Euler
equations on structured grids. A blend of second order and fourth order dissipation terms are
added for stability and maintaining smooth shocks. Time integrations are performed using an
explicit multistage Runge-Kutta technique. Local time stepping and residual smoothing are also
utilized for convergence acceleration. Due to its marching nature, MIM3DSB is computationally .

efficient and uses very little memory for large grids.
MIM3DSB has been used to predict sonic boom signatures of an axisyrnmetric projectile,
and two low boom aircraft configurations (Refs. 10 and 11). Good correlation was achieved for
the simple projectile. For low boom aircraft, the code was shown to achieve a good correlation
with measured data for the forward half of the near-field signature. However, some discrepancies
were observed in the latter half and they were attributed to possible deficiencies in the wind tunnel
model and the numerical definition used (Ref. 10).
AIRCRAFT CONFIGURATION
The low boom configuration analyzed in this paper was designed to exhibit a "hybrid"
sonic boom ground signature utilizing a combination of linear and modified linear methods. The
"hybrid" signature type (Ref. 13) begins with a flat-top region which later converts to a ramp.
This signature is thought to be less sensitive to atmospheric perturbations than the ramp type
alone and illustrated in Fig. 1. The target ground signature for this concept has a nose
overpressure of 0.84 psf for a cruise weight of 610,000 lbs at 47,000 ft. The ramp portion of the
signature rises to an overpressure of 1.45 psf. The low boom aircraft is designed to transport 250
passengers over 5,500 nautical miles at a takeoff gross weight of 650,000 Ibs. The cruise Mach
number varies from Mach 1.6 overland (25% of cruise mission) to 2.0 over water (75% of cruise
mission) where the signature is unconstrained. The aircraft is approximately 300 ft. long and has
wing span of 140 ft. (Fig. 2).
COMPUTATIONAL GRID
Sonic boom computations require adequate grid resolution near the air& for
aerodynamic analysis. Adequate resolution at several body lengths below and aft of the aircraft is
also required for pressure signature predictions. A typical grid topology of crossflow plane grids
stacked in the marching direction would not be suitable for such an application since the number
of points noxmal to the body remains constant as the solution is marched downstream. This results
in a very coarse mesh and loss of grid resolution and accuracy. To overcome this problem, Siclari
and Darden (Ref. 10) proposed a unique multiblock grid topology. First, the base of configuration
is extended with a sting of approximately one body length. The sting then expands into a Mach
cone surface with the Mach angle of the freestream Mach number. A flow tangency boundary
condition is imposed on the surface of the aircraft and sting. A freestream boundary condition is
applied on the surface of the Mach cone. The first block of the present grid topology, a series of
crossflow plane grids stacked in the marching direction, contains the aircraft. n e s b g md ~ \ e
m c h cone surface are contained in the second block. The outer boundary of this grid topology is
a p t e d to the shape of the bow wave by computation. Hence, each crossflow plane grid is . extended in the normal direction to capture the bow and embedded shocks.The details of this
. pmedure are given in Ref. 10.
The computational grid is generated internally by MIM3DSB and is shown in Fig. 3.
~ p p r ~ x h a t e l y 1.2 million grid points were used in this case. The resolution of the first block
(Fig. 3a) is (89x64) in the crossflow planes with 100 marching steps. There are 112 axial steps in
the second block (Fig. 3b) with (85x65) resolution in the crossflow planes. The computational
time nquind for the present case on CRAY-YMP of NASA Langley Research Center is
approximately 2 hours. The run time memory required is about 2.5 megawords, or 17 bytes per
grid point.
RESULTS AND DISCUSSIONS
Computations were performed for the design overland cruise Mach number of M, = 1.6
and cruise angle of attack, u = 3.84'. The computed pressure contours on the symmetry plane are
illustrated in Fig. 4. The sting, which is about one aircraft length long, is also depicted in this
figure. Flow field features such as shocks emanating from the nose, the wing leading and trailing-
edges, and the sting attachment junction are captured and represented by isobars.
Figure 5 shows the pressure pattern in a plane perpendicular to the aft end of the aircraft.
The bow shock and sting attachment shocks are also shown in this figure. The wing on the present
model has a section with reduced sweep on the outer panels which generates a stronger shock that
is illustrated in Fig. 5. Two axial stations were chosen to analyze the flow on the wing. In Fig. 6,
Stations 1 and 2 are located immediately upstream and downstream of the leading-edge break
point, respectively. A comparison of normalized pressure patterns at these stations (Fig. 6) shows
a higher overpressure on the lower side of Station 2. An expansion region due to the contour of
the fuselage is also shown at the upper side of Station 2.
To obtain the pressure signature on the ground at various azimuthal angles, flow fields on
. cylindrical surfaces at several radii wen extracted from the three-dimensional solution. Three
. l23

cylinders with r/l= 0.5, 1.0, and 3.0 were chosen, where r/l is ratio of cylinder radius to length of
the aircraft and is equivalent to the non-dimensional separation distance.
Figures 7-9 display the three-dimensional pressure footprint of the aircraft on these
cylinders. Significant axial variation in the pressure pattern is featured on all cylinders. In
addition, considerable circumferential variation is present on cylinders at r/l= 0.5 and 1.0.
However, changes in circumferential pattern appear to have diminished at r/l = 3.0. Note that
maximum and minimum pressures are represented by colors white and black, respectively, as
indicated by the color bar.
Both on and off-centerline pressure signatures at a separation distance of r/l = 0.5 are
illustrated in Fig. 10. The axial and circumferential variations can also be observed in the pressure
signatures shown in these figures. Three distinct and separate overpressure peaks are evident for
the lower azimuthal angles (e.g., Q, = 0' and 15") at r/l = 0.5. The first peak represents the nose
shock. The second and third peaks are attributed to the shocks emanating from wing leading-edge
highly swept forward and reduced-sweep outer sections, respectively. The peaks are followed by
an expansion and another shock due to the wing trailing-edge. At higher angles (@= 45') the
leading-edge overpressure is mainly governed by the shock from the reduced sweep sections of
the wing. Thus, the third peak becomes more prominent with an overpressure value greater than
that of the third peak at lower angles. At r/l = 1.0 (Fig. ll), the centerline pressure signature
becomes flat after the second peak and then ramps to the third peak. Off-centerline pressure
signatures for this case display a behavior similar to that of r/l = 0.5. The pressure patterns at r/l=
3.0, shown in Fig. 12, indicate only two distinct overpressure peaks. It is assumed that the shocks
due to wing leading-edge areas, before and after the leading-edge break point, have coalesced as
they traveled three aircraft lengths.
The Thomas code (Ref. 5) was used to extrapolate the near-field pressure data to the
ground. Pressure signatures on the ground are obtained by extrapolating near-field pressure
signatures. The signatures at 1-11 = 0.5, 1.0, and 3.0 are used as inputs to the Thomas code. The
flight altitude and ground reflection factor are assumed to be 47,000 and 1.9, respectively. The
ground pressure signatures are plotted in Fig. 13. The signature at y = 0.0 is the signature on the
flight track centerline and is extrapolated from the @ = 0'. Azimuthal angles of 15, 30, and 45
degrees result in lateral distances of y = 2.7,6.0, and 12.0 miles, respectively.
For all azimuthal angles, the Thomas code predicts that the near-field signature would

rsist to the ground. For example, the centerline ground pressure plot (Fig. 13a) displays pe sign a m s with the same overall features as observed in near-field. Figure 13a indicates that
Pfedicted initial rises on the ground due to nose overpressures have the same values for all thr&
,igna-s and are approximately 0.9 psf. The magnitude of pressure rises due to the leading-edge
,, the ground decreases as the separation distance is increased. The magnitude of expansion and
,&sequent shock at the trailing-edge, however, increases with separation distance. Using
propagation method of Ref. 5 and near-field pressure signatures from proper separation distances,
it is expected to predict similar pressure signatures on the ground. However, comparison of the
signatures plotted in Fig. 13a indicates that three noticeably different centerline pressure
signatures from the same aircraft are predicted at the same location on the ground. The differences
in these signatures are results of differences in the near-field signatures. That is perhaps the three-
/ dimensional and nonlinear effects are still present and smng at smaller separation distances. I i Other factors resulting from smaller separation distances which may also affect the accuracy of
! signatures are discussed by Mack and Darden (Ref. 14). Reference 14 discusses the
need to determine limits on neat-field separation distance at which pressure signatures are
obtained for the purpose of extrapolation from the aircraft to the ground. At other lateral stations,
the initial pressure rises for ali three signatures have comparable but slightly smaller values than
at the centerline (Fig. 13 b-d). Using Thomas code, it is predicted that the effects of atmosphexe to
be greatest at = 45' (y = 12.0 miles). The leading-edge shocks appear to coalesce to one
I instantaneous shock. The magnitude of this shock also diminishes as separation distance is I
increased. An instantaneous shock from the ~ailing-edge is also evident in Fig. 13 d.
Figure 14 displays the ground pressure signatures at various azimuthal angles versus time.
The signatures are extrapolated from the near-field pressure data calculated at r/l = 0.5. The t h e -
dimensional effects of the aircraft are clearly shown in this figure. The largest initial pressure rise
occurs at the centerline. However, the secondary shock appears to be greatest at y=12.0 miles.
Although the extrapolated signatures exhibit some similar features, they produce different
levels of loudness on the ground. The loudness of each signature is calculated following a
procedure proposed by Shepherd and Sullivan (Ref. 15) and is plotted versus the lateral distance
to the side of the flight path axis (y) in Fig. 15. Loudness is a well-understood chatacteristic of
human hearing and provides a reasonable prediction of people's reaction to sonic booms (Refs. 15
and 16). Loudness can be used as a parameter to quantify the magnitude of sonic booms. . Therefore, it is suitable for comparative assessments of different ground pressure signatures.
*

The aircraft's three-dimensional effects on the loudness are illustrated in Fig. 15. For all
separation distances, the loudest boom is felt on centerline. This is expected since the initial
presswe jump at each separation distance is shown to be greatest at the centerline (Fig. 14).
However, the loudness does not continually decrease as lateral distance is increased from the
centerline. For example, for a signature from r/l = 3.0, the magnitude of loudness at y ~12 .0 miles
is about 0.5 dB(PL) greater than the loudness magnitude at y = 2.7 and 1.7 dB(PL) greater than at
6.0 miles, respectively. Thi3 is consistent with the fact that the loudness prediction procedure
takes the entire waveform into consideration and larger values of the intermediate shocks are
observed at @ = 45". The near-field pressure signatures of angles greater than 50' are not
predicted to reach the ground. Signatures from r/l = 0.5 and 1.0 exhibit similar loudness behavior.
The shock coalescence and flow smoothing that take place further away from the aircraft
will result in diminishing the nonlinear and three-dimensional effects. Therefore, the level of
loudness on the ground should be independent of separation distance, if pressure data are taken
from proper separation distances. The effects of separation distances which are considered hex!
are summarized in Fig. 15. The level of loudness generated by a signature decreases as the
starting solution separation distance increases. This is due to the fact that different ground
pressure signatures were predicted from near-field pressure signatures at various separation
distances (Fig. 13). Additionally, it is important to note that in order to obtain the pressure data at
about three body lengths below the aircraft in the present study, the computation must be carried
out to about five to six body lengths aft of the aircraft. Hence, larger grid step sizes in the axial
direction are required for this extended computation. Therefore, there are possibilities of shock
smearing and inherent inaccuracies due to large step sizes which may affect the solutions at larger
separation distances. Further grid refinement study in the axial direction may indicate to what
extent the differences in the levels of loudness for signatures from different separation distances
are attributed to grid sensitivity.
CONCLUSIONS
Flow past an aircraft with low boom characteristics was computationally simulated. This
was accomplished by solving the three-dimensional Euler equations on an efficient structured grid
tailored for sonic boom calculations. The near-field pressure signatures both on and off-axis at
three separation distances below the aircraft were obtained.

r The influence of separation distance on the near-field pressure patterns, predicted ground I pressure signatures, and the level of loudness on the ground was shown. The pressure data from
distvlces produced signatures with similar overall fearures and yet different levels of
These differences were attributed to diminishing nonlinear and three-dimensional
effects that take place further away from the aircraft. Loss of grid resolution due to large grid
step sizes may also contribute to this cause. In summary, the level of loudness decreased as the
distance was increased Future work will involve a grid refinement study to investigate
the effects of grid resolution on the predicted level of loudness on the ground. I
The pressure patterns on cylindrical surfaces were obtained to investigate the three-
dimensional effects of the aircraft on the sonic boom patterns. These effects were presented via
1 ground pressure signatures and boom loudness. The largest initial rise in the pressure was
I observed at the centerline and that resulted in the loudest boom predicted on the flight track axis.
i However, loudness of similar magnitude may be felt at about 12.0 miles to the sides of the
centerline where larger intermediate shocks with smaller rise times were predicted.
REFERENCES
1. Whitham, G.: The Flow Pattern of a Supersonic Projectile. Comrnun. Pure & Applied
Math.
2. Walkden, F.: The Shock Pattern of a Wing-Body Combination, Far From the Flight Path.
Aeronautical Q., Vol. IX, Pt. 2, May 1958, pp 164-194.
3. Hayes, W, Haefeli, R., and Kulsrud, H.: sonic Boom Propagation in a Stratified
Atmosphere, with a Computer Program. NASA CR-1299,1969.
4. Thomas C.: Extrapolation of Sonic Boom Pressure Signature by the Waveform
Parameter Method. NASA TN D-6832, June 1972.
5. Ferri, A., Siclari, M., 'ling, L.: Sonic Boom Analysis for High Altitude Flight at High
Mach Numbers. AIAA Paper No. 73- 1035, October 1973.
6. Ferri A,, 'ling, L., and Lo, R.: Nonlinear Sonic Boom Propagation Including the
Asymmetric Effects. AIAA J., Vol. 15, No. 5, May 1977, pp 653-658.
7. Darden, C.: An Analysis of Shock Coalescence Including Three-Dimensional Effects

8. Vatsa, V., Turkel, E., and Abolhassani, J.: Extension of Multigrid Methodology to
Supersonic/Hypersonic 3-D Viscous Flow. NASA CR-187612, August 1991.
9. Pittman, J., Bonhaus, D., and Siclari, M.: Euler Analysis of a High Speed Civil
Transport Concept at Mach 3. J. of Aircraft, Vol. 28, No. 4, April 1991, pp 239-245.
10. Siclari, M. and Darden, C.: CFD Predictions of the Near-Field Sonic Boom
Environment for Two Low Boom HSCT Configurations. AIAA Paper No. 91-1631,
June 199 1, Honolulu, Hawaii.
11. Siclari, M. and Darden, C.: An Euler Code Prediction of Near- to Mid-Field Sonic
Boom Pressure Signature. AIAA Paper No. 90-4000, Oct. 1990, Tallahassee, Florida.
12. Darden, C., Hayes, W., George, A., and Pierce A.: Status of Sonic Boom Methodology
and Understanding. NASA CP-3027, January 1988, Hampton, Virginia.
13. Haglund, G.: HSCT Designs for Reduced Sonic Boom. AIAA Paper No. 91-3130-CP,
September 199 1, Baltimore, Maryland.
14. Mack, R. and Darden, C.: Limitations on Wind-Tunnel Pressure Signature
Extrapolation. Sonic Boom Workshop, NASA CP-3173, 1992.
15. Shepherd, K. and Sullivan, B.: A Loudness Calculation Procedure Applied to Shaped
Sonic Booms. NASA TP-3 134, November 1991.
16. Darden, C., Shepherd, K.: Assessment and Design of Low Boom Configurations for
Supersonic Transport Aircraft. DGLWAIAA 14th Aeroacoustic Conference, Aachen,
Germany, May 1992.

F i p 1. A "hybrid" sonic boom signature, flat top and ramp.
Figwe 2. Geometry of the low boom aircraft.

Figure 3. Two-block grid topology of sonic boom computation, a) Block 1, b)
Block 2.

Figure 4. Computed pressure contours on the plane of symmetry.
Figure 5. Computed pressure pattern at the aft end of the aircraft.

Figure 6. Computed crossflow pressure patterns on the wing at two axial stations.
PRESSURE CONTOURS at r/l = 0.5
Figure 7. Three-dimensional pressure footprint of the aircraft on a cylindrical
surface with r/l = 0.5.
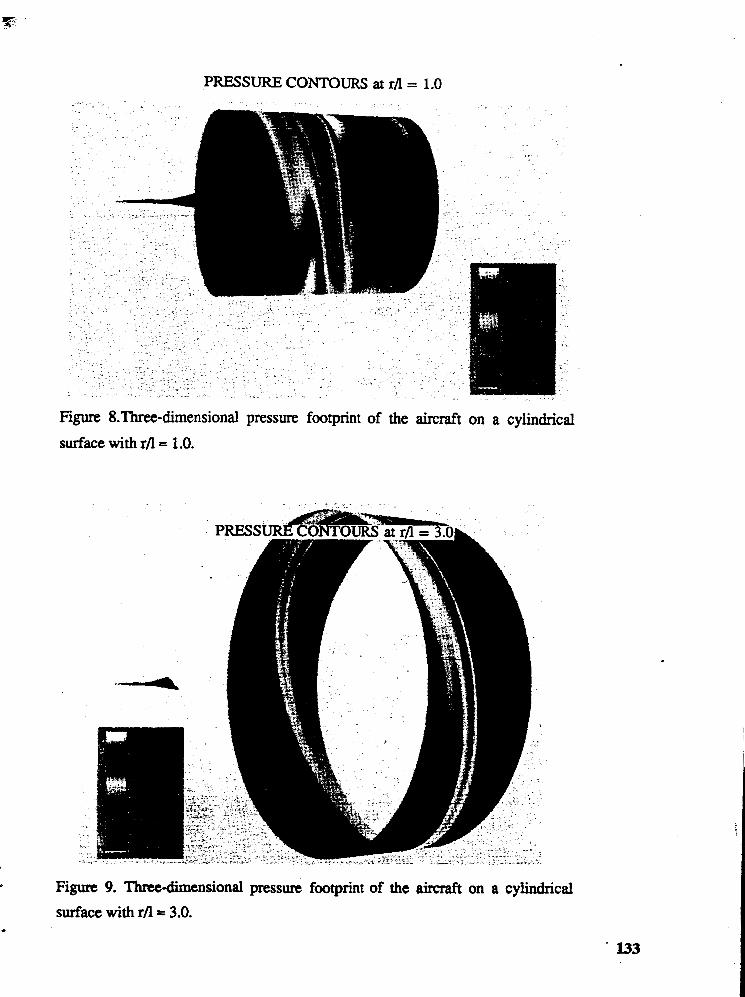
PRESSURE CONTOURS at r/l = 1.0
Figun 8.Three-dimensional pressun footprint of the aircraft on a cylindrical
surface with r/l = 1 .O.
Figure 9. Three-dimensional pressure footprint of the aimaft on a cylindrical
surface with r/l = 3.0.

-.028 I -.028 0 160 320 480 640 800 0 160 320 480 640 800
x', ft x, ft (c) (dl
Figure 10. On and off-centerline pressure signatures at r/l = 0.5.
Figure 1 1. On and off-centerline pressure signatures at ril = 1.0.
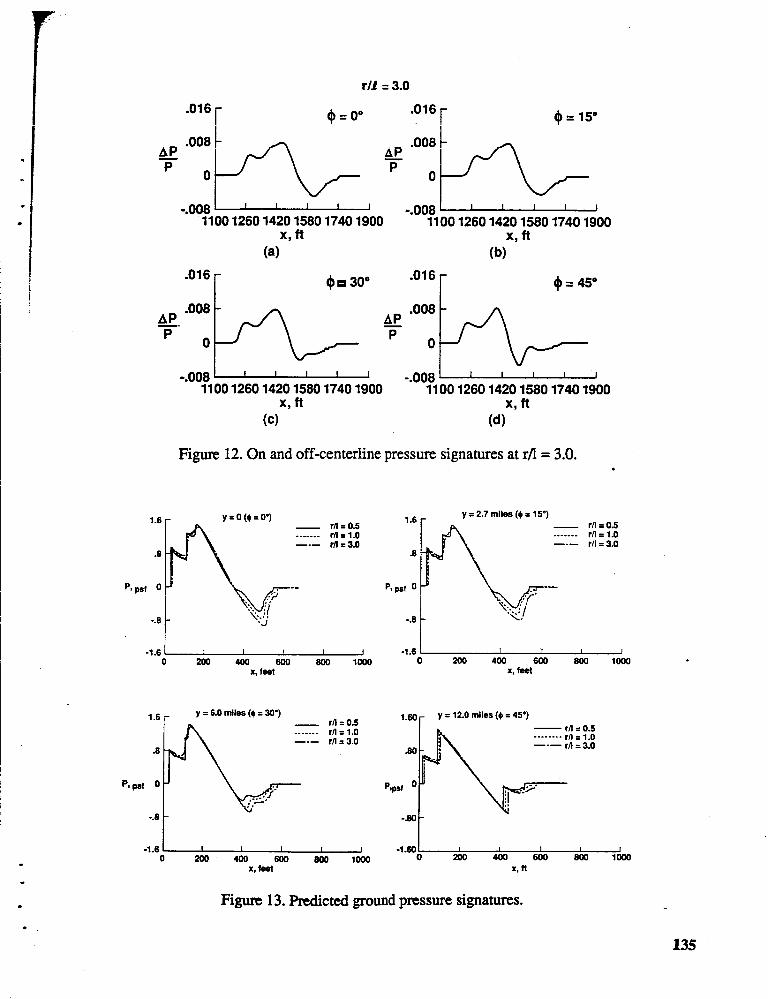
Figure 12. On and off-centerline pressure signatures at r/l = 3.0.
y = 2.7 miles (+ = 15") - m = 0 5 .------ rn=i.o --- rn = 3.0 rll 3.0
.- \. ' ... :i
-.a <,
-1.6 1 0 200 400 600 8 0 0 l o o O
-1.6 1 0 200 400 600 800 1000
x, fwt x, feet
1.6 y = 6.0 miies ($ = 30') 1-60 - y = 12.0 miles (4 = 45') - rn = 0.5 ....... rn=i.o - rn = 0.5 ----- *..
rn = 3.0 --- rn = 1.0 fl= 3.0
-m -
Figwe 13. Predicted ground pressure signatures.

Loudness, dB(PL)
1.60
1.20
0.80
* V)
a 0.40 a-
0.00
-0.40
-0.80
0 2.7 6.0 12.0 y, miles
-
-
-
-
-
-
I I I I I 1 I
-50. 0. 50. 100. 150. 200. 250. 300. 350.
Figure 15. Three-dimensional and separation distance loudness trends.
Time, msec
Figure 14. Predicted ground pressure signature at various lateral stations
extrapolated from r/l = 0.5.

APPLICATION OF COMPUTATIONAL FLUID DYNAMICS AND LAMINAR FLOW TECHNOLOGY FOR IMPROVED
PERFORMANCE AND SONIC BOOM REDUCTION
Percy J. Bobbitt Eagle Engineering, Inc.
Hampton Division
ABSTRACT
A discussion is given of the many factors that affect sonic booms with particular emphasis on the application and development of improved CFD codes. The benefits that accrue from interference (induced) lift, distributing lift using canard configurations, the use of wings with dihedral or anhedral and hybrid laminar flow control for drag reduction are detailed. The application of the most advanced codes to a wider variety of configurations along with improved ray-tracing codes to arrive at more accurate and, hopefully, lower sonic booms is advocated. Finally, it is speculated that when all of the latest technology is applied to the design of a supersonic transport it will be found environmentally acceptable.

INTRODUCTION
Supersonic transport configurations have changed considerably over the years starting with variable sweep and clipped delta concepts and evolving to arrow wings and cranked deltas. Fuselages and wings could easily be identified as separate components in the early 70's but in more recent concepts the two are blended to the point that one cannot tell when one stops and the other starts. The inboard portion of the wing of many configurations employ exaggerated strakes with high sweeps (- 75') which extend forward to the apex of the configuration. As a result of these changes, sonic boom overpressures have decreased from slightly above 2 psf to values nearing 1.0 psf. Still further reductions appear feasible, perhaps to around 0.75 psf as conjectured in figure 1. L/D values have also seen steady improvement (see fig. 2), the cruise L/D of the Concorde is about 7.0, SCAR concepts had cruise WD's of about 9 and recent cranked deltas 10.0. Similar improvements in transonic and takeoffhanding L/D's have been made (see fig. 2). It is generally conceded that additional improvements are possible in L/D in al l the flight regimes.
One of the technologies thought to have the potential to make a significant improvement in W D through the reduction in viscous drag is hybrid laminar flow control (HLFC). This
technology, which has proven successful in the wind tunnel and in flight at transonic speeds, is now being developed for transport application at supersonic speeds. Its utilization will clearly impact wing design and thus aircraft weight, performance and sonic boom.
Improvements in structural weight fraction and engine efficiencies are equally important technology advances in the attainment of an environmentally sound supersonic transport. A lighter weight airplane will have a smaller wing and lower thrust engines, yielding lower sonic booms and fuel consumption and emissions. A discussion of weight concerns is given in the paper by C. Driver in reference 1
In the present paper we will discuss how HLFC technology impacts wing geometry as well as other configuration variables thought to be beneficial from an L/D and/or sonic boom perspective. Among the configuration variables are wings and canards arranged to increase interference lift and improve lift distribution and wing dihedral to improve propagation characteristics. The . improvement of state of the art aerodynamics and ray-tracing CFD codes to explore and perhaps optimize these concepts will also be discussed.
SYMBOLS
chord

drag coefficient (= D
P_v_~ S,f 1
lift coefficient L
drag force
lift force
airplane altitude
equivalent length of airplane
free stream Mach number
local static pressure
static pressure jump (= p -p,)
radial distance
Reynolds number based on length of configuration
maximum thickness of airfoil
free stream velocity
distance from leading edge in streamwise direction
distance from centerline in spanwise direction
angle of attack
dihedral angle
sweep angle
free stream density

Subscripts:
max maximum value
trans value at transition
1 value of the canard
value for the main wing
Abbreviations:
CFD computational fluid dynamics
HLFC hybrid laminar flow control
HSCT High Speed Civil Transport
LEFI' Leading Edge Flight Test
N.F. normal flow
NLF natural laminar flow
SCAR Supersonic Cruise Aircraft Research
S.F. spanwise flow
SONIC BOOM REDUCTION
Sonic booms, in addition to NO, emissions and engine noise, were the primary environmental concerns for supersonic transport designers during the 1960's and they remain so today. There is confidence, nevertheless, that these concerns can be treated successfully through continued research and the diligent application of state-of-the-art technologies. More efficient engines, lighter weight structural concepts and materials, and more accurate a@ capable aerodynamic codes will a l l contribute to lower sonic booms. Concepts not previously treatable using linear methods, and not producible using the 1960's structures technology, may now be explored.
The most difficult aspect of this systems-engineering challenge is the effect that these technologies have upon one another. One parameter cannot be changed without impacting the others unless the specific problem foxmulation or design permits the application of various constraints.

I , .
The primary factors affecting sonic boom and, hence, the design for a supersonic transport
Mach number Aircraft weight Altitude/Atmosphere Aircraft size and shape Deceleration/Acceleration Engine position and exhaust Lift distribution/generation DihedralJAnhedral Viscous effects Aircraft performance
.
I I A few remarks will be made about each of these factors with special emphasis on the last four.
I are:
I Mach Number
Mach number affects the dynamic pressure which, in turn, infiuences the angle of attack that a given configuration must fly to maintain altitude. It can also have a major impact on interference effects such as induced lift and drag. Mach number determines whether a shock is attached or detached and whether for a given wing the leading-edge normal Mach number is subsonic or supersonic. Mach number is a factor in all viscous phenomena including shock boundary layer interactions.
Weight
Weight, of course, determines the amount of lift required to maintain straight and level flight. As lift increases for a given configuration and flight condition, so does the intensity of the boom. Due to the boom sensitivity to weight, it is perhaps more important to reduce the weight of a supersonic transport for given payload than any other type of aircraft. The aerodynamic efficiency and size of a given configuration along with the structures, materials, and systems required to fabricate it are all critical factors in the weight and, hence, the sonic boom intensity.
Altitude is a known critical factor in NO, emissions and a factor in the character and intensity of the sonic boom signature. Nontrivial differences can occur in the sonic boom signature depending on the altitude of flight and whether a real or simplified atmosphere is used in the prediction (see ref. 2). Ideally, several "real" atmospheric models should be used to evaluate the boom for HSCT coxifigurations including seasonal variations and atmospheric inversions. Since the variations in atmospheric properties must be discretized when employing ray tracing programs, the resolution employed can also affect the boom pressure signature calculated.

Aircraft Shape
Many configurations produce an N-shaped pressure signature long before the wave impacts the ground. There are configuration shapes and lengths, however, whose pressure signatures do not reach this terminal state as discussed in NASA SP's 180 and 255, AIAA preprint 89-1105, NASA TP 1348, as well as many other papers. Generally one attempts to shape the effective area distribution of a configuration such that a "plateau" wave and/or finite rise time wave are propagated. The attributes of these signatures (see later discussion on optimum shape) were discovered in the mid-60's and further refined in the 70's and still provide the primary targets for configuration design.
Aircraft Size
Aircraft size has many of the implications of "weight' since larger size usually means a heavier airplane. Increases in length normally have a beneficial effect on the sonic boom; however, one must be careful how the length is increased and the associated boom affected before making any judgement on its value. When size can be increased and the ratio of aircraft weight to wing area maintained or decreased, then size will be beneficial.
Attitude, Deceleration and Acceleration
Thezattitude a vehicle has with respect to the ground'has a first order effect on the boom signature. Consequently, the climb and descent phases of flight must be tailored to minimize the sonic boom. Since one is usually accelerating during climb the possibility of a focused boom must be considered.
Engine Position and Exhaust
Normally, engines will be placed, and sometimes configurated to maintain as smooth an area distribution as possible. When this is done, the wave drag will usually be at or near its minimum value for the configuration being evaluated. In addition, the engines will create a disturbance that must be allowed for in the sonic boom calculations. An important aspect of the engine as far as sonic boom is concerned is the exhaust, hence in a proper evaluation of an aircraft's sonic boom, whether theoretical or experimental, the exhaust must be modeled. In summary, the seledtion of an engine location and whether or not the engines should be paired (two pods of two engines) or located singly has important implications for the boom.
Lift Distributions
As noted by Ferri (ref. 3), "In order to reduce the sonic boom, interference effects must be utilized. The introduction of lift in thefiont of an airplane makes the equivalent area distribution similar to the cross-sectional area distribution of a blunt body." Figure 3 from Ferri's paper shows a simplified two-surface configuration. W1th 1/3 of the lift carried by the canard, a significant decrease in the maximum Apshock was realized. The potential of two-surface, canard wing configurations was not thoroughly explored in the 60's nor has it been explored in recent times. The application of current CFD codes to two-surface configurations, using a more accurate minimum boom area distribution as a guide, is clearly needed.

Interference Lift
h&if&ie~ce effects S~ k t)ntlh_ k.neficial anc! hannfd. They can affect drag and lift md in t$e 60% were difficult to assess. With the advent of the new full potential, Euler and Navier- . stokes CFD codes and improved grid schemes, interference assessments can be made in a much
. more straightforward and accurate manner. Where interference lift is a nontrivial component of be total lift the near field signatures must be accurately portrayed by a higher order code to determine if there are any attendant sanic boom reductions. Equivalent axisymrnetric bodies .
used for boom prediction
Fem and Ismail (ref. 3) examined the use of the body compression field on the wing underside and the expansion field on the top to increase lift without proportional drag increases. Figure 4 from that same reference shows, however, that the compression field increases lift and drag in the same proportion for a semi circular body located on the lower side of the wing. As a consequence, no increase in L/D over a symmetrically located circular body is realized. However, the expansion field of an afterbody on the top of a wing should not experience such a cancellation. The important thing to remember is that as long as L/D is not decreased, interference lift will yield a lower sonic boom. An example of four "induced lift" configurations embodying a canard are shown in figure 5. There are many variations on this "induced lift" scheme, including fuselage shaping, but they require optimization. The application of 3-D Navier-Stokes and 3-D ray propagation codes to this problem should be a high priority.
Dihedral and Anhedral
We have just discussed induced lift as a means of reducing sonic boom. Another configuration variable thought to be worth additional study is wing dihedral or anhedral. Data from references 4 and 5 give a few clues of the potential. Near field spanwise (Aplp),,, variations indicate reduced levels for dihedral (see fig. 6a from ref. 4) and increased levels for Anhedral relative to a flat wing. Sonic boom calculations based on the propagation of the centerline pressure signatures for the three wings are shown in figure 6b. There is a problem, however, with the wave propagation calculations in that they do not fully account for the radial and circumferential variations of the near field. It is clear from the physics of acoustics propagation that all gradients as well as magnitudes should be matched at the interface of the pressure field and ray tracing code. In the case of dihedral there is a divergence of the pressure field and for anhedral a convergence followed by divergence of the pressure field that is not represented by the "cylindrical" propagation of most ray propagation codes (see sketch).
flat dihedral anhedral
Sketch of Idealized Ray Propagation Patterns For a Flat Wing and Wings with Dihedral and Anhedral

The fact that the anhedral (App),, curve is above the flat wing curve in figure 6b is an artifact of the position (h/l = 4.5) where the pressures were measured (see sketch). The contention here is that the benefits of dihedral and anhedral is underestimated and the underestimate increases with increasing Mach number. The latter is true since the wing pressure fields becomes more planar, or two dimensional like. The equivalent axisymmetric source distributions used for lift in linear theory provide the highest pressures on the centerline; dihedral and anhedral should reduce the level and move the maximum off the centerline. At the very least they should spread the energy more evenly over the ground. As a consequence, one would expect that more of the pressure field to be expended above and beyond the lateral cutoff leaving less for impact with the ground (see sketch).
cutoff
dihedral flat
Sketch of Idealized Ray Propagation Patterns Relative to the Lateral Cutoff
In summary, then we have to:
Propagate the real 3-D pressure field and not an idealized one. Solve the 3-D ray propagation equations. Adopt a new attitude with respect to what represents an optimum 3-D configuration. Measure radial and lateral gradients in wing tunnel flow fields for use in ray tracing codes.
A further contention is when advantage is taken of dihedral (anhedral), induced lifts, canards and 3-D minimization that moderate sweeps, more amenable to laminar flow, will look more attractive. CFD practitioners have an opportunity, to push sonic boom technology to the next level and perhaps reduce sonic booms to sonic "boomlets."
Viscous Effects
It has been shown in a number of papers that the boundary layer thickness and its contributions to the configurations effective shape cannot be ignored in the prediction of sonic booms (ref. 6). If an inviscid code is used for minimkition purposes then boundary layer displacement thickness must be subtracted from the input geometry to arrive at the actual shape that will produce the minimum. It is important then to have some idea at the displacement thicknesses on the body and wing if one uses an inviscid code in boom minimization. In the analysis of a given configuration, boundary layers on the various aircraft components must be

taken into account, hence local Reynolds numbers, Mach numbers and pressure gradients become important. Clearly, a thick boundary layer will result in a higher sonic boom than a thin one (ref. 6). Consequently, the sonic boom associated with an aircraft will be favorably affected by HLFC.
LOW Supersonic and Transonic Performance
SUPERSONIC LAMINAR FLOW CONTROL
.
.
The use of suction for Laminar Flow Control (LFC) to facilitate drag reduction goes back to the early 1900's and was vigorously pursued in the 50's and 60's. Around 1970 LFC received a "new lease on life" from NASA's Aircraft Energy Efficient Program (ACEE). This program was formulated to provide the technology to increase the efficiency of large transports beyond that of the transport aircraft then flying. One of the components of this program was the Langley LFC Program carried out in the Langley 8-foot TPT on a 7-foot chord model. It had both slotted and perforated surfaces and was designed for a Mach number of 0.82. The extent of suction was variable so that both full chord and partial chord suction could be examined. Finally, and more pertinent to the present discussion, a Hybrid Laminar Row Control (HL;FC) concept was tested where suction was applied in the leading edge region and a favorable pressure gradient beyond the suction cutoff enabled laminar flow back to the 90 percent chord under some conditions.
While one has his principal focus on cruise LP, sonic boom, weight, etc., there must also be some consideration given to the performance of the various designs at off design speeds. The efficiency of flight at low supersonic and transonic speeds as well as at landing and rake-off must be considered. The lowest boom configuration may, for example, have poor transonic performance and the highest landing speed. If overland supersonic flight is not possible for whatever reason, then efficient transonic flight could be a very large "plus."
Also sponsored by the ACEE Program was a series of flight tests focusing on Natural Laminar Flow (NLF) and LFC. The latter program had the acronym LEFT (Leading Edge Flight Test) and was aimed at the practical problems that arise at or near the leading edge of laminar flow wings. Insect contamination and deicing are two of the major ones. Also of interest in this program were the problems of c o n w a t i o n in an airport environment and flight through clouds, rain and icq crystals. A Lockheed Jetstar was equipped with two LFC gloves, one designed by Lockheed and the other by McDonnell Douglas. The Douglas glove had a perforated titanium surface and the 'Lockheed glove had a slotted aluminum surface. Test flights spanned about one year, much of it in simulated airline service, and found no significant adverse effects.
Since the completion of the ACEE Program, several other successful flight tests have been completed as part of NASA Langley's drag reduction program including a B-757 glove to evaluate the effect of engine noise on transition and, more recently, a B-757 test of a large HFLC glove.
At supersonic speeds some relevant wind tunnel tests have been carried out, many in the 1950's and 1960's, some of more recent vintage in NASA Langley's Supersonic Quiet Tunnel.
. Flight tests of a laminar flow glove at supersonic speeds are rare if nonexistent. A flight test program is, however, in progress utilizing an F-16XL which has approximately 65 degrees of .

sweep and sufEcient sustained supersonic flight capability for diagnostic experimentation. More flight experiments, perhaps using a different aircraft, should be carried out after further wing optimization studies are completed and, consequently, configuration options better understood. CFD and experimental wing studies should be undertaken including airfoil research to better understand the utility of both sharp and rounded leading edges and the types of pressure distributions required to minimize the extent and level of suction for a given extent of laminar flow. Investigations such as that carried out in the 60's based on the linear theory design of turbulent wings should be instituted using CFD codes for HLFC concepts and concurrent sonic boom calculations. Wing planform studies to provide an understanding of the effect of sweep on wave drag, sonic boom, LID, suction-mass-flow requirements and transition are also required. In addition both diamond and arrow type planforms should be examined to determine if low chord Reynolds numbers (arrow wings) are more conducive to large extents of laminar flow than a wing with low sweep in the mid-chord region.
Some clues are provided in reference 7 where calculations of transition location as a function of sweep and Mach number are compared to data obtained by S. Pate in 1963 and documented in reference 8 (see fig. 7). It shows that beyond a sweep of 55 degrees only a trivial amount of NLF exists and suction must be used to obtain significant runs of laminar flow. Figure 8 from the same reference shows the small effect of sweep on wave drag for a fixed CL leading one to believe that the real "trade off' on sweep is between sonic boom and friction drag. It is easy, when one looks at the data in reference 7, to come to the conclusion that' the optimum sweep from a performance standpoint, for a laminar-flow wing is substantially less than for a turbulent flow wing. Optimum sweep in this context is one that yields the maximum drag reduction per unit suction system weight.
Figure 9 shows a sketch of a diamond wing of moderate sweep and a cranked delta planform with high inboard sweep. Also depicted is what the isobars of the two wing shapes might look like. The lower sweep of the isobars in the mid-chord region of the diamond wing would be more conducive to an HLFC concept than wings, such as the cranked delta where the isobars on average have higher sweeps.
If moderate sweeps are found to be advantageous for HLFC and low drag, then the wing leading edges will probably be supersonic (shock sweep > leading sweep) with small radii'or sharp leading edges. At off design (lower) Mach numbers, these leading edges will be a handicap - particularly at transonic Mach numbers. To overcome this problem, an articulated multifunction leading edge is proposed. It is deployed from the lower surface in order to keep the top surface free from hinges, steps and gaps. There are several versions of this device, one is shown schematically in figure 10. This type of leading edge can cany out the same functions as a vortex flap during landing and takeoff and increase L/D during transonic cruise. At low supersonic speeds, it might also decrease drag by obtaining a larger fraction of the available leading edge suction.
Another possible by-product of the application of LFC to supersonic transports is the use of the suction compressors to blow the flaps during landing and takeoff. 'Iko dimensional tests of an airfoil with a blown trailing edge flap and deflected leading edge achieved a C- equivalent to that obtained using a leading edge Krueger flap with a triple-slotted trailing edge flap. The thin
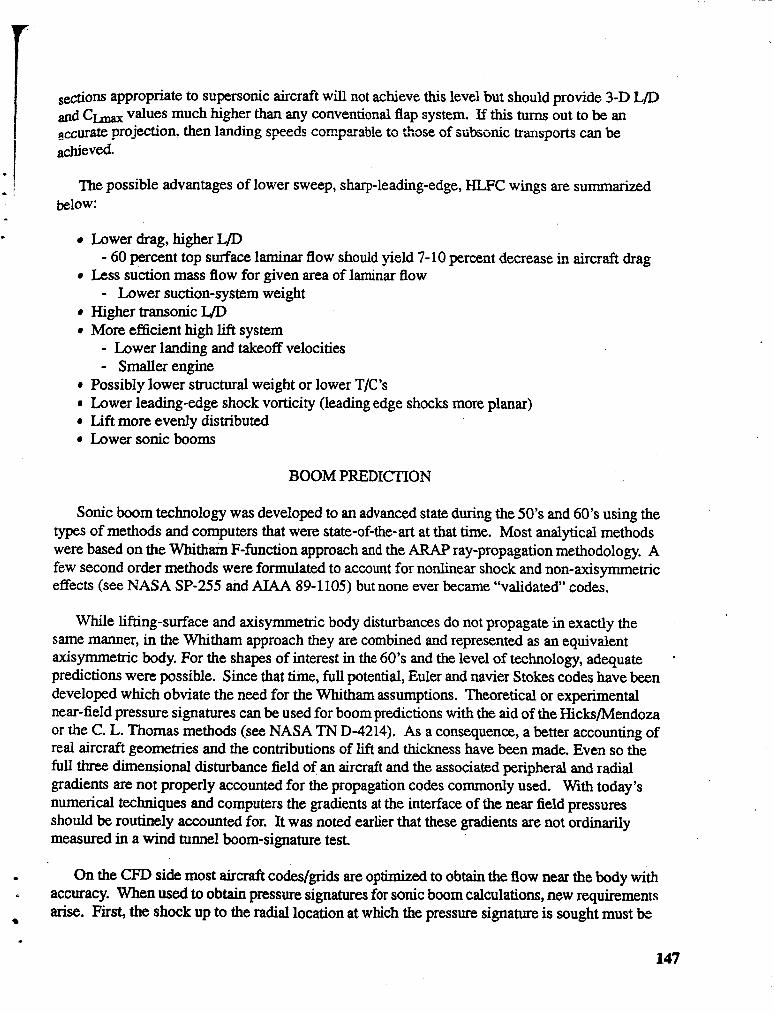
, d o n s appropriate to supersonic aircraft will not achieve this level but should provide 3-D L/D and C- values much higher than any conventional flap system. If this turns out to be an nccurate projection, then landing speeds cn~.pssb!e tc those ~f aiibs~nic transports can be - achieved
- The possible advantages of lower sweep, sharp-leading-edge, HLFC wings are summarized - below: -
. Lower drag, higher L/D - 60 percent top surface laminar flow should yield 7- 10 percent decrease in aircraft drag
Less suction mass flow for given area of laminar flow - Lower suction-system weight
Higher transonic IJD More efficient high lift system
- Lower landing and takeoff velocities - Smaller engine
Possibly lower structural weight or lower TIC'S Lower leading-edge shock vorticity (leading edge shocks more planar) Lift more evenly distributed Lower sonic booms
BOOM PREDICTION
Sonic boom technology was developed to an advanced state during the 50's and 60's using the types of methods and computers that were state-of-the-art at that time. Most analytical methods were based on the Whitharn F-function approach and the ARAP ray-propagation methodology. A few second order methods were formulated to account for nonlinear shock and non-axisymmetric effects (see NASA SP-255 and AIAA 89-1105) but none ever became "validated" codes.
While lifting-surface and axisymmetric body disturbances do not propagate in exactly the same manner, in the Whitham approach they are combined and represented as an equivalent axisymmetric body. For the shapes of interest in the 60's and the level of technology, adequate . predictions were possible. Since that time, full potential, Euler and navier Stokes codes have been developed which obviate the need for the Whitharn assumptions. Theoretical or experimental near-field pressure signatures can be used for boom predictions with the aid of the HicksJMendoza or the C. L. Thomas methods (see NASA TN D-4214). As a consequence, a better accounting of real aircraft geometries and the contributions of lift and thickness have been made. Even so the full three dimensional disturbance field of an aircraft and the associated peripheral and radial gradients are not properly accounted for the propagation codes commonly used. With today's numerical techniques and computers the gradients at the interface of the near field pressures should be routinely accounted for. It was noted earlier that these gradients are not ordinarily measured in a wind tunnel boom-signature test.
. On the CFD side most aircraft codes/grids are optimized to obtain the flow near the body with accuracy. When used to obtain pressure signatures for sonic boom calculations, new requirements
* arise. First, the shock up to the radial location at which the pressure signature is sought must be

resolved with high accuracy. Second, the calculation must be made well beyond the base of the body to insure that the reannost point of the pressure signature "sees" the entire configuration and the near wake. To cater to these requirements means more grid points, more storage, and perhaps some modification of the grid scheme.
Optimum radius distributions from, a sonic boom standpoint, of power-law bodies (r axn) based on linear theory, yield n values which vary from 114 to 314 depending on the altitude and Mach number (see paper by L. B. Jones, D. S. Hague, and R. T. Jones). Since this type of area distribution is provided by a "blunt" equivalent axisymmetric shape which leads to a detached shock, the linear attached shock solution must be viewed as an approximate one. Note that the equivalent area distribution can be composed of both thickness and lift components and that the "blunt body" can be provided by a lifting surface or fuselage. Now with the application of modem CFD codes, a true optimum an be determined for various types of aircraft geometries. The computer resources required will be large but so will the reward.
An indication of the capabilities of current CFD technology to predict the aerodynamics of supersonic cruise vehicles can be obtained from a number of recent papers. One of particular note is that of V. Vatsa (ref. 9) which compares calculated pressures, forces and moments for a cranked delta configuration. Figure l l a from this paper shows the configuration; figure l l b shows the agreement of the predicted 1st and drag coefficients with data at a Mach number of 3.0. Pressure distribution comparisons show similar agreement. The addition of suction boundary conditions and transition criteria are needed to estimate the performance of HLFC wings with the same degree of precision, i.e., with Navier-Stokes codes. Euler equations plus boundary layer codes can also be used to advantage. Some calculations of this type have already been accomplished in connection with F- 16XL glove experiment.
A summary of the areas that CFD can contribute to supersonic aircraft design is given below:
Configuration design and analysis Sonic boom Engine placement - performance - boom, including engine exhaust - flutter Buffet Met and exhaust flows Loads High lift Transition and suction requirements for HLFC 3-D ray tracing
CONCLUDING REMARKS
The two barrier environmental problems in supersonic commercial transport design are sonic booms and engine NOx emissions. The former, which is the subject of the present workshop, has many technical facets as well as economical implications. If the boom of a supersonic transport

cannot be reduced to acceptable levels for overland flight, substantial losses in productivity will result. In the present paper an attempt has been made to show that there are technologies and configuration options that, if fully explored, will lead to reduced sonic booms and perhaps h m s e ~ r f e m m c e ES weU. W-th fie ~ ~ E S P L ! ~?plic.tion of CFD zed expc~'mer?tnl t=!c to supersonic HLFC, induced lift, canard configurations, dihedraVanhedral and ray tracing one can look forward to the reduction of sonic booms to sonic "whooshs."
REFERENCES
1. Driver, Cornelius: What Gross Weight and Range for an Advanced HSCT. Proceedings of NASA Sonic Boom Workshop, Feb. 25-27,1992.
2. Darden, Christine M.: Minimization of Sonic-Boom Parameters in Real and Isothermal Atmospheres. NASA TN D-7842, March 1975.
3. Fem, Antonio and Ismail Ahmed: Report on Sonic Boom Studies. Second Conference on Sonic Boom Research held at NASA Washington, DC, NASA SP-180. May 9- 10, 1968.
4. Hunton, Lynn W.: Cumnt ~ e s e k h in Sonic Boom. Second Conference on Sonic Boom Research held at NASA Washington, DC, NASA SP- 180. May 9- 10, 1968.
5. Carlson, Harry W., Barger, Raymond L., and Mach, Robert J.: Application of Sonic-Boom . . . Mmmmation Concepts in Supersonic Transport Design. NASA TN D-7218, June 1973.
6. Mack, Robert J., and Darden, Christine M.: Wind-Tunnel Investigation of the Validity of a Sonic-Boom-Minimization Concept. NASA TP 1421, October 1979.
7. Goradia, S. H. and Bobbitt P. J.: Theoretical Investigation for the Effects of Sweep, Leading- Edge Geometry, and Spanwise Pressure Gradients on Transition and Wave Drag at Transonic and Supersonic Speed with Experimental Correlations. SAE Technical Paper Series 881484, Aerospace Technology Conference and Exposition, Anaheim, CA, October 3-6, 1988.
8. Pate, S. R., and Brillhart, R. E.: Investigation of Boundary Layer Transition on Swept Wings at March Numbers 2.5 to 5. AEDC-TDR-65-10, July 1963.
9. Vatsa, Veer N., Turkel, Eli, and Abolhassani, J. S.: Extension of Mutigrid Methodology to ~ u ~ e r s o n i c ~ ~ ~ e r s o n i c 3-D Viscous Flows. Fifth Copper Mountain Conference on Multigrid Methods, March 3 1-April 5,1991.

0 - Concorde - SCR - Goal
Figure 1. - Improvements in sonic boom overpressures relative to Concorde.
CRUISE
% Improvement 50
25
0
- Concorde
-SCR
TRANSONIC TAKEOFF - LANDIN2 CI -
100 - 100
75 - 75 2 96 %
Improvement 50 - 9 Improvement 50 3
25
O W n O
Figure 2. - LJD improvements in cruise, landingltakeoff and transonic flight regimes of supersonic transport designs since the Concorde.

-2.0 L
Figure 3. - Sonic boom signatures of simple canardwing configurations.
LID
Figure 4. - WD variations with CL for two conical wing-body configurations at Mach numbers of 1.5 and 3.0.

Figure 5. - Sketches of various types of induced-lift canard configurations.
(a) Lateral (Ap4),, variations. (b) Centerline (Ap/p) - .
Figure 6. - Dihedral wing characteristics. M, = 1.7; CL = 0.2.

Circular Arc Section TIC = .03, M, = 3.0,
Chord Reynolds No. = 6 x lo6, a = O0
Probe Location Station
- Theoretical computations for external disturbance level in tunnel , , , Theoretical computations for negligible external disturbancd level
for free air conditions 0 Experimental transition by sublimation technique @ Station #2
Leading edge sweep A, deg.
1.0
S
'6 dctrpns
.4
3
Figure 7. - Comparison of transition locations in wind tunnel conditions and in free air.
- -----.--.-
S.F. 'Itansition for -
-- N.E l'kansition for free air conditions \ -
supersonic tunnel - L I I 1 1 I I I I I 1 I
Biconvex Airfoil Section TIC = 0.0465, M, = 2.5
Free stream chord Reynolds no. = 0.6 x lo6 Infinitely swept wing conditions WD, = 9.15 occurs @ CL.= .12
0 5 10 15 20 25 30 35 40 45 50 55
.om C~wave
.OM (one surface)
L.E. Sweep, A, deg.
Figure 8. - Effect of CL on the variation of supersonic wave drag with sweep.

/ Isobars
i
Figure 9. - Comparison of isobars for diamond and &ed delta wings.
0 0 -- pivot locations
Figure 10. - Sketch of a leading edge device for sharp-edged supersonic wings.

(a) Generic supersonic tnnsp0x-t.
0 Experimental data - Present results
alpha alpha (deg. j
(b) CL and CD comparisons. Figure 11. - Geometry of a supersonic transport configuration and the predicted lift
and drag coefficients compand to experiment. M, = 3.0, Rel = 6.3 x lo6

Page intentionally left blank

SONIC BOOM PREDICTION FOR THE LANGLEY MACH 2 LOW-BOOM CONFIGURATION
Michael D. Madson NASA Ames Research Center
Moffett Field, CA
SUMMARY
Sonic boom pressure signatures and aerodynamic force data for the Langley Mach 2 low sonic boom configuration were computed using the TranAir full-potential code. A solution-adaptive Cartesian grid scheme is utilized to compute off-body flow field data. Computations were performed with and without nacelles at several angles of attack. Force and moment data were computed to measure nacelle effects on the aerodynamic characteristics and sonic boom footprints of the model. Pressure signatures were computed both on and off ground-track. Near-field pressure signature computations on ground-track were in good agreement with experimental data. Computed off ground-track signatures showed that maximum pressure peaks were located off ground-track and were significantly higher than the gignatures on ground-track. Bow shocks from the nacelle inlets increased l i t and drag, and also increased the magnitude of the maximum pressure both on and off ground-track.
INTRODUCTION
The High Speed Research Program (HSRP) has been initiated with the goal of designing and testing a supersonic commercial transport aircraft with acceptable aerodynamic qualities, acceptable emission levels and, if possible, sonic boom signatures that would permit supersonic flight over land. It is generally con- sidered that a signature with an initial overpressure of 0.5-1.0 psf and a noise level of 72 DbA or less on the ground would be acceptable, although no firm definition of acceptability has been established.
In support of the HSRP program, a conceptual low-boom aircraft geometry was designed at NASA Langley using a process that integrates low boom design and aerodynamic performance methods (ref. 1). A drawing of the Mach 2 conceptual model is shown in figure 1. This configuration was designed to produce a "flat-top" pressure signature with a maximum overpressure of slightly less than 1 psf on the ground. Wind tunnel data were obtained at -2.0 and 2.5 for several values of CN. Pressure signatures were measured on ground-track at several distances from the model. Drag data were not measured during the tests.
There are several efforts ongoing to calculate accurate near- and far-field pressure signatures (refs. 2- 6) and to design low sonic boom aircraft (refs. 1,7). These efforts utilize different approaches to the com- putation of offbody pressure signatures and the extrapolation of the signatures to the ground. Significant use is still being made of the Whitham method (ref. 8). a quasi-linear technique introduced in 1952. Most of the cment efforts an focused on the application of computational fluid dynamics (CFD) codes to the prob

lem. The basic approach is to compute pressure signatures at a distance from the model which is far en i O"& :
for the model effects to be considered axisymmetric (typically anywhere from 0.5 to 1.0 body lengths), then
extrapolating the signature to the far-field using a conventional technique such as the Whitham method. this way, lift and equivalent area are taken into account in the computation. Lift calculations from non-linw CFD codes are more accurate than those from the linear methods which were originally used.
For this paper, the TranAir code (refs. 9,lO) was used to compute force data for the Mach 2 model, as well as offbody pressure signatures for sonic boom calculation. TranAir solves the non-linear fuII-potential equation for subsonic, transonic, and supersonic flow about arbitrary configurations. The surface game9 is defined by networks of surface panels in the same manner as linear-potential panel methods. Also, w& sheets must be defined from the trailing edges of lifting surfaces to enforce the Kutta condition. The flow- field is defined as a rectangular array of Cartesian grid points, within which is embedded the surface defini- tion of the configuration. The decoupling of the surface and grid definition processes allows the user to routinely analyze very complex and realistic models. TranAir was developed to compute the aerodynamics of complex configurations in the three flow regimes (refs. 11-18), but its solution-adaptive flow-field grid capability makes it ideal for computing offbody pressure signatures for sonic boom analysis and design. A validation of TranAir's ability to accurately compute offbody pressure signatures was recently completed (ref. 6).
Computational results for the Mach 2 model with and without flow-through nacelles were obtained at -2.0 for angles of attack ranging from -1 to 6 degrees. Pressure signatures were calculated near the model and extrapolated to distances at which experimental data were measured using a quasi-linear extrapo- lation technique (ref. 19). Good agreement was found between experiment and computation for the Mach 2 model without nacelles. Experimental data with open nacelles showed an unexpected spike in the pressure signature. TranAir results for the cases of flow-through nacelles and blocked nacelles verified that the spike was caused by unstarted nacelles in the tunnel. Also verified was the existence of off ground-track signa- tures which had maximum pressures exceeding those which exist on ground-track. This phenomenon was fmt predicted by Siclari (ref. 3).
WIND TUNNEL MODEL AND TEST PROCEDURE
The Mach 2 model was designed to produce a low sonic boom signature on the ground with the fol- lowing constraints: A cruise Mach number of 2.0, a cruising altitude of 55,000 ft, a beginning-cruise weight of 550,000 Ib, a range of 5000 nm, and a length of approximately 300 ft. The goal of the design was to produce a "flat-top" signature on the ground, in which there is an initial shock of approximately 1 psf, which remains constant until an expansion from the aft end of the model is encountered. The final design for the conceptual model is 313 ft long with a wing span of 160 ft, a wing dihedral of 4.6O, a "platypus" nose with a blended wing root, and a supersonic outboard leading edge. Four circular nacelles 1
approximately 34 ft long are placed near the inboard trailing edge to minimize volume and interference I
effects. A wind tunnel model of the Mach 2 configuration was manufactured based on the final design. The i I

length of the wind tunnel model is approximately 12 in, with an integrated sting and an external strain gauge on the sting for n m a l force and moment measurement.
x 1-a Jt L I ~ tiinnel tests of the Mach 2 model were mnducteci in the XASA Ames 9 ft by 7 ft Supersonic Wind Tunnel and the NASA Langley 4 ft Supersonic Wind Tunnel. A photograph of the Mach 2 model installed in the test section of the Arnes 9 ft by 7 ft tunnel is shown in figure 2. Note that the model is in- stalled in a wing-vertical attitude in the tunnel. Pressure signatures in the wind tunnel are obtained by two static pressure probes mounted along the side wall of the tunnel which faces the underside of the model. One probe is a reference (seen in the lower left comer of figure 2) placed out of the zone of influence of the model, and away from the model centerline to keep the probe shock from interfering with the flow along the centerline of the model. The overpressure probe is placed along the model centerline, and within the zone of influence of the model (seen in the upper left portion of figure 2). The probe positions remain constant, and the the model is traversed along the flow axis by a motor-driven shaft mounted on the suppoxt assembly as seen at the far right edge of figure 2, downstream of the angle of attack mechanism. The measurement of the pressure signature begins with the model in the downstream position in the test section, and data points are taken as the model is traversed in the upstream direction.The distance between the model and the over- pressure probe is increased or decreased by moving the motor-driven horizontal strut on which the model is attached. Experimental pressure signatures were obtained at distances ranging from 0.65 to 5.3 body lengths from the model.
DISCUSSION OF COMPUTATIONAL METHOD
TranAir solves the non-linear full-potential equation for subsonic, transonic, and supersonic flow about arbitrary configurations. The theoretical aspects and the solution method used by TranAir have been reported (refs. 9,20-23) and will not be addressed here. Instead, a description of the code from an applica- tions standpoint is presented.
The surface definition of the configuration being analyzed is defined by networks of surface panels, in the same manner as panel method codes. The surface definition of the Mach 2 model with flow-through nacelles is shown in figure 3. Appmximately 10,300 surface panels were used to define this configuration, which were organized into 93 networks. Wakes from the wing trailing edge, nacelle exits, and fuselage base were defined by 29 networks consisting of a total of 620 wake panels. Removal of the nacelles re- duced the number of surface panels to about 7,500 (31 networks), and the number of wake panels to 164 (8 networks). Unlike panel methods, the number of surface panels defining the configuration has a small effect on the CPU time required to obtain the solution. Instead, factors including the freestream Mach number, the number of grids for which the solution is computed, the number of flow-field grid points for each grid, and whether a solution-adaptive or multi-grid scheme is chosen to solve the problem drive the CPU time requirement.

The flow field is defined by a rectangular array of Cartesian grid points. This method of surface-grid and flow-field definition avoids the use of surface-conforming flow-field grids, and allows for the routine set-up and analysis of arbitrary and complex aerodynamic configurations. For transonic flow problems, the Cartesian grid need only be large enough to encompass any supercritical flow regions. The code solves the Prandtl-Glauert equation around the outer set of grid boxes, thus the flow need merely be linear, not unper- turbed, at the grid borders. For fully supersonic problems, however, the grid must extend far enough away that reflected shocks from the grid boundaries do not intersect the configuration surface. Experience has suggested that for pressure signature measurements away from the body, grid boundaries be established as far as two body lengths below and behind the model. A large global grid tends to improve the quality of the solution near the boundaries of the grid, and reduces the percentage volume of the global grid which must be highly refined for the offbody computations.
The solution-adaptive grid-refinement capability within TranAir is critical to the accurate prediction of shocks away from the surface of the model. For sonic boom calculations, a relatively dense grid must be maintained to significant distances from the body to calculate an accurate pressure signature. The initially uniform flow-field grid is adaptively refined based on local flow conditions. In regions where shocks and large velocity gradients exist, the grid will be successively refined until adequate resolution is obtained. A refinement consists of dividing a grid box into eight geometrically similar boxes. An oct-tree data structure is used to efficiently store and access pertinent information regarding the refined grid.
The user may exert significant influence on the refinement process. One or more hexahedral regions may be defined within the global grid. Maximum and minimum refinement levels within these regions may
., be specified by the user. The refinement controls within this region supersede the globally specified refine- ment criteria. This allows for the definition of regions of "interest" or "disinterest," depending on whether the user specifies additional refinement or limits the refinement within the volume. Examples of regions that might be defined include a region enclosing a wing leading-edge to increase grid resolution for a careful drag study and a region enclosing the empennage limiting the refinement so that more grid points are avail- able for a winglnacelle integration study. For the case of sonic boom prediction, a user-specified region underneath the aircraft is usually required to obtain accurate offbody pressure signatures at distances up to one body length from the surface.
Figure 4 provides an example of a TranAir solution adaptive grid for the Mach 2 model. Figure 4(a) shows a 2-D cut along the centerline of the model. Figure 4(b) shows a cut through the wing and the cen- terline of the inboard nacelle. These slices clearly display the solution-adaptive capability of the code, as well as the relationship between the flow-field grid boxes and the surface geometry. A typical solution for the Mach 2 model used 8MW of central memory, approximately 200MW of temporary disk space, and about 2 CPU hours on a Cray Y-MP.
Flow quantities from TranAir are available both on the surface and in the flow-field. A graphics pro- gram has been written (ref. 10) that allows for the inspection of the non-uniform grids generated by TranAir. Another graphics program has been modified (ref. 24) to read TranAir geor&q information and

aerodynamic quantities on the surface of the configuration. The program displays wire mesh and shaded- surface renditions of the model and flow quantities such as velocity, pressure coefficient, or local Mach number on the configuration surface.
RESULTS
TranAir force data computed for a series of angles of attack for the nacelle-on and nacelle-off cases are presented in figure 5. The presence of the nacelles increased Q by approximately 0.005 due to the positive pressures on the lower surface induced by the nacelles. This increase in lift may be slightly under-predicted because of a violation of the isentropic assumption near the inlet bow-shock. The nacelles caused an in- crease in drag of about 20 counts. The pitching moment was nearly identical for the two cases. Wind tun- nel tests were conducted both with and without nacelles. Values of CN and CM were measured but drag data was not measured. . _
TranAir predictions for WD for the nacelle-on and nacelle-off cases are shown in figure 6. Viscosity is neglected for these calculations, so the UD values shown in figure 6 are significantly higher than what would be measured in a wind tunnel test. The presence of the nacelles lowers the maximum UD for the configuration by 30% relative to the nacelle-off case. The angle of attack at which the maximum L4D occurs is about 0.25' for the nacelle-off case, and about 0.75" with the nacelles on.
The Mach contours on the lower surface of the Mach 2 model without nacelles are shown in figure 7. For this case, IL=2.0 and Cfl.05. Two prominent features appear in this figure. The first is the large expansion region along the aft of the fuselage and the trailing edge of the wing. Also apparent is the large compression region along the leading edge of the outboard wing section. The compression is caused by the supersonic leading edge along the outboard wing section. The effect of this compression on the sonic boom footprint of the model will be discussed later in this section.
The Mach contours presented in figure 8, also for M,=2.0 and Cfl.05, show the effect of the nacelles on the surface Mach numbers for the Mach 2 model. Significant compression regio& are in- duced by the nacelles on the lower surface of the wing, causing an increase in case. The complex nature of the flow on the underside of the model due to the presence of the nacelles is evident in the figure. Bow shocks in front of the inlets can be seen to impinge on each other, and the neigh- boring nacelle. The effect of the inlet bow shock on the fuselage is evident. The bow shocks also weaken the expansion along the trailing edge of the wing.
relative to the nacelle-off
A plot of Ap/p, for a nacelle-off run at M,=2.0 and Cp~=O.05 is shown in figure 9. The signature was measured below the model at an h/L (distance from model in the centerplane normalized by the model length) of 0.651. The flat top signature generated by the first 60% of the model is a desirable low-boom characteristic, and was a goal of the design process. The computational results were obtained by sampling the flow-field at W . 2 0 and extrapolating to the h/L distance at which tunnel data were measured. The
161

computational results are in good agreement with experiment with two exceptions. First, the magnitude of the nose overpressure is low compared with experimental data. The strength of the nose shock dissiPatcs very quickly, and better results are obtained from measurements closer to the body. The grid structure shown in figure 4(a) shows that the flow-field grid is highly refined near the nose, but becomes relatively coarse at -.20. Second, the expansion along the aft portion of the fuselage is interrupted by a Weak compression of unknown origin. It is felt than an imperfection in the wind tunnel model may have caused the weak shock.
Tests conducted with the nacelles installed yielded a significantly different pressu~e-signature aft flat-top region (figure 10). A large shock appears in the data which was not anticipated during the design process. A closer look at the nacelle geometry (figure 3) shows that the leading edge is blunt, tapering down to a constant-diameter internal duct. The Mach contours from figure 8 clearly show that bow shocks are present in front of the nacelle inlets which affect the pressure signature at the centerline of the model. The computed magnitude of the pressure peak at the centerline caused by the nacelles was quite low in corn. .
parison with experiment. It was felt that the magnitude of the experimental pressure peak may have been caused by unstarted nacelle inlets.
A numerical study was undertaken to verify the cause of the strong shock in the experimental press^
signature. Two models were analyzed in which the nacelles were modeled as flow-through, and with blocked inlets. For these cases, M,=2.0 and CN=0.07. TranAir pressure signature measurements are compared with experimental data in figure 10. Again, TranAir results were computed at -.20 and extrapolated to W . 6 5 1 , where experimental data were measured These results show that the cause of the large shock in the signature is most likely due to flow blockage at the nacelle inlets. The flow-through case also has a significant compression along the model centerplane due to shocks from the inlets, though much lower in magnitude. TranAir predicts the shape of the pressure signature well, but underpredicts the magnitude of the compression at the centerplane caused by the bow shock from the nacelle inlets for the blocked-nacelle case. The smallest flow-field grid box in the vicinity of the nacelles measures about 0.03 in. in length in all three directions, which is equivalent to almost 400 grid points along the length of the body. However, this only corresponds to three boxes across the nacelle inside diameter, and less than seven across the outside diameter (figure 4a). This type of resolution will permit an adequate estimate of the flbw features at the inlet to compute global effe~ts'reasonabl~ well, but will not resolve the bow shock strength well enough to compute its proper contribution to the pressure signature in the flow field.
Two factors in predicting offbody pressure signatures for a complex configuration need to be bal- anced: the fineness of the grid required to accurately capture flow-field features away from the body, and the distance from the model at which data should be calculated in order to assure that the three-dimensional effects have been incorporated into the pressure signature. In making a computational prediction, these two factors may need to be compromised in order to obtain the most accurate computational solution within both code and machine limitations.

A series of shocks aft of the model appear in the measured data shown in figure 10. These are caused by the presence of the model-supporting hardware downstream. These smaller shocks eventually coalesce into one very large shock which begins to overtake the model tail shock, n-e downstream hardw= is not included in the TranAir analysis.
Previous results from CFD (ref. 3) indicated that the maximum overpressure for the Mach 2 model does not exist on ground-track. Instead, peak overpressures are found off ground-track. Experimental data for the Mach 2 model have verified this phenomenon. The surface contours in figures 7 and 8 show large compressions along the outboard wing leading edge indicating peak pressures in that region. A series of TranAir runs were made for the Mach 2 model with and without nacelles to evaluate the sonic boom foot- prints generated by the two configurations. Figure 11 shows the sonic b m footprints (Mach contours) at 0.20 body lengths from the Mach 2 model without nacelles for e 2 . 0 and angles of attack ranging from 1 to 5 degrees. The planform of the model is shown semi-transparent above the plane for visual reference. The sonic boom footprints for the model with nacelles are shown in figure 12. For both cases it is seen that a strong compression followed by a large expansion exists off ground-track. The compression is caused in large part by the supersonic outboard leading edge. The expansion originates at a point along the fuselage where the diameter begins tapering down, and propogates along the trailing edge of the wing. Plots of Ap/- on and off ground-track for the Mach 2 model without nacelles are shown in figure 13 for CH.08 at h/L=0.20. The corresponding plots for the Mach 2 model with nacelles are presented in figure 14. The off ground-track location is represented in degrees from the model centerline at 0.20 body lengths from the model. Comparing the two cases shows several differences in the signatures caused by the presence of the nacelles. The peak pressure on ground-track was increased significantly by the impinging bow shock from the inboard inlet. Peak pressures at all ground-track stations were increased to some degree by the nacelles. The expansion from the wing trai!ing edge was reduced slightly by the presence of the nacelles. This was caused by the interruption of the expansion from the fuselage and wing trailing edge by the inlet bow shocks.
CONCLUSIONS
The TranAir full-potential code, using a solution-adaptive grid refinement procedure on an unstruc- tured Cartesian mesh, was used to compute the aerodynamics and the offbody pressure signatures of the NASA Langley Mach 2 model, which was designed to produce a flat-top pressure signature on the ground for low boom considerations. Computational pressurr: signatures were calculated by combining TranAir offbody results with a quasi-linear extrapolation technique. Comparisons with experimental data on ground- track were in good agreement. The front half of the signature shows the flat-top that was one of the design goals. The presence of the nacelles causes several adverse effects. There are strong bow shocks from the nacelle inlets at I~Le2.0 which cause a strong compression in the pressure signature. TranAir runs with flow-through nacelles and blocked-inlets showed that the nacelles of the wind tunnel model were probably blocked. TranAir results showed a bow shock of significant strength for the flow-through nacelles which cause unexpected compressions in the pressure signatures both on and off ground-track. Off ground-track

pressure signature computations show that the maximum pressures in the sonic boom footprint for the Mach 2 model occur off ground track due in large part to the supersonic outboard leading edge. This is truebwith and without nacelles, although the bow shock from the nacelles increase the maximum pressure peaks a- tive to the nacelles-off case. To be a viable model, design modifications to the Mach 2 model will be neces. sary. The outboard leading edge must be made subsonic to alleviate the large compressions off ground- track. Also, the nacelles must be more carefully defined to minimize or avoid large bow shocks, which impacts peak pressures both on and off ground track.
REFERENCES
Mack, Robert J.; and Needleman, Kathy E.: A Methodology for Designing Aircrafr to Low Sonic Boom Constraints. NASA 734-4246, 199 1. Cheung, Samson H.; Edwads, Thomas A.; and Lawrence, Scott L.: Application of CFD to Sonic Boom Near and Mid Flow-Field Prediction. AIAA Paper 90-3999, 1990. Siclari, Michael J.; and Darden, Christine M.: CFD Predictions of the Near-Field Sonic Boom Environment for Two Low Boom HSCT Configurations. AIAA Paper 9 1 - 163 1,199 1. Page, Juliet A.; and Plotkin, Kenneth J.: An Eficient Method for Incorporating Computational Fluid Dynamics Into Sonic Boom Prediction. AIAA Paper 9 1-3275, 199 1. Cliff, Susan E.; and Thomas, Scott D.: EulerlExperiment Correlations of Sonic Boom Pressure Signatures. AIAA Paper 9 1-3276, 199 1. Madson, Michael D.: Sonic Boom Predictions for Three Generic Models Using a Solution- Adaptive Full-Potential Code. AIAA Paper 91-3278,1991. Haglund, George T.: HSCT Designs for Reduced Sonic Boom. AIAA Paper 91-3103, 1991. Whitham, G. B.: The Flow Pattern of a Supersonic Projectile. Cornm. Pure & Appl. Math., Vol. V, No. 3, Aug. 1952, pp. 301-348. Johnson, Forrester T.; et. al.: TRANAIR: A Full-Potential, Solution-Adaptive Rectangular Grid Code for Predicting Subsonic, Transonic, and Supersonic Flows About Arbitrary Cot& urations (Theory Dochn t ) . NASA CR-4348,199 1. Johnson, Forrester T.; et. al.: TRANAIR: A Full-Potential, Solution-Adaptive Rectangular Grid Code for Predicting Subsonic, Transonic, and Supersonic Flows About Arbitrary Co&g urations (User Guide). NASA CR-4349,199 1. Erickson, Larry L.; Madson, Michael D.; and Woo, Alex C.: Application of the TranAir Full- Potential Code to the F-16A. AIM J. Aircraft, Vol. 24, No. 8, 1987, pp. 540-545. Madson, Michael D.: Transonic Analysis of the F-16A with Under-Wing Fuel Tanks: An Ap plication of the TranAir Full-Potential Code. AIAA Paper 87-1 198,1987. Madson, Michael D.; Carmichael, Ralph L., and Mendoza, Joel P.: Aerody-c Analysis of Three Advanced Configurations Using the TranAir Full-Potential Code. NASA CP-3020, Vol. 1, Part 2, 1989, pp. 437-452.

14. Goodsell, Aga M.; Madson, Michael D.; and Melton, John E.: TranAir and Ezder Compm tions of a Generic Fighter Including Comparisons with Experimental Data. AIAA Paper 89- 0263, 1989.
15. Johnson, Forrester T.; et. al.: Application of the TranAir Rectangzdar Grid Approach to the Aerodynamic Analysis of Complex Configurations. AGARD Specialists' Meeting on Applica
. tions of Mesh Generation to Complex 3-D Configurations, Loen, Norway, 1989.
16. Chen, A. W.; Curtin, M. M.; Carlson, R. B.; and Tinoco, E. N.: TRANAIR Applications to - ~ngine/Airh-ame Integration. AlAA J. Aircraft, Vol. 27, No. 8, 1990, pp. 7 16-721.
17. Cenko, Alex; Tseng, Wei; Phillips, Kenneth, and Madson, Michael: TranAir Applications to Tramonic Flowjleld Predictions. AIAA Paper 9 1-020 1,199 1.
18. Madson, Michael D.; and Erickson, Larry L.: Toward the Routine Aerodynamic Analysis of Complex Configurations. Applied Computational Aerodynamics, edited by P. A. Henne, AIAA Progress in Astronautics and Aeronautics, Vol. 125, 1990.
19. Thomas, Charles L.: Extrapolation of Sonic Boom Pressure Signatures by the Wavefonn Pa rarneter Method. NASA TN D-6832,1972.
20. Samant, Satish S.; et. al.: TranAir: A Computer Code for Transonic Analyses of Arbitrary Configurations. AIAA Paper 87-0034, 1987.
2 1. Rubbert, Paul E.; et. al. : A New Approach to the Solution of Boundary Value Problems In volving Complex Configurations. Computational Mechanics -Advances and Trends, pub lished by ASME, New York, 1986, p. 49.
22. Melvin, Robin G.; et. al.: Local Grid Refinement for Transonic Flow Problems. 6th Interna tional Conference on Numerical Methods in Laminar and Turbulent How, Swansea, U.K. 1989.
23. Bieteman, Xlichael B.; et. al.: Solution Adaptive Local Rectangular Grid Refinement for Tran sonic Aerodynamic Flow Problems. 8th GAMM Conference on Numerical Methods in Fluid Mechanics, Delft, The Netherlands, 1989.
24. Hermstad, Dexter L.. RAID User's Guide. Sterling Federal Systems, Inc. Technical Note No. 33, Rev. 3, 1991.

1. Three-view drawing of the Mach 2 model.

2. Mach 2 model installed in NASA Ames 9 fi by 7 ft supersonic wind tunnel.
3. TranAir surface-panel definition of the Mach 2 model with flow-through nacelles.

4. 2-Dimensional cuts through TranAir solution-adaptive grid for the Mach 2 model with flow- through nacelles, &=2.0, C~=0 .07 .
a.Centerplane. b.Through wing and centerline of inboard nacelle.

- TranAir, w1Nacelles - - - - - TranAir, ~ /~Nacel les
5 . TranAir force and moment predictions for the Mach 2 model with and without nacelles, M42.0.
a.Lift vs. angle of attack b.Lift vs. drag c.Lift vs. pitching moment
- Flow-through Nacelles Without Nacelles
I
6. TranAir L/D predictions for the Mach 2 model with and without nacelles, &2.0.

7. Mach contours for the Mach 2 model without nacelles, M,=2.0, C ~ 4 . 0 5 .
8 . Mach contours for the Mach 2 model with flow-through nacelles, e 2 . 0 , C ~ a . 0 5 .

0 Experiment
'0° "r Tran Air
-.025
-.050 4 6 8 10 12 14 16 18 20 22
i X (in)
I 9. Pressure signature comparisons on ground-track for the Mach 2 model without nacelles, I h/L=0.65 1, M,=2.0, C~=0.05 . !
0 Experiment - Flow-through Nacelles .14r - - - - - Blocked Nacelles
2 4 6 8 10 12 14 16 18 20 22 24 26 X (in)
10. Pressure signature comparisons on ground-track for the Mach 2 model with flow-through nacelles, m.65 1, M,=2.0, C ~ = 0 . 0 7 .

1 1. TranAir sonic boom footprints for the Mach 2 model without nacelles, h/L=0.20, Moo=2.0.
12. TranAir sonic boom footprints for the Mach 2 model with flow-through nacelles, h/L=0.20, MWz2.0.

- On ground-track ........... 20 degrees off ground-track -.-.- 40 degrees off ground track - - - - - 50 degrees off ground track
-lo r --- 60 degrees off ground track
-.06 I I I I I I I I I I 2 4 6 8 10 12 14 16 18 20 22
X (in)
i
i 13. TranAir off ground-hack pressure signature comparisons for the Mach 2 model without nacelles, i
w.20, M-=2.0, CpO.08.
- On ground-track a . . . . , . . . . . 20 degrees off ground-track
40 degrees off ground track - - - - - 50 degrees off ground track
.10 r --- 60 degrees off ground track
-.w 1 I I I 1 I I I I I I 2 4 6 8 10 12 14 16 18 20 22
X (in)
14. TranAir off ground-track pressure signature comparisons for the Mach 2 model with flow-through nacelles, -0.20, M,=2.0, C ~ = 0 . 0 8 .

Page intentionally left blank

GROUND SIGNATURE EXTRAPOLATION OF THREE-DIMENSIONAL NEAR-FIELD CFD PREDICTIONS FOR SEVERAL HSCT CONFIGURATIONS
M.J. Siclari Grumman Corporate Research Center
Bethpage, New York 1 17 14
SUMMARY
A CFD analysis of the near-field sonic boom environment of several low boom High Speed Civilian Transport (HSCT) concepts is presented. The CFD method utilizes a multi-block Euler marching code within the context of an innovative mesh topology that allows for the resolution of shock waves several body lengths from the aircraft. Three-dimensional pressure footprints at one body length below three-different low boom aircraft concepts are presented. Models of two concepts designed by NASA to cruise at Mach 2 and Mach 3 were built and tested in the wind tunnel. The third concept was designed by Boeing to cruise at Mach 1.7. Centerline and sideline samples of these footprints are then extrapolated to the ground using a linear waveform parameter method to estimate the ground signatures or sonic boom ground overpressure levels. The Mach 2 concept achieved its centerline design signature but indicated higher sideline booms due to the outboard wing crank of the configuration.
Nacelles are also included on two of NASA's low boom concepts. Computations are carried out for both flow-through nacelles and nacelles with engine exhaust simulation. The flow- through nacelles with the assumption of zero spillage and zero inlet lip radius showed very little effect on the sonic boom signatures. On the other hand, it was shown that the engine exhaust plumes can have an effect on the levels of overpressure reaching the ground depending on the engine operating conditions. The results of this study indicate that engine integration into a low boom design should be given some attention.
Because of a renewed interest in the deployment of a fleet of High Speed Civilian Transports (HSCTs) during the first decade of the 21st century, NASA and industry are devoting a considerable amount of effort to the study of sonic booms that accompany supersonic flight. One of the priority economic issues in the development of such a fleet is whether overland flight is possible. Overland supersonic flight might significantly increase the profitability of a fleet of supersonic transports. NASA's High Speed Research Program is devoting a major effort to the area of sonic boom prediction.
Currently, efforts have focused on the use of careful area shaping to design low boom concepts. Computer codes currently in use for the design and analysis of low boom configurations are based on Whitham's modified linear theory analysis (Ref. I), which was extended to apply to lifting bodies by Walkden (Ref. 2).
Since the fust interest in supersonic transports in the early '70's, computers and computational capabilities have increased by orders of magnitude. Presently, computational fluid dynamics (CFD) codes can compute the complete nonlinear flow about an aircraft in minutes to an . hour on a supercomputer.

This paper describes the use of a supersonic marching CFD methodology to predict the near-field three-dimensional pressure patterns generated by candidate low boom designs. A very efficient three-dimensional Euler finite volume code is used for these predictions. Calculations were carried out using a grid topology that has been modified to reduce the inaccuracies caused by grid spreading often suffered with CFD methods when calculations several body lengths downstream become necessary.
Each aircraft design generates a unique pressure footprint much like a fingerprint. The present approach is to use the CFD code to predict the pressure footprint typically at one or more body lengths below the aircraft. At this distance, the flow disturbances will have become small enough such that a method based on linear theory will be valid and allow the extrapolation of this footprint to the ground.
In carrying out this procedure several issues still remain. It is still not clear how far from the aircraft to carry the computation so that linear theory will apply. There may not be any hard and fast rules in that the distance may be governed by several parameters such as Mach number and surface slopes. In Ref. 3, the computations were carried out to one, two, and three body lengths below the aircraft. These signatures were then extrapolated to the ground using the code of Thomas (Ref. 4), which uses a waveform parameter method for the extrapolation. The resulting signatures showed no significant differences in the level of the sonic boom although the shapes of the signatures showed some minor differences. Whether these minor differences are due to varying accuracy in the computations, or to three-dimensional effects of the flow field, is still not well understood. The one-dimensional extrapolation of these signatures naturally neglects all three-dimensional effects, and hence i t is important that these effects be diminished prior to using an extrapolation theory to the ground. As a result of the findings in Ref. 3, all of the computations presented in this paper were carried out to one body length below the aircraft.
FEATURES OF CFD METHOD FOR SONIC BOOM COMPUTATIONS
The present CFD method has been developed in the last several years by the author and is described in detail in Refs. 5 and 6. The technique involves solving the unsteady three- dimensional Euler equations in a spherical coordinate system using a central difference crossflow finite volume scheme within the context of an implicit marching technique. The equations are driven to a steady state solution at each marching plane using a multi-stage Runge-Kutta time integration scheme with local time stepping, residual smoothing, and multi-grid to accelerate convergence. The implicit nature of the marching scheme removes constraints in the axial step size other than those required for geometric accuracy. The scheme is very fast and requires little , memory, and hence computations on grids with a large number of points can be carried out quite easily. The computation is started by assuming a small conical nose based on the true geometric nose cross section of the vehicle. All shocks are currently captured within the context of this scheme.
Standard aerodynamic CFD computations are primarily concerned with the accurate prediction of the surface characteristics of the aircraft and, at most, the behavior of the flow field in the immediate vicinity of the aimaft. Sonic boom computations, on the other hand, require the resolution of the aircraft flow field, in particular, the shock wave pattern several body lengths downstream. For example, to predict the pressure footprint at just one body length below the aircraft, the computation must be carried out to three to five body lengths aft of the aircraft depending upon the freestream Mach number. The entire computation, for supersonic flows, is bounded by the bow shock generated by the nose of the aircraft. The distance between the bow shock and vehicle surface increases as a function of the axial distance from the nose of the vehicle. Given a fixed number of mesh points between the bow shock and inner boundary, this results in

poor resolution of the shock waves. There are several possible approaches to alleviate this problem. One is to increase the number of grid points in areas of the computation far from the nose of the vehicle and use a unique mesh stretching or adaptation that puts grid points in areas where they me most ~ e d d to resolve the shxks.
In this paper, a different approach is adopted that relies upon knowledge of the behavior of - the flow field and does not require hundreds of points between the outer bow shock and the inner
q boundary. Figure 1 illustrates the basic features of this scheme. The computation is camed out in the context of an axial multi-block scheme. The meshes of the block interfaces need not match. This allows for an increase in mesh points as the grid gets further from the nose of the vehicle. It also allows for discontinuities in geometry at grid interfaces to simulate inlets and exhaust flows. At the outer boundary, the mesh is adapted to the bow or outermost shock wave. This also conserves grid points. The outer boundary is self-adapted as the computation proceeds downstream. A difference in just one or two degrees at the outer boundary can cause a significant loss in grid points outside the bow shock and, hence, a corresponding loss in resolution. To avoid the large distance between the bow shock and inner boundary downstream of the aircraft, the inner boundary is modeled as a rotated Mach cone surface downsmam of .the sting or afterbody extension of the aimaft. The length of the sting will then dictate how far the computation can proceed downstream of the aircraft since the sting will eventually affect the recompression shock of the aircraft's signature. To achieve a signature one body length below the aircraft, the length of the sting will typically be one-half to one aircraft length long.
AIRCRAFT SllNG
MACH CONE WNSTREAM BOUNDARY
NON-MATCHING INTERFACES
SELF-ADAPTIVE OUTER BOUNDARY
02-0161413
Figure 1. Grid topology and features used for sonic boom computations.

NASA's LOW BOOM MACH 2 AND MACH 3 CONCEPTS
In Ref. 3, the signatures of NASA's Mach 2 and Mach 3 concepts without engine nacelles were computed using the present approach. Some details of the design of the wind tunnel models for these two concepts are presented in Ref. 7. Wind tunnel models of these two concepts were also built and tested. Both aircraft were designed to be about 300 feet in length. The wind tunnel models were built to lnOOth scale, making them about one foot in length. Figure 2 shows a comparison between wind tunnel data and computed signatures at one body length below the airmfk Good correlation was achieved for the forward part of the signature. The latter half of the measured wind tunnel signature exhibited two additional secondary shocks and a larger expansion in comparison to the computed results. The origin of these secondary shocks is still being studied.
Both the computed and measured signatures were extrapolated to the ground using the code of Thomas (Ref. 4). Figure 3 shows a comparison of these results. The Mach 2 concept was designed to cruise at an altitude of 55,000 feet and the Mach 3 concept at 65,000 feet. For both concepts, the extrapolated ground signatures from both the computation and wind tunnel data compared favorably. In the present study, a reflection factor of 1.9 was used in computing the extrapolated ground signatures. Also noted on the figures is the target design signatures for both concepts. The Mach 2 aircraft compared favorably with its intended target signature, whereas the extrapolated signature of the Mach 3 aircraft was well above its design target levels. The two concepts were designed for two different types of signatures: the Mach 2, for a flat topped or constant level signature prior to expansion, and the Mach 3, for a ramped signature. The discrepancy in design signature and extrapolated wind tunnel data and computation for the Mach 3 concept may possibly be attributed to the breakdown of linear theory at the higher Mach number and also possibly due to the inability of being able to achieve the ramped type of signature.
THE BOEING-911 LOW BOOM MACH 1.7 CONCEPT
Figure 4 shows the geometry of the Boeing-911 low boom Mach 1.7 concept. Also shown are the computed signature at one body length and the extrapolated ground signature for the aircraft at an altitude of 44,000 feet. This signature exhibits three shocks prior to the expansion. The fust shock is the nose shock and the second is the wing shock. The third shock prior to the expansion is most likely the sting shock. The fuselage geometry was truncated for the computation and fitted with a sting. The interesting aspect of this concept is that the character of the signature persists to the ground with very little coalescence of these shocks, at least according to the waveform parameter method used for the extrapolation. The Mach 3 concept indicated a higher degree of coalescence to an N-wave. The Boeing-9 11 concept based on the present computations indicates about a 1.5 lbs/ft2 overpressure.
Figure 5 shows some illustrations of the computed surface pressures for this concept dong with some pressure contours just aft of the configuration.
Figure 6 shows the three-dimensional pressure footprint of the aircraft in a plane one body length below the aircraft. Also shown are the centerline sampling and sideline signatures of the footprint. The double shock character of the centerline signature persists laterally. The third sting shock is localized to the vicinity of the centerline. Also, the highest signature overpressures are localized near the centerline and attenuate laterally. As will be shown in a subsequent section, the lateral and monotonic attenuation of signature overpressures is not always the case.
i ! i

MACH 2 MACH 3
0.06 0 DATA
i M = l 1 I 0.04
momsoom mom 7oom amm mom w#)# 700.00 800.00 00.00 m m 11mm m ~ ) a m X (FEET) X (FEET)
920161 014
Figure 2. Comparison of computed and wind tunnel pressure signatures at h/l=l for NASA's Mach 2 and Mach 3 low boom configurations.
i o m
h = 55000 FEET h = 65000 FEET
0 DATA - - EULER
820161415 Figure 3. Comparison of extrapolated ground signatures from computations and wind tunnel data at M=l for the Mach 2 and Mach 3 aircraft.

92-01 61 4 0 1
Figure 4. Computed and extrapolated ground signatures for the Boeing-911 Mach 1.7 low boom configuration.
- - P (LBSI FT~)
lJ
THE MACH 2 AND MACH 3 CONCEPTS WITH FLOW-THROUGH NACELLES
*L 0.02 I I i
-
-0.01 I I L
500 700 900.00 300.00 X (FEET)
Extending the study of Ref. 3 to include the effects of nacelles was the primary thrust of the present study. Figure 7 shows the Mach 2 and Mach 3 geometry with the original designed nacelle geometry used in the present computations. The nacelle geometry was the same for both. configurations. The locations of the nacelles were different; with the Mach 2 aircraft having the nacelles situated more closely to the underside of the aircraft. The nacelles were not staggered in the present study for computational convenience. The nacelles were basically axisymmetric. The first set of computations carried out was for flow-through nacelles. The computation assumed that all of the mass entering the face of the nacelles or inlet was completely swallowed. The exhaust assumed freeswarn and axial flow conditions.
2.00 I t -
-050 - -1.00 . -
I I i -150 -100.00 100 300 500.00
X (FEET) -
Figure 8 shows the pressure footprint computed with flow-through nacelles at one body length below the aircraft for the Mach 2 concept. The flow-through nacelles have only a minor effect on the pressure footprint and signatures in comparison to those computed in Ref. 3 without nacelles. Figure 8 also shows that the sideline signatures exhibit a higher overpressure than the centerline signature. This was found to be true in Ref. 3 and is caused by the outboard wing crank ; of the aircraft.
! In a similar fashion, Figure 9 shows the pressure footprint for the Mach 3 concept. The
flow-through nacelles on the Mach 3 aircraft also have only a minor effect on the signatures in

Figure 5. Surface pressures and downstream pressure contours for the Boeing-911 Mach 1.7 low boom configuration.

Y = 450 FEET Y--
MACH 1.7
h = 300 FEET
92-0161-017
Figure 6. Pressure footprint and sideline signatures at M = l for the Boeing-911 Mach 1.7 low boom aircraft.

MACH 3
Q2-0161412
Figure 7. Geometry of the NASA Mach 2 and Mach 3 low boom aircraft with four nacelles. 183

MACH 2
h = 300 FEET
Figure 8. Pressure footprint and sideline signatures at h/l=l for the NASA Mach 2 low boom aircraft with flow-through nacelles.

Figure 9. Pressure footprint and sideline signatures at h/l=l for the NASA Mach 3 low boom aircraft with flow-through nacelles.

comparison with those computed in Ref. 3 without nacelles. As with the Mach 2 concept, the Mach 3 aircraft also indicates higher sideline overpressures due to the outboard crank of the wing.
Figure 10 serves to show the effect of the wing crank on the sideline or lateral attenuation of peak overpressures that was first computed in Ref. 3. One can take the sideline signatures of Figures 8 and 9 and, using the Thomas code, extrapolate the individual sideline signatures to the ground with the appropriate hi' and azimuthal angle computed from these figures. These extrapolations naturally assume that three-dimensional effects have diminished and can be neglected in the one-dimensional extrapolation. If one then takes the peak overpressure and plots them versus sideline or lateral distance in miles, Figure 10 results. For the Mach 2 concept, the sideline signatures exhibit two shocks prior to expansion. Both peak overpressures were plotted in Figure 10 for the Mach 2 aircraft As indicated by this figure, larger overpressures occur in the sideline signams of this aircraft. These larger sideline overpressures axe primarily a three- dimensional effect due to the cranked outboard section of the wing, which may not be accounted for in the sonic boom minimization design theory. The same type of sideline overpressure plot is shown for the Mach 3 concept. The Mach 3 ground signatures exhibited primarily an N-wave type of behavior. Hence, only one peak sideline overpressure is plotted. Even so, slightly higher levels of overpressure are indicated off of the centerline trajectory of the vehicle.
Figure 10 can be very instructive in critiquing the design of a low boom aircraft. Both concepts have a greater than 1 1blft2 corridor of 50 miles (i.e., k 25 miles) approximately. Actually, the Mach 3 concept has a slightly smaller corridor, about 40 miles. The type of curves shown in Figure 10 could also be optimized to yield the smallest corridor of boom annoyance by designing a vehicle with the fastest lateral attenuation of maximum overpressure.
MACH 2 LATERAL DECAY OF SONIC BOOM MACH 3 LATERAL DECAY OF SONIC BOOM
-am -am -10.00 om 10.00 am am -30.00 -mm -10m 0.004 iom mm am Y(UILES) y w=)
920161.016
Figure 10. Sideline ground peak overpressure decay for NASA's Mach 2 and Mach 3 configuraiions without nacelles.
THE MACH 2 AND MACH 3 CONCEPTS WITH NACELLES AND EXHAUST SIMULATION
t I
In this section, a detailed study of the effects of the nacelles including the engine exhaust simulation is presented, along with more details of the computations cited earlier with nacelles.
186

The computation was carried out on seven grid blocks containing the following:
Block 1
Grid P o i n ~ 6,687 55,272 82,593 225,150 17 1,457 282,387 1,046.945 1,880,49 1 TOTAL
The mesh is described as (circumferential by normal by axial number) grid points. A total of 1.9 million grid points was used for the complete computation to yield the pressure field approximately one body length below the vehicle. The fist four grid blocks served to gradually increase the number of grid points and switch from a simple body grid to a wing-body grid as the computation proceeded aft on the vehicle. The fifth grid block contained the engine nacelles and the special grid developed for their geometry. The sixth block reverted to a wing-body grid containing the engine exhaust. The nacelles extended beyond the wing trailing edge which complicated the boundary conditions. The seventh grid reverted to a simple polar grid since the wing no longer existed, only the sting and engine exhausts. The engine exhausts persisted in the grid until the exhaust was extrapolated out of the grid when it intersected with the downstream Mach cone surface. The entire computation took approximately one hour on a Cray YMP computer.
As mentioned earlier, the inlets were initiated by assuming that all of the mass entering the face of the engine is swallowed or zero spillage is assumed. The exhaust of each nacelle was simulated by injecting mass into the flow and by assuming the flow was no longer isoenergetic. In other words, the enthalpy downstream of the engines was no longer assumed to be constant. The actual engine operating conditions for the Mach 2 aircraft obtained from NASA and used in the computation were as follows:
The exhaust pressure ratio for the Mach 2 aircraft is matched with freestream. These conditions lead to exhaust jets with approximately a 2.4 Mach number.
Due to the sparsity of mesh points within the engine exhaust itself, the details of the plume internal flow fields are not expected to be accurate. In addition, the engine exhaust mass is injected at the nearest grid points lying within the engine exit diameter. In other words, the grid does not conform to the circular exit of the nozzles and the circular geometry is only approximated within a locally Cartesian mesh.
Figure 11 shows the computational grid and computed pressure contours for the Mach 2 aircraft towards the back of the nacelles. Figure 12 shows the surface geometry of the Mach 2 concept with the engine nacelles. Figure 13 shows the simulated exhaust plumes issuing from the engine nacelles. The plumes were visualized by painting high Mach number surfaces within the flow field. In this case, Mach number surfaces greater that 2.15 Mach number were painted from the flow field.
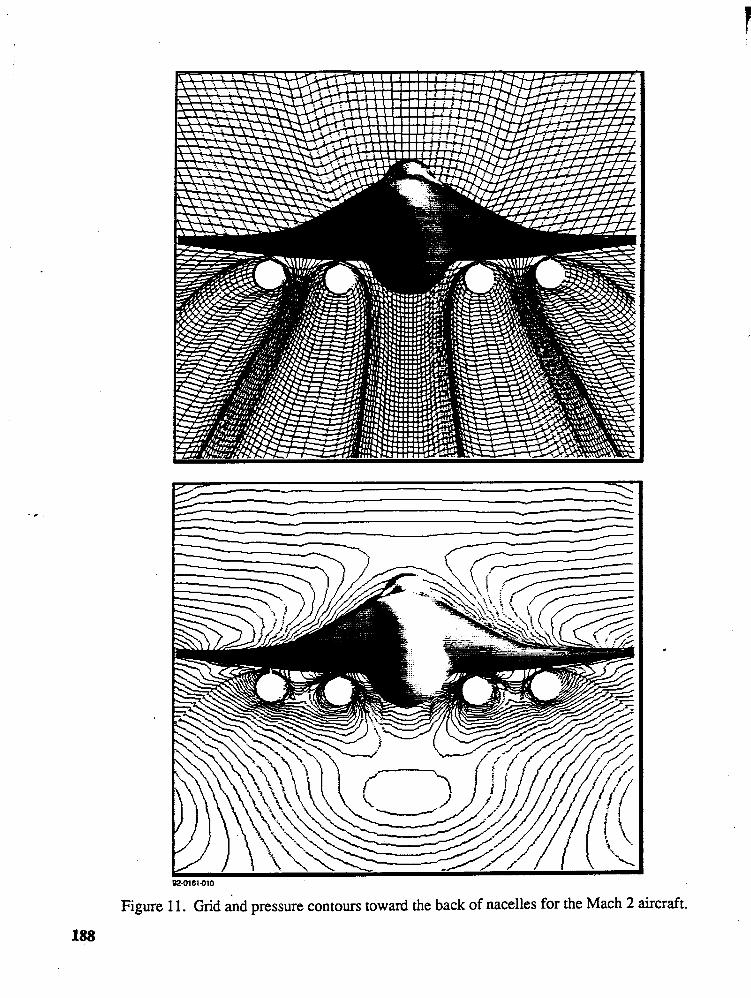
92-0161-010
Figure 11. Grid and pressure contours toward the back of nacelles for the Mach 2 aircraft.
188

Figure 12. Surface geometry with nacelles and pressure contours for the Mach 2 aircraft.
Figure 13. Pressure painted surface and high Mach surfaces in jet exhaust for the Mach 2 aircraft.
189

Given the above exhaust conditions with matched pressure ratio, it is not expected that a strong air shock or plume shock should develop due to a single jet exhaust. The plume air shock is typically generated by the coflow of air over the expanded plume boundary (i.e., for underexpanded jets). The combined effect of four engines in close proximity may lead to an amplification effect due to the interaction of all four plume air shocks with the sting shock and aircraft flow field. Figure 14 shows the pressure contours at stations aft of the engine exit plane. A shock is seen to develop below the engines that coalesces into a single shock extending to the lower symmetry plane of the aircraft.
The engine nacelles and exhaust simulation was also carried out for the Mach 3 aircraft using a similar block structure and number of grid points. The Mach 3 engine operating conditions were as follows:
The jet plume is slightly underexpanded and the jet exit Mach number for these conditions was computed as 4.92. As a result of these conditions (i.e., underexpanded jet and higher exhaust Mach number), it is expected that the engine exhaust for the Mach 3 aircraft will have a greater effect on the pressure field below the aircraft.
Figures 15 and 16 show the computational grid and pressure contours toward the back of the nacelles for the Mach 3 concept. The engines of the Mach 3 aircraft a not situated as close to the aircraft in comparison to the Mach 2 concept.
Figure 17 shows the exhaust simulation for the Mach 3 aircraft. The exhaust is depicted by painted surfaces with Mach number greater than 3.1. This yields some high Mach number surfaces on the leeward side of the aircraft. It is interesting to note that the aircraft flow field has a marked effect on the characteristics of the exhaust flow.
Figure 18 shows pressure contour plots at stations aft of the nacelle exit plane. For the Mach 3 aircraft a relatively strong shock quickly develops and surrounds all four nacelles. Further aft, a very complicated shock pattern develops as a result of the interaction of all four nacelles. The plume air external shocks also interact with the body sting shock. The shock system eventually moves away from the underside of the vehicle as a single strong shock in the vicinity of the symmetry plane with weaker shocks to the side.
Figure 19 shows the computed pressure footprint and signatures for the Mach 2 aircraft at one body length below the aircraft with nacelles and exhaust simulation. The effect of the exhaust can be seen in the centerline signature as a weak shock. This shock did not occur in the flow- through nacelle computation of Figure 8.
Figure 20 shows the computed pressure footprint and signatures for the Mach 3 aircraft at one body length below the aircraft with nacelles and exhaust simulation. The effect of the-exhaust flow can be seen more markedly in the centerline pressure signature. The exhaust conditions of the Mach 3 aircraft lead to a much stronger shock in the signature. The engine exhaust overpressure surpasses the level of the sideline wing crank shock Figure 20 can be compared to Figure 9 with flow-through nacelles. The effect of the engine exhaust is localized to the vicinity of the symmetry plane. The extent of this shock can be seen in the three-dimensional pressure pattern.

Figure 14. Pressure contours downstream of nacell
(4)
les with engines operating for the Mach 2 aircraft.

Figure 15. Grid and pressure contours toward the back of nacelles for the Mach 3 aircraft.

S2-0161003
Figure 16. Surface geometry with nacelles and pressure contours for the Mach 3 aircraft.

9SO161-MEI
Figure 17. Pressure painted surface and high Mach surfaces in jet exhaust for the Mach 3 aircraft.

S%0161005 (3) (4)
Figure 18. Pressure contours downstream of nacelles with engines operating for the Mach 3 aircraft.

MACH 2
h = 300 FEET
Figure 19. Pressure footprint and sideline signatures at M=l for the NASA Mach 2 low boom aircraft with engine exhaust simulation.

0.073 I MACH 3
Figure 20. Pressure footprint and sideline signatures at h/l=l for the NASA Mach 3 low boom aircraft with engine exhaust simulation.

The effect of the engine exhaust on the overall centerline signatures can be summarized by Figure 21. The solid lines represent flow-through nacelles and the dashed lines represent the effect of engines with plume exhaust simulation. The Mach 2 exhaust has only a minor effect on the near-field pressure signature but when extrapolated to the ground yields a secondary downskm shock with an overpressure magnitude slightly greater than the initial shock. However, the increment or delta is relatively small for this shock.
The Mach 3 exhaust shows a marked effect on the near-field signature in the form of a relatively strong secondary shock. When extrapolated to the ground, the shocks coalesce and the signature becomes a standard N-wave with an increase in overpressure from about 1.5 to above 2 lbslft2.
CONCLUSIONS
The present study has demonstrated that three-dimensional effects that may be neglected in standard sonic boom minimization techniques should be considered more carefully. It has been demonstrated that sideline boom overpressures can be higher than the levels occurring directly below the aircraft by as much as 25%. These higher sideline overpressures are primarily due to the &ed supersonic leading edge outboard panel of the wing. In addition to marginally accounting for three-dimensional effects, any form of linear theory may be inadequate in dealing with the class of strong shocks that occur for supersonic leading wings. These shocks violate the premise of linear theory.
Engine effects also were studied. It was found that for the class of nacelle geometry studied (i.e., underwing nacelles hung from pylons), the effect of nacelles alone (i.e., flow- through) did not significantly alter the sonic boom signature. The engine exhausts were also simulated. It was found that the effect of the exhaust on the signature and the generation of multiple plume shock waves interacting with each other and the surrounding aircraft flow field was sensitive to the engine operating conditions. For the Mach 2 aircraft with matched pressure exhaust and lower velocity ratio, the effect of the exhaust generated a relatively weak secondary shock in the signature just prior to expansion. On the other hand, the Mach 3 concept with a slightly underexpanded operating condition and higher velocity ratio, resulted in a much stronger
I secondary shock in the signature which coalesced with the nose shock to form an N-wave at the ground. Hence, it increased the boom overpressure by about 15%.
A lower Mach 1.7 Boeing-911 configuration was also studied and found to yield an overpressure at the ground of about 1.5 lbs/ft2. The Mach 3 configuration was designed to have a ramped type of pressure signature. The computed results for this aircraft did not yield a signature that exhibited the ramp shape of the target design signature. On the other hand, the Mach 2 and Mach 1.7 aircraft were designed for a flat topped signature. The target shape of the Mach 2 concept and overpressure levels was essentially achieved directly underneath the aircraft. On the other hand, the Boeing-911 configuration did not exhibit the target flat top shape and also exhibited higher levels than expected.

MACH 2 MACH 3
Figure 21. Comparison of h/l=l and extrapolated ground signatures for both flow-through nacelles and nacelles with engine exhaust simulation for the Mach 2 and Mach 3 configurations.

REFERENCES
1. Whitham, G.B.: The Flow Pattern of a Supersonic Projectile. Cornm. Pure & Applied Math.
2. Walkden, F.: The Shock Pattern of a Wing-Body Combination, Far From the Flight Path. Aeromutical Q., vol. IX, pt. 2, May 1958, pp. 164- 194.
3. Siclari, M. J. and Darden, C.: CFD Predictions of the Near-Field Sonic Boom Environment for Two Low Boom HSCT Configurations. AIAA Paper No. 91-1631, presented at AIAA 22nd Fluid Dynamics, Plasma Dynamics & Lasers Conference, Honolulu, HI, June 1991.
4. Thomas, C. L.: Extrapolation of Sonic Boom Pressure Signatures by the Waveform Parameter Method. NASA TN D-6832,1972.
5. Siclari, M. J. and Del Guidice, P.: Hybrid Finite Volume Approach to Euler Solutions for Supersonic Flows. AIAA J., vol. 28, no. 1, Jan. 1990, pp. 66-74.
6. Siclari, M. J.: Three-Dimensional Hybrid Finite Volume Solutions to the Euler Equations for Supersonic/Hypersonic Aircraft. AIAA Paper No. 89-028 1, presented at AIAA 27th Aerospace Sciences Meeting, Reno, NV, Jan. 1989.
7. Mack, R. J. and Needleman, K. E.: The Design of Two Sonic Boom Wind Tunnel Models from Conceptual Aircraft which Cruise at Mach Numbers of 2.0 and 3.0. AIAA Paper No. 90-4026, presented at AIAA 13th Aeroacoustics Conference, Tallahassee, FL, Oct. 1990.

LMTATIONS ON WIND-TUNNEL PRESSURE SIGNATURE EXTRAPOLATION
Robert J. Mack L&iglej; Research Center
Harnpton, VA
Christine M. Darden Langley Research Center
Harnpton, VA
SUMMARY
Analysis of some recent experimental sonic boom data has revived the hypothesis that there is a closeness limit to the near-field separation distance from which measured wind tunnel pressure signatures can be extrapolated to the ground as though generated by a supersonic-cruise aircraft. Geometric acoustic theory is used to derive an estimate of this distance and the sample data is used to provide a preliminary indication of practical separation distance values.
INTRODUCTION
Whitham's body of revolution flow field prediction theory, reference 1, and Walkden's extension to lifting wing-bodies, reference 2, have enabled engineers and designers to predict wind-tunnel flow-field pressure and ground-level pressure signature characteristics from research models and supersonic aircraft for the past thirty years. Initially, comparisons between wind-tunnel measured signatures and theor&ically predicted signatures varied from good to poor. Good agreement between theory and measured data was found to depend on Mach number, configuration complexity, model attitude, and the ratio of measurement distance to model length. Corrections to effective length for angle of attack removed one major source of disagreement, and a linear-theory restriction on area-rule volume computations to Mach numbers less than about 3.0 took care of another. With the introduction of a modified linear theory wing analysis code, reference 3, the degree of good agreement improved even more due to the empirical technique used to account for nonlinear Mach number and wing thickness effects. Thus, it became possible to use the Mach-slice area-ruling feam of a wave drag code, reference 4, a modified linear theory lift analysis code, reference 3, and a corrected nacelle-wing interference lift code, reference 5, to calculate total equivalent areas from descriptions of wing, fuselage, nacelle, fin, and other components of complex wind-tunnel models and conceptual supersonic cruise aircraft. Then, good predictions of wind-tunnel and of ground-level pressure signatures were obtained using the Hayes' stratified- atmosphere propagation code, ARAP, reference 6.
A second method, reference 7, for obtaining ground-level signatures uses a pressure

signahue measured near the wind tunnel model which is convened to an equivalent F-function. The Hayes' ARAP propagation code uses this F-function as an input, and predicts the gr0und-1~~~ overpressure signature.
A third method of obtaining ground-level signatures, presented by Thomas in reference 8 9
is a variation of the second method. A wind-tunnel pressure signature, measured under the model, is expressed in waveform parameters and then extrapolated through a stratified, standard atmosphere from a short distance under the aircraft at cruise altitude to the ground. This method also obviates the need for the detailed geometrical descriptions of the aircraft and for the analytical codes which calculate equivalent areas from volume and lift distributions. Since both the Thomas method and the Hayes' method assume that the disturbances are propagated in a two-dimensional .
manner, both give similar results.
A fourth method employs an Euler, a Full potential, a Parabolized Navier-S tokes, or some similar higher-order Computational Fluid Dynamics, CFD, code to calculate a pressure signature . .
close to the model or aircraft. Then, as with the previous method, this signature is extrapolated to
the ground through a stratified, standard atmosphere by the ARM or the Thomas propagation codes.
With the design and construction of larger, more complex wind tunnel models to capture more aircraft details, and the increased use of CFD codes to predict near-field overpressures, a question surfaced concerning the minimum separation distance to insure that an extrapolated pressure signature would accurately represent a measured ground-level overpressure signature. it arose from numerical and computational requirements imposed by the development of these new CFD codes, from the size of these new, larger, more sophisticated wind tunnel models, and from the cross-section area of existing wind-tunnel test sections. The purpose of this paper is to explore the acoustical, mathematical, and aerodynamic nature of the problem to obtain a clear understanding of the situation, and to obtain some realistic boundaries and boundary parameters for workable answers to the problem. Wind-tunnel data will be used to support the hypothesis that limits are necessary, and as guidelines in support the analytic/empirical prediction of near-field limits on wind tunnel model-probe separation distances.
SYMBOLS
b wing span, ft
CFD Computer Fluid Dynamics
F(x) Whitham F-function
h distance in z-direction from wing apex or body nose to field line, in or ft
1 wing lifting length or root chord length, ft

M Mach number
P free-stream ambient pressure, psf
4 p increment in pressure due t~ mode!lzirmft flow f eld, psf
r radius of the Mach cone touching the wing tip trailing edges with vertex along a iine at distance h, ft
x distance along the longitudinal axis, in or ft
XI, x2 distance, in x-direction, to the Mach cone vertices from the wing apex, ft
Ax difference in lengths, x2 - XI, ft
Y distance normal to the x-axis in the wing spanwise direction, ft
z distance normal to the x-y plane, ft
a angle of attack, degrees
P Mach number parameter; J M ~ - 1.0
Y ratio of specific heats, 1.40 for air
rl normal distance between the local span line and the Mach cone touching the wing
tips (see figure 8), ft
CL Mach angle, sin-' (1.01 M), deg
WLND TUNNEL MEASUREMENTS AND EXTRAPOLATIONS
An analysis of some recent experimental data demonstrated that the question of a minimum initial pressure measurement distance for the extrapolation of pressure signatures needed to be resolved. The experimental data were signatures measured from models designed to generate specially-shaped pressure disturbances meant to persist in form, but not strength, from cruise altitude to the ground. Figures 1 and 2 show samples of these wind-tunnel pressure signatures measured in test section one of the Langley Unitary Plan wind tunnel.

Figure 1. Pressure signature from the Mach 2.0 model at M = 2.0 and h = 6.0 inches
In figure 1, the signature was measured at six inches, (about 0.50 body length or about 0.94 span length), while in figure 2, it was measured at twelve inches (about 1.0 body length or about 1.88 span lengths).
0.0 8.0 16.0 24 .O x , in.
Figure 2. Pressure signature from the Mach 2.0 model at M = 2.0 and h = 12.0 inches
Test conditions for these signatures were a Mach number of 2.0 and a Reynolds number of 2.0 million per foot. The code developed by Thomas, reference 7, was used to predict the signature at twelve inches when extrapolated from one measured at a distance of six inches. In 1
i
figure 3, the extrapolated signature and the measured signature at twelve inches are compared. I I I !

x / 2 Figure 3. Comparison of the signature measured at twelve inches to the signature measured
at six inches and extrapolated to twelve inches, M = 2.0.
The two signatures agree very well near the nose. However, aft of x 11 = 0.4 , differences suggest that some of the three dimensional features of the flow field found at six inches have coalesced and merged. However, the extrapolated signature does not display this to the same degree as the measured signature. Next, the wind tunnel pressure signatures were treated as though they were measured at one-half and one body lengths below a full-sized aircraft and extrapolated from a cruise altitude of 55,000 feet to the ground, using the Thomas code. The signatures obtained are shown and compared in figure 4.
from one body length - - - -
Figure 4. Comparison of pressure signatures measured at one-half and one body length, extrapolated from cruise altitude to the ground, M = 2.0 .
The two extrapolated pressure signatures show similar overall features. Again, there are differences that suggest that they came from aircraft with similar, though slightly different,

geometry. In figure 5, these extrapolated wind tunnel signatures are compared with a theoretical signature obtained from a sonic boom analysis of aircraft geometry which included only its fuselage-wing volume and lift contributions.
Extrapola led from 112 body length from one body length - - -
Figure 5. Comparison of extrapolated and predicted ground pressure signatures, M = 2.0 .
Three similar yet noticeably different signatures are seen. Since the same atmosphere was theoretically traversed by each pressure signature, the unique shape of each pressure signature suggests that perhaps different F-functions were calculated and extrapolated, or different pressure signatures were measured and extrapolated.
Since the F-functions were derived from measured pressure signatures, and the measurements were taken at two different separation distances, it would be logical to assume that the separation distance is a factor. Close in, three dimensional flow features permeate the shock and pressure field, while further away, some shock coalescence and flow smoothing has take; place. A further consideration arises from the shock waves of a sufficient strength, Ap/ p > 0.10, (usually this ratio is less than about 0.02 on wind tunnel signatures) to be outside the theoretically small disturbance limitations of the prediction and propagation methods developed by Whitham and Hayes. This consideration would not apply in this case since the overpressures shown in figures 1, 2, and 3 do not exceed the aforementioned disturbance threshold.
Another factor to be considered in the analysis is the effect of Reynolds number. The wind tunnel tests were conducted at a unit Reynolds number of 2.0 million per foot. At a cruise altitude and a cruise Mach number of 55,000 feet and Mach 2.0 , the unit Reynolds number is about 1.87 million per foot, a difference in unit Reynolds number which is relatively small. However, the scale factor between the model and the aircraft is 1.0 : 300.0. So the displacement thickness and volume

on the model is disproportionately large compared with that on the full-scale aircraft. Any extrapolation of extreme near-field wind tunnel overpressure signatures to obtain ground pressure signatures will carry these scale effects as well as fuselagelwing-lift three-dimensional effects and exaggerate their infiuence. I I ~ m e i , ex~apo!ation of wind tur?~~,! presstire signatures can done after the signatures which have been measured at reasonable distances have been corrected to full- scale Reynolds number conditions, a commom treatment for force-model data.
A final point to be considered concerns the engine nacelles even though they were not on the models whose signatures are shown in figures 1 to 5. These components are very small because the aircraft model is small. Even the largest sonic boom models are only about twelve inches in length and six inches in span. Their finite-strength shock waves in the extreme near field come directly from the inlet lip and from shock wave reflections off of the lower surface of the wing. They are discrete-disturbance bodies in the flow field of the wing-fuselage which have tailored, blended, and distributed-disturbance surfaces. Since they are usually well aft on the aircraft, their pressure disturbances are closer to the measurement probe than the nose and forebody because of wing-fuselage camber and model angle of attack. In the extreme near field, they generate prominent, superimposed waves; in the mid-field and cruise distance-field, their shock waves attenuate rapidly and blend gradually into a quasi-two dimensional wave pattern. While the nacelles are important, the wing lift will be the primary subject of this paper because it is the dominant source of pressure disturbances from the aircraft. However, some comments on the magnitude and effect of the disturbances produced by the nacelles will be forthcoming later.
THEORY
Whitham's body-of-revolution theory, and Walkden's extension of this theory to wings at lifting conditions, were the basis of a method for predicting the disturbance felt on the ground from the flow field disturbances of an aircraft cruising at supersonic speed. The method was based on a thin, slender aircraft, small induced shock and pressure disturbances, low to middle supersonic range Mach numbers where real gas effects are negligible, and the observer being far from the flight path. This last condition assures that the pressure disturbances perceived by a ground observer were propagating in a two-dimensional manner through the atmosphere.
Although these conditions are met with an aircraft at cruise altitude with the observer on the ground, not all are met when a static pressure probe is in close proximity to a wind-tunnel model. If the model is a slender body of revolution aligned with the flow, these condition are met at very close distances because the body diameter is small relative to the measurement separation distance, the pressure disturbances are small compared with the ambient pressures, and the body is not developing lift. It is the presence of lift as well as volume on a wing-body model that causes three-dimensional, near-field flow features such as vortex flow, local separation and reattachment, boundary layer transition, etc. that are not handled accurately by the two dimensional extrapolation

applied to data measured in the extreme near-field.
The cylindrical propagation model presumes that all disturbances are about equally distant ; from the observer. With the observer in close and the aircraft or model at finite angle of attack, the disturbances from the aft end are disproportionately represented. At a mid-field rather that a near- field distance, these three-dimensional characteristics of the flow field blend and merge so that the characteristics of the real propagation field more closely agree with those of the theoretical propagation model. This limitation is accounted for in sonic boom analysis using the ARAP code, where the initial signal at three body lengths assumes a cylindrical mode of propagation.
Extreme near-field pressure measurements can also produce a second source of error. Pressure disturbances from model or aircraft volume and lift effects that are felt at a point in the flow field are bound within a limiting characteristic surface usually represented by a Mach cone. With the observer on the ground, this cone extends so far that the section of its surface that intercepts the aircraft is essentially flat. Thus, far-field Mach slicing planes can be used in the analysis of cruise aircraft sonic boom characteristics. The wind-tunnel conditions, on the other $
hand, are near-field, depending on model size, so the Mach-cone surfaces "passed" through the model to obtain a distribution of the disturbance sources are very curved. Figure 6, a two-view of a slender aircraft in supersonic-cruise flight can be used to illustrate these ideas.
Infersect ions
2 14 2/2 ---
[so 1 - - - - - - -
Figure 6. Two-view of aircraft in supersonic cruise flight.
Observers or probes beneath the aircraft and along a Mach h e from the wing trailing edge I
will see disturbances forward of the indicated Mach cone-wing intersection curves; Mach cones 1 I
whose vertices are at the three indicated distances and on the Mach line. The additional disturbance i !

sources that are felt as the observer moves further away will show in the character of the calculated F-function or on the measured pressure signature. This is especially important since the aircraft designer with low sonic boom constraints is using the ground reference plane which is about 180.0 body lengtirs ciistani. In contrast, wind tunnei measurements aie i&~i i a: scpiifation distances of one-half to three or so body lengths. So, a Whitham F-function derived from these near-field, ~ach-cone intercepted areas will not be the same as a Whitharn F-function calculated from planar, far-field, Mach-plane intercepted areas, will not give the same signatures, and will not conform to the framework of Whitham's method except in an approximate way. A simple example will illustrate this point. It will also serve as a basis for establishing limits on the near-field distance used to obtain overpressure signatures that can be reliably extrapolated from cruise altitude to the gound.
The lift from an extended wing surface is the dominant disturbance contribution on an aircraft or a wind-tunnel model of a supersonic cruise aircraft. At cruise conditions, the equivalent area due to lift can be eight to ten times larger than the equivalent area due to volume at the aft end of the aircraft. To focus on the area-rule treatment of the lift distribution in this analysis, a conceptual low-boom configuration at cruise conditions has deliberately been simplified to a thin, uncambered wing with zero dihedral. Camber, twist, dihedral, and airfoil thickness would add realism, but not clarity, to the picture and have been omitted. The wing at a low angle of attack is shown in figure 7 along with some near-field wave characteristics.
Figure 7. Slender wing at angle of attack in supersonic flow.
The simplified wing has all the essentials for examining the treatment of the lift distribution because it now depends only on planfonn shape. The flow field characteristics which focus at the

vertices have complex curvature due to local pressure perturbations. However, to keep the analysis simple, these characteristic surfaces will be assumed to have the shape of Mach cones. Note that the Mach cone that intersects the wing root chord trailing edge intercepts only part of the total lifting pressures. When this Mach cone moves a short distance aft, it touches both tips and encompasses all the lifting pressures. Now note, as was mentioned in figure 6, that a Mach cone with its vertex at a hundred or more span lengths away intercepts all the lift as it lays tangent with the first Mach cone position. In what follows, the ramifications of these observations will be explored. A three view drawing of this sketch, figure 8, is presented so that the methods used in the analysis of the longitudinal lift distribution can be easily explained.
Figure 8. Three view of lifting wing in supersonic flow.
The front view shows the intersection of the wing-tip Mach cone, vertex at x2, with a plane normal to the x-axis which touches the trailing edge of the wing tips. A projection of this Mach i
I cone into the x-y plane, including the lines through vertex point x t , is seen in the top view. i ,
The side view shows the wing-tip Mach cone projection onto the x-z plane intersecting the x-axis at x2 , the wing root chord, and a Mach line from the wing's root chord trailing edge to the point xl where it crosses a line parallel to the flow velocity vector at a measurement distance, h. Wing geomeay and acoustic characteristic lines shown in this three view are used to describe the flow field characteristics felt by an observer in the near- and far-field. I

Since each view is a projection onto aplane, the Mach cones appear as lines. This simplifies the discussion of both near-field and far-field characteristics. In the far-field, the curvature of the Mach-cone surface passing through the wing is almost W t e i.e. the surfaces used to "slice" the wing are nearly pianar. h the near-iieid, the important intersections of the Mach cone with the wing are well defined. The distinctive features of both the near-field and the far-field are used to determine areasonable distance at which theoretical or experimental signatures can be extrapolated with accuracy and confidence from under the aircraft to the ground.
A Mach cone with its Vertex at xl intercepts the wing at the trailing-edge of the root chord; at points on the wing ahead of the trailing edge, the intersection of the Mach cone and the wing surface is a conic curve. Thus, some of the wing's outer volume and lift-disturbance sources are not felt at xl as seen in figure 8. However, the Mach cone that just touches the wing tip trailing edges, where the lift growth has reached its maximum level, has its vertex at x2. Using acoustic theory to keep the mathematics and physics simple, the longitudinal distances to these field point locations noted in figure 8 are:
X I = lcosa + B(h-lsina)
and
x2 = lcosa + pr
there
r2 = ( b / ~ ) ~ + ( (h - lsina) 2,
Clearly, x2 is greater than xl ; the difference depending on the Mach number, the angle of attack, the distance, and the whg span. At the distance, h , from the model/aircraft, the incremental length, Ax , which is the distance between the the vertex of the Mach-cone touching the tips and the Mach-plane touching the root chord trailing edge can be represented by the equation
While this distance increment could be used to measure the differences between near-field and far-field wave characteristics, a more reasonable measure of the local Mach cone curvature can be estimated from q , the normal distance from the local span line to the Mach cone

span, line at
If the separation, h , b , the wing chord, 1 separation distance,
, is sufficiently large, this distance should be small relative to the Q* j , or the wing root chord projection, lcosa . Along the observations h , and parallel to the x-axis, both the mid-field and the far-field F, i
functions would be similar and resemble the measured disturbance if it were further away than ! !
some limiting distance which will be derived in the Discussion. Beyond this limiting separation I
distance, an extrapolation of the near-field F-function or its counterpart derived from a near-field . pressure signature using
F (x) = -
i taken from reference 1, would provide a reasonably accurate estimate of ground
I
overpressures or the corresponding noise loudness. Although this discussion and the derived equations are somewhat simplified, they are based on experimental data, figures 1 and 2, and highlight the need for measuring data at separation distances which are consistant with the limitations of the applicable propagation theory.
Whitham derived the F-function and the corresponding characteristic equation on the basis of far-field assumptions. Experience has demonstrated that both can be used in the mid-field and in some near-field situations if certain slenderness conditions are met. Using equation (5) to determine criteria for minimum measurement distances is very empirical since it is derived from geomemcal acoustics. A wing having camber, twist, dihedral, and a trailing edge with forward or , rearward swept sections would not fit neatly into this model framework. However, at distances along the root chord and forward of the trailing edge, local span lines would approximate a wing section where equation (5) would apply if the wing camber and twist were not severe. The aeroacoustic modeling of the wing and the Mach ray paths aft of this point would be more complicated, but would not refute the physical situation described by equation (5). Further, the measured extrapolated, and predicted pressure signatures presented in the Wind Tunnel Measurements And Extrapolations section, figures 1 to 5, show that most of the contributing flow field features associated with lift have already been identified. Thus equation (5) is useful because its derivation is straightforward and because it can be applied almost anywhere if the model or aircraft is as slender as required by high aerodynamic efficiency and low sonic boom requirements. In the Discussion section which follows, these equations and ideas will be developed further. I
DISCUSSION
The need for determining proper near-field measurement distances so that wind-tunnel or theoretical pressure signatures can be extrapolated has been outlined and demonstrated in the

previous sections. There is no doubt that the extrapolation method is useful when a complete description of the model is unavailable, the machining inaccuracies are difficult to account for, or the modeVaircraft scale factor is large (as it usually is with sonic boom models). The question is, as it was stated earlier: How smaii can modei-probe separation distances be to insure that the measured pressure signatcres are mostly two-dimensional in nature so as to maintain the extrapolation methodology from modeVaircraft to the field-pointlground observer?
Begin the answer with equation (5) from the previous section. Substituting equation (3) into equation (5) and nondimensionalizing with b , the span, gives -
This can be simplified by assuming that, at typical aircraft attitudes,
h n lsina
which is not an unusual flight or test condition. Using a binomial expansion, equation (7) can be simplified and expressed as
whichindicates thatit is span rather than length which isof first-order importance.
To judge how well equation (8a) approximates equation (7), a comparison of q/b values calculated from equation (7) and (8a) are shown in figure 9 for M = 1.6, 1 = 300.0 feet, b = 160.0 feet, and a = 2.0 degrees.

0 1 1 ! I I I I
0 I 2 3
h // b
Figure 9. Comparison of q/b values from equations (7) and (8a). M = 1.6 .
The Mach number in equations (7) and (8a) is seen to be a strong influence on the value of I I
q/b , but the values obtained from the two equations disappear after a separation distance of about ; 0.75 span lengths. A comparison of q/b values calculated from equation (7) for three cruise Mach 1 numbers are shown in figure 10 for the sample conceptual aircraft with 1 = 300.0 feet, b = 160.0 feet, and a = 2.0degrees. L
I
.15
1 = 330.0 f t
Figure 10. Comparison of results from equation (7) for Mach numbers of 1.6, 2.0, and 2.4. I

At increasing Mach numbers, the condition that q/b be small will be increasingly more difficult to meet for a distance, h , found in wind tunnel test sections which will be between one sr-d ten span lengths (ahout one-half and five body lengths). Aircraft length is seemingly unimportant but enters implicitly through the high-aerodynamic-efficiency-cruise condition that the span/length ratio, br' , be small; usually it is about 0.50 or less.
Since aircraft length, 1 , can be replaced by the more general length, x , when the span is interpreted as the local span, b(x) , equation (8) permits local span conditions to be readily calculated and some conclusions to be made. Figure 11 shows the change in q/b along the longitudinal length of a delta wing when 1 = 300.0 feet, h = 150.0 feet, b =160.0 feet, M =2.0, and a = 2.0 degrees. For comparison, the values of q/b on an uncambered Mach 2.0 wing are also shown. Note that in this example, h / 1 is 0.5, a typical near-field condition.
0 I00 200 300
x , ft
Figure 11. Variation of qlb along a delta wing and a flat Mach 2.0 model wing.
It should be noted that the delta wing will have more area than the Mach 2.0 wing and will therefore generate more lift at the given angle of attack, a , of two degrees. However, the differences between extreme near-field and far-field conditions under discussion are based on wing geometry rather than lift.
The desired condition that q/b or q/l be small is usually met at the nose of the aircraft because the local span is much less than the full span. Moving rearward along the aircraft, the local span increases reducing the value of the ratio, b/h , and increasing the magnitude of q/b , an effect more noticeable on the delta than on the Mach 2.0 aircraft wing. Predictions of overpressures near the nose from far-field codes would be in good agreement with measurements because the

comsponding part of the F-function would be appropriately mid- to far-field. As the wing leading edge sweep decreases, the rapid build-up in span and lift alters the nature of the F-function intended for extrapolation. The F-function changes, as the length increases, from one that is mid- to far- field, to one which is more near-field, providing an extrapolation F-function which would push the limits of propagation theory accuracy.
These results have provided information and a method to answer the questions. How small a separation distance is permitted to assure accurate and reliable extrapolations from cruise altitude to the ground? One possible level of certainty could be obtained from selecting a "curvature" limit, q/ b , such as
q/b = 0.01
which gives, using equation (8a)
or from equation (8b)
Applying this to a body of revolution at zero angle of attack such as a 4.0 degree semi- vertex angle cone in Mach 2.0 flow, the span, b , would be replaced by the maximum cone I
! diameter. Using h/l as a parameter because the cone has no "span" leads to the value 1
I
h/l= 1.514
For the aircraft with dimensions given in figures 9,10, and 11, the value of M obtained is
M = 5.774
This one-percent-of-span limit is very restrictive and may be a more demanding limit than can be met in most supersonic flow test sections. However, it does provide a reasonably conservative value of a limiting distance.
A second possible level would be a more lenient value of q/' such as
Axb = 0.05
which results in

For the four-degree semi-vertex angle, slender cone example, this results in
while for the sample aircraft dimensions
The five-percent-of-span requirement is much less demanding and is within the measurement limits of the larger supersonic wind tunnel test sections. An in-between value of
would insure that the desired propagation characteristics would be adequately maintained while allowing latitude for test section and CFD code limitations. This value, using dimensions from the example aircraft at M = 2.0, gives
a value which can be met in many of the larger supersonic-flow wind tunnel test sections.
These are arbitrarily selected values which were used because of the sparsity of experimental data. If the available data, figure 5, is pressed into service, some very tentative indications can be found. In figure 5, the values of h / 1 for each signature are 0.5, 1.0, and 171.9, with the corresponding values of / b being 0.1 187,0.0596, and 0.0003 respectively. The agreement between the signatures is good only for about the first one hundred feet. The value of q/b which corresponds to this length (see figure 11) is about 0.016 to 0.020 , not a strong recommendation for extrapolations of pressure signature measured at one or less body lengths. However, much more data is needed to verify such a call for separation distances of three and more body lengths ( six and more span lengths).
This method was derived from simplified geometrical acoustics and therefore is empirical in its form as well as conservative in its predictions. Very likely, a more exact, higher-order method which accounted for flow-field disturbance strengths would yield similar but even more restrictive

predictions. This higher-order method would use multiply-curved characteristics surfaces which would trace the propagation paths originating from the compression and expansion regions. No matter what separation distance is chosen for the measurement of pressure data, this method can provide, using equation (7) or @a), a numerical evaluation of how closely the wind tunnel data is approximating a two-dimensional propagation wave-form and how credible an extrapolated ground-level pressure signature can be expected.
COMMENTS AND QUALIFICATIONS
The Whitharn F-function has been refered to several times in this report because it acts as the disturbance potential of an equivalent body of revolution which represents a real body of revolution, a wing, or even an aircraft in supersonic flight. This F-function can be calculated if a full description of the geometry is available, and if an accurate lift distribution can be estimated from the geometry should the wing-body be at a lifting attitude. It can also be derived from a pressure signature measured at a separation distance where three dimensional flow features have, for the most part, settled out. Flow field disturbances at various distances can then be predicted from this F-function in the various wave propagation theory, altitude, and atmosphere models. The key point in this discussion is that the same F-function be used throughout the flow field between the aircraft and the ground to obtain predicted pressure signatures.
It is with these theoretical and experimental limitations as a base that equations (7) and (8) were derived. Obviously, the value given to 7\/b or q/l can be relaxed further than those mentioned, but these larger values and corresponding less-accurate representations of the mid-field or far-field ground observer's F-function introduce an increasing loss of accuracy.
A similar discussion could be directed toward the area-rule treatment of the interference- lift produced on the wing lower surface by engine nacelles. Without going into more details than have been presented, the nacelles generate discrete pressure disturbances which will require a different limiting distance before they blend into the established wing-fuselage pressure signature . pattern desired by the aircraft designer. The shock waves generated and their reflections off the I
wing lower surface will merge and coalesce only after spreading outward for several span lengths. i
Thus, the distances suggested in this paper are conservative near-field estimates and measurements at distances farther away are definitely desireable. i
Reynolds number effects will have to be treated in a manner similar to that used to correct wind tunnel drag data. The CFD code that best predicts the pressure signatures at the wind tunnel Reynolds number will be used to predict the pressure signature at free flight Reynolds number at a suitable separation distance. This pressure signature could then be extrapolated to obtain a ground signature which would be representative of those generated by the real aircraft in supersonic cruise mode.

CONCLUDING REMARKS
A need to determine limits on near-field separation distances at which experimental pressure signatures will be measured for the purpose of extrapolation from aircraft to the ground has been discussed and established. Empirical means for estimating these limits were derived from simple models and first-order acoustic theory and were shown to depend primarily on the local or total wing span, b , the distance from the wing or model/aircraft nose to the field line, h , and the Mach number through the parameter, P . A second-order dependence on the wing.length, 1 , and the effective angle of attack , a , was shown to be of lesser effect except at extreme near-field distances in very close proximity to the wing or lower body surface.
The results of this study cast some doubt on the accuracy of ground-level signatures obtained by extrapolating experimental signatures measured at 1.0 or less span lengths, h / b , from the rnodeVaircraft. Limits obtained in the discussion indicated that one to two body lengths for a slender body of revolution and from 9.0 to 13.0 span lengths, depending on Mach number, are needed to permit the three-dimensional aspects of the Mach-cutting surfaces sufficient distance to decrease in curvature so that the equivalent area growth stays within the limitations of two- dimensional propagation characteristics. These separation distances were obtained from arbitrary and conservative limits on the "curvature" parameter q / b . It was also shown in the discussion that more lenient values of this parameter might permit usable signatures as close as 4.0 to 5.0 span lengths (about 2.0 to 2.5 body 1engths)depending on Mach number. However, the brief discussion of nacelle integration effects on near-field pressure measurements added emphasis to the recomendation that measurement distances should be as large as is practical for a given wind tunnel test section cross section.
REFERENCES
1. Whitham, G. B. : The Flow Pattern of a Supersonic Projectile. Comm. Pure & Appl. Math., vol. V, no. 3, Aug. 1952, pp. 301-348.
2. Walkden, F. : The Shock Pattern of a Wing-Body Combination, Far From The Flight Path. Aeronautical Quarterly, vol. IX, pt. 2, May 1958, pp. 164-194.
3. Carlson, Harry W. and Mack, Robert J. : Estimation of Wing Nonlinear Aerodynamic Characterisrics at Supersonic Speeds. NASA T. P. 17 18, 1980.
4. Harris, Roy V. , Jr. : A Numerical Technique for Analysis of Wave Drag at Lifting Conditions. NASA TN D-3586,1966.
5. Mack, Robert J. : A Numerical Method for Evaluation aqd Utilization of Supersonic Nacelle-Wing Interference. NASA TN D-5057, 1969.

6. Hayes, Wallace D., Haefeli, Rudolph C., and Kulsrud, H. E.: Sonic Boom Propagation In A Stratified Atmosphere, With Computer Program. NASA CR- 1299, 1969.
7. Hicks, Raymond H. and Mendoza. Joel P. : Prediction of Aircraft Sonic Boom Characteristics From Experimental Near Field Results. NASA TM X-1477, 1967.
8. Thomas, Charles L. : Extrapolation of Sonic Boom Pressure Signatures by the Waveform Parameter Method. NASA TN D-6832,1972.

SOME CONSIDERATIONS ON THE INTEGRATION OF ENGINE NACELLES INTO LOW- BOOM AIRCRAFT CONCEPTS
Robert 3. Mack NASA Langley Research Center
Harnpton, VA
SUMMARY
A study of wind-tunnel data has shown why unexpected strong shock waves appeared in the wind tunnel pressure signatures of two low-boom models, and has indicated that changes to the current methods for analyzing and designing low-boom aircraft are needed. The discussion provided corrections for the interference lift code, and suggested methods of treatment for the equivalent areas of the aircraft, especially the nacelles and the interference lift, which were to be used in the aircraft design and the sonic boom analysis.
INTRODUCTION
The first low-boom theory validation bodies that departed from the body-of-revolution format by including lift effects were simple wing-fuselage models1. They were built to test the minimum sonic boom theory of Seebass and ~ e o r ~ e ~ , and the variable nose blunting modification of ~ a r d e n ~ . Results from the wind tunnel tests of these models showed that, at a Mach number of 1.50, there was reasonably good agreement between theory and experiment. However, at a Mach number of 2.70, good agreement was found orlly in the forward half of the signatures. These less satisfactory results were attributed to the linear theory used to obtain the lift distribution. With the introduction of the modified linear theory wing analysis code, limitations associated with linearized theory were corrected and satisfactory predictions of area-ruled lift distributions were obtained4.
As a follow-on to the low-boom validation study in'reference 1, additional sophistication and complexity was employed in two low-boom models by including wing camber and twist, engine nacelles, fuselage camber, and a vertical tail in the design. Wind tunnel tests of these second-generation low-boom validation models (samples given in Appendix A) revealed unforeseen problems. The pressure signatures from these models showed unexpected strong shock waves originating from the nacelles. An initial analysis of these data suggested that a strong shock, caused by choked flow, stood in front of each nacelle inlet. However, further analysis of the low- boom model wind-tunnel data along with some supplemental isolated-nacelle wind tunnel model data indicated that this simple explanation was not the total answer. Moreover, the analysis suggested that some changes to the usual method of treating nacelle flow-field effects and nacelle-

interference lift effects in the design and analysis of supersonic-cruise aircraft5 would be
necessary.
The main purpose of this paper is to analyze these unexpected strong shock waves that have been traced to the under-the-wing nacelles. Once the reasons for the appearance of these stronger- than-expected disturbances have been identified, practical methods will be then be suggested for integrating nacelles with the wing-fuselage to keep the aircraft flow field free of finite-size 'shock waves except for the controlled-strength shock waves from the nose and the tail.
SYMBOLS
A, CFD
F(Y
h
M
equivalent areas, f?
Computer Fluid Dynamics
Whitharn F-function
distance between the model and the probe, in
Mach number
free stream pressure, psf
incremental overpressure, psf
distance along pressure signature, in
effective distance along the lor~gitudinal axis, ft
effective distance parameter it1 the Whitham F-function, ft
Y ratio of specific heats, for air, y = 1.40
6 tangent of the flow deflection angle, see equations (1) and (3)
K correction factor defined in equation (4b)
5 Ap / p , see equation (2)
50 first order Whitham theory estimate of 6 , see equation (3)

DISCUSSION
The measured pressure signatures generated by the second-generation sonic boom validation models (samples in APPENDlX A) showed unexpected and unpredicted strong shock waves. Preliminary analysis of the data suggested that, because of their small size, the cylindrical duct within the nacelle had suffered choked flow so that a strong, detached shock stood at each nacelle inlet. Analysis of data from supplemental wind tunnel model tests with nacelles of varying sizes surfaced another possible cause of the shocks, one which would introduce extra shocks whether the flow in the nacelle constant-area duct was or was not choked.
Engine nacelles, on the wind tunnel low-boom models tested, were moderately-slender, symmetrical bodies of revolution mounted in pairs under the wing lower surface. In this near-field position, inlet lip shock waves striking the wing surface were considerably stronger than those predicted by the Whitharn theory in the interference lift computer code. These direct flow field effects were complicated by the nacelle shock waves which were reflected from the wing lower surface. In designing these models, the strength of the direct and reflected nacelle-induced shock waves and the attendant flow field pressures were underestimated. So the underestimation of the reflected shock wave strengths lead to underestimated nacelle-wing interference forces. Because the sonic boom prediction code in reference 6 is based on the assumption of small-disturbance propagation, the weaker predicted strengths of the nacelle-lip shock waves were extrapolated as weak-disturbance pressure signatures from the low-boom aircraft which propagated to the ground.
The presence of strong shocks also presented a need for improved integration methods. Careful wing-fuselage blending permitted a slow steady initial growth in volume and lift equivalent area. Near the trailing edge of the lower wing surface, the nacelles initiated a pattern of abrupt, strong shocks rather than a pattern of weak, distributed-pressure disturbances. Aircraft surface realignment which would accom~~odate,cornpensate, and neutralize these shocks and their reflections would also need to be finite and rapid (rather than small and gradual), initiated well ahead of the nacelle inlet location. Any "smearing" or averaging of pressure gradients in the analysis codes would "soften" and smooth the abrupt start of the nacelle-wing interference-lift effects. Thus, the prediction codes that underestimated the shock strengths also under-prescribed . the accommodation and added to the problem.
Aircraft models of sufficient size could have nacelles large enough to establish and maintain one hundred percent flow through tlie constant area duct. This would dispose of any problems caused by choked-inlet-flow, i.e. detached shocks, but it would still leave the problem of predicting the extreme-near-field shock strengths, from direct and reflected shock waves, to be addressed. In the following section, each of these points will be arialyzed and corrections to existing methods will be suggested.

METHOD CORRECTIONS
The method for determining the flow field disturbances effects of the engine nacelles on the aircraft and on the surrounding flow field required two conections. First, the strengths of the shock waves and the pressure field in the extreme near field need to be corrected. Second, the incremental F-functions from the nacelle geometry and the interference lift must be integrated into the total aircraft volume and lift F-function.
Shock Strength Correction. The interference lift induced by the nacelles flow field on the wing lower surface is estimated by a computer code based on Whitharn theory'. This theory has been experimentally tested and verified at distances as close as one nacelle length. However, for a nacelle whose length is six to nine mean diameters, a considerable part of the interference zone is within a radial distance of one to five nacelle diameters. The shock wave strengths and flow-field pressures predicted by the Whitham theory code at these extreme near-field distances would definitely be less than found in the real flow.
One correction, found in reference 8 from equations (151) and (174), estimates the flow- field pressure changes from weak shock and expansion theory. The first two terms in these equations are the same, and have the form
Writing
and using
(3)
as the estimated magnitude of Ap/p obtained from Whitham theory, equation (1) can be written in ratio form as,
or more conveniently as

where
At best, this is an empirical nonlinear correction, but it does account for some second-order overpressure and Mach number effects. In figure 1, a plot of K versus Mach number is shown.
Figure 1. Mach number effects on the value of K .
The value of K can be significant for Mach numbers between 1.0 and 1.2, but this is where supersonic theory is not very applicable and is seldom used. Beyond a Mach number of 2.0, the value of K is approximately 0.40 and asymptotically approaches a value of 3/ 7 or about 0.42857 for y = 1.40. Note that within the usual range of Mach numbers and Ap/ p where Whitham theory is used, namely Mach numbers between 1.4 and 3.0 and Ap/ p = f 0.02 , the total correction, as found from equation (4), is approximately 1.008, very close to 1.0 as it should be for the theory to be applicable. However, in the close proximity of an engine nacelle, Ap / p can be 0.30 and larger, in which case the correction factor is 1.12 or larger.

When the local nacelle-wing interference pressures are corrected using equation (4), a better estimate of interference lift, drag, and pitching moment is obtained. Incremental equivalent areas due to nacelle-wing interference are also more accurate. However, the problem of a rapid, local increase of equivalent area due to nacelle-wing interference still remains.
Nacelle and Nacelle-Wing Interference F-functions. The usual method for computing the F-function of the entire aircraft (and from the F-function, the pressure signature) involves adding equivalent areas from each of the components. The equivalent areas from the fuselage, wing, wing lift, and fin are added and treated as a single area distribution because they are usually blended and integrated so smoothly that they appear to the air flow as a single slender body with small perturbations along its length. Figure 2 shows Mach-sliced areas from these four components for a supersonic cruise aircraft designed to have low sonic boom ground overpressures and shock strengths.
Figure 2. Equivalent areas from aircraft fuselage, wing, wing lift, and fin.
Nacelles, especially axi-symmetric ducted nacelles, are often mounted under and away from the wing or fuselage surface. The flow would "see" them as separate bodies, and therefore "see" .discrete, rather than smoothly blended, disturbances.
Figure 3 is the F-function computed from the combined fuselage, the wing, the wing lift, and the fin equivalent areas shown in figure 2. The accuracy of this F-function is based on the assumption that the components have been well integrated and blended during the preliminary design procedure.

Figure 3. Typical F-function computed from equivalent areas in figure 2.
A three-view drawing, figure 4, shows the conceptual aircraft that is the source of the equivalent areas in figure 2 and the F-function in figure 3. On this configuration, the engine nacelles are seen in the usual under-the-wing location.
Figure 4. Three-view of a conceptual aircraft with a typical nacelle-wing arrangement.

Since this is a highly blended configuration, the areas and the first and the second derivatives of the fuselage, wing, wing lift, and the fin areas are usually smooth and continuous. Still, the F-function is not smooth and continuous even though there are no surface discontinuities, or "jumps" in area growth. It is due mainly to the numerical treatment of the area inputs.
Interference lift is generated in the zone bounded by the intersection of the wing lower surface and trailing edge with the nacelle inlet shock. The equivalent areas from the longitudinal nacelle-wing interference lift growth are shown in figure 5.
Figure 5. Equivalent areas due to nacelle-wing interference lift.
If the nacelles were slender and pointed, the initial equivalent areas would be proportional to x z and the F-function would be zero at y = 0.0 . Since, however, the nacelles are ducted, the F- function at y = 0.0 is non-zero, and may be large even though the magnitude of the maximum equivalent area of the interference lift is only about 1/40' of the wing lift for each nacelle pair. Since flow-field disturbances are determined by the weighted and integrated second derivatives of the area, the rapid growth of interference-lift equivalent area can lead to predictions of shock strengths which can rival the shock strength from the fuselage nose. The F-function computed from the nacelle-wing interference lift areas, figure 5, is shown in figure 6.
Figure 6. Computed F-function from areas specified in figure 5.

!
This is the F-function from just one pair of engine nacelles; there will be another F- function, similar in shape but shifted in effective length, x, , from the other pair of nacelles on the
1
! aircraft. The flow field disturbances from the aircraft are obtained by summing the F-function components. This combined F-function is shown in figure 7.
Figure 7. Combined F-function computed from fuselage, wing, wing lift, fin, and interference lift equivalent areas. (The dashed lines show the original lines in figure 6.)
If the nacelle equivalent areas were added to the fuselage, wing, wing lift, and fin equivalent areas and these total areas were used to derive an F-function, the "spikey" discontinuity would have been severely rounded and its effect on the near-field pressure predictions would have been lost.
The identification and acoustic treatment of flow field disturbance sources requires an additional step. This involves the disturbance from each nacelle as though it were an isolated body. Equivalent areas from the nacelle are shown in figure 8.
Figure 8. Isolated-nacelle equivalent areas.

If the engine nacelles were mounted close to the fuselage-wing surface, and integrated with careful volumetric blending to the fuselage-wing-fin airframe, their volume contribution could be computed together. In the below-the-wing position, however, lumping the nacelles with the fuselage-wing-fin results in an area distribution where the nacelle flow-field shocks and pressures are underestimated. The F-functions from the isolated nacelles are shown in figure 9.
Figure 9. Isolated engine nacelle F-function computed from areas in figure 8.
When they are added to the F-function in figure 7, the total aircraft F-function shown in figure 10 is obtained.
Figure 10. F-function of all aircraft components. (The dashed lines show the F-function before the increments from figure 9 were added.) I

A typical desired F-function for a low-boom cruise ircraft is added to the F-function in figure 10 for comparison in figure 1 1.
Figure 11. Comparison of aircraft and low boom F-functions. (The short dashed lines are from F-function features shown in figure 10.)
Figure 11 shows that extra shocks could have appeared in the extreme near-field measured pressure signatures even with one hundred percent flow through the nacelle ducts, and that the ideal pressure signatures would not be realized at the cruise distance with the full-scale aircraft. Engine nacelle volume and interference lift equivalent areas are a small contribution to the total equivalent areas dominated by contributions frorn the wing lift. Small discontinuities in area growth are almost imperceptable and can be compensated for, in most cases, by small changes in local fuselage areas. However, sizeable discontinuities in component area growth are smoothed over when all the areas are summed. Therefore, no discontinuities will appear in the F-function calculated with the summed areas even though they are required for complete accuracy.
When equivalent areas alone are considered, agreement between the aircraft's and the desired low-boom equivalent areas usually is interpreted to mean that low boom constraints have been achieved. In the larger scope of low-boom methodology, there must also be, and usually is, agreement between the aircraft's and the desired low-boom F-functions. The total aircraft equivalent areas, figure 2, were derived from the low-boom F-function with the assumption that all
components could be integrated smoothly together. Fuselage, wing, wing lift, and fin integration usually fit within the scope of these assumptions. Engine nacelles, however, do not fit these assumptions. Therefore, new techniques and/or applications of the old theory and methodology are required.
The methods used at the Langley Research Center emphasized the agreement between equivalent areas for low-boom design. This aided greatly in the integration of aircraft components to obtain a conceptual aircraft with high aerodynamic efficiency and the potential for generating low-strength ground overpressures. Methods used by others emphasized the agreement between the aircraft and the desired F-function with overall equivalent areas monitored to assure that total lift, incremental engine nacelle area differences between the exhaust and the inlet, and the fuselage wake areas were accounted for in the net flow field effect. It is now clear that a synthesis of both methods should be used to meet design objectives for obtaining practical, low-boom, conceptual aircraft configurations.
CONCLUDING REMARKS
The need for making corrections and adjustments to the methods that estimate interference lift effects has been discussed. Corrections for underestimated shock strengths and flow field pressures due to engine nacelles were derived. Additionally, the discrete-disturbance nature of the nacelle flow field was discussed and a technique for correcting the existing analysis method which predicts flow field overpressure signatures was presented. Application of both these corrections
-. should permit more accurate predictions of ground-level sonic boom signatures and aid in the design and analysis of low-boom, supersonic cruise configurations.
Corrections to the interference lift code and revisions to the equivalent area 1 F-function methodology will help the problem concerning analysis procedures. The second problem, nacelle- induced shocks, will require finding nacelle shapes that produce weaker inlet lip shocks while at the same time generating practical levels of nacelle-wing interference lift whose equivalent areas "grow" initially at a more gradual rate. These two requirements may be in direct conflict but are worth investigating.
Axisyrnrnetric and two-dimensional nacelles with under-the-wing trailing edge mounting seem to be the preferred types and location. Moving the engine nacelles from under the wing to the aft fuselage has been tried before, and now with benefits to sonic boom possible, might merit being tried again.

REFERENCES {
s (1) Mack, Robert J. ; and Darden, Christine M. : Wind-Tunnel Investigation of the Validity t of a Sonic-Boom-Minimization Concept. NASA TP- 1421, 1979. 4
I (2) Seebass, R. ; and George, A. R. : Sonic-Boom Minimization. Journal of the Acoustic e Society of America, vol. 51, no. 2, pt. 3, Feb. 1972, pp. 686-694. .. (3) Darden, Christine M. : Sonic-Boom Minimization with Nose-Bluntness Relaxation.
B NASA TP-1348, 1979.
(4) Carlson, Hany W. ; and Mack, Robert J. : Estimation of Wing Nonlinear Aerodynamic Characteristics at Supersonic Speeds. NASA TP- 17 18, 1980.
(5) Mack, Robert J. ; and Needleman, Kathy E. : A Methodology for Designing Aircraft to Low Sonic Boom Constraints. NASA TM-4246, 199 1.
(6) Hayes, Wallace D. ; Haefeli, Rudolph C. ; and Kulsrud, H. E. : Sonic Boom Propagation in a Stratified Atmosphere, with Computer Program. NASA CR-1299, 1969.
(7) Whitham, G. B. : The Flow Pattern of a Supersonic Projectile. Communication on Pure and Applied Mathematics, vol. V, no. 3, Aug. 1952, pp. 301-348.
(8) Ames Research Staff : Equations, Tables, and Charts for Compressible Flow. NACA Report 1135, 1953.
APPENDIX A
The following pressure signatures are samples of experimental data from two low-boom- constrained wind tunnel models. In both figures, the model is a conceptual aircraft designed to cruise at a Mach number of 2.0 at an altitude of 55,000 feet. Since this model was designed primarily to validate low-boom technology, high aerodynamic efficiency was of secondary importance.
The wind tunnel tests were conducted at conditions of a Mach number of 2.0, a totaI temperature of 125.0 degrees Fahrenheit, and a unit Reynolds number of 2.0 million per foot. Free- stream pressures were measured with a two-hole conical probe whose semi-vertex angle was 2.0 degrees.
In figure A-1, the model had nacelles tnade of a composite material. In order to maintain f o m and strength, the walls were thickened in an inward direction. This decreased the internal duct diameter and made the inlet lips blunter than desired. The pressure signature was measured 24.0 inches beneath the model.

Shifted J zero line
" , !::::::::: ..........
................. , , ......... .............. I......... ----- .......... .......... .......... . . . . . . . .......... I ........ .......... .................
A X Figure A- 1. Model with composite nacelles with h = 24.0 inches.
........................ "',. ........... .'"'.'....." .. ...... ............................ . . . . . . . . # . . . . . . . . . . . . . ....................................................... ............................ ................................................. ........................ ...................................... ( . . ................ .......................................................... . . . . . . . . . . . . . . . . . . . . ' . . . . " . I ~ ; ' . . . . . . . ' . . . . " . . . . . . . " . . ".. ........ . . . . . . . I . . . . . . . . . . . . . . . "" ............................. .......................... . . I%.. . . . . . . . . . . . . . . '..""". ............................................ 1:::::::::
. . . . . . . . . I . . . . . . . . . ....................... ... ...... ".".."..... , : ..."..':::::::: ..... . . . . . . . . . I . . . . . . . . . I . . .......,..... .... ............................ J.g., .... .......... ------.- --.-'. ...............,.. ;;j;i;ij;;;;;i;;f;;;::;;:; ................... - ............ . I . .\ ... , ,::"..."..".. ............................. .....*....I - :::: ::." ................... ......................
Note: There is a shifted-zero line on the data plot. Several
........ .j. ....... --::::y:::!::::::::=:::::::::
reference-pressure
, ....... L ........ J .......... .......... ----- .".. .......... "" '
(......... 1
;:::::::;:
data
.................................... , ......... ......................... ......................... ;-5yi:::::+iiiiii:: ....................... ......, ,++; ::.* ....................................... 1 .......................... :..:...:::.:.i:i;:$:::::::::: .............................I ............ ............... .............................. -- ---- --.- ----- C- ---- ---.-.. . . . . """ , . . . . . . . . . . . , . . . .C. .C. . . . . . . . . ............................. 1 . .............. ........................................ ................... 1 ......... #.i::T:::::::::::: ......................................... .., ......... .................................... 1 . . ............
.............................. ................................................ ... ......... ....._. I
points
...................... I . ........ .........,......... .............................. ......................................................... , ......... .........,......... . . . . . . . . . I . . . . . . . . . . . "...'.. ........................................................... I::::::::: :::::::::!:::::::::):::::::::!::::::::::::::::::: ............................. ( . . . . . . . . . I . . . . . . . . . . . . . . . . . . . .......................................................... ----- -- ---- --.- ----- C .--- -------- ;::::::::: ................................................. ;::::::::: :::::::::::::::::::::::::::::i::::::::::::::::::: ......... ................................................. ..... .......... ............................. I . . . . . . . . . . . . . . ......... ................................................ ) .......... ...................,.........)................... . . . . . . . . . . . . . . . . . . . . . . . . . . . . . . . . . . . . . . . . . . . . . . . . . . . . ~
were selected to be the basis for the reference axis. Some were incorrect and were removed. However, the old zero-pressure line remained in place, and was noticed after the paper was prepared.
There are several interrelated effects causing the strong shocks from the nacelles. The first is the blunt inlet lips, the second effect is possibly due to the reduced internal duct area, and a third possible effect could be due to the reduced Mach number of .the flow field under the wing aggravating conditions leading to the previous effects. Two of these effects are relieved by using nacelles with adequate diameters and sharp inlet lips.
In figure A-2, the model had stainless steel nacelles with an inlet lip edge radius made to about 0.003 inch tolerances.

A X Figure A-2. Model with sharp-lip nacelles at h = 6.0 inches.
In both figures, the pointed, well-defined pressure peak after the nose shock defines the disturbances caui&l by the nacelles.

Page intentionally left blank

NACELLE AND FOREBODY CONSIDERAT'IONS IN DESIGN FOR REDUCED SONIC BOOM
George T. Haglund Boeing Commercial Airplane Group
Technology & Product Development /Aerodynamics h g k z r i n g Seattle, Wa 98124-2207
SUMMARY
Several aspects of designing for reduced sonic boom were investigated to assess the adequacy of the conventional modified linear theory. For a simple test case of a nacelle with a small forecowl angle (2 degrees) mounted below a flat plate, the linear theory compared favorably for a case with simulated nacelle lift and for a CFD analysis. In a second study, several methods of analyzing the area distribution due to volume were examined. And finally, in a preliminary study, the effect of forebody shape on the rise time of the bow shock was investigated, indicating a significant increase (several msec) can be obtained by proper forebody shaping.
INTRODUCTION
Modified linear supersonic theory has proven to be a very powerful and useful tool for the analysis and design of slender supersonic aircraft between Mach 1.2 to about Mach 3.0. The soundness of the theory is indicated by its ability to give useful results with slight modification well beyond the expected range of validity, for example, blunt bodies at Mach numbers up to 6.0.
For the design of low-sonic-boom aircraft, the modified linear theory (MLT) has been used with reasonable success. However, questions have surEaced about the accuracy of MLT for defining the very precise pressures required for a low-sonic-boom aircraft. A related concern is the proper implementation of MLT, since there is some latitude in the geometry modeling within MLT. In this study, two aspects of designing for reduced sonic boom were selected (nacelles and fuselage forebody) for comparing to CFD results ("STUFF," a PNS code in the Euler model).
A third study reported here is the possibility that fuselage forebody shaping can influence the shock wave rise time at the ground, providing reduced sonic boom loudness with little penalty to the airplane.
Wo& done on contract NAS1-19360, Task 6.

These studies were completed between December 1991 and February 1992 under NASA Langley contract NAS1-19360.
NAC- LZFT INTERFERENCE EFFECTS
The strong local pressure f ~ l d produced by the nacelles provides a beneficial lifting effect for nacelles located beneath the wing and near the wing trailing edge. For low sonic boom design, however, it is difficult to incorporate this strong pressure field into the desired overall smooth pressure distribution; this may require severe fuselage area-ruling, signifcant nacelle stagger, or modified nacelle forebody shapes. A more fundamental question, however, is whether the standard Modified Linear Theory (MLT) method provides an accurate calculation of the pressures, in particular the reflected nacelle pressure from the wing lower surface.
A simple test case was devised for verifying the MLT lift interference effect. The geometry for the test case is shown in Figure 1. A 20-foot long nacelle with a forecowl angle of 2 degrees is mounted below a flat plate. The sonic boom calculated in the usual manner for volume and lift is shown in Figure 2, using the methods of References 1 and 2.
The Lift effect can be simulated with a mirror-iniage nacelle by considering volume effects only without a wing reflecting surface (see the bottom half of Figure 1). This was compared to the sonic boom F-function calculated in the usual manner for volume and lift, with the nacelle installed below a flat-plate wing surface. The two methods should agree, except for the effect of the Mach cuts on the volume F-function for the mirror-image nacelle, which shifts the F-function values aft slightly, as can be seen in Figure 3. This result verifies that the MLT is capturing the major features of the flow field beneath the nacelle for this simple nacelle geometry.
This analysis was carried a step further by using a Cm) calculation method called "STUFF" (a PNS code in the Euler mode). Figure 4 compares the MLT and STUFF results at two distances away (10 and 20 feet) directly below the nacelle. Close to the nacelle, STUFF indicates that there is some blockage or shielding by the nacelle itself (the MLT on the other hand assumes a "transparent" nacelle). Further away, however, there is - better agreement, although in the CFD STUFF pressure distribution the shocks are smeared due to the numerical effects. Figure 5 shows the pressure signatures propagated to the ground using the Thomas method (Reference 3). Both of the STUFF pressure signatures underestimate the bow shock strength compared to MLT.
The results of Reference 4 suggest that corrections need to be applied to the MLT method for a forecowl angle of 6 degrees. The results of this study suggest, however, little or no correction is needed for the small forecowl angle of 2 degrees.

FOREBODY, ANGLE-OF-ATTACK, AND CAMBER EFFECTS
Several different methods have -been used in the basic m & t ~II~GTJ. $.ILT> for calculating the area distribution due to volume. A major difference is the method that places the configuration at angle-of-attack, which produces significantly greater equivalent areaq. A secondary difference is in the treatment of camber, twist, and dihedral.
The method used at Boeing does not include camber or angle-of-attack effects in wave drag or volume calculations. The reasoning for this approach is as follows. Strictly speaking, the linear theory assumes all disturbances are in one horizontal plane since there are no influence coefficients for out-of-plane effects. This basic assumption of the linear theory suggests that camber and angle-of-attack effects should not be included in wave drag
. (volume) calculations. The camber and angle-of-attack effects are accounted for in the drag-due-to-lift calculation; to include them in volume effects would be double bookkeeping. The 1080-91 1 configuration was designed with this "no-camber" method as described above.
However, there is some evidence -that the above reasoning and the "no-camber" method are not correct. CFD results of the 1080-91 1 predict quite different sonic boom waveforms than the 'ho-camber" method (References 5, 6 and 7). Figure 6 compares MLT "no-camber" results with a CFD code, STUFF, showing a bow shock of about 1.4 psf instead of the MLT 1.0 psf shock. Figure 7 compares the forebody pressures for several versions of MLT (camber and anglesf-attack) and CFD at 160 inches below the 1080-91 1 configuration.
More indepth study is required to firmly establish the proper method for calculating wave drag and volume effects for sonic boom andysis and design.
FOFUBODY SHAPE EFFECTS ON BOW SHOCK RISE TlME
It is well-known that shock wave overpressure has a very powerful effect on shock wave rise time. At lower overpressures, the effects of molecular relaxation of oxygen .and nitrogen in the lower atmosphere produce a significant shock thickening (or increased rise time) and reduced loudness. In designing for reduced sonic boom, we have focused on reducing the shock wave intensities to somewhat less than 1.0 psf, which provides reduced loudness through the increased rise time, as well as the reduced shock intensity.
In reducing the shock strengths much below 1.0 psf, however, the configuration design becomes more difficult, with deficiencies in takeoff gross weight, drag, balance, and high lift capability. In this study an attempt was made to examine the waveform characteristics just behind the shockwaves to see if there were some way to increase the rise time through configuration design.
Figure 8 shows a series of very simple sonic boom waveforms that were used in this study. Each waveform has a bow shock of about 0.5 lb/ft2, but the waveforms have different slopes of pressure just behind the bow shock. The effect of duration was also considered, and was one way to obtain variations in the slope of pressure just behind the
shock. The six signatures were propagated from 44000 ft. altitude to the ground using the method of Raspet and Bass (Reference 8). This method is a numerical technique that alternates between calculations of the wave steepening in the time domain and atmospheric absorption in the frequency domain. A standard atmosphere was used with 10% relative humidity, except 50% relative humidity below Z O O 0 ft. altitude.
The pressure slope just behind the shock has a significant effect on the rise time, as shown in Figure 9. The N-waves have the longest rise times, of about 10 msec, while the "ramp" waveform has the shortest of 5 msec. The increasing or constant pressure just behind the shock (cases 2, 5 and 6) reduces the rise time by feeding energy from low frequency to high frequency (the shock steepening effect). Duration has no effect, except as it influences dp/dx behind the shock. Case 2 has a very short constant-pressure region behind the shock and amazingly has the same rise time of case 5, which has a much longer constant-pressure region.
These results have implications for configuration design. The designer can control the pressure level of the shock as well as the pressure slope behind the shock. By designing for a slight expansion just behind the shock, an increase of about 2 msec in rise time can be obtained. The forebody would have to be slightly smaller in diameter to achieve the desired effect. While this may mean an added constraint on the configuration design, the benefits in terms of reduced loudness may be attractive.
Several other important conclusions are as follows:
1. The statistical rise time data from sight test programs have been used to estimate rise times of shaped booms. However, these results indicate that "flat-top," "ramp," or "hybrid" waveforms would have shorter rise times than N-waves of the same amplitude.
2. A numerical method, such as the Raspet and Bass technique, must be used to calculate the rise time of complex waveforms (or alternatively the similar method of Reference 9).
3. . The "ramp" waveform (also called the minimum-shock waveform) has the shortest rise time. In addition, it is sensitive to atmospheric variations and therefore is a poor candidate waveform for low-boom design.
4. The effects of turbulence on sonic boom propagation have been ignored and could modify these results.
5 . A slightly decreasing pressure just behind the shock can provide a significant increase in rise time. For the waveforms studied the rise time varied &om 5 msec to 10 msec for 0 5 psf shock strength.

REFERENCES
1. Middleton, W. D.; and Lundry, J. L.: A System for Aerodynamic Design and Analysis of Supersonic Aircraft. Part 1, General Description and Theoretical Development, NASA CR 335 1, December 1980.
2. Hayes, W. D.; Haefeli, R. C.; and Kulsrud, H. E.: Sonic Boom Propagation in a Stratified Atmosphere, with Computer Program, NASA CR 1299,1969.
3. Thomas, Charles L.: Extrapolation of Sonic Boom Pressure Signatures by the Waveform Parameter Method, NASA TN D-6832, June 1972.
4. Mack, Robert J.: New Considerations About Nacelle and Nacelle-Wing Interference Force Effects on the Flow Field Around a Supersonic Cruise Aircraft. NASA HSR Sonic Boom Workshop, NASA CP-3 173, 1992.
5 . Cheung, S.; and Edwards, T.: Supersonic Airplane Design Op tmht ion ' Method for Aerodynamic Performance and Low Sonic Boom. NASA HSR Sonic Boom Workshop, NASA CPp-3173, 1992.
6 . Siclari, M. J.: Ground Signature Extrapolation of 3D Near-Field CFD Predictions for Several HSCT Configurations. NASA HSR Sonic Boom Workshop, NASA CP -3 173,1992.
7. Cliff-Hovey, Susan: Computational / Experimental Analysis of Two Modem Low Boom Cofl~gurations. NASA HSR Sonic Boom Workshop,NASA CP-3173 1992.
8. Raspet, R.; and Bass, H.: Comparison of Shock Wave Rise Time Prediction Techniques. AZAA 904001, October 1990.
9. Robinson, Leick D.: A Numerical Model for Sonic Boom Propagation Through an Inhomogeneous, Windy Atmosphere. NASA HSR Sonic Boom Workshop, NASA CP,-3 172, 1992.

r STANDARD METHOD
.WIbG SURFACE ;FLAT PLATE)
I
INLET RA31US = 2.3( FT
D l STANCE, x', FEET
Figure 1. Geometry for simple test case -- single nacelle mounted below a flat plate and simulated lift with a mirror-image nacelle.
- SIMULATED LIFT
8 -
+ 4 W W LL
N
MIRROR-IUGE
I-
NACEL1,E
k NACELLE
U) - 0
-4 -
-8
TO SIMULATE
-I-..--------.-------.--...-..-------------
CENTERLINE,
-4 0 4 8 12 16 20 24 1
DISTANCE. X , FEET
NACELLE
L I F T
Z = t 3 . 5
CENTERLINE ---..-------------------..-.I------------
EFFECT
=T
Z = -3 .5
------.
'T ------.
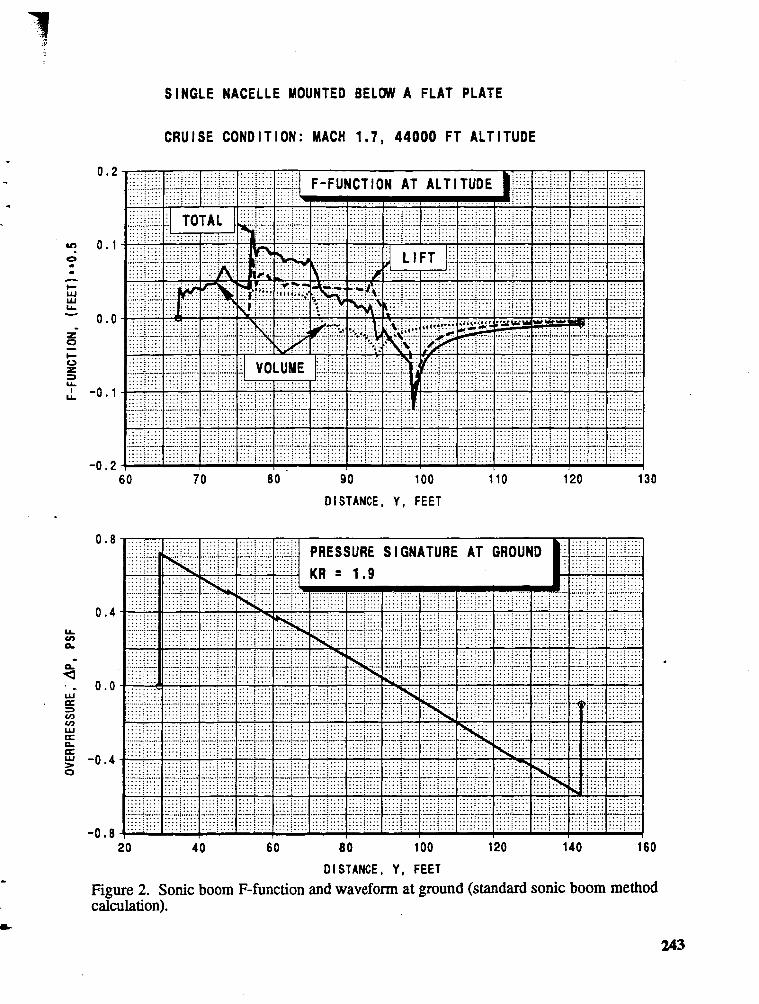
SINGLE NACELLE MOUNTED BELOW A FLAT PLATE
CRUISE CONDITION: MACH 1.7, 4 4 0 0 0 F T ALTITUDE
1 . 1 , 2 0 40 6 0 80 100 120 140 160
D l STANCE, Y , FEET
Figure 2. Sonic boom F-function and waveform at ground (standard sonic boom method calculation).

SINGLE NACELLE MOUNTED B E L W A FLAT PLATE
CRUISE CONDTION: MACH 1 . 7 , 4 4 0 0 0 FT ALTITUDE
DISTANCE, Y , FEET
Figure 3. Sonic boom F-function and waveform at ground (standard method compared to simulated lift case).
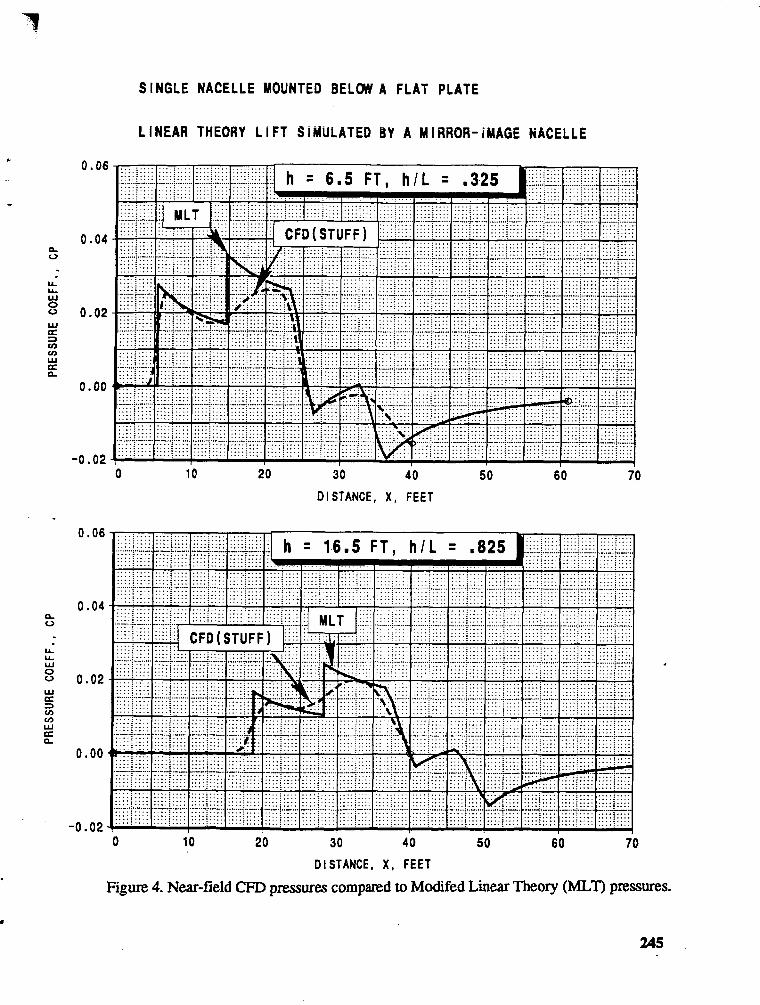
SINGLE NACELLE MOUNTED BELOWA FLAT PLATE
L INEAR THEORY L I F T SIMULATED BY A MIRROR-i#AGE NACELLE
D l STANCE, X , FEET
D l STANCE, X , FEET
Figure 4. Near-field CFD pressures compared to Modifed Linear Theory (MLT) pressures.

THOMAS PROPAGATION METHOD, KR = 1 . 9 , STANDARD DAY.
-20 0 2 0 40 6'0 80 100 120
DISTANCE, X , FEET
Figure 5. Pressure signatures propagated to the ground (Thomas Method).
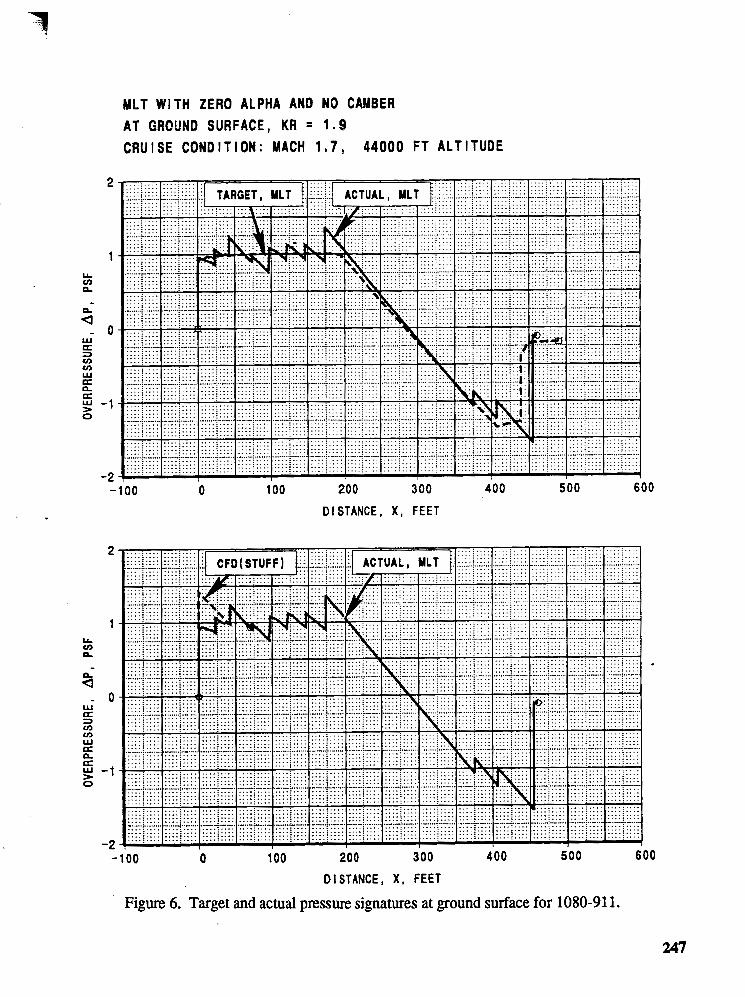
MLT Wl TH ZERO ALPHA AND NO CAMBER AT GROUND SURFACE, KR = 1 .9 CRUISE CONDIT ION: MACH 1 . 7 , 44000 FT ALT ITUDE
DISTANCE, X , FEET
D l STANCE, X , FEET
Figure 6. Target and actual pressure signatures at ground surface for 1080-91 1.

PRESSURE DISTRIBUTIONS 1 6 0 INCHES DIRECTLY B E L W
CRUISE CONDTION: MACH 1 . 7 , 4 4 0 0 0 F T ALTITUDE
.... .... .... ............. .... . . . . . . . . . . . . . . . . . . . . . . . . . . . . . . . . . . . . . . . . . . . ........._._. .... .... .... .... .... .... .... ............. :.... . ._.:_._. :.... :.... : ._. :._..
. . . . . . . . . . . . . . . . . . . . . . . . . . . . . . . . . . . . . . . . . . . . . . . . . . . . . . . . . . . . . . . . . . . . . . . . . . . . . . . . . . . . . . . . . . . . . . . . . . . . . . . . . . . . . . . . . . . . . . . . . . . . . _ _ . . I . . _ . . ._.:__.. ....,._.. i . . . . i . . . . i . . . . :..__ :_ . . . :.... I . . . . :.... :....
. . . . . . . . . . . . . . . . . . . . . . . . . . . . . . . . . . . . . . . . . . . . . . . . . . . . . . . . . . . . . . . . . . . . . . . . . . . . . . . . . . . . . . . . . . . . . . . . . . . . . . . . . . . . . . . . . . . . . . . . . . . . . . .............................................................................................................................. .............................................................................................................................. .... .... .... .... .... .... . . . . . . . . . . . . .... .... ... . . . . . . . . . . . . . . . . . . . ..... ..... ..... ...... ..... .... ........................ ......... ..... .... .... ... .... .. . . . . . . . . . . . . . . . . . . . . . . . . . . . . . ......... . . . . . . . . .............................................................................................................................. :..._ i . . . . :_... : . ._. i . . . . ._.. , . ._. i . . . . i . . . . i . . . . :..._ :....
.... .... .... . . . . . . . . . . . . . . . . . . . . . . . . . . . . . . . . . . . . . . . .... . . . . . . . . . . . . . . . . . . . . . . : ._ ....- ._ :.._ :_ .- : : : : :..- :
. . . . . . . . . . . . . . . . . . . . . . . . . . . . . . . . . . . . . . . . . . . . . . . . . . . . . . . . . . . . . . . . . . . . . . . . . . . . . . . . . . . . . . . . . . . . . . . . . . . . . . . . . . . . . . . . . . . . . . . . . . . _ . ._ :__ . . :.... : . . _ . :_... . ._.: ._.. __..:..,. : . . . : _ _ _
i . . . . ,.._. i . . . . r . . . . : ._. :..._ : . . . . :.... : . . . . I 3
-20 0 20 40 6 0 80 100 120
DISTANCE, X , FEET
-20 0 20 4 0 60 8 0 100 120
DISTANCE, XI FEET
Figure 7. Forebody pressure distributions for 1080-91 1 at 160 inches directly below.

T I ME, SECONDS
Figure 8. Waveforms at ground surface for rise time study (KR = 1.0).
0 . 8 -
LL 0.4 V) P.
$ LU 5 o o . o - . cn Ln LU a n a UJ > 0 - 0 .4
-0.8 -0.04 0 .00 0.04 0.08 0.12 0.16 0 . 2 0 0.24
T I ME, SECONDS
7
CASE 1 CASE 3 CASE 4

............... ............... SHOCK STRENGTH
-0.008 -0.006 -0.004 -0.002 0.000 0 .002 0.004 0 .OC
PRESSURE SLOPE BEHIND SHOCK, DPIDX, LBIFT3
Figure 9. Effect of pressure slope behind the shock on rise time.

1992 Sonic Boom Workshop Atten&es/Participants--Restricted Session 2/27/92
Daniel G. Baize Mail Stop 412 NASA Langley Research Center Hampton, VA 23665-5225
(. Raymond Burger Mail Stop 128 NASA Langley Research Center Hampton, VA 23665-5225
Percy Bobbitt Eagle Engineering, Inc. Tower Box 77 2101 Executive Drive Hampton, VA 23666
Dr. Samson Cheung . MCAT Institute Mail Stop 258-1 NASA Ames Research Center
- . Moffett Field, CA 94035
Susan Cliff Mail Stop 227-2 NASA Ames Research Center Moffett Field, CA 94035
Micah Downing ALIOEBN Wright-Patterson, AFB OH 45433
lbm, Edwards Mail Stop 258-1 NASA Ames Research Center
.I Moffett Field, CA 94035
Willard E. Foss, Jr. Lockheed Engineering & Sciences Co. Mail Stop 406 NASA Langley Research Center Hampton, VA 23665-5225
Dr. Kamran Fouladi Lockheed Engineering & Sciences Co. Mail Stop 412 NASA Langley'Research Center Hampton, VA 23665-5225
George T. Haglund Mail Stop 9R-84 Boeing Commercial Airplane Group P.O. Box 3707 Seattle, WA 98124-2207
Raymond Hicks* Mail Stop 227-2 NASA Ames Research Center Moffett Field, CA 94035
Mahendra C. Joshi Mail Code 36-60 McDonnell Douglas Aircraft Co. 3855 Lakewood Boulevard Long Beach, CA 90846
Robert J. Mack Mail Stop 412 NASA Langley Research Center Hampton, VA 23665-5225 .
Mike Madson Mail Stop 227-2 NASA Ames Reeearch Center Moffett Field, CA 94035
1992 Sonic Boom Workshop Attendees/Participants--Restricted Session 2/27/s2
Domenic J. Maglieri Eagle Engineering, Inc. Tower Box 77 2101 Executive Drive Hampton, VA 23666
Joel Mendoza* Mail Stop 227-2 NASA Ames Research Center Moffett Field, CA 94035
Steven S. Ogg Mail Stop 6H-FK Boeing Commercial Airplane Group P.O. Box 3707 Seattle, WA 98124-2207
Kenneth J. Plotkin Wyle Laboratories Suite 701 2001 Jefferson Davis Highway Arlington, VA 22202
John Morgenstern Mail Code 35-59 McDonnell Douglas Aircraft Co. 3855 Lakewood Boulevard Long Beach, CA 90846
Capt. Helmut H. Reda Code ASDNAXP U . S. Air Force Wright-Patterson AFB, OH 45433
Alan K Mortlock Mail Code 35-29 McDonnell Douglas Aircraft Co. 3855 Lakewood Boulevard Long Beach, CA 90846
Daze R. Satran Mail Stop 227-2 NASA Ames Research Center Moffett Field, CA 94035
Kathy E. Needleman Kevin P. Shepherd Lockheed Engineering & Sciences Co. Mail Stop 463 Mail Stop 412 NASA Langley Research Center NASA Langley Research Center Hampton, VA 23665-5225 Hampton, VA 23665-5225
Benjamin Neumann Mail Code OAST/RF' NASA Headquarters Washington, DC 20546
Norbert F. Smith McDonneU Douglas Aircraft Co. Suite 120 22 Enterprise Parkway Hampton, VA 23666
Gene L. Nihart Victor Sothcott Mail Stop 6H-FR Eagle Engineering, Inc. Boeing Commercial Airplane Group Tower Box 77 P.O. Box 3707 2 10 1 Executive Drive Seattle, WA 98124-2207 Hampton, VA 23666

2 1992 Sonic Boom Workshop AttendeesIParticipants--Restricted Session 2/27/92
Brenda M. Sullivan Mail Stop 463 N-MA Langley Research Center Hampton, VA 23665-5225
6
Louis C. Sutherland Consultant to Wyle Labs 27803 Longhill Drive Rancho Palos Verdes, CA 90274

REPORT DOCUMENTATION PAGE I Form Approved
OM6 No. 0704-0188 Public r+ng burden f u t h i cdlection of information h estimated to werage 1 hour p r r.lponse including the ti- f u revirrin; i n m d o n r . wchin; airtin; dab ~ u r ~ ;ahwin; and numbinin; the data needed. and cunpbting and reviewing the ccliectmn of i n f u r m h Send m m e n t r re wdin; Lh burden &mate u any othw n p u t of dlecrion of inlamalion. indudingruuatiar for reducing this burden towashington Headquarterr S w i c o Directcrate for hf-ation Opwationr and Reputs. 1215 Jefl- h v i r Highuny. Suite lm4. Arlington. VA 22202-4302. and to the Offtce of Management and Budget. ?ape& Rduclion Project (07040188). W a h i n e . DC 20503
1. AGENCY USE ONLY(Lerve blank)l2. REPORT DATE '
13. REPORT TYPE AND DATES COVERED I October 1992 I Conference Publication
4. TITLE AND SUBTITLE ( 5. FUNDING NUMBERS I I High-Speed Research: Sonic Boom
Volume I1
6. AUTHOR(S) . . Chmtme M. Darden, Compiler
7. PERFORMING ORGANIZATION NAME(S) AND ADDRESS(ES) ( 8. PERFORMING ORGANIZATION 1 NASA Langley Research Center HaGton, VA 23681-0001.
REPORT NUMBER
GI7146
I 9. SPONSORING/MONITORING AGENCY NAMEfSl AND ADDRESStESI 110. SPONSORINGIMONITORING
National ~ k o u a u t i a snd Space ~dministration Waahgbn, DC 2W0001
AGENCY REPORT NUMBER
NASA CP-3173
Christine U Darden: Langley %sear& Center, Hampton, Virginia.
12a. DISTRIBUTION/AVAILABlLlTY STATEMENT 112b. DISTRIBUTION CODE I
A ~ i ~ h - ~ p k e d ~ o n i c BOO& Workshop was held at NASA Laagley Fkearch Center on February 25-27, 1992. The purpose of the workshop was to make presentations on current research activities and accomplishments and to assess progrea in the area of sonic boom since the program was initiated in FY-90. Twenty-nine papers were presented during the 21/2 day workshop. Attendees included representatives from academia, industry, and government who are actively involved in sonic-boom research.
14. SUBJECT TERMS 115. NUMBER OF PAGES I Sonic boom minimization; Economic benefit of overland ~upersonic fight; Low- boom configurations; CFD sonic boom analysis; Whitham theory analysis; Sonic I boom extrapolation I A20
17. SECURITY CLASSIFICATION OF REPORT '
ITAR - - tandwd F a m 29 Rev. 2-89 R ma. i nq
20. LIMITATION OF ABSTRACT ITAR
18. SECURITY CLASSIFICATIO~ OF THIS PAGE Unclrrssified
19. SECURITY CLASSlFlCATlOh OF ABSTRACT Unclassiied


![u[sonic] Modbus - Lambrecht meteo](https://static.fdokumen.com/doc/165x107/6334bd04a6138719eb0b33dc/usonic-modbus-lambrecht-meteo.jpg)


