
I IASA - NASA Technical Reports Server
196
NASA Contractor Report 3908 f NASA-CR-3908 19850024452 \__ An Error-Dependent Model of Instrument-Scanning Behavior in Commercial Airline Pilots Dennis H. Jones LIBRARY _OPY GRANT NGT 47-003-801 JULY 1985 ii i .... , _'_0 L.ANGLEY RESEARCH CENTER LIBRARY,[,lASh, HAMPTO.N, V!RGINIA. I IASA
-
Upload
khangminh22 -
Category
Documents
-
view
3 -
download
0
Transcript of I IASA - NASA Technical Reports Server

NASA Contractor Report 3908 f NASA-CR-390819850024452\__
An Error-Dependent Model of
Instrument-Scanning Behaviorin Commercial Airline Pilots
Dennis H. Jones
LIBRARY_OPYGRANT NGT 47-003-801
JULY 1985 ii i .... , _'_0
L.ANGLEY RESEARCH CENTER
LIBRARY,[,lASh,HAMPTO.N,V!RGINIA.
I IASA


NASA Contractor Report 3908
An Error-Dependent Model ofInstrument-Scanning Behaviorin Commercial Airline Pilots
Dennis H. Jones
Old Dominion UniversityNorfolk, Virginia
Prepared forLangley Research Centerunder Grant NGT 47-003-801
N/ ANational Aeronauticsand Space Administration
Scientific and TechnicalInformation Branch
1985


ABSTRACT
AN ERROR-DEPENDENT MODEL OF INSTRUMENT-SCANNINGBEHAVIOR IN COMMERCIAL AIRLINE PILOTS
Dennis H. Jones
Old Dominion University
Since the work of Fitts and his colleagues, researchers have
been using eye-movement data to evaluate various aspects of
pilot instrument scanning behavior. Although Senders' work
indicated that llnk values and transitional probabilities
could be accurately predicted using a random sampling
process, several investigators have recently suggested that
pilot scanning behavior was deterministic. However, there
has been no clear empirical evidence to support a
deterministic hypothesis. The present research presents a
new flexible model of pilot instrument scanning behavior
which assumes that the pilot uses a set of deterministic
scanning patterns on (i) the pilot's perception of error in
the state of the aircraft, and (2) the pilot's knowledge of
the interactive nature of the aircraft's systems.
Statistical analyses revealed that a three-stage Markov
process composed of the pilot's three predlcted lookpolnts,
occurring 1/39, 2/30, and 3/30 of a second prior to each LP,
accurately modelled the scanning behavior of 14 commercial
airline pilots while flying steep turn maneuvers in a Boeing
737 flight simulator. Furthermore, the modelled scanning
iii

data for each pilot were not statistically different from
the observed scanning data in comparisons of mean dwell
time, entropy, and entropy rate. These findings represent
the first direct evidence that pilots are using
deterministic scanning patterns during instrument flight.
The results are interpreted as direct support for the
error-dependent model and suggestions are made for further
research that could allow for identification of the specific
scanning patterns suggested by the model.
iv

TABLE OF CONTENTS
Page
LIST OF TABLES ....................................... vi
LIST OF FIGURES ...................................... ix
INTRODUCTION .................................... i
Background ................................. iiiRecent Research ............................
Dick's Mini-Scan Model ..................... 14
Patterning Hypotheses ...................... 17
Purpose Of Present Research ................ 18
Conceptual Presentation Of The Model ....... 18
METHOD .......................................... 24
24Subjects ...................................Data Collection And Reduction .............. 24
Steep Turn Maneuver ........................ 29Development Of The Mathematical Model ...... 32
RESULTS AND DISCUSSION .......................... 36
Control Movements .......................... 36
Goodness-Of-Fit Test ....................... 36
Preliminary Analyses UsingThree-Stage MARKOV .................... 38
Deterministic Scanning Patterns ............ 39
Patterning Versus Error-DependentPatterns .............................. 54
Evaluating The Model Using A FourStage MARKOV Process .................. 55
Performance Measures ....................... 61
SUMMARY AND CONCLUSIONS ......................... 65
7OREFERENCES ...........................................
• 75APPENDIX A ...........................................
APPENDIX B ........................................... 79
APPENDIX C ........................................... 155
v

LIST OF TABLES
Table Page
i Senders' Approximate Method for ComputingTransitional Probabilities and Link
Values (from Clement et al., 1967) .............. 5
2 Number of Transitions and Amount of
Time for Each Segment of the
Steep Turn Maneuver ............................. 33
3 Number of Control Movements
for Each Segment of the
Steep Turn Maneuver ............................. 37
4 Chi-Square Values from Goodness-of-FitTests Comparing First Order Matrices
of Actual Transitions with Transitions
Predicted Using Three Previous Lookpoints ....... 41
5 Number of Fixations and Mean Dwell Time
on the Airspeed Indicator During EachSegment of the Steep Turn Maneuver for
Actual Data and Data Predicted UsingThree Previous Lookpoints ....................... 42
6 Number of Fixations and Mean Dwell Time
on the Roll Indicator During EachSegment of the Steep Turn Maneuver for
Actual Data and Data Predicted UsingThree Previous Lookpoints ....................... 43
7 Number of Fixations and Mean Dwell Time
on the Command Bars During EachSegment of the Steep Turn Maneuver for
Actual Data and Data Predicted UsingThree Previous Lookpoints ....................... 44
8 Number of Fixations and Mean Dwell Time
on the Altimeter During EachSegment of the Steep Turn Maneuver for
Actual Data and Data Predicted UsingThree Previous Lookpolnts ....................... 45
vi

Table Page
9 Number of Fixations and Mean Dwell Timeon the Automatic Direction Finder (ADF)
During Each Segment of the Steep TurnManeuver for Actual Data and Data Predicted
Using Three Previous Lookpoints ................. 46
i0 Number of Fixations and Mean Dwell Time
on the Horizontal Situation Indicator (HSI)
During Each Segment of the Steep TurnManeuver for Actual Data and Data Predicted
Using Three Previous Lookpolnts .................. 47
II Number of Fixations and Mean Dwell Timeon the Instantaneous Vertical Speed
Indicator (IVSl) During Each
Segment of the Steep Turn Maneuver forActual Data and Data Predicted Using
48Three Previous Lookpoints ......................
12 Number of Fixations and Mean Dwell Time
on the Engine Instruments During Each
Segment of the Steep Turn Maneuver forActual Data and Data Predicted Using
49Three Previous Lookpoints .......................
13 Number of Fixations and Mean Dwell Time
For Nonspecific During Each
Segment of the Steep Turn Maneuver forActual Data and Data Predicted Using
Three Previous Lookpoints ....................... 50
14 Actual and Predicted Entropy
Measures for Each Segment of the
Steep Turn Maneuver ............................. 52
15 Actual and Predicted Entropy Rate
Measures for Each Segment of the
Steep Turn Maneuver ............................. 53
16 Chi-Square Values from Goodness-of-FitTests Comparing First Order Matricesof Actual Transitions During Right Turn
with Transitions Predicted Usingthe Transitional Probabilities
Calculated During Left Turn ..................... 56
17 Chi-Square Values from Goodness-of-FitTests Comparing First Order Matricesof Actual Transitions with Transitions
Predicted Using Three Previous Lookpointsand One Control Status .......................... 58
vii

Table Page
18 Mean Pitch Error, Roll Error, and IVSI
Reading During Each Segment of SteepTurn Maneuver with Standard Deviation ........... 62
19 Mean Intercorrelation Matrix (N=31) forVariables in Each Segment of the
Steep Turn Maneuver ............................. 63
viii

LIST OF FIGURES
Figure Page
I Error Dependent Model ........................... 19
2 Fllght Instrument Panel ......................... 25
3 Steep Turn Maneuver ............................. 31
ix


Introduction
For over three decades scientists have been using eye-
movement data to evaluate various aspects of human instru-
ment-scanning behavior. One primary focus of this llne of
research has been the information gathering processes of
pilots while "controlling an aircraft attitude, location, and
rates of movement in three dimensional space" (Fitts, Jones,
& Milton, 1950a, p. 24). Although much has been learned
about instrument monitoring and sampling behavior, important
questions remain about pilot instrument-scanning as an
information gathering process.
Background
Instrument Panel Arrangements. The pioneering work in
the area began with a series of reports by Fitts and his
collegues for the u.s. Air Force (Jones, Milton, & Fitts,
1949; Milton, Jones, & Fitts, 1949; Fitts, Jones, & Milton,
1950b; Milton, Mclntosh, & Cole, 1951; _ilton & Wolfe, 1952).
Using a 35 mm camera, these researchers recorded the eye-
movements of 40 pilots flying a variety of maneuvers with
different instrument panel arrangements. Their results were
ultimately used to design the standard instrument panel
arrangement used in most American and western European
military and commercial aircraft (McCormick, 1976).

Fitts and his colleagues initially reduced the eye-
movement data into three dependent variables: (i) the number
of fixations per instrument, (2) the mean duration of
fixations per instrument (i.e. mean dwell time ), and (3) the
number of transitions between each instrument and every other
instrument. By summing the number of transitions between any
two instruments (i.e. disregarding direction) and dividing by
the total number of transitions the researchers developed a
fourth dependent variable, llnk values. It was assumed that
the link values provided the most important evaluation of the
arrangement of instruments. The assumption was that instru-
ments with high link values should be placed closely together
on the instrument panel. For example, Fitts et al. (1950a)
wrote:
Eye movements in both directions betweeninstruments have been combined. The "largest" link
value, accounting for 29 percent of all eyemovements, was between the cross pointer and the
directional gyro. The longest important link wasbetween the cross pointer and the gyro horizon.Placement of the most frequently used instrument,the cross pointer, at the extreme left, was
obviously a poor arrangement for ILAS landings(p. 26).
Thus, link values became the primary dependent variable
by which Fitts et al. evaluated the various instrument panel
arrangements. They also seemed to assume that link values
were indicative of overall scanning behavior. In their
discussion of how the data were interpreted, Fitts et al.
(1950a) wrote:

3
It is reasonable to assume that the frequency
of eye fixations on any given instrument is anindication of the relative importance of thatinstrument. The length of fixations, on thecontrary, may be more properly considered as anindication of the relative difficulty of checkingand interpreting particular instruments. Thepattern of eye movements--i.e, the link valuesbetween the instruments--is a direct indication ofthe goodness of the different panel arrangements(p. 29).
The work by Fitts and his colleagues was instrumental in
stimulating research into instrument-scanning behavior. They
demonstrated clearly that the arrangement of instruments on
the panel can influence the pattern of eye-movements and that
the instruments can be arranged in a manner to facilitate
optimal performance (see Seeberger & Wierwille, 1976). In
fact, the instrument panel arrangements were found to be such
a determining factor in instrument-scanning, Fitts et al.
made no attempt to interpret scanning behavior as an infor-
mation gathering process.
Sender's Visual Sampling Model. Senders (1955) was
interested in the manner in which human operators processed
information from complex displays. During his investigations
(1964; 1966), he applied information metrics (Shannon &
Weaver, 1948) to instrument monitoring behavior in an attempt
(I) to determine whether the bandwidth of the signal from
each instrument influenced fixatlonal probabilities, and (2)
to evaluate the amount of workload imposed on the operator by
the instruments. An important assumption of Senders' (1966)
model was that operators were aperiodic in their sampling of
instruments, such that successive observations (i.e., transi-
tions) were independent.

4
Senders assumed that the probability of a transition to
instrument i was the product of the probability of a fixation
and the dwell time on instrument i divided by the sum of the
products of the probability of fixation and the mean dwell
time for all instruments (X). Furthermore, it was assumed
that the probability of a transition between two instruments
(in one direction) was simply the product of the probabili-
ties of fixating on each instrument. Therefore, link values
were twice the probability of a transition between two
instruments. However, since Senders assumed that a trans-
ition could be made from an instrument to itself, and these
transitions could not be observed, a correction was added.
He suggested that since the probability of a transition
2between instrument _ and itself is Pi' the correct calcula-
tion of the llnk value between instrument _ and instrument
WaS:
Pi__i = 2PiFj2
i-_P (x)Senders tested his model using a monitoring task in the
laboratory (1964) and with actual flight data (1966). In
both cases he found that the model accurately predicted the
transitional probabilities and link values between instru-
ments. For example, Clement, Graham, & Best (1967) demon-
strated the validity of Senders method using data from the
work of Milton et al. (1951). Table 1 shows the approximate
method used by Senders.
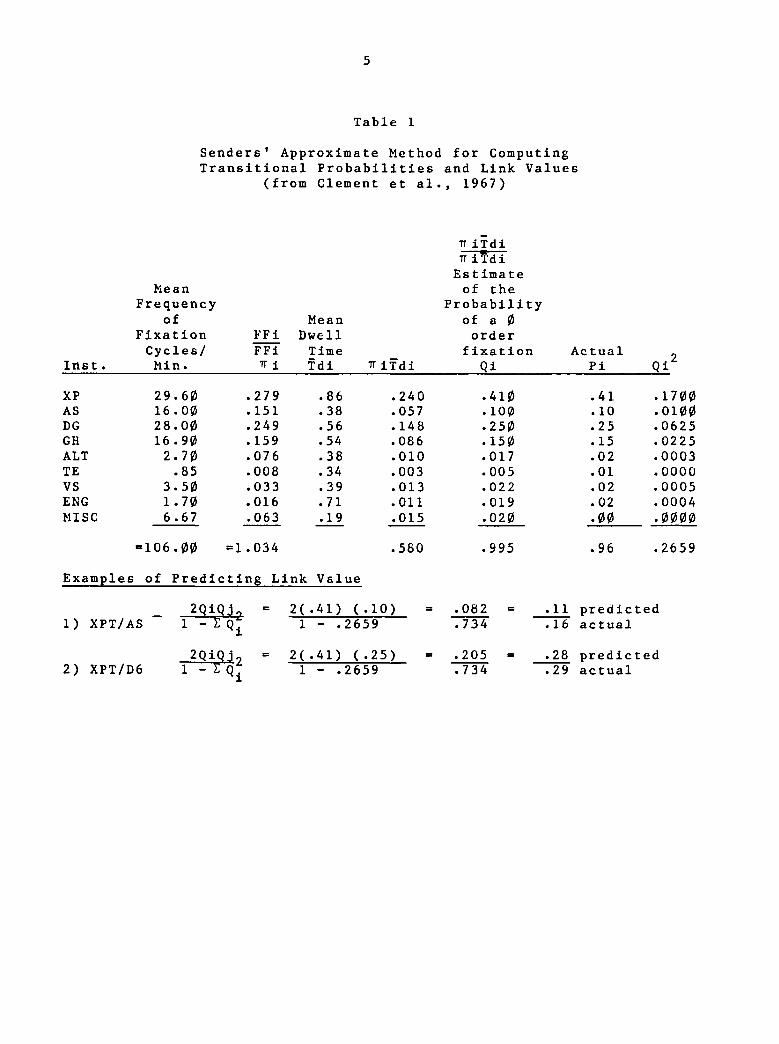
Table i
Senders' Approximate Method for ComputingTransitional Probabilities and Link Values
(from Clement et al., 1967)
iTdi
i-VdiEstimate
Mean of the
Frequency Probabilityof Mean of a
Fixation FFi Dwell order
Cycles/ FFi Time fixation Actual 2Inst. Min. _ i Tdi _iTdi Qi Pi Qi
xP 29.6_ .279 .86 .240 .41_ .41 .17_AS 16.0_ .151 .38 .057 .i0_ .i0 .01_DG 28.0_ .249 .56 .148 .25_ .25 .0625
GH 16.9_ .159 .54 .086 .15_ .15 .0225ALT 2.7_ .076 .38 .010 .017 .02 .0003TE .85 .008 .34 .003 .005 .01 .0000
VS 3.5_ .033 .39 .013 .022 .02 .0005
ENG 1.7_ .016 .71 .011 .019 .02 .0004
MISC 6.67 .063 .19 .015 .02_ ._ ._
=i06._ =1.034 .580 .995 .96 .2659
Examples of Predicting Link Value
2QiQJ_ = 2(.41) (.I0) = .082 = .ii predicted
i) XPT/AS i - _ QI i - .2659 .734 .16 actual
2QiQJ 2 = 2(.41) (.25) = .205 = .28 predicted
2) XPT/D6 I - E Qi i - .2659 .734 .29 actual

6
Senders' work was one of the first attempts to model the
instrument-monitorlng behavior both by subjects in a labora-
tory (1964) and by pilots (1966). The fact that a zero-order
Markov process accurately modeled transitional probabilities
and link values between the instruments Suggested that the
subjects were using random patterns to scan the instruments.
However, Senders has argued that the visual sampling model
probably does not reflect the actual scanning behavior of the
pilot. Senders (1973) wrote:
My model for the transition process treats theobserver as if he drew at random from the set ofdisplayed signals with the probabilities equal tothe fixation probabilities each time a transitionis made. Such an observation would make trans-itions between instruments without regard for anyreal or imagined relation between signals dis-played. Although I do not contend that pilots infact behave this way in aircraft, it is nonethelesstrue that the predictions of the model are in closeenough accord with the actual link values measuredin flight to have served as a basis for decisionson the layout of instrument panels (p. iii).
The significant limitation to Senders' model is that the
model dealt specifically with monitoring behavior. The oper-
ator was assumed to be a passive observer who obtains infor-
mation from the instrument panel randomly, applying equal
weights to all the instruments. It is contended by the
present author that one of the most important research
questions has to be whether pilots are, in fact, randomly
scanning the instruments patterns while controlling aircraft
flight. It is also suggested that scanning patterns are not
random, but are influenced by the pilots' decisions about
tolerable error and their knowledge of the relationship

between control movements and other aircraft systems.
Further, if similarities in scanning patterns exist, the
information can be useful in training (see Braune & Trollip,
1981) and problem intervention (see Jones, Coates, & Kirby,
1983).
While Senders has continued his work on instrument-
monitoring behavior (e.g. Senders & Posner, 1976), it was his
work with Carbonell and the incorporation of an internal
model (c.f. Smallwood, 1967; Braune, Kessel, & Wickers, 1978)
that guided this line of research toward understanding the
information processing aspects of pilot scanning behavior.
Carbonell's Queuelng Model of Visual Sampling.
Carbonell (1966), Carbonell, Ward, and Senders (1968), and
Carbonell, Senders, & Ward (1969) proposed a queueing model
of visual sampllng that used information about each pilot's
scanning strategy to predict the fraction of time spent on
each instrument. The major assumptions of the model were:
i. The instruments compete for the pilot'sattention; each time he looks at one
instrument, he is postponing the observationof others;
2. The queue discipline stems from an intelligentdecision made by the pilot at each time. Weassume that he tries to minimize the total
risk involved in not observing the otherinstruments;
3. This risk is given for each instrument by aunitary cost times the probability that the
displayed value may, while not being observed,exceed a certain threshold that could lead tosome catastrophic result;
4. The pilot's task in visually sampling his
instruments is part of a feedback loop closedthrough his control actions;

5. If the pilot does not exert control, displayedvalues are not zero-mean Gauss(an signals;...
the mean will be given by the last reading ofthe instrument, while the variance
monotonically increases with time. Thisincrease is due to the signal autocorrelationwhich decreases with time, and also to a
divergence term accounting for forgetting andfear of a sustained drift.
6. If the pilot exerts control, he will beconcerned not with the absolute reading of
each instrument, but rather with variations
with the readings he has expected to obtain atthat time. (_arbonell et al., 1968)
In addition, the authors assumed that the pilot looked
at each instrument for a fixed amount of time (0.4 sec).
Longer looks were accounted for as sequential selections of
the same instrument in 0.4 second time periods.
Using an electro-oculographic technique (Kris, 1958),
Carbonell collected eye-movement data and instrument data on
three Air Force reserve pilots while flying selected
maneuvers in a llnk trainer. Each run was divided into three
phases: (i) beginning to descend, (2) turn, and (3) landing
approach. Each total run produced 240 look points over a
96-second eye-movement data collection period. This is
consistent with the researcher's assumption that fixation
durations were at a constant rate of 0.4 sec.
Subsequent to simulator flight data collection, each
pilot was given a questionnaire and asked to specify (i) the
minimum deviation for each instrument he could perceive; (2)
the deviations for each instrument he would like to stay
within; and (3) the emergency action deviations for each

instrument. The pilots were also asked to rate the impor-
tance (i.e. cost) of each instrument and rate how their
concern would grow as a function of time should individual
instruments would become inoperative. This last rating
(actually a graphical representation) was used as a means of
predicting fixation as a function of the length of time since
the last reading. These data were obtained for each phase of
the simulation run.
The data for each pilot were submitted to a computer
algorithm which calculated actual deviations for each instru-
ment and predicted fixation durations for each pilot in each
phase of the simulation run. The results indicated that (I)
the statistical model accurately predicted the percentage of
fixations on each instrument, and (2) there was a high
correlation between the predicted and actual dwell times.
Although Carbonell et al. (1968) suggested that "the model
has shown itself capable of accurately representing the
behavior of pilots visually sampling their instruments during
an instrumented flight" (p. 87), there was no attempt to
match actual transitional probabilities with those predicted
by the model. These data would be extremely valuable,
especially since Carbonell et al. (1968), as well as Senders
(1973) report that individual differences between the pilots
were small.
Aside from the obvious problem that Carbonell's queuelng
model has to be tuned to each pilot, using each pilot's
individual estimates of costs, tolerances, action thresholds

i0
and divergence functions (Sheridan & Ferrell, 1974), there
are other problems in the assumptions of the model. As
Greenstein and Rouse (1978) have pointed out, the model
continues to emphasize instrument monitoring rather than
overall scanning behavior. The differences are more than
semantic. Greensteln et al. (1978) wrote:
The models cited above emphasize the
monitoring of displays, rather then the decisionsor actions that result from the human operator's
perception of the displayed values. The operator'smotivation for monitoring the displays is the
possibility that an event which requires hisattention may occur (p. 32).
Furthermore, since Carbonell et al. (1968) only pre-
dicted duration of fixation on each instrument, it may be
important to follow the reasoning of Allen, Clement, and Jex
(1970) in differentiating instrument scanning and instrument
sampling. They defined the differences as follows:
Scanning is defined here as the process ofselecting and fixating each instrument in an arrayof, or specific portions of, a complex displayfield. For the manual control tasks a "scanning
traffic pattern" is involved, causing a giveninstrument to be sampled frequently. However, notall instruments are sampled at the same frequency.
Sampling covers the perceptual acts of:focusing on a display; interpreting this as an
appropriate command or error signal; and perceivingits displacement, rate (or direction), and,
possibly, acceleration during a sequence offixations. In the present context, the samplingdoes not have to be impulsive or periodic (p. 5).
Thus, the queueing model of Carbonell (1966; 1968) can
best be viewed as a model of sampling behavior as defined by
Allen et al. (1970). While the model focuses on the internal
processes of the pilot, the statistical procedures did not

Ii
allow for making comparisons between the scanning patterns of
the subjects.
Recent Research
Early research efforts into instrument scanning behavior
were limited to a great extent by problems associated with
eye-movement data collection techniques. In addition, most
of the early research was aimed at the evaluation of instru-
ment panel arrangements and human monitoring/sampling
behavior.
From the early 1970's to the present, there has been a
rapid growth and development of eye-movement recording
devices (see Young & Sheena, 1975) and microcomputers to aid
in data collection and analyses. Within this last decade, a
great deal has been learned about specific aspects of pilot
scanning and controlling behavior, but important questions
remain about the processes used by the pilot to gather
information from the instrument panel.
For example, in an extensive review of the literature,
Braune (1981) found that a long line of recent research
indicated that experienced pilots do not follow deterministic
scan patterns when flying under instrument conditions (eg.
Weir & Klein, 1970; Allen et al. 1970; Spady, 1978; Harris &
Christhilf, 1980). In addition, most of these researchers
have found that, although pilots tended to gather information
from the same instruments, the patterns they used may be
quite different.

12
However, in the last two years, several researchers have
suggested that pilots do have regular scanning patterns (e.g.
Tole, Stephens, Harris, & Ephrath, 1982; Ellis & Stark, 1981;
Ellis, 1982) and point out that the recurring problem in this
line of research has been to find a statistical method for
making comparisons between transitional probability matrices.
In fact, Ellis (1982) has argued that researchers cannot find
determinism in scanning simply by making non-statlstlcal
comparisons of transition matrices. He wrote:
In general, pilot scanning behavior has notbeen shown to exhibit gross determinism (i.e. acirculatory scanning pattern), despite pilots oftenreported impressions that they are indeed using aregular scanning technique to read their flightinstruments. However, the presence of a partiallydeterministic scanning pattern that differs fromthe kind of pattern produced by stratified randomsampling with replacement is difficult to infor-mally recognize. It requires testing to demon-strate (p. 1006).
Ellis (1982) and Ellis and Stark (1981) have detailed a
statistical method for making comparisons between transition
matrices. They used a chl-square goodness-of-fit test to
compare the obtained transitions with what would be expected
if the transitions were simply random. Ellis et al. (1981)
found that for some comparlsons_ their subjects deviated in a
statistically significant way from what would be expected if
the scanning behavior was random rather than deterministic.
Ellis (1982) drew inferences from the scanning data after
collapsing certain cells of the matrix into single cells and
testing each cell using one degree of freedom.

13
A different and innovative technique has been suggested
by Tole et al. (1982) who used the information theory
measure, entropy, as an index of the orderliness within the
scanning pattern. Tole et al. wrote:
In the case of instrument scan, entropy has
the units of bits/sequence and provides a measureof the randomness (or orderliness) of the scanpath. The higher the entropy, the more disorder is
present in the scan. The maximum possible entropyis constrained by the experimental conditions. The
entropy measure used the same probabilities whichare present in transition matrices, but it yields asingle, more compact expression for the overall
behavior of the probabilities, rather than pre-
senting them each individually (p. 4).
The disadvantage of the entropy measure appears to be
that it does not allow the researcher to make comparisons
between pilots for similarity in scanning behavior. While
two pilots may have the same level of non-randomness, they
cannot be assumed to be scanning with similar scanning
patterns.
In addition, Tole, Stephens, Harris, and Ephrath (1983)
developed another data reduction technique which may be
useful in evaluating scanning patterns. Tole et al. (1982)
had collected eye-polnt-of-regard data on three pilots using
the Honeywell oculometer (see Spady, 1978). In order to
evaluate fixation sequences, the researchers chose to ignore
dwell times in the data and compare the resulting ordered
llst of instrument fixations. Tole et al. (1982) wrote:
As mentioned earlier, the oculometer providesan indication of instrument dwells as a function of
time. If the dwell times are ignored, an ordered
llst of instrument fixations may be developed for

14
each pilot under various loadings. These lists maybe broken into smaller segments or sequences ofvarious lengths for easier analysis. Each
different sequence may be considered as a component
of the overall scan pattern. One may hypothesizethat those sequences most frequent during the
maneuver are most important to the pilot, and
indicate an ordered scan pattern (pp. 58-59).
By choosing the i0 most frequent sequences for each pilot as
indicators of scan patterns, Tole et al. (1982) found that
they could account for over 50 percent of the scan pattern of
experienced pilots.
Another potentially important dependent measure devel-
oped by Tole et al. (1982) was entropy rate. This measure
was also derived from information metrics in an attempt to
quantify variations in dwell tlme under different levels of
mental loading. Tole et al. found that entropy rate
(expressed as bits/second) was related inversely to mental
workload. Interestingly, their results indicated that the
scanning patterns used by experienced pilots were less
sensitive to disruption by increased task difficulty.
These findings are significant and suggest that (i)
there is orderliness in instrument scanning behavior, (2) the
amount of orderliness in instrument scanning may be an
indication of the workload of the pilot, and (3) there may be
statistical techniques that quantify scanning patterns within
eye-movement data that have heretofore been overlooked.
Dick's Mini-Scan Model
The most recent attempt to model pilots' behavior was by
Dick (1980). Dick reanalyzed data collected by Spady (1978)
involving seven pilots flying ILS simulations in a Boeing 737
15
flight simulator. Dick's intention was to combine eye-
movement data with control movement data and develop a model
of pilot scanning behavior. He analyzed the pilots' eye-
movements for various segments of the flights and used factor
analytic techniques to reduce the data. The results indi-
cated that I0 primary factors were present in the data: (i)
monitoring airspeed; (2) horizontal and vertical situation;
(3) lateral information; (4) glide slope tracking/vertical
information; (5) altitude - "where he is and when"; (6)
monitoring position; (7) monitoring technique; (8) glide
slope tracking; (9) internal tracking; (i0) roll.
Dick suggested that these components indicate that a
pilot's instrument scanning strategy is related to aircraft
parameters rather than the physical position of the instru-
ments. That is, each component represents a "bundle of
information" gained by various combinations of the instru-
ments through the use of minl-scan patterns. He wrote:
Essentially, what we are claiming with the
information bundle idea is that each pilot has nota single scan pattern, but rather a series of
information collection procedures (mini patterns)which are used flexibly in combination with
controlling strategies (p. 38).
Dick used the various components in discriminant
analysis and found that the analysis could successfully
discriminate between segments and pilots. Bowever, Dick's
findings of individual differences between the pilots are not
radically different from those findings reported in the
review by Braune (1981). For example, Dick (1980) wrote:

16
Individual differences among pilots exist inthe way they collect information. The success of
the discriminant analysis in distinguishing pilotsis the result of differential weightings of the
components. Some pilots apparently check one
parameter at a time (e.g. components 3 and 4) whileothers may combine vertical and horizontal positioninto one (e.g. component 2). The similarity in
mean dwell times (Spady, 1978) shows the pilots areusing the instruments for the same amount of time,
while the components show that the integration ofthe instrument in the scan may be different for
different pilots; thus while individual scanpatterns may differ, the emphasis on categories ofinformation remains fairly stable and it is this
emphasis on information which apparently gets
translated through to control inputs. However,this does not necessarily imply that the basis fordecision making about an individual control is thesame for all pilots (p. 16).
Dick found support for his information bundle/mini-scan
hypothesis by analyzing eye-movement data surrounding control
inputs. He suggested that there were clear patterns of
scanning surrounding controlling behavior and specific to
each type of control mode. However specific data to support
this hypothesis were not presented.
The concept of mini-scan patterns is a plausible
explanation of pilot scanning behavior during instrument
flight. As Carbonell (1966) pointed out, there can be no
doubt that the instruments assume different weightings during
various maneuvers or, for that matter, various segments of a
specific maneuver. Furthermore, it is logical to assume that
there is a relationship between controlling and scanning
behavior. Dick's work suggests that the consistent finding
of similarities between pilots' instrument-sampling behavior,
but differences in instrument-scannlng may reflect differ-
ences among the pilots in their application of weights to
instruments when making control inputs.

17
It should be noted, however, that Dick's statistical
analyses were limited to factor analytic techniques which may
have served to maximize differences rather evaluate simi-
larites between pilots. For example, an evaluation of
transitional probability matrices (see page 30) surrounding
control inputs would have been extremely instructive.
Finally, Dick made no attempt to bring his theories together
in a form that permits a test of the model in predicting
scanning behavior.
Patterning Hypotheses
It should be mentioned that another line of reasoning
exists concerning the scanning behavior of experienced
pilots. Several researchers have indicated that pilots
report that they were using regular scanning patterns (Ellis,
1982; Ellis & Stark, 1981; Spady, 1978). Indeed, many pilots
suggested to this author that they were taught to follow a
"spoke-and-wheel" pattern, a "T-shaped" pattern, or a
"circulatory" pattern. Although documentation of these
patterns was not found in the training or scientific liter-
ature, the belief of their existence seems so widespread
among pilots and flight training personnel that this pos-
sibility cannot be ignored.
Essentially these patterns of scanning have one impor-
tant aspect in common. The patterning hypothesis suggests
that the spatial and temporal patterns used in obtaining
information from the instrument panel do not interact with
the information being obtained, but are the result of

18
techniques obtained during training. The patterning hypo-
thesis can be differentiated from other hypotheses in that
the former is stable and should be recognizable across
maneuvers, while the latter are flexible and infer some
interaction between the pilot, the instrument panel, and
controlling behavior.
Purpose of Present Research
The purpose of the present research was to present a
new, flexible model of pilot instrument-scanning behavior
that emphasizes the interaction between the pilot and the
information being obtained from the instrument panel. The
model is intended to be simple enough to guide future
researchers in areas such as training, problem-intervention,
mental workload, and instrument panel design. However, in
this initial research, the purpose was to model the
instrument scanning behavior of commercial airline pilots
flying two symmetrical segments of a steep turn maneuver.
Conceptual Presentation of the Model
The error-dependent model shown in Figure i is based on
the following premises:
I. The performance of pilot P depends to a large
extent on his/her piloting experience and
knowledge of the inter-relatedness of the
aircraft systems. Experience and knowledge of
systems interact such that the pilot is aware
of the amount of error within any system
allowed by federal regulations and the flight
training manual (AM).

_.YES
Pilot I
P H Scan
Control Instrument Is)
Input Cx Xi
I Experience k'"'_ TheManual I....."AM NO
YES
Cognitive Instrument (s) , _X Ch?onge/Template X State
NOt .T
Desired st°reIof _AAI x=lD-Aj_ ......] ActualStateofAircraft ID) J.....J Aircraft (At
A Scan/_,M= Maximum Error (According to Monual)
Instrument(s} NO=
_,AI x = Actual Error (According to Pilot) X
_Ix = Maximum Error (According to Pilot) I
YES
Control , ]'
Hypothesis: A I < _,M Input cxX
FigureI. Error Penendent!1odel
20
2. Experience, knowledge of systems, and knowledge
of allowable error form a cognitive template
(mental picture) of the desired state of the
aircraft which the pilot uses as a reference
during flight.
3. By scanning the aircraft instruments, the pilot
is seeking to obtain information about the
actual state of the aircraft. During each
visual fixation where information from the
instruments is percelved, the pilot evaluates
the difference between the actual state of the
aircraft (A) and the desired state of the
aircraft (D). Thls difference (AAI) is then
compared to the amount of tolerable error
allowed by some internal criterion within the
pilot (A i).
4. AI is a function of experience, environment,
and/or personality traits, and may vary from
instrument to instrument, maneuver to maneuver,
or day to day. However, under normal circum-
stances, A I wlll be less than A M"
5. Instrument scanning patterns vary, to a large
extent, with the information being obtained
from the instrument panel. Under normal
circumstances, the instrument scanning patterns
conform to one of three po6slble states of the
aircraft:

21
a. Error-Free--The instruments indicate that
the aircraft is operating with all systems
within acceptable error limits.
b. Error-State--This indicates that at least
one of the aircraft instruments (x) exceeds
Ix (i.e. A Alx > Alx)"
c. State-Change--This indicates that the air-
craft is in the process of being reposi-
tioned by the pilot, such that one or more
instruments are indicating a transient
state.
6. Since the piloting task is a closed-loop
system, instrument scanning behavior will be
related to control movements.
7. There are basically two types of control
movements:
a. State Control Movements--These control
movements are executed in order to fly an
aircraft from Point A to Point B. They are
either executed because of instructions
from ground control personnel, or are
predetermined by the particular flight
protocol. In either case, the pilot makes
a control input to reposltion the aircraft
for reasons other than a response to error.

22
b. Error-Driven Control Movements--These
control movements are executed in reaction
to the pilot's decision that an error
exists in one or more of the aircraft's
systems (AA > 41)"
8. A pilot will periodically decide if state
control movements are necessary. This is
especially true when the pilot is involved in
timed maneuvers. The cognitive template is
updated each time a state control movement is
dictated.
The error-dependent model assumes that the pilot's
scanning behavior is purposeful and deterministic. For each
maneuver performed by the pilot, there is a subset of
instruments relevant to its proper performance. The pilot
will scan the subset of instruments using an "error-free"
scanning pattern until an error is detected within an
instrument. When the pilot detects an error, he/she will
initiate an "error-drlven" scanning pattern (i) to determine
the cause of the error and (2) monitor the effects of the
control input used to correct the error on related aircraft
systems. In other words, the experienced pilot knows that
the presence of an error in one instrument may indicate the
potential for an error in another related system. A classic
example would be airspeed and pitch attitude. A pilot
perceiving an error while scanning the airspeed indicator
knows it is possible that an improper pitch attitude could be

23
responsible. Furthermore the pilot is cognizant that a
control input to correct an error in one aircraft system
(e.g., pitch attitude) may also affect the relative position
of other aircraft systems and their respective instrument(s)
(e.g., airspeed). Indeed, it is suggested that the major
difference between the experienced and novice pilot is this
awareness of the inter-relatedness of the aircraft systems.
Furthermore, it is the experienced pilot's knowledge of the
ways in which the aircraft's systems interact which underlies
the logic for assuming that the pilot uses deterministic
scanning patterns.
In summary, the error-dependent model of instrument-
scanning conceptualizes the scanning behavior of experienced
pilots as being composed of a set of deterministic scanning
patterns implemented to optimize performance and minimize the
potential for error in the state of the aircraft. These
scanning patterns include: (I) an "error-free" pattern,
(2) "error-drlven" pattern(s), and (3) patterns associated
with systematic changes in the state of the aircraft.
The present investigation attempted to validate the
error-dependent model using statistical techniques which
allow for the comparison of actual and predicted instru-
ment-scanning parameters. The major goal was to determine if
individual and collective commercial airline pilots were
using random, as opposed to deterministic, scanning patterns
during instrument flight.

24
Method
Subjects
The subjects were four Boeing 737 instructor pilots
(IPs), 12 experienced 737 pilots (Ps), one 737 pilot
trainee (TP), and one 737 copilot trainee (TC). Data for two
IPs (IPI and IP2) and two experienced pilots (P04 and PI2))
were eliminated due to a high percentage of invalid lookpoint
(LP) data.
Data Collection and Reduction
The data were collected during the course of two studies
(Jones, et al., 1983; Harris & Spady, 1982) at Piedmont
Airlines Flight Training Center, Winston-Salem, NC. The
experienced pilots were undergoing proficiency checks in the
Boeing 737 flight slmulator. The pilot and copilot trainees
were participating in the flight training program consisting
of five simulator sessions of four hours duration.
Eye-movement data were collected using the NASA/Langley
oculometer system, described in detail elsewhere (Harris &
Christhilf, 1980; Spady, 1978). The system used a corneal
reflection technique that allowed for a cubic foot of head
movement (Merchant, Morrissette, & Porterfield, 1974). As
can be seen in Figure 2, an electro-optic head, through which
an infrared light was emitted, was installed in the lower
inside instrument panel of the pilot and copilot's station.
The reflection from the cornea returned back through the

NASAL-82-5,257
Figure 2. Flight instrument panel

26
electro-optic head providing a discrete voltage level which
corresponded to the subject's LP. The system was calibrated
to each subject prior to data collection so that voltage
levels fell within fixed X-Y boundaries for both instrument
panels. The system provided LP data at the rate of 30 per
second.
In addition to the LP data, data were collected on
stick, wheel, throttle and rudder deflection at the rate of
i0 per second. Further, 20 measures of aircraft performance
and instrument readings were also collected at the rate of
one per second. The data were transferred via an A-D link
from the simulator's computer to a microprocessing system
which stored all the data on floppy disks.
The LP data were encoded to indicate the instrument
being observed at each 30th of a second. Specific codes were
recorded in those cases when the subject made a saccade
between instruments, blinked, or was "out-of-track." The
boundaries established for the instrument panels allowed for
LP data on 26 different instrument locations; however, a
preliminary analysis of these data revealed that over 95% of
the subjects' lookpoints (LPs) were on nine flight
instruments. These were: (I) Airspeed Indicator (AS), (2)
Roll Attitude Indicator (ROLL), (3) Command Bars (CBARS), (4)
Barometric Altimeter (ALT), (5) Automatic Direction Finder
(ADF), (6) Horizontal Situation Indicator (HSI), (7)
Instantaneous Vertical Speed Indicator (IVSI), (8) Engine
Instruments, and (9) Nonspecific. Nonspecific LPs were
included in the analyses for this study but "out of track'"

(i.e. blinks) were not.
27
The data for control movements,
instrument readings, and aircraft performance were trans
formed to indicate position, and the metric appropriate for
each instrument.
Subsequently, a series of computer algorithms were
implemented to prepare the data for detailed analyses.
Specifically, since the LP data, control movement data, air
craft performance, and instrument readings were sampled at
differing points in time, and the goals of the present
research required that control movements and LPs correspond
in time, the data were submitted to a computer interpolation
algorithm (see Program 1, Appendix C). The algorithm made
linear interpolations between each pair of sequential data
samples and output data files containing instrument number,
stick position, wheel position, rudder position, throttle
position, and instrument readings which corresponded in time
for each 30th of a second. The maximum possible error in the
time difference between the LP data and control position was
9/30s of one second; for instrument readings, 29/30s of one
second.
The control position data were then submitted to a
computer algorithm which evaluated control positions over one
second intervals and determined whether a control movement
had occurred. The criteria used for designation of the
occurence of a control input were based on an empirical
determination of the system by Harris (1983).
It should be noted that since the rudder pedal and
throttle were not used for the selected segments of the steep

28
turn maneuver (see below) these data were not submitted for
analysis.
Following the determination that a control movement had
occurred, the algorithm determined (i) the exact point in the
one second interval where the criterion was exceeded, (2) the
direction of the control movement (i.e. nose up or nose down
for stick; and left or right turn for wheel; and (3) the
duration of the control movement. The algorithm converted
the control position data to control status data indicating
either no control movement, positive control movement, or
negative control movement (see Program 2, Appendix C).
Finally, since it was assumed that a pilot makes a decision
about a control movement prior to the beginning of the
movement, the algorithm encoded the three data points (i/i0
sec.) prior to the beginning of each control movement
indicating "control decision in progress." Therefore, for
each type of control there were four possible control status
designations: (i) no control movement, (2) control decision
in progress, (3) positive control input, and 14) negative
control input. The terms positive and negative are used
generically and should be replaced by the directions of
movement appropriate for each type of control.
Transition Matrices--The summary and analysis of the LP
data focused on transition matrices and transitional
probability matrices. A transition matrix presents the
frequency with which the subject's LP was instrument ¥ at
time, _, given that he/she was looking at instrument X at
time, t-l.

29
Transition matrices are converted to transitional
probability matrices in which the entries represent the
probabilities that the subject's LP was instrument _ at time,
_, given that the subject's LP was instrument X at time, t-l.
It should be noted that transition matrices and trans-
itional probability matrices can be multi-dimensional. For
example, transitional probabilities can be computed as the
probabilities that a subject's LP was instrument _ at time,
_, given that the subject's LP was instrument _Y at time, _t-1,
and instrument _, at time, t-___2. Although multl-dimensional
matrices were employed in this investigation, the data were
presented in the two-dimensional format (i.e. a From-To
matrix) to facilitate the presentation of the data.
Steep Turn Maneuver
Data were collecteO for the subjects flying a variety of
different maneuvers. Three major factors contributed to the
decision to use the steep turn maneuver for this study.
First, the steep turn maneuver is not a standard flight
maneuver performed routinely by pilots flying commercial
routes. Therefore the task itself is not overlearned, yet
requires fundamental piloting skills. Second, most maneu-
vers, especially landing maneuvers, have variable error
tolerances across time. Since the error-dependent model in
Figure I suggests the pilot undergoes mental computations to
make decisions about control movements, it was deemed neces-
sary to select a maneuver with stable error tolerances.

30
Third, the steep turn maneuver requires the pilot to make two
symmetrical turns at a 45 ° bank. Since there has been
limited research on within-subject behavior in instrument-
scanning, this maneuver provided a unique opportunity to
evaluate similarities within pilots, as well as between
pilots.
Figure 3 presents a graphic representation of the steep
turn maneuver. The details of the steep turn maneuver as
described in the Boeing 737 Pilot Training Manual iBoeing,
1975) can be found in Appendix A. Basically, the pilot is
required to make two 180 ° turns at a 45 ° bank, maintaining a
constant airspeed and altitude. The training manual also
provides hints to the pilot for scanning the aircraft
instruments.
The steep turn maneuver was originally divided into 5
segments: (i) preparation and roll-in, (2) maintain first
turn, (3) roll-out of first turn and roll-in second turn, (4)
maintain second turn, and (5) roll-out of second turn. How-
ever, during data reduction, it was found that, auring the
roll-in and roll-out portions of the maneuver, the yoke
blocked the infrared light being emitted from the electro-
optlc head (see Figure 2). Therefore, Segment 2 and Segment
4 were used for the present study. The Segments were
identified as follows: The data were submitted to a computer
algorithm which stored data from the moment the aircraft
exceeded a 39 ° bank angle (roll-ln) until the bank angle was
less than 39 ° (roll-out).

31
Altitude: 10,000Ft. (Optional)
Airspeed: 250 Knots
Left
0riginat . _gins 45°Heading Bank
_OriginalHeading- 180°
_k_ ._ Begins
_',_,__,€,',,__....._I''_\ /.5° Bank39°- Out I 390 In _ Originat
Right HeadingTurn
Figure 3. Steep Turn Maneuver

32
Since the pilots were variable in how quickly they
banked the aircraft to 45 °, there were differences between
pilots and within each pilot in the number of transitions
(i.e. length of time) in each segment of the steep turn
maneuver. Table 2 shows the number of transitions (i.e.
number of data points) and the amount of time in each segment
by the subjects. It should be noted that data for the pilot
and copilot trainees were analyzed for Session i and Session
5. The pilot trainee (TP) performed the left turn of the
steep turn maneuver twice during Session I. The data for the
copilot trainee (TC) performing the right turn in Sessions I
and 5 were eliminated due to an excessive amount of "out-of-
track" time. Therefore, there were 31 separate data files
for analysis in this study.
Development of the Mathematical Model
Ideally, this research would have been conducted by
collecting instrument-scanning data on each subject (i)
during an "error-free" state, (2) during the introduction of
various types of instrument error (i.e. "error-driven"
state), and (3) during various types of state changes. In
this way, the transition matrices for each subject could be
compared for similarities or differences in scanning patterns
under the various experimental conditions. Furthermore,
comparisons could be made of the amount of error within each
instrument that each pilot considered excessive. It would
also be possible to evaluate the relationship between error
tolerances, reaction-tlme, and performance. From these data,

33
Table 2
Number of Transitions and Amount of Time for Each
Segment of the Steep Turn Maneuver#
Left Turn Right Turn
Subject Transitions Seconds Transitions Seconds
IP3 1104 36.80 1131 37.70IP4 1141 38.03 1063 35.43POI 1083 36.10 1104 36.80
P02 1124 37.47 1144 38.03P03 1085 36.17 1239 41.30P05 1303 43.43 1263 42.10
PO6 1120 37.33 1199 39.97PO7 1064 35.47 900 30.00
P08 1046 34.87 1130 37.67PO9 1380 46.67 1122 37.40
PIO i010 33.67 920 30.67PII 908 30.27 934 31.13TPl(1) 1174 39.13 865 28.80TPl(2)* 1437 47.80
TP5 1339 44.63 1200 40.00TCI 882 29.40 ** **
TC5 i000 33.33 ** **
*Second Left Turn
**Not Available
# IP = Instructor PilotP = Pilot
TPx = Trainee Pilot (Session #)
TCx = Trainee Copilot (Session #)

34
conclusions could be drawn about optimal scanning patterns
for use in related research areas (e.g., training and
problem-interventlon).
The present experimental design was limited by a number
of factors. Most importantly, time and economic constraints
did not allow for the implementation of the complex experi-
mental design described above. Furthermore, important
instrument data, (airspeed indicator and barometric alti-
meter) were not available for all of the subjects. The
mathematical model used to predict instrument-scanning
behavior, as originally conceived, was to focus on previous
LPs and the mean error tolerances specific to each instrument
for each subject. Since the error tolerances for the air-
speed and altimeter were not available for all the subjects,
it was decided that control status (CS) measures would be
used as an indicator of error tolerances (i.e A is) for each
subject. According to the error-dependent model, control
movements are the behavioral indication of the pilot's
decision that there is an error in the state of the aircraft;
therefore, scanning patterns that are "error-drlven" or
associated with state changes should be identifiable using CS
measures. Scanning patterns associated with the "error-free"
state would be identifiable when no control movements have
occurred.
The goal of the mathematical model was to isolate
statistically the transitional patterns exhibited by the
pilots. Various combinations of LPs and CSs were used in

$5
multi-stage Markov processes in an attempt to identify a
configuration of parameters that would accurately model the
scanning behavior of the subjects. This approach assumes
that the pilots' scanning behavior will, in fact, exhibit
some measure of determinism and that the deterministic
scanning patterns are related to LPs and CSs.

36
Results and Discussion
Control Movements
Table 3 shows the number of stick and wheel movements
made by each subject during each segment of the steep turn
maneuver. The data indicate that (i) there were differences
between pilots and within each pilot for the two segments,
and (2) each pilot spent some portion of time within each
segment in an "error-driven" state (as indicated by the
number of CS measures).
Goodness-of-Fit Test
It was decided a-priori that the preliminary analyses of
the data would be a chi-square goodness-of-fit test using the
frequency counts from the transition matrix of the actual
data as the expected frequencies and the output of the model
as the observed frequencies. The model was represented by
the average frequency counts from the transition matrices of
i0 data files resulting from the implementation of the model.
The goodness-of-fit test was suggested by Ellis & Stark
(1981). The major difference was that Ellis & Stark used
data computed from the model suggested by Senders (1964) as
the expected frequencies and their data provided support for
a deterministic hypothesis of instrument scanning when the
expected and observed frequencies were statistically dif-
ferent. The analyses reported here support an hypothesis of
determinism when the statistical hypothesis is accepted.

37
Table 3
Number of Control Movements for Each Segmentof the Steep Turn Maneuver#
Left Turn Right Turn
Subject Stick Wheel Total Stick Wheel Total
IP3 20 8 28 28 14 " 42IP4 17 17 34 14 5 19
POI 7 4 ii 6 7 13P02 23 14 37 25 17 42
P03 9 2 ii 4 2 6PO5 14 7 21 23 14 37P06 25 34 59 37 23 60POT 19 5 24 17 8 25
PO8 17 9 26 21 23 44P09 50 26 76 33 25 58
PIO 22 9 31 33 13 46PII 22 8 30 21 20 41
TPI(1) 31 i0 41 17 5 22TP2(2)* 42 Ii 53 ......TP5 29 13 42 28 14 42TCI 23 9 32 ** ** **TC5 24 8 32 ** ** **
*Second Left Turn**Not Available
#1P = Instructor PilotP = Pilot
TPx = Trainee Pilot (Session #)TCx = Trainee Copilot (Session #)

38
It should be noted that, although the mathematical models
used in this research employed multl-dlmenslonal transition
matrices, the matrices were collapsed to two-dimensional
matrices for purposes of this test.
Preliminary Analyses Using Three Stage Markov
In the previous sections, details were given of the data
reduction procedures used to encode the LP and CS measures.
By conceptualizing the LPs and CSs in time as a multi-stage
Markov process, it was hoped that the pilot's scanning pat-
terns would be congruent with this form of a mathematical
model. Specifically, the transitional probabilities for each
subject's actual data were submitted to the model's computer
algorithm which utilized a three-stage Markov process aug-
mented by a random number generator to produce i0 data files
as models of that subject's LPs over time. The model was
initiated in each case by using the first three LPs of the
subject's actual data. As a result, the model produced a
series of LPs that was three less than the number of LPs in
the actual data.
The first attempt to model the pilots' scanning behavior
used the subject's LP at time, t-i (LPt_I) , the control
status for the stick at time, t-i (CSSt_I) and the control
status for the wheel at time, t-I (CSWt_I) to predict each LP
at time, _(LPt). A preliminary analysis of the data revealed
that this configuration of parameters failed to model accur-
ately the scanning behavior for a subsample of the subjects
(N=6).

39
Subsequently, it was decided to combine the four CS
measures for the stick and wheel into one composite measure
containing 16 possible combinations (see Table i, Appendix
A), thus allowing another LP to be added to the mathematical
model. This configuration of parameters, LP t-2' LPt-I'
CSt_I, also failed to model accurately the scanning behavior
for the subsample of subjects. Similar results were found
when the number of ¢S measures were reduced from 16 to nine
(removing "control decision in progress" status) and also
from nine to four (removing the distinction between positive
and negative control movements).
Taken together, the preliminary analyses revealed that a
three-stage Markov composed of LPs and multiple measures of
control status (as indicators of A i) failed to capture
statistically the scanning patterns of the subjects. This
would be expected if (I) the pilots were using a random
scanning pattern for each segment of the maneuver, (2) the
pilots were using scanning "patterns" that were not related
to the information being obtained from the instrument panel,
or (3) the "error-dependent" model is correct, but the CSs,
as configured, were not accurate indicators of 4"
Deterministic Scanning Patterns
To evaluate the possibility of random scanning patterns
as an explanation for the model's attempts, the modeling
approach was implemented to predict scanning behavior using a
configuration of parameters composed of each pilot's three

40
previous LPs (i.e. LPt_ 3, LPt_2, LPt_I) (see Program 3,
appendix C). Table 4 shows the chi-square values from the
goodness-of-fit test for each subject. In every case the
transition matrix for the average of i0 data files was not
statistically different from the transition matrix for the
actual data. The goodness-of-fit matrices for all the
subjects are presented in Tables 1-31 (Appendix B).
This finding represents the first clear, direct evidence
in the literature that pilots are using deterministic, not
random, scanning patterns during instument flight. In order
to document this finding further, it was necessary to
demonstrate that the modelled data were not statistically
different from the actual data for measures of (i) mean dwell
time, (2) entropy, and (3) entropy rate.
Fixations and Mean Dwell Time--Tables 5-13 present the
actual and predicted number of fixations and mean dwell times
for each instrument in each segment of the maneuver.
Although the transition matrices for the goodness-of-flt
tests contained diagonal entries which represented the total
proportion of time spent on each instrument, this analysis
allowed for the comparison of actual and predicted instrument
sampling behavior.
A comparison of the predicted and actual mean dwell
times using a multiple analysis of variance (MANOVA) revealed
that there was no significant difference between the actual
and model data sets (F[9,22] = 1.1387, _ > .05). This
finding supported the validity of a three-stage Markov

41
Table 4
Chi-Square Values from Goodness-of-Fit Tests
Comparing First Order Matrices of Actual Transitions
with Transitions* Predicted using Three Previous Lookpoints
Left Turn Right Turn
Subject Chi-Square/df Chi-Square/df
IP3 16.929/23 19.586/25IP4 11.834/19 15.305/19POI 6.712/14 13.767/18PO2 7.635/19 19.840/19P03 11.220/21 7.330/17P05 6.420/21 16.295/22P06 15.635/24 12.309/22
POT 5.234/16 7.010/12P08 9.448/17 10.643/17P09 11.608/22 9.149/21PI0 10.937/17 5.513/17PII 2.948/21 12.036/20TPI(1) 7.165/15 1.138/14TPI(2)** 5.876/21
TP5 12.231/18 9.714/18TCI 1.883/15 ***TC5 19.496/21 ***
*Average of i0 Predictions**Second Left Turn
***Not Available

Table 5
Number of Fixations and Mean Dwell Time on the Alrspeed Indicator
During Each Segment of the Steep Turn Haneuver for Actual Dataand Data Predicted* Uslng Three Prevlous Lookpoints
Left Turn R19ht Turn
Actual Predtcted Actual Predlcted
# Mean # Mean # Mean # Mean
of Dwell of Dwell of Dwell of Dwell
Sub_ Flxatlons Tlme S,D___.__,Flxatlons Tlme S,D.____, Flxatlons Tlme S,D, Flxatlons Tlme S,D,
IP3 9 .2667 .198 9,2 .2_23 .200 10 .2835 .169 9.1 .3252 .281IP_ 5 ,0733 ,043 _,9 ,0811 ,045 7 ,1143 ,139 7,5 ,0868 ,106P01 5 ,5800 ,146 4,3 ,6486 ,_52 6 ,6778 ,209 5,3 ,6559 ,477 .,t-.
P02 3 ,4556 ,184 4,0 ,4187 ,295 3 ,5000 ,058 _,3 ,5792 ,305P03 2 ,2667 ,047 2,1 ,1700 ,092 2 ,6500 ,024 2,0 ,6881 ,438
P05 7 .6571 .320 6,9 ,6297 ,489 4 .3333 .245 3,3 .3089 .348P06 5 ,0533 ,045 5,6 ,0568 ,039 2 ,1167 ,118 2,1 ,1200 ,095P07 0 ,0000 ,000 0,0 ,0000 ,000 0 ,0000 ,000 0,0 ,0000 ,000
PO8 O .0000 .DO0 0.0 .0000 .000 I .0333 .000 1.2 .0235 ,000
P09 Z ,0667 ,Og7 1.3 .0556 .008 2 ,0667 .OOO 1.2 .0533 .000
PlO 1 .0333 .000 .9 .0200 .000 5 .3000 .212 4.6 .2546 .145Pll 20 .2650 .199 20.9 ,2493 .217 5 .4933 ,089 4,8 .4b,74 .267
TPI(1) 1 ,1667 .000 1.2 .1617 .015 2 .3DO0 .047 2.4 .2516 ,114TPI(2)** 7 .0667 ,064 6.0 .0563 ,042 ..............TP5 5 ,3400 ,223 5,7 ,3673 ,296 7 ,2190 ,168 7,2 ,2125 ,166TC1 3 .9000 .567 2,7 .9861 .467 *** *** *** *** *** ***
TC5 9 ,3000 ,271 9,0 ,3175 ,334 *** *** *** *** *** ***
"Average of 10 Predictions**Second Left Turn
***Not Available

Table 6
Number of Flxatlons and Mean Dwell Tlme on the Roll Indicator
Durlng Each Segment of the Steep Turn Maneuver for Actual Data
and Data Predicted* Uslng Three Prevlous Lookpolnts
Left Turn Rlght Turn
Actual Predicted Actual Predicted
# Mean # Mean # Mean # Mean
of Dwell of Dwell of Dwell of Dwell
Subject F1xatlons Time S,D___.__,Fixations Time S,D._.__t,Fixations Tlm__e S,D____L. F1xatlons Time S,D____t.
IP3 2] .3913 .205 22.6 .4101 .345 26 .3526 .225 23.9 .3168 .273IP4 16 .2458 .175 17.7 .2723 .217 13 .2795 .235 12.8 .2638 .216
P01 1 .0667 .000 0.0 .0000 .000 3 .2889 .150 2.7 .3628 .093 J>t.d
P02 11 .3121 .291 10.0 .3tlA1 .282 11 .3333 .250 10.4 .3325 .227
P03 6 .3111 .233 6.9 .2995 .178 8 .1667 .067 8.9 .1589 .082P05 31 .4688 .477 31.6 .4554 .501 42 .2706 .279 41.7 .3139 .318
P06 25 .4107 .313 27.4 .4276 .444 8 .2708 .376 7.0 .2910 .272P07 17 .3039 .328 15.7 .3013 .428 5 .0600 .028 4.6 .0541 .024
P08 0 ,0000 ,000 0,0 ,0000 ,000 0 ,0000 ,000 0,0 ,0000 ,000
P09 3 .0889 .069 3.1 .1043 .074 12 .1833 .137 11.6 .1788 .115PIO 16 .3208 .334 16.0 .3787 .413 27 .6037 ,492 26,4 .6147 .564
Pll 0 .0000 .000 0.0 .0000 .000 1 .1667 .000 .8 .0783 .012TPI(1) 2 .3000 .141 1.7 .2739 .094 3 ,1667 .067 2.9 .1686 .0481P1(2)** 10 .0900 .118 10.7 .0851 .081
TP5 6 .1278 .090 5.1 .1254 .051 4 .1083 .088 4.4 .1456 .112TC1 5 .5133 .218 5.3 ,5060 ,293 *** *** *** *** *** ***
TC5 9 .2778 .233 10.0 .2672 .187 *** *** *** *** *** ***
*Average of 10 Predictions**Second Left Turn
***Not Available

Table 7
Number of Fixations and Pean Dwell Time on the CommandBars
During Each Segment of the Steep Turn Haneuver for Actual Data
and Data Predicted* Using Three Prevlous Lookpolnts
Left Turn Right Turn
Actual Predicted Actual Predicted
# Hean # Hean # Hean # Hean
of Dwell of Dwell of Dwell of DWell
Subject Fixations Time S.D. Fixations Time S.D. Fixations Tlme S.D. Fixations Time S.D.
IP3 21 .4111 .285 19.9 .3761 .329 26 ,3308 .406 25.2 ,3862 ,549
1P4 31 .5419 .404 33.1 .4986 .421 31 .5172 .490 29.3 .5005 .513P01 20 1.2133 .586 21.5 1.0996 1.087 26 .4393 .335 26.6 .4380 .362PO2 23 .8725 .946 25.3 .8186 .897 22 1.0227 .659 21.8 1.0305 .972
P03 19 1.O070 1.030 19.7 .9126 .927 25 1.0707 ,939 24.6 1,1022 1,O12P05 19 .3070 .259 20.4 .2992 .247 33 .3485 .305 30.6 .3472 .359
P06 27 .3259 .229 27.5 .3124 .230 30 .6Oll .531 30.9 .6128 .589P07 21 .9762 .719 21.1 1.0181 .885 9 2.6222 1.092 12.3 2.0550 1.606
PO8 31 ,5032 .356 30.6 .5076 .437 16 1.2667 1.136 19.3 1.2349 1.129P09 31 .7742 .596 32.2 .7077 .614 30 .5322 .630 29.4 .5251 .553
PlO 24 .5181 .437 23.7 .5392 .495 16 .3292 .345 15.5 .3706 .318Pll 25 .3600 .284 25.8 .3717 .295 26 .5436 .367 25.4 .5669 .509TPI(1) 23 .7536 .502 23.6 .7831 .740 23 .6333 .351 22.8 .6409 .647TPI(2)** 37 .7802 .526 37.0 .7566 .738 --
TP5 38 .4825 .265 37.7 .4858 .416 30 .5911 .390 31,9 .5989 .517TC1 18 .8537 .597 16.8 .9079 .823 *** *** *** **, *** ***TC5 24 .3986 .452 24.3 .4033 .394 *** *"* *** *** *** ***
*Average of 10 Predictions**Second Left Turn
***Not Available

Table 8
Number of Fixations and Mean Dwell Tlme on the Altimeter
Durlng Each Segment of the Steep Turn Maneuver for Actual Dataand Data Predicted* Using Three Prevlous Lookpotnts
Left Turn R19ht Turn
Actual .Predicted Actual Predicted
# Mean # Mean # Mean # Mean
of Dwell of Dwell of Dwell of Dwell
Subject Fixations Tlme S.D__. Flxatlons Tlme S.D_____. Fixations Tlme S.D. Flxatlons Tlme S.D.
IP3 18 .4537 .220 19.5 .5000 .418 19 .4246 .226 19.4 .h417 .338IP4 24 .3611 .181 23.8 .3538 .275 28 .2262 .185 30.8 .2203 .179P01 10 .1600 .150 11.1 .1515 145 7 .4381 .133 7.2 .5236 .439 J>• l,.,n
PO2 14 .4571 .201 14.0 .4306 .343 7 .4952 .152 6.9 .4406 .286P03 19 .3912 .170 20,4 .3700 .299 11 ,5333 .210 10.5 .5564 .413
P05 14 .6667 .295 15.0 .6756 .540 23 .td+78 .187 23.5 .4237 .317PO6 15 .46qg .198 14.1 .4643 .352 17 .4253 .215 15.9 .3971 .318
P07 6 .5000 .112 6.0 .4608 .343 6 .3500 .119 6.6 .3205 .152P08 14 .3619 .193 13.0 .3321 .236 13 .3359 .169 13.4 .3397 .262PO9 21 .4381 .117 22.5 .4258 .317 18 .4093 .151 19.0 .3843 .332PlO 17 .3608 .262 15.4 .3509 .290 17 .3176 .136 18.0 .3007 .207
Pll 7 .3476 .205 6.5 .3774 .249 17 .2412 .100 15.6 .2493 .14L1.
TPI(1) 0 .DO00 .000 0.0 .0000 .000 0 .0000 .000 0.0 .0000 .000
TPl(2)** 8 .0333 .OOO 9.0 .0333 .DO0 --TP5 23 .4391 .104 24.3 .4211 .346 27 .2494 .157 24.6 .2426 .185TC1 10 .OA67 .117 10.0 .493_ .364 *** *** *** *** *** ***
TC5 15 .6156 .235 13.9 .6074 .459 *** *** *** *** *** ***
*Average of 10 Predictions**Second Left Turn
***Not Available

Table 9
Number of Fixations and Mean Dwell Time on the Automatic Direction Flnder (ADF)Durlng Each Segment of the Steep Turn Haneuver for Actual Data
and Data Predicted* Using Three Previous Lookpotnts
Left Turn R19ht Turn
Actual Predicted Actual Predicted
# Mean # Mean # Mean # Mean
of Dwell of Dwell of Dwell of Dwell
Ftxatlons Tlme S,D____=Fixations Tlme S,D__._, Fixations Tlme S,D, Fixations Tlme S,D,
IP3 5 .OBO0 .lOg 4.9 .0597 .056 2 .0333 .000 1,9 .0300 ,000
IP4 O ,DO00 ,DO0 0,0 ,0000 ,OOO 0 ,OOOO ,000 0,0 ,OOOO ,ODD
POl 0 .ODD0 .DO0 O.O .0000 .000 0 .ODD0 .DO0 O.O .OOOO .DO0
P02 0 ,DO00 ,000 0,0 ,0000 ,DO0 0 ,OOO0 ,000 0,0 ,0000 ,000 o_
P03 I ,2667 ,DO0 1,2 ,2028 ,057 0 ,OOOO ,DO0 0,0 ,0000 ,000
P05 0 .DO00 .OOO 0.0 .0000 .DO0 0 .DO00 .000 O,O ,OOO0 .000
PO6 8 ,2833 .191 5.0 .211G .19_ 3 .3889 .126 3.3 ,_103 .18_P07 2 .6500 .028 2.1 .6756 .271 0 .ODD0 .DO0 0.0 .OOO0 .DO0
P08 7 .3571 .230 6.2 .3588 .325 6 .4611 .125 5.8 .8226 ,287P09 3 .7000 .145 3.1 .7893 .#32 6 .3278 .249 6.6 ,8063 ,333PIO 3 .2111 .069 2.3 .1882 ,053 2 .1000 .0#7 1.6 ,0911 .015
Pll 6 .0889 .036 6.1 .0860 ,031 1 ,2000 .000 1.0 ,0781 .012TPI(1) 1 ,0667 .000 ,8 ,0800 .000 1 ,0333 .000 .9 ,0233 ,000IP1(2)** 1 .0333 .OOO 1.0 .0200 .000 --
TP5 1 .1667 .OOO 1.5 .1017 .021 O ,DO00 ,000 0.0 ,0000 .000TC1 0 ,0000 .000 0,0 ,0000 .000 *** *** *** *** *** ***TC5 6 .1056 .124 5.3 .0982 .087 *** *** *** *** *** ***
*Average of 10 Predlctlons**Second Left Turn
***Not Available

Table 10
Number of Fixations and Mean Dwell Time on the Horizontal Situation Indicator (HSI)
During Each Segment of the Steep Turn Haneuver for Actual Data
and Data Predicted* Using Three Previous Lookpotnts
Left Turn Right Turn
Actual Predicted Actual Predicted
# Hean # Mean # Mean # Heanof Dwell of Dwell of Dwell of Dwell
Subject Flxatlons Tlme S.D. Flxatlons Tlm__e S.D. Fixations Tlme S.D. Flxatlons Tlme S.D.
IP3 11 .4182 .224 10.5 .4616 .378 10 .4067 .207 10,8 .3492 .235IP4 2 .4333 .283 1.5 ,3694 .209 6 .2611 .169 7.1 .2740 .222
P01 0 .0000 .000 0.0 .0000 .000 0 .bOO0 .000 0.0 .0000 .000P02 5 .4333 .175 5.3 .3389 .214 4 .5000 .082 3.9 .4667 .307 ,t,,,,,jP03 4 .2500 .263 3.4 .4007 .500 3 ._111 .327 3,5 ._150 ._56
P05 5 .6467 .290 5.2 .7248 .424 1 .1000 .000 ,5 .0400 .000P06 8 .4042 .186 8.1 .3430 .298 8 .5083 .254 8.3 .4875 .381
P07 1 1.0333 .000 1.2 .5328 .172 2 .5000 .141 1,3 .8344 .367Po8 _ .3333 .221 4.0 .4392 .384 5 .4867 .308 5,6 .4480 .381P09 5 .6067 .305 5.1 .6812 .549 6 .6222 .337 6.7 .5152 .424
PIO 0 .0000 .000 0.0 .0000 .000 0 .0000 .000 0.0 .0000 .000Pll 6 .3611 .114 6.0 .3689 .227 11 .430) .129 11.2 .4167 .)24
TPI(1) 25 .6933 .546 24.9 .6381 .556 21 .4968 .173 20,2 .5534 .517TPI(2)** 30 .4200 .191 30.0 .4526 .341 --
TP5 13 .4000 .176 11.4 .3845 .288 10 .3967 .171 10.1 .3958 .324TC1 2 .2667 .236 2.0 .1456 .093 *** *** *** *** *** ***
TC5 7 .7667 .432 8.3 .7753 .591 *** *** *** *** *** ***
*Average of 10Predictions**Second Left Turn
***Not Available

Table 11
Number of Fixations and Mean Dwell Time on the Instantaneous Vertical Speed Indicator (IVSI)
During Each Segment of the Steep Turn Haneuver for Actual Dataand Data Predicted* Using Three Previous Lookpoints
Left Turn Right Turn
Actual Predicted Actual Predicted
# Mean # Mean # Mean # Mean
of Dwell of Dwell of Dwell of Dwell
Subject Fixations Time S.D___.tFixations Tlme S.D. Fixations Time S.D. Fixations Time S.D.
IP3 O .0OO0 .000 0.0 .0OOO .O00 0 .0000 .0OO 0.O .OO00 .OO0
IP4 2 .ZOO0 .141 1.6 .1825 .029 4 .2250 .110 4.8 .1974 .103 _-O0
P01 3 .7222 .351 3.3 .8116 .555 2 1.9500 .B72 2.4 1._961 .664
PO2 0 .0000 .000 0.0 .0000 .000 1 .0333 .000 1,2 .0300 .000P03 6 .3222 .075 5.7 .3503 .256 7 ._238 .167 5.9 ._328 .362
P05 4 .4667 .072 3.8 .3758 .195 4 .3333 .122 3.8 .336_ .207P06 7 .2905 .108 7.1 .2826 .179 6 .3667 .0_2 6.7 .3889 .306
P07 2 ._833 .118 2.3 .4683 .211 3 .6667 .145 3.3 .5889 .306P08 6 .4722 .365 5.8 .6007 .5_1 4 .3917 .262 _.6 ._054 .3_P09 8 .3458 .246 8._ .3603 .256 2 .3500 .118 2.3 .3389 .208
PIO 0 .0000 .000 0.0 .0000 .DO0 0 .0000 .000 0.0 ,0000 .000Pll _ .1750 .20_ 2.9 .1889 .133 3 .24_4 .217 3.5 .2648 .228
TPI(1) 0 .0000 ,000 0.0 .0000 .000 0 .0000 .000 0.0 .0000 .000
TPI(2)** 0 .0000 .000 0.0 .0000 .000 --TP5 0 .0000 .000 0.0 .0000 .000 0 .0000 .OOO 0.0 .0000 .000
TC1 0 .0000 .000 0.0 .0000 .DO0 *** *** *** *** *** ***
TC5 1 .0667 .000 .6 .0200 .000 *** *** *** *** *** ***
*Average of 10 Predictions**Second Left Turn
***Not Available

Table 12
Number of Fixations and Mean Dwell Time on the Engine InstrumentsDuring Each Segment of the Steep Turn Maneuver for Actual Data
and Data Predicted* Using Three Previous Lookpolnts
Left Turn Rlght Turn
Actual Predicted Actual Predicted
# Hean # Mean # Mean # Hean
of Dwell of Dwell of Dwell of Dwell
Subject Fixations Tlm__ee S.D. Fixations Tlm.___e S.D.____. Fixations Time S.Do Fixations Time S,D,
IP3 0 .0000 .000 0.0 ,0000 .000 0 .0000 .000 0.0 .0000 .000
IP4 0 .0000 .000 0.0 .0000 .000 0 .0000 .000 0.0 .0000 .000
P01 0 .0000 .000 0.0 .0000 .000 6 .3389 .249 5.7 .2958 .259 ,L,,,_0
P02 0 .0000 .000 0.0 .0000 .000 2 .8167 .071 2.4 .6164 .401
P03 0 .OOOO .000 0.0 ,0000 .000 0 .0000 .000 0,0 .0000 .DO0
P05 0 ,0000 .000 0.0 ,OOO0 ,OOO 0 ,0000 ,000 0,0 ,DO00 .000P06 1 .5000 .000 ,6 .2117 .021 0 ,0000 ,000 0,0 ,0000 .000
P07 0 ,0000 .000 0.0 ,0000 ,000 0 ,0000 .000 0.0 ,0000 ,000P08 0 .0000 .000 0.0 .0000 .000 1 ,7667 .000 .5 .2967 .003P09 1 .2667 .000 .7 .1100 .02_ 0 .0000 .000 0,0 .0000 .000
PIO 0 .0000 .000 0.0 .OOO0 .OOO 0 .DO00 .000 0.0 .0000 .000Pll 1 ._333 .000 .8 .3400 .005 1 .1333 .000 1.5 .0975 .022
TPI(1) 0 .0000 .000 0.0 .0000 .000 0 .0000 .000 0.0 .0000 .000TP2(2)** 0 .0000 .000 0.0 .DO00 .000 --
TP5 0 .0000 .000 O.O .DO00 .000 0 .DO00 .000 0.0 .0000 .000TC1 0 .0000 .000 0.0 .0000 .000 *** *** *** *** *** ***
TC5 0 .0000 ,000 0.0 .DO00 .000 *** *** *** *** *** ***
*Average of 10 Predlctlons
**Second Left Turn***Not Available

Table 13
Number of Fixations and Mean Dwell Tlme for Nonspectflc
During Each Segment of the Steep Turn Haneuver for Actual Dataand Data Predtcted* Using Three Previous Lookpolnts
Left Turn R19ht Turn
Actual Predicted Actual Predicted
# Mean # Mean # Mean # Mean
of Dwell of Dwell of Dwell of Dwell
Subject Fixations Tlme S.D. Fixations Time S.D. Fixations Tlme S.D. Ftxatlons Tlme S.D.
IP3 44 .0818 .093 45.0 .0778 .081 40 .1225 .203 41.0 .1358 .169IP4 50 .1400 .137 50.8 ,1423 ,143 50 .1233 .142 52,7 .1355 .158P01 23 .2217 .193 24.9 .2237 .227 40 .2858 .341 39,9 .2929 .250
P02 36 .1120 .126 36.0 .1151 .152 32 .1042 .118 33.0 .1065 .104 o
P03 39 .1026 .095 40.4 .1056 .103 27 .0679 .052 27.2 .0712 .062P05 41 .0984 ,082 41.2 .0972 .075 54 .1142 .115 53.9 ,1104 .112
P06 44 .0939 .092 44.9 .0949 .088 51 .0922 .127 51.8 .0857 .104P07 22 .1591 ,301 23,8 ,1617 ,276 15 .0667 .407 17.1 .0686 .044P08 44 .1712 .164 44.2 .1736 .186 32 .0917 .096 35,5 .0900 .093
P09 60 .0706 ,067 63.5 .0727 .076 43 .1240 ,138 45.5 .1213 .122PIO 40 .2325 .254 38.0 ,2374 ,283 33 .0606 .049 35.0 .0662 .050
Pll 48 .2021 .271 48.3 .1998 .218 53 .0843 ,074 51.3 ,0852 .081
TPI(1) 33 .1101 .131 34.7 .1108 .105 34 .0794 ,046 33,3 .0801 .047TPI(2)** 48 .0993 ,115 48.0 .1023 .119 --TP5 66 .1268 .119 68.8 .1276 .095 56 .1714 .209 57.0 .1593 .179
TC1 21 .1794 .264 20.1 .1930 .299 *** *** *** *** *** ***TC5 31 .1054 .237 32.9 .0925 .144 *** *** *** *** *** ***
*Average of 10 Predictions**Second Left Turn
***Not Available

51
process composed of three previous LPs as an accurate model
of the scanning behavior of the pilots.
Entropy--The entropy measure was developed by Harris and
his colleagues as an indication of the orderliness within a
set of scanning data. The entropy measure combines the
transitional probabilities into a single measure that
increases linearly with the amount of "randomness" (see
Program 4, Appendix C). Although this measure continues to
be in the development stage (see Tole & Young, 1983), the
measure provided another procedure for evaluating the
goodness of fit of the model. Table 14 presents the actual
and predicted entropy measures for each segment of the steep
turn maneuver.
The correlation between the actual and predicted entropy
measures was .995, df = 12, indicating a near perfect match
for these measures.
Entropy Rate--Entropy rate, also developed by Harris and
his colleagues, combines the transitional probability matrix
with a dwell time matrix (see Program 5, Appendix C) to form
a metric that Tole et al. (1982) demonstrated to be related
inversely to mental workload for moderately skilled pilots.
Since the transitional matrices and dwell time data were
found not to be statistically different, it was expected that
there would be a high correlation between predicted and
actual entropy rates. Table 15 shows the entropy rate
measures for each segment of the steep turn maneuver. As
expected, the correlation between these two measures was
.944, df = 12.

52
Table 14
Actual and Predicted* Entropy Measures for EachSegment of the Steep Turn Maneuver
Left Turn Right Turn
Subject Actual Predicted Actual Predicted
IP3 3.18238 3.09981 3.16806 3.10968
IP4 2.67938 2.66388 2.92871 2.95477POI 1.88317 1.894)0 2.88705 2.75889
P02 2.47527 2.44793 2.43233 2.41074PO3 2.54962 2.58919 2.13995 2.08859PO5 3.08121 3.01573 2.97359 2.85922
Po6 3.34721 3.21779 2.90761 2.83646P07 2.37861 2.26012 1.45221 1.44328
P08 2.73649 2.65569 2.34227 2.23563P09 2.57905 2.61802 2.92742 2.89877PI0 2.60733 2.52581 2.45994 2.42770
PII 3.10377 2.99914 2.89414 2.80641TPI(1) 1.91220 2.04101 2.08230 2.07837TPI(2)** 1.88950 2.03764
TP5 2.75829 2.71839 2.66524 2.64434TCI 2.42945 2.37615 *** ***TC5 3.09476 2.98906 *** ***
*Average of I0 Predictions**Second Left Turn
***Not Available

53
Table 15
Actual and Predicted* Entropy Rate Measures
for Each Segment of the Steep Turn Maneuver
Left Turn Right Turn
Subject Actual Predicted Actual Predicted
IP3 .99733 .99991 .94726 .94582IP4 .98955 .89352 1.19761 .89352
POI .40529 .31949 .72796 .61869P02 .70377 .67422 .73431 .78097
P03 .90462 .95160 .54983 .50135P05 .90010 .98526 1.06142 .89633
P06 1.27821 1.24256 .97447 .93041P07 .39423 .40314 .47667 .22842PO8 .73652 .70655 .74923 .73847
P09 .77804 .64122 1.09196 1.00153PIO .70815 .65279 1.10057 .85808PII 1.15464 1.01925 1.14349 .95097
TPI(1) .41764 .31617 .51796 .51303TPI(2)** .35013 .41217TP5 .90985 .96766 .85930 .82567TCI .47867 .49079 *** ***TC5 1.01721 1.07515 *** ***
*Average of I0 Predictions**Second Left Turn
***Not Available

54
Discussion--These findings are clearly supportive of the
hypothesis that pilots are using deterministic scanning
patterns while obtaining information from the instrument
panel. The results indicate that their scanning behavior can
be accurately reproduced using the three predicted lookpoints
occurring 1/30th, 2/30ths, and 3/30ths prior to each pre-
dicted LP. It can be argued that this configuration of
parameters reflects a composite of the scanning patterns
predicted by the error-dependent model. For example, these
findings would be expected if the CS measures were not
accurate indicators of A I" However, these results would also
be expected if each pilot were using stable patterns of scan-
ning that were not influenced by the type of information
obtained from the instruments. The following analysis
attempted to evaluate these possibilities.
Patterning Versus Error-Dependent Patterns
As indicated above, many pilots and flight training
personnel have suggested that they follow certain temporal
and spatial patterns, learned during flight training, to scan
the instruments. A "spoke and wheel" pattern, for example,
suggests that the pilot uses one primary instrument as a
central data source and obtains information from other
relevant instruments by scanning a relevant instrument,
returning to the primary instrument, scanning another
relevant instrument, returning to the primary instrument,
etc. In order to determine whether such stable patterns were
used by the pilots in this research, the transitional

55
probabilities established for each pilot during the left turn
of the maneuver were used in an attempt to model the pilot's
scanning behavior during the right turn of the maneuver (see
Program 6, Appendix C).
Table 16 shows the chi-square values from the goodness-
of-fit tests comparing the actual data for the right segment
of the steep turn maneuver with the data modelled using the
transitional probabilities from the left turn. The
goodness-of fit matrix for each subject is presented in
Tables 32-45 (Appendix B). In every case, the transition
matrices were statistically different, indicating that the
pilots were not using similar scanning behaviors for each
segment of the maneuver. Therefore, it was concluded that
the pilots could not be using a stable pattern of scanning
behavior, but a flexible strategy such as the one predicted
by the error-dependent model. It is possible that stable
scanning "patterns" (e.g., spoke and wheel) can accurately
describe a pilot's scanning behavior during "error-free"
states, but these findings do not support the patterning
hypothesis as a general description of instrument scanning
behavior.
Evaluating The Model Using A Four Stage Markov Process
Since the pilot's scanning behavior was accurately
modelled using a configuration of parameters composed
strictly of previous LPs, an attempt was made to model
scanning behavior using three previous lookpoints and a
composite control status measure containing four indices of

56
Table 16
Chi-Square Values from Goodness-of-Fit TestsComparing First Order Matrices of Actual TransitionsDuring Right Turn with Transitions* Predicted Using
The Transitional Probabilities Calculated During Left Turn
Subject Chi-Square/df
IP34 118.628/25#IP4R 68.626/19#
POIR 783.701/18#PO2R 209.609/19#
DO3R 254.517/17#PO5R 2679.874/22#PO6R 1293.917/22#
POTR 1841.437/12#POSR 576.279/17#POgR 210.063/21#
PIOR 2076.423/17#PIIR 787.198/20#
TPIR 60.109/14#TPSR 86.680/18#TC**
*Average of i0 Predictions #_ < .05**Not Applicable

57
control status: (I) no control movements, (2) stick control
movement, (3) wheel control movement, and (4) stick and wheel
control movements. The Markov process using, LPt_3, LPt_2,
LPt_I, CSt_I, was used to model the scanning behavior of eachi
subject for each segment of the maneuver (see Program 7,
Appendix C).
Table 17 presents the chi-square values from the
goodness-of-fit tests for each segment of the steep turn
maneuver. Of the 31 different tests, 12 were not statis-
tically different from the actual data. The goodness-of-flt
matrices are presented in Tables 46-76 (Appendix B).
A review of the individual matrices reveal that in many
cases, the magnitude of the chi-square was largely influenced
by one or two comparisons. There seemed to be a consistent
pattern surrounding the failure of these four parameters to
predict transitions involving the "non-specific" LP (e.g. see
Table 55, Appendix B.) The conclusion from these analyses
must be that this configuration of parameters was only
marginally successful in modelling the scanning patterns of
the pilots.
Discussion--One goal of this research was to use various
configurations of each subject's previous LPs and CS measures
to isolate the scanning patterns predicted by the error-
dependent model. There are at least four possible explana-
tions why the inclusion of the control status measure failed
to provide a more consistent fit with the actual data.

58
Table 17
Chi-Square Values from Goodness-of-Fit TestsComparing First Order Matrices of Actual Transitions
with Transitions* Predicted Using
Three Previous Lookpoints and One Control Status
Left Turn Right Turn
Subject Chi-Square/df Chi-Square/df
IP3 8.064/23 153.265/25#IP4 5.222/19 57.036/19#POI 42.108/14_ 10.592/18
PO2 72.302/19# 94.755/19#PO3 20.427/21 33.574/17#P05 28.874/21 18.405/22
P06 56.498/24# 50.611/22#P07 119.815/16# 299.087/12#P08 10.974/17 117.275/17#
P09 258.496/22# 136.160/21#PIO 27.942/17# 28.732/17#
PII 49.540/21# 14.289/20TPI 16.121/15 6.152/14
TPI(2)** 33.027/21TP5 7.400/18 4.175/18TC1 806.422/15# ***
TC5 223.437/21# ***
*Average of i0 Predictions #_ < .05**Second Left Turn
***Not Available

59
First, the algorithm used to transform control position
data into control status data identified the point in time
when control movements began and identified each subsequent
data point as "control movement in progress" until the move-
ment ended. Therefore, the assumption was that "error-
driven" scanning behavior was stable during the entire course
of a control movement. It may well be that scanning patterns
are influenced by temporal factors surrounding the detection
of an error and the initiation of the control input. There
is no a priori reason to believe that pilots use "error-
driven" state scanning patterns during the entire duration of
a control input. It should be noted that attempts were made
to restructure the actual data files so that control status
measures reflected arbitrary, equal time periods prior to and
subsequent to the initiation of a control input. Preliminary
analyses revealed these attempts to be unsuccessful in model-
ling scanning patterns accurately. However, this approach
requires further consideration using systematic changes in
temporal periods surrounding the initiation and termination
of control inputs.
Second, it is possible that the presence of "non-
specific" LPs within the data may have affected the ability
of the mathematical models to be more consistent in modelling
the actual scanning behavior. "Non-specific" LPs identified
those cases when the subject was "in track" but not looking
within specific X-Y boundaries. In most cases the non-
specific measure indicated that the subject was making a

60
saccade between instruments. Since the non-specific desig-
nation cannot he associated with aircraft state, it may be
unreasonable to assume that its occurrence is influenced by a
configuration of parameters that include control status
measures. In fact, it can be argued that the presence of the
non-speclfic LP introduces a random segment into an essen-
tially non-random process. Future researchers should
consider various means of removing the influence of the
non-specific designation from the data sets.
Third, it is possible that the separate instrument
scanning patterns assumed by the error-dependent model cannot
be isolated using the methodology described in this study.
It is possible, for example, that combining the control
status measures for stick and wheel into one composite
measure made the CS parameter less sensitive to changes in
scanning behavior. Although the present research attempted
to evaluate various configurations of the parameters, there
were many others that could have been tested, using the stick
and wheel control status measures individually and in com-
bination.
Finally, it is possible that pilots' instrument-scannlng
behavior is entirely situation specific and cannot be delin-
eated using the error-dependent model. A pilot's scanning
and sampling behavior may be highly individualistic and
subject to extreme variations due to factors other than
his/her perception of error in the aircraft state. For
example, there is little or no information about the
61
relationship between magnitude of the error, type of error,
and scanning behavior. Future research would benefit by an
experimental design that collects eye-movement data on each
subject while flying the aircraft in an error-free state
(e.g. straight and level). By gradually and systematically
introducing error into the aircraft state, it would be
possible to evaluate gradual differences between "error-free"
and "error-drlven" scanning behavior.
Performance Measures
If instrument scanning patterns can be shown to be
related to overall performance, this line of research can
have a major impact in the training of pilots (Braune, 1981).
Although the present research has provided important new
information about pilot scanning behavior, specific infer-
ences about the relationship with performance cannot yet be
drawn. It is possible, however, to gain some insight into
the relationship between the pilot's performance and the
indices of scanning behavior used in the present research.
Table 18 shows the mean pitch error, mean roll error and mean
IVSI reading for each segment of the steep turn maneuver.
These data were calculated using absolute values. A zero for
each performance measure would indicate perfect performance.
The performance data were combined with the actual and
predicted entropy and entropy rate measures, the total number
of control movements, and the total number of fixations to
produce the mean intercorrelation matrix presented in Table
19.

62
Table 18
Mean Pitch Error, Roll Errort and IVSI Reading During EachSegment of Steep Turn Maneuver wlth Standard Devlatlon ( )
Left Turn Right Turn
Subject Pltch Roll IVSI Pltch Roll IVSI
IP3 .876 .753 311,367 1.038 2.002 270.943
(.514) (1,220) (194,247) (.583) (1.141) (164.131)
IP4 1.084 2,280 216.346 1.390 1.496 210.506
(0.7163 (1.385) (135.073) (.752) (1.289) (127.287)
P01 .66# 1.705 321.055 1.271 1.886 266.016
(.608) (1.149) (161.189) (.361) (1.321) (151.016)
P02 1.170 1,797 177.034 1,866 3,308 259.287
(.650) (.994) (134.042) (.575) (2.118) (262.286)
P03 .837 2.485 203.034 .643 4.613 194.9_J+
(.691) (1.781) (228.007) (.412) (.2473 (113.046)
I)05 .493 3.358 139.704 1.733 2.498 342.822
(.319) (.930) (92.096) (1.011) (1.56#) (212.399)
P06 .699 1.928 292.228 1.046 1.524 390.638
(.568) (1.285) (221.629) (.573) (1.096) (220.819)
P07 1.386 2.930 220.776 1.498 3.557 347.488
(.606) (1.297) (128.068) (.831) (1.567) (248.749)
PO8 .640 2.031 272.818 1.738 1.866 381.231
(.509) (1.149) (179.206) (.723) (1.433) (337,950)
P09 .673 2.293 280.301 .977 2.931 290.155(.509) (1.306) (270,939) (.845) (1.063) (288.689)
PlO .711 1,936 205,103 1.352 1.629 374.068
(.359) (1.252) (121.064) (1.076) (1.066) (273.488)
Pll .595 2.372 220.938 .889 2,930 337,311
(.530) (1.181) (189.053) (.663) (1.491) (178,021)
TPI(1) .486 1.098 159.276 .551 3.558 222,606
(.254) (1.003) (165.294) (.466) (1.0_,) (123.578)
TPI(2)* .874 1.010 302.136 ....
(.593) (1.019) (232.6#0) ....
TP5 .634 2.491 256.951 .514 1.844 175.6#8
(.475) (1.668) (149.324) (.309) (1.637) (86.720)
TC1 1.619 2.383 681.852 ** ** **
(1.349) (1.570) (383.796) ** ** **
TC5 .836 .905 260.734 ** ** **
(.609) (.9730 (155.907) ** ** **
*Second Left Turn
**Not Available

Table 19
Mean Intercorrelatlon Matrix (N=31) for Variables
in Each Segment of the Steep Turn Maneuver*
A_EE P__E AE__RR PE___RR C__MM FIX P__EE R__EE IVSI
AE 1.000 0.995# 0.824# 0.892# 0.215 0.682# 0.106 0.245 0.050
PE 1.000 0.838# 0.908# 0.229 0.710# 0.127 0.248 0.072AER 1.000 0.944# 0.270 0.637# 0.009 0.139 0.044PER 1.000 0.251 0.684# 0.0802 0.180 0.I01
CM 1.000 0.450 0.030 0.280 0.221FIX 1.000 0.248 0.281 0.216PE 1.000 0.061 0.493#RE 1.000 0.112
IVSI 1.000W
AE = Actual Entropy Measure *dr = 12
PE = Predicted Entropy Measure #p < .05AER = Actual Entropy RatePER = Predicted Entropy RateCM = Number of Control Movements
FIX = Total Number of FixationsPE = Mean Pitch Error
RE = Mean Roll Error
IVSI = Mean IVSI Reading

64
The data from the mean intercorrelation matrix reveal:
(i) There was a high positive correlation between the
entropy and the entropy rate measures (_ = .824,
d__ff= 12, _ < .05). Since the entropy measure
increases as the level of "randomness" in scanning
behavior increases and since a high entropy rate
measure has been found to be related inversely to
mental workload (Tole et al., 1982), this finding
suggests that the amount of randomness in a pilot's
scan increases as mental workload decreases. This
suggests the possibility that pilots may use non-
deterministic patterns when the aircraft is in an
error-free state.
(2) The entropy and entropy rate measures were posi-
tively correlated with the total number of fixations
(_ = .682, _df = 12, _ < .05; _r = .637, __dr= 12,
< .05, respectively. This would be expected if
the pilot increases his/her rate of scanning during
periods of increased random scanning and during
periods of low mental workload.
(3) Of the three performance measures, the only
statistically significant correlation was between
mean pitch error and mean IVSI reading (_ = .493,
d_._f= 12, _ < .05). This finding was expected given
the systematic relationship between pitch attitude
and vertical speed.

65
Summary and Conclusions
One of the most frequently cited examples of a "man-
machine" interface is the pilotlng task. Since the work of
Fitts and his colleagues, researchers have proposed various
methods to evaluate the information gathering processes used
by pilots during instrument flight. Fitts and his colleagues
performed the pioneering work in this area and demonstrated
the usefulness of eye-movement data in the evaluation of
instrument panel arrangements. Their work demonstrated the
importance of link values as a measure of the "goodness" of
the placement of the instruments on the panel. Most impor-
tantly, their investigations stimulated a new line of
research that sought to uncover various aspects of pilot
information processing contained in the eye movement data.
The mathematical model used by Senders (1964; 1966a) was
found to predict link values accurately and suggested the
possibility that pilots used random patterns to scan aircraft
instruments (Sheridan & Ferrell, 1974). Although Senders
never contended that pilots do, in fact, scan the instruments
randomly (Senders, 1973), the statistical evidence to support
a deterministic pattern hypothesis has not proven to be
easily obtained.
66
Senders work with Carbonell (Carbonell et al., 1968;
Carbonell et al., 1969) and Smallwood (Senders et al., 1966b:
Smallwood, 1967) demonstrated the importance of scanning
behavior as an information gathering process and stressed the
importance of an internal representation of the interaction
between the pilot and the various instruments. Although
these researchers found that mathematical procedures which
emphasized an "internal-model" accurately predicted instru-
ment sampling behavior, the procedures did not allow for
evaluating whether the subjects used random or deterministic
scanning patterns.
Recently there has been renewed interest in the question
of whether pilots use deterministic or random scanning
patterns during instrument flight. Harris and his colleagues
(Harris et al., 1982; Tole et al., 1982; Tole et al., 1983)
have developed new and potentially important metrics that
allow for a single measure of "non-randomness" in scanning
patterns and can be used to estimate the degree of mental
workload being imposed on the pilot during instrument flight.
Similarly, Ellis (1982) and Ellis and Stark (1981) have
begun to apply the metrics used in pattern recognition
research (see Noton & Stark, 1971) to evaluate eye-movement
patterns during simulated flight tasks. For example, Ellis
(1982) provided evidence that subjects' scanning patterns
were statistically different from what would be expected if
they were scanning using the random pattern modelled by
Senders (1964; 1966).

67
The present research has provided the first direct
evidence that pilots use deterministic, not random, scanning
patterns during instrument flight. The results indicated
that a configuration of parameters, which combined the three
previous predicted lookpoints, accurately modeled the scan-
ning behavior of each subject, ranging in skill from copilot
trainee (undergoing his/her first training session in a
Boeing 737 simulator) to instructor pilots. Furthermore, the
data modeled for each subject were not statistically dif-
ferent from the actual data in measures of mean dwell time,
entropy, and entropy rate. Taken together, these findings
provide conclusive evidence of the deterministic nature of
scanning behavior used by commercial airline pilots, and
indicate direct support for a model such as the error-
dependent model depicted in Figure i.
The error-dependent model represents a new, simplistic
model of scanning behavior which assumes that a pilot uses a
variety of deterministic scanning patterns during instrument
flight. The various attempts to isolate the transition
patterns using configurations of the parameters which
included control status measures were only marginally suc-
cessful. Several possible explanations for these findings
were provided, and it is hoped that future research will be
more successful in isolating the scanning patterns predicted
by the error-dependent model.
The statistical analyses revealed that there was
variability between pilots and within each pilot for the

68
symmetrical segments of the steep turn maneuver. It was also
found that the pilots used statistically different scanning
patterns during the symmetrical segments, thereby eliminating
the possibility that the deterministic patterns were stable,
temporal, or spatlal patterns learned during flight training.
Thls finding was interpreted as support for the error
dependent model.
Finally, it should be noted that the error-dependent
model does not propose to provide a definitive presentation
of the processes surrounding the instrument-scanning behavior
of pilots. The conceptual basis can be found repeatedly
throughout the literature and the model may be remarkable
only for its simplicity. In fact, the underlying premises of
the model were also suggested by Rouse (1980) not as an
explanation of scanningbehavior, but as an explanation of
human behavior in general. Rouse (1980) wrote:
Thus, we propose that the human be viewed as an
organism who receives input from the environment,compares the inputs to what was expected, processesthese two types of information in a variety ofways, and then perhaps, but not necessarily,
produces some action that may modify the
environment. This process continually iterates,and thereby people walk, drive automobiles, repairairplane engines, manage insurance companies, andso on (p. 134).
Inevitably, an instrument scanning model must bring
together the theoretical propositions from many disciplines,
including estimation theory, control theory, queueing theory,
and information processing theory, to be fully descriptive of
all the complexities involved in the piloting task. In the
meantime, it is hoped that the present research will arouse

69
the curiosity of other investigators and rekindle interest in
understanding the processes involved in "controlling an
aircraft attitude, location, and rates of movement in three
dimensional space (Fitts et al., 1950a, p. 24).

7O
References
Allen, R. W., Clement, W. F., & Jex, H. R. Research on
display scanning, sampling, and reconstruction using
separate main and secondary tracking tasks. NASA
CR-1569, 1970.
Braune, R. J. Towards an internal model of pilot training.
Savoy, IL: University of Illinois at Urbana-Champalgn,
Aviation Research Laboratory, TR-ARL-81-1, 1981.
Braune, R. J., & Trollip, S. R. Towards an internal model
in pilot training. TR-I-81, First Symposium on
Aviation Psychology, 1981, pp. 316-325.
Carbonell, J. R. A queueing model of many-instrument visual
sampling. IEEE Transactions on Human Factors in
Electronics, 1966, HFE (4), 157-164.
Carbonnel, J. R., Ward, J. L., & Senders, J. W. A queuelng
model of visual sampling: Experimental validation.
IEEE Transactions on Man-Machine Systems, 1968, MME-9,
pp. 82-87.
Carbonell, J. R., Senders, J. W., & Ward, J. L. Human
sampling processes: A slmulatlon-validation study.
NASA CR-1258, 1969.
Clement, W. F., Graham, D., & Best, J. J. A re-examlnation
of eye-movement data. Technical Memorandum 163-A,
Systems Technology, Inc., Hawthorne, California, 1967.

71
Dick, A. O. Instrument scanning and controlling: Using eye
movement data to understand pilot behavior and
strategies. NASA CR-3306, 1980.
Ellis, S. R., & Stark, L. Pilot scanning patterns while
viewing cockpit displays of traffic information.
Proceedings of the 17th Annual Conference on Manual
Control, JPL Publication 81-95, 1981, pp. 517-524.
Ellis, S. R. Contingency in visual scanning of cockpit
traffic displays. Proceedings of the Human Factors
Society, 1982, pp. 1005-1009.
Fitts, P. M., Jones, R. E., & Milton, J. L. Eye fixations
of aircraft pilots. III. Frequency, duration, and
sequence of fixations when flying airforee ground
controlled approach system (GCA), Air Material Command,
AF TR-5967, 1950a.
Fitts, P. M., Jones, R. E., & Milton. Eye movements of
aircraft pilots during instrument-landlng approaches.
Aeronautics Engineering Review, 1950b, 9(2), pp. 24-29.
Greenstein, J. S., & Rouse, W. B. A model of human event
detection in the multiple process monitoring system.
Proceedings of the 14th Annual Conference on Manual
Control, 1978.
Harris, R. L., & Christhilf, D. M. What do pilots see in
displays. Paper presented at the Annual Meetlng of the
Human Factors Society, Los Angeles, CA, October 1980.
Jones, D. H., Coates, G. D., & Kirby, R. H. The
effectiveness of incorporating a real-time oculometer

72
system in a commercial flight training program. NASA
CR-3667, 1983.
Jones, R. E., Milton, J. L., & Fitts, P. M. Eye fixations
of aircraft pilots, IV. Frequency, duration, and
sequence of fixations during routine instrument flight.
Air Material Command AF TR-5975, 1949.
Kessel, C., & Wickers, C. D. The internal model: A study
of the relative contribution of proprioception and
visual information to future detection in dynamic
systems. Proceedings from the 14th Annual Conference
on Manual Control, 1978.
Kris, E. C. A technique for electrically recording eye
position. WADC TR-58-660, 1958.
McCormick, E. J. Human Factors in engineering and design.
New York: McGraw-Hill, 1976.
Merchant, J., Morissette, R., & Porterfield, J. L. Remote
measurement of eye direction allowing subject motion
over one cubic foot of space. IEEE Transactions of
Biomedical Engineering, 1974, 21, p. 309-317.
Milton, J. L., Jones, R. E., & Fitts, P. M. Eye fixations
of aircraft pilots; II. Frequency, duration, and
sequence of fixations when flying the USAF instrument
low approach systems (ILAS). Air Material Command AF
TR-5839, 1949.
Milton, J. L., Mclntosh, B. B., & Cole, E. L. Eye fixations
of aircraft pilots; Vl. Fixations during day and night
ILAS approaches using an experimental instrument panel

73
arrangement. Air Material Command AF TR-6570, 1951.
Milton, J. L., & Wolfe, F. J. Fixations during zero-reader
approaches in a jet aircraft. WADC TR 52-17, 1952.
Noton, D., & Stark, L. Scanpaths in saccadic eye movements
while viewing and recognizing patterns. Vision
Research, 1971, II, 929-942.
Rouse, W. B. Systems engineering models of human-machine
interaction. New York: North Holland, 1980.
Seeburger, J. J., & Wierwille, W. W. Estimating the amount
of eye movement data required for panel design and
instrument placement. Human Factors, 1976, 18(3),
281-292.
Senders, J. W. Man's capacity to use information from
complex displays. In H. Quastler (Ed.) Information
theory in psychology. Illinois: The Free Press, 1955.
Senders, J. W. The human operator as a monitor and
controller of multidegree of freedom systems. IEEE
Transactions on Human Factors in Electronics, 1964,
HFE-5, pp. 2-5.
Senders, J. W. A re-analysls of pilot eye-movement data.
IEEE Transactions on Human Factors in Electronics,
1966a, HFE-7, pp. 103-106.
Senders, J. W. Visual scanning behavior. In Visual Search,
Proceedings of the National Research Council Committee
on Vision Symposium, 1970, National Academy of Science,
Washington, D.C.

74
Senders, J. W., & Posner, M. J. M. A queuelng model of
monitoring and supervisory behavior. In T. B. Sheridan
& G. Johannsen (EDS.) Monitoring behavior and
supervisory control. New York: Plenum Press, 1976.
Shannon, C. E., & Weaver, W. The mathematical theory of
communication. Urbana, IL: University of Illinois
Press, 1948.
Sheridan, T. B., & Ferrell, W. R. Man-machlne systems:
Information, control, and decision models of human
performance. Cambridge, MA: MIT Press, 1974.
Smallwood, R. D. Internal models and the human instrument
monitor. IEEE Transactions on Human Factors in
Electronics, 1967, HFE-893), 181-187.
Spady, A. A., Jr. Airline pilot scan patterns during
simulated ILS approaches. NASA TP-1250, 1978.
Tole, J. R., Stephens, A. T., Harris, R. L., Sr., & Ephrath,
A. R. Visual scanning behavior and mental workload in
aircraft pilots. Aviation, Space, and Environmental
Medicine, 1982, I, 54-61.
Tole, J. R., Stephens, A. T., Vivaudou, M., Ephrath, A., &
Young, L. R. Visual scanning behavior and pilot
workload. NASA CR-3717, 1983.
Wier, D. H., & Klein, R. H. The measurement and analysis of
pilot scanning and control behavior during simulated
instrument approaches. NASA CR-1535, 1970.
Young, L. R., & Sheena, D. Eye movement measurement
techniques. American Psychologist, 1975, 30, 315-330.

75
Appendix A
Description of the Steep Turn Maneuver(Taken from 737 Pilot Training Manual, Boeing, 1975)
STEEP TURNS
Objective
The objective of the steep turn maneuver is to familiarizethe pilot with the airplane handling characteristics,
particularly elevator control. It is not intended that thepilot should bank greater than 30 degrees for normal,abnormal or emergency procedures.
Stabilize in trim at 250 knots on heading and altitude.Pitch trim is not used during the turn so that the pilot may
experience the higher control forces required at bank anglesgreater than 30 degrees. Avoid abrupt aileron inputs. Thesteep turn entry is accomplished in the same manner as a
normal turn entry. An increase in lift is required as thebank angle is increased at a constant airspeed and altitudeto balance the increase in load factor (g). The additional
lift is obtained by increasing the angle of attack (pitchattitude). The increased lift causes increased drag which
requires an increase in thrust to maintain airspeed and
altitude. As elevator pressure is applied to increase pitchattitude to maintain altitude, an increase in thrust will berequired to maintain the airspeed constant.
During Turn
Pitch and thrust control are the same as for a normal turn;however, larger pitch adjustments will be required for a
given altitude deviation. Varying the angle of bank whileturning makes pitch control more difficult. Excursions from
the entry conditions should he corrected by smooth, positivecontrol inputs and/or thrust. If altitude loss becomesexcessive, reduce the angle of bank as necessary to regain
positive pitch control. A rapid instrument scan is required
to detect deviations early enough to be corrected by smalladjustments.

76
Instrument Characteristics
Attitude Director Indicator (ADI)
During steep turns it has cyclical precession in pitch.Although the actual airplane pitch attitude will remain
constant in a perfect steep turn, the instrument indication
of pitch attitude will slowly vary throughout the turn. Donot rely upon it for pitch attitude other than for small
corrections based on short-perlod observations.
Tolerances
Satisfactory demonstration of proficiency in steep turns a
turn of at least 180 degrees in each dlr_ction must becompleted maintaining assigned altitude i00 ft at 250 kts +
i0 kts and roll out on assigned heading + i0 °.m
Instantaneous Vertical Speed Indicator (IVSI)
This instrument interprets the change of acceleration and
displays this as a change to vertical speed. Thus, a rapidincrease in g forces as a steep turn is entered causes a
transient display of approximately 200 FPM climb, even thoughthe airplane is maintaining altitude perfectly, andconversely, a transient of approximately 200 FPM descent
appears due to the reduction in g force during a fastrollout. Allow for this feature by relying on the IVSI for
correct indications only during periods of steady g force.
Altimeter
The altimeter is accurate and useful during steep turns. Be
alert to the direction and rate of altimeter needle movement,using smooth elevator control pressure changes forcorrections.
Horizontal Situation Indicator (HSI)
During steep turns, each of the airplane's two compasssystems usually displays a different indication on the
Captain's and the First Officer's HSI's. This is caused bythe individual response of each directional gyro, associated
amplifier, and flux valve. Therefore, the HSI's may differ
as much as 20 ° during the turn and for a short periodrollout.
Airspeed
The airspeed is very slow to change due to the relatlvelysmall changes in thrust and drag. Anticipate therequirements for thrust changes and apply them at the first
positive indication of change on the airspeed indicator.
Normally a slight increase in thrust will be required.(Note: If the airspeed bug is rotated to 250 knots on the
airspeed indicator, it will assist in the instrument scan.)

77
Rollout
Be alert to correct for the more than normal pitch attitudeand power used during the turn. Roll out at the same rate as
used with normal turns. Normally the desired heading shouldbe led by 10-15 degrees; however, individual technique willdetermine the exact amount of lead.

78
Table i
16 Original Control Status Measures*
Number Control Status
i No control movements
2 Stick decision being made
3 Positive stick input being made4 Negative stick input being made5 Wheel decision being made
6 Positive wheel input being made7 Negative wheel input being made
8 Stick and wheel decisions being made9 Positive stick input/wheel decision
i0 Negative stick input/wheel decision
ii Stick declsion/positive wheel input
12 Stick decision/negative wheel input
13 Positive stick input/posltlve wheel input14 Positive stick input/negative wheel input15 Negative stick input/posltive wheel input
16 Negative stick input/negative wheel input
*The terms positive and negative are used generically to
describe the direction of the control input. In actualitythey represent:
Control Positive Negative
Stick Nose up Nose down
Wheel Left turn Right turn
79
Appendix B
TABLE 1
GOODNESS OF FIT MATRIX FOR IP3LUSING THREE PREVIOUS LODKPDINTSA=ACTUAL TRANSITIOhSP=PRE_ICTED TRANSITIONS *C=CHI-SQUARE VALUES
AS ROLL CBARS ALT ADF HSI IVSI ENG NON ROWA- 63.00 3.00 1.00 2.00 1.00 C.O0 0,00 O.OO Z.O0 q. CCP- 57.L0 3.60 1.20 1.60 1.00 0.00 0.00 0.00 1.80 9.20C- 0,55 0.00 0.00 0.00 0,00 0.00 O.CO 0.00 0.00 O.OC
A- 1.00 247°00 9.00 l.OC 0.00 C.O0 0.00 0.00 12o00 2.00P- 0.60 268°20 8.10 1.30 0.00 0.00 0.00 0.00 12.30 I.qCC- 0.00 0.01 0.09 0.00 0.00 0.00 0.00 0.00 0.01 O.OC
A- 2.00 8.00 238.00 1.00 1.00 0.00 0.00 O.OC _.00 4.0CP- 1.80 B.O0 199.60 1.30 O.BC O.O0 0.00 0.00 7.70 3.qCC- 0.00 0.00 6.20 O.OC 0.00 0.00 0.00 0.00 0.19 O.OC
A- 2°00 1.00 1.00 227.00 0°00 0.00 0.00 G.O0 l_.O0 4.00P- 3.30 1.00 0.70 266.20 0.00 0.00 0.00 0.00 14.40 5.00C- 0.00 0.00 0.00 6.77 0.00 0.00 0.00 0.00 0.01 O.OG
A- 0.00 0.00 1.00 2.00 7.00 0.00 0.00 0.00 L.O0 4._CP- 0.00 0.00 1.3C 2.50 4.10 0.00 0.00 0.00 1.00 4.80C- 0.00 0.00 0.00 0.00 1.20 0.00 O.CO 0.00 0.00 O.OG
A- 0.00 3.00 0.00 0.00 2.00 127.00 0.00 0.00 6.00 5.00P- 0.00 2.30 O.GC 0.00 1.30 134.g0 0.00 O.OC 6.80 3.60C- 0,00 0.00 0.00 0.00 0.00 0.49 0.00 0.00 O.ll 0.3q
A- 0.00 0.00 0.00 0.00 0.00 0.00 0.00 0.00 0.00 0.00P- 0°00 0.00 0,00 0.00 0.00 0.00 0.00 0.00 0.00 O.OCC- 0.00 0.00 0.00 O.OC 0.00 0.00 0.00 0.00 0.00 O.OC
A- 0.00 0.00 0.00 0.00 0°00 0.00 0.00 O.OO 0.00 O.OCP- 0.00 0.00 0.00 0.00 0.00 C.CO 0.00 0.00 0.00 0.00C- 0.00 0.00 0.00 0.00 0.00 0.00 0.00 0.00 0.00 O.OC
A-- _.00 8.00 8.00 IZ.O0 1.00 11.00 0.00 0.00 64.00 5.0CP- 3.50 7.70 8.60 12.8C 1.80 10.50 O.CO 0.00 5q.30 5.3CC- 0.00 0.01 0.05 0.05 0.00 0.02 O.CO 0.00 0.35 0._2
NUMBER OF CELLS = 20DEGREES OF FREEDOM = lqCHI-SQUARE - 16.51l
*- AVERAGE OF 10 PREDICTIONS

80
TABLE 2
GOODNESS OF FIT _ATRIX FOR IP3RUSING THREE PREVIOUS LOOKPOINTSA=ACTUAL TRANSITIONS
P=PREDICTED TRANSITIONS *C=CHI-SQUARE VALUES
AS ROLL CBARS ALT ADF HSI IVSI EHG NON WOwA- 75.00 0.00 5.00 1.00 0.00 2.00 0.00 0.00 2.00 5.0C
P- 75.90 0,00 4.20 0.50 0.00 2,10 0.00 0.00 2,30 4.qcC- 0.01 0.00 0.13 O.OO O.OC C.00 0.00 0.00 0.00 O,OC
A- 0,00 24q.00 LO.OO q.0o 1.00 0.00 0.00 0.00 6.00 [.OC
P- O.O0 199.60 9.00 8.1C 1.20 C.O0 O.CO 0.00 5,50 1.20C- 0,00 9.80 0.10 0.09 O.OC O.CO 0.00 0.00 0.04 0,04
A- 2.00 15.00 232.00 0.00 0.00 1.00 0.00 O.OC 8.00 3.0C
P- 1.60 14.40 256.80 0.00 O.O0 1.10 0.00 0.00 7,90 2.70C- O.O0 0.02 2.65 O.OG 0.00 C.CO 0.00 0.00 0°00 0.03
A- 0.00 2.00 0.00 223.00 0.00 0.00 0.00 0.00 17.00 2.0C
P- 0.00 2.00 0.00 238,00 O.O0 0.00 0.00 0.00 17.20 2.0CC- 0.00 0.00 0.00 1.01 0.00 0.00 0.00 0.00 0.00 O.OC
A- 1.00 0.00 0.00 0.00 0.00 1.00 0.00 0.00 0,00 2.00P- 0.70 0.00 0.00 0.00 O.OO 1.20 0.00 0.00 0,00 /.qcC- 0.00 0.00 0.00 O.OC 0.00 C.O0 O.CO 0.00 0.00 O,OC
A- 0,00 0.00 3.00 0.00 0,00 112.00 0.00 0.00 7,00 3,00P- 0.00 0.00 3.40 O.OO 0.00 qq.60 O.O0 0.00 7.10 )._C
C- 0.00 0,00 0,00 O,OG 0.00 1.37 0.00 0,00 0,00 0,05
A- 0.00 0.00 O.OO O.OC 0.00 O.OO C.CO 0.00 0.00 O.OCP- 0.00 0.00 0.00 0.00 0.00 0.00 O.CO 0.00 0.00 O.OOC- O.O0 0.00 0.00 0.00 0.00 0o00 0.00 O.O0 0.00 O.CC
A- O.O0 0.00 O.CC O.OC 0.00 0.00 O.CO 0.00 0.00 O.OCP- 0.00 0.00 O.O0 0.00 0.00 0.00 O.CO 0.00 0.00 0.00
C- 0.00 0.00 0.00 O.OO 0.00 O.CO 0.00 0.00 0.00 O.OC
A- 7.00 8.00 8.00 9.0C 1.00 6.00 0.00 0.00 107,00 l. OCP- 6.80 7.50 8,60 10.80 0.70 6.40 0.00 0.00 126.80 0.7CC- 0.01 0.03 0.05 0,36 0.00 0.03 0.00 0.00 3,66 O.Og
NUMBER OF CELLS = 26DEGREES OF FREEDOM = 25CHI-SQUARE = 19.586
$- AVERAGE OF IC PREDICTIONS

81
TABLE 3
GOODNESS OF FIT MATRIX FOR IPALUSING THREE PREVIOUS LOQKPOINTSA=ACTUAL TRANSITIONS
P=PREDICTED TRANSITIONS $C=CHI-SQUARE VALUES
AS ROLL CBARS ALT AOF HSI IVSI ENG NON ROWA- 6°00 0.00 3.00 0.00 O,OC 0.00 0,00 0.00 2,00 5.0CP- 7.70 0.00 2.50 0.00 0.00 0.00 0.00 0.00 2.40 4.qcC- O.AB 0.00 0.00 0.00 0.00 0.00 O.CO 0.00 0.00 O.OC
A- 0.00 102.00 B.O0 O.OO 0.00 O.CO O.O0 O.OO 7.00 O.OCP- 0,00 127.60 9,60 0.00 0.00 0.00 0.00 O.OC 1.gO O.OCC- 0.00 _.43 0.32 O.OC 0.00 0°00 O.GO 0.00 0.12 O.OC
A- 1°00 11.00 473.00 0.00 0.00 0.00 0.00 O.OC 19.00 I.OCP- I.40 13.10 655,00 O.OC 0.00 0.00 O.CO C.O0 18.20 1._CC- 0,00 0.40 0.68 O.OC O.OO 0.00 0.00 0.00 0.03 9.16
A- 0.00 3.00 1.00 236°00 0.00 0.00 0.00 0.00 ZO.O0 4._CP- 0.00 2.70 0.80 227.2C 0.00 C.O0 0.00 0.00 20.10 3.50C- 0.00 0.00 O.CO 0.33 0,00 0.00 0.00 0.00 0.00 0.06
A- 0.00 0.00 O.CO 0.00 0.C0 C.CO 0.00 0.00 O.CO O.OCP- 0.00 0.00 0.00 0.00 0.00 0.00 0.00 0.00 0.00 O.OCC- 0.00 0.00 0.00 0.00 0.00 0.00 0.00 0.00 0.00 O.OC
A- 0.00 0.00 1.00 0.00 0.00 24,00 0.00 0.00 1.00 2.0CP- 0.00 0.00 1.20 0.00 0.00 17._0 0.00 0.00 0.30 1.5CC- 0.00 0.00 0.00 0.00 0.00 1.81 0.00 0.00 0.00 0.13
A- 0°00 0.00 0.00 1.00 0°00 0.00 10.00 0.00 1,00 ?.OCP- 0.09 0.00 O.CC 0.7C 0.00 0.00 8.20 0.00 0.90 1.6CC- 0.00 0.00 O.CO 0.00 0.00 0.00 0.32 0.00 0.00 0.0_
A- 0.00 0.00 0.00 0.00 0.00 0.00 0.00 0.00 0.00 O.OCP- 0.00 0.00 0.00 O.OC 0.00 0.00 0.00 0.00 0.00 O.OCC- 0.00 0.00 O.CO O.OC 0.00 0.00 0.00 0.00 0.00 O.OC
A-- 4.00 Z.O0 17.00 Z3.O0 O.O0 2,00 2.00 0.00 160.00 10.00P- 3.50 1.90 19.00 23.10 O,O0 1.50 1,60 C,O0 161.50 8.50C- 0.00 0.00 0.24 O.OC 0.00 0.00 0.00 0,00 0.01 0.22
NUMBER OF CELLS = 20DEGREES OF FREEDOM = LqCHI-SOUARE = 11.834
*- AVERAGE OF 10 PREDICTIONS

82
TABLE 4
GOODNESS OF FIT MATRIX FOR IP4RUSING THREE PREVIOUS LOOKPOINTSA=ACTUAL TRANSITIONSP=PREOICTED TRANSITIONS $C=CHI-SQUARE VALUES
AS ROLL CBARS ALT ADF HS[ IVSI ENG NON ROW
A- 17.00 0.00 2.00 Z.O0 0.00 0.00 0.00 0.00 3,00 7.00P- ll.BO 0.00 2.30 2.50 0.00 C.O0 O.CO 0.00 2.60 7.40C- l.Sq 0.00 O.CC O.OO 0.00 O.CO 0.00 0.00 0,00 0.02
A- 1.00 96.00 /O.CC 1.00 0.00 0.00 0.00 0.00 1,00 3.00P- 0.90 BB.bO 9.50 0.80 0,00 0,00 0.00 0.00 L,_O 3.10
C- 0.00 0.57 0.02 0.00 0.00 0.00 0.00 0.00 0.00 0,00
A- 1.00 7.00 450.00 3.00 0,00 3.00 0.00 C.OC 17.00 7.00P- I,00 6.I0 407.60 2.60 0.00 3.50 0,00 0.00 15.60 7.1C
C- 0.00 0.12 4.00 0.00 0.00 C.00 0.00 0.00 0.12 O.OC
A- 1.00 2.00 2.00 162.00 0.00 1.00 2.00 0.00 20.00 8,00
P- 1.LO 2.L0 2.10 170.50 0.00 1.10 2.60 0.00 21.70 q,ocC- 0.00 0.00 0.00 0.45 0.00 0.00 0.00 0.00 O.L_ O.t3
A- 0.00 0.00 0.G0 0.00 0.00 0.00 0.00 0.00 0.00 O.OGP- 0.00 0.00 0,00 0.00 0,00 C.O0 0.00 0.00 0,00 OoOCC- 0.00 0.00 0.00 O.OC 0.00 0.00 0.00 0.00 0.00 0o00
A- 0.00 0.00 O.O0 0.00 0.00 41.00 0.00 0.00 b.O0 0.00P-- 0.00 0o00 0.00 0°00 0.00 _q.50 0o00 0.00 7.10 O.OCC- 0.00 0.00 0.00 O,OG 0,G0 1.76 G.GO 0,00 0.20 O.O0
A- 0.00 0.00 0.00 I.OC 0.00 0.00 23.00 0.00 3.00 4.0CP- 0.00 0.00 0.00 1.40 0.00 0.00 25.50 0.00 3.30 4,7CC- 0.00 0.00 0.00 0.00 0.00 C.CO 0.27 0.00 0.00 0,12
A-- 0.00 0.00 0.00 0.0C 0,00 0.00 0.00 0.00 0.00 O.OC
P- 0.00 0.00 0.00 0.00 0.00 0.00 0.00 0.00 0.00 O.OCC- 0.00 0.00 0.00 0.00 0.00 C.00 C.CO C.O0 0.00 O,OC
A-- 4.00 4.00 16.00 21.00 0.00 2.00 2.00 0.00 135.00 12.0CP- 4.50 4.60 15,40 23.50 0.00 2.50 2,20 0.00 161.50 13.80C- 0.00 0.00 0.02 0.30 0.00 C.00 0.00 0.0C 5,20 0.27
NUMBER OF CELLS = 20
DEGREES OF FREEDOM = lq
CHI-SQUARE = 15.305
€- AVERAGE OF 10 PREDICTIONS

83
TABLE 5
GOODNESS OF FIT MATRIX FOR POILUSING THREE PREVIOUS LODKPOINTSA=ACTUAL TRANSITIONSP=PREDICTED TRANSITIONS ,C=CHI-SQUARE VALUES
AS ROLL CBARS ALT ADF HSI IVSI ENG NON ROWA- B2.OC 0,00 _.OC O,OC 0.00 0.00 0.00 0.00 L.O0 5.0¢P- B4.90 0.00 3.30 0.00 0.00 0.00 0.00 0.00 1.00 _.3GC- 0.I0 0.00 0.00 O.OC 0.00 O.O0 0.00 0.00 0.00 0.IC
A- 0.00 l.O0 0.00 0.00 O.CO 0.00 0.00 0.00 1.00 2.00P- 0.00 0.00 0.00 O.OO 0.00 0.00 0.00 0.00 0.00 O.OCC- 0.00 0.00 0.00 O.OC 0.00 O.OO 0.00 0.00 0.00 2.0C
A- 2.00 0.00 708.00 Z.O0 0.00 0.00 L,O0 0.00 LS,00 5.00P- 1.60 0.00 677.60 Z.SC 0.00 O.O0 0.90 C.OG 15.60 5.0CC- 0.00 0.00 1.32 0.00 0.00 0.00 O.O0 0.00 0.02 O.OC
A- 0.00 0.00 2.00 38.0C 0.00 O.O0 I.00 0.00 b.O0 3.0CP- 0.00 0.00 2.50 39.60 0.00 0.00 1.30 0.00 7.30 3._¢C- 0.00 0.00 0.00 0.07 0.00 0.00 0.00 O.O0 0.28 0.21
A- 0.00 0.00 O.OC O.OC 0.00 C.OG 0.00 0.00 0.00 O.OCP- 0.00 0.00 0.00 0.00 0.00 0.00 O.O0 0.00 0.00 O.OCC- 0.00 0.00 0.00 0.00 0,00 0.00 O.CO 0.00 0.00 0.00
A- 0.00 0.00 0.00 O.OO O.OO O.QO 0.00 0.00 0.00 O.OCP- O.OO 0o00 0.00 0.00 0.00 0.00 0.00 0.00 0.00 0.0¢C- 0.00 0.00 0.00 0.00 0.00 C.O0 O,CO 0.00 0.00 O.OC
A- 0.00 0.00 O.CO 3.0C 0.00 0.00 62,00 0.00 0.00 3.0CP- 0.00 0.00 O.O0 3.30 0.00 O.OO 70.10 0.00 0.00 3.3CC- 0.00 0.00 0.00 0.00 0.00 0.00 1.06 0.00 0.00 0.03
A- 0.00 0.00 0.00 O.OC 0.00 C.O0 O.CO 0.00 0.00 O.OGP- 0.00 0.00 0.00 0.00 0.00 C.O0 O.CO 0.00 0.00 O.OCC- 0.00 0.00 0.00 0.00 0.00 0.00 O.O0 O.OC 0.00 O.OC
A- 3.0C 0.00 1_.00 5.00 O,CO C.O0 1,C0 0.00 130,00 4.OCP- Z.70 0.00 15.70 5.3C 0.00 0.00 1.10 C.O0 l_2.gO 3.8CC- 0.00 0.00 0.21 0.02 0.00 0.00 0.00 0.00 1.28 0.01
NUMBER OF CELLS = 15DEGREES OF FREEDOM = 1_CHI-SOUARE = 6.712
_- AVERAGE OF I0 PREDICTIONS

84
TABLE b
GDCDNESS OF FIT MATRIX FOR PO1RUSING THREE PREVIOUS LODKPOINT5A=ACTUAL TRANSITIONSP=PRECICTEC TRANSITIONS *
C=CHI-SQUARE VALUES
AS ROLL CBARS ALT AOF HSI IVSI ENG NON RnWA-- 116.00 0.00 3.00 0.00 0.00 C.O0 0.00 0.00 3.00 _.0¢P- g6.50 0.00 3.6C O.CC O.CO C.O0 O.CO 0.00 L.70 5.30C- 3.Z8 0.00 0.00 O.OG 0.00 C.OO 0.00 0.00 O.O0 0.0_
A- 0.00 23.00 1.00 O.OC O.OC C.O0 0.00 0.00 2.00 3.00P- O.O0 25.00 o.gc O.OC 0.00 0.00 0.00 O.O0 1.80 2.7CC- O.O0 0.17 0.00 0.00 0.00 0.00 0.00 0.00 0.00 0.03
A-- 1.00 0.00 317.00 O.OC O.CO 0.00 2.00 C.O0 2Z.O0 3.00P- 1.00 0.00 317.0C O.OC O.O0 C.OO 2.40 C.O0 2Z.60 3._0C- O.O0 O.O0 O.O0 0.00 0.00 O.OO 0.00 0.00 0.02 0.05
A- O.O0 0.00 O.O0 85.0C 0.00 C.O0 O.CO 0.00 7.00 O.OCP- 0.00 0.00 O.OC 111.5C 0.00 0.00 0,00 0.00 7,20 O.OCC- 0.00 0.00 0.00 8.Z6 O.O0 O.O0 C.CO 0.00 0.01 0,0¢
A- 0.00 0.00 0.00 O.OO 0.00 0.00 0.00 0.00 0.00 O.OCP- O.O0 0.00 O,CC 0.0C O.CO 0.00 0.00 0.00 0,00 _.OCC- O.O0 0.00 O.O0 O.OC O.O0 0.00 0.00 0.00 0.00 0.00
A- O.O0 0.00 O.OO O.OO 0.00 O.GO 0.00 0.00 0.00 0o0CP-- 0.00 0.00 0.00 O.OO 0.00 C.CC O.CO 0.00 0.00 O.OCC- O.O0 0.00 0.00 0.00 O.CO C.O0 0.00 0.00 0.00 0.00
A-- 0.00 O.OO 2.00 0.00 0.00 O.O0 115.00 0.00 0,00 2.00P- O.O0 O.OO 2.10 0.00 0.00 C.CC i08.I0 0.00 0.00 2.10C- O.O0 0.00 0.00 O.OC 0.00 C.O0 0.41 O.OO 0.00 O.OC
A- 0.00 0.00 0.00 0.00 0.00 0.00 0.00 55.00 b.O0 O.OCP- 0.00 0.00 0.00 0.00 0.00 0.00 O.CO _6.90 5.70 O.OCC- 0.00 0.00 O.GO O.OC 0.00 0.00 0.00 1.19 0,02 O.OC
A-- 5.00 3.00 20.00 7.00 0.00 0.00 0.00 5.00 303.00 3.OOP- 4.30 Z.70 ZO.O0 7.2C 0.00 0.00 0.00 5.60 306.20 2.70C- 0.10 0.00 0.00 0.01 0.00 C.O0 0.00 0.07 0.03 0.03
NUMBER OF CELLS = 19DEGREES OF FREEDOM = 18CHI-SQUARE = L3.767
*- AVERAGE OF lO PREDICTIONS

85
TABLE 7
GOODNESS OF FIT MATRIX FOR PO2LUSING THREE PREVIOUS LOCKPOINTSA=ACTUAL TRANSITIONSP=PREDICTED TRANSITIONS *
C=CHI-SQUARE VALUES
AS ROLL CBARS ALT ADF HSI IVSI ENG NON ROWA- 38.00 0.00 3.00 O.OQ 0.00 0.00 0.00 0.00 0.00 3.00
P-- 51.30 0.00 4.00 0.00 O.OO C.00 0.00 0.00 0.00 4.00C- _.66 0.00 0.00 O.CC 0.00 0.00 0.00 0.00 0.00 0.33
A-- 0.00 92.00 2.00 3.00 0.00 0.00 0.00 0.00 5.00 5.OCP- 0.00 9_,70 Z,30 3.10 0,00 O,CO 0,00 0.00 _,bO 5,_CC- 0.00 0.08 0.00 O.OC 0.00 C.00 0.00 0.00 0.03 0.03
A- 2,00 _.00 578.CC 1.OC 0.00 O.O0 0.00 0.00 Ib.O0 3.0CP- 2.60 4.90 573.90 1.30 0.00 D.CO O.O0 C.00 15.90 3.nOC- 0.00 0.00 0.03 0.00 0.00 0.00 0.00 0.00 0.00 0.27
A- 0.00 O.O0 4.00 17B.00 O.OO 0.00 0.00 0.00 10.00 4.00
P- 0.00 0.00 6.40 165.80 0.00 0.00 0.00 0.00 9.40 4.40C- 0.00 0.00 0.00 0.84 0.00 0.00 O.CO C.O0 0.04 0.04
A- 0.00 0.00 Q.CC O.OO O.CO Q.CO 0.00 0.00 0.00 O.OGP- O.OO 0.00 0,00 0.00 0.00 C.O0 0.00 0.00 0.00 O.OOC- 0.00 O.O0 O.O0 0.00 0.00 0.00 0.00 0°00 0.00 O.OC
A- 0.00 0.00 Q.CC 0.00 O.OC 60.00 0.00 0.00 5.00 0.00P- O°O0 0.00 O.OO O.OO 0.00 52.g0 0.00 0.00 5.10 O.OGC- 0.00 0.00 O.OO O.CC O.CC 0.84 0.00 0.00 0.00 O.CC
A- O.OO O.O0 O,CO O.OO 0,00 O.O0 C.CO 0.00 0.00 0.00P- 0.00 0.00 0.00 0.00 0.00 0.00 0.00 0.00 0.00 O.OCC- 0.00 0.00 O.CO 0.00 0.00 0.00 0.00 0.00 0.00 O.OC
A- 0.00 0.00 O.CO O.OC 0.00 C.00 0.00 0.00 0.00 O.OCP- C,O0 O.O0 O.CC O.QC 0.00 0.00 O.CO 0.00 0.00 O.OCC- 0.00 0.00 0,00 0.00 0.00 O.O0 C.CO 0.00 0.00 O._G
A- 1.00 6.00 14,00 I0.00 0.00 5.00 C.CO O.OO 85.00 1.00P- 1.40 5.10 L4.60 q.6c 0.00 5.30 0.00 0.00 87.80 1.6GC- 0o00 0.13 0.03 0.02 O.CO O,OZ O,O0 0.00 o.oq 0.1_
NUMBER OF CELLS = 20DEGREES OF FREEDOM = 19CHI-SQUARE = 7,b35
*- AVERAGE OF 10 PREDICTIONS

86
TABLE 8
GOODNESS OF FIT MATRIX FOR POZRUSING THREE PREVIOUS LOCKPCINTSA=ACTUAL TRANSITIONSP=PREDICTED TRANSITIONSC-CHI-SQUARE VALUES
AS ROLL CBARS ALT ADF HSI IVSI ENG NON ROWA- _2.00 0.00 1.00 0.00 O.O0 C.O0 1.00 0.00 1.00 3.0C
P- 66.60 O.O0 l. O0 O.O0 O.OO C.O0 1.20 0.00 2,10 _,3CC- I_._I O.O0 O.O0 0.00 0.00 O.CO C,O0 CoO0 0.00 0.56
A- O.O0 99.00 5.00 O.OC O.CO C.CO O.CO 0,00 6.00 O.OCP- 0.00 9_.80 _.30 O.OO O.O0 0.00 0.00 0.00 5.90 O,OCC- 0.00 0.18 0.I0 O.OC 0.00 0.00 0.00 0.00 0.00 O.OC
A-- 1°00 2.00 653.00 2.0C 0.00 0.00 0.00 OoOO 17.00 5.00P- 1.20 1.80 63_.70 1.gO O.O0 C.O0 0.00 0.00 16.40 _.gC
C- 0.00 O.O0 0.51 0.00 O,O0 O.CO O,CO 0.00 0.02 O.OC
A- 0.00 0.00 3°00 97.00 0.00 O.CO C.CO 0.00 _.00 7.00P- O.OO O.O0 3.60 B1.20 0.00 C.GO 0.00 0.00 3.50 b,gGC- O.OO O.O0 O.O0 Z.57 O.O0 0.00 0,00 0.00 0.00 O,OC
A- O.OO 0°00 O.CC OoCC O.OC 0.00 O.O0 0.00 0.00 0,0CP- O.OO O.O0 O.CO O.OC 0.00 0.00 O.CO 0.00 0.00 O,OGC- O.O0 O.O0 O.OO O.O0 O,O0 O.OO O.OO O.O0 0.00 O,OC
A- O.OO l,O0 0.00 O,OC 0.00 56,00 0.00 C°O0 3.00 4.0CP- O.O0 O.90 O.O0 O.0C 0.00 5_.50 O.C0 0.00 Z,80 3.70C- O°OG O.O0 O.OC O.OG O.O0 C.O_ 0°00 0.00 0.00 0.02
A-- 0.00 0.00 0.00 0.00 0.00 C.OO O°CO 1.00 O.O0 1,0CP- O.O0 O.O0 0.00 O.OC 0.00 C.CO O.O0 1.ZO 0,00 1.ZCC- O,O0 0.00 O.O0 O.OC O.OC C.OO C.O0 0.00 O.O0 0.04
A- O.OO O.O0 1.00 O.O0 O.O0 C.CO O.CO _7,00 L.O0 Z.OCP- 0.00 0.00 1.CO OoCC O.O0 O.O0 C,CO 52.70 L.40 Z._CC- 0.00 O.O0 O,CC O.O0 O.DO O.O0 O.OO 0.69 0.00 0,08
A-- 2.00 B.O0 11.00 5.0C 0.00 _.00 O.O0 1.00 68.00 7,COP- 3°10 7.70 12.1C 5.OC O.O0 3.qO O.CO 1.10 7Z,60 B,1CC- O.OO OoO1 O.ll O.OC O.OO O.O0 O.O0 O.O0 0.31 0.17
NUMBER OF CELLS = 20DEGREES OF FREEDOM = LqCHI-SQUARE = 19.840
*-- AVERAGE OF L0 PREDICTIONS
87
TABLE 9
GOODNESS OF FIT MATRIX FOR P03LUSING THREE PREVIOUS LOOKPOINTSA=ACTUAL TRANSITIONSP=PRECICTED TRANSITIONS *
C=CHI-SQUARE VALUES
AS ROLL CEARS ALT ADF HSI IVSI ENG NON ROWA-- 1_.00 0.00 0.00 0.00 1.00 0.00 0.00 0.00 1,00 2.0¢P- 12.30 0.00 0.00 O.OC L.20 0.00 0.00 0.00 0,90 2,LCC- 0.21 0.00 0.00 0.00 0.00 O.GO 0.00 0.00 0,00 0,00
A- 0.00 50.00 0.00 I.00 0.00 C.O0 O.CO 0.00 5.00 I.OGP- O.O0 56.60 0.00 1.20 O,CO 0.00 0.00 0.00 5,60 L,2CC- 0.00 0.87 0.00 0.00 0.00 0.00 O,CO " 0.00 0,07 0.04
A- 2.00 0.00 554.00 Z.O0 O.CC 2.00 0.00 C.O0 14.00 6.00P- 2.L0 0.00 518.40 1.80 0.00 1.80 0.00 0.00 13.60 5,7CC- C.O0 0.00 2.2g O.OC 0.00 0.00 0.00 O.O0 O.Ol 0.02
A- 0.00 2.00 _.00 204.00 0.00 0.00 1.00 C.O0 12.00 7.00P- 0.00 2.60 3.70 206.90 0.00 0.00 0.60 C.O0 13.30 _.qCC- 0.00 0.00 0.00 0.04 0.00 0.00 0.00 0.00 0.1_ O.OC
A- 0.00 0.00 0.00 0.00 7.00 0.00 0.00 0.00 1.00 /.OCP- 0.00 0.00 0.00 0.00 9.80 0.00 0.00 0.00 1.20 1.20C- 0.00 0.00 0.00 0.00 1.12 0.00 0.00 0.00 0.00 0.0_
A- 0_00 0.00 1.00 0.00 0.00 26.00 0.00 0.00 2.00 3.00P- 0,00 0,00 I,60 O.OC 0.00 38.00 O,CO 0.00 1.80 3._CC- 0.00 0.00 0.00 0.00 0.00 5.54 0.00 0.00 0.00 0.05
A- 0,00 0.00 0.00 3.00 0.00 0.00 52.C0 0.00 3,00 6,CCP-- 0.00 0.00 0.00 2.60 0.00 C.O0 53°20 0.00 3,00 5.b0C- 0.00 0.00 0.00 0.00 0.00 0.00 0.03 0.00 0.00 0.03
A- 0.00 0.00 0.00 0.00 0.00 0.00 0,00 0.00 0.00 O,OCP- 0.00 0.00 0.00 0.00 0°00 0.00 0,00 0.00 0.00 O.OCC- 0.00 0.00 0.00 O.OC 0.00 C.O0 0°00 0.00 0.00 O.OC
A- 0.00 _°00 15.00 13o00 0.00 2°00 5,00 0.00 Bl.O0 6,0CP- 0.00 4.30 1_._0 14.80 0.00 1.60 5°10 0.00 87.00 5.gCC- 0.00 0.00 0°02 0.25 O.O0 0.00 0,00 C.O0 0._ O.OO
NUMBER OF CELLS = 22DEGREES GF FREEDOM = 21CHI-SQUARE = 11.220
*- AVERAGE OF 10 P_EDICTICNS

88
TABLE LO
GOODNESS OF FIT MATRIX FOR PO3RUSING THREE PREVIOUS LO_KPOINTSA=ACTUAL TRANSITIONSP=PREDICTED TRANSITIONS *
C=CHI-SQUARE VALUES
AS ROLL CBARS ALT AOF HSI IVSI ENG NON ROW
A- 37.00 0.00 l. OC 0.00 0.00 O,OO 0.00 0.00 1.00 2.0CP- 62.80 0.00 1.00 0.00 0.00 C.O0 O.CO C.O0 O.BO 1.80
C- 0.91 0.00 0.00 0.0C 0,00 C.CQ O.O0 O,00 0.00 0.02
A- O.O0 32.00 8.00 O.OC 0.00 0.00 0.00 0.00 0.00 O,OGP- 0.00 33.00 8.g0 O.OC O,O0 C.CO O.CO 0.00 0.00 O.OCC- 0,00 0.03 O.IC O.OC 0.00 O.O0 O.O0 0.00 0,00 O.OC
A- 2.00 2.00 77B.00 3.00 0.00 2.00 1.00 0.00 1_.00 10._0P- 2.00 2.00 776,g0 3.00 O,O0 2.20 O.gO O.O0 13.90 I0.1C
C- 0.00 0.00 0.01 0.0C 0.00 C.O0 O.O0 0.00 0.00 O.OC
A-- 0.00 0.00 2.00 165.0C 0.00 0.00 2.00 0.00 7,00 _.OCP- 0.00 0.00 2.70 161.80 0.00 0.00 1.30 0.00 6._0 _.OCC- 0.00 0.00 0.00 0.06 O.O0 O.O0 0.00 0.00 0.05 0.00
A- 0.00 0.00 O.CO O.OC 0.00 O.O0 0.00 0.00 0.00 O.OC
P- O.O0 O.O0 O,O0 0.00 0.00 0.00 0.00 0.00 0.00 O.OCC- 0.00 0.00 0.00 0.00 0.00 0.00 O.O0 0,00 0.00 O.OC
A-- O.00 0.00 0.00 O.OC 0.00 36.00 0.00 0.00 3.00 3.00P-- 0.00 0.00 0.00 0.00 0.00 63.20 O.CO 0.00 3._0 3._CC- O,O0 O.O0 0.00 O,OO 0.00 2.69 O.CO C.O0 0.00 0.05
A- 0.00 0.00 1.00 _.00 0.00 0.00 B2.00 0.00 Z.O0 7.00P- 0.00 0.00 O.BO 3.60 0.00 Q.O0 66.60 0.00 1.70 5.gCC_ O.OO 0.00 O.O0 0.00 0.00 0.00 2.8q 0.00 O.O0 0.17
A- 0.00 0.00 0.00 0.00 0.00 C.O0 C.O0 0.00 0.00 O.OCP- 0.00 0.00 0.00 O.OC 0.00 0.00 0.00 0.00 0.00 _.OC
C- 0.00 0.00 0.00 O.OC 0.00 0.00 0.00 0.00 0,00 O.OC
A- 0.00 6.00 Z2.OC 6°00 0.00 1.00 6.C0 C.O0 Z8.O0 9.00
P- 0.00 6.g0 11.20 6.10 O,CO 1.30 3.70 0.00 31.10 g.lOC- O.OO 0.13 0.05 O.O0 0.00 C.00 0.00 O.O0 0.3_ O.OC
NUMBER OF CELLS = 18DEGREES OF FREEDOM = 17
CHI-SCUARE = 7.330
_- AVERAGE OF 10 PREDICTIONS
89
TABLE 11
GOODNESS OF FIT MATRIX FOR P05LUSING THREE PREVIOUS LOCKPOINTSA=ACTUAL TRANSITIONS
P=PREDICTED TRANSITIONS *
C=CHI-SQUARE VALUES
AS ROLL CBARS ALT ADF HSI IVSI ENG NON ROWA-- 131o00 4.00 1.00 1.00 0.00 0.00 0.00 0.00 1,00 7,0CP- 120.20 _°30 0.80 0.60 0.00 0.00 0.00 0.00 I.I0 _.8CC- O.8g 0.00 0.00 O.OC 0.00 0.00 0.00 0.00 0.00 0.31
A- _.00 _05.00 0,00 _.00 O.OO I.O0 0.00 C.O0 21.00 9.0CP- _,30 398.90 0.00 5.00 0.00 1.00 0.00 0,00 21,00 I0.3CC- 0.00 0°09 0.00 O.OO O.O0 C°CO 0.00 0.00 0.00 0.1_
A-- G.O0 12.00 156.00 0.00 0.00 1.00 C.O0 0.00 6.00 I,OCP- C.O0 13.60 162,20 0.00 0.00 1._0 O,CO 0.00 5._0 l._OC- 0.00 0.21 0.25 0.00 0.00 O.CO O.CO 0.00 0.06 O,tb
A- I.00 5.00 0.00 266.00 0.00 0.00 2.00 0.00 b.O0 3,0CP- lo20 5.20 0.00 279.3C 0°00 0°00 2.10 0,00 6.30 3,3CC- 0.00 0°01 0.00 0.66 O.O0 C.OO 0,00 0.00 0.02 0.03
A- 0.00 0.00 O,CO O.OC 0.00 O.O0 0.00 0.00 0,00 O.OCP- 0.00 0.00 O.GO 0.00 0.00 C.O0 0.00 0.00 0.00 0.00C- 0.00 0.00 0.00 0.00 0,00 0.00 O,CO 0.00 0,00 O°OC
A- 0.00 1.00 0.00 O.OC O.GO q2.CO C.O0 0.00 4.00 5.0CP- 0.00 o.go O,OO O.OC 0,00 97._0 0,00 0.00 _,LO 5,0CC- 0,00 0.00 0.00 O.OO 0.00 0.32 0.00 0.00 0.00 O.OC
4- C.O0 0.00 0.00 1.00 0.00 C.O0 52.00 0.00 3.00 _.OCP- O.O0 0.00 0.00 I.4C O.CO O.OO 3q.20 0.00 2.30 3.7CC- 0.00 0.00 O,OC 0.00 0,00 O°O0 3.15 0.00 0.00 0.02
A- 0.00 0.00 0.00 O.OG 0.00 0.00 O°CO O.O0 0,00 O.OCP- 0.00 0.00 0.00 0.00 0.00 C.O0 0.00 0.00 0,00 0.00C- 0.00 O.O0 O.CO O.OO 0.00 0.00 0.00 0,00 0.00 O.OC
A- 2.00 8.00 18.00 8.00 0,00 3.00 2.00 0.00 80.00 7.0CP- 1.40 7.60 1q.60 8.0C O°CO 2.80 1.70 0°00 78.70 5.9CC- 0.00 0.02 0.16 O.OO 0.00 0.00 0.00 O.OO 0°02 O°L7
NUMBER OF CELLS = 22DEGREES OF FREEDOM = 21CHI-SQUARE = 6._20
•- AVERAGE OF 10 PREDICTIQNS
90
TABLE lZ
GOODNESS OF FIT MATRIX FOR POSRUSING THREE PREVIOUS LOOKPOINTSA=ACTUAL TRANSITIONSP=PREEICTEO TRANSITIONS *C=CHI-SOUARE VALUES
AS ROLL CBARS ALT ADF HSI IVSI FNG NON ROW
A- 36.00 3.00 0.00 1.00 0.00 0.00 0.00 O.O0 0,00 4.00P- 26.40 2.70 O.CC 0.5C O.O0 O.OO O.O0 C.OC 0.00 3.?C
C- 2.56 0.00 0.00 0.00 0.00 C.O0 0.00 0.00 0,00 0,16
A- 1.00 299.00 8.00 IO.OC O.CO C.OO O.CO 0.00 22,00 1.00P- 1.00 367.30 6.50 11.00 O,CO O.CO O.O0 C.OO 22.90 I.00
C- 0.00 7.80 0.28 0.I0 O.O0 O.OO O.O0 O.O0 0.06 0.0C
A- l.O0 ll. O0 312.00 O.OC 0.00 C.O0 0.00 C.O0 21.00 I.CC
P- 0.30 12.50 288.20 O.OC O.O0 0.00 O.O0 0.00 17.60 0.30C- 0.00 0.20 1.82 O.OC 0.00 0.00 0.00 O.O0 0.55 0.4_
A- 1.00 13.00 O.O0 286.00 0.00 O.O0 1.00 0.00 8.00 2.00P- O.qO 11.30 0.00 278.70 O.OC O.CO 1.20 0.00 9.qO 2.1G
C- O.O0 0.22 O.CO 0.19 O,OC 0.00 O.O0 C.O0 0.45 0.00
A-- 0.00 0.00 0.00 O.OO 0.00 0.00 O.CO 0.00 0.00 O.OCP- O.O0 0.00 0.00 0.00 O.CO 0.00 0,00 0.00 0.00 O.OG
C- 0.00 0.00 0.00 O.OC 0.00 0.00 O.O0 0.00 0.00 O.OO
A- 0.00 O.OO 0.00 O.OO 0.00 2.00 0.00 0.00 L.O0 3.00P-- 0.00 0.00 O.OO O.OC O.OO 1.G0 O.CO 0.00 0.50 L.SCC- 0.00 0.00 O.OC 0.00 0.00 0.00 0.00 0.00 0.00 0.7_
A- O.OO O.OO 0.00 2.0G O.OC 0.00 3_.00 0.00 2.00 6.00P- 0.00 0.00 O.OO 1.8C O.OC 0.00 36.70 0.00 2.00 3.BCC- 0.00 0.00 0°00 0,00 0.00 O.O0 C.01 0.00 0.00 0.01
A- 0.00 0.00 0.00 O.OC 0.00 0.00 0.00 C.O0 0.00 O.OCP- 0.00 O.OO 0.00 O.OC 0.00 0.00 0.00 0.00 0.00 O.OC
C- 0.00 0.00 O.CC O.OO 0.00 0.00 0.00 0.00 0.00 O.OC
A- I.00 15.00 25.00 q.o0 0.00 l.OO 3,C0 0.00 131.00 5.00P- 1.10 15.20 26.10 10.20 0.00 0.50 2.60 0.00 126.60 _.20C- 0.00 0°00 0.03 0.16 O.CC 0.C0 0.00 0.00 0.33 O.L3
NUMBER OF CELLS = 23
DEGREES OF FREEDOM = 22CHI-SQUARE = 16.2q5
*- AVERAGE OF 1G PREDICTIONS
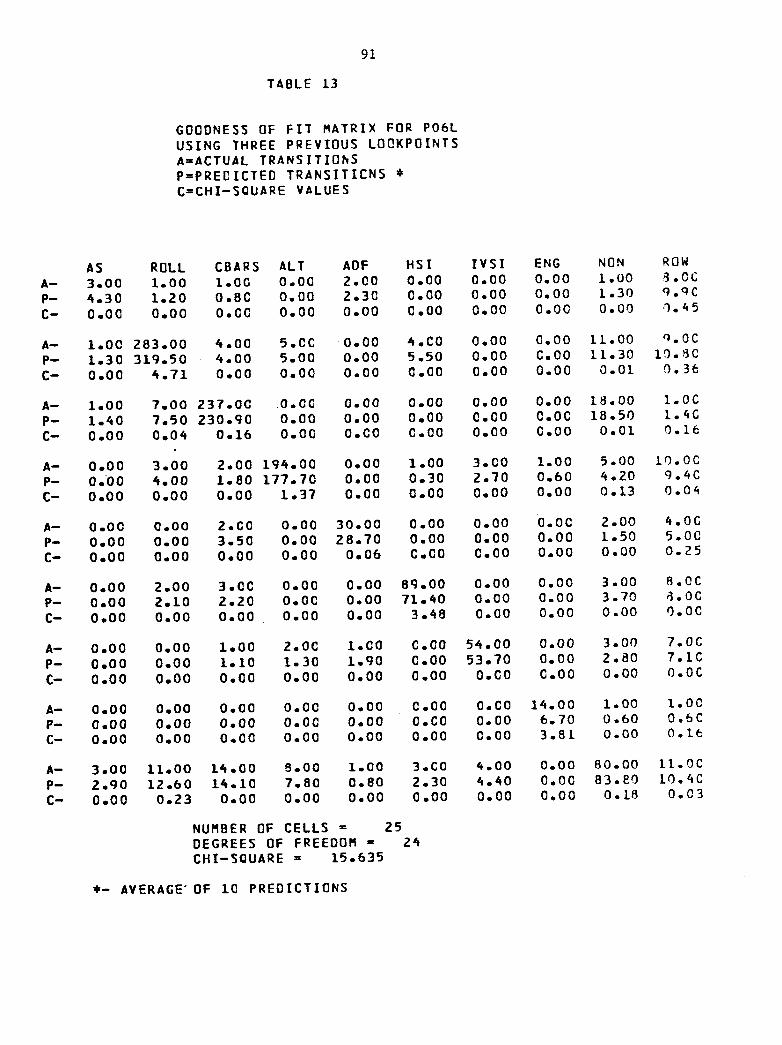
91
TABLE 13
GOODNESS OF FIT MATRIX FOR P06L
USING THREE PREVIOUS LOOKPOINTSA=ACTUAL TRANSITIONS
P=PRECICTED TRANSITICNS *
C=CHI-SQUARE VALUES
AS ROLL CBARS ALT ADF HSI IVSI ENG NON ROWA- 3,00 1.00 1,00 0,00 2,00 0,00 0,00 0,00 1,00 _.OC
P- 4,30 1,20 0,8C 0,00 2,30 0,00 0,00 0,00 L,30 q,qC
C- 0,00 0,00 0,00 0,00 0,00 0,00 0,00 0,00 0,00 0,45
A- 1,00 283,00 4,00 5°CC 0,00 4,00 0,00 0,00 11.00 O.OCP- 1.30 319.50 4.00 5.00 0.00 5.50 0.00 C.O0 11,30 10,80C- 0,00 4,71 0,00 0,00 0,00 C,00 0,00 0,00 0.01 0,3_
A- 1,00 7,00 237,00 .0,00 0,00 0,00 0,00 0,00 18,00 1,00
P- 1,40 7,50 230°gO 0,00 0,00 0,00 C,00 O,OC 18,50 1,_CC- 0,00 0,04 0,16 0,00 O,CO C,O0 0,00 0,00 0,01 O,Ib
A- 0°00 3,00 2,00 Ig4,00 0,00 1,00 3,00 1.00 5,00 lO.OC
P- 0,00 4,00 I,80 177,70 0,00 0,30 2,70 0,60 4,20 9,_CC- 0,00 0,00 0,00 I,37 0,00 0,00 0,00 0,00 0,13 0,0_
A- O.O0 0.00 2.00 0.00 30.00 0.00 0.00 0.00 2.00 4.0GP- 0.00 0.00 3.50 0.00 28.70 0,00 0.00 0.00 1.50 5.00C- 0.00 0.00 0.00 0.00 0,06 C.CO 0.00 0.00 0.00 0.25
A- 0,00 2,00 3,0C 0,00 0,00 8g,O0 0,00 0,00 3,00 8.00P- 0,00 2,10 2,20 O,OC 0,00 71,40 0,00 0.00 3.70 _.OC
C- 0.00 0.00 0.00 0.00 0.00 3.48 0.00 0.00 0.00 0.00
A- 0,00 0.00 1,00 2.0C 1.00 C°O0 54.00 0.00 3,00 7.00P- 0°00 0.00 1.10 1.30 L.gO C.O0 53.70 0,00 2.BO 7.10C- 0,00 O,OO 0,00 0,00 0,00 O,OO O°CO C,O0 0,00 O,OC
A- 0,00 0,00 0,00 0,00 0,00 0,00 0,C0 14,00 1,00 1.00P- 0.00 0°00 0.00 O.OC 0°00 0.C0 0.00 6.70 0.60 0.6CC- 0,00 0,00 0o00 0,00 0,00 0,00 0,00 3,81 0,00 O.le
A- 3,00 11,00 14,00 8,00 1,00 3,C0 4,00 0.00 80.00 ll. OC
P- Z.90 12.60 14,10 7.80 0.80 2.30 _.40 0,00 83._0 10._CC- 0,00 0,23 0,00 0,00 0,00 0,00 0,00 0,00 0,18 0,03
NUMBER OF CELLS = 25DEGREES OF FREEDOM = 24CHI-SGUARE = 15.635
*- AVERAGE'OF 10 PREDICTIONS

92
TABLE 14
GOODNESS OF FIT MATRIX FOR PO6RUSING THREE PREVIOUS LOCKPOINTSA=ACTUAL TRANSITIONS
P=PREDICTED TRANSITICN5 €C=CHI-SQUARE VALUES
AS ROLL CBARS ALT ADF HSI IVSI ENG NON ROWA- 5.00 0.00 O.OO 0.00 1,00 O.O0 0.00 0.00 1.00 2.00
P- 6.10 O.O0 O.GC O.OC 1.00 O.O0 0.00 0.00 I.I0 2,IC
C- 0.2_ 0.00 0.00 0.00 O.CO 0.00 0.00 0.00 0.00 0.0¢
A- 0.00 57.00 3.00 Z.OC 0.00 0.00 0.00 G.OO 3,On _._CP- O,OC 56.20 3.CC 1.gO 0.00 0.00 0.00 C.O0 2oi0 7.00
C- 0.00 0.01 0.00 0.00 0.00 0.00 O.OO 0.00 0.00 0.12
A- 0,00 2.00 511.00 1.00 2.00 1.00 0.00 CoOC 23,00 5.CCP- 0.00 1.50 532.6C 1.10 2,30 O.gO 0.00 0.00 24.50 5,BOC- 0.00 0.00 O.gl 0.00 0.00 0.00 0.00 0.00 0.10 0,01
A-- 0.00 1.00 1.00 205.00 0.00 1.00 2.00 C.O0 12.00 5.00
P- 0.00 O.BO 1.30 172._C 0.00 0.70 l,gO 0,00 II.00 4.70C- 0.00 0.00 0.00 5.18 0.00 0.00 0.00 0.00 0.08 0.02
A-- 0.00 0.00 0.00 1.00 32.00 0.00 0.00 0.00 2,00 3,00
P- 0.00 0.00 0.00 1.00 61,20 0.00 G.00 0.00 2,20 3.20C- 0.00 0.00 0.00 0.00 2.66 0.00 O.CO 0.00 0,00 0.01
A- I,O0 0.00 1.00 0.00 0.00 116.00 0.00 0.00 b.00 2.00P- 1,10 O.O0 1.30 0.00 O.CO II0.I0 0.00 0.0o 5.qo 2._c
C- 0.00 0.00 0.00 0.00 0.00 0.13 0.00 0.00 0.00 0.08
A-- 0.00 0.00 1.00 0.0C 0.00 1.00 60.00 0.00 6.00 6.00P-- 0,00 0.00 I._0 0.00 0.00 1.30 70.00 0,00 4.00 6.70C- 0.00 0.00 O.GO O.OC 0.00 0,00 1.67 O.OG 0.00 0.08
A- 0,00 0.00 0.00 0.00 0.00 0.00 0.00 C,00 0.00 O.OCP- 0.00 0.00 0.00 O.OC O.O0 0.00 0.00 0.00 0.00 O.OCC- 0.00 0.00 0.00 0.0C 0,00 0.00 0.00 0.00 0.00 O.OC
A-- 1.00 5.00 2_.00 12.0C 0.00 5.00 6.00 0.00 90.00 5,OC
P- 1.00 _°70 23,90 ll,gC 0.00 5._0 _.80 C.OO Bl,_O 5.COC- 0.00 0.02 0.00 O.OC 0.C0 0.03 C.00 0.00 0.82 0.13
NUMBER OF CELLS = 23DEGREES OF FREEDOM = 22CHI-SQUARE = 12.309
_- AVERAGE OF 10 PREDICTIONS

93
TABLE 15
GOODNESS OF FIl MATRIX FOR P07LUSING THREE PREVIOUS LOOKPOINTSA=ACTUAL TRANSITIONSP=PRE_ICIEC TRANSITIONSC=CHI-SQUARE VALUES
AS ROLL CBAR5 ALT ADF HSI IVSI ENG nON POWA-- 0.00 0.00 O.OO O°OC 0.00 0.00 0.00 0.00 0.00 O.OC
P- 0.00 0.00 O.CC O.OC 0.00 0.00 0.00 0.00 0.00 O.OC
C- 0.00 O.OO 0.00 O.CO O.OC C.CO C.CO 0.00 0.00 O.OC
A- 0.00 138o00 I0,00 3.00 0.00 0.00 O.CO 0.00 _.00 7.00
P- 0.00 126o30 9.20 2.30 0.00 O.CO O°CO 0.00 _.00 b.3C
C- 0.00 0.99 0.06 O.OC O.CO C.O0 0.00 C.OG 0.00 0.07
A- 0.00 11.00 593.00 0.00 0.00 0.00 0.00 0.00 10.00 O.OCP- 0.00 9._0 602.30 0.00 0.00 O.CO O.CO C.O0 11,_0 O.OC
C- 0.00 0.23 0.15 0.00 O.CC G.O0 0.00 0.00 0.20 O.OC
A- 0.00 2.00 0.00 B_.O0 O.O0 C.O0 0.C0 0.00 _.00 5.00P- 0.00 2.30 0.00 77.2C O.CO 0.00 0.00 O,O0 3.60 5.gO
C- 0.00 O.OO O.OG 0.55 0.00 0.00 0.00 0.00 0.00 0.00
A- 0.00 0.00 0.00 0.00 37.00 0°00 0.00 0°00 2.00 2.0C
P- 0.00 0.00 0.00 0.00 37.30 0.00 0.00 0.00 2.00 2.00
C- 0,00 0.00 0,00 0.00 0.00 0.00 O.CO 0°00 0°00 0.0¢
A- 0.00 0.00 0.00 O.OC 0.00 30.G0 0°00 0.00 1.00 L.O_P- 0.00 0.00 0.00 0.00 0.00 23°60 O.CO C.O0 1.10 1.1C
C- 0.00 0.00 0.00 O.OC 0.00 1.37 0.00 0.00 0.00 0.01
A- 0.00 1.00 O.OO 0.00 0°00 0.00 27.00 0.00 1.00 2.0C
P- 0.00 1.50 0.00 0.00 0.00 O.O0 28.40 0.00 0.70 2.20C- 0.00 0.00 0.00 O.OG 0.00 O.GO 0.07 0.00 0.00 0.02
A- 0.00 0.00 0,00 0.00 0.00 0.00 0.00 0.00 0.00 O.OCP- 0.00 0.00 0.00 0.00 0.00 6.00 0.C0 0,00 0.00 O.OC
C- 0.00 0.00 0.00 0.00 0.00 _.00 0.C0 0.00 0.00 O.OC
A- 0.00 3.00 11.00 3.0C 2.00 1.00 2.00 0.00 83.00 11.00P-- 0.00 2.50 11.90 3.70 2.10 1.20 2.30 0.00 93.70 11.80C- 0.00 0.00 0.07 0.00 0,00 0.00 0.C0 0.00 L.3R O.Ofi
NUMBER OF CELLS = 17DEGREES OF FREEDOM = 16CHI-SQUARE = 5.23_
• - AVERAGE OF 10 PREDICTIONS

94
TABLE L6
GOODNESS OF FIT MATRIX FOR PO7RUSING THREE PREVIOUS LOCKPOINTSA=ACTUAL TRANSITIONSP=PRECICTEC TRANSITIONS #C=CHI-SQUARE VALUES
AS ROLL CBARS ALT ADF HSI IVSI ENG NON ROWA- O.OO 0.00 0.00 O.OC 0,00 0.00 0,00 0.00 O,OO O.OCP- O.O0 0.00 0.00 O.OO O.OC C.CO 0,00 0.00 0,00 O.OCC- 0.00 0.00 0.00 O.OC 0.00 C.O0 0.00 0.00 0.00 O.OC
A- 0.00 4.00 3.00 O.OC 0.00 0.00 O.CO 0.00 2.00 9.00P- 0.00 3.20 3.20 O.OC O.OC 0.00 0.00 0.00 L._O 7.BCC- O.O0 0.00 0.00 0.00 0.00 0.00 0.00 0.00 0.00 0.16
A- 0.00 1.00 6q6.0C 2.00 0.00 1.00 1.00 0.00 7.00 5.0GP- 0.00 0.90 671,50 2.00 0.00 0.40 0,80 0.00 7,40 4.10C- 0.00 0.00 0.86 O.OC 0.00 0.00 0.00 0.00 0.02 0.16
A- 0,00 4.00 0,00 57,0G 0,00 0.00 0,00 0o00 Z,O0 6.0QP- 0.00 3.70 0.00 54.q0 0,00 0.00 0.00 0.00 2.80 6.5CC- 0.00 0.00 0.00 0.08 0.00 O.CO 0.00 0.00 0.00 0.0_
A- 0.00 0.00 0.00 0.00 0.00 0.00 0.00 C.O0 0,00 0.30P- 0.00 0.00 O.OC O.OC O.O0 0.00 0.00 O.OG 0.00 O.OCC- 0o00 0.00 0.00 0.00 0.00 O.O0 0.00 0.00 0.00 O.OG
A- 0.00 0.00 0.00 O.OC 0.00 28.00 O.O0 0.00 1.00 L.OCP- 0,00 0,00 O,CO 0,00 0.00 36.g0 O.O0 0.00 1.30 1.30C- 0.00 0.00 0.00 - 0.00 0.00 2.83 O.CO 0.00 0.00 O.Og
A- O,O0 0.00 O,O0 O,OC 0,C0 C,CO 57,C0 0.00 3.00 3.00P- 0.00 0.00 0.00 O.OC 0.00 0.00 67.60 0.00 3.20 3.20C- O.O0 0.00 0.00 O.OO O.O0 0.00 1.q7 0.00 0.00 0.01
A- 0.00 0.00 0.00 0.00 0.00 C.CO 0.00 0.00 0.00 O.OCP- 0.00 0o00 0.00 0.00 O.O0 C.CO 0.00 O.OO 0.00 O.OCC- 0.00 0.00 0.00 O.OC 0.00 O.OC 0.00 0.00 0.00 O.CC
A- 0.00 0.00 8.00 4.00 0.00 1.CO 2.00 C.OC 15,0o 7,00P- O.O0 O.O0 q,lO 4.60 0.00 0.90 2.50 0.00 17.70 3.0¢C- 0.00 0.00 0.15 O.OC 0.00 0.00 0.00 0.00 0._ o.I_
NUMBER OF CELLS = 13DEGREES OF FREEDOM = 12CHI-SQUARE - ?.010
*- AVERAGE OF 10 PREDICTIONS

95
TABLE 17
GOODNESS OF FIT MATRIX FOR POBLUSING THREE PREVIOUS LOCKPOINTSA=ACTUAL TRANSITIONSP=PREDICTED TRANSITIONSC=CHI-SQUARE VALUES
AS ROLL CBARS ALT ADF HSI IVSI ENG NON ROWA- 0.00 0.00 0.00 0.00 O.OC O.CO 0.00 0.00 0.00 O.OCP- 0.00 0.00 O.CC O.OC 0,00 0.00 C.O0 0.00 0,00 O.OOC- 0.00 0,00 O.OO O.OC O.O0 0.00 0.00 O.OC 0.00 O.OC
A- 0,00 0.00 O.O0 O.OC 0.00 C.O0 0o00 0°00 0o00 O,OCP- 0.00 0.00 O.CC O.OG 0.00 C.O0 C.CO O.OC 0.00 O.OOC- 0.00 0.00 0.00 0.00 0.00 0.00 0°00 0.00 0,00 0o00
A- 0.00 0.00 437.00 3.00 3.00 2.00 O.CO C.O0 22°00 B.OCP- 0.00 0.00 435.60 Z.SC 2.50 2.30 0.00 0,00 Z2,60 7._CC- 0.00 0°00 0.01 O.OC 0.00 O.O0 0.00 O.O0 0.02 0,02
A- O.O0 0.00 2.00 138.0C 1.00 0.00 I.00 0.00 i0.00 6.0CP- O°O0 0.00 L°gC 116°50 0°90 O.CO 0.70 0°00 9.60 3.50C- 0.00 0.00 O.O0 3,35 0.00 O.O0 0.00 O.O0 0,0_ O.Oe
A-- 0.00 0.00 0.00 0.00 68.00 C.O0 1.C0 0.00 6.00 1.0GP- 0.00 O.OO O.OC O.OC 62,60 0.00 O.gO 0.00 5.30 0.9CC- 0.00 0.00 0.00 0.00 0.63 O.CO 0.00 0.00 0.08 0.01
A- 0.00 0.00 2.00 0.00 0.00 36.00 1.00 0.00 L.O0 6°00P- 0.00 0°00 2.00 0.00 O.CO 66._0 0°80 0°00 L,20 4,0CC- 0.00 0.00 0.00 O.OC 0,00 2.ZO 0,00 0.00 0.00 O.OO
A-- 0.00 0.00 0o00 l.OC O.GO 0.00 7q. O0 0.00 5.00 1.0CP- 0.00 0.00 O.CC 1.00 O.O0 0.00 q6.80 C.O0 4.70 L.OCC- 0.00 0.00 0°00 0.00 0.00 O.O0 3.1b 0.00 O.OZ 0.00
A- 0.00 0o00 0.00 O.OC O.OC 0.00 0.00 0.00 0.00 O°OCP- 0.00 0.00 O.GO O.OC O.OO O.O0 0.00 0.00 0.00 O.OCC- 0.00 0.00 0o00 0.00 O.CO C°O0 O.CO 0.00 0.00 O,OC
A- 0.00 0.00 27.00 q°O0 3.00 2.00 3.00 O.OO 182.00 _.OCP- O.OO 0.00 26.70 9.20 2.80 1.70 3,40 0.00 IBS,00 7.90C- 0,00 0.00 O.OC O.OC 0.00 C.O0 0.00 0.00 0,05 O.OC
NUMBER OF CELLS = 18DEGREES OF FREEDOM = 17CHI-SQUARE = 9.668
e- AVERAGE OF 10 PREDICTIONS

96
TABLE 18
GOODNESS OF FIT MATRIX FOR POBRUSING THREE PREVIOUS LOOKPOINTS
A=ACTUAL TRANSITIONSP=PRECICTED TRANSITIONSC=CHI-SCUARE VALUES
AS ROLL CBARS ALT ADF HSI IVSI ENG NON ROW
A- 0,00 0,00 0.00 0,00 1,00 0,00 0,00 0.00 0.00 1.00P- 0,00 0,00 O,OC 0,00 1,20 0,00 0,00 0,00 0.00 1.20C- O.O0 0.00 0.00 0.00 0.C0 C.O0 O.Co 0.0o o. OO o.0_
A- 0.00 0.00 O,CC 0,00 0.00 0,00 0,00 0.00 0.00 O.OCP- 0,00 0.00 0,00 0.00 0,00 0.00 O,CO C.O0 0.00 O.OC
C- 0.00 0,00 0.00 O.OC O,CO C.CG 0.00 0.00 0.00 O.OC
A- 1,00 0,00 665,C0 4.00 I.00 1.00 0.00 O.O0 11.00 7.00
P- l.ZO 0,00 875,00 4.80 0,60 O.BO 0,00 C,O0 11.40 7._CC- 0.00 0.00 0,15 0.00 O,OC C.CO 0.00 C.O0 0.01 0,02
A- 0,00 0,00 0,00 llB.OC 0,00 0,00 0,00 0,00 13,00 O.OC
P- 0,00 0,00 0.00 120.60 0,00 C.O0 0,00 O.O0 13.20 O.OCC- 0°00 0.00 0.C0 0.0_ 0.00 O.O0 0.00 0.00 0.00 O°OC
A- 0.00 0,00 2,00 O.OC 77,00 I.00 0.00 1.00 2.00 6.00
P- 0.00 0.00 1.90 0.00 65,00 1,30 0.00 0.50 2,00 5.7CC- 0.00 0.00 O.CC 0.00 1.87 0.00 0.00 O.O0 0.00 O.OI
A- 0,00 0,00 I°00 0,00 0,00 68,00 1,00 0,00 3,00 5.00P- O.O0 0.00 O°gO 0.00 0.00 60.00 0.60 0.00 _.I0 5.60C- 0,00 0,00 O,OC 0,00 0,00 0,94 O,O0 O,OC 0.00 0.07
A- 0.00 0.00 0.00 1.00 0.00 0.00 43.00 0.00 3.00 _.OCP- 0.00 0.00 0°00 0.70 0.00 C.00 50,00 0,00 3.80 4.50C- 0.00 0.00 O.OC O,OC 0.00 C.CO 1.14 C.OC 0.00 O,Ce
A-- 0,00 0,00 0,00 L,O0 0.00 0,00 C,CO 22.00 0,00 Z.OCP- 0,00 0.00 0.00 0.50 O.OC C.CO 0.00 11.10 0.00 0.50C- 0.00 0.00 O,OC O,OG 0.00 C.O0 O.CO 5.40 0.00 0.25.
A- 0,00 0,00 15,00 7,0C 4,00 3.00 3.00 0.00 56,00 IO.OG
P- 0,00 0,00 16,50 7,%C 4.00 3.50 4.00 0,00 59°40 11.50C- 0°00 0,00 0,15 0,02 0,00 0,00 0,00 0,00 0,21 0,22
NUMBER OF CELLS = lBDEGREES OF FREEDOM = 17CHI-SQUARE = 10.643
#- AVERAGE OF 10 PREDICTIONS

GOODNESS OF FIT MATRIX FOR POgLUSING TRREE PREVIOUS LOCKFGINTSA=ACTUAL TRANSITIONSP=PREDICTEC TRANSITIONS *C=CHI-SQUARE VALUES
AS ROLL CBARS ALT ADF HSI IVSI ENG NON ROW
A- 2.00 0.00 O.CC O.CC 0.00 0.00 0.00 1.00 1.00 4.00P- 1,40 0.00 O,OC O,OC 0.00 O,CO 0.00 0.70 0,60 2.70
C- 0,00 0.00 0.00 O.OC O,O0 C.CO O.CO 0.00 0.00 0.42
A- 0.00 5.00 3.00 0.00 O.CO 0.00 0.00 0.00 0.00 3.0CP- 0.00 7.i0 3.10 0.00 0.00 0.00 0,00 O.OC 0,00 3.10
C- 0,00 0.88 0.00 0.00 0.00 0.00 0,00 0,00 0,00 0.00
A- 1.00 0.00 689.00 0.00 O.CO C.CO 0.00 0.00 30.00 1.OGP- 0.60 0.00 6_.7C 0.00 0.00 0.00 0.00 0.00 31.00 0.50C- O.OC 0.00 2,B5 0.00 0.00 0.00 0,00 0.00 0.03 0.I_
A- 0.00 0.00 2.00 255.00 O.OC 0.00 1.00 0.00 18,00 3.0¢P- 0°00 0.00 1._0 257.70 0.00 0,00 0.90 O,OG Lg.bO Z.BCC- 0.00 0.00 0.00 0.03 0.00 0.00 0.00 0,00 0.14 0.01
A-- 0.00 0.00 0.00 0.00 60.00 0.00 0.00 0.00 3.00 3.00P- 0.00 0.00 O.CC 0.00 63.80 0.00 0.00 0.00 3.10 3.ICC- 0.00 0.00 0.00 0.00 0,2_ 0.00 0.00 0.00 0.00 0.0G
A- 0.00 1.00 1.00 0°00 0.00 86.00 0,00 0.00 Z,O0 _.OGP- 0.00 1.20 1.30 0°0C 0.00 103.80 0.00 0.00 Z.60 5.1CC- 0.00 0.00 0.00 0.00 0.00 3°68 0.00 0,00 0.00 O.3G
A-- 0.00 0.00 0.00 1.00 0.00 2.00 75.C0 G.O0 5.00 3.00P- 0.00 0.00 0.00 1,20 0.0G 2.10 80.50 0.00 4,90 3.30C- 0.00 0.00 0.00 O.OC 0,00 0.00 0,_0 0.00 0,00 0.03
A- 0.00 0.00 0.00 0.00 0°00 C.CO 0.00 7.00 1.00 I.OCP- 0.00 0.00 0,00 O.OC 0.00 0.00 0.00 _.00 0.70 0.70
C- 0°00 0°00 0°00 O.OC 0.00 0.00 0°00 1.29 0.00 o.oq
A-- 1°00 2.00 24.00 ZO.O0 3.00 3.00 7.00 0.00 67.00 9.00P- 0.70 1.90 25,90 21.3C 3.10 3.00 7.50 O.O0 74.10 _.7CC- 0.00 0,00 0.15 0.08 0.00 0.00 0,0_ 0,00 0,75 0.01
NUMBER OF CELLS = 23DEGREES OF FREEDDM = 22
CHI-SQUARE = 11,608
• - AVERAGE OF 10 PREDICTIONS

98
TABLE ZO
GOODNESS OF FIT MATRIX FOR POgR
USING THREE PREVIOUS LOOKPOINTSA=ACTUAL TRANSITIONS
P=PREDICTEO TRANSITIONSC=CHI-SQUARE VALUES
AS ROLL CBARS ALT ADF HSI IVSI ENG NON ROWA- 2.00 0.00 0.00 0.00 Z.O0 0.00 0.00 0.00 0.00 4.OGP- 1,20 0.00 0.00 0.00 1.20 C.CC O.O0 O.O0 0,00 _.4CC- 0.00 0.00 O.OC 0.00 O.OO 0.00 0.00 0.00 0.00 O.h4
A- 0.00 54.00 8.00 0.00 0.00 0.00 0.00 0.00 4.00 4.00P- C.O0 51.90 7.60 O.OC O.OC C.O0 C,O0 O.OC 4.00 4.00C- 0°00 0.08 O.OZ O,OC 0,00 0.00 0.00 0,00 0.00 0.00
A- 0.00 7.00 44q.00 L.O0 L.O0 O.O0 O,CO 0.00 20.00 2.0GP- 0.00 7.50 430.50 0.80 o.qc O.CO O.CO 0.00 19.q0 1.7CC- 0.00 0.04 0,76 0.00 0.00 O.CO 0.00 0.00 0.00 0.04
A- O.O0 0.00 8.00 Z03.00 0.00 1.00 O.O0 0.00 9.00 1.0CP- O.O0 0.00 7,00 20Z.40 O.OO 1.80 0.00 0.00 9.80 1.8GC- 0.00 0.00 0.13 O.OC 0.00 C.O0 0.00 0.00 0.07 0.64
A- 0.00 0.00 O.CC 1.00 53.00 1.00 0.00 0.00 4.00 6.0CP- O.O0 0,00 0,00 I.30 67,60 0.90 0.00 0.00 4.00 6.2CC- o.oo c.oo o.oo o.oc 4.02 o.oo c.oo 0.00 o.00 0.01
A- O.OO 2°00 0.00 0.00 0.00 106.00 0.00 0.00 4.00 6,OGP-- 0.00 2.20 0°00 0.00 0.00 97.70 O°CO C°O0 _.50 6.7CC- 0.00 0,00 O.CC - O.OC O.CO 0.65 0.00 0.00 0.00 0,C8
A- 0.00 0°00 0.00 O.OG O.O0 C.OO 19.00 0.00 2,00 2.0CP- 0.00 O.OO O.OG O.OC 0.00 O.O0 24.60 0.00 2.30 2.3CC- 0.00 0,00 O.CC O.OO O.OC 0.00 1.65 O.OO 0.00 0.05
A- 0.00 0.00 0.00 O.OO O.OO 0.00 0.00 O.O0 0,00 O.OCP- 0.00 0.00 0.00 0.00 0.00 0.00 0.00 0.00 0.00 O.OCC- 0.00 0.00 0.00 O.OO 0.00 O.CO C.CO O.O0 0.00 0.00
A- 2.00 2.00 14.C0 16.0C 3.00 4.00 2,C0 O.O0 117°00 13.0CP- l,ZO 1.90 I_.80 I6.gO _.30 4.00 2.30 0.00 121,00 13,7CC- 0.00 0.00 0.05 0.05 0.00 C.O0 C.O0 C.O0 0.14 0.04
NUMBER OF CELLS = Z2DEGREES OF FREEDOM = Z1CHI-SQUARE = 9.1_g
_- AVERAGE OF 10 PREDICTIONS

99
TABLE 2L
GOODNESS OF FIT MATRIX FOR PIOLUSING THREE PREVIOUS LOOKPOINTSA=ACTUAL TRANSITIONSP=PREDICTED TRANSITIONS *C=CHI-SQUARE VALUES
AS ROLL CBARS ALT ADF HSI IVSI ENG NON ROWA- 0.00 0.00 1.00 0.00 0.00 C.O0 0.00 0.00 0.00 1.00P- 0.00 0.00 0.90 O.O0 0.00 C.O0 0.00 0.00 0.00 0,90C- 0.00 O.OO 0.00 0.00 0.00 O.O0 0.00 0.00 0.00 O.Ol
A- 0.00 138.00 3.00 3.00 0.00 C.CO 0.00 C.O0 g.00 5.00P- 0.00 16_.90 3.80 Z.80 0.00 O.CO O.GO 0.00 9.LO 5.50C- 0.00 5.2_ 0.00 O.OO 0.00 C.O0 C.GO 0.00 0,00 0.0_
A- 0.00 5.00 34q.00 I.Ofl 0.00 0.00 0.00 0.00 IB,O0 1.00P-- 0.00 6.00 357.60 1.30 0.00 0.00 0.00 0.00 16,10 L,3CC- 0.00 0.20 0.21 0.00 0.00 0.00 0.00 0.00 0,20 0.0_
A- 0.00 5.00 0.00 167.00 0.00 0.00 0.00 0.00 12.00 0.90P- 0,00 _.20 0.00 I_.70 0,00 O.CO O.CO 0,00 10.90 O.OGC- 0.00 0.13 0,00 Z.98 0.00 0,00 0,00 0.00 0.10 O.OC
A- 1.00 0.00 1.CO 0.00 16.00 0.00 0,00 0.00 l. O0 3.0CP- 0.90 0.00 0,50 O.OO 11o80 0.00 0.00 0.00 0.90 ?.30C- 0.00 O.OO 0.00 0.00 L.IO 0.00 0.00 0°00 0.00 0.16
A- 0.00 0.00 0.00 0.00 0.00 C.CO 0.00 0.00 0.00 0.00P- 0.00 0.00 0.00 O.OC 0°00 0.00 0.00 0.00 0.00 O.OCC- 0.00 0.00 0.00 0.00 0.00 0.00 0.00 0.00 0.00 0,00
A- 0.00 0.00 0.00 0.00 0.00 C.O0 0.00 0.00 0,00 O.OCP- 0.00 0°00 O°OC 0.00 0.00 0.00 0.00 0.00 0.00 O.OCC- 0.00 0.00 0.00 0.00 0.00 C.O0 0.00 0.00 0.00 O.OG
A- 0.00 0.00 O.OC 0.00 0.00 C.CO 0.00 0.00 0.00 0.00P- G.OC 0.00 O.CO 0.00 0.00 0.00 O.GO 0.00 0,00 0.00C- 0.00 0.00 0.00 0.00 0.00 C.CO 0,00 O,OC 0.00 C,OC
A- 0.00 6.00 Lq.00 12.00 3.00 C.00 0.00 0,00 239.00 3.00P- 0.00 5.80 18.5C 11,30 2.30 0.00 0,00 0.00 23L.70 2.30C- 0°00 0°01 0,01 0,0_ 0,00 O.CO C.CO 0.00 0.22 0.16
NUMBER OF CELLS = 18DEGREES OF FREEDOM = 17CHI-SGUARE = 10.937
_- AVERAGE OF 10 PREDICTIONS

1DO
TABLE 22
GOODNESS OF FIT MATRIX FOR PIORUSING THREE PREVIOUS LOCKPOINTSA=ACTUAL TRANSITIONSP=PREDICTED TRANSITIONS *C=CHI-SQUARE VALUES
AS ROLL CBARS ALT ADF HSI IVSI ENG NON ROWA- 60.00 0.00 1.00 1.00 1.00 0.00 0.00 0.00 2.00 5.0CP- 32,50 O,O0 0,60 1,00 0.90 C,CO O,CO 0.00 Z.10 4.60C- 1,41 0,00 0,00 0,00 0,00 C,O0 O,CO C.O0 0,00 0.03
A- O.OO 462.00 3.00 7.00 0.00 0.00 0.00 0.00 16.00 3.0CP- 0,00 446,60 2,70 6,3C O,OC C.O0 0,00 0.00 16.60 Z.TCC- O.OO 0.51 0.00 0.07 O.O0 0.00 0.00 0.00 0.02 0.03
A- l.OO 3,00 142.00 0,00 0.00 O,O0 0.00 0.00 12.00 4o0CP- 0.70 Z.70 155.30 O.OC 0.00 0.00 0.00 0.00 11,90 3.40C- O.O0 0.00 1.25 O.OC 0.00 0.00 0.00 C.OO 0.00 0,0_
A- 0,00 13.00 1.00 145.00 0,00 O,OO O,O0 0,00 3,00 4.00P- 0.00 13.80 0.80 144.3D 0.00 0.00 0.00 0.00 3.40 _.2CC- 0.00 0.05 0.00 0.00 O.CO C.CO G.O0 O.O0 0.00 0.01
A-- 1.00 0.00 1.00 0.00 4.00 0,00 0.00 0.00 0.00 5.0¢P- 0.90 O.OO 0.70 0.00 3.70 O.CO 0.00 0.00 0.00 5.30C- 0,00 0,00 0,00 O,OO O,O0 O,OO O,O0 0,00 0.00 0.08
A- 0.00 0.00 O.O0 0.00 0.00 O.OO O.O0 0.00 0.00 0.00P- 0.00 0.00 0.00 0.0C 0.00 O.OO O.O0 0°00 0.00 O.OCC- 0,00 0,00 O,OO . O.OC O,OC C.O0 0,00 0.00 0.00 0.00
A- O,O0 O,O0 0.00 O,OO 0,00 0,00 0.00 0,00 0,00 0.00P- 0,00 0.00 0,00 0,00 0.00 O,O0 0,00 0,00 0.00 0.00C- 0,00 0,00 0,00 O,OO O.OO C.O0 0.00 0,00 0,00 0.0C
A- 0.00 0.00 O.OO O.OO O.CO C.O0 O.CO 0.00 0.00 O.OCP- 0,00 0,00 0,00 O,OO 0,00 0.00 0.00 0.00 0.00 0.0CC- 0.00 0.00 O.GC 0.00 0.00 O.O0 G.GO 0.00 O.O0 0.0C
A- 3,00 10,00 lO.O0 9,0C l,O0 O.OO 0,00 0.00 27,00 _,OGP- 3.00 q.90 10.70 10.70 0.70 O.O0 0.00 0.00 33.50 3.7CC- 0.00 0.00 0.05 0.32 0.00 0.00 O.O0 O.OO 1.56 0.02
NUMBER OF CELLS = 18DEGREES OF FREEDOM = L7CHI-SGUARE = 5.513
*- AVERAGE OF 10 PREDICTIONS

101
TABLE 23
GOODNESS OF FIT MATRIX FOR P11LUSING THREE PREVIOUS LOOKPOINTSA=ACTUAL TRANSITIONS
P=PREDICTED TRANSITIONS *C=CHI-SQUARE VALUES
AS RDLL CBARS ALT ADF HSI IVSI ENG NON R_WA- 13g.00 0.00 4.00 O.OO 4,00 O.OO 0.00 1.00 11.00 9.00P-- 134.80 O.OO 4.50 O.OC 4.10 C.O0 0.00 0.80 11.20 q._GC- 0.13 0.00 O.OO 0.00 O.O0 0.00 0.00 0.00 O.O0 0.02
A- 0.00 0.00 O.O0 O.OC 0.00 0.00 C.O0 0.00 O.OO O.OC
P- Q.O0 O.O0 0.00 0.00 0.00 C.O0 0.C0 0.00 0.00 O.OOC- O.OO O.OD 0.00 O.OC O,CO 0.00 0.00 O.OO 0.00 O,OC
A- 4.D0 0.00 2_5.00 0,00 0.00 2.00 Q.O0 0.00 18,00 6.00P- 4.40 0.00 256.80 o.cc 0.00 1.70 O.CO 0.00 19.70 5,[cC- O.DO 0.00 0.57 O.CC 0.00 0.00 0.00 O.OO 0.16 O.OC
A- 0.00 O.OO 0.00 66.00 O.OO O.OO O,CO O.OO 7.00 O.OCP- O.O0 O.OO 0.00 62.bC O.O0 C.O0 O.CO O.O0 b,30 O.OCC- O.O0 O.OO 0.00 0.18 0.00 O.O0 O.CO O.OO 0.07 O.OC
A- 1.00 0.00 0.00 0.00 IO.DO 0.00 O.O0 C.OC 5.00 1.0CP- 1,20 O.OO O.O0 0.00 9.60 O,OO O.CO 0.00 4.90 1.20
C- O,DO O.OO 0.00 0.00 0.02 O.CO 0.00 O.OO 0.00 0.0_
A- 0.00 O.OO 2.00 O.OC 1.DO 59.00 0.00 0.00 3.00 6.0CP- 0.00 0.00 1.50 O.OO 1.20 59.20 0.00 0.00 3.10 5.80C- O.O0 0.00 0.00 0.00 0.00 0.00 0.00 C.O0 0.00 0.01
A- 1.00 0.00 0.00 1.00 O.OO 0.00 17.00 O.OD 2.00 _,00P-- 0.50 0.00 0.00 1.10 0.00 O.O0 12.gO 0.00 1.30 2.qcC- O.OO 0.00 O.OO 0.00 0.00 O.OO O.gq 0.00 0.00 0.30
A- O.O0 0.00 0.00 O.OC O.O0 0.00 O.O0 12,00 1.00 l. OC
P- O.OO O.OD 0.00 0.00 0.00 0.00 C.CO 10,60 0.80 0.80C- O.OO 0.00 0.00 0.0C O.O0 0.00 O.OO 0,16 0.00 0.0_
A-- I_.DO 0.00 19.00 6.00 1.00 4.00 _.OO O.OO 2_3,00 q. OCP- 1_.80 0.00 lg.80 5._0 0.80 _.30 2.gO 0.00 Z_L.20 8.0CC- 0.05 0.00 0.03 0.06 0,00 0.00 0.00 0.00 0.01 O.L1
NUMBER OF CELLS = 2ZDEGREES DF FREEDOM = 21CHI-SQUARE = 2.g48
•- AVERAGE OF 10 PREDICTIONS

102
TABLE 2_
GOODNESS OF FIT MATRIX FOR PZIRUSING THREE PREVIOUS LOOKPOINTSA=ACTUAL TRANSITIONSP=PRECICTED TRANSITIGNSC=CHI-SOUARE VALUES
AS ROLL CBARS ALT ADF HSI IVSI ENG NON ROWA- 69.00 0.00 2.00 0.00 1.00 0.00 0.00 0.00 2.00 5.0C
P- 5g.fiO 0o00 Z.O0 0.00 1.00 O.O0 O,CO 0.00 1.80 _._CC- 1.31 0.00 O.C_ 0.00 0.00 C.O0 0.00 0.00 0.00 0.01
A- 0.00 _.00 O.CC 0.00 0.00 0.00 0.00 O.OG 1.00 5.0C
P- 0.00 Z._O 0.00 0.00 0.00 0.00 O.GO 0.00 0.80 3.20C- 0.00 0.00 0.00 O.OG 0.00 C.O0 0.00 0.00 0.00 0.65
A- 1.00 1.00 398.00 1.GC O.CO 2.00 0.00 0.00 20.00 5.0GP- 1.00 0.80 _Ob.20 1._0 0.00 3.00 0.00 GoO0 13._0 6.20
C- 0.00 0.00 0.17 O.OO 0.00 0.00 O.O0 O.OO 0.07 0.2_
A- 0.00 0.00 0.00 106.00 0.00 0.00 0.00 0.00 17.00 O.OCP- 0.00 0.00 0.00 99.5C 0.00 0.00 0.00 0.00 15.60 O.OCC- 0.00 0.00 O.OC 0.4C 0.00 0.00 0.00 0.00 0.12 O.OG
A- 0.00 0.00 0.00 O.OO 5.00 O.O0 C.O0 0.00 1.00 1.00P- 0.00 0.00 O.CC O.OC 3.70 0.00 0.00 0.00 1.00 1.0CC-- 0.00 0.00 O.OO 0.00 0.3_ 0.00 0.00 C.O0 O.O0 O.OG
A- 0.00 0.00 0.00 O.OO 0,00 131.C0 1.00 0.00 10.00 L.O0P-- 0.00 0.00 0.00 O.OG 0.00 1Z9.50 1.00 0.00 10.00 L.OCC- 0.00 0.00 0.00 O.OC 0.00 0.02 0.00 0.00 0.00 O.OC
A- 0.00 0.00 O.OC 1.00 O.O0 1.00 19.00 O.OO L.O0 3.0CP- 0,00 0.00 O.OO 1.0C 0.00 1.30 30.qO 0.00 1,10 3._0C- 0.00 0.00 0.00 O.OC O.OC O.CO 7.45 0.00 0.00 0.05
A- 0.00 0,00 O.CC O.OC 0.00 0.00 0.00 3.OG L,O0 _.OGP- 0.00 0.00 0.00 0.00 0.00 O.O0 0.00 _._0 1.50 5.90C- 0.00 0.00 0.00 O.OC 0.00 0.00 0.00 0.00 0.00 0.9C
A- 4.00 0.00 2_.00 1_.00 0.00 8.C0 2.00 1.00 81.00 7.00
P- 3.80 0.00 Z3._0 13.20 0.00 6.90 2.50 1.20 79,B0 7.ticC- 0.00 0.00 0.01 0.05 0.00 0.15 0.00 0.00 0.02 0.04
NUMBER OF CELLS = 21DEGREES OF FREEDOM = 20
CHI-SGUARE = 12.036
_- AVERAGE OF 10 PREDICTIONS

103
TABLE 25
GOODNESS OF FIT MATRIX FOR TPILUSING THREE PREVIOUS LOOKPGINTSA=ACTUAL TRANSITIONSP=PREDICTEO TRANSITIONSC=CHI-SQUARE VALUES
AS ROLL CBARS ALT ADF HSI IVSI ENG NON ROWA- 4.00 0.00 1.00 O.OC 0.00 C.O0 0.00 0.00 0.00 5.00P- 5.10 0.00 1.20 O.OC 0.00 0.00 0.00 C.O0 0.00 6.30C- 0.00 0.00 0.00 0,00 O.OO C,CO 0.00 0.00 0,00 _.34
A- 0.00 16.00 1,00 O.OC 0.00 O.O0 0.00 0.00 1,00 2.00P- 0.00 15.30 0.70 O.OC 0.00 0.00 0,00 0.00 1.00 1.70C- 0.00 0.03 0.00 O.OC 0.00 0.00 0.00 0.00 0.00 0.04
A- 1.00 1.00 497.00 O,OC O,CO 6.C0 0,00 C.O0 15.00 2.00P- 1.ZO 1.00 530,30 0°00 0.00 5.50 O.GO C.O0 15.60 2.2CC- 0.00 0.00 2.23 0.00 0.00 0.04 0.00 0.00 Oe02 0.02
A-- 0.00 0.00 0.00 O.OC 0.00 C.O0 0.00 0.00 0.00 O.OCP- 0.00 0.00 O.CO 0.00 0.00 0.00 0,00 0.00 0.00 O.OCC- 0.00 0.00 0.00 0.00 0.00 C.O0 0°00 0.00 0.00 O.OG
A- 0.00 0.00 0.00 0.00 1.00 I.00 0°00 0.00 0.00 2.0GP- 0.00 0.00 O.OO O.OC 0,80 0.80 0.00 0.00 0.00 L.6CC- 0.00 0.00 0.00 0.00 0.00 0°00 0.00 0.00 0.00 0.08
A- 0.00 1.00 6°00 0°00 0.00 _95°00 C°O0 C.O0 17.00 I°OCP- 0.00 0.70 6.70 O.OC 0.00 451.g0 0,00 0.00 17,10 O.TOC- 0.00 0.00 0.08 O.OG 0.00 3.75 0°00 0.00 0,00 O.Og
A- 0.00 0.00 0.00 0.00 0.00 0.00 0°00 0.00 0.00 O.OCP- 0°00 0.00 0.00 O.OO 0,00 0.00 O°O0 0.00 0.00 O,OOC- 0.00 0°00 0.00 0.00 0.00 0.00 0°00 0.00 0.00 0°00
A- 0.00 0°00 0.00 0,00 0.00 0.00 0°00 0°00 0,00 O.OCP- 0.00 0.00 0.00 O.OC O.OC C.O0 0.00 0.00 0,00 O,OCC- 0.00 0.00 0.00 O,OC 0.00 0.00 O.O0 0.00 0.00 O.OC
A- 0.00 0.00 14.00 0.00 1.00 18.00 C.O0 0.00 76.00 1.0GP- 0.00 0.00 15.20 0.00 O.BO 18.60 C,O0 0.00 80.50 0,_0C- 0.00 0.00 0.I0 O.OO O.OC C.02 O,O0 0.00 0.27 0.04
NUMBER OF CELLS = 16DEGREES OF FREEDOM = 15CHI-SQUARE = 7o165
_- AVERAGE OF 10 PREDICTIONS

104
TABLE 26
GOODNESS OF FIT MATRIX FOR TPIXUSING THREE PREVIOUS LOOKPOINTSA=ACTUAL TRANSITIONSP=PRECICTEO TRANSITIONS #C=CHI-SOUARE VALUES
AS ROLL CBARS ALT ADF HSI IVSI ENG NON RUWA- 7.00 0.00 2.00 0.00 0.00 2.00 0.00 0.00 3.00 7.00
P- 6.20 0.00 2.40 O.OC 0.00 1.30 0.00 0.00 2,30 6.0CC- 1.12 0.00 O.OC O.OC 0,00 0.00 0.00 0,00 0.00 0.14
A- 0.00 17.00 5.00 O.OO 0.00 2.00 0.00 O.00 3.00 5.00
P- 0.00 16.60 5.60 0.00 0,00 1.70 0.00 0.00 3,60 5.30C- O.O0 0.02 0.03 O.OC 0.00 0.00 0.00 0.00 0.00 0.02
A- 1.00 2.00 829.00 3.00 0.00 6.00 0.00 0.00 2_.00 b. OGP- 0.60 2.30 796._0 3.20 0.00 5.30 0.00 0.00 25.20 6, IC
C- 0.00 0.00 1,28 0.00 O.CO C.OB 0.00 0.00 0.06 O.OC
A-- 0.00 0.00 Z.00 0.00 0.00 5.00 0.00 0.00 l.O0 3.0GP- 0.00 0.00 2.50 0.00 0.00 5.gO O.CO 0.00 O.bO 3.1CC- 0.00 0.00 0.00 0.00 O.OC 0.16 C.CO 0.00 0.00 0,00
A- 0.00 0.00 0.00 0.00 0.00 0.00 0.00 0.00 1.00 1.00
P- 0.00 0.00 0.00 0.00 0.00 0.00 0.00 0.00 1,00 I,OCC- 0.00 0.00 0.00 0.00 0.00 C.O0 0.00 0.00 0.00 0.00
A- I.O0 0.00 10.00 3.0C 1.00 368.00 0.00 0.00 15.00 5.0CP- 0.90 0.00 10.30 3.10 L.O0 375._0 0.00 0.00 1_.30 5.00C- 0.00 0.00 0.01 0.00 0.00 2.16 O.O0 0.00 0.03 O.O0
A- 0.00 0.00 0.00 O.OC 0.00 C.O0 0.00 0.00 0.00 O.OG
P- 0.00 0.00 0.00 0.00 0.00 O.O0 0.00 0.00 0.00 O.OCC- 0.00 0.00 0.00 0.00 0.00 0.00 O.CO 0.00 0.00 O.OC
A- 0.00 0.00 0.00 0.00 0.00 G.O0 O,CO 0.00 0,00 O.OG
P- 0.00 0.00 0.00 O.OC 0.00 0.00 O.O0 O.O0 0.00 O.OCC- 0.00 0.00 0.00 O.OC 0.00 C.CO 0.00 0.00 0.00 O.OC
A- 5.00 8.00 18.00 2.00 0.00 15.00 0.00 0.00 g5,00 2.00P- 6.50 8.60 16,60 Z.TC 0.00 15.80 C.CO 0.00 99.90 2.70C- 0.05 0.02 0.16 O.OO 0.00 O.C_ 0.00 0.00 0.25 3.2_
NUMBER OF CELLS = 22DEGREES OF FREEDOM = 21CHI-SQUARE = 5.876
e- AVERAGE OF IC PRECICTIONS

105
TABLE Z7
GOODNESS OF FIT MATRIX FOR TPIRUSING THREE PREVIOUS LOOKPOINTSA=ACTUAL TRANSITIONSP=PRECICTED TRANSITIONSC=CHI-SQUARE VALUES
AS ROLL CBARS ALT AOF HSI IVSI ENG NON ROWA- 16.00 0.00 0.00 0.00 0.00 0.00 0.00 0.00 2,00 2.00
P- 17.70 0.00 0.00 0.00 0,00 0.00 0.00 C.O0 2.30 2.3C
C- 0.18 O.O0 0.00 0.00 0.00 C.OC 0.00 0.00 0.00 0.05
A- 0.00 12.00 2.00 0.00 0.00 C.CO 0.00 0.00 L.O0 3.00
P- 0.00 II.50 /.gO 0.00 0,00 0.00 0.00 0,00 1.00 2.90C- 0.00 0.02 0.00 0.00 0.00 O.OC C.CO 0.00 0.00 0.00
A-- 1.00 1.00 414.00 O.OC 0.00 3.00 O.CO 0.00 17.00 5.0CP- 1.80 0.70 403.50 0.00 0.00 3.70 0.00 0.00 16.00 6.2GC- 0.00 0.00 0.27 0.00 0.00 0.00 C.O0 0.00 0.06 0.2g
A- 0.00 0.00 0.00 0,00 0.00 C.O0 0.00 0.00 0,00 O.OGP- 0.00 0.00 0.00 O.OC 0.00 0.00 0.00 0.00 0.00 O.OCC- 0.00 0.00 0.00 0.00 0.00 C.O0 C.CO C.O0 0.00 O.OC
A- 0.00 0.00 0.00 0.00 0.00 1.00 0,00 0.00 0.00 1.00P- O.O0 0.00 0.00 O.OG 0,00 O.gO 0.00 0.00 0.00 O.gC
C- 0.00 0.00 0.00 0.00 0.00 0.00 0.00 0.00 0.00 0.01
A- 0.00 0.00 7.00 O.OC 0.00 292.00 0.00 0.00 I_.00 0.00P- 0.00 0.00 6.60 O.OC 0.00 2gg.lO 0.00 C.O0 13.60 O._CC- 0.00 0.00 0.02 0.00 0.00 0.17 C.CO 0.00 0.01 O,OC
A- 0.00 0.00 0.00 O.OC 0.00 C.O0 O.CO 0.00 0.00 O,OCP- 0.00 0.00 0.00 O.OC 0,00 0.00 0.00 0.00 0.00 O.OCC- 0.00 0.00 0.00 0.00 0.00 C.O0 O.GO 0.00 0.00 0.0¢
A- 0.00 0.00 0.00 O.OC 0.00 C.O0 0.00 0.00 0.00 O.OC
P- 0.00 0.00 0.00 0.00 0.00 0.00 0.00 0.00 0.00 q. OGC- 0.00 0.00 0.00 0.00 O.GC 0.00 0.00 O.OC 0.00 O.OC
A- 1.00 2.00 14.00 0.00 L.CO 16.00 0.00 0.00 47.00 _.OCP- 0.50 2.20 13.90 O.OC O.gO 15.50 0.00 0.00 46.70 3.6¢C- 0.00 0.00 0.00 O.OC 0.00 0.02 0.00 O.OC 0.00 0.0_
NUMBER OF CELLS = 15DEGREES OF FREEDOM = 14CHI-SQUARE = 1.138
_- AVERAGE OF LO PREDICTIONS

106
TABLE 2B
GOODNESS OF FIT MATRIX FOR TPSL
USING THREE PREVIOUS LOOKPOINTSA=ACTUAL TRANSITIONSP=PREOICTED TRANSITIONS
C=CHI-SQUARE VALUES
AS ROLL CBARS ALT ADF HSI IVSI ENG NON ROW
A- 46.00 O.OO Z.00 1.00 0.00 0.00 O.O0 0.00 Z.O0 5.00P- 60°40 0°00 2.00 O.gO 0.00 0.00 0.00 0.00 2.80 5.7G
C- 4.51 0.00 0°00 0.00 0,00 0.00 0.00 0.00 0.00 O.IC
A-- 0°00 17.00 2.00 I.OC 0.00 0.00 0.00 O.OC 3.00 6.00
P- 0°00 12.70 I.50 1.00 0°00 C.O0 O.CO 0.00 2.60 5.10C- 0°00 I°09 0.00 O.OG 0,00 C.O0 0.00 0°00 0.00 0.13
A- 2,00 l.OO 512.00 O.OO I.00 6.00 0.00 C.O0 27.00 _.OO
P- 2,00 0.90 504.00 O.OC 1,50 5°00 C.O0 0.00 27.90 _.4GC- 0.00 0.00 0,13 0.00 0.00 0.17 0,00 0.00 0.03 0,0_
A- 0.00 0.00 0.00 280°00 0.00 0.00 O°O0 C.O0 23.00 O.OCP- 0.00 0.00 0.00 284.q0 O.O0 O.O0 0.00 0.00 2_.20 O.OGC- 0°00 0°00 0.00 O.Og 0.00 O.O0 0.00 0°00 0.06 0.00
A- 0.00 0.00 0.00 O.OC 4,00 0.00 0°00 0.00 L.O0 5.00P- 0.00 0.00 0.00 0.00 5°40 0°00 0.00 0.00 1.50 6.90
C- 0.00 0.00 0.00 0.00 0,00 0.00 0.00 0.00 0.00 0.72
A- 0.00 1.00 I.00 1.00 0.00 143.00 0°00 0.00 10.00 3.00P- 0.00 0.90 1.00 0.7C O,O0 118.70 0.00 0.00 8,80 2.60C- 0.00 0.00 O.CO O.OO O.O0 4,13 0.00 0°00 0.I_ 0.05
A- 0°00 0.00 0.00 0.00 0.00 0°00 0.00 0.00 0.00 O.OGP- 0.00 0.00 0.00 0.00 0°00 O.O0 0°00 0.00 0.00 O.GC
C- 0.00 O.OO 0.00 0.00 0.00 0°00 0.00 0.00 0.00 O.OC
A-- O.O0 0.00 0.00 0.00 0°00 0°00 0.00 O°OO 0,00 O,OCP- 0°00 0.00 0.00 0.0C O.CC 0.00 0°00 0.00 0.00 O.OCC- 0.00 0.00 0.00 0.00 0.00 0.00 0,00 O.OO 0.00 O.OC
A- 3.00 4.00 32.00 ZO.OO 0.00 7.00 0°00 0,00 185,00 7.00P- 3.70 3.30 33.20 21°70 0.00 6._0 0.00 C.O0 LqS°_O 7.00C- 0°00 0°00 0.04 0o14 0.00 0.05 0.00 0.00 0.58 0.00
NUMBER OF CELLS = 19DEGREES OF FREEDOM = 18CHI-SOUARE = 12°213
•- AVERAGE OF 10 PREDICTIONS

107
TABLE 29
GOODNESS OF FIT MATRIX FOR TPSRUSING THREE PREVIOUS LODKPOINTS
A_ACTUAL TRANSITIONSP=PREDICTED TRANSITIONS
C=CHI-SQUARE VALUES
AS ROLL CBARS ALT ADF HSI IVSI ENG NON ROWA- 39°00 0.00 1.00 0.00 O°OO 0.00 0.00 0.00 6.00 L.OCP- 38.00 0,00 L,O0 O.OC O.OC C°O0 O.CO 0.00 6.20 1.00C- 0.03 0.00 0.00 0.00 0.00 O.O0 0.00 0.00 O.Oi O.O0
A- O.O0 9.00 1.00 2.00 0.00 O.DO 0.00 0.00 L.O0 4.0CP- 0.00 14.10 1.60 L.qO 0.00 0.00 O.O0 0.00 0,90 4.4CC- 0.00 2.89 0.00 0.00 0.00 C.OO 0.00 0.00 0.00 0.04
A- 2.00 2.00 50Z.O0 Z.O0 0.00 2.00 0.00 C.O0 Z2,O0 _.OCP- Z.SO 2.50 536.60 1.10 O.O0 2._0 0.00 0.00 Z3.O0 8.5CC- O.OO 0,00 2.3B 0.00 0.00 C.O0 O°O0 O.O0 0.05 0.03
A- 2.00 0.00 1.00 175.00 O.O0 2.00 0.00 0.00 21o00 5.0CP- 1.70 0°00 1.30 154°70 O.O0 l.OO 0,00 C.O0 20.30 4.00C- O.OO 0.00 0.00 2.35 O.O0 C.O0 O.O0 O.O0 0.02 0.20
A- 0.00 0.00 0.00 0.00 0.00 0.00 O.O0 O.O0 0.00 O.OCP- 0.00 O.O0 O.O0 0.00 0.00 O.O0 O.CO 0.00 0.00 O.OCC- O°O0 O.O0 0.00 0.00 0.00 O.O0 O°O0 0.00 0.00 0.00
A-- O.O0 O°OO Z.O0 Z.OO 0.00 IOg.O0 0.00 0.00 6.00 4.figP- 0.00 0.00 2.40 Z°IO 0.00 I02.80 0.00 O°O0 5.60 4.50C- 0.00 0.00 O.OO O.OO 0.00 0°35 0.00 0.00 0.03 0.0_
A- O.O0 0.00 0.00 0.00 0.00 0.00 O.O0 0.00 0.00 0.00P- O.O0 0.00 O.O0 O°OO 0.00 0.00 O.O0 O.O0 O.O0 O.OCC- 0.00 0°00 0.00 O.OC 0.00 0.00 0.00 0°00 0.00 O.OG
A-- 0.00 0.00 0.00 0.00 0.00 0.00 O.O0 0.00 0,00 0.00P-- 0.00 0.00 0.00 O.OO 0.00 C°O0 0.00 0.00 0.00 O.OCC- O.O0 0.00 O.O0 O.CC 0.00 0.00 O.O0 O.O0 0,00 O,OC
A- 3.00 Z.OO 25.00 ZO.OO 0.00 6.00 0,00 0.00 232,00 5.00P- 3.00 1.90 Z5.60 19.5C O,O0 6.70 O°OO 0.00 215.60 4.gCC- 0o00 0100 OIOI 0°01 OeO0 CoOB 0100 O.O0 1.16 O.OC
NUMBER DF CELLS = 19DEGREES OF FREEDOM = LBCHI-SQUARE - 9.714
•- AVERAGE OF IO PREDICTIONS

108
TABLE 30
GOODNESS OF FIT MATRIX FOR TCILUSING THREE PREVIOUS LOOKPDINTS
A=ACTUAL TRANSITIONSP=PREDICTED TRANSITIONS
C=CHI-SOUARE VALUES
AS ROLL CBARS ALT ADF HSI IVSI ENG NON ROWA- 78.00 0.00 3.00 O.OG 0.00 0.00 0.00 O.O0 0.00 3.00P- 75.30 O.O0 2.70 0.00 O.O0 O.OO O.O0 O.OO O.O0 2.7C
C- 0.09 0.00 O,O0 O.OO O.OO O.O0 0.00 O.OO 0.00 0,03
A- 0.00 7Z.O0 3.00 1.00 O.O0 C.O0 0.00 0.00 l.O0 5.0CP- 0.00 68.50 2.80 1.3C O.OO CoO0 0.00 0o00 1.00 5.LCC- 0.00 0.17 O.OC O.O0 0.00 0.00 0.00 0.00 0.00 O.OO
A- l.OO _.00 4_3.00 6.06 O.O0 O.OO O°OO O.O0 8,00 9.0C
P- 0.70 3.70 _35.90 _.50 0.00 O.OO 0,00 0.00 7,bO _.qoC- O.O0 0.00 0.11 0.00 0.00 O.O0 0.00 0.00 0.02 O.OC
A- 0.00 0.00 I,00 IZ_.O0 O.OC 0.00 0.00 0.00 9.00 1.0C
P- 0.00 0.00 1.30 133.00 0.00 0.00 0,00 O.O0 8,50 1.3GC- O.O0 0.00 O.OO 0.65 O.O0 0.00 O.O0 O.O0 0.03 o.oq
A- 0.00 0.00 0.00 O.OC 0.00 0.00 0.00 0.00 0.00 O.OOP-- 0.00 0.00 O.OO OoOO 0.00 0.00 0°00 O.O0 0o00 0.00
C- 0.00 0.00 0.00 0.00 0.00 C.O0 O.CO C.O0 0.00 O.OC
A- O.O0 0.00 0.00 0.00 0.00 I_.00 0.00 O,OO 2,00 Z,O0P- O.O0 0.00 0°00 O.OO 0.00 1Z.60 0.00 0.00 Z.O0 2.0CC- 0.00 0.00 O°OO 0.00 0.00 0.1_ 0.00 O.OO 0.00 O.OC
A- O.OO 0.00 0.00 O.OG O.CO 0.00 O,O0 0.00 0.00 O.OCP- 0.00 O.O0 0°00 O°OO 0°00 0.00 0.00 0,00 0.00 O,OC
C- 0.00 O.OO O.O0 O.OO O.OO 0.00 O.O0 0.00 0.00 O.OC
A- O.OO 0.00 O.OC 0.00 0°00 C.OC O.CO C.O0 0.00 O.OC
P- 0.00 0.00 0.00 0.00 0.00 0.00 O°O0 0,00 0.00 O,O0C- 0.00 0.00 O.OO 0.00 0.00 0.00 O°O0 0.00 0.00 O.OC
A- 2.00 1.00 Ll. CO 5.0C O.O0 2.00 0,00 O,O0 92.00 5.0GP- Z,OO 1.60 I0.00 _.ZO 0,00 2.00 0.00 0.00 q6.BO 5,_CC- 0.00 0.00 O.Cg 0.13 O°O0 0.00 0.00 O.OC 0.25 0.07
NUMBER OF CELLS = 16DEGREES OF FREEDOM = 15CHI-SOUARE = I.883
_- AVERAGE OF 10 PREDICTIONS

109
TABLE 31
GOODNESS OF FIT MATRIX FOR TC5LUSING THREE PREVIOUS LOOKPOINTSA=ACTUAL TRANSITIONSP=PREOICTEO TRANSITIONS *C=CHI-SOUARE VALUES
AS ROLL CBARS ALT ADF HSI IVSI ENG NON ROW
A- 72,00 0.00 2.00 1.00 3.00 0.00 0.00 0.00 3,00 g.OCP- 60,10 0.00 Z.20 1.00 3.50 0.00 0.00 0,00 Z,lO B,BC
C- 1.97 0.00 0.00 0.00 0.00 0,00 0,00 0.00 0.00 d. O0
A- 0.00 66.00 5,00 0,00 0.00 0.00 0,00 0.00 _,00 _,OCP- 0.00 62.40 _.80 0.00 0.00 0.00 0.00 0.00 _.I0 _.i0
C- O.OC 0.20 0.01 0.00 0.00 0.00 0.00 0.00 0.00 0.00
A-- 1.00 q.O0 263.00 3.0C 1.00 1,00 0,00 0,00 8,00 5.0C
P- 1,10 g.lO 266.20 Z.SC 0,90 0.70 O.CO 0.00 8.80 5.2CC- 0.00 0.00 0.0_ 0.00 0.00 0.00 C.GO 0,00 0.08 0.11
A- 2,00 0.00 _.00 262.0C 0.00 1.00 1.00 0.00 7,00 8.0CP- 1.'10 0.00 _.CO 2Bl.gC 0.00 0.70 1.30 0.00 8.80 7,IC
C- 0.00 0.00 0.00 I.51 0.00 0.00 0,00 0.00 0,46 0.I0
A-- 1.00 0.00 0.00 0.00 13.00 I.00 0.00 0.00 _.00 6.OOP- 1.I0 0.00 0.00 0.00 13.30 0.70 0.00 0.00 4°50 5.30
C- 0.00 0.00 O,CO 0.00 0.01 0.00 0.00 0.00 0.00 0.02
A- 0.00 0.00 2.00 O.OC 1.00 154.00 0.00 0.00 _.00 7.0C
P- 0.00 0,00 1,50 O.OO 0,80 liB,gO O.OO 0.00 3,70 b. OCC- 0.00 0.00 O.OO O°OC 0.00 8.00 0.00 0.00 0.00 0.1_
A- 0.00 0,00 0.00 0.00 0,00 0.00 1.00 0.00 1.00 2.0C
P- 0.00 0.00 O.O0 0°00 0.00 G.CO 1.30 0.00 1.30 2,6G
C- 0.00 O.OO 0.00 0.0C O,O0 0.00 0.00 0.00 0.00 0.18
A- 0.00 0.00 0.00 0.00 0.00 0.00 0.00 0.00 0,00 0.00P- 0.00 0.00 0.00 0.00 0,00 0.00 0.00 0.00 0.00 O.OC
C- 0°00 0.00 0.00 0.00 0.00 0.00 0.00 0.00 0.00 0.00
A- 5.00 0.00 10.00 ll. OO 1.00 _.00 O.CO 0.00 67.00 5.0G
P- 5.60 0.00 10.80 12.7C 1.10 3.go 0.00 0.00 87.50 5,0CC- 0.07 0.00 O.G6 0.26 0.00 0.00 O,CO C,O0 b,Z7 O.OC
NUMBER OF CELLS = 22DEGREES OF FREEDOM = 21
CHI-SQUARE = Ig,696
1- AVERAGE OF I0 PREDICTIONS
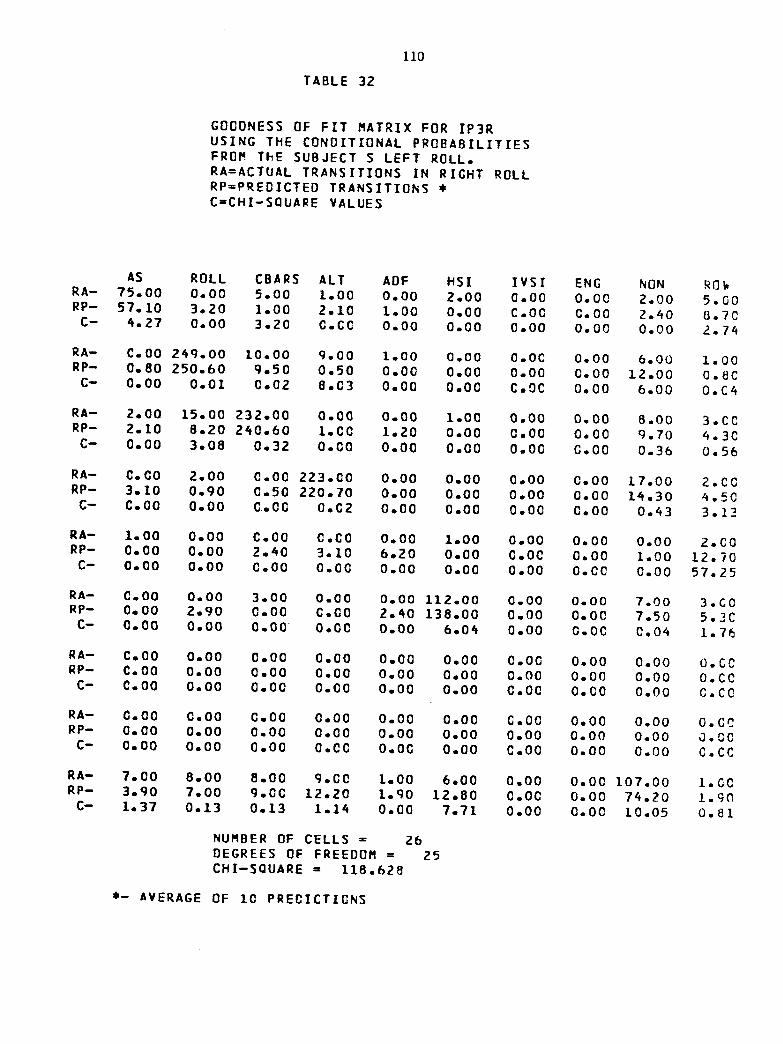
110
TABLE 32.
GOODNESS OF FIT MATRIX FOR IP3R
USING THE CONDITIONAL PROBABILITIESFROM ThE SUBJECl S LEFT ROLL.
RA=ACTUAL TRANSITIONS IN RIGHT ROLLRP=PREDICTEO TRANSITIONS *C=CHI-SQUARE VALUES
AS ROLL CBARS ALT ADF HSI IVSI ENG NON ROWRA- 75.00 0.00 5.00 l. O0 0.00 2.00 0.00 0.00 2.00 5.00RP-- 57.10 3.20 1.00 2.10 1.00 0.00 C.00 0.00 2._0 8.70
C- 4.27 0.00 3.20 C.CC 0.00 0.00 0.00 0.00 0.00 2.7_
RA- C.O0 2_q. O0 I0.00 q. O0 L.O0 0.00 O.OC 0.00 6.00 1.00RP- 0.80 250.60 g.50 0.50 0.00 0.00 0.00 0.00 12.00 O,@C
C- 0.00 0.01 0.02 8.03 0.00 0.00 C.OC 0,00 6.00 O.C_
RA-- 2.00 15.00 Z32.00 0,00 0.00 1.00 0.00 0.00 8.00 3,CCRP- 2.10 8.20 2_0.60 1.00 1,20 0.00 0,00 0.00 q.70 _.30
C- O.O0 3,08 0.32 0.00 0.00 0.00 0.00 C.OO O.3b 0,56
RA- 0.00 2.00 0.00 223.00 0.00 0.00 0.00 0.00 17.00 2.CORP- 3.10 0.90 0.50 220.70 0.00 0.00 0.00 0.00 1_.30 4.50
C- C.O0 0.00 C. OG 0.C2 0.00 0.00 O,OO C.O0 0.43 3.13
RA- 1.00 0.00 C.O0 C,CO 0.00 1.00 0.00 0.00 0,00 2,C0RP- 0.00 0.00 2._0 3.10 6.20 0.00 0.00 0.00 1.00 12.70C- 0.00 0.00 C.O0 O.O0 0.00 O.OO 0.00 0.00 0.00 57.25
RA- _.00 0.00 3.00 0.00 0.00 112.00 0.00 0.00 7.00 3,GO
RP- 0.00 2.90 0.00 C.OO 2.40 138.00 0.00 0.00 7.50 5,3CC- 0.00 0.00 0.00 O.GC 0.00 6.0_ 0.00 O.OC 0.0_ 1.7_
RA- C.O0 0.00 0.00 0.00 0.00 0.00 O.OO 0,00 0.00 O.CCRP- C.O0 0.00 0.00 0.00 0.00 0.00 0.00 0.00 0.00 O.CCC- C.O0 0.00 O.OO 0.00 0.00 0.00 C.O0 0.00 0.00 C.CO
RA- 0.00 0,00 O.O0 0.00 0.00 0.00 D,00 0.00 0.00 O,CORP- 0.00 0.00 0.00 0.00 0.00 0.00 0.00 0.00 0.00 O.CO
C- 0.00 0.00 0.00 O.OO O.OC 0.00 C.00 0.00 0.00 0.C¢
RA- 7.00 8.00 8.00 g.co 1.00 6,00 0.00 O,OO I07.00 L.CORP- 3.q0 7,00 q. OC 12.20 1.gO 12,80 O.OC 0,00 7_.20 l.g_C- 1.37 0.13 0.13 1.1_ 0.00 7.71 0.00 0.00 10.05 0.81
NUMBER OF CELLS = Z6DEGREES OF FREEDOM = 25CHI-SQUARE = 118,628
_- AVERAGE OF 10 PREDICTIONS

111
TABLE 33
GOODNESS OF FIT MATRIX FOR IP4RUSING THE CONDITIONAL PROBABILITIES
FROM THE SUBJECT S LEFT ROLL.RA=ACTUAL TRANSITIONS IN RIGHT ROLLRP=PREDICTED TRANSITIONS #
C=CHI-SQUARE VALUES
AS ROLL CBARS ALT ADF HSI IVSI ENG NON ROWRA- i?o00 0.00 2.0C 2.C0 0.00 0.00 0.00 0,00 3.00 7.C0
RP- 4.60 0.00 3,30 0.00 0.00 O.OO 0.00 0,00 I,_0 4,70C- g. O4 O.OO C.O0 O.CO O.OC O.OC C.O0 O,OC 0.00 0.7_
RA- 1.00 g6.O0 10.00 l. O0 0.00 0.00 0.00 0.00 1.00 3.00
RP- 0.00 110.60 9.90 O.CO O.O0 O.OO 0.00 0.00 7.30 7,3C
C- C. OO 2.2Z C.O0 C.CO O.O0 O.O0 0.00 0.00 0.00 o.lb
RA- I°OO 7.00 _50.00 3.00 O.O0 3.00 0.00 0.00 LT.O0 7.CO
RP- C.50 L2°30 _LO.60 0,00 0.00 0.00 0.00 0.00 20.30 0,5CC- 0,00 4.01 3°45 0,_0 0.00 0.00 O.OC O.OC 0.64 b°C_
RA- I.00 2.00 2.OO 162.00 0.00 I,00 2.0C O.O0 20.00 8.GORP- 0.00 3.ZO 0.60 2Z2.30 O.OO 0.00 0.00 0.00 Lq,30 3,_0C- 0.00 O.O0 O.OO L5.62 0°00 O.OO G.OC O°OC O.OZ 2.21
RA- 0.00 0.00 C.O0 O.QO 0.00 0.00 0.00 0.00 0.00 O.OORP- 0.00 0.00 0.00 0.00 0.00 0.00 0.00 O.O0 0.00 0,00
C- 0.00 O.O0 O.O0 O.O0 O.OO O.OO O.OO 0,00 0°00 G°GC
RA- 0.00 O.O0 O.O0 O.CO 0.00 41,00 0.00 0.00 6.00 O,O0RP- C.O0 G°OO O.gO O°OC 0.00 Zq.2O 0°00 O.O0 1,10 0,_0
C- O. OO O°O0 O,O0 O.CO O.OO 3._0 0.00 O,OO 4.00 C,CC
RA- 0°00 0.00 C.OC 1.00 O.OO 0.00 Z3.OC 0.00 3.00 _.CORP- C.O0 O.OO C.O0 1.30 0.00 0.00 g. BO 0.00 0.50 L,BO
C- 0.00 O.OO O,OC O.OO O.O0 O.O0 7,58 O°OO 0.00 L.2I
RA- C.O0 0.00 0.00 0.00 0.00 0.00 0.00 O.OC 0.00 O,CC
RP- 0.00 0.00 0.00 0.00 O.O0 0.00 0.00 0,00 0.00 O,CCC- 0.00 O.OO 0,00 0.00 0.00 0.00 0.00 0.00 0.00 O.CO
RA- 4.00 4°DO 16.OO Zl. O0 O.OO 2,00 Z.OC O,OC 135,00 IZ.CCRP- 4°20 1.80 17.80 Z2.20 0.00 2.I0 1.90 0.00 150.00 I0.00
C- 0.00 0.00 0.20 0.07 O.OO O.O0 0.00 O,O0 1.67 0,33
NUMBER OF CELLS = 20DEGREES OF FREEDOM = 19CHI-SQUARE = 68°626
t- AVERAGE OF LO PREDICTIONS

112
TABLE 34
GOODNESS OF FIT MATRIX FOR POIRUSING THE CONDITIONAL PROBABILITIESFROM THE SUBJE{T S LEFT ROLL.RA=ACTUAL TRANSITIONS IN RIGHT ROLLRP=PREOICTED TRANSITIONS *C=CHI-SQUARE VALUES
AS ROLL CBARS ALT ADF HSI IVSI ENG NON ROW
RA- 116.00 0.00 3.00 C.O0 0.00 0.00 C.OG 0.00 3.00 6.00RP- 71.50 0,00 3.40 O,OO 0.00 O.O0 O.O0 0.00 0.60 4,G0C- 17.07 0.00 0.00 0.00 0.00 0.00 C.O0 0.00 0.00 0,67
RA- 0.00 23.00 I.OC O.O0 O.OO 0.00 0.00 0.00 2,00 3,C0RP- O.O0 O.OO 0.00 O.OO 0.00 0.00 O.OO O,OO 0.00 0,00C- C.O0 23.00 0,00 O.O0 0.00 O,O0 0.00 O,OO 0.00 3,CC
RA- 1.00 0,00 317.00 O.GO 0.00 O,O0 2,00 0,00 22.00 3,C0RP- 1.70 O.O0 721.4C 1.60 O.OO O.O0 1.70 O.OO 14.50 5,C0C- 0.00 0.00 515.90 0.00 0.00 0.00 O.OC 0.00 2.5b 1.33
RA- 0.00 O.O0 O.OO 85.00 0.00 O.OO 0.00 0.00 7.00 O.CORP- O.O0 0.00 2.40 32.30 0.00 O.O0 1.30 0.00 6.40 3,70C- 0.00 O.O0 0.00 32.b7 0.00 0.00 O.OC O.O0 0.05 C.O0
RA-- 0.00 0.00 C.O0 0.00 0.00 O.OO O.O0 O,OO 0,00 O.OCRP- C.O0 O.O0 C.DQ 0.00 0.00 O.O0 0.00 0.00 0.00 O,O0
C- 0.00 0.00 O.OO G,GO 0,00 O.O0 0.00 0.00 O.O0 O,CC
RA- 0.00 0,00 O.gO 0.00 0.00 0.00 C.OO 0.00 o.oo O.OeRP-- 0.00 O.O0 0.00 O.O0 0.00 O.OO O.OO 0,00 0.00 O,GCC- 0.00 0.00 0.00 0.00 0.00 0.00 G.O0 0.00 0.00 O.CO
RA- 0.00 O.O0 2.00 C.GO 0.00 O.OO 115.00 0.00 0.00 2.GCRP- 0.00 O.OO C.OC 4.1C 0.00 0,00 95.00 0,00 0.00 4,10
C- C.O0 0.00 0.00 0.00 0.00 0.00 3.48 O,OC 0.00 2,2l
RA- C.O0 O.O0 0.00 0.00 0.00 O.OO C.OC 55.00 6._0 O,OCRP- C.O0 O.O0 O.OO C.CO 0.0C C.O0 C.OC 0.00 0,00 O,CCC- C. O0 O.O0 0.00 O.O0 0.00 O.O0 O.OO 55.00 6.00 O,CO
RA- 5.00 3.00 2C.OO 7.CC 0.00 O.OO 0.00 5.00 303,00 3.CCRP- 2,60 O.OO 14.20 4.40 0.00 0.00 1,20 C,O0 llq.70 1,20C- I.15 0.00 1.6B O.q7 0.00 0.00 O°O0 5,00 ILO,B9 1.08
NUMBER OF CELLS = 19DEGREES OF FREEDOM = 18CHI-SQUARE = 783.701
_- AVERAGE OF 10 PREDICTIONS

113
TABLE 35
GOODNESS OF FIT MATRIX FOR PO2RUSING THE CONDITIONAL PROBABILITIES
FRGM THE SUBJECT S LEFT ROLL.RA=ACTUAL TRANSITIONS IN _IGHT ROLLRP=PREDICTED TRANSITIONS *C=CHI-SQUARE VALUES
JS ROLL CBARS ALT ADF HSI IVSI ENG NON ROWRA-- 42.00 C.O0 l.OC O.CO 0.00 0.00 1.00 0.00 t. O0 3.CORP- 4C.00 0.00 3.20 0.00 0.00 0.00 0.00 0.00 0.00 3.20
C- 0.10 0.00 0.00 0.00 0.00 0.00 0.00 0.00 0.00 C.Cl
RA- 0.00 9q.00 5°00 C.CO 0.00 0.00 0.00 O,OO 6.00 0.00
RP- C.00 103.30 1.70 2.80 0.00 0.00 0°00 0.00 6.00 2.80C- 0.00 O.lq 2.18 0,00 0.00 0.00 0.00 0.00 0.00 O.CC
RA-- 1.00 Z.00 653.00 Z.00 0.00 0.00 C.00 0.00 17o00 5.C0RP-- l.gO 5.00 544.70 0.80 0.00 0.00 0.00 0.00 16.lO 7.70
C-- OeO0 0e00 17.g6 0,00 0.00 0,00 OeO0 Oe00 0.05 I._
RA-- 0.00 0.00 3.00 97.00 0.00 0.00 0.00 0.00 4.00 7.CCRP- 0.00 C.O0 3.80 202.10 0.00 0,00 0.00 0.00 10.30 I_.LO
C- 0°00 0.00 0.00 113.88 0.00 0.00 0.00 0,00 0.00 7.20
RA-- 0°00 0.00 0.00 C.O0 0°00 0.00 0°00 0.00 0.00 O.CC
RP- 0.00 0.00 0.00 0.00 0.00 0.00 0.00 0.00 0.00 0,00C- C.O0 0.00 0.00 0.00 0.00 0.00 0.00 0.00 0.00 0,00
RA-- 0.00 t. O0 0.00 0.00 0.00 56.00 0.00 0.00 3.00 _.CCRP- C.O0 0.00 0.00 0.00 0.00 68.80 0.0D O.OC 5.70 5,70
C- 0.00 0°00 0.00 0.00 0.00 2,93 0.00 O.OC 0,00 0.72
RA- 0.00 0.00 0.00 0.00 0.00 0.00 C.00 1.00 0.00 1.00RP- C.O0 0.00 0.00 0.00 0.00 0.00 C.OC 0.00 0.00 O.pC
C- 0.00 0.00 0.00 C.O0 0.00 0.00 0.00 0,00 0.00 1.CC
RA- 0.00 O.OO 1.00 0.00 0.00 O.O0 0.00 47.00 1.00 2,CG
RP- 0.00 0.00 C.OC C.CC 0.00 0.00 0.00 0,00 0.00 G.¢CC- 0.00 0.00 C.00 0.0C 0.00 0.00 0.00 47.00 0.00 2.00
RA- 2.00 8.00 ll. O0 5,CC 0.00 6.00 0.00 1.00 b8°O0 7,CCRP- 1.ZO 5.BO 14,60 LO,TC 0.00 5.70 0.00 0.00 85._0 6.q0C- 0o00 0.60 1.18 6.50 0.00 O.D0 0.0C 0.00 4.66 0,00
NUMBER OF CELLS = 20DEGREES OF FREEDOM = 19CHI-SQUARE = ZOg.bOq
t- AVERAGE OF lO PREDICTIONS

114
TABLE 36
GOODNESS OF FIl MATRIX FOR PO3RUSING THE CONDITIONAL PROBABILITIESFROM THE SUBJECT S LEFT ROLL.RA=ACTUAL TRANSITIONS IN RIGHT ROLL
RP=PRECICTEO TRANSITIONSC=CHI-SQUARE VALUES
AS ROLL CBARS ALT ADF HSI IVSI ENG NON ROW
RA- 37.00 O. OO 1.00 C.CO O.O0 0.00 0.00 O,OC 1.00 2.C0RP- 17,50 0.00 O.OC O.OO 1.50 0,00 0.00 0,00 I.I0 2.60C- i0.28 0.00 O.OO 0.00 0.00 O.O0 0.00 0.00 0.00 0,1_
RA- O. OO 32.00 8.00 O.OO O.O0 0.00 C.O0 O.O0 0.00 O.OORP- O. OO 51.60 O.O0 0.80 O.OO O.O0 O.OC O.OO 5.50 b.30C- C.O0 12.00 8.00 0.00 0.00 0.00 CoO0 0°00 0,00 C.O0
RA- 2.00 2.00 778.0C 3.00 0.00 2.00 1.DO 0.00 1_.00 IO,CORP- 2.60 O.OO 634.4C 2,20 0.00 2.10 O.OO O.O0 L7.O0 b._OC- 0.00 0.00 26.51 G.GO O.OC 0o00 O.O0 O.O0 0°6_ 0,96
RA- O.O0 0.00 2.00 165.00 0.00 O.OO 2.00 O.OO 7.00 4,GORP- 0.00 1.00 4.8C 213.10 O.OC O°OO 1.50 C.OC 12o60 7.3CC- O.OO O.O0 C.O0 14.02 0.00 O.O0 0.00 0.00 4.48 2.72
RA- C.O0 O.O0 0.00 O,CO 0.00 O.O0 O.O0 O.O0 0.00 O,CCRP- O. O0 0.00 C.O0 O.CC 11.50 0.00 O°00 0.00 1.50 13,CCC- _.OO 0.00 O.O0 O.OO O.OO O.O0 O.O0 0,00 0.00 O,CO
RA- C.O0 0.00 O.O0 O.O0 O.O0 34.00 0.00 O.O0 3.00 3.00RP- 0.00 0.00 2._0 O.OO O.O0 46.00 O.OO O.O0 2.10 4,50
C- 0.00 0.00 0.00 0.00 0.00 4.24 0°00 0.00 0.00 0,75
RA- 0.00 O.O0 1.00 4.00 O.OO O.O0 82.0C O.OO 2,00 7,GO
RP- C.O0 O.00 C°OO 3.30 0.00 O.O0 5q.20 C.O0 _.40 7.70C- 0°00 0.00 C°OO O.CO 0.00 0.00 6.34 O.OC 0.00 C,C7
RA- O.O0 O.O0 O.O0 O.O0 0.00 0.00 0.00 0.00 0,00 O.O0RP- C,OO 0.00 O.O0 0.00 O.O0 0.00 O.OC 0.00 0.00 O.CO
C- 0°00 O°O0 C°O0 0.00 O.O0 C.OO 0.00 0,00 O,O0 0°00
RA- 0.00 6.00 12.00 4.00 0.00 I.O0 4.00 O.O0 28.00 9.CORP- O°O0 5.30 16o70 13.60 O.OO 2.50 6.20 0,00 gl. O0 22,30
C- 0.00 0.08 1.84 O.OO 0.00 0.00 O.O_ O.OO 1_1.75 l_._S
NUMBER OF CELLS = 18DEGREES OF FREEDOM = 17CHI-SOUARE _ 254o517
• - AVERAGE OF LO PREDICTIONS
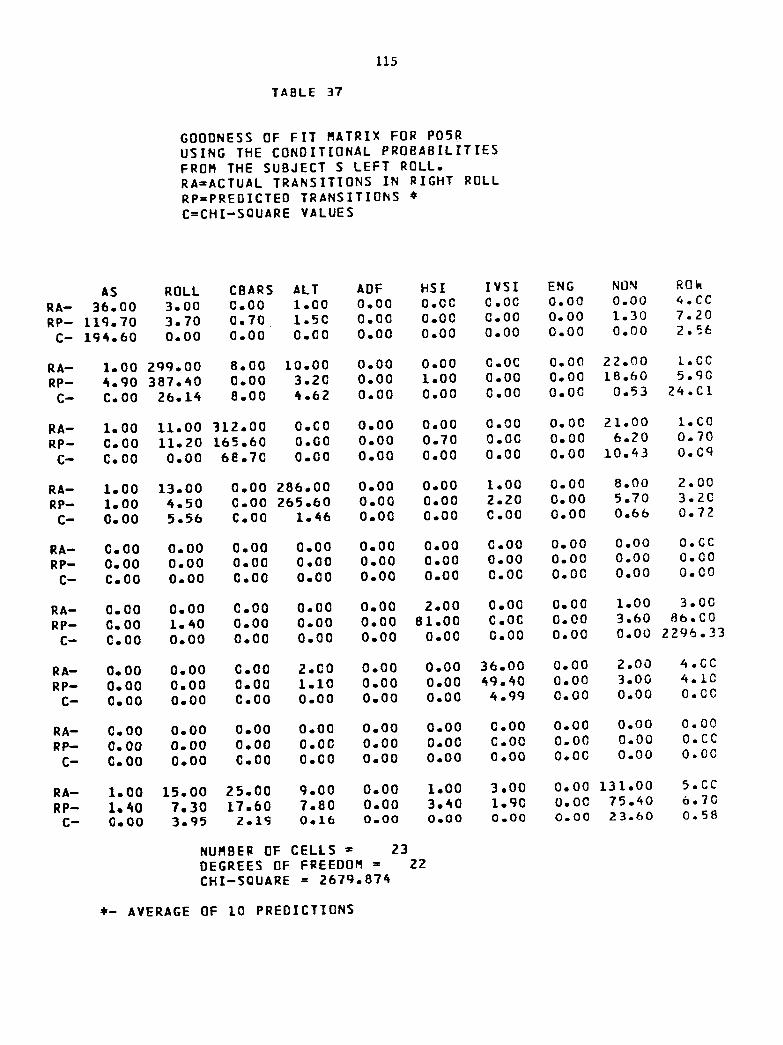
115
TABLE 37
GOODNESS OF FIT MATRIX FOR PO5RUSING THE CONDITIONAL PROBABILITIESFROM THE SUBJECT S LEFT ROLL.RA=ACTUAL TRANSITIONS IN RIGHT ROLLRP=PREDICTED TRANSITIONS #C=CHI-SQUARE VALUES
AS ROLL CBARS ALT ADF HSI IVSI ENG NON ROW
RA- 36.00 3,00 0.00 1.00 0.00 0.00 0.00 O.OO 0.00 4.CCRP- llq.70 3.70 0.70 1.5C 0.00 0.00 O.OG 0.00 1.30 7.20
C- 196.60 0.00 0.00 0.00 0.00 0.00 0.00 0.00 0,00 2.56
RA- 1.DO zqg.o0 8.00 10.00 0.00 0,00 G.OC 0.00 22.00 L.CCRP- 4.gO 387.40 0.00 3.20 O.O0 1,00 0.00 0.00 18.60 5.goC- C.O0 26.16 8.00 4.62 O.O0 O.OO 0.00 O,OG 0,53 24,CI
RA- 1,00 11,00 312.00 O.CO 0.00 0.00 0.00 0.00 21.00 l. CORP- C. O0 11.20 165.60 0.O0 O.O0 0.70 0,00 0.00 6.20 0.70
C- C. OO 0.00 68.70 0.00 O.OO 0.00 0.00 0.00 10,43 o.cq
RA- 1.00 13,00 0.00 Z86.00 0.00 0.00 1.00 0.00 8,00 2.00RP-- 1.00 6.50 C.O0 265.60 0.00 0.00 2.20 0,00 5.70 3.20
C- O. O0 5.56 C.00 1.66 O.O0 0.00 C.O0 0.00 0.66 0.72
RA- C.O0 0.00 0.00 0.00 0.00 0.00 C.O0 0.00 0.00 O.CCRP- 0.00 0.00 0.00 0.00 0.00 0.00 0.00 0.00 0.00 0.00
C- C.O0 0.00 C.O0 0.00 O.O0 0.00 0.00 O.OO O,O0 0.00
RA- C.O0 O.OO C.O0 0,00 O.O0 2.00 0,00 0.00 1.00 3.00
RP- 0.00 1.60 O.O0 0.00 0.00 81.00 C.OC 0.00 3.60 fib. COC- C.O0 0.00 0.00 0.00 0.00 0,00 0.00 0,00 0.00 229_.33
RA- O. O0 O.O0 0.00 2.C0 O.O0 0.00 36.00 0.00 2.00 4.CC
RP- 0.00 0.00 0.00 1.10 0.00 O.O0 _g.40 0.00 3.00 6.10C- 0.00 0.00 0.00 0.00 0.00 0.00 6.gg 0.00 0.00 0.00
RA- C.O0 0.00 O.O0 0.00 0.00 0.00 C.O0 0.00 0.00 0.00RP- 0.00 0.00 0.00 0,00 0.00 O.O0 C.OO 0.00 0.00 O.CC
C- C. O0 O.OO C.O0 O.CO 0.00 0.00 0,00 O.OC 0.00 0.00
RA-- 1.00 15.00 25.00 g.O0 0.00 1.00 3,00 O,O0 131.00 5.CC
RP- 1.40 7,30 17.60 7.BO O.O0 3.60 1.go 0.00 75._0 6.70C- G.O0 3.95 2.1_ 0.16 0.00 0.00 0.00 0.00 23.60 0.58
NUMBER OF CELLS = 23DEGREES OF FREEDOM = Z2
CHI-SQUARE = 267g.874
#- AVERAGE OF 10 PREDICTIONS

116
TABLE 38
GOODNESS OF FIT MATRIX FOR PO6RUSING THE CONDITIONAL PROBABILITIES
FROM THE SUBJECT S LEFT ROLL.
RA=ACTUAL TRANSITIONS IN RIGHT ROLLRP=PREDICTED TRANSITIONS *C=CHI-SQUARE VALUES
AS ROLL CBARS ALT ADF HSI IVSI ENG NON ROW
RA- 5.00 0,00 O,O0 0.00 1.00 O.OO C,OC 0.00 1.00 2,GCRP- 2.70 1.20 1.40 0.00 2.00 O.OO 0.00 O.OC 0.80 5.40C- 1.06 0,00 C.00 0.00 0.00 0,00 O.OO C.O0 0.00 5.78
RA- 0.00 57.00 3.00 2.00 0.00 O.OO 0.00 0.00 3.00 8.C0RP- 0.80 300,20 3.40 6,10 O.OO 4.00 O.OO 0.00 13.20 27.50
C- O.O0 229b.33 C.O0 0.00 0.00 C.O0 0.00 0.00 0.00 47.53
RA- 0.00 2.00 511.00 1.00 2.00 1.00 0.00 0.00 23.00 0.00
RP- O.gO 8.70 238.1D O.OO 0.00 0.00 0.00 0.00 lB.40 g.6CC- O°O0 0.00 145.74 C.CC 0.00 0,00 0.00 0.00 0.92 2.16
RA- O. O0 1,00 1.00 205.00 0.00 1.00 Z.OC 0.00 12.00 5,00RP- C.O0 2.80 3°20 230.80 0.00 1.20 3.00 1.40 5.60 11.60
C- 0.00 0.00 C.O0 3.25 0.00 0.00 O.O0 0.00 3.41 _.71
RA- C.O0 0.00 0,00 I.00 32°00 0°00 0,00 0,00 2,00 3,0CRP- 0.00 0.00 2.20 O.CO 37.20 0°00 0.00 0.00 2.00 _.20
C- C.O0 0.00 C.00 0.00 0.84 0.00 O.OO 0,00 0.00 0.48
RA-- 1.00 0.00 1.00 0,00 0.00 114°00 O.OO 0,00 6.00 2,00RP- 0.00 2.10 3.60 O.CO 0.00 106.30 0.00 O.OC 3.L0 5.70
C- C.O0 0.00 0.00 0.00 0.00 0.52 O.O0 0,00 1.40 6.84
RA- 0.00 0°00 I.00 0.00 0.00 1.00 60.00 0,00 4.00 6.C0RP- 0.00 0.00 0.80 I.60 1.00 0.00 39.70 O.OC Z.60 5,_0
C- C.O0 0.00 0.00 0.00 0.00 0.00 6.87 0.00 0.00 O.C1
RA-- 0.00 0.00 0.00 0.00 0.00 0.00 O.OO 0.00 0.00 O.CCRP- 0.00 0.00 C.OO 0.00 0.00 0,00 0.00 15,70 1.30 _7,CC
C- C.O0 0.00 C,O0 O.OC 0.00 0.00 O.OO 0,00 0.00 O,CC
RA- 1.00 5.00 24.00 12,00 0,00 5.00 6,00 0.00 90.00 5.00RP- 3.70 12.80 13.70 9.00 1.40 3.60 2,80 0,00 79.10 7,gC
C- O°O0 12.17 4.42 0.75 O.O0 0.39 0.00 0.00 1.32 L._S
NUMBER GF CELLS = 23DEGREES OF FREEDOM = 22CHI-SQUARE = 1293.917
_- AVERAGE OF 10 PREDICTIONS

117
TABLE 39
GOODNESS OF FIT MATRIX FOR PO7RUSING THE CONDITIONAL PROBABILITIESFROM THE SUBJECT S LEFT ROLL.RA=ACTUAL TRANSITIONS IN RIGHT ROLLRP=PRECICTED TRANSITIONSC=CHI-SQUARE VALUES
AS ROLL CBARS ALT ADF HSI IVSI ENG NON ROW
RA-- 0.00 0.00 C.O0 O.CO 0.00 0.00 0,00 0.00 0.00 O.CORP- C.OO O.O0 0.00 0.00 O.OO O.O0 C.OC 0,00 0.00 O,O0
C- C.00 0.00 0.00 O.CO 0.00 0.00 0.00 0.00 0.00 O.CO
RA- 0.00 4,00 3,00 O.O0 0.00 0.00 O.O0 O.OC Z.00 9.C0
RP- 0.00 113.60 B.ZC Z.60 O.OO 0.00 0.00 O.OC 3.80 12_,20C- C.00 O.O0 O.OO 0°00 0.00 O.O0 O.OO O,OC 0,00 1578,74
RA- 0°00 l. O0 696.00 2.00 0°00 I°00 1.00 0,00 7.00 5.C_RP- 0.00 lO.O0 507.BO 0.00 0.00 0.00 C.00 0.00 7.B0 IO,CC
C- O. OO 0.00 5G.8_ O.CO O.OO 0.00 O.OC O.OO 0.09 5.CC
RA- D.00 4.00 0.00 57.00 0.00 0.00 _.00 O.O0 2.00 6.00RP-- 0.00 1.90 0,00 59.10 O.OO 0.00 0.00 0.00 2.60 _,50
C- C°00 0.00 C.OC C.C8 0°00 0.00 O°OO O.OO 0,00 0.3_
RA-- C.00 0.00 0.00 0.00 0.00 0.00 O.OO O,OC 0.00 O,OCRP-- C.00 0.00 O.OC 0.00 46,I0 0.00 O.OO O,OC 2.40 48.5¢
C- O.O0 0.00 0.00 0.00 0.00 0.00 O.OO 0,00 0.00 O,CC
RA- C.00 0.00 C.OO 0.00 0.00 ZB.O0 0.00 0,0C 1.00 1,GORP- 0°00 0.00 0.00 0°00 0.00 17.00 O.OO 0°00 0.50 0,5C
C- 0.00 0.00 _.00 0.00 0.00 _.3Z O,OC O.O0 0.00 0.25
RA- O. O0 O.O0 O.O0 O,CO 0.00 0.00 57.00 0,00 3,00 3.GORP- 0.00 1.00 O.OO 0.00 0.00 0.00 25.30 0.00 0.90 /.qC
C- D.00 0.00 C.CC C,O0 0.00 0.00 17.63 O,OC 0.00 O._C
RA- O°O0 0.00 C.O0 G.OC 0.00 0.00 0.00 0.00 0.00 O.OCRP- _.O0 O.O0 0.00 O°O0 0.00 O.O0 C.O0 C.O0 0.00 0.00
C- 0.00 0°00 O.O0 O,OO 0.00 O.O0 O,OC O.OC 0.00 G,CC
RA- 0.00 0.00 B°OO _.00 0.00 I,00 Z.OC O,O0 L5.00 7,00
RP- C. O0 1. BO g.4O 1,gO Z,_O 0.50 2.00 0,00 67,40 8,6CC- 0.00 0.00 0.26 0.00 0.00 0.00 O.OC 0.00 163.05 0.37
NUMBER OF CELLS = 13DEGREES OF FREEDOM = 12CHI-SQUARE = 1841°437
_- AVERAGE DF LC PREDICTIONS

118
TABLE _0
GOODNESS OF FIT MATRIX FOR POBRUSING THE CONDITIONAL PROBABILITIESFROM THE SUBJECT S LEFT ROLL.RA=ACTUAL TRANSITIONS IN RIGHT ROLLRP=PREDICTED TRANSITIONSC=CHI-SQUARE VALUES
AS ROLL CBARS ALT ADF HSI IVSI ENG NON ROW
RA- 0.00 0.00 0.00 C.CO 1.00 0.00 0.00 0.00 0.00 I,C0RP- 0.00 0.00 C.O0 0.00 0.00 0.00 0.00 0.00 0.00 0.00C- C.O0 0.00 C.O0 O.O0 0.00 0.00 0.00 C.OO O.O0 L.O0
RA- C.O0 0.00 O.OO 0.00 0.00 0.00 C.OC 0.00 0.00 O.CCRP- O. CO C,OO 0.00 0.00 0,00 0,00 0.00 0,00 0.00 O,GC
C- 0.00 0.00 0.00 0,00 0.00 0.00 0.00 0.00 0.00 0.00
RA- 1.00 0.00 665.00 4.00 1.00 1.00 0.00 0,00 11.00 7,C0RP- 0,00 O.O0 486.20 3.70 3.70 1.50 0.00 0.00 24.80 8.90
C- -O.O0 0.00 48.07 0,00 0.00 0.00 0.00 0.00 L7.31 O,SZ
RA- C.00 0.00 0.00 118.00 0.00 0.00 0,00 0,00 13.00 0,00RP- O. O0 0.00 2.20 151.90 0.50 0.00 I.50 O.OC I0.20 4,20
C- 0.00 0.00 0.00 9.7_ O.OO 0.00 O.OO 0.00 0.60 O.CO
RA- 0.00 0.00 2.00 0.00 77.00 l.O0 0.00 1.00 Z.OO 6,00RP- 0.00 0.00 0.00 0.00 58.80 O.O0 1.10 0.00 5.40 6.50
C- C. O0 0,00 C.00 0.00 4.30 0.0Q 0.00 0.00 0.00 O.C_
RA- O=O0 0.00 1.00 0.00 0.00 b8.00 1.00 O. OC 3,00 5,GO
RP- C.O0 0.00 2.00 0.00 O.OO 26.70 0.30 0.00 0.70 3.00C- 0o00 0,00 0.00 C.CO 0.00 25,08 O.OO 0.00 0,00 0.80
RA- O.O0 0.00 C.OO l. CO 0o00 0,00 43.0C 0.0C 3._0 4.00RP- C.O0 0.00 O.O0 O.gO O.OO C,OC Bq.50 0,00 5.90 b. BC
C- 0.00 O.O0 0o00 0.00 0.00 O°O0 50.28 0.00 0.00 l.g6
RA- 0°00 0.00 C.O0 1°00 0.00 O.OC 0°00 22,00 0.00 I.CCRP- C.O0 0.00 O.O0 0.00 0.00 O.CO O.OG 0,00 0.00 O.O0C- C.00 0.00 C.O0 0.00 0.00 0.00 0.00 22.00 0.00 l. CC
RA- 0.00 0.00 15.00 7.00 4.00 3.00 3.00 O.OO 56,00 1C,CORP- 0.00 0.00 ZB.gO g.gO Z.30 1.50 4.2C 0.00 201.70 8.00
C- C.00 0.00 12,88 1.20 0.00 0.00 C,OC 0.00 379.08 O,_C
NUMBER OF CELLS = 18DEGREES OF FREEDOM = 17CHI-SQUARE = 576.279
_- AVERAGE OF 10 PREDICTIONS

119
TABLE 41
GOODNESS OF FIT MATRIX FOR POqRUSING THE CONDITIONAL PROBABILITIESFROM THE SUBJECT S LEFT ROLL.RA=ACTUAL TRANSITIONS IN RIGHT ROLLRP=PREDICTED TRANSITIONSC=CHI-SQUARE VALUES
AS ROLL CBARS ALT ADF HSI IVSI ENG NON ROWRA- 2.00 0.00 G.OC C.CO 2.00 0.00 C.O0 0.00 0.00 6.CC
RP- 1.40 0.00 0.00 0.00 0.00 O.GO 0.00 0.70 0.50 2,60
C- C.O0 0.00 O.O0 0.00 0.00 0.00 0.00 0.00 0.00 O._q
RA- 0.00 54,00 8.00 0.00 0.00 0.00 0.00 0.00 4.00 4,00
RP- 0.00 4.20 3.00 C.CO 0.00 0.00 0.00 O.Oe 0.00 G.CCC- 0.00 _5.93 3.13 G.CO 0.00 0,00 0.00 0.00 0.00 _,CO
RA- 0.00 7.00 4_9.0C I,OC 1.00 0.00 0.00 0.00 20.00 2.C0RP- C.50 0.00 541.q0 C.CC 0.00 O.OO O.OC C.O0 25°10 0.50
C- 0.00 7,00 19.22 0.00 0.00 0.00 0.0C 0.00 1.30 1.13
RA- 0.00 0.00 8.00 203.CC 0.00 1.00 0.00 0.00 q,O0 l. CORP- 0.00 0.00 1.3C 200.40 0.00 0.00 0.60 0.00 I_.00 O.eO
C- 0.00 0.00 5.61 0.03 0.00 0.00 0.00 G.00 2.78 0.16
RA- 0.00 0.00 0.00 1.00 53.00 1.00 G.OC G.OC 4.00 6.00RP- C°00 0.00 0.00 0.00 _Z.8O 0.00 0.00 0.00 2.I0 2,I0
C- C.O0 0.00 C.OC C.OC 1.q6 0.00 0.00 0.00 0.00 2.53
RA- C.O0 2.00 0.00 0.00 0.00 106.00 0,00 O.OC 4.00 6.00RP- G. O0 1.10 1.20 O.OO 0.00 100.50 O.OO 0,00 1.90 4,2C
C- C.O0 0.00 C.O0 0.00 0.00 O.2q 0.00 0.00 0.00 0,5_
RA- 0.00 0.00 0.00 0.00 0.00 0.00 lq.O0 0,00 2,00 2,CC
RP- 0,00 0.00 C.O0 0.4C O.OG 1.40 56.0C 0.00 _,60 6._CC- O.O0 0.00 C°O0 O.OO 0°00 0.00 72.05 O.OO 0.00 q.68
RA- O.00 0.00 C.O0 0.00 0.00 0.00 0.00 G,OC 0.00 C.CCRP- 0.00 0.00 0.00 O.O0 0.0C 0.00 0.00 5.10 0.70 5,80C- 0.00 0.00 0.00 O.O0 0.00 0,00 0.00 0.00 0.00 0.00
RA- 2.00 2.00 14.00 16.00 3.00 4.00 2.00 O.OC 117.00 13,CCRP- 0.70 1.q0 lq.50 15.gO 2.10 3.00 5.80 0,00 57,70 13._0C" G.O0 0.00 2.16 O°OO 0.00 0.00 0.0C 0,00 30.06 o.cz
NUMBER OF CELLS = 2ZDEGREES OF FREEDOM = ZlCHI-SOUARE = 210.063
•- @VERAGE OF 10 PREDICTIONS

120
.TABLE 42
GOODNESS OF FIT MATRIX FOR PIORUSING THE CONDITIONAL PROBABILITIES
FROM THE SUBJECT S LEFT ROLL.RA=ACTUAL TRANSITIONS IN RIGHT ROLLRP=PREDICTED TRANSITIONS
C=CHI-SQUARE VALUES
AS ROLL CBARS ALT ADF HSI IVSI ENG NON ROW
RA- 4C.00 0.00 1.00 1.00 1.00 O.O0 C.O0 0.00 2.00 5.CO
RP- 0.00 0.00 0,_0 0.C0 O.O0 0.00 0.00 0.00 0.00 0._0
C- 40.00 0.00 C,O0 C.GO 0.00 0.00 0.00 0.00 0.00 _.23
RA- C.O0 662.00 3.00 7.00 0.00 0.00 0.00 0.00 16.00 3.00RP- C.O0 122.20 2.60 3.00 0.00 0.00 C.O0 0.00 8.40 2.bCC- C.O0 269.92 C.OC 2.2g O.O0 0.00 0.00 0.00 3.61 C.C5
RA-- 1.00 3.00 142.00 0.00 0.00 0.00 C.O0 0.00 12.00 4.C0
RP- 0.00 5.10 320.80 O.RC O.OC O.O0 C.OC 0.00 16.30 6.G0
C- 0.00 0.00 225.14 0.00 O.OO 0.00 0.00 0.00 1.5_ I.CC
RA- 0.00 13.00 1.00 145.C0 0.00 0.00 0.00 0.00 3.00 _.GCRP- C.O0 4.10 C.OO 145.20 0.00 0.00 0.00 0,00 11.40 II._0
C- 0.00 6,Og C.OC 0.00 0.00 0°00 0.00 G.O0 C.O0 13.6q
RA- 1.00 O. O0 l.O0 O.OO _.00 0.00 0.00 0.00 0.00 b. CORP- 0.40 O.O0 0.80 0.00 8.00 C.00 0.00 0.00 0.70 g.go
C- C.O0 0.00 0.00 O.CC 0.00 O.O0 C.OC O.O0 0.00 Z.5_
RA- 0.00 0.00 0.00 0.00 0.00 0.00 0.00 0.00 0.00 O.CO
RP- 0.00 0.00 0.00 0.00 0.00 0.00 0.00 0.00 0.00 C.CCC- C.O0 O.O0 C.CC C.CC O.OO O.O0 0.00 0.00 0.00 O.CC
RA- C.OO 0.00 C.OO 0.00 0.00 O.O0 O.OO O.O0 0.00 0.0 o
RP- C.O0 0.00 0.00 0.00 0.00 0.00 O.OC C.OC 0.00 G.CCC- C.O0 O.O0 0.00 O.O0 0.00 0.00 O.OC 0.00 0.00 O.GC
RA- C.O0 0.00 0.00 O.O0 0.00 0.00 0.0C O.O0 0.00 O.CO
RP- 0.00 O.O0 0.00 C.CO 0.00 O.OO 0.00 0.00 0.00 C.CCC- 0.00 0.00 C.OO 0.00 0.00 0.00 0.00 0.00 0.00 0.00
RA- 3.00 i0,00 I0.00 g.o0 l.OO 0.00 C.00 0,00 ZT.O0 _.00
RP- C,O0 3.gO 18.80 12.00 l.gO 0,00 O,OC 0.00 22q.I0 l.gO
C- C°OO 3.72 7.74 1.CO O.OO O.O0 O.OC G.O0 1512.76 I.I0
NUMBER OF CELLS = IB
DEGREES OF FREEDOM = 17CHI-SQUARE = 2076.423
_- AVERAGE OF IC PREDICTIONS

GOODNESS OF FIT MATRIX FOR PIIRUSING THE CONDITIONAL PROBABILITIESFROM THE SUBJECT S LEFT R_LL,RA=ACTUAL TRANSITIONS IN RIGHT ROLLRP=PREDICTED TRANSITIONS *C=CHI-SQUARE VALUES
AS ROLL CBARS ALT AOF HSI IVSI ENG NON ROW
RA- 6g. O0 O.OO 2.00 O.CO 1.00 0.00 0,00 0.00 2.00 5.00RP- 130.20 0.00 3,_0 0,00 _.60 0.00 0.00 1.00 I0.90 lg.gO
C- 5_,2B 0,00 C.O0 O.OO 0.00 0.00 O.O0 0.00 0,00 44,_0
RA- 0.00 _.00 C.O0 0.00 0,00 0.00 0.00 O.OC 1.00 5,CO
RP- C.O0 0.00 0.00 O.CO 0.00 0,00 C.OG 0.00 0.00 O.COC- 0.00 0.00 C.OC G.CD 0.00 0.00 0,00 C.00 0.00 5.00
RA- 1.00 1,00 39B.00 1.C0 0.00 2.00 C.OC 0,00 20,00 5,GORP- 3.00 0.00 Z32.gO 0.00 0.00 2.90 0.00 0.00 L8.O0 5._C
C- C.O0 0.00 68._9 0.00 0.00 0.00 0.00 0,00 0.20 0,16
RA- C.O0 O.OO C.00 i06.00 0.00 0.00 C.O0 0.00 17,00 O.CO
RP- 0.00 0.00 0.00 86,_0 0.00 0.00 C.OC 0.00 B.BO O,OCC_ 0.00 0.00 Q.O0 3.62 0.00 O,O0 0.00 0,00 3.q6 0,00
RA- O.O0 0.00 0.00 0,00 5.00 0.00 0.00 0.00 1.00 l,CO
RP- I. I0 0.00 Q.00 0.00 11.60 0.00 O.OO 0.00 5.30 6._C
C- 0.00 0.00 C.00 0.C0 8.71 0.00 0.00 O,OC 0.00 Z9.16
RA- 0.00 0.00 0.00 0.00 0.00 131.00 1.00 C.OC LO.O0 1.00RP- C.O0 0.00 2.50 C,CC 1.10 53.70 0.00 O.OC 2.90 3.60
C- 0.00 0.00 C.OO O.GC 0.00 _5.61 0.00 0.00 5.04 6.76
RA- 0.00 0.00 0.00 1.00 0.00 1.00 19.00 O.OO 1.00 3,CCRP- O. gO 0,00 C.OG 1.50 0.00 0.00 14.90 0.00 2.10 _.5C
C- G,O0 0.00 C.00 0.00 0.00 0.00 0.88 0.00 O.O0 0.75
RA-- 0.00 0.00 0.00 0.00 0.00 0.00 0.00 3.00 1.00 _.CORP- C.O0 G.O0 0.00 0.00 O.OO 0.00 0.00 21,50 1.00 Z2.50
C- C.O0 C.O0 C.00 0.00 0.00 0,00 0.00 0.00 0.00 B5,56
RA-- _.00 0.00 2_.00 14.00 0.00 8,00 2.00 1,00 81.00 7.CCRP-- 14.gO 0.00 18.30 6._0 0.90 3.70 _.60 0.00 259.00 20,_0C- C.O0 0.00 1.35 _.13 0,00 Z,31 O,OC 0,00 391,1b Z5._5
NUMBER OF CELLS = 21DEGREES OF FREEDOM = 20CHI-SQUARE = 787.1q8
t- AVERAGE OF 10 PREDICTIONS
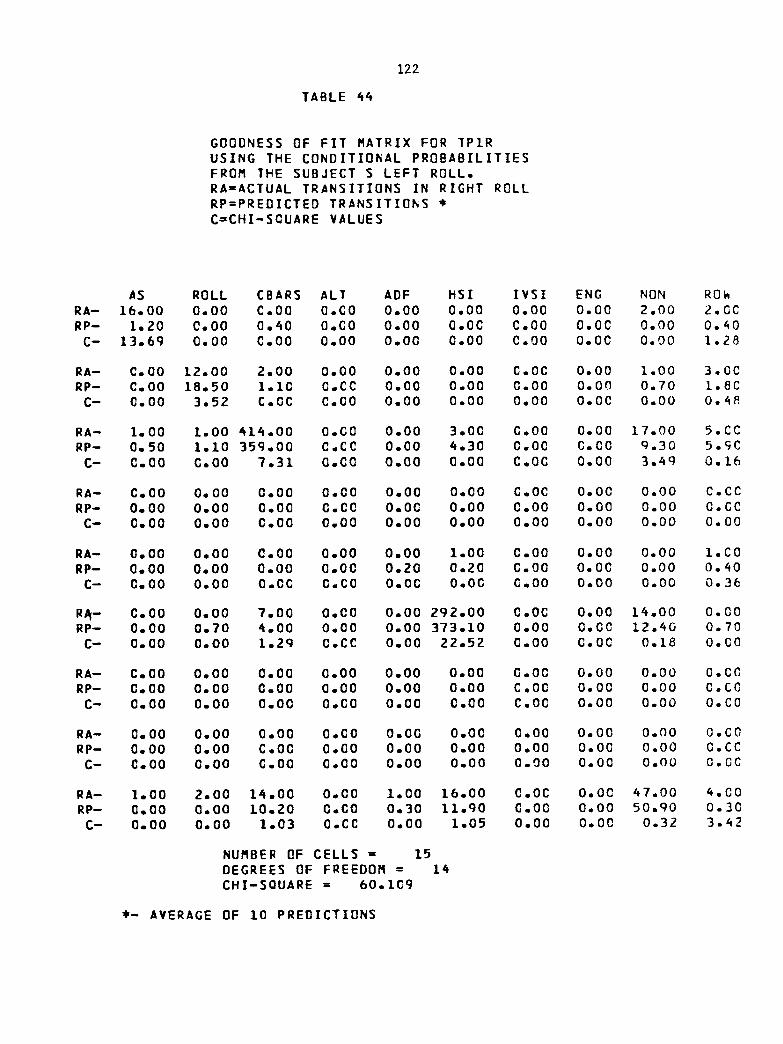
122
TABLE 44
GOODNESS OF FIT MATRIX FOR TPIRUSING THE CONDITIONAL PROBABILITIESFROM THE SUBJECT S LEFT ROLL,RA=ACTUAL TRANSITIONS IN RIGHT ROLLRP=PREDICTED TRANSITIONSC=CHI-SQUARE VALUES
AS ROLL CBARS ALT ADF HSI IVSI ENG NON ROW
RA- 16.00 O.O0 C.OO O,CO 0.00 0,00 0.00 O,O0 2.00 2,GC
RP- 1,20 O,O0 O._O O.GO 0.00 O.OC C.O0 O.OC 0.00 0,40C- 13.69 0,00 C.OO O.O0 0.00 O.OO 0,00 0,00 0.00 1.28
RA- C. O0 12.00 2.00 0.00 0.00 0.00 C.OC 0,00 1.00 3,0CRP- C.OO 18.50 1.10 C.CC 0.00 O.OO 0.00 O.OO 0.70 1,8C
C- 0.00 3,52 C.OC O.O0 0.00 O.O0 0,00 O.OC 0.00 0._8
RA- 1.00 1.00 _L_.O0 O.GO 0.00 3.00 G.O0 0.00 17.00 5,CCRP- 0.50 I.i0 35q.00 C,CC 0.00 4.30 C.OC C.O0 q.30 5.qC
C- C.O0 C,O0 7.31 Q.00 0.00 O.OO C.OC 0.00 3.4q 0,16
RA- C.O0 0.00 0.00 0,00 O.OC O.O0 G.OC 0.00 0.00 C.CC
RP- O. O0 O.O0 0.00 O,OC O.OC O.OO O.OO 0.00 0.00 O,CCC- C.O0 O.O0 C.OO 0,00 O.OO O.O0 O.OO O.OO O.OO 0,00
RA- O.OO O,OO 0.00 O.OO 0.00 l.O0 C.OD O.O0 0.00 1,C0
RP- O.OO 0.00 O.OO 0.00 0.20 0.20 O.OO O, OO 0.00 0._0C- O. O0 0.00 O.OC C.CO O.OC O.OC C.O0 0.00 0.00 0.36
R_- C.O0 O.OO 7.DO O.CO O.OO 292.00 O.OC O,OO 14.00 O,O0RP- 0.00 0.70 4.00 O.O0 0.00 373.10 0.00 O.OO 12.40 0,70
C- O. O0 0.00 1.2q O.CC O.OO 22.52 C.O0 C.OC 0.18 O,CO
RA- C.OO O.O0 O.OC O.O0 0.00 O.OO G.OC 0.00 0°00 O.CC
RP- C.O0 0.00 C.OO O.O0 0.00 O,OO C,OC 0.00 0,00 C.COC- C.O0 0.00 O.OO O,CO 0.00 O.QO C.OC 0.00 0.00 O.CO
RA- O.O0 O.O0 0.00 O,GO O.OG 0.00 0.00 0.00 0.00 O,CORP- 0.00 O.O0 C.00 O,O0 O.O0 0.00 0.00 O.O0 0,00 O.CC
C- C.O0 0.00 C.00 O.CO 0.00 0.00 Q.O0 0.00 0.00 O.OC
RA- I.O0 2.00 16.00 O.CO 1.00 16.00 O.OC O,OC 47,00 4.00
RP- Q.O0 O.O0 LO.ZO 0.C0 0.30 ll.gO C.O0 0,00 50.gO 0.30C- 0.00 O.O0 1.03 C.CC O.O0 1.05 O.OO 0.00 0.32 3.42
NUMBER OF CELLS = 15DEGREES OF FREEDOM = 1_CHI-SQUARE = 60.1C9
t- AVERAGE OF 10 PREDICTIONS
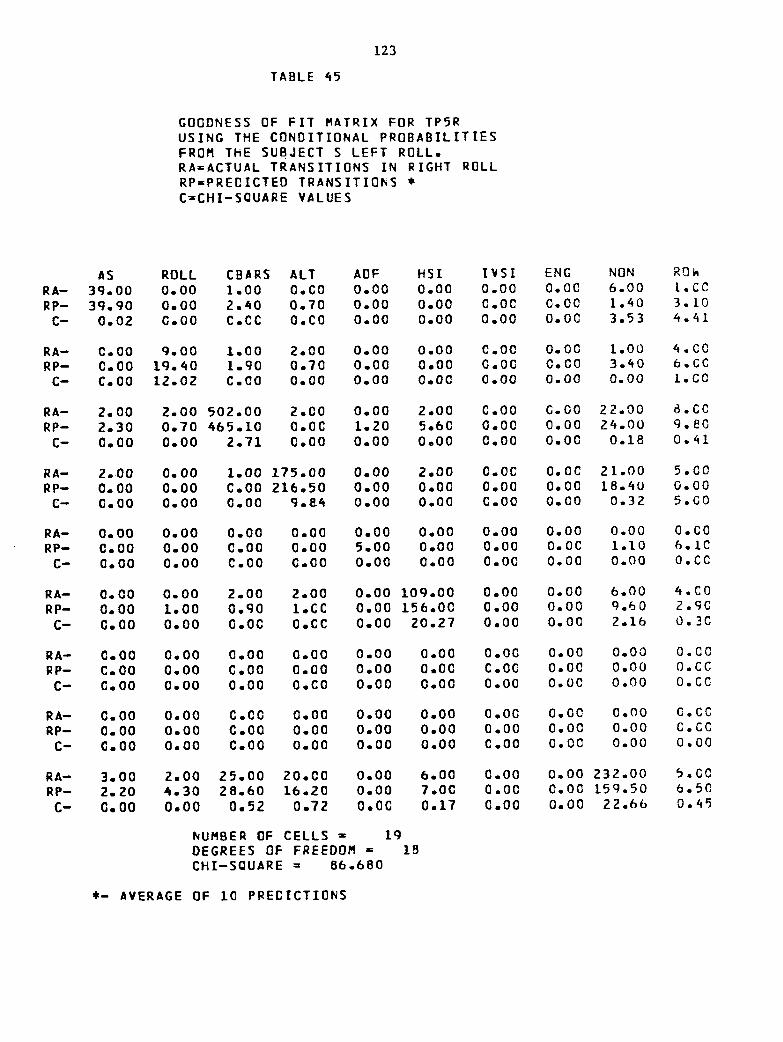
123
TABLE _5
GOODNESS OF FIT MATRIX FOR TPBR
USING THE CONDITIONAL PROBABILITIES
FROM THE SUBJECT S LEFT ROLL.RA=ACTUAL TRANSITIONS IN RIGHT ROLLRP=PRECICTED TRANSITIONS
C=CHI-SQUARE VALUES
AS ROLL CBJRS ALT ADF HSI I_SI ENG NON ROWRA-- 3g. O0 0.00 1.00 O.CO 0.00 0.00 0.00 0.00 6.00 [.CC
RP- 39.90 0.00 2._0 0.70 0.00 0.00 C.OC 0.00 1.40 3.L0C- 0.02 0.00 C.CC O.CO 0.00 0.00 0.00 O.OC 3.53 _.41
RA-- 0.00 g. O0 1.00 2.00 0.00 0.00 C.O0 0.00 1.00 _.CORP- 0.00 Ig.60 I.gO 0.70 0.00 0.00 0.0C O.GO 3._0 b. CC
C- C.O0 12.02 C.O0 0,00 0.00 0.00 0.00 0.00 0.0o /,CO
RA- 2.00 2.00 502.00 2.00 0.00 2.00 C.O0 G.O0 22.00 6.C0RP- 2.30 0.70 665.10 O.OC i.20 5.6C 0.00 0.00 2_.00 g.80
C- 0,00 0.00 2.71 0.00 O.OO 0.00 O.O0 0.00 0.18 0._I
RA- 2.00 0.00 1.00 175.00 0.00 2.00 O.OC 0.0C 21.00 5.00RP- 0°00 0.00 C.O0 216.50 O.O0 0.00 O.O0 0.00 IB._O 0.00
C- C.OO 0.00 0.00 9.86 0.00 0.00 C.O0 0.00 0.32 5.00
RA- O.O0 0.00 0.00 0.00 0.00 0.00 0.00 0.00 0.00 O.CORP- C.O0 0.00 C.O0 0.00 5.00 0.00 0.00 O.OC 1.10 6.10
C- 0.00 O.O0 C.O0 C°00 0.00 0.00 O.OC 0.00 0.00 O,CC
RA-- 0°00 0.00 2.00 2.00 O.O0 I09.00 0.00 0.00 6.00 _.CORP- 0.00 l. O0 O.gO I.CC 0.00 156.00 0.00 O.O0 q.60 2._0
C- G.O0 0.00 C.OC O.CC O.O0 20.27 0.00 0.00 2.16 0.30
RA- C.O0 0.00 0.00 0.00 0.00 0.00 0.00 0.00 0.00 0.00RP- C.O0 0.00 C.O0 O.OO 0.00 O.OC C.OC O.OO 0.00 O.CCC- C.O0 0.00 0.00 O.CO 0.00 0.00 0.00 O.OO 0.00 O.CC
RA- 0.00 0.00 C.CO O.OO 0.00 O.OO 0.00 0.00 0.00 G.CC
RP- 0.00 O.OO C.O0 0.00 0.00 0.00 0.00 O.OO 0.00 G.CCC- C.O0 0.00 C.O0 0.00 0.00 0.00 C.O0 0.00 0.00 0.00
RA-- 3.00 2.00 25.00 20.00 0.00 6.00 0.00 0.00 232.00 5.GO
RP- 2.20 6.30 28.60 16.20 0.00 7.0C O.O0 O.OC IBg.50 6.5QC- C. O0 0.00 0.52 0.72 O.OC 0.17 C.O0 0.00 22.66 0._5
NUMBER OF CELLS = lqDEGREES OF FREEDOM = 1BCHI-SQUARE = 86.6B0
_- AVERAGE OF 10 PRECICTIONS

124
TABLE 46
GOODNESS OF FIT MATRIX FOR IP3LUSING THREE PREVIOUS LOOKPOINTSAND OhE CONTROL STATUS.A=ACTUAL TRANSITIONSP=PREDICTED TRANSITIONS *
C=CHI-SQUARE VALUES
AS ROLL CBARS ALT ADF HSI IVSI ENG NON ROWA- 63.00 3.00 1.00 2.00 1,00 0.00 0.00 0.00 2.00 9.00P- 61.10 2,60 0,50 I._0 0.60 0.00 0.00 C.OC 3.60 8.70C- C,06 0.00 0.00 0.00 0.00 0.00 0.00 C.O0 0.00 0.01
A- 1.00 247.00 9.00 1,00 0.00 0.00 0.00 0.00 12,00 2.00
P- o,qo 251.70 I0.60 0.50 0.00 0,00 O.O0 0.00 12.20 L._CC- 0.00 o.og 0.28 0.00 0.00 C.O0 0.00 0.00 0,00 0.16
A- 2.00 8,00 238.00 1,00 I.00 0.00 0.00 0.00 9,00 4.CCP- 2.20 8.00 242.30 0.7C 1.30 0.00 0.00 O.O0 lO.iO _.20C- 0.00 0.00 0.G8 O.OC 0.00 0.00 0.00 0.00 0.13 O.Ol
A- 2.00 1.00 1.00 227.00 0.00 0.00 0.00 0.00 14.00 _.0CP- 2.60 1°50 0.80 lgq°6c 0.00 0.00 0.00 0.00 LZ.gO Q.gcC- 0.00 0.00 0.00 3.31 0.00 0.00 0.00 0.00 0.09 0.2G
A- 0.00 0.00 1.00 2.00 7.00 O.O0 0.00 0.00 I.O0 _.OCP- 0.00 0.00 0.80 Z.60 8.AO 0.00 0.00 0.00 l.lO %.5CC- 0.00 0.00 O.OC O.OC 0.28 C.OC 0.00 0.00 0.00 0.0_
A- 0,00 3.00 0.00 O.OO 2.00 127.00 0.00 0.oo b.oo 5.oc
P- 0.00 3.80 0.00 O.OC 1.00 123.60 C.CO 0,00 7.70 4.80C- 0.00 0.00 0.00 o.oc O.GO 0.09 0.00 0.00 0.48 0.01
A-- 0.00 0.00 0.G0 0.00 0.00 0.00 0.00 0.00 0,00 O.OCP- 0.00 0.00 0.00 0.00 0.00 0.00 0.00 0.00 0.00 3.0C
C- 0.00 0.00 0.00 0.00 0.00 0.00 0.00 0.00 0.00 O.OG
A- 0.00 0.00 O.CO O.OC 0.00 0.00 0.00 0.00 0.00 O.COP- 0.00 0.00 0.00 0.00 0.00 0.00 0.00 0.00 0.00 0,0C
C- 0.00 0.00 0.00 0.00 0.00 C.00 0°00 0,00 0,00 O.OC
A- 4.00 8.00 8.00 12.00 1,00 ii.00 0.00 0.00 64.00 fi,OCP- 3.00 8.50 8.gO 12.60 1.60 13.10 0.00 C.OC 75.60 _.60C- 0.00 0,03 0.10 0.03 O.CO 0.40 0.00 0.00 2.L0 0.03
NUMBER OF CELLS = 24DEGREES OF FREEDOM = 23CHI-SQUARE = 8.064
_- AVERAGE OF iO PREDICTIONS

125
TABLE 47
GOODNESS OF FIT MATRIX FOR IP3R
USING THREE PREVIOUS LOCKPOINTSAND O_E COhTRCL STATUS.A=ACTUAL TRANSITIONSP=PRECICTED TRANSITIONS *
C=CHI-SQUARE VALUES
AS ROLL CBARS ALT ADF HSI IVSI ENG NON ROWA- 75.00 0.00 5.00 l. OO 0.00 2.00 0.00 0.00 Z.O0 5.0C
P- 56.10 0.00 3.20 0.4C O.CO 2.40 0.00 0.00 2.40 5.ZCC- 4.76 0.00 0.65 O.OC 0.00 C.00 0.C0 O.O0 0.00 0.0!
A-- 0.00 zBq.o0 10.00 q. O0 l.O0 0.00 O.CO 0.00 b. O0 I.OCP- 0.00 188.20 8.40 13.50 1.00 0.00 0.00 0.00 12.40 I.CCC- 0.00 14.85 0.26 2.25 0,00 0.00 0.00 0.00 6.83 O.OC
A- 2.00 15.00 232.00 0.00 0.00 1.00 0.00 0.00 8,00 3.0CP- 2.40 10.70 171.60 0.00 0.00 0.00 0.00 0.00 9.40 2,_C
C- 0.00 1.23 15.72 0.00 0.00 O.QO 0.00 0.00 0.24 0.12
A- 0.00 2.00 0.00 223.00 0.00 0.00 0.00 C.O0 17.00 2.00P- 0.00 1.50 0.00 318.40 0.00 C.00 0.00 0.00 20.70 1.50
C- 0.00 0.00 0.00 40.81 0.00 0.00 C.O0 0.00 0.81 0.13
A- 1.00 0.00 0.00 0.0C 0.00 1.00 0.00 0.00 0.00 2.00P- 0.00 0.00 0.00 0.00 0.00 0.90 O.CO 0.00 O.lO l. OGC- 0.00 0.00 0.00 O.OC 0.00 0.00 0.00 0.00 0,00 0.50
A-- 0.00 0.00 3.00 0.00 0.00 llZ.OO 0.00 0.00 7.00 3.00P- 0.00 0.00 3.30 0.00 0.00 82.00 0.00 0.00 5.70 3.30
C- 0.00 O.OO 0.00 O.OC 0.00 6.04 0.00 0.00 0.2_ 0.03
A- O.O0 0.00 0.00 0.00 0.00 0.00 0.00 0.00 0.00 O.OCP- 0.00 0.00 0.00 O.OC 0.00 C.CO 0.00 0.00 0.00 O.OCC- 0.00 0.00 0.00 O.OC 0.00 0.00 O.CO C.O0 0.00 0.00
A- 0.00 0.00 0.00 0.00 0.00 0.00 0.00 0.00 0.00 O.OC
P- 0.00 0.00 0.00 O.OC 0.00 0.00 0.00 0.00 0.00 O.OCC- 0.00 0.00 0.00 0.00 0.00 0.00 0.00 0.00 0.00 O.OC
A- 7.00 8.00 8.00 9.00 1.00 6.00 0,00 0.00 107.00 1.OCP- 6.00 22.60 7.70 8.6D 0.00 5.70 0,C0 0.00 161.70 O.OCC- 0.1_ 26.64 O.OL 0.02 0.00 0.02 C.CO 0.00 27.q6 1.OC
NUMBER OF CELLS = ZbDEGREES OF FREEDOM = 25CHI-SQUARE = 153,265
#- AVERAGE OF I0 PREDICTIONS

126
TABLE 48
GOODNESS OF FIT MATRIX FOR IPALUSING THREE PREVIOUS LOOKPDINTSAND ONE CDhTRGL STATUS.A=ACTUAL TRANSITIONS
P=PRE_ICTED TRANSITIONS #C:CHI-SGUARE VALUES
AS ROLL CBARS ALT ADF HSI IVSI ENG NON ROWA- 6.00 0.00 3,00 0,00 0.00 0.00 0.00 0.00 2.00 fi.OCP- 4,40 O,OO 3,90 0,00 0,00 C.GO O,CO 0.00 1,60 fi.5CC- 0.43 0.00 O.CO O.OC O,Cfl 0.00 0.00 0.00 0.00 0.05
A- 0,00 102.00 8.00 0.00 0,00 0.00 0,00 0.00 7.00 O.OCP- 0,00 96.20 8.00 O,OC O,OO O.OO O,CO O,OO 7,90 O,OCC- 0.00 0,33 O.OC O.OC 0.00 0.00 0.00 0.00 0.12 O.OC
A- 1,00 11.00 473,00 0,00 0,00 0,00 O,O0 0.00 19,00 1.0GP- 0.80 10.30 477.20 O.OC 0.00 O.O0 0.00 0.00 20,50 O.BCC- 0.00 0,04 0.04 O.OC O,O0 0.00 0.00 C.O0 O.IZ 0°04
A- O.O0 3.00 1,00 236,00 0,00 O.OO 0,00 0,00 20,00 4.0CP- O,O0 2,70 0,90 216.30 0.00 C.GQ 0,00 0,00 19,40 3.6CC- 0,00 O.O0 O,O0 I.64 0.00 C.O0 0,00 0.00 0.02 0.04
A- 0,00 0,00 0,00 0,00 0,00 0,00 O,O0 0,00 0,00 O.OCP- O,O0 0,00 0,00 0,00 0,.00 O.OO 0,00 0,00 0,00 0.00C- 0,00 O,O0 0,00 O.OG O,OC C.CO 0,00 O.O0 0.00 O.CC
A- 0.00 0.00 1.00 O.O_ O.CO Z_.OO O,O0 0.00 1.00 2.0CP- 0.00 0,00 0,I0 O,OC 0,00 Z_,40 0,00 0,00 1.80 1.9CC- 0°00 0.00 0.00 O.OO 0°00 0°01 0.00 C.OC 0.00 O.OI
A- 0,00 O,O0 0,00 l,OO O,OC O,CO I0,00 0.00 1.00 2.00P- O,00 0.00 0.00 1,10 0.00 0,00 g,O0 0.00 1.i0 2.2¢C- 0°00 0.00 0,00 O°OC 0.00 0,00 0,10 0,00 0,00 0.02
A- 0,00 0.00 O,GO 0,00 0.00 0,00 0,00 C.00 0.00 O.OCP- 0,00 0,00 0,00 O,OO O,OO 0.00 0,00 0.00 0.00 O,OCC- G.O0 0.00 O°OO O.OC O.OC _.CC 0.00 0.00 0,00 O,OC
A- _.00 2.00 17.00 23.00 0.00 2.00 2.00 0.00 160.00 10,00P- _,70 Z,80 1B,30 2Z,30 0,00 l,gO 2.20 0.00 177,20 II.6CC- 0,00 0,00 O.IC 0.02 0,00 0,00 O.CO 0.00 L°B_ 0.2e
NUMBER OF CELLS = 20DEGREES OF FREEDOM = LgCHI-SQUARE = 5.222
t- AVERAGE OF IC PREDICTIONS

GOODNESS OF FIT MATRIX FOR IP4R
USING THREE PREVIOUS LOCKPOINTSAND ONE CONTRGL STATUS.
A=ACTUAL TRANSITIONSP=PREDICTED TRANSITIONS *
C=CHI-SOUARE VALUES
AS ROLL CBARS ALT ADF HSI IVSI ENG NON _WA- 17,00 0.00 2.00 2.00 0.00 0,00 0.00 0.00 3.00 7.00
P- 15.60 0.00 L.SC 2.20 0.00 0.00 O.CO C.O0 3.30 7.GCC- 0.12 O.OO O.OC 0.00 0.00 0.00 O.CO C.O0 0,00 O.OC
A-- 1.00 96.00 I0.00 I.OG 0.00 O.OO 0.00 0.00 l.O0 3.0CP- 0.70 71,70 8.70 0.80 0.00 C.OO O.OO 0.00 l.lO 2.bC
C- O.O0 6.15 0.17 O,OG 0.00 O.OO 0.00 O.O0 0.00 0.05
A- 1.00 7.00 450.00 3.00 O.O0 3.00 O.CO 0.00 17,00 7.00P- 0.80 6.ZO 417.70 2.20 0.00 3.20 0.00 0.00 17.20 _.20
C- 0.00 0.09 Z.32 0.00 0,00 C.O0 0.00 0.00 O,O0 0.09
A- 1.00 2.00 2.00 162o00 0.00 1.00 Z.O0 O.OG 20,00 _.00P- O.qO 2.10 2.50 151.10 O.O0 1.20 2.30 O.OO 18.10 9.00C- 0.00 0.00 O.OC 0.73 0.00 O.OO 0.00 0_00 O.LB 0.13
A-- O.OO 0.00 O.O0 O.OO 0.00 O.OO O.OO O.OO 0.00 O.OCP- 0.00 0.00 O.O0 0.00 0.00 0.00 0.00 O.O0 0.00 O.OCC- 0.00 0.00 O.O0 O.OC 0.00 C.CQ O.O0 0.00 0.00 O.GC
A- 0.00 0.00 0.00 O.OO 0.00 61.00 0.00 O.OO 6.00 0.00
P- 0.00 O.OO 0.00 - 0.00 0.00 67.I0 0.00 0.00 b.6O O.OCC- O.O0 O.OO 0.00 O.OC O.O0 0.gl O.CO 0.00 0,06 O,OC
A- 0.00 0.00 0.00 1.00 O.O0 C.O0 23.00 O.OO 3.00 4.0CP- O.O0 0.00 O.OO 1.70 O.OO O.O0 50.00 O.OO 7.b0 Q.3C
C- O.OO 0.00 O.OC O.OO O.O0 O.O0 31.70 O.O0 0.00 7.02
A- 0.00 0.00 0.00 O.OC 0.00 0.00 C.OO O.OO 0.00 O,OC
P- 0.00 0.00 0.00 0,00 O.OO 0.00 0,C0 0.00 0.00 O,OCC- 0.00 0.00 0.00 O.OC 0.00 C.OO 0.00 0.00 0.00 O.OC
A- 6,00 6.00 16.CC 21.00 O.O0 2.00 2.00 0.00 135.00 12.OCP- 6.60 3.00 16.20 20.40 0.00 2.20 7.40 0.00 161.10 17.20C- O.O0 O.OO 0.00 0.02 O,CO C,O0 0,00 0°00 5,05 2.Z5
NUMBER OF CELLS = 20DEGREES OF FREEDOM = 19CHI-SQUARE = 57.036
t- AVERAGE OF 10 PREDICTIONS

128
TABLE 50
600DNESS OF FIT MATRIX FOR POlLUSING THREE PREVIOUS LOOKPOINT5AND ONE COhTR_L STATUS.A=ACTUAL TRANSITIOhSP=PRECICTEC TRANSITIONS $C=CHI-SQUARE VALUES
AS ROLL CBARS ALT ADF HSI IVSI EHG NOt_ QOWA- 82.00 O.OO _.CC 0.00 O.CO 0.00 0.00 0.00 [.0_ 5.0CP- g3.30 O.OO 3.50 O.OC 0.00 0.00 O.O0 0.00 0._0 3.gC
C- 1.56 0.00 0.00 0.00 0.00 C.OC G.O0 0.00 0,00 0.2_
A- 0.00 1.00 0.00 O.OC 0.00 C.OO 0.00 0o00 1.00 2.0C
P- O.OO 0.00 O.O0 O,OC 0,00 0,00 0,00 0,00 0,00 O.OGC- 0,00 0.00 0.00 0.00 0.00 C.O0 O.GO 0.00 0,00 Z.OC
A- Z.OO O.OO 708.00 Z.O0 0.00 C.O0 1.00 C.O0 15.00 5.0CP- 1.30 C.OO 659.20 Z.SC 0.00 0.00 O.gO O.O0 IZ.60 5.0C
C- O.O0 0.00 3.36 0.00 0.00 C.CO 0.00 0.00 0.38 O,OC
A- 0.00 O.O0 2.00 38.00 O.O0 C.O0 I.CO 0.00 6.00 3.00P- O.O0 O.OO 1.10 4Z.80 O.CO C.O0 I.I0 0.00 IZ.80 2.2CC- 0.00 0.00 0.00 0.61 0.00 C.O0 0,00 0.00 7.71 O.Zl
A- 0.00 O.OO O.OC O.OO 0.00 0.00 C.CO 0.00 0.00 O.OC
P- 0.00 0.00 0.00 0.00 0,00 C.O0 0.00 O.OO 0.00 O.OCC- 0.00 0.00 O.OO 0.00 O.O0 C.OO 0,00 0.00 0.00 0.00
A- 0.00 0.00 0.00 0.00 O.O0 C.O0 0.00 0.00 0.00 O.OC
P- 0.00 0.00 0.00 0.00 0.00 C.OO 0.00 0,00 0.00 O.OCC- 0.00 0.00 0.00 0.00 0.00 C.O0 C.O0 0.00 0.00 O.OC
A- 0.00 0o00 0.00 3.00 0.C0 C.00 6Z,00 0.00 0.00 3.00P- 0.00 0.00 O.OC 1.70 O.OO C.O0 _3.10 0.00 l.bO 3.3CC- 0.00 0.00 O.CO 0.00 O.OC O.O0 5.76 0.00 0.00 0.03
A- 0.00 0.00 0.00 0.00 O.O0 O.OO 0.00 0.00 0.00 O.OCP- 0.00 0.00 0.00 0.00 0o00 C.O0 C.O0 0.00 0.00 OoOCC- 0,00 0o00 0.00 0.00 0,00 0.00 C.O0 0.00 0.00 O°OC
A- 3.00 O.OO I%.00 5.00 0.00 C.O0 1.00 0.00 130.00 4.0C
P- Z.60 0.00 13.60 10.8C O.CC C.CO 1.40 0.00 172.b0 4,0CC- 0.00 0.00 0.01 6.27 O.O0 0.00 0.00 0°00 13.g6 O,OC
NUMBER OF CELLS = 15DEGREES OF FREEDOM = 14CHI-SQUARE = 42.108
•- AVERAGE DF IO PREDICTIONS

129
TABLE 51
GOODNESS OF FIT MATRIX FOR POIRUSING THREE PREVIOUS LO_KPOINTSAND ONE CDhTROL STATUS.
A=ACTUAL TRANSITIONSP=PREDICTED TRANSITIONS *
C-CHI-SQUARE VALUES
AS ROLL CBARS ALT AOF HSI IVSI ENG NON ROWA- 116.00 0.00 3.00 0.00 0.00 0.00 0.00 0.00 3.00 6.00
P- q3.80 0.00 3.30 0.00 0.00 C.CO 0.00 0,00 3,20 6,5CC- 4.25 0.00 0.00 0,00 O,O0 O.O0 0.00 0.00 0.00 0.0_
A- 0.00 23°00 1.00 0.00 0.00 0.00 0.00 0.00 2.00 3.0CP- 0.00 19.50 0.50 0.00 0.00 0.00 0,00 0.00 2.50 3,00C- 0.00 0.53 0.00 0.00 0.00 0.00 0.00 0.00 0.00 O,OG
A- 1.00 0.00 317.00 0.00 0.00 0.00 2.00 C.O0 22.00 3.0CP- 1.90 0.00 335.80 0.00 0,00 O.O0 1.80 0.00 22,00 3.70
C- 0.00 0.00 1.11 O.OC 0.00 C.CO 0.00 0.00 O.CO 0,16
A-- 0.00 0°00 0.00 85.00 0.00 0.00 O.CO 0.00 7.00 O.OCP- 0.00 O.OO 0.00 g6.10 0,00 C.O0 O.O0 0.00 8.30 O.OCC- 0.00 0.00 O.OC 1.45 0.00 0.00 0.00 0.00 0.24 O.OC
A- 0.00 0.00 0.00 0.00 0.00 0.00 0.00 0.00 0.00 0.00P- 0.00 0.00 0.00 0.00 0.00 0.00 0.00 0.00 0.00 O.OCC- 0.00 0.00 0.00 0.00 0.00 O.O0 0.00 0.00 0.00 O.OC
A- 0.00 0.00 0.00 0.00 0.00 0.00 0.00 0.00 0.00 O.OC
P- 0°00 0.00 0.00 O.OC 0.00 C.O0 0.00 O.OC 0.00 O.OCC- 0°00 O.OO O.CC O°OC 0.00 0.00 0.00 0.00 0.00 O.OC
A- 0.00 0.00 2.00 0.00 0.00 0.00 115.00 0.00 0.00 2,00P- 0.00 0.00 1.20 0.00 0.00 O.O0 106.50 0.00 O,bO 1.80C- 0.00 0.00 0.00 O.OC O.CO C.O0 0.63 0.00 0.00 0.02
A-- 0.00 0.00 0.00 0.00 0.00 0.00 0.00 55.00 6.00 O.OCP- 0.00 0.00 0.00 0.00 0.00 C.O0 0.00 45.80 5.50 O.OC
C- 0.00 0.00 O.OC O.OC 0.00 0.00 0.00 1.54 0.04 O.OC
A- 5.00 3.00 20.00 7.00 0.00 0.00 0.00 5.00 303.00 3.00P- 4.60 3.00 21.?0 8.30 0.00 O.CO O.CO 4.70 30q.40 3.00C- 0.03 0.00 0.1_ 0.24 O.OC O.O0 0.00 0.02 0.14 O.OC
NUMBER OF CELLS = zqDEGREES OF FREEDOM = 18CHI-SQUARE - 10.592
t- AVERAGE OF 10 PREDICTIONS

130
TABLE 52
GOODNESS OF FIT MATRIX FOR PO2LUSING THREE PREVIOUS LOOKPOINTSAND ONE COMTROL STATUS.A=ACTUAL TRANSITIONSP=PRE_ICTED TRANSITIONS *C=CHI-SQUARE VALUES
AS ROLL CBARS ALT ADF HSI IVSI ENG NON ROW
A-- 38.00 0.00 3.00 O.OG 0.00 0.00 0.00 0.00 0.00 3.0CP- 24.00 C.00 2.00 0.00 0.00 0.00 0.00 0.00 O.BO 2.80C- 5.16 0.00 0.00 0.00 0.00 C.O0 0.00 0.00 0.00 0.01
A-- 0°00 92.00 2.00 3.00 0.00 0.00 0°00 0°00 5.00 5.0C
P- O.OO I04.20 Z.6C 2.5C 0.00 0.00 0.00 0.00 ?.go fi.ICC- 0.00 1.62 0.00 0.0C 0.00 0.00 O.CO 0.00 1.68 O.O0
A- 2.00 5.00 578.0C I.OC 0.00 C.O0 0.00 C.00 16.00 3.0CP- 1.60 _.90 521.40 1.3C O.CO O.OC 0.00 C.O0 15.BO 2.70
C- 0.00 0.00 5.5_ O.OC O.CO 0,00 0.00 0.00 0.00 0.03
A- 0.00 0.00 _.00 178.00 0.00 0.00 0.00 C.00 10.00 4.0CP- 0.00 0.00 3.30 158.70 0.00 C.00 0.00 C.O0 13.20 3.3CC- 0.00 0.00 0.00 Z.Og 0,00 C.CO 0.00 0.00 1.02 0°12
A- 0.00 0.00 0.00 O.OO 0.00 0.00 0.00 0.00 0.00 O.OO
P- O.OO 0.00 0.00 0.00 0°00 0.00 O.CO 0.00 0.00 O°OC
C- 0.00 0.00 0.00 O.OG 0.00 0°00 0.00 0.00 0.00 0.00
A- 0.00 0.00 0.00 0.00 0.00 60.00 O.CO 0.00 5.00 0.00
P- 0.00 0.00 O.OC O.OC 0.00 57.10 0.00 0.00 4.60 O.OCC- 0.00 0.00 O.GO O.OC O.OO 0.1_ 0.00 0.00 0.03 O.OC
A- 0.00 0.00 0.00 0.00 0.00 0.00 0.00 0.00 0.00 O.OCP- 0°00 0.00 0.00 O.OC O.CC C.O0 0.00 0.00 0.00 O.OC
C- 0.00 0°00 O°CC O.OG 0.00 0°00 0.00 0.00 0.00 O.OC
A- 0.00 0.00 0.00 0.00 0.00 0.00 0.00 0.00 0.00 0.0CP- 0.00 0.00 0.00 0.00 0.00 C.O0 0°C0 0.00 0.00 0.0C
C- 0.00 O.OO 0.00 O.OC 0.00 C.O0 0.00 0.00 0.00 O.OC
A- 1.00 6.00 16.00 lO.OO 0.00 5.00 0.00 O.O0 85.00 I.CCP- I.60 8.10 15.20 I2.gO 0.00 6.60 0.00 0.00 152.10 1.4CC- 0.00 0°74 0.10 0.86 0.00 0.03 0.C0 0.00 52.97 0.16
NUMBER OF CELLS - 20DEGREES OF FREEDOM = lqCHI-SQUARE = 72.302
•- AVERAGE OF lO PREDICTIONS

131
TABLE 53
GOODNESS OF FIT MATRIX FOg PO2RUSING THREE PREVIOUS LDOKPOINTSAND ONE CONTROL STATUS.A=ACTUAL TRANSITIONSP=PRECICTEO TRANSITIONS *C=CHI-SQUARE VALUES
AS ROLL CBARS ALT ADF HSI IVSI ENG NON ROW
A- 42°00 0.00 /.CO 0.00 0.00 0,00 I.CO 0,00 L,O0 3.00P- 33.30 0.00 0.50 0.00 0.00 C.O0 0,20 0.00 Z.70 3.4CC- 1.80 0.00 0.00 O.O0 0.00 O.O0 O.CO C.O0 0.00 0.0_
A- 0,00 99.00 5.00 0.00 0.00 O,GO 0.00 O.OC 6,00 O.CCP- O.OC lO0.OO 3,70 0.0G O.CO C.O0 C,CO 0.00 8.i0 O.OG
C- 0.00 O.OI 0.34 O.OC O,OC 0.00 O.CO 0.00 0.74 O.OC
A- I°O0 2.00 653.00 2.00 0.00 0.00 O.CO C,O0 17.00 5.00P- 0.90 I.80 597.60 Z,SC 0.00 0.00 0.00 0.00 16.60 5,50C- 0.00 0°00 4,70 0.00 0.00 0.00 0.00 0.00 0.01 0.05
A- 0.00 0.00 3,00 97,00 0.00 0.00 0.00 0.00 4,00 7,0CP- 0.00 0.00 2.80 87°50 0.00 0.00 O.O0 0.00 _.90 7.70
C- 0.00 O.O0 O.OO 0.93 0.00 0,00 O.OO 0.00 0,00 0°07
A- 0.00 O.O0 0.00 0.00 0.00 0.00 O.CO 0.00 0,00 O,OC
P- 0.00 O.OO 0,00 0.00 0,00 0.00 O.GO 0.00 0,00 0.00C- 0.00 0.00 0.00 0.00 0.00 C.O0 O°OO 0.00 0°00 0.00
A- 0.00 I°00 O,O0 0.00 0.00 56.00 0.00 0.00 3,00 _.00
P- 0.00 I°00 0.00 0.00 0.00 I06.80 0.00 C.O0 5,20 b.2GC- 0.00 0.00 O.OC O.CC 0.00 46.08 0.00 0.00 0,00 1.21
A- O.O0 0.00 0.00 0.00 0,00 0.00 0.00 1.00 0.00 1.OCP- 0.00 0.00 0.00 O.OC 0.00 C.O0 C.CO 0.20 0.00 0.2C
C- 0.00 0.00 0.00 O.OG 0.00 C.OC C.O0 0.00 0.00 0._4
A- 0.00 0.00 I°OG 0.00 0.00 0.00 0,00 47.00 1.00 2.0C
P- 0.00 0°00 0.70 0,00 O.O0 C.O0 O.CO Iq.70 0,50 1.2C
C- 0.00 0°00 0.00 0.00 0.00 0°00 O.OO 15.86 0.00 0.32
A- 2.00 8.00 11.00 5.00 0.00 4.00 C.O0 1.00 68.00 7,0CP- 3.00 g.O0 13.qo 4.90 0.00 6.20 0.00 1.00 LO_.50 lO,2CC- O,OO O°L3 0.76 0.00 0.00 O.O0 0.00 0.00 19.5q 1._6
NUMBER OF CELLS = 20DEGREES OF FREEDOM = 19CHI-SGUARE = 94.755
_- AVERAGE OF LO PREDICTIONS
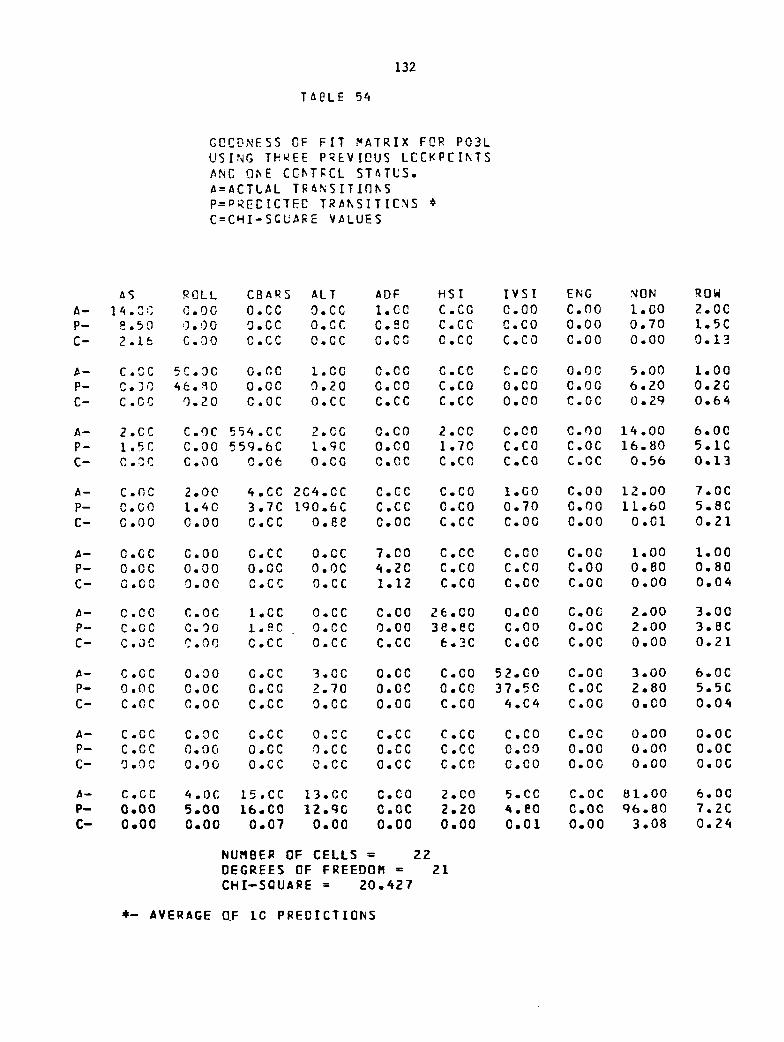
132
TAeLE 54
GOODNESS CF FIT MATRIX FOR PO3L
USING THREE PREVIOUS LCCKPCINTS_NC q_E CC_T_CL STAT_S.
a=ACTLAL TRANSITI_SP=PRECICTEC TRanSITIONS *
C=CHI-SCU_RE VALUES
AS ROLL CBARS ALT ADF HSI IVSI ENG NON ROW
A- 1_. _" _"_, _.00 O.CC O.CC l. CO C.CG 0.00 C.O0 l.O0 20C
P- e,5O ).00 O,CC O.CC C.90 C,CC O.CO 0.00 0.70 1.5CC- 2.16 C.O0 C.CC O.CC O.CC C.CC C.CO 0.00 0.00 0.13
A- C.SC 5C.0C O._C l. CO O.CC C.CO C.CO 0.00 5.00 1.00
P- C,30 46._0 0.0C O,?O 0.00 C.CO 0.C0 0.00 b.ZO 0.2CC- C.OC 0.20 C.OC O.CC C.CC C.CC 0.00 C.OC 0.29 0.64
A- 2.CC C.OC 554.CC 2.CC 0,C0 2.00 C,O0 C.O0 14,00 6,00P- 1,5C C.O0 55q.6C £,gC 0.00 1,70 C.CO C.OC 16.80 5.1CC- C.3C C.OO 0,06 O.CO O,OC C,CC C.CO C.OC 0.56 0.13
A- C._C 2.00 4,CC 2C4.0C O.CC C.CO I.GO Co00 12.00 7o0CP- C.GO 1.40 3.7C 190.5C C.CC C.CO 0.70 0.00 ll.bO 5.8C
C- C.O0 C,O0 C,CC 0.88 C,OC C.CC C.O0 O,OO 0,01 0.21
A- O.GC C.O0 C.CC O.CC 7.00 C.CO C.00 C.OO i. O0 1.00
P- 0.0C 0.00 O,OC 0,0C 4.20 C.CO C.CO C.00 0.80 0.80C- O,CO O.OO C.CC O.CC 1.12 C.CO C.CO C.00 0.00 0.04
A- C.CC C.OC I,CC O.CC C,OO 26.00 O.O0 C.OG 2.00 3.00P- C.OC C.O0 I._C O.CC 0.00 3e.ec c.00 0.0c z.00 3.8c
C- C.OC C.OO C.CC O.CC C,CC e.2C C.00 C.OC 0.00 0.21
A- C.CC 0.00 G.CC 3.0C O.CC C.CO 52.C0 O.O0 3.00 6.0C
P- O.OC O.OC O,CC Z.70 O.OC 0.C0 37.50 C.OC 2.80 5.56
C- C.OC C,O0 C.CC O.CC 0.0G C.CO 4.C4 C,OO O.O0 0.0_
A- C,CC C.O0 C.CC O.CC C,CC C.CC C,CO C.OC 0.00 0.0CP- C,CC 0.00 O.CC O,CC O.CC C.CC 0.00 0.00 0.00 0.0CC- O,OC 0.00 O.CC O,CC O.CC C.CO O.CO C.OO 0.00 0.0C
_- C,CC 4.0C lS.CC 13.0C C.CO 2.00 5.¢0 C.OC 81o00 6.00P- O.O0 5.00 /6,CO 1z.qc O.OC 2.20 4.80 C.OC 96.80 7.2CC- 0.00 0.00 0.07 0.00 0.00 0.00 0.01 0.00 3.08 0.24
NUMBER OF CELLS = 22DEGREES OF FREEDOM = 21CHI-SQUARE = 20.427
*- AVERAGE OF LC PREDICIIDNS

133
TABLE 55
GOODNESS OF FIT MATRIX FOr PO3RUSING THREE PREVIOUS LOOKPOINTSAND O_E COkTRDL STATUS.
A=ACTUAL TRANSITIONSP=PREDICTED TRANSITIONSC=CHI-SQUARE VALUES
AS ROLL CBARS ALT ADF HSI IVSI ENG NON ROWA- 37,00 0.00 1,00 O.OC O.CO C.CO O.O0 O.OO 1.00 2.0CP- 35.00 0.00 0.7C O.GC 0,00 0.00 0.00 0.00 l.lO I._CC- 0.II 0.00 O.GC 0.00 0.00 0,00 0.00 0.00 0.00 0.02
A- 0.00 32°00 8.00 O.OC O.CO C.CC C°O0 C.OC 0.00 O.CCP- O°O0 35.90 8.bO 0.00 0.00 C.OO O.O0 0.00 O,IO 0.1CC- 0.00 O,_B 0.05 O.OC O.CO 0.00 0.00 0,00 0.00 O.OC
A- 2.00 2.00 778.00 3.0C 0.00 2.00 1.C0 O.O0 14.00 lO.OCP- 1.80 /.BO 769.00 2.70 0.00 1._0 0.60 0.00 15.L0 8.3¢C- 0.00 0.00 O.IC O.CG 0.00 CoO0 0.00 0°00 O.Oq 0.29
A-- O.OC 0.00 2.00 165.0C O.OO C.CO 2.00 0.0C 7.00 4.0CP- 0.00 0.00 2.30 145.80 C.OC C.OO I.50 0.00 5.20 3.8CC- 0.00 0.00 O°CO 2.23 O.CO O°O0 0.00 C.O0 0._6 0.Cl
A-- 0.00 0.00 0.00 0.00 0.00 O.CO O.CO 0.00 0.00 O.OCP- 0.00 0.00 O.OC O.OC O.OO C.O0 0.00 O.O0 0.00 O.OCC- 0.00 0.00 O.OO 0.00 0.00 O.CO 0.00 O.O0 0.00 0.00
A- 0.00 0.00 0.00 O.OC 0,00 3_.OO O.CO C.O0 3,00 3,0CP- 0.00 0.00 0.00 O.OC C.OC 52.30 0.00 0.00 2.60 2.6CC- O,OO 0.00 O.O0 0.00 0.00 9.85 O.O0 0.00 0,00 0.05
A- 0.00 0.00 I.00 4.00 O.DC C.CO 82.00 C.O0 2,00 7.0CP- 0.00 0°00 I.1C 2.7C O.OC C.CO 68°50 0.00 2.60 6.4CC- O.OO 0.00 O.CO O.OC O.OO C.OO 2.22 0.00 0,00 0.05
A- 0.00 0.00 0.00 0.00 0.00 0.00 0.00 0.00 O,OO O.OCP- 0.00 O.O0 O.OO O.O0 0.00 O.OO O,OO O°OC 0.00 0.0CC- 0,00 0.00 O.CO 0.00 0.00 C.CO C.CO C.O0 0.00 O,OC
A- 0°00 6.00 12.00 _.00 0.00 1.00 4.00 0.00 2B.O0 _.OCP- 0,00 6.90 10.70 3,50 O,OC 1.20 _.30 C°O0 50.00 9o0CC-- 0.00 0.13 0.1_ O.CC C.GO 0.00 0.00 0.00 17.29 O.OC
NUMBER OF CELLS = 18DEGREES OF FREEDOM = 17CHI-SQUARE = 33.57_
*- AVERAGE OF LO PRE_ICIIONS

134
TABLE 56
GOODNESS OF FIT MATRIX FOR PO5LUSING THREE PREVIOUS LOOKPOINT5AND ONE COhTROL STATUS.A=ACTUAL TRANSITIONSP=PRE_ICTED TRANSITIONS *C=CHI-SOUARE VALUES
AS ROLL CBARS ALT ADF HSI IVSI ENG NON QUW
A-- L31.O0 6.00 1.00 I=00 0.00 C.O0 0.00 0.00 1.00 7,0CP- L29.90 3.10 0.70 1.70 O.OO C.O0 O.O0 0.00 2.60 _.3G
C- 0.01 0.00 O.OO O.OO O.O0 0°00 0.00 0.00 0.00 0.2_
A- 4.00 405.00 0°00 _.CO O.OC 1.00 C.CO C.O0 Zl.O0 q,OCP- 5°40 403.00 0.00 3.8C 0.00 1.30 0.00 C.O0 19.30 I0.5C
C- 0.00 0.01 0.00 0.00 0.00 0.00 0.00 0.00 0,14 0.29
A- 0.00 12.00 156.00 0,00 0.00 1.00 0.00 0.00 b,O0 1.0CP- C.O0 11.30 158.90 O.OO 0.00 1.40 G.O0 0.00 7.30 I,_0
C- 0°00 0.04 0°05 0.00 0.00 C.O0 0.00 0.00 0.28 0.1_
A-- 1.00 5.00 0.00 266°00 0.00 0°00 2.00 0.00 6.00 3.OCP- 0.80 _.80 O,CO 207.70 0.00 0.00 I.70 C.O0 b._O 2o5¢
C- 0.00 O.Ol 0.00 12.78 0°00 0.00 0.00 C.O0 0.03 0.08
A- 0.00 0.00 0.00 O.OC 0.00 0.00 O.O0 O.OO 0.00 O.OCP- 0.00 0.00 O.OO O.OG O.O0 0.00 0.00 0.00 0.00 O.OC
C- 0°00 0.00 0.00 O°OC 0.00 O.CO 0°00 0.00 0.00 0.30
A-- 0.00 1.00 0°00 O.OC 0.00 92°C0 CoCO 0.00 _.00 5.0CP- 0.00 1.50 0.00 0.00 0.00 124._0 0.00 0.00 _.30 5,BCC- 0.00 0.00 O.OC O.CC O.CO 11.77 0.00 0.00 0,00 0,13
A- 0.00 0.00 0.00 L.O0 0°00 0.00 52,00 O°OC 3.00 4.0CP- 0,00 0.00 0.00 0.40 O.O0 O.CO 55.00 C.OO 3.90 _.3CC- 0.00 0.00 O.CC O.OC O.O0 0.00 0.17 O.OO 0,00 0.02
A- 0.00 0.00 0.00 O.OO 0.00 0°00 0,00 O.OO 0,00 O.OCP- 0.00 0.00 0.00 0.00 0.00 C.O0 O.CO 0,00 0,00 O.OC
C- 0.00 0.00 O.OC O.OC 0.00 0.00 0.00 0°00 0.00 O.OC
A- 2.00 8.00 18.00 8.00 0.00 3.00 2.00 0.00 80.00 7.0CP- Z.10 8.70 19.70 7.7C O,OC 3.10 2.60 O.OC 93,80 7.8CC- 0.00 O°Ob 0.16 0.01 0.00 0.00 O.O0 C.O0 Z.38 0.3_
NUMBER OF CELLS = 22DEGREES OF FREEDOM = Z1CHI-5OUARE = Z8°876
$- AVERAGE OF 10 PREDICTIOhS

135
TABLE 57
GOODNESS OF FIT MATRIX FOR POSRUSING THREE PREVIOUS LO_KPOINTSAND ONE CONTROL STATUS.A=ACTUAL TRANSITIONSP=PREDICTEC TRANSITIONS *C=CHI-SQUARE VALUES
AS ROLL CBARS ALT ADF HSI IVSI ENG NON ROWA-- 36.00 3,00 0.00 1.00 0.00 O.CO G.CO 0.00 0,00 _.OC
P- 28.90 2.80 O.OC O.gC 0.00 0,00 0.00 O.OO O,BO _.5CC- 1,40 0,00 0.00 0.00 0.00 0.00 0.00 0.00 O,O0 O.Oe
A- 1.00 299.00 8.00 lO.OG O.OC C,O0 0.00 C.O0 22.00 I.CCP- 1.20 289.40 6,00 9,5C O.O0 0.00 O.CO 0.00 2_,70 1.2CC- 0.00 0.31 0.5C 0.02 0.00 C.O0 0.00 0.00 0.33 0.0_
A- 1.00 ll. O0 312.00 O,OC 0,00 C.CO C.O0 0.00 21.00 I.OC
P- 1.60 9.60 287.40 O.OC 0.00 0,00 O.GO 0.00 21.20 L.DCC- O.OC 0.28 L.g4 0.0C 0.00 C.QO O.CO 0.00 0.00 O.)b
A-- I.O0 13.00 0.00 286.00 0.00 C.CO I.CO 0.00 8,00 2.0C
P- 0.90 12.qO 0.00 274.g0 0.00 C.O0 0.70 0.00 7.90 1.6CC- 0.00 0,00 O.CC 0._3 O.O0 C.O0 0.00 O.O0 0,00 0.0_
A- O.O0 0.00 0°00 0.00 0.00 C.O0 C.CO 0.00 0.00 O.OC
P- 0.00 0.00 O.OO 0.00 O.OC C.CO O.CO O.OG 0.00 O.OCC- 0.00 0.00 O.O0 0.00 0.00 0.00 0.00 O.OO 0,00 O,OG
A- 0.00 O.OO 0.00 O.OC 0.00 2.00 O,CO C.OO L.O0 3.0CP- 0.00 0.00 0,00 0.00 0.00 2.10 O.CO 0.00 L,lO 3.2C
C- 0.00 0.00 O.QO O.QC O.OC 0,00 0.00 0.00 0.00 0.01
A- O.OC 0.00 0.00 2.00 0.00 0.00 36.00 0.00 2.00 4.0CP- 0.00 0.00 O.OC 2.50 0.00 0.00 47.50 C.O0 2.50 5.0CC- 0.00 0.00 O.OO 0.00 O.CO C.O0 3.67 0.00 0.00 0.25
A- O,OO O.O0 0.00 0.00 0.00 0.00 O.O0 O.OC 0,00 O,OC
P- 0.00 0.00 O.CO 0.0C 0.00 C.O0 O.CO C.O0 O.GO O.OCC- 0.00 0.00 0.00 O,OC O.O0 C.CO O.OO 0.00 0.00 O.OC
A-- 1.00 15.00 25.00 g. O0 0.00 1.00 3.00 0.00 L3L.O0 5.0CP- 0,80 16.30 25,50 IO.lC O,CC 1.1O _.30 0.00 163.90 5.2CC-- 0.00 0.Ii O.Ol 0.13 O.OC O.O0 0.00 0.00 8.26 0.2_
NUMBER OF CELLS = 23DEGREES OF FREEDOM = 22CHI-SQUARE = 18._05
*- AVERAGE OF LO PREDICTIONS

136
TABLE 58
GOODNESS OF FIT MATRIX FOR P06LUSING THREE PREVIOUS LOOKPOINTSAND ONE COhTRCL STATUS.A=ACTUAL TRANSITIONSP=PREDICTED TRANSITIONSC=CHI-SQUARE VALUES
AS ROLL CBARS ALT ADF HSI IVSI ENG NON ROW
A- 3.00 l.O0 1.00 0.00 2.00 C.O0 0,00 0.00 1,00 8.00P- 0.20 O.qO 0.40 O.CC 1.60 0.00 0.00 0.00 1,20 4.3C
C- 0.00 0.00 0.00 0.00 0.00 0.00 0.00 0.00 0.00 1.71
A- 1.00 283.00 4.00 5.00 0.00 4.C0 0.00 C.O0 ll,O0 g. OCP- 1.00 241.40 3.30 3.8C 0.00 4.10 0.00 O.OC 12.20 8._¢
C- O.O0 6.12 0,00 O.2g 0.00 0.00 C.OO 0.00 0,13 0.04
A- 1.00 7.00 237.00 O.OC 0.00 C.O0 O.CO 0.00 18.00 l,OCP- C.60 3.70 197.80 0.00 0.00 O.CO O.CO 0.00 23.g0 0.60C- 0.0G 1.56 6.48 0.00 0.00 0.00 0.00 0.00 I,g3 O.l_
A- 0.00 3.00 2.00 lq4.00 0.00 1.00 3.C0 1.00 5.00 IO.OCP- 0.00 3.30 1.50 LTq.qO O.O0 1.70 2.10 0.90 5.50 9.5GC- G.O0 0.00 0.00 1.02 0.00 C.O0 0,00 0.00 0,05 0.02
A- 0.00 0.00 2.00 0.00 30.00 O.O0 0.00 0.00 2.00 _.OCP- 0.00 0.00 1.4C O.OC 33.20 0.00 0.00 0.00 3.90 5,3CC- 0.00 0.00 O.CO 0.00 0.34 O.GO O.O0 0.00 0,00 0,_2
A- 0.00 2.00 3.00 0.00 0.00 8q.O0 O.GO 0.00 3.00 _.OG
P- 0.00 2.qo 1.70 0.00 O.CO 117.20 O.O0 0.00 4.00 B.6CC- 0.00 0.00 O.CO 0.00 0.00 8.q4 0.00 0.00 0,00 0.05
A- 0.00 0.00 1.00 2.00 1.0C C,O0 54.00 C.OG 3,00 7,OCP- 0.00 0.00 0.40 /.60 0.30 O.O0 61.50 0.00 5.q0 9.20C- 0.00 0.00 0.00 0.00 O.GO C.O0 1.04 0.00 0,00 0.21
A- 0.00 0.00 O.OC 0.00 0,00 0.00 0.00 14.00 1.00 1.00P- 0.00 0.00 0.00 0.00 0.00 O.OO C.CO II.60 O.qO O.qG
C- 0.00 O.OO O.OC O.OC 0.00 C.O0 0.00 0.41 0.00 0.01
A-- 3.00 11.00 14.00 B.O0 1.00 3.00 4.00 0.00 BO,O0 11,0CP- 2.60 13,00 19.80 q.80 3.40 2.80 _.10 C.O0 121,00 14.qCC- 0.00 0.36 2.40 0.40 O.O0 C.O0 O.CO C.O0 21.01 L.38
NUMBER OF CELLS = 25DEGREES OF FREEDOM = 24
CHI-SQUARE = 56.498
t- AVERAGE OF 10 PREEICTIDNS

137
TABLE 59
GOODNESS OF FIT MATRIX FOR PO6RUSING THREE PREVIOUS LOOKPOINTSAND ONE COhTROL STATUS.A=ACTUAL TRANSITIONSP=PRE_ICTED TRANSITIONS *C=CHI-SGUARE VALUES
A5 ROLL CBARS ALT ADF HSI IVSI ENG NON ROWA- 5.00 0.00 0.00 0.00 1,00 C.O0 0.00 0.00 l.OO 2.0CP- Z.O0 0.00 0.00 O.OO 0.50 C.00 0.00 0.00 l.O0 1.5CC- 1.80 0.00 O.GO O.OC O.OC 0.00 0.00 0.00 0.00 0.13
A- 0.00 57.00 3.00 Z,00 0.00 0.00 0.00 C.OO 3,00 8,0C
P- 0.00 33.00 I.IC 1.20 0.00 0.00 O.GO 0.00 3,50 5.BCC- 0.00 I0.II 0.00 0.00 0.00 O.CO C.O0 0.00 0.00 0.6G
A- 0.00 2.00 511.00 I.OG 2.00 l.OO 0.00 0.00 23.00 _.OCP- 0.00 1.90 48b.CC 0.8C 2.70 1.40 0.00 0.00 23.40 6.8CC- 0.00 0.00 1.22 0.00 0.00 0.00 0.00 0.00 0.01 0.11
A- 0.00 1.00 1.00 205,0G 0.00 1.00 2,C0 C.O0 12.00 5.0CP- 0.00 0.40 3.70 196.20 0.00 1.20 1.10 0.00 12,70 6.4C
C- 0.00 0.00 O.CC 0.57 0.00 0.00 O.O0 O.OC 0.04 0.3_
A- 0.00 0.00 0.00 l. OG 32.00 0.00 0.00 0.00 2.00 3.0CP- 0.00 0o00 0.00 0o3C 28.60 0.00 0.00 0.00 2.90 3,ZC
C- 0.00 0.00 O.CC 0.00 0.40 0.00 0.00 0.00 0.00 0.01
A- l.OO 0.00 1.00 0.00 0.00 114.00 O.CO 0.00 6.00 2.0C
P- 0.90 0.00 1.30 O,OG 0.00 168.50 0.00 O.OG B.O0 2,20C- 0.00 0.00 0.00 0.00 0.00 26.05 0.00 0.00 0.67 0.02
A- O.OO 0.00 1.00 0.00 0.00 1.00 6C.00 0.00 4,00 _._GP- 0.00 0.00 0.3C 0.0C O.OC 0.70 45.60 0.00 5.00 6.0CC- 0.00 0.00 O.CC 0.00 0.00 0.00 3.66 0.00 0.00 O.OC
A- 0.00 0.00 0.00 0.00 O.O0 0.00 O.CO 0.00 0,00 O.OC
P- 0.00 0.00 0.00 0.00 0.00 0.00 O.CO O.OG 0.00 0.00C- 0.00 O.O0 0.00 O.OC 0.00 C.O0 0.00 0.00 0.00 O,OC
A- 1.00 5.00 2_.00 12.00 0.00 5.00 4.00 O.OG qO.O0 5.0CP- 0.60 3.50 26.50 16.00 0,00 6.q0 5.00 0.00 104,80 5,6CC- 0.00 0._5 0.01 1.33 O.OO O.TZ O.GO ¢.00 Z._3 0.07
NUMBER OF CELLS = 23DEGREES OF FREEDOM = 22CHI-SQUARE = 50.611
t- AVERAGE OF 10 PREDICTIONS

138
TABLE 60
GOODNESS OF FIT MATRIX FOR P07LUSING THREE PREVIOUS LI]OKPOINTSAND ONE CONTROL STATUS.A,,ACTUAL TRANSITIONSP=PREDICTED TRANSITIONS *C=CHI-SQUARE VALUES
AS ROLL CBARS ALT AOF HSI IVSI ENG NON ROWA- 0,00 0,00 0,00 O,OC 0.00 0.00 0.00 0,00 0.00 C.OCP- 0,00 0,00 0,00 0,00 0,00 C.O0 O,CO 0,00 0°00 O°OCC- 0,00 0,00 0,00 O.OC 0,00 C.CO 0.00 0.00 0.00 O.OC
A- 0.00 138,00 10,00 3,00 0,00 0.00 0.00 0.00 4.00 7.0CP- C.O0 111.90 6,60 1.80 0.00 0.00 0.00 O.OC 3.80 5.60C- 0.00 _.9_ 1.16 O.OC 0.00 0.00 0.00 0.00 0.00 O.Z8
A-- 0,00 11.00 593.00 O.OC 0.00 0.00 0,00 0.00 I0.00 O°OCP- 0,00 8.30 525,10 O,OC 0,00 0,00 O,CO 0.00 9.90 O.OCC- 0,00 0,66 7,77 O,OC 0,00 0,00 0,00 0.00 0.00 0,00
A- 0,00 2,00 .0,00 84,00 0,00 0,00 0,00 0,00 _.00 6.00P- 0,00 0,70 0,00 BZ.70 0,00 0,00 0.00 0.00 _.20 _.qCC- 0,00 0,00 0,00 0.02 0,00 0.00 0.00 0.00 0.00 0.20
A- 0,00 0,00 0,00 0.00 37,00 0,00 0,00 0.00 2.00 2°00P- 0.00 0.00 0.00 0.00 36.30 0.00 0.00 0.00 L.80 I.BCC- 0°00 O,OO 0,00 O.OC 0,01 0,00 0,00 0.00 0.00 0.02
A-- 0.00 0.00 0.00 O.OO 0.00 30.00 0.00 0.00 L.O0 1.00P- 0,00 0,00 0,00 0,00 0,00 ZZ,90 0,C0 0.00 1,60 1,6CC- 0,00 0,00 0,0C O.CC 0.00 1,6B 0,00 0.00 0,00 0.36
A- 0.00 1.00 0.00 0.00 0.00 C.O0 27.C0 0.00 L,O0 2._0P- 0.00 0.60 0.00 0.00 0.00 C.O0 53.20 O.O0 Z.30 2,qCC- 0,00 0,00 O,OC O,OC 0,00 G,O0 25,_2 0.00 0,00 O._L
A- 0,00 0.00 O,CO 0,00 0,00 0,00 0,00 0,00 0,00 O.OCP- 0.00 0,00 0.00 0.00 0.00 0.00 O.CO 0.00 0.00 O.OCC- 0,00 0,00 0,00 0,00 0,00 C.O0 O,CO 0,00 0.00 O.OC
A- 0.00 3.00 11.00 3,0C 2,00 1,00 2.00 0.00 83,00 II.OCP- 0,00 2.80 11,20 3.20 1,80 L.60 2.gO C.O0 162.B0 12.30C- 0,00 0,00 0,00 0,00 0,00 0,00 0,00 0.00 76,72 0.15
NUMBER OF CELLS = 17DEGREES OF FREEDOM = 16CHI-SQUARE = 119,815
•- AVERAGE OF 10 PREDICTIONS

139
TABLE 61
GOODNESS OF FIT MATRIX FOR PO7R
USING THREE PREVIOUS LOOKPOINTSAND ONE COhTROL STATUS.
A=ACTUAL TRANSITIONSP=PRECICTED TRANSITIONS *
C=CHI-SQUARE VALUES
AS ROLL CBARS ALT ADF HSI IVSI ENG NON ROW
A- 0.00 0.00 0.00 0.00 O.CO 0,00 0.00 0.00 0.00 O.CGP- O.O0 0.00 0.00 0.00 0.00 0.00 C.00 0.00 0.00 O.OC
C- 0.00 0.00 0.00 O.OC 0.00 C.00 C.00 0.00 0.00 O.OC
A- 0.00 6.00 3.00 0.00 0.00 0.00 0.00 0.00 Z.O0 9.00
P- 0.00 1.90 3.50 0.00 0.00 0.00 0.00 0,00 1.30 b,TC
C- 0.00 0.00 0.00 O.OC 0.00 0.00 0.00 0.00 0.00 0.5_
A-- 0.00 1.00 696.CC Z.OC 0.00 I.O0 1.00 0.00 7.00 5,00P- 0.00 0.50 59_.80 1.30 0.00 1.00 o.go 0.00 7.20 3.7C
C- 0.00 O.O0 1_,71 0.00 O,O0 0.00 0.00 C.00 O.O1 0.3_
A- 0.00 6.00 0.00 57.00 0.00 0.00 0.00 0.00 Z.O0 5.CCP- 0.00 6.30 0.00 61.60 0.00 0.00 0.C0 0.00 1,80 6.10
C- 0.00 0.00 0.00 0.37 0.00 0.00 0.00 0.00 0.00 O.OC
A- O.O0 0.00 0.G0 O.OG 0.00 C.DO 0.00 O.OO 0.00 O.OCP- 0.00 0.00 0.00 0.00 O.O0 0.00 0,00 0.00 0.00 0.00
C- O.OO 0.00 0.00 O.OC O.O0 0.00 0.00 0.00 0.00 O.OC
A-- 0.00 0.00 0.00 O.OC 0.00 28.00 0.00 0.00 1.00 1.0G
P- 0.00 O.OO 0,00 O.OC O,O0 8g.90 0,00 0.00 6,70 _.?CC- 0.00 0.00 0.00 O.OC 0,00 136.8_ 0.00 C.00 0.00 13.6q
A- O.OO 0.00 0.00 O.OC 0.00 0.00 57.00 0.00 3.00 3.00P- O.O0 0.00 O.OC 0.00 0.00 0.00 61.70 C.OO 3.L0 3.10C- 0.00 0.00 O.OO 0.00 0.00 0.00 4.11 0.00 0.00 O.OO
A- 0.00 0.00 0.00 0.00 O.OO C.00 0.00 0.00 0.00 O.OC
P- O.O0 0.00 0.00 O.OC O.D0 0.00 0.00 0.00 O.G0 0.00
C- O.OO 0.00 0.00 O.OC 0.00 C.00 0.00 0.00 O.O0 O.OC
A- O.O0 0.00 8.00 _.OC 0.00 1.00 2,C0 C.O0 15.00 7.0CP- O.OO 0.00 7.10 6.g0 0.00 3.70 2.30 0.00 58.50 LO.qCC- 0.00 0.00 0.10 0.00 0.00 0.00 0.00 C,OO 12b.15 2.17
NUMBER OF CELLS = 13DEGREES OF FREEDOM = 12CHI-SQUARE = 299.087
•- AVERAGE OF 10 PREDICTIONS

140
TABLE 62
GOODNESS OF FIT MATRIX FOR P08LUSING THREE PREVIOUS LOCKPOINTSAND ONE CONTROL STATUS.A-=ACTUAL TRANSITIONSP=PREDICTED TRANSITIONSC=CHI-SQUARE VALUES
AS ROLL CBARS ALT ADF HSI IVSI ENG NON ROW
A- 0.00 0.00 0.00 0.00 0.00 O.O0 O,O0 0.00 0.00 O.OGP- 0.00 O.OO 0.00 O.OO 0.00 C.OG 0.00 O.O0 0.00 O,OO
C- 0.00 O.OO 0.00 0.00 0.00 C.OO 0.00 0.00 0.00 O,OG
A- 0.00 0.00 O.CC 0.00 0.00 0.00 0.00 O.OG 0.00 O.OCP- O.OO 0.00 0.00 0,00 O,OO 0.00 O.O0 0,00 0,00 O.OCC- 0.00 0.00 0.00 0.00 0.00 C.O0 0.00 0.00 0.00 O.OC
A- 0.00 0.00 437.00 3.00 3.00 2.00 0,00 C.OC 22.00 8.00P- 0.00 0.00 _68.50 3.30 2._0 2.I0 0.00 0.00 20,70 7.BCC- 0.00 0.00 2.27 0.00 0.00 O.G0 O.O0 0.00 0.08 O.OC
A- 0.00 0.00 2.00 138.00 L,O0 C.O0 1.00 0.00 I0,00 _,00P- 0.00 0.00 1.30 132.30 l,lO C.O0 I.I0 C.O0 10.50 3.5CC- 0.00 0.00 0.00 0.24 O.OC C.O0 0.00 0.00 0.02 0.06
A- 0.00 0.00 0.00 O.OC 68.00 0.00 1.00 0.00 6,00 1.OCP- O.OD 0.00 0.00 0.00 54.90 0.00 I.I0 0.00 5.90 l.lCC- O.O0 0.00 0.00 0,00 Z.52 C.O0 0.00 0.00 0,00 0.01
A- 0.00 0.00 Z.q0 O.OC 0.00 36.C0 1.00 O.OO 1.00 4.0CP- 0.00 0.00 0._0 _ 0.00 0.00 Z3.30 1.20 0.00 2,BO _._0C- 0.00 0.00 0.00 O.OO 0.00 4.48 0.00 0.00 0.00 0.0_
A- 0.00 O.OO 0.00 1.00 0,00 C.O0 79.C0 0.00 5.00 I.OG
P-- 0.00 O.OO 0.00 1.10 0,00 C.O0 71.50 0.00 5,90 1,10C- O.O0 0.00 0.00 0.00 0.00 O.GO 0.71 O.OO 0,16 O,Ol
A-- 0.00 0.00 O.GC 0.00 0,00 O.O0 0.00 0.00 0.00 O,OCP- 0.00 0.00 0.00 0.00 0,00 C.O0 0.00 0.00 0.00 0.00C- 0.00 0.00 0.00 O.OC 0.00 0.00 0.00 0.00 0.00 0,00
A- 0.00 0.00 Z7.00 9.00 3.00 2,00 3°00 0,00 IBZ.O0 8.00P- 0.00 O.OO 27.60 8.60 3,50 2._0 3.60 0.00 18_.90 q,50C- 0.00 0.00 0.01 0.02 0.00 0.00 0.00 0.00 0.05 0.28
NUMBER OF CELLS = 18
DEGREES OF FREEDOM = 17CHI-SQUARE = 10.974
_- AVERAGE OF 10 PREDICTIONS

141
TABLE 63
GOODNESS OF FIT MATRIX FOR PO8R
USING THREE PREVIOUS LOOKPOINTSAND ONE CONTROL STATUS.
A=ACTUAL TRANSITIONSP=PREDICTED TRANSITICNS *
C=CHI-SQUARE VALUES
AS ROLL CBARS ALT ADF HSI IVSI ENG NON POWA- 0.00 0.00 O.OC 0.00 1,00 C.O0 0.00 0.00 0.00 I.OC
P- 0.00 0.00 0.00 0.00 0.80 0.00 0.00 0.00 0.I0 o.gcC- 0.00 0.00 0.00 O.OC 0.00 0.00 0.00 0.00 0.00 0.01
A- 0.00 0.00 0.00 0.00 0.00 C.O0 0.00 C.O0 0.00 O.OC
P- 0.00 0.00 0.00 0.00 0.00 0.00 0.00 0.00 0.00 O.OCC- 0.00 0.00 0.00 O.OC 0.00 0.00 0.00 0.00 0.00 O.OC
A- 1.00 0.00 665,C0 4.00 1.00 1.00 0.00 0.00 11.00 7.00
P- 0.90 0.00 690.60 4.10 0.70 1.50 0.00 0.00 IL.80 7.20C- 0.00 0.00 O.gg 0.00 0.00 0.00 0.00 0.00 0.06 0.01
A-- 0.00 0.00 0.00 118.00 O.OC 0.00 0.00 0.00 13.00 0.00P- O.O0 O.OO 0.00 B6.gC 0.00 0.00 0.00 C.O0 11.70 O.OCC- 0.00 0.00 0.00 8.20 0.00 0.00 0.00 0.00 0.13 O.OC
A- 0.00 0.00 2.00 O.OC 77.00 1.00 0.00 1.00 2.00 6.00P- 0.00 0.00 l.gO O.OC 59.10 0.50 0.00 0._0 1.50 4.30C- 0.00 O.OO O.CO 0.00 4.16 0.00 0.00 0.00 0.00 0._
A-- 0.00 0.00 1.00 0.00 0.00 6B.00 1.00 0.00 B.O0 5.00
P- 0.00 O.OO O.gO 0.00 0.00 91.10 0.60 0.00 3.10 _.60C- O.O0 0.00 0.00 0.00 0.00 7.85 0.00 0.00 0.00 0.03
A- 0.00 0.00 0.00 1.00 0.00 0.00 43.C0 0.00 3.00 _.OCP- 0.00 0.00 0.00 0.30 O.CO 0.00 11.80 G.O0 1.40 1.70
C- 0.00 O.OO 0.00 0.00 0.00 C.CO 22.64 0.00 0,00 1.32
A- 0.00 0.00 0.00 1.OC 0.00 0.00 0.00 22.00 0.00 1.OCP- 0.00 0.00 0.00 0.2C 0.00 O.CO 0.00 3.30 0.20 0._0
C- 0,00 0.00 0.00 0.00 0.00 C.O0 0.00 15.q0 0,00 0.3e
A- 0.00 0.00 15.00 7.00 4.00 3.00 3.00 0.00 5b. O0 lO.OCP- 0.00 0.00 15.80 7.10 2.90 2.70 1.10 C.O0 111.00 6.70C- 0.00 0.00 0.04 0.00 0.00 0.00 O.CO 0.00 5_.02 l. Og
NUMBER OF CELLS = 18DEGREES OF FREEDOM = 17CHI-SQUARE = 117.275
€- AVERAGE OF i0 PREDICTIONS

142
TABLE 64
GOODNESS OF FIT MATRIX FOR POOLUSING THREE PREVIOUS LOOKPOINTSAND ONE CONTROL STATUS.A=ACTUAL TRANSITIONSP=PREDICTED TRANSITIONS
C=CHI-SQUARE VALUES
AS ROLL CBARS ALT AOF HSI IVSI ENG NON ROW
A- 2.00 0.00 O.OC 0.00 O,OO C.O0 0.00 1.00 1,00 _.CGP- 1.50 0.00 0.00 0.00 0.00 0.00 0.00 O.OO 3.10 _.6CC- 0.00 0.00 0.00 0.00 0.00 0.00 O.CO 0.00 0.00 O.Cq
A- 0.00 5.00 3.00 O.OC O.CC 0.00 0.00 0.00 0.00 3.00P- 0.00 g.00 2,40 0.00 0,00 0.00 0.00 0.00 0.50 2°gO
C- 0.00 3.20 0.00 0,00 0.00 C.O0 0.00 0.00 0.00 O.OC
A- 1.00 0.00 689,00 O.OC 0,00 O.O0 0.00 O.O0 30.00 1.00P- 1.60 0.00 620.80 0.00 0.00 0.00 O,CO 0.00 26.60 1.60C- 0.00 0.00 6.75 0.00 0°00 O°CO O.CO O.O0 0.3g 0.3e
A- 0.00 0.00 2.00 255.00 0°00 O.CO l.CO O.O0 18.00 3.00
P- 0.00 0.00 O.gO 203.60 0,00 0.00 0.60 0.00 16.70 1.50C- 0.00 0.00 0.00 I0._ O.OO 0.00 0.00 O.O0 O.Oq 0.75
A- 0,00 0.00 0.00 0.00 60.00 0,00 O.GO 0.00 3.00 3.0G
P- 0.00 0.00 O,CO O.OC 63.60 O.O0 0.00 O.O0 3.70 3°7CC- 0.00 0.00 0.00 0.00 O.Ig 0.00 0.00 0.00 0,00 0.I_
A-- 0.00 I.00 1.00 O.OC 0°00 86.00 0.00 C.O0 2.00 4.0CP- 0.00 1.00 1.10 0.00 0.00 101.00 0.00 0.00 1.80 3.qo
C- 0,00 0.00 0.00 " 0.00 O.O0 2.62 O.CO 0.00 0.00 O.OC
A- 0.00 0.00 0,00 1.0C O.O0 2.00 75.00 O.O0 5.00 3.GOP- 0.00 0.00 0.00 0._0 0.00 1.60 61.10 0.00 6._0 2,00C- 0.00 0.00 0.00 0.00 O.OO 0.00 2.58 0.00 0.3q 0.33
A- 0.00 0.00 O°OO 0.00 0,00 C.CO 0,00 7.00 I,00 l,OO
P- 0.00 0.00 0°00 0.00 0.00 C.OO 0.00 O.O0 0.00 O.OCC- 0.00 0.00 0.00 O.OC 0.00 0.00 0.00 7.00 0.00 1.00
A- 1.00 2.00 24.00 20.00 3.00 3.00 7.00 0°00 67.00 Q.OCP- 1.50 1.90 23.30 17.gC 3.70 2._0 7.80 0.00 188.90 g,5CC- 0.00 0.00 0.02 0.22 0.00 0.00 O.Og 0.00 221.7g 0.03
NUMBER OF CELLS = 23DEGREES OF FREEDOM = 22
CHI-SQUARE = 258._g6
t- AVERAGE OF LO PREDICTIONS

143
TABLE 65
GOODNESS OF FIT MATRIX FOR PO9RUSING THREE PREVIOUS LODKPOINTSAND ONE CONTROL STATUS.A=ACTUAL TRANSITIONSP=PRECICTED TRANSITIONSC=CHI-SQUARE VALUES
AS ROLL CBARS ALT ADF HSI IVSI ENG NON ROW
A- 2.00 0.00 O.OO O.OC 2.00 0.00 0.00 0.00 0,00 4.0CP- Z.8O 0.00 O,CO O.OO Z.60 O.O0 0.00 0.00 0.30 5,7CC- 0.00 O.OO 0,00 0.00 0.00 0.00 0.00 0.00 0,00 0.72
A- 0.00 54.00 8.00 O.OO O.O0 C.OO C.O0 O.OO 4.00 4.0CP- 0.00 31.80 4.20 0.00 0.00 O.O0 0.00 O.OC 5,60 5,6CC- 0.00 q.13 1.81 0.00 O.O0 O.O0 0.00 O.O0 0.00 0.64
A- O.OO 7.00 449.00 I.00 1.00 O.CD O.O0 C.OO 20.00 Z.OC
P- 0.00 6.10 380.2C l. IO 0,70 0.00 0.00 O.O0 18,40 1,80C- 0.00 0.12 10.54 0.00 0.00 0.00 0.00 0.00 0.13 0.02
A- 0.00 0.00 8.00 203.00 0.00 1.00 C.CO O.O0 9.00 1.0CP- O.O0 0.00 6.50 208.30 0,00 1.80 0.00 0,00 lO.gO 1.8CC- O.O0 0.00 0.28 0.14 O.O0 C.OO 0.00 0.00 0.40 0.64
A- 0,00 O°O0 0°00 L.OC 53.00 1.00 0.00 0.00 4.00 6.0CP- 0.00 O.OO O.O_ 0.5C L03,50 0.60 O.O0 0.00 4.bO 5.70C- O.O0 0.00 0.00 0.00 48.12 O.O0 O.CO O.OO 0,00 0.01
A- 0.00 2.00 0.00 O.OC O.O0 I06.00 0.00 0.00 _,00 6.0CP- O.O0 0.40 O.OC 0.00 O,O0 61.00 O.O0 C.O0 b.40 6.BCC- 0,00 O.O0 0.00 O.OO O.O0 19.10 O.O0 0.00 0,00 0.11
A- 0.00 0,00 O.OO O.OC 0.00 C.O0 19.00 0.00 Z,O0 2.0C
P- 0.00 O.O0 O.QC O.OO O.O0 O.OO 37.30 0.00 4,40 4.4CC- 0.00 0.00 O.OC 0.00 0.00 C.O0 17.63 O.O0 0.00 Z.88
A- 0.00 0.00 0.00 O.OO 0.00 O.O0 0.00 0.00 0.00 O.OCP- 0.00 O.O0 O.CO O.OC 0.00 O.O0 0.00 0.00 0.00 O.OC
C- 0.00 O.OO O.CC 0.00 0.00 0.00 O.CO 0.00 0.00 O.OC
A-- 2.00 2.00 14,00 16.00 3.00 4.00 2.00 C.O0 117,00 13o00P- 2.90 3.30 15.10 17.7G Z,70 4,50 4.40 0,00 167._0 L7.8CC- O.OD 0.00 O.Cq 0.18 O.D0 0.00 0.00 0.00 Zl,71 1.77
NUMBER OF CELLS = 2ZDEGREES OF FREEDOM = ZlCHI-SQUARE = 136.160
•- AVERAGE OF 10 PREDICTICNS

144
TABLE 66
GOODNESS OF FIT MATRIX FOR PLOLUSING THREE PREVIOUS LOOKPOINTSAND ONE CONTROL STATUS.A=ACTUAL TRANSITIONSP=PREDICTED TRANSITIONS *C-CHI-SQUARE VALUES
AS ROLL CBARS ALT ADF HSI IVSI ENG NON ROW
A- 0.00 0.00 1.GO 0.00 0.00 0.00 O.CO 0.00 0.00 L,OCP- 0.00 O.O0 1.30 O.OC O.O0 C.O0 0.00 0.00 0.00 1.3¢
C- 0.00 0.00 O.CC 0.00 O.OO 0.00 0.00 0.00 0.00 O.Oq
A- 0.00 138.00 3.00 3.00 0.00 O.CO 0.00 0.00 9.00 6.0C
P- O,OO 136.60 3.80 3.60 0.00 C.CO 0.00 0.00 8.10 7._0C- 0.00 0.01 0.00 0.00 0.00 0.00 0.00 0.00 0.09 0.33
A- 0.00 5.00 349.00 1.OO 0.00 0.00 O.CO C.O0 18,00 I.OCP- 0.00 5.40 341.00 I.20 0.00 O.O0 0.00 C.O0 17.70 1.20C- 0.00 0.03 0.18 O.OC 0.00 0.00 0.00 0.00 0.00 0.0_
A- 0.00 5.00 0.00 167.00 0.00 0.00 O.CO C.O0 12.00 O.OCP- 0.00 4.30 0.00 149.g0 O.O0 0.00 O.O0 C.O0 12.40 0.00C- O.OO 0.10 O.CC 1.75 0.00 O.O0 0.00 0.00 O.OL O.OO
A- 1.00 0.00 1.00 0.00 16.00 O.O0 0.00 0.00 1.00 3.0CP- 1.30 0.00 Z.20 0.00 35.90 C.O0 C.O0 0.00 0.00 3.50C- 0.00 0.00 0.00 O.OC 24.75 C.OO 0.00 0.00 0.00 0.08
A- 0.00 0.00 0.00 0.00 0.00 0.00 O.CO 0.00 0°00 O.OCP- O.OO 0.00 0.00 O.OC 0.00 0.00 O.CO C.OO 0.00 O.OCC- 0.00 0.00 O.O0 0.00 0.00 C.O0 0.00 O.O0 0.00 O.OC
A- 0.00 0.00 O.OO O.OG 0.00 0.00 O.OO 0.00 0.00 O.OCP- O.OO 0.00 0.00 O.OO 0.00 0.00 0.00 C.O0 0,00 O.OC
C- 0.00 0.00 O.CO 0.00 0,00 C.O0 0.00 0.00 0.00 O.OC
A- 0.00 0.00 O.CO O.OC O.OO 0.00 0.00 0.00 0.00 O.OCP- 0.00 0.00 0.00 0.00 0.00 0.00 0.00 O.O0 0,00 O.OCC- 0.00 O.O0 O.OO 0.00 0.00 0.00 C.O0 0,00 0.00 0.00
A- 0.00 6.00 19.C0 1Z.OC 3.00 0.00 0,00 0.00 239,00 _.OCP- 0.00 6.60 17.20 11.00 3.50 O.OO O.CO 0.00 243.00 3.5GC- 0°00 0.06 0.17 0.08 0.00 O.GO O.CO 0.00 0.07 0,08
NUMBER OF CELLS = 18DEGREES OF FREEDOM = 17CHI-SQUARE - 27.9_2
*- AVERAGE OF 10 PREDICTIONS

145
TABLE 67
GOODNESS OF FII MATRIX FOR PIORUSING THREE PREVIOUS LOCKPOINTSAND ONE COhTROL STATUS.A=ACTUAL TRANSITIONSP=PREDICTED TRANSITIONS *C=CHI-SQUARE VAL_ES
AS ROLL CBARS ALT AOF HSI IVSI ENG NON ROWA- 40.00 0.00 1.00 1.00 1.00 0.00 0.00 0.00 2.00 5.00P- 25.80 0.00 0.70 O.ZO 0,60 C.CO O,CO 0.00 2,60 4.ICC- 5.04 0.00 0.00 O.OO 0.00 O.OO O.CO C.O0 0.00 O.Ib
A- 0.00 462.00 3.00 7.00 0.00 0.00 0.00 0.00 16.00 3.00P- 0.00 435,60 2.g0 5.70 O.O0 C.00 C.O0 C.O0 18.00 2.gCC- 0.00 1.51 0.00 0.24 0.00 0.00 0.00 0.00 O,Z5 0,00
A- 1.00 3.00 142.00 0.00 0.00 0.00 0.00 0.00 12.00 4.00P- 1.50 4.40 165.80 O.OC 0.00 0.00 O.O0 0.00 12.50 5.90C- 0.00 0.00 3.9q 0.00 0.00 0.00 0.00 0.00 O.OZ O._C
A- 0.00 13.00 1.00 165.00 0.00 0.00 0,00 0.00 3.00 4.00P- 0,00 10.70 1.00 137.30 O,O0 0.00 0.00 0.00 _.10 5.LCC- 0.00 0.41 0.00 0.41 O.O0 0.00 0.00 0.00 0.00 0.30
A- 1.00 0.00 1.00 0.00 4.00 0.00 0.00 0.00 0.00 6.00P- 0.40 0.00 0,50 O.OC 2.00 C.OC 0.00 0.00 0.50 3._CC- 0.00 0.00 0.0C O.OC 0.00 0.00 0.00 0.00 0.00 1.13
A- 0.00 0.00 0.00 0.00 0.00 0.00 0.00 0.00 0.00 0.00P- 0.00 0.00 0.00 0.00 0.00 O.CO O.CO 0.00 0,00 O.OCC- 0.00 0.00 0.00 O.OC O.GO 0.00 0.00 0.00 0.00 O.OC
A- 0.00 0.00 0.00 0.00 0.00 0.00 0.00 0.00 0.00 O.OCP- 0.00 0.00 0.00 O.OC 0,00 0,00 0.00 0,00 0.00 O.OCC- 0.00 0.00 0.00 0.00 O.O0 0.00 O.CO O.OO 0.00 O.OC
A- 0.00 0.00 0.00 0.00 O.OO 0.00 0.00 0.00 0.00 O.OCP- 0.00 0.00 0.00 O.OC 0.00 0.00 0.00 0.00 0.00 O.OOC- 0.00 0.00 0.00 0.0C O.OC C.O0 0.00 0.00 0.00 O.OC
A- 3.00 I0.00 I0.00 q. O0 1.00 0.00 0.00 0.00 27.00 _.OCP- 2.ZO 11.40 13.40 9.90 0,80 0.00 0.00 O.OO 45.50 3.00C- O.O0 0.20 1.16 O.Oq 0.00 G.O0 O.CO 0.00 12.68 0.25
NUMBER OF CELLS = tBDEGREES OF FREEDOM = 17CHI-SQUARE = 28.732
*- AVERAGE OF I0 PREDICTIONS

146
TABLE 68
GOODNESS OF FIT MATRIX FOR PIILUSING THREE PREVIOUS LD_KPOINTS
AND ONE COhTROL STATUS.A=ACTUAL TRANSITIONSP=PREEICTED TRANSITIONS *
C=CHI-SQUARE VALUES
AS ROLL CBARS ALT ADF HSI IVSI ENG NON ROWA- 139,00 0.00 4.00 O.OC 4.00 0.00 O.OO I.O0 LL,O0 q,oc
P- 1_3,10 0.00 3.50 O.O0 3.80 C,OC O.CO 1,20 LL,30 8.50
C- 1.43 0.00 O.OO O.OC O.CO C.CO O.O0 0.00 0.01 0.03
A- 0.00 O.O0 0.00 0.00 0.00 0.00 O,O0 0.00 0.00 O.OC
P- O.O0 0.00 O.CC O.OO 0.00 O.O0 O.CO C.OG 0.00 O.OCC- O.OO 0.00 0.00 0.00 0.00 C.O0 0.00 0.00 0.00 0.00
A-- 4.00 0.00 245,00 0.00 0.00 2.00 O.O0 0.00 18.00 5.0C
P- 4.20 0.00 178,70 O.Q0 0.00 2.00 0.00 C.O0 Ib,30 6.20C- 0.00 0.00 17.g4 O.OC 0.00 0.00 0.00 0.00 0,16 0.01
A- 0.00 0.00 0,00 66.00 O.O0 0.00 0.00 O.O0 7.00 O.OCP- O.OO 0.00 0.00 55.50 O.OO O.O0 O.CO O.O0 6,60 O.OGC- 0.00 0.00 O.OC 1.67 0.00 C.CO O.CO 0.00 0.02 O.OC
A- 1.00 0.00 0.00 O.O0 IO.O0 0.00 0.00 0.00 5,00 L.OC
P- 0.70 0.00 0.00 O.O0 9.40 0,00 0,00 0.00 4.90 0.7CC-- 0.00 O.O0 O.G_ 0.00 0.04 O.OO O.GO C.OC 0.00 0.0_
A-- 0.00 0.00 Z.O0 0.00 L.O0 59.00 0.00 0.00 3.00 6.00P- 0.00 O.O0 1.40 - O.OO O.BO 47.20 O.CO O.OC 3.30 5.5CC- 0.00 0.00 O.O0 0.00 0.00 2,36 0,00 0.00 0.00 0.04
A- 1.00 O.O0 0.00 L.O0 0.00 C.O0 L7,00 0.00 Z.O0 _.OGP- 1.30 0.00 0.00 2.60 O.O0 O.O0 25,60 0.00 L.40 5.3CC- 0,00 0,00 O'CC 0.00 0.00 0.00 _.35 O.OG 0,00 0._2
A- 0.00 0.00 0.00 0.00 0.00 O.O0 0.00 12,00 1,00 [.OCP- 0.00 0.00 0.00 O.OC 0.00 0.00 O.O0 I0.40 L.ZO 1.2C
C- 0.00 0.00 O.GO 0.00 0,00 0.00 0.00 0.21 0.00 O.q4
A-- I_.00 0.00 Lg.00 6.00 1.00 4.00 4.00 0.00 Z43,00 9,0C
P- 13.60 O.O0 L7.70 4.DO 1,00 3.50 5.30 C.OO 312,50 g.8CC- 0.01 0,00 0.09 0.67 O,O0 O.OC O.CO C.OC 19,88 0.07
NUMBER OF CELLS = 22DEGREES OF FREEDOM = 21CHI-SGUARE = 4q.5_0
•- AVERAGE OF LO PRECICTIONS

147.
TABLE 69
GOODNESS OF FIT MATRIX FOR PIIRUSING THREE PREVIOUS LOOKPOINTSAND ONE COhTR_L STATUS.A=ACTUAL TRANSITIONS
P=PREDICTED TRANSITIONS
C=CHI-SQUARE VALUES
AS ROLL CBARS ALT ADF HSI IVSI ENG NON ROWA- 6g.O0 0.00 2,00 0.00 I.O0 0.00 0.00 0.00 2.00 5.0CP- 73.50 0.00 O.gO 0.00 0.80 0.00 0.00 0.00 2.60 4.30C- Q.29 0.00 0.00 0.00 0.00 0.00 C.00 O.O0 0.00 O.IC
A- 0,00 4.00 0.00 0,00 0,00 0.00 0.00 0.00 L.O0 5.00P- 0.00 _.gO 0.00 0.00 0.00 O.CO 0.00 0.00 1.30 h°2CC- 0.00 0.00 0.00 O.OC 0.00 C.O0 0.00 0.00 0.00 0.2_
A- 1.00 1.00 398.00 I.OC 0.00 2.00 0.00 0.00 20.00 5.00P- 0,80 1.30 406.20 1.40 O.O0 1.80 0.00 0.00 18.I0 5.30C- 0.00 O.QO 0.17 0.00 0.00 0.00 O.CO 0.00 0.18 0.02
A-- 0.00 0.00 0.00 106.00 0.00 C.CO 0.00 0.00 17.00 0,00P- 0.00 0.00 0.00 95.50 0.00 C.O0 0.00 0.00 Zb.50 O.OCC- 0,00 0.00 O.OC 1.04 0.00 0.00 0.00 0.00 0.01 O.OG
A- 0.00 0.00 0.00 O.OC 5.00 0.00 0.00 0.00 1.00 1.00P-- 0.00 0.00 0.00 0.00 3,00 0.00 0.00 0.00 0,80 O.SCC- 0.00 0.00 0.00 0.00 0.80 C.00 0.00 0.00 0.00 0.04
A- 0.00 0.00 0.00 0,00 0.00 131.00 1.00 0.00 10,00 l,OCP- 0.00 0.00 0.00 0.00 0.00 119.40 1.30 0.00 7.40 1.30C- 0.00 0.00 0.00 O.OG 0,00 1.03 O.GO 0.00 O.b8 O.O_
A-- 0.00 0.00 0.00 I.OO O.OO 1.00 19.C0 0.00 1.00 3.00P- 0.00 0.00 0.00 0.10 0.00 1.10 11.60 0.00 2.30 3.5¢C- 0.00 0.00 0.00 O.OO 0.00 O.CO 2.88 0.00 0.00 0.08
A- O.O0 0.00 0.C0 0.00 0.00 0.00 0,00 3.00 I.O0 _,00P- 0.00 0.00 0.00 0.00 0.00 0.00 0.00 4.70 1.80 6.50C- 0.00 0.00 0.00 0.00 0.00 0.00 0.00 0.00 0.00 l. Se
A- _,O0 O.OO 24.00 l_.OC 0.00 8,00 2.00 1.00 81.00 7.0CP- 3.50 0.00 23.20 14.6G 0.00 5.80 2.30 1.80 9g,70 7.60C-- 0.00 0.00 0.03 0°03 0.00 0.60 O.CO 0.00 4.32 0.05
NUMBER OF CELLS = 21DEGREES OF FREEDOM = 20CHI-SQUARE = I_,28g
_- AVERAGE OF 10 PREDICTIONS

148
TABLE 70
GOODNESS OF FIT MATRIX FOR TPILUSING THREE PREVIOUS LOCKPOINTSAND ONE CONTROL STATUS.A=ACTUAL TRANSITIONSP'PREDICTED TRANSITIONSC=CHI-SQUARE VALUES
AS ROLL CBARS ALT ADF HSI IVSI ENG NON ROWA-- 4.00 0.00 1.00 O.OC 0.00 0.00 0.00 0,00 0.00 5.00P- 3.70 0.00 0.80 0.00 0.00 0.00 0.00 0.00 0,10 4.6CC- O.OO 0.00 O.O0 O.OO O.O0 0.00 O.CO 0.00 0.00 0.03
A- 0.00 16.00 1.00 0.00 0.00 0.00 0.00 0.00 L.O0 2.0CP- 0.00 II.10 1.20 0.00 0.00 0.00 0.00 0.00 L._O ?.6CC- O.O0 1.50 O,O0 O.OC O.O0 C.O0 O.O0 O.OC 0.00 _.1_
A- 1.00 1.00 497°00 0.00 0.00 6.00 0.00 0.00 15.00 2.0GP- 0.90 1.00 _93.60 O.O0 0.00 5.80 0.00 C.O0 17.50 L.qCC- 0.00 0.00 0.02 0.00 0.00 C.01 0.00 C.O0 0.42 O.OC
A-- 0.00 0.00 0.00 0.00 0.00 G.O0 0.00 0.00 0.00 0.00P- 0.00 0.00 O.OO 0.00 0.00 0.00 0.00 0.00 0.00 O.OCC- O.O0 O.O0 0.00 O.O0 0.00 0.00 0.00 0.00 0.00 O.OC
A- O.O0 O.O0 O.O0 O.OC 1.00 1.00 O.O0 0.00 0.00 2.00P- O°O0 O.OO 0.00 0.00 0.90 O.gO 0.00 O.O0 0.30 2.10C- O.O0 0.00 0.00 0.00 O.O0 O.O0 0.00 O.OO 0.00 O.OC
A- 0.00 1.00 6.00 O.OG 0o00 495.00 0.00 0.00 17.00 1.00P- 0.00 I.60 6.go 0.00 0.00 462.50 0.00 0.00 15.00 1.60C- 0.00 0.00 0.13 O.OC O.O0 2.13 0.00 0.00 0.06 0.3e
A- 0.00 0.00 0.00 O.O0 O.OO C.O0 0.00 0.00 0.00 0.00P- 0.00 0.00 0.00 0.00 0.00 0.00 0.00 0.00 0.00 O.CCC- 0.00 0.00 0,00 0.00 O.O0 0.00 0.00 0.00 0.00 O.OC
A- 0.00 O,O0 O.O0 0.00 O.O0 C.O0 C.OO O.OO 0,00 O.OCP- 0.00 0o00 0.00 O.OC O,O0 C.O0 O.O0 O.O0 0.00 O.OCC- 0.00 0°00 0.00 O°OC 0°00 O.O0 0.00 O.O0 0.00 O.OC
A- 0.00 C.O0 14.C0 O.OC I.O0 18°C0 0.00 0.00 7b. O0 1.0CP- O.O0 C.O0 15.50 0.00 1.20 20.60 O.O0 O.O0 104.50 1,2CC- O.O0 0.00 0.16 O.O0 O.O0 0.38 C.CO 0.00 I0.69 0.0_
NUMBER OF CELLS = 16DEGREES OF FREEDOM = 15CHI-SQUARE = 16.12L
#- AVERAGE OF 10 PREDICTIONS

149
TABLE 71
GOODNESS OF FIT MATRIX FOR TPIX
USING THREE PREVIOUS LOOKPOINTSAND ONE CONTROL STATUS.
A=ACTUAL TRANSITIONSP=PREDICTED TRANSITIONS $C=CHI-SOUARE VALUES
AS ROLL CBARS ALT ADF HSI IVSI ENG NON ROWA- 7.00 0.00 2.00 O.OC 0.00 2.00 0.00 0.00 3.00 7.0C
P- 11.40 O.OO 1.40 0.00 0.00 1.80 0.00 0.00 3.30 b. SC
C- 2.77 0.00 0.00 O.OO 0.00 0.00 0.00 0.00 0.00 0.04
A- 0.00 17.00 5.00 O.OC 0.00 2.C0 0.00 O.OO 3.00 5.0CP- O.O0 28.80 5.20 0.00 0.00 1.60 0.00 0.00 4.40 5.0CC- 0.00 B.I9 0.01 0.00 0.00 C.O0 0.00 0.00 0.00 0.2C
A- 1.00 2.00 B29.00 3.00 0.00 6.00 O.O0 0.00 24.00 _.OOP- I.I0 2.50 7q2.40 Z.6C 0.00 7.00 0.00 0.00 24.00 b.2CC- 0.00 0.00 1.62 0.00 0.00 0.17 0.00 0.00 0.00 0.01
A- 0.00 0.00 2.00 O.OG 0.00 5.00 0.00 0.00 1.00 3.0CP- O.OO O.O0 1.60 0.00 0.00 3.80 0.00 0.00 0.80 2.4C
C- O.OO 0.00 0.00 0.00 0.00 0.29 0.00 0.00 O.O0 0.12
A-- 0.00 0.00 0.00 O.OC 0.00 0.00 0.00 0.00 1.00 I.OC
P- 0.00 0.00 O.CC O.OC 0.00 0.00 0.00 0.00 0.70 0.70C- 0.00 0.00 0.00 0.00 0.00 0.00 0.00 0.00 0.00 0.09
A- l.O0 0.00 lO.O0 3.0C 1.00 348.00 0.00 0.00 15.00 5.0CP- 1.20 0.00 10.10 2.20 0.70 323.00 0.00 0.00 16.70 4.10C- 0.00 0.00 0.00 0.00 0.00 l. BO 0.00 0.00 o.lq 0.16
A- 0.00 0.00 O.OO O.OC 0.00 0.00 0.00 0.00 0.00 O.OC
P- 0.00 0.00 O.O0 O.OC O.O0 0.00 O.O0 0.00 0.00 O.OCC- O.OO 0.00 0.00 0.00 0.00 0.00 O.CO 0.00 0.00 O.OC
A-- 0.00 0=00 O.OO 0.00 0.00 0.00 0.00 0.00 0.00 O.OCP- 0.00 0.00 O.CO O.OC 0.00 0.00 O.CO 0.00 0.00 O.OC
C- O.O0 0.00 0.00 0.00 0.00 0.00 0.00 0.00 0.00 0.00
A- 5.00 8.00 18.00 Z.O0 0.00 15.00 C.O0 0.00 qS.00 _.OCP- _.ZO 8.70 18.60 1°4C O,CO 15.9C O.CO 0.00 134.90 1._GC- 0.13 O.Ob O.OZ 0°00 0.00 O.Z_ 0.00 0.00 lb.76 o.le
NUMBER OF CELLS = 22DEGREES OF FREEDOM = 21CHI-SQUARE = 33°027
• - AVERAGE OF 10 PREDICTIONS

150
TABLE 72
GOODNESS OF FIT MATRIX FOR TPIR
USING THREE PREVIOUS LOQKPQINTSAND O_E CONTROL STATUS.
A=ACTUAL TRANSITIONSP=PRECICTED TRANSITIONSC=CHI-SQUARE VALUES
AS ROLL CBARS ALT ADF HSI IVSI ENG NON ROW
A- 16.00 0.00 OoOO O.OO O.CO O.GO 0.00 0.00 2.00 2,00
P- 10.80 0.00 O,GO O.CC 0.00 0.00 0.00 0.00 1.70 1.7CC- 1.69 O.O0 0,00 O.OO 0.00 0.00 O.O0 0.00 0.00 0.04
A- 0.00 Z2.00 2.00 O.OC 0.00 0.00 0.00 O.OC 1.00 3.0CP- 0,00 13.90 2,20 O.OC O.OC O.CO O.O0 0.00 l.bO 3.80C- 0.00 0.30 0,00 0.00 0.00 C.O0 G.O0 0.00 0.00 0.21
A- 1.00 1.00 414,00 0.00 O.O0 3.00 0.00 0.00 17.00 5.0CP- 1.00 1.30 429.70 0.00 0.00 3.50 0.00 0.00 17.80 5.80
C- O.OO 0.00 0.60 O.OO 0.00 0.00 O.CO 0.00 0.04 0.13
A- 0.00 0.00 0.00 O.OO 0.00 O.O0 O.O0 0.00 0.00 O.OC
P- 0.00 0.00 O.CC O.OC O.OC C.CO 0.00 0.00 0.00 O.OCC- 0.00 0.00 0,00 O.OC 0.00 0o00 0.00 0.00 0.00 O.OC
A- 0.00 0.00 0.00 0.00 O.OC l.O0 O.CO O,O0 0.00 I.OC
P- O.O0 0.00 O.O0 O.OC O.OC 1.10 C.O0 0.00 0.20 1.30C- 0.00 0,00 0.00 O.OO 0,00 0.00 0.00 0o00 0.00 o.oq
A-- 0.00 0.00 7,00 0.00 0.00 Z92.00 0,00 C.O0 14.00 O.OC
P- 0.00 0.00 7,50 O.OO 0.00 267.30 0.00 0.00 13.00 O.OCC- 0.00 0.00 0.04 0.00 0.00 2.09 O.O0 0.00 0.07 0.00
A- 0.00 0.00 0,00 O.OO O.O0 C.OO O.CO O.OO 0.00 O.OC
P- 0.00 0.00 0,00 O.OO 0.00 O.OC O.CO 0.00 0.00 O.OCC- O.O0 0.00 O,CC O.OC 0.00 0.00 O.O0 O.OO 0.00 0.00
A- 0.00 0.00 0.00 0.00 0.00 0.00 0.00 O.O0 0.00 O.OGP-- 0.00 0.00 0.00 O.OC 0.00 0.00 O.O0 0.00 0.00 O.OCC- 0.00 0.00 O.O0 O.OC O.O0 C.00 O.CO 0.00 0.00 O.OC
A- l.O0 2.00 I_.00 O.OC 1.00 16.00 0.00 O.O0 47.00 4.00P- 0.70 2.50 13.90 0.00 1.30 15.90 O.CO C.OO 53.10 4.5CC-- 0.00 0.00 0.0C O.O0 O.O0 C.O0 0.00 O.O0 0.79 0.0_
NUMBER OF CELLS = 15DEGREES OF FREEDOM = 14CHI-SQUARE = 6.152
1- AVERAGE OF IC PREDICTIONS

151
TABLE 73
GOODNESS OF FIT MATRIX FOR TPSLUSING THREE PREVIOUS LOOKPOINTSAND ONE CONTROL STATUS.A=ACTUAL TRANSITIONSP=PREDICTED TRANSITIONS *C=CHI-SQUARE VALUES
AS ROLL CBARS ALT ADF HSI IVSI ENG NON ROWA- 66,00 0,00 2,00 I,O0 0.00 0,00 0,00 0,00 2.00 5.0CP- 34,80 0,00 L,70 0,80 0,00 0,00 0,00 0,00 2.70 5.20C- 2,73 0,00 0,00 O,OO 0,00 0,00 0.00 0,00 0,00 0.01
A-- O.O0 17.00 2,00 I.O0 0.00 0.00 0.00 0.00 3.00 6.0CP- 0.00 11.90 L.O0 O.BC 0.00 0.00 0,00 0.00 3,50 5.3CC- 0.00 1.53 O.OC 0.00 0.00 0.00 O.O0 0.00 0,00 0.08
A- 2.00 1.00 512.00 O.OC l,CO 6.00 0.00 O.OO 27.00 4.00P- 2.10 0.90 512.50 O.OC 0.90 5.70 0.C0 0.00 30.00 3,gOC- 0.00 0.00 0.00 O.OC 0.00 C.02 0.00 0.00 0.33 O.OC
A- 0,00 0,00 O.GC 280.00 0,00 0.00 0.00 0.00 23.00 O.OCP- 0,00 0,00 0,00 278,60 0,00 0,00 0,00 0,00 Z2./O 0.00C- 0.00 0.00 0.00 0.01 0.00 C.O0 0.00 C.O0 0.04 O.OC
A- 0,00 O,O0 O,DC O,OC 4,00 O,O0 0,00 0.00 L.O0 5.00P- O.O0 0.00 0.00 0.00 3.80 0.00 0,00 0.00 0.90 4.7GC- O,O0 0,00 0,00 0,00 0,00 0.00 0.00 0..00 0,00 0,02
A- O.O0 1.00 l. O0 l.OC 0.00 143o00 0.00 0.00 10.00 3.0CP- O.O0 1.30 1.20 1.60 0.00 137.20 0.00 0.00 9.60 4.10C- 0,00 0,00 0,00 O.OC 0,00 0,24 0,00 0.00 0,02 0.40
A- 0,00 0.00 0,00 0,00 0,00 C,O0 0.00 O,O0 0.00 0.00P- O,O0 OoO0 O,CO O,OC 0,00 0,00 0,00 0,00 0,00 0.00C- O,O0 0,00 0,00 0,00 0,00 0,00 0,00 0,00 0.00 0.0¢
A- 0,00 0,00 0°00 0.00 O,CO C.CO 0,00 0.00 0.00 0.00P- 0,00 0,00 O,CO O.OC 0,00 0,00 0,00 0.00 0.00 O.OGC- 0,00 O,OO 0.00 0,00 0,00 0,00 0,00 0,00 0,00 O.OC
A- 3.00 4.00 32.00 20.00 0.00 7.00 0,00 O.O0 185.00 7.00P- 3.10 3°LO 35.10 19o10 O.O0 8.20 0.00 0.00 200.80 &.2CC" 0,00 0.00 0.30 0.04 0.00 0.Z1 0.00 O.O0 L,35 0,0_
NUMBER OF CELLS = 19DEGREES OF FREEDOM = 18CHI-SQUARE = 7.400
€- AVERAGE OF LO PREDICTIONS

152
TABLE 74
GOODNESS OF FIT MATRIX FOR TP5RUSING THREE PREVIOUS LOOKPQINTS
AND ONE CONTROL STATUS,A=ACTUAL TRANSITIONSP=PREDICTED TRANSITIONS *
C=CHI-SQUARE VALUES
AS ROLL CBARS ALT ADF HSI IVSI ENG NON ROW
A- 39,00 0,00 1,00 0.00 0,00 0,00 O,O0 0,00 6.00 1.00
P- 3g,70 0,00 l.lO 0,00 0,00 0.00 0.00 0.00 6.50 i. I0C- 0,01 0,00 0,00 O.OC 0,00 0,00 0,00 0.00 0,0_ O.CI
A- 0,00 9,00 1.00 2,00 0,00 O.O0 0.00 0.00 1.00 _.00P- 0,00 6.b0 0,80 2,50 0,00 0.C0 O,O0 0,00 L.30 4,60
C- 0.00 0.64 0.00 O.OC O.OO C.CO 0.00 0.00 0.00 O.Oq
A- 2,00 2,00 502,00 2.00 0,00 2,00 0,00 O.O0 22,00 8.0CP- 1.60 1.go 501.Q0 2.30 0.00 2.50 Q.CO 0.00 21.80 3.3CC- .0,00 0,00 0,00 0.00 0,00 O.OO q,O0 0.00 0.00 O.OI
A- 2.00 0.00 1.00 175.0G 0.00 2.00 0,00 0.00 21.00 5.0CP- Z,40 O,O0 0,40 184,40 0,00 2,30 O,O0 O,OO 20,80 5.10
C- 0,00 0.00 O.OO 0.50 0,00 0,00 O,O0 0.00 0.00 O.OC
A-- O.OO 0.00 0.0C 0.0C 0.00 C.CO 0.00 O,OO 0.00 O,OCP- O,OO 0.00 O,OO 0.00 0,00 0,00 0,00 0.00 0.00 O.OOC- 0.00 0,00 0.00 O,OO 0.00 C.O0 0,00 0.00 0.00 O.OC
A- 0,00 0,00 Z,O0 Z,O0 0,00 IQg,CC O,CO 0,00 b,O0 4,00P- 0.00 0.00 2.00 1.60 0.00 93.60 0.00 0.00 7.00 3.4CC- 0,00 0,00 0.00 O,OC 0.00 2.IB 0,00 C.O0 0.17 O.Oq
A- 0,00 0,00 O,OC 0,00 0,00 C,O0 C°CO O,O0 0,00 O.OCP- 0,00 0,00 O,O0 0,00 0°00 C,O0 O,O0 0.00 0.00 O°OG
C- 0,00 0,00 0,00 0.00 O.CO C.O0 O.O0 0,00 0.00 O.OG
A- 0,00 0.00 O,OC O,OC 0,00 C,O0 C,O0 0,00 0.00 O.OCP- 0,00 0,00 O,OC O,OC O,O0 O,O0 0.00 0,00 0,00 q. OG
C- 0.00 0.00 0°00 0.00 0.00 0.00 O°CO 0°00 0.00 0.00
A- 3,00 2,00 25,CC 20.0C 0.00 6.00 0.00 O.OO 232.00 5.CCP- 3.60 2.70 26.10 lg.8C 0.00 5.70 0.00 0.00 234,20 6.30C- 0°00 O.O0 0.05 O.OO 0.00 0.02 0.00 C.O0 0.02 0.3_
NUMBER OF CELLS = LqDEGREES OF FREEDOM = 18CHI--SQUARE = 4,175
t- AVERAGE OF lO PREDICTIONS

153
TABLE 75
GOODNESS OF FIT MATRIX FOR TCILUSING THREE PREVIOUS LDOKPOINTSAND ONE CONTROL STATUS,A=ACTUAL TRANSITIONS
P=PREDICTED TRANSITIONS €C'CHI-SOUARE VALUES
AS ROLL CBARS ALT ADF HSI IVSI ENG NON ROWA-- 78.00 0.00 3.00 0.00 0.00 0.00 O.CO 0.00 0.00 3.0CP- 30.70 O,OO 0.80 0.00 0,00 0.00 0.00 O.OC 6,70 7,5CC- 2B.68 O.OO O.CO 0.00 0.00 0.00 O.OO O.OC 0,00 6,75
A- 0.00 72.00 3.00 1.00 0.00 C.O0 0.00 0.00 1.00 5.00P- 0.00 121.10 1,00 0.3C 0,00 O,OO 0.00 0.00 0,70 ?.OCC- O.O0 33,_8 0,00 O.OC 0.00 C.O0 O,O0 0.00 0,00 1,8C
A- 1.00 _.00 _3.00 _.00 0.00 0.00 O.O0 0.00 8,00 9,0CP- 0.30 2°30 2_8.q0 2.I0 0.00 O.O0 0.00 0.00 13.?0 4.70C- 0.00 0.00 85.0_ 0.00 0.00 0.00 0.00 0.00 _.06 2.05
A- O.O0 O.OO 1.00 12_.00 0.00 C.O0 0.00 0.00 9.00 l.OGP- 0,00 O.O0 O.TC 68.0C O.O0 0.00 O.OO 0.00 5.q0 0.70C- 0°00 0.00 0.00 25.29 0.00 0.00 0.00 0.00 L.07 0.0_
A- 0.00 0.00 0.00 O.OC O.GO 0.00 O.GO 0.00 0.00 O,OCP- O.DO O.OO 0.00 0.00 0.00 0.00 0.00 0.00 0.00 O.OCC- 0,00 0.00 0.00 0°00 0.00 0.00 0.00 0,00 0,00 0,00
A- O.OO 0.00 0.00 0.00 0.00 I_.00 O.CO 0.00 2.00 2.0CP- 0°00 0.00 0.00 0.00 0.00 9.10 0.00 0.00 7.90 7.gCC- 0.00 O.OO O.O0 O.OC 0.00 1.71 0.00 0,00 0.00 17._C
A- O.O0 0.00 O.CO O.OC 0.00 C.O0 0.00 0.00 0.00 O.OCP- 0.00 0.00 0.00 0.00 0.00 C.OO 0.00 0.00 0.00 O.OCC- 0.00 0.00 0.00 O.OC 0.00 0.00 0.00 0.00 0,00 O,OC
A- 0.00 0.00 0.00 0.00 0.00 C.O0 O.CO 0.00 0.00 O.OCP- O.OC O.OO 0.00 O.OC 0.00 C.O0 0.00 0,00 0.00 O.OCC- 0.00 0.00 0.00 0.00 0.00 0.00 O,OO 0.00 0,00 O,OC
A-- 2.00 1.00 11.00 5.0C 0°00 2.00 C.O0 O.O0 gZ.O0 5,0CP- 7.20 0.20 16.00 4._0 0.00 8.00 0.00 C.O0 322.00 15.40C- 0.00 0.00 2.27 0.07 0,00 C.O0 0.00 0.00 575,00 21.53
NUMBER OF CELLS = 16DEGREES OF FREEDOM = L5CHI-SGUARE = 8C6._22
*- AVERAGE OF 10 PREDICTIONS

154
TABLE 76
GOODNESS OF FIT MATRIX FOR TC5LUSING THREE PREVIOUS LOOKPOINTSANt ONE CONTROL STATUS.A=ACTUAL TRANSITIOhSP=PREDICTED TRANSITIONS $C=CHI-SQUARE VALUES
AS ROLL CBARS ALT AOF HSI IVSI ENG NON ROWA- 72.00 0.00 2.00 1.00 3.00 0.00 O.CO O.O0 3.00 9.0C
P- 45.00 0.00 1.10 O,qO 2,00 C.O0 0.00 C.OC 13.10 L7.1GC- 10.13 0.00 0.00 0.00 0.00 0.00 O.CO 0,00 0,00 7.zq
A- 0.00 66.00 5.00 O.OC 0.00 O.O0 0.00 0.00 _.00 4,0C
P- 0.00 63.30 5.70 0.00 O.OO 0.00 0.00 O.OO 3.50 3.50C- 0.00 0.11 O.IO 0.00 0.00 0.00 0.00 0.00 O.OO O.Oe
A- I.O0 9.00 263,00 3.00 1.00 l.CO O.CO O.O0 B.O0 6.00P- O.ZO 9.20 1BB.TC 1.00 0.60 0.00 O.CO 0,00 q,60 1,80C- 0.00 C.O0 ZO.gg O.OO 0.00 0.00 0.00 O.OO O,3Z 2.9_
A- 2.00 0.00 4.00 262.00 0.00 l. OO I.00 0.00 7.00 8.00
P- 2,20 0.00 3.60 Z46.10 0.00 O.BO 0.80 0.00 6.gO 7._CC- 0.00 0.00 0.00 o.q6 0.00 0.00 0.00 O.O0 O.OO 0.04
A- 1,00 0.00 0.00 0.00 13.00 1.00 O.OO O.O0 4.00 6.0CP- L.bO 0.00 0.00 O.OC L.gO 1.20 0.00 0.00 Z.O0 4,80C- 0.00 0.00 O.GO 0.00 9.48 0.00 0.00 0.00 0.00 0.2_
A- 0.00 O.O0 Z.00 O.OO 1.00 154.00 0.00 0.00 _.00 7.0CP- 0.00 0.00 1.20 0.00 0.40 171.80 0.00 O.O0 3.20 _.BC
C- 0.00 0.00 O.OO 0.00 O.CO 2.06 0.00 0.00 0.00 O._q
A-- 0.00 0.00 0.00 O.OC 0.00 O,OO 1.00 0.00 1.00 2.00
P- 0.00 O.O0 O.CC O.OO 0.00 C.O0 0.60 0.00 0,80 l._CC- O,OO 0.00 O.CO 0.00 0.00 0.00 0.00 0.00 0.00 0.18
A- O.O0 0.00 0.00 0.00 O.O0 0.00 O.OO O.O0 0.00 O.OCP- 0.00 0.00 0.00 O.CC O.CQ C.OO 0.00 0.00 O.OO O,OC
C- 0.00 0.00 O.OC O.OC 0.00 0.00 0.00 0.00 0.00 0.00
A- 5.00 0.00 I0.00 11.00 l. O0 4.00 0.00 O.O0 67,00 5.00P- 13.20 0.00 8.10 12.60 1.80 2.80 O.CO O.O0 168.50 4.60C- 13.45 C.O0 0.36 0.23 0.00 0.00 O.CO 0.00 153.76 0.03
NUMBER OF CELLS = ZZDEGREES OF FREEDOM = ZlCHI-SQUARE = 223.437
=- AVERAGE OF LO PREDICTIONS

155
Appendix C
Program i
Fortran Program to Perform Linear Interpolationsfor Control Position, Aircraft Position,
and Instrument Readings

156
DIMENSION XO(3,I0,S),E(S,I0,12),A(S,I0,12),R(3,I0,12),T(3,I0,12)l,Fl(3,10),F2(S,IO),PIT(S,10,12),ROLL(3,10,12),HEAD(3,10,12)2,ALT(S,I0,12)yAS(Sy10,12),XIVS(StI0112)iNO(S,101S),XGS(3,10112)3,XLO(S,I0,!2),NA(8)INMN(15)COMMON H(4,3)II=27
I2=19I3=31
WRITE(2,99)II, I2, II,I399 FORMAT(4A1)
777 MRITE(I,992)992 FORMAT(2OX,' STATUS OF SUBJECT? ',/,20X,' 1= PILOT '
I,/,20X,' 2= COPILOT',/,2OX,' 3= IP ',///,25X,'>')READ(1,993) NSTAT
993 FORMAT(II)RX=66.RY=132.IF(NSTAT.EQ.2)RX=60.IF(NSTAT.EG.2)R¥=I20.IF(NSTAT.GT.S)GO TO 777HRITE(I,990 )
990 FORMAT(2OX,' WHAT IS THE FILE NAME ? ',/,120X, ' EXAMPLE : >IPIECT DAT<CR> ',///,25X,">')
991 FORMAT(SA2)READ(I,991) NA
CALL OPEN(9,NA,2)WRITE{I,888)
888 FORMAT(//,2OX,' WHICH MANEUVER IS BEING SAMPLED ? ',I//,25X,'>')READ(I,S89)NMN
889 FORMAT(tSA2)
778 WRITE(I,994)994 FORMAT(2OX, ' HOW OFTEN DO YOU WANT THE DATA SAMPLED 9 ,
1,/_20X,' I= I SAMPLE PER SECOND ',/,20X,' 2= I0 SAMPLES PER2SECOND ',/,20X,' 3= 30 SAMPLES PER SECOND ',///125X,'>')READ(I,993) NCNTIF([email protected])NNCT=IIF([email protected])NNCT=IOIF(NCNT.EO.S)NNCT=30IF(NCNT.GT.S)GO TO 778JE=ILE=IJX=ILX=IIF(NCNT.EQ.2)_E=IOIF(NCNT. EO.2)JX=I
IF(NCNT. EO.2)LE=IIF(NCNT. EO.S)JE=IOIF(NCNT.EO.3)LE=3WRITE(I,145)
145 FORMAT(///,SX,' FROM WHICH SECOND WOULD YOU LIKE THE SAMPLING ',I'TO BEGIN ? ',/,SX,' (USE 13 FORMAT! E.G. "015") ',/////,25X,'>')READ(1,3S3)NSB
333 FORMAT(I3)
779 WRITE(I,14B)
148 FORMAT(IX,///,' IS THERE A SPECIFIC SECOND WITHIN THE DATA ',

157
I'WHERE YOU WANT THE SAMPLING TO END ? ',I//_28X, ' i= YES_-".=? NO ',III,35X, '>')READ (i,993) NSQIF(NSQ. EQ.I)GO TO 153IF(NSQ. EQ.2)NSE=9_9IF(NSG. NE.2)GO TO 779GO TO 775
153 WRITE(I, IbO)160 FORMAT(///,15X, ' AT WHICH SECOND WOULD YOU LIKE THE SAMPLING
i TO END? ',/,15X,' (USE I3 FORMAT! E.G. "065") ',/////,25X,'>')READ (i,333) NSE
775 WRITE(I, 611)ell FORMAT(///,5X, ' WOULD YOU LIKE THE NAME OF THE INSTRUMENT',
I' FOR EACH OCULOMETER NUMBER? ',///, 28X, ' i= YES 2= NO ',///,235X, '>' )READ (i,993) INSTIF(INST. EQ.2)GO TO 175IF( INST.GT.2)GO TO 775WRITE(2, 61S)
613 FORMAT(SIX, ' OCULOMETER NUMBER ',15X, ' INSTRUMENT NAME ',/,iSIX, 19('-') i5X,19('-'),//,41X, ' 0 ',22X, ' NON-SPECIFIC TRACK ',2/,41X_ ' i ' 22X, ' OUT OF TRACK ',/,_IX, ' 2 ',22X, ' WINDSCREEN ',3/,41X, ' 3 ' 22X, ' AIRSPEED ',/,_IX, ' _ ',22X, ' ROLL INDICATOR ',4/,41X, ' 5 ' 22X , ' COMMAND BARS ',/,41X, ' b ',22X, ' GLIDE SLOPE ',
' 8 ' 22X1 ' LFT ALTIMETER ',5/,_IX, ' 7 " 22X, ' LOCALIZER ',/,_IX,6/,%IX,' 9 ' 22X, ' RT ALTIMETER ',/,41X,' iO '21X,' RAD',
' 12 ' 21X, ' HSI ',7" ALTIMETER ',l,41X, ' II ',21X, ' ADF ',l,4iX,8/,_IX, ' 13 ',2iX, ' IVSI ',/,41X, ' 14 ',21X, ' BACKUP ATTITUDE ',8/,_IX, " 15 ',21X, ' FUEL QUANTITY ',/,SSX,8' 16 - 24 ',igx, ' ENGINE INSTRUMENTS ',/,S8X, ' 25 & 26 ',igX,9, ' FUEL FLOW ',////////)
i75 WRITE (1,8)8 FORMAT(/////,25X, ' THE FILE IS OPEN ')
WRITE (2,17)NA, NNCT, NMN17 FORMAT (54X,' FILE : ',8A2,/,5_X,' DATA ARE AT ',I2,' PER SECOND 'i, /,54X, " MANEUVER : ',15A2)WRITE (2,18)
18 FORMAT (/,SX, 'T',IX, 'OCU',SX, 'STICK',5X, 'WHEEL',SX, 'RUD P',5X,i 'THR' ,6X, 'PITCH' ,6X, 'ROLL',6X, 'HEAD' ,6X, 'ALT' ,5X, 'SPEED' ,7X, 'IVSI '2,5X, 'GLIDE',SX, 'LOCAL')XM=O •IT=OACNT=ONCAL=iONT=O.DO 51 I=i, SDO 52 J=i, iODO 53 K=i,12E(I,J,K)=O.A(I, J,K)=O.R(I, J,K)=O.T(I,J,K)=OXO(I, J, i)=O.XO(I, J, 2)=0.XO(I,J,3)=O.Fi(I, J')=O.F2(I,J)=O.
PIT(I,J,K)=O.ROLL(I, J,K) =0.HEAD( I,J,K) =0.

158
ALT(I,J,K)=0.AS(IFJpK)=O.XIVS(I,J,K)=O.XOS(I,J,K)=O.XLO(I,J,K)=O.
53 CONTINUE52 CONTINUE51 CONTINUE
101 ACNT=ACNT+IIF(ACNT.EO.I. )M=IIF(ACNT.GT.i. )M=3DO 2 I=M,SDO 3 J=i,1-0READ( 9,41,ERR=200,END=548) XO(I,Jpi),E(ItJ,2)FA(I,I,3),R(I,J,4)i,XO(I,J,2),T(I,J,6),FI(I,J),F2{I,J),XO(I,J,3)
41 FORMAT(gFS.0)3 CONTINUE2 CONTINUECALL CINTP(E,2)CALL CINTP(A,3)CALL CINTP (R,_)CALL CINTP(T,6)DO 70 I=l,3IH=ODO 71 J=I,10IF(F2(I,J).EO.-2048.)GO TO 106IH=IH+I
71 CONTINUE106 DO 500 M=I,4
MM=IH-4+MIF(MM.LT.1)MM=MM+I0H(M,I)=MM
500 CONTINUEIH4=H(I,I)IHS=H(2_I)IHS=H(S,I)IH7=H(4_I)PIT(I, IH4, 7)=Fl(I_IH4)ROLL(I,IH4,8)=F2(I,IH4)IF(I.LT.3)GO TO 790XM=FI(I,IHS) - FI(I-I,IHS)IF(ABS(XM).GT.2048)GO TO 689GO TO 790
689 IF(FI(I,IHS).GT.FI(I-I,IHS|)GO TO 89_.890 FI(I,IHS)=FI(I_IH5).4096.
GO TO 790891 FI(I,IHS)=FI(I,IH5)-4096.790 HEAD(I,IHS,7)=FI(I,IHS)
ALT(I,IHS,8}=F2(I,IHS)AS(I,IH6,7)=FI(I,IH6)XIVS(I,IH6,8)=F2(I,IH6)XOS (I,IHT,7)=FI(I,IH7)XLO(I,IHT,8)=F2(I,IHT)
70 CONTINUECALL SINTP(PIT,7)CALL SINTP(ROLL,8)CALL 5INTP(HEAD, 7)CALL SINTP(ALT, 8)CALL SINTF (AS,7)CALL SINTP(XIVS,8)

159
CALL SINTP (XGS, 2)CALL SINTP(XLO, 8)I=2DO 44 J=l,10DO 4¢ K=I, 12PIT( I,J,K) =PIT( I,J,K)I€0.96ROLL (I,J, K )=ROLL( I,J,K)/€0.96HEAD(I, J,K)=(HEAD(I,J,K)+2048)III.S8ALT( I,J,K)=(ALT( I,J,K)+2048)I: ¢096AS(I,J, K)=(AS(I,J,K)+2048)I16. S8XIVS(I_ JyK)=(XIVS(I_JpK)I(-20.48))*60
XGS(I,J, K)=XGS(I,J,K)11024XLO( I,J,K) =XLO(I, J,K)/I02€T(I,J,K)=((T(I,J,K)+¢99.)/1358. )*I00.E(I,J,K)=(E(I, J,K)*O. 00601)+I. 0576A(I, J, K)=(A(I,J,K)*0.0566)
R( I,JpK)=(R( I,J,K)*O. 00267)+. 085544 CONTINUE
I=2DO ¢5 J=1,10DO ¢5 L=I,3NO( I,I,L) = (XO(I,I,L)+RX)/RY
¢5 CONTINUEI=2NT=NT+IIF(NT. LT.NSB)GO TO I€7IF(NT. GT.NSE)GO TO 5¢8DO 73 I=I,JE, IXDO 74 L=I,LE, LXIF(L. EQ. I)K=IIF(L. EQ. 2)K=5IF(L. EQ. S)K=914RITE(2,5)NT, NO( I,J,L),E(I,J,K) ,A( I,J,K) ,R( I,J,K) ,T( I,J,K)
I, PIT( I,I,K) ,ROLL(I, I,K),HEAD( I,I,K) ,ALT( I,I,K) ,AS (I,J,K)2, XIVS( I,J,K) ,XG8 (I,J,K),XLO(I,J, K)5 FORMAT(IX, IS, IX, IS,12(Ix, Fg.3))
74 CONTINUE78 CONTINUE
147 CONTINUEI=2
DO 641 1=1,10E(I,J,2)=(E(I,I,2)-l.0576)/.00601A( ItJ, 3)=A( 1_I,3)/. 0566R( I,I, 4)= (R(I,J,€)-. 0855)/. 00267T(IyI, 6)=( (T(I,Jp6)/100. )*1358. )-€99
641 CONTINUEDO 75 I=I, 2DO 76 ,.T=1,10XO(I,I, 1)=XO(I+1,1,1)E(I,J,Z)=E(I+I,I,2)A(I,I,S)=A(I+I,Jt 3)R(I,J,€)=R( I+l,3,€)XO(I,I, 2)=XO(I+I_I_ 2)T( I,I, 6)=T( I+l,I,6)FI(I,J)=FI( I+i,J)F2(I,J)=F2(I+I,J)XO( I,J,3) =XO( I+1,I,3)
76 CONTINUE75 CONTINUE
GO TO lOl

160
200 HRITE(lt 77)7"? FORMAT( ' READ ERROR ')
GO TO 202548 IF(NSE. EO. 99g) NSE=NT
WRITE(I, 162)NSE162 FORMAT(//,2OX,' THE SAMPLING ENDED AT SECOND #',13,/)
HRITE{ $,78 )78 FORMAT( ///, 25X, ' END OF FILE ',//,25X)202 STOP
ENDSUBROUTINE CINTP(X,L)DIMENSION X(3, iO,i2)I=2DX=ODO 24 l=i, iODO 24 K=i,12KK=K-L.IF (KK)21, _'_2,"o._"
21 IF(J.NE.1)GO TO 212211 DX=X(I, J,L}-X(I-I, I0,L)
O0 TO 22212 DX=X(I, JvL)-X(I, J-i, L)
GO TO 2223 IF(J. NE. IO)GO TO 232
231 DX=X(I+It i_L)-X(Iv J,L)GO TO 22
232 DX=X(I, J+l, L)-X(I_ J,L)22 XKK=KK24 X(I,J,K)=X(I,I,L}+(XKK*DX/12. )
RETURNENDSUBROUTINE SINTP(X,L)DIMENSION X(3,10,12)COMMON H(4p3)DATA NC/O/NC=NC+IIi_(NC.GT. 8 )NC=iM= (NC+I)/2I=2LT=H (M,I+l)LM=H (M,I)LB=H (M,I-l)DX=ODO 55 J=l,lODO 55 K=I,12KK=( (J-I)*I2+K)- ((LM-I)*I2+L }IF(KK)21,51,23
21 DX=X( I,LM, L)-X (I-l,LB,L)X(I,O',K)=X(I_ LM, L)+(FLOAT(KK)*DX)/(120. +((LM-LB)*I2. ))GO TO 55
23 DX=X (I+l, LT, L)-X (I,LM, L)51 X(I,J,K)=X(I,LM_L)+(FLOAT(KK)*DX)/(120. +((LT-LM)*I2. ))55 CONTINUE
RETURNEND

161
Program 2
Fortran Program to Detect and Encode Control Movementsfor Stick, Wheel, Throttle, and Rudder

162
C THIS PROGRAM IS DESIGNED TO TRANSFORM CONTPOL PDS[TIONC DATA INTO CONTROL MOVEMENT OATAtWHERE:C 0 : NO CONTRqL MOVEMENTSC L = CONTROL DECISION IN PROGRESS(.I SEC PRIOR TO C_|C +2 = POSITIVE CONTROL MOVEMENTC STICK- • = NOSE UPC WHEEL- . = RIGHT TURNC THROTTLE- * = INCREASE POWERC -2 = NEGATIVE CCNTROL PCVE_ENT
DIMENSION OCU{16OO),S{IbOO),W(L6OC)gT(lbOO),P(IbOO),R(L_O0)L,XH(IbOO)_LT(16OC)gAS(I6OO),VSI(IbOO),LS(IbOC)gLw(LEO0)2,LT(1600)tNIO{I)COMMON NCTOP_N(ACCESS='SEQINOUT',UNIT=II,DEVICE='TTY')OP_N(ACCESS='SEQINt_UNIT=2ZgFILE=tWHAT.DAT',DEVICE=tDSK'!Op_N(ACCESS='SEQOUT'gUNIT=22,FILE='TEST.',DEVICE='nSR')OPEN(ACCESS='APPEND',UNIT=23,FILE='CMS.',DEVICE='DSK'|NCT=ODO lC I=l,15OOOCU(1)=OS{I)=O.W(1)=O.T{I)=O.P(1)=O.R{I)=O.XH(II=O.ALT(I)=O.VSI{I)=O.ASfI)=O.LS{I)=OLW{I}=OLT{I}=O
LO CONTINUEI=O
I00 I=I.lREAD(ZI,BO,END=2OO)OCU(I),S(I),W(I)_T{I),P{I|,R(1),XH(Ii
L,ALT(1),AS(I),VSI|I)80 FORMAT{I_,B{Fg.3)_FLO.3)
NCT=NCT.IGO TO I00
200 CONTINUECALL CNTRLfS_.3OI_LS,LSEV)CALL CNTQL(W_3.0,LW,LWEV)CALL CNTRL(T,I.5,LT,LTEV)DO 25 I=I,NCTWRITE(22,QO}CCU(I),LS(I),LW{I),LT(I),PfI),R(1),XH(1)
I_ALT(II_AS{I|tVSI(I|90 FORMAT(4(IX_I3),5(IX,FS.3),IX F9.3)Z5 CONTINUE
WRITE(II,516!516 FORMAT{2OX, e SUBJECT ID e)
READ(IIt517)NID_17 FORMAT(IAS)
WRITE(23,gL)NID,LSEV,LWEVtLTEV
91 FORMAT(IOXtLA5tlOX_I4,1OX_I_IOX_I4|STOPENDSUBROUTINE CNTRL{X,CRIToLX,NEVENT)DIWENSIDN X(15OC),LX(I_OO)COMMON NCT

163
LOGICAL SGNTST,ONEPASNEVENT=OPCNT=.05SGNTST=.TRUE.ONEP_S=.TRUE°ISFLGS=O
O0 I I=31,NCTCALL AVGY(.YIAVGY,X{I-30|I
CALL AVGY(Y2_VGY,X(I-I_))IF(ABSKY2AVGY-YIAVGY).LT.(PCNT*CgIT))SGNTST=.FaLSE-VALUE=(X{I}-X(I-30))IF{ABS{VALUE).GE.CRIT)GO TO llOIF((ABS(X(II-X(I-ISII.GT.CRITI.AND.SGNTSTILX{II=2*ISGNIFI,NOT.ONEPAS)GO TO 1ONEPAS=°FALSE.CALL CORNER|X(I-3OI_JMAX,-I.)O0 9q K=JMAX,31LX(I.K-31)=O
gg CONTINUEGO TC l
ii0 ISGN=+IIF(VALUE.LT.O.)ISGN=-ILX{I}=2*ISGNIF(°NOT°SGNTST)GO TO 120IF{ISGN,NE.ISFLGSI GO TO LZOIF{ONEPASIGO 10 1ONEP_S=.TRUE.
DO 91 J=l,50IF(LX{I-JI.NE.OIGD TO I
91 LX{I-JI=LX{IIGO TO l
120 ISFLGS:ISGNSGNTST=.TRUE.ONEPAS=.TRUE.NEVENT=N_VENT.ICALL CDRNER{X(I-30),JMAX_.I.)LX(I*J_AX-321=[LX(I+JMAX-33|=lLX{I.JMAX--3_}=IO0 3 K=JMAXt31LXfI.K-31)=Z*ISGN
3 CONTINUE1 CONTINUE
RETURNENDSUBROUTINE AYGYKXgXX)DIMENSION XX{15)X=O.DO I I=1,15X=X+XX{I)
I CONTINUEx=x/15RETURNEND
SUeROUTINE CCRNER(Y,JM&X,SS)DIMENSION Y(3I)JmaX=OXOEL=O.DELf(Yf3I)-Y(1))/]O.IF(D_L.LT.O. IR_L=-[,

164
IF(DEL.EQ.q. IREL=G.IF(DEL.GT.O. IREL=.[.O0 2 J=2,30TDEL=(Y(If.(J-II*DEL-Y(JIf_REL_$SIF(TDEL.LT.XDEL)GO TO 2
XDEL=TDELJMAX=J
2 CONTINUEQETURNEND

165
Program 3
Fortran Program to Predict Each Pilot's Lookpoint (LP)
at Time, _, Using 3 Previous Lookpoints
(LPt_ 3, LPt_2, LPt_I) , where _ = 1/30 of A Second

166
C THIS PPGGRAB USES THREE PREVIOUS LPS TO PREDICT ThEC FOURTH.
DIMENSIGN LP(1600|,X(g,g_gggI_XN(g_g,9|OPENfACCESS='SEQIhOUTt,UNIT=I1,DE_ICE=tTTY °)OPEN(ACCESS=ISEQIN'tUNIT=ZI_FILE='PCllLZ,RED',DEVICE='DSK t)OPENfACCESS=eSEQOUTI,UNIT=Z2,FILE=JPCIIL.PRE',DEVICE=IDSK I}OPEN(ACCESS=ISEGOUTt,UNIT=23,FILE=IpCLIL.PRB',DEVICE=IOSK°;CALL TIME{|,J)IR=(Jl_Og6)CALL SETRAN{IM)DO 55 I=l,1600LPtl)=O
55 CONTINUEDO 56 I=l,qDO 56 J=lggDO 56 K=l_qXNfI,J,K)=O.00 56 L=I,9X{I_J,K,L;=O.
56 CONTINUETN=O.
NCT=OI=O
I00 I=I.l_EAD(21,80,END=2OO|LP(I)
80 FORMAT(I{2X,12|)NCT=NCT+IGO TD IO0
200 CONTINUEDO L I=4,NCT_=LP(I)L=LP(I-L|K=LP(I-Z}J=LPfI-3|X(JgKgLtM|=X(J,K,LgM)*I.XN{J,K,L)=XN(J,K_L|.I.
l TN=TN.I.DO 2 J=l,9DO Z K=I,9DO Z L=I,9IF(XNfJ_K,L|.EQ.O. IGO TO 2XNfJtKtL')=XN(JtKtL)/TN
2 CONTINUEDO 3 J=199DO 3 K=lygO0 3 L=ltgO0 3 M=I,9IFfX{J,K,L,MI.EQ.O.)GO TO 3XfJ1K_LtM)=X(J,KgL,M}/TNX|JtKtLtM|=X{J,K_L,M)IXNfJgK_L)
3 CONTINUEDO 5 J=L99OO 5 K=ly9O0 5 L=L,9DO 9 M=2_g
5 X(J_K,LIM|=X(J_K_L,MI*X(J,KgLIM-1}DO bbb I=I,9O0 666 J=l,9DO b66 K=l,9DO bbb L=lt9

167
WRITE(23,_b6_)X|I,J,KtL}b666 FORM_T([email protected])
666 CONTINUE
DO 9ggQ 11=1,i0JfQK=OL=OO0 999 I=_,NCTIF(I.EQ.3 JfLP(I-31IF(I.EO.3 K=LP(I-2)IF(I.EQ.3 L=LP{I-I)IF(I.GT.3 JfKIF{I.GT.3 K=LIF{I.GT.3 LfIPP=RAN(XX)O0 6 MffilggIF(P.LE.X{JtKtLtM)|GO TO 7
6 CONTINUE7 IPfM
WRITE(Z2,BIIIP81 FORMAT{I(16)I
ggg CONTINUE999g CONTINUE
STOPEND

168
Program 4
Fortran Program to Compute Entropy

169
DIMENSION SUM(1G,IO}_PER(LO,LOI_NN(I|
I,SUMC(IC),SUMR{IOI,SUMPC{IOI,SUMPR{LOI,UNC[8]NNS=OSU_P=O.npEN(ACCESS='SEQIhOUT',UNIT=LI,D@VICE=eTTYtlOPEN(ACCESS='S_QI_t,UNIT=21,FILE=IWHAT.DAT',DEVICE=tDSK'IOPEN{ACCESS='APPFhO I,UNIT=22,FILE='ENTD.ALL' ,CEVICF=tOSK '|ENT=O.TC=O.TSR=O.TSC=O.TPR=O.TPC=O.NT=ODO qq I=I,I0DO 9g J=itlOSUM(T,J]=O.PER{I,J}=O.
9g CONTTNUEWRITEILI,8[)
8L FORMAT(LOX, I SUBJECT ID 11REAO(II,821NN
B2 FURMAT(ZA5)NT=LIF(NT.EO.1)NNT=30IF{NT._Q.Z|NNT=I5IF{NT.EQ.3)NNT=IOTF{NT.EQ.4INNT=6IF(NT.EQ.SINNT=5IF(NT°EQ.6|NNT=3IF{NT.EQ.7)NNT=2IF(NT°EQ°8|NNT=IIF(NT.EO,Z|NC=IIF(NT.EQ.2)NC=2IF{NT.EQ.3INC=3IF(NT.EQ._) NC=4IF(NT._Q.5INC=5IFINT.EQ.6)NC=gIF(NT.EQ.7|NC=I_IFfNT.EQ.8INC=2gREAD(21,85)I
85 FORMAT{14]I00 M=I
IF(NC.FQ.2IM=2IF(NC.EQ.3IM=200 55 K=M,NCIFfNC.EQ.1IGO TO 55READ(2[_38,END=2OOILM
38 FORMAT(I1]55 CONTINUE
REAOIZI_85,END=ZOOIJSUM(ItJ}=SUM(I,J).[.T=JTC=TC.L.GO TC LO0
200 CONTINUE00 3C [=I,IODO 30 J=l,lOIF(SUM(I,J].EG.C. IGO T_ 30PER(ItJI=PER(I,J|*(SUM(I,J)/TC|

170
30 CONTINUESUwP=0,DB gOO I=i,ICD0 qoo J=I,L0IF(PER(I,J}.EQ.0.00)GO Tq g00SUMP=SUMP.PER{IgJI*|ALOGIO{PER(I,J}I/{ALOGIO(2.|)|
gO0 CONTINUEENT=ENT.(-SUMP|WRITE|22,bbbINNeENT
_66 FORMAT{IOX,I_5,10X,F?.5|STOPEND

171
Program 5
Fortran Program to Computer Entropy Rate

172
C THIS PRGGRaM IS _ESIGhED TC COMPUTE FNTRDPY RATE.FOURC MATRICES ARE NEEDED:C L.MATRIX I_DICATING THE NUMBER OF TRANSITIONSC BETWEEN EACh PAIR OF INSTRUMENTS[O DIAGONALC ENTRIES)
C 2."ATRIX INDICATING THE TRANSITIONAL PROBABILITIESC BETWEEN EACH PAIR OF INSTRUMENTS.C 3."ATRIX INDICATING THE SUM OF DWELL CCUNTSC BETWEEN EACh P_IR OF INSTRUMENTS.
C 4.MATRIX INDICATING AVERAGE DWELL TIME FOR EACHC PAIR OF INSTRUMENTS:
C DT[I,J)= h OF DWELLS FOR I£JIN OF TRANS FOR I&Jl30C ENTROPY RATE= -SUM OF PfI,JICLOG2 P(I,J)IDT(I,J)
DIMENSION LP(1600},NT(IO, LO),NR(1C),NC(lO)gPT(IO,LO)I,SCP{IO),SRP[IOI,T(LO,IOI,ND[IO,IC),NRD[IO),NCD(IO)2,NN(1),PD|IO,IO],SRPD(13),SCPD(IO),XND(LO_IO)COMMON NCT,NTT,TPITPD,SUWtENTOPEN(ACCESS='SEQIkOUT',UNIT=II,DEVICE='TTY')OPEN(ACCESS=ISEQIN',UNIT=Z1,FILE='TCISLC.NEWt,DEVICE=,DSK ,)OPEN(ACCESS='SEQOUT',UNIT=2Z,FILE='TCISLC.ENTR',DEVIC£='flSK,)OPEN(ACCESS='APPEND',UNIT=23,FILE='ENTR.ALL'_CEVICE='DSK')NCT=OI=OTP=O.NTT=OXTT=O.TP=O,ONTO=OENT=O.SUM=O.
DO 1 I=i,1600I LP(1)=O
DO Z I=l,lODO 2 J=l,lONT{I_J)=OPT(ItJ)=O.T(I_J)=0,NDII_J]=OPDfI,J)=O,XND(I,J)=O.
2 CONTINUE00 3 I=l,lONR{I)=ONC{I)=OSCP(1)=O.SRPIII=O.NCD{I)=ONRD(1)=OSRPD(1)=O.SCPD[II=O.
3 CONTINUEI=O
1DO I=I+Z_EAD(ZI,80,END=ZOO)LP(1)
BO FORMAT{I_|NCT=NCT.IGO TO 100
200 CONTINUEWRITE(L1,61)
BI FO_MAT(/OX,* SUBJECT IO '1

L73
PEAD(II,_2)NN82 FORMAT(IA5|
CALL NTRANS{LPtNT,NR,NC,NTT,ND,NRD_NCDthTD)WRITE(22,B]|NN
83 FORMAT{//,IOX, tTRANSIIION MATRIX FOR SUBJECT ',IA5)WRITE(22,84|
84 FORMaT{I_3Xt'ASI'ZXo eROLL'°LX''CgARSetlX_'ALTI_2XL,e_DF,,ZX,'HSII,?X,'IVSI',IX,eENGI,2X,tN_Nt,2X,'OUTI"Z2X,'SUM')• DO _ Iffil,lOWRITF(22t85|fNT(I,J)tJ=I, IO|,NC(I|
85 FORMATIII{LX,14})4 CONTINUE
WRITE(ZZ,BSI(NR(II,I=I,LOI,NTTCALL PTRANS(_TtPTgSCPtSRPtTP,T)WRITE{22tBBINN
86 FORMAT{//_'TRANSITION PROBAeILITY MATRIX FOR SU£JECT ',LA51WRITE(22,8_81
888 FORM_T(I,4X_tASI_Xt IRCLLe_ZX_mCBARSI_3X'IALT'_XtIADF'It4X_IHSI,t3X,mIVSI't4X,IENG',4Xt'NON'_4X,'OUT'_X_'SUM')DO 5 Ifl,lOWRITE(22_B71(PT(IgJI,J=I, IO|tSCP(I|
87 FORMAT(IO(LX_FB.4),LX_F7.4|5 CONTINUE
WRITE(22,B7|(SRP{I}sIffiI,IO|_TPWRITE(22,88|NN
88 FORMATt//tIOXt' DWELL MATRIX FOR SUBJECT e,lA5)WRITE(22,84|DO 6 I=i,lOWRITE(ZZ,85)fND(I,JI,Jf/,IOI,NCD(I}CONTINUEWRITE{Z2,B5|(NRD{II,I=Z,IO|_NTDCALL PDWELLiNO,T,PD_SFPD,SCPD,TPD|WRITEi22tBqINN
8g FORMAT(//_ = DWELL TIPE MATRIX FOR SUBJECT ',IAS)WRITE{ZZ,8881DO 7 I=I,I0WRITE{22,87|fPDfltJI,J=/,/O),SCPO(I]
7 CONTINUEWRITE{Z2,87)(SRP_(1)_I=I_IOI,TPDCALL LENTRfPT,PD_ENT|WRITE(Z2_gO)NNtENT
90 FORMAT{lit' THE ENTROPY RATE FOR SUBJECT ',IAS,'IS ',F7.51WRITE(_3,5551NN_ENT
555 FORMAT{IOX_AS_LOX_F7.5|STOPENDSUBROUTINE NTRANS(LPthTtNRthCtNTT,NO_NROtNCD_NTD|COMMON NCTtTPtTPD,SUMt_NTDIMENSION LP(16CO},NT(IOtIO|tNR(IO}sNC{IOI_ND(IO'ED)
L_NRD(EO)_NCD(EO|I=OLCNT=OMCNT=O
tO0 I=I.[IF(LP{I.II.E{.LP(I|)ICItl02
I01LCNT=LCNT.LGO Tn ton
102 IFILCNT.LT.3|IO2,104103 LCNT=O

174
GO TO lOOI0_ L=LP([I
I=I.l
O0 I J=I,hCT-LIF(LP{J+II.EQ.LP(JII1059106
105 MCNT=MCNT.LGO TO I
LOb IF(MCNT,LT,3)I07,IO8L07 MCNT=O
GO TO I
lOB M=LP{JIIF(L.EQ.MILCNT=LCNT.MCNTIFfL.EQ.M)MCNT=OIF(L.EQ.M|GO 10 INT(L,Mt=NT(LgM).INOfL,MI=NO{L,M|*LCNT_MCNTL=MLCNT=MCNTMCNT=O
I CONTINUEDO 2 I=l,f300 2 J=l,lONR[J}=NR(JI+NT(I,J)NRD(J}=NRD[J)eNC(I,J)NC(II=NC{I).NT{I,J|NCD(II=NCDfII.ND{I,J)NTT=NTT.NTfI_J)NTD=NTD.ND(I_J)
2 CONTINUERETURNENDSUBROUTINE PTRANS(NT,PT,SCP,SRP,TP,T)DIMENSION NT(LOIIO),PT(1OtLO},SCP(IO)tSRP(IOI,T(IO,LO|COMMON NCTeNTTXTT=NTTDO 1 I=1,10OO I J=L,IO
I T(19J)=NTEIgJ)nO 2 I=l,1000 2 J=l_lOIF{T(I,J].EQ.O.)GO TO 2PT(I,JI=T(I_JIIXTTSRP(JI=SRP(JI.PTII,J)SCP(I)=SCP[I)+PT(I_J)TP=TP.PTIItJ)
2 CONTINUERETURNENDSUBROUTINE POWELL(ND,T,PD,SRPD,SCPD,TPO)DIMENSION ND{IOglG)_T|IO_LO)_XND(IOglO)tPD(IO_IO|_SRPD{IO)
L,SCPD(LO|COMMON NCT,NTTDO i I=l,lO00 I J=l,lO
I XND(I_J)=NDfI,J}DO 2 I=1,I0DO 2 J=i,lOIF(TfI_J)._Q.O.|GG TO 2PD(I,J)=XND(I_J)/T[I,J)/30
2 CONTINUE

175
00 3 l=l,lO00 3 J=/,lOSRI30(J)=SRPD{Jt+PD(I,J)SCPDflI=SCPO(1)+POII,J)TPD=TPr)_-PD(I,J)
3 CONTINUERETURNENDSUBROUTINE L__NTRf PT,PD_ENT)OIME_SION PT{IO,LOI,PD(IO_IO|DO I l--L,lO00 I J=l,lOIF(PDflgJ}.EO.O.}GO TO ISUM=SUM+(PT(ItJ)_(_LOGLO(PT(I_J}/ALOGLO(7.I)))/PO( I,Jl
l CONTINUEENT=-SUMRETURNEND

176
Program 6
Fortran Program to Predict Each Pilot's ScanningBehavior for the Right Segment of the Steep Turn Maneuver
Using Each Pilot's TransiTional Probabilitie6Computed in the Left Segment

177
C THIS PRCGR4M IS CESIGN~D TO REAC IN ThE CONDITIO~AL PRCBABIlITIESC FOR SEGM~NT X ANC T~E FIRST 3 LPS ~RO~ SEG~ENT Y TO TO T~ST HOWC WEll THE SCANNING STRATEGY FOR S;G~ENT X WILL P~EDICT THE lPSC IN SEG1"ENT Y.
DIMENSION Xfq,q,q,qlQPF.~fACCC.SS='SEOI~OUT',UNIT=ll,O~VICE='TTY'1
OPEN(ACCESS='S~CI~',U~IT=21,FIlE='TClll.PRe',CFVTCE='aSK'I
OPEN(ACCESS='SEanUT',UNIT=23,FIlE='TC15l.3p.E',nEVICE='aSK"CALL TII1FfI,JIIt1=f J/40<HdCALL SETRANf 1M)00·1 1-=1,qDO 1 J-=1,<;DO 1 K=1,QDO 1 L=1,QREAD(Zl,8CIXrI,J,K,ll
80 FQRMAT(2X,F8.611 CONTINUE
WRITEfll,5001500 FORMATflOX,'lPl"
REAOfll,501llPl501 FORMAHIlJ
IoiRIP:(1l,50ZJ502 FORMATfl0X,'LPZ')
REAOfll,501ILP2WRITEfll,503)
~03 FORMATf10X,'lP3')QEADCll,50UlP3WRITE( 11,504)
504 FORI1ATflOX,'lENGTH')READfll,50S)NCT
505 FORMAT( I'll00 qqqq 11-1,10DO qqq N-4,NCTIFfN.EQ.4>"I=lPlIFfN.EQ.4JJ=LP2IFfN.EO.4)I(=LP3IFfN.GT.4JI=JIFfN.GT.4JJ=1(IFfN.GT.'t)I(=IPP=RANfXX)1)0 6 l'l,9IFfP.lF.Xfl,J,K,LJ)GO TO 7
6 CONTINUE7 IP=l
WRITEf23,8ZJ IP8Z FORMATflfI6J)
qqq CONTINUE9q99 CONTINUE
STOPEND

,178
Program 7
Fortran Program to Predict Each Pilot's Lookpoint (LP)
at Time, _, Using S Previous Lookpointsand i Control Status (CS) Measure
(LPt_3, LPt_2, LPt_I) , where _ = 1/30 of a Second

i 179
C THIS PROGRAM USES 3 PRrVICUS LPS AND I PREVIOUS CCNTROL ST^TUSC TO PREDICT LP.
DIMENSIOF LP(1600|,NCS(tBOOJ,X{9,q,q,_,g),XN(_,q,9,_)OPEN(ACCESS='SEQIhOUT',UNIT=II,DEVICE='DSK')GP_N(ACCESS='SFGOUT',bNIT=_3,FILE='COATES.MAT',DEVIC_='DSK')OPEN{ACCESS='S6QIh'_UhIT=ZI,FILE='TCIILZ.RED',OEVICE='DSK')OPEN{ACCESS='SEGOUT',UNIT=ZZ,FILE='TCIIL.ZQE',_EVICE='D3v')CALL TIME(I,J!IM=(JI4Og6)CALL SETRAN(IM)DO 55 T=I,16C0LP(I}=ONCS(T)=O
55 CONTINUE
DO 56 I=I,9O0 56 J=i,q00 56 K=ItgO0 56 L=114XN(I,J,K,L)=C.CO 5b M=l,qX(I,J,K,L,_)=O°
56 CONTINUETN=O.NCT=OI=q
IO0 I=I+l
READ{21,BO,ENO=ZOOILP{II,NCS{I)80 FORMAT(Z{ZXtI2))
NCT=NCT.IGO TO LO0
200 CONTINUEDO 1 N=4,NCTM=LP(N}L=NCSIN-I)K=LP(N-1IJ=LPfN-2|I=LP(N-3)X(I,JtK,L,MI=XII,J,K,LeM}.I.XN(I,J,K,LI=XN(I,J,K,L)+I.
I TN=TN.[.DO 2 I=1_9O0 2 J=1,gDO 2 K=I,gDO 2 L=I,4IF(XN(I,J,K,L).EO.O.IGO TO 2XNII,J,K_LD=XNII_J,K,L)/TN
Z CONTINUE
DO 222 L=I,_O0 222 l=l,gWRITEK?3,777)L,I
777 FORMAT(/,15X,'CONT_OL STATUS n ',I2,/,15X,'LOCKPOLNT _ ',I?,/)O0 222 Jffil_9WRITE{Z3,778}IXN(I,J,K,L|,K=I,q|
778 FORMaT{Q(ZX_F6.5}}222 CONTINUE
DO 3 I=I,9O0 3 J=l,9O0 3 K=l,gO0 3 L=I_Q

180
DO 3 t1=l,QIFlX(I,J,K,L,M).EO.O.)GO TO 3XII,J,K,L,~)=Xll,J,K,L,M)/T~X(I,J,K,L,M)=Xll,J,K,L,~'/XNll,J,K,L)
J CONTINUEDO 5 l=l,qDO 5 J=l,qDO 5 K=l,qno 5 L=l,1t00 5 11=2,9
5 X(I,J,K,L,~J=XlI,J,K,L,MJ+X(I,J,K,L,M-l)
DO qqqq tI=l,lODO qqq N=lt,NCTIFlN.EO.4)I=LPIN-3)IFIN.EO.4)J=LPlN-2)IFIN.EO.4JK=LPIN-l)IFlN.GT.4)I=JIFIN.GT.4)J=KIFIN.GT.4JK=IPL=NCSI~-lJ
P-RANlXX)no b l'I""l,QIF(P.LE.XII,J,K,L,~)JGOTO 7
6 CONTINUE7 IP-=M
WRtTEIZZ,81)IP,NCSINJ81 FORMAT(ZrIbJl
qqq CONTINUEqqqq CONTINUE
STOPEND


1. Report No.
NASA CR-3908I2. Government Accession No. 3. Recipient's Catalog No.
4. Title and Subtitle
An Error-Dependent Model of Instrument-ScanningBehavior in Commercial Airline Pilots
7. Author(s)
Dennis H. Jones
9. Performing Organization Name and Address
Old Dominion UniversityNorfolk, Virginia 23508
12. Sponsoring Agency Name and Address
National Aeronautics and Space AdministrationWashington, DC 20546
5. Report Date
July 19856. Performing Organization Code
8. Performing Organization Report No.
10. Work Unit No.
11. Contract or Grant No.
NGT 47-003-801
14. Sponsoring Agency Code
505-45-33-0715. Supplementary Notes
Langley Technical Monitor: Randall L. Harris, Sr .. The information presented in this report was offered as a dissertation in partial
fUlf1ll~e~t of :he r~quirements for the Degree of Doctor of Philosophy, Psychology,Old Dom1n1on Un1vers1ty, Norfolk, Virginia, May 1983.
16. Abstract
The present research presents a new flexible model of pilot instrument scanningbehavior which assumes that the pilot uses a set of deterministic scanning patternson (1) the pilot's perception of error in the state of the aircraft, and (2) the pilot'sknowledge of the interactive nature of the aircraft's systems. Statistical analysesrevealed that a three-stage Markov process composed of the pilot's three predictedlookpoints eLP), occurring 1/30, 2/30, and 3/30 of a second prior to each LP,accurately modelled the scanning behavior of 14 commercial airline pilots whileflying steep turn maneuvers in a Boeing 737 flight simulator. Furthermore, themodelled scanning data for each pilot were not statistically different from theobserved scanning data in comparisons of mean dwell time, entropy, and entropy rate.These findings represent the first direct evidence that pilots are using deterministicscanning patterns during instrument flight. The results are interpreted as directsupport for the error-dependent model and suggestions are made for further researchthat could allow for identification of the specific scanning patterns suggested bythe model.
17. Key Words (Suggested by Author(s))
Pilot ModelPilot Scanning Behavior
18. Distribution Statement
Unclassified - Unlimited
Subject Category 53
19. Security Classif. (of this report)
Unclassified
20. Security Classif. (of this page)
Unc1ass ified
21. No. of Pages
192
22. Price
AOS
N-30S For sale by the National Technical Information Service, Springfield, Virginia 22161NASA-Langley, 1985


National Aeronautics and SPECIAL FOURTH CLASS MAIL Postage and Fees Paid
Space Administration BOOK National Aeronautics andSpace Administration
Washington, D.C. NASA-45120546
Official Business
Penalty for Private Use, $300
POSTMASTER: It"Undeliverable (Section 1S8Postal Manual) Do Not Return