19950008438.pdf - NASA Technical Reports Server
28
NASA Technical Paper 3467 CECOM Technical Report 94-E-1 Spatial Awareness Comparisons Between Large-Screen, Integrated Pictorial Displays and Conventional EFIS Displays During Simulated Landing Approaches Russell V. Parrish and Anthony M. Busquets Langley Research Center • Hampton, Virginia Steven P. Williams Joint Research Programs Office CommandControl and Systems Integration Directorate Communications Electronics Command Langley Research Center • Hampton, Virginia Dean E. Nold The George Washington University • Washington, D.C. National Aeronautics and Space Administration Langley Research Center • Hampton, Virginia 23681-0001 October 1994
-
Upload
khangminh22 -
Category
Documents
-
view
4 -
download
0
Transcript of 19950008438.pdf - NASA Technical Reports Server

NASA Technical Paper 3467
CECOM Technical Report 94-E-1
Spatial Awareness Comparisons BetweenLarge-Screen, Integrated Pictorial Displays andConventional EFIS Displays During SimulatedLanding Approaches
Russell V. Parrish and Anthony M. Busquets
Langley Research Center • Hampton, Virginia
Steven P. Williams
Joint Research Programs Office
Command�Control and Systems Integration DirectorateCommunications Electronics Command
Langley Research Center • Hampton, Virginia
Dean E. Nold
The George Washington University • Washington, D.C.
National Aeronautics and Space AdministrationLangley Research Center • Hampton, Virginia 23681-0001
October 1994

This publication is available from the following sources:
NASA Center for AeroSpace Information
800 Elkridge Landing Road
Linthicum Heights, MD 21090-2934
(301) 621-0390
National Technical In!brmation Service (NTIS)
5285 Port Royal Roa_
Springfield, VA 22161.2171
(703) 487-4650

Summary
Although modern flight decks now feature so-
pifisticated computer-generated electronic displays,
the display formats themselves are largely electronicrenditions of earlier electromechanical instruments.
New computer graphics capabilities nlake possible
large-screen, integrated pictorial formats to improve
situation awareness, pilot/vehicle interaction, and
aircraft safety with the potential for significant oper-atiollal benefits. The purpose of this research was to
COulpare the spatial awareness of coinmcrcial airline
pilots on simulated landing approaches using conven-
tional flight displays with their awareness using ad-vanced pictorial "pathway in the sky" displays. An
extensive sinmlation study was c(inducted in whictl
16 commercial airline pilots repeatedly performed
simulated conlt)lex microwave landing system (MLS)
approaches to closely spaced parallel runways with anextremely short final segment. Four separate display
configurations were utilized in the sinmlated flights:
a conventional primary flight and navigation displaywith raw guidance data and the Traffic Collision and
Avoi(tance System (TCAS) II; the same conventional
instrmnents with an active flight director; a 40 ° field-
of-view (FOV), integrated, pictorial pathway forinatwith TCAS II symbology; and a large-screen 70 °
FOV version of tile pictorial display. Scenarios in-
volving conflicting traffic situation assessinents and
recoveries fl'om flight path offset conditions were usedto assess spatial awareness (own ship position rela-
tive to tile desired flight, route, tile runway, and ()tiler
traffic) with the various display formats. The study
showed that tile integrated pictorial displays consis-tently provided substantially increased spatial aware-
ness over the conventional electronic flight informa-
tion systems (EFIS) display formats. Tim wider FOVpictorial display gave equivalent objective results as
the narrower pictorial format and subjectively was
preferred by 14 of tile 16 pilots. The other two pilots
had no preference between tile two pictorial formats.
Introduction
Advances in future airplane cockpits are being
made possible by the rapid progress in display ine-
dia, graphics and pictorial displays, computer tech-
nologies, and hunlan factor methodologies. These
technologies may enable the design of cockpits with
improved crew situation awareness and workload,safety, and operational efficiency during critical mis-
sion phases. (See ref. 1.) Govermnent and industry
research programs have been established to develop
and apply these technologies. One such progranl in-volves the use of "synthetic vision" to enable subsonic
transport operations when visibility is restricted and
to provide tile cornerstone technology for more ad-
vanced airplanes, such as a high-speed civil transport
that may have limited forward visibility because ofcomplex aerodynamic and economic requirements.
Various studies have been undertaken to assess
tile requirements (ref. 2) and to deternline the perfor-
mance (ref. 3) of synthetic vision systems. One stu(ty
(ref. 4) has indicated mnnerous potential benefits for
a future high-speed civil transport in which syntheticvision is used instead of lowering the nose (hiring
landing, taxiing, and takeoff maneuvers. Thesepo-
tential benefits include improved aerodynamic effi-
ciency, reduced weight, and as much as a 15-percent
reduction in takeoff gross weight through reduced fuelreserves. Synthetic vision capabilities are defined
herein as the resourceflll merging of imaging sen-
sors (such as fog-cutting sensors), pictorial graphics
displays incorporating geographic and feature data-t/ases, and advanced navigational aids (such as the
differential Global Positioning System). An ever-
increasing interrelationship between onboard capa-
bilities and airspace inanagement systems is also
generally accepted; therefore, higher levels of crewsituation awareness are required to iml)rove perfor-
mance and safety. (See ref. 5.) Initial investigations
are being conducted on cockpit flight displays to op-timize the spatial awareness component of situation
awareness. (See refs. 6 8.) This t)aper focuses on
large-screen, integrated pictorial dist)lays as an ap-
proach to synthetic vision technology and on opti-
mizing crew spatial awareness.
To understand situation awareness (SA) in civil
transport operations, a definition is necessary. Regal,
Rogers, and Boucek (ref. 8) state that SA implies
"that the pilot has an integrated understanding ofthe factors that will contribute to the safe flying ofthe aircraft under normal or non-normal conditions."
As SA increases, "the pilot is increasingly able to
'think ahead of the aircraft,' and . . . do this for a
wider variety of situations." This anticipation entails"a knowledge of present states, fllture goals, and
the procedures used to get from one to the other."
Regal, Rogers, and Boucek go on to expound that,
for the commercial pilot, another dimension of SAinvolves the individual components. One of the inore
important of these components is spatial awareness,
which in this paper involves knowledge of the own
ship position relative to the desired flight route, the
runway, and the other traffic.
The objective of the investigation reported herein
was to evaluate and compare the spatial awarenesscomponent of pilots using displays representative

EFIS w/o flight director
Primary flight displayNavigation displayTCAS II symbologySpeed commands
EFIS with flight director
Primary flight displayNavigation displayTCAS II symbologyRoll/pitch/speed commands
40 ° pictorial
Primary flight displayNavigation displayTCAS It symbologyRoll/pitch/speed commands
70 ° pictorial
Primary flight displayNavigation displayTCAS II symbologyRoll/pitch/speed commands
Figure 1. Spatial awareness study display formats.
of conventional electronic flight information systems
(EFIS) with two wide-field-of-view pictorial displayconcepts. (See fig. 1.) Two formats based on a
Boeing 757 instrumentation layout were used as the
representative conventional EFIS formats. Four al-
ternate display concepts were compared. The EFIS
formats, used as baselines, were identical except that
one incorporated a flight director (with pitch and rollcommands displayed on two perpendicular needles in
the attitude display) and the other forced the pilot to
employ raw deviation error (instrument landing sys-
tem localizer and glideslope indicators) without thebenefit of flight director guidance. Both formats were
included for calibration purposes, as spatial aware-
ness was hypothesized to be quite different for the
two conditions. For example, if the pilot concen-
trated only on centering the flight director needles,
awareness of surrounding events might suffer; if the
pilot er _ployed raw position errors, spacial awareness
might increase.
The two pictorial concepts were identical "path-way in the sky" formats, varying only in horizon-
tal fielc-of-view (FOV) presentations of 40 ° and 70 °.
PictoriM perspective displays with pathway formats
have been investigated extensively by flight display
researchers (refs. 6, 7, and 9-15) because of the po-tential benefit of enhanced SA. However, in those
studies, the researchers have not attempted to mea-
sure the. benefits directly. The investigation reported
in this paper was intended to test the hypothesis of
gains ir_ spatial awareness from the pictorial aspectsof the display formats. The investigation was cast
in terms of a single pilot who employs head-down
display:;. Further explanation of the display formats
follows in the section "Display Conditions."

Abbreviations
AGL above ground level
CRT cathode ray tube
DERP design-eye reference point
EFIS electronic flight information system
FMS flight management system
FOV field of view
HUD head-up display
ILS instrument landing system
MLS microwave landing system
ND navigation display
OTW out the window
PFD primary flight display
rms root mean square
SAL standard approach to landing
TCAS Traffic Collision and Aw)idance
System
VISTAS visual imaging simulator for transport
aircraft systems
VSI vertical speed indicator
Sinmlator Description
The Cockpit Technology Branch at Langley Re-search Center has developed a flexible, large-screen
flight display research system, the VISTAS (visual
imaging sinnflator for transport aircraft systems),which was utilized in this experiment. The simu-
lator contains the following elements: the simulator
visual system (visual system hardware and graph-
ics generation hardware and software), the aircraftmathematical model, and the simulator cockpit.
Simulator Visual System
The flexible core of the visual system is embodied
in dual, full-color, high-resolution cathode ray tube
(CRT) projectors that are configured to vary the pro-
jected display aspect ratio by matching the edges andoverlapping the images from each projector. Each
projected image is 15 in. high by 20 in. wide (stan-
dard 3:4 aspect ratio), so a maximum 15- by 40-in.image can be achieved. This maximum configura-
tion was used to present the four display concepts
for this investigation. The images are generated by
the dual graphics display generators that operated in
synchronization and used the same visual database
to produce a single, large-screen, integrated picture
(combined by the projection system onto the rear-projection screen that serves as the main instrument
panel for the simulated aircraft). Each generator pro-vides image resolutions up to 1280 x 1024 pixels in
a 60-Hz progressive scan format (per projector). As
the design-eye reference point (DERP) for transport
cockpit applications is typically about 28 in., the full40-in-wide display provides a maximum 70 ° FOV.
Aircraft Mathematical Model
A simplified six-degree-of-freedom mathematical
model of a two-engine, medium-weight transport air-
plane was used in this study. The linear transfer
functions and gains were obtained empirically to rep-resent a fixed-wing generic transport airplane. The
control system represented a system with a basic-ratecommand without attitude hold. Turbulence was in-
troduced into the inathcmatical model through the
addition of a disturbance component (a summation
of eight independent sine waves) to the roll rate vari-able. The level of turbulence was considered moder-
ate by the participating pilots.
Simulator Cockpit
The visual and interactive control elements of this
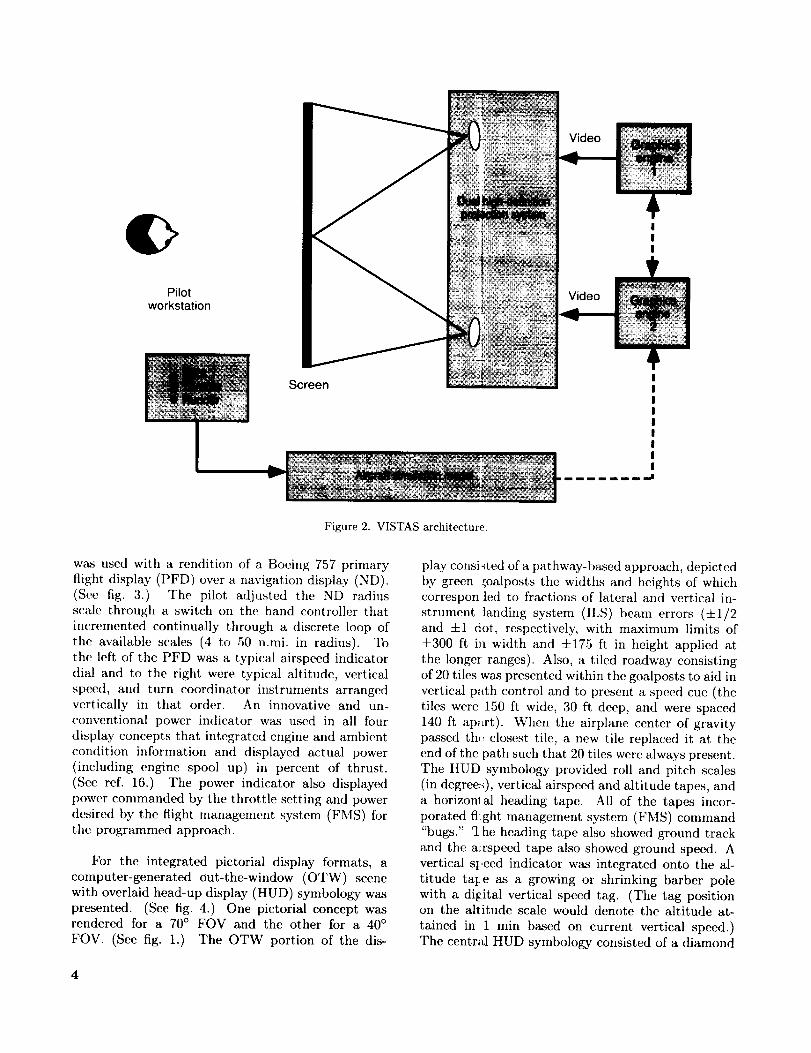
flight display research tool have been integrated intoa pilot workstation. (See fig. 2.) The pilot work-
station was configured as the pilot side of a generic
transport, fixed-wing airplane in which the seat could
be positioned to place the pilot's eyes at DEI/P. Theworkst.atioIl also accominodated the dual-head pro-
jection system and the rear-projection screen thatsinnflated the instrument panel. A two-degree-of-
freedom sidearm hand controller with spring center-
ing provided pitch and roll inputs to the airplanemathematical modeh A throttle level provided the
throttle inputs; typical self-centering rudder pedals
provided yaw inputs. The display screen (instrumentpanel) was titled to provide a 17 ° line of sight (from
horizontal) over the top of the screen, which is typical
of over-the-glareshield views in most airplanes. Thescreen display surface was set perpendicular to the
pilot's light of sight. This workstation was then used
to explore the advantages and limitations of large-
screen pictorial, reconfigurable display concepts andassociated interactive techniques.
Display Conditions
This experiment was designed to assess the spatial
awareness component based on integrated pictorial
displays compared with conventional EFIS formats.
The two EFIS displays, utilized as baseline measures,differed only in that one lacked the flight directorcommand bars. A basic T instrument arrangement
3
Video
Pilotworkstation
IIIIIIIII
Figure 2. VISTAS architecture.
was used with a rendition of a Boeing 757 primary
flight display (PFD) over a navigation display (ND).(See fig. 3.) The pilot adjusted the ND radius
scale through a switch on the hand controller that
incremented continually through a discrete loop of
the available scales (4 to 50 n.mi. in radius). Tothe left of the PFD was a typical airspeed indicator
dial and to the right were typical altitude, vertical
speed, and turn coordinator instruments arranged
vertically in that order. An innovative and un-conventional power indicator was used in all four
display concepts that integrated engine and ambient
condition information and displayed actual power
(including engine spool up) in percent of thrust.
(See ref. 16.) The power indicator also displayed
power commanded by the throttle setting and power
desired by the flight management system (FMS) forthe programmed approach.
For the integrated pictorial display formats, a
computer-generated out-the-window (OTW) scenewith overlaid head-up display (HUD) symbology was
presented. (See fig. 4.) One pictorial concept wasrendered for a 70 ° FOV and the other for a 40 °
FOV. (See fig. 1.) The OTW portion of the dis-
play consisted of a pathway-based approach, depictedby green ;4oalposts the widths and heights of whichcorrespon.]ed to fractions of lateral and vertical in-
strument landing system (ILS) beam errors (+1/2and -1-1 dot, respectively, with maximum limits of
+300 ft in width and ±175 ft in height applied at
the longer ranges). Also, a tiled roadway consisting
of 20 tiles was presented within the goalposts to aid in
vertical path control and to present a speed cue (thetiles were 150 ft wide, 30 ft deep, and were spaced
140 ft ap,.rt). When the airplane center of gravity
passed th,, closest tile, a new tile replaced it at the
end of the path such that 20 tiles were always present.The HUD symbology provided roll and pitch scales
(in degree:_), vertical airspeed and altitude tapes, and
a horizonl al heazling tape. All of the tapes incor-
porated flight management system (FMS) command
"bugs." "[he heading tape also showed ground track
and the airspeed tape also showed ground speed. Avertical speed indicator was integrated onto the al-
titude talce as a growing or shrinking barber pole
with a digital vertical speed tag. (The tag positionon the altitude scale would denote the altitude at-
tained in 1 rain based on current vertical speed.)The central HUD symbology consisted of a diamond
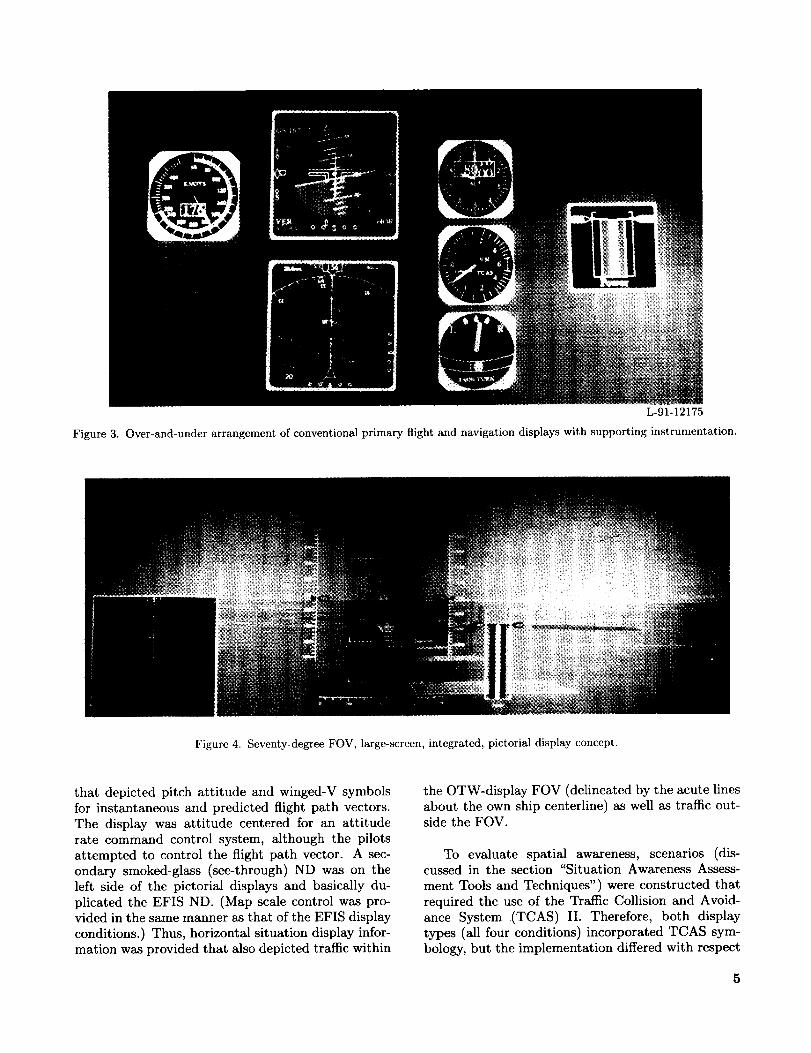
L-91-12175Figure3.Over-and-underarrangementof conventional primary flight and navigation displays with supporting instrumentation.
Figure 4. Seventy-degree FOV, large-screen, integrated, pictorial display concept.
that depicted pitch attitude and winged-V symbols
for instantaneous and predicted flight path vectors.
The display was attitude centered for an attitude
rate command control system, although the pilots
attempted to control the flight path vector. A sec-ondary smoked-glass (see-through) ND was on the
left side of the pictorial displays and basically du-
plicated the EFIS ND. (Map scale control was pro-vided in the same manner as that of the EFIS display
conditions.) Thus, horizontal situation display infor-mation was provided that also depicted traffic within
the OTW-display FOV (delineated by the acute lines
about the own ship centerline) as well as traffic out-side the FOV.
To evaluate spatial awareness, scenarios (dis-cussed in the section "Situation Awareness Assess-
ment Tools and Techniques") were constructed that
required the use of the Traffic Collision and Avoid-
ance System (TCAS) II. Therefore, both display
types (all four conditions) incorporated TCAS sym-
bology, but the implementation differed with respect
5

Conventional with flight director 70° field-of-view pictorial
(a) TCAS II advisory (yellow circle symbology).
Conventional with flight director 70 ° field-of-view pictorial
(b) TCAS II resolution (red square s) mbology).
Figure 5. TCAS II advisory and resolution displays.
to the TCAS command portion. (See fig. 5.) The
conventional displays incorporated TCAS symbology
on the ND that depicted airplane positions, rela-tive altitude tags, and vertical direction (if climbing
or descending). The symbology is defined for pur-
poses of this experiment in table I. In actual fieldservice, the TCAS advisory algorithms have changed
and their implementation has become more sophis-
ticated since the inception of this experiment. For
the conventional displays, the TCAS command to ei-ther climb or descend was implemented on the verti-
cal speed indicator (VSI) as a color-coded command
bar. (See fig. 5.) The pilot responded by keeping theVSI needle in the green portion of the indicator (andout of the red). 1 When this response was achieved,
the pilot was following the TCAS command at anappropriate vertical rate. Warnings and commands
were strictly visual. Auditory displays (which are
normally a part of TCAS) were considered but were
1The actual display is in color; those colors are not shownherein.
not employed because they would negate the abil-
ity to measure spatial awareness differences between
display fi,rmats.
For tl_e pictorial displays, TCAS symbology was
implemei_ted in the same manner on the secondary
see-through ND. However, one important augmenta-tion was made to the pictorial scene: the computer-
generatec image of traffic in the OTW scene was
also enclosed in a TCAS symbol with the appro-
priate color- and shape-coded warnings. No reso-
lution co:nmand (i.e., no vertical speed command)was presented with the pictorial formats. Full-state-
variable depiction of the OTW traffic was utilized
to avoid ,mdesirable discrete updates, which could
cause undue notice or awareness of traffic. (TCAStransponders do not presently encode sufficient state
information for full-state-variable depiction.) For all
four display conditions, TCAS was turned off below
500 ft ab:)ve ground level (AGL), although unfilled
blue squares were used to represent other traffic on
the ND displays (an unfilled black square was used
on the OTW portion of the pictorial displays), andtheir positions were continually updated.
6

Table I. TCAS II Symbology
Symbol a Definition
O Unfilled bhm diamond
• Solid blue diamond
• Solid yellow circle
• Solid red box
Nonthreatening
Proximity traffic:Within 1200 ft altitude
6 n.mi.
Nonthreatening
Traffic advisory:Within 1200 ft altitude
<45 see
Resolution advisory:Estimated miss
distance <_750 ft
<_30 sec
aThe actual display has these symbols in color; for purposes of
this report, the symbols are in black and white.
The pictorial formats discussed above incorporatenone of the sensor elements associated with synthetic
vision systems for reduced visibility operations with
subsonic airplanes or for the lack of forward visi-
bility with a future high-speed civil transport (in
which synthetic vision is used instead of lowering thenose). However, the other pictorial elements of syn-
thetic vision are included (pathway representation,
geographic/feature databases, and dependence on
advanced navigational aids). Therefore, this paperfocuses on large-screen, integrated, pictorial displays
as an approach to synthetic vision technology and
the problem of optimizing crew spatial awareness.
Situation Awareness Assessment Tools
and Techniques
The assessment of situation awareness is prob-
ably much more difficult than any attempted defi-nition. Several techniques have been suggested in
the literature, each with advantages and drawbacks.The most common method is to measure traditional
pilot/vehicle performance; however, no direct rela-
tionship has been established between performanceand awareness. Therefore, performance measures
should be supplemented by additional techniques.
(See refs. 17-21.) The following additional tech-
niques, compiled from Tenney et al. (ref. 18), wereconsidered.
Think-Aloud Protocols
Subjects are encouraged to verbalize what they
are thinking and describe what they are doing and
why. This technique is somewhat intrusive and isutilized only if the subject verbalizes anyway. The
experimenter takes notes and compares the subject's
statements with the subject's actions.
Anomalous Cues and Detection Time
Scenarios are set up that introduce slowly devel-
oping problems that may require some subject in-
teraction. The experimenter then measures the time
elapsed before the subject detects the problem as wellas the time before any corrective action is taken.
Freezing and Probing
This method entails a direct approach in which
the experimenter either interrupts or "freezes" the
task, then takes some form of measurement. Usually,
the experimenter asks relevant questions (in effect,
probing the subject) concerning that task. (See
refs. 19 and 20.) Often questions are asked aboutfuture events (based on what has transpired until
the moment of task freezing), which may provide
greater insight about the subject's awareness of thesituation at that moment. In other words, the better
the SA, the more accurately the subject will predict
the immediate future. In addition, after resuming the
task, the experimenter may take other measurements
indicative of SA (such as time to restore to some
predetermined condition). These methods requirecaution because not only has the original task been
corrupted, but the probe results must rely on the
subject's short-term memory.
Static Image Flash and Quiz
Subjects are evaluated for recognition of staticinformation, scenarios, or conditions when presented
over a short period. The more accurately the subject
perceives or recognizes the situation thus presented,the better the SA must be with that particular
information display system.
Garden Path and Detection Time
The subject is led to an erroneous conclusion by
slowly developing parallel events. Then the experi-menter measures the time elapsed before the subject
detects the mistake in interpretation. (The subject
is presented information in such a way that a failure
is correctly realized; however, it is attributed to the
wrong source.) Scenarios for this technique are moredifficult to formulate.
Subjective Methods
The subject completes questionnaires either ver-bally or by handwritten means and expresses per-
sonal opinions or feelings about the topic.

Spatial Awareness Techniques
Forthisexperiment,severaltechniquesfromtheliteraturewerechosenbasedupontheability to gen-eratesuitabletransportapproachandlandingoper-ations. Someof thesetechniquesweresuccessfullyapplied;otherswereeitherincorrectlyimplementedor wereunsuccessfulin providingmeaningfulresults,usuallybecausereplicateswerelackingor becausestatisticalcontrolof experimentalconditionswasin-sufficient.Reference21addressesthesuccessfulandunsuccessfulapplicationsof thesetechniquesin thesubjectstudyfromthestandpointofeffectiveSAas-sessmentmethodologies.As thefocusof this paperis on thecomparisonof integratedpictorialdisplaysand conventionalEFIS displays, only the success-
ful techniques (those that yielded meaningful results)are discussed herein.
The traditional lateral and vertical root mean
square errors were recorded directly during the ba-
sic or standard task, which was to follow a stan-
dard approach to landing (SAL). Three SA scenarios,which induced new tasks, were implemented within
the SAL. Two conflicting traffic scenarios were gen-
erated, one which consisted of crossing traffic sit-
uations that caused TCAS alerts (the Traffic Con-flict Scenario), and the other which involved runway
bhmders by traffic on landing approach to a parallel
runway (the Runway Blunder Scenario). The thirdscenario, the Path Offset Scenario, exposed each pi-
lot to incidents of total display system failure fol-
lowed by sinmlated display recovery. The pilot's taskwas, upon display system recovery, to determine the
own ship location relative to the desired flight path,
then to return to the flight path in a timely manner.Finally, numerous subjective questionnaires were ad-
ministered in which the subject evaluated the dis-
plays by answering relevant questions and by rank-
ing the displays based upon the perception of the
awareness afforded. Unsolicited subject commentswere also recorded throughout the trials. Fhrther
explanations of the individual scenarios, SA eval-
uation techniques, and measures are in the nextsection.
Experimental Tasks, Schedule, and
Questionnaires
Sixteen pilots were the subjects of the experi-
ment. All have extensive cockpit experience and
most are with national commercial airlines. (Three
are test pilots with commercial airplane manufactur-ers.) Four separate experimental tasks were embed-
ded within the spatial awareness assessment efforts.
These tasks were induced by scenarios generated to
exercise the selected SA assessment methods previ-ously dis(ussed. These scenarios included the Stan-
dard Approach to Landing, the Traffic Conflict Sce-nario, th( Runway Blunder Scenario, and the Offset
Scenario, all of which were implemented within theSAL.
Standard Approach to Landing
The Standard Approach to Landing task wasabout 27 n.mi. long and involved a simulated com-
plex, mi(rowave landing system (MLS) approach
(fig. 6) to closely spaced, parallel runways. The short
final approach segment was only 1.7 n.mi. long. The
SAL, the neighboring traffic routes (fig. 7), and therunway configuration (fig. 8) were constructed to pro-
vide a very complex environment of sufficient dura-
tion (aboat 10 rain per flight) for exercising the se-lected SA measurement tools. The environment was
not inten(ted to replicate the real world but merely to
represent a somewhat realistic, demanding future en-vironmem. Active traffic was included on all routes;
that is, several airplanes preceded and followed theown ship on the basic SAL, a constant stream of traf-
fic was on the SAL leading to the parallel runway, andoccasional traffic was on the crossing route.
Figure 6. S mulated MLS standard approach to right runway.
The pilot's task was to fly the SAL manually (in-
cluding th rottle inputs) using the head-down display.
Although recognized that conventional EFIS displaysare not used to fly below decision height altitudes in
real situations (e.g., 200 ft) without an OTW transi-
tion, for this investigation the flight ended at the run-
way threshold without an OTW transition. However,
all awareness scenarios in the investigation were com-pleted well before a 200-ft altitude was reached. The
Crossing Crossingtraffic traffic
................ Y 36R star "_
36R JRunways
36L
36R starentry _ J
36L star
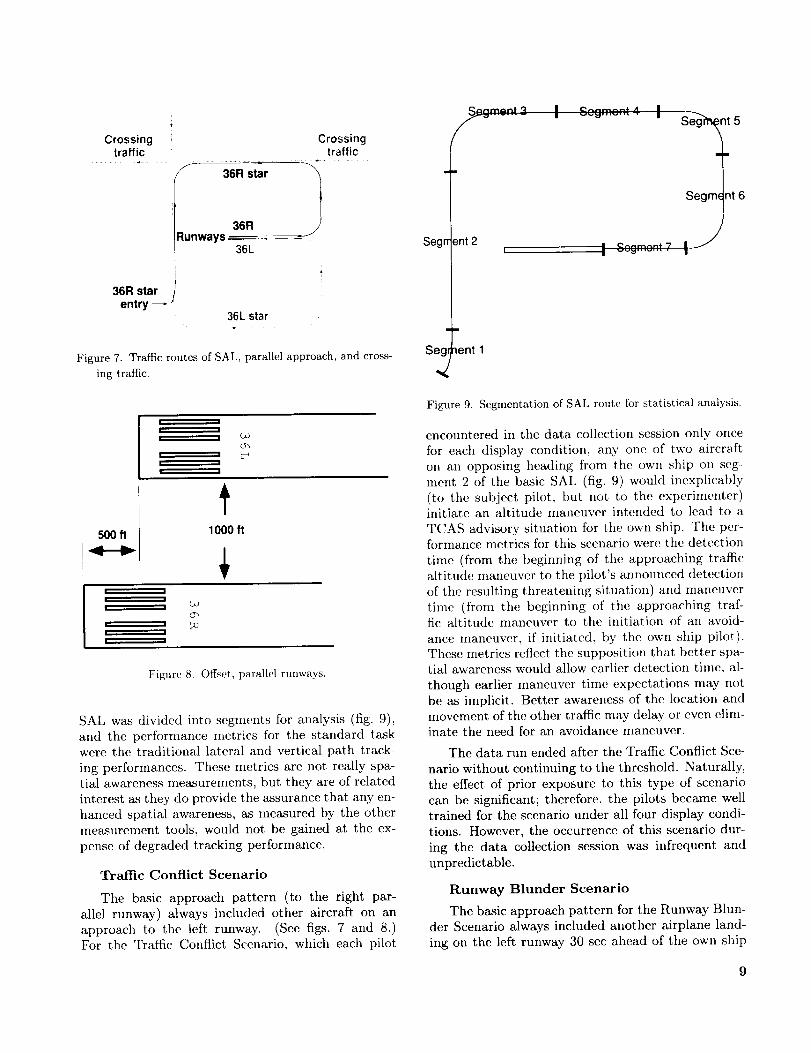
Figure 7. Traffic routes of SAL, parallel approach, and cross-
ing traffic.
.===
Segn ent 2I
Setent 1
q II c, ..... ; ,4 I-- I v_,,._, ,, _ I
t6
,J
| |
| || | (oo
0"5
| |
I |
500 ft
t1000 ft
| |
i w L.O| |
! •
| |
Figure 8. Offset, parallel runways.
SAL was divided into segments for analysis (fig. 9),
and the performance metrics for the standard taskwere the traditional lateral and vertical path track-
ing performances. These metrics are not really spa-tial awareness measurements, but they are of related
interest as they do provide the assurance that any en-
hanced spatial awareness, as measured by the othermeasurement tools, would not be gained at the ex-
pense of degraded tracking performance.
Traffic Conflict Scenario
The basic approach pattern (to the right par-
allel runway) always included other aircraft on anapproach to the left runway. (See figs. 7 and 8.)For the Traffic Conflict Scenario, which each pilot
Figure 9. Segmentation of SAL route for statistical analysis.
encountered in the data collection session only once
for each display condition, any one of two aircraft.
on an opposing heading from the own ship on seg-ment 2 of the basic SAL (fig. 9) would inexplicably
(to the subject pilot, but not to the experimenter)initiate an altitude maneuver intended to lead to a
TCAS advisory situation for the own ship. The per-formance metrics for this scenario were the detection
time (from the beginning of the approaching trafficaltitude maneuver to the pilot's announced detection
of the resulting threatening situation) and maneuver
time (from the beginning of the approaching traf-fic altitude maneuver to the initiation of an avoid-
ance maneuver, if initiated, by the own ship pilot).These metrics reflect the supposition that better spa-tial awareness would allow earlier detection time, al-
though earlier maneuver time expectations may notbe as implicit. Better awareness of the location andmovement of the other traffic may delay or even elim-inate the need for an avoidance maneuver.
The data run ended after the Traffic Conflict Sce-
nario without continuing to the threshold. Naturally,
the effect of prior exposure to this type of scenario
can be significant; therefore, the pilots became welltrained for the scenario under all four display condi-
tions. However, the occurrence of this scenario dur-
ing the data collection session was infrequent andunpredictable.
Runway Blunder Scenario
The basic approach pattern for the Runway Blun-
der Scenario always included another airplane land-
ing on the left runway 30 sec ahead of the own ship
9

(landingon theright parallelrunway).Forthissce-nario,whicheachpilot encounteredin thedatacol-lectionsessiononlyoncefor eachdisplaycondition,the leadaircraftwouldinexplicablyleavethedesig-natedlandingpatternandcrossin frontof theownshipflight pathduringfinal approach.(Thisdevia-tion wouldoccurwhilethe ownship'splannedalti-tudewas400ft AGL.TheTCASadvisoryandreso-lution logicwasturnedoffbelow500ft, althoughtheappropriatedisplaysstill presentedthe traffic withunfilledbluesquares.)Theperformancemetricsforthis scenariowerethe detectiontime (fromthe be-ginningof thecrossingmaneuverby theneighboringtraffic to the pilot's announceddetectionof the re-sultingthreateningsituation)andthemaneuvertime(fromthebeginningof thecrossingmaneuverto theinitiation of anavoidancemaneuver,if initiated,bytheownshippilot). Aswith theTrafficConflict Sce-
nario, better spatial awareness was assumed to al-
low earlier detection time, although earlier maneu-
ver time expectations may not be as implicit. Betterawareness of the location and movement of the other
traffic may delay' or even eliminate the need for anavoidance maneuver.
The effect of prior exposure to this type of sce-
nario can also be significant; therefore, the pilotsbecame well trained for the scenario under all four
display conditions. As with the Traffic Conflict Sce-
nario, the occurrence of the Runway Blunder Sce-nario during the data collection session was infre-
quent and unpredictable. Collection of the root mean
square (rms) tracking data ended before initiation of
the Runway Blunder Scenario.
Offset Scenario
The Offset Scenario exposed each of the 16 pi-
lots to 4 incidents of simulated recovery from displaysystem failure for each display condition. In this sce-
nario, the standard task was interrupted when the
display screen was blanked for a significant period,
after which the original display condition would reap-pear (simulating recovery from a main display system
failure). Upon reappearance, the position of the own
ship relative to the desired flight path had changed
(the aircraft had been offset to one of two pre-
determined positions relative to the planned flight
path), which thus introduced a new task. The pi-lot's new task in this scenario was to determine the
location of the own ship relative to the desired flight
path, then to return to the flight path in a timely
manner; the pilot was to respond as though the simu-lated vehicle were a passenger airliner. Two scenario
conditions were used: placing own ship 1000 ft above
and 750 ft to the left of the flight path in segment 4
10
of figure 9 (directly in line with approaching trafficand in a TCAS resolution situation); the other in-
volved placing the own ship above and to the rightof the flight path (again in segment 4, with no threat-ening traffic). Two replicates of each scenario condi-
tion (and thus four offset runs per display condition)were used to increase the statistical power. Because
the airplane heading was not changed for either off-
set position, the pathway was always in view with
the pictorial displays upon display system recovery.
The performance measure for this scenario was
recovery time. A return to flight path was definedas achievement of an error of less than half a dot in
lateral and vertical tracking and a heading error ofless than 5° . Better spatial awareness was assumed
to allow earlier position determination and result in a
shorter recovery time. For this scenario, the standard
task was interrupted in segment 3 of figure 9, and
the offset placed the airplane in segment 4. Thestandard rms tracking performance measures were
not gathered for segments 3 and 4 during an approachthat included the Offset Scenario. Howew_r, tracking
data collection was resumed after path recovery for
the remaining segments of the flight (segments 5 7).
Schedule
Table [I presents a typical 2-day schedule for a
pilot participating in the experiment. After being
briefed on the purpose of the experiment, the detailsof each display condition, and the various scenarioconditions, the pilot was allowed about 20 rain to be-
come familiarized with the handling characteristics ofthe airplmte model in unstructured flight maneuvers.
Half the pilots used the conventional EFIS without
the flight director display condition for this purpose;
the other half used the 70 ° pictorial display condi-
tion. The pilots were thoroughly trained with the
standard approach task, then were thoroughly ex-
posed to the scenario condition for each display con-dition. The second day was the data collection ses-
sion. The display conditions were randomly blocked
Fable II. Spatial Awareness Schedule
Day 1 (_10 hr)
Briefing session
Training session:Characteristics familiarization
Display conditions 1 4
Day 2 (_10 hr with rest periods)Data collection:
Display conditions 1 4
Questionnaires

TableIlI. DataCollectionSession
Displaycondition
aConditiom
Approachconditions a
R*, 04, Ol, R, Oa, T, R, O2
R, O1, T, R, Oa, O4, R*, 0,2
R, O3, T, R, 02, R*, O4, O1
R, 02, R*, 04, O1, R, 03, T
Questionnaires
Display"Intrusion evaluation
X X
X X
X X
X X
Display
comparison
R signifies a standard approach.R* signifies a standard approach with runway bhmder.T signifies a traffic avoidance maneuver.On signifies an offset occurrence.
across pilots, and the experimental tasks were ran-domized within each display condition. Table III
presents an outline of a typical session, the details
of which varied from pilot to pilot.
Questionnaires
As shown in table III, each pilot was asked to
complete two questionnaires at the end of the data-
gathering runs for each display condition. The firstquestionnaire probed specific items concerning the
traffic scenarios encountered with that display condi-
tion, and the second dealt with the evaluation of that
display concept in general. After completing all runsand the individual display concept questionnaires for
each display condition, the pilots completed a final
questionnaire that involved detailed comparisons of
the four display concepts.
Experimental Results and Discussion
The four scenarios were designed as full-factorial,
within-subjects experiments, with pilots, display con-
dition, any scenario conditions, and any replicates asthe factors. Extensive pilot variability is expected;
therefore, pilot variability was isolated from the rest
of the analyses by its inclusion as a main factor in theexperiments. The data collected in the experiments
were analyzed using univariate analyses of variance
for each metric. Newman-Keuls tests (discussed in
ref. 22) of individual means were performed at vari-ous stages in the analyses. (All such tests were made
at a 1-percent significance level.) The objective re-
sults are presented and discussed for each scenario,
and some subjective results are discussed thereafter.
Traffic Conflict Scenario
The Traffic Conflict Scenario exposed each pilotto one of two similar traffic avoidance situations for
each display condition. No replication was used;therefore, the only factors in the experimental design
were the pilots and the display conditions.
Table IV summarizes the analysis results for de-tection time and maneuver time. Figures 10 and 11
graphically present the results of the Traffic Con-
flict Scenario. All 16 pilots detected each threat-
ening situation, regardless of the display condition.
(See fig. 10.) However, the differences between thedetection times for the EFIS display conditions
and the pictorial display conditions (fig. 11, about
10 see) were statistically significant. Differences
within the display types (EFIS and pictorial) were
not significant.
Table IV. Analysis of Variance Results for Trail%Conflict Scenario
[From figures 10 and 11]
Degrees
Factor of freedom Significance a
Detection time
Pilots 15 *
Display 3 **Error 45
Total 63
Maneuver time
Pilots 14
Display 3Error 2__0_0
Total b37
aSignificance:-Not significant at levels considered.*Significant at 5-percent level.
**Significant at 1-percent level.bMissing 26 cases.
11

16
14i
12
el0
o 8Jn
6,4
2
ID ManeuveredII Detected
Conventional Flight director 40 ° piclodal 70 ° pictorial
Display
Figure 10. Traffic Conflict Scenario number of detections and
subsequent maneuvers.
8O
I60
s0 ["'-"40t-O
8 3oO
2Or-1
10
0Conventional
i i• Mean + Std dev
----- Meana, Mean - Std dev
I
Flight directoT
I I I
40' pictorial 70 ° pictorial
Display
Figme I l. Traltic Conflict Scenario mean d('l_'ction times per
display ('(mc¢'ptand cotlditi(m.
ended. In any case, the analysis of variance for the
maneuvel time measure found no statistically signifi-
cant diffe 'ences for any factors of the scenario exper-
iment (arid no figures are presented).
The ilfference from these results is that the pic-
torial displays provided the pilot with better traffic
information than did the EFIS displays. Detection
of the threatening traffic situations occurred earlierand at greater distances (the 10-sec-earlier detection
time translates into 1 n.mi. of increased separation)
with the pictorial displays; and with the increased
awareness of the situation, the pilots initiated feweravoidance maneuvers.
Runway Blunder Scenario
The Runway Blunder Scenario exposed each pilotto one incident for each display condition in which
another airplane landing on the left parallel runway
30 sec ahead of the own ship inexplicably (to the
subject pilot, but not to the experimenter) crossesthe own ship flight path on final approach to the right
runway. Figure 12 illustrates the Runway Blunder
Scenario and the obvious visual advantages of thepictorial display formats. No replication was used;
therefore, only pilot factors and display conditions
were analyzed.
Table V summarizes the results of the analysesfor detect on time and nmncuver time. With the
EFIS dist lays, about half the bhmders were (te-
tected. ('Fhe map scale was always on maxinmmon final at_proach.) With the pictorial displays, the
The altitude maneuver executed by the approach-ing traffic usually resulted in a TCAS advisory or a
TCAS resolution, with the outcome dependent upon
the current tracking performance of the own ship.
Thirty-eight own ship avoidance maneuvers were ex-
ecuted (fig. 10); in 26 cases the pilot decided not toexecute a maneuver. The maneuvers may have re-
sulted from a TCAS resolution or from an indepen-
dent decision of the own ship pilot. The no-maneuverdecisions may have been made because the situation
was judged not serious. The 23 no-maneuver cases
with the pictorial displays can be attributed to such
judgments, as no TCAS resolution was presented to
the pilots and the requirement for a maneuver waswholly their decision. Detailed analysis of the three
no-maneuver cases with the conventional displays re-
vealed that TCAS resolutions were presented. How-
ever, in each case the pilot's response to the TCAScommand came so late that the maneuver detection
logic used for scoring was not tripped before the run
Table V. Analysis of Variance Results for Rmlway
Blunder Scenario
Degrees• aFacto_ of freedom Sigmficanee
Detection time
Pilots 15
Disp[_ 3 **
Error 3_.QTota! b48 -
Maneuver time
Pilots 12 *
Displab 3 **
Error 15 -Tota %0
aSignifica) ,ce:
-Not siLnificant at levels considered.
*Significant at 5-percent level.
**Significant at 1-percent level.
bMissing 15 cases.
CMissing _3 cases.
12

L-93-663(a)ConventionalEFISwithflightdirectordisplayformat
with incurringtraffic(unfilledbluediamondin color
version) near beginning of incursion maneuver.
L-93-664
(b) Conventional EFIS with flight director display formatwith incurring traffic (unfilled blue diamond in color
version) near end of incursion maneuver.
L-93-661 L-93-660
(c) Portion of pictorial display format with incurring traffic (d) Portion of pictorial display format with incurring traffic
(airplane silhouette enclosed by black square) near begin- (airplane silhouette enclosed by black square) near end of
ning of incursion maneuver, incursion maneuver.
Figure 12. Runway Blunder Scenario depicting parallel traffic incursions.
16 pilots detected all threatening situations. (See
fig. 13.) The differences between the mean detectiontimes for the EFIS display conditions and the picto-
rial display conditions (fig. 14, about 8 sec) were sta-
tistically significant. The difference within the EFIS
display types (3.3 sec sooner for the flight directorcondition versus without the flight director) also was
significant, whereas the difference between the picto-rial conditions (0.7 sec sooner for the 40 ° condition)was not.
Of the 64 runway blunder incidents, 15 went un-
detected under the EFIS display conditions. (See
fig. 13.) Within the 49 detected incidents, the pilots
chose to initiate a go-round maneuver in 31 cases.
Analysis of the maneuver time measure for those31 cases revealed significant differences between most
paired means comparisons. (See fig. 15.) The ma-neuver time difference between the EFIS displays
was statistically significant, with the flight directormean 4.6 sec earlier than the EFIS without the flight
13

16
14
12
10
_o 8E_
6
4
2
o
[] Maneuvered• Detected
Conventional Flight director 40 ° pictorial 70 ° pictorial
Display
Figure 13. Runway Blunder Scenario number of detections
and subsequent maneuvers.
3O
25q}
20E
,.-150
_0o
5
0 !
_--,,--- Mean
A Mean-Stddev
I I I
Conventional Flight director 40 ° pictorial 70° pictorial
Display
Figure 14. Runway Bhmder Scenario mean detection times
per display concept and condition.
35
3Oo
25K)
E 20
ID
gl0
5
0 I
• Mean + Std dev--4-- Mean
z, Mean-Stddev
I I I
Conventional Flight director 40 ° pictorial 70° pictorialDisplay
Figure 15. Runway Blunder Scenario mean times to maneuver
since detection.
director mean. The pictorial display mean of 40 ° was
a significant 3.4 sec earlier than the flight directormean. The difference between the 40 ° and the 70 °
pictorial display means (2.0 sec earlier with the 70 °
pictorial display) was not statistically significant.
14
The inference from these results is that the pic-
torial displays provided the pilot with better trafficawareness near the runway than did the EFIS dis-
plays. Fifteen of the 32 runway blunder incidences
went undel;ected with the EFIS displays; detection inthe remaining 17 incidents came later than with the
pictorial displays. Also, with the increased awareness
of the runway situation, the pilots initiated fewer go-round maneuvers when they used the pictorial dis-
plays. Within the EFIS display conditions, the detec-tion time and the maneuver time means were lower
for the EFIS flight director condition. Without the
flight director, the pilot is probably intent on inter-
preting the raw error information and controlling to
minimize glide slope and localizer deviations duringfinal approach. Less time would thus be available to
monitor the neighboring traffic than when just fol-lowing the flight director commands.
Offset Scenario
The Offset Scenario exposed each pilot to four
incidents of simulated recovery from display systemfailure for each display condition. The pilot's task
in this scenario was, upon display system recovery,
to determine the location of the own ship relative to
the desired flight path, then to return to the flightpath in a timely manner. Two scenario conditions
were used, one placing the own ship in a TCASresolution situation and the other in an unthreatened
position. Two replicates of each scenario condition
were used; and therefore, the factors analyzed were
pilots, dist,lays, scenario condition, and replicates.
Table _I summarizes the results of the analysesfor recovery time. (A return to path was definedas achieve:nent of an error of less than half a dot
in lateral and vertical tracking and a heading errorof less than 5°.) Statistically significant differences
were founc between the displays and the interaction
between t)le displays and the scenario conditions.
Figure 16 !)resents the results for the display factorand figure 17 graphically presents the results for the
second-order interaction between the displays andthe scenario conditions. In figure 16, more time is re-
quired to iecover when using the conventional EFIS
displays w thout the flight director. With the flight
director, the recovery time was 14.6 sec quicker than
without tt:e flight director, and the performanceswith the pi :'torial displays were at least 10.2 sec faster
than the flight director results; these differences werestatisticall:" significant. The difference between the
pictorial conditions (2.5 sec faster for the 40 ° condi-tion) was Itot significant.
Figure 17 shows that with the two conventional
EFIS display conditions, the pilots took longer to

TableVI. AnalysisofVarianceResultsforOffsetScenario
Degreesof SignificanceaofFactor freedom recoverytime
PilotsDisplaysConditionsReplicatesPilots× DisplaysPilots× ConditionsDisplays× ConditionsPilots x Displays
× Condition
Error
Total
aSignificance:
15
31
1
4515
3
45
127255
-Not significant at levels considered.*Significant at 5-percent level.
**Significant at 1-percent level.
90
80
7003
60E•.= 50
o 30ID
rr 20
100
• Mean + Stddev---4-- Mean
_, Mean-Std dev
! I I
Conventional Flightdirector 40° pictorial 70° pictorialDisplay
Figure 16. Offset Scenario mean times to recover to intended
flight path per display concept and condition.
8O
o 700
60m-E 50k_
40
30o
2o
10
0
- _ - Left condition--,,--- Right condition
I | i I
Conventional Flightdirector 40°pictorial 70° pictorialDisplay
Figure 17. Offset Scenario second-order interaction between
displays and scenario conditions; mean times to recover
to intended flight path per display concept and condition.
recover from the left offset condition (the TCAS traf-
fic resolution case) than from the right offset condi-tion. For the conventional EFIS without the flight di-
rector, the difference was a significant 13 sec, whereas
the significant difference for the flight director casewas about 6 sec. The differences for the two pictorial
cases were not statistically significant.
The inference from these results is that the pilots
were able to determine the own ship location rela-
tive to the desired flight path and return to the flight
path more quickly with the pictorial displays. Theflight director recovery was faster than the conven-
tional display without the flight director, probably
because interpreting the raw error information was
more time-consuming than just following the flightdirector commands. The difference in recovery time
between the pictorial displays and the flight director
display was attributed to better spatial awareness,
but it might also involve more aggressive manual in-tercepts of the flight path with the pictorial displays
versus the intercept logic within the flight director.
Perhaps a better spatial awareness metric for this
scenario would have been maneuver time (the timeelapsed before maneuvering began, as was used in
the Runway Blunder scenario).
The statistically meaningful results from the sce-nario conditions within the Offset Scenario (the
second-order interaction term) occurred with theconventional EFIS displays. When the display sys-
tem recovered from the simulated display failure
to reveal a TCAS resolution situation (the left off-
set condition), the pilots probably responded to theTCAS vertical resolution before attempting to de-
termine the own ship location relative to the desired
flight path and returning to the flight path. There-
fore, recovery took longer for the left offset conditionthan for the right. With the pictorial displays, the
sense of urgency to move is much higher for the left
offset condition, and the direction of desired move-
ment is readily determined from the visual presenta-
tion. (The maneuvering response to a TCAS resolu-tion under the pictorial display conditions was left to
the pilot's discretion, as opposed to the EFIS TCAS
resolution of vertical movement.) Therefore, recoverywas initiated more quickly for the left offset condition
than for the right (offset condition with no threaten-
ing traffic), although the 3- to 3.5-see differences werenot statistically significant.
Subjective Results
Table III enumerates the nine questionnaires
administered to each pilot. The summary of those
subjective results (which is sufficient for this paper)
revealed a dramatic improvement in all aspects of
15

10
9
8
7o')
o 612.
5
4
3
2
1
0
12
[] Conventional
[] Flight director
[] 40 ° pictorial
[] 70 ° pictorial
Very Somewhat Neutral Somewhat Veryhard hard easy easy
(a) Ease of becoining disoriented.
CD
O
g-
11
10
9
8
7
6
5
' 13
2
[] Conventional
[] Flight director
[] 40 ° pictorial
[] 70 ° pictorial
I
Very Somewhat Neutral Somewhat Veryhard hard easy easy
(b) Ease of maintaining spatial awareness.
Figure 18. Rating results from pilots for two subjective
categories.
spatial awareness when both pictorial formats were
used and, in particular, when the large-screen 70 °
version was involved. Figure 18 presents rating re-
sults for two subjective categories as typical exam-ples. The pilots were asked to rate, the ease of be-
coming disoriented and, in an opposite connotation
16
(as a sanity check, the same question), the ease
of maintaining spatial awareness when using each
display c,mfiguration (without comparison to the
other display configurations). In both instances, thetwo pictorial formats dramatically improved spatial
awareness and, in particular, when the large-screen70 ° version was involved.
Anotbw subjective assessment of each display
configuration (without comparison to the other dis-
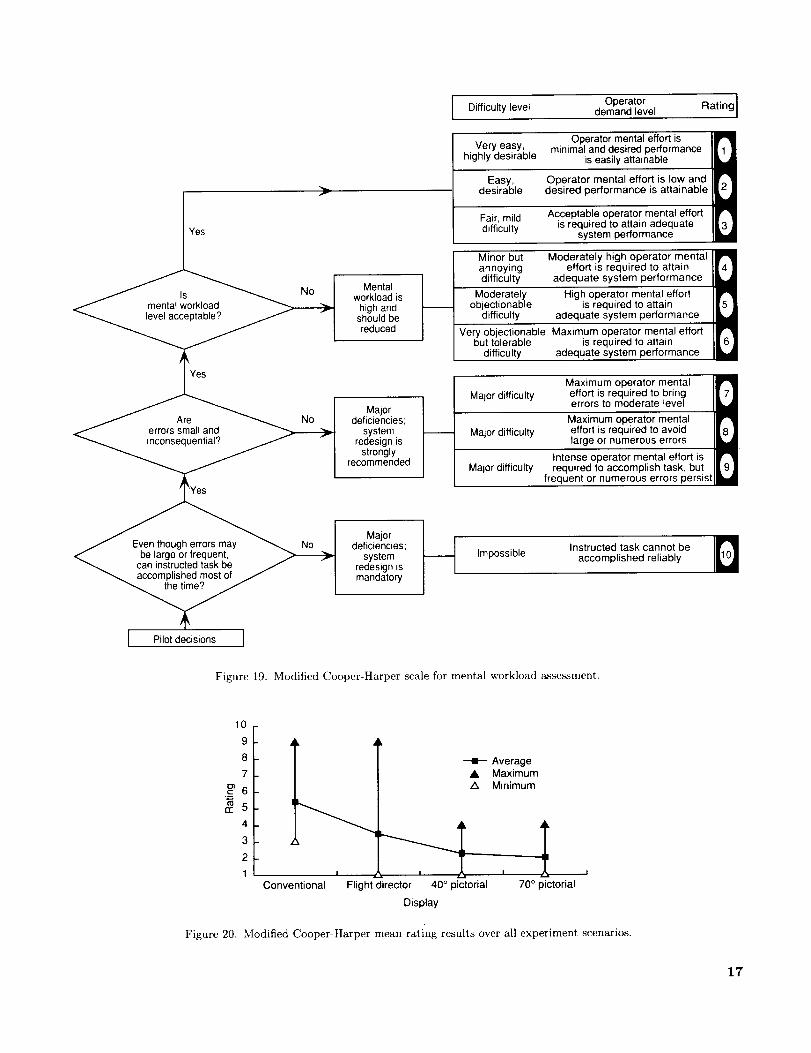
play configurations) used the Modified Cooper-
Harper scale (modified to extend its utility beyondhandling quality evaluations; ref. 2a) that is shown in
figure 19. Figure 20 presents the average, maximum,
and minimum ratings (not plus or minus the stan-dard deviations) for all experiment scenarios. The
two pictorial formats distinctly improved the mod-
ified ratiig (in both mean rating and spread), al-though differences between the two fields of view werehard to az_sess within the confinements of lower endof the scale.
Figure 21 presents the results of comparative rank
ordering by the pilots for several categories on a scale
of 1 (tile most desirable display,) to 10 (the least desir-able displ;ly). The average, maximum, and minimum
rankings ]_resented (not. plus or minus the standard
deviations,). The categories are used to corot)are thedisplay concepts over all the scenarios. The pilots
ranked db;play effectiveness for success in monitoringtraffic, fol reduction of their workload, and for their
reactions regarding the entire experiment. Again,
be_se(t on tile subjective comments, the pictorial for-mats sub:_tantially improved all aspects of spatial
awareness (in both average ranking and spread). In
particular the large-screen 70 ° version was preferredby 14 of tm 16 pilots; two pilots had no preference.
In ado ition to the formal questionnaire results,
other sub}ective comments were obtained. Particu-
larly notable are the following:
"Like flying on a beautiful VFR [visual flightrules] day "
"Provi des immediate assessment of thesituation .... "
"Abilfiy to fly complex approaches is greatly
improved."
"Easier to detect traffic incursions and runwayblunders.'
"Displ:_y of pictorial world is natural and easy to
interpret."
Objective Tracking Performance Results
In addition to the SA measurement techniques,
standard rms tracking data were collected and
),
Yes
No
[ Pilot decisions J
Mentalworkload is
high andshould bereduced
Majordeficiencies;
systemredesign is
stronglyrecommended
Majordeficiencies;
systemredesign ismandatory
Operator Rating II demand levelDifficulty level
Operator mental effort is 111]Very easy, minimal and desired performance
highly desirable is easily attainable
Easy, Operator mental effort is low and 112]desirable desired performance is attainable
Fair, mild Acceptable operator mental effort r,_ldifficulty is required to attain adequate ik,_j
system performance
Minor but Moderately high operator mentalannoying effort is required to attain r4_
difficulty adequate system performance •
Moderately High operator mental effort r5_objectionable is required to attaindifficulty adequate system performance • •
Very objectionable Maximum operator mental effort • •but tolerable is required to attain 6
difficulty adequate system performance • •
Maximum operator mental F •Major difficulty effort is required to bring 7
errors to moderate level • •
Maximum operator mental • •
Major difficulty effort is required to avoid 8large or numerous errors • •
Intense operator mental effort is • •Major difficulty required to accomplish task, but 9
frequent or numerous errors persist • •
Impossible Instructed task cannot be I1_101accomplished reliably
Figure 19. Modified Cooper-Harper scale for mental workload a.ssessment.
10 -
9 -
8 - --t- Average
7 - • Maximum
6 - /k Minimum
3-
2 -
Conventional Flight director 40 ° pictorial 70 ° pictorial
Display
Figure 20. Modified Cooper-Harper mean rating results over all experiment scenarios.
17

• Maximum
• Average
• Minimum
10 = Least desirable display1 = Most desirable display
10
9
8
7
6Eto 5
rr4
3
2
1
0
To monitor traffic
I
Conventional
I I i
Flight 40 ° pictorial 70 ° pictorialdirector
¢-
cc
10
9
8
7
6
5
To reduce workload
I I I I
Conventional Flight 40 ° pictorial 70 ° pictorialdirector
c"to
¢r
10
9
8
7
6
5
,I$
4
3
2
1
0 iConventional
Overall ranking
_L
I I I
Flight 40 ° pictorial 70 ° pictorialdirector
Figure 21. Comparative rank ordering by pilots ::or three categories.
analyzed. The standard or basic SAL was divided
into segments for this purpose (fig. 9), with tile fol-lowing designations:
Segment Descript ion
Turning entry
Straight descent
Descending turn
Transition to straight and level, deceleration
Level turn
3 ° descent, deceleration, and turn final
Short final approach
The analysis for segment 1 (entry to the SAL fromthe off-path initial conditions) was not meaningful in
terms of spatial awareness or display format results
and is not presented. Table VII presents a summaryof the analyses of variance results for the rms of the
vertical aI,d lateral tracking errors for the other seg-
ments. St_ttistically significant differences were foundbetween pilots, displays, and the interaction of those
two factors. Pilot response varied greatly (as ex-pected); t mrefore, pilot variability was isolated from
the rest oI the analyses by its inclusion as a main fac-
tor in the analyses. The pilot-by-display interaction
typically indicated that the pilots reacted differently
to the dislflay effect; that is, one pilot might exhibit
a very larvae difference during two display conditions,whereas another pilot would exhibit a smaller dif-
ference. The differences were typically in the same
direction, with only the magnitudes varying among
pilots.
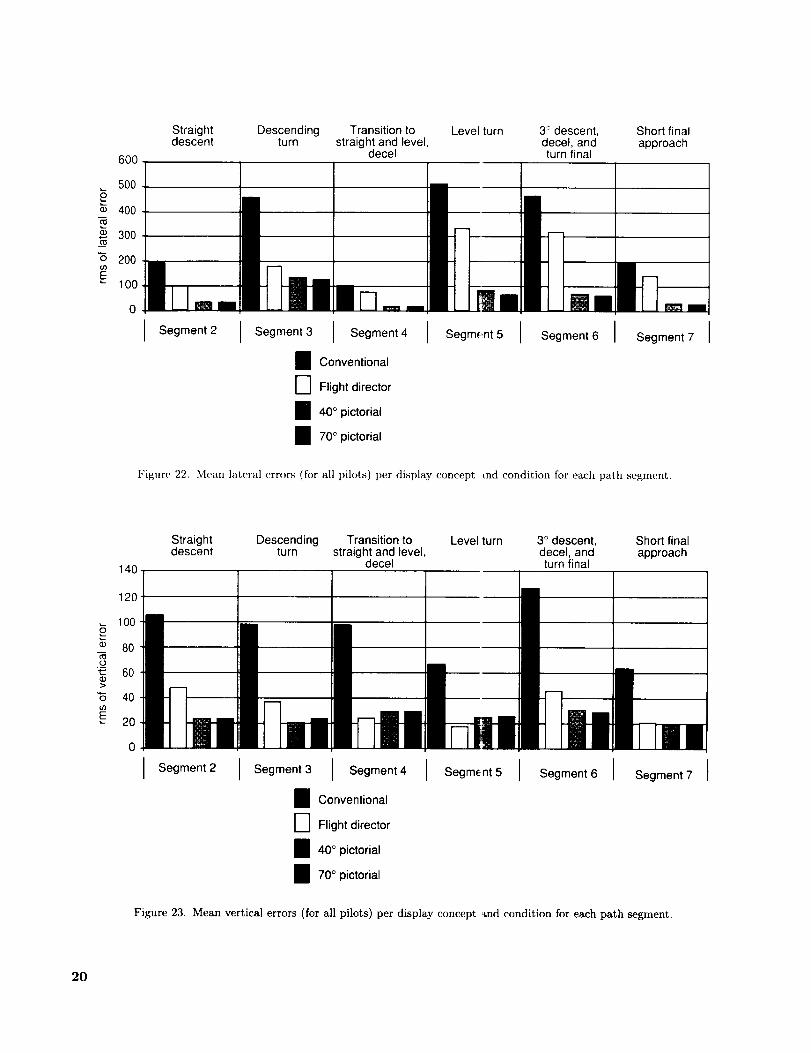
Figure 22 presents a comparison of the displaycondition rms lateral error means from the 16 pilots
for each segment. Not surprisingly, the lateral track-
ing perfor:nance error was significantly larger for ev-ery segment of the SAL in which the conventional
EFIS was used without the flight director display.Differences between the conventional EFIS with the
18
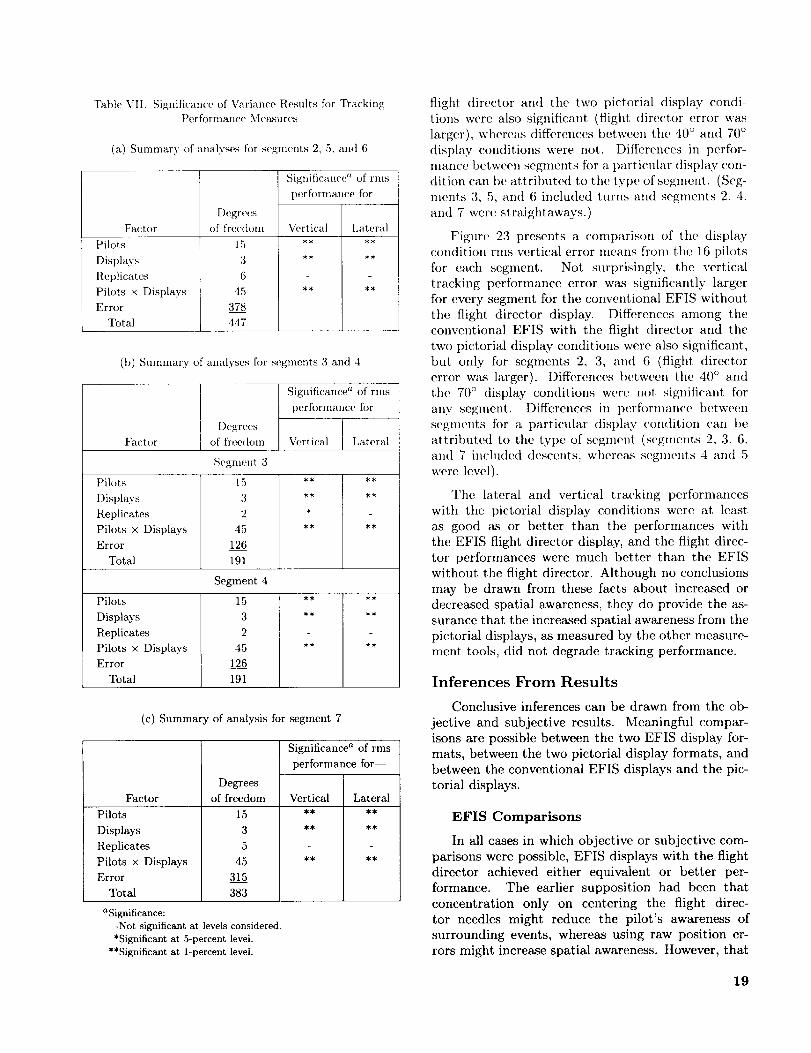
Table VII. Significance of Variance Results for TrackingPerformance Measures
(a) Summary of analyses for segments 2, 5, and 6
Factor
Pilots
Displays
Replicates
Pilots x Displays
Error
Total
Degrees
of freedoni
15
3
6
45
378
447
Sigmflcance of rms
performance for
Vertical Lateral
(b) Smnmary of analyses for segments 3 and 4
Degrees
of free([olll
Significance" of rms
performance for
Factor Vertical Lateral
Segment 3
Pilots
Displays
Replicates
Pilots x Displays
Error
Total
15
3
2
45
126
191
Segment 4
Pilots
Displays
Replicates
Pilots x Displays
Error
Total
15
3
2
45
126
191
(c) Summary of analysis for segment 7
Factor
Pilots
Displays
Replicates
Pilots x Displays
Error
Total
a Significance:
Degrees
of freedom
15
3
5
45
315
383
Significance a of rms
performance for--
Vertical Lateral
-Not significant at levels considered.
*Significant at 5-percent level.
**Significant at 1-percent level.
flight director and the two pictorial display condi-
tions were also significant (flight director error was
larger), whereas differences between the 40 ° and 70 °
display conditions were not. Differences in perfor-
mance between segments for a t)articular display (:on-
dition can t)e attrilmted to the type of segment. (Seg-
ments 3, 5, and 6 included turns and segments 2, 4,
and 7 were straightaways.)
Figure 23 presents a comparisoll of the display
condition rms vertical error means from the 16 pilots
for each segment. Not surprisingly, the vertical
tracking performance error was significantly larger
for every segment for the conventional EFIS without
the flight director display. Differences among the
conventional EFIS with the flight director and the
two pictorial display conditions were also significant.,
but only for segments 2, 3, and 6 (flight director
error was larger). Differences between the 40 ° and
the 70 ° display conditions were not significant for
any segment. Differences in t)erfornmnce t)etween
segments for a particular display condition can be
attributed to the type of segment (segments 2, 3, 6,
an(t 7 included descents, wtlerea_s segm(,nts 4 an(t 5
were level).
The lateral and vertical tracking performances
with the pictorial display conditions were at least
as good as or better than thc performances with
the EFIS flight director display, and the flight direc-
tor performances were much better than the EFIS
without the flight director. Although no conclusions
may be drawn from these facts about increased or
decreased spatial awareness, they do provide the as-
surance that the increased spatial awareness from the
pictorial displays, as measured by the other nmasure-
ment tools, did not degrade tracking performance.
Inferences From Results
Conclusive inferences can be drawn from the ob-
jective and subjective results. Meaningful compar-
isons are possible between the two EFIS display for-
mats, between the two pictorial display formats, and
between the conventional EFIS displays and the pic-
torial displays.
EFIS Comparisons
In all cases in which objective or subjective com-
parisons were possible, EFIS displays with the flight
director achieved either equivalent or better per-
formance. The earlier supposition had been that
concentration only on centering the flight direc-
tor needles might reduce the pilot's awareness of
surrounding events, whereas using raw position er-
rors might increase spatial awareness. However, that
19
"6
E
600
5OO
400
300
200
100
0
I
Straightdescent
Descendingturn
Transition to Level turn 3 ° descent, Short finalstraight and level, decel, and approach
decel turn final
Segment 2 I Segment 3 I Segment 4
I Conventional
D Flight director
i 40 ° pictorial
I 70 ° pictorial
Segment5 Segment6 I Segment7 I
Figure 22. Mean lateral errors (for all pilots) per display concept md condition for each path segment.
¢D
._oI=tD>
"6t/}
E
140
120
100
8O
6O
40
20
0
Straight Descending Transition to Level turn 3 ° descent, Short finaldescent turn straight and level, decel, and approach
decel turn final
I Se0men'2I Se0men,3 I Se0ment4I Se0m_.,SI Se0ment_I Se0men,7 II Conventional
D Flight director
I 40 ° pictorial
I 70 ° pictorial
Figure 23. Mean vertical errors (for all pilots) per display concept and condition for each path segment.
2O

suppositionwasprovedinvalidhere.Perhapsthekeywordin that suppositionwasthewordonly. Better
spatial awareness appears to be gained because the
flight director imposes a lower path-tracking work-
load on the pilot, thereby allowing time to scan other
sources of information besides the flight director nee-
dles. Use of raw data error in the EFIS without the
flight director requires that almost constant attention
be devoted to the path-tracking t.ask.
Pictorial Comparisons
The objective data revealed equivalent perfor-
mance for the 70 ° pictorial display compared with the
40 ° FOV. Tile subjective data, however, revealed a
strong preference for the wider FOV, particularly for
awareness during turning entry and traffic situations.
EFIS and Pictorial Comparisons
Both the objective and subjective data demon-
strated that the integrated pictorial displays in-
creased spatial awareness ow_r the conventional EFIS
display formats.
Concluding Remarks
An extensive sinmlation study was performed
to determine and compare the spatial awareness of
commercial airline pilots on simulated landing ap-
proaches using conventional flight displays with their
awareness using advanced pictorial "pathway in the
sky" displays. Various situation awareness measure-
ment techniques were incorporated within the sce-
narios. Conflicting trattic situation assessments and
flight path recaptures after recovery from simulated
display" system failure were ereate.d to assess spa-
tial awareness using different display formats. Both
objective and subjective techniques were employed.
The spatial awareness scenarios yielded results that
were consistent across and within the objective and
subjective measures.
The objective data analyses revealed that bet-
ter spatial awareness performance was achieved when
the flight director was included in the electronic flight
information systems (EFIS) display. However, the in-
tegrated pictorial displays consistently provided sub-
stantially increased spatial awareness compared with
either of the conventional EFIS display formats. Ob-
jective data results for the wider field-of-view (FOV)
pictorial display were equivalent to those obtained
with the narrower pictorial format.
The subjective results, which were also summa-
rized herein, indicated a strong preference for the
flight director within the EFIS displays. However,
the subjective study revealed that all aspects of spa-
tial awareness were dramatically improved by the two
pictorial formats and, in particular, by the large-
screen version with a 70 ° FOV.
Therefore, integrated pictorial displays show sig-
nificant promise for improving situation awareness.
These types of formats also can be the basis for
an effective synthetic vision system, one which
can solve restricted visibility problems associated
with advanced subsonic and future high-speed civil
transports.
NASA Langley Research Center
Hampton, VA 23681-0001
July 1, 1994
References
1. Hatfiehl, Jack .l.; and Parrish Russell V.: Advanced
Cockpit Technology for Future Civil Transport Aircraft.
The Cockpit of the 21st Century Will High Tech Payoff?
AESS, Nov. 1990, pp. 77 87.
2. Regal, D.; and Whittington, D.: 28A: Synthetic Vision
in Commercial Aviation-Display Requirements. SID 9/?
Digest, Volume XXlV, May 1993, pp. 441 .144.
3. 7th Plenary Session of the Synthetic Vision Certification
Issues Study Team Ptvce.cding.s, FAA, June 1992.
4. Swink, ,lay R.; and Goins, Richard T.: High Speed Re-
search System Study Advanced Flight Deck Configura-
tion Effects. NASA CR-189650, 1992.
5. Brahm% ,lames tt., ed.: Aerospace Technology: to the
21st Century. Aerosp. Eng., vol. 12, no. 1, Jan. 1992,
pp. 8 17.
6. I)orighi, Nancy S.; Ellis, Stephen R.; and Grunwaht,
Arthur J.: Evaluation of Perspectiw' l)isplays on Pi-
lot Spatial Awareness in Low Visibility Curved Ap-
t)roaches. ,4 (?ollect_on of TcchTzical Papers 8th AIAA
Computing in Aerospace Conference, Volume 1. Oct. 1991,
pp. 153 158.
7. l)orighi, Nancy S.; GrunwaM, Arthur J.; and Ellis,
Stephen R.: Perspective Forlnat For a Primary Flight
Display and Its Effect on Pilot Spatial Awareness.
Proceedings IEEE/AIAA llth Digital Avionics Syslcm.s
Conference, 1992, pp. 307 312.
8. Regal, David M.; Rogers, William It.; and Boucek,
George P., .lr.: Situational Awareness in the Commer-
cial Flight Deck Definition, Measurement, and Enhance-
ment. Proceedings of the 7th Aerospace BehavioTal Tech-
nology Conference and Ezposition, SAE, 1989, pp. 65 69.
{Available as SAg Tech. Paper Set. 881508.)
9. Grunwald, Arthur J.; Robertson, James B.; and Hatfield,
Jack J.: Evaluation of a Computer-Generated Perspec-
tive Tunnel Display for Flight-Path Following. NASA
TP-1736, 1980.
21

10.Jensen,RichardS.:PredictionandQuickeninginPer-spectiveFlightDisplaysforCurvedLandingApproaches.Hum. Factors, vol. 23, no. 3, June 1981, pp. 355 363.
11. Hoover, George W.: Shelley, Stephen H.; Cronauer,
Victor; and Filarsky, Stephen M.: The Command Flight
Path Display--All Weather, All Missions. Proceedings of
the 6th Advanced Airerew Display Symposium, U.S. Naval
Air Test Center, May 1984, pp. 144 156.
12. Wickens, Christopher D.: Haskell, Ian: and Harte, Kareu:
Ergonomic Design for Perspective Flight-Path Disl)lays.
IEKE Control Syst. May., vol. 9, June 1989, pp. 3 8.
13. Reising, John; Barthelemy, Kristen; and Hartsoek, David:
Pathway-in-the-Sky Evaluation. Proceedings of the Fifth
lnterTmtional Symposium on A_iation Psychology, Vol-
rune 1, R. S. ,lensen, ed., Ohio State Univ., 1989,
pp. 2;I;I 238.
1-1. Busquets, Anthony M.; Parrish, Russell V.: and Williams,
Steven P.: Effects of Alternate Pictorial Pathway Dis-
play's and Stereo 3-D Presentation on Silnulatcd Transport
Landing Approach Performance. Proc. Ser. Volume 1157,
John O. Merritt and Scott S. Fisher, eds., SHE, 1991,
t)P-91 102.
15. l_artiehl, \Voodrow: and l)tosenberg, Craig: The Effect of
Geomelric Field of View and Tunnel Design for Perspec-
tive Flight-Path I)isp[ays. 22nd International Conformance
on Environmental Sy.stcms, SAE, July 1992. (Available
as SAE Teeh. Paper Ser. 9211',11.)
16. Abtn)lt. Terence S.: Task-Oriented Display Design
(?on('ept and Example. Aerospace Technology Corlfe,'vnce
amt F.rpo.situm, SAE, Set)t. 1989. (Availabh, as SAE q_'ch.
Paper Set. 892230.)
17. Sarter, Nadine B.; and Woods, David D.: Situation
Awareness A Critical But Ill-Defined Phenomenon. Int.
J. Aviat. Psgchol., vol. 1, no. 1, 1991, pp. 45 57.
18. Tenne,,, Yvette J.: Adams, Marilyn Jager: Pew,
Richmd W.; Huggins, A, W. F.: and Rogers, William H.:
A Principled Approach to the Measurement of Situation
Awareness in Commercial Aviation. NASA CR-4451,
1992.
19. En(tsRy, Mica R.: Situation Awareness Global As-
sessment Technique (SAGAT) Aircraft Pilots-Vehicle
Interface Design. Proceedings of the: IEEE National
Aerosl, ace and Electronic,s Confcrcm'c, Vohnne 3, May
1988, pp. 789 795.
20. Endshw, Mica R.: A Methodology for the Ot)jectivcMeasu elnent of Pilot Situation Awareness, S_tuational
Aware_less in Aerospace Op_rat,ons, AGARD-CP-,178,
Oct. 1989.
21. Busquets, A. M.; Parrish, R. V.; Williams, S. 1).; and
Nold, D. E.: A Comparison of Pilots' Aecet)tance and
Spatial Awareness \Vhen Usit,g EFIS vs. Pictorial Display
Fol'nmts h)r Coml)lex, Curved l,amting At)proaches. Sit-
uational Awareness in (_?on_t)lc:r Sy.slcm.s, l/. 1). Gibson,
D. ,I. _;arlan(1, and ,l. M. ]{oouce, e(ls.. Eml)ry-lliddh'
Aerona ltieal Univ. Press, 1991, pp. 1:1!t 167.
22. Steel, Ioberl (;. 1).: and Torrie, ,lames I1.: Princ_plc.s
and Pr,*eedurcs of Statistics. McGraw-Hill Book Co., Inc.,1960.
23. Boff, Kenneth R.: and IAncoln, .lanet E., eds.: En-
,qineering Data Comperldiun_ Hizman P_rceptzon and
l_cTforl'mncc, 15lurer: I1. ttarry (;. Armstrong Aer()sp.
Med. l{<'s. Lab., \Vright-Patt(,rs(m Air Force Base. 1988,
l}p. 16-71 1615.
22


Form Approved
REPORT DOCUMENTATION PAGE OMB No. 0704-0.188
Public reportin_ burden fo_ this collection of information is estimated to average 1 hour per response, including the time fc_ reviewing instructions, searching existing data sources,gathering and maintaining the data needed, and completing and reviewing the collection of information Send comments regarding this burden estimate or any other aspect of thiscollection of information, inc{uding su_,gestlons f_ reducing this burden, to Washington Headquarters Service.% Directorate for Information Operations and Reports, 1215 JeffersonDavis Highway, Suite 1204. Arllngton, VA 22202-4302, and to the Office of Management and Budget, Paperwork Reduction ProJect (0704-0188), Washington. DC 20503
1. AGENCY USE ONLY(Leave blank) I 2. REPORT DATE 3. REPORT TYPE AND DATES COVERED
I October 1994 Technical Paper
4. TITLE AND SUBTITLE r5. FUNDING NUMBERS
Spatial Awareness Comparisons Between Large-Screen, Integrated
Pictorial Displays and Conventional EFIS Displays During Simu- WU 505-64-53-03
lated Landing Approaches6. AUTHOR(S) " PR 1L162211AH85
Russell V. Parrish, Anthony M. Busquets, Steven P. Williams,and Dean E. Nold
7. PERFORMING ORGANIZATION NAME(S) AND ADDRESS(ES) 8. PERFORMING ORGANIZATION
NASA Langh, y Research Center Joint Research Programs Office REPORT NUMBER
ftampton. VA 23681-0001 Command/Control and Systems Integratit n Dir.
Conmtunications Electronics Command L-17356
NASA Langley Research Center
Hampton, VA 23681-0001
9. SPONSORING/MONITORING AGENCY NAME(S) AND ADDRESS(ES) 10. SPONSORING/MONITORING
National Ae.ronallti('s and Space Administration AGENCY REPORT NUMBER
V_hington, DC 20546-0001 NASA TP-3467
and
U.S. Army Conmnmications Electronics Command CECOM TR-94-E-1
Fort Monmouth, NJ 07703-5603
11. SUPPLEMENTARY NOTES
Parrish and Busquets: Langley Research Center, Hampton, VA; _'illiams: JRPO, Command/Control and
Systems Integration Directorate, CECOM, Langley Research Center, Hampton, VA; Nold: The GeorgeWashington University, Washington, D.C.
12a. DISTRIBUTION/AVAILABILITY STATEMENT 12b. DISTRIBUTION CODE
Unclassified Unlimited
Subject Category 05
13. ABSTRACT (Maximum 200 words)
An extensive simulation study was performed to determine and compare the spatial awareness of commercialairline pilots on simulated landing approaches using conventional f ight displays with their awareness using
advanced pictorial "pathway in the sky" displays. Sixteen commercial airline pilots repeatedly made simulated
complex microwave landing system approaches to closely spaced parailel runways with an extremely short finalsegment. Scenarios involving conflicting traffic situation assessments and recoveries from flight path offset
conditions were used to assess spatial awareness (own ship positiol relative to the desired flight route, the
runway, and other traffic) with the various display formats. The sit ration assessment tools are presented, as
well as the experimental designs and the results. The results demonstrate that the integrated pictorial displayssubstantially increase spatial awareness over conventional electronic flight information systems display formats.
i i
14. SUBJECT TERMS
Spatial awareness; Large screen, Integrated pictorial displays; Eh ctronic flight
information systems; EFIS displays; Simulated landing approaches; _, ISTAS
17. SECURITY CLASSIFICATION
OF REPORT
Unclassified
,ISN 7540-01-280-5500
18. SECURITY CLASSIFICATIOI_
OF THIS PAGE
Unclassified
19. SECURITY CLASSIFICATIOI_
OF ABSTRACT
Unclassified
15. NUMBER OF PAGES
23
16. PRICE CODE
A0320. LIMITATION
OF ABSTRACT
Standard Form 298(Rev. 2-89)Prescribed by ANSI Std Z39-1829B-102