19770012208.pdf - NASA Technical Reports Server
268
TECHNICAL NOTE FINAL REPORT CONTRACT NAS8-28988 N7719152 1111111111111111111111111111 TN-FT-76-4 METHODS FOR DATA REDUCTION AND LOADS ANALYSIS OF SPACE SHUTTLE SOLID ROCKET BOOSTER MODEL WATER IMPACT TESTS SEPTEMBER 1976 Prepared by AERO IHYDRODYNAMIC S GROUP ADVANCED DEVELOPMENT DEPARTMENT CHRYSLER CORPORATION SPACE DIVISION NEW ORLEANS, LOUISIANA REPRODUCED BY, NJlI u.s. Department of Commerce National Technical Information Service Springfield, Virginia 22161
-
Upload
khangminh22 -
Category
Documents
-
view
1 -
download
0
Transcript of 19770012208.pdf - NASA Technical Reports Server
TECHNICAL NOTE
FINAL REPORT
CONTRACT NAS8-28988
N77191521111111111111111111111111111
TN-FT-76-4
METHODS FOR DATA REDUCTION AND LOADS ANALYSIS
OF
SPACE SHUTTLE SOLID ROCKET BOOSTERMODEL WATER IMPACT TESTS
SEPTEMBER 1976
Prepared by
AERO IHYDRODYNAMIC S GROUPADVANCED DEVELOPMENT DEPARTMENT
CHRYSLER CORPORATION SPACE DIVISIONNEW ORLEANS, LOUISIANA
REPRODUCED BY, NJlIu.s. Department of Commerce
National Technical Information ServiceSpringfield, Virginia 22161


SUMMARY
This report presents the methodology used to predict full-scale Space Shuttle
Solid Rocket Booster (SRB) water impact loads from scale model test data.
Tests conducted included 12.5 inch and l20inch diameter models of the SRB.
Geometry and mass characteristics of the models were varied in each test series
to reflect the current SRB baseline configuration. Nose first and tail first
water entry modes were investigated with full-scale initial impact vertical
velocities of 40 to 120 ft/sec, horizontal velocities of 0 to 60 ft/sec., and
off-vertical angles of 0 to ±30 degrees. The test program included a series of
tests with' scaled atmospheric pressure.
Scaling relationships were established analytically and later verified by test.
Full-scale equivalent loads were subsequently estimated by applying these scaling
relationships to the model test data for the current SRB baseline configuration.
Load distributions on the cylindrical body, aft bulkhead, nozzle and skirt were
predicted for the significant dynamic events of initial impact ,cavity collapse,
maximum penetration, rebound and slapdown.
Loads developed during water impact were found to have a significant influence
on the structural design of the SRB. Initial impact loads are critical to
the design of the nozzle, aft skirt, aft bulkhead, lower cylindrical body
and auxiliary components mounted in the nozzle-skirt annulus region. Loads
developed during cavity collapse also define design requirements for the aft
skirt and lower cylindrical body. Hydrostatic loads developed during maximum
penetration are significant to the design of the lower cylindrical body,
i

while slapdown loads influence the design of upper cylindrical body and
forward Skirt.
This study was conducted in support of the NASA/MSFC Booster Recovery Program
under NASA/MSFC Contract NAS8-28988.
ii

TABLE OF CONTENTS
PAGE
LIST OF ILLUSTRATIONS v
LIST OF TABLES x
1.0 INTRODUCTION 1-1
2.0 TEST MODELS AND INSTRUMENTATION 2-1
3.0 TEST PROGRAMS 3-1
3.1 TEST SERIES C-143 3-13.2 NOL 12.5 INCH MODEL TEST 3-23.3 TEST SERIES C-145 3-23.4 TEST SERIES P-015 3-33.5 TEST SERIES P-022 3-33.6 TEST SERIES P-029 3-43.7 TEST SERIES TMS-333 3-43.8 TEST SERIES UNO-l 3-5
4.0 DATA ACQUISITION AND PROCESSING 4-1
5.0 SRB WATER IMPACT DYNAMIC EVENTS 5-1
5.1 INITIAL IMPACT 5-15.2 CAVITY FORMATION AND COLLAPSE 5-4
. 5.3 MAXIMUM PENETRATION 5-75.4 REBOUND AND SLAPDOWN 5-7
6.0 SCALING RELATIONSHIPS 6-1
7.0 DATA ANALYSIS 7-1
7.1 INITIAL IMPACT 7-37~2 CAVITY COLLAPSE 7-67.3 MAXIMUM PENETRATION 7-107.4 SLAPDOWN 7-10
8.0 FULL SCALE LOADS 8-1
8.1 INITIAL IMPACT 8-18.2 CAVITY COLLAPSE 8-118.3 MAXIMUM PENETRATION 8-178.4 SLAPDOWN 8- L88.5 COMPONENT Lo.~DS 8-23
8.5.1 NOSE CONE FRUSTUM LOADS 8-248.5.2 SYSTEM TUNNEL LOADS 8- 268.5.3 E. T. ATTACH RING LOADS 8-26
iii
TABLE OF CONTENTS (CONTINUED)
PAGE
8.5.4 AFT SEPARATION MOTOR LoADS 8-278.5.5 TVC PACKAGE LOADS 8-278.5.6 NoZZLE ACTUATOR LOADS 8-288.5.7 HEAT SHIELD/AFT END RING LOADS 8-308.5.8 SRM CLEVIS JOINT PIN RETAINER BAND LOADS 8- 31
9.0 REFERENCES 9-1
APPENDIX A TYPICAL SET OF MODEL TEST DATA A-I
APPENDIX B SCALING OF TAIL-FIRST, VERTICAL WATER B-1ENTRY MODEL TESTS OF THE SPACE SHUTTLESOLID ROCKET BOOSTER
iv

FIGURENUMBER
2-1
2-2
2-3
2-4
2-5
2-6
3-1
4-1
5-1
5-2
5-3
6-1
6-2
6-3
6-4
6-5
6-6
LIST or ILLUSTRATIONS
TITLE
156 Inch-Diameter SRB Configuration
Space Shuttle Solid Rocket Booster 4/11/73Baseline Configuration
11/1/75 Baseline SRB Water Impact Configuration
Basic Model, 4-11-73 Configuration
Pressure Transducer Locations, 4-11-73Configuration
Accelerometer Locations, 4-11-73 Configuration
SRB Water Impact Loads Coordinate System
Data Acquisition and Processing Block Diagram
Qualitative Vehicle Trajectory During Impact
SRB Water Impact Dynamic Events
Cavity Development and Collapse
Comparison of 12.5 Inch and 120 Inch-DiameterModel Peak Internal Nozzle Pressures
Comparison of 12.5 Inch and 120 Inch-DiameterModel Internal Nozzle Pressures (Peak Values)
Comparison of 12.5 Inch and 120 Inch-DiameterModel Internal Nozzle Pressures (10 MilisecondAverage)
Comparison of 12.5 Inch and 120 Inch-DiameterModel Internal Nozzle Pressures (Peak Values)
Comparison of 12.5 Inch and 120 Inch-DiameterModel Internal Nozzle Pressures (10 Mi1isecondAverage)
Comparison of 12.5 Inch and 120 Inch-DiameterModel Peak Slapdown Pressure
v
PAGENUMBER
2-8
2-9
2-10
2-11
2-12
2.:..15
3-15
4-4
5-9
5-10
5-13
6-5
6-6
6-7
6-8
6-9
6-10

FIGURENUMBER
6-7
6-8
7-1
7-2
7-3
7-4
7-5
7-6
7-7
7-8
7-9
7-10
7-12
7-13
7-14
LIST OF ILLUSTRATIONS (Continued)
PAGETITLE NUMBER-
Comparison of 12.5 Inch and 120 Inch-Diameter Model 6-11Primary Slapdown Pressures (Peak Values)
Comparison of 12.5 Inch and 120 Inch-Diameter Model 6-12Primary Slapdown Pressures (10 Milisecond Average)
Typical Model Test Data (Test P015-70) 7-13
Pressure Distribution at Nozzle Toe-In (With 7-14Nozzle Extension)
Determination of Maximum Pitch and Axial Accelera- 7-15tion Times
Description of Vehicle Aft End Geometry (with 7-16Nozzle Extension)
Pressure Distribution at Maximum Pitch Acceleration 7-17(Without Nozzle Extension)
Pressure Distribution at Maximum Pitch Acceleration 7-18(With Nozzle Extension)
Correlation of Nozzle Pressure D2l 7-19
Extrapolation of Nozzle Pressures 7-20
Variation of Nozzle Internal Pressure with Impact 7-21Conditions, Maximum Pitch Acceleration
Pressure DistributiclU at Maximum Axial Acceleration 7-22(With Nozzle Extension)
Variation of Maximum Acceleration Levels with Impact 7- 23Conditions, Maximum Pitch Acceleration
Variation of Maximum Acceleration Levels with Impact 7-24Conditions, Maximum Pitch Acceleration
Normalized Shear Force, Beriding Moment, and Axial 7-25Force Distributions, Maximum Axial or PitchAccelerations
Qualitative Description of Cavity Formation and 7-26Collapse
vi
FIGURENUMBER
7-15
7-16
7-17
7-18
7-19
7-20
7-21
7-22
7-23
8-1
8-2
8-3
8-4
8-5
8-6
8-7
8-8
LIST OF ILLUSTRATIONS (Continued)
PAGETITLE NUMBER---
Typical cavity Collapse Radial Pressure Distribution, 7-28NOL 12.5 inch-Diameter Model
Cavity Collapse Pressure Distributions, SRM Case 7-29and Aft Skirt PresSures
Cavity Collapse Pressure Distribution Factor, Kc 7-30
Cavity Collapse Pressure Distribution Function 7-31Parameter, TJ
Variation of Penetration Depth With Impact 7-32Conditions
Variation of Angle at Maximum Penetration with 7-33Impact Conditions
Typical Time Histories of Slapdown Pressures 7-34
Typical Full Scale Trajectory for Vehicle C.G., 7-35Test P015-70
Qualitative Vehicle Trajectory During Impact 7-36
Correlation of Internal Skirt Pressures, Maximum 8-36Pitch Acceleration Event
Correlation of Bulkhead Pressures, Maximum Axial 8-37Acceleration Event
Correlation of C.G. Accelerations, Maximum Pitch 8-38Acceleration Event
Correlation of C.G. Accelerations, Maximum Axial 8-39Acceleration Event
Correlation of Peak Lee Side Cavity Collapse 8-40Pressure
Correlation of C.G. Accelerations at Cavity 8-41Collapse
SRB Water Impact Cavity Collapse Loads 8-425/1/75 Full Scale Configuration
Maximum Penetration Depth 8-43
vii

FIGURENUMBER
8-9
8-10
8-11
8-12
8-13
8-14
8-15
8-16
8-17
8-18
8-19
8-20
8-21
8-22
8-23
8-24
8-25
8-26
8-27
LIST OF ILLUSTRATIONS (Continued)
TITLE---Pitch Angle at Maximum Penetration Depth
MinUnum Expected Ullage Pressure for SolidRocket Motor
Typical Nose Pitch Acceleration Time History
Typical C.G. Pitch Acceleration Time History
Typical Slapdown Pressure Time History
Slapdown Pressure Distribution Procedure
Slapdown Pitch Angle (6LW) - Degrees
Slapdown Radial Pressure Distributions
Variation of Slapdown Keel Peak Pressure wjthImpact Condition
SRB Slapdown Dynamics
SRB Water Impact Slapdown Loads, 5/1/75 FullScale Configuration, Keel Pressure
SRB Water Impact Slapdown Loads, 5/1/75 FullScale Configuration, Applied Pressure andInertial Reaction Loads
SRB Water Impact Slapdown Loads, 5/1/75 Ful1Scale Configuration; Bending Moment
SRB Water Impact SlapdownLoads, 5/1/75 FullScale Configuration, Shear
Component Acceleration Load Factors
Surface Pressure Coefficients for SRB Nose ConeFrustum
Nose Cone Configuration and Coordinate System
Systems Tunnel Water Impact Pressure Distributions
E.T. Attach Ring Water Impact Pressure Loads
viii
PAGENUMBER
8-44
8-45
8-46
8-47
8-48
8-49
8- 50
8-51
8-52
8-53
8-54
8-55
8-56
8-57
8-58
8-59
8-60
8-61
8-62
FIGURENUMBER
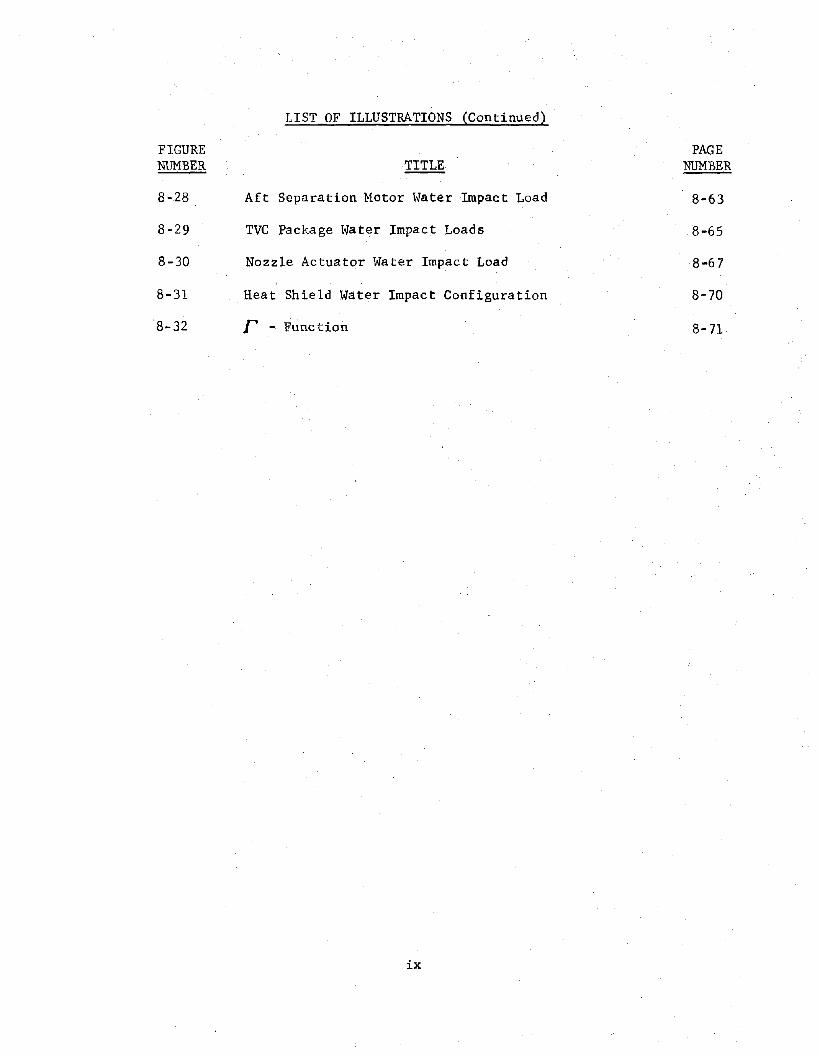
8-28
8-29
8-30
8-31
'8-32
LIST OF ILLUSTRATIONS (Continued~
TITLE
Aft Separation Motor Water Impact Load
TVC Package Water Impact Loads
Nozzle Actuator Water Impact Load
Heat Shield W~ter Impact Configuration
r - Function
ix
PAGENUMBER
8-63
8-65
8-67
8-70
8-71
TABLENUMBER
2-1
2-2
2-3
3-1
3-2
3-3
3-4
3-5
3-6
3-7
3-8
8-1
8-2
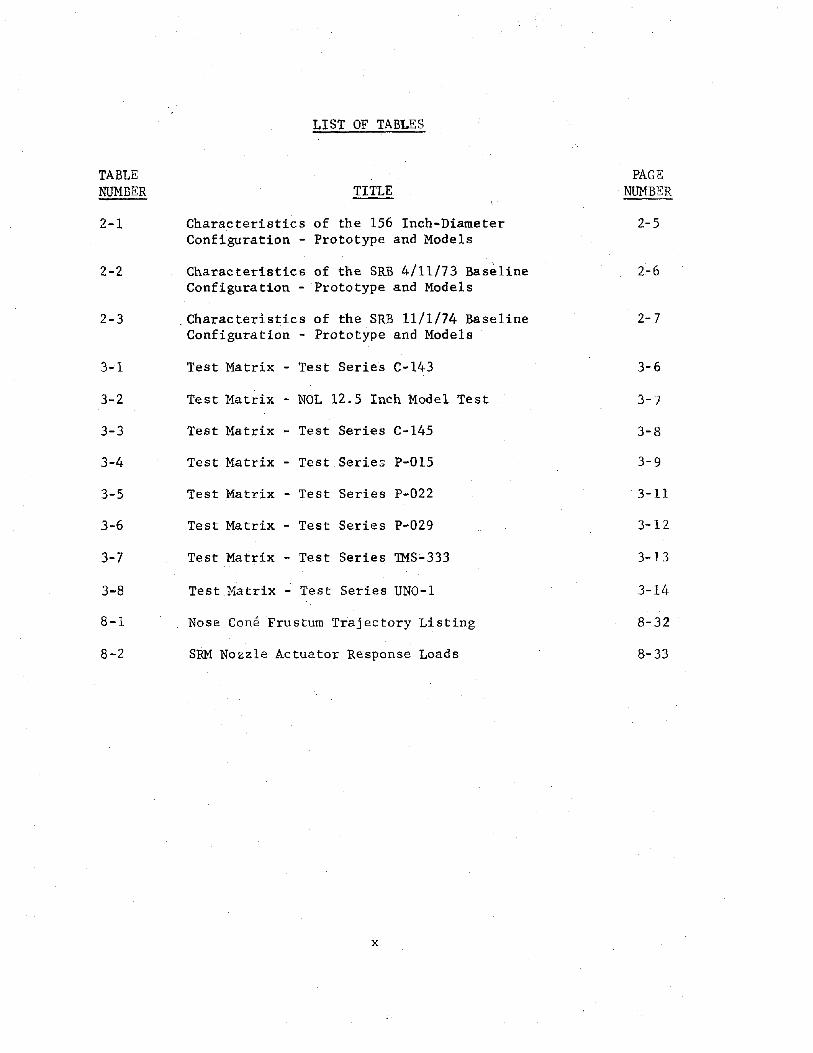
LIST OF TABLES
TITLE
Characteristics of the 156 Inch-DiameterConfiguration - Prototype and Models
Charac teristics of the SRB 4/11/7'.3 BaselineConfiguration - Prototype and Models
_Characteristics of the SRB 11/1/74 BaselineConfiguration - Prototype and Models
Test Matrix - Test Series C-143
Test Matrix - NOL 12.5 Inch Model Test
Test Matrix - Test Series C-145
Test Matrix - Test Series P-015
Test Matrix - Test Series P-022
Test Matrix - Test Series P-029
Test Matrix - Test Series TMS~333
Test Matrix - Test Series UNO-1
Nose Cone Frustum Trajectory Listing
SRM Nozzle Actuator Response Loads
x
PAGENUMBER
2-5
2-6
2-7
3-6
3-)
3-8
3-9
3-11
3-12
3-13
3-14
8-32
8-33

SECTION 1.0
INTRODUCTION
The initial stage of the Space Shuttle launch configuration will consist of
two parallel-burn solid rocket boosters (SRB). After burn-out, the boosters
will separate and return to earth for a sea landing. They will then be re
covered at sea and subsequently refurbished for use again in later flights.
Although a parachute recovery system will be used for deceleration prior to
impact, the SRB will land with considerable vertical velocity. In addition,
surface wi nds may superimpose appreciable drift velocities. Therefore, the
SRB will experience relatively high acceleration and pressure loads at the
time of impact and must be designed to withstand these loads in addition to
the normal operating loads imposed during the propulsive boost ascent and
stage separation phases.
In order to assess the magnitude and nature of these water impact loads and to
study the general feasibility of water recovery, a test program was
initiated using scale models of the SRB. Initial tests were conducted with
a 12.5 inch-diameter model, geometrically similar to the original SRB design,
which was a l56-inch diameter SRB. The objectives of these tests were to
evaluate entry modes, flotation attitudes, penetration characteristics, fun
damental fluid dynamic characteristics, and to obtain preliminary design
loads. Additional tests were performed with a 120 inch-diameter Titan IIIC
SRB for the purpose of verifying scaling relationships previously determined
analytically. Results of these tests are described in References 4 to 8.
More recent tests were designed to study the SRB 4-11-73 and 11-1-74 baseline
1-1
configuration. In these programs, 12.5 inch-diameter models were used
to evaluate configuration effects and to assess the effects of wind
drift (horizontal velocity).
The data base accumulated during the scale model test programs has been
used to predict full scale water impact loads and assess the impact of
configuration changes as the SRB evolved from the original design to
the current 5/1/75 configuration. These loads for the various SRB con
figurations have been published in References 1 to 3 and 30 to 33.
These loads have served as a basis for trade studies related to SRB
structural design and selection of the required recovery system. The
methodology used in the data reduction and subsequent analysis is pre
sented here.
-1-2
SECTION 2.0
TEST MODELS AND INSTRUMENTATION
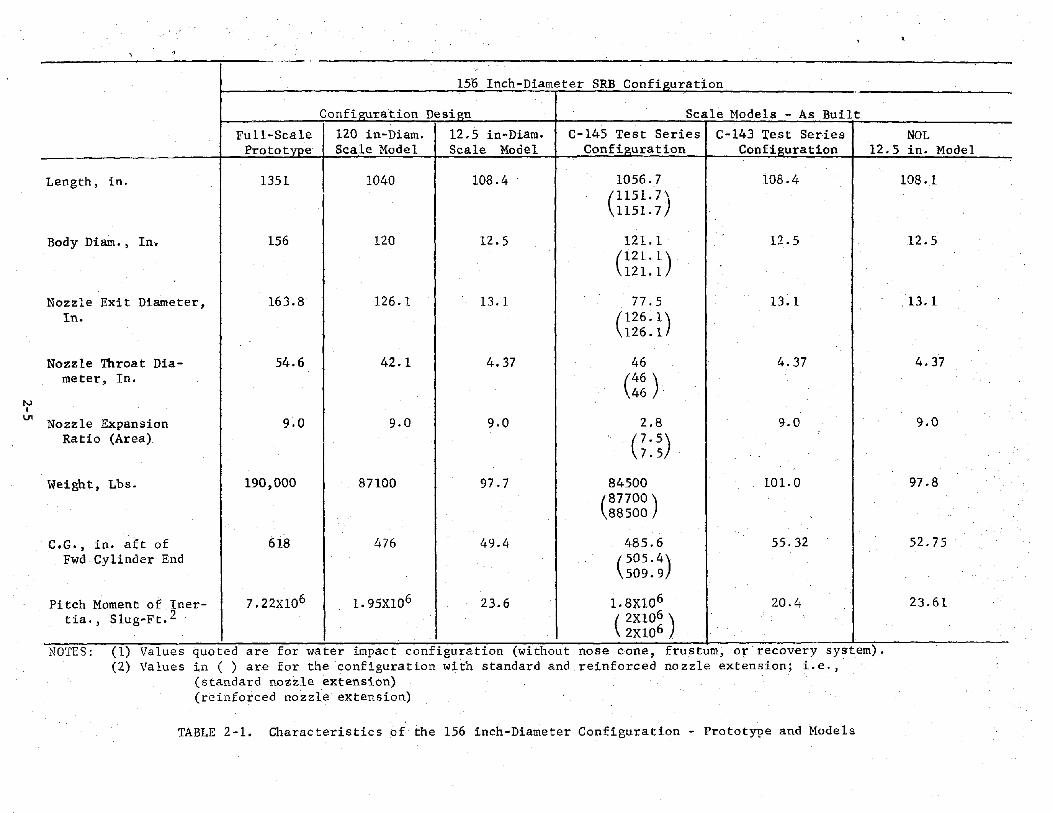
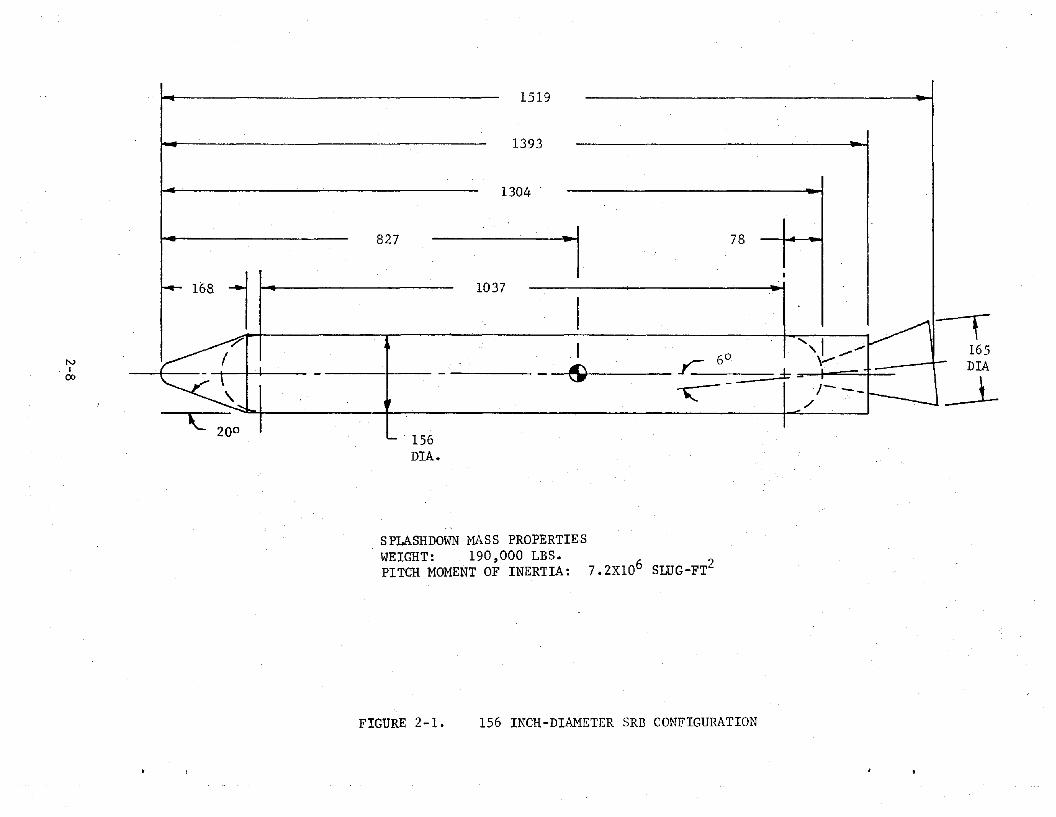
The configurations used in these. tests were of two basic designs, a modified
Titan III-C SRB and the 4-11-73 baseline SRB configuration. The modified
Titan III-C SRB design, 156 in. in diameter, reflects initial thinking on
the Space Shuttle design concept which called for a booster with fixed,
canted nozzle, shielded by a straight skirt as illustrated in Figure 2-1.
Two instrumented models, one of 12.5 inch-diameter and the other of 120
inch-diameter, were fabricated and tested. Pertinent dimensions and mass
characteristics of the prototype and test models are given in TableT.
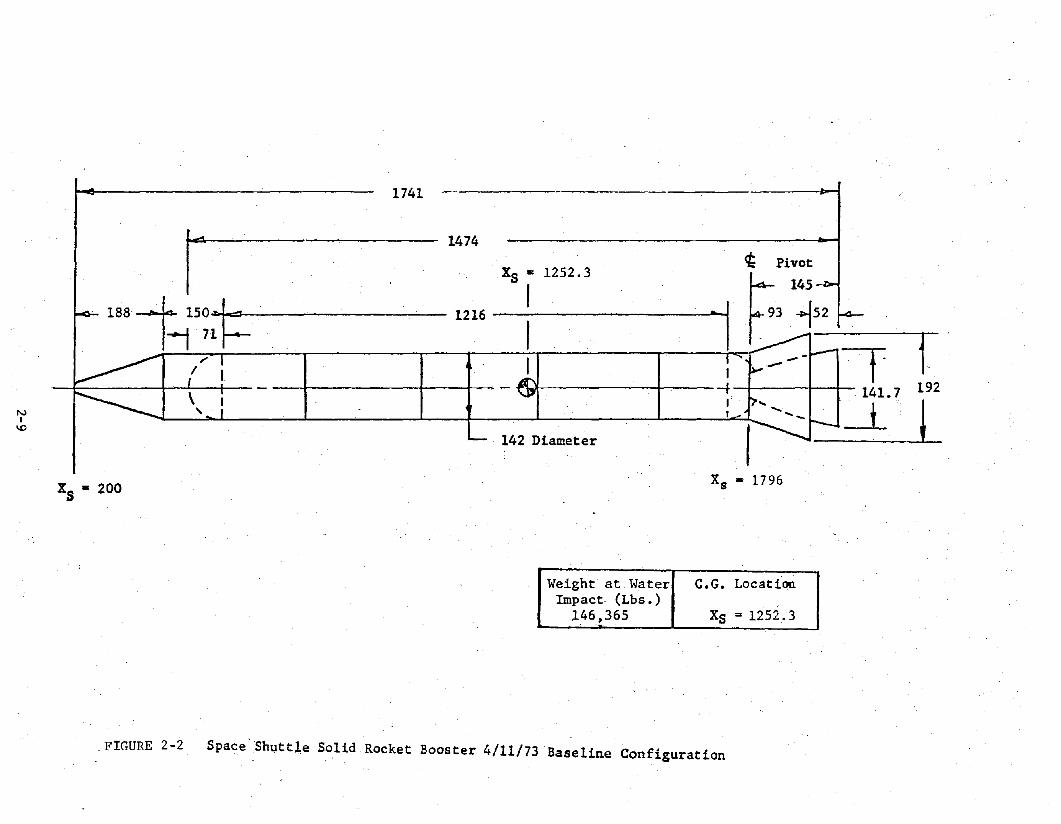
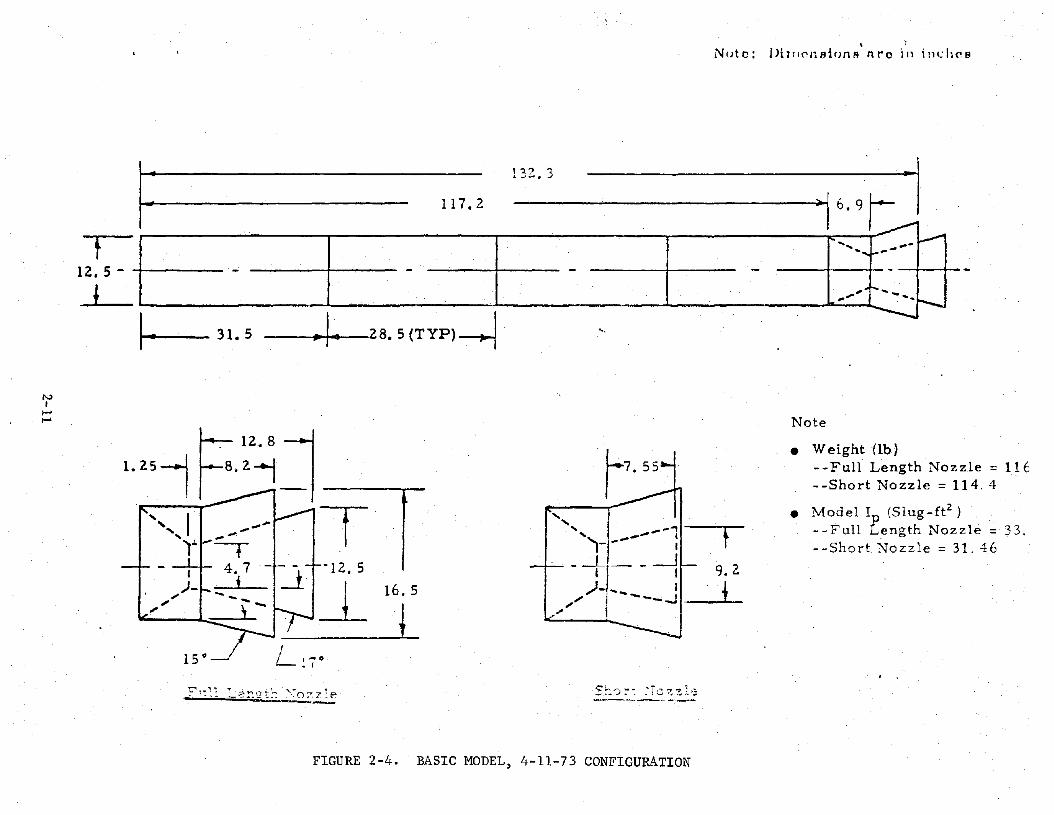
The 4-11.-73 baseline configuration reflects a later design decision to in
corporate a gimballed nozzle for booster thrust control. The design, shown
in Figure 2-2, features a notzle whose neutral position is in line with the
vehicle axis and which is shielded by a flared skirt to permit gimba1ling.
Several variations of this configuration were tested with a 12.5 in. diameter
modeL The original configuration incorporated a full-length nozzle ("long
nozzle", "with nozzle extension"). Early testing indicated that water impact
loads on the nozzle were quite severe. In order to provide for relief of
these loads if later deemed necessary, the design option of jettisoning the
nozzle extension prior to water impact was incorporated into the program.
Therefore, a model configuration with shortened nozzle (~'short no?zle",
"without nozzle extension") was also tested to simulate· the case in which the
nozzle extension is jettisoned. The basic model was fitted with a conical
aft bulkhead. It was later modified to incorporate a spherical aft bulkhead
2-1

and was further modified to incorporate a baffle in the nozzle-skirt annulus
region to protect the aft bulkhead from the severe pressure loads of initial
impact as experienced earlier 'in tests with the short nO?zle configuration.
Pertinent dimensions and mass characteristics of the 4-11-73 configuration and
models used in the different tests (discussed in the following sec tion) are
given in Table II.
The models were designed with sufficient strength to behave under load effec
tively as rigid bodies. Total weights center of gravity and pitch moment of
inertia were scaled as well as possible within the many constraints of design
and instrumentation requirements. As can be seen in the tables s the models
were overweight by no more than 15%, the center of gravity was within 6% (of
model length) of the design locations and pitch moment of inertia was within
:hO% of the design value. No attempt was made to scale mass distribution or
elastic properties of the full-scale vehicle since the structural design was
still in its embryonic stages at the time and subject to certain change.
Moreover, such scaling would have imposed serious limitations and restric
tions on the amount and location of instrumentation installed on the model.
The basic model, used for the primary tests (MSFC Test No. P-015) of the 4-11-73
configuration is shown in figure 2-4.
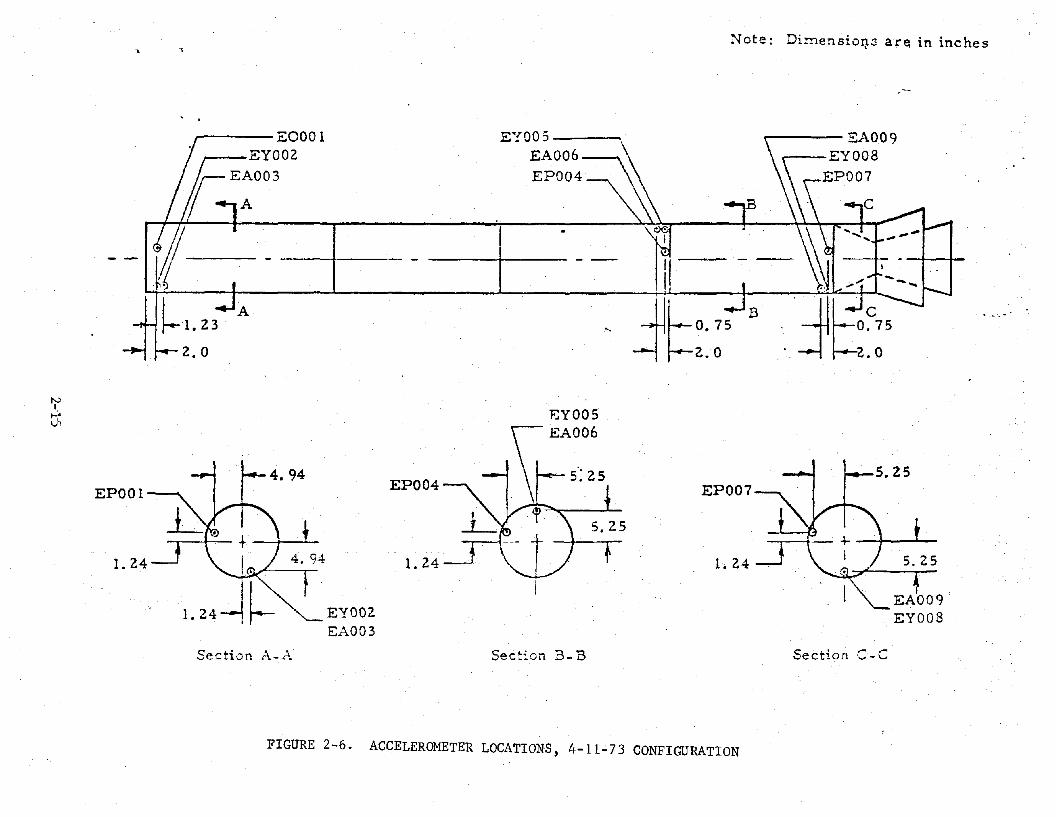
The models were instrumented with approximately 50 transducers to measure
pressures, accelerations and strains. Transducers were strategically located
to give maximum, or otherwise significant, measurements on the cylinder, aft
Skirt, nozzle and bulkhead. Three sets of axial, pitch and yaw accelerometers
were located near the nose, center of gravity and tail to aid in determining
total vehicle loads. Pressure transducer and accelerometer locations for the
2-2

basic 4-11-73 configuration model are shown in figures 2-5 and 2-6. Strain
gages were distributed so as to determine local stresses over the vehicle
and shear, bending moment and axial force at one station. Pressure trans-I
ducers were located so as to aid in determining the loads on individual com-
ponents and to help in assessing the fluid dynamics involved in the water
impact. Slight variations in the type, number and location of transducers
were made to meet the data requirements defined by individual test objec-
tives. In all cases, an epoxy potting compound and silicone grease were
used to waterproof the instruments, and RTV was added to protect the trans-
ducers from thermal shock at water entry. Nevertheless, strain gages bonded
to.the vehicle skin were quite susceptible to damage during test, and very
little data was obtained from them. Due to the shortcomings in strain data
no attempt was made at stress analysis in the present study. However, such
analyses have been made, using data from the 120 inch-diameter model, and
are reported separately in References 13 and 14. Accelerometers and pressure
transducers were bench-calibrated in the MSFC Metrology Laboratory prior to
installation in the model, and calibration resistances were determined for
purposes of electrical simulation of the calibration signal iater during
testing.
Signal conditioning equipment was packaged in a sealed instrumentation canis-
ter mounted inside the mode~ near its center of gravity. The canister con-
tained approximately 60 Wheatstone bridge balance circuits and three 21~chan-
nel constant bandwidth multiplexers .. Each multiplex system had a 96 kc center
frequency and 10 channels on 8 kc spacing each side of center frequency. All
channels had a 12 kc bandWidth.
2-3

The models were painted with longitudinal stripes along the 90 0 meridians
and circumferentially at three axial locations to aid in the analysis of
high speed photographic data.
2-4
\
---156 Inch-Diameter SRB Configuration
Configuration Design Scale Models - As Built
Full-Scale 120 in-Diam. 12.5 in-Diam. C-l45 Test Series C-l43 Test Series NOLPrototype Scale Model Scale Model Confilmrat ion Configuration 12.5 in. Model
mgth, in. 1351 1040 108.4 1056.7 108.4 108.1(1151.7)
1151. 7
ldy Diam., In. 156 120 12.5 121.1 12.5 12.5e21.1 )121. 1
:>zzle Exit Diameter, 163.8 126.1 13.1 77.5 13.1 13.1In. (126.1)
126.1
lzzle Throat Dia- 54.6 42.1 4.37 46 4.37 4.37meter, In.
(:~ ):>zzle Expansion 9~0 9.0 9.0 2.8 9.0 9.0Ratio (Area) (7.5)
7.5
eight, Lbs. 190,000 87100 97.7 84500 101. 0 97.8
(87700)88500
.G., in. aft of 618 476 49.4 485.6 55.32 52.75Fwd Cylinder End (505.4)
509.9
itch Moment of Iner- 7.22X10⁶ 1. 95Xl06 23.6 1.8X10⁶ 20.4 23.61tia., Slug-Ft. 2 ( 2X10⁶ )
2X10⁶
C
p
w
B
N
N
L
NI
\J1 N
NOTES: (1) Values quoted are for water impact configuration (without nose cone, frustum, or-recovery system).(2) Values in ( ) are for the configuration with standard and reinforced nozzle extension; Le.,
(standard nozzle extension)(reinforced nozzle extension)
TABLE 2-1. Characteristics of the 156 inch-Diameter Configuration - Prototype and Models

!')I
0'\
4-11-73_Baseline Configuration
Configuration Design 12.5 in-Diam. Scale Models - As Built
P-015 Test Series P-022 Test Series P-029 Test SeriesFull-Scale 12.5 in-Diam. Configuration Configuration ConfigurationPrototype Scale Model
(Conical Bulkhead) (Spherical Bulkhead) Spherical BulkheadShort Nozzle
! with Baffle1553 (1) 136.7 136.9 138.8
'Length, in. (1501) (2) (132.1) (132.3)(3) (132.3) (3) (132.3) (3)
Body Diam., in. 142 12.5 12.5 12.5(142) (12.5) (12.5) (12.5) (12.5)
-Nozzle Exit 142 12.5 12.5 12.5
Diameter, in. (105) ( 9.25) ( 9.25) ( 7.4) ( 7.4)-Nozzle Throat 53.4 I 4.7 4.7 4.7
Diameter, in. (53.4) I (4.7) (4.7) (4.7) (4.7)-_. -
Nozzle Expansion ! 7.1 7.1 7.1 7.J.Ratio (Area) (4.6) (4.6) (4.6) (2.5) (2.5)
-
Weight, Ibs.146,365 (4) 99.8 116.7 115.6
(143,165) (97.7) (114.4) (113.0) 111.0-----C.G., in. Aft of I 864.3 76.1 74.3 73.2
Fwd. Cylinder End (850.1) (74.8) (73.5) (71.8) (70.6)
Pitch Moment of 7.1l8x1Q6(4) 37.6 34.0 39.7Inertia, Slug-ft. 2 6.832xl06 36.0 31.5 (39.0) (38.5)
NOTES: (1) Values quoted are for water impact configuration (without nose cone, frustum, or recoverysystem.
(2) Values in ( ) are for nozzle extension removed; i.e., llshort nozzle".(3) Includes forward bulkhead lip.(4) Total mass and mass distribution taken from Ref. 15 for water impact configuration.
TABLE 2-2. Characteristics of the SRB 4-11-73 Baseline Configuration - Prototype and Models
NI
.......
Length - Inches
Body DiameterInches
Nozzle Exit DiameterInches (ShortNozzle)
Nozzle Throat Diameter
Weight - Pounds
C.G. Aft of FwdCylinder End
Pitch Homentof InertiaSlug-Ft2
Configuration Desi~~_ 12.5 Inch Diameter12.5 Inch Diameter Hodel As Built
Full Scale Model Scale lMS-333 Test
1530.2 131. 01 131.01
146 12.50 12.5
107.7 9.22 9.22
54.4 4.66 4.66
159706 100.2 107.2
891.4 76.3 77 .1
8.33 x 10⁶ 38.3 40.9
I.-
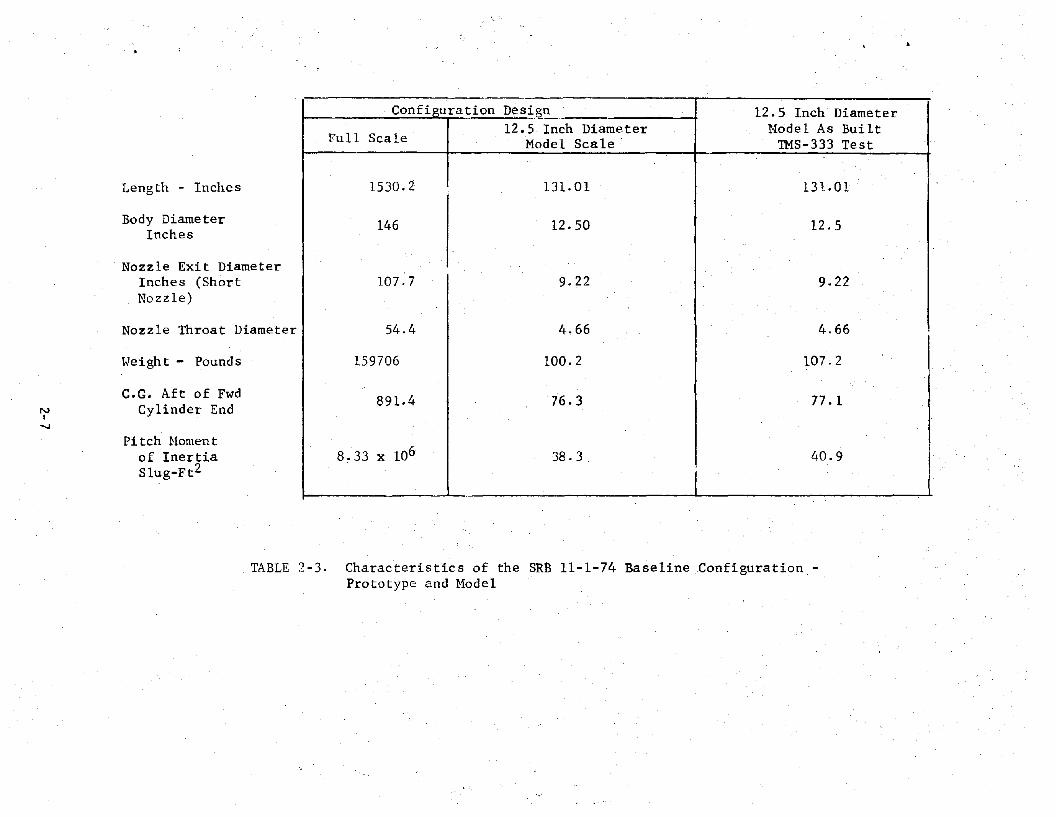
TABLE 2-3. Characteristics of the SR13 11-1-74 BaselineConfigurationPrototype and Model
,165DIA
J-156DIA.
1519
1393
1304
78·1I
827
1037
II 6°.r=
/-----s - --
~ /
--NI
ex>
SPLASHDOWN MASS PROPERTIESWEIGHT: 190,000 LBS.PITCH MOMENT OF INERTIA: 7.2X10⁶ SLUG-FT2
FIGURE 2-1. 156 INCH-DIAMETER SRB CONFIGURATION
1741
1474
I Xs ~ 1252.3 t PiVot
188 ---"'I 1504-- I r 145
l--tI ~1r- 1216 I -1 r. 93 "'+{15__
2--_--:..-
-t= I! I _ _ I I --- :-r r\jt'j__-----I-- -+ I-
I 141.7 192
,- -! L142 Diameter --- I -:: ----L-_
NI
\0
Xs • 200Xs = 1796
Weight at Waterl C.G. LocatiCXlImpact (Lbs.)
146,365 I Xs = 1252.3
. FIGURE 2-2 Space' Shuttle Solid Rocket Booster 4/11/73 Baseline Configuration
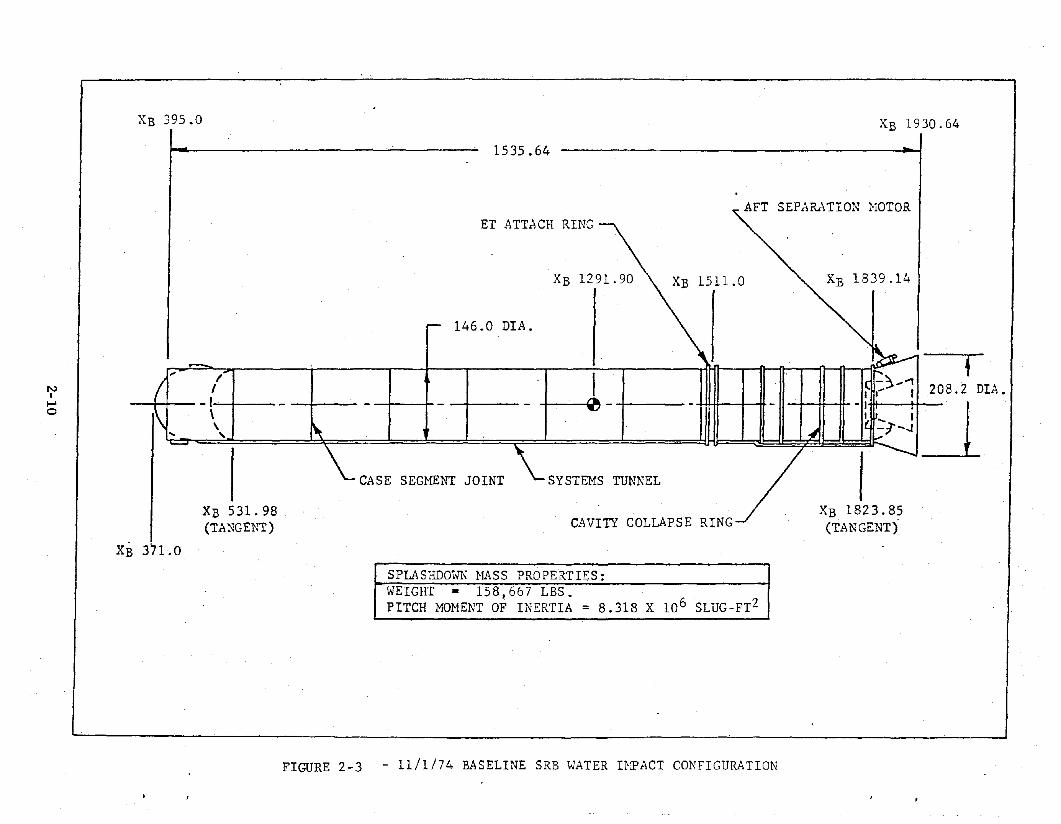
XB 395.0 XB 1930.64
1535.64
XB 1823.85(TANGENT)
SEPARATION HOTOR
CAVITY COLLAPSE RING
SYSTEMS TUNNEL
ET ATTACH RING
146.0 DIA.
CASE SEGMENT JOINT
XB 531.98(TANGENT)
" -r+- . . I .. . I ;:~'~ 208.2 DIA.I I .'["8 -l,-J±I.,-l· 0-1 -1±il1ffJf-j =-t
NI.....o
XB 371.0
SPLASHDOWN HASS PROPERTIES:WEIGHT = 158,667 LBS.PITCH MOMENT OF INERTIA = 8.318 X 10⁶ SLUG-FT2
FIGURE 2-3 - 11/1/74 BASELINE SRB WATER I~PACT CONFIGURATION
N()to: Dllllf'I1Bionfl' nro ill 11ll:hcB
-I . - .•. 1-1- [~ Et~·--+-+-~~
NI
I-'I-' Note
-
• Weight (lb)--Full Length Nozzle:: 11E- -Short Nozzle:: 114. 4
• Model I (Slug-Hz) .--Full Length Nozzle:: 33.--Short Nozzle:: 31. 46I
-l[ 9.2I i- - I 1/~-----J -.-___,,'" I
'" I
16. 5
i-.lr-12. 5
-l!I ,- 0'-- ... I
_.....",.~"",.
~4. 7
i
15 0 ----1
~t.:~l '!" <?-~_2't:: >~ozz~e--s.t. ,") :- -: .. 7<: ~ '! l '";
FIGURE 2-4. BASIC MODEL, 4-11-73 CONFIGURATION

Note: Dimensions are in inches
-.D 0"- 0"- 0 -.D 0 -.D ...... -.D 0 -.D 0"-0 ...... - 0 0 0 U'1 C"'1 0 0 U'1 ....... . - . . . . . .eo -.D ~ C"'1 N C"'1 C"'1 ~ U'1 -.D -.D ~
N C"'1 ~ U'1 -.D r- eo 0"- 0
n I I I lei I I I I I L............-
......
11 'I' 'I' 'I' "I' 'I' I ' I' , 'I' 'I' 'I' ! J I' 'I' 'j' ....
I J 1 J 1 1 l J ", 1 l 1......0 ,
0 0 0 0 0 J 0 0 0 0 -< - ' - N, I I I I I I I I I I I , .Q Q Q Q Q • Q Q Q Q Q Q C4 r-
AL -BL .-t-.:>I~t-.:,
D-20
---+- ~SO
D-06 § 1
Section A- A Section B- B
FIGURE 2-5 PRESSURE TRANSDUCER LOCATIONS, 4-11-73 CONFIGURATION(a) MODEL CYLINDER PRESSURE TRANSDUCERS
Note: Dimensions are in inches
D-26
D- 2 9-+-+--+ • _
Section /\- (I.Spdion J',. H
5. 75i
sl'b_~
A10.2--8_-+-__B_.1-D:29 - -+--
~ 3.0
""",,-" D-26
"
.... D-24......
--'-4- ... D-25
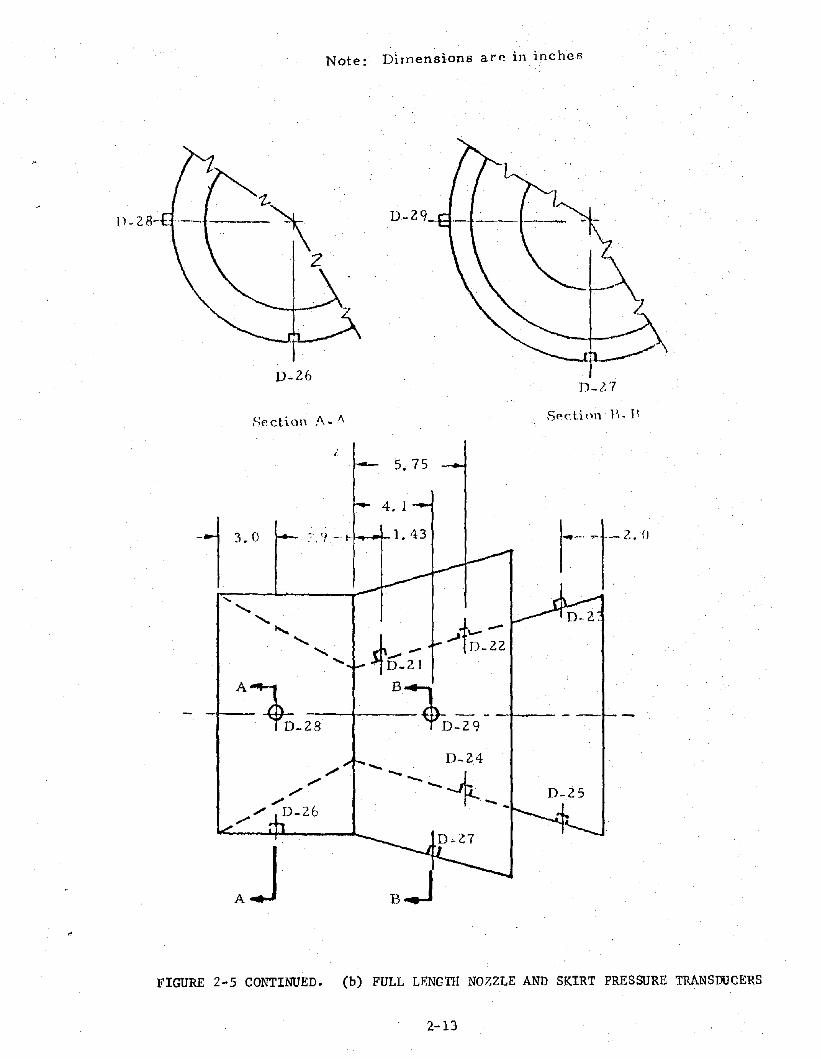
FIGURE 2-5 CONTINUED. (b) FULL LENGTH NOZZLE AND SKIRT PRESSURE TRANSDUCERS
2-13

D- 28 --I::l-~---------
Section A-A
Note: Dimensions are in inches
D- Z9--1=+--+----+--
Section B- B
...." ..... ..... ,)ii
........ D:3J.t- D-22 I
Ai ;- B~ !-f--+ _-.:..:-+--- -+ .--+--+-
D-28 1 D-Z9
",J- _ . D-Z5 ~// -----.l~J
,/"", ~D-26
,Lll'Y Oli' THill", ~'IS POOI~
FIGURE 2-5 CONTINUED. (c) SHORT NOZZLE AND SKIRT PRESSURE TRANSDUCERS
2:'14
., Note: DimensioQ..3 are in inches
• EA009• EY008
EP007
JJLO.7;-'B--Il-z.o
.~.
EY005 \\EA006
EP004.· \ '\.
i - --.
A~l. Z3
Z.O
!'-)I...,:.d,
EPOOl
1. Z4
EY002EA003
EP004
1. 24
EP007
1. 24 5.25
'"""'- EAO 09EY008
Section A-A SeCtion B- B Section C- C
FIGURE 2-6. ACCELEROMETER LOCATIONS, 4-11-73 CONFIGURATION


SECTION 3.0
TEST PROGRAM
The test program consisted of a number of drop tests, using the scale
models of the SRB described in Section 2.0. The tests were conducted at
the NASA/MSFC Over Water Launch (OWL) Tank Facility in Huntsville, Ala
bama: the Naval Ordnance Laboratory (NOL) Hydroballistics Tank in White
Oak, Maryland; The University 0 f New Orleans, New Orleans, Louisiana~ and
the Long Beach Naval Shipyard (LBNS), Long Beach, California. The drops
were made into calm water, in the nose-first and tail-first entry modes~
impact conditions varying with entry velocity and pitch angle. Defini
tion of the entry parameters is illustrated in Figure 3-1. The test pro
gram consisted of eight series of tests, conducted in the following
chronological order:
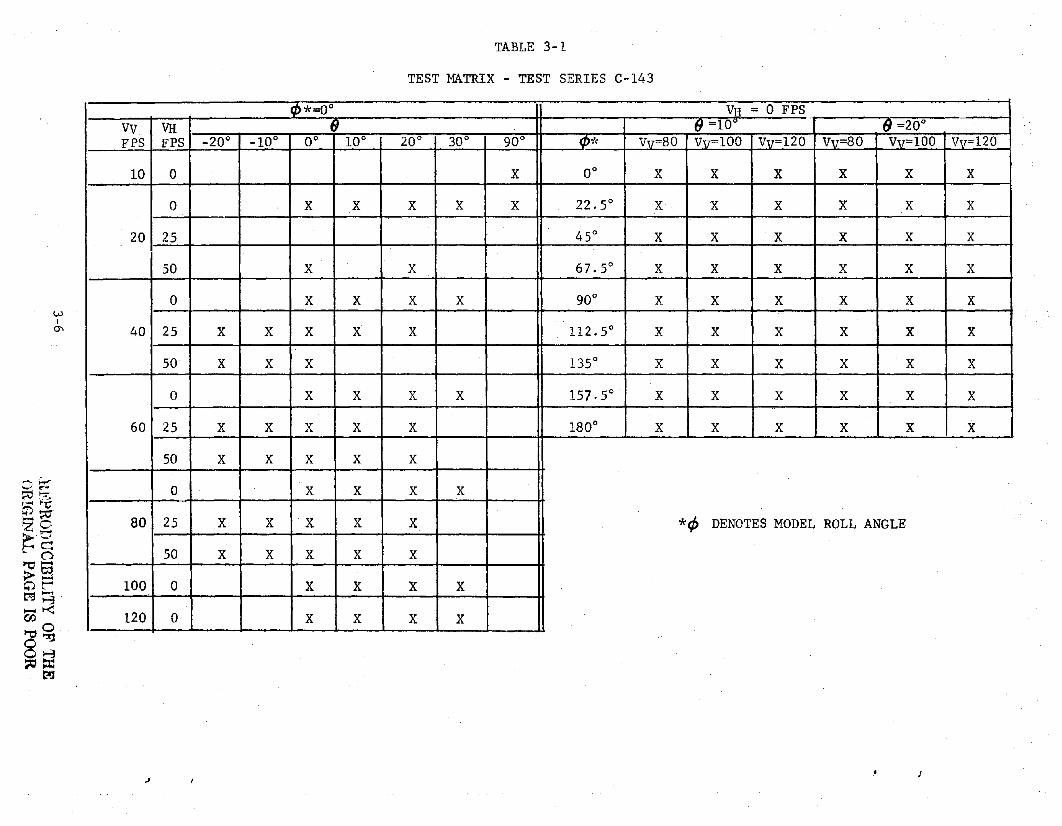
3.1 Test Series C-143
These were the initial tests of the program and were conducted in the
OWL tank during the period ~ovember 1972 to April 1973, in accordance
with the requirements of Reference 9. A total of 114 tests were con
ducted, using a 12.5 inch-diameter model of the 156 inch-diameter SRB
configuration. The objectives of these tests were to evaluate entry
modes, flotation attitudes, penetration characteristics, fundamental
loads. Nose-first and tail-first entry modes were investigated, with
impact conditions covering the full-scale range of vertical velocity,
Vv = 80 to 120 ft/sec, horizontal velocity, VH = 0 to 50 ft/sec, and
pitch angle, () = 0 to 30° (Fig. 3-1). The te s t matrix is shown in
3-1
Tab Ie 3- L A detailed description of the tests is presented in
Reference 4.
3.3 Test Series C-145
These tests w~re conducted at the LBNS facility during the period Febru
ary 10 - March la, 1973, in accordance with the requirements of Refer
ence 6. A total of 22 tests were conducted, using a 120 inch-diameter
model of the 156 inch diameter SRB configuration. In addition to the
fundamental objectives of the earlier test series, these tests were con
ducted to verify scaling relationships. All tests were in the tail-first
entry mode, with Vv = 8 to 80 ft/sec, VIi = 0 and () = 10 to 30°. The test
3-2
matrix is shown in Table 3-3. A detailed description of these tests is
presented in Reference 7.
3.4 Test Series P-015
These tests were conducted in the OWL tank during the period July 1-27,
1973, in accordance with the requirements of Reference 16. A total of
127 tests were conducted, using a 12.5 inch-diameter model of the
4-11-73 baseline configuration (with and without nozzle extension), to
evaluate the effects of drift velocity and the updatedSRB configuration.
The tail-first =ntry mode was investigated, with Vv = 80 to 120 ft/sec,
VH = 0 to 60 ft/sec and 9 = 0 to ~30°. The test matrix is shown in
Table 3-4. A detailed description of these tests is presented in
Reference 17.
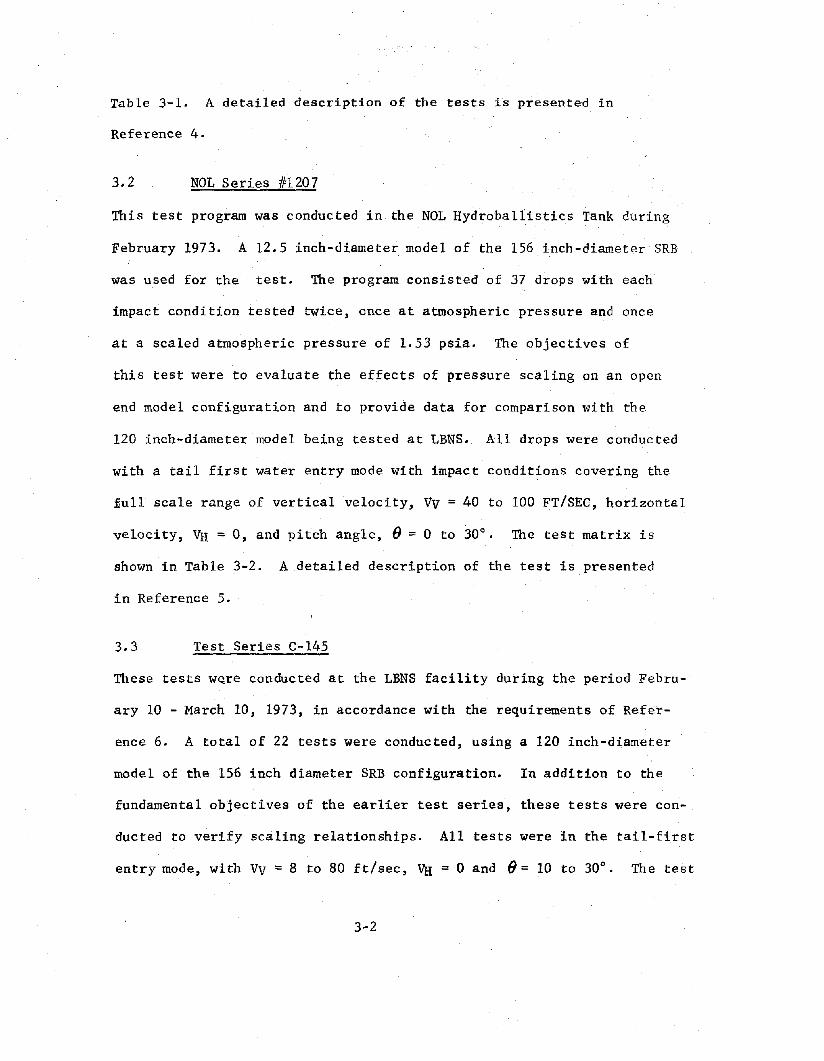
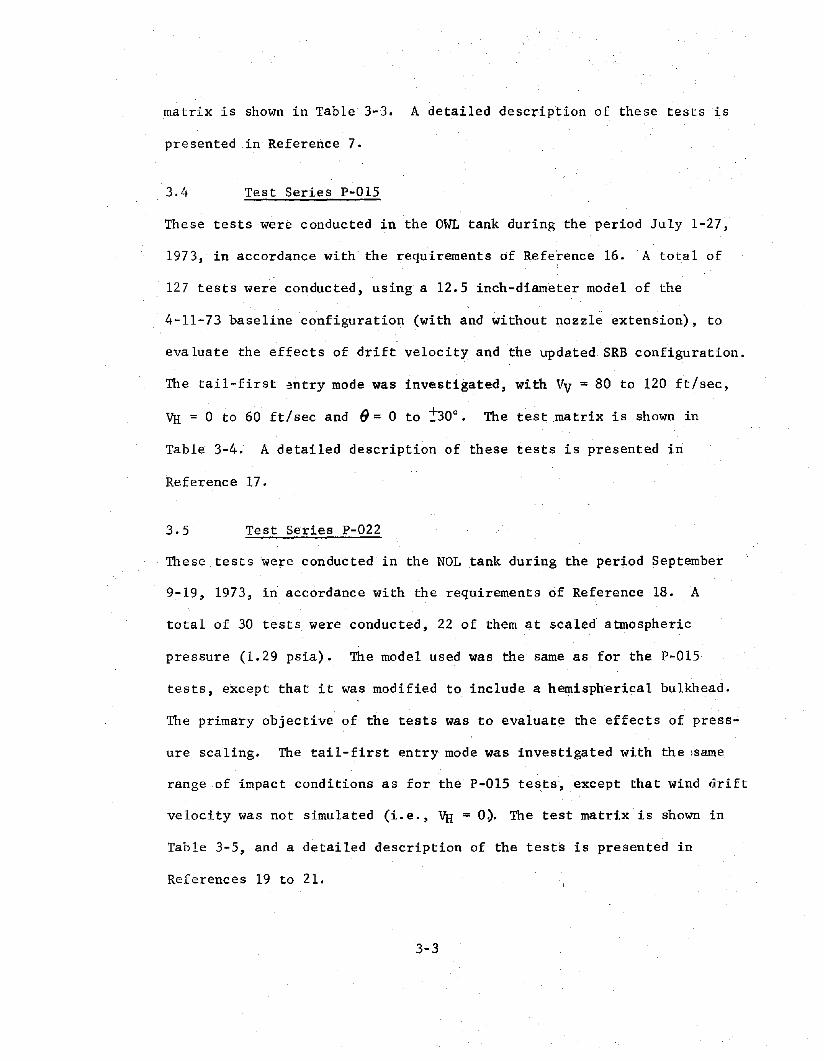
3.5 Test Series p-022
These tests were conducted in the NOL tank during the period September
9-19, 1973, in accordance with the requirements of Reference 18. A
total of 30 tests were conducted, 22 of them at scaled atmospheric
pressure (1.29 psia). The model used was the same as for the P-015
tests, except that it was modified to include a hemispherical bulkhead.
The primary objective of the tests was to evaluate the effects of press
ure scaling. The tail-first entry mode was investigated with the ;same
range of impact conditions as for the P-015 tests, except that wind drift
velocity was not simulated (i.e., va = 0). The test matrix is shown in
Table 3-5, and a detailed description of the tests is presented in
References 19 to 21.
3-3
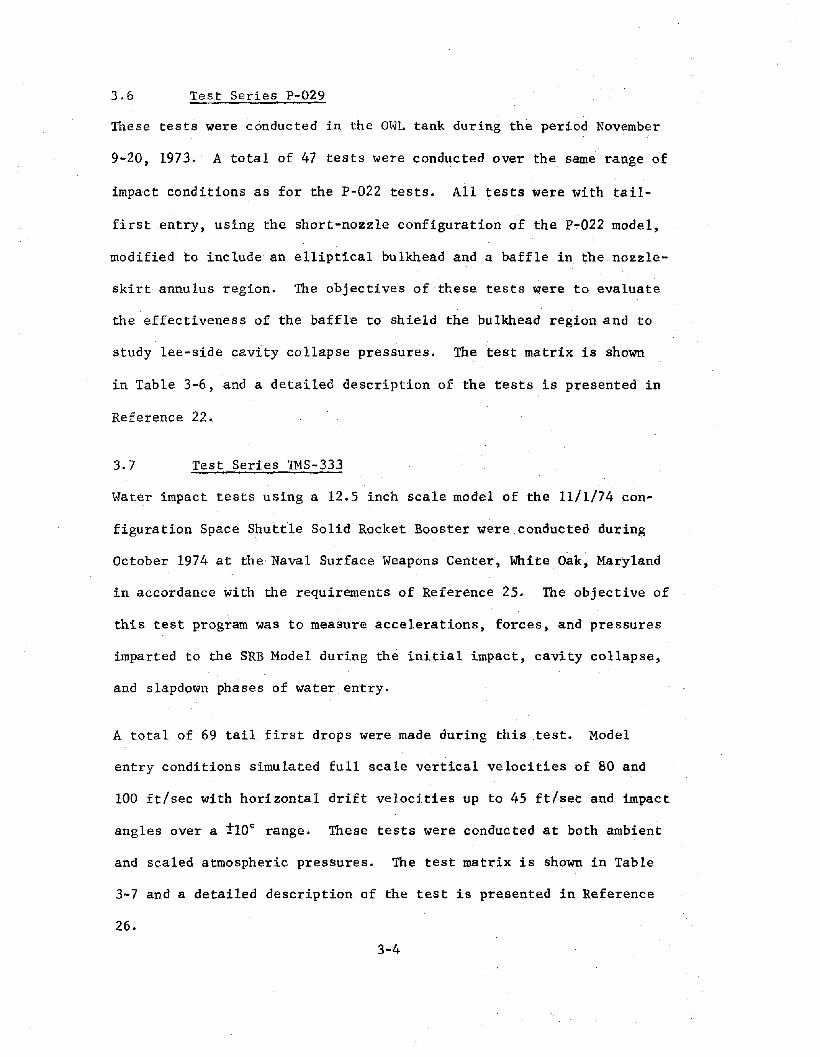
3.6 Test Series p-029
These tests were conducted in the OWL tank during the period November
9-20, 1973. A total of 47 tests were conducted over the same range of
impact conditions as for the P-022 tests. An tests were with tail
first entry, using the short-nozzle configuration of the P~022 model,
modified to include an elliptical bulkhead and a baffle in. the nozzle
skirt annulus region. The objectives of these tests were to evaluate
the effectiveness of the baffle to shield the bulkhead region and to
study lee-side cavity collapse pressures. The test matrix is shown
in Table 3-6, and a detailed description of the tests is presented in
Reference 22.
3.7 Test Series TMS-333
Water impact tests using a 12.5 inch scale model of the 11/1/74 con
figuration Space Shuttle Solid Rocket Booster were conducted during
October 1974 at the Naval Surface Weapons Center, White Oak~ Maryland
in accordance with the requirements of Reference 25. The objective of
this test program was to measure accelerations, forces, and pressures
imparted to the SRB Model during the initial impact, cavity collapse,
and slapdown phases of water entry.
A total of 69 tail first drops were made during this .test. Model
entry conditions simulated full scale vertical velocities of 80 and
100 ft/sec with horizontal drift velocities up to 45 ft/sec and impact
angles over a tlO° range. These tests were conducted at both ambient
and scaled atmospheric pressures. The test matrix is shown in Table
3-7 and a detailed description of the test is presented in Reference
26.
3-4

,-
3.8 Test Series UNO-l
Water impact tests using a fore-shortened 12.5 inch diameter model
simulating the aft cylinder and nozzle/skirt geometry of the 11/1/74
and 5/1/75 configurations of the Space Shuttle Solid Rocket Booster
were conducted during September 1975 at the University of New Orleans
School of Engineering Hydrodynamics Tank, New Orleans, Louisiana in ac
cordance with the test plan of Reference 28. The objective of this pro
gram was to evaluate changes in nozzle loads for the 5/1/75 configuration
due to the addition of the compliance ring and a one-foot extension of
the nozzle)and to substantiate the analytically defined increase of
nozzle loads of the 5/1/75 baseline update.
A total of 49 drops were made with five geometric configurations. Model
entry conditions simulated full scale vertical velocities of 70, 80, and
90 FPS with water impact angles of 0, 5, and 10 degrees. Horizontal
drift velocity was not simulated in this test which was conducted at
atmospheric pressure. The test matrix is shown in Table 3-8 and a detailed
description of the test is presented in Reference 29.
3-5
WI
0"1
-~"-" f!""
;:;:1""r-4 ~e
~~Zc>. Vt""C::o~§c;;t""'t'38OO~
'"dO8:~.~
t-J
TABLE 3-1
TEST MATRIX - TEST SERIES C-143
C/>*=OO \Tn = 0 FPS -VV V'H ~ (I =10u (J =20°FPS FPS _20° _10° 0° 10° 20° 30° 90° C/>·k Vv=80 Vv=100 Vv=120 Vv=80 Vv=100 Vv=120
10 0 X 0° X X X X X X
0 X X X X X 22.5° X X X X X X
20 25 45° X X X X X X
50 X X 67.5° X X X X X X
0 X X X X 90° X X X X X X
40 25 X X X X X 112.5° X X X X X X
50 X X X 135° X X X X X X
0 X X X X 157.5° X X X X X X
60 25 X X X X X 180° X X X X X X
50 X X X X X
0 X X X X
80 25 X X X X X *<1> DENOTES MODEL ROLL ANGLE
50 X X X X X
100 0 X X X X
120 0 X X X X
.J! )

TABLE 3-2
TEST MATRIX NOL SERIES #1207
P if> Vv 8PSIA DEGO FT/SEC 0° 10° 20° . 3D"
14.7 0° 40 X X X X
J60 X X X X
100 X X X X
45° 40
j 60 - X X X,100 X X
1.53 0° 40 X X
t 60 X X X X
100 X X X X
45° 40
1 60 X X X
100 XX X
2.5 0° 60 X
4.0 X
8.0 X
3-7-': ,
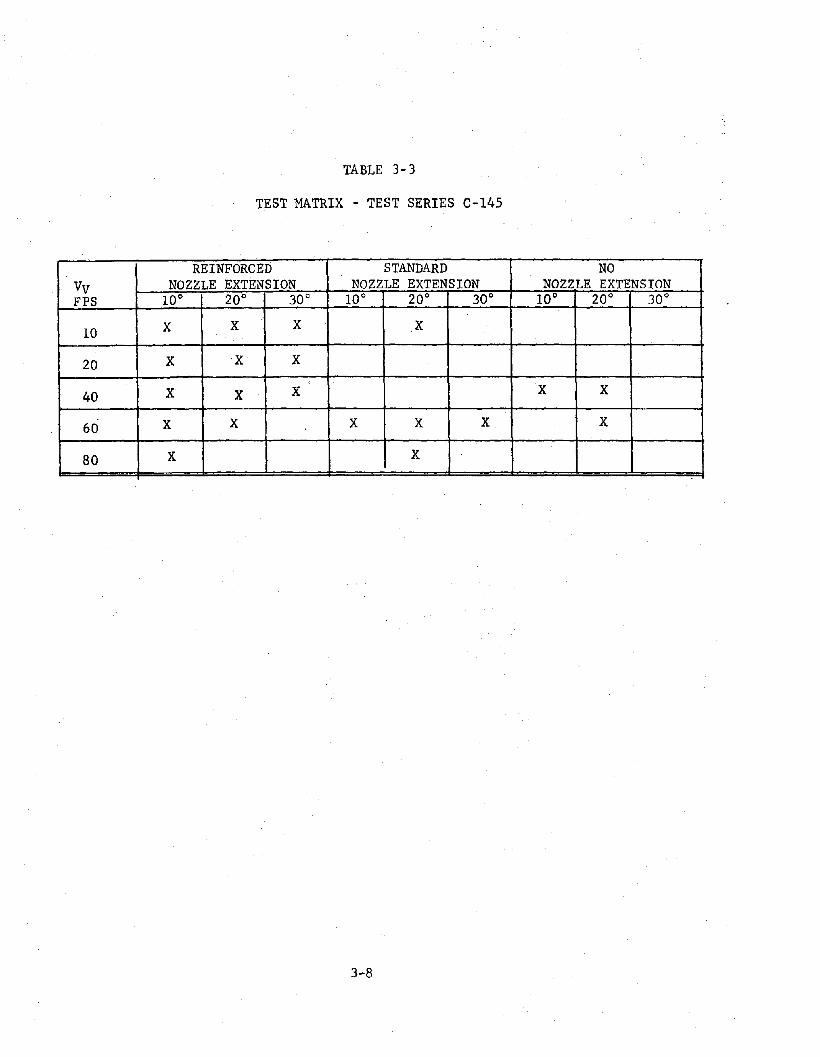
TABLE 3-3
TEST MATRIX - TEST SERIES C-145
REINFORCED STANDARD NOVv NOZZLE EXTENSION NOZZLE EXTENSION NOZZLE EXTENSIONFPS 100 200 30° 10° 20° 30° 10° 20° 30°
10 X X X X
20 X X X
40 X X X X X
60 X X X X X X
80 X X
3-8

TABLE 3-4a
TEST MATRIX - TEST SERIES P-015WITH NOZZLE EXTENSION
..
Vv VH ~ c
FPS FPS _20° _10° 0° 10° 20° 30°X,~ X* X'~ X*0
60 30X
60
X* X* Xi(X'~0
X X X X Xi(80 30
X X X X X60
0x* x* x* X,~
X X X X X,~
100 30
X X X X X60
0X X,'( X,'( Xi(
X X X X X*120 30
X X X X X60
* Model rolled 180°
3-9
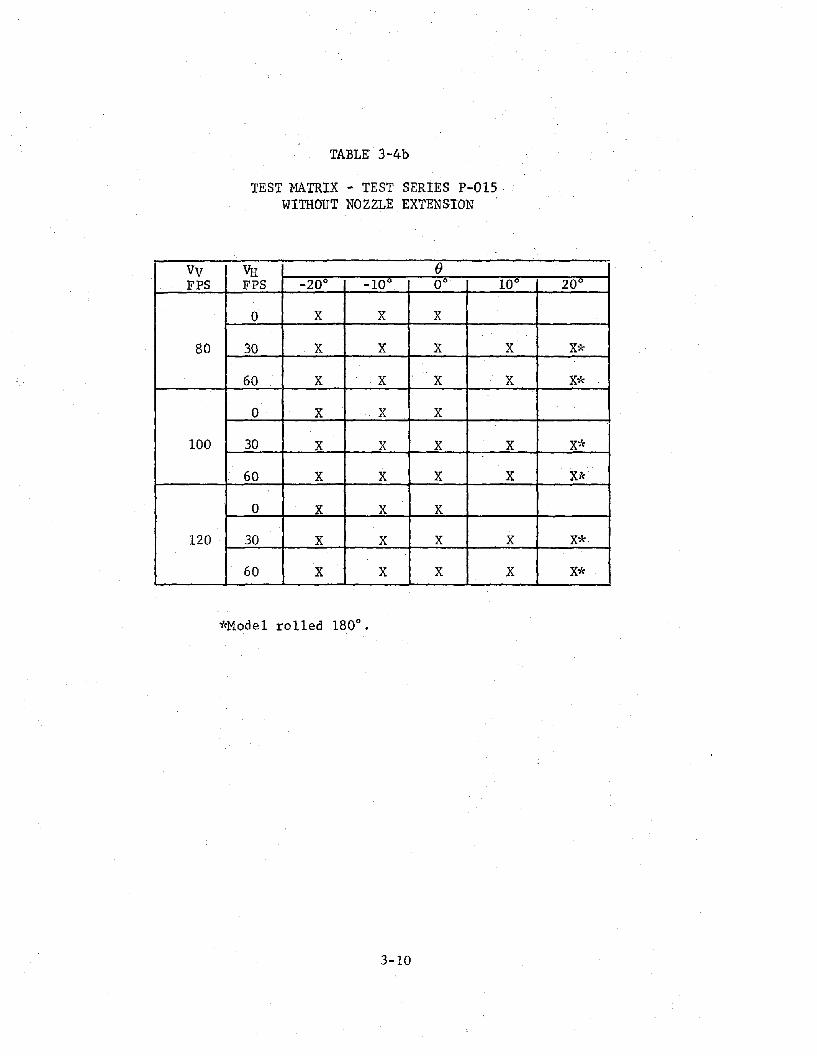
TABLE 3-4b
TEST MATRIX - TEST SERIES P-015WITHOUT NOZZLE EXTENSION
Vv VII ()
FPS FPS -20° _10° 0° 10° 20°
0 X X X
80 30 X X X X x*
60 X X X X x*
0 X X X
100 30 X X X X X*
60 X X X X x*
0 X X X
120 30 X X X X x*
60 X X X X x*
*Model rolled 180°.
3-10

TABLE 3-5
TEST MATRIX - TEST SERIES P-022WITH NOZZLE EXTENSION
Pa Vv 6PSIA FPS 0° 10° 20° 30°
80 X X X
1.29 100 X X
120 X X X X
80 X X
14.7 100 X X..
120
WITHOUT NOZZLE EXTENSION
Pa Vv 6PSIA FPS 0° 10° 20° 30°
80 ~ X X
1. 29 100 X X X
120 X X X .X
80 X X
14.7 100 X X
120
3-11

TABLE 3-6
TEST MATRIX - TEST SERIES P-029WITH NOZZLE EXTENSION, rp = 180°
Vv ~~
FPS 0° 10°
80 X X
100 X X
120 X X
WITHOUT NOZZLE EXTENSION, 4> = 180°
Vv (J
FPS 0° SO 10° ISo 30°
80 X X X X
100 X X X X* X*
120 X X X X* X*
*Model rolled 90°
WITHOUT NOZZLE EXTENSION, WITH BAFFLE, 4> =0°
Vv ()FPS 0° 10° 20° 30°
80 X X X X
100 X X X X
120 X X X X
3-12

TABLE 3-7DROP NUMBER MATRIX NOL TEST TMS-333
9i,.
Vv VH Po:> t/> .'
,..10°, _5° 0° +5° +10°
80 0 14.7 Q X X X'.
15 X~
30 , X-45 X X X
0 120 X X
15
30
45 X
0 1.26 0 X X X
15 X X X X
30 X X X
45 X X
0 120 X X
15 X X X X
30 -45
100 0 14.7 0 X X X
15 X
30 X
45 X X X
0 120 X X
15
30
45 X
0 1.26 0 X X X
15 X X X X
30 : X X X
45 X X
0 120 X X
15 X X X X
30
45 X X
3-13 llEPllODUC1B1LITY 'oF -THEORIGINAL PAGE IS pOOR
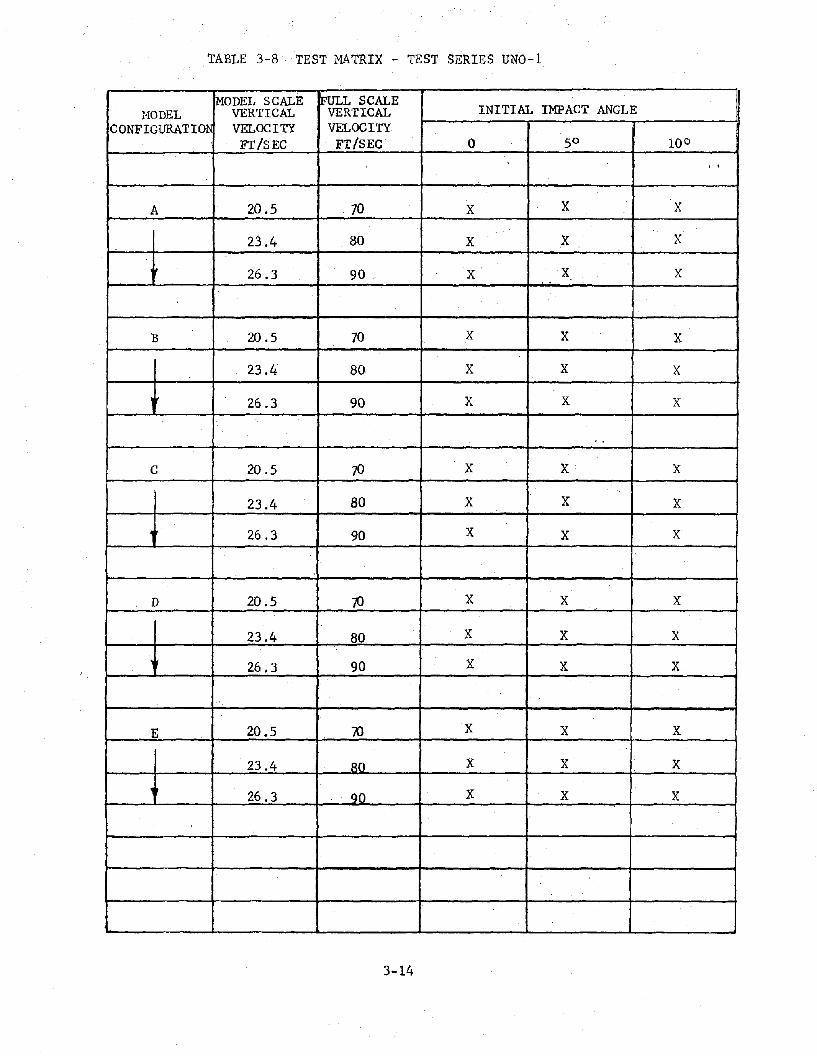
TABLE 3-8 TEST MATRIX - TEST SERIES UNO-1
IMODEL SCALE IFuLL SCALEINITIAL IMPACT ANGLEMODEL VERTICAL VERTICAL
CONFIGURATION VELOCITY VELOCITYFT/SEC FT/SEC 0 5° 10°
..
A 20.5 70 X X X
23.4 80 X X X
26.3 90 X· X X..
B 20.5 70 X X ..X
23.4 80 X X X
I 26.3 90 X X X
..
C 20.5 70 X X X
23.4 80 X X X
" 26.3 90 X X X
D 20.5 70 X X X
23.4 80 X X X
~ 26.3 90 X X X
E 20.5 iU X X X
23.4 80 X X X
• 26.3 X90 X X
3-14
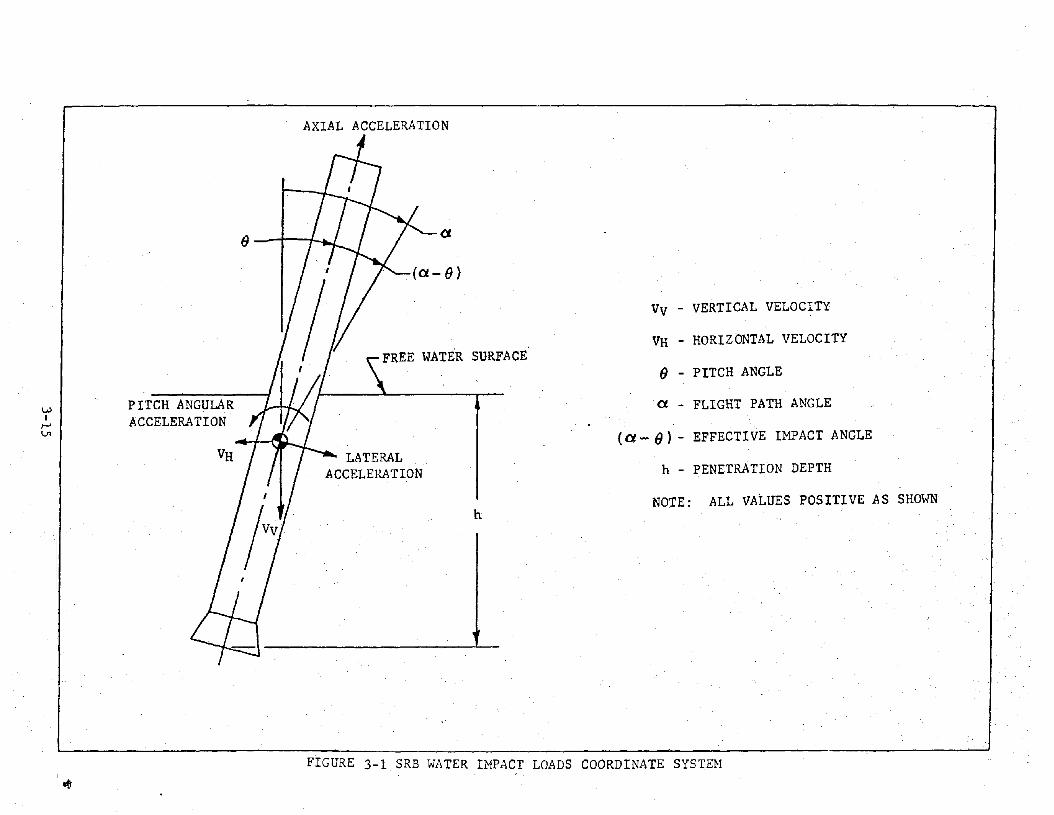
. AXIAL ACCELERATION
h
VH - HORIZONTAL VELOCITY
() - PITCH ANGLE
Cl - FLIGHT PATH ANGLE
NOTE: ALL VALUES POSITIVE AS SHOWN
Vv -VERTICAL VELOCITY
(Cl- ()) - EFFECTIVE UlPACT ANGLE
h - PENETRATION DEPTH
Cl
FREE WATER SURFACE
LATERALACCELERATION
()_ I !-....
VH
PITCH ANGULARACCELERATION
LVI
I-'VI
~
FIGURE 3-1 SRB WATER IHPACT LOADS COORDINATE SYSTEH


SECTION 4.0
DATA ACQUISITION AND PROCESSING
A wire cable was provided to carry the transducer signals from the onboard
signal conditioner to an instrumentation trailer for recording on analog
magnetic tape. The cable consisted of five wires to transmit power, elec
trical calibrations, and three multiplexed data signals. It was attached
to the model near the C.G. and was dropped with and alongside the model
during testing to minimize forces applied to the model by the cable. In
the instrumentation trailer, seven tape tracks were used to record three
multiplexed data signals, a 50 KC tape speed compensation signal, model
release signal, IRIG-Btime, and a voice signal.
Prior to each test, with model suspended above the water, calibration
resistors were shunted across all transducers and pretest calibrations
taken. After recording data during the test, post test calibrations were
performed in a similar manner with the model in calm water. After each
test, the data tape was played back through a demodulator and recorded on
oscillograph charts. The oscillographs were then examined for data qual
ity, polarity, and IRIG-B time. Based on the results of this examination,
modifications or improvements to the instrumentation were made as required
prior to subsequent testing.
The analog tape was then sent to the MSFC Computation Laboratory for digitiz
ing and plotting. The tape was played back, one data· track at a time, with
the multiplexed signals passing through tuners with individual frequencies
corresponding to the center frequencies of the multiplex channels. Thus,
the original multiplex signal was separated into 21 individual signals.
4-1

These signals were then fed through a low pass filter (100 cps for test
series TMS-333 and 220 cps for all others) into a discriminator which
measured the deviation from center frequency and assigned to is a four digit
magnitude. Digitizing was carried out at the rate of 1000 samples per second.
The computer then read each discriminator in sequence, recycling to repeat
the process for the next millisecond in time. Computer time required for one
complete set of readings was approximately 8 microseconds.
During the digitizing, the computer tracked the 50 KC reference signal,
adjusting time to compensate for any minute variations in speed of the tape
transport of the original analog data recorder. Overall control of the
process was keyed to IRIG-B time. The analog tape was sampled during the
pretest calibration, the test (beginning before model release and continu
ing through slapdown), and the post test calibration. Output from the
digitizing computer consisted of a digital tape containing IRIG-B time fol
lowed by 44 data points for each measured quantity: each data point corres
ponding to times one millisecond apart. This format was repeated until
all data had been included. The calibrations were then used to express
magnitudes of the digitized data in terms of engineering units, and all
values were corrected for zero biases.
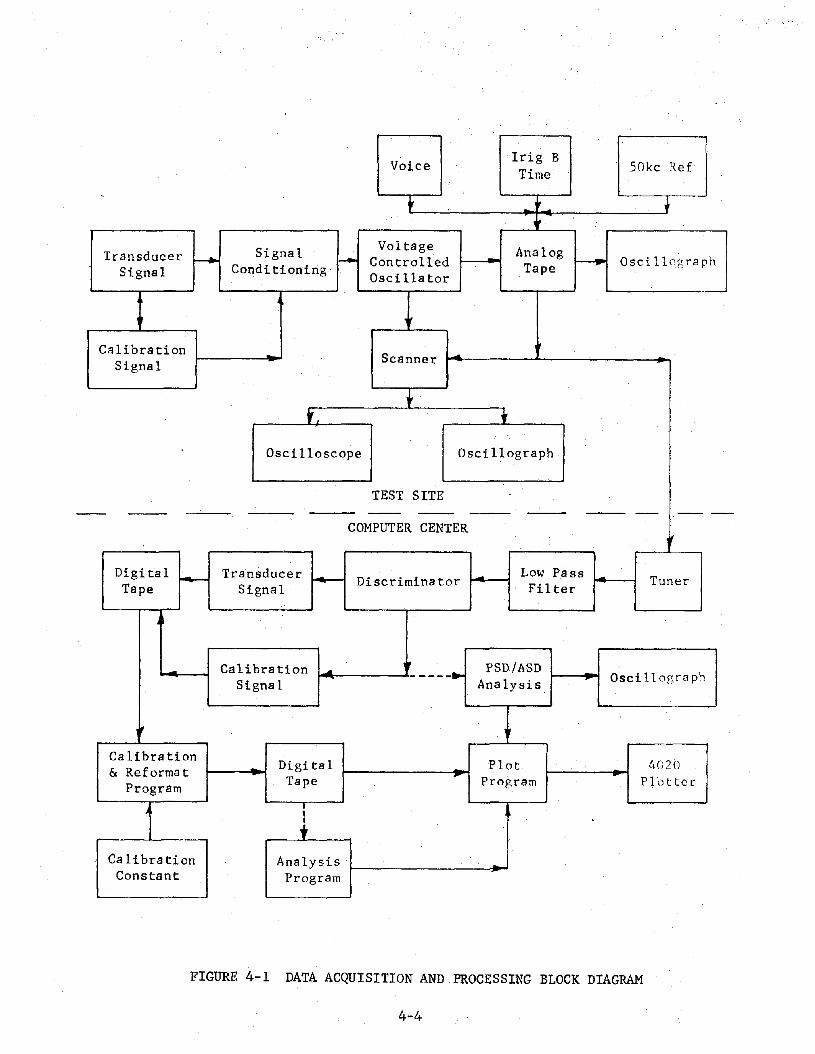
Finally, the tapes were processed in a merge and reformat program which
converted the data to Fortran form and rearranged it on files in a pre
scribed numerical sequence. A plot tape was generated and time histories
of all measured quantities plotted on a Stronberg-Carlson 4020 Plotter.
A schematic of the data acquisition and processing system is shown in
figure 4-1.
4-2
Photographic coverage for the tests was provided by 16 mm high-speed movie
cameras. In OWL Test Series P-015, P-029, and C-143, data cameras were
mounted above and below the waterline, while split image photography (with
the centerline of the camera lens at the waterline) was used in NOL Test
Series P-022 and TMS-J33. All cameras were above the waterline for LBNS
Test Series C-145. In all cases, one camera (or set of,cameras) was placed
in the model pitch plane, the other perpendicular to it. All were aimed
at the impact point. In the LBNS tests, an additional camera was mounted
inside the model to record the flow of water through the nozzle.
Camera speed was set at 250 frames per second. Timing lines were recorded
on the margin of the film for exact determination of frame speed. A rec
tangular grid with horizontal and vertical lines one foot on center was
photographed on each reel of film to provide a linear distance calibration.
Flash bulbs, which illuminated at model release, were placed in the field
of view of the cameras to coordinate time with the electrical instrumenta
tion.
4-3
Irig BSOkc RefVoice Time
t + Jf
Signal Voltage AnalogTransducer f--+ t- Controlled - ~ Osci llographSignal Conditioning
Osci lla torTape
j
1
Ca Ii bra tion ~
Scanner ...Signal
t, f
Oscilloscope Oscillograph
TEST SITE-- -- ~ -- -- -- - --
COMPUTER CENTERIt
Digital f-- Transducer r-- - Low Pass TunerTape Signal Discriminator Filter
Calibration .... , PSD/ASDOscillograph-----....
Analysis~
Signal
,Calibration
Digi ta 1 Plot 4Ci20& ReformatTape r Program PlotterProgram
A :+
Calibration Analysis --Constant Program
FIGURE 4-1 DATA ACQUISITION AND PROCESSING BLOCK DIAGRAM
4-4
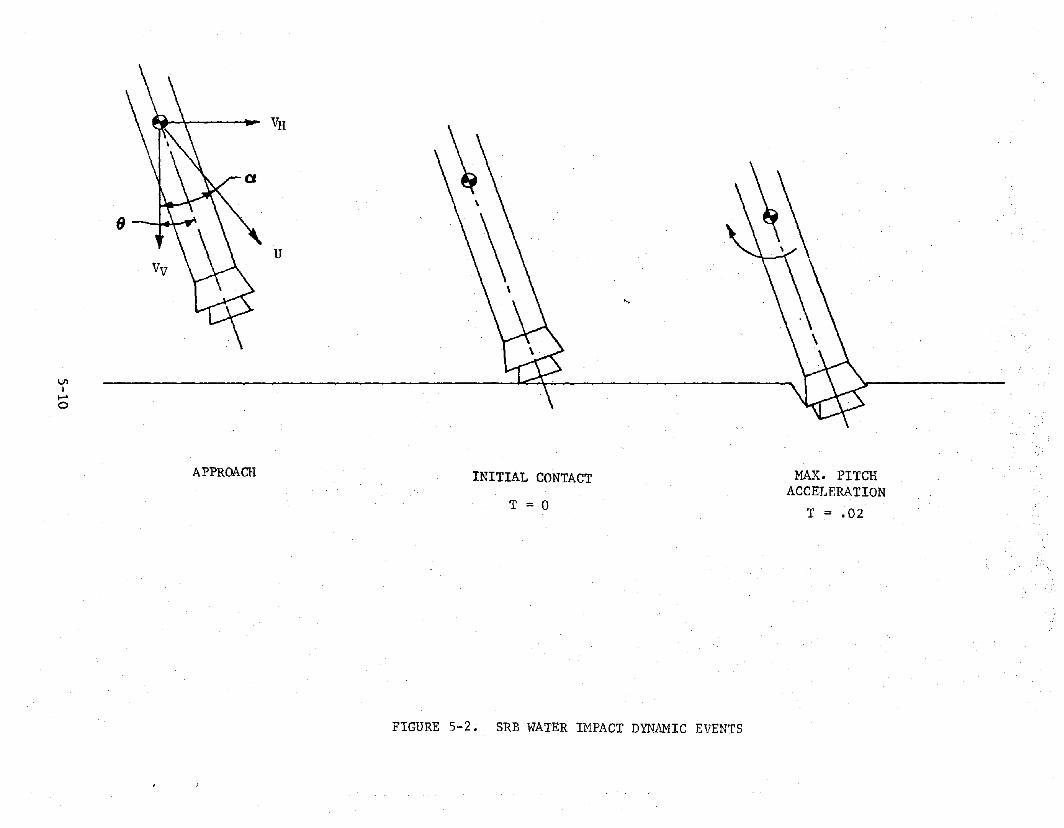
SECTION 5.0
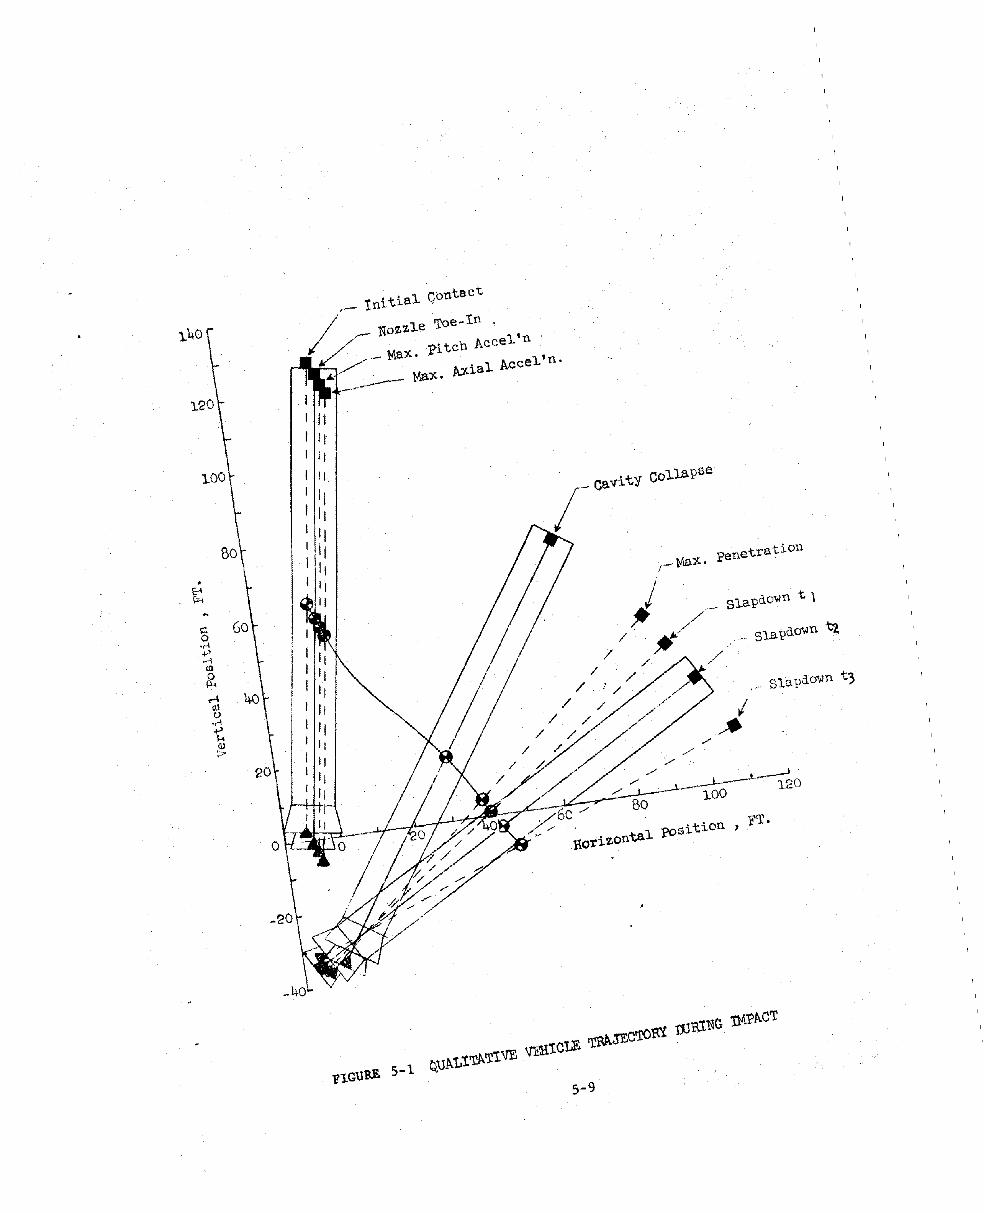
SRB WATER IMPACT DYNAMIC EVENTS
Water impact of the SRB as revealed by high speed photographic records
and measured data from the model tests allows a qualitative description of
entry phenomena. This description is best viewed as individual phases con-
sisting of initial entry, cavity formation and collapse,maximum penetra-
tion, and rebound and slapdown (Figures 5-1 and 5~2). Within these phases,
there are one or more distinct events Which establish possible design criteria
as indicated below:
Entry Phase
Initial Entry
Event
lkzzle Toe-in
Max. PitchAcceleration
Max. AxialAcceleration
Annulus Stagnation
Possible Design Criteria
External Crushing Pressure onNozzle Keel (Long Nozzle)
Normal Load on Nozzle and Skirt,Vehic Ie Bending Moment, Pressureson Nozzle & Skirt.
Axial Load on Nozzle, VehiclePressure Loads on Nozzle, Skirt
Crushing Load on Bulkhead
Cavity Forma- Cavity Collapsetion & Collapse
Max. Penetration Max. Penetration
Crushing Load on Aft Case & Skirt
Crushing Load on Aft Case
Rebound andSlapdown
Slapdown Crushing Load on Forward Case atVarious Times (to' t i , tZ)
5.1 Initial Impact
Nozzle Toe-in. As the vehicle enters the water, there is a very short
time interval following initial contact with the liquid free surface during
which only a portion of the nozzle extension is wetted. The remainder of
the vehicle is dry. For negative impact angles, this wetted portion is on
5-1

the keel side of the nozzle. If water entry is accompanied by appreciable
horizontal velocity (VH ~ '" 30 ft/sec), significant external nozzle keel
pressures result and the event is designated as nozzle "toe-in". Inthis
case, the component of fluid velocity normal to the body at impact is maxi
mized. Pressures associated with this flow develop over the nozzle external
surface. The flow separates from the internal nozzle surface on the keel side
giving rise to near ambient pressure on the nozzle internal surface. As a re
sult, the vehicle is subject to a momentary pitching moment, while the wetted
portion of the nozzle extension is subject to a local short-duration compres
sion (buCkling) load. Nozzle toe-in, as a distinct event, is observed only
with the long nozzle configuration at the relatively high effective· impact
angles associated with large horizontal velocity and negative impact attitude.
Maximum Pitch Acceleration. As the vehicle penetrates further the increasing
flow of water into the nozzle and nozzle~skirt annulus compresses the entrapped
air in the motor case chamber. Due to the normal velocity component, the flow
is asymmetric, causing a build-up of fluid along the inner walls of the skirt
and nozzle on the lee side. The resulting pressure build-up over the external
keel and internal lee surfaces producing a considerable normal force and pitch
ing moment on the vehicle. This time is designated the maximum pitch accelera
tion event.
Maximum Axial Acceleration. Moments later, with continued penetration, the
nozzle flows full. Nozzle and skirt internal pressures rise sharply, producing
maximum hoop loads and for the configuration without nozzle extension, the noz
zle/Skirt annulus stagnates by impact of the water head with the motor case
aft closure bulkhead. This produces the maximum vehicle axial acceleration
event and maximum local pressure loads on most of the appendage structure
and subsystem components. The time interval between maximum pitch and
5-2

and axial accleration is a function of effective impact angle', decreasing
with decreasing angle until the two events become indistinguishable [or near
zero angles.
Annulus Stagnation (With Nozzle Extension). Although the vehicle has lost
considerable momentum during the deceleration of initial impact for the con
figuration with nozzle extension, penetrating velocity is still sufficient
to cause flow past the nozzle to separate at the nozzle exit plane. As back
pressure builds up in the nozzle-skirt annulus region, the separating free
streamlines from the nozzle exit plane diverge wi,th time. As a result, the
flow passage between separating free surface and vehicle skirt continually
decreases. About 30 maee. (ulodel scale) after the time of maximum axial ac
celeration, the separating free streamline has diverged to the point where
it encloses the aft rim of the skirt. Therefore, oncoming flow is diverted
around the skirt, and flow into the nozzle-skirt annulus is completely cut
off. The annular slug of water entrained between the nozzle and skirt con
tinues toward and finally stagnates on the bulkhead. There is a spike in
bulkhead pressure w~th a corresponding spike in axial acceleration, the mag
nitude of which is much smaller than that of the earlier maximum axial accel
eration event for this configuration. The associated loads on the nozzle
wall are compressive (buckling) from the throat to the aft end of the skirt
and tensile (hoop) from there to the exit plane.
Annulus Stagnation (Without Nozzle Extension)
With continued penetration a quasi-steady state flow is established in
side the nozzle and internal pressures drop rapidly. In the nozzle/
skirt annulus a cavitating flow has been established along the walls as
- 5-3
a result of wakes from the nozzle compliance ring and the large struc
tural rings inside of the skirt. Arter the water slug impacts the aft
closure, bulkhead pressures begin to decay to approximately·SO% of peak
value as a pressure wave reflects back through the annulus. Local press
ure in the water increases and all internal cavitation collapses. Nozzle,
skirt, and bulkhead pressures rise with all areas being subjected to
approximately the same pressure which is on the order of 2/3 of the
peak bulkhead pressure during maximum axial acceleration. In addition
to compressive buckling, the stagnation results in a negative nozzle
axial load, pulling it away from the bulkhead, due to the stagnation
pressure being much larger than the nozzle internal pressures at this
time. For Some impact conditions the magnitude of the negative nozzle
axial force is approximately equal to the positive axial load during maxi
mum axial acceleration.
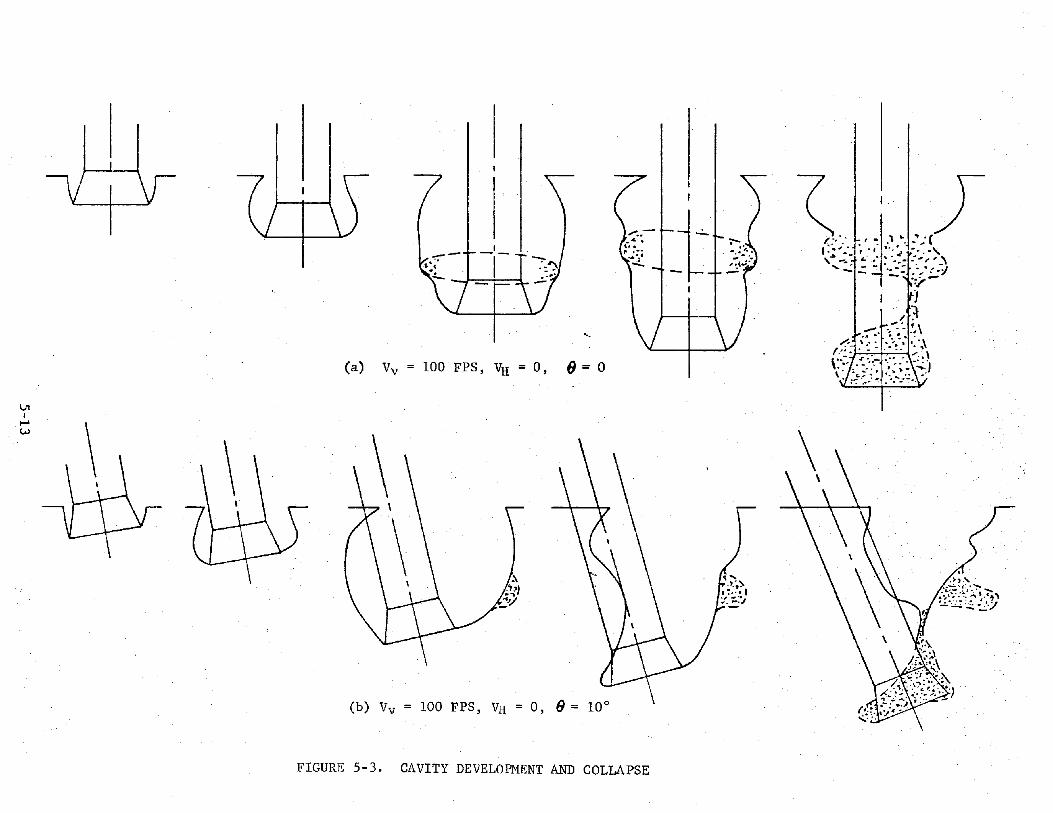
5.2 Cavity Formation and Collapse
For a pure vertical entry, i.e. initial horizontal velocity and pitch angle
are zero, the cavity formation and collapse is symmetrical about the vehicle
centerline as shown in Figure 5-3. Vertical velocity for the caSe illustrated
is 100 ft/sec., full scale.
5-4
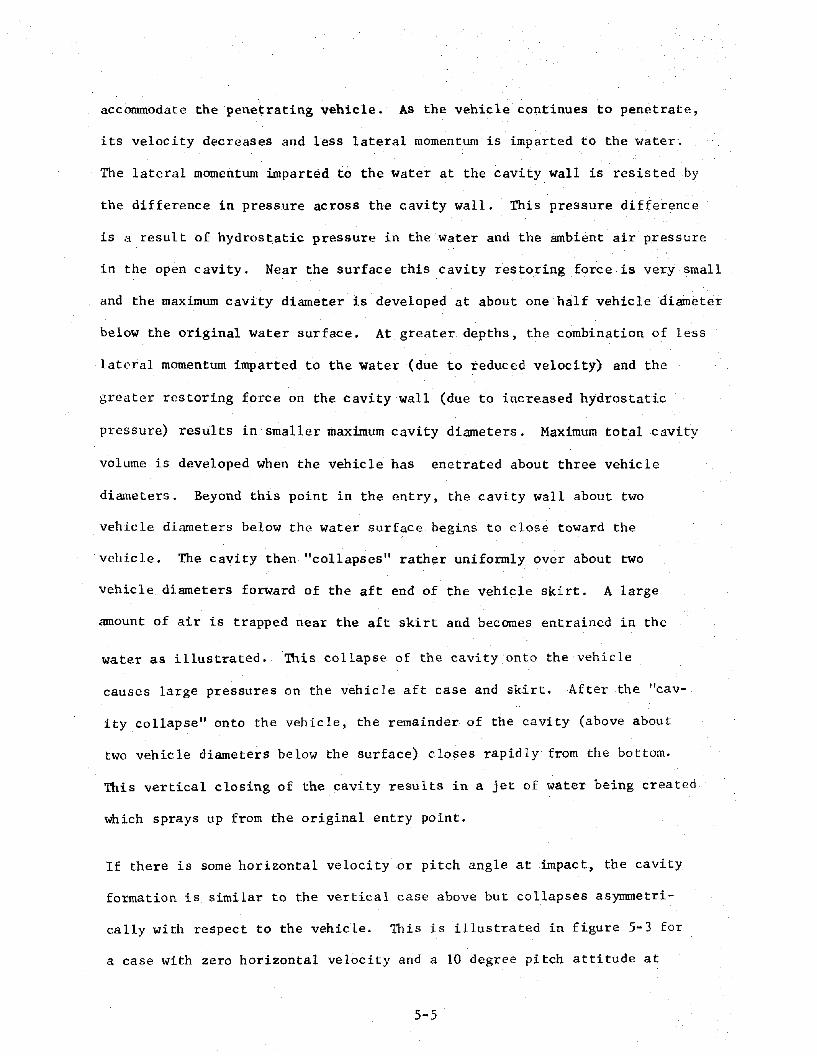
accommodate the 'penetrating vehicle. As the vehicle continues to penetrate,
its velocity decreases and less lateral momentum is imparted to the water.
The lateral momentum imparted to the water at the cavity wall is resisted by
the difference in pressure across the cavity wall. This pressure difference
is a result of hydrostatic pressure in the water and the ambient air pressure
in the open cavity. Near the surface this cavity restoring force is very small
and the maximum cavity diameter is developed at about one half vehicle diameter
below the original water surface. At greater depths, the combination of less
lateral momentum imparted to the water (due to reduced velocity) and the
greater restoring force on the cavity wall (due to increased hydrostatic
pressure) results in smaller maximum cavity diameters. Maximum total cavity
volume is developed wh~n the vehicle has enetrated about three vehicle
diameters. Beyond this point in the entry, the cavity wall about two
vehicle diameters below the water surface begins to close toward the
vehicle. The cavity then "collapses" rather uniformly over about two
vehicle diameters forward of the aft end of the vehicle skirt. A large
amount of air is trapped near the aft skirt and becomes entrained in the
water as illustrated. This collapse of the cavity onto the vehicle
causes large pressures on the vehic le aft case and skirt. After the "cav
ity collapse" onto the vehicle, the remainder of the cavity (above about
two vehic le diameters below the surface) closes rapidly from the bottom.
This vertical closing of the cavity results in a jet of water being created
which sprays up from the original entry point.
If there is some horizontal velocity or pitch angle at impact, the cavity
formation is similar to the vertical case above but collapses asymmetri
cally with respect to the vehicle. This is illustrated in figure 5-3 Eor
a case with zero horizontal velocity and a 10 degree pitch attitude at
5-5
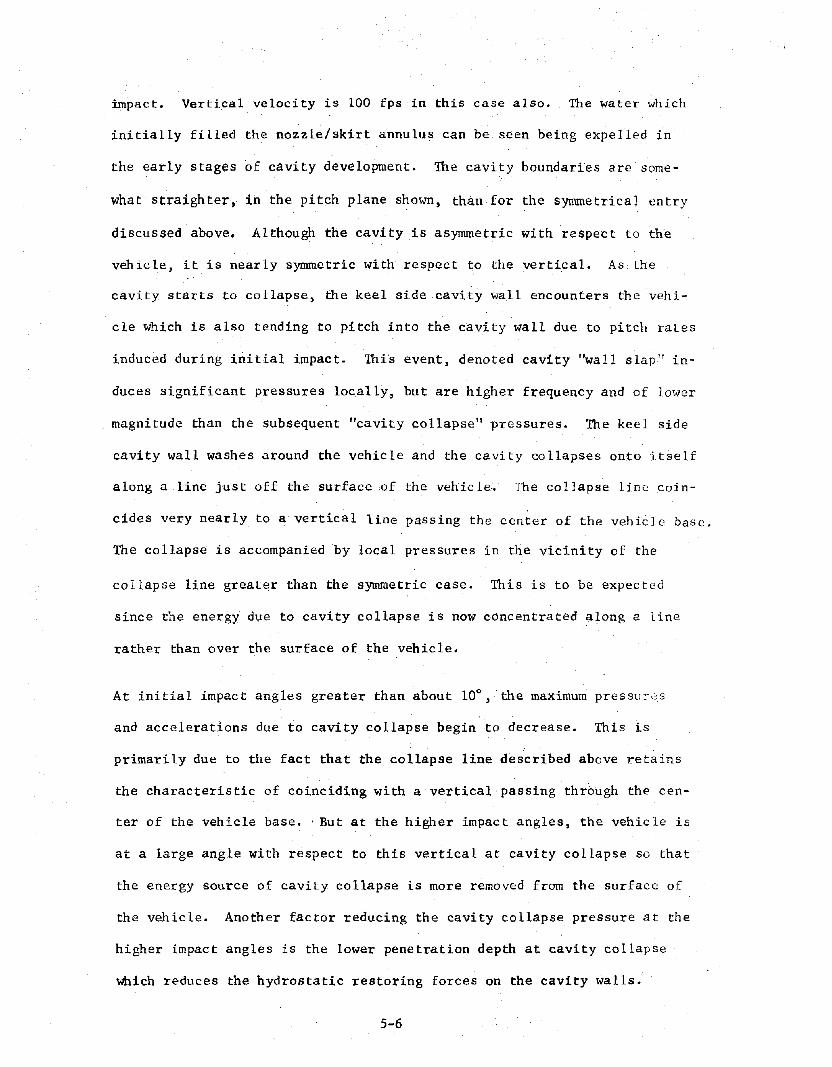
impact. Vertical velocity is 100 fps in this case also. The water which
initially filled the nozzle/skirt annulus can be seen being expelled in
the early stageso£ cavity development. The cavity boundaries are some
what straighter, in the pitch plane shown, than for the symmetrical entry
discussed above. Al though the cavity is asymmetric with respect to the
vehicle, it is nearly symmetric with respect to the vertical. As the
cavity starts to collapse, the keel side cavity wall encounters the velli
cle which is also tending to pitch into the cavity wall due to pitch rates
induced during initial impact. This event, denoted cavity "wall slap" in
duces significant pressures locally, but are higher frequency and of lower
magnitude than the subsequent "cavity collapse" pressures. The keel side
cavity wall washes around the vehicle and the cavity collapses onto itself
along a line just off the surface of the vehic Ie. The co llapse Une: coin
cides very nearly to a vertical line passing the center of the vehicle base.
The collapse is accompanied by local pressures in the vicinity of the
collapse line greater than the symmetric case. This is to be expected
since the energy due to cavity collapse is now concentrated Cilong a line
rather than over the surface of the vehicle.
At initial impact angles greater than about 10° ,the maximum preSSUl'"2S
and accelerations due to cavity collapse begin to decrease. This is
primarily due to the fact that the collapse line described above retains
the characteristic of coinciding with a vertical passing through the cen
ter of the vehicle base•. But at the higher impact angles, the vehicle is
at a large angle with respect to this vertical at cavity collapse so that
the energy source of cavity collapse is more removed from the surface of
the vehicle. Another factor reducing the cavity collapse pressure at the
higher impact angles is the lower penetration depth at cavity collapse
which reduces the hydrostatic restoring forces on the cavity walls.
5-6
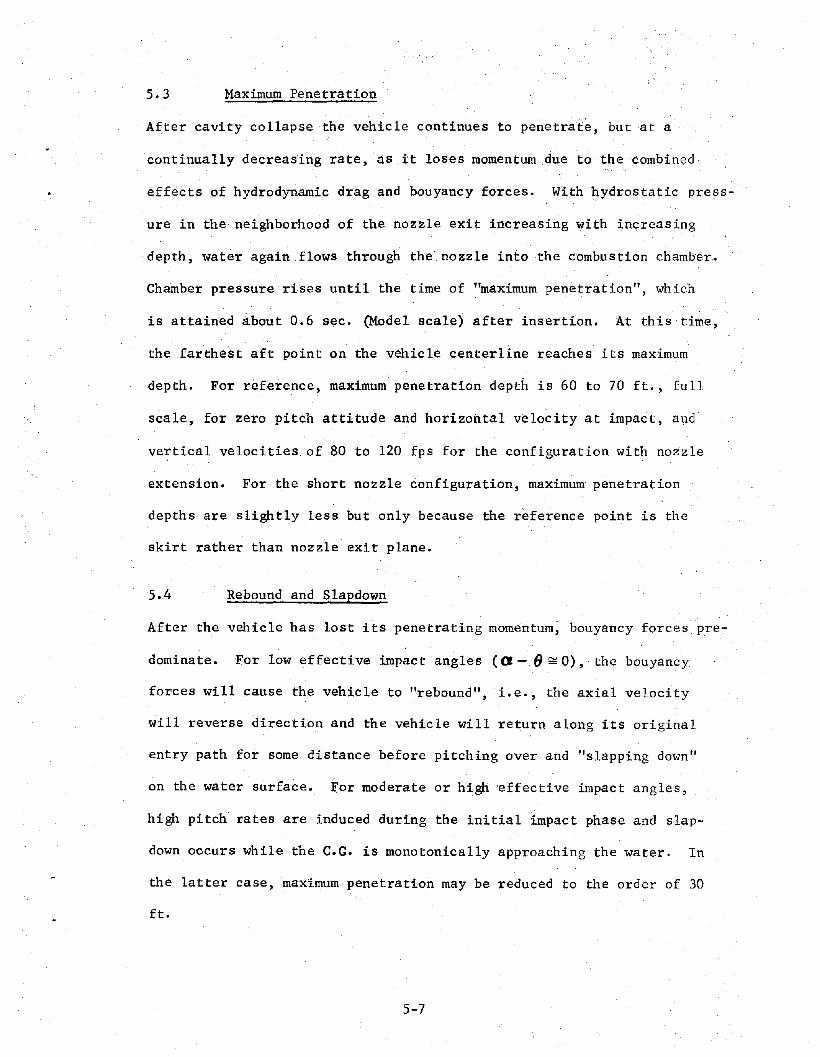
5.3 Maximum Penetration
After cavity collapse the vehicle continues to penetrate, but at a
continually decreasing rate, as it loses momentum due to the combined·
effects of hydrodynamic drag and bouyancy forces. With hydrostatic press
ure in the neighborhood of the nozzle exit increasing with increasing
depth, water again flows through the nozzle into the com1:>ustion chamber.
Chamber pressure rises until the time of "maximum penetration", which
is attained about 0.6 sec. (Model scale) after insertion. At this time,
the farthest aft point on the vehicle centerline reaches its maximum
depth. For reference, maximum penetration depth is 60 to 70 ft., full
scale, for zero pitch attitude and horizontal velocity at impact, and
vertical velocities of 80 to 120 fps for the configuration with nozzle
extension. For the short nozzle tonfiguration, maximum penetration
depths are slightly less but only because the reference point is the
skirt rather than nozzle exit plane.
5.4 Rebound and Slapdown
After the vehicle has lost its penetrating momentum~ bouyancy forces pre
dominate. For low effective impact angles (a - 6 ~ 0), the bouyancy
forces will cause the vehicle to "rebound", Le., the axial velocity
will reverse direction and the vehicle will return along its original
entry path for some distance before pitching over and "slapping down"
on the water surface. For moderate or high effective impact angles,
high pitch rates are induced during the initial impact phase and slap
down occurs while the C.G. is monotonically approaching the water. In
the latter case, maximum penetration may be reduced to the order of 30
ft.
5-7
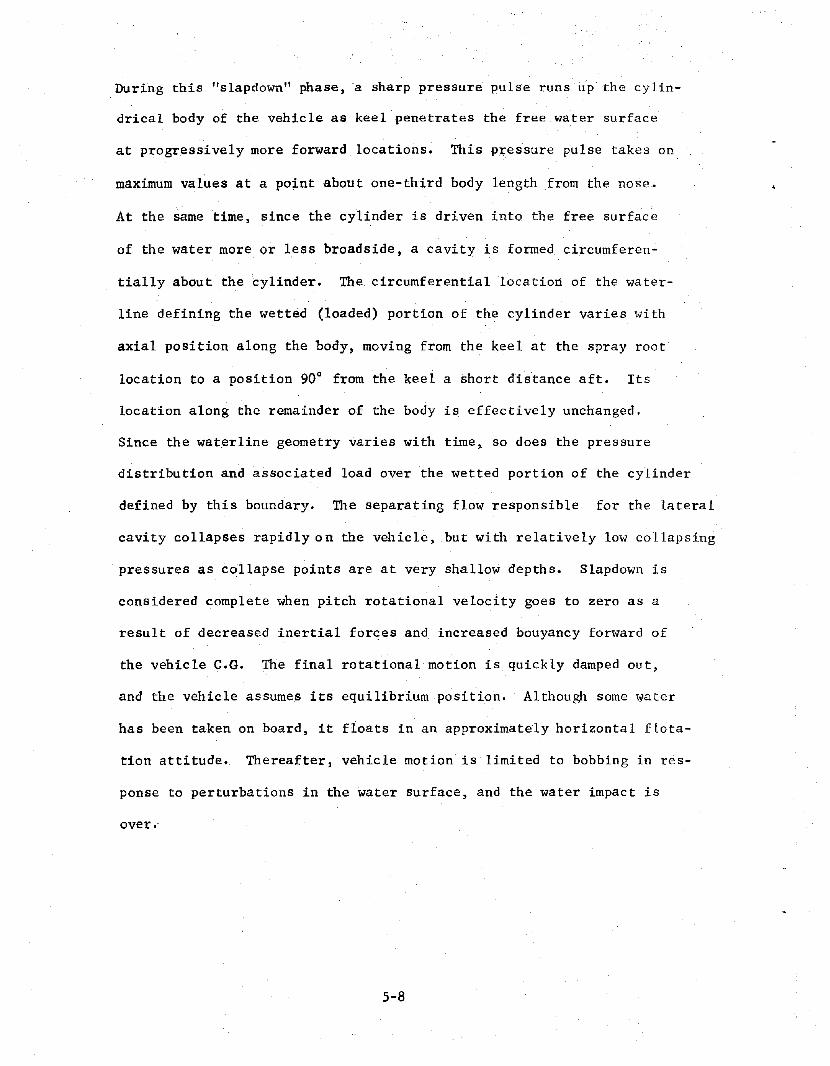
During this "slapdown" phase, 'a sharp pressure pulse runs up the cylin
drical body of the vehicle as keel penetrates the free water surface
at progressively more forward locations. This p:t;"essure pulse takes on
maximum values at a point about one-third body length from the nose.
At the same time, since the cylinder is driven into the free surface
of the water more or less broadside, a cavity is formed circumferen-
tially about the cylinder. The circumferential location of the water-
line defining the wetted (loaded) portion of the cylinder varies with
axial position along the body, moving from the keel at the spray root
location to a position 90° from the keel a short distance aft. Its
location along the remainder of the body is effectively unchanged.
Since the waterline geometry varies with time, so does the pressure
distribution and associated load over the wetted portion of the cylinder
defined by this boundary. The separating flow responsible for the lateral
cavity collapses rapidly on the vehicle, but with relatively low collapsing
pressures as collapse points are at very shallow depths. Slapdown is
considered complete when pitch rotational velocity goes to zero as a
result of decreased inertial forces and increased bouyancy forward of
the vehicle C.G. The final rotational motion is quickly damped out,
and the vehicle assumes its equilibrium position. Although some water
has been taken on board, it floats in an approximately horizontal flota
tion attitude. Thereafter, vehicle motion is limited to bobbing in res
ponse to perturbations in the water surface, and the water impact is
over.'
5-8
1.40
1.20
1.00
Bo
60
40
20
o
./'_ 1uttie..l contact
~r- Nozzle Toe-In/~._ Me.:lt. l.'i teb Acce1. 'n
.1<-/._~ Ma:lt. A:ltial ACcel'n.
,'" slapdo'Wn t3
~./
\;11I~..c::>
VH
u
~.
APPROACH INITIAL CONTACT
T =0
FIGURE 5-2. SRB WATER IMPACT DYNAMIC EVENTS
MAX. PITCHACCELERATION
T = .02
VII........
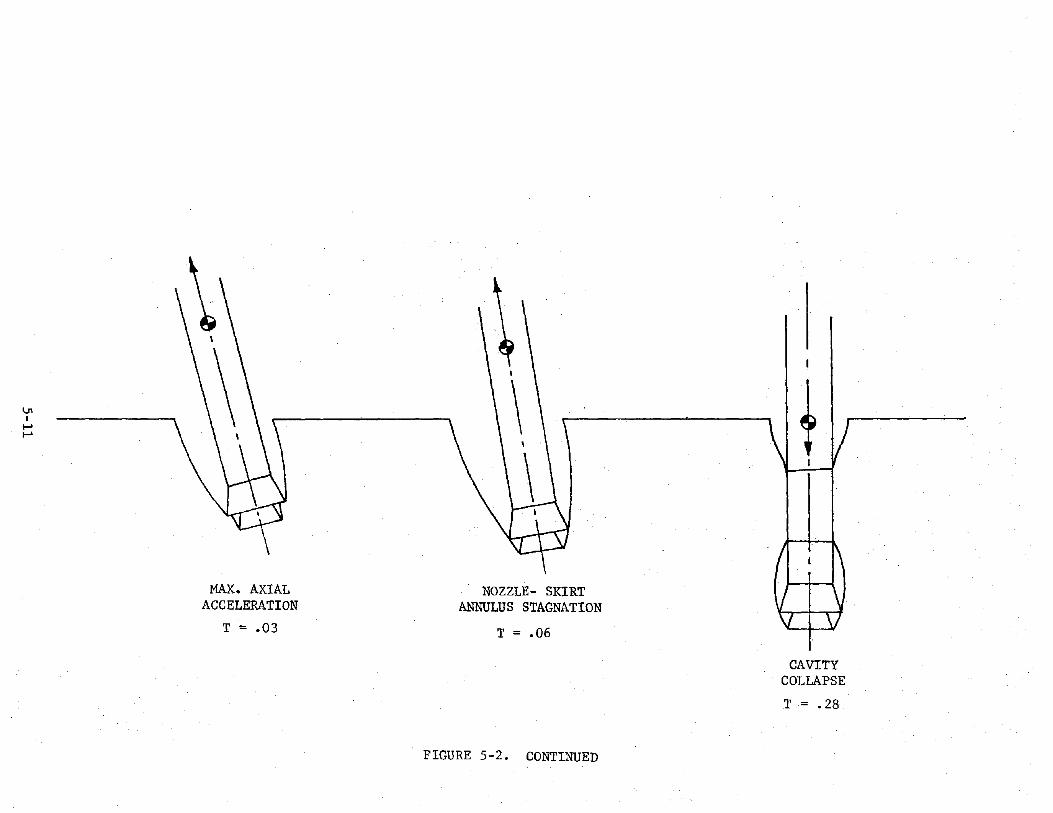
MAX. AXIALACCELERATION
T = .03
NOZZLE- SKIRTANNULUS STAGNATION
T = .06
FIGURE 5-2. CONTINUED
CAVITYCOLLAPSE
T= .28

/"
SLAPDOWN
T = .50
~.
REBOUND
1U1'Il-'Ir-J
MAX. PENETRATION
T = .38
FIGURE 5-2 CONTINUED
...
0,6=10°
100 FPS, VH = 0, 8 = 0
100 FPS, VH(b) Vv
(a) Vv
VII
I-'l"..)
FIGURE 5-3. CAVITY DEVELOPMENT AND COLLAPSE

SECTION 6.0
SCALING RELATIONSHIPS
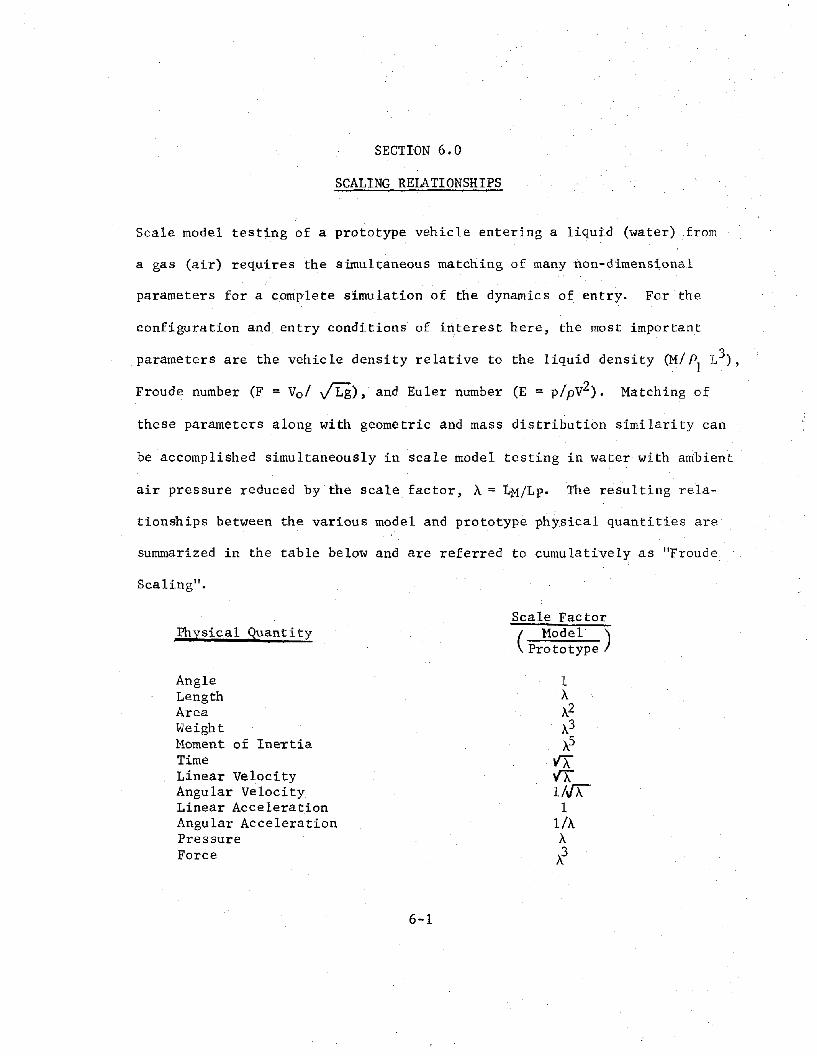
Scale model testing of a prototype vehicle entering a liquid (water) from
a gas (air) requires the simultaneous matching of many non-dimensional
parameters for a complete simulation of the dynamics of entry. For the
configuration and entry conditions of interest here, the most important
parameters are the vehicle density relative to the liquid density (M/PI
L3),
Froude number (F = vol v!Li), and Euler number (E = p/pV2). Matching of
these parameters along with geometric and mass distribution similarity can
be accomplished simultaneously in scale model testing in water with ambient
air pressure reduced by the scale factor, A = LM/Lp. The resulting rela-
tionships between the various model and prototype physical quantities are
summarized in the table below and are referred to cumulatively as "Froude
Scaling",
Physical Quantity
AngleLengthAreaWeightMoment of IneTtiaTimeLinear VelocityAngular VelocityLinear AccelerationAngular AccelerationPressureForce
6-1
Scale Factor
('Hodel )
Prototype
1AA2
A3AS
-rAVAl/Jr'
1l/AA
A3
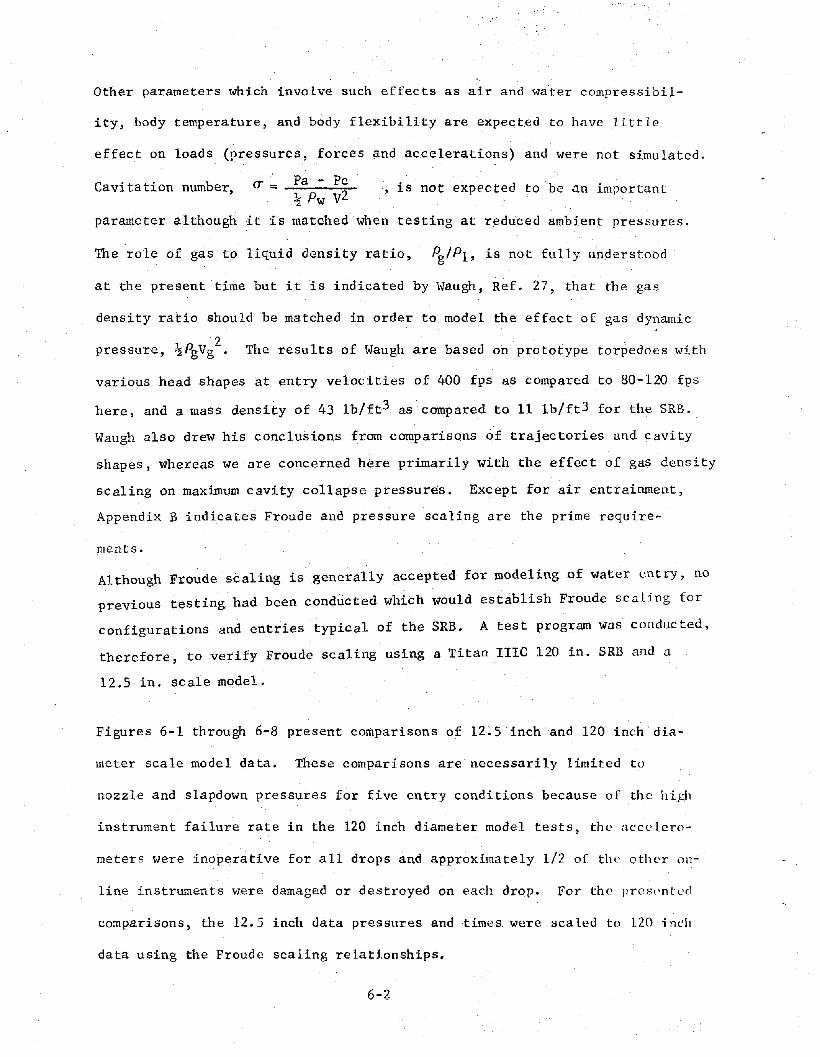
Other parameters which involve such effects as air and water compressibil-
ity,body temperature, and body flexibility are expected to have little
effect on loads (pressures, forces and accelerations) .and were not simulated.
Cavitation number, ~ =
parameter although it is
Pa - Pc
~ Pw V2
matched
, is not expected to be an important
when testing at reduced ambient pressures.
The role of gas to liquid density ratio, PgIP1, is not fully un~erstood
at the present time but it is indicated by Waugh, Ref. 27, that the gas
density ratio should be matched in order to model the effect of gas dynamic
pressure, ~PgVg2. The results of Waugh are based on prototype torpedoes with
various head shapes at entry velocities of 400 fps as compared to 80-120 fps
here, and a maSS density of 43 lb/ft3 as compared to 11 lb/ft3 for the SRB.
Waugh also drew his conclusions from comparisons of trajectories and cavity
shapes, whereas we are concerned here primarily with the effect of gas density
scaling on maximum cavity collapse pressures. Except for air entrainment,
Appendix B indicates Froude and pressure scaling are the prime require-
ments.
Although Froude scaling is generally accepted for modeling of water entry, no
previous testing had been conducted which would establish Froude scaling for
configurations and entries typical of the SRB. A test program was conducted,
therefore, to verify Froude scaling using a Titan IIIC 120 in. SRB and a
12.5 in. scale model.
Figures 6-1 through 6-8 present comparisons of 12.5 inch and 120 inch dia-
meter scale model data. These comparisons are necessarily limited to
nozzle and slapdown pressures for five entry conditions because of the hi~l
instrument failure rate in the 120 inch diameter model tests, the nccelero-
meters were inoperative for all drops and approximately 1/2 of the' other 011-
line instruments were damaged or destroyed on each drop. For the I'rC8t'ntc<!
comparisons, the 12.5 inch data pressures and times were sea led to 120 i 11l'h
data using the Froude scaling relationships.
6-2
Figure 6-1 shows the maximum nozzle· preSSl,1res for Vv = 40FT/SEC at () == 10°,
20°, and 30°, and for Vv = 60 FT/SEC at B = 10° The data presented are
peak values for 120 inch data and 10 millisecond average values forlZ.S
inch. The aft nozzle pressure, No. 42, Compares well for all conditions,
the throat pressure, No. 41, has a tendency to fall off at the higher im
pact angles.
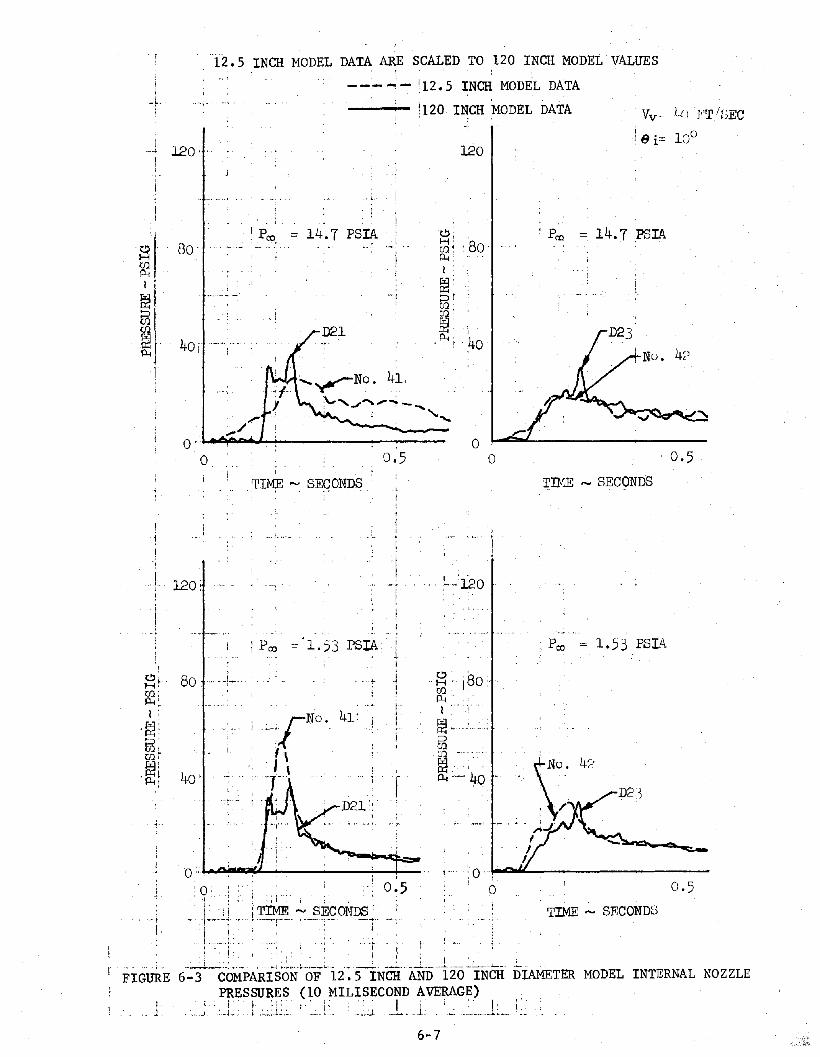
Figures 6-2 and 6-3 show time history overlay tracing oJ nozzle pressures
for Vv =: 40 FT/SEC and () == 10°. The upper plots on each page compare 120
inch data with 12.5 inch data taken at Pro = 14.7 psia, the lower plots
present the same comparison with the 12.5 inch data taken at Pro = 1.53
psia. The first figure, 6-2, presents true value data for both models and
the second figure, 6-3, presents 10 millisecond average data for both models.
Figures 6-4 and 6-5 show similar plots for an entry coridition of Vv = 60
FT/SEC and f) = 10°. With the exception of the maximum pressure value at
the throat, the 120 inch data compares very well with the 12.5 inch data
taken at Pro = 1.53 psia. The appearance of the 120 inch scale throat press
ure, D2l, indicates that it may have been driven into the car~ier frequency
band edge on the data tape and folded down. This phenomena has been en
countered on other test data when the data system vqltage controlled os
cillators are not tuned to their center frequency and the transducer puts
out a high signal level. Referring back to Figure 6-1 ,for the impact con
ditions of Vv = 40 FT/SEC and f) =: 30°, the th~oat pressure D21 reads 72 psi.
It is expected that this pressure would increase at lower impact angles for
a given vertical velocity. Also the widely separated double peaks on D2l
in figures 6-2 through 6-5 are typical for high impact angles but were not
observed on other data for f) =: 0° and 10°.
6-3
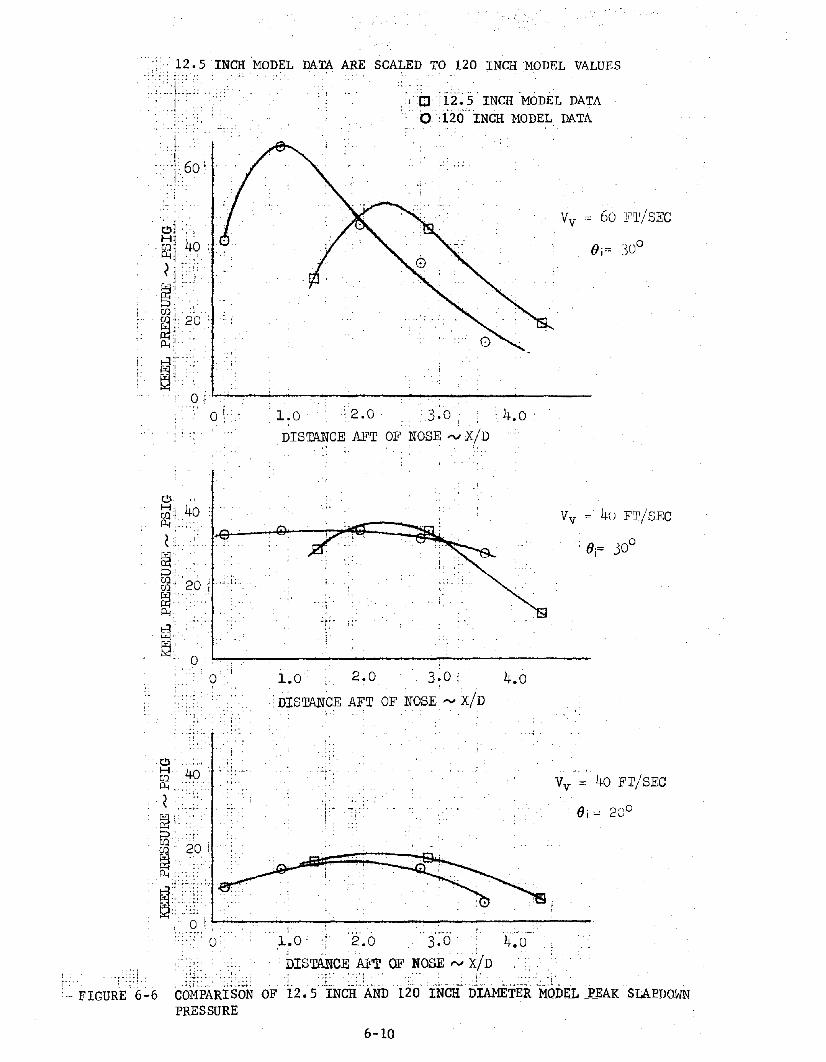
Figure 6-6 presents comparisons of primary slapdown keel pressures for
the 12.5 inch and 120 inch scale models. The data shown is peak value 120
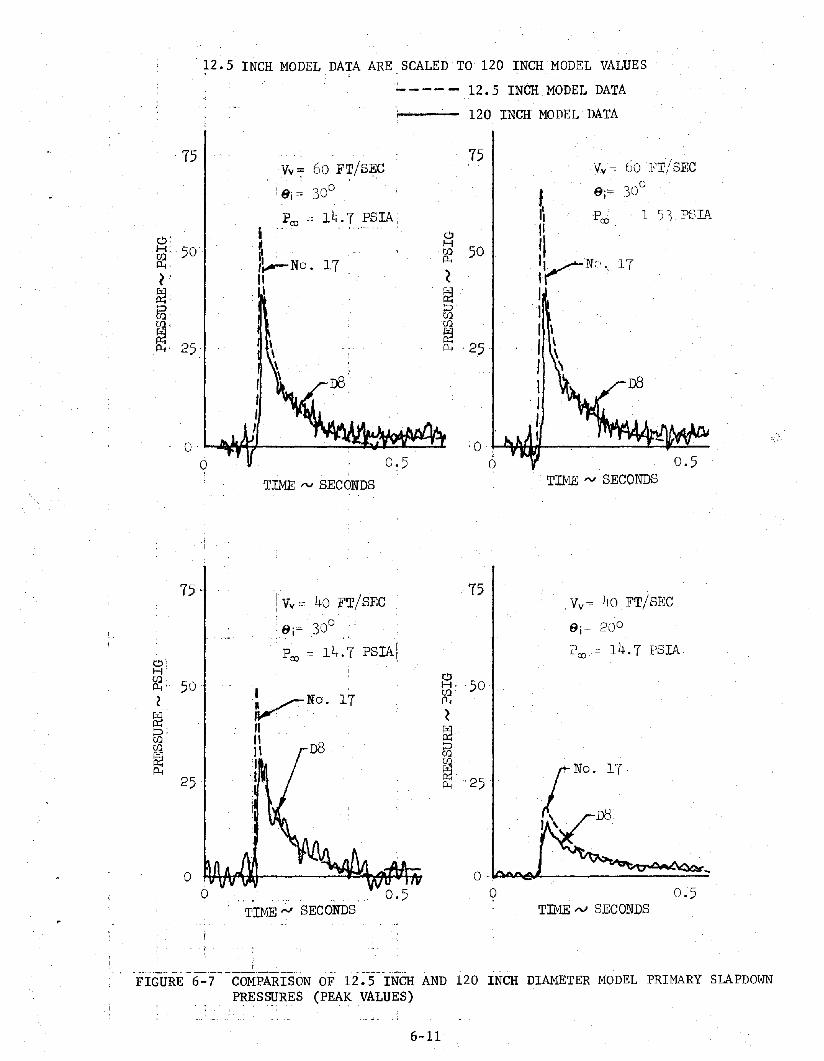
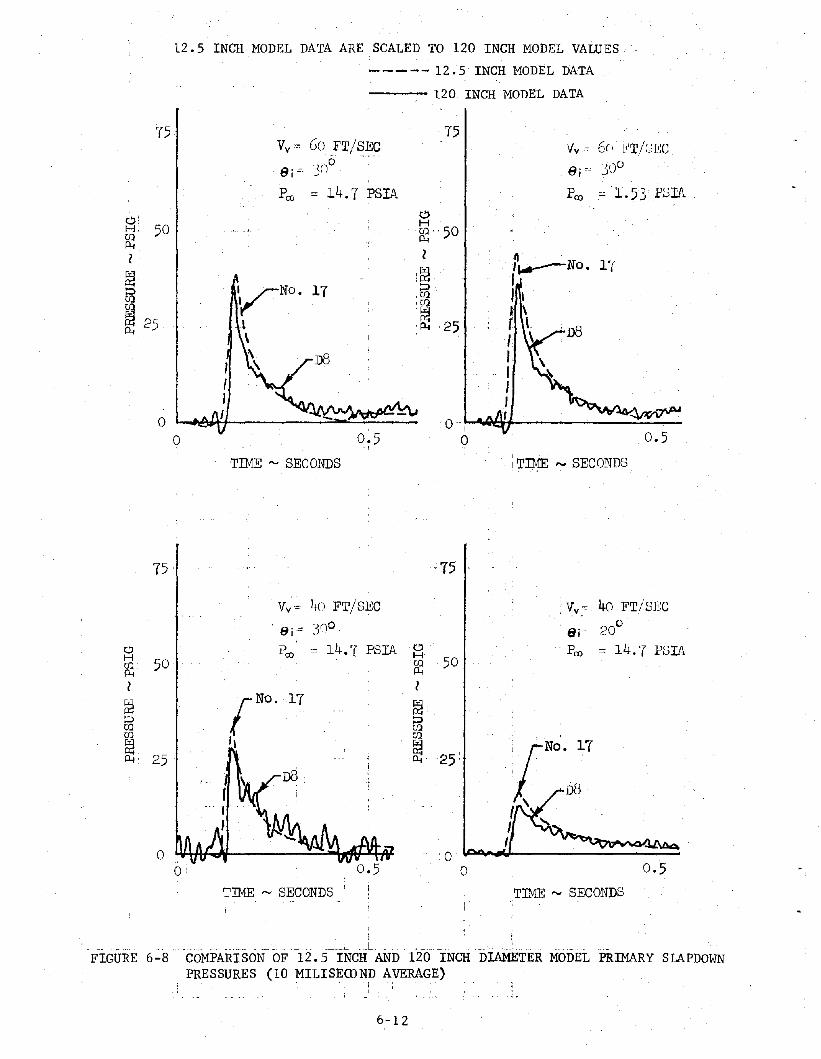
inch data and 10 millisecond average 12.5 inch model data. Figure 6-7
presents time history overlay tracings of peak value slapdown pressures
for the two models. Figure 6-8 shows the same comparisons using 10 milli
second average data for both models. The 12.5 inch data is generally
higher at the maximum value but it compares very well over the time history
of the measurements.
6-4

o 0.1. 0.8 1.2
DISTANCE AFT OF NOZZLE THROAT "V X D
12.5 INCH MODEL DATA ARE SCALED T9.120 INCH MODEL VALUES
CJ 12.5 INCH MODEL DATA
o ,go IN.CH MODEL DATA
~
L~VV = hO FT SEC ~ V - 60 FT GECv -
8i= 300j '\ 8i= 100
60 '\0 60 "\0 0L...J L...J
(f) '\ ~Q.,
\~[J ~
~ hO '\ ~ hO0
:::> :::>(f)
~(f)
(f) (f)
~ ~Q., Q.,
~ 20 EJ '\ :§20
N NN N0 0z z
o 0o O.h 0.8 1.2
DISTANCE AFT OF NOZZLE THROAT -v X D
60
~~ hO:::>(f)
~Q.,
~ 20KNoZ
o
Vv = hO FT SEC
8i = 10060
o
Vv = 40 FT SEC
8i= 200
DISTANCE AFT OF NOZZLE THROAT "V X D
oo O.h 0.8 1.2
oo O.h 0.8 1.2
DISTANCE AFT OF NOZZLE THROAT ~ X D..J..._~. _
FIGURE 6-1 COMPARISON OF 12.5 INCH AND 120 INCH DIAMETER MODEL PEAK n-TERNALNOZZLE PRESSURES
6-5
RFiPtt(1)UCIBILIIY OF THE0RIGlli"AL PAGE IS Pronf?

vv-
12.5 INCH MODEL DATA ARE SCALED TO 120 INCH MODEL VALUES
- - - - - 12.5 INCH MODEL DATA
120 INCH MODEL DATA LO YT SEC
leO -- ,- 120
.5o
oo
o
Pro = Ill. 7 PSIA Pc 1!.L.7 PSIA
0 21.. '-' 80 80- -Cfl Cfla... a...I - I
~ ~:::J :::JtJ) tJ)tJ). tJ)
~ ~ D230..., hO 0... !LO
hI
IIHE ".." SECONDS IIHE ~ SECONDS
oo0.5o
o
120 120
Peo = 1.53 PSIA Pw 1. 53 PSIA
0,0
80 '-' 80l-' tJ)tJ)
~~NO, hI a...0... II
~ "~
I :::J
55 ,I tJ)
Ii tJ)m
~~ !.LO , I a... hOQ..,
D2":J
TIME "'J SECONDS TIME -' SECONDS
1FIGURE 6-2 COMPARISON OF 12.5 INCH AND 120 INCH DIAMETER MODEL INTERNAL NOZZLE PRESSURES
(PEAK VALUES)J
6-6
I---I 120-"
12.5 INCH MODEL DATA ARE SCALED TO 120 INCH MODEL VALUESI
----- 112.5 INCH MODEL DATA
--~ 1120 INCH MODEL DATA
120
......
. 0.5
. Pcp = 14.7 PSIA
oo
~: , .(/); '80p-<'I : :
g::j::=>tgs,g::j. !
, P-t: j
, ,40
0.5
14.7 PSIA
~
,../.o.~~......,,-+---------
o
G' 80'H{f.lp-<I i
~l~If.l
re 40i
.TIM,E ...., SEQONDS .,I
TIME ,... SECONDS
.L
··J· 120 •I •.:----120
INTERNAL NOZZLE
TIME ,... SECONDS
, PCXl 1.53 PSIA
o,--- ':,0'~~~---------
c!) •.
--H --'180.--(/) .p-<I .'
g::j .c .,;,
85(/) -- .. - ., ...
g::j "p-<---' 40 --
,
r
j.
1
i
." +
... i
,,... J -~_ ••.. ~,i. •._._~_!,..._
I
i P CXl 1. 53 pSIA 1I
;-;rr;o. 41
, . I \'. . \, .. '''Y--I
'0,'!" i~T'
i 'i iTIME ~ SECONDS.-1------·" .. , · ..-~r--- ---.,'- -~ .. -.,'I ' : ;.
_L_:, ,, !
o :.~~'3iIJ--'--~_---'-~,...-0.5
6-3 COMPARISON OF 12.5 INCH AND 120 INCH DIAMETER MODELPRESSURES (10 MILlSECOND AVERAGE)
.__.. -'- ~ __L ,J.:"':L !-:..l'. ..: -i."L, 1_" ..:,'... ,.1:.. I.
6-7
,'fI·
FIGURE
I... __ J,

Vv tY I!·'rr/SEC
12.5 INCH MODEL DATA ARE SCALED TO 120 INCH MODEL VALUES
----- 12.5 INCH MODEL DATA;
120 INCH MODEL DATA
_I 120: -120
Pro = 14.7 PSIA
~H 80:~I
~,
55(I)
~P-1 40
0.5
D23
o~~----------o0.5o
o
TIME -v SECONDS TIME IV SECONDS
o -,L.oj=.1oClL_......... ...--_
0.5o
120 ' 120,~
Pc.o 1.53 PSIAI' - P.n 1.53 PSIA
I'
':~ 'VNO
•41
~
H 80', .
H: 80'(I)
I'(1)-
P-1 P-1I
"I
42~ I - D21 ~:::::> 55(I)(I) (I)
~ 40~
P-1 P-1-40'
TIME 'V SECONDS '.--, ,,~.,-,
TIME "'" SECONDS
. ~ .I
··l.- ~- ..--FIGURE 6-4 COMPARISON OF 12. 5 INCH AND
PRESSURES (PEAK VALUES), \ 'T' I '
.... --~--... ." ;.
_.
120 INCH DIAMETER MODEL INTERNAL NOZZLE
6-8

12.5 INCH MODEL ~ATA ARE SCALED TO 120 INCH MODEL VALUES
------ 12.5 INCH MODEL DATA
i 120 INCH MODEL DATA Vv ' (IJ Y'rh:;E:c
120 120
14.7 PSIA
iN'i' 4~;
',-"" --_....-""~
oo
Co?H 80'i£I'
f)3::=>(I).(I):
f)3P-! 40
D21 .
iND. 41
".--'"""-- ............. .....
14.7 PSIA. !
I,,/
"./
o
40
o
80
TIME '" SECONDS TIME'" SECONDS
120 120 REPItODUCtBILITY OF THEORIGINAL PAGE IS POOR
: Pen = 1. 53 PSIA P<Xl = 1. 53 PSIA
oo
t\:VNO•
411
\ .
,..~ ~
.....
.~ 80(I)P-!I
f)385(I)
~. 40
o 100.c;;;:L _
o 0.5TIME'" SECONDS TIME '" SECONDS
.~_.. • ~ ~__ • ._. •. __ • _ .••.. '. __---' _. _ __ ••• •••" __ _ h
FIGURE 6-5 COMPARISON OF 12.5 INCH AND 120 INCH DIAMETER MODEL INTERNAL NOZZLEPRESSURES (10 MILlSECOND AVERAGE)
6-9
., .. 12.5 INCH MODEL DATA ARE SCALED TO 120 ):NCH·.MODEL VALUES.;1
. ~I' ,0. j i2:~ 5 INCH 'MODEL DATA
, b. ~ 120 INCH MODEL DATA
I, ....
1. 0 . , 2.0 " 3·0 i • 4.0.. DISTANCE AFT OF' NOSE ~ X/D
Vy "" 60FT/SEC
(}j:= 30°
Vy = 4u FT/SEC
, OJ= 30°
C:l "~1 40P; ... ::'
L.~.~:. ,
gs',.~OI;l:-~ ....P; ..
..... -.H(i:l.
~:, o :~,.....-----------------,.;.-.--------, 1.0 2~0 3~0 ! 4.0
::DISTANCE AFT OF NOSE,,y X/D
Vy = 40 FT/SEC
4.0
,,,
'",
I'"~ "i ....... ~.~•• ," .:~, OJ "~j:'.: l .!' :. .. ~ __ ....:.. ~..:_"i
COMPARISON OF 12. 5 "INcH'AND 1io' INcif DiAMETER MQDItL _P_EAK SLAPDUWNPRESSURE
I; ;1:·
, ,C:l' """,,~. 40 '
P; ,::'::,
,~ :, .:: .
~i.' .~' :'i:gs. 20 ["~' '
P; ,,,
~!:~,.~,;i,:~<J;
o il--~_.,.._-_-~-------------:.-->: . 0" i~o::1 '2.0 :" 3'~'6 :
i o. ; !
DISTANCE AFT OF NOSE,..., X/D
,. FIGURE 6-6
6-10
12.5 INCH MODEL DATA ARE SCALED TO 120 INCH MODEL VALUES
- - - - - 12. 5 INCH MODEL DATA
120 INCH MODEL DATA
-I
75 ' I 40 FT/SEC75
I Vv"" vv-= 40 FT/SEC
B'= 30° 8i= 20°'. I .'!
14.7 PSIA! p -= 14.7 PSIAP ""e>i co coHitf.l'
50e>
50!=Lt'
•H·tf.l
1 .~NO. 17 !=Lt
g§ , '. .~
:::::>. II~tf.l II
tf.l II :::::>g§ tf.l
I tf.l [NO. 17!=Lt I ~25 P-< 25
J\ DB
0 o ...""
0 0.5TIME roJ SECONDS TIME rV SECONDS
...__..... ~ ...;._--.l. ... ._ .. __FIGURE 6-7 COMPARISON OF 12.5 INCH AND 120 INCH DIAMETER MODEL PRIMARY SLAPDOWN
PRESSURES (PEAK VALUES)
6-11
12.5 INCH MODEL DATA ARE SCALED TO 120 INCH MODEL VALuES
~_ .... _- 12.5 INCH MODEL DATA
--- 120 INCH MODEL DATA
75Vv c=: 60 FT/SEC
0'"8 ·=- ~()I J
Pel) = 14.7 PSIA
Vv'" 6(\ tllT/~~EC
8j cc 3lP
Pco = 1.53 PSIA ,
01 0HH: 50 CQ 50f£ P-l
2 l ~ ,
~!~
I~No. 17
17 :=> I,CQ I ,iCQ
CQ'~ ~' \
~ 25 P-l 25 t \I \I,
I II ,I ,
°I 0', r
° 0.5 0 0.5-,TIME'" SECONDS ;TIME ,... SECONDS
°oo
75 :75
Vv c= ho FT/SEC ,vv."" 40 FT/SEC
8i -= 3°°, 8i ~c)Oo
0 Pco -- 14. 'r PSIA 0 Pco = 14.7 PSIA,HH 50' CQ 50CQ'P-l P-l
2 1
~ rNO•
17~,
:=> gtoto to'~ '1 ~ 17P-l. 25 P-l 25:
TIME ,..., SECONDS TIME '" SECONDS
i
_.... . .. ._.. _'. _ ..-L. ,_. .. .__.._~.~., _FIGURE 6-8 COMPARISON OF 12.5 INCH AND 120 INCH DIAMETER MODEL PRIMARY SLAPDOWN
PRESSURES (10 MILISEmND AVERAGE). I ' ','
6-12

SECTION 7.0
DATA ANALYSIS
Typical plots of the drop test data are presented in Figure 7-1. Superim
posed on the time histories in the figure are indications of the times of
the various dynamic events characterisizing the impact, as described in
Section 5.0. As described earlier, the models were fabricated to be essen
tially rigid bodies. Nevertheless, they were not complete rigid. As a
result, there waS some minor dynamic response of the structure, excited
by the impulsive loads of initial impact producing small oscillations
in pressures and accelerations ..
Since the elastic properties of the models were not to scale, instanteous
values of the data subject to these high frequency oscillations cannot
necessarily be taken at face value, as they do not accurately reflect the
hydroelastic response to be expected of the full-scale vehicle. At the
smne time, it must be remembered that the primary purpose of the model test
oata is to serve as a basis for generating full-scale loads for SRB struc
tural design, and the stress analysis methods to be used in formulating
that design are based on a static analysis. Therefore, the dynamic values
of pressures and accelerations acting on the model during water impact can
not be used directly and must be replaced by equivalent static values which
will produce stresses in the supporting structure equal to the maximum
values actually developed by the short-duration dynamic loading.
7-1

The stress developed in a structure supporting a short-duration dynamic
load is not only a function of the magnitude of the applied load, but it
is also strongly dependent on the duration over which the load is applied.
This duration defines an as:ociated frequency. Depending on how this fre
quency compares with the natural frequency ·of the structure, the dynamic
amplification factor will be greater or less than unity. That is, the
stresses induced in the structure by the actual dynamic load will be greater
than or less than those that would be induced by a load of the same magni
tude and distribution applied for an extended period of time.
A method for determining the equivalent static load for a given short
duration dynamic load, presuming the supporting structure can be repre
sented as a linear, elastic system with one degree of freedom, is given
in Reference 23. Using this method, equivalent static values were deter
mined for typical short-duration pressure pulses developed on the model
during water impact. At the same time, the actual pressure-time histories
were averaged by computer over various averaging time intervals and re
plotted. The calculated equivalent static values were then compared with
the magnitudes taken on by the same pressure in the time-averaged plots.
The comparison showed that equivalent static values for the pressures and
accelerations developed on the model during water impact could be approxi
mated by reading 10 millisecond averages of the original data. Therefore,
in reducing the data for the model tests, 10 millisecond average values
were read for all quantities with the exception of cavity collapse data.
The pulse period for cavity collapse is of the same order as the case
natural period for the first ring mode and actual peak values were used
for this event.
7-2

7.1 Initial Impact
Nozzle Toe-in. Initial contact by the vehicle with the liquid free sur
face was detected by the accelerometers. All registered an instantaneous
displacement from their free-fall positions at the moment of contact. The
time of nozzle toe-in was then given by the spike in nozzle external press
ure immediately after initial contact (Figure 7-1). Only a limited portion
of the nozzle extension is wetted at this time, and only one transducer
read non-zero pressure. Therefore, the precise boundary of the wetted
surface and distribution of pressure over this surface could not be deter
mined and had to be assumed. It was assumed that only that portion of the
nozzle extension not shielded by the skirt from relative flow due to the
horizontal component of velocity was wetted (Figure 7-2). The pressure
associated with this flow was then taken to be constant along the ¢> = 0°
meridian and to vary circumferentially with the cosine of the ray angle,
¢>. Flow separation (zero pressure) was assumed at the nozzle exi.t plane
or at ¢> = :t"90°, whichever was encountered first by the individual stream
lines of the presumed flow.
Maximum Pitch Acceleration. This event was detected by all three pitch
accelerometers. By definition, the time for this event is taken to be the
time at which the value of the pitch acceleration reaches a maximum. Due
to the elasticity of the model structure, the time indicated for the event
by the three accelerometers was not always precisely the same; under cer
tain impact conditions, the indicated time varied by 2 to 4 milliseconds.
Therefore, the output of the accelerometer located farthest aft, and
therefore closest to that portion of the vehicle over which the impact
7-3

loads were applied, was selected as the reference for determining the
time of maximum pitch acceleration (Fig. 7-3).
The nozzle and skirt are only partially wetted at the time of maximutll
acceleration, and since the number of pressure transducers installed
in this region was limited~.a precise description of . the wetted boundary
was not obtained. Therefore, for purposes of evaluating the loads, the
boundary was prescribed by a rather arbitrary interpolation between
wetted and unwetted transducer locations. Since only one transducer
on the skirt and one on the nozzle were wetted along the ~ = 00 meridian,
pressures along the wetted portions of the meridian were assumed constant.
Two transducers measuring nozzle internal pressure along the ¢= 1800
meridian gave non-zero and unequal readings, so the longitudinal distri-
bution of pressure along the meridian was assumed to vary linearly.
Based on the results of Ref. 4, the circumferential distributions were
assumed to vary with the cosine of the ray angle, as described in Figures
7-4 through 7-6.
Nozzle and skirt pressures were read at the time of maximum pitch accelera-
tion for all tests. With actual impact conditions (VV, Va, ()) measured
from the photographic data for each test, the resultant velocity, U and
effective impact angle (ex - ()) were calculated by,
U = JV'r,z + va:2
(ex - ()) = tan-l (~) - e
pThe equivalent non-dimensional pressure, was then calculated for
~PU2
each measured nozzle and skirt pressure and plotted as a function of
7-4
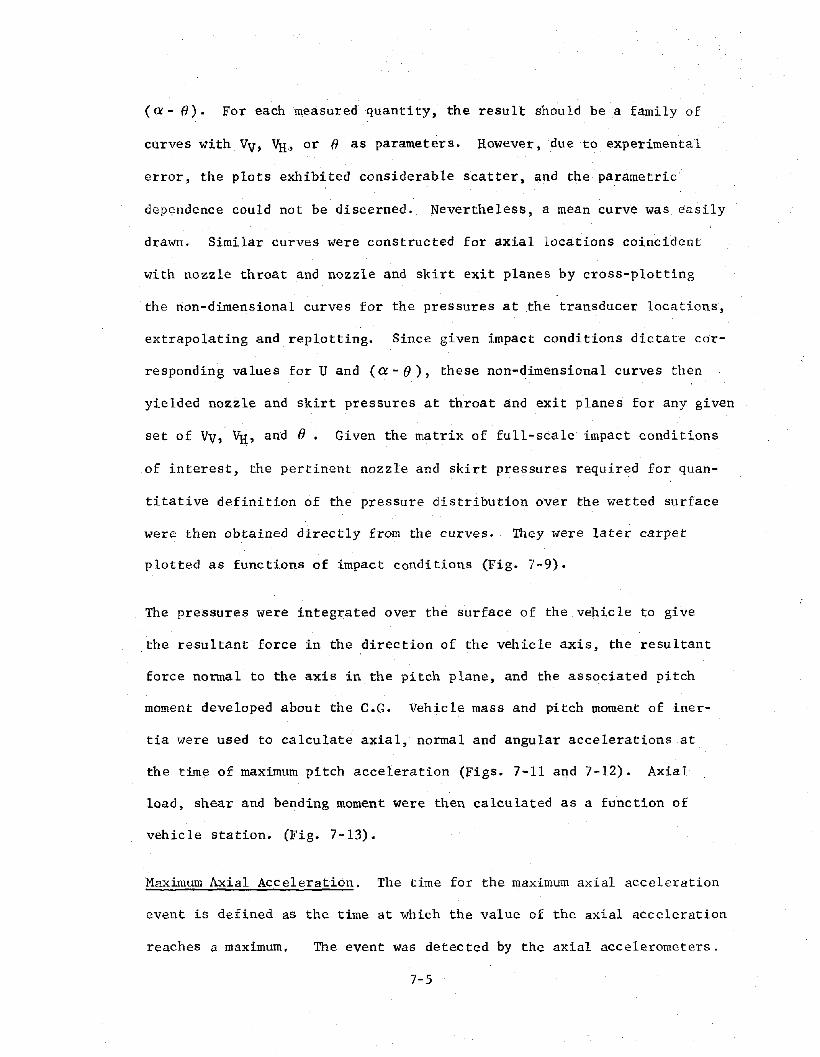
(a - fJ). For each measured quantity, the result should be a family of
curves with VV, %., or 0 as parameters. However ,due to experimental
error, the plots exhibited considerable scatter, and the parametric
dependence could not be discerned. Nevertheless, a mean curve was easily
drawn. Similar curves were constructed for axial locations coincident
with nozzle throat and nozzle and skirt exit planes by cross-plotting
the non-dimensional curves for the pressures at the transducer locations,
extrapolating and replotting. Since given impact conditions dictate cor
responding values for U and (a - () ), these non-dimensional curves then
yielded nozzle and skirt pressures at throat and exit planes for any given
set of VV, VH, and (). Given the matrix of full-scale impact conditions
of interest, the pertinent nozzle and skirt pressures required for quan
titative definition of the pressure distribution over the wetted surface
were then obtained directly from the curves. They were later carpet
plotted as functions of impact conditions (Fig. 7-9).
The pressures were integrated over the surface of the vehicle to give
the resultant force in the direction of the vehicle axis, the resultant
force normal to the axis in the pitch plane, and the associated pitch
moment developed about the C.G. Vehicle mass and pitch moment of iner
tia were used to calculate axial, normal and angular accelerations at
the time of maximum pitch acceleration (Figs. 7-11 and 7-12). Axial
load, shear and bending moment were then calculated as a function of
vehicle station. (Fig. 7-13).
Maximum Axial Acceleration. The time for the maximum axial acceleration
event is defined as the time at which the value of the axial acceleration
reaches a maximum. The event was detected by the axial accelerometers.
7-5
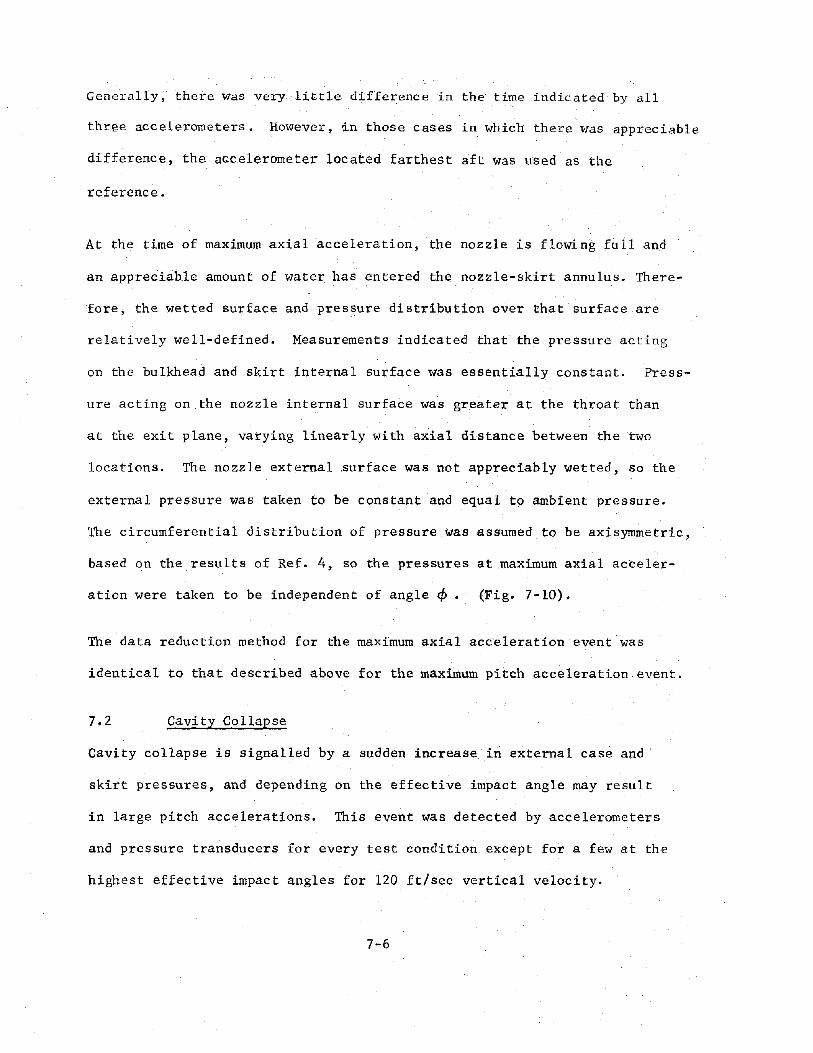
Generally, there was very little di££erencein the time indicated by all
three accelerometers. However, in those cases in which there was appreciable
difference, the accelerometer located farthest aft WaS used as the
reference.
At the time of maximum axial acceleration, the nozzle is flowing full and
an appreciable amount of water has entered the nozzle-skirt annulus. There
fore; the wetted surface and pressure distribution over that surface are
relatively we ll-defined. Measurements indicated that the pressure acting
on the bulkhead and skirt internal surface was essentially constant. Press
ure acting on the nozzle internal surface was greater at the throat than
at the exit plane, varying linearly with axial distance between the two
locations. The nozzle external surface was not appreciably wetted, so the
external pressure was taken to be constant and equal to ambient pressure.
The circumferential distribution of pressure was assumed to be axisymmetric,
based on the results of Ref. 4, so the pressures at maximum axial acceler
ation were taken to be independent of angle ¢. (Fig. 7-10).
The data reduction method for the maximum axial acceleration event was
identical to that described above for the maximum pitch acceleration event.
7.2 Cavity Collapse
Cavity collapse is signalled by a sudden increase in external case and·
skirt pressures, and depending on the effective impact angle may result
in large pitch accelerations. This event was detected by accelerometers
and pressure transducers for every test condition except for a few at the
highest effective impact angles for 120 ft/sec vertical velocity.
7-6

For the "typical model test data" of Figure 7-1, cavity collapse occurs
at about 0.3 second after impact. The tail pitch accelerometer (EP007)
goes from a pre-cavity-collapse quasi-steady level of +2 g's to a -1 g
peak in about .02 seconds, and quickly returns to a post-cavity-collapse
level of +1 g. At the same time, peaks are noted in the skirt external
pressure (D0026), skirt internal pressure (D0028) and the nozzle internal
pressure (D0025). This test condition corresponds to a rather high effec
tive impact angle (a - () = 32°) and cavity collapse does not result in
severe loads. The +2 g tail accelerometer reading before cavity collapse
is due to the fact that the keel centerline is wetted, i.e. the cavity
does not envelope the vehicle, from just after impact through the oomplete
entry.
Cavity collapse loads were found to be primarily a function of effec
tive impact angle, ct- () , but for convenience are first discussed as a
function only of pitch angle for zero horizontal velocity conditions.
For a pure vertical impact, cavity development and collapse is symmetric
about the vehicle centerline and results in sudden increase in pressure
from zero to about 5 psig (model scale) over the aft 2 to 3 diameters of
the vehicle. The cavity shape and resulting maximum pressures on the
keel and lee meridians at cavity collapse are illustrated in figure 7-14a.
Maximum cavity collapse pressures are encountered at (a-e) ~ 10°. For this case
the cavity envelopes the entire vehicle below the water surface until maxi-
mum cavity size is attained. The cavity collapses aSYmmetrically with respect
to the vehicle but axisYmmetrically with respect to a line just off the lee
7-7
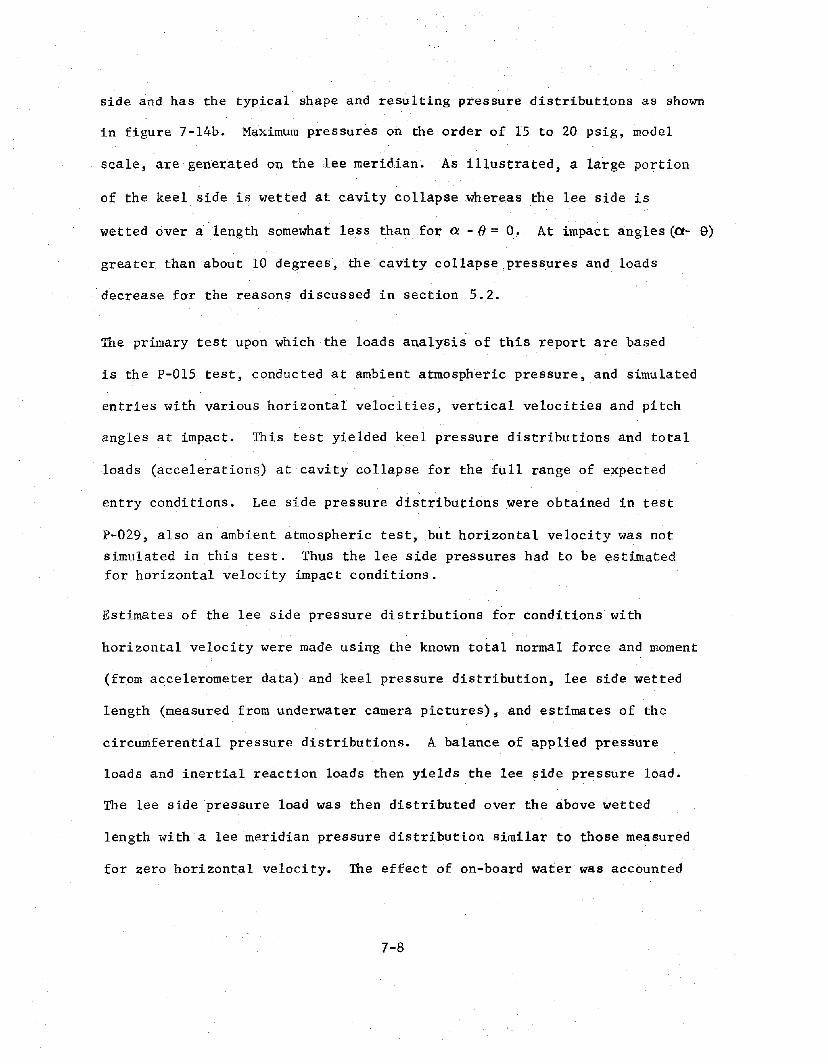
side and has the typical shape and resulting pressure distributions as shown
in figure 7-l4b. Maximum pressures on the order of 15 to 20 psig, model
scale, are generated on the lee meridian. As illustrated, a large portion
of the keel side is wetted at cavity collapse whereas the lee side is
wetted over a length somewhat less than fora - e= O. At impact angles (0- e)
greater than about 10 degrees, the cavity collapse presSures and loads
decrease for the reasonS discussed in sectibn 5.2.
The primary test upon which the loads analysis of this report are based
is the P-015 test, conducted at ambient atmospheric pressure, and simulated
entries with various horizontal velocities, vertical velocities and pitch
angles at impact. This test yielded keel pressure distributions and total
loads (accelerations) at cavity collapse for the full range of expected
entry conditions. Lee side pressure distributions were obtained in test
P-029, also an ambient atmospheric test, but horizontal velocity was not
simulated in this test. Thus the lee side pressures had to be estimatedfor horizontal velocity impact conditions.
Estimates of the lee side pressure distributions for conditions with
horizontal velocity were made using the known total normal force and moment
(from accelerometer data) and keel pressure distribution, lee side wetted
length (measured from underwater camera pictures), and estimates of the
circumferential pressure distributions. A balance of applied pressure
loads and inertial reaction loads then yields the lee side pressure load.
The lee side pressure load was then distributed over the above wetted
length with a lee meridian pressure distribution similar to those measured
for zero horizontal velocity. The effect of on-board water was accounted
7-8
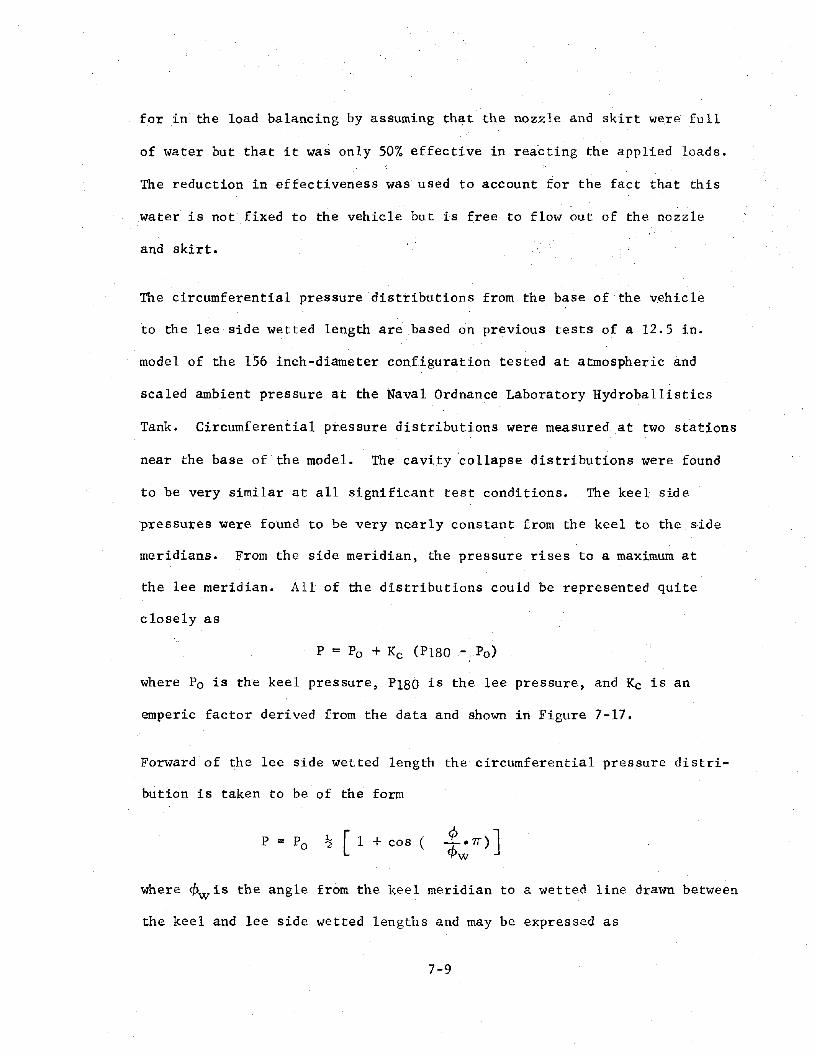
for in the load balancing by assuming that the nozzle and skirt were full
of water but that it was only 50% effective in reacting the applied loads.
The reduction in effectiveness was used to account for the fact that this
water is not fixed to the vehicle but is free to flow out of the nozzle
and skirt.
The circumferential pressure distributions from the base of the vehicle
to the lee side wetted length are based on previous tests of a 12.5 in.
model of the 156 inch-diameter configuration tested at atmospheric and
scaled ambient pressure at the Naval Ordnance Laboratory Hydroballistics
Tank. Circumferential pressure distributions were measured at two stations
near the base of the model. The cavity ·collapse distributions were found
to be very similar at all significant test conditions. The keel side
pressures were found to be very nearly constant from the keel to the side
meridians. From the side meridian, the pressure rises to a maximum at
the lee meridian. All of the distributions could be represented quite
closely as
P = Po + Kc (P180 - : Po)
where Po is the keel pressure, P180 is the lee pressure, and Kc is an
emperic factor derived from the data and shown in Figure 7-17.
Forward of the lee side wetted length the circumferential pressure distri-
bution is taken to be of the form
P = Po ~ [ 1 + cos (
where ~wis the angle from the keel meridian to a wetted line drawn between
the keel and lee side wetted lengths and may be expressed as
7-9
~ =w,.;1
cos
7.3 Maximum Penetration
Maximum penetration was determined through analysis of high speed motion
picture data recorded during the model test programS. These films were
viewed with a Vanguard Film Analyzer and the relative position of a point on
the model was tracked on successive frames from shortly before impact
until the model was obscured by the water spray. Time and the x,y, () model
cOQrdinates were then processed in a computer program which calculated the
horizontal and vertical position and velocity of the model nose, e.G.,
and tail during water entry.
The reduced photographic data was examined and the point of maximum pene-
tration selected: The model depth and pitch angle at maximum penetration
were smoothed and carpet plotted as a function of impact condition.
7.4 Slapdown
As discussed in Section 5,slapdown is defined as that phase of water
entry where high pitch rates induced by the initial impact and/or unstable
buoyancy forces rotate the vehicle to pitch attitudes where the keel
meridian of the forward portion of vehicle is rapidly entering the water.
The vehicle e.G. is generally at or approximately one diameter below the
water surface during this phase of water entry, the pitch angle is at 50
to 80°, and the instantaneous center of rotation is near the vehicle base.
This corresponds to keel meridian locations up to about 4 diameters from
the nose penetrating the water surface at high velocities. High local
7-10
pressures and forces are generated which eventually reduce the angular
velocity to zero and the vehicle settles to a near horizontal floating
attitude~'
Slapdown occurs over a finite time period with time varying ,pressures
and accelerations acting on the vehicle, ,and there is no specific time
at which structural loads are obviously at a maximum. In order to inves-
tigate the variation of structural loads with time during slapdown, press-
ure distributions were integrated over the vehicle to obtain applied load
distributions and the inertial reaction load distributions were calculatedI
for several times during slapdown. The time points selected fo~ slapdown
load analyses were keyed to the times at which the keel pressure measured
at selected transducer locations was at a maximum. Results of these analy-
ses showed that keying the load analyses to maximum pressure times at
transducer locations D0003, D0005 and D0006 (Figure 7-21), would yield
three time points, one of which would always correspond to very near maxi-
mum values of local pressure, and/or shear and bending moment. Structural
analysis at these three times (tl, t2, t3, corresponding to maximum press-
ure times measured by D0006, DODOS, D0003 respectively) should therefore
give near maximum st!esses for any given impact condition.
The slapdown phase is illustrated by the typical model test data and cor-
responding full scale trajectory shown in Figures 7-21 and 7-22. Initial
full scale impact conditions for this run are: Vv = 84 fps, VH : 34 fps,
(J = -8.9 deg. The pitch angular velocity increases rapidly to about 19
deg/sec during the initial impact phase and then gradually increases to
7-11
about 45 deglsec until cavity collapse occurs at t = 1.0 sec. Priorto
cavity collapse the keel side of the vehicle beneath the water surface
is exposed to hydrodynamic pressures while the lee side is in a cavity
at near ambient pressure, causing significant tip over moments. After
cavity collapse, both keel and lee sides experience nearly the same press-
ure and the pitch angular velocity remainS constant till about t = 1.2 sec.
The vehicle C.G. penetrates the free water surface at t = 1.3 sec at a pitch
angle of -50 degrees, and slapdown pressures on the keel side above the
C.G. have already started to reduce the pitch angular velocity. tI, t2
and t3 are 1.4, 1.58 and 1.78 seconds, respectively for this run as indi-
cated on the trajectory. At t3, the pitch angular velocity is down to
28 deg/sec, and is monotonically decreasing.
The tbtal vehicle forces and accelerations during slapdown are generally
of low frequency (on the order of 1 cps) and low amplitude (less than
4 g's at vehicle nose) when compared to initial impact while the local
peak pressures on the vehicle keel are high frequency and high amplitude
(see pressures D0003, D0005, D0006, Figure 7-21). The slapdown pressure
time history for a given keel pressure transducer actually appears as a
suddenly applied pressure with an exponential decay to approximately local
hydrostatic. Although the local peak pressures near the keel penetration~. ..'
location appear as a high frequency pressure pulse, the overall keel press-
ure load induces low frequency vehicle loads, on the order of 1 Hz. The
vehicle position for the above three slapdown times are illustrated
in Figure 7-23.
7-12
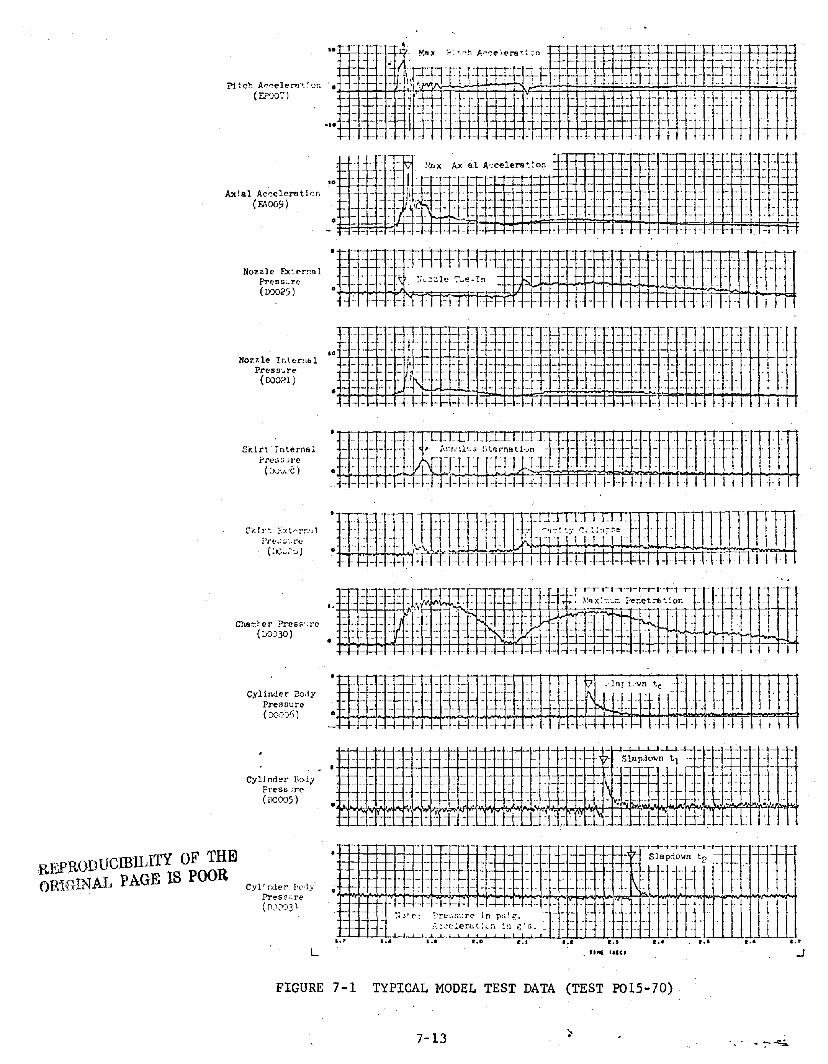
··~m::l:t:* r-mEEBHEB3f....r -r TT-r+- kf !I.!IX ?: ~"h A~~elera~~;n 1= -- .; I(~J--~ .... ~-l--: t - -:r-t-=f- -i/=-: - - ---- - -- =r~: =t- ~Hj.J: =;1*"1=+'-- !\ 1- -~ --- -- - '-1- - -+- T - - iT ~L - -~ - - t- - __1 I -11 t ~-r
Pitch A~~elero._~or• • - -- - - - -j~\I'; ." I -.'. - i-I. c!_ -I ---- --- r- ---, -:f(E?()07) .... i' - 11: '- - -- -- -- .... ,- '1'1- ---L -t- .... -
-I. ~ ~_: =~I-- -,l~ -~ ~ :: _' .... ~ _' .... ~ _#-~ _>: =:: .... ~ ~ ~ --_ :Ott .~ -:: -, '
Nozzle F.x~er"el
Press~r"
(DJ025)
Nozzle 1nt"r:o&1Prc.. ss .... re
(00021)
Sr.lrt Interrllili~1"~~.G..i.l"e
(:Mh:t:)
'.--........ _.... -TILLLLLIJIITLL1- --- -, .... ---- - - - --:: - - - - - ill111''-o ~ ~ '. ---- ~ -~ : ---lil~F-i~I'~:;TT!lt<r:l- -~-- ~. ~ ~~ -~ == ; -: ~ ~- -- -~-:f '-1- -!-
_ --- - -I- - -1-1- - --i~--ll- --, ,1-1- -I- -~-l -1- - -I-Ill Ii-I I
-f-I-+-HH-I- - --- ,- -1- -- .... - -- -+- - - --1,- - - - -- - -. --' - -_-- - -:.;)t_e: ~-'rc~',s'~re in p:;l€". ... - - -
:"\2-.=e':'erut;L:1 !on b'G. _ . ~ ~~ _- _. _. _ .. _.' .
RETRODUCIBILITY OF THEORiGINAL PAGE IS POOR
Cylinder BodyPresGure(DCo-J-J" )
Cylinder BodyPress _;re -(00005)
Cyl' nder I'cd:;PreSSi.lre(n 1,)-J3 \
L
: -~--_::::=~: -~:~:::~~~j:i-ti~lr ---: - -11- -+ - ,-1- - - + -I--+- - --1- - f-l-I-~--I-l-l--l--l ~-I .... I- 11-1 I t I
II--I~ - , ..l---I-L--J--t-!-._.... -- - -- n-~• _ .... - - -- ........ - - - --f- - - -- - -.... _,~lel"l,,\m t] -- --- -, -- - .... -, - ---
.... ::~ - -~ - .~~ ~- ~~ ~ ~. ~ - -- ~- -- - -~ -1\ -~~ .... -- ~ --- .... - ~ -~-~: -~- ~- -~ -- -- -:.... --- -.... - - - f- ........ -- - - .... - - - -'- - .... - - - 3--- ---- ----- -" -, --
o i"'ir.~:--r .... ' .."'" - _ •• ~ .;"J'.- .... _ .... .... Jjj~_ -11-:--1-_ = '--I- - -1- j-_f_tLl-- ~ ~ iJ f1 J
-~""""-·t-t-""""-t-t-1- - -
+++_+++_++-_+++++-_+-__+_-+-__-l-_-l--I---l-I--I-t-I---I---II-UW-I,W-I->W_ SIs pd",m t 2 =.... -I+-+-+-H
- -~- - -: ~- - -: =~ ~. =: - ~ ~ -- .~ - =-~ -= ~ - ==-- -- -~ ---, ~. -=j-l- ..
IJJJJIt;.'~--'---'---;,""••.1-!-~•.L;••-L---"---'-'-;.-i;;-•• .L-l....-I-..-L:-.L,-.I L.l......~• •~.LULLoJ•.--:-.l• ...LJ~••-,-1....Ll-l.:.l..,-l,...Ll-i,J-,.. I.',rIC lICU
FIGURE 7-1 TYPICAL MODEL TEST DATA (TEST P015-70)
7-13
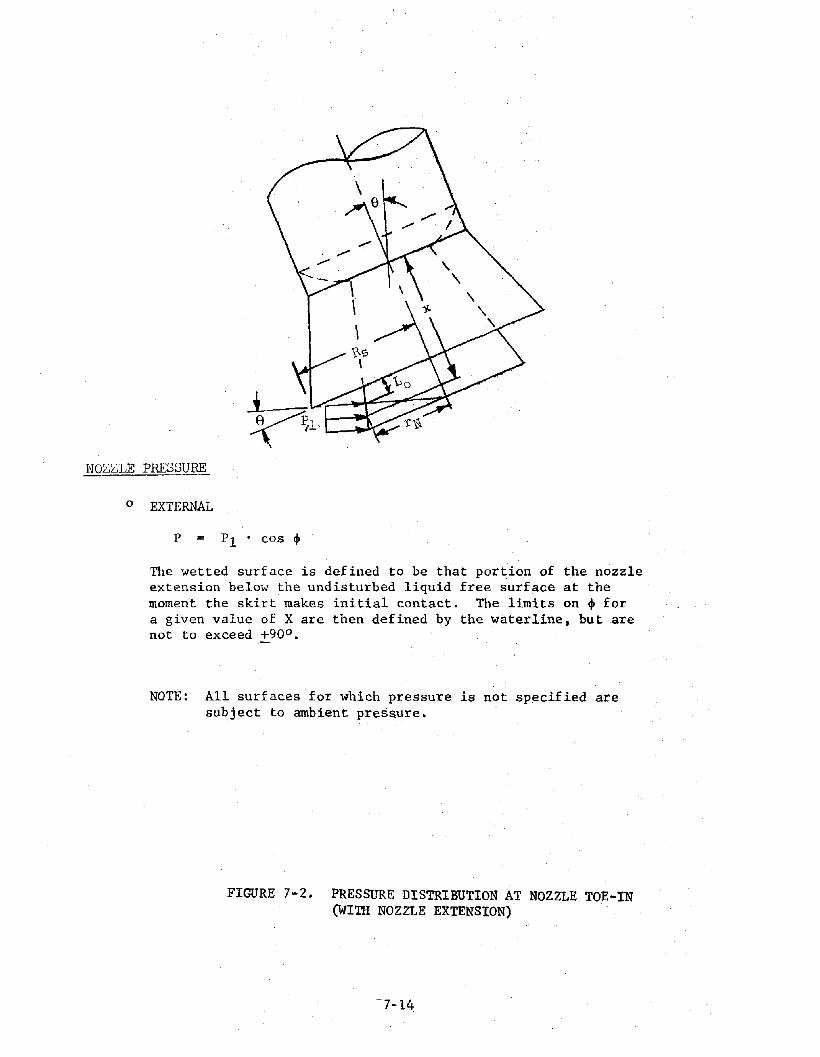
NOL;L;LE PRESSURE
o EXTERNAL
The wetted surface is defined to be that portion of the nozzleextension below the undisturbed liquid free surface at themoment the skirt makes initial contact. The limits on ljl fora given value of X are then defined by the waterline, but arenot to exceed +90 0 •
NOTE: All surfaces for which pressure is not specified aresubject to ambient pressure.
FIGURE 7-2. PRESSURE DISTRIBUTION AT NOZZLE TOE-IN(WITH NOZZLE EXTENSION)
7-14
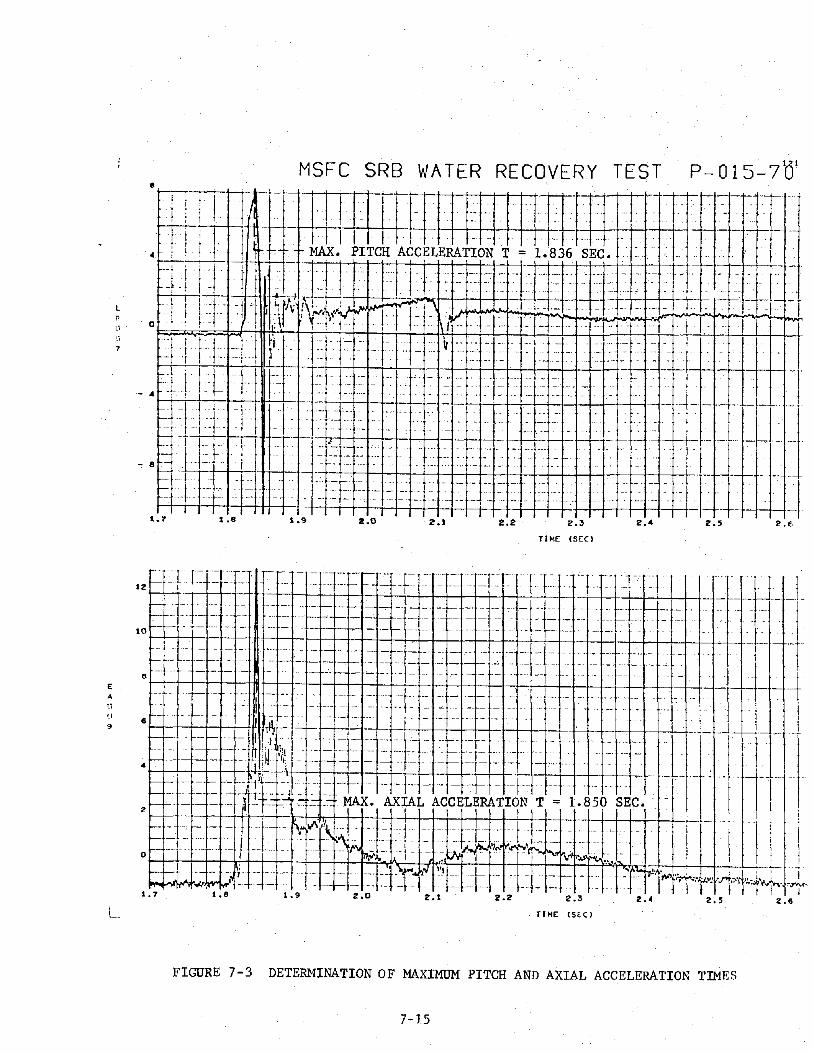
MSFC SRB WATER RECOVERY T~STP-015-7~1
E:r-
2.62.52.32.12.01.8
L.-..L-.-L..~"+-t-t-t-+'-, 'tt'-t-t-.-H-t---''-'-+-t.---+..- --++-t--. -+--t--~ ~~.H-+-:~::=:-H-+--.+4--H-+-t-+-t-t-H-I--'--_·_L_·· _··1··I I I - - 1-.. - --- - ..-- -.... --. "---.-- r~ _
TIME (SEC)
..... -. '-'._.-.- _.~ - - --- _. - .-
TIME (SEC)
1.81.7
.....T-r- .-- ..- r.~ -.-- ,- -.. r- '-- ' .. r-' _.... :-........- ----.,... .'..-., .....,-- "., !12~t··· ...._- - _. --' . . ..- -.. ---t- - -t- .-. - -- ._.._.- . . ,. ....
'--'-1'" '-of-- -- - -t-,- --f- -. _or-c. _. -- -- -.. _ __ _1,,_._ --.-t-- __ ._.. I. -._l--j-+-~-_.~I--. -- ---r--'f-'-~ -- -1- ..- _ .•.- -- -. - -- - . "- -- -- - ._-t-. -- _. - ...
10t---t----t-----e--1----t·--··t---1·--·ffiH-+-t----+t-~-t:_-++--1_-_+-·-+_I-+--+-_I·· M-·'+--_+--..-+_---4.--'+.'_1-_..-+---.1---_+-1__+_... --4._-'+'-+-+-1---+._-.+---+-_.+--+-'+-I_ t I-_..--t- ._. - -. .c .. _.-. - ._.__. . _ .._ ..'_; ._ ....•__ ._. __...••._ ._ ·1- ··-r.·
-- .• ----- -'-' .--.----------+--..-.-- -.. _-- ..._--t-.-' - "--' .-. -.--.- - ...- \
8 Lt--._'t'-' ..."-.r-f--.. :_-.r--_=~:~~ ~ =-~_.-~ ~. :~. ===.~~ _. -. - --'.-. _'- __L_1
J.r-: -.- -. --. _. _. '- -' _ -. ~ ... 1._ -- -- ..- "- ._ ....•.. -- --"- - ._- -- _.. _. --
L_
t1
9
EA
FIGURE 7-3 DETERMINATION OF MAXIMUM PITCH AND AXIAL ACCELERATION TIMES
7-15

'- _.
---------~
~------/
BULKHEAD
SKIRT
NOZZLE. !
\
I II ~- t F1----- LS
FIGURE 7-4 - DESCRIPrION OF VEHICLE AFT END GEOMErHY. (lfITH NOZZLE EXTElJSION)
'\ -I -I
--I ep,I I
-+- .I i Keel- (cf>=D°rx II
II -.. ..j
/ --'--- ---------
7-16

BULIffiEAD PRESSURE
• INTERNAL
P =Pambient = const.(
-LB < x < 0 )-lS00 <ro ~ +1800
- , -• EXTERNAL
. P = Pambient + ~ (P1 - Pambient)(l-coslj»
SKIRT PRESSURE
.• INTERNAL
P = Pambient + ~(PI80 - Pambient)(l-cosep)
P = P3 • cos eJ>
NOZZLE PRESSURE
• INTERNAL
P = Pambient + ~'PISO - Pambient)(l-cosep)
• EXTERNAL
P = P.6' • cos eJ>. (")
(P6 - Pambient )
Po = Pambient + -. ·x1N
NOTE: All surfaces for which pressure is not specified are subject toambient pressure .
.'FIGURE 7-5. - PRESSURE DISTRIBUTION AT MAXIMUM PITCH
ACCELERATION (WITHOUT NOZZLE E.XTENSION)
7-17

BULKHEAD PRESSURE
SKIRT PRESSURE
NOZZLE PRESSURE
• INTERNALP = Pambient = canst.
• EXTERNALP= Pambient = const.
• INTERNAL
P= Pambient = canst.
• EXTERNAL
P = PI • cos cf>
( -L13 < x <: u )L' - - 0. -18l) S. et S +ltk:
(-LB. < x < 0 )0- - a-180 S <p S +180
(0 < x < LF)
.-1800 s: <p ~ +180°
(LF < x < LF )V- ..,.
-900 S <p S +900
P = Pambient + !• INTERNAL
(,1'180 - Pambient)· (1 - cos ep )
-(LN~LE S x S1N+LE),-1800 $ <P S +1800 '
-(P3-P2)· (x _Iw+~)LwLE 4 )
P = PI • COB c/>
• EXT.E:RNAL
(LF S x ~ Lri )-
-900 ~ <I> S +900
NOTE: All surfaces for ~hich pressure is not specified are subject toambient pressure.
FIGURE 7-6 - PRESSURE DISTRIl3UTION AT MAXIMUM PITCHACCELERATION (WITH NOZZLE EXTENSION)
7-18
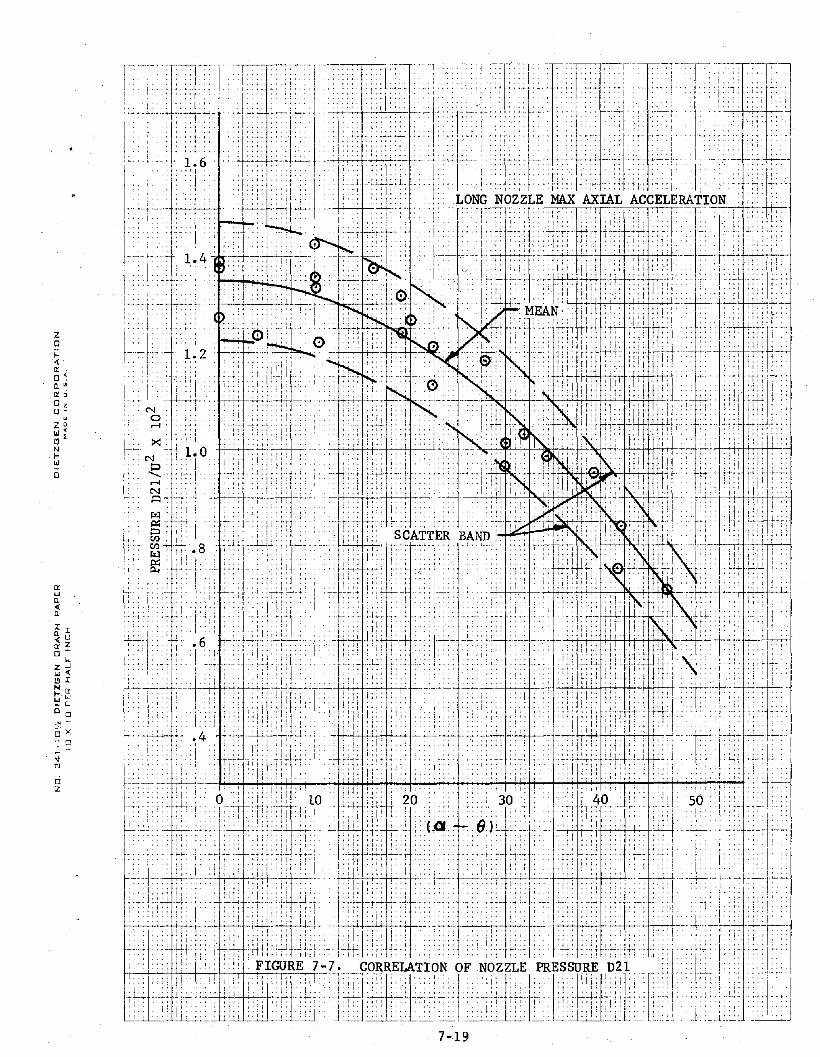
zo...,,«II: .o ~
n. •11::>oU
zwCIN...W
o
II:wQ.
«[l
I IQ.
U« Z
g~Z.Jw «CI I
~~~Q.0 0
6~"; 0
"rJciZ
'~r:-:-,TOO. . . ! . .
7-19
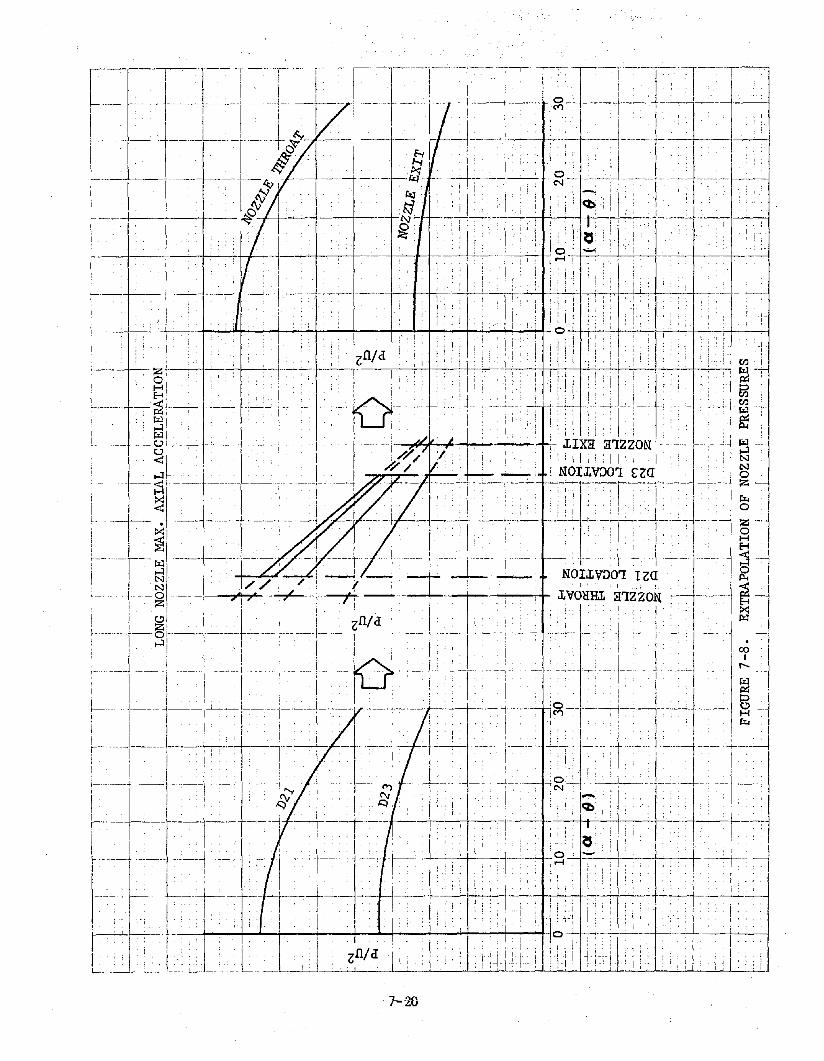
7--20

Max .. Pitel] Undefinedat VH ::: 0, () =- 0
iII
i
!" i
NOTE:
, . \
.,..... ,
,
II .
i I()~: -llP
(} ::: _100 '., ' ;. " I
.. l
, ' I'
! j ;
, ,;
4/n CONFIGURATION ! , ' ,: WITH NOZZLE EXTENSION .. !,.
Max. Piteh Und.ei'inedat VH == (), e 0' 0
-j I .' Ii I I I I
VARIATION OF NOZ/:,LE INTEHNAL PRE~)SURE WI'l1I IMPACT CONDITIONSMAXIMUM PITCH ACCELERA1'ION
I
I./
200
o
80
40
120II
\\I
I160
FIGURE 7-9
I I
- ,-.-- ~- ---"T J'-'-- -;--- -• • • I I •
, . '", , . ,
. .... . .~.... - _. .-... .
I
160 .... i- -
(J c= _20 0 ;'
I
II A
[J)
P-J
7- 21

BUl,KHEAD l'l{ESSURE
SKIRT PRESSURE
<t INTERNAL
p ~ PaniliientConst.
.. EXTERNAL
P = P1' canst.
NOZi'.LE PRESSURE
P2
I
• INTERNAL
P == PI canst.
• EX1'ERNAL
P ~ Pambient canst.
(I INTERNAL
e EXTERNAL
P ~ Pambient canst.
(0 < X "LF \
-1800 ;; ¢ ;: +180°J
(0 < Y < LT" \
.:.180° ~ q, ~ +lRao )
NOtrE: 1\11 [;llri'aceL'; 1';'1' vJllich pre:";Gure is not specified are Gubject Loambient pressure.
FIGURE 7-10 PRESSURE DISTRIBUTION AT MAXI.MUM AXIALACCELERATION (WITH NOZZLE EXTENSION)
7-22

. I
I'
(J = 0 0
II
,.. 1 ..
I
I
.1
(J = _10 0
jl
. ~ . ~I." ~
-lo ~e! () I
1
orP
i'Y .
I I ()I tjlI c§J 4,~\"Y -
.... I~~
j \,: i
, !
, .
----.- -- ..+.~~.- -~._.._~... -_ .. ~-""._"-~'--'~-'-."--.--"--'-"-'-~"-."'-"'_.'-""':"o·-:'-T" "1-1~-.~~._-,. ··r·--·"~·4'~_-'.'-'--" - 1'-" ," ·f.
. . . : hill CONFIGURATION . '," i '.;: .. . I''. ': ~I.~H. ~O~~L.~.~ENSION~. : .. :. <_ j: ... '. ./ ..
II·I
. - j" .
Ie = _20 0
... /
o,0
C\J
I~I
I ~()1"I
'VARIATION OF MAXIMUM ACCELERATION LEV.ELS WITH IMPACTCONDITIONS - MAXIMUM PITCH ACCELERATION
I -"11
FIGURE 7-11I ---1- I
III
III1
8
.. 10 I
U)
o
'2
~"l0,HiE-<I 6~ I .ffi~oo~
;;j. 4H,~:
~I
I!i
I
7-23

I\
!iII/.I
., j00 I
I
I
i
I.\II
... ( ... 1
I.i
I' !
~ i .
!'0~.
!
II
I. .. iI
I.I
(J T· .~~~~, .. ,II I
': b"'jI~ I~.---::'~j
, Ve'
I'j'
I. I.
I
-..-...-----..... .. '-- ... . . . --..--.' .-'---.; r-----.: "- ~- ---',-', .' ," 4/11 CONFIGURATIOIJ ,,'; ; " ;!:.
, WITH NOZZLE EXTBNSION . "
IIII
.. \,
o&
"y
I!I
Ir
I, I
() = _20 0
I
II
I
II
I
20
~,
I·····1
o
0) i~; :
1
"I~!
.1 150'
" I" 15oH
~fY~tju 10o.~
:~t3b'~ 5
oFIGURE
I
i7-12 VARIATION OF MAXDIDH ACCELJ<]{ATION LEVELS WITH IMPACT
CUNDITIONS - MAXIMDtJI PITCH ACCELEHA'rION
7-24
.... \ .. - '1. ,
II
!j
I
----_. ---'''''' •. -- - '"!"'" ~ •
: .: ~ :.'
i;I
I I.II.. 1
ISHEAR AND BENDING MOMENT ARE ZEROAT MAXIMUM AXIAL ACCELERATION
I'I'
""""1 4/11 CONFIGURATION " ,, "'. WITH OR WI'~'H?U.~c-NOZZ~ ~~~SI~N
i!; ! 1 ,
II •
. I
I NOTE:I
III, I, I
I I I .I I 1 I· i k---I-/iii I ~I;i
I i II I i I!! I I'
I( ! .L~-'-~~-Iii
: I I --t.~--:-I I Iii Ik'~11j ! 1 I I: 1-.-..:---+-1-+-1~--'---'+--
)~oo 6qo 80,0' 1v.lO I 120J [ 111!)O I 161°0 18\00
.j I L 'I ,VEHICLE STATION,IN. I ' I .. j I : •
JL. I I I I ; I,,_'1_L. - I 1-'~-~~_-rlJ_NORMALIZED SHEAn ponCE, BENDING MOMENT AND AXIAL FOHCE DISTRIBUTIONS
MAXIMUM AUAL OR PITCH ACCELERATIONS
·5
i10i
0U)
0...~~0~0r:<4n:;
t5 -·5~U)
I\I
-l.J
()1. !)
"'.
I·'.
"[-1
N !Q c:; I.. ~~ .,/
~~.', ..Hr::::l~
II I
: 1.~) I, ,
0,~!
I
r:,-i' i0'0:;,0' 5'f..r--i .I •
IH\;::\';x: I<r;1
--'f.I-GURE, 7-13
7-25
T = .02 T = .04 T = .16 T .24 T = .34
"IN0\
Il<
~mCf.I~
g:;
TIME LOCAL HYDROS~TIC
FIGURE 7-14 QUALITATIVE DESCRIPTION OF CAVITY FORMATION AND COLLAPSE(a) NEAR-ZERO EFFECTIVE IMPACT ANGLE

T
LEE SIDE
KEEL SIDE
T = .24
WALL SLAP
LOCAL HYDROSTATIC
T = .04
~
rzJp:j
gCI)
rzJ
8:
T
'-JI
N'-J
TIME
FIGURE 7-14 CONTINUED (b) MODERATE EFFECTIVE IMPACT ANGLE

j-;--t···
I1-,
---- .... ~-~--- .... - _.- ~
I1-'-I-,
L.. --\
"\'-
'-!.. ~.-l '
. -, --> -..... ~_.- _.' -~~-:-~,:.~:~ .~--;.----.~ -.".-,.. i
!i'-:.!-L. _J :-- - _
L_ ::-:--:--j'." ·1
-.,t
. I"
-,I.L
,CAVITY COLLAPSE RADIAL PRESSUREiDISTRIBUTIONS AT STATION 104.2
i. ~_.:
,,i
"j
-1
.:: i•. _f
"l _. ::.:t-~'::_J
r-~ ~k·~ _~~:~ L --'-
1--
:}:
. i
180
;
·7+-l-L·i:····r··,t •-t"~·:1'-~-r~l~:4rj- "
; '- .:"_L-,,~_:T':::ff:j:~;-{-~r~ttl
;-. .; -c~;':~~:E~ :f:0'cFL:l- ..tt
135
1.53 psia14.7 psia '._
, __ 1_---45
~::-c.··t,~_·.: - -- - ,', ... - ;-~- -;~~_':"~:_---':-,:---~~~iC;:1-::-:"'~ ---~. _l_.~_~: '·'jd:,;.tf' c. -:Vv - 16.97 Ft/Sec I _ ~_, _. l, .•-- : . __ . . . 1.
1.
"_._L~_J,,-~i9i ~-~()IJFiiJi~F+'-,-': ..~+c"+~h"-~~ ~~~.:~-- '~~;~-'j-t:~.~'!
o
• c. b£Y'~ .~~
o.{.I
fx4§5:'
._~~:;-
.; .. fx4--"ft'
d__"~;',T ... ,·!hJf~~rr,· i I. --- ,+'j_.'--- -. L ' -i
"
~::..
Lt:· -
~~~~l-J-:~t::~>i- -
L
I
L'
~':";-c '-r:-' -,-. i··- -1'--' ---
L:~_!-T,:c
I--.JII
NCX)
. RADIAL ANGLE (ip') ~ DEGREES- - -,. '~_.'- ......--... ----_. -;-"-------_._.._.- .
FIGURE 7-15 TYPICAL CAVITY COLLAPSE RADIAL PRESSURE DISTRIBUTION,NOL 12.5 INCH DIAMETER MODEL
CAVITY COLLAPSE
SRM CASE AND SRB AFT SKIRT· PRESSURES
LW K, ,
x
111. PKEEL
(0=0)-----
SRM CASE
P = PULLAGE, UNIFORM
K--,--------
PLEE(121=180 0 )
INTERNAL PRESSURES
SRB AFT SKIRT
o s X S LF' -180 0 s 0 s 1800
EXTERNAL PRESSURES
CIRCUMFERENTIAL DISTRIBUTION
P = PKEEL, LW L SX S LW K, ,
KC' SEE FIGURE 111-2; -1 [2( X - Lw,L)0w = cos ( )LW K - LW L, ,
LONGITUDINAL DISTRIBUTION
SEE FIGURES FOR PKEEL & PLEE VS. STATION
FIGURE 7-16 CAVITY COLLAPSE PRESSURE nlSTRTBUnONS SRM CASE AND AFT SKIRT PRESSURES
7-29
, . '----~-I~-I---~-I----t~-f-~--- -~-~--- ---t-- I r----'~t=--=== - --- -- ---;j----i-- [--r---r-·--t===I=~=' == -=-~ =--:== =:- - -:=:..-t===i- ---~-.=1----l---t==;---------- - 11/1/74 CONFIGURATION __, t --- ---.-- ._--f-- I • .j
l==---=--=f==-= -j--------=:-- --~-~----~----I--·-l-u---j---t==V----I-----1--- --- . -- --------t' 1. I~- . -'- --=--t=-- --==:=== ==--=::= -==--=-=l===t:=:-=)~:-=- === -===1--.---= --==--=r=~~~~=== -- =-=.- =:=====- --=--f==1
t===- l-=-=_=-~~=- -==J= . . .=~-~ --=~~ ~~~~=-=j~=~~~h=.-~=_f=L-=== -~- -=~~~~=l~~:==f--- -~I--::-~~U==-- -===:1=---=-F-~1=~=j
'.JI
Wo
-~I' i !~
I i I+------1-;-----1
~
t -=1..:.._:~:=r::~b~--i·- '-E7 -1--::=---,-l '=l--~--l-·--l=~=:=:=-l::"=-+-=:=!~--:'I:=-t- -----r:- ..·-.L=:=ll0--=:=--I{---==t=--::-i~o:- !--I-==1===-=--- =~-=-+-=:=-=:. --===-...:=,=~r===I==j.-::=-~PD ~=Li-Nciii---~-~ :ri~~ J~is-=-C=!~~-~~= :~,~=i:=:':----! -- .:: ===r==-:---·t;==~______• ~l __ '--_~ \ / \____ ___MERI IN. ,0, __.. +_~ __ .+ . . ' I_*..__ .L ~_
-- --,--,----F'II1''="RJDIAN --- ---'-!--- ----·,··I----·-·-i-------i---i-----:-~.-:--- -I - - ;--- '---·i-----'_ --~.-_.I-:_:.-__:~r-_-'- -- JERfDIAiV-~-- =-=---- ===--l~~::---i' --; --..-_--t-:::'F==--~=-- -- l~:==-..:-l=~==-::-l::.:.~-==::-::t'====--:::I ==-, ~=.=-: ====:~;-==r::=-::::J:: -:-=---~----1 =-..- -i--.--,--.-
=1 ----:-J==-=::(-=::=:~~-::: ~:~--._FI~.~lm -1· ?-":~?-l--~~. ~~~-~-I~~~._~-~~-~---~-REssl~-~.I.S!~~.BU!~7~~Af~T~~'j _,~ . =~:~:~i=:::'::::- _- . t= !-- I
--t-----'-----I- -- -- -T--- - -- --- -1-'-' •-t-- --·-1--- ---r----:---~ -. ------1---" ----I ---I
!-~-j==I~.--·----1-'-.---1-.:'1=:::=-~I:'= -'~l-~~r~.'i~:=-_~_7-1-" .--.+-----~'.'~"'. ~t--:-.',''-f-----.. , .-' -- '! .. ----:-===:=:.=---!---==r=-; --=l---~=-l==::--_;-'-~--:·"':=:-+~-'- --- '--. --:1==.1..:-_l===L===+--~t------~--':'-I--r -----,-- ==f=! -----,-,'- ,._--: ~,.- :---I--~-" __-,. ------t--.i----

"-JI
WI-'
IL-l,:;: 5 X 5 TO THE CE~TIMETERjr).~·,:;;:; 18 X ~4 cv
KEUF'"F"El & ESSER CO.
--_.~---~-~-----~--
46 1610¥ ,,= ( ! ~l l.:. s .....

jI
Ii,,,II,I
II
i, .
I
i!III
II1I
I
, ..
I1
1
I
,. '
II
. i Ij I
j;,ji<
t<; I" Ii
II
__ _..... - I
I,I,III
, ': ;"; I
., :~Lbo-:
o=100 I / ~ fO°
I IIii' II .. I'
, .. . . .1··· I· .. -..;: ..~ -~ 1-
FIGURE 7-19
VARIATION OF PEN1'TRATION DEPTH WITHIMPACT CONDITIONS
.0
I
I.... .I.I
I- .. II
50
" - 40
.. 60
Ii \'1 .. . I
I _.. _I
I
I
30
I
II
20I
I I
·1
. I .
70'1
.1I
I. ! i
I
I
60I1 ..-
I50
40
70
I
I
iI..
iIj
I
! -.--'-r' .
7-32
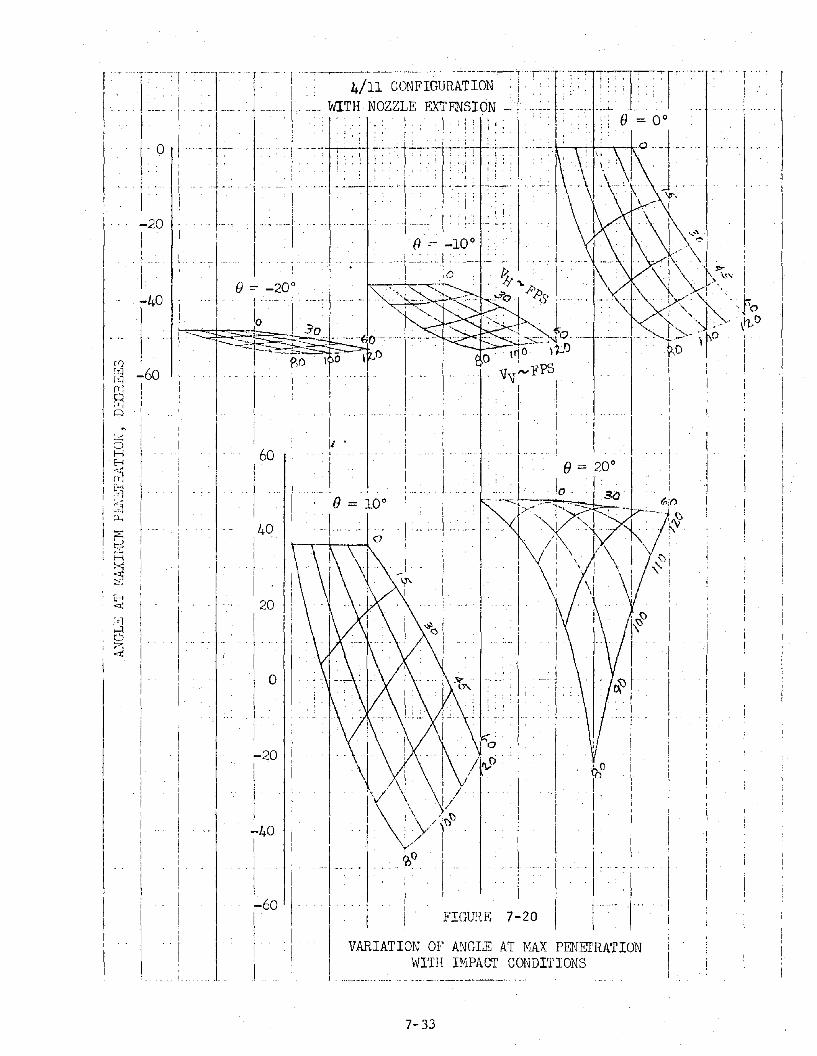
II
I!
(nOII'
!I
'I;
FIGUHE 7-20 I
, ,
--'. ---iT ~--;7-
: . ", '! •
----: ~.,.-:---
, ': I
i'
, ; 4/11 CONFIGUrrATION,,-.- WITH NOZZLE EXTENSION --
20
o
-60
-20
Ii-40
I, j
II
I-I
\
II
i
-20
[
I-40II- :-60I!II
~. -, 'f -:---~-" --:-:--j_._-: ,---' ,'. . , . .
. . . ... I:::E:::
IVARIATION OF ANGLE AT HAX PENETRATION
WI'l'H IMPACT CONDITIONS
7-33
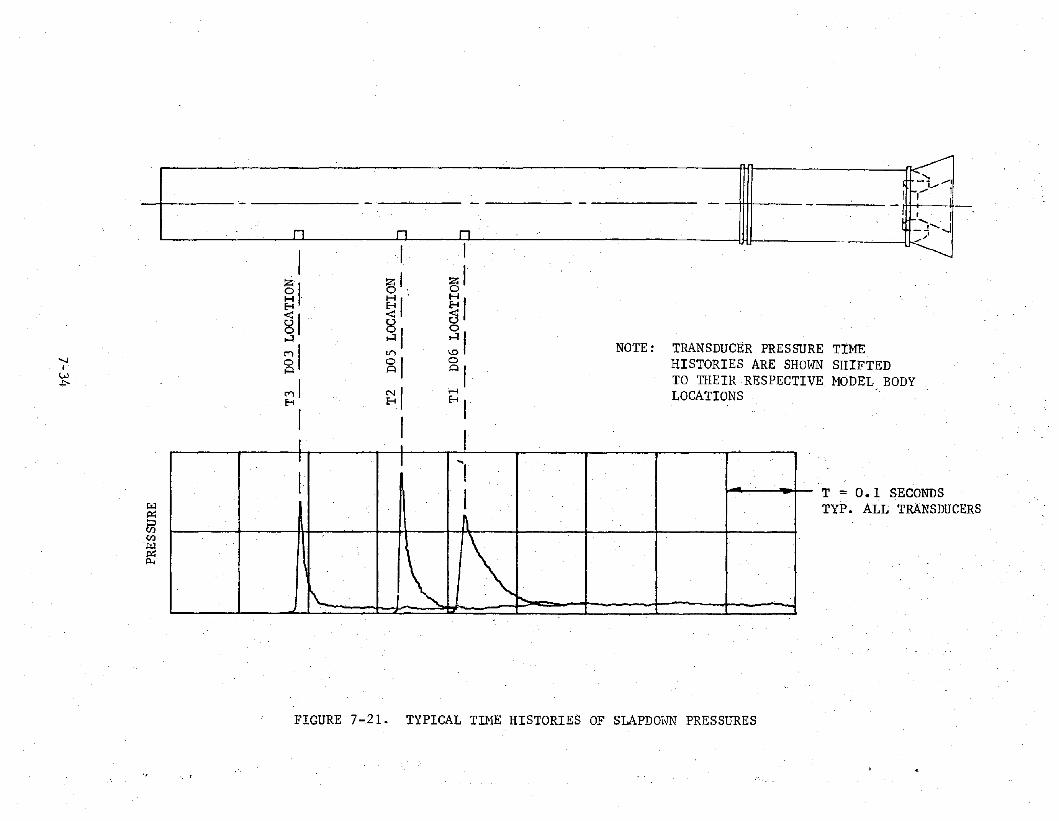
.. ~
.-...."
- --i.............•
- - I ,...... I
n
--n n -
~ " . I
I I I_J'-..1
<-Jsl zl0,
H SI81 §/,..:l
-....I 81 tr\
I 81w ~
~ MI ~IH
I I
zlo
~I~Io~I...-l
HI
I
NOTE: TRANSDUCER PRESSURE TIMEHISTORIES ARE SHOWN SHIFTEDTO THEIR RESPECTIVE MODEL BODYLOCATIONS
I II I
-I I I ....,
r--
f I I IIII
II ~
r-
1\ 1\ \J.....l
f\ - rIL
T = 0.1 SECONDS~ I I II I 1\ r I I I I I I TYP. ALL TRANSDUCERS
~CI.l~
€C
FIGURE 7-21. TYPICAL TIME HISTORIES OF SLAPDO\\TN PRESSURES
" _,1:

._- '-
_1- _'---- __•.__ . __ .,.__
"
50 I--t--+---,f---t--+~-+--+--+-t--t--t--+-t--t--t---j-t--t---t--jt-i-+-t--:t-T-+-+-t-+-j--f--f-- - . - - .__.- -- -c_ _ _ I_~. --- -- -- -- ---. _
~- - '- --- I~ --- - -- --f-- -- --- -- _. - -- -- '-- - -'- --.-' _.. _. _.--- -~ - - -- -- ~- -' -- - - - --- ._- ·-1- _1_._ . '-1_ -,--- ..•._- ._. _:c __ ·__ 1·
o tf--:J=ll~·--tll=1=tl=tf--=~'-=-J-=c:rll--=J=l=J~=~--=~-=+r=--ll-=-~-=-t:L-:-~'1='-~-~==i==+~=1~ - -- -. .-~I--f--- ~f'- - --. __ -.=t.;;.;'-I--.-:L_....-l-~r::r::.~ ---I'- 1--.,._. ~_ -- _ .:.::~ _~Io- 1 ~. . .
l-.--I---I-~_l__ p!-- ---- - >-- -- -I~--f-- ,-- --.. _- - .
........-+--I--1c:::: p l-l-l-- -- - -- -- --I--- -
50 ~-l--:::;>1--4~-I--!-++-+-lI--+--I-++-t-l-+-+-+-t--t--I--1--t--+--+-l-~-_...- .- f-- ~~
V<.ct:icalF'usi ti on
(ft. )
°kJ-+--I--I--1--+--+-+--4--.l;-1l-t-~~+-+-++++-+-+-t-t.,.-f-'-lrr-I-+-+-t-1=---~"""-kL--I- - --f--'--~' __ -- ~- --_.-- -..-_. --. ---- -.' --" -- -.- - - r-- ""-k 1_ '.. -'-'- _ - '---' _.- -._
---=~~~~~~======~~--~---~jf')l'i :,;untalj'u::.; i.tion
(ft.)
~""- .
-:1--1---+--1--+--- -I-- I-I-"~J;:::::~~ ==-.=-=-_ -- ::::-= __~--~--~- ~ .
.. 0 ~ e-I-·- -I---- - -- .--.'
~I- -- c-- - -- i- _I~ I-- '---f- f---- - >--- -'--1--1--- ,-- -.,. --h-I----I-f-- - .-. ---1--- _.-..---- -- -- .-_. -- ~-..-- ._- "- 1- --~I-- -.-. _.. -- ..._ -- - --- ---- -'--' .. -.- - - -'- -1---- -- -- -__ .- - --. --.- ..
-
100 ~-+--+-I-+--+--II-+--+--+-t--+--+-t-t--+-!--1f--1-+-t-'-+-+-\-'-+-+---l:-+--+-+-j
..
~I- -1-- - ..1--I--I--+--I-~I-·I--f- -I--I---I---I--~I--- - -- --t--- ~---- '-l-o-h.." -I-I--- _1_ _ ...:.. _1_1__ .__ • ,- _
[,:::1-- ..- I-- -- I-I- ~I--I- -- -- .~.- _. ----
~-I-- - -K --~--I-+---l---f--'--1'--'- .- ~I-- -- -- --
f---I-- - '---I--- --- --.
~~----,---._--~----------~~--_.~-----~_._----
o l-..l-J--II-..l-_L-JL.L..J-J_l--l---!---1_L...-1--1---Ji---l--L.-1-.-,-~-1--1..-1-_~..!---J----.li...-.l-_I__ ._
VH'UcalVC'}uc:ity(L'L/:.;cc)
1----1---1-·-1--1--· 1--1-----1---11--4--+-1--·1-- -----I----l---II--I--+--I---1--\-·I---+--~---·--- .. - - -..
.J_I
llo:dzontalVdocity(nlDec)
i--I- ->-- --- -1-+-4.--l·- 1-1-- --1--+-+--+-- --- .-.-- --- '.--f-I-- -1-+--+-lI--1-+--+-f-'--+-+-t--l~+- -I---~-1-1- -- ._--~I-~
_ 20 f-I-- -- f-- -1--1::::;1;..-1- - .-
~f-_~I--I_+--+"'----J_I-I-+-+---1f--+--+-t.-_f-~ :=~C:~,=':P:~~=~ ~ :-__~:30 ~f-r;;z -~f::::L....~,--I_-_I_-+_I-4----t_--f- __ -~._F-:: -1- -...,. -·-1_1- -_. - -_. -.-
·-1- -- - _ - -- - --_. --- -.-.---~l--- _.1--.-- '--- .- .---.- - 1-.-- .-. --
.. 0 ~>--_. ---- -- -- --- -f-f--- -f---- --1-1--1--1---..- - --. -- ---- - ...---' ._- --
Fi L:'! [ f\.ngle~Jeg)
--.----+-- -<>-r-t--i --....--+--1---+--.---.--1--1---+-f-;--t-- ---t----t---t----+-~t·--;I-;-I-~ ---
l---I-----I----1 -I--I-----I---I---I--1--+'----J--1---4---I- - 1- - -f--- I-- -- - - - --
f-- ~ f--f--.--- c= ...:-;.:;::.1----1--
.. 0'-- ---- -...- --~~-_r-.--,-. --.---.---.-,--:..,----r-"-,.--;_p,--r---r------, --";"'-+---l--"'.---l_I_-.-_-__ =.~E:~ ~~_
1---~-I------1--I-----I--I---I-.I---~-1---I-_1-- .~J._o<t:::;;:;;:::::..I---'I-~-_f - --f--ll--f-+--~-- --- - ---. I-- --~~ - --l--I--I------I__I-t----t'--.,-=~_._----~f~-- - ,.- -- - .-- - c- - .-. - .-.
----::::::: --e- ~j,-.J--I---+.:...--I-- -----I----1l--t---· -.--. - - .. _.Pi tc 11 Angular 20 l-+-+,+-4=::~:t-~-~-l--+_+__+-1-~+_+-+_l_-J-~-f-++_+_l__1f__f_+_+_+_t_i
I------I-----¥---r-=-J.- --II--4--1---f'-I--I I---I-~I--·I----t--I-'----J-I---I--.-.-- --- -' -- -- -- --- -V",loci ty ~-H7q.._-+_-'-i_1__ 1-_-I_-+-_1_-1-_~1--1_,_-!~I-+--I--+--~--f--_ _ __. .._..(deg/sec) 17
111- -'--. ~-I- - - --I-I-- - -- --- --~.
01--lL4--1--1-l--l-+--+-+--JI-~4--!--+-!---JI-+-+-++-+--1-+-+-++-+--t-I-+-+--t
1.6
-I---f---I--- - -- -- -- - -- - -' ---- ---. - - .-1-----1-_+_1,_1_1-__.i_1- - -- - ..-1-----1-----1----.._1-__ -- .- :...__ - -- -. -.--1---.__1.----'1-1-1- -- '--- .-
0.2 0.4 0.6 0.8 1.0 1.2 1."o
'l'ime i'r::\ifJ Initial Contact (sec)FIGURE 7-22. TYPICAL FULL SCALE TRAJECTORY FOR VEHICLE C.G., TEST P015-70
7-35
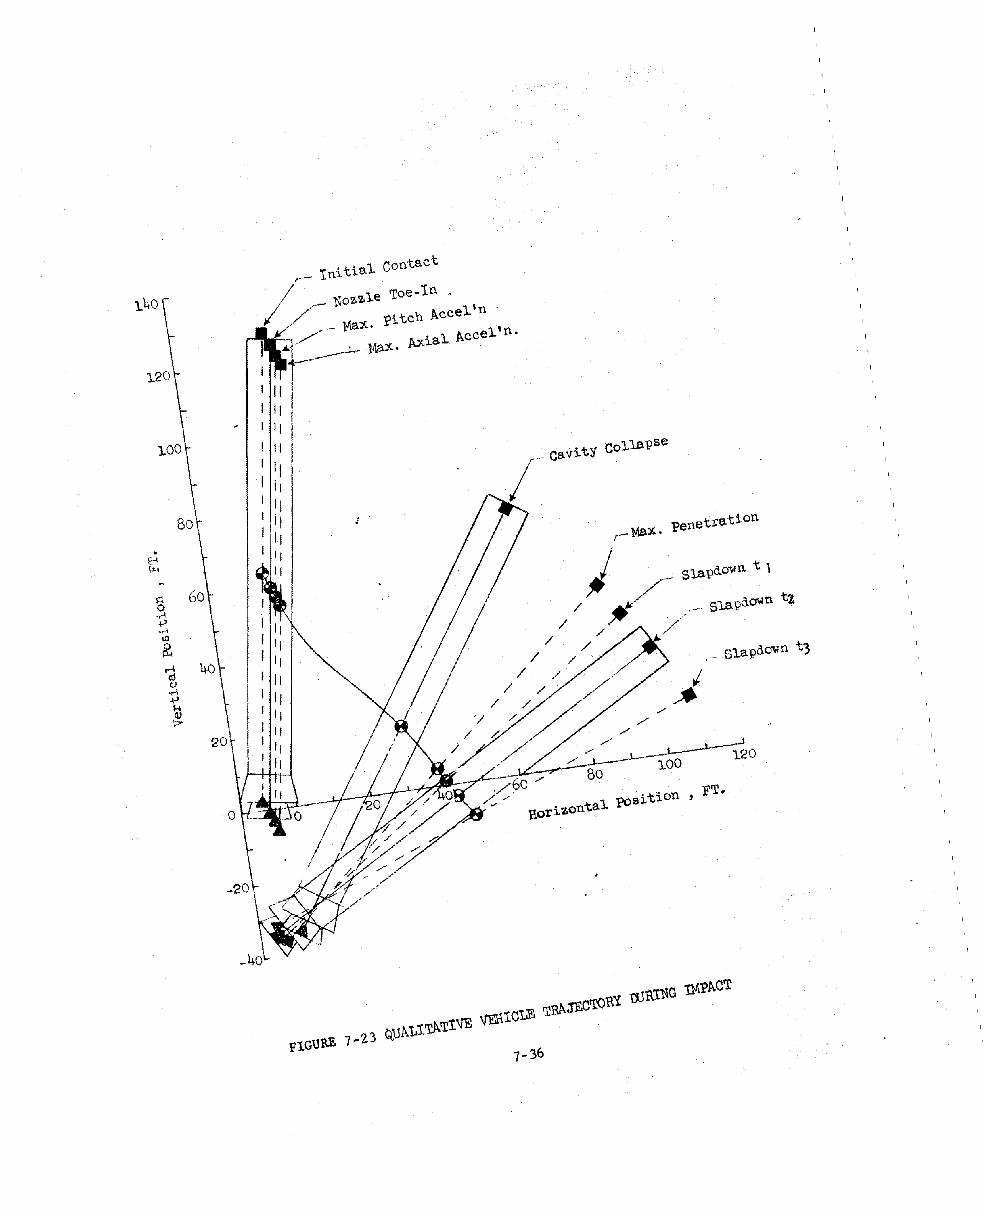
_40
1.40
1.20
1.00
80
60
40
20
o
_20
I'~ lntttn~ contnct
/ ~07>7>1.e Toe-In
j,t'/. /~._ Ma)t.. Piteh Aecel 'n../ __..--:--Ma)t.. Axia1. Accel'n.
7-36

SECTION 8.0
FULL SCALE LOADS
Full scale water impact loads were calculated for SRB configurations as
they evolved from the initial 156 inch diameter SRB to the oarrent 5/1/75
baseline configuration. These loads cover significant loading events
from initial water contact through final settling iIi the water. A data
base compiled from scale model tests and Froude scaling techniques were
used to generate SRB loads as a function of water entry condition. This
section presents the procedures used to calculate SRB loads in order of
their occurrence from initial impact thr~ugh cavity collapse, maximum
penetration, and slapdown.
8.1 Initial Impact
Vehicle loads at initial impact were determined at three events, maximum
vehicle pitch acceleration, maximum vehicle axial acceleration, and maxi
mum negative axial load on the nozzle. Maximum pitch acceleration was
detected by all three pitch accelerometers. By definition, the time for
this event is taken to be the time at which the pitch acceleration reaches
a maximum. Due to the elasticity of the. model structure, the time indi
cated for the event by the three accelerometers was not always precisely
the same; under certain impact conditions, the indicated tline varied by
2 to 4 milliseconds. Therefore, the output of the accelerometer located
farthest aft, and therefore closest to that portion of the vehicle over
which the impact loads were applied, was selected as the reference for
determining. the time of maximum pitch acceleration.
8-1

The time for the maximum axial acceleration event is defined as the time
at which the axial acceleration reaches a maximum. This event was detec-
ted by the axial accelerometers. Generally, there was very little differ-
ence in the time indicated by all accelerometers. However, in those cases
where there was some appreciable difference, the accelerometer loca.ted
farthest aft was used as the reference.
At the maximum axial acceleration event the maximum positive axial and
lateral loads on the nozzle also occur. As the annulus between the nozzle
and skirt fills and the water head impacts the bulkhead, the forces on
the nozzle reverse direction and the nozzle is pulled away from the bulk-
head. This is the nozzle maximum negative axial load event and the time
of this event waS defined by peak negative axial load measured on the
nozzle strain gage balance.
Pressures on the no.zzle, skirt and bulkhead were read at the time of
these three events for all pressure scaled tests. Using the actual impact
conditions (VV, VH, 8) for each test, the resultant vehicle velocity, U,
and effective impact angle (a - (j) were calculated by:
(a - 0) = tan-1 (Va)· _()Vv
For maximum pitch and maximum axial acceleration events the measured press
ures were nondimensionalized by the resultant dynamic pressure, q = ~PU2,
and plotted as a function of (a - 8). This resulted in a family of curves
for each locally measured pressure with VV, VH, or (jas parameters. For
8-2

the event of maximum negative nozzle load which occurs latest in time,
the effect of a was small and the nondimensional pressures correlated
primarily with (). By cross-plotting the nondimensional curves for the
pressures at the transducer locations, extrapolating, and replotting,
curves were constructed for axial locations coincident with nozzle throat
and nozzle and skirt exit planes. Figures 8-1 thru 8-4 illustrate corre-
lations of data at the three events. For any given set of full scale
impact conditions the pertinent full scale nozzle, skirt, and buikhead
pressures were then obtained directly from the normalized c~rves.
The axial and pitch accelerometers were read at the three events and used
to calculate axial, lateral, and angular accelerations at the dry. vehicle
C.G. accelerations were then divided by q and plotted VS(a - (}). The
correlated curves were used to define C.G. accelerations. The two aft
model accelerometers, located at full scale station 1826, were correlated
in the same manner and used to 'define nozzle inertial loads.
Data from the nozzle force balance was first corrected for balance inter-
actions and nozzle inertial loads then forces and moments were transferred
to the nozzle throat. These data were further adjusted to account for thei,
compliance ring and a one foot nozzle extension resulting from redefihition
of the nozzle extension separation plane. As test data was not available
this adjustment was made analytically using the following equations for
positive axial forces:
Axial Force
Lateral Force
8-3
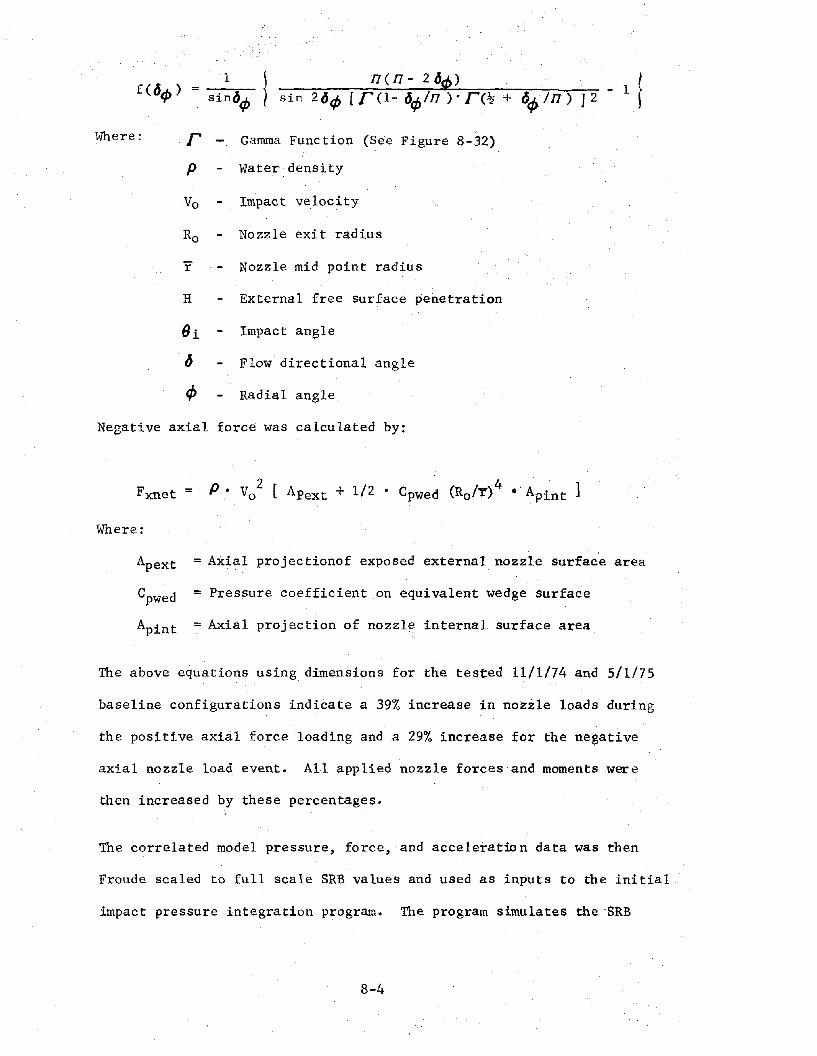
sinn(n- 2{)e/!) . . .. . .. _ 1 t
2{)t/J[ r(l-6¢ln ). r(~ + 6¢ In) 12 ~
Where: rp
Gamma Function (See Figure 8-32)
Water density
Vo Impact velocity
Ro Nozzle exit radius
r Nozzle .mid point radius
H External free surface penetration
6i Impact angle
{) Flow directional angle
~ Radial angle
Negative axial force was calculated by:
Where:
Apext = Axial projectionof exposed external nozzle surface area
Cpwed = Pressure coefficient on equivalent wedge surface
Apint = Axial proj ection of nozzle internal surface area
The above equations using dimensions for the tested 11/1/74 and 5/1/75
baseline configurations indicate a 39% increase in nozzle loads during
the positive axial force loading and a 29% increase for the negative
axial nozzle load event. All applied nozzle forces and moments were
then increased by these percentages.
The correlated model pressure, force, and acceleration data was then
Froude scaled to full scale SRB values and used as inputs to the initial
impact pressure integration program. The program simulates theSRB
8-4

skirt/nozzle area geometry as a series of conical frustums and rings.
The skirt is modeled as two frustums and three rings, the aft closure is
modeled as one frustum and one ring, the internal nozzle is modeled as
two frustums, and the external nozzle is modeled as one conical frustum.
Four pressures act on each frustum and ring assuming a cos tP distribu-
tion circumferentially and a linear distribution axially. Atypical
frustum segment is shown below.
RL1P3 P4 t
X L.... Z
!PI PZ
RO --.iThe pressure distribution is defined by:
P = P1 + (PZ-Pl) (l-~os ifJ) +' ~ [P3+(P4-P3)
[ PI+(PZ-Pl) (l-C~S0) J !f
(I-cos 4>2 J2 -
This equation defines a (hcos4» distribution for 0 ~ i/J $, 1800 and a
linear distribution for 0 ~ X ~ L. Integrating the pressures over the
frustum surface results in loads defined by:
8-5
For external surfaces n is an odd integer and for internal surfaces n is
an even integer~
The ring segments shown below aSSume a (1 ... cos</» distribution over the
upper and lower surfaces.
~Pl
Integrating the pressures over the ring surface results in:
1T(R2 _R2 ) [ (P l - P3) + (P2 - P4) ]Fx 2 1 0
Fz = 0
1T (R 3 _ R3 ) [(P2 - P4) + (P3 - Pl ) 1~
--6 1 0
8-6

M = °z
The program calculates applied nozzle loads and total vehicle axial and
nonnal forces and the pitching moment about the C.G. The SRB mass and
pitch moment of inertia are used to calculate total vehicle axial, lateral
and angular accelerations. The calculated accelerations and nozzle applied
loads from pressure integrations were compared to the correlated accelero-
meter readings and nozzle strain gage loads. The pressures were then
tempered within an allowable r&nge of ~10% until the integrated loads
agreed with measured forces and accelerations. The pressures, vehicle
accelerations, and nozzle loads were then carpet plotted as functions of
impact conditions.
The initial loads documentation presented data for Vv = 80, 100, and 120
FPS. For each vertical velocity data was presented for VH = 0, 15, 30,
45, and 60 FPS and -9:i = -10, -5, 0, 5, and 10°. Finalization of the
SRB parachute design resulted in a nominal vertical impact velocity of
85 FPS with a maximum expected deviation of 2"5 FPS, and a new set of
water impact loads. was prepared presenting data for Vv = 80, 85, and 90
FPS. These data were derived from a direct q interpolation of the Vv = 80
and 100 FPS. The d&ta presentation consisted of vehicle C.G. accelera-
tions, 15 pressures in the nozzle/skirt annulus, applied nozzle loads,
and inertial nozzle loads.
The previously described loads were derived from test data utilizing a
model with a rigid concentric nozzle. However, the full scale n07,zle is
not rigid and will deflect up to t5° as a function of the dynamic responS0
8-7

characteristics ofthe gimbal system and the applied load transient during
impact. Therefore, nozzle loads incorporating the effect of nozzle motion
were defined on the basis that:
1. Overall vehicle dynamics are not significantly influenced by
nozzle deflections of less than 5° in either plane.
2. Nozzle applied axial load is primarily a function of total
vehicle impact velocity vector and nozzle pitch plane attitude.
Nozzle deflections in the yaw plane of less than 5° are insig
nificant to the magnitude of this force.
3. Only the initial phase of the nozzle applied load pulse,
during nozzle filling, is significantly affected by nozzle
vectoring. That portion of the nozzle load transient due to
stagnation of the nozzle/skirt annulus flow is not affected by
deflections of the nozzle less than SO in either plane.
4. The component of nozzle lateral force in the yaw plane due
to vectoring out of the pitch plane is dependent only on vehicle
vertical impact velocity and not significantly affected by the
horizontal drift velocity component or initial impact pitch
plane attitude.
Within these assumptions, nozzle total applied load at any time (t), can
be defined as the sum of the axial force component (not significantly af
fected by nozzle vectoring); the lateral force component in the vehicle
pitch plane (defined by the total velocity vector and nozzle pitch plane
attitude) and the lateral force component in the yaw plane (determined only
8-8
by yaw plane deflection angle and vertical velocity component). The total
force vector can then be wr~tten as,
where an and Pn are the respective angular deflections in each plane
at any given time, t; and Vv, VH, and 9i are initiai vehicle water impact
conditions.
The applied load moment about the nozzle throat centerline reference
point may also be expressed as,
Although nozzle loads vary with impact conditions, the load time history
for each component can be represented by one of two characteristic shapes.
One curve for impact conditions when VH =0 or 91 is less than br equal
to zero and one curve for impact conditions with positive values of VH
and 8i. Applied load time histories were normalized to the peak positive
and negative magnitudes of the pulse, and the traces were shift·ed slightly
to make the peaks of the axial and lateral forces time consistent for each
case. lhe inertial time histories were normalized to the magnitude of the
peak negative load.
Plots of the magnitude of the first and second applied load peaks were
prepared for axial force and lateral force and moment in the pitch plane.
+lhese data which were presented for an impact angle range of -ISo were
derived from extrapolation of tlO° data. Lateral forces and moments in
the yaw plane were taken from the slope of applied normal force and pitch-
ing moment data for VH = 0 FPS. The slope of this data is linear over
the range of tlO° and yaw plane forces were expressed as:

2Yaw force = 8.4 Vv P n
?Yawing Moment: 368 Vv-~n
where:
Vv Vertical velocity in ft/sec
Pn = Nozzle deflection angle in degrees
Nozzle response loads were calculated using a dynamic computer model of
the SRB. This math model simulated the geometry, mass, and stiffness of
the SRB aft closure, skirt, heat shield, nozzle, nozzle actuators, flex
bearing, gimbal stops and the snubber. The elasti~ity of the model com-
ponents was assumed to be linear regardless of the load range. The nor-
malized time histories of applied and inertial nozzle loads along with
peak value force and moment data as a function of impact condition were
used to calculate the time variant nozzle loads. This was an iterative
procedure beginning at T = 0 calculating the nozzle loads and applying
them to the nozzle until time Ti when the nozzle deflects to Ofi, tii.
The new values of Eli + Of i and Pi were used to reenter the peak load
data arrays and determine updated peak nozzle loads. These were multiplied
times normalized nozzle loads at time Ti+j and new nozzle deflection
angles (OCi+j, Pi+j ) were calculated.
The loads were updated until the nozzle axial load reversed • At this time
stagnation is occurring in the nozzle skirt annulus and nozzle loads are
dependent only upon initial impact conditions. The peak nozzle loads at
maximum negative nozzle axial force were multiplied times the normalized
time histories for the remainder of the impact.
Nozzle response loads were calculated for Vv· 85 FPS, va = 5, 20 and 45
FPS, Eli = -5°,0°, and +5°, and a vehicle flight path angles relative to
the nozzle E actuator of 45°,90°, 135°, 180°, and 225°. Forces and
8-10
moments along the x, y, and z axes were calculated for the flex bearing,
aft closure, flex bearing aft end ring, and nozzle snubber ring. Contact
forces were calculated for the snubber along with axial forces for the
nozzle actuators. Peak values of the forces and moments were smoothed
and carpet plotted as functions of entry condition and flight path ~ngle.
8.2 Cavity Collapse
As described in Section 5, the cavity collapse load event is a result of
a high speed entry into the water by the SRB which generates a large open
(ventilated) cavity during the entry phase•. For a pure vertical entry
(VH = 0, 9i = 0) the cavity development and collapse is axisynunetric with
the cavity wall collapsing on approximately the aft 2 diameters of the
vehicle.
For moderately non-vertical entries (a - 8 ~ 10°) the cavity collapses on
itself along a line slightly inclined to the vehicle surface and emanating
from the lee side of the vehicle base. The pressures associated with these
conditions are much higher than for a pure vertical entry but are localized
near the leeward meridian and about one vehicle diam~ter forward of the
base. For large effective entry angles (a - 8 »10°), the cavity collapses
along a line inclined at a large angle to the vehicle and significant press
ures are experienced only on the lee side near the base of the vehicle.
Cavity collapse does not occur simul taneous1y along the vehicle for any
of the entry conditions but generally occurs within about a 10 msec. (model
scale) time span. Circumferential pressures do peak simultaneously, how
ever, and since the critical loading is expected to be in the circumferen
tial direction (i.e. a ring load), the peak cavity collapse pressures over
the 10 msec. time span were combined and considered a distinct event.
8-11
The pressure pulse associated with cavity collapse is approximately trian
gular with about a 15 to 20 msec. (model scale) pulse duration. A simple
one dimensional analysis of the response of the full scale vehicle first
ring mode to this loading indicates that the equivalent static loading
corresponding to the dynamic load.is very nearly equal to the peak load
and peak pressures were therefore taken to be representative of·equivalent
static pressures. A more rigorous structural dynamic ~nalysis to cavity
collapse loading is of course recommended to establish the validity of
this simplified approach.
Analysis of the pressure. data consisted of plotting longitudinal and cir
cumferential distributions of peak pressures at the measurement stations
on the model. At each station there were three transducers located at
the 0°, 180° and 210° meridian locations. In addition, many of the drop
conditions were repeated with the aft model section rotated 120°. Com
bination of the data for these two drops would, with the assumption of
planar symmetry, theoretically yield data at 30° meridional increments.
It was found, however, that lack of repeatability of drop conditions for
the 120 0 rolled cases and steep pressure gradients near the collapse meri
dian combined with off nominal roll and y9.W angles precluded a direct mea
surement of maximum lee side pressure and distributions for each drop
condition. The approach used therefore was to select those drop condi
tions where near nominal (zero) roll and yaw conditions were attained to
define peak pressures and distributions and then use correlations to define
other drop conditions.
Significant features of these distributions are the very high pressure
gradients near the leeward meridian and the nearly constant levels on
the windward side. The rate of fall-off of lee side pressure was found
8-12

to be proportional to the peak pressure and is attributed to the rapid
diffusion of energy with distance associated with cavity collapse lines
in close proximity to the SRB.
The circumferential pressure distribution was math-modeled as being con-
stant on the keel side (-90° ~ ep :5 90°) and varying on the lee side as
The exponent, n, was obtained from correlations of the circumferential
pressure distribution (as measured by the lee side pressure drop,
P( cP= 180°) - P( ep = 210°» with the magnitude of the lee side pressure.
A correLation parameter, I - (}cc' was found which correlated the effects
of initial horizontal velocity and pitch angle on cavity collapse press-
ures and loads. The significance of this correlation parameter is that
it is an approximate measure of the angle between the cavity collapse
line ( I from the vertical) and the vehicle centerline «(} cc from the ver
ticCll), and thus is a measure of the proximity of the cavity collapse
line to the vehicle.
Correlations of maximum lee side pressures with ~ - 8ce are shown in fig
ure 8-5. At low values of I - (}ec' the cavity collapses on the vehicle
axisymmetrically and maximum pressures are 9 and 11 psig for Vv = 80 and
100 fps. At moderate ~ - (}ec' on the order of 10 to 20°, the cavity2
collapses on itself near the lee side and maximum pressures rise to 18 to
22 psig. The higher maximum pressures associated with these conditions
are attributed to the concentration of the collapse energy near the lee
8-13
Olside. Most of the data for 2 - 0cc greater than 20° was only run at
ambient atmospheric pressure and not at the pressure scaled ambient press-
ure required for scaling the cavity collapse phenomena. In the absence
of pressure scaled data for these conditions, the ambient atmospheric
runs were assumed to be representative and the curves were fairedinto
this data.
The above correlation was used to determine maximum lee side pressures
for all conditions. The measured lee side pressures were then propor-
tioned to match the correlated maximum value and used with measured wind-
ward pressures to define the longitudinal distributions along the windward
and leeward meridians. Aft of the lee side wetted length, ·Lw l' equation,
was used to define the circumferential distribution. Forward of the lee
side wetted length,the pressure varied little with meridian angle and
was taken to be constant from the windward meridian to the wetted angle,
= cos- l [2(X-LW,L) J(LW, K-LW, L)
This definition of pw aSSumes that the cavity wall intersects the vehicle
along a planar surface between the windward and leeward wetted lengths,
LW K and LW L respectively., ,
Vehicle accelerations at cavity collapse were evaluated from the peak nor-
mal accelerations mea'sured by the two aft pitch accelerometers. These
readings were used to calculate angular and normal accelerations at the
dry vehicle C.G. The C.G. acceleratfuns were then plotted as a function
8-14
aof 2 Bcc and curves were faired through the data for vertical impact
velocities of 80 and 100 ft/sec. Data for Vv == 120 ft/sec was extrapola-
ted from the curves for Vv = 80 and 100 ft! sec.
The correlated pressure and acceleration data were then Froude scaled to
full scale values and i~put to a computer program for calculatio~ of cavity
collapse loads. This program considers the SRB to be a rigid body with
pressure and inertial forces concentrated at discrete points, located 20
inches on center. Only forces normal to vehicle center line are considered.
Inputs to the loads program are:
a. SRB mass dissribution as a function of vehicle station.
b. Onboard water as a function of vehicle station.
c. Lee and keel side wetted lengths.
d. Lee and keel side longitudinal pressure distributions.
e. Normal and angular accelerations at the vehicle C.G.
f. Pressure integration factors as a function of wetted lengths andlocal lee side pressure.
The program calculates the vehicle C.G. and pitch moment of inertia, and
the local pressure and inertial shear forces at each 20 inch body section.
The local shears are then integrated longitudinally to determine the net
lateral load and the centroid of application for the pressure and iner-
tial loads. The net loads are then compared and all inp~ pressures
are ratioed so that the net pressure load is equal to the net inertial
load, and the vehicle angular acceleration is adjusted so that the centroids
of the two shear diagrams match. The adjusted pressure and inertial
8-15

shears are then combined and total vehicle shear and bending moment dia
grams are calculated.
If the pressure and inertial forces balanced with.in 3% the input data
was considered satisfactory. If the load balance was not satisfactory,
the input data was reviewed and individual pressures and/or accelerations
were adjusted, generally less than 10%, and a new set of vehicle loads
was calculated.
The output from the cavity collapse loads program are presented as plots
of lee side pressure distribution, keel side pressure distribution, press
ure shear diagram, inertial shear diagram, total vehicle shear diagram,
and total vehicle bending moment diagram. Figure 8-7 illustrates typical
results from the loads program.
Initially cavity collaiJse loads were prepared for the impact condition
range of Vv = 80, 100, and 120 FPS, VH = 0, 15, 30, 45, and 60 FPS, and
ei = _100, -5°, OC, 5~, and 10°. After design definition of the SRB
recovery system, the loads presetitation was changed to vertical veloci
ties of 80, 85, and 90 FPS. The 85 and 90 FPS data was derived through
q interpolations of the correlated 80 and 100 FPS data. The new data
presentation also incorporated additional horizontal velocities of 5
and 20 FPS. These were included as a result of a Monte C~rlo statis
tical analysis that indicated that the SRB had a 90% probability of
impacting the water with an impact angle hetween :!:"5° and a horizontal
velocity between 5 and 45 FPS with the mean value being 20 FPS.
The cavity collapse loads as prepared encompassed more than 100 impact
conditions. As it would be impractical to analyze this quantity of
8-16
data from a structural design standpoint, it was decided .to reduce
the cavity collapse loads to a more simplified definition. This was
based on the fact that the primary objective was to define a set of
design capability loads with provisions to identify attrition rates
due to pertubations of loads resulting from deviations from nominal
impact conditions. The approach can then be to define a set of nominal
loads with pertubation functions which allow the loads to be applied
over the complete range of impact conditions.
The nominal loads were defined using data for Vv = 85 FPS, 05 VH ::: 45 FPS,
and -5°::: 9i ::: +5° • Over this range of impact conditions (except for
Va = 0, 9 = 0°) the wetted lengths and keel pressures are approximately
the same and the lee side pressure distributions have the same shape
with variations in magnitude. The nominal pressure distributions were
defined as the numerical average of all pressure data. The peak lee
side pressure was used with correlated data to define the impact para
meter a/2 - 9ce and this value defined CG accelerations.
The final data presentation consisted of load plots for two data cases,
Vv = 85 FPS, Va = 0, and 9i = 0, and Vv = 85 FPS nominal cavity collapse.
Also presented were carpet plots of penetration depth and peak lee side
pressure along with procedures for defining overall vehicle pressure
and load distributions as a function of impact condition.
8.3 Maximum Penetration
Maximum penetration is attained when the farthest aft point along the
vehicle centerline reaches its maximum depth. The event can be observed
clearly in the underwater photographic records. These records were used
8-17
to measure penetration depth, pitch angle and velocity at the ti~e of
maximum penetration. Penetration depth and pitch angle were then plotted
as a function of impact conditions (Figs. 8-8 and 8~9).
The vertical velocity of the vehicle is zero at the t~e of max~um
penetration. There is some pLtch rotation, but resulta.nt velocities are
negligibly small, so dynamic pressures can be neglected. 'Iherefore,
pressures acting on the vehicle are essentially defined by local hydro-
static values alone. That is -
P = pgh
where h = distance below the liquid free surface. With vehicle attitude
(pitch angle, () ) and maximum penetration depth known asa function of
impact conditions, definition of vehicle geometry then leads directly
to the calculation of depth and corresponding hydrostatic pressure for
all points on the vehicle,. Cylinder body internal pressure was again
assumed constant, at the minimum value dictated by case temperature as
given in Fig. 8~lO, and was regarded to be independent of impact condi
tions.
8.4 Slapdown
Vehicle slapdown is defined as the phase of rapid angular rotation and
'lateral displacement from the near vertical to the horizontal flotation
position. As this event occurs the forward portion of the vehicle is
subjected to large oblique impact or slam pressures with the water press
~re wave propagating radially around the cylindrical surface and longi
tudinally forward along the keel meridian. During slapdown the vehicle
C.G. is at or approximately 1 diameter below the water surface and the
body rotation is about a point near the base. The local crossflow velo
cities on the rear half of the vehicle are low and do not produce s1gni-
-8 ..18

ficant hydrodynamic pressures. On the forward portion of the vehicle,
crossflow velocities increase and substantial pressures are encountered.
The peak pressure increases as the slapdown progresses, reaching.maximum
value when the pressure wave is approximately 2 diameters aft of the nose
and then decreases as the wave moves to the nose.
Due to the time variation of p re/isure and acceleration forces duri ng S lal'
down there is no obvious instant when the total vehicle structural loads
are at a maximum. Therefore, in calculating slapdown loads, three or
more time points were used so that the maximum 'load condition would be
encompassed. These time points corresponded to the time of peak press
ure at selected keel pressure transducer locations. At the selected time
points model data was evaluated for use as inputs to the loads program.
During slapdown the vehicle is subjected to low frequency pitchaccelera
tions as shown in figures 8-11 and 8-12. These were read from the three
model accelerometers at the times of interest. The readings were then
plotted and used to calculate the normal and angular accelerations at
the dry vehicle e.G. These accelerations were then carpet plotted as a
function of water entry condition for each time point. Smooth curves were
faired through any irregularities and the data was extrapolated to cover
impact conditions of interest where test data was not available.
The time history of slapdown pressure at a given body station appears as
suddenly applied pressure decaying slowly to local hydrostatic pressure.
As shown in Figure 8-13, the peak pressure is over a very short time dura
tion which should contribute very little to the vehicle structural res
ponse other than some finite localized panel loads. The total vehicle
external pressure load distribution was therefore treated as being com-
8-19

prised of a low frequency base load (assumed to be static at any given
time slice) with the shorter pulse spray root pressure superimposed on
top of it. The spray root pulse load was treated as a localized single
degree of freedom system and the equivalent static pressure load for the
spray root pressure spike is approximately 1/3 of the high frequency
pulse peak. It should be stated that only the high frequency pressure
spike, over and above the low frequency load pulse was actually reduced
to an equivalent static value. All other pressures were read at a given
instant in time and assumed as static. For expediency of hand reading
data plots, the ten millisecond averaging routine was utilized as the
best approximation of the equivalent maximum static values. More recently
a complete set of differential equations have been incorporated into the
data analysis system to define exactly the equivalent static response of
a single degree of freedom system. These results agree quite well with
ten millisecond average values, based upon the full scale vehicles response
natural frequencies.
Keel pressure distributions for the forward portion of the body were
read from model test data at the selected time points during slapdown.
These data were plotted as a function of water entry condition for each
transducer location and time point. The data was then smoothed and extrapo
lated to cover entry conditions where test data was not available. On the
rear portion where pressures are hydrostatic the values were calculated
for expediency rather than reading model data. These calculations were
based on wetted length determined from transducer data, and the model
pitch angle read from photographic data.
Radial pressure distributions were developed from correlations of previous
model test data. These data were used to define radial distribution
8-20

relationships as a function of longitudinal station normalized by keel
pressure. Definition of these distributions are presented in Figures 8-14
through 8-17.
There is a significant amount of internal water, on the order of 100,000
pounds full scale, in the vehicle during slapdown which effectively al
ters the SRB mass characteristics. The quantity and location of the water
could not be determined from available test data so estimates were used.
It was assumed that the nozzle and skirt would be completely full and
that inside of the case the water would be approximately at the nozzle
throat with the surface parallel to the outside free water surface. Fig
ure 8-18 shows the estimated injested water locations. In the loads pro
gram this water is accounted for by adding it to the dry SRB mass distri
bution.
The correlated pressure and acceleration data were then Froude scaled to
full scale values and input to a computer program for calculation of
slapdown loads. This program considers the SRB to be a rigid body with
pressure and inertial forces concentrated at discrete points located 20
inches on center. Drily forces normal to vehicle centerline are considered
in the loads program.
Inputs to the slapdown loads program are:
a. SRB mass distribution as a function of vehicle station.
b. Onboard water as a function of vehicle station.
c. Lee and keel side wetted lengths.
d. Keel side longitudinal pressure distribution.
8-21

e. Nonnal and angular accelerations at the vehicle G.G.
f. Vehic Ie pi tch ang Ie.
g. Pressure integration factors as a function of wetted length andkeel pressure.
The program calculates the vehicle C.G. and pitch' moment of inertia, and
the local pressure and inertial shear forces at each 20 inch body section.
The local shears are then integrated longitudinally to determine the net
lateral load and the centroid of application for the pressure an~ iner-
tial loads. The net loads are then compared and all input pressures are
ratioed so that the net pressure load is equal to the net inertial load,
and the vehicle angular acceleration is adjusted so that the centroids
of the two shear diagrams match. The adjusted pressure and inertial
shears are then combined and total vehicle shear and bending moment dia-
grams are calculated.
If the pressure and inertial forces balanced within 3% the input data was
considered satisfactory. If the load balance was not satisfactory, the
input data was reviewed and individual pressures and/or accelerations were
adjusted, generally less than 10%, and a new set of vehicle loads were
calculated.
The output from the slapdown loads program are presented as plots of keel
pressure distribution, applied pressure load, applied inertial load, the
total vehicle shear diagram, and the total vehicle bending moment diagram.
Figures 8-19 through 8-22 show typical results from the loads program.
The initial slapdown loads documentation was prepared for impact conditions
of Vv = 80, 100, and 120 FPS, VH = 0, 15, 30, 45, and 60 FPS, and g~ = -10°,
_5°, and 0°. Loads were presented at four time points during slapdown for
8-22
each impact condition. These data were later interpolated to provide data
for vertical velocities of 85, and 90.FPS. As previously discussed in the
Cavity Collapse section, it was not practical to structurally analyze the
large quantity of slapdown data and a set of nominal loads WaS defined
for a vertical impact velocity of 85 FPS. The pressure and accelerations
used to calculate the nominal loads were the numerical average of data for
Vv = 85 FPS, Vh = 20 and 45 FPS, and 8i = 00 and _5°.
Loads were calculated at four time points which corresponded with the ini
tial keel wetting at vehicle stations 1009, 769, 569, and 409. Four plots
are presented for each time point, applied keel pressure, applied pressure
and inertial loads, vehicle shear and vehicle bending moment. Also presented
are carpet plots of peak keel pressure as a function of impact condition and
procedures for defining pressure and load distributions for impact conditions
of interest.
8.5 Component Loads
In addition to overall SRB loads, component level acceleration and pressure
loads were developed for selected SRB structures. The components considered
were:
1. Nose Cone frustum
2. Systems tunnel
3. E.T. Attach Ring
4. Aft separation motor
5. TVC package
6. Nozzle actuator
7. He~t Shield/Aft End Ring
8. SRM Clevis Joint Pin Retainer Band
8-23
Component acceleration loads were derived from model accelerometer data.
These data were reviewed for peak axial and pitch accelerations over the
complete range of water impact conditions. TIle data was presented as
peak axial and lateral acceleration for three vehicle zones; the fwd.
skirt, the SRM case, and the aft skirt. Gomponent acceleration loads
are shown in Figure 8-23.
Due to time, model scale, and instrumentation limitations, it was not
feasible to simulate model hardware for direct measurement of component
pressure loads. TIlerefore, these loads were generated using empirical
methods as discussed in the following paragraphs.
8.5.1 Nose Cone Frustum Loads
TIle SRB nose cone is to be recovered using the drogue chute of the main
SRB recovery system to decelerate the nose frustum prior to water impact.
The nose cone is expected to impact the sea with vertical velocities be
tween 40 and 60 ft/sec, horizontal drift velocities from 0 to 45 ft/sec,
and pitch angles up to 20°.
Water impact loads on the SRB Nose Cone Frustum were generated using
empirically de~ived water impact pressure coefficients and a two degree
of freedom trajectory program. TIle water impact pressure coefficients
were obtained from model test pressures for the SRB nozzle and aft skirt,
nondimensionalized by the dynamic pressure, and correlated with the
local angle of attack. Internal and external pressures were correlated
independently and the results are shown in Figure 8-24.
TIle two degree of freedom trajectory program allowed the Nose Cone Frus
tum to decelerate along its velocity~ctor but was constrained from
rotating, i.e. its pitch attitude was fixed. Water impact pressures
8-24

were computed for the wetted portion of the vehicle from the above press-
ure coefficients and the pressures integrated to obtain the applied forces
and decelerations. The wetted portion of the vehicle was taken as that
portion of the vehicle below the free water surface.
Cavitation over external surfaces was accounted for by applying zero press-
ure coefficients (pressure equals zero psig) when the keel meridian angle
of attack, £¥keel, was negative. Cavitation on the external lee side, when
the keel meridian is at a positive angle of attack, was accounted for by
applying a pressure distribution such that the pressure at and beyond the
90° meridian was zero psig. Internal cavitation was accounted for by us-
ing a pressure distribution such that the pressur~ on the internal keel
meridian was zero (psig) when the keel meridian angle of attack was posi-
tive. Figure 8-25 illustrates the pressure distributions used in the analy-
sis.
The nose cone frustum trajectory was calculated for O.2sec by which time
all forces had reached maximum values and were decaying. The results
Table 8-1. Nomenclature for the listing is presented below:
NOSE CONE FRUSTUM TRAJECTORY NOMENCLATURE
AN
AX
B
LWl, LW2, LW3
PI
P2
P3
Normal acceleration, gls
Axial acceleration, gls
Penetration depth, in.
Wetted lengths along longitudinal axis on keel, centerline, and lee meridians, inches forward of Station 395.
Pressure acting on external side of bottom ring, psig.
Pressure acting on internal keel meridian of Nose ConeFrustum, psig.
Pressure acting on external keel meridian of Nose ConeFrustum, psig.
8-25

P4
T
THDD
THETA
VH
vv
8.·5.2
Pressure acting on internal lee meridian of Nose ConeFrustum
Time from impact, seconds.
Pitch angular acceleration, radian/sec2
Pitch angle at impact, degrees
Horizontal velocity at impact, fps
Vertical velocity at impact, fps
Systems Tunnel Loads
During water impact the systems tunnel, which runS the full length of the
SRM case, will be subject to the same loads as the case. The peak normal
pressure load will occur during cavity collapse with the tunnel on the
lee side of the vehicle. The peak lateral load .should occur during slap-
down with the tunnel near but not on the keel so that a ventilated cavity
is formed on one side of the tunnel with the other side subjected to keel
slapdown pressure. Figure 8-26 illustrates the systems tunnel pressure
distributions.
8.5.3 E. T. Attach Ring Loads
The E. T. attach ring, located at SRB Station 1511, will be subjected to
cavity collapse loads followed by hydrostatic pressures through maximum
penetration, rebound, and slapdown. During cavity collapse, the ring will
be first subjected to axial pressures as the cavity collapse wave propagates
forward and then to radial pressures as the wave passes over the ring. The
axial pressures were driven from maximum valves read from lee and keel
pressure transducers located tmmediately aft of the E. T. ring during test
TMS-333. The lateral loads are assumed to be equal to cavity collapse
pressure distributions at Sta. 1511. Figure 8-27 illustrates the E. T. ring
pressure loads.
8-26

8.5.4 Aft Separation Motor Loads'
The SRB has four aft separation motors mounted on the outside of the aft
skirt approximately at the midpoint of the skirt. Each motor is approxi-
mately I foot in diameter and three feet long. During initial impact, the
motors will be in the ventilated cavity created by the skirt and will not
be subjected to pressure loads until wall slap or the onset of cavity col-
lapse.
With the motors on the keel side, they will first be subjected to either an
axial load for pure vertical entry, or an axial and lateral load for a com-
bined horizontal and vertical velocity entry. These load conditions will be
followed by a stagnation loading as the cavity collapses. If the motors are
on the lee side of the vehicle they only receive the stagnation load con-
dition.
In the absence of test data, the initial axial and lateral pressures were
calculated using a flat plate pressure coefficient of 2.0 and the vehicle
velocity at cavity collapse. Correlations of photographic and accelerometer
trajectory data show that velocities at cavity collapse are approximately
60% of initial impact velocities. The pressures Pl and P2
(Figure 8-28)
were calculated by:
VCavity Collapse
P = 2 P V~c/2
= (0.6) (Vlnitial Impact)
Pressure Pl considers only vertical velocity and Pressure P2 considers vertical
and horizontal velocities. Pressure P3 is the maximum skirt cavity collapse
pressure.
8.5.5 TVC Package Loads
Two TVC packages are located inside of the aft skirt. They consist of a
number of cylindrical and spherical shapes attached to an open rectangular
8-27
I-beam framework that is approximately 3 ft. x 4 ft. Due to the small scale
model SRB, it was not feasible to simulate this hardware in the test program.
Also, because of the complex geometry of these packages and their location
within the skirt, the flow is not amenable to rigorous analysis.
A simple analysis, however, was performed and the resulting estimates should
be adequate for providing an overall design load. Pressure PI was calcu
lated as q and preSsure P2 WaS calculated as 2 x q. The estimated pressure
distributions and magnitudes are given in Figure 8-29. The maximum axial
load is PI as is the maximum lateral lbad which can exist in any direction
normal to the SRB centerline. The stagnation loading condition is P2 applied
uniformly around the component.
The maximum TVC package TVC package axial load occurs at the same time as
the vehicle maximum positive axial acceleration event. The maximum lateral
load can occur anytime from shortly after the vehicle maximum positive axial
acceleration event to just prior to the maximum nozzle negative axial load
event. For analysis purposes, assume that the TVC lateral load can occur
in combination with either of the aforementioned vehicle loading events.
The maximum TVC stagnation load occurs at the same time as the maximum
nozzle negative axial load event.
8.5.6 Nozzle Actuator Loads
Each SRB has two actuators located within the aft skirt. The actuator load
ing is generated from two sources, the first being the actuator axial load
transmitted between the nozzle and skirt. This load was presented with
initial impact data. The second source of load is caused by the water im
pacting the actuator. The actuator WaS not simulated in the test program
8-28
because of the restrictively small model size. Therefore,a simple analy-
sis was perfonned, the results of which are given in Figure 8-30. The lateral
pressure loading is P1 whereas the axial is PZ' The stagnation loading con
dition is P3 applied uniformly around the actuator. Actuator impingement
pressures PI and Pz were calculated from the following equation:
P = Coc q sin6
cos6 = cos (8i + TAN- l Vh/Vv) cos (E +fJ)
where:
CDC = Cross Flow Drag Coefficient = 1. Z for P1 and 1.5 for Pz
6 = Flow impingement angle ~ 360 for Pl and 180 for Pz
E = Skirt cone half angle =180
tl = Incidence angle of nozzle actuator = 180
q = Dynamic pressure = ~ p vZ
Stagnation pressure P3 was calculated as Z x q.
Actuator maximum axial, maximum lateral, and maximum stagnation pressure
loads occur in the same time sequence as the corresponding TVC pressure
loads defined above.
During the initial impact dynamic sequence, the SRM nozzle is exposed to
large applied and inertial reaction loads. Resultant nozzle motion within
snubber limits then produce large actuator response loads. These loads have
been analyzed for the specific impac t conditions presented in Table 8- 2 de
fining three possible levels of damage to the actuator system.
The actuator fluid by-pass valve will open under an approximate lZO KIP load
allowing the actuator to respond with a constant load. This value WaS used
8-Z9
as input to the nozzle system response analysis. Under some conditions load
relief provided by the fluid by-pass valve is insufficient to keep up with
the applied load, resulting in an increase in the actuator response load
to values far exceeding the 120 KIP by-pass limit.
Table 8-2 presents peak actuator response loads for the various impact con
ditions analyzed. The three values presented for each condition are maximum
values and correspond to the three dynamic loading events of initial impact:
1) maximum nozzle positive applied load; 2) nozzle maximum negative applied
load; and, 3) nozzle inertial reSponse after decay of the nozzle external
applied pressure load.
To define the total actuator load external applied pressure loads defined
above must be combined with the actuator response loads due to nozzle mo
tion at the respective dynamic loading events, that is, use PI and P2 for
event (1), and P3 for events (2) and (3). Use linear interpolation for
pressures at intermediate angles not analytically defined on Figure 8-30.
8.5.7 Heat Shield/Aft End Ring Loads
The heat shield concept analyzed is shown in Figure 8-31. The heat shield
is relatively lightweight flexible curtain type structure which will fail
under the water impact loading environment. Before failing, however, the
heatshield will be loaded up to its capability (approximately 10 psig)
which, in turn, will load up the aft skirt end ring. The maximum end ring
water impact pressure is an order of magnitude greater than the current
heat shield capability. Figure 8-31 illustrates the heat shield in the pre
water impact configuration. Upon water impact, the heat shield mOves up to
the position shown by the dashed line as it is being loaded up. It takes
8-30
approximately 10 m sec for the heat shield to reach this state from its pre
impact configuration. Shortly thereafter, the shield will fail as the load
increaseS to its maximum value. On the other hand, the aft skirt end ring
pressure builds up to a peak pressure of 85 to 125 psig in approximately 3
to 5 m sec. Therefore, the aft end ring can be loaded up to its maximum
value before the heat shield will fail. Hence, for strength analysis pur-
poses, the capability of the heat shield should be combined with the peak
water impact aft ring pressure.
8.5.8 SRM Clevis Joint Pin Retainer Band Loads
SRM clevis joint pin retainer band shear loads have been estimated and are
presented herein. The slapdown dynamic loading event, which occurs during
water entry, subjects the pin retainer band to the worst case of shear load-
ing. The shear loading is caused by skin friction drag. Water entry tra-
jectories obtained from model tests were combined with drag data to esti-
mate the shear loading. Using a conservative approach, the maximum shear
loading is estimated to be 0.5 psig. The reentry aerodynamic shear loadingI
is an order of magnitude less.
8-31

TABLE 8-1 NOSE CONE FRUSwM TRAJECTORY LISTING
w " 50 •• \'l1 :: 4~., ~tT" " ~.,
T e AX ,,1-1 ~DD L\.II LWi! Lw3 Pl ~ P3 P4
.001 .(/:10 3. 55~ .17':1 53.653 .':l':l':l .':l':l') .571 5~ .63,} .':l':l':l .000 46.61~
.':102 1. I'}'} 5.111 .504 74. 54'} .000 .000 1.141 5~.442 .O':lO .000 46.491
.003 1.7'l7 6.357 .'}72 96.99,} .OO':l .0O':l 1.710 5~ .157 .0'.)0 .':lOO 46.297
.004 2.3n 7.3'39 1.362 111.2')5 .':lOO .000 2.277 57; 7'l9 .O':lO .000 46.045
.005 2.9"17 8.372 1.990 130.967 .O'J'J .000 2."142 57.3"10 .000 .000 45.746
.006 3.577· ''1.113 2.413 142.476 .O'J'J .000 3.4'J4 56.900 .0'.)0 .OO'J 45.3'33
.':107 4.165 1':1.':137 3.139 lEO.534 .01)/) .1)00 3.964 56.373 .OO'J .':I':I'J 45.':I'J'J
.O'J"I 4.75Cl 10.751 3.663 175.47'l .Cl')l) .Cll)/) 4.521 55.7'l3 .Cll)/) .0'JCl 44.557
.009 5.332 11.466 4.35"1 1%.755 .0Cl') .I)/)Cl 5.074 55.17':1 .000 .001) 44.074
.010 5.910 12.\\4 4.999 ~1.096 .0')0 .'Y.JI1 5.624 54.5'J3 .O'JI) .O'J':. 43.549
.0\\ 6.4'14 12.7'J4 5.59"1 2')9.923 .O'J'J .00') 6.171 53.79"1 .':l'JO .':l'J':l 42.9"14
.0\2 7.055 \3.279 6.277 223.125 .'JI)/) .I)I)'J 6.714 53.'J57 .'JO'J .O'J'J 42.3>\5
.0\3 7.62\ \3.771 6.'11'1 230 .124 .01)/) .I)/)':l 7.253 S2.2~3 .':l'J0 .Q':l':l 41.749
.0\4 8.\>:14 14.275 7.5'3'J 242.'JIJ5 .I)I)'J .'J':l':l 7.7'l'.\ 51.4'.\2 .O'J'J .'JIJ'J 41.'J'I6
•ell 5 "1.743 14.€/'I2 7.9"16 247.3'35 .I)I)'J .1)/)1.1 ~ .32'J 5':l.652 .I)'J'J .O'J'J 40.391)
.016 9.297 15.\\6 '.\.647 257."144 .'J'J'J .orY.l "1.'.\47 49.'.\02 .'JOO .'JO'J 39.673
.0\ 7 9."147 15.445 9.'377 261.737 .'JI)/) .I)/)'J 9.371 4'.\.92~ .I)/)'J .'JI)/) 3>\.929
.01'.\ 10.392 15.>:109 9.696 27'J.696 .'JI)/) .'J'J'J 9.'.\9'J 48.'J4':l .O'J'J .'JIJIJ Y\ .161
.019 1'.1.933 16.'J65 1'J.'J64 273.164 .'31)/) .I)I)'J 1'.1.4'J5 47.135 .'JIJ'J .'J'J'J 37.365
.D2'J tl.47'J 16.36\ 10.629 2'.\'J.au .'.11)/) .I)/)'J 1'.1.915 46.221 .'JIJ'J .O'J'J 36.557
.'.121 12.1)/)2 16.551 HJ.936 2"11.7'l2 .'JI)/) .'J'J? 11.422 45.296 .'J'JO .'J'J'J 35.732
.022 \2.530 16'7'l3 }1.437 2'.\7.75'J .'JI)/) .01)/) 11.924 44.367 .'J'J'J .'J'J'J 34.9'J1
.023 13.'J53 16.912 11.&\6 '2'n.7'l'J .'3'J'J .I)I)'J 12.422 43.431 .'J'J'J .'31)/) 34.'J57
.D24 13.571 17.D>:I2 12.115 292.309 .'JI)/) .'31)/) 12.915 42.496 .'J'JIJ .'.1'J'.1 33.213
.'.125 14.D>:I5 17.157 12.31.H 291.3'.J6 .'J'.1'J .I)/)'J 13.4'.14 41.5EO .I)/)'J .O'J'J 32.362
.'J26 14.594 17.269 12.663 294.4"12 .'.1'J'J .a'.10 13."1"1"1 4'.1.629 .':l0':l .':l':l':l 31.514
.'.127 15.'.199 17.295 12."1'.14 292.57'l .':ll)/) .1)/)0 14.369 39.7'.1'J .':l'J':l .'JI)/) 30.664
.'.12>:1 15.599 17.353 13.0"13 294.491 .01)/) .I)I)'J 14."145 3'3.7'l0. .'.1'.1'.1 .'.1'J':l 29.822
.'.129 16.'.195 17.337 13.176 291.826 .'.11)/) .1)/)'.1 15.316 37.%6 .IJIJI'J .'.1'.1'J 2"1.9'.\2
.'.130 16.5>'\5 17.345 13.37'l 292.572 .'.11)/) .I)I)'J 15.7'l3 36.964 .'J':l0 .':l'J'.1 2"1.153
.'.131 17.'.172 17.2'\>:1 13.432 2'.\9.24'.1 .1)/)'.1 .00'.1 16.246 36.'.15"1 .'.1'J0 .0'.1':l 27.33':l
.032 17.554 17.244 13.556 2>:1'3.'.\57 .'.J'J':l .1)/)0 16.7'.15 35.162 .001) .':l1)0 26.52'J
.033 1~ .031 17.157 13.57'l 2':I5.':l44 .'J'J':l .I)I)'J 17.159 34.27'l .'J':l':l .0orJ 25.721
.034 1'1.5'34 17.069 13.621 2"13.653 .':l'JlJ .01)/) 17.E09 33.413 .':l0':l .'J'J'J 24.936
.035 18.973 16.961 13.626 27'l.544 .000 .0'.10 18.'J55 32.561 .':l':l0 .O'JO 24.165
.036 19.437 16.>'\15 13.534 274.672 .01)/) .'J':l0 18.497 31.727 .000 .000 23.410
.D37 19.>'\97 16.711 \3.5"15 272.97'l .O'J'J .'J'J'J 1'.\.934 30.911 .'3'J'J .000 22.673
.038 2'J.352 16.549 \3.475 267.'.\11 .O'JO .01)/) 19.3&\ 3O.IU! .052 .000 21.95'.1
.039 ~.>'\'J3 16.42'J 13 .474 265.':l72 .'J'J'J .01)/) 19.797 29 .331 .277 .000 21.245
.04D 21.25'.1 16.251 13.362 259.530 .000 .01)1) 2'J.223 2"1.5&\ .497 .000 2'J.556
.041 21.693 16.094 13.296 256.122 .000 .1)/)0 2'J.644 27."124 .710 .000 19.M6
.042 22.132 15.92'J 13.1>'\6 25'.1.615 .000 .':l00 21.062 27.097 .917 .':l0':l 19.232
.D43 22.567 15.725 13.1)14 244.739 .01)0 .0':l0 21.476 26.39'J 1.116 .000 1"1.596
.044 22.99"1 15.565 12.955 241.241 .'JOO .'JOO 21.8"16 25.7'J2 1.30"1 .O'JO 17.9"10
.045 23.425 15.366 12'7'l2 235.430 .000 .000 22.292 25.032 1.493 .000 17.379
.046 23.>'\47 15.1"17 12.671 231.493 .0'.10 .':l00 22.694 24.3"10 1.671 .000 16.797
.047 24.267 14.990 12.507 225."142 .0'.10 .000 23.093 23.746 1.843 .OO'J 16.232
.048 24.682 14.7"l0 12.301 22'J.Oll .000 .000 23.488 23.130 2.007 .oem 15.684
.049 25.093 14.€lJ3 12.195 216.10'J .O'J'J .134 23.MO 22.533 2.163 .000 15.154
.050 25.501 14.396 11.996 210.444 .000 .5&\ 24.268 21.953 2.314 .000 14.640
••:151 25.905 14.205 11."144 2'J6.237 .000 .99"1 24.652 21.399 2.457 .oem 14.143
.052 26.305 14.'.105 11.663 2'J0 .>'\3'1 .00'.1 1.424 25.033 20."143 2.595 .000 13.662
.053 26.7'J2 13.796 \\ .449 195.332 .0'.10 1.946 25.411 20.313 2.726 .O'JD \3.197
.054 21.096 13.612 11. 305 191.2EO .000 2.265 25.7'l5 19.799 2.949 .OQQ 12.74"1
11111111
8-32

TABLE 8-2 SRi'! t\liZL.:LE ACnJATCJR RES PONSE LOADS
• •
(X}I
Wv.>
ll1PACT CO:\DITION AC111ATOR E x 10- 3 LBS. :\CHHTOR F x 10- 3 LBS.
fh ¢ NOZZLE AXIAL LOADING EVENT NOZZLE AXIAL LOADING EVENT"VH I'L\.\. POSlHAX. :\EG. REBOU~W ~L\X_._ POSjHAX. NEG i REBOUND-- - - - ~
- - - -~
5 -5 145 - 60 - 120 +120 - 120 +120 - 70
20 I I - 120 + 120 - 80 -120 - 120 +120
45 - 170 -120 +120 -210 -120 +120
5 0 + 40 - 120 + 120 + 50 -120 + 120
20 - 50 -120 + 120 - 50 -120 +120
45 if -120 -120 + 120 -120 -120 +120
5 +5 + 60 -130 +130 + 60 -120 +140
20 + 40 +120 -120 - 90 +120 + 120
45 -120 +120 -120 -120 +120 -120
0* -5 +90 + 80 -120 + 120 - 60 -120 +140
5 +60 -120 + 120 -120 -120 +140,
20 -120 +120 - 70 - -120 -120 +140-~--
35 + 50 -130 +110 -195 +160 - 80--
45 ir - 90 -110 - 60 '-320 -380 +200
0* 0 +100 -120 +120 +100 -120 + 120
5 -120 +120 - 60 -120 + 120 - 80
20 I -120 + 120 - 60 -120 -120 + 120
45 r -110 +120 - 60 -210 -120 +- 135

TABLE 8-2 SRN 1\0ZZLE I\C111ATOR RESPONSE LOADS (Continued)
ex>I
W.po-
D1PACT C01\:,l TION AC111ATORE x 10- 3 LBS. I\CTUATOR F x 10- 3 LBS.
NOZZLE AXIAL LOADING EVENT NOZZLE AXIAL LOADING EVENT "'1I (h ¢> NAX. POS . NAX. NEG1REBOUNDUAX. _~O~. }1fI.~. NEG LREBOUND
- 120 ~ +12~ r-- + 70-
5 +5 +90 - 45 -120 +120--- _0 ___ •
20 -60 -120 +140 -30 +120 -120
45 - 70 .,.120 +120 -120 +160 -130- - -- --- -- - -
5 -5 + 135 +120 +120 -120 - 80 -120 +120-
20 +120 + 60 -120 -120 -120 +120 I
45 +225 + 120 -120 -225 -120 +120
5 0 +110 -120 . +120 + .io -120 +120
20 +120 -120 +120 - 80 -120 +120
45 +150 +120 -120 -150 -120 +120
5 +5 - SO -120 +120 + 70 -125 +120
20 + 60 -204 + 120 - 20 -+ 120 -120-
30 +120 -270 +120 - 90 +110 -120
45 +120 -270 +120 -120 +120 -120
5 -5 +180 +120 -110 -120 +80 -120 +120
20 +140 -130 - 50 + 60 -120 +120
25 +210 -120 - 60 + 60 -120 +120
45 I +370 +530 -180 - 20 +120 -120.
5 0 +120 -120 +120 +80 -120 +120
•

TABLE 8-2 SRM NOZZLE ACTUATOR RESPONSE LOADS (Continued)
•
C»I
WVt
DiPACT CONDITION ACTUATOR E x 10- 3 LBS. ACTUATOR F x 10- 3 LBS.
Oi ¢> NOZZLE AXIAL LOADING EVENT NOZZLE AXIAL LOADING EVENT :VII NAX. POS MAX. NEG· REBOUND HAX. POS NAX. NEG. REBOUND
~
20 a +180 +120 -100 -120 + 70 -120 +120
45 +270 + 180 -120 +30 -120 +120
5 +5 .- 15 -125 + 120 -70 -120 +120- -
20 + 90 -225 +120 + 25 -120 +120
40 . - 30 -285 +120 + 30 -120 +120
45 ~ +120 -255 +120 +20 .; 90 +110
5 -5 +225 + 115 -115 -100 + 120.
-120 + 115
20 + 120 -120 - 70 + 120 -120 - 50
30 +120 -120 - 50 +120 -120 .,. 60
45 +225 + 129 -120 +230 +120 -120
5 0 +110 -120 +120 +120 '-120 +120
20 +120 -110 - 90 + 120 -120 -120
45 +150 +120 -120 +150 +'1'20 -120. .
5 +5 + 20 -120 +120 - 80 -120 +120..20 + 60 -160 +120 + 60 -140 +120
45 +110 -160 +120 +110 -160 +120-.
* VALUES FOR VH = 0 MAY BE USED FOR ALL¢ ANGLES.NOTE: PLUS INDICATES ACTUATOR COMPRESSIGN
MI~~S INDICATES ACTUATOR TENSION

i.• j-- ..,
." 1'-
I .-
-rII
,! -.-
!
II
--J--- .-i---I
jI._---- i--
I!,
, I.--" -1-- --"i- ..
ii
- . _._._~--_ .
"1
---~-----
I!
20 I 30 ; 40 I(at--B): .. --i---- - -1-----1--I . i I I---j----+ ._-;,-~-----~i
-f-:--II
10-.1
I
-~------ I
II
.- ! ---I.
i--·--f- -
iI
i
I: I
--+---~Q
III
,II_._-1 _,1
, i ,. 1 .. 1 . I '
19 ; 20. I 30.. I 40 . I . 50.---i-----; -- .(<x-d-E-J--j -~-J---+-_:-;-J-:--j---j---- .L_
__l_~ .J_. I_.l LJ L__CORRELATION OF INTERNAL SKIRT PRESSURES,: ,--MAXIMUM PITCH ACCELERATION EVENT i I
. __.~. .... __." ... _ .. ,__~._,.. _-------..<--. ._ ...I.... •• _.__ J.._ ., __ . __ L .. _
o
;._-_._.
o
. 008
1---j
I
.020--
I"1---
I,,.016
I
.. 1---- ..-. _--' .I.. I
I.012
!I·
i
i.008
ii
-.-1-Ii
-_--I-
I
I___J __
---TI
---i_
I_.1.
----r .004Ii
--rL._.~ !-. _
II
......1._I
._--~-!
J-----
~-~- i·-------+
!-----++I
D37/q -i--
I--·--1--
I---I.J \
I-II1--
I
D26/q -~ .004 :iI
._.._ .._1 __
I
I.- --1-- 0 ~---- 0
-~""-_.. .--- ."----
_L ----L 'I i FIGURE 8-1-
.1_ _.~_____ __ ... _
--r-I!. j--i
-j--I,
+
i'----
,'..
8-36

.. 1iI,,
- --II
---Of .-,
.. \
I
---l .Jj-'" 1- -- I
I I
.1- -
-tof
---l-- --I
. I+__-_L._
:.!i----- +--. II I
-~--7+---I' II It:- --'--j- -!! . i;.c-r--fI, : iI: ,
j .. -
-~-J'
!L
; .I
________ J
iI
.._.~ --I
!.- t - ..•-
40 50-----~--' -!-------~_.
, ,i I
I I Ii I--+ -1'-I I
. iI I___ i +__I . .i i. i
--~------- TII----1"
I
20 30 .
I(a -- -8-}~---I I
! __J
10 I, II I- :---------1----i i
I
-- -~-·---r--, ,ii
-----1------- -
---f - L --I,I
I I
o 10 i 20 . 30 40 I 5p___ ~--- ~_ <-a """t8..).-I-____ __J ~------;--.I' .' I' i II! ! I . I I . i..... ..... . .. L_(-_·r-t ~-·I
-----'-------J----- ,----J------ ---J:--- -··~~--~--I---FIGURE 8-2. CORRELATION OF BULKHEAD PRESSURES,
MAXIMUM AXIAL ACCELERATION EVENT
0-
,---i--
I,
t._.---L-..-_
-----t---I
I------T-
II.03,Ij- <i>
.02 ---1--,I
,
D32/qI
-j- L
I,i
.01
1--- ________.''_.1 [----, i
"
If----.. _----!-
,!I
Li
I II I
r- .03I
1--- - -~--I !i---
,.02
! ID31/q ----r- iIiI.- --- .01I
i I
! !i--- r---- '--1-'-IIr-- 0
! 0! iI I
IJ._..... --- -T- ~---~_....- .
II
-1'"i-.. j
i
r-- -~
8-37
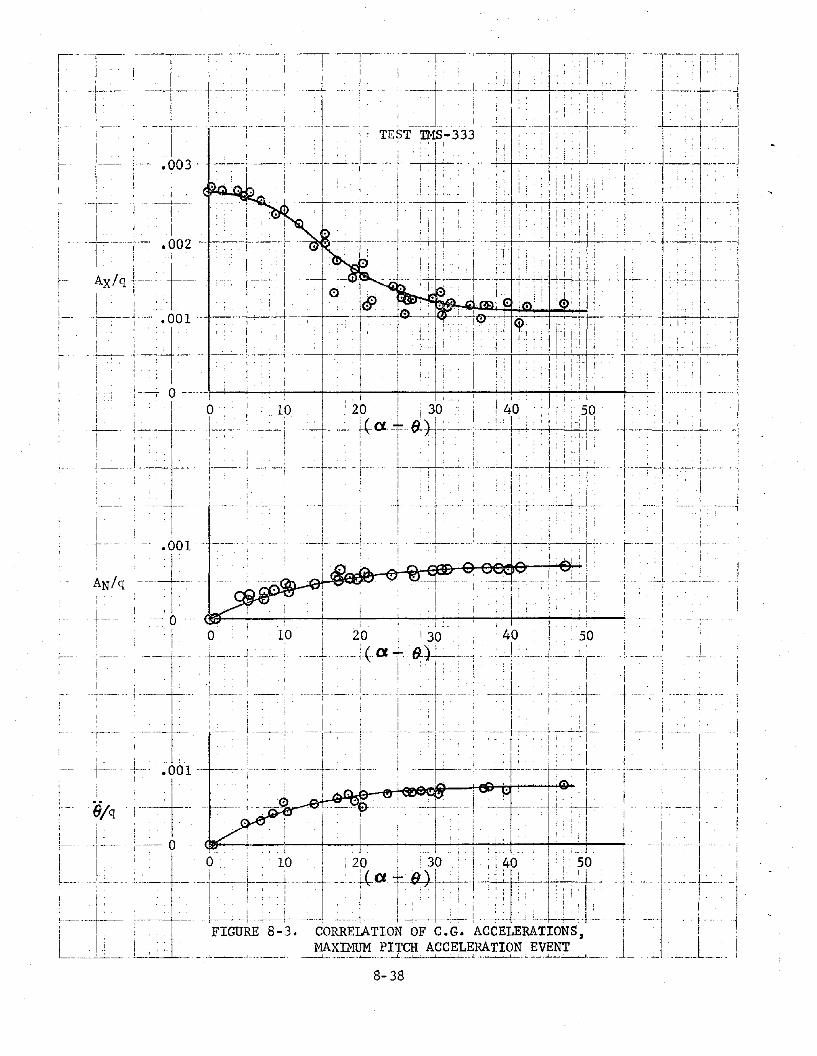
8-38

-,
- • ......, ,"_ - "0-
1
I
-II
I--1-'-- --r-'
--tI,
__ , .____ i. l----··
I
I
I.- r-I
i I1 _ ...._--tI
IIII ,r----r---·I' ;")----1 -.i
,1
..... '-" ..!"-
····_~--·--··--·-·-r-·-·· T'I I Ij I ', I I
_·_.JI~_ t---~+-i
----j ----- .. 1-----.1---
, I
jl----1---, . I
i I I,.-----j--- t~'--'j-'-'
!--~, ... - -l~.+-~.---:I I I
------1._-- _...._....l._... ~-~... ;_.n!)-...:.'o.......t:l,.! I
i-----! --_.. ;..
II
I___ . .1 .__ ..
J
---T'---!
..,..··-t ._,,--
iI
TEST TMS-333
20 30 !, (at":" () )~. ., I ,
1-_.+-
I
1i
I'; 0
;10
!-.- -
r
.001
Io
~_~_t_"'--+-r_'-_8_§_J_iQ---i-e-..,..--.-......-..,,_.--~
i'
o 10 20 30(a- eo)
40 50I!
50
- .001
oo 10 20 30
(ex ""0+1--: 40
-. i
,.... 1-··---·_·_·· ,. ,
I
I. -,_.----_.
!. --. --+-~.
Ir 1 ._._-..;...•_-_ .• - I ..
FIGURE 8-4. CORRELATION OF C.G. ACCELERATIONS,MAXnruM AXIAL ACCELERATION EVENT
• __ 1 .••. _.__ ,.__ ,'. .• -1.. ..••. __ .~_J_
8-39

I) ')1 \ _--I....l.J...L.~__~._~)"., r r ;-f' 1, __:_.:.....:.1_'· ',IT ,') 'I T ;~.:...[ ; tjl'rl·'rr" :.:..LLl..:....LL.1...Li
8-40
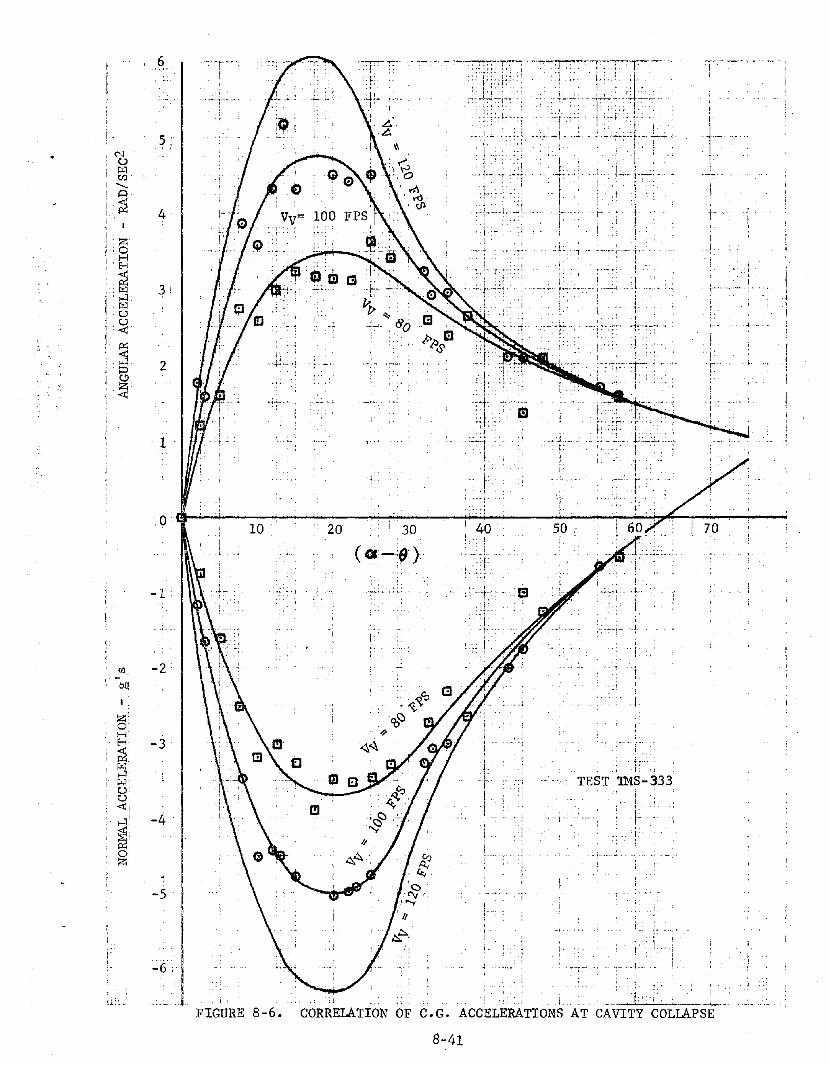
I-fi
, I
.;
-: ,~-: 1 .J :' I·r·····-.··-·;·~ .•
i,,)
l''r"!
".j
I
,.,L
!I,
.f·"1:
/'
TEST TMS-333
"'1
::1;1
-toI
,I"I
IL'
! 'i'" :;
j,
,,I".
I
: : 1
I ,Ii--~' _._-,.-:.,i
·l·1
'1
,_ .; i
:
I '
l';··
i,
i, .. ,,..-r-"~ .
"
I
TI
-;
.iI
.)
-":-r~'-'I .
•. J: ....1 ,/:.:';' , __-l......
FIGURE 8-6. CORRELATION OF C.G. ACCELERATIONS AT CAVITY COLLAPSE
8-41
1
2
4
3:
5:
6
. 0 "(llIo-----<---1-O-----'---2-0---l""I~I"!"'3-0---........;.---------:-.....-i-:::I""""""--:--.;.,........--,.--
(<\i'-~~'}
-5
-2 .
-4
-3
I,
!.
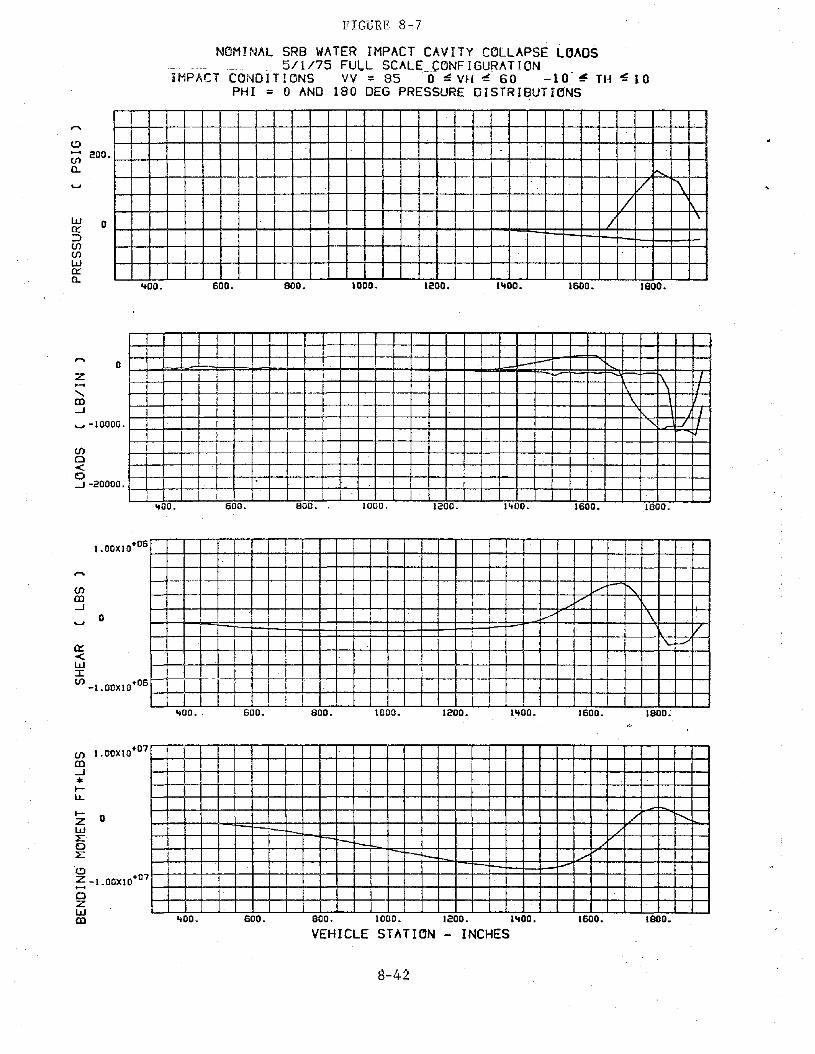
FIGURE 8-7
NOMINAL SRB WATER IMPACT CAVITY CGLLAPSE LOADS-~ -..----_. .__ 5/1/75 FULL SCAL~_..cCJNFIGURATION _iMPACT CONDITIONS VV = 85 0 ~ VH -:! 60 -10 ~ TH ~ 10
PHI = 0 AND 180 DEG PRESSURE DISTRIBUTIONS
........
V ~/
/\
,.....(!).... 200.Uln.~
w 00::;)UlUlW0:0..
"00. 600. BOO. 1000. 1200. •"00. 1600. IBOO •
Ulo<o...J -20000.
z.......en...J
~ -10000.
,.....o ~
,-
I1\ \ 1/
\ \ lJ\ I
" -VItJ
."00. 600. 800. lOaD. 1200. 1'100. 1600. 1800.
1.00XIO+06
Ulen...J
o~
0:<WIUl_I.00XIO+06
v .... 1"-.V
i l-..... \I V
'- L./
-
I I"00. 600. 800. 1000. 1200. 1..00. 1600. IBOO.
/ ..........r-- I--. /---I-- - I-- ./
Ul •. 00XIO+07
en...J
*l-lL.
~ 0WLoL
(!)
Z -1.OOXI0+07....ozwen 'tOO. 600. BOO. lOaD. 1200. 1"00.
VEHICLE STATIGN - INCHES
$-42
1600. 1800.

I1
::f6"Mtiz
Ilf !llrlll!I!III,IIII,I,! 'iW~~!I!!lllllql!:,' ~Wnll!II~ljlil Wl~!l rrrtJ.111ijl)'1 j TIJlj11!;~f!tl.!W!i!!I.j:, '1m, ffijll llWilf1.'!I!J iii! iii! Iffllf,i.!;'IHUril',llt,14! ~:II th~} 1"~~tf+I'+tt+Jtj-L rr' () 11~'I!w'ttl~'t{It+d'" nr'i+'~I"J''''r;.Ij.;II[' tIl,tlif! J1 i I Jill! Ii'l I I: 11/1 II II :1\,1 :11' ~~. I(~~L l,I r II 'j jill TIlil ill!! r! :i!L1[t:i im :1:·: I,m !.'ii!'I',1 1F: ;1 '
I II I I ' 1111'1'1' I'" <III 'II .. "",,!.. I 11" Itlll't~I:;llt .. I.'''I,tl''I'·il'''1 1 II ' I I 'I : :' :.:" .:.:.. .' 'i, II.,,! r: ~ i 'I:'" I' \ 1i 1.1.1 !Ii! j i.!; :1 i : II i:. III
I'i' :' '1' en i~ll~i'r, t ~:I~~II ";+t', t1f'Hi.~h:~jl·tltrrr.,'I+I'+I:I:H+t~i 111 \illlllllillillliillillli ~)~ ." ] 'j ::' '~l It . I l' j' Ii '.~! i i : l:1~j,i, !'I'1
11iI ! j
1m :/1 Ii N; I ill I II Ii~IH+H+H+ttt+HI II ~ ~:1 i II i l; IJI , I II .11: I 11t;· tttt1t,+H,!H.ttttH
1\\\1111\11 . II Ii· i-ij,· l ,(!j I t I • I' it 1 !'~ I ldt l' '1 tJ irI. . jJ . jl II ~,.I: .. I I It;., :,ll! :..l< Ii '1 ' ~ I . ' :1 IUJ I, , ~l'·. l~[l:IIT
' I I' II j II I IT ~t \ fjJ ,1 I) 111 II I 'I' ,., I I ~ "I itl 'I ..~ ""r:ii~
Ii III I It I Ij'l I ·I! ::1,' II ifJ1
, I lif'iI !./';I' I~ u.i! i{{U' ~(1 Iill i I III :i'I' i :1111 UI i~ I Iii; :i,: :!1: !i!: !i:! I!:: : jII, ,I I ' I '. :.' I :I'!I !I/.:~:I I : I I' Ii· I::: II' I II I,I[i !1!llli: I:!: I::: i:i! I,'," ij[i'
, , ' ''' I I I I 'i.. ': i , ",II· I I , III ,I , 1111 """, I." ... 1 . ,,' I"
IIi 1'1 j I I i .jl, II, III lilli' i~l! I~: !I\!~ I 1'11/1, PI Ii I!!i!!i' 'II 111 II!! I!!I i;iT !II: :q: :!I, li'! :;:1
I! ,1]1.1 II .,~ I~~ li1 '~f 1 I 'I' iI 'lfljt! l! !"! li~ Iii i ti!Hiii lii;jlji :i~t 1! I I t I j lttL~ I lit! I lilt! d~ ,inl !~illjl1til I! 11m TI' jir '!llllil 'flj ,n~+I-r"++,,lttH-tll:: 1 I t I I., ,: ,fi1~ti fir. H+ ~I';~; !iii,
ltHtt!1f#ij+H,-ttt:-ttt,:+11+' I, Ii I ,'I 1: I /I, I ~ I',., I 'lift :11:~ I W~WiITmff:tt~~8t~L,ll il!l~j (11+1 ~t.. 11lr1 !II. II! r,~t ! : !~ iii!, ,'II' lift Ii!Ji~ mil! ,l1i!lrr!1 !:~! ~:~,~ ~ lW~1Il lI h rl :H11 Jill I II!! I II!I tIl 'I ~J..II· ~.:I 11,1 I r* 1 11" IIIIII. ,ll\'! ,.,,!l.l. ,.,. ,ILl "I\tIT~f
j'l' " , r 't I' . I I'm.~: I .~' "H" I J'I II I' I:., 't ",. ", '" A[If! ~11 +rli ! 1 ll tj til II i ;lil I: r ': ~tl HJ~ ~. rJ 1T': J ;~ jT I ,111Ii:! ilil ;:~; :.:~ rh: ·;~i :,, " 1\ !, :ill 11\ I ,\ ill\ I . : 'iN- 0, ;#0, • I, II, \' lill 11\1 'Ii 'li, il•• iill ,:', ,ij: S I':: ,iIz' !i I! ,,' lUI ! IJ.' i~ IHI ~l 'I.~ IllIlH H0: I I L1' ~~j +i'l l'i:'~I' . 1+1 '. P ,'.1 ;..! ltlt ~ H~, '.:~: , ~ ;u .' ,I, I,'! ' ' I ' II ,1 I,; J1 Ii! i; Ii III ~ ~w
1 ~ I, . o"~'; j}:; \ \ 111\ III !'[lll'l j \, \full:;: .,: ~ >'I
f
'' ~p. II"~ :~jl.~ "it~ ~;l Ii lilHfi IAAIIl+l'H~~;:H,q~Zi.t·!l: 0: I ,.,1 , 1"; III ,1. il· I III' Iii Iii; il! 1,·1 ,." 'II ILl I '
: ~I Ijlj,l . i jll 1~11: 'iJ ' :J liJ:H~'I' ';'~,I'! I' I T: I. I. ~1·~~,'I~n! i' /It~ im !mIf/'Lifft ' ~Il. I!'!~ [' II ':>', ,fi! IV.I!, ~jm1Ul . i r' I 1 1101 'f 1 ][,. ItI' ,1-1 .1 .IJJ 11f·. ~ i :> ;'\\ 'j" I I!TKJ!, 1\\ "11\ "r) :11:): ,;1; II Iii' :; I') Iii' I:'! ::. '" I: I i
"-'H+4+H+l+ ':""" 6>:'~:! , .. !'!'.tIH~I~ J+:.!.j"IIW4f4. H :.1+11.-:t! I I ' " rm ~ I~!I,~ I ;1 , Ij I:,' III: '1 I I Ii I : ! mr :l!i ,; Ix ,: !. ,S f II ,Iii ll!i r.f; :~ j '1 I" jL il rill iliiill '~ jll! l
-; I "I I Itill ,j. 00 rtitf'~ ~'I I, r I ' ,~ r I rr Ii~ i rHi d,1 ~
'IIII I ' I I' I [, I . ! II 'I' !!,! I!i r.<:l i! j I"II I ' . i I. ~ trti 1 ] ~ I'Hj'li::'lii g:\tj 1 I It .. ' Ij :i!1 ! l i I 'ItJ1 !!!, ill ~ irjl 1 1II I i 1 1 l'i iii ii itT j'I1': i 1
, ' I "i l\dll\" i:~ ~~.~
I ! j!. ,·1 + I J I 111./ /J ~ j fij'! i, ,ll'llllj::, l~'lil,d! jJ;.:,[~ !jrj! \~
IfU I ,I I I H11+ 1111 t, [:; ~ I I
:ltllttti,itti ~ 1[; lJr ' i f '1!lif!1 I It, ~1~rUi~ .!il®I r ~ II 'ill I ~ I!. . .. /j~ ,'j j f ~I! Ii II! II 11 IW),IH+H-HHI++1+H+H IW I "" I " 111 \ 1111\ \ II
1$tttttHfttfttt'tttttHh·. I 111. 111 IIII II Ill!
I I' j 1~ w ~I t!1f+·jf11+ft+I+H
.111. I j; _J, 11,1, ,I ,!,I JL /lliltl!l!i111jji!!!j!J' t
l1 II ~JiMII;HI (4) H.Ld3a NOI.LV1l.L3N3d 1;ln~1t ',ijd I 'In jtl;l) Ij i);lIlf1 Wi I
II Hit 1111111111111111111111 HIllflllnlilll 1 ill IJlIIIII i lliulli l-U.L1!111u..u1iI...............8-43

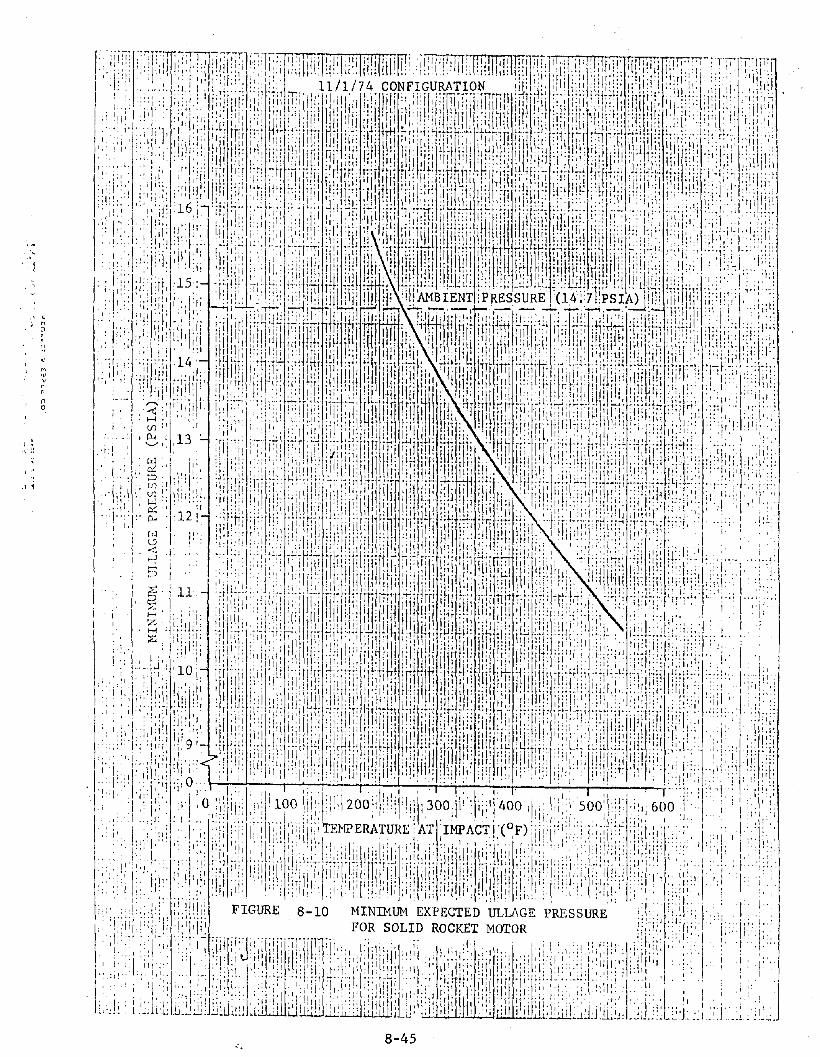
.,
.' <M
:lr,,.,.,<'M,"",,no
r·iii~l;~m~'1'In~I"I'!I;~II'~:;1;~n~i: ' :riilji !i,i[,!,f i/'I!lliiif: ,;!:I 1i!II': ;'!lTfiilBf1TIf!J!!; ! 'I'! .i:~ .. i,lif!: i[P:!i;1fj0?ir:':"i'lT!r~1, ,,, 1'1'1,1 " .. I "I ", 1'1 , .. , '1l1l1' , .".11. \" •.•1::: I .. , ",' [!!;1iI1, ... "., l' 'I "'II"" . 'I' , 'PI rl 1'1 "" ,'11' 'I
' I' \ : I :', I • I I 1 I I" I : ' I j! I • I: J:' I I' :" ! ~ Ii: I " I, I l (,:, . I , ' , . , . I 1, ' " '" I,' . ':' : :!.' :,1 11/1/74 CONFIGURATION !I '1\:" I II!! ',' I:': l: ',.: :1' III ,.,\ \I:l:l 1.1', ,
" ,. J., .,. I ···f :r:'l' .,. '''1 "J r'~'r' ··nT·'r! ''<1':1'" li-:jl r1 •1 "llll! 11' '1' I""'"' ,',': , " 1 'li"""'II: ,,: "1', "I" III :1.,'11 11 "I 1111';1 ',1: " I 11"1 '1IIfl" '11' 1'11" 'l";"~' I '1'1' :," ,', 'II ",: ' ,,". "1'1'"' • II' I '1' I ! I, 'I' II I I' i It \' I' \ \1 I" t '\'\\' I ' \ \11 1 , ,I 1'1' . '\
" :. .'. ,:;I' !, I,' I" I'!:; Ihi: i' I' .. i II i!!' I,' . I: I :[' !! Ii, i1'1.: I j ;lj'I ,';' '1'1' '!I, .:- I :'F :It· 1'1 i1:, ::. ~ ! Ii' I : : ~' I, ,;II: f!', " ,.;'I '" I' ., 'I " '", "" ", W' .. '/'1 II, I I' 'III .,' ,I 'II ' , I I '~l . ,. 1 ·1 It I " .1.,11 \ . ""I" ,I I" "I "" I' I· [I I ., li'l'l I : I. ' II: 1. 1'1 I II: j' • 'I :.' 1.1 1\' 1 1,;\ ,I ~', t~l·'I.\ I •• \1:," ",' .\,:;' I II" ,. t';I;'" ,.. '1" 1,.1 •• r If" ~.. • .l.d'm H" ".' jJ . .;M -" •• ,L· •1 I~' •.1.,. '-n I ,J "1' r-l .-.-l'·'ll.;.l ••..( r'" " .•.. ,.
, ,', , " "'j I "'''l "'1'1" I' 1:11" I'" " , . 'I . 1'1 '., ,I \. I' 'p"'" 'I" I ' .1'1"1" 'I "',' ',; I" '\., I \' 'II I' i'l "I', III " 1" I ': 'I I' 1\1 ,; '1 111 ,'\1. I." i " \; , '~I Ii I' ",I 'II:, :" '\ h 1'1' i' \i I':' I \ I ·· ..1,\" [" '\. ,
,,·'1'1' :'.. 1'1" I, (, It' .. ,I III :r' J ~;l 11,1,' I I:' ill I." L ~t 1: 11 'I U ,': lI'l ':1.: .• !: ""11 '11 'It tt':·: 1'/:: ! .:,: . I :" '1"" " ,·f .! ::: Iii. ,':: I( !li!rl!.ll ,'II/Ii::, :., ,i!l lli :jl:: 'I!i .'ii ill;' !:i; : l':!i~:' '!'J< ,iii I': 1:1::I,~:: Il' Ii::, I',:. ::11 \,:1
, .,,' ";, , :,' :--, h:1 :;~:I-tf .;.j. : .. "r,ttt: "'f '~I' ~I!' '~' ~!tt 111 "'Ihr'~! '1;'-; .. ".l:-~ IJ;j1~':' ,~~'~~I:' ~: •. , .. j -I.:" ':I:I":~, ',' ." I I' 'I I" I' I'" li"l·I '1 'I!': "1 1[·1' II' ,,' UI . I"ll" ',," I ~ .i l ·l "" .. ''\.\ '\" "I( , .,' .. , 'I',", 'I" I' Iii! .. j • ~ :: I 1,1:1 '1 , ,1.1
1
I I 11 id'l ,~: I, ~l :, ~'J 1,; ,:,\,,'11 1. l'f l ,:t'l j : 1;11·': l~ I: III, "I 1'1,:':,1 I
: . I·.' ''': ,': "I II' "., "': II'~ ,'d If'' ,I:", .. :.! ,.J 11 ,. ':,t' I"~ :1' II. 'If' ,·.ll··,l :1·\ ,!:- .rl' "1'::" :' ",' 'I:' ''1', ,. "ill'''!! ' , ",. " , " " .. 1 ,II, ,"'. '1 1,. j I ,. I" '111• I ," , I, 1I' "I ,I 11" ,I. . ., 'j" p, '1'" , I'" ""'1 11\,"i",' 11 '\ I : ,I, ' 11"1 :",\'. JIlt,,: i \:' i II (~:: ,111, '1 til'l\ ,I I,ll,:': ,'j' ',,', " • I:. • "1. '~' I' 1'1 ,I:'
"'j'; ." ,,"I' 16 i 'Ti:-I" ""1' Ii :"_1',"1 ''''1 Ii' ;~'l "I::I--,'~'TT; rllill~-' '1~~'i~iJ t'::\-:-, :··1·· ..:· :;.;Ii;-;\·:'·'I"·I· '1';: 'j · ..·1·" . if'::',J. \ 'II!" !I': il :. !::l ~~l" :i' II: f: '1:,1J!. :I!~ :'I!:d: I!;; !i:\ ,:, ~'~:I:1 ~ 1:l::' :P~:, ::::I':l i,' 1 ;;, ;\,i/:l, : I'" ; ,;,1''I' ,"., 1'1 " I,. "'Irl ,·!lnl·) 1'/'" ., ,I,·" " .!.\I II" 1\.1 ,!~I 'tJ .1.111" ,11'l'll' '11"'" h, I.. ·, I' I I ,..."., ,I,· I''~ '. I', ,J,::. " Iii! ,:: ,\,1 1 'I"'i" ::1" !'j!;' ,',II; ',i l.: (1)' Ill! : 'II \I'I! l'l' 1,\\ :!'I i:;i ',i:l i.'III~il' ":,:'; ":':': ',i I, : I .liI':,
J t I' 'I' t" I" I ',. I 'I l" "I'l .,~ tt' I 11 ""/'" ,,' II, I. " I '/ ",II, I " , " , ,I '.,· • l' ,'•• , ••.•• ··'[--r· ." , '1~ , t· 't···· , j'T •••.•0- "'1 - ., .. , ""\' 1· .. >I"
I,:'. '" I' ,, :,' I. , ,'I', " , ',1:""'" " ' ,:: I' '1'1 ,Ill 11'\ I ,', tl' I'll: I 'I ,II:: ' t", ","',! I" \, , , . .. ., ,I:: "
I '1'1 I" '1'1 ", ' " "1'[/ '1,' iI'I.I, '1 1•1
1' , '11 I I", I I{ \., I ,1 1'1 "l{ 1.1·" "1"""1 I' I.. I II.I I' I·:'· "", " 't""'" 'I'· "\': i I' il'il:'!' 1'1,' II!: :,1 1:1 I.:tll,j t/\j-i'l "ltqi!' t";pll: Iii, .,': ::: . ,,'~, I';
',. ,', ,,:: :;:1 ;:"', "I'" 'I"~ "t'\ :I'l~ ,J.U· 1'11;1 til;j!ltl'l,:'r: :!:. :1 I,: I'i' 1"'~'t'lll1"I"lii lilll'II!; i.:.i ,; .' I' ',i
I I1
1' . 15 I 'III' , • II., '';11 , I l' 'I' I I" ,I, I,." t' ., i, ' II 'l 1~" I '1" " 'l.! ,. I'" t" I ,· ,,,. "It . '''1'' -, ..,,, t···~· t-t· ..; '7T" ~" .... ~... ~ .... ·t· .-.... _. -_. '1'" '" ,.•-. '" 1'1' .. . ,....."1';' II 1'1" " 'l' "~I: 1',:\ 1 ' 'I 'III "I ;\:, i'llllI'I' ,jli'AuuIENT :PDC'SSURE '(14"7 lpSIAqlill 1 "Iii I'i :'," :1' .
, ,.: :: I' ' : I I' ';i ' .;... ',r .::: '!:: : L i!l t1 L " . t, '~' ..\l·W : ~u;. " • I. , '.::..l: '! \1. i I: I. !:: I' I' I' I ~ I:
, ' . I ',':!I: ,':,. ,I-.,~ ", ll,' '1;'--,.:1 " "1'" ""I:I~--:-"-',,:' ':~I:-'·' ;--~'-I':i;TII-I""I" i;: ':!:iI: l! I, I .:· ,'II ' 'II. "11'1. 1 , ,I, I "4" ill; II ,j I l1 j' ' ,II 'J1+I ,I .. , 1" •• " .. "i-1 . ·,,·1 .. , L'j"ll " i'· . ":' . iil~ "'1 :I( :I:i i'I!; iT1Uii~ tnl'lii1\' .trfj:ll'j TJT1~, 11[1 I, '11[; ,TIl l1r;imj"l,r'll~nli';: ill! ~:: iTlitl'"': :!;:I':jT1 ii(l'i:', T:i~i':I';i :'-:'
I, I 1"', I I III I I" 'III'" It I 'I'" I .r 'I " '1'" I' ,j I \111 I I' \' I, l' Ill' ,II ,., j'I" I I,. I' ,"'" . ,\. "" ". "', . \1 ,. II" r'I"[ \., 1"'1 1'''''11' , 't·· .. " '1111 '1"I"w ",,' ' .... '.,. J', ", I ~: ' ':1 il:, il !ll!i l:,: Ill! :rii if:1 ,!i: :'('llli' llli' {:~ llit: :~!: i,'·~;:I,'.·:: '::1;: i:~:!A :Ii,,;i!; !!il::: ,:'ij,;" :I! ,'.',.. . .... , 14' -1'iI11' ·'·.... ·1 't
J r~r 1.1, .••. "1"'1 ~_.\' .,d .. w1'1> 'T" '·1·l.1t ..• '····1 ..... ·<.; ••w •• r..
I..··
1--1 I I-I. , .. \....· . "I 'I ,I, II . I .,~ I II' I 11'1'1 "I 1"1' "1 \11'/ I' I I I' 'I 't 'I" j' "'j" I' "f' I ,.. , . .,r, , " ,,'; ,', ! II ii, ,. i Ij I' I::;! I' II:: I I.: I, :I! I,' I' 'I: I' I ::11 il' i" I: 1,[, [11):, 1,)1 I :ill i! i'll' li:: ,l!i II,; ': I .. ' ::!' I::: I:: ,; i' i", , : 'I' :' ITII'!' , \,h! 1,,\ jl ;"!Il:[, :fJ!H"I,i. 1j' .I;:I,!'I\ 'lh ~!l ·If ,'::I;f:' r' ." , t I'. \'!r' 1.,\ 'I, I: . I,:,! '''.',11..
, , , jl I 11I 'j ,1'.' II' " I., 1 '1, .. ,·11. ", III III' ~" I I '11'~'I~' I·, " " 'I '1'1,1, II,d .I, .. '" . ..' 'I I '' ,'II " II: I.' , lIt I" I' : ,~I '1 .~ i ,L I I, 1\ :, j;,,, I : I I,';; l'" I ,I: I' q I : 11'1' I; I !,. ti: I I I' \I' ~ \ I.· ~ .. " .. Jr····· .... \, .. ,.h·· + ,...... , r'" .In "\", ·t' '+r ~ .... --'1-' ,"~·tl.," ... !, _ ..... "·-1·'" r" .•" . , .•.. ,, , -::?: 'II:!,I I:, T, ,'::-I"i,1 !1:il:lll: '1 1/"':11' 'II Ii, !:j'll III"" t':I':,I",' i:li1ii"1 ,:1; .ii: i.'\'II,:, ,!'il.·I;: "[I .1: ,;'., \ .. : I,,:I ' "I ", 'II' I 'I' '1'1' II ii' I .. I') ,.. , 1'1' ," . II' It'" 'I' ", IIH· , "j""'" ,.',.• 'jl'I' t-,> 1· \.. , t'l' ,.l-j'" 1t"'I'" " "11 '. '1" , •. , .. I " .'. '" . ',.1(/):' , " " , ,I'" I 'i 1\' iI' :. I" I 1'1' I I I',: '11'1 I .1,:, ' . i', Ii "I' l ;I ; i '" I '. : . ' i'!" I'·:'· ,'. '\'
, ,... . I t l 'I I,' :: ' • ; I ; I I l I: I. I 1, It,. I . {i ~ :ii, I I : " • I I I " .. : , \1 ,I I I '. I 1 I· ., : : I I I:' I· . , 13 ., , '-' __ l ;-rJ,. .'-J "J. '1tT .+'[ ,.11. "'1- .". '1/'" '···111'1' .•' - r ..1 •• ,~.. ..., ,.,
: I ' '-'" " ' .' I'I':: I :':" Ii:! ; i I : II ";!'!!,: I !I" I "i 'i I Ii I! '1111' J I:! ':! 1'\'i 'Il . 'l: >,' I' : il", ';:1 i' ' :i, ,: I, :!': :>1 \::" ", i'I: I,: til::'" I ,I " I' II ,I I "'II j' 1111 ' 11'1 ) l-fl '. I 'I" 'tt I '" II . I'j I ' 'it ,I I' I, 'I t I' I I "· ~.,,:, 1'::' 01'1',,' ,'li II' 1'/1 11 ',: ',1 I:; l.Ti II I '!'i I ,. I, :i 1::'1:' ... ··I .. p I,,: i: I,:., I;' ,'1 ::::: 'I,': ""\'"I ; ,. P" ",,,,, :1, "~I: "I '1'/:' ill 1i1,1.: i:,;,,!i 'i,~ll!~ '1, 11:' :,:" • ,:1, ',! ,:\::,! :'1' ,i'I':': I: . .:: ,.. : :Y '; \ :.
• ' ::::> I'" '" .', ,. ,. '.' [.; 1 ,·,·t-· •· ..1 "'j , •• •· ..1-··:..k· -1 ~. ·Jrl, ,~••. ).Jl_, , LI· , .., I Ul "I '.. 'I' 'I" :" I,'[' " .1'1"" ," "t' "I'", II: ":1 '''I',"1'\'I' r 'II" '1 1"\'1' ,,:ill; 'I \"1'11 ,I: .:::"\1"11'" "" 'I' I ".\ '"I I' I' t, I" 1 t 'I' II l '\ I, II I 'I' I, I l' 11 I' "I .,1 I' t·, '"., I, I ",I I
" I,' , i::J.: \11, :1, 'ilj":: i;'ll d:., '; ! 1\1.; :1,:II'li' :1' 1-1 'I': i'i1 ;'iJj'lil ':[" ,iii' ';;'Itl'fi ;.: ,lii\I:" ;;1 rl:!::::i"': ~",I ':l'! I :,'I '\ 1 I ~. '1 :, ~ j I : ; : \ I! 'I \ t.1: i 1 ,: Ii:: I q 1n !i lJ i I! :;<~ Ii :, i ~ '~I\.. ; I !::' ': i: I i ~: j d11 ;j j: 1; l' '.' ,: \:' ", I ' I ~
.j p.., '1. 12 , . "'h' jl r 1-·1····· ,., ·,It r t II- I ~l 1.1.. ~ "r."-'" :.J.I • .., '1 _, / .. , , .1 .., ' " ' I ' I:, .,., !!,'. ·II.I'! I I, 'II' \' :I 11 11 ., I'!: 1'1' 'I II ',:., ", J ':" ,',' 'II '11\1 II' it: 1\: , ", I .Ii I" , , . ": '.I ,\1 1
111, , '\ II -! \ '\ J J' I' 'Ill 1 1"11' I I • r.' 'I I , III ,,, I' ,
, W I I" I,d '." ' .. :" 'I"~I'I /11 1 ':,', 'f'" III ,,: 11'/ :,.::Ii Lt· 'P'!' ,It'.: ::1"" I'''''' .I CJ " '.1.', '1:1 ; :: I 'I I," :: I I: ,.' I Ii ", " I: : II I' I:,' "., , . I ,,,:' .1' . . 'I ' , '
, ,~ I I' ," \.", ·1, ., I' "" 1\ .,' ,,' "I '" I, ' • "1""" 'I' ,. " '" I)," I' , ,~ I ',,', jj ,. ,I. I, " ,', 'I' , I' 'I, I" , " j I, , , ," I 'I ',~ ..... , •• , ~,'J • , .'-< 'rr:"'" "'Tft .- _., .... ">'11 --\"""'r:..,-, , l"\" , .~...,"'" ..., ,',. ,... '. , ... l.
, I ,....l , 1"'''' I ' , "It i ill I't'l;: I'; 11'1' 1'1' 'I: il'l\ I" i ",' 'i.[ I':!' !I I'll" "I"';' 'I, I' i' ;tI; : i" I '. , .. ':r-J, I , I I I • ' : I II', 1. 1\ ~ I 1 fI '1 [ I l! I ,I' I : \ I II '. I II I I I 1 I II , !" 'I 1 I I:III ':': ;,I I I ~' " ,: I ",' I", 1':::> I " , ,., " 'I '\ .. ,' II ,. 11 ..1 It·· 'j 'I' J' r' ['" .. '1'1..:.' 1 ... \ 1--1 I !fl' '". 't"I' ... 1 .. '\ ., ..
! " 'j :, '1
11: "II' :\l~ II ,I ':\1 " 11,/ ,'~' !tlt ~ . ','i'L, I It;:,. :: , :.1' ':;~ :,'\ I '1". , ·1:: " ", 1', '; III Ij. : ~ fI,l \ ,', ';" "I ~'1' ,IJI .I:. : ,\,,': "', I: ":' ,! •. ::.,: ., I.: I",', ,1"
?i III ::I-,'r'~,'';!tii'il';';;II-I'! 11I:1ii:: mlr:r: rITj'ij!rrr r~l rl':: ii'::(111: i-\1:I'i':; ';p'ri::,' ':1';:: 'liT;:' '1:':'~',' ," 1";:1""· ~., I' 'i: l:ill':'j.rii :('i1 1\:/ i ji ;' '; ;I,I'IIPI '\' I /Ji l' 'Iii- :.!; t11:1;IlI'I., i::! '!.'!;':.'. 'I'" ::., ", I ,:.: z;:,! :i'l'!!i,'" 'I:, ' ill'I' ,::\ :\:: 'I' ~ '1. 1: t lil:;!1 lii l' ',';!: :;!"f":; i'li'l ;,1,1 :'I'I'i:', 'li t , ""I' '1 1' " 'I I 1
I H ·1·,:· .... '-1 :~I '.:" ~;:I- 'II~" :JjJj .,.~ ....;;1.14L 1UUT, +u. I): ;:1.; ;1:, 1·.:...I~,.t ::~j ' .. ' :, ,.. I .... : .. :.:. :::.,.......
I :' ~ I::, 'j:I,' :;, !\i. :'lil,l,i 'jill 'II; :>,;1 1, '. 'ii!~ill' l.'ifil"1 .J!! :/11 11,11' iiii 1\\:/',':', :;',:::1 '!I::' ~1'1!i'I;:li" i:' ;" : ,. I' 'II"" I 1'1' 1 'I "I '" .I' j 1"1"\ J "'j I' 'j"" I' I, .. , I ' I, I', I I' , I 'I· ' '''I'' \' .. ".,., "1 ]" '''\1'' ·1"" 1'1 . 'll~ " 1" ,. It"'·' ... It' ,"I'" ..... , '." """" '. l'," II' ':':" lilli, 'I, ' :1 .. , , . I' .' .. \, li\ I 'I: " ,i' ": :,1','1'1':1 ," ,',' .': 'I·' : " :i '\'I "I , I I' I I'", IJ)' '. , I· II, ' •• Lit iii' ,II' ,I l' I" j, 1111/ I" <I' .1, t I' 'j"" I I '
' , ... J ' '10 ':r' j.:, "1':1" ~ JJ.:[ll~:.L. ....:: .:~ hi I
r··l 11" ·I j · ·1': itl:;.L. ~r· Ijtr ·r:·tfl:; ·.. :I ..l! "1"i··: 1 II;.;; ....... :,. I' :;
, : I'; I'" \' :. I I':: '\ l' ,I,' , I ' : '. ". 1\ : I '1 'f' " ,I: I II l' \! : 1'1" I' "',' 1... . :, '1' I;' : : ' , . . ' , : • :, I'I 'l, . 'II t '11' II 'J I I I 'I"
jlll t,1 "I 1 • I ,\ II • Ill' 1'1 Illl II I,,, 1"1/ I 'I' I: 'loll "I" 1'1',,", " ,; I'" I' , jll' . " ',,' I"~, I. \ 'II ,'.:1 "I"JII"I '!:f [J. \[1:1",\: ·:;1\··;; I':; :;;'1:':1 .11. ,I' I'" 'ji;.I:: :/ .. ' t.'
1' .. 'I , I"~ I' I' II" I" 'II I' 'I . I II' ' '1 ' . I' '" "1 I III .. " ')' .".. ,'" ",.. ,. "1'",. 'I' I" ,I, '1 i 1'1 ",1 'II 'jllill ; i . I '.,' it!1 I',:' I q"11 ,'I:'illl I,' ': ,Ii: I , ';':1 . ' " 'I" · ... 1' 'I' ,,'
'.", ",I:,. 'I:: 'I I'" '11.1~' I II 'lL!; .... :t;. I~r' + +1 .;1 .:.: "t: ~L, t: •. ~'.: ·~t"·+ .:..1":.\ .:.,.1: 1, :'::I'~'~ .:.:j.'. ,;;:, ,,' .' .,,''. , '", I' I, : l"" 1'11"'; :il) .1\\ ·'.i\11 : 1111'1'1 11 '1.'1 :1,: "I'li .; " j :':, " 'II':,: 1''','111, .:1': i '11,'1 ,I' 111 ;1 'I .. , I II"~
I I " , , ' I I : l I I I ,!' I ! ;! : I: I' 'I I I :; I I I: J I .! , ~ I' I: :; I' ,,:' 'II .'I, 'I" \' I r ':: I : ' ~ II ':' I I: , .: ' : , ' , \". "'1'" 'I""'''' 'I 1'1 ('" .. " I [. I ' ... til' '11·"1. I ... , 1\"1· 1 "., . I I ,... II· ..· 'r l " .'. . , j"
' .1:, ',I \', 1'1 ,. 11 ", ;i'l 'Ii ,'\ :i) ,!/I ',' "1:/1,\', '1',/' ... I;; ,I,. I" '1':': :U" : " ":," ,: 'i. :I,' ::1, ,Ii, ,,"', ' , 1'1,' J " I,,! I, I ' I'll" I I '~ Ifl'l ,." 'I " 111 q'l It .. , L" I, '" I' 't '1'1" '1' ,", '" I'.. 9'- ':1' 'I': 11,1 •.• ··:t I'lll :•.• I., :.• , ~r'l, 1\:' ~:1'111'11'~'" , \.11.:. 't1T';'j": .!. t~.tL ,.... ,... ~. ~' .. 'j:' .,:' ':"1: I:· , . , ' " I I" '" 'II ill II '[I' 1'" II II '\ • 'j1 'I It'" ,I' "" I I' '''''' I" II I' I' II' . I' ." ,II I, "I: I ,. 1!1,:' !11