notice - NASA Technical Reports
137
N O T I C E THIS DOCUMENT HAS BEEN REPRODUCED FROM MICROFICHE. ALTHOUGH IT IS RECOGNIZED THAT CERTAIN PORTIONS ARE ILLEGIBLE, IT IS BEING RELEASED IN THE INTEREST OF MAKING AVAILABLE AS MUCH INFORMATION AS POSSIBLE
-
Upload
khangminh22 -
Category
Documents
-
view
5 -
download
0
Transcript of notice - NASA Technical Reports

N O T I C E
THIS DOCUMENT HAS BEEN REPRODUCED FROM MICROFICHE. ALTHOUGH IT IS RECOGNIZED THAT
CERTAIN PORTIONS ARE ILLEGIBLE, IT IS BEING RELEASED IN THE INTEREST OF MAKING AVAILABLE AS MUCH
INFORMATION AS POSSIBLE
E81-10MAY f1 4 1591
DC-L1-04051
JSC-17116
200..
AgRISTARSlate . under KSA sponsorship
e elrly and 4:41' dis-
v, ► firth Resources SurveyiWorrnahon and w0111ju' 113WIty
uie mode Ihett:0t."
+; Ctomes ^C 1UPs/Land Cover
A Joint Program forAgriculture andResources InventorySurveys ThroughAerospaceRemote Sensing
'A a rch 1981
EVALUATION OF LARGE AREA CROP ESTIMATION TECHNIQUESUSING LANDSAT AND GROUND-DERIVED DATA
1- 1 ^1UU) lLVAL.' V ur I.AhuE Ah L• it i , ► . t
1rlA: i^b 'I ..Lt1h1 _ :i U.;iN.; LAN1,LiAI A11J
i1,^L'-^td1V..J UAiA (Lucn ►tor d LUjLr,te %_:Llllq
:► d ►ta j<:1LU ► , L) l iu ^ uL Auu /A r AJILSCL J.:C JJ/ 4 J
Nd 1-..'0 ^ 1 1
U u.: A-1 :
6^,_,jj
M. L. Ards, R. K. Lenninyton,
11. V. Martin, W. G. McGuire, and S. S. Shen
Lockheed Fnnineering and Management Services Company, In,;.1R''' Road 1, Houston, Texas 77058
•
P,
P ~4a' R ..^ f
`41ii11./O „
•
C1 ^,
P'n JtS, 4F ES pf
rQ;^
W p\t l/
PF
Lyndon B. Johnson Space CenterHouston. Texas 77058
1. Retort No, 2. Government Accession No, 3. Recipient's Catalog No.
C- . - . JSC-171164. Title and Subtitle 5, Report Date
Evaluation of Lar-ge Area Crop Estimation Techniques ch_118 I
Using Landsat and Ground-Derived Data6. Performing organization Corte
7. Author(s) B. Performing organization Reywrt NoM. L. Penis, R. K. Lennington, MI. V. Martin, W. G. McGuire,and. S. S. Shen L^ SC 15763MS Q-
10, Work Unit No,9, Performing Organization Name and Address
Lockheed Engineering and Management Services Company, Inc. 11, Contract or Grant No1830 NASA Road 1Houston, Texas 77058 NAS 9-15800
13. Type of Report and Period Covered12, Sponsoring Agency Name and Address
National Aeronautics and Space Administration Tpchnical Repor t14. Sponscrims Apncy caveLyndon B. Johnson Space Center
Houston, Texas 77058 15, Supplementary Notes
16, Atash'act
This paper describes the results of the National Aeronautics and Space AdministrationDomestic Crops and Land Cover Classification and Clustering study on large area cropestimation using Landsat and ground truth data. One objective was to evaluate thecurrent crop area estimation approach of the Economics and Statistics Service of theU.S. Department of Agriculture in terms of the factors that are likely to influencethe bias and variance of the estimator. A second objective was to investigate alternativeprocedures involving replacements for the clustering algorithm, the classifier, or theregression model used in the original U.S. Department of Agriculture procedure.
1
17. Key words (Suggested by Author(s)) i8, Distribution Statement,
Large area crop estimation, Landsat, fullframe processing, regression estimator,clustering, classification, cross-validation
19, Security pauif. (of this reports 20. Security Claulfx (of this pager 21. No. of Pages 22. Price'
Unclassified- Unclassified 136
I—T
EVALUATION OF LARGE AREA CROP ESTIMATION TECHNIQUES
USING LANOSAT AND GROUND-DERIVED DATA•
Job Order 71-352
This report describes the activities of theDomestic Crops/Land Cover project of the AgRISTARS program.
t 4f
PREPARED BY
M. L. Amis, R. K. Lennington, M. V. Martin, W. G. McGuire, and S S. Shen
APPROVED BY
T. a
!
C. Minter, SupervisorTechniques Development Section
t ainwrig t, ManagDevelo ent and Evaluation De rtment
I LOCKHEED ENGINEERING AND MANAGEMENT SERVICES COMPANY,- INC.
i Under Contract NAS 9-15800
Fora
Earth Resources Research Division
Space and Life Sciences Directorate
NATIONAL AERONAUTICS AND SPACE ADMINSITRATIONLYNDON B. JOHNSON SPACE CENTER
HOUSTON, TEXAS
March 1981
LEMSCO-15763
}
I
I
PREFACE
The Agriculture and Resources Inventory Surveys Through Aerospace Remote
Sensing is a 6-year program of research, development, evaluation, and
application of aerospace remote sensing for agricultural resources, which
began in fiscal year 1960. This program is a cooperative effort of the
National Aeronautics and Space Administration, the U.S. Agency for Inter-
national Development, and the U.S. Departments of Agriculture, Commerce,
and the Interior.
The work which is the subject of this document was performed within the
Earth Resources Research Division, Space and Life Sciences Directorate, at the
Lyndon D. Johnson Space Center, National Aeronautics and Space Administration.
Under Contract NAS 9-15800, personnel of Lockheed Engineering and Management
Services Company, Inc., performed the tasks which contributed to the completion
of this research.
r
rF'ECE 11iG PAGE CLANK NOT PplAPLo
a`
V
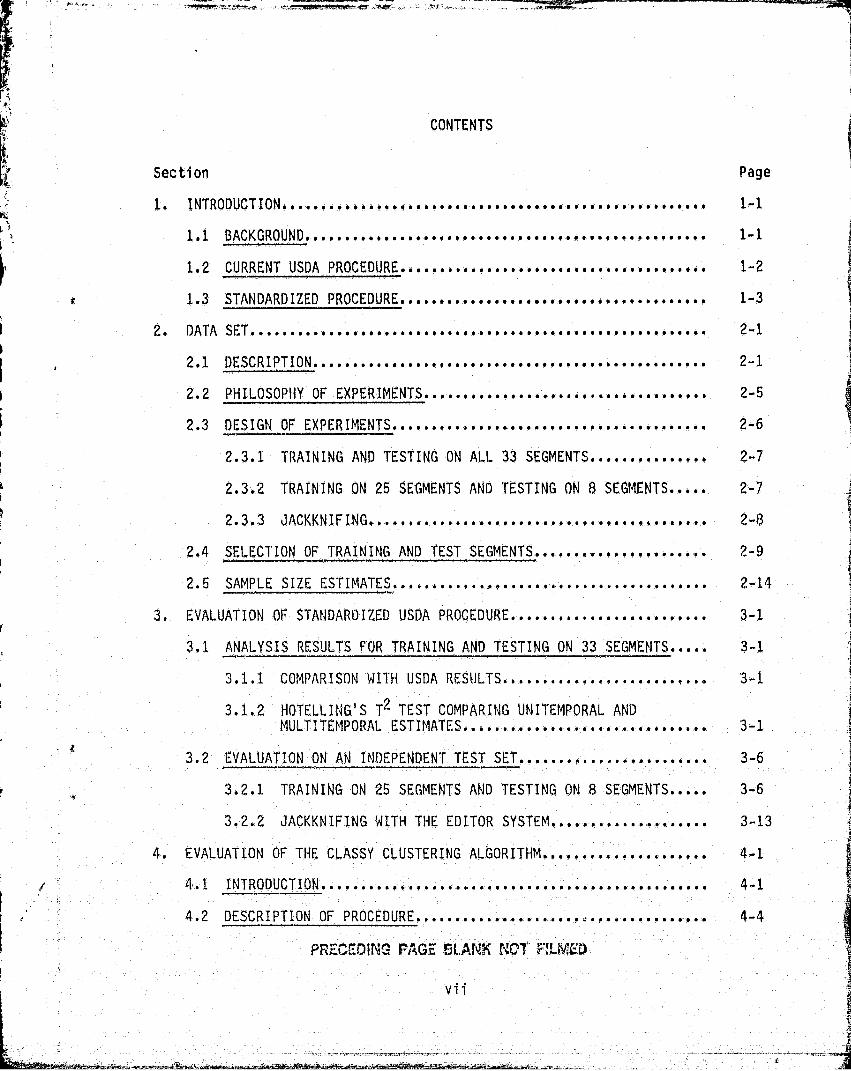
CONTENTS
Section
1. INTRODUCTION.....• .... ... ................... Y. 1.......i.........
1.1 BACKGROUND.. ........... ...»..................,.,... ., .....
1.2 CURRENT USDA PROCEDURE ... ...............................s..
1.3 STANDARDIZED PROCEDURE........ .............................
2. DATA SET .......................... ......._...................
2.1 DESCRIPTION.. ...............................,....,.......;
2.2 PHI LOSOPHY OF EXPERIMENTS .... . ....................6.990.....,
2.3 DESIGN OF EXPERIMENTS..,........ ..............,............
2.3.1 TRAINING AND TESTING ON ALL 33 SEGMENTS ...............
2.3.2 TRAINING ON 25 SEGMENTS AND TESTING ON D SEGMENTS.....
2.3.3 JACKKNIFI-NG ..........................................
2.4 SELECTION OF TRAINING AND TEST SEGMENTS .... ..........•..•••.
2.5 SAMPLE SIZE ESTIMATE S............ ........:..................
3. EVALUATION OF STANDARDIZED USDA PROCEDURE. ........9.........999.
3.1 ANALYSIS RESULTS FOR TRAINING AND TESTING ON 33 SEGMENTS..... 3-1
3.1.1 COMPARISON WITH USDA RESULTS .............r..,....,,,.. 3-1
3.1.2 HOTELLING'S T2 TEST COMPARING UNITEMPORAL ANDMULTITEMPORAL ESTIMATES..;
32 EVALUATION ON AN INDEPENDENT TEST SET.......,,.. ............. 3-6
3.2.1 TRAINING ON 25 SEGMENTS AND TESTING ON H SEGMENTS..... 3-6
3.2.2 JACKKNIFING WITH THE EDITOR SYSTEM.....,....,........, 3-13'
4. EVALUATION OF THE CLASSY CLUSTERING ALGORITHM..................... 4-1
4.1 INTRODUCTION .... 9 ..........:..............,p.................. 4-1e
4.2 DESCRIPTION OF PROCEDURE. ...... ........ ......... ....so.. 4-4
9vii o
Page
1-1
1-1
1-2
1-3
2-1
2-1
2-5
2-6
2-7
2-7
2-
29
2-14
3-1
Section
Pace
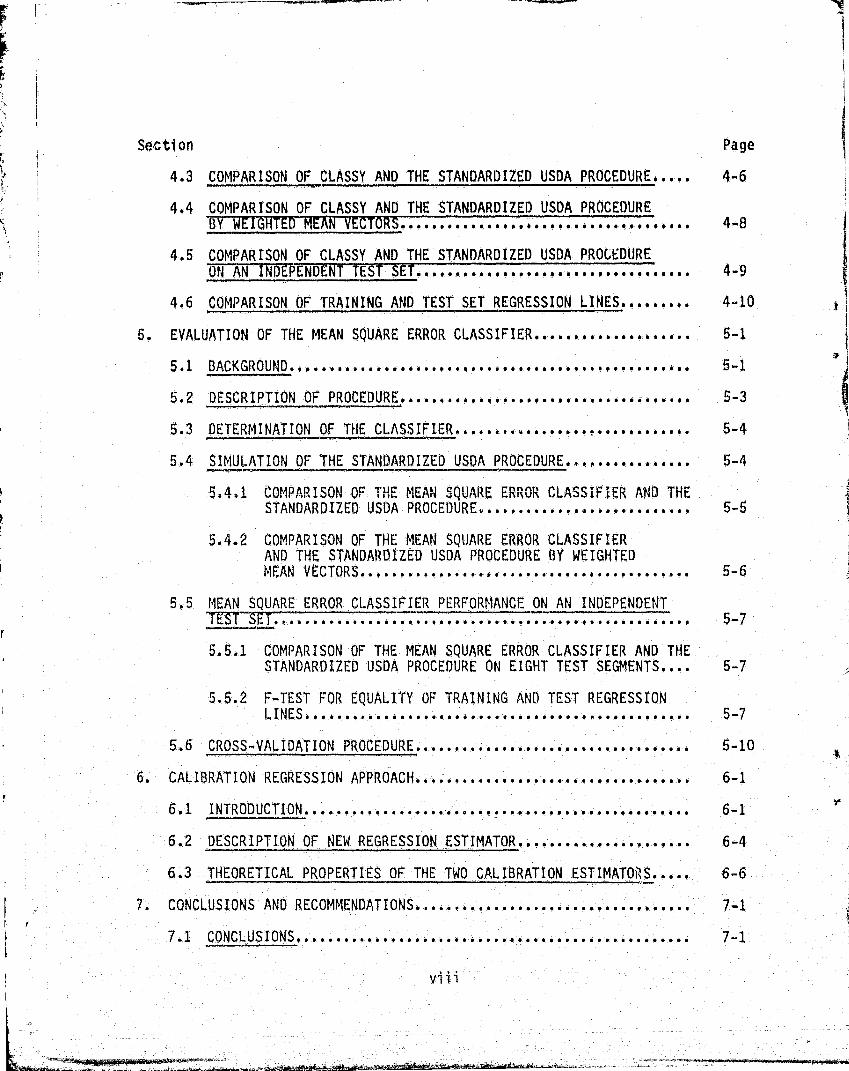
4.3 COMPARISON OF CLASSY AND THE STANDARDIZED USDA PROCEDURE..... 4-6
4.4 COMPARISON OF CLASSY AND THE STANDARDIZED USDA PROCEDURE
BY WEIGHTED MEAN VECTORS . ............... . .. . ..... . ...........
4-8
4.5 COMPARISON OF CLASSY AND THE STANDARDIZED USDA PROCEDUREON AN INDEPENDENTE _ ............................
4-9
4.6 COMPARISON OF TRAINING AND TEST SET REGRESSION LINES.........
4-.10
5. EVALUATION OF THE MEAN SQUARE ERROR CLASSIFIER ....................
5-1
5.1 BACKGROUND .: ...................................,.....
5-1
5.2 DESCRIPTION OF PROCEDURE.... ... .. ......................... 5-3
5.3 DETERMINATION OF THE CLASSIFIER ................»....6064.. 5-4
5.4 SIMULATION OF THE STANDARDIZED USDA PROCEDURE ................
5 -4
5.441 COMPARISON OF THE MEAN 'SQUARE ERROR CLASSIFIER AND THE
STANDARDIZED USDA PROCEDURE ...................0....... 5-5
5.4.2 COMPARISON OF THE MEAN SQUARE ERROR CLASSIFIERAND THE STANDARDIZED USDA PROCEDURE BY WEIGHTED
MAN VVECTORS. ..,........,,... ....................... 5-6
55 MEAN SQUARE ERROR CLASSIFIER PERFORMANCE ON AN INDEPENDENT77-71 .. 5-7♦ ! .. ! . ! . . .. • • 6 66 6 . . • .:•: • .. ! 6 6 6 6 ..^ ......... F • ...... • .. ...
5.5.1 COMPARISON OF THE MEAN SQUARE ERROR CLASSIFIER AND THESTANDARDIZED USDA PROCEDURE ON EIGHT TEST SEGMENTS.... 5-7
5.5.2 F-TEST FOR EQUALITY OF TRAINING AND TEST REGRESSIONLINES..................... .....•..................•... 5-7
5.6 CROSS-VALIDATION PROCEDURE........ ..... ....................0 _5-10
6. CALIBRATION REGRESSION APPROACH.,.............................. 6-1
' 6.1 INTRODUCTION ... l .... ..•..... ................................ 6- 1
6.2 DESCRIPTION OF NEW REGRESSION ESTIMATOR ......... 6666.......... 64
6.3 THEORETICAL PROPERTIES OF THE TWO CALIBRATION ESTIMATOP^S..... 6-6
f 7. CONCLUSIONS AND .RECOMMENDATIONS....,........ ..... . ... ...•......... 7-1
7.1 CONCLUSIONS ............... .....6 ....... ..,.666 ........ . .... ... 7-1
fviii
Section Page
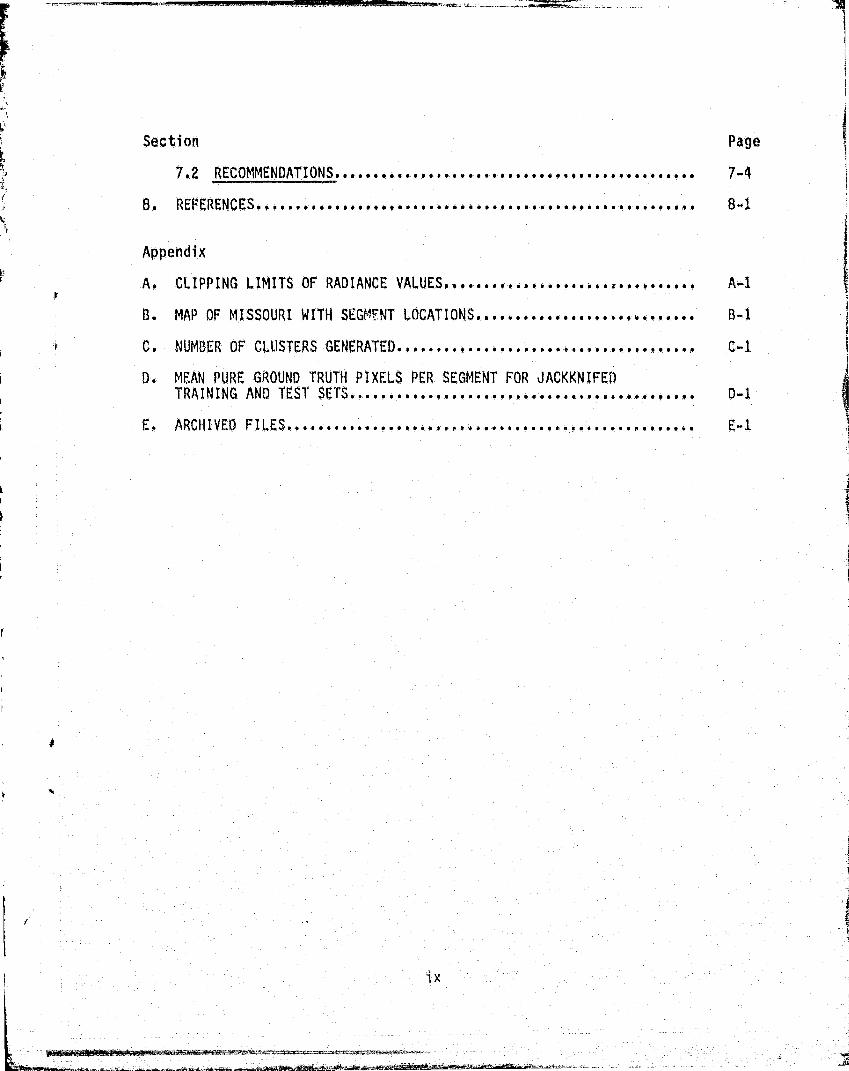
7.2 RECOMMENDATIONS.............,..,,.. ................... 7_4
`: 8. REf^ERENCES.. ............................................... ^-^A '.
Appendixk`
A. CLIPPING LIMITS OF RADIANCE VALUES,. ...... A-1
B. MAP OF MISSOURI WITH SEGM NT LOCATIONS ....
...............:....... R-1
I ^ C. NUMBER OF CLUSTERS GENERATED ...................................... C-1
0. MF,.AN PURE GROUND TRUTH PIXELS PER SEGMENT FOR JACKKNIFEDTRAINING AND TEST SETS ................. ... ...,..........«..,. ., D_,I
G E ARCHIVED F IL ES.. .... ............ E^.1.
iI
i
1
C
I
r
i
t
r'
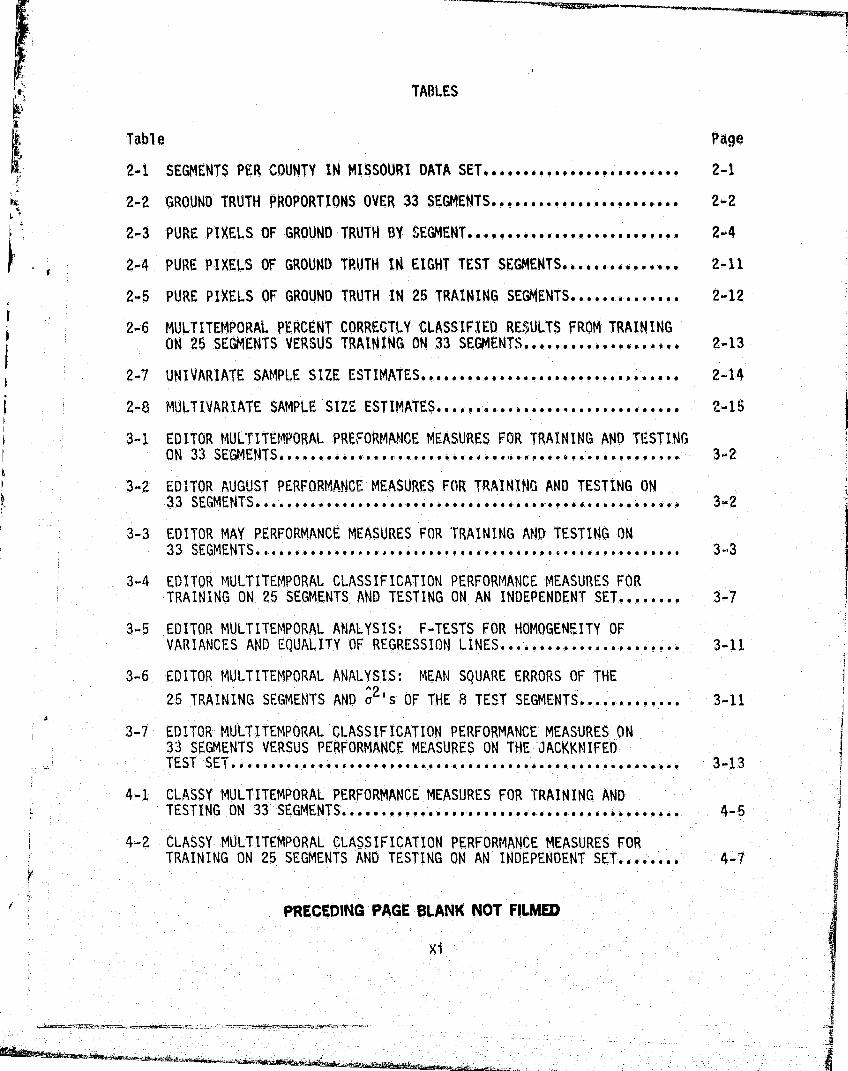
TABLES
Table Paige
lit 2-1 SEGMENTS PER COUNTY IN MISSOURI DATA SET ......................... 2-1
2-2 GROUND TRUTH PROPORTIONS OVER 33 SEGMENTS ........................ 2-2
G; 2-3 PURE PIXELS OF GROUND TRUTH BY SEGMENT ........................ 2-4
2-4 PURE PIXELS OF GROUND TRUTH IN EIGHT TEST SEGMENTS ................ 2-11
2-5 PURE PIXELS OF GROUND TRUTH IN 25 TRAINING SEGMENTS...... <....... 2.12
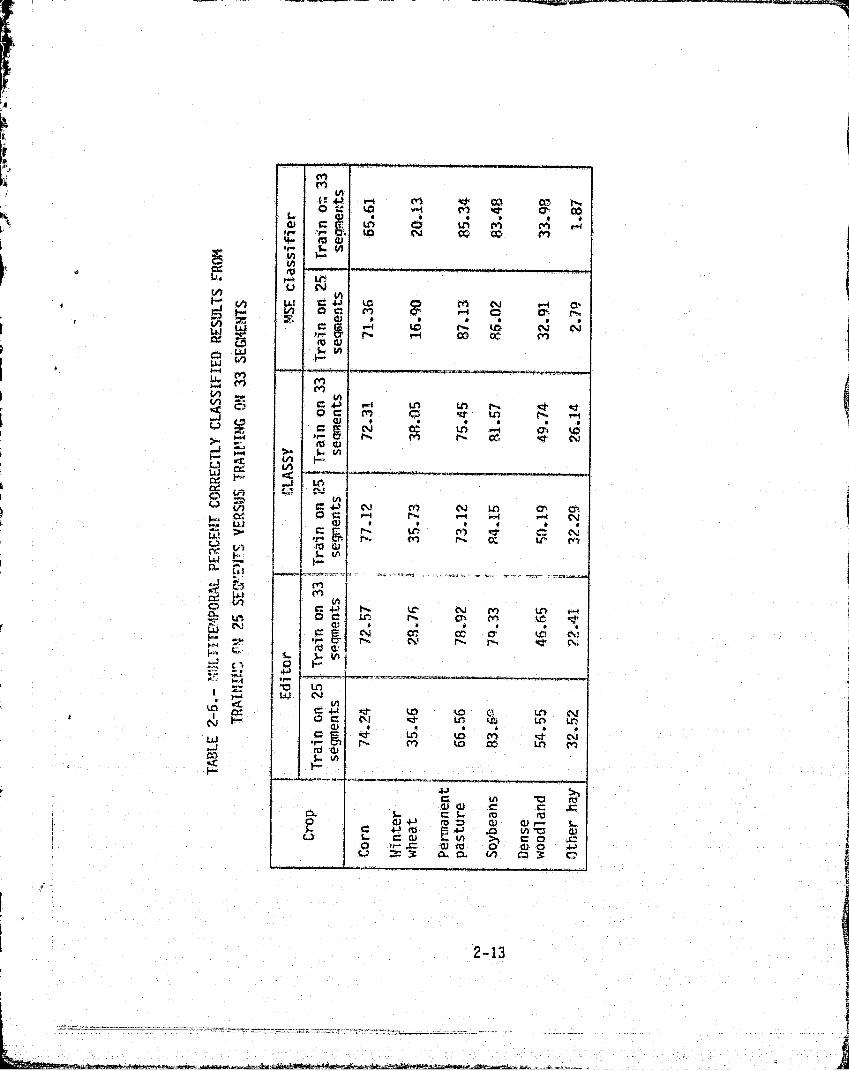
I2-6 MULTITEMPORAL PERCENT CORRECTLY CLASSIFIED RESULTS FROM TRAINING
ON 26 SEGMENTS VERSUS TRAINING ON 33 SEGMENTSSo ............... ... 2-13
2-7 UNIVARIATE SAMPLE SIZE ESTIMATES ...........................-.. 2-14
^ 2-8 MULTIVARIATE SAMPLE - SIZE ESTIMATES ...................•..••.,..., 2-15
0 3-1 EDITOR MULTITtRPO.RAL PERFORMANCE MEASURES FOR TRAINING AND TESTINGjON 33 SEGMENTS..............,, ................................... 3.2
3-2 EDITOR AUGUST PERFORMANCE MEASURES FOR TRAINING AND TESTING ON33 SEGMENTS ........................ ..,.................. ... 3=2
` 3-3 EDITOR MAY PERFORMANCE MEASURES FOR 'TRAINING AND TESTING ON33 SEGMENTS ... ............+. ► ..................p.....,.,....... 3-3
3-4 EDITOR MULTITEMPORAL CLASSIFICATION PERFORMANCE MEASURES FORTRAINING ON 25 SEGMENTS AND TESTING ON AN INDEPENDENT SET........ 3.7'
3-5 EDITOR MULTITEMPORAL ANALYSIS: F—TESTS FOR HOMOGENEITY OFVARIANCES AND EQUALITY OF REGRESSION LINES.... o........ .......... 3-11
3-6 EDITOR MULTITEMPORAL ANALYSIS: MEAN SQUARE ERRORS OF THE
25 TRAINING SEGMENTS AND o 2 's OF THE S TEST SEGMENTS... o ... o..o.. 3-119a
3-7 EDITOR MULTITEMPORAL CLASSIFICATION PERFORMANCE MEASURES ON33 SEGMENTS VERSUS PERFORMANCE MEASURES ON THE JACKKNIFEDTEST SEi ...............,....................................... 3-13
4-1 CLASSY MULTITEMPORAL PERFORMANCE MEASURES FOR TRAINING ANDTESTING ON 33 SEGMENTS ............ ..................... ......., 4-5
4-2 CLASSY MULTITEMPORAL CLASSIFICATION PERFORMANCE MEASURES FORTRAINING ON 25 SEGMENTS AND TESTING ON AN INDEPENDENT SET........ 4-7
i
PRECEDING PAGE BLANK NOT FILMEDxi
I—= I
i`
^ Table Page
4-3 CLASSY MU4TITEMPORAL ANALYSIS: F-TESTS FOR HOMOGENEITY OFVARIANCES AND EQUALITY OF REGRESSION LINES ...............«««..««« 4-11
z 5-1 MSE CLASSIFIER MULTITEMPORAL PERFORMANCE MEASURES FOR TRAININ GAND TESTING ON 33 SEGMENTS ......... ,.«..... 5-6
5-2 MSE CLASSIFIER MULTITEMPORAL ANALYSIS: F-TESTS FOR HOMOGENEITY OFVARIANCES AND EQUALITY OF REGRESSION LINES....«...........«.....« 5-8
5-3 MSE CLASSIFIER MULTITEMPORAL PRRFORMANCE MEASURES FOR TRAININGON 25 SEGMENTS AND TESTING ON AN INDEPENDENT SET .............. .. 5-9
5-4 MSE CLASSIFIER MULTITEMPORAL ANALYSIS: F-TESTS FOR HOMOGENEIT'°p OF VARIANCES AND EQUALITY OF REGRESSION LINES IN CROSS4ALIDATIONr/te
1
1yy (^PROCEDURE.. ....(;I.. ►.•...i....fi.«. . ► .. ►.*.««. a.«.. M.... 11. i...« R f 100«.«.' N1 «.• 5-II ...
6-1`
CALIBRATION ESTIMATORS U 1 AND U2•...«..«{«.... ► . ► ..f.« .«.«..l.. 5-9
6-2A A
BIAS AND OF AND U^ ^.• ► ^^.r4t.:.•r«f.•r•^••••^ . ► ^•••«.!•.••rr.1
tV"'1Q .
r 7-1 COMPARISON OF MULTITEMPORAL PERFORMANCE MEASURES FOR
a TRAINING AND TESTING ON 33 SEGMENTS, •....,..f..•f........f•.... 7-2
7-2 COMPARISON OF MULTITEMPORAL PERFORMANCE MEASURES ON ANINDEPENDENT TESTSETA :. ! • ! •.. f • .' * • 111 }... • ^ ♦ ► • ► .... 4 • ♦ 0 • • • • • • • « . ! .
t/yf(
w '" Y
A-1 CORN CLIPPING LIMITS...f.... wf. •.....>.ff.,.....l..........l..... A-1
A-2 WINTER WHEAT CLIPPING LIMITS.. ....w ....... ► ..•...l.. ► .fy.. l ..... A-2
r A-3 PERMANENT PASTURE CLIPPING LIMITS ....... A-3
A-4 SOYBEANS CLIPPING; LIMITS.. ...... ......... .... ► ...n..,...... .., A-4
AI-5j DENSE WOODLAND CLIPPING LIMITS ....................•.,.... .......y
A-5
A-6 OTHER HAY CLIPPING LIMITS.. .............E .......,..... ► ......... A-S
C-1 NUMBERS OF CLUSTERS GENERATED - TRAINING AND
TESTING ON ALL 33 SEGMENTS ..... .... ... ......_f..............:.., C-I
0-1 JACKKNIFING PROCEDURE — MEAN PURE GROUND TRUTH PIXELSPER SEGMENT IN THE 11 TRAINING AND TEST SETS•. .1..!.........004. D-1
X17a,
1. INTRODUCTION
1.1 BACKGROUND—,—
This report describes the results of the Domestic Crops and Land Cover classi-fication and clustering study on area estimatton. The objectives of the study
are as follows-,
Task 1* To understand the current crop area estimation approach of the Econom-ics and Statistics Service (ESS) of the U.S. Department of Agriculture(USDA) in terms of the factors that are likely to influence the biasand variance of the estimators.
Task 2 k, To develop and evaluate alternative clustering, classification, andregression methods that could be inserted into the evrrent ESSestimation procedure.
Task 3c To begin studies that may lead to an improved estimation procedure.
Task I was intended to support Task Z by providing a working understanding ofthe current ESS crop estimation approach. Such understanding is needed indesigning appropriate experiments for evaluating and comparing alternativecomponents.
Consideration of these alternative methods in Task 2 was principally motivatedby two factors, First, it was believed that a more theoretically based clus-
toring algorithm would be appropriate. In particular, the CLASSY algorithmdeveloped at the Lyndon B. Johnson Space Center (JSC) had performed well intests and was the candidate clustering replacement. CLASSY is an adaptive max-imum likelihood clustering algoritbm which models the overall data distributionas a mixture of multivariate normals. In addition to its clustering proper-ties, CLASSY can also be used to provide direct area estimates. A second fac-tor was the belief that the Editor procedure should ideally use independent
data sets for developing the regression equation and evaluating area esti-
mates. One way to do this would be to divide the available data into training
and test portions. Alternatively, this could be accomplished by generating
quasi-independent segments for regression using a jackknifing technique. The
Mean Square Error (MS) classifier lends itself well to this use, as it makesno parametric assumptions; thus, there are fewer parameters estimated with thealgorithm, implying more stable parameter estimam;to, It was felt that, due tothis robust nature, the MSE classifier would be more extendible to an inde-
OL pendent test set.
1.2 CURRENT USDA PROCEDURE
The current USDA acreage estimation procedure comprises registration anddigitization of ground truth and raw Landsat data, development of an estimatoron the portions of the area of interest for which ground truth is available,
and application of that estimator to the whole area of Interest. This study isconcerned with the procedure used in developing the estimator.
The acreage estimation pro(edure involves the followin g steps:
a. A registered raw data se l: for the area of interest for which ground truth
is available is selecte ,7 . The data could be unitemporal or multitemporal,and, usually, both are studied. The data set is separated by crop type.
It is optional to remove border pixels, poorly reoistered fields, poorly
reported fields, and pixels with extreme spectral values relative to thevest of the crop type.
b. Each ground truth crop is clustered separately, yieldino a group ofclusters with known cluster labels.
c. Several options are excercised and parameters specified. Among these are:
(1) specifying the minimum and maximum number of clusters per crop type
(2) specifying separability of clusters in specteal space
0) specifying percent convergence when combining clusters
(4) specifying a priori probabilities
(5) seeding clusters
(6) pooling the resulting clusters
(7) dropping clusters with small populations
(8) not clustering crops with sifiall populations
d. After the training set has been clustered, it is then classified; and, for
each crop, a regression Is performed between the ground truth and the num-
ber of pixels *;Iassifled into that crop class.
e. Based on the r2 of the regression, the percent correctly classified, and the
time available, the analyst may repeat earlier steps with differentparameters or options, or may drop crop types being clustered in an effortto increase the r2 and the percent correctly classified. Thus, for each
crop, a regression estimator is obtained which will predict the amount ofground truth present in the area of interest when that area is classified.
143 STANDARIZED PROCEDURE
For this study, it was necessary to standardize the use of the USDA cropestimation procedure so that alternative clustering and classifying componentscould be evaluated. The following options and parameter values were
recommended through discussions with USDA analysts;
a. Specifying a priori probabilities.
b. Clustering only crop types with a minimum of 200 pure pixels available.
c. Clustering pure pixels only.
d. Removing pixels with extreme Spectral values relative to others of the same
ground truth crop type.
o. Specifying a minimum and a maximum number of clusters per crop type (from 1to 15) and a minimum cluster population (from 150 to 200 pixels).
f. Specifying separability of clusters in spectral space to be in the range of0.6 to 0.8.
g. Specifying convergence when combining clusters to be within the range of 95to 99 percent.
With these recommendations and a desire to choose an exact procedure, the USDAEditor software was exercised on data provided by the USDA. For this data set,a priori probabilities for each crop clustered were specified as the proportion
of that crop present in the training set.
4
1-3
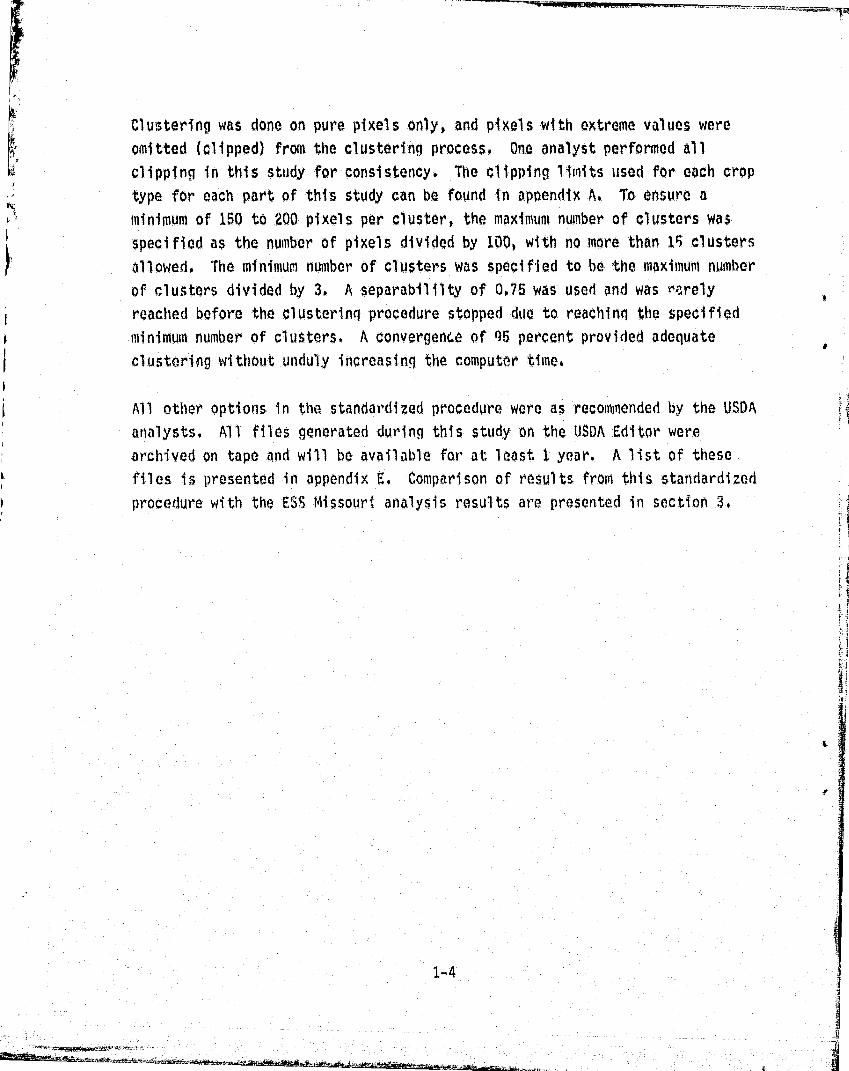
Clustering was done on pure pixels only, and pixels with extreme values wereomitted (clipped) from the clustering process. One analyst performed allclipping in this study for consistency. The clipping limits used for each croptype for each part of this study can be found in appendix A. To ensure aminimum of 160 to 200 pixels per cluster, the maximum number of clusters wasspecified as the number of pixels divided by 100, with no more than 15 clustersallowed. The minimum number of clusters was specified to be the maximum number
of clusters divided by 3. A separabililty of 0.76 was used and was vrrely
reached before the clustering procedure stopped due to reaching the specifiedminimum number of clusters. A convergence of 95 percent provided adequateclustering without unduly increasing the computer time.
All other options in the standardized procedure were as recommended by the USDAanalysts. All files generated during this study on the USDA Editor werearchived on tape and will be available for at least I year. A list of thesefiles is presented in appendix E. Comparison of results from this standardizedprocedure with the M Missouri analysis results are presented in section 3.

{ 2. DATA SET
1
F =
2.1 DESCRIPTION
The Landsat data used in this study included 33 segments in northwest Missouri,
each having an area of approximately 1 square mile (259 hectares). These
r, segments were all contained in strata 10 (50 to 100 percent agriculture) and
had little cloud cover. Data were available for two dates: May 14 and
f August 3, 1979. An additional 12 segments from the August date were avail=able
but not analyzed because of heavy cloud cover. The counties represented in the
Missouri data set are listed in table 2-1. The ground truth proportions in the
f
33 analyzed segments are given in table 2-2
TABLE 2y1.- SEGMENTS PER COUNTY IN
MISSOURI DATA SET}
Number ofi
County segments
IDaviess 5 t'Harrison 5 1
iPutnam 2
Schuyler 3
Mercer 3 J'c
Caldwell 3i
Gentry 4 r
Sullivan 4'
Linn 5
Livingston 5
Grundy 3
De Kal b
-3
Total 45
2-1_^ra
`motS
II^^
6
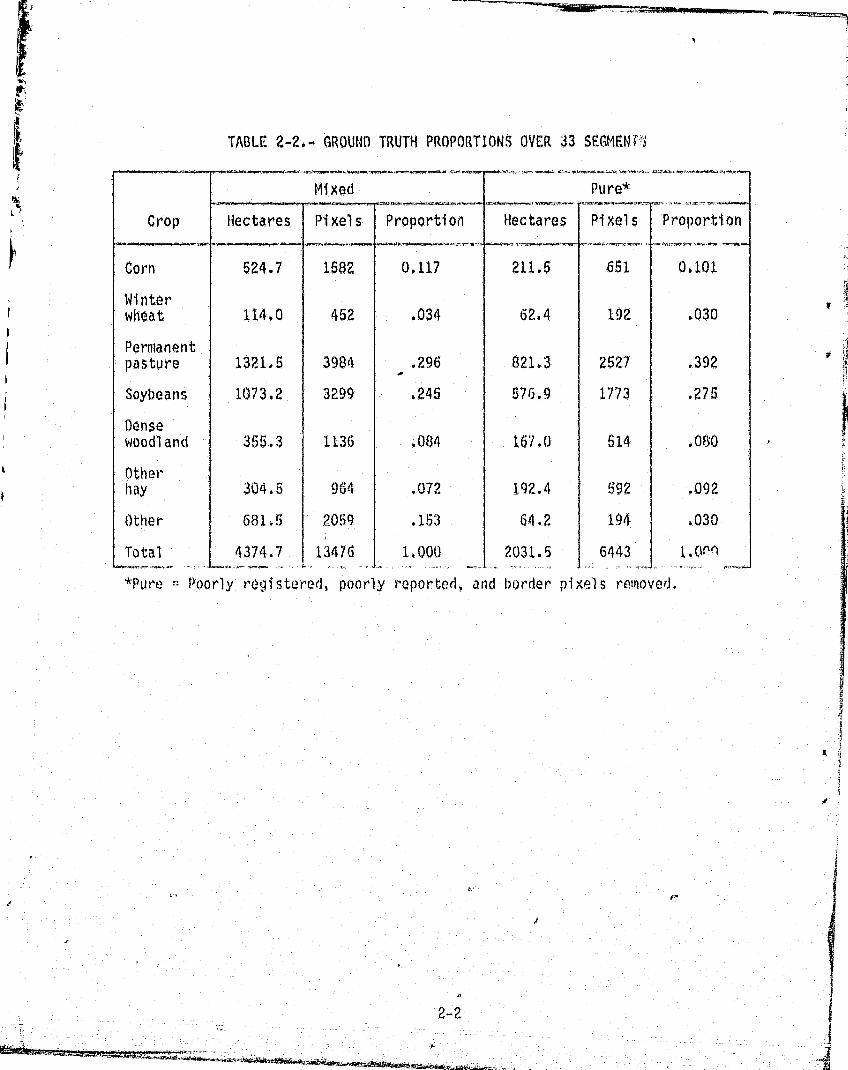
TABLE 2-2. , GROUND TRUTH PROPORTIONS OVER 33 SFGM6NN
Crop
Mixed Pure*
Hectares Pi xels ProportionHectares Pixel s Proportion
Corn 524.7 1552 0.117 211.5 651 0.101
Winterwheat 114.0 452 .034 62,4 192 .030
Permanent
pasture 1321.5 3934 .296 021.3 2527 .392
Soybeans 1073.2 3299 .245 576.9 1773 .275
Densewoodland 355.3 1136 .054 167.0 514 .080
Other
hay 304.6 964 .072 192.4 592 .092
Other 601.5 2059 .153 64.2 194 .030
Total 4374.7
x
13476 1.000 2031.5 6443 1.001
*Pure = Poorly regi stered, poorly reported, and border pixel s removed.
0 i
i 1
' The major crops in this study are corn, soybeans, and pasture, which represent
about 12, 25, and 30 percent of the crops present in each segment, respec-
tively. Three additional crops are also studied; winter wheat (3 percent),
dense woodland (8 percent) and other hay (7 percent). About 15 percent of the
segments consisted of other craps, mainly wasteland. For a given crop, the
minimum number of pure pixels considered for analysis was 200. The crops
lumped together as "other" had well below 200, and other hay, dense woodland,
and winter wheat were marginal. The! best performance ('as measured by percent
correctly classified) in most cases was obtained for permanent pasture, inI
which over 2500 pure pixels were available for training.
iListed in table 2-3 are the number of pure pixels present in ground truth in
' each of the 33 segments used in this study, broken down by crop type. The
sample mean and sample standard deviation are also listed.
The Missouri data set provided by the USDA was available at the dolt, Beranek, 1
Newman (B8N) remote processing center in Boston, where the USDA Editor software
also resided. The same Missouri data set was placed on tape and sent to the
Laboratory for Applications of 'Remote Sensing (LABS) at Purdue University.
Software for alternate clustering and classification used in this study was
located at LARS. The Missouri data sets at both BBN and LARS were identical.
The following information foreach pixel was provided in the data set:
a. four channel values from May 14
b. four channel values from August 3
c. ESS crop code 9
d. segment number
e. tract and field identification9
f. 4andsat row and column
g. flag indicating a border pixel
i
I 2-3
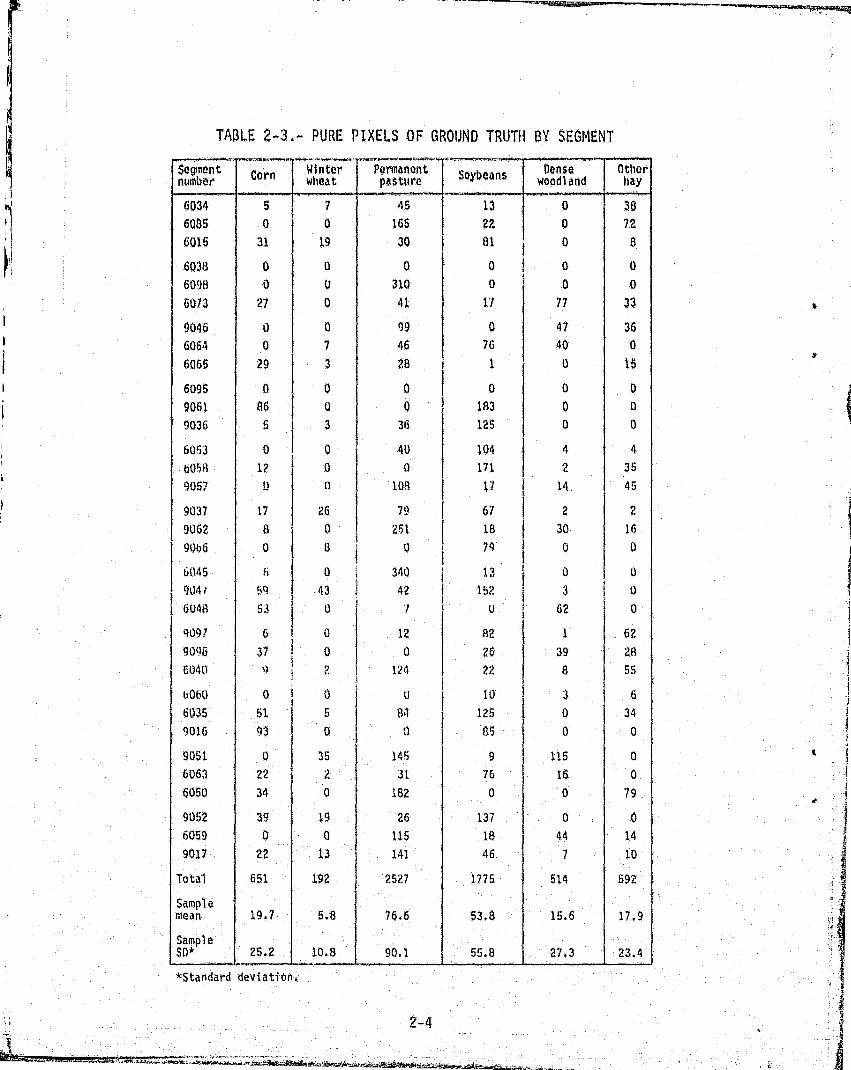
TABLE 2-3,,— PURE PIXELS OF GROUND TRUTH BY SMENT
$aentnuI el
CornWinterwheat
Permanentpas 41re
SoybeansDense
WeodlandOtherhay
6034 5 7 45 13 0 34
6085 0 0 165 22 0 72
6015 31 19 30 81 0 8
4034 0 0 0 0 0 0
6095 0 U 310 0 r 0 0
6073 27 0 41 17 77 33
9046 0 0 99 0 47 36
6064 0 7 46 76 40 0
6065 29 3 28 1 0 15
6095 0 0 0 0 0 0
9061 86 0 0 183 0 0
9036 5 3 36 125 0 0
6053 0 0 40 104 4 4
50'" 12 0 0 171 2 359057 tt 11 108 17 14 45
9037 17 26 79 67 2 2
9062 8 0 251 18 30 16
9Ob6 0 8 0 79 0 0
6045 5 0 # 340 13 ^ 0 U
9041 69 43 42 152 3 0
6046 53 07
u 62 09097 6 0 12 82 1 62
9096 37 0 0 26 39 286040 3 2 124 22 8 55
b050 0 ► 0 U 10 3 6
4035 51 5 84 125 0 34
9016 93 0 0 86 0 0
9051 0 35 145 9 115 0
6063 22 2 31 75 16 0
6050 34 0 182 0 0 79
9052 39 19 26 137 0 0
6059 0 0 115 18 44 14
9017 22 13 141 46 7 10
Total 651 192 2527 1775 514 592
Samplemean 19.7 5.8 76.6 53.8 15.6 17.9
Sample$0* 25.2 10.8 90.1 55.8 27.3 23.4
4
r
:wtt
ri
2.2 PHILOSOPHY OF EXPERIMENTS
The experiments were designed to understand the performance of Editor and to
compare performance when alternative components are inserted. To motivate the
analysis, two main variables X and Y can be considered, where X is the crop
acreage derived from the classifier (or the number of classified pixels,
depending upon choice of units) and Y is the corresponding ground truth acreage
for the segment. In the current method of analysis, Y is regressed onto X, as
if X were a fixed variable. Also, the regression is developed on the training
set instead of an independent sample. Certain subtle and often overlooked
features of the classified variable X are not accounted for in the current
method of analysis. In particular, the values which X assumes are a function
of
a. The observed spectral values and ground truth labels of the segments used
to calibrate the classifier (training set). This implies that X is a
random variable since the training set is picked at random.
b. The number of observations in the training set. The larger the training
set, the less sensitive the classifier is to the random selection process
for picking the training set.
Now letX!,q'...,X
1X1,X2,...,XN
2
be two sets of classifier-deri ved acreages over two sets of randomly selected
segments. Both sets of segments are assumed to have been picked from the same
population. Ideally, Yi regressed onto X!, i = 1, • . • ,N I , should be "about" the
same as Y; regressed onto X, i ='1,..,N2 . The following conjectures arise;:
a. If Xi is obtained by classifying the training set and X^ is obtained by
classifying an independent set, the regressions wil l be different for
"small" training sample sizes.
b. If X'1 obtained by classifying the training set and X is obtained by
d classifying an independent set, then the XI-values will be more closely
r
2-5

3i
correlated with the Yi-values than will be the X1-values. This point has
bearing on the relevance of the r2 values obtained by Erditor and reported
by the USDA. {
co If X i ' is obtained through a jackknifi ng procedure and X^ is obtained by
classifying an independent set, then the regressions of Yi onto X, and Yi
onto Xi will be "about" the sane. This conjecture is probably classifier
dependent and is one of the reasons why a linear classifier was selected
for study.
2.3 DESIGN DE: EXPERIMENTSF
In keeping with the conjectures presented in the Philosophy of Experiments
i
section, the design of experiments was done in three levels. The first level
consisted of training and testing on all 33 segments. This corresponds to the
current USDA estimation procedure. In the second level, the data set was
partitioned into a training set and a test set to assess the performance and
the validity of the current USDA estimation procedure. Jackknifing techniques
were used in the third level as a means of obtaining independent test sets
f which were larger than those obtainable by using a single training-and-test
j
partitioning of the data. This experimental design was strongly influenced by
the belief that the sampl e of segments chosen to obtain estimates is a critical"
part in the whole estimation process.
r
Many of the experiments were roan in parallel as a means of comparing alterna-
tive components. That is, the standardized USDA procedure was first run on a
data set, and the procedure was repeated with the only change being the use of
the CLASSY c1A1stering algorithm to generate cluster statistics which were then
inserted into the Editor system. Then a corresponding analysis was performed
using the MSE classifier software. One experiment was designed for the USDA
Editor to specifically evaluate one particular method of estimation,' namely
jackknifing. A separate jackknifing experiment for the MSE classifier was
designed. The experiments are described below in further detail and, unless
explicitly stated, all 'analysis is with multitemporal data.'
2-C
c

4
2.3.1 TRAINING AND TESTING ON ALL 33 SEGMENTS
The current USDA method of training on a sample and developing the regressions
on the training set was performed using all 33 segments. The following
comparisons were made:
a. Comparison of unitemporal versus multitemporal - The entire estimation
process was carried out for unitemporal data and for multitemporal data
within the current Editor system. Summary statistics were collected. The
Hotelling's T2 test was used to determine if multitemporal data produced
significantly better estimates than unitemporal This test is described in
detail in section 3.1.2.
b. Comparison of the current standarized USDA procedure versus the CLASSYclustering algorithm - The entire estimation process was performed using
the standarized USDA procedure. The process was repeated but with CLASSY
cluster statistics inserted into the Editor system. Summary statistics
were collected. The Hotelling's T2 test was used to determine if the use
of CLASSY produced significantly better estimates on the training set than
the current USDA procedure.
c. Comparison of the current standarized USDA procedure versus the MSEclassifier - The entire estimation process was performed using the MSE
classifier software. Summary statistics were collected. The Hotelling'sT2 test was used to determine if the use of the MSE classifier produced
significantly better estimates on the training set than the current U =SDAprocedure,
2.3.2 TRAINING ON 25 SEGMENTS AND TESTING ON 8 SEGMENT;
The data set was divided into two sets: a training set of 25 segments used to
develop a classifier and a test set of 8 segments independent of the trainingset. The classifier developed on the training set was used to classify boththe training and test sets. Regressions for the six crops of interest weredeveloped on the training set and also on the test set. This was carried out
with the standardized USDA procedure and again with CLASSY as a component of
the Editor system, and finally with the MSE classifier software. Summary
2 -7
statistics ve presented in later sections. The following tests andcomparisons were made;
a. For each of the three classification choices, an F-test was performed todetermine if the regression line developed on the training set for a givencrop was equal to the regression line developed on the test set. (Apreliminary test for homogeneity of variance must be carried out first.)This test indicates if the regression line developed on the training set is
extendible to the test set, A discussion of this test appears insection 3.2.1.
b. The current USDA clustering procedure was compared with the CLASSY cluster-ing algorithm. The Hotelling ' s T2 test was performed to determine if the
use of CLASSY produced significantly better estimates on an independent set
than the USDA procedure, The estimates for the independent set were ob-tained from th e regression line, which was developed on the training set.
c. The current USDA classifictition procedure was compared with the MSE classi-
fication. The HotAlli.nlq's T2 test was performed to determine if the use of
the MSE classifier produced significantly better estimates on an indepen-
dent set than the IISDA proceduro.
M.3 JACKKNIVING
Jackknifing techniques were used to simulate -the procedUre of training on asample and developing regressions on an independent set. The followingexperiments worn condui^tpd.
a. Oackknifinti within tho Fdi tor system
By repeating the division of the data set into training and test portionsso that all segments appear exactly once in a test group, the combined test
groups from all repetitions represent a quasi-independent test set.Summary statistics and regressions were obtained from this quasi-indepen-dent test set and were compared to results obtained when training andtesting on all 33 seqments. Details of this j ackknifing are given in alater section.
r.
b. Jackknifing, with the MSE classifier
The data set was divided into sets consisting of 25 and 8 segmentso Theset of 25 segments was further divided into a set of 24 training segmentsand d set of I test segment. This division of the 25 segments was repeatedso that each of the 25 segments appeared exactly once as a test segment.These test segments were combined to form a quasi-independent test set of25 segments. The Hotelling ' s T2 test was performed to determine if theregressions developed on the quasi-independent test set produced si qnifi-cantly better estimates on ^n independent set than did the regressionsdeveloped on the 25 segments without jackknifing. For each crop, an F-testwas performed to determine If the regression line developed on the quasi.
independent test set was equal to the regression line developed on anindependent test set * Details of this Jackknifing appear in section 5.6,Cross -Validation Procedure,
2.4 SELECTION OF TRAINING A40 TEST SEGMENTS
Before -training and test segments were selected, the geography, strataboundaries, and the Landsat imagery of the area covered by the 33 segments were
studied. These segments, when plotted on a topographic map of Missouri, covereda rectangular area rou ghly 100 miles (160 kilometers,) oil a side. Thisrectangle represented about one-eighth of the land area in Missouri * Aboutthree-quarters of the segments were 800 feet ( 244 meters) in elevation. Theremaining segments were scattered around the perimeter at 1000 feet(305 meters).
The geography was rolling. No major urban areas were nearby. A copy of thetopographic map is included in appendix R. Some cloud cover was at the edge ofthe scene, but very little was over the segments. A fairly uniform colordistribution prevailed.
County maps with strata boundaries were provided by the USDA, with the 33 seq-ments identified on them. All 33 segments were in strata 10. Very few were
2-9
near the strata boundaries, and the segments were evenly distributed over the
counties (see table 2-1).
There were, then, two factors in the choice of training and test segments, both
related to geography. It is assumed that if soil characteristics vary over the
region, they will be most different between segments that are widely separated
geographically. Also, segments located at the extreme edges of the re g ion wereslightly higher in elevation, Therefore, to obtain representative training
segments and representative test data, each g roup of segments should be
distributed uniformly over the geographic region covered by all 33 segments
Eight independent test segments were chosen by laying out a uniform grid with
eight boxes over the topographic map. One segment from each box was randomly
selected, The remaining 25 segments constituted the trainin g group. Listed intables 2-4 and »5 are the segment number and ground truth crops present (in
pixels) for the test and training grou ps, and the comparisons with all33 segments.
These groups wore found S ,itisfactery, since they are both fiirly representativeof the total data set of 33 sopment, And still provide some variation.
To further validate that the r5 training segments are representative of the
entire data set, the porcent of the training set correctly classi fied whentraining with 2 r, sentl if knt = ind wi th kill ^i qoq,cants t 1.rn pr;3sont.ed in table 2 -6.
The similarity of these results are i ndicative that the 25 traini ng segments
are representative.
In the Editor jackknifing experiment, it was nece ssary to partition the data.
i nto 11 groups of 3 segments each. This was accomplished by laying a grid wi th
three boxes over the topographic map such that 11 segments fell into each box.
Three segments were then chosen randomly, one from each box. This was repeated
10 times, obtaining 11 test groups of 3 segments each. Each corresponding
training group was composed of the remaining 30 segments. Mean values for each
of the 11 test and trainin gk g groups can be found in appendix 0.
t
^-10
Yn
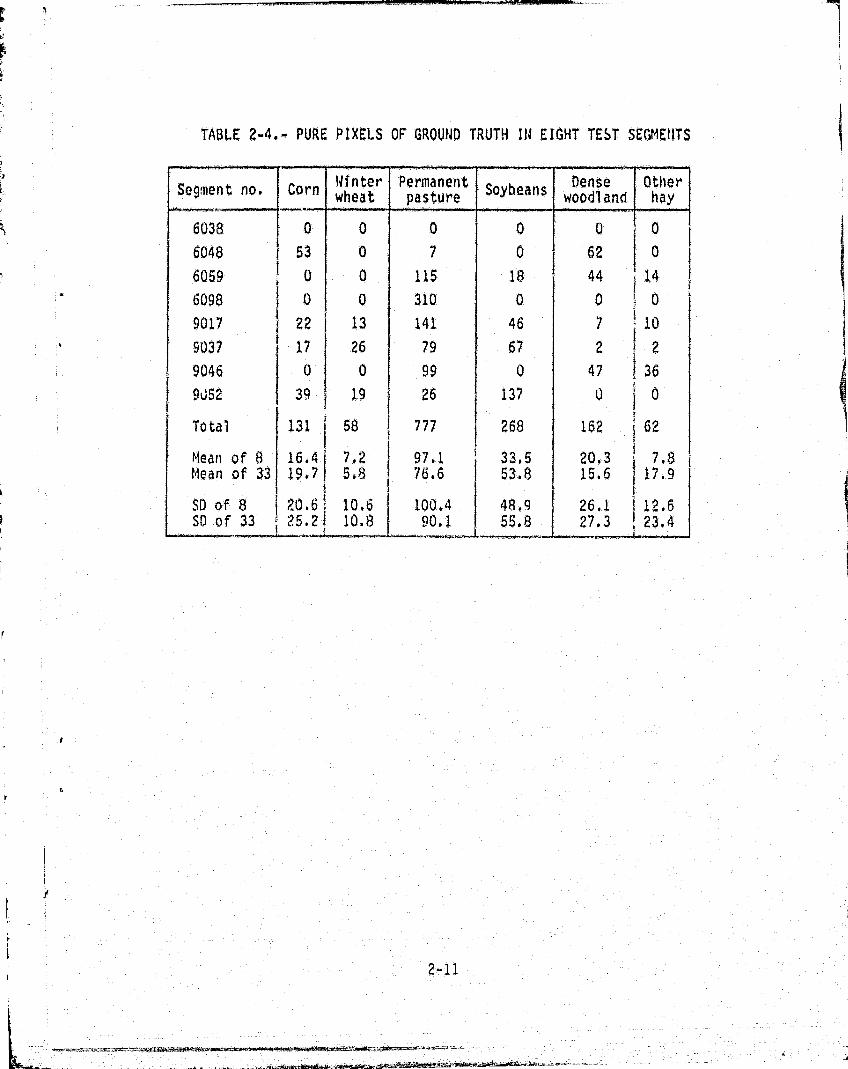
TABLE 2-4.- PURE PIXELS OF GROUND TRUTH 114 EIGHT TEST SEGMENTS
Segment no, Corn Winterwheat
Permanentpasture
SoybeansDense
woodlandOther
hay
5038 0 0 0 A 0 05048 53 0 7 0 62 0
5059 0 0 115 18 44 145098 0 0 310 0 0 09017 22 13 141 46 7 109037 17 26 79 57 2 29045 0 0 99 0 47 1369052 30 19 26 137 0 0
Total 131 58 777 258 152 62H X
Mean of 8 1614 7.2 97.1 33,5 20,3 7.8Mean of 33 19.7 5.8 75,5 53.8 15.5 17.9
SD of 8 20151 .10.6 100.4 48.9 25,1 12.6SO of 33 25:2 10.8 90.1 $5.8 27.3 23,41
f
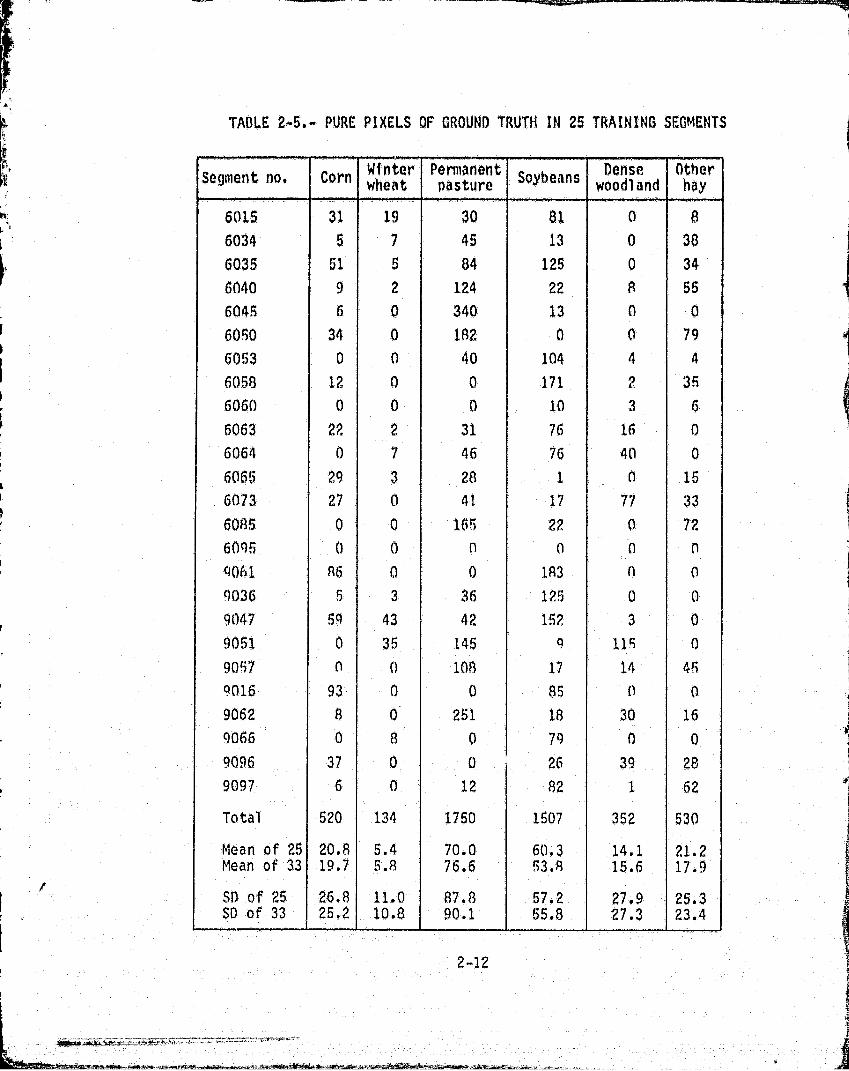
Segment no. Corn Winterwheat
Permanentpasture Soybeans Dense
woodlandOtherhay
60115 31 19 30 61 0 8
6034 5 7 45 13 0 38
6035 61 6 54 125 0 34
6040 9 2 124 22 R 556045 6 0 340 13 0 060,50 34 0 102 0 0 796053 0 0 40 104 4 46058 12 0 0 171 2 3560601 0 0 0 10 3 66063 22 2 31 76 16 06064 0 7 46 76 40 060165 29 3 28 1 0 156073 27 0 41 17 77 336085 0 0 165 22 0 726095 0 0 n 0 0 nt1061 n6 0 0 183 n 09036 5 3 36 1?5 0 09147 59 43 42 152 3 09051 0 35 145 9 115 09057 0 01 108 17 14 459016 93 0 0 85 09062 8 0 251 18 30 169066 0 G 0 79 0 0
9096 37 0 0 26 39 289097 6 0 12 82 1 62
Total 5201 134 1750 1507 352 530
Mean of 25 20.8 5.4 70.0 60.3 14.1 21.2Mean of 33 19.7 5.8 76.6 53.8 15.6 17.9
SD of 25 26.5 11.0 87.8 57.22 27.9 25.3SD of 33 25.2 10.8 90.1 55.8 27.3 23.4
4
TA84E 2-5.- PURE PIXELS OF GROUND TRUTH IN 25 TRAINING SEGMENTS
;I
r
t
^ wY
M
t ^
0
to
ua ^"'
i c,a
r
I Yom`
r
- CX3
r
V1
tom(i 4D N co ^ m'r.. 'A
^Ih
R: S11
LLI c wV)^ c I
1.4 ta C114 N
o Vtorte. cc
cn _
ti►
r, . ^ °scv
r.^ ^^ m
Yjw ,+ r cc m
k^ v+
vs
o cca
LO
{+ t19G C 01 ct U*)
U*)U*)N , w
Lna
t"LD Co In
tA4) C C
5.. c L !li
•G^!/^ CS t11
U 5 C c a SI1cu
Average 0.05 a 0-1-Crop ground MSE A Percent
truth 0=0.1 a-0.2 0.0.3 6=001 0x002 K-3
Corn 15.909 68.165 0.1 231 167 127 177 122 AA
.15 103 74 57 7 q 54 40
.2O 58 42 32 45 31 22
Winter 4.365 24.577 0.1 1104 797 CtIE^ R45 58c1 421wheat
.1q 01 355 270 376 ^ 258 ` 1A7
^^..^.^.20 '276 200 152 212 14;5 10C
Permanent 40.047 320.887 0.1 172 124 95 132' 90 66pasture .15 77 55 47 rq 40 29
.20 43 31 24 33 i 23 17
Soybeans 32.522 128.773 0,1 105 76 58 80 55 40
.15 47 34 26 36 25 18
.20 27 19 15 20 14 10
Dense 10.768 83.933 0.1 620 448 241 475 326 236woodland
.15 276 199 152 211 145 105
.20 155 112 Ab 119 82 59
Other hay 9.228 92.3.70 0.1 929 670 511 711 488 354
.15 413 298 228 316 217 158
.20 233 168 128 178 122 89
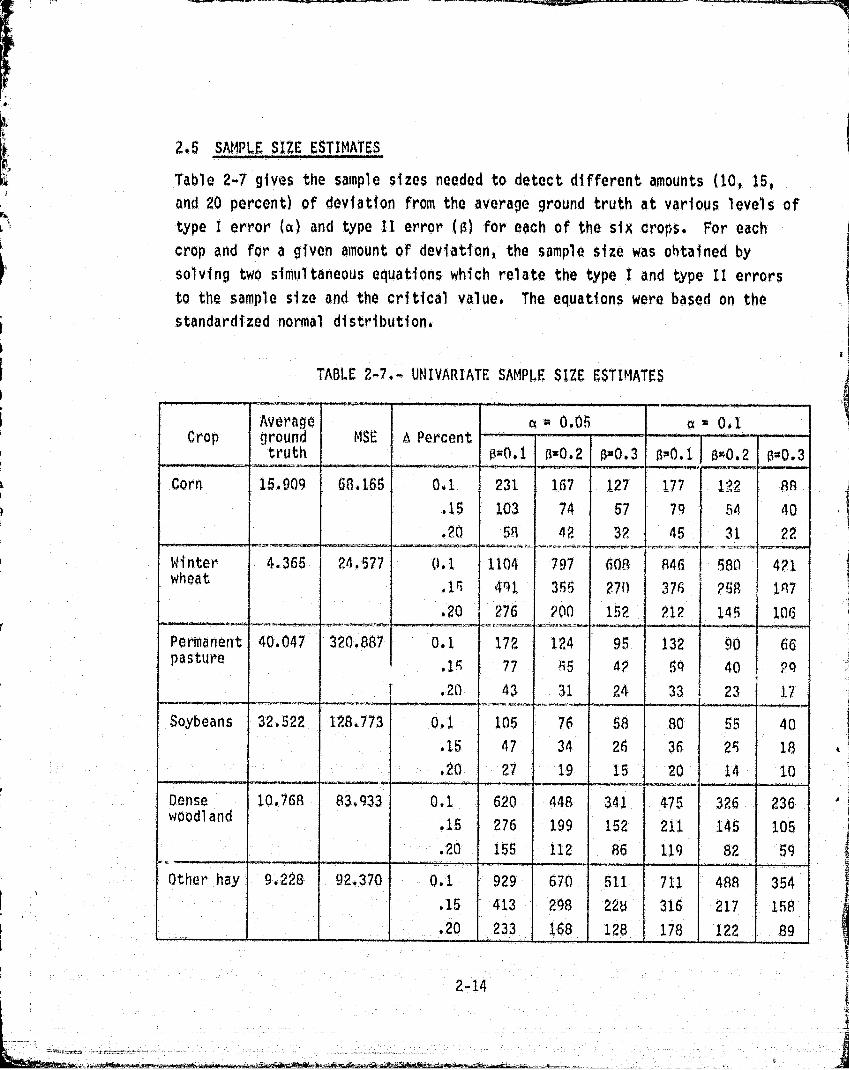
2.5 SAMPLE SIZE ESTIMATES
Table 2-7 gives the sample sizes needed to detect different amounts (10, 15,
and 20 percent) of deviation from the average ground truth at various levels of
type I error (a) and type It error (0) for each of the six crops. For each
crop and for a given amount of deviation, the sample size was ohtained by
solving two simultaneous equations which relate the type I and type It errors
to the sample size and the critical value. The equations were based on the
standardized normal distribution.
TABLE 2-7., UNIVARIATE SAMPLE SIZE ESTIMATES
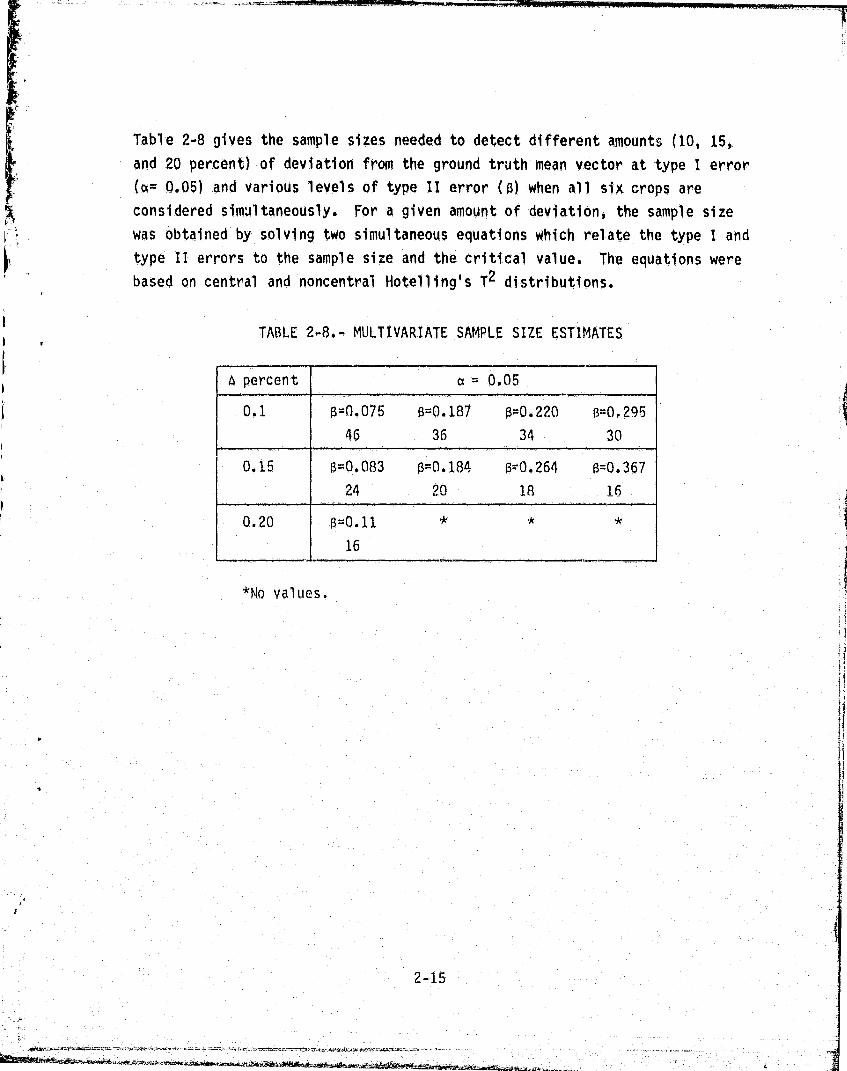
Table 2-8 gives the sample sizes needed to detect different amounts (10, 15,
and 20 percent) of deviation from the ground troth mean vector at type I error
(a- 0.05) and various levels of type II error (a) when all six crops are
considered simultaneously. For a given amount of deviation, the sample size
was obtained by solving two simultaneous equations which relate the type I and
type II errors to the sample size and the critical value. The equations were
based on central and noncentral Hotelling's T 2 distributions.
TABLE 2-8.- MULTIVARIATE SAMPLE SIZE ESTIMATES
4 percent « = 0.05
0. 1 0=0.076 0=0.187 0=0.220 0=0. 295
46 36 34 30
0.15 5=0.083 0=0.184 O 0.264 t=0.367
Or. 4 20 is 16
0.20 ^=Q-11
16
IQ
3. EVALUATION OF STANDARDIZED USDA PROCEDURE
3.1 ANALYSIS RESULTS FOR TRAINING AND TESTING ON 33 SEGMENTS
3.1.1 COMPARISON WITH USDA RESULTS
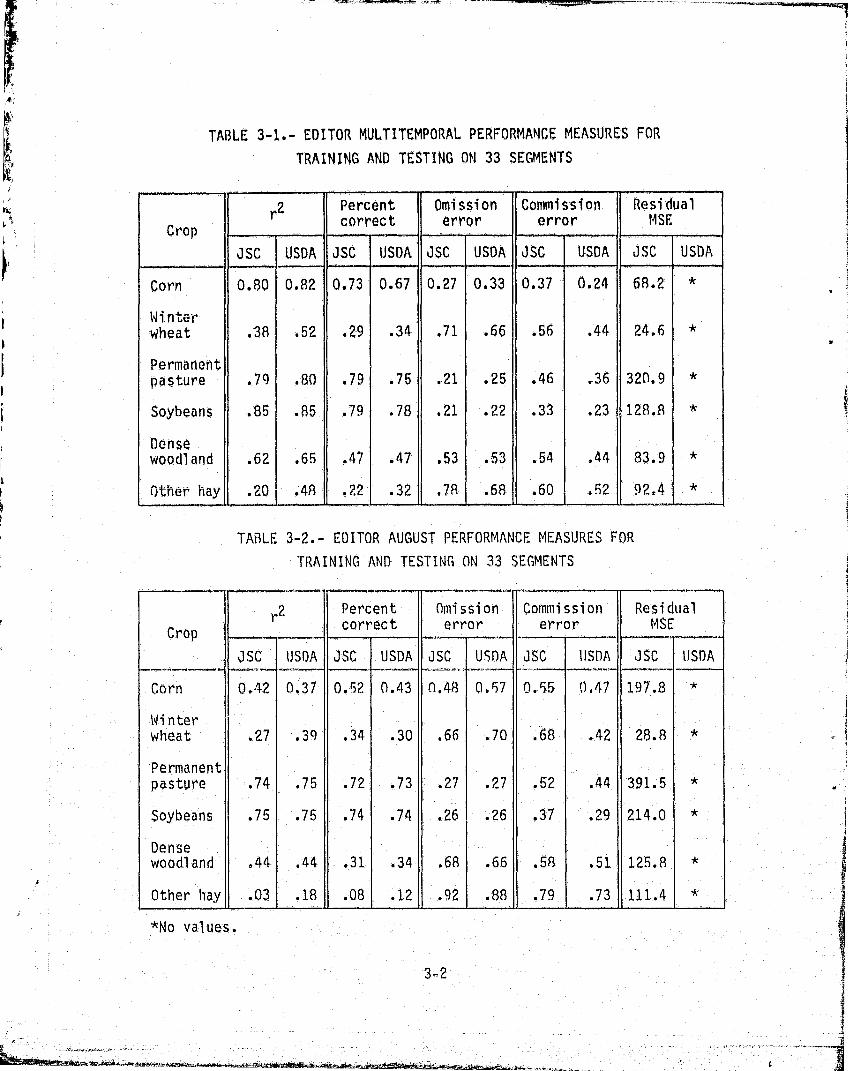
In tables 3-1, 3-2, and 3-3 are listed the omission error, the commission
error, the residual MSE, and the r 2 of the regression for each crop from runs
made with the standardized procedure and all 33 segments for training (columns
headed JSC). Also included (when available) for comparison are figures provided
by the USDA from similar runs made by USDA analysts (columns headed USDA)-.
The percent correctly classified is equal to one minus the omission error.
From the omission and commission errors, it is apparent that the August acqui-
sition provided better results than the May acquisition. In section 3.1.2, a
multivariate statistical test was performed to determine if multi temporal data
provided significantly better estimates than the August data.
3.1.2 NOTELLING'S T2 TEST COMPARING UNITEMPORAL AND MULTITEMPORAL ESTIMATES
To compare the performance of the standardized USDA procedure using different
types of data, namely unitemporal and nultitemporal, a criterion to measure theperformance must first be defined. The criterion adopted in this study is a
vector consisting of the absolute differences between the ground truth and the
regression estimate for each of the six crop types of interest. Multivariate
statistical analysis techniques have been applied, because the major objective
is to evaluate the performance of the procedures in classifying and estimating
the crop hectarage of all six crop types simultaneously. To compare the
unitemporal and multitemporal results, a test is made of the equality of the
two mean vectors of the absolute differences (vectors of means of the absolute
value of the differences.) If the hypothesis of equal mean vectors is
rejected, the type of data yielding a smaller mean vector of absolute dif-
ferences between the ground truth and the regression estimate is preferred.`'
Cropr2
Percentcorrect error
Omission Commissionerror
ResidualMSE
JSC USDA JSC USDA JSC USDA JSC USDA JSC USDA
0. 2 0.37 0.52 0.43 0.97 0.55 0.47 197.8Corn 0.48
Winterwheat .27 .39' .34 .30 .66 .70 .68 .,42 28.8
Permanentpasture .74 .75 .72 .73 .27 .27 .52 .44 391.5
Soybeans .75 .75 .74 .74 .,26 .26 .37 .29 214.0
Densewoodl and ,44 .44 .31 .34 .68 .66 .51 125.8
Other hay .03 .18 .08- .12 .92 .88 .79 .73 111.4
A,
TABLE 3-1.- EDITOR MULTITEMPORAL PERFORMANCE MEASURES FOR
TRAINING AND TESTING ON 33 SEGMENTS
I
Cropr2
Percentcorrect
Omissionerror
Commissionerror
ResidualMSE
JSC USDA JSC USDA JSC USDA JSC
.,..
USDA JSC USDA
Corn 0.80 0.82 0.73 0.67 0.27 0.33 0.37 0.24 68.2'
tinterwheat .38 452 .29 .34 .71 .66 .56 .44 24.6
Permanentpasture .79 .80 .79 .75 .21 .25 46 .36 320.9
Soybeans .85 .85 .79 .78 .21 .22 .33 .23. 128.8
Densewoodland .62 .65 .47 .47 .53 .53 .54 .44 83.9
Other hay . 20 .48 .22 .32 .78 .68 .60 ..q 2 92.4
TABLE 3-2.- EDITOR AUGUST PERFORMANCE MEASURES FOR
TRAINING AND TESTING ON 33 SEGMENTS
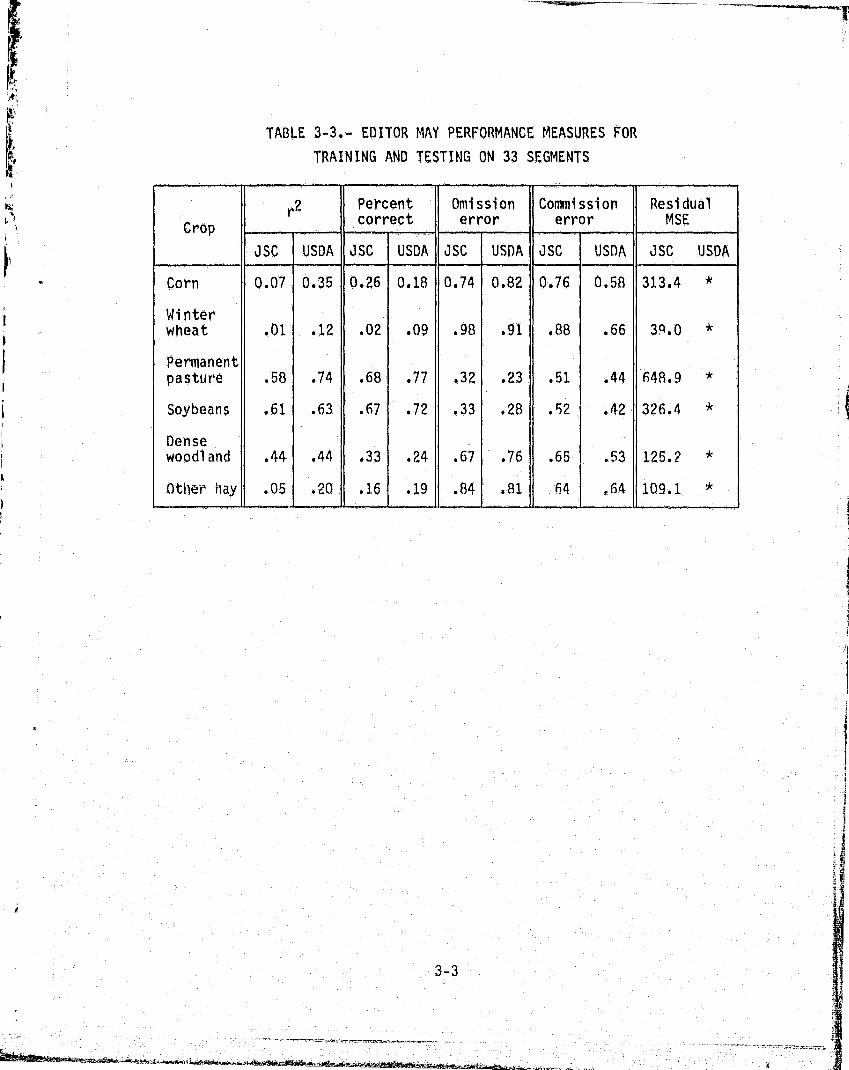
TABLE 3-3.- EDITOR MAY PERFORMANCE MEASURES FOR
TRAINING AND TESTING ON 33 SEGMENTS
Cropr2
Percentcorrect
Omissionerror
Commissionerror
ResidualMSE
JSC USDA JSC USDA JSC I USDA JSC I USDA JSC USDA
Corn 0.07 0.35 0.26 0.18 0.74 0.82 0.76 0.58 313.4
Wi nterwheat .01 . 12 .02 .09 .98 .91 .88 .66 39.0
Permanentpasture .58 .74 .68- .77 .32 .23 .51 44 648.9
Soybeans .61 .63 .67 .72 .33 .28 .52 .42 326.4
Densewoodland .44 .,44 .33 .24 .67 .76 .65 .53 125.2
Other hay .05 .20 .16 .19 :84 .81 .64 .64 109.1
J^y
F
ft^
f^
f 1
LF
n,
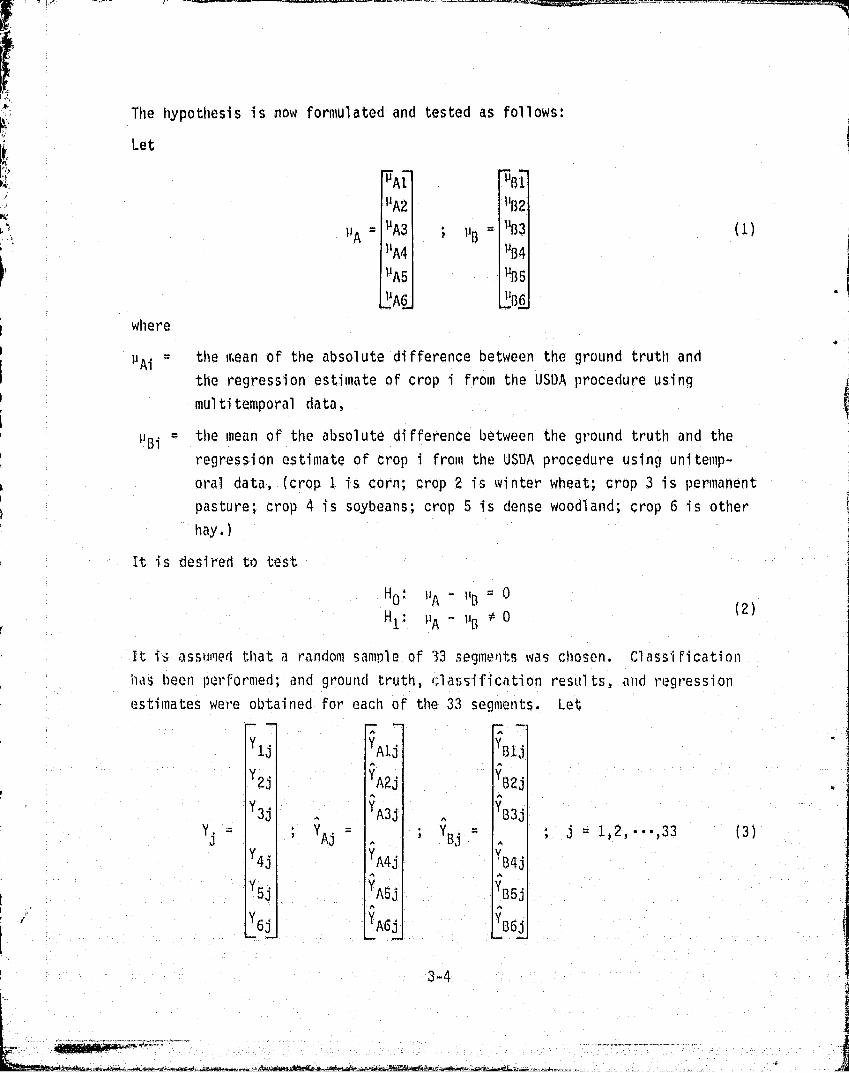
The hypothesis is now formulated and tested as follows;
Let
VAl 'S1
uA2 u[32
4 `°, uA = uA3 # uD =11B3 I
I 'M x B4
^t uA5 uE35
Xj I'afi x
where
I'M = the ir,ean of the absolute difference between the ground truth and
the regression estimate of crop i from the USDA procedure using
mul ti temporal data,
L
Bi = the mean of the absolute difference between the ground truth and the
regression estimate of crop i from the USDA procedure using unitemp-
w oral data, (crop :I is corn; crop 2 i s winter wheat; crop 3 is permanent
pasture; crop 4 is soybeans; crop 5 is dense woodland; crop 6 is other
hay.
It is desired to test
HO: ! 'A 1 'D =
H1 PA -UD O
^2)
r
It is assumed that a random sample of 33 segme nts wa s chosen. Cla ssif icat ionhas been performed; and ground truth, Gl-assification results, and regression
estimates were obtained for each of the 33 segments. Let
YIa YAli YBli
Y2 YA2j Y52j
Y3aA YA3i
AyD3j
Y, = YaAi
_ YB,1
_ ;J 1,2,.- . ,33 (3)
Y43 YA4j Y54a
y 5i YA5j Y55j
iv
r Y6A
YA6jA
6jj
F3-4
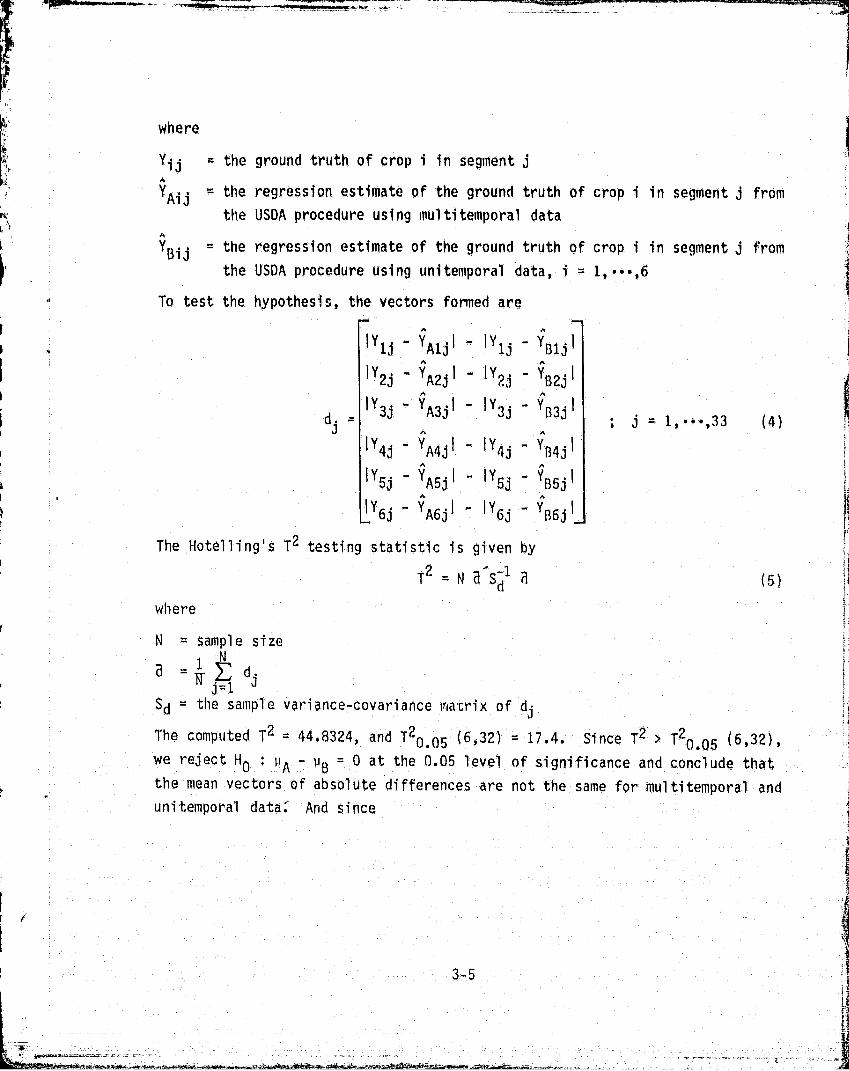
where
Yij the ground truth . of crop i in segment j
r YAij the regression estimate of the ground truth of crop i in segment j fromthe USDA procedure using multitemporal data
I YR13 = the regression estimate of the ground truth of crop i in segment j from
the USDA procedure using unitemporal data, i_ i,•••,
To test the hypothesis, the vectors formed arei
^ IY ^ Y I ^ IY Y Iw 1^ AIj 1j B1jI
Y2j YA2j Y2j - YB2jiA
IY3j " YA3j I IY3j Yt33j Ia dj
j I, 0,•,33 (4)
IY4j _ YA4ji _ IY 4i Y^4jl
1^ .IY5j - YA5j
.I -
IY5j Ya5j l Lj
r
`A
A
5
IY6j _ YA6j I IY6j YI16j
The Notelling's T2 testing statistic is given byi
T2N d'S-1
wherer
N = sample sizeN
a - N
da t1
Sd = the sample variance-covariance matrix of dj
The computed T 2 = 44.3324, and T20.05 (6,32) = 17.4. Since T2 > T20.05 (6,32)1
we reject H0 : P A - p B = 0 at the 0.05 level of significance and conclude that
the mean vectors of absolute differences are not the same for multitemporal and
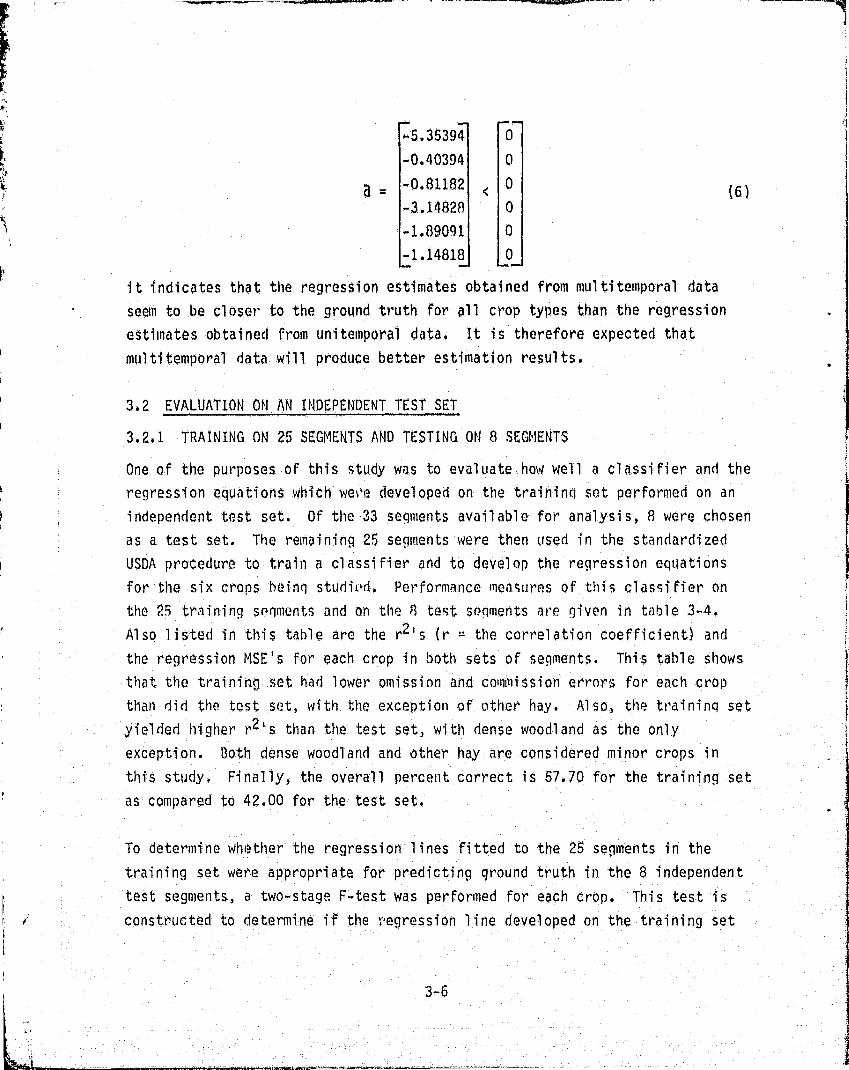
unitemporal data: And since
r`
3-5
h
a
-5.3ar39 0
-0.40394 a
0.81182 < 0 (6)
-3.14828 0
1,89091 0
-1.14818 O
it indicates that the regression estimates obtained from multitemporal data
seen to be closer to the ground truth for all crop types than the regression o
estimates obtained from unitemporal data. It is therefore expected that
multitemporal data will produce better estimation results.
3.2 EVALUATION ON AN INDEPENDENT TEST SET
I__
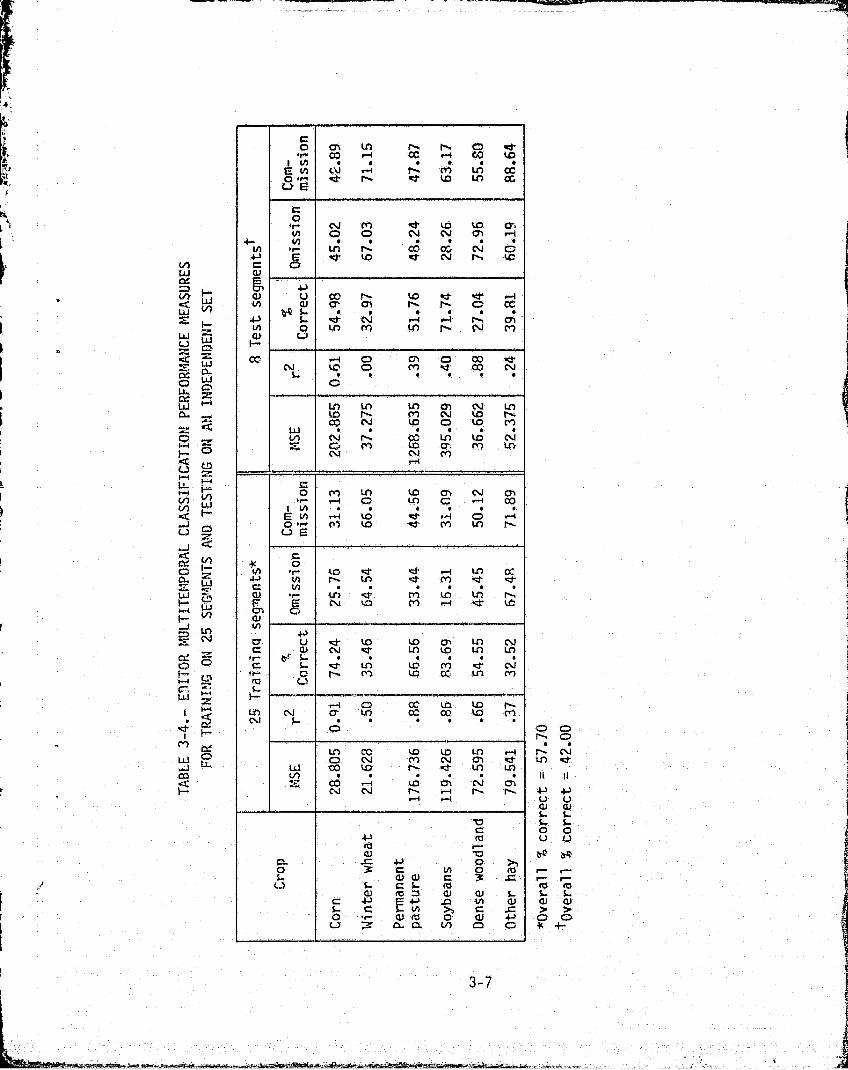
3.2.1 TRAINING ON 25 SEGMENTS AND TESTING ON 8 SEGMENTS
One of the purposes of this study was to evaluate how well a classifier and theregression equations which wooe developed on the trainin g set performed on an
independent test set. Of the 33 segments available for analysis, 8 were chosenias a test set. The remaining 25 segments were then used in the standardized
USDA procedure to train a classifier and to develop the regression equations
for the six crops being studivd. Performance meafiures of this classifier on Ithe 25 training soqmonts and on the 8 test segments are riven in table 3-4.
r Also listed in this table are the r 2 1 (r == the correlation coefficient) and
the regression MSE's for each crop in both sets of segments. This table showsthat the training set had lower omission and commission errors for each cropthan did the test set, with the exception of other hay. Also, the traininq setyielded higher r2 's than the test set, with dense woodland as the onlyexception. Both dense woodland and ether hay are considered minor crops in
r
thi's study, Finally, the overall percent correct is 57.70 for the training setas compared to 42.00 for the test seta }
To determine wh+ether the regression lines fitted to the 25 segments in the
training set were appropriate for predicting ground truth in the 8 independent
test segments, a two-stage F-test was performed for each crop. This test is
r constructed to determine if the regression line developed on the training set
3-b
r _
o ON to r.. r. o
VN} 0) r1 n M LO w0 t$ r. d w Ln ccV r
r~
iQ N M *J Lp t0 Q3VL Q C7 N N M
(A 9 C6 col N C3d l4 tr N r., tG
C
c0 a a 0rn rte'+ n cc
4Q M - N
ccN k
V-i coQ
Ln Ln Ln Q1 N Lnto r^- m N t0 r Ico N tL7 Q to M
w • • rLn cz
(` NM L;}
r-3
O M Ln w m N CTrr` .-L 0 Ln G coEuZ r-+ LtJ d rrt O .-1
c
4J vir-s
Lin ^ m *It aC'c: Ln
Fc^vk to c ttm
ua d to t0 m Ln Nc w N -^r Ln Lo Ln Ln
+r e- 1.c 'L. 4 Ln tL M 4 N. i.- o r^ M 1.0q Cc Ln mraf-
r•-f C) oc k.0 w f`-Ln
a, LM cc 00 tD m
Ln cc tp LO Ln r-f
w C to r. 1 - f.n LrLn • • • • +^= a} r•t tU N m
N N n r-1 t`. f
`L3
s1J
O 3 C W O: -roll
3 .cL L
Or ^ m
O Qu 3 f1 tZ to m C)
O
1
1
I.1
D
Ln -ct 1
II 11
j
S- S- )o au
b-0 bQ
r^ r•r`fu ` m
a
O O-K +-
lAt,_t
F k
0Lucz
ccn
LdLJw
N
LLJa
•^
ow
C4w
M
CLw
FI
CL
I
trte-+La_
►"^
' W
i ^
uQ
F-
tLLJ
hF `
h
`r
V7r - Ln
N
a^ C
I Cuj
fM
t., M tY
w....f C'licz
r
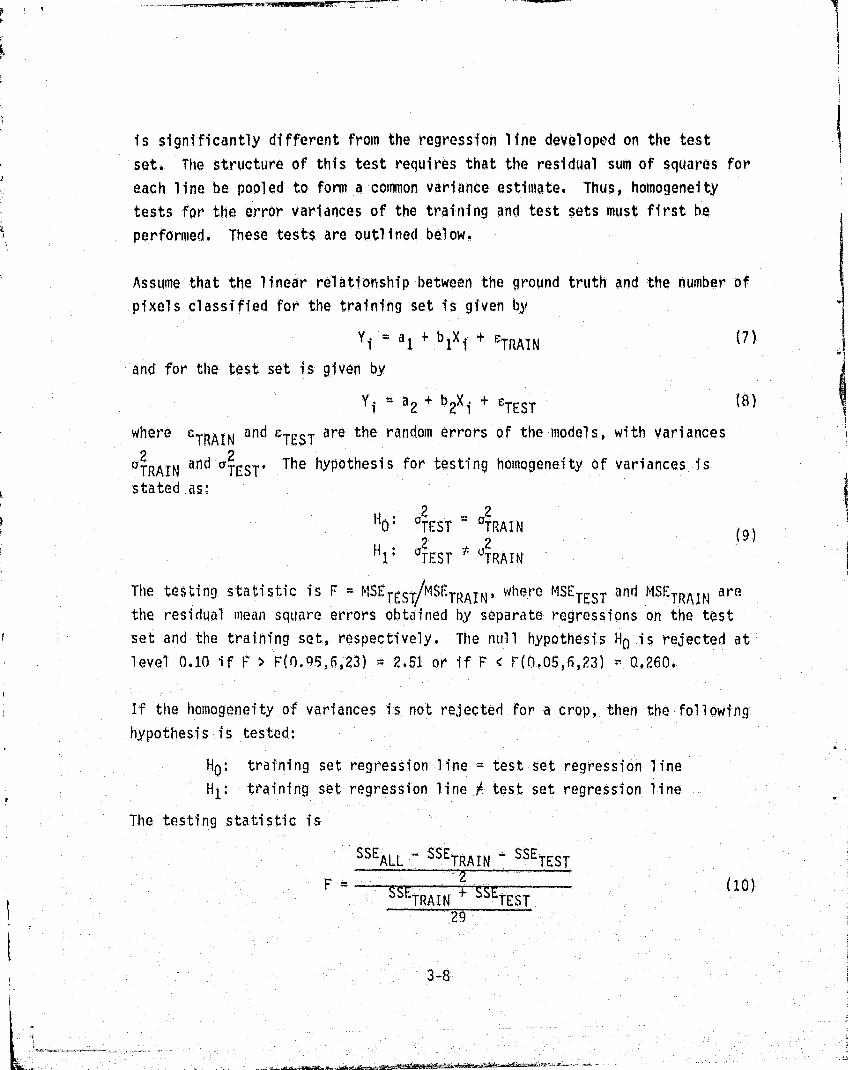
is significantly different from the regression line developed on the test
set. The structure of this test requires that the residual sum of squares for
each line be pooled to form a common variance estimate. Thus, homogeneity
tests for the error variances of the training and test sets must first be
performed. These tests are outlined below.
Assume that the linear relationship between the ground truth and the number of
pixels classified for the training set is given by
Y i ' ai + b 1X i eTRAIN (7)
and for the test set is given by
Yi , a2 + b2xi + cTEST
(g)
where eTRAIN and
eTEST are the random errors of the models, with variances
?. 2°TRAIN
and aTCST'
The hypothesis for testing homogeneity of variances is
stated as:
2 - zHO.
TEST y 'TRAIN(9)
i H1' NEST `'TRAIN'
The testi ng stati sti c is F MSE - , where MSE and MSFT^ST^MSE TttAIN TEST 'TRAIN a rethe residual mean square errors obtained by separate regressions on the test
set and the training set, respectively. The null hypothesis HO is rejected at
level 0.10 if F > FPM5,6,23) = 2.51 or if F t f (0.05,6,23) 0.260.
If the homogeneity of variances is not rejected for a crop, then the following
hypothesis is tested;
HO , training set regression line - test set regression line
H Itraining set regression line test set regression line
The testing statisti c is
SSE ALL' SSETRAIN " SSETEST
F '} (10)
`TRAIN TEST' J29
3-8
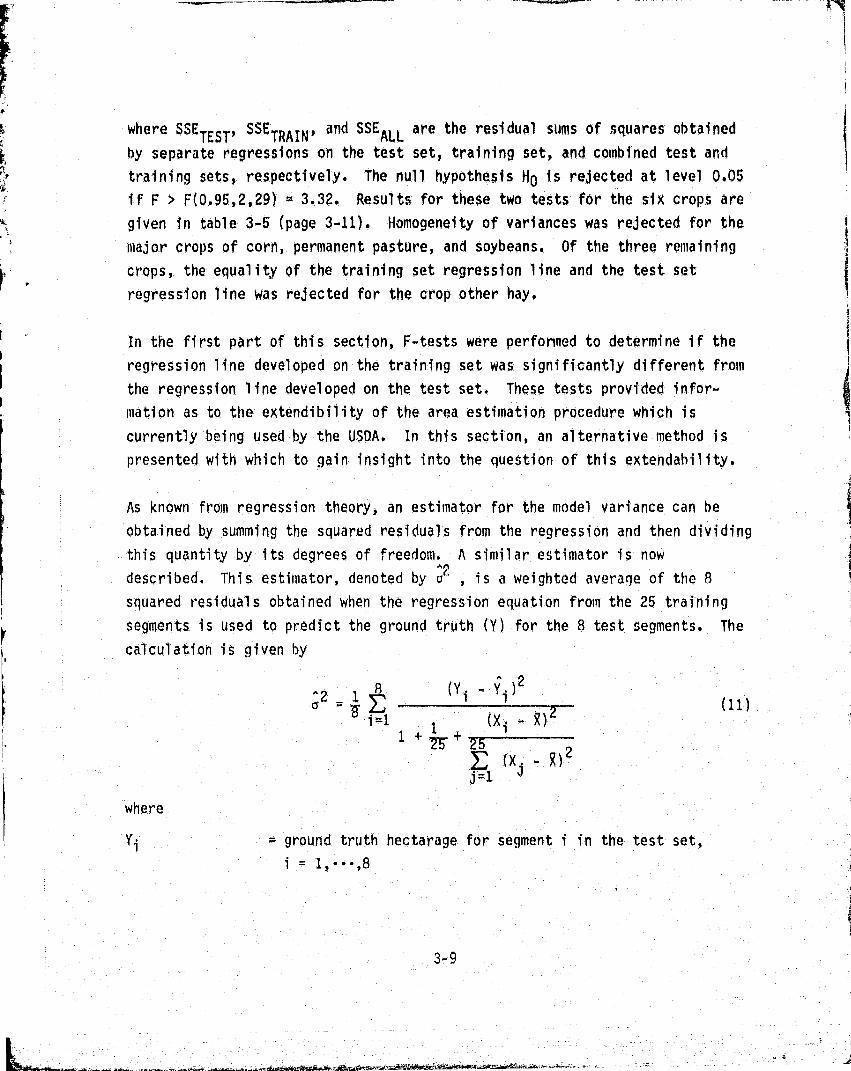
where SSE TEST' SSETRAIN' and SSE ALL
are the residual sums of .squares obtainedby separate regressions on the test set, training set, and combined test andtraining sets, respectively. The null hypothesis Hp is rejected at level 0.05If F > F(0.95,2,29) = 3.32. Results for these two tests for the six crops aregiven in table 3-5 (page 3-11). Homogeneity of variances was rejected for themajor crops of corn, permanent pasture, and soybeans. Of the three remainingcrops, the equality of the training set regression line and the test setregression line was rejected for the crop other hay.
In the first part of this section, F -tests were performed to determine if theregression line developed on the training set was significantly different fromthe regression line developed on the test set. These tests provided infor-mation as to the extendibility of the area estimation procedure which iscurrently being used by the USDA. In this section, an alternative method ispresented with which to gain insight into the question of this extendability.
As known from regression theory, an estimator for the model variance can be
obtained by summing the squared residuals from the regression and then dividing
this quantity by its degrees of freedom. A similar estimator is nowdescribed. This estimator, denoted by a` is a weighted average of the 8
squared residuals obtained when the regression equation from the 25 training'segments is used to predict the ground truth (Y) for the 3 test segments. Thecalculation is given by
" 2d2 - 1 (Y1 - Yi)
(11)
1++75
(X -)2
where
Y i ground truth hectarage for segment i in the test set,i - 1 • .. 8
3-9
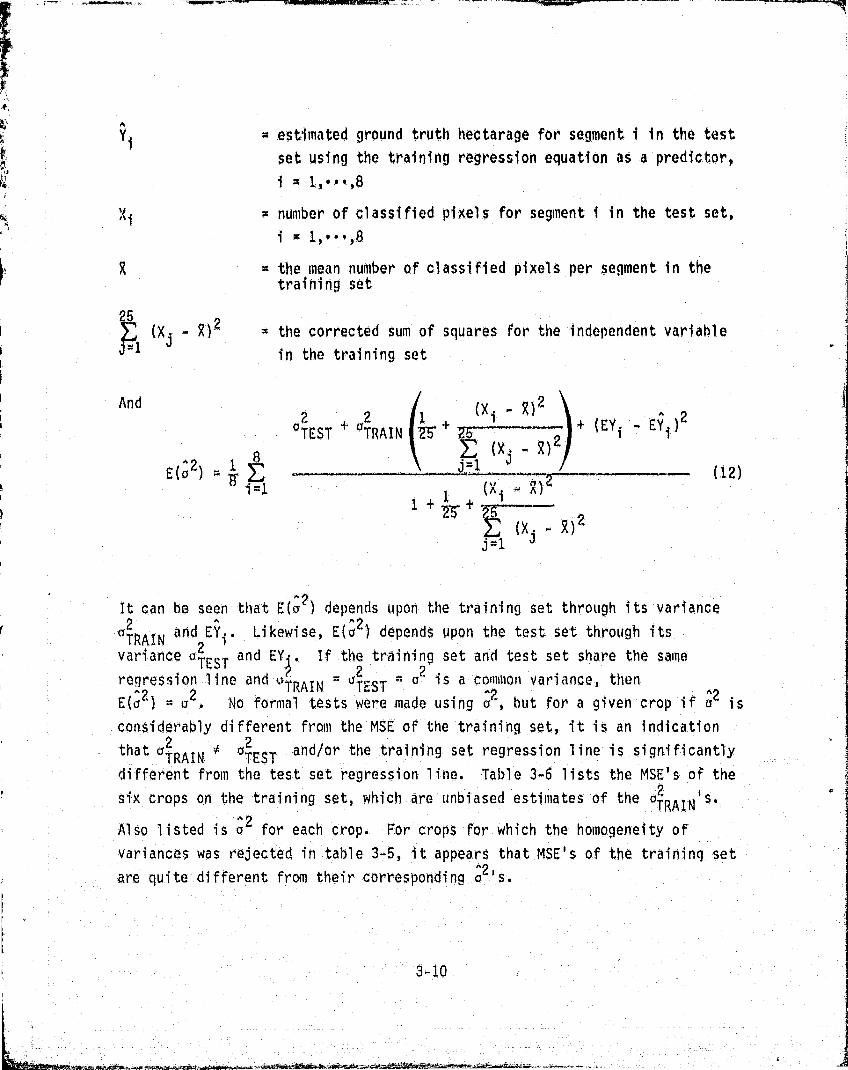
Y i - estimated ground truth hectarage for segment i in the test
set using the training regression equation as a predictor,
i = 1,000,8
X ix number of classified pixels for segment i in the test set,
i x 1,,.. . ,8
R = the mean number of classified pixels per segment in thetraining set
25(X^ - R) _ the corrected sum of squares for the independent variable
in the training set
And1 (Xi
_ R)2*2
°TEST `TRAIN(EYi EYi)
(X3R)x
1 j"1 (.12)E(a)(X
..
2^7 f(X -)E=1 J
It can be seen that E(a 7 ) depends upon the training set through its variance
0TRAIN and EYiLikewise, E(02) depends upon the test set through its
variance aTEST
and EY If the training set and test set share the same
regression line and i,= a2- 02 is a common variance, thenTRAIN TEST
E(a 2 ) # a2. No formal tests were made using a2, but for a given crop if v2 is
considerably different from the ME of the training set, it is an indication
that a2 * 02 and/or the training set regression li ne is significantlyTRAIN TEST
different from the test set regression line. Table 3-6 lists the MSE's of the
' six crops on the training set, which are unbiased estimates of thecr 2's.TRAIN
Also listed is a 2 for each crop. For crops for which the homogeneity of
variances was reJected in table 3-5, it appears that MSE's of the training set
are quite different from their corresponding o2'1s.
.I
3-1D
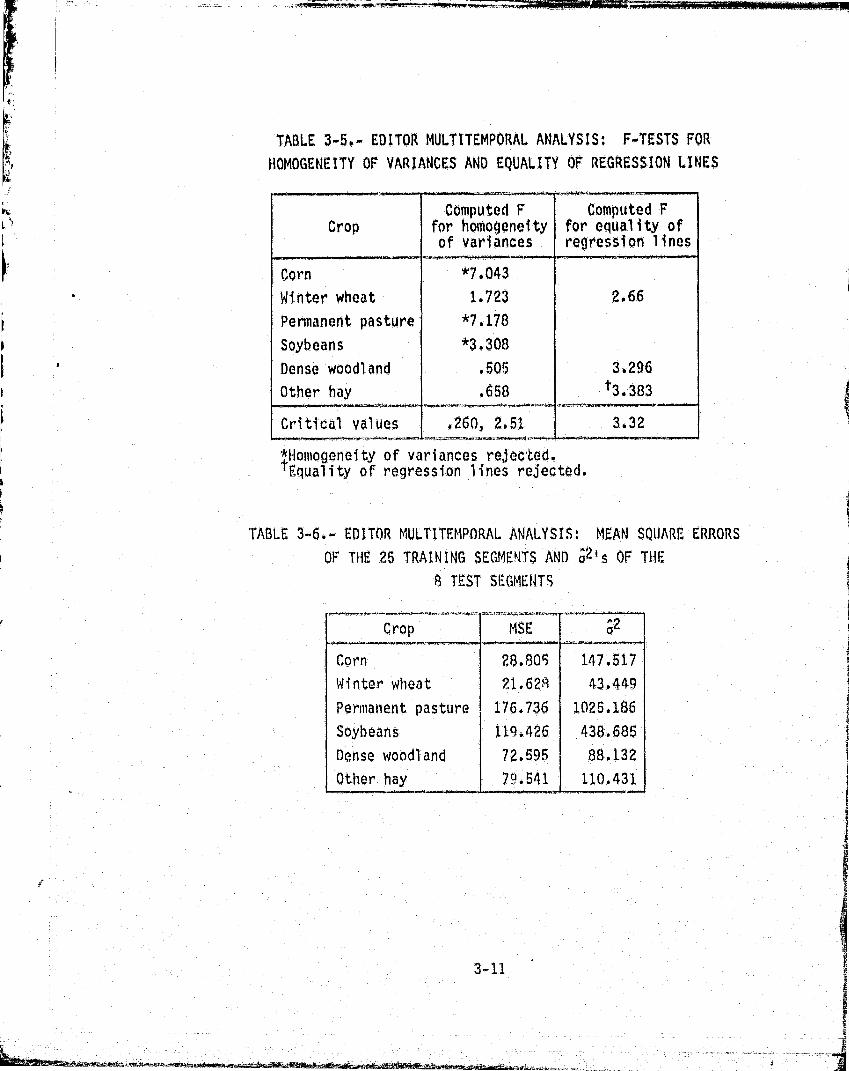
TABLE 3-5.- EDITOR MULTITEMPORAL ANALYSIS: F-TESTS FOR
HOMOGENEITY OF VARIANCES AND EQUALITY OF REGRESSION LINES
CropComputed F
for homogeneityof variances
Computed Ffor equality ofregression lines
Corn *7.043'
Minter wheat 1.723 2.66
Permanent pasture *7.178
:Soybeans *3.308
Dense woodland 605 3.296Other hay .658 t3.363
Critical values .260, 2.51 3.32
*Homogeneity of variances rejected.tEquality of regression lines rejected.
TABLE 3-6.- EDITOR MULTITEMPORAL ANALYSIS: MEAN SQUARE ERRORS
OF THE 25 TRAINING SEGMENTS AND 0^ 2 's OF THE
8 TEST SEGMENTS
Crop MSE 02
Corn 23.805 147.517
Winter wheat 21:628 43.449Permanent pasture 176.736 1025.186
Soybeans 119.426 438.685Dense woodland 72.595 88.132Other hay 79.541 110.431
3-11
3.2.2 JACKKNIFING WITH THE EDITOR SYSTEM
Ideally; it is desirable to have a large sample with which to train a classi-
fier and another large sample Independent of the first with which to develop a
regression line. The advantage of having a large sample is that the sampling
variability is reduced as the sample size increases. When it is impossible to
have a large training sample as well as a large sample with which to develop
the regression line, a jackknifing procedure can be employed. The jackknifing,
which is now described, simulates the method of training a classifier on asample and 'then developing a regression on an independent sample.
The 33 segments were grouped Into 11 sets containing 3 segments each. One setof 3 segments became the test set, while the remaining 10 sets were pooled and
used to train a classifier. The test set containing three segments was thenclassified, This procedure was repeated 10 more times, with each set of
3 segments being the test set exactly once, and the remaining 30 segments being
used to train a cla vi? ful I H I T& _4 -,fl -,. IrLe
"I test sets were then combined, resulting in
a sample of 33 segments, each having ground truth (Y) and a classificationvariable W.
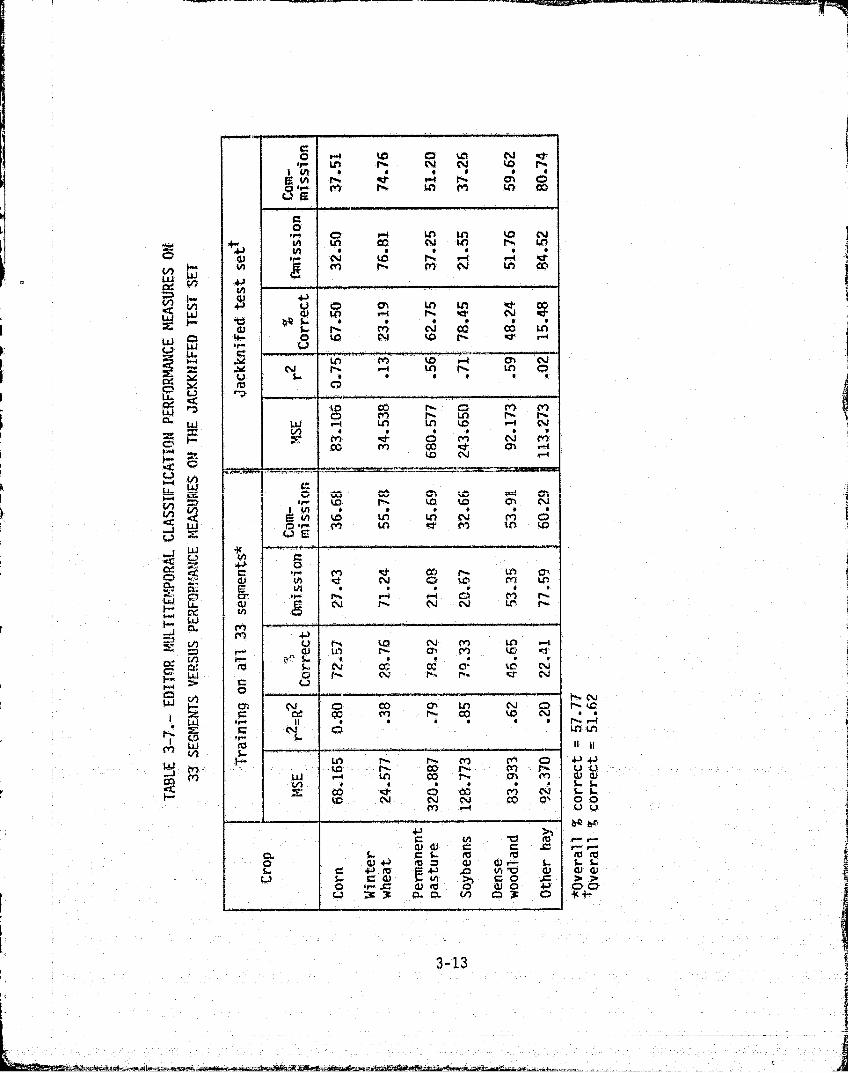
Regrossion equations for the 6 crops of interest were developed on this coin-bi ped set of 33 segments. The regression MSE's, rN, and classificationperformance measurements are
given in table 3-7 for this combined set. For
comparison, the classification results obtained when all 33 segments were usedto train the classifier tire also qivon. 4ith only one exception, the omissionand commission error rates are higher in the jackknifed set than in the set
where 411 33 seqments were used in the training. Also, the r2 's are lower in
the Jackknifed set. For the major crops of corn, permanent pasture, and
soybeans ) the decrease in r2 is 0.15, 0.23, and 0,14, respectively. The
results of this jackknifing study indicate that the r 2 s reported by the USDA
are overestimated..
cnp
Isss
1
`f
Lai
c
P
LAJ
4
4 W
^
`ti
t
GL
..1
I 0
c
L)
uj LL
wCL
V)
C2:
Lcdw
° !
CD
W
W
y
ra N r' "e d r-1 r- C7► 0
C...
^^
N Lin coLON
LnLn
toP"+
C%jLn
yj^N ^ Lt5 1`► ►ri' r-i
Ln"^'co
4J
N
W
^,4J
^y.,M4
Im-^j
(1)
LOA
,♦RV
Ln
W
vd,A Y
C6 LA
Ln .. Ln Sys.
k .0 coM..
C m m
C, h) ^'
Ln ct m LO Lo
G
(v ^0 d ^Cr)
GAG'+ mLo (71
Lo
LnN
C. t
C3
P.,
r-
to
CC14
N
OCt•a*
M
Q"fl-
Ln
tCst
".4
CVN
^0
^'a) co CYA Ln
!LS
A Qw r-+ co r- mLi,! 1-4 to co r" rn m
CX 8 06 M CV
4S 0'
to
C
41 'Qf C C
G S- C t. to rd
bC. C 4-) ME +3
r0 kn "a a)
U 3 LPL C.n cl 3 0
i
ip
j
j
IL 11;
f^. sue.,.
U U i
r- rr
N Q1
* f-
4. EVALUATION OF THE GLASSY CLUSTERING ALGORITHM
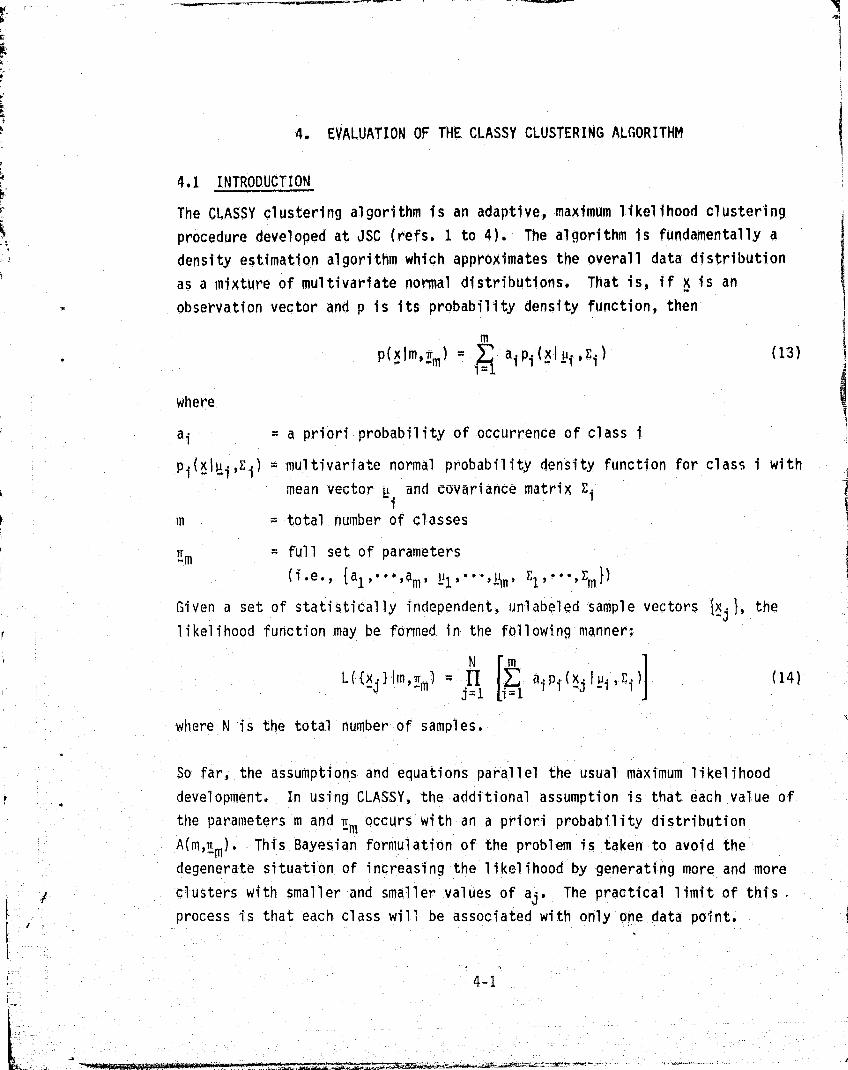
4.1 INTRODUCTION
The CLASSY clustering algorithm is an adaptive, maximum likelihood clustering
procedure developed at JSC (refs. 1 to 4). The algorithm is fundamentally a
density estimation algorithm which approximates the overall data distribution
as a mixture of multivariate normal distributions. That is, if x is an
observation vector and p is its probability density function, then
m
p (xlm 'nm) ^
ai>pi (xi :ui 0 Et-
where
a i a priori probability of occurrence of class i
p i (xlu i ,E i ) = multivariate normal probability density function for class i with
mean vector u , and covariance matrix Zit
m total number of classes
ar m = full set of parameters
- (^ ^. e. ,. {. a^ ! • • . dam' ^jl ^ • •.• , l^n ,. ^^q , ^ ^ ^ , Lm. })
Given a set of statistical ly independent, unlabeled sample vectors {x j }, the
likelihood function may be formed in the following manner:
N r m
L( {x. }Im,am) = jj aipi(x•Iui, i ) (14),j-1 i-1 "^
i
where N is the total number of samples.
So far, the assumptions and equations parallel the usual maximum likelihood
development. In using CLASSY, the additional assumption i s that each value of
the parameters m and R occurs with an a priori probabil i ty distribution
A(m,nm). This Bayesian formulation of the problemis ;taken to avoid the
degenerate situation of increasing the likelihood by generating more and more
'f
clusters with smaller and smaller values of a j . The practical limit of this
i process is that each class will be associated with only one data point.
4_1
1
(13)
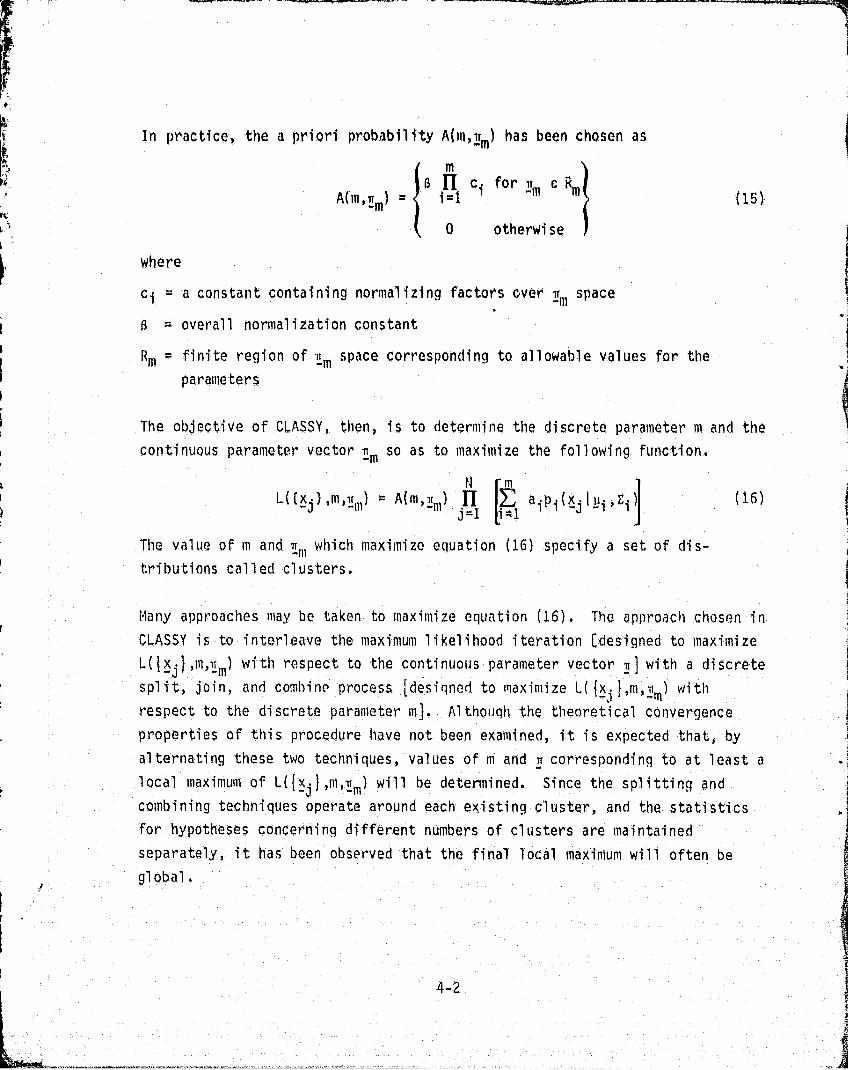
In practice, the a priori probability A(rn,,rm ) has been chosen as
MB rl c for ti e
RMA(m>,rm ) i=1 i_m
(15)
0 otherwise
where
c i = a constant containing normalizing factors over r m space
o = overall normalization constant
Rm = finite region of ar m space corresponding to allowable values for the
parameters
? The objective of CLASSY, then, is to determine the discrete parameter m and the 1
continuous parameter vector Tr m so as to maximize the following function.
N r in
L((xj},m,n,,,) = A(m ,rm ) n aipi (xj I ui ' i ) (16)j-1 i 1
The value of m and ,rm which maximize equation (16) specify a set of dis-
tributions called clusters.
rMany approaches may be taken to maximize equation (16). The approach chosen in
CLASSY is to interleave the maximum likelihood iteration [designed to maximize
L(Ixj },m,,r m ) with respect to the continuous parameter vector ,r] with a discrete
split, join, and combine process 'designed to maximize L(Ixyi l,m, 1m) withrespect to the discrete parameter m]. Althounh the theoretical convergenceproperties of this procedure have not been examined it is expected that b} p y
alternating these two techniques,, values of m and n corresponding to at least a
local maximum of L(I ,<j},m,,rm) will be determined. Since the splitting and
combining techniques operate around each existing cluster, and the statistics
for hypotheses concerning different numbers of clusters are maintained
separately, it has been observed that the final local maximum will often beglobal
4-2
7
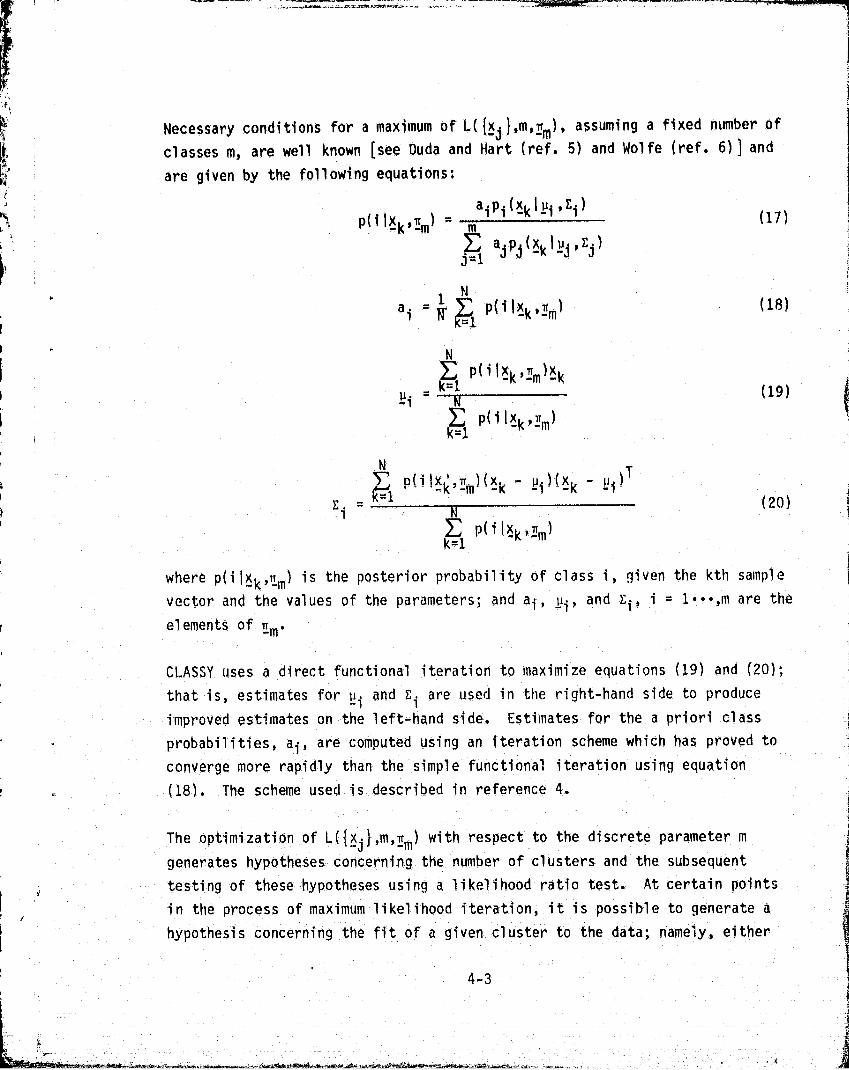
Necessary conditions for a maximum of U 1xj},m,Z.), assuming a fixed number of
classes m, are well known (see Duda and Hart (ref. 5) and Wolfe (ref. 6)] and
are given by the following equations:
aipi(xkJui,Ei)p (iix k ,nm) - m
E aj;p,j=1
( xk I u )
N
a ili lr I1 ptxk'nm)
Np(i Ix ,nm)xk
u i =1
E PH l xk,nm)k=1
N
P- ( i Ixk " !M )( x k - ui )(xk Pi)TE -
^1 - - -
ip(i J x^ n?rm)
k=1
where p(ilx k ,,rm) is the posterior probability of class i, given the kth sample
vector and the values of the parameters; and a i , ,p i , and E i , i 1---,m are the
elements of ,rm.
CLASSY uses a direct functional iteration to maximize equations (19) and (20);
that is, estimates for a and E i are used in the right-hand side to produce
improved estimates on the left-hand side. Estimates for the a priori class
probabilities, a i , are computed using an iteration scheme which has proved to
converge more rapidly than the simple functional iteration using equation
(18). The scheme used is described in reference 4.
The optimization of L(16j },m,-am) with respect to the discrete parameter m
generates hypotheses concerning the number of clusters and the subsequent
testing of these hypotheses using a likelihood ratio test. At certain points 1
r ain the process of maximum likelihood iteration, it is possible to generate a
k hypothesis concerning the fit of a given cluster to the data; namely, either
f
(17)
(18)
(19)
(20)
4-3
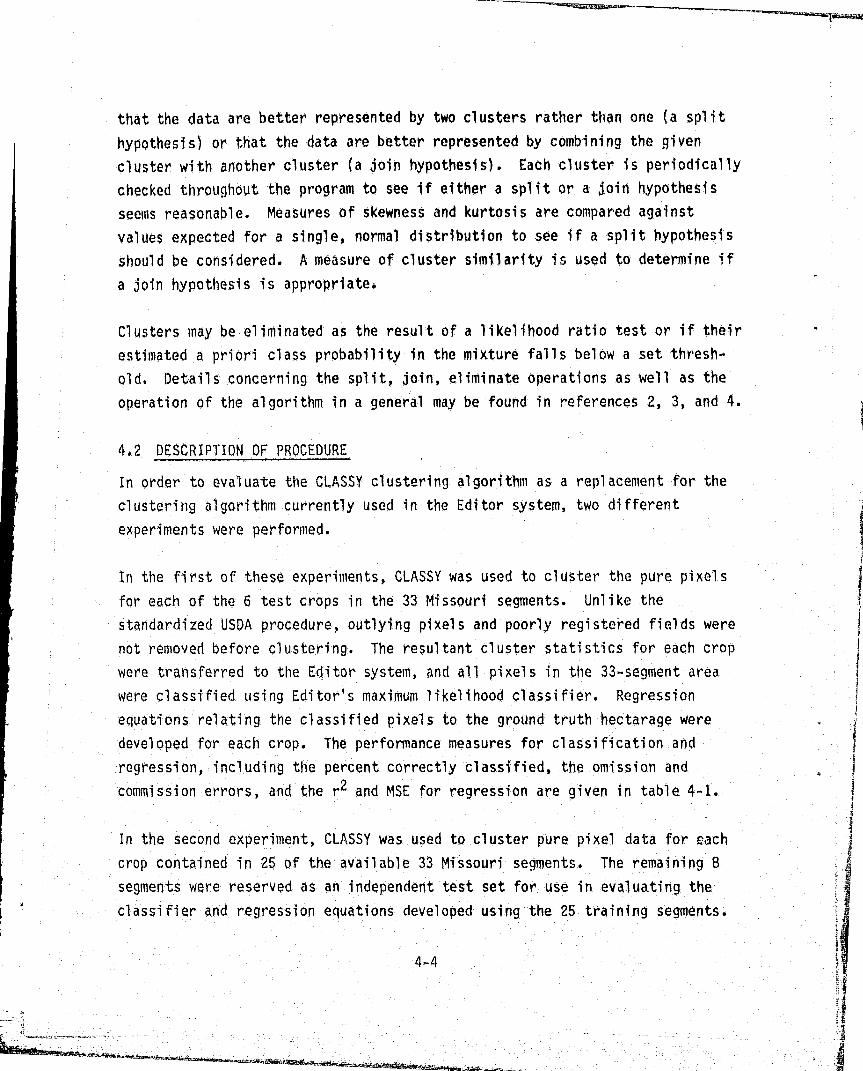
that the data are better represented by two clusters rather than one (a splithypothesis) or that the data are better represented by combining the givencluster with another cluster (a ,join hypothesis). Each cluster is periodicallychecked throughout the program to see if either a split or a join hypothesis
seems reasonable. Measures of skewness and kurtosis are compared against
values expected for a single, normal distribution to see if a split hypothesisshould be considered. A measure of cluster similarity is used to determine if
a join hypothesis is appropriate.
Clusters may be eliminated as the result of a likelihood ratio test or if their
estimated a priori class probability in the mixture falls below a set thresh-
old. Details concerning the split, join, eliminate operations as well as the
operation of the algorithm in a general may be found in references 2, 3, and 4.
4.2 DESCRIPTION OF PROCEDURE
In order to evaluate the CLASSY clustering algorithm as a replacement for the
clustering algorithm currently used in the Editor system, two different
experiments were performed.
In the first of these experiments, CLASSY was used to cluster the pure pixels
for each of the 6 test crops in the 33 Missouri segments. Unlike the
standardized USDA procedure, outlying pixels and poorly registered fields werenot removed before clustering. The resultant cluster statistics for each crop
were transferred to the Editor system, and all pixels in the 33-segment area
were classified using Editor's maximum likelihood classifier. Regression
equations relating the classified pixels to the ground truth- hectarage were u
developed for each crop. The performance measures for classification and
regression, including the percent correctly classified, the omission andcommission errors, and the r2 and MSE for regression are given in table 4-1.
In the second experiment, CLASSY was used to cluster pure pixel data for eachcrop contained in 25 of the available 33 Missouri segments. The remaining 8segments were reserved as an independent test set for use in evaluating theclassifier and regression equations developed using the 25 training segments.
({
4.4
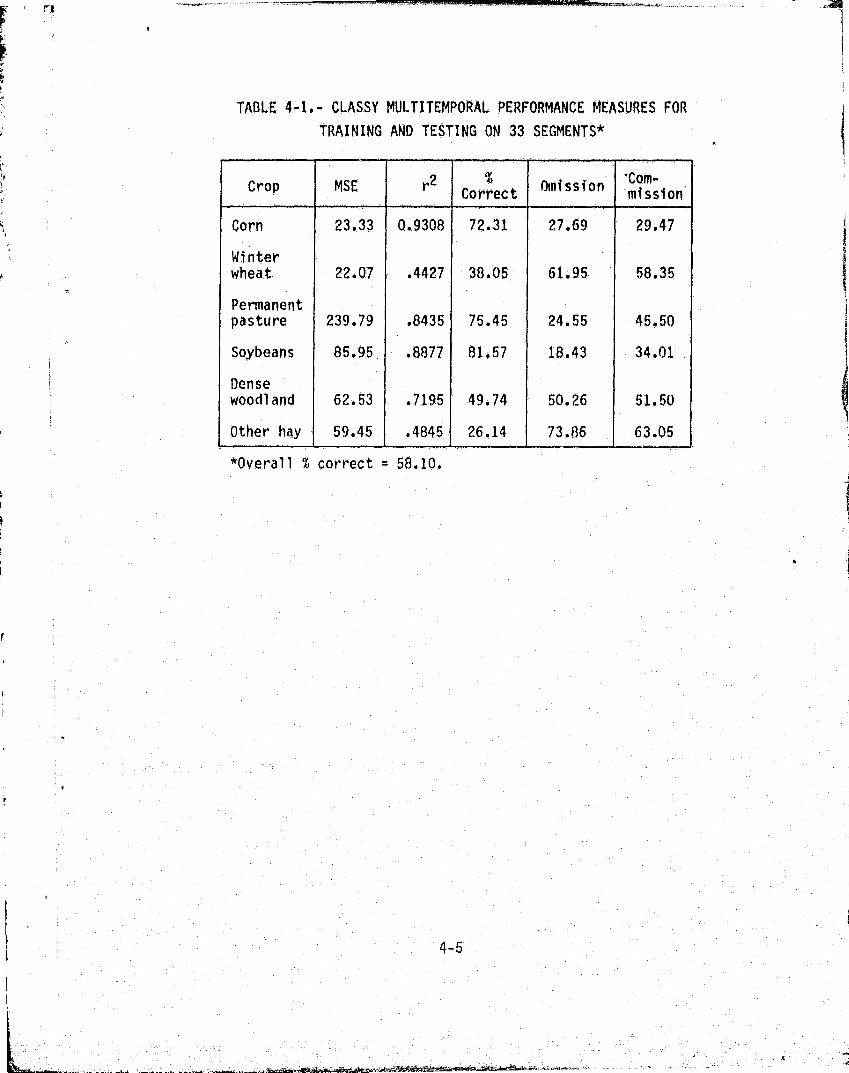
Crop MSE rCorrect Omission2 %
Corn 23.33 0.9308 72.31 27.69 29.47
Winterwheat 22.07 .4427 38.05 61.95 58.35
Permanentpasture 239.79 .8435 75.45 24.55 45.50
Soybeans 85.95 .8877 81.57 18.43 34.01
Densewoodland 62.53 .7195 49.74 50.26 51.50
Other hay 59.45 .4845 26.14 73.86 63.05
TABLE 4-1.- CLASSY MULTITEMPORAL PERFORMANCE MEASURES FORTRAINING AND TESTING ON 33 SEGMENTS*
'Com-
}
i
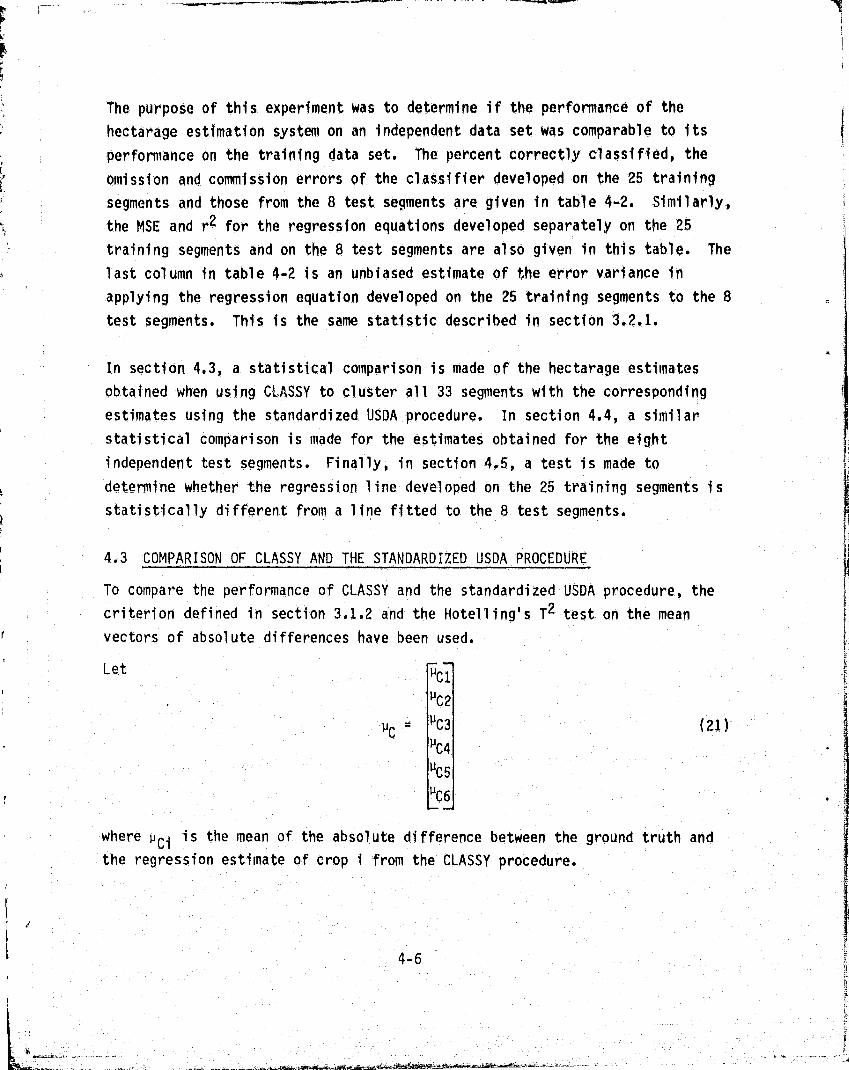
The purpose of this experiment was to determine if the performance of the
hectarage estimation system on an independent data set was comparable to its
performance on the training data set. The percent correctly classified, the
omission and commission errors of the classifier developed on the 25 training
segments and those from the 8 test segments are given in table 4.2. Similarly,
the MSF and r 2 for the regression equations developed separately on the 25
training segments and on the 8 test segments are also given in this table. The
last column in table 4-2 is an unbiased estimate of the error variance in
applying the regression equation developed on the 25 training segments to the 8
test segments. This is the same statistic described in section 3.2.1.
-
In section 4.3, a statistical comparison is made of the hectarage estimates
obtained when using CL ASSY to cluster all 33 segments with the corresponding
estimates using the standardized USDA procedure. In section 4.4, a similar
statistical comparison is made for the estimates obtained for the eight
independent test segments. Finally, in section 4.5, a test is made to
determine whether the regression line developed on the 25 training segments is
statistically different from a line fitted to the 8 test segments.
i 4.3 COMPARISON OF CLASSY AND THE STANDARDIZED USDA PROCEDURE
To compare the performance of CLASSY and the standardized USDA procedure, the
criterion defined in section 3.1.2 and the Hotelling ` s T2 test on the meanr vectors of absolute differences have been used.
LetNC1
uC2
uC = uC3 (21)
"C4
uC 5
- uC6
where pCi is the mean of the absolute difference between the ground truth and
the regression estimate of crop i from the CLASSY procedure.
FY.
4-6
l
^E

F i-f
► : h-1.
L^
CL"Q
^I
LA.
NWaON
l UJLujcn
EzI U.1
Uz4QU-j ^
1uj
WCDZWWO2
-+
m z
iQ
cc
WinLn4
C)
Ln
H
Jc.2 z
^ J Q
' QatQCl
WH
^W
C.7Wto
.J
1 ^=LON
Lf) Q
tU
1
Nc!-
Wan
F^-
f(NaN ^ r- O
O Oct Q) qt O LD N^r- C7 O 00 t`+ Lt7 M
i LA • • • • • •0 . 0r ^ v °i
CN
O N 0 c nLn co LO co4-) y) • • • r • •LOO M NCCE) E ^ 00 r-
br
N4-) (L) O^1 r-4NN 7!^ L • • • • • •
F- O LC) d LO r*^ .-^ NU
00
^O
L1oo cm v 000
a' M M• . •
000•
N•
O
00 cocr .M-1 d'
.U)-^ d^'
N PI) d N tb N wtN ^ U) U)
r-1
O 00 Oct LD M st M•r• d M LD tt d r- 1
E Ln O mot r i N N_t0
m tD ct M at LO.E
CO
V) 000 N ^ c 0000 n.(
4 tR . • . • •
a)E E N ^o N wC)
tJ1(A +j
a)Q1 OU) r1 ^ .--I .-1 N
•r b-P L t— In M wr C) NC O r- M r- 00 Ln M.^. V.tp
H LO co C- C)^L.f) N N CO ^t fl- LD
{\1 CL' CR1 L[T co 000 r^ Ln
0
lD N 00 C) U') QO C- CO r-1 Q t 1 1
LuN M V)
N •--1
Ln 10,G) d C C .0
O 0) ;+-f ^' ^' O 01 r LL C 4J M N +J A to b w
OO F-=C1 w bN Od C- OM +J COV t`! 3 3V--4 0.. M. t!' N N 0 3 "-1- O ko
iI{ae
aa
j
=1
i
J1
I
N 00lD M
CY) "Lfl
i
^ Q*
11 11
4J4) Q))L L.
UU
r r i9
b ^
ai aLi
O Oit +-
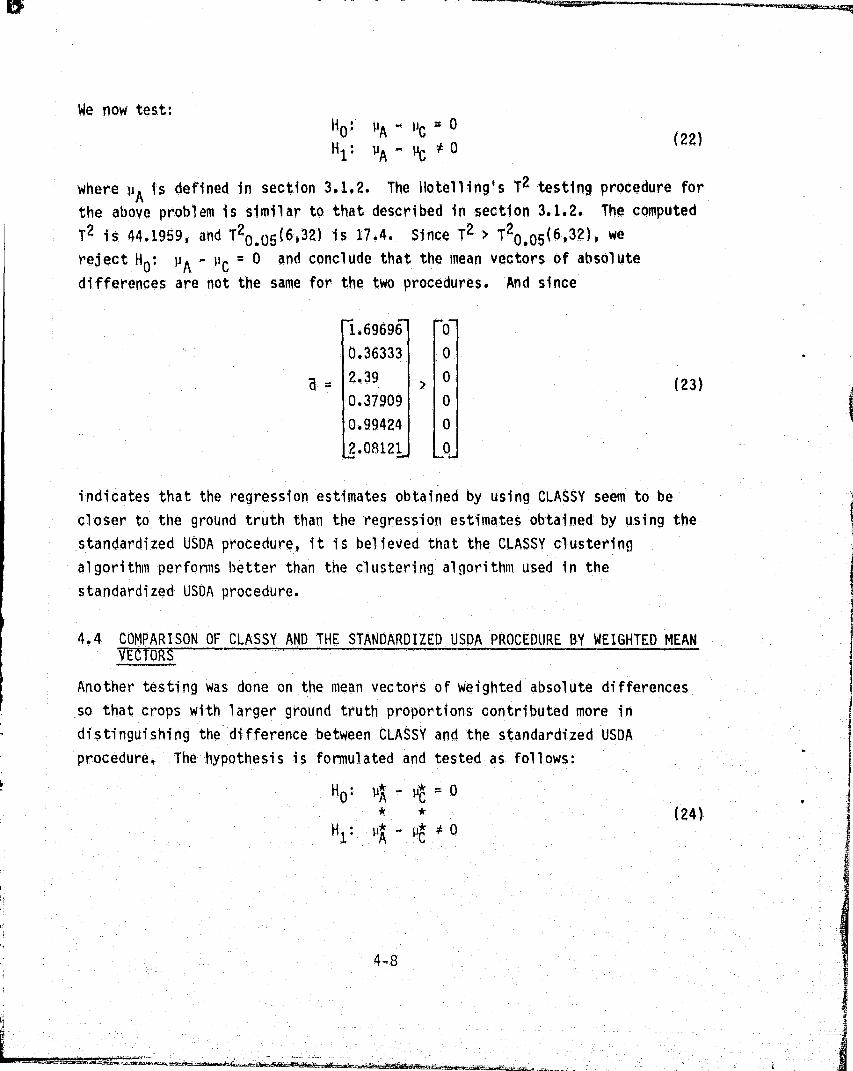
We now test:HO:
uA-
PC^0
14 1: PA - PC 0
(221
where p is defined in section 3.1.2. The Hotelling's T 2 testing procedure forthe above problem is similar to that described in section 3.1.2. The computed
T2 is 44.1959, and T20.05 (6,32) is 17.4. Since T2 > T20.05(6,32), we
reject HO : PA u 0 = O and conclude that the mean vectors of absolutedifferences are not the same for the two procedures. And since
1.69696 0
0.36333 0
a - 2.39 > 0 (23)
0.37909 0
0.99424 0
2.08121 0
indicates that the regression estimates obtained by using CLASSY seem to be
closer to the ground truth than the regression estimates obtained by using thea
standardized USDA procedure, it is believed that the CLASSY clustering
algorithm performs better than the clustering algorithm used in the
standardized USDA procedure.
4.,4 COMPARISON OF CLASSY AND THE STANDARDIZED USDA PROCEDURE BY WEIGHTED MEANVECTORS^
Another testing was done on the mean vectors of weighted absolute differences
so that crops with larger ground truth proportions contributed more in
distinguishing the difference between CLASSY and the standardized USDA
procedure. The hypothesis is formulated and tested as follows:
H O : uA 4C 0
Hu*
0(24)
1 • A uC
4_$
i
e
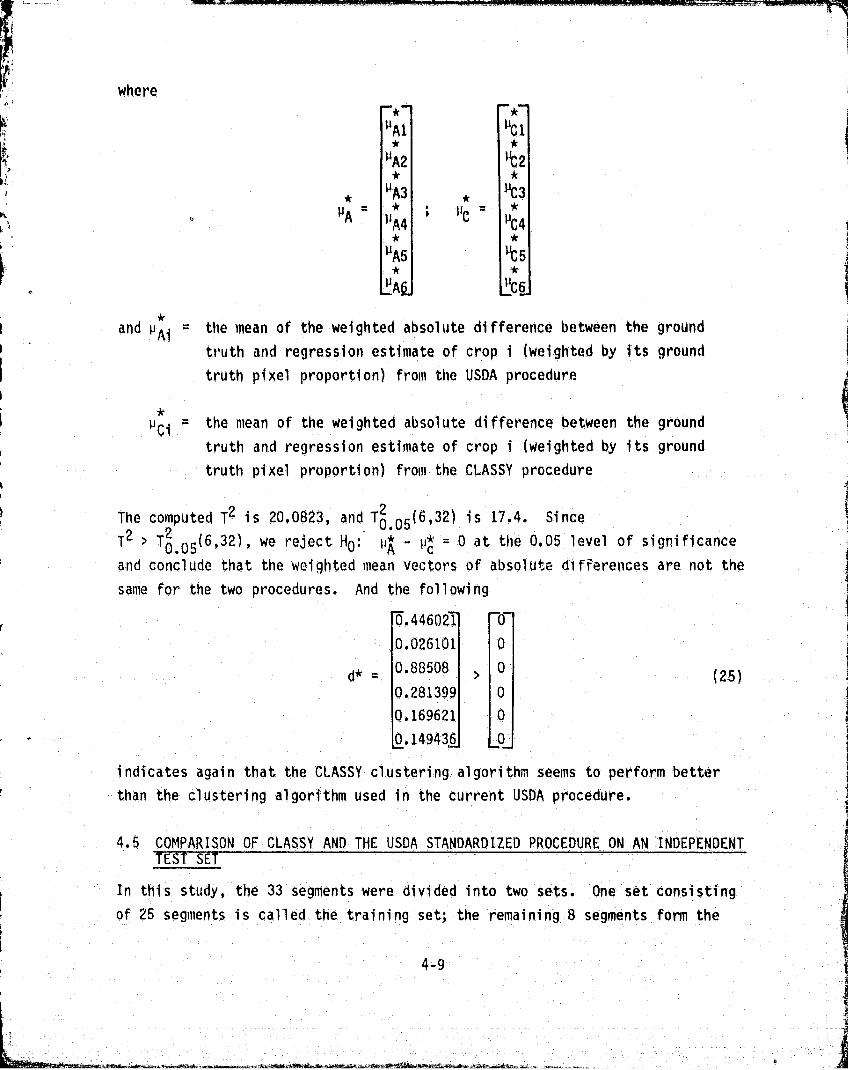
where
uA1
uC 1
1jA2
t2'
uA3
OC3
n
PA
1'R4 ►JC -
'C4
"A5
It 5,r
PAC
4'C6
and uAi ^ the mean of the weighted absolute difference between the groundtruth and regression estimate of crop i (weighted by its ground
truth pixel proportion) from the USDA procedure
u i the mean of the weighted absolute difference between the ground
truth and regression estimate of crop i (weighted by its ground
truth pixel proportion) from the CLASSY procedure
The computed T2 is 20.0823, and T 05(6,32) is 17.4. SinceT2 > T0,05(6,32), we reject HO : laA - t,* -- 0 at the 0.05 level of significance
and conclude that the weighted mean vectors of absolute differences are not the
same for the two procedures. And the followingi
r
14460210,
0.026101 0
Y 0.88508 ^ 0(25)
0.281399 0
0.169621 0
0.149436 LO
indicates again that the CLASSY clustering algorithm seems to perform better
than the cl usteri ng algorithm used in the current USDA procedure.
4.5 COMPARISON OF CLASSY AND THE USDA STANDARDIZED PROCEDURE ON AN INDEPENDENTTEST SE
I'n this study, the 33 segments were _divided into two sets. One set consisting
of 25 segments is called the training set; the remaining 8 segments form the
4-9
4C". uws.r94.iewtt.«^^hr' Yw"iY k.- aro_...r SdGd^,t 'IkbW^siuWt•.:3e76'D' `^. sw`.u:•w: -+w-nwn .... va.
u
test set. The 25 training segments were used in training the classifier and inobtaining the regression coefficients. The regression line was then applied to
the eight test segments to determine how well the line predicts crop hectarage
using an independent set. This study has been completed for both CLASSY and
the standardized USDA procedure. To compare th? performance of CLASSY and the
standardized USDA procedure on an independent test set, a similar Hotelling's
T2 test, as in the previous section has been done on the eight segments.
The computed T2 is 11.035, and TO .05 (6,7) is 405.92. With this sample of 8
segments, since T 2 < T6 .05 (6,7), there is not enough statistical evidence to
reject the hypothesis that the mean vectors of absolute differences between
ground truth and the regression estimate are the same for the two procedures on
an independent test set. A larger independent test set would be more
appropriate because the critical value T (p,N - 1) decreases rapidly as thesample size N increases.
4.6 COMPARISON OF TRAINING AND TEST SET REGRESSION LINESt
In order to determine if the regression line fitted to the 25-segment training
data was appropriate for the 8 independent test segments, a two-stage F-test,
as described in section 3.2, was performed. The results are presented in`
table 4-3. Corn and permanent pasture did not pass the homogeneity of variancetesta The test for equality of regression lines indicates that the regression
s
lines are different only for dense woodland and other hay. However, the factthat corn and permanent pasture failed the homogeneity of variance test indi-cates that different regression models exist for the training and the test sets
}}

TABLE 4-3.- CLASSY MULTITEMPORAL ANALYSIS. F-TESTS FORHOMOGENEITY OF VARIANCES AND EQUALITY OF REGRESSION LINES
CropComputed F
for homogeneityof variances
Computed Ffor equality ofregression lines
Corn *13.03
Winter wheat 1.34 0.09
Permanent pasture *5.03Soybeans 1.66 0.10Dense woodland 1.05 t6.82'Other hay 1.01 f3.61
Critical values .260, 2.51 3.32
*Homogeneity of variances rejected.tEquality of regression lines rejected.
S. EVALUATION OF THE MEAN SQUARE ERROR CLASSIFIER
5.1 BACKGROUND
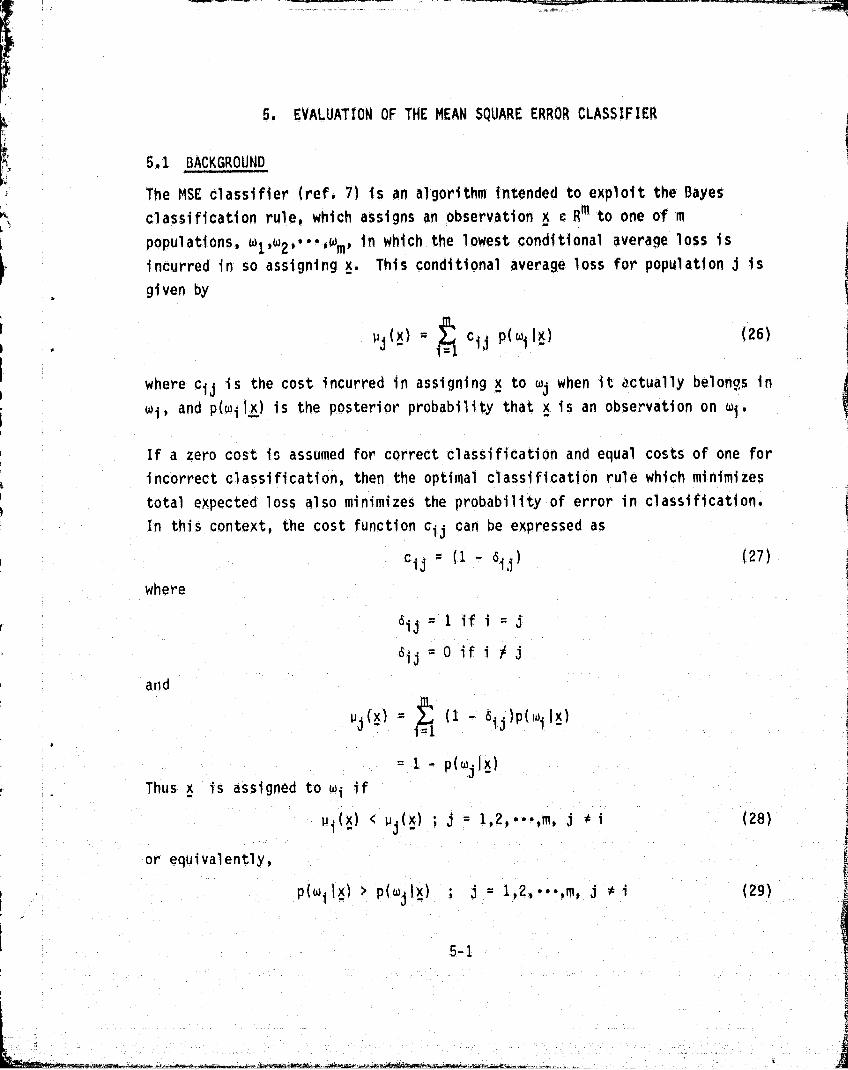
The MSE classifier (ref. 7) is an algorithm intended to exploit the Bayes
classification rule, which assigns an observation x c Rm to one of mpopulations, wl,w2,•••,wm, in which the lowest conditional average loss is
incurred in so assigning x. This conditional average loss for population j is
given by
uj(x) = ci j p ( wi lx) (26) C
I where cij is the cost incurred in assigning x to wj when it actually belongs inr
wi, and p(w ix) is the posterior probability that x is an observation on wi.I!
If a zero cost is assumed for correct classification and equal costs of one for
incorrect classification, then the optimal classification rule which minimizes
total expected loss also minimizes the probability of error in classification.
I`n this context, the cost function c i f can be expressed as
cij
(1 8ij ) (27)
where
aij=Iifi= j
sij =0 ifj
andK
uj (x) = ^ (1 - d ij )p(wi Ix)i=1
1 P(wj (X)
Thus x is assigned to wi if i
ui(x) < u^(x) , j 1,2+ •• • ,m, j i (28)
or equivalently,{
p(wi lx) > p(w lx) j 1 2,, ...m, j # i (29,)i
-51

The particular algorithm used in this experiment was developed by S, G. Thadania
(ref. 7),F;Yt
For a given observation x, m loss functions are estimated where, for each J,
11 j (6) Is approximated by
A ox) aT (x) (30)k
where
C is an r-dimensional vector whose components are linearly independent functionsI` of x, and
aj = (aj1,•••,ajr)T
is a parameter vector determined so that the following MSE is minimal;
E [u.(x) - u (a ,x) j2 (31)T
The expectation with respect to the overall mixture density function is denoted
by ET I . } ,
r It has been shown (ref. 7) that the vector a that minimizes equation (31) is a
the same vector that minimizesf
mMj(a^
k R) _ p(w )E [ .uj (a j ,x) c o o (32)
^R=1 1
where E,(-) denotes the expectation with respect to the conditional probability
density function p(61wR); addition ally, if we define
r
_ F.1a
i 12
mNk
MN (a j ) - + R Cpj(aa,Xi ) c a (33)
5-2
I

,f
where x i is the itth training sample from class w; and It J 1 2 - aT a, then if
C^ i (x) Tt i (x) ] < a i X 1,---,r (34)
4 z it a* 01M
it can be shown that
1im r j (a 1 X M (y (35)N+
The approach, then, is to minimize MN(a^} with respect to aj and to use a
reasonably large number of training samples. If N i represents the number of
training samples from class i and N = N 1 + «•• + Nm , then
NZ
^ jk^l
044 (h) + CIr - 1 cR3 i l
(xi ^)
(36)
Where the elr terns assures that the sum is positive definite.
Since equal costs of 1 for misclassification are assumed: this minimizing
vector can be expressed as
N
a* S t(x 4T(x ) + cl -1 « m t(x ) (37)_a
[ktl - -k - -k
r-1- ;
5.2 DESCRIPTION OF PROCEDUREi
The procedure used in testing and evaluating the MSE classifier on the USDA
data set consisted of the following four tasks. i
-a. A determination of the most appropriate form of the classifier.}
b. A simulation, using the MSE classifier, of the standardized USDA procedure i
in which the classifier is trained on all the data for which ground truth
is available.
c. A performance evaluatic::'', of the MSE classifier on an independent test set.
5.3
I x
d. An investigation of the efficacy of using a cross-validation procedure toproduce a different regression estimator.
A detai ied discussion of each of the four tasks and the results follows.
5.3 DETERMINATION OF THE CLASSIFIER
This task addressed the issues of whether pure pixels only should be used intraining the classifier and whether the terms of either a linear or quadraticfunction should be the components of §(x). Separate computer runs were made inwhich pure pixels and then all pixels were used, respectively, for training.Additional runs were made using, first, a linear form of I(x) and then aquadratic form. The conclusion reached was that a classifier trained on all
the pixels in the crops of interest and using a quadratic form of the vector
function t(x) produced the best classification results.
Since no clustering is done in the algorithm, valuable information is probablylost in restricting the training set to pure pixels. In each subsequent taskdescribed, reference 'to training the classifier will assume the use of all
pixels in the training set and the terms of a quadratic function as entries of
,P W .
5.4 SIMULATION OF THE STANDARDIZED USDA PROCEDURE
In this task, the MSE classifier was trained on the crops of i-nterest in the
33 segments and then used to classify all pixels in the 33 segments. For eachcrop, the absolute values of the resi'dua'ls were compared to the correspondingUSDA results using`a Hotelling's T 2 test for multivariate data. This test was
applied again on the same data with the exception that, for each segment, the
absolute values of the residuals were weighted by the proportions of the crops
of interest in that segment. A discussion of the results of both testsfollows. Following this discussion is table 5-1. This table reflects thestatistics collected over the 33 segments.

i
k
5.4.1 COMPARISON OF THE MEAN SQUARE ERROR CLASSIFIER AND THE STANDARDIZED USDAPROCEDURE
The Hotelling's T2 test, as described in section 3.1.2, has been performed to
compare the results from the MSE classifier with the results from the
standardized USDA procedure. Stated below are the testing procedure and the
inferences.
l`
zLet
u01
uD 2
uD 103(38 )
ti 'D4
!^! 1D5
uD5
where PDi
is the mean of the absolute difference between the ground truth and
the regression estimate of crop i from the MSE classifier.
We testHO;
PApp 0
(39)H 1
: 'A - I'D 0
wherej A is defined in section 3.1.2,
a
Using the ground truth and regression estimates on the 33 segments, ther
computed T2 is 21.777 and T6 05 (C 32) is 17.4. Since T 2 > T6.05(5,32), wei
reject H0 11 A - I'D = 0 at the 0.05 level of significance and conclude that the
mean vectors of absolute differences are not the same for the two procedures.
In this case, however, we have
4.52919
0.27372
a _ 1.17319(aD)
-0.34008
0.67899
4.15128
5-5
A 'Y .°_'x^_..^'uk.^-z d'.."fLY Yrttfr,';^q+..has'bv5yz.ti1.`ttMt.'s1zN311.es'sv'wC-..'^:t,. .,c„'+^',..t. .. •.„ .. ..
e",^,.-.v.atne=•.s":rvx _ 31: inF^i^.e_ l: ' ,. _ _._ .r.*^4'°"'^:.Z :..vy^e. *44.a_+u

Crop MSC r2 % Correct Omission Commission
Cohn 51.90 0.5460 65.61 0.3439 0.2412
Winter 24.63 .3751 7.(1.13 .7987 .4013wheatPermanent 361.16 .7643 85.34 .1466 .5001pastureSoybeans 128.02 .8478 83.48 .1652 .3573
Dense 95.15 .5733 33.98 .6602 .4765woodland
Other 115.38 ..0005 1.87 .9813 .4706hay
Thus, it cannot be concluded that one procedure is better than the other
because the elements in ado not have the same sign.
5.4.2 COMPARISON OF MEAN SQUARE ERROR CLASSIFIER AND STANDARDIZED USDAPROCEDURE BY WEIGHTED MEAN VECTORS
Similar testing, as in section 4.4, was done on the mean vectors of weighted
absolute differences. We test
Hot uA Q = 0
tai)H 1; F1A ^'n D
where pA is defined earlier and p D is defined in a similar manner as pA.
The computed T 2 is 0.2557 and T606,32) is 17.4. Since T2 < T6.05(6,32),there is not enough statistical evidence to reject the hypothesis that the
weighted mean vectors of absolute differences are the same for the two
procedures.
TABLE 5-1.- MSE CLASSIFIER MULTITEMPORAL PERFORMANCE MEASURES FOR
TRAINING AND TESTING ON 33 SEGMENTS*
l
1
5.5 MEAN SQUARE ERROR CLASSIFIER PERFORMANCE ON AN INDEPENDENT TEST SET
The MSE classifier was trained on the same 25 segments previously referred toas the training set, and all pixels in the 33 segments were classified. The
regression equation determined by the 25 points obtained in the trainingprocess was used to predict the ground truth hectares in the 8 test segments.
A Hotelling's T2 test was app"lied on the mean vectors of absolute differences
of the ground truth and regression estimates on the 8 test segments. The test
is now described.
5.5.1 COMPARISON OF THE MEAN SQUARE ERROR CLASSIFIER AND THE STANDARDIZED USDAPROCEDURE ON EIGHT TEST SEGMENTS
When the performance of the MSE classifier was compared to that of thestandardized USDA procedure on an independent test set, a Hotelling's T 2 test
on the mean vectors of the absolute differences was conducted on a set of eightsegments. The computed T 2 was 25.1924 and T 2 .05 (6,7) was 405.92. Since T 2 <
T0 .05(s,7), there is, again, not enough evidence to reject the hypothesis. A
larger independent test set is needed.
5.5.2 F-TEST FOR EQUALITY OF TRAINING AND TEST REGRESSION LINES
The two-stage F-test described in section 3.2 was used to determine if the
regression line fitted through the 25 points using the MSE classifier was
adequate to predict the ground truth in the 8 test segments. The results are
presented in table 5-2. Corn and permanent pasture failed the homogeneity ofvariances test. The test for equality of the regression lines was not rejectedfor any crop which passed the homogeneity of variances test. following
table 5-2, table 5-3 'displays performance statistics compiled on the 25training segments and on the 8 test segments.
t
5-7 a

i1
TABLE 5-2.¢ MSE CLASSIFIER MULTITEMPORAL ANALYSIS: F-TESTS FOR
HOMOGENEITY OF VARIANCES AND EQUALITY OF REGRESSION LINES
CropComputed F
for homogeneityof variances
Computed Ffor equality ofregression lines
Corn *11.896Winter wheat 1.600 1.240
Permanent pasture *4.009
Soybeans 1.939 1.516
Dense woodland .3979 1.724
Other hay .6094 2.332
Critical values .2600 2.51 1 3.32
*Homogeneity of variances rejected.tEquality of regression lines rejected.
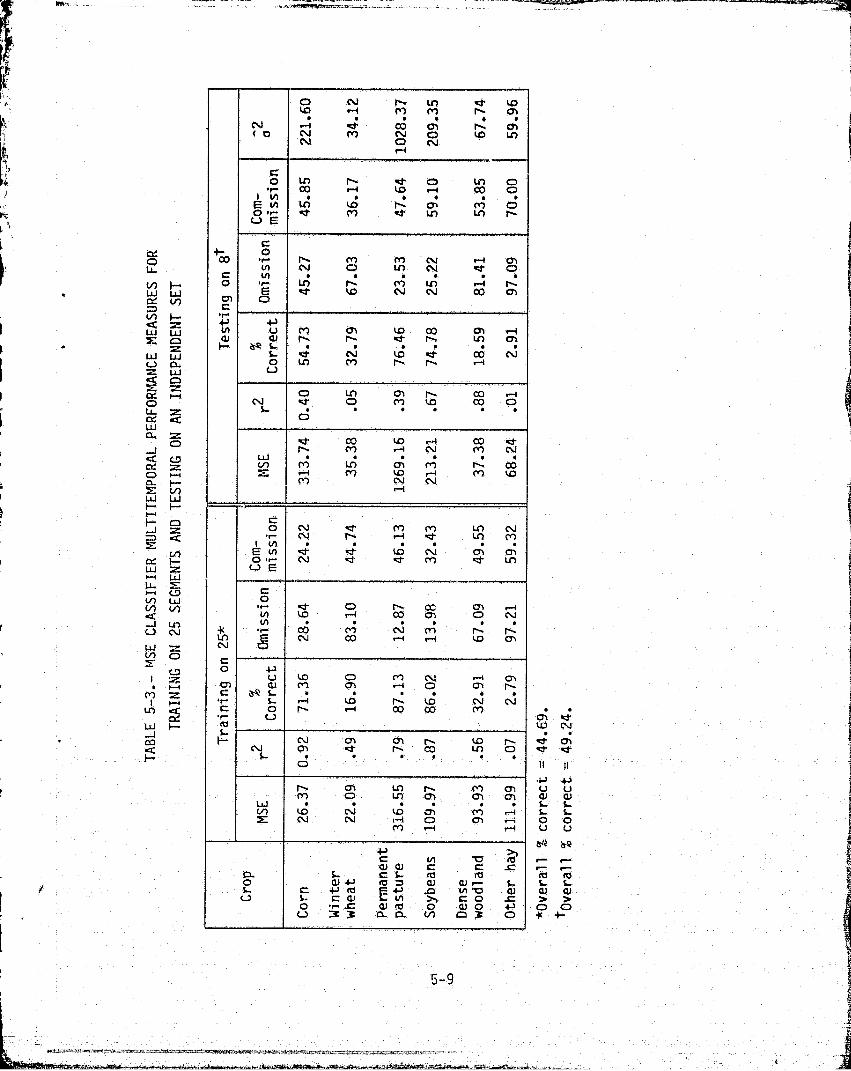
LOi,
V) WO
^
Ln
LtiFw
`I
w
a LM
Io
0-4
LL-
` w dQ
V C.9jP
Lnh w lw.
f -R^
O
J ZQ
w
r-. wU..
V) ii
C ^ N
LtJ ZN O
1
M ZLni
G',7
d
F-_ianN
Y
ifV
O N r Ln tD19 i i M Cl
NNM
Oko to
N
C'O Ln r- ct O Lr) OOQ r^ tD r1 00 O•r-
,E q* m ^ tLnn LOo
c00
•0 N L N off•
Ipct kn N N 00 m
C
Ut^/1 m 0) to 00 0) .-1
L 4 N 1p Olt 00 N0
to M n
^Oi O M 000.(V w 0O
ot co w coh M N Nui
..• M N t0N
O N d M M LO NN 7- r-# cf In M
E N d .4 t.[) N aT ChO +r N Kt tt m Lnto E
c•orKt O
0 w `-1 00 CT C) N
N rN-4N 'M-t w (nNC:O
U) ^') CT O cn ti,r $- .-1 tD h ld N CVC O r- r--( 00 co M
C^•fir
N rn rn t` tp r`Fs-CV Ch ^ t\ q ^ O
O
LO r—L{ a 0 C
wV) N w a r> .- aN N e--i 0 CT n
M «-+ r-1
4-)an Q b
ajC] L C S - fOti rtf
y v Ws av ^ 3 d G. tN In 3 0
•CJlW N
v ofv
A
^
y
U11
V
S. LL LO OU U
itQ
b b
aa)) niC)'
ic +-
s
I
Y
C
b
5.6 CROSS-VALIDATION PROCEDURE
The current USDA procedure is to develop a regression estimator by fitting a
line to the points obtained from the training data. The objective of the
fourth and final task was to determine if the estimate of the ground truth
hectares in the eight test segments could be improved by using a different
regression line based on a procedure referred to as cross- validation. Of the
25 training segments, 1 segment is left out, and the MSE classifier is trained
on the remaining 24 segments. The omitted segment is then classified as if it
represented an independent test set. This process is repeated for each of the
25 segments, thus producing 25 points through which a regression line is
fitted. The 8 test segments are then classified using the MSE classifier
a s
developed on all 25 segments, and the ground truth hectares for these 8
segments are predicted from the regression line,
Two tests were conducted on the results. The first was the two-stage F- test
for the equality of the regression line determined in the cross-validation
procedure and the regression line fitted to the eight test segments. These
results are presented in table 5-4. It is noted that, in the cross-validation
procedure, the hypothesis for equality of variances was rejected for woodlands
in addition to the corn and pasture crops previously rejected in the noncross-
validation procedure.
The final question to settle was which of the two procedures, cross-validation
or noncross- validation, yielded a regression line which best predicted the
ground truth for an independent set. The Hotelling's T 2 test previously
discussed was used on the ei ght test segments. In thi s applicati on,
11 0 : P ioil U(42)a
N 1' u I ^'TI 9
where
1u I = mean vector of absolute differences between the ground truth and the
regression estimate on an independent set using cross-validation i nF
obtaining the fitted line on the 25 points.
5-1O
f
z
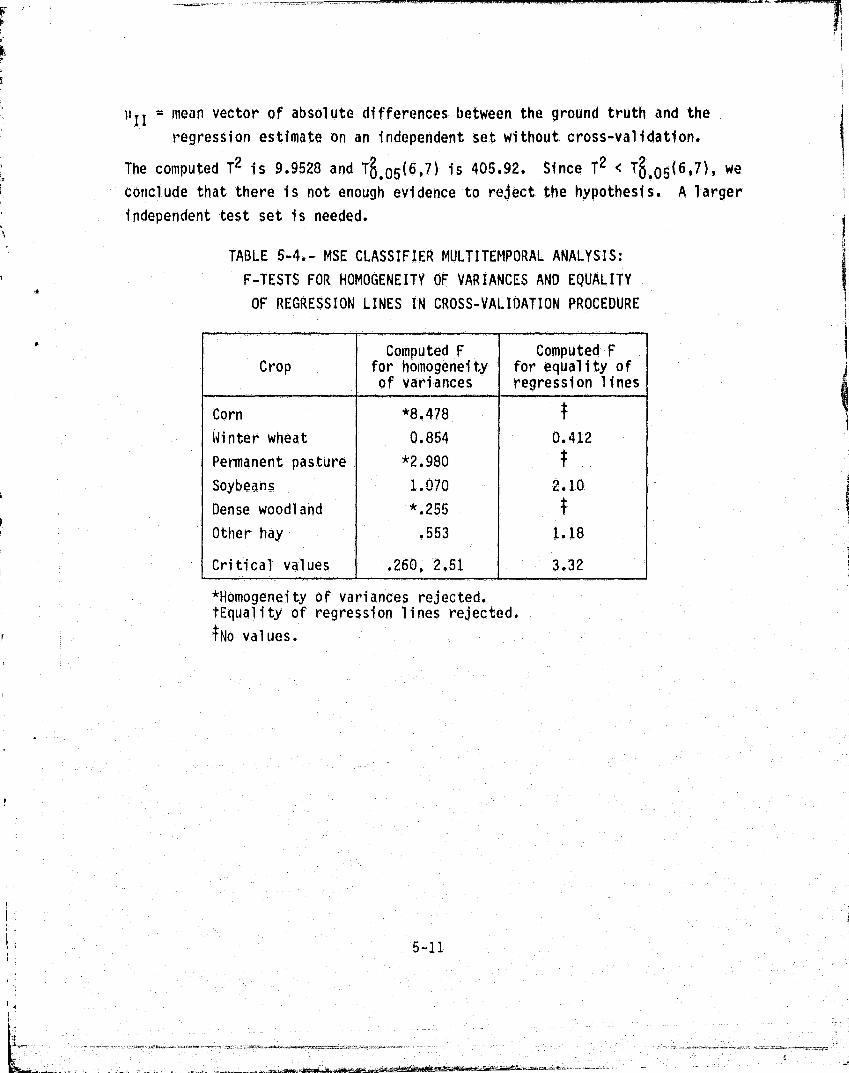
uII mean vector of absolute differences between the ground truth and the
regression estimate on an independent set without cross-validation.
The computed T2 is 9.9528 and T6 . 0 5 (6,7) is 405.92. Since T 2 < TS .05(6,7), weconclude that there is not enough evidence to reject the hypothesis. A largerindependent test set is needed.
TABLE 5-4.- MSE CLASSIFIER MULTITEMPORAL ANALYSTS:
F-TESTS FOR HOMOGENEITY OF VARIANCES AND EQUALITY
OF REGRESSION LINES IN CROSS-VALIDATION PROCEDURE
R
CropComputed F
for homogeneityof variances
Computed Ffor equality ofregression lines
Corn *8.478
Winter wheat 0.854 0.412
Permanent pasture *2.980 1So ybeans 1:070 2.10
Dense woodland *.255
Other hay .553 1.18
Critical values .260, 2.51 3.32
*Homogeneity of variances rejected.tEquality of regression lines rejected.
INo-values.

6. CALIBRATION REGRESSION APPROACH
6.1 INTRODUCTION
Statistical methods have often been illustrated with beautiful examples without
adequately emphasizing the abstract ideas that underlie the methods; that is,
ideas essential to correct statistical thinking. The result has been that
certain problems with similar objectives appear amenable to identical
statistical solutions when, in fact, intrinsic differences exist which Alter
considerably the details of their solutions. It is often the case that the
practitioner is interested in assessing the value of some quantity which is
impracticable to assess or impossible to observe directly in a given instanc±^0
the estimation being performed with the aid of a relationship between the
quantity whose value is sought and another whose value can be determined
directly. The curve-fitting procedure usually adopted depends on the
additional assumption that the values of the independent variables are known
exactly (without error) - an assumption often passed by without emphasis. This
simplification of problems without explicit mention of the fact fosters
misconceptions that are carried over into analysis of data, a particularly bad
misconception being that the variable whose value is to be estimated
automatically assumes the role of the dependent variable. The calculation and
use of dosage-response curves to estimate dosage constitute an example. The
dosage-response curve should he evaluated from a series of observations, with
dosage as the independent variable, and the curve then used to estimate unknown
dosages from observable responses.
To illustrate the aforementioned in more detail, assume that a linear relation
prevails between U and V '.
aO +alU+a2V=0 (43)
6-1
a

which may be written in the equivalent forms
V=a+AU
(44)
where
o 0/a2
1 /01 2 i
U Z y + N (46)
where
Y -a0
/al
- Ct 24a 1
A common impression regarding the principles of curve-fitting seems to be: If
one is interested in estimating V from U, then take V - a + bU as the estimate
of equation (44), if one were fitting by the method of least squares, the a and
b that -minimize E(V V i ) would be found. on the other hand, if one is
interested in estimating U from V, then U : c + dV is to be fitted, the val uesA
of c and d being chosen so as to make U a good fit in terms of the deviations
(Ui U i ?. It does not seem to by generally realized that the fitting should
be done in terms of the deviations which actually represent "error." Thus,when the research worker selects the U-values in advance, holds U to these
values without error, and then observes the corresponding V-values, the errors
are in the V-values. So, even if the researcher is i nterested in using'
observed values V Q of V to estimate U, he should nevertheless fit V = a + bU
and then use the inverse of this relation to estimate U 4 i.e., U No a)/b.Let us examine this from the viewpoint of the theory of least squares.
Consider the case where the values of U are selected (or adjusted) by the t
research worker, and the corresponding values of V are found by observation.
One can minimize ^(V i - V i ) and ECU U i ) thereby obtaining the two lines,
respectively:
V=a+ bU (46)
U = c + dV (47)
1 6-2_

IF
Vi ) minimized
ANOVA I
M_i - U ) z minimized
ANOVA II
Total variability of V's about Total variability of U's about
their mean: EN i - O) 2 their mean: EN i - 0)2
Reduction effected by (46); Reduction effected by (47);bt(U i - 0) (Vi - 'V) d-E(Ui - MY - 7)
Deviation about V Deviation about U
4(V - 7) 2 - bt(U i - DXV i - V) EN dE(Ui - 0)(V i - 0)
E(V i - V i ) (Ui - Ui
The ANOVA tables are interpreted as follows. On the left, E(V i W gives a
measure of the observed variability of the V-values. The second row of ANOVA I
gives the portion of the observed variability of the V-values that can be
attributed to the dependence of V on U, and the last row indicates the mag
ni'tude of the portion of (Vi - V) P that must be attributed to "error" (this
portion has been minimized by the fitting process). In ANOVA II, on the other
hand, Z(Ui - Q) 2 represents the variability in the chosen values of U which
resulted from the way in which the researcher selected them, and it should be
noted that the corresponding values observed for V have in no way entered into
their determination. Consequently, the apparent dependence of the U on the V,
measured by the second row of ANOVA II, is a spurious dependence, and the last
row of this table cannot be interpreted as being a measure of the "error" in
the V -values, since it is that portion of the variability of the U-values that
cannot be accounted for by the variability of the V-values. Briefly stated,
when the values of U have been selected by the researcher and the corresponding
V-values observed, the line obtained by minimizing Z Ui) is meaningless;
and, accordingly, equation (46) is the only correct estimate of the postulated
linear relationship between U and V. Therefore, if it is desired to reason tfrom V to U, this must be done by means of U = NO a) /b.
One example is to calibrate an instrument, say a pressure' gauge. Assume that
the increase in gauge marking is linearly proportional to the increase in
pressure. To calibrate the gauge, one subjects it to two or more controlled

pressures (U) and notes the gauge markings M. Using these data, theparameters are calculated, and the gauge is calibrated. The gauge is then usedto determine unknown pressure (U) simply by reading the marking VO andobtaining U = (VC - a)/b.
The calibration problem is very general. Consider the problem of estimatingthe ground truth crop-type acreage of an area segment from the acreage obtainedby classifying the Landsat data. To establish the relation between the twoacreages, a number of segments was selected'. The ground truth acreages ofthese segments were recorded and held as constants. The segments were thenprocessed by a classification algorithm, and the classification acreages wereobtained. In view of the fact that the ground truth acreages were controlledand the classification acreages depended upon spectral observations which canbe regarded as chance occurrences and, therefore, are relatively imprecise, itseems only appropriate to consider the ground truth as the independent variableand classification acreages as the dependent variable: The ground truthacreage (U) of a new segment is then estimated from observing theclassification acreage (Vo) of that segment by the equation U No a) /b.
More detail on the application of this calibration model to the crop -typeacreage estimation problem will be given in the next section.
r 6.2 DESCRIPTION OF NEW REGRESSION ESTIMATOR
This section provides a brief description of the regression method currently
being used by the USDA to estimate the ground truth crop-type acreages. Denotethe ground truth acreage by U and the acreage obtained from classifying theLandsat-data by V. Using the sample of 33 segments, U is regressed onto V.
Ground truth acreages (U i ) and their corresponding classification acreages (Vi)are obtained for each of the 33 segments. The relation between U and V is then
assumed to be
Ui Y + SVi + i - 1,... } 33 (48)
6-4
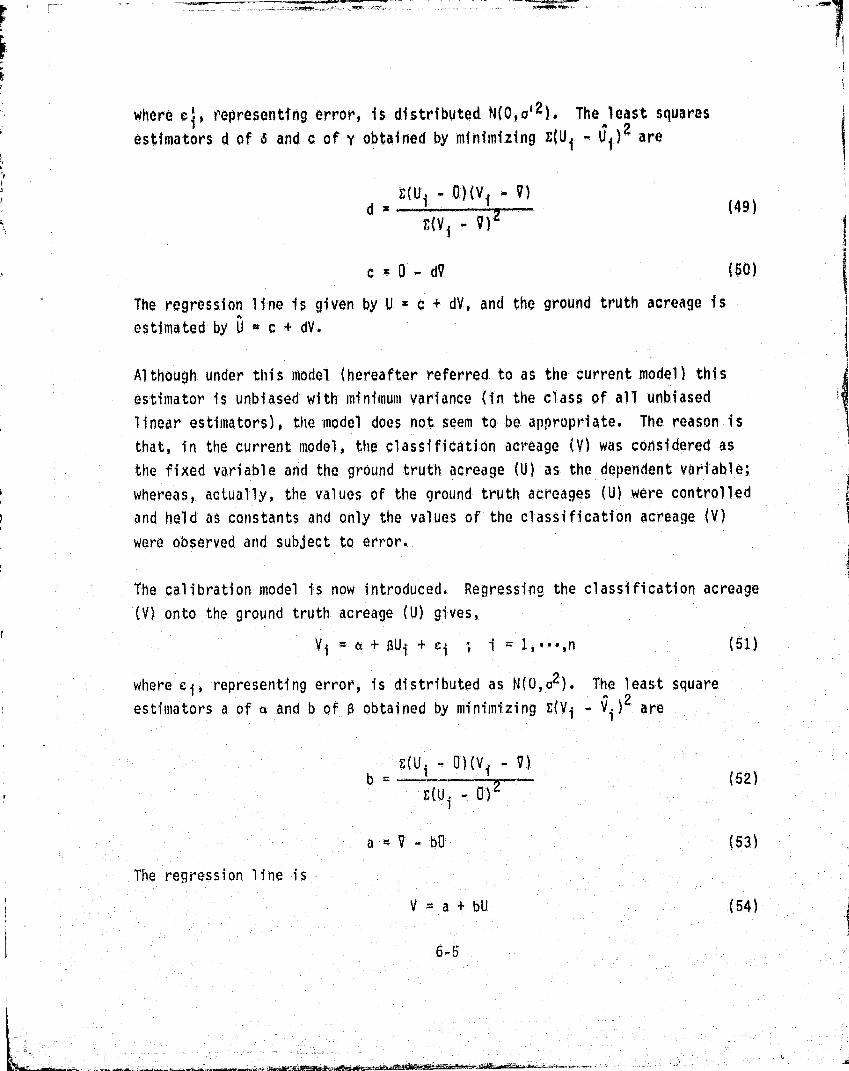
i++I
where c , representing error, is distributed. N(O,v ,2 ). The least squaresestimators d of 6 and c of Y obtained by minimizing Z(U i ,. UO 2 are
E(U iO)(Vio)d a (49)
UZ
c x 0 - d0 (5O)
The regression line is given by U - c ++ dV, and the ground truth acreage isestimated by U - c + dV
Although under this model (hereafter referred to as the current model) thisestimator is unbiased with minimum variance (in the class of all unbiased
linear estimators), the model does not seem to be appropriate The reason is
that, in the current model, the classification acreage (V) was considered asthe fixed variable and the ground truth acreage (U) as the dependent variable;whereas, actually, the values of the ground truth acreages (U) were controlledand held as constants and only the values of the classification acreage (V)
were observed and subject to error.
The calibration model is now introduced. Regressing the classification acreage
(V) onto the ground truth acreage (U) gives,
V i : 0 + Ru i + C i i - 1,...,n (51)
where c i , representing error, is distributed as N(o,c2). The least squareestimators a of a and b of 0 obtained by minimizing E(V i - Vi ) 2 are
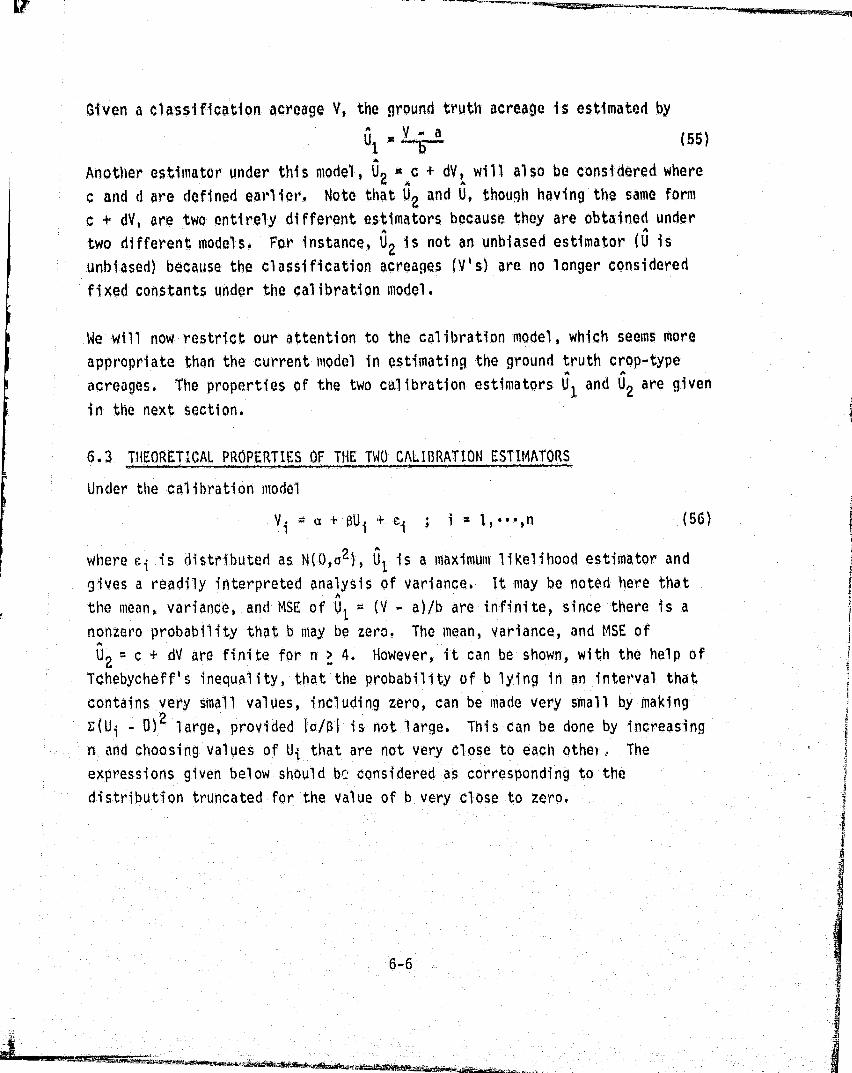
Given a classification acreage V, the around truth acreage is estimated byA ,1 a
Ut(56)
Another estimator under this model, Uz = Ac + dV,^ wi11 also be considered where
c and d are defined earlier, Note that U, and U, though having the same form
c + dV, are two entirely different estimators because they are obtained under
two different models. For instance, Uz is not an unbiased estimator (U is
unbiased) because the classification acreages (V's) are no longer considered
fixed constants under the calibration model.
We will now restrict our attention to the calibration model, which seems more
appropriate than the current model in estimating the ground truth crop-typo
acreages. The properties of the two calibration estimators U and U, are given
in the next section.
6.3 THEORETICAL PROPERTIES OF T11G TWO CALIBRATION ESTIMATORS
Under the calibration model
Vi
+ aUi + ci
i 1, n (56)
where e i is distributed as N(O,o2 ), U is a maximum likelihood estimator and1gives a readily interpreted analysis of variance. It may be noted here that
r
the mean, variance, and MSE of U I = (V a)/b are infinite, since there is a
nonzero probability that b may be zero. The mean, variance, and MSE of
U2 = c + dV are fini te for n > 4. However, it can be shown, with the help of
Tchebycheff's inequality, that the probability of b lying in an interval that
contains very small values, including zero, can be made very small by making
D(U i - Ol 2 large, provided is/01 is not large. This can be done by increasing
n and choosing values of Ui that are not very close to each othei, Theexpressions given below should b,2 considered as corresponding to the
distribution truncated for the value of b very close to zero.
6-5
dui: ss ... ..
UP

Let UO be the quantity to be estimated and let
A(U i - 0)2
2 _ (57)
aU - n I —_"
2
9 1 + .- -. (58)S aU
f Then, to order n,
7 1
bias NO(U - 0) (59)
!^ 1 (n 1) '0 0
var (U)a 2 n + 1 + 3a2 a2
(0 U )? (60)(
1 n (n1 R7 (n - 1) oV 0
2 2MSE (U 1 ) _ -°- n
1 + - 3a2 -^-- + -° -2- (0 UO ) 2 (61)4 (n 1)a' 0 (n - 1)aUR
bias ( U2 ) _ = a-2 20 --z Z03 {0 - UO ) (62)S QU
8 n au 6
var (U)02 n + 1 + 02 (0 2 2e + 6) + a2 2a4)2
r 2 n (n - 1) 6u 0e^ (n - 1) 0Z n 00e
(63)
MSE (U ) - a2 n + 1 + a2 (e2 - 2e + 6)
Y 2-n (n - 1)oU 5 e A
a
2 4
(n - 1)a U50 6 aue ne
6-7
Li's
_.:
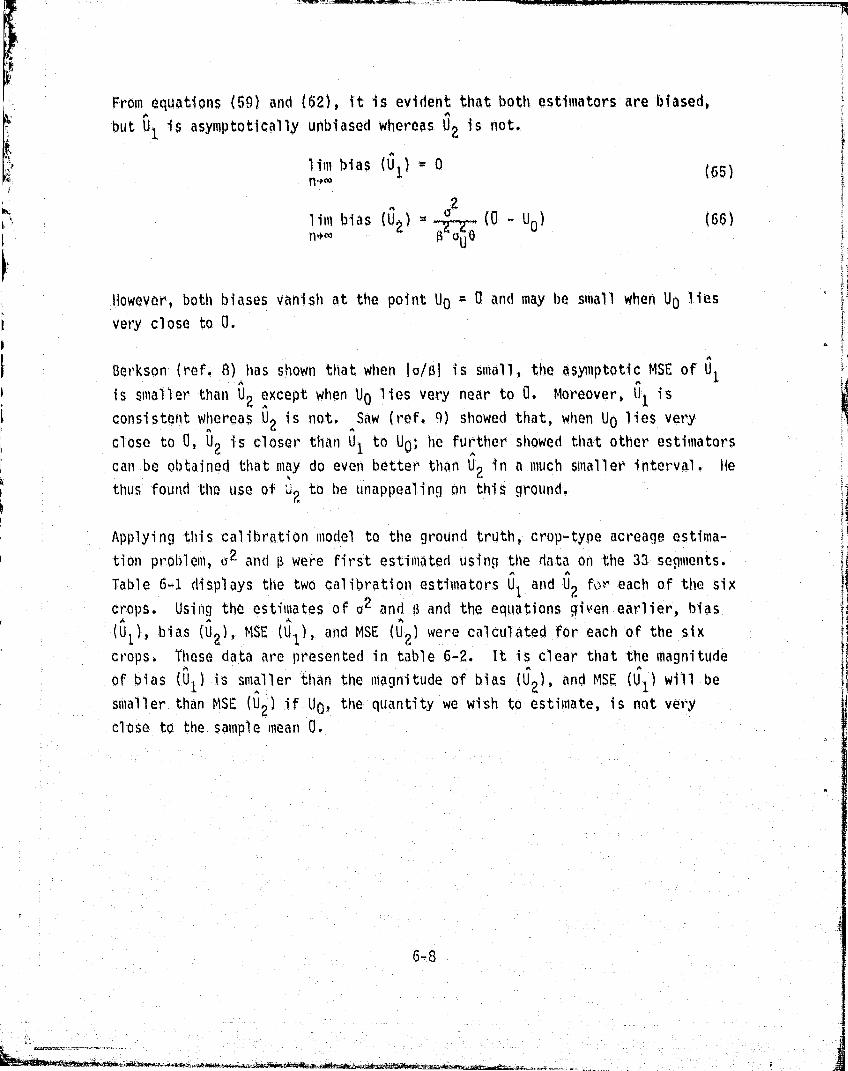
From equations (55) and (62), it is evident that both estimators are biased,A A
but U 1 is asymptotically unbiased whereas U2 is not.
lim bias (U l ) Q (5)n•^
21 im bias ( U2 ) ( - UQ ) (66)n+00 R OUQ
However, both biases vanish at the point Up = 0 and may he small when Up lies
j very close to Q. I'r I
Berhson (ref. 8) has shown that when l a/5l is small, the asymptotic MSE of U lk
is smaller than U2 except when Up lies very near to 0. Moreover, U 1 is
I consistent whereas U is not. Saw (ref. g ) showed that, when Up lies very2
` close to Q, tip is closer than U 1 to UU ; he further showed that other estimators j
can be obtained that may do even better than U2 in a much smaller interval. lie
thus found the use of to be unappealing on this ground. ,)
x
Applying this calibration model to the ground truth, crop-type acreage estima -
tion problem, c2 and 0 were first estimated using the data on the 33 segments.
Table 6-1 displays the two calibration estimators U l and U2 for each of the six
crops. Using the estimates of o2 and 5 and the equations given earlier, bias ^'+
( U l ), bias (U 2 ), MSE (U I ), and MSE (U 2 ) were calculated for each of the six
crops. These data are presented in table 6-2. It is clear that the magnitude
of bias (U1) is smaller than the magnitude of bias (U2 ), and MSE (U1) will be
smaller than MSE (U2) if UG, the quantity we wish to estimate, is not very
close to the sample mean U
6-8
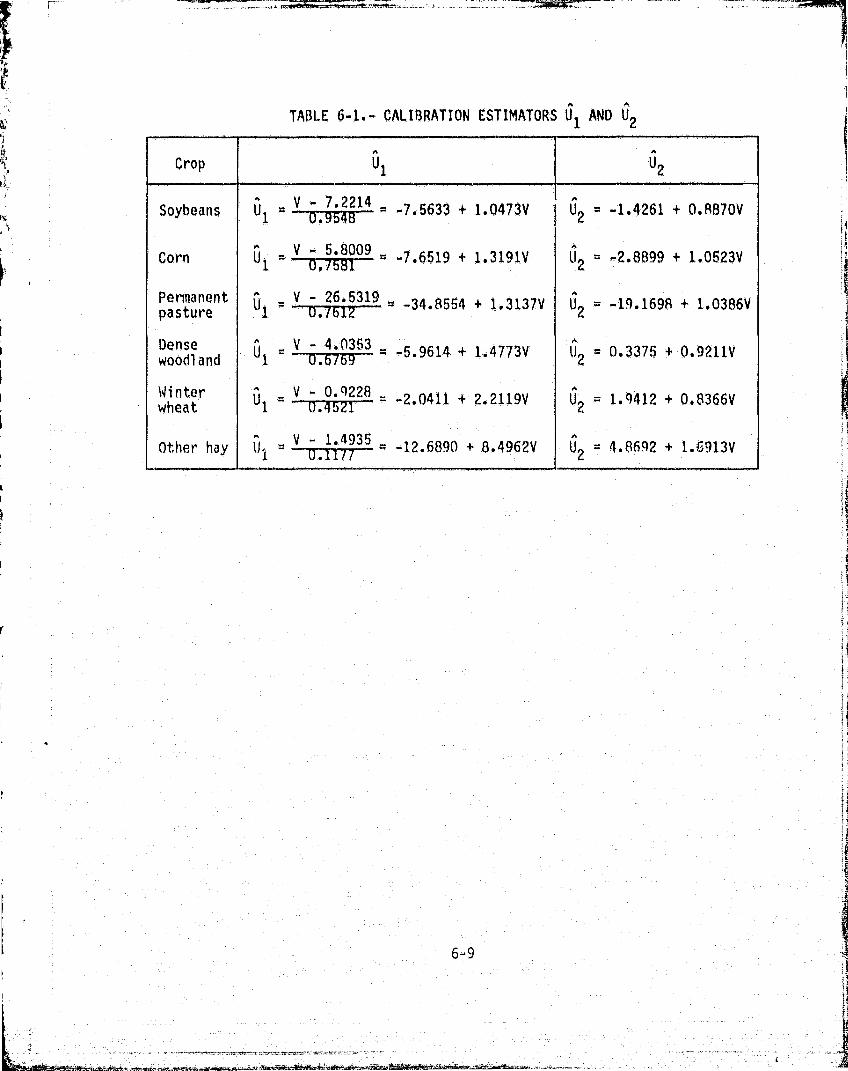
TABLE 6-1.- CALIBRATION ESTIMATORS U 1 AND U2
CropU1
U2
Soybeans^U 1 - V - 7.2214
0 . 9548^ -7.5633 + 1.0473V U2 = -1.4261 + 0.8870V
Corn UV - 5.8009 =
7651.9 + 1.3191V U = -2.8899 + 1.0523V
entpasture
U 1
` V - 26.5319^1^+
- -3'
+ 1.3137VU ?.
= -19.1698 + 1.`0386Vpasture
DenseU 1
= V"""".^6T^9""""
- 4.03 53 _D
6769 _ 5 .9614 + 1 4773V' it = 0.3375 + 0.9211Vwoodland 2
Winter ^1
_ V- '-'
- 0.9228._0.4521
.. 2.0411 + 2.2119V U = 1.9412 + 0.8366Vwheat 2
Other hay U I= V - 1.4935i-
U.1117 - 12.6890 + 8.4962V U 2 = 4.8692 + 1.6913V
E^
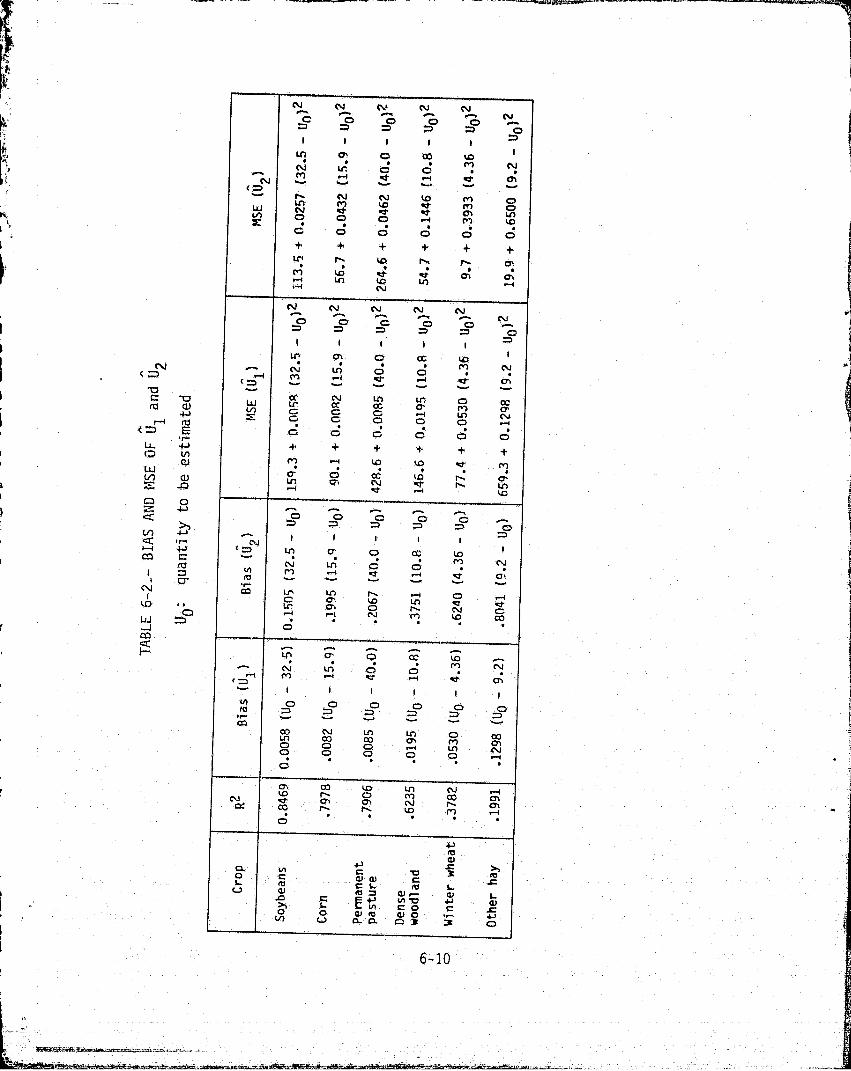
Ny N cy N N
6 1 4+
^' Q t10 to 1
N LA OM N
LON Lp M p
wLIJ
oN ov m L°n
^4 ', C O d Q O O
tf^ f ^D h q,
•M-I LO tz LLn^.1 N rS
Nra r
^ NY =
I
CD
1 1 1 1^Lt+ O CC tp
CV..
qc,• •
Ln•
O• N
„M Cf CT
ccu, Noc
Ln to Gro a
G C
or
C
oLn
rd C? O O: C G C p Q
Lt- 4.t + + t * +I 0 LS)
lli
f+1M
NO
Ln
O ccN
In acY f~
fm Q^
O ^Ln 41 ^^i Q r CW.
1 I I A 1 4
c S^ L!7 Q Q 6( lD 1
N N Ln O ^' N1(10 M ” v a
vrco IT Ln 1'^, : v-i i
tr Cl,uj
.-t L QM tp
COC
J O- Ln.
lC3 Q` C+ cc LL?^ N Ln
.G Q M N
S ^ M ^ ^ "'1 d' O1
C G1 s
coLn
mCO ^
O .-1. Ln
O^ C
Q O O O pO a
00 ~V" f` to M .-a
C;
b
CL ya;
O CCam. C idl
a 41IA r pJ i
0 o y b Uf C/) 4) o°a- a as s
ta
t
6-10
rt
k^
t
..:..^•, wwrr•^,.^.:, ,::._...,._._...._.- __-__w----mac. ....^c.,m.^.s.:...
7. CONCLUSIONS AND RECOMMENDATIONS
7.1 CONCLUSIONS
With regard to the standardized USDA procedure used in this study, it seems
clear that the oul titemporal data produce significantly better estimates than
those obtained using unitemporal data. In addition, it is to ear that the cur-
rent practice of evaluating the classifier and developing the regression on the
same data set used to train the classifier can lead to optimistic performance
estimates. With the possible exception of winter wheat and dense woodland,
both of which had small populations, performance measures calculated using an
independent test set and similar measures calculated using a cross-validation
approach were uniformly worse than the samemeasures calculated on the trainingset. It also soeins clear that the regression equation developed on the train-
ing data may not be appropriate for the test data. All crops tested, except
winter wheat and dense woodland, showed differences in the regression models
for fines calculated on a training set andon an independent test set.
The CLASSY clustering algorithm, when substituted for the current USDA cluster-
ing method, produced improved estimates. The estimates were significantly
better than the standardized USDA procedure when testing and training were done
on all 33 segments. The performance measures for the 33 segments are summarized
in tahla 7-1.
r
The independent test set of eight segments was not large enough to allow the
detection of any significant difference between the procedure using CLASSY and
the standardized USDA procedure; however, the performance measures, as listed
in table 7-2, indicate an improvement when using CLASSY clustering,
It is worthwhile to note that this improvement in performance was obtained
despito the fact that CLASSY requires no decisions from an analyst concerning
the number of clusters, separability thresholds, or other arbitrary parameters.
In addition, CLASSY was operating with data for which the outlying observations
had not been removed. Such observations were removed in the course of
t
!
r ;
l
71` i1
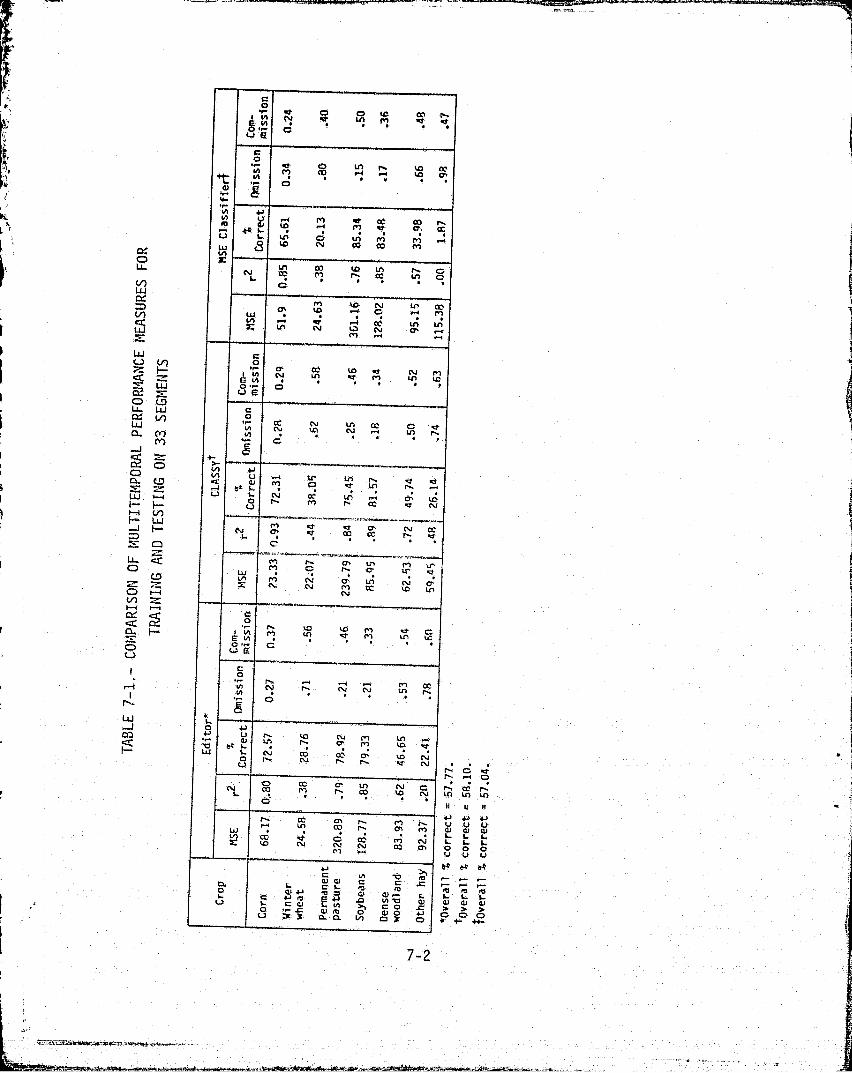
to CO I.,v InIn0.-
'~ d" 0 CC+t
LA (I cr,
IA 41oc 00w m cr, oc
In In C4to 4N 00 co rn
tLL
N MCi ci 9
LLJ
toN In (We
V) LLI-i
I "!
•
C5In
cf` In toLe) toL cli C,
LLJu 0
C j
LLJN
CD
C)U-= V)Lij CC In cc cN
U!
4(-"
CI LM UCL tr In
(U P In
w u C%j cc Lr)0 r-1-4f-4 V)
cc v cv
ujC,
cr, cv cccc
U-C)
cr, In w-U.1In m C^ LA
ccC) 1J 1 Lp
tz ko
c:
cli In
LU41
u C"i In
Wz I^ C, ws- cli co Oz 'f;0
r
+C%iCD cc In IN)co m c r-
cjL. c^ In in In
It If
cc m 4jM u"u
41u
cf^ M w wC^ cc m C%I
1.%^cli coof 140 0
u u u
41c LM
L41 a) 0) 1- ISO- M- ILO
E41 wIn ai
43.1 m .0oll a) 0 0
w>
4)>
a sC)
7-2
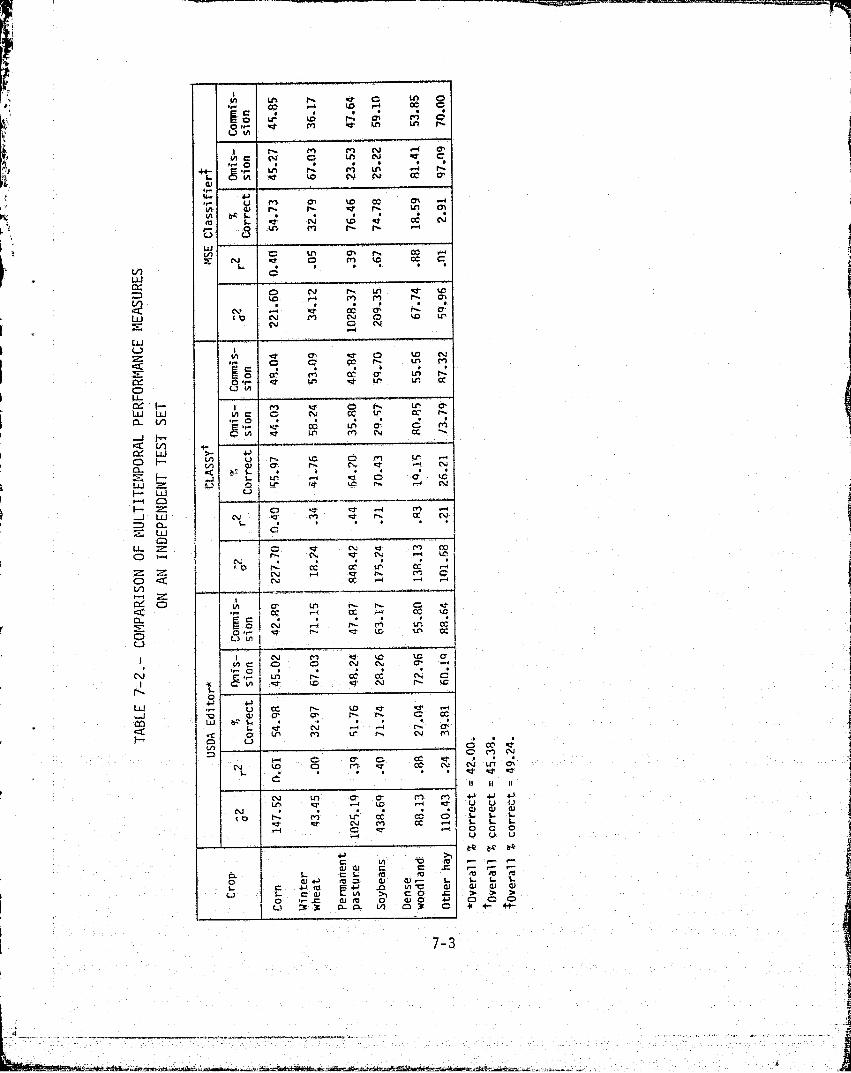
l {^
LnLLJ
uj11
wi
•^
W-C.7
W W
IV)
` CL
LsJ .'^-
.~J W
E WQLL-
C) Lcn _
CeC
GL
fO
N
W
co•
r
r
v c cr^ ago ^ ^o .-^ a
ccc
a nr.. LnV ^
Q.11 C N 4m N D' C
cMV N.0
v t^c cc^ crvr^
h tin0 II f`. h V Im
o Ln M f+ h
tn Q Ln M
Pte... _OC •^+
'r <t O M ip CC CNL.
C
LntC0 M M ^'" Cts
N ...i. Kr cc CT f- cr(a cli cli
CV.0
C-4
rp....C..
CC
cc Ln MC
*
• • •ra tMlt d U, Ut cc
CJ (A
en CP` CTG i^t CC t!` CC V%
r^ Oco
M N oMm
,0 V
,,,^.. L tC• r-t C C. C tGC.1
C^m
cT •*t M -rN Kr M St' f'.. cc N
C
Rq
fr- CL" cc ll^ pC rlIf(-4
cv
cc
LA c
}
CC ^ cc to cz r` r i Ln CC
ccu LA
rr.. OE rr in n CC CY C, CK C N cf`. ko -cr N n ttLO
-cr .-+
b
4
0 C~`. N n C cC.
d O lf'1 M tr r`, 04 MV)C r-t.. C O' G.. cc d'
tD: O M V Ci N
C
C7,.m M
t p•
n...
'M tt' OC CC.
O^ d
CC ,-+eft C r
4)41 v E^ c o r^= m m o v o N
COt 3 3 0. C. CO p 3 C
r1
C M N
N . .0 41d
U..U V
siO.i LCU v v
00 0
7-3
I
executing the standardized procedure. This represents another source of
subjective analyst input not needed when using CLASSY.
The MSE classifier did not produce significantly better hectarage estimatesthan the standardized USDA procedure when evaluated on either the training set
or the independent test set. However, this classifier showed less sensitivityto the training/test degradation discussed earlier. This is evidenced by the
fact that the hypothesis of equality of regression lines fitted to the trainingand test data sets was accepted for all crops except corn and permanent
pasture, which failed the homogeneity of variances test. Also, the overall
percent correct on the independent test set decreased least when using the MSE
classifier. This greater extendibility might be expected due to the fewer
parameters required to be estimated in using this classifier.
The calibration approach to regression points out a fundamental problem in the
current regression model and suggests an alternative which has severaltheoretical advantages.
7.2 RECOMMENDATIONSi
Several recommendations seem appropriate at the conclusion of this study.
First, the use of CLASSY clustering in place of the current Editor clusteringalgorithm is recommended. CLASSY seems to offer a tangible improvement to the
current Editor system in terms of increased performance and decreased analyst
interaction.
Also, the study seems to indicate that the regression estimator may beimproved. Use of a simpler classifier might make regression more extendible,and improved performance is expected using the calibration regression
4
approach. Unfortunately, this issue is not clearly decided at this time. Therecommendation is that additional research to improve regression /proportion
estimation be conducted. 'i'his should include actual tests of the calibrationapproach as well as other alternative approaches. Such approaches include a
regression model in which both ground truth and classification acreages are
considered random and the use of direct proportion estimates. In an
7-4
r.:,

operational setting, it is recommended that jackknifinq be used to obtain more
realistic performance estimates.
A
A final e recommendation is that any future work be conducted with a larger data
set, if possible. The sample size estimates reported in section 2.2 as well asour own experience in making the various tests indicate that the sample size of
the Missouri data set is only marginally sufficient if testing is carried out
on all the traininn data. The data set is not sufficiently large to achieve
significant test results if it is divided into training and test portions. Thej sample size estimates reported in section 2.3 should serve as a guide inr selecting future data sets and in designing future experiments.
r
p
A

y
m
8. REFERENCES
1. Lennington, R. K.; and Malek, H.: The CLASSY Clustering Algorithm
Description, Evaluation, and Comparison with the Iterative Self-Organizing
Clustering System (ISOCLS). LEC- 11289, March 1978.
2, Lennington, R. K.; and Rassbach, M. E. • CLASSY - An Adaptive Maximum
Likelihood Clustering Algorithm. LEC-12145, May 1978, [presented at the
Ninth Annual Meeting of the Classification Society (North American Branch),Clemson University (Clemson, South Carolina), May 21-23, 19781.
3. Lennington, R. K.; and Rassbach, M. E.: Mathematical Description andProgram Documentation for CLASSY, An Adaptive Maximum Likelihood Clustering
Method. LEC-12177 (JSC-14621), April 1979.
4, Lennington, R. K.; and Rassbach, M. E. CLASSY An Adaptive Maximum
Likelihood Clustering Algorithm. Proceedings of Technical Sessions,Volume 11, LACIE Symposium, October 1978, JSC-16015 (Houston, Texas),July 1979.
5. Duda, R. 0.; and Hart, P. E.: Pattern Classification and Scene Analysis. i
John Wiley and Sons (New York), 1973.
6. Wolfe, J. H.: Pattern Classification by Multivariate Mixture Analysis.Multivariate Behavioral Research, vol. 5, 1970, pp. 329-350.
7. Thadani, S. G.: A Nonparametric Loss-Optimal Pattern Classification
} System. LEC-11451 (JSC-13901), April 13, 1978.
8. Berkson, J.: Estimation of a Linear Function for a Calibration Line.Technometrics, vol _11, 1969, pp. 649-660.
g . Saw, J. C.: Letter to the Editor. Technometrics, vol. ,12, 1970, p. 937.
,g
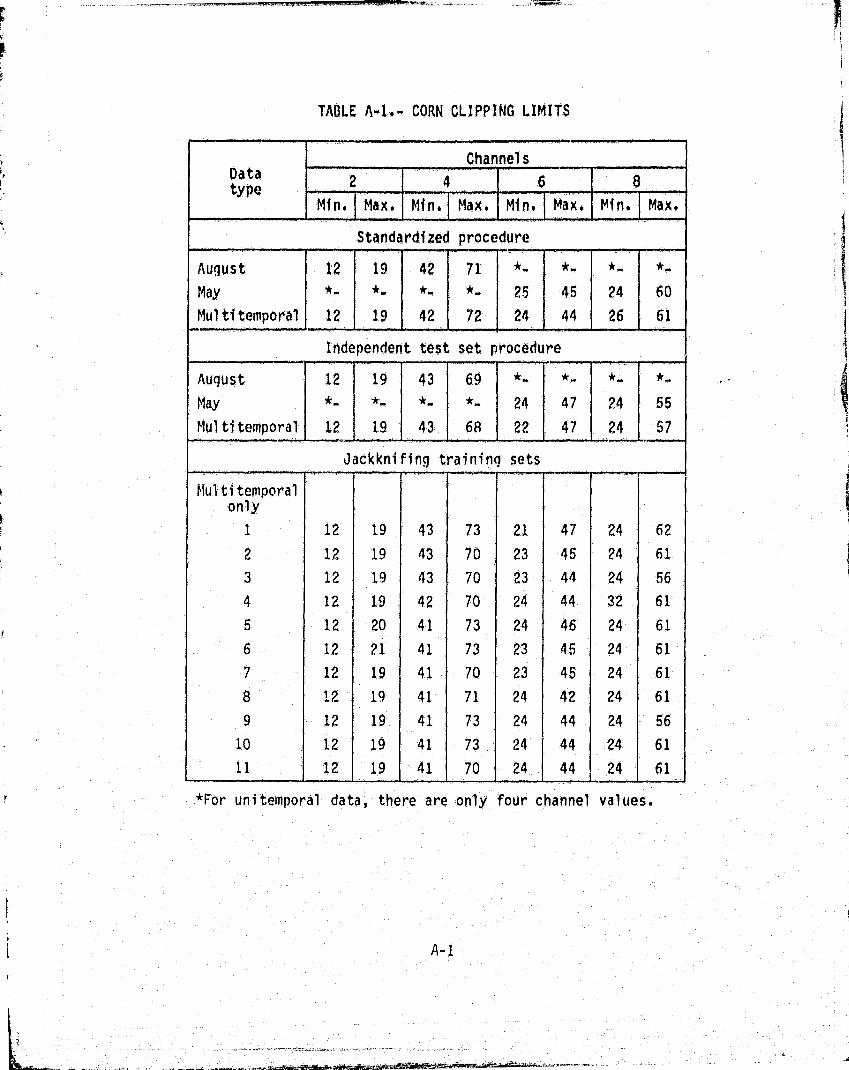
TABLE A- 1,- CORN CLIPPING LIMITS
i
ChannelsData
type2 4 6 8
n.Max f Min, Max. Min. Max. Min. Max.
Standardi zed procedure
Augus t 12 19 42 71 *,. *»,. *,.
May *- - *- *- 25 45 ?4 60
Multitemporal 12 19 42 72 24 44 26 61
Independent test set procedure
August 12 19 43 69 *.. *..,
May *- *- *- *_ 24 47 24 55
Multi temporal 12 19 43 68 22 47 24 57
Jackknifing training sets
Multitemporalonly
1 12 19 43 73 21 47 24 62
2 12 19 43 70 23 45 24 61-
3 12 19 43 70 23 44 24 56
4 12 19 42 70 24 44 32 61
5 - 12 20 41 73 24 46 24 61
6 12 21 41 73 23 45 24 61
7 12 19 41 70 23 45 24 61
G 12 19 41 71 24 42 24 61
9 12 19 41 73 24 44 24 56
10 12 19 41 73 24 44 24 61
11 12 1 19 1 41 1 70 1 24 1 44 24 1 61
I
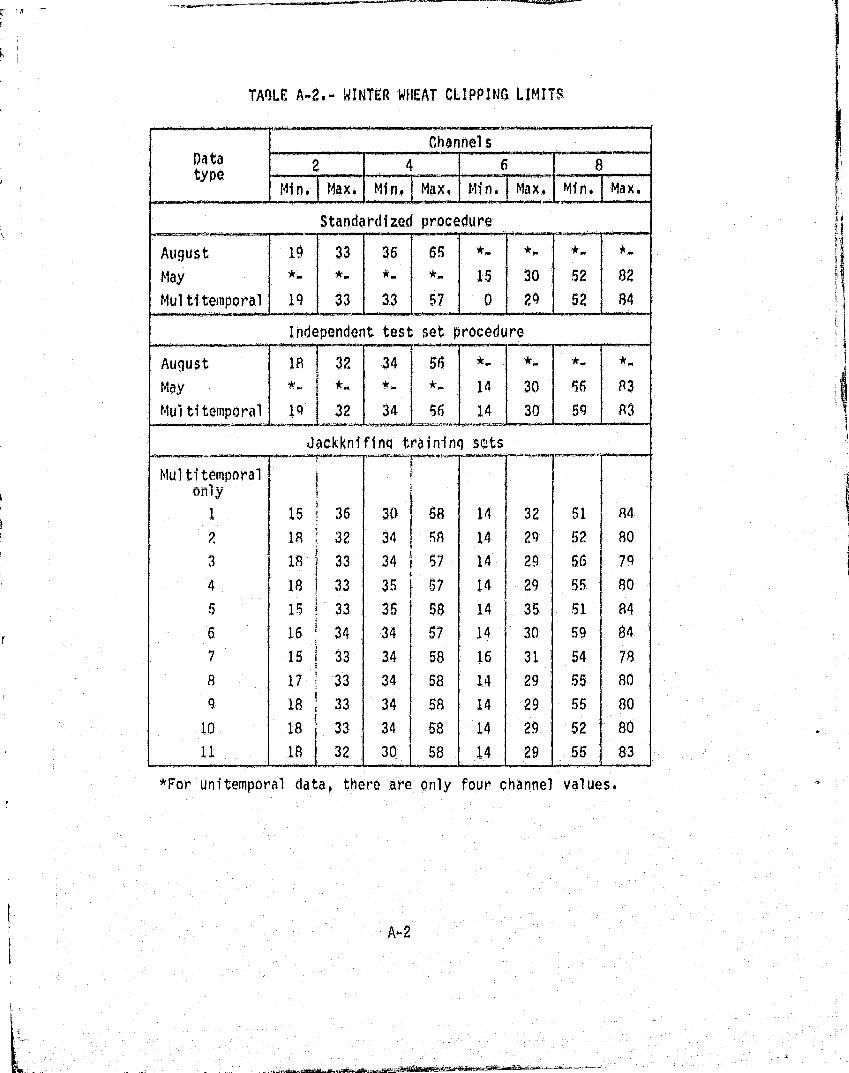
ChannelsDo to 2 4type
Mina Max, Min. Max. Min. Max, Min, Max.
Standardized procedure
August 19 33 36 6 * *- *• *-
May 15 30 52 82
Mul ti temporal 19 33 33 57 0 29 52 84
Independent test set procedure
August 1s 32 34 56May *- * *- * 14 30 55 83
Muititemporal 1 Q 32 34 56 14 30 59 R3
Jackknifing training sets
Mul ti temporalonly
1 15 36 30 58 14 32 51 84
2 1R 32. 34 58 14 29 52 80
3 18 33 34 j 57 14 29 50 79
4 18 33A
35 57 14 24 55 80
5 15 33 35 58 14 35 51 84
6 16 34 344
57 14 30 59 84
7 15 33 34 58 16 31 54 78
8 17 33 34 58 14 29 55 80
9 18 33 34 58 14 29 55 80
10 1$ 33 34 58 14 29 52 80
11 188 32 30 58 14 29 15 83
i
i
TAM A-2.- WINTER WHEAT CLIPPING LIMITS
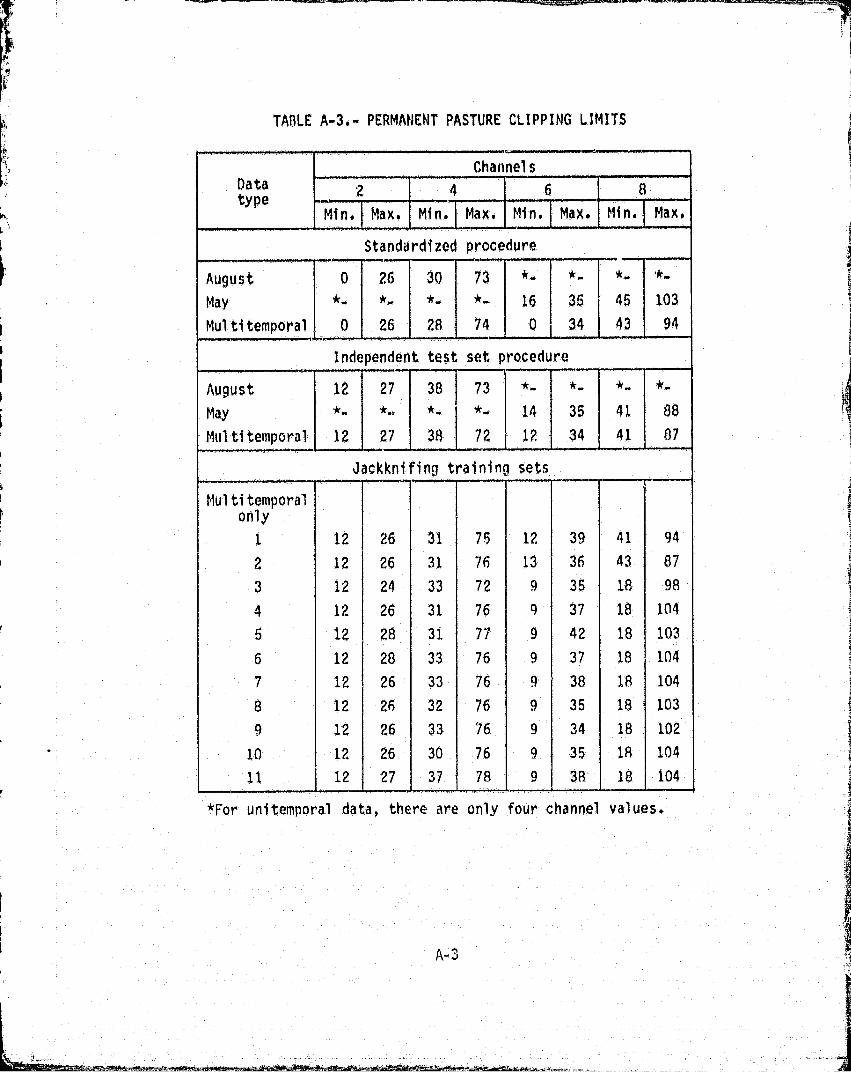
TABLE A-3.- PERMANENT PASTURE CLIPPING LIMITS
fi
f
^a
Charnel sData z
- 4
.8type
Min. Max. Min. Max. Min. Max. Min. Max.
Standardized procedure
August 0 26 30 73
May 16 36 45 103
Multitemporal 0 26 28 74 0 34 43 94
Independent test set procedure
August 12 27 38 73
May *- *i4 *- *- 14 35 41 88
Mul titemporal 12 27 38 72 12 34 41 87
Jackknifing training sets
Mul ti temporal
only
1 12 26 31 76 12 39 41 94
7 12 26 31 76 13 36 43 87
3 12 24 33 72 9 36 18 98
4 12 26 31 76 9 37 18 104
5 12 28 31. 77 9 42 18 103
6 12 28 33 76 9 37 18 104
7 12 26 33 76 9 38 18 104
8 12 26 32 76 9 35 18 103
9 12 - 26 3 l6 9 34 18 102
10 12 26 30 76 9 36 18 104
11 12 27 1 37 1 9 38 18 104
i
i4a
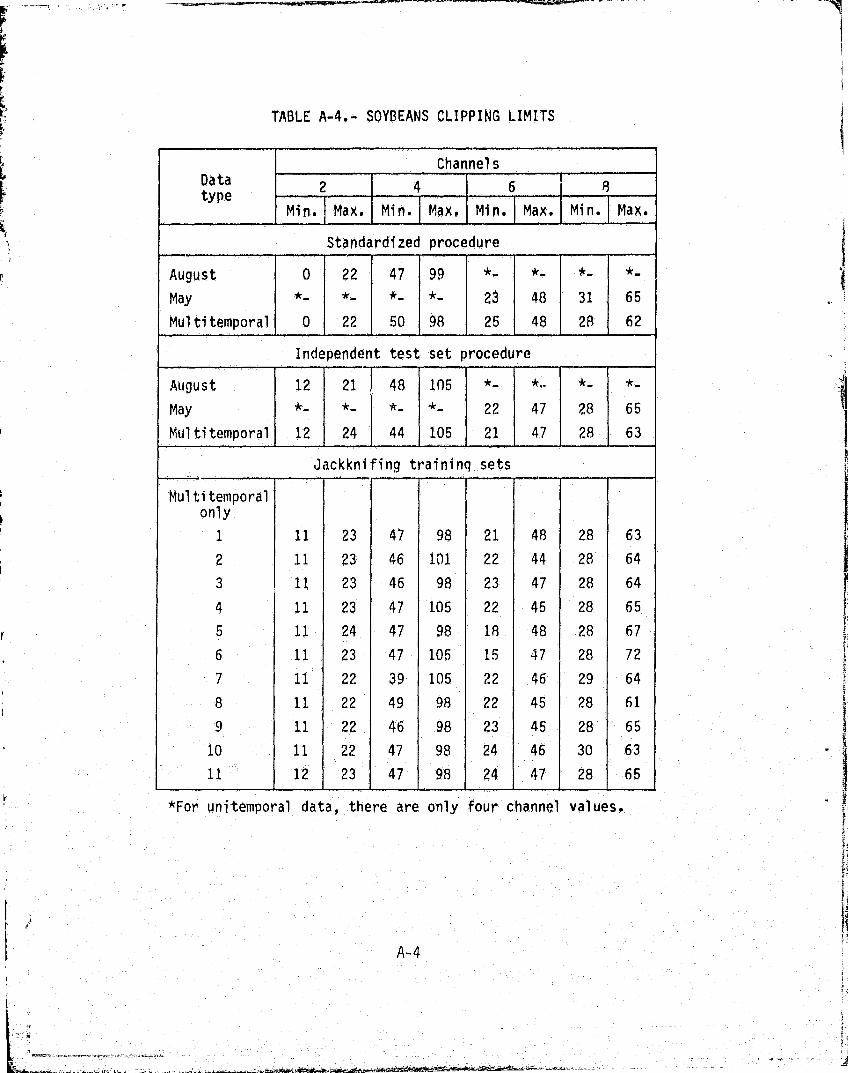
s
TABLE A-4.- SOYBEANS CLIPPING LIMITS
ChannelsData 2 4 6 1
8type
Min. Max. Min. Max. Min. Max. Min. Max.
Standardized procedure
August 0 22 47 99 *., *_ *.._
May *- *- *- *- 23 48 31 65
Multitemporal 0 1. 22 50 98 25 48 28 62
Independent test set procedure
August 12 21 I 48 105
May *- *- *- *- 22 47 28 65
Multitemporal 12 24 44 105 21 47 28 63
Jackknifing training _sets
Mul-ti temporalonly
1 11 23 47 98 21 48 28 63
2 11 23 46 101 22 44 28 64
3 11 23 46 98 23 47 28 64
4 11 23 47 105 22 45 28 65
5 11 24 47 98 18 48 28 67
6 11 23 47 105 15 47 28 72
7 11 22 39 105 22 46 29 64
8 11 22 49 98 22 45 28 61
9 11 22 46 98 23 45 28 65
10 11 22 47 98 24 46 30 63
11 12` 23 47 98 24 47 28 65
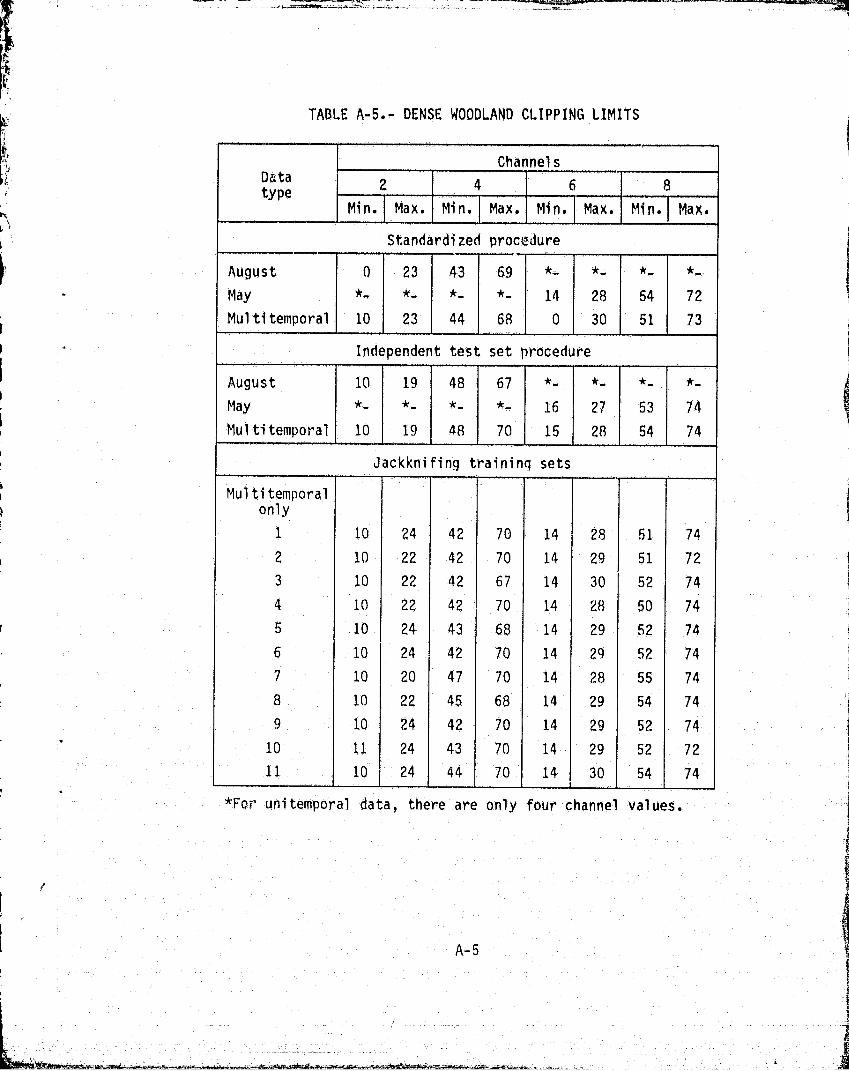
z
^xf'
rs. I r
TABLE A-5. DENSE WOODLAND CLIPPING LIMITS
ChannelsDatatype
2 4 6 8Mi n. Max. Min. I Max. Min. Max. Mina Max.
Standardized procedure
August 0 23 43 69
May 14 28 54 72
Multitemporal 10 23 44 68 0 30 51 73
Independent tent set procedure
August 10 19 48 67
May *- *- *- *- 16 27 53 74
Multitemporal 10 19 48 70 15 28 54 74
Jackknifing trai ninq sets
Multitemporal
only
1 10 24 42 70 14 28 51 74
2 10 22 42 70 14 29 51 72
3 10 22 42 67 14 30 52 74
4 10 22 42 70 14 28 50 74
5 10 24 43 68 14 29 52 74
6 10 24 42 70 14 29 52 74
7 10 20 47 70 14 28 55 74
10 22 45 68 14 29 54 74
9 10 24 42 70 14 29 52 74
10 11 24 43 70 14 29 52 72
11 10 24 44 70 14 , 30 54 74-
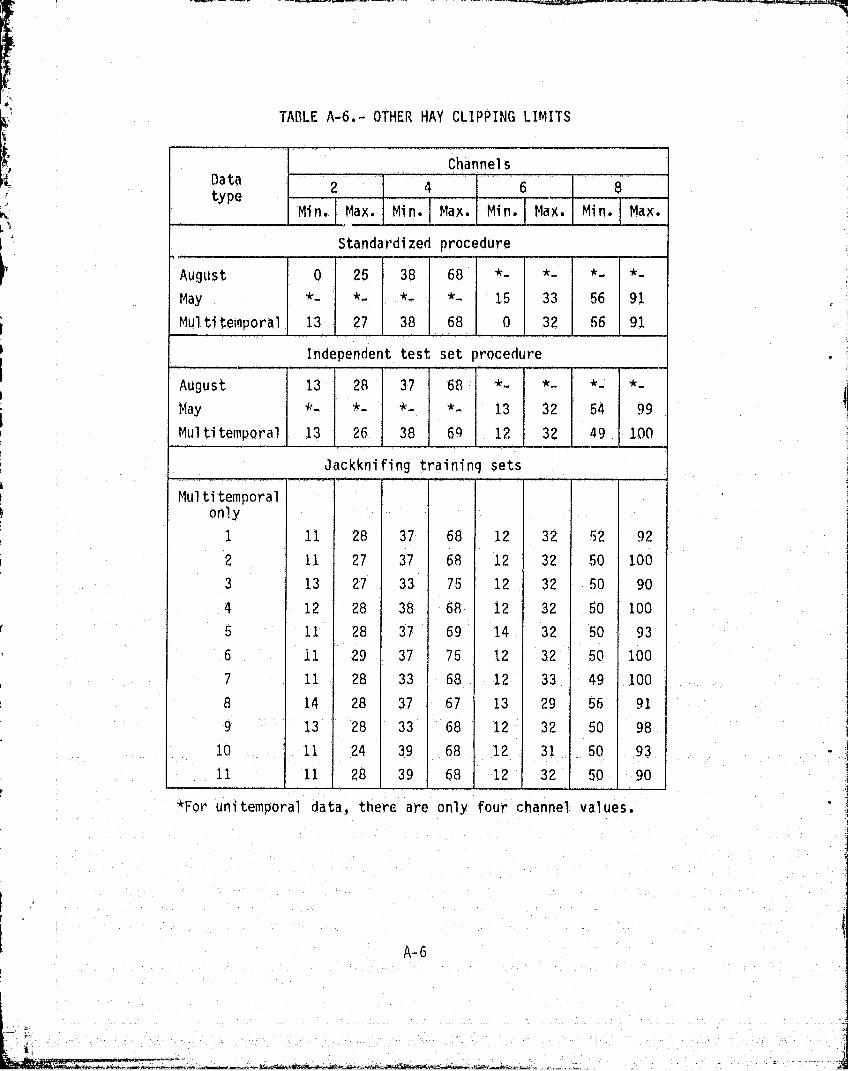
TABLE A-6.- OTHER HAY CLIPPING LIMITS
ChannelsData
_ 2 4 6 8type --•
Min. Max. Min. Max. Min. Max. Mind Max.
Standardized procedure
August 0 25 38 68
May *- *-- *- 15 33 56 91
Multi temporal 13 27 38 68 0 32 56 91
Independent test set procedure
August 13 28 37 68
May lr- *- *- *- 13 32 54 99
Multitemporal 13 26, 38 69 12 32 49 100
Jackknifing training sets
Multitemporalonly
1 11 28 37 68 12 32 92 92
2 11- 27 37 68 12 32 50 100
3 13 27 33 75 12 32 50 90
4 12 28 38 68 12 32 50 100
5 11 28 37 69 14 32 50 93
6 11 29 37 75 12" 32 50 100
7 11 28 33 68 12 33 49 100
8 14 28 37 67 13 29 56 91
9 13 28 33 68 12 32 50 98
10 11 24 39 68 12 31 50 93
11 11 28 39 68 12 32 50 90
iiI
i
`^T>>
d
^T
A
4
4
a
i APPENDIX A3
14AP OF MI'SSOURI VMITH SEGMENT LO^CATIQNS
i
r
r
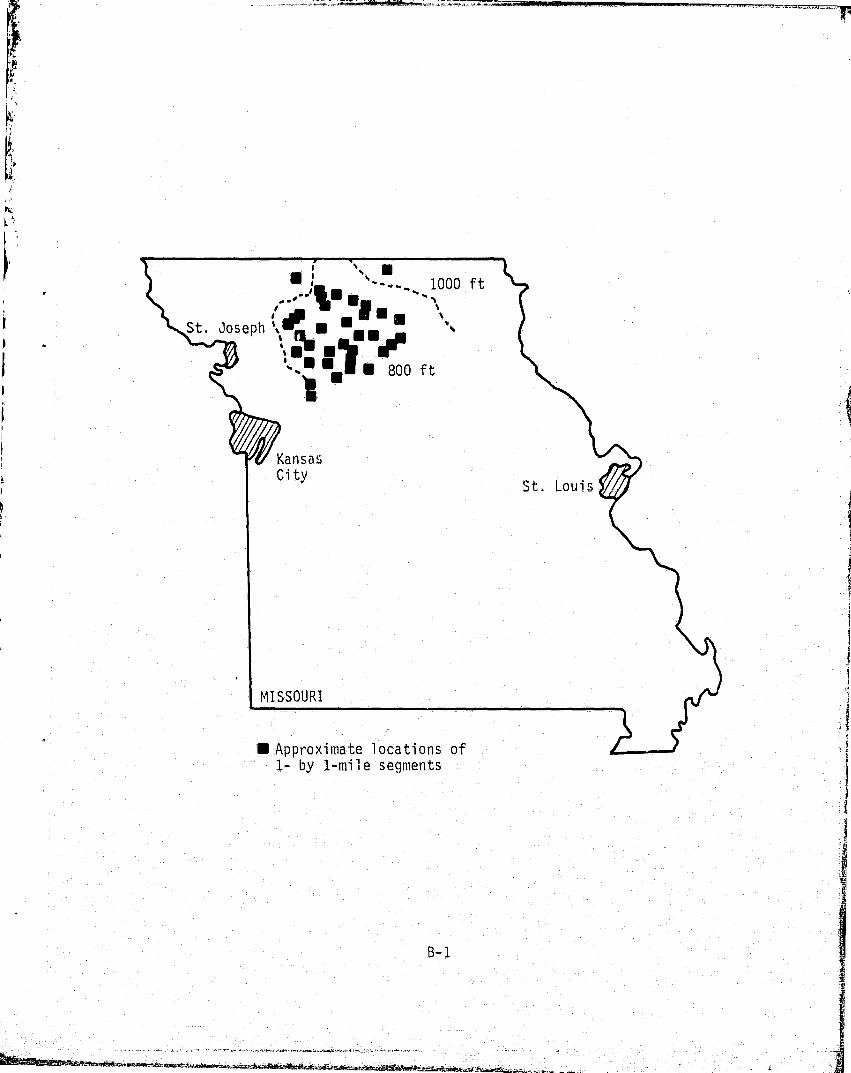
_
1000 f ti
IN NSt, Joseph ``dP n •••
^•^ • 800 ft
•
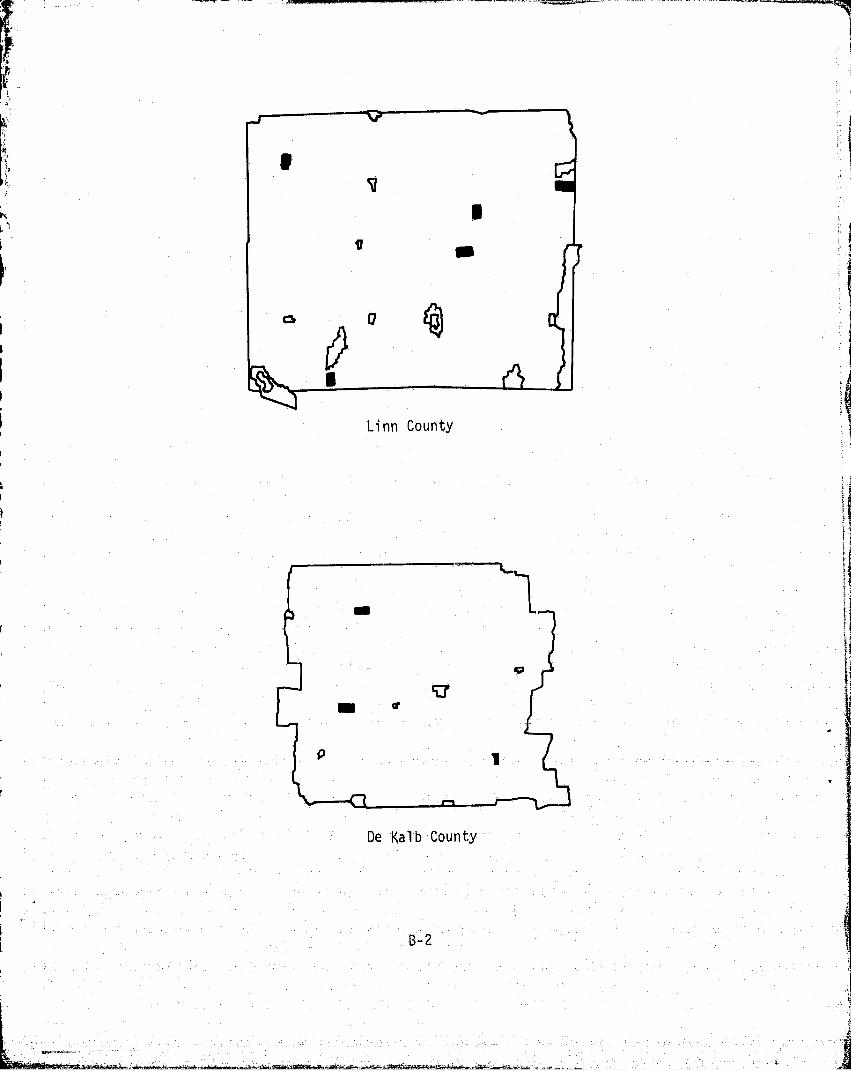
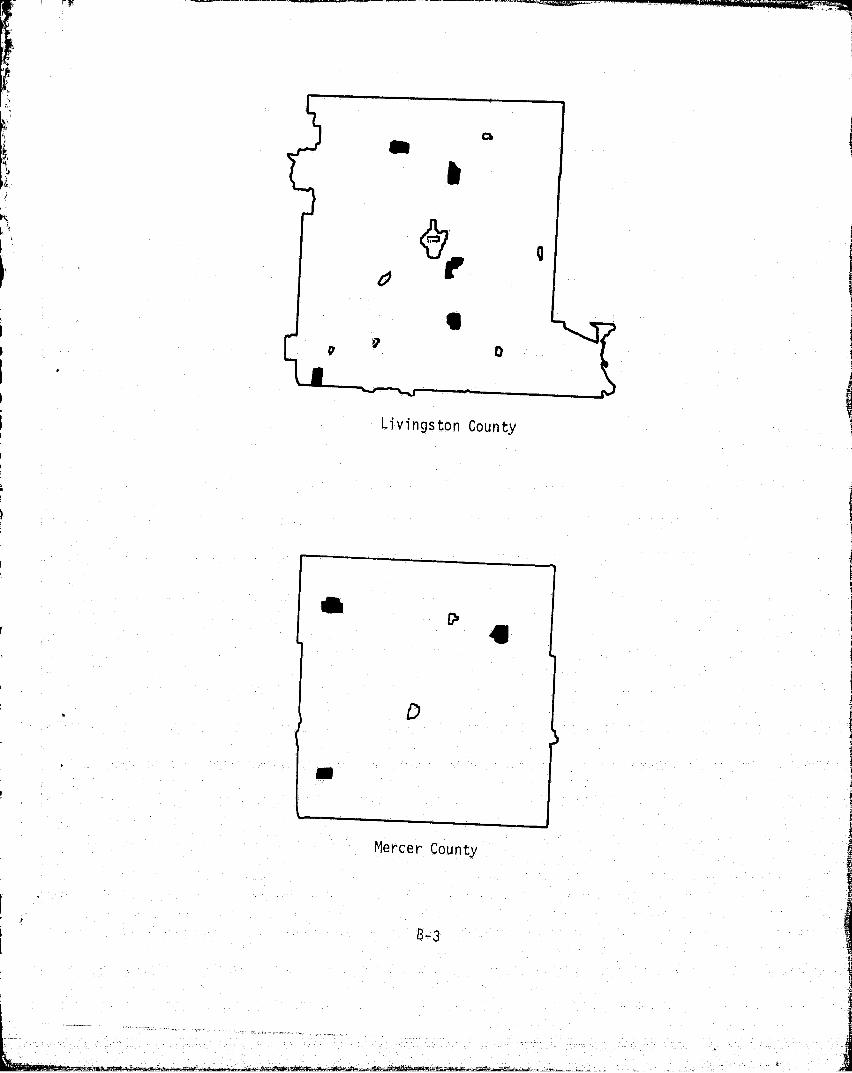
r^^.
we^%
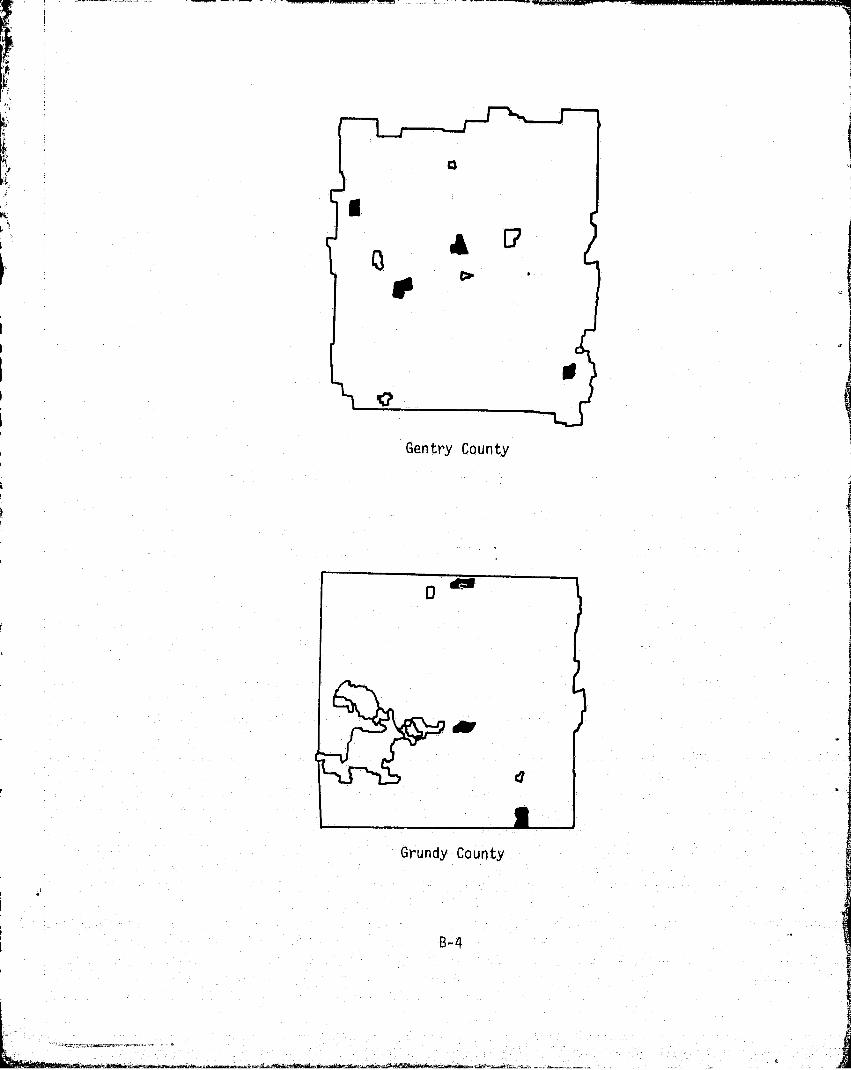
Gentry County
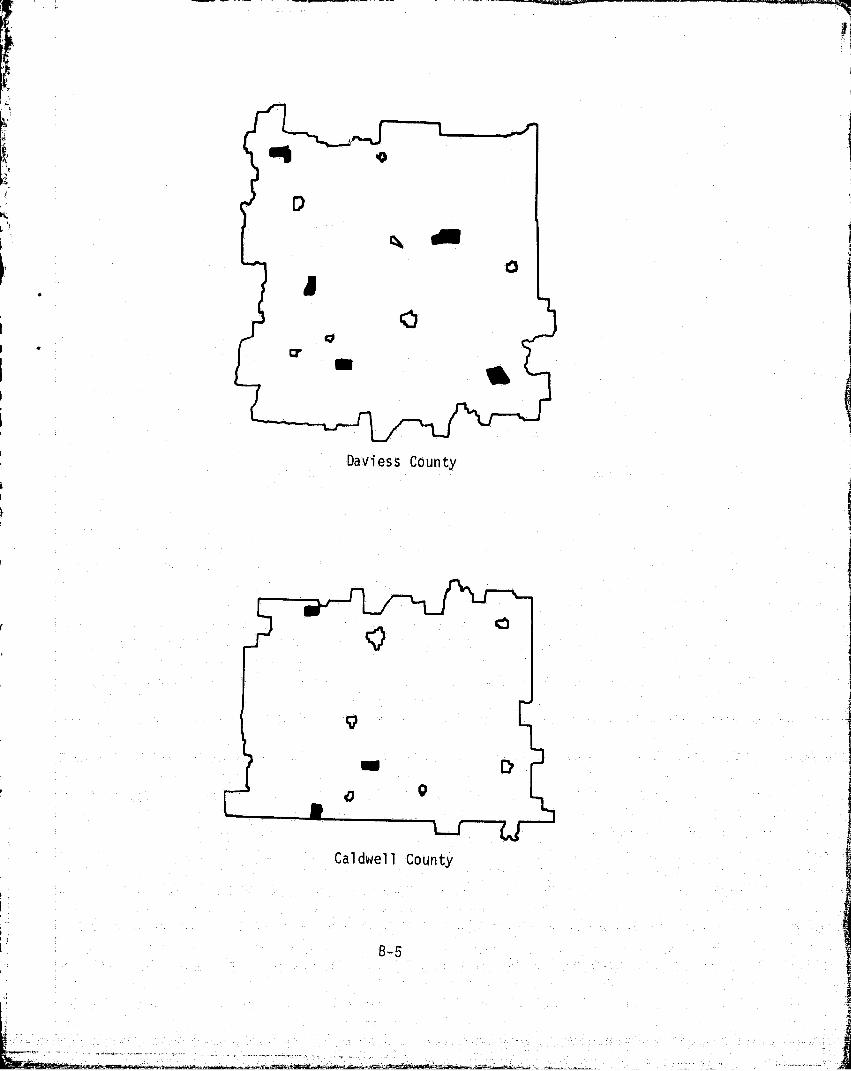
Davess County
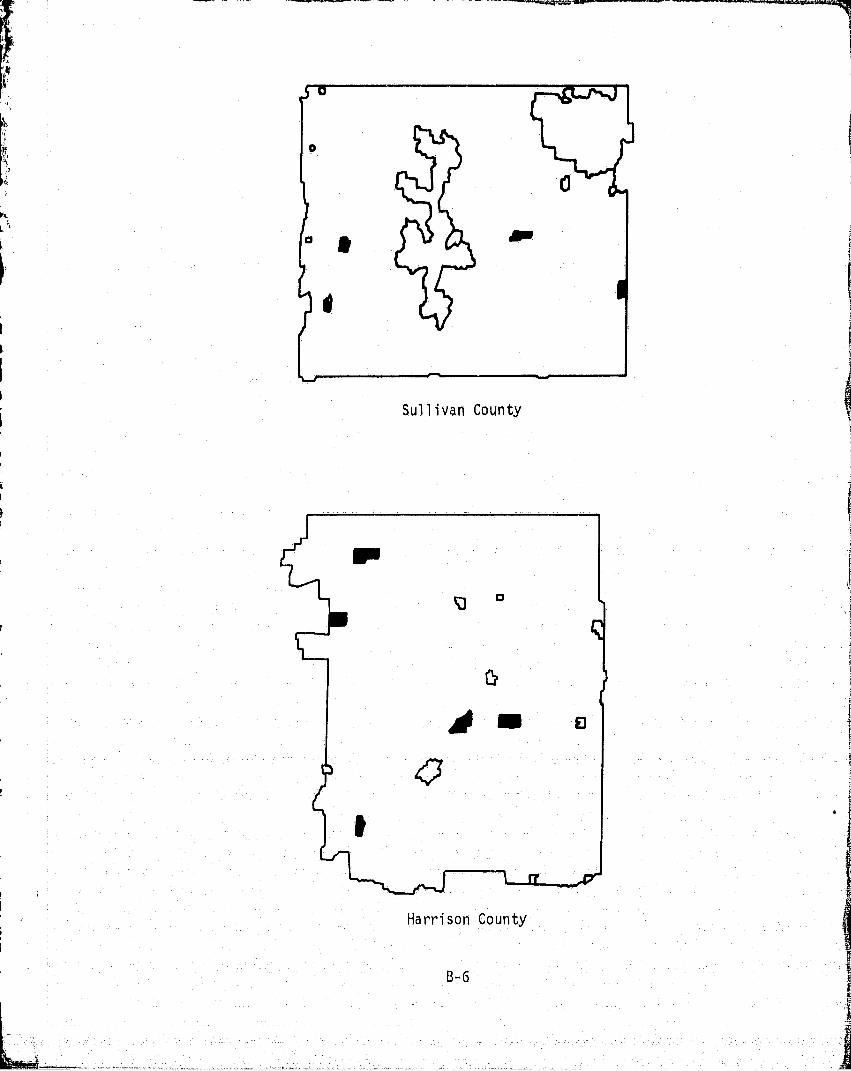
^.
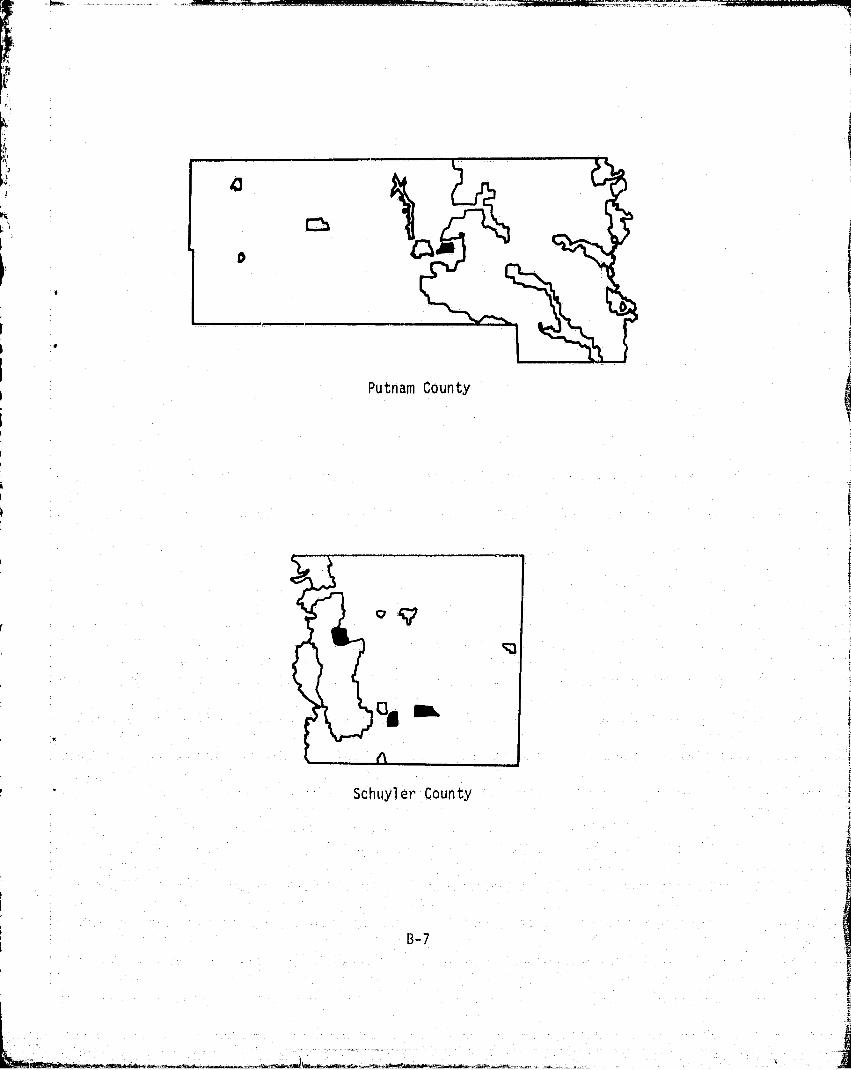
Putnam County
r
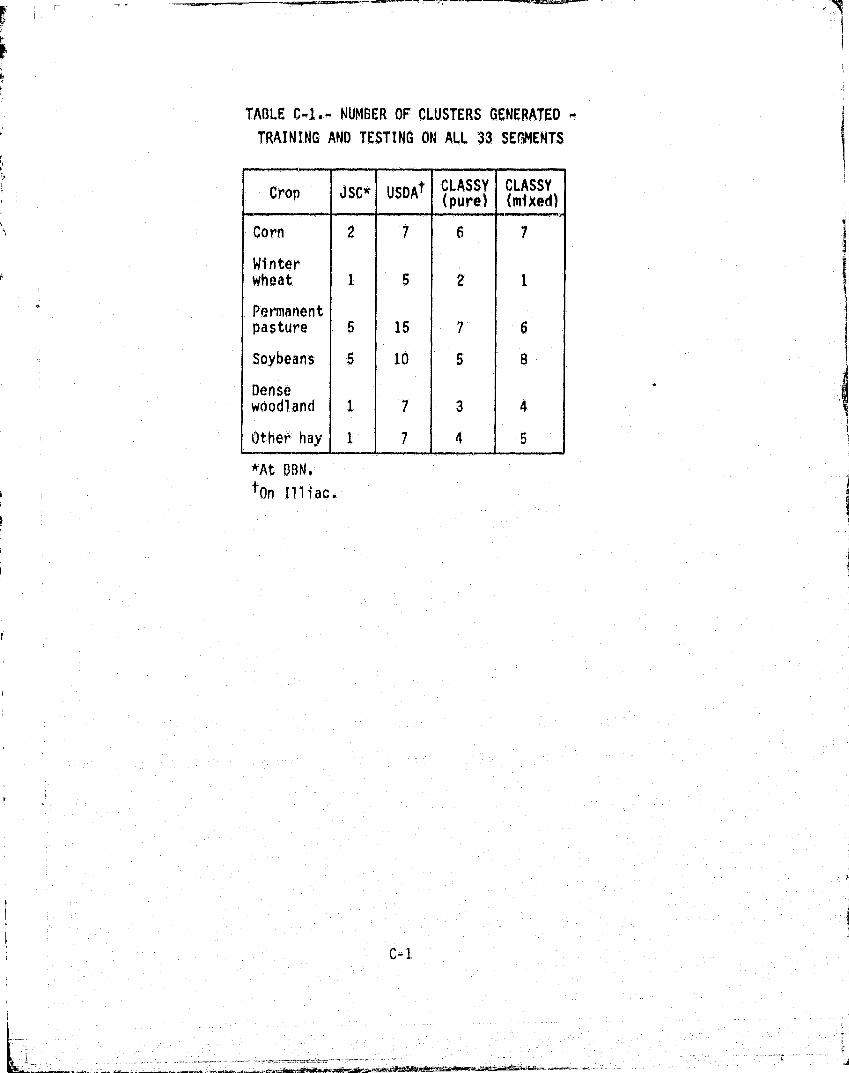
TABLE E-1.- NUMBER OF CLUSTERS GENERATED
TRAINING AND TESTING ON ALL 33 SEGMENTS
i
Cron JSC USDAt(pure) (mixed)
Corn 2 7 6 7
Winterwheat 1 5 2 1
Permanentpasture 5 15 7 6
Soybeans 5 10 5 8
Densewoodland 1 7 3 4
Other hay 1 7 4 5
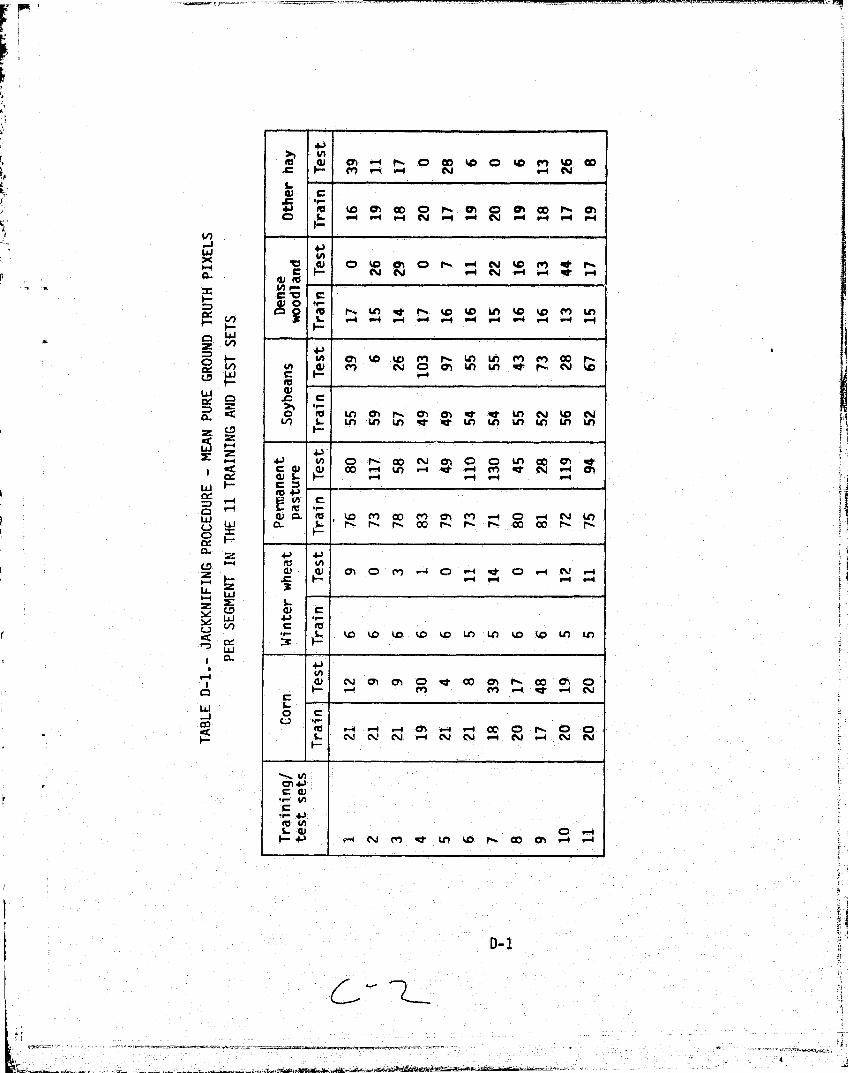
4.)V)
0)
41 (a iD m OO O P% m 0 m P.- mCD v-4 P-4 P4 C44J P-0 P-4 M v-4 P-4 P-4 r-f
41(A
0 kc 0) 0 r, -.4N
wc C*j P-4 P-4 IW "4
4A
0f" r.. LO 41* rl. w w Ln tD ko m Ln
s-4 -4 P-4 P-4 P-4 P • r-4 r-4 v-4 -4 P-4
4-)W m rl + L9) U") m m co I -
0 M N 0 05 ul Ul -r
0 to U) 0) P► 0) CY) 4w of LC) N %D C14Ln U.) LA Lo et 4e Li) LA Ln Ln LO W)
+j in CD fl- OD C%J c) C Q Ln cc 0) Rt00 V-4 Lo V-4 at V-4 m Olt " 0-4 0!
9-4 V-4 r-4 r-f
M 4-)
E4A cM r-
(L) CL m to m OC) M CY) M v1 C) v-4 (%JpCL r" co r" r- f- co co r- Pp
4) 01 CD M 4 C%J r-4-4 ^4 V-4 V-4
S- kO tD tD tO tD LO U) tD tO LA*) Ln:3c F-
4J04) .N-! 0) 0) CD mt 00 m r- co m 0
r-4 wAr ^4 oj
r-4 r 4 v-4 4M -4 V-4 CC 0 P. O QS- MI " -4 N N 4 M 4 NF-
Mme ''4J
to
4-) F-4 N m 4tt LO to n w m 9-4 0-4
uiX0.4Cl-
'UJ
Zim
t000)OC)ck: LLJ
Lil
O
0.4
0.4
UJce
OwL)
wC)MCL-Lo
U-ui
Nd wYL.) LO
cewCL
w-iC.0F-
Al
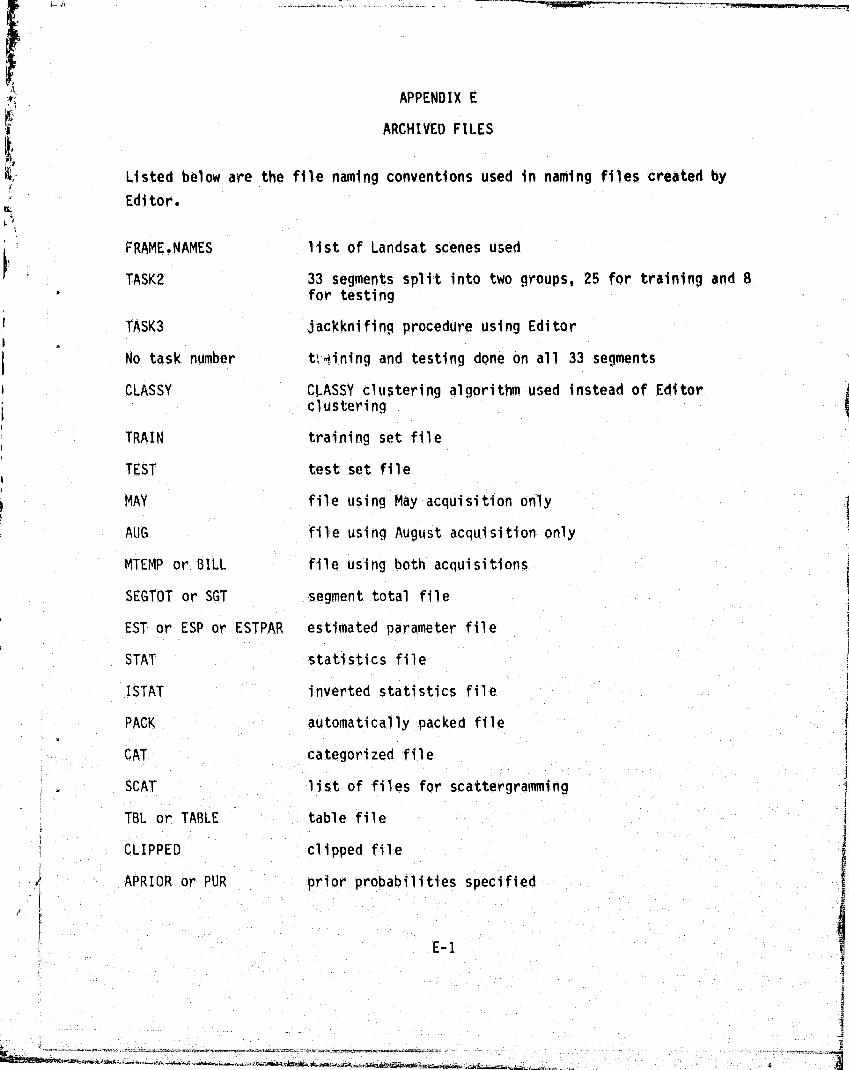
APPENDIX E
ARCHIVED FILES
Listed below are the file naming conventions used in naming files created by
Editor.
FRAME-NAMES list of Landsat scenes used
fk TASK2 33 segments split into two groups, 25 for training and 8for testing
TASKS Jackknifing procedure using Editor
j No task number t4ining and testing done on all 33 segments
i CLASSY CLASSY clustering algorithm used instead of Editorclustering
TRAIN training set file
w TEST test set file
MAY file using May acquisition only
AUG file using August acquisition only
MTEMP or BILL file using both acquisitions
SEGTOT or SGT segment total filej
EST or ESP or ESTPAR estimated parameter file
STAT statistics file1
ISTAT- inverted statistics file s
PACK automatically packed file
CAT categorized file 1
SCAT list of files for scattergramming
TBL or TABLE table file
CLIPPED clipped file
APRIOR or PUR prior probabilities specified°' I
('- E-1
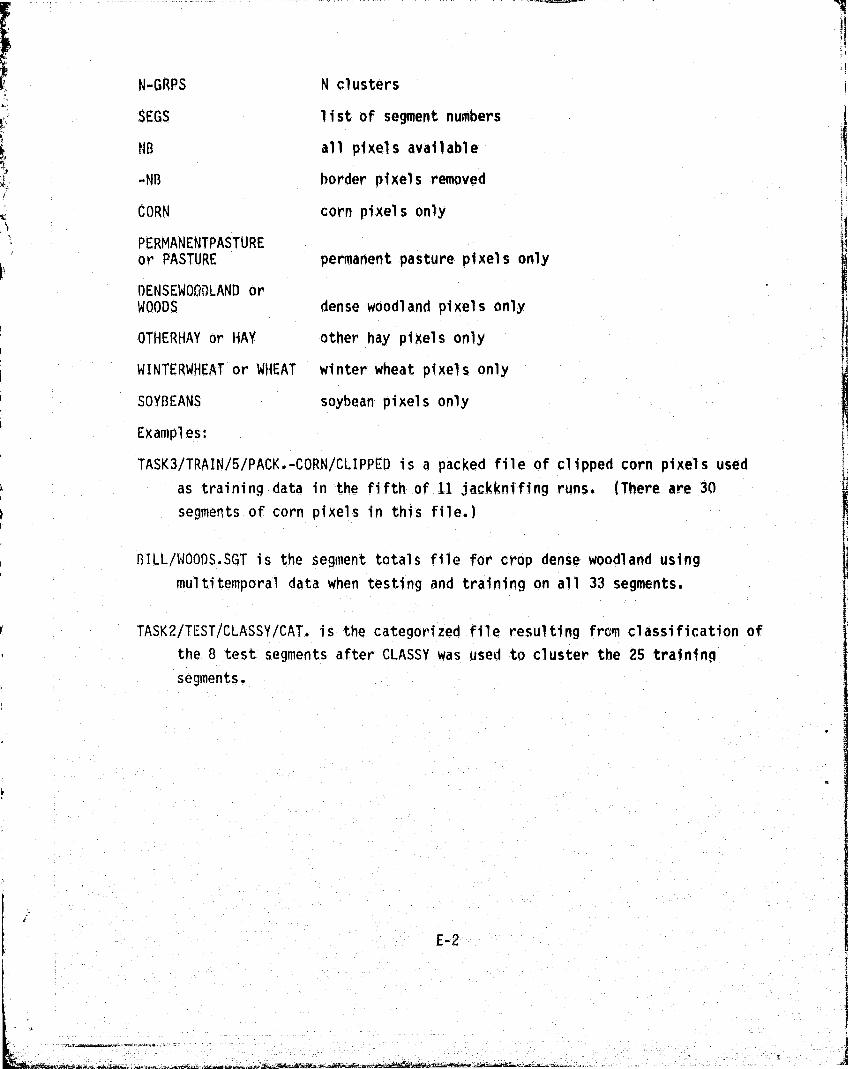
N-GRPS N clusters
SEES list of segment numbers
NB all pixels available
-NB border pixels removed
CORN corn pixels only
PERMANENTPASTURE
or PASTURE permanent pasture pixels only
DENSEWOO LAND orWOODS dense woodland pixels only
OTHERHAY or HAY other hay pixels only
WINTERWHEAT or WHEAT winter wheat pixels only
SOYBEANS soybean pixels only
Examples:
TASK3/TRAIN/5/PACK.-CORN/CLIPPED is a packed file of clipped corn pixels used
as training data in the fifth of 11 jackknifi ng runs. (There are 30
segments of corn pixels in this file.)
BILL/WOODS.SGT is the segment totals file for crop dense woodland using
multitemporal data when testing and training on all 33 segments.
r TASK2/TEST/CLASSY/CAT. is the categorized file resulting from classification of
the 3 test segments after CLASSY was used to cluster the 25 training
segments.
Fk
E-2
.. .ees..,...r^^xe^c^c.ax.PSmr^roe...xi^„rxws^aa^ ` ^^^'4 ^»nncss.^5°7F-• " r-+db_;_a^a.,,^..a. .., .,. .. .. _ ,.. ..
<JSCA-RAMS. NAMES
<JSC>TASK /TRAIN.SEGSi2
<JSC>TASK2/TEST.SI:QS 2
< JSCMAYMHEAT. 5STPAR; I< JSCMAYMMCAT. SECITOT; I<11SOMAY/TABLE.; 4<J$C>MAY/STAT.-WINTERWtir.AT/CLIP;I<JSC>MAY/STAT.15-QRPS/CLXP/EP;l<JSC>MAY/STAT.-OTHCR14AY/CLIP;I<JSC>MAY/STAT,-DCNSE!400DLAND/CLIP;I<JSC>MAY/STAT.-SQ)'OEANS/CLIP;l<JSC>MAY/STAT.-PERMANi r.NTPASTURE/CLIP;I<JSC>MAY/$TAT.-CORN/CLIP;l<JSC>MAY/SOYSEANS.ESTPAR;l<JSC>HAY/SOYBEANS.SEQTOT;l<JSC>MAY/PERMPAST-ESTPAR;l<JSC>MA)'/PCRMPAST,SEGTOT;l<JSC>MA1'/PACK.-PERtIANCNTPASTURE/CLIP;1<JSC>MAY/PACK--DTHERHAY/CLIP;l<JSC>MAY/PACK.-DENSEWOODLAND/CLIP;I< JSC>tlA)'/PACK - -SOYS ANS/CLIP; I< J5C>MA)'/PACK. -14INTERWHEAT/CLIP; I<JSC>MAN'/PACK,-CURN/CLIP; i<JSC;IMAY/PACK.-OTHERHAY/11079;1<JSC>MAY/PACK.-DENSEWOODLAND/MO79;1< JSC MAY/ PACK. -83 0)'BEANS/M07.5; I<J$C>tlA^'/PACK.-PERMANENTfloSTURE/MQ7S;I<JSC>MAY/FACK.-WINTERWIAEAT/M07S?'I<JSC>HAY/PACK.-CORN/MO7S;1<JSC>MAY/PACK.-NS/MQ70;1< JSC XMAY/ PACK ,. NB /M079; I<JSC>MAY/ISTAT.tV-ORPS/PUR;l<JSC>MAYY'ISTAT.15-GRPS/EP;i<JSC>MAY/HA)'.ESTPAR;l<JSC>MAY/HAY.SEGTOT;l<JSC>MAY/DENSEW0Q0S.ESTPAR;1< J SC>MA MENSE14000S, SEOTOT O, i< JSC >MA)' /CDRN * E5TPAR; I<JSC>MAY/CORN.GEGI -OTf i<JSC>MAY/CAT.;l
<JSC>AUVISOYBEANU.-ESTPARAMETER;2<JSC>AUG/SOY8EANS.-SCGTOI *AL;2<JSC>AUO /SAklTAa4E.;2<JS0AUQ/CAT.NB-ZZQPS/PUC;1<JSC>AUG/CAL.PRIQR;l<JSq>AUG/WZNTeRWHEAT.-ESTPARAMETC-R;I<JSC>AUO/W1NTWflMEAT. -SEGTOTAL; I<JOC>AUO/STAT--ZZGPS/EP;l<JSC>AUO/STAT.-OTHERHAY/CLIP;l<JSC>ALJG/STAT.-DENSEHOOPLAND%CLIP;I<JSC>AUa/STAT.-SO) ' BEANS/CLIP;l<JSC>AUCi /STAT.-PERMANCNTPASTURE/CLIP;I<JSC>AUG/STAT.-WINTER14HEAT/CLIP;I<JSC>AUQ/STAT.-CQRN/CLIP;l<JSC>AUG / SO)'BEANS. -EStPARAMETER;I<JSC>AIJG/SQ)'SEANS--SEGTOTAL;l<JSC>AUG/SAYTA$LC.*r i<J6C>AUG/PERMPAST.-SEGTPTAL^l<JSC>AUO/PACK.-SOYBEANSiCLIP;l<JSC>AUG/PACK.-OTHERHAY/CLIP;l<.)SC>AUU/PACK.-DKNSEWOODLAND/CLIP;I<J$C>AUO/PACK.-PEiiMANENTPASTURE/CLIP;,i<JSC>AUCIPACK.-WINTERWHEAT/CLZII;I<JSC>AUQ/PACK.-CORN/qLIP;l<JSC>AUQ/PACK.-NB/MD79;1<JSC>AUO/PACX,ND/PIQ7S;1<J.SC>AUG/D!'HER14AY.-6STPARAMPTER;I<JSC>AUG/OTHERI•IAI*. -SECT i OTAL; I<J$C>AUG/fSTAT,-Z'QPS/PUR;l(JSC>AUG/ISTA-T.-ZzGpWEp;l<JSC>AU6/0r.NSEWO.-ESTPARAMEI'ER;l<JSC>AUG/I)ENSEWD.-SEGTOTAL;l<)SC>AUQ/COPN.-ESTPARAMETEI?f'l<JSC>AUG/CORNe-SEGTOTAL;!
T110 CCU OV,01 PONO-A
<JSC>DjLI./woODS.Esp;l<JSC>8ILL/WOOVS.$6T;l<JSC>8ILL/WHCAT,,CSP;l<JSC>SILI./WHCAT.SGT;l<JSC>BILL/TBL. ► Z<JSC>DlLL/SUY8EANS.CSP ► 1<JSC>BJ4L/SOYSEANS. SGT; l<JSC>oILL/PA5TURE.ESP;1<JSC>DILL/PASTURE.SOT ► l<JSC>OlLt./PACK.-OT14ERHAY/CLIPPED;I<JSC>ialLL/PACK.-OCNSEWOODLANO/CLIPPED;I<JSC>BILL/PACK,-SOYOFAN$/CLIPPr.D'► I<JSC>BILL/PACK.-PCOMANCNTPASIURE/CLIPPED;tOBIO<JSC>OILL/PACK.-WINTCRWHEAI'/CLIPPCD;I<JS0BILL/PACK.-CORN/CLIPPED;l<JSC>8ILL/PACK,-NO/MO7S;1<JSP>OILL/PACK.NB/MD7S;1<JSC>DILL/ISTAT.ISGRPS/APRIOiR,;Z<JSC>BILL./HAY.ESP ► l<J5C>S144/HAY.SGT;l<JSC>SILL/CORN.ESP;i<JSP>8ILL/CQRN. SGT; l<JSC>BILLICAT.;3
"J
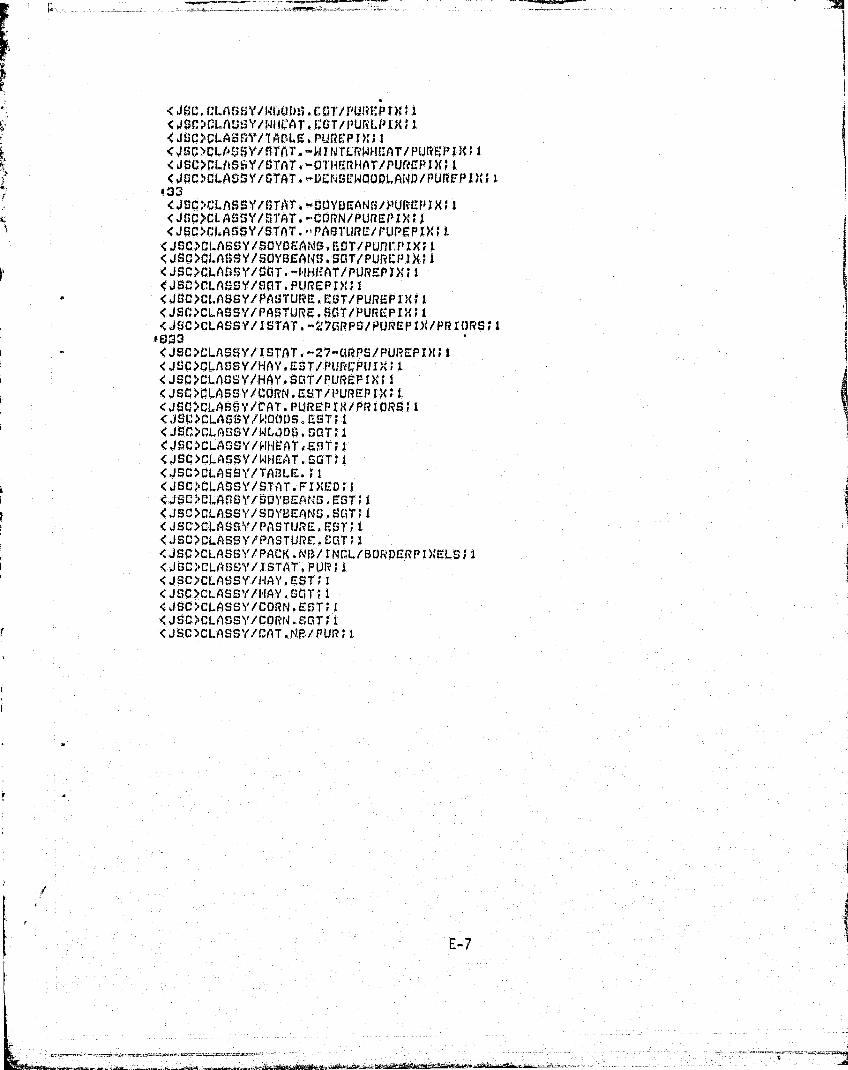
< JqC, CLASSY/14400 1:7. GUT/ PUR61 t). 1* 1
<JSG)GLA ljl 4Y/141W'AT. IXT/1 1URLPIR. I
< JS C>CLAfUS* Y/ STAT - 41 J NTLRWICAT/ PURF, 11 IX; I< JSC>GLA5 l.,'Y/STAT. — OTIiF.:RHAT/PUrMf)D',; I
<JSC>CLAS$Y/STAT. —VENSEWOODLAND/ PUREP IA"; 1#33
J SO >CL ASSY/STAT. -CORN/ PUREP IM I<JSC>CI.ASSYISTAT.---PASI'URe/rLi perix; t
< JSQ >CLASSY/SOYBEANS. gEiT/ p urvl:' Pl X; I< JSC>CLA5SY/.(j'OT . -WHFAT/PUR5P I X; I
< JSC>CLA-dSY/SGT - PUREP IX; I<J$C>C4A$SY/PASTUt`^E.C.UT/PUREPI)(;I<JSC>CLASSY/PASTURC.SGT/PURL:,'.PIX;I< JSC >CLASSY/ I STAT. -270RPS/ PUREP VUPR I ORS; ItE)33
-< JSC>CLASS)'/ I STAT. -27-CIRPS/PUREP Dif ; I<JSC>CLASSY/I-IAY.CST/Pt)r^CP(Jl/t; I<JSC>CLASSY/HAY.SCiT/PUREPI>f;I< JSQ>MASSY/CORN. EST/1 1UREP I X; iZJSC>CI,ASSYICAT.PUREF)XX/PRIORS;i< JSQ CLASSWWOOOS. MST; i<JSG>CLA rjSY/14LQV$. rMT; 1< J $C >CLASSY/ WHEAT a C9T; 1< JSC)CLA5SY/1*MAT. SOT; I<JSC>QLASSY/TABLE.)' l< JSC>CLASt"SY/STAT. FIXED; I<JSa>CLASSY/SQ)'SEANS -EST; I<JSC>CLASSY/SDYBEANS.SCiT;l< JSC>C4.AS5Y/PASTtJrNE. EST; i<JSC>CLASSY/PASTURr.VGT;l< JSQ >CLASSY/ PACK, NV I NCL /BORDER P IXELS; I<JSC:, CLASBY/I8TAT. PUR; I< J$C>CLASSY./IIAN, EST rl< JSC >CLASSY/MAY. SOT; I<JSC>CLASSY/CDRN.E,5T;l<JSC>CLASSY/CORN.SGT; I<JSC>CLASSY/r.AT,NR/PUR;l
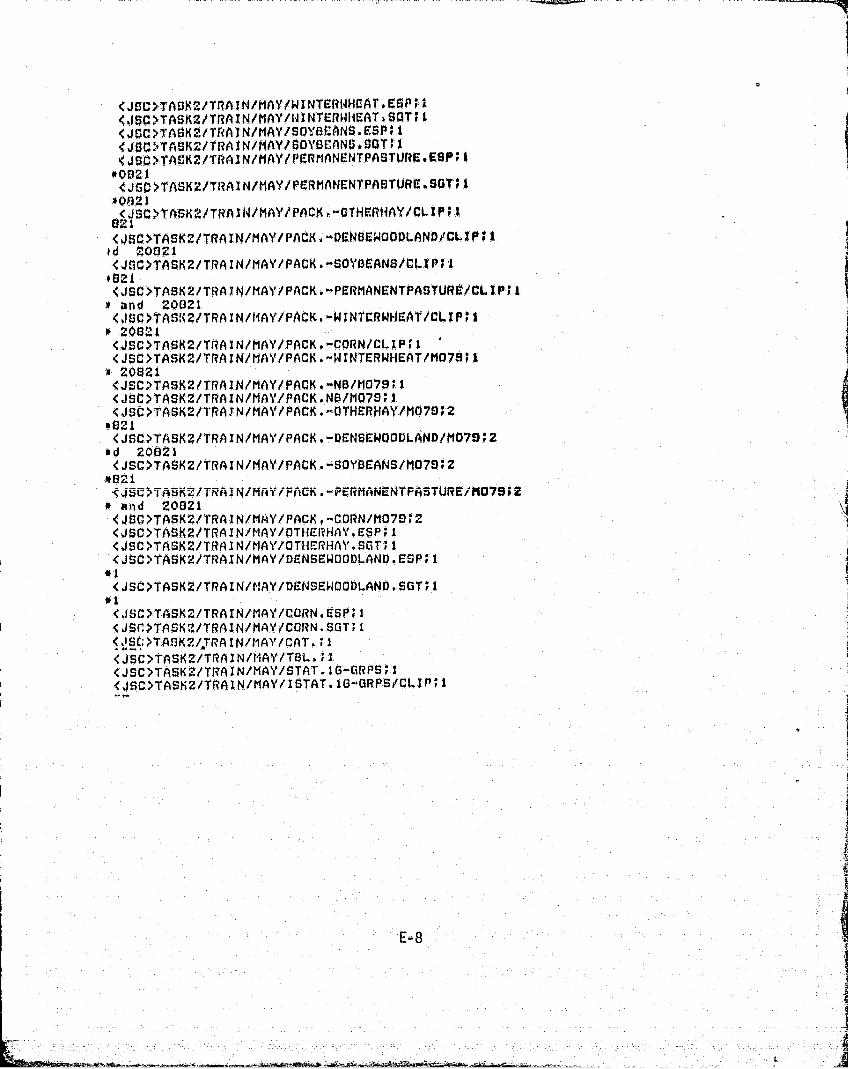
0
<JSC> TASK2/TRAIN/iMAY'/WINTERIJHCAT. ESP;<.ISC>TASK2/TWAIN/MAY/I4INTER WI II:AT ► S GT; I<JBC>TASK2/TRAIN/MAY/SOYBCANS.KSP;1<J$C-, TASK2/ TRAIN /t1AY/S GI YBE> ANO SGTII
<J$C>TAZK2/TRAIN/MAY/PERtIANENTPASTURE.ESP;100021<JGC>TASK2/'TRAIN/MAY/PCRMANENTPASTURE. SGT'i1
a<J$C>TASK2/TRAIN#/MAY/ PACK, -01HERHAY/CE.IP;1
<JSC>TASK2/TRAIN/MAY/PACK.-DENSi rltiODLANA/CLIP#-id 20021<J$C>TASK2/TRAIN/MAY/PACK.-SOYD ANS/CLIPiI*621<JSC>TASKZ/TRAIN/MAN'/PACK.-PERMANENTPASTURC2 !`CLIP11M and 20021<JSOTASS2/TRAIN/MAY/ PACK. -WINTCRWHCAT/ CLIP' i^ ?0021<JSC>TASK2/TRAIN/MAY/ PACK. -CORN/CLIP;I<JSC>TASK2/TRAIN/MAY/ PACK. -WINTERWHEAT/M079II
20821<JSC>TASK2/TRAIN/MAY/PACK.-NC/M07011<JSC>TASK2/TRAIN/MAY/PACK.NB/MO79 ► 1<JSC>TASK2/1'RAFN/MAY/PACK.-OTHERHAY/MO79I2
x021,
<JSC>TASK2/TRAIN/MAY/PACK. —DENSCWOOD44ND/MO79 2Md 20621<JSC>TASK2/TRAIN/MAY/PACK.—SOYBEANS/M07£1.2*621<45C>TASK2/TRAIN/MAY/PACK.-PERMANENTPASTURE/MG7912
R and 20021<JSC>TASKZ/TRAIN/MAI'/PACK.-CORN/MO79P2<JSC>TASK2/TRAIN/MAN''/OTHERHAY.ESP ► 1<JSC>TASK2/TRAIN/MAW/OTHE"RHAY.SOT; I<JSC>TASK2/TRAIN/MAY/DENSEWOODLAND. ESP; I
*1<JSC>TASK2/TRAIN/MAN'/DI NSIEWOODt.AND.SGT ► 1
*1<,JSC>TASK2/TRAIN/MAN`/CORN.f SP I<JSC>T.ASK2/TRAIN/MAN'/CORN.SGT'rl<JSG>T;ASK2/„TRAIN/MAN"/CAT.; 1<JSC>TASK»/TRAIN/IIAY/TSL. 1,<JSC>TASK2/TRAIN/MAY/STAT.16-GRPS ;I
K 6 IN/MAY/I rTAT 1G-M GRPa/ CEr1ni 1<JSC >TAS_»fT A ^
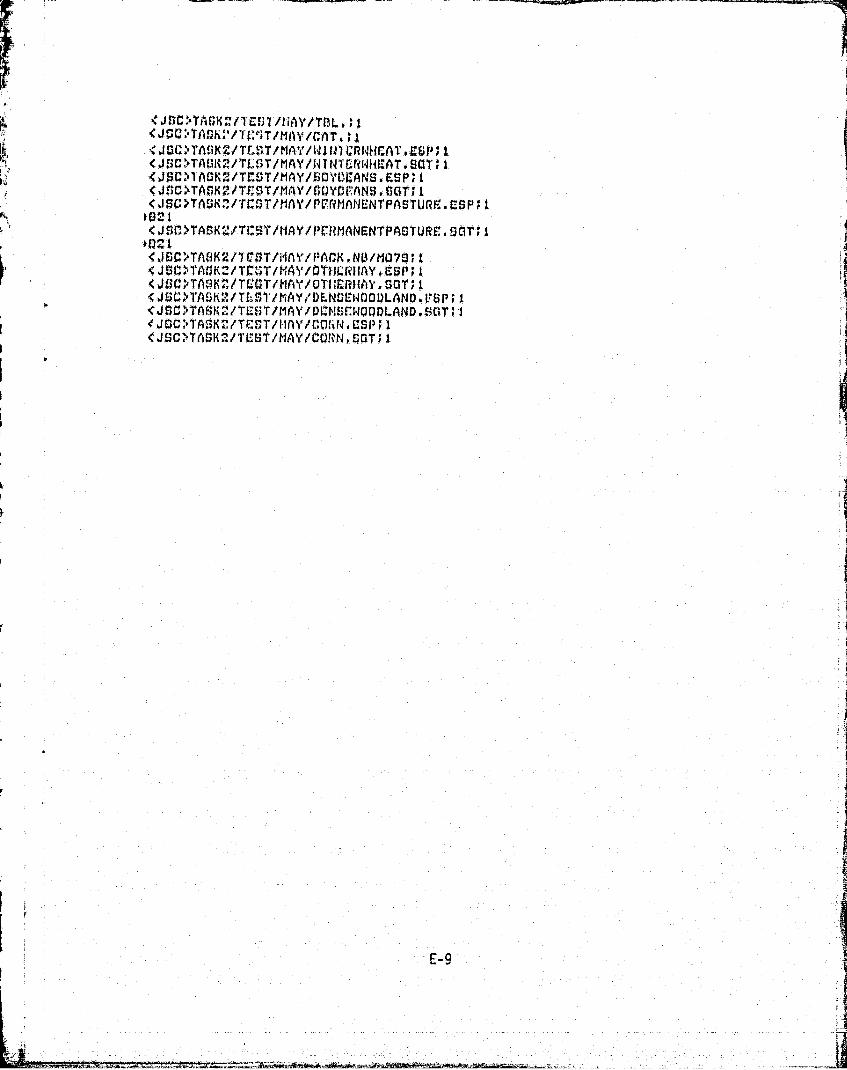
^JSC.'-TAGHZ/TCGl/IiAY/TSL. ' I<J« C TVFIT /MAY /CAT,< JS0TA9K2/TFXT/MAY/W1 III CRNHCAT , 1:$P; I< J90TAVKVTL0T/ MAY /141 WRWHEAT. SOT; I<J$C>I'ACK2/TCST/MAY/60YUCANS, ESP; I< J$C >TASK 2 /TCSTIMAY/ SOYBEANS. SOT; I<J$C>TAUK.I./T.C$T/.MAY/PC'riMAtICNTPASTURP.*.C-SP,* t
1021< J SC ) TASK t.., / TCUT /MAY /PC HMANCNTPAS TURC. 5 OT; 1
1021<JSC>TA.BK2/lCST/i4A`/PACK NO/MU70; I< JSC.s l'ASK"ft/TCOT/MA)'/OTtILRI(AY. ESP; I<Jf)*C,* E TA SKZ/TCOT/MAY/QT[i'LRIIAY. SOT; I<JtU*WTAaKZ/Tl.;SI'/NAY
0SP'DLNSEW0ODLAND.F;l
<J$C>TASK'* /TEUT/MAY/Or^MOrWOODLAND,SPT;JJ QC,*# TASK *'ITCST / MAY / CORN. ESP; I
<JSC>TASK'-'/TEST/flAYICQRN,SOT;I
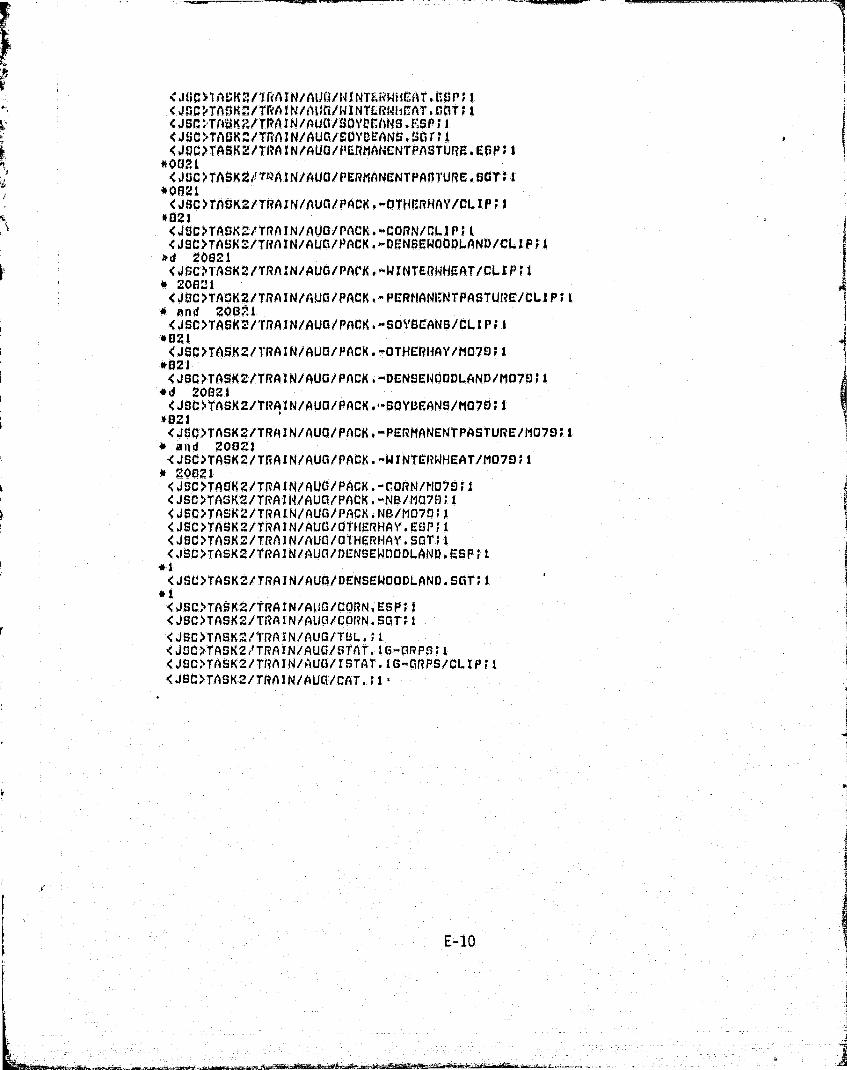
< JIIC^l A'jKZ /I RA I N/AUO/W I NTERWHEAT. Elf< JSCMSK"/TRA I WAUNWINTUNIX AT. G(<J$C'*,TAUK?.ITPAIN/AUG/SOYDCANS.P.SP;;<JSC>TAUK"/TRAIN/AUG/SOYBCANS.sar;^<JVC>TASKZ/I'RA I N/AUO/I'LRMAfXNTPAST(
&Atl #) i
<JUC>TASK2/*TPAIN/AUO/PERMANENTPAOI'URE.SGT;t*0821
<J$C>TASK2/TRAIN/AUS/PACK.-OTHRRHAY/CLIP;10021<JSC>TASK2/TRAIN/AUG/PACK.-CORN/CLIP;t<JSC>TASKZ/TRAIN/AUG/PACK,-DgNSENOODLAND/CLIP;l
)ad 20821<JSC>TASK2/TRAIN/AUO/PAVA.-WI14TERWHEAT/CLIP;I
* 2001< JOC >TASK2/TRA I N/AUG / PACK s- PERMANENTPASTURGUCLIP; i
0 and 20871<JSC>TASKZ/TRAIN/AUS/PACK.-SOYSCANS/CLIP;I
*021<J$C>TASK2/1'RAIN/AUG/PACK.-OTf4CRl4AY/MO78;1
*021<JSC>TASKZ/TRAIN/AUG/PACK.-DENSE140ODLAND/MO79;1
*d 20021<jSC,S TASK2/TRAIN/AUO/PACK.,-SOYBEANS/MO70;1
#821<JSC>TASKZ/TRAIN/AVO/PACK,-PERMANENTPASTUr%E/MD79;1
* aild 20OZIL< JSC>TASK2/ TRA I N/AUS/ PACK. -W INTERWHEAT/MU79,1 I
* 20x32 <JBP>TASK2/TRAIN/AUO/PACK.-CORN/MU79tI<JSC>TA592/TRAIN/AUOIPACK.-NB/llO7.9;1<J$C>TASK2/TRAIN/AUG/PACK,NB/11070:1<JSC>TASK2/TRAIN/AUU/OTHERHAY.ESP;I<JSC>TASXZITRAIN/AUC/DIHERHAY.SGT;i<.ISC>TASK2/TRAIN/AUG/DENSEWOODLAND.E$P;1
*1<JSC>TASK2/TRAIN/AUG/DENSf^WOODLAND.SOT;i
*1<JSC)TASKZITRAINIALJG/CORN,ESP;t<JSC>TASK2/TRAIN/AUG/CORN.SGT;l<JSC>TASK2/TRAIN/AUa/TBL.;1<JSC>TASK2,'TRAIN/AUCi/STAT.16-CiRPV):i<J$C>TASK2/TRAIN/AUG/rSTAT-10-ORPSICLIP;I<JSC>TASK2/TRAIN/AUG/CAT.;I -
<4=TAGK."/TCGT/AUGil4 I NVIRWIINAT. SLIT #* I< J I.;C,*#, TASK'-'/TE.T/AtJtA/t4 INTGRI41frAT. ESP #* 2< J9C^TA5K"/T0T/AfJCs/GU -'UANU. CUP; 14 JOC,',TA$K"/TCUT/AUVi/DO"'DEANS, SaT; I<JSC>TAaKZ/TE;ST/AUO/pr.4'tIANC, NTf)ASTUr?E,C$f*, ; Itool<J$C>TASKZ/TCUr/AUO/PERMANENTPAStURE.SGT;I
#021<JSC>TASK2/TCST/AUO/PACK.14B/MO70;14JUC>TASK""/TCr^T/AUS/OTI!ER[iAY.E$P;I
SOT; Le.JSC>TA5K2/TCUT/AUG/DLtISCWOUDLAND.C-,SP;I< J 50 >TASK Z/ TrUT/AUCi /DrINU WOO DLAND, OCIT; I<JSC>I'ASK'"/TEUT/AUG/CDRN,CSP;I<JP)C 5TAE;I'w:-,/ TV'-'j'T/AUCt/CDRN. 6aT * I< jM*,,TASR2/1 -CVT/AjVli CAT.
wi
i
' <JSC>TASK2/TRAIN/MTEMP/TLL1.;I<JSC>TASKZ/TRAIN/MTE:PIP/MiT.1G-GRP ta'; I<JSC>TASK :/TtiAIN/MTEMP/ISTAI*.1G- 6RPS/CLIP;,I
won77<JCC>TASK2/TI,AIN/PITEMP/CAT.;1<JSC>TASKZ/TRAIN/MTEMP/WINTERWHEAT.ESP;
*1<JSC>TASK2/TRAIN/MTEMP/WINTERWHEAT.SGT;1.
<JGC>TASKZ/TRAIN/t1TEMP/$OYUEANS.ESP; 1<JSC>TASK«/TRAIN/MTEMP/SOYDE'ANS. GOT; 1< JSC>TASK2/TRA IN/CITE*MP/ PI=Rf goNENTPASTURE . ESP;
* 20821<JSC>TASK2/TRAIN/tITEMP/PERMANENTPASTURC-.S(iT;1
20821<JSC>TASKZ/TRAIN/MTEMP/PACK.-OTHERHAY/CLIP; i
*20821<JSC>TASK2/TRAIN/MTEMP/PACK.•-DENSEWOODLAND/CLIP;1
,*and 20821<JSC>TASK2/'TRA I1I/MTEMP/PACK . -S01'SEANS/CL I P; I.
X201321<JSC >TASK?/TRAIN/MTEMP/ PACK . -PERMANENTPASTURE/CLIP;1*9 and 20021<JSC>TASK2/TRAIN/MTEMP/PACK.-WINTERWHEAT/CLIP;1
*d '20821<JSC>TASKZ/TRAIt4/MTEMP/PACK.-CORN/CLIP;1
*1<JSC>TASK2/TRAIN/MTEMP/PACK.-OTHERHAYVM079;1*20821<4SC>TASK2/TRAIN/MTEMP/PACK'.-DENSEWOODLAND/MO79;1
*and 20821I
<JSC>TASK2/TRAIN/MTEMP/PACK.^SOYBEANS /M079;1-20821
<J.SC>TASK2 /TRAIN/MTEMP/PACK.-PERMANEN(TPASTURE/MO79;1w9 and 20821<JSC>TASK2/TRAIN/MTEMP/PACK.-WINTERWHEAT /MO79;1
+d 20821<JSC>TASKZ/TRAIN/MTEMP/PACK.-CORN /M079;1
I
<,JSC>TASK2/TRAIN/MTEMP/PACK.-NB/MO79;1<JSC>TASKZ/TRAIN/t1TEMP/PACK.NB/MO79;'1<JSC>1`ASK:!/TRAIN/MTEMP/OTHERHAY.ESP;1<JSC>TASK2/TRAIN/MTEMP/OTHERHAY.SGT;1<JSC>TASKZ/TRAIN/MTEMP/DENSEWOODLAND•ESP;1W821<JSC>TASKZ/ RAIN/MTEMP/DENSEWGJDLAND.SGT;1
0821<JSC>TASK2 /TRAIN/MTEMP/CORN.ESP;1<JSC>TASK2/TRAIN/MTEMP/CDRN.SGT;1
<JSCrTASKZ/TEST/MTEMP/TSL.;Z<JSC?TASK^/TEST/MTEMP/CAT.;1<JSC>TASKZ/TEST/MTEMP/WINTERWHEAT.ESP;1;JSC>TASKZ/TEST/t1TEMP/WiNTERWHEAT.S(iT;f<4SC>TASK2/TEST/MTEMP/SOYBEANS.ESP;I<JSC>TASKZ/TEST/MTEMP/SOYREANS'.SOT;I<JSC>TASK2/TEST/MTEMP/PERMANENTPASTURCoESP I
*20021<JSC>TASK2/TEST/MTEMP/PERMANENTPASTURE.SGT !
*20021<JSC>TASK2/TEST/MTEMP/PACK.NB/MO79;1<JSC>TASK2/TEST/MTEMP/OTHERHAY.ESP;1<JSC?TASK2/TEST/MTEMP /OT14ERHAY.SGT;I<,JSC>TASK2/TEST/tITEMP/DENSEWOODLAND.ESP;I
*21<JSC>TASKZ/TEST/MTEMP/DENSEWOODLAND.SGT;1
*a<JSC>TASAZ/TEST/MTEMP/CORN. SOT;1<JSC>TASKZ/TEST/MTEMP/CORN.ESP;1
k
0k"I PpC^Af• p
p1^ QUAI-1
<JSC>TASK2TEST/CLASSY/SOYBEANS.6ST ;I<JSC>TASKZ/TRAIN/CLASSY/140ODS.EST;I<JSC>TASK2/TRAIN/CLASSY/WOODS,SCiT;<JSC>TAGK2/TRAIN/CLASSY/WHEAT. SGT;1<JSC>TASK2/TRAIN/CLASSY/WHEAT.EST;I<JSC>TASKZ/TRA'IN/CLASSI'/SOYBEANS.EST ;1<JSC>TASK2/TRAIN/CLASSY/SDYBEANS,JGT ;1<JSC>TAS KZ/TRAIN/CLASSY/PASTURE.EST;1<JSC`>TASK2/TRAIN/CLASSY/PASTURE.SGT;1<JSC>TASK2/TRAIN/CLASSY/HAY.EST;I<JSC>TASK2/TRAIN/CLASSY/HAY.SGT;I<JSC>TASKZ/TRAIN/CLASSY/CORN.EST;1<JSC>TASKZ /TRAIN/CLASSY/CORN.SCT;I<JSC>TASKZ/TRAIN/CLASSI'/CAT,;I<JSC>TAEKZ/TEST/CLASSY/WOODS,,EST;I<JSC>TASK2/TEST/C4ASSI'/1400DS.SGT;1<JSC>TASKZ/TEST/CLASSY/WHEAT.E;,ST;1<JSC>TASK2/TEST/CLASSY/WHEAT.S"uT41<JSC>TASK2/TEST/CLASSI'/SOYBEANS4SCiT i<JSC>TASKZ/TEST/CLASSY/PASTURE.EST;i<JSC>TASK2/TEST/CLASSY/PASTURE.SOT;I
4
<JSC>TASK2/TEST/CLASSY/HA Y.EST;i<JSC>TASKZ/TEST/CLASSI' /HA1'. SGT' ;1<JSC>TASK2/TEST/CLASSI'/CORN.EST;1<JSC>TASK2 /TEST/CLASSY/CORN. SGT; I<JSC>TASK2/TEST/CLASSY/C}^T.;1<JSC >CLASSY /TRAIN/TA6LE.;1SJSC >CLASSY/TEST/TABLE.;1<JSC>TASKZ/TRAIN/CLASS T/ISTAT.•-24GRPS/PUR;I00853<J$C +TASK2/TRAIN/CLASSI'/ISTAT.- 24OR PS/EP; 1
► 053<JSC >TASK2/TRAIN /CLASSI'.BOUT; 1<JSC>TASK2/TCST /CLASSI'.BOUT 1<JSC>TASK2/CLASSY/STAT.-OTH5R;I<JSC>1`ASK2/CLASSY/STAT.-PERMANENT;1<JSC>TASK2/CLASSY/STAT.-SOYBEANS;!<JSC*^TASKZ/CLASSY /STAT.-SOYBEANS;2<JSC>TASK/CLASSI'/STAT. -CORN;1<JSC>TASK2/CLASSY/STAT.-WINTER;1<JSC>TASK2/CLASSY/STAT."DENSE l
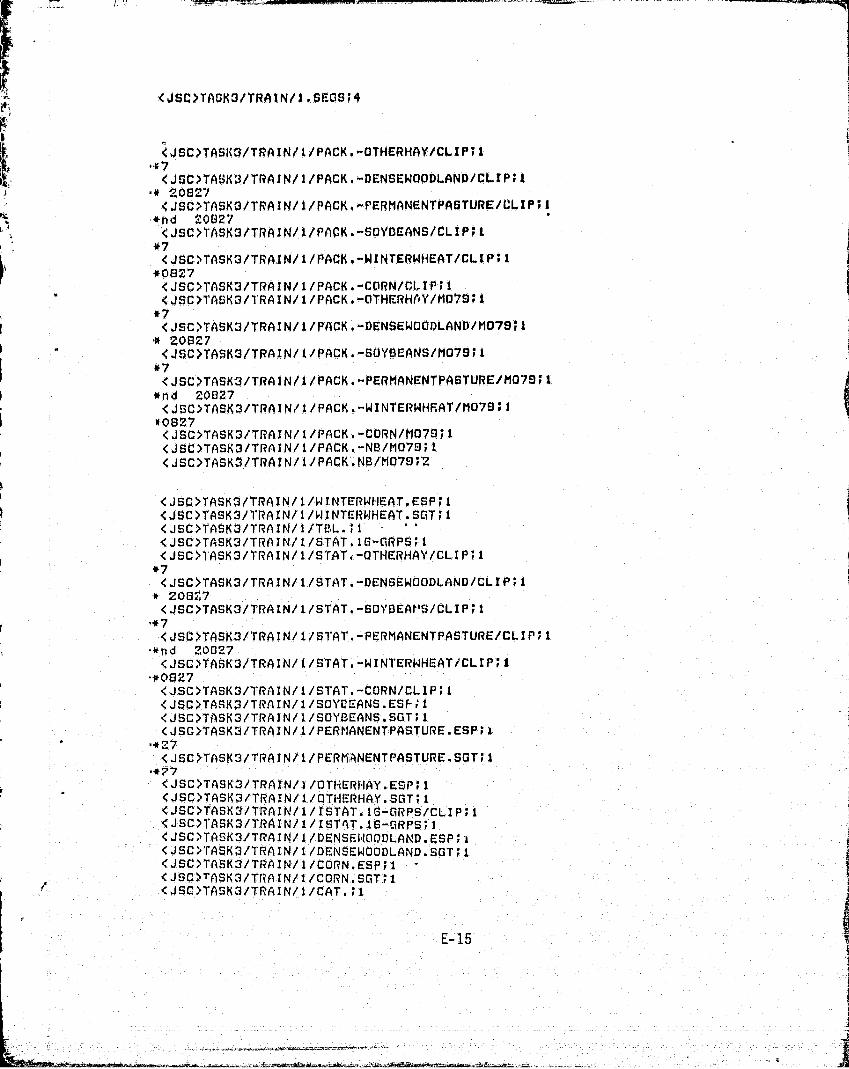
<JSC>TAGK3/TRA%N/I.SEGS;4
<JSC>TASI(3/TRAIN/1/PACK.-OTHERHAY/CLIP;I-47<JSC>TA$K3/TRAIN/1 /PACK,-DENSEWOODLAND/CLIP;I20OZ7
<JSC>TASK3/TPAIN/l/PACK.-PERMANENTPASTURE/CLIP;I*nd 20027
<JSC>TASK3/TRAIN/1 /PACK.•SOYBEANS/CLIP;L*7
<JSC>TASK3/TRAIN/i/PACK.-WINTERWHEAT/CLIP;I*0827
<JSC>TASK3/TRAIN/l/PACK.-CORN/01,IP;1<JSC>TASK3/1'RAIN/l/PACK.-OTHERHPY/MO70;I
*7<JSC>TASK3/TRAIN/l/PACK.-DENSEWOODLAND/M079 ► 1
20827<JSC>TASK3/TRAIN/1/PACK.-SOYSEANS/MU79;i
#7<JSC>TASK3/TRAIN/l/PACK.-PERMANENTPASTURE/MO79;1
*nd 20827<JSC>TASK3/TRAIN/1/PACK.-WINTERWHEAT/MO79;1
X0827<JSC>TASK3/TRAIN/1/PACK.-CORN/M079;1<JSC>TASK3/TRAIN/l/PACK.-NB/MU79;1<JSC>TASK3/TRAIN/1/PACK.NB/MO79;2-
<JSC>TASK3/TRAIN/1/WINTERWHEAT.ESP;I<JSC>TASK3/TRAINII/4IINTEI3WHEAT-SOT;I<JSC>TASK3/TRAIN/l/TBL-f1<JSC>TASK3/TRAIN/i/STAT.16-CiRPS;I<JSC>I"ASK3/TRAIN/1 /STAT,-OTHERIIAI'/CLIP;I
*7<JSC>TASK3/TRAIN/1/STAT.-DENSEWOODLAND/CLIP;I
ZOOZ7<JSC>TASK3/TRAIN/1/STAT.-SO1'BEAt'S/CLIP;I
*7<JSC>TASK3/'1'RAIN/1/SI'AT.-PERMANENTPASTURE/CLIP;I
-*nd 20027<JSC>TASK3/TRAIN/i/STAT.-WINI'ERWHEAT/*CLIP;I
-*0827<JSC>TASK3/TRAIN/1 /STAT.-CORN/CLIP;I<JSC>TASK3/TRAIN/1/SOYCEANS.ESF;I<JSC>TASK3/TRAIN/1/S01'BEANS.SGT;I<JSC>TASK3/TRAIN/l/PERtIANENTPASTURE.ESP;I
•*C7<JSC>TASK3/TRAIN/1/PERti,ANENTPASTURE.SGT;I
<JSC>TASK3/TRAIN/)/OTIiCRIiAY.ESP;I<JSC;,TASK3/TRAIN/I/QTHERHAY.SGT;I<JSC>TASK3/TRAIN/141STAT.16-CiRPS/CLIP;I<JSC>TASK3/TRAIN/1/ISTAT.16-nRPS;I
1 , 0,DLAND.ESP;i<JSC>TASK3/TRAIN/l/DENSF10<JSC>TASK3/TRAIN/1/DENSE:WOODLAND.SGT;I<JSC)TASK3/TRAIN/1 /CORN.ESP;1<JSC>TASK3/TRAIN/1/CORN.SaT;1<JSC>TASK3/TRAIN/1/CAT.;l
E-15

K
i(
<JSC>TASK3/TEST/l/WINTERWHEAT.SGT;I<JSC>TASK3/TEST /l/WINTERWHEAT.ESP;I<JSC >TASK3/TEST/I/TBL.;l<JSC>TASK3/TEST/1/SOYSESNS.ESP I<JSC>TASK3/TCS T/I/SOYSEANS.SUT;I<JSC>TASK3/TEST/I/PERMANENTPASTURE.ESP;I
*7<JSC>TASK3/TEST/l/PERPIANENTPASTURE.SGTI
►7<JSC>TASK3 /TEST/l/PACK.NB/MO79"► 1<JSC>TASK3/TEST/I/OT14ERHAY.ESP;I<JIC>TASK3/TEST/1/OTFIERHAY.SGT;I<JSC>TASK3/TEST/l/DENSEWOODLAND.ESP;I<JSC>TASK3/TEST/I/DENSEWOODLAND.SGT`;I<JSC>TASK3/TEST/i/CORN.CSP;I<JSC>TASK3/TEST/l/CORN.SGT+I<JSC>TAS93/TEST/I/CAT.1<JSC>TASK3/TEST/I.SEGS2 I
r-

<J$C'>TASK3/TRAIN/.".GEGS;l b
<J$C^TASK3/TRAIN/C/WINTERWHEAT ESP;1<JSC;TASK3/TRA114/3/WINTEr'WHEAT.SGT;1<JSC >TASK3/TRAIN /2/TSL.;1<JSC>TASK3/TRAIN/Z/`STAT.I 0-GRPS'r 1
l
<JSC>TASK3/TRAIN/ /STAT. -OTHERHAY/CLIP;i3SJSC>TA;393/TRAIN/2/STAT.-DENSEWOODLAND/CLIP;120833
<JSC}TASK3/TRAIN/2/STAT.—SOYBEANS/CLIP;I*3<JSC>TASK3/TRAIN/?/STAT.—PERMANENTPASTUIRE/CLIP;1and ?0833<JSC>TASK3/TRAIN/2/STAT.-14INTERWHEi4T/CLIP;1*0833<JSC>TASK3/TRAIN/2/STAT.—CORN/CLIP ;I<JSC>TA5K3/TRAIN/2/SQYSEANS.ESP;1<JSC>TASKS/TRAIN/2/;OYBEAN'J.SGT;<J$C>TASK3/TRAIN/2/PERMANENTPASTURE.ESP;I
lf33
<JSC>TASK3/TRAIN/2/PERMANENTPASTURE.SGT;I*33
<JSC>TASK3/TRAIN/2/PACK.-SDYSE'ANS/CLIP;I
<JSC>TASK3/TRAIN/2/PACK.-OTHERHAI' /CLIP;1r #3
<JSC>TASK3/TRAIN/2/PACK.-DENSEWOODLAND/CLIP;1200;33
<JSC>TASK3/TRAIN/Z/PACK.-PERMANENTPASTURE/CLIP;1*nd 20833<JSC>TASK3/TRAIN/3/PACK.r-WINTERWHEAT/CLIP;I
*0033<JSC>TASK3/ TRAIN/z /PACK.-CORN/CLIP ;i<JSC>TASK3/TRAIN/2/PACK.-OTHERHAY/MO73;1
*3<JSC>TASK3/TRAIN/3/PACK.-DENSEWOODLAND /M079 ;120833
<JSC>TASK3/TRAIN/2/PACK.-SOYBEANS/MQ79;1*3<JSC>TASK3/TRAIN/3/PACK.-PERMANENTPASTURE/MO79;1*nd 20833<JSC?TASK3/TRAIN/2/PACK;-WINTERWHEAT/M079 ;1
*0833<JSC>TASK3/TRAIN/2/PACK.-CORN/M07$;1<JSC>TASK3/TRAIN/2/PACK.-NB/MD"S;1<JSC?TASK3/TRAIN/T-/PACK.NB/MO79;1<JSC>TASK3/TRAllq/2/OTHERHAI'.ESP;1
.: <JSC>TASK3/TRAIN/2/OTHERHAI'.SGT;i<JSC>TASK3/TRA IN/C/ISTAT.16-GRPS/CLIP;1<'JSC>TASK3/TRAIN/ /ISSTAT. iO--G PS; 1'<JSC>TASK3/TRAIN/2/DENSEWOODLAND.ESP;1<JSC>TASK3/TRAIN/^/DENSEWOODLAND.SGT;I<JSC?TASK3/TRAI'N/2/CDRN.ESP';1<JSC?TASK3/TRAIN/2/CORN.SGT;1<JSC?TASK3/TRAIN/2/CAT.;1t IRr3T'8RK'aJrrZ)6TN/? Zr i5T-r7TI rG 1
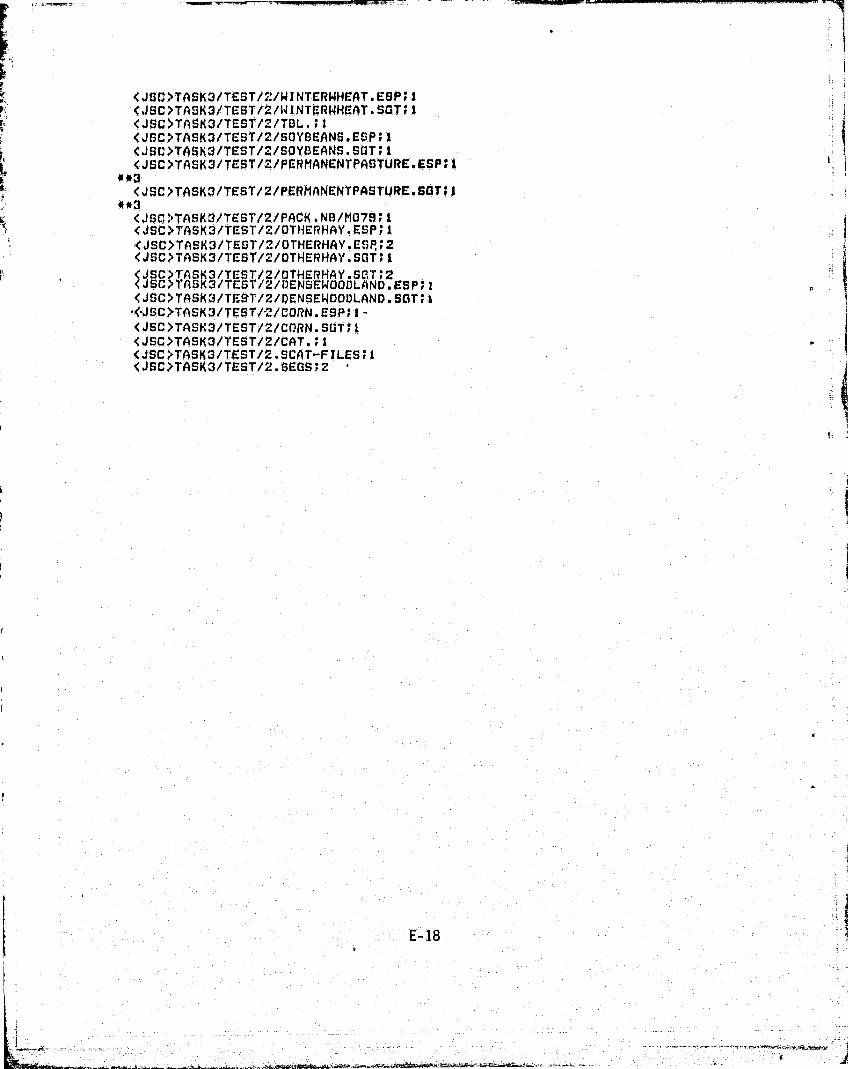
<JSC>TASK3/TEST/r^./NINTERWNEAT.ESP;1<JSC>TASK3/TE'ST/2/WINTERWHEAT.SGT;1<JSC>TASK3/TEST/?/TBL.;i<JSC>TASK3/TEST/Z/SOYBEANS.eSP;i<JSC>TASK3/TEST/Z/SOY,SEANS.SOT;I<JSC>TASK3/TEST/Z/PERMANENTPASTURE.ESP;I
03<JSC>TASK3/TEST/2/PERMANENTPASTURE.SLT;I
**3<JST;; TASK3/TESL'/2/PACK.NB/M079; 1< JSC >TASK3/TEST/Z/OTHERHAY.ESP;1<JSC>TASK3/TEST/2/DTHERHAY.ESR;.c.<JSC>TAS}K(3/TEST/2/OTHERHAY.SGT;I
<JSC>TAS 3^TEST /VVENSEWOODLLAND ESP; 2<JSC>TASK3 /TEST/Z /AENSEWOODLANO. SOT I
^<•JSC>TASK3/TEST/Z/CORN. ESP; I-
<JSC>TASK3/TEST/2/CORN.SGT;i
I
y
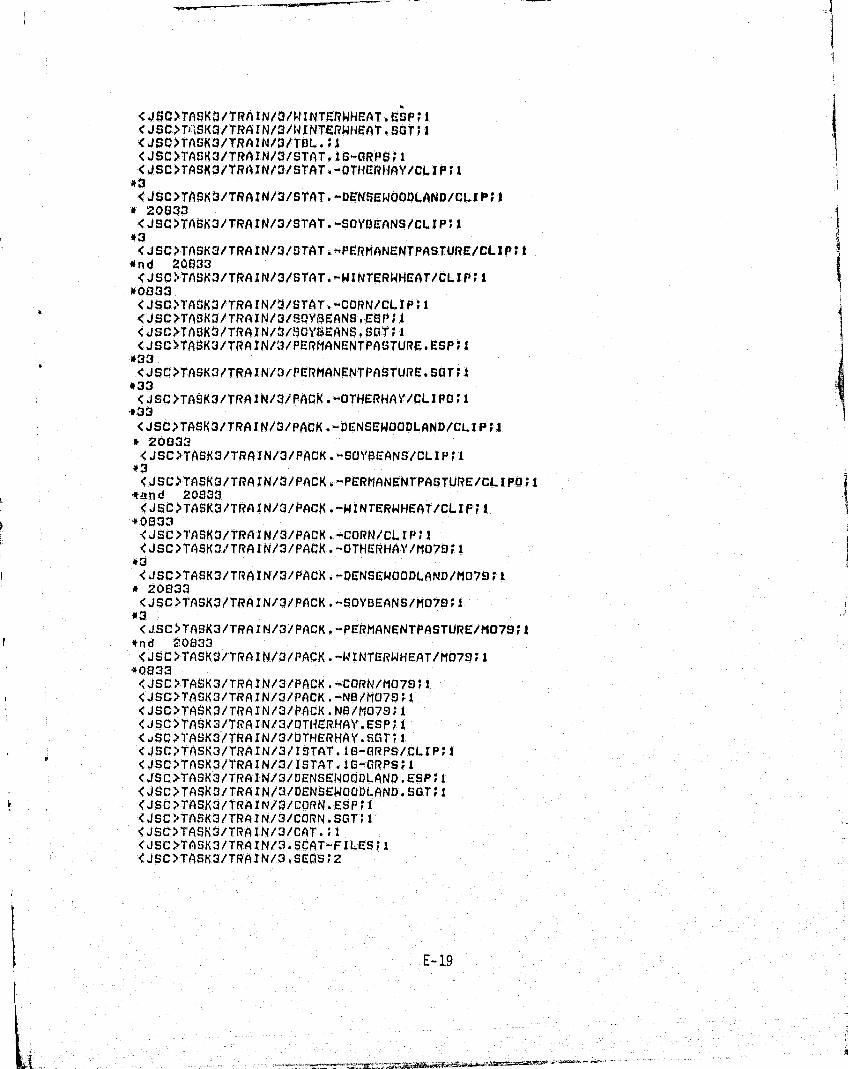
A
<J$C>TASKO/TRAIN/O/WINTERWHEAT.EaP;t< JSC>T)."iSK3/TRA IN/3/141 NTERW14EAT - SOT; I< JSC>TA foK:I/TRA I N101 TBL. ; I<J$C>TASK3/TRAIN/$/STAT.16-ORPS;i<JSC>TASK3/YRAIN/`3/STAT.-OTI(ERHAY/CLIPII
<JSC>TASX3/TRAIN/3/STAT.-DENSE140ODLAND/C'-IP;I20033
<JSC>TASX3/TRAIN/3/STAT.-SOYSEANS/CLIP;I
<JSC>TASK3/TRAIN/3/STAT.-PERMANENTPASTURE/CLIP;I*nd 20033<JSC,',TASK3/TRAIN/3/$TAT.-NINTERWHEAT/C41P;I
<JSC>TASK:I/TRAIN/3/STAT.-CURN/CLIP;I<JSC >TASK3/ TRA IN/3/S0Y$EANS - ESP Vl<JSC>TASK3/TRAIN/3/SOYSirr"ANS.$GT;I<JSC>TASK3/TRAIN/,3/PERMANENTPASTURE. ESP; I#33KJSC>TASK3/TRAIN/3fPERMANENTPASTURE.SGT;l
*33<JSC>TASK3/TRAIN/3/PACK.-DTHERHAY/CLIPO;I
*33<JSC>TASK3/TRAIN/3/PACR.-DENSEWOODLAND/CLIP;I.20033
<JSC>TASK3/TRAIN/3/PACK.-SO)'01-:ANS/CLIP;I43<JSC>TASK3/TRArN/3/PACK,-PERMANENTPASTURE/CLIPO;l*and 2003<JSC>TASK3/TRAIN/3/PACK.-WINTERWHEAT/CLIP;I
.*01333<JSC>I'ASK3/TRAIN/3/PACR.-CORN/CLIP;1< JSC>TASKO/TRA IN/3/PACK. -OTHERHAY/M07S; I
*3 i
<JSC>TASK3/TRAIN/3/PACK.-DENSEWOOPLAND/MD79;I20833
<JSC>TASK3/TRAIN/3/PACK.-SON'BEANS/MD79;1*3<JSC>TASK3/TRAIN/3/PACK.-PERMANENTPASTURE/M079;1*nd 20833<JSC>TASK3/TRAIN/3/PACK.-WINTERWI3EAT/MO79;1*0833<JSC>TASK3/TRAIN/3/FACK.-CORN/MO79;1<JSC>TASI(3/TRAIN/3/PACK.-NB/MU79;1<JSC>TASK3/TRAIN/3/PACK.NS/MO79;1< JSC>TASK3/TRA IN/3/UTI qERHA)'. ESP; I<jSO>TASK3/TRAIN/31UTHERHAY.SGT;I<JSQ>TASK3/TRAIN/3/ISTAT.10-ORPS/CLIP;I<JSC>TASK3/TRATN/3/ISTAT.18-GRPS;I<J$C>TASK3/TRAIN/3/DENSE140ODLAND.ESP;I<jSC>TASK3/TRAIN/3/DENSEWOODLAND.SGT;1<JSC>TASK3/TRAXN/3/C0RN-ESP;1<JSC;-TASX3/TRAIN/3/C0RN. SOT; 1<jSC>I'ASK3/TRAIN/3/CAT.;l<JSC>TASK3/TRAIN/3.SCAT-FILES;i<jSC>TASK3/TRAJN/3.SCQ$;2
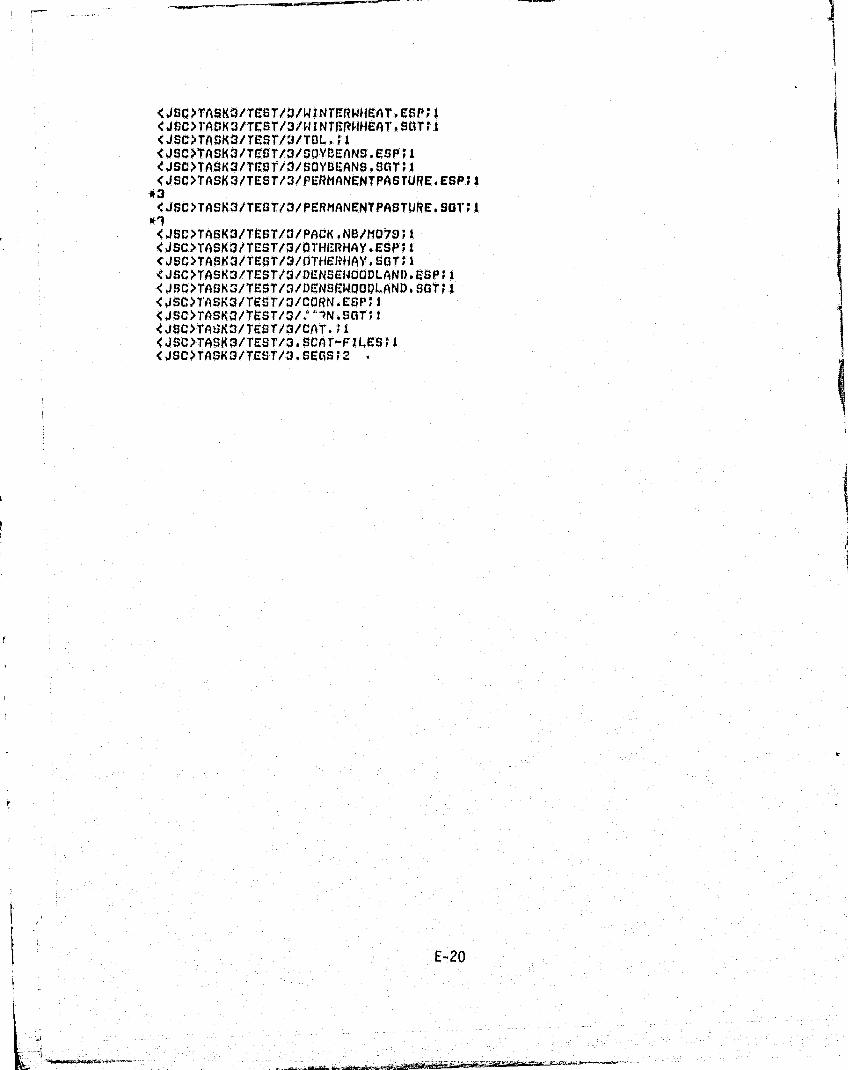
<JSC>TASKO/TCST/O/WINTFRWflEAT.ESP;I<JSC>I*ASKtl/TCST/3/PI I NTORPMEAT, SLIT; I<JSC>TASK3/TCST/3/TB4.;l<JSC>TASX3/TCST/3/$QYDIZANS.E$P;t<JSC>TASK3/TROT/3/SOYDEANS.SPT;I<JSC>TASK3/TEST/3/PERMANENTPASTURE.ESP;I
*3<JSC>TASK3/TEST/3/PERMANENTPASTURC,50I*;I
*1<JSC>TASK3/TEST/3/PACKiNS/MO79;1<JSC>TASK3/TEST/3/01'HERHAY.E8P;I<JSC>TASK3/TEST/3/OT14ERliAY*SGT;I<J$C>TASK3/TEST/3/DENSC1400DLAND-ESP;I<JSC>TASK3/TEST/3/0,EN$r.WUOPLAND, SGT; I<JSC>TASK3/TCST/3/CQRNiESP;1<JSC>TASK3/TSST/3/:"IN.SOT;l<JSC>TAaK3/TEST/3/CAT.;l<J$C>TASK3/TEST/3.SCAT-FILES;l<JSC>TASK3/TEST/3.$EQS;Z -
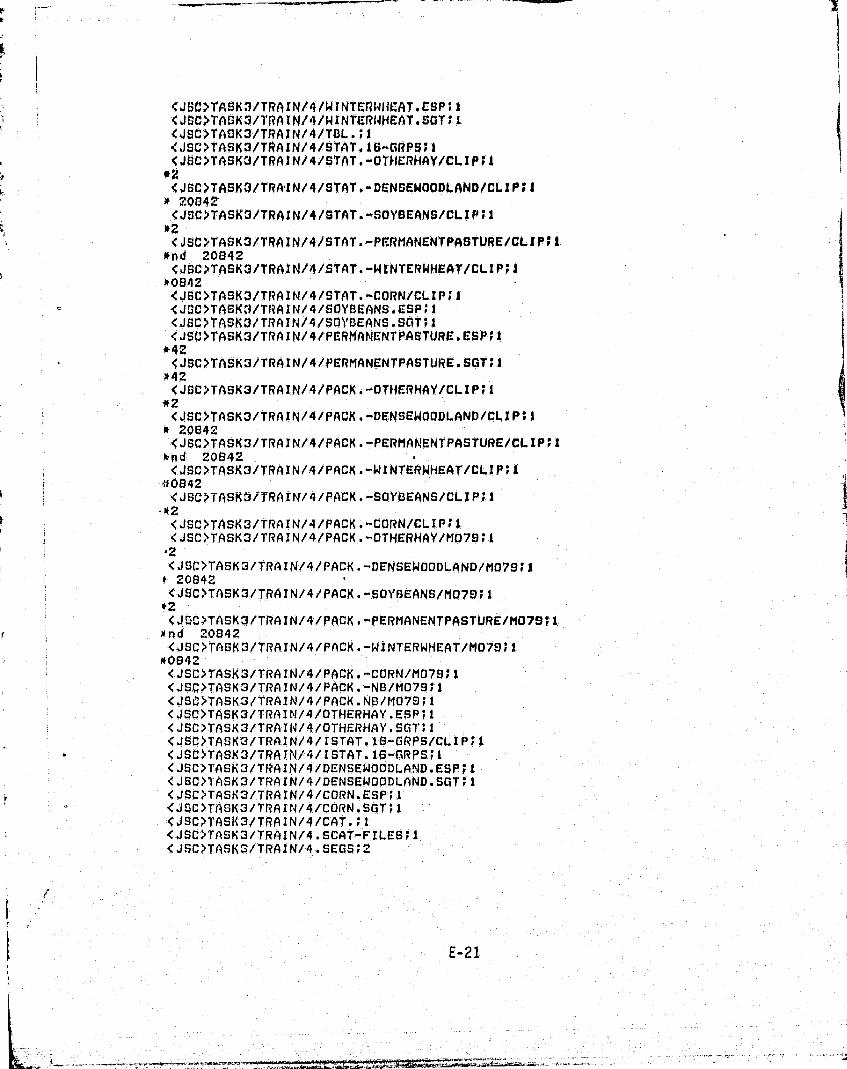
iI
1
<JSL>TF.SK3/TRAIN/4/WINTERW14CAT.CSP;I<JSC>TASK3/TRAIN/4/WINTER14fiCAT.SGY; I<JSC>TAK3/TRAIN/4/TRL.;1<JSC>TASKS/TRAIN/4/STAT.I6-CRPS;I<JSC>TASK3/TRAIN /4/STAT.-OTHERHAY/CLIP;1
*2<4SC>TASK3/TRA-IN/4/STAT.-DENSEWOODLAND/CLIP;I20042<JSC>TASK3/TRAIN/4/GTAT.-SOYBEANS/CLIP;I
*Z<JSC>TA8K3/TRAIN/4/STAT.-PERMANENTPASTURE/CLIP;I*Ad 20042<JSC>TASK3/TRAIN/4/STAT'.-WINTERWHEAT/CLIP;I
*0842<JSC>TASK3/TRAIN /4 /STAT.-CORN/CLIP;1<JSC>TASK)/T13AIN/4/SOYDEANS.ESP;I<JSC>TASK3/TRAIN/4/501'DEANS.SGT'r1<JSC>TASK3/TRAIN/4/PERMANENTPASTURE.ESP;
*4Z<JSC>TASK3/TRAIN/4/PERMANENTPASTURE.SOT ;I
*42<JSC>TASK3/TRAIN/4/PACK.-OTHERHAY/CLIP;I
*2<JSC>TASK3/TRAIN/4/PACK.-DENSEWOODLAND/CLIP;1
^► 20842<JSC>TASK3/TRAIN/4/PACK.-PERMANENTPASTURE/CLIP;1*nd 20642<JSC>TASK3/TRAIN/4/PACK.-WINTERWHEAT/CLIP;I
a*0842<JSC>TASK3/TRAIN/4/PACK.-SOYBEANS/CLIP;I
42<JSC>TASK3/TRAIN/4/PACK.-CORN/CLIP;<JSC>TASK3/TRAIN/4/PACK.-OTHERHAY/MO79;1
.2<JSC>TASK3/TRAIN/4/PACK.=-DENSEWOODLAND/MO79;1
F 20842<JSC>TASK3/TRAIN/4/PACK.-SOYBEANS/MO79;1
*2<JCC>TASK3/TRAIN/4/PACK.-PERMANENTPASTURE/M0791:
xnd 20042<JSC>TASK3/TRAIN/4/PACK.-WINTERWHEAT/M07S;1»0842<JSC>TASK3/TRAIN/4/PACK.-CORN/MO7S;1<JSC>TASK3/TRAIN/4/PACK.- NB/MO79;1<JSt>TASK3/TRAIN/4/PACK.NB/MO79;1<JSC?TASK3/TRAIN/4/OTHERHAY.ESP;1<JSC>TASK3/TRAI14/4/OTHERHAY.SCil';i<JSC>TASK3/TRA IN/4IISTAT.16-GRPS/CLIP;I<JSC}TASK3/TRAIN/4/ISTAT. 16-tRPS;i<JSC> TASK3/T{CAIN/4/DENSEWOODLAN D ESP;1
<JSC>1'ASK3/TRAIN /4 /DENSEWOOALAND.SOT;I<4SC>TASK3/TRAIN/4/CORN.ESP;'1<JSC >TAGK3/TRAIN/4/CORN.SGT;1,<JSC>TASK3/TRAIN/4 /CAT..;1<JSC>TASK3/TRAIN/4`.SCAT-FILES;1<JSC>TASK3/TRAIN/4-.SECS;2
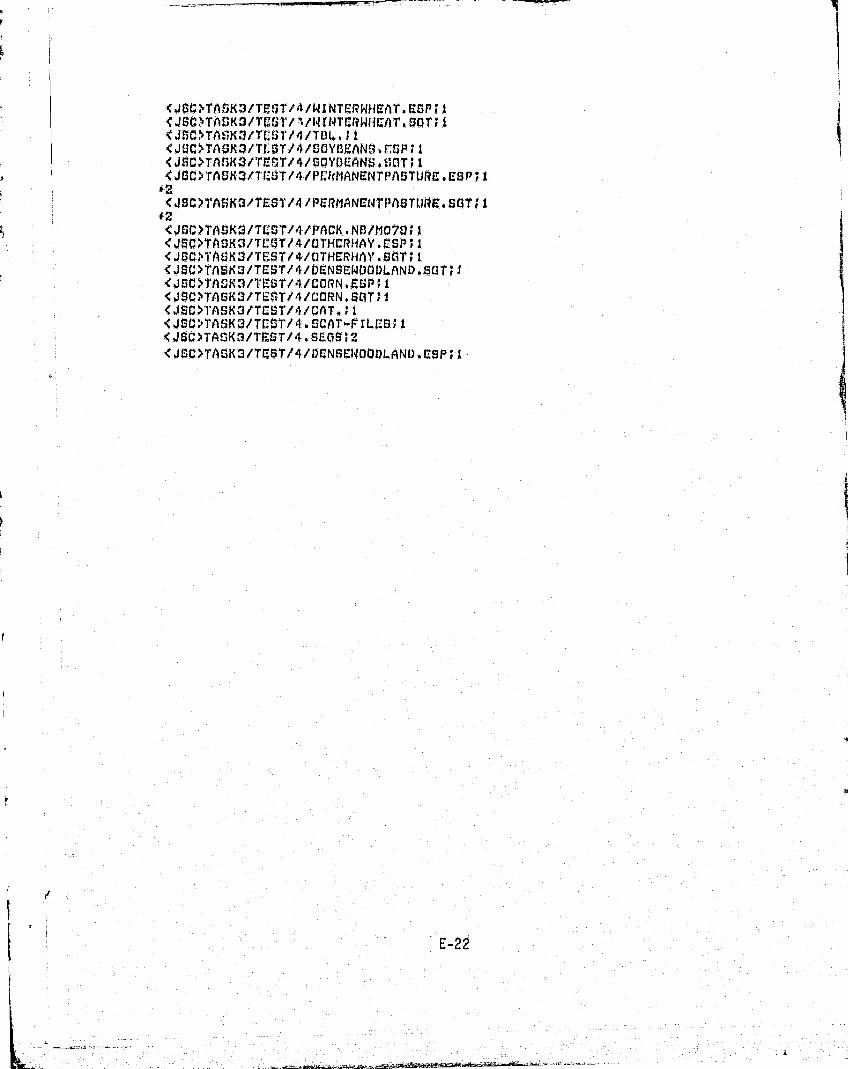
4J$C>TASK3/TCST14/WINTURWfICAT.EGP;IJS0TASK3/TR3T/ ,1/14 INTIMMICAT. SCAT; .1
<JSCXrA0K3/TCUT/4/TV4,;1< JUC>TASK3/Tl : ST/4/100YMANS. ESP; I< JSC> TASKVTH-T/ 4 /SOYBEANS. VGT; I< JSC>TAUK3/T(;'ST/4/PCI?MANENTPASTURE. ESP; I2<JSC>TASXD/TEST/4/PCRMANENTPASTLIPIZ. SOT' L
< JSC >TASK 3 /TL:UT/ 4/OTHCRfIAY. t SP; I<J$C>I*ASX3/TEST/4/OTHER14AY.SGT; I<J$G>TASK3/TEST/4/DaNSEWOODLAND-BUT;I<JS0TAUK3/TEST/4/CORN,SSP;1<J$C>TASK3/T,E$T/4/CORN,S0T;l
< JSC>TASKalTC5T/4 /CAT.; I<JSCMSK3/TUSTl4.SCAT-FILCS;l<J8C>TASX3/TF-ST/4.SE0$;2<J$C>TASK3/TaST/4/DCNSE1400DLAND,C,SP;I
E-22
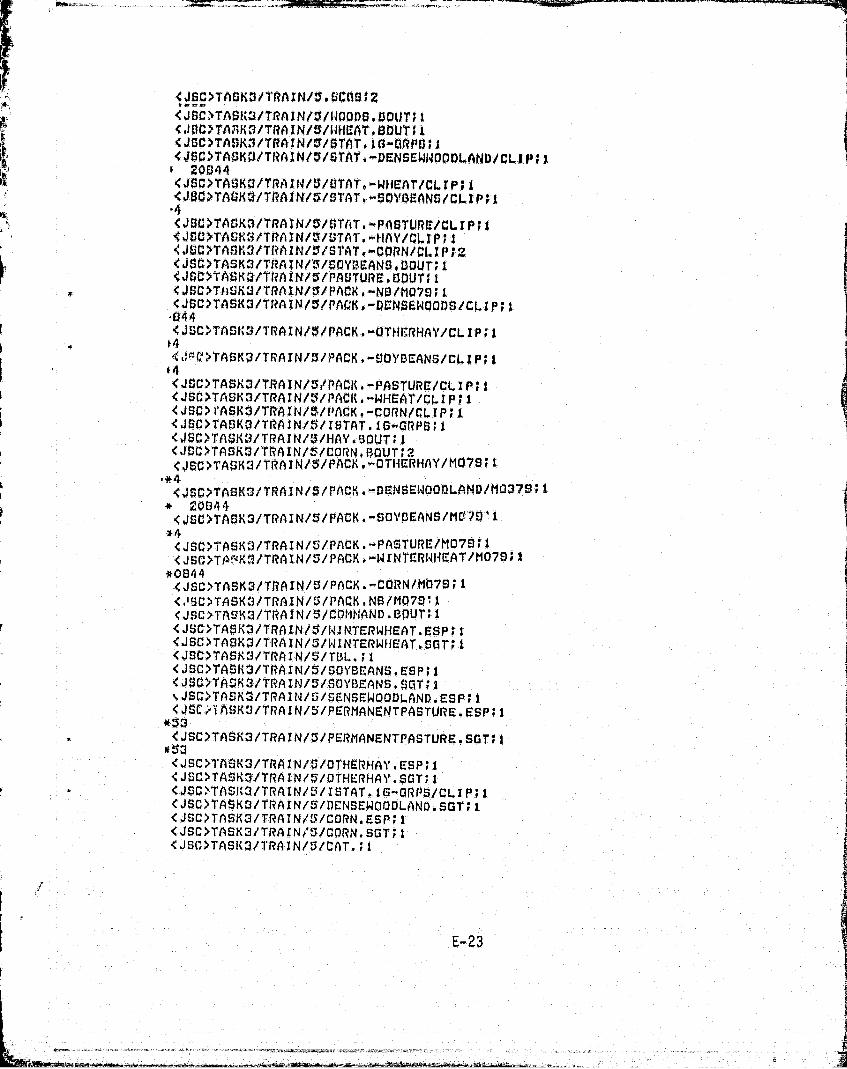
<JSC>TAGK2/T'RA.> N/ GC0S; 2' <1JSCNTASMI/TRAINIV140006.DOUTI 11' ^.1SC>TA;iK^?ITRAfNf^71dHCA'1" ► Eibl1'1`i 1
<JSC>TA IKI/TRAIN/U/STAT,16- iRPU; 1<J$C>TASK;JITRAIN/l/STAT.-DaNSa WWOODLAND/CLIP .
20844<4$C>TASKO/TRAIN/!$/UTAT.-WHCAT/CLIPJSC>TA KC/TRAIN/ /STAT,^-SOYDaANS/CLIP;°4
<JSC>TASKS/TRAIN/S/STAT.-PASTURE/CLIP;'I<JSC>TAS93/TRAIN/Z/UTAT,-flAY/CLIP ► 1<JSC>TAS93/TtiAIN/"t/STAT, -CORN/CI.I P; M<JSC>TASK3/TRAIN/'S/SDYOEANS, UGUT;'<JSC>TASK3fTRAIN/5/PAUTURC.DCUT; i<JSC>TI)CKU/TRAINIV PACK, -NB /MD79;i<JSC>TASK.3/TRAIN/5/PACK,-DCNSENOOPS/CLIP;I
-044I <JSC>TASfCS/TRAIN/5/ PACK. -OTHE RHAY/CLIP; I l
'tJ?.`>TASKS/TRAINID/PACK,-SOYBEANS/CL IF; t
<JSC>TASKS/TRAIN/S/PACK.-PASTURE/CLIP;!<JSC>'CASK3/TRAINlS/PACK,-WHEAT/CLTP;i
'
<JSC >1'ASKS/TRAIIJ/ /E'ACK. ,-CGRN/C4IP; 1<JSC>'I`ASK3/TRAIN/S/ISTAT.10-t RPS I 1<JSC>TASK3/TRAIN/:3/HAY.SOUT;1<J$C>TASKS/TRAIN/'K/`CORN. ROUT; 2<J$C>TASK3/TRAIN/$/PACK.-OTIiCRHAY/MO7S;I
4°*
r ,«+ ^.n.r.u..sres e^ lnAMU _nr CCI l 77q.t tronar rnAlr.#..r ^,.,. ...:d,....dGGGI.! NU. Ml ^. ; I
I 20044a <JSC>TASK3/TRAIN/5/ PACK .—SOYBEANS /MG'1S'i;
*4<JSC>TASK3/TRAIN/5/PACK.-PASTURE/MO79;1<JSC>TF1'gK3/TRAIN/SIPACK.—WINTCRWI4CAT/MO79G I
*0844<JSC>TASKS/TRAIN/$ /PACK.—CORN/M07S ;i<.ISC>TASK3/TRAIN/$/RACK.NS/MO7011CJSC>TAVI(3/TRAIN/ I/COMMAND.L'AUT; 1
r CJSC>TASK3/TRAIN/5/14INI'ERWHEAT.CSP;1<JSC>TASK3/TRAIN/5/14INTERWHEAT.SGT';S<JSC)TASK3/TRAIN/5/T11L.;1<JSC>TA$K3 /TRAIN/5/,OYEEANS.ESP;1<JSC>TASf 3/TRAIN/3/SGYBEANS.$CiT; l%JSG>TASK3/TRAlt4/5/ aNS WOODLAND.ESP; i< J SC,' 'I ASKS/TRAIN/5/PERMANI*NTPASTURE . ESP; 1
*53 1<JSC>TASK3/TRAIN/5/PERMANENTPASTURE.SGT;1
053
<JSC>TASK3/TRAIN/$/OTHERFIAY.ESP;1<JSC>TASKl/TRAIN/S/OTHERHAI`.SGT'.i
k
<JSC"TA$A3/TRAIN/5/ I STAT. 18-ORPS/CL I P; !< J SC>TA$K3/TRAIN/a/DENSEWOODL.AND.SGT; i<JSC>TASK3/TRAINI:5/CORN.ESP;1<JSC>TASK3/TRAIN;;/CQRN.SGT r{JSC>TASI 3/"1'RATN/5/CAT. 'r
`
E-23
_ 3i
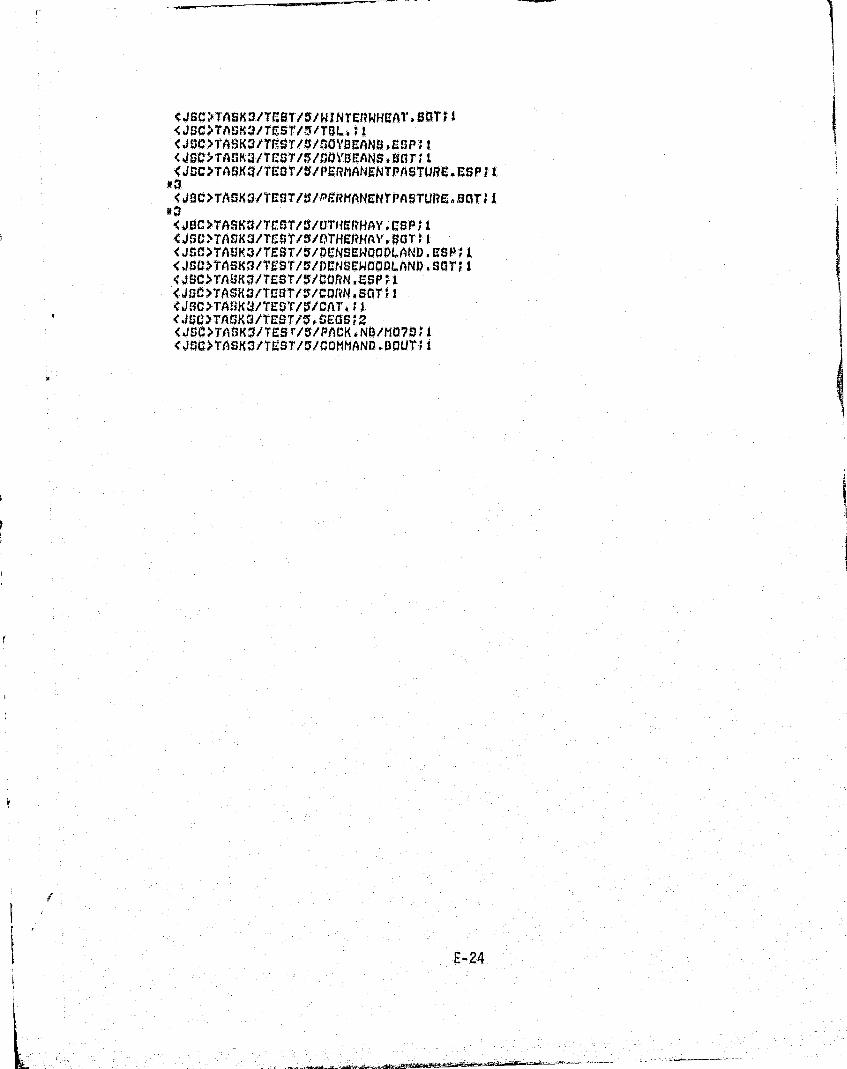
<JSC>TASKS/TCSt`/f/WINTERWHEAT'.SOTtI<JSC?TAVK:3/TCST'/^/TUL. R I<J$C>TASK3/Tr4tT/ /SOYOaAOS,t SP I.<J$C>TASKU /TCST /".S/ SDYSCANS,SGTl 1<JDC>TASK3/TC ST/S/F eRMANENTPASTURS. CSP; I
*a< JSC> TASKS/TEST/:I/PEPMANENrPASTUREoDaTS t
#3<48C>TA1K2/TC"T/V/OTHERHAY.CSP i< JSC? TASK.`3/TCS'1"/ 5/OTHEI2NAY. SGT; 1<J1TC?TA K3/TEST/ /T1CIdS6t,l0ADLAND, ESP; 1< JGC>TA$Ka/TE$T/S/DCNSEWOODLAND.SRTS 1<JSC>TAUK /TE T/S/COPN.CSPI1.<JGG?TASK2/TEST/V/CDRN.SOTI2<JRGSTARKO/`CE$T/S/CAT. S I..<.IGC?TASKS/TCST/OtSEGS;Z<4&G?TAaK2/TEST/S/PACK.NB/M070 1<40C>TASK3/ ` EST/OT/CCMMAND.DQUT l
4
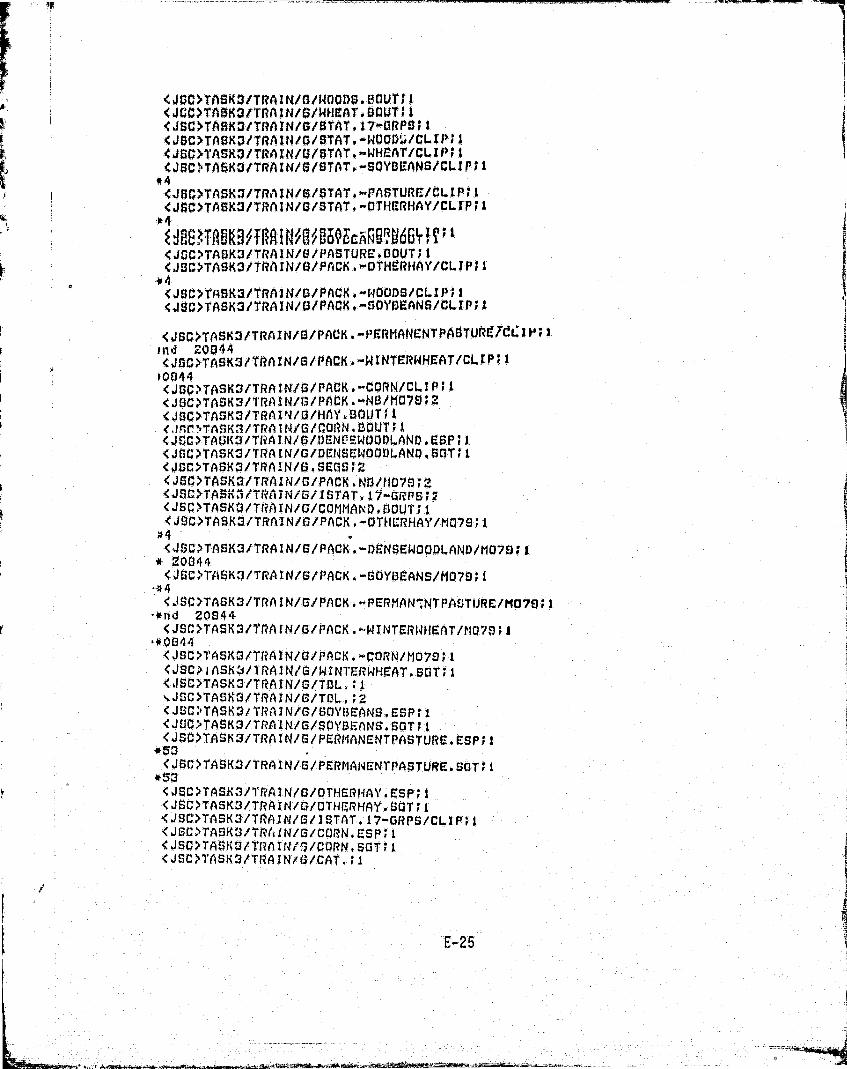
<JGC>TASK*/ RAlH/G/tlaODS. Dti'CI1<JC1>TASK3/TRAIN/G/WHEAT.00UT;I<JSC>TASK3/TRAIN/S3/STAT.17-ORPS;I
f <JSC>'TAOK /'TRAIN/O/STAT,-140000;/CLIP; I<JSC>TASKO/TRAIN/U/STAT -WH,CAT/CL.IP; I<JSC>TASKS/TRAIN/O/STAT.-SOYDEANS /CL,IP;I
*4<J$G>TASK3/TRAIN/O/BTAT —PASTURC/GLIPI t<J$C>TASK3/TRAIN/O/STAT, -OTHaRHAY/CLIP;]k4
<J$C>TASK3/TRAIN/U/PASTURE:.BOUT;I4JSC'>TASK:I/TRAIN/O/PACK.-OTHtRHAY/CLIP 1
*4<JSC>TASTK3/TRAIN/S/PACK.-WOODS/CLIP#'1<JSC>TASK3/TRAIN/Ii/PACK.-SOYCOANS/CLIP;I
<JSG>TASK3/TRAIN/S3/PACK.-1 1,ERMANaNTPAOTUP47dC I N I+11d ZDS44<40C>TASK3/1`RAIN/S/PACK.-WINTERWHCAT/CL,LP#'
00044<JSC>TASK3/TRAIN/G/PACK.-CORN/C41 P I<JUC>TASK3/1*RAIN/O/PACK.-NIA/ 1070;<J5C>TASK3 /TF3AlNIG/HAYm8OU T3 ItJRr± TASKI/TRAIN1G/CORN,5OUT;I<JSC>TASK3lTr"AIN/G/DGNP!CW ?OPLAND.CSP;1<JGC>TASK3/TRA IN/G/DENSCWOOD1-AND. SC T; 1<JSC>TASK3/TRAIN /G SaOS;"<JSIC>TASKO/TRAIN/G/PAOK NO/t!07S;N.tnc.>{A$inarTRttIN/1:;.% 5TAY t7-GiRPS:"a<JSC>TASK;3/TRAIN/G /CGM MAND. SOOT; 1<J«SC>TASK3/TRA'IN/C/PACK.-OTHS:RHAY/MD78;'I4<J$C'>TASK3/TRAIN/S/PACK.-DENSCWOODL,AND/MO79;1'
* 20044<JSC>TASK3/TRAIN/S/PACK.-SOYBEANS;/MU70;S
<JSC>TASK3/TRA I N/G/PACK . --^PERMAN",^NTPA STIJRC/MO79; I j•*nd 20044
<JSaC>TASKS/TRAIN/G/PACK. -WINTER10IEAT1 OM; I-*004A<JSC>TASK3ITRAIN/G/PACK.-CORN/MO70;1< J$C>SASK3 /TRAIN/S/WINTERWHEAT.SGT 1<JS3C>'TASK3/TRAIN/G/TESL, t T^-JSC`>TASK3/TRAIN/G/TD4.;<JSG;F TASK3/TI?A]14//G/S g1'lSEANS. ESP;1<J;iC>TASK3/TRAIN/G/SOYS3E nNS.SGT; 1<JSC>TASK3/TRA IN/S/PCRtIANGNTPASTURE.ESP;i
*SO'<JSS >TASK^/TRAIN/S/PEsRMA14ENTPASTURE. SGT; 1
*53<JSC>TASK 3/'1`PAIN/G/OTMERI AY CSP;1<JSC>TA5K3/TRAIN/C/UTNGRHAY.SCT; 1<JSC'>TASK:3/TRAIN/G/ISTAT.17—ORPS/CLIP;!<JSC?TASKS/TR(t SN/G/CORN. ESP L 1<JSC>TASK3/TRAI'N /CGRN.SGT,1<JSG>TASK3/TRAINl(3/GAT.;1
er S
E-2
i
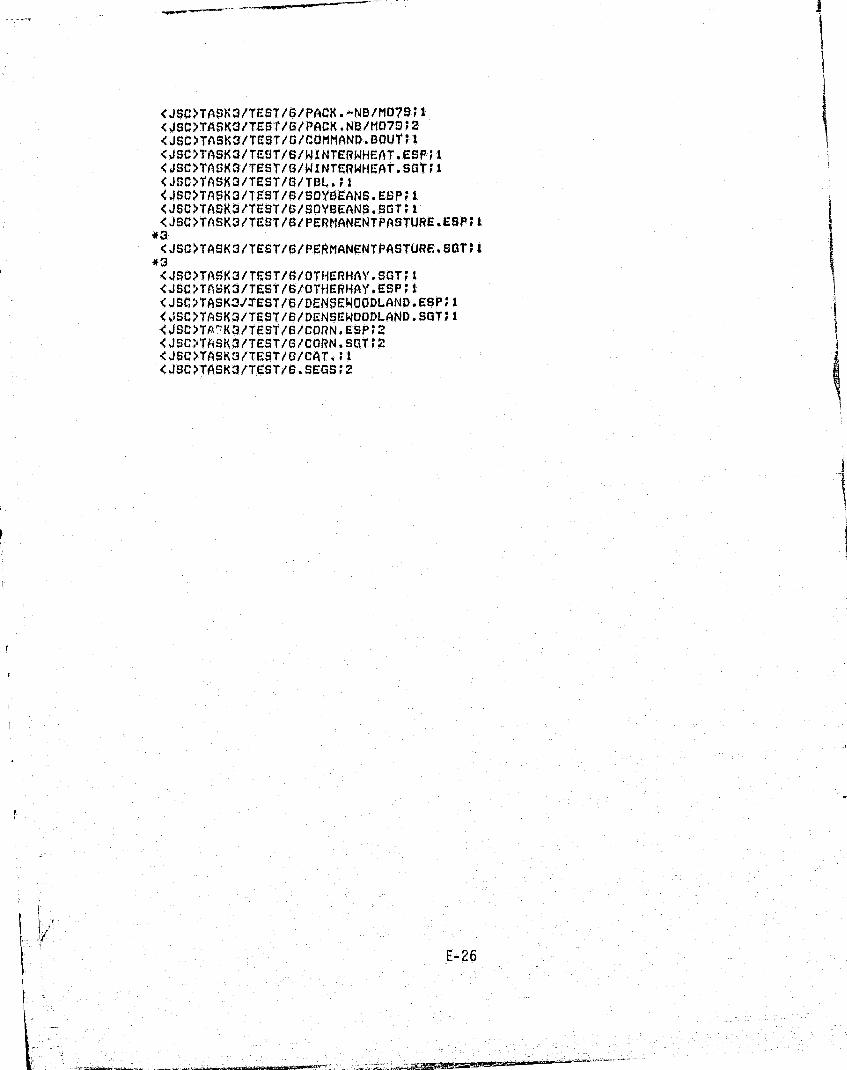
<JSC>TASK3/TEST/S/FLACK.-NO/MO79;1<JSC>TASK3/TES`r/6/PAiCK . NFL/MU70; 2<Jac>TASK3/TEST/G/CUMMAND.BOUT;1<JSC>1'ASK3/TEST/S/14INT£RWH£AT.ESP; I<JSC>TASK3/TEST/S/WINT£RWH£AT.SGT;i<JSC>TASK3/TEST/G/T8I..;l<JSC?TASK3/TEST/B/SOYSEANS- ESP;<JSC>TASK3/TCST/C /SOYBEANS.SGT;1<JSC>TASK3/TEST/G/PERMANENTPASTURE.ESP 1*3<JSC>TASK3/T£ST/S/PERMANENTPASTURE- SOT;1
*3<JSC>TASK3/TEST/S/DTE4ERHAY.SGT;l<JSC>TASK3/TEBT/S/OTHERHAY.ESP;I<JSClTASK3,/TEST/B/DENSEHOODLAND.ESP;l<JSC>TASK3/TEST/S/DENSEWOOD4AND.SOT l<JSC>TA"K3/TEST /S/CDRN.ESP;3<JSC,TASK3/TEST/G/CORN.SGT;2<JSC>TASK V TEST/S/CAT.;i<JSC>TASK3/TEST/S.SE»GS;2
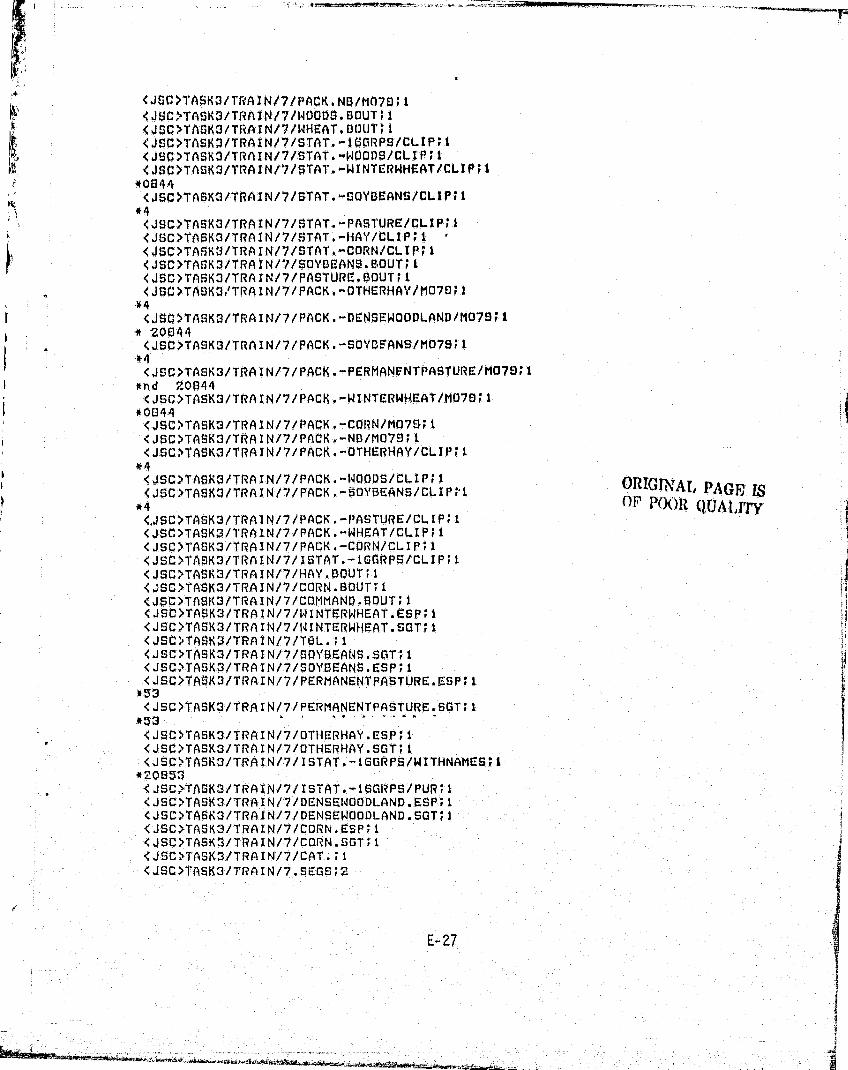
f'
' <JSC>TASK3/TRAIN/7/PACK.NO/MO70;1<JSC>TASK5/TRAIN/71WOODS.BDUT;1
1 <JSC>TASKO/TRAIN/7/14HEAT.Bt3UT;i<JSC>TASKO/TRAIN/7/STAT. — IOGIZPS/CLIP; 1<JSG>TASK3/TRAIN/7/STAT.—WOODS/CLIP;!<J$C>TASK3/TRAIN/7/STAI'.^-WINTERWHEAT/CLIP; 1
F *0844<JSC>TASK3/TRAIN/7/STAT.-SOYBEANS/CLIP;I
*4<JSC>TASK3/TRAIN/7/5TAT.—PASTURE/CLIP;I
' <JSC?TASK3/TRAIN/7/STAT.-14AY/CLIP;!<J$C>TASK3/TRAIN/7/STAT.—CORN/CLIP;!<JSC>TASK3/TRAIN/7/SDYBEANS.BOUT;1<JSC>TASK3/TRAIN/7/PASTURE.BDUT;1.
. <JSC>TASK3'TRA1N/7/PACK.— OTHERHAY/MD70;1*4
I <JSC>TASK3/TRAIN/7/PACK.-D5NSEWOODLAND/MU7J;1* 20844
!I <JSC}TASK3/TRAIN/7/PACK.—SOYDEANS/MO78;1
*4! <JSC>TASK3/TRAIN/7/PACK.-PERMANENTPASTURE/MO79;1
*nd 20041<JSC>TASK3/TRAIN/7/PACK.—WINTERWHEAT/MD70;1,*0044 4
' <JSC?TASK3/TRAIN/7/PACK.--CORN/MD79;i<JSC>TASK3/TRAIN/7/PACK.-NB /M079; 1<JSC>TASK3/TRAIN/7/PACK.--OTHERHAY/CLIP;!
*4<JSC>TASK3/TRAIN/7/PACK.--WOODS/CLIP; 1
SOYBEANS ORIGINAL PAGE IS<JSC>TA$K3/TRAIN/7/PACK.—/CLIP;i*4 POOR QUAI,try<.JSC>TASK3/TRAIN/7/PACK.-PASTURE/CLIP;i
` <JSG>TASK3/1"RAIN/7/PACK.--WHEAfi/CLIP; 1<JSC>I'ASK3/TRAIN/7/PACK.—CORN/CLIP;1<JSC>TASK3/TRAIN/7/ISTAT. — iCriRPS /'CLIP;!<JSC?TASK3/TRAIN /'7/HAY.BOUT;1<JSC?TASK3/TRAIN /7 /CORN.BOUT;i<JSC?TAS K3/TRAIN/7/CDMMAND.BGUT;i<JSC>TASK3/TRAIN/7/WINTERWHEAT.ESP;1<JSC?TASK3/TRAIN/7/14INTERWHEAT.SGT;1<JSC>TAS0/TRAIN/7/T6L.;1 F1<JSC>TA8K3/TRAIN/7/SDYBEANS.SGT;1<JSC>TASK3/TRAIN/7/SOYBEANS.ESP;1 3+<JSC?TASK3/TRAIN/7/PERMANENTPASTURE.CSP;1
ks3<JSC>TASK3/TRAIN/7/PERMANCNTPASTURESGT;1
*153. I . . . . _ ., .. . .
<JSC>TASK3/TRAIN/7/DTHCRHAY.ESP;`1<JSC>TASK3/TRAIN/7/OTHERHAY.SGT;i<JSC>TASK3/TRAIN/7/ISTAT.-GGRPS/WITHNAMES;1*OBGa
<JSC>TASK3/TRAIN/7IISTAT.-IDG1RPS/PUR;<JSC?TASK3/'TRAIN/7/DENSE114ODDl.AND.ESP; 1<JSC>TASK3/TRAIN/7/DENSE±WOODLAND.SGT;1 9
<JSC>TASK3/TRAIN/7/CO ►sN.CSP;i<JSC>TASK3/TRAIN/7/CORN.SGT;1<JSC>TASK3/TRAIN/7/CAT.;!,<JSC>TASK3/TRAIN/7.S50S;y
E-27
w i+RWY$ 4i'^LW .Wf1:1'Zi r"^. +It%::dII'J+uLtp .•• M7R'Ot ' .5 r_:.s' = ...
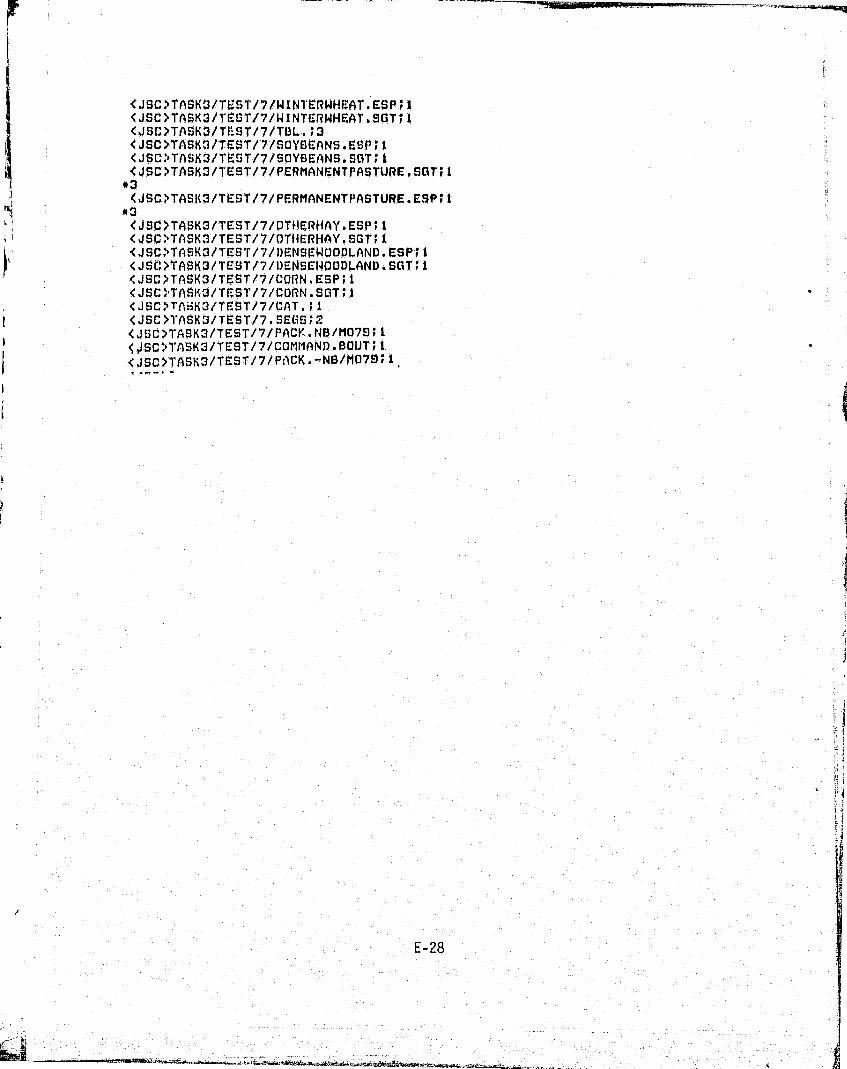
<JSC>TASK3/Tt:ST/7/WINI.'ERWHEAT.E$P;I<JSC>TASK3/TEST/7/WINTERWHCAT.SGT;I<JSC>TASK3/Tl'-- ST/7/TBL.;3<J5C>TASKI/Tf:$T/7/SDYBEANS.ESP;1<JSC,', TASK3/1'EST/7/SOYBEANS.SGT;I<JSC>TASK3/TEST/7/PERMANF.NTPASTURE .SGT;1
#3<JSC>TASK3/TES'r /7/PERMANENTPASTURE•ESP;1
*3
<JSC>TASK3/TEST/7/DTilERHAY.ESP;I<J$C>TASK3/TEST/7/OTiiERHAY-SCI T; I<JSC>TASK3/TES'F/7/1)EN$EWUODL AND.ESP;I
^' <JSC>TASK3/TEST/7/DENSC1400DLAND.SCiT; I<JSC>TASKO/TEST/7/CORN.E5P;1<JSC'f^TASK3/Tj:ST/7/CORN.SGT; I<JSG> Tr,8K3/TEST/?/CAT.;l -<JSC>1'ASK2/TEST/7 . SEGS; 2<JSC>TASK3/T5ST/7/PACK.t4B/MO79;I^ JSC>I'ASK3/TEST/7/COMMAND.BDUT;1<JSC>TASK3/TCST/7/PACK.-Ng/MO79;1,
E-28
<JSC>TASK3/TRAIN/G.S505;2<JSC>TASK3/TRAIN/8/WOODS.BOUT;1<JSC >TASK O/TRA IN lO/1414!:AT.BOUT; I<JSC,'ETASK3/TRAIN/B/STAT.—IUORPS/CLIP;t<JSC>TASK3/TRAIN/U/STAT.—OTHERHAY/CLIP;I
*4<JSC>TASK3/TRA11 4 /8/STAT.—DENSEWOODLAND/CLIP;I20044
<JSC>TASK3/TRAIN/8/SI'AT.-SD'tBEANS/CLIP;I*4
<JSC>TASK3/TRAIN/Q/STAT.—PERMANENTPASTURE/CI.IP;I*nd 20044
<JSC>TASK3/TRAIN/S/STAT.—WINTERWHEAT/CLIP;I
<JSC>TASK3/TRAIN/O/ STAT.—CURN/CLIP;I<J$C>TASK3/TRAIN/Q/SU1'BEANS-BOUT;I<JSC>TASK3/TRAIN/8/PASTUREoBOUT;I<JSC>I'ASK3/TRAIN/B/PACK.—OTHE13HAY/M0/9;1
*4<JSC>TASK3/TRAIN/8/PACK.—DENSEWOODLAND/M079;120844
<JSC>TASK3/TRAIN/B/PACK.—SOYBEANS/MO79;1*4
<JBC>TASK3/TRArN/B/PACK.—PERMANENTPASTURE/M079;1*nd 20844
<JSC>TASK3/TRAIN/8/PACK.—WINTERWHEAT/MD79;1*0844
<JSC>TASK3/TRAIN/8/PACK.—CURN/M079;1<JSC>TASK3/TRA I N/8/ PACK. — UTHERHAY/Cl, I P; 1
*4<JSC>TASK3/TRAIN/8/PACK.—DENSCWDODLAND/CLIP;120844
<JSC>TASK3/TRAIN/B/PACK.—SOYBEANS/CLIP;I#4<JSC>TASI(3/TRAIN/B/PACK.—PERMi)NENTPASTURE/CLIP;1
*nd 20844<J$C>TAS143/TRAIN/O/PACK.—CORN/CLIP;I<JSC>TASK3/TRAIN/8/PACK.—WINTERWHEAT/CLIP;I
X0844 ^
<J$C>TASK3/TRAIN/8/PACK.—NB/MO79;1<JSC>TASK3/TRAIN/841STAT.-,ISGRPS/CLIP;I<JsC>TAsKl/TRAIN/B/HAY.BOUT;i<J9C>TA9K3/TRAIN/9/CORN.BOUT;1<JSC>TASK3/TRAIN/8/COMMAND.BOUT ; I<JSC>TASK3/TRAIN/8/WHEAT.BOUT;1<JSC>TASK3/TRAIN/$/STAT.—WINTERWHEAT/CLIP;I
*OB44<JSC>TASK3/TRAIN/e/PACK.NB/MD79;1<JSC>TASK3/TRAIN/B/14INTERWHEAT.ESP;I<JSC>TASK3/TRAIN/8/WINTERWHEAT-SOT;t<JSC>TABK3/TRAIN/@/TBL.;1<JSC>TASK3/TRAIN/8/SOYBEANS.ESP;I<JSC>TASK3/TRAIN/B/SQ1'BEANS.SGT;t<JSC>TASK3/TRAIN/G/PERMANENTPASTURE. ESP;I*53<.JSC>TA$K3/TRAIN/G/PERMANENTPASTURE.SGT;I
#53
E -29
j
F 1
4
JSC>TASK3/TRAIN/O/CTHCRIIAI'. SGT;1<JSC>TASit3/TRAIN/E)/UTIICRHAY.ESP; 1<JSC>TASK3/TRAIN/S/ISTAT.^15GRPS /WITHNAMCS;1
t2Qa53<JSC>TASK3/TRAIN/B/ISTAT.-IVORPS/PUR;i<JSC>TASK3/TRAIN/B/UCNSCPIQQDLAND.GSP;1<JSC>TASK3/TRAIN/S/DCNSl14IDQDLANA.SGT;t<JSC>TASK3/TRAIN/8/C0RN.ESP;1<JSC>TA$K3/TRAIN/S/C0PN.SGT l<JSC>TASK3/TRAIN/a /CAT.;I
<JSC>T'ASK3/TEST/B/PACK.-NO/MO79;1<JSC>TASK3/TEST/B/WOODS.EST;I<JSC>TASK3/TEST/U/WOODS.SGT;l<JSC>TASK3/TEST/B/WHEAT.EST;I<JSC>TASK3/TEST/B/WHEAT.SGT;l<JSC>TASK3/TEST/8/TABLE.;t<JSC>TASK3/TEST/8/PACK.NB/MO79;1<JSC>TASK3/TEST/8/COM11AND.BOUT61<_JSC>TASK3/TEST/8/SOYBEANS.EST;1<JSC>TASK3/TEST/8/SO'(BEANS.SGT;i<JSC TASK3/TEST/B/PASTURE.EST;1<JSC>TASK3/TEST/S/PASTURE.SGT;1<JSC>TASK3/TEST/8/HAY.EST ► 1<JSC>TASK3/TEST/8/HAY.SGT;I<.1SC>TASK3/TEST/B/CORN.EST;1<JSC>TASK3/TEST/B/CORN.SGT;l<JSC>TASK3/TEST/B/CAT.;1<JSC>TASK3/TEST/B.SE6S;2
w
k
I
s
<JSC>TASK3/TRAIN/9.CCGS;4<JSC>TASK3/TRAIN/9/STAT.16-01RPS;1<JSC>TASK3/TRAIN/S/STAT,-OTHERHAY/CLIP;1
*4<JSC>1`ASK3/TRAIN/9/STAT.-DENSEWOODLAND/CLIP;20644
<JSC>TASK3/TRAIN/9/STAT.^ISOYSE:ANS/CLIP;1*4<JSC>TASK3/TRAIN/S/STAT.-PERMANENTPASTURE/CLIP;i
*rid 20844<JSC>TASK3/TRAIN/9/STAT.-WINTERWHEAT/CLIP;1
*0844<JSC?TASK3 /TRAIN/S/STAT.-?CORN/CLIP.1<JSC>TASK3/TRAIN/9/PACK.NB/MO79;1<JSC>TASK3/TRAIN+'9/ISTAT.16-GRPSI<JSC>TASK3/TRAIN/D/COMMAND.6DUT;1<JSC>TASK3/TRAIN/S/WOODS.EST;1<JSC>TASK3/TRAIN/S/WOODS.SGT;i<JSC>TASK3/TRAIN/3/14HEAT.EST;1<JSC?TASK3/TRAIN /9 /WHEAT.SGT;1<JSC>TASK3/TRAIN/O/TABLE.;1<JSC?TASK3/TRAIN/9/SOYBEANS.EST 1'<JSC>TASK3/TRAIN/9/SOYBEANS.SGT;1<JSC?TASK3/TRAIN/9/PASTURE.EST;1<JSC>TASK3/TRAIN/S/PASTURE.SGT;1<JSC>TASK3/TRAIN/J/ISTAT.I6-GRPS/CLI'P;1<JSC:, TASK3/TRAIN/9/HA`+`.FST 1<JSC>TASK3/TRAIN/9/HAi'.SGT;1<JSC>TASK3/TRALN/9/CORN,EST';1<JSC;TASK3/TRAIN/9/CORN !GT;l<JSC?TASK3/TRAIN/S/CAT.;1<JSC?TASK3/TRAIN/9/WOODS.BOUT;I<JSC>TA5K3/TRAIN/J/WHEAT.SOUT;i<JSC>TASK3/TRAIN/9/SOYBEANS.BOUT;I<JSC>TASK3/TRAIN/S/PASTURE.BUUT;<JSC>TASK3/TRAIN/S/PACK.-OTHERHAY/M079;1
*4<JSG>TASK3/TRAIN/9/PACK.-DENSEWOODLrND/MO79;124844
<JS.:>TASK3/TRAIN/S/PACK.-SOYBEANS/MO79;1*4CJSC)TASK3/TRAIN/9/PACK.-PERMANENTPASTURE/MO79;1
*n_d 20844<JSC>TA9K3/TRAIN/J/PACK.-WINTERWHEAT/MO79;1
*0644<JSC>TASK3/TRAIN/S/PACK.-CORN/MO79;1<.JSC>TASK3/TRAIN/S_/PACK.-OTHERHAY/CLIP;1
*4<JSC>TASK3/TRAIN/9/PACK.-DENSEWOODLAND/CLIP;I20844
<JSC>TASK3%TRAIN/S/PACK.-SOYBEANS/CLIP ;1*4<JSC>TASK3/TRAIN/9/PACK.-PERMANENTPASTURE/CLIP;1
*nd 20844<JSC>TASK3/TRAIN/9/PACK.-WINTERWHEAT/CLIP;1
*0844<JSC>TASK3/TRAIN/9/PACK.-CORN/CLIP;1<JSC>TASK3/TRAIN/9/PACK.-NB/MO79;1
/ <'JSC>TASK3/TRAIN/S/HAY.BOUT;1<JSC>TASK3/TRAIN/9/CORN.BOUT;1
OR'G'NAL PAGE IbE-32 OF POOR QUALITY
u S
I
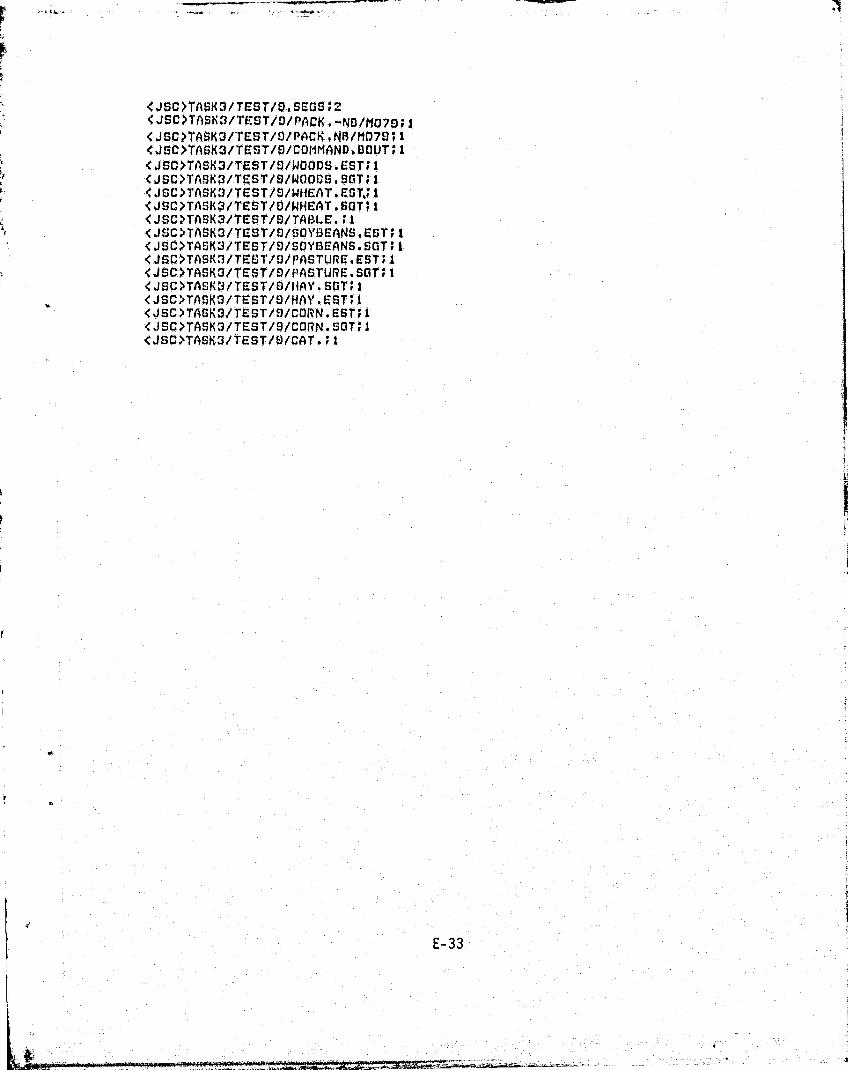
<JSC>TASK3/TEt5T/0, SEOS;Z<JSC>TASK3/TrST/D/PACK.-NO/MO70;1<JSC>TASK3/TEST/9/PACK -N8/M079; I<JSC>TASK3/TEST/Q/COIIMAND. BOUT; I<JSC>TASK3/TEST/9/WOODSoCST;l<JSC>TASK3/TEST/9/WQQDS.SGT;l< J SC >TASK 3/TEST/ D/WHEA T. EST,; I<JS0TASK3/TCST/0/WHEAT-50T;1<JSC>TASK3/TEST/D/TABLE.;l< J SC >TASK 3/ TCST/0 /SOYSEANS. EST; I<JSC>TASK3/TEST/S/SUYBEANS.SCT;I< J SC >TASK3 MEST/S/ PASTURE. EST; 1<JSC>TASK3/TEST/9/PASTURE.sar;1<JSC>TASK3/TEST/D/HAY-$rvT; I<JSC>TASK3/TEST/9/HAY-E$T;l<JSC>TASK3/TEST/S/CORN,EST;t<JSC>TASK3/TEST/S/CORN-SOTF61<JSC>TASK3/TEST/O/CAT.;1
E-33
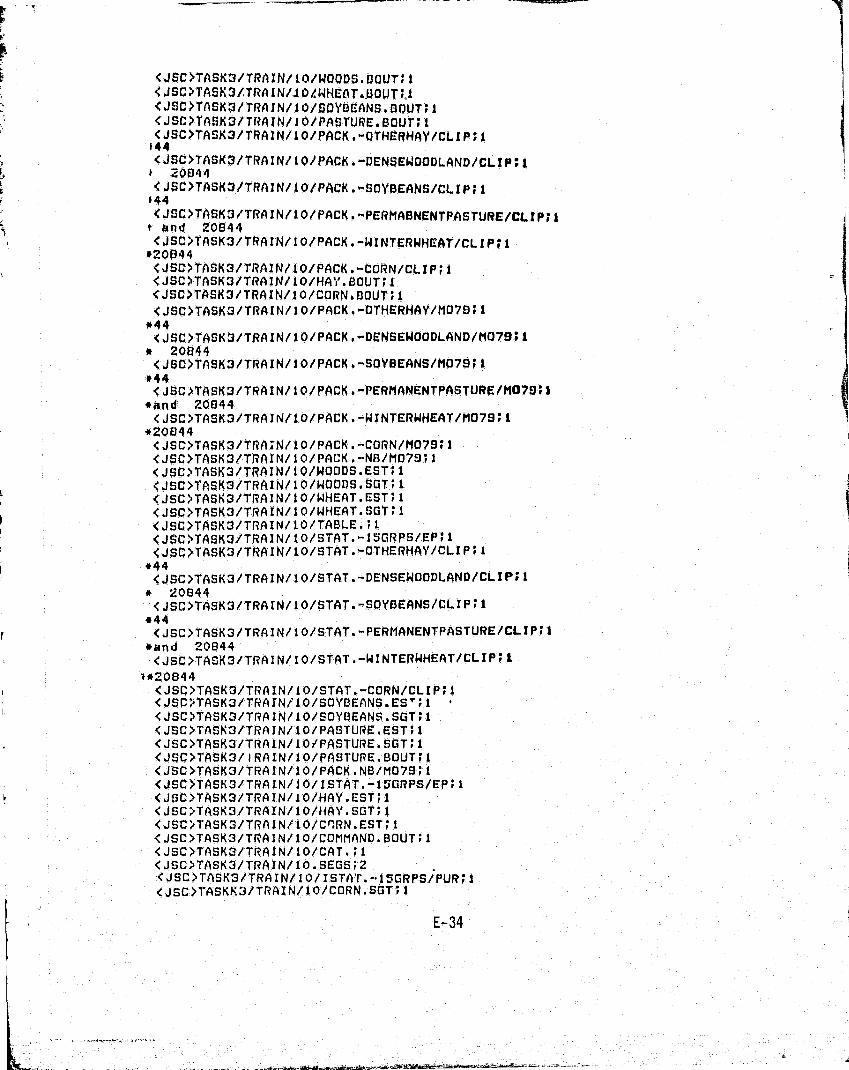
<JSC>TASK3/TRAIN/10/WOQDS.BOUT;t<JSC >TASK31TRAINII O/WHCAT,J3OUT;xi<JSC>TASKS/TRAIN/10/SOYBCANS.SOUT;1<JSC>T'ASK3/TRAIN/10/PASTURC.SOUT;t<JSC>TASK3/TRAIN/10/PACK.-OTHERHAI' /CLIP ;1144<JSC>TASK3/TRAIN/10/PACK.-DENSEWOODLAND/CLIP;1
20944<JSC>TASK3/TRAIN/10/PACK.--SOYBEANS/CLIP;1044<JSC>TASK3/TRAIN/10/PACK.-PERMASNENTPASTURE/CLIP;I
a nd 20844<JSC>TASK3/TRAIN/10/PACK.-WINTERWHEAT/CLIP;1
*20844<JSC>TASK3'/TRAIN/10/PACK.°CORN/CLIP;I<JSG>TASK3/TRAIN/10/HAY.8OUT;l<JSC>TASK3/TRAIN/10/CORN.BOUT;1<JSC>TASK3/TRAIN/10/PACK.-OTHERHAY/MO79 ;1
*44<JSC>TASK3/TRAIN/10/PACK'.-DENSEWOODLAND/MO791* 20844<JSC>TASK3/TRAIN/10/PACK.-SOYBEANS/MO79;1
*44<'JSC>1`ASK3/TRAIN/10/PACK.-PERMANENTPASTURE/MO79;1*and 20844CJSC>TASK3/TRAIN/10/PACK.-WINTERWHEAT/MO79;1
*20844<JSC>TASK3/TRAIN/10/PACK.^CORN/MO79;1<JSC>TASK3/TRAIN/10/PACK.-NR/M079;1<'JSC>TASK3/TRAIN/10/WOODS.EST;l<JSC>TASK3/TRAIN/10/WOODS.SGT;I<JSC>TASK3/TRAIN/10/WHEAT.EST;1<-JSC>TASK3/TRAIN/10/WHEAT.SGT;lCJSC)TASK3/TRAIN/10/TABLE.;1<JSC>TASK3/TRAIN/10/STAT.-ISGRPS/EP;1CJSC>TASK3/TRAIN/10/STAT.-OTHERHAY/CLIP;i
*44<_JSC>TASK3/TRAIN/10/STAT.-DENSEWOODLAND/CLIP;I
2004 4<JSC>TASK3/TRALN/10/STAT.-SOYSEANS/CLIP;
444<JSC>TASK3/TRAIN/10/STAT.-PERMANENTPASTURE/CLIP;l*and 20844<JSC>TASK3/TRAIN/10/STAT-WINTERWHEAT/CLIP;
1*20844<JSC>TASK3/TRAIN/10/STAT.-CORN/CLIP;I<JSC TASK3/TRAIN/10/SOYBEANS.ES';1<J'C^TASK3/TRAIN/!0/[01'BEAN^ SGT'1
I•,
Cit! C)TASK3/TRAIN/10/PA LIT "Mr EST'1
<JSC>TASK3/TRAIN/10/PASTURE.SGT;1<JSC>TASK3/!RAIN/10/PASTURE.BOUT;1<;JSC>TASK3/TRAIN/10/PACK4NB/MO79;1<JSC>TASK3/TRAIN/10/ISTAT 15GRPS/EP;I<J9C>TASK3/TRAIN/IO/HAY.EST;1CJSC>TA9K3/TRAIN/10/HAY.SGT;1<JSC>TASK3/TRAIN/10/CP-RN.ESTi1CJSC>TASK3/TRAIN/10/COMMAND.BOUT;1<JSC>TASK3/TRAIN/10/CAT.;1<JSC>TASK3/TRAIN/IO.SEGS;2<JSC>TASK3/TRAIN/10/ISTA'r.-150RPS/PUR ;1<JSC>TASKK3/TRAIN/10/CORN.SGT1
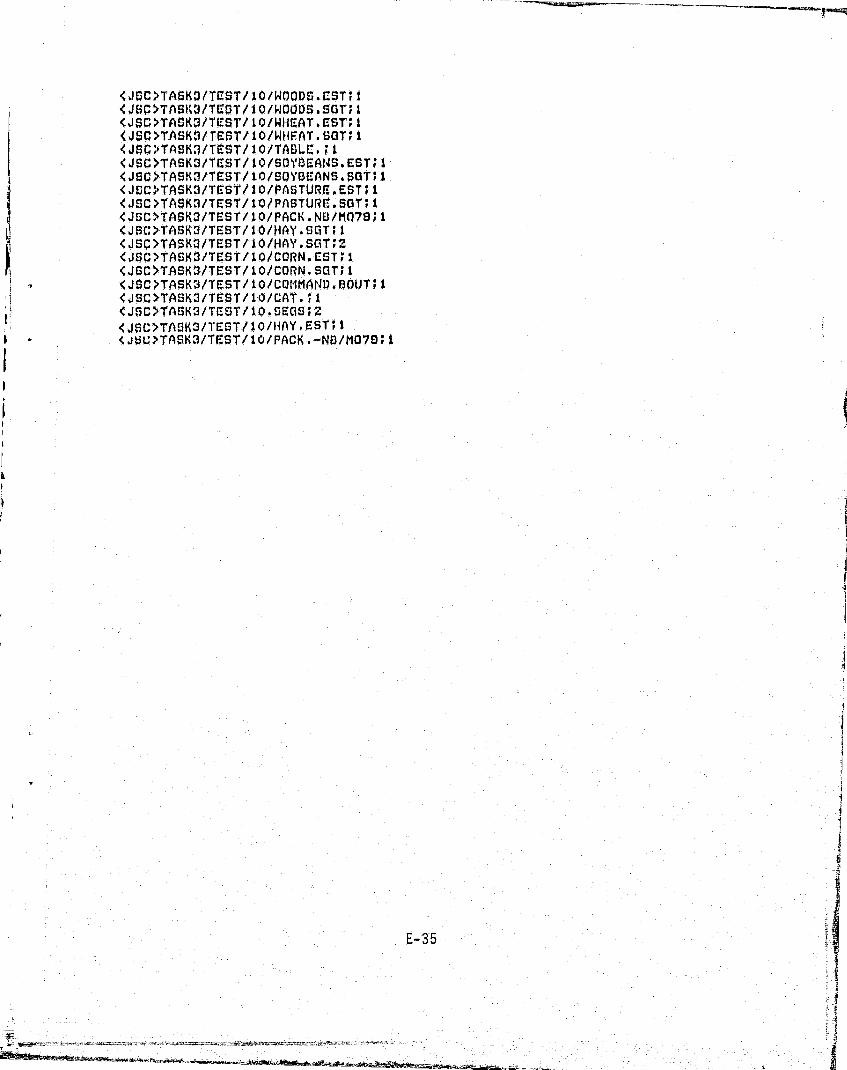
<JPC>TASA3/TCST/10/WOODS.CST;l<JSO>TASK3/TCST/10/WQUDS.SGT;1<JSC>TASK3/TCST/ 10/WHEAT. CST; I<JSC>TASK.IITEST/10/WIIFAT- SOT ;I<JSC>TASK3/TEST/10/TA8LC,;1<JSC>TASK3/TEST/I0/SOYBEANS.EST;I<JSC>TASK3/TES7'/iO/SUYDCANS. SGT; I<JSC>TASK3/TEST/10/PASTURr..E$T;I<JSC>TASAI/TEST/10/PAStURE.SGT;I<JSC>TASK3/TEST/10/PACK.NB/MO7S;I<JSC>TASK3/TEST/10/HAY.SGT;1<JSC>TASK3/TEST/10/HAY.SGT;Z<J$C>TASK3/TEST/10/CORN.CST ► 1<J6C>TASKt)/TEST/10/CQRN-SGT;1<JSC>TASK3 /TEST/ WCOMMAND.BOUT; I<JSC>TASK3/TEST/10/CAT.;1<JSC>TASK3/TCST/10-SEGS;Z<JSC>TASK3/TEGT/10/HAY,EST;1<JUL;>TASK3/TEST/10/PACKo—NO/MO79;1
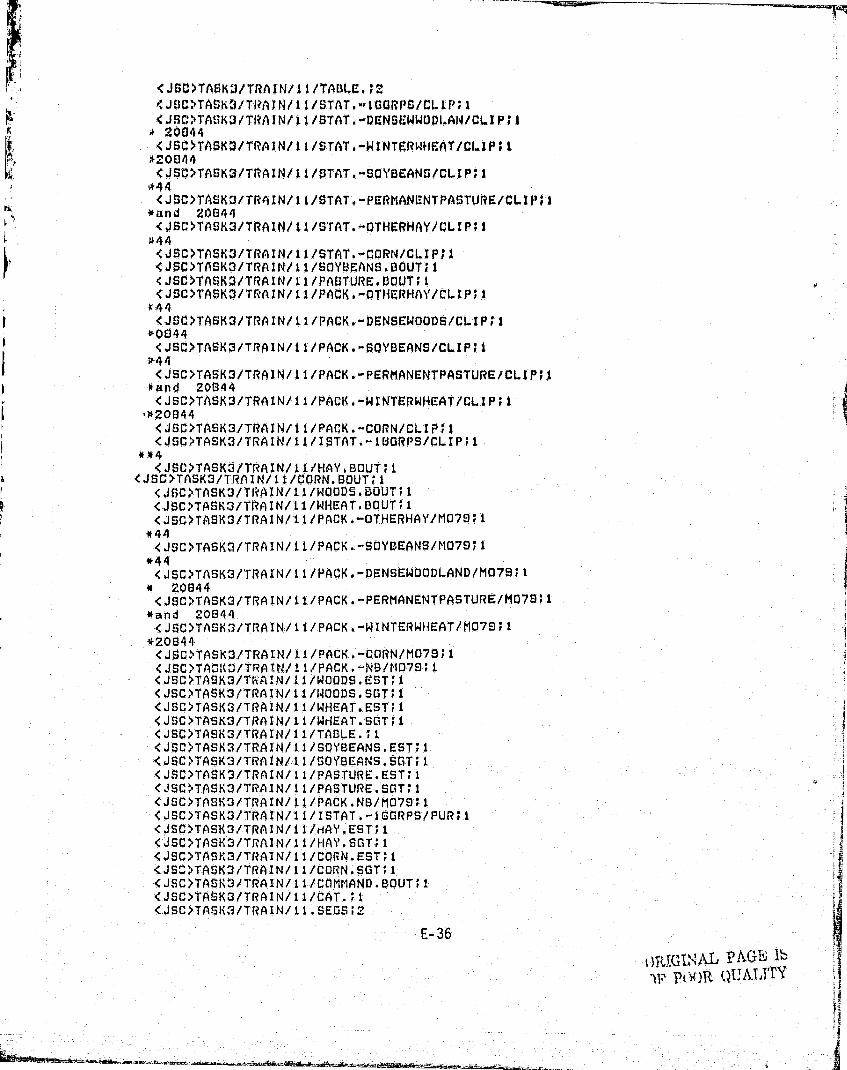
f
k6
't <JSC>TASKU/TRAIN/l1/TAULC.S2<J:SC>TASK3/ TliAIN/1,t/STAT.- IGGRPS/C4LP; I
` <JSC>TAsSK3/TRAIN/11/STAT.-DCNSL*WWODI„AN/CLI'Pi 1+ 20044<JSC>TASKO/TRAIN/111STAT.-WINTERWHFAT/CLIP;I
*L01344<JSC>TASK3/TRAIN/11/STAT.-SOYSEANS/CLIP ► 1
*4Ar` <JSC>TASK3/TRAIN/Ii/STAT.-PERMANCNTPASTURE/CLIP;'1" *and 20840
<JSC>TASK3/TRAIN/11/QrAT.-OTHERHAY/CLIP;1t 944
<JSC>TASK3/TRAIN/11/STAT.-CORN/CLIP;I<JSO>TASK3/TRAIN/11/SQYOEANS.BOUT;I<JSC>TA"K3/TRAIN/11/PASTURF.DQUT;I<J$C>TASKO/TRAIN /11/PACK,-OTHERHAY/CLIP;I
t4 4
I <JSC>TASK3/TRAIN/11/PACK.-DENSEWOODS/CLIP;1*0044<JSC>TASK3/TRAIN/11/PACK.-SOYBEANS/CLIP;I
P'4a<JSC>TASK3/TRAIN/il/PACK.-PERMANENTPASTURE/CLIP;i
*and 20844 !<JSC>TASK3/TRAIN/Il/PACK,-WENTERWHEAT/CLIPii F
-*20a4a! <JSC>TASK3/TRAIN/1i/PACK.-CORN/CLIP;IIi <JSC>TASK3/'TRAIN/11/ISTAT.-IWGRP5/CLIP;1
**4<JSC>TASK3 /TRAIN/11 /HAY.BDUT1
<JSC>TASK3/TRAIN/11/CORN.BOUT;i<JSiC>TASK3/TRAIN/li/WQODS BOUT;1
I <JSC>TASK3/TRAIN/i1/WHEAT.BQUT;1
<JSC>TASK3/TRAIN/i1/PACK. r-OTHERHAY /M079;1 - 9*4a
j <JSC>TASK3/TRAIN/ii/PACK.-SOYBEANS/MO79;1*44<JSC>TASK3/TRAIN/ii/PACK.r-DENSEW00DLAND/MD79;1
20844<JSC>TASK3/TRAIN/ii/PACK.-PERMANENTPASTURE/MC7$;I
*and 70644<JSC>TASK3/TRAIN/11/PACK.--WINTERWHEAT/MO79;1
*20644<JSC>TASK3/TRAIN/ii/PACK.-CORN/M0791<JSC>TAO!(3/TRA IN/ i 1/ PACK. -N3/MQ79; 1<JSC>TASK3/TNAI.N/1i/WQQDS.EST;1<JSC>TASK3/TRAIN/li/WOODS.5GT;1<JSC>TASK3/TRAIN/11/WHEAT.EST;1<JSC>TASK3/TRAIN/i1/WHEAT.SGT;1<JSC>TASK3/TRAIN/il/TABLE.';1<JSC>TASK3/TRAINIii/SOYBEANS.EST;1<JSC>TASK3/TRAI:N/11/SOYBEANS.SGT;_1<J8C>TASK9/TRAIN/Si/PASTURE.EST;1<JSC+TASK3/TRAIN/il/PASTURE.SGT1 S
<JSC>TASK3/TRAM/il /PACK.NS /MO79;1<JSC>TASK3/TRAI'N/SS/ISTAT.-iGGRPS/PUR;1<JSC>TASK3/TRAIN/11/HA1'.EST;i<JSC>TASK3/TRAIN/11/HAY.SGT;1<JSC>TASK,l/TRAIN/11/CORN.EST;l<JSN>TASK3/TRAIN/11/CORN.SGT;1<JSC>TASK3/TRAIN/11/COMMAND.BQUT;1<JSC>TASK3/TRAIN/11/CAT.; i g
<JSC>TASK:3/TRAIN/i1.SEGS;2
E-36a
r^^^AJ'`
F^^ I ? ^ Ly ^^^1&1II. l l
-•— .m:nn^.wrk;wvanwtc ._ _,^-3am.-^erx?..i.n,Y^.rz, €ii1
<JSC>TASK3/TEST/IL/WDODS.EST;1<JSC>TASK3/TaST/I1/WQODS.SGT;l<JSC*NTASK3/TCST/
I1/WIIEAT.EST;I
<JSC>TASK3/TCST/Il/WHEAT.SGT;l<JSC>TASK3/TEST/If/TA8L6, ► 1<JSC>TASK3/TEST/Ii/SO1'BEANS.EST;I<JSC>TASK3/TEST/Ii/SOYBEANS.SGT;I<JSC>TASK3/TEST/li/PASI'URE.EST ► I<JSC>TASK3/TEST/Ii/PASTURE. SGT ;I<JSC>TASK5/TEST/Ii/PACK.NB/MO79;1<JSC>TASK3/TEST/I1/HAY.EST;1<JSC>TASK3/TCST/11/14AY.SGT;l<JSC>TASK3/TaST/I1/CORN.EST ► 1<JSC>TASK3ITCST/Il/CORN.SGT;l<JSC>TASK3/TEST/I1/COMMAND.BUUT;I<JSC>TASK3/TEST/IIICAT, ► l<JSC>TASK3/TEST/lI.SEG3;2
PAGV, 1p
pf