
35thAerospace Mechanisms Symposium - NASA Technical ...
314
J/Y/ N AS,_C P_2001 - 209626 35 th Aerospace Mechanisms Symposium Compiled by: Edward A. Boesiger Proceedings of a symposium held at The Four Points Hotel, Sunnyvale, CA Hosted by the Ames Research Center and Lockheed Martin Space Systems Company Organized by the Mechanisms Education Association May 9-11, 2001 May 2001
-
Upload
khangminh22 -
Category
Documents
-
view
4 -
download
0
Transcript of 35thAerospace Mechanisms Symposium - NASA Technical ...

J/Y/N AS,_C P_2001 -209626
35thAerospace Mechanisms SymposiumCompiled by: Edward A. Boesiger
Proceedings of a symposium held at
The Four Points Hotel, Sunnyvale, CA
Hosted by the Ames Research Center and
Lockheed Martin Space Systems Company
Organized by the Mechanisms Education Association
May 9-11, 2001
May 2001

NASA Center for AeroSpace Information7121 Standard Drive
Hanover. MD 21076-1320
(301 ) 621-0390
Available from:
National Technical Information Service
5285 Port Royal Road
Springfield. VA 2216 I(703) 487-4650
PREFACE
The Aerospace Mechanisms Symposium (AMS) provides a unique forum for those
active in the design, production and use of aerospace mechanisms. A major focus isthe reporting of problems and solutions associated with the development and flightcertification of new mechanisms. Organized by the Mechanisms Education Association,
the National Aeronautics and Space Administration and Lockheed Martin Space
Systems Company (LMSSC) share the responsibility for hosting the AMS. Now in its35th year, the AMS continues to be well attended, attracting participants from both theU.S. and abroad.
The 35th AMS, hosted by the Ames Research Center (ARC) in Mountain View,
California, was held May 9, 10 and 11, 2001. During these three days, 25 papers werepresented. Topics included deployment mechanisms, bearings, actuators, pointing and
optical mechanisms, Space Station mechanisms, release mechanisms, and testequipment. Hardware displays during the supplier fair gave attendees an opportunity tomeet with developers of current and future mechanism components.
The high quality of this symposium is a result of the work of many people, and theirefforts are gratefully acknowledged. This extends to the voluntary members of the
symposium organizing committee representing the eight NASA field centers, LMSSC,and the European Space Agency. Appreciation is also extended to the session chairs,
the authors, and particularly the personnel at ARC responsible for the symposiumarrangements and the publication of these proceedings. A sincere thank you also goesto the symposium executive committee who is responsible for the year-to-year
management of the AMS, including paper processing and preparation of the program.
The use of trade names of manufacturers in this publication does not constitute anofficial endorsement of such products or manufacturers, either expressed or implied, by
the National Aeronautics and Space Administration.
iii

iv
SYMPOSIUM SCHEDULE
TUESDAY, 8 MAY 2001
6:30-8:30 CHECK-INFour Points - Pinot Noir Room
WEDNESDAY, 9 MAY 2001
8:00 Wednesday Presenters' Breakfast - Petit Sirah Room
8:00 CHECK-IN AND REFRESHMENTS - Grand Ball Room
9:OO INTRODUCTORY REMARKS
Ron Mancini, Host ChairmanNASA Ames Research Center, Mountain View, CA
Stuart H Loewenthal, General ChairmanLockheed Martin Space Systems Company, Sunnyvale, CA
CENTER WELCOME
Dr. Henry McDonald, Center DirectorNASA Ames Research Center, Mountain View, CA
9:3O SESSION I - BEARINGS & TRIBOLOGY
Michael Eiden, Session ChairESA/ESTeC, Noordwijk, The Netherlands• The Role of Bearing and Scan Mechanism Life Testing in Flight Qualification of the MODISInstrumentSteven VanDyk, Raytheon Systems Company, Santa Barbara, CA; Brian Dietz, Moog, Inc.,Chatsworth, CA; Kenneth Street, William Jones & Mark Jansen, NASA Glenn Research Center,Cleveland, OH; Michael Dube, Nye Lubricants, Inc., New Bedford, MA; Rajeev Sharma & RoamerPredmore, NASA Goddard Space Flight Center, Greenbelt, MD
• Dry Lubrication of Space-Related Tribocomponents with Diamond-Like Carbon CoatingsGabriel Pont, CNES, Toulouse, France; C. Donnet, J. Fontaine, M. Belin & T. Le Mogne, LTDS,
Ecully, France; Y. Berthier & S. Descartes, LMC, Villeurbanne, France; C. Heau, HEF,Andrezieux-Boutheon, France• Effect of Alternate Solvent Diluents on PFPE Performance
Christopher Dayton & Robert Warden, Ball Aerospace & Technologies Corporation, Boulder, CO• Improving the Robustness to Vibration and Temperature Effects for a Scanner Duplex BallBearing AssemblyMerritt Webb, Thomas Brewer & Benjamin Joffe, tTT Defense Aerospace/Communications
Division, Fort Wayne, IN
11:30 LUNCH BREAK
1:00 SESSION II- DEPLOY/RETRACT
Andy Tao, Session ChairTRW Space & Technology Division, Redondo Beach, CA• Retractable Trunnion Pin Mechanism
Wayne Jermstad & Mark Landeck, NASA Johnson Space Center, Houston, TX• Design of the X34 Speedbrake Mechanism Under Volume, Stiffness, Cost and ScheduleConstraints
William Kim, Orbital Sciences Corporation, Dulles, VA• Dust Cover for a Mars Lander Solar Cell ExperimentScott Christiansen & Kurt Lankford, Starsys Research Corporation, Boulder, CO
vii

• SRTM Mast Damping Subsystem Design and Failure InvestigationJeffrey Umland, Jet Propulsion Laboratory, Pasadena, CA• Fly Cast Maneuver for Shuttle Radar Topography MissionThomas Trautt, AEC-Able Engineering Company, Goleta, CA
3:30 BREAK
3:45 SESSION III- POSTER PREVIEW
Dave Putnam, Session Chair
Lockheed Martin Space Systems Company, Sunnyvale, CA
• Development of "Super-Flat" Strain Wave Gearing
Yoshihide Kiyosawa, Yoshihiro Tanioka & Keiji Ueura, Harmonic Drive Systems, Nagano, Japan• Zero Play Hinge Latch
Mike Cabiran, Lockheed Martin Space Operations, Houston, TX• Non-Metallic Hold Down and Release for an RF AntennaDavid Hernandez, NEA Electronics, Inc., Chatsworth, CA
• Fault tolerant Magnetic Bearing for Turbomachinery
Benjamin Choi & Andrew Provenza, NASA Glenn Research Center, Cleveland, OH• Methods for Improving Yield of Liquid Salt Bath Nitrocarburized 13-8PH Steel ComponentsIrwin Hochler, Aeroflex Laboratories, Farmingdale, NY
• Wear and Corrosion Resistant PM Tool Steels for Advanced Bearing ApplicationsBrian Hann, P. Kilonsky & M. Sperber, Crucible Compaction Metals Division, Oakdale, PA; DennisSmith, Honeywell Aerospace Electronic Systems, Glendale, AZ• A Low-Shock Stage Separation Mechanism
S. Vara Prasad Rao & Deepak Agrawal, Defense Research & Development Laboratory,Hyderabad, India
6:30-9:30 RECEPTION & DISPLAYS AT THE FOUR POINTS - Champagne Room
Invited component and software suppliers display current products and provide tutorials.
THURSDAY, 10 MAY 2001
8:00 Thursday Presenters' Breakfast - Petit Sirah Room
9:00 SESSION IV - ACTUATORS & LATCHESBob Neff, Session Chair
Space Systems/Loral, Palo Alto, CA
• Design of a High Resolution Hexapod Positioning MechanismJamie Britt, NASA Goddard Space Flight Center, Greenbelt, MD
• Lessons Learned from the Design and Implementation of a Potentiometer Assembly for anAntenna Pointing Mechanism Application
Bradley Arkwright & Pietro DiLeonardo, Honeywell Aerospace Electronic Systems, Glendale, AZ;Colin Francis & Richard Gahart, Space Systems/Loral, Palo Alto, CA• MIRO Calibration Switch Mechanism
Jason Suchman, Yuki Salinas & Holly Kubo, Jet Propulsion Laboratory, Pasadena, CA• A Robotic Rover-Based Deep Driller for Mars Exploration
Tomi Ylikorpi, Technical Research Center, Helsinki, Finland; G. Visentin, ESA, Noordwijk, TheNetherlands; J. Suomela, Helsinki University of Technology, Helsinki, Finland• Design and Verification of Space Station EVA-Operated Truss Attachment SystemGabriel Katell, The Boeing Company, Canoga Park, CA
11:30 LUNCH BREAK
viii

1:00
3:00
3:15
3:30
SESSION V - SOLAR ARRAYS
Jason WakugawaBoeing Satellite Systems Inc, El Segundo, CA• A Four Panel, Rotating Solar Array Wing for the TIMED Spacecraft Mechanism Design,Development and Test ResultsSteven Vernon & David Persons, Johns Hopkins University Applied Physics Laboratory, LaurelMD
• Validation of TSX-5 Solar Array Deployment by Correlated Simulation and TestBrian Gore, The Aerospace Corporation, El Segundo, CA• Milstar Solar Array Boom DeploymentThomas Pace & Steven Honodel, Lockheed Martin Space Systems Company Sunnyvale, CA• The Curwin" Design: A Novel Solar Array Concept for ConstellationsHenk Cruijssen & Gerard Kester, Fokker Space BV, Leiden, The Netherlands
BREAK
ANNOUNCEMENTSDR. CHARLES COALE AWARD ANNOUNCEMENTEUROPEAN SPACE MECHANISMS & TRIBOLOGY SYMPOSIUM PREVIEW
SPECIAL PRESENTATION
SOFIA - Stratospheric Observatory For Infrared Astronomy - A Project OverviewNans Kunz, SOFIA Project Engineering Manager, NASA Ames Research Center
5:30-10:30 SYMPOSIUM BANQUET ON SAN FRANCISCO BAY
5:30 Buses leave hotel parking lot7:00 Bay Cruise / Dinner10:00 Disembark cruise, board buses and return to the hotel
FRIDAY, 11 MAY 2001
8:00 Friday Presenters' Breakfast - Petit Sirah Room
9:O0 SESSION VI - RELEASE MECHANISMS
Brian Gore, Session ChairThe Aerospace Corporation, El Segundo, CA
• Hitchhiker Marman Band Interconnect LinkageGary Slebzak & Gene Barrett, Swales Aerospace, Inc, Beltsville, MD• Taking Commercial Spacecraft Practices Too FarChuck Lazansky & Scott Christiansen, Starsys Research Corporation, Boulder, CO• Design and Development of a Miniature Mechanisms Toolkit for Micro SpacecraftCliff Willey & Stuart Hill, Johns Hopkins University Applied Physics Laboratory, Laurel, MD; Brett
Huettl, Starsys Research Corporation, Boulder, CO• Design, Development and Testing of a T-0 Environmental Control System Ground DisconnectPaul Schwindt & Bruce Hardman, NASA Kennedy Space Center, FL
11:00 BREAK
11:15 PRESENTATION: An Overview of ARC
William E Berry, Deputy Center DirectorNASA Ames Research Center
11:45 TECHNICAL SESSIONS CONCLUSION
1:00-3:00 AMES RESEARCH CENTER FACILITY TOUR
ix

SYMPOSIUM ORGANIZING COMMITTEE
Ronald E. Mancini, Host Chairman, NASA ARC
Stuart H. Loewenthal, General Chairman, Lockheed Martin
Edward A. Boesiger, Operations Chairman, Lockheed Martin
Obie H. Bradley, Jr., NASA LRCMichael J. Eiden, ESA/ESTeC
Carlton L. Foster, NASA MSFC
Robert L. Fusaro, NASA GRCClaef F. Hakun, NASA GSFC
Christopher P. Hansen, NASA JSCAlan C. Littlefield, NASA KSC
Edward C. Litty, JPLFred G. Martwick, NASA ARC
Stewart C. Meyers, NASA GSFCMartha E. Milton, NASA MSFC
Fred B. Oswald, NASA GRCMinh Phan, NASA GSFC
John F. Rogers, NASA LRC
Donald R. Sevilla, JPLMark F. Turner, NASA ARC
James J. Zakrajsek, NASA GRC
SYMPOSIUM ADVISORY COMMITTEE
H. Mervyn Briscoe, ESA/ESTeC (ret)
David F. Engelbert, NASA ARC (ret)
Otto H. Fedor, Lockheed Martin (ret)John W. Redmon, Sr., NASA MSFC (ret)
Alfred L. Rinaldo, Lockheed Martin (ret)William C. Schneider, NASA JSC (ret)
Bowden W. Ward, Jr., NASA GSFC (ret)

CONTENTS
Symposium Schedule ............................................................................................................................... vii
Symposium Organizing and Advisory Committees .................................................................................... x
The Role of Bearing and Scan Mechanism Life Testing in Flight Qualification ofthe MODIS Instrument ................................................................................................................................ 1
Steven VanDyk, Brian Dietz, Kenneth Street, William Jones, Mark Jansen,
Michael Dube; Rajeev Sharma & Roamer Predmore
Dry Lubrication of Space-Related Tribocomponents with Diamond-Like Carbon Coatings ..................... 15
Gabriel Pont, C. Donnet, J. Fontaine, M. Belin, T. Le Mogne; Y. Berthier S. Descartes; C. Heau
Effect of Alternate Solvent Diluents on PFPE Performance ..................................................................... 25
Christopher Dayton & Robert Warden
Improving the Robustness to Vibration and Temperature Effects for a Scanner Duplex
Ball Bearing Assembly .............................................................................................................................. 35
Merritt Webb, Thomas Brewer & Benjamin Joffe
Retractable Trunnion Pin Mechanism ...................................................................................................... 47
Wayne Jermstad & Mark Landeck
Design of the X34 Speedbrake Mechanism Under Volume, Stiffness, Cost andSchedule Constraints ................................................................................................................................ 57
William Kim
Dust Cover for a Mars Lander Solar Cell Experiment .............................................................................. 71Scott Christiansen & Kurt Lankford
SRTM Mast Damping Subsystem Design and Failure Investigation ........................................................ 83
Jeffrey Umland
Fly Cast Maneuver for Shuttle Radar Topography Mission ...................................................................... 95Thomas Trautt
Development of "Super-Flat" Strain Wave Gearing ................................................................................ 109
Yoshihide Kiyosawa, Yoshihiro Tanioka & Keiji Ueura
Zero Play Hinge Latch ............................................................................................................................ 115Mike Cabiran
Non-Metallic Hold Down and Release for an RF Antenna ...................................................................... 121
David Hernandez, Jr
Fault tolerant Magnetic Bearing for Turbomachinery ............................................................................. 127
Benjamin Choi & Andrew Provenza
V

Methods for Improving Yield of Liquid Salt Bath Nitrocarburized 13-8PH Steel Components ............... 133Irwin Hochler
Wear and Corrosion Resistant PM Tool Steels for Advanced Bearing Applications .............................. 139
Brian Hann, P. Kilonsky, Dennis Smith & M Sperber
A Low-Shock Stage Separation Mechanism .......................................................................................... 145
S. Vara Prasad Rao & Deepak Agrawal
Design of a High Resolution Hexapod Positioning Mechanism .............................................................. 149Jamie Britt
Lessons Learned from the Design and Implementation of a Potentiometer Assemblyfor an Antenna Pointing Mechanism Application .................................................................................... 163
Bradley Arkwright, Pietro DiLeonardo, Colin Francis & Richard Gahart
MIRO Calibration Switch Mechanism ..................................................................................................... 179
Jason Suchman, Yuki Salinas & Holly Kubo
A Robotic Rover-Based Deep Driller for Mars Exploration ..................................................................... 185Tomi Ylikorpi, G. Visentin; & J. Suomela
Design and Verification of Space Station EVA-Operated Truss Attachment System ............................ 199Gabriel Katell
A Four Panel, Rotating Solar Array Wing for the TIMED Spacecraft Mechanism
Design, Development and Test Results ................................................................................................. 213Steven Vernon & David Persons
Validation of TSX-5 Solar Array Deployment by Correlated Simulation and Test .................................. 227Brian Gore
Milstar Solar Array Boom Deployment .................................................................................................... 237Thomas Pace & Steven Honodel
The "Curwin" Design: A Novel Solar Array Concept for Constellations .................................................. 251Henk Cruijssen & Gerard Kester
Hitchhiker Marman Band Interconnect Linkage ..................................................................................... 265Gary Slebzak & Gene Barrett
Taking Commercial Spacecraft Practices Too Far ................................................................................. 275Chuck Lazansky & Scott Christiansen
Design and Development of a Miniature Mechanisms Toolkit for Micro Spacecraft .............................. 287Cliff Willey, Brett Huettl & Stuart Hill
Design, Development and Testing of a T-0 Environmental Control System Ground Disconnect .......... 301Paul Schwindt & Bruce Hardman
vi
The Role of Bearing and Scan Mechanism Life Testing in Flight Qualification of the MODISInstrument
Steven G. VanDyk', Brian J. Dietz", Kenneth W. Street ÷, William R. Jones +, Jr., Mark J. Jansen*, MichaelDube ÷+, Rajeev Sharma *÷*, Roamer E. Predmore ÷++
Abstract
The Moderate Resolution Imaging Spectroradiometer (MODIS) is an instrument aboard the Terra (EOS
AM-l) satellite and has been operating successfully since December 1999. MODIS has been viewing theentire Earth's surface and gathering data to better understand the global dynamics and processes
occurring on land, in the oceans, and in the lower atmosphere. All observations are made through anextremely high resolution, optically and mechanically precise, scan mirror motor/encoder assembly. Thereliable performance of this assembly depends on two duplex bearing pairs lubricated with Pennzane, a
synthetic hydrocarbon, formulated with lead napthanate. This paper describes the results of acceleratedand operational life tests. It also describes the post-test analyses of the disassembled bearings. Analyses
were performed using micro-Raman, micro-FTIR, X-ray Photoelectron Spectroscopy (XPS), ScanningElectron Microscopy (SEM), and Size Exclusion Chromatography (SEC). In general, the three sets of
bearings in each of the test stations were in very good condition after accumulating 68, 144, and 209million revolutions, respectively. Some of the bearings exhibited lubricant degradation, indicated by
viscous lubricant deposits on the cage and raceways.
Introduction
At the onset of the MODIS development, Pennzane had not been flown on Goddard long-life lubricated
space mechanisms. Accelerated and real-time life tests were conducted on MODIS scan bearings todemonstrate that Pennzane would successfully lubricate the mechanism for the 5-year (53.4 million
cycles) life. Three sets of duplex MODIS bearings were tested at 23°C & 20.3 RPM for 68 millionrevolutions (Station IV); at 37°C & 50 RPM for 144 million revolutions (Station III); and at 45°C & 72 RPM
for 209 million revolutions (Station II). Six months before launch, the 37°C accelerated life test wasdisassembled and two of the three bearing sets were severely worn (Ref. 1). These results raised doubts
about flightworthiness of the MODIS instrument. Fortunately, a flight quality scan mechanism had alsobeen tested for 4.7 years at that time. Measurements of torque margins and operating parameters of the
engineering model scan mechanism with only a few months of operating time and the life test mechanismshowed no torque variation or operating parameter variation. From these measurements, it was concludedthat no measurable bearing wear or lubricant degradation occurred during the 4.7-year life test. After
almost 5 years of damage free scan mechanism life testing, it was concluded that the TERRNMODISinstrument was safe to fly. The wisdom of Goddard's requirement for an expensive scan mechanism life
test rather than less expensive bearing life testing was demonstrated.
This paper describes the bearing wear and lubricant degradation and distribution after the acceleratedbearing life test at 45°C and the real time life test at 23°C. After 68 million cycles (1.3 lives) in theboundary lubrication regime at 23°C, part of the oil had crept into the support structure. The oil color wasdark amber, but in many cases the viscosity was unchanged, all balls, retainers and races were wettedand contained oil meniscuses, and little wear was observed on the balls or races. After 209 million
revolutions (3.9 lives) at 45°C, more oil creeped into the support cups, the oil was black and viscous, allballs, retainers and races were wetted, small meniscuses of oil were at the ball race junctions, and very
* Raytheon Systems Company, Santa Barbara Remote Sensing, Santa Barbara, CA
** Moog, Inc., Schaeffer Magnetics Division, Chatsworth, CA+ NASA Glenn Research Center, Cleveland, OH
** Nye Lubricants, Inc., New Bedford, MA+++ NASA Goddard Space Flight Center, Greenbelt, MD
Proceedings of the 35 thAerospace Mechanisms Symposium, Ames Research Center, May 9-11, 2001

limited wear was observed on the balls and races. Dark deposits of lead or lead napthanate were notvisible, indicating the lead napthanate remained dissolved in Pennzane after 209 million revolutions at
45°C. This formulation of Pennzane performed very well at high temperature and in the boundarylubrication regime. The lubricant and bearing surfaces have been analyzed using micro-Raman, micro-FTIR, XPS, SEM and SEC and the results summarized.
Comparison of the bearing wear and the lubricant degradation after life testing at 23°C and 45°C, clearlydemonstrated that the severe bearing damage found in the 37°C accelerated life test originated from a
thermal control failure. This drove the bearing test temperature well above 90°C, as suggested in theReference 1.
As with most long-life lubricated mechanisms, lubrication life, bearing precision, and dynamic performanceare the critical factors in the operation of the scan motor/encoder. As a first phase of lubricant selection for
MODIS, bearings were lubricated with several candidate lubricants, accelerated life tests performed, andresults evaluated. A synthetic hydrocarbon, Pennzane SHF-X-2000 with 2.5% lead napthanate and 0.6%antioxidant additives, was selected. The second phase of lubricant selection consisted of three lubricant
life tests. These results were reported in Ref. 1 and in this paper. The third phase was the successfulqualification life test of the scan motor/encoder mechanism.
Three bearing test stations were constructed to evaluate the life of Pennzane lubricant for the MODIS
optical scan mechanism. Five-flight quality scan motor/encoder mechanisms were fabricated, assembled
and tested. The engineering model was used to develop the optical scanning control system. The secondmechanism was used for qualification life testing and has successfully completed that testing. The thirdmechanism was flown in the MODIS instrument on the TERRA satellite. The fourth mechanism will be
flown in the MODIS instrument on the AQUA satellite later this year. The fifth mechanism remains as aspare.
Each scan motor/encoder mechanism contains two duplex bearing pairs driven by a brushless dc-motor.
Pennzane SHF-X-2000 is a synthetic hydrocarbon lubricant and was chosen for the bearings and
mechanism. To mitigate instrument risk, both accelerated and operational speed life testing were
conducted in parallel with the mechanism design and fabrication in order to verify the lubricant life earlyenough in the program to switch lubricants for MODIS if accelerated testing revealed early anomalies.
Accelerated and Real-Time Pennzane Life Test Method
In each test station, three flight quality, 440C steel, 66.675-mm (2.625-inch) outer diameter, 50.800-mm
(2-inch) inner diameter, DF duplex pair bearings with a 165-N (37-pound) preload were used. Thebearings, phenolic laminate retainers, and sintered nylon reservoirs were lubricated in accordance with
flight requirements. The test station is illustrated as Figure 1. Each bearing pair was contained in its own
clamp/housing. The housings also contained lubricant reservoirs. Station II and III housings were fitted
with inner and outer race heaters. A strain gauge was mounted on a cantilever beam supporting eachbearing enclosure to measure the torque. The inner races of three duplex pairs were driven by a common
drive shaft. Instantaneous torque readings were recorded every 15 minutes. The monthly average of thesereadings was plotted over the life of the test (see Figure 2). One telemetry platinum resistancethermometer (PRT) was mounted to each bearing outer race housing. Two control PRTs (Stations II and
III only) were also mounted to each bearing housing (one on the outer race and one for the inner race). Alltesting was performed under vacuum. Although all the Pennzane lubricant was tested in the boundary
lubrication regime, the acceleration factor was established as similar calculated specific film thickness (_,)in all three-test stations. This method was used as an arbitrary way of creating an accelerated lubricationlife test. Three duplex pairs of bearings were tested in Station II at 72 RPM and 45°C, in Station III at 50RPM and 37°C and 22°C and in Station IV at 20.3 RPM and 23°C.

\
Performance Evaluation of the Qualification Life Test Scan Mechanism
Evaluation of the life test bearings from Station III (37°C and 50 RPM) had shown severe degradation(Ref. 1). To regain confidence in the MODIS scan mechanism before the launch of TERRA/MODIS, aperformance evaluation was conducted on the like-new engineering model (EM) and the qualification life
test mechanism after 4.7 years of testing.
The performance of the two test units was measured by evaluating the motor drag torque and phase errorsignals. At that time (11-1999), the EM scanner had accumulated a few hundred thousand cycles whereasthe LTU had completed close to one mission lifetime, about 45.8 million cycles, in vacuum testing.
Both scanners tested had their spin axis vertical with an equivalent inertia disk attached to represent the
scanner mirror at the top end of the drive system shaft. The hardware used to record the drag torque and
phase error signals was a portable data acquisition system running LabVIEW TM software and all data was
recorded at 250 samples per second.
The steady state drag torques measured on the MODIS EM and LTU scanner units were about 67 mN-m
(9.4 oz-in) and 87 mN-m (12.2 oz-in) respectively, indicating a beginning-of-life and a end-of-life torquemargin of greater than 20. The more important parameter of margin on phase lock for both units is ahealthy 200 percent. Because of the design similarities between the EM and LTU scanner units and thePFM and FM-1 MODIS scanners, it was concluded that the PFM and FM-1 unit MODIS scanners had
sufficient margin for a five-year mission life on the Terra and EOS-PM programs.
Test Results From Station III -- 50 RPM at 37°C
Bearing life test Station Ill results were reported at the 34 th Aerospace Mechanisms Symposium (Ref. 1).
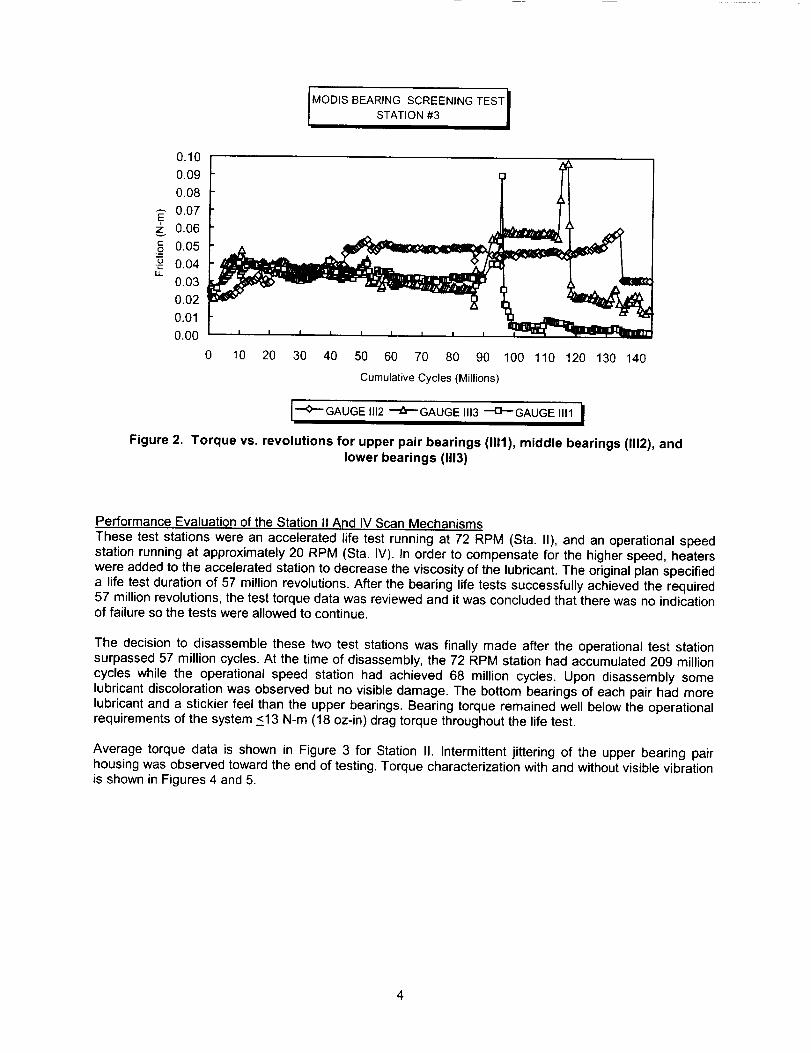
Bearings in this station indicated consistent operation well past 57 million revolutions until a suspectedheater malfunction occurred at 88 million cycles (Figure 2). The test continued until 144 million revolutionswere achieved, then it was switched off, and disassembled.
IMODISBEARINGSCREENINGTESTISTATION#3
0.100.090.08
,_ 0.07z 0.06_, 0.05
0.04
0.03
0.02
0.01
0.00
LL
Figure 2.
0 10 20 30 40 50 60 70 80 90 100 110 120 130 140
Cumulative Cycles (Millions)
I'-O--'GAUGEIII2--'Z_'-'GAUGE Ill3--'I3--GAUGE Ill1 I
Torque vs. revolutions for upper pair bearings (1111),middle bearings (1112),andlower bearings (1113)
Performance Evaluation of the Station II And IV Scan Mechanisms
These test stations were an accelerated life test running at 72 RPM (Sta. II), and an operational speedstation running at approximately 20 RPM (Sta. IV). In order to compensate for the higher speed, heaterswere added to the accelerated station to decrease the viscosity of the lubricant. The original plan specified
a life test duration of 57 million revolutions. After the bearing life tests successfully achieved the required57 million revolutions, the test torque data was reviewed and it was concluded that there was no indicationof failure so the tests were allowed to continue.
The decision to disassemble these two test stations was finally made after the operational test stationsurpassed 57 million cycles. At the time of disassembly, the 72 RPM station had accumulated 209 million
cycles while the operational speed station had achieved 68 million cycles. Upon disassembly somelubricant discoloration was observed but no visible damage. The bottom bearings of each pair had more
lubricant and a stickier feel than the upper bearings. Bearing torque remained well below the operationalrequirements of the system <13 N-m (18 oz-in) drag torque throughout the life test.
Average torque data is shown in Figure 3 for Station II. Intermittent jittering of the upper bearing pairhousing was observed toward the end of testing. Torque characterization with and without visible vibrationis shown in Figures 4 and 5.
4

I MODIS BEARING SCREENING TEST ISTATION #2
0.10
0.09
0.08
_" 0.07
0.06
0.05"5 0.04
" 0.03
0.02
0.01
0.00
Figure 3.
0 20 40 60 80 100 120 140 160 180 200
Cumulative Cycles (Millions)
-"O_GAUGE 112_GAUGE 113-'D-'GAUGE II1 I
Torque vs. revolutions for upper pair bearings (111), middle bearings (112), and
lower bearings (113)
TORQUE CHARACTERISTICS IGAUGE II1
0.11
o°o 0.08
_0.07v 0.06
0.05E 0.04
_- 0.030.020.01
Figure 4.
0 1 2 3 4 5 6 7 8 9 10 11 12 13 14 15
Revolutions
Torque characterization for Station II upper bearing pair with visible vibration
5
0.110.1
0.09
,_" 0.08z 0.07
0.06=_0.05_r
8 0.04_- 0.03
0.020.01
0
JTORQUE CHARACTERISTICSGAUGE 112 I
I I I I I I I I I
0 1 2 3 4 5 6 7 8 9 10 11 12 13 14 15
Revolutions
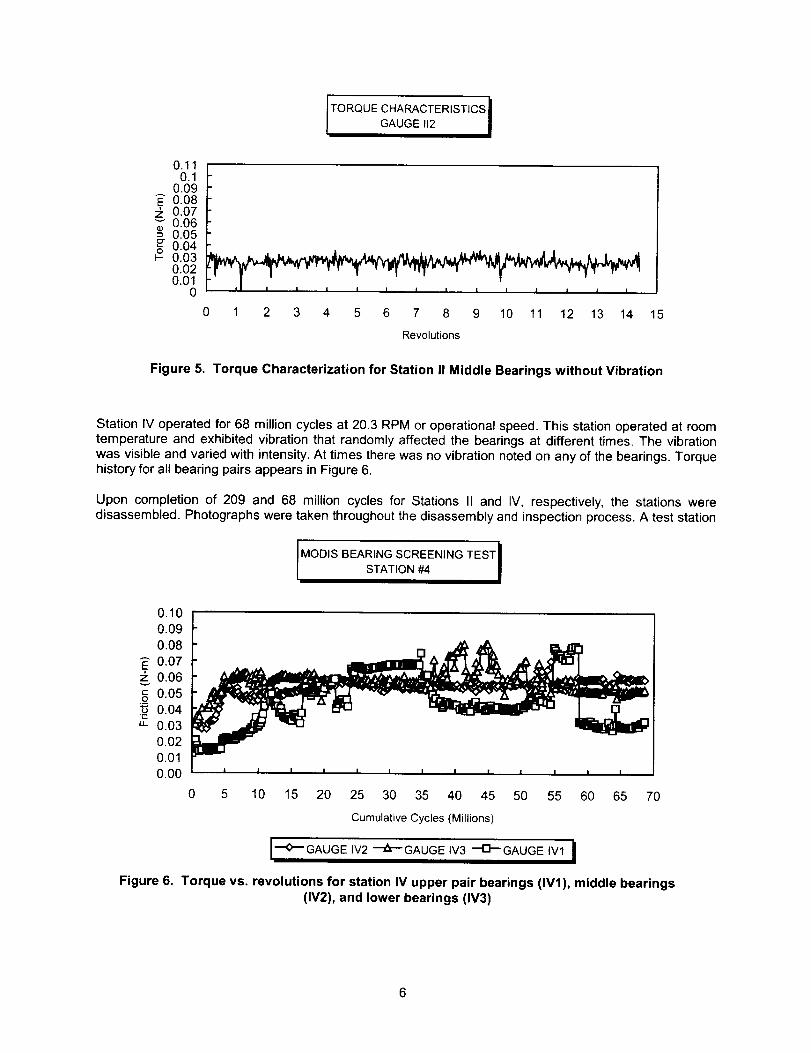
Figure 5. Torque Characterization for Station II Middle Bearings without Vibration
Station IV operated for 68 million cycles at 20.3 RPM or operational speed. This station operated at roomtemperature and exhibited vibration that randomly affected the bearings at different times. The vibration
was visible and varied with intensity. At times there was no vibration noted on any of the bearings. Torquehistory for all bearing pairs appears in Figure 6.
Upon completion of 209 and 68 million cycles for Stations II and IV, respectively, the stations weredisassembled. Photographs were taken throughout the disassembly and inspection process. A test station
i,MODIS BEARING SCREENING TEST|
ISTATION #4
0.10
0.09
0.08
_" 0.070.06
0.050.04
"E
u_ 0.03
0.02
0.01
0.00
Figure 6.
0 5 10 15 20 25 30 35 40 45 50 55 60 65 70
Cumulative Cycles (Millions)
I-'0-- GAUGE IV2 --_-- GAUGE iV3 --D-- GAUGE iV11
Torque vs, revolutions for station IV upper pair bearings (IV1), middle bearings(IV2), and lower bearings (IV3)

prior to disassembly is shown in Figure 7. The complete shaft and all bearing components were removedfrom the test station and transported to a class 100 flow bench in a class 100,000 clean room for further
inspection.
!il.....
Figure 7. Test station prior to disassembly
One of the disassembled bearings (4-012) is shown in Figure 8. Although not easily seen in the macro
photograph (Figure 8), dark viscous deposits are seen on the cage and raceways. A higher magnification
photograph (Figure 9) shows an example of these deposits in a raceway. Two other photographs showingthe variation and distribution of lubricant within the raceways appear in Figures 10 (greater amount of
lubricant) and Figure11 (lesser amount of lubricant).
Figure 8. Disassembled MODIS 4-012 bearing
Figure 9. Darkened lubricant deposit

Figure10.OnebearingfromStationIIwitha greateramountof lubricant
Figure11.OnebearingfromStationIIwithalesseramountof lubricant
AnalyticalResults
In general, the results showed the balls, retainers, and races were still lubricated and in good condition atthe end of test. The top bearing assemblies had less lubricant in both stations II and IV and bottom
bearing assemblies had a thicker grease-type residue. There was no sign of dry debris in any of thebearing assemblies. The oil had darkened significantly and was more viscous, almost like honey. Wear
paths were seen in the races and on some of the balls. There was no sign of elongation in the retainerpockets. However, some slight metallic debris was observed on some of the retainers. The metallic debriswas noticed only on station IV.
Raman and Infrared analyses of the lubricant indicated the standard signature for non-degradedPennzane. XPS, SEM, and EDAX showed the normal elemental composition for 440C steel. The most
striking demonstration of lubricant degradation was observed in some bearings as a thickened lubricantdeposit with almost grease like in consistency. These deposits occurred on both races and on the cage.
For the SEC analysis, the cages were all weighted and then extracted using tetrahydrofuran (THF). Thesolution was then concentrated and injected into a size exclusion chromatograph. An example from
bearing 4-012 appears in Figure 12. The detector signal is plotted as a function of molecular weight (MW).Several peaks are evident. The negative peaks at low MW are injection peaks. The peak at 195, whichoccurs in all samples, is an artifact from a preservative in the mobile phase (THF). The next peak
represents the degraded Pennzane compound. The higher MW peak at about 1300 represents theprimary Pennzane material as well as a contribution from the lead napthanate. The broad high MW peakcentered about 18,000 represents polymerized lubricant. This high MW peak does not occur in unusedsamples.
The weight of extracted lubricant varied from bearing to bearing with the smallest amount being about 9mg from cage 4-015 and 49 mg from cage 4-002A. This compares to the nominal amount of 75 mgimpregnated at build up. In addition, dark residues were observed on cages 4-002A, 4-005A, 4-006A and
4-015A. Photographs for these two cages after THF extraction appear in Figures 13a and 13b.

8OO0
7000
60,00
5000
4000
3000
20,00
1000
OC'O
000
Figure 12.
,/BHT Artifact
Pennzane +
Pb Napthenate \
High MW_
Product I I \
L, I i
S,oo iooo +_oo 2o0o 2soo 3o0o 35!o0 40o0 4s.oo moo Ss:oo eo.00Mmnutes
Size exclusion chromatogram from extracted lubricant from cage4-012
(a) (b)
Figure 13. Photograph of extracted cage from 4-002A (a) and 4-015A (b)
9

PerformanceMeasurement Test
Performance tests on the MODIS engineering model (EM) and life test unit (LTU) scanners were made todetermine the changes in performance over the expected on-orbit life of the flight unit. The EM and LTUscanners tested were equivalent units to the PFM (in service) and FM-1 scanner, which is scheduled to flyshortly on the EOS-PM (Aqua) program. As a minimum, the scanner drive systems must operatecontinuously for five years in a constant velocity mode for Earth scanning. The scanner drive systemutilized a phase-lock loop control system for maintaining scan rate at the desired value during operation.
Scan motor drag torque and phase error signal performance from both test units was measured, recordedand evaluated. The EM scanner had seen a few hundred thousand rotation cycles whereas the LTU hadcompleted more than one mission lifetime and about 58 million cycles in vacuum testing.
Both scanners tested had their spin axis vertical with an equivalent inertia disk attached to represent thescanner mirror at the top end of the drive system shaft. The hardware used to record the drag torque andphase error signals was a data acquisition system running LabVIEW TM software and all data was recordedat 250 samples per second. Figures 14 through 19 document results obtained from the tests performedand are discussed below.
Figure 14 documented the running or steady state drag torque of the EM scanner, which had an averagevalue of 67 mN-m (9.4 oz-in). During this test, the EM unit maintained the required rotation rate of 20.3
rpm with phase-lock control. The beginning-of-life requirement for this value was 110 mN-m (15 oz-in),which was met. The current limit on the PFM and FM-1 MODIS units was about one amp for the flightcondition which indicated that the beginning of life torque margin for the scanner was greater than 20.
Figure 15 documented the measured phase error signal of the EM scanner under turn ON and steadystate conditions. When the scanner was initially turned on, there was a large error signal generatedbetween the commanded rate and the actual rate, shown by the indicated spike shortly after turn-on. Thephase-lock circuitry was designed to reduce the error between the commanded rate and the actual rate
over a given time, therefore the error signal reduced shortly after turn-on to a value of about 1 volt peak-to-peak. This was equivalent to a phase error of about 20 micro-radians under steady state scannerrotation.
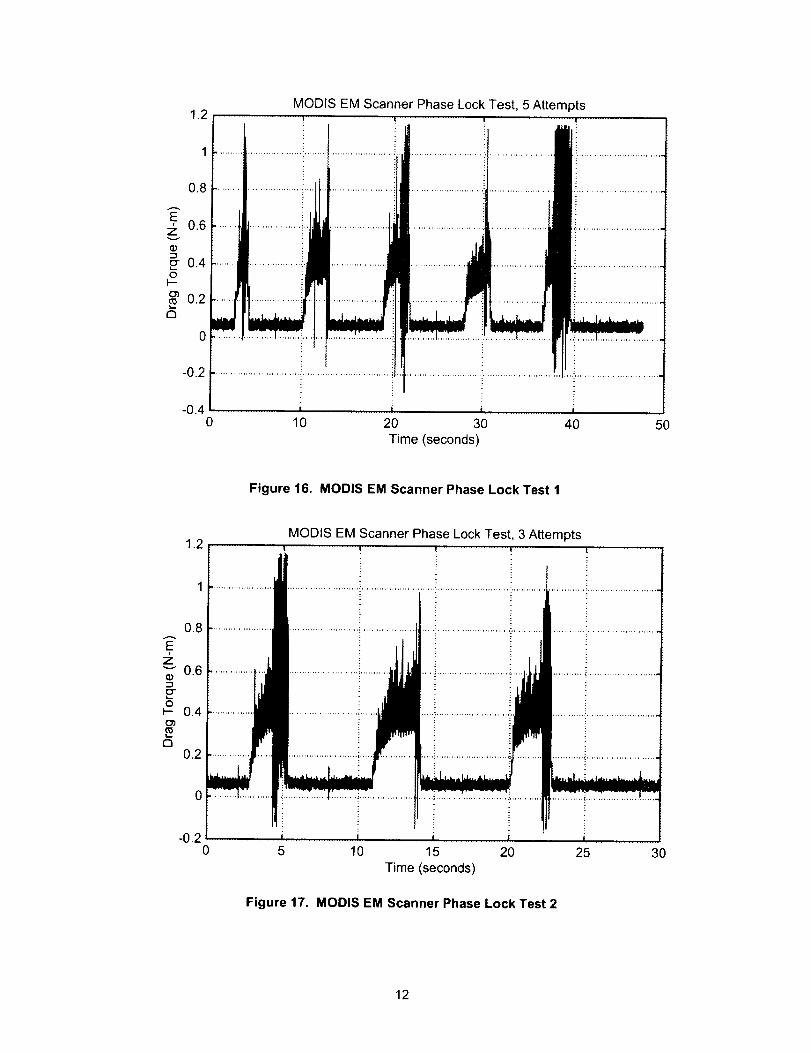
In Figures 16 and 17 eight attempts to bring the EM scanner out of phase lock by increasing the externaldrag torque on the drive system were shown. Due to the limitation of the test setup, the external drag wasincreased manually and the LED on the EM scanner electrical control box was observed to go outindicating the scanner was out of phase lock. The two figures also showed maximum drag torque wherethe scanner went out of phase lock. This drag torque compared to the maximum available torque of thescanner motor established the margin that existed for being in phase lock for the EM scanner unit. When
the transient drag torque events on Figures 16 and 17, were omitted, retrieving and averaging themaximum drag from the eight attempts indicated that the drag at which point the scanner phase lock waslost occurred at about 710 mN-m (100 oz-in). The PFM and FM-1 units had a scanner actuator currentlimit of about one amp from their power supplies, which indicated a margin on phase lock of about 200%at the beginning-of-life. This meant that the PFM and FM-1 unit scanners had about three times the
available torque capacity in their scanner drive systems to maintain scanner phase lock.
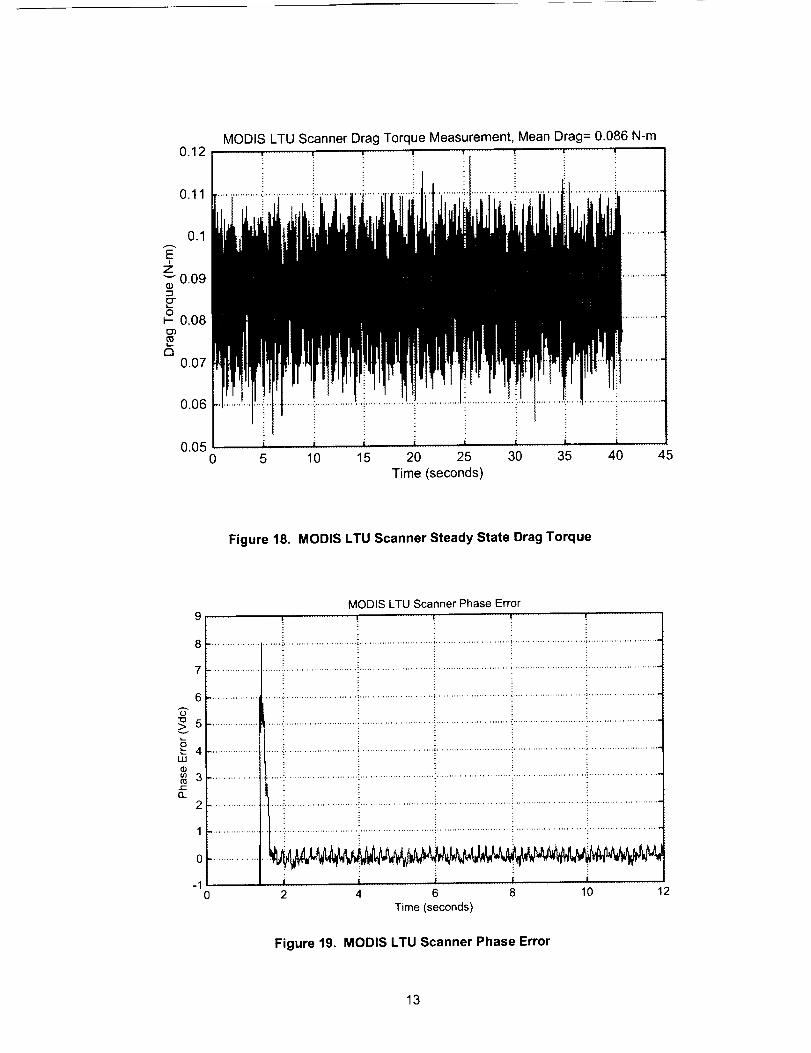
Figure 18 documented the running or steady state drag torque of the LTU scanner which had an averagevalue measured of about 86 mN-m (12.2 oz-in) after running more than one mission lifetime of 58 million
cycles in vacuum. During this test, the LTU unit maintained the required rotation rate of 20.3 rpm withphase-lock control. The measurement indicated that at the end of (one mission) life, the torque margin forthe scanner was greater than 20.
Figure 19 documented the measured phase error signal of the LTU scanner under turn ON and steadystate conditions. Similarly as with the EM unit system, when the LTU scanner was initially turned on, therewas a large error signal generated between the commanded rate and the actual rate, shown by theindicated spike shortly after turn-on. The phase-lock circuitry was designed to reduce the error betweenthe commanded rate and the actual rate over a given time, therefore there was a reduction in error signalshortly after turn-on to a value of about 0.5 volt peak-to-peak. This was equivalent to a phase error ofabout 10 micro-radians under LTU scanner steady state rotation.
10
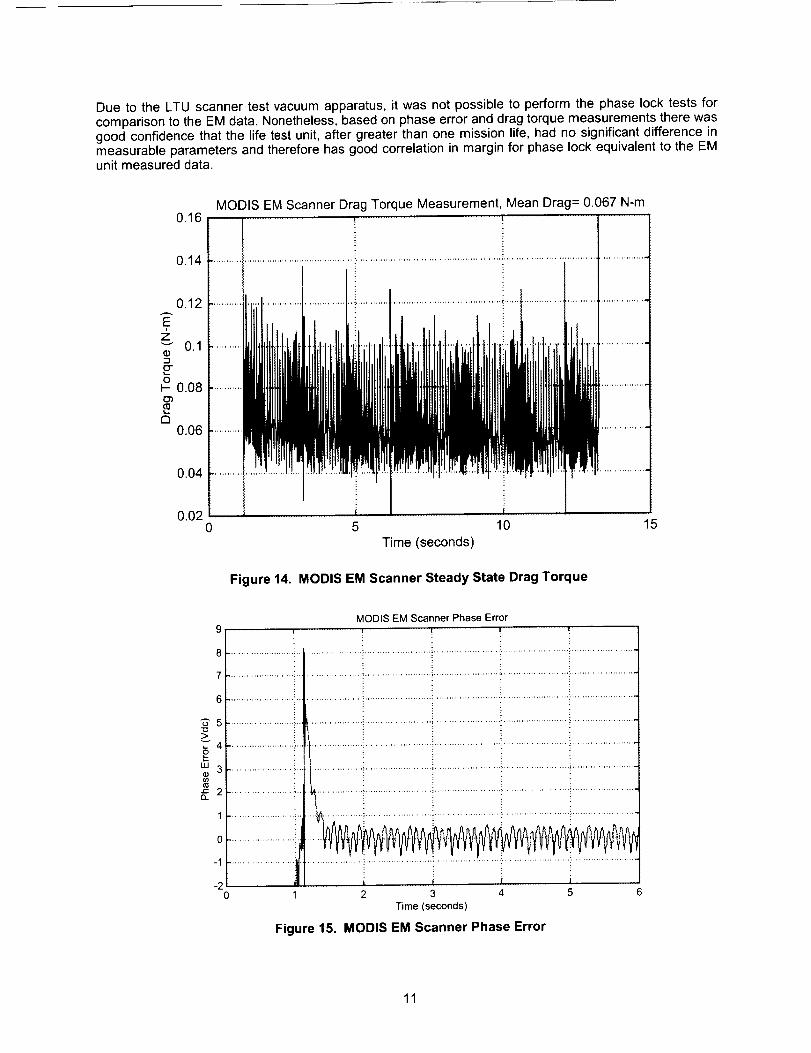
Dueto theLTUscannertestvacuumapparatus, it was not possible to perform the phase lock tests forcomparison to the EM data. Nonetheless, based on phase error and drag torque measurements there wasgood confidence that the life test unit, after greater than one mission life, had no significant difference inmeasurable parameters and therefore has good correlation in margin for phase lock equivalent to the EMunit measured data.
0.16
0.14
0.12
Zv 0.1
o_- 0.08
1210.06
MODIS EM Scanner Drag Torque Measurement Mean Drag= 0.067 N-m
0.04
0.020
Figure 14.
5 10 15
Time (seconds)
MODIS EM Scanner Steady State Drag Torque
MODIS EM Scanner Phase Error
g
8 .............................. * ...................... i ..........................................................................................................
7 .............................. • ...................... , ..........................................................................................................
6 ..............................................................................................................................................................
.......................... .,...................... _.......................... j .......................... ......................................................
2 .............................. :l
1 .............................
0 .............................
-2 _i i i i i0 1 2 3 4 5 6
Time (seconds)
Figure 15. MODIS EM Scanner Phase Error
"o
>,- 4oi-
"' 3
¢-(3.
11
MODIS EM Scanner Phase Lock Test, 5 Attemptsl ! t l
I ! I
10 20 30Time (seconds)
50
Figure 16. MODIS EM Scanner Phase Lock Test 1
Ei
Zv
of-
£3
-0.20
MODIS EM Scanner Phase Lock Test, 3 Attempts
I i
5 10 15 20Time (seconds)
Figure 17. MODIS EM Scanner Phase Lock Test 2
25 3O
12
MODIS LTU Scanner Drag Torque Measurement, Mean Drag= 0.086 N-m0.12
0.11
0.1
EI
z_" 0.09
EO
0.08O3
a0.07
0.06
0.050 5 10 15 20 25 30 35 40 45
Time (seconds)
Figure 18. MODIS LTU Scanner Steady State Drag Torque
MODIS LTU Scanner Phase Error
6G"
25-'- 4UJ
p_3¢-
13_
2
1
0
-1
.................... i ...........................................................................................................................................................|
................... I .............................................................................................................................. : ............................
0 2 4 6 8 10 12
Time (seconds)
Figure 19. MODIS LTU Scanner Phase Error
13

Conclusions
The steady state drag torques measured on the MODIS EM and LTU scanner units were about 67 mN-m
(9.4 oz-in) and 87 mN-m (12.2 oz-in) respectively indicating a beginning-of-life and a end-of-life torquemargin of greater than 20. The more important parameter of phase lock margin for both units was ahealthy 200 percent. Because of the design similarities between the EM and LTU scanner units and thePFM and FM-1 MODIS scanners, it was concluded that the PFM and FM-1 unit MODIS scanners had
sufficient margin for a five-year mission life on the EOS-AM (Terra) and EOS-PM (Aqua) programsrespectively.
Lessons Learned
As a worn slip ring was the cause of heater loss in the accelerated test station, it was shown that the test
equipment must be more robust than the hardware being tested. Also, in the presence of gravity,
considerations for the orientation of test samples should be given. Where feasible, rotation of the samplesshould be performed to counter the effects of gravity. The labyrinth seal should match that of the flightconfiguration. And lastly, when testing mechanical systems consider the frequency of the test apparatus.In this test it was noted that jitter, seen during life testing, was likely due to the cantilevered test arm
resonating or coupling with the rotational speed of the bearings.
Acknowledgements
J. Uber, S. Cicchelli, and M. Roberto, NASA Goddard Space Flight Center.
A. DeForrest, Raytheon Systems Company, Santa Barbara Remote Sensing.L. Alegre, S. Natvipada, D. Owens, T. Phan, P. Tokeshi and H. Tsui, Moog SMD.N. St. Pierre and M. LaRochelle, Nye Lubricants
References
1. Brian J. Dietz, Steven G. VanDyk and Roamer E. Predmore, "Earth Scanner Bearing Accelerated LifeTest", 34 m Aerospace Mechanisms Symposium, May 2000, pp 303-316.
14

,.-/.j/f'
Dry Lubrication of Space-Rated Tribocomponents with Diamond-Like Carbon Coatings
G. Pont', C Donnet*', J. Fontaine*', M Belin'*, T. Le Mogne'*, Y Berthier-', S Descartes*'*, C Heau ....
Abstract
This paper details a four year effort in the development of Diamond-Like Carbon (DLC) coatings for spacerelated tribocomponents. After a brief presentation of the coating deposition technique, flat-on-disc
tribometer results are shown. These results, coupled with analytical characterizations, show that thecoatings tribological behavior strongly depends on deposition parameters. The deposited films may be
divided into two categories: the high-friction ones and the ultralow-friction ones. Tribological tests havebeen performed on bearings in high vacuum conditions after optimizing the adhesion underlayers. The
results show that the DLC tested could be very satisfactory for some applications. Some others DLC
coated components (gears, screw-nut) will be tested in a very near future.
Introduction
DLC coatings as dry lubricants are being studied all over the world because they are very promising whenused under certain conditions. For example, friction coefficient under Ultra-High-Vacuum (UHV) can be
very low. Today, some industries already use DLC as a dry lubricant (hard disks drives in computermanufacturing for example).
A few years ago, CNES (French Space Agency) and LTDS, studied various commercial DLC coatings inorder to assess the film composition parameters that led to effective coatings for space mechanisms dry
lubrication. During this phase, strong contacts were established with the IBM Research Division (Watson,NY), who provided DLC samples showing ultralow friction under UHV [1]o Then, CNES, LTDS, LMC and
HEF (a surface treatments specialized French company) decided to go further in the development of DLCcoatings that could be used in the space industry [2]. The goal of this paper is to present the main results
of this study as some DLC coated space mechanisms components (bearings, gears, screw-nut) are beingtested.
What is DLC?
A DLC is an amorphous metastable material deposited by PVD or PECVD techniques on a fewmicrometers. It consists of a disordered covalent network of carbon atoms, containing several carbonhybridization (mainly sp 2 and sp3), in which different elements, mainly hydrogen, sometimes impurities or
doping elements (nitrogen, fluorine...) can be incorporated. The main parameters describing the structureare thus the sp2/sp 3 ratio and the hydrogen content [3], which in turn strongly depend on the deposition
process.
Many kinds of DLC, with various properties, have been developed all over the world. In fact, the 'DLC'terminology describes more a family of materials than a single material. Depending on the elaboration
process, DLC with a wide range of hydrogen content (a-C or a-C:H) may be deposited, showing high (upto 0.7) or very low (down to 0.007) friction coefficient [4]. The DLC we have been interested in during this
study are hydrogenated DLC (a-C:H), produced without doping agents.
* CNES Mechanisms Department, Toulouse, France
_ Laboratoire de Tribologie et de Dynamique des Systemes (LTDS), Ecully, FranceLaboratoire de Mecanique des Contacts (LMC), Villeurbanne, France
.... HEF, Andr_zieux-Boutheon, France
Proceedings of the 3_ h Aerospace Mechanisms Symposium, Ames Research Center, May 9-11, 2001
15
Experimental setup
Deposition Process
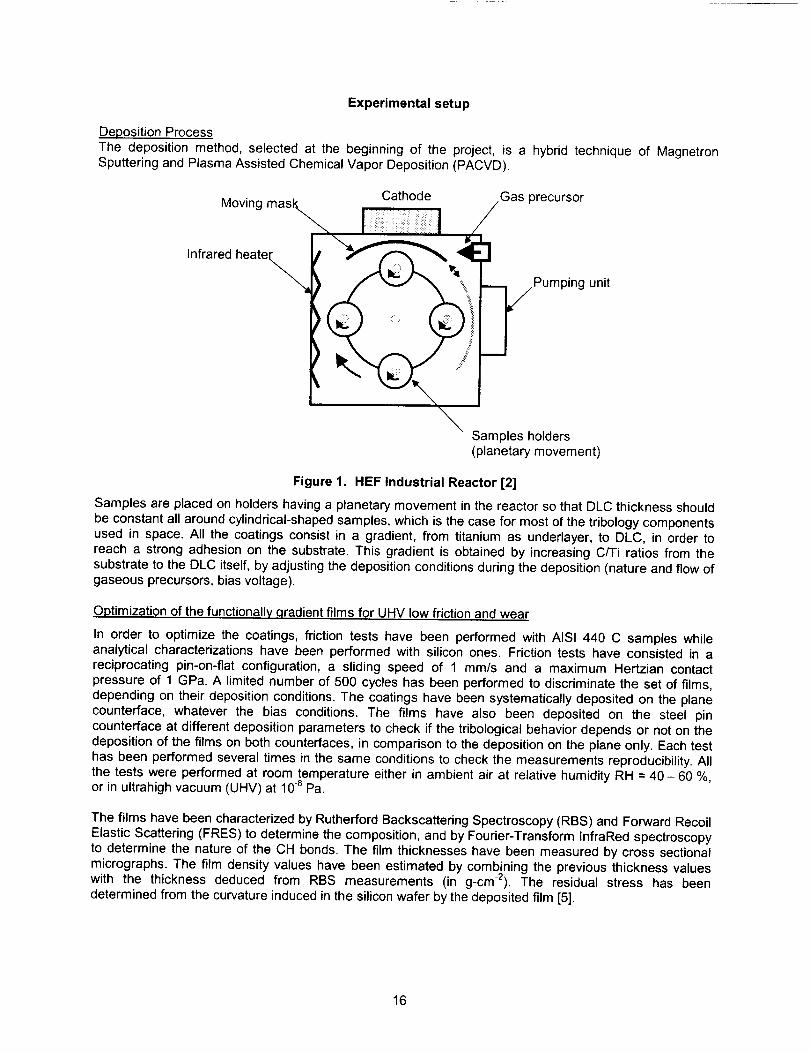
The deposition method, selected at the beginning of the project, is a hybrid technique of MagnetronSputtering and Plasma Assisted Chemical Vapor Deposition (PACVD).
M . ^,. Cathode _Gas precursorovlng ma_r_ /
I i,J ,/Infrared heater,, "__ _E]
_._ Pumping
\Samples holders(planetary movement)
unit
Figure 1. HEF Industrial Reactor [2]
Samples are placed on holders having a planetary movement in the reactor so that DLC thickness should
be constant all around cylindrical-shaped samples, which is the case for most of the tribology componentsused in space. All the coatings consist in a gradient, from titanium as underlayer, to DLC, in order to
reach a strong adhesion on the substrate. This gradient is obtained by increasing CFFi ratios from thesubstrate to the DLC itself, by adjusting the deposition conditions during the deposition (nature and flow ofgaseous precursors, bias voltage).
Optimization of the functionally .qradient films for UHV low friction and wear
In order to optimize the coatings, friction tests have been performed with AISI 440 C samples whileanalytical characterizations have been performed with silicon ones. Friction tests have consisted in a
reciprocating pin-on-flat configuration, a sliding speed of 1 mm/s and a maximum Hertzian contact
pressure of 1 GPa. A limited number of 500 cycles has been performed to discriminate the set of films,
depending on their deposition conditions. The coatings have been systematically deposited on the plane
counterface, whatever the bias conditions. The films have also been deposited on the steel pincounterface at different deposition parameters to check if the tribological behavior depends or not on the
deposition of the films on both counterfaces, in comparison to the deposition on the plane only. Each testhas been performed several times in the same conditions to check the measurements reproducibility. Allthe tests were performed at room temperature either in ambient air at relative humidity RH = 40 - 60 %,or in ultrahigh vacuum (UHV) at 10 .8 Pa.
The films have been characterized by Rutherford Backscattering Spectroscopy (RBS) and Forward Recoil
Elastic Scattering (FRES) to determine the composition, and by Fourier-Transform InfraRed spectroscopyto determine the nature of the CH bonds. The film thicknesses have been measured by cross sectionalmicrographs. The film density values have been estimated by combining the previous thickness valueswith the thickness deduced from RBS measurements (in g-cm-2). The residual stress has been
determined from the curvature induced in the silicon wafer by the deposited film [5].
16
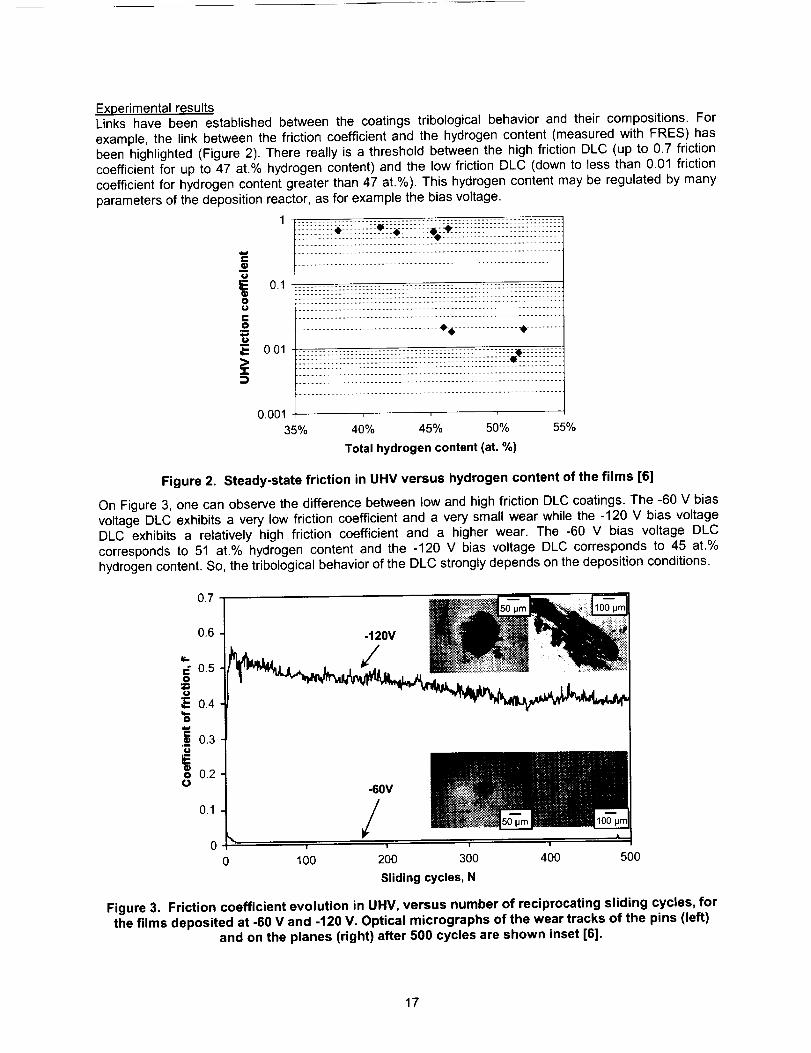
Experimental resultsLinks have been established between the coatings tribological behavior and their compositions. For
example, the link between the friction coefficient and the hydrogen content (measured with FRES) has
been highlighted (Figure 2). There really is a threshold between the high friction DLC (up to 0.7 frictioncoefficient for up to 47 at.% hydrogen content) and the low friction DLC (down to less than 0.01 friction
coefficient for hydrogen content greater than 47 at.%). This hydrogen content may be regulated by manyparameters of the deposition reactor, as for example the bias voltage.
1 ...................................................................
...................................................................
ZZZI_ZZZIZZZZZZZZZZZIZ[ZZI
0.1 !.:_:-_--.:_:_:_--_!!! ! !_-_!!!.:-! !! }[ ! -:}! --_:!:?--!!!! !! !_:-!! }-!:-.:.:!!!!!
g .:_:.-.::_:_:_-_-_:.:_:_:_-_:.:.::_!:_-:-_:_:_-:.:.:_:.-_-:.-.:_:_:_-_:.-_:_:_:_:.:_-_-.:.-.:_:_::_-_-.-.:.:: :.:_:_-_-:..................................................................
....................................% ................. ........
i o.ol !!!!!!!!!!!!!!!::!!!!!!!!!!!!!!!!!!!!!!!!!!!!!!!!!!!!!!_*_!!!!!!!!!!...................................................................
:[[[_-ZZ[_-ZZIIZ[][Z-Z Z[[[I[]I][[:Z:Z[[[Z Z[[I][[Z:Z[[Z...................................................................
0.001 , , ,
35% 40% 45% 50% 55%
Total hydrogen content (at. %)
Figure 2. Steady-state friction in UHV versus hydrogen content of the films [6]
On Figure 3, one can observe the difference between low and high friction DLC coatings. The -60 V bias
voltage DLC exhibits a very low friction coefficient and a very small wear while the -120 V bias voltage
DLC exhibits a relatively high friction coefficient and a higher wear. The -60 V bias voltage DLCcorresponds to 51 at.% hydrogen content and the -120 V bias voltage DLC corresponds to 45 at.%
hydrogen content. So, the tribological behavior of the DLC strongly depends on the deposition conditions.
_..0
:G
's
o
0.7
0.6
0.5
0.4
0.3
0.2
0.1
0 i
0 100 400 500
-60V
,/!
200 300
Sliding cycles, N
Figure 3. Friction coefficient evolution in UHV, versus number of reciprocating sliding cycles, for
the films deposited at -60 V and -120 V. Optical micrographs of the wear tracks of the pins (left)and on the planes (right) after 500 cycles are shown inset [6].
17
Optimized DLC characteristics
After the optimization process, coatings were selected in order to be tested while coated on real
mechanisms parts. The main characteristics of these coatings are summarized Table 1.
Table 1. Optimized DLC characteristics [5]
Friction coefficient under UHV 0.01
Friction coefficient under ambient air 0.2
4Typical thickness (including underlayer) (pro)
Top layer hydrogen content (at%)
Density (g.cm -_)
Residual stress (GPa)
51
1.5
-0.6
Environment sensitivity
Some tests have been performed in order to check environment DLC sensitivity, with IBM DLC coated
samples [1][7]. The hydrogen content of the coating was 42 at.% and the tests conditions were the same
than those described before. While these IBM films should not be directly compared to the TiCH filmspresented in this paper, they have been considered as model DLC films for the study of the environmental
effects on the friction. Both belong to the hydrogenated DLC film category, deposited by the same basictechnique (PACVD). Since the IBM reactor is however different than the HEF one, the films do not exhibit
exactly the same properties for the same composition. This result is paramount for the study of DLC films,
whose properties and tribological behavior are always related to their optimization on a given depositionreactor only.
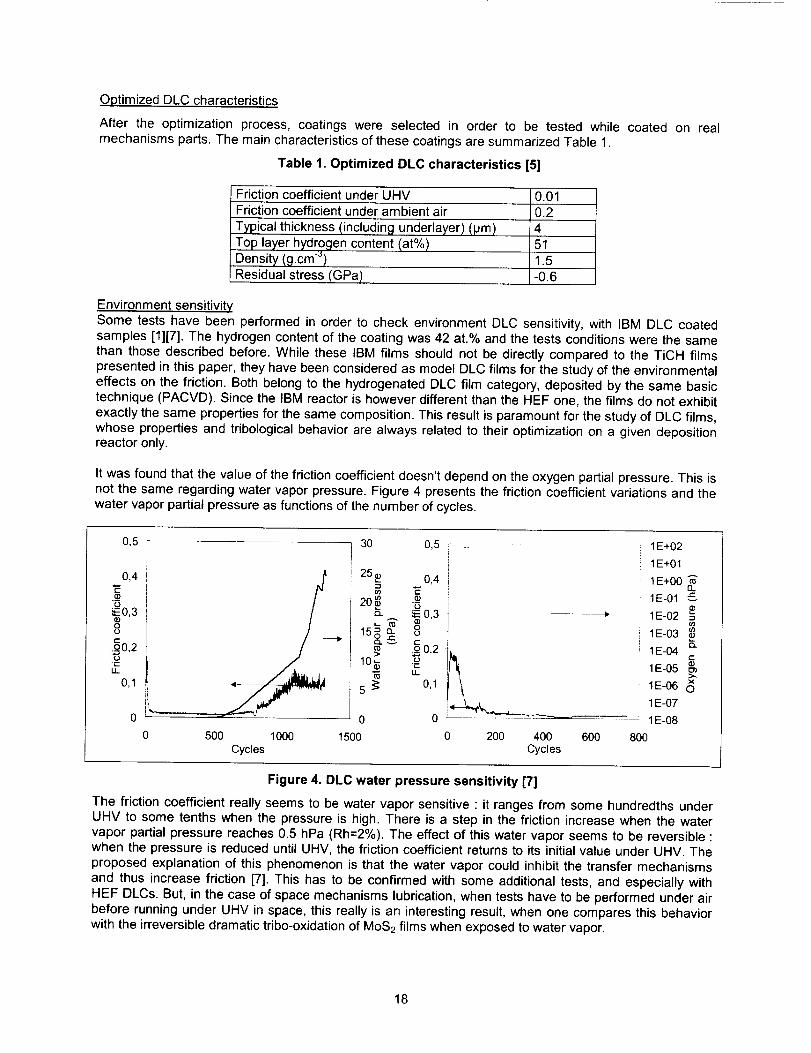
It was found that the value of the friction coefficient doesn't depend on the oxygen partial pressure. This isnot the same regarding water vapor pressure. Figure 4 presents the friction coefficient variations and thewater vapor partial pressure as functions of the number of cycles.
0,5
0,4
r..)
_0,30
._0,2U
Ii
0,1
30 0,5
0,4¢.-
__ _0,3
.£ 0,2
0,1
0
25220_
(3.
L
--* 15_
10_
55
_ 0
lO00 15o0Cycles
1E+02
J 1E+01
1E+00Ei 1E-01 _._
: 1E-02 B
1E-03 _e_
1E-04t-
1E-05 g
1E-06 _
1E-07
0 1E-08
0 500 0 200 400 600 800Cycles
Figure 4. DLC water pressure sensitivity [7]
The friction coefficient really seems to be water vapor sensitive : it ranges from some hundredths underUHV to some tenths when the pressure is high. There is a step in the friction increase when the water
vapor partial pressure reaches 0.5 hPa (Rh=2%). The effect of this water vapor seems to be reversible :when the pressure is reduced until UHV, the friction coefficient returns to its initial value under UHV. The
proposed explanation of this phenomenon is that the water vapor could inhibit the transfer mechanisms
and thus increase friction [7]. This has to be confirmed with some additional tests, and especially with
HEF DLCs. But, in the case of space mechanisms lubrication, when tests have to be performed under airbefore running under UHV in space, this really is an interesting result, when one compares this behavior
with the irreversible dramatic tribo-oxidation of MoS2 films when exposed to water vapor.
18

DLC coated mechanisms components testing
Ball BearinqsThe first tests of the optimized DLC coatings were performed on angular contact ball bearings from ADR
Company. The DLC tested has been deposited at a bias of - 60V and a current intensity of 2 A. Theircharacteristics are summarized Table 2.
Table 2. Tested bearings characteristics
Outside diameter (mm)
Inside diameter (ram)
Ball diameter (mm)Number of balls
Contact angle (o)
Preload (N)
Induced Contact Stress (MPa)Material
Parts coated
55
35
3.969
26
15
100±10
1130
AISI440C
Rings (tracks) and cages
After the first bearing pair was coated, the external rings appeared to be very deformed. This was due to
the joint effect of the temperature and the rings support. We proceeded to a test that measured the
highest temperature during the process. It appeared to be higher locally than the stainless steel temperingtemperature. This maximum temperature was reached during the etching of the substrate, prior to
deposition. So, we decided to adjust the etching temperature and, also, to change the ring support
geometry in order not to radially stress the rings.
A second pair of bearings was coated and tested. First, the torque was measured under air in order to
verify that no major changes had occurred with the coating. Then, the bearing pair was placed in a Ultra-
High-Vacuum chamber and a 'life test' began. This test consisted in a continuous rotation movement (30rpm), during which the torque, the temperature inside the torquemeter and near one of the motionless
rings were measured. Figure 5 is a picture of the test bench and Table 3 shows the evolution of the
torque during the test.
Figure 5. Test Bench
19
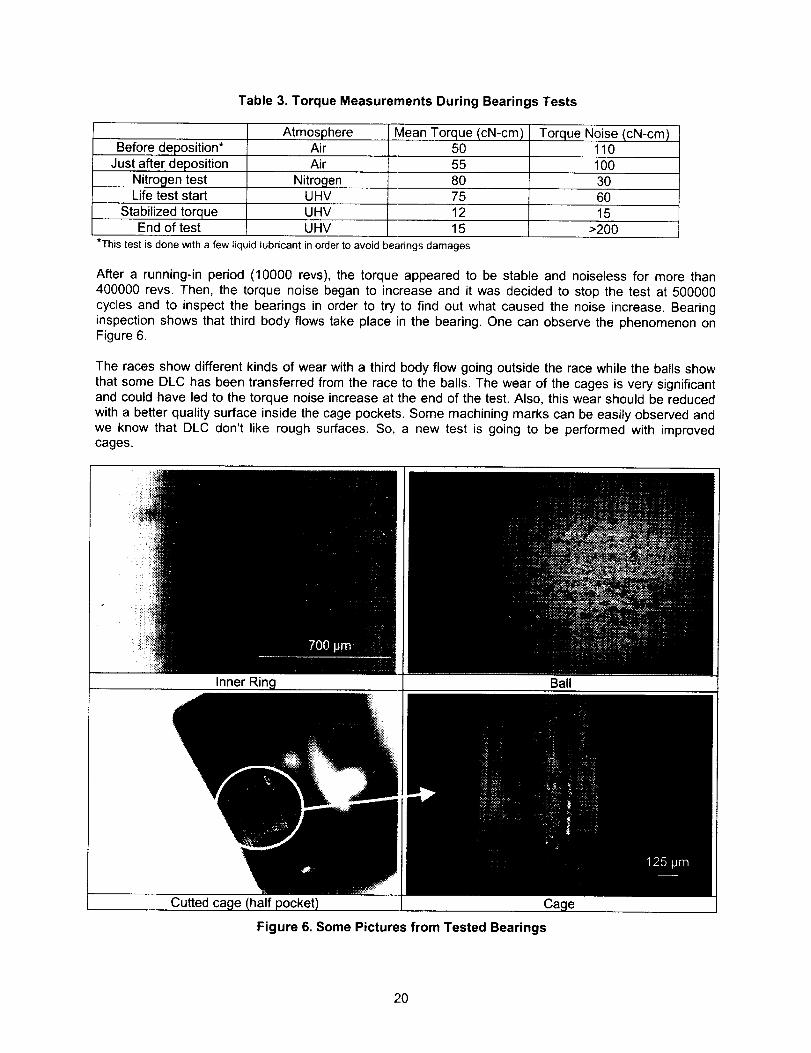
Table 3. Torque Measurements During Bearings Tests
Before deposition*
Just after deposition
Nitrogen testLife test start
Stabilized torqueEnd of test
*This test is done with a few li(
I AtmosphereAir
Air
NitrogenUHV
UHV
UHV
Mean Torque (cN-cm)50
55
8O
75
12
15
uid lubricant in order to avoid bearings damages
Torque Noise (cN-cm)110
100
3O
60
15
>200
After a running-in period (10000 revs), the torque appeared to be stable and noiseless for more than400000 revs. Then, the torque noise began to increase and it was decided to stop the test at 500000
cycles and to inspect the bearings in order to try to find out what caused the noise increase. Bearinginspection shows that third body flows take place in the bearing. One can observe the phenomenon onFigure 6.
The races show different kinds of wear with a third body flow going outside the race while the balls show
that some DLC has been transferred from the race to the balls. The wear of the cages is very significantand could have led to the torque noise increase at the end of the test. Also, this wear should be reduced
with a better quality surface inside the cage pockets. Some machining marks can be easily observed and
we know that DLC don't like rough surfaces• So, a new test is going to be performed with improvedcages.
Inner Ring Ball
Cutted cac Cage
Figure 6. Some Pictures from Tested Bearings
20
RF Switch Bearin,qRADIALL Company uses a small bearing from RMB company in T-type coaxial switches. This bearing is
submitted to quick oscillating movements (60 ° amplitude in about 20 ms in each direction). An axial loadof about 15 N is applied to this bearing via the actuator magnet. The main characteristics of the bearing
are summarized Table 4.
Table 4. RF switch bearing characteristics
Outside diameter (mm)
Inside diameter (mm)
Balls diameter (mm)Number of balls
Axial load at rest (N)
Switching axial load (N)Material
Parts coated
11
15
23
AISI 440C
Rings (tracks) and cages
Two kinds of tests, relative to the bearing lubrication, have been performed at RADIALL. First, the existing
MoS2 lubrication under ambient atmosphere (50% RH) led to switching problems at about 50000commutations. The need is 300000 commutations under space vacuum condition, but the product can be
operated by customers before launch under variable and indefinite conditions (humidity, pressure,number of commutations...) due to storage, ground operations, transportation. So ideally RADIALL wishes
the product to be able to widthstand the complete life (300000 commutations) including a period in groundcondition as well as the period in orbit condition. The recommendation for the use of the MoS2 lubrication
might be difficult to achieve for ground operations, storage and transportation. There is a need for a new
dry lubricant.
RADIALL decided to lubricate the bearing with the same DLC that was deposited on the ADR bearings
presented above. With the present DLC, there was no problem to perform the whole number ofcommutations under atmosphere. At the beginning of 2001, RADIALL is going to perform a qualification
tests sequence (including commutations under UHV) with a DLC lubricated bearings switch. This really is
the first commercial application of our DLC.
Since the qualification test deals with the whole commutator, it is not possible to have direct information
on the bearing behavior. Incorporating bearing dedicated sensors would significantly modify thecommutator. It has thus been decided to perform bearing tests in order to compare DLC to MoS2 using
torque measurements on a specific test bench.
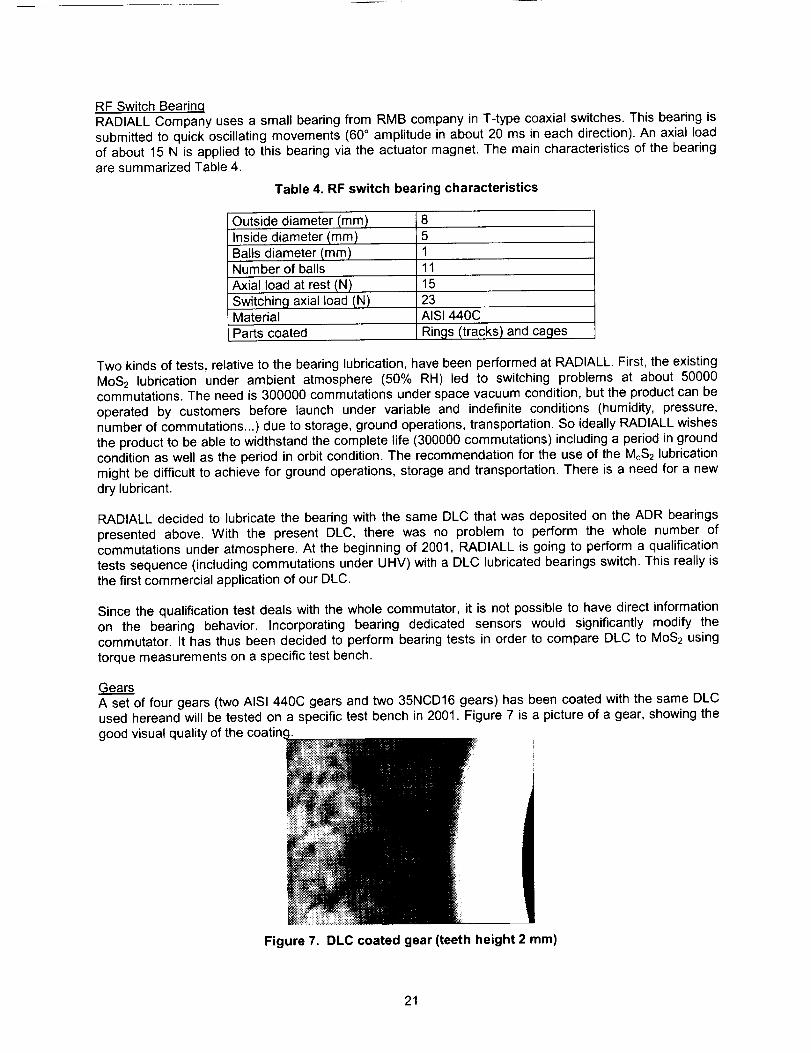
GearsA set of four gears (two AISI 440C gears and two 35NCD16 gears) has been coated with the same DLCused hereand will be tested on a specific test bench in 2001 Figure 7 is a picture of a gear, showing the
good visual quality of the coatin
Figure 7. DLC coated gear (teeth height 2 mm)
21
Screw-nut
For the Mars Netlander mission, the 'lnstitut de Physique du Globe de Paris' (IPGP), SODERN companyand CNES are developping a Very Broad Band seismometer in order to better understand the Martian
internal structure [8]. This seismometer consists in a pendulum (spring and mass) rotating around an
elastic pivot. This pendulum being very sensitive, it has to be balanced via a mass displacement system,driven by a motor and a screw-nut device.
The screw-nut device has to be designed taking into account the fact that the seismometer is placed in avacuum chamber in order to obtain a good quality pendulum. The screw is made of titanium, its diameter
is 3 mm and its step is 0.25 mm. Backlash is removed from the system by using a pair of half-nuts
separated by a spring which induces a 0.2 N radial preload. Half-nuts are usually made of brass. Testswith this last configuration showed limited life, so it has been decided to test DLC-coated nuts made oftitanium.
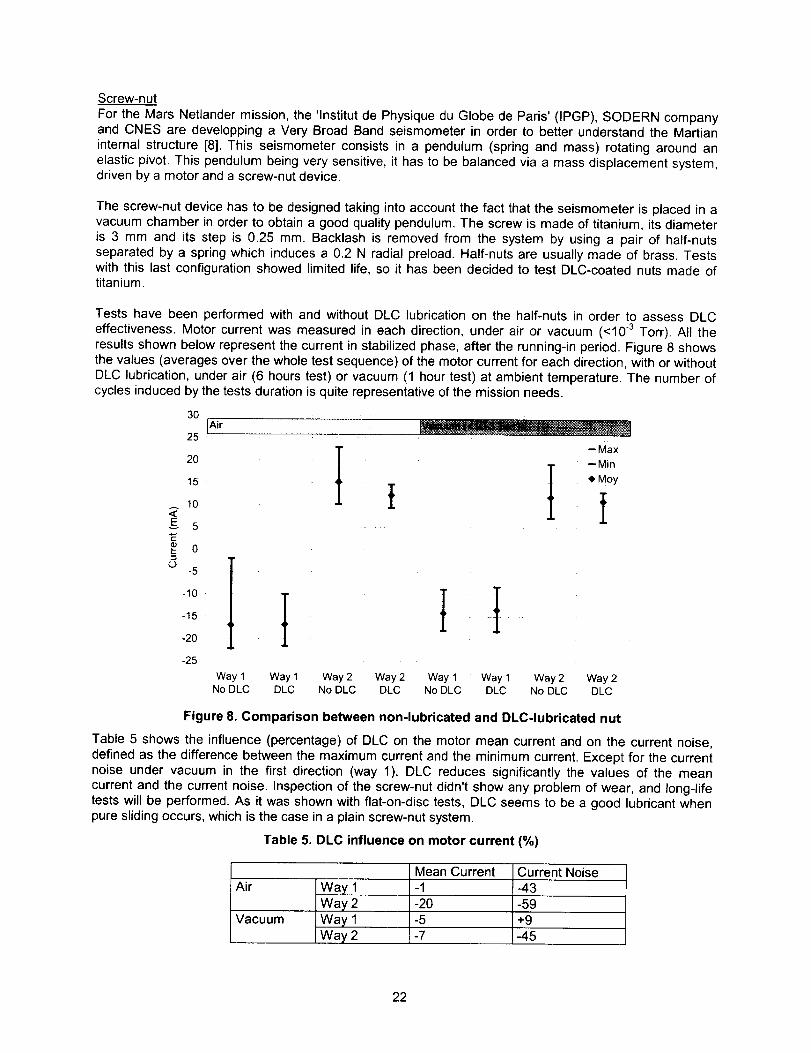
Tests have been performed with and without DLC lubrication on the half-nuts in order to assess DLC
effectiveness. Motor current was measured in each direction, under air or vacuum (<103 Torr). All theresults shown below represent the current in stabilized phase, after the running-in period. Figure 8 showsthe values (averages over the whole test sequence) of the motor current for each direction, with or without
DLC lubrication, under air (6 hours test) or vacuum (1 hour test) at ambient temperature. The number ofcycles induced by the tests duration is quite representative of the mission needs.
30[Air
25
20
15
10
g 5r-
_- 0o
-5
-10
-15
-2O
-25
I t-- Max-- Min
I t IWay 1 Way 1 Way 2 Way 2 Way 1 Way 1 Way 2 Way 2No DLC DLC No DLC DLC No DLC DLC No DLC DLC
Figure 8. Comparison between non-lubricated and DLC-lubricated nut
Table 5 shows the influence (percentage) of DLC on the motor mean current and on the current noise,
defined as the difference between the maximum current and the minimum current. Except for the currentnoise under vacuum in the first direction (way 1), DLC reduces significantly the values of the mean
current and the current noise. Inspection of the screw-nut didn't show any problem of wear, and long-lifetests will be performed. As it was shown with flat-on-disc tests, DLC seems to be a good lubricant whenpure sliding occurs, which is the case in a plain screw-nut system.
Table 5. DLC influence on motor current (%)
Mean Current
Air -1
Vacuum
Way 1
Way 2
Way 1
Way 2
-2O
-5
-7
Current Noise-43
i -59
+9
-45
22

Conclusion
Diamond-Like Carbon (DLC) coatings, deposited by a hybrid technique of magnetron sputtering and
plasma-assisted chemical vapor deposition, have been studied. Friction tests, coupled with analyticalcharacterizations, show that the coatings exhibit a wide range of friction behavior, depending on the
coating composition and, thus, on the deposition conditions. An underlayer optimization study has alsobeen performed in order to obtain a strong adhesion on the substrate. The selected solution is a gradientfrom titanium to DLC , from the steel substrate to the surface.
Promising tribological results have been obtained with DLC deposited ball bearings even though a lot of
additional work still remains. For example, the cage/ball contacts will be optimized in order to decreasethe significant wear observed. Nevertheless, a small DLC coated RF switch bearing showed better
behavior than MoS2 coated bearing and could led to the first space commercial application of the DLCcoatings if the qualification tests succeed. Some other components are going to be tested in the next
months (screw-nut device, gears, other bearings...) The work presented here is very innovative becauseit could lead to the qualification of a new space mechanisms lubrication solution. It is consistent with the
current development of diamond-like carbon films for various applications, including low friction and wearin extreme conditions.
Acknowtedgments
We are grateful to the Region Rh6ne-AIpes for supporting the present study.We thank N. Striebig, S. Cacho, O. Pot and B. Brient from IPGP for the screw-nut tests, which have been
performed in IPGP laboratories.
References
[1] Donnet Ch, Le Mogne Th, Belin M, Sicre J, Pont G, Grill A, Patel V, Jahnes C; "Diamond-LikeCarbon Coatings for Vacuum and Space Tribology"; 7th European Space Mechanisms and Tribology
Symposium; Noordwijk (Ned); October 1997
[2] Fontaine J.; "Elaboration, Caracterisation et Tribologie de Couches Minces DLC (Diamond-Like
Carbon) pour la Lubrification des Mecanismes Spatiaux"; These de Doctorat; 2000.
[3] Donnet Ch, Fontaine J., Le Mogne Th, Belin M, Terrat J.P., Heau Ch., Pont G; "Tribologie deCouches Minces de Carbone pour Mecanismes Spatiaux"; Journee Technique CETIM; December 1998.
[4] Grill A., Diamond and Related Materials, 8 (1999) 428.
[5] Fontaine J., Donnet Ch, Le Mogne Th, Belin M, Berthier Y, Terrat J.P., Heau Ch., Pont G;"Towards the Solid Lubrication of Space Mechanisms by Diamond-Like Carbon Coatings"; 8 thEuropean
Space Mechanisms and Tribology Symposium; Toulouse (France); Sept 1999.
[6] Donnet Ch, Fontaine J., Le Mogne Th, Belin M, Terrat J.P., Heau Ch., Vaux F., Pont G;"Diamondlike Carbon-Based Functionally Gradient Coatings for Space Tribology"; ICMCTF'99; 1999.
[7] Donnet Ch., Le Mogne Th, Ponsonnet L., Belin M, Grill A., Patel V., Jahnes C.; "The Respective
Role of Oxygen and Water Vapor on the Tribology of Hydrogenated Diamond-Like carbon Coatings";
Tribology Letters 4; 1998.
[8] Cacho S., Lognonne P., Karczewski J.F., Pont G., Coste G.; "A Very Broad Band 3 AxisSeismometer to Study Internal Structure of Mars"; 8th European Space Mechanisms and Tribology
Symposium; Toulouse (Fra); September 1999.
23

24

Effect of Alternate Solvent Diluents on PFPE Performance
Christopher J. Dayton and Robert M. Warden*
Abstract
A lubrication study has been completed which tested the effect of various CFC (Freon) substitutes on the
performance of perfluoroalkylpolyether (PFPE) lubricants applied to rolling element bearings. Three
bearing pairs were tested concurrently, differing only in the diluent used for the final step in the processingof the bearings. The objectives of the bearing tests were to: 1) quantify in terms of stress-cycles the
approximate point at which the onset of lubricant polymerization occurs and 2) determine what effect theuse of different solvents have on the period of time prior to the onset of polymerization. This paperprovides a detailed description of the processing of the ball bearings, the test articles, the text fixture, the
data logging philosophy, and the results of the study.
Introduction
The tong-term reliable performance of bearings operating in a space environment requires careful
selection of the appropriate liquid or dry lubricant. PFPE is one class of liquid lubricant with extensivespace flight history. Relative to hydrocarbon lubricants, PFPE's generally have lower vapor pressures,which reduces the evaporative loss from critical interfaces. They also have higher viscosity index values,
which translates into lower bearing torques at low operating temperatures. This type of lubricant, however,does not possess good miscibility for traditional, space-proven additives that readily dissolve in
hydrocarbon lubricants. Also, PFPE's have a tendency to polymerize, especially when employed ininterfaces where metal-to-metal contact is prevalent (the boundary lubrication regime). Unfortunately, this
is the typical operating regime for many components within space-borne instruments.
Over the past fifteen years,the propensity of PFPE's to
undergo an autocatalyticpolymerization when
subjected to stress in thepresence of certain metalshas been the subject ofextensive study. 1'2 Further-more, several articles have
been written documenting thevarying response of this classof lubricant relative to its
propensity to polymerize withrespect to both the cleaningmethods and the type of
contacting materialsemployed. 3'4'5 These latter
studies were largely prompted
by the Montreal Protocol,which prohibits the productionTF), that had been widely used
Figure 1. Bearing test setup as-run configuration
of certain ozone depleting chemicals (ODC's), such as CFC-113 (Freonas cleaning agents and PFPE diluents.
The linear PFPE oil Brayco 815Z, and the grease analogue Braycote 601, have been used for many years
in space flight instruments. For example, when the last of the Hubble Space Telescope (HST) science
Ball Aerospace & Technologies Corporation, Boulder, CO
Proceedings of the 35 th Aerospace Mechanisms Symposium, Ames Research Center, May 9-11, 2001
25
instrumentsareinstalledbytheyear2004,theselubricantswillbepresentinat leastonemechanismperscienceinstrument.Althoughproneto polymerization,thereareapplicationswherethe use of thislubricantis justified;usuallydueto a relativelylowtotalnumberofrevolutionsincombinationwithlowtomoderatebearingstresses.Toverifysuitability,comparisonto similarlife-testedengineeringmodelsmaybeperformed.Anotherapproach,definedbelow,is to quantifythecumulativecombinedeffectof dutycyclesandcontactstresses.Thisfirst-ordertechniquefor establishingperformancemarginsis narrowlydefinedby the expectedoperatingparameters,suchas lubricantoperatingregime,Hertziancontactstress,anddutycycles,establishedbythehardwareto besimulated.
Thisobjectivewasaccomplishedthroughthesimultaneoustestingof threebearingpairsoperatingat lowcontactstress,withtheonlyvariabledistinguishingonesetfromanotherbeinglimitedtotheoil diluent.Thediluentwasusedin thepreparationof anoil solution,whichin turnwasusedto rinseoff excessoil,and to performparticlecounts.As explainedbelow,this processwassubsequentto all cleaningandlubricationsteps.Itwasanticipatedthatthistestwouldthereforenotonlyprovidethetimeperiodpriortheonsetof lubricantpolymerization,butalsoyieldinformationregardingtheeffectof thediluent,if any,withrespecttotheperformanceofthe lubricatedbearings.
Test Approach
The solvents studied were: Du Pont's Freon TF (CFC-113), Du Pont's Vertrel ® XF, and 3M's Novec TM
HFE-7100. Vertrel XF is a hydrofluorocarbon, or HFC solvent, whereas HFE-7100 is a hydrofluoroether.Like Vertrel XF, HFE-7100 has zero Ozone Depletion Potential, but lower values for Global WarmingPotential and Atmospheric Lifetimes than Freon TF or Vertrel XF. Neither replacement solvent isconsidered to be a volatile organic compound by the EPA. The Freon TF served as the control.
Three back-to-back bearing pairs, SBB part number 3HAR007P5A, were procured for this test. These
non-separable 440C angular contact bearings were obtained with one-piece machined phenolic cages,
and were selected based on availability. Since the reliability of the test could therefore not be increased byduplicating bearing pairs, great care was exercised during the processing of the bearings to minimizevariables. All bearing pairs were maintained as sets throughout processing by serial numbers positioned
on the large face of each outer race. To avoid potential preload problems, balls were segregated andmaintained with the appropriate inner and outer race. 6
The bearing lubrication was performed at Ball Aerospace & Technologies Corp., and was typical of theprocessing performed for the lubrication of fight bearings. The processing consisted of disassembly using
a fixture used to heat the outer race, and cool the inner race. All components were inspected at highmagnification after an initial hydrocarbon solvent cleaning. Following further hydrocarbon solvent cleaningand extensive baking, all phenolic cages were simultaneously impregnated for several hundred hours at
elevated temperature with the same lot of specially processed Brayco 815Z. The special process is aproprietary vacuum baking procedure that reduces the volatility of the oil. The vapor pressure measured at
Ball Aerospace using a thermally controlled quartz crystal microbalance measurement technique wasfound to be less than lo10 14 torr at room temperature.
Following the impregnation of the cages and reassembly, each bearing was cleaned until the particlelevels were in accordance with MIL-STD-1246 Level 100 for metals, and less than Level 200 for all
particles. This process used a five-percent by weight solution of the oil in the appropriate solvent: either
Freon TF, Vertrel XF, or HFE-7100. This solvent substitution was the only difference that each bearingpair was subjected to during processing. The rinse resulted in a deposition of approximately 20 mg of oil
on the ball and raceway surfaces; enough to produce a slight oil meniscus between the ball and raceway,but slightly less than what would normally be required for flight bearings. If these had been flight bearings,additional oil would have been added.
26

Usinga BallAerospace-developedlubricant film thickness program that corrects for side leakage from thecontact ellipse, and the bearing parameters summarized in Table I, the lambda ratio (elastohydrodynamicfilm thickness to composite ball and raceway surface roughness) was determined to be approximately 0.6
when the bearings were operated at room temperature and 50 rpm. This calculated lambda ratio is
probably greater than what actually existed since flooded conditions were assumed. The surfaceroughness term was calculated from an average of measurements of the bearing inner raceways,performed by the bearing manufacturer and summarized later in the paper in Table I1.
Table I. Test Bearing Properties
PropertyPart Number
Number of Grade 10 Balls, Diameter
Pitch Diameter
Value
SBB 3HAR007P5A
Initial Contact AngleOuter and Inner Race Conformities 0.524 and 0.520
Thrust Load
Mean Inner Raceway
Hertzian Compression Stress
18, 6.35 mm (0.25 inch)
45 mm (1.771 inch)12.80
approximately 62 N (14.0 Ib)
approximately 450,000 kPa (65,000 psi)
The test was performed in a vacuum chamber at less than 1 x 10⁵ torr, at room temperature, with one
three day excursion to +13 deg C and another short excursion to +30 deg C. Each set of test bearings
was continuously monitored for torque (method defined in the Test Apparatus section).
Each of the sets of angular contact bearings were housed in separate stainless steel bearing cartridges
with a compliant axial preload of about 62 N (14 Ib). This load resulted in a nominal ball-to-inner-racewayHertzian contact stress of approximately 450 MPa (65 ksi). The objective was to operate the processedbearings under boundary lubrication conditions. The intention of using a light preload was twofold: it was
representative of several bearing pairs operating in the HST, and it was thought that this would allow for alonger test duration prior to the onset of polymerization.
Labyrinth seals with a length-to-
gap ratio of approximately 30 to 1enclosed both sides of the duplex
pair. This resulted in reducing theapparent exit area byapproximately 88 percent, thus
reducing evaporative loss. Thelabyrinths, coupled with the lowvapor pressure of the vacuum-
stripped lubricant resulted in anegligible evaporative loss.
Low surface energy barrier filmwas applied to surfaces adjacent
to the bearings to limit loss due to
creep.
Prior to commencement of the
test, the preloaded bearings wererun-in under the same thermal
vacuum conditions that would be
present during the test. The run-
in period was 16 days. This wasfollowed by removal of the
Vacuum feed_ IJ IN I tl_
for slgnal_ _ i llld4_
l! places
Vacuum feed-thru
for motor
Figure 2. Test Fixture Showing 6 Bearing Pairs
27
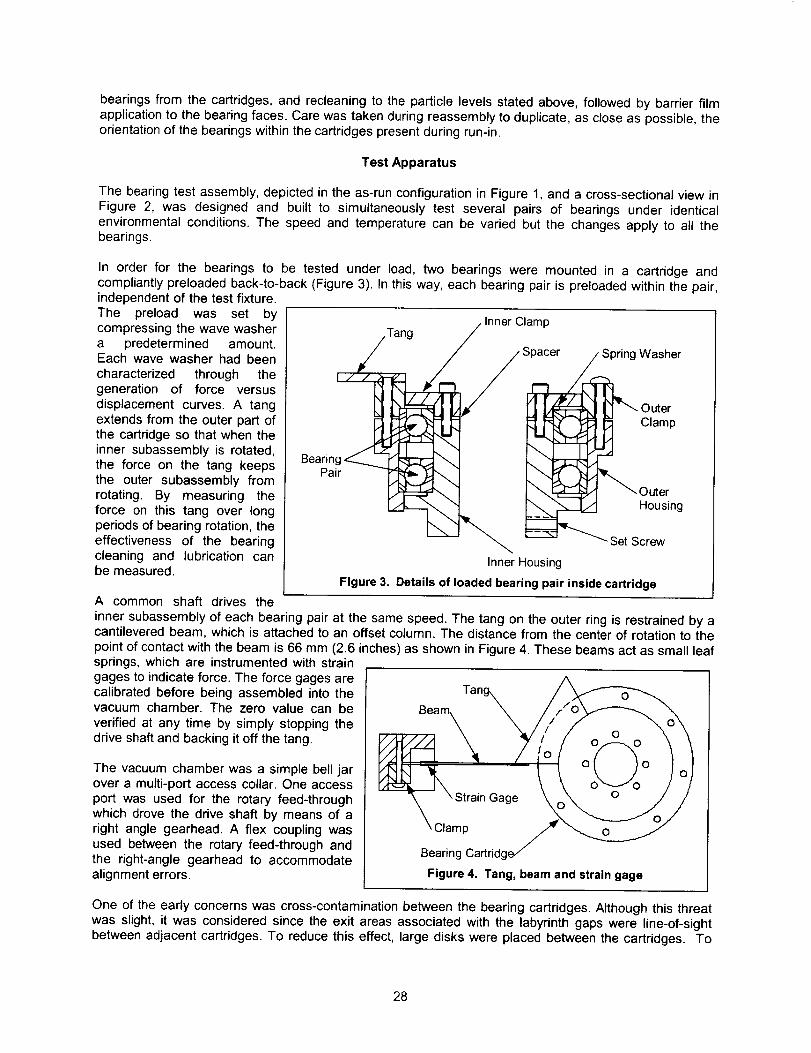
bearingsfromthecartridges,andrecleaningto theparticlelevelsstatedabove,followedbybarrierfilmapplicationtothebearingfaces.Carewastakenduringreassemblyto duplicate,ascloseaspossible,theorientationofthebearingswithinthecartridgespresentduringrun-in.
Test Apparatus
The bearing test assembly, depicted in the as-run configuration in Figure 1, and a cross-sectional view in
Figure 2, was designed and built to simultaneously test several pairs of bearings under identical
environmental conditions. The speed and temperature can be varied but the changes apply to all thebearings.
In order for the bearings to be tested under load, two bearings were mounted in a cartridge and
compliantly preloaded back-to-back (Figure 3). In this way, each bearing pair is preloaded within the pair,independent of the test fixture.
The preload was set bycompressing the wave washera predetermined amount.Each wave washer had been
characterized through the
Tang
Bearing ,,---,--
Pair
I,
generation of force versus
displacement curves. A tangextends from the outer part ofthe cartridge so that when the
inner subassembly is rotated,
the force on the tang keepsthe outer subassembly from
rotating. By measuring theforce on this tang over longperiods of bearing rotation, the
effectiveness of the bearingcleaning and lubrication canbe measured.
/Inner Clamp
Spacer
\
"1
\'___
Spring Washer
_ OuterClamp
_'_- Outer
Housing
- Set crew
Inner Housing
Figure 3. Details of loaded bearing pair inside cartridge
A common shaft drives the
inner subassembly of each bearing pair at the same speed. The tang on the outer ring is restrained by acantilevered beam, which is attached to an offset column. The distance from the center of rotation to the
point of contact with the beam is 66 mm (2.6 inches) as shown in Figure 4. These beams act as small leafsprings, which are instrumented with strain
gages to indicate force. The force gages arecalibrated before being assembled into thevacuum chamber. The zero value can be
verified at any time by simply stopping thedrive shaft and backing it off the tang.
The vacuum chamber was a simple bell jarover a multi-port access collar. One access
port was used for the rotary feed-throughwhich drove the drive shaft by means of a
right angle gearhead. A flex coupling wasused between the rotary feed-through andthe right-angle gearhead to accommodatealignment errors.
Tan%
_-_StrainGage 1 _-O °_'_'JO_/y
B_21r_ Partridge_ _
Figure 4. Tang, beam and strain gage
One of the early concerns was cross-contamination between the bearing cartridges. Although this threat
was slight, it was considered since the exit areas associated with the labyrinth gaps were line-of-sightbetween adjacent cartridges. To reduce this effect, large disks were placed between the cartridges. To
28

furtherreduceparticulatecontamination,theentirevacuumchamberwasorientedonitsside,sothatanyerrantparticleswouldbepulledbygravityto thesideof thechamberinsteadof landingon theadjacentcartridge.Barrierfilmwasusedto preventlubricantlossesduetocreeping.
To heatandcoolthebearingsevenly,a thermalshroudwasplacedbetweenthebearingtestfixtureandthe insideof the belljar. Thethermalshroudwassimplya largesheetof copperwithcoppertubingsolderedon to theexteriorsurfaceinan "S"pattern.Toincreasetheemissivityof theinteriorsurfaceofthe shroud, a Ball Aerospace-developed black polyimide paint was applied. This assembly was then rolledinto a cylinder. The ends of the tubing were run through liquid feed-throughs in the access ring. Hot or cold
liquid could then be pumped through the shroud, which could then radiatively heat or cool the bearings. Inorder to offset the heat sinking caused by the vacuum chamber flange and housing, the housing was
wrapped with thermal tape. By balancing the shroud and housing temperatures, a fairly uniform end-to-end temperature was achieved.
The process of collecting data for a long-term test presented some interesting challenges to the design ofthe data logging system. Although the measurement of the data needed to be accurate, the process only
needed to occur about once every hour. A typical printout is shown in Figure 5. Reliability and flexibilitybecame more important than bandwidth. An "elegant" solution was found by using a data logger system
manufactured by Validyne Engineering Corp. This system consisted of an interface board on to which the
signat wires were connected and a processing card, wflich plugs into a spare stot in a personat computer.For this test, a surplus 386-50 was used with DOS 5.0 as the operating system.
Date Time 1 2 3 4 T1 T2
05/27/98 14:49:15 0.000 0.1706 0.1679 0.1293 29.36 29.5405/27/98 14:59:15 0.000 0.1835 0.1478 0.1203 29.12 29.18
05/27/98 15:09:15 0.000 0.1801 0.1573 0.1116 28.88 29.0305/27/98 15:19:15 0.000 0.1974 0.1329 0.1231 29.13 29.30
Key: 1 = empty bay; 2 = Freon TF processed bearing pair retention force (pounds); 3 = Vertrel XF processedbearing pair; 4 = HFE-7100 processed bearing pair; T1 = Base Temperature ( C); T2 = Top Temperature (C)
Figure 5. Typical printout
The outputs from the strain gages as well as thermocouple leads were passed through electrical feed-throughs in the access collar of the vacuum chamber. These wires were then attached to the interfaceboard, which also converted the signal from analog to digital. The interface board can be configured many
ways so that each of the eight channels can be hooked up to monitor voltage, current or temperature. Thisboard is connected to the computer by a 50-wire ribbon cable.
The display is meant to be toggled between two modes. The set-up mode allows data acquisitionproperties such as report frequency and averaging to be set. Also in this mode, channel titles and number
of decimal places are selected. In the logging mode, data is being gathered and displayed on the screen.Up to 32 different channels can be monitored and viewed at the same time.
The Validyne processor can process information much faster than what was needed for this test, but italso allows long periods of time between cycles. For this test, the time period between readings wasinitially set at 3600 seconds, but increased to six times per hour after 2.85e106 revolutions. At the
appropriate time, the data logger would read the strain gage values as well as the temperature values.The reported values were actually an average of 50 instantaneous values. The date, time and eight datavalues were then printed in a single row on the printer, and also appended to files on a both the hard disk,
and a 3.5-inch floppy. For hard copy backup, a wide-carriage, tractor-feed, dot-matrix printer allowedprinting of all relevant data on a single line. A box of fan-fold paper would last many months withoutinterruption.
29
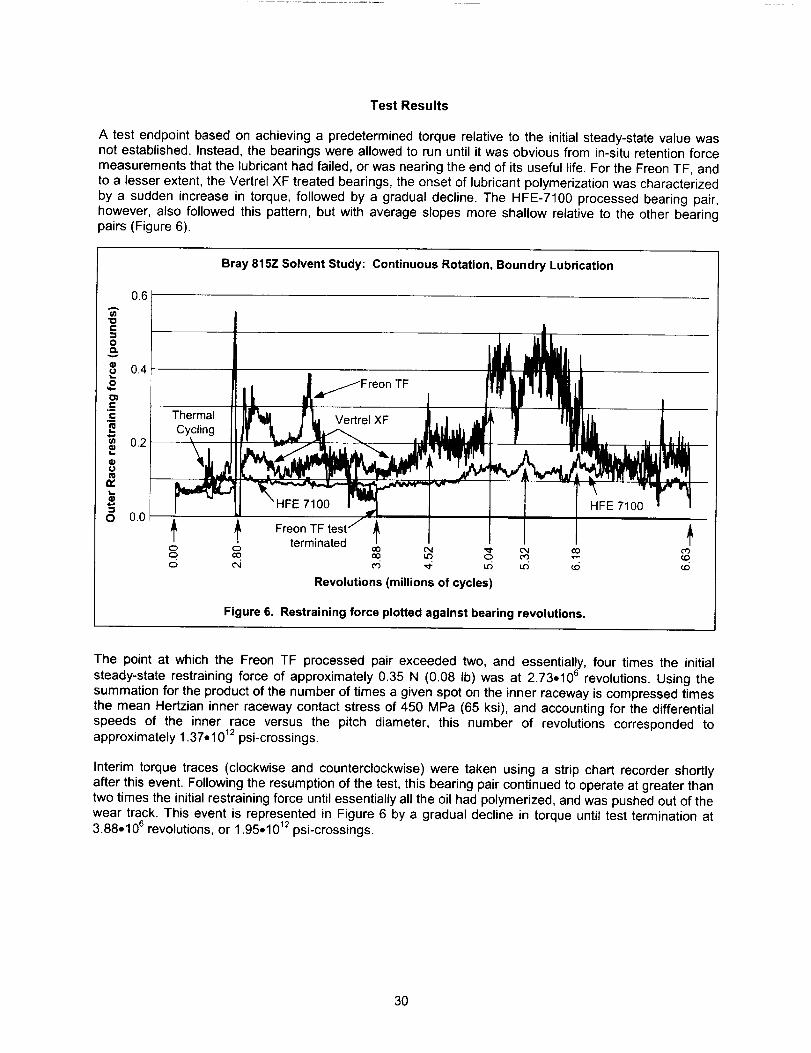
Test Results
A test endpoint based on achieving a predetermined torque relative to the initial steady-state value wasnot established. Instead, the bearings were allowed to run until it was obvious from in-situ retention force
measurements that the lubricant had failed, or was nearing the end of its useful life. For the Freon TF, andto a lesser extent, the Vertrel XF treated bearings, the onset of lubricant polymerization was characterized
by a sudden increase in torque, followed by a gradual decline. The HFE-7100 processed bearing pair,
however, also followed this pattern, but with average slopes more shallow relative to the other bearingpairs (Figure 6).
Bray 815Z Solvent Study: Continuous Rotation, Boundry Lubrication
_ °61 --t ..... 1_ l_Jto
04 . , to Ptlnlrllt I[ sFreon TF J
•; ill T,e,-,T,a,_ _L Ver,re,XF J, J,_ _ m[j,.
_ , IIIf -tJJ _ ,_/_la_ICycling ,-- ,- _ r 'W_ ....
FE 7100
+ + I(:5 e,i _ _ _ u_ _6
Revolutions (millions of cycles)
Figure 6, Restraining force plotted against bearing revolutions.
The point at which the Freon TF processed pair exceeded two, and essentially, four times the initial
steady-state restraining force of approximately 0.35 N (0.08 Ib) was at 2.73.106 revolutions. Using thesummation for the product of the number of times a given spot on the inner raceway is compressed timesthe mean Hertzian inner raceway contact stress of 450 MPa (65 ksi), and accounting for the differential
speeds of the inner race versus the pitch diameter, this number of revolutions corresponded toapproximately 1.37-1012 psi-crossings.
Interim torque traces (clockwise and counterclockwise) were taken using a strip chart recorder shortlyafter this event. Following the resumption of the test, this bearing pair continued to operate at greater thantwo times the initial restraining force until essentially all the oil had polymerized, and was pushed out of the
wear track. This event is represented in Figure 6 by a gradual decline in torque until test termination at3.88-106 revolutions, or 1.95.1012 psi-crossings.
30
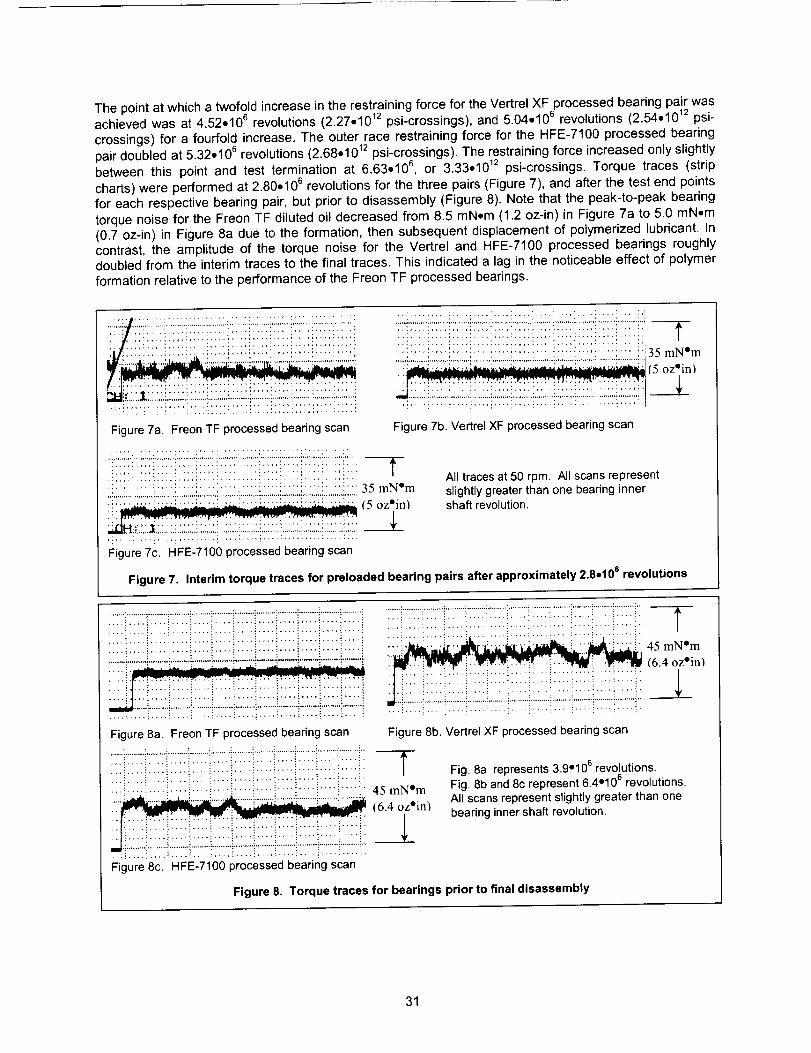
Thepointatwhichatwofoldincreasein therestrainingforcefortheVertrelXFprocessedbearingpairwasachievedwasat4.52.106revolutions(2,27.10+2psi-crossings),and5.04.106revolutions(2.54.10+2psi-crossings)for a fourfoldincrease.TheouterracerestrainingforcefortheHFE-7100processedbearingpairdoubledat 5.32.106revolutions(2.68.10+2psi-crossings).Therestrainingforceincreasedonlyslightlybetweenthis pointandtest terminationat 6.63.106,or 3.33.10+2psi-crossings.Torquetraces(stripcharts)were performed at 2.80.106 revolutions for the three pairs (Figure 7), and after the test end points
for each respective bearing pair, but prior to disassembly (Figure 8). Note that the peak-to-peak bearing
torque noise for the Freon TF diluted oil decreased from 8.5 mNom (1.2 .z-in) in Figure 7a to 5.0 mN.m(0.7 .z-in) in Figure 8a due to the formation, then subsequent displacement of polymerized lubricant. In
contrast, the amplitude of the torque noise for the Vertrel and HFE-7100 processed bearings roughlydoubled from the interim traces to the final traces. This indicated a lag in the noticeable effect of polymer
formation relative to the performance of the Freon TF processed bearings.
+iiii.......i ii!fi.....!?i......iiii?ili+ii+?ii:':::'_ii':':i_:i_i_.:_:i_2! 1:2_ 2121;2_ii++222!2:2_!22;i!
Figure 7a Freon TF processed bearing scan
........................... .++ ......... .... ; .............
......... ,..,..+.+,.,.. .................. , ........................................ +........... o....................
.... +,.:,., ......... ._,., ...... : ......... ; .... ,+ .++, ,._+.,. /....... , ...... , ......................... ; ........... . .... ,+..............................................................,...................,.........,..........................._.2 --"'--.u-_%J
Figure 7c. HFE-7100 processed bearing scan
........ ,,..: ........ + ........... •...:,..,: ............ ,,+. _k
/.)J lill'_ 111
___L"! .... i .... i .... _.... i .... i .... _.... i.... : .... i .... _.... :,
Figure 7b. Vertrel XF processed bearing scan
All traces at 50 rpm. All scans representslightly greater than one bearing innershaft revolution.
Figure 7. Interim torque traces for preloaded bearing pairs after approximately 2.8.10 s revolutions
!+i ..........................i........._.........i........._.........::........._........_........_........--.--:.........i...........
• ..! .... ! .... _ .... : .... : .... ! .... : .... ! .... i .... ; .... ! .... i*
1"6.4oz'inl
""_ .... _ .... i .... i .... .... i .... ! .... i "'+! .... i .... i .... ."
Figure 8b. Vertrel XF processed bearing scan
Fig. 8a represents 3.9"106 revolutions.Fig. 8b and 8c represent 6.4"106 revolutions.All scans represent slightly greater than onebearing inner shaft revolution.
Figure 8. Torque traces for bearings prior to final disassembly
31
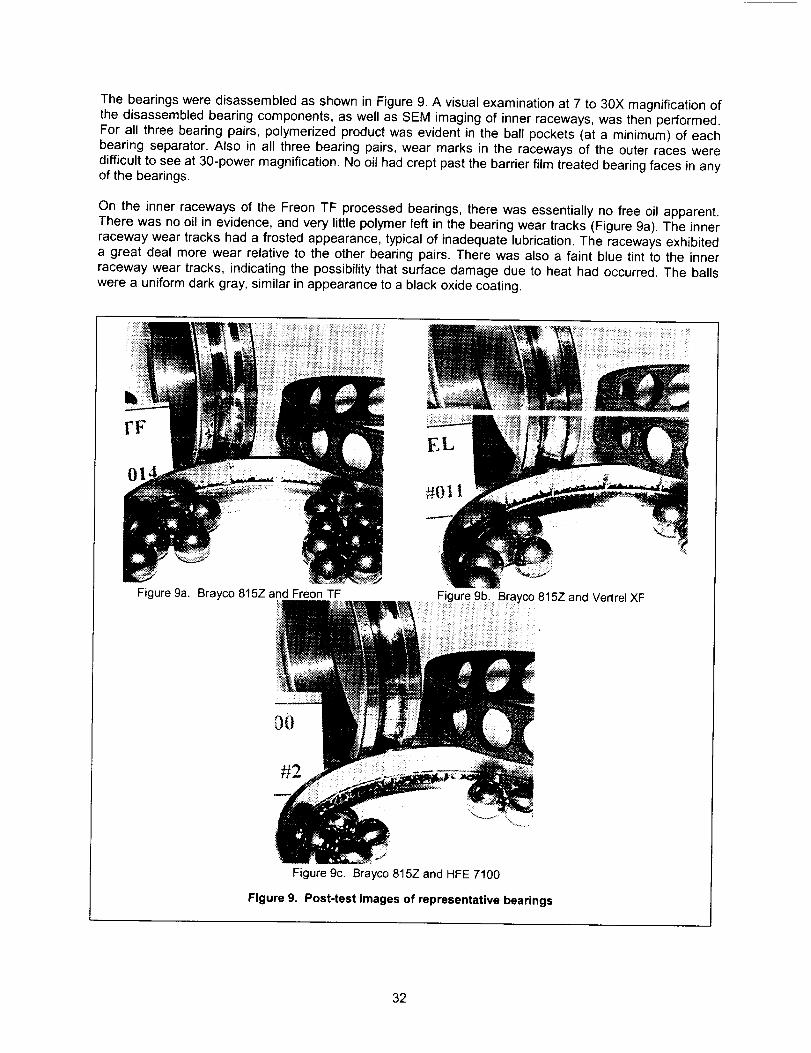
ThebearingsweredisassembledasshowninFigure9.Avisualexaminationat7 to 30Xmagnificationofthedisassembledbearingcomponents,aswellasSEMimagingof innerraceways,wasthenperformed•Forall threebearingpairs,polymerizedproductwasevidentin theballpockets(at a minimum)of eachbearingseparator.Alsoin all threebearingpairs,wearmarksin the racewaysof theouterracesweredifficulttoseeat30-powermagnification.Nooilhadcreptpastthebarrierfilmtreatedbearingfacesinanyof thebearings.
Ontheinnerracewaysof the Freon TF processed bearings, there was essentially no free oil apparent•
There was no oil in evidence, and very little polymer left in the bearing wear tracks (Figure 9a). The innerraceway wear tracks had a frosted appearance, typical of inadequate lubrication. The raceways exhibiteda great deal more wear relative to the other bearing pairs. There was also a faint blue tint to the inner
raceway wear tracks, indicating the possibility that surface damage due to heat had occurred. The balls
were a uniform dark gray, similar in appearance to a black oxide coating.
rF
Figure 9a. Brayco 815Z and Freon TF Figure 9b. Brayco 815Z and Vertrel XF
#2
Figure 9c. Brayco 815Z and HFE 7100
Figure 9. Post-test images of representative bearings
32

The VertrelXF treatedbearinghada slightamountof oil mixedin with the polymerpresentin the(predominantlyinner)raceways.Whilewearmarkswerepresenton the innerraceways,the grindinggroovesintroducedduringthebearingmanufacturingprocesswerestillreadilyapparent.TheballswerealightershadeofgrayrelativetothoseassociatedwiththeFreonTFprocessedbearings.
A surprisingamountofoilwaspresentandintermixedwiththepolymerlocatedwithintheinnerracewayoftheHFE-7100processedbearings.Other than the great circle wear marks, the balls looked almost new.
The races were only lightly worn.
Axial profilometer measurements were taken for the inner races of each bearing before and after testing
(Table II). The post-test roughness values are a composite average of measurements of the wear trackplus approximately an equal axial distance outside the wear track. Note that only in one instance did thesurface roughness increase, and not surprisingly, it is associated with one of the Freon TF processed
bearings. It is surprising, however, that the other half of the pair was not as rough. This observation wassupported by SEM imaging.
Table II. Inner Raceway Axial Surface Roughness
Diluent &
Bearing Serial No.
Freon TF; _13
Freon TF; _14
Vertrel XF; _11
Vertrel XF; "12
HFE-7100; "01
HFE-7100; "02
Surface Finish
Before Test*
3.77
4.83
5.98
6.92
3.99
3.73
(rms)After Test**
6.14
2.92
2.64
2.27
3.67
2.47
*Performed by Split Ballbearing, Div. MPB Corp.**Performed by FALEX Corp.
Discussion and Future Work
The stress-cycle values obtained from bearing tests are of benefit only when the test and actual hardware
parameters (materials, stress levels, cleaning techniques, etc.) are similar. For example, it has beendemonstrated that an exponential correlation exists between stress and useful lubricant life; 5 therefore,
linear extrapolations for projected bearing performance from bearing tests operated at reduced stress
levels should be approached with caution. The bearing parameters evaluated in this test, however, weresimilar to the parameters that exist in certain HST bearings (recently processed with Vertrel XF dilutedBrayco 815Z), with the exception that the HST bearings contained varying ball counts. The psi-crossing
allowables generated in this test provided a means to calculate "ballpark" performance margins, withrespect to lubricant polymerization, for these bearings.
From the results of this limited study, there is an indication of potential benefit obtained from the use of theHFE-7100 to process Brayco 815Z lubricated 440C bearings relative to the diluents Freon TF, or Vertrel
XF. No attempt was made to determine the quantity or chemical nature of any possible impuritiesassociated with the solvents tested. The construction of further bearing tests would consider the inclusion
of a greater number of bearing pairs to increase the reliability of the test, and the use of different lots ofHFE-7100. The use of HFE-7100DL (hard disk lubricant grade with low ionics, and less than 1 ppmnonvolatile residue) may be included to further investigate the role that impurity quantity may play.
33

Conclusion
The use of non-CFC solvents and diluents compare favorably with the traditional CFC-113 (Freon) solventand diluent and in this test resulted in improved ball bearing performance. These results support previousfindings for Vertrel XF, and indicate possible further benefits through the use of a hydrofluoroether diluentrather than Freon TF in the processing bearings.
Acknowledgements
The authors wish to thank Mr. Kent Roller for his expertise in the post-test inspection of the bearingsurfaces, as well as Mr. Brad Scott and Mr. Harry Poehlmann for their comments in reviewing this paper.The authors also want to recognize the contributions of all the machinists and technicians who helped toput this test together and keep it running.
References
1. Mori, S., Morales, W., "Reaction of Perfluoroalkylpolyethers (PFPE) With 440C Stainless Steel inVacuum Under Sliding Conditions at Room Temperature," NASA Technical Paper 2883, 1989
2. Carre, D, "The Performance of Perfluoropolyalkylether Oils Under Boundary Lubrication Conditions,"Tribology Transactions, Volume 31,4, pp. 437-441
3. Loewenthal, S.H., Jones, Jr., W.R., and Predmore, R.E., "Life of Pennzane and 815Z LubricatedInstrument Bearings Cleaned With Non-CFC Solvents," NASA Technical Note NASA/TM 1999-209392, September, 1999
4. Didziulis, S.V., Childs, J.L., and Carre, "Effects of Varying Ball Bearing Cleaning Processes onLubricant Life," Aerospace Report Number ATR-98(2126)-1, The Aerospace Corporation, ElSegundo, CA
5. Jones, Jr., W.R., Pepper, S.V., Jansen, M.J., Nguyen, Q.N., Kingsbury, E.P., Loewenthal, S.H.,
Predmore, R.E., "A New Apparatus to Evaluate Lubricants for Space Applications - The Spiral OrbitTribometer (SOT)," NASA Technical Report Number NASA/TM 2000-209935, March, 2000
6. Phinney, D.D., Pollard, C.L., and Hinricks, J.T., "Experience with Duplex Bearings in Narrow AngleOscillating Applications," 22nd Aerospace Mechanisms Symposium, NASA Langley, May 4-6, 1988
34
r
Improving the Robustness to Vibration and Temperature Effects for a Scanner Duplex Ball
Bearing Assembly
Merritt Webb*, Thomas Brewer* & Benjamin Joffe
Abstract
Precision mechanisms such as scanners require precise bearing preloads coupled with preload stabilityover temperature and vibration. The bearing retaining system is critical to achieving the required preload
and maintaining it. A scanning motor bearing retaining system was recently redesigned to achievebearing preload stability. A new retaining system design, coupled with material changes, resulted in a
precise and tailorable design. When the motor was subjected to vibration and thermal variation, the modalproperties did not shift indicating the bearing preload had not changed. This was a significant
improvement over the previous design which often-showed modal shifts of vibration of 25 Hz or more.
Introduction
The National Oceanic and Atmospheric Administration and the National Aeronautics and Space
Administration have developed and operated a series of polar orbiting meteorological satellites since1978. There were originally known as the Television Infrared Observation Satellites and are know known
as Polar Orbiting Environmental Satellites (POES). The POES satellite operates in an 870 km circularnear polar orbit. The orbit is sun synchronous. The primary imaging instrument on the POES is the
Advanced Very High Resolution Radiometer (AVHRR).
The AVHRR is a six channel imaging radiometer. The six channels cover the spectrum from the visibleand near infrared to 12 microns. The channels are co-registered to provide multispectral data. The
instrument has an instantaneous field of view of 1.3 milliradians, providing a nominal spatial resolution of1.1 km at nadir.
The first AVHRR, a/1 series, was launched in 1978. Improvements were implemented and the first/2series was launched in 1981. Improvements to the scan motor were implemented to provide more torque
and longer life resulting in the/3 series. The first/3 AVHRR was launched in 1995.
The AVHRR images are produced by a rotating scanner sweeping across the earth. The collected energyis focused on discrete co-registered detectors. The detectors are sampled, as a group, by an analog to
digital converter at discrete time intervals. For an image to be assembled from this data, a very preciserotation rate is required of the scanner.
The AVHRR scanner uses an 80-pole hysteresis synchronous motor. The motor is a 2-phase motordriven by 240-Hz square waves in quadrature. The scanner is shown in Figure 1. This motor produces a
rotational rate of 37.699 radians/second (360 RPM). The motor is inherently synchronized to the drive
wave, producing very low jitter. The cardinal requirements for the scanner are listed in Table 1.
The two square waves in quadrature alternately energize the motor windings. The square wave drivesignal is derived from a high precision clock, in order to provide a low jitter drive source. The motor rotor
accelerates during start-up until it becomes synchronous with the rotating field. It then follows the fieldwith a phase delay. This phase delay is referred to as the "slip angle". The slip angle will vary if the loadvaries.
In order to minimize the torque hash variations the motor uses MPB $1724 ball bearings (1.0625-inch
bore) in a duplex pair. The bearings are Class 7T+, produced to an ITT-generated source control drawing.
* ITT Defense, Aerospace/Communications Division, Fort Wayne, Indiana.
Proceedings of the 35 th Aerospace Mechanism Symposium, Ames Research Center, May 2001
35

Themotoris drivenopenloopwith2 squarewavesin quadrature.Thismakesthe driveelectronics,simple,inexpensiveand veryreliable.Theactuallife,on-orbitof theAVHRRscannerhasaveraged5years.Failureofthespacecrafthasbeenthemostcommoncausefortheendofscannerlife.
Figure 1. AVHRR Scanner
Table 1. AVHRR Scanner Cardinal Requirements
Requirement
Free Body Torque, gross outputtorque delivered by motor
without losing synchronismMaximum Allowable Power
Rotational Jitter
Value
> 0.508 N-m
7.5 W
<34 microseconds
Comment
When operated at a supply voltage of 20,5 to24.5 volts
Power measured at 0.565 N-m
Synchronization Drift < +3 microseconds Measured over a 24 hour period
Orbital Lifetime 3 years
Natural FrequencyTemperature
> 100 Hz
10 to 30 C
X axis: 11.44 GRMSY axis: 19.40 GRMS
Z axis: 8.12 GRMS
Vibration
Peak-to-peak variation of rotational period for
98% of measurements over a 20 min period.
Requirement is for the complete instrumentOperating temperature of Instrument,
measured at the baseplateTitan II ELV levels
36

Therelativelylowtorqueoutputcombinedwiththeveryseveredriftandjitterrequirementsrequireveryhighprecisionbearings.Therunningtorqueandtorquehascharacteristicsofthesebearingsmustremainconsistentovertime,temperatureandvibrationforthe scannerto operateproperly.Thescanneris anopenloopdevice.Thus,individualparametersmustbe carefullycontrolled.As a resultof this,a greateffortis madein thecleaning,lubrication,andsettingofthepreloadandcontactangleofthebearingsandtheinstallationofthebearingsintothescanners.
Figure2 showsa blockdiagramof thescanner.Thisis a simplebutremarkablyaccuratemodel.Thismodelisusedtopredictscannerperformance,andhasbeenverifiedbytestresults.
Km _t......I
Tv
y !J.: 1/Js _ 1/sn ' -----/
_---J 0i 1I
Figure 2. Block Diagram of Scanner
Based on "hunting" frequency measurements, taken on a scanner, the parameters shown in Figure 2 aredefined in Table 2. The hunting frequency is the basic natural frequency at which the rotor oscillates
relative to the rotating field.
Table 2. Scanner Motor Parameters
Parameter Value
0.0067
Units
Tv N/A, input parameter
e N/A output parameter radians
Kb 0.0036 N-m-s/radians
Km 6.3251 N-m/radian
Description
Scanner rotating inertiaTorque variations from bearing
torque hash*, load variations etc.Slip angle variation between
motor and rotating electric field in
windingsSystem damping from friction
magnetic hysteresis, etc.Electromagnetic "stiffness",
essentially the restoring constantbetween the rotor and the
rotating electric fieldBased on measurements taken on A302 scanner
* Torque hash is defined as the non-repetitive torque variations that occur as a bearing rotates.
Utilizing the values shown in Table 2, a plot of the transfer function for the disturbance torque into thescanner versus frequency is shown in Figure 3. As can be seen, in Figure 3 the system is very lightly
damped. In this the damping is approximately 1% of critical. Typical values range from 0.5% to 1.5%. Thismeans that disturbances at low frequencies tend to greatly affect the jitter performance.
37
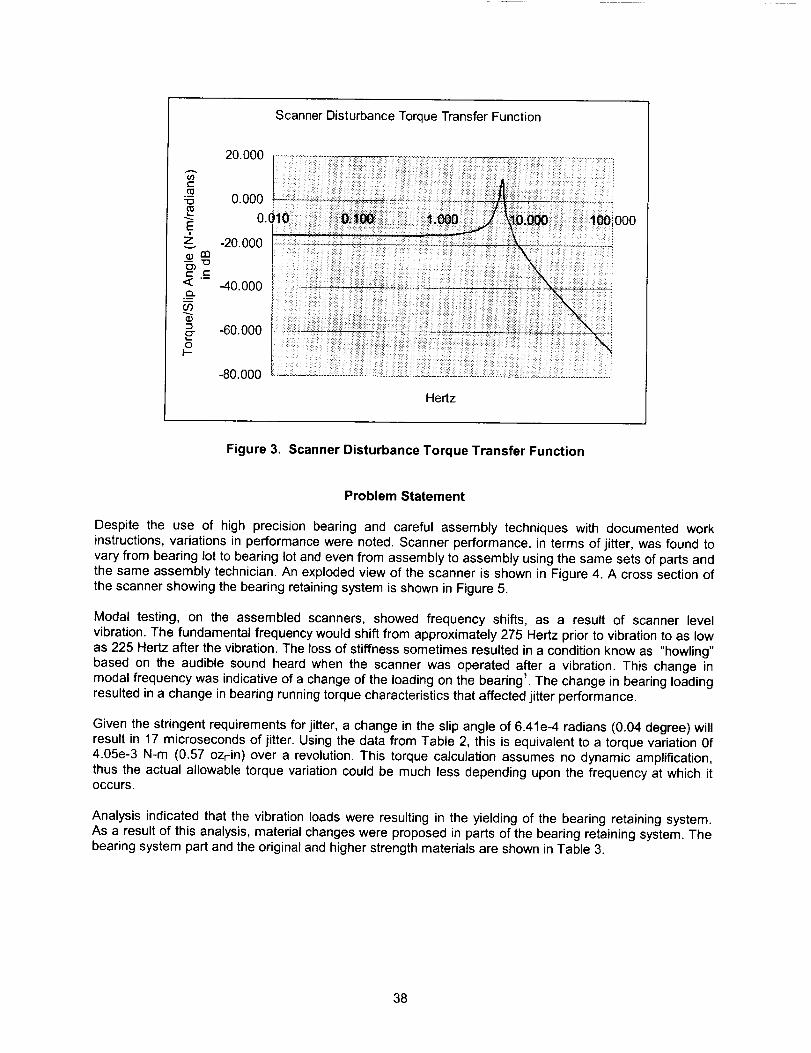
ScannerDisturbanceTorqueTransferFunction
20.000
t-
0.000
0.(,Eg -20.000
e-- e--
< - -40.000E;L
O9
= -60.0000
I--
-80.000
Hedz
Figure 3. Scanner Disturbance Torque Transfer Function
Problem Statement
Despite the use of high precision bearing and careful assembly techniques with documented work
instructions, variations in performance were noted. Scanner performance, in terms of jitter, was found to
vary from bearing lot to bearing lot and even from assembly to assembly using the same sets of parts andthe same assembly technician. An exploded view of the scanner is shown in Figure 4. A cross section ofthe scanner showing the bearing retaining system is shown in Figure 5.
Modal testing, on the assembled scanners, showed frequency shifts, as a result of scanner level
vibration. The fundamental frequency would shift from approximately 275 Hertz prior to vibration to as low
as 225 Hertz after the vibration. The loss of stiffness sometimes resulted in a condition know as "howling"based on the audible sound heard when the scanner was operated after a vibration. This change in
modal frequency was indicative of a change of the loading on the bearing 1. The change in bearing loadingresulted in a change in bearing running torque characteristics that affected jitter performance.
Given the stringent requirements for jitter, a change in the slip angle of 6.41e-4 radians (0.04 degree) willresult in 17 microseconds of jitter. Using the data from Table 2, this is equivalent to a torque variation Of
4.05e-3 N-m (0.57 ozrin) over a revolution. This torque calculation assumes no dynamic amplification,
thus the actual allowable torque variation could be much less depending upon the frequency at which itoccurs.
Analysis indicated that the vibration loads were resulting in the yielding of the bearing retaining system.As a result of this analysis, material changes were proposed in parts of the bearing retaining system. Thebearing system part and the original and higher strength materials are shown in Table 3.
38
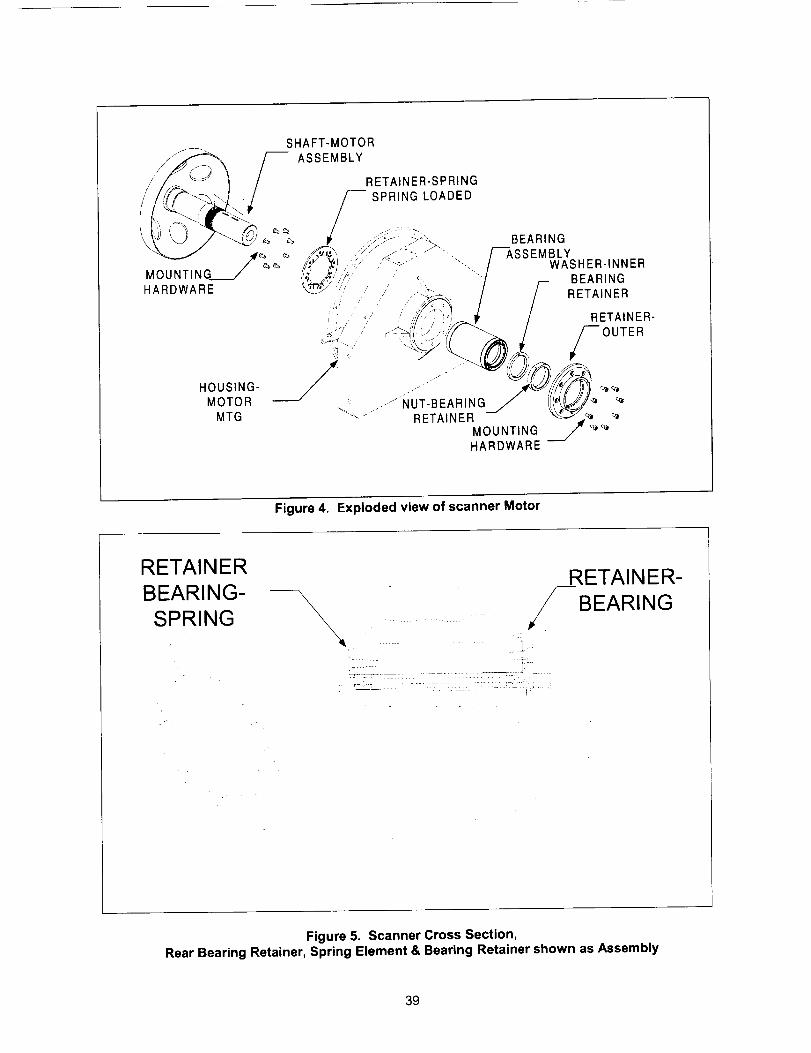
Figure 4. Exploded view of scanner Motor
RETAINER
BEARING-
SPRING
_, t ¸
RETAINER-
BEARING
Figure 5. Scanner Cross Section,Rear Bearing Retainer, Spring Element & Bearing Retainer shown as Assembly
39

Table 3. Scanner Cross section Parts and Materials for Original and Higher Strength Designs
Item
1
Title
Housing, Scanning MotorShaft Scan Motor
Outer Bearing Race
Old Material
Beryllium HP-20S-200Inconel X-750
New Material
Beryllium HP-20S-200Inconel X-750
440C Steel 440C Steel
4 Inner Bearing Race !440C Steel 440C Steel
5 Outer Bearing Spacer 416 Steel 416 Steel
6 Inner Bearing Spacer 416 Steel 416 Steel
7 Washer, Inner Bearing 304 CRES A286 Steel
8 Retainer-Spring 304 CRES Custom 455 H1000
9 Retainer - Outer 6061-T6 Aluminum 7075-T7351 Aluminum
10 Nut, Bearing Retainer 304 CRES A286 Steel
11 Screws-Spring Retainer 304 CRES A286 Steel12 304 CRESScrews-Outer Retainer A286 Steel
After the higher strength parts had been manufactured and installed into the scanner the scanner was
retested. The material changes made the scanner much more robust with respect to vibration. There was
very little change in natural frequency as a result of vibration. However, when tested over temperature,the jitter performance was found to vary greatly and in fact the scanner failed to meet the specificationrequirements at a temperature extreme.
Further analysis was performed and 2 root causes were discovered:
1. Tolerance stack-up and subtle assembly made the actual preload on the bearing very inconsistent on
an assembly to assembly basis. The actual preload could vary beyond limits specified on the drawingas a result of these variations.
2. The coefficient of thermal expansion (CTE) mismatches resulted in a variation in bearing preload asthe temperature changed.
The pretoad variations resulted in variations in bearing running torque and more significantly bearingtorque hash over temperature. As can be seen from Figure 3, variations in torque will cause the slip angleand hence the rotational period to vary. This variation resulted in velocity jitter which, in this case,exceeded specification limits.
The analysis indicated that, for a bulk temperature change of as little as 10 degrees C, if the bearing is atthe low end of the preload tolerance, the temperature change can result in zero preload.
Design Solution
A typical design solution for a high precision bearing mount such as this would be to add an elementflexible element such as a wave washer. The wave washer or similar element would be much more
flexible than the bearing spacers or rotor shaft. The purpose of this would be to allow for expansion and
contraction due to bulk temperature changes while maintaining a constant preload on the bearing.
However, in this case the installation of an element such as a wave washer was not an option. The motorand bearings had already been purchased. The available axial space was not adequate for theinstallation of this type of element.
One of the other problems with the use of a wave washer or disk washer is their relatively low loadcapacity. During vibration, the AVHRR scanner bearing experiences loads approaching 1000 pounds.
This is well beyond the load capacity of existing wave and disk washers, given the small amount of axialspace available. Figure 6 illustrates a typical bearing installation utilizing a wave washer.
40

Existin ArtFREE
THICKNESS HEIGH1
L--------OEA"ING0.0. LOAO 'tWORK HEIGHT
Figure 6. Typical Bearing Installation utilizing a Wave Washer
As shown in Figure 6, the duplex ball bearing mount device clamps the bearing axially. (Axially clampedis defined as applying a force along the axis of rotation to the races of the bearing). As the bearing is
clamped the components of the retaining system will deflect.
As the bearing is clamped, the axial spring will deflect, applying a load to the race that is proportional tothe deflection. Thus, variations in the deflection of the spring will result in variations in the load on the
bearing. Thus, increased torque results in an increased load.
Disc springs, wave springs and finger disc springs from another manufacturer are also used, but theexisting spring concepts design have a variation of load on the order of +25%. This is not acceptable for
high precision mechanisms, which require stable performance, especially over a long period of time undersevere environment condition, as required of space flight mechanisms.
Jf these springs were eliminated from the design in Figure 6 it would be impossible to cJamp the bearing
without changing the effective preload. The original design of bearing retainer for one of the ends of theAVHRR hysteresis scanner motor was a simple flat washer fastened to the motor housing with eight
countersunk screws. This design produced spring rates in the shaft axial direction in excess of 875,000N/mm. Thus there was little of the flexibility that is typically desired in a bearing retainer design.
41
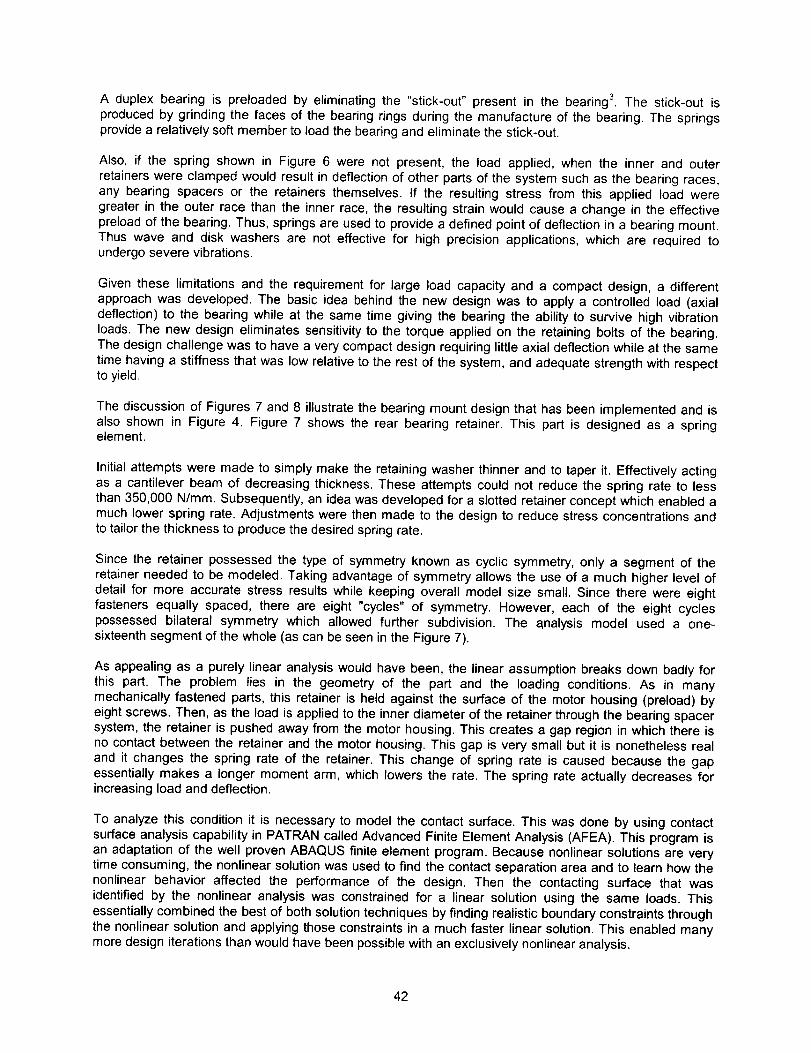
A duplexbearingis preloadedby eliminatingthe "stick-out"presentin the bearing3. Thestick-outisproducedbygrindingthefacesof thebearingringsduringthemanufactureof thebearing.Thespringsprovidea relativelysoftmembertoloadthebearingandeliminatethestick-out.
Also,if the springshownin Figure6 werenotpresent,the loadapplied,whenthe innerand outerretainerswereclampedwouldresultindeflectionof otherpartsofthesystemsuchasthebearingraces,anybearingspacersor the retainersthemselves.If the resultingstressfromthisappliedloadweregreaterin theouterracethantheinnerrace,theresultingstrainwouldcausea changein theeffectivepreloadof thebearing.Thus,springsareusedto providea definedpointofdeflectioninabearingmount.Thuswaveand diskwashersarenoteffectivefor highprecisionapplications,whichare requiredtoundergoseverevibrations.
Giventheselimitationsandthe requirementfor largeloadcapacityand a compactdesign,a differentapproachwasdeveloped.Thebasicideabehindthenewdesignwasto applya controlledload(axialdeflection)to the bearingwhileat thesametimegivingthebearingtheabilityto survivehighvibrationloads.Thenewdesigneliminatessensitivityto thetorqueappliedon the retainingboltsof thebearing.Thedesignchallengewastohaveaverycompactdesignrequiringlittleaxialdeflectionwhileatthesametimehavinga stiffnessthatwaslowrelativetotherestofthesystem,andadequatestrengthwithrespecttoyield.
Thediscussionof Figures7 and8 illustratethebearingmountdesignthathasbeenimplementedandisalsoshownin Figure4. Figure7 showstherearbearingretainer.This partis designedas a springelement.
Initialattemptsweremadeto simplymaketheretainingwasherthinnerandto taperit. Effectivelyactingasa cantileverbeamof decreasingthickness.Theseattemptscouldnotreducethespringrateto lessthan350,000N/mm.Subsequently,anideawasdevelopedfora slottedretainerconceptwhichenabledamuchlowerspringrate.Adjustmentswerethenmadeto thedesignto reducestressconcentrationsandtotailorthethicknesstoproducethedesiredspringrate.
Sincethe retainerpossessedthetypeof symmetryknownas cyclicsymmetry,onlya segmentof theretainerneededto bemodeled.Takingadvantageof symmetryallowstheuseof a muchhigherlevelofdetailfor moreaccuratestressresultswhilekeepingoverallmodelsizesmall.Sincetherewereeightfastenersequallyspaced,thereare eight"cycles"of symmetry.However,eachof the eightcyclespossessedbilateralsymmetrywhichallowedfurthersubdivision.The analysismodeluseda one-sixteenthsegmentofthewhole(ascanbeseenintheFigure7).
Asappealingas a purelylinearanalysiswouldhavebeen,the linearassumptionbreaksdownbadlyforthis part. The problemlies in the geometryof the part and the loadingconditions.As in manymechanicallyfastenedparts,thisretaineris heldagainstthesurfaceof themotorhousing(preload)byeightscrews.Then,astheloadisappliedtotheinnerdiameteroftheretainerthroughthebearingspacersystem,theretaineris pushedawayfromthemotorhousing.Thiscreatesa gapregioninwhichthereisnocontactbetweentheretainerandthemotorhousing.Thisgapis verysmallbut it is nonethelessrealandit changesthespringrateof theretainer.Thischangeof springrate is causedbecausethegapessentiallymakesa longermomentarm,whichlowerstherate.Thespringrateactuallydecreasesforincreasingloadanddeflection.
Toanalyzethisconditionit is necessaryto modelthecontactsurface.Thiswasdoneby usingcontactsurfaceanalysiscapabilityinPATRANcalledAdvancedFiniteElementAnalysis(AFEA).Thisprogramisanadaptationof thewellprovenABAQUSfiniteelementprogram.Becausenonlinearsolutionsareverytimeconsuming,thenonlinearsolutionwasusedtofindthecontactseparationareaandto learnhowthenonlinearbehavioraffectedthe performanceof the design.Thenthe contactingsurfacethat wasidentifiedby the nonlinearanalysiswasconstrainedfor a linearsolutionusingthe sameloads.Thisessentiallycombinedthebestofbothsolutiontechniquesbyfindingrealisticboundaryconstraintsthroughthenonlinearsolutionandapplyingthoseconstraintsina muchfasterlinearsolution.Thisenabledmanymoredesigniterationsthanwouldhavebeenpossiblewithanexclusivelynonlinearanalysis.
42
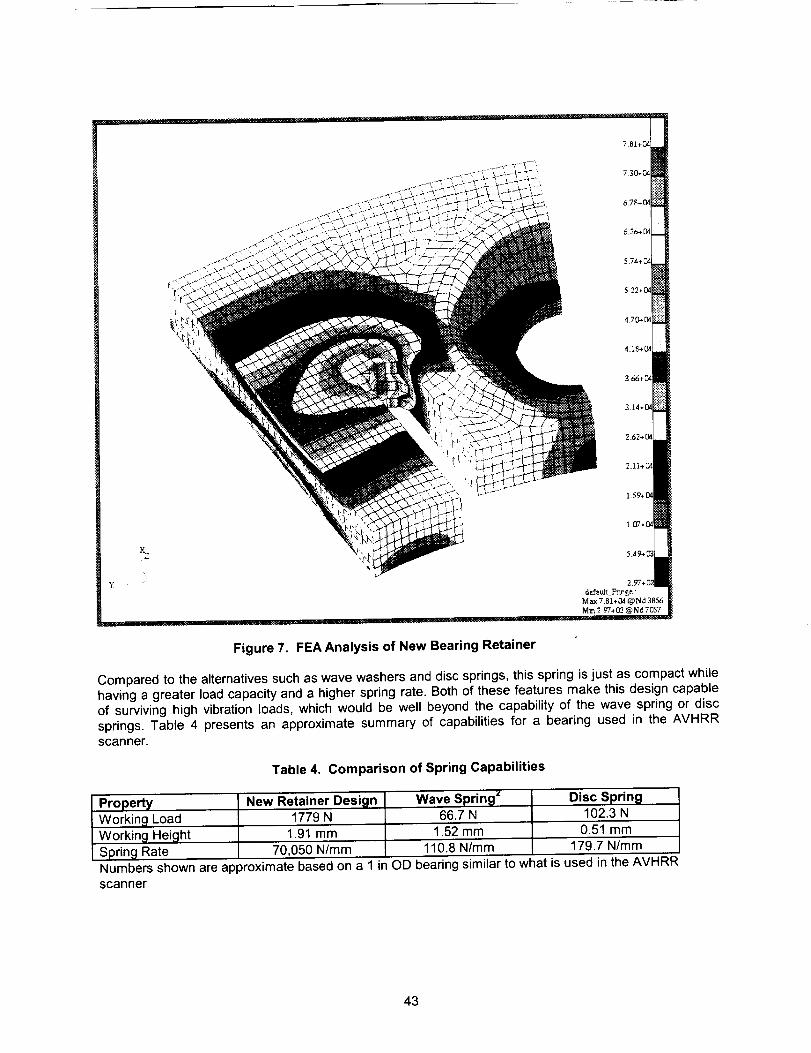
Figure 7. FEA Analysis of New Bearing Retainer
Compared to the alternatives such as wave washers and disc springs, this spring is just as compact while
having a greater load capacity and a higher spring rate. Both of these features make this design capableof surviving high vibration loads, which would be well beyond the capability of the wave spring or disc
springs. Table 4 presents an approximate summary of capabilities for a bearing used in the AVHRRscanner.
Table 4. Comparison of Spring Capabilities
Property New Retainer Design Wave Spring z
Working Load 1779 N 66.7 N
Working Height
Spring Rate
Disc Spring102.3 N
1.91 mm 1.52 mm 0.51 mm
70,050 N/ram 110.8 N/mm 179.7 N/mm
Numbers shown are approximate based on a 1 in OD bearing similar to what is used in the AVHRRscanner
43

Thenextaspectof thebearingmountdesignis shownin Figure8. Thisis theballbearingretainer.Itappliesthe loadto the outerracethroughthecombinedpreloadresultingfromthetorqueon4 bolts(amoreuniformloadingconditionwouldbe achievedby using8 boltsor screws).This part is matchmachinedtothe"stick-out"ofthespecificbearingandhousingused.
Thebasicapproachis thatas torqueis appliedto the retainerbolts,the rearretainerspringelementdeflects.Thismatchmachiningisdesignedto providea specificdeflectionin thespringshownin Figure7. Oncethatdeflectionhasbeenachievedtheretainerseatsagainstthehousingandnofurthertoadisimpartedto the bearing.Thisresultsin theforceversusdeflectioncurveseenin Figure9 for the newdesign.Thiscanbecomparedto thecurvefor theolddesignalsoshowninFigure9. Thereductioninvariationprovidedbythenewdesignisveryapparent.
RETAINER-BEARING
Figure 8. Ball Bearing Retainer
A cross section of the new design in the assembled condition is shown in Figure 5.
In the old design, the high stiffness of the rear retainer meant that other parts of the system would deflect.
Thus the load on the bearing would be dependent upon the actual preload applied by the retaining boltsand the actual dimensions of the piece parts. The old design used shims to attempt to achieve a tailored
fit (instead of match machining) however this allowed excessive variation given the high stiffness of therear retainer.
44

BearingLoadversusClampingTorque
2500
_- 2000v
1500
1ooo
m 500
1 2
--NewDesign : : :: :: i
3 4 5 6
Bearing Retainer Clamping Torque (N-m)
7 8
Figure 10. Bearing Load versus Clamping Torque Characteristics
The new design combined with match machining resulted in a consistent assembly, that was compact
yet, flexible. The effectiveness of the new design has been proven by its successful implementation onthe POES AVHRR scanner. Modal testing performed before and after vibration showed little changes in
natural frequencies. Running torque data taken on the motor showed a consistent preload. A summary ofthe modal performance is shown in Table 5.
Table 5. Comparison of Modal Data New Design versus Old Design
First Mode prior to Vibe
Old Design290
New Design270
First Mode after Vibe 240 - 220 270
Delta 50 - 70 0
Table Units are hertz
Measurement error of modes is estimated to be 5 Hz.
Numbers in Table are approximate, based on a number of "Old Design Builds."
Conclusion
When working with an existing design and attempting to trouble shoot or improve the existing design,improving one aspect can have unintended consequences, or indicate other short comings in the design.
A systematic systems engineering approach must be taken on any redesign effort to account for all thefactors and requirements that affect the designs performance.
A very compact and flexible, yet strong, bearing retaining system was developed for the AVHRR scanner.The use of detailed finite element models and nonlinear analysis enabled the design to be successfully
analyzed and implemented.
45

Thenewbearingmountdesignhasthefollowingfeatures:
Theabilityof thebearingstoselfalign.Sincethefingersshownin Figure7eachsupporta sectionofthebearingtheywillindependentlyadjusttoprovidethecorrectsupport.Thisprovidesrepeatabilityofassembly.Thehighspringrateof the rearretainer(Figure7) coupledwiththe solidmountingof theretainer(Figure8) allowstheassemblyto survivehighlevelsof vibrationwithouta changein assemblyposition.Asa resultthedesignisabletoachieveoutstandingdeviceperformance.Itprovidesa stablebearingpreloadoverthermalvariations
A patenton thisapproachhasbeenappliedfor.TheUnitedStatesPatentandTrademarkOfficehasissuedSerialnumber09/702,510fortheapplicationfiledon31October2000.
,
,
3.
References
Ball and Roller Bearings Theory, Design and Application, Johannes Brandlein, Paul Eschmann,
Ludwig Hasbargen, Karl Weigand, John Wiley & Sons, New York, 1999, p. 311.
Smalley Steel Ring Company Catalog, Wheeling, Illinois, 60090.
Machine Design Theory and Practice, Arron D. Deutschman, Walter Michaels, Charles E. Wilson,Macmillian Publishing Company, New York, 1975, p. 454.
46

/(
Retractable Trunnion Pin Mechanism
Wayne Jermstad* and Mark Landeck*
Abstract
The X-38 is a technology demonstration project for the proposed International Space Station Crew Return
Vehicle. The project consists of several atmospheric flight vehicles and an unmanned spacecraft. This
paper will discuss the design, development, and testing of a Retractable Trunnion Pin Mechanism used tomount the spacecraft in the payload bay of the space shuttle orbiter for launch.
Introduction
The X-38 Vehicle 201 is an unmanned spacecraft being developed in-house at NASA's Johnson Space
Center (JSC) by a joint government/industry team. The V-201 spacecraft is launched in the payload bay
of the space shuttle orbiter. Figure 1 shows the general arrangement of the V-201 spacecraft in thepayload bay. The V-201 spacecraft is attached to the space shuttle orbiter at five points using 82.55-mm
(3.25-in) diameter trunnion pins. Three trunnion pins are located on the De-orbit Propulsion Stage (DPS),which is attached to the rear of the V-201 spacecraft. Two trunnion pins attached to the orbiter Iongerons
carry X and Z loads, and a keel pin carries Y loads. The remaining two trunnion pins are mounted to theforward bulkhead of the V-201 spacecraft and carry loads in the Z direction only. Because the nose of the
V-201 spacecraft is quite narrow, an Airborne Support Equipment (ASE) cradle is used to provide amounting point for the forward trunnion pins. The pins protrude from the V-201 spacecraft and are
retained by Payload Retention Latch Assemblies (PRLAs). These pins must be retracted before re-entryof the V-201 spacecraft to provide the original outer mold line shape for aerodynamic purposes. A
retractable trunnion pin mechanism has been developed to meet these requirements.
DP8 Trunnion PinDe-orbit
Propulsion Stage
(DPS) Fins
Folded
DP8Trunnion
Pin
ZX
y_
Shuttle PayloadBay
X-38 Vehicle201
Airborne
SupportEquIprnent(ASE)
RetractableTrunnion PinMechanismand PRLA
RetractableTrunnion PinMechanismand PRLA
Figure 1. V-201 Spacecraft in Space Shuttle Orbiter Payload Bay
* NASA Johnson Space Center, Houston, TX
Proceedings of the 35mAerospace Mechanisms Symposium, Ames Research Center, May 9-11, 2001
47

Background
The X-38 project is a demonstration of technology for the proposed International Space Station Crew
Return Vehicle. The project consists of several atmospheric flight vehicles and an unmanned spacecraft.The design of the X-38 vehicles uses a lifting body shape originally developed by the U.S. Air Force X-23
(SV-5) and X-24A project in the mid-1960's. The X-38 spacecraft is launched by the space shuttle and
deployed by the Remote Manipulator System. The DPS performs the de-orbit burn and is jettisoned priorto entry. The spacecraft enters the atmosphere as an unpowered glider like the space shuttle orbiter.When the spacecraft becomes subsonic, it deploys a large, steerable parafoil for its final descent tolanding. The spacecraft landing gear utilizes skids rather than wheels.
Early on in the spacecraft design cycle the five-point attachment scheme described earlier was chosen.
This configuration is nearly statically determinate, which simplifies loads calculations and reduces the
interaction between the orbiter structure and the spacecraft structure. Once this basic layout was
determined, the next big decision was whether to locate the forward pins on the spacecraft side or on theASE cradle. Locating the pins on the ASE cradle simplified the spacecraft design and lowered the
spacecraft weight, but made re-stowing the spacecraft in the payload bay very difficult. In order to carrythe high launch and landing loads the pins would have had to go into tight tolerance holes on the
spacecraft. Once the pins were pulled out of the spacecraft, re-inserting them would have been virtuallyimpossible. Locating the pins on the spacecraft side greatly simplified the on-orbit operations. In addition,
the already existing and proven PRLA could be used to retain the pins.
The original design concept used a trunnion pin that was jettisoned pyrotechnically. Packaging this
concept was quite difficult. It quickly became apparent that the original pin interface location (on a cabinring frame halfway down the length of the vehicle) did not have sufficient space or strength for themechanism. A decision was made to move the trunnion pin interfaces to the cabin forward bulkhead
where there was more space available. Moving the mechanism to the spacecraft nose also helped byreducing nose ballast.
Driving Requirements
The trunnion mechanism must be mechanically locked in both the extended and retracted positions. Itmust be able to carry an ultimate load of 200 kN (45,000 Ibf). To accommodate vehicle deflections of
+76.2 mm (+3 in) the mechanism must have an extension distance of 355.6 mm (14 in). The mechanism
must be able to function between -73°C (-100°F) and 66°C (150°F). The mechanism has a 3-mission lifewith a cycle life of 8 cycles.
Design Overview
The trunnion pin retraction mechanism is pneumatically actuated with nitrogen gas. The vehicle Attitude
Control Subsystem provides the gas supply required for the mechanism to operate. A single N2 line runsfrom tanks in the rear of the spacecraft and branches off to connect to the two retraction mechanisms.
Having a single line synchronizes the two retraction mechanisms by supplying pressure to bothsimultaneously. The two retraction mechanisms are attached to the forward bulkhead of the V-201 crew
cabin as shown in Figure 2. Each mechanism is attached using a combination of shear pins and bolts
threaded into locking inserts. The trunnion pins protrude through the nose structure as shown in Figure 3.Once retracted, a Thermal Protection System cap on the end of the trunnion pin conforms to the originalouter mold line shape of the vehicle (see Figure 4 and Figure 5). Each trunnion pin retraction mechanism
is approximately 152 mm (6 in) in diameter and 965 mm (38 in) long in the extended position. Eachmechanism weighs approximately 667 N (150 Ibf).
48
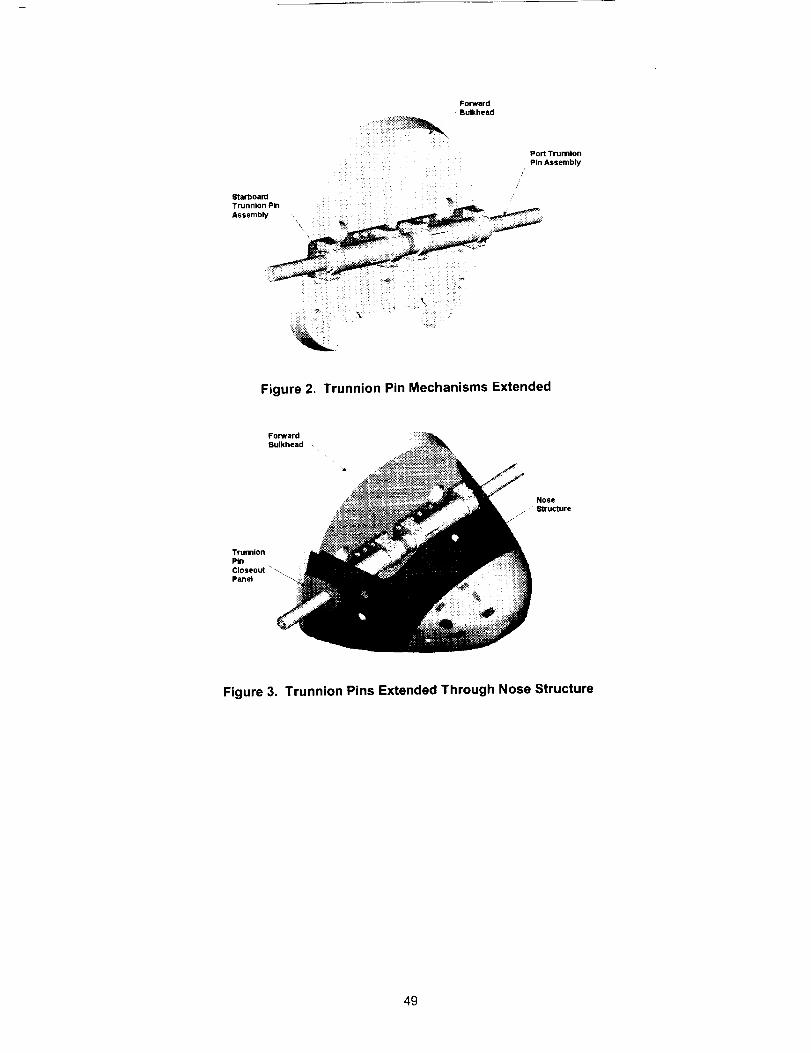
Starlooam
Trunnlon Pin
Assembly
Forward
Bulkhead
Port Trunnion
Pin Assembly
Figure 2. Trunnion Pin Mechanisms Extended
Forward
Bulkhead --
Nose
._ Structure
Trumlon
Pin
Closeout "'-_Panel
Figure 3. Trunnion Pins Extended Through Nose Structure
49
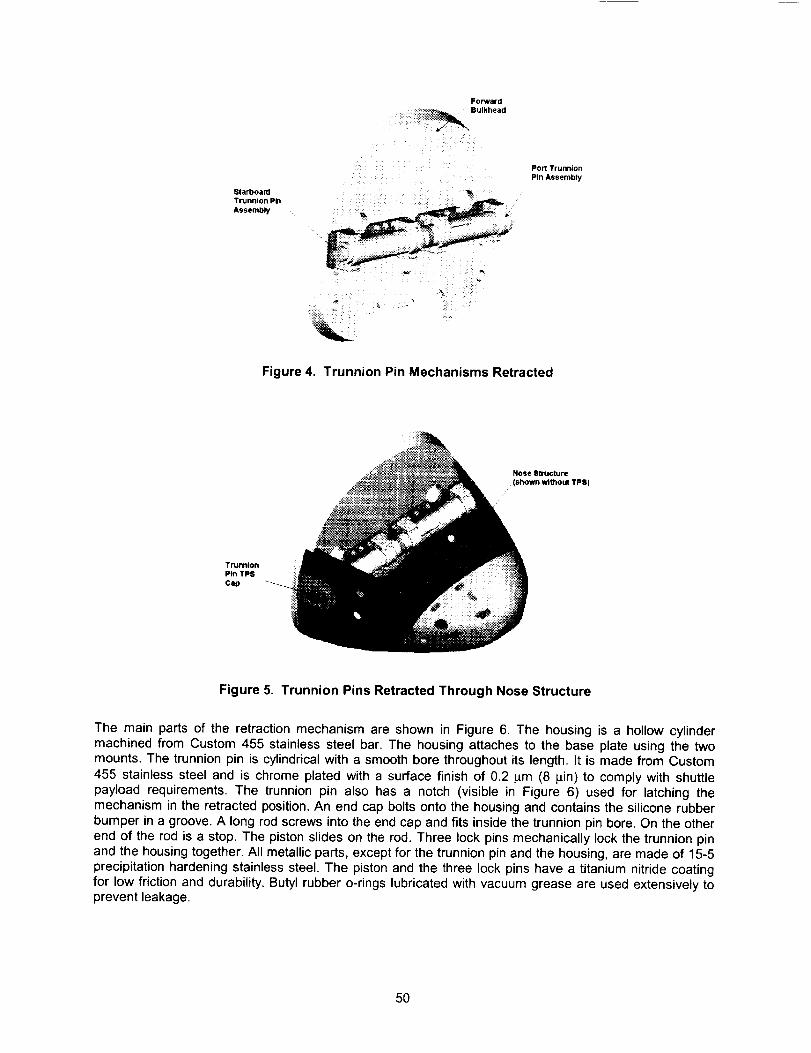
Forward
:._!:_ Bulkhead
Starboard
Trunnion Pin
Assembly
Port Trunnion
Pin Assembly
Figure 4. Trunnion Pin Mechanisms Retracted
Trumion
Pin TPS
Cap ----__
Nose Structure
Figure 5. Trunnion Pins Retracted Through Nose Structure
The main parts of the retraction mechanism are shown in Figure 6. The housing is a hollow cylindermachined from Custom 455 stainless steel bar. The housing attaches to the base plate using the twomounts. The trunnion pin is cylindrical with a smooth bore throughout its length. It is made from Custom
455 stainless steel and is chrome plated with a surface finish of 0.2 p.m (8 pin) to comply with shuttlepayload requirements. The trunnion pin also has a notch (visible in Figure 6) used for latching themechanism in the retracted position. An end cap bolts onto the housing and contains the silicone rubber
bumper in a groove. A long rod screws into the end cap and fits inside the trunnion pin bore. On the other
end of the rod is a stop. The piston slides on the rod. Three lock pins mechanically lock the trunnion pinand the housing together. All metallic parts, except for the trunnion pin and the housing, are made of 15-5
precipitation hardening stainless steel. The piston and the three lock pins have a titanium nitride coatingfor low friction and durability. Butyl rubber o-rings lubricated with vacuum grease are used extensively toprevent leakage.
50
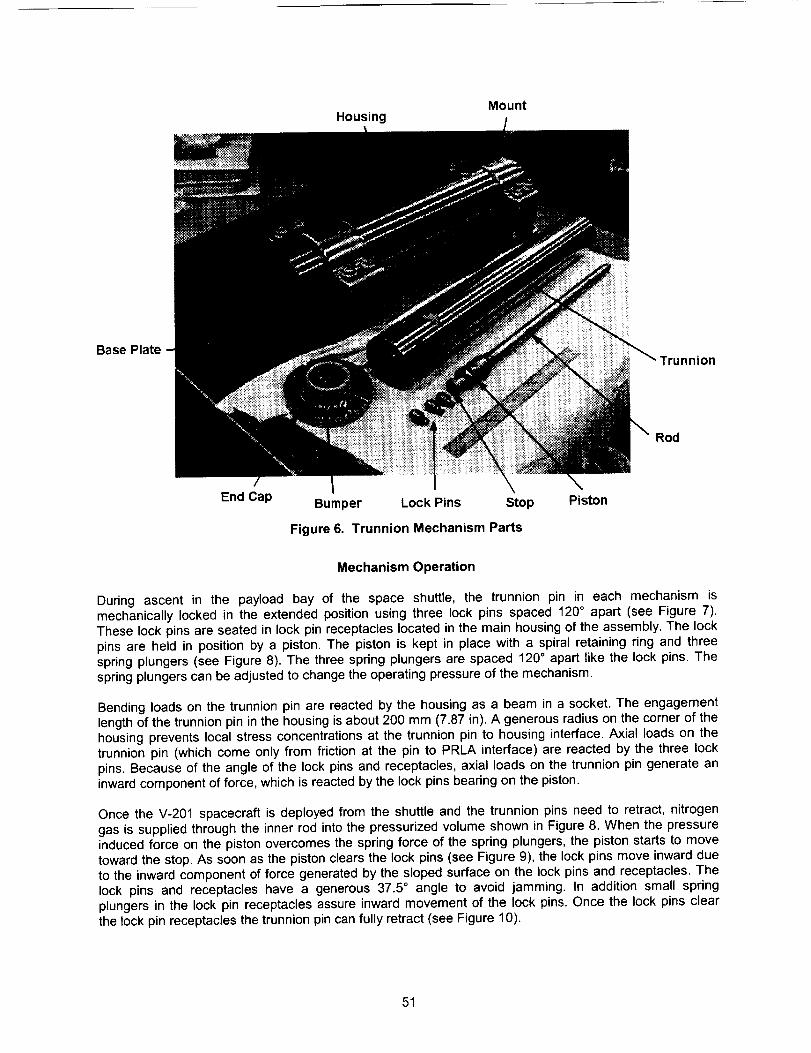
MountHousing
Base Plate
Rod
End CapBumper Lock Pins Stop Piston
Figure 6. Trunnion Mechanism Parts
Mechanism Operation
During ascent in the payload bay of the space shuttle, the trunnion pin in each mechanism ismechanically locked in the extended position using three lock pins spaced 120 ° apart (see Figure 7).
These lock pins are seated in lock pin receptacles located in the main housing of the assembly. The lockpins are held in position by a piston. The piston is kept in place with a spiral retaining ring and three
spring plungers (see Figure 8). The three spring plungers are spaced 120 ° apart like the lock pins. Thespring plungers can be adjusted to change the operating pressure of the mechanism.
Bending loads on the trunnion pin are reacted by the housing as a beam in a socket. The engagement
length of the trunnion pin in the housing is about 200 mm (7.87 Jn). A generous radius on the comer of thehousing prevents local stress concentrations at the trunnion pin to housing interface. Axial loads on thetrunnion pin (which come only from friction at the pin to PRLA interface) are reacted by the three lock
pins. Because of the angle of the lock pins and receptacles, axial loads on the trunnion pin generate an
inward component of force, which is reacted by the lock pins bearing on the piston.
Once the V-201 spacecraft is deployed from the shuttle and the trunnion pins need to retract, nitrogengas is supplied through the inner rod into the pressurized volume shown in Figure 8. When the pressure
induced force on the piston overcomes the spring force of the spring plungers, the piston starts to movetoward the stop. As soon as the piston clears the lock pins (see Figure 9), the lock pins move inward dueto the inward component of force generated by the sloped surface on the lock pins and receptacles. The
lock pins and receptacles have a generous 37.5 ° angle to avoid jamming. In addition small springplungers in the lock pin receptacles assure inward movement of the lock pins. Once the lock pins clear
the lock pin receptacles the trunnion pin can fully retract (see Figure 10).
51

Piston
Lock Pin
Receptacle(3X)
Lock Pin
Housing
I
Trunnion
Figure 7.
TrunnionStop
Rod
Cross Section of Mechanism Showing Lock Pins
Lock Pin
Receptacle
Housing
PistonLock Pin Rod
Spring Plunger
Pressurized Volume
Figure 8. Cross Section of Mechanism in Locked Position
Gas Supply
52
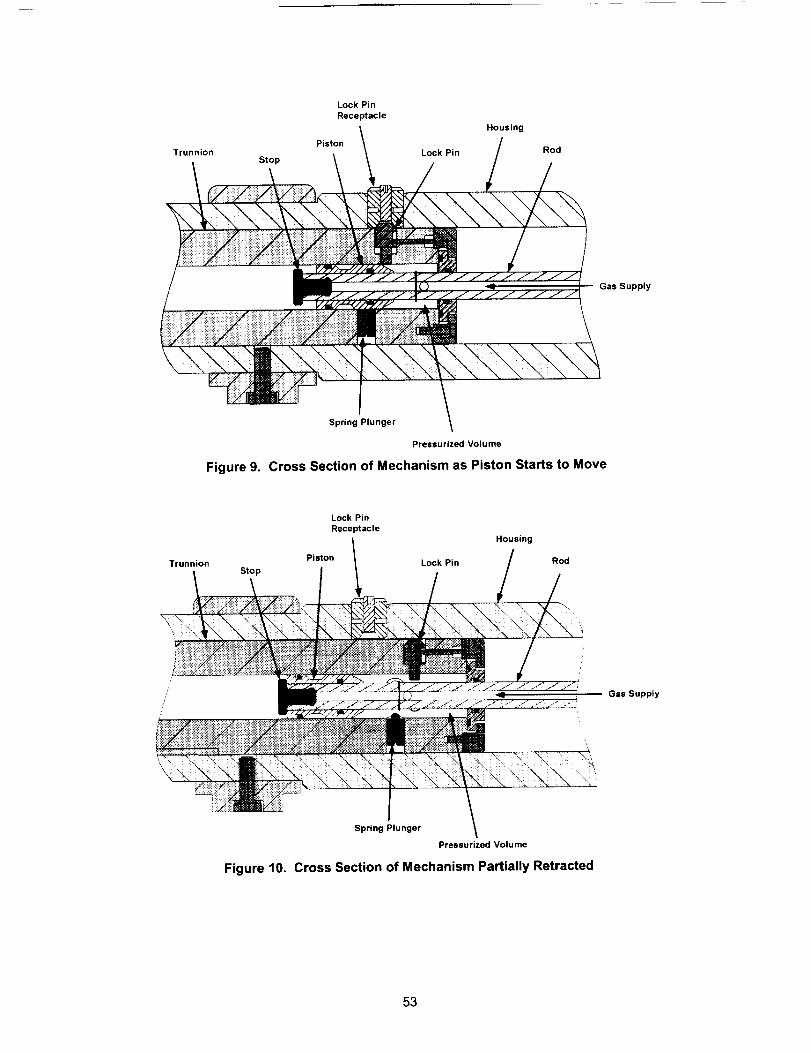
TrunnionStop
Lock Pin
Receptacle
PistonLock Pin
Housing
Rod
Gas Supply
Figure 9.
Spring Plunger
Pressurized Volume
Cross Section of Mechanism as Piston Starts to Move
TrunnionStop
Figure 10.
Lock Pin
Receptacle
Piston
Housing
Lock Pin Rod
Spring Plunger
Pressurized Volume
Cross Section of Mechanism Partially Retracted
Gas Supply
53

To prevent rotation of the trunnion pin with respect to the housing, a slot is cut into the trunnion pin and akey is attached to the housing as shown in Figure 11.
Trunnion
Figure 11.
Socket Head
Key Cap Screw (2X)
Cross Section Showing Key and Slot in Trunnion
The trunnion pin retracts rapidly (in less than one second). To absorb the energy of impact and to prevent
rebounding, a silicone rubber bumper is used (see Figure 12). A notched groove in the trunnion pin and acantilevered latch attached to the main housing are used to lock the trunnion pin in the retracted position(see Figure 12).
To unlock the trunnion pin mechanism for re-use, the key must first be removed from the trunnion pin slot.The trunnion pin is then manually rotated to lift the latch from the notch in the trunnion pin. The trunnion
pin can then be fully extended and the key put back in place. A plunger is then used to push the pistonback over the spring plungers into its locked position.
Trunnion Latch
/Housing Bumper
Figure 12. Cross Section of Mechanism Retracted and Locked
54

Testing
A dedicated qualification unit was built to perform developmental and qualification testing for the
retraction mechanism. The developmental test program is complete. The qualification test program will
take place during the spring and summer of 2001. The following paragraphs describe the testing that hasalready been performed, and the future testing planned for the mechanism.
Proof Pressure
Before functional testing could begin, a proof pressure test of the trunnion retraction mechanism to 1.5
times the maximum design pressure (MDP) was required by the JSC safety organization. The proof
pressure test would also serve as a functional test since the mechanism was expected to retract at apressure lower than the proof pressure. The initial proof pressure test revealed some defects in the
mechanism. The mechanism was pressurized to 4.14 MPa (600 psi). The piston was heard to unlock, butthe trunnion pin did not retract. The pressure was then reduced to a safe level of 517 kPa (75 psi). The
trunnion pin was shaken by hand and it retracted. An audible leak was observed but the leak rate was notmeasured. A post-test examination of the mechanism drawings and tolerances showed that the leak was
likely occurring around the three lock pins. The lock pins were subsequently modified to add an o-ring
groove and o-ring.
A new proof pressure test was conducted after the additional o-ring was added to the three lock pins. This
test was also used as a functional evaluation. The mechanism was again pressured to 4.14 MPa (600psi). Once again the piston was heard to unlock. The trunnion pin appeared to move a small amount but itdid not retract. This time there was no audible leak. The pressure was increased to the 5.17 MPa (750
psi) proof pressure and held for five minutes. After five minutes, leakage had reduced the pressure by
345 kPa (50 psi). The pressure was then reduced to 4.14 MPa (600 psi). The trunnion pin was shakenand it immediately retracted. A mechanical jam was now suspected.
After the test, the pin was disassembled. Small nicks were observed on the tips of the three lock pins and
on the inside of the main housing. A subsequent examination of the drawings and tolerances showed thatit was indeed possible for the tip of the lock pins to catch the edge of the lock pin receptacle hole on the
housing if the lock pin receptacles were improperly adjusted. This explained why the trunnion pin moved
a small amount and then stopped. The problem was solved by proper adjustment of the lock pinreceptacles. The pin was re-assembled, this time tightening the receptacles until they came in contact
with the trunnion pin. The receptacles were then unscrewed just enough to break contact. After this fix themechanism retracted successfully. Most likely this adjustment problem, and not the leak, was the reasonwhy the mechanism did not work in the original pressure test.
Function
A functional evaluation of the trunnion pin mechanism was performed with an initial pressure of 345 kPa(50 psi). The pressure was then raised to 4.14 MPa (600 psi) in increments of 345 kPa (50 psi). At each
pressure the pin unlocked and retracted as designed. At high pressures the bumper came out of itsgroove due to the high impact energy. A design fix is in work to keep the bumper in its groove. After
completion of this series of tests it was concluded that the new adjustment of the lock pin receptacles wascorrect. The procedure was documented in the mechanism rigging and repair manual.
Calibration
Adjusting the pre-load in the three spring plungers adjusts the mechanism operating pressure. A test wasconducted to calibrate the three spring plungers. With the mechanism in the extended and locked
position, the three spring plungers were adjusted to have the same pre-load. Pressure was slowlyincreased until the mechanism unlocked and retracted. This pressure was recorded. The mechanism wasthen disassembled so that the spring plungers could each be screwed in one-half turn. After re-assembly,
pressure was again slowly increased until the pin unlocked and retracted. This procedure was repeated todetermine the mechanism operating pressure as a function of spring plunger position. The same test was
conducted using quick bursts of pressure with similar results.
55

Future testinq
A complete qualification test program will be performed on the trunnion pin mechanism. The mechanism
will be functioned in a thermal vacuum test at both the hot and cold temperature extremes. Themechanism will be static tested to 1.2 times limit load and then functioned. Qualification for AcceptanceVibration Testing and Qualification Vibration Testing will be performed, with functional tests of the
mechanism after each. Life cycle testing will be performed on the qualification unit. After completion of life
cycle testing the qualification unit will be static tested to ultimate load (1.5 times limit). The two flight units
will be proof pressure tested, have a spring plunger calibration test, and be acceptance vibration tested ina vehicle level vibro-acoustic test.
Remaining Work
In addition to the completion of the qualification test program, some additional design work remains onthe trunnion pin mechanism. Microswitches must be incorporated for both the extended and stowed
positions. Redundant locking devices must be added for all threaded devices. This work will be done priorto the start of the qualification test program.
Conclusions
A retractable trunnion pin mechanism has been developed which can carry a high structural load in alocked extended position, then retract into a locked stowed position. Development testing indicates that
the mechanism concept is sound. The mechanism can operate over a wide range of operating pressures.While there is more work to be done, so far the mechanism meets all its design requirements.
56
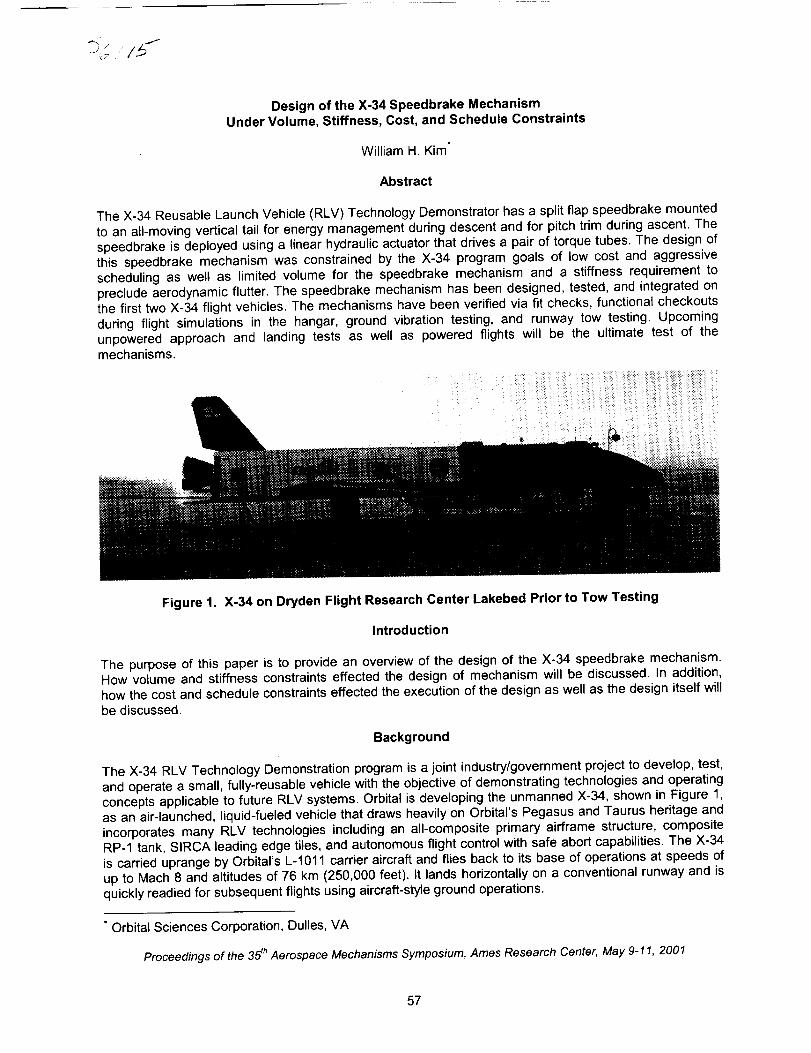
Design of the X-34 Speedbrake MechanismUnder Volume, Stiffness, Cost, and Schedule Constraints
William H. Kim
Abstract
The X-34 Reusable Launch Vehicle (RLV) Technology Demonstrator has a split flap speedbrake mounted
to an all-moving vertical tail for energy management during descent and for pitch trim during ascent. Thespeedbrake is deployed using a linear hydraulic actuator that drives a pair of torque tubes. The design of
this speedbrake mechanism was constrained by the X-34 program goals of low cost and aggressivescheduling as well as limited volume for the speedbrake mechanism and a stiffness requirement to
preclude aerodynamic flutter. The speedbrake mechanism has been designed, tested, and integrated on
the first two X-34 flight vehicles. The mechanisms have been verified via fit checks, functional checkoutsduring flight simulations in the hangar, ground vibration testing, and runway tow testing. Upcoming
unpowered approach and landing tests as well as powered flights will be the ultimate test of themechanisms.
Figure 1. X-34 on Dryden Flight Research Center Lakebed Prior to Tow Testing
Introduction
The purpose of this paper is to provide an overview of the design of the X-34 speedbrake mechanism.
How volume and stiffness constraints effected the design of mechanism will be discussed. In addition,how the cost and schedule constraints effected the execution of the design as well as the design itself willbe discussed.
Background
The X-34 RLV Technology Demonstration program is a joint industry/government project to develop, test,and operate a small, fully-reusable vehicle with the objective of demonstrating technologies and operatingconcepts applicable to future RLV systems. Orbital is developing the unmanned X-34, shown in Figure 1,
as an air-launched, liquid-fueled vehicle that draws heavily on Orbital's Pegasus and Taurus heritage andincorporates many RLV technologies including an all-composite primary airframe structure, composite
RP-1 tank, SIRCA leading edge tiles, and autonomous flight control with safe abort capabilities. The X-34
is carried uprange by Orbital's L-1011 carrier aircraft and flies back to its base of operations at speeds ofup to Mach 8 and altitudes of 76 km (250,000 feet). It lands horizontally on a conventional runway and isquickly readied for subsequent flights using aircraft-style ground operations.
* Orbital Sciences Corporation, Dulles, VA
Proceedings of the 35 thAerospace Mechanisms Symposium, Ames Research Center, May 9-11, 2001
57

Twocompleteairframeshavebeenfabricatedand assembledat Orbital'sDullesIntegrationandTestFacility.Athirdfuselagehasbeenfabricatedandis currentlybeingassembled.Systemtestingonthefirstairframeis underwaywithseveralcaptivecarryflighttestsonthe L-1011carrieraircraftcompletedandseveralrunwaytowtestsatDrydenFlightResearchCentercompletedaswell.Unpoweredapproachandlandingtestsaswellaspoweredflightswillbeperformeduponcompletionofgroundtesting.
Requirements
The X-34 wing provides the required lift to change the vehicle flight path angle during the pull-up
maneuver after separation from the carrier aircraft, and during the re-entry pull-up. The wing alsoprovides cross range and maneuverability during the final approach and landing. Aerodynamic attitude
control in pitch and roll is provided by elevons supported off the trailing edge of the wing. A fuselagemounted body flap also provides pitch control.
The all-moving vertical tail provides lateral stability and control for the X-34 during atmospheric flight. Asplit flap speedbrake mounted to the all-moving vertical tail provides drag which is used for energy
management during descent [1]. The X-34 speedbrake mechanism is unique in that it is the first split flapspeedbrake mounted to an all-moving vertical tail that is designed for transonic and hypersonic flight (up
to Mach 8) and is actuated with a single linear hydraulic actuator. In addition to serving as a drag device,another unique feature of the speedbrake is that it is used as a pitch trim device both during ascent anddescent. As shown in Figure 2, during the first 40 s of flight, elevon deflection, when the speedbrakes are
opened to 75 °, does not exceed -15 °. If the speedbrakes are not opened (0° deflection), elevon deflectionincreases to -20 °. Thus, the speedbrakes provide an additional 5 ° of elevon capability on ascent andkeep the elevons well below the saturation level of -34 ° [2].
In contrast, the Shuttle speedbrake is a split flap mounted to a fixed vertical stabilizer and is actuated with
multiple rotary actuators. The split flaps on Shuttle are used as speedbrakes between Mach 10 and 5.
They are used as both a rudder and speedbrake below Mach 5 and are used for pitch trim only duringdescent [3].
0
-2
-4
_-6._ -8
-10
_-12o_) -14
,m-16
-18
-20
0
i'
---75 ° Speedbrake
0 _ Speedbrake
i
600
5OO
_400
!300
.u
200
100
0
0 10 20
Dynamic Pressure
Nominal Mach Number
10 20 30 40 50 60 30 40 50
Time (eec) Time (sec)
2.00
1 80
1.60
1.40
1.20 _
_E1.00 z
0.80
0.60
0.40
0.20
Q00
60
Figure 2. The Speedbrake is Used for Pitch Trim During Ascent to Offload Elevon Demand
The all-moving vertical tail consists of a rudder, rudder mechanism, two speedbrakes, and a speedbrake
mechanism. The rudder is fabricated using graphite epoxy/aluminum honeycomb monocoque sandwichpanel construction for the skins and ribs. The rudder mechanism consists of a steel torque shaft with twotapered roller bearings. The speedbrake panels are monocoque sandwich panel construction with
graphite epoxy facesheets and aluminum honeycomb core. The speedbrake mechanism consists ofseveral metallic components.
The driving load case for the speedbrakes occurs during ascent when the speedbrakes are deployed 75 °
to help pitch the nose of the vehicle up. As shown in Table 1, at Mach 1.25 and a dynamic pressure of
58

26.42kPa(552psf),3,767N-m(33,338in-lb)of hingemomentisgeneratedoneachspeedbrakepanel.Theresultantnormalforceoneachpanelis 17,263N (3,881Ib).Theresultantaxialforceoneachpanelis 5,698N(1,281Ib).Theresultantspeedbrakeactuatorforceis54,388N(12,227Ib)whichcorrespondstoa 1,959N-m(17,342in-lb)momenton thetorquetubes.
Table 1. Speedbrake Load Cases
Ascent_sb
75 °
Mach
1.25
Entry 90 ° 6.60
Q HM FN
26.42 kPa 3,767 N-m 17,263 N
(552 psf) (33,338 in-lb) (3,881 Ib)15.61 kPa 1,417 N-m 6,494 N
(326 psf) (12,543 in-lb) (1,460 Ib)
FA
5,698 N
(1,281 Ib)2,144 N
(482 Ib)
The surface motion requirement for the speedbrakes is 0 ° to 90 ° and +/- 10 ° for the all-moving verticaltail. The slew rate requirement is 30°/s for the speedbrakes and 45°/s for the all-moving vertical tail. In
addition to loads, the qualification temperature requirement for the composite speedbrake is 176°C(350°F). Thermal blankets and barriers are used to keep the composite structure below this limit. The
speedbrakes are required to be interchangeable between airframes [4].
Constraints
The tail cross section geometry was constrained by the need to fit within the cavity in the fuselage of the
L-1011 carrier aircraft. This cavity, which was originally designed to house the Pegasus vertical fin, wasmodified to accommodate the X-34 all-moving vertical tail and was kept as small as possible to minimize
structural modifications to the aircraft. Because the tail is actually embedded within the fuselage of thecarrier aircraft, the tail can potentially impact the carrier aircraft during the separation sequence.
Extensive dynamic analyses were performed in order to verify adequate clearance between the tail andthe cavity existed for safe separation. Figure 3 shows the path of the tail relative to the cavity in 0.10 s
intervals after separation from the carrier aircraft. An area of the speedbrake was actually truncated at theintersection of the trailing edge and tip chord in order to increase the clearance margin between X-34 and
the L-1011. The tail cross section geometry was also constrained by the desire to have as thin a tail aspossible in order to minimize drag due to flow separation during transonic and supersonic flight of X-34. A
tail cross section was selected (tic = 17%) that was large enough to accommodate the speedbrakemechanism but still fit within the L-1011 cavity.
A stiffness constraint is derived from the requirement that all control surfaces on X-34 be flutter free. This
constraint drives the design of most of the speedbrake components. Cost and schedule constraints arederived from the overall X-34 program cost and schedule allocations set at the beginning of the program.
These constraints drive the execution of the design in terms of the use of a small, highly efficient team,modular/common components, simplified assembly tooling, robust designs, and advanced design and
analysis tools.
59

80
60
I ,°
0
I 20
-4O
56O
L-1011 _ =
560 600 620 640 660 680 700
FORE-AFT RESPONSE (INCHES, Positive right)
100
Path of Tail __
After Sep
(.10 s intervals) 8o
i ,°
720 740
L-1011
Envelope
r
70
-20
-40 -20 0 20 40
LATERAL RESPONSE (INCHES, Positive right)
Figure 3. The All-Moving Vertical Tail was Constrained by the L-1011 Envelope
Volume Constraint
The design of the X-34 speedbrake mechanism demonstrated that it is possible to design a compactcontrol surface deployment mechanism to fit into a small volume. The limited volume available for the
mechanisms (defined by the trailing edge of the all-moving vertical tail and the inner mold lines of the two
speedbrake panels) required that the mechanism be very compact. Figure 4 shows views of a partiallyintegrated speedbrake mechanism in the open and closed position as well as a depiction of the availablevolume for the speedbrake mechanism.
Available Volume
for Spe:dbr a:e ---_.
/ ;I_ i
f
Figure 4. The Speedbrake Mechanism was Constrained by the Speedbrake Panels and Tail
The speedbrake mechanism consists of a speedbrake hydraulic actuator, speedbrake actuator clevis,
crank arm, crank arm clevis, drive links, scissor links, torque tubes, pillowblocks, piano hinges,
6O
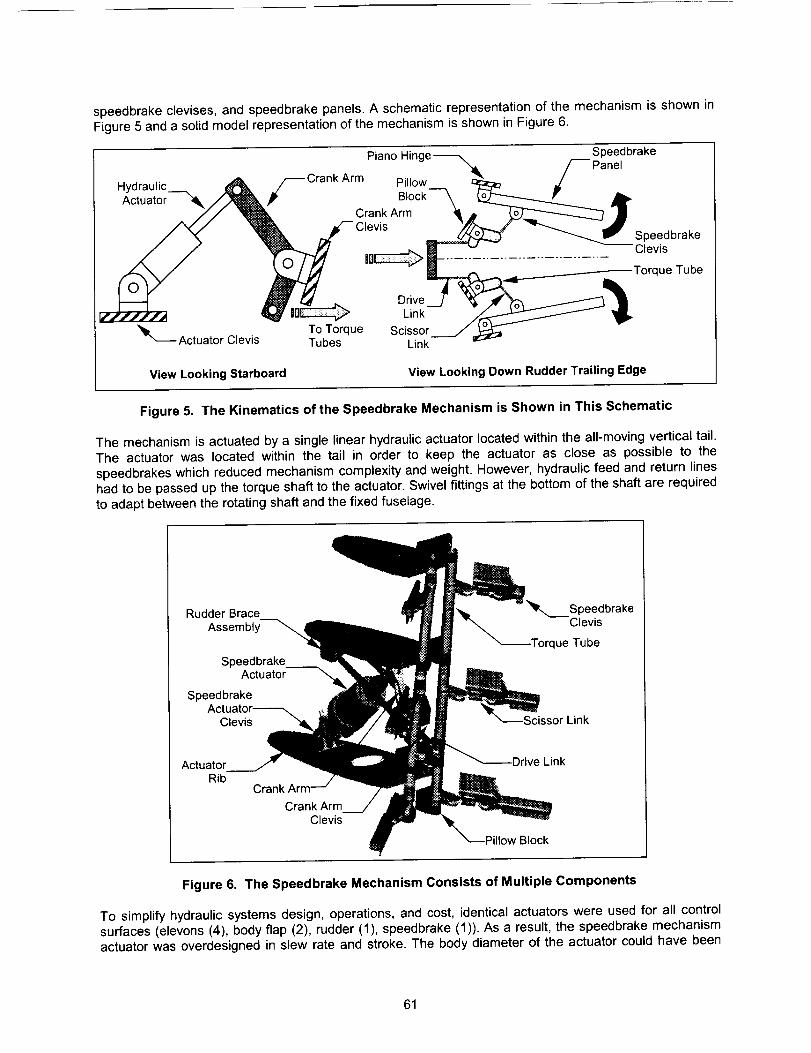
speedbrakeclevises,andspeedbrakepanels.A schematicrepresentationof themechanismis showninFigure5andasolidmodelrepresentationofthemechanismisshowninFigure6.
PianoHinge-_Hydraulic _ _Crank Arm PillowActuator _ _ )1_ Block
. // _ Crank Arm
,,//_ _l_ k fOlevis _
_ w r,t DriveI,f.,llll_'l_ _ _' IB_ Link
To Torque Scissor_-Actuator Clevis Tubes Link
Speedbrake
_(//---- Panel
"qK_._._J Speedbrake
Clevis
Torque Tube
View Looking Starboard View Looking Down Rudder Trailing Edge
Figure 5. The Kinematics of the Speedbrake Mechanism is Shown in This Schematic
The mechanism is actuated by a single linear hydraulic actuator located within the all-moving vertical tail.
The actuator was located within the tail in order to keep the actuator as close as possible to thespeedbrakes which reduced mechanism complexity and weight. However, hydraulic feed and return lines
had to be passed up the torque shaft to the actuator. Swivel fittings at the bottom of the shaft are required
to adapt between the rotating shaft and the fixed fuselage.
Rudder Brace SpeedbrakeAssembly Clevis
ue Tube
SpeedbrakeActuator
Speedbrake
Clevis Link
Actuator Drive LinkRib
Crank ArmClevis
Pillow Block
Figure 6. The Speedbrake Mechanism Consists of Multiple Components
To simplify hydraulic systems design, operations, and cost, identical actuators were used for all control
surfaces (elevons (4), body flap (2), rudder (1), speedbrake (1)). As a result, the speedbrake mechanismactuator was overdesigned in slew rate and stroke. The body diameter of the actuator could have been
61

smallerif the actuatorwasoptimizedfor speedbrakerequirements.Thespecificationsof the controlsurfaceactuatorsarediscussedfurtherintheCostandScheduleConstraintssectionofthispaper.
Theactuator'sbodydiameterdrovethespanwiselocationof theactuatorin theall-movingverticaltail.The actuatorwas locatedas closeto the tip chordof the rudder as possible while still maintaining
clearance to the inner mold line (23.9 mm (0.943 in) skin-to-cylinder clearance). The use of graphite
epoxy monocoque sandwich panel construction allowed for larger rib spacing than traditional metallicsemi-monocoque skin-stringer construction since sandwich panel construction has a greater specific
stiffness. The larger bay spacing (457 mm (18 in)) allowed for more room in the actuator bay for thehydraulic systems. The speedbrake actuator hydraulics are shown in Figure 7.
The speedbrake actuator is attached to a rib on the all-moving vertical tail with a stainless steel clevis anda stainless steel crank arm/clevis sub-assembly attached to the aft spar of the tail. While the design of the
stainless steel fittings is conventional, the attachment of the fitting to the graphite epoxy structure requiredcareful consideration. In order to transfer the actuator load into the rib, it was necessary to thicken the rib
facesheets locally, add metallic thru-bushings to prevent bearing failure in the facesheets, and add astainless steel backing plate to prevent fastener pull thru. Similarly, local doublers and a backing plate
were added to the aft spar. A rudder brace assembly was also required to reduce loading into the skin-to-
spar joints by transferring a portion of the load to the rib above the actuator via a pair of stainless steelstruts. These reinforcements were made late in the design/analysis phase but were easily accommodated
within the concurrent engineering environment. The ability of the concurrent engineering environment tohandle these additions is discussed in the Cost and Schedule Constraints section of this paper.
MinimumClearance_
Figure 7. The Speedbrake Actuator was Located as Close to the Tip Chord of the Rudder asPossible
The crank arm/clevis sub-assembly is connected via two scissor links to the torque tubes. The scissor
links have spherical bearings at each of their ends to adapt between the motion in the plane of the crankarm and the motion in the different planes of each torque tube. These 'narrow' profile bearings (PIN
M81935/4-8) were not typically stocked by vendors and required lead times in excess of nine months.Vendors did stock 'wide' profile bearings (PIN M81935/1-8) but these bearings were less compact and
had a lower load rating than the 'narrow' profile bearings. (Two shipsets of 'narrow' profile bearings werelocated after several weeks of searching.) The torque tube rotation axes are parallel to the hingeline
rotation axes for simplicity. The hingeline axes are driven by the outer mold line (OML) of the all-movingvertical tail which is swept aft and tapers from root to tip chord. As a result of this sweep and taper, the
torque tubes are not parallel to each other but 'toe-in' towards the tip chord. Because of this 'toe-in' andbecause the diameter of the torque tube was driven by stiffness concerns (discussed in the Stiffness
62
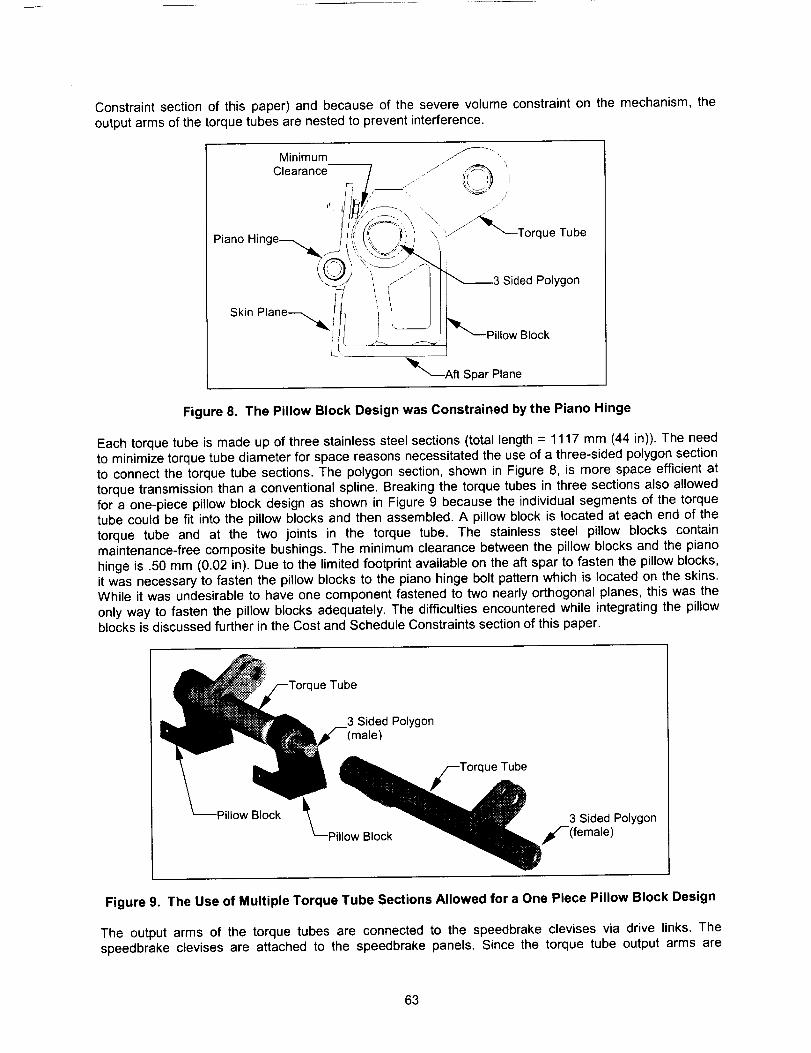
Constraintsectionof thispaper)and becauseof theseverevolumeconstrainton themechanism,theoutputarmsofthetorquetubesarenestedto preventinterference.
MinimumClearance
,I i/
PianoHinge--_(__
SkinPlane_,_I !
': ,.JJ_ _3 Sided Polygon
! I B,ock
_'_---Aft Spar Plane
Figure 8. The Pillow Block Design was Constrained by the Piano Hinge
Each torque tube is made up of three stainless steel sections (total length = 1117 mm (44 in)). The needto minimize torque tube diameter for space reasons necessitated the use of a three-sided polygon section
to connect the torque tube sections. The polygon section, shown in Figure 8, is more space efficient attorque transmission than a conventional spline. Breaking the torque tubes in three sections also allowed
for a one-piece pillow block design as shown in Figure 9 because the individual segments of the torquetube could be fit into the pillow blocks and then assembled. A pillow block is located at each end of the
torque tube and at the two joints in the torque tube. The stainless steel pillow blocks contain
maintenance-free composite bushings. The minimum clearance between the pillow blocks and the pianohinge is .50 mm (0.02 in). Due to the limited footprint available on the aft spar to fasten the pillow blocks,
it was necessary to fasten the pillow blocks to the piano hinge bolt pattern which is located on the skins.While it was undesirable to have one component fastened to two nearly orthogonal planes, this was the
only way to fasten the pillow blocks adequately. The difficulties encountered while integrating the pillowblocks is discussed further in the Cost and Schedule Constraints section of this paper.
Pillow Block
Tube
3 Sided Polygon(male)
Torque
Pillow Block
Tube
3 Sided Polygon
f(female)
Figure 9. The Use of Multiple Torque Tube Sections Allowed for a One Piece Pillow Block Design
The output arms of the torque tubes are connected to the speedbrake clevises via drive links, Thespeedbrake clevises are attached to the speedbrake panels. Since the torque tube output arms are
63
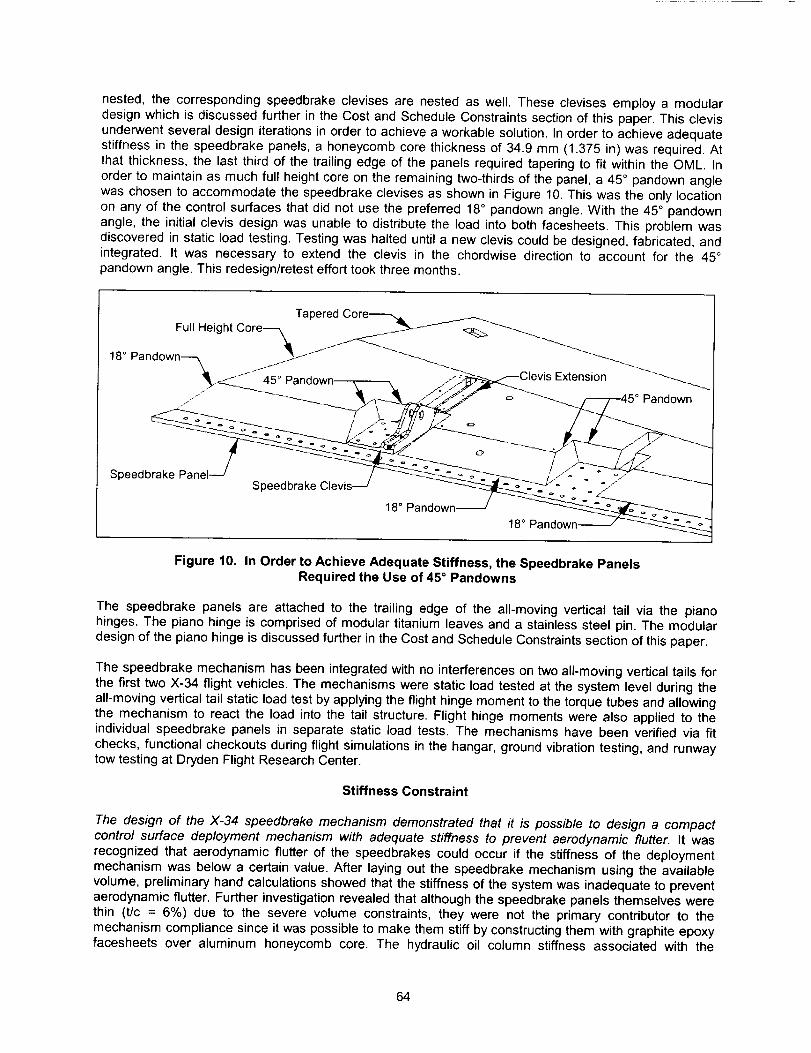
nested,the correspondingspeedbrakeclevisesarenestedas well.Theseclevisesemploya modulardesignwhichis discussedfurtherintheCostandScheduleConstraintssectionofthispaper.Thisclevisunderwentseveraldesigniterationsinorderto achieveaworkablesolution.Inorderto achieveadequatestiffnessin thespeedbrakepanels,a honeycombcorethicknessof 34.9mm(1.375in)wasrequired.Atthatthickness,the lastthirdof thetrailingedgeof thepanelsrequiredtaperingto fit withintheOML.Inorderto maintainasmuchfull heightcoreontheremainingtwo-thirdsof thepanel,a 45° pandownanglewaschosento accommodatethespeedbrakeclevisesasshowninFigure10.Thiswastheonlylocationonanyof thecontrolsurfacesthatdidnotusethepreferred18° pandownangle.Withthe45° pandownangle,the initialclevisdesignwasunableto distributethe loadintobothfacesheets.Thisproblemwasdiscoveredinstaticloadtesting.Testingwashalteduntila newcleviscouldbedesigned,fabricated,andintegrated.It wasnecessaryto extendthe clevisin the chordwisedirectionto accountfor the 45°pandownangle.Thisredesign/retestefforttookthreemonths.
TaperedCore_
Fu,He h,18 ° Pan__
° a°O°w°
Speedbrake Panel
18° Pandown ° ° = o
Figure 10. In Order to Achieve Adequate Stiffness, the Speedbrake PanelsRequired the Use of 45 ° Pandowns
The speedbrake panels are attached to the trailing edge of the all-moving vertical tail via the pianohinges. The piano hinge is comprised of modular titanium leaves and a stainless steel pin. The modular
design of the piano hinge is discussed further in the Cost and Schedule Constraints section of this paper.
The speedbrake mechanism has been integrated with no interferences on two all-moving vertical tails for
the first two X-34 flight vehicles. The mechanisms were static load tested at the system level during theall-moving vertical tail static load test by applying the flight hinge moment to the torque tubes and allowingthe mechanism to react the load into the tail structure. Flight hinge moments were also applied to theindividual speedbrake panels in separate static load tests. The mechanisms have been verified via fit
checks, functional checkouts during flight simulations in the hangar, ground vibration testing, and runwaytow testing at Dryden Flight Research Center.
Stiffness Constraint
The design of the X-34 speedbrake mechanism demonstrated that it is possible to design a compactcontrol surface deployment mechanism with adequate stiffness to prevent aerodynamic flutter. It was
recognized that aerodynamic flutter of the speedbrakes could occur if the stiffness of the deployment
mechanism was below a certain value. After laying out the speedbrake mechanism using the availablevolume, preliminary hand calculations showed that the stiffness of the system was inadequate to preventaerodynamic flutter. Further investigation revealed that although the speedbrake panels themselves werethin (t/c = 6%) due to the severe volume constraints, they were not the primary contributor to the
mechanism compliance since it was possible to make them stiff by constructing them with graphite epoxyfacesheets over aluminum honeycomb core. The hydraulic oil column stiffness associated with the
64

actuatorwasa largecontributortothecompliance,but it wasnotpossibleto alterits designbecauseoftherequiredcommonalitywiththeothercontrolsurfaceactuators.
Analysisshowedthatthe nextlargestcontributorto thecomplianceof thesystemaftertheoil columnstiffnesswas the torquetubes.(The torquetubes initiallyaccountedfor 73% of the speedbrakemechanismstiffness.)Sincethetorquetubeswerelongandsmallindiameter,theirrotationalcompliancerelativeto theothercomponentswashigh.Inorderto reducethisundesirablecompliance,thediameterofthetorquetubeswasincreasedfrom25.4mm(1.00in)to 38.1mm(1.50in).Thisincreaseindiameterreducedclearancesbetweencomponents(Figure8) butdecreasedthecompliancedramaticallywhichincreasedthespeedbrakemechanismstiffnessby58%.Thedesignwasfinalizedandgivento StructuralDynamicsResearchCorporation(SDRC),the firm taskedto performa detailed speedbrake flutter
analysis.
Figure 11. X-34 at Dryden Flight Research
Center prior to Ground Vibration Testing,March 1999
Figure 12. Rudder and SpeedbrakesInstrumented with Accelerometers for
Ground Vibration Testing
SDRC's initial modal analysis predicted a rigid body 'scissors mode' of the speedbrakes at 17.135 Hz. Atthat frequency, a potential flutter instability exists for the low supersonic portions of the flight envelope.
This instability was found to be a single-degree-of-freedom (DOF) instability, not the classicalbending/torsion coupling instability. Single DOF instabilities may result from asymmetric shock-boundary
layer interactions. The instability could be eliminated by increasing the mechanism stiffness considerably(i.e.: increasing the torque tube diameter beyond 38.1mm (1.5 in)). However, the stiffness increase
required was not feasible given the volume and mass constraints on the mechanism [5]. A modification tothe control system involving active damping using pressure feedback was developed in order to deal with
this problem.
SDRC's initial flutter analysis also revealed that aerodynamic loading increased the stiffness of the
system. This loading occurs when the speedbrakes are deployed into the airstream [5] but not when thespeedbrakes are closed. It was decided to preload the speedbrakes in the closed position by 'pinching'
the trailing edge of the speedbrakes together. A set of elastomer pads was installed in three locationsalong the span of the speedbrake to provide a bearing surface, and the actuator is used to provide the
preload force.
A Ground Vibration Test (GVT) was performed on the flight hardware at Dryden Flight Research Center
(Figures 11 and 12). Data from that test were used to calibrate and confirm SDRC's analyses. The rigidbody 'scissors mode', found at 37 Hz during GVT, was higher than the initial 17 Hz prediction (Figure 13).The initial modal analysis was refined by correcting modeling discrepancies and was able to predict the
mode at 37 Hz. These data are summarized in Figure 14 [6]. With the mode at 37 Hz, the control systemactive damping modification actually decreased stability, and so, it was removed after GVT.
65
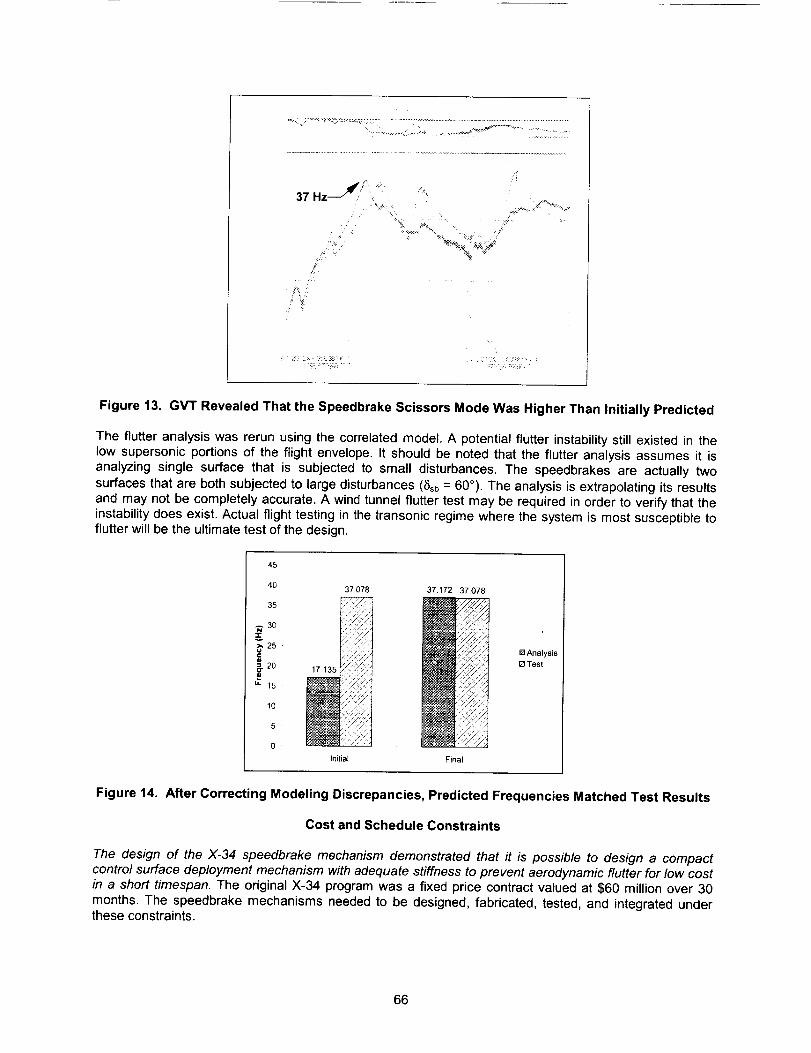
7 ¸.
37 Hz_f' '_ _
_,..J % j:
Figure 13. GVT Revealed That the Speedbrake Scissors Mode Was Higher Than Initially Predicted
The flutter analysis was rerun using the correlated model. A potential flutter instability still existed in thelow supersonic portions of the flight envelope. It should be noted that the flutter analysis assumes it is
analyzing single surface that is subjected to small disturbances. The speedbrakes are actually two
surfaces that are both subjected to large disturbances (6_b = 60°). The analysis is extrapolating its results
and may not be completely accurate. A wind tunnel flutter test may be required in order to verify that theinstability does exist. Actual flight testing in the transonic regime where the system is most susceptible toflutter wilt be the ultimate test of the design.
45
40
35
_. 3O
_ 2s_ 2og
u. 15
10
5
0
37078
Initial
37,172 37,078
Final
[] Analysis
I;3 Test
Figure 14. After Correcting Modeling Discrepancies, Predicted Frequencies Matched Test Results
Cost and Schedule Constraints
The design of the X-34 speedbrake mechanism demonstrated that it is possible to design a compactcontrol surface deployment mechanism with adequate stiffness to prevent aerodynamic flutter for low costin a short timespan. The original X-34 program was a fixed price contract valued at $60 million over 30
months. The speedbrake mechanisms needed to be designed, fabricated, tested, and integrated underthese constraints.
66

Inorderto minimizecosts,thenumberof peopleworkingonthespeedbrakeswaskeptto a minimum.Atanygiventime,no morethan threeengineerswereworkingon the speedbrakemechanismandtheyperformeda largenumberof tasksincluding:design,modeling,analysis,drafting,projectmanagement,fabrication/integration/testsupport,test planning,test fixturedesign/analysis.Mostcomponentswerefabricatedout-of-houseandwerethen integratedat Orbital'sDullesIntegrationandTestFacility.Thesystem-leveltestingwasperformedat the all-movingverticaltail subcontractortestfacility(CompositeOptics,Inc.,SanDiego).The smallteamallowedfor communicationon a dailybasisbetweenteammembers.Theprimarydesignandanalysiswasperformedbythesameengineer.InkeepingwiththeX-34designphilosophy,documentationwaskepttoa minimum.
Advanceddesignandanalysistoolswerealsousedto minimizecost.SDRCIDEASMasterSeries5wasusedto producea solidmodelof themechanism,whichis shownin Figure6,thatallowedthecomplexthreedimensionalmechanismsto befit-checkedonthe computerbeforepartswerefabricatedandnointerferenceswerefoundwhentheactualhardwarewasintegrated.
In orderto minimizethe needfor complexandtimeconsuminganalyses,the X-34structuraldesignphilosophywas to producea designthatwas robustenoughto relyon simpleranalysesusingmoresevereloadfactors.TheX-34programappliedsafetyfactorsof 1.25for yieldand1.50for ultimatetoflight limit levels [4]. Havinga robustlydesignedmechanismprovidedadditionalconfidenceinimplementinganaggressiveschedule.
Whereverpossible,componentswereanalyzedusingsimplehandcalculationsinsteadof detailedfiniteelementmodelsor notanalyzedat all butverifiedina systemleveltest.Forexample,componentswithwell-definedload paths such as cleviseswere analyzedusingonly hand calculations,MathCadworksheets,andMS Excelandwerethenverifiedin test.Componentswithmorecomplexloadpathssuchasthepillowblocksrequiredfiniteelementmodelinginadditiontotesting.
Anothercostreductionmethodwasimplementingmodulardesignwhereverpossible.TheX-34programmandatedthe useof a commonhydraulicactuatorsincethis resultedin significantcostsavings.Theactuatorwassizedfor the highbandwidthelevonsand rudderin strokeand rate.The speedbrakesrequireda slowerslewrateandhadsmallerstrokerequirements,whicharesummarizedinTable2.Thestroke,force,andslewraterequirementswerederivedfromstabilityandcontrolrequirements.A commonpianohingedesignwasusedfor all X-34controlsurfaces(elevons,bodyflap,andspeedbrake).Thepianohingedesignwasselectedfor its inherentabilityto serveas a thermalbarrieralongthe controlsurfacehingeline.Thepianohingeassemblyitselfwasdesignedusingmodularcomponentsinordertosavecostbyreducinguniqueparts.Thespeedbrakeclevisesalsoaremodularin thattheyweredesignedto be usedas eitherrighthandor left handpartsrequiringhalf as manydashconfigurationson thedrawing.In orderto maintainoperationalflexibility,all X-34controlsurfacesweredesignedto be fullyinterchangeable.It is possibleto exchangesurfacesfromvehicletovehicle.BoththeSN001andSN002all-movingverticaltailshavebeeninstalledon theA-1 vehicleat differenttimes.In the caseof thespeedbrakes,thismeantusingmatchedtoolingto drillthehingelineboltpatternsoneachserialnumberoftheall-movingverticaltailandspeedbrakes.
Table 2. Actuator Design Specifications vs. Requirements
Inboard Elevon Requirement
Outboard Elevon Requirement
Body Flap Requirement
Rudder Requirement
Speedbrake RequirementCommon Actuator Design Specification
Stroke Force
128 mm (5.061 in) 4,762 kg (10,500 Ib)
95 mm (3.878 in) 4,762 kg (10,500 Ib)
106 mm (4.195 in) 3,815 kg (8,411 Ib)
62 mm (2.466 in) 2,296 kcj (5,063 Ib)
114 mm (4.506 in) 5,546 kg (12,227 Ib)
180 mm (7.100 in) 10,069 kg (22,200 Ib)
Slew Rate
45°/s
45°/s
30°/s
45°/s
30°/s
45°1s
A high degree of concurrent engineering was employed in the execution of the speedbrake mechanism
design. It was necessary to release parts for production with minimal analysis in order to maintainschedule. When problems did occur, it was possible to retrofit solutions into the existing design.
67
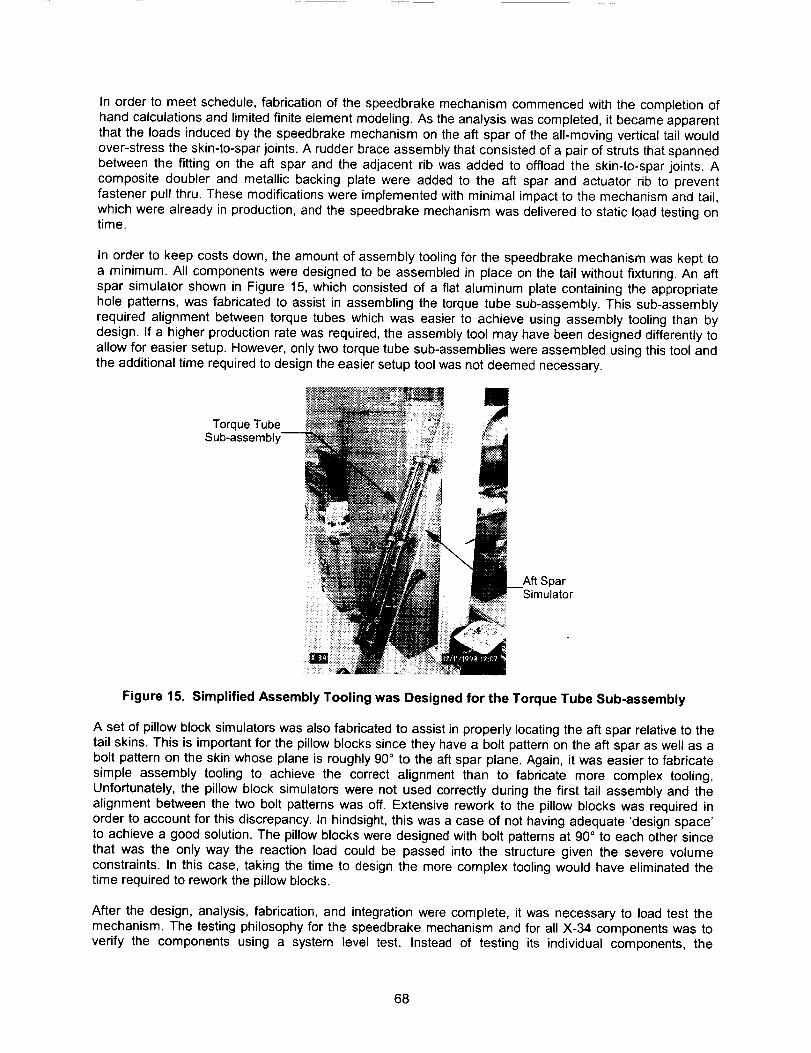
Inorder to meet schedule, fabrication of the speedbrake mechanism commenced with the completion of
hand calculations and limited finite element modeling. As the analysis was completed, it became apparentthat the loads induced by the speedbrake mechanism on the aft spar of the all-moving vertical tail would
over-stress the skin-to-spar joints. A rudder brace assembly that consisted of a pair of struts that spannedbetween the fitting on the aft spar and the adjacent rib was added to offload the skin-to-spar joints. A
composite doubler and metallic backing plate were added to the aft spar and actuator rib to preventfastener pull thru. These modifications were implemented with minimal impact to the mechanism and tail,
which were already in production, and the speedbrake mechanism was delivered to static load testing ontime.
In order to keep costs down, the amount of assembly tooling for the speedbrake mechanism was kept toa minimum. All components were designed to be assembled in place on the tail without fixturing. An aft
spar simulator shown in Figure 15, which consisted of a flat aluminum plate containing the appropriatehole patterns, was fabricated to assist in assembling the torque tube sub-assembly. This sub-assembly
required alignment between torque tubes which was easier to achieve using assembly tooling than bydesign. If a higher production rate was required, the assembly tool may have been designed differently to
allow for easier setup. However, only two torque tube sub-assemblies were assembled using this tool andthe additional time required to design the easier setup tool was not deemed necessary.
Torque TubeSub-assembly--
Aft SparSimulator
Figure 15. Simplified Assembly Tooling was Designed for the Torque Tube Sub-assembly
A set of pillow block simulators was also fabricated to assist in properly locating the aft spar relative to the
tail skins. This is important for the pillow blocks since they have a bolt pattern on the aft spar as well as abolt pattern on the skin whose plane is roughly 90 ° to the aft spar plane. Again, it was easier to fabricate
simple assembly tooling to achieve the correct alignment than to fabricate more complex tooling.Unfortunately, the pillow block simulators were not used correctly during the first tail assembly and the
alignment between the two bolt patterns was off. Extensive rework to the pillow blocks was required inorder to account for this discrepancy. In hindsight, this was a case of not having adequate 'design space'to achieve a good solution. The pillow blocks were designed with bolt patterns at 90 ° to each other since
that was the only way the reaction load could be passed into the structure given the severe volumeconstraints. In this case, taking the time to design the more complex tooling would have eliminated thetime required to rework the pillow blocks.
After the design, analysis, fabrication, and integration were complete, it was necessary to load test the
mechanism. The testing philosophy for the speedbrake mechanism and for all X-34 components was toverify the components using a system level test. Instead of testing its individual components, the
68

speedbrake mechanism was tested at the system level as part of the all-moving vertical tail static loadtest. The full flight integration of the speedbrake mechanism with the exception of the speedbrake panels,speedbrake clevises, and hydraulic actuator were installed into a flight tail (speedbrake simulator andactuator simulator were used in place of flight articles). The composite speedbrake panels and aluminumspeedbrake clevises were protoflight tested individually in a separate static load test.
Since the interfaces between the metallic mechanism and the graphite epoxy tail were challenging toanalyze, it was beneficial to test at a system level not only verify the integrity of the individualcomponents, but also to verify the interfaces between the components. Most unforeseen problems occurat joint and interfaces. System level testing is a highly efficient way of discovering these problems [7].
As shown in Figure 16, the mechanism was verified by first protoflight testing to 125% of design limit. Inorder to verify that the protoflight test did not introduce any damage, the mechanism was then acceptancetested to 100% of design limit. The acceptance test was then repeated. The peak strains and deflectionsbetween each acceptance test were required to be within 5% and the strains and deflections wererequired to return to with 5% of the peak value in order to verify that no damage was propagating thru themechanism or structure. Designing and testing to 125% of the design limit ensures a robust structure andaccounts for uncertainties in trajectories, loads, analysis methods, and manufacturing processes [7].
Two speedbrake mechanisms were fabricated for the X-34 program and each mechanism was subjectedto protoflight testing. In contrast to a high rate production program, it is more efficient to test and fly eacharticle to account for the inherent manufacturing and processing differences that arise in a low volumeprototype program such as X-34 [7].
Protoflight Loading
Eor8
P
Design 125%
Limit DesignLimit
First Acceptance
_or5
Second Acceptance
¢or_
FlightTest
10
DesignLimit
DesignLimit
Figure 16. Protoflight - Acceptance Test Approach [7]
69

Conclusions
The X-34 split flap speedbrake mechanism is actuated with a single linear hydraulic actuator, is mountedto the all-moving vertical tail, and is designed for transonic and hypersonic flight. The speedbrake
mechanism is used for energy management during descent and for pitch trim both during ascent anddescent. The design of the mechanism was subjected volume constraints due to carrier aircraft
compatibility and aerodynamic requirements as well as a stiffness constraint due to a no-flutterrequirement. These constraints drove the layout and design of the mechanism. In addition, the execution
of design was subject to cost and schedule constraints set by program goals. In order to accomplish thetask, a small team employed advanced design and analysis tools in order to work as efficiently as
possible but also recognized that certain analyses could be performed using simple hand calculations or
not performed at all but verified in a system level test. Modular and robust designs were created as wellas simplified assembly tooling to control costs. The team subcontracted with experts in certain subject
areas and utilized a high degree of concurrent engineering. The X-34 speedbrake mechanismdemonstrates that it is possible to design a compact control surface deployment mechanism with
adequate stiffness to prevent aerodynamic flutter for low cost in a short timespan. This ability contributedsignificantly to the success of the X-34 program.
References
1. Pamadi, Bandu N., Gregory J. Brauckmann, Michael J. Ruth, and Henri D. Fuhrmann, "AerodynamicCharacteristics, Database Development and Flight Simulation of the X-34 Vehicle", AIAA 2000-0900.
2. Brauckmann, Gregory J., "X-34 Vehicle Aerodynamic Characteristics", AIAA-98-2531.
3. Jenkins, Dennis R., Space Shuttle: The History of Developing the National Space TransportationSystem. Motorbooks International. Osceola, WI, 1992.
4. X10001, Load and Design Criteria X-34. Orbital Document, Rev C, 6/30/99.
5. Blades, Eric L., Mike Ruth, and Henri D. Fuhrmann, "Aeroelastic Analysis of the X-34 LaunchVehicle", AIAA-99-1352.
6. Blelloch, Paul, Eric L. Blades, and Thomas L. Dragone, "Modeling and Correlation of the X-34 LaunchVehicle", AIAA-2000-1777.
7. Dragone, Thomas L., "Structural Innovations in Design, Manufacturing, and Testing on the X-34Reusable Launch Vehicle", AIAA-2000-5309.
Acknowledgements
The author would like to thank Tom Dragone, Henri Fuhrmann, Mike Ruth, and Bryan Sullivan of Orbital
Sciences Corporation for their assistance with this paper.
70
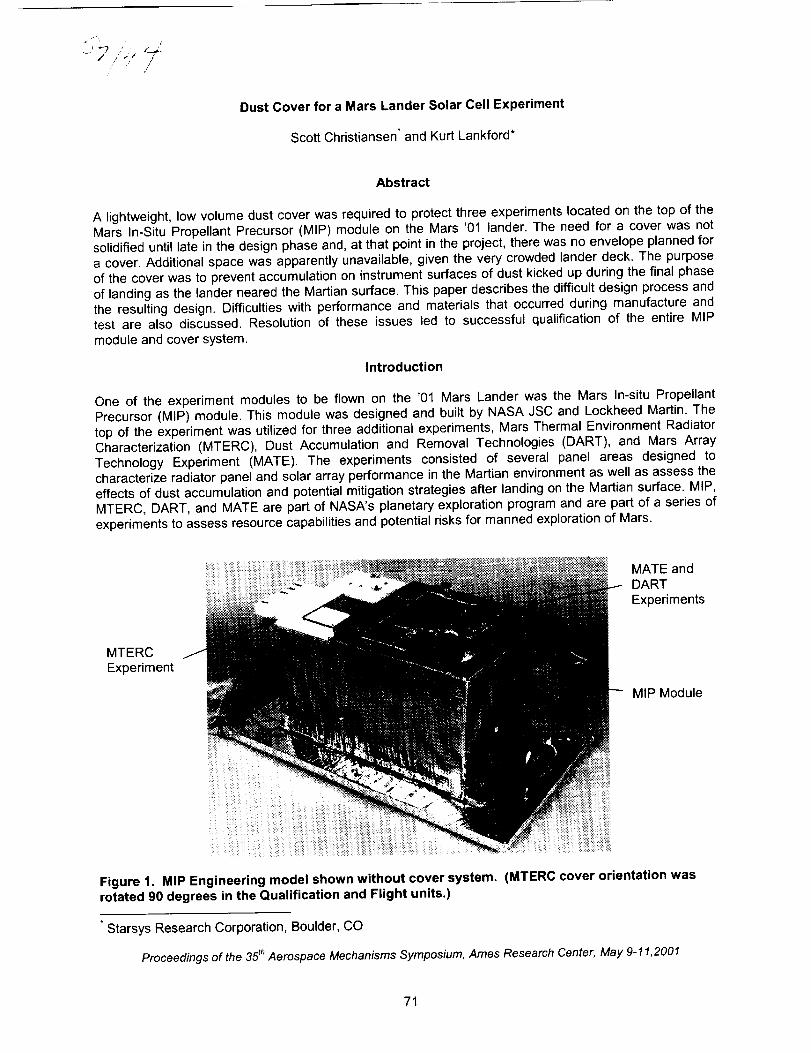
j /...i // ," /,
Dust Cover for a Mars Lander Solar Cell Experiment
Scott Christiansen" and Kurt Lankford*
Abstract
A lightweight, low volume dust cover was required to protect three experiments located on the top of theMars In-Situ Propellant Precursor (MIP) module on the Mars '01 lander. The need for a cover was not
solidified until late in the design phase and, at that point in the project, there was no envelope planned fora cover. Additional space was apparently unavailable, given the very crowded lander deck. The purpose
of the cover was to prevent accumulation on instrument surfaces of dust kicked up during the final phase
of landing as the lander neared the Martian surface. This paper describes the difficult design process andthe resulting design. Difficulties with performance and materials that occurred during manufacture and
test are also discussed. Resolution of these issues led to successful qualification of the entire MIPmodule and cover system.
Introduction
One of the experiment modules to be flown on the '01 Mars Lander was the Mars In-situ Propellant
Precursor (MIP) module. This module was designed and built by NASA JSC and Lockheed Martin. The
top of the experiment was utilized for three additional experiments, Mars Thermal Environment RadiatorCharacterization (MTERC), Dust Accumulation and Removal Technologies (DART), and Mars Array
Technology Experiment (MATE). The experiments consisted of several panel areas designed tocharacterize radiator panel and solar array performance in the Martian environment as well as assess the
effects of dust accumulation and potential mitigation strategies after landing on the Martian surface. MIP,MTERC, DART, and MATE are part of NASA's planetary exploration program and are part of a series of
experiments to assess resource capabilities and potential risks for manned exploration of Mars.
MTERC
Experiment
MATE and
DART
Experiments
MIP Module
Figure 1. MIP Engineering model shown without cover system. (MTERC cover orientation wasrotated 90 degrees in the Qualification and Flight units.)
Starsys Research Corporation, Boulder, CO
Proceedings of the 35thAerospace Mechanisms Symposium, Ames Research Center, May 9-11,2001
71
Background
It has been observed in past Mars missions that dust collecting on solar cells used on the Martian surface
rapidly blocks solar energy and leads to eventual spacecraft failure. The experiments on the uppersurface of MIP were designed to better characterize the dust collection phenomenon, and consisted of a
number of small solar cells and radiator panels mounted on the upper, stepped surface of the MIPexperiment enclosure. A number of solar cells and associated equipment were present to assess general
cell performance and dust collection rates as well as to attempt dust mitigation techniques.
• Several different types of solar cells were included to assess their performance in the Martianenvironment and their sensitivities to dust accumulation. (MATE)
• Several cells were mounted on surfaces of different slopes to determine if the dust might slide off.Several cells were set-up near suspended wires such that small electrostatic fields could be used to
attempt to repel dust from a specific area. (DART)
• Two small radiator panels were open to the Martian sky to assess thermal radiation characteristics
and dust effects. (MTERC)
In all cases, the intent was to establish baseline operating performance for each experiment and thenmonitor performance and potential degradation as environmental dust collected on each cell.
In designing the experiments, it was very important to be able to have reasonable knowledge of initial
dust loading and thereby to reasonably establish the initial operating conditions of the cells (initial dustloading was expected to be zero or near zero). Throughout the evolution of the design of the experiments,the possibility of the need for a cover had been raised and discussed several times. It was initially unclear
whether or not a cover was needed and the added mass and cost pushed the cover into the "we reallydon't need that" zone. In addition, the experiments were housed in a very tightly packed landing vehicle
and, based on all the envelope constraints, there was not any room for a cover.
Late in the design process for MIP and the upper panel experiments the recurring cover conversation
was, once again, renewed. In an attempt to resolve the issue more detailed analyses of the landingconditions were undertaken. While some still thought that the risk of dust accumulation during landing
was minimal, a credible analysis indicated that the landing thrusters would stir up a very large dust cloud.Under certain conditions, this dust could settle and deposit up to a millimeter of dust on the uppersurfaces of the spacecraft and instruments. If this were the case the uncovered experiments would be
finished before they began. Based on this analysis several lander mission experiments (including the MIP
module as well as the rover) that might be sensitive to this dust adopted the strategy that if there was anyway to retrofit the experiment and still fit within the spacecraft, a dust cover was to be included. In thecase of the MIP module, NASA-JSC, Lockheed Martin, and Starsys began working closely together to
determine if a cover for the experiment was even feasible.
Design problems
Instrument requirementsThe three experiments on the top surface of the MIP module needed to be protected from swirling dust
during landing and settling dust after touchdown and engine shutdown. With all of the various solar cellsand panels, the surface was very uneven and non-symmetrically shaped. In some ways the upper surface
resembled a city block with buildings of differing sizes and heights. The cover would need to protect all ofthese instrument features without touching or damaging them. To make the problem more difficult, the
surface consisted of separate sections at different levels. To maximize exposure to the Martian sky andview of the sun, the field-of-view for the experiments required that the cover not block the view above 15
degrees from the planes of the surface sections.
Because protection from swirling dust was necessary, the cover system also needed to protect the sideaspects of the upper surface and experimental sections. The side sections needed to be tall enough tosupport the cover above the experiment components. In several areas side rails used to support the
72
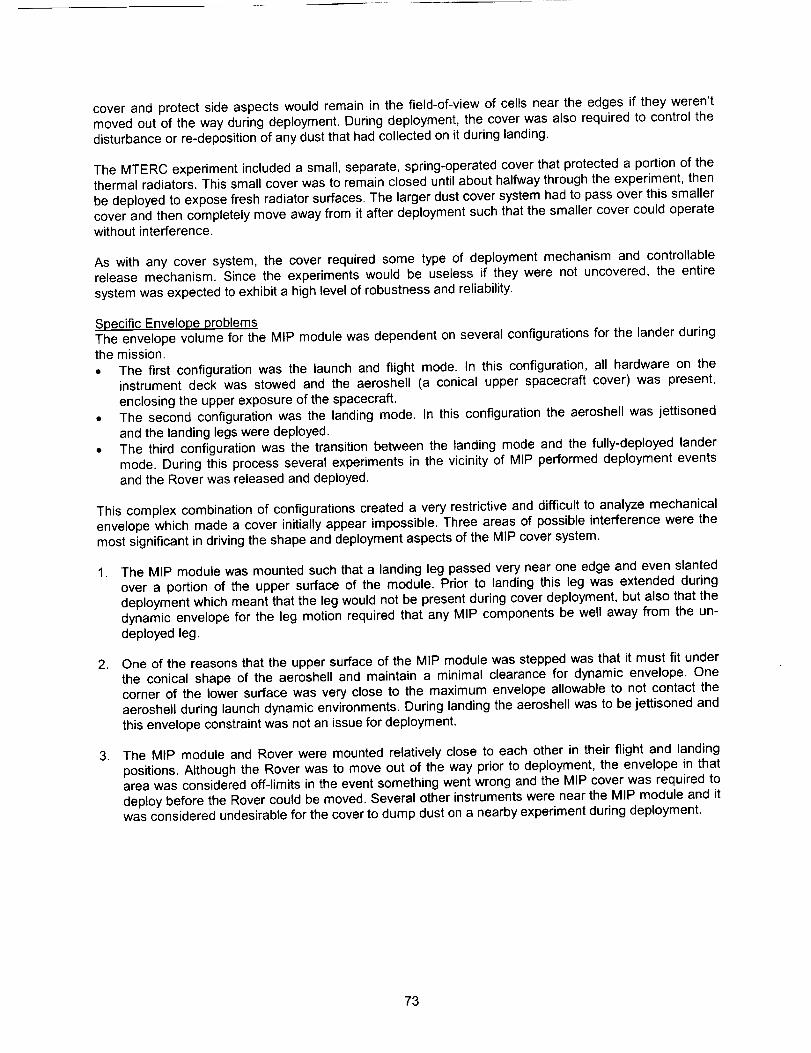
coverandprotectsideaspectswouldremainin thefield-of-viewof cellsneartheedgesif theyweren'tmovedout of the way during deployment. During deployment, the cover was also required to control thedisturbance or re-deposition of any dust that had collected on it during landing.
The MTERC experiment included a small, separate, spring-operated cover that protected a portion of the
thermal radiators. This small cover was to remain closed until about halfway through the experiment, then
be deployed to expose fresh radiator surfaces. The larger dust cover system had to pass over this smallercover and then completely move away from it after deployment such that the smaller cover could operatewithout interference.
As with any cover system, the cover required some type of deployment mechanism and controllablerelease mechanism. Since the experiments would be useless if they were not uncovered, the entire
system was expected to exhibit a high level of robustness and reliability.
Specific Envelope problems
The envelope volume for the MIP module was dependent on several configurations for the lander duringthe mission.
• The first configuration was the launch and flight mode. In this configuration, all hardware on the
instrument deck was stowed and the aeroshell (a conical upper spacecraft cover) was present,
enclosing the upper exposure of the spacecraft.
• The second configuration was the landing mode. In this configuration the aeroshell was jettisoned
and the landing legs were deployed.• The third configuration was the transition between the landing mode and the fully-deployed lander
mode. During this process several experiments in the vicinity of MIP performed deployment events
and the Rover was released and deployed.
This complex combination of configurations created a very restrictive and difficult to analyze mechanical
envelope which made a cover initially appear impossible. Three areas of possible interference were themost significant in driving the shape and deployment aspects of the MIP cover system.
. The MIP module was mounted such that a landing leg passed very near one edge and even slantedover a portion of the upper surface of the module. Prior to landing this leg was extended during
deployment which meant that the leg would not be present during cover deployment, but also that the
dynamic envelope for the leg motion required that any MIP components be well away from the un-deployed leg.
. One of the reasons that the upper surface of the MIP module was stepped was that it must fit underthe conical shape of the aeroshell and maintain a minimal clearance for dynamic envelope. One
corner of the lower surface was very close to the maximum envelope allowable to not contact theaeroshell during launch dynamic environments. During landing the aeroshell was to be jettisoned and
this envelope constraint was not an issue for deployment.
. The MIP module and Rover were mounted relatively close to each other in their flight and landingpositions. Although the Rover was to move out of the way prior to deployment, the envelope in that
area was considered off-limits in the event something went wrong and the MIP cover was required todeploy before the Rover could be moved. Several other instruments were near the MIP module and it
was considered undesirable for the cover to dump dust on a nearby experiment during deployment.
73
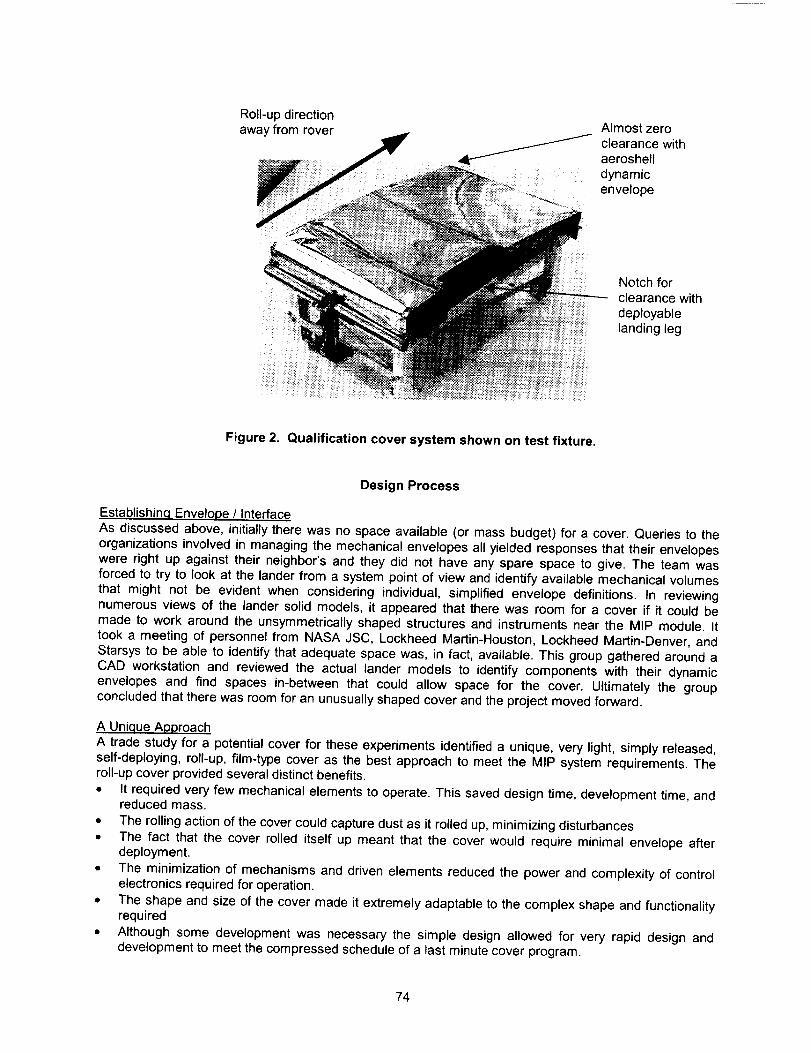
Roll-updirectionawayfromrover
Almost zero
_ clearance withaeroshell.... : .... dynamic
envelope
Notch forclearance with
deployable
landing leg
Figure 2. Qualification cover system shown on test fixture.
Design Process
Establishin.q Envelope / InterfaceAs discussed above, initially there was no space available (or mass budget) for a cover. Queries to the
organizations involved in managing the mechanical envelopes all yielded responses that their envelopeswere right up against their neighbor's and they did not have any spare space to give. The team was
forced to try to look at the lander from a system point of view and identify available mechanical volumesthat might not be evident when considering individual, simplified envelope definitions. In reviewingnumerous views of the lander solid models, it appeared that there was room for a cover if it could be
made to work around the unsymmetrically shaped structures and instruments near the MIP module. It
took a meeting of personnel from NASA JSC, Lockheed Martin-Houston, Lockheed Martin-Denver, andStarsys to be able to identify that adequate space was, in fact, available. This group gathered around a
CAD workstation and reviewed the actual lander models to identify components with their dynamicenvelopes and find spaces in-between that could allow space for the cover. Ultimately the group
concluded that there was room for an unusually shaped cover and the project moved forward.
A Unique ApproachA trade study for a potential cover for these experiments identified a unique, very light, simply released,
self-deploying, roll-up, film-type cover as the best approach to meet the MIP system requirements. Theroll-up cover provided several distinct benefits.
• It required very few mechanical elements to operate. This saved design time, development time, andreduced mass.
• The rolling action of the cover could capture dust as it rolled up, minimizing disturbances
• The fact that the cover rolled itself up meant that the cover would require minimal envelope afterdeployment.
• The minimization of mechanisms and driven elements reduced the power and complexity of controlelectronics required for operation.
• The shape and size of the cover made it extremely adaptable to the complex shape and functionality
required
• Although some development was necessary the simple design allowed for very rapid design and
development to meet the compressed schedule of a last minute cover program.
74

Basic components of cover
The final design included the following components:
• Self-rolling Kapton film cover - The main cover was a single sheet of Kapton film. On each edge astainless steel constant torque spring was bonded to provide the rolling action. Across the movingend of the cover was an aluminum tube that served to interface with the release latch and hold the
end of the cover during launch environments, o provide some structural stiffness and maintain the
stowed cover shape the cover was designed to be shaped in a curve. Additionally two stiffening strips
were bonded across the cover in two places.
• Self-retracting side rails - On the two sides of the cover several deployable side rails were mountedto the MIP module. The side rails were needed to support the Kapton cover above the sensitive solar
cells. They were also required to move out of the field-of-view after deployment. Each side rail wasmounted on a pair of pivots with torsion springs that would cause the side rails to flip out away from
the upper surface experiments. The side rails had tabs on their edges to engage with slots in thecover to create a stable structure when the cover was stowed.
• Release Latch - The Release Latch was a simple paraffin actuator powered pin-puller mechanism.Two paraffin actuators were utilized to redundantly retract the release pin. When stowed, the release
pin trapped the Tension Bar between the pin and a cradle on the latch body. Two additional cradleswere present at the ends of the Tension Bar to support the Tension Bar during dynamicenvironments.
Side Rail
EngagementTabs
Roll-upcover
ReleaseLatch
Side Rails
Tension Bar
Figure 3. Basic cover system components shown in stowed position on test fixture.
(Unit shown is the qualification unit in the final configuration.)
Li,qhtwei,qht materialsThe original design did not include mass budget for a cover, and the mass of a cover system was not
included in the module structural design or analysis. To make the cover as light as possible, mechanicalcomponents were minimized and lightweight materials were used wherever possible. The cover was
fabricated from 0.125-mm Kapton coated with aluminum on one side. The side rails were fabricated fromUltem (polyetherimide) and used small aluminum pivots that mounted to existing MIP module structural
elements. The two constant-torque springs were made from 6-mm wide by 0.1-mm thick 302 stainlesssteel strips, The latch was designed to be as light as possible while including redundant paraffin
actuators. Total mass of the delivered flight cover system was 472 grams.
75
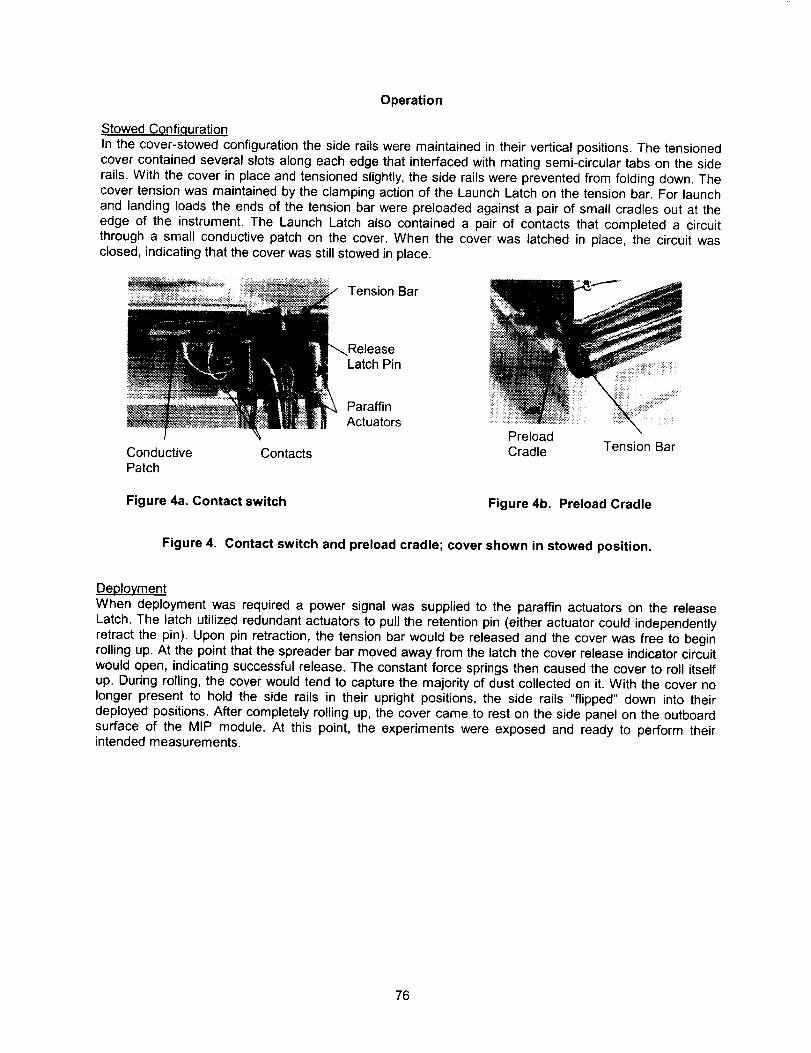
Operation
Stowed Confiquration
In the cover-stowed configuration the side rails were maintained in their vertical positions. The tensioned
cover contained several slots along each edge that interfaced with mating semi-circular tabs on the side
rails. With the cover in place and tensioned slightly, the side rails were prevented from folding down. Thecover tension was maintained by the clamping action of the Launch Latch on the tension bar. For launch
and landing loads the ends of the tension bar were preloaded against a pair of small cradles out at the
edge of the instrument. The Launch Latch also contained a pair of contacts that completed a circuitthrough a small conductive patch on the cover. When the cover was latched in place, the circuit wasclosed, indicating that the cover was still stowed in place.
Tension Bar
Conductive ContactsPatch
Figure 4a. Contact switch
ReleaseLatch Pin
ParaffinActuators ;.................
PreloadCradle Tension Bar
Figure 4b. Preload Cradle
Figure 4. Contact switch and preload cradle; cover shown in stowed position.
Deployment
When deployment was required a power signal was supplied to the paraffin actuators on the release
Latch. The latch utilized redundant actuators to pull the retention pin (either actuator could independentlyretract the pin). Upon pin retraction, the tension bar would be released and the cover was free to beginrolling up. At the point that the spreader bar moved away from the latch the cover release indicator circuit
would open, indicating successful release. The constant force springs then caused the cover to roll itselfup. During rolling, the cover would tend to capture the majority of dust collected on it. With the cover no
longer present to hold the side rails in their upright positions, the side rails "flipped" down into theirdeployed positions. After completely rolling up, the cover came to rest on the side panel on the outboard
surface of the MIP module. At this point, the experiments were exposed and ready to perform theirintended measurements.
76
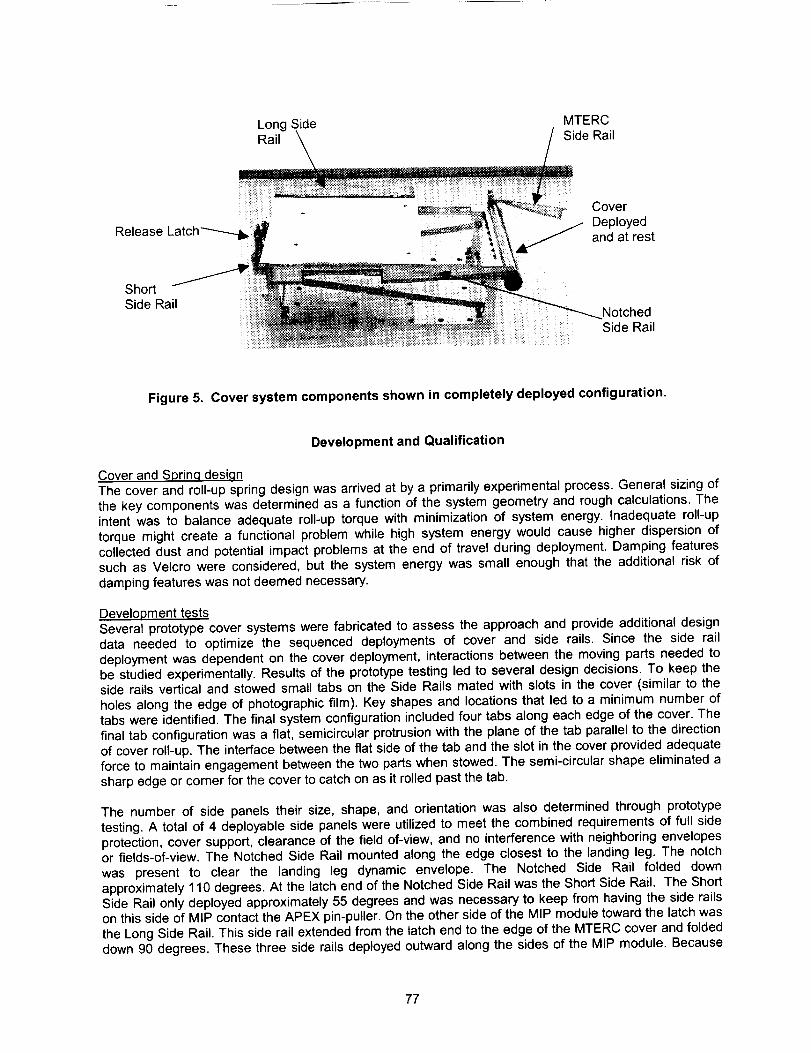
LongSide MTERCRail SideRail
ReleaseLa
ShortSideRail
Cover
._ Deployedand at rest
Notched
Side Rail
Figure 5. Cover system components shown in completely deployed configuration.
Development and Qualification
Cover and Sprin.q desi.qn
The cover and roll-up spring design was arrived at by a primarily experimental process. General sizing ofthe key components was determined as a function of the system geometry and rough calculations. The
intent was to balance adequate roll-up torque with minimization of system energy. Inadequate roll-uptorque might create a functional problem while high system energy would cause higher dispersion of
collected dust and potential impact problems at the end of travel during deployment. Damping featuressuch as Velcro were considered, but the system energy was small enough that the additional risk of
damping features was not deemed necessary.
Development tests
Several prototype cover systems were fabricated to assess the approach and provide additional designdata needed to optimize the sequenced deployments of cover and side rails. Since the side raildeployment was dependent on the cover deployment, interactions between the moving parts needed to
be studied experimentally. Results of the prototype testing led to several design decisions. To keep theside rails vertical and stowed small tabs on the Side Rails mated with slots in the cover (similar to the
holes along the edge of photographic film). Key shapes and locations that led to a minimum number oftabs were identified. The final system configuration included four tabs along each edge of the cover. The
final tab configuration was a flat, semicircular protrusion with the plane of the tab parallel to the directionof cover roll-up. The interface between the flat side of the tab and the slot in the cover provided adequate
force to maintain engagement between the two parts when stowed. The semi-circular shape eliminated asharp edge or corner for the cover to catch on as it rolled past the tab.
The number of side panels their size, shape, and orientation was also determined through prototype
testing. A total of 4 deployable side panels were utilized to meet the combined requirements of full sideprotection, cover support, clearance of the field of-view, and no interference with neighboring envelopesor fields-of-view. The Notched Side Rail mounted along the edge closest to the landing leg. The notch
was present to clear the landing leg dynamic envelope. The Notched Side Rail folded down
approximately 110 degrees. At the latch end of the Notched Side Rail was the Short Side Rail. The ShortSide Rail only deployed approximately 55 degrees and was necessary to keep from having the side railson this side of MIP contact the APEX pin-puller. On the other side of the MIP module toward the latch was
the Long Side Rail. This side rail extended from the latch end to the edge of the MTERC cover and foldeddown 90 degrees. These three side rails deployed outward along the sides of the MIP module. Because
77

theMTERCcoveralsodeployedin thisdirection,thefourthsiderail,theMTERCSideRail,couldnotbemountedalongthisedge.TheMTERCSideRailwasmountedona pivotontheendof themoduleanddeployed180degreesoutwardawayfromthemoduleon the endwherethe coverwasattached(seeFigure5).
Additionaldevelopmenttestinginvolvedassessingthe dispersionof dust duringdeployment.Dustdispersiontestswereperformedunderearthgravityand ambientair pressure.Analysisby JPL ofpreviousmissiondataindicatedthatthetextureofthedustis probablysimilartothatof talcumpowderorflour.Forourdusttests,flourwassprinkledoverthecoverto simulatea l-ram layercollectionof dust.Thecoverwasthenreleasedanddeployed.Duringtherollingactionofthecover,mostof thedustwascapturedbetweentheKaptonlayersoftheroll,A relativelysmallamount(severalpercent)escapedoutoftheendsof therollandwasdepositedontheSideRailsurfacesoneithersideof thetestmodel.Swirlingair effectscausedsomedusttoswirlaroundbehindedgesofthemovingcoverresultinginanextremelysmallamount(muchlessthan1%)ofdustbeingdepositedontheedgesoftheexperimentaltestsurfaces(seeFigure6). The amountand locationof possibledust that mightbe re-depositedon the MIPinstrumentswasconsideredacceptablebytheexperimentprincipalinvestigators.Astherollreacheditsstationaryattachmentpointit tendedtoovertravelanddepositdustfroma portionofthecoveratthebaseof thetestmodel.Thishadbeenexpectedatsomelevelandthedirectionofcoverdeploymenthadbeenchosento assurethatdustre-depositedinthiswaywouldfallharmlesslyon the outer edge of the landerinstrument deck.
Figure 6. After dust-loaded deployment test, dust is present on deployed Notched Side Rail and acorner of the experiment area
Dust on deck
area below final
cover-deployedposition
Figure 7. After dust-loaded deployment test dust is present on deck area below final deployedposition of cover roll.
78

Qualification
Based on the prototype unit test results a qualification cover system was manufactured. A MIP modulestructural simulator was built to allow the proper configuration of the cover system. The system was made
up of six separate subassemblies that relied on the MIP structure to support and properly locate them.
This structural simulator was used for all tests including vibration, acoustics, and thermal/vacuum.
The qualification unit was tested according to a relatively typical spacecraft qualification plan. The testsincluded vibration, acoustic, thermal cycling (-98C to +55C), and thermal vacuum functional tests. The
unit passed its functional tests, but several characteristics observed during the tests led to changes in theflight unit. During vibration testing the spring guide bushings were damaged due to interference with the
pivot attachment features on the short side rail (see Figure 8). The bushing damage did not lead to afunctional failure, but the design was changed to eliminate the interference and bushing damage.
During testing of this unit a small tear was noted at the edge on one of the slots where the cover wrappedaround the corner of one of the Side Rails at the latch end of the cover (see Figure 9). This area is more
highly stressed than the other engagement slots. The problem was resolved by bonding patches ofKapton film as doublers around the two slots at the Side Rail corners. The tearing did not reoccur during
resumption of qualification testing.
After qualification testing at a component level at Starsys the qualification cover system was delivered to
NASA JSC. There the system was mounted to the MIP module qualification unit and subjected to system-level testing with the module. The cover system functioned successfully throughout the qualification tests.After extended thermal cycling with operation at low temperature in reduced atmosphere (simulation of
Mars atmospheric pressure of 6 Torr), cracking of several Ultem parts at bolted attachment points was
noted (see Figure 10). While the system had functioned properly, the cracking of the parts wasconsidered unacceptable. Investigation of the failure was inconclusive as to the cause. Differential
expansion leading to overload of the parts was considered, although the system had been exposed togreater temperatue extremes in previous tests. Low impact resistance of the Ultem was also considered,
but the parts that exhibited cracking were not exposed to the highest impacts during deployment. Withoutcausing excessive delays or increased costs due to an extensive investigation, the solution for this
problem was to replace the Ultem parts at risk with aluminum parts of the same design. This maintained
the functionality of the parts while increasing their strength and resistance to cracking. Subsequent testswere successful and the design was adopted for flight.
The flight unit was manufactured including important design changes based on results and observationsobtained during qualification testing. The cover system has been delivered and has been integrated ontothe flight model of the MIP module. The entire module is currently being stored in anticipation of a future
flight mission.
79
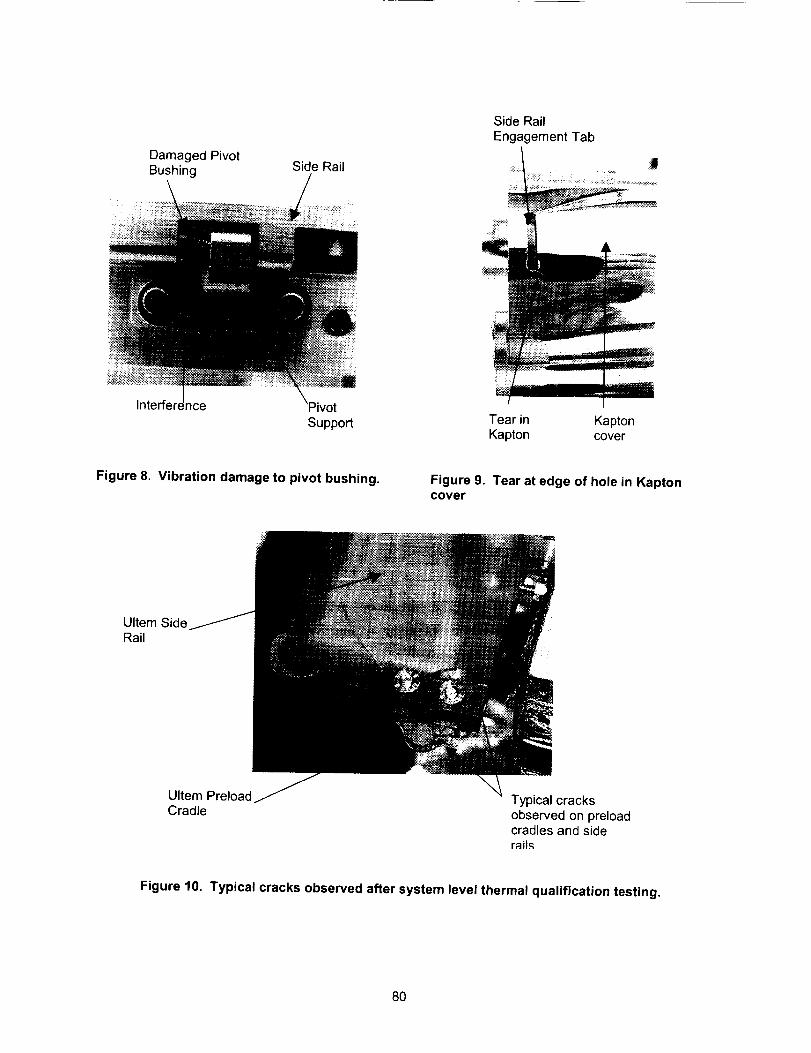
DamagedPivotBushing SideRail
SideRailEngagementTab
Support Tearin KaptonKapton cover
Figure 8. Vibration damage to pivot bushing. Figure 9. Tear at edge of hole in Kaptoncover
Ultem Side
Rail
Ultem Preload Typical cracks
Cradle observed on preloadcradles and siderail._
Figure 10. Typical cracks observed after system level thermal qualification testing.
8O

Lessons
Spacecraft component mechanical envelopes are often simplified and do not necessarily reflect the
shape or exact size of the component they define. In a spacecraft assembly there is often space to be
found if an accurate system level model can be utilized. A major difficulty in working difficult envelopeproblems (especially from a subcontractor point-of-view) is to get all of the organizations responsible for
the individual envelopes together to agree that the space actually exists.
While Kapton and Ultem are relatively well understood materials, additional care, analysis, and testing is
extremely valuable when using them in applications that may induce unusual or uncharacteristic loading.Both Ultem and Kapton can be used in lightweight, structural/mechanical, spacecraft applications if
proper precautions are taken assess their load conditions. In that these two materials are plastics andpredicting thermal and impact affects is not exact, testing of the parts is extremely critical. Failure modes
for these materials may be different than those typically considered in traditional analyses.
MTERCSide
MTERC
Experiment
ReleaseLatch
Long MIP ModuleSide Rail
Figure 12. Qualification unit MIP module with cover system.
Shown in stowed configuration during qualification vibration testing.
Summary / Conclusions
Given a very difficult design problem the MIP cover system was designed and manufactured to meet therestrictive envelope and mass requirements. The MIP module and cover system have passed
qualification testing and flight models have been fabricated and tested. The module was scheduled to flyon the Mars Surveyor 2001 mission that has been cancelled due to changes in NASA's Mars exploration
program. The MIP module may be included in a future Mars mission, but it is not specifically scheduled tobe aboard a specific mission at this time.
81

82
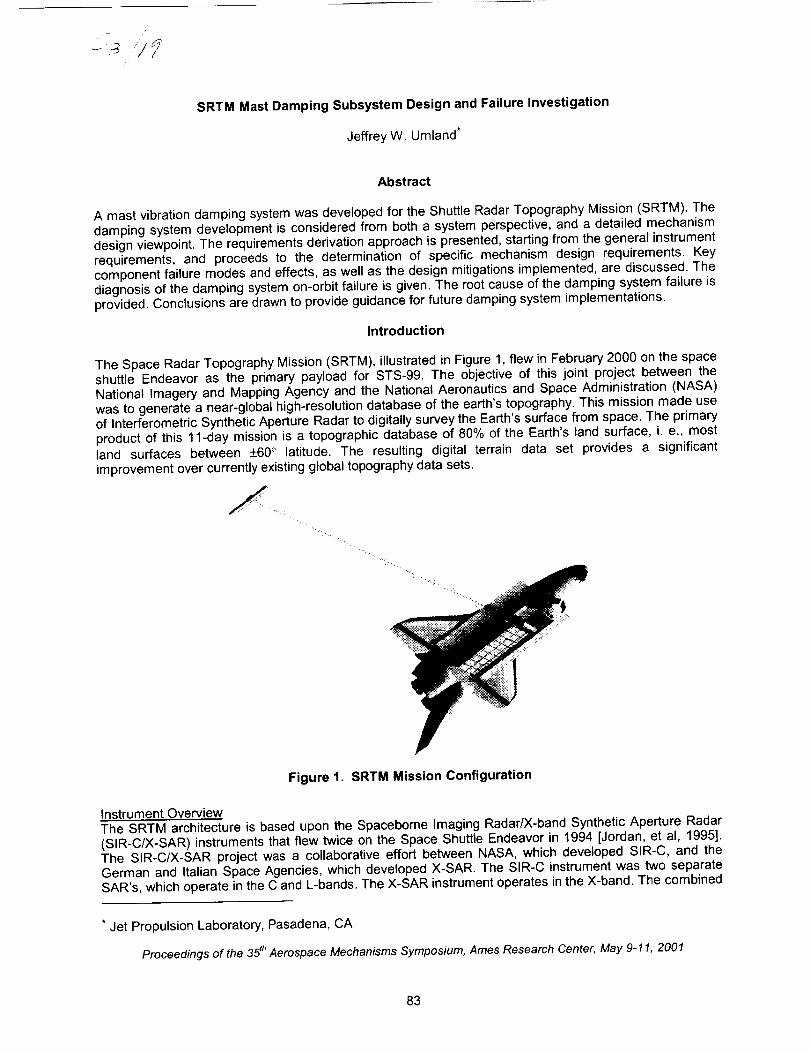
SRTM Mast Damping Subsystem Design and Failure Investigation
Jeffrey W. Umland*
Abstract
A mast vibration damping system was developed for the Shuttle Radar Topography Mission (SRTM). Thedamping system development is considered from both a system perspective, and a detailed mechanismdesign viewpoint. The requirements derivation approach is presented, starting from the general instrumentrequirements, and proceeds to the determination of specific mechanism design requirements. Keycomponent failure modes and effects, as well as the design mitigations implemented, are discussed. Thediagnosis of the damping system on-orbit failure is given. The root cause of the damping system failure isprovided. Conclusions are drawn to provide guidance for future damping system implementations.
Introduction
The Space Radar Topography Mission (SRTM), illustrated in Figure 1, flew in February 2000 on the spaceshuttle Endeavor as the primary payload for STS-99. The objective of this joint project between theNational Imagery and Mapping Agency and the National Aeronautics and Space Administration (NASA)was to generate a near-global high-resolution database of the earth's topography. This mission made useof Interferometric Synthetic Aperture Radar to digitally survey the Earth's surface from space. The primaryproduct of this 11-day mission is a topographic database of 80% of the Earth's land surface, i. e., most
land surfaces between +60 ° latitude. The resulting digital terrain data set provides a significant
improvement over currently existing global topography data sets.
_i _ _,
Figure 1. SRTM Mission Configuration
Instrument Overview
The SRTM architecture is based upon the Spaceborne Imaging Radar/X-band Synthetic Aperture Radar(SIR-C/X-SAR) instruments that flew twice on the Space Shuttle Endeavor in 1994 [Jordan, et al, 1995].The SIR-C/X-SAR project was a collaborative effort between NASA, which developed SIR-C, and theGerman and Italian Space Agencies, which developed X-SAR. The SIR-C instrument was two separateSAR's, which operate in the C and L-bands. The X-SAR instrument operates in the X-band. The combined
* Jet Propulsion Laboratory, Pasadena, CA
Proceedings of the 35 th Aerospace Mechanisms Symposium, Ames Research Center, May 9-11, 2001
83
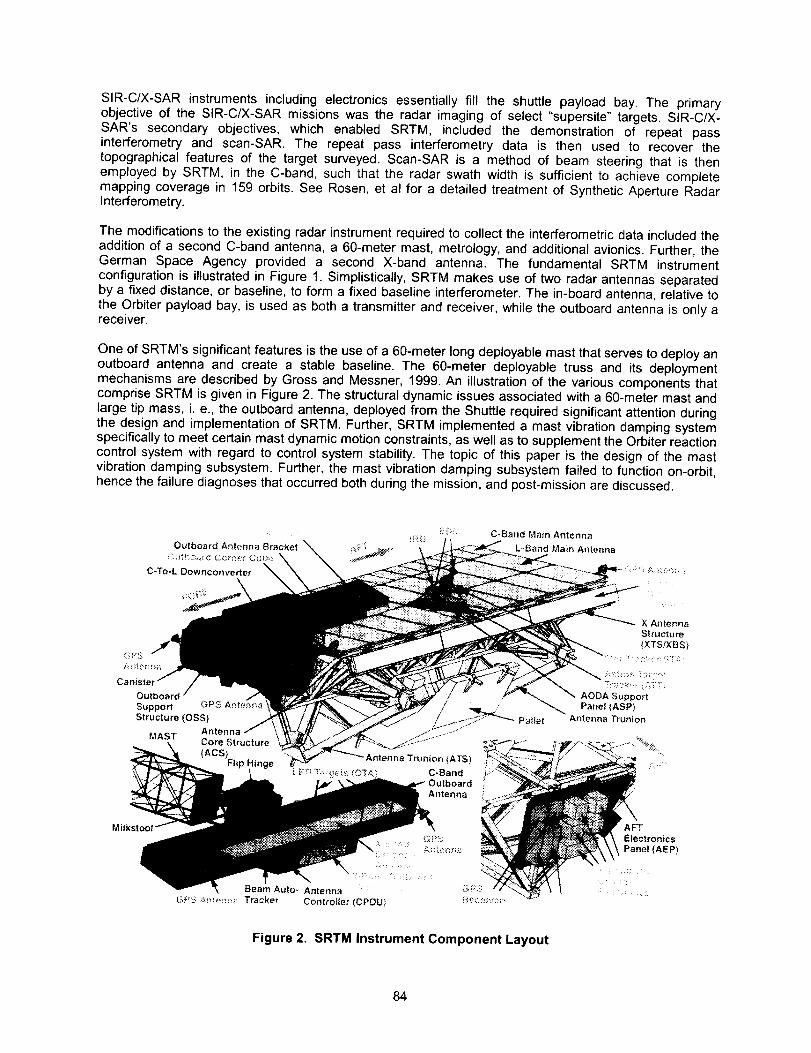
SIR-C/X-SARinstrumentsincludingelectronicsessentiallyfill the shuttlepayloadbay.The primaryobjectiveof the SIR-C/X-SARmissionswasthe radarimagingof select"supersite"targets.SIR-C/X-SAR's secondaryobjectives,which enabledSRTM, includedthe demonstrationof repeat passinterferometryand scan-SAR.The repeatpass interferometrydata is then used to recoverthetopographicalfeaturesof the targetsurveyed.Scan-SARis a methodof beamsteeringthat is thenemployedby SRI-M,in the C-band,suchthattheradarswathwidthis sufficientto achievecompletemappingcoveragein 159orbits.SeeRosen,et al for a detailedtreatmentof SyntheticApertureRadarInterferometry.
Themodificationstotheexistingradarinstrumentrequiredto collectthe interferometricdataincludedtheadditionof a secondC-bandantenna,a 60-metermast,metrology,andadditionalavionics.Further,theGermanSpaceAgencyprovideda secondX-bandantenna.The fundamentalSRTMinstrumentconfigurationis illustratedin Figure1. Simplistically,SRTMmakesuseof tworadarantennasseparatedbyafixeddistance,or baseline,to formafixedbaselineinterferometer.Thein-boardantenna, relative tothe Orbiter payload bay, is used as both a transmitter and receiver, while the outboard antenna is only areceiver.
One of SRTM's significant features is the use of a 60-meter long deployable mast that serves to deploy anoutboard antenna and create a stable baseline. The 60-meter deployable truss and its deploymentmechanisms are described by Gross and Messner, 1999. An illustration of the various components thatcomprise SRTM is given in Figure 2. The structural dynamic issues associated with a 60-meter mast andlarge tip mass, i. e., the outboard antenna, deployed from the Shuttle required significant attention duringthe design and implementation of SRTM. Further, SRTM implemented a mast vibration damping systemspecifically to meet certain mast dynamic motion constraints, as well as to supplement the Orbiter reactioncontrol system with regard to control system stability. The topic of this paper is the design of the mastvibration damping subsystem. Further, the mast vibration damping subsystem failed to function on-orbit,hence the failure diagnoses that occurred both during the mission, and post-mission are discussed.
Milk!
....:,i F_;,9
Outboard Antenna Bracket ,:_,,-
C-To-L Downconverter
OutboardSupport GP$ A_teP, na
Structure (OSS)
AntennaMAST
Antenna Tn.mion (ATS)
Outboard
Antenna
C-Band Main Antenna
L-Band Main Antenna
Pallet
AFTElectronics
Panel (AEP)
!: :
Figure 2. SRTM Instrument Component Layout
84

Mast Vibration Damping System
The mast vibration damping requirements were driven by several coupled factors, specifically: a) themetrology system's mast dynamic motion tracking capability, b) SRTM instrument pointing requirements,c) attitude control disturbance torques associated, and d) the Orbiter dynamic disturbance environmentinduced by the attitude control system. SRTM utilized a metrology system to provide relative outboardantenna position and attitude knowledge during radar interferometer operation. This metrology systemconsisted of two subsystems. The subsystem, which drove the damper design, consisted of the AstrosTarget Tracker (ATT), and three Optical Target Assemblies (OTA's). The ATT was essentially a startracker that had been refocused to 60-m. Each OTA contained an LED, which was pointed towards theATT, and acted as a psuedo-star that the ATT was able to track. The combination of the ATT and OTA's
provided an accurate estimate for five of the outboard antenna's six rigid body degrees of freedom, theATT and OTA constellation does not accurately measure range to the outboard antenna. A Leica rangefinder supplemented the ATT by directly measuring the distance to a retroreflector array mounted on theoutboard antenna. With respect to instrument pointing, the nominal attitude during data acquisition was to:1) fly the Orbiter with its tail pointed along the velocity vector, 2) rotate the Orbiter about its roll-axis suchthat the mast was 45 degrees from the local vertical, and 3) radar radiating surfaces oriented toward theground. The Orbiter reaction control system was used to maintain SRTM pointing within a 0.1 deg attitudedeadband, and 0.01 deg/sec attitude rate deadband. Given the attitude requirement and combinedSRTM/Orbiter mass properties, the gravity gradient torque was the dominant disturbance torque to theShuttle reaction control system. Specifically, the gravity gradient torque tended to rotate the combinedOrbiter and mast system such that the mast longitudinal axis was oriented along the local vertical. The
Orbiter's Digital Auto-Pilot was configured such that the 9-kg (24-1b) Vernier Reaction Control System jetswere used for attitude control during radar operations. Based on the attitude control requirements, andconfiguration versus the disturbance torque applied to the system, the reaction control system generatedpositive roll commands that resulted in jet firings to counter the gravity gradient torque. As a consequenceof these jet firings transient vibrations in the mast were generated. Mast tip motion was not a concern tothe operation of the radar as an interferometer provided that the knowledge of the tip motion wasacquired. Hence, the ATT and LED's were added to track the mast motion. The capability of the ATT toacquire and track the motion of the LED's defined a maximum rate of mast motion that could be tracked,this limit was defined to be 6 cm/sec (2.36 in/sec) at the tip of the mast. Additionally, in order for the ATTto acquire the LED the mast tip rates were required to be less than 6 mm/sec (0.24 in/sec) for ten percentof the time during data acquisition. Therefore a mast vibration damping system was implemented toenable the ATT to acquire and track the mast motion given the vibration environment generated by the
attitude control system.
Vibration Damping RequirementsSRTM implemented a mast vibration damping subsystem in order to meet mast tip dynamic motionrequirements. Early in the project design phase, a preliminary coupled Orbiter and deployed maststructural dynamic math model was created. This math model was employed in attitude controlsimulations to provide: a) propellant consumption estimates, b) mast tip dynamic motion estimates, and c)mast damping requirements. Given that the final damping system implementation was not determined, thepreliminary math model was a "modal" model, i. e., the true complex modal behavior associated withdiscrete viscous damping elements was approximated. The results of these early simulations showed thatthe mast damping mechanisms should be designed to achieve "high", i. e., greater than 10%, dampingratios in the deployed mast's first orthogonal bending vibration mode pair and the first torsional vibrationmode. These requirements were later confirmed via simulation of a final coupled model which included thecomplex modal behavior associated with the discrete damping elements.
Vibration Damping System ConceptConceptually, the approach employed towards the design of the mast damping system was to concentratesufficient modal strain energy at the mast interface to the inboard antenna such that only a few discretedamping elements are required to damp the mast. In practise, what this means is that, the structuralelements which connect the mast to the to inboard antenna structure are softened, i. e., their stiffness is
reduced, such that approximately half the modal strain of the deployed system's first modes of vibration isconcentrated at these elements.
85

Release Joints (3X)
CA T Forward Bipod- 2 Rigid Struts
r'
Canister / L,,,,,
CA T Vertical Strut
- Torsional Damper
CA T Aft Bipod- 1 Damper Strut- 1 Rigid Strut
CA T Axial Strut
TSS Shear Link (3X)
TSS
TSS Tension Link (3X)
Figure 3. Mast Canister and Canister Attachment Truss (CAT)
The structural attachment of the mast, via the mast canister, to the inboard antenna structure is shown inFigure 3; this structure was called the canister attachment truss (CAT). The CAT is a kinematic, i. e.,statically determinate, structure which serves to attach the mast and the mast canister to the inboardantenna structure. The CAT forward bipod and the CAT axial strut form a rigid tripod with a monoball, orspherical bearing, at its vertex. The monoball located at the vertex of this rigid tripod is a fixed rotationpoint about which the entire deployed mast rotates as a rigid body. The attitude of the mast relative to itsfixed rotation point is controlled by the aft bipod, and the vertical strut. The mast damping elements werelocated at the aft bipod, and the vertical strut. The damping elements located in the aft bipod controlled themast's first two orthogonal bending modes, while the damping element located in the vertical strutcontrolled the mast's first torsional mode. A conceptual model of the damping system implementation isgiven in Figure 4.
E1
Figure 4. SRTM Conceptual Dynamic Model
Note that the CAT is the only structure, which connects the SRTM outboard equipment, i. e., outboardantenna, mast, and mast canister, to the Orbiter. The mass of the outboard equipment is on the order of1340 kg (3600 Ibm). Hence, the CAT was designed to meet structural requirements derived from launchand landing, i. e., specific loads and frequency requirements. Conceptually it was acknowledged that the
86
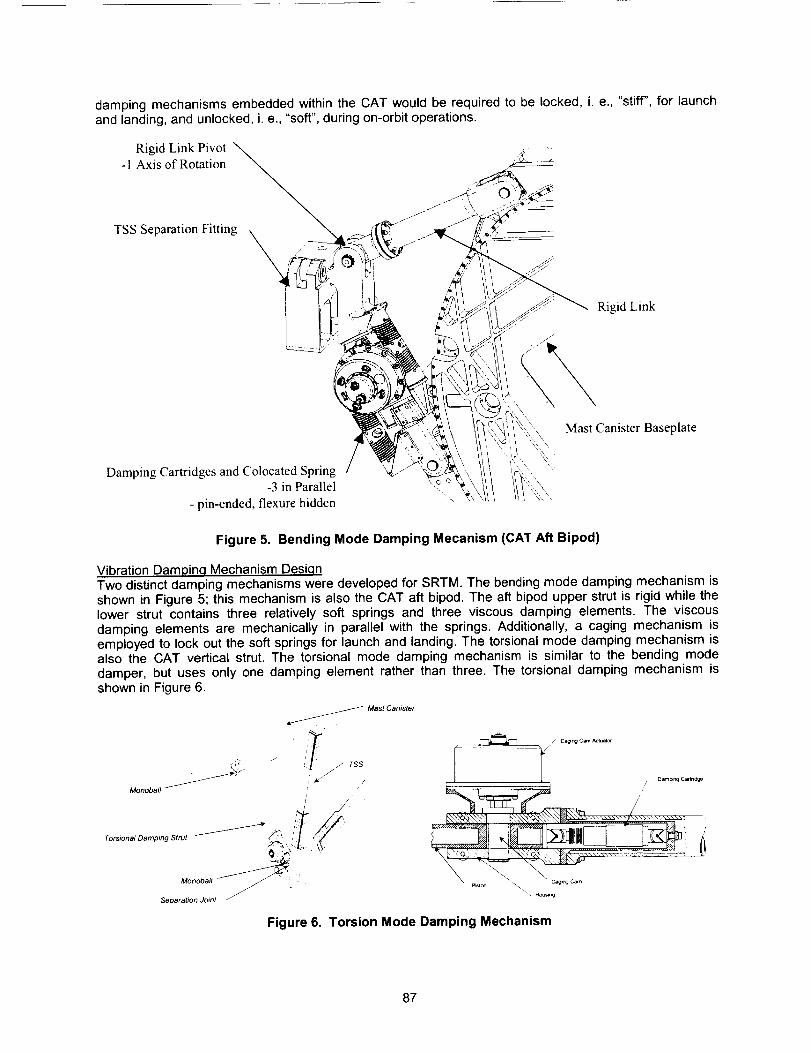
damping mechanisms embedded within the CAT would be required to be locked, i. e., "stiff", for launchand landing, and unlocked, i. e., "soft", during on-orbit operations.
Rigid Link Pivot- I Axis of Rotation
TSS Separation Fitting
Rigid Link
Mast Canister Baseplate
Damping Cartridges and Colocated Spring-3 in Parallel
- pin-ended, flexure hidden
Figure 5. Bending Mode Damping Mecanism (CAT Aft Bipod)
Vibration Dampinq Mechanism DesiqnTwo distinct damping mechanisms were developed for SRTM. The bending mode damping mechanism isshown in Figure 5; this mechanism is also the CAT aft bipod. The aft bipod upper strut is rigid while thelower strut contains three relatively soft springs and three viscous damping elements. The viscous
damping elements are mechanically in parallel with the springs. Additionally, a caging mechanism isemployed to lock out the soft springs for launch and landing. The torsional mode damping mechanism isalso the CAT vertical strut. The torsional mode damping mechanism is similar to the bending mode
damper, but uses only one damping element rather than three. The torsional damping mechanism is
shown in Figure 6.
Monoba#
Torsional Darnpmg Strut _- _'
7%
Monoball '
Separation Joint i
Mast Canister
Figure 6. Torsion Mode Damping Mechanism
87

Thedynamicimpedancesof therespectivedampingmechanismsweresizedina two-stepprocess.Also,giventheCATgeometry,andthemastmodeshapes,thesizingeffortfora givendamperwasuncoupledfromtheother.First,thestaticspringstiffnesswasdeterminedasoutlinedabove,thatis themechanicalspringstiffnessof thedampingmechanismwasadjusted,in thiscasereduced,untilapproximatelyhalfthe modalstrainenergyfor the modeor modesof interestwasconcentratedin the elementswhichrepresentedthedampingmechanism.Relativeto thebendingmodedamper,variationsonthisapproachwerealsotriedandit wasdeterminedthatacceptableresultswereachievedwiththeupperbipodstrutrigidandthelowerbipodstrutsoft.Specifically,thecumulativestaticspringstiffnessof thebendingmodedamperlowerstrutwasspecifiedto be87kN/m(500Ibf/in).Thecumulativestaticspringstiffnessofthetorsionmodedamperwasdeterminedto be 4.4 kN/m (25 Ibf/in).The secondstep in the damperrequirementdefinitionprocesswas to determinethe dampingcoefficient.A sensitivityanalysiswasperformedby allowingthe cumulativedampingcoefficientfor a given dampingmechanismto beanalyticallyvariedfrom zero to infinity.Oncethe root locusassociatedwith the system'sstructuraldynamicswasknown,themechanismdampingrequirementwasdeterminedbyselectingthedesiredsetof structuraldynamics,i. e.,frequencyanddampingratio,fromtherootlocusplot.Therootlocusplotforthebendingmodedampingmechanismis giveninFigure7, seeUmlandandEisen2001for a furtherdiscussionof theSRTMstructuraldynamiccharacteristics.Notethatin therootlocusdiagramtheradialgridlinesrepresentconstantdampingratiocontours,whilecirclesrepresentfrequencygiveninradian/sec.Furtherthearrowshownnextto the lociindicatesthedirectionof increasingdampingcoefficient.Thecumulativedampingcoefficientforthebendingmodedampingmechanismwasdeterminedto be370kN-s/m(2100Ibf-sec/in),implyingthatthedampingcoefficientforeachofthethreedampingcartridgesis120kN-s/m(700Ibf-sec/in).Whilethedampingcoefficientfor the torsionmodedampingmechanismwasspecifiedtobe4.4kN-s/m(25Ibf-sec/in).
6 ' 0'3 u F I
0.7, " "", _,_. L" .
09" , " '-'_-'¢
"_ s 65:__4__4(3_t{_t 88&(_ !
-_ , , : ',..-, _.:_
-2 k-" , ,"/J-;.
o9'_ ", " "< '
-4 ,," "-L ; ;o7",. ,,' "?'--:_
0_"-j _.., 0,3 " _-1"_--
-12 -10 -8 -6 -4 -2 0
Real Axis
I8.9
-..,,.'.08
06 /
/
04 ,'t
-_ 02 ;<
0
-02
-04
-06
-08 ,. -"
0"9-1 i
-2 -1 5
o7, o% oS o'4l
Yaw Mode __
"-2":,3_8:......................_o____i............
/
" " Og"" 0 " O.op-1 -05 0
Real Axis
Figure 7. Bending Mode Damping Mechanism Root Locus Diagram
Damping Cartridge Design
A trade study was conducted early in the SRTM design phase, first to determine the necessity for a mastdamping system, and then to determine an adequate damping system design concept. The mast dampingapproaches considered in the trade study included: active struts, Coulomb friction dampers, and linearviscous dampers. A linear viscous damping approach was selected based on several factors: 1) passiveenergy dissipation, 2) simple design concept, 3) amenability to existing analysis tools, and 4) designheritage. The viscous damping cartridges selected and used in both SRTM mast vibration dampingmechanisms were a modification of a hermetically sealed vibration isolator previously described byKlembczyk and Mosher and U. S. Patent 4,638,895. The viscous damping cartridge contained within thevendor's vibration isolator readily met the SRTM damping approach selection criteria. It was expected thatseveral modifications of the existing damping cartridge design would be needed in order to meet SRTM
requirements, specifically the physical damping coefficient, and the overall stroke, i. e., length of travel.There are several differences between the SRTM damping cartridges as procured and the vibration
88
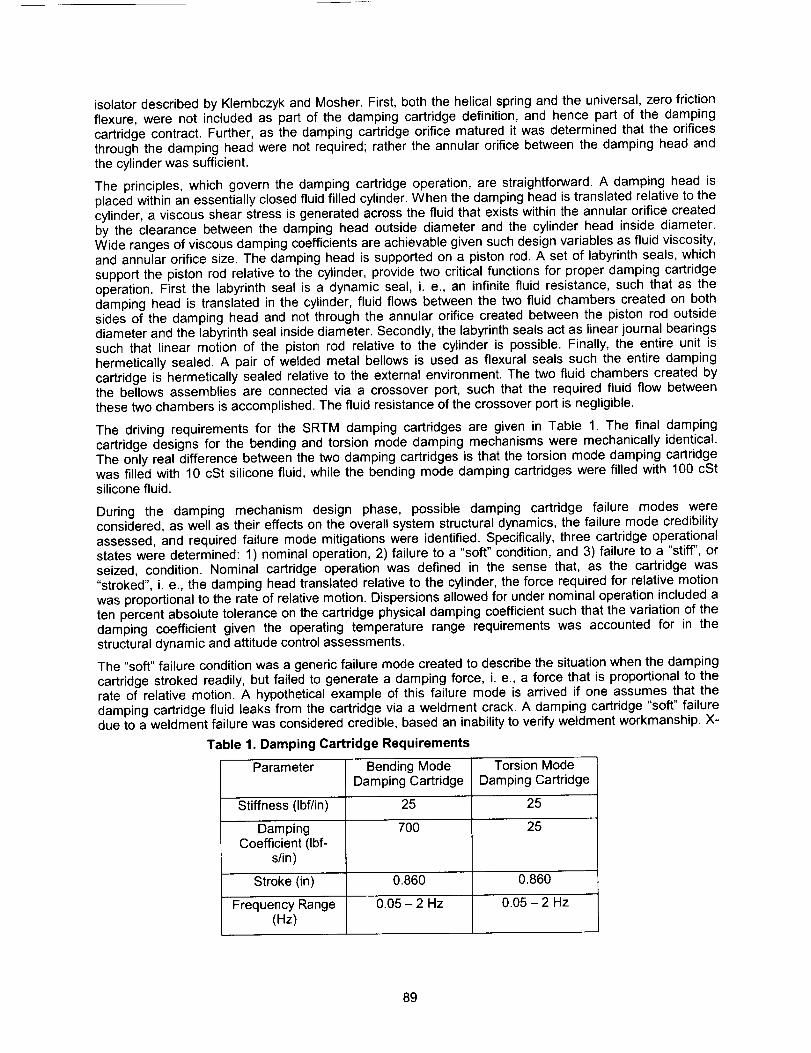
isolatordescribedbyKlembczykandMosher.First,boththehelicalspringandtheuniversal,zerofrictionflexure,werenot includedas partof the dampingcartridgedefinition,and hencepartof the dampingcartridgecontract.Further,as thedampingcartridgeorificematuredit wasdeterminedthattheorificesthroughthedampingheadwerenotrequired;rathertheannularorificebetweenthedampingheadandthecylinderwassufficient.Theprinciples,whichgovernthedampingcartridgeoperation,arestraightforward.A dampingheadisplacedwithinanessentiallyclosedfluidfilledcylinder.Whenthedampingheadis translatedrelativetothecylinder,a viscousshearstressisgeneratedacrossthefluidthatexistswithintheannularorificecreatedbytheclearancebetweenthe dampingheadoutsidediameterandthecylinderheadinsidediameter.Widerangesofviscousdampingcoefficientsareachievablegivensuchdesignvariablesasfluidviscosity,andannularorificesize.Thedampingheadis supportedona pistonrod.A setof labyrinthseals,whichsupportthepistonrodrelativeto thecylinder,providetwocriticalfunctionsfor properdampingcartridgeoperation.Firstthe labyrinthsealis a dynamicseal,i. e., an infinitefluidresistance,suchthatas thedampingheadis translatedin thecylinder,fluidflowsbetweenthetwofluidchamberscreatedonbothsidesof the dampingheadandnotthroughtheannularorificecreatedbetweenthe pistonrodoutsidediameterandthelabyrinthsealinsidediameter.Secondly,thelabyrinthsealsactaslinearjournalbearingssuchthat linearmotionof the pistonrod relativeto the cylinderis possible.Finally,theentireunit ishermeticallysealed.A pairof weldedmetalbellowsis usedas flexuralsealssuchthe entiredampingcartridgeis hermeticallysealedrelativeto theexternalenvironment.Thetwofluidchamberscreatedbythebellowsassembliesare connectedvia a crossoverport,suchthatthe requiredfluidflowbetweenthesetwochambersisaccomplished.Thefluidresistanceofthecrossoverportisnegligible.
Thedrivingrequirementsfor the SRTMdampingcartridgesare givenin Table1. Thefinaldampingcartridgedesignsforthe bendingandtorsionmodedampingmechanismsweremechanicallyidentical.Theonlyrealdifferencebetweenthetwodampingcartridgesis thatthetorsionmodedampingcartridgewasfilledwith10cStsiliconefluid,whilethebendingmodedampingcartridgeswerefilledwith100cStsiliconefluid.
Duringthe dampingmechanismdesign phase,possibledampingcartridgefailure modeswereconsidered,aswellastheireffectsontheoverallsystemstructuraldynamics,thefailuremodecredibilityassessed,andrequiredfailuremodemitigationswereidentified.Specifically,threecartridgeoperationalstatesweredetermined:1)nominaloperation,2) failuretoa "soft"condition,and3) failureto a "stiff",orseized,condition.Nominalcartridgeoperationwasdefinedin the sensethat, as the cartridgewas"stroked",i. e.,thedampingheadtranslatedrelativeto thecylinder,theforcerequiredforrelativemotionwasproportionaltotherateof relativemotion.Dispersionsallowedforundernominaloperationincludedatenpercentabsolutetoleranceonthecartridgephysicaldampingcoefficientsuchthatthevariationofthedampingcoefficientgiventhe operatingtemperaturerangerequirementswas accountedfor in thestructuraldynamicandattitudecontrolassessments.The"soft"failureconditionwasagenericfailuremodecreatedtodescribethesituationwhenthedampingcartridgestrokedreadily,but failedto generatea dampingforce,i. e., a forcethatis proportionalto therateof relativemotion.A hypotheticalexampleof this failuremodeis arrivedif oneassumesthatthedampingcartridgefluidleaksfromthecartridgeviaa weldmentcrack.A dampingcartridge"soft"failuredueto aweldmentfailurewasconsideredcredible,basedaninabilitytoverifyweldmentworkmanship.X-
Table 1. Damping Cartridge Requirements
Parameter Bending ModeDamping Cartridge
Stiffness (Ibf/in) 25
Damping 700Coefficient (Ibf-
s/in)
Stroke (in) 0.860
Frequency Range 0.05 - 2 Hz(Hz)
Torsion Mode
Damping Cartridge
25
25
0.860
0.05 - 2 Hz
89
rayinspectionofallcartridgeweldmentswasconsideredinconclusiverelativeto weldmentworkmanship,giventhatanyconclusionregardingtheintegrityoftheconvolutedbellows'insidediameterweldswouldbespeculativeat best.Standardleaktestswereperformedonthebellowsassembliesto verifyhermeticity,buta evaluation of the bellows inside diameter welds, for a measurement of such parameters as weld
penetration, was considered impractical. Further, standard leak test evaluation of the cartridge finalclosure welds was also impractical. The final closure welds were visually and X-ray inspected. The softfailure of a damping cartridge was considered credible. Additionally, this failure mode was considered to
be a random failure, rather than a failure common to all damping cartridges implemented on SRTMBased on the soft failure mode coupled with a Shuttle payload safety two-fault tolerance requirements, inthis case the concern was changes in the structural dynamic which could lead to attitude control instability,the bending mode damping mechanism was designed to incorporate three damping cartridges.
Gas bubble formation within a fluid filled damper is a significant concern; this concern is further
exacerbated in space applications. Stewart, Powers, and Lyons, 1998, have discussed an example of thisproblem in regard to rotary dampers. This degraded performance condition is similar to the soft failure
mode. Effectively, the gas bubble can act like a very soft spring that is in series with the damping element.The gas bubble effect can be so severe that from a dynamic perspective a deadzone or backlash is
created within the damper when a gas bubble is formed within the fluid. The primary protection againstgas bubble formation within the viscous fluid used here was a volumetric overfill, and the use of the
bellows as an accumulator, such that pressure was maintained on the fluid once the cartridge entered avacuum environment. The approach taken toward the over pressurizing the fluid was to fill the damper ata temperature below the specified operating temperature, in this case below -40°C. The silicone fluid has
a positive volumetric expansion coefficient relative to temperature, i. e., as the fluid's temperatureincreases its volume increases as well. Further, in the damping cartridge application considered here thebellows were used as an accumulator, that is the bellows were a flexible container which could expandand contract with the fluid's volumetric changes. Given that the bellows are elastic with volumetric springstiffness, then as the fluid expands due to a temperature increase, moderate fluid pressure increases are
incurred due to the bellows accumulator effect. Finally, thermal control was applied to the dampingcartridges such that the nominal minimum expected operating temperature was -17°C (0°F). Given this
minimum expected operating temperature, the fluid volumetric expansion, and the bellows springstiffness, the minimum expected fluid pressure was determined to be approximately 103 kPa (15 psi).
The silicone fluid was degassed prior to cartridge filling. Unfortunately, the fluid was only exposed to avacuum of approximately 10 .2 Torr. Further, the fluid was exposed to the ambient atmosphere during the
filling process. Hence, the fluid was not considered completely degassed. Therefore, the possibility ofbubble formation was considered highly unlikely, but credible. The issue of gas bubble formation within thedamping cartridge was ultimately resolved by requiring a set of structural dynamic identification tests beperformed during that SRTM on-orbit checkout phase. The success criteria of the identification tests was
structured such that if the measured structural dynamics matched preflight predictions then the mission
could proceed to its mapping phase, conversely if the measurements did not match the predictions thenchanges would be required to the attitude control design before mapping was authorized.
The "stiff" failure mode generically described any of the conditions where the damping cartridge wasseized, i. e., it could not be stroked. The primary concern here was seizure of the piston rod in the linearjournal bearings, i. e., the labyrinth seals, due particulate contamination that could cause this single slidingsurface interface to jam. The mitigations employed to protect against journal bearing seizure includedsilicone fluid filtration prior to the cartridge filling process, cartridge component precision cleaning prior toassembly, and cartridge assembly in a controlled clean environment, i. e., a flow bench. Given that the
SRTM damping cartridges were a modification of a proven design that had not exhibited any in-serviceseizure type failures, the design heritage provided additional confidence that this design was notsusceptible to seizure type failures. In an effort to minimize any friction force due to incidental contact of
the piston rod with the labyrinth seals, tight concentricity tolerances were employed on the cylinder, andlabyrinth seal assemblies. Further, cross-blade flexures, i. e., universal joints, were employed at each endof the cartridge such that end moments, which would be created due to various misalignments, would beminimized. Fluid freezing was also classified as a stiff failure. This type of stiff failure was protected
against by thermally controlling the damping cartridges such that the nominal minimum cartridgetemperature was -17°C (0°F) versus the silicone fluid freezing temperature of approximately -70°C.
Further the minimum cartridge operating temperature without thermal control was -35°C. For the purposes
90
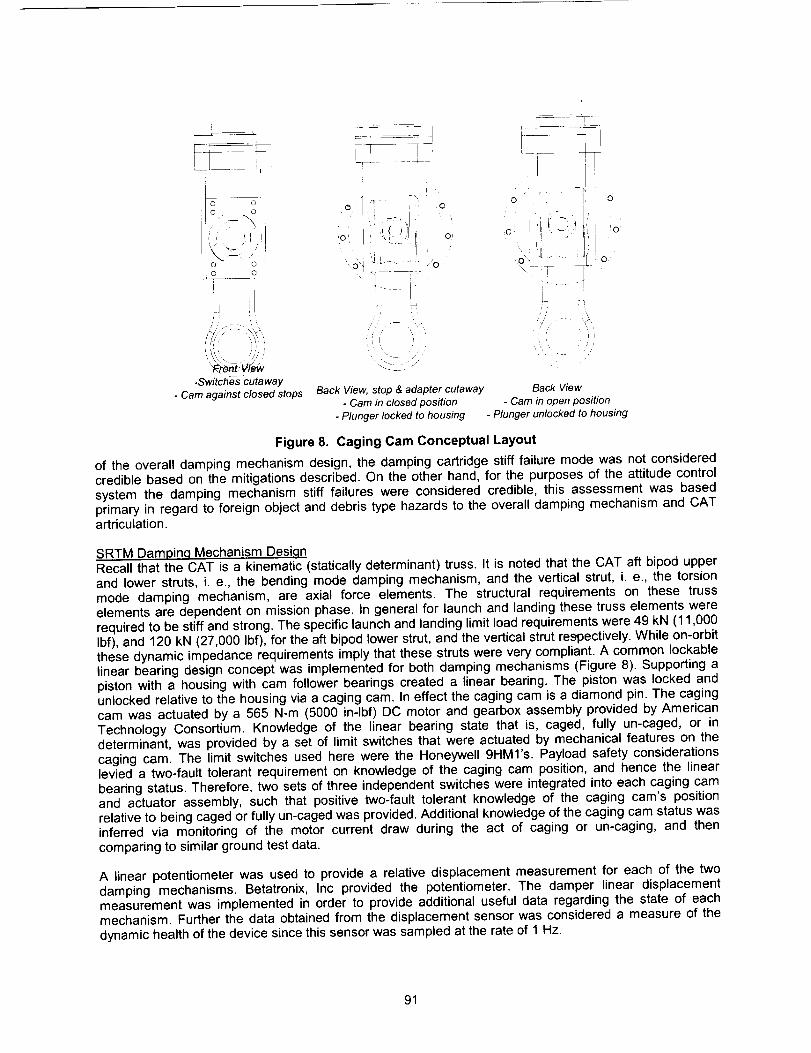
i
I°
o 0
O 0
-SwitchEs-cutaway- Cam against closed stops
// ¸¸¸'2
Back View, stop & adapter cutaway- Cam in closed position
i ,ii'
04 i.o
i 7,
i', ,' ','I Ii , i
2U_ _/
- Plunger locked to housing
Back View- Cam in open position
- Plunger unlocked to housing
Figure 8. Caging Cam Conceptual Layout
of the overall damping mechanism design, the damping cartridge stiff failure mode was not considered
credible based on the mitigations described. On the other hand, for the purposes of the attitude controlsystem the damping mechanism stiff failures were considered credible, this assessment was basedprimary in regard to foreign object and debris type hazards to the overall damping mechanism and CATartriculation.
SRTM Dampin.q Mechanism DesignRecall that the CAT is a kinematic (statically determinant) truss. It is noted that the CAT aft bipod upperand lower struts, i. e., the bending mode damping mechanism, and the vertical strut, i. e., the torsionmode damping mechanism, are axial force elements. The structural requirements on these trusselements are dependent on mission phase. In general for launch and landing these truss elements wererequired to be stiff and strong. The specific launch and landing limit load requirements were 49 kN (11,000Ibf), and 120 kN (27,000 Ibf), for the aft bipod lower strut, and the vertical strut respectively. While on-orbitthese dynamic impedance requirements imply that these struts were very compliant. A common Iockablelinear bearing design concept was implemented for both damping mechanisms (Figure 8). Supporting apiston with a housing with cam follower bearings created a linear bearing. The piston was locked andunlocked relative to the housing via a caging cam. In effect the caging cam is a diamond pin. The cagingcam was actuated by a 565 N-m (5000 in-lbf) DC motor and gearbox assembly provided by AmericanTechnology Consortium. Knowledge of the linear bearing state that is, caged, fully un-caged, or indeterminant, was provided by a set of limit switches that were actuated by mechanical features on the
caging cam. The limit switches used here were the Honeywell 9HMI's. Payload safety considerationslevied a two-fault tolerant requirement on knowledge of the caging cam position, and hence the linearbearing status. Therefore, two sets of three independent switches were integrated into each caging camand actuator assembly, such that positive two-fault tolerant knowledge of the caging cain's positionrelative to being caged or fully un-caged was provided. Additional knowledge of the caging cam status wasinferred via monitoring of the motor current draw during the act of caging or un-caging, and then
comparing to similar ground test data.
A linear potentiometer was used to provide a relative displacement measurement for each of the twodamping mechanisms. Betatronix, Inc provided the potentiometer. The damper linear displacementmeasurement was implemented in order to provide additional useful data regarding the state of eachmechanism. Further the data obtained from the displacement sensor was considered a measure of the
dynamic health of the device since this sensor was sampled at the rate of 1 Hz.
91
Damper Failure Investigation
Pre-Mission Investiqation and Flight RationaleApproximately two months before the eventual SRTM launch date the flight spare torsion mode dampingcartridge was discovered to have seized, while the spare bending mode damping cartridge appeared tofunction normally. Further quantitative evaluation of both damping cartridges showed that: 1) the sparebending mode damping cartridge function normally, and 2) the torsion mode damping cartridge began tostroke only after a force of greater than 440 N (100 Ibf) was applied. Normally, the torsion mode dampingcartridge stroked once 1 N (0.25 Ibf) was applied. Additional testing showed that once the torsion cartridgewas cooled to 0°C the cartridge stroked readily. A trend was inferred based on these two data points in thesense that whatever caused the cartridge seizure was relieved as the unit's temperature was decreased.Based on this trend, a dimensional interference between the labyrinth seal inside diameter and the piston
rod outside diameter was suspected to be the cause of the cartridge seizure. The piston rod was 15-5stainless steel. While the labyrinth seal was made from Torlon material, and installed into a 302 stainlesssteel housing with a moderate interference fit. Based on the materials used for the labyrinth seal and thepiston rod, as well as the residual stress created in the labyrinth seal due to the press fit, it was known thatthe clearance between the labyrinth seal and the piston rod would increase with a decreasing unittemperature. Hence, given the test data, a possible failure cause was suspected. The torsion modedamping cartridge was disassembled, and a dimensional interference of 0.005 to 0.007 mm (0.0002" to0.0003") was measured between one of the labyrinth seals and the piston rod. Further it was determinedthat the piston rod outside diameter had not changed and that the inside diameter of the labyrinth seal wassmaller than expected. The design data on the relevant assembly drawing showed that the normalclearance between the labyrinth seal and the piston rod should be 0.035 +0.005 mm (0.0014" +0.0002").Examination of the quality assurance paperwork for each damping cartridge set showed that a finalmachining operation instruction, where the clearance between the seal and rod was adjusted within therequirements, was omitted on the entire torsion mode damping cartridge tot. Consequently it could not beverified that the clearance between the seal and the piston rod was correct. The required final machiningoperation and the proper clearance was verified on the bending mode damping cartridges.
Yet, the torsion mode damping cartridges were verified to function properly during acceptance testing 10months earlier, which implies that adequate, if not the required, clearance existed between the seal and
piston rod. Therefore, a very serious concern was evident in that, the labyrinth seal was dimensionallyunstable with respect to time. Two possible physical mechanisms were proposed to explain the temporaldimensional instability of the labyrinth seal material: 1) swelling due to silicone fluid absorption, and 2)stress relaxation driven by the residual stress associated with the press fit. Fluid absorption into thelabyrinth seal material was not considered credible given the dissimilar chemistry of the silicone fluid andTorlon. Stress relaxation of the labyrinth seal material was postulated as the physical mechanism that ledto the seizure of the torsion mode damping cartridge. Included in the damping cartridge assemblyprocedure is a labyrinth seal post-press fit stress relief heat treatment. During this investigation it wasdetermined that the heat treatment performed was inadequate. This determination was based on a set oftests run on residual labyrinth seal assemblies, which had been previous heat-treated. A second heattreatment was performed on the residual hardware and typically a 0.0005" decrease in the labyrinth sealinside diameter was measured. Therefore, it was postulated that the labyrinth seal long term dimensionalchange was driven by a stress relaxation mechanism.
The seizure of the spare torsion mode damping cartridge was attributed to two factors: 1) the clearancebetween the piston rod outside diameter and labyrinth seal inside diameter was less than required on theassembly drawing; and 2) the clearance between these two parts was reduced to an interference viastress relaxation of the labyrinth seal. There was no justification that the flight torsion mode dampingcartridge was any different than the spare, thus it was concluded that flight torsion mode dampingcartridge was likely to be seized as well. On-orbit operation of the torsion mode damper was not requiredeither for instrument performance or for payload safety. On the other hand, proper bending mode damperoperation was required for instrument performance. Payload safety considerations required that thebending mode damper function within an expected and previously assess envelope. An acceptable forflight rationale was generated for the bending mode damper based on: 1) quality assurance paperworkverification that the clearance between the labyrinth seal and the piston rod was per the drawing callout,and 2) an adequate clearance between the seal and piston rod was estimated based on a worse caseassumption of the stress relaxation driven dimensional change of the seal inside diameter.
92
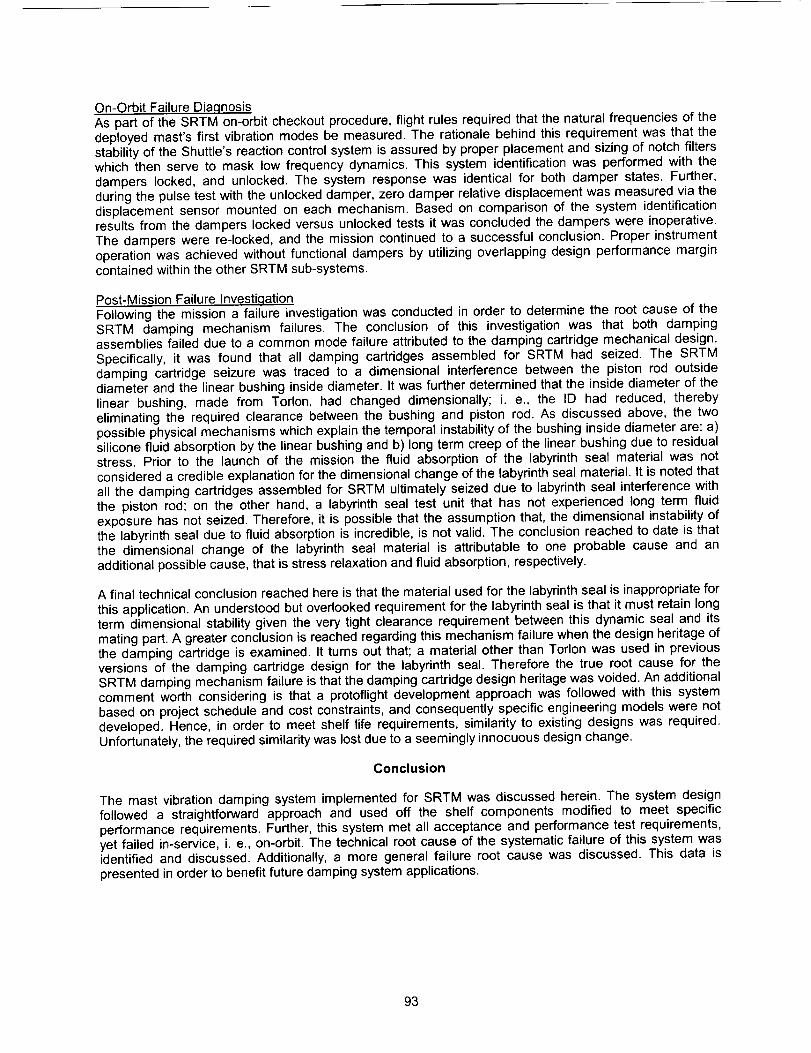
On-Orbit Failure Diaqnosis
As part of the SRTM on-orbit checkout procedure, flight rules required that the natural frequencies of thedeployed mast's first vibration modes be measured. The rationale behind this requirement was that thestability of the Shuttle's reaction control system is assured by proper placement and sizing of notch filterswhich then serve to mask low frequency dynamics. This system identification was performed with thedampers locked, and unlocked. The system response was identical for both damper states. Further,during the pulse test with the unlocked damper, zero damper relative displacement was measured via thedisplacement sensor mounted on each mechanism. Based on comparison of the system identificationresults from the dampers locked versus unlocked tests it was concluded the dampers were inoperative.The dampers were re-locked, and the mission continued to a successful conclusion. Proper instrument
operation was achieved without functional dampers by utilizing overlapping design performance margincontained within the other SRTM sub-systems.
Post-Mission Failure Investi.qationFollowing the mission a failure investigation was conducted in order to determine the root cause of theSRTM damping mechanism failures. The conclusion of this investigation was that both dampingassemblies failed due to a common mode failure attributed to the damping cartridge mechanical design.Specifically, it was found that all damping cartridges assembled for SRTM had seized. The SRTMdamping cartridge seizure was traced to a dimensional interference between the piston rod outsidediameter and the linear bushing inside diameter. It was further determined that the inside diameter of thelinear bushing, made from Torlon, had changed dimensionally; i. e., the ID had reduced, therebyeliminating the required clearance between the bushing and piston rod. As discussed above, the two
possible physical mechanisms which explain the temporal instability of the bushing inside diameter are: a)silicone fluid absorption by the linear bushing and b) long term creep of the linear bushing due to residualstress. Prior to the launch of the mission the fluid absorption of the labyrinth seal material was notconsidered a credible explanation for the dimensional change of the labyrinth seal material. It is noted thatall the damping cartridges assembled for SRTM ultimately seized due to labyrinth seal interference withthe piston rod; on the other hand, a labyrinth seal test unit that has not experienced long term fluidexposure has not seized. Therefore, it is possible that the assumption that, the dimensional instability ofthe labyrinth seal due to fluid absorption is incredible, is not valid. The conclusion reached to date is thatthe dimensional change of the labyrinth seal material is attributable to one probable cause and anadditional possible cause, that is stress relaxation and fluid absorption, respectively.
A final technical conclusion reached here is that the material used for the labyrinth seal is inappropriate for
this application. An understood but overlooked requirement for the labyrinth seal is that it must retain longterm dimensional stability given the very tight clearance requirement between this dynamic seal and itsmating part. A greater conclusion is reached regarding this mechanism failure when the design heritage ofthe damping cartridge is examined. It turns out that; a material other than Torlon was used in previousversions of the damping cartridge design for the labyrinth seal. Therefore the true root cause for theSRTM damping mechanism failure is that the damping cartridge design heritage was voided. An additionalcomment worth considering is that a protoflight development approach was followed with this systembased on project schedule and cost constraints, and consequently specific engineering models were notdeveloped. Hence, in order to meet shelf life requirements, similarity to existing designs was required.Unfortunately, the required similarity was lost due to a seemingly innocuous design change.
Conclusion
The mast vibration damping system implemented for SRTM was discussed herein. The system designfollowed a straightforward approach and used off the shelf components modified to meet specificperformance requirements. Further, this system met all acceptance and performance test requirements,yet failed in-service, i. e., on-orbit. The technical root cause of the systematic failure of this system wasidentified and discussed. Additionally, a more general failure root cause was discussed. This data ispresented in order to benefit future damping system applications.
93
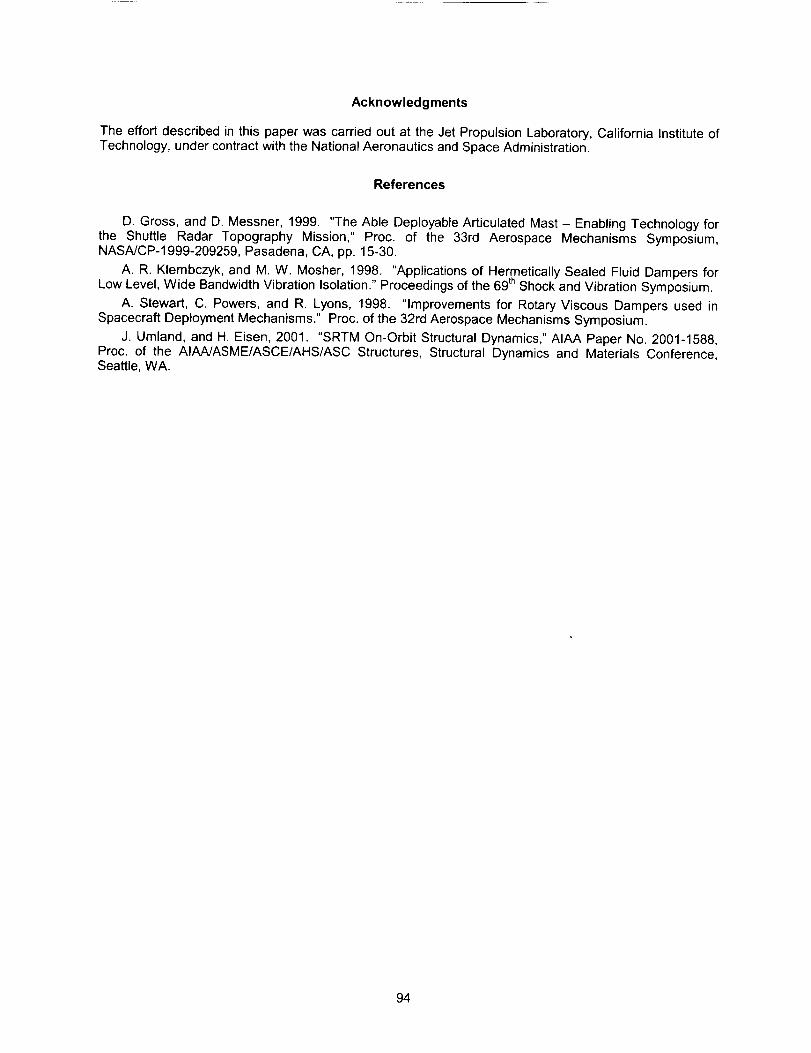
Acknowledgments
The effort described in this paper was carried out at the Jet Propulsion Laboratory, California Institute ofTechnology, under contract with the National Aeronautics and Space Administration.
References
D. Gross, and D. Messner, 1999. "The Able Deployable Articulated Mast - Enabling Technology forthe Shuttle Radar Topography Mission," Proc. of the 33rd Aerospace Mechanisms Symposium,NASA/CP-1999-209259, Pasadena, CA, pp. 15-30.
A. R. Klembczyk, and M. W. Mosher, 1998. "Applications of Hermetically Sealed Fluid Dampers forLow Level, Wide Bandwidth Vibration Isolation." Proceedings of the 69 th Shock and Vibration Symposium.
A. Stewart, C. Powers, and R. Lyons, 1998. "Improvements for Rotary Viscous Dampers used inSpacecraft Deployment Mechanisms." Proc. of the 32rd Aerospace Mechanisms Symposium.
J. Umland, and H. Eisen, 2001. "SRTM On-Orbit Structural Dynamics," AIAA Paper No. 2001-1588,Proc. of the AIAA/ASME/ASCE/AHS/ASC Structures, Structural Dynamics and Materials Conference,Seattle, WA.
94

• /
Fly Cast Maneuver for Shuttle Radar Topography Mission
Thomas A, Trautt"
Abstract
The orbital maintenance maneuver referred to as the fly cast maneuver was used in the Shuttle RadarTopography Mission to prevent a 60-meter boom supporting a radar antenna from vibrating excessively.The thruster burn sequence is derived in this paper. Analytical results of the boom response and actualflight data are presented.
Introduction
The Shuttle Radar Topography Mission (SRTM), which flew in February 2000, obtained data to map inthree dimensions most of the earth's land surface between 56° south latitude and 60° north latitude. Themission was a joint project between the National Aeronautics and Space Administration and the U.S.National Imagery and Mapping Agency with the Jet Propulsion Laboratory serving as the primecontractor.
The main hardware components are the main antenna mounted in the cargo bay of the space shuttle, a60-meter deployable boom, and an outboard antenna mounted at the end of the boom. The main antennais both a radar transmitter and receiver. The outboard antenna is a radar receiver. Radar interferometry isused to compute heights of the earth's surface.
While taking data, the space shuttle was in a decaying orbit and required occasional orbital maintenancemaneuvers to boost the shuttle back to the desired orbit. Typically, orbital maintenance maneuversconsist of a single pulse of one thruster or several thrusters fired simultaneously for the durationnecessary to boost the space shuttle back to the desired orbit. With this approach, the dynamic responseof the SRTM boom cantilevered from the space shuttle would not have had an adequate margin of safety.
To reduce the dynamic response, a firing sequence was derived for a single degree of freedom system.The derived firing sequence is referred to as the fly cast maneuver. The firing sequence consists of threepulses. The first pulse puts the correct amount of energy into the first mode so that a second pulse whentimed correctly will cause a static deflection. Since the deflection is static during the second pulse, theduration of the second pulse can be adjusted without affecting the deflection. The correct timing andduration of the third pulse brings the first mode back to rest.
An analogy to a multiple degree of freedom system is derived. The fly cast maneuver derived for thesingle degree of freedom system is applied to an analytical model of the space shuttle and boom andflight data is presented.
Deployable Boom
The deployable boom was built by AEC-Able Engineering. The boom is composed of 86 collapsible baysand one solid bay at the free end. The length of each bay in the deployed configuration is 0.6975 meter.In the stowed configuration, 85 bays are fully collapsed and 1 bay is partially collapsed. The collapsedbay length is 0.0159 meter. The boom is stowed in a canister with a maximum diameter of 1.36 metersand length of 2.92 meters. During orbit, the boom was deployed one bay at a time from the canister. Afterthe data was taken, which took about 10 days, the boom was retracted into the canister, collapsing onebay at a time while still in orbit.
AEC-Able Engineering Company, Goleta, CA
Proceedings of the 3_ hAerospace Mechanisms Symposium, Ames Research Center, May 9-11, 2001
95
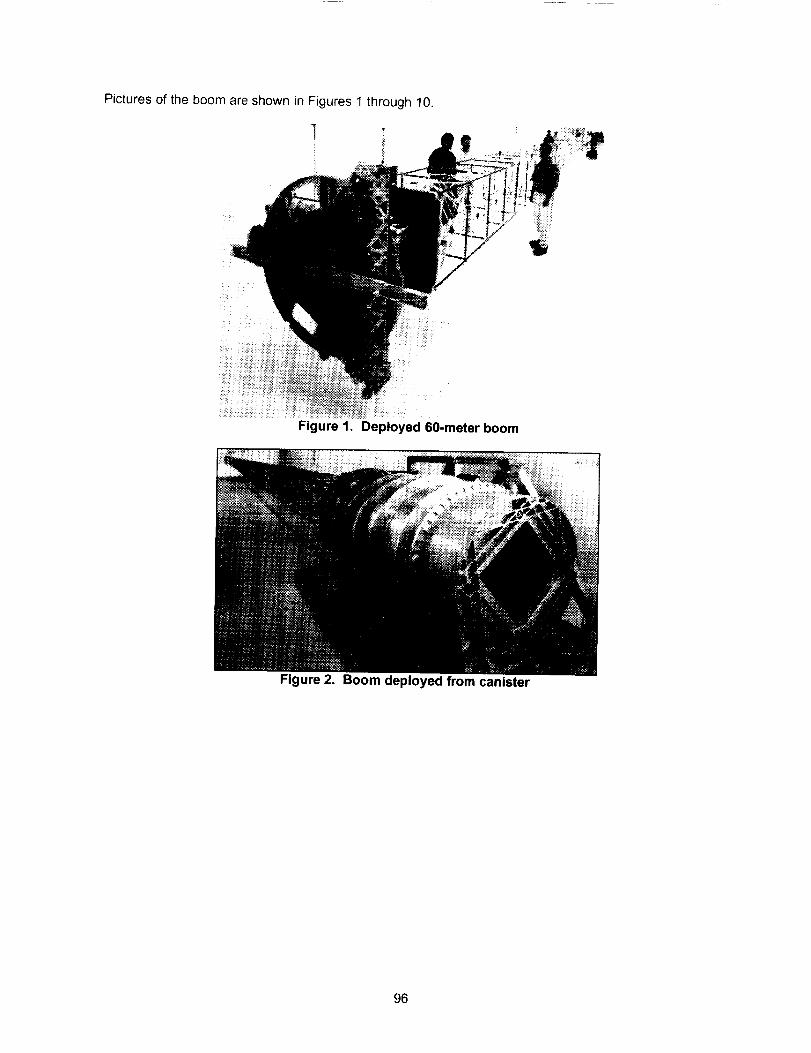
PicturesoftheboomareshowninFigures1through10.
Figure 1. Deployed 60-meter boom
Figure 2. Boom deployed from canister
96
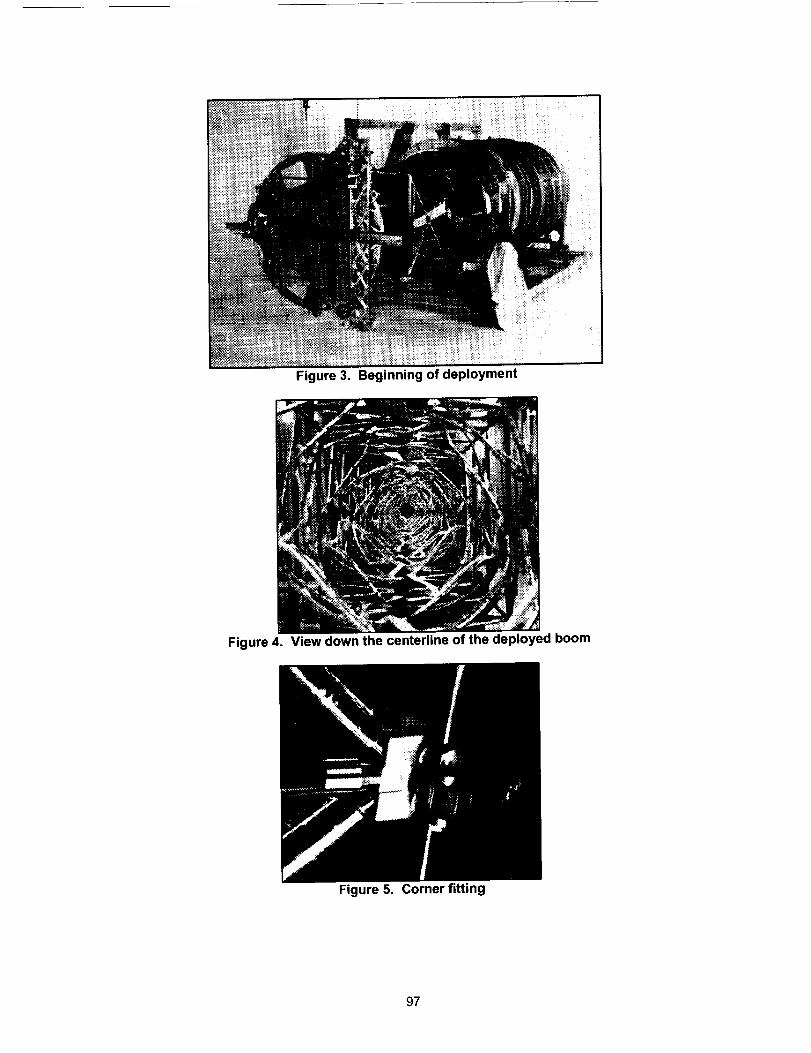
, ii!iiliii/i ! !if!' iii!iliiiiii!ilili!ii!ili!ii!i!i!ii
Figure 3. Beginning of deployment
Figure 4. View down the centerline of the deployed boom
Figure 5. Corner fitting
97
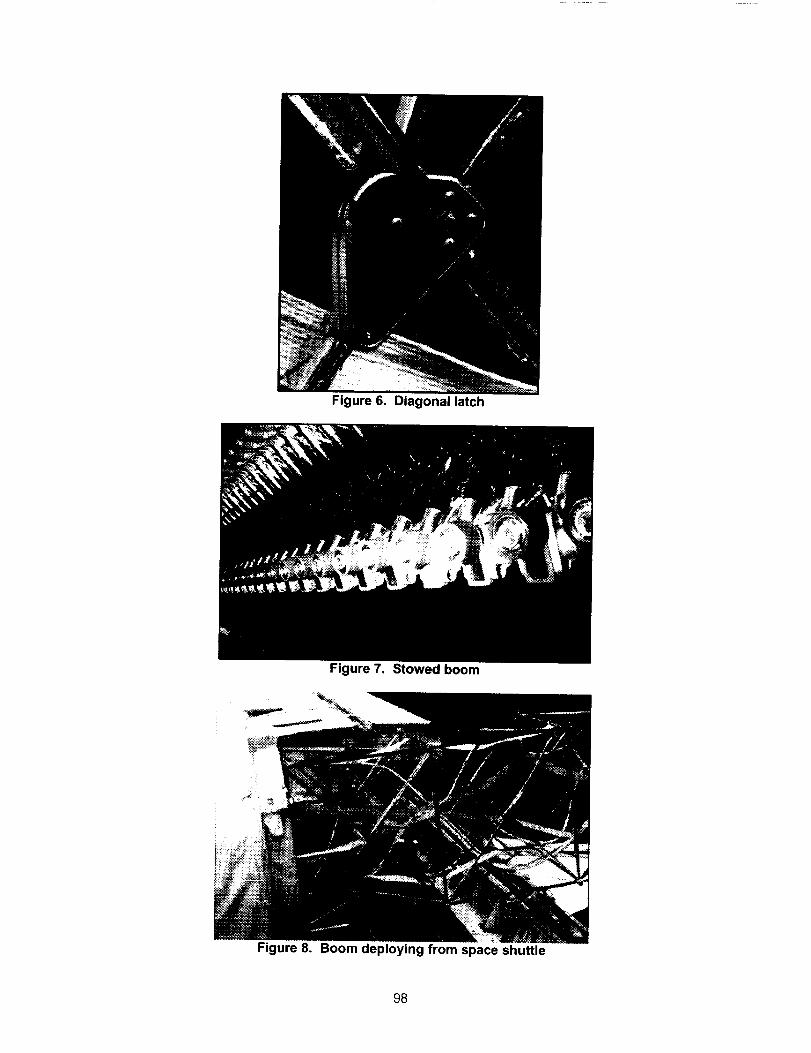
Figure 6. Diagonal latch
Figure 7. Stowed boom
Figure 8. Boom deploying from space shuttle
98

Figure 9. Portion of deployed boom viewed from space shuttle
Figure 10. Antenna and end of boom viewed from space shuttle
Firing Sequence Derivation
The fly cast firing sequence is derived for a single degree of freedom model as shown in Figure 11.
)_ acceleration inputspring mass
x(t), relative displacement
Figure 11. Single degree of freedom model
99

Theequationof motionfor thissystemis
J_+ (o2x= -a (1)
wherex is displacement of the mass relative to the moving support, (0 is the circular natural frequency ofthe system in radians per unit time, 'a' is the acceleration input at the support, and the dots indicatederivatives with respect to time. The solution to this equation with constant acceleration is given by thefollowing equations.
x(t) = -a/_ 2+ (xo+a/o)2)cos(O)t) +(Vo/_o)sin(a)t) (2)
v(t)/e) = -(x0+a/e)2)sin((t}t) + (Vo/e))cos(cot) (3)
In these equations, v is relative velocity, x0 is the initial relative deflection, v0 is the initial relative velocity,and t is time. We assume the initial displacement and velocity are zero. At the end of a constantacceleration pulse of duration, tl, the relative displacement and relative velocity are
Xl = -a/e) 2+ (a/e)2)cos((_l) (4)
vl/o) = -(a/e)2)sin(e)tl) (5)
Turning the pulse off for a duration, t2, after the initial pulse will result in the following relativedisplacement and relative velocity at the end of the t2 duration.
x2 = xlcos((._2) + (vjo.))sin(e)t2) (6)
v2/o) = -xlsin(fJ}t2) + (vl/r3)cos((tX2) (7)
From these two equations, the following equations can be obtained.
x2sin(O_2) + (v2/(J))cos((l}t2)= Vl/O_)
x2cos(03{2) - (v2/OJ)sin((J}t2) = Xl
(8)
(9)
Applying another pulse at the end of the t2 duration results in the following response of the system duringthe pulse.
x(t) =-a/(t)2+ (x2+a/o)2)cos( e)t) + (v2/(o)sin(e}t) (10)
For x(t) to be constant, the following conditions must be satisfied.
x2 = -a/(_ (11 )
v2 = 0 (12)
Substituting equations (4), (5), (11), and (12)into equations (8) and (9) and canceling some terms, weobtain
sin((tX2) = sin((t}{1) (13)
cos((£t2) = 1 - cos((t}tl) (14)
100

Thesolutiontotheseequationswiththeshortestdurationoftimeisasfollows.
0._1= 03t2=/I;/3
tl = t2= (_:/3)(1/0))= (_:/3)(T/2/t)=T/6
(15)
(16)
In the last equation,T is thenaturalperiodof thesystem.At the end of the mainpulseof arbitraryduration, t3, the relative displacement and relative velocity are
x3 = x2 = -a/_o2
V3=v2=O
(17)
(18)
The pulse is turned off for a duration, t4, and on again for a duration, t6, resulting in the following relativedisplacements and relative velocities at the ends of the t4 and t5 durations.
x4 = X3COS(0./L4)= (-a/e)2)cos((t)t4) (19)
v4/CO= -x3sin(o._) = (a/o)2)sin(eY,4) (20)
x5 = -a/ct_ + (x4+a/o)2)cos(Cots)+ (v4J(o)sin(Cot5) (21)
V5/(0= -(x4+a/(j)2)sin(O.}ts)+ (v4/(O)cos(O3t5) (22)
Combining equations (21) and (22), the following equations can be obtained.
x_sin((t}t5) + (v5/(..t))cos((t}t5)= v4/(.o- (a/o.)2)sin(cet5) (23)
xscos(o_ts) -(Vs/(.0)sin((t}t5)= x4 +alo_ - (a/(.02)cos(oY5) (24)
At the end of the t5 duration, we want the system to return to zero relative deflection and zero relativevelocity. Setting x5 and v5 to zero results in the following equations.
0 = v4/O)- (a/O)2)sin((..Q:5) (25)
0 = x4 +a/O._ - (a/Co2)cos((t_5) (26)
These equations are combined with equations (19) and (20) to obtain the following equations.
0 = sin(crY4)- sin((ot5) (27)
0 = cos(cot.4)+ 1 - cos(o_5) (28)
These equations are similar to equations (13) and (14). The solution with the shortest duration is
t4 = t5 = T/6 (29)
Figure 12 shows the pulse sequence and response of a single degree of freedom system with a 0.1 Hznatural frequency. The response to a single pulse is shown in Figure 13 for comparison. The response toa single pulse has twice the amplitude of the response to the fly cast pulse sequence.
101

f lflycastpulse sequence
0
-1 _ \\relative deflection/ _
0 i0 20
_e. (sec)Figure 12. Fly cast sequence and response of single degree of freedom system
(normalized to static condition)
_
I I
-2 r_lai_vedeflectionI I
o tot_ne,(sec)20 3o
Figure 13. Single pulse input and response of single degree of freedom system(normalized to static condition),
The firing sequence was derived for a single degree of freedom without damping. The error fromneglecting damping is analyzed below. The equation of motion for the single degree of freedom withdamping is
+ 2(,(0_" + (02x = -a
where _ is the damping ratio and eL)is the undamped natural frequency in radians per unit time. The
relative displacement and relative velocity responses are given by the following equations.
[ a] ]V0 + _ X0 ----
'_ 0.) + (0 2
__a Jc°s((0dt ) + sin((%t) (30)+(02 1___2
_Ia] 1v(t) _ _(0t x0+ ,_v +vo-- - e- -- cos((%t) + sin((0dt ) (31)
102

where
o)d = _ - 42 e_ (32)
The damping ratio of the first mode of the boom is approximately 0.005. Applying the firing sequence to a
single degree of freedom system with this damping ratio results in the relative displacement profile shownin Figure 14. The maximum deflection magnitude is 0.89% greater than without damping. This error is
similar to the amount of decay of a damped system over a period, T/3, as follows.
1- e -((°t = 1- e -(O'O05)(2=/T)(T/3) = 0.0104 = 1.04% (33)
0._I
00
".it
-05¢)
"-_ -1
I I
-1.5 I I0 10 20 30
(sec)
Figure 14. Response of damped system to fly cast sequence(normalized to static condition),
Multiple Degree of Freedom Analogy
Neglecting damping, a multiple degree of freedom system can be modeled in the following form.
M._/+K-x =B.f (34)
In this equation, M is the system mass matrix, K is the system stiffness matrix, x is a vector of degrees offreedom, B is a loading matrix, and f is a vector of forcing functions. The vector, x, can be related to the
modal amplitudes, u, by the equation,
x = @u, (35)
where the columns of @ are eigenvectors of the system. The eigenvectors are normalized with respect to
the mass matrix to obtain the following result where I is the identity matrix.
(]DTM(_ = I (36)
Substituting equation (35) into equation (34) and multiplying by @'r results in the following equation.
I.ii+E_.u =_TB.f (37)
103

where
(38)
The matrix, f_, is diagonal and the diagonal terms are squares of the natural frequencies of the system.In equation (37), the modal amplitudes are uncoupled from each other. The equation for mode i can bewritten as follows.
ii i +(0. 2 .u i = (_TB. f)i (39)
This equation is analogous to equation (1) for the single degree of freedom. By tuning the firing sequenceto a particular mode, the response of that mode will be similar to the single degree of freedom responsein Figure 14.
Analytical Results
The boom coordinate system and orientation of the boom relative to the space shuttle are shown inFigure 15. A finite element model is shown in Figure 16.
•-'::;'??......
:'-'-:_-cC
Y 14 °
Z
Figure 15. Space Shuttle and boom
104

antenna modeled with __
beam elements
Space Shuttle modeled as _1_
point mass "¢_th mer'aa 7
'__ beam 2°md:l_ with
stiff b eams':____
Figure 16. Finite element model
The lowest natural frequency from the finite element model is 0.1 Hz due to bending of the boom aboutthe Z axis. This mode is the most affected by the thrusters used for orbital maintenance. The period, 10seconds, of the first mode is used to compute the fly cast pulse sequence for the finite element analysis.The pulse durations on the space shuttle can be adjusted in increments of 0.08 second. To compute theworst case response accounting for the time increments of the thrusters, durations of 0.08 second areadded to the short pulses and to the durations between the pulses. The short pulse duration for the finiteelement analysis is then calculated as follows.
short pulse duration = (10 sec)/6 +0.08 sec = 1.75 sec
The firing sequence applied to the finite element model is as follows.
on for 1.75 secoff for 1.75 secon for 13.0 secoff for 1.75 secon for 1.75 sec
The boom tip deflections due to the firing sequence are shown in Figure 17. The bending moments at theroot of the boom are shown in Figure 18. The bending strength of the boom is 9200 N-m. The twobending moments combined will meet the required safety factor of 2.0.
105

0.1
0.0
-0.3
ax,in sA2)II uz, (m) i=L-- ux, (m)
i i i
0 5 10 15 20 25 Itime, (sec) I
..... J
Figure 17. Boom tip deflections and space shuttle x-acceleration
'!l
1000 .....................................................................................................................................................................................i '
o !
-1000
-2000
-3000
-4000 ....
0 5 10 15 20 25
time, (sec)
Figure 18. Boom bending moments and space shuttle x-acceleration
Flight Results
During orbit, the first natural frequency of the boom was measured prior to applying the fly castmaneuver. The period for the first natural frequency was 10.53 seconds. As mentioned in the previoussection, the pulse durations can be adjusted in increments of 0.08 second. Dividing the period by 6 androunding to the nearest multiple of 0.08 second results in a duration of 1.76 second. This duration wasused for the short pulses and durations between pulses in the fly cast maneuver. Boom tip deflectionsscaled from camera scenes taken during a fly cast maneuver are compared with the finite element resultsin Figures 19 and 20. The fly cast maneuver starts at time, 1.0 second, in the plots. The actual deflectionsare similar to the deflections obtained from the finite element model.
106

v 0.1._o"5 0.0
-0.1×
-0.2
0.3 t
0.2 ............... HE !
[-- finite element] _ __.__i
..... ......-0.3 ,
0 5 10 15 20 25time, (sec)
Figure 19. Boom tip x deflections during fly cast maneuver
0.3 ..........................................................................................................................................................................................
0.2
Ev 0.1t-O_= 0.0o
-0.1N
-0.2
,[ finite element 1actual !
-0.3
0 5 10 15 20 25time, (sec)
Figure 20. Boom tip z deflections during fly cast maneuver
Conclusion
The typical single pulse orbital maintenance maneuver would have required the boom to be retractedbefore each maneuver. The boom takes about 20 minutes to retract and 20 minutes to deploy. Using thefly cast maneuver, the loads on the boom were low enough that the boom did not have to be retractedprior to the maneuver and allowed more time for taking data.
Acknowledgments
The author would like to acknowledge Bill Layman from JPL for suggesting that a pulse sequence couldbe found to deflect the boom in a static deflected shape similar to fly casting a fishing pole.
107

108
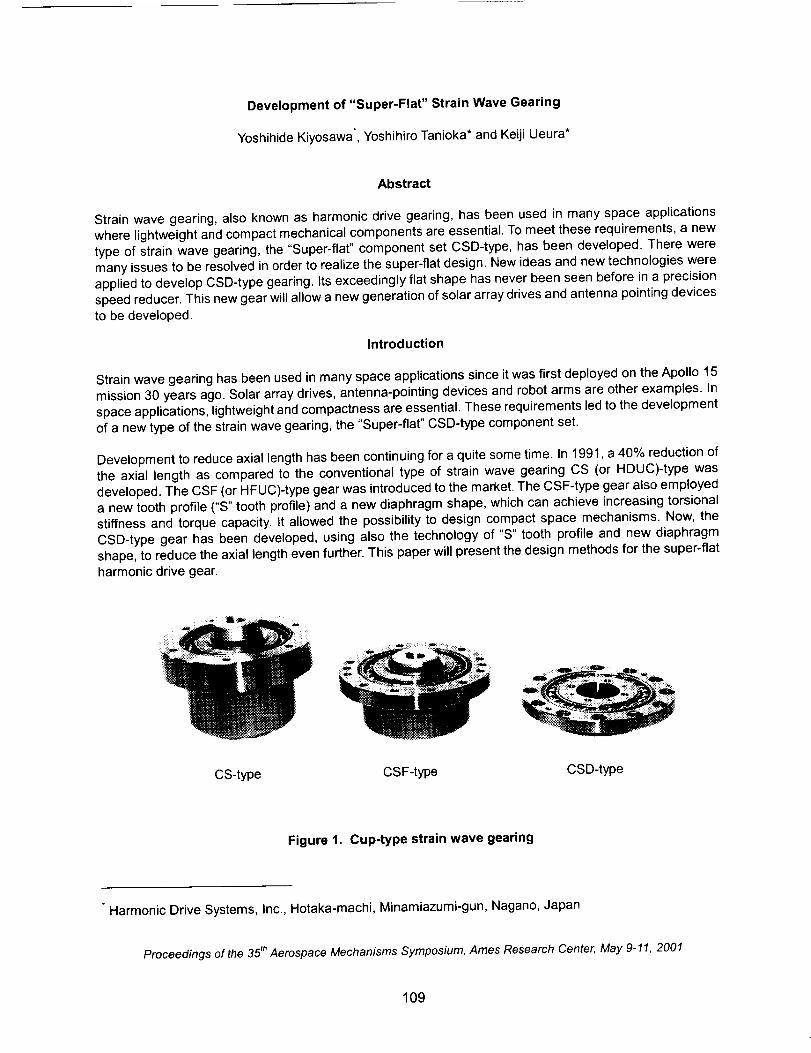
Development of "Super-Flat" Strain Wave Gearing
Yoshihide Kiyosawa*, Yoshihiro Tanioka* and Keiji Ueura*
Abstract
Strain wave gearing, also known as harmonic drive gearing, has been used in many space applications
where lightweight and compact mechanical components are essential. To meet these requirements, a new
type of strain wave gearing, the "Super-flat" component set CSD-type, has been developed. There were
many issues to be resolved in order to realize the super-flat design. New ideas and new technologies were
applied to develop CSD-type gearing. Its exceedingly flat shape has never been seen before in a precision
speed reducer. This new gear will allow a new generation of solar array drives and antenna pointing devices
to be developed.
Introduction
Strain wave gearing has been used in many space applications since it was first deployed on the Apollo 15
mission 30 years ago. Solar array drives, antenna-pointing devices and robot arms are other examples. In
space applications, lightweight and compactness are essential. These requirements led to the development
of a new type of the strain wave gearing, the "Super-flat" CSD-type component set.
Development to reduce axial length has been continuing for a quite some time. In 1991, a 40% reduction of
the axial length as compared to the conventional type of strain wave gearing CS (or HDUC)-type was
developed. The CSF (or HFUC)-type gear was introduced to the market. The CSF-type gear also employed
a new tooth profile ("S" tooth profile) and a new diaphragm shape, which can achieve increasing torsional
stiffness and torque capacity. It allowed the possibility to design compact space mechanisms. Now, the
CSD-type gear has been developed, using also the technology of "S" tooth profile and new diaphragm
shape, to reduce the axial length even further. This paper will present the design methods for the super-flat
harmonic drive gear.
CS-type CSF-type CSD-type
Figure t. Cup-type strain wave gearing
Harmonic Drive Systems, Inc., Hotaka-machi, Minamiazumi-gun, Nagano, Japan
Proceedings of the 35 thAerospace Mechanisms Symposium, Ames Research Center, May 9-11, 2001
109

Design of "Super-flat" Strain Wave Gearing
The strain wave gearing principle is unique in transmitting high torque through an elastically deformable
component. The gear has just three concentric elements:
• The Circular Spline (CS) is a solid cylindrical ring with internal gear teeth•
• The Flexspline (FS) is a non-rigid, thin cylindrical cup with external teeth at the open end of the cup.
The closed end of the cup is provided with a mounting flange for connecting machine elements.
• The Wave Generator (WG) is comprised of a thin-raced ball bearing fitted onto an elliptical plug,
serving as a high efficiency torque converter.
Circular Spline
Flexspline
Wave Generator
Figure 2. Basic gear components
To reduce the overall length of the gear, a new super-flat shape FS and thin WG bearing were designed.The width of the CS was also reduced to fit to the FS tooth width. Figure 3 shows a comparison between
design dimensions of the conventional model (CS-type), the current model (CSF-type), and CSD-type gear.
All gears are size 20. This new type of gear is approximately 50% of the length of the CSF-type gear and
30% of the CS-type gear. There were many issues to be resolved in order to realize the super-flat design.
¢70
¢70
• '
Figure 3. Dimensions of CS-type, CSF-type and CSD-type gear
110

Technical Challenges Related to the Super-flat Design and their Solutions
Fati.que stren,qth of FS tooth bed
To reduce the overall length of the gear, a new 50% shorter FS was designed. The tooth width itself was
reduced by 50% compared to the CSF-type. The reduction of tooth width causes decreasing fatigue
strength of the FS tooth bed. This was confirmed by the results of prototype testing at the early stages of
development.
The CSF-type FS tooth shape was designed with tooth relief to prevent tooth interference. Figure 4 shows
an example of the tooth shape with relieving. In designing the CSD-type FS, the relieving was eliminated to
increase tooth contact area as much as possible. A method other than tooth relief was used to solve tooth
interference, as will be discussed later. The success of this design was confirmed by the result of prototype
testing.
Flexspline ____diaphragm j_- --,,
I.___ __ I Conin__ _______ ! ang
Z:i,_'/ WG "
i_"_,! major axis
CSD_ CSF-type
\
Figure 4. Relieving Figure 5. Coning of Flexspline
Fatique stren,qth of FS diaphraqm
When the FS and WG are assembled, the FS is elastically deformed into a conical shape by the elliptical
shape of the WG. This elastic deformation is called "coning". The coning angle increases as the FS length is
shortened. (Figure 5). The increase in the coning angle will cause an increase in the repeated bending
stress at the diaphragm and a reduction in the fatigue strength. Furthermore, as shown in Figure 6, a
substantial effect on the fatigue strength is also anticipated if there is a mounting error.
Based on the stress values obtained by finite element analysis, the limit for mounting errors for the FS as a
function of the fatigue fracture of the diaphragm were calculated. Figure 7 shows an example of a gear size
50 with gear ratio 100:1. This calculation confirmed that the allowable mounting error, when considering
repeated peak torque, exceeds the recommended assembly tolerance of the gear. This provides evidence
of the robustness of the CSD-type design.
Startinq torque
The larger coning angle poses a challenge to smooth rotation of the gear due to increased tooth
interference and a decrease of the gap within the bearing raceway. This causes the starting torque of the
gear to increase. To prevent tooth interference, a new elliptical shape for the WG plug has been developed.
This new shape is optimized for the CSD-type gear. The new elliptical shape adjusts a moving locus of the
FS tooth. It was successfully applied to the CSD-type gear of size 50 and ratio 100:1 with this larger coning
angle.
111

TheconingoftheFSdeformstheouterraceoftheWGbearing,withlargerconinganglescausinglargerconicaldeformations.ThisdeformationgeneratesanaxialtranslationbetweentheWGouterraceandtheinnerracecausinginterferencebetweentheracesandballs.Thistendsto increasethestartingtorqueofthegear.Topreventthisundesiredeffectofconing,theradialclearanceofthebearingwasoptimizedfortheCSD-typegear.Asa resultoftheseoptimizations,theincreaseofstartingtorquewaskeptataminimum.
Inclination
Deviation
EEE
o7
£3
0.3
0.2
0.1
CSD-50-100
repeated peak torque
Recommended
/_elerance for assembly _
_ I I I I I "_I
0 0.1 0.2 0.3 0.4 0.5 0.6
Inclination
0.7
[deg.]
Figure 6. Mounting error of Flexspline Figure 7. Misalignment limit for Flexspline
Torsional stiffness
The larger coning angle requires larger clearances between the inside of the FS and the outside of the WG
bearing. This accommodates the larger conical deformation of the FS. Additionally, the WG bearing has alarger radial clearance optimized for the CSD-type gear. These clearances have an influence on the
torsional stiffness of the gear. When a torque is applied to the gear, the clearances within the gear arereduced as the result of elastic deformation of each element of the gear.
I
-800
2.0E-03
._o
0
_- 1.0E-03
J 1'3 PLr___ J_,
-4o
-l.0E-03
-2.0E-03
Figure 8.
I I
400 800
Torque (NT1)
Torque-torsion Curve of CSD-50-100
Figure 8 shows the torsional characteristics viewed from the low speed shaft when the load torque isapplied to the low-speed shaft with the high-speed shaft fixed. There is no noticeable decrease in stiffness
in the low torque region. This shows that optimizing the clearances within the WG for the CSD-type geardoes not degrade the torsional stiffness.
112
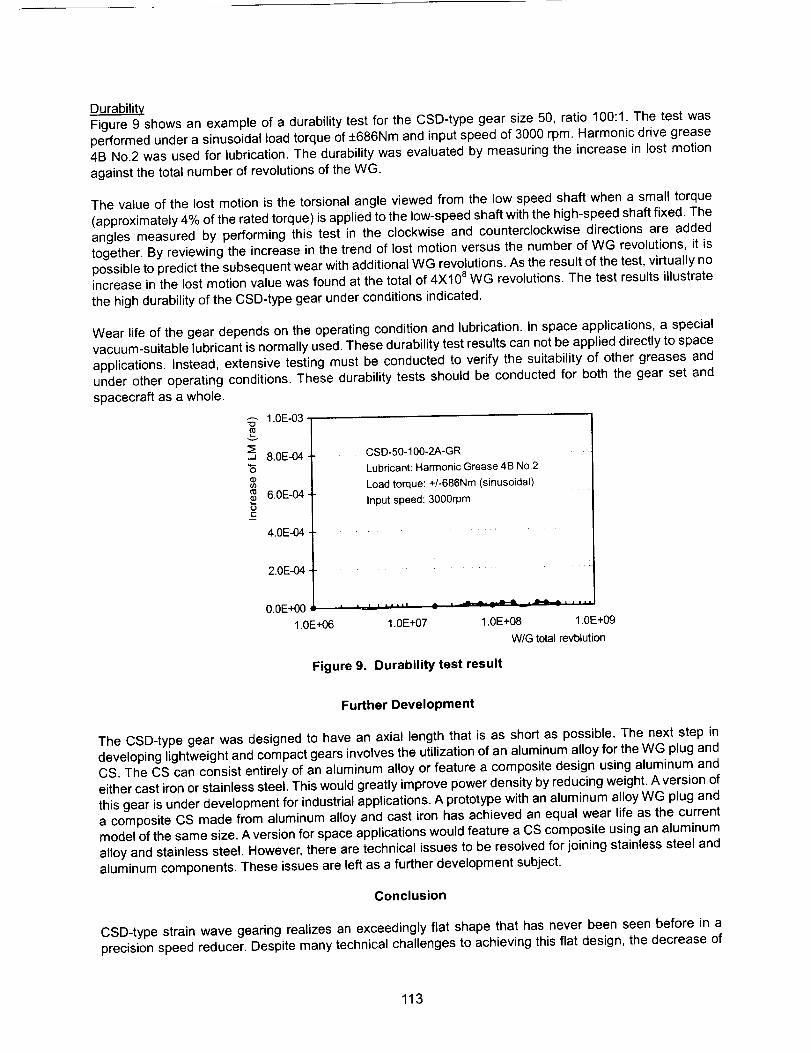
DurabilityFigure 9 shows an example of a durability test for the CSD-type gear size 50, ratio 100:1. The test was
performed under a sinusoidal load torque of +686Nm and input speed of 3000 rpm. Harmonic drive grease
4B No.2 was used for lubrication. The durability was evaluated by measuring the increase in lost motion
against the total number of revolutions of the WG.
The value of the lost motion is the torsional angle viewed from the low speed shaft when a small torque
(approximately 4% of the rated torque) is applied to the low-speed shaft with the high-speed shaft fixed. The
angles measured by performing this test in the clockwise and counterclockwise directions are added
together. By reviewing the increase in the trend of lost motion versus the number of WG revolutions, it is
possible to predict the subsequent wear with additional WG revolutions. As the result of the test, virtually noincrease in the lost motion value was found at the total of 4X10⁸ WG revolutions. The test results illustrate
the high durability of the CSD-type gear under conditions indicated.
Wear life of the gear depends on the operating condition and lubrication. In space applications, a special
vacuum-suitable lubricant is normally used. These durability test results can not be applied directly to space
applications. Instead, extensive testing must be conducted to verify the suitability of other greases and
under other operating conditions. These durability tests should be conducted for both the gear set and
spacecraft as a whole.
1.0E-03"D
v
-- 8.0E-04"6
6.0E-04tjt-
4.0E-04
2.0E-04
0.0E+00
1.0E+06
CSD-50-100-2A-GR
Lubricant: Harmonic Grease 4B No.2
Load torque: +/-686Nm (sinusoidal)
Input speed: 3000rpm
1.0E+07
Figure 9.
1.0E+08 1.0E+09
W/G total revbtution
Durability test result
Further Development
The CSD-type gear was designed to have an axial length that is as short as possible. The next step in
developing lightweight and compact gears involves the utilization of an aluminum alloy for the WG plug and
CS. The CS can consist entirely of an aluminum alloy or feature a composite design using aluminum and
either cast iron or stainless steel. This would greatly improve power density by reducing weight. A version of
this gear is under development for industrial applications. A prototype with an aluminum alloy WG plug and
a composite CS made from aluminum alloy and cast iron has achieved an equal wear life as the current
model of the same size. A version for space applications would feature a CS composite using an aluminum
alloy and stainless steel. However, there are technical issues to be resolved for joining stainless steel and
aluminum components. These issues are left as a further development subject.
Conclusion
CSD-type strain wave gearing realizes an exceedingly flat shape that has never been seen before in a
precision speed reducer. Despite many technical challenges to achieving this flat design, the decrease of
113
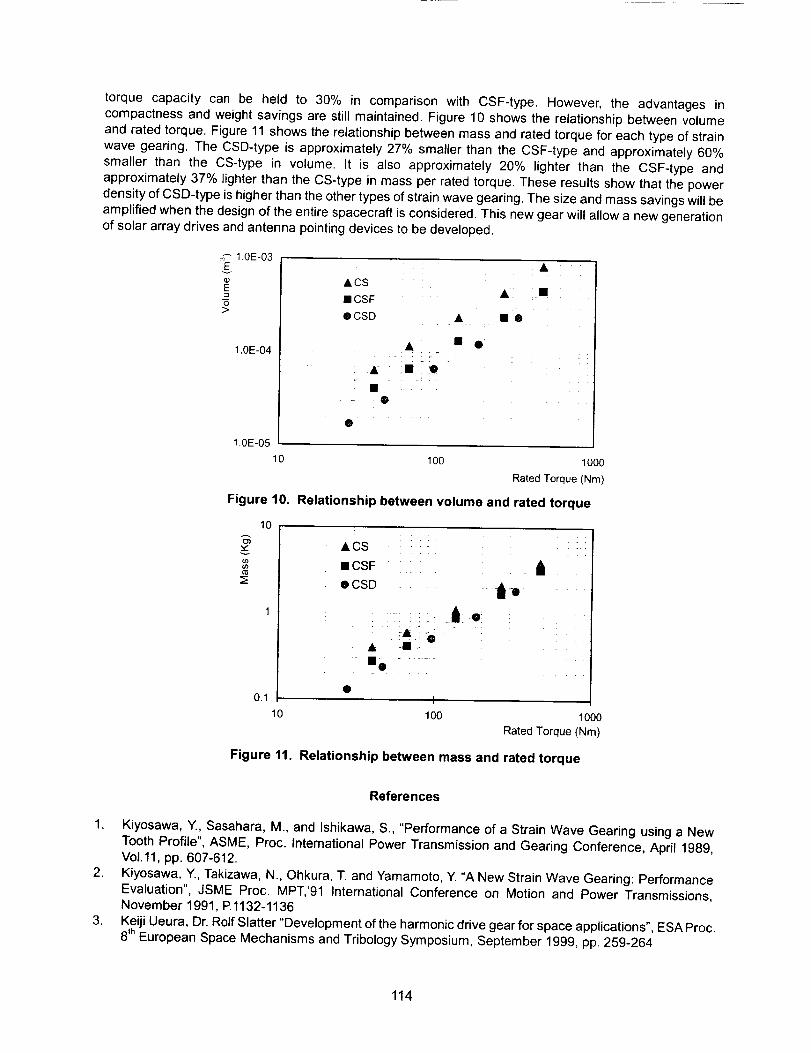
torquecapacitycan be held to 30% in comparisonwith CSF-type.However,the advantagesincompactnessandweightsavingsarestillmaintained.Figure10showstherelationshipbetweenvolumeandratedtorque.Figure11showstherelationshipbetweenmassandratedtorqueforeachtypeofstrainwavegearing.TheCSD-typeis approximately27%smallerthantheCSF-typeandapproximately60%smallerthan the CS-typein volume.It is also approximately20% lighterthan the CSF-typeandapproximately37%lighterthantheCS-typeinmassperratedtorque.TheseresultsshowthatthepowerdensityofCSD-typeishigherthantheother types of strain wave gearing. The size and mass savings will be
amplified when the design of the entire spacecraft is considered. This new gear will allow a new generation
of solar array drives and antenna pointing devices to be developed.
1.0E-03E
v
E
>
1.0E-04
t .0E-05
10
Figure 10.
lO
0.1
10
&cs
iCSF
®CSD &
A • •
& Jl
• A
,,i®
o
100 1000
Rated Torque (Nm)
Relationship between volume and rated torque
&CS .....
• CSF ....
OCSD .... 11
0I
1O0 1000Rated Torque (Nm)
Figure 11. Relationship between mass and rated torque
References
1. Kiyosawa, Y., Sasahara, M., and Ishikawa, S., "Performance of a Strain Wave Gearing using a NewTooth Profile", ASME, Proc. International Power Transmission and Gearing Conference, April 1989,
Vo1.11, pp. 607-612.
2. Kiyosawa, Y., Takizawa, N., Ohkura, T. and Yamamoto, Y. "A New Strain Wave Gearing: Performance
Evaluation", JSME Proc. MPT,'91 International Conference on Motion and Power Transmissions,November 1991, P. 1132-1136
3. Keiji Ueura, Dr. Rolf Slatter "Development of the harmonic drive gear for space applications", ESA Proc.
8th European Space Mechanisms and Tribology Symposium, September 1999, pp. 259-264
114

CA
J
Zero Play Hinge Latch
Mike Cabiran
Abstract
A zero play hinge latch was designed by using a tapered latching pin to stop the hinge from returningfrom its unfolded position. The tapered latch pin would hold the hinge without any play by wedging it
against a backstop. Any play caused by tolerances is taken up by additional axial movement andtherefore wedging by the spring-loaded tapered latching pin. This particular idea should be widely
useable in space structures since many stiff, long, and light structures are used in space as often it is
necessary to keep play at a minimum. Some reasons for this would be the need to hold a camera steadyto focus, to hold stowage in precise volumes, etc.
Introduction
This paper presents a description of the design, manufacture, testing, and problems of a zero play latchdesign using a tapered latch pin. The zero play hinge latch was designed to provide a small, stiff,
minimum play hinge and latch arrangement for folding, then unfolding a tubular frame, as shown in Figure1, which would support a cloth cover as shown in Figure 4. Figure 4 shows the frame and cloth cover but
not the cord that goes through the holes and around the frame and ties at the end. This frame and clothcover were originally designed to be folded into a compact shape, transported to the International Space
Station (ISS), then through several hatches to the Zarya module, (formerly known as the FGB module),unfolded, then clamped in position in the Zarya module while on-orbit as shown in Figure 5. Figure 5
shows FGB enclosure 17 clamped to the Zarya frame. Some dimensions are shown. Also the CrewTransfer Bag (CTB) is shown in the frame. This frame with the cloth cover was called the FGB enclosure.
The FGB enclosures were too large to fit through the entry hatches of the modules of the ISS at their fullvolume and therefore had to be folded to fit through when on-orbit. When they were unfolded, they had to
be precisely sized and stiff since any extra play would result in violating the imposed boundaries of 1 cm
(0.394 in) outside of the defined volume. This was to prevent interference by the stowed items withdelicate avionics and clearances used for ventilation. Other requirements were that the FGB enclosure
had to be able to be assembled into a larger space than it could fit through meaning that it had to easilyexpand into place. It had to be able to be easily clamped into place in zero gees and without any tools.
See Figure 5. Also, there could be no pinch points in the hinge mechanism. The hinge needed to beabout as stiff as the tubing, however, much of the stiffness of the enclosure assembly was provided bythe cross bracing from corner to corner of the assembly with Nomex webbing as shown in Figure 4. Two
main features of the enclosure then was that it had to be foldable and compact, and once unfolded, it hadto be stiff. One of the problems with making complex mechanisms stiff is the accumulation of clearances
due to tolerances from manufacturing. This problem was solved by using a tapered latch pin, which byaxial movement could hold the hinge open and take up any accumulation of clearances.
Description of a Zero Play Hinge Latch
The actual loads on the FGB Enclosure were relatively low since they were caused by stowed goods in a
micro-gravity environment. The maximum load the frame would encounter from acceleration would be .11g's from a berthing maneuver for a duration of 1 second. During this maneuver the frame would need to
restrain the mass of its contents, i.e., CTBs, to within 1 cm. The CTBs have a mass density of 400.5kg/m 3 or about 22.7 kg for 1 full size CTB. The FGB volumes are numbered from 1 to 22 and the volumes
we were designing for, 1-4 and 14 and 17 were calculated to deflect at most 0.292 cm (0.115 in) from the
Lockheed Martin Space Operations, Houston, TX
Proceedings of the 35 th Aerospace Mechanisms Symposium, Ames Research Center, May 9-11, 2001
115
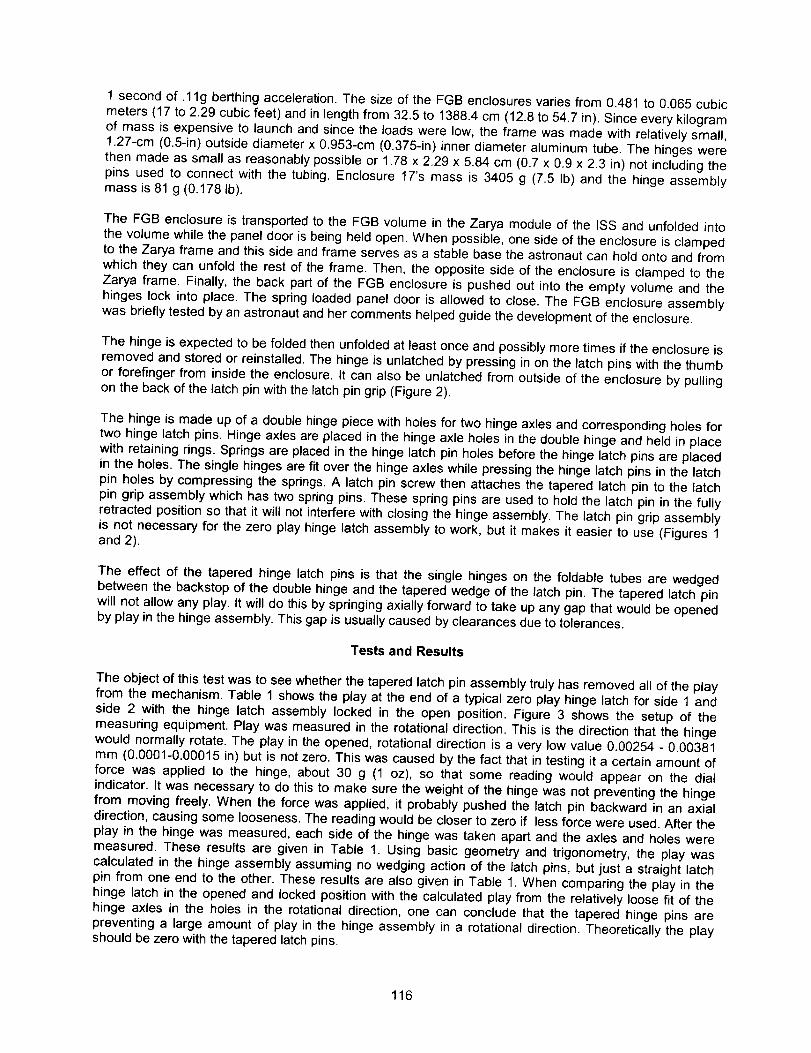
1secondof .11g berthing acceleration. The size of the FGB enclosures varies from 0.481 to 0.065 cubic
meters (17 to 2.29 cubic feet) and in length from 32.5 to 1388.4 cm (12.8 to 54.7 in). Since every kilogram
of mass is expensive to launch and since the loads were low, the frame was made with relatively small,1.27-cm (0.5-in) outside diameter x 0.953-cm (0.375-in) inner diameter aluminum tube. The hinges werethen made as small as reasonably possible or 1.78 x 2.29 x 5.84 cm (0.7 x 0.9 x 2.3 in) not including the
pins used to connect with the tubing. Enclosure 17's mass is 3405 g (7.5 Ib) and the hinge assemblymass is 81 g (0.178 Ib).
The FGB enclosure is transported to the FGB volume in the Zarya module of the ISS and unfolded into
the volume while the panel door is being held open. When possible, one side of the enclosure is clampedto the Zarya frame and this side and frame serves as a stable base the astronaut can hold onto and from
which they can unfold the rest of the frame. Then, the opposite side of the enclosure is clamped to the
Zarya frame. Finally, the back part of the FGB enclosure is pushed out into the empty volume and thehinges lock into place. The spring loaded panel door is allowed to close. The FGB enclosure assembly
was briefly tested by an astronaut and her comments helped guide the development of the enclosure.
The hinge is expected to be folded then unfolded at least once and possibly more times if the enclosure isremoved and stored or reinstalled. The hinge is unlatched by pressing in on the latch pins with the thumb
or forefinger from inside the enclosure. It can also be unlatched from outside of the enclosure by pullingon the back of the latch pin with the latch pin grip (Figure 2).
The hinge is made up of a double hinge piece with holes for two hinge axles and corresponding holes fortwo hinge latch pins. Hinge axles are placed in the hinge axle holes in the double hinge and held in place
with retaining rings. Springs are placed in the hinge latch pin holes before the hinge latch pins are placedin the holes. The single hinges are fit over the hinge axles while pressing the hinge latch pins in the latch
pin holes by compressing the springs. A latch pin screw then attaches the tapered latch pin to the latchpin grip assembly which has two spring pins. These spring pins are used to hold the latch pin in the fully
retracted position so that it will not interfere with closing the hinge assembly. The latch pin grip assemblyis not necessary for the zero play hinge latch assembly to work, but it makes it easier to use (Figures 1and 2).
The effect of the tapered hinge latch pins is that the single hinges on the foldable tubes are wedgedbetween the backstop of the double hinge and the tapered wedge of the latch pin. The tapered latch pin
will not allow any play. It will do this by springing axially forward to take up any gap that would be openedby play in the hinge assembly. This gap is usually caused by clearances due to tolerances.
Tests and Results
The object of this test was to see whether the tapered latch pin assembly truly has removed all of the playfrom the mechanism. Table 1 shows the play at the end of a typical zero play hinge latch for side 1 and
side 2 with the hinge latch assembly locked in the open position. Figure 3 shows the setup of themeasuring equipment. Play was measured in the rotational direction. This is the direction that the hinge
would normally rotate. The play in the opened, rotational direction is a very low value 0.00254 - 0.00381mm (0.0001-0.00015 in) but is not zero. This was caused by the fact that in testing it a certain amount of
force was applied to the hinge, about 30 g (1 oz), so that some reading would appear on the dial
indicator. It was necessary to do this to make sure the weight of the hinge was not preventing the hingefrom moving freely. When the force was applied, it probably pushed the latch pin backward in an axialdirection, causing some looseness. The reading would be closer to zero if less force were used. After the
play in the hinge was measured, each side of the hinge was taken apart and the axles and holes weremeasured. These results are given in Table 1. Using basic geometry and trigonometry, the play was
calculated in the hinge assembly assuming no wedging action of the latch pins, but just a straight latchpin from one end to the other. These results are also given in Table 1. When comparing the play in the
hinge latch in the opened and locked position with the calculated play from the relatively loose fit of thehinge axles in the holes in the rotational direction, one can conclude that the tapered hinge pins are
preventing a large amount of play in the hinge assembly in a rotational direction. Theoretically the playshould be zero with the tapered latch pins.
116
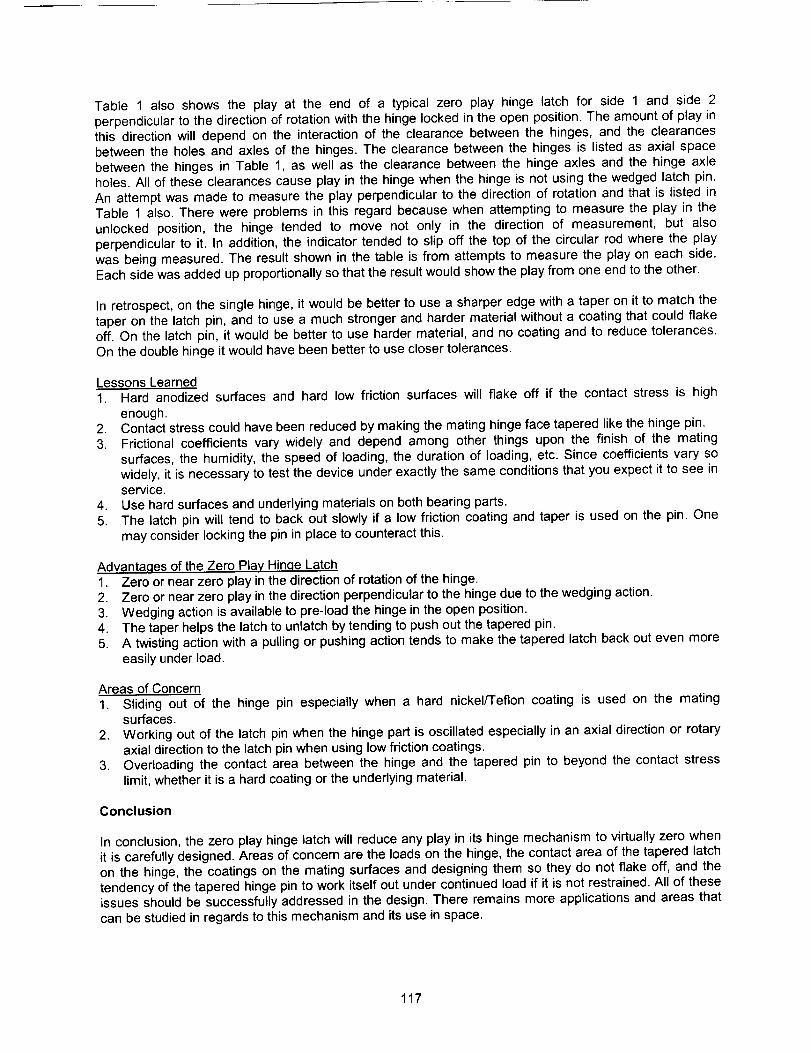
Table 1 alsoshowsthe playat the end of a typicalzeroplay hingelatchfor side 1 and side 2perpendicularto thedirectionof rotationwiththehingelockedintheopenposition.Theamountof playinthis directionwilldependon theinteractionof the clearancebetweenthe hinges,andtheclearancesbetweentheholesandaxlesof thehinges.Theclearancebetweenthehingesis listedasaxialspacebetweenthehingesin Table1, as wellas the clearancebetweenthehingeaxlesandthehingeaxleholes.Allof theseclearancescauseplayin thehingewhenthehingeis notusingthewedgedlatchpin.Anattemptwasmadeto measuretheplayperpendicularto thedirectionof rotationandthatis listedinTable1 also.Therewereproblemsin thisregardbecausewhenattemptingto measuretheplayin theunlockedposition,the hingetendedto movenot only in the directionof measurement,but alsoperpendicularto it. In addition,the indicatortendedto slipoff thetopof thecircularrodwherethe playwasbeingmeasured.Theresultshownin thetableis fromattemptsto measuretheplayoneachside.Eachsidewasaddedupproportionallysothattheresultwouldshowtheplayfromoneendtotheother.
In retrospect,onthesinglehinge,it wouldbebettertousea sharperedgewitha taperonit to matchthetaperonthelatchpin,andtousea muchstrongerandhardermaterialwithouta coatingthatcouldflakeoff.Onthelatchpin,it wouldbebetterto usehardermaterial,andnocoatingandto reducetolerances.Onthedoublehingeitwouldhavebeenbettertouseclosertolerances.
Lessons Learned
1. Hard anodized surfaces and hard low friction surfaces will flake off if the contact stress is high
enough.2. Contact stress could have been reduced by making the mating hinge face tapered like the hinge pin.3. Frictional coefficients vary widely and depend among other things upon the finish of the mating
surfaces, the humidity, the speed of loading, the duration of loading, etc. Since coefficients vary sowidely, it is necessary to test the device under exactly the same conditions that you expect it to see inservice.
4. Use hard surfaces and underlying materials on both bearing parts.
5. The latch pin will tend to back out slowly if a low friction coating and taper is used on the pin. One
may consider locking the pin in place to counteract this.
Advanta,qes of the Zero Play Hin,qe Latch1. Zero or near zero play in the direction of rotation of the hinge.
2. Zero or near zero play in the direction perpendicular to the hinge due to the wedging action.3. Wedging action is available to pre-load the hinge in the open position.
4. The taper helps the latch to unlatch by tending to push out the tapered pin.5. A twisting action with a pulling or pushing action tends to make the tapered latch back out even more
easily under load.
Areas of Concern
1. Sliding out of the hinge pin especially when a hard nickel/Teflon coating is used on the matingsurfaces.
2. Working out of the latch pin when the hinge part is oscillated especially in an axial direction or rotary
axial direction to the latch pin when using low friction coatings.3. Overloading the contact area between the hinge and the tapered pin to beyond the contact stress
limit, whether it is a hard coating or the underlying material.
Conclusion
In conclusion, the zero play hinge latch will reduce any play in its hinge mechanism to virtually zero when
it is carefully designed. Areas of concern are the loads on the hinge, the contact area of the tapered latchon the hinge, the coatings on the mating surfaces and designing them so they do not flake off, and the
tendency of the tapered hinge pin to work itself out under continued load if it is not restrained. All of theseissues should be successfully addressed in the design. There remains more applications and areas that
can be studied in regards to this mechanism and its use in space.
117
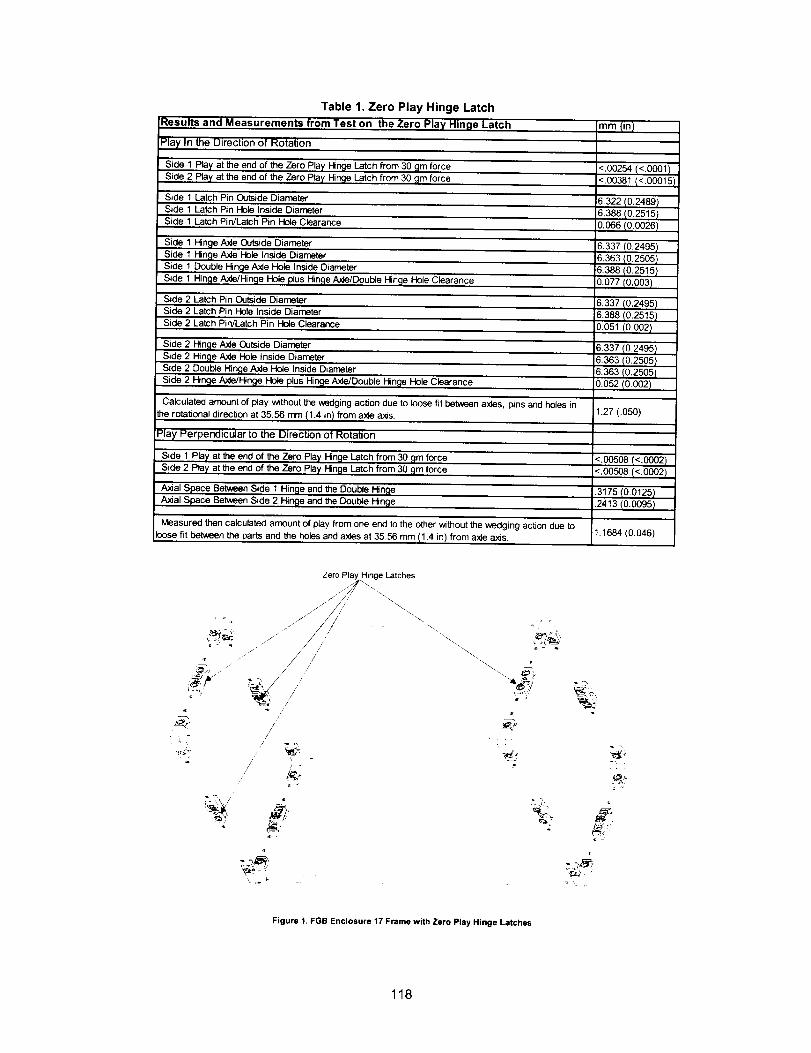
Table 1. Zero Play Hinge Latch
Results and Measurements from Test on the Zero Play Hinge Latch
Play In the Direction of Rotation
Side 1 Pla_' at the end of the Zero Play Hincje Latch from 30 _lm force
Side 2 Pla_/at the end of the Zero Play Hin_le Latch from 30 9m force
Side 1 Latch Pin Outside Diameter
Side 1 Latch Pin Hole Inside DiameterSide 1 Latch Pin/Latch Pin Hole Clearance
Side 1 Hinge Axle Outside Diameter
Side 1 Hincje _ Hole Inside Diameter
Side 1 Double Hin_le Axle Hole Inside Diameter
Side I Hinge Axle/Hinge Hole plus Hinge A,de/Double Hinae Hole Clearance
mm (in I
<.00254 (<.0001 /
<.00381 (<.00015)
6.322 (0.24891
6.388 (0.2515 /
0.066/0.0026 )
6.337(0.2495)6.363f0.2505}6.388(0.2515/0.077(0.003)
Side 2 Latch Pin Outside Diameter 6.337 t0.2495)
Side 2 Latch Pin Hole Inside Diameter 6.388 10.2515)
Side 2 Latch Pin/Latch Pin Hole Clearance 0.051 (0.002 /
Side 2 Hinge Axle Outside Diameter
Side 2 Hinge Ade Hole Inside Diameter
Side 2 Double Hinge Axle Hole Inside Diameter
Side 2 Hinge hode/Hin_le Hole plus Hir_le Axle/Double Hinge Hole Clearance
Calculated amount of play w_thout the wedging action due to loose fit between axles, pins and holes in
the rotational direction at 35.56 mm (1.4 inI from axle a_s.
Play Perpendicular to the Direction of Rotation
Side 1 Play at the end of the Zero Pla_/Hinge Latch from 30 _lm forceSide 2 Play at the end of the Zero Play Hinge Latch from 30 _m force
A,,dal Space Between Side 1 Hinge and the Double Hinge
A_al Space Between Side 2 Hin_le and the Double I_n_le
Measured then calculated amount of play from one end to the other without the wedging action due to
loose fit between the parts and the holes and axles at 35.56 mm tl.4 in) from axle axis.
6.337 10.2495/
6.363 (0.2505 /
6.363t0.2505 )
0.052 (0.002 /
1.27 (.050)
<.00508 (<.0002)
<.00508 (<.0002)
.3175(0.0125 /
.2413 (0.0095 /
1.1684 (0.046)
Zero Play Hinge Latches
/
/
\
,=
Figure 1. FGB Enclosure 17 Frame with Zero Play Hinge Latches
118

t.atch Pin Screw
L_t_l,ei_Grip _
Spring Pin __ _ r '
- ¢ - /Retaining Rin_
Hinge Latch Pin Holes -- _. /
Hinge .Axle Holes ...... _ ublc HingeDouble }tin_c Backstop
_-'_--,_,_- _lt/" /._. Tapered Latch pi nLatch Pin Spring _.
- _ _ Single Hinge
Figure 2, Zero Play Ilinge Latch - Exploded and Assembled Viev,'s
Clam_crew r
Clam [_ Ze o Play Hinge Latch Assembly
recision V-blo% - Dial_ir
=
Precision Flat Table
Stand
Figure 3. Zero Play Hinge Latch Test Assembly. Rotational Direction
119

Remlorcements j-- "
Figure 4. FGB Enclosure Frame 17 with Cover and Reinforcement
Lt:"
Figure 5. FGB Enclosure 17 Frame Interface Control Drawing showing where and how it attaches to Zarya Frame
120
/
Non-Metallic Hold Down and Release for an RF Antenna
David J. Hernandez Jr."
Abstract
Quick release mechanisms typically use metallic rods as preload-carrying members. This is often not aviable solution for restraint and release components that are connected to an RF Antenna. This is
because metal extensions remaining after release can interfere with the antenna's communicationssignals.
Astrium Ltd. (formerly Matra Marconi Space) required an antenna release mechanism that incorporates aquick release with negligible source shock output. However, the mechanism could not disrupt the
antenna's transmission after the antenna was released from the stowed position. In addition, a tensilepreload had to be maintained for a 6-month period with a rod elongation not to exceed 5% of the rod
length.
NEA met these requirements by integrating a Glass Fiber/Epoxy Laminate 10G/40 ("Tufnol") rod into theNEA-patented split-spool hold down and release mechanism. The combination of the non-metallic rod
and the split-spool device (SSD) provides an effective method of applying and maintaining the necessarypreload for launch as well as providing a "virtually" shock-free release.
Introduction
Release mechanisms are devices that allow release of a device that is initially stowed during launch and,later, to be deployed when in space. These devices include, among others, solar arrays, reflectors,various instruments, covers or antennas.
Astrium Ltd. required such a release device to be used in conjunction with the deployable antennas forthe MetOp spacecraft. Two different tensile preloads for antenna restraint, and the location of the hold
down points, forced the development of two release systems.
A preload of 3700 N was to be applied at the elbow of the antenna. At this location the antenna wasrestrained by a SSD integrated with a titanium rod. A tensile preload of 2000 N was to be applied at the
antenna end. At this location the antenna was restrained by a SSD integrated with a Tufnol rod. Theantenna and the hold down points are shown in Figure 1. In the figure, release assembly (RA) 001 refersto the location of the SSD with the titanium rod and IRA 002 refers to the location of the SSD with a Tufnol
rod.
A 4.5-amp current pulse over a duration of 35 milliseconds was required to activate both SSDs.
Furthermore, the configuration of each mechanism had to remain identical per the Astrium specification.The ability to incorporate both titanium and Tufnol rods is possible with the SSD release mechanism. TheSSD's preload-carrying capability varies with the diameter and material of the rod used in conjunction withthe mechanism.
The SSD's strength capability is important. With its present design the Model 9101P SSD, independent of
the rod diameter and rod material, will withstand up to 20000 N. Consequently, any potential creep fromthe SSD would come directly from the rod. This is because the SSD is used at a fraction of its loadcarrying capability (less than 25%).
" NEA Electronics, Inc., Chatsworth, CA
Proceedings of the 35 th Aerospace Mechanisms Symposium, Ames Research Center, May 9-1 I, 2001
121
O
O
0 ,0
A
Figure 1. Antenna Hold Down Points
Mechanism Actuation
The release of the mechanism requires activation through a fuse wire initiator assembly. The release time
of the fuse wire is approximated by the following equation:
Ws > c ppV.._ * 1.25
W = Watts (I 2 * R)s = Time in seconds to actuate
cp = Thermal Capacitance of fuse wire
p = Density of fuse wireVwire " Volume of fuse wire between contacts
When the value of the left side of the equation exceeds the melting point value on the right, the actuationtime can be approximated within 2 milliseconds. The 25% additional thermal mass (1.25 coefficient)
accounts for any potential losses from conduction, convection, and radiation. While the wire does not meltduring actuation, it does reach temperatures close to the melting point. It is the pull of the restraining wire
on the fuse wire that separates or opens the fuse wire circuit. For analysis in determining the mechanismactuation time it is safe to assume the melting temperature of the wire. At this temperature the wire would
no longer be a solid capable of resisting the force of the restraining wire.
The fuse wire length used in this mechanism was optimized. It was optimized to allow for a margin ofgreater than 10 milliseconds to the lowest time the actuation current was supplied by the MetOp power
supply.
122
SSD Shock Output
The source shock from the mechanism's release of the rod was also an important requirement. The
mounting and location of the hold down points, in addition to the antenna's sensitivity, necessitated a verylow shock output. Astrium Ltd. required that the SSD mechanism emit shock levels less than 0.8 x
frequency of emission. The shock was to be measured by accelerometers (10 - 10000 Hz) in the Z axison a 61 cm x 61 cm x 19 mm (2' x 2' x ¾") aluminum plate at 127 mm (5 inches) and 254 mm (10 inches)from the source.
During actuation the source shock produced a peak level of 160 g's at 7000 Hz using a 42-mm longTufnol rod. The tensile preload on the rod was 2500 N. The negligible source shock is attributed to the
split-spool restraint and release principal. The test data demonstrated that the mechanism with the Tufnolrod exhibited a greater shock emission than their titanium counterparts. It is believed that the reason for
the greater shock emission is because the Tufnol material has a higher elastic modulus than the titanium.
NEA engineers assume that the slow release of the rod's strain energy is the reason for the overall
negligible shock emitted. The measured preload drop over time in milliseconds after actuation wouldseem to confirm this hypothesis.
Non-Metallic Rod Development
A significant challenge for NEA in developing the Hold-Down and Release Mechanism for Astrium Ltd.was selection of the non-metallic rod material. The properties that are important in the material selectioninclude:
• High tensile strength
• High electrical resistance
• RF transparency
• High modulus of elasticity
• Low creep characteristics
The more common non-metallic materials used in space were eliminated because they did not sufficientlymeet the requirements above. These materials include but are not limited to ULTEM, Delrin, TORLONand PEEK.
After a thorough review of the above parameters, Astrium Ltd. recommended using a material namedTufnol. A rod diameter of 7.95 mm, with a tensile strength of 300 MPa, was more than capable of
withstanding the 4000-N maximum preload requirement. The operational preload of 2000 N would bemaintained at the MetOp spacecraft level by means of a flexure plate as shown in the Astrium design in
Figure 2. What remained was the creep behavior of the Tufnol under preload over an extended period oftime.
In this configuration the flexure plate maintains the preload via bending. For this reason elongation in
excess of 0.18 mm would cause an unacceptable non-preload condition.
The practical application for the SSD mechanism is to preload it during assembly of the MetOp satellitebus and stow it for a period of six months. It was necessary for Astrium Ltd. to specify that the Tufnol rod
survive a preload of approximately 2500 N for this six-month period. Furthermore, Astrium added a
temperature requirement of 30°C +5°C/-0°C for the six-month condition. This would represent theconditions that the MetOp bus would be stowed in.
NEA constructed a test to simulate the stowed conditions. Assembled in hardware made to the flight
configuration, the Tufnol rod was preloaded to approximately 2450 N. This load was the maximum
operational preload case in ambient conditions (room temperature of 15°C to 20°C).
123

Support Structure
Tension Rod
Ejection Piston
Hard Contact
Point
Release
Actuator
Figure 2. MetOp Antenna Configuration
When the SSD mechanism was placed in the oven, the preload increased to approximately 2465 N. Thepreload was adjusted to maintain a constant load. However, the time for adjusting the constant load was
for a period of 60 days. After that time, the load was allowed to decay at its own rate withoutadjustments. A graph depicting the load as measured by a load cell in compression is shown in Figure 3.
2500
2480
2460
2440
2420
2400
2380
2380
2340
2320
\
\
2300
0 20 40 60 80 100 120 140 160 180
Oay$
Figure 3. Tufnol Rod Load vs. Time
124
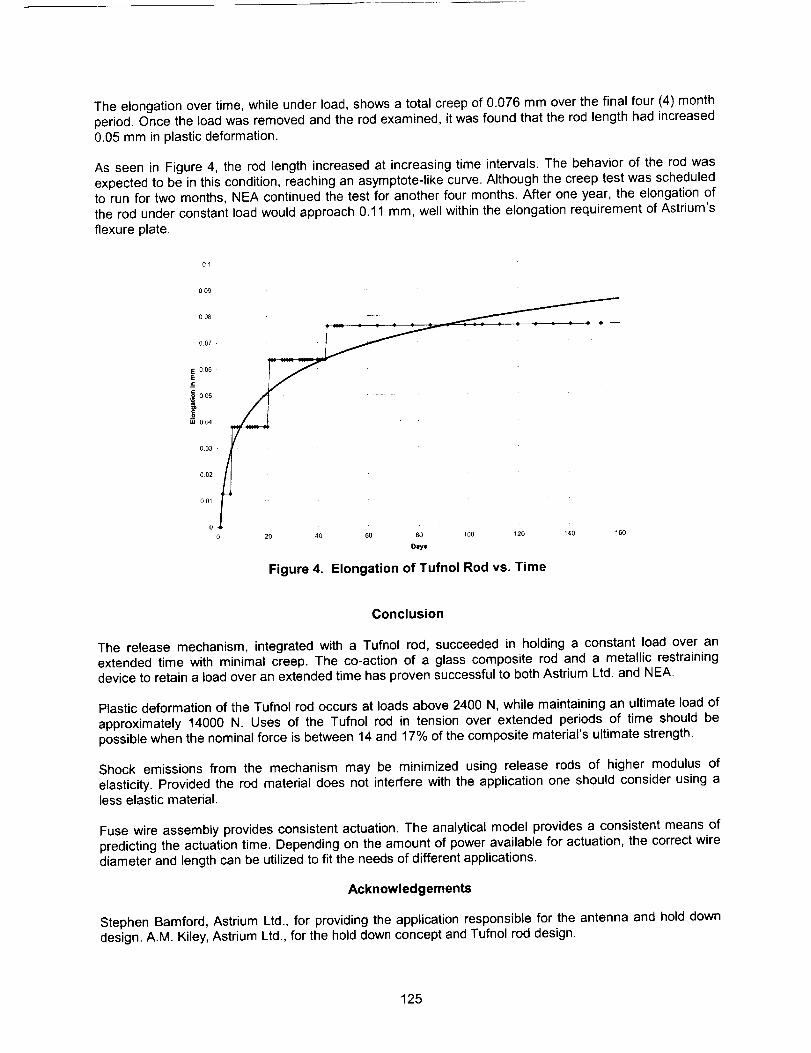
Theelongationovertime,whileunderload,showsatotalcreepof0.076mmoverthefinalfour(4)monthperiod.Oncetheloadwasremovedandtherodexamined,itwasfoundthattherodlengthhadincreased0.05mminplasticdeformation.
Asseenin Figure4, therodlengthincreasedat increasingtimeintervals.Thebehaviorof therodwasexpectedto beinthiscondition,reachinganasymptote-likecurve.Althoughthecreeptestwasscheduledto runfortwomonths,NEAcontinuedthetestforanotherfourmonths.Afteroneyear,theelongationoftherodunderconstantloadwouldapproach0.11mm,wellwithintheelongationrequirementofAstrium'sflexureplate.
01
0 09
0 o8
007
EE006
.E
005
o"=' 0C_
(].03
002
001
0
0 20 40 60 80 100 120 140 160
Dayl
Figure 4. Elongation of Tufnol Rod vs. Time
Conclusion
The release mechanism, integrated with a Tufnol rod, succeeded in holding a constant load over an
extended time with minimal creep. The co-action of a glass composite rod and a metallic restrainingdevice to retain a load over an extended time has proven successful to both Astrium Ltd. and NEA.
Plastic deformation of the Tufnol rod occurs at loads above 2400 N, while maintaining an ultimate load of
approximately 14000 N. Uses of the Tufnol rod in tension over extended periods of time should bepossible when the nominal force is between 14 and 17% of the composite material's ultimate strength.
Shock emissions from the mechanism may be minimized using release rods of higher modulus ofelasticity. Provided the rod material does not interfere with the application one should consider using aless elastic material.
Fuse wire assembly provides consistent actuation. The analytical model provides a consistent means of
predicting the actuation time. Depending on the amount of power available for actuation, the correct wirediameter and length can be utilized to fit the needs of different applications.
Acknowledgements
Stephen Bamford, Astrium Ltd., for providing the application responsible for the antenna and hold downdesign. A.M. Kiley, Astrium Ltd., for the hold down concept and Tufnol rod design.
125

126

Fault Tolerant Magnetic Bearing for Turbomachinery
Benjamin Choi* and Andrew Provenza*
Abstract
NASA Glenn Research Center (GRC) has developed a Fault-Tolerant Magnetic Bearing Suspension rigto enhance the bearing system safety. It successfully demonstrated that using only two active poles outof eight redundant poles from each radial bearing (that is, simply 12 out of 16 poles dead) levitated therotor and spun it without losing stability and desired position up to the maximum allowable speed of20,000 rpm.
In this paper, it is demonstrated that as far as the summation of force vectors of the attracting poles androtor weight is zero, a fault-tolerant magnetic bearing system maintained the rotor at the desired positionwithout losing stability even at the maximum rotor speed. A proportional-integral-derivative (PID)controller generated autonomous corrective actions with no operator's input for the fault situationswithout losing load capacity in terms of rotor position. This paper also deals with a centralized modalcontroller to better control the dynamic behavior over system modes.
Introduction
Magnetic suspension is now a competitive technology for aerospace applications such as gas turbineengines and energy storage flywheels. Despite their many benefits, active magnetic suspension systemsmay sustain failures in any one of many complex components: displacement probes, DSP controlboards, power amplifiers, communication buses, wiring, etc. A failure in any one of these could mean acomplete failure of the entire system. Because of this, concerns about overall system reliability havearisen. For some applications, double or even triple redundancy in mechanical systems is required.Redundancy in a typical magnetic system may require extra duplicate components powered up andready to go with a voting mechanism in place to chose (see Field, et al., 1998). This can work withamplifiers, probes, DSP boards, and perhaps even wire bundles, but not necessarily for electromagneticcoils.
Maslen, et al. (1998) showed that symmetry of poles in a magnetic bearing is not required for control.Appropriate coil currents can be determined to prescribe an arbitrary force for many combinations offaults in coils, amplifiers, or connectors. Na, et al. (2000) developed optimized solutions for faultscenarios for an 8-pole heteropolar magnetic bearing. They found that an 8-pole bearing with up to fivefailed coils can maintain control over a rotor provided there was sufficient position stiffness and damping.Chen (2000) has also shown that a magnetic bearing can operate without all of its coils functioning.
In this paper, a fail-safe controller for a fault-tolerant magnetic suspension test rig was demonstrated.Without changing the initial control gain parameters, the controller successfully enabled a rotor to spin upto the maximum allowable speed of 20,000 rpm with only two controlled poles out of eight from eachradial bearing.
Fault-Tolerant Maqnetic Bearing RigThe NASA Glenn Research Center has a facility to study a fault tolerance in magnetic suspensionsystems. The test rig and associated hardware are shown in Figure 1. The rotor is 68.6 cm (27") long,weighs 10.4 kg (23 Ib), and is driven by an air turbine. The air turbine can spin up to 60,000 rpm, but therotor can only be spun up to 20,000 rpm due to the stress limitations in the Hyperco 50 rotor laminations.The rotor is attached to the air turbine with a helical flexible coupling, which provides some axial rotor
" NASA Glenn Research Center, Cleveland, OH
Proceedings of the 35thAerospace Mechanisms Symposium, Ames Research Center, May 9-11, 2001
127
support.Thereis no thrust bearing,but the two radialmagneticbearingsprovideadditionalaxialrestoringforcesthroughreluctancecenteringeffects.Thestaticpredictedloadcapacityof each radialbearingis 113 kg (250Ib). In typicalapplications,a radialbearingsystemis designedwith a loadcapacityof threetimesthe rotorweight.In thiscasethebearingsaregrosslyoversizedandalmostanorderof magnitudestrongerthanrequired.Faulttolerantbearingdesignswill mostlikelybeoversized,butnotthismuch.Oversizedbearingseliminatea potentialsourceof non-linearityduringfaulttolerancetesting.As shownin Figure2, each bearinghas8 coils(includingfour redundantcoils),whichareindividuallycontrolledby their own dedicatedPWM transconductancepoweramplifiers.For thisconfiguration,a decoupleris requiredfor eachbearing(seeMeeker,1996).Thebearingnearthe airturbine(in-board)is poweredbytwo-stateamplifiersandtheoutboardbearingis poweredbythree-stateamplifiers.Ten eddycurrentdisplacementprobesin threedifferentplanesmonitorthe motionof therotor.
Thereareseveralwaysto simulatecircuitfaultsin this facility.Thereare mechanicalswitchesandvoltagecontrolledswitchesin the circuitsboth in frontof the each amplifierand each coil. Themechanicalswitchescanbecontrolledmanuallyfromthecontrolpanel(Figure3).Thevoltage-controlledswitchescanbeopenedandclosedwitha 0 and5 voltsignal,respectively.CircuitfaultscanalsobesimulatedbycontrollingthecommandsignalsfromthemagneticcontrollertothePWMamplifiers.
System Dynamics
For proportional-integral-derivative (PID) feedback control the following relation is represented thedecentralized dynamics of the suspension system:
meqJt:+ K,.K a_: + (KiK p - K , ), + K,K, I xdt = O (1)
where KI, is the proportional control gain, K t is the integral control gain, Ka is the derivative control gain,
and, m_,jis the equivalent lumped mass of the rotor.
For centralized control force from each radial bearing, the following equation represents the centralizeddynamics of the fault-tolerant magnetic suspension system
F,.2 (k, X.,q+.,-:)+(k,+k ).l.o +(q= - "' " (2)4
Control SystemThe control system uses a proportional-integral-derivative (PID) control algorithm, which is implementedwith the MATLAB/Simulink software. A real-time ANSI C code was generated, compiled, anddownloaded to a dSPACE control system (Figure 4), which is an integrated software and electroniccontrol unit combination (MATLAB software and dsl003/dsl004 alpha-combo, multiprocessor board). Itfound that fundamental shortcoming exists in the block diagram based controller as applied to the event-driven fault-tolerant control application. The number of blocks used in the overall control systemdrastically increased the loop time (or sample time). To overcome this deficiency, a customized blockwas used to incorporate a fault-tolerant control algorithm written in ANSI C with the control hardware. Itreduced the loop time by about 45%, reducing a lot of Simulink blocks to implement a fault-tolerantcontrol algorithm.
Unlike other magnetic suspension test rigs at GRC, the fault-tolerant test rig had severe sensor noise,which caused an intolerable operating noise. To cancel sensor noise, a moving average (MA) filter wasimplemented to smooth out five running points. Since a MA filter is a Finite Impulse Response filter,which cannot be implemented in real time fashion (the next two future values are unknown). To makethis non-causal filter causal, we had to shift the index back by two (that is, two sample times).
Figure 5 shows a controller cockpit window that allows modification of magnetic bearing parameters suchas bias, stiffness, damping, and integral. Also it includes a feature for various fault-tolerant situations formultiple coil and amplifier failures. It has a switch for a decentralized PID controller or centralized modalcontroller. At critical modes, a centralized modal controller was sufficient to suppress the vibration
128
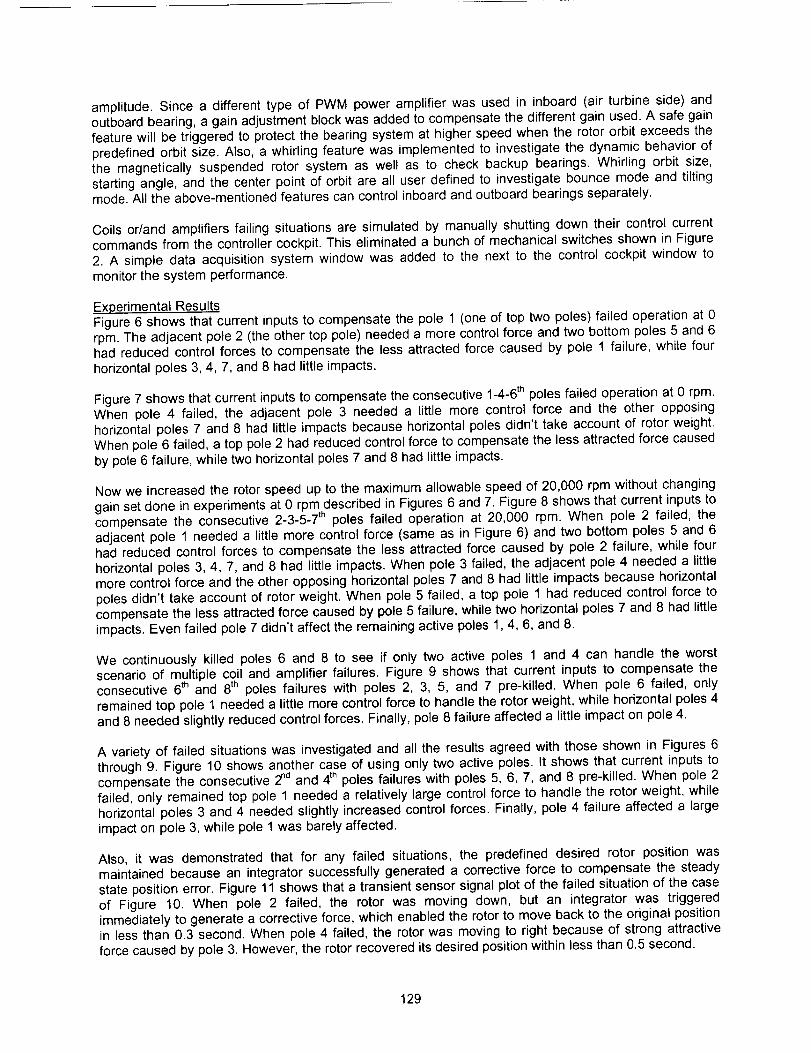
amplitude.Sincea differenttypeof PWMpoweramplifierwasusedin inboard(air turbineside)andoutboard bearing, a gain adjustment block was added to compensate the different gain used. A safe gainfeature will be triggered to protect the bearing system at higher speed when the rotor orbit exceeds thepredefined orbit size. Also, a whirling feature was implemented to investigate the dynamic behavior ofthe magnetically suspended rotor system as well as to check backup bearings. Whirling orbit size,starting angle, and the center point of orbit are all user defined to investigate bounce mode and tiltingmode. All the above-mentioned features can control inboard and outboard bearings separately.
Coils or/and amplifiers failing situations are simulated by manually shutting down their control currentcommands from the controller cockpit. This eliminated a bunch of mechanical switches shown in Figure2. A simple data acquisition system window was added to the next to the control cockpit window tomonitor the system performance.
Experimental ResultsFigure 6 shows that current inputs to compensate the pole 1 (one of top two poles) failed operation at 0rpm. The adjacent pole 2 (the other top pole) needed a more control force and two bottom poles 5 and 6had reduced control forces to compensate the less attracted force caused by pole 1 failure, while fourhorizontal poles 3, 4, 7, and 8 had little impacts.
Figure 7 shows that current inputs to compensate the consecutive 1-4-6th poles failed operation at 0 rpm.When pole 4 failed, the adjacent pole 3 needed a little more control force and the other opposinghorizontal poles 7 and 8 had little impacts because horizontal poles didn't take account of rotor weight.When pole 6 failed, a top pole 2 had reduced control force to compensate the less attracted force causedby pole 6 failure, while two horizontal poles 7 and 8 had little impacts.
Now we increased the rotor speed up to the maximum allowable speed of 20,000 rpm without changinggain set done in experiments at 0 rpm described in Figures 6 and 7. Figure 8 shows that current inputs tocompensate the consecutive 2-3-5-7 th poles failed operation at 20,000 rpm. When pole 2 failed, theadjacent pole 1 needed a little more control force (same as in Figure 6) and two bottom poles 5 and 6had reduced control forces to compensate the less attracted force caused by pole 2 failure, while fourhorizontal poles 3, 4, 7, and 8 had little impacts. When pole 3 failed, the adjacent pole 4 needed a littlemore control force and the other opposing horizontal poles 7 and 8 had little impacts because horizontalpoles didn't take account of rotor weight. When pole 5 failed, a top pole 1 had reduced control force tocompensate the less attracted force caused by pole 5 failure, while two horizontal poles 7 and 8 had littleimpacts. Even failed pole 7 didn't affect the remaining active poles 1,4, 6, and 8.
We continuously killed poles 6 and 8 to see if only two active poles 1 and 4 can handle the worstscenario of multiple coil and amplifier failures. Figure 9 shows that current inputs to compensate theconsecutive 6th and 8th poles failures with poles 2, 3, 5, and 7 pre-killed. When pole 6 failed, onlyremained top pole 1 needed a little more control force to handle the rotor weight, while horizontal poles 4and 8 needed slightly reduced control forces. Finally, pole 8 failure affected a little impact on pole 4.
A variety of failed situations was investigated and all the results agreed with those shown in Figures 6through 9. Figure 10 shows another case of using only two active poles. It shows that current inputs tocompensate the consecutive 2_dand 4th poles failures with poles 5, 6, 7, and 8 pre-killed. When pole 2failed, only remained top pole 1 needed a relatively large control force to handle the rotor weight, whilehorizontal poles 3 and 4 needed slightly increased control forces. Finally, pole 4 failure affected a largeimpact on pole 3, while pole 1 was barely affected.
Also, it was demonstrated that for any failed situations, the predefined desired rotor position wasmaintained because an integrator successfully generated a corrective force to compensate the steadystate position error. Figure 11 shows that a transient sensor signal plot of the failed situation of the caseof Figure 10. When pole 2 failed, the rotor was moving down, but an integrator was triggeredimmediately to generate a corrective force, which enabled the rotor to move back to the original positionin less than 0.3 second. When pole 4 failed, the rotor was moving to right because of strong attractiveforce caused by pole 3. However, the rotor recovered its desired position within less than 0.5 second.
129
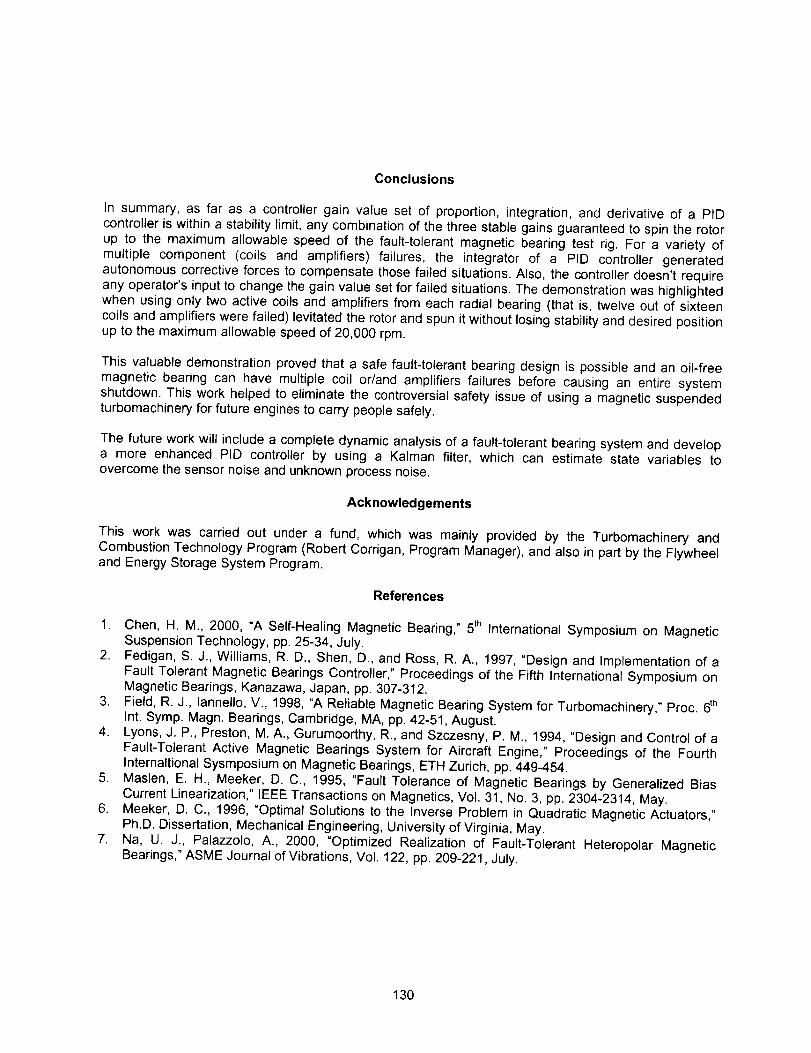
Conclusions
In summary, as far as a controller gain value set of proportion, integration, and derivative of a PIDcontroller is within a stability limit, any combination of the three stable gains guaranteed to spin the rotorup to the maximum allowable speed of the fault-tolerant magnetic bearing test rig. For a variety ofmultiple component (coils and amplifiers) failures, the integrator of a PID controller generatedautonomous corrective forces to compensate those failed situations. Also, the controller doesn't requireany operator's input to change the gain value set for failed situations. The demonstration was highlightedwhen using only two active coils and amplifiers from each radial bearing (that is, twelve out of sixteencoils and amplifiers were failed) levitated the rotor and spun it without losing stability and desired positionup to the maximum allowable speed of 20,000 rpm.
This valuable demonstration proved that a safe fault-tolerant bearing design is possible and an oil-freemagnetic bearing can have multiple coil or/and amplifiers failures before causing an entire systemshutdown. This work helped to eliminate the controversial safety issue of using a magnetic suspendedturbomachinery for future engines to carry people safely.
The future work will include a complete dynamic analysis of a fault-tolerant bearing system and developa more enhanced PID controller by using a Kalman filter, which can estimate state variables toovercome the sensor noise and unknown process noise.
Acknowledgements
This work was carried out under a fund, which was mainly provided by the Turbomachinery andCombustion Technology Program (Robert Corrigan, Program Manager), and also in part by the Flywheeland Energy Storage System Program.
References
1. Chen, H. M., 2000, "A Self-Healing Magnetic Bearing," 5t" International Symposium on MagneticSuspension Technology, pp. 25-34, July.
2. Fedigan, S. J., Williams, R. D., Shen, D., and Ross, R. A., 1997, "Design and Implementation of aFault Tolerant Magnetic Bearings Controller," Proceedings of the Fifth International Symposium onMagnetic Bearings, Kanazawa, Japan, pp. 307-312.
3. Field, R. J., lannello, V., 1998, "A Reliable Magnetic Bearing System for Turbomachinery," Proc. 6thInt. Symp. Magn. Bearings, Cambridge, MA, pp. 42-51, August.
4. Lyons, J. P., Preston, M. A., Gurumoorthy, R., and Szczesny, P. M., 1994, "Design and Control of aFault-Tolerant Active Magnetic Bearings System for Aircraft Engine," Proceedings of the FourthInternaltional Sysmposium on Magnetic Bearings, ETH Zurich, pp. 449-454.
5. Maslen, E. H., Meeker, D. C., 1995, "Fault Tolerance of Magnetic Bearings by Generalized BiasCurrent Linearization," IEEE Transactions on Magnetics, Vol. 31, No. 3, pp. 2304-2314, May.
6. Meeker, D. C., 1996, =Optimal Solutions to the Inverse Problem in Quadratic Magnetic Actuators,"Ph.D. Dissertation, Mechanical Engineering, University of Virginia, May.
7. Na, U. J., Palazzolo, A., 2000, "Optimized Realization of Fault-Tolerant Heteropolar MagneticBearings," ASME Journal of Vibrations, Vol. 122, pp. 209-221, July.
130
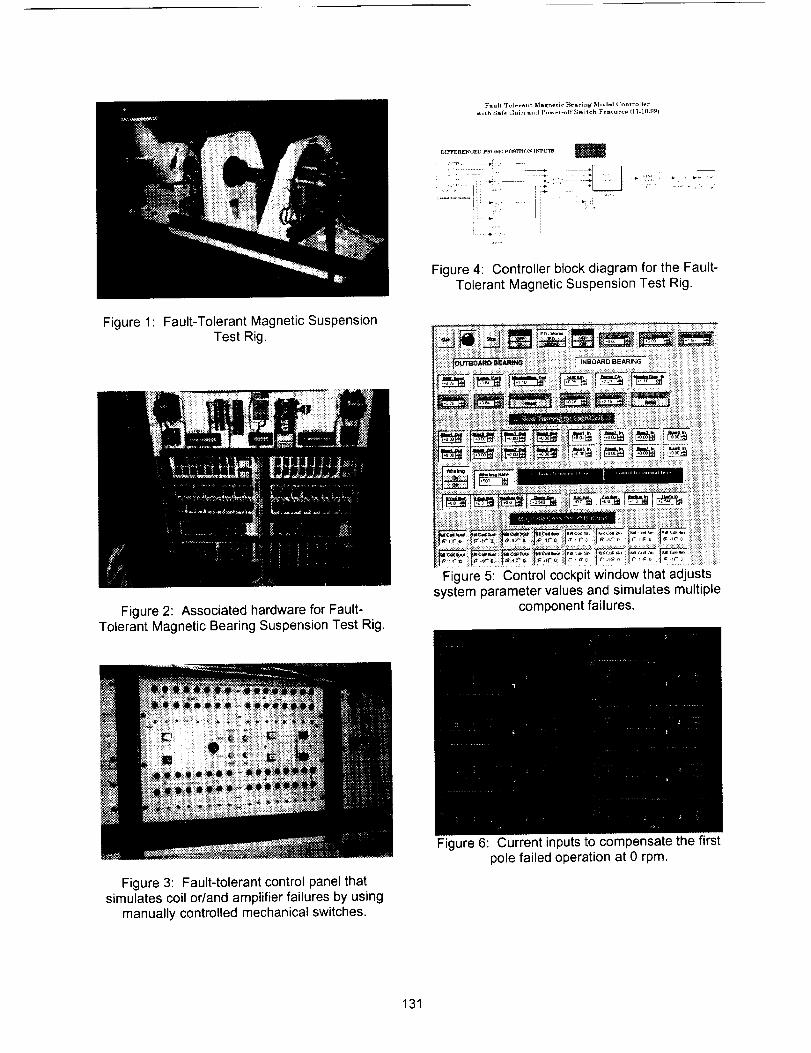
Fault Tolerant ,_la_ne¢ic' _ear_ng ,_(odnl Controller
_'iLh Safe Gain and power_f_.'_itch Feature_ (I I-i0-99)
Figure 1 Fault-Tolerant Magnetic Suspension
Test Rig.
DI]rFERENOED PROBE pO_ITIr)N i_rPt]l_
] "'
Figure 4: Controller block diagram for the Fault-Tolerant Magnetic Suspension Test Rig.
Figure 2: Associated hardware for Fault-Tolerant Magnetic Bearing Suspension Test Rig.
Figure 5: Control cockpit window that adjusts
system parameter values and simulates multiplecomponent failures.
Figure 3: Fault-tolerant control panel thatsimulates coil or/and amplifier failures by using
manually controlled mechanical switches.
Figure 6: Current inputs to compensate the first
pole failed operation at 0 rpm.
131
Figure 7: Current inputs to compensate theconsecutive 1-4-6 th poles failed operation at 0
rpm.
Figure 10: Current inputs to compensate theconsecutive 5-6-7-8-2-4 th poles failed operation
at the maximum allowable speed of 20,000 rpm.Only two active coils of 1 and 3.
Figure 8: Current inputs to compensate theconsecutive 2-3-5-7 th poles failed operation atthe maximum allowable speed of 20,000 rpm.
Figure 11: Transient sensor plot of the failedsituation of Figure 13. The 5-6-7-8 th poles pre-failed, followed by the 2-4 th poles failed case.
Only two active coils of 1 and 3 at 20,000 rpm.
Figure 9: Current inputs to compensate theconsecutive 2-3-5-7-6-8 thpoles failed operation
at the maximum allowable speed of 20,000 rpm.Only two active coils of 1 and 4.
132
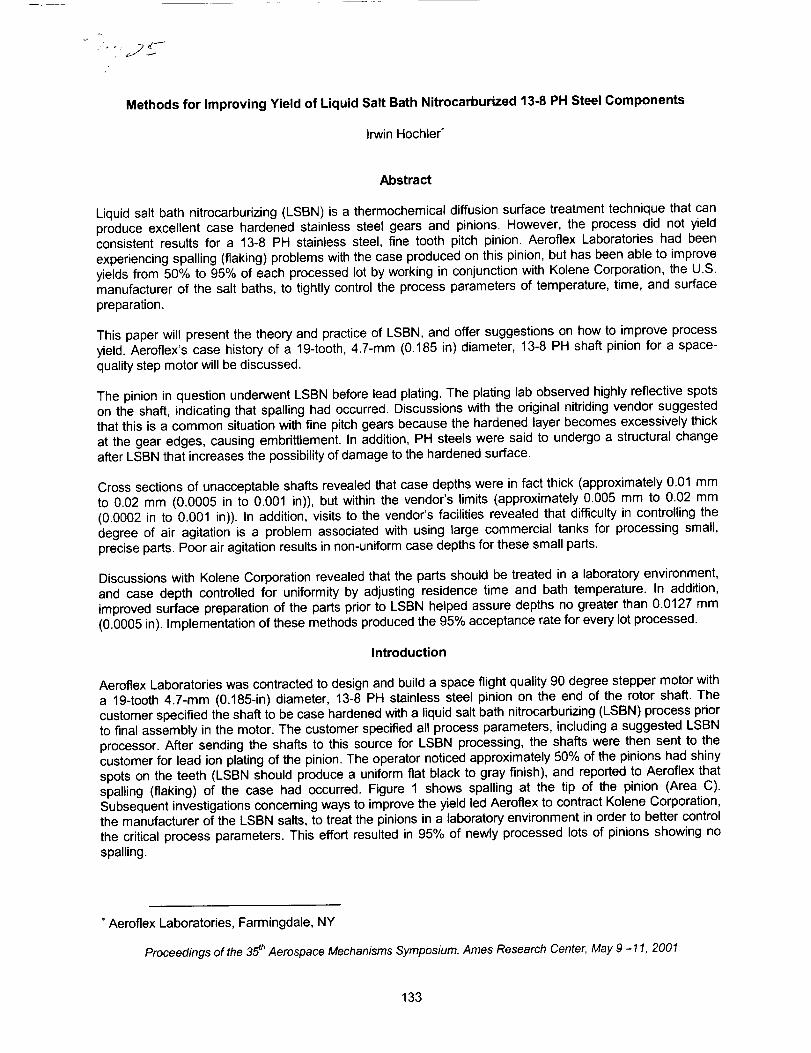
/"
Methods for Improving Yield of Liquid Salt Bath Nitrocarburized 13-8 PH Steel Components
Irwin Hochler _
Abstract
Liquid salt bath nitrocarburizing (LSBN) is a thermochemical diffusion surface treatment technique that canproduce excellent case hardened stainless steel gears and pinions. However, the process did not yield
consistent results for a 13-8 PH stainless steel, fine tooth pitch pinion. Aeroflex Laboratories had beenexperiencing spalling (flaking) problems with the case produced on this pinion, but has been able to improve
yields from 50% to 95% of each processed lot by working in conjunction with Kolene Corporation, the U.S.manufacturer of the salt baths, to tightly control the process parameters of temperature, time, and surface
preparation.
This paper will present the theory and practice of LSBN, and offer suggestions on how to improve processyield. Aeroflex's case history of a 19-tooth, 4.7-mm (0.185 in) diameter, 13-8 PH shaft pinion for a space-quality step motor will be discussed.
The pinion in question underwent LSBN before lead plating. The plating lab observed highly reflective spots
on the shaft, indicating that spalling had occurred. Discussions with the original nitriding vendor suggestedthat this is a common situation with fine pitch gears because the hardened layer becomes excessively thick
at the gear edges, causing embritUement. In addition, PH steels were said to undergo a structural changeafter LSBN that increases the possibility of damage to the hardened surface.
Cross sections of unacceptable shafts revealed that case depths were in fact thick (approximately 0.01 mmto 0.02 mm (0.0005 in to 0.001 in)), but within the vendor's limits (approximately 0.005 mm to 0.02 mm
(0.0002 in to 0.001 in)). In addition, visits to the vendor's facilities revealed that difficulty in controlling thedegree of air agitation is a problem associated with using large commercial tanks for processing small,
precise parts. Poor air agitation results in non-uniform case depths for these small parts.
Discussions with Kolene Corporation revealed that the parts should be treated in a laboratory environment,
and case depth controlled for uniformity by adjusting residence time and bath temperature. In addition,improved surface preparation of the parts prior to LSBN helped assure depths no greater than 0.0127 mm
(0.0005 in). Implementation of these methods produced the 95% acceptance rate for every lot processed.
Introduction
Aeroflex Laboratories was contracted to design and build a space flight quality 90 degree stepper motor witha 19-tooth 4.7-mm (0.185-in) diameter, 13-8 PH stainless steel pinion on the end of the rotor shaft. Thecustomer specified the shaft to be case hardened with a liquid salt bath nitrocarburizing (LSBN) process prior
to final assembly in the motor. The customer specified all process parameters, including a suggested LSBNprocessor. After sending the shafts to this source for LSBN processing, the shafts were then sent to the
customer for lead ion plating of the pinion. The operator noticed approximately 50% of the pinions had shinyspots on the teeth (LSBN should produce a uniform flat black to gray finish), and reported to Aeroflex thatspalling (flaking) of the case had occurred. Figure 1 shows spalling at the tip of the pinion (Area C).
Subsequent investigations concerning ways to improve the yield led Aeroflex to contract Kolene Corporation,the manufacturer of the LSBN salts, to treat the pinions in a laboratory environment in order to better control
the critical process parameters. This effort resulted in 95% of newly processed lots of pinions showing nospelling.
* Aeroflex Laboratories, Farmingdale, NY
Proceedings of the 35thAerospace Mechanisms Symposium, Ames Research Center, May 9 -11, 2001
133
Figure 1. Spalled Gear Pinion (Area C)
Process Background
In order to understand the reasons for the problems encountered in this process, a description of LSBN is
presented. LSBN uses a combination of potassium and sodium cyanate salts (KCNO and NaCNO) in a
molten state, typically at 580°C (1075°F). These salts react with the iron at the steel surface and releasecarbon and nitrogen as follows:
8 CNO- = 2CO3 -2+ 4CN- + CO2 + [C]Fe -I-4[N]Fe (1)
The desired product in this reaction is the 4[N]Fe, or epsilon iron nitride. This compound improves the wearresistance of steels.
The reaction and subsequent diffusion of the carbon and nitrogen is represented schematically in Figure 2.On the left is the KCNO salt, which releases the C and N at the surface to produce the compounds shown in
Equation 1. The zone where reaction occurs is called the compound layer, and is the area where spallingproblems may occur. Compound layers range in thickness from 0.005 mm to 0.025 mm (0.0002 in to 0.001in), depending on residence time, bath temperature, and the alloy composition of the treated steel. Unreacted
nitrogen will diffuse below the compound layer, producing a solution of nitrogen in iron. This layer, called the
diffusion zone, can impart improved fatigue strength on the processed part if it is aged at 300°C (570°F) inorder to precipitate Fe4N _. This layer is much deeper than the compound layer, measuring up to 1.02 mm(0.040 in) 2. Figure 3 shows a typical low carbon steel after LSBN treatment, showing the relative thickness of
the compound zone and the diffusion zone, as well as the iron nitdde needles formed in the diffusion zone
after aging.
1Wensing, Donald, et al, "Liquid Nitriding," ASM Committee on Liquid Carburizing, p. 254.
2Wensing, p. 254.
134

Figure 2. Schematic of the Nitrocarburizing Process 3
Compound
Figure 3. Nitrocarburized Low Carbon Steel 4
Enqineerin.q Properties of Nitrocarburized Steels
The enhanced engineering properties of steels processed wJth LSBN involve improved wear resistance,reduced coefficient of friction, and improved fatigue strength. The improved wear resistance is primarily dueto increased surface hardness (640 minimum Knoop KHloo for 13-8 PH steel). In addition, the surface of thecompound layer during processing develops microporosities which act as reservoirs for lubricant 5. These
micropores make the surface ideal for holding lead plating, which help improve wear resistance. The reducedcoefficient of friction is also due to the increased surface hardness, and generally results in a coefficient of
3Easterday, James R., "Salt Bath Ferritic Nitrocarburizing," Kolene Corporation Technology Update (1996),
4PE2sterday, p. 3.
SEasterday, p. 3.
135

0.38.Theimprovedfatiguestrength,asmentionedpreviously,isa resultof ironnitrideformedinthediffusionzone,andgenerallyresultsinanimprovementof25%to35%instainlesssteelsz.
LSBN Process Description
The parts are usually cleaned first in an alkaline rinse to remove any surface oxides. They are preheated to
approximately 400°C (750°F) in order to reduce the possibility of thermal shock and to dry the partscompletely.
The parts are then placed in the salt bath, generally kept at 580°C (1075°F). The critical parameter to control
at this stage is the cyanate concentration, which must be kept at 34%-38% for proper compound layerformation 8. If the concentration falls below this range, a proprietary nitrogen-bearing polymer is added, which
reacts with the carbonate in the bath to form cyanate. The residence time in the bath depends on the materialprocessed and the required compound layer thickness, and is usually 15 minutes minimum, 30 minutesmaximum for 13-8 PH and 17-4 PH steels. The last factor to be considered in the bath is aeration, which is
accomplished by using air spargers on the bottom of the tank. The air to the spargers is dried and filtered,and its function is to improve surface contact with the parts and the liquid.
The parts are then removed from the salt bath, and are placed in a quench tank. This tank is kept at 400°C
(750°F) and contains oxidizing (nitrate) salts. The oxidizing salts convert any remaining cyanide and cyanates
to carbonates, thus stopping any further surface reactions. In addition, the lower temperature of the quenchbath prevents any distortion of the parts due to thermal stress. The parts are usually kept in this bath for 5 to20 minutes.
After removal from the quench tank, the parts are air cooled to room temperature, and residual salts are
rinsed off with water. At this stage, the parts should have a uniform black finish. One piece is usuallysectioned and tested for hardness and thickness of the compound layer, as well as hardness of the diffusionzone.
Problems Associated with LSBN Processed Stainless Steels
The LSBN process usually provides predictable and uniform results for a wide range of steels and even castiron. However, some difficulties arise when processing stainless steels. The chromium and nickel in stainless
steels are also nitride formers; therefore, the compound layer contains chromium and nickel nitrides inbetween grain boundaries. This results in a very brittle compound layer, which increases the chance of
spalling. The molybdenum in 13-8 PH steel also scavenges nitrogen, thus adding to the possibility of spallingin this alloy. In addition, the nitriding reactions occur very quickly, so residence time is critical in order to
prevent formation of an excessively heavy compound layer. Furthermore, the diffusion zone is not as deep as
in non-alloyed steels because a great deal of the free nitrogen is scavenged by the alloying elements;therefore, the nitrogen cannot diffuse well into the steel. Finally, corrosion resistance is compromised due tothe reactions of the alloying elements chromium and nickel.
Case History
The 13-8 PH pinions that were initially processed were done according to the customer's specifications,
which were based on their years of experience using LSBN. The parts were required to be heat treated to RC4245 prior to LSBN processing. The salt bath temperature was specified to be less than the heat treat
temperature in order to prevent any degradation in the hardness, and the residence time was to be adjustedto produce a compound layer between 0.005 mm and 0.025 mm (0.0002 in and 0.001 in). However, whenthis specification was followed for the Aeroflex pinion, a chromium nitride embrittled compound layer close to
0.025 mm (0.001 inch) resulted in too much buildup on both sides of the fine pitch tooth, and spalling
occurred. In other words, the specification tolerances on the compound layer thickness for this particular parthad to be tightened.
6Easterday, p. 9.7Easterday, p. 9.8Easterday, p. 4.
136
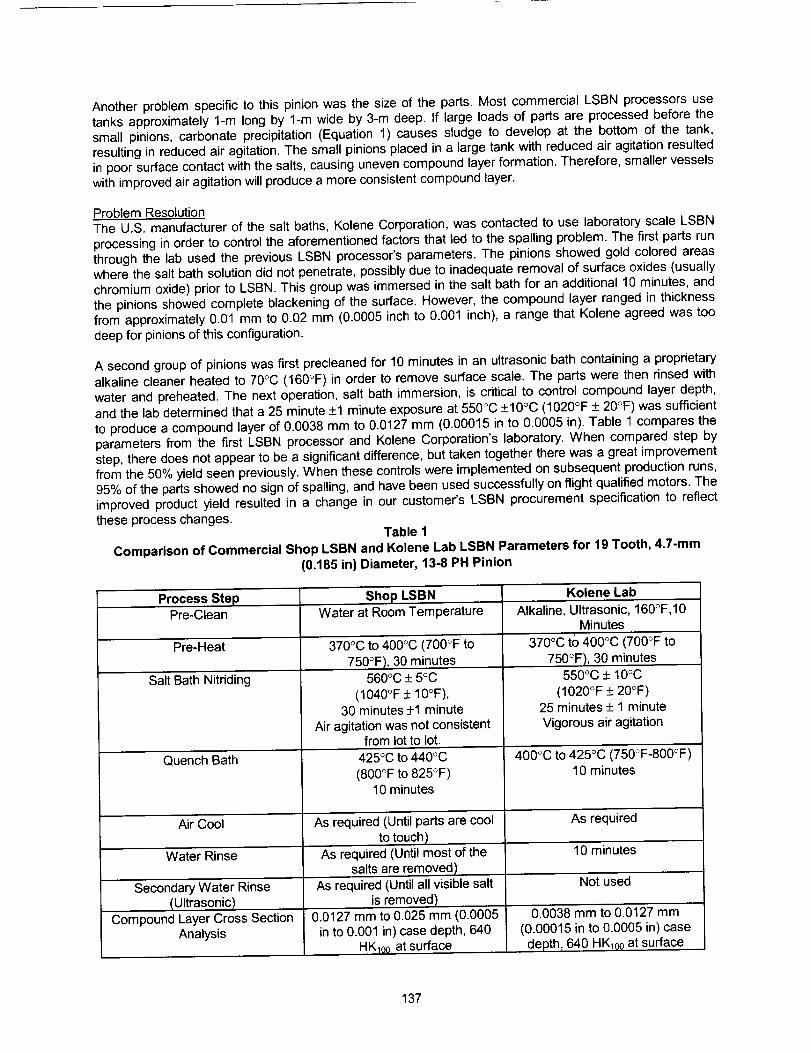
Anotherproblemspecificto thispinionwasthesizeof theparts.MostcommercialLSBNprocessorsuse
tanks approximately 1-m long by 1-m wide by 3-m deep. If large loads of parts are processed before thesmall pinions, carbonate precipitation (Equation 1) causes sludge to develop at the bottom of the tank,
resulting in reduced air agitation. The small pinions placed in a large tank with reduced air agitation resultedin poor surface contact with the salts, causing uneven compound layer formation. Therefore, smaller vesselswith improved air agitation will produce a more consistent compound layer.
Problem Resolution
The U.S. manufacturer of the salt baths, Kolene Corporation, was contacted to use laboratory scale LSBNprocessing in order to control the aforementioned factors that led to the spalling problem. The first parts run
through the lab used the previous LSBN processor's parameters. The pinions showed gold colored areaswhere the salt bath solution did not penetrate, possibly due to inadequate removal of surface oxides (usually
chromium oxide) prior to LSBN. This group was immersed in the salt bath for an additional 10 minutes, andthe pinions showed complete blackening of the surface. However, the compound layer ranged in thickness
from approximately 0.01 mm to 0.02 mm (0.0005 inch to 0.001 inch), a range that Kolene agreed was toodeep for pinions of this configuration.
A second group of pinions was first precleaned for 10 minutes in an ultrasonic bath containing a proprietary
alkaline cleaner heated to 70°C (160°F) in order to remove surface scale. The parts were then rinsed with
water and preheated. The next operation, salt bath immersion, is critical to control compound layer depth,
and the lab determined that a 25 minute +1 minute exposure at 550°C +10°C (1020°F + 20°F) was sufficientto produce a compound layer of 0.0038 mm to 0.0127 mm (0.00015 in to 0.0005 in). Table 1 compares the
parameters from the first LSBN processor and Kolene Corporation's laboratory. When compared step bystep, there does not appear to be a significant difference, but taken together there was a great improvementfrom the 50% yield seen previously. When these controls were implemented on subsequent production runs,
95% of the parts showed no sign of spalling, and have been used successfully on flight qualified motors. Theimproved product yield resulted in a change in our customer's LSBN procurement specification to reflect
these process changes,Table 1
Comparison of Commercial Shop LSBN and Kolene Lab LSBN Parameters for 19 Tooth, 4.7-mm
(0.185 in) Diameter, 13-8 PH Pinion
Process StepPre-Clean
Pre-Heat
Salt Bath Nitriding
Quench Bath
Air Cool
Water Rinse
Secondary Water Rinse
{Ultrasonic)Compound Layer Cross Section
Analysis
Shop LSBN
Water at Room Temperature
370°C to 400°C (700°F to
750°F), 30 minutes560°C + 5oc
(1040°F + 10°F),30 minutes +1 minute
Air agitation was not consistentfrom lot to lot.
425°C to 440°C
(800°F to 825°F)10 minutes
As required iUntil parts are cool
to touch)As required (Until most of the
salts are removed)
As required (Until all visible salt
is removed)0.0127 mm to 0.025 mm (0.0005
in to 0.001 in) case depth, 640HK1o0 at surface
Kolene Lab
Alkaline, UItrasonic, 160°F, 10
Minutes
370°C to 400°C (700°F to
750°F), 30 minutes550°C + 10oc
(1020°F + 20°F)25 minutes + 1 minute
Vigorous air agitation
400°C to 425°C (750°F-800°F)10 minutes
As required
10 minutes
Not used
0.0038 mm to 0.0127 mm
(0.00015 in to 0.0005 in) casedepth, 640 HK100 at surface
137
Conclusions
The process parameters shown in Table 1 are only applicable for this particular part; however, some generalguidelines for successful yields when using PH stainless steels can be summarized as follows:
. Pay close attention to the part geometry. If there are fine threads, fine gear teeth, or other small detailspresent on the surface to be nitrided, specify a case depth of 0.013 mm (0.0005 inch) maximum. The
temperature and residence time will be determined by testing sample pieces until the desired case depth isachieved.
. Make sure the LSBN processor thoroughly cleans the parts before nitriding, preferably by using a heated
alkaline ultrasonic bath. Any scale on the surface will prevent uniform compound layer formation.
• Make sure the processor maintains vigorous air agitation in the salt bath tank when processing parts withfine surface geometries.
References
,
2.1996.
Wensing, Donald, et al. "Liquid Nitriding." ASM Handbook Volume 04: Heat Treating (1991).Easterday, James R. "Salt Bath Ferritic Nitrocarbudzing." Kolene Corporation Technology Update,
138

_i_ / ,,,.LL ,-
Wear and Corrosion Resistant PM Tool Steels for Advanced Bearing Applications
B. Hann*, P. Kilonsky*, D. Smith** and M. Sperber*
Abstract
A need exists for new bearing materials that possess properties not attainable with conventional bearingmaterials such as M50, 52100, and 440C. These materials must have a combination of the following: high
attainable hardness, high hot hardness, dimensional stability at high temperature, wear resistance,corrosion resistance, toughness, and rolling contact fatigue resistance. With Powder Metallurgy (PM)
technology, higher alloy contents with greater volume fractions of fine (< 5 pro) primary carbides may beachieved, without the adverse segregation inherent in conventional materials. Various PM alloy materials
are in development to address the current and future needs of the bearing users.
Several papers have been published discussing CPM ® VIM CRU ® 20 TM, a cobalt-free PM high-speed
steel, which has exhibited some significant property advantages compared to M50 and 52100. ThoughCPM ® VIM CRU ® 20 TM shows promise for many bearing applications, the need for a high hardness,
corrosion resistant bearing material has yet to be addressed. Several high hardness, corrosion resistant
PM tool steels have recently been developed. New materials have been developed with corrosion
resistance properties comparable to commercially available bearing grade stainless steels, but withsubstantially improved wear resistance.
Introduction
An issue that still exists for the aerospace designer is the need for a corrosion resistant material that may
be used to produce critical bearings requiring high hardness, dimensional stability, and toughness. Moreand more aerospace bearings are operating in a more open environment than was required in previous
designs. In some instances, bearings are not only exposed to hard abrasives in the lubricating media, butalso to corrosive attack by moisture, acids, or lubrication breakdown constituents.
A secondary, but equally important issue that needs to be addressed is shelf life. A conventional bearingmaterial may be suitable for a given application, but often corrosion takes place while in inventory that
precludes the material from being used for its intended application. Corrosion resistant bearing materials
exist, but the attainable hardness, and therefore compressive strength and wear resistance, are notequivalent to their conventional counterparts, like 52100 or M50. Bearing candidate materials with
excellent corrosion resistance, good toughness, and hardness level greater than 62 HRc have beendeveloped.
Employing the same principles used to develop CPM ® VIM CRU ® 20 TM, the PM process has been applied
to develop a new advanced bearing material that is both wear and corrosion resistant.
Background
PM materials have been successfully commercialized for non-corrosive bearing environments. CPM ® VIM® TM
CRU 20 , a vacuum induction melted (VIM) version of M62 high-speed tool steel, has been discussedin various papers [1-3]. CPM ® VIM CRU ® 20 TM has exhibited rolling contact fatigue life comparable tosilicon nitride and superior to conventional bearing grades, like M50 and M50NiL [1]. CPM ® VIM CRU ®
20 TM has also been used in bearing raceways with silicon nitride balls, to provide for a hybrid bearing
design with higher load capacity and longer life than 52100 [2,3]. Currently four life tests of ReactionWheels and Control Moment Gyroscopes are running using these hybrid bearings. One of the CMG tests
* Crucible Compaction Metals Division, Oakdale, PA** Honeywell Satellite Systems Operation, Phoenix, AZ
Proceedings of the 35 th Aerospace Mechanisms Symposium, Ames Research Center, May 9-11, 2001
139
hascompletedfouryearsof its planned10-yearlife.ThoughCPM_ VIMCRU®20TM has shown a higher
compressive yield strength than 440C materials, the material is limited to non-corrosive environments.
The advantage of PM materials is that they may be manufactured with higher alloy contents thanconventional steels, since cooling rates from the molten state are on the order of 104 to 108 °C/second,
compared to 10 -1 °C/second, typical for conventional ingot metallurgy. This fast cooling rate allows for a
fine grain size, a highly alloyed matrix, and the formation of fine (< 5 pm) homogeneously dispersedprimary carbides. Essentially, the gas atomized powder particle may be considered a micro-casting.
Higher levels of carbide formers may be added to the initial melt, producing a greater volume fraction of
primary carbides. After melting and atomization, the powder metal is classified by screening (250 pm
maximum particle diameter is typical), blended to homogenize the particle size distribution, encapsulatedin a mild steel mold, evacuated and hermetically sealed, and then consolidated to full density via hot
isostatic pressing (HIP). From this point, conventional steel-making processes may be used to convert theconsolidated powder to bar form. PM materials typically exhibit improved hot workability due to the
inherently fine grain size and lack of alloy segregation.
Screening classifies the powder such that the maximum theoretical inclusion size is limited to the sieve
opening size, important for rolling contact fatigue resistance. In some cases, non-metallic inclusion levelsare capable of meeting specifications for vacuum induction melted plus vacuum arc remelted (VIM-VAR)
quality bearing steel [1]. A given PM tool steel alloy displays a toughness advantage over conventionaltool steel, due to the absence of carbide banding, coarse carbides, and carbide angularity [4]. Another
advantage inherent with PM materials is in non-destructive testing (NDT). Higher levels of resolution arepossible in ultrasonic inspection, which decreases the likelihood of a large inclusion from getting intoservice.
A secondary benefit seen in PM tool steels is the attainable surface finish, which is considerably finer
than conventional tool steels due to the small, evenly dispersed carbides, which have less effect on thesurface roughness when pullouts occur. This has benefits in reducing noise in operation and initial run-in
contamination. However, it must be kept in mind that the improved wear resistance makes it more difficultto achieve a near finish dimension, so specialized machining and grinding equipment is often required.
VIM CRU ® 60 TM Development
Two chemistry modifications of CPM ® VIM CRU 80 TM, a commercially available corrosion resistant tool
steel, were developed. By increasing vanadium carbide contents of these steels, metal-to-metal, abrasiveand corrosive wear resistance properties improve [5]. Nominal compositions for the CPM ® VIM CRU 80 TM
chemistry variations (CPM ® VIM CRU ® 60 TM and 98VN084) and other corrosion resistant bearing
materials may be found in Table 1.
Table 1. Corrosion Resistant Bearin¢ Material ComMaterial C Cr Mo- Ni V
440C 1.05 17 0.5 ....440 N-DURTM [6] 0.65 14.5 ......
BG42_' 1.15 14.5 4 -- 1.2
Cronidur30_ [7] 0.33 15.5 1 .....Pyrowear_ 675 [8] 0.07 13 1.8 2.6 0.60
CPM_VIM CRU_ 80 TM 2.35 14 1 --- 9CPM_VIM CRU_ 60 TM 3.25 14 2.5 -- 12
98VN084" 3.4 14 1 -- 14.5CPM_ MPL-1 3.75 24 3 -- 9
Compositions are reportedin wt.%. *ExperimentalGrade
)ositions and Hardnes,,
Other CarbideVolume %
-- -16.1 N < 16-- 16
.3 N 4.55.4 Co ?
-- 2328
--- 31.5-- 46
Levels
AttainableHardnessI_+1,Rc)
5961
62.559
64 (case)62646364
Three pilot-size heats each of CPM ® VIM CRU ® 60 TM and 98VN084 were melted and atomized to yield
enough powder to produce a large, commercial-size compact. The compacts were HIP, GFM radial
140
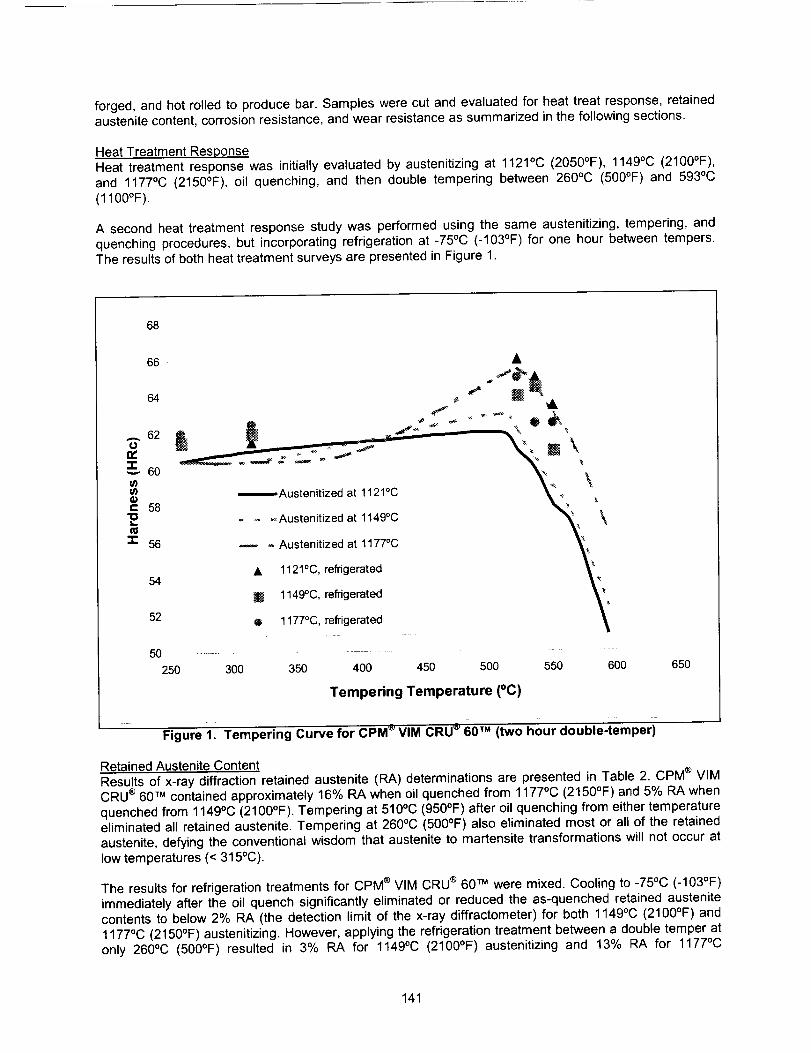
forged,and hot rolled to produce bar. Samples were cut and evaluated for heat treat response, retained
austenite content, corrosion resistance, and wear resistance as summarized in the following sections.
Heat Treatment Response
Heat treatment response was initially evaluated by austenitizing at 1121°C (2050°F), 1149°C (2100°F),and 1177°C (2150°F), oil quenching, and then double tempering between 260°C (500°F) and 593°C
(1100°F).
A second heat treatment response study was performed using the same austenitizing, tempering, andquenching procedures, but incorporating refrigeration at -75°C (-103°F) for one hour between tempers.
The results of both heat treatment surveys are presented in Figure 1.
68
66
64
,... 62O
Z 60
c- 58"om
56
•m_,Austenitized at 1121°C
_ _Austenitized at 1149°C
- Austenitized at 1177°C
• 1121°C, refrigerated64
B 1149°C, refrigerated
52• 1177°C, refrigerated
50 ....................................
250 300 350 400 450 500 550 60O
Tempering Temperature (°C)
650
Figure 1. Tempering Curve for CPM ® VIM CRU ® 60'M (two hour double-temper)
Retained Austenite Content
Results of x-ray diffraction retained austenite (RA) determinations are presented in Table 2. CPM ® VIMCRU ® 60 TM contained approximately 16% IRA when oil quenched from 1177°C (2150°F) and 5% RA when
quenched from 1149°C (2100°F). Tempering at 510°C (950°F) after oil quenching from either temperature
eliminated all retained austenite. Tempering at 260°C (500°F) also eliminated most or all of the retainedaustenite, defying the conventional wisdom that austenite to martensite transformations will not occur at
low temperatures (< 315°C).
The results for refrigeration treatments for CPM ® VIM CRU ® 60 TM were mixed. Cooling to -75°C (-103°F)
immediately after the oil quench significantly eliminated or reduced the as-quenched retained austenite
contents to below 2% RA (the detection limit of the x-ray diffractometer) for both 1149°C (2100°F) and1177°C (2150°F) austenitizing. However, applying the refrigeration treatment between a double temper at
only 260°C (500°F) resulted in 3% RA for 1149°C (2100°F) austenitizing and 13% IRA for 1177°C
141
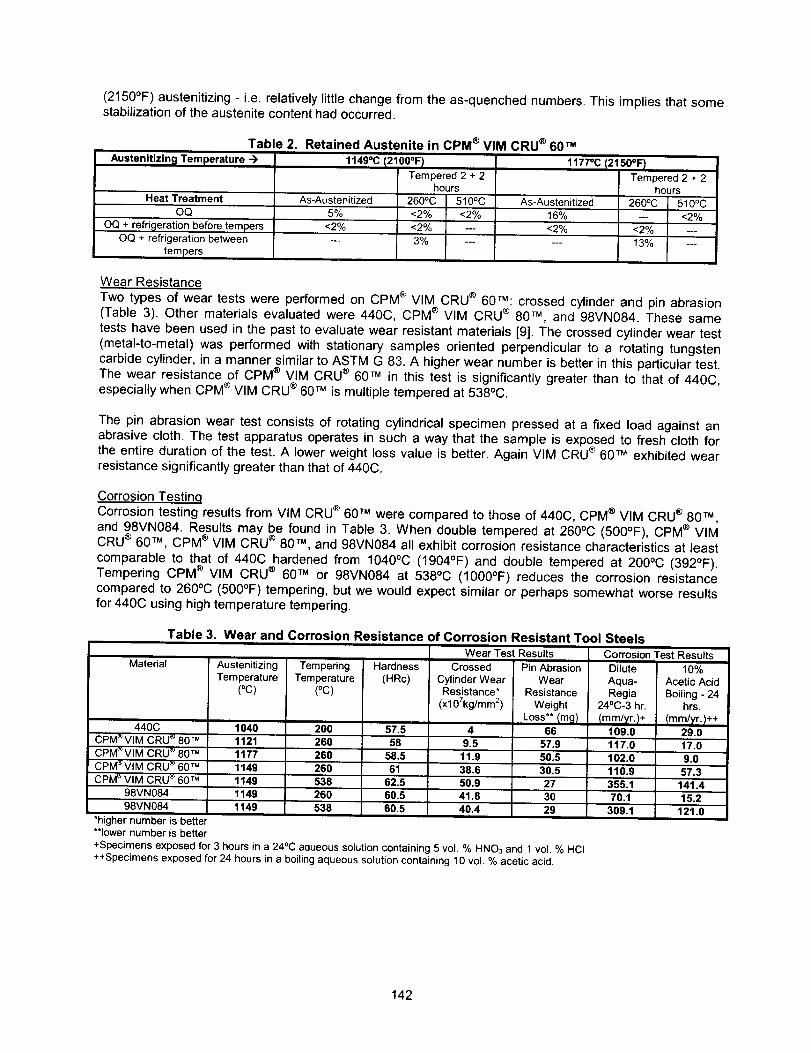
(2150°F) austenitizing - i.e. relatively little change from the as-quenched numbers. This implies that some
stabilization of the austenite content had occurred.
Table 2. Retained Austenite in CPM ® VIM CRU ® 60 TM
Austenitizing Temperature -)
Heat Treatment As-Austenitized
OQ 5%
OQ + refrigeration before tempers
OQ + refrigeration between
tempers
<2%
1149°C 12100°F)
Tempered 2 + 2
hours
260°C 510°C
<2% <2%
<2% ---
3% ---
1177°C (2150°F I
Tempered 2 + 2
hours
As-Austenitized 260°C 510°C
16% --- <2%
<2% <2% ---
--- 13% ---
Wear Resistance
Two types of wear tests were performed on CPM ® VIM CRU ® 60TM: crossed cylinder and pin abrasion
(Table 3). Other materials evaluated were 440C, CPM ® VIM CRU ® 80 TM, and 98VN084. These same
tests have been used in the past to evaluate wear resistant materials [9]. The crossed cylinder wear test
(metal-to-metal) was performed with stationary samples oriented perpendicular to a rotating tungsten
carbide cylinder, in a manner similar to ASTM G 83. A higher wear number is better in this particular test.
The wear resistance of CPM ® VIM CRU ® 60 TM in this test is significantly greater than to that of 440C,
especially when CPM ® VIM CRU ® 60 TM is multiple tempered at 538°C.
The pin abrasion wear test consists of rotating cylindrical specimen pressed at a fixed load against an
abrasive cloth. The test apparatus operates in such a way that the sample is exposed to fresh cloth for
the entire duration of the test. A lower weight loss value is better. Again VIM CRU ® 60 TM exhibited wear
resistance significantly greater than that of 440C.
Corrosion Testinq
Corrosion testing results from VIM CRU ® 60 TM were compared to those of 440C, CPM ® VIM CRU ® 80 TM,
and 98VN084. Results may be found in Table 3. When double tempered at 260°C (500°F), CPM ® VIM
CRU ® 60 TM, CPM ® VIM CRU ® 80 TM, and 98VN084 all exhibit corrosion resistance characteristics at least
comparable to that of 440C hardened from 1040°C (1904°F) and double tempered at 200°C (392°F).
Tempering CPM ® VIM CRU ® 60 TM or 98VN084 at 538°C (1000°F) reduces the corrosion resistance
compared to 260°C (500°F) tempering, but we would expect similar or perhaps somewhat worse results
for 440C using high temperature tempering.
Table 3. Wear and Corrosion Resistance of Corrosion Resistant Tool Steels
Wear Test Results Corrosion Test Results
Material
440C
CPM_VIM CRU _ 80 TM
CPM_VIM CRU _ 80 TM
CPM_VIM CRU _ 60 TM
CPM®VIM CRU _ 60 TM
Austenitizing
Temperature
(°C)
1040
Tempering
Temperature
(°C)
200
Hardness
(HRc)
57.5
Crossed
Cylinder WearResistance*
(xl0Zkg/mm 2)
4
Pin Abrasion
Wear
Resistance
Weight
Loss** (mg)
66
Dilute
Aqua-
Regia24°C-3 hr.
(mm/yr.)+
109.0
10%
Acetic Acid
Boiling - 24hrs.
{mm/_'r.l++29.0
1121 260 58 9.5 57.9 117.0 17.0
1177 260 58.5 11.9 50.5 102.0 g.0
1149 260 61 38.6 30.5 110.9 57,3
1149 538 62.5 50.9 27 355.1 141.4
98VN084 1149 260 60.5 41.8 30 70.1 15.2
98VN084 1149 538 60.5 40.4 29 309.1 121.0
*higher number is better
**lower number is better
+Specimens exposed for 3 hours in a 24°C aqueous solution containing 5 vol. % HNO3 and 1 vol. % HCI
++Specimens exposed for 24 hours in a boiling aqueous solution containing 10 vol. % acetic acid.
142
Discussion/Conclusions
It has been demonstrated that the PM process may be used to manufacture wear and corrosion resistantsteels [1-5,9]. With proper heat treatment, CPM ® VIM CRU ® 60 TM is capable of attaining 63-65 HRC after
multiple tempering in the range 524-538°C (975°F-1000°F) for maximum secondary hardening and
optimum stress relieving. This is significantly greater than the attainable hardness capability of 440C, andalso somewhat better than that of BG42 ® bearing steel. Although some corrosion resistance is sacrificed
compared to laboratory results obtained for low temperature tempering, the corrosion resistance of CPM ®VIM CRU ® 60 TM tempered at 524-538°C (975-1000°F) is still significantly better than that of non-corrosion
resistant bearing steels. High attainable hardness also results in optimum compressive strength and wear
resistance, which were two of the primary objectives of the alloy design. High compressive strength isimportant for static load capacity and fatigue strength in some advance bearing designs.
Acknowledgements
The authors would like to recognize Robert Dixon, William Stasko, and Maria Sawford of Crucible
Research Center for their ongoing support of this program.
References
1. Pearson, P.K., Moll, J.H., Hannigan, C.J., Atwell, D.R. "Evaluation of P/M Tool Steels for Bearing
Applications," Specialty Materials and Composites Advances in Powder Metallurgy and ParticulateMaterials - 1994, Volume 5, Metal Powder Industries Federation, Princeton, N J, 1994, pp. 155-163.
2. Smith, D. W., Leveille, A.R., Hilton, MR., Ward, P.C., "Rex 20 / Si3N4 Control Moment GyroscopeBearing Development," 32 raAerospace Mechanisms Symposium, 13-15 May 1998.
3. Hilton, M.R, Ward, P.C., LeveiUe, A.R., Park, W., McClintock, D.A., Smith, D.W., "Rolling ContactFatigue and Load Capacity Tests of M62 Bearing Steel", 32 °_ Aerospace Mechanisms Symposium,
13-15 May 1998.4. Stasko, W., Pinnow, K.E., Eisen, W.B., "Development of Improved PM Wear and Corrosion Resistant
Tool Steels," 4 thInternational Tooling Conference, Bochum, Germany, 1996.
5. Dixon, R.B., Stasko, W., Pinnow, K.E., "Particle Metallurgy Tool Steels," ASM Handbook, Volume 7,
Powder Metal Technologies and Applications, ASM International, Materials Park, OH, 1998, pp. 786-802.
6. Tomasello, C.M., Maloney, J.L., Ward, P.C., Materkowski, J.P., "A New Corrosion Resistant,
Martensitic Stainless Steel For Improved Performance in Miniature Bearings," Bearing Steels: Into the21 st Century, ASTM STP 1327, J. J. C. Hoo and W. B. Green, Jr., Ed., American Society for Testing
and Materials, West Conshohocken, PA, 1998, pp. 437-446.7. Trojahn, W., Streit, E., Chin, H.A., Ehlert, D., "Progress in Bearing Performance of Advanced Nitrogen
Alloyed Stainless Steel, Cronidur 30," Bearing Steels: Into the 21 st Century, ASTM STP 1327, J. J. C.
Hoo and W. B. Green, Jr., Ed., American Society for Testing and Materials, West Conshohocken, PA,
1998, pp. 447-459.8. McCaffrey, T.J., and Wert, D.E., "Development of a Stainless Corrosion Resistant Carburizing
Bearing Steel," Creative Use of Bearing Steels, ASTM STP 1195, J. J. C. Hoo, Ed., American Society
for Testing and Materials, Philadelphia, 1993, pp. 137-148.9. Stasko, W., Pinnow, K.E., Eisen, W.B., "Development of Ultra-High Vanadium Wear Resistant Cold
Work Tool Steels," Advances in Powder Metallurgy & Particulate Materials - 1996, Volume 5, T.M.Cadle and K.S. Narasimhan, compilers, Metal Powder Industries Federation, Princeton, N J, 1996, pp.16-179 - 17-188.
Crucible, CPM ®, VIM CRU ®, CPM ® VIM CRU ® 20 TM, CPM ® VIM CRU ® 60 TM, and CPM ® VIM CRU ® 80 TM
are trademarks or service marks of Crucible Materials Corporation.
440 N-DUR TM is a trademark of Timken Latrobe Steel Company.BG42 ® is a registered trademark of Timken Latrobe Steel Company.Cronidur 308 is a registered trademark of FAG Kugelfischer Group.
Pyrowear ® 675 is a registered trademark of Carpenter Technology Corporation.
143

144

A Low-Shock Stage Separation Mechanism
S. Vara Prasad Rao" and Deepak Agrawal*
Abstract
A low-shock pyrobolt-actuated stage separation mechanism for multi-stage aerospace vehicles has been
designed, developed and successfully tested. The mechanism is found highly reliable, easy to assembleand disassemble, and generates very low operational shock. This stage separation mechanism is very
useful for the applications in which the separation plane is very near to shock sensitive packages. Design,development and testing experiences, which the authors have come across during the development of
this low-shock stage separation mechanism, are presented.
Introduction
Various mechanisms can be employed for stage separation of a large multi-stage vehicle, depending onthe space availability, ease of integration, and most important of all, the permissible shock levels
generated due to stage separation. Very large vehicles employ flexible linear-shaped charge cords,
where large shocks (of the order of 50,000 to 100,000 g) are produced, do tolerate the same, since theshock duration is of the order of few tens of microseconds. Moreover in such vehicles, shock sensitive
devices like relays and computers are configured in such a way (distance as well as with specialmountings) that they do not remain vulnerable. But for vehicles where such high shocks are not
permitted, separation mechanisms with very low shock are specially designed to suit the specific purpose.One such low-shock stage separation mechanism is the "pyrobolt-actuated stage separation mechanism".
Two stages are fastened together with six or eight pyrobolts. When all the pyrobolts are operatedsimultaneous, the stage separates.
Pyrobolt-Actuated Stage Separation Mechanism
The key element in this stage separation mechanism is the pyrobolt, which is specially designed for this
purpose. Pyrobolt consists of an electro-explosive pyro cartridge, piston, cylinder, a round-head releasebolt, and four collets with an arrestor as shown in Figure 1. This assembly is kept locked before operation
by a locking pin. The release bolt head is engaged in the four collets and can come out when the colletsare allowed to move radially outwards. The arrester stops the radial outward movement of the collets. The
arrester is locked to the casing by a locking pin. When the pyro cartridge is fired, the arrestor moves updue to pyro pressure after shearing the locking pin, hits the check nut and stops. The arrestor thus makes
the collets free to move out. Pyro cartridge pressure acts on the piston also. The piston pushes therelease bolt out. Pyrobolt release operation is shown in Figure 1.
Two stages have a flanged interface and are joined together with a number of pyrobolts. The number of
pyrobolts required to join the two stages depends upon the load, bending moment, and space available tomount pyrobolts. More pyrobolts in the joint requires more firing current. Less pyrobolts in the joint needs
a bigger diameter of each pyrobolt, and so a pyrobolt requires more mounting space and wider interfaceflange. The designer has to select number of pyrobolts to join two stages based on the firing current
supply source limitations and space available to mount pyrobolts.
Interface Bolted Joint
Loads at the separation interface are mainly axial force, bending moment, and shear force. The bolted
joint is designed for these loads. Tensile force on a pyrobolt is estimated for these loads. The joint mayopen in two possible ways as shown in Figure 3. It may open about the neutral axis as per beam bendingtheory or it may open about the edge of the stage. Pyrobolts at one side of the axis will experience tensile
"Defense Research & Development Laboratory, Hyderabad, India
Proceedings of the 35 thAerospace Mechanisms Symposium, Ames Research Center, May 9-11, 2001
145

forcewhenthejointopensabouttheneutralaxis.All theboltsin the jointwillexperiencetensileforcewhenthejointopensabouttheedgeofthestage.
Tensileforceshavebeencalculatedfor bothpossiblewaysof joint opening,andthereleasebolt isdesignedforthehighertensileforceoutof these.ForthejointopeningabouttheneutralaxisasshowninFigure2(a),themaximumforcewillbeinthebolt,whichis farthestfromaxisof openingandit isgivenby
F1 : (BM .PCD • Ab)I(2 " Isy)
where PCD= pitch circle diameter
Ab = bolt cross-section area
Isy = Ib + Ab 7-x_2
Ib = moment of inertia of the bolt
x, = distance from neutral axis
For the joint opening about the edge of the stage, it is assumed that the tension in bolt developed due to
the bending moment is proportional to the distance of the bolt from the edge of the section. Assuming n(even number) number of bolts are necessary to withstand loads, all the bolts of the joint will be in tension
and the joint will try to open about the N-A axis as shown in Figure 2(b). Maximum tensile force will be inthe bolt that is farthest from axis of opening and given by
F. = 8 °BM/3 °n "PCD
Separation Dynamics
The pyro cartridge generates high-pressure gases (order of 80 MPa) in the free volume between the
piston and pyro cartridge. Gas pressure acts on the pyro cartridge and piston. Since the pyro cartridge is
mounted on the arrestor, the arrestor moves and makes the collets free. Once the collets are free, theymove radially outwards with the force transferred by the release bolt on collets, and at the same time thepiston moves ahead and pushes the bolt out. The force acting on the piston is sufficient to move the bolt
against friction forces. The stroke length of the piston is sufficient to push the bolt out of the pyroboltcasing. Since the arrestor and release bolt move in opposite directions, the net recoil force on the
pyrobolt mounting is less and so recoil shock is less. Major shock in pyro devices is due to recoil forces,
which is very low in pyrobolt. So the separation shock is less. The pyrobolt is assembled with two stagesas shown in Figure 3. The pyrobolt after firing is shown in Figure 4. A guide is provided all along the
circumference as shown in Figure 4 to avoid lateral movement of the spent stage just after the pyroboltsare fired. The spent stage can separate when it rotates about its edge as shown in Figure 5. The bolt
head may interfere with the on-going stage as shown in Figure 5. This may lead to a disturbed stageseparation. This can be avoided if the guide length is sufficient and local flange thickness of on-goingstage is minimum. The tapered hole in the flange will also allow the bolt head to come out without
interfering as shown in Figure 5.
Separation Shock
Separation shock is measured by placing accelerometers at different locations on the spent stage and theon-going stage. Bruel & Kjaer model 8309 accelerometers are used. Three sensors 1, 2 & 3 are placed tomeasure axial shocks and 4, 5, & 6 are placed to measure radial shocks. The shock levels at the
locations are given in Table 1.
Table 1: SeparationLocation
1
2
3
4
5
6
Shock Levels at Different Locations
Shock Level
600g, for 20 ms
500g, for 20 ms
2009 , for 10 ms
100g, for 10 ms
500g, for 20 ms5009 , for 20 ms
146

Conclusion
Stage separation shock in pyrobolt-actuated stage separation is very low and so this stage separationmechanism is very useful for applications where the separation plane is close to shock sensitive
packages/passengers. The assembly and disassembly of stages are easy and safe. Maintenance of the
separation system is easy and safe. The functionality of a pyrobolt can be confirmed by pneumaticpressure before it is assembled to the flying vehicle.
References
1. S. Vara Prasad Rao, Deepak Agrawal. "Pyrobolt for Low Shock Stage Separation Mechanism".
National Seminar on Aerospace & Related Mechanisms, Paper 13.2. Neil Butterfield. "Pyrotechnic Release Devices". Space Vehicle Mechanisms Elements of Successful
Design edited by Peter L. Conley.3. Karl O. Brauer. "Handbook of Pyrotechnics"
p .
Before operation After operation
Figure 1. Pyrobolt before operation and after operation
I---t - t---I
......... i
(a). Joint opening about Neutral axis (b). Joint opening about edgeFigure 2. (a), (b): Possible ways of joint opening
147

r_ 4
5. .
f_r
H
!il
i i_
Figure 3. Pyroboltbefore firing
Figure 4. Pyroboltafter firing
Figure 5. Releasedspent stage
Figure 6. Stage bolted joint assembly
148
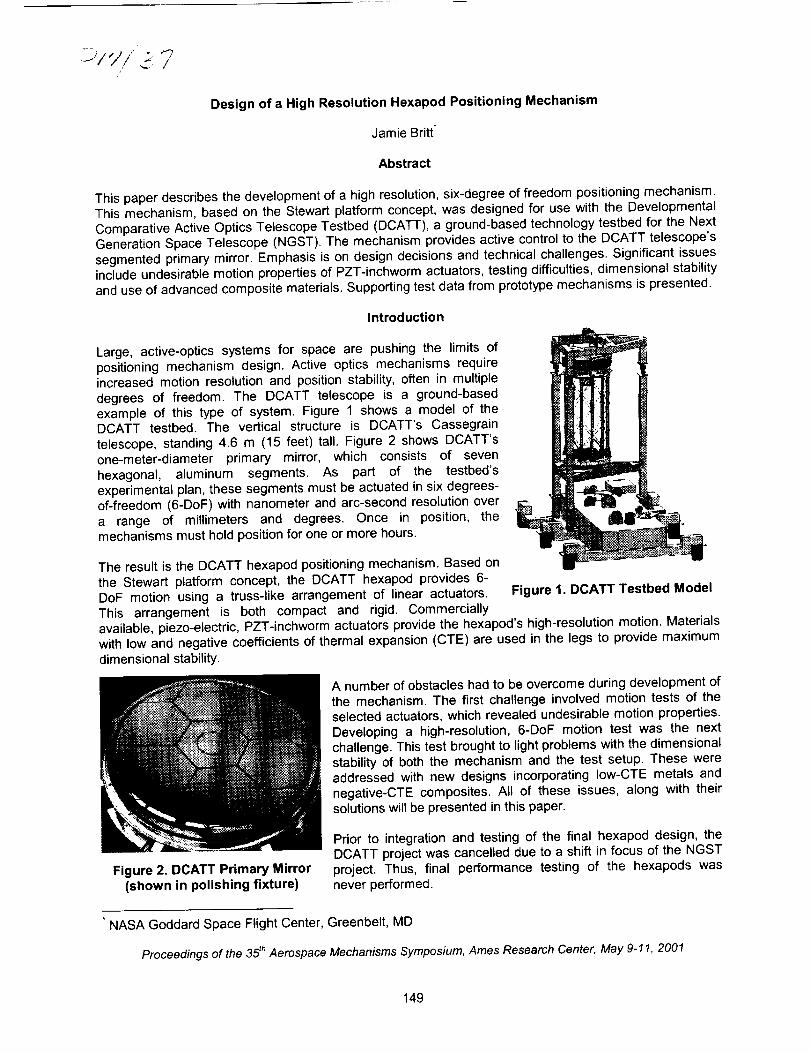
•--/V/ //
Design of a High Resolution Hexapod Positioning Mechanism
Jamie Britt*
Abstract
This paper describes the development of a high resolution, six-degree of freedom positioning mechanism.This mechanism, based on the Stewart platform concept, was designed for use with the Developmental
Comparative Active Optics Telescope Testbed (DCATT), a ground-based technology testbed for the NextGeneration Space Telescope (NGST). The mechanism provides active control to the DCATT telescope's
segmented primary mirror. Emphasis is on design decisions and technical challenges. Significant issuesinclude undesirable motion properties of PZT-inchworm actuators, testing difficulties, dimensional stability
and use of advanced composite materials. Supporting test data from prototype mechanisms is presented.
Introduction
Large, active-optics systems for space are pushing the limits of
positioning mechanism design. Active optics mechanisms requireincreased motion resolution and position stability, often in multiple
degrees of freedom. The DCATT telescope is a ground-based
example of this type of system. Figure 1 shows a model of theDCATT testbed. The vertical structure is DCATT's Cassegrain
telescope, standing 4.6 m (15 feet) tall. Figure 2 shows DCATT'sone-meter-diameter primary mirror, which consists of seven
hexagonal, aluminum segments, As part of the testbed'sexperimental plan, these segments must be actuated in six degrees-
of-freedom (6-DoF) with nanometer and arc-second resolution overa range of millimeters and degrees. Once in position, the
mechanisms must hold position for one or more hours.
The result is the DCATT hexapod positioning mechanism. Based onthe Stewart platform concept, the DCATT hexapod provides 6-DoF motion using a truss-like arrangement of linear actuators. Figure 1. DCATT Testbed Model
This arrangement is both compact and rigid. Commerciallyavailable, piezo-electric, PZT-inchworm actuators provide the hexapod's high-resolution motion. Materials
with low and negative coefficients of thermal expansion (CTE) are used in the legs to provide maximumdimensional stability.
A number of obstacles had to be overcome during development ofthe mechanism. The first challenge involved motion tests of the
selected actuators, which revealed undesirable motion properties.Developing a high-resolution, 6-DoF motion test was the next
challenge. This test brought to light problems with the dimensionalstability of both the mechanism and the test setup. These were
addressed with new designs incorporating Iow-CTE metals andnegative-CTE composites. All of these issues, along with their
solutions will be presented in this paper.
Figure 2. DCATT Primary Mirror
(shown in polishing fixture)
Prior to integration and testing of the final hexapod design, theDCATT project was cancelled due to a shift in focus of the NGSTproject. Thus, final performance testing of the hexapods was
never performed.
• NASA Goddard Space Flight Center, Greenbelt, MD
Proceedings of the 35 thAerospace Mechanisms Symposium, Ames Research Center, May 9-11, 2001
149

DCATT Hexapod Requirements
General Requirements
The DCATT testbed was created to test optical wavefront control for NGST. The goal was to use these
methods to achieve diffraction-limited performance in the DCATT telescope. This required active control
of the telescope's segmented primary mirror. The DCATT hexapod was designed to perform this task.
The segments were constructed from machined aluminum with mirror surfaces of polished-nickel. Each
outer segment weighed 2.3 kg (5 Ib). The center segment weighed 1.4 kg (3 Ib). All seven segments hadto be actuated in 6-DoF from beneath the mirror. Thus, each mechanism had to support and actuate the
weight of a segment• In addition, light passing through center segment's hole could not be obstructed.
Actuation Ran,qe and Resolution
Table 1 gives the range and resolution requirements for the DCATT hexapod in three critical degrees offreedom. Tip and tilt are rotations perpendicular to the optical axis of the mirror. Piston is linear motion
parallel to the optical axis of the mirror. Although the other degrees of freedom where required, they did
not have specific resolution or range requirements attached to them. They simply had to be of the sameorder of magnitude as the critical three.
Table 1. Actuation Requirements: Resolution and Range
Tip/tilt resolution +/- 0.01 arc-sec
Tip/tilt range +/- 0.5 °
Piston resolution +/- 0.1 I_m
Piston range +/- 0.05 mm
The DCATT hexapod's resolution requirement is driven by the need to align the segments of the primarymirror. The range requirement is driven by the need to misalign the segments by optically large values atthe start of an experiment.
Position Stability
A minimum requirement for jitter motion was not given at the start of the design process. Jitter stabilitywas implied by a 100-Hz minimum-stiffness goal for the hexapod's first mode of vibration.
Long-term stability was implied by a requirement that the telescopebe "self-compensating" for dimensional changes caused by thermal
expansion. This mandated that the structure have the same CTE asthe mirrors. Since the mirrors were made of aluminum, the structure
and hexapods were to be aluminum as well.
DCATT Hexapod Concept
Figure 3 shows a computer model for the aluminum DCATThexapod. Each leg contains an IW-700 PZT Inchworm linear actuatormanufactured by Burleigh Instruments 1. All parts are aluminum
except for the actuators and three flexures in each leg. Figure 4
shows an exploded view of a leg assembly. The flexures provide thesame degrees of freedom as ball-and-socket joints in an ideal
Stewart platform, but without the frictional problems of real ball-and-
socket or universal joints. Figure 3. Hexapod Model
Burleigh Instruments, Inc., Burleigh Park, Fishers, New York, 14453-0755
150

UpperHousing
(Aluminum)_LowerHousing _
(Aluminum)
Clamps
_¢_ Lower Shaft (Aluminum)
(Aluminum)
Flex-Pivot -
Axial Rotation Flexure
(Steel)
2-Axis _
BendingFlexure
(Steel)
Rod End \
(Aluminum)
"a
Upper Shaft
(Aluminum)
_., Burleigh IW-700Actuator
2-Axis
BendingFlexure
(Steel)
Figure 4. Exploded View of Hexapod Leg
Table 2 shows the stated performance of the IW-700 actuators. Table 3 shows the predicted performance
of the hexapod compared to the requirements. These predictions were calculated using the IW-700performance numbers and a kinematics model based on the geometry of the hexapod.
Table 2. IW-700 Performance
Minimum Step Size:
Actuation Rankle:
4nm
6ram
Table 3. Predicted Hexapod Performance
Motion
Tip/Tilt Resolution
Tip/Tilt Range*
Piston Resolution
Piston Range*
Requirement+/-0.01 arc-sec
+/- 0.5 deg
+/- 0.1 #m+/- 0.05 mm
Predicted Performance
+/-~0.002 arc-sec
+/- 1.0 deg w/+/-1.0 mm piston
+/- 1.7 deg w/+/-0.5 mm piston
+/- 2.0 deg maximum range
+/- -0.005 _Jm
+t- 0.5 mm w/+/-1.7 deg range
+/- 1.0 mm w/+/-1.0 deg range+/- 3.4 mm maximum range
*NOTE: Maximum ranges for all degrees of freedom are coupled. Sample extremes within the motion
envelope are given.
PZT-lnchworm Actuator Motion Issues
For a good portion of the design process, the assumption was made that the IW-700 actuators wouldmove with the resolution stated in Table 2 over their entire range of motion. This would allow the
actuators to be operated in an essentially open-loop fashion. Control software would determine how fareach actuator had to move to position the mirror segment and then command a certain number of
151

actuatorstepsto achievethatmotion.Characterizationof theactuatormotionwasnotdoneuntillaterintheprogram.Thiswasa mistake,ascharacterizationturnedupa significantdesignissue.
TheIW-700inchwormconsistsofa movingshaft,twoPZTclamps,anda thirdPZTelementthatchangesthedistancebetweenthetwoclamps.Figure5 showshowtheseelementsworktogetherto movetheshaft.First,PZTElement1clampstheshaftwhilePZTElement2extends.Thiscausestheshaftto moveto the left. Thedistancemovedis determinedby thevoltageappliedto Element2. A 1 V incrementcausesa singlestepof 2-4nm.After665steps,Element2 becomesfullyextended.ThenElement3clampsthe shaftfollowedbythereleaseof Element1. In thisconfiguration,the shaftwill continuetomoveto theleftasElement2contracts.Thisprocessisrepeatedtomovetheshaftthroughtheactuator'sentirerangeofmotion.
21 • 3 •
Off Unclamp 1 [
[ ] I
I:_ • F::Z_
Clamp 1 Contract 2
] I
Extend 2 Clamp 1
I I I
Clamp 3 Unclamp 3 I l I[_ I
[_ • I Ii • ,
Figure 5. Inchworm Actuator Motion
Characterization tests of the actuators revealed that a motion discontinuity occurs when the clampsexchange. Imperfections in the way the clamps grip the shaft cause the shaft to move forward or
backward by an uncontrolled amount. Tests showed this discontinuity to be as large as 215 rim. Sincethousands of clamp changes occur throughout the actuator's range, this prevents the actuator from being
accurately commanded in an open-loop fashion. Furthermore, it was feared that the actuator could have"dead-zones", positions within the length of a discontinuity that the actuator could never reach.
Figure 6 shows a graph of commanded actuator position plotted against measured position determined
using a Zygo laser-ranging interferometer. The actuator has been run back and forth repeatedly through
the same clamping cycle. That is, the actuator was run through 1330 steps, causing element 2 to gothrough full expansion and contraction, and causing both clamps to open and close on the shaft. Then theactuator was run backwards to its starting position, and the process was repeated.
The discontinuities can be clearly seen every 665 steps. It is important to note that discontinuities occur inboth the forward and reverse directions, but with different magnitudes. Discussions with the manufacturer
suggest that the magnitudes vary depending on the actuator's loading condition. This result suggested
that by moving back and forth across a discontinuity, the actuator could achieve any position within its
152
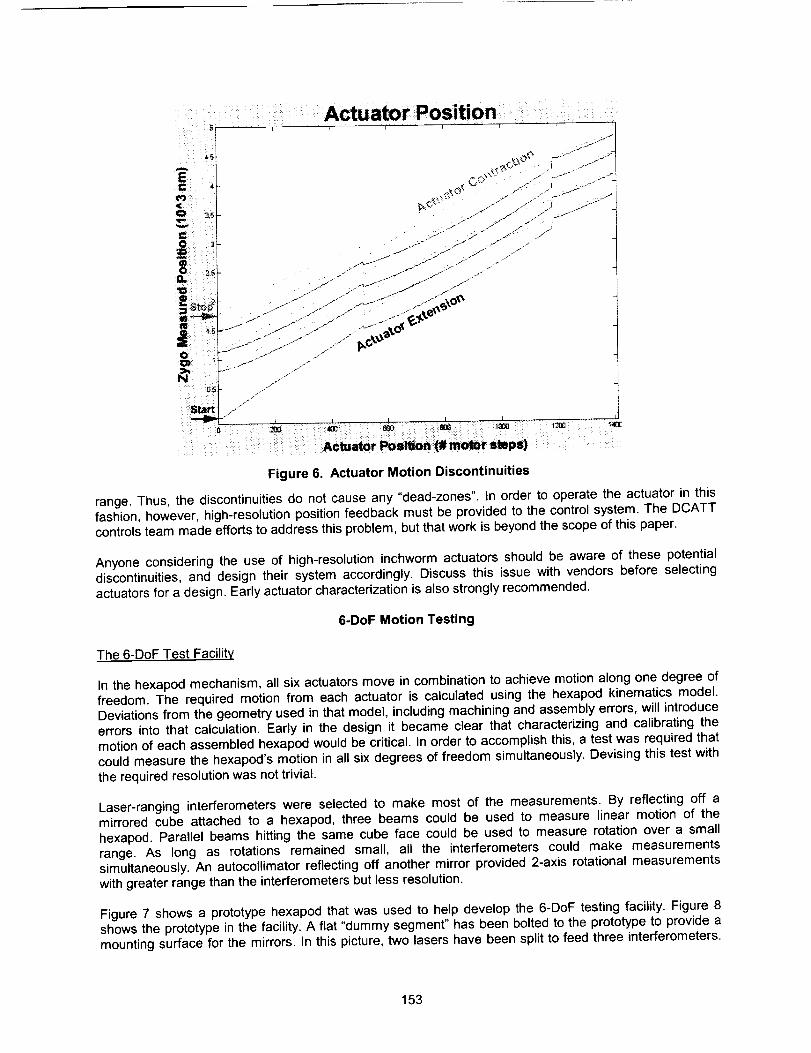
Figure 6. Actuator Motion Discontinuities
range. Thus, the discontinuities do not cause any "dead-zones". In order to operate the actuator in thisfashion, however, high-resolution position feedback must be provided to the control system. The DCATTcontrols team made efforts to address this problem, but that work is beyond the scope of this paper.
Anyone considering the use of high-resolution inchworm actuators should be aware of these potentialdiscontinuities, and design their system accordingly. Discuss this issue with vendors before selectingactuators for a design. Early actuator characterization is also strongly recommended.
6-DoF Motion Testing
The 6-DoF Test Facility
In the hexapod mechanism, all six actuators move in combination to achieve motion along one degree offreedom. The required motion from each actuator is calculated using the hexapod kinematics model.Deviations from the geometry used in that model, including machining and assembly errors, will introduceerrors into that calculation. Early in the design it became clear that characterizing and calibrating themotion of each assembled hexapod would be critical. In order to accomplish this, a test was required thatcould measure the hexapod's motion in all six degrees of freedom simultaneously. Devising this test withthe required resolution was not trivial.
Laser-ranging interferometers were selected to make most of the measurements. By reflecting off amirrored cube attached to a hexapod, three beams could be used to measure linear motion of thehexapod. Parallel beams hitting the same cube face could be used to measure rotation over a smallrange. As long as rotations remained small, all the interferometers could make measurementssimultaneously. An autocollimator reflecting off another mirror provided 2-axis rotational measurementswith greater range than the interferometers but less resolution.
Figure 7 shows a prototype hexapod that was used to help develop the 6-DoF testing facility. Figure 8shows the prototype in the facility. A flat "dummy segment" has been bolted to the prototype to provide amounting surface for the mirrors. In this picture, two lasers have been split to feed three interferometers.
153
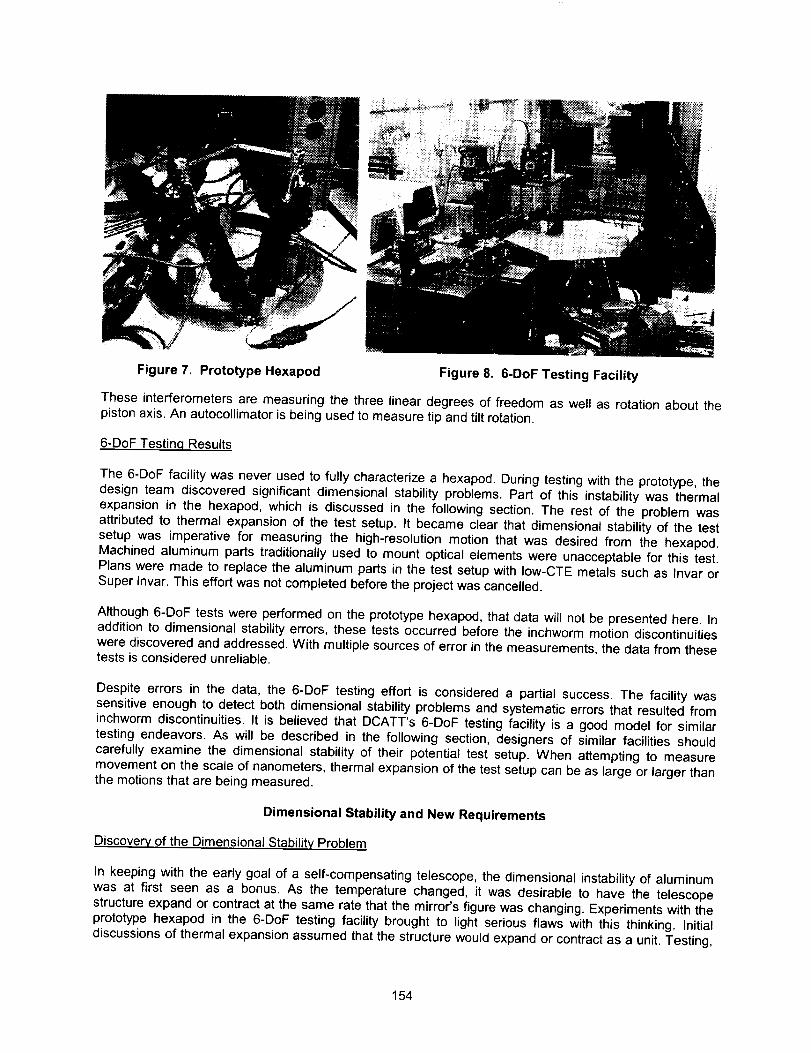
Figure 7. Prototype Hexapod Figure 8, 6-DoF Testing Facility
These interferometers are measuring the three linear degrees of freedom as well as rotation about the
piston axis. An autocollimator is being used to measure tip and tilt rotation.
6-DoF Testin,q Results
The 6-DoF facility was never used to fully characterize a hexapod. During testing with the prototype, thedesign team discovered significant dimensional stability problems. Part of this instability was thermal
expansion in the hexapod, which is discussed in the following section. The rest of the problem wasattributed to thermal expansion of the test setup. It became clear that dimensional stability of the test
setup was imperative for measuring the high-resolution motion that was desired from the hexapod.Machined aluminum parts traditionally used to mount optical elements were unacceptable for this test.
Plans were made to replace the aluminum parts in the test setup with Iow-CTE metals such as Invar orSuper Invar. This effort was not completed before the project was cancelled.
Although 6-DoF tests were performed on the prototype hexapod, that data will not be presented here. In
addition to dimensional stability errors, these tests occurred before the inchworm motion discontinuitieswere discovered and addressed. With multiple sources of error in the measurements, the data from thesetests is considered unreliable.
Despite errors in the data, the 6-DoF testing effort is considered a partial success. The facility wassensitive enough to detect both dimensional stability problems and systematic errors that resulted from
inchworm discontinuities. It is believed that DCATT's 6-DoF testing facility is a good model for similartesting endeavors. As will be described in the following section, designers of similar facilities should
carefully examine the dimensional stability of their potential test setup. When attempting to measuremovement on the scale of nanometers, thermal expansion of the test setup can be as large or larger than
the motions that are being measured.
Dimensional Stability and New Requirements
Discovery of the Dimensional Stability Problem
In keeping with the early goal of a self-compensating telescope, the dimensional instability of aluminumwas at first seen as a bonus, As the temperature changed, it was desirable to have the telescope
structure expand or contract at the same rate that the mirror's figure was changing. Experiments with theprototype hexapod in the 6-DoF testing facility brought to light serious flaws with this thinking. Initial
discussions of thermal expansion assumed that the structure would expand or contract as a unit. Testing,
154
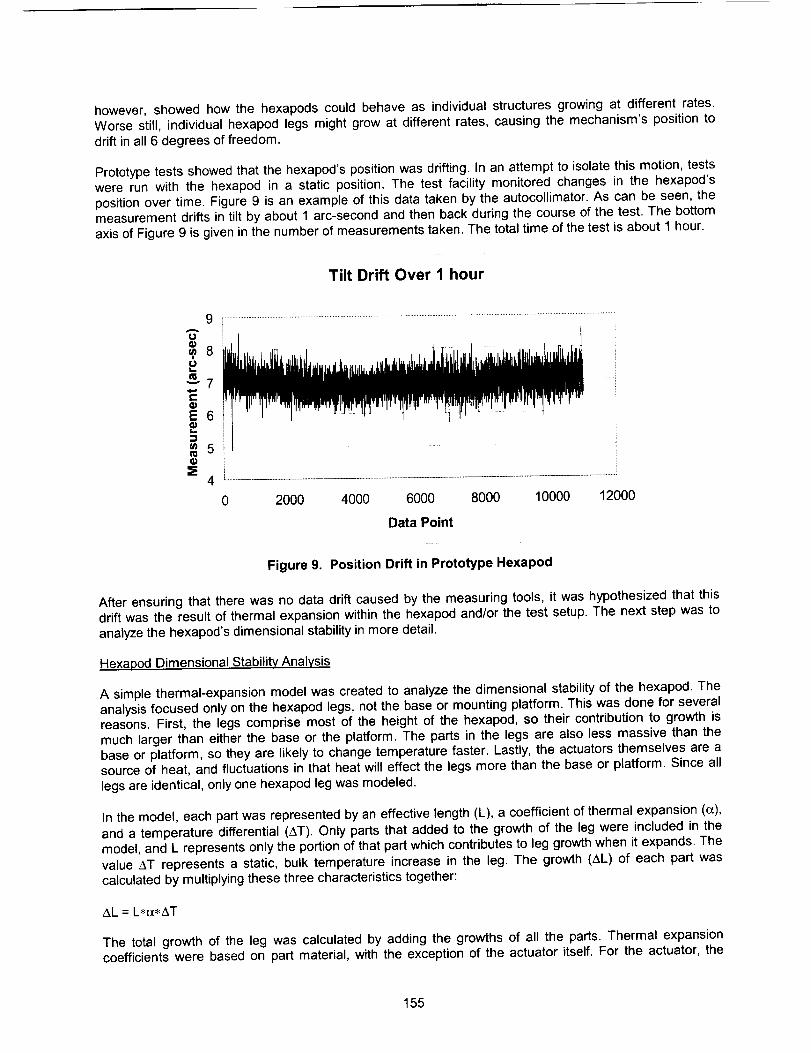
however,showedhowthe hexapodscouldbehaveas individualstructuresgrowingat differentrates.Worsestill, individualhexapodlegsmightgrowat differentrates,causingthemechanism'spositiontodriftinall6 degreesoffreedom.
Prototypetestsshowedthatthehexapod'spositionwasdrifting.In anattemptto isolatethismotion,testswererunwith the hexapodin a staticposition.Thetest facilitymonitoredchangesin the hexapod'spositionovertime.Figure9 is anexampleof thisdatatakenbytheautocollimator.As canbeseen,themeasurementdriftsintilt byabout1arc-secondandthenbackduringthecourseofthetest.Thebottomaxisof Figure9isgiveninthenumberofmeasurementstaken.Thetotaltimeofthetestisabout1hour.
Tilt Drift Over 1 hour
0 2000 4000 6000 8000 10000 12000
Data Point
Figure 9. Position Drift in Prototype Hexapod
After ensuring that there was no data drift caused by the measuring tools, it was hypothesized that thisdrift was the result of thermal expansion within the hexapod and/or the test setup. The next step was to
analyze the hexapod's dimensional stability in more detail.
Hexapod Dimensional Stability Analysis
A simple thermal-expansion model was created to analyze the dimensional stability of the hexapod. Theanalysis focused only on the hexapod legs, not the base or mounting platform. This was done for severalreasons. First, the legs comprise most of the height of the hexapod, so their contribution to growth is
much larger than either the base or the platform. The parts in the legs are also less massive than thebase or platform, so they are likely to change temperature faster. Lastly, the actuators themselves are a
source of heat, and fluctuations in that heat will effect the legs more than the base or platform. Since alllegs are identical, only one hexapod leg was modeled.
In the model, each part was represented by an effective length (L), a coefficient of thermal expansion (_),
and a temperature differential (AT). Only parts that added to the growth of the leg were included in the
model, and L represents only the portion of that part which contributes to leg growth when it expands. The
value z_T represents a static, bulk temperature increase in the leg. The growth (_L) of each part wascalculated by multiplying these three characteristics together:
_L = L*(z_AT
The total growth of the leg was calculated by adding the growths of all the parts. Thermal expansion
coefficients were based on part material, with the exception of the actuator itself. For the actuator, the
155
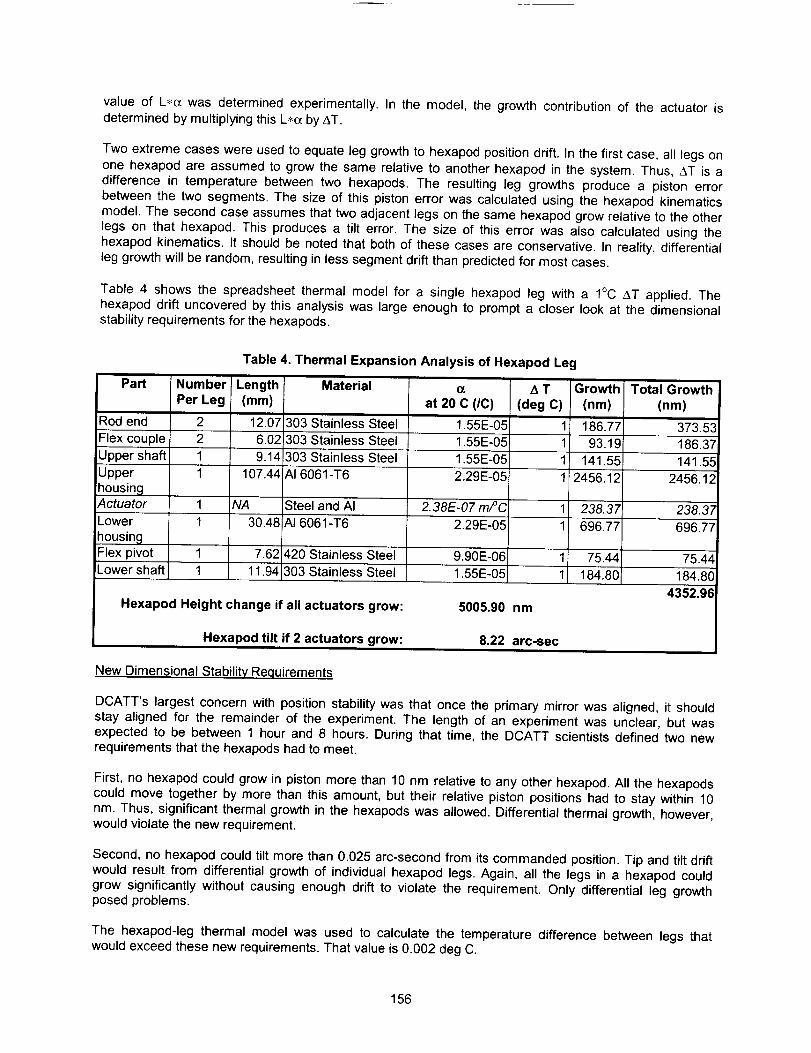
valueof L_o_wasdeterminedexperimentally.In the model,thegrowthcontributionof the actuatorisdeterminedbymultiplyingthisL_e_byAT.
Twoextremecaseswereusedto equateleggrowthto hexapodpositiondrift.Inthefirstcase,all legsononehexapodareassumedto growthesamerelativeto anotherhexapodin thesystem.Thus,2_Tis adifferencein temperaturebetweentwo hexapods.The resultingleg growthsproducea pistonerrorbetweenthetwo segments.Thesizeof thispistonerrorwascalculatedusingthe hexapodkinematicsmodel.Thesecondcaseassumesthattwoadjacentlegson the same hexapod grow relative to the otherlegs on that hexapod. This produces a tilt error. The size of this error was also calculated using the
hexapod kinematics. It should be noted that both of these cases are conservative. In reality, differentialleg growth will be random, resulting in less segment drift than predicted for most cases.
Table 4 shows the spreadsheet thermal model for a single hexapod leg with a 1°C AT applied. The
hexapod drift uncovered by this analysis was large enough to prompt a closer look at the dimensionalstability requirements for the hexapods.
Part Number
Per Leg
Rod end 2
Flex couple 2
!Upper shaft 1
1Upper!housingActuatorLower
housin 9
Flex pivot!Lower shaft
Table 4. Thermal Expansion Analysis of Hexapod Leg
Length(mm)
12.07
6.02
9.14
107.44
1 NA
1 30.48
1 7.62
1 11.94
Material o_ A T
at 20 C (IC) (deg C)
303 Stainless Steel 1.55E-05 1
303 Stainless Steel 1.55E-05 1
303 Stainless Steel 1.55E-05 1
AI 6061-T6 2.29E-05 1
Steel and AI 2.38E-07 mPC li
AI 6061-T6 2.29E-05 1
420 Stainless Steel 9.90E-06
303 Stainless Steel 1.55E-05
Growth Total Growth
(nm) (nm)
186.77 373.53
93.19 186.37
141.55 141.55
2456.12 2456.12
238.37 238.37
696.77 696.77
75.44 75.44
84.801 184.801
4352.96
Hexapod Height change if all actuators grow: 5005.90 nm
Hexapod tilt if 2 actuators grow: 8.22 arc-sec
New Dimensional Stability Requirements
DCATT's largest concern with position stability was that once the primary mirror was aligned, it shouldstay aligned for the remainder of the experiment. The length of an experiment was unclear, but wasexpected to be between 1 hour and 8 hours. During that time, the DCATT scientists defined two new
requirements that the hexapods had to meet.
First, no hexapod could grow in piston more than 10 nm relative to any other hexapod. All the hexapodscould move together by more than this amount, but their relative piston positions had to stay within 10
nm. Thus, significant thermal growth in the hexapods was allowed. Differential thermal growth, however,would violate the new requirement.
Second, no hexapod could tilt more than 0.025 arc-second from its commanded position. Tip and tilt drift
would result from differential growth of individual hexapod legs. Again, all the legs in a hexapod could
grow significantly without causing enough drift to violate the requirement. Only differential leg growthposed problems.
The hexapod-leg thermal model was used to calculate the temperature difference between legs thatwould exceed these new requirements. That value is 0.002 deg C.
156
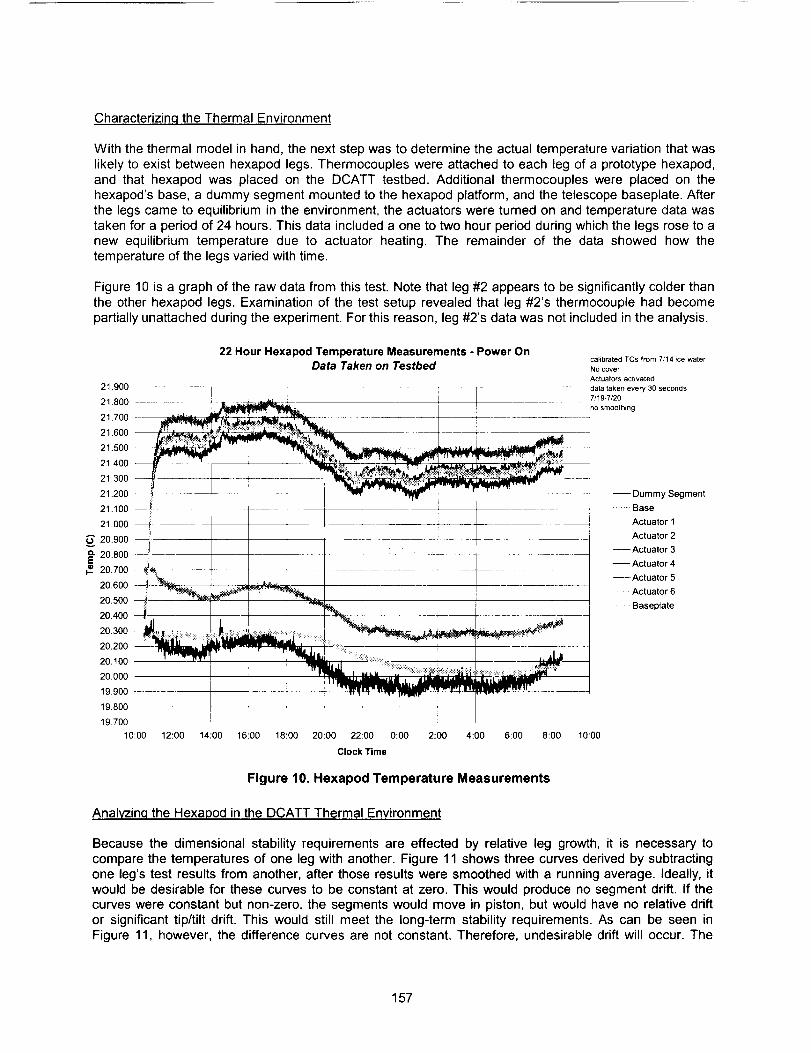
Characterizinq the Thermal Environment
With the thermal model in hand, the next step was to determine the actual temperature variation that waslikely to exist between hexapod legs. Thermocouples were attached to each leg of a prototype hexapod,
and that hexapod was placed on the DCATT testbed. Additional thermocouples were placed on thehexapod's base, a dummy segment mounted to the hexapod platform, and the telescope baseplate. After
the legs came to equilibrium in the environment, the actuators were turned on and temperature data was
taken for a period of 24 hours. This data included a one to two hour period during which the legs rose to anew equilibrium temperature due to actuator heating. The remainder of the data showed how thetemperature of the legs varied with time.
Figure 10 is a graph of the raw data from this test. Note that leg #2 appears to be significantly colder thanthe other hexapod legs. Examination of the test setup revealed that leg #2's thermocoupte had become
partially unattached during the experiment. For this reason, leg #2's data was not included in the analysis.
21.900
21.800
21.700
21.600
21.500
21.400 --
21.300
21.200
21.100
21.000
_" 20.900
" 20.800E
20.700
20.600
20.500
20.400
20.300
20.200
20.100
20.000
19.900
19.800
19.700
10:00
22 Hour Hexapod Temperature Measurements - Power Oncafibrated TCs from 7/14 _ce water
Data Taken on Testbed NocoverActualors activated
I I data taken every 30 seconds
J ,,, 7119-7/20
...... _ _ll,_ 1 " n ..... ,h,ng
ii l_ . _ "IW " " " "tl_p" ' ' - ........ Dummy Segment
...........Base
Actuator 1
Actuator 2
-- Actuator 3
-- Actuator 4
..... Actuator 5
Actuator 6
..... Baseplate
L
12:00 14:00 16:00 18:00 20:00 22:00
Clock Time
0:00 2:00 4:00 6:00 8:00 10:00
Figure 10. Hexapod Temperature Measurements
Analyzin,q the Hexapod in the DCATT Thermal Environment
Because the dimensional stability requirements are effected by relative leg growth, it is necessary tocompare the temperatures of one leg with another. Figure 11 shows three curves derived by subtracting
one leg's test results from another, after those results were smoothed with a running average. Ideally, itwould be desirable for these curves to be constant at zero. This would produce no segment drift. If the
curves were constant but non-zero, the segments would move in piston, but would have no relative driftor significant tip/tilt drift. This would still meet the long-term stability requirements. As can be seen in
Figure 11, however, the difference curves are not constant. Therefore, undesirable drift will occur. The
157
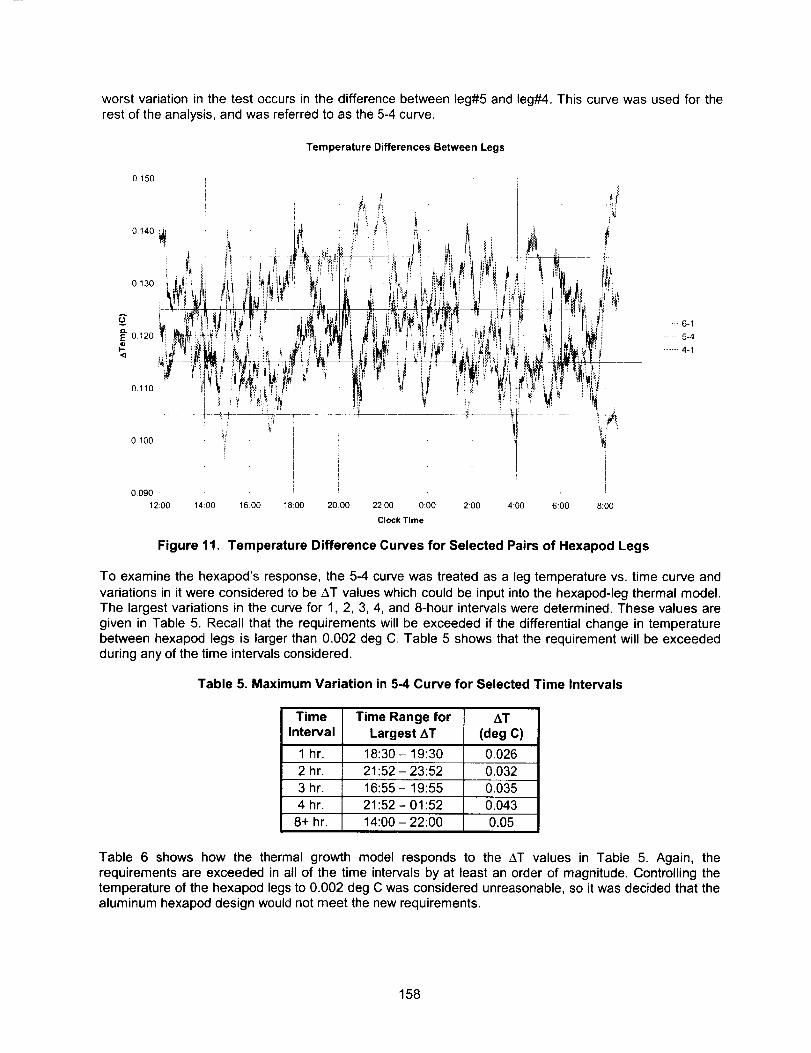
worst variation in the test occurs in the difference between leg#5 and leg#4. This curve was used for the
rest of the analysis, and was referred to as the 5-4 curve.
Temperature Differences Between Legs
0150
0140
0.130
0120I-
.... 6-1
5-4
..........4-1
0110
0 t00
0090
12:00
!
14:00 16:00 18:00 20:00 22:00 0:00 2:00 4:00 6:00
Clock Time
I
8:00
Figure 11. Temperature Difference Curves for Selected Pairs of Hexapod Legs
To examine the hexapod's response, the 5-4 curve was treated as a leg temperature vs. time curve and
variations in it were considered to be AT values which could be input into the hexapod-leg thermal model.The largest variations in the curve for 1, 2, 3, 4, and 8-hour intervals were determined. These values are
given in Table 5. Recall that the requirements will be exceeded if the differential change in temperaturebetween hexapod legs is larger than 0.002 deg C. Table 5 shows that the requirement will be exceededduring any of the time intervals considered.
Table 5. Maximum Variation in 5-4 Curve for Selected Time Intervals
Time
Interval
1 hr.
2hr.
3hr.
4 hr.
8+ hr.
Time Range for AT
Largest AT (deg C)
18:30 - 19:30 0.026
21:52 - 23:52 0.032
16:55 - 19:55 0.035
21:52 - 01:52 0.043
14:00 - 22:00 0.05
Table 6 shows how the thermal growth model responds to the AT values in Table 5. Again, therequirements are exceeded in all of the time intervals by at least an order of magnitude. Controlling thetemperature of the hexapod legs to 0.002 deg C was considered unreasonable, so it was decided that the
aluminum hexapod design would not meet the new requirements.
158
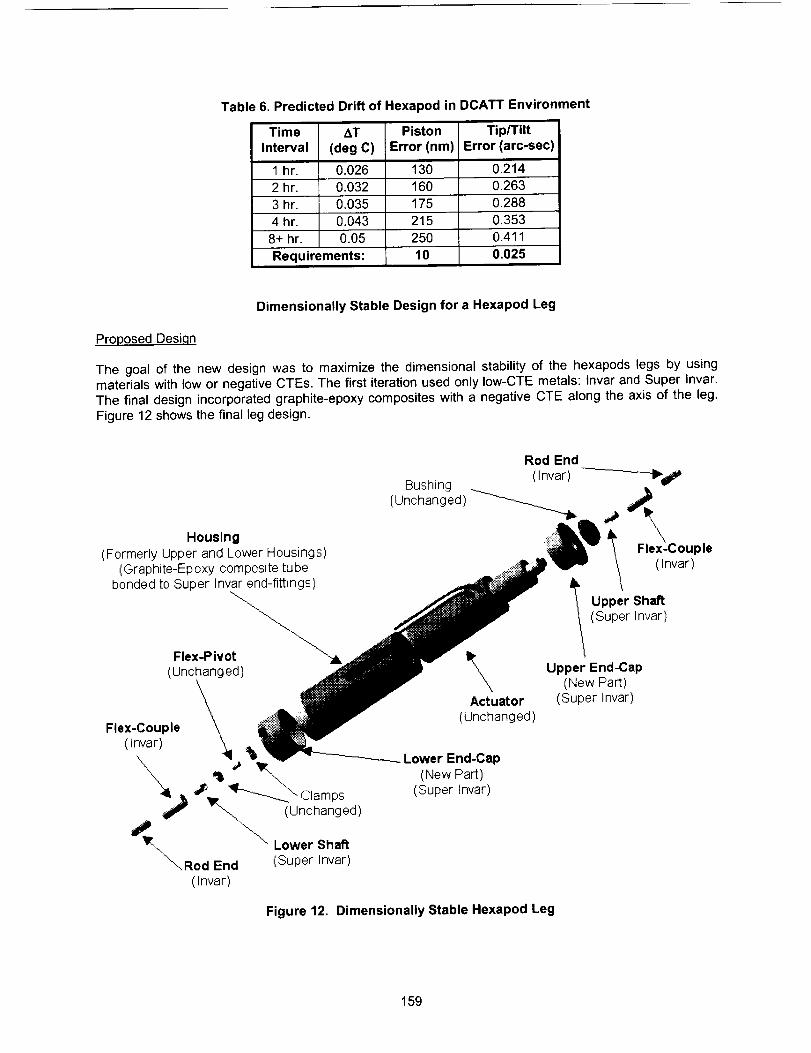
Table 6. Predicted Drift of Hexapod in DCATT Environment
Time AT Piston Tip/Tilt
Interval (deg C) Error (nm) Error (arc-sec)
1 hr. 0.026 130 0.214
2 hr. 0.032 160 0.263
3 hr. 0.035 175 0.288
4 hr. 0.043 215 0.353
8+ hr. 0.05 250 0.411
Requirements: 10 0.025
Dimensionally Stable Design for a Hexapod Leg
Proposed Desiqn
The goal of the new design was to maximize the dimensional stability of the hexapods legs by using
materials with low or negative CTEs. The first iteration used only Iow-CTE metals: Invar and Super Invar.The finat design incorporated graphite-epoxy composites with a negative CTE along the axis of the leg.
Figure 12 shows the final leg design.
Housing
(Formerly Upper and Lower Housings)(Graphite-Epoxy composite tube
bonded to Super Invar end-fittings)-...
Flex-Pivot _'_
(Unchanged)
Flex-Couple k(Invar)
x_' _ Clamps
_ (Unchanged)
Lower Shaft\Rod End (Super Invar)
(Invar)
Rod End
\Actuator
(Unchanged)
l \Flex-Couple
(Invar)
Upper Shaft
(Super Invar)
Upper End-Cap
(New Part)(Super Invar)
Lower End-Cap
(New Part)(Super Invar)
Figure 12, Dimensionally Stable Hexapod Leg
159

Composite Desiqn Effort
The design of the composite tube required its own effort, with assistance from a materials engineer
specializing in composites. Analysis suggested that with the proposed leg concept, a composite tubecould be designed that would provide the leg assembly with a near-zero CTE in the axial direction. The
goal for the tube was to have a CTE in the axial direction of -4.4E-6 per deg C. Specific analysis was alsorequired to estimate the effective CTE of the overlap between the tube and the Super lnvar end-fittingsthat were bonded to it.
The composite material designed uses 9 layers of Amoco's T50 graphite fiber with Cytec Fiberite's 954-2A cyanate ester resin. A layup of 30130/-30/-30/0/-30/-30/30/30 was predicted to provided the desiredCTE of -4.4E-6 per deg C. This layup takes advantage of the large Poisson's ratio of the material to
amplify the negative thermal expansion of the tube. As the temperature increases, the tube expands indiameter, and this causes the tube to shrink in the axial direction. This is in addition to axial shrinking
caused by the negative CTE of the composite fibers themselves. This layup design has reduced strengthand stiffness compared to other layup options. In this application, however, the strength and stiffnessproperties were determined to be adequate. This was an acceptable trade.
Since the hexapod would be in a terrestrial environment, dimensional changes caused by moistureabsorption in the composite were a concern. The composite selected had a large coefficient of moisture
expansion (CME). This effect had to be minimized, or the new hexapod would be just as dimensionallyunstable as the old one. This problem was solved by applying a moisture barrier. Parylene-C, a polymer
commonly used for conformal coating electronics, was selected. This vapor-deposited coating is easy andinexpensive to apply and has a very low rate of moisture transmission. The coating itself is thin and
compliant, so it was not expected to change the thermal expansion properties of the part.
Final Desiqn
Table 7 shows the predicted expansion of the dimensionally stable hexapod design with a 1 deg C ATapplied. Table 8 shows how the model behaves when the temperature variations from Table 5 are
applied. The analysis predicted this design would meet the requirements with significant margin. A 1.53deg C temperature change between legs is necessary to cause this model to exceed the driftrequirements.
Part Number
Per Leg
Rod end 2
Flex couple 2
!Upper shaft 1
Upper cap 1
Upper bond
HousingActuator* 1
Lower Cap 1Lower bond i 1
Flex pivot 1Lower shaft 1
Table 7. Expansion of Dimensionally Stable Hexapod Design
Length Material (z t_ T Growth
(mm) at 20 C (IC) (deg C) (nm)
12.065
6.0198
9.144
6.48
15.875
70.74i
NA
28.94
15.875
7.62
11.938
Invar 1.25E-06
Invar 1.25E-06 1
Super Invar 3.00E-07 1
Super Invar 3.00E-07 1,
Invar-to-Comp. Joint
Graphite-EpoxySteel and AI
!Super Invar
Invar-to-Comp. Joint
-1.60E-06
-3.83E-06
2.38E-07
3.00E-07
-1.60E-06 1
420 Stainless Steel 9.90E-06 1
Super Invar 3.00E-07 1
15.08
7.52
2.74
1.94
-25.35i
-270.93
238.37
8.68
-25.35
75.44
3.58
Hexapod Height change if all actuators grow: 62.48 nm
Total Growth
(nm)
30.16
15.05
2.74
1.94
-25.35
-270.93
238.37
8.68
-25.3_
75.44
3.58
54.33
Hexapod tilt if 2 actuators grow: 0.10258 arc-sec
160

Table 8. Predicted Response of New Hexapod Design to Measured Tern
Time AT Piston Tip/Tilt
Interval (deg C) Error (nm) Error (arc-sec)
1 hr. 0.026 0.17 0.00028
2 hr. 0.032 0.22 0.00034
3 hr. 0.035 0.23 0.00038
4 hr. 0.043 0.28 0.00046
8+ hr. 0.05 0.33 0.00054
Requirements: 10 0.025
}erature Environment
Invar Considerations
Before incorporating Invar or Super Invar into the mechanism, the design team did considerable research
to fully understand these complex metals. Invar's CTE varies non-linearly with temperature, so theoperating thermal environment must be well understood. Achieving the listed properties for Invar requires
specific heat treatment, and machining Invar after the heat treatment will alter these properties.Therefore, heat treatment is required again for finished parts. Lastly, Invar is subject to dimensional creep
over long periods. Consider all these properties carefully before deciding to use Invar or Super lnvar. Theprimary source of Invar information used by the DCATT team was "The Invar Effect ''2.
Final Status of DCATT Hexapods
Fabrication and Assembly Status
The DCATT project was cancelled shortly after the dimensional stability design effort. Limited funds weremade available to fabricate parts for one hexapod in the interest of verifying design elements that might
be useful to future projects. At this time, all parts have been fabricated, but the hexapod itself has notbeen assembled. Thermal expansion tests have been performed on some of the components to verify
design predictions of their CTE. Final assembly and testing of a hexapod is not currently being pursueddue to funding and manpower limitations. It is possible, however, that renewed interest in the future may
revive this development effort.
Component-Level CTE Testinq
CTE tests have been performed on several of the composite tubes. The results show an average CTE of-3.83E-6 per deg C over a temperature range of 7-31 deg C. This is within 13% of the design value. One
measurement was made on each of two sub-assemblies consisting of composite tubes bonded to theirSuper Invar end-fittings. Both CTE measurements were -1.9E-6 per deg C. More measurements on the
sub-assemblies were not possible on the restricted budget, so the sub-assembly CTEs carry lessconfidence than the tube CTEs.
Dimensional Stability Predictions with Measured CTEs
If the measured CTEs are included in the hexapod thermal models, the design performance degrades bynearly a factor of 10. This still meets the drift requirements, however. Worst case 8-hour drifts are 6 nm in
piston and 0.01 arc-second in tip/tUt. Drift requirements are exceeded by a 0.09 deg C differential
temperature change. Table 9 further details these results.
2 "The Invar Effect: A Centennial Symposium." International Symposium on the Invar Effect (1996:Cincinnati, Ohio). ed. Jerry Wittenauer. Warrendale, PA: Minerals, Metals & Materials Society, 1996
161
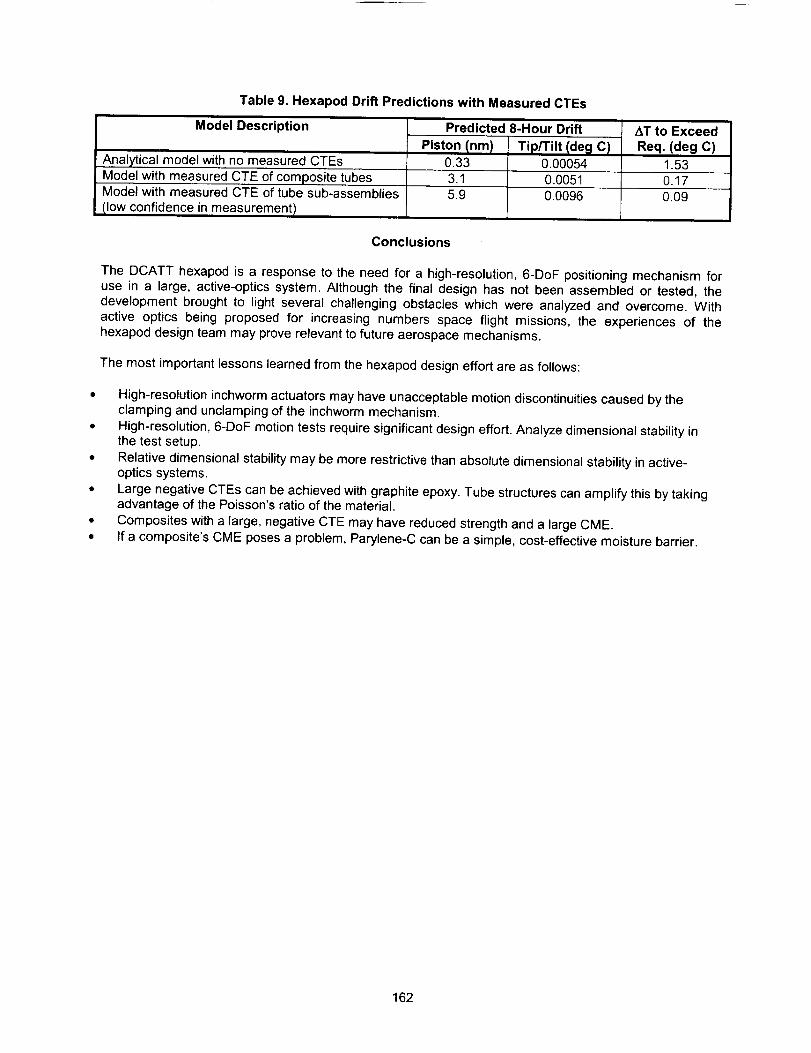
Table 9. Hexapod Drift Predictions with Measured CTEs
Model Description
Analytical model with no measured CTEs
Model with measured CTE of composite tubesModel with measured CTE of tube sub-assemblies
(low confidence in measurement)
Predicted 8-Hour Drift
Piston (nm I Tip/Tilt Ideal C I0.33 0.00054
3.1 0.0051
5.9 0.0096
AT to Exceed
Req. (deg C)
1.53
0.17
0.09
Conclusions
The DCATT hexapod is a response to the need for a high-resolution, 6-DoF positioning mechanism foruse in a large, active-optics system. Although the final design has not been assembled or tested, the
development brought to light several challenging obstacles which were analyzed and overcome. Withactive optics being proposed for increasing numbers space flight missions, the experiences of the
hexapod design team may prove relevant to future aerospace mechanisms.
The most important lessons learned from the hexapod design effort are as follows:
High-resolution inchworm actuators may have unacceptable motion discontinuities caused by the
clamping and unclamping of the inchworm mechanism.
High-resolution, 6-DoF motion tests require significant design effort. Analyze dimensional stability inthe test setup.
Relative dimensional stability may be more restrictive than absolute dimensional stability in active-
optics systems.
Large negative CTEs can be achieved with graphite epoxy. Tube structures can amplify this by takingadvantage of the Poisson's ratio of the material.
Composites with a large, negative CTE may have reduced strength and a large CME.
If a composite's CME poses a problem, Parylene-C can be a simple, cost-effective moisture barrier.
162

";i H• J '?
..... //
Lessons Learned from the Design and Implementation of a Potentiometer Assembly
for an Antenna Pointing Mechanism Application
Bradley Arkwright*, Pietro Di Leonardo*, Colin Francis'* and Richard Gahart**
Abstract
Potentiometers are often used as position sensing devices for positioning mechanisms. They haveproven to be a low-cost, reliable telemetry device when used in the correct environment and fabricated
using controlled processes. Several lessons learned were realized from a development effort in which
rotary potentiometers were used in an antenna positioning mechanism. In this application, each actuatormakes use of two rotary type potentiometers: one for fine telemetry and one for coarse telemetry. The
units are required to operate between -45°C and +105°C, with a required life (for the fine potentiometer)in excess of 1,800,000 revolutions.
Lesson learned and issues that will be discussed include:
• Dealing with potentiometer noise at low temperature
• Workmanship, cleanliness, and handling issues associated with fabrication of potentiometers
• Material selection for the potentiometer wiper assembly
• Resistive track deadband geometry and size
• Test equipment and flight electronics design precautions and recommendations that should beemployed when testing or operating potentiometers
The following performance parameters and trend data resulting from qualification and life testing will alsobe discussed in the paper:
• Potentiometer element resistance values as a function of life and temperature
• Potentiometer accuracy as a function of life and temperature
• Wiper preload
Introduction
Figure 1 illustrates an exploded view of a rotary actuator assembly that utilizes a coarse potentiometerand fine potentiometer in tandem to indicate the precise position of the actuator output. The design issuesdiscussed herein have all been resolved and the units have completed full qualification, life testing and
production, and are currently accumulating on orbit life aboard several commercial communicationsatellites.
In the standard actuator design, a redundant potentiometer assembly is integrated directly on the backend of the motor that serves as the fine telemetry output. The fine potentiometer is a two piece unit
mounted directly on the back end of the motor shaft. In the final design, the primary and redundantresistive tracks each have an approximate 15-degree deadband with the primary and secondary
deadbands oriented 180 ° apart. This configuration ensures continuous electrical readout over 360
degrees when both tracks are monitored. When used in conjunction with the coarse potentiometer (of
similar construction) on the output shaft of the actuator, the fine potentiometer provides precise positionaloutput. The coarse potentiometer and fine potentiometer on the motor are different in diameter but verysimilar in construction and materials. The coarse potentiometer is non-redundant but it only provides
rough positioning data in order to specify which revolution the fine potentiometer is on.
i Honeywell Aerospace Electronic Systems, Glendale, AZSpace Systems / Loral, Palo Alto, CA
Proceedings of the 3_ h Aerospace Mechanisms Symposium, Ames Research Center, May 9-11, 2001
163
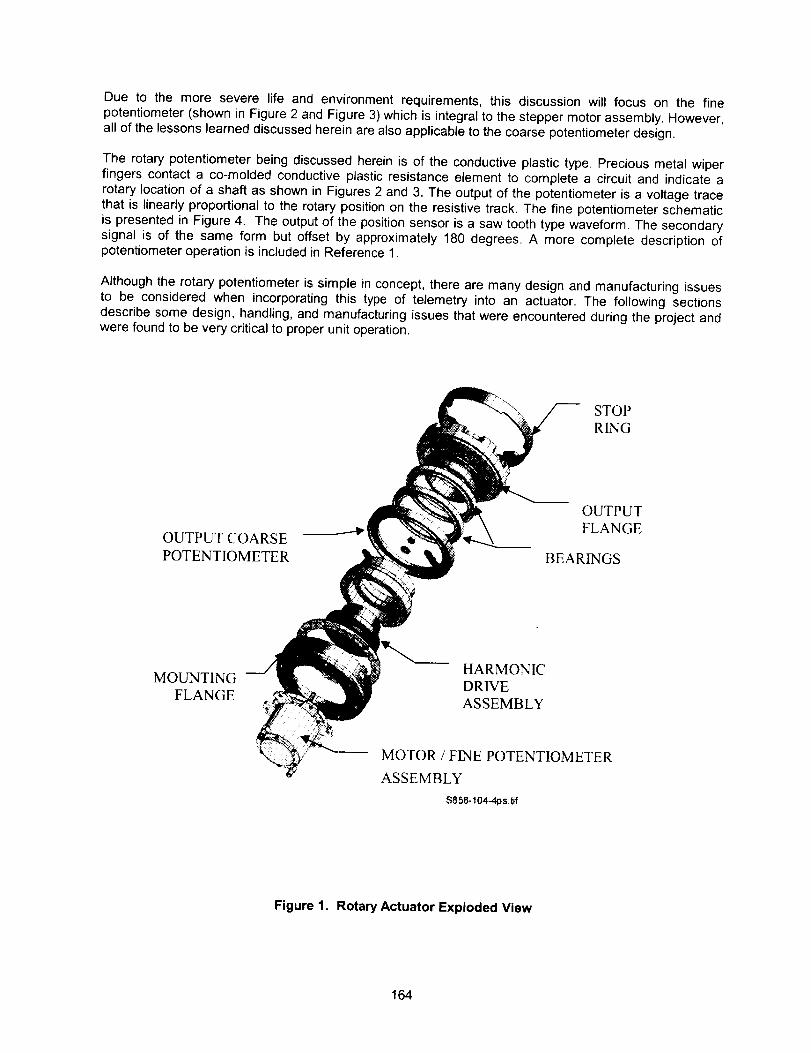
Due to the more severe life and environment requirements, this discussion will focus on the finepotentiometer (shown in Figure 2 and Figure 3) which is integral to the stepper motor assembly. However,all of the lessons learned discussed herein are also applicable to the coarse potentiometer design.
The rotary potentiometer being discussed herein is of the conductive plastic type. Precious metal wiperfingers contact a co-molded conductive plastic resistance element to complete a circuit and indicate arotary location of a shaft as shown in Figures 2 and 3. The output of the potentiometer is a voltage tracethat is linearly proportional to the rotary position on the resistive track. The fine potentiometer schematicis presented in Figure 4. The output of the position sensor is a saw tooth type waveform. The secondarysignal is of the same form but offset by approximately 180 degrees. A more complete description ofpotentiometer operation is included in Reference 1.
Although the rotary potentiometer is simple in concept, there are many design and manufacturing issuesto be considered when incorporating this type of telemetry into an actuator. The following sectionsdescribe some design, handling, and manufacturing issues that were encountered during the project andwere found to be very critical to proper unit operation.
STOP
RING
OUTPUT COARSE
POTENTIOMETER
OUTPUTFLANGE
BEARINGS
MOUNTING
FLANGE
HARMONIC
DRIVE
ASSEMBLY
MOTOR / FINE POTENTIOMETER
ASSEMBLY
S858-104-4p s.tif
Figure 1. Rotary Actuator Exploded View
164

Figure 2. Fine Potentiometer Assembly (Part of Stepper Motor Assembly)
{The fine potentiometer assembly is mounted directly to the back end of the stepper motor assembly.It is easily accessible for inspection via the removal of a back cover.}
..........................................ik_ ,i ¸ ........
Figure 3. Fine Potentiometer Assembly- Wiper Detail
165
Potentiometer Noise at Cold Temperature in Vacuum
During life testing, after approximately 45,000 motor revolutions, the fine potentiometer began exhibiting
noise traces as shown in Figure 5 during cold thermal vacuum testing.
With each successive cycle, the minimum temperature at which the noise began slowly increased (i.e.,the noise appeared at a warmer temperature). A thorough cause and effect investigation was initiated to
determine the root cause of the anomaly. The investigation focused on several possible causes:
Dynamic Instability: The noise could have been caused by dynamic instability of the motor as it
steps through its detent positions.
Mechanical Interference: The noise could have been caused by interference between the motorback cover and the rotating wiper assembly on the fine potentiometer.
Surface Contamination: The noise could have been caused by the introduction of contaminants
between the contacting surfaces.
The investigation proceeded to demonstrate that the noise was actually caused by the dynamic formation
of an electrical insulator at the interface of the wiper and the resistive element of the potentiometer. Thisphenomena lead to a thorough examination and characterization of the electrical interfaces and theirsurrounding materials.
The baseline wiper material was PALINEY_7 (Ref. 2), a precious metal alloy comprised of palladium,
silver, copper, gold and platinum. The potentiometer substrate material is Diallyl Phthalate (DAP) with aresistive track co-molded into the substrate material. The literature in Ref.2 (see Table 1) cites Palladium
and Platinum as the two most highly catalytic metals in the formation of frictional polymers. This supports
the theory for polymer formation since PALINEY'_7 contains large amounts of Palladium and Platinum.
During operation, this very reactive surface rides on short chain polymers from the DAP resistive glazeformulation along with lithium sterates used as mold releases by the potentiometer manufacturer. This
creates an ideal environment for the formation of a polymeric film. The unit sensitivity to this film isincreased at cold temperature when the film solidifies and creates an insulating barrier between the
wipers and resistive track. Under these conditions it is not unexpected to observe noisy or nonlinearvoltage output from the potentiometer due to this lack of intimate wiper contact with the element surface.
A design change was then instituted which changed the wiper material from PALINEY®7 to NEYORO _'
G, which is a gold alloy. The literature in Ref. 2 cites Gold as several times (-20X) less catalytic thanPalladium or Platinum (see Table 1 ).
Based on surface analyses results which showed evidence of general debris and contamination on the
elements, it was also deemed necessary to implement stricter cleanliness precautions while handling orviewing potentiometers. All personnel within the immediate area of an exposed potentiometer are now
required to wear clean room hats and masks. The hat and mask are in addition to the generalrequirement of smocks and lint free gloves. The potentiometers are handled within a Class 100,000 rated
area and a Class 100 flow hood. Only when the potentiometers are closed up inside a unit is the hat andmask requirement relieved.
166
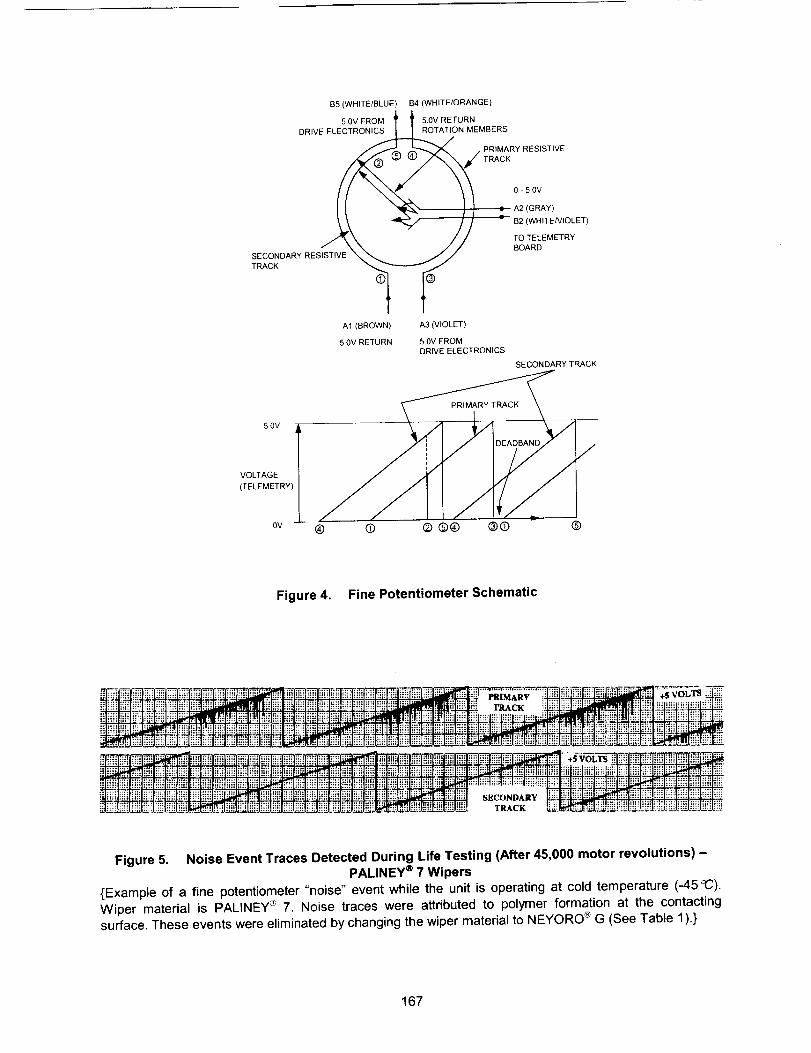
PR,.ARYRES,S ,VE
II _(,_, ) ] ,a A2(GRAY)
_hl_k _ // " B2 (WHITENIOLET)
/XX // TOTELEMETRYSECONDARY RESISTIVE _ // BOARD
TRACK __J
°t t°A1 (BROWN) A3 (VIOLET)
5.0V RETURN 5.0V FROMDRIVE ELECTRONICS
SECONDARY TRACK
5.0V
/
ov ® @ ® ®® ®0 ®
VOLTAGE
(TELEMETRY)
Figure 4. Fine Potentiometer Schematic
::. _.i !... !.E ........ ;......... :: :_:. M: ,,._ " :'_ i';"':"_" !h :":_ "_:..,::: .:= .... ,.'_':_'..,"--_':..,: :,,. : ."i..:_'t_._'_,"m._.._o_ , ..'_. "_.'_.' -- :":£O. ..... "_'._ ........ ...,--,--_............._.............................. /_ _._ ...... .-: ......... : ............... ,... 'OL_.................. _ ......... _L'4_Z :.................... +_ _, .......
:: =::: =_:.... "'" _'[. | _ _ ff _ : : .-,...:i _:.:i hi! i'!" .:: :.:: :::." :., :::: :::: ::: :::: :::: :=_ :=:: ::u :'" '" "i!! !!':! EIT i_ _iil h.:_ ..:: i!!! _! :!£L':iiJ ::!:
................._ .... ,...........:..,..... .,.,L.,=It:Ix::=:;_:::: :::: :_::
Figure 5. Noise Event Traces Detected During Life Testing (After 45,000 motor revolutions) -PALINEY ® 7 Wipers
{Example of a fine potentiometer "noise" event while the unit is operating at cold temperature (-45 _C).
Wiper material is PALINEY _= 7. Noise traces were attributed to polymer formation at the contacting
surface. These events were eliminated by changing the wiper material to NEYORO _ G (See Table 1).}
167
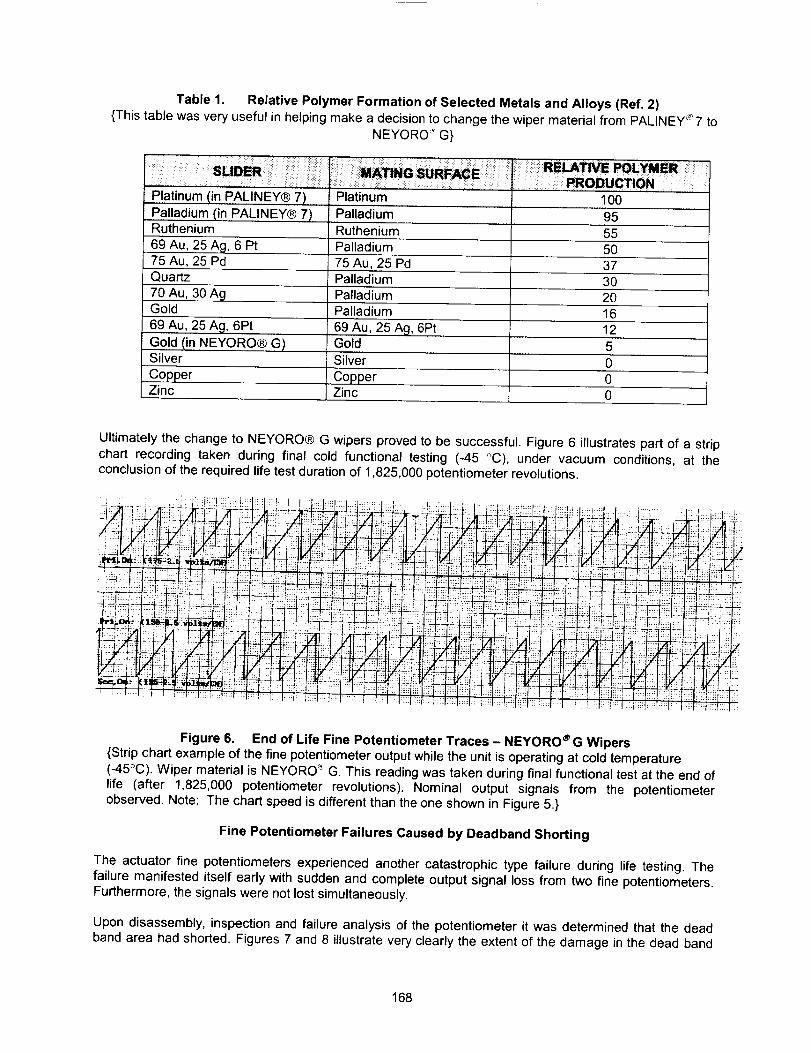
Table 1. Relative Polymer Formation of Selected Metals and Alloys (Ref. 2)
{This table was very useful in helping make a decision to change the wiper material from PALINEY :+7 to
NEYORO '_G̀}
Platinum (in..PALINEY® 7)
Palladium (in PALINEY® 7)'Ruthenium
69 Au, 25 Acj, 6 Pt75 Au, 25 Pd
Platinum
Palladium
Ruthenium
Palladium
75 Au, 25 Pd
Quartz Palladium
70 Au, 30 AgGold
69 Au, 25 A 9, 6Pt
Gold (in NEYORO® G)Silver
CopperZinc
Palladium
Palladium
69 Au, 25 A 9, 6PtGold
Silver
100
I.. 9555
50
37
3O
20
16
12
5
0
Copper 0Zinc 0
Ultimately the change to NEYORO® G wipers proved to be successful. Figure 6 illustrates part of a strip
chart recording taken during final cold functional testing (-45 °C), under vacuum conditions, at the
conclusion of the required life test duration of 1,825,000 potentiometer revolutions.
I I f i
_i;i_]..:!:+!_:L._±_'_ Ji: '+12' :'i _! i:i[ :25:1:r::,: 5 / : :
Figure 6. End of Life Fine Potentiometer Traces - NEYORO ® G Wipers
{Strip chart example of the fine potentiometer output while the unit is operating at cold temperature
(-45°C). Wiper material is NEYORO _ G, This reading was taken during final functional test at the end of
life (after 1,825,000 potentiometer revolutions). Nominal output signals from the potentiometerobserved. Note: The chart speed is different than the one shown in Figure 5.}
Fine Potentiometer Failures Caused by Deadband Shorting
The actuator fine potentiometers experienced another catastrophic type failure during life testing. The
failure manifested itself early with sudden and complete output signal loss from two fine potentiometers.Furthermore, the signals were not lost simultaneously.
Upon disassembly, inspection and failure analysis of the potentiometer it was determined that the dead
band area had shorted. Figures 7 and 8 illustrate very clearly the extent of the damage in the dead band
168
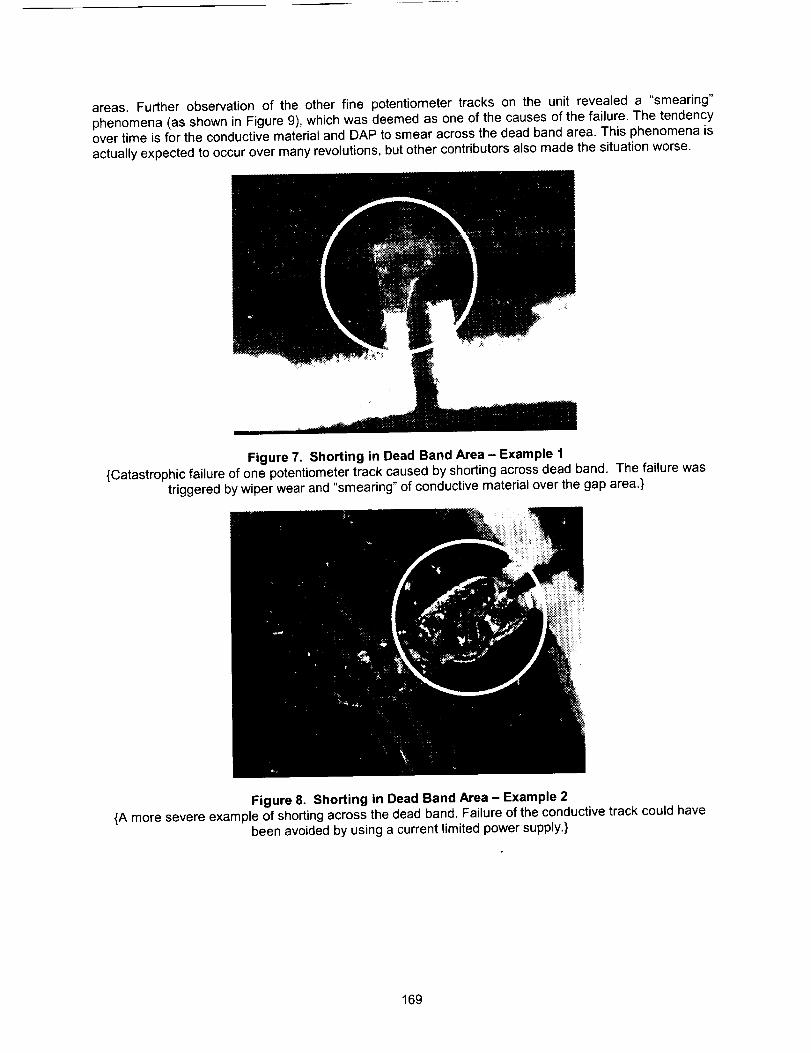
areas. Further observation of the other fine potentiometer tracks on the unit revealed a "smearing"phenomena (as shown in Figure 9), which was deemed as one of the causes of the failure. The tendency
over time is for the conductive material and DAP to smear across the dead band area. This phenomena isactually expected to occur over many revolutions, but other contributors also made the situation worse.
Figure 7. Shorting in Dead Band Area - Example 1
{Catastrophic failure of one potentiometer track caused by shorting across dead band. The failure was
triggered by wiper wear and "smearing" of conductive material over the gap area.}
Figure 8. Shorting in Dead Band Area - Example 2
{A more severe example of shorting across the dead band. Failure of the conductive track could havebeen avoided by using a current limited power supply.}
169

Figure 9. "Smearing" Effect of Conductive Track Across Dead Band Area{Over many revolutions (1,825,000) this is an expected effect. But with a small dead band gap and
expected wiper wear, this phenomenon proved to be catastrophic. (See Figures 7 and 8)}
Normal wiper wear over many revolutions causes a flat patch formation on the contact area of the wipersas shown in Figure 10. As the wiper traverses across the dead band area over life and the wear patch
gets larger, the wipers actually can bridge across the dead band as the wear patch exceeds the gapwidth. The dead band gap therefore needs to be large enough to accommodate the normal, expected
wear patch on the wiper assembly.
Workmanship issues were also identified with the dead band manufacturing process as shown in Figure11. The small dead band requirement caused the manufacturing process to be very difficult and not
repeatable. The process involved a mechanical removal of the conductive material, which caused thequality of the required dead band gap to be less than acceptable and certainly very uncontrollable in
terms of size and geometry. This process also caused the exposure of silver epoxy used to create the
wire tab connections for the potentiometer. Exposed silver epoxy is visible along one edge of the gap.Although it was never determined that the exposed silver epoxy in the dead band area actually was apartial cause of the failure, it certainly was undesirable.
Furthermore, the investigation revealed that the 5V power supply being used to power up the
potentiometers was not current limited low enough to protect the potentiometers. During nominaloperation this would not be an issue. However, this added to the catastrophic type failure since the test
equipment did not offer sufficient protection against mis-wiring or against inadvertent current draws by theunit. A current limited supply was then implemented to protect the hardware from excessive current going
through the unit.
Figure 12 shows a sample of a strip chart output that captures the shorting phenomena across the deadband. By monitoring the current limited supply line on the strip chart channels it was possible to capture
the shorting events on one potentiometer track. The hash marks indicate additional current draw from thesupply. This only became visible when a current limited supply was used since the added current draw is
relatively small.
170
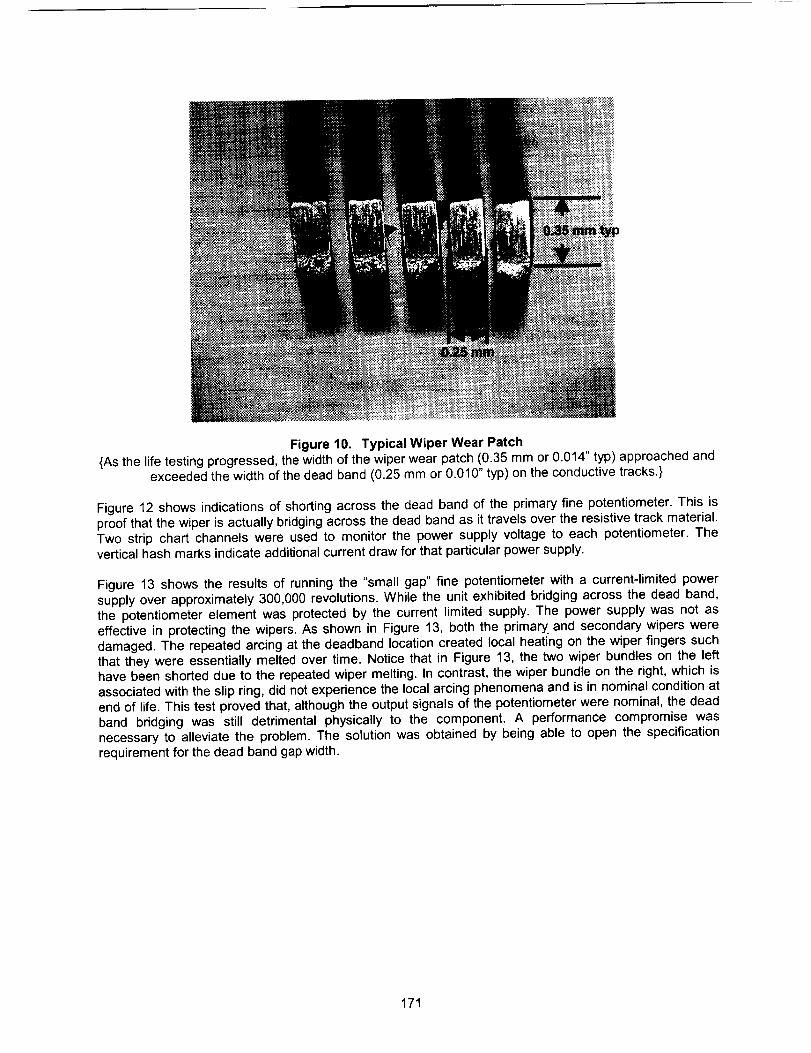
Figure 10. Typical Wiper Wear Patch
{As the life testing progressed, the width of the wiper wear patch (0.35 mm or 0.014" typ) approached andexceeded the width of the dead band (0.25 mm or 0.010" typ) on the conductive tracks.}
Figure 12 shows indications of shorting across the dead band of the primary fine potentiometer. This is
proof that the wiper is actually bridging across the dead band as it travels over the resistive track material.Two strip chart channels were used to monitor the power supply voltage to each potentiometer. The
vertical hash marks indicate additional current draw for that particular power supply.
Figure 13 shows the results of running the "small gap" fine potentiometer with a current-limited power
supply over approximately 300,000 revolutions. While the unit exhibited bridging across the dead band,the potentiometer element was protected by the current limited supply. The power supply was not as
effective in protecting the wipers. As shown in Figure 13, both the primary, and secondary wipers were
damaged. The repeated arcing at the deadband location created local heating on the wiper fingers suchthat they were essentially melted over time. Notice that in Figure 13, the two wiper bundles on the lefthave been shorted due to the repeated wiper melting. In contrast, the wiper bundle on the right, which is
associated with the slip ring, did not experience the local arcing phenomena and is in nominal condition atend of life. This test proved that, although the output signals of the potentiometer were nominal, the dead
band bridging was still detrimental physically to the component. A performance compromise wasnecessary to alleviate the problem. The solution was obtained by being able to open the specificationrequirement for the dead band gap width.
171
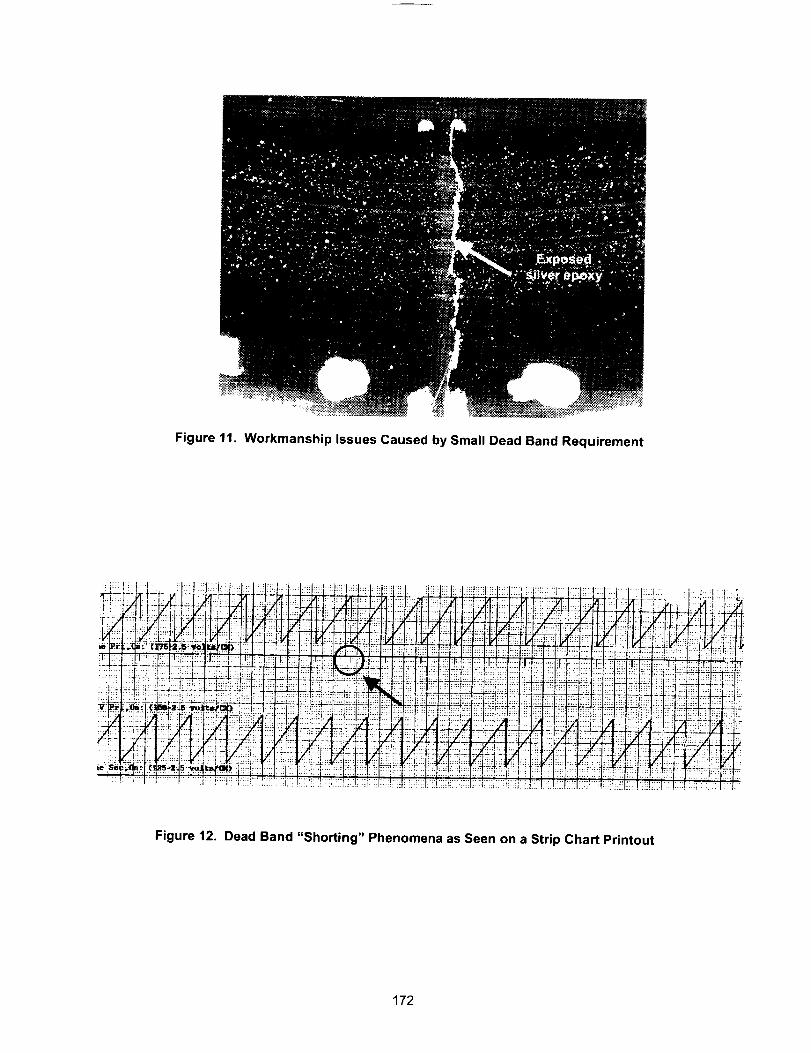
Figure 11. Workmanship Issues Caused by Small Dead Band Requirement
;ii I:!:.:t i!l :, j
:l_ .-:rl-:: ::1!:!'l:_::_: .._:,.._d.
":,' 1:_ _l:/q 'i''k =-:'" ':':::._:::
I:'5 ""'1"""" '-'"....................
_ _' .... :}-:::. .-5}: ÷ :7 !! :<!.;5:
__i_::'"'"'"i:i_;ii_"7iiii!ii
__iii_!i;_!!!!t!!i!!!!_,'!ii!!!!_i!i_!!i!f
Z
!!q
i!_:!
::: !f_i I
7
i_::7
....I.I.,L: ;.-,I;I...... I." 77{{ :::',:
:::-- i__f!!!_t:.--r-! .... [{4-: _-:i:
:?:z:_7-:2;Z ::I:
iX'-'::i::: :-
'. :1.. J .....
=, ,
,-t-t- +- -,i---.-
.... i.i. I ....
. i. i .• ,+l.,t ....
.... i...°_ ....
!r-_ib::.!t
Figure 12. Dead Band "Shorting" Phenomena as Seen on a Strip Chart Printout
172

V
Figure 13. Wiper Wear After Running a Life Test With a Current Limited Supply
The new configuration shown in Figure 14 opened the gap width from 0.25 mm to 1.5 mm (0.010" to
0.060"). This width had substantial margin over the predicted wiper wear patch (shown in Figure 10).This wide gap configuration proved to be easy to manufacture and control. The vendor was now able to
use a very repeatable and proven masking technique to generate the larger gap.
A final life test was conducted to validate the final gap configuration. Figure 15 shows the same dead
band crossing at the completion of over 1,825,000 cycles.
Figure 14. Corrected Dead Band Configuration - Pre Life Test
173
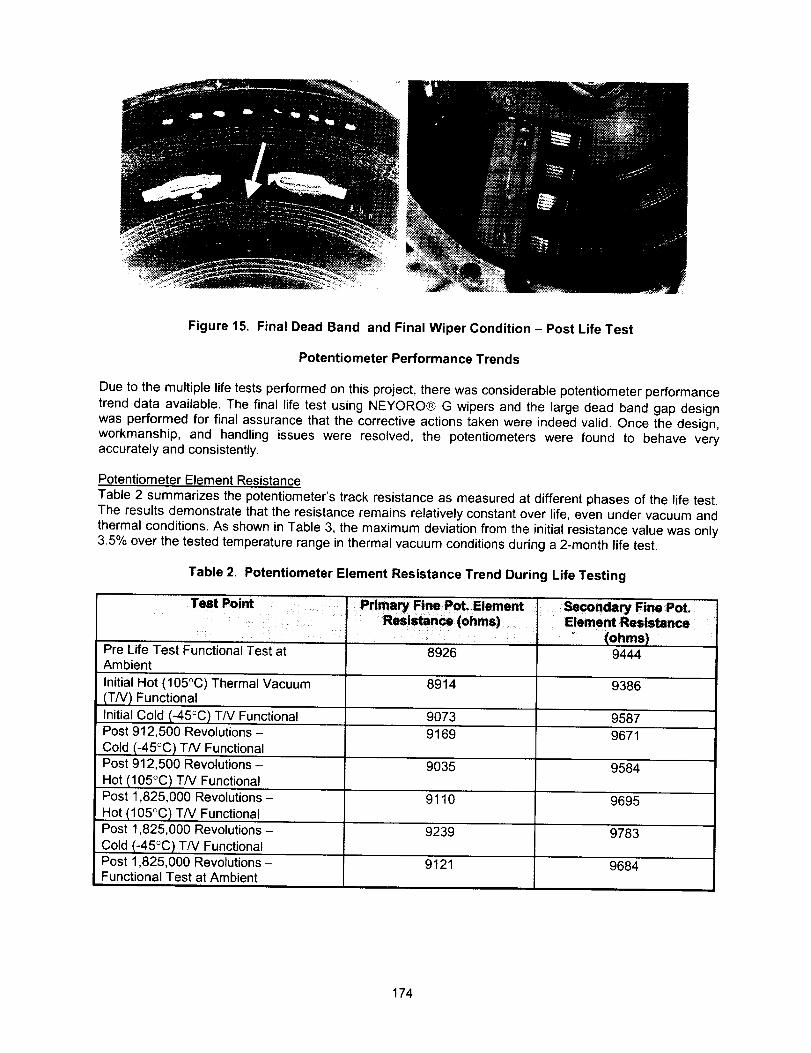
Figure 15. Final Dead Band and Final Wiper Condition - Post Life Test
Potentiometer Performance Trends
Due to the multiple life tests performed on this project, there was considerable potentiometer performance
trend data available. The final life test using NEYORO® G wipers and the large dead band gap designwas performed for final assurance that the corrective actions taken were indeed valid. Once the design,
workmanship, and handling issues were resolved, the potentiometers were found to behave veryaccurately and consistently.
Potentiometer Element Resistance
Table 2 summarizes the potentiometer's track resistance as measured at different phases of the life test.
The results demonstrate that the resistance remains relatively constant over life, even under vacuum and
thermal conditions. As shown in Table 3, the maximum deviation from the initial resistance value was only3.5% over the tested temperature range in thermal vacuum conditions during a 2-month life test.
Table 2. Potentiometer Element Resistance Trend During Life Testing
Test Point :_ _ __!,_ :_ !i_!_i__ _
Pre Life Test Functional Test at
Ambient
Initial Hot (105°C) Thermal Vacuum
(TN) Functional
Initial Cold (-45°C) TN FunctionalPost 912,500 Revolutions -
Cold (-45°C) T/V FunctionalPost 912,500 Revolutions -
Hot (105°C) T/V FunctionalPost 1,825,000 Revolutions -
Hot (105°C) TN FunctionalPost 1,825,000 Revolutions-
Cold (-45°C) TN FunctionalPost 1,825,000 Revolutions -Functional Test at Ambient
8926
Secon_w Fine Pot.Element Resistance
" (ohms)9444
8914 9386
9073 9587
9169 9671
9035 9584
9110 9695
9239 9783
9121 9684
174

Table 3. Potentiometer Resistance Maximum Deviation
Case
....Maximum Negative'Deviation from Initial
Maximum Positive
Deviation from Initial
Primary Potentiometer Percent
..... ,Resistance Change-0.5%
+3.5%
Secondary Potentiometer Percent
Resistance Change ,-0.6%
+3.5%
Potentiometer AccuracyPotentiometer linearity or accuracy over life was also a parameter of primary concern. The output value of
the potentiometer at one prescribed motor detent position was measured at various points during the lifetest. The data in Table 4 shows the variation of the potentiometer read-out at different phases of the life
test. The reference position is a mechanical scribe mark located on the motor output shaft and motor
mounting housing. The primary and secondary fine potentiometer readings were very repeatable over life.As can be seen from the voltage readings, the accuracy drift over life did not vary by more than 0.01 volt,
which is equivalent to 0.46 degree at the motor. Going through the gear ratio, this converts to only 0.003degree at the output of this particular actuator design.
Table 4. Potentiometer Accuracy Drift Over Life
{A scribe mark was used as a reference position. The data indicates the variation of the finepotentiometer readings for the same baseline scribe position, over life.}
i ,,i ,lu,i
Baseline Scribe Reading'
+105°C Pre-life test Functional Scribe
Position
Primary Fine
pote,ntiometer Voltage;(v )3.832
Secondary Fine
potent!ometer Voltage (v)1.245
3.834 1.245
-45°C Pre-life test Functional Scribe 3.833 1.243Position
1,200,000 Revolutions +105°C 3.836 1.244Functional Scribe Position
1,200,000 Revolutions -45°C Functional 3.831 1.241Scribe Position
1,200,000 Revolutions Ambient Scribe 3.839 1.240Reading
1,825,000 Revolutions Final +105°C 3.842 1.239Functional Scribe Position
1,825,000 Revolutions Final -45°C 3.838 1.237Functional Scribe Position
1,825,000 Revolutions Ambient Scribe3.840 1.239
Reading
Note: Average Potentiometer Performance: 69 degrees/volt or 0.0145 volt/degree
Linearity of the potentiometer was also found to be well within specification over life. Table 5 tabulates the
linearity error that was measured over the course of one of the life tests. It shows that the potentiometerwas very accurate over all temperature ranges, during the life test and at the end of life. Table 5 showsthat the end of life linearity error is only 0.0274 volt or 1.89 degrees at the motor shaft. Note that this error
also includes a maximum error of 0.2 degree attributed to motor step error. Going through the gear ratio,this converts to only 0.012 degree at the output of this particular actuator design.
175

Table 5. Potentiometer Linearity Error during Life Testing
Case ' Temperature (°C) * _imary FinePotentiometer
Linearity Error (o)Pre Life Test Functional Test Ambient 0.911
Initial T/V Functional 105 4.347 4.416
Initial T/V Functional -45 0.214 0.193
Post 912,500 Revolutions TN - 45 0.145 0.386Functional
Post 912,500 Revolutions TN 105 0.200 0.276Functional
Post 1,825,000 Revolutions 105 3.105 3.036TN Functional
Post 1,825,000 Revolutions - 45 3.064 3.098TN Functional
Post Life Test Functional Test Ambient 1.891 1.435at Ambient
* Note that this is the linearity error at the motor shaft as read by the potentiometer
* Secondary FinePotentiometer
Linearity,Error (o)0.897
Wiper PreloadWiper finger preload on the element can effect both nominal performance and wear life. If wiper preload is
too low, then it is possible that the wiper fingers can lose contact with the element at certain temperatureextremes and the output signal would be lost. If wiper preload is too high, then wiper wear can be
accelerated and total operational life will be compromised. However, during this project a rather broad
range of preloads was found to perform successfully. Figure 13 presented earlier, shows how the wipertips were melted due to the local arcing at the deadband. Clearly the wiper preload was drasticallyeffected due to this wiper damage and yet the potentiometer output signal showed nominal performanceat end of life.
Conclusions
One of the first considerations to be taken when selecting a component to be incorporated into a
mechanism or any design, should be heritage of that component. Specifically, it is important that theproposed application be very similar to past heritage and should be supported by qualification and life
testing. It is necessary to scrutinize any performance requirements that are not supported by heritageexperience or applications. One such example in this project was the initial small deadband size.
Although it was a heritage size for a deadband for the potentiometer vendor on some past designs, thoseapplications did not actually have the wipers travelling over the deadband during actual operation. It is
very important to make sure that a vendor clearly understands the application of their component in theend product even if it appears to be well defined in the procurement specification. Typically, whatever
component is scrutinized the least in a design usually has the most risk related to it.
There were a number of technical and producibility type lessons learned on this project. Because of therelative simplicity of the rotary potentiometer, it is very easy to overlook all the details of the design that
can have a very real effect on the performance of the unit.
Electrical output noise from a rotary potentiometer has been an issue that many have experienced. Wipermaterial choice and element cleanliness has a definite effect on the tendency for electrical output noise tooccur. The formation of any insulating polymer layers on the element surface seems to be much less
prevalent when a gold alloy type wiper like NEYORO _' G is utilized instead of a palladium or platinum type
alloy like PALINEY_7. However, these potentiometers seemed only to be sensitive to this polymerizationformation at relatively cold temperature. It is recommended that these types of potentiometers not be
utilized at temperatures less than approximately -20°C unless the design is proven by significant life
testing.
176
Thesizeof the resistivetrackdeadbandis particularlycriticalif theapplication requires the wipers to
travel over the deadband during normal operation. It is important that the size of the deadband is aminimum of 3 times bigger than the length of the wear patch on the wiper fingers at end of life. This
margin will account for wiper wear rate variability, deadband geometry consistency, wiper preloadvariation, and temperature effects, etc. Although the size of the wiper wear patch will vary in each
configuration and application, the wear patch length in this application was found to grow from 0.025 mm
(0.001 inch) at beginning of life to 0.35 mm (0.014 inch) (Figure 10) at end of life after 1,825,000
revolutions (= 1.75 diameter track). The size of the wear patch at end of life was consistent over multiplelife tests. The larger deadband was also found to be much more producible and consistent in terms offabrication.
Related to the deadband shorting issue, it was determined that is also good practice to utilize a current
limited power source when testing potentiometers to protect the units from damage due to inadvertentmis-wiring. This lesson learned extends to the design of actual spacecraft electronics also.
Because of the delicate nature of the wipers and the relatively low wiper preload, great care has to be
taken in terms of handling and cleanliness of potentiometers. It is recommended that the potentiometersbe handled like bearings in terms of cleanliness requirements until contained inside a unit or covered.
Special shipping precautions must be taken with the wiper assemblies to ensure that the delicate wipersdo not get damaged simply due to the shipping process.
Although wiper preload was found to have a rather wide acceptable range for successful performance, itis still important to measure/inspect the wiper preload accurately both at the vendor and prior to
installation into a unit. Without adequate dimensional inspection of the wiper preload, performance can beaffected in an extreme situation where the preload is very low.
Despite all the design issues encountered with rotary potentiometer as discussed herein, the units
performed exceptionally in both qualification testing, life testing, acceptance testing and ultimately on-orbitover a rather large temperature range. The units proved to be very physically robust and never
encountered any issues associated with structural loading or vibration testing. In addition to the datapresented herein, a considerable amount of test data was amassed for various life tests and over 20 flight
units which supports the use of potentiometers for this type of application. When the design and handling
precautions recommended herein are instituted, these rotary potentiometers yield very linear andrepeatable positional output.
Rotary potentiometers have been utilized successfully for decades as the telemetry device for precision
rotary actuators. While potentiometers are rather simple devices, there are many basic design parametersto be considered as discussed herein, Great care should be taken when operating potentiometers in coldenvironments and in long life applications. However, rotary potentiometers are still a relatively low-cost,
lightweight telemetry option that yields accurate and repeatable results even over extreme environments,and they should still be considered a viable option as a telemetry device in future precision actuators.
References
1. Conley, Peter L., Space Vehicle Mechanisms, 1998.
2. Pitney, Kenneth E., Ney Contact Manual, The J.M. Ney Company, Bloomfield, Connecticut, 1973
177

178
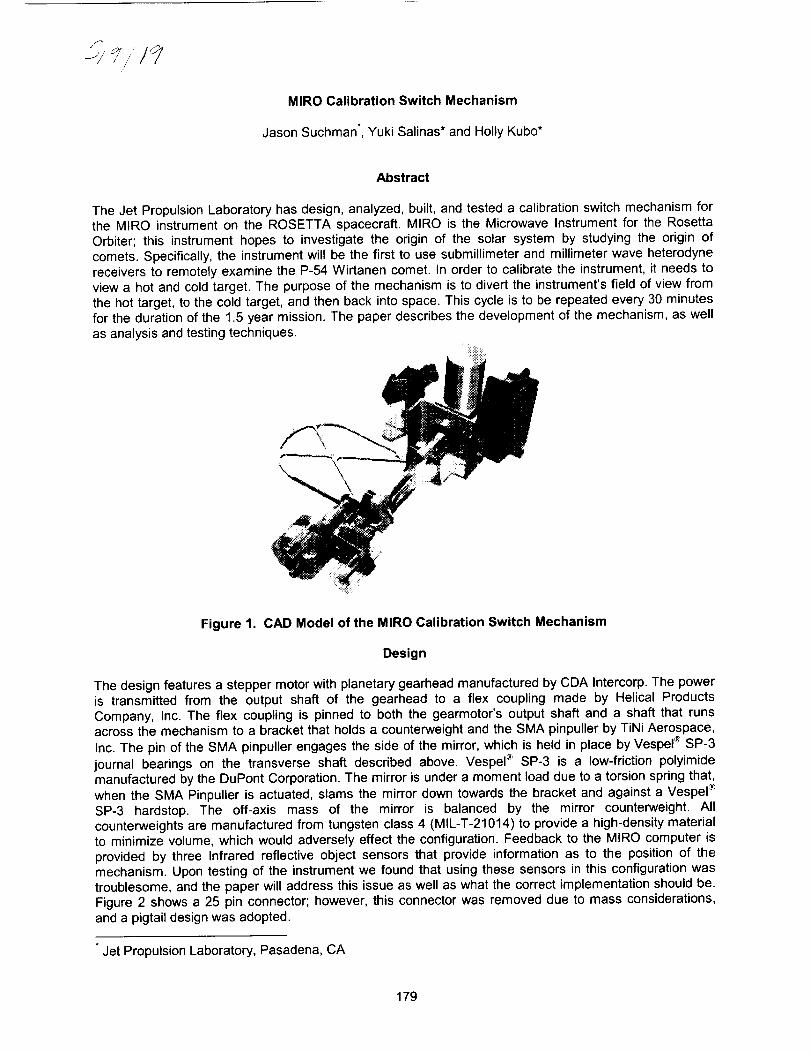
/: /
/
MIRO Calibration Switch Mechanism
Jason Suchman*, Yuki Salinas* and Holly Kubo*
Abstract
The Jet Propulsion Laboratory has design, analyzed, built, and tested a calibration switch mechanism forthe MIRO instrument on the ROSETTA spacecraft. MIRO is the Microwave Instrument for the Rosetta
Orbiter; this instrument hopes to investigate the origin of the solar system by studying the origin of
comets. Specifically, the instrument will be the first to use submillimeter and millimeter wave heterodynereceivers to remotely examine the P-54 Wirtanen comet. In order to calibrate the instrument, it needs to
view a hot and cold target. The purpose of the mechanism is to divert the instrument's field of view from
the hot target, to the cold target, and then back into space. This cycle is to be repeated every 30 minutesfor the duration of the 1.5 year mission. The paper describes the development of the mechanism, as well
as analysis and testing techniques.
Figure 1. CAD Model of the MIRO Calibration Switch Mechanism
Design
The design features a stepper motor with planetary gearhead manufactured by CDA Intercorp. The poweris transmitted from the output shaft of the gearhead to a flex coupling made by Helical Products
Company, Inc. The flex coupling is pinned to both the gearmotor's output shaft and a shaft that runsacross the mechanism to a bracket that holds a counterweight and the SMA pinpuller by TiNi Aerospace,
Inc. The pin of the SMA pinpuller engages the side of the mirror, which is held in place by Vesper _ SP-3
journal bearings on the transverse shaft described above. Vespel _ SP-3 is a low-friction polyimidemanufactured by the DuPont Corporation. The mirror is under a moment load due to a torsion spring that,when the SMA Pinpuller is actuated, slams the mirror down towards the bracket and against a Vespel _'
SP-3 hardstop. The off-axis mass of the mirror is balanced by the mirror counterweight. All
counterweights are manufactured from tungsten class 4 (MIL-T-21014) to provide a high-density materialto minimize volume, which would adversely effect the configuration. Feedback to the MIRO computer is
provided by three Infrared reflective object sensors that provide information as to the position of themechanism. Upon testing of the instrument we found that using these sensors in this configuration was
troublesome, and the paper will address this issue as well as what the correct implementation should be.
Figure 2 shows a 25 pin connector; however, this connector was removed due to mass considerations,
and a pigtail design was adopted.
"Jet Propulsion Laboratory, Pasadena, CA
179

..°- -°.
PINPULLER
COUNTERWEIGHT
Figure 2. Overall Configuration of the MIRO Calibration Switch Mechanism
One complexity of the system was its need for a repeatable failsafe device. A shape memory alloy (SMA)
pinpuller, developed through a partnership between TiNi Aerospace, Inc. and JPL, was chosen to perform
this function. The pinpuller features a primary and a redundant circuit to provide added reliability. Thedevice is good for smaller applications where a small stroke and a small pull force is adequate. Anotherconsideration in selecting this device was its cleanliness. A great deal of high precision instruments are in
very close proximity to the mechanism, so outgassing of materials and lubricants is of great concern (totalmass loss < 1%; volatile condensable mass < 0.1%).
180
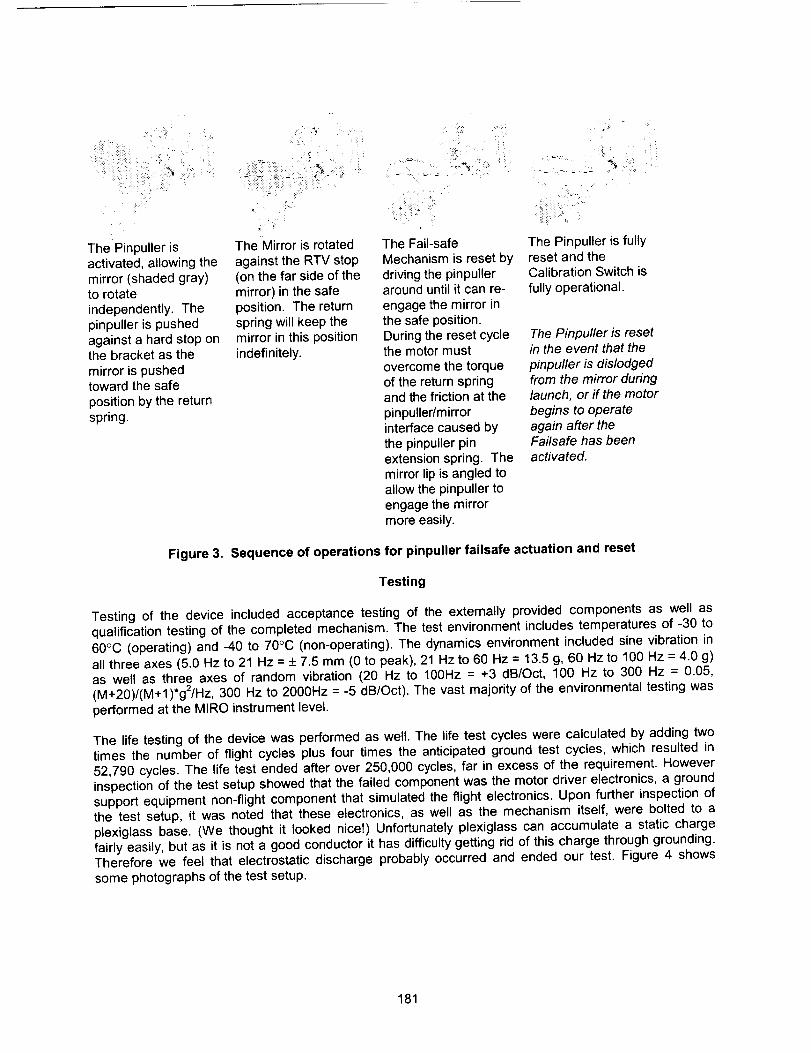
i: iiiii!iiiii!!!ii ii!ii !!iiiiiiiiii i iiii ¸¸¸ i
The Pinpuller is
activated, allowing the
mirror (shaded gray)to rotate
independently. The
pinpuller is pushed
against a hard stop onthe bracket as the
mirror is pushedtoward the safe
position by the returnspring.
The Mirror is rotated
against the RTV stop(on the far side of the
mirror) in the safeposition. The return
spring will keep themirror in this position
indefinitely.
The Fail-safe
Mechanism is reset by
driving the pinpulleraround until it can re-
engage the mirror in
the safe position.
During the reset cyclethe motor must
overcome the torqueof the return springand the friction at the
pinpuller/mirror
interface caused by
the pinpuller pinextension spring. Themirror lip is angled to
allow the pinpuller to
engage the mirrormore easily.
_,i -
The Pinpuller is fullyreset and theCalibration Switch is
fully operational.
The Pinpuller is resetin the event that the
pinpuller is dislodgedfrom the mirror duringlaunch, or if the motor
begins to operate
again after theFailsafe has been
activated.
Figure 3. Sequence of operations for pinpuller failsafe actuation and reset
Testing
Testing of the device included acceptance testing of the externally provided components as well as
qualification testing of the completed mechanism. The test environment includes temperatures of -30 to
60°C (operating) and -40 to 70°C (non-operating). The dynamics environment included sine vibration in
all three axes (5.0 Hz to 21 Hz = + 7.5 mm (0 to peak), 21 Hz to 60 Hz = 13.5 g, 60 Hz to 100 Hz = 4.0 g)
as well as three axes of random vibration (20 Hz to 100Hz = +3 dB/Oct, 100 Hz to 300 Hz = 0.05,(M+20)/(M+I)*g2/Hz, 300 Hz to 2000Hz = -5 dB/Oct). The vast majority of the environmental testing was
performed at the MIRO instrument level.
The life testing of the device was performed as well. The life test cycles were calculated by adding twotimes the number of flight cycles plus four times the anticipated ground test cycles, which resulted in52,790 cycles. The life test ended after over 250,000 cycles, far in excess of the requirement. However
inspection of the test setup showed that the failed component was the motor driver electronics, a groundsupport equipment non-fiight component that simulated the flight electronics. Upon further inspection of
the test setup, it was noted that these electronics, as well as the mechanism itself, were bolted to aplexiglass base. (We thought it looked nice!) Unfortunately plexiglass can accumulate a static charge
fairly easily, but as it is not a good conductor it has difficulty getting rid of this charge through grounding.Therefore we feel that electrostatic discharge probably occurred and ended our test. Figure 4 shows
some photographs of the test setup.
181
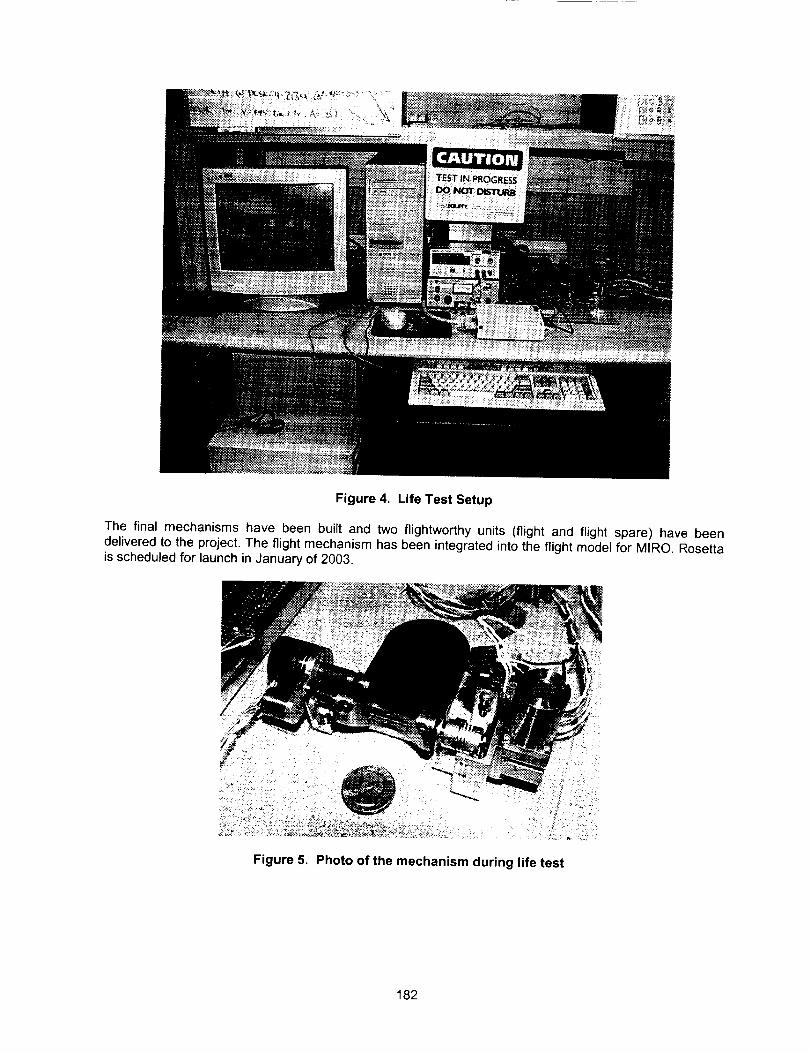
Figure 4. Life Test Setup
The final mechanisms have been built and two flightworthy units (flight and flight spare) have beendelivered to the project. The flight mechanism has been integrated into the flight model for MIRO. Rosettais scheduled for launch in January of 2003.
Figure 5. Photo of the mechanism during life test
182
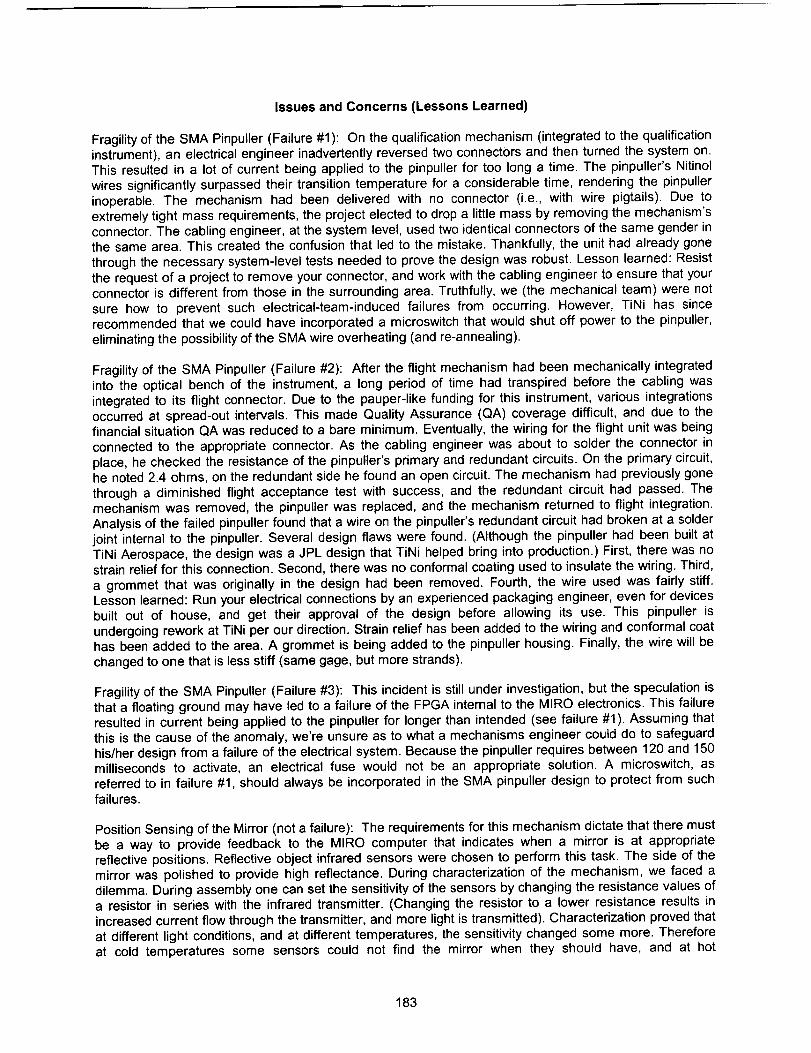
Issues and Concerns (Lessons Learned)
Fragility of the SMA Pinpuller (Failure #1): On the qualification mechanism (integrated to the qualification
instrument), an electrical engineer inadvertently reversed two connectors and then turned the system on.This resulted in a lot of current being applied to the pinpuller for too long a time. The pinpuller's Nitinol
wires significantly surpassed their transition temperature for a considerable time, rendering the pinpuller
inoperable. The mechanism had been delivered with no connector (i.e., with wire pigtails). Due toextremely tight mass requirements, the project elected to drop a little mass by removing the mechanism's
connector. The cabling engineer, at the system level, used two identical connectors of the same gender inthe same area. This created the confusion that led to the mistake. Thankfully, the unit had already gone
through the necessary system-level tests needed to prove the design was robust. Lesson learned: Resist
the request of a project to remove your connector, and work with the cabling engineer to ensure that yourconnector is different from those in the surrounding area. Truthfully, we (the mechanical team) were not
sure how to prevent such electrical-team-induced failures from occurring. However, TiNi has sincerecommended that we could have incorporated a microswitch that would shut off power to the pinpuller,
eliminating the possibility of the SMA wire overheating (and re-annealing).
Fragility of the SMA Pinpuller (Failure #2): After the flight mechanism had been mechanically integratedinto the optical bench of the instrument, a long period of time had transpired before the cabling was
integrated to its flight connector. Due to the pauper-like funding for this instrument, various integrationsoccurred at spread-out intervals. This made Quality Assurance (QA) coverage difficult, and due to thefinancial situation QA was reduced to a bare minimum. Eventually, the wiring for the flight unit was being
connected to the appropriate connector. As the cabling engineer was about to solder the connector in
place, he checked the resistance of the pinpuller's primary and redundant circuits. On the primary circuit,he noted 2.4 ohms, on the redundant side he found an open circuit. The mechanism had previously gone
through a diminished flight acceptance test with success, and the redundant circuit had passed. Themechanism was removed, the pinpuller was replaced, and the mechanism returned to flight integration.
Analysis of the failed pinpuller found that a wire on the pinpuller's redundant circuit had broken at a solderjoint internal to the pinpuller. Several design flaws were found. (Although the pinpuller had been built at
TiNi Aerospace, the design was a JPL design that TiNi helped bring into production.) First, there was nostrain relief for this connection. Second, there was no conformal coating used to insulate the wiring. Third,
a grommet that was originally in the design had been removed. Fourth, the wire used was fairly stiff.Lesson learned: Run your electrical connections by an experienced packaging engineer, even for devicesbuilt out of house, and get their approval of the design before allowing its use. This pinpuller is
undergoing rework at TiNi per our direction. Strain relief has been added to the wiring and conformal coathas been added to the area. A grommet is being added to the pinpuller housing. Finally, the wire will be
changed to one that is less stiff (same gage, but more strands).
Fragility of the SMA Pinpuller (Failure #3): This incident is still under investigation, but the speculation is
that a floating ground may have led to a failure of the FPGA internal to the MIRO electronics. This failureresulted in current being applied to the pinpuller for longer than intended (see failure #1). Assuming thatthis is the cause of the anomaly, we're unsure as to what a mechanisms engineer could do to safeguard
his/her design from a failure of the electrical system. Because the pinpuller requires between 120 and 150milliseconds to activate, an electrical fuse would not be an appropriate solution. A microswitch, asreferred to in failure #1, should always be incorporated in the SMA pinpuller design to protect from such
failures.
Position Sensing of the Mirror (not a failure): The requirements for this mechanism dictate that there mustbe a way to provide feedback to the MIRO computer that indicates when a mirror is at appropriatereflective positions. Reflective object infrared sensors were chosen to perform this task. The side of the
mirror was polished to provide high reflectance. During characterization of the mechanism, we faced adilemma. During assembly one can set the sensitivity of the sensors by changing the resistance values ofa resistor in series with the infrared transmitter. (Changing the resistor to a lower resistance results in
increased current flow through the transmitter, and more light is transmitted). Characterization proved that
at different light conditions, and at different temperatures, the sensitivity changed some more. Thereforeat cold temperatures some sensors could not find the mirror when they should have, and at hot
183
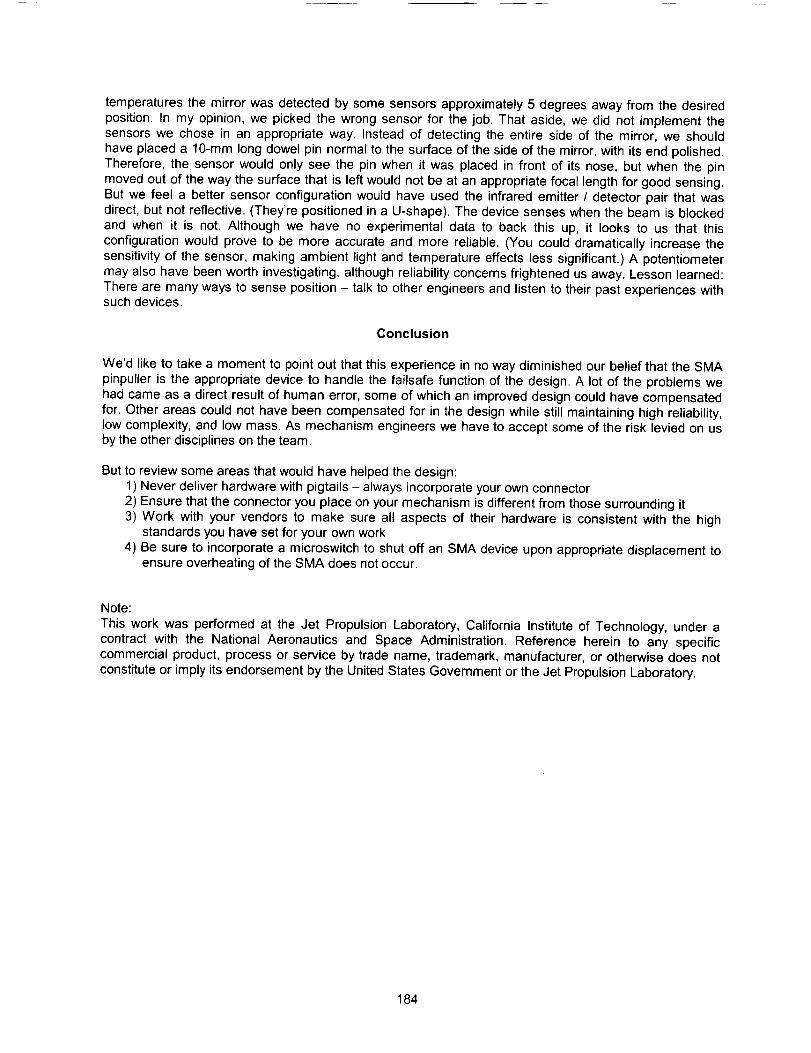
temperaturesthemirrorwasdetectedbysomesensorsapproximately5 degreesawayfromthedesiredposition.In my opinion,wepickedthewrongsensorfor the job.Thataside,wedidnot implementthesensorswe chosein anappropriateway.Insteadof detectingtheentiresideof the mirror,weshouldhaveplaceda 10-mmlongdowelpinnormaltothesurfaceof thesideof themirror,withitsendpolished.Therefore,thesensorwouldonlyseethepinwhenit wasplacedin frontof its nose,butwhenthepinmovedoutofthewaythesurfacethatis leftwouldnotbeatanappropriatefocallengthforgoodsensing.Butwefeela bettersensorconfigurationwouldhaveusedtheinfraredemitter/ detector pair that wasdirect, but not reflective. (They're positioned in a U-shape). The device senses when the beam is blocked
and when it is not. Although we have no experimental data to back this up, it looks to us that thisconfiguration would prove to be more accurate and more reliable. (You could dramatically increase the
sensitivity of the sensor, making ambient light and temperature effects less significant.) A potentiometer
may also have been worth investigating, although reliability concerns frightened us away. Lesson learned:There are many ways to sense position - talk to other engineers and listen to their past experiences withsuch devices.
Conclusion
We'd like to take a moment to point out that this experience in no way diminished our belief that the SMA
pinpuller is the appropriate device to handle the failsafe function of the design. A lot of the problems we
had came as a direct result of human error, some of which an improved design could have compensated
for. Other areas could not have been compensated for in the design while still maintaining high reliability,low complexity, and low mass. As mechanism engineers we have to accept some of the risk levied on usby the other disciplines on the team.
But to review some areas that would have helped the design:
1) Never deliver hardware with pigtails - always incorporate your own connector
2) Ensure that the connector you place on your mechanism is different from those surrounding it
3) Work with your vendors to make sure all aspects of their hardware is consistent with the highstandards you have set for your own work
4) Be sure to incorporate a microswitch to shut off an SMA device upon appropriate displacement toensure overheating of the SMA does not occur.
Note:
This work was performed at the Jet Propulsion Laboratory, California Institute of Technology, under a
contract with the National Aeronautics and Space Administration. Reference herein to any specificcommercial product, process or service by trade name, trademark, manufacturer, or otherwise does not
constitute or imply its endorsement by the United States Government or the Jet Propulsion Laboratory.
184
A Robotic Rover-Based Deep Driller for Mars Exploration
T. Ylikorpi, G. Visentin , and J. Suomela
Abstract
VTT Automation has developed an advanced rover-based mobile drilling device for planetary exploration.
The mobile Robotic Sampling System has been designed to perform deep (up to 2 meters) soil samplingon the surface of Mars or other planetary objects. Due to the complexity of the task, very strict mass and
volume limitations, and the need for complete automation of all its operations, the system demands a veryambitious mechatronic design. In this paper, the design of the system is described as well as the first
functional prototype to be manufactured and now under testing. This work is being performed under
European Space Agency funding by Space Systems Finland Ltd. as the prime contractor, together withthe Technical Research Center of Finland (VTT, Finland) (the drill system) and Helsinki University of
Technology (the roving system and drill electronics).
Introduction
In the past few years the world has witnessed the discovery of life forms thriving in extreme environments
such as rocks several kilometers underground or underwater thermal vents where temperatures exceed+100 degrees Celsius. These environments were previously considered to be too hostile to sustain any
form of life. One of the possible implications of this unexpected proliferation and survivability of life formsis that some sort of life could have possibly also evolved on other planets and moons like Mars or Europa.
In order to develop instruments for searching for any signs of such extraterrestrial life, the EuropeanSpace Agency has funded a technology research contract called "Micro Robots for Scientific Applications
2". Under this contract, a Robotic Sampling System (RSS) consisting of an automated drilling device anda tracked roving vehicle has been designed and constructed. The RSS consists of the following
components: 1) A Mobile Drilling Platform that is basically a small (10 kg) tracked rover whose function is
to house the drilling and sampling subsystem and transport it between the lander and the sampleacquisition locations. 2) A Drilling and Sampling Subsystem (DSS) to perform the actual drilling and
sampling. 3) A Docking and Sample Delivery Port on the lander where the RSS can deliver the collectedsamples for further processing. Figure 1 illustrates the mission scenario.
"_ LANDER came
LANDER
i" -,.f3: - ......:C
_'-'tether
rover with drilling and sampling subsystem on-board
Figure 1. Robotic sampling system scenario.
Technical Research Center of Finland, Helsinki, Finland
ii European Space Agency, Noordwijk, The NetherlandsHelsinki University of Technology, Helsinki, Finland
Proceedings of the 35th Aerospace Mechanisms Symposium, Ames Research Center, May 9-11, 2001
185
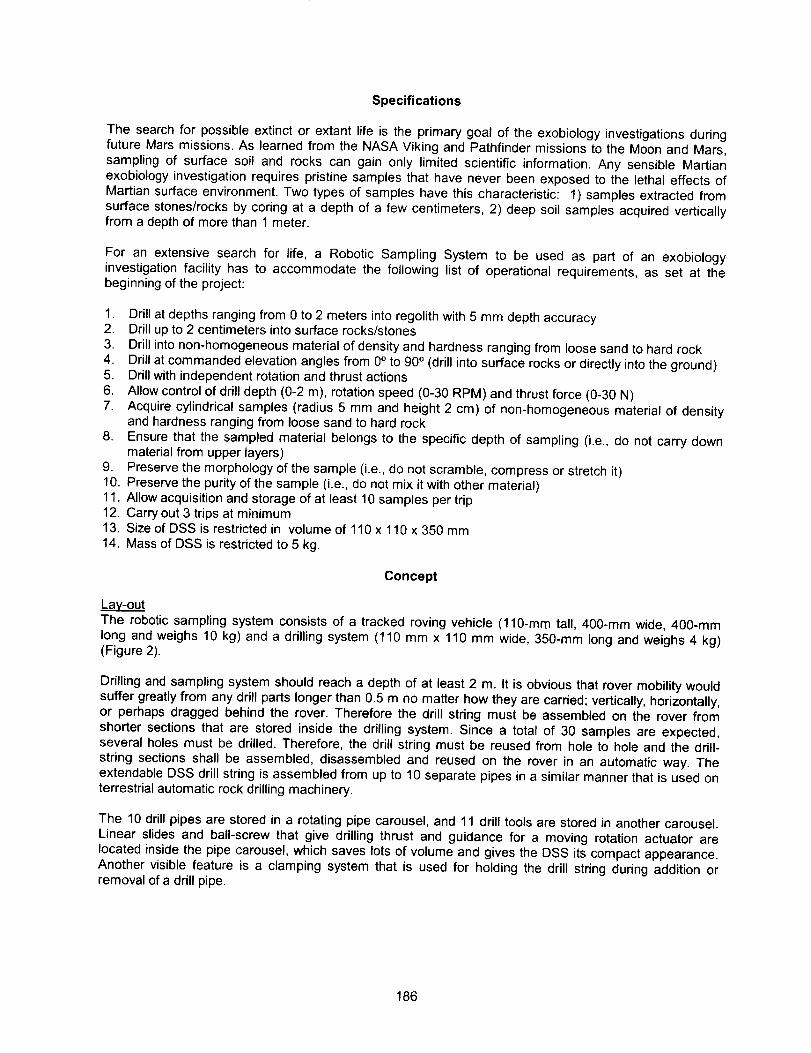
Specifications
The search for possible extinct or extant life is the primary goal of the exobiology investigations duringfuture Mars missions. As learned from the NASA Viking and Pathfinder missions to the Moon and Mars,
sampling of surface soil and rocks can gain only limited scientific information. Any sensible Martianexobiology investigation requires pristine samples that have never been exposed to the lethal effects of
Martian surface environment. Two types of samples have this characteristic: 1) samples extracted fromsurface stones/rocks by coring at a depth of a few centimeters, 2) deep soil samples acquired vertically
from a depth of more than 1 meter.
For an extensive search for life, a Robotic Sampling System to be used as part of an exobiologyinvestigation facility has to accommodate the following list of operational requirements, as set at the
beginning of the project:
1. Drill at depths ranging from 0 to 2 meters into regolith with 5 mm depth accuracy
2. Drill up to 2 centimeters into surface rocks/stones3. Drill into non-homogeneous material of density and hardness ranging from loose sand to hard rock
4. Drill at commanded elevation angles from 0° to 90 ° (drill into surface rocks or directly into the ground)5. Drill with independent rotation and thrust actions
6. Allow control of drill depth (0-2 m), rotation speed (0-30 RPM) and thrust force (0-30 N)
7. Acquire cylindrical samples (radius 5 mm and height 2 cm) of non-homogeneous material of densityand hardness ranging from loose sand to hard rock
8. Ensure that the sampled material belongs to the specific depth of sampling (i.e., do not carry down
material from upper layers)9. Preserve the morphology of the sample (i.e., do not scramble, compress or stretch it)
10. Preserve the purity of the sample (i.e., do not mix it with other material)11. Allow acquisition and storage of at least 10 samples per trip
12. Carry out 3 trips at minimum13. Size of DSS is restricted in volume of 110 x 110 x 350 mm
14. Mass of DSS is restricted to 5 kg.
Concept
Lay-outThe robotic sampling system consists of a tracked roving vehicle (110-mm tall, 400-mm wide, 400-mm
long and weighs 10 kg) and a drilling system (110 mm x 110 mm wide, 350-mm long and weighs 4 kg)(Figure 2).
Drilling and sampling system should reach a depth of at least 2 m. It is obvious that rover mobility would
suffer greatly from any drill parts longer than 0.5 m no matter how they are carried; vertically, horizontally,or perhaps dragged behind the rover. Therefore the drill string must be assembled on the rover from
shorter sections that are stored inside the drilling system. Since a total of 30 samples are expected,several holes must be drilled. Therefore, the drill string must be reused from hole to hole and the drill-
string sections shall be assembled, disassembled and reused on the rover in an automatic way. Theextendable DSS drill string is assembled from up to 10 separate pipes in a similar manner that is used on
terrestrial automatic rock drilling machinery.
The 10 drill pipes are stored in a rotating pipe carousel, and 11 drill tools are stored in another carousel.Linear slides and ball-screw that give drilling thrust and guidance for a moving rotation actuator are
located inside the pipe carousel, which saves lots of volume and gives the DSS its compact appearance.
Another visible feature is a clamping system that is used for holding the drill string during addition orremoval of a drill pipe.
186
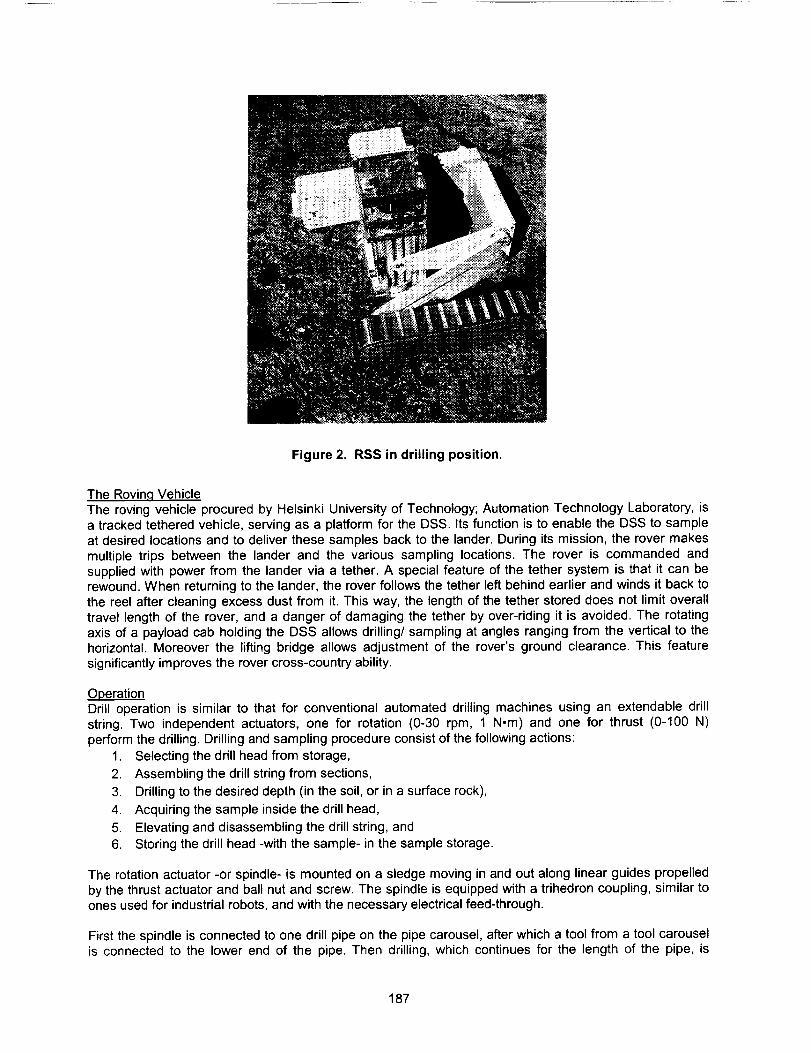
Figure 2. RSS in drilling position.
The Rovin,q Vehicle
The roving vehicle procured by Helsinki University of Technology; Automation Technology Laboratory, isa tracked tethered vehicle, serving as a platform for the DSS. Its function is to enable the DSS to sampleat desired locations and to deliver these samples back to the lander. During its mission, the rover makes
multiple trips between the lander and the various sampling locations. The rover is commanded and
supplied with power from the lander via a tether. A special feature of the tether system is that it can berewound. When returning to the lander, the rover follows the tether left behind earlier and winds it back to
the reel after cleaning excess dust from it. This way, the length of the tether stored does not limit overall
travel length of the rover, and a danger of damaging the tether by over-riding it is avoided. The rotatingaxis of a payload cab holding the DSS allows drilling/sampling at angles ranging from the vertical to thehorizontal. Moreover the lifting bridge allows adjustment of the rover's ground clearance. This feature
significantly improves the rover cross-country ability.
OperationDrill operation is similar to that for conventional automated drilling machines using an extendable drill
string. Two independent actuators, one for rotation (0-30 rpm, 1 N-m) and one for thrust (0-100 N)
perform the drilling. Drilling and sampling procedure consist of the following actions:
1. Selecting the drill head from storage,
2. Assembling the drill string from sections,
3. Drilling to the desired depth (in the soil, or in a surface rock),
4. Acquiring the sample inside the drill head,
5. Elevating and disassembling the drill string, and
6. Storing the drill head -with the sample- in the sample storage.
The rotation actuator -or spindle- is mounted on a sledge moving in and out along linear guides propelled
by the thrust actuator and ball nut and screw. The spindle is equipped with a trihedron coupling, similar toones used for industrial robots, and with the necessary electrical feed-through.
First the spindle is connected to one drill pipe on the pipe carousel, after which a tool from a tool carouselis connected to the lower end of the pipe. Then drilling, which continues for the length of the pipe, is
187

started.Asthespindlereachesthelowerlimitof itstravel,a clampingsystemcrabsonthepipeandthespindleisseparatedfromthedrillstring.Astheclampingsystemholdsthedrillstringsteady,thespindleiselevatedbackto theupperendof the linearfeedanda newpipeis selectedfromthepipecarousel.Afterthe spindleis connectedto thenewpipethatis furtherconnectedto the drillstringheldby theclampingsystem,the clampcanbeopenedanddrillingcanbecontinuedfor an anotherlengthof thepipe.The procedureis repeateduntilthe desireddrillingdepthis reached.Retractionof the toolandstoringthepipesinthepipecarouselisa sequenceoppositetotheassemblyanddrilling.
Toolbitdesignis suchthatasthetoolpenetratesthroughterrain,soilcanflowthroughit, enteringfromthelowerendandexitingfromholesin the upperendof thetool.This is howthetoolalwaysholdsasamplerepresentingthecurrentdepthin terrain.Uponretrievalofthetool,internalwedgesor flapsinsidethetoolholdthesampleandpreventitfromfallingoutofthetool.
TheRSSdoesnotcontainanymeansfor anchoringto preventrotationor movingof thesystemduringdrillingoperations.Initialrequirements,andalsoselectionof the motorsandhardwaredesign,limitthedrillthrustto30Nandtorqueto 1Norn.Simulatedtestsusingoff-loadingmethodsindicatethattheweightof the RSSonMarswouldholdit stillonsandysurfaceduringdrilling,but forexample,on theMoon'ssurfaceadditionalholdingmethodswouldbeneeded.
Passive and active operations
During system design, a trade-off between passive and active operations had to be made several times.
Active operations are operated with actuators, like motors and solenoids, and thus provide highcontrollability and flexibility of these actions.
Passive operations, however, rely on geometry and movement of other parts of the system to provide the
desired action. Passive operations do not need separate actuators or any sort of power or informationtransmission, and so they have less effect on volume, mass and control needs. Passive operations can
not be re-programmed though, and they produce a risk in case something should go wrong, in case ofjamming of movement, for example.
Since the DSS already has many degrees of freedom and power feed to motors and actuators appeared
quite challenging already in the beginning, it was decided to utilize passive operations as much aspossible. Active operations were selected where operation was required independent from currentoperational state of drilling system.
Active operations:Carousel rotation
Spindle rotationDrill feed
Spindle locking solenoid
Clampers
Two independent carousels. Any of the tools or pipes can be selected.
Independent drill rotation.
Independent drill thrust.
The spindle must be connected to and separated from the drill string inthe lower end and in the upper end of travel. In the case of stringemergency release, the spindle must be released also in the middle oftravel.
The clampers must be able to operate together with the locking
solenoid, i.e., anytime in the drilling phase.
188
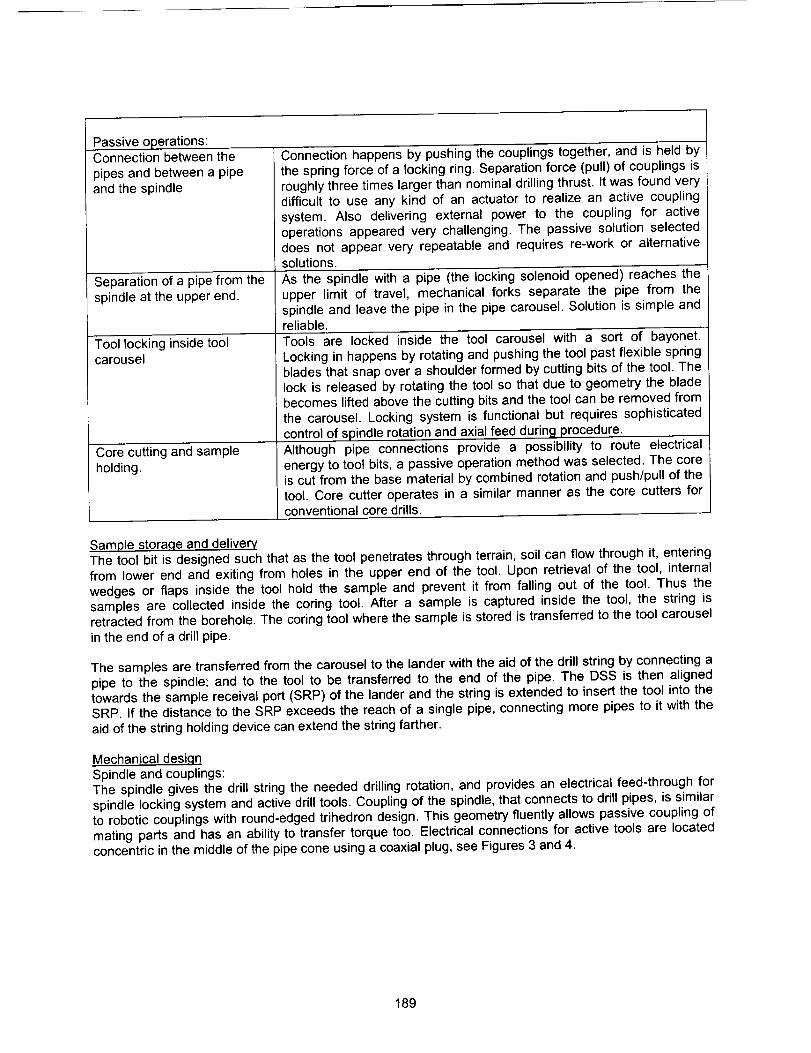
Passiveoperations:Connectionhappensby pushingthecouplingstogether,andis 'heldbyConnectionbetweenthe
pipesandbetweena pipeandthespindle
Separationofapipefromthespindleattheupperend.
Toollockinginsidetoolcarousel
Corecuttingandsampleholding.
thespringforceofa lockingring.Separationforce(pull)of couplingsisroughlythreetimeslargerthannominaldrillingthrust.Itwasfoundverydifficultto useanykindof anactuatorto realizean activecouplingsystem.Also deliveringexternalpowerto the couplingfor activeoperationsappearedverychallenging.The passive solution selected
does not appear very repeatable and requires re-work or alternativesolutions.
As the spindle with a pipe (the locking solenoid opened) reaches the
upper limit of travel, mechanical forks separate the pipe from the
spindle and leave the pipe in the pipe carousel. Solution is simple andreliable.
Tools are locked inside the tool carousel with a sort of bayonet.
Locking in happens by rotating and pushing the tool past flexible springblades that snap over a shoulder formed by cutting bits of the tool. The
lock is released by rotating the tool so that due to geometry the bladebecomes lifted above the cutting bits and the tool can be removed from
the carousel. Locking system is functional but requires sophisticated
control of spindle rotation and axial feed durin 9 procedure.
Although pipe connections provide a possibility to route electricalenergy to tool bits, a passive operation method was selected. The core
is cut from the base material by combined rotation and push/pull of thetool. Core cutter operates in a similar manner as the core cutters forconventional core ddlls.
Sample stora.qe and delivery
The tool bit is designed such that as the tool penetrates through terrain, soil can flow through it, entering
from lower end and exiting from holes in the upper end of the tool. Upon retrieval of the tool, internalwedges or flaps inside the tool hold the sample and prevent it from falling out of the tool. Thus the
samples are collected inside the coring tool. After a sample is captured inside the tool, the string isretracted from the borehole. The coring tool where the sample is stored is transferred to the tool carousel
in the end of a drill pipe.
The samples are transferred from the carousel to the lander with the aid of the drill string by connecting apipe to the spindle; and to the tool to be transferred to the end of the pipe. The DSS is then alignedtowards the sample receival port (SRP) of the lander and the string is extended to insert the tool into the
SRPo If the distance to the SRP exceeds the reach of a single pipe, connecting more pipes to it with theaid of the string holding device can extend the string farther.
Mechanical desi.qn
Spindle and couplings:The spindle gives the drill string the needed drilling rotation, and provides an electrical feed-through for
spindle locking system and active drill tools. Coupling of the spindle, that connects to drill pipes, is similarto robotic couplings with round-edged trihedron design. This geometry fluently allows passive coupling of
mating parts and has an ability to transfer torque too. Electrical connections for active tools are locatedconcentric in the middle of the pipe cone using a coaxial plug, see Figures 3 and 4.
189
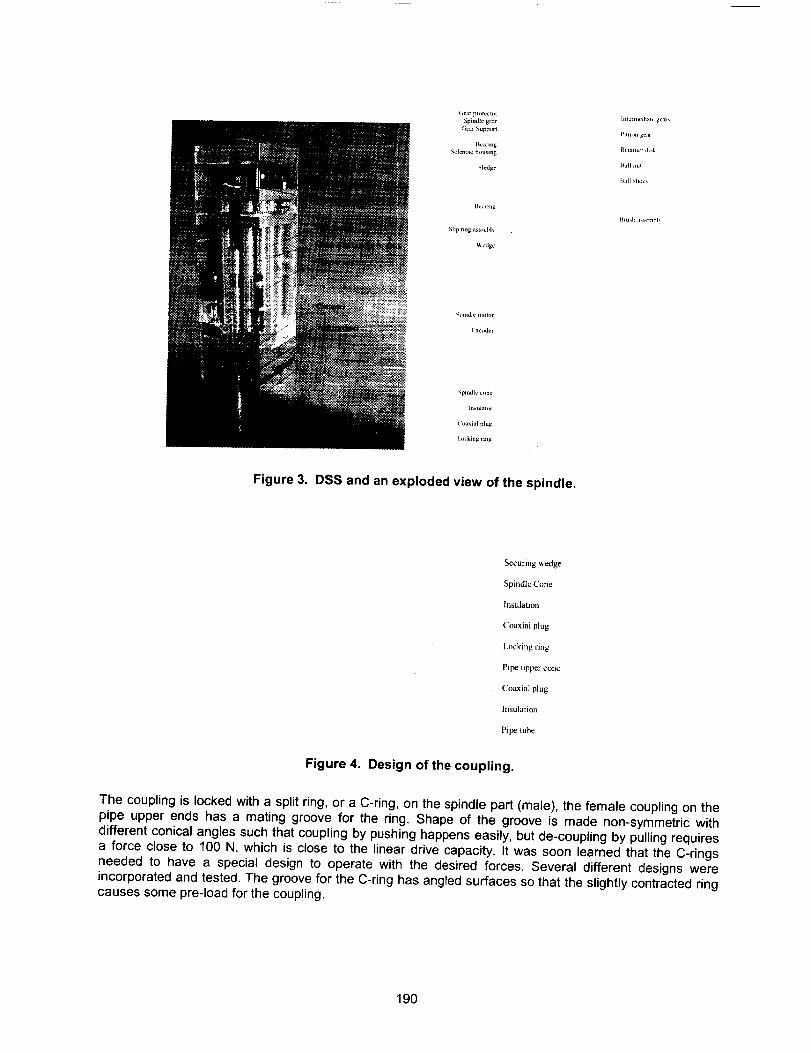
Gear pro¢cCltn
Spindk' gear
Gent Support
Bcanng
Sol_l,,,,d bous,_
_l_dg¢
Bca,mg
Silp ring assschl_.
_, edge
In1 em_cd_lc gCal_
p,,,,_l gear
R ¢lainer d,sk
Ihdl nhdc_
Spindle cone
hlsulator
Coaxial plug
Locking nng
Figure 3. DSS and an exploded view of the spindle.
Securing wedge
Spindle Cone
Insulation
Coaxial plug
Locking ring
Pipe upper cone
Coaxial plug
{nsula'_ion
Pipe tube
Figure 4. Design of the coupling.
The coupling is locked with a split ring, or a C-ring, on the spindle part (male), the female coupling on the
pipe upper ends has a mating groove for the ring. Shape of the groove is made non-symmetric withdifferent conical angles such that coupling by pushing happens easily, but de-coupling by pulling requiresa force close to 100 N, which is close to the linear drive capacity. It was soon learned that the C-rings
needed to have a special design to operate with the desired forces. Several different designs were
incorporated and tested. The groove for the C-ring has angled surfaces so that the slightly contracted ringcauses some pre-load for the coupling.
190

Figure 5. Prototypes and final design of the C-ring. Diameter of the ring is -9 mm.
An in-house developed spindle solenoid (or an electromagnetic flip-flop)(Figure 6) is used to operate a
wedge that can prohibit contraction of the locking ring and thus control disconnection of the spindlecoupling when separating pipes from each other and from the spindle. When the wedge is locatedbetween the ends of the C-ring, its contraction is prohibited and de-coupling requires very high forces.
De-coupling may happen nominally when the wedge is removed from between the ends of the C-ring.The solenoid is a flip-flop-type using a permanent magnet core to maintain each of its two positions and
thus does not require any springs, separate locking mechanisms, or continuous power input. Power feedis realized with a capacitor that can produce a high short-term output power for solenoid, while collecting
energy for the next operation with a low input power.
Figure 6. Electromagnetic flip-flop and a wedge.
A disadvantage with circular C-rings was also found. Prior to coupling, the C-ring is in a free state and canrotate freely during coupling. The ring may rotate so that it slightly touches thin end the securing wedge.
After the coupling is performed, however, the ring is in slightly stressed state to provide some preload for
the coupling. In the stressed state the ring can cause extra friction, which prevents moving of the securingwedge and thus prevents securing action or release of the lock. A couple of designs were tested toreduce movement of the ring. First, a single axial spring wire was mounted on the ring opposite the split to
give some guidance. Later the ends of the ring were shaped so that two stationary pins would define the
position of the unstressed ring. This enhanced action of the ring slightly. A larger ring would allow largertolerances and would make use of the moving wedge easier. It was also noted, that the hardened steel
ring has a tendency to dig into softer steel, which makes separation force unrepeatable. Further externaltorque or bending has some effect on release forces, which may be due to non-symmetric modified ringsor minor geometrical errors in ring-groove geometry. Altogether the system seems to be very sensitive to
the accuracy of the geometry.
A simple in-house developed slip-ring assembly (Figure 7) is used to transfer electricity to the rotating
spindle for the spindle solenoid and active drill tool functions. There are five isolated lines in the slip ring.For prototyping purposes the rings are made of brass and brushes are made of spring steel. One ring has
a split to be used for absolute spindle position detection.
191
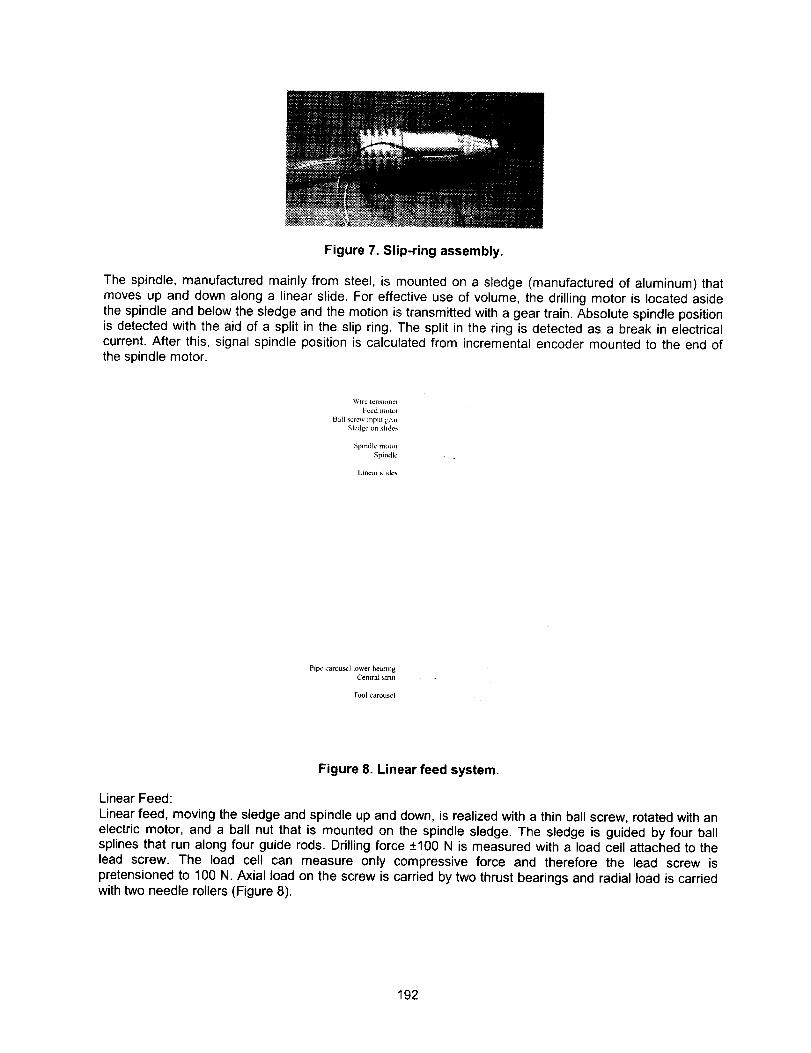
Figure7.Slip-ringassembly.
The spindle, manufactured mainly from steel, is mounted on a sledge (manufactured of aluminum) that
moves up and down along a linear slide. For effective use of volume, the drilling motor is located aside
the spindle and below the sledge and the motion is transmitted with a gear train. Absolute spindle positionis detected with the aid of a split in the slip ring. The split in the ring is detected as a break in electricalcurrent. After this, signal spindle position is calculated from incremental encoder mounted to the end ofthe spindle motor.
Wire tenslonct
Feed lllt_[()i
Bail screw inpul gear
Sledge on slides
Spindle molar
Spindle
Lim:ar shdes
Pipe carousel lower beanng
Central strut
Tool carousel
Figure 8. Linear feed system.
Linear Feed:
Linear feed, moving the sledge and spindle up and down, is realized with a thin ball screw, rotated with an
electric motor, and a ball nut that is mounted on the spindle sledge. The sledge is guided by four ballsplines that run along four guide rods. Drilling force +100 N is measured with a load cell attached to the
lead screw. The load cell can measure only compressive force and therefore the lead screw is
pretensioned to 100 N. Axial load on the screw is carried by two thrust bearings and radial load is carriedwith two needle rollers (Figure 8).
192

Axialpositionofthesledgeismeasuredwiththeaidofa linearpotentiometerconstructedof0.3-ramthickstainlesssteelwiregivingresistanceapproximately0-8ohmsoverthe measuringrange.To maintainconstanttensioninthewirestheyaretensionedwithtwocompressionsprings.
DrillPipes:Thedrillpipes,constructedof aluminum,arelocatedinapipecarousel.Insidediameterof thepipesis13mm,outsidediameteris 15mm,andthethree-endedhelicalfluteoutsidethepipehasa 17-ramouterdiameter.Couplingsin theendsof pipesaremadeof steelandpresentthesamedesignasthespindlecoupling,butwithoutanysecuringmeans.
Connectionbetweenthe pipeshappensby pushingthemtogetheruntilthe lockingringsnapsintothegroove.The three-endedflute is symmetricand so the pipescanbe connectedin anyof the threepossibleorientations.Disconnectionof twodrill pipesfromeach otherhappenswhenthe clampingmechanismholdsthelowerpipeandspindlepullstheupperpipeapart.Thenthelockingsolenoidin thespindleisopenedbya commandandthesledgeis drivento theupperposition.Duringelevationof thespindle,a mechanicalde-couplingmechanismseparatesthepipefromthespindle,leavingit in thepipecarousel.A tool isseparatedfromthe pipebyfirstdrivingthetoolintothetoolcarouselandlockingit inthere.Thenthepipeispulledwiththeaidofthesledgeapartfromthetool.
Forenhancedor special sampling actions, two power lines are routed through drill pipe couplings to allow
use of possible active drilling tools in the end of drill string. These possible tools include, for example,percussive tools and ultrasonic tools. Dr. T. C. Ng and Holinser Group have already developed a designfor a suitable active percussive tool in University of Hong Kong. Special measuring instruments can be
mounted in the tools for measuring temperature, contact force, etc.
Pipe carousel:The pipes are located in a pipe carousel, which has a skeleton-like appearance with thin vertical bars andslotted disks at both ends. The design allows the spindle to be located and move inside the carousel,which saves a lot of volume. The pipes are not mounted positively to the carousel, but sit in the slots
surrounded by structures above the upper disk and around and below the lower disk. The rotation of thecarousel is actuated with a Maxon d13 motor located outside the carousel and a gear rim connected to
the upper end of the carousel. The carousel is positioned to the correct angular positions with two limitswitches and index pins; one for each pipe indexing and one for absolute position indicator. In the bottomof the carousel there is a slot through which the drilling happens. In order to prevent inadvertent falling of
a pipe into the slot, two spring-loaded pushers add some friction between the pipe and pipe carousel.
Tool Carousel:The tools, which also double as sample containers, are stored in a tool carousel. There are 11 storage
cups for the tools. The tools are mounted to the cups with a bayonet-like passive mechanism. The tool isinserted to the carousel with combined and controlled feed and tool rotation. With the aid of an aligning
pin the tool finds correct position in the carousel and three flat springs snap over upper edge of drilling
bits holding the tool. For removing the tool it is rotated so that a bulge in the side of the tool lifts the springabove the edge and sets the tool free. Coupling between the tool and string is similar to the pipeconnections. The locking between the carousel and the tool makes it possible to disconnect the tool from
the string simply by pulling. Actuation and position sensing of the tool carousel is similar to that of the pipecarousel, except that the Maxon dl0 motor is located inside the carousel support (Figure 9).
193
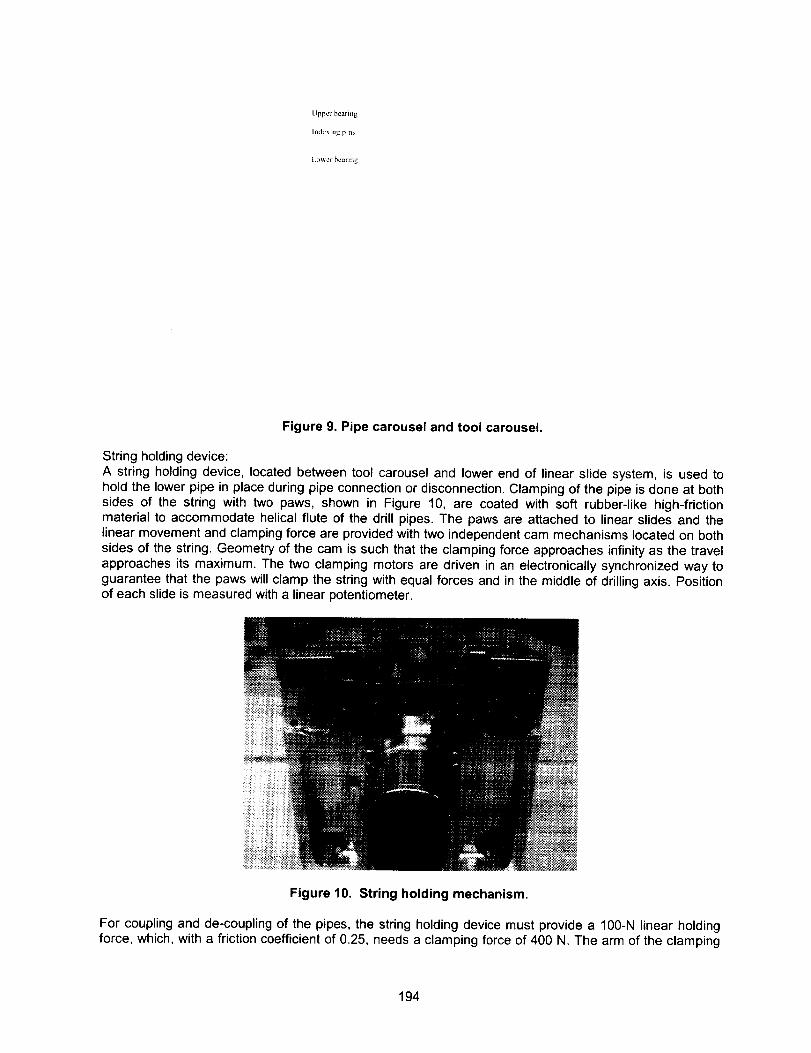
I.o_ cr bearing
Figure 9. Pipe carousel and tool carousel.
String holding device:
A string holding device, located between tool carousel and lower end of linear slide system, is used tohold the lower pipe in place during pipe connection or disconnection. Clamping of the pipe is done at both
sides of the string with two paws, shown in Figure 10, are coated with soft rubber-like high-frictionmaterial to accommodate helical flute of the drill pipes. The paws are attached to linear slides and thelinear movement and clamping force are provided with two independent cam mechanisms located on both
sides of the string. Geometry of the cam is such that the clamping force approaches infinity as the travel
approaches its maximum. The two clamping motors are driven in an electronically synchronized way to
guarantee that the paws will clamp the string with equal forces and in the middle of drilling axis. Positionof each slide is measured with a linear potentiometer.
Figure 10. String holding mechanism.
For coupling and de-coupling of the pipes, the string holding device must provide a IO0-N linear holdingforce, which, with a friction coefficient of 0.25, needs a clamping force of 400 N. The arm of the clamping
194

forcewillremaina minimum0.5mm,whichgivestheneededtorquein thecamaxleof0.2N.m,WithaMaxonREd13118430motorandMaxon110316gear(max.torque0.3N°m),a400-Nclampingforceisreachedwitha0.75-mmforcearm, or with 0.5-arm, a 600-N clamping force is achieved.
Tools
In the beginning of the project it was considered whether to use hammering action to chip the material or
not. From a mechanical point of view, it was considered whether to develop a hammering system on thedrill - even two meters and 10 couplings above the drill bit, or to fit a miniature hammering device inside a
drill pipe. From an electrical point of view, the power need for such a hammering device was considered.From a scientific point of view, it was considered whether the interesting remains of possible fossils would
be found from sediment layers of sandstone and limestone-like materials, or do we really need to drill into
hard rock like granite. After these considerations, it was decided to produce this first prototype withouthammering action and rely on cutting and grinding based removal of material. For this purpose, very hard
and sharp diamond-like drill bits would suit the best. If for scientific reasons carbon-based materials cannot be used, boron-nitride hard-alloy would provide a good replacement. For this prototype the tool bits
are made of industrial hard-alloy Sandvik DZ05 having HV30 hardness on Vickers scale.
The tool used for sampling duplicates as a drilling bit and a core drill, as shown in Figure 11. The tool isdesigned to drill a 17-ram-diameter hole into rock material and to contain a 9-ram diameter and 20-ram-
long core inside it. A crown that carries out the cutting is constructed of six cutting bits made of hard alloy.
During drilling a core develops inside the drill while the bit crown chips material. Chips are conveyed tothe surface by the external helical profile. Once the coring section is full, the head cutter chips the core
top. The effect is that the bit penetrates deeper into the material always holding a 20-ram core of thecurrent depth. When the desired depth has been reached, the core is broken apart from the base material
with the aid of a wedge-shaped core lifter by lifting and turning the drill. This action is similar to that usedwith conventional rock-core drills. For sampling of sand or other similar loose soil, specially designed flaps
will be mounted next to the core lifter to hold sample inside the tool during lifting. A total of nine tools arestored in the tool carousel and they are intended to penetrate into rocks of hardness similar to limestone
and sandstone. In this configuration, the DSS will carry individual tools for each sample to be acquiredduring a single trip between the lander and the sampling location. A fresh tool will be attached to the drill
string before each sample acquisition, and then subsequently detached with the sample inside.
_/I ¸ , _
J
Figure 11. Tool design and prototypes (missing drill bits here).
Preliminary tests with different types of cutting tools were carried out in early stage of project. The testsshow cutting power that would collect a rock core 10 mm in diameter and 15 mm in height within a few
hours. Quick tests on very hard and abrasive Finnish granite indicate that with given thrust and power itwould be possible to collect similar rock core in a time frame of tens of hours, however, durability andselection of drill bit material will be a critical issue. The tools that were tested were (Figure 12):
195
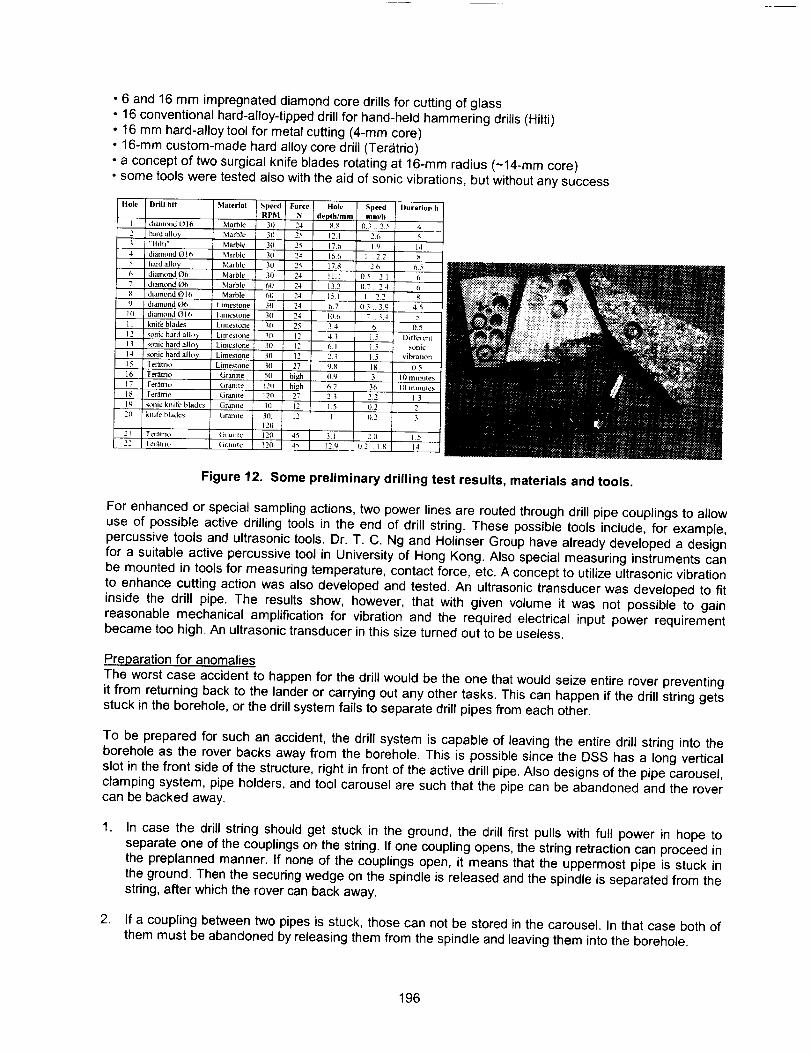
• 6 and16mmimpregnateddiamondcoredrillsforcuttingofglass• 16conventionalhard-alloy-tippeddrillforhand-heldhammeringdrills(Hilti)• 16mmhard-alloytoolformetalcutting(4-mmcore)• 16-mmcustom-madehardalloycoredrill(Ter_trio)• a conceptoftwosurgicalknifebladesrotatingat16-mmradius(~14-mmcore)• sometoolsweretestedalsowiththeaidof sonic vibrations, but without any success
Hole Drill bit Materi_l Speed
RPM
[ diamond (:)16 Marble 30
2 [lard allo_ Marble 30
3 "ttihi" Marble 30
4 diamond OI6 Marble 31)
5 hard allo_ Marble 31)
6 diamond O6 Marble 30
7 diamond 06 Marble 611
8 diamond 016 Marble 6(I
_t di,unond 06 Limestone 30
I0 diamond OI6 Limestone 31)
l I knife blades. Limestone 31)
12 sonic hard allo_ Limestone 30
I _ s,anic hard alto_' Limestone 30
14 sonic hard alloy Limestone 30
] 5 Teratrio Limestone 30
1,,5 Te_tno Granite 51)
17 rert_trio Oral1)te 120
18 Ter_itno Granite 121)
I t_ sonic knife blades Gratlitc 30
2(I k_'.it_ blades Gramte 3(I,
12O
21 Ter3trio i Granite 120
22 t t_:ttrio Granite 121)
Force I Hole ] Speed
N j depth/mm ] mm/h
24 [ 8S /0._ 2.:_25 l 12,1 26
25 I 17.. I I.O
25 [ 17.g [ 2.6
24 / II.t Io.5..2,l
24 I 13,2 /°-7.2.24 1 15,1 t I '_'_
24 / 67 1°33'_24 ] 10,6 I 1 7.. 3,425 3.4 I 0
12 4,3 i 15
12 6,1 I 15
12 2.3 ] 15
27 9,g I 18
high 0.9 I 3
high ] 6.2 ] 36
27 23 I 2.2
12 t.5 1 02
I2 l I 0.2
45 3.1 I 2.0
45 2.9 .2. g
|)uterine b
4
5
14
65
6
b
8
4.5
5
0,5
Different
sonic
vibration
0.5
10 minutes
10 minutes
13
2
3
1.5
14
Figure 12. Some preliminary drilling test results, materials and tools.
For enhanced or special sampling actions, two power lines are routed through drill pipe couplings to allow
use of possible active drilling tools in the end of drill string. These possible tools include, for example,percussive tools and ultrasonic tools. Dr. T. C. Ng and Holinser Group have already developed a design
for a suitable active percussive tool in University of Hong Kong. Also special measuring instruments canbe mounted in tools for measuring temperature, contact force, etc. A concept to utilize ultrasonic vibration
to enhance cutting action was also developed and tested. An ultrasonic transducer was developed to fitinside the drill pipe. The results show, however, that with given volume it was not possible to gain
reasonable mechanical amplification for vibration and the required electrical input power requirement
became too high. An ultrasonic transducer in this size turned out to be useless.
Preparation for anomaliesThe worst case accident to happen for the drill would be the one that would seize entire rover preventingit from returning back to the lander or carrying out any other tasks. This can happen if the drill string gets
stuck in the borehole, or the drill system fails to separate drill pipes from each other.
To be prepared for such an accident, the drill system is capable of leaving the entire drill string into theborehole as the rover backs away from the borehole. This is possible since the DSS has a long vertical
slot in the front side of the structure, right in front of the active drill pipe. Also designs of the pipe carousel,clamping system, pipe holders, and tool carousel are such that the pipe can be abandoned and the rover
can be backed away.
. In case the drill string should get stuck in the ground, the drill first pulls with full power in hope toseparate one of the couplings on the string. If one coupling opens, the string retraction can proceed in
the preplanned manner. If none of the couplings open, it means that the uppermost pipe is stuck inthe ground. Then the securing wedge on the spindle is released and the spindle is separated from the
string, after which the rover can back away.
2. If a coupling between two pipes is stuck, those can not be stored in the carousel. In that case both ofthem must be abandoned by releasing them from the spindle and leaving them into the borehole.
196
3. If thecouplingonthespindleis stuck,onlyonepipecanbeusedandthelengthofthepipelimitsthepossiblesamplingdepth.
4. Incasethetoolgetsstuckonthepipe,onlythisonepipeandthisonetoolcanbeused,buttherovermaintainsitsmovingcapability.
Development and prototyping
The entire drilling system was designed with IDEAS 3D modeling software, which was of a great help
when fitting all moving parts and components inside the limited volume. At certain stage of development
and modeling it was decided that instead of continued visual modeling a hardware-model would provide amore concrete playground and faster progress. The 3D model was translated into an STL-file that was
used to produce a plastic model of the most important parts (roughly 30 pieces) with fused depositionmodeling (FDM) method. This plastic prototype was fitted with all mechanical motions, not electrically
driven though, which clearly exposed potential interference and tight places.
Some of the part placement, like the micro switches, was done first with the plastic model and only thentransferred to the computer model. Also all of the mountings and screws were designed with the prototype
first. This approach appears to be very fast and efficient. However, a couple of things that should havebeen done in this time were left to wait for the final model, which later turned out to be a mistake. Details
like the pipe holder (that prevents a pipe from dropping from the carousel into the drilling hole), toolcleaning brushes and complete wiring design, turned out to be extremely difficult and took a lot of time at
the stage where there was not the time reserved. In general details like these, and also all new features,
should be prototyped and tested simultaneously during designing to avoid surprises in assembly and
integration phase.
Testing
The drill performance is to be tested on a set-up constructed of a platform and a 2-m-long transparent
plastic tube. The soil sample to be drilled into is prepared into the tube and the drilling system sits on theplatform, mounted either on a separate jig or on the roving vehicle. Drilling speed and thrust are
measured with the drill's own instrumentation, while torque-measuring system is mounted to the jig. The
sample to be prepared will consist of dry sand with varying grain size and compactness, added withoccasional boulders of marble, lime stone and sand stone, The aim of the tests is to determine drilling
speed, power and forces, and to demonstrate capability to obtain samples from the desired depth andfrom the desired materials.
Vacuum compatibility and qualification for space
This device is merely an advanced proof-of-principle model; operations of which still require developmentfor better efficiency and reliability. The model is constructed of commercial and self-manufactured
components, but its operation does not rely on any special parts or materials that could not be made
space-qualified.
On a mechanical point of view, the design lacks launch locks that might be necessary for a space
instrument, and mass can still be reduced by another -0.5 kg with optimized structural design. Effects ofthermal expansion, thermal balance, and protection against dust must be studied carefully to guarantee
operation of the drill in space environment.
Lessons Learned
Pipe Couplin.qs
Round-edged trihedron design familiar from robot wrist/tool interfaces appears to suit well for automatedconnections between parts. A split ring, or a C-ring, for securing of the coupling, although simple in design
and easy to use, has some disadvantages related to clinging and possibly to ring orientation.
197
Drillinq tests
With a rotary core drill, 30-N thrust, 30 RPM, without hammering action, core diameter -10 mm and depth-15 mm, using hard-alloy cutting tool bits, it takes a few hours to take a sample from a soft rock like
marble or lime stone. For hard rock like granite it takes a time frame of tens of hours, but durability andselection of drill bit material would be a critical issue. For hard rocks rotation speed has a great effect, thefaster the better.
General
3D volumetric development together with rapid prototype modeling techniques is a very efficient and fast
way to design complex systems with moving parts.
Prototyping and testing of mechanical subsystems already during design phase is very important. Nothingshould be left to be invented with the final hardware.
Pay attention for design of wire harness, especially if it is moving.
Conclusions
The work presented here produced the first prototype of a small mobile robotic drilling device capable to
extend and retract an extendable drill string reaching up to two meters into soil. Scaling the device smallera lighter and smaller drill can be developed, or if desired to drill deeper, a bigger scale drill with similaractions could be constructed. With this size, and especially with scaled-down devices, volume available
for drill motors sets certain limits for applicable drilling power and speed. The lessons learned section
indicates some of the development targets that should be considered for the next generation of theprototype.
References
1. 'Exobiology in the Solar System and The Search for Life on Mars' ESA SP-1231, ISBN 92-9092-520-5
2. 'Nanokhod Microrover Heading Towards Mars' Fifth international Symposium on Artificial Intelligenceand Automation in Space, I-Sairas '99, ESA SP-440 August 1999
3. 'A Robotic Deep Driller for Mars Exploration' J.Suomela, Helsinki University of Technology, Helsinki,Finland; G. Visentin European Space Agency, Noordwijk, The Netherlands; T.Ylikorpi, Finnish
Technical Research Center, Helsinki, Finland; MZelikman Space Systems Finland, Helsinki, Finland;
Invited session on "Mechatronic Applications in Aerospace", IFAC-2000
198

•¢'_' Z
Design and Verification of Space Station EVA-Operated Truss Attachment System
Gabriel Katell*
Abstract
This paper describes the design and verification of a system used to attach two segments of theInternational Space Station (ISS). This system was first used in space to mate the P6 and Z1 trussestogether in December 2000, through a combination of robotic and Extra-Vehicular tasks. Features thatprovided capture, coarse alignment, and fine alignment during the berthing process are described.Attachment of this high value hardware was critical to the ISS's sequential assembly, necessitating theinclusion of backup design and operational features. Astronauts checked for the proper performance of
the alignment and bolting features during on-orbit operations. During berthing, the system accommodatestruss-to-truss relative displacements that are caused by manufacturing tolerances and on-orbit thermalgradients. After bolt installation, the truss interface becomes statically determinate with respect to in-planeshear loads and isolates attach bolts from bending moments. The approach used to estimate relativedisplacements and the means of accommodating them is explained. Confidence in system performancewas achieved through a cost-effective collection of tests and analyses, including thermal, structural,vibration, misalignment, contact dynamics, underwater simulation, and full-scale functional testing. Designconsiderations that have potential application to other mechanisms include accommodating variations offriction coefficients in the on-orbit joints, wrench torque tolerances, joint preload, moving element
clearances at temperature extremes, and bolt-nut torque reaction.
Introduction
The construction of the ISS presents many challenges due to its large size and complexity. Multiplesegments are brought to orbit via the Space Shuttle. Once on-orbit, the segments must be unberthed fromthe Orbiter's cargo bay, moved to the ISS, then attached to the ISS. In other applications, it makes sense
to accomplish these tasks solely via autonomous and robotic tasks. Due to the critical nature of the ISSpower system segments, however, a new attachment system was designed to be operated byspacewalking astronauts who could quickly react to any problems encountered during assembly. Thesystem was first used to mate the P6 and Z1 trusses together. This paper describes the many designconsiderations associated with the new attachment system and the unique verification approach used togain confidence in system performance.
The P6 Long Spacer is an integrated truss structure that will provide the ISS with power, using solararrays and batteries, and communications for voice and telemetry. The P6 was carried into orbit on STS-97, ISS flight 4A, where it was attached to the rest of the ISS through the Z1 Truss. The Z1 is anintegrated truss structure that provides a mating location for the P6 Long Spacer, attitude controlhardware, and communication hardware for the ISS. The Z1 was carried into orbit on STS-92, ISS flight3A, where it was attached to Node 1 of the ISS. Figure 1 shows the Z1 element in its launch configurationwhile Figure 2 shows the P6 element in its launch configuration. Figure 3 is a photograph of the ISS at theconclusion of STS-97, showing the P6 attached to the ZI.
Design and Operations Overview
The truss attachment system is the hardware used to align, mate, and attach the P6 Long Spacer to theZ1 Integrated Truss Assembly. The mating is accomplished with the use of the Shuttle RemoteManipulator System (SRMS) and Extra-Vehicular Activity (EVA). The system, shown in Figures 4 and 5,consists of four sets of coarse alignment cones/receptacles, four sets of fine alignment cones with integralbolt mechanisms and nuts, and a capture latch/capture bar mechanism to pull the interfaces together.Figure 4 shows the Z1 side of the interface plane. The Z1 zenith bulkhead supports the Capture LatchAssembly (CLA), four coarse alignment receptacles, and four fine alignment bolt mechanisms. Figure 6
* The Boeing Company, Canoga Park, CA
Proceedings of the 35_hAerospace Mechanisms Symposium, Ames Research Center, May 9-11, 2001
199
showsthe P6side of the interfaceplane.The P6 nadirfacecontainsthe capturebar, four coarsealignmentcones,andfourfinealignmentnutassemblies.
Operatin.q PhasesThe truss berthing and attachment has four distinct operating phases: Phase I-SRMS positioning, PhaseII-interface alignment, Phase Ill-bolt down, and Phase IV-demating. Phase I consists of manipulating the
P6 into position near the Z1, using the SRMS. The P6 is positioned using the Space Vision System so thatall four P6 coarse alignment cones have their cylindrical tips at or below the plane of the Zl coarsealignment bushing faces. Meeting that Ready to Latch (RTL) criteria ensures that the P6 segment'scapture bar is placed within the capture envelope of the Zl capture latch. The EVA astronauts visuallyverify that the ready to latch condition has been achieved, completing Phase I operations.
In Phase II, astronauts use the electric wrench to close the Z1 capture latch. As the latch claws close uponthe P6 capture bar the Z1 and P6 segments are pulled together, the fine alignment features engage, andthe P6 moves laterally with respect to the Z1. The SRMS is placed in its Test mode during Phase II toreduce resistance to the fine alignment. SRMS Test mode is a "limped" mode in which the joint servos
have no control authority and the SRMS joints are relatively compliant to end effector motion. The Z1 finealignment/bolt mechanism is shown in Figure 6. The P6 long spacer nut installation is shown in Figure 7.When the fine alignment cones (shear cylinders) on the Z1 side fully seat in their receptacles on the P6,
the capture bar is approximately 6 mm from fully seated in the capture latch. Continuing to close thecapture latch deflects the capture bar's backup structure, which produces a small preload between the Z1and P6 structures.
To complete Phase Ill, the EVA astronauts first verify the fine alignment features are fully seated bychecking the gap between the P6 and Z1 housings, using a convenient tool of a known width. Next, thecrew tightens the primary structural attach bolts to fasten the truss segments to each other in thesequence noted in Figure 5. The resulting configuration is shown in Figure 8. The bolt design incorporatesa "self-feeding feature" which provides a small axial force to initiate bolt thread engagement so that thecrewmember does not have to push on the end of the bolt during tightening. During tightening, the crewchecks that the bolt is turning, advancing, and the running torque is low. The bolt preload is controlled bytorque alone. Primary bolt installation torque is reacted by two pins in the Z1 shear cylinder engagingmatching slots in the P6 primary balls. After the bolts are fully tightened, the preload applied by the capturelatch is released by EVA actuation, the SRMS ungrapples the P6, and the attachment process (Phase III)is complete. Later in the ISS assembly sequence, the P6 is removed from the Z1 and moved to apermanent location on the outboard truss, at P5. The Phase IV tasks associated with the dematingoperation are the reverse of Phases I through III.
Where possible, the three phases associated with truss berthing and mating are separate and havedistinct, identifiable beginning and ending points. In addition, confidence for proceeding with the nextphase can be gained by establishing specific verification criteria. For example, the interface alignmentphase is verified complete prior to initiating bolt operations, by checking that the fine alignment features
have accomplished the lateral positioning, and that the capture latch has accomplished the axialpositioning. The practical means of determining that the alignment has been achieved to within the designlimits of the system is by having the EVA crew check the ZI to P6 housing distance. The gap checkconfirms that the lateral offset is within the capability of the bolt threads to engage the nut, even with thenut rotated within its spherical bearing.
Capture Latch DescriptionThe Capture Latch Assembly, mounted on the Z1 truss, consists of two opposing claws connected to aseries of linkages, a drive screw, and a geared drive train (Figure 9). The input shaft to the drive train,when driven at a constant 15 RPM, will cause the claw to rotate from fully open to fully closed inapproximately 6 minutes 45 seconds, although it may be driven faster or slower. Assuming the capturebar, a solid steel cylindrical shaft mounted on the P6 truss, is within the sweep area of the claws, the clawswill then pull the bar, and the attached P6 truss, towards the Z1 truss, forcing the two interfaces to comply.For use on the Z1, the CLA's input is extended by a tube to the outer edge of the truss where theastronaut has good access.
2OO
Contingency Desiqn and Operational FeaturesIn Phase II, if the capture latch fails to close, the astronauts have contingency procedures for routing
special straps between the trusses and with a winch, they temporarily hold the interface together duringbolt engagement 1. To accommodate failures in Phase Ill, bolt-down, each fine alignment device
incorporates two contingency attachment bolt/nut combinations to allow a structural connection to bemade in the event the primary bolt cannot be engaged (see Figure 8). At each corner of the truss, themechanism is two fault tolerant for achieving structural integrity. Therefore if the primary bolt cannot beengaged, one contingency bolt can be engaged. If that contingency bolt cannot be engaged, the secondcontingency bolt can be employed.
Specific operational procedures were _orepared through the development of flowcharts that addressedpotential anomalous on-orbit conditions. Manufacturing tolerances and thermal-structural deflections maycreate an offset between the capture bar and the capture latch (see Figure 10). These offsets affect latch
preload and the ability to fully seat the shear cylinders at the shear carrying corners of the truss.Procedures were devised to loosen the capture latch if the bar/latch offset causes excessive Z1 bolt to P6nut misalignment, as detected by the truss-to-truss gap check. An analysis was conducted to derive thenumber of turns the latch would need to be loosened.
Contingency bolts and associated threaded spacers are launched with the Z1 in the position shown inFigure 6. EVA astronauts extend the spacer sleeve. The spacer serves to maintain the gap between theZ1 fine alignment housing and the P6 corner fitting so that no bending moments are created due to thedistance between the fine alignment shear cylinder's centerline and the contingency bolt's centerline. Aspecial lock tool is installed over the spacer sleeve to keep it from turning during contingency bolt
operations (see Figure 11). The tool incorporates an additional feature for use in contingency operationsto measure the gap between Z1 and P6 housings3. If needed, the tool's tapered protrusion is placed
between the housings until the edges contact the housings. The housing gap is indicated by graduatedlines on the protrusion, which are visible to the crew.
All contingency nuts in P6 fine alignment device slide in Y-Z plane. Even if the primary bolt fails to engage,shear is transferred through the shear cylinders on primary bolt at the two truss corners that are intendedto react shear. Operational procedures ensure the shear cylinder is seated even if the primary bolt is not
completely engaged.
Contingency bolt installation torque is reacted by a locking plate on the P6 assembly (see Figure 12). Aftercontingency bolt torqueing, this plate is removed by EVA and stowed for future use. A pry bar can be usedto assist in plate removal while the contingency ball flats press against the plate's slotted hole. Plate
removal allows the contingency ball/nut races to slide and rotate as required to accommodate thermal-structural deflections.
If the capture latch cannot be released nominally, there are backup means to release the preload byturning the P6 capture bar in its eccentric bushings, and releasing the Z1 capture latch claws via EVAhandles on the Z1 zenith bulkhead 2.
For demating (Phase IV), the device includes a release mechanism, an EVA operated lock pin, to allowdisconnect of the P6 from the Z1 should the primary EVA bolt become stuck in the P6 sleeved nut (seeFigure 12) during engagement. If the nut gets stuck, contingency tools and means exist to replace the nut(threaded sleeve) in the P6 fine alignment assembly, thereby restoring the original fault-tolerance of thejoint for connection of P6 to P5. The self-feeding nut in the Z1 bolt assembly is made of plastic which willshear off as the bolt/nut together are unscrewed, if the bolt has stuck to the nut at a significantengagement depth. This feature is required because there is a small difference in thread pitch betweenthe outer and inner diameters of the P6 sleeve/nut.
Thermal-Structural AnalysisThe accommodation of structural deflections caused by the temperature gradients was one of the mostimportant considerations in designing the truss attachment system. Estimates of the temperaturedistributions were made using ISS thermal models of both the pre-mate and post-mated conditions.Transient thermal analysis was used to determine truss temperatures at the point in time when the matingwas expected to occur. Numerous flight attitudes, sun angles, hardware configurations, shadowing, and
201

trussthermalpropertieswereevaluatedintheanalyses.Oncetemperaturesweredeterminedfromthethermalmodels,theywere mappedontothe correspondingelementsof thestructuralfiniteelementmodels.Finiteelementanalysiswasthenperformedto determinestructuraldeflections.Throughfurtherprocessing,therelativedeflectionsofcorrespondingP6to Z1attachpointswerecalculated.Todeterminethe deflectionsin a relativesense,thefixedcornerwas the origin of a coordinate system that waspositioned angularly by +/-Y sliding corner 4.
Attachment Restraint
Figure 5 indicates the degrees of freedom in the fine alignment assembly's primary nuts located at eachcorner of the P6. Figure 8 shows a cross section of a fine alignment mechanism with the Z1 primary EVAbolt engaged into the P6 long spacer primary nut. Spherical bearings are used around both the primaryand contingency nuts to provide a limited rotational freedom about the Y and Z axes. This bearing
arrangement provides relief for on-orbit differential thermal expansion and distortion that may occurbetween the Z1 and P6 during on-orbit operations. The arrangement also accommodates angularmisalignments due to manufacturing tolerances.
In addition to the rotational degree of freedom in the primary nut assemblies, there are provisions forsliding in the Y-Z plane to allow for differential thermal expansion of the P6 and Z1. One corner of the P6incorporates a fine alignment nut assembly that is fixed from sliding in the Y-Z plane. A second cornerincorporates a nut assembly that is allowed to slide in the Y-direction only. The two remaining cornersincorporate nut assemblies that are allowed to slide in the Y-Z plane. This arrangement allows the bolts toreact shear and torsional loads, while still allowing the structures to expand and contract thermally.
The sliding degrees of freedom in the P6 nut side of the fine alignment mechanism is accomplished byincorporating a gap between the bearing race and the truss corner fitting. The magnitude of these gaps isestablished based upon both part tolerances and predicted thermal displacements. All of the contingencynuts in the P6 fine alignment device are allowed to slide in the Y-Z plane. The shear cylinder at the primarybolt locations still carry shear loads even when the contingency bolt is installed.
After the structural connection is made, loads are transmitted across the Z1-P6 interface as follows:
+/- Z in-plane shear load - reacted by fixed truss joint & truss joint that is free to slide in the +/-Y direction+/- Y in-plane shear load - reacted by fixed truss joint only+/- X axial load - reacted by all four truss joint corners
Race-Nut CenterinqThe P6 primary races contain springs that keep the ball/nut elements centered for entry of the Z1 finealignment shear cylinder (see Figure 13). The P6 ball opening, Z1 shear cylinder tip, and the P6 centeringspring geometries ensure fine alignment feature engagement when lateral misalignments are present, aslimited by coarse alignment feature clearances. Such misalignments may be due to thermal gradients andmanufacturing tolerances. The P6 contingency races contain springs that keep the ball/nut elementscentered for Z1 contingency spacer seating (see Figure 14).
Bolt Installation Torque ReactionPrimary bolt installation torque is reacted by two pins in the Z1 shear cylinder engaging matching slots inthe P6 primary balls. These features keep the P6 nut from turning during installation of the Z1 bolts. Inaddition, the nut is free to slide and rotate after full torque is applied. The torque reaction features weredesigned to engage with the P6 primary ball/nut rotated to its limits, translated to its limits, and with themaximum gap predicted from the thermal and manufacturing tolerance studies. Figure 15 shows a layoutof the Z1 shear cylinder entering the P6 ball/nut with the Z1 torque reaction pin capable of resisting torqueagainst the P6 balrs slot. The layout shows the shear cylinder axially separated from the P6 ball adistance equal to the maximum expected gap predicted from the thermal and manufacturing tolerance
studies. The shape of the slot in the P6 ball and the positioning of the pin in the Z1 shear cylinder werecritical, having been derived from a series of layouts reflecting the expected relative misalignments. Thoselayouts ensured that the Z1 pin would enter the P6 primary ball even with the ball rotated to its limit.
2O2
Joint Preload Considerations
The primary and contingency bolts must be tightened to a sufficiently high torque to create a preload thatprevents joint separation under the influence of external loads. The maximum torque is limited by strength,fracture and fatigue considerations. With upper and lower limits defined, a range of permitted torquevalues is therefore determined. Typically, another factor must be taken into account- the change inpreload associated with tightening the bolt at the various predicted on-orbit temperatures, due to thedifference in thermal expansion coefficients between the bolt and clamped materials. In the case of thesubject attach system, however, the bolt, shear cylinder, retaining nut, and threaded sleeve are allstainless steel alloys with similar coefficients of thermal expansion. Variations in bolt-nut interface frictioncoefficients are examined in the joint analysis that place additional constraints on the bolt torque allowable
range. Development tests were conducted to characterize the friction coefficients associated with thespecific materials, sizes, surface finishes, and lubricants of the truss attach system joints s. These tests
were conducted in air, and at vacuum, over the expected temperature range. The attach bolts, races, ballsand nuts are dry film lubricated with Molybdenum Disulfide.
The primary bolt sizing calculations included misalignment loads associated with closing a maximum axialgap that may exist at the time of bolt-up, due to truss-to-truss interface out-of-plane manufacturingtolerances and thermal-structural deflections. The contingency bolt sizing did not include this misalignmentload because the contingency spacer sleeve bridges, but does not close, the axial gap. On-orbit
mechanical loads are also part of the joint design loads.
After the preload range was computed, the torque range was determined and a wrench with adequatetorque accuracy was selected _. In the case of the subject truss attachment system, the final tightening of
the bolts was accomplished using a manual torque wrench that had an accuracy of +/-10% in theexpected operating and torque ranges.
Design Tolerance Studies
A large number of tolerance analyses were performed to ensure that the selected design dimensions ofthe truss attachment system features provide the required performance in the different operating phases z.
This section describes the evaluations of truss in-plane differential displacement, out-of-plane relativedisplacement, and relative rotations due to warpage. In addition, studies of the clearances of the movingelements are addressed. During and after mating, temperature gradients exist within the P6 and Z1trusses. Such gradients cause the structure to deflect from its nominal shape. The tolerance assessmentincluded thermal conditions that exist during pre-mate and post-mate configurations.
In-Plane Differential DisplacementsAnalysis was performed to predict the maximum thermal-structural displacements in the mating plane,across the Zl-P6 interface. Relative displacements were predicted between each of the four corner finealignment features, between each of the four coarse alignment features, and between the coarse and finealignment features.
A check was made to ensure radial clearance exists between the coarse alignment P6 cone's cylindricalbody and Z1 coarse alignment bushing inside surface when displacements are at their extremes. The
coarse alignment features must have clearance post-mating, so that shear loads are only transmitted atthe fine alignment connections. The analysis was repeated for both nominal and worst case detail partdimensions, and overall positional tolerances. Clearances for pre-mate and post-mate thermal conditionswere examined.
The clearance between the P6 fine alignment primary ball/race and the P6 comer fitting bore for each of
the four corners, one to another, was analyzed as well. Race clearances must exist, post-mating to ensurethat shear loads are reacted by the intended statically determinate system.
A calculation was made to determine the radial clearance between the fine alignment Z1 shear cylinder
and the P6 receptacle (nut) when these two items first begin to engage (by capture latch closure). Thecalculation was repeated with the items displaced by thermal-structural gradients and manufacturing
tolerances. A detailed layout revealed that the shear cylinder would enter the ball properly.
203

Selectionof the minimumclearancebetweenthecoarseconeandbushingwasdrivenbythethermal-structuraldisplacementsbetweenthe coarsealignmentfeaturesthat are furthestfrom the fixedfinealignmentnut.Oncethis selectionwasmade,a calculationshowedthat entryof the fine alignmentfeatureswouldalwaysoccurwiththemaximumclearancebetweenthecoarsealignmentfeatures.
Analysisconfirmedthatwiththepredictedthermaldisplacements,dimensionaltolerances,andpositionaltolerances,whenthecoarsealignmentfeaturesengage,thefinealignmentalwaysbegintoengage,evenconsideringthepotentialforfreeplayassociatedwiththeprimaryracecenteringsprings.
Out of Plane Relative DisplacementsManufacturing tolerances and temperature gradients in and between the Z1 and P6 trusses shift the out-of-plane (X-direction) positions of the fine alignment features when the Z1 capture latch is closed on the
P6 capture bar, prior to structural bolt engagement. Stated another way, three of the four shear cylinderswill seat, but the fourth might not be seated. The primary attach bolt's stroke, bolt strength, contingencyattach sleeve stroke, and contingency attach bolt strength were found to be sufficient to seat the finealignment Z1 shear cylinders in the P6 receptacles (nuts). For this truss attachment system, the capturelatch preload is not sufficient to seat the fine alignment Z1 shear cylinder in the P6 receptacle (nut).
With the shear cylinder not fully seated, there could be a bolt to nut centerline offset that must beaccommodated by attach bolt's lead-in. Analysis and test confirmed the capability to engage the threads inthis offset condition.
Relative Rotations Due to Warpa,qeTemperature differences between the Z1 and P6 might produce warpage that creates relative rotationbetween the Z1 bolt and P6 nut assemblies. The amount of the rotations due to thermal effects was
analytically predicted. Rotational freedom was provided in the design, in the form of spherical bearings forboth the primary and contingency nut assemblies sufficient to accommodate the predicted rotations due tothermal gradients and manufacturing tolerances. In addition, an analysis concluded that the on-orbitmechanical loads do not rotate the bearing to its travel limit, thereby confirming that local moments remainreleased.
Movin.q Element Clearances
Analysis was performed to ensure clearance exists, with worst case predicted temperatures, and withworst case dimensions, between the following components: Z1 shear cylinder outer surface to P6 primaryball inside surface, Z1 contingency bolt spacer to contingency bolt, Z1 microconical fitting to primary bolt,
Z1 spring retainer nut to primary bolt, Z1 shear cylinder to primary bolt, ZI launch restraint cap to housing,Z1 launch restraint cap to shear cylinder, Z1 shear cylinder to self-feeding nut, P6 ball to race sphericaldiameters, P6 race width to housing, and Z1 primary bolt to self-feeding nut. The Z1 launch restraint nut,shown in Figure 16, secures the primary bolt from rattling during launch, and is removed by the EVA crewon the mission prior to berthing.
Verification Program
Confidence in system performance was achieved through a cost-effective collection of tests and analyses,including thermal, static loads, vibration, misalignment, contact dynamics, underwater simulation, and full-scale functional testing 8. A balance between tests and analyses at the component and system levels
resulted in an integrated verification approach. The relationship between component level testing andsystem level characteristics is described for each test in the following sections.
Qualification Vibration Test
A qualification vibration test was performed to demonstrate the ability of Z1 & P6 fine alignmentassemblies to withstand the maximum expected launch vibration environment with a qualification margin.This component level test correlated to system level performance in that the vibration spectrums used forthe test were derived from system (cargo element) level acoustic tests. The fine alignment bolt and nutassemblies passed all functional tests after being exposed to the vibration environments 9.
2O4

Qualification Thermal Cycle TestA qualification thermal cycle test was performed to demonstrate the ability of the fine alignmentassemblies to perform in the ISS space environment, meeting all thermal and mechanical performancerequirements 1°. This component level test correlated to system level performance in that the temperatures
used for test were predicted from system level (truss) thermal analysis. The component test partly verifiesability of the P6 primary and contingency nuts to comply with the predicted system borne misalignmentsrelative to Z1 fine alignment features. The test also evaluated bearing rotation and race sliding attemperature extremes.
With regard to nut rotation/sliding performance, results of this ambient pressure test correlate well withresults of an earlier Human Thermal Vacuum (HTV) test 11. In the HTV test, a misalignment test wasperformed at temperature extremes, simulating both overall truss thermal-structural deflections and localmechanism thermal-structural deflections (clearance changes due to differential coefficients of thermalexpansion between mechanism moving elements). Functional testing at several points of this test wassuccessful, including confirmation that the primary bolt did not loosen as a result of thermal cycling, andvisual inspection revealed no change occurred. The test also verified that the fine alignment features,
bolts, launch restraint cap, etc. have sufficient clearance to engage/disengage at temperature extremes.
Qualification Misaliqnment TestA qualification misalignment test was performed to verify that the Z1 and P6 fine alignment interfacesengage and can be bolted together when there is an angular misalignment between the two structures,when there is a lateral offset between the Z1 and P6 assemblies, and when there is a gap between the Z1shear cylinder and the face of the sleeve in the P6 ball/receptacle 12.
This component level test correlated to system level performance in that the thermal-structural deflectionsthat the mechanism's degrees of freedom are designed to accommodate, are the truss deflections. These
truss deflections are due to overall Z1 to P6 truss temperature differences, not local temperatures of themechanisms themselves. Test gaps and misalignments simulate those that may occur between the P6and Z1 due to worst case system level on-orbit thermal effects and manufacturing tolerances. Thiscomponent test also correlated to system level performance in that the test fixture simulated the P6 trussbackup structure stiffness. The P6 finite element model was used to calculate required fixture stiffness.Fixture stiffness was test verified prior to use in the misalignment test. A graphical view of themisalignment test setup is shown in Figure 17.
In the qualification misalignment test, performed at room temperature, only simulated overall trussthermal-structural deflections were addressed. However, in the HTV test, the misalignment test wasperformed at temperature extremes, simulating both overall truss thermal-structural deflections, and localmechanism thermal-structural deflections (clearance changes due to differential coefficients of thermalexpansion between mechanism moving elements). Therefore results of both the qualification and HTVmisalignment tests provided confidence that the mechanism would perform as required in the spaceenvironment.
Qualification Static Loads Test
The qualification static loads test was performed to verify the functionality of the test articles after theapplication of 1.0 times the design limit on-orbit loads _3.An additional objective was to measure the forcerequired to slide the P6 assembly under applied limit loads. The strength of the test article was verified for1.5 times the design limit on-orbit loads. This component level test correlated to system level performancein that the structural test load values were derived from system-level analyses. These loads include on-orbit mechanical loads, thermal loads, and misalignment loads due to manufacturing tolerances. Testcases included configurations with only the primary bolt engaged, and cases with only the contingency boltengaged. After the application of limit loads, no damage was found and the units passed the mechanicalfunctional tests. No failure occurred after application of ultimate loads. Load versus deflection data wasrecorded for each load case and was used to determine joint stiffnesses.
Qualification Contact Dynamics TestA special contact dynamics test was performed to validate the mathematical model of the trussattachment's fine alignment features, comprising the ball-nut and shear cylinder at one truss corner TM. Thismodel, together with the SRMS and CLA models made up the system level model, or full simulation as it
205
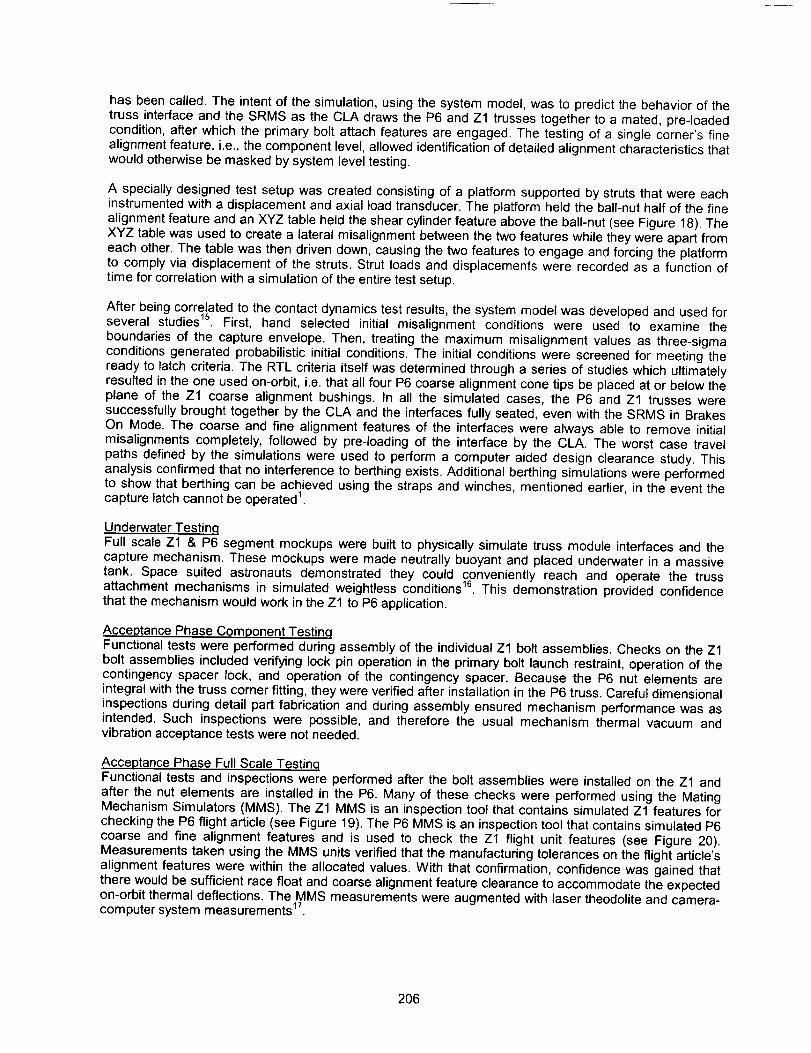
hasbeencalled.Theintentof thesimulation,usingthesystemmodel,wasto predictthebehaviorofthetrussinterfaceandtheSRMSastheCLAdrawstheP6andZ1 trusses together to a mated, pre-loadedcondition, after which the primary bolt attach features are engaged. The testing of a single corner's finealignment feature, i.e., the component level, allowed identification of detailed alignment characteristics thatwould otherwise be masked by system level testing.
A specially designed test setup was created consisting of a platform supported by struts that were eachinstrumented with a displacement and axial load transducer. The platform held the ball-nut half of the finealignment feature and an XYZ table held the shear cylinder feature above the ball-nut (see Figure 18). The
XYZ table was used to create a lateral misalignment between the two features while they were apart fromeach other. The table was then driven down, causing the two features to engage and forcing the platformto comply via displacement of the struts. Strut loads and displacements were recorded as a function oftime for correlation with a simulation of the entire test setup.
After being correlated to the contact dynamics test results, the system model was developed and used forseveral studies is. First, hand selected initial misalignment conditions were used to examine the
boundaries of the capture envelope. Then, treating the maximum misalignment values as three-sigmaconditions generated probabilistic initial conditions. The initial conditions were screened for meeting theready to latch criteria. The RTL criteria itself was determined through a series of studies which ultimatelyresulted in the one used on-orbit, i.e. that all four P6 coarse alignment cone tips be placed at or below theplane of the Z1 coarse alignment bushings. In all the simulated cases, the P6 and Z1 trusses were
successfully brought together by the CLA and the interfaces fully seated, even with the SRMS in BrakesOn Mode. The coarse and fine alignment features of the interfaces were always able to remove initialmisalignments completely, followed by pre-loading of the interface by the CLA. The worst case travelpaths defined by the simulations were used to perform a computer aided design clearance study. Thisanalysis confirmed that no interference to berthing exists. Additional berthing simulations were performedto show that berthing can be achieved using the straps and winches, mentioned earlier, in the event thecapture latch cannot be operated _.
Underwater TestinqFull scale Z1 & P6 segment mockups were built to physically simulate truss module interfaces and thecapture mechanism. These mockups were made neutrally buoyant and placed underwater in a massivetank. Space suited astronauts demonstrated they could conveniently reach and operate the trussattachment mechanisms in simulated weightless conditions _6. This demonstration provided confidencethat the mechanism would work in the Z1 to P6 application.
Acceptance Phase Component TestinqFunctional tests were performed during assembly of the individual Z1 bolt assemblies. Checks on the Z1bolt assemblies included verifying lock pin operation in the primary bolt launch restraint, operation of thecontingency spacer lock, and operation of the contingency spacer. Because the P6 nut elements areintegral with the truss corner fitting, they were verified after installation in the P6 truss. Careful dimensionalinspections during detail part fabrication and during assembly ensured mechanism performance was asintended. Such inspections were possible, and therefore the usual mechanism thermal vacuum andvibration acceptance tests were not needed.
Acceptance Phase Full Scale TestinqFunctional tests and inspections were performed after the bolt assemblies were installed on the Z1 andafter the nut elements are installed in the P6. Many of these checks were performed using the MatingMechanism Simulators (MMS). The Z1 MMS is an inspection tool that contains simulated Z1 features forchecking the P6 flight article (see Figure 19). The P6 MMS is an inspection tool that contains simulated P6coarse and fine alignment features and is used to check the Z1 flight unit features (see Figure 20).Measurements taken using the MMS units verified that the manufacturing tolerances on the flight article'salignment features were within the allocated values. With that confirmation, confidence was gained thatthere would be sufficient race float and coarse alignment feature clearance to accommodate the expectedon-orbit thermal deflections. The MMS measurements were augmented with laser theodolite and camera-computer system measurements _z.
206

Conclusions
This paper reviewed the design and verification of a Space Station truss attachment system that wassuccessfully used for the first time to mate the ISS Z1 and P6 segments, in December 2000. The
mechanisms were designed and used in a manner that, as much as possible, kept the berthing, interfacealignment, and bolt-down phases separate. Contingency procedures were developed for the EVAastronauts to use in response to on-orbit anomalies. A robust system was developed whichaccommodated interface misalignment caused by manufacturing tolerances and thermal gradients. Theverification approach resulted from a balance between tests and analyses at the component and systemlevels.
References
1. "Z1 to P6 Berthing Using Payload Retention Devices", Gabriel Katell, The Boeing Company,Rocketdyne Propulsion & Power, April 16, 1999, EID-03968.
2. "Evaluation of Z1 Capture Latch to P6 Capture Bar Preload", Gabriel Katell, The Boeing Company,Rocketdyne Propulsion & Power, November 22, 1999, EID-05257.
3. "Rocketdyne Truss Attachment System (RTAS) Design/Verification Technical Interchange Meeting",Gabriel Katell, The Boeing Company, Rocketdyne Propulsion & Power, April 29, 1999, EID-03899.
4. "Z1-Stack Flight 4A IDR3 Z1/P6 and P6LS/P61EA Interface Loads", Robert Rudd, The Boeing
Company, February 16, 1998, A92-J195-STD-M-RAR-9800016.5. "Rocketdyne Truss Attachment System (RTAS) Bolt Development Torque-Preload Test", George
Raquelsantos, The Boeing Company, Rocketdyne Propulsion & Power, May 17, 1999, ETD-MD4-C01178.
6. "RTAS Mechanism- Z1 Side (P6 to Z1) Stress Report", Bill Ng, The Boeing Company, Rocketdyne
Propulsion & Power, June 23, 1999, EPS-S-PV-16-01-017.7. "Rocketdyne Truss Attachment System (RTAS) Design Tolerance Analysis", Gabriel Katell & Stanley
Gordon, The Boeing Company, Rocketdyne Propulsion & Power, July 12, 2000, EID-03256.8. "Rocketdyne Truss Attachment System (RTAS) Verification Plan", Gabriel Katell, The Boeing
Company, Rocketdyne Propulsion & Power, March 26, 1998, EID-02267.9. "Rocketdyne Truss Attachment System Fine Alignment Bolt/Nut Qualification Vibration Test Report",
Frank Chang & Keli Asato, The Boeing Company, Rocketdyne Propulsion & Power, March 12, 1999,ETD-PQ4-C01180.
10. "Rocketdyne Truss Attachment System Fine Alignment Bolt/Nut Qualification Thermal Cycle TestReport", Gabriel Katell & Keli Asato, The Boeing Company, Rocketdyne Propulsion & Power, March31, 1999, ETD-PQ4-C01181.
11. "HTV #7 Test Results- BMRRM Dual Latch, RTAS Bolts, Z1 Keel, Russian Tools", John Maddux, TheBoeing Company, Rocketdyne Propulsion & Power, October 15, 1999, EID-00722-103.
12. "Rocketdyne Truss Attachment System Fine Alignment Bolt/Nut Misalignment Qualification TestReport", Gabriel Katell & Keli Asato, The Boeing Company, Rocketdyne Propulsion & Power, April 8,1999, ETD-PQ4-C01189.
13. "Rocketdyne Truss Attachment System Fine Alignment Bolt/Nut Qualification Static Test and Z1Contingency Spacer Lock Tool Strength Test Report", Gabriel Katell & Alfred Lewis, The BoeingCompany, Rocketdyne Propulsion & Power, May 13, 1999, ETD-PQ4-C01191.
14. "Rocketdyne Truss Attachment System Fine Alignment Hardware Contact Dynamics Test/AnalysisCorrelation Report", Gabriel Katell, The Boeing Company, Rocketdyne Propulsion & Power, April 20,1999, EID-03970.
15. "Rocketdyne Truss Attachment System Full Simulation Report", Teri Krene, The Boeing Company,Rocketdyne Propulsion & Power, August 2, 1999, EID-03954.
16. "Crew Consensus Test Report", Cathy Therrien, The Boeing Company, Rocketdyne Propulsion &Power, June 22, 1998, EID-00722-51.
17. "P6 RTAS Race Concentricity Assessment", Gabriel Katell, The Boeing Company, RocketdynePropulsion & Power, October 10, 2000, EID-05780.
207

/"_ T-
2 ') i
_ "Ib IM
Figure 1. Zl Cargo Element Figure 2. P6 Cargo Element
r
Figure 3. ISS at STS-97 Conclusion
Fine AlignmentBolt Mechanism
CaptureLatch Coarse Alignment
Bushing
Figure 4. Z1 Zenith Bulkhead Truss Attachment Features
208

Free in + Y _ /-- Free in Y-Z Plane-,_
_rner D (#4)
Corner C (#2)
Capture Bar
C°arse Alignment C°ne e_ z£_xFine Alignment Receptaci
Fixed in Y-Z Plane "_:_k, _" Free in Y-Z Plane
Corner B (#1) _ _ Corner A (#3)Note: in addition to the in-planefreedoms identified, all four
corners have limited swivel
freedom ( Oy, O_)
Figure 5. P6 Long Spacer Truss Attachment Features
Fine Alignment Shear Cylinder Torque Reaction Pros
b i
. tlt -J II ,Contingency Spacer
ZI Zenith BulkheadLocking Device I .,
_ - - _ Contingency Bolt Spacer
- - Primary Attachment Bolt
Note: Sho'._11 with launch restraint cap removed prior to berthing
Figure 6. Zl Fine Alignment/Bolt Installation
(.;round Strap, Stoveed Position__ Long Spacer Comer Fitting
j .
-_ Contingency Bal[Nut
- _. _ _,- Threaded Sleeve
- _ Primary Ball
Torque Reaction Slots
Figure 7. P6 Fine Alignment/Nut Installation
2O9

i
P6 Long Spacer _ _ Z1 Truss
Contingency Nut Locking Plate -_ iS Race Float
Ground Strap "_ \\ / /Locking Plate _ \\ / /
Contingency BalVNut _ "_ //
Sleeve Retention PIP pin _ _ _-= _ /
j -- //
Threaded Sleeve _..\ ____ . __:? :._. //\ /
\\\ / . //
//
1"
/ /
// /
/ y"_ Fine Alignmem Shear
Primary. Race // /
Centering Spring / Cylinder
/ Primary Attachment Bolt
Long Spacer _ /Comer Fitting /
Primary Ball
Contingency Spacer Locking Device
Contingency Bolt Spacer/
/ __ ('ontingency
Attachment Bolt
Self-Feeding Nut
Microconical Torque/--- Reaction Fitting
//
. -?.
\
l
i
t: _? k
i
Figure 8. P6-Z1 Mated Configuration
I_ Zl CAPTURE LATCH
I i'" 275
fl
5l'43' -_ , 080
/
I_ R6 CAPTURE BAR
Figure 9. Capture Latch Assembly Figure 10. Capture Latch-Capture Bar Offset
210

Note: Ground Strap Not Shown For Clarity
Ground SIrap Stoppage Bolt --
Contingency Nul Locking Plate
4-
Contingency BalUNul
Threaded Slec', c ,_,
Primal* Ball
-- Sleeve Retention PIP pin
t4 4'
y::-
-. PIP Pin Slec',c
Figure 11. ZI Congingency SpacerLock Tool
i : _ : i:iii_iil ¸¸¸i¸i ¸
Figure 13. P6 Primary Racewith Centering Springs
Figure 12. P6 Fine Alignment/Nut InstallationRear View
Figure 14. P6 Contingency Racewith Centering Springs
i ....
l__
I_ I ,:,Fr__ET
Figure 15. Zl Shear Cylinder Entering P6 Ball/Nut,at Ready to Bolt Configuration
Figure 16. Z1 Fine Alignment/Bolt Assembly
211
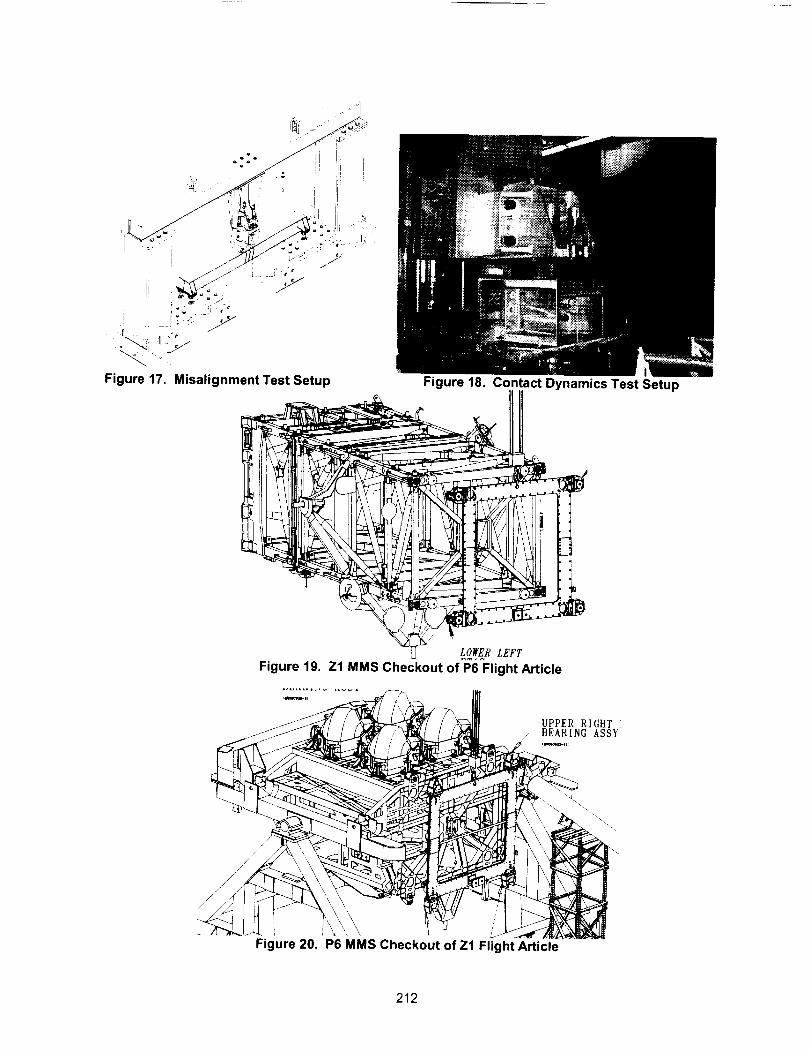
.°_,°o
Misalignment Test Setup
r J
,IFigure 19.
Figure 18. Contact Dynamics Test Setup
• k
LO_'ER LEFT
Zl MMS Chec_kout of P6"Flight Article
Figure 20.
UPPER RIGHT/ BEARING ASSY
P6 MMS Checkout of Z1 Flight Article
212
.... f7
A Four Panel, Rotating Solar Array Wing for the TIMED SpacecraftMechanism Design, Development and Test Results
Steven R. Vernon* and David F. Persons"
Abstract
The TIMED (Thermosphere, Ionosphere, Mesosphere, Energetics and Dynamics) spacecraft is the first
science mission sponsored by the NASA Office of Space Sciences in the Sun Earth Connections programand is being developed by the Johns Hopkins University Applied Physics Laboratory (JHU/APL).
Requirements for the field-of-view (FOV) of the instruments, pointing accuracy, jitter requirements, the
requirement for an anti-sun, cold side of the spacecraft, and sun angle variations during the year placedsevere limitations on the design of the solar array. Presented is a timeline of system concept evolution to
illustrate the many design iterations required as the design team reacted to changes in key spacecraftand program requirements. Also given are several of the mechanism trades off studies performed, along
with a detailed description of the final design. The mechanical ground support equipment, analysis
(dynamics and stress), mechanism materials and finishes, and flight qualification testing are covered indetail. Flight array deployment test results are presented and the "lessons learned" during the engineering
model development and testing program are summarized.
Introduction
The Applied Physics Lab (APL) of the Johns Hopkins University has a long and successful history ofspacecraft, sensor and mechanism design for a wide variety of space missions and sponsors. Since the
early 1960's many government agencies such as the Navy, Air Force, BMDO and NASA haveapproached APL for consultation and solutions to problems of national interest.
The APL system design philosophy is probably best stated as one tailored to each individual mission.
APL specializes in unique and "one of a kind" types of missions where a fast response is required. One
constant throughout every mission APL has undertaken is to establish a close association between thelead engineers and the hardware they are responsible for producing. The lead engineers are empowered
to make technical as well as schedule decisions in a close team environment where they are exposed tothe requirements and challenges facing the program office and the other subsystem engineers. The lead
engineer of a subsystem is expected to be involved in the project from "cradle to grave". Formal reviewsare also held and are of a high quality, utilizing outside and internal reviewers. The APL panel members
are often the most critical and difficult reviewers the technical lead engineers face.
For the TIMED mission, the two decisions that had the most impact upon the solar array design were
made at the system engineering level. The first decision was to allow unlimited power system growth tooccur in order to meet the science instrument requirements for continuous operation (24 hours per day, 7
days a week) from the start of in-orbit initial operations until the conclusion of the mission. The orbit and
the precession rate chosen created a solar array and associated power system that on the surfaceappears far in excess of the typical spacecraft of this size and class. The second decision was to co-manifest TIMED with a second spacecraft to minimize launch costs. This decision created an immediate
mass problem for the array that influenced the design throughout the development effort.
Program Requirements Evolution
For the TIMED solar array, evolving program and system requirements drove three major designiterations in 18 months between the CoDR (Conceptual Design Review) and the CDR (Critical Design
"The Johns Hopkins University Applied Physics Laboratory, Laurel, MD
Proceedings of the 35th Aerospace Mechanisms Symposium, Ames Research Center, May 9-11, 2001
213

Review).These iterationsprovidean interestingexampleof the effectsof 'requirementcreep' onmechanicaldesign.
Nonetheless,severalbasicrequirementsandtheir effectsremainedrelativelyconstantthroughoutthedesignprocessandareasfollows:
• Spacecraft Orbit: 625 km circular, 74.1 ° inclination, 2°/day precession rate, 12000 eclipses. This
environment set solar array temperature excursions to +/- 100 ° C.
• Spacecraft: 3 axis stabilized, nadir pointing.
• SABER Instrument Radiator FOV: Required a cold side of the spacecraft to constantly point anti-sunward and limited solar panel width to 122 cm to eliminate reflected sunlight onto the radiator.
• TIDI Instrument Telescope FOV: Additional requirements by the 4 telescopes that limited the
Solar array width to 122 cm.
• Rotation An.qle: Arrays must rotate 0-100 °, single axis after deployment (0 ° position).
For the CoDR, held December 1994, a 300 W maximum orbit average power, 11.14 meters 2 array was
chosen. Consisting of 2 wings, each wing consisted of two aluminum honeycomb panels angled with a10° droop, using silicon BSFR cells with 0.15-mm CMX cover-glass. With an OSC Taurus launch vehicle
baseline, the 950 kg allowable spacecraft launch mass provided plenty of available mass for the array. To
reduce program costs after this review, spacecraft design efforts were reduced to a low level to allow timefor the science instrument designs to 'catch up' and firm up their requirements through continued designefforts.
During this down time, an experienced array design team was chosen, consisting of the TIMED leadspacecraft mechanical engineer, a structures and kinematics analyst, the TIMED lead spacecraft thermal
engineer, a senior designer, and a junior designer. Up through delivery of the flight wings to thespacecraft, none of these team members worked full time on the solar array due to budget and manpowerconstraints. The analyst (at 75%) and the junior designer (100% from EDR to CDR) spent the most time.
By the spacecraft preliminary design review (PDR), held February 1997, significant changes were madeas requirements firmed up and new issues surfaced. As of January 1997, TIMED was co-manifested with
the JASON spacecraft on a Delta 7920-10 launch vehicle to minimize launch costs. As a result, themaximum TIMED spacecraft launch mass was reduced to 660 kg. Mass immediately became a significantissue for the solar array design. Exacerbating the mass issue was the growth in the required maximum
orbit average power from 300 W to 410 W. Packaging constraints increased the number of panels perwing from two to four, increasing the parasitic hinge, damper and release masses proportionally. Inresponse to these significant changes, the 12.8 m 2 baseline array at spacecraft PDR consisted of two
rotating wings, each with four GrCE (graphite/cyanate ester) face sheets and aluminum honeycombsandwich panels, GaAs cells, each wing with a 30 ° droop.
Table 1: Evolving Power System Requirements Summary
Program Power (BOL) Cell TypeMilestone
CoDR 1200 Watts SiliconPDR 2240 Watts GaAs
S/A EDR 2412 Watts GaAs
CDR 2412 Watts GaAs
Flight Hardware 2453 Watts GaAs
Allowable Mass,
Total Kg.
90+ Kg.
110 Kg. Max
110 Kg. Max
110 K9. Max8O.9 Kg.
Cell Area
(meters 2)11.1
12.8
11.1
11.1
11.1
Droop
Angle10_30 _
20 u
20 u
20 u
Deployment System and Individual Mechanism Trade Studies Performed
After spending approximately 30 days searching available sources in the literature, it became apparentthat there were six competing deployment system designs that might satisfy our requirements. Thesesystems are briefly summarized below with their associated advantages and disadvantages:
214
1. Freedeploymentsystem,noratedampers.a. Advantages:Lowestcostandmass,simpletodesignandfabricate.b. Disadvantages:Controlchallenge,highvelocitydeployment,motionpathcontrolnot
withinacceptablelimits,no heritageor informationavailablewith othermissionsororganizations,verylargeIockuploads.
2. Singlemotordrivensystemwithsynchronizedpanel-to-paneldeployment.a. Advantages:Robust,largemotortorquemarginsavailable,momentumcontrolusing
motor,predictablemotionpath,arrayretractionin flightpossible(nota requirement),similarflightsystemsinuse.
b. Disadvantages:Highestmassandcost,multiplepartsandfailurepoints,longleadtimefor engineeringmodelmotor,motordriveandcontrolelectronicsarehigh$ andmasscostfora"onetime"event.
3. Springdrivensystemwithsynchronizedpanelto paneldeploymentusingeddycurrentdampersformomentumdampening.
a. Advantages:Lowercost,similarmassto "2" above,singledamperat theyokecontrolssystemmomentum,eddycurrentdamperrequiresnopower.
b. Disadvantages:Mechanicallycomplex,manysinglepointfailurepoints,no recentflighthistoryfoundonavailableeddycurrentdampers,highmassandsizefordamper,systemmassveryhigh,smalladjustmentrangeofdamper.
4. Freedeploymentsystemwith"saloondoor"hingesandovertraveldampers.a. Advantages:low cost andmass,longAPL historywith this styleof hinge,minimal
complexity,andminimalpowertooperate.b. Disadvantages:Controlchallenge,highpaneldeploymentvelocity,challengingto lock
panelsinplace,totallyunpredictablemotionpathcontrol.5. Freedeploymentwithviscousdampervelocitycontrol(PDRBaseline).
a. Advantages:communicationsatelliteheritage,acceptablemass and cost, goodmomentumcontrol,acceptablemotionpathvariability,dampershavewiderangeofadjustment.
b. Disadvantages:Temperaturecontrol of dampersrequired,additionaldampertest,qualificationandcharacterizationprogramrequired.
6. "Offtheshelf'purchasefromanoutsidevendor.a. Advantages:Shiftsubstantialriskand headaches to the vendor.b. Disadvantages: No "off the shelf' design realistically available, modification to existing
designs required, substantial investment of time to monitor contract and technical issueswith travel involved of key personnel at often inopportune times (personnel availability).
We evaluated each option in detail and chose option "5", the free deployment system using viscousdampers at each hingeline. The relatively simple design coupled with acceptable mass and cost weighed
heavily.
The team recognized early on that with the manpower and schedule constraints present, make or buy
decisions for individual mechanisms leaned heavily toward the buy side. As a result, the decision wasmade to investigate and buy commercially-available damper and release mechanisms and adapt heritagehinge, ball & socket, and bearing designs to the purchased items. Briefly summarized here are the resultsof the trade studies:
1. Choice of eddy current vs viscous fluid damper.
a. Viscous dampers have flight heritage at APL and GSFC.b. Large range of adjustment available for viscous damper.c. Air bubble concerns with viscous damper.
d. Concern with high-speed gearing in eddy current damper.
215

The DEBManufacturingModel1025viscousrotarydamperwas chosenwithseveralmodificationssuggestedbyDEBand GSFC in fill and testing procedures to minimize concern over the development ofan air bubble in the fluid during vacuum operation.
2. Choice of release mechanism.
a. Pin puller: Extensive heritage at APL, high shock, hard to adapt to this configuration,
relatively high mass.b. Release nut: Low mass, low shock, easily adaptable to separation bolt configuration.c. Thermal knife: High power in comparison with other options, concern about simultaneous
deployment of each pair.d. Cable cutter: Extensive heritage at APL, high shock, cable would replace separation bolt,
would need load cell in place of strain gage in the bolt.
The Hi-Shear 9321 low shock series separation nut was chosen combined with a strain-gaged BeCu bolt
as the release system for each wing.
Design Timeline and Concept Evolution
The major features of the array deployment system gradually matured as the program progressed.Summarized below is the design as it stood at selected program milestones. Since much of the
spacecraft design had been completed, more time could be spent on the array design, enabling a good
deal of progress to be made in one year.
Solar Array Baseline Desi.qn at Spacecraft PDR, February 19, 1997
• Four (123 cm x 132 cm x 1.59 cm thick) panels per wing.
• Aluminum core panels with GrCE face sheets to eliminate 'thermal twang' of the panels duringtransitions in and out of eclipse.
• Two torsion spring hinges with viscous dampers per inter-panel hinge line.
• Torsion spring actuated yoke also with viscous damper.
• 4 ball & socket supports per wing to take shear during launch.
• 2 pyro pin pullers with long bolts with load washers that control panel preload and release each wing.
• Pin pullers located on spacecraft side to minimize pyro shock to solar cells.
• Heated dampers (8 W max) to control damper temperature.
• Panels lock at the end of deployment.
• Cells on outside panel face outward during launch.
• Solar array deployment actuator (SADA): Schaeffer Magnetics Type 3 actuator motor.
Due to manpower constraints, the solar array baseline design was very immature at the spacecraft PDR.After PDR, the updated four panel/wing Pro-Engineer layout was completed, allowing the NASTRAN
structural analysis of the wing in both the stowed and deployed conditions to proceed. By the end ofMarch, 1997, completion of the initial kinematic deployment analysis using 2D Working Model v4.0
provided the flight baseline spring and damping coefficients, uncovered lock-up loads, facilitated damperprocurement, and permitted the flight hinge design to start. As the flight mechanism designs matured, a
separate solar array engineering design review (EDR) was held in July 1997 to review the progress madeto that date. GSFC mechanism experts served on the review board and suggested changes that
significantly improved the JHU/APL wing design. First-cut deployment test plans and very preliminaryground support equipment designs to support the wing deployment testing also were reviewed. Solar
array design changes from the spacecraft PDR are summarized below:
Solar Array Desi,qn at Sub-System E.DR, July 1997• On-orbit SADA rotation set at 0°-100 °.
• 20 o droop angle chosen to minimize solar pressure torques (for PDR it was 30°).
• Low-shock separation nuts substituted for heritage pin pullers, nuts mounted on backside ofoutermost wing panel for accessibility.
216

• Instrumented(strain-gauged)releaseboltchosenoverloadcelldesignto savemass.• Constantforce leafspringreplacedtorsionspringat yokehingeto solvepackagingproblemsand
savemass.• Cellsmovedto oppositesidesof panelstoreducetheangleof rotationintothesunrequiredduring
initialdeploymentandtoprotectcellsfromdamageduringintegration.• 4 Supportpoints(2 release,2 ball& socket)substitutedfor6 points(atPDR)basedonNASTRAN
stowedfrequencyanalysis.
Solar Array Design at Spacecraft CDR, December, 1997The solar array design was essentially complete at the spacecraft critical design review (CDR), held in
December 1997. Solar array design changes from the solar array EDR are summarized below:
• Four (199.6 cm x 125.2 cm x 1.3 cm thick) panels per wing (11.1 m 2 total array area).
• Aluminum face sheets replaced GrCE facings. Thermal twang of aluminum faces was evaluated anddeemed acceptable under the TIMED jitter requirements. Use of aluminum faces allowed use of
magnesium inserts, representing a large mass savings over the titanium inserts required for
coefficient of thermal expansion (CTE) compatibility with GrCE facings.
• Two self-aligning spherical bearings at each inter-panel hinge line replaced the two Envex bushings.
• One spring/damper assembly per inter-panel hinge line instead of two to save mass.
• Hi-Shear 9321 low-shock separation nut chosen.
• Retraction spring on release bolt added to increase clearance between bolt and panel based ondetailed kinematic analysis.
• Four point wing interface to the spacecraft modified to two flats at the release bolts, one ball and
socket, and 1 'V' groove to accommodate the difference in temperatures between the spacecraft body
and the wing assembly after the approximately two hour time span between launch and wingdeployment.
• Modified damper cover from aluminum to magnesium to save weight.
Concern was expressed at the CDR concerning the number of eclipse cycles, the large size of the cells,
and the CTE mismatch between GaAs cells and aluminum face sheets. In addition, in-depth conversationwith the launch vehicle manufacturer indicated that 53 kg additional spacecraft launch mass was
available by making various minor changes to the launch profile. It was decided to initiate anotherstructural iteration on the substrates, using GrCE cloth face sheets with downsized titanium inserts. This
was accomplished with drawing release in February 1998.
Summary of Solar Array System Milestone Dates:;_ Conceptual Design Review (CoDR): December, 1994; Spacecraft design activities halted.
Preliminary Design Review (PDR): February 19, 1997.Solar Array Engineering Design Review (EDR): July 19, 1997.
;_ Critical Design Review (CDR): December 3, 1997.;* Substrate Contract Fabrication Start/Finish: 2/98 to 7/30/98
_, Cell Vendor Lay down Contract Start/Finish: 8/98 to 9/20/99;_ APL Mechanical Assembly Start: 9/30/99.;_ SC Environmental Test Start: 10/18/99.
Flight Design Configuration
Figure 1 illustrates the TIMED spacecraft in the orbital configuration. Figure 2 shows a solar array wing inthe launch configuration.
217
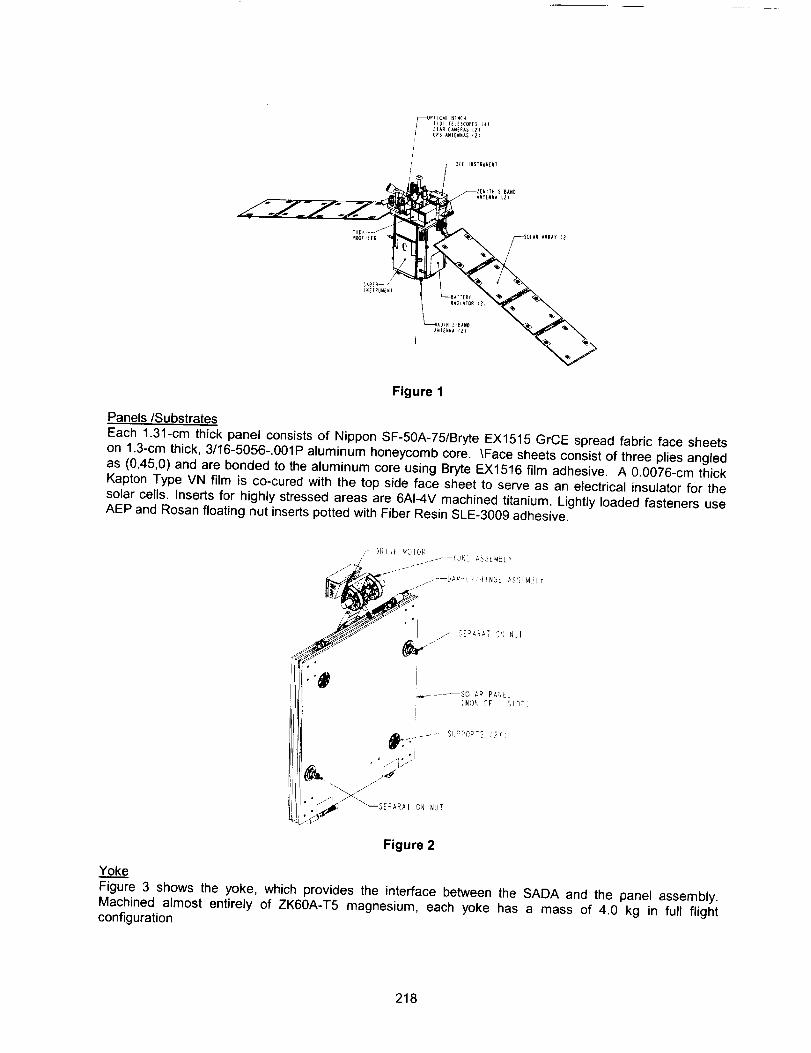
IpCAt BEWCH
I_DI T[LESCOP[_ ;4)STAR CAWERAS (2_
G_S AW1EWWAS _2_
_$E( INSTRUMENT
I
ANI(_NA t21
Figure 1
Panels/Substrates
Each 1.31-cm thick panel consists of Nippon SF-50A-75/Bryte EX1515 GrCE spread fabric face sheets
on 1.3-cm thick, 3/16-5056-.001P aluminum honeycomb core. \Face sheets consist of three plies angledas (0,45,0) and are bonded to the aluminum core using Bryte EX1516 film adhesive. A 0.0076-cm thick
Kapton Type VN film is co-cured with the top side face sheet to serve as an electrical insulator for the
solar cells. Inserts for highly stressed areas are 6AI-4V machined titanium. Lightly loaded fasteners useAEP and Rosan floating nut inserts potted with Fiber Resin SLE-3009 adhesive.
Figure 2
Yok_.._._e
Figure 3 shows the yoke, which provides the interface between the SADA and the panel assembly.Machined almost entirely of ZK60A-T5 magnesium, each yoke has a mass of 4.0 kg in full flight
configuration
218

Figure 3
Energy for the 70 ° deployment of the yoke attach arm is provided by a 2-ply beryllium copper (BeCu)
constant-force leaf spring that provides drive torque that is >5.0 times the measured friction torque. Thearm rotates by virtue of four Kaydon preloaded angular contact bearings lubricated with Braycote 601
grease. Two DEB viscous rotary dampers provide velocity control for the yoke deployment arm. Twoadjustable stops precisely locate the array at the end-of-travel (EOT), with a limit switch to sense proper
deployment. Having no latch at the yoke enables each wing to fold during re-entry, providing the properburnup/debris scenario.
SADA
The SADA provides the 110 ° of rotation required by the wing during orbital operations. It is a standardM OOG/Schaeffer Type III harmonic drive actuator. A rotary potentiometer provides 180 ° of position data.
A typical rotation angular velocity for this actuator will be ~l°/sec. A Type III actuator provides the desiredshaft/bearing stiffness for the deployed array wing. The torque margin on the motor is calculated to be
much greater than 5.0.
HinqesPanel hinge lines consist of two stainless steel, self-aligning spherical bearings, one of which is joined toa single spring/damper assembly. Each bearing is lubricated with Braycote 601 grease. The hinge, shafts
and bearing housings are made of ZK60A-T5 magnesium hard coated with a proprietary 'Mag-oxide'coating provided by Luke Engineering. The single DEB viscous damper is mounted to the main shaftthrough a flexible coupling and provides velocity control over the entire 180 ° of travel. At each spherical
bearing housing, a small leaf spring rides up and over a wedge and provides a solid Iockup of each panelhinge line at the EOT. Each hinge line of a wing has a custom Elgiloy helical torsion spring whose
variable preload is set based on the results of kinematic analysis and ground test. The spring providesdrive torque that is >5.0 times the measured friction torque.
Viscous Dampers
The DEB Manufacturing Model 1025 viscous rotary damper was chosen to provide deployment ratecontrol for each wing. Building on Goddard Spaceflight Center (GSFC) experience with this damper,
extensive testing was performed to characterize typical damper performance under various temperatureand load conditions. The damper uses a rotating vane to force CV-7300 silicone fluid of chosen viscosity
through an adjustable orifice, providing up to 1411 N-cm of torque in a package weighing -0.5 kg.
For this model damper, the damping coefficient was found to vary nonlinearly with needle valve setting,temperature, direction of rotation, and surprisingly, with applied torque. The latter characteristic influences
the testing sequence for setting up and testing the flight wings. To accurately predict the behavior of aparticular damper under temperature and various needle valve settings, the net torque that each damper
sees must be accurately measured. Therefore, the spring torque and drag torques from pin friction,
219
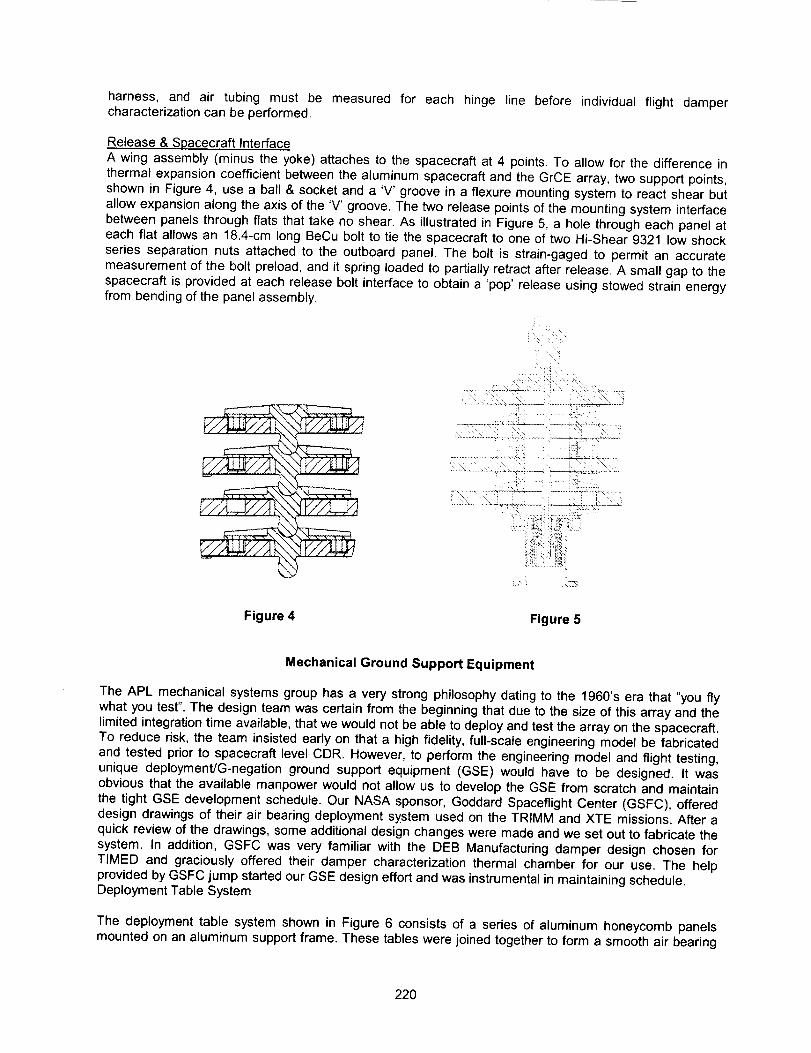
harness,and air tubingmust be measuredfor each hinge line beforeindividualflight dampercharacterizationcanbeperformed.
Release & Spacecraft Interface
A wing assembly (minus the yoke) attaches to the spacecraft at 4 points. To allow for the difference in
thermal expansion coefficient between the aluminum spacecraft and the GrCE array, two support points,shown in Figure 4, use a ball & socket and a 'V' groove in a flexure mounting system to react shear but
allow expansion along the axis of the 'V' groove. The two release points of the mounting system interfacebetween panels through flats that take no shear. As illustrated in Figure 5, a hole through each panel at
each flat allows an 18.4-cm long BeCu bolt to tie the spacecraft to one of two Hi-Shear 9321 low shockseries separation nuts attached to the outboard panel. The bolt is strain-gaged to permit an accurate
measurement of the bolt preload, and it spring loaded to partially retract after release. A small gap to thespacecraft is provided at each release bolt interface to obtain a 'pop' release using stowed strain energy
from bending of the panel assembly.
Figure 4
_.__. . __. ._-;_ ......... :._.:.::.-;
_:5: ' !,'_>
Figure 5
Mechanical Ground Support Equipment
The APL mechanical systems group has a very strong philosophy dating to the 1960's era that "you fly
what you test". The design team was certain from the beginning that due to the size of this array and thelimited integration time available, that we would not be able to deploy and test the array on the spacecraft.
To reduce risk, the team insisted early on that a high fidelity, full-scale engineering model be fabricatedand tested prior to spacecraft level CDR. However, to perform the engineering model and flight testing,
unique deployment/G-negation ground support equipment (GSE) would have to be designed. It wasobvious that the available manpower would not allow us to develop the GSE from scratch and maintain
the tight GSE development schedule. Our NASA sponsor, Goddard Spaceflight Center (GSFC), offereddesign drawings of their air bearing deployment system used on the TRIMM and XTE missions. After a
quick review of the drawings, some additional design changes were made and we set out to fabricate thesystem. In addition, GSFC was very familiar with the DEB Manufacturing damper design chosen for
TIMED and graciously offered their damper characterization thermal chamber for our use. The helpprovided by GSFC jump started our GSE design effort and was instrumental in maintaining schedule.
Deployment Table System
The deployment table system shown in Figure 6 consists of a series of aluminum honeycomb panelsmounted on an aluminum support frame. These tables were joined together to form a smooth air bearing
220
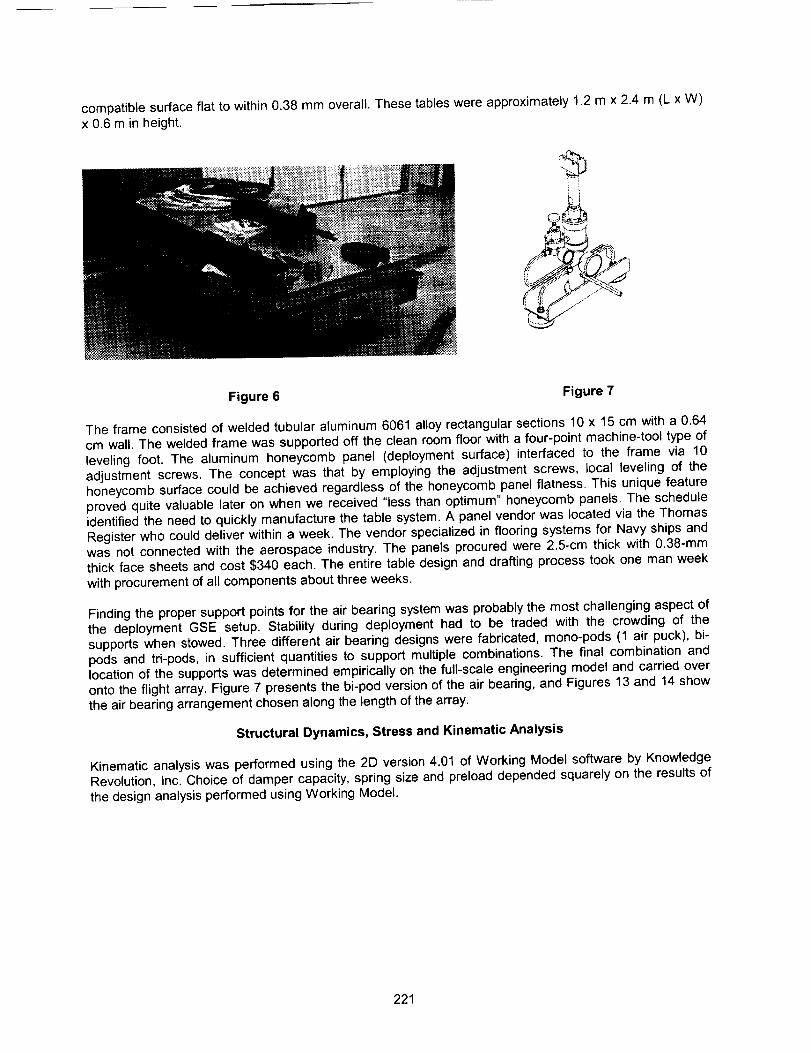
compatiblesurfaceflatto within0.38mmoverall.Thesetableswereapproximately1.2m x 2.4m(Lx W)x 0.6minheight.
Figure 6 Figure 7
The frame consisted of welded tubular aluminum 6061 alloy rectangular sections 10 x 15 cm with a 0.64cm wall. The welded frame was supported off the clean room floor with a four-point machine-tool type of
leveling foot. The aluminum honeycomb panel (deployment surface) interfaced to the frame via 10adjustment screws. The concept was that by employing the adjustment screws, local leveling of the
honeycomb surface could be achieved regardless of the honeycomb panel flatness. This unique featureproved quite valuable later on when we received "less than optimum" honeycomb panels. The schedule
identified the need to quickly manufacture the table system. A panel vendor was located via the ThomasRegister who could deliver within a week. The vendor specialized in flooring systems for Navy ships and
was not connected with the aerospace industry. The panels procured were 2.5-cm thick with 0.38-mm
thick face sheets and cost $340 each. The entire table design and drafting process took one man weekwith procurement of all components about three weeks.
Finding the proper support points for the air bearing system was probably the most challenging aspect of
the deployment GSE setup, Stability during deployment had to be traded with the crowding of thesupports when stowed. Three different air bearing designs were fabricated, mono-pods (1 air puck), bi-pods and tri-pods, in sufficient quantities to support multiple combinations. The final combination and
location of the supports was determined empirically on the full-scale engineering model and carried overonto the flight array, Figure 7 presents the bJ-pod version of the aJr bearing, and Figures 13 and 14 show
the air bearing arrangement chosen along the length of the array.
Structural Dynamics, Stress and Kinematic Analysis
Kinematic analysis was performed using the 2D version 4.01 of Working Model software by Knowledge
Revolution, Inc. Choice of damper capacity, spring size and preload depended squarely on the results ofthe design analysis performed using Working Model.
221

TIMED Solar Array Engineering Model
Trial1 & Trial2 vs Working Model Predictions
Angular Position vs Time
TI - T2=tl
29O
=¢ 0 ._ 1_3 20 3O 40 50 6O
_
-200
Elap_d Time, (_c)
fl-¥_e
_, T1 .blr_ge1-2
Tl-blr_e2.3
TI -_noe3-4
o T2-¥oke
,:; T2-1_gel.2
T2.I-mge2-3
• T2-Hnge3-4
_&ldlnge 2-3
Figure 8
_z
i::l
Figure 9
Lockup loads were derived from the velocities uncovered from the deployment analysis. The engineeringmodel deployment test results were used to verify the rigid body kinematic model. Figure 8 gives the
deployment angle vs. time curves generated for each joint for both the engineering model test and
analysis model. Agreement is quite good given the accuracy that joint friction was known during ground-based deployment. The curves with * and square icons also illustrate the ability of the analysis todiagnose GSE problems, in this case an uneven floor section that slowed the deployment of hinges 1-2
and 3-4. The diamond icon curves show a slower deployment during test than predicted by analysis forthe yoke dampers. Further investigation uncovered that the yoke dampers, which were loaded with a
more viscous silicone fluid than the panel dampers, required a more sensitive adjustment procedure than
222
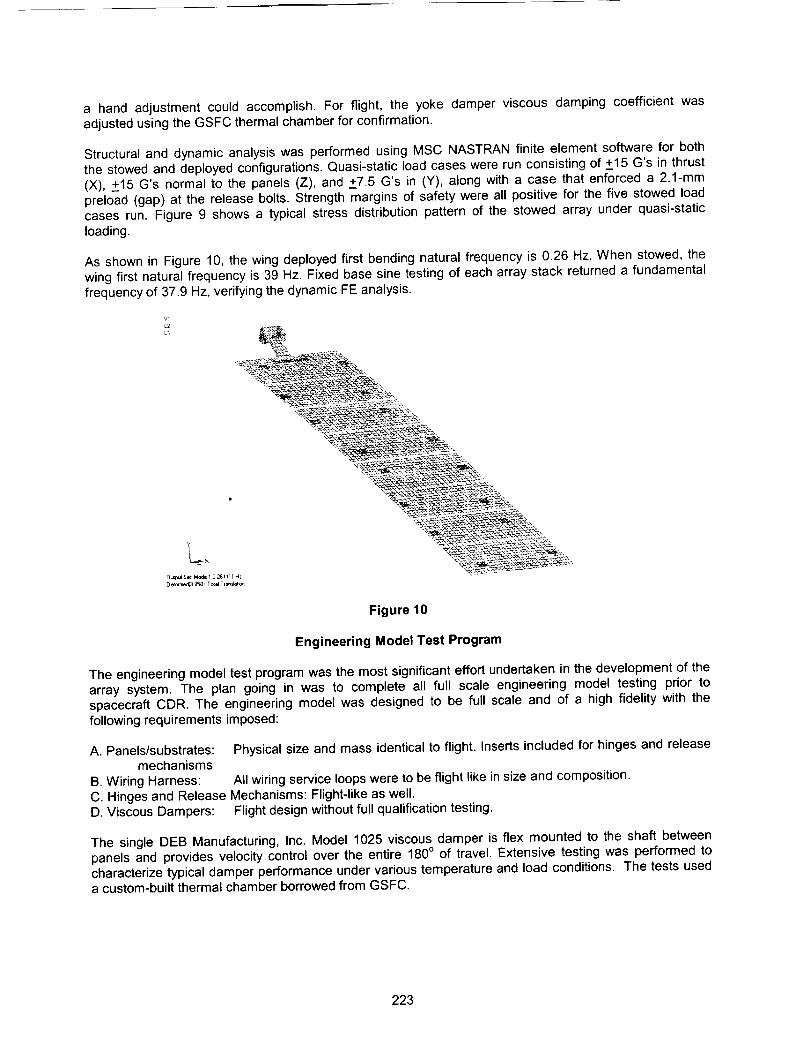
a handadjustmentcouldaccomplish.Forflight, the yokedamperviscousdampingcoefficientwasadjustedusingtheGSFCthermalchamberforconfirmation.
StructuralanddynamicanalysiswasperformedusingMSCNASTRANfiniteelementsoftwarefor boththestowedanddeployedconfigurations.Quasi-staticloadcaseswererunconsistingof +15G'sin thrust(X),+15G's normalto thepanels(Z),and+7.5G's in (Y),along with a case that enforced a 2.1-mmpreload (gap) at the release bolts. Strength margins of safety were all positive for the five stowed load
cases run. Figure 9 shows a typical stress distribution pattern of the stowed array under quasi-static
loading.
As shown in Figure 10, the wing deployed first bending natural frequency is 0.26 Hz. When stowed, thewing first natural frequency is 39 Hz. Fixed base sine testing of each array stack returned a fundamental
frequency of 37.9 Hz, verifying the dynamic FE analysis.
Figure 10
Engineering Model Test Program
The engineering model test program was the most significant effort undertaken in the development of thearray system. The plan going in was to complete all full scale engineering model testing prior to
spacecraft CDR. The engineering model was designed to be full scale and of a high fidelity with thefollowing requirements imposed:
A. Panels/substrates: Physical size and mass identical to flight. Inserts included for hinges and releasemechanisms
B. Wiring Harness: All wiring service loops were to be flight like in size and composition.
C. Hinges and Release Mechanisms: Flight-like as well.D. Viscous Dampers: Flight design without full qualification testing.
The single DEB Manufacturing, Inc. Model 1025 viscous damper is flex mounted to the shaft betweenpanels and provides velocity control over the entire 1800 of travel. Extensive testing was performed to
characterize typical damper performance under various temperature and load conditions. The tests useda custom-built thermal chamber borrowed from GSFC.
223
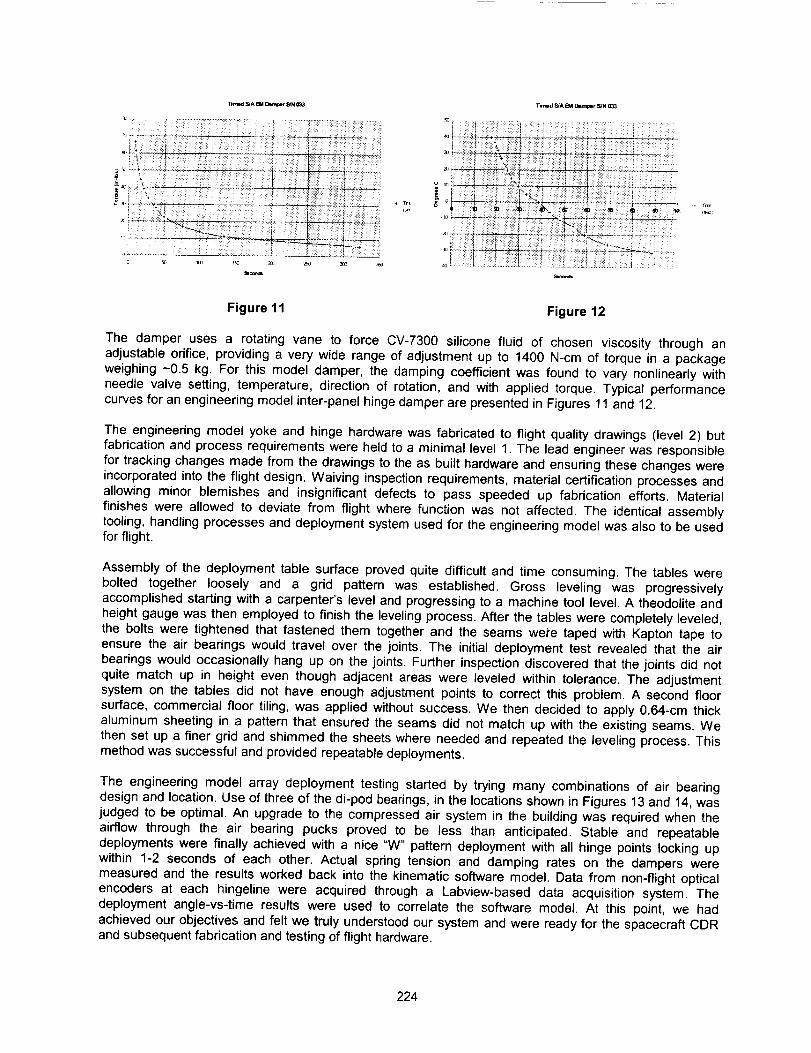
_med _A _ [3Rml_r S/N 033 TirnBd _A E_I Da_wer S/N 0_3
Figure 11 Figure 12
The damper uses a rotating vane to force CV-7300 silicone fluid of chosen viscosity through an
adjustable orifice, providing a very wide range of adjustment up to 1400 N-cm of torque in a packageweighing -0.5 kg. For this model damper, the damping coefficient was found to vary nonlinearly with
needle valve setting, temperature, direction of rotation, and with applied torque. Typical performancecurves for an engineering model inter-panel hinge damper are presented in Figures 11 and 12.
The engineering model yoke and hinge hardware was fabricated to flight quality drawings (level 2) butfabrication and process requirements were held to a minimal level 1. The lead engineer was responsible
for tracking changes made from the drawings to the as built hardware and ensuring these changes wereincorporated into the flight design. Waiving inspection requirements, material certification processes and
allowing minor blemishes and insignificant defects to pass speeded up fabrication efforts. Material
finishes were allowed to deviate from flight where function was not affected. The identical assemblytooling, handling processes and deployment system used for the engineering model was also to be used
for flight.
Assembly of the deployment table surface proved quite difficult and time consuming. The tables werebolted together loosely and a grid pattern was established. Gross leveling was progressively
accomplished starting with a carpenter's level and progressing to a machine tool level. A theodolite andheight gauge was then employed to finish the leveling process. After the tables were completely leveled,
the bolts were tightened that fastened them together and the seams wei'e taped with Kapton tape toensure the air bearings would travel over the joints. The initial deployment test revealed that the air
bearings would occasionally hang up on the joints. Further inspection discovered that the joints did notquite match up in height even though adjacent areas were leveled within tolerance. The adjustment
system on the tables did not have enough adjustment points to correct this problem. A second floorsurface, commercial floor tiling, was applied without success. We then decided to apply 0.64-cm thick
aluminum sheeting in a pattern that ensured the seams did not match up with the existing seams. Wethen set up a finer grid and shimmed the sheets where needed and repeated the leveling process. Thismethod was successful and provided repeatable deployments.
The engineering model array deployment testing started by trying many combinations of air bearingdesign and location. Use of three of the di-pod bearings, in the locations shown in Figures 13 and 14, was
judged to be optimal. An upgrade to the compressed air system in the building was required when theairflow through the air bearing pucks proved to be less than anticipated. Stable and repeatable
deployments were finally achieved with a nice "W" pattern deployment with all hinge points locking upwithin 1-2 seconds of each other. Actual spring tension and damping rates on the dampers were
measured and the results worked back into the kinematic software model. Data from non-flight opticalencoders at each hingeline were acquired through a Labview-based data acquisition system. The
deployment angle-vs-time results were used to correlate the software model. At this point, we hadachieved our objectives and felt we truly understood our system and were ready for the spacecraft CDR
and subsequent fabrication and testing of flight hardware.
224

Flight Array Test Program
To accurately predict the behavior of a particular damper under temperature and various needle valvesettings, the net torque that each damper sees must be accurately measured. Therefore, the springtorque and drag torques from pin friction, harness, and ground support air tubing must be measured for
each flight hinge line before individual flight damper characterization can be performed. Since the
dampers' damping coefficient varies greatly with temperature, for flight, redundant heaters are mounted
on each damper to control the housing temperature within the range of +15°C to +20°C.
Due to a very late delivery of the fully populated flight substrates from the vendor, we were limited to only
two weeks to assemble, deployment test, vibrate, deployment test again and integrate each wing into thespacecraft for spacecraft- level environmental testing! The lessons learned on the engineering model
proved invaluable and more than paid for the investment during this difficult period. The fabrication
tooling, data acquisition system and the deployment system performed flawlessly. Sine vibration testing ofeach wing went smoothly with no gapping observed at the release bolts, verifying the preload in the strain
bolt was correct. Post-vibration deployment testing, shown in Figures 13 and 14, noted no changes in thedamper settings or in deployment behavior. The yoke was integrated first to allow for a full 180 ° of rotation
of the SADA, verifying proper harness loop routing and tiedown. Integration of each wing with thespacecraft went well without any modification of interface components required. The following test matrix
details the entire test program implemented for the engineering model and flight solar array hardware.
Table 2
t ........ TIMED S_acecraft
...........i....................................................Mo_i_i.................... T
Once the arrays were integrated, the spacecraft underwent sine vibration testing at JHU/APL, and
acoustics, mass properties, and self-induced shock testing at GSFC. As part of the shock test, eachwing's separation nut pyrotechnics were fired, and each tethered wing was allowed to swing a few
degrees from the spacecraft. This 'pop & catch' test demonstrates that sufficient clearances existbetween the array and last minute additions during the integration process such as thermal blankets andharness.
Conclusions and Lessons Learned
1. As we have learned on other JHU/APL mechanism designs as well, an engineering model is anincredible resource, provided it simulates all important aspects of the flight design such as function,behavior, lubrication and surface finish, GSE handling fixtures, tooling, etc. We were able to develop the
actual flight assembly and handling processes and procedures on the engineering model allowing theflight arrays to be assembled, deployment tested, environmentally tested, and delivered to the spacecraftin two weeks!
225

,
.
.
.
Figure 13 Figure 14
Encourage outside reviewers. Fresh eyes provided valuable design suggestions during the array
EDR. The GSFC reviewers remained helpful contacts, sharing experiences on similar designs andproviding insight into design intent (not always reflected) on the air bearing GSE drawings that were
provided by GSFC.
Be willing to toss out a really "bad" idea even late in the game where risk to the flight hardware ispossible. Unfortunately the one assembly we could not test out was the wing integration fixture. It was
an offset CG-compensating fixture used solely for flight integration on the spacecraft, and thus couldnot be accurately tested using the engineering model array. When we tried to use it for flight
integration, the fixture was too massive to safely handle the much lighter weight flight wing. We thensubstituted 4 men for one fixture, greatly reducing the risk.
Establish good personal relationships with peers in other organizations. We developed good
relationships with suppliers and GSFC employees thus allowing us to "cut through the red tape" whenquick responses were needed to problems.
Design and implementation of deployment GSE can be as much of an effort as the flight array design.
As such, cost, schedule and manpower resources must be allocated in sufficient quantities or the testprogram can be jeopardized.
226
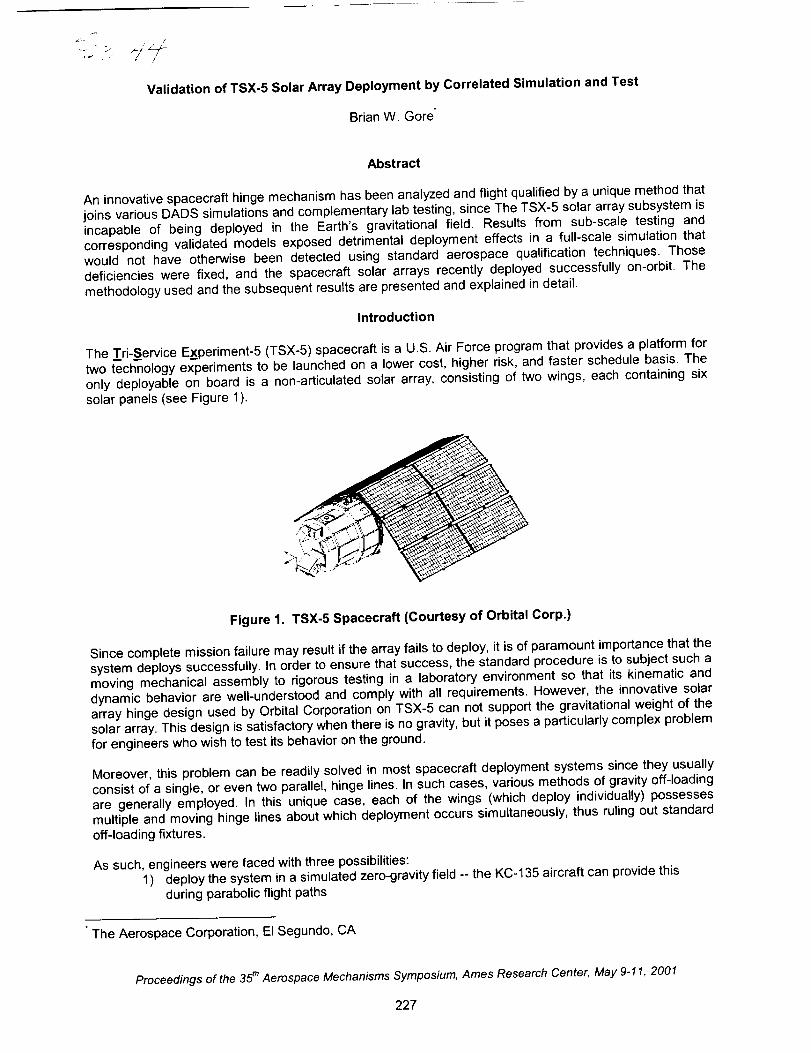
.s;, /
Validation of TSX-5 Solar Array Deployment by Correlated Simulation and Test
Brian W. Gore"
Abstract
An innovative spacecraft hinge mechanism has been analyzed and flight qualified by a unique method thatjoins various DADS simulations and complementary lab testing, since The TSX-5 solar array subsystem is
incapable of being deployed in the Earth's gravitational field. Results from sub-scale testing andcorresponding validated models exposed detrimental deployment effects in a full-scale simulation that
would not have otherwise been detected using standard aerospace qualification techniques. Thosedeficiencies were fixed, and the spacecraft solar arrays recently deployed successfully on-orbit. The
methodology used and the subsequent results are presented and explained in detail.
Introduction
The Tri-Service Ex_periment-5 (TSX-5) spacecraft is a U.S. Air Force program that provides a platform fortwo technology experiments to be launched on a lower cost, higher risk, and faster schedule basis. The
only deployable on board is a non-articulated solar array, consisting of two wings, each containing sixsolar panels (see Figure 1).
Figure 1. TSX-5 Spacecraft (Courtesy of Orbital Corp.)
Since complete mission failure may result if the array fails to deploy, it is of paramount importance that the
system deploys successfully. In order to ensure that success, the standard procedure is to subject such amoving mechanical assembly to rigorous testing in a laboratory environment so that its kinematic anddynamic behavior are well-understood and comply with all requirements. However, the innovative solararray hinge design used by Orbital Corporation on TSX-5 can not support the gravitational weight of the
solar array. This design is satisfactory when there is no gravity, but it poses a particularly complex problemfor engineers who wish to test its behavior on the ground.
Moreover, this problem can be readily solved in most spacecraft deployment systems since they usuallyconsist of a single, or even two parallel, hinge lines. In such cases, various methods of gravity off-loading
are generally employed. In this unique case, each of the wings (which deploy individually) possessesmultiple and moving hinge lines about which deployment occurs simultaneously, thus ruling out standardoff-loading fixtures.
As such, engineers were faced with three possibilities:
1) deploy the system in a simulated zero-gravity field °- the KC-135 aircraft can provide thisduring parabolic flight paths
The Aerospace Corporation, El Segundo, CA
Proceedings of the 35 thAerospace Mechanisms Symposium, Ames Research Center, May 9-11, 2001
227

2) employagravityoff-loadingfixtureusingballoons,cables,etc.3) useacombinationofanalyticalandsub-scaletestingtechniquesto evaluatethevalidityofthe
deploymentsystem
Thefirstchoicewascompletelycost-prohibitivegiventhelowbudgetof theprogram.Thesecondchoicewasattemptedbutwithquestionableresultssincetheballoonshada significantaidingorhinderingeffecton individualpanels.Hence,the latterwaschosenasthecourseof action.Thispapershalldiscussthetestingandanalyticalprocedureaswellasthe lessonslearnedthroughouttheevolutionofthisevaluationprocess.
Threeorganizations took part in this testing: Orbital Corporation (TSX-5 prime contractor), Planetary
Systems Corporation (TSX-5 solar array expert), and The Aerospace Corporation (customer technicalrepresentative.
Background
In order to understand the issues involved with this deployment system, it is first necessary to understandthe design of the hinge, since it serves as the structural link between panels, as well as the motive force todeploy them. Figure 2 depicts the hinge of interest, which was invented by Walter Holemans and patented
by Orbital Corporation (Patent # US05715573).
Figure 2. Hinge, Stowed & Deployed
One can see that the link (the diamond-shaped piece between the panels) has a plunger attached on eachside via a revolute joint. On the other end of each plunger, which resides within the interior volume of its
respective panel, is a seat against which the deployment springs actuate. When the compressed springreleases its energy, the plunger is pulled into the panel, and the link rotates and slides along the paneledge and up into its seated position, also inside each panel. One of the most important features to note
about this hinge is that it has virtually no capability to support shear loading when not latched, thus gravityoffloading becomes a major necessity.
1 .I 1<-q
.... [.i
Figure 3. Solar Array Deployment Sequence (Courtesy of Orbital Corp.)
228

On a largerlevel,Figure3 showshowthe hingesact to movethe solararraysfrom their stowedconfigurationtotheirdeployedconfiguration.
Twoadditionalpointsshouldbe identifiedat thistime: 1)duringdeployment,the hingesallowa certainamountof over-travelof the panelsbeforesettlingin the deployedconfiguration,and2) thedeployedconfigurationofthetwowingsisnotplanar(seeFigure1).Attheoutsetoftheprogram,it wasarguedthata wingdeploymentstaggeringmechanismshouldbeemployedsothatthetwowingswouldnothiteachother.Inaddition,it wassuggestedthatenergydissipatingsoftstopsbeaddedto preventdamageshouldeitherwinghitanypartofthespacecraftbottomcoreplate.Oncethetechnicalexpertsembracedtheseideas,severalmajorquestionsremained:
1. Howlongshouldthedeploymentstaggeringdevicewaitto releasethesecondwing?2. Does2n_wingdeploymentcausea"tail-wagging-the-dog"disturbancesufficienttounseatthe
1stdeployedwing?3. Doesover-travelofeitherwinginduceexcessivebendingstressinthepanelsorspacecraft
coreplate?
4. Willanyotherpanelover-travel(withinaparticularwing)causedetrimentalcontactofthedeployingsolararray?
5. Docoreplatesoftstopsnecessarilypreventdetrimentalover-travel of the deploying solarwing?
Note that there are a total of 12 panels and hinge lines, very few of which are parallel during deployment.
As such, it is nearly impossible to effectively offload the effects of gravity during a wing deployment test.This same subject was mentioned in Reference 1 (but with highly questionable ground test results), andthis effort strove to find a solution. It was clear that a validated model would be necessary to satisfactorily
address all of these issues, thus the sole remaining option to qualify this deployment scheme design
was a correlated analysis and test.
Modeling and Testing
Figure 4 illustrates the overall procedural flow that will be discussed in this section; note the three different
box styles for each step of testing, output, and modeling, and the fact that this is a highly integratedmethodology.
Test and characteriz-
ation of sample hinge
(test) (output)
I (model)
Test of 2-panel systerr
Figure 4. Integrated Correlation Methodology
229

Thefirststepwasto performa seriesof testsona singlehingethatwasconnectedto twosmallcouponsof honeycombpanelsubstrates.Thistestwasdoneto characterizethespringproperties,friction,andover-traveltendenciesof the hingedesign.Thosepropertieswere thenusedto correlatea DADS(DynamicAnalysisandDesignSystem;LMS-CADSI,Coralville,IA)modelof that same sample hinge
setup.
The model contained a very high level of fidelity by including not only the spring, mass properties of thepanel coupons, and air drag resistance forces on them, but also the geometric rolling/sliding contactbehavior between the link and the hinge housing. With the friction coefficient between the link and the
panel housing being the only real unknown, it was varied within normal expected ranges until the over-travel shown in the model was very near what was found in the sample hinge test.
At that time, the need to incorporate a wing staggering mechanism into the spacecraft design wasbeginning to become clear. With the light sample substrate, an over-travel angle of 20-30 degrees was
observed in test. As stated above, with the two wings possessing a non-planar deployed configuration, this
level of over-travel would certainly produce an impact between the wings during a simultaneousdeployment. This is a highly undesirable condition given the fragile nature of the solar cells mounted to the
panels.
Another conclusion drawn at this point in the procedure was that a simplified hinge model would benecessary in order to create the eventual goal - a correlated spacecraft model. Due to the high level ofcalculation necessary during the model solving process (primarily due to the rolling/sliding contact
elements in the hinge model), it became evident that it would be unfeasible to duplicate this setup in the3._22necessary locations in a spacecraft model. The run-time for this sample hinge model wasapproximately 40 minutes for 1.25 seconds of simulation of one hinge. The spacecraft model was
expected to take approximately 60 seconds and contain 24-32 hinges, and the relationship is non-linearwhen combining such sets of elements in a comprehensive model. Hence, it was decided that the full
spacecraft model would need to have simplified revolute joint/spring hinges, while still capturing thecorrect behavior of these innovative devices.
The next step in the process was probably the key to the entire effort - performing a meaningful sub-scaletest to be used as a platform from which the entire spacecraft model would be extrapolated. Figure 5
illustrates the setup used for this 2-panel test. A grounded-body spacecraft mockup was used, along withtwo dummy panels which had large holes cut out to minimize the effects of air resistance. The core/roothinge line had four hinges across it, similar to the corresponding location on the flight unit; the root/outer
hinge line had two hinges across it, simulating the most outboard hinge lines on the spacecraft. Wiring
harnesses similar to those used in flight were routed across both hinge lines.
Core/Root HingelineRoot/Outer HingelineRoot Panel
Potentiometer (ty Ij,.
Outer Panel ._
Figure 5. 2-Panel Test Setup Schematic
The entire assembly was supported using air bearings on a granite table - recall that these hinges haveno capability to provide lateral stiffness (vertical direction here) until they are latched. The air bearing
230
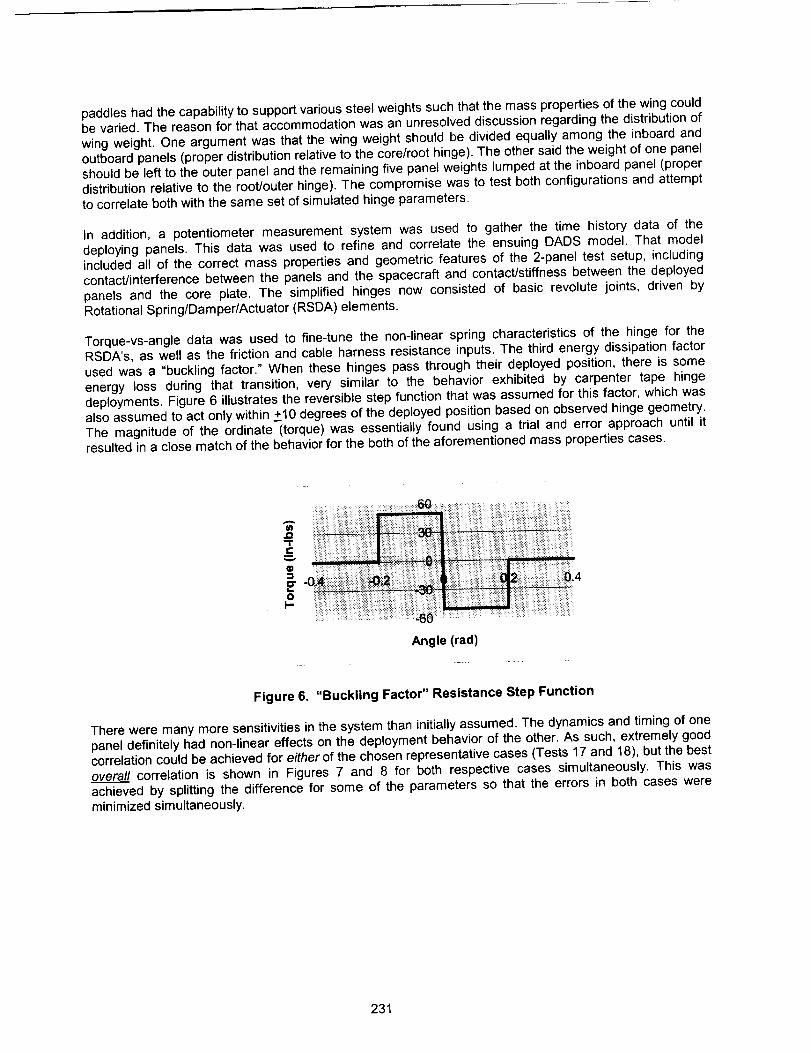
paddleshadthecapabilitytosupportvarioussteelweightssuchthatthemasspropertiesofthewingcouldbevaried.Thereasonforthataccommodationwasanunresolveddiscussionregardingthedistributionofwingweight.Oneargumentwasthatthewingweightshouldbedividedequallyamongtheinboardandoutboardpanels(properdistributionrelativetothecore/roothinge).Theothersaidtheweightofonepanelshouldbelefttotheouterpanelandtheremainingfivepanelweightslumpedattheinboardpanel(properdistributionrelativeto theroot/outerhinge).Thecompromisewasto testbothconfigurationsandattempttocorrelatebothwiththesamesetofsimulatedhingeparameters.
In addition, a potentiometer measurement system was used to gather the time history data of the
deploying panels. This data was used to refine and correlate the ensuing DADS model. That modelincluded all of the correct mass properties and geometric features of the 2-panel test setup, including
contact/interference between the panels and the spacecraft and contact/stiffness between the deployedpanels and the core plate. The simplified hinges now consisted of basic revolute joints, driven by
Rotational Spring/Damper/Actuator (RSDA) elements.
Torque-vs-angle data was used to fine-tune the non-linear spring characteristics of the hinge for theRSDA's, as well as the friction and cable harness resistance inputs. The third energy dissipation factor
used was a "buckling factor." When these hinges pass through their deployed position, there is some
energy loss during that transition, very similar to the behavior exhibited by carpenter tape hingedeployments. Figure 6 illustrates the reversible step function that was assumed for this factor, which wasalso assumed to act only within +10 degrees of the deployed position based on observed hinge geometry.
The magnitude of the ordinate (torque) was essentially found using a trial and error approach until itresulted in a close match of the behavior for the both of the aforementioned mass properties cases.
iI::
°m
EOI--
Angle (rad)
Figure 6. "Buckling Factor" Resistance Step Function
There were many more sensitivities in the system than initially assumed. The dynamics and timing of onepanel definitely had non-linear effects on the deployment behavior of the other. As such, extremely goodcorrelation could be achieved for either of the chosen representative cases (Tests 17 and 18), but the best
overall correlation is shown in Figures 7 and 8 for both respective cases simultaneously. This was
achieved by splitting the difference for some of the parameters so that the errors in both cases wereminimized simultaneously.
231
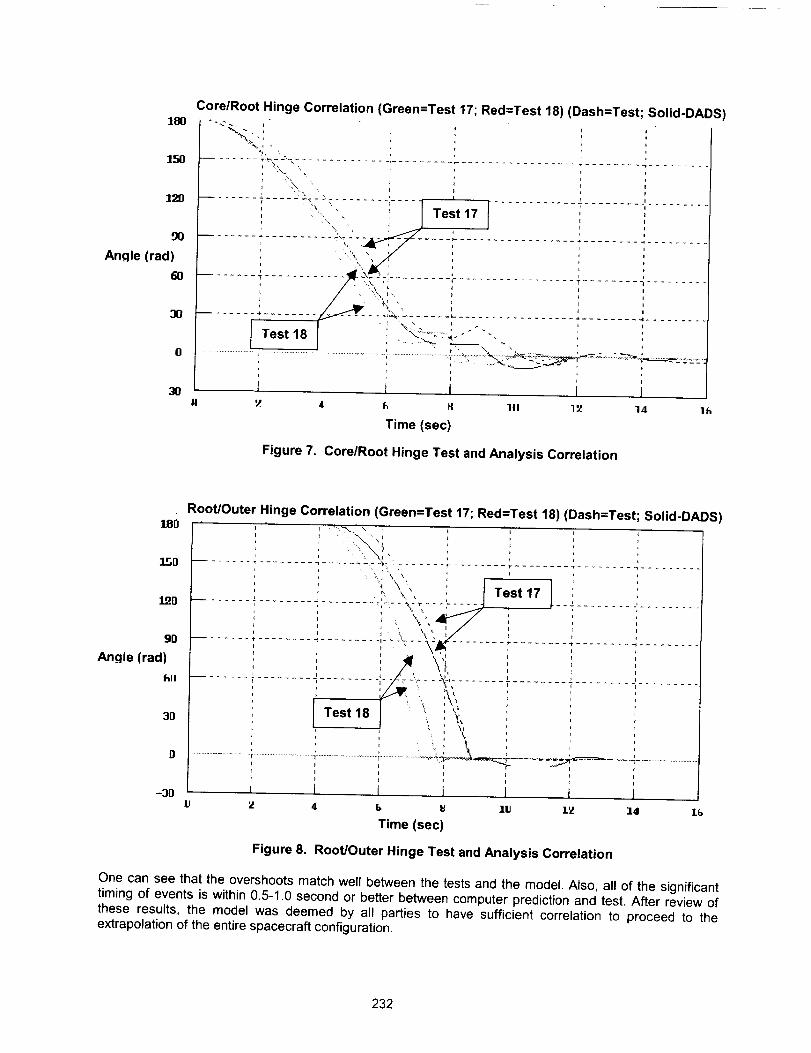
180
150
9O
Angle (rad)
6o
3o
30
Core/Root Hinge Correlation (Green=Test 17; Red=Test 18) (Dash=Test; Solid-DADS)
= - _ - :" ............. 1 r _ ........ , ........
.... :......" ' / T__ct 17 I ' 'I . -. _ .... E I
....... "r ........... - ".._q" _- "., ............................ T ........ 1 ........
/ _= "-, I t I
/ _-_ % . , , ,................. /'_ ......... -_r........._-................. -_........ -_........
, . r ., _. ,, .- , ,Test 18 | ' \i_:_:","" "'. ' ;
...................i...................................................................,.............................:, "_:_ _::.=_*_"::_'__ ................_:_-:_'_
' ; ;i i I i i
II _. 4 F, 14 111 1_ 14 I h
Time (sec)
Figure 7. Core/Root Hinge Test and Analysis Correlation
15D
lO.D
9D
Angle (rad)
ftll
3D
-3O
i i i i
i ' ' iI , I ,, I I IILl 2 4 r_ I_ ]El 12 ]d 10
Time (sec)
Figure 8. Root/Outer Hinge Test and Analysis Correlation
One can see that the overshoots match well between the tests and the model. Also, all of the significanttiming of events is within 0.5-1.0 second or better between computer prediction and test. After review of
these results, the model was deemed by all parties to have sufficient correlation to proceed to theextrapolation of the entire spacecraft configuration.
232

Withthe properspringanddamperparametersobtained,the nextstepwasto usethosevaluesin aDADSmodelof the entire spacecraft. This model is comprised of a bus, two wings with six solar panels on
each, the wing deployment staggering mechanism, and other features to represent the realistic nature ofthe deployment behavior. One such feature are two "mousetrap" springs, or articulation fingers, on eachwing between the outer panels to control relative panel motion and speed (see Figure 9). An AVI format
animation file exists in Reference 2 that shows the solar array deployment event, from the fully stowed tothe fully deployed configuration.
O = 4-hinge line Articulation
G = 3-hinge line Fingers
O = 2-hinge line
Core
Plate
Figure 9. Hinge and Articulation Finger Locations on Spacecraft (Courtesy of Orbital Corp)
Results
In the analysis, the second wing is released after 25 seconds, rather than 60 seconds, which was
arbitrarily chosen when the program decision needed to be made. It has been proven that keeping the 60-second delay was not only prudent and conservative, but it also prevented the need for additional software
changes at that late date in the program schedule.
There were other minor issues uncovered through the use of this model that might never have been
rectified otherwise. The biggest issue was the fact that the articulation finger that controls the two outerpanels closest to the spacecraft centerline (the upper one pointed out in Figure 9) was ineffective on thestaggered wing (and maybe both). Those panels separated approximately 25.4 cm (10 inches) at the tips,
and the spring finger is only a few (5-8) centimeters long. The reason for the separation is the fact thattheir respective inner panels, when deployed, are not planar, but instead form a 12-degree angle witheach other.
Two out of four of these articulation mechanisms that are used to keep the panels under a semi-controlled
deployment were shown in the model to lose contact with their respective panels. Depending on the actuallevel of variability in the hinge torque, the leading panel can become the lagging panel due to a loss of
contact. If that occurs, the mousetrap spring would interfere with the latch-up of the panels, much like abroomstick across a doorjamb would prevent the door from fully closing. The hardware was evaluatedprior to flight and it was discovered that the fingers were placed in the wrong locations, too close to the
outboard tips of the wings. Based on a geometric calculation, they were relocated to a more effectivelocation further inboard along their respective hinge lines.
Also due to the 12-degree offset between these panels, it was discovered that this location has thepotential for creating the same re-contact scenario as between the two deploying wings, which was solved
233

by addingthe staggeringmechanism.Sincethat solutionis not feasiblein this location,engineersdiscussedaddingfoamto the areasthatcouldpossiblycontact;however,it is unclearwhetherthecontractoreverincorporatedthisfeature.
Atthispoint,theteamreflectedbackonthefivemajorquestionstobeansweredattheoutsetofthisproject,andassembledthefollowinganswers:
.
How long should the deployment staggering device wait to release the second wing?The DADS model predicted that the vibrations of each wing were sufficiently
settled after approximately 25 seconds. It is believed that keeping the accepted60-second delay was not only prudent and conservative, but it also prevented the
need for additional software changes at a late date in the schedule.
Does 2_d wing deployment cause a '?all-wagging-the-dog" disturbance sufficient to unseat the 1st
deployed wing?
No. The deployed wing and joint stiffness is sufficient to preclude contact betweenpanels on different wings during deployment.
, Does over-travel of either wing induce excessive bending stress in the panels or spacecraft coreplate?
No. The maximum moment caused by the core plate interference was 6.2 N-m
(55 in-lb) for both wings. Although this may appear counter-intuitive since thewings deploy slightly differently, it is because the final, roll-out motion is nearly thesame for both, with the same moments of inertia and very nearly the same
speeds.
A calculation was done, applying this moment to the root panel in order to see theeffects. The stress induced in the face sheets resulted in less than 6.2 MPa (900psi), maximum, and the corresponding overall face sheet elongation due to
bending is about 0.01 mm (0.4 mils) - hardly worth a concern, given thecompliant adhesive used to bond the cells to the panels.
. Will any other panel over-travel (within a particular wing) cause detrimental contact of deploying
solar array?Possibly. Due to the non-planar nature of the 12-degree offset at two hinge lines, itwas discovered using the DADS model that these locations have the potential for
creating the same re-contact scenario as between the two deploying wings, thelatter of which was solved by adding the staggering mechanism.
5. Do core plate soft stops necessarily prevent detrimental over-travel of the deploying solar wing?No. During the test, there was little or no effect given by rubber foam placed along
the edge of the core plate. In fact, it actually appeared as though a lar_er over-travel angle was exhibited with the soft stop present. There is no explanation for
this phenomenon, except for the possibility that the foam slows the inner panel atthe end of its travel range, thus changing the dynamics of the wing as a whole. It
was readily seen using the DADS model that the interaction between the twopanels of a single wing can have a large impact on the over-travel angle.
Conclusion
The foremost conclusion brought about by this entire task is that it is desirable to design a system that canbe tested on Earth so the extensive methodology discussed herein is not necessary. However, it is not
always possible to do so, and in those instances, it has been shown that iterative correlated test andanalysis CAN work. The TSX-5 program accepted many items based on this process:
234

Thewingstaggeringmechanismand its time delay
;_ The placement / relocation of"mousetrap" articulation fingers_* The removal of foam on the core plate due to lack of need
The lack of detailed FEM modeling for solar cell cracking at end-of-travel
It should be noted that the support of management to execute proper testing is essential in this process,
because if this methodology is chosen, one must remember that the computer model is only as good asthe data going into it. Although this may not be a revelation, it is indeed one more valid argument proving
the need of an extensive a meaningful testing program.
The ultimate proof? TSX-5 successfully deployed its solar array on-orbit June 7, 2000...
@
Lessons Learned
_, Design a system that can be effectively tested within Earth's gravitational field
When using an air bearing system, ensure sufficient stiffness laterally (so paddle doesn't cock
over) and provide for adjustment vertically.
In areas of possible hardware contactJcollision, test configuration with rubber/foam/etc, installed,
since it may have dramatically different effects than expected.
Test, Test, then Test some more...
Acknowledgements
The author would like to express extreme gratitude toward Walter Holemans, who designed the subjecthinge while at Orbital and displayed an energetic and unwavering commitment to excellence throughoutthis entire procedure. After leaving Orbital, Walter acted as a gratis consultant in order to ensure this work
was completed. It should also be noted that these efforts would not have been possible without Orbitarstechnical expertise provided by Michael Whalen and management support provided by Pat Davis. Allillustrations of the TSX-5 spacecraft used herein (Figs. 1, 3, & 9) are reprinted with the permission of
Orbital Corporation.
References
1, Daniel, Walter K., and Bidinger, G. Michael, " Deployment Dynamics of Solar Arrays with a Link-in-Slot, fh
Hinge/Latch Mechanism,' 34 Aerospace Mechanisms Symposium, May 2000.
2. TSX-5 spacecraft website at htt.p://www.te.plk.af.mil/stp/tsx5/craft/craft.html
3. Holemans, Walter and Gore, Brian, "TSX-5 Solar Array Deployment Test Plan and Report," October1999.
235

236

./
Milstar Solar Array Boom Deployment
Thomas B. Pace" and Steven M. Honodel*
Abstract
The Milstar Solar Array Boom is a mature design that has been successfully deployed in test dozens of
times and has been successfully deployed on orbit six times. On June 7, 2000, one of the Booms did notfully deploy during its thermal vacuum ground test at cold temperatures. The problem was caused by a
piece of ground test equipment, a restraint mechanism that had developed excessive friction. Thisrestraint mechanism had been used for over 100 test deployments and had never been refurbished. The
anomaly had a positive effect in that this restraint mechanism was reexamined to determine where design
improvements could be made to increase friction margins. A significant lesson learned is that evenrelatively low cycle deployment test equipment can experience wear-out problems and must be routinely
inspected during long multiyear programs like Milstar.
Introduction
There are two Booms on each Milstar satellite. Each pair of Booms serves three basic purposes. First,
they move the two solar arrays away from the vehicle so that the arrays can be safely deployed. Second,they rotate the two solar arrays so that the arrays can track the Sun. And third, they transfer the power
generated by the two solar arrays to the vehicle.
The Milstar Solar Array Boom is a large electro-mechanical device that is approximately 23 cm (9 in) wideby 23 cm (9 in) thick by 171 cm (67.5 in) long and weighs about 32 kg (70 Ib). The Boom has two hinges
on it, an inboard hinge and an outboard hinge (Figure 1). Each hinge contains two sets of negator leafsprings that provide 32 N-m (286 in-lb) of torque. One eddy current damper on each hinge provides
damping. The inboard hinge connects the Boom to the vehicle and upon deployment, it rotates the Boomaway from the vehicle. The outboard hinge supports a flexible substrate solar array (FSSA) and upon
deployment, it rotates the FSSA away from the vehicle and positions it for deployment. The range that the
inboard hinge deploys in the first part of the deployment is critical. If the inboard hinge deploys too far toofast, there is the possibility that the FSSA Deployment Canister could be driven into the vehicle payload(Figures 2 & 3). Therefore, a device called a Tripwire Mechanism (TM) is used to restrain the motion of
the inboard hinge during the first part of the deployment.
The TM consists of a spring-loaded spool that pays out a stainless steel cable (Figure 4). When installed,the TM is bolted to a fixed point on the vehicle. Then its cable is pulled off of its spool and bolted into
another fixed point 140 cm (55 in) away. Midway across the span of the cable, the cable is placed on ahook that is mounted to the base of the FSSA. The springs in the TM ensure that the cable is under
tension across this span. Upon being released from its stowed position, the inboard hinge wants to fullydeploy but it is restrained by the tripwire cable. Although the inboard hinge is restrained, the outboard
hinge is free to rotate. In fact, the tripwire force aids the deployment of the outboard hinge. This allows theFSSA to rotate clear of the vehicle payload and thus eliminates any possible interference. As the
outboard hinge rotates the FSSA, the hook also rotates as it is mounted to the FSSA. After the outboardhinge rotates far enough, the angle of the hook changes enough so that the cable is able to slide off of
the hook. At this point, the inboard hinge is free to rotate and complete the deployment (Figure 5).
Lockheed Martin Space Systems Company, Missiles and Space Operations, Sunnyvale, CA
Proceedings of the 35 thAerospace Mechanisms Symposium, Ames Research Center, May 9-11, 2001
237
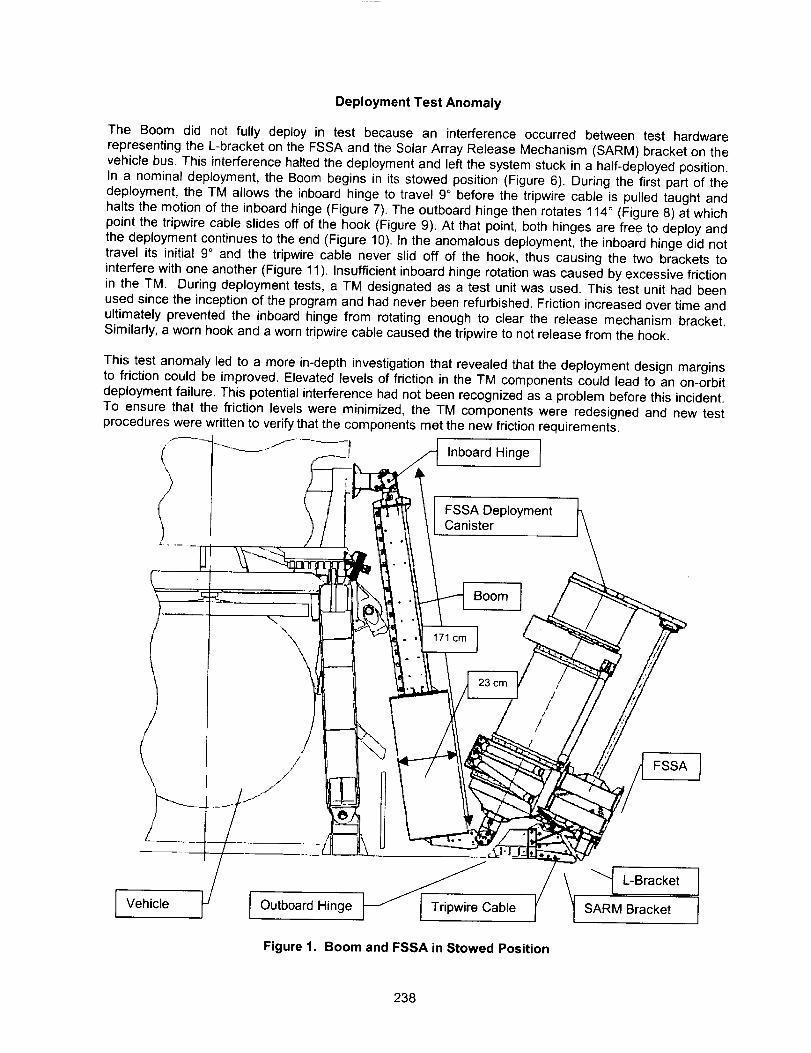
Deployment Test Anomaly
The Boom did not fully deploy in test because an interference occurred between test hardware
representing the L-bracket on the FSSA and the Solar Array Release Mechanism (SARM) bracket on thevehicle bus. This interference halted the deployment and left the system stuck in a half-deployed position.
In a nominal deployment, the Boom begins in its stowed position (Figure 6). During the first part of thedeployment, the TM allows the inboard hinge to travel 9° before the tripwire cable is pulled taught and
halts the motion of the inboard hinge (Figure 7). The outboard hinge then rotates 114 ° (Figure 8) at whichpoint the tripwire cable slides off of the hook (Figure 9). At that point, both hinges are free to deploy and
the deployment continues to the end (Figure 10). In the anomalous deployment, the inboard hinge did not
travel its initial 9 ° and the tripwire cable never slid off of the hook, thus causing the two brackets tointerfere with one another (Figure 11 ). Insufficient inboard hinge rotation was caused by excessive friction
in the TM. During deployment tests, a TM designated as a test unit was used. This test unit had beenused since the inception of the program and had never been refurbished. Friction increased over time and
ultimately prevented the inboard hinge from rotating enough to clear the release mechanism bracket.Similarly, a worn hook and a worn tripwire cable caused the tripwire to not release from the hook.
This test anomaly led to a more in-depth investigation that revealed that the deployment design marginsto friction could be improved. Elevated levels of friction in the TM components could lead to an on-orbit
deployment failure. This potential interference had not been recognized as a problem before this incident.To ensure that the friction levels were minimized, the TM components were redesigned and new test
procedures were written to verify that the components met the new friction requirements.
i 17 i cm I
//
! FSSA
VehiTle ,Outboard Hinge _Cable I SA_RMLB:_:::: t
Figure 1. Boom and FSSA in Stowed Position
238
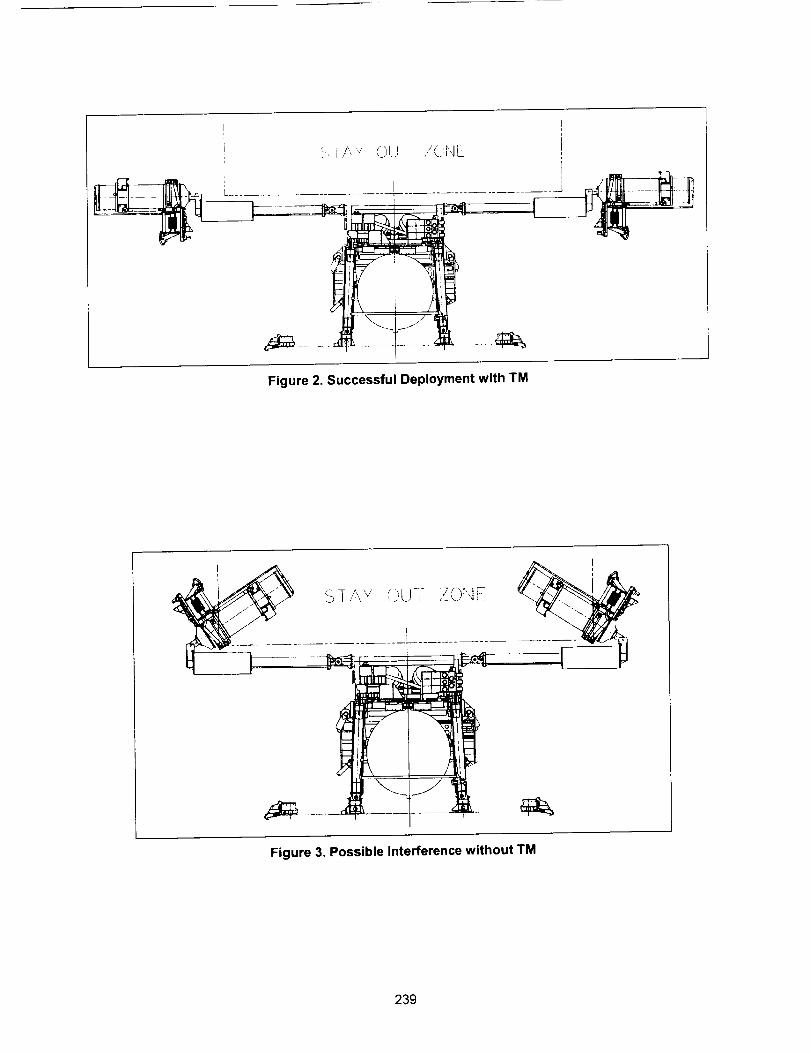
i
Figure 2. Successful Deployment with TM
Figure 3. Possible Interference without TM
239

TripwireCableSpool
TripwireExit Hole
TripwireCable
Figure 4. Tripwire Mechanism Drawing
Cable Position AfterDeployment
ICable Position Before I
Deployment I
i O_,o'eI_ _"
Stowed Position First Motion Cable Sliding Off Hook
Figure 5. Tripwire Mechanism Function
240
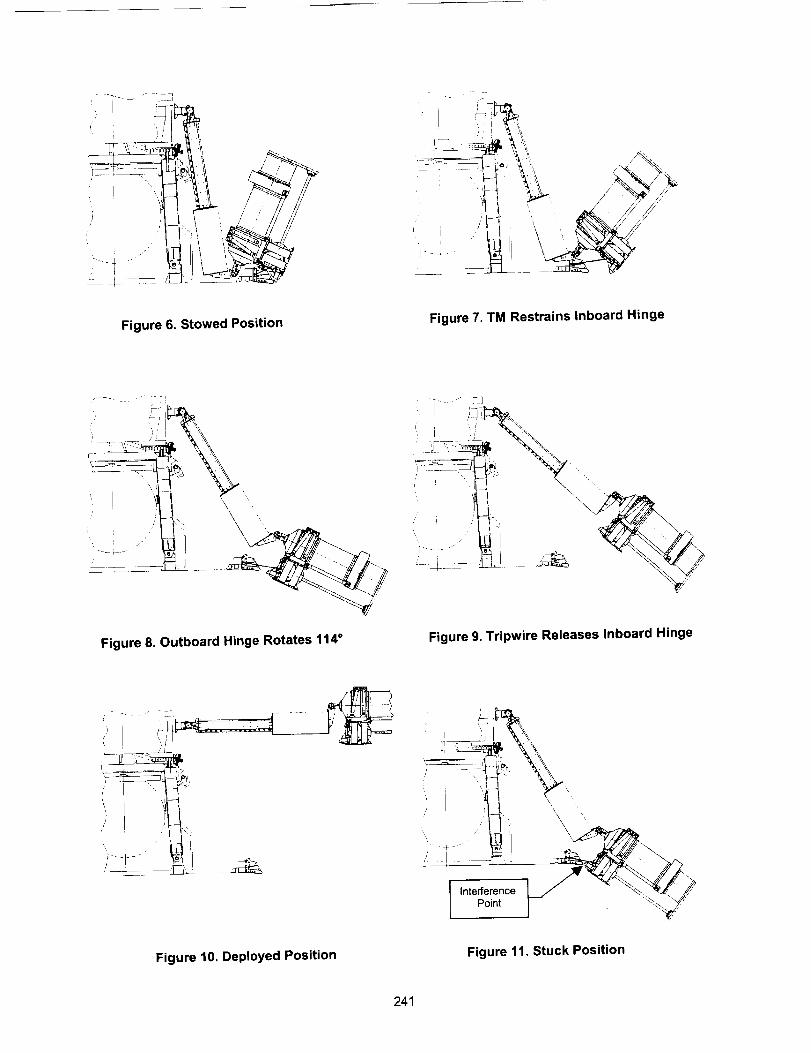
_ t .........i:_
_ _l,_,_, _J/J___
Figure 6. Stowed Position Figure 7. TM Restrains Inboard Hinge
Figure 8. Outboard Hinge Rotates 114 ° Figure 9. Tripwire Releases Inboard Hinge
/
\
I InterferencePoint
Figure 10. Deployed Position Figure 11. Stuck Position
241
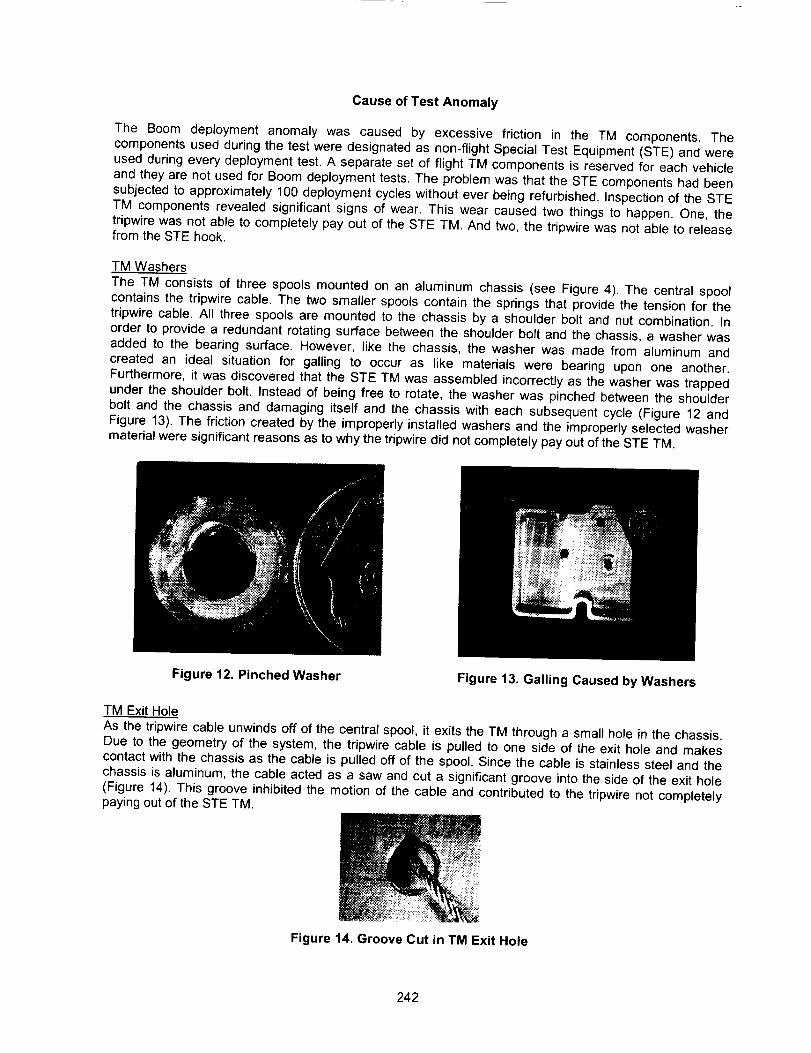
Cause of Test Anomaly
The Boom deployment anomaly was caused by excessive friction in the TM components. The
components used during the test were designated as non-flight Special Test Equipment (STE) and wereused during every deployment test. A separate set of flight TM components is reserved for each vehicle
and they are not used for Boom deployment tests. The problem was that the STE components had been
subjected to approximately 100 deployment cycles without ever being refurbished. Inspection of the STETM components revealed significant signs of wear. This wear caused two things to happen. One, the
tripwire was not able to completely pay out of the STE TM. And two, the tripwire was not able to releasefrom the STE hook.
TM Washers
The TM consists of three spools mounted on an aluminum chassis (see Figure 4). The central spoolcontains the tripwire cable. The two smaller spools contain the springs that provide the tension for the
tripwire cable. All three spools are mounted to the chassis by a shoulder bolt and nut combination. Inorder to provide a redundant rotating surface between the shoulder bolt and the chassis, a washer was
added to the bearing surface. However, like the chassis, the washer was made from aluminum and
created an ideal situation for galling to occur as like materials were bearing upon one another.Furthermore, it was discovered that the STE TM was assembled incorrectly as the washer was trapped
under the shoulder bolt. Instead of being free to rotate, the washer was pinched between the shoulder
bolt and the chassis and damaging itself and the chassis with each subsequent cycle (Figure 12 andFigure 13). The friction created by the improperly installed washers and the improperly selected washermaterial were significant reasons as to why the tripwire did not completely pay out of the STE TM.
Figure 12. Pinched Washer Figure 13. Galling Caused by Washers
TM Exit Hole
As the tripwire cable unwinds off of the central spool, it exits the TM through a small hole in the chassis.Due to the geometry of the system, the tripwire cable is pulled to one side of the exit hole and makes
contact with the chassis as the cable is pulled off of the spool. Since the cable is stainless steel and thechassis is aluminum, the cable acted as a saw and cut a significant groove into the side of the exit hole
(Figure 14). This groove inhibited the motion of the cable and contributed to the tripwire not completelypaying out of the STE TM.
i i ii ,i.... ___C_:__
._
Figure 14. Groove Cut in TM Exit Hole
242

Tripwire Cable
Upon examining the STE tripwire cable, kinks were found in the section of cable that feeds through the
exit hole in the TM (Figure 15). In the anomalous deployment configuration, one of these kinks waslocated in the groove that was worn in the exit hole of the STE TM. Additional force is required to pullthese kinks through the exit hole but the Boom was not capable of providing this extra force. Therefore,
the tripwire cable was not allowed to completely pay out of the STE TM.
Figure 15. Kinks in Tripwire Cable
Hook
The final piece of the puzzle was the hook. Like the TM chassis, the hook was also made of aluminum.
When the stainless steel tripwire cable was dragged over the aluminum hook repeatedly, a groove wascut in the STE hook (Figure 16). With a pristine hook, the tripwire cable should slide off the hook at a
hook slip angle of 12 degrees. With the groove cut in the STE hook, the tripwire never released from thehook even though the hook slip angle was 43 degrees. Subsequently, this caused the motion of the
inboard hinge to be restrained longer than normal.
Figure 16. Groove Cut in Hook
Corrective Action
Because the deployment anomaly was caused by worn components, fixing the STE system would have
simply required replacing the worn parts with new parts. But the STE components duplicate what is usedon the flight vehicle, so the anomaly prompted the design team to determine the system's sensitivity to
TM friction. Therefore, the goal of the investigation was to not only fix the problem but to ensure that thisanomaly would never occur again.
243

Desiqn Chanqes
The initial TM design used aluminum washers to provide a redundant rotating surface between the
shoulder bolts and the aluminum chassis. In order to eliminate the galling produced by bearing aluminumwashers against an aluminum chassis, the aluminum washers were removed and replaced with stainless
steel washers. In addition, the new stainless steel washers were coated with a dry film lube in order toreduce friction even more.
To reduce the amount of wear on the TM exit hole, the entire TM chassis was coated with a teflon
impregnated anodic coating. Previously, the TM chassis was coated with just an alodine coating whichonly provided protection from corrosion, not wear. The new anodic coating is much more wear resistant
and protects the TM exit hole from the sawing motion of the stainless steel tripwire cable. Furthermore,
the impregnated teflon in the anodic coating serves to lubricate the TM exit hole, reducing the amount ofwear caused by the cable. The contact between the tripwire cable and the exit hole could not be
eliminated because due to the geometry of the system, the exit hole acts as a pulley for the tripwire cable.
Like the TM chassis, the hook was also coated with the same teflon anodic coating, thus reducing frictionand increasing wear resistance.
Finally, the kinked tripwire cable in the STE TM was simply replaced.
Test Chanqes
The original TM acceptance test did not apply "Test As You Fly" principles. It simply measured the springforce in the TM by pulling the tripwire cable straight out of the exit hole and then letting it retract. This is
an important measurement but this is not how the TM is used during flight. During flight, the tripwire cableis pulled out of the mechanism with a side load and the cable rubs on the surface of the exit hole.
Therefore, a new acceptance test was written that tested the TM in this manner. A special set of STE was
built that allowed the force required to extend the cable to be measured versus payout radius (Ref Fig 5).All TMs were required to test below a maximum force requirement at ambient, cold, and hot
temperatures. The STE TM that was used in the deployment anomaly failed this test. All of theredesigned flight TMs passed this test easily.
Through this investigation, it was also discovered that the hook slip angle, i.e., the angle at which a
tensioned tripwire cable slides off of the hook, was critical. Therefore, a simple incline test was designedto measure this slip angle. An analysis of the deployment (discussed below) determined that the slip
angle should be no greater than 20 degrees. The STE hook that was used in the deployment anomalyand that had the groove cut in it had a slip angle of over 43 degrees and failed this test. All of the
redesigned flight hooks measured no greater than 12 degrees and easily passed this test.
Results
Prior to these design changes, the critical clearance between the L-bracket and SARM bracket for a
nominal deployment measured 6.0 cm (2.4 in). With the new design changes, the critical clearance hasbeen more than doubled to 12.7 cm (5 in).
Analysis
The deployment tests are an important method of verifying workmanship and performance in thermalvacuum extremes. As in most programs, such testing is constrained by technical limits, cost, and the risk
of damaging flight hardware. Deployment analysis and simulation were used to complement testing andfurther verify the Boom performance on-orbit. An analysis was performed for the Boom system with theobjective of predicting hardware clearance on-orbit with a reliability of 0.999999.
A computer model of the Boom deployment including the offload system for testing was developed usingan in-house, multi-body dynamics solver called Ezdyn. The model represents the Boom as 2 rigid bodieswith springs, dampers, joints, and various forcing functions to simulate friction, deadband, etc. The
overhead counterbalance system is represented with 4 rigid bodies tied with joints and cable forces. The
model duplicated the hang-up when the payout radius of the tripwire cable (Ref Fig 5) was limited to 34.5
244
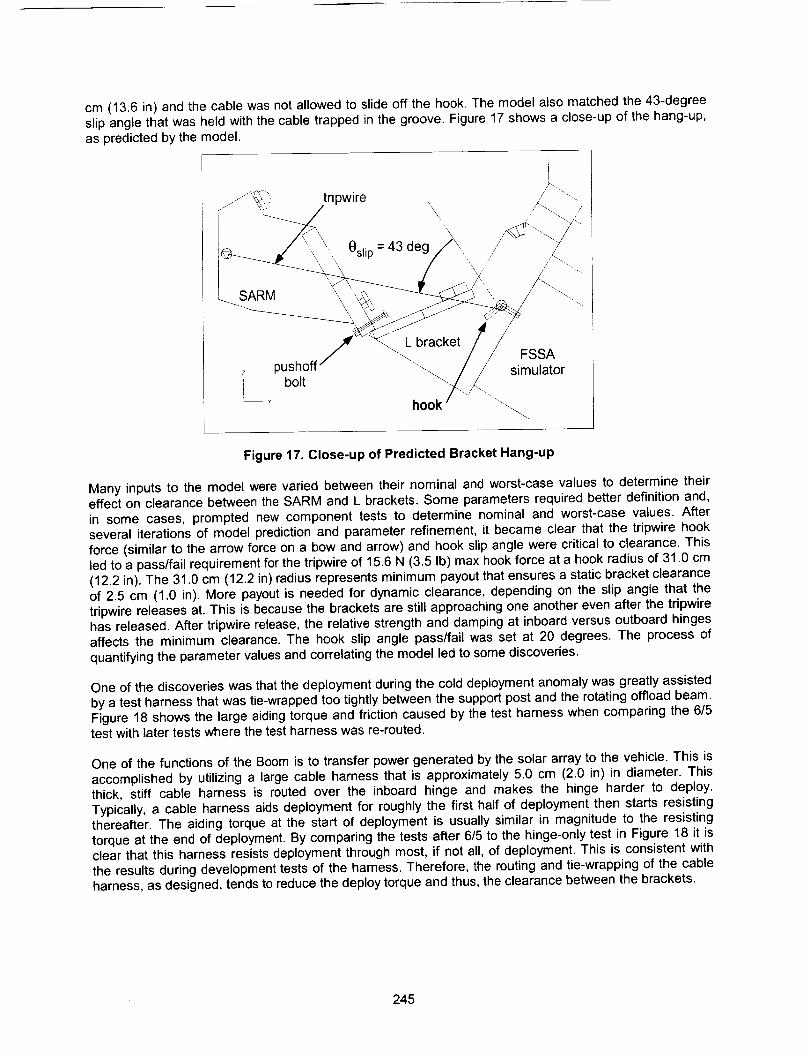
cm (13.6in)andthecablewasnotallowedto slideoffthehook.Themodelalsomatchedthe43-degreeslipangle that was held with the cable trapped in the groove. Figure 17 shows a close-up of the hang-up,as predicted by the model.
J
f/.-_"_:1 tripwire , .
\\,,, Oslip= 43 deg/,,, //
z PUbSo_tn" "_ /// simulator
[--_ hook ""'"'_.
Figure 17. Close-up of Predicted Bracket Hang-up
Many inputs to the model were varied between their nominal and worst-case values to determine theireffect on clearance between the SARM and L brackets. Some parameters required better definition and,
in some cases, prompted new component tests to determine nominal and worst-case values. Afterseveral iterations of model prediction and parameter refinement, it became clear that the tripwire hook
force (similar to the arrow force on a bow and arrow) and hook slip angle were critical to clearance. Thisled to a pass/fail requirement for the tripwire of 15.6 N (3.5 Ib) max hook force at a hook radius of 31.0 cm
(12.2 in). The 31.0 cm (12.2 in) radius represents minimum payout that ensures a static bracket clearanceof 2.5 cm (1.0 in). More payout is needed for dynamic clearance, depending on the slip angle that the
tripwire releases at. This is because the brackets are still approaching one another even after the tripwirehas released. After tripwire release, the relative strength and damping at inboard versus outboard hinges
affects the minimum clearance. The hook slip angle pass/fail was set at 20 degrees. The process of
quantifying the parameter values and correlating the model led to some discoveries.
One of the discoveries was that the deployment during the cold deployment anomaly was greatly assisted
by a test harness that was tie-wrapped too tightly between the support post and the rotating offload beam.Figure 18 shows the large aiding torque and friction caused by the test harness when comparing the 6/5test with later tests where the test harness was re-routed.
One of the functions of the Boom is to transfer power generated by the solar array to the vehicle. This isaccomplished by utilizing a large cable harness that is approximately 5.0 cm (2.0 in) in diameter. This
thick, stiff cable harness is routed over the inboard hinge and makes the hinge harder to deploy.Typically, a cable harness aids deployment for roughly the first half of deployment then starts resisting
thereafter. The aiding torque at the start of deployment is usually similar in magnitude to the resistingtorque at the end of deployment. By comparing the tests after 6/5 to the hinge-only test in Figure 18 it is
clear that this harness resists deployment through most, if not all, of deployment. This is consistent withthe results during development tests of the harness. Therefore, the routing and tie-wrapping of the cable
harness, as designed, tends to reduce the deploy torque and thus, the clearance between the brackets.
245

A
ii
c
Eo
c°i
Z
o
r-
400
350
300
250
200
150
100
#1009 Cold Deploy Data
...........................6/5 deploy
----e---- 8/22 deploy
-+ 8/31 deploy
. : -9/25 start deplyd
10/3 start stowed
_--.._ "_:o..... ---o-.- hinge only
]....... __:._ .... _. _. •.................." .... £r_._ -_+_q...... o_ =:_._............
0 10 20 30 40 50 60 70 80 90
Inboard Deploy Angle (deg)
Figure 18. Comparison of Deploy Torque over Various Tests on a Single Boom
Comparing the 9/25 and 10/3 results in Figure 18 shows that the cable harness takes a significantlydifferent set depending on the Boom orientation during cool down. If the Boom is cooled in its stowed
position, the cable harness takes a cold set in that stowed position and significantly decreases theavailable torque of the hinge, compared to the torque when the cable is cooled in the deployed position.
The starting orientation of the Boom was not precisely specified during testing, and at least one torquemargin test is known to have started from the deployed position instead of stowed.
Another discovery was the large unit-to-unit variation in inboard hinge torque. Figure 19 shows the deploy
torque measured from several Booms. Simulation of the Booms with lower torque values shows that thereis very little clearance margin even after matching the weakest tripwire to that Boom. The only
requirement levied on the torque tests is to demonstrate 100% minimum torque margin, which all theBooms in Figure 19 (without the tripwire) possess.
246

Cold Deploy Data - All Booms
350
300I
e,-
E 25o0p.
_3c_. 200
0
¢ 150
100
0 10 20 30 40 50 60 70 80 90
Inboard Deploy Angle (deg)
Figure 19. Unit-to-Unit Variation in Inboard Deploy Torque
A third discovery is that the torque margin of the inboard hinge while the tripwire is engaged was notperformed at the beginning of the program. With the tripwire engaged, the torque margin of the inboardhinge is well below the program requirement of 100%. At first glance, torque margin might seem irrelevant
here since the purpose of the tripwire is to hold back the inboard hinge temporarily. However, the inboard
hinge must deploy the Boom sufficiently to maintain clearance for the outboard hinge as it deploys.Failure of the inboard hinge to provide this clearance results in a hang-up as seen in the deploymentanomaly. Therefore, the torque margin must be at least greater than zero through some payout distance
of the tripwire to prevent a hang-up. The torque margin must be large enough to accommodate variationsin the tripwire force among others. As the STE tripwire force increased with wear the torque margin of the
inboard hinge dropped. Therefore, a torque margin analysis early on might have tipped the scales againstusing a tripwire by highlighting the Boom's sensitivity to it.
The torque margin for the Boom depends on the trajectory because there are two degrees of freedom in
the Boom, the two hinges. A minimum torque margin of 50% was determined at first, based on a staticanalysis of the Boom where the tripwire payout was adjusted to maintain 2.5 cm (1.0 in) of clearance
between brackets for all achievable hinge angles. This method was dropped because the clearancecontinues to drop for a period after the tripwire is released. The current analysis method determines
torque margin directly from the worst-case dynamic clearance simulation for each Boom. This analysisindicates that a torque margin of 38% when the tripwire is released is needed to prevent a hang-up duringa dynamic deployment. This number is lower than the earlier method because the tripwire is paid out
further in the dynamic analysis and creates a larger resisting force on the inboard hinge.
A fourth discovery during this analysis was that the deadband in the dampers is a significant factor for
clearance, and the stowing procedure influences the amount of deadband available for the nextdeployment. At the beginning of hinge motion, the Boom accelerates away from the release bracket
247
quicklyuntilthedamperdeadbandis takenup.At thispointthe deploymentslowsconsiderably.If thehingetorqueis lowandthedeadbandis small,thetripwiremaynotpayout fullybythetimetheSARMandL bracketsapproacheachother.ThedamperdeadbandcanvarywitheachinstallationoftheBoomonthevehicle,makingthepredictionofdeadbandstrokeveryuncertainforon-orbitdeployment.
Oncethemodelwascorrelatedtothedeploymenttestswiththe improvedtripwireandhook,thenominalandworst-on-worstflightsimulationswereperformed.Thenominalcold-temperatureperformancefor allBoomshada predictedclearanceontheorder of 10.0 to 12.7 cm (4 to 5 in). With 15 parameters beingvaried, the worst-on-worst performance, not surprisingly, resulted in a hang-up. A sensitivity study of theparameters was then performed and the dominant parameters were determined. When only the four most
dominant parameters were set to worst-case, the objective of predicting clearance with a reliability of0.999999 was achieved.
Lessons Learned
This deployment anomaly provides many lessons to the design team. Some of them are obvious and
reaffirm basic aerospace practices while others are less obvious and perhaps more valuable because ofthat.
The first lesson is that any STE used during testing should be inspected and refurbished at appropriate
intervals. The Boom deployment tests have been occurring for about a decade and the TM componentshad no planned maintenance procedure. Some of this can be attributed to the fact that several engineers
have been responsible for the Boom over the years. This turnover tends to drain knowledge andfamiliarity with the hardware. A well written test procedure should identify possible problems and instruct
the team to conduct the appropriate inspections prior to reuse of STE. Everything from inspecting forcomponent wear to performing torque hysteresis plots of the offload system are items to be considered
when writing a test procedure.
Ground test anomalies are not all bad. In this case, the deployment test anomaly alerted the design teamto a failure mode that was never fully appreciated before this incident. This led to design improvements to
increase margins. The lesson to be learned here is that the cost required to conduct extensive tests onevery single piece of flight hardware can be well worth it if the tests identify a potentially serious problem.The Milstar program was required to perform deployments at hot and cold thermal vacuum conditions with
every Boom. In contrast, many programs are under pressure to qualify a design with a qual unit and then
do abbreviated flight tests in order to save money. If that had been the case here, the design team mayhave never discovered this failure mode. In the long run, eliminating tests could end up costing more
money rather than saving it.
An important way to reduce the risk of an on-orbit failure is through deployment analysis. Deploymentanalysis and simulation is helpful in identifying design sensitivities that may not show up in test or are
difficult to verify by test. Perform, as appropriate, a torque margin, kinematic, dynamic, and/or clearanceanalysis early. This will help to identify sensitive parameters, determine if other tests, procedures, or
requirements are needed, catch problems with a design, or anticipate test-related problems before it istoo late or too costly to make changes.
Special care and keen insight must be used when deciding which tests are value-added; keep in mind allof the variables that could affect the test. In the case of the Boom, there are several variables such as the
level of friction in the TM, the amount of torque in the hinge springs, the damping in the dampers, etc.
One critical variable is the routing of cable harnesses, especially when they are routed over hinge lines.
Special care must be taken to ensure that harnesses are not overstressed or improperly routed and thatthey are representative of flight geometry and constraints. Also, cable harnesses used during test must
be inspected to ensure that they are properly routed and thermally controlled as needed to minimize theirinfluence on the test. Tie-wraps are often used to control the routing of cable harnesses but care must betaken not to overuse tie-wraps. Tie-wraps are great for making neat and well-maintained harnesses, but
they also make the cable a lot stiffer. If this cable is run over a hinge line, the available torque of the hinge
248
maydecreasesignificantly,especiallyat coldtemperatures.Unlessthedeploymentmarginis large,usethe minimumnumberof tie-wrapsor tapethatwilladequatelycontroltheworkingspaceanddynamicmotionof anyharnessescrossinga deployablejoint, and controlthe routingand constrainingin adrawing.
And finally,specialcareneedsto be takenwhendesigningtest equipment.Requirementsfor testequipmentaren'talwayslessdemandingthanfor flightequipment.In this case,all of the STETMcomponentspassedtheir componenttest. However,this componenttest was designedwith flighthardwarerequirementsthatassumedthattheTMcomponentswouldseerelativelyfewcycles.However,theTM componentsweresubjectedto over100cyclesatthetimeof theanomaly.In addition,theTMwasnottestedin the(bowandarrow)geometrythatisseenatthesystemlevelwherethehighestforcesandwearoccur.Thedesignteamneedsto considerthattestconditionscanbemoreof adesigndriverthantheactualflightconditions.
Conclusions
The wear-out failure mode of the Boom test equipment had a positive outcome in that it taught the design
team many valuable lessons. These lessons were learning how to improve test equipment inspectionprocedures, realizing the importance of in-depth testing of every unit, recognizing the value of analysis as
a design tool, learning that cable routing is a critical variable, and understanding the factors that areinvolved in test equipment design. But the most important outcome of the deployment anomaly was that it
led to design improvements that increased Boom deployment margins. A previously unknown point offailure was quickly remedied, thus improving the probability of success in Solar Array Boom deployments
for the remaining Milstar satellites.
249

250
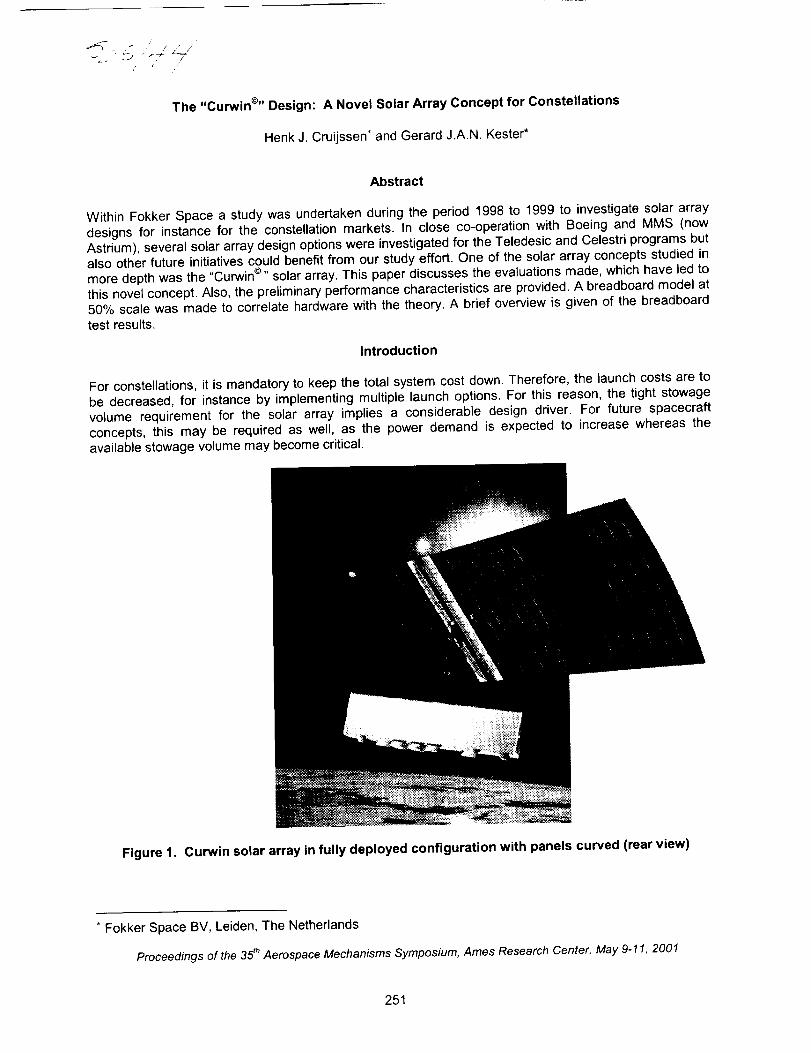
/
The "Curwin ©'' Design: A Novel Solar Array Concept for Constellations
Henk J. Cruijssen* and Gerard J.A.N. Kester*
Abstract
Within Fokker Space a study was undertaken during the period 1998 to 1999 to investigate solar array
designs for instance for the constellation markets. In close co-operation with Boeing and MMS (nowAstrium), several solar array design options were investigated for the Teledesic and Celestri programs but
also other future initiatives could benefit from our study effort. One of the solar array concepts studied inmore depth was the "Curwin ©'' solar array. This paper discusses the evaluations made, which have led to
this novel concept. Also, the preliminary performance characteristics are provided. A breadboard model at50% scale was made to correlate hardware with the theory. A brief overview is given of the breadboardtest results,
Introduction
For constellations, it is mandatory to keep the total system cost down. Therefore, the launch costs are tobe decreased, for instance by implementing multiple launch options. For this reason, the tight stowage
volume requirement for the solar array implies a considerable design driver. For future spacecraft
concepts, this may be required as well, as the power demand is expected to increase whereas theavailable stowage volume may become critical.
Figure 1. Curwin solar array in fully deployed configuration with panels curved (rear view)
* Fokker Space BV, Leiden, The Netherlands
Proceedings of the 3_ h Aerospace Mechanisms Symposium, Ames Research Center, May 9-11, 2001
251

Solar Array Technical Requirements
The following table provides the technical requirements. These requirements were not firm and changed
several times during the course of the study. These were triggered by the merger between the Teledesicand Celestri project, which resulted in an increased power demand.
Table 1: Major technical requirements (typical for constellation type solar arrays)
Parameter
Power at End of Life (EOL)conditions
Drop-off orbit
Operational OrbitLifetime
Architecture
Volume
Overall Mass target (specific)
Max deployed area / Momentof Inertia
Sun tracking mechanism
Field of View
Stowed resonance frequencyDeployed resonance
frequency
Deployment shock
Teledesic
4.3 'kW later increased to 8.4 kW
~ 300 km
1375 km, i = 84.7 °
9 -10 years
2 wings on a central extension
arm from top side of the SIC
250 mm tapering off to 150 mm
> 35 W/kgN/A
Double rotation axis SADM /
gimbal mechanismVisual line of sight / contact with
the neighboring S/Cfl > 35 Hz
fl > 0.3 Hz
Celestri
7.6 kW up to 8.4 kW
- 300 km
1375 km, i = 48 °
12 years2 separate wings on a yokefrom either side of the SIC
250 mm height
> 35 W/kg.Less than 10500 kg-m z
Double rotation axis / gimbal
no details available
fl > 40 Hz
First mode to be fl > (6/I) U_with I = inertia
N/A < TBD N-m
A high degree of design commonality was strived for from the beginning of the study. For both the
Teledesic / Celestri solar array this has lead to the following technical design drivers
End-of-Life (EOL) power (4.3 kW up to 8.4 kW).Stowage volume on spacecraft (S/C) (150 mm tapering to 250 mm)
Deployed resonance frequency fl > 0.3 HzDeployment trajectory to reach the fully deployed configuration must be controlled and within
certain constraints (i.e. stay-out zones)Total solar array mass ( > 35 W/kg)
Field of view and moment of inertia in deployed configuration
Specific Proqrammatic requirements:Typical programmatic constraints were implemented to verify the proposed technical designs against theschedule and cost constraints.
;- Development schedule: first demonstration launch in 2003, thereafter regular launch rate;* Launch rate: every week one launch, resulting in a delivery rate: one array per 2 weeks for
Celestri (maximum case): one array per 2 working days for Teledesic (maximum logistic case)Non-recurring cost: TBD to initiate and endorse to a maximum extent lowering of the recurring
cost, recurring cost: < $1M per array. (4.3 kW EOL), based on a production lot of 180 satellites tobe produced in 4 years
252
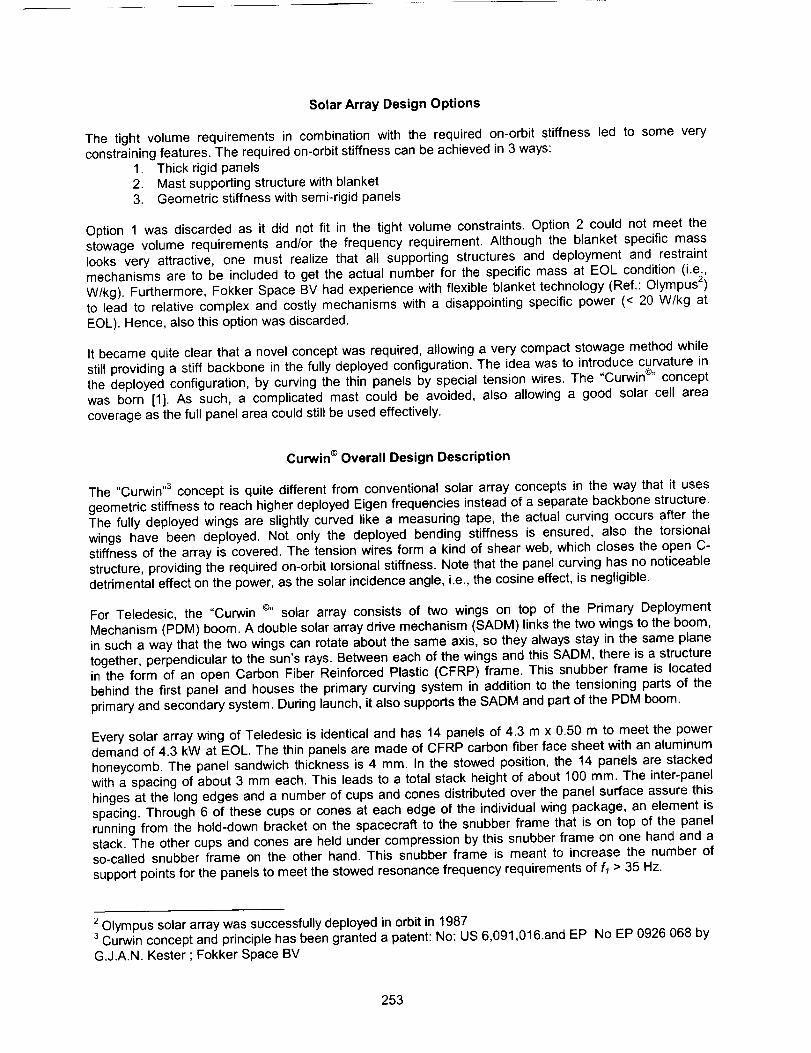
Solar Array Design Options
The tight volume requirements in combination with the required on-orbit stiffness led to some veryconstraining features. The required on-orbit stiffness can be achieved in 3 ways:
1. Thick rigid panels
2. Mast supporting structure with blanket3. Geometric stiffness with semi-rigid panels
Option 1 was discarded as it did not fit in the tight volume constraints. Option 2 could not meet the
stowage volume requirements and/or the frequency requirement. Although the blanket specific masslooks very attractive, one must realize that all supporting structures and deployment and restraint
mechanisms are to be included to get the actual number for the specific mass at EOL condition (i.e.,W/kg). Furthermore, Fokker Space BV had experience with flexible blanket technology (Ref.: Olympus 2)
to lead to relative complex and costly mechanisms with a disappointing specific power (< 20 W/kg at
EOL). Hence, also this option was discarded.
It became quite clear that a novel concept was required, allowing a very compact stowage method whilestill providing a stiff backbone in the fully deployed configuration. The idea was to introduce curvature inthe deployed configuration, by curving the thin panels by special tension wires. The "Curwin ¢'' concept
was born [1]. As such, a complicated mast could be avoided, also allowing a good solar cell areacoverage as the full panel area could still be used effectively.
Curwin © Overall Design Description
The "Curwin "3 concept is quite different from conventional solar array concepts in the way that it uses
geometric stiffness to reach higher deployed Eigen frequencies instead of a separate backbone structure.
The fully deployed wings are slightly curved like a measuring tape, the actual curving occurs after thewings have been deployed. Not only the deployed bending stiffness is ensured, also the torsional
stiffness of the array is covered. The tension wires form a kind of shear web, which closes the open C-structure, providing the required on-orbit torsional stiffness. Note that the panel curving has no noticeable
detrimental effect on the power, as the solar incidence angle, i.e., the cosine effect, is negligible.
For Teledesic, the "Curwin ©" solar array consists of two wings on top of the Primary Deployment
Mechanism (PDM) boom. A double solar array drive mechanism (SADM) links the two wings to the boom,in such a way that the two wings can rotate about the same axis, so they always stay in the same planetogether, perpendicular to the sun's rays. Between each of the wings and this SADM, there is a structure
in the form of an open Carbon Fiber Reinforced Plastic (CFRP) frame. This snubber frame is locatedbehind the first panel and houses the primary curving system in addition to the tensioning parts of the
primary and secondary system. During launch, it also supports the SADM and part of the PDM boom.
Every solar array wing of Teledesic is identical and has 14 panels of 4.3 m x 0.50 m to meet the powerdemand of 4.3 kW at EOL. The thin panels are made of CFRP carbon fiber face sheet with an aluminum
honeycomb. The panel sandwich thickness is 4 mm. In the stowed position, the 14 panels are stackedwith a spacing of about 3 mm each. This leads to a total stack height of about 100 ram. The inter-panel
hinges at the long edges and a number of cups and cones distributed over the panel surface assure thisspacing. Through 6 of these cups or cones at each edge of the individual wing package, an element is
running from the hold-down bracket on the spacecraft to the snubber frame that is on top of the panelstack. The other cups and cones are held under compression by this snubber frame on one hand and aso-called snubber frame on the other hand. This snubber frame is meant to increase the number of
support points for the panels to meet the stowed resonance frequency requirements of f_ > 35 Hz.
2 Olympus solar array was successfully deployed in orbit in 1987
3 Curwin concept and principle has been granted a patent: No: US 6,091,016.and EP No EP 0926 068 byG.J.A.N. Kester ; Fokker Space BV
253
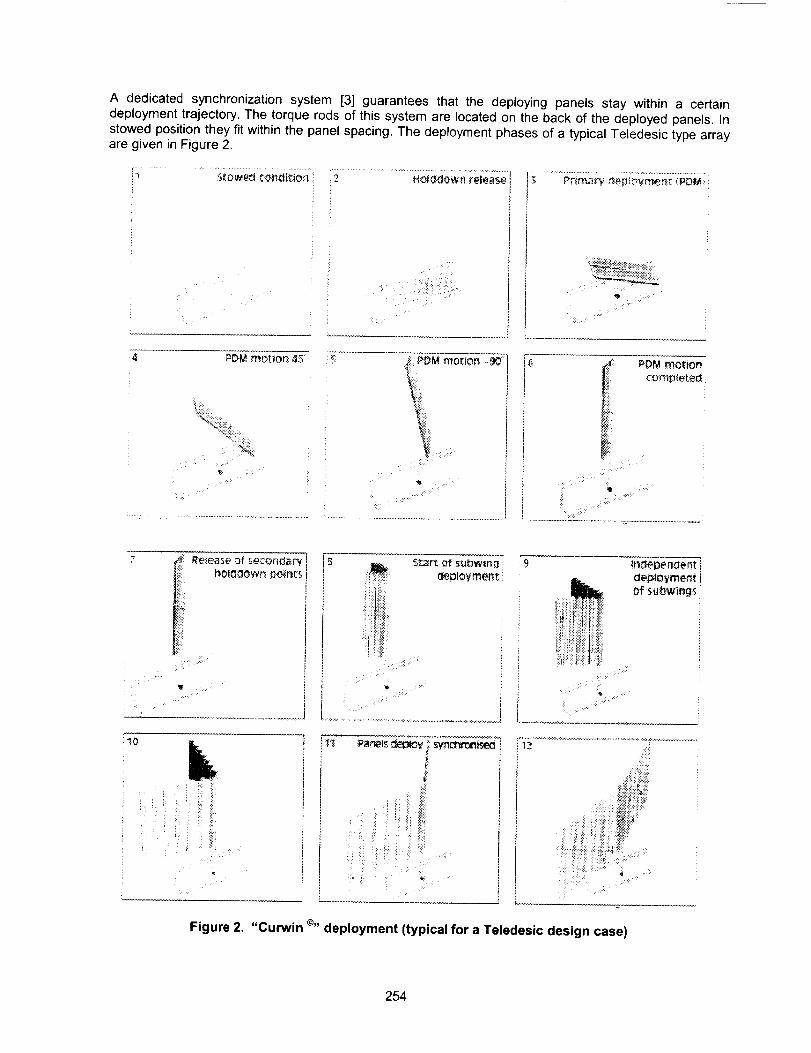
A dedicatedsynchronizationsystem[3] guaranteesthat the deployingpanelsstay withina certaindeploymenttrajectory.Thetorquerodsof thissystemarelocatedon thebackof thedeployedpanels.Instowedpositiontheyfitwithinthepanelspacing.Thedeploymentphasesof atypicalTeledesictypearrayaregiveninFigure2.
i_ _[owed:ond_ion :'2 H,_d;downrelease
<
J
iiii_ :_i: :;¸_¸¸¸¸_:¸
Lii!ilii,' i_,,_iiiI_I;_..... i
L
4 PDM mrY_or_ _3'
...... i! iI _iii;; ¸¸¸_:....
compteter_
....
i:i
deployment_UbWlmg_
110
Ilki:
i i__ _
]J
i '
T__iii ¸ i
Figure 2. "Curwin ©'' deployment (typical for a Teledesic design case)
254
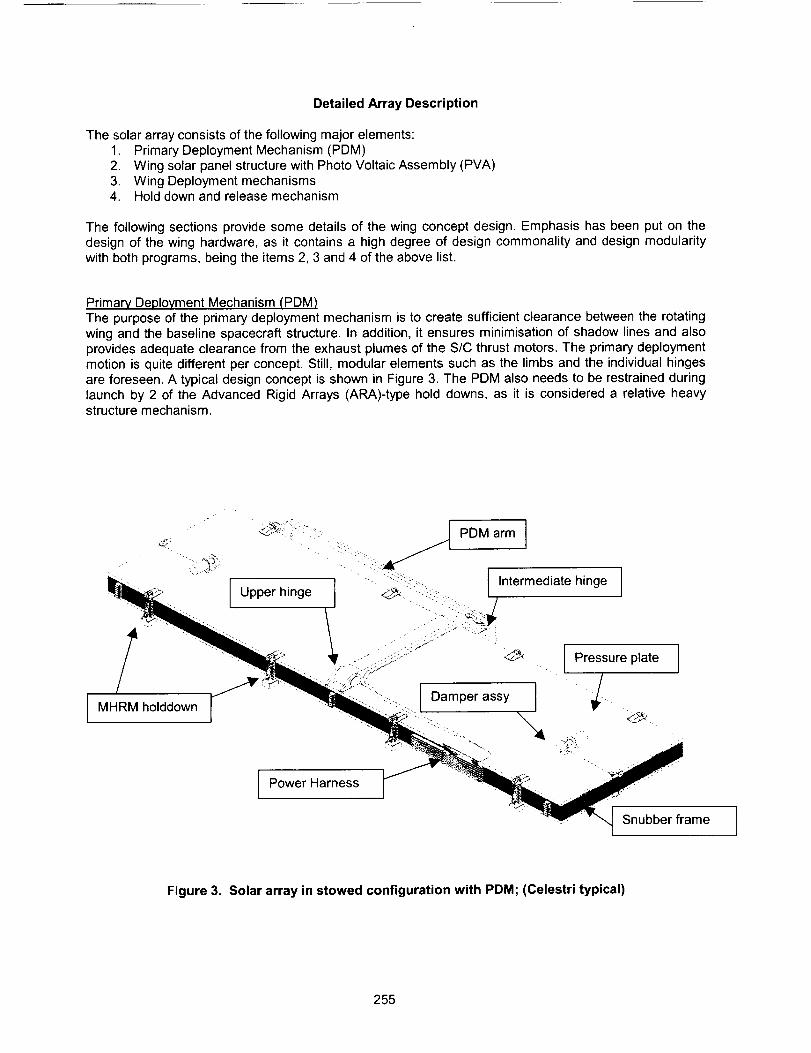
Detailed Array Description
The solar array consists of the following major elements:
1. Primary Deployment Mechanism (PDM)2. Wing solar panel structure with Photo Voltaic Assembly (PVA)
3. Wing Deployment mechanisms4. Hold down and release mechanism
The following sections provide some details of the wing concept design. Emphasis has been put on the
design of the wing hardware, as it contains a high degree of design commonality and design modularity
with both programs, being the items 2, 3 and 4 of the above list.
Primary Deployment Mechanism (PDM)
The purpose of the primary deployment mechanism is to create sufficient clearance between the rotatingwing and the baseline spacecraft structure. In addition, it ensures minimisation of shadow lines and also
provides adequate clearance from the exhaust plumes of the S/C thrust motors. The primary deploymentmotion is quite different per concept. Still, modular elements such as the limbs and the individual hinges
are foreseen. A typical design concept is shown in Figure 3. The PDM also needs to be restrained duringlaunch by 2 of the Advanced Rigid Arrays (ARA)-type hold downs, as it is considered a relative heavystructure mechanism.
• <_:_ r_ ..:.... _ PDM arm
I I '- _'":__ .... I Intermediate hinge I
Upperh,nge ._.<,_iiiii;-:-.,i.-;::_ I/ I
"" -> ,_ . ".-- ;:_-:; " 04 Pressure plate
..... . _". ",z Damper assyM/RM holddown _ _i. '_ :i..
• " -. Snubber frame
Figure 3. Solar array in stowed configuration with PDM; (Celestri typical)
255
The Winq Panel Packaqe: The winq solar panel packa.qes structure (2-off)
Each wing package consists of:Fourteen (14) thin semi-rigid CFRP panels
equipped with thin film type solar cellselectrical inter panel power transfer harness
Pressure plate
Snubber-frame interfacing with the S/C including the jack curving mechanism2 x 6 primary ARA-type hold-down points
2 secondary modified ARA-type hold-down points
Thin semi-riqid CFRP solar panels with PVAThe wings consist of a number of relatively thin sandwich panels, measuring 4.3 m x 0.50 m. The
sandwich is Aluminum honeycomb with CFRP face sheets on both sides. The baseline panel thickness is4 mm. The photo-voltaic assembly is based on the application of large thin film cells such as amorphous
Silicon or the novel Copper Indium (Di) Sulphide (CIS) type cells are now emerging. The front side of thepanels are equipped with solar cells, while the backside is used for the electrical wiring and the
synchronization system. The design of the cell substrate is aimed to accommodate two cell types, i.e., the
'conventional' but heavier and more expensive mono-crystalline Silicon or GaAs type cells as well as themuch lighter and cheaper thin film, e.g., amorphous Silicon cells.
Thin film Solar Cell Technoloqy
The concept to be selected should allow the use of novel thin film solar cell technology. TheAmorphous Silicon thin film (a-Si) cell is resistant to high radiation environment [2]. An additional
reason for implementing this cell type is the low associated cost and low mass. Typically, themanufacturing process allows for bulk production as required for constellations.
Panel and inter-panel electrical harnessThe rear side of the panel is equipped with a flexible electrical harness in order to minimize the
resistance torque during deployment, especially under the extreme temperature conditions. A
single uninterrupted flex-print is design baseline to eliminate the 'conventional' inter-panel powertransfer harness and connectors. This will result in a lower mass, compact flat stowage, low cost
and a reliable performance. This flex-print design also reduces the multiple ohmic losses at the'conventional' inter-panel connector junctions. Redundancy requires that there are 2
uninterrupted flex-print harness.
Snubber frame:
The purpose of the snubber frame is to obtain a stiff interface towards the spacecraft structure. As thethin panels have a relative high flexibility, it is required to have a stiff frame such to meet the stowedresonance frequency requirement of fl > 35 Hz. The CFRP frame has interface points towards the 12
hold down points. It includes the "jack mechanism". (see: deployment mechanisms section)
Pressure Plate (optional)
To close the box, a pressure plate of CFRP is foreseen. The total panel package is kept tight together bymeans of the earlier mentioned snubber frame and the pressure plate. The pressure plate interfaces with
the last life panel. The pressure plate can be deleted in case the spacecraft acts as a supportingstructure. This means a close interaction with the S/C builder. As such, 25 mm of stowage height couldbe saved.
256
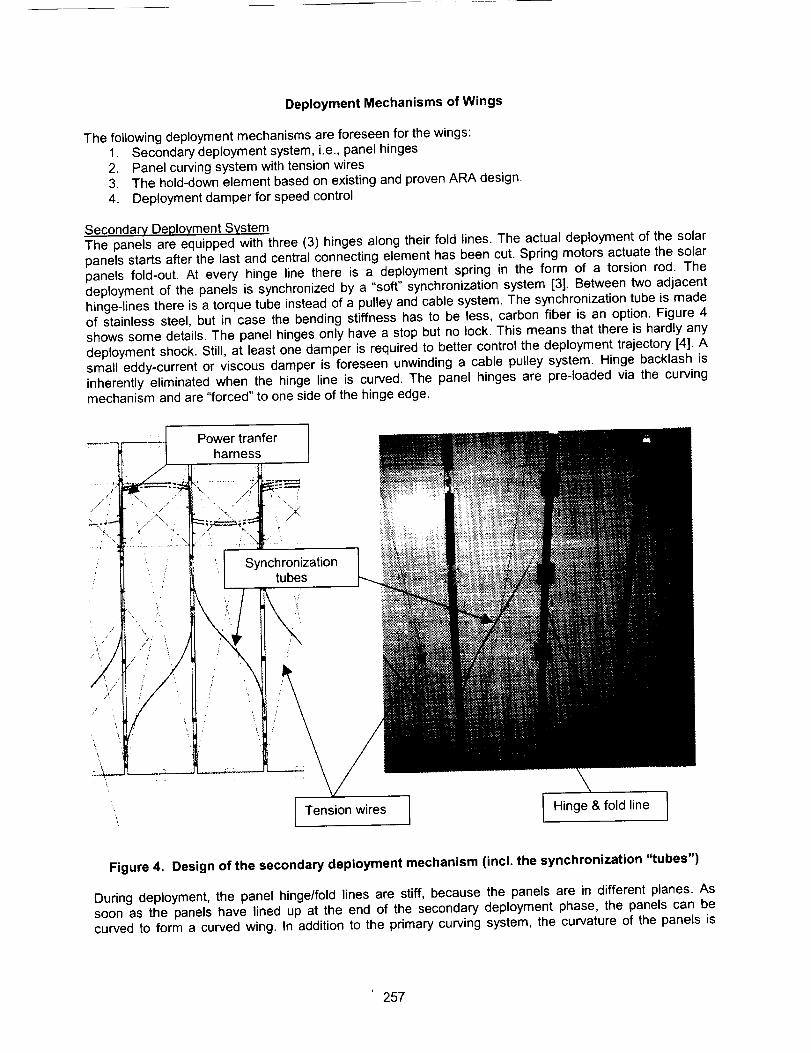
Deployment Mechanisms of Wings
The following deployment mechanisms are foreseen for the wings:
1. Secondary deployment system, i.e., panel hinges
2. Panel curving system with tension wires3. The hold-down element based on existing and proven ARA design.
4. Deployment damper for speed control
Secondary Deployment SystemThe panels are equipped with three (3) hinges along their fold lines. The actual deployment of the solar
panels starts after the last and central connecting element has been cut. Spring motors actuate the solarpanels fold-out. At every hinge line there is a deployment spring in the form of a torsion rod, The
deployment of the panels is synchronized by a "soft" synchronization system [3]. Between two adjacenthinge-lines there is a torque tube instead of a pulley and cable system. The synchronization tube is made
of stainless steel, but in case the bending stiffness has to be less, carbon fiber is an option. Figure 4shows some details. The panel hinges only have a stop but no lock. This means that there is hardly any
deployment shock. Still, at least one damper is required to better control the deployment trajectory [4]. Asmall eddy-current or viscous damper is foreseen unwinding a cable pulley system. Hinge backlash is
inherently eliminated when the hinge line is curved. The panel hinges are pre-loaded via the curving
mechanism and are "forced" to one side of the hinge edge.
Power tranfer
' .,/_ harness._._
/ _' / Synchronization: =: tubes
\
//
ETens'onw'resI I"'noe''o'O"oeI
Figure 4. Design of the secondary deployment mechanism (incl. the synchronization "tubes")
During deployment, the panel hinge/fold lines are stiff, because the panels are in different planes. Assoon as the panels have lined up at the end of the secondary deployment phase, the panels can be
curved to form a curved wing. In addition to the primary curving system, the curvature of the panels is
257
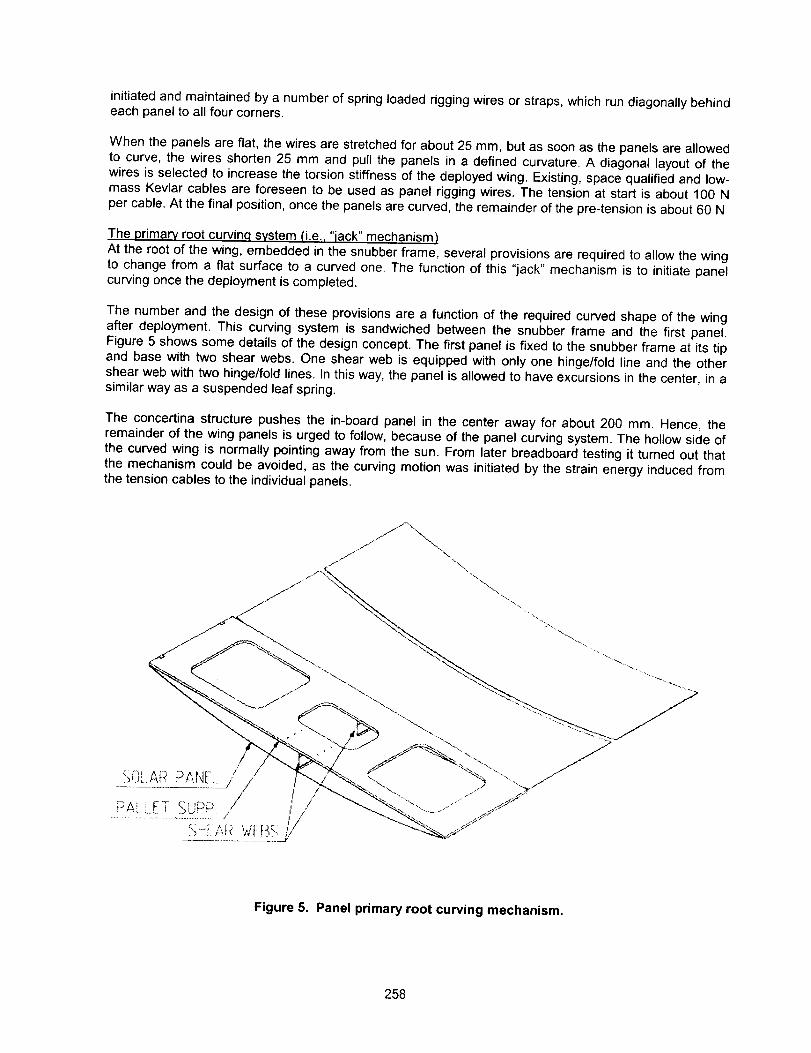
initiatedandmaintainedbya numberof springloadedriggingwiresorstraps,whichrundiagonallybehindeachpaneltoallfourcorners.
Whenthepanelsareflat,thewiresarestretchedforabout25mm,butassoonasthepanelsareallowedto curve,thewiresshorten25mmandpullthepanelsin a definedcurvature.A diagonallayoutof thewiresisselectedto increasethetorsionstiffnessofthedeployedwing.Existing,spacequalifiedandlow-massKevlarcablesareforeseento beusedaspanelriggingwires.Thetensionat startisabout100Npercable.Atthefinalposition,oncethepanelsarecurved,theremainderofthepre-tensionisabout60N
The primary root curvinq system (i.e., "lack" mechanism)
At the root of the wing, embedded in the snubber frame, several provisions are required to allow the wingto change from a flat surface to a curved one. The function of this "jack" mechanism is to initiate panel
curving once the deployment is completed.
The number and the design of these provisions are a function of the required curved shape of the wingafter deployment. This curving system is sandwiched between the snubber frame and the first panel.
Figure 5 shows some details of the design concept. The first panel is fixed to the snubber frame at its tip
and base with two shear webs. One shear web is equipped with only one hinge/fold line and the othershear web with two hinge/fold lines. In this way, the panel is allowed to have excursions in the center, in a
similar way as a suspended leaf spring.
The concertina structure pushes the in-board panel in the center away for about 200 mm. Hence, theremainder of the wing panels is urged to follow, because of the panel curving system. The hollow side of
the curved wing is normally pointing away from the sun. From later breadboard testing it turned out thatthe mechanism could be avoided, as the curving motion was initiated by the strain energy induced from
the tension cables to the individual panels.
.I//'\\
...., . . , ,. _ _i/ "---. ...+s_-
Figure 5. Panel primary root curving mechanism.
258
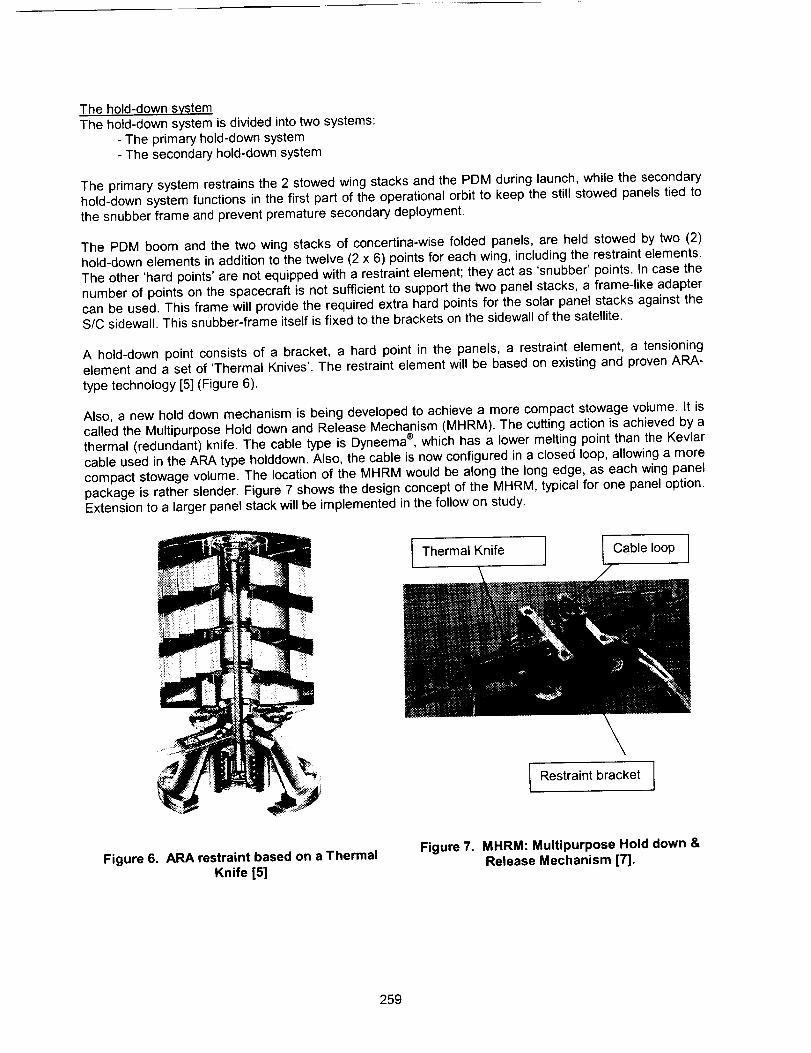
The hold-down systemThe hold-down system is divided into two systems:
- The primary hold-down system- The secondary hold-down system
The primary system restrains the 2 stowed wing stacks and the PDM during launch, while the secondary
hold-down system functions in the first part of the operational orbit to keep the still stowed panels tied to
the snubber frame and prevent premature secondary deployment.
The PDM boom and the two wing stacks of concertina-wise folded panels, are held stowed by two (2)hold-down elements in addition to the twelve (2 x 6) points for each wing, including the restraint elements.
The other 'hard points' are not equipped with a restraint element; they act as 'snubber' points. In case thenumber of points on the spacecraft is not sufficient to support the two panel stacks, a frame-like adapter
can be used. This frame will provide the required extra hard points for the solar panel stacks against theS/C sidewall. This snubber-frame itself is fixed to the brackets on the sidewall of the satellite.
A hold-down point consists of a bracket, a hard point in the panels, a restraint element, a tensioningelement and a set of 'Thermal Knives'. The restraint element will be based on existing and proven ARA-
type technology [5] (Figure 6).
Also, a new hold down mechanism is being developed to achieve a more compact stowage volume. It iscalled the Multipurpose Hold down and Release Mechanism (MHRM). The cutting action is achieved by athermal (redundant) knife. The cable type is Dyneema ®, which has a lower melting point than the Kevlar
cable used in the ARA type holddown. Also, the cable is now configured in a closed loop, allowing a more
compact stowage volume. The location of the MHRM would be along the long edge, as each wing panelpackage is rather slender. Figure 7 shows the design concept of the MHRM, typical for one panel option.Extension to a larger panel stack will be implemented in the follow on study.
Thermal Knife Cable loop I
\I Restraint bracket I
Figure 6. ARA restraint based on a ThermalKnife [5]
Figure 7. MHRM: Multipurpose Hold down &
Release Mechanism [7].
259

Structural Performance
Deployed Wing Analyses:Both for the stowed as well for the deployed wing, structural analyses was executed (FEM/NASTRAN).
For the deployed wing, also a non-linear analysis was done, in which the sensitivity against the followingthree parameters was investigated:
_. Tension loads in the straps / tension wiresp- Amount of curvature of the semi-rigid panels
;,- Stiffness of the tension wires or strapsIt was found that the stiffness of the (sub) wing could be tuned with the above parameters. The lowest
frequency was a torsion mode (f_ - 0.278 Hz), followed by a bending mode (fl ~ 0.577 Hz). Increase intorsion rigidity could be achieved by increasing the stiffness of the tension straps in combination with the
panel curvature. Also, the PDM-stiffness determines the overall deployed wing behavior greater thanexpected. This can be tuned by the geometry of the CFRP tube of the primary linkage.
Y
__'-"-_ _ * ....... =-._;:........ , .................... 3.0;/
X
Torsion mode: 0.278 Hz
":W::: ; /-.
•01
.__, -_ _:._.. ._. _ _.. Bending mode: 0.577 Hz
Y y. Y y
- _ _ ×
Figure 8, Typical mode shapes of a fully deployed wing (Ref: Teledesic)
Mass performance:
A preliminary mass table (See Table 2) is provided showing the typical masses involved (based on therelative low value of about 8% cell efficiency at EOL conditions). The PDM and all mechanisms are
included which contribute to -30% of the overall mass. Especially, the PDM with the double gimbal SADMis a heavy structure, and is fully driven by the constellation requirements. But in case a normal V-yoke
structure is used, and no active motorized PDM hinges are used, considerable mass saving is foreseen.
260
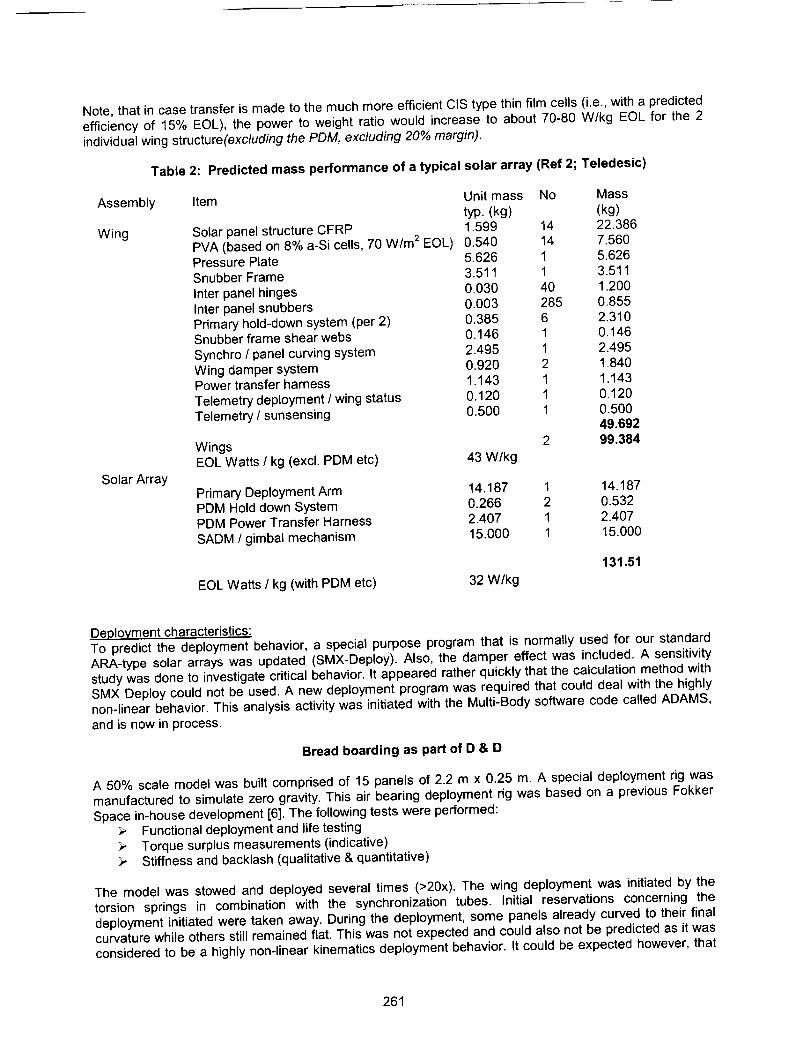
Note,thatincasetransferismadetothemuchmoreefficientCIStypethinfilmcells(i.e.,withapredictedefficiencyof 15%EOL),the powerto weightratiowouldincreaseto about70-80W/kgEOLfor the2individualwingstructure(excludingthe PDM, excluding 20% margin).
Table 2: Predicted mass performance of a typical solar array (Ref 2; Teledesic)
Assembly
Wing
Solar Array
Item Unit mass No Mass
typ. (kg) (kg)
Solar panel structure CFRP 1.599 14 22.386PVA (based on 8% a-Si cells, 70 W/m 2 EOL) 0.540 14 7,560Pressure Plate 5.626 1 5,626
Snubber Frame 3.511 1 3,511
Inter panel hinges 0.030 40 1,200Inter panel snubbers 0.003 285 0.855
Primary hold-down system (per 2) 0.385 6 2,310Snubber frame shear webs 0.146 1 0,146
Synchro ! panel curving system 2.495 1 2,495Wing damper system 0.920 2 1840Power transfer harness 1.143 1 1,143
Telemetry deployment / wing status 0.120 1 0.120
Telemetry / sunsensing 0.500 1 0.50049.692
2 99.384Wings
EOL Watts / kg (excl. PDM etc)
Primary Deployment ArmPDM Hold down SystemPDM Power Transfer Harness
SADM / gimbal mechanism
43 W/kg
14.187 1 14.1870.266 2 0.532
2.407 1 2.40715.000 1 15.000
EOL Watts / kg (with PDM etc) 32 W/kg
131.51
Deployment characteristics:To predict the deployment behavior, a special purpose program that is normally used for our standard
ARA-type solar arrays was updated (SMX-Deploy). Also, the damper effect was included. A sensitivitystudy was done to investigate critical behavior, It appeared rather quickly that the calculation method withSMX Deploy could not be used. A new deployment program was required that could deal with the highly
non-linear behavior. This analysis activity was initiated with the Multi-Body software code called ADAMS,
and is now in process.
Bread boarding as part of D & D
A 50% scale model was built comprised of 15 panels of 2.2 m x 0.25 m. A special deployment rig was
manufactured to simulate zero gravity. This air bearing deployment rig was based on a previous FokkerSpace in-house development [6]. The following tests were performed:
Functional deployment and life testingTorque surplus measurements (indicative)
_" Stiffness and backlash (qualitative & quantitative)
The model was stowed and deployed several times (>20x). The wing deployment was initiated by the
torsion springs in combination with the synchronization tubes. Initial reservations concerning the
deployment initiated were taken away. During the deployment, some panels already curved to their finalcurvature while others still remained flat. This was not expected and could also not be predicted as it wasconsidered to be a highly non-linear kinematics deployment behavior. It could be expected however, that
261

anyprematurecurvingof the panel would impose excessive friction forces at the hinges. In reality, this
was not the case. On the contrary, it helped the deployment motion by the energy released from thecontracting tension cables.
Figure 9. The scale model (50%) of the Curwin in fully deployed state (one wing)
A restart of the deployment was always possible, even when a certain amount of the panels had alreadyreached their curved (=deployed) position. It was observed that the curving of the panels near the
deployed condition is not a potential resistance source, but instead stimulates the further deployment ofthe remaining panels. During the wing BB testing it was clearly demonstrated that some form of damping
would be required to control the additional deployment energy coming from the curving panels and also tocontrol the deployment trajectory.
Table 3: Stiffness performance of a typical 50% scale wing (Ref 2; Teledesic)
Out of plane stiffness El average
In plane stiffness El average
Torsion stiffness GIp average
1600 Nm 2
20000 Nm 2
740 Nm 2
The stiffness as measured fulfilled the requirement. An expected knock-down of 4 was observed inbending and torsion, however, still meeting the anticipated requirement of fl > 0.3 Hz for the flight design
case. Life testing showed no observable degradation; the tension wires remained intact with no
degradation. Although no large shocks occurred, it was considered mandatory to implement a
262
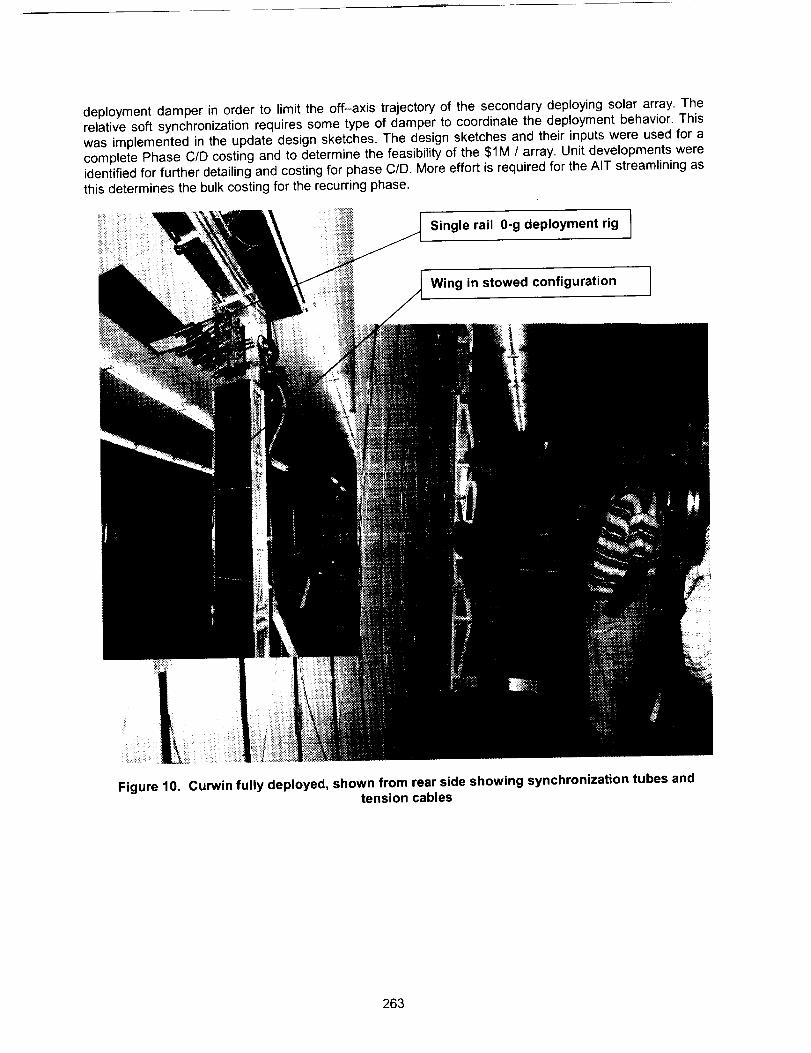
deploymentdamperin order to limit the off-axis trajectory of the secondary deploying solar array. Therelative soft synchronization requires some type of damper to coordinate the deployment behavior. This
was implemented in the update design sketches. The design sketches and their inputs were used for a
complete Phase C/D costing and to determine the feasibility of the $1M / array. Unit developments wereidentified for further detailing and costing for phase C/D. More effort is required for the AIT streamlining as
this determines the bulk costing for the recurring phase.
Single rail O-g deployment rig 1
Wing in stowed configuration I
Figure 10. Curwin fully deployed, shown from rear side showing synchronization tubes andtension cables
263

Conclusions
The reservations concerning the deployment feasibility and associated deployment principles were fully
covered by the 50% scale breadboard model. Deployment was feasible despite first reservations.Stiffening of the deployed array by bending the ultra-thin panels not only worked on paper, but was also
proven in extensive BB-testing.
Summarizing:1. Compact stowage of the thin panel stack can be achieved, still meeting the frequency requirements
for both the stowed configuration as well as the fully deployed configuration.
2. The mechanism complexity such as HDRS and hinges are well known and therefore are notconsidered a large risk (Fokker Space BV design heritage).
3. The PDM is a relatively complicated and costly mechanism due to the required deployment trajectory.
Commonality for Teledesic and Celestri could still be achievable.4. A power-to-weight ratio of 35 W/kg at EOL for MEO and also under a relative high radiationenvironment after 10 years seems achievable. This is the case for the thin film cells, but even more for
the CIS type cells, which offer better performance. (i.e., 70 to 80 W/kg at EOL conditions)
5. Implementation of thin film technology on ultra thin panels was selected as the most favorable celltechnology. This could be either a-Si type cells, new CIS type cells presently under development or even
ultra thin GaAs cells which are now also emerging.
Acknowledgements
I want to thank the Dutch NIVR for funding this study. Without their help, a "jump start" would never havebeen possible. They realized the importance to be there in time. Also, the phase-A and phase-B team,
which created a tremendous output in such a short time. This helped the design team to establish abaseline relatively quickly. Last but not least, the hardworking BB-team, which, with their enthusiasm,
were able to create, build and test this 50% scale model in just 3 months.
References
1. Curwin Solar Panel System: Patent No: US 6,091,016 and Europa 97204099.22. Phase B1 data package to NIVR CONSA and a-Si developments: CONSA-SER-SER-095
3. Solar Panel Synchronization System patent No US 6,031,178 and EP 98200951.64. BB test results of 1/2scale Curwin © model: Phase B1 study note CONSA-FS-SER-094
5. Thermal Cutting Hold-down & Release Mechanism. Second European Space Mechanisms & TribologySymposium, Meersburg, Germany, Symposium Book ESA SP-231.
6. Fokker Space Solar Array Deployment Rigs (A. P. Eggers and H. J. Cruijssen; 33 r_ Aerospace
Mechanisms Symposium, Pasadena, California May 1999; NASA/CP-1999-209259,
7. System for holding together and separating parts of a construction: US patent: 5,716,157 andEP:0716982
264
/J Hitchhiker Marman Band Interconnect Linkage
Gary R. Slebzak* and Gene Barrett*
Abstract
The Hitchhiker (HH) project offers experimenters the ability to eject small satellites into orbit from theSpace Shuttle's cargo bay. During launch the satellite is secured to the HH ejection system using apyrotechically releaseable marman band assembly. Due to an on-flight anomaly, the actuation of themarman band assembly was examined using high speed video. The video showed a potential for re-contact of the marman band assembly with the satellite from rebound effects before the satellite wassufficiently deployed, thereby creating a hazardous satellite tip-off situation. This paper describeshow the energetic release and subsequent motion of the assembly is controlled through the use of aclamp interconnect linkage system in conjunction with a system of pull down springs. The linkagesystem was selected as opposed to a more conventional "catcher" system due to hardware specificinterfaces and adaptability to existing band hardware. The linkage system controls the releasingband motion by supporting and decoupling the pyrotechnic cutter mass from the clamp portion of theassembly, allowing unrestricted motion of the clamps until the system is in the fully expandedcondition at which point the linkage acts as an over-center mechanism inhibiting rebound andcollapse of the assembly back toward the satellite. In addition, the entire assembly is pulled downand away from the satellite and separation plane by the pull down spring system that also secures itin the post deploy configuration. Since the entire actuation takes place in less than 30 milliseconds,successful functional testing of the newly developed mechanism was documented and verified usinghigh-speed video at 1000 frames/second.
Introduction
The Hitchhiker project is sponsored by the Shuttle Small Payloads Project (SSPP) at Goddard SpaceFlight Center (GSFC). The SSPP has been providing the technology and hardware for ejecting smallsatellites into orbit using the Space Shuttle as a platform since the mid 1980's. This service beganwith the NUSAT satellite in 1985 as part of the Get Away Special (GAS) program. NUSAT becamethe first satellite to be ejected from a shuttle carried GAS canister using the GAS Ejection System,which later evolved into the Hitchhiker Ejection System (HES). The latest series of satellitedeployments during 1998-1999 has used a combination of the HES and the more versatile PalletEjection System (PES). It was during one of these deployments, MightySat-01 on STS-88 inDecember of 1998 that standard orbiter video taken during the satellite ejection also detected debrisapparently generated during the deployment. It was determined that the debris was, in fact, one ofthe components of the ejection system and that prompted an extensive investigation into the causeof the anomaly. The investigation proved to be both educational and enlightening. The cause of thedebris was not that dramatic and was traced to a workmanship issue. However, the investigationfurther revealed deficiencies in the ejection system configuration only detectable by the use of high-speed photography. The Hitchhiker (HH) marman band interconnect linkage is the designimprovement developed to correct the inherent deficiencies discovered in the ejection systemmarman band used in both the HES and PES.
Ejection System BackgroundThe SSPP ejection systems (Figure 1, PES shown) are similar in design and use the same basictechnique for deploying satellites. Essentially, the satellite is placed onto a spring-loaded push plate,which is compressed and secured to the ejection system base using a marman band clamp assembly(Figure 2). The marman band assembly was developed in the early 1970's by Rockwell for deployingsatellites from Delta rockets and the design has been used without change. The assembly consists oftwo halves of the marman band, which clamp the satellite and base together using separation bolts.The halves are also connected to each other by means of leaf springs, which assist in bandseparation and keep the released band as a single assembly following deployment. The released
Swales Aerospace, Beltsville, MD
Proceedings of the 35thAerospace Mechanisms Symposium, Ames Research Center, May 9-11, 2001
265
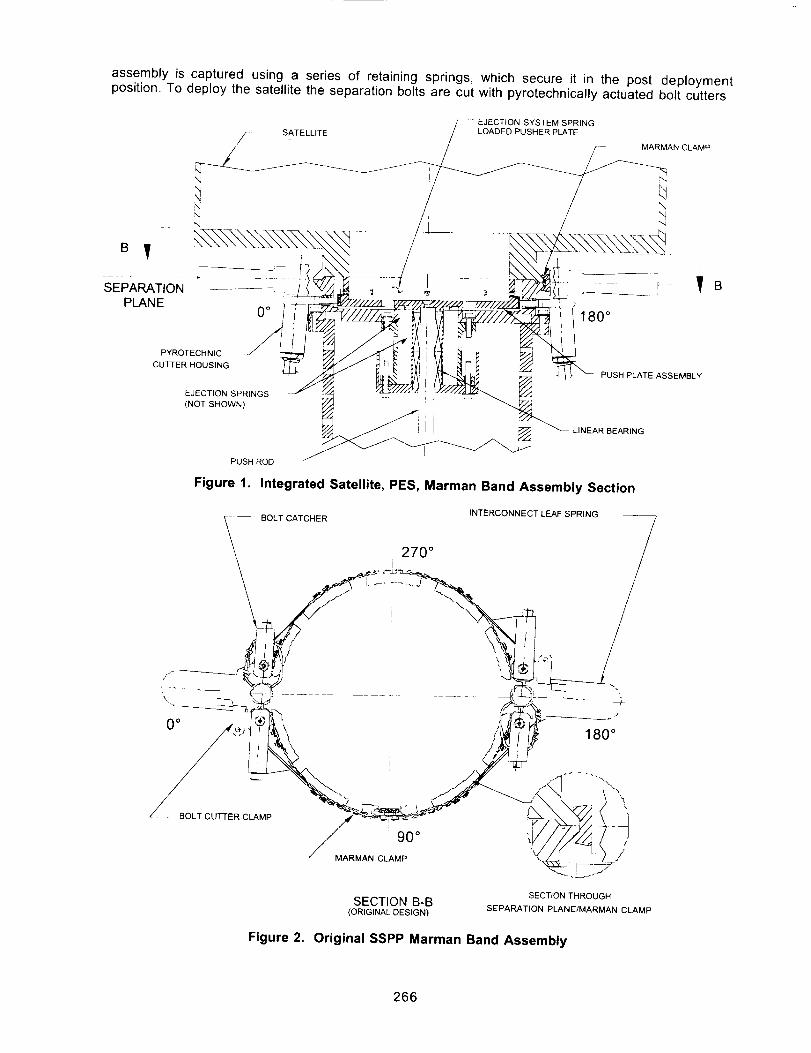
assembly is captured using a series of retaining springs, which secure it in the post deploymentposition. To deploy the satellite the separation bolts are cut with pyrotechnically actuated bolt cutters
EJECTION SYSTEM SPRING
SATELLITE LOADED PUSHER PLATEMARMAN CLAMP
\
N
SEPARATION .... . , _ _ ....
PLANE0° 180 °
PYROTECHNIC
CU'Iq-E R HOUSING
EJECTION SPRINGS
(NOT SHOWN)
PUSH ROD
Figure 1.
PUSH PLATE ASSEMBLY
LINEAR BEARING
Integrated Satellite, PES, Marman Band Assembly Section
INTERCONNECT LEAF SPRING
BOLT CATCHER
270 °
\
90 °
MARMAN CLAMP
\\
180 °
SECTION B-B(ORIGINAL DESIGN)
SECTION THROUGH
SEPARATION PLANE/MARMAN CLAMP
Figure 2. Original SSPP Marman Band Assembly
266
releasing the marman clamp and thereby, allowing the spring loaded push plate to eject the satelliteinto orbit.
During the investigation connected with the on orbit debris issue, the motion of the marman clampassembly was studied using video recorded at 1000 frames per second. When viewed at a playbackrate of one frame per second, this video revealed that the marman clamp assembly would separate,reach the end of travel, rebound back and re-contact the separation plane before the satellite couldbe deployed. Any re-contact with the satellite prior to being fully deployed could result in a hazardous"tip-off' and mission-compromising situation. It was also apparent that the basic configuration of theassembly had a tendency to exacerbate separation plane re-contact. Design improvements wererequired to eliminate the hazardous condition and improve overall system reliability.
Marman Clamp Design Improvement
Design RequirementsThe following goals were established to guide the design improvement effort:1. Eliminate the re-contact of the marman band assembly with the satellite and/or separation plane,
thus, avoiding a safety hazard.2. Prevent any change to the marman band clamping load path, which would invalidate previous
analysis, and testing.3. Improvements must be retrofittable and compatible with both the HES and PES.
To meet the design requirements, it was necessary to do a more in depth study of the high-speedvideo and attempt to isolate problem areas in the existing design. Several points were identified:1. When released the marman clamp assembly reacted in a very uncontrolled and undesirable
manner.2. The bolt cutter assemblies comprised a large portion of the overall mass of the marman clamp
assembly. Their method of attachment to one end of each clamp inhibited the free motion of theband as it expanded in a "tail wagging the dog" fashion. The cutter assembly immediatelypivoted about the end of the clamp bumping and slapping the separation plane during release.The design of the clamp used to secure the bolt cutter was inadequate and in need ofimprovement.
3. The interconnect leaf springs which joined the two marman clamps, were determined to have littleeffect in band separation compared to the strain energy in the band due to the bolt preload. Theleaf springs, in fact, contributed to the rebound effects of the band due to their stored energywhen fully expanded at the end of travel.
4. The stops that the marman clamp assembly come to rest on after separation were located suchthat they would direct the rebounded assembly back toward the separation plane. A more robustdesign was needed to accommodate impact loading.
5. The retaining springs that secure the marman clamp assembly after separation, if redesigned,could act as "pull-down" springs and contribute to the controlling of band motion.
Desiqn Trade-offsBased on the design requirements and the existing hardware configuration and deficiencies, designapproach trade-offs were performed. Two approaches were considered:1. The more conventional method for marman band applications, which would involve adapting the
ejection systems to incorporate a "band catcher".2. The hardware specific approach in which a series of design improvements to the existing
hardware is used to meet the requirements.
Conventional approach - Band CatcherPreliminary concepts for a band catcher revealed that any type of mechanism that would meet thesafety requirement for fail safe operation of the dual bolt cutters involved complex configurations. Inaddition, the mechanism would have to adapt to the ejection systems such that they could beintegrated into the SSPP standard 141 liter (5 ft3) canister which has a 50.8-cm (20-inch) insidediameter. Since the marman clamp assembly has approximately a 25.4-cm (10 inch) outside diameterin the clamped configuration, there would be limited space for the assembly to actuate during deployand still be captured by a second mechanism. There were also reliability issues concerning anadditional mechanism of that complexity. Finally, the catcher mechanism would have to adapt to boththe HES and PES, which have substantially different base configurations that would involve design(s)of separate interface mounting hardware.
267

Hardware specific approach
The hardware specific design approach, which was adopted, involved modifying the existinghardware only as needed to control the motion of the marman band assembly to meet therequirements. By minimizing and delaying rebound effects, as well as translating the assembly downand away from the separation plane, the motion of the assembly could effectively be controlled.Thereby, satisfying the requirement of eliminating re-contact with the separation plane. Also, sincethe modifications only affected the marman band assembly, they were easily adapted to both theHES and PES. It was determined that the bolt cutter housing(s) contributed only negative effects tothe marman clamp assembly actuation. Decoupling the mass of the bolt cutter housing from themarman clamps would permit the clamps to freely separate during actuation and redirect the energythat was causing the cutter housing to impact the separation plane. It was decided that a linkage
could be adapted to the existing load clamping components of the assembly allowing the clamps tofreely separate and, in addition, support the bolt cutter housing. In addition to the incorporation of
the linkage to control the marman clamp assembly movement, the existing retaining springs could beredesigned to have greater capacity and function as pull down springs as well. By also redesigningand relocating the stops well below the separation plane, the springs could pull the band down andaway during actuation.
Marman Band Interconnect Linkage
The linkage named the, Marman Band Interconnect Linkage (MaBIL), was designed such that itcould use the excess energy of the expanding clamp assembly to move the bolt cutter radially awayfrom the separation plane and then when fully extended act as an over center latch to minimizerebound.
The MaBIL (Figure 3) replaced the leaf springs as a clamp interconnect feature eliminating the storedenergy effects contributing to rebound. Additional benefits of MaBIL are the relatively large mass ofthe links compared to the total marman clamp assembly and linkage joint friction, both of whichcontribute to the slowing of the energetic separation.
Desi_qn
As with many hardware designs, cost and schedule are always of concern and this was no exception.In particular, schedule was in the forefront. The SSPP ejection systems were essentially groundeddue to the safety concerns until the satellite re-contact issue was resolved. It was highly desirable todevelop a sound design with as little iteration as possible.
The linkage configuration that was developed consists of a central bolt cutter clamp connected oneach side to the existing marman clamps through a series of two links. Using the parametric 3Dmodeling capability of Pro Engineer TM to model the existing marman clamp components and developthe new design, it was made possible to assure correct interfacing with the existing hardware andavoid interferences in the newly designed components. The modeling also made it relatively easy toassess the linkage in the pre-deploy (clamped) and post-deploy (open) condition. Configuring thelinkage to collapse into the small volume available when the marman band assembly was in theclamped condition became the starting point for the design. It was essential that the links and boltcutter clamp were able fold up without interference, providing access to the bolt cutters and othercomponents. Once configured in the closed position the length of the links were optimized in theexpanded configuration to function within the envelope of the 50.8-cm (20") diameter canister whileproviding the greatest amount of expansion for deployment.
The details of the design were added to the basic linkage configuration. Link connections weredesigned as clevis joints to assist in load transfer and minimize binding effects. The completed designwas structurally analyzed to provide positive safety margins using factors of safety of 2.0 on yield and2.6 on ultimate material strength. These factors of safety were used in lieu of structural testing asspecified in the HH Cars Accommodations & Requirements Specifications (CARS), 740-SPEC-008,thereby, minimizing testing and reducing cost and schedule impact. The analysis was also used tooptimize component features. Thermal compatibility between linkage component materials and otherinterfacing components was required to assure that the mechanism would actuate properly at allenvironmental extremes. Based on these factors corrosion resistant steels from the Table I of "DesignCriteria for Controlling Stress Corrosion Cracking", MSFC-SPEC-522B, were selected, 15-5 PHcondition H1025 for the links and cutter clamp, and A286 hardened to RC 30 min for the clevis pins.
268

o
©
w
qz_Jw0
<,
0(,.9
1.11_z
u.ln,"p-
en
Figure 3. Exploded View - Marman Band Interconnect Linkage
269

Preliminary Test & Evaluation
Since the unproven linkage design was being fabricated from relatively costly materials requiring alonger procurement cycle and considerable machining time due to the material toughness, thedecision was made to develop an Engineering Test Unit (ETU) using readily available, easilymachinable materials. The ETU (Figures 4, 5 & 6) provided many benefits:
1. Development and verification of component fabrication programs using less costly materials2. Design verification tool for form, fit and assembly techniques3. Low level functional testing of linkage assembly via manually releasable separation bolt4. Increased confidence level in design
The ETU assembled easily, requiring no additional procedures or processes. When assembled a fewdesign improvements became apparent, Most notably, by threading the bolt cutter clamp screwaccess hole in two of the links, setscrews could be installed after assembly to eliminate the freemovement the bolt cutter assembly, which was a concern under launch vibration conditions. Whenassembled using a manually releasable separation bolt, functional tests with up to a 10% separationbolt preload could be repeatedly conducted, filmed at normal and high speed and reviewed withoutthe expense and availability of using pyrotechnically actuated bolt cutters. Numerous tests wereperformed and in all cases the mechanism actuated nominally. As a final test of the ETU, the
opportunity became available to perform a single test with the full 8896-N (2000-1b) separation boltpreload and record it using high-speed digital video.
With the increased level of confidence in the linkage design provided by the ETU and testing,materials were ordered and fabrication of the protoflight unit authorized.
Protoflight Test & Evaluation
As was learned during the investigation into the on flight anomaly, viewing the playback of theassembly's actuation recorded on high speed video proved to be the only acceptable method of
verifying that MaBIL met the requirements. For the protoflight functional testing the opportunitybecame available to use high-speed digital video as opposed to high-speed film cameras used
during the previous investigation. The digital video, while not having the resolution of the filmcameras, provided other advantages. Before performing a test, the setup could be verified to befunctioning properly, and following a test, the recording was available for immediate playback withouthaving the delay due to film processing. The immediate playback feature provided the ability to tweakor change the setup based on what was viewed in the previous test. The overall test time was alsoreduced improving cost and schedule. The HH Marman Band Interconnect Linkage Test Procedure,
SSPP, 870-PROC-587, was developed to specify the test article configuration, functional tests,thermal tests and vibration tests required for the flight qualification of the.MaBIL.
Functional Test
The functional tests consisted of assembling the protoflight units to the PES in a full flightconfiguration (Figures 7) and taking high speed video at 1000 frames per second from the top andside of both the nominal dual pyrotechnic bolt cutter and single bolt cutter firings. The videos were
then reviewed at a playback rate of 1 frame per second to determine if the requirements were met.Real time observations of each test gave the indication that the linkage controlled the motion of theactuating mechanism as expected. Review of the video playback confirmed that in each case the
MaBIL performed as designed, permitting the marman band to release independent of the bolt cutter(mass), while the supported bolt cutter was moved radially away from the separation plane. Then,once the band expanded to the end of travel, the bolt cutter remained in the "locked out"
configuration (Figures 5 & 7), allowing minimal rebound of only the marman clamps. The pull downsprings effectively pulled the assembly below the separation plane and to rest on the stops.Incidental contact was limited to contact between the marman clamp shoes and the ejection systemsupport base with said contact occurring below the separation plane. Based on these observationsthe MaBIL was determined to have met the functional design requirements and could be subjectedto environmental testing.
Thermal Testing
The thermal testing consisted of subjecting the test article to one thermal cycle, from the hot case at+70°C to the cold case at -50°C, with a four-hour soak period at each extreme. Then back to each
temperature extreme for a final four-hour soak and mechanism demonstration. The mechanismdemonstration consisted of a worst case single cutter firing and only visual observation since the
270
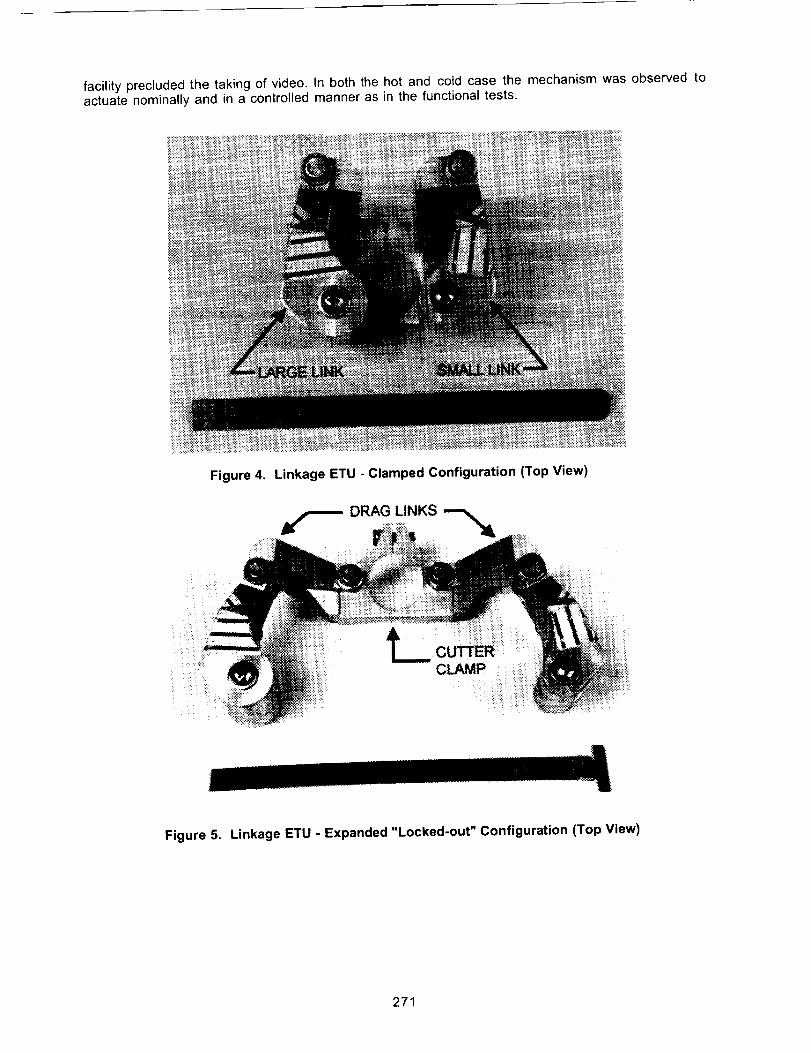
facility precluded the taking of video. In both the hot and cold case the mechanism was observed toactuate nominally and in a controlled manner as in the functional tests.
Figure 4, Linkage ETU - Clamped Configuration (Top View)
L
Figure 5. Linkage ETU - Expanded "Locked-out" Configuration (Top View)
271
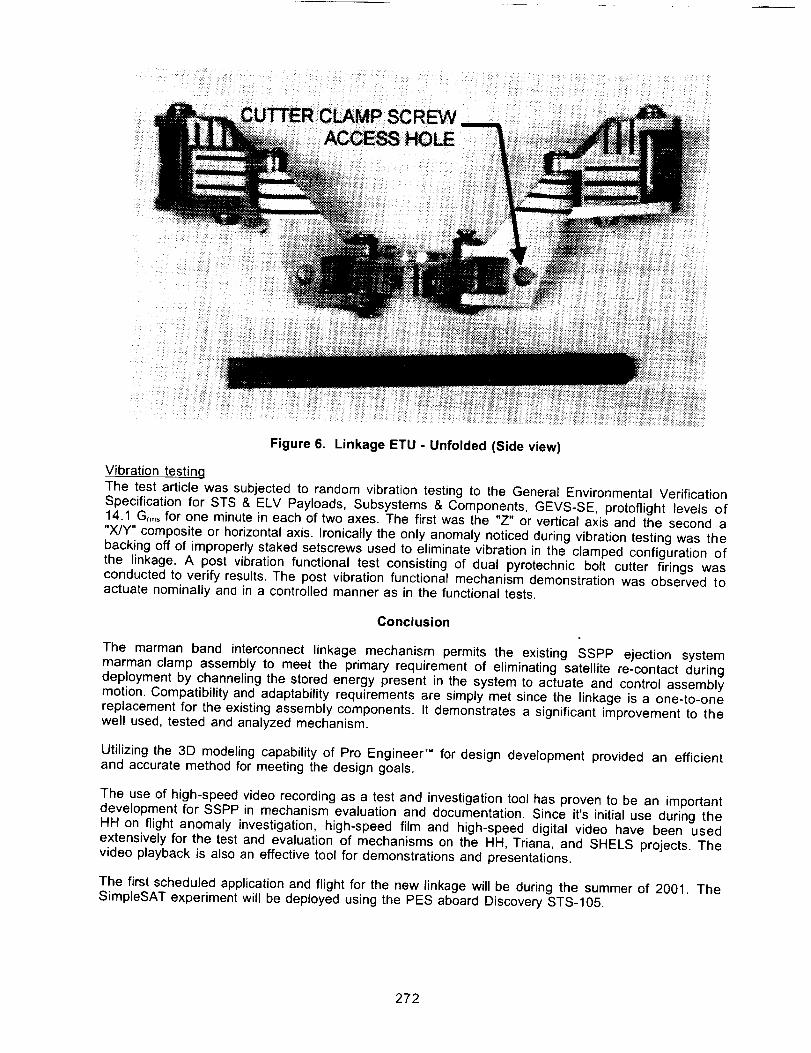
Figure 6. Linkage ETU - Unfolded (Side view)
Vibration testing
The test article was subjected to random vibration testing to the General Environmental VerificationSpecification for STS & ELV Payloads, Subsystems & Components, GEVS-SE, protoflight levels of14.1 Grr, s for one minute in each of two axes. The first was the "Z" or vertical axis and the second a
"X/Y" composite or horizontal axis. Ironically the only anomaly noticed during vibration testing was thebacking off of improperly staked setscrews used to eliminate vibration in the clamped configuration ofthe linkage. A post vibration functional test consisting of dual pyrotechnic bolt cutter firings wasconducted to verify results. The post vibration functional mechanism demonstration was observed toactuate nominally and in a controlled manner as in the functional tests.
Conclusion
The marman band interconnect linkage mechanism permits the existing SSPP ejection systemmarman clamp assembly to meet the primary requirement of eliminating satellite re-contact duringdeployment by channeling the stored energy present in the system to actuate and control assemblymotion. Compatibility and adaptability requirements are simply met since the linkage is a one-to-onereplacement for the existing assembly components. It demonstrates a significant improvement to thewell used, tested and analyzed mechanism.
Utilizing the 3D modeling capability of Pro Engineer TM for design development provided an efficientand accurate method for meeting the design goals.
The use of high-speed video recording as a test and investigation tool has proven to be an importantdevelopment for SSPP in mechanism evaluation and documentation. Since it's initial use during theHH on flight anomaly investigation, high-speed film and high-speed digital video have been usedextensively for the test and evaluation of mechanisms on the HH, Triana, and SHELS projects. Thevideo playback is also an effective tool for demonstrations and presentations.
The first scheduled application and flight for the new linkage will be during the summer of 2001. TheSimpleSAT experiment will be deployed using the PES aboard Discovery STS-105.
272

PULL DOWN STOPS ---_ _ MARMAN BAND INTERCONNECT LINKAGE ASSEMBLY
/ k
S
_"_L Y) ISOMETRIC VIEW TOP VIEW
MARMAN BAND ASSEMBLY / PES - CLAMPED CONFIGURATION
Figure 7
-- PULL DOWN STOPS
Y(X) i
X(Y)
ISOMETRIC VIEW TOP VIEW
EXPANDED MARMAN BAND ASSEMBLY - RESTING ON PULL DOWN STOPS
Figure 8
273

References
1. NASA GSFC, "Hitchhiker Customer Accommodations & Requirements Specification", 740-SPEC-O08, 1999.
2. NASA MSFC, " Design Criteria for Controlling Stress Corrosion Cracking", MSFC-SPEC-522B,1987.
3. Slebzak, G.R., "Hitchhiker Marman Band Interconnect Linkage Test Procedure", SSPP, 870-PROC-587, 2000.
4. NASA GSFC, "General Environmental Verification Specification for STS & ELV Payloads,Subsystems, and Components" GEVS-SE, 1996.
274

/
Taking Spacecraft Commercial Practices Too Far
Chuck Lazansky" and Scott Christiansen*
Abstract
In the radically changing, commercially driven spacecraft market emphasis has been placed on driving theprice of components to an absolute minimum. This paper considers the question: How does the push for
simple, low-cost devices effect the risk of failure in the use of the device? Starsys Research developed aparaffin-powered pinpuller for the Iridium ® program. The design was very successful in its simplicity,
reliability, and low cost. However, costs to integrate, operate, and control the pinpuller on orbit were higherthan expected as a result of the design simplicity. Ultimately, the problems were addressed and flight
operation of the mechanisms was successful.
After the program, the pinpuller was re-designed to address the limitations of the Iridium device. Thesimplified control, integration, and ground use of the new pinpuller have won wide appeal despite a slightly
higher unit cost. In retrospect, we learned some important lessons and potential pitfalls in high-volumespacecraft component design.
This paper will describe the specific problems encountered with the Iridium pinpuller, and how they cameabout. How those problems were addressed in the improved design will also be presented. Finally, a
discussion of how the lessons of Iridium have effected our design process will be included.
Introduction
The Iridium Pro.qramIn 1994, Starsys Research won a contract that would transform the company into a high-volume
manufacturer of space-flight hardware. Starsys was chosen as supplier of the hold-down and releasemechanisms (HDRMs) for the Iridium Satellite Constellation. The project included design and qualification
of the hardware, followed by an aggressive delivery schedule of weekly shipments over the course of 22months. This delivery schedule matched Iridium's planned production rate of 1 satellite per week for the
80 spacecraft to be manufactured.
In addition to the HDRM hardware, a device was needed to cage and release the gateway and cross-link
antenna gimbals. An HOP pinpuller concept was selected as the most straightforward and cost-effectivesolution. Twelve (12) of the pinpullers were required per spacecraft, and with spares, over 1000 units were
required for the constellation.
Starsys would be a supplier to the manufacturer of the antenna subsystems. The pinpullers would be
shipped to the customer, installed in the antenna, tested, and delivered to the prime contractor forassembly into the spacecraft. All of the development work would be done with our customer. We did not
work directly with the end-user of the spacecraft.
Commercial Desiqn ApproachDesign for a high-volume commercial application was a significant shift for Starsys. The target price forthe pinpuller was roughly $600 per unit, with half the costs estimated to come from parts, and half fromlabor. At the time, typical paraffin actuators were built in lot sizes of 5, at almost 10 times this target cost.
The sheer volume of hardware to be delivered week after week required that Starsys take a very differentapproach to the design, assembly, and testing of the pinpuller.
Starsys Research Corporation, Boulder, CO
Proceedings of the 35 thAerospace Mechanisms Symposium, Ames Research Center, May 9-11, 2001
275
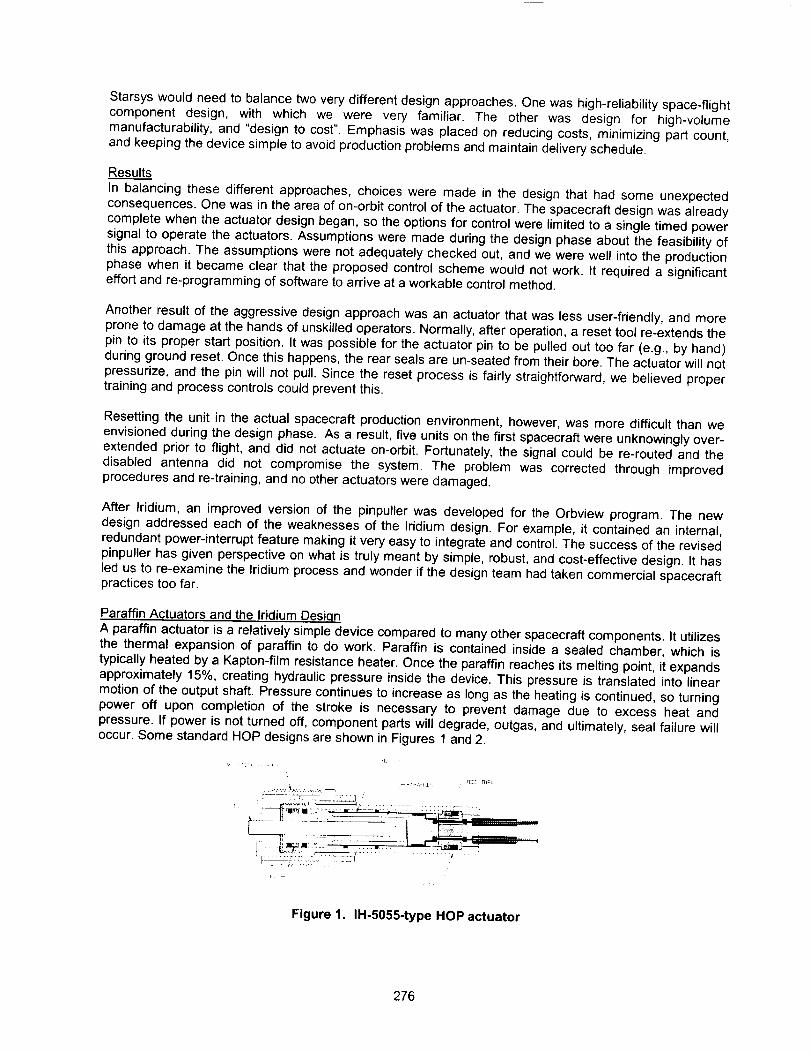
Starsyswouldneedtobalancetwoverydifferentdesignapproaches.Onewashigh-reliabilityspace-flightcomponentdesign,with which we were very familiar.The otherwas designfor high-volumemanufacturability,and"designto cost".Emphasiswasplacedonreducingcosts,minimizingpartcount,andkeepingthedevicesimpletoavoidproductionproblemsandmaintaindeliveryschedule.
ResultsIn balancingthesedifferentapproaches,choicesweremadein the designthathadsomeunexpectedconsequences.Onewasin theareaofon-orbitcontroloftheactuator.Thespacecraftdesignwasalreadycompletewhentheactuatordesignbegan,sotheoptionsforcontrolwerelimitedto a singletimedpowersignalto operatetheactuators.Assumptionsweremadeduringthedesignphaseaboutthefeasibilityofthisapproach.Theassumptionswerenotadequatelycheckedout,andwewerewellintotheproductionphasewhenit becameclearthattheproposedcontrolschemewouldnotwork.It requireda significanteffortandre-programmingofsoftwaretoarriveataworkablecontrolmethod.
Anotherresultof theaggressivedesignapproachwasanactuatorthatwaslessuser-friendly,andmorepronetodamageatthehandsofunskilledoperators.Normally,afteroperation,aresettoolre-extendsthepinto its properstartposition.Itwaspossiblefortheactuatorpinto bepulledouttoofar (e.g.,byhand)duringgroundreset.Oncethishappens,therearsealsareun-seatedfromtheirbore.Theactuatorwillnotpressurize,andthepinwillnotpull.Sincetheresetprocessis fairlystraightforward,webelievedpropertrainingandprocesscontrolscouldpreventthis.
Resettingtheunitin theactualspacecraftproductionenvironment,however,wasmoredifficultthanweenvisionedduringthedesignphase.Asa result,fiveunitsonthefirstspacecraftwereunknowinglyover-extendedpriorto flight,anddid notactuateon-orbit.Fortunately,thesignalcouldbe re-routedand thedisabled antenna did not compromise the system. The problem was corrected through improvedprocedures and re-training, and no other actuators were damaged.
After Iridium, an improved version of the pinpuller was developed for the Orbview program. The newdesign addressed each of the weaknesses of the Iridium design. For example, it contained an internal,redundant power-interrupt feature making it very easy to integrate and control. The success of the revised
pinpuller has given perspective on what is truly meant by simple, robust, and cost-effective design. It hasled us to re-examine the Iridium process and wonder if the design team had taken commercial spacecraftpractices too far.
Paraffin Actuators and the Iridium Desi,qn
A paraffin actuator is a relatively simple device compared to many other spacecraft components. It utilizesthe thermal expansion of paraffin to do work. Paraffin is contained inside a sealed chamber, which is
typically heated by a Kapton-film resistance heater. Once the paraffin reaches its melting point, it expandsapproximately 15%, creating hydraulic pressure inside the device. This pressure is translated into linearmotion of the output shaft. Pressure continues to increase as long as the heating is continued, so turning
power off upon completion of the stroke is necessary to prevent damage due to excess heat andpressure. If power is not turned off, component parts will degrade, outgas, and ultimately, seal failure willoccur. Some standard HOP designs are shown in Figures 1 and 2.
Figure 1. IH-5055-type HOP actuator
276

Figure 2. EH-3525 Hermetically Sealed HOP Actuator
A cross section of the Iddium pinpuller design is shown in Figure 3. The body, or pressure vessel, is
titanium with a kapton heater applied to the surface. The titanium pin has Viton o-ring seals at each end.The larger diameter of the rear seals creates a net retraction force on the shaft when the paraffin chamberpressurizes. A Torlon mounting flange provides the mechanical interface, and good thermal isolation so
that a spacer is not necessary.
Figure 3. Iridium Pinpuller, extended position
277
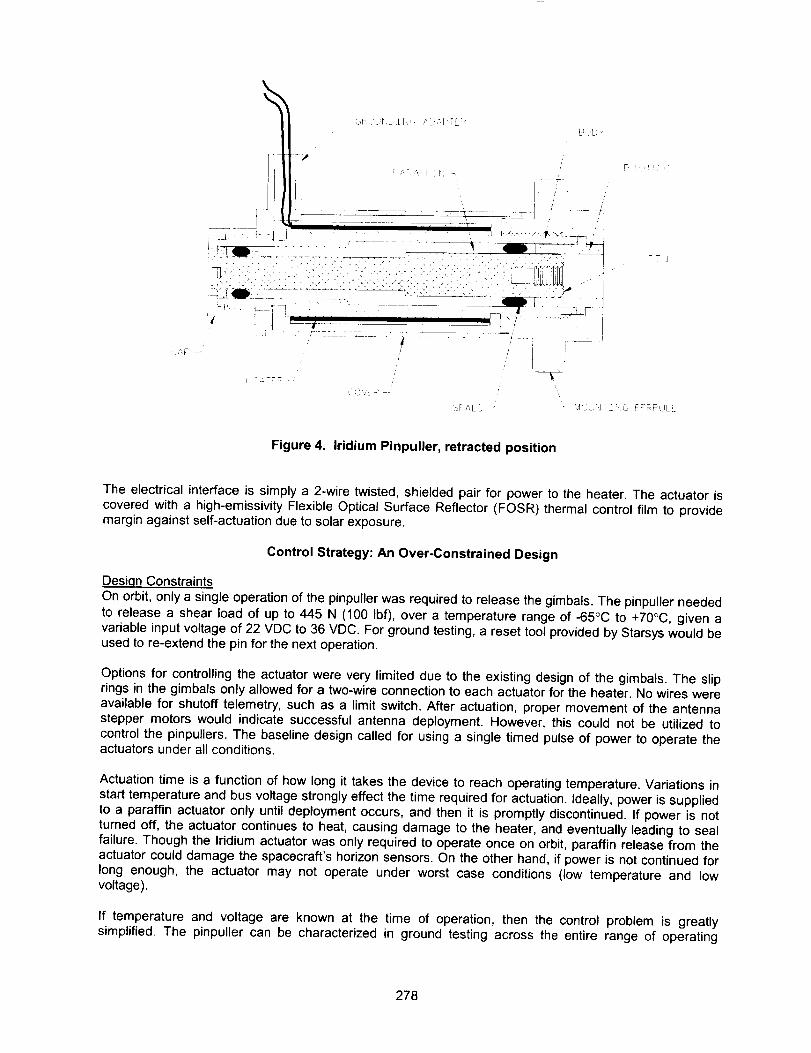
1-p
Lh L
-/ " I I I I I I I I I I r --I _ _"
. L --
_E,_, _-- LI:jJTZ',b FErFL, L[
Figure 4. Iridium Pinpuller, retracted position
The electrical interface is simply a 2-wire twisted, shielded pair for power to the heater. The actuator iscovered with a high-emissivity Flexible Optical Surface Reflector (FOSR) thermal control film to provide
margin against self-actuation due to solar exposure.
Control Strategy: An Over-Constrained Design
Design ConstraintsOn orbit, only a single operation of the pinpuller was required to release the gimbals. The pinpuller needed
to release a shear load of up to 445 N (100 Ibf), over a temperature range of -65°C to +70°C, given a
variable input voltage of 22 VDC to 36 VDC. For ground testing, a reset tool provided by Starsys would beused to re-extend the pin for the next operation.
Options for controlling the actuator were very limited due to the existing design of the gimbals. The slip
rings in the gimbals only allowed for a two-wire connection to each actuator for the heater. No wires wereavailable for shutoff telemetry, such as a limit switch. After actuation, proper movement of the antennastepper motors would indicate successful antenna deployment. However, this could not be utilized tocontrol the pinpullers. The baseline design called for using a single timed pulse of power to operate theactuators under all conditions.
Actuation time is a function of how long it takes the device to reach operating temperature. Variations instart temperature and bus voltage strongly effect the time required for actuation. Ideally, power is supplied
to a paraffin actuator only until deployment occurs, and then it is promptly discontinued. If power is notturned off, the actuator continues to heat, causing damage to the heater, and eventually leading to sealfailure. Though the Iridium actuator was only required to operate once on orbit, paraffin release from the
actuator could damage the spacecraft's horizon sensors. On the other hand, if power is not continued forlong enough, the actuator may not operate under worst case conditions (low temperature and low
voltage).
If temperature and voltage are known at the time of operation, then the control problem is greatlysimplified. The pinpuller can be characterized in ground testing across the entire range of operating
278
conditions.Onorbit,theconditionsat thetimeof deploymentcanbe read,andtheappropriatepower-ontimedeterminedbya softwaretablelook-up.However,temperatureandvoltageatthetimeofdeploymentwouldnotbeavailable.Temperaturesensorswerenotpossiblesincenoadditionalwiringwasavailable.Evenif wiringwereavailable,theactuatorswereondifferentsidesof thespacecraft,whichwouldseedifferentoperatingenvironments.Severaltemperaturesensorswouldhavebeenrequired.Andtherewasnoplanto readbusvoltage.Thevoltageat timeof deploymentcouldvarybetween22and36V,or 11wattsof inputpowerto almost30watts!Wedidnotknowif a singletimedpowerpulsecouldworkacrosssuchawidevoltageandtemperaturerange,yettherewaslittleflexibilityintheserequirements.
Analternativeconceptwaspresentedas asolutionduringanearlydesignmeeting.Starsyscoulddesignan internalpower-disconnect,whichwouldopenthe powercircuitwhenthe pinhad pulled,providinginherentcontrol.However,to keepoverallprogramcost down,developmentworkwas discouraged.Emphasiswasplacedonutilizingproven,existingdesigns.To ourcustomer,therisk,costandscheduleof thislevelofdesignworkdidnotfit theprogramphilosophy.Starsysagreedto designtheactuatorsuchthatthesingletime-outapproachwouldwork.
To summarize,thedesignchallengeof thetime-outcontrolstrategyisasfollows:selecta singlepower-ontimethatguaranteesfullactuationcanoccurfromthelow-temperature,low-voltagecondition,andthenverifythattheactuatorcansurvivethissamepowerdurationwiththehighvoltageconditionfromthehightemperature.Failureofeitheroneofthesewouldjeopardizeamajorspacecraftfunction.
Strateqy for Time-out ControlFirst, the heater was sized for operation under the worst case conditions. The specification required full
pin retraction within 12 minutes in the coldest environment (-65°C) at the lowest voltage (22 VDC), with a
partially failed heater operating at 75% of capacity. Using a model that balances heat input with conductivelosses at actuation temperature, and adding appropriate margin, it was found that 8 watts was sufficient to
meet the requirement. This dictated a nominal heater resistance of 44 ohms overall.
The heater design was also driven by the 2-wire limitation. Normally, 4 heater wires are desirable for two
separate, redundant heater circuits. The design challenge was to build some degree of redundancy intothe 2-wire circuit. This was achieved through the layout of the resistive elements within the Kapton-
laminated heater. Four separate heater traces were placed between two "bus-bar" traces, all operating inparallel with an overall resistance of 44 ohms. In theory, a single element failure would still leave 3 othertraces intact (or 75% of heater capacity), allowing full retraction under the worst-case conditions.
The heater is a critical component in the actuator, and methods for verifyirlg proper heater performance
had already been well developed. For example, 100% incoming inspection is performed, including anelectrical test. In-process inspections exist for the application of the heater to the body. Electricalverification tests are performed regularly for the remainder of assembly and testing process. Given these
procedures, and the robust heater design, the sacrifice of full heater circuit redundancy was traded for asimple two-wire power circuit.
With the heater sized properly for worst case operation, the issue of actuator survival was addressed. Theactuator would need to survive for the duration of the power signal under hot, high voltage conditions. The
operating pressure inside the actuator, under nominal 222-N (50 Ibf) load, is approximately 20.2 MPa(3000 psi). To prevent extrusion failure of the Viton seals, internal pressures must be kept below 68.9
MPa (10,000 psi). Some paraffin actuators incorporate a shear feature to achieve this. This is a part,usually a flat disk, which fails in pure shear due to excess internal pressure, allowing expansion of the waxchamber volume. The expansion reduces the hydraulic pressure to below critical levels, thereby reducing
the risk of seal failure or rupture of the body. A shear disk was not to be included in the pinpuller.
The pinpuller shaft was given almost 100% excess travel beyond the required stroke to create more
internal volume for wax expansion. After the 0.635-cm (0.250-in) stroke required for release, the pin wouldcontinue to retract another 0.635 cm (0.250 in) to an internal hard stop. To reach critical pressures with
the pin at hard stop would require that the wax be brought to temperatures above the survival range of theheater. The temperature required to expand the paraffin to seal extrusion pressures (68.9 MPa or 10,000
279
psi)wasestimatedto bebetween230°Cand250°C.Thelaminatingadhesivelayerof FEPin theheatersoftensandmeltsatapproximately200°C.Giventheclosespacingof theinconelheatertracesandtheactionofmeltingandflowingFEPadhesive,theheatingelementswereexpectedto contact,burn,andfailatcriticaltemperatures.Ourobservationsofheat-damagedheaterssupportedthis.On-orbit,heaterfailureisa muchmoredesirablemodethansealfailure(assumingdeploymenthasalreadyoccurred).
Insummary,thedesignstrategyto makethesingletime-outcontrolschemeworkwas:
1)Highpowerinputwillensureactuationatextremeconditions
2)100%pinover-travelwillminimizeriskofover-pressurization
3)Heaterfailurewillstopheatinputbeforesealfailurecanoccur
Problems with the Control Strate,qy:
The critical assumption that over-travel and heater failure would prevent paraffin release was not true.During survival testing, in which power to the actuator is left on indefinitely, heating continued 100% of the
time until seal failure occurred. Heater failure was expected to take place at actuator temperatures of
200°C to 230°C. The actual survival temperature of the actuators was found to be 260°C to 270°C, due toextrusion of the rear seals. The heater design was extremely robust, and not even partial element failure
was noted for the duration of the program. Ironically, this resistance to failure undermined our designassumptions and the control strategy.
The problem was compounded by a tolerance stack error, which was discovered after the first 15 ship-sets had been integrated. The error resulted in a gap (about 0.127-0.178 mm [0,005 in -0.007 in]) in the
area of the rear seal when the pin is in the fully retracted position. The presence of this gap meant the rearseal could extrude, and paraffin could escape at pressures below 68.9 MPa (10,000 psi). The problemcould be corrected, but the solution required removing 1.27 mm (0.050 in) of the pin over-travel. This
reduced the margins on seal survival due to extended power by roughly 10%. This led us to performtesting on how long actuators could survive with the gap discrepancy, and with the 1.27 mm (0.050 in) of
reduced over-travel. It was during this testing that we learned the heaters were not a failure mode to relyon to prevent paraffin release.
The awareness that the control strategy would not work occurred late in the program, almost 25% throughthe satellite production phase. The spacecraft systems engineers had the software ready to provide a
fixed-duration power signal to the pinpullers. It was not clear what level of re-design and/or retrofit wouldbe necessary to solve this problem. We worked very closely with the lead engineer of the spacecraft
company to find a workable solution.
Both Starsys and our customer had been aggressive about utilizing a simple, low-cost release device. In
our efforts to meet the program's needs, we were overly optimistic in our assumptions about how tocontrol the device. Finally, those assumptions were not fully investigated until late in the program.
Solution of the Control Problem
The problem was approached in two steps: The first was to narrow the expected operating temperature
and voltage range. This was carried out by the spacecraft company. The second was for Starsys toconduct a battery of survival and actuation time tests to characterize the performance of the pinpullers.
The initial voltage range was 22 VDC to 34 VDC. Closer analysis by the electrical team showed that at thetime of deployment, the voltage range could be narrowed to 26 to 33 VDC. This reduced the possible
power supplied from a range spanning 15.3 watts to a range of 9.4 watts, or an almost 40% narrowerpower range. The use of voltage regulators was considered, but 12 individual regulators would have beenrequired due to wiring configuration. This was cost prohibitive and not a desirable solution. Temperature
range was reduced in similar fashion. Changing deployment sequence on the spacecraft, and operatingthe pinpullers earlier narrowed the temperature range. The expected low temperature was increased from
-65°C to -40°C, and +65°C remained as the high temperature.
280

A seriesof tests was performed in a thermal-vacuum chamber to determine survival times (and verify
operation times) throughout the narrowed temperature and voltage range. Survival time was defined asthe time to seal extrusion and paraffin release, which was a discrete, observable event in the testchamber. Survival times for actuators with the seal-gap discrepancy were also determined, since the first
15 ship-sets were potentially effected. Once enough data points had been collected, the data was plottedas a series of curves showing response time as a function of power input. A survival curve, showing
survival times from +65°C as a function of input power, was added. The resulting plot is shown in Fig.5.
GMA/XI_ Laum_ I.m:k I_ms_ion Tines
Ba_d on Quid. Test Vaiuas
14 16 10 20 22 24 "_ M 30 -_
I/V_qe, W_
34
Figure 5. Response time curves (and estimated survivability line)
Even before the testing was complete it was clear that a single power-on time would not work over the
wide range of operating conditions. The best solution to this was measuring bus voltage just prior to
operation on-orbit, and having the system software select the power duration from a look-up table. It was
apparent to Starsys that this was a considerable effort for the spacecraft company at this stage in theprogram. Nevertheless, a voltage feedback system and table look-up software was put in place on allspacecraft. In the unlikely event of incomplete deployment of one of the antenna, it would be possible tomanually power individual pairs of actuators. However, this would have been very impractical for largenumbers of actuators, and was considered only as a backup plan. The summary of the solutions adopted:
Summary of Solution to Actuator Control Problem
1) Voltage and temperature range narrowed by earlier deployment2) Testing conducted to characterize actuator operation and survival3) Bus voltage was fed back and used to select a power-on time (based on test results) via a table
look-up in control software.4) In case of incomplete deployment, manual powering of the actuators was possible.
281
Thisstrategywas implementedwitha 100%successrate on-orbit.With the exceptionof the fivepinpullersdamagedduringgroundoperations(to bediscussedin the nextsection)all cross-linkandgatewayantennadeployedasplanned.
"HumanFactors" in Ground Operations
An advantage to using HOP actuators is their ability to be used and reset multiple times for groundoperations. The drive to reduce the part count and the complexity of those parts led to a design which was
vulnerable to procedural errors by operators. As a result, 5 pinpullers on the first spacecraft wereinadvertently damaged prior to flight, and were unable to deploy.
Desi.qn Choices
After operation, an HOP pinpuller must be reset. Reset consists of heating the unit to melt the paraffin,and then installing a specially designed reset tool, which screws into the front end of the retracted pin. Thetool exerts a spring force on the shaft, which slowly re-extends the pin as the wax cools. Once the actuator
is cooled to below the melting point of the paraffin, the tool can be removed, and the actuator is ready forthe next operation.
The first prototype units of the pinpuller were designed with a step feature that would act as a stop against
over-extending the pin. This step on the pin came to rest against the front seals as the actuator was reset.However, the step caused problems during the reset process. The actuator was required to reset with 68N
(15 Ibf) or less, and it took more force than this to push the pin through the solidifying paraffin. When thestep did come to rest against the seals, it would force small bits of solid paraffin through the seals. Inaddition, there was the possibility that the stop feature might damage the front seals. The existing stopfeature could not be used.
Any other design option for the stop feature meant adding parts, complexity in assembly, and cost. It
would also add to the envelope, which was limited. However, without a stop feature for the extendedposition it would be possible to pull the pin out farther than the zero-position, which could un-seat the rear
seals from the small (rear) bore. If left in that position and powered, the actuator wilt fail to pressurize, andliquid paraffin will flow around the rear seal and out of the actuator. Still, the feasibility of removing the stopfeature altogether was considered.
There were design precedents for the lack of a front hard stop in the puller. Several models of paraffin
actuator do not have a zero-stop and rely on the interface to limit pin motion. For example, the IH-5055actuator rod is virtually unrestricted in its motion (in both directions) except by its interface. The issue wasexplored with our customer, and the decision we arrived at was to eliminate the front hard-stop feature.
The zero-position of the pin would be established by the reset tool rather than a stop feature. To minimizethe risk of over-extension, processes would be carefully controlled. Only properly trained technicians
would use the qualified Starsys tool per the established procedures. Proper pin extension would also beverified following each reset to insure the pin had not been over-extended.
Results - Ground Operation ErrorsThe lack of a hard stop for the nominal shaft position made the actuator vulnerable to operator error. The
confidence in process controls on the ground was unfounded for several reasons. First, though the resetprocess was easy at the antenna level, it was much more complicated at the spacecraft level. Physical
access to the pinpullers was somewhat restricted. The antenna had to be powered in groups, and thatmeant resetting several actuators simultaneously. Moreover, the pinpullers were one small component outof many on the spacecraft, and probably received less attention than they did at the antenna level. These
difficulties, combined with the variability of greater numbers of people working with the actuators at theintegration facility, led to improper resetting of several actuators on the first spacecraft produced.
Starsys first learned of this through a telephone call received immediately after the launch of the firstgroup of spacecraft. Five antenna on one of the spacecraft were not moving after all the pinpullers had all
been operated. The pinpullers were operated a second time, with a longer power duration. Still, thestepper motors could not move the antenna. It was clear that the pins had not pulled, and that additional
282

poweringof thedeviceswouldnothelp.We workedto supportthe investigationwithboththeantennamanufacturerandthespacecraftcompany.
Justa fewweekspriortothefirstlaunch,Starsyshadbeencontactedaboutdamagedpinpullersatboththeantenna and spacecraft facilities. Each facility returned a unit to Starsys for evaluation, though each
was already aware that the cause of the damage was improper operation. During testing, one unit waspowered for well over 5 minutes when the maximum time for ground operation was set at 3 minutes. This
actuator had obvious heat damage, extruded seal material, and had lost paraffin. Another unit had beenmanually over-extended during resetting. Apparently, the users had attempted to "help" the reset tool by
pulling on it while the pin was extending. This defeated the built-in stop incorporated in the reset tool. Dueto the compact design, extending the shaft only 1.27 mm (0.050 in) beyond its zero-point can unseat the
rear seals. Once this happens, the actuator is compromised. If the operator pushes the shaft back in,there is a risk of tearing the seal on the body's interior corner. If the seal remains unseated, then at thenext operation, the actuator will not fully pressurize, and paraffin will escape.
It quickly became clear that the reason the actuators did not deploy the antenna was that they had been
reset improperly or otherwise damaged on the ground. Paraffin was found on the floor where thespacecraft was assembled as evidence of either over-extension or over-powering of the units. At this
point, our involvement in the investigation was no longer necessary and we found it difficult to get furtherinformation from the spacecraft company. Sources indicated to us that training difficulties and workforce
turnover were issues at the integration facility. Nevertheless, the problem was addressed by morethorough training of the operators. An inspection of the pin position was added following actuator reset, toverify proper extension. This solved the problem, and no other instances of improper reset occurred. The
partially disabled spacecraft did not adversely effect the overall functioning of the satellite network. Thecommunication signals were re-routed to other satellites to compensate.
Both the antenna contractor and the spacecraft manufacturer experienced difficulties in ground operationsincluding excess power duration and improper resetting. Though the procedures were clear and well
known, the magnitude of the project and the many people involved created many opportunities for error.Design decisions which simplified the device left too little margin for error in ground operations. The
actuator was prone to "human factors", and though it showed better than "four-nines" reliability on paper, itwas reduced to 5 failures in 1000 in actual use due to being damaged prior to flight.
Figure 6. The Improved Design (Type SP-5025 pinpuller)
283
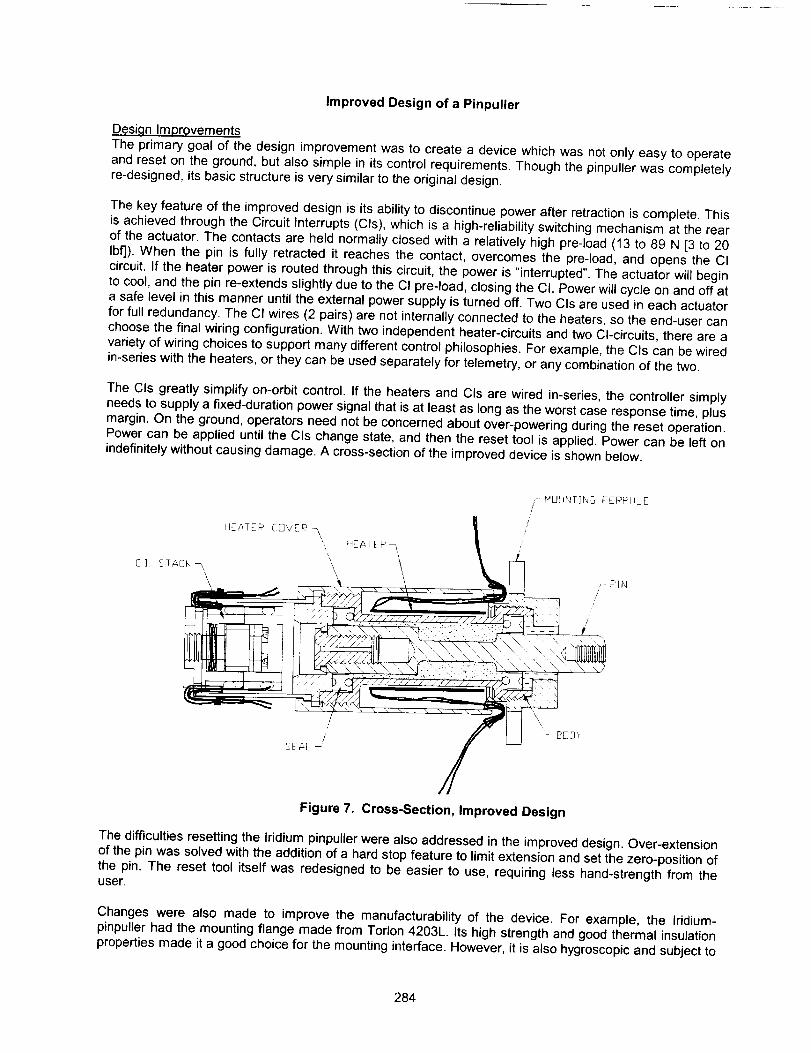
Improved Design of a Pinpuller
Desi,qn ImprovementsThe primary goal of the design improvement was to create a device which was not only easy to operateand reset on the ground, but also simple in its control requirements. Though the pinpuller was completely
re-designed, its basic structure is very similar to the original design.
The key feature of the improved design is its ability to discontinue power after retraction is complete. Thisis achieved through the Circuit Interrupts (CIs), which is a high-reliability switching mechanism at the rear
of the actuator. The contacts are held normally closed with a relatively high pre-load (13 to 89 N [3 to 20Ibf]). When the pin is fully retracted it reaches the contact, overcomes the pre-load, and opens the CIcircuit. If the heater power is routed through this circuit, the power is "interrupted". The actuator will begin
to cool, and the pin re-extends slightly due to the CI pre-load, closing the CI. Power will cycle on and off ata safe level in this manner until the external power supply is turned off. Two CIs are used in each actuator
for full redundancy. The CI wires (2 pairs) are not internally connected to the heaters, so the end-user canchoose the final wiring configuration. With two independent heater-circuits and two CI-circuits, there are a
variety of wiring choices to support many different control philosophies. For example, the CIs can be wiredin-series with the heaters, or they can be used separately for telemetry, or any combination of the two.
The CIs greatly simplify on-orbit control. If the heaters and CIs are wired in-series, the controller simplyneeds to supply a fixed-duration power signal that is at least as long as the worst case response time, plus
margin. On the ground, operators need not be concerned about over-powering during the reset operation.Power can be applied until the CIs change state, and then the reset tool is applied. Power can be left on
indefinitely without causing damage. A cross-section of the improved device is shown below.
Figure 7. Cross-Section, Improved Design
The difficulties resetting the Iridium pinpuller were also addressed in the improved design. Over-extensionof the pin was solved with the addition of a hard stop feature to limit extension and set the zero-position ofthe pin. The reset tool itself was redesigned to be easier to use, requiring less hand-strength from theuser.
Changes were also made to improve the manufacturability of the device. For example, the Iridium-pinpuller had the mounting flange made from Torlon 4203L. Its high strength and good thermal insulation
properties made it a good choice for the mounting interface. However, it is also hygroscopic and subject to
284
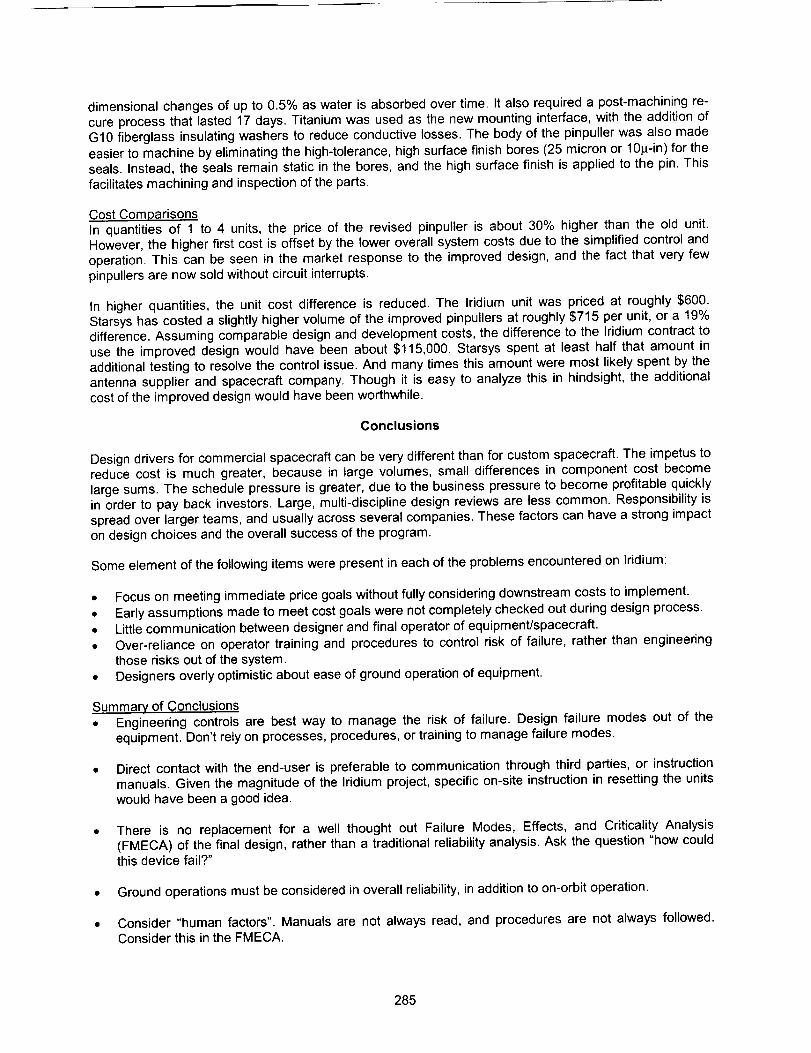
dimensionalchangesofupto 0.5%aswaterisabsorbedovertime.Italsorequireda post-machiningre-cureprocessthatlasted17days.Titaniumwasusedasthenewmountinginterface,withtheadditionofG10fiberglassinsulatingwashersto reduceconductivelosses.Thebodyof thepinpullerwasalsomadeeasiertomachinebyeliminatingthehigh-tolerance,highsurfacefinishbores(25micronor 10p-in)fortheseals.Instead,thesealsremainstaticin thebores,andthehighsurfacefinishisappliedtothepin.Thisfacilitatesmachiningandinspectionoftheparts.
Cost ComparisonsIn quantities of 1 to 4 units, the price of the revised pinpuller is about 30% higher than the old unit.However, the higher first cost is offset by the lower overall system costs due to the simplified control and
operation. This can be seen in the market response to the improved design, and the fact that very few
pinpullers are now sold without circuit interrupts.
In higher quantities, the unit cost difference is reduced. The Iridium unit was priced at roughly $600.
Starsys has costed a slightly higher volume of the improved pinpullers at roughly $715 per unit, or a 19%difference. Assuming comparable design and development costs, the difference to the Iridium contract to
use the improved design would have been about $115,000. Starsys spent at least half that amount inadditional testing to resolve the control issue. And many times this amount were most likely spent by the
antenna supplier and spacecraft company. Though it is easy to analyze this in hindsight, the additionalcost of the improved design would have been worthwhile.
Conclusions
Design drivers for commercial spacecraft can be very different than for custom spacecraft. The impetus to
reduce cost is much greater, because in large volumes, small differences in component cost becomelarge sums. The schedule pressure is greater, due to the business pressure to become profitable quickly
in order to pay back investors. Large, multi-discipline design reviews are less common. Responsibility isspread over larger teams, and usually across several companies. These factors can have a strong impact
on design choices and the overall success of the program.
Some element of the following items were present in each of the problems encountered on Iridium:
• Focus on meeting immediate price goals without fully considering downstream costs to implement.
• Early assumptions made to meet cost goals were not completely checked out during design process.
• Little communication between designer and final operator of equipment/spacecraft.
• Over-reliance on operator training and procedures to control risk of failure, rather than engineeringthose risks out of the system.
• Designers overly optimistic about ease of ground operation of equipment.
Summary of Conclusions
• Engineering controls are best way to manage the risk of failure. Design failure modes out of theequipment. Don't rely on processes, procedures, or training to manage failure modes.
Direct contact with the end-user is preferable to communication through third parties, or instructionmanuals. Given the magnitude of the Iddium project, specific on-site instruction in resetting the units
would have been a good idea.
There is no replacement for a well thought out Failure Modes, Effects, and Criticality Analysis(FMECA) of the final design, rather than a traditional reliability analysis. Ask the question "how couldthis device fail?"
• Ground operations must be considered in overall reliability, in addition to on-orbit operation.
• Consider "human factors". Manuals are not always read, and procedures are not always followed.Consider this in the FMECA.
285

• Expectmorevariabilityin productionprocesseswith highervolumes,multiplework shifts,etc.Commercialspacecraftgetlesshighlevelattentionandscrutinythancustomspacecraft.
Thelessonslearnedon Iridium have had an effect on our approach to new designs. We consider issues
such as ease of operation and reset more carefully. In short, we design hardware to do more so the userhas to do less. More attention is given to control issues. We work with the customer on the details of thecontrol system early in the design process. We make sure we have direct contact with the final operator of
the spacecraft, and are available for support during integration and ground testing.
286

- >.."J/.i
Design and Development of a Miniature Mechanisms Tool-kit for Micro Spacecraft
Cliff E. Willey', Brett Huettl", Stuart W. Hill"
Abstract
With the continued push for smaller, faster, and cheaper spacecraft comes a new era in mechanism
design. The desire to develop "Micro Satellites", along with advances in the processing and selection of
materials, have created an abundance of opportunities to miniaturize mechanisms. Simple designs withdirect applications of developing technologies are ideal for these miniature mechanisms. This paper will
focus on the design and development of a miniature satellite "tool kit". The Johns Hopkins UniversityApplied Physics Laboratory (APL) and Starsys Research developed six new miniature mechanisms under
a NASA Advanced Technology Development Program. The mechanisms developed included a Micro andMini Separation Nut, a Mini Rotary Actuator, a Mini Burn Wire Release, a Mini Linear Actuator, and a Mini
Redundant Release Mechanism. This paper will discuss the concepts evaluated, designs chosen forfabrications, problems encountered during development, achieved performance characteristics, and
recommendations for future development.
Introduction
Micro-satellites in the 10-100 kg range are being developed for scientific, commercial and militaryapplications. For their size, these spacecraft will have very sophisticated payloads and missions. This isdue to advances in miniaturization of electronics, RF systems, sensors, and instruments. The Johns
Hopkins University Applied Physics Laboratory is developing many leading edge technologies for a wide
variety of micro-sat applications. The APL micro-spacecraft concept (Figure 1) provides a modular-customizable bus that is 3-axis stabilized, has redundant IEEE 1394 data bus, on-board instrument
processing, and makes use of developments in miniaturized electronics. NASA, military, and commercialmicro-satellite programs are making similar advances with miniaturized payloads and electronics.
Highly integrated SICelectronics shown with
covers removed
Mass = 30 kg
Miniaturized
Instrument
Chip-on-Board
Electronics
MEMS Sensor
Miniature Mechanisms
Miniaturized Star Camera
Miniaturized GPS Receiver
Miniaturized RF System
Figure 1. JHU/APL Concept MicroSat
Johns Hopkins University Applied Physics Laboratory, Laurel, MD
Starsys Research Corporation, Boulder, CO
Proceedings of the 35 thAerospace Mechanisms Symposium, Ames Research Center, May 9-11, 2001
287

Significantminiaturemechanismdevelopmentsare neededfor theseup-and-comingmicro-satelliteprograms.Miniaturizationis neededfor deploymentof solararrays,booms,and instrumentdevices.Therearesomeoff-the-shelfmechanismsthataresmall,but thesestill requireanorderof magnitudereductioninsizetomeettheneedsformicro-satellites.TheAdvancedTechnologyDevelopmentProgramat JHU/APLis currentlyfundingresearchfordevelopmentof miniaturemechanismsandis collaboratingwithStarsysResearchto provideoff-the-shelfselectionsofthesedevices.Thishasleadtothecreationofthe MiniatureMechanismsToolKit. Thetool kit contains6 newmechanisms(Table1) for useoninstruments,solararrays,andotherdeployableor mechanismdrivendevice.All of thesemechanismscanbeeasilyscaledforavarietyofoutputrequirementsandshowpromiseforadditionalminiaturization.
Mechanism
TypeMicro
Sep-NutMini
Sep-Nut
RotaryLatch
Burn WireRelease
ActuationDevice
ShapedSMA
ShapedSMA
SMATorsion
Sprin 9
Company
Starsys
Starsys
Fuse WireMini Linear
Actuator SMA Wire JHU/APLMini
Redundant ShapedRelease SMA JHU/APL
Table 1. Mechanism Descri
Mass Size
(gm) (mm)
2O
Starsys 5
JHU/APL 0.07
0.5
<3.8
Power
)tions
Load
Capability LifetimeRelease
Time
7.6X5.1X12.7 <2 watts 22 N > 100 Actuations -30 sec
15.2X15.2X25.4 2-5 watts 90 N > 100 Actuations 30-60 sec
12.7X12.7X12.7 2-5 watts ! 0.042 N-m > 100 Actuations < 15 sec
1-2 amps10.2X7.0X3.9 X volts 45 N 1 Actuation < 5 msec
0.25 amps5.6X5.6X16 8 volts 40 N > 1000 Actuations < 10 msec
10.2X10.2X23 2-4 watts 6 N > 100 Actuations 30-60 sec
This project addressed the design of several types of mechanisms including separation nuts, release
devices, linear actuators, and rotary actuators with a range of load capability. Performance requirementsfor these mechanisms are not well established due to the infancy of the micro-satellite designs.Therefore, assumptions were made for requirements to handle loads of 12-45 N, make the size small as
possible, use low power, provide low shock, and make the mechanisms easily resettable. Shape MemoryAlloy (SMA) was chosen to drive most of the mechanisms due to its capability of providing high forces in a
very small package. SMA's are also very quick responding when electrically driven directly through the
material. A burn wire mechanism was also developed by JHU/APL due its capability to be highlyminiaturized yet provide good strength capability and reliable operation. The following sections will give adetail explanation of the six mechanisms developed.
Mini Separation Nut
Desiqn Approach
The Mini Separation Nut was designed by Starsys to be similar in operation to conventional nut release
devices and release a small screw. The design uses a segmented nut constrained by a collar. With the
collar in place, the segments are held in the shape of a nut, allowing a mating screw to be threaded andtightened in place. The collar is maintained in position by a compression spring that prevents the collar
from moving due to vibration loads. The collar is driven in opposition to the spring by a SMA element. Torelease the screw and nut, power is supplied to a heater or directly to the SMA element. As it is heated
through its transformation temperature, the element recovers previously induced strain, and drives thecollar to allow the segmented nut to separate, releasing the screw. When power is discontinued, the
mechanism can be manually reset. The screw can then be re-inserted into the nut and the sequencerepeated.
The SMA element consists of 3 SMA springs that are used to axially move a collar that restrains the nut
segments (see Figure 2). The three SMA springs (2) are nested in a cylindrical housing (1). On top of
these rests the Spring Washer (4) and collar (5). In the latched position, a compression spring (7)
288
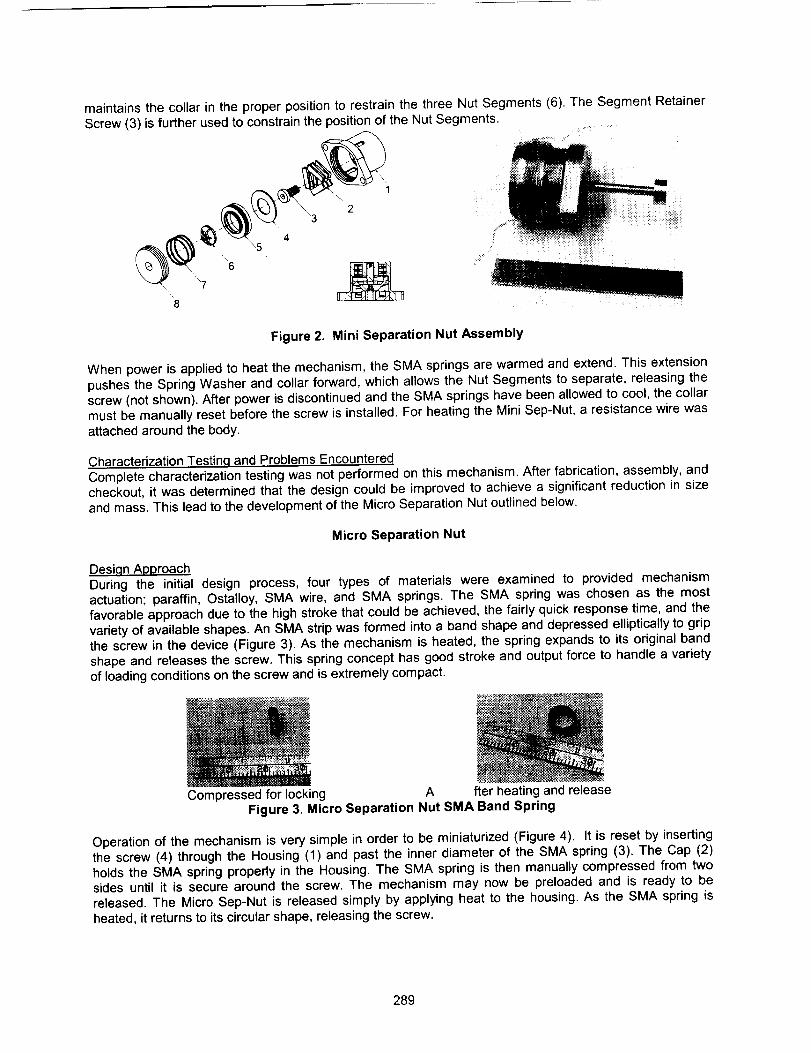
maintainsthecollarin theproperpositionto restrainthethreeNutSegments(6).TheSegmentRetainerScrew(3)isfurtherusedtoconstrainthepositionof theNutSegments.
Figure 2. Mini Separation Nut Assembly
When power Js applied to heat the mechanism, the SMA springs are warmed and extend. This extensionpushes the Spring Washer and collar forward, which allows the Nut Segments to separate, releasing the
screw (not shown). After power is discontinued and the SMA springs have been allowed to cool, the collarmust be manually reset before the screw is installed. For heating the Mini Sep-Nut, a resistance wire was
attached around the body.
Characterization Testin,q and Problems Encountered
Complete characterization testing was not performed on this mechanism. After fabrication, assembly, andcheckout, it was determined that the design could be improved to achieve a significant reduction in sizeand mass. This lead to the development of the Micro Separation Nut outlined below.
Micro Separation Nut
Desi.qn ApproachDuring the initial design process, four types of materials were examined to provided mechanism
actuation; paraffin, Ostalloy, SMA wire, and SMA springs. The SMA spring was chosen as the mostfavorable approach due to the high stroke that could be achieved, the fairly quick response time, and the
variety of available shapes. An SMA strip was formed into a band shape and depressed elliptically to grip
the screw in the device (Figure 3). As the mechanism is heated, the spring expands to its original bandshape and releases the screw. This spring concept has good stroke and output force to handle a varietyof loading conditions on the screw and is extremely compact.
I------Compressed for locking A
/mfter heating and release
Figure 3. Micro Separation Nut SMA Band Spring
Operation of the mechanism is very simple in order to be miniaturized (Figure 4). It is reset by insertingthe screw (4) through the Housing (1) and past the inner diameter of the SMA spring (3). The Cap (2)
holds the SMA spring properly in the Housing. The SMA spring is then manually compressed from twosides until it is secure around the screw. The mechanism may now be preloaded and is ready to be
released. The Micro Sep-Nut is released simply by applying heat to the housing. As the SMA spring is
heated, it returns to its circular shape, releasing the screw.
289
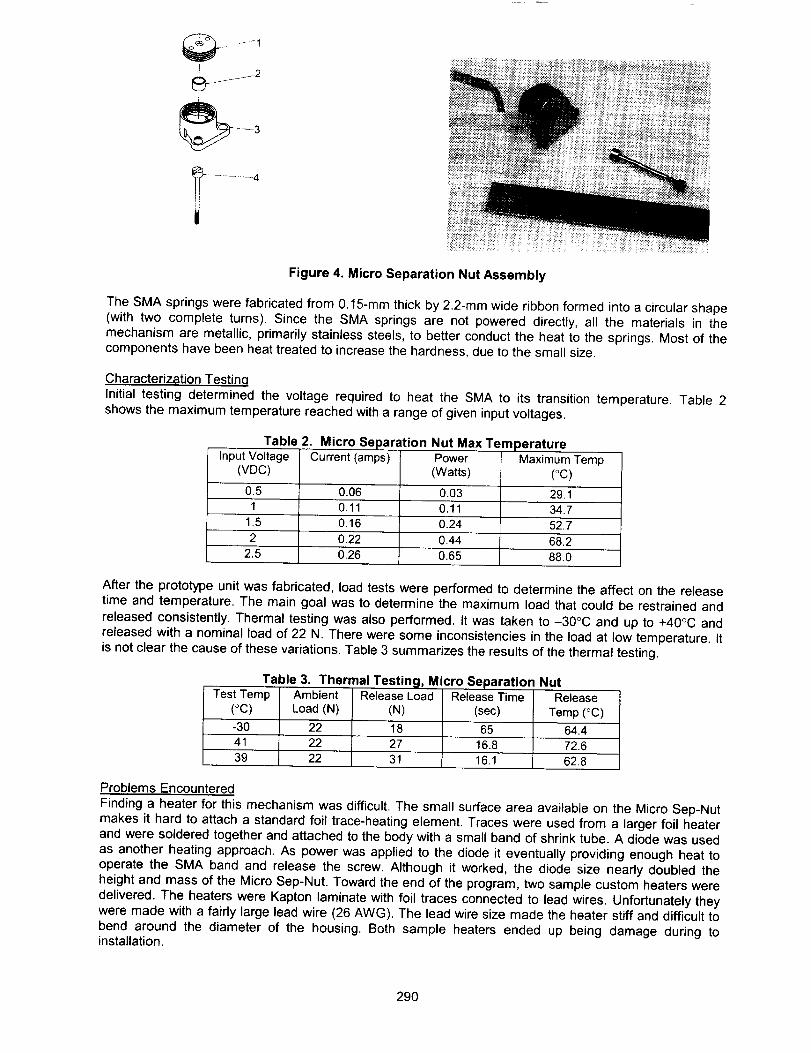
r_- r-''_ 1
.... 3
I
......... 4
Figure 4. Micro Separation Nut Assembly
The SMA springs were fabricated from 0.15-mm thick by 2.2-mm wide ribbon formed into a circular shape(with two complete turns). Since the SMA springs are not powered directly, all the materials in the
mechanism are metallic, primarily stainless steels, to better conduct the heat to the springs. Most of thecomponents have been heat treated to increase the hardness, due to the small size.
Characterization Testinq
Initial testing determined the voltage required to heat the SMA to its transition temperature. Table 2
shows the maximum temperature reached with a range of given input voltages.
Tab5
Input Voltage(VDC)
2. Micro SeparationCurrent (amps)
Nut Max TemperaturePower Maximum
(Watts)Temp
(oc)0.5 0.06 0.03 29.1
1 0.11 0.11 34.7
1.5 0.16 0.24 52,7
2 0.22 0.44 68,2
2.5 0.26 0.65 88.0
After the prototype unit was fabricated, load tests were performed to determine the affect on the releasetime and temperature. The main goal was to determine the maximum load that could be restrained and
released consistently. Thermal testing was also performed. It was taken to -30°C and up to +40°C andreleased with a nominal load of 22 N. There were some inconsistencies in the load at low temperature. Itis not clear the cause of these variations. Table 3 summarizes the results of the thermal testing.
Table 3. Thermal Testing, Micro SeparationTest Temp Ambient Release Load Release Time
(°C) Load (N) (N) (sec)
-30 22 18 6541 22 27 16.8
39 22 31 16.1
NutRelease
Temp (°C)
64.472.6
62.8
Problems Encountered
Finding a heater for this mechanism was difficult. The small surface area available on the Micro Sep-Nut
makes it hard to attach a standard foil trace-heating element. Traces were used from a larger foil heater
and were soldered together and attached to the body with a small band of shrink tube. A diode was usedas another heating approach. As power was applied to the diode it eventually providing enough heat to
operate the SMA band and release the screw. Although it worked, the diode size nearly doubled theheight and mass of the Micro Sep-Nut. Toward the end of the program, two sample custom heaters were
delivered. The heaters were Kapton laminate with foil traces connected to lead wires. Unfortunately theywere made with a fairly large lead wire (26 AWG). The lead wire size made the heater stiff and difficult to
bend around the diameter of the housing. Both sample heaters ended up being damage during toinstallation.
29O
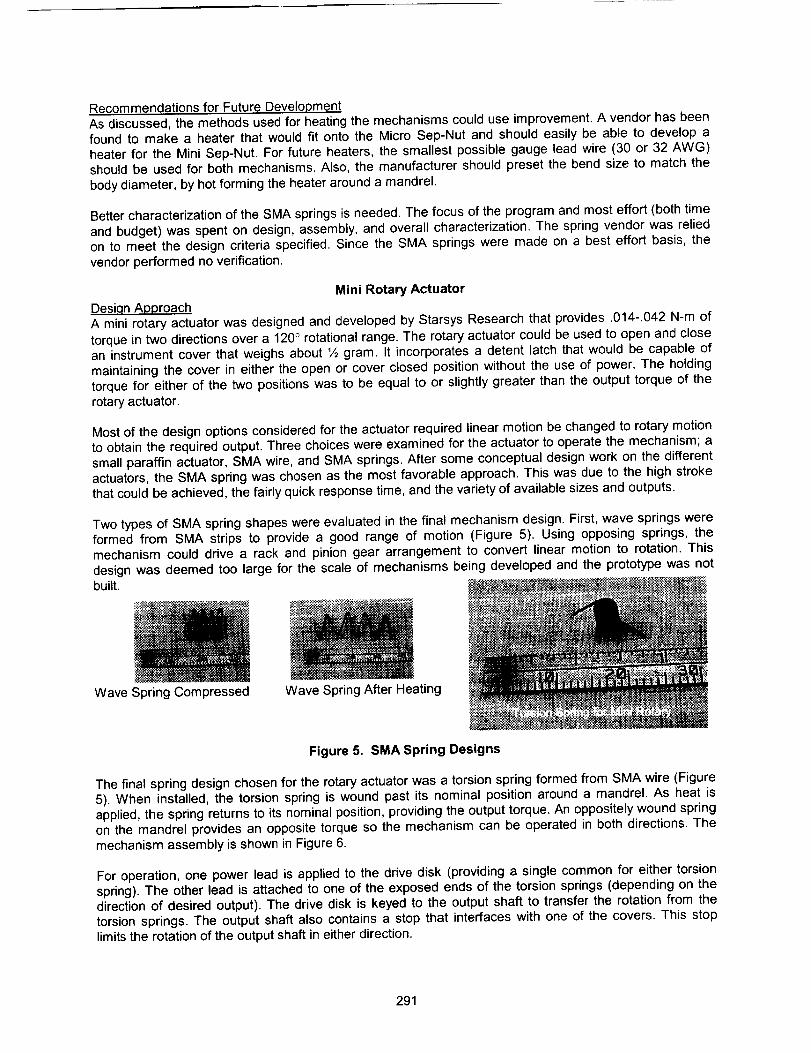
Recommendations for Future Development
As discussed, the methods used for heating the mechanisms could use improvement. A vendor has beenfound to make a heater that would fit onto the Micro Sep-Nut and should easily be able to develop a
heater for the Mini Sep-Nut. For future heaters, the smallest possible gauge lead wire (30 or 32 AWG)should be used for both mechanisms. Also, the manufacturer should preset the bend size to match the
body diameter, by hot forming the heater around a mandrel.
Better characterization of the SMA springs is needed. The focus of the program and most effort (both time
and budget) was spent on design, assembly, and overall characterization. The spring vendor was reliedon to meet the design criteria specified. Since the SMA springs were made on a best effort basis, the
vendor performed no verification.
Mini Rotary ActuatorDesign Approach
A mini rotary actuator was designed and developed by Starsys Research that provides .014-.042 N-m of
torque in two directions over a 120 ° rotational range. The rotary actuator could be used to open and close
an instrument cover that weighs about 1/2gram. It incorporates a detent latch that would be capable ofmaintaining the cover in either the open or cover closed position without the use of power. The holding
torque for either of the two positions was to be equal to or slightly greater than the output torque of therotary actuator.
Most of the design options considered for the actuator required linear motion be changed to rotary motionto obtain the required output. Three choices were examined for the actuator to operate the mechanism; a
small paraffin actuator, SMA wire, and SMA springs. After some conceptual design work on the differentactuators, the SMA spring was chosen as the most favorable approach. This was due to the high stroke
that could be achieved, the fairly quick response time, and the variety of available sizes and outputs.
Two types of SMA spring shapes were evaluated in the final mechanism design. First, wave springs wereformed from SMA strips to provide a good range of motion (Figure 5). Using opposing springs, the
mechanism could drive a rack and pinion gear arrangement to convert linear motion to rotation. Thisdesign was deemed too large for the scale of mechanisms being developed and the prototype was notbuilt.
IIIWave Spring Compressed Wave Spring After Heating
Figure 5. SMA Spring Designs
The final spring design chosen for the rotary actuator was a torsion spring formed from SMA wire (Figure
5). When installed, the torsion spring is wound past its nominal position around a mandrel. As heat isapplied, the spring returns to its nominal position, providing the output torque. An oppositely wound spring
on the mandrel provides an opposite torque so the mechanism can be operated in both directions. Themechanism assembly is shown in Figure 6.
For operation, one power lead is applied to the drive disk (providing a single common for either torsion
spring). The other lead is attached to one of the exposed ends of the torsion springs (depending on thedirection of desired output). The drive disk is keyed to the output shaft to transfer the rotation from the
torsion springs. The output shaft also contains a stop that interfaces with one of the covers. This stoplimits the rotation of the output shaft in either direction.
291

TorsonSprng:ue
Figure 6. Mini Rotary Actuator
Characterization Testinq
Because of the small size of the mechanism, it was difficult to measure some of the performance
characteristics. We were unable to obtain an accurate measurement of the internal friction. Also, testingwas limited since most of the effort was focused on developing the various designs and developing the
torsion spring design into a functional prototype. No thermal testing or life cycling was performed on themechanism. Operational testing showed the mechanism to be sensitive to power-on time. If a constant
current was applied to the SMA spring, there was a risk of damaging the SMA spring by heating it to atemperature where the spring material is re-annealed. The best firing sequence for this mechanism would
be several short (1-second maximum) pulses until telemetry signals the cover is to the open or closedposition.
Torque measurements were made with a calibrated torque gauge attached to the output shaft of the
mechanism. As the mechanism was powered, the output torque of 0.042 N-m was measured. This turnedout to not be a very accurate measurement. The torque output of just the torsion springs themselveswould have been more useful. However, no fixturing was developed to test the springs accurately.
Problems Encountered
The most difficult requirement of the design was that it was necessary for the mechanism to operate in
both directions. This meant the mechanism had to be capable of opening and closing the cover. A simpleunidirectional drive mechanism would have been much simpler, yet not nearly as useful. The main
problem that the dual motion presented is that the output spring is always working to reset the oppositedirection spring. This greatly reduces the available output torque, since approximately half the output
torque is required to reset the other spring.
Another problem encountered during the design was how to incorporate a detent (required to maintain the
rotary latch in either of the end positions). The initial approach used with the torsion spring design was a
leaf spring of metal that contacted a flat on the drive disk in either the open or closed position. The leafspring also provided the common contact point for the electrical circuit, since one end of both torsion
springs was in contact with the drive disk at all times. This approach resulted in too much drag on thedrive disk, decreasing the amount of output torque available. The leaf spring also provided little actual
holding torque for the mechanism in either of the end positions.
Recommendations for Future DevelopmentThe ultimate success of this design will rely on further refinement of the SMA torsion spring. The torque of
the spring is considerably less than needed for the desired output torque of the mechanism. Increasingthe wire diameter will eventually result in an increased output torque, but it will at some point lead to a
larger overall mechanism.
292

Thedetentapproachinitiallyusedin thedesignneedsimprovement.Anotherapproachto consideris touseanotherSMAdeviceto latchandunlatchthemechanismineitherendposition.Ideallythiswouldbeconnectedin serieswiththetorsionspringsothatwhenpoweris applied, it both releases the latchingdevice and operates the torsion spring. However, the practical implementation of this could be difficult. It
may be necessary to add a second circuit to operate the latching component if a SMA device is used.
This too could add complexity in being able to properly time the events.
Crimp contacts need to be added to the ends of the SMA springs for electrical connection. The prototypewas connected manually and this was not practical for actual flight use. It was found the SMA wire does
not easily accept solder. For the common contact the drive disk, it needs a method to reduce drag fromthe wire contact. One solution may be to add a metal shaft through the output shaft to contact the drive
disk and then crimp or solder a contact onto the end of this. The end would then be allowed to rotate
freely as the mechanism rotates.
Miniature Burn Wire Release
This tiny release mechanism was developed at APL for a miniature instrument cover or similar deviceneeding an extremely compact, low mass, and low power actuation device• It uses a burn wire to directly
carry the tensile load of a cover or screw that is attached to its retainer. Current applied to the wire willbreak or fuse the wire at the location of the retainer to cause release of the hardware attached to it. This
is unique from other types of satellite burn wire releases. This mechanism uses the wire to directly carry
the tensile load; therefore it is a highly simplified design that can be greatly miniaturized. It is also an easydesign to scale up or down according to the requirements of the device it is attached to.
AluminumHousng i /. , _- _ _
Wtth mounting ears---.-._._ _ I / i
Aluminum Ret ainer_------_ !
Kick-off ' _-
Sprmg_ }_:"
BeCu Burn Wir_._.._ i_:"l
G-lO Wire Attach Ji il
"Button"-_ f_
Housing
Retainer
Assembly
Bum Wire
Figure 7. Mini Burn Wire Release Assembly
Desi,qn ApproachIt was determined early in the design process that to highly miniaturize this mechanism, it had to contain
the fewest parts possible. The burn wire release mechanism (shown in Figure 7) has only 5 componentswith only one of those that are released with the cover. These components are also multifunctional. The
burn wire is used to hold the mechanism together, carry the restraint load, make electrical connection,and initiate the release action. Wire size was based on restraining a 100-gram cover. The rest of the
mechanism was designed to package as compactly as possible and provide thread for a small screw. Akick-off compression spring was incorporated to overcome friction or other small forces that might hang-
up the mechanism. Beryllium copper was chosen for the wire material based on its excellent mechanicalproperties as well as its high resistivity. Pure copper wire of the same diameter takes a much highercurrent to burn. Stainless steel wire has similar properties as BeCu and could work as well.
293
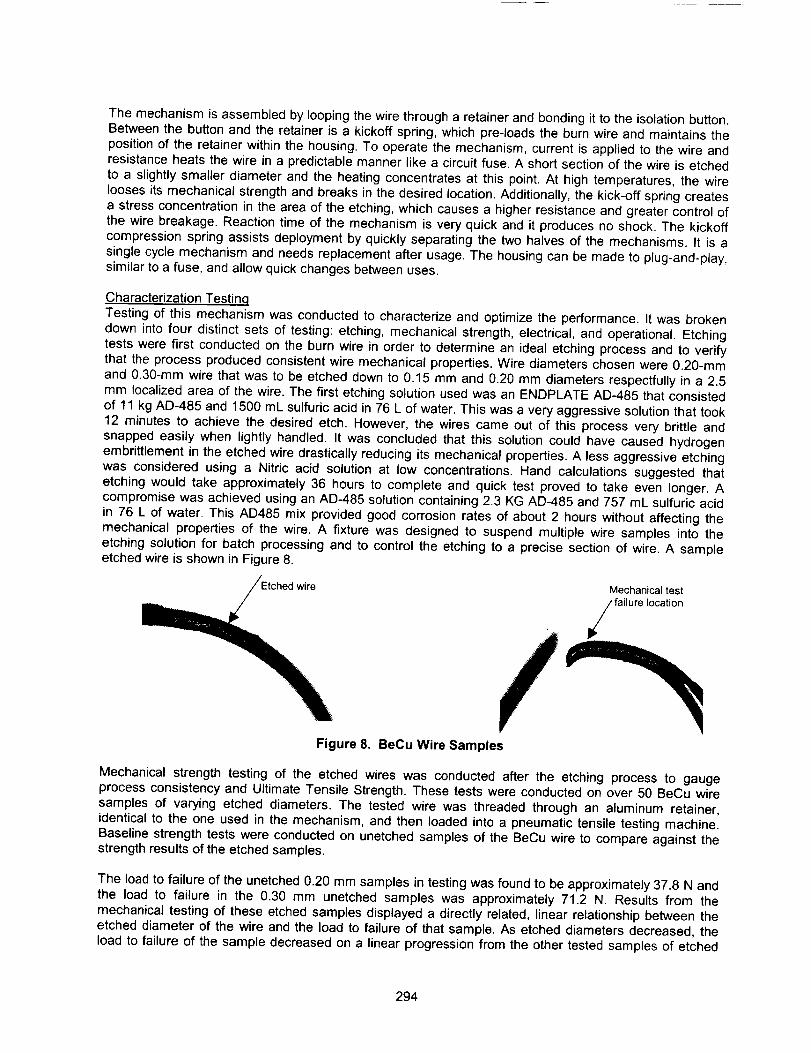
Themechanismisassembledbyloopingthewirethrougha retainerandbondingit totheisolationbutton.Betweenthebuttonandtheretaineris a kickoffspring,whichpre-loadstheburnwireandmaintainsthepositionof theretainerwithinthehousing.Tooperatethemechanism,currentis appliedto thewireandresistanceheatsthewireina predictablemannerlikea circuitfuse.Ashortsectionofthewireis etchedto a slightlysmallerdiameterandtheheatingconcentratesat thispoint.At hightemperatures,thewireloosesitsmechanicalstrengthandbreaksinthedesiredlocation.Additionally,thekick-offspringcreatesa stressconcentrationintheareaof theetching,whichcausesa higherresistanceandgreatercontrolofthewirebreakage.Reactiontimeof themechanismis veryquickandit producesnoshock.Thekickoffcompressionspringassistsdeploymentbyquicklyseparatingthetwohalvesof themechanisms.It is asinglecyclemechanismandneedsreplacementafterusage.Thehousingcanbemadeto plug-and-play,similartoa fuse,andallowquickchangesbetweenuses.
Characterization Testinq
Testing of this mechanism was conducted to characterize and optimize the performance. It was brokendown into four distinct sets of testing: etching, mechanical strength, electrical, and operational. Etching
tests were first conducted on the burn wire in order to determine an ideal etching process and to verifythat the process produced consistent wire mechanical properties. Wire diameters chosen were 0.20-mm
and 0.30-ram wire that was to be etched down to 0.15 mm and 0.20 mm diameters respectfully in a 2.5mm localized area of the wire. The first etching solution used was an ENDPLATE AD-485 that consisted
of 11 kg AD-485 and 1500 mL sulfuric acid in 76 L of water. This was a very aggressive solution that took12 minutes to achieve the desired etch. However, the wires came out of this process very brittle and
snapped easily when lightly handled. It was concluded that this solution could have caused hydrogen
embrittlement in the etched wire drastically reducing its mechanical properties. A less aggressive etchingwas considered using a Nitric acid solution at low concentrations. Hand calculations suggested that
etching would take approximately 36 hours to complete and quick test proved to take even longer. Acompromise was achieved using an AD-485 solution containing 2.3 KG AD-485 and 757 mL sulfuric acidin 76 L of water. This AD485 mix provided good corrosion rates of about 2 hours without affecting the
mechanical properties of the wire. A fixture was designed to suspend multiple wire samples into theetching solution for batch processing and to control the etching to a precise section of wire. A sample
etched wire is shown in Figure 8.
wire
Figure 8. BeCu Wire Samples
Mechanical test
failure location
Mechanical strength testing of the etched wires was conducted after the etching process to gaugeprocess consistency and Ultimate Tensile Strength. These tests were conducted on over 50 BeCu wire
samples of varying etched diameters. The tested wire was threaded through an aluminum retainer,
identical to the one used in the mechanism, and then loaded into a pneumatic tensile testing machine.Baseline strength tests were conducted on unetched samples of the BeCu wire to compare against thestrength results of the etched samples.
The load to failure of the unetched 0.20 mm samples in testing was found to be approximately 37.8 N and
the load to failure in the 0.30 mm unetched samples was approximately 71.2 N. Results from themechanical testing of these etched samples displayed a directly related, linear relationship between the
etched diameter of the wire and the load to failure of that sample. As etched diameters decreased, theload to failure of the sample decreased on a linear progression from the other tested samples of etched
294

wire.Fromthismechanicaltesting,it wasconcludedthattheetchingprocesswiththeAD-485solutiondidnot adverselyaffectthe mechanicalpropertiesof the wire,andtheseetchedwireswouldbe abletoconsistentlysupporttheloadrequirementsfortheBurnWireMechanism.
Electricaltestingof thesampleswasperformedto determinetheelectricalcharacteristicthatwouldberequiredto efficientlybreaktheburnwireattheetchedportionof thesample.Similarto themechanicaltesting,thealuminumretaineridenticaltotheoneusedinthemechanismwasusedintheelectricaltestswith the burnwire samplethreadedthroughit. A preloadof approximately 9 N was applied to thealuminum retainer. Initial testing of both the 0.20-mm and 0.30-mm wire began at 28.8 V and 7.5 A, which
is a standard setting on most satellites. Both types of wire successfully broke at the etching. Somedamage to the aluminum retainer was observed due to the large voltage running through the burn wire
before breaking. Also, the wire developed a black carbon like deposit on it. Minimum power requirementswere determined next and are shown in Table 4. A range of amps and voltage can be accommodated
with this mechanism and the wire diameter and etch diameter can be changed to accommodate a lowersetting if needed.
Table 4. Burn Wire Electrical Tests
Wire Etch Low Power Optimum High PowerDiameter Diameter Setting Power Setting Limit
7.5 amps@ 7.5 amps@ 28.8 [email protected] mm7.5 volts 7.5 volts 7.5 volts
7.5 amps@ 7.5 amps@ 28.8 [email protected] mm7.5 volts 7.5 volts 7.5 volts
6 amps@ 10 amps@ 28.8 [email protected] mm 0.18 mm8 volts 15 volts 7.5 volts
5 amps@ 7.5 amps@ 28.8 [email protected] mm 0.15 mm5 volts 7.5 volts 7.5 volts
Finally, after the initial three sets of tests, actual tests of the mechanism in a simulated operational setup
were conducted. All of the information about the performance of the bum wire from the previous threesets of tests was incorporated into the mechanism. The setup for operational testing called for the
assembly of the actual mechanism itself and installing it into a mock instrument cover.
Applied current to the mechanism caused the burn wire to break as predicted at the etched area of the
wire and the instrument cover easily deployed. This process was completed over 20 times with the 0.20-mm wire etched to 0.15 mm. As for the operational tests with the 0.30-mm samples, many times thecurrent required to break the wire and deploy the cover caused the burn wire to weld itself into the
aluminum retainer and restrict the cover from opening. This performance of the 0.30-mm wire proved
again that this configuration was not the optimal way to assemble the Burn Wire mechanism. Oneunexpected problem with the Burn Wire mechanism that was encountered in both the 0.20-mm and 0.30-mm configurations was the occurrence of electrical arcs from the wire itself to portions of the instrument
cover, attachment bracket, or even the mechanism itself. This was a noticeable problem in the operationof the mechanism, but one that can be resolved with changes in material selection of components.
Overall, the Burn Wire mechanism performed extremely well during operational testing. As with all new
technologies, problems were encountered; however, these problems are seen as ones that require minordesign changes rather than overall changes that could affect other aspects of the mechanism that have
already been tested.
Recommendations for Future DevelopmentUsing non-conducting materials in the mechanism would minimize shorting damage. Shorting of the wire
over to an instrument is an unacceptable problem for this design, especially when integrated withsensitive instruments several shorts occurred during tests. Components that were damaged and any
others threatened by possible shorting or arcing could be made from a ceramic to give it the strength andelectric isolation needed to prevent such a problem. The housing, which is a critical component of the
295

design,couldalsobemadefromTorlonorotherthermoplastic.Thiswouldprovidealowfrictionsleevetoholdtheretainer.
The housingcan be redesignedto makethis mechanisma plug-initemto maketestingeasier.Allassemblieswere handinstalledintothe testhousingsandeachelectricleadconnectedmanually.Apackagesimilarto a busfusecouldbedesignedto easehandlingandinstallationof the mechanism.Handlingof miniaturescrewsshouldbeavoidedbecauseof howfragiletheyareandhoweasyit is toloosethemwithinaninstrument,whichwasdemonstratedtimeandagainthroughouttesting.
Furtherminiaturizationis possiblewiththismechanism.Inorderto handmachineandhandassembletheprototype,standardfit andtoleranceswereused.Alternativefabricationprocessshouldbeconsideredtotakethemassandvolumeanothersteptowardsbeinga "micro"sizedmechanism.Theprototypeburnwiremechanismhasbeenshownto haveexcellentreliabilityandthepossibilityforfurtherminiaturization.It is simplein designandtheburnwiretestshaveshownveryconsistentresults.It currentlymeetsthecriteriafor miniatureinstrumentcovers,buthaspossibilityfor useinnumerousapplicationsona micro-satelliteprogram.Theminiburnwirereleasemaydevelopintoa keymechanismdevicefor theAPLMicroSatprogram.
Mini Linear Actuator
Linear actuators are prevalent in satellite programs as triggers or switches for mechanical devices. Thereis a definite need for a miniaturized version of this type of mechanism for future micro satellites. This mini
linear actuator, developed at APL, is designed to provide a quick acting, low shock linear motion. Thismechanism has progressed in development from first prototype into a more optimized prototype. The
second prototype was designed and constructed after a small set of cursory tests was conducted on theinitial prototype. From the lessons learned, a large decrease in size and mass was obtained without
performance loss.
Figure 9. Mini Linear Actuator
Travel Pin.__._
SMA Wire.._ _i
o.o,6mmII
Isolation /
Desiqn Approach
The motion (or strain) of typical SMA materials is limited to 8% of the amount of material. A nominaldesign for this mechanism would limit strain to 2% to ensure adequate fatigue margin. Therefore, thisrestriction, as well as the amount of wire contained within the mechanism itself, limits the stroke this
mechanism will be able to produce. For example, a wire length of 20 mm (0.8 inch), the stroke would be
0.4 mm (0.014 inch). In this design, Nickel-Titanium wire is heated by running current through the wire.The current heats the wire directly via resistance in the wire. Response time is very quick, (-1/10 sec),
and the device is not too sensitive to its external thermal environment (in air). Through a strain recovery
296

processin thematerial,thewirecontractswhenheatedandreturnswhencooledusingthecompressionbiasspring.It isaself-latchingdevicethatis fullytestable.TheassembledconceptisshowninFigure9.
BothprototypemechanismsutilizeSMAwirefor actuatingthismechanism.Itworksasa highforce,lowshockpinpullerthatcantriggera numberof latchdeviceson instrumentsshuttersor covers.Theminilinearactuatoris self-resettableusinga bias returnspring(Figure9) and can operatein-flightfornumerousactuationswithoutanyexternalassistanceor resets.Withdesignimprovements,thesecondunithadan85%reductioninmassandvolumeandimprovedtheperformanceofthepinactuation.
Characterization Testin.q
Operational test were performed on both units using a simple electrical circuit directly connected to theSMA wire. This electrical circuit was able to repetitively cycle the mechanism through its entire range of
motion through the use of a capacitor. The circuit delivered 0.25 A at 8.5 V with the capacitor charging
and discharging every two to three seconds. Motion of the travel pin created by the contracting SMA wirewas measured through the use of a Linear Voltage Displacement Transducer (LVDT) in direct contactwith the travel pin of the mechanism• When the travel pin is displaced by the SMA contractions, this
causes the LVDT to displace and record the motion. Pin displacement for the first test unit was
approximately 0.30-0.33 mm, which is also predicted through calculation. The second test unitincorporated a longer SMA wire (in a smaller package design) and increased displacement to 0.53 mm.
Figure 10 shows the results from the second mechanism tests. Note the consistent and repeatable
motion displayed by the mechanism.
Linear MOtl QFI
0 O25
0 02
0015
001
0 005
-0 005
-- Linear Motion 1
20 25 30 2.5 40 45 50 55 6£
_me (I}
Figure 10. Mini Linear Actuator Operational Tests Results (Second test unit)
Lifetime testing was conducted on the second unit following the characterization testing using the samesetup and equipment. This test revealed that the mechanism performed nominally for over 1000 cycles
followed by a gradual decay of performance until failure at 12,000 cycles (after 10 hours of operation).This was performed in-air under ambient conditions and is to be followed by thermal-vacuum testing that
is yet to be conducted.
297
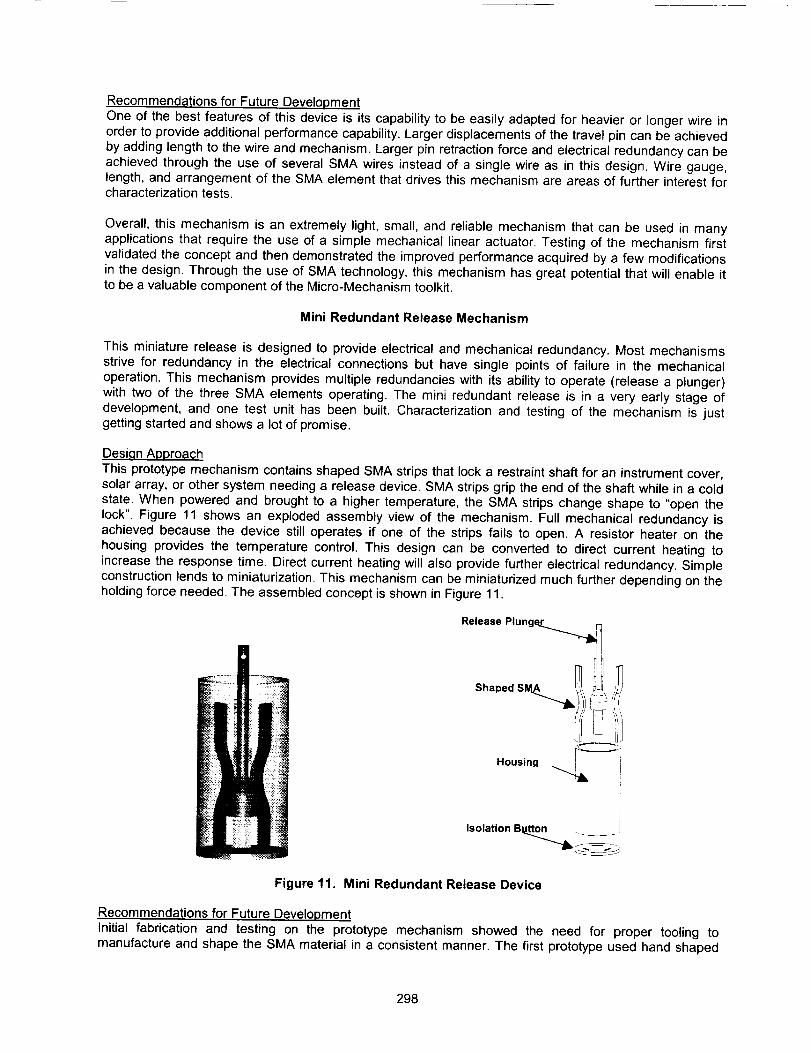
Recommendations for Future Development
One of the best features of this device is its capability to be easily adapted for heavier or longer wire inorder to provide additional performance capability. Larger displacements of the travel pin can be achieved
by adding length to the wire and mechanism. Larger pin retraction force and electrical redundancy can beachieved through the use of several SMA wires instead of a single wire as in this design. Wire gauge,length, and arrangement of the SMA element that drives this mechanism are areas of further interest forcharacterization tests.
Overall, this mechanism is an extremely light, small, and reliable mechanism that can be used in many
applications that require the use of a simple mechanical linear actuator. Testing of the mechanism firstvalidated the concept and then demonstrated the improved performance acquired by a few modifications
in the design. Through the use of SMA technology, this mechanism has great potential that will enable itto be a valuable component of the Micro-Mechanism toolkit.
Mini Redundant Release Mechanism
This miniature release is designed to provide electrical and mechanical redundancy. Most mechanisms
strive for redundancy in the electrical connections but have single points of failure in the mechanical
operation. This mechanism provides multiple redundancies with its ability to operate (release a plunger)
with two of the three SMA elements operating. The mini redundant release is in a very early stage ofdevelopment, and one test unit has been built. Characterization and testing of the mechanism is justgetting started and shows a lot of promise.
Desi.qn Approach
This prototype mechanism contains shaped SMA strips that lock a restraint shaft for an instrument cover,solar array, or other system needing a release device. SMA strips grip the end of the shaft while in a cold
state. When powered and brought to a higher temperature, the SMA strips change shape to "open the
lock". Figure 11 shows an exploded assembly view of the mechanism. Full mechanical redundancy isachieved because the device still operates if one of the strips fails to open. A resistor heater on the
housing provides the temperature control. This design can be converted to direct current heating toincrease the response time. Direct current heating will also provide further electrical redundancy. Simple
construction lends to miniaturization. This mechanism can be miniaturized much further depending on theholding force needed. The assembled concept is shown in Figure 11.
Release Plun(
HousingI
Isolation B, tton i
Figure 11. Mini Redundant Release Device
Recommendations for Future Development
Initial fabrication and testing on the prototype mechanism showed the need for proper tooling tomanufacture and shape the SMA material in a consistent manner. The first prototype used hand shaped
298

SMAmaterialthatsuccessfullyoperatesthemechanism,butpulloutforcefluctuatesdependingonhowwelltheSMAshapingisperformed.Tolerancesneedtobeheldtighterwithin the assembly.
A higher level of redundancy can be achieved with heater elements directly attached on each strip. Also,
there will be faster response times for initiation of the release if heaters drive the SMA rather than the
entire housing and assembly. APL has applied heaters to similar types of material.
Leaf springs may be incorporated into the design to provide a reset capability and also to provide ameans for having consistent reset. A range of strip sizes and various ways of restraint on the plunger will
be investigated. This could lead to a more optimum approach, higher restraint capability, and greaterminiaturization.
Lessons Learned
Designing and developing mechanisms at this scale requires a different approach than what mostmechanism designers are accustomed to. There are a number of considerations that must be addressed
in order to ensure correct, optimal performance of these mechanisms. These issues also encompass notonly operational considerations, but also issues that indirectly affect a mechanism's performance if not
adequately addressed, such as fabrication and assembly.
Tolerances and Workin.q with Small PartsWorking with parts this scale intrinsically leads to tolerance issues. A small dimensional discrepancy on a
part can lead to a significant change in mechanism performance. On the Mini Sep-Nut, the initial partswere machined with too great of tolerance, preventing the nut segments from forming a tight nut to thread
the screw into. In a second iteration, the collar was machined-to-fit to achieve a close fit with the housingand nut segments, providing a tight interface for the screw threads. It is important to remember when
designing small components that some of the parts may need secondary machining to achieve thedesired assembled fit. The mechanisms in this tool kit were designed so that the dimensional variations
lead to a minimal impact on the mechanism's overall performance.
The size of the components created some difficulties in fabrication. As discussed, tight tolerances
required on small dimensions made the parts more expensive. The most difficult parts to machine werethe screw and nut for the Micro Sep-Nut. The screw had a 0.80-127 thread with a 0.76-mm shaft. The
screw size and thread made the component very fragile. During the cutting of the threads, the shaftdeformed. It would have been beneficial to utilize a specialized vendor with a Swiss milling machine and
experience in fabricating miniature components.
Miniaturized components are very difficult to handle with manual machining and hand assembly
processes. Automated or tooled processes are needed to hold tighter tolerances, improve consistency,and simplify the assembly of the actual mechanism. Additional attention could be required due to possible
changes in material selection, which might also introduce new challenges in the fabrication ofcomponents and assembly of the mechanism.
Shape Memory Alloy
The use of Shape Memory Alloy (SMA) creates a number of considerations that must be examined aspart of the design process. Additional work with SMA will allow for additional understanding of this unique
material and configurations that optimize its performance.
It is critical to carefully characterize the performance of the SMA element prior to incorporating it into thedesign. By doing so, this will help the designer understand the behavior of the SMA. Many of the custom
shapes or forms are somewhat inconsistent in their behavior, and it is important to understand theseeffects and how they will impact the overall mechanism design.
The control strategies for applying power directly to the SMA must be carefully considered and applied. It
is easy to damage the SMA element if power is applied for too long. If the SMA element is heated for toolong, it can take a new set.
299
Conclusions
The key factor for shrinking mechanism size is to reduce complexity. The mini separation nut design wastaken from a conventional separation system and was simply scaled down. It was judged to be not quite
miniaturized for the micro satellite uses that was envisioned. By radically redesigning the mini separationnut, the micro separation nut was able to get the performance needed with 3 components instead of 8
and was 75% lighter and smaller and lighter than the mini separation nut. Another example is the burnwire mechanism, which is the smallest and lightest in the tool kit due its simplified and streamlined design.
Its this kind of streamlining that is needed to address the micro satellite needs.
Some of these mechanisms give up redundancy for simplicity. This may be a risk that constellations ofsmall and inexpensive micro satellite constellations will be willing to take. If redundancy is required, there
are options in this tool kit that provide it. Micro mechanisms are going to need to break from traditional
mechanism design to meet the need of future micro satellites.
The problems encountered in this project were not completely addressed and fully tested. Continuation of
this project is expected to look in more detail at manufacturability, assembly, characterization of SMA's
and, and power and mass optimization for these mechanisms. From the brief testing performed, thereappears to be attainable solutions to all the problems encountered. Future work should yield mechanisms
that are qualified for flight. These will be some of the smallest and lightest mechanical componentsavailable that provide precise and consistent performance for micro satellite as well as traditional satellite
programs.
References
Helvajian, Henry. "Microengineering Aerospace Systems." The Aerospace Press, American Institute ofAeronautics and Astronautics, 1999.
Madou, Mark. "Fundamentals of Microfabrication." CRC Press, 1997
Waram, Tom. "Actuator Design Using Shape Memory Alloys." Second Edition, 1993
300

Form Approved
REPORT DOCUMENTATION PAGE ouBNo.o7o4-o188
Public reporting burden for this collection of information is estimated to average I hour per response, including the time for reviewing instructions, searching existing data sources,gathering and maintaining the data needed, and completing and reviewing the collectton of information. Sand comments regarding this burden estimate or any other aspect of thiscoltection of information, including suggestions for reducing this burden, to Washington Headquarters Services. Oireclorate for information Operations and Reports. 1215 JeffersonDavis Highway, Suite 1204, Arlington, VA 22202-4302, and to the Office of Management and Budget, Paperwork Reduction Project (0704-0188), Washington, DC 20503
1. AGENCY USE ONLY (Leave blank) 2. REPORT DATE 3. REPORT TYPE AND DATES COVERED
May 2001 Conference Publicationi I
4. TITLE AND SUBTITLE 5. FUNDING NUMBERS
Proceedings of the 35th Aerospace Mechanisms Symposium
6. AUTHOR(S)
Edward A. Boesiger, Compiler
PERFORMINGORGANIZATIONNAME(S)ANDADDRESS(ES)
Ames Research Center
Moffett Field, CA 94035-1000
9. SPONSORING/MONITORING AGENCY NAME(S) AND ADDRESS(ES)
National Aeronautics and Space Administration
Washington, DC 20546-0001
712-30
8. PERFORMING ORGANIZATION
REPORT NUMBER
A-00V0037
10. SPONSORINGIMONITORING
AGENCY REPORT NUMBER
NAS A/CP-2001-209626
i
11. SUPPLEMENTARY NOTES
Sponsor: Mechanisms Education Association
Point of Contact: Ronald E. Mancini, Deputy Chief, Systems Engineering Division, Ames Research Center,MS 213-1, Moffett Field, CA 94035-1000
12a. DISTRIBUTION/AVAILABILITY STATEMENT 12b. DISTRIBUTION CODE
Unclassified -- Unlimited
Subject Category 15 Distribution: Standard
Availability: NASA CASI (301) 621-0390
13. ABSTRACT (Maximum 200 words)
The proceedings of the 35th Aerospace Mechanisms Symposium are reported. Ames Research Center
hosted the conference, which was held at the Four Points Sheraton, Sunnyvale, California, on May 9-11,
2001. The symposium was sponsored by the Mechanisms Education Association. Technology areas covered
included bearings and tribology; pointing, solar array, and deployment mechanisms; and other mechanisms
for spacecraft and large space structures.
14. SUBJECT TERMS
Spacecraft components, solar array deployment, bearings, tribology, covers,
latches, dampers, retraction mechanisms.
17. SECURITY CLASSIFICATION 18. SECURITY CLASSIFICATION
OF REPORT OF THIS PAGE
Unclassified Unclassified
NSN 7540-01-280-5500
19. SECURITY CLASSIFICATION
OF ABSTRACT
15. NUMBER OF PAGES
31216. PRICE CODE
A14
20. LIMITATION OF ABSTRACT
Standard Form 298 trey. 2-B9)Prescr)bed by ANSJ Std Z39.1 e
298 - 102