45th Aerospace Mechanisms Symposium - NASA Technical ...
596
i NASA/CP-20205009766 45 th Aerospace Mechanisms Symposium Compiled/Edited by: Edward A. Boesiger Proceedings of a symposium Hosted by the NASA Johnson Space Center and Lockheed Martin Space Sponsored and Organized by the Mechanisms Education Association 2020
-
Upload
khangminh22 -
Category
Documents
-
view
1 -
download
0
Transcript of 45th Aerospace Mechanisms Symposium - NASA Technical ...

i
NASA/CP-20205009766
45th Aerospace Mechanisms Symposium Compiled/Edited by: Edward A. Boesiger
Proceedings of a symposium Hosted by the NASA Johnson Space Center and
Lockheed Martin Space Sponsored and Organized by the Mechanisms Education Association
2020

ii

iii
PREFACE The Aerospace Mechanisms Symposium (AMS) provides a unique forum for those active in the design, production and use of aerospace mechanisms. A major focus is the reporting of problems and solutions associated with the development and flight certification of new mechanisms. Sponsored and organized by the Mechanisms Education Association, responsibility for hosting the AMS is shared by the National Aeronautics and Space Administration and Lockheed Martin Space. The 45th AMS was scheduled to be held in Houston, Texas on May 13, 14 and 15, 2020. Unfortunately, the worldwide COVID-19 pandemic did not allow this. These proceedings are published however in order to provide these lessons learned and mechanism design information to the mechanism community. Topics included instrument mechanisms, release devices, Mars 2020 mechanisms, tribology, actuators and compliant mechanisms. The high quality of this symposium is a result of the work of many people, and their efforts are gratefully acknowledged. This extends to the voluntary members of the symposium organizing committee representing the eight NASA field centers, Lockheed Martin Space, and the European Space Agency. Appreciation is also extended to the session chairs, the authors, and particularly the personnel at JSC responsible for the symposium arrangements and subsequent cancellation and the publication of these proceedings. A sincere thank you also goes to the symposium executive committee who is responsible for the year-to-year management of the AMS, including paper processing. The use of trade names of manufacturers in this publication does not constitute an official endorsement of such products or manufacturers, either expressed or implied, by the National Aeronautics and Space Administration.

iv

v
CONTENTS
Symposium Organizing and Advisory Committees .......................................................................... ix Nanometric Positioning with IASI-NG‘s Beam Splitter Mechanism Actuator ..........................................1
Francois Barillot, Jocelyn Rebufa, Gladys Jaussaud & Adrien Guignabert
Spectrometer Scan Mechanism for Encountering Jovian Orbit Trojan Asteroids.................................. 15 Kenneth Blumenstock, Alexander Cramer, Joseph Church, Jason Niemeyer, Fil Parong, Sam Zhao, Nerses Armani & Kenneth Lee
Point Ahead Mechanism for Deep Space Optical Communication – Development of a New Piezo-Based Fine Steering Mirror ………………………………………….. .................................... 29
Adrian Guignabert, Thomas Maillard, Francois Barillot, Olivier Sosnicki & Frank Claeyssen
Design, Development and Verification of the METimage Mechanisms ............................................... 43 Sebastian Rieger & Armin Jago
Challenges of the Development of a Compliant Focus Mechanism Submitted to the Harsh Martian Environment for the ExoMars Rover Mission ................................................................................. 59
Antoine Verhaeghe, Gerald Perruchoud, Philippe Schwab, Mathias Gumy, Julien Rouvinet & Lionel Kiener
Lessons Learned from Qualification of HDRM for Ultralight LP-PWI Boom for ESA JUICE Mission ........ 73 Maciej Borys, Ewelina Ryszawa, Łukasz Wiśniewski, Maciej Ossowski & Jerzy Grygorczuk
Development of a Family of Resettable Hold-Down and Release Actuators based on SMA Technology and Qualification of Different Application Systems......................................................... 87
Marcelo Collado, Cayetano Rivera, Javier Inés, José San Juan, Charlie Yeates, Michael Anderson, Francisco Javier Rivas, Mónica Iriarte, Jens Steppan, Calem Whiting & Karine Murray
Development and Post-Testing Anomalies of the Parker Solar Probe Clamshells Development .......... 103
Mark Bryant Mars 2020 Rover Adaptive Caching Assembly: So Many Challenges .............................................. 117
Milo Silverman & Justin Lin Sealing Station Mechanisms for the Mars 2020 Rover Sample Caching Subsystem .......................... 137
Jesse Grimes-York & Sean O’Brien Design and Development of a Robust Chuck Mechanism for the Mars 2020 Coring Drill .................... 151
Anthony Barletta
Percussion Mechanism for the Mars 2020 Coring Drill .................................................................. 165 Kyle Chrystal
STIG: A Two-Speed Transmission Aboard the Mars 2020 Coring Drill............................................. 179
Timothy Szwarc, Jonathan Parker & Johannes Kreuser
Development of the Next Generation Battery Cell Isolation Switch .................................................. 193 Ruben Betancourt & Michel Knight
vi
A Fast-Acting Self-Energized, Low-Cost Valve for Air Cannons ...................................................... 199 Lee Brown
Development of a Low-Shock Separation Nut Out of the Pyrotechnic Class ..................................... 205 Sebastien Perez, Frederic Miralles & François Degryse
Lubricant Degradation in High-Load, High-Cycle Actuator Test Using Heritage Harmonic Drives for the Multi-Angle Imager for Aerosols Instrument................................................................................. 211
Michelle Easter Multi-Mission Deployable Boom: Spring Mechanism Design, Failure Investigation, and Resolution ...... 227
Christine Gebara & Paul Lytal NSI Performance Improvement Through the use of Automation ..................................................... 235
Jason Kozmic, Bill Gratzl & Hobin Lee Microvibrations Modelling and Measurement on Sentinel 4 UVN Calibration Assembly using a Piezoelectric 6 Component Force Dynamometer ......................................................................... 241
Benoit Marquet Lubrication Concept Evaluated for Geared Actuators under Starved Conditions................................ 255
Erik Nyberg, Ichiro Minami & Jonny Hansen Development of a Universal and Scaleable Mechanism Control Electronics Configured to Application Solely by Parameter and Software Configuration ......................................................................... 261
Udo Rapp & Juan Camilo Garcia Hernandez Eddy Current Effects in Spacecraft Mechanisms .......................................................................... 269
Emilia Wegrzyn, Claudia Allegranza, Thomas Adam, Florian Liebold & René Seiler Recovery and Operational Best Practices for Reaction Wheel Bearings .......................................... 277
Michael Dube, Jeff Fisher, Stuart Loewenthal & Peter Ward Laboratory Studies of Spacecraft Fluid Lubricant Mobility and Film Thickness .................................. 287
Peter Frantz, James Helt & Steve Didziulis Efficacy of Lead Naphthenate for Wear Protection in High Vacuum Space Mechanisms .................... 301
Jason Galary Bearing Anomaly for the Sentinel 6 Supplemental Calibration System ............................................. 315
Gale Paulsen, Dylan Van Dyne, Fredrik Rehnmark, Phil Chu & Ted Iskenderian Parker Solar Probe MAG Boom Design, Analysis and Verification .................................................. 329
Weilun Cheng, Calvin Kee & John Wirzburger
Development of a Low-Shock Payload Fairing Jettison System ...................................................... 343 Boris Halter, Josef Zemann, Simon Wieser, Beatrice Burkhart, Mathias Burkhalter, Alberto Sánchez & Oliver Kunz
Deployment Mechanism for an Earth Re-Entry Deployable Decelerator........................................... 355 Carl Kruger
vii
Lessons Learned During the Development, Qualification, and Production of the MM Solar Array......... 369 Thomas Pace
Solid-State Hinge Mechanism for Simple Panel Deployment System .............................................. 383
Thomas Rose, William Hensley & William Francis
Mars 2020 Motor Bearing Failure, Investigation and Response ...................................................... 397 Dave Suffern, Jeff Mobley & Stephen Smith
Mars 2020 maxon Commercial Motor Development from Commercial-Off-the-Shelf to Flight-Qualified Motors, Gearboxes, and Detent Brakes: Overcoming Issues and Lessons Learned........................... 411
Michael LoSchiavo, Rebecca Mikhaylov, Robin Phillips & Lynn Braunschweig Mars 2020 Center Differential Pivot Restraint: Flexurized Spring System Providing Compliance for Rover Mobility Deployment Prior to Landing ........................................................................... 427 Matt Cameron & Kevin Liu Astrobee Free-Flyer Nozzle Mechanism ..................................................................................... 441 Earl Daley Major Design Choices and Challenges that Enabled the Success of the Ejectable Data Recorder System .................................................................................................................... 455 Jeff Hagen, Michael Burlone & Kristina Rojdev Design and Test of the Orion Crew Module Side Hatch................................................................. 469 Lance Lininger & Kyle Gotthelf Design, Development, Testing, and Flight of the Crew Dragon Docking System ............................... 483 Jaret Matthews, Caitlin Driscoll, Edward Fouad, Andrew Welter, Marc Jamulowicz & Jessica Ipnar Highlights of the Next Generation AIAA Moving Mechanical Assemblies Standard ............................ 495 Brian Gore & Leon Gurevich Micro-Vibration Attenuation Using Novel Flexible Pivot Design....................................................... 503 Luc Blecha, Yoël Puyol, Simon Hayoz, Fabrice Rottmeier & Martin Humphries Compliant Mechanisms Made by Additive Manufacturing .............................................................. 517 Lionel Kiener, Hervé Saudan, Florent Cosandier, Gérald Perruchoud, Vaclav Pejchal, Sébastien Lani & Antoine Verhaeghe Flexible Waveguides for RF Transmission across PSP HGA Rotary Actuator ................................... 529 Deva Ponnusamy, Weilun Cheng, Ted Hartka, Devin Hahne, Calvin Kee, Mike Marley & David Napolillo Thermal Vacuum Testing Lessons Learned for Small Stepper Motors and a CubeSat Translation Mechanism ............................................................................................................................ 543 Alex Few, Lynn Albritton & Don McQueen Design and Development of the GPM Solar Array Drive Assembly, Orbital Performance and Lessons Learned .............................................................................................................. 555 Alejandro Rivera, Glenn Bock, Alphonso Stewart, Jon Lawrence, Daniel Powers, Gary Brown & Rodger Farley

viii
Two-Axis Antenna Pointing Mechanism Qualification for Juice Mission Dual-Band Medium Gain Antenna ......................................................................................................................... 573 Jorge Vázquez, Mikel Prieto, Jon Laguna & Antonio Gonzalez

ix
SYMPOSIUM ORGANIZING COMMITTEE
Host Chair – Brandan Robertson, NASA JSC
General Chairman - Edward A. Boesiger, Lockheed Martin Space Deputy Chairman - Stuart H. Loewenthal, Lockheed Martin Space (retired)
William Caldwell, NASA ARC Damon C. Delap, NASA GRC Jared A. Dervan, NASA MSFC Adam G. Dokos, NASA KSC
Michael J. Dube, NASA NESC Carlton L. Foster, NASA MSFC (retired)
Lionel Gaillard, ESA/ESTeC Claef F. Hakun, NASA GSFC
Christopher P. Hansen, NASA JSC Louise Jandura, JPL
Alan C. Littlefield, NASA KSC (retired) Ronald E. Mancini, NASA ARC (retired)
Fred G. Martwick, NASA ARC Donald H. McQueen, Jr., NASA MSFC
Robert P. Mueller, NASA KSC Benjamin J. Nickless, NASA LaRC Joseph W. Pellicciotti, NASA HQ
Minh Phan, NASA GSFC Joseph P. Schepis, NASA GSFC
Donald R. Sevilla, JPL James E. Wells, NASA LaRC
Jonathan P. Wood, Lockheed Martin Space

x

1
Nanometric positioning with IASI-NG ‘s Beam Splitter Mechanism Actuator
Francois Barillot*, Jocelyn Rebufa*, Gladys Jaussaud* and Adrien Guignabert *
Abstract This paper presents a piezoelectric motor which provides linear motion and very high resolution (40 nm steps). First, the space application (IASI-NG instrument onboard METOP-SG satellite) and associated performance requirements are presented. The internal architecture of the motor and its main components are then explained. A first focus is done on the experimental verification of the threaded interface lifetime which is a key element of the mechanism. A second focus is on the nanometric position test bench. Achieved results are provided for resolution, motion quality and position stability. Finally, results from the vibration test campaign are presented.
Introduction Many space projects have shown need for stable sub-micrometer positioning linear actuators. They are typically needed to adjust the mirror position of sensitive optical instruments after launch during initialization or throughout flight life to accommodate aging and other long-term variations. In addition, as long periods can be expected between position changes, it is mandatory that the actuator remains passive (i.e., not powered) once the adequate position is achieved. This need is met in the IASI-NG space instrument, where a linear actuator offering a 30-nm step resolution and an unpowered position stability of 0.30 µm over 6 months was requested. Combined with the requirement of surviving launch, these specifications are beyond the capacity of existing linear piezo motors. For example, in [1] the piezomotor survival against vibration loads was not proven. Such external forces will apply directly on both the motor friction surface and the piezo ceramic and may damage the motor. This can be circumvented using a launch lock mechanism at a price of added mass and complexity. In order to meet such a need, Cedrat Technologies (CTEC) has built a hybrid actuator, starting from its patented Fine Stepping Piezoelectric Actuator (FSPA) [2], but using a combination of its magnetic and piezoelectric technologies to reduce electrical requirements. This new linear stepping actuator first generates a rotating movement and then turns it into a translation movement. It offers nanometric positioning resolution combined with the ability to hold its position without power and during launch without the need for any launch lock mechanism.
IASI-NG & Beam Splitter Mechanism The Infrared Atmospheric Sounding Interferometer New Generation (IASI-NG) is a key payload element of the second generation of European meteorological polar-orbit satellites (METOP-SG) dedicated to operational meteorology, oceanography, atmospheric chemistry, and climate monitoring. It will provide operational meteorology data such as temperature and humidity atmospheric profiles and also monitor other gases like ozone, methane or carbon monoxide on a global scale. The instrument is developed under the lead of CNES, who is responsible for the development and procurement of the IASI-NG System (Instrument, Ground Processing software, Technical Expertise Center). Airbus Defence and Space was selected for development of the “Space Segment” mainly consisting of the Instrument itself.
* CEDRAT Technologies, Meylan, France ; [email protected]
Proceedings of the 45th Aerospace Mechanisms Symposium, NASA Johnson Space Center, 2020
2
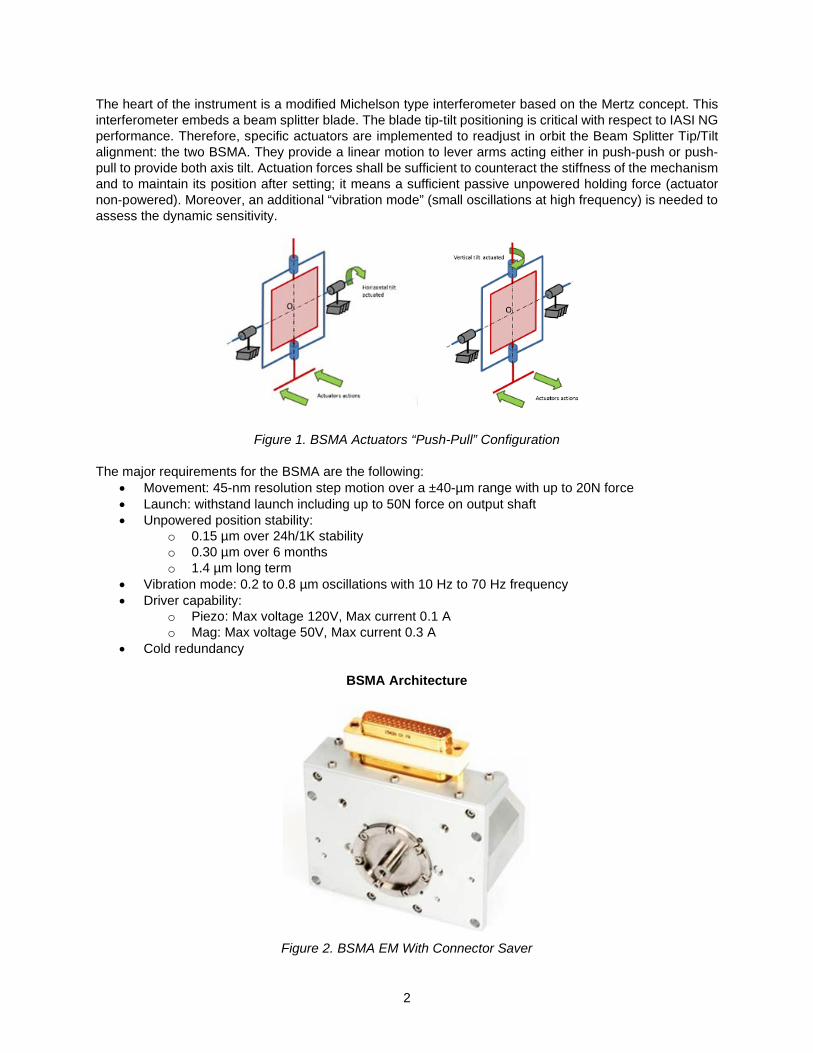
The heart of the instrument is a modified Michelson type interferometer based on the Mertz concept. This interferometer embeds a beam splitter blade. The blade tip-tilt positioning is critical with respect to IASI NG performance. Therefore, specific actuators are implemented to readjust in orbit the Beam Splitter Tip/Tilt alignment: the two BSMA. They provide a linear motion to lever arms acting either in push-push or push-pull to provide both axis tilt. Actuation forces shall be sufficient to counteract the stiffness of the mechanism and to maintain its position after setting; it means a sufficient passive unpowered holding force (actuator non-powered). Moreover, an additional “vibration mode” (small oscillations at high frequency) is needed to assess the dynamic sensitivity.
Figure 1. BSMA Actuators “Push-Pull” Configuration The major requirements for the BSMA are the following:
• Movement: 45-nm resolution step motion over a ±40-µm range with up to 20N force • Launch: withstand launch including up to 50N force on output shaft • Unpowered position stability:
o 0.15 µm over 24h/1K stability o 0.30 µm over 6 months o 1.4 µm long term
• Vibration mode: 0.2 to 0.8 µm oscillations with 10 Hz to 70 Hz frequency • Driver capability:
o Piezo: Max voltage 120V, Max current 0.1 A o Mag: Max voltage 50V, Max current 0.3 A
• Cold redundancy
BSMA Architecture
Figure 2. BSMA EM With Connector Saver

3
Overall architecture The core BSMA is based on the combination of the following elements: • Fine Stepping Piezoelectric Actuator (FSPA): these piezoelectric motors provide a 320-µm
displacement range and a resolution smaller than 50 nm, • Parallel Pre-stressed Actuators (PPA): these actuators are used to generate the sine oscillations for
the vibration mode. • Eddy Current Sensor: these sensors are used to monitor the effective position of the BSMA output
shaft. In order to achieve cold redundancy, each of these elements has to be doubled inside the BSMA. The two FSPAs motors are connected by a lever arm which sums the position of the two motors. This architecture divides by a factor of two the displacement generated by the FSPA. This improves motor resolution by a factor of two but at the cost of a doubled stroke for the motor.
Figure 3. BSMA Internal Architecture
Electrical interconnection of the components is achieved through a multilayer PCB that also includes the eddy current sensors. A single SUB-D connector is then attached on the side of the BSMA to connect the harness. FSPA Actuator The FSPA is a new brand of patented piezoelectric motors from Cedrat Technologies. It is a combination of a Rotating Stepping Piezoelectric Actuator (RSPA) and a differential screw. This FSPA piezomotor is mainly proposed as a product for industrial and laboratory applications, among CTEC range of SPA piezo motors [3]. However, its compact design and vacuum compatibility is an opportunity for cost-effective space applications such as micro satellites or constellations nano satellites. FSPA piezo motors main advantages are:
• 5-mm displacement range with up to 120N driving force, • compact casing (Ø50 mm x 45 mm) and low mass (150 g), • typical stepping size adjustable from 50 nm to 250 nm, • holding force while unpowered, against external forces, that can exceed 1 kN, • end-stops that passively prevent the motor from exceeding its operational stroke including in case
of a faulty command from the user. The high holding force at rest allows to avoid the use of an additional launch-lock mechanism. This FSPA motor can be used for nano positioning of an optical payload. It could even be used as an HDRM (Hold Down and Release Mechanism) for another mechanism.

4
Figure 4. FSPA35XS, Drive Electronics & Load Curve
The FSPA stick/slip operating principle is based on inertial forces as other SPA [4]. The consequence is that some short current spikes are needed to generate the pulses. For IASI-NG a requirement is to minimize the need for current spikes in order to facilitate electronic design. A magnetic clutch is then added to the original RSPA motor. This clutch allows to open the contact between the RSPA module and the rotor when it reverts to its original position. The maximum current for piezoelectric components can then be reduced below 100 mA (even using larger ceramics than usual).
Figure 5. Kinematic Chain of FSPA Inside BSMA
Figure 5 shows the kinematic chain for the FSPA inside the BSMA. The step sequence is the following:
1. Start powering the magnetic clutch to reinforce the torque transmission between the RSPA module and the rotor
2. Power the RSPA module to generate a small rotation. Rotation is transmitted to the rotor through the clutch.
3. Reverse power in the magnetic clutch to cut the contact with the rotor 4. Cut power of the RSPA to have it return to its initial position. The rotor stays in place. 5. Cut power of the magnetic clutch. Rotor is then locked in place.
Each step results with a fraction of a turn rotation (α) for the rotor. As the rotor is connected to the structure through screw 1, the rotation causes a small translation (α.p1) of the rotor relative to the structure. Further, the output shaft (which cannot rotate) moves relative to the rotor in the opposite direction(-α.p2) because of screw 2.
-5
0
5
10
15
20
25
0 20 40 60 80 100 120
Spee
d (µ
m/s
)
Load(N)

5
The resulting displacement of the rotor versus the structure is then α(p1-p2). This configuration allows the use of larger threads, which are needed to withstand the loads, while allowing very small steps per turn otherwise not possible. Magnetic clutch A key aspect of the BSMA is then its electromagnetic clutch. This clutch was designed based on the following constraints:
• transmit torque during stepping sequence, • complete loss of contact during release, • closed when unpowered, • perform more than 1 million operation cycles without detrimental wear • coil temperature within acceptable range, • mass allowing RSPA module to support clutch without assistance of any launch-lock mechanism.
The clutch design is based on an electromagnet principle. Magnetic technology was selected as it allows larger displacement compared to piezoelectric ceramics. This is needed to generate a gap which is large enough to accommodate for manufacturing and assembly tolerances.
Figure 6. Partial Cut View Showing Rotor, Clutch and RSPA Module
In practice, the clutch consists of 6 pallets driven by the central coil and magnet. Each pallet can rotate around a flexible blade when the magnetic coil is powered. At the end of the pallet is a friction tooth that will interface with the rotor and transmit torque from the RSPA module. A permanent magnet generates some flux which closes the pallets (and therefore the clutch) when the electromagnet is not powered. Performance of the clutch was optimized using magnetic simulation (Figure 7) in order to minimize its size and heating while providing enough force to ensure torque transmission. As the rotor turns, the distance between the tooth and rotor contact surface can vary significantly depending on the rotor runout and other manufacturing tolerances. A major point of concern during the design was to ensure that magnetic forces would not vary excessively, remaining high enough to ensure proper torque transmission.

6
Figure 7. Clutch Magnetic Simulation Figure 8. Flexible Pivot Stress Simulation
Specific attention was also needed for the design of the flexible blades in order to ensure a high transmission stiffness while preserving a low flexure stress and flexure stiffness. High strength steel was used to ensure a >99% reliability of the clamp including the fatigue effect over lifetime. Prestressed Piezoelectric Actuator (PPA) A double PPA is placed between the lever arm and the output shaft. This PPA is composed off 2 stacked piezoelectric components to provide redundancy. The supplied piezo components have been validated for space application with a LAT (Lot Acceptance Test). This LAT sequence, composed of several test group samples, was established thanks to previous work with agencies (ESA and CNES).
Differential Screw Wear Test Bench Guided lever arm A lever arm connects the two FSPAs and the output shaft. The resulting position of the shaft is the mean position of the two FSPAs. Redundancy is then achieved as each FSPA can move the output shaft independently from the other one.
Figure 9. Schematic of BSMA for Max Position, Lever Tilt Angle is Exaggerated
However, a major consequence of this architecture is that the lever arm tip displacements are not straight. The rotation of the arm induces a side displacement which must be supported by the threaded interfaces. This design was selected due to its compactness and considering that:
• Static load is rather small (<100N) compared to allowable screw tension in static conditions, • Speed is very low (allowing contact heat to dissipate), • Limited lifetime requirement (100 operations).

7
Screws excessive wear As expected, the alignment of the clutch with the rotor was a major difficulty during assembly. Several assembly methods had to be tested on the first engineering models to identify the best options. During one of the tests and due to a mishandling, one of the screws was damaged and had to be replaced. After disassembly, it was found that the other screws showed excessive deformation and wear (even considering the specific history of the model).
Figure 10. EM1 Screws, Left Screw Shows Excessive Wear,
Right Screw Was Damaged Due to Mishandling Following this result, it was decided to upgrade the design of the BSMA. The major design improvements were to:
• replace initial soft screw material with a high strength stainless steel with space heritage, • use both liquid and solid space qualified lubricants to minimize the risk of dry contact.
Test bench verification In order to validate the updated design, it was decided to build a dedicated test bench. Two major elements were to be considered for the test bench design:
• Kinematic Accuracy: movement shall be as close as possible to the effective movement in the BSMA,
• Load Accuracy: preload shall be the same as in the BSMA, • Accelerated Test: rotation speed must be accelerated to get an acceptable test duration.
A geared electric motor was used to drive the differential screw rotor. Transmission to the rotor was done using gear wheels. Gears would not be acceptable for normal use as their resolution is much too large for the application, but this was acceptable for the accelerated test, where each cycle was a complete turn of the rotor.
Figure 11. Differential Screw Test Bench
8
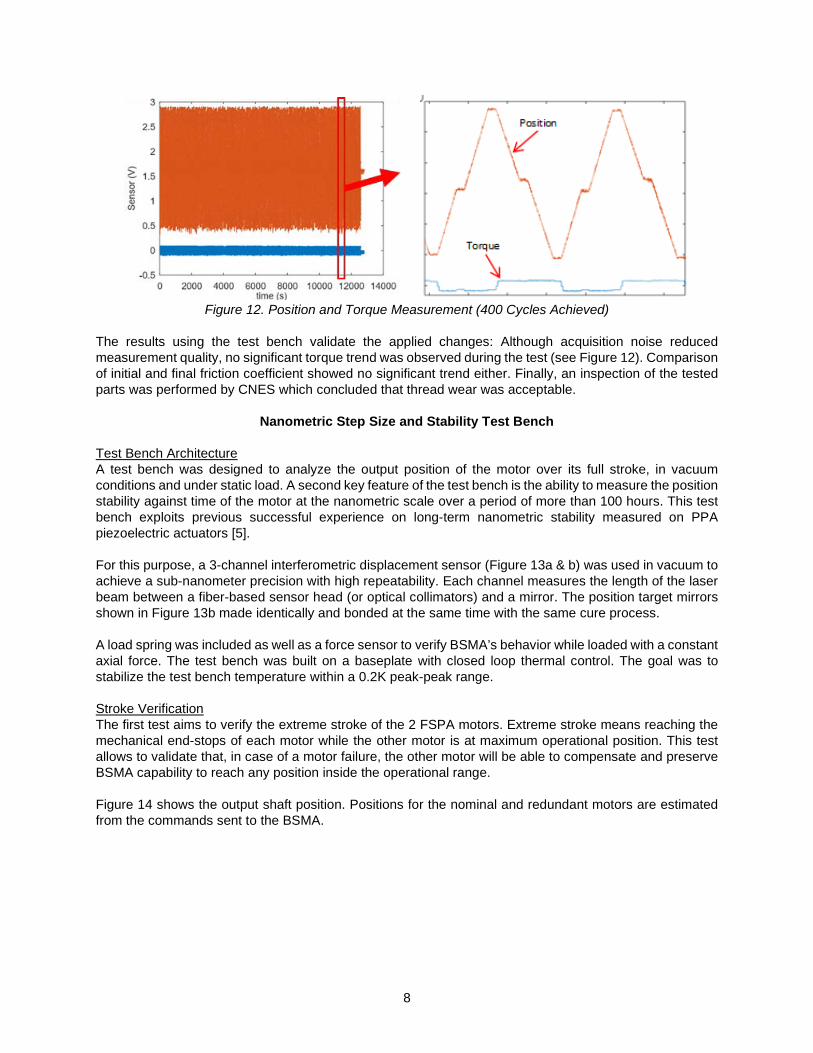
Figure 12. Position and Torque Measurement (400 Cycles Achieved)
The results using the test bench validate the applied changes: Although acquisition noise reduced measurement quality, no significant torque trend was observed during the test (see Figure 12). Comparison of initial and final friction coefficient showed no significant trend either. Finally, an inspection of the tested parts was performed by CNES which concluded that thread wear was acceptable.
Nanometric Step Size and Stability Test Bench Test Bench Architecture A test bench was designed to analyze the output position of the motor over its full stroke, in vacuum conditions and under static load. A second key feature of the test bench is the ability to measure the position stability against time of the motor at the nanometric scale over a period of more than 100 hours. This test bench exploits previous successful experience on long-term nanometric stability measured on PPA piezoelectric actuators [5]. For this purpose, a 3-channel interferometric displacement sensor (Figure 13a & b) was used in vacuum to achieve a sub-nanometer precision with high repeatability. Each channel measures the length of the laser beam between a fiber-based sensor head (or optical collimators) and a mirror. The position target mirrors shown in Figure 13b made identically and bonded at the same time with the same cure process. A load spring was included as well as a force sensor to verify BSMA’s behavior while loaded with a constant axial force. The test bench was built on a baseplate with closed loop thermal control. The goal was to stabilize the test bench temperature within a 0.2K peak-peak range. Stroke Verification The first test aims to verify the extreme stroke of the 2 FSPA motors. Extreme stroke means reaching the mechanical end-stops of each motor while the other motor is at maximum operational position. This test allows to validate that, in case of a motor failure, the other motor will be able to compensate and preserve BSMA capability to reach any position inside the operational range. Figure 14 shows the output shaft position. Positions for the nominal and redundant motors are estimated from the commands sent to the BSMA.

9
Figure 13 - BSMA Stability Test Bench
Figure 14 - Extreme Position Verification Test in Air
(a) Overview of the loading assembly (b) The 3-channel interferometric displacement sensor without loading
assembly
(c) Inside overview of the test bench (d) Outside overview of the test bench in
ISO7 clean room
Glued target mirror
(a) Full stroke (b) Direction change
End-stop verification of margins

10
Step Sizes A major characteristic of the BMSA is its ability to generate very small steps. Figure 15 shows analyses of step size for nominal and redundant motor when cycling over the operational range and against its lifetime. Performing a direction change does not impact step size nor shows any sign of backlash (Figure 15b). Average displacements (red points) for 3 consecutive steps are very stable for both motors and over the complete range (Figure 15a). Step size appears noisier for forward steps compared to backward. This result remains to be investigated to separate effective step variations from acquisition and post-processing noise.
Figure 15 – Step Size Analyses
The step size distribution appears to follow a normal law with a standard deviation of 4.3 nm for the nominal motor and 4.9 nm for the redundant motor (Figure 15b). In other words, the variation for more than 99% of steps is lower than ±10 nm. Averaging on 3 steps decreases significantly the step size scattering (less than 12% variation for 3 steps averaging). Lifetime Test The lifetime qualification was still underway at the time of this document. Air lifetime is complete and shows a slow decrease of the average step size. Less than 4 nm of step size decrease has been verified after 1 million steps (320 times the cycle life). The step size distribution shows a comparable standard deviation before and after the lifetime test in air.
Figure 16 - Step Size Against Lifetime
(a) Step size against the stroke (Flight Model FM1)
(b) Step size for nominal & redundant motor averaged on 5 steps (Flight Model FM1)
(a) Approximative step size against lifetime
(Qualification model – cycles in air ) (a) Step size distribution over the operational
stroke before and after 1.2 million steps
11
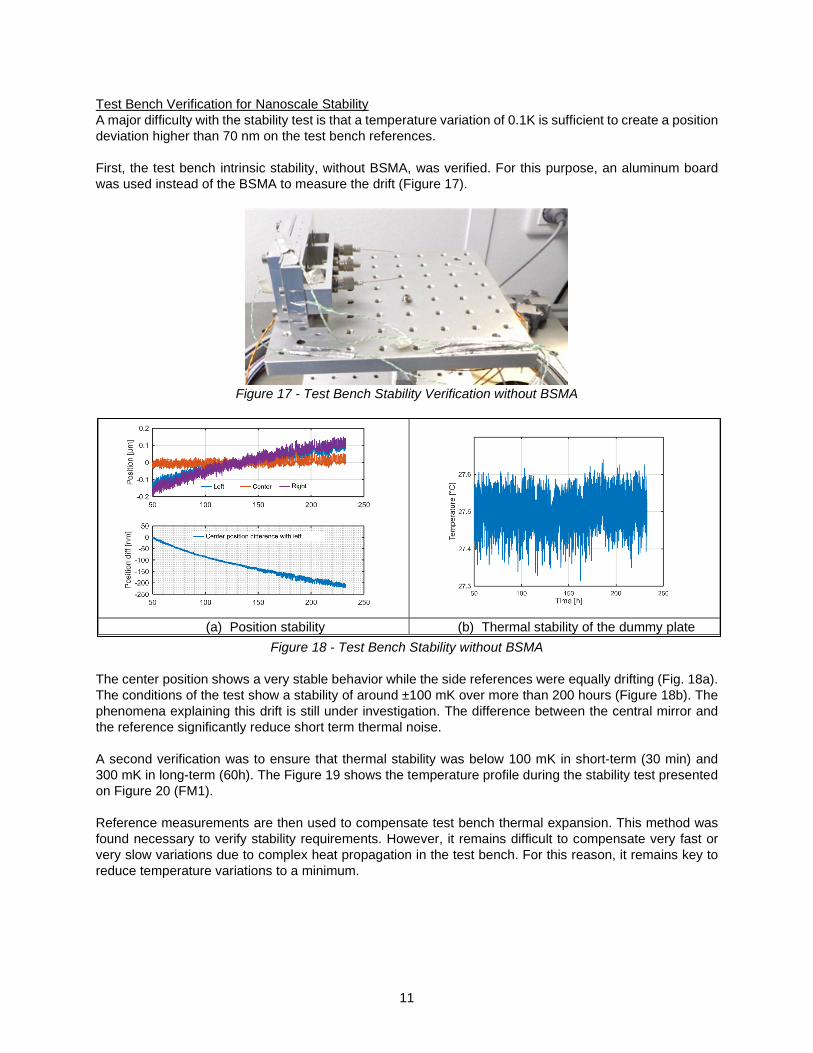
Test Bench Verification for Nanoscale Stability A major difficulty with the stability test is that a temperature variation of 0.1K is sufficient to create a position deviation higher than 70 nm on the test bench references. First, the test bench intrinsic stability, without BSMA, was verified. For this purpose, an aluminum board was used instead of the BSMA to measure the drift (Figure 17).
Figure 17 - Test Bench Stability Verification without BSMA
Figure 18 - Test Bench Stability without BSMA
The center position shows a very stable behavior while the side references were equally drifting (Fig. 18a). The conditions of the test show a stability of around ±100 mK over more than 200 hours (Figure 18b). The phenomena explaining this drift is still under investigation. The difference between the central mirror and the reference significantly reduce short term thermal noise. A second verification was to ensure that thermal stability was below 100 mK in short-term (30 min) and 300 mK in long-term (60h). The Figure 19 shows the temperature profile during the stability test presented on Figure 20 (FM1). Reference measurements are then used to compensate test bench thermal expansion. This method was found necessary to verify stability requirements. However, it remains difficult to compensate very fast or very slow variations due to complex heat propagation in the test bench. For this reason, it remains key to reduce temperature variations to a minimum.
(a) Position stability (b) Thermal stability of the dummy plate

12
Figure 20 - Thermal Measurement During Stability of FM1
Stability Test One crucial objective of this test bench is to verify the stability of the BSMA position over time. The first step of the test is to place the BSMA in stable environmental conditions (vacuum, regulated temperature) and then wait more than 60 hours for test bench and BSMA internal components to stabilize. A single step is then performed, and position is monitored for another 30 hours. The stability test shows that the ±150-nm stability requirement over 24 hours is achieved.
Figure 20 - FM1 Post-Processed Position during Stability Test (Difference between output shaft position and left reference)
Figure 20 shows the results of the stability test for the flight model FM1. A difference between the output shaft position and references is performed in order to remove the main effects from temperature variation. Moreover, a correction slope is removed from the test bench verification test without BSMA described in the previous paragraph. The post-processed stability curved shows an exponential decrease, then the step and a rather stable behavior. A possible explanation for the exponential effect at the beginning would be the PPA ceramics stabilization following air-vacuum transition. It is interesting to note that the step is not followed by a loss of stability.
Mechanical Environment Testing Random vibration testing was performed on the qualification model and flight models. Three axes were tested. Flight models were protected against contamination during the test by a plastic film.
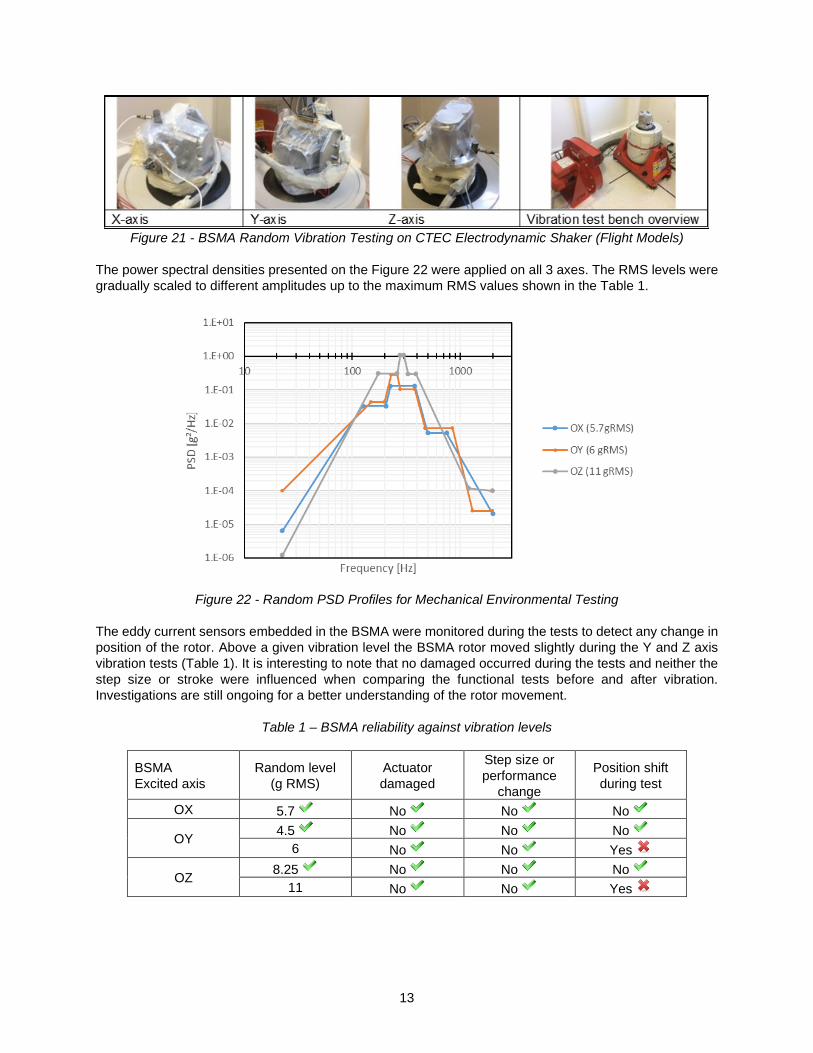
13
Figure 21 - BSMA Random Vibration Testing on CTEC Electrodynamic Shaker (Flight Models)
The power spectral densities presented on the Figure 22 were applied on all 3 axes. The RMS levels were gradually scaled to different amplitudes up to the maximum RMS values shown in the Table 1.
Figure 22 - Random PSD Profiles for Mechanical Environmental Testing
The eddy current sensors embedded in the BSMA were monitored during the tests to detect any change in position of the rotor. Above a given vibration level the BSMA rotor moved slightly during the Y and Z axis vibration tests (Table 1). It is interesting to note that no damaged occurred during the tests and neither the step size or stroke were influenced when comparing the functional tests before and after vibration. Investigations are still ongoing for a better understanding of the rotor movement.
Table 1 – BSMA reliability against vibration levels
BSMA Excited axis
Random level (g RMS)
Actuator damaged
Step size or performance
change
Position shift during test
OX 5.7 No No No
OY 4.5 No No No 6 No No Yes
OZ 8.25 No No No 11 No No Yes

14
Conclusion A new patented piezoelectric motor is presented with associated experimental results achieved on the qualification and flight models. This motor is undergoing qualification to be used inside IASI-NG Instrument onboard METOP-SG satellite. The major requirements for the BSMA were fulfilled:
• Movement: 40-nm resolution step motion over a ±40-µm range with up to 20-N force • Position stability experimentally verified: less than 100nm variation over 48h, • Launch capability without launch-locking mechanism: No damage at all tested levels, some
movements occurred for highest levels.
Acknowledgment The authors thank Frédéric DI GESUS and Francois FAURE from AIRBUS DS as well as Laurent CADIERGUE from CNES, for both their technical and financial support.
References 1. S. Henein, P. Spanoudakis, P.Schwab, I. Kjelberg, L. Giriens, Y. Welte, L.Dassa, R. Greger, U.Langer,
Design and Development of The Point-Ahead Angle Mechanism For The Laser Interferometer Space Antenna (LISA), Proc. Conference ESMATS 2009
2. F. Barillot, K. Benoit, C. Belly, A. Guignabert, O. Freychet, Fine Stepping Piezoelectric Actuator (FSPA) for IASI-NG, Conference ACTUATOR, Bremen (G), 25-27 june 2018 – Proceedings B5.5 p26
3. Stepping Piezo Actuators (SPA), Cedrat Technologies, 2019, from https://www.cedrat-technologies.com/en/products/piezo-motors/stepping-piezo-actuators.html
4. C. Belly, T. Porchez, M. Bagot, F. Claeyssen, CEDRAT TECHNOLOGIES, Improvement of Linear and Rotative Stepping Piezo Actuators using design and control, B2.3 Proc ACTUATOR 2012, Pub Messe Bremen (G), June 18-20, 2012
5. T. Porchez, F. Barillot, C. Belly, Nanometric positioning with piezo actuator and high stability strain gages, Proc. Conference ESMATS 2015
15
Spectrometer Scan Mechanism for Encountering Jovian Orbit Trojan Asteroids
Kenneth A. Blumenstock*, Alexander K. Cramer*, Joseph C. Church*, Jason A. Niemeyer*, Fil A. Parong*, Sam Zhao*, Nerses V. Armani**, and Kenneth Y. Lee**
Abstract
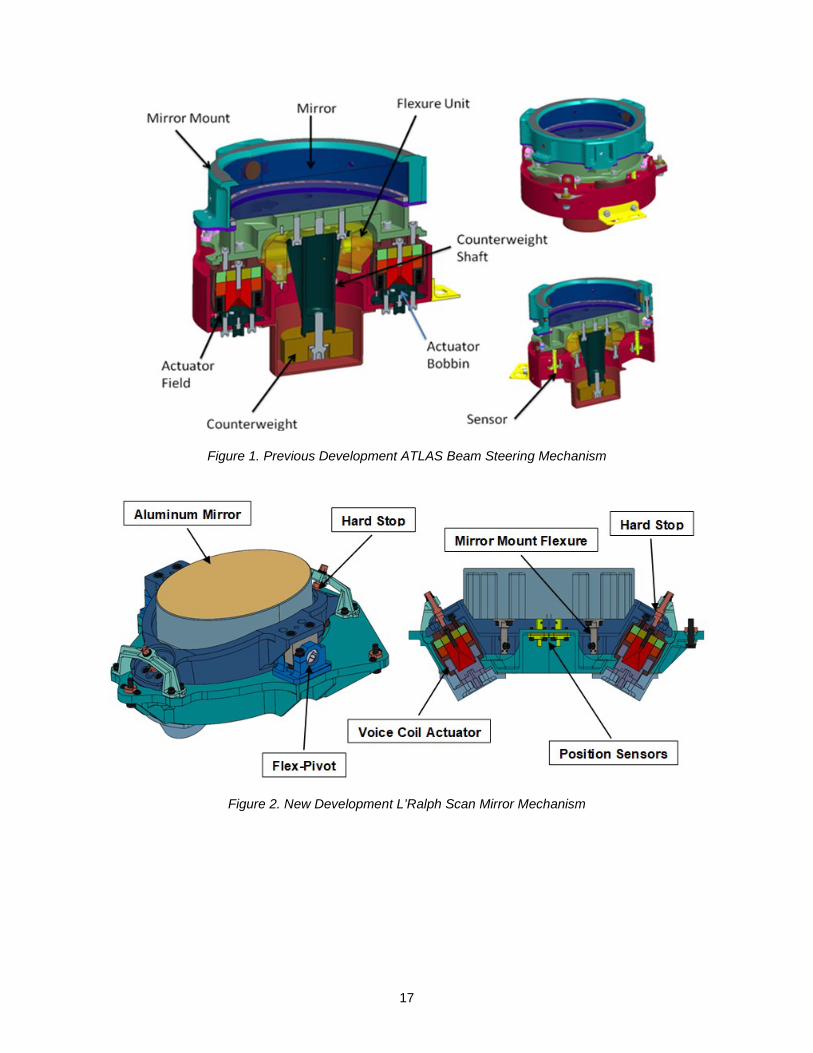
This paper describes the design, testing, and lessons learned during the development of the Lucy Ralph (L’Ralph) Scan Mirror System (SMS), composed of the Scan Mirror Mechanism (SMM), Differential Position Sensor System (DPSS) and Mechanism Control Electronics (MCE). The L’Ralph SMS evolved from the Advanced Topographic Laser Altimeter System (ATLAS) Beam Steering Mechanism (BSM), so design comparisons will be made. Lucy is scheduled to launch in October 2021, embarking upon a 12-year mission to make close range encounters in 2025 and 2033 with seven Trojan asteroids and one main belt asteroid that are within the Jovian orbit. The L’Ralph instrument is based upon the New Horizons Ralph instrument, which is a panchromatic and color visible imager and infrared spectroscopic mapper that slewed the spacecraft for imaging. The L’Ralph SMM is to provide scanning for imaging to eliminate the need to slew the spacecraft. One purpose of this paper is to gain understanding of the reasoning behind some of the design features as compared with the ATLAS BSM. We will identify similarities and differences between the ATLAS BSM and the L’Ralph SMM that resulted from the latter’s unique requirements. Another purpose of this paper is to focus upon “Lessons Learned” that came about during the development of the L’Ralph SMM and its MCE, both mechanism engineering issues and solutions as well as Ground Support Equipment issues and solutions that came about during the validation of requirements process. At the time of this writing, the L’Ralph SMM has been flight qualified and delivered to the project.
Evolution of the L’Ralph Scan Mirror Mechanism Let us consider the ATLAS Beam Steering Mechanism (BSM) depicted in Figure 1 as our basis of comparison [1]. The ATLAS BSM’s purpose is to point rather than to scan. It has two degrees of freedom provided by a custom flexure design, locating orthogonal axes of rotation behind a relatively heavy glass mirror with a dielectric coating. With the flexure axes location well behind the mirror, the actuators provide some counterbalancing, but the tungsten counterweight attached by its titanium shaft is the predominant means for balancing. Four custom voice coil actuators with redundant windings provide two-axis actuation and damping. A non-redundant inductive sensing system with two axes incorporates two pairs of differential sensors which view aluminum target areas at four locations of the moving plate behind the mirror. The angular range of each axis is ±5 milliradians (mrad). On-orbit operating temperature is 10°C to 35°C. The L’Ralph SMM depicted in Figure 2 requires only a single axis of rotation with an angular range of ±36 mrad, more than seven times the BSM angular range. The mirror is lightweighted aluminum rather than glass with the sensor targets incorporated into the backside of the mirror. The inductive displacement sensor technology has a full range linear displacement resolution compatible with both BSM and SMM, though in terms of angular resolution, BSM and SMM are quite different since their angular ranges are quite different. Due to SMM required redundancy, two sensor pairs were moved as close together as the target diameters would allow. This achieved the needed angular range and resolution, such that the inductive sensor pairs operated over their full linear displacement range of ±0.25 mm. With a single axis system, it was convenient and beneficial to locate conventional flex pivots on a rotation axis that passes through the mirror. This allowed locating the axis such that mass was balanced without the need for a shaft and counterweight, saving significant mass and eliminating additional structural dynamics.
* NASA Goddard Space Flight Center, Greenbelt, MD ** ATA Aerospace LLC, Greenbelt, MD
Proceedings of the 45th Aerospace Mechanisms Symposium, NASA Johnson Space Center, 2020
16
The flex pivots selected were typical brazed type rather than the higher strength electron-beam welded type. Electron-beam welded type flex pivot fatigue life is recommended to be derated according to a technical note by Donegan, Richard J., “Weld versus Braze,” (n.d.) at the Riverhawk Co., Inc. website [2]. It has become a common practice of the GSFC Electro-Mechanical Systems branch to incorporate significant damping into actuators of precision pointing and scanning mechanisms as a means to reduce the effect of both external and internal disturbances, reducing controller burden, thus improving success in meeting performance requirements. In linear actuators, this is accomplished by a pair of connected copper sleeves that surround both the OD and ID of the bobbin. Often, it would be desired to have even higher damping than we incorporate, but it can become impractical due to actuator size limitations. Scan rates must be low enough to incorporate high damping such that actuator power to overcome damping is not significant. For the SMM, the actuator is a stretched version of the BSM actuator in order to meet SMM stroke needs, but damping is roughly doubled due to a much lower on-orbit operational temperature range of -120°C to -89°C, which reduces resistance thus increasing damping. At the low temperature extreme, the system is nearly critically damped. The SMM Mechanism Control Electronics (MCE) incorporates a Field-Programmable Gate Array (FPGA). The Jovian orbit puts the spacecraft rather far from the sun, reducing solar array effectiveness. This resulted in the imposition of a power requirement for the MCE of less than 4 watts, significantly lower than the BSM MCE which required 13 watts. Fortunately, the sensor system is a relatively low power device requiring 0.4 watt. The BSM MCE utilized high resolution ADCs with low-noise op amps for the feedback signal. Identical components were unnecessarily used in greater quantities for telemetry, along with multiplexers, all of which are rather power-hungry components. For the SMM MCE, significantly reducing the number of telemetry signals, implementing standard noise op amps, and lower resolution ADCs with built in multiplexing, reduced power considerably. For the controller feedback signals, the heritage components were kept to maintain optimal closed-loop performance. Power savings also resulted from the reduction in components since only single-axis control was needed. Substituting a low quiescent power amplifier for driving the actuator pair saved an additional 0.5 watt over the previously used power op-amp.
Scan Mirror Optical Challenges The primary challenge of the Scan Mirror design depicted in Figure 3 was to satisfy the flatness requirement of the optical surface, 45 nanometers RMS, while balancing size and inertia. In order to minimize thermal distortion effects, the primary material for the structure of the Telescope Assembly, including all mirrors, was selected to be aluminum 6061-T651. All components which contribute to the system alignment were thermal cycled during the fabrication process to provide dimensional stability in the operating temperature environment. The optical surfaces were diamond turned and then silver coated for optimal reflectance in the specified wavelength range. The Scan Mirror geometry was selected to minimize flatness impacts from gravity release, diamond turning “fling,” assembly, and on-orbit thermal gradient effects. Pocketing and tapering of the mirror were used to reduce mass while maintaining stiffness. All of these sensitivities were predicted and the design guided by finite element and other analysis tools. The Scan Mirror also had to possess features for mechanical interface, alignment references and fiducials, as well as conductive targets within the back of the mirror for the inductive displacement sensors. The Scan Mirror is supported by three aluminum blade-style flexures to provide a secure and reliable load path that is tolerant to mounting process imperfections and thermal gradients. Alloy 7075-T651 was selected to provide the strength necessary to survive launch loads without the coefficient of linear thermal expansion (CTE) change that would be necessary with a more traditional titanium or other alternative material flexure. The flexures feature clearances at pin locations to absorb manufacturing tolerances. The flexures are bolted to the mirror and moving housing with accompanying plates that possess cavities which, during assembly, are injected with epoxy to register the flexure position to the pins. Figure 4 depicts a flexure as well as an accompanying plate configured for this process, known as “liquid pinning.”
17
Figure 1. Previous Development ATLAS Beam Steering Mechanism
Figure 2. New Development L’Ralph Scan Mirror Mechanism

18
Figure 3. Lightweighted Aluminum Scan Mirror
Figure 4. One of Three Mirror Mount Flexures with Associated Plate for Liquid Pinning
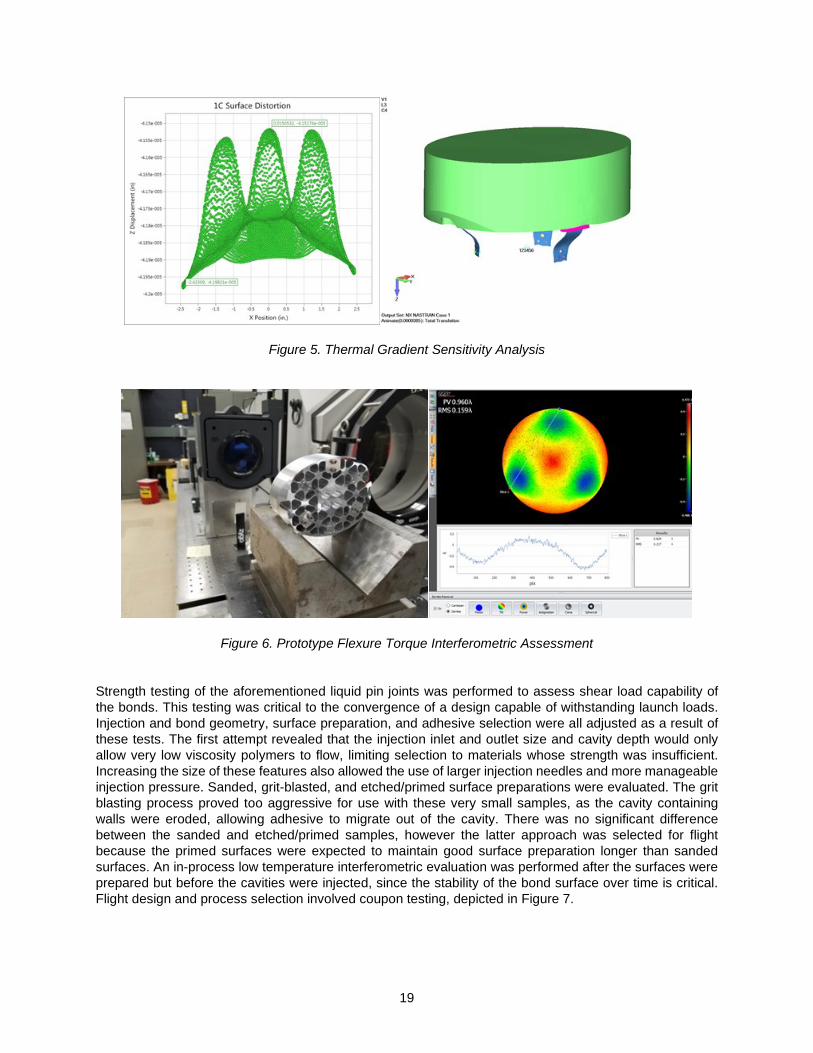
Prototype testing early in the design process uncovered a high sensitivity of mirror flatness to the flexure bolt preload torques. This finding resulted in two significant design changes. The first change was to remove mirror material under the flexure installation locations creating an undercut (Figure 3) such that strains could not propagate to the optical surface directly. This change was effective but did not alone minimize errors to acceptable levels. A second change was implemented to result in lower bolt preload in the cold operating environment while also maintaining preload at ambient conditions to prevent interface gapping under launch vibration. This was achieved using a low-CTE titanium bolt and high-CTE aluminum standoff (Figure 4). Figure 5 provides thermal gradient sensitivity analysis results of the mirror surface. Vibration and low temperature interferometric tests confirmed the soundness of this strategy. Figure 6 provides one of the interferometric test results.
19
Figure 5. Thermal Gradient Sensitivity Analysis
Figure 6. Prototype Flexure Torque Interferometric Assessment Strength testing of the aforementioned liquid pin joints was performed to assess shear load capability of the bonds. This testing was critical to the convergence of a design capable of withstanding launch loads. Injection and bond geometry, surface preparation, and adhesive selection were all adjusted as a result of these tests. The first attempt revealed that the injection inlet and outlet size and cavity depth would only allow very low viscosity polymers to flow, limiting selection to materials whose strength was insufficient. Increasing the size of these features also allowed the use of larger injection needles and more manageable injection pressure. Sanded, grit-blasted, and etched/primed surface preparations were evaluated. The grit blasting process proved too aggressive for use with these very small samples, as the cavity containing walls were eroded, allowing adhesive to migrate out of the cavity. There was no significant difference between the sanded and etched/primed samples, however the latter approach was selected for flight because the primed surfaces were expected to maintain good surface preparation longer than sanded surfaces. An in-process low temperature interferometric evaluation was performed after the surfaces were prepared but before the cavities were injected, since the stability of the bond surface over time is critical. Flight design and process selection involved coupon testing, depicted in Figure 7.

20
Figure 7. Liquid Pin Joint Shear Load Measurement Test Setup and Coupons after Joint Failures
Scan Mirror System Performance Verification
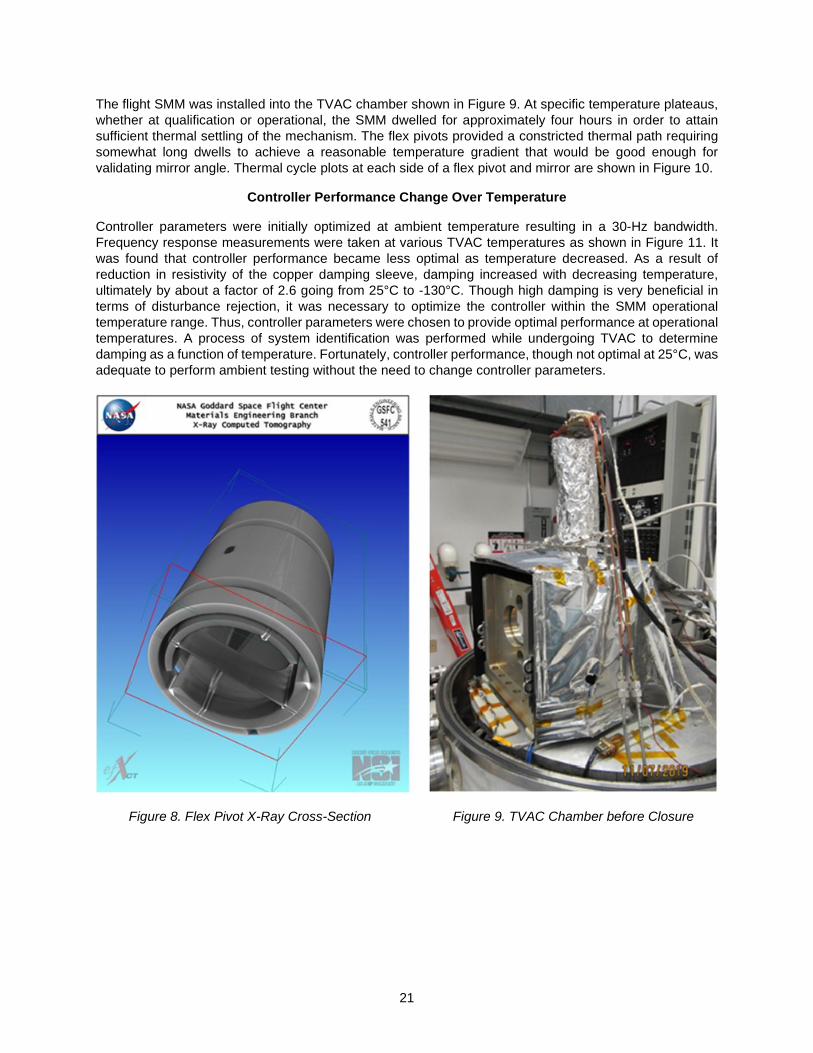
The SMM Engineering Test Unit (ETU) vibration tests, which included 22 g sine burst, swept sine, and random, were deemed very successful with no evidence of damage to the structure, no degradation of mirror figure, and no damage to the flex pivots. Post-test inspections did however suggest that the neutral angle of the mirror had changed slightly with respect to the fixed housing as a result of flex pivot shift despite being clamped. To correct this issue in the flight design, alignment and preload-angle clocking features were milled into the flex pivots to engage with set screws in the clamps. Non-destructive X-ray cross-section evaluations of the pivots were performed before and after these modifications to ensure that the brazed joints were not disturbed. Figure 8 is an X-ray cross-section of the flex pivot with the clocking features.
The major challenge of performance verification for this system was to accurately measure commanded mirror position across the on-orbit operational temperature range of -120°C to -89°C. A primary and redundant DPSS is used in L’Ralph to provide mirror position feedback for closed-loop control. Each DPSS was tested by the vendor at various temperatures within the operating temperature range to validate performance, but that testing was performed with a flat double-sided aluminum target on the moving portion of a linear stage placed between an opposing differential sensor pair on the fixed portion of that stage. The sensor arrangement in L’Ralph is different, with each sensor of a pair arranged side-by-side and its relatively large angular rotation of ±36 mrad might add some non-linearity since the target becomes less orthogonal to each sensor as the mirror moves away from mid-range. Furthermore, each sensor target at the back of the mirror is at the bottom of a counterbore, so there is possibility of a non-linearity contribution by the cylindrical conductive surface surrounding each sensor. Any non-axial motion of the mirror resulting from flex pivot behavior could be yet another contributor to sensor non-linearity. Therefore, validation of commanded mirror position was a necessity at the mechanism level.
The ATLAS BSM also required mirror position validation while in a thermal vacuum (TVAC) test chamber. The solution was to use an Inter-target Differential Electronic Autocollimator (IDEA) developed by Leviton Metrology Solutions, Inc. This is a very compact optical instrument as compared with a typical autocollimator. One of its features is the ability to measure the mirror angle of interest while calibrating against a reference mirror, which we located on the fixed portion of the mechanism under test. With IDEA looking through a window on the chamber, motion of the mechanism mount within the chamber is calibrated out by the fixed reference measurements. The IDEA system that was custom developed by the vendor for BSM was limited to measuring an angle somewhat beyond that of the BSM range of motion of ±5 mrad. A new version of IDEA was developed by the vendor with the capability to measure with some margin beyond that of the L’Ralph angular range of ±36 mrad.
21
The flight SMM was installed into the TVAC chamber shown in Figure 9. At specific temperature plateaus, whether at qualification or operational, the SMM dwelled for approximately four hours in order to attain sufficient thermal settling of the mechanism. The flex pivots provided a constricted thermal path requiring somewhat long dwells to achieve a reasonable temperature gradient that would be good enough for validating mirror angle. Thermal cycle plots at each side of a flex pivot and mirror are shown in Figure 10.
Controller Performance Change Over Temperature
Controller parameters were initially optimized at ambient temperature resulting in a 30-Hz bandwidth. Frequency response measurements were taken at various TVAC temperatures as shown in Figure 11. It was found that controller performance became less optimal as temperature decreased. As a result of reduction in resistivity of the copper damping sleeve, damping increased with decreasing temperature, ultimately by about a factor of 2.6 going from 25°C to -130°C. Though high damping is very beneficial in terms of disturbance rejection, it was necessary to optimize the controller within the SMM operational temperature range. Thus, controller parameters were chosen to provide optimal performance at operational temperatures. A process of system identification was performed while undergoing TVAC to determine damping as a function of temperature. Fortunately, controller performance, though not optimal at 25°C, was adequate to perform ambient testing without the need to change controller parameters.
Figure 8. Flex Pivot X-Ray Cross-Section Figure 9. TVAC Chamber before Closure

22
Figure 10. Fixed Pivot Clamp, Moving Pivot Clamp, and Mirror Temperature Transitions
Figure 11. Closed-loop Bode Plots of the Scan Mirror System at Various Temperatures
23
Mirror Position Sensor System Non-Linearity and Thermal Error Correction
Non-Linearity Correction The original MCE FPGA design had only gain and offset terms for converting DPSS voltage to mirror angle. It was decided to expand this to a third-order polynomial correction to compensate for higher-than-expected non-linearity in the DPSS output. The DPSS tuning process balances non-linearity, thermal stability, and resolution; the latter two were deemed more important to correct in hardware, though non-linearity could be corrected in firmware. At the mechanism level, calibration was performed with our autocollimator as a reference. At the instrument level, calibrations will be performed by scanning across a known star field prior to each encounter. This correction is a polynomial which is computed on each 5 kHz position sample before it is passed to the feedback input of the mechanism’s closed-loop controller.
Performance testing at each environment started with sensor recalibration, where static DPSS voltage measurements were compared to autocollimator measurements at over 200 points across the range of motion. The remaining scripted tests were divided into three parts; stability, repeatability, and scan tests. For the stability tests, the SMS was commanded to dwell for several minutes each at various fixed positions across the optical range of the mirror while data such as pointing stability, pointing error, and standby power were captured. Repeatability tests commanded the SMS to a series of test positions in a cyclic manner to ascertain how repeatably the mechanism was able to position the mirror. Finally, the SMS was commanded to scan across several optical ranges at several scan rates to obtain data such as optical smear, torque, and scan power. These tests were automated, and test results were trended across the entire mechanism test campaign to verify the performance of the mechanism against system requirements.
Mechanism performance testing showed all requirements were achieved except for one: the pointing resolution requirement. DPSS gain and non-linearity vary with temperature, but because of recalibration prior to each test, there was no noticeable performance degradation across the range of qualification temperatures. The pointing resolution issue appears to be a result of thermal gradients present during the sensor calibration step, which ultimately led to large residuals in the calibration data and thus inaccurate sensor parameters for the controller. To obtain valid calibration parameters, it was necessary wait until mechanism temperature was stable to within ±1.5°C of the desired temperature plateau. As a result, there were consistent pointing errors, especially at the end-of-travel positions where non-linearity is higher, and least-squares polynomial fitting has the highest residuals. Rate and smear are the driving requirements for this mechanism, so relaxation of the pointing resolution specification was deemed acceptable by the project.
Thermal Error Correction Initial tests of the ETU SMS revealed a drift in mirror position with a time constant on the order of 20 seconds. In stability tests where the SMS was commanded to step and hold at a mirror position, the DPSS would report the SMM mirror position as stable at the commanded location, while autocollimator measurements would show the SMM mirror had overshot and was slowly settling into position. The inverse was true in tests where a constant current was used to drive the SMM into one of its hard-stop locations: the autocollimator would show the mirror angle to be static as expected, while DPSS measurements would show the SMM mirror had undershot and was slowly drifting to the expected location. Further testing showed that the initial amplitude of this drift scaled linearly with the size of the step: a larger step meant a larger initial error. Stepping from one end of travel to the other, a 70-mrad motion, led to approximately 200 µrad of initial error.
This drift turned out to be a thermal phenomenon correlated with self-heating of the sensor heads themselves. An experiment was run by the vendor where a single sensor head was heated approximately 1°C, which resulted in a voltage error equivalent to less than 1 mrad, decaying with a similar time constant to what was seen in the SMS. The vendor found by measurement under normal operation, power dissipation of a single sensor head changed by a few milliwatts. Based upon the sensors head’s approximate thermal resistance, moving the SMM from one end of travel to the other would lead to a fractional °C change in temperature for a sensor pair. Based on the results of the sensor heating experiment, that temperature delta would cause a voltage error consistent with what was observed in SMS
24
testing. Further experimentation by the vendor included measuring the temperature change of the sensor heads with thermocouples for full-range moves of their test fixture. Results from this testing show both that full-range steps cause the temperature deltas predicted by the sensor head heating test, and that the time constants of both the temperature change and position error are roughly correlated.
To minimize impact on the existing controller design, correction for this drift was handled within the FPGA firmware but outside the feedback loop. An algorithm that predicted the sensor drift was summed with the position command input.
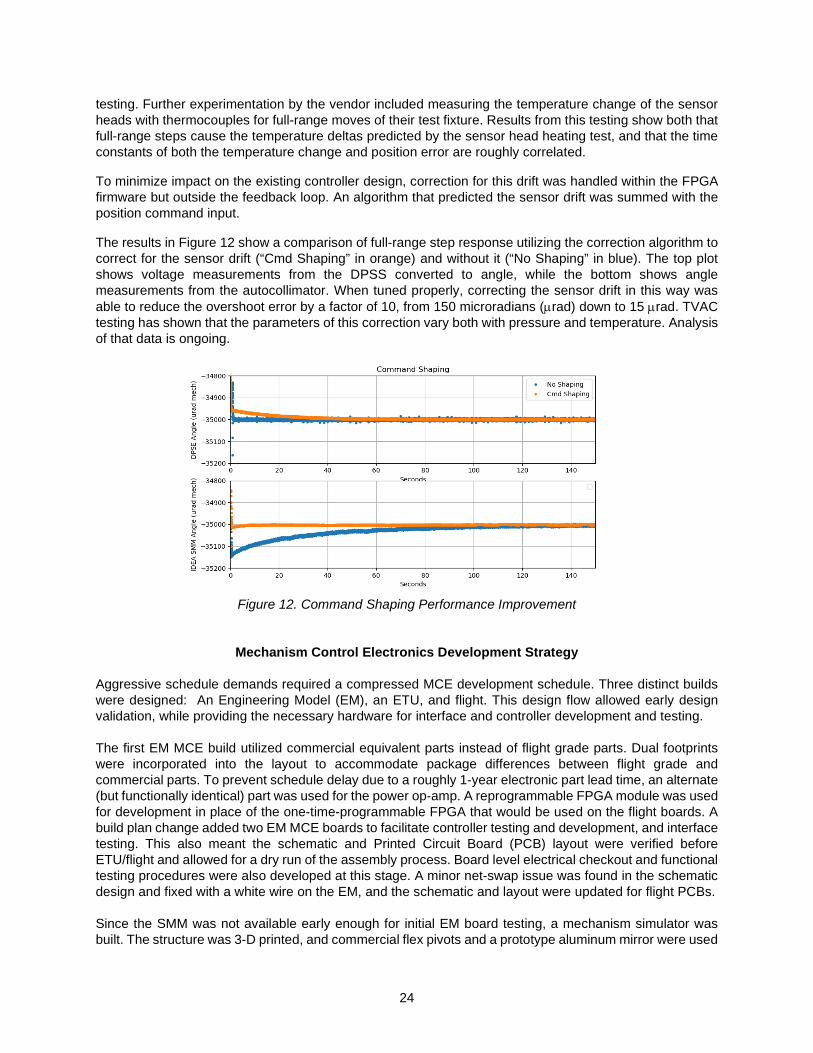
The results in Figure 12 show a comparison of full-range step response utilizing the correction algorithm to correct for the sensor drift (“Cmd Shaping” in orange) and without it (“No Shaping” in blue). The top plot shows voltage measurements from the DPSS converted to angle, while the bottom shows angle measurements from the autocollimator. When tuned properly, correcting the sensor drift in this way was able to reduce the overshoot error by a factor of 10, from 150 microradians (µrad) down to 15 µrad. TVAC testing has shown that the parameters of this correction vary both with pressure and temperature. Analysis of that data is ongoing.
Figure 12. Command Shaping Performance Improvement
Mechanism Control Electronics Development Strategy
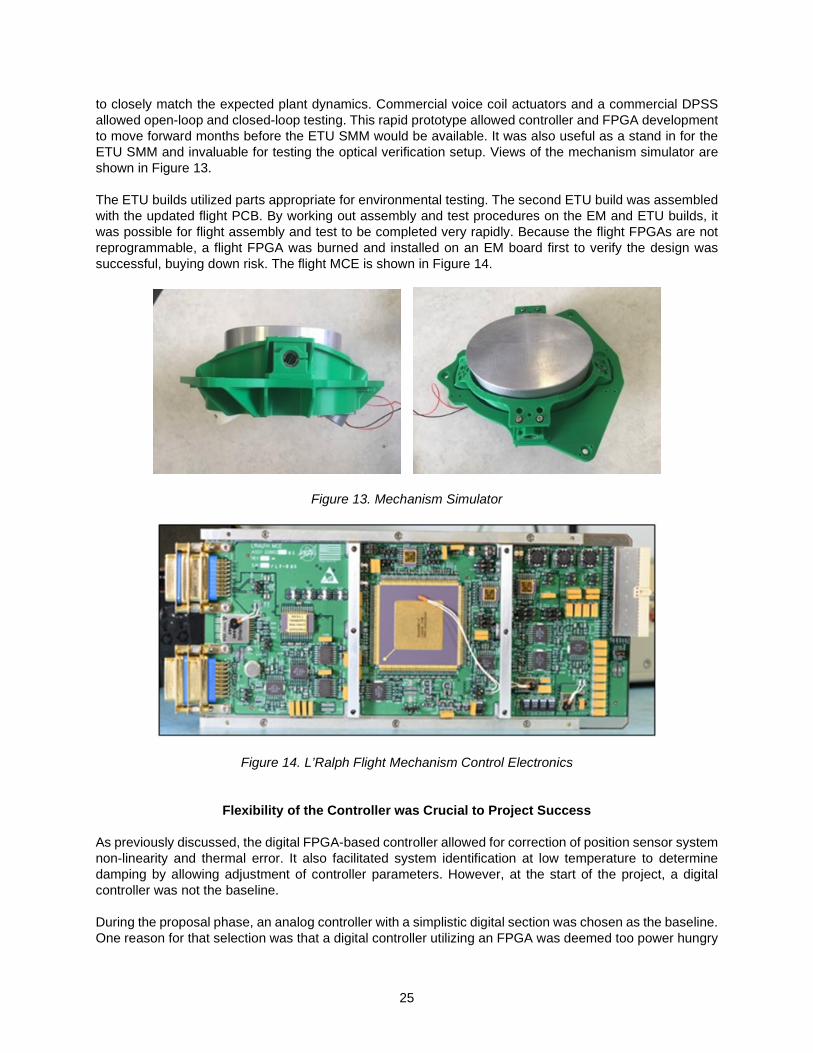
Aggressive schedule demands required a compressed MCE development schedule. Three distinct builds were designed: An Engineering Model (EM), an ETU, and flight. This design flow allowed early design validation, while providing the necessary hardware for interface and controller development and testing. The first EM MCE build utilized commercial equivalent parts instead of flight grade parts. Dual footprints were incorporated into the layout to accommodate package differences between flight grade and commercial parts. To prevent schedule delay due to a roughly 1-year electronic part lead time, an alternate (but functionally identical) part was used for the power op-amp. A reprogrammable FPGA module was used for development in place of the one-time-programmable FPGA that would be used on the flight boards. A build plan change added two EM MCE boards to facilitate controller testing and development, and interface testing. This also meant the schematic and Printed Circuit Board (PCB) layout were verified before ETU/flight and allowed for a dry run of the assembly process. Board level electrical checkout and functional testing procedures were also developed at this stage. A minor net-swap issue was found in the schematic design and fixed with a white wire on the EM, and the schematic and layout were updated for flight PCBs. Since the SMM was not available early enough for initial EM board testing, a mechanism simulator was built. The structure was 3-D printed, and commercial flex pivots and a prototype aluminum mirror were used
25
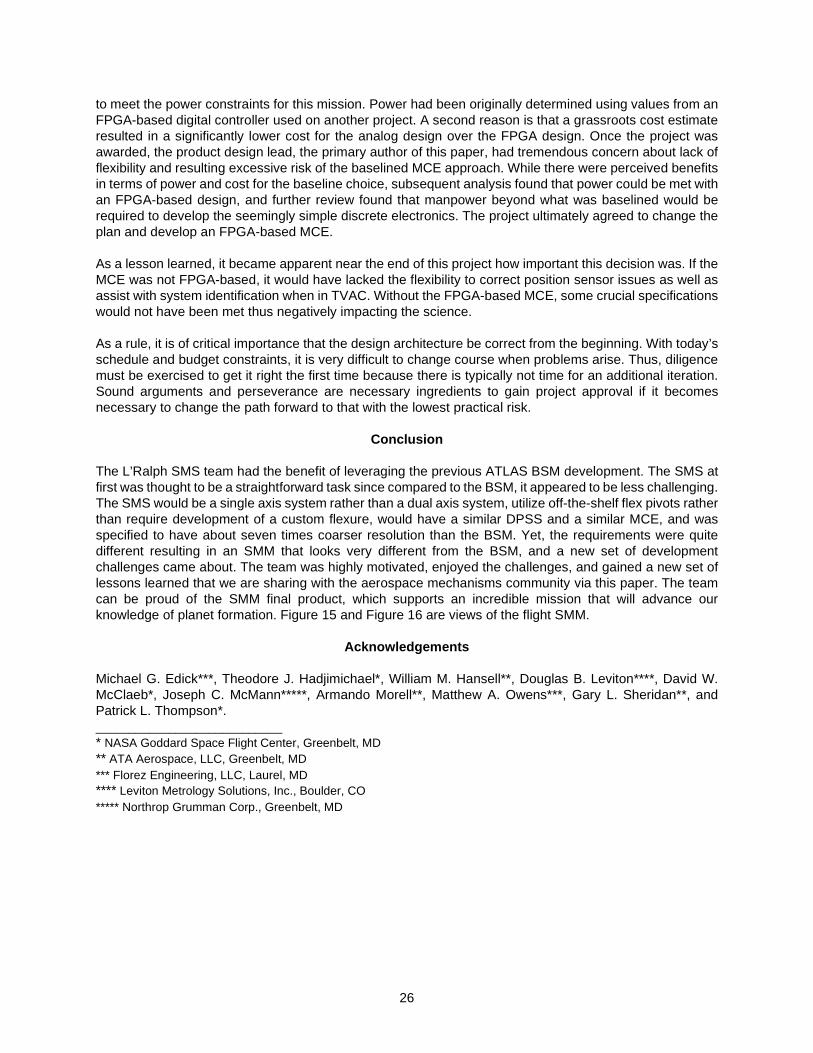
to closely match the expected plant dynamics. Commercial voice coil actuators and a commercial DPSS allowed open-loop and closed-loop testing. This rapid prototype allowed controller and FPGA development to move forward months before the ETU SMM would be available. It was also useful as a stand in for the ETU SMM and invaluable for testing the optical verification setup. Views of the mechanism simulator are shown in Figure 13. The ETU builds utilized parts appropriate for environmental testing. The second ETU build was assembled with the updated flight PCB. By working out assembly and test procedures on the EM and ETU builds, it was possible for flight assembly and test to be completed very rapidly. Because the flight FPGAs are not reprogrammable, a flight FPGA was burned and installed on an EM board first to verify the design was successful, buying down risk. The flight MCE is shown in Figure 14.
Figure 13. Mechanism Simulator
Figure 14. L’Ralph Flight Mechanism Control Electronics
Flexibility of the Controller was Crucial to Project Success As previously discussed, the digital FPGA-based controller allowed for correction of position sensor system non-linearity and thermal error. It also facilitated system identification at low temperature to determine damping by allowing adjustment of controller parameters. However, at the start of the project, a digital controller was not the baseline. During the proposal phase, an analog controller with a simplistic digital section was chosen as the baseline. One reason for that selection was that a digital controller utilizing an FPGA was deemed too power hungry
26
to meet the power constraints for this mission. Power had been originally determined using values from an FPGA-based digital controller used on another project. A second reason is that a grassroots cost estimate resulted in a significantly lower cost for the analog design over the FPGA design. Once the project was awarded, the product design lead, the primary author of this paper, had tremendous concern about lack of flexibility and resulting excessive risk of the baselined MCE approach. While there were perceived benefits in terms of power and cost for the baseline choice, subsequent analysis found that power could be met with an FPGA-based design, and further review found that manpower beyond what was baselined would be required to develop the seemingly simple discrete electronics. The project ultimately agreed to change the plan and develop an FPGA-based MCE. As a lesson learned, it became apparent near the end of this project how important this decision was. If the MCE was not FPGA-based, it would have lacked the flexibility to correct position sensor issues as well as assist with system identification when in TVAC. Without the FPGA-based MCE, some crucial specifications would not have been met thus negatively impacting the science. As a rule, it is of critical importance that the design architecture be correct from the beginning. With today’s schedule and budget constraints, it is very difficult to change course when problems arise. Thus, diligence must be exercised to get it right the first time because there is typically not time for an additional iteration. Sound arguments and perseverance are necessary ingredients to gain project approval if it becomes necessary to change the path forward to that with the lowest practical risk.
Conclusion The L’Ralph SMS team had the benefit of leveraging the previous ATLAS BSM development. The SMS at first was thought to be a straightforward task since compared to the BSM, it appeared to be less challenging. The SMS would be a single axis system rather than a dual axis system, utilize off-the-shelf flex pivots rather than require development of a custom flexure, would have a similar DPSS and a similar MCE, and was specified to have about seven times coarser resolution than the BSM. Yet, the requirements were quite different resulting in an SMM that looks very different from the BSM, and a new set of development challenges came about. The team was highly motivated, enjoyed the challenges, and gained a new set of lessons learned that we are sharing with the aerospace mechanisms community via this paper. The team can be proud of the SMM final product, which supports an incredible mission that will advance our knowledge of planet formation. Figure 15 and Figure 16 are views of the flight SMM.
Acknowledgements Michael G. Edick***, Theodore J. Hadjimichael*, William M. Hansell**, Douglas B. Leviton****, David W. McClaeb*, Joseph C. McMann*****, Armando Morell**, Matthew A. Owens***, Gary L. Sheridan**, and Patrick L. Thompson*. ____________________________ * NASA Goddard Space Flight Center, Greenbelt, MD ** ATA Aerospace, LLC, Greenbelt, MD *** Florez Engineering, LLC, Laurel, MD **** Leviton Metrology Solutions, Inc., Boulder, CO ***** Northrop Grumman Corp., Greenbelt, MD

27
Figure 15. L’Ralph Flight Scan Mirror Mechanism Front View
Figure 16. L’Ralph Flight Scan Mirror Mechanism Rear View
References
1. Blumenstock, Kenneth A., et al. "ATLAS Beam Steering Mechanism Lessons Learned." Proceedings of the 43rd Aerospace Mechanisms Symposium, (May 2016), pp. 1-14.
2. Donegan, Richard J. “Weld versus Braze.” [Engineering considerations regarding electron beam welded versus brazed flex pivots]. Retrieved from http://riverhawk.com/weld-versus-braze/, (n.d.)

28

29
Point Ahead Mechanism for Deep Space Optical Communication Development of a New Piezo-Based Fine Steering Mirror
Adrien Guignabert*, Thomas Maillard*, Francois Barillot*, Olivier Sosnicki* and Frank Claeyssen*
Abstract
The purpose of this paper is to present the development of a novel tip-tilt mechanism, with integrated optics, designed for the JPL Deep Space Optical Communication (DSOC) module of the upcoming Psyche mission (2022 launch). This paper presents the design, assembly and tests of the produced models. Regarding the design phase, an emphasis was put on the mirror calculations to ensure that the required flatness would be maintained after integration, and that the part would withstand the thermal/mechanical environment. The actual optical measurements performed after assembly are also presented. The qualification results for a new alpha-case removal process for titanium parts are presented. Tests results are especially interesting regarding the temperature behavior of the mechanism, impact on the stroke, and strain gage sensor feedback.
Introduction
In the upcoming NASA Psyche mission (2022 launch), JPL is planning the assessment of a first Deep Space Optical Communication (DSOC) module. In this module, a Point Ahead Mechanism (PAM) aims at steering the optical downlink signal towards anticipated earth position during DSOC communication phases. As a background, for 20 years, Cedrat Technologies (CTEC) has provided various piezoelectrically-actuated Beam Steering Mirrors as well as Fast Steering Mirrors for space missions (PHARAO for CNES, ATLID for Airbus DS) as well as for optronic equipment in defense [1-5]. More recently, CTEC has also been active in Free Space Optical Communication with a new large-stroke Fast Steering Mirror [4]. In this context, CTEC was subcontracted by L3Harris, to design, manufacture and test the performance of the PAM engineering and flight models for JPL PSYCHE DSOC. The developed PAM is a new tip-tilt mechanism based on low-voltage Amplified Piezoelectric Actuators (APA®), exploiting its space heritage. This paper presents the design, assembly and tests of the produced PAM models, covering the involved technologies and failure modes: piezo materials for actuation, strain gages for indirect angular position sensing, mechanical parts treatments, tip-tilt mechanical structure, mirror flatness, etc.
Mechanism Design
Specifications and Timeline The main specifications for this mechanism were to ensure an angular stroke of ±2,8 mrad throughout the full operational temperature range of the mission (-25/+50°C full perf, -40/+65°C reduced perf) and a mirror surface flatness under 63 nm while remaining inside a very limited volume and surviving launch vibrations. The project really started in summer 2018 with a preliminary feasibility study aimed at validating these specifications, which ended positively in Fall 2018. The initial design was first based on ATLID mechanism but specific requirements made it progressively, noticeably different in the end. The required schedule for the final mechanism development, i.e,. delivering Flight models less than 1 year after the actual project start, was very unusual and challenging.
* Cedrat Technologies, Meylan, France; [email protected]
Proceedings of the 45th Aerospace Mechanisms Symposium, NASA Johnson Space Center, 2020

30
Mechanism Overview The piezo actuators are wired in 2 push-pull configurations (1 per axis) to allow direct mirror rotation control. The PAM itself is composed of the following parts:
- A bracket baseplate (in aluminum): The APA® are fixed on it with screws. - 4 APA® (in titanium): They provide the required displacement and are fixed to the baseplate and to
the mirror support via flexural pivots. The APA® are equipped with Strain Gauge (SG) sensors that are bonded in place
- 4 circular pivots (in titanium). - A mirror support (in INVAR) which holds the mirror. - A guiding blade (in titanium) soldered onto the central cylinder that stiffens the assembly. - A Silicon Carbide (SiC) substrate-based mirror from Mersen OptoSiC®
Figure 1. PAM Overview Including Piezo and Optical Technology from Cedrat Technologies
Strain Gauge Sensing In order to be able to monitor the mirror angle, an indirect solution using strain gages placed on each piezo actuator is selected, based on space heritage from other projects, especially ATLID on this matter, which enabled an important development on SG assembly process. The initial SG redundancy requirement was lifted, because it required an important wiring complexity (32 instead of 16 wires), amongst other additional constraints. The project used constantan, 350-ohm SG. There are 2 SG per piezo stack, mounted in one full Wheatstone bridge per rotation axis to maximize the sensitivity while minimizing thermal drift. All SG wires and printed circuit board (PCB) traces are the same length to limit offset drift. New Piezo Actuator Design The existing CTEC actuators were either slightly too short in stroke or not stiff enough to ensure the mechanism survival during launch. The mechanism consists of 4 APA®, derived from CTEC standard APA120S but specifically designed for the application needs. Based on CTEC space heritage, the APA® shell was made from Ti6Al4V titanium, allowing a theoretical infinite fatigue lifetime in the specified operational conditions and an interesting stiffness/mass ratio. Another benefit of the use of titanium rather than steel as used in standard products, is the reduction of the thermal stroke effect due to a better CTE match (9 ppm/K) to the piezo stack (typically -3 to +1ppm/K) compared to a high performance stainless steel for example (10-11 ppm/K). A total of 18 APA® were assembled and tested, the results are indicated in Table 1.

31
Table 1. PAM Actuators Measured Results Full stroke
(170 V pp) 1st coupled
resonant frequency µm Hz Average measured 149.2 6963.6 Standard deviation measured 2.0 60.9 Design value (worst case) 130.4 6151 Difference measurement/design value 14% 13%
The design values are based on expected worst case parameters, i.e., low piezo gain and stiffest shell when calculating the stroke. A conservative approach was used to ensure that the required mechanism stroke would always be reached, which resulted in average margins of 14% for the stoke and 13% for 1st resonant frequency.
Integrated Optics – Mirror Development
The PAM is designed around one of its core components: the mirror. For this new project, CTEC used its experience on piezo-optical aerospace projects and collaborated with partners in order to fully integrate the optical hardware development, from the SiC mirror design to its integration and optical verifications. Mirror design One of the main design constraints of an embedded optics mechanism is to keep the mirror surface deformation to a minimum in order to limit the induced optical wave front error below the requirements. In this case, a maximum of 63-nm mirror surface flatness is the requirement. In order to ensure the specification would be reached, CTEC developed tools and performed specific simulations in the early design phase, specifically including verification of induced surface figure error caused by mechanical biases and thermal deformation, as well as optimization of mirror shape and dimensions.
Figure 2. Mirror Surface Deformation Simulation Meshing and Boundary Conditions (Screw Tension and
Torque Case) (Left) - Mirror Surface Deformation Evaluation Results (Right) The mirror design process is based on a finite element simulation of each mirror deformation contributor: mirror clamping to its support, actuator height variation, screw tightening and thermal operational. Each case used representative boundary conditions. The resulting displacement on each of the mirror surface points is then exported. A MATLAB program is then run to post process the results from the simulation. Extracting the RMS reference plane from this data set, it calculates the distance of each point to this plane, the peaks and valley of the deformed mirror and the resulting RMS deformation. The specific contribution of each evaluated case on the mirror deformation is then summed up to give an estimation of the total expected mirror surface deformation.

32
PAM development also included a regular mirror optical verification at different stages of the assembly, with the intention of having the ability to stop the process should a mirror appear to be out of the acceptable range or show significant surface figure changes from one step to another. With the recent CTEC experience on this matter, such regular controls also allowed us to learn a lot regarding the impact of each assembly step as well as providing a safer project assembly process.
Figure 3. Mirror interface (left) and surface verification with interferometer (right)
Mirror Verification Results A total of 4 PAM were produced and the mirror Reflected Wavefront Error, Peak-to-Valley (RWE PV, basically 2 times mirror surface flatness error SFE) was measured in different phases, i.e., mirror in the initial free condition, once clamped on its mount, and eventually after final integration in mechanism.
Table 2. PAM Mirror Surface Flatness Measurement Results PAM model 1.Free coated
mirror 2.Mirror clamped on mount
3.Mirror integrated in final mechanism
Calculation: Mechanism contribution to mirror deformation
RWE PV
(nm)
RWE RMS (nm)
RWE PV (nm)
RWE RMS (nm)
RWE PV
(nm)
RWE RMS (nm)
RWE PV (nm)
RWE RMS (nm)
EM 38.1 10.1 34.9 8.9 41.3 10.6 3.2 0.5 EQM 22.2 6.2 27.2 6.6 38.7 10.3 16.5 4.1 FM1 23.2 5.5 19.4 4.6 26.6 6.0 3.4 0.5 FM2 28.9 8.1 33.8 8.2 34.1 9.5 5.2 1.4 Average 28.1 7.5 28.8 7.1 35.2 9.1 7.1 1.6
With an average 35.2 nm and a maximum of 41.3 RWE PV, the <127-nm RWE specification was reached with significant margin. The last column evaluates the proper mechanism contribution to mirror deformation based on the difference between final and the initial RWE PV measurements. The mechanism average contribution to the mirror deformation appears to be limited to 7.1 nm PV and 1.6 nm RMS.

33
Eventually, we can compare these results to the expected worst-case deformations evaluated during the design phase. The thermomechanical contribution could not be evaluated so only mechanism induced deformation are considered.
Table 3. Comparison of mirror measurements and expected design worst cases
Average measured impact of mechanism on mirror RWE (nm)
Average measured impact of mechanism on mirror SFE (nm)
Evaluated worst case for mirror SFE (mechanism integration only) (nm)
PV 7.1 3.5 5.7 RMS 1.6 0.8 3.1
All measured values are within the expected range of mirror deformation, indicating that the conservative simulation approach was correct in that case.
Mechanism Production and Assembly
Titanium Parts – Alpha Case Removal Process Qualification The use of titanium for some parts, justified by its interesting mechanical properties and heritage on previous CTEC mechanisms (for similar parts) is not without drawbacks. The main issue is due to the use of wire electro discharge machining (WEDM) for the “flexible” parts manufacturing, i.e., the actuator amplification shell and the guiding blade at the center of the mechanism. This manufacturing technique is required due to the parts geometry.
Figure 4. WEDM titanium parts, guiding blade (left) and actuator shell (right), different scale
The WEDM locally heats the material which can induce the formation of an alpha case on the surface, with the adverse effect of lifetime reduction (up to 30% according to [6]), and possibly unexpected failures. This alpha case, usually a few µm thick, can be removed through proper chemical etching. For this mechanism, the already qualified manufacturer was not compatible with the required schedule (overload), hence a backup option had to be identified and qualified. The new supplier proposed an acid etching process. The qualification process was the following:
• Machine a set of guiding blade and actuator shell, identical to flight design (supplier, process, material batch, dimensions)
• Perform an alpha case analysis before acid etching, parts in initial state, as well as an interstitial hydrogen contamination measurement.
• Pass the parts through the acid etching process, adjusted to remove the required thickness • Perform an analysis after the chemical etching: alpha case and interstitial hydrogen
contamination • The process is qualified if analyses show no trace of alpha case after etching and no more than
150 ppm interstitial hydrogen contamination.
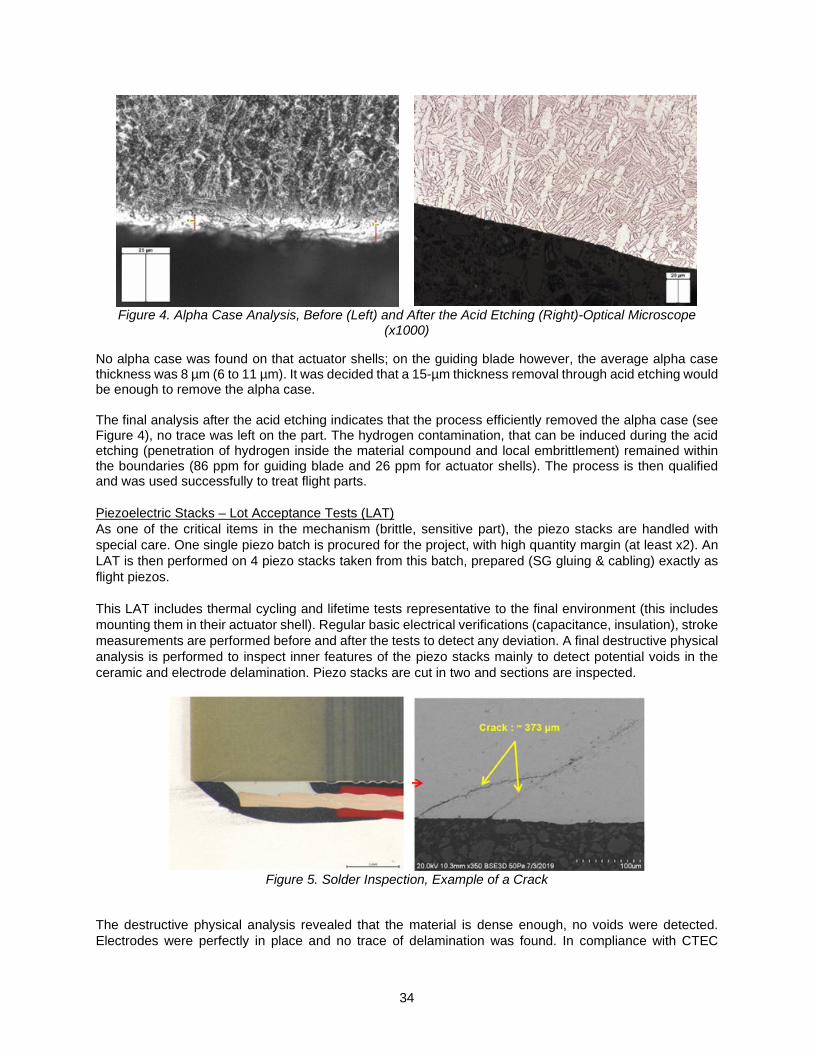
34
Figure 4. Alpha Case Analysis, Before (Left) and After the Acid Etching (Right)-Optical Microscope
(x1000)
No alpha case was found on that actuator shells; on the guiding blade however, the average alpha case thickness was 8 µm (6 to 11 µm). It was decided that a 15-µm thickness removal through acid etching would be enough to remove the alpha case. The final analysis after the acid etching indicates that the process efficiently removed the alpha case (see Figure 4), no trace was left on the part. The hydrogen contamination, that can be induced during the acid etching (penetration of hydrogen inside the material compound and local embrittlement) remained within the boundaries (86 ppm for guiding blade and 26 ppm for actuator shells). The process is then qualified and was used successfully to treat flight parts. Piezoelectric Stacks – Lot Acceptance Tests (LAT) As one of the critical items in the mechanism (brittle, sensitive part), the piezo stacks are handled with special care. One single piezo batch is procured for the project, with high quantity margin (at least x2). An LAT is then performed on 4 piezo stacks taken from this batch, prepared (SG gluing & cabling) exactly as flight piezos. This LAT includes thermal cycling and lifetime tests representative to the final environment (this includes mounting them in their actuator shell). Regular basic electrical verifications (capacitance, insulation), stroke measurements are performed before and after the tests to detect any deviation. A final destructive physical analysis is performed to inspect inner features of the piezo stacks mainly to detect potential voids in the ceramic and electrode delamination. Piezo stacks are cut in two and sections are inspected.
Figure 5. Solder Inspection, Example of a Crack
The destructive physical analysis revealed that the material is dense enough, no voids were detected. Electrodes were perfectly in place and no trace of delamination was found. In compliance with CTEC

35
previous experience, small 45° cracks were detected in the vicinity of the electrodes. These cracks are believed to be caused by the thermal expansion and contraction of the electrode during soldering. Since they are covered in epoxy potting, the cracks’ progression is contained. However, one unusually placed and lengthy crack was detected. Unusual by its location, starting from piezo edge instead of from the electrode, and by its length, 2.2 mm compared to the usual few hundred µm.
Figure 6. Piezo N°3, Black Wire Side Unusual Crack (Length 2.2 mm)
Raising questions, investigations were performed but no clear specific root cause was identified. It was found that this crack was slightly visible from the exterior and most importantly not going through the entire stack (staying near the electrode, under the epoxy).
Figure 7. Exterior View of the Crack
One possible root cause for this crack is stress concentration due to a slight mispositioning inside the actuator shell and to the selected prestress level. Simulations representing this mispositioning allowed CTEC to map the induced stress concentration and the result is visually similar to the observed crack pattern.
Figure 1. Photo of Piezo Mispositioning and Simulation of Corresponding Principal Deformation Map (Cut
View) Matching Crack Pattern
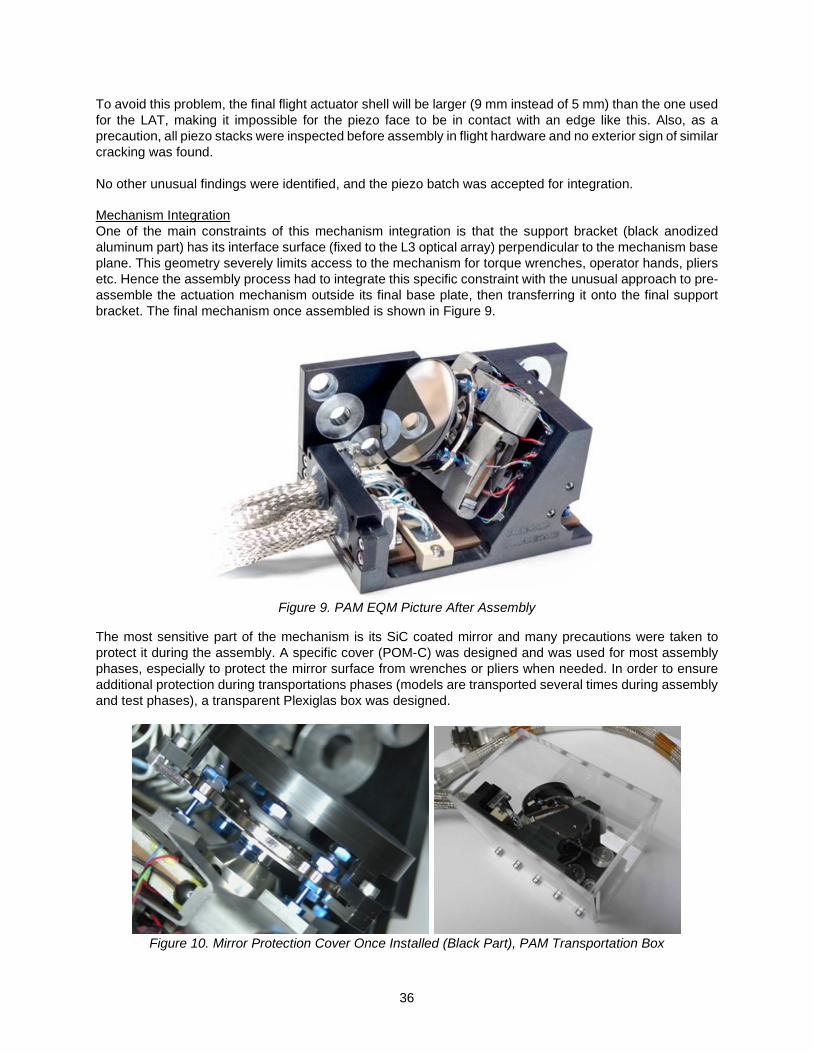
36
To avoid this problem, the final flight actuator shell will be larger (9 mm instead of 5 mm) than the one used for the LAT, making it impossible for the piezo face to be in contact with an edge like this. Also, as a precaution, all piezo stacks were inspected before assembly in flight hardware and no exterior sign of similar cracking was found. No other unusual findings were identified, and the piezo batch was accepted for integration. Mechanism Integration One of the main constraints of this mechanism integration is that the support bracket (black anodized aluminum part) has its interface surface (fixed to the L3 optical array) perpendicular to the mechanism base plane. This geometry severely limits access to the mechanism for torque wrenches, operator hands, pliers etc. Hence the assembly process had to integrate this specific constraint with the unusual approach to pre-assemble the actuation mechanism outside its final base plate, then transferring it onto the final support bracket. The final mechanism once assembled is shown in Figure 9.
Figure 9. PAM EQM Picture After Assembly
The most sensitive part of the mechanism is its SiC coated mirror and many precautions were taken to protect it during the assembly. A specific cover (POM-C) was designed and was used for most assembly phases, especially to protect the mirror surface from wrenches or pliers when needed. In order to ensure additional protection during transportations phases (models are transported several times during assembly and test phases), a transparent Plexiglas box was designed.
Figure 10. Mirror Protection Cover Once Installed (Black Part), PAM Transportation Box
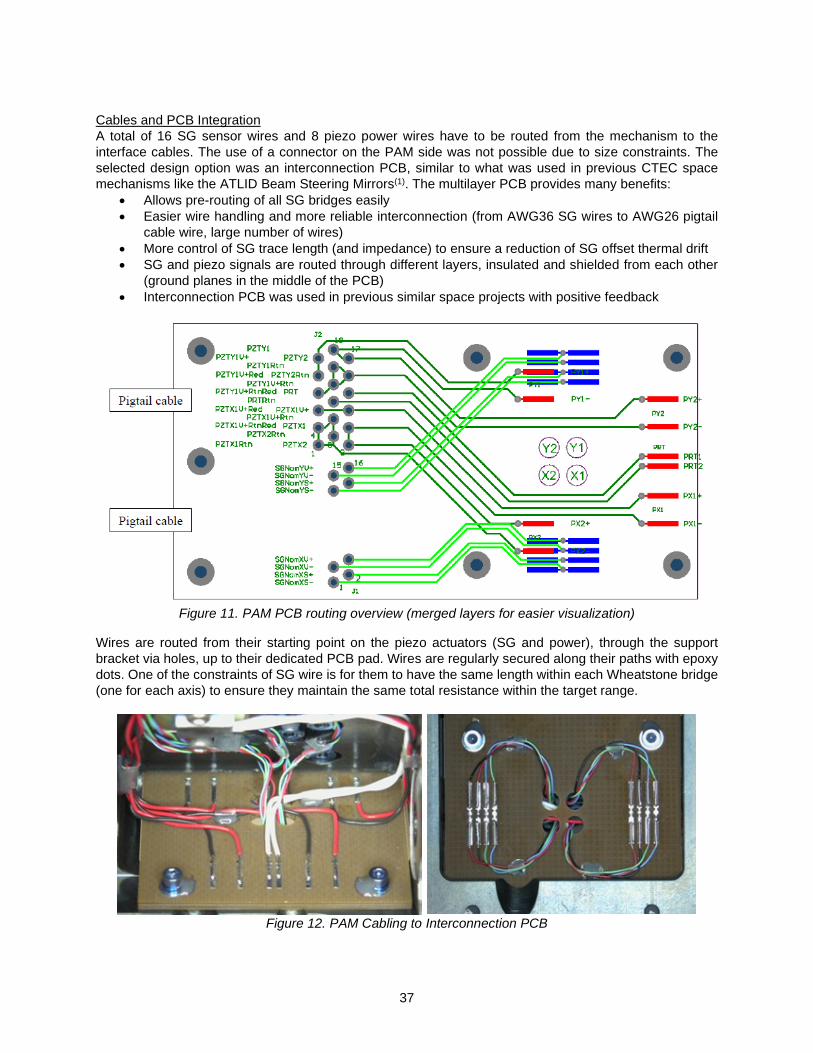
37
Cables and PCB Integration A total of 16 SG sensor wires and 8 piezo power wires have to be routed from the mechanism to the interface cables. The use of a connector on the PAM side was not possible due to size constraints. The selected design option was an interconnection PCB, similar to what was used in previous CTEC space mechanisms like the ATLID Beam Steering Mirrors(1). The multilayer PCB provides many benefits:
• Allows pre-routing of all SG bridges easily • Easier wire handling and more reliable interconnection (from AWG36 SG wires to AWG26 pigtail
cable wire, large number of wires) • More control of SG trace length (and impedance) to ensure a reduction of SG offset thermal drift • SG and piezo signals are routed through different layers, insulated and shielded from each other
(ground planes in the middle of the PCB) • Interconnection PCB was used in previous similar space projects with positive feedback
Figure 11. PAM PCB routing overview (merged layers for easier visualization)
Wires are routed from their starting point on the piezo actuators (SG and power), through the support bracket via holes, up to their dedicated PCB pad. Wires are regularly secured along their paths with epoxy dots. One of the constraints of SG wire is for them to have the same length within each Wheatstone bridge (one for each axis) to ensure they maintain the same total resistance within the target range.
Figure 12. PAM Cabling to Interconnection PCB

38
Qualification and Test Campaign
Static Performance The 4 mechanism performance parameters are verified at different steps of their acceptance tests. An initial good health verification was also performed to ensure that the piezos and SG were correctly cabled. At the time of this paper publication, only 3 mechanisms were tested, results are presented in Table 4.
Figure 13. EQM Y Axis Full Stroke Measurement (Mirror Angle vs Push-Pull Voltage) and Admittance
Sweep for EQM Y axis – Coupled Resonance Frequency Identification
Table 4. Static Measurement Results for PAM EM/EQM and FM2
Parameter Required value EM EQM FM2 PAM total stroke at ambient (-10/+150V)
X axis >6 mrad 8.0 mrad 8.7 mrad 8.5 mrad Y axis >6 mrad 8.6 mrad 8.6 mrad 8.5 mrad
SG response at ambient- Functional tests FTM-01-B (cf, III,8) Offset X axis / -0.71 mrad -0.27 mrad -0.46 mrad Y axis / -0.76 mrad -0.35 mrad 0.11 mrad Gain X axis / 1.57 mrad/V 1.49 mrad/V 1.76 mrad/V Y axis / 1.38 mrad/V 1.54 mrad/V 1.67 mrad/V
1st coupled resonance frequency X axis >800Hz 1495 Hz 1301 Hz 1257 Hz Y axis >800Hz 1242 Hz 1272 Hz 1272 Hz
PAM mass Total mass / 497.2 g 497.9 g 495.1 g
The mechanism total stroke is compliant with the specification with significant margin, since design anticipated some stroke loss at cold temperature. The total stroke is similar for all models/axes, the slight variation observed is expected and linked to the piezo actuators’ stroke/stiffness variation. SG parameters are noted for information, only the variation of these parameters (over temperature) matters. Note that SG measurements are taken after bridge output conditioning (5V excitation, 337 and 352 V/V gain for X and Y).

39
Thermal Vacuum Testing The Qualification campaign for the EQM included both non-operational (NOP) and operational (OP) thermal vacuum cycling. Target vacuum is <10-5 mbar. Tests A,B,C are functional tests (stroke, SG and admittance sweep).
Figure 14. NOP and OP Thermal Vacuum Cycling Test Schematic
The main objective of the OP Thermal Vacuum Cycle is to characterize the variation of PAM stroke (expected loss in cold) and SG performance throughout the OP temperature range. Only the results of this test are detailed in this paper. The OP Thermal Vacuum Cycle consists of testing the mechanism (full stroke, SG parameters) at different incremental temperatures (every 10°C). Given that the PAM applied voltage was not constant during the full test (4 days with electronic and room temperature variations), the stroke results are normalized with respect to the voltage range applied, called stroke/voltage gain. The stroke results are shown in Figure 15.
Figure 15. X and Y Stroke/Voltage Gain Through OP Temperature Range – EQM Results
The stroke/voltage gain plot for both axes show the expected bell shape, with a maximum at ambient temperature and loss at cold and hot temperatures. A 7% loss can be seen at -30°C and around 2% loss at +60°C. A conservative 20% and 15% stroke loss was assumed in the design phase (based on past experience on worst cases), explaining the high final stroke margin. The other noticeable feature is the thermal hysteresis, which should not be there: it is expected for the mechanism to have the same stroke for same temperature (the stroke vs voltage hysteresis observed is however nominal and expected). The reason for this is probably a consequence of the fact PAM temperature was not fully stabilized, tests were performed slightly too quickly after reaching target temperatures and resulted in this thermal hysteresis. The actual temperature data is measured on the PAM support bracket (interface) located under the mechanism, piezo temperatures were not monitored to avoid any potential damage/contamination. Hence it is not possible to directly measure or control piezo temperature.
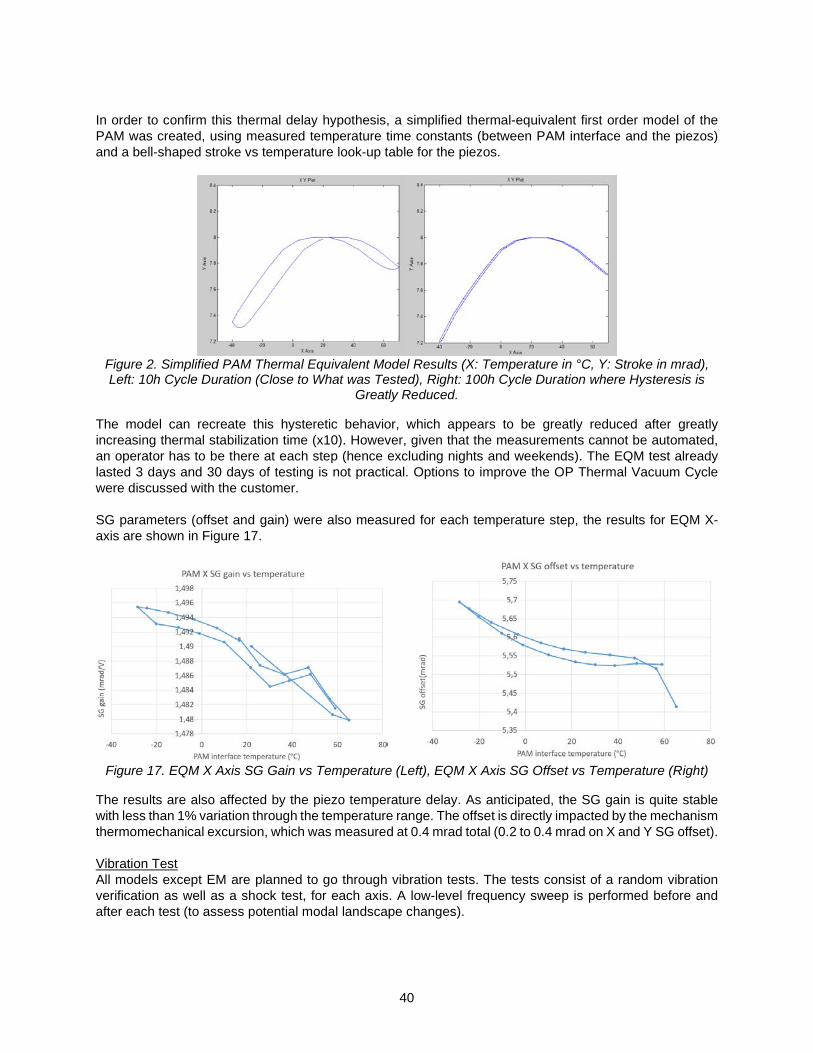
40
In order to confirm this thermal delay hypothesis, a simplified thermal-equivalent first order model of the PAM was created, using measured temperature time constants (between PAM interface and the piezos) and a bell-shaped stroke vs temperature look-up table for the piezos.
Figure 2. Simplified PAM Thermal Equivalent Model Results (X: Temperature in °C, Y: Stroke in mrad), Left: 10h Cycle Duration (Close to What was Tested), Right: 100h Cycle Duration where Hysteresis is
Greatly Reduced.
The model can recreate this hysteretic behavior, which appears to be greatly reduced after greatly increasing thermal stabilization time (x10). However, given that the measurements cannot be automated, an operator has to be there at each step (hence excluding nights and weekends). The EQM test already lasted 3 days and 30 days of testing is not practical. Options to improve the OP Thermal Vacuum Cycle were discussed with the customer. SG parameters (offset and gain) were also measured for each temperature step, the results for EQM X-axis are shown in Figure 17.
Figure 17. EQM X Axis SG Gain vs Temperature (Left), EQM X Axis SG Offset vs Temperature (Right)
The results are also affected by the piezo temperature delay. As anticipated, the SG gain is quite stable with less than 1% variation through the temperature range. The offset is directly impacted by the mechanism thermomechanical excursion, which was measured at 0.4 mrad total (0.2 to 0.4 mrad on X and Y SG offset). Vibration Test All models except EM are planned to go through vibration tests. The tests consist of a random vibration verification as well as a shock test, for each axis. A low-level frequency sweep is performed before and after each test (to assess potential modal landscape changes).

41
Regarding the random vibration test, the preliminary levels for which the mechanism was analyzed to were 10 grms (20-2000 Hz span with a 50 to 800 Hz 0.08 g²/Hz plateau). Later in the project, when the updated and refined DSOC full system vibration simulations were performed, the specified levels at PAM interface location had to be increased. The final random vibration levels are much higher and follow the power spectral density (PSD) shown in Table 5.
Table 5. Final PSD for PAM Random Vibration Test X -Axis Test Spec Y-Axis Test Spec Z-Axis Test Spec
FREQ(Hz) ASD(g²/Hz) FREQ(Hz) ASD(g²/Hz) FREQ(Hz) ASD(g²/Hz) 20 0.100 20 0.1 20 0.1 50 3.500 50 3.5 50 3.5 150 3.500 395 3.5 340 3.5 2000 0.010 2000 0.01 2000 0.01
Grms = 28.03 Grms = 42.0 Grms = 39.5 Updated mechanism simulation showed that these new levels remain acceptable, regarding mechanical stress in the parts. The cables and wires, however, were more affected, raising concerns with the updated vibration levels. Wire and cable epoxy staking upgrades are being implemented to mitigate the risk of wire damage, mainly by reducing the free length between tie-down locations.
Figure 18. Overview of SG Wires, Initial Configuration (Left) and Reinforced Cabling (Right)
At the time of paper publication, full level vibration tests are planned on a representative model. Mechanism Delivery Status At the time of the paper publication, the engineering model (EM) has been delivered. The EQM vibration test is still to be performed for closure of design verification. FM2 acceptance test series has started with thermal vacuum cycling. FM1 was unfortunately irreparably damaged during a subcontracted bake-out failure (decompressive explosion, not implosion, something not expected in a vacuum test), and a new model will be assembled using spare parts and tested.
Conclusion
In this paper, the development, procurement, integration and testing of a novel double tilt PAM mechanism is presented. The mirror integration verification method is explained and the comparison with actual measurements indicate that the results were quite reliable for this case. The test results now available are presented and indicate that the PAM mechanism is working as intended. Some measurement artifacts on the OP Thermal Vacuum Cycle (thermal hysteresis) were investigated and some improvements will be implemented for incoming FM2 tests.

42
The upcoming tests are the random vibration and shock with increased levels. The cable wiring is being reinforced in order to ensure the mechanism survival.
Acknowledgment
The authors want to thank all partners involved, among others: Marshall Bernklow and Richard Aigbaeken from L3-Harris-SSG, as well as Dan McDonald and Joseph Kovalik from JPL Optical Communication Laboratory for their support during the project.
References
1. R. Le Letty, F. Barillot, H. Fabbro, F. Claeyssen, Ph. Guay, L. Cadiergues, Miniature Piezo Mechanisms
for Optical and Space applications Proc ACTUATOR Conf, Pub. Messe Bremen (G), June 2004, pp 177-180
2. E. Prevost, A. Weickman, S. Belmana, F. Bourgain, O. Sosnicki, F. Claeyssen, Beam Steering Mechanism For Earthcare Atmospheric Lidar Instrument Atlid – An Ultra-Stable Piezoelectric Tip Tilt Mechanism, Proc. ICSO, Biarritz, Oct. 2016
3. F. Claeyssen, T. Maillard, O. Sosnicki, F. Barillot, A.Pages, C.Belly, A.Bataille, M.Logeais, G.Aigouy, T.Porchez, F. Bourgain, Beam Steering Mirrors from space applications to optronic solutions, Proc. OPTRO Conf, Paris, Feb. 2018
4. F. Claeyssen, K. Benoit, G. Aigouy, T.Maillard, M. Fournier, Olivier Sosnicki, Large-Stroke Fast Steering Mirror For Space Free-Space Optical Communication, Proc. OPTRO Conf, Paris, Feb. 2020
5. F. Bourgain, O. Sosnicki, C. Belly, F. Barillot, F. Claeyssen, An Improved Accurate Beam Steering Piezoelectric Mechanism for ATLID Instrument, Proc. Actuator 2014 Vol. pp. 293-296
6. T. Mower., Degradation of titanium 6Al-4V fatigue strength due to electrical discharge machining, International Journal of Fatigue, vol.64, pp 84-96

43
Design, Development and Verification of the METimage Scanner and Derotator Mechanisms
Sebastian Rieger* and Armin Jago*
Abstract This paper presents the major design choices and lessons learned from the development and verification of the METimage Scanner and Derotator mechanisms. The modification of a standard drive unit design to project-specific requirements is described. This includes a presentation of design modifications that were implemented to meet long-term storage requirements. Tests with notable lessons learned are explained and the derived lessons learned are discussed. Details on the design and development of the optical components, the METimage Solar Calibration Device mechanism, and the control electronics are not presented in the paper.
Introduction METimage is a cross-purpose, medium resolution, multi-spectral optical imaging radiometer for meteorological applications onboard the MetOp-SG satellites. It is capable of measuring thermal radiance emitted by the Earth and solar backscattered radiation in 20 spectral bands from 443 to 13,345 nm [1]. The instrument is developed by Airbus Defence and Space on behalf of the German Space Administration. The METimage instrument is based on three key optical assemblies which include mechanisms. These are the Scanner Assembly, the Derotator Assembly, and the Solar Calibration Device (see Figure 1). All three mechanisms are developed by Airbus and the mechanisms team is embedded in the instrument team. The optical elements and the mechanism control electronics are developed by external partners. This paper focusses on the Scanner mechanism and the Derotator mechanism.
Figure 1. Scanner, Derotator, Solar Calibration Device (left to right, not to scale)
As shown in Figure 2, the Scanner mechanism is located at the Nadir-side entrance of the optical head of the instrument. The Scanner mirror is tilted by 45 degrees and reflects the optical beam into the telescope at an angle of 90 degrees. The Derotator is located inside the instrument, between the telescope and the detectors. It rotates at exactly half the speed of the Scanner in order to achieve a regular imaging geometry in the focal plane. During sun calibration phases, the Solar Calibration Device mechanism rotates one of its diffusors such that it is exposed to sunlight; the sunlight is reflected into the field of view of the scanner.
* Airbus Defence and Space GmbH, Friedrichshafen, Germany [email protected] / [email protected]
Proceedings of the 45th Aerospace Mechanisms Symposium, NASA Johnson Space Center, 2020
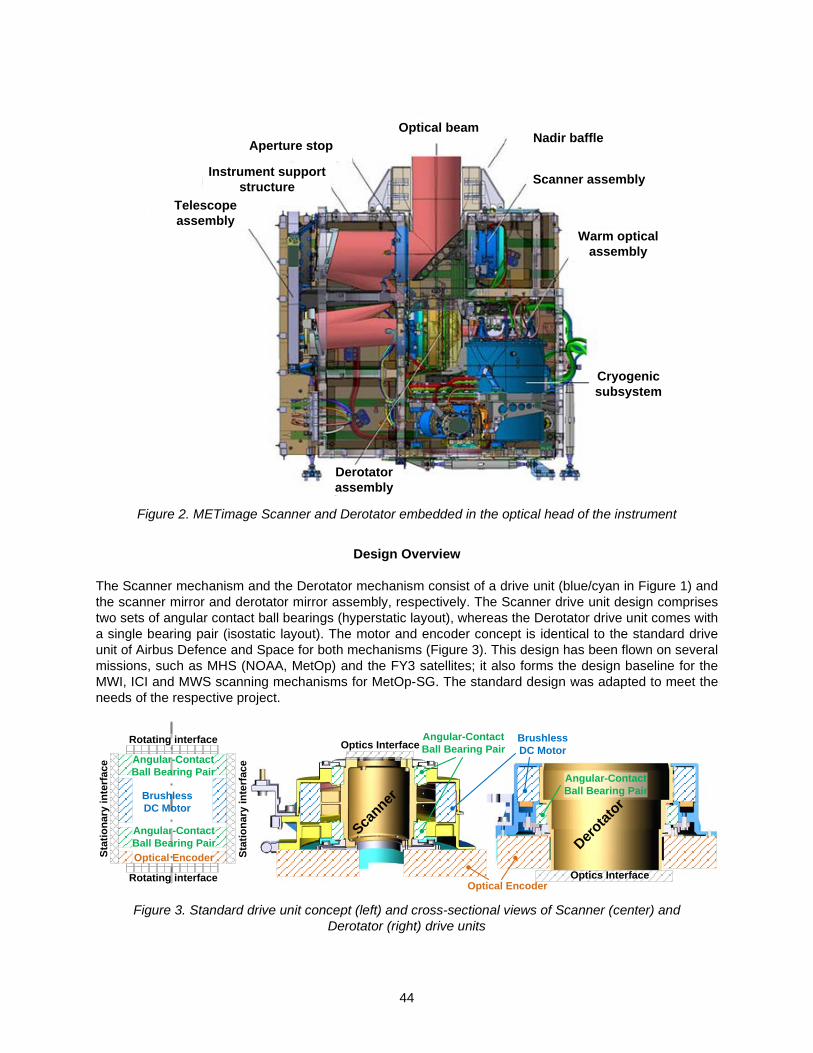
44
Figure 2. METimage Scanner and Derotator embedded in the optical head of the instrument
Design Overview
The Scanner mechanism and the Derotator mechanism consist of a drive unit (blue/cyan in Figure 1) and the scanner mirror and derotator mirror assembly, respectively. The Scanner drive unit design comprises two sets of angular contact ball bearings (hyperstatic layout), whereas the Derotator drive unit comes with a single bearing pair (isostatic layout). The motor and encoder concept is identical to the standard drive unit of Airbus Defence and Space for both mechanisms (Figure 3). This design has been flown on several missions, such as MHS (NOAA, MetOp) and the FY3 satellites; it also forms the design baseline for the MWI, ICI and MWS scanning mechanisms for MetOp-SG. The standard design was adapted to meet the needs of the respective project.
Figure 3. Standard drive unit concept (left) and cross-sectional views of Scanner (center) and
Derotator (right) drive units
Telescope assembly
Optical beam
Scanner assembly
Warm optical assembly
Cryogenic subsystem
Derotator assembly
Instrument support structure
Aperture stop Nadir baffle
Angular-ContactBall Bearing Pair
Brushless DC Motor
Optical Encoder
Optics Interface
Optics Interface
Angular-ContactBall Bearing Pair
Brushless DC Motor
Optical Encoder Stat
iona
ry in
terf
aceAngular-Contact
Ball Bearing Pair
Rotating interface
Rotating interface
Stat
iona
ry in
terf
ace
Brushless DC Motor
Angular-ContactBall Bearing Pair
Scanner
Derotat
or

45
Adaptation of Standard Design to METimage Requirements In order to reduce programmatic and technical risk, existing (flight-proven) concepts, designs and components were selected wherever feasible. This came with the following benefits:
• Use of high TRLs was made and, hence, qualification effort was reduced • Common procurement with other projects could be performed • A well-advanced design was available early in the project • Testing of flight-representative mechanisms/components was possible at an early stage • Flight-grade components of early models could be re-used for flight models
The METimage Scanner and Derotator designs are based on the existing standard drive unit concept but were modified in order to meet the specific METimage needs. Performance requirements The performance drift error (PDE) of the Scanner and, to a lesser extent, of the Derotator is one of the key performance parameters of the METimage instrument. The PDE has a direct impact on the image quality as it affects the co-registration of the instrument. The Scanner PDE during earth view shall not exceed 25 µrad over a period of 10 ms; the Derotator PDE shall not exceed 100 µrad. The PDE is the maximum pointing error in a window of 10 ms, relative to the pointing error at the beginning of this window. Significant effort was spent on both mechanisms and control electronics in order to obtain designs compliant to this requirement. The major mechanism contributors to the PDE are
• Bearing friction variations • Motor disturbance torques • Encoder measurement accuracy
Bearing friction and friction variation were minimized by reducing the diameter and the preload of the bearings. Consequently, different bearing dimensions were selected for Scanner and Derotator, respectively; the large diameter of the Derotator shaft and the corresponding Derotator bearing size would have resulted in too high friction for the Scanner mechanism. The disturbance torques of the motor occur mainly at the following frequencies (per motor revolution):
• Rotor pole number: caused by magnets passing an imperfection on the stator • Stator slot number: caused by imperfections on the rotor passing the stator slots • Product of rotor pole number and stator slot number, divided by their greatest common divisor:
motor cogging, caused by the fact that the magnetic field is dependent on the distance between magnets and stator slots
The brushless DC motor design of the standard drive unit comes with a keyway at the stator outer diameter (Figure 4). This keyway was introduced as a positioning feature for projects where drive electronics without modifiable commutation angle offset are used. For these cases, the motor needs to be integrated into the mechanism in a pre-defined orientation. This positioning feature is neither needed for the METimage mechanisms, nor can the corresponding motor disturbances be accepted. Therefore, the keyway was removed for the METimage motor design.
Figure 4. Motor stator positioning keyway that was removed in the METimage design

46
Manufacturing tolerances and imperfections on magnets or stator sheets might cause unacceptable disturbances. In order to mitigate this risk while maintaining cost-efficient motor design and manufacturing without unnecessarily tight tolerances, feed-forward harmonics suppression was implemented into the controller of the mechanism drive electronics. The feed forward allows compensation of known, repeatable disturbances by means of pre-programmed, position-dependent motor current variation. Motor cogging was reduced by skewing of the stator sheet metal stack (refer to Figure 5). Skewing also reduces the torque constant of the motor slightly. This was acceptable for both the Scanner and the Derotator. Motor disturbances could have been minimized by using an iron-less motor. However, the torque constant of an iron-less motor was expected to be approximately 40-50% lower than the one of the baseline (iron) motor. This would not have been acceptable from a power and torque budget point of view.
Figure 5. Motor stator skewing
The Performance Drift Error is calculated from Absolute Performance Errors (APE). The APE is the difference between actual position and target (commanded) position for any given point in time. During flight, the actual position is determined with the absolute optical encoder that is part of the mechanism. Therefore, measurement uncertainties of the encoder have a direct impact on the APE and PDE:
• Low-frequency encoder errors (below the controller bandwidth) are followed by the mechanism. This results in a deviation to the target scan profile. The actual (physical) performance of the mechanism is affected, but this cannot be determined from the position data.
• High-frequency encoder errors (above the controller bandwidth) are not followed by the mechanism but corrupt the recorded position data. The actual (physical) performance of the mechanism and, hence, the co-registration of the instrument is not affected.
In order to minimize the impact of measurement uncertainties on the mechanism performance, stringent requirements were imposed on the encoder. The performance of all encoders was checked with an external reference encoder during mechanism assembly. The second major performance requirement is off-axis motion of the scan mirror (“wobble”). The time-independent (also referred to as asynchronous or random) wobble of the Scanner mechanism shall be <10 µrad peak-peak; the one of the Derotator shall not exceed 20 µrad. In contrast to the synchronous (repeatable) wobble, the asynchronous wobble cannot be corrected during ground processing. The time-independent wobble is caused by any non-deterministic behavior of the bearings. Non-deterministic behavior of the bearings can be attributed to the balls, which rotate and spin in a unpredictable manner. The variation of the ball diameter, as defined in ISO 3290, was identified as the major contributor to the time-independent wobble. Surface roughness is approximately one order of magnitude lower, and the deviation of the spherical form of the ball has a minor influence as the ball is the softest element in the bearing. Therefore, balls of grade 3 were selected for the bearings. The distance between the rings of the bearing pairs was maximized as much as possible.

47
Power consumption requirements The scan profile of the Scanner and Derotator was optimized for integration time per pixel during earth view. The scan period of 1.728 seconds is defined by the satellite orbit and the spatial resolution of 500 m at Nadir. Consequently, a dynamic scan profile with a low velocity during earth view and sun calibration and a high-acceleration/deceleration phase outside this range was defined (refer to Figure 6). The need to maximize earth view duration was traded against power and exported torques requirements.
Figure 6. Scan profile of Scanner and Derotator
The combined peak power consumption of the Scanner and Derotator mechanisms had to be less than 40 W. The average power consumption over one revolution had to be less than 8.0 W and 6.0 W, respectively, for the Scanner and Derotator mechanism. A multitude of parameters affect the power consumption of a mechanism. The major ones are:
• Bearing friction • Motor losses (mainly iron and copper losses) • Inertial moments during acceleration phases • Encoder power consumption
In order to re-use existing designs as much as possible, the encoder was not modified. Motor power could have been reduced by approximately 30% by using NdFeB magnets; however, motor magnets made from SmCo were preferred for programmatic reasons (refer to section Long-term storage). Bearing friction was minimized by sizing the bearings to the actual needed dimension, and by reducing the preload to the minimum possible value that was required to ensure that the mechanisms withstand the launch environment (Scanner: 88-mm pitch diameter, Derotator: 124 mm). In addition, the Derotator bearing concept was modified for power as well as lifetime reasons: instead of two bearings in hyperstatic layout, one bearing in an isostatic layout was chosen. This was found feasible in a trade of power against performance requirements. Inertial moments that need to be overcome by the motor occur during acceleration and deceleration phases. They are dependent on the rotating inertia and the acceleration. The resulting inertial moment is overcome by motor phase current increase and, hence, causes higher power consumption. Together with the instrument team, a scan profile was found that satisfied the instrument needs and for which the Scanner

48
and the Derotator were compliant to the power requirements with SmCo magnets. This permitted avoiding NdFeB magnets. Cleanliness and contamination control METimage is an optical instrument. The mechanisms carry optical components and, thus, had to meet stringent cleanliness and contamination requirements. In general, the CVCM (Collected Volatile Condensable Materials) and RML (Recovered Mass Loss) limits of Table 1 applied to the mechanisms.
Table 1. Particulate and molecular contamination requirements
Mass of material concerned CVCM [%] RML [%] > 100 g < 0.01 < 0.1 10 – 100 g <0.05 <1 < 10 g <0.1 <1
The CVCM and RML limits were considered for selection of surface treatments (paints) and lubricants. It was decided not to use polyurethane-based paints as these paints show high outgassing levels over long time. Black Keronite and Acktar FractalBlackTM were implemented for all thermo-optical coatings. A surface modification process developed at Airbus which creates black surfaces with high solar absorptivity (titanium: 0.98, aluminum: 0.84) and infrared emissivity (titanium: 0.94, aluminum: 0.95) while at the same time providing an excellent bonding pre-treatment (e.g. for bonding heaters, thermistors) [4] was not selected by the time the decision for the coatings was made. This was due to the – by that time – unclear handling constraints of the surfaces treated with the laser. However, laser processes developed by Airbus were applied for increasing friction coefficients (refer to section Temperature ranges) and for performing REACh-compliant bonding pre-treatment for motor bonding [11].
Figure 7. Blackening by surface modification with laser (left: laser-treated titanium prototype, right:
microscopic view of laser-treated surface) [4]
The heritage bearing lubricant for most scanning mechanisms at Airbus Friedrichshafen is grease Maplub SH051-a, in combination with phenolic resin cages that are impregnated with Nye 2001a. These MAC-based lubricants were chosen due to their excellent lifetime (in terms of revolutions) which exceeds the lifetime of PFPE-based lubricants by far [2]. However, according to current literature, PFPE-based greases and oils like Braycote 601EF and Fomblin Z25 have a better outgassing behavior; for instance, the vapor pressure of Fomblin Z25 is reported to be one order of magnitude better than the one of Nye 2001a [3].

49
Table 2. Lubricant outgassing data
Lubricant Vapor pressure at 20°C [mbar]
Vapor pressure at 100°C [mbar]
TML [%] CVCM [%] Reference
Requirement N/A N/A 1 (RML) 0.1 Table 1
Fomblin Z25 1.60E-13 2.80E-09 0.04 0.01 [3]
9.35E-10 (25°C) 3.53E-09 0.17 N/A [10]
Nye 2001a 5.33E-12 1.33E-08 0.40 N/A [3]
N/A 1.80E-09 0.08 0.12(*) Test [6] (*) Correcting the CVCMs for bulk evaporation losses was not possible due to QCM saturation. Therefore, non-compliance (0.12% vs. specified <0.10%) was accepted. In order to assess the suitability of the heritage MAC-based lubricants for METimage, an outgassing test of the batch of Nye 2001a foreseen for the METimage Scanner and Derotator was performed. This test yielded that the actual outgassing behavior of Nye 2001a was far better than expected and, except for the CVCM, was in the same order of magnitude as the one of Fomblin Z25 [6]. It is not clear whether this observation is valid only for the tested batch, or whether literature data on Nye 2001a are in general too conservative. Temperature ranges The specified non-operating temperature range of the Scanner and Derotator mechanism is -35°C to +55°C (design temperatures). In order to ensure zero slippage, the following modifications of the standard drive unit design were implemented:
• Iso-static mounts added at the interface between mechanism and instrument panel (Figure 8) • Laser treatment of slippage-critical surfaces performed (Figure 9)
Iso-static mounts are widely used design features for optical instruments. They compensate thermal expansion mismatches in radial direction. This prevents slippage of interface bolts due to thermal loads.
Figure 8. Iso-static mounts of Scanner
As mentioned in section Cleanliness and Contamination Control, a surface functionalization process that increases friction between adjacent parts has been developed and qualified at Airbus. This process is based on a laser treatment of the surfaces between two friction partners. Application of this process increases the friction coefficient significantly, which helps to prevent bolt slippage. For instance, the friction coefficient for laser-treated surfaces of titanium on titanium (Ti6Al4V) is >0.5, the one for titanium on aluminum 7075 is >0.8.

50
Figure 9. Laser-modified surfaces for increased friction coefficient
Lifetime The lifetime requirement of the Scanner mechanism is 201 million revolutions; the requirement for the Derotator mechanism is 101 million revolutions. Both values include on-ground operation and margins as per ECSS-E-ST-33-01C. The design operating range of both mechanisms was specified as 10°C to 34°C. Due to local dissipation, bearing temperatures were calculated to reach more than 50°C during operation. Lifetime analysis per ISO 281 of the standard drive unit concept (hyperstatic bearing layout) with the bearing size required for the Derotator (pitch diameter 124 mm) yielded that this design was not feasible for the given temperature environment and lifetime requirement. Due to its design principle, the Derotator has to accommodate the conic optical path (105 mm to 89 mm in diameter) and the bearing size could not be reduced. Therefore, the Derotator bearing layout was changed to an isostatic one (one bearing pair in back-to-back configuration), the contact angle was increased to >30 deg, and the preload was decreased by approximately 25%. This yielded a drastic improvement in calculated life: 60 billion revolutions for the iso-static design vs. 62 million revolutions for the original hyperstatic design. The Derotator performance requirements, which are less stringent than the Scanner ones, were still met. Long-term storage The specification required that the mechanisms be designed, manufactured and qualified to sustain at least 15 years of storage on satellite level plus 5 additional years on-ground lifetime. This requirement imposed careful selection of materials and processes with respect to corrosion, stress corrosion cracking, long-term stability, creep, etc. The following major design choices were made:
• Nickel plating of motor rotor yoke and stator sheet metal stack • Selection of SmCo magnets (instead of NdFeB)
Nickel plating of steels is a widely used low-risk process. However, the plating of the stator sheet metal stacks was a major concern. Protrusions of the bonding varnish between the metal sheets cannot be avoided during stator baking. The protrusions can be removed on the outer diameter of the stator by turning. On the inner diameter and in the stator slots, the bonding varnish cannot be removed. As nickel does not adhere to bonding varnish, a continuous nickel layer cannot be achieved on the inner diameter of the stator and in the stator slots (refer to Figure 10, left). This was confirmed in a damp-heat test (7 days, 50°C, 95% relative humidity): the stator sample showed significant levels of corrosion at these locations, whereas the outer diameter and the entire rotor yoke did not show corrosion at all. Corrosion at the inner diameter of the motor stator, which is only 1 mm away from the rotor magnets, could not be accepted. In order to increase the corrosion resistance of the stator while maintaining the robust nickel layer, it was decided to add a secondary moisture barrier on top of the nickel layer. Parylene, a polymer primarily used as moisture barrier on printed circuit boards, was selected. Parylene is less robust with respect to handling than nickel, but adheres well to many substrates, including the bonding varnish of the stators. Hence, the chosen approach came with the following advantages:
• At least one continuous moisture barrier available at all locations on the stator, even at spots where the nickel did not adhere well
Lasered titanium surfaceBlank titanium

51
• All handling surfaces (outer diameter) have two continuous layers, i.e. any potential damage to the outer Parylene layer (e.g. during AIT) could be accepted
The entire stator was coated with Parylene after nickel plating and before wiring and potting.
Figure 10. Bonding varnish protrusions visible after Nickel plating (left), corrosion on nickel-plated stator
sample after humidity test (top right) and sample with Parylene layer after humidity test (bottom right)
Two types of magnet materials were considered during the design of the motor: NdFeB and SmCo. By the time the MetOp-SG projects were started, an alert had been raised on a previous NdFeB type used on MetOp (first generation). The nickel-plating of the motors had delaminated and the magnets had corroded. SmCo is resistive to corrosion but is known to be brittle and its remanence is approximately 30% lower than the one of NdFeB, which causes higher power consumption of the mechanism. More corrosion-resistant NdFeB types had become available since the development of the MetOp satellites. However, our magnet supplier recommended not using nickel plating due to several issues observed with such platings on magnets in the past. Hence, the new type of NdFeB and a coating or plating would have had to be qualified for space and long-term storage. From an accommodation point of view, motor designs with SmCo magnets as well as with NdFeB magnets were feasible. The higher power consumption of a SmCo magnet motor was traded against technical and programmatic risk associated with a qualification program for the MWI, ICI, MWS and METimage projects, with two agencies, four instrument primes, and the satellite prime involved. After a scan profile had been agreed that permitted the use of SmCo magnets from a technical point of view, the decision was made to use SmCo magnets. It should be noted that this resulted in some handling issues during AIT; even our most experienced AIT personnel struggled with the brittleness of the magnets and – despite being extremely careful – damaged a couple of magnets.

52
Figure 11. SmCo magnets damaged during AIT
Breadboard Testing
The breadboard model of the BepiColombo Antenna De-Spin Mechanism was used to demonstrate the feasibility of the chosen control loop design and to obtain an understanding of the required motor and encoder performance at an early stage of the project. As its design comprised a single bearing pair in back-to-back layout, it was also used to assess the suitability of a back-to-back bearing layout for the Derotator. The Antenna De-Spin Mechanism breadboard was hardware-in-the-loop during controller testing with an xPC and Simulink models of the controller. The outcome of the tests was:
• Chosen cascaded control loop (motor current, velocity, position) suitable • Motor stator to be skewed in order to reduce cogging torque disturbances • Encoder spikes at high speeds during acceleration phase to be filtered • High-frequency error of encoder has significant impact on measured PDE of mechanism
Consequently, a skewed motor design was selected (also refer to section Performance Requirements), a median filter was implemented into the controller design, and the high-frequency error specification of the encoder was narrowed.
Lubricant Testing and Re-lifing An outgassing test of Nye 2001a oil was performed in order to assess the suitability of this oil and the Maplub SH051-a grease for the project. As pointed out in section Cleanliness and Contamination, the oil outgassing behavior was significantly better than expected from literature. The grease Maplub SH051-a has been discontinued. This type of grease was used for most heritage scanning mechanisms at Airbus Friedrichshafen. To date, no successor showing similar performance has been identified. Maplub SH type b lifetimes are expected to be approximately one order of magnitude lower than that of the type a greases [2]. In addition, torque peaks at low speeds and de-mixing at temperatures higher than 40°C were reported for the Maplub type b greases in an information note distributed by supplier MAP. The torque peaks were later confirmed by analysis and bench testing [7]. Based on these findings, the project decided to keep using the discontinued Maplub SH051-a grease. The batch of grease available for the MWI, ICI, MWS and METimage projects was manufactured in 1999 and its shelf life has formally expired. It was tested in a spiral orbit tribometer at the European Space Tribology Laboratory (ESTL) and compared against test data of a freshly manufactured sample of the same grease. The tribological performance (friction and lifetime) of the 20-year-old Maplub SH051-a grease is presented in Table 3; it was demonstrated to be no worse than that of a freshly manufactured grease batch. The variance of spiral orbit tribometer test data was higher for the re-lifed grease. Therefore, mixing of the re-lifed grease was recommended as a precaution, although improvements gained by physical re-mixing of the grease were anticipated to be marginal at best at bearing level. This is due to the fact that the amount of grease in a bearing is several orders of magnitude higher than the amount applied to the ball in a spiral orbit tribometer test. [5]

53
Table 3. Mean tribological data for re-lifed vs. fresh Maplub SH051-a grease [5]
Grease Lifetime (orbits/µg)
Initial friction coefficient
Mid-life friction coefficient
Re-lifed grease 11,050 0.07 0.093 Fresh grease 9,569 0.07 0.100
Life Tests
Life testing of Scanner and Derotator was performed in order to demonstrate that the mechanisms met the specified lifetime requirements of 201 million revolutions for the Scanner and 101 million revolutions for the Derotator, respectively. Life test approach The bearings were considered the only life-limited (in terms of revolutions) items of the mechanisms. The following approach was chosen:
• Build up full mechanism model (with optics dummy and industrial encoder) • Perform cumulated environmental testing • Perform accelerated life test in thermal-vacuum conditions
Full models of Scanner and Derotator were built up. This was necessary as different bearing layouts and types had been selected for the two mechanisms (refer to sections Design Overview and Lifetime). Life-testing of standalone bearings was ruled out; such an approach would not have been flight-representative: pre-conditioning of the bearings by representative environmental testing would not have been possible and mounting conditions of the bearing in the mechanisms could not have been considered. Environmental testing of the life test models was performed in order to stress the bearings in a similar manner as the flight bearings. The worst-case environmental loads of a flight mechanism would be three times proto-flight testing (mechanism level, instrument level, satellite level) plus launch loads and in-orbit loads. Therefore, the following environmental pre-conditioning was performed:
• Vibration testing along three axes with qualification loads and 4x proto-flight duration (= two times qualification duration)
• Shock testing along three axes (3 full-level shocks per axis) • Thermal-vacuum testing (1 cycle non-operating temperatures, 7 cycles operating temperatures)
The predicted contact stresses during vibration were much higher than the ones during non-operational temperature cycling (2,000 MPa vs. 1,500 MPa for the Scanner bearings). Therefore, no additional benefit would have been obtained from doubling the thermal vac (TV) test duration (and cost). The life test was performed under consideration of the following constraints:
• The life test has to be accelerated in order to finalize it in reasonable time. The duration of the life tests at nominal speed would have been 11 years.
• The baseline temperature of the life test should not be overly conservative; the average temperature over one orbit, including hot case margins, was considered a reasonable choice.
• Analytical predictions yielded that the bearings operate in the mixed lubrication regime; any acceleration of the life test (= speed increase) required an increased temperature during the test in order to keep the oil film thickness constant
• It was decided to limit the temperature to 60°C at the bearing; there is little experience with fluid-lubricated bearings permanently operated beyond this temperature for such a long duration.
• The Hertzian pressures in the life test environment had to be similar to the ones on orbit • The number of load changes (rotational acceleration/deceleration, stops) in the accelerated test
had to be the same as in a non-accelerated test • The rotational acceleration should be the same for the non-accelerated test and the accelerated
test in order to avoid overstressing the bearing cages

54
Accelerated testing Accelerated testing of bearings lubricated with fluid lubricants (oils and/or greases) is not trivial. It is widely accepted that the lubrication regime should be maintained when accelerating a test in order to keep the test representative. For lubrication containing grease instead of pure oil, no tribological validation can be performed beyond any tribological criticism. In addition, there is no practical means to measure the oil film thickness in an assembled mechanism [8, 9]. The test data evaluation performed to select the METimage life test temperatures was based on the assumption that, when varying speed and temperature, same torque is an indication for same oil film thickness. Despite the mentioned uncertainties, keeping the oil film thickness constant was considered the most suitable and widely accepted approach when accelerating a test with fluid lubricants. In addition, this approach is considered conservative due to accelerated tribo-chemical degradation of lubricants at higher temperatures. The maximum possible acceleration factor was initially determined from bearing film thickness calculations. The final value was confirmed by friction measurements of the bearings of the life test models. The friction measurement was performed with the bearings integrated into the mechanism; the motor was not mounted as its resistive torque would have corrupted the bearing friction measurements. The friction measurements were performed at different temperatures and operating speeds in a dry nitrogen atmosphere. The results of the Derotator bearings are shown in Figure 12. Subsequently, the friction torque ((3) in Figure 12) at the nominal average speed of the mechanism (1) and at the nominal average temperature (2) over one orbit was determined. Assuming that same friction torque meant same oil film thickness, the life test temperatures (4) for different speeds could directly be read from the plot. Respecting the 60°C limit this yielded an acceleration factor of 3 for both mechanisms.
Figure 12. Bearing friction measurement results and life test acceleration factor for Derotator
The MWS and MWI/ICI projects ran their life tests with acceleration factors of 3.9 (MWS, discontinuous scan profile like METimage) and 5 (MWI/ICI, constant speed), respectively, and at temperatures between 40°C and 50°C. The life tests of the IASI-NG mechanisms developed by Airbus Toulouse for CNES were performed with an acceleration factor of approximately 11 at a temperature of 62.5°C. This was possible due to the lower operating temperature of IASI-NG. Life test profile The profile for the accelerated life test of the Scanner is shown in Figure 13. The major constraints were:
• The average velocity was increased as described in the previous paragraphs.
0
100
200
300
400
0 10 20 30 40 50 60 70 80
Torq
ue [m
Nm
]
Speed [rpm]
0°C
10°C
20°C
30°C
40°C
50°C
60°C
(1)
(3)
(2) 32.5°C
Nominal average speed 17.5 rpm Acceleration x2
x3 x4
(4) 50°C (4) 60°C
(4) 65-70°C

55
• The same number of load direction changes as for a life test at nominal velocity had to be performed. This implied that that a dynamic profile with one acceleration phase and one deceleration phase per revolution had to be performed.
• The acceleration/deceleration during the life test was kept the same as in the nominal scan profile in order not to over-stress the cages of the bearings
• The ratio between constant velocity phases and acceleration/deceleration phases was kept constant (approximately 69% constant speed, 15.5% acceleration, 15.5% deceleration)
• Controller capability and power availability had to be given for the accelerated test case (the peak power consumption of the profile was optimized by inverting the acceleration and deceleration phases)
Figure 13. Scanner life test profile for acceleration factor 3
Life test results Both the Scanner and the Derotator life tests are still running. The environmental campaigns (vibration, shock, thermal-vacuum cycling) have been finalized successfully. The life tests are continuously monitored automatically by EGSE and the set current is recorded. Once per day, the accelerated profile is interrupted and current measurements are performed at pre-defined constant speeds. Motor current is used as an indicator of bearing friction. The motor current during the first 55 million revolutions of the Scanner life test is shown in Figure 14. The low-speed motor current slightly decreased during the initial phase of the test. This is attributed to a smoothening of the bearing internal surfaces. The motor set current readings became noisier during summer (approximately day 230 onwards). This behavior is attributed to the fact that – besides bearing heating – no active temperature control of the TV chamber is performed. Temperature variations of the facility, which are more pronounced during summer when the air conditioning is working with high effort to keep the room temperature within the specified limits, directly impact the temperature in the TV chamber. The spikes at the beginning of the test and around day 90 are related to automatic switch-offs of the setup. The industrial encoder that is used for the life tests instead of the flight encoders provided erroneous position feedback to the control loop, which reacted by increasing the current beyond the limit defined for automatic switch-off. The initial root-cause analysis at the beginning of the test came to the conclusion that the analog-to-digital converter of the encoder, which had been placed inside the TV chamber, was not vacuum-compatible. After replacing the original analog-to-digital converter and mounting it outside the chamber, the test was re-started and the position spike issue seemed to be solved. When it returned around day 90, a more thorough assessment had to be performed. After initial assembly of the mechanism, the industrial encoder had been calibrated using its auto-calibration & reference search feature and its
0
100
200
300
400
500
600
700
0 0.25 0.5 0.75 1 1.25 1.5 1.75 2
Velo
city
[deg
/s]
Time [s]
Nominal profile
Life test profile

56
performance had been demonstrated in a test with an external reference encoder. The encoder stator had then been temporarily dismounted for the vibration test. After re-integration, encoder performance was again demonstrated using an external reference encoder. Subsequently, TV testing was started and the mechanism including encoder was operated successfully under thermal-vacuum conditions. No position spikes were observed in any of the tests. The root-cause analysis finally led to the conclusion that the industrial encoder should have been re-calibrated using its auto-calibration & reference search feature after the second integration to the mechanism. AIT personnel had integrated the encoder stator twice in almost identical positions and orientations, i.e. within some microns; this is why the encoder worked at all after the vibration test. However, the missing proper calibration led to a spontaneous loss of reference from time to time, which caused the position spikes and, consequently, triggered the overcurrent protection. During the encoder performance test after vibration and during the TV test, this issue had – for either good or bad luck – simply not occurred. Based on this assessment, the TV chamber was opened and the industrial encoder was re-calibrated. The encoder spikes did not re-appear.
Figure 14. Scanner motor current during first 55 million revolutions
Summary and Conclusion The METimage Scanner and Derotator mechanism designs were established by modifying a standard drive unit design to project-specific requirements. Breadboard- and component-level testing was performed in order to reduce the design risk at an early stage. Flight-representative life test models (except for the industrial encoder) were built up. Environmental testing of the life test models has been completed
Set current at accelerated velocity and scan profile
Measured current at constant velocity (CV)
6 deg/s156 deg/s480 deg/s642 deg/s

57
successfully. The accelerated life tests of both models under thermal-vacuum conditions have been started and are ongoing. The following major lessons learned have been derived from the project so far:
• Despite efforts to minimize the development and qualification activities, significant modifications of the standard drive unit design were required in order to meet the specific requirements of the Scanner and the Derotator, respectively.
• The tribological performance (friction and lifetime) of 20-year-old Maplub SH051-a grease was demonstrated to be no worse than that of a freshly manufactured grease batch.
• The actual outgassing behavior of the used batch of Nye 2001a is far better than expected and, except for the CVCM, was in the same order of magnitude as the one of Fomblin Z25.
• Design for long-term storage comes with very specific challenges concerning material choice. For programmatic reasons, SmCo magnets were selected instead of the technically more feasible NdFeB ones. A secondary moisture barrier had to be added on top of the traditional Nickel plating on the motor stator in order to guarantee corrosion resistance at all locations.
• Representative accelerated life testing of fluid lubricated bearings is (still) a major challenge. The widely accepted approach of maintaining oil film thickness by increasing the test temperature is considered conservative but comes with uncertainties (oil film thickness calculation, lubrication regime assessment, validity for greased bearings). Dynamic scan profiles require particular attention in order to ensure that the cages are stressed in a representative manner during the life test.
• A surface functionalization process that increases friction between adjacent parts was implemented to prevent bolt slippage. The qualification of this process yielded excellent results: the friction coefficient for laser-treated surfaces of titanium on titanium (Ti6Al4V) is >0.5, the one for titanium on aluminum 7075 is >0.8.
Acknowledgements
The work described was performed on behalf of the German Space Administration with funds from the German Federal Ministry of Transport and Digital Infrastructure and co-funded by EUMETSAT under DLR Contract No. 50EW1521.

58
References 1. Wallner, O., Ergenzinger, K. and Schmülling, F. “METimage Instrument Development Status.”
Proceedings of ICSO 2018 (2018) 2. Buttery, M. “An Evaluation of Liquid, Solid, and Grease Lubricants for Space Mechanisms Using a
Spiral Orbit Tribometer.” Proceedings of the 40th Aerospace Mechanisms Symposium (2010) 3. ESR Technology Ltd. “ESA Space Tribology Handbook”, 5th edition (2013) 4. Süss, M., Strobel, V., Zapata, A. “Black functionalised surfaces by using laser technologies.”
European Congress on Advanced Materials and Processes (2017) 5. Buttery, M. “GEN-ESTL-TM-0215 Airbus MetOp-SG Grease Assessment.” Issue 2 (2016) 6. de Heij, P. “TEC-QTE-8772 Dynamic outgassing test and vapour pressure measurement of Nye
2001a vacuum lubricant oil – test report.” Issue 1 (2016) 7. Busquet, M., et al “Space grease tribological behavior for reformulation: numerical and experimental
investigations.” Proceedings of ESMATS 2017 (2017) 8. Lewis, S. “ESTL/TM/199 Guidelines for Accelerated Testing of Liquid Lubricated Mechanisms.” (1997) 9. Lewis, S., et al “Accelerated Testing of Tribological Components - Uncertainties and Solutions.“
Proceedings of the 44th Aerospace Mechanisms Symposium (2018) 10. Orlandi, M. "QM 5633 VBQC - Kinetic Outgassing of Fomblin Z25 - Test Report." Issue 1, revision 1
(2009) 11. Süss, M., Strobel, V. “Laser Surface Modification – An E2E success story for cost efficient bonding
preparation.” Deutscher Luft- und Raumfahrtkongress (2018)
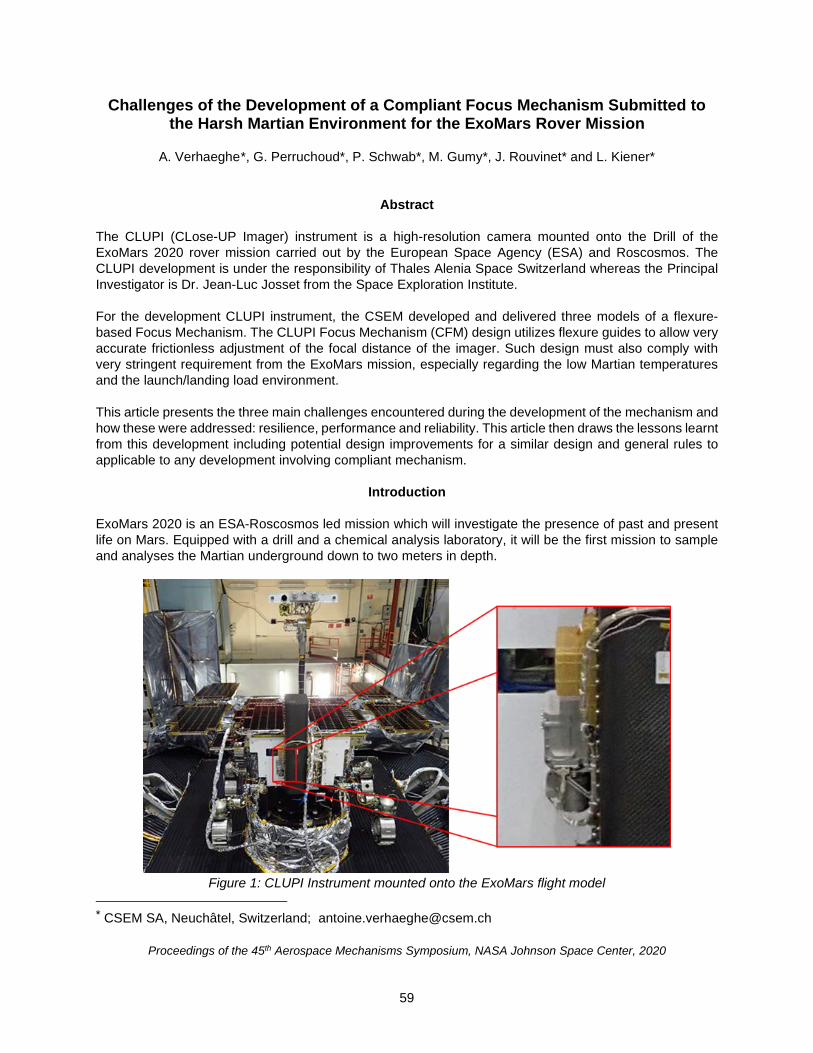
59
Challenges of the Development of a Compliant Focus Mechanism Submitted to the Harsh Martian Environment for the ExoMars Rover Mission
A. Verhaeghe*, G. Perruchoud , P. Schwab* *, M. Gumy*, J. Rouvinet* and L. Kiener*
Abstract
The CLUPI (CLose-UP Imager) instrument is a high-resolution camera mounted onto the Drill of the ExoMars 2020 rover mission carried out by the European Space Agency (ESA) and Roscosmos. The CLUPI development is under the responsibility of Thales Alenia Space Switzerland whereas the Principal Investigator is Dr. Jean-Luc Josset from the Space Exploration Institute. For the development CLUPI instrument, the CSEM developed and delivered three models of a flexure-based Focus Mechanism. The CLUPI Focus Mechanism (CFM) design utilizes flexure guides to allow very accurate frictionless adjustment of the focal distance of the imager. Such design must also comply with very stringent requirement from the ExoMars mission, especially regarding the low Martian temperatures and the launch/landing load environment. This article presents the three main challenges encountered during the development of the mechanism and how these were addressed: resilience, performance and reliability. This article then draws the lessons learnt from this development including potential design improvements for a similar design and general rules to applicable to any development involving compliant mechanism.
Introduction
ExoMars 2020 is an ESA-Roscosmos led mission which will investigate the presence of past and present life on Mars. Equipped with a drill and a chemical analysis laboratory, it will be the first mission to sample and analyses the Martian underground down to two meters in depth.
Figure 1: CLUPI Instrument mounted onto the ExoMars flight model
* CSEM SA, Neuchâtel, Switzerland; [email protected]
Proceedings of the 45th Aerospace Mechanisms Symposium, NASA Johnson Space Center, 2020
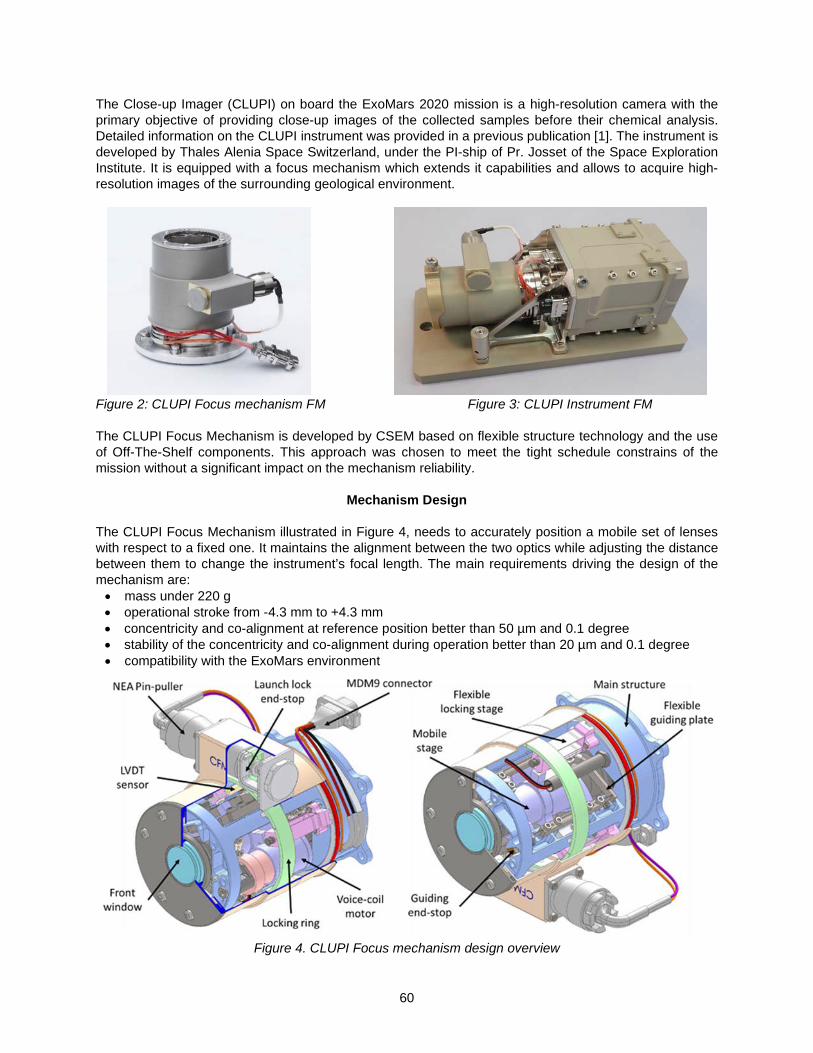
60
The Close-up Imager (CLUPI) on board the ExoMars 2020 mission is a high-resolution camera with the primary objective of providing close-up images of the collected samples before their chemical analysis. Detailed information on the CLUPI instrument was provided in a previous publication [1]. The instrument is developed by Thales Alenia Space Switzerland, under the PI-ship of Pr. Josset of the Space Exploration Institute. It is equipped with a focus mechanism which extends it capabilities and allows to acquire high-resolution images of the surrounding geological environment.
Figure 2: CLUPI Focus mechanism FM Figure 3: CLUPI Instrument FM The CLUPI Focus Mechanism is developed by CSEM based on flexible structure technology and the use of Off-The-Shelf components. This approach was chosen to meet the tight schedule constrains of the mission without a significant impact on the mechanism reliability.
Mechanism Design The CLUPI Focus Mechanism illustrated in Figure 4, needs to accurately position a mobile set of lenses with respect to a fixed one. It maintains the alignment between the two optics while adjusting the distance between them to change the instrument’s focal length. The main requirements driving the design of the mechanism are: • mass under 220 g • operational stroke from -4.3 mm to +4.3 mm • concentricity and co-alignment at reference position better than 50 µm and 0.1 degree • stability of the concentricity and co-alignment during operation better than 20 µm and 0.1 degree • compatibility with the ExoMars environment
Figure 4. CLUPI Focus mechanism design overview

61
Flexible Guiding Structure The guiding function of the mechanism is carried out using a flexible structure system composed of three flexible guide plates. Each plate is a deformable parallelogram, having four flexure blades acting as joints as illustrated by Figure 5. By combining these three plates in an equilateral prism as illustrated in Figure 6, quasi-isostatic linear guiding is obtained. This guiding allows linear movement along the Z axis (optical axis) and blocks all other degrees of freedom. The obtained guiding has a non-linear rigidity along the main axis which increases from 34 N/m at rest position to 95 N/m at operational end-of-stroke The displacement stroke is limited by flexible end-stops made of a stack of two blades. These end-stop contact points are at ±4.6 mm and they dampen excessive displacement of the mobile stage up to ±5.0 mm.
Figure 5. Flexible guiding plate Figure 6: Mechanism guiding structure
COTS Actuator and Sensor In order to drive the mechanism, compact and contactless solutions have been implemented. To save costs and development time, off-the-shelf components were chosen: • a Voice-Coil Motor from Moticont • a Linear Variable Differential Transformer (LVDT) sensor from Singer Instrument & Control Ltd
Figure 7: LVDT sensor & voice-coil actuator

62
Launch Locking System To prevent mechanism movement and to avoid excessive stresses in the guiding flexure blades during the launch and Mars landing phases of the mission, a launch locking system has been implemented. This system is illustrated in Figure 8. The launch lock consists of a non-explosive actuator (NEA) from Eaton actuating a grooved ring and locking stages. In the locked position, the locking stages keep the mobile stage under pressure exerted by the ring. When the NEA is released, it pulls on the grooved ring which rotates, aligning recesses in the ring above each of the three locking stages. Theses recesses allow the locking stage to retract thus freeing the mobile stage.
Figure 8: Launch locking system
Encountered Challenges
During the mechanism development a great variety of challenges were encountered Many issues were resolved with solutions compatible primarily with cost and schedule constraints. These challenges can be classed into three main domains: resilience, performance and reliability. Resilience The biggest challenge of the CLUPI CFM development was to design a mechanism resilient to the ExoMars harsh mechanical environment. Such an environment can be summarized by the following points:
• Random vibration up to 33 Grms • Sinusoidal vibration up to 25 g (between 30 Hz and 100 Hz) • Shock up to 1500 G’s
When designing flexible structure, meeting strong vibration requirements is always a trial due to the intentional removal of friction and thus very low damping. For the CLUPI development, this task was made even more complex due a significant change in the random vibration specification which occurred during the detailed design phase (after PDR). Therefore, to meet the resilience required, multiple iterations of design were needed with associated analysis and tests. The complete process is described in Figure 9. The mechanical load specifications for random vibration were updated multiple times after PDR due to parallel progress in the overall instrument design. The specifications, their rationales and their random vibration levels are shown in the Table 1.
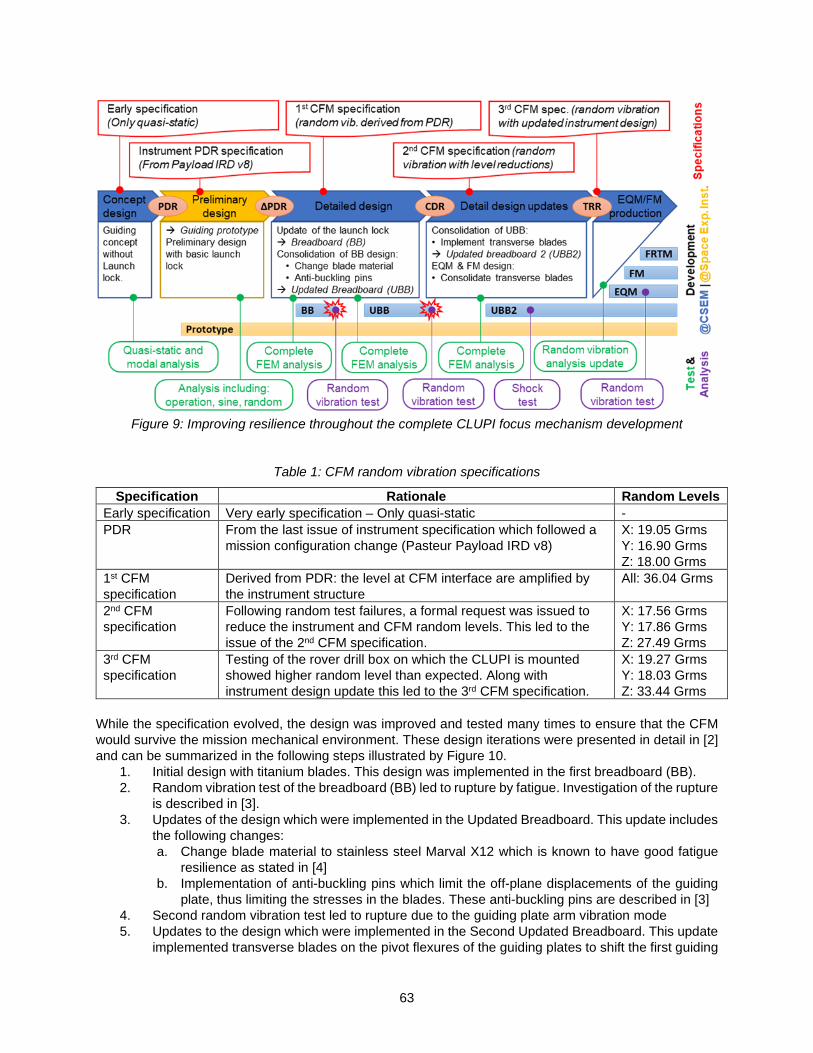
63
Figure 9: Improving resilience throughout the complete CLUPI focus mechanism development
Table 1: CFM random vibration specifications
Specification Rationale Random Levels Early specification Very early specification – Only quasi-static - PDR From the last issue of instrument specification which followed a
mission configuration change (Pasteur Payload IRD v8) X: 19.05 Grms Y: 16.90 Grms Z: 18.00 Grms
1st CFM specification
Derived from PDR: the level at CFM interface are amplified by the instrument structure
All: 36.04 Grms
2nd CFM specification
Following random test failures, a formal request was issued to reduce the instrument and CFM random levels. This led to the issue of the 2nd CFM specification.
X: 17.56 Grms Y: 17.86 Grms Z: 27.49 Grms
3rd CFM specification
Testing of the rover drill box on which the CLUPI is mounted showed higher random level than expected. Along with instrument design update this led to the 3rd CFM specification.
X: 19.27 Grms Y: 18.03 Grms Z: 33.44 Grms
While the specification evolved, the design was improved and tested many times to ensure that the CFM would survive the mission mechanical environment. These design iterations were presented in detail in [2] and can be summarized in the following steps illustrated by Figure 10.
1. Initial design with titanium blades. This design was implemented in the first breadboard (BB). 2. Random vibration test of the breadboard (BB) led to rupture by fatigue. Investigation of the rupture
is described in [3]. 3. Updates of the design which were implemented in the Updated Breadboard. This update includes
the following changes: a. Change blade material to stainless steel Marval X12 which is known to have good fatigue
resilience as stated in [4] b. Implementation of anti-buckling pins which limit the off-plane displacements of the guiding
plate, thus limiting the stresses in the blades. These anti-buckling pins are described in [3] 4. Second random vibration test led to rupture due to the guiding plate arm vibration mode 5. Updates to the design which were implemented in the Second Updated Breadboard. This update
implemented transverse blades on the pivot flexures of the guiding plates to shift the first guiding
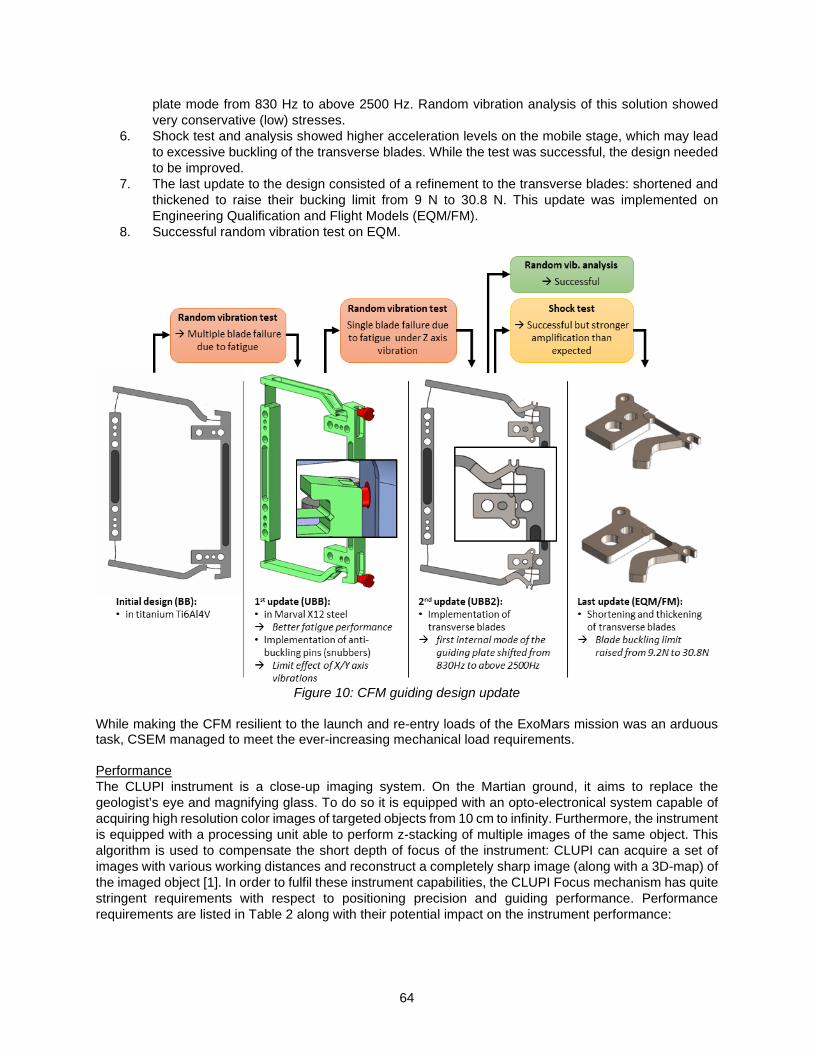
64
plate mode from 830 Hz to above 2500 Hz. Random vibration analysis of this solution showed very conservative (low) stresses.
6. Shock test and analysis showed higher acceleration levels on the mobile stage, which may lead to excessive buckling of the transverse blades. While the test was successful, the design needed to be improved.
7. The last update to the design consisted of a refinement to the transverse blades: shortened and thickened to raise their bucking limit from 9 N to 30.8 N. This update was implemented on Engineering Qualification and Flight Models (EQM/FM).
8. Successful random vibration test on EQM.
Figure 10: CFM guiding design update
While making the CFM resilient to the launch and re-entry loads of the ExoMars mission was an arduous task, CSEM managed to meet the ever-increasing mechanical load requirements. Performance The CLUPI instrument is a close-up imaging system. On the Martian ground, it aims to replace the geologist’s eye and magnifying glass. To do so it is equipped with an opto-electronical system capable of acquiring high resolution color images of targeted objects from 10 cm to infinity. Furthermore, the instrument is equipped with a processing unit able to perform z-stacking of multiple images of the same object. This algorithm is used to compensate the short depth of focus of the instrument: CLUPI can acquire a set of images with various working distances and reconstruct a completely sharp image (along with a 3D-map) of the imaged object [1]. In order to fulfil these instrument capabilities, the CLUPI Focus mechanism has quite stringent requirements with respect to positioning precision and guiding performance. Performance requirements are listed in Table 2 along with their potential impact on the instrument performance:

65
Table 2: CFM performance requirement and their impact of the CLUPI performance
CFM requirement Impact on CLUPI performances Positioning repeatability of 20µm Poorer repeatability will impact the sharpness of the images
acquired due slightly off-focus lens Positioning resolution of 5µm Poorer resolution may impede the proper functioning of the z-
stacking algorithm and of the auto-focusing algorithm. Mobile stage parallelism at rest position better than 0.1°
Lack of parallelism at rest may impact the image quality
Mobile stage concentricity at rest position better than 50µm
Lack of concentricity at rest could impact the image quality
Mobile stage parallelism stability along stroke better than 0.1°
Lack of parallelism stability may impact the image quality and the ability to perform the z-stacking due to erroneous co-registration of successive images
Mobile stage lateral shifts along stroke (concentricity stability) better than 20 µm
Lack of concentricity stability could impact the image quality and the capability to perform the z-stacking due to erroneous co-registration of successive images
To achieve such performance the following approaches were implemented: 1. Completely frictionless design along with a LVDT sensor and Voice-coil actuation: with such a
configuration, the mechanism positioning capabilities are mainly driven by the control loop performance and the electronics used to drive the actuator and sensor. With a frictionless mechanism and considering that CLUPI operates only when the rover is immobile, the control loop can be very simple and achieve excellent performance, especially after a proper sensor calibration.
2. Fine tolerance chain between the mobile and the fixed optics: the parallelism and concentricity at rest
are guaranteed by a very stringent tolerance chain throughout the flexurized guiding structure. 3. Axisymmetrical construction: the axisymmetry of the guiding structure improves the parallelism and
concentricity at rest, since (undesired) lateral motions tend to counteract each other, instead resulting in very small (benign) rotation of the optics about the optical axis. The axisymmetry of the guiding also guaranties parallelism and concentricity stability throughout the movement as the errors induced by the movement in a perfectly axisymmetric construction also remain axisymmetric, i.e. normal and centered on the guiding axis.
Such approaches were in general well implemented with the following exceptions:
• The CFM design is not a perfectly axisymmetric construction. To fulfill this approach, the sensor and actuator should have been either centered onto the optical axis or repeated around the optical axis. Early in the design, the trade-off selected a single set of off-centered sensor and actuator for mass and cost saving. This resulted in an off-centered actuation force which generates a significant error of concentricity and parallelism stability. Such error was identified early as a potential non-conformity, based first on FEM analyses and then on breadboard testing.
• The LVDT sensor was selected for its compactness. Because of its miniature size, the radial gap between the mobile rod and the fixed coil body is very narrow (about 0.04 mm). With such a tiny gap, it is not possible to guaranty the absence of contact between the two parts during the movement especially with the errors introduced by the lack of axisymmetry. Therefore, even with a perfect initial alignment of the two parts of the LVDT, during the movement, the mobile and fixed part make contact, generating tiny friction forces which can climb up to 50mN. This residual friction force impacted the positioning performance, which thankfully remained within the requirements.
In the end the compliance of the EQM and FM to performance requirements is provided in Table 3.

66
Table 3: EQM and FM compliance to CFM performance requirements
Requirement (measurement) EQM FM Positioning repeatability of +/-20µm ~ At the limit Positioning resolution of 5µm ~ At the limit Mobile stage parallelism at rest position better than 0.1° < 0.034° < 0.043°
Mobile stage concentricity at rest position better than 50µm < 61 µm
Exceeded by ~20% < 30 µm
Mobile stage parallelism stability along stroke better than 0.1° < 0.068° < 0.12°
Exceeded by ~20% Mobile stage lateral shifts along stroke (concentricity stability) better than 20µm < 68 µm
Exceeded by x 4 < 114 µm Exceeded by x 6
It is worth noting that after delivery of the instrument to ESA, the optical performance was assessed in the instrument calibration campaign to be acceptable. Reliability Reliability of systems for space is an essential requirement: the system must work reliably throughout its complete lifetime as no repair can occur after launch. In the case of the CLUPI mechanism the reliability of the guiding structure was quite straight forward once on Mars and safely released from its launch lock, since normal operation does not generate any stresses significant for fatigue consideration, the mechanism is safe from any risk of failure. Considerable efforts were made to ensure that the actuator and sensors were compatible to 300 sols in the Martian environment [3]. Additionally, all routing, soldering and contact crimping was made according to the relevant ECSS standard. Thus, the major of risk of failure of the mechanism is related to the launch lock system: if the launch lock fails to release, the CLUPI instrument capability would be considerably reduced as the instrument would only be able to image target at a fixed defined distance (about 26 cm). In order to reduce this risk, the following mitigations were implemented:
• The locked position of the optics corresponds to a working distance at which some critical operation of the instrument can still be carried out: while locked, the instrument is capable to image the drilled core sample collected by the rover drill and placed into the sample drawer [1].
• The actuation system of the launch lock system is a space-qualified non-explosive actuator (NEA) manufactured by Eaton.
• Extensive testing of the launch locking system was carried out at breadboard level in order to ensure that the coating of the friction surfaces and the actuation forces were selected with sufficient margin: not enough margin and the launch lock may not release; too much margin and the NEA released energy propagates to the guiding structure and may damage it. This early testing included many force measurements to assess the friction coefficient best and worst-case values. Furthermore, high-speed imagery of the unlocking process allowed for a better understanding of the propagation of the released energy onto the guiding structure [3].
Despite these efforts, the launch locking mechanism remained a very sensitive component with its reliability and efficiency excessively dependent on the resetting procedure. Two important observations were made during the qualification of the EQM, one of which led to a partial failure during the thermal-vacuum qualification test.
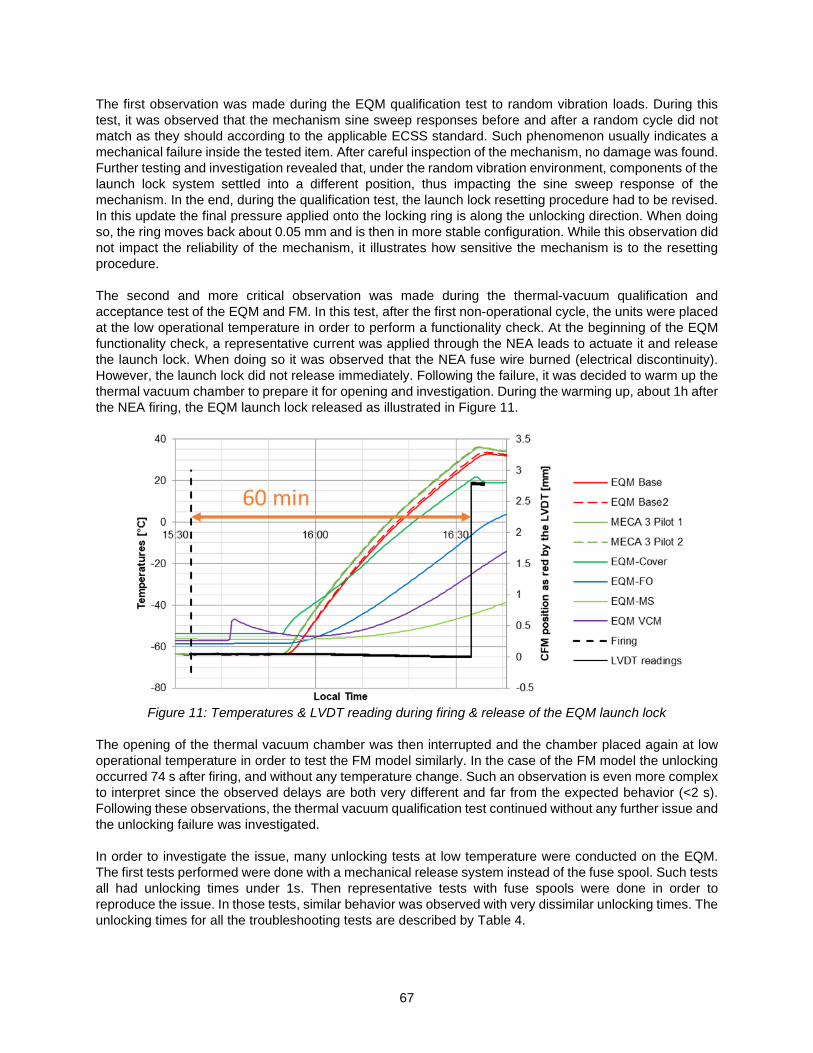
67
The first observation was made during the EQM qualification test to random vibration loads. During this test, it was observed that the mechanism sine sweep responses before and after a random cycle did not match as they should according to the applicable ECSS standard. Such phenomenon usually indicates a mechanical failure inside the tested item. After careful inspection of the mechanism, no damage was found. Further testing and investigation revealed that, under the random vibration environment, components of the launch lock system settled into a different position, thus impacting the sine sweep response of the mechanism. In the end, during the qualification test, the launch lock resetting procedure had to be revised. In this update the final pressure applied onto the locking ring is along the unlocking direction. When doing so, the ring moves back about 0.05 mm and is then in more stable configuration. While this observation did not impact the reliability of the mechanism, it illustrates how sensitive the mechanism is to the resetting procedure. The second and more critical observation was made during the thermal-vacuum qualification and acceptance test of the EQM and FM. In this test, after the first non-operational cycle, the units were placed at the low operational temperature in order to perform a functionality check. At the beginning of the EQM functionality check, a representative current was applied through the NEA leads to actuate it and release the launch lock. When doing so it was observed that the NEA fuse wire burned (electrical discontinuity). However, the launch lock did not release immediately. Following the failure, it was decided to warm up the thermal vacuum chamber to prepare it for opening and investigation. During the warming up, about 1h after the NEA firing, the EQM launch lock released as illustrated in Figure 11.
Figure 11: Temperatures & LVDT reading during firing & release of the EQM launch lock
The opening of the thermal vacuum chamber was then interrupted and the chamber placed again at low operational temperature in order to test the FM model similarly. In the case of the FM model the unlocking occurred 74 s after firing, and without any temperature change. Such an observation is even more complex to interpret since the observed delays are both very different and far from the expected behavior (<2 s). Following these observations, the thermal vacuum qualification test continued without any further issue and the unlocking failure was investigated. In order to investigate the issue, many unlocking tests at low temperature were conducted on the EQM. The first tests performed were done with a mechanical release system instead of the fuse spool. Such tests all had unlocking times under 1s. Then representative tests with fuse spools were done in order to reproduce the issue. In those tests, similar behavior was observed with very dissimilar unlocking times. The unlocking times for all the troubleshooting tests are described by Table 4.
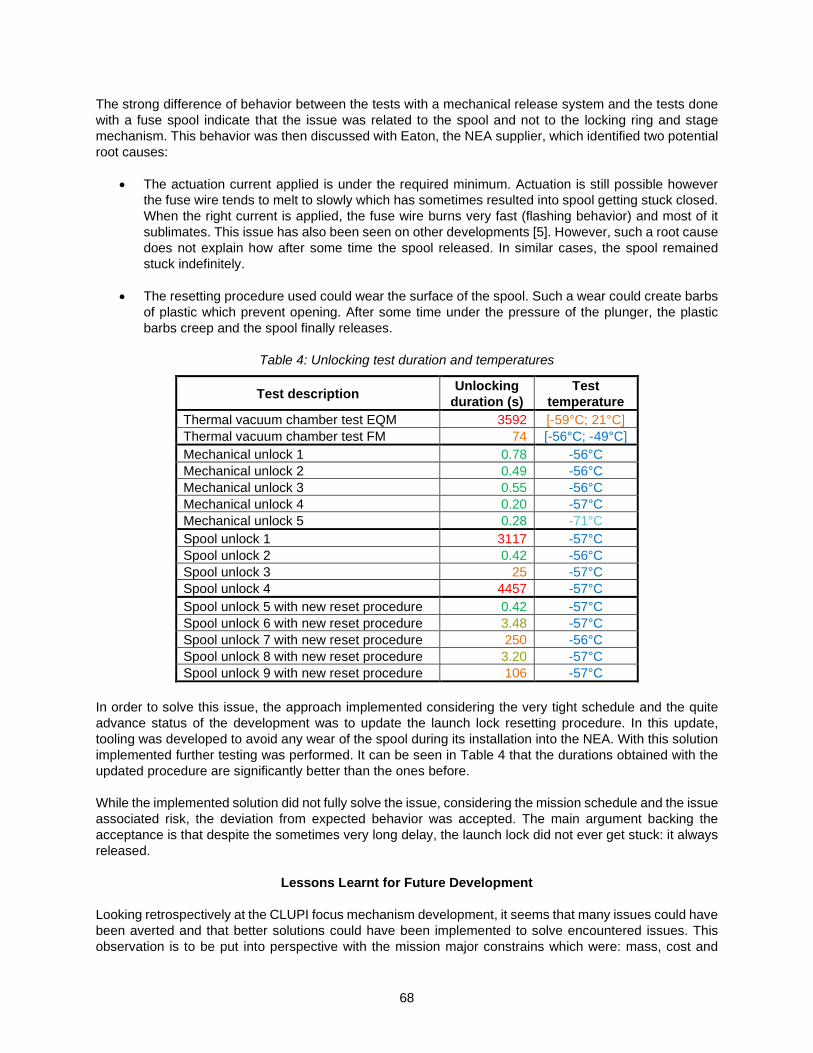
68
The strong difference of behavior between the tests with a mechanical release system and the tests done with a fuse spool indicate that the issue was related to the spool and not to the locking ring and stage mechanism. This behavior was then discussed with Eaton, the NEA supplier, which identified two potential root causes:
• The actuation current applied is under the required minimum. Actuation is still possible however the fuse wire tends to melt to slowly which has sometimes resulted into spool getting stuck closed. When the right current is applied, the fuse wire burns very fast (flashing behavior) and most of it sublimates. This issue has also been seen on other developments [5]. However, such a root cause does not explain how after some time the spool released. In similar cases, the spool remained stuck indefinitely.
• The resetting procedure used could wear the surface of the spool. Such a wear could create barbs of plastic which prevent opening. After some time under the pressure of the plunger, the plastic barbs creep and the spool finally releases.
Table 4: Unlocking test duration and temperatures
Test description Unlocking duration (s)
Test temperature
Thermal vacuum chamber test EQM 3592 [-59°C; 21°C] Thermal vacuum chamber test FM 74 [-56°C; -49°C] Mechanical unlock 1 0.78 -56°C Mechanical unlock 2 0.49 -56°C Mechanical unlock 3 0.55 -56°C Mechanical unlock 4 0.20 -57°C Mechanical unlock 5 0.28 -71°C Spool unlock 1 3117 -57°C Spool unlock 2 0.42 -56°C Spool unlock 3 25 -57°C Spool unlock 4 4457 -57°C Spool unlock 5 with new reset procedure 0.42 -57°C Spool unlock 6 with new reset procedure 3.48 -57°C Spool unlock 7 with new reset procedure 250 -56°C Spool unlock 8 with new reset procedure 3.20 -57°C Spool unlock 9 with new reset procedure 106 -57°C
In order to solve this issue, the approach implemented considering the very tight schedule and the quite advance status of the development was to update the launch lock resetting procedure. In this update, tooling was developed to avoid any wear of the spool during its installation into the NEA. With this solution implemented further testing was performed. It can be seen in Table 4 that the durations obtained with the updated procedure are significantly better than the ones before. While the implemented solution did not fully solve the issue, considering the mission schedule and the issue associated risk, the deviation from expected behavior was accepted. The main argument backing the acceptance is that despite the sometimes very long delay, the launch lock did not ever get stuck: it always released.
Lessons Learnt for Future Development Looking retrospectively at the CLUPI focus mechanism development, it seems that many issues could have been averted and that better solutions could have been implemented to solve encountered issues. This observation is to be put into perspective with the mission major constrains which were: mass, cost and

69
schedule. Furthermore, these solutions may appear straightforward, now that the development is complete, but they were certainly not as obvious at the beginning of the project. That is precisely why it is important to look back to the now completed development and identify important lessons that would help future developments. These lessons learned presented here are two-fold. There are specific lessons about what could be done from the beginning if a very similar mechanism were to be developed. Then there are more generic lessons about aspects which had an important impact on the CLUPI Focus Mechanism but are also applicable to a lot of other mechanism developments. Improvement for a Future Focus Mechanism Solutions were found to answer the issues and address the challenges of the CLUPI Focus Mechanism. However, these solutions had to be compatible with the very tight mission schedule. For the development of a future focus mechanism such solutions could be implemented at earlier stage in the development and thus be better integrated in the design. In some case, alternative more elegant solutions could be implemented. All these solutions were presented in detail in [6] and are summarized hereafter:
1. Improvement of mechanical interfaces: It would allow a reduction of the amplification and transmission of the mechanical load to the focus mechanism.
Figure 12: Improvement of bracket design to improve mechanical interface
2. Transverse Blades Integrated to the Guiding Plate Structure: A more symmetrical design of the
guiding plate would allow a better optimization of the flexure parameters to increase resilience without impacting the guiding movement stiffness.
Figure 13: Transverse blades integrated to the guiding plate structure
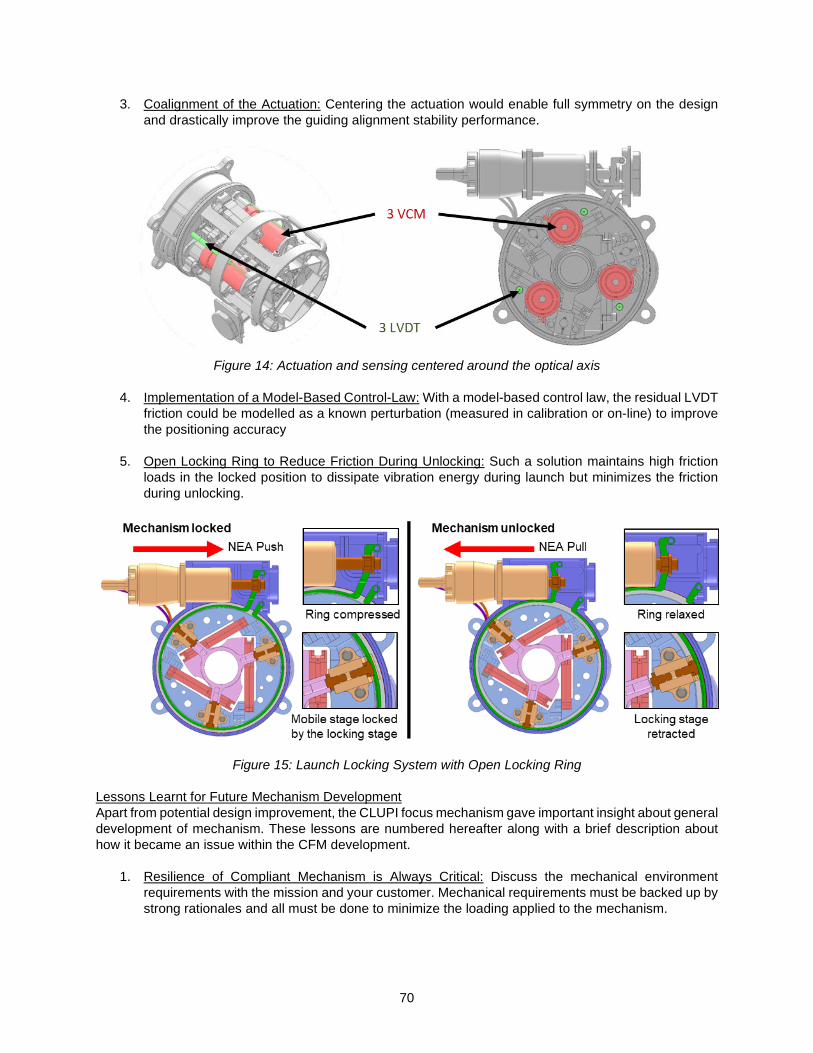
70
3. Coalignment of the Actuation: Centering the actuation would enable full symmetry on the design and drastically improve the guiding alignment stability performance.
Figure 14: Actuation and sensing centered around the optical axis
4. Implementation of a Model-Based Control-Law: With a model-based control law, the residual LVDT
friction could be modelled as a known perturbation (measured in calibration or on-line) to improve the positioning accuracy
5. Open Locking Ring to Reduce Friction During Unlocking: Such a solution maintains high friction loads in the locked position to dissipate vibration energy during launch but minimizes the friction during unlocking.
Figure 15: Launch Locking System with Open Locking Ring
Lessons Learnt for Future Mechanism Development Apart from potential design improvement, the CLUPI focus mechanism gave important insight about general development of mechanism. These lessons are numbered hereafter along with a brief description about how it became an issue within the CFM development.
1. Resilience of Compliant Mechanism is Always Critical: Discuss the mechanical environment requirements with the mission and your customer. Mechanical requirements must be backed up by strong rationales and all must be done to minimize the loading applied to the mechanism.
71
In the CLUPI focus mechanism development, the mechanical environment specification severity increased drastically at a late stage of the project. This led to additional (and extensive) design iterations at CSEM in an already very tight schedule. Efforts were done to make sure that the mechanism would be compatible with the interfacing structure. Further improvements could have been implemented on the interfacing structure to reduce its impact on the amplification of random levels.
2. In Compliant Mechanisms, Avoid Poorly Constrained Intermediate Stages: internal modes of the guiding structure are often the root-cause to compliant mechanism failure. While overall structural modes are dampened by the assembled structure and the mobile stage modes are dampened by a launch lock, intermediate stage modes cannot be easily locked and are not dampened.
In the CFM development, the intermediate stage mode (originally at 830 Hz) was an important source of stresses in the mechanism. It is not damped by any phenomenon but the internal material damping. Thus, the intermediate stage arm behaves as a tuning fork and stresses the blades above their limit. The solution was to better constrain the arm with a transverse blade. This solved the problem but could have been implemented at an earlier stage of the project thus saving the cost and time of developing further breadboards.
3. Most Compliant Mechanisms Need Launch Locks: This is especially true when the guiding rigidity is low, which is needed achieve long strokes. In these cases, the development of launch locking must be started early in the development of the compliant mechanism. This allows for a better integration of the locking system in the mechanism and may even allow for a locking of the intermediate stages.
At the very beginning of the CFM development no launch lock was designed. Not that it was not foreseen as necessary by the engineering team, but because the cost of the launch lock development was not included in the first feasibility study. Furthermore, the feasibility study report did not mention explicitly the need for a launch lock. Due to this missing information, the customer was misled to believe no launch lock would be required. Thus, during mass budget negotiations, no allowance was made for such a system. It was only shortly before the instrument delta PDR that the need of a launch lock was identified and flagged as critical. The late-coming launch lock design was then highly constrained by an already very tight schedule and mass budget.
4. Test as You Fly, as Early as Possible: While mission representative tests are often associated with extensive costs, they are the only way to anticipate issues with multiple root-causes.
The failure of the CFM launch lock during qualification is a good example to justify the need for “test as you fly” method: many tests were performed to make sure that the unlocking would behave as expected:
• Launch lock friction and force characterization measurements successful
• NEA tested alone, with representative actuation current and low temperature successful
• Launch lock mechanism tested at ambient with mechanical release representative successful
However, the first time the launch locking system was tested integrally in-flight representative condition was during the thermal vacuum qualification test, during which the system failed to unlock within an acceptable duration.

72
Conclusion Despite a very rocky path filled with potholes and obstacles, CSEM managed to lead the development of the CLUPI Focus mechanism up to delivery and integration within the instrument. The mechanism qualification campaign showed that it can survive all the mission environment requirements. Its mechanism performance was measured to be acceptable and this was confirmed during the instrument calibration campaign performed by ESA and the Space exploration Institute. The mechanism reliability was deemed acceptable even if it is greatly impacted by the sensitivity of the launch locking mechanism to the resetting procedure. Overcoming these issues lead to a successful development from which a lot of lessons were learnt. This was only made possible by an efficient collaboration between CSEM and its dedicated partners: Space Exploration Institute, Thales Alenia Space Switzerland, ESA, EATON, Singer Instrument Ltd, Petitpierre SA, Arcofil SA and Fisba Optics AG. Presently, the mechanism was successfully integrated onto the CLUPI flight model which was mounted onto the ExoMars rover drill. Hopefully, with a launch currently planned for July 2020, the first images of the Martian ground taken by CLUPI and its focus mechanism will be acquired in spring 2021.
References 1. Josset, J.-L., Westall, F., Hofmann, et al. (2017). The Close-Up Imager Onboard the ESA ExoMars
Rover: Objectives, Description, Operations, and Science Validation Activities. Astrobiology, 17, 595–611. https://doi.org/10.1089/ast.2016.1546
2. Verhaeghe, A., Perruchoud, G., Schwab, P., Gumy, M. (2019). Challenges of the development of a compliant Focus Mechanism submitted to the harsh Martian environment for the ExoMars Rover mission. Presented at Final Presentation Day, ESTEC, Noordwijk.
3. Verhaeghe, A., Perruchoud, G., Schwab, P., Gumy, M. (2017). Development Challenges of a Focus
Mechanism Design for ExoMars Mission Submitted to the Harsh Martian Environment and Utilizing Off-the-Shelf Equipment. In 17th European Space Mechanisms and Tribology Symposium. Presented at the ESMATS, Hartfield. http://esmats.eu/esmatspapers/pastpapers/pdfs/2017/verhaeghe.pdf
4. Spanoudakis, P., Schwab, P., Kiener, L., Saudan, H., Perruchoud, G. (2015). Development Challenges
of Utilizing a Corner Cube Mechanism Design with Successful IASI Flight Heritage for the Infrared Sounder (IRS) on MTG; Recurrent Mechanical Design Not Correlated to Recurrent Development. In 16th European Space Mechanisms and Tribology Symposium. Presented at the ESMATS, Bilbao. http://esmats.eu/esmatspapers/pastpapers/pdfs/2015/spanoudakis.pdf
5. Yoon, J., Betancourt, R. (2019). Battery Cell Bypass Switches – A Case Study in Test Like You Fly
Merits. In 18th European Space Mechanisms and Tribology Symposium. Presented at the ESMATS, Munich. http://esmats.eu/esmatspapers/pastpapers/pdfs/2019/yoon.pdf
6. Verhaeghe, A., Perruchoud, G., Schwab, P., Gumy, M., Rouvinet, J. (2019). Lessons Learnt during the
Development of a compliant Focus Mechanism for the EXOMARS Rover Mission. In 18th European Space Mechanisms and Tribology Symposium. Presented at the ESMATS, Munich. http://esmats.eu/esmatspapers/pastpapers/pdfs/2019/verhaeghe.pdf

73
Lessons Learned from Qualification of HDRM for Ultralight LP-PWI Boom for ESA JUICE Mission.
Maciej Borys*, Ewelina Ryszawa*, Łukasz Wiśniewski*, Maciej Ossowski* and Jerzy Grygorczuk*
Abstract The paper presents the complications appearing during the qualification campaign of the Langmuir Probe – Plasma Wave Instrument (LP-PWI). The article focuses on one subsystem of LP-PWI: the Hold Down and Release Mechanism (HDRM). After the qualification vibration test, the HDRM was supposed to open to release the LP-PWI boom. However, the mechanism was blocked. The analysis presented reveals several root causes of this failure. The following root causes were identified: an optimistic functional analysis, incorrect integration processes, and neglected finishing of the parts. The second part of the paper shows the improvements implemented in the HDRM and the result of these changes. Finally, the lessons learned from the qualification process of the LP-PWI and HDRM failure are presented.
Introduction The LP-PWI is one of the instruments within the Radio & Plasma Wave Investigation experiment on board ESA’s JUICE (Jupiter Icy Moon Explorer) mission. The experiment consists of four identical LP-PWIs mounted on the edges of JUICE Spacecraft (S/C). The main objective of the instrument is to provide crucial information about the bulk plasma surrounding Jupiter’s icy moons. The instrument is built in cooperation with the Swedish Institute of Space Physics in Uppsala under contract with ESA Prodex. The article begins with a general description of the LP-PWI architecture and an introduction to the main environmental and technical requirements. The state-of-the-art section presents an overview of the boom with a short description of the main subsystems. The paragraph on system overview gives a detailed description of HDRM. The next chapters of the article focus on the qualification campaign and problems that appeared after the vibration test. The core of the article is the analysis of the HDRM’s failure to open. The root causes of this failure and further solutions are described. As a summary, the paper presents all HDRM design and process improvements that helped overcome all the problems encountered with the opening of the HDRM. Final conclusions and lessons learned can be found in the last chapter.
State of the Art The HDRM is a part of the bigger instrument - the LP-PWI (Figure 1). The LP-PWI is a two-section boom ended with Langmuir Probe (LP) [1]. The LP is a spherical sensor made of titanium and covered with TiAlN (Titanium Aluminum Nitride). The LP on board JUICE mission is 100 mm in diameter, which is two times larger than those on board Rosseta [2] and Cassini missions [3]. The two sections of the boom are made of CFRP (Carbon Fibers Reinforced Plastic) tubes ended with titanium interfaces and covered with Single Layer Insulation. The interfaces allowed to link the tubes with two hinges: Base and Central. Both are very similar. They are equipped with clock springs, which drive the boom, and a latching mechanism. The Central Hinge opens to 180 deg, while the Base Hinge opens to 135 deg. In a deployed configuration all LP-PWIs are positioned at an angle of 45 deg to the S/C longer edge.
* ASTRONIKA Sp. z o.o., Warsaw, Poland
Proceedings of the 45th Aerospace Mechanisms Symposium, NASA Johnson Space Center, 2020

74
Figure 1. LP-PWI overview (CAD model deployed configuration – left; CAD model stowed configuration – right; as built model stowed configuration - bottom)
The boom has two HDRMs: Base HDRM and HDRM#2, which hold the CFRP tubes in a stowed configuration during the launch. The Base HDRM is placed close to the Langmuir probe while HDRM#2 is placed close to the Central Hinge. The position of HDRM#2 was optimized to maximize the first natural frequency of the boom. Both mechanisms are identical in terms of functionality; the difference between them lies in the structure: HDRM#2 is standalone while Base HDRM shares the structure with the Base Hinge. In a stowed configuration the boom’s length is under 1.6 m; it deploys to the length of 3 m. The LP-PWI’s angular position must be kept within ±0.5 deg cone with a tip in Base Hinge. The length of the boom must be kept within the tolerance of ±5 mm. During the mission the LP-PWI will be exposed to highly demanding environmental conditions. There are four identical LP-PWI booms located on three different corners of the S/C. As consequence, the level of Sun illumination is different for each boom. The S/C trajectory comprises a close Sun approach with high Sun illumination, as well as long time spent in the shadow during Jovian Tour with Sun eclipse. This leads to a wide range of temperatures on the LP, ranging from -220°C up to 200°C. However, the main driver behind LP-PWI’s architecture was a limited mass budget – in order to comply with requirements, each LP-PWI needed to have a mass under 1.3 kg. The low mass of the unit did not allow for using hold and release mechanisms available on the market due to the mass requirement. The HDRM also needed to be part of the boom structure. In the LP-PWI, the HDRMs are also the main support of the boom as well as the interface with the S/C. Each HDRM contains mechanical and electrical interfaces with the S/C. The design concept of the HDRM was based on the Hold Down and Release Mechanism from MUPUS instrument on Rosseta mission [4]. A similar design was later also used in the DRAGON-8U Nanosatellite Orbital Deployer [5]. However, this specific application (for LP-PWI) forced a major tailoring of the mechanism.

75
HDRM System overview The core of the HDRM is a Preload Jaw which provides the preload to the CFRP tubes and keeps them in the stowed configuration (Figure 2). The Preload Jaw consists of a stainless-steel V-shape spring with two Tension Clamps attached to each arm of the spring. The Tension Clamps press the Tube Interface, which is attached to the upper 2nd section of the boom. The upper section lays down on the separators, which are a part of the lower 1st section of the boom. The pressing on the Tube Interface is transferred through separators to the lower section and it holds both of the CFRP tubes. The Tube Interface is equipped with overlay made of Vespel SP1. The Tension Clamps are made of nitrided titanium, which is essential for further investigation in this article. The materials are a good and stable friction pair with friction coefficient 0.21-0.24 in vacuum, in room and low temperature (-80°C) [6]. Vespel SP1 also has high strength, which does not degrade significantly in the higher temperatures (tensile strength: 86.2 MPa at 25°C; 41.4 MPa at 260°C). These features make Vespel SP1 the best choice for this application.
Figure 2. HDRM design In a closed position of the HDRM, the Preload Jaw is bent and supported by two levers. The levers are connected to each other above the CFRP tubes with a Vectran string. The string is wrapped around the resistors placed in the lever. The resistors play a role of thermal knives that cut the Vectran string. In a single HDRM, there are two resistors (one on each lever): primary and redundant. The geometry of the lever combined with the inclination angle of the Tension Clamp (α) lowers the loads seen by Vectran string with a ratio 28.5. The opening of the HDRM (Figure 3) is initiated by a weakening of the Vectran string by heat from deployment resistors. The levers are motorized by their own torsion springs and they are released after cutting of the Vectran string. The constrain resulting from the closed levers disappears, and the V-shape spring comes back to its open position. The Tension Clamps stop pressing the Tube Interface and the boom’s sections are ready to be opened.
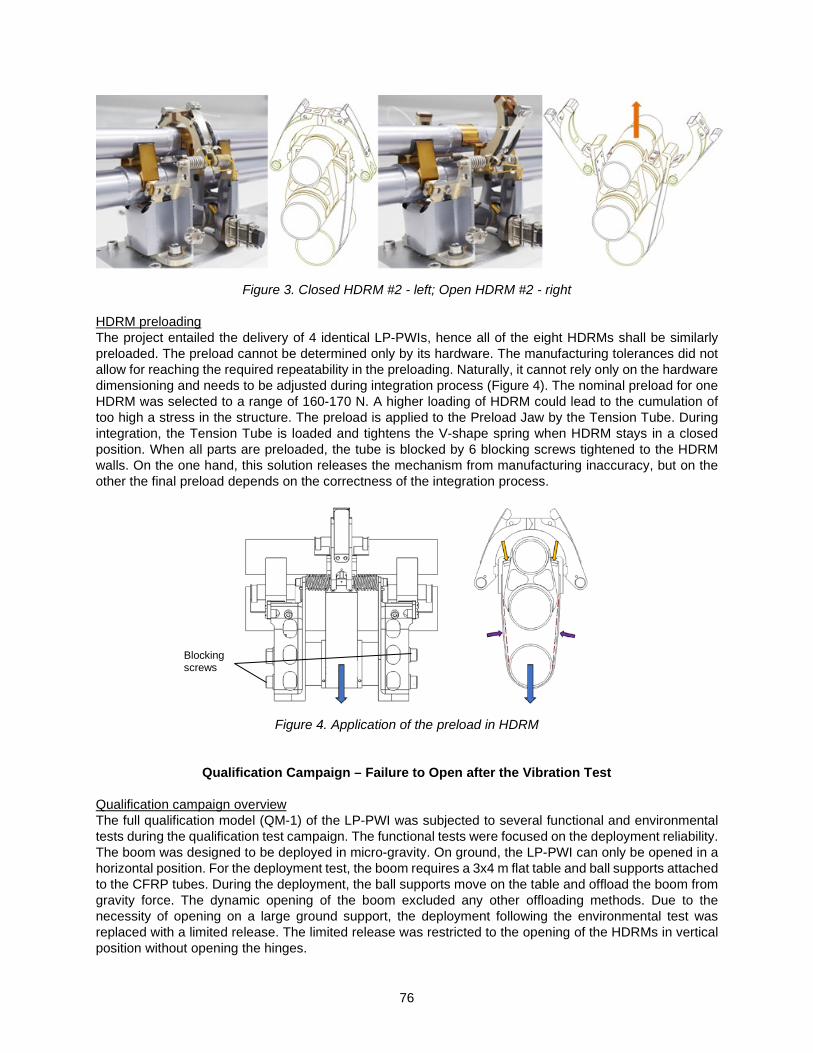
76
Figure 3. Closed HDRM #2 - left; Open HDRM #2 - right HDRM preloading The project entailed the delivery of 4 identical LP-PWIs, hence all of the eight HDRMs shall be similarly preloaded. The preload cannot be determined only by its hardware. The manufacturing tolerances did not allow for reaching the required repeatability in the preloading. Naturally, it cannot rely only on the hardware dimensioning and needs to be adjusted during integration process (Figure 4). The nominal preload for one HDRM was selected to a range of 160-170 N. A higher loading of HDRM could lead to the cumulation of too high a stress in the structure. The preload is applied to the Preload Jaw by the Tension Tube. During integration, the Tension Tube is loaded and tightens the V-shape spring when HDRM stays in a closed position. When all parts are preloaded, the tube is blocked by 6 blocking screws tightened to the HDRM walls. On the one hand, this solution releases the mechanism from manufacturing inaccuracy, but on the other the final preload depends on the correctness of the integration process.
Figure 4. Application of the preload in HDRM
Qualification Campaign – Failure to Open after the Vibration Test Qualification campaign overview The full qualification model (QM-1) of the LP-PWI was subjected to several functional and environmental tests during the qualification test campaign. The functional tests were focused on the deployment reliability. The boom was designed to be deployed in micro-gravity. On ground, the LP-PWI can only be opened in a horizontal position. For the deployment test, the boom requires a 3x4 m flat table and ball supports attached to the CFRP tubes. During the deployment, the ball supports move on the table and offload the boom from gravity force. The dynamic opening of the boom excluded any other offloading methods. Due to the necessity of opening on a large ground support, the deployment following the environmental test was replaced with a limited release. The limited release was restricted to the opening of the HDRMs in vertical position without opening the hinges.
Blocking screws
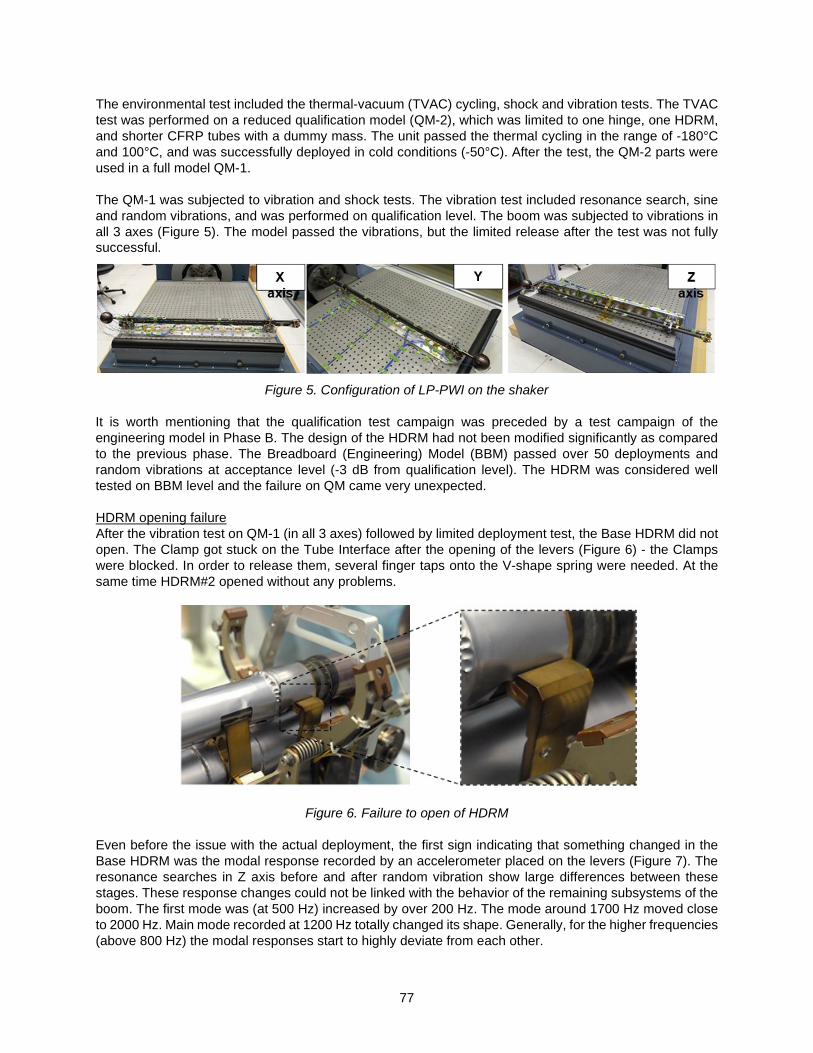
77
The environmental test included the thermal-vacuum (TVAC) cycling, shock and vibration tests. The TVAC test was performed on a reduced qualification model (QM-2), which was limited to one hinge, one HDRM, and shorter CFRP tubes with a dummy mass. The unit passed the thermal cycling in the range of -180°C and 100°C, and was successfully deployed in cold conditions (-50°C). After the test, the QM-2 parts were used in a full model QM-1. The QM-1 was subjected to vibration and shock tests. The vibration test included resonance search, sine and random vibrations, and was performed on qualification level. The boom was subjected to vibrations in all 3 axes (Figure 5). The model passed the vibrations, but the limited release after the test was not fully successful.
Figure 5. Configuration of LP-PWI on the shaker It is worth mentioning that the qualification test campaign was preceded by a test campaign of the engineering model in Phase B. The design of the HDRM had not been modified significantly as compared to the previous phase. The Breadboard (Engineering) Model (BBM) passed over 50 deployments and random vibrations at acceptance level (-3 dB from qualification level). The HDRM was considered well tested on BBM level and the failure on QM came very unexpected. HDRM opening failure After the vibration test on QM-1 (in all 3 axes) followed by limited deployment test, the Base HDRM did not open. The Clamp got stuck on the Tube Interface after the opening of the levers (Figure 6) - the Clamps were blocked. In order to release them, several finger taps onto the V-shape spring were needed. At the same time HDRM#2 opened without any problems.
Figure 6. Failure to open of HDRM
Even before the issue with the actual deployment, the first sign indicating that something changed in the Base HDRM was the modal response recorded by an accelerometer placed on the levers (Figure 7). The resonance searches in Z axis before and after random vibration show large differences between these stages. These response changes could not be linked with the behavior of the remaining subsystems of the boom. The first mode was (at 500 Hz) increased by over 200 Hz. The mode around 1700 Hz moved close to 2000 Hz. Main mode recorded at 1200 Hz totally changed its shape. Generally, for the higher frequencies (above 800 Hz) the modal responses start to highly deviate from each other.

78
The increase and the major change of modal responses turned out to be the first symptom that something was blocked in the HDRM. After the unsuccessful HDRM opening it became clear that the blocked Clamp transfers the loads from the CFRP tubes to the levers differently. This caused the change in the modal response.
Figure 7. Resonance response of the lever in Base HDRM in Z-axis before and after vibration of QM-1
Root Cause of the Failure After the failure of the Base HDRM the most critical task was to find the root cause of the problem. At the beginning, blocking of the Tension Clamp seemed very unlikely. The design of the HDRM was well known and had been used in two others flight instruments. However, a deeper analysis revealed 4 potential root causes of this failure. All of them affect each other, therefore it is impossible to clearly identify which problem was the most critical for the system. Preload change during vibration As mentioned above, the QM-1 was not the first model that was tested. The qualification phase was proceeded by the breadboard (engineering model) testing phase. The HDRMs in BBM and in QM-1 were practically identical in terms of the Preload Jaw design. The BBM passed similar tests during the breadboard test campaign. However, the BBM was subjected to random vibrations with a level reduced to -3 dB (from qualification level) due to the limitations of the available shaker. Hence, the BBM had never seen full qualification loads before the QM vibe test. The preload in LP-PWI was between 160 N and 170 N. This value was established by scaling the preload form the MUPUS instrument. The vibration loads in the Preload Jaw were estimated at 1120 N. It was clear that the preload was not high enough to avoid gapping during vibrations. Unfortunately, a higher preload could not be applied due to the strength limitation of the HDRM structure. Strengthening the structure would affect the mass budget and therefore could not be applied. There was also a strong conviction that if the BBM survived the vibrations, then the QM-1 should also pass the test. However, the qualification level of random vibrations appeared to be critical. The gapping between the Tension Clamp and the Tube Interface caused micro movement of the Clamps (Figure 8), which led to a higher tension of the V-shape spring and leveraged the preload.
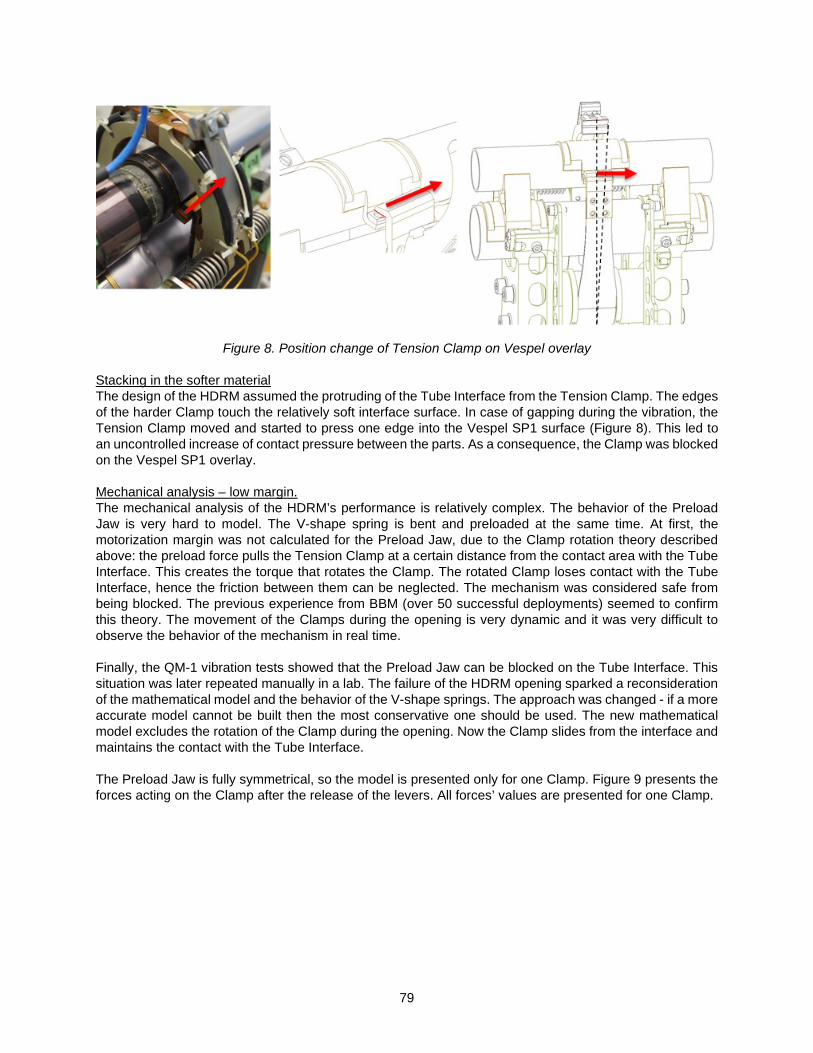
79
Figure 8. Position change of Tension Clamp on Vespel overlay Stacking in the softer material The design of the HDRM assumed the protruding of the Tube Interface from the Tension Clamp. The edges of the harder Clamp touch the relatively soft interface surface. In case of gapping during the vibration, the Tension Clamp moved and started to press one edge into the Vespel SP1 surface (Figure 8). This led to an uncontrolled increase of contact pressure between the parts. As a consequence, the Clamp was blocked on the Vespel SP1 overlay. Mechanical analysis – low margin. The mechanical analysis of the HDRM’s performance is relatively complex. The behavior of the Preload Jaw is very hard to model. The V-shape spring is bent and preloaded at the same time. At first, the motorization margin was not calculated for the Preload Jaw, due to the Clamp rotation theory described above: the preload force pulls the Tension Clamp at a certain distance from the contact area with the Tube Interface. This creates the torque that rotates the Clamp. The rotated Clamp loses contact with the Tube Interface, hence the friction between them can be neglected. The mechanism was considered safe from being blocked. The previous experience from BBM (over 50 successful deployments) seemed to confirm this theory. The movement of the Clamps during the opening is very dynamic and it was very difficult to observe the behavior of the mechanism in real time. Finally, the QM-1 vibration tests showed that the Preload Jaw can be blocked on the Tube Interface. This situation was later repeated manually in a lab. The failure of the HDRM opening sparked a reconsideration of the mathematical model and the behavior of the V-shape springs. The approach was changed - if a more accurate model cannot be built then the most conservative one should be used. The new mathematical model excludes the rotation of the Clamp during the opening. Now the Clamp slides from the interface and maintains the contact with the Tube Interface. The Preload Jaw is fully symmetrical, so the model is presented only for one Clamp. Figure 9 presents the forces acting on the Clamp after the release of the levers. All forces’ values are presented for one Clamp.
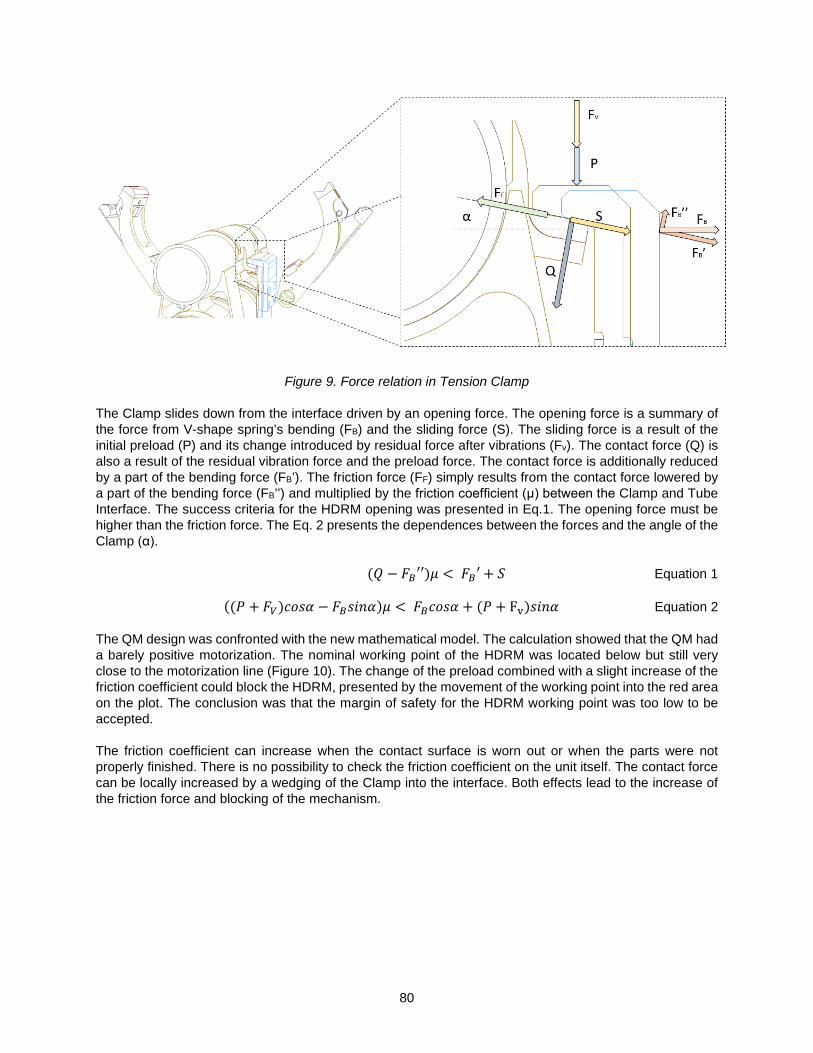
80
Figure 9. Force relation in Tension Clamp
The Clamp slides down from the interface driven by an opening force. The opening force is a summary of the force from V-shape spring’s bending (FB) and the sliding force (S). The sliding force is a result of the initial preload (P) and its change introduced by residual force after vibrations (Fv). The contact force (Q) is also a result of the residual vibration force and the preload force. The contact force is additionally reduced by a part of the bending force (FB’). The friction force (FF) simply results from the contact force lowered by a part of the bending force (FB’’) and multiplied by the friction coefficient (μ) between the Clamp and Tube Interface. The success criteria for the HDRM opening was presented in Eq.1. The opening force must be higher than the friction force. The Eq. 2 presents the dependences between the forces and the angle of the Clamp (α).
(𝑄𝑄 − 𝐹𝐹𝐵𝐵′′)𝜇𝜇 < 𝐹𝐹𝐵𝐵′+ 𝑆𝑆 Equation 1
((𝑃𝑃 + 𝐹𝐹𝑉𝑉)𝑐𝑐𝑐𝑐𝑐𝑐𝑐𝑐 − 𝐹𝐹𝐵𝐵𝑐𝑐𝑠𝑠𝑠𝑠𝑐𝑐)𝜇𝜇 < 𝐹𝐹𝐵𝐵𝑐𝑐𝑐𝑐𝑐𝑐𝑐𝑐 + (𝑃𝑃 + Fv)𝑐𝑐𝑠𝑠𝑠𝑠𝑐𝑐 Equation 2
The QM design was confronted with the new mathematical model. The calculation showed that the QM had a barely positive motorization. The nominal working point of the HDRM was located below but still very close to the motorization line (Figure 10). The change of the preload combined with a slight increase of the friction coefficient could block the HDRM, presented by the movement of the working point into the red area on the plot. The conclusion was that the margin of safety for the HDRM working point was too low to be accepted. The friction coefficient can increase when the contact surface is worn out or when the parts were not properly finished. There is no possibility to check the friction coefficient on the unit itself. The contact force can be locally increased by a wedging of the Clamp into the interface. Both effects lead to the increase of the friction force and blocking of the mechanism.

81
Figure 10. Motorization of Preload Jaw – QM-1 (α=10deg; FB=6N; μ=0.22)
Preload application Another cause of the preload change following the vibration test could be a wrong method of its application. The lower preload causes a higher gaping than it was expected. Generally, the preload is adjusted during the integration process by the loading and movement of the tension tube (Figure 4). In BBM the preload was applied in a vertically positioned boom. The Tension Tube was loaded with an adjusted mass. In QM-1 the method was modified. The preload was applied through the force meter with a stiff hook attached to the tension tube. The HDRMs walls were constrained and could not move due to the horizontal positioning of the boom. In this configuration, the wedging of the tube between the walls was highly possible (Figure 11). The force meter indicated the correct value of the preload, but this force was not necessary fully transferred to the Preload Jaw. It could have been consumed by the blocking of Tension Tube between the HDRM walls. This way of the preload adjusting did not allow for the full control of the preload in HDRM. As a consequence, the final preload could have been randomly lower, which led to a higher gapping during the vibration test. The final position of the tube as well as its tilting were not measured. Additionally, the tilted tube tightened the Preload Jaw asymmetrically. The asymmetrical position of the V-shape spring causes higher pressure of one side of the Clamps, which increases the tendency of pressing the edge into the soft Vespel SP1 overlay. The modification between the BBM and the QM-1, which was intended to be an improvement, introduced an additional uncertainty to the mechanism.
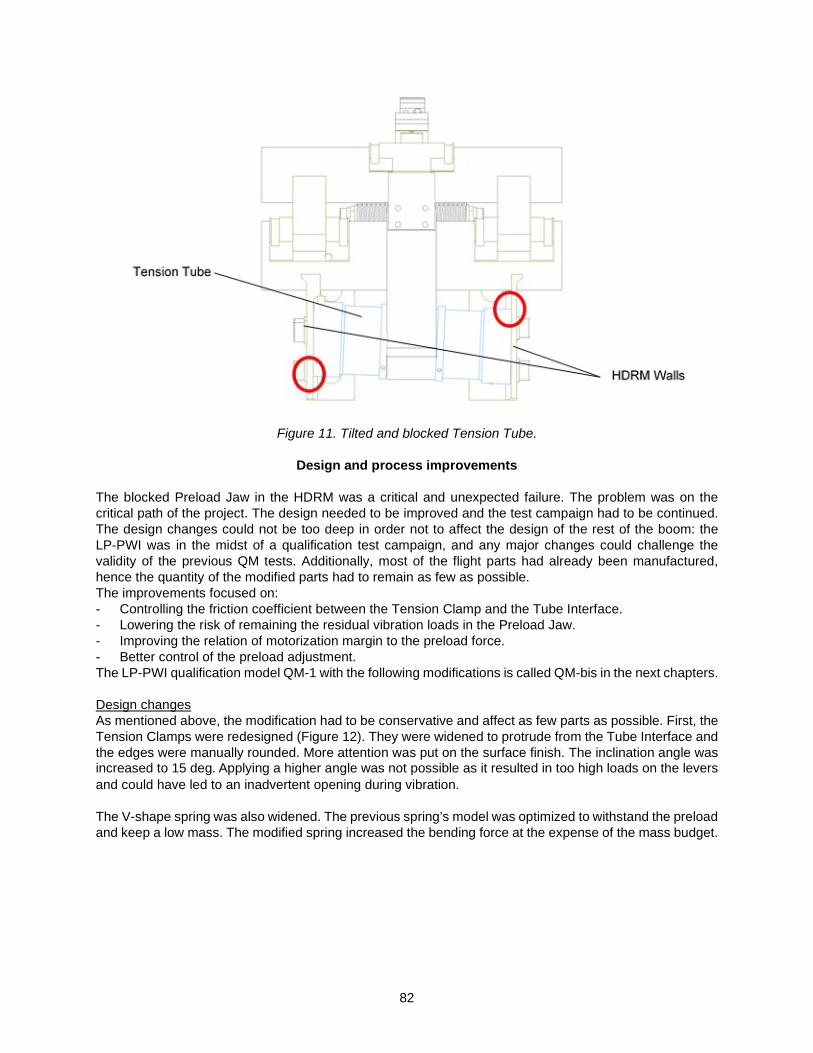
82
Figure 11. Tilted and blocked Tension Tube.
Design and process improvements
The blocked Preload Jaw in the HDRM was a critical and unexpected failure. The problem was on the critical path of the project. The design needed to be improved and the test campaign had to be continued. The design changes could not be too deep in order not to affect the design of the rest of the boom: the LP-PWI was in the midst of a qualification test campaign, and any major changes could challenge the validity of the previous QM tests. Additionally, most of the flight parts had already been manufactured, hence the quantity of the modified parts had to remain as few as possible. The improvements focused on: - Controlling the friction coefficient between the Tension Clamp and the Tube Interface. - Lowering the risk of remaining the residual vibration loads in the Preload Jaw. - Improving the relation of motorization margin to the preload force. - Better control of the preload adjustment. The LP-PWI qualification model QM-1 with the following modifications is called QM-bis in the next chapters. Design changes As mentioned above, the modification had to be conservative and affect as few parts as possible. First, the Tension Clamps were redesigned (Figure 12). They were widened to protrude from the Tube Interface and the edges were manually rounded. More attention was put on the surface finish. The inclination angle was increased to 15 deg. Applying a higher angle was not possible as it resulted in too high loads on the levers and could have led to an inadvertent opening during vibration. The V-shape spring was also widened. The previous spring’s model was optimized to withstand the preload and keep a low mass. The modified spring increased the bending force at the expense of the mass budget.

83
Figure 12. Tension Clamp design changes
The change of the Tension Clamp led to the modification of the Tube Interface. The titanium part of the interface was already attached to the CFRP tube and replacing them was not possible. Only the Vespel SP1 overlay could have been replaced. Because the Clamp angle had been changed, the overlay needed to be adjusted as well. The simplest solution was to round the contact surface of the overlay and create a linear contact with the Tension Clamp (Figure 13). This solution also had other benefits. In the previous design, the contact area between the Clamp and the Tube Interface was random. The manufacturing tolerances of the parts did not allow for perfect surface-to-surface contact. As a consequence, the Clamp pressed the overlay in random points under not necessarily a correct angle. Rounding of the overlay improved the control over the contact area and inclination angle. The disadvantage of this solution included higher Hertzian stresses of the linear contact, but it remained within accepted range. As a plastic material, Vespel SP1 can be easily deformed under pressure without risk of breaking. In this case, after exceeding the Hertzian stresses, the overlay simply adjusts its shape to the Tension Clamp and creates the sufficient surface to surface contact area.
Figure 13. Vespel SP1 overlays modification Change of the preload application process The process of preload adjustment in the HDRM was also improved. The load was applied with a mass attached to the tension tube, similarly as in the BBM. During the process the boom was put in a vertical position, hence the HDRM’s walls did not have to be screwed to the integration plate. Thanks to this, the HDRM walls were not rigidly fixed and a clearance remained between them and the Tension Tube. The tube was able to move freely without the risk of tilting and blocking. The position of the Tension Tube was observed from the beginning of preloading to the blocking by the screws. A lot of effort was put to ensure

84
that the final position of the tension tube is parallel. After constraining the tube in HDRM, its exact position was measured with the accuracy of 0.01 mm. The measurements were taken on both sides of the Tension Spring. All deviations of readings higher than 0.05 mm meant it was necessary to reapply the preload. This inspection assured that the tube was not tilted by more than 0.15 deg.
Test Campaign Continuation All design changes were focused on improving the motorization margin of the Preload Jaw. Figure 14 presents the comparison between the motorization of the Preload Jaw in QM-1 and in QM-bis. The increase of the Tension Clamp’s inclination angle and the modification of the V-shape spring made the HDRM much more independent from the preload and friction coefficient changes. The widening of the Tension Clamp and rounding of its edges excluded the possibility of the titanium edge sticking into the Vespel SP1. A well-finished surface of the overlays and the Clamps assured as low friction coefficient as possible. The margin of safety for the HDRM working point was significantly increased.
Figure 14. Motorization of Preload Jaw – QM-bis (α=15 deg; FB=8 N; μ=0.22)
The modified qualification model (QM-bis) was vibrated once again in accordance with the same test specification. During the vibrations, it was apparent that the applied changes improved the mechanism. The comparison of modal responses (performed before and after the nominal random vibration test) from the accelerometer placed on the lever was more accurate than it was in the QM-1 (Figure 15). Previously, a major increase of the modes’ frequencies and a great difference of the modes at frequencies above 800 Hz were observed. In the QM-bis the first mode decreases its frequency after the test. It can be explained by the initial setting of the mechanism. For higher frequencies the resonance characteristics remained similar before and after random vibration. Any major shift was not observed, and the main mode is almost identical.

85
Figure 15. Resonance response of the lever in Base HDRM before vibration and after in Z-axis for QM-bis The QM-bis passed the vibration test – the modal responses were very similar. For most of the parts it was the second vibration with the qualification level which additionally proved the endurance of the boom. The limited release just after the vibrations was successful as well - both HDRMs were opened. The qualification campaign could resume. All other tests, including full deployments and shocks, were completed successfully. The LP-PWI was fully deployed over 50 times during the qualification test campaign (QM-1: 8 deployments; QM-bis: 49 deployments). In the end, the LP-PWI reached TRL7.
Conclusions and Lessons Learned
The experience from the qualification campaign of LP-PWI is essential and can be used for other projects. Several lessons learned were extracted:
Great heritage and successful breadboarding does not guarantee reliability of the mechanism. Several issues were neglected at the beginning of the project. The first motorization model of the Preload Jaw was too optimistic. The preload value was simply scaled from another instrument without confronting it with the real loads acting on the unit. These steps were taken due to the lack of a good analysis in the early phase of the project, but also due to strong faith in the reliability of the mechanism. The good heritage of HDRM and successful breadboard campaign discouraged implementation of any improvements.
In simulations and mathematical models, the most conservative approach should be considered as the baseline. The analysis of the behavior of the Preload Jaw was neglected in the project. The inability to build a detailed mathematical model was replaced with an optimistic approach. The mechanism was considered unlikely to block. If a sufficiently detailed mathematical model is too complicated to achieve, the most conservative approach should always be used. In addition, in the early design process, the mechanism shall demonstrate clearly defined constraints and parameters that are verifiable and controllable during the manufacturing, assembly and testing process. When the project constraints appear, the design compromises are embedded and sufficient level of risk awareness needs to be tracked and not forgotten.
The harder material should always protrude from a softer one. One of the basic mistakes in the design was the decision to make the Tube holders wider than the Tension Clamp. In consequence, the edges of the Clamp could wedge into the tube holders’ overlays. The overlays made of Vespel SP1 are much softer than the nitride titanium Clamp. The wedged edge of the Clamp generates much higher Hertzian stresses and deforms the overlay. In the connections where one material is much softer than the other one, a contact of the hardest edges shall be avoided.

86
Parts inspection The inspection and rejection of the parts with questionable quality at an early stage is critical. The project was under high time pressure. The risk of using several parts with surface or shape defects was underestimated. Not enough attention was put on the surface finishing and rounding of the parts’ edges. The accepted parts were not in a bad condition and they passed the standard acceptance criteria, however, the standard inspection did not consider their specific application. In some cases, the parts were not properly finished. The elements that are part of the interface or a component of the friction pair should always have excellent surface finish and the inspection shall assume their future function. In addition, if the quality of the critical parts raises any question, the risk of accepting them may lead to costs much higher than those resulting from the delays or production of new ones.
Acknowledgments
The work described in this article was performed under a contract with the European Space Agency’s Prodex No. 4000119065/16/NL/JK. The Primary Investigator of the project is IRF Uppsala led byJan-Erik Wahlund (PI), Jan Bergman (Instrument manager), Victoria Cripps and Sara Gomis (Instrument Product Assurance Managers). The project is supervised by ESA’s expert Ronan Le Letty. Astronika’s engineers who also participated in the research and development activity described herein are: Tomasz Kuciński (project managers at initial stage of the conntract), Kamil Bochra, Mateusz Duda, Michał Bogoński, Mateusz Grzyb, Karol Jarocki, Łukasz Bereś, Filip Szymański, Paweł Miara, Henryk Gut. The authors would like to thank the above mentioned for their support.
References 1. M. Borys, L. Wiśniewski, J. Grygorczuk, et al. ‘’LP-PWI deployable boom for JUICE mission – innovative
features and breadboard model development’’ 17th European Space Mechanisms and Tribology Symposium (ESMATS), Hatfield, UK, September 20-22, 2017
2. A.Sjögren, ‘’Modelling of Rosetta Langmuir Probe Measurements’’ UPTEC F09 063, Uppsala, Sweden, October, 2009
3. K.S. Jacobsen a,, J.-E. Wahlund b , A. Pedersen, ‘’Cassini Langmuir probe measurements in the inner magnetosphere of Saturn’’, Planetary and Space Science 57 (2009) 48–52
4. Grygorczuk, J., Banaszkiewicz, M., Seweryn, K., Spohn, “MUPUS Insertion device for the Rosetta mission” Journal of Telecommunications and Information Technology (1/2007), pp50-53.
5. M Dobrowolski, J Grygorczuk, B Kędziora, M Tokarz, M Borys ‘’DRAGON-8U Nanosatellite Orbital Deployer’’; Proceedings of the 42nd Aerospace Mechanisms Symposium; NASA/CP-2014-217519; 487-496
6. J. Grygorczuk, M. Dobrowolski, L. Wisniewski, “Advanced Mechanisms and Tribological Tests of the Hammering Sampling Device CHOMIK ” 14th European Space Mechanisms and Tribology Symposium (ESMATS), Constance, Germany, September 28-31, 2011

87
Development of a Family of Resettable Hold-Down and Release Actuators Based on SMA Technology and Qualification of Different Application Systems
Marcelo Collado(1), Cayetano Rivera(1), Javier Inés(1), José M. San Juan(2), Charlie Yeates(3), Michael
Anderson(3), Francisco Javier Rivas(4), Mónica Iriarte(5), Jens Steppan(6), Calem Whiting(7) and Karine Murray(7)
Abstract The present work summarizes the development of a complete family of resettable Hold Down and Release Actuators (HDRA), called REACT, based on Shape Memory Alloys (SMA), from its conception to its qualification as component and subsequent integration in several final users’ systems. The paper details different topics involved in this development, including technological developments, design conceptions of the actuators, their unit qualification and their integration and qualification in different subsystems.
Introduction The work presented in this paper was performed in the frame of an European project were a consortium of seven partners collaborated in the development of a family of HDRAs for general use. The partnership covered the definition of requirements for a variety of typical applications used by system integrators, the development and assessment of the required technologies, such as SMAs and the tribology of release mechanisms, the development up to qualification of the actuator and the qualification of several systems integrating the new device. The resulting REACT actuators have several advantages with respect to existing alternatives:
• Easily resettable by manual operation through the separation plane without disassembly from the system, enabling the test of the final units before flight. An important reduction in Assembly Integration and Test (AIT) costs at the system level is enabled bre eliminating disassembly and refurbishment operations.
• Low-shock compared to other technologies. • Non-explosive devices, therefore they do not require special safety and security measurements
during installation and handling. • Wide range of operating temperatures. Two different temperature options are offered to customers:
standard temperature and extended temperature.
Development of REACT family The new design started from Arquimea’s experience with the design of a previous HDRA, which was completely redesigned to overcome the limitations found in the first version and optimize the final performanc as detailed in [1]. Three different models were developed: 5kN, 15kN and 35kN, in two different variants: standard operation temperature (-90ºC to +65ºC), based on NiTi, and extended temperature (-90ºC to +120ºC), motorized by SMARQ®, which was evaluated in previous ESA activities [2].
(1) Arquimea Ingeniería, Leganés, Spain; [email protected] (2) University of the Basque Country UPV/EHU, Leioa, Spain (3) ESTL | ESR Technology Ltd, , Warrington, United Kingdom (4) Airbus Defence and Space, Madrid, Spain (5) AVS - Added Value Solutions, Elgoibar, Spain (6) SpaceTech GmbH, Immenstaad, Germany (7) Surrey Satellite Technology Limited, Guildford, United Kingdom
Proceedings of the 45th Aerospace Mechanisms Symposium, NASA Johnson Space Center, 2020

88
The REACT design employs a segmented nut configuration, where the load is connected with a standard threaded interface. The nut is split in 3 segments. The mechanism is based on an over-center configuration. The thread segments are connected by link bars to a third element, called the external ring, which has a single degree of freedom in the longitudinal axis. The external ring is blocked in the preload or reset configuration by a set of balls, maintaining the nut segments closed and therefore supporting the external load. Once a trigger element, motorized by means of SMA initiators, unblocks the balls, the external ring is moved to a second position by internal springs. At this position, the nut segments are open and the load is released. The new mechanism allows its reset by simple manual operations from the interface plane, by returning the external ring to the reset position with a simple tool. This reduces the complexity of AIT operations, reducing costs and improving system operations.
Figure 1. REACT QM Models. Different sizes and mechanical interfaces.
Development of Shape Memory Alloy Technologies for High Temperature Environments
REACT actuator uses a trigger system based on a SMA wire, which at the environment temperature is in the low temperature phase called martensite. When heated, this SMA fibre contracts by shape memory effect once its transformation to the high temperature phase (austenite) is reached. During this contraction, the SMA fibre produces a force high enough to trigger the mechanism. Two different SMA can be used in REACT. A commercial NiTi alloy is used for operation temperatures below 65ºC. Another High Temperature Cu-based SMA, SMARQ, is mounted in REACT allowing operating temperatures up to 125ºC because it has actuation temperatures over 140ºC. In Figure 2a, the thermal transformation of the SMARQ alloy is plotted, showing the small thermal hysteresis between cooling (direct transformation, in blue) and heating (reverse transformation, in red), obtained by integration of differential scanning calorimetry measurements. The last part of the direct thermal transformation during cooling extends along a broad temperature range, because the martensite plates have to nucleate against the internal stresses created during the progress of the transformation. However, it is enough to apply an external stress to promote the nucleation of the oriented martensites, getting a large transformation strain. In Figure 2b, a transformation strain close to 8% is measured for a stress of 23 MPa. This curve represents the thermal transformation under a constant load and is representative of the behavior of the material in a situation similar to the working condition of REACT. This kind of experiments were performed in a specific test setup working in an ultra-high vacuum (UHV) of 2∙10-8 mbar [1], and many measurements were performed at different temperatures in such an UHV environment, showing that the SMARQ material exhibits a good reliability in the space environment.

89
Figure 2. Behavior of SMARQ fibres used in the REACT extended temperature range. (a) Thermal
transformation cycle without load. (b) Thermal transformation cycle under 23 MPa load. Two examples of SMA fibre activation under UHV are presented in Figure 3, for two different environmental conditions and activation parameters. In Figure 3a, the fibre was under UHV inside a cryostat at -110ºC, working against a load or 62 MPa, and in this case the electrical current on the heater surrounding the SMA fibre was a pulse of 3 A with an increasing ramp of 0.5 s, a constant current time of 6 s and a decreasing ramp of 0.5 s (curve red). The delay of the response of the triggering SMA fibre is rather long (about 5 s) because of the very low initial temperature of the SMA fibre, requiring to be heated above 125ºC before actuation. However, once the actuation starts, the complete strain contraction of 3.5 % (limited by a sensor) was accomplished in 1 s (curve blue). In the second example of Figure 3b, the SMA fibre was in UHV at 125ºC working against the same load of 62 MPa. Nevertheless, in this case, although the current pulse sent to the heater has the same profile than before, a lower maximum current is used, 1.5 A. The delay to start the response was shorter, as expected from the higher environment temperature, but the actuation time was longer, as a consequence of the lower heating current. In both cases (a) and (b), four cycles are plotted superimposed to show the reproducibility of the actuation process. The parameters of the activation current pulse can be easily tunned in order to get the response required by the customer.
Figure 3. Plots of the activation current pulse (red), and strain-time response of the SMARQ fibres, measured in UHV of 2 ∙10-8 mbar. (a) Cryogenic test at -110ºC. (b) High-temperature test at 125ºC.
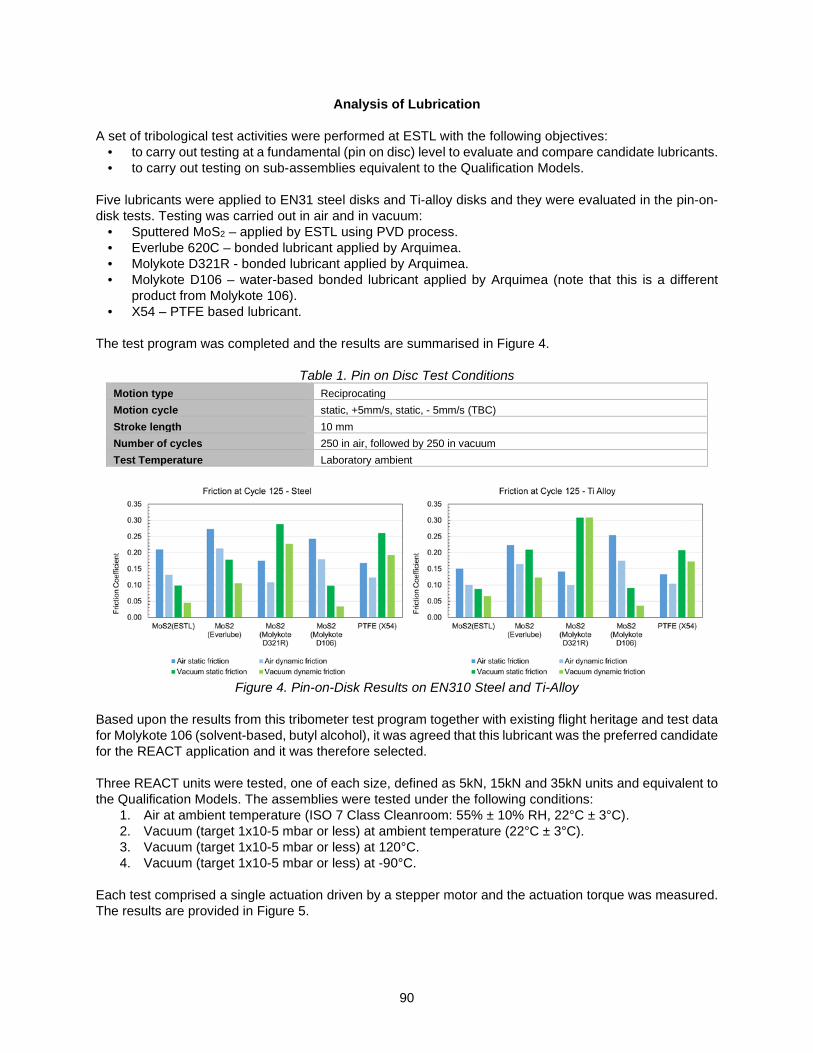
90
Analysis of Lubrication A set of tribological test activities were performed at ESTL with the following objectives:
• to carry out testing at a fundamental (pin on disc) level to evaluate and compare candidate lubricants. • to carry out testing on sub-assemblies equivalent to the Qualification Models.
Five lubricants were applied to EN31 steel disks and Ti-alloy disks and they were evaluated in the pin-on-disk tests. Testing was carried out in air and in vacuum:
• Sputtered MoS2 – applied by ESTL using PVD process. • Everlube 620C – bonded lubricant applied by Arquimea. • Molykote D321R - bonded lubricant applied by Arquimea. • Molykote D106 – water-based bonded lubricant applied by Arquimea (note that this is a different
product from Molykote 106). • X54 – PTFE based lubricant.
The test program was completed and the results are summarised in Figure 4.
Table 1. Pin on Disc Test Conditions Motion type Reciprocating Motion cycle static, +5mm/s, static, - 5mm/s (TBC) Stroke length 10 mm Number of cycles 250 in air, followed by 250 in vacuum Test Temperature Laboratory ambient
Figure 4. Pin-on-Disk Results on EN310 Steel and Ti-Alloy
Based upon the results from this tribometer test program together with existing flight heritage and test data for Molykote 106 (solvent-based, butyl alcohol), it was agreed that this lubricant was the preferred candidate for the REACT application and it was therefore selected. Three REACT units were tested, one of each size, defined as 5kN, 15kN and 35kN units and equivalent to the Qualification Models. The assemblies were tested under the following conditions:
1. Air at ambient temperature (ISO 7 Class Cleanroom: 55% ± 10% RH, 22°C ± 3°C). 2. Vacuum (target 1x10⁻⁵ mbar or less) at ambient temperature (22°C ± 3°C). 3. Vacuum (target 1x10⁻⁵ mbar or less) at 120°C. 4. Vacuum (target 1x10⁻⁵ mbar or less) at -90°C.
Each test comprised a single actuation driven by a stepper motor and the actuation torque was measured. The results are provided in Figure 5.
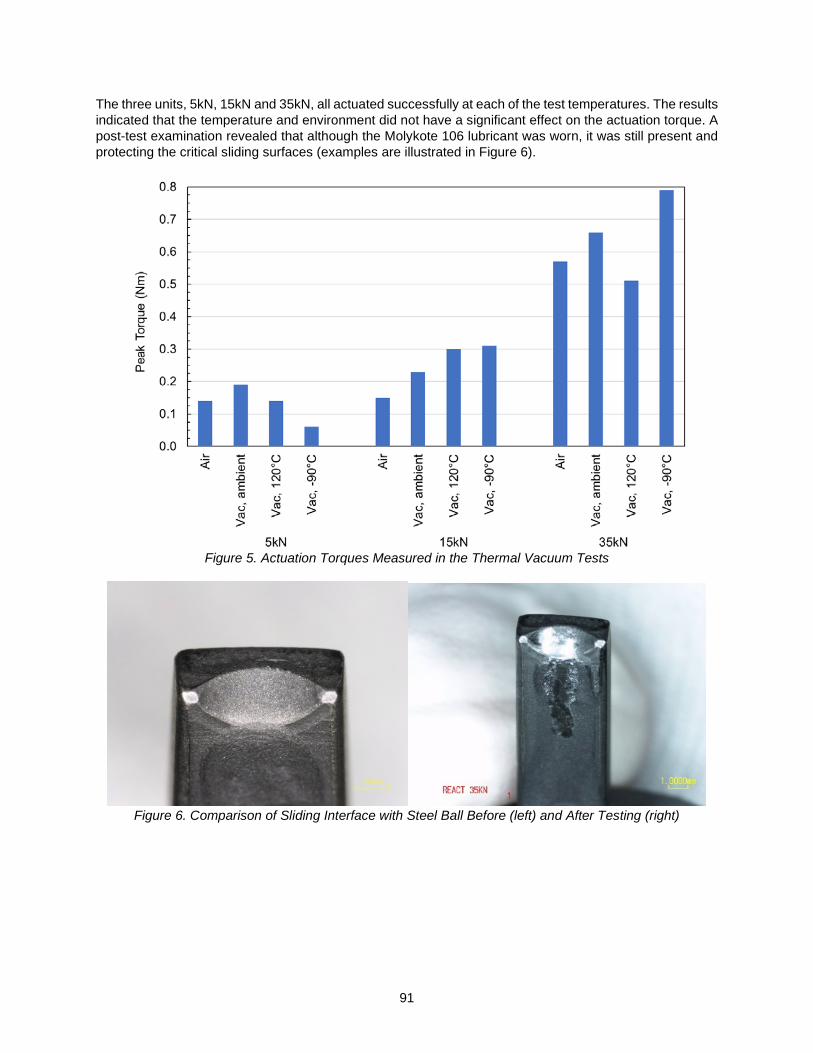
91
The three units, 5kN, 15kN and 35kN, all actuated successfully at each of the test temperatures. The results indicated that the temperature and environment did not have a significant effect on the actuation torque. A post-test examination revealed that although the Molykote 106 lubricant was worn, it was still present and protecting the critical sliding surfaces (examples are illustrated in Figure 6).
Figure 5. Actuation Torques Measured in the Thermal Vacuum Tests
Figure 6. Comparison of Sliding Interface with Steel Ball Before (left) and After Testing (right)

92
REACT Qualification Campaign A complete qualification campaign has been defined for each model and temperature variant, for a total of 6 campaigns. Each campaign includes 3 different units covering different mechanical interfaces for the customers. Figure 7 summarizes the qualification campaign sequence for each variant.
Figure 7. REACT Qualification Campaign
The qualification campaigns of the REACT 5kN and 15kN Standard Temperature units have already been completed, while the rest of campaigns are on-going. The main results and findings are:
• The units are being qualified to a lifetime over 50 cycles, which enables for at least 10 cycles on ground and one in orbit, according to ECSS. Extension to 70 cycles during qualification to enable up to 15 on ground uses is being implemented on new campaigns. REACT 15kN Standard temperature has already completed its qualification for 70 cycles.
• All the units withstood their proof load (6.5 kN, 19 kN and 43.5 kN, respectively) with high stiffness and were able to release even under such preloads. Axial stress tests have shown that the strength of each unit are well above the specification values. REACT 5kN has shown a strength over 18 kN, where the test resulted in external bolt fracture without any sign of damage to the device, which was still showing normal behavior actuating in nominal conditions. The REACT 15kN test resulted in the breakage of the external bolt at 45 kN and the device showed nominal behavior after the test. In the case of REACT 35kN, a maximum preload of 100 kN was reached, at which point the interface between the bolt and the tensile machine was broken. The unit was still fully operative after such load. These values show the robustness of the design and a high confidence in the device mechanical strength due to the application of design margins.
• Vibration and shock environments were succesfully applied to all the models, showing that the device holds the rated load without issues.
• The units were subjected to 6 thermal cycles over the operating range, followed by actuations at low and high temperature extremes. The devices showed good behavior during the cycling and actuated successfully.
• Misalignment and creep tests were performed to characterize the devices. The results during misalignment tests showed that the units were able to accomodate half-cone angles of more than 4.5º during integration and release. Creep tests were run for more than 6 months succesfully, showing very low initial preload loss followed by stabilization. Nominal actuation has been achieved after the test. Creep tests are being extended to 12 months.
• Force margin tests have been completed by assembling SMA initiators with a fraction of the nominal cross-section, and therefore a fraction of the available output force. This way, the force margins of

93
the real devices can be obtained. These tests were completed in different environmental conditions for each model: ambient conditions, minimum temperature with air (worst case for the lubricant) and minimum and maximum temperature in vacuum. The models showed margins above 6X in all cases, as required by ECSS [4], with some models showing more than 11X margin. This value shows the reliability of the device to operate under worst conditions.
Figure 8. REACT Qualification – Left: Vibration test. Right: Missalignment test
Launcher Separation System
For the qualification of REACT as the release device for an Airbus DS separation system, a fully flight representative clamp-band type LPSS937* was chosen as the test item. The LPSS* Separation System is the Airbus DS solution for clamp-bands where low shock and high load carrying capability are essential. Airbus DS is a provider of Separation Systems in the European market for Ariane-5, Soyuz and VEGA launchers. Also, in the American market, Airbus DS provides Separation Systems for Space-X and Orbital-ATK. Finally, in the Japanese market, Airbus DS clamp-bands fly in HIIA and will soon fly in HIII launchers.
Figure 9. Airbus DS LPSS* Separation Systems (left). Endurance results during LPSS937* qualification.
To enable the use of REACT on LPSS*, some mounting/adaptation hardware was designed and manufactured. Later, the LPSS937* clamp-band, employing a REACT 15kN Extended Temperature model, were subjected to the standard qualification test campaign applied to all Airbus DS flight separation systems. The test campaign began with a functional release test, to verify that the REACT enabled proper performance of the clamp-band. Although the functionality of the system for minimum, nominal and maximum band tensions was correct, an unexpected hooking of the “key” was detected. The “key” is a part that trasmits the tension load of the clamp band to the REACT through a shock reduction mechanism. The

94
main outcome of these tests was the need for a device to eject the key faster than the movement of the shock reduction mechanism. This device could be a simple pull-out spring. The next step was the life test campaign consisting of ten tensioning/release tests to demonstrate that the clamp-band will survive to launch after ten releases. The main outcome of this campaign was the confirmation of the hooking issue (Figure 10 left). The LPSS937* plus REACT assembly was subjected to a random vibration level of 20-G RMS showing a stable and adequate dynamic behavior without high amplification. After the successful environmental test, the clamp-band was released to demonstrate the survival of all its components including the REACT release device.
Figure 10. LPSS937* qualification setups using REACT. Vibration test (left). Thermal Vacuum Test
(center). REACT detail connected to the clamp-band (right). The thermal qualification of the LPSS937* plus REACT assembly was performed in vacuum conditions. The assembly was submitted to four cycles between LPSS* extreme cold and hot qualification temperatures of -55°C to 120°C. Functional releases were performed both at cold and hot conditions demonstrating the correct function of the REACT as the LPSS* release device. Finally, the clamp-band was tensioned to its nominal band tension and this parameter was measured and recorded for more than one month to determine its relaxation. The observed behavior was normal, with a relaxation of just 0.3 kN in the mentioned time period. Conclusion
• Tensioning operation torque/preload relationship and the repeatability of this parameter in consecutive operations is similar using REACT to the release devices previously used on LPSS*.
• It is necessary to implement an extractor for the key bolt (bolt retained by REACT) either installed in REACT body or as part of the LPSSS937* mechanism. The lack of this extractor creates an incompatibility between the velocity of the key bolt driven by the opening of the band mechanism and the movement of REACT fixed to the clamp-band main-beam. The result of this incompatibility is an unexpected hooking between two pieces that causes an off-nominal band release.
• Main outcome of this work is that, although there are still a set of activities to be done prior to the conclusion of formal REACT qualification for Airbus DS clamp-bands, it is clear that the device is an option, at least for a given type of missions where the activation time of several seconds is acceptable.
Planetary Exploration Subsystem
Added Value Solutions (AVS) participated in the development and qualification of a Hold Down and Release Mechanism for a planetary exploration subsystem. AVS designed a HDRM based on the REACT 5kN to hold and release the Sample Canister of an interplanetary sampling tool. The “Sampling Tool Mechanism for Low Gravity Bodies” developed by AVS collects a minimum of 100 g of regolith from the surface of a

95
low gravity celestial body for later transfer to the next step in the sampling chain. Therefore, once the regolith has been sampled successfully, it is necessary to perform two disengagement sequences:
• The first disengagement releases some parts of the mechanism leaving the canister exposed. For doing this three HDRM's located 120˚ apart are needed.
• The second disengagement releases the sample canister and here is where the new REACT Hold Down and Release mechanism (HDRM) design is considered.
Figure 11. Sampling Tool Mechanism (left), 1st Disengagement (center) and 2nd Disengagement (right) Two models were developed in order to qualify the 5kN REACT HDRM: an Engineering Model (EM) to test the functionality of the design and a Qualification Model (QM), which was subjected to a qualification campaign. The functional test campaign was successful as all the requirements were met during the execution of the complete series of measurements. The HDRM EM released every time after the REACT EM 5kN actuator fired. The only issue encountered was related to the resetting procedure of the actuator, but they were solved for the QM phase. The results of the qualification tests are explained hereafter. A total of 22 releases were carried out, two of them in vacuum (10-6 kPa) and at a temperature of +120°C and -90°C. All of the deployments were successful. The HDRM survived to 25-G quasi-static acceleration along all axes, as well as to 31-G RMS during the random-vibration testing. Low-level sine-sweeps were performed before and after each random-vibe test. The pre- and post- sine sweeps were compared to verify that there were no eigenfrequency shifts greater than the predetermined tolerance of 5%.
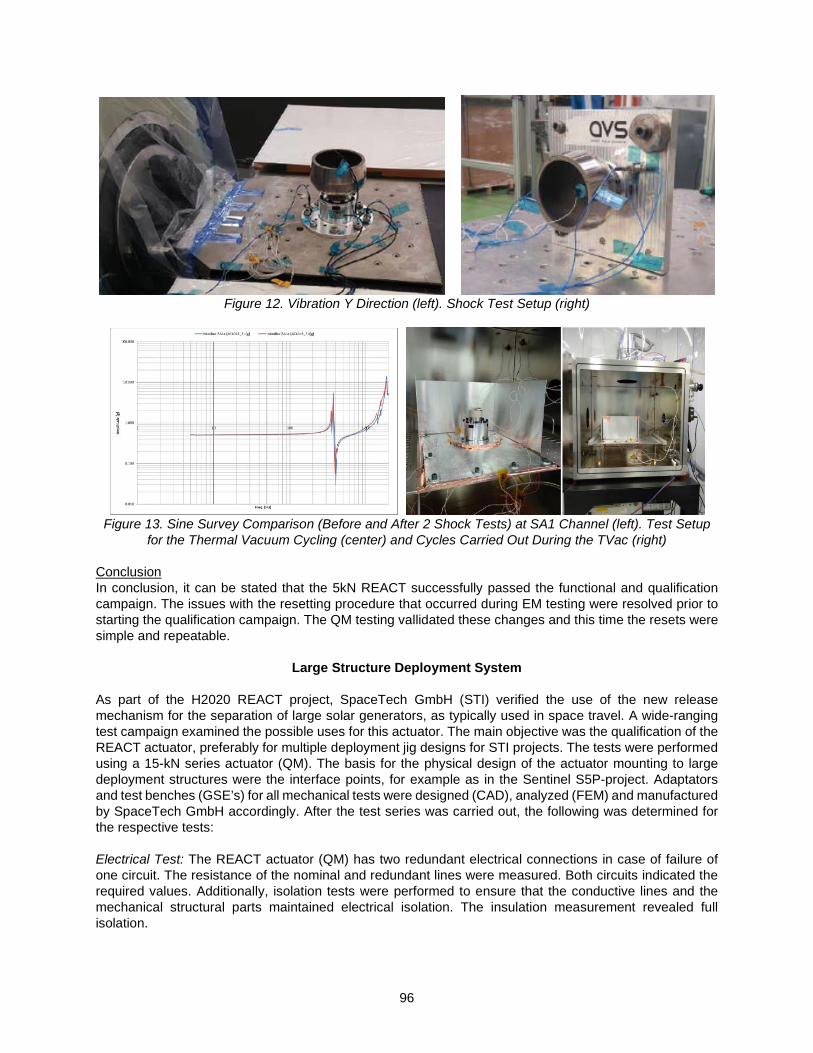
96
Figure 12. Vibration Y Direction (left). Shock Test Setup (right)
Figure 13. Sine Survey Comparison (Before and After 2 Shock Tests) at SA1 Channel (left). Test Setup
for the Thermal Vacuum Cycling (center) and Cycles Carried Out During the TVac (right) Conclusion In conclusion, it can be stated that the 5kN REACT successfully passed the functional and qualification campaign. The issues with the resetting procedure that occurred during EM testing were resolved prior to starting the qualification campaign. The QM testing vallidated these changes and this time the resets were simple and repeatable.
Large Structure Deployment System As part of the H2020 REACT project, SpaceTech GmbH (STI) verified the use of the new release mechanism for the separation of large solar generators, as typically used in space travel. A wide-ranging test campaign examined the possible uses for this actuator. The main objective was the qualification of the REACT actuator, preferably for multiple deployment jig designs for STI projects. The tests were performed using a 15-kN series actuator (QM). The basis for the physical design of the actuator mounting to large deployment structures were the interface points, for example as in the Sentinel S5P-project. Adaptators and test benches (GSE’s) for all mechanical tests were designed (CAD), analyzed (FEM) and manufactured by SpaceTech GmbH accordingly. After the test series was carried out, the following was determined for the respective tests: Electrical Test: The REACT actuator (QM) has two redundant electrical connections in case of failure of one circuit. The resistance of the nominal and redundant lines were measured. Both circuits indicated the required values. Additionally, isolation tests were performed to ensure that the conductive lines and the mechanical structural parts maintained electrical isolation. The insulation measurement revealed full isolation.
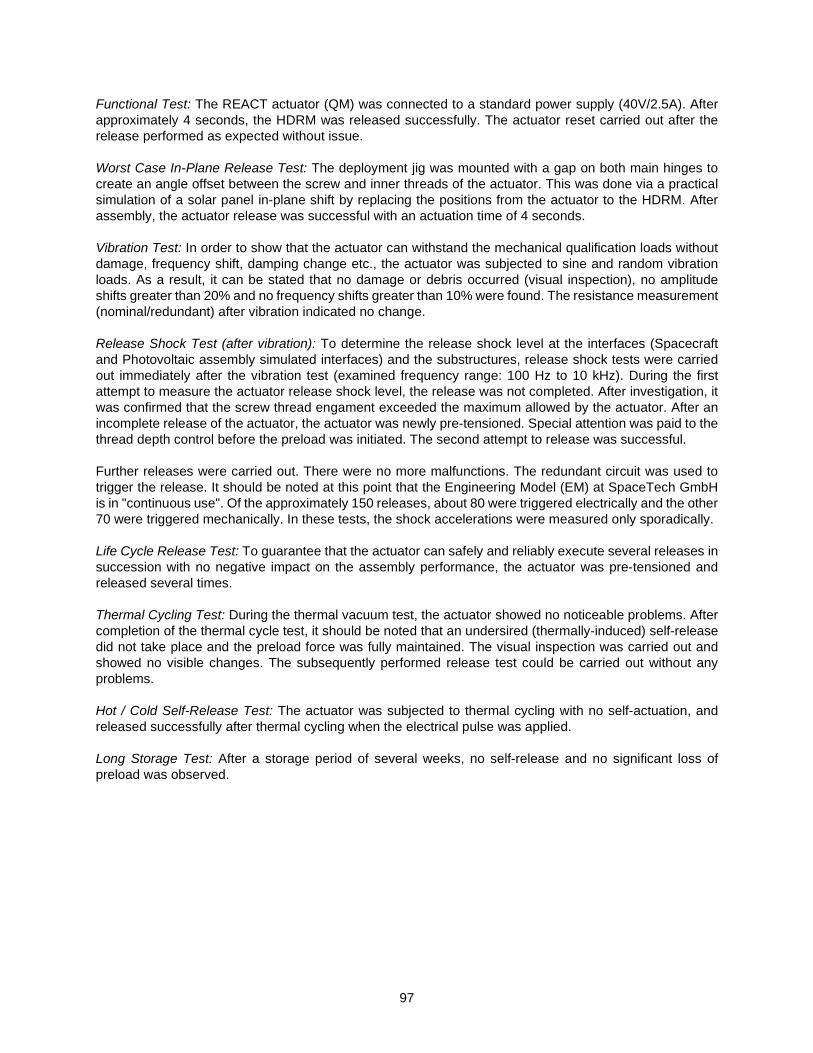
97
Functional Test: The REACT actuator (QM) was connected to a standard power supply (40V/2.5A). After approximately 4 seconds, the HDRM was released successfully. The actuator reset carried out after the release performed as expected without issue. Worst Case In-Plane Release Test: The deployment jig was mounted with a gap on both main hinges to create an angle offset between the screw and inner threads of the actuator. This was done via a practical simulation of a solar panel in-plane shift by replacing the positions from the actuator to the HDRM. After assembly, the actuator release was successful with an actuation time of 4 seconds. Vibration Test: In order to show that the actuator can withstand the mechanical qualification loads without damage, frequency shift, damping change etc., the actuator was subjected to sine and random vibration loads. As a result, it can be stated that no damage or debris occurred (visual inspection), no amplitude shifts greater than 20% and no frequency shifts greater than 10% were found. The resistance measurement (nominal/redundant) after vibration indicated no change. Release Shock Test (after vibration): To determine the release shock level at the interfaces (Spacecraft and Photovoltaic assembly simulated interfaces) and the substructures, release shock tests were carried out immediately after the vibration test (examined frequency range: 100 Hz to 10 kHz). During the first attempt to measure the actuator release shock level, the release was not completed. After investigation, it was confirmed that the screw thread engament exceeded the maximum allowed by the actuator. After an incomplete release of the actuator, the actuator was newly pre-tensioned. Special attention was paid to the thread depth control before the preload was initiated. The second attempt to release was successful. Further releases were carried out. There were no more malfunctions. The redundant circuit was used to trigger the release. It should be noted at this point that the Engineering Model (EM) at SpaceTech GmbH is in "continuous use". Of the approximately 150 releases, about 80 were triggered electrically and the other 70 were triggered mechanically. In these tests, the shock accelerations were measured only sporadically. Life Cycle Release Test: To guarantee that the actuator can safely and reliably execute several releases in succession with no negative impact on the assembly performance, the actuator was pre-tensioned and released several times. Thermal Cycling Test: During the thermal vacuum test, the actuator showed no noticeable problems. After completion of the thermal cycle test, it should be noted that an undersired (thermally-induced) self-release did not take place and the preload force was fully maintained. The visual inspection was carried out and showed no visible changes. The subsequently performed release test could be carried out without any problems. Hot / Cold Self-Release Test: The actuator was subjected to thermal cycling with no self-actuation, and released successfully after thermal cycling when the electrical pulse was applied. Long Storage Test: After a storage period of several weeks, no self-release and no significant loss of preload was observed.

98
Figure 14. REACT Actuator (QM) Test Setup Vibration Test, Sensor Positions
Conclusion The initial problems lay with the misunderstanding of the narrow tolerance for the screw-in depth during system assembly, which led to functional failures during the tests. This was identified and solved. Based on this, suggestions were made that should lead to an improvement in the monitoring of the actuator during the various test phases. The release shock test results indicate an exceedance of the required limits at the interface points (input), especially in the upper frequency range. Whereas on the dummy mass, the shock loads remained well below the requirement. These exceedances can be explained by the fact that the interface measurement points were located directly on the bracket for the tests performed in this project. At the output interface points, the shock response spectrum levels are likely to be significantly reduced by the damping of the structure. The final actuator mass and dimensions are significantly higher than the actuator of other competitors, which makes it especially difficult to use the REACT as a standard deployment solution for SpaceTech at the moment. If the mass of the actuator could be reduced, it would be an extremely attractive solution compared to the products of the competition. Above all, the extremely fast-recoverable preload is an enormous advantage. As already mentioned above, the reliability has been tested at SpaceTech GmbH in a lifetime comprising either electrical or mechanical releases far above the qualification limits.
Small Satellite Deployable Subsystem The project undertaken at SSTL tested the 35kN standard temperature variant of REACT from Arquimea. SSTL were involved from the start of the project, defining requirements necessary for use in small satellite deployable systems. Test campaign of an EM could not be completed due to the mechanism not holding the maximum preload after a certain number of tests. This was mainly due to the selection of an excessively fine thread pitch. Arquimea further refined the design after these issues and sent a QM for SSTL to test. The qualification tests were completed and confidence was gained that the mechanism could perform consistently.

99
The qualification tests used REACT as the release mechanism within a solar array (HDRM). HDRMs are used by SSTL to secure deployable solar panels against the spacecraft during launch, and release once commanded in orbit. SSTL specifically adapted the HDRM design and qualification test set up to integrate the REACT actuator. Historically, many of the release actuators used by SSTL are not resettable by the end user and are must be returned to the manufacturer after one use, causing large impacts on schedules. REACT has the advantage of being easy to reset and non-explosive. The qualification test plan was driven by the requirements set out at the start of the project. This included testing the 35-kN preload, making sure the release and reset functions were as expected, and verifying that there was no degradation in performance after experiencing simulated in-orbit environments through vibration and thermal vacuum testing. After first confirming that the actuator received met expected properties such as mass, dimensions and wire resistance, it was set up in a tensile test machine to verify it could hold the maximum preload (Figure 14 left). The actuator was fixed in the machine using bespoke MGSE which held the actuator down and pulled a load of 35 kN on a bolt fixed within the mechanism, and held for a period of time. This was repeated including application of a low no-fire current of 0.8 A on primary and secondary circuits to make sure that a small accidental current would not inadvertently cause deployment. Tests showed that the actuator held the load perfectly with no reduction in load. The actuator was fitted into SSTL’s solar array deployment test setup (Figure 15 center). The actuator was mounted within a hold down and release system incorporating a cup (spacecraft side) and cone (array side), kick-off springs to help separation, and a bolt catcher to trap the deployed bolt from the actuator. REACT was attached to the cup within the setup. The final deployment angle was set by SSTL tape spring hinges. Deployment was confirmed by an integrated micro-switch, which allowed for measurement of the mechanism’s actuation time. The functional tests were carried out using preloads of 16, 22 and 35 kN on both primary and secondary circuits. During these tests, shock was measured with the use of two accelerometers attached to the system. Each planned functional test successfully deployed the panel, and shock values remained under the required limit. After the successful deployment tests, the system set up was moved to the vibration test machine and underwent low level sine tests, qualification sine tests and random vibration in all three axes, at a nominal preload of 22 kN. The system passed all vibration qualification tests. The preload on the REACT mechanism did not decrease during testing and the deployments performed post testing were successful. The final qualification tests occurred while attached to a thermal plate within a vacuum chamber over a period of 4 days. Initially, one full thermal cycle at vacuum was carried out, with a maximum temperature of 60°C and minimum of -85°C, after which deployment tests occurred at a nominal preload of 22 kN at hot, cold and ambient. All thermal vacuum tests were successful with actuation time varying with temperature as expected. Ambient pressure and temperature deployment tests on primary and secondary circuits were carried out after the thermal vacuum testing to prove function had not been compromised. Both tests were eventually successful, although the primary test required an increase of voltage to the actuator to get a successful deployment. Conclusion The REACT mechanism successfully completed qualification testing whilst integrated within an SSTL HDRM for a small satellite deployable solar panel. The qualification testing demonstrated that the mechanism could perform as required during all stages of operation on ground and in simulated orbital environments. There were some occasions in which difficulty was experienced in actuating the device due to lack of margin between expected actuation time and maximum allowed pulse duration, however, with a more flight representative electrical setup, these issues would most likely be removed.

100
Figure 15. Proof Test (left). Function Deployment Test Setup (center). Use of Reset Tool (right).
The resetting of the actuator (Figure 14 right) was easy and the feedback from the mechanism gave the operator confidence that the device had been reset properly. At no point was there any concern that the reset may not work or that the mechanism may not hold preload after a reset. Throughout the testing the REACT QM device was released 15 times (6 Pre-EVT, and 9 either during or Post-EVT), against its specified life of 10 releases on ground and 1 in orbit, which gives good confidence of the device’s life.
Conclusions A whole family of HDRAs has been developed and qualified in this activity, including their quailification in systems for different applications. One of the key advantages of REACT is its resettability, which allows the users to perform integration and multiple tests in a short time, especially when compared to other existing solutions. This characteristic is especially interesting as a cost-efficient solution to improve the Manufacturing, Assembly, Integration and Test operations at system and satellite levels. Moreover, the resettability enables a test-what-you-fly and fly-what-you-test philosophy. In addition to that, the temperature range is competitive for most applications, giving different actuation options for different applications and uses (shorter actuation time and power for lower temperature environments, different load levels, mechanical interface options including compatibility with existing solutions,…). Another important advantage is its proven reliability, the high mechanical and force margins shown by the devices in the worst environment conditions. The devices have shown successful operation under a wide range of preload levels, from 0N to levels over their nominal preload, allowing loads over proof levels to be released during the campaign. In addition to that, the device showed capabilities to withstand loads much larger than nominal, maintaining functionality, which gives an additional robustness level, showing survivavility to any unexpected event. Finally, the device shows good stiffness and creep behaviour. During the work, several lessons learned have been identified:
• A good analysis of the concept and its potential failure modes should be done as early as possible in the development.
• Reducing the contact pressures in the critical friction points is very important. • The selection of lubricants together with a proper definition of contacts, materials and preparation of
the surfaces is critical for a good and reliable space mechanism, as shown after the issues detected on the design selected at the beginning of the activity.

101
• Thermoelastic effects have to be well considered from the beginning of the design, especially for devices with wide operation range.
• Adaptation to typical electrical interfaces of customers is important to reach the market. • The development of many variants of a new product in parallel is really difficult to handle in terms of
cost, time and risk. It would be recommended to develop a first variant and then develop the rest of them.
• Testing as early as possible during the development is key to find potential issues and problems. • A good definition of tooling and its interface with the thermal chambers is critical to reach good thermal
cycling and to save time and money during test cycles. • EGSE sometimes is as critical as the flight device. The risk associated to poorly designed electrical
equipment may compromise the integrity of the devices, with the consequent impact. • EGSE can be a sub-product of the activity. It is an important asset to improve the market access of
REACT, reducing the costs and complexity of customers to test the new product. • It is important to tune the shock with a representative device prior to qualification, in order to avoid
excessive levels during test. It is important to keep high frequency responses within limits. • It is needed to improve the clarity of the documentation shared with customers. The requirements for
assembly of the unit into the system and its use (adjustment of electrical pulses for different conditions) is critical.
• It is a good practice to offer guidance to customers for the adaptation of their designs to the characteristics of the product.
Finally, there is a list of lessons learned coming from the users’ experiences, where collaboration between partners has been key for the identification of requirements, issues and the evolution of the product:
• Better definition of critical points in user manuals, to avoid any misunderstanding that may lead to handling or operation errors. These manuals were tuned after the first users experiences.
• Implementation of a quick user guide to summarize the most critical points for the use of REACT. • Elaboration of white notes to guide the users in the particularities of the device and its integration in
systems. • Evolution of the test setups to be offered to customers as EGSE. It will allow easier use of the devices
in addition to reduce the adoption time for customers. • It is important to collaborate with customers to ensure a proper design and use of the equipment. • Improvement of key details description in ICDs.
Currently, REACT qualification campaign is ongoing for some models and different milestiones for each model have been accomplished:
• REACT 5kN Standard Temperature has reached flight heritage as part of eSAIL mission in 2020. • REACT 5kN Extended Temperature has also reached flight heritage in two missions in 2019. • REACT 15kN Standard Temperature has succesfully completed its qualification. • REACT 15kN Extended Temperature model is in the middle of qualification campaign and has
already been selected for several flight missions. • REACT 35kN Standard and Extended Temperature are running their qualification campaigns.
Acknowledgement
The project showed in this work has received funding from the European Union’s Horizon 2020 research and innovation program under grant agreement No 640241 (project REACT – Resettable Hold-Down and Release ACTuator).

102
References 1. Collado, M., Rivera, C., Inés, J., Sánchez, J. " Evolution of a resettable Hold-Down and Release Actuator
Based on SMA Technology." 18th European Space Mechanisms and Tribology Symposium, 2019 2. Collado, M., Cabás, R., López-Ferreño, I., San Juan, J. " Functional Characterization of a Novel Shape
Memory Alloy." Journal of Materials Engineering and Performance, Volume 23, Issue 7 (July 2014), 2321-2326; DOI: 10.1007/s11665-014-1104-7.
3. I. López-Ferreño, U. Urrutia, P. Lorenzo, M. Collado, C. Rivera, N. Escudero, T. Breczewski, M.L. Nó, J. San Juan, “Ultra-High-Vacuum experimental equipment to characterize shape memory alloys for space applications”. Materials Today: Proceedings 2S (2015) S953-S956.
4. ECSS-E-ST-33-01C - Mechanisms.

103
Development and Post-testing Anomalies of the Parker Solar Probe Clamshells
Mark Bryant*
Abstract The Johns Hopkins University Applied Physics Laboratory built and flew a novel deployable antenna containment mechanism specifically for use on Parker Solar Probe. These mechanisms came to be known as “the clamshells”; a moniker earned for a deployment that was reminiscent to the movement of their ocean-bound namesake. This document describes the fundamental design and development efforts associated with these mechanisms. Furthermore, it will delve into to the subsequent investigation of the deployment anomaly that that occurred during protoflight testing and resulted from dimensionally non-compliant parts and effects of titanium-to-titanium galling.
Introduction The NASA Parker Solar Probe (PSP) spacecraft, built by the Johns Hopkins University Applied Physics Laboratory (JHU/APL), was launched from Cape Canaveral, FL on August 12, 2018. The spacecraft, shown partially in Figure 1, will provide new data on solar activity and make critical contributions to our ability to forecast major space weather events that impact life on Earth1. During the development of PSP, APL conceived, fabricated, tested and integrated a unique, partially deployable antenna containment system for launch and testing environments. These mechanisms were successfully deployed two days after the launch of Parker Solar Probe. Formally referred as the Antenna Retention System (ARS), this late-stage development effort served the purpose of attenuating the anticipated excursions of the ~2100 mm (~82 in) niobium V1, V2, V3 and V4 FIELDS instrument antennas (provided by the Space Sciences Laboratory at the University of California, Berkeley) during spacecraft (SC) testing and launch. A result of the flexible nature of the antennas, their stowed mounting location, and the fact they spanned multiple SC interfaces, containment was necessary to prevent damage to other SC components. The ARS system, as depicted in Figure 1, is comprised of a one-time deployable, SC structure-mounted clamshell mechanism, and a series of static fork-shaped snubbers mounted to the thermal radiators directly adjacent to the instrument hinge. The deployment of the clamshell mechanism is completely independent of the FIELDS deployment hinge; the former is deployed first, enabling the latter to individually deploy each antenna from the stowed launch position to the final, radially extended configuration beyond the umbra of the Thermal Protection System. Each of the four FIELDS antennas have a corresponding clamshell mechanism, and a set of carefully aligned forks adjusted to the natural shape of the stowed antenna. The clamshells at the FIELDS V1 and V2 locations shared similar mounting bracket geometry, V3 and V4 mounting brackets were completely unique to the others (Figure 2). Though the mounting brackets varied, the clamshell mechanism at each location were identical.
* Johns Hopkins University Applied Physics Lab, Laurel, MD; [email protected]
Proceedings of the 45th Aerospace Mechanisms Symposium, NASA Johnson Space Center, 2020
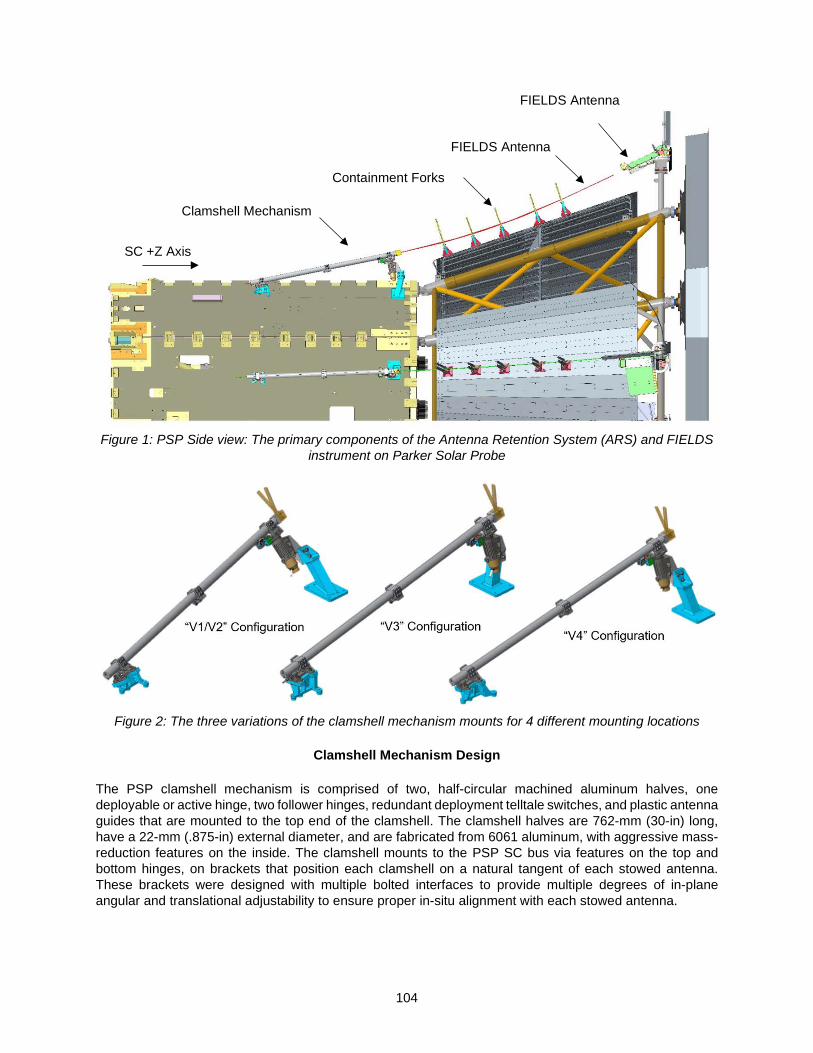
104
Figure 1: PSP Side view: The primary components of the Antenna Retention System (ARS) and FIELDS
instrument on Parker Solar Probe
Figure 2: The three variations of the clamshell mechanism mounts for 4 different mounting locations
Clamshell Mechanism Design
The PSP clamshell mechanism is comprised of two, half-circular machined aluminum halves, one deployable or active hinge, two follower hinges, redundant deployment telltale switches, and plastic antenna guides that are mounted to the top end of the clamshell. The clamshell halves are 762-mm (30-in) long, have a 22-mm (.875-in) external diameter, and are fabricated from 6061 aluminum, with aggressive mass-reduction features on the inside. The clamshell mounts to the PSP SC bus via features on the top and bottom hinges, on brackets that position each clamshell on a natural tangent of each stowed antenna. These brackets were designed with multiple bolted interfaces to provide multiple degrees of in-plane angular and translational adjustability to ensure proper in-situ alignment with each stowed antenna.
Clamshell Mechanism
Containment Forks
FIELDS Antenna
FIELDS Antenna
SC +Z Axis

105
Figure 3: Top view: The clamshell mechanism that corresponds to the V1 FIELDS antenna position.
When deployed, the clamshells hinge open along the length of the tube created by the halves. They do not open much; only 15 degrees per half (Figure 4), but this is more than sufficient to release the 3.2-mm (.125-in) diameter antenna. They are not designed to physically clamp or restrain the antenna, but only to loosely contain it. The 6.4-mm (.25-in) clamshell ID enables to the antenna to rattle slightly and freely translate axially, as not to impart any additional loads into the FIELDS instrument from the SC deflections that occur during SC vibration events. The closed side of one clamshell half features an “anti-trapping” tab along its length, to prevent the antenna from getting hung up or caught in the gap formed when the mechanism is deployed. Similarly, the yellow Ultem® blocks on the end of each clamshell half ease the transition of the antenna into the end of the tube; a location determined to have the highest dynamic contact. Extensive material testing was performed to ensure Ultem® compatibility with niobium antennas.
Figure 4: Top view: The clamshell mechanism depicted in the closed (left) and open (right) condition.
The heart of the mechanism, the active hinge, utilizes a TiNi Aerospace P10 Pinpuller to provide the motive force to deploy the greater mechanism. A TiNi P10 pinpuller is designed to retract 9.5 mm (.375 in) with 44 N (10 lbf) of pulling force2. Due to the shear load limitations of the pinpuller pin as specified by TiNi, it was necessary to isolate the vibration loads imparted by the mass of the clamshell from the pinpuller pin. This isolation is performed by a titanium slider cup, which is fastened to the end of the pinpuller via a loose spherical interface and engages two titanium legs built to each clamshell hinge half. When the pinpuller is actuated, the sliding cup translates along the axis of the pin, disengaging the clamshell legs, and enabling each spring-loaded clamshell half to pivot open (see Figure 5). The spherical interface between the

106
Pinpuller pin and the cup prevents binding of the sliding cup in the housing by eliminating all potential over-constraining degrees of freedom. The intentional loose fit of the spherical interface ensures that no external moments or side loads can be imparted onto the pinpuller pin due to assembly tolerances or launch shifts. Only the retraction force can be imparted into the cup.
Figure 5: The details of the active clamshell hinge, in stowed and deployed positions.
Left: Cross-section, Right: Housing not shown The other two hinges are spring-loaded follower hinges that simply provide additional opening torque via torsion springs at each location. These hinges feature no release mechanism or lock, and the mass of the center hinge is supported entirely by the clamshell halves. The bottom hinge is designed to accommodate ±3.2 mm (.125 in) of change in the axial length of the clamshells (Figure 6), and this eliminates the potential for the mechanism to bind from temperature-induced dimensional changes (CTE). Furthermore, the bottom shaft was cut with a profile of spherical undercuts, to further minimize the potential for binding, and provide additional angular adjustment during SC integration.
Figure 6: A side view of the bottom hinge illustrates the bottom mounting bracket and the gaps designed
to accommodate CTE effects of the aluminum clamshells
“Slider Cup”
Engagement Legs
TiNi P10 Pinpuller
Spherical Interface

107
Also attached to the active hinge bracket are four Honeywell 9HM1 micro switches to provide redundant deployment telltale signals of each clamshell half. Resistors of different values were placed in-line in the harness, as to indicate “left-open”, “right-open” and “fully-open” states. A small aluminum lever arm attached directly to the clamshell engaged the switches directly when stowed (Figure 7) and disengaged only when the clamshell reached the fully open, 15-degree state. These switches functioned perfectly upon the actual deployment in space but proved to be very difficult to set and tune on the ground. The #2 attachment screws needed to be torqued enough to prevent shifting of the switch, but not so much to crush the thin exterior case. The risk of a false telltale reading was also partially mitigated by analyzing the SC IMU data to show the shock of each at deployment.
Figure 7: A bottom isometric view of the redundant telltale switches
Materials and Coatings
The mounting brackets and clamshell halves are fabricated from aluminum, and are iridite coated and electroless nickel plated, respectively. All of the mechanism parts are 6Al-4V titanium, including the active hinge housing, the sliding cup, the hinge halves and shafts. This fact becomes an important detail in the anomaly investigation to be detailed later. The decision to uniformly fabricate all mechanism parts from titanium was made to eliminate the effects of CTE mismatch within the tightly-fitting, high-precision mechanism components, and in some cases, for strength considerations. The two halves of the titanium spherical interface screwed onto the pinpuller are unfilled PEEK, the springs are Elgiloy®, and all the fasteners are stainless steel.
All titanium mechanism components are titanium anodized with a type 2 Tiodize® process, with local application of Dicronite® (tungsten disulfide) dry film lubricant on all moving or sliding surfaces. No additional lubrication was used in the assembly, except on the fasteners.

108
Development Effort As a result of the late schedule addition of the Antenna Retention System, the clamshell mechanism was developed on a very aggressive timeline. Two engineering model (EM) versions of the clamshell mechanism were built and tested before the flight units were fabricated. The first EM provided a successful proof of concept of the mechanism, and the environmental testing scheme. The second EM implemented most of the flight-like mass reduction efforts and added the telltale switch assembly. The differences between the second EM and the flight implementation were intentionally very minor, including maintaining EM2-to-flight continuity with the fabrication shops selected for each part. Each iteration of the design was fully vibration (Figure 8) and thermal vacuum (TVAC) tested, and dozens of ambient temperature, post-vibration and hot/cold deployments (Figure 9) were executed. Additionally, ARS system-level containment tests were conducted at three points during the PSP development effort: during the SC modal test, the full SC vibration test, and a specially built SC “stiffness simulator”, as shown in Figure 10. This simulator provided a test bed to perform ARS-level tests at higher vibration levels, while eliminating the risk to the actual SC bus. In each case, surrogate FIELDS antennas were captured in EM clamshells and forks. Efficacy of the retention system was determined through high-speed video and measurements from the video of the antenna maximum excursions as observed during the modal test, and the SC stiffness simulator vibration tests. The flight clamshells were qualified separately and added to the SC after the complete SC vibration test, but before the complete SC TVAC test.
Figure 8: V1 and Spare flight clamshells on a vibration table

109
Figure 9: Flight clamshell mechanisms staged for TVAC testing.
With the exception of some erroneous telltale indications observed during the EM2 clamshell development, no anomalies occurred during mechanism-level testing. The telltale design was modified and follow up thermal and vibration testing was conducted to verify the correction. This was considered to be a reasonable step in the development process, and while additional attention was given to the telltale configuration as a result, it was not considered to be a serious anomaly. No deployment failures occurred through EM2 development, and the clamshells enjoyed a perfect record of functionality.
Figure 10: Left: EM Clamshell with preliminary fork configuration.
Right: EM Clamshells on structure “stiffness simulator”
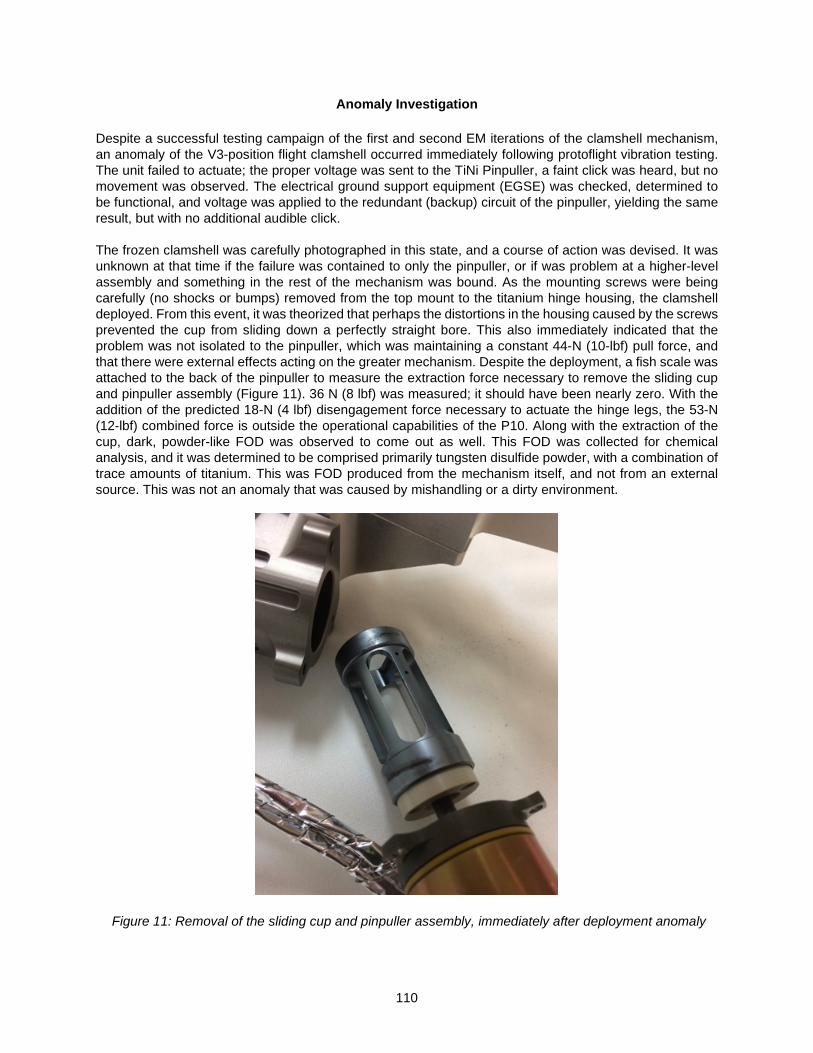
110
Anomaly Investigation Despite a successful testing campaign of the first and second EM iterations of the clamshell mechanism, an anomaly of the V3-position flight clamshell occurred immediately following protoflight vibration testing. The unit failed to actuate; the proper voltage was sent to the TiNi Pinpuller, a faint click was heard, but no movement was observed. The electrical ground support equipment (EGSE) was checked, determined to be functional, and voltage was applied to the redundant (backup) circuit of the pinpuller, yielding the same result, but with no additional audible click. The frozen clamshell was carefully photographed in this state, and a course of action was devised. It was unknown at that time if the failure was contained to only the pinpuller, or if was problem at a higher-level assembly and something in the rest of the mechanism was bound. As the mounting screws were being carefully (no shocks or bumps) removed from the top mount to the titanium hinge housing, the clamshell deployed. From this event, it was theorized that perhaps the distortions in the housing caused by the screws prevented the cup from sliding down a perfectly straight bore. This also immediately indicated that the problem was not isolated to the pinpuller, which was maintaining a constant 44-N (10-lbf) pull force, and that there were external effects acting on the greater mechanism. Despite the deployment, a fish scale was attached to the back of the pinpuller to measure the extraction force necessary to remove the sliding cup and pinpuller assembly (Figure 11). 36 N (8 lbf) was measured; it should have been nearly zero. With the addition of the predicted 18-N (4 lbf) disengagement force necessary to actuate the hinge legs, the 53-N (12-lbf) combined force is outside the operational capabilities of the P10. Along with the extraction of the cup, dark, powder-like FOD was observed to come out as well. This FOD was collected for chemical analysis, and it was determined to be comprised primarily tungsten disulfide powder, with a combination of trace amounts of titanium. This was FOD produced from the mechanism itself, and not from an external source. This was not an anomaly that was caused by mishandling or a dirty environment.
Figure 11: Removal of the sliding cup and pinpuller assembly, immediately after deployment anomaly
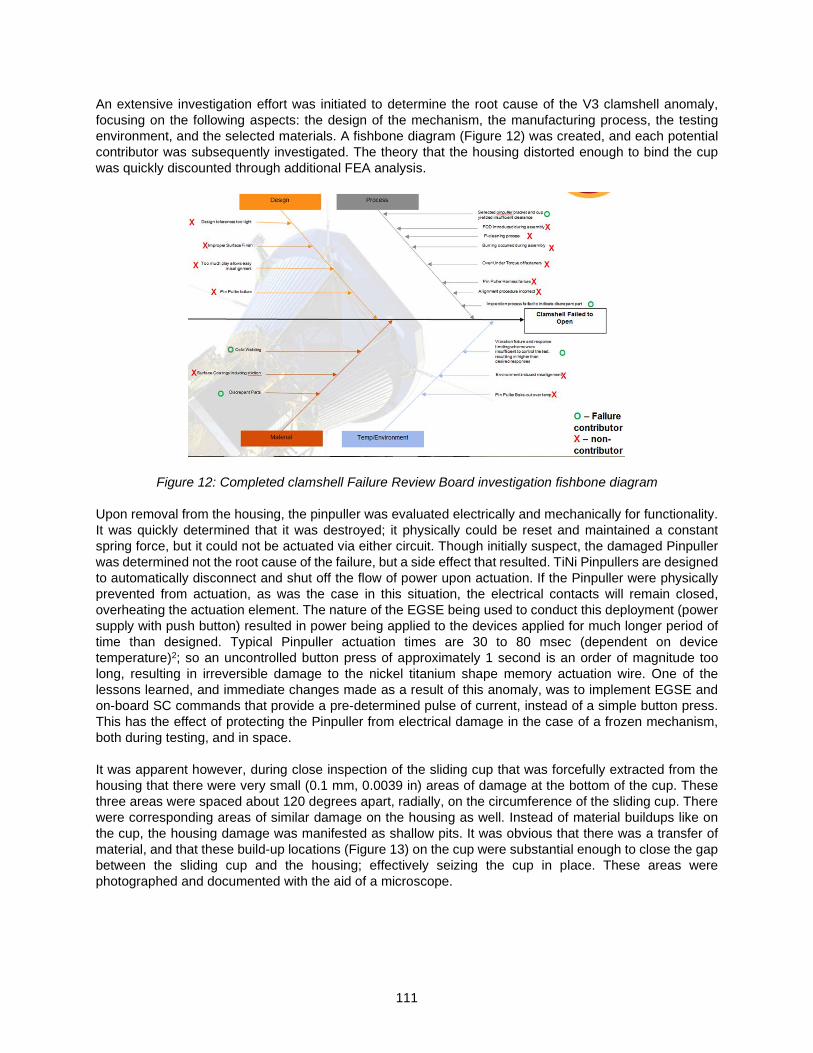
111
An extensive investigation effort was initiated to determine the root cause of the V3 clamshell anomaly, focusing on the following aspects: the design of the mechanism, the manufacturing process, the testing environment, and the selected materials. A fishbone diagram (Figure 12) was created, and each potential contributor was subsequently investigated. The theory that the housing distorted enough to bind the cup was quickly discounted through additional FEA analysis.
Figure 12: Completed clamshell Failure Review Board investigation fishbone diagram Upon removal from the housing, the pinpuller was evaluated electrically and mechanically for functionality. It was quickly determined that it was destroyed; it physically could be reset and maintained a constant spring force, but it could not be actuated via either circuit. Though initially suspect, the damaged Pinpuller was determined not the root cause of the failure, but a side effect that resulted. TiNi Pinpullers are designed to automatically disconnect and shut off the flow of power upon actuation. If the Pinpuller were physically prevented from actuation, as was the case in this situation, the electrical contacts will remain closed, overheating the actuation element. The nature of the EGSE being used to conduct this deployment (power supply with push button) resulted in power being applied to the devices applied for much longer period of time than designed. Typical Pinpuller actuation times are 30 to 80 msec (dependent on device temperature)2; so an uncontrolled button press of approximately 1 second is an order of magnitude too long, resulting in irreversible damage to the nickel titanium shape memory actuation wire. One of the lessons learned, and immediate changes made as a result of this anomaly, was to implement EGSE and on-board SC commands that provide a pre-determined pulse of current, instead of a simple button press. This has the effect of protecting the Pinpuller from electrical damage in the case of a frozen mechanism, both during testing, and in space. It was apparent however, during close inspection of the sliding cup that was forcefully extracted from the housing that there were very small (0.1 mm, 0.0039 in) areas of damage at the bottom of the cup. These three areas were spaced about 120 degrees apart, radially, on the circumference of the sliding cup. There were corresponding areas of similar damage on the housing as well. Instead of material buildups like on the cup, the housing damage was manifested as shallow pits. It was obvious that there was a transfer of material, and that these build-up locations (Figure 13) on the cup were substantial enough to close the gap between the sliding cup and the housing; effectively seizing the cup in place. These areas were photographed and documented with the aid of a microscope.

112
Figure 13: Locations and micrograph of damaged area on the circumference of the sliding cup
Dimensional Analysis A detailed investigation of the dimensional clearance between the cup and the housing began, to determine what the realized clearances between the two parts were, and if they were designed to be too tight. All previous clamshell mechanisms (EM1, EM2, and Flight) were disassembled and each housing and cup part measured. Up to this point, each iteration of both the housing ID and the sliding cup OD were only spot checked; only one measurement of each were taken of one part in the lot. In addition to the full post-inspection, it was determined that the profile, or effective shape of the parts should be measured and ascertained as well. This was accomplished by taking multiple diameter measurements of each part, in the critical areas of part interaction. As depicted in Figure 15 these diameter measurements were made in 1.27mm (0.050 in) step increments along the length of each part.
Figure 14: Snippets of original flight drawings of critical diameter dimensions and tolerances

113
Figure 15: Detailed measurements and shape of all sliding cups fabricated up to the time of the anomaly
This inspection process was illuminating, as it became immediately clear that the specific sliding cup that seized was out of family from all of the other sliding cup parts that were fabricated during the entire mechanism development effort. In addition to the effects of a larger outside diameter sliding cup, which effectively reduced the diametrical gap between the parts to half (.022 mm, .0009 in), (Figure 16) from the average nominal (.045 mm, .0018 in), but the back half of the sliding cup was tapered over .0254 mm, (.001 in) diametrically over the distance of approximately 8 mm (.32 in). The spots where the damage occurred corresponded exactly where the diameter was the largest. The resulting tapered-shape adds credence to the theory that the affected sliding cup was contacting with the housing on a line profile only, as opposed to the distributed as-designed surface contact of a correctly fabricated cylinder. A line contact would effectively magnify the contact stresses to the reduced areas of contact during the vibration testing that was performed immediately prior.
.
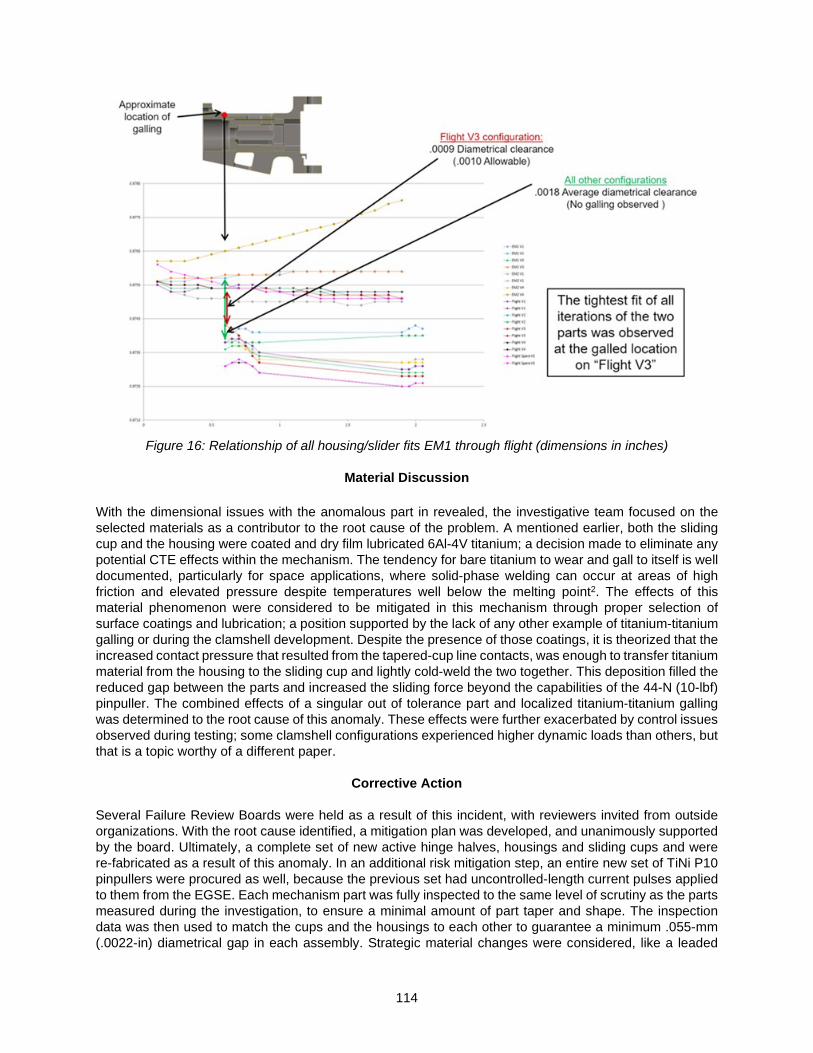
114
Figure 16: Relationship of all housing/slider fits EM1 through flight (dimensions in inches)
Material Discussion
With the dimensional issues with the anomalous part in revealed, the investigative team focused on the selected materials as a contributor to the root cause of the problem. A mentioned earlier, both the sliding cup and the housing were coated and dry film lubricated 6Al-4V titanium; a decision made to eliminate any potential CTE effects within the mechanism. The tendency for bare titanium to wear and gall to itself is well documented, particularly for space applications, where solid-phase welding can occur at areas of high friction and elevated pressure despite temperatures well below the melting point2. The effects of this material phenomenon were considered to be mitigated in this mechanism through proper selection of surface coatings and lubrication; a position supported by the lack of any other example of titanium-titanium galling or during the clamshell development. Despite the presence of those coatings, it is theorized that the increased contact pressure that resulted from the tapered-cup line contacts, was enough to transfer titanium material from the housing to the sliding cup and lightly cold-weld the two together. This deposition filled the reduced gap between the parts and increased the sliding force beyond the capabilities of the 44-N (10-lbf) pinpuller. The combined effects of a singular out of tolerance part and localized titanium-titanium galling was determined to the root cause of this anomaly. These effects were further exacerbated by control issues observed during testing; some clamshell configurations experienced higher dynamic loads than others, but that is a topic worthy of a different paper.
Corrective Action
Several Failure Review Boards were held as a result of this incident, with reviewers invited from outside organizations. With the root cause identified, a mitigation plan was developed, and unanimously supported by the board. Ultimately, a complete set of new active hinge halves, housings and sliding cups and were re-fabricated as a result of this anomaly. In an additional risk mitigation step, an entire new set of TiNi P10 pinpullers were procured as well, because the previous set had uncontrolled-length current pulses applied to them from the EGSE. Each mechanism part was fully inspected to the same level of scrutiny as the parts measured during the investigation, to ensure a minimal amount of part taper and shape. The inspection data was then used to match the cups and the housings to each other to guarantee a minimum .055-mm (.0022-in) diametrical gap in each assembly. Strategic material changes were considered, like a leaded

115
bronze sleeve between the cup and the housing, but the review board deemed such a drastic change to be too risky. There was no available volume for the additional thickness of a sleeve. Despite being considered a risk, the original coated and lubricated titanium parts remained in the design. The clamshells were already slated to be integrated late in the SC I&T schedule, so the delays associated with this investigation and corrective action necessitated a considerable amount of re-planning and schedule modification. Though EM2 clamshells were present in two locations on the flight structure during SC vibration testing, the new flight units had to be qualified individually, separate from the SC. The final integration of the clamshells occurred in early 2018, weeks before the full SC TVAC test. This was a hard deadline; four deployed clamshells had to be present on the SC to gather relevant thermal balance data. Final alignments of the complete ARS system were performed months later, in May 2018.
Conclusion and Lessons Learned There is an adage that states generally, “All testing failures are good failures”, and this anomaly is a perfect example of the truth in that statement. Though severity of this issue can be debated, the marginal nature of the failure (the pinpuller almost had enough force to overcome the cold-welds) presents a potential scenario that had this failure not occurred when it did, it could have resulted in a much larger problem later in the mission. Had the V3 clamshell deployed as expected, the damage may not have been detected until it was too late. That damage could have further compounded during SC vibration tests and launch, resulting in a worst-case scenario where the mechanism didn’t deploy when it needed to in space. In addition to a partial loss of Level-1 mission requirements on a flagship NASA mission, the failure investigation would have been impossible to complete with certainty. A lack of comprehensive inspection data, and the parts impossible to recover, only postulations could be made about a true final root cause. Ultimately, this anomaly and subsequent investigation resulted in a more robust, and reliable mechanism that enabled mission requirements to be met. Primary Lessons Learned:
• Avoid dynamic titanium on titanium interfaces, and do not rely on surface coatings and lubrication to fully mitigate galling and cold welding effects.
• Fully inspect all size and form critical mechanism components.
• Anomalies can beget additional anomalies, which can become red herrings and distractions in an
investigation. This was the case with the EGSE-damaged pinpuller.
• Take steps, however conservative, with GSE to protect the hardware. Both MGSE and EGSE used during this development exacerbated the anomalous conditions.
Acknowledgements
The fantastically supportive and professional Parker Solar Probe development team at the Johns Hopkins University Applied Physics Lab.
References 1. Parker Solar Probe, parkersolarprobe.jhuapl.edu/index.php#the-mission. 2. “Pinpuller.” TiNi Aerospace, Inc., 27 Oct. 2017, tiniaerospace.com/products/space-pinpuller/. 3. P. D. Miller and J. W. Holladay. " Friction and Wear Properties of Titanium." Wear, vol. 2, 1958-1959,
pp. 133.

116

117
Mars 2020 Rover Adaptive Caching Assembly: Caching Martian Samples for Potential Earth Return
Milo Silverman* and Justin Lin*
Abstract The Adaptive Caching Assembly (ACA) is part of the Sampling and Caching System on the Mars 2020 Perseverance Rover and consists of multiple stations that process, hermetically seal, and store sample tubes containing collected Martian material, either rock cores or regolith samples, in preparation for caching on the surface of Mars. The ACA stations consist of seven active degrees-of-freedom, as well as a large number of passive mechanisms that must operate in extreme Mars temperature and pressure conditions. A robotic arm within the Rover manipulates the sample tubes between ACA stations as part of an end-to-end sampling sequence and utilizes a compliant end effector to accommodate misalignments during station interactions. Stringent hardware cleanliness requirements were dictated to ensure collected samples would not be compromised, which significantly impacted the design, assembly, and test operations of the ACA. Three ACAs were assembled to support ground testing and flight operations, which were exposed to environmental testing to validate functionality in Mars-like conditions. A number of challenges existed from design through test, including volume constraints, mechanism controllability and operation, the effects of tight tolerances, and cleanliness requirements.
Introduction The Adaptive Caching Assembly is part of the Sampling and Caching System (SCS) on the Perseverance Rover (Figure 1), which successfully launched on July 30, 2020, and will land on Mars in February 2021. The Rover’s primary mission has a duration of one-and-a-half Martian years, or approximately three Earth years. The Mars 2020 Perseverance Rover design is heavily based on the Mars Science Laboratory (MSL) Curiosity Rover, which has been operating on the surface of Mars since August 2012; however, Perseverance is outfitted with a new sampling system and scientific instrument suite to address the new mission goals. The Perseverance Rover has four main science objectives: looking for habitability, seeking biosignatures, caching samples, and preparing for humans [1]. Seven science instruments are located on the Rover to address many of these objectives via remote and in-situ observations and operations.
Sampling and Caching System The Sampling and Caching System’s purpose is to create the cache of scientifically selected and documented Martian materials by collecting rock cores and regolith samples, packaging these materials into hermetically sealed sample tubes, and depositing them on the Martian surface for potential return to Earth. These packaged samples must meet stringent science-driven contamination control requirements which drive the physical architecture and hardware implementation: less than 10 ppb organic carbon, less than 1 terrestrial viable organism per sample, and limits on inorganic contamination on elements that impact returned sample science. SCS must also perform rock abrasion and dust removal operations to prepare surfaces for scientific instrument assessment, and then position the instruments for the assessment. SCS consists of two robotic systems which work in conjunction with each other to perform the mission functions: one MSL-like robotic system on the outside of the Rover consisting of a Robotic Arm and Turret, and one new autonomous robotic system on the inside of the Rover called the Adaptive Caching Assembly.
* Jet Propulsion Laboratory, California Institute of Technology, Pasadena, CA
Proceedings of the 45th Aerospace Mechanisms Symposium, NASA Johnson Space Center, 2020
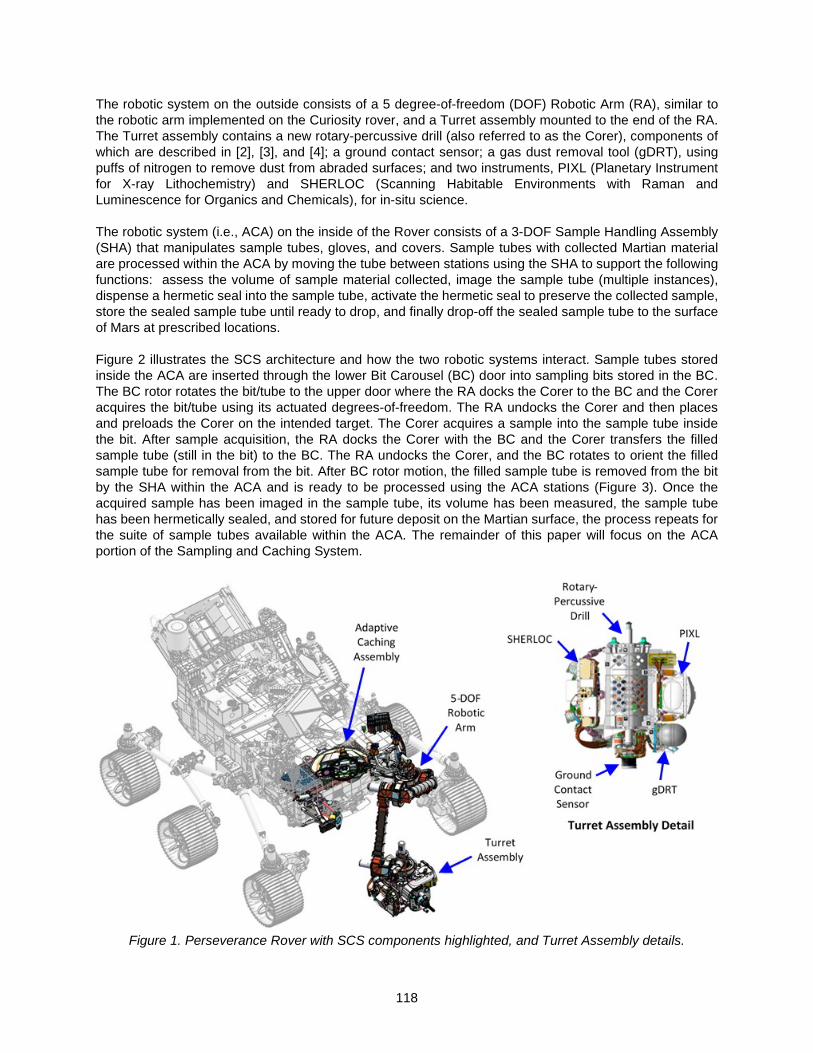
118
The robotic system on the outside consists of a 5 degree-of-freedom (DOF) Robotic Arm (RA), similar to the robotic arm implemented on the Curiosity rover, and a Turret assembly mounted to the end of the RA. The Turret assembly contains a new rotary-percussive drill (also referred to as the Corer), components of which are described in [2], [3], and [4]; a ground contact sensor; a gas dust removal tool (gDRT), using puffs of nitrogen to remove dust from abraded surfaces; and two instruments, PIXL (Planetary Instrument for X-ray Lithochemistry) and SHERLOC (Scanning Habitable Environments with Raman and Luminescence for Organics and Chemicals), for in-situ science. The robotic system (i.e., ACA) on the inside of the Rover consists of a 3-DOF Sample Handling Assembly (SHA) that manipulates sample tubes, gloves, and covers. Sample tubes with collected Martian material are processed within the ACA by moving the tube between stations using the SHA to support the following functions: assess the volume of sample material collected, image the sample tube (multiple instances), dispense a hermetic seal into the sample tube, activate the hermetic seal to preserve the collected sample, store the sealed sample tube until ready to drop, and finally drop-off the sealed sample tube to the surface of Mars at prescribed locations. Figure 2 illustrates the SCS architecture and how the two robotic systems interact. Sample tubes stored inside the ACA are inserted through the lower Bit Carousel (BC) door into sampling bits stored in the BC. The BC rotor rotates the bit/tube to the upper door where the RA docks the Corer to the BC and the Corer acquires the bit/tube using its actuated degrees-of-freedom. The RA undocks the Corer and then places and preloads the Corer on the intended target. The Corer acquires a sample into the sample tube inside the bit. After sample acquisition, the RA docks the Corer with the BC and the Corer transfers the filled sample tube (still in the bit) to the BC. The RA undocks the Corer, and the BC rotates to orient the filled sample tube for removal from the bit. After BC rotor motion, the filled sample tube is removed from the bit by the SHA within the ACA and is ready to be processed using the ACA stations (Figure 3). Once the acquired sample has been imaged in the sample tube, its volume has been measured, the sample tube has been hermetically sealed, and stored for future deposit on the Martian surface, the process repeats for the suite of sample tubes available within the ACA. The remainder of this paper will focus on the ACA portion of the Sampling and Caching System.
Figure 1. Perseverance Rover with SCS components highlighted, and Turret Assembly details.

119
Figure 2. Sampling System Architecture.
Adaptive Caching Assembly Description and Operations
The ACA consists of stations/components as identified in Figure 3 (CAD images), and Figures 4 and 5 (as-built images):
Figure 3. ACA CAD images with stations identified, rotated to a bottom up view for visibility. Left image: SHA stowed for launch, and bit carousel doors closed.
Right image: SHA extended for sample tube operations, and bit carousel doors open.

120
Figure 4. As-built ACA – Bottom Up View.
Figure 5. As-built ACA – Front View (mounted on test fixture).
The Caching Component Mounting Deck (CCMD) is a monolithic titanium structure to which all ACA stations interface, and interfaces to the Rover via three bipod assemblies. All ACA stations are made from titanium to minimize thermally induced position errors for robotic operations using the SHA. While the ACA is designed to fit within the Rover for launch through landing, surface operations on Mars require the SHA to extend approximately 200 mm below the Rover’s bellypan. Therefore, an ejectable bellypan was implemented directly below the ACA volume, which is released after landing to provide the SHA with an unobstructed volume to extend into during operations. Surface features are assessed via Rover imaging prior to SHA motion to prevent contact with potential obstacles below the Rover.

121
The ACA consists of 7 active degrees of freedom via gear motor assemblies (planetary gearboxes mated to brushless motors with magnetic detent brakes) described in [5]. The gear motors support actuation of the Bit Carousel, SHA, End Effector (EE), and Sealing Station. A significant number of passive ball lock mechanisms are implemented throughout the ACA to support locking and unlocking of hardware from various stations/components via SHA interaction. Hardware using ball lock mechanisms/features include the bits, sample tubes, gloves, covers, EE tube gripper, and the seal dispenser. A set of ball lock mechanism design guidelines were developed across the ACA to ensure consistency for each use case and included details such as recommended geometry and clearances for mechanism features. These guidelines also accounted for dust inclusion in the mechanisms, which is a real concern for proper functionality. ACA Operations A high-level end-to-end flow of the sample collection, processing, storage, and tube drop-off for a single collected sample, focused on ACA operations, is shown in Figure 6. Every step, with the exception of the three Sample Collection steps involving the Corer, requires a robotic interaction between the SHA and an ACA station utilizing appropriate force and position limits to safeguard the hardware. The entire operation from Sample Collection through Sample Storage executes autonomously in a few hours. If a fault were to occur during the sequence, the ACA is capable of recovering autonomously in some cases; otherwise, operations will stop and the Rover will “phone home” for assistance before proceeding. All Sample Processing steps identified as imaging or assessment based are for documentation purposes only (to support sample return selection), and are not decisional for proceeding through the full sequence, meaning operations will not stop based on the results of those activities unless a non-recoverable fault were to occur.
Figure 6. End-to-end sequence for caching each sample tube on Mars Instead of dropping off each sample tube once it’s processed, the current expected strategy is to place the processed sample tube into storage until enough samples are collected in a particular region of interest, at which point a group of samples will be dropped off at a designated location for caching. The location of drop-off will be meticulously documented to support potential future retrieval and return to Earth, since the sample tubes could become covered with dust and not easily visible. More than one drop-off location for groups of sample tubes may be designated during the mission based on the number of regions of interest visited for sampling activities.
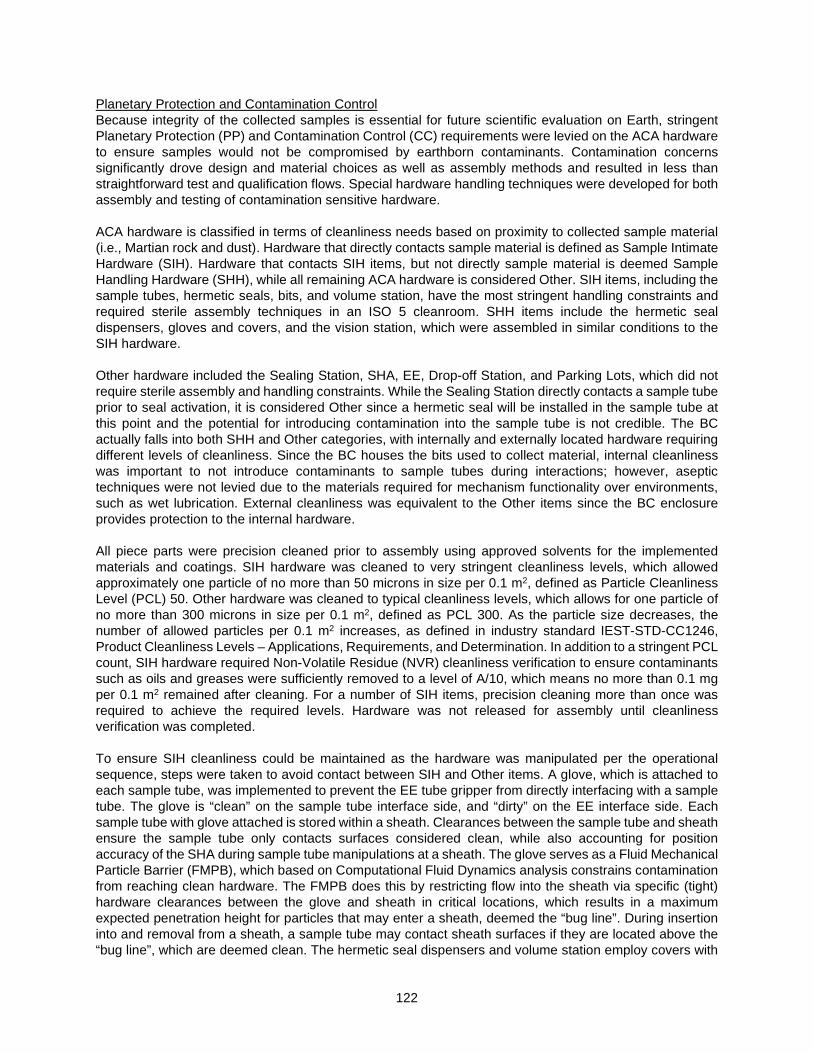
122
Planetary Protection and Contamination Control Because integrity of the collected samples is essential for future scientific evaluation on Earth, stringent Planetary Protection (PP) and Contamination Control (CC) requirements were levied on the ACA hardware to ensure samples would not be compromised by earthborn contaminants. Contamination concerns significantly drove design and material choices as well as assembly methods and resulted in less than straightforward test and qualification flows. Special hardware handling techniques were developed for both assembly and testing of contamination sensitive hardware. ACA hardware is classified in terms of cleanliness needs based on proximity to collected sample material (i.e., Martian rock and dust). Hardware that directly contacts sample material is defined as Sample Intimate Hardware (SIH). Hardware that contacts SIH items, but not directly sample material is deemed Sample Handling Hardware (SHH), while all remaining ACA hardware is considered Other. SIH items, including the sample tubes, hermetic seals, bits, and volume station, have the most stringent handling constraints and required sterile assembly techniques in an ISO 5 cleanroom. SHH items include the hermetic seal dispensers, gloves and covers, and the vision station, which were assembled in similar conditions to the SIH hardware. Other hardware included the Sealing Station, SHA, EE, Drop-off Station, and Parking Lots, which did not require sterile assembly and handling constraints. While the Sealing Station directly contacts a sample tube prior to seal activation, it is considered Other since a hermetic seal will be installed in the sample tube at this point and the potential for introducing contamination into the sample tube is not credible. The BC actually falls into both SHH and Other categories, with internally and externally located hardware requiring different levels of cleanliness. Since the BC houses the bits used to collect material, internal cleanliness was important to not introduce contaminants to sample tubes during interactions; however, aseptic techniques were not levied due to the materials required for mechanism functionality over environments, such as wet lubrication. External cleanliness was equivalent to the Other items since the BC enclosure provides protection to the internal hardware. All piece parts were precision cleaned prior to assembly using approved solvents for the implemented materials and coatings. SIH hardware was cleaned to very stringent cleanliness levels, which allowed approximately one particle of no more than 50 microns in size per 0.1 m2, defined as Particle Cleanliness Level (PCL) 50. Other hardware was cleaned to typical cleanliness levels, which allows for one particle of no more than 300 microns in size per 0.1 m2, defined as PCL 300. As the particle size decreases, the number of allowed particles per 0.1 m2 increases, as defined in industry standard IEST-STD-CC1246, Product Cleanliness Levels – Applications, Requirements, and Determination. In addition to a stringent PCL count, SIH hardware required Non-Volatile Residue (NVR) cleanliness verification to ensure contaminants such as oils and greases were sufficiently removed to a level of A/10, which means no more than 0.1 mg per 0.1 m2 remained after cleaning. For a number of SIH items, precision cleaning more than once was required to achieve the required levels. Hardware was not released for assembly until cleanliness verification was completed. To ensure SIH cleanliness could be maintained as the hardware was manipulated per the operational sequence, steps were taken to avoid contact between SIH and Other items. A glove, which is attached to each sample tube, was implemented to prevent the EE tube gripper from directly interfacing with a sample tube. The glove is “clean” on the sample tube interface side, and “dirty” on the EE interface side. Each sample tube with glove attached is stored within a sheath. Clearances between the sample tube and sheath ensure the sample tube only contacts surfaces considered clean, while also accounting for position accuracy of the SHA during sample tube manipulations at a sheath. The glove serves as a Fluid Mechanical Particle Barrier (FMPB), which based on Computational Fluid Dynamics analysis constrains contamination from reaching clean hardware. The FMPB does this by restricting flow into the sheath via specific (tight) hardware clearances between the glove and sheath in critical locations, which results in a maximum expected penetration height for particles that may enter a sheath, deemed the “bug line”. During insertion into and removal from a sheath, a sample tube may contact sheath surfaces if they are located above the “bug line”, which are deemed clean. The hermetic seal dispensers and volume station employ covers with

123
a similar FMPB feature to maintain hardware cleanliness requirements for hermetic seals and the volume probe prior to and between usage on Mars. In the dispensers and volume station, the sample tube may only contact surfaces considered clean similar to within a sheath. Refer to Figures 19, 20, and 21 for depictions of a glove and covers in their respective installed cases. In addition to precision cleaning and FMPB hardware features to achieve and maintain SIH hardware cleanliness, a high temperature bake-out at 350°C in air for a minimum of 1 hour was prescribed. This bake-out initiates combustion cleaning for the elimination of viable organisms and the reduction of organic carbon on hardware surfaces and occurs as the last process prior to hardware delivery to the Kennedy Space Center for installation into the Rover. As a result, the SIH and associated SHH items must participate in the bake-out together as an assembly, which includes the STSA and the DVT assemblies. Material selection was critical for all STSA and DVT hardware to ensure compatibility with the high temperature bake-out. Spring materials such as Elgiloy were implemented versus typical stainless steel options. High temperature compatible materials were implemented such as Ti-6Al-4V and A286, as well as dry film lubrications such as molybdenum disulfide (MoS2) and tungsten disulfide (WS2). Non-metallics were not permitted due to the temperature requirement. All other ACA hardware was exposed to both a station-level and a full ACA-level bake-out at 110°C for durations up to 141 hours. These bake-outs were a Dry-Heat Microbial Reduction for PP purposes, as well as to meet surface cleanliness and outgassing requirements for CC. Thermoelectrically Controlled Quartz Crystal Microbalance was implemented to verify outgassing rates were met during bake-outs in thermal vacuum environments. Overall, the PP and CC constraints introduced a number of challenges that resulted in novel hardware solutions, as well as hardware processing changes along the way due to lessons learned discussed later in this paper.
ACA Station Descriptions Bit Carousel The Bit Carousel (BC) is mounted to the CCMD on the ACA and extends through a cut-out in the Rover top deck and front panel to accommodate both tube and bit exchange operations. A non-permeable fabric close-out covers the gap between the BC and Rover structures to prevent contamination from entering the ACA volume within the Rover from above. The docking assembly is the critical interface between the ACA and Turret for bit exchange operations with the Corer and is mounted to the front of the BC (Figure 7). During bit exchange, four docking posts on the Corer structure engage the docking cones on the docking assembly as the RA brings the Turret closer to the BC. Due to the kinematics of the 5-DOF RA, continued advancement of the Corer results in a rotation of the Corer on the end of the RA, meaning the docking posts are now rotating with respect to the docking assembly. The docking assembly therefore rides on a passive bearing mechanism that compensates for this Corer rotation. The bearing mechanism consists of a dry film lubricated four-point contact (X-type) bearing from Kaydon, implemented due to packaging limitations. Docking is considered complete once contact switch mechanisms located at the bottom of each docking cone are fully activated and the desired preload force is achieved. A minimum of 3 out of 4 switch activations are required to proceed. Because of the induced rotation during docking, a single speed variable reluctance resolver from Ducommun, Inc. is implemented on the docking assembly to measure the resulting amount of rotation, which is used to adjust for Corer-to-bit orientation during bit exchange. When the Turret undocks from the BC, a return spring mechanism brings the docking assembly back to its original position to support the next docking operation. The return spring mechanism consists of a cam roller design, with a detent in the cam to center the mechanism, and the roller located at the end of a flexure to enforce re-centering.

124
Figure 7. BC Docking Assembly.
Internal to the BC is a rotor mechanism assembly which actuates the carousel’s rotor structure to a desired position for either tube or bit exchange operations (Figure 8). The rotor structure is the primary interface within the BC for the bit holders with bits installed, as well as a sample tube sheath with a sample tube and glove installed. The rotor mechanism assembly consists of an electronically commutated gear motor, harmonic drive, and dual speed resolver from Ducommun Inc., with a back-to-back set of angular contact bearings spaced apart to carry both launch and operational loads. Wet lubrication is used within the rotor mechanism components, which requires heating for proper functionality at cold temperatures on Mars. A spring energized Teflon seal is used to prevent debris from entering the mechanism within the rotor assembly. Additionally, spring energized Teflon seals are used to prevent wet lubrication from migrating into the carousel, which would be a contamination concern for the bits. The rotor mechanism does not contain a hard stop and is free to rotate clockwise (CW) or counterclockwise (CCW) indefinitely as commanded. The gear motor contains no brake, and only relies on a magnetic detent for holding position. Inside the BC resides a suite of nine bits to support coring (6x), regolith collection (1x), and abrading (2x) operations. These bits are “locked” within bit holders when not in use to survive not only launch vibration and Rover traverse loading, but both bit exchange with the Corer and tube exchange with the SHA. The bit holders contain both axial and radial cam rollers to align a bit within a holder and minimize tipping which could be detrimental for tube-to-bit insertion. In addition, an axial spring mechanism provides compliance to accommodate misalignments during bit insertion and removal activities from a bit holder via the drill. The BC assembly contains an upper and lower opening in its structure. The lower entry point allows for sample tubes to be inserted into bits for sample acquisition, as well as removal from a bit once a sample has been collected (Figure 8). The upper entry point supports bit exchange operations with the Corer assembly. Both of these openings utilize a one-time deployment door to maintain cleanliness of the hardware within the BC until release on the surface of Mars. Both doors consist of a passive spring-actuated hinge mechanism held closed by a latch that is deployed via a release mechanism. The release mechanism is a series of passive spring-actuated mechanisms initiated by a separation nut non-explosive actuator (NEA) device from Ensign-Bickford Aerospace & Defense Company.

125
Figure 8. Tube Exchange Configuration in the BC (coring bit in tube exchange position at lower door opening, locked in a bit holder).
When the doors are closed, a HEPA filter allows for venting during launch depressurization, and to minimize contamination from entering the BC prior to door actuation on the surface of Mars. Once the doors are deployed on Mars, crushable honeycomb absorbs the shock and determines the final resting position of the doors during surface operations on Mars. This position has been factored into the overall assembly to ensure inadvertent contact does not occur with surrounding hardware, and sufficient clearance exists for interfacing hardware, such as the Turret/Corer during docking. Sample Handling Assembly The SHA is a 3-DOF robotic arm approximately 0.5-meter long with a compliant, single DOF End Effector (EE) mounted at the end of the arm (Figure 9). The SHA is responsible for all sample tube, glove, and cover manipulations between ACA stations. In order to reach the required operational work space in the ACA, the SHA uses a prismatic joint, identified as the Z-stage, which is actuated by an electronically-commutated gear motor assembly; and two revolute joints, identified as the shoulder and elbow joints, which are actuated by electronically-commutated gear motors with harmonic drives and dual speed absolute position resolvers. The Z-stage is responsible for the linear motion of the SHA, and is designed to allow the EE, or any component (i.e., sample tube, glove, cover) on the EE, to interact with the ACA stations utilizing a minimum preload capability of 350 N. This applies only during station interactions when the SHA is retracted and not fully extended. A minimum clearance of 4 mm between the top of a hermetically sealed sample tube attached to the EE and the lowest feature of each ACA station is accommodated when the SHA is fully extended such that the sample tube can be manipulated safely in free space within the ACA volume. The Z-stage consists of an outer housing that directly interfaces to the CCMD, and an internal translation tube called the slide adapter that mounts to the shoulder (Figure 10). A welded metal bellows between the outer housing and the shoulder closes out the Z-stage and protects the internal components from Martian dust. The slide adapter translates against the outer housing using two sets of eight track roller bearings: one set is attached to the end of the outer housing and preloaded against the external surfaces of the slide adapter and the other set is attached to the slide adapter and preloaded against the internal surfaces of the outer housing. These track roller bearings are set sufficiently apart to carry the cross-axis moment and side loads, and with the slide adapter and the bore of the outer housing having square cross-sections, the
Rotor Mechanism

126
preloaded track roller bearings support torsion loads and minimize rotations between the slide adapter and outer housing. A lead screw mechanism drives the slide adapter with the lead screw and actuator assembly mounted to the outer housing and the nut mounted to the slide adapter. Both the leadscrew and nut are mounted with gimbals to isolate the lead screw from any bending and radial loads. To limit the travel of the Z-stage, hard stop tabs are mounted directly to the free end of the lead screw and directly contact tabs on the nut gimbal when fully extended and tabs in the shoulder when fully retracted. The shoulder and elbow joints provide precise lateral positioning and placement of the EE at all stations with sufficient torque capability during station interactions, as well as holding torque during Rover traverse stow. Both joints are identical in design and utilize the structural member of the arm as housings for the joints. The gearmotor directly attaches to the gearmotor housing with the output connected to the wave generator of the harmonic drive through an Oldham coupling. Downstream of the harmonic drive is the output shaft that is supported by a back-to-back duplex bearing pair separated by a spacer for increased stiffness and reduction in wobble. To further reduce misalignments, the output shaft is pinned and match drilled to the flexspline of the harmonic drive. Embedded in the output shaft is the dual speed resolver from Ducommun Inc. to provide precise position feedback and knowledge of the joint. When stowed for launch, the SHA is restrained by two NEA separation nut mechanisms, similar to the devices used for the BC door releases. One NEA is used to launch-restrain the Z-stage assembly, while the other is used to launch-restrain the SHA forearm, located at the end of the arm before the EE interface.
Figure 9. SHA Overview (EE not installed).
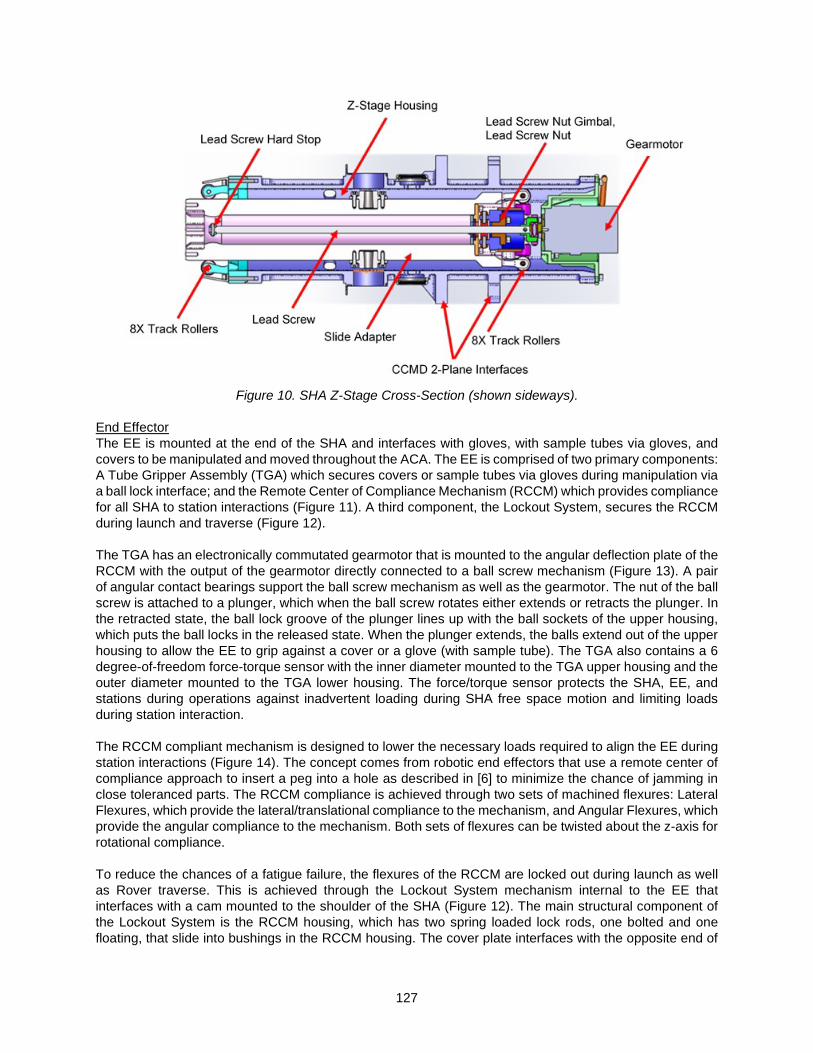
127
Figure 10. SHA Z-Stage Cross-Section (shown sideways).
End Effector The EE is mounted at the end of the SHA and interfaces with gloves, with sample tubes via gloves, and covers to be manipulated and moved throughout the ACA. The EE is comprised of two primary components: A Tube Gripper Assembly (TGA) which secures covers or sample tubes via gloves during manipulation via a ball lock interface; and the Remote Center of Compliance Mechanism (RCCM) which provides compliance for all SHA to station interactions (Figure 11). A third component, the Lockout System, secures the RCCM during launch and traverse (Figure 12). The TGA has an electronically commutated gearmotor that is mounted to the angular deflection plate of the RCCM with the output of the gearmotor directly connected to a ball screw mechanism (Figure 13). A pair of angular contact bearings support the ball screw mechanism as well as the gearmotor. The nut of the ball screw is attached to a plunger, which when the ball screw rotates either extends or retracts the plunger. In the retracted state, the ball lock groove of the plunger lines up with the ball sockets of the upper housing, which puts the ball locks in the released state. When the plunger extends, the balls extend out of the upper housing to allow the EE to grip against a cover or a glove (with sample tube). The TGA also contains a 6 degree-of-freedom force-torque sensor with the inner diameter mounted to the TGA upper housing and the outer diameter mounted to the TGA lower housing. The force/torque sensor protects the SHA, EE, and stations during operations against inadvertent loading during SHA free space motion and limiting loads during station interaction. The RCCM compliant mechanism is designed to lower the necessary loads required to align the EE during station interactions (Figure 14). The concept comes from robotic end effectors that use a remote center of compliance approach to insert a peg into a hole as described in [6] to minimize the chance of jamming in close toleranced parts. The RCCM compliance is achieved through two sets of machined flexures: Lateral Flexures, which provide the lateral/translational compliance to the mechanism, and Angular Flexures, which provide the angular compliance to the mechanism. Both sets of flexures can be twisted about the z-axis for rotational compliance. To reduce the chances of a fatigue failure, the flexures of the RCCM are locked out during launch as well as Rover traverse. This is achieved through the Lockout System mechanism internal to the EE that interfaces with a cam mounted to the shoulder of the SHA (Figure 12). The main structural component of the Lockout System is the RCCM housing, which has two spring loaded lock rods, one bolted and one floating, that slide into bushings in the RCCM housing. The cover plate interfaces with the opposite end of

128
the lock rod. Affixed to a clevis directly adjacent to the lock rod and cover plate interface is a roller supported by a shoulder bolt and locking nut. This roller rides on a clearance-fit bushing and is supported on both faces by thrust washers. When the roller engages the cam during stow operations, the cover plate compresses towards the RCCM housing and restrains the RCCM by a series of pins and holes present at both the lateral and angular stages. These interfaces restrain motion of the RCCM via a load path back to the primary structure, the RCCM housing.
Sealing Station The Sealing Station supports two functions within the ACA: to activate a hermetic seal within a sample tube, and to drop-off a sample tube from the Rover for retrieval by a potential future sample return mission. To accomplish these functions, the Sealing Station consists of two mechanism assemblies, a ram mechanism to conduct seal activation, and a gripper mechanism to support the sample tube during seal activation as well as perform sample tube drop-off, as described in [7]. The ram mechanism is capable of generating more than 20 kN with a stroke of approximately 16 mm (Figure 15). To achieve this, a gear motor drives a gear train that connects to a planetary roller screw from SKF, Inc. that provides the linear
Tube Gripper
Assembly
EE Harness
Tube Gripper Plunger Force-Torque
Sensor
Remote Center of
Compliance Mechanism
(RCCM) – within
housing
End Effector Structure and Interface to SHA
RCCM Cover Plate & Lockout Rods (shown locked out)
Compression Spring
Bolted Lockout Rod
Cover Plate Cam
Roller
Floating Lockout
Rod
Lower Housing
Plunger
Upper Housing
Force-Torque Sensor
Gearmotor
Lead Nut
Angular Contact Bearing
Pair
Angular Deflection Plate
RCCM Housing Angular Flexure Lateral Flexure
Lateral Deflection Plate
Lower Cover
Figure 11. End Effector Assembly. Figure 12. End Effector Lock-out System.
Figure 13. Tube Gripper Assembly Cross-Section.
Figure 14. RCCM Cross-Section.

129
motion necessary to mechanically activate a hermetic seal within a sample tube, within a small package. The gripper mechanism is actuated via a gear motor connected through a gear train to the gripper, which opens and closes to “grip” or release a sample tube within the station. A kicker is attached to the gripper mechanism, which rotates with the actuated gripper, to enforce a sample tube to release from the station during the drop-off sequence. Figure 16 shows a cross-section of the Sealing Station with the ram in contact with a hermetic seal at the start of the seal activation sequence within a sample tube, and the kicker in a retracted position. The ram will travel approximately 3.5 mm from this position until the ram hard stops on the gripper at which point the hermetic seal has been fully activated within the sample tube. Full activation occurs when the hermetic seal knife-edge feature has fully expanded into the sample tube wall, thereby creating a seal.
Figure 15. Sealing Station Ram and Gripper
Figure 16. Cross-Section of Sealing Station with
Sample Tube in Position for Hermetic Seal Activation.
Sample Tube Storage Assembly The STSA houses thirty-nine flight sample tube assemblies within storage sheaths (Figure 17). Within each sheath is a sample tube and a glove. Figure 19 shows a cross-section of an empty sample tube with glove attached in a sheath. A glove serves two purposes: 1) Prevents contamination from entering a sheath to maintain sample tube cleanliness, and 2) Provides an interface between the SHA and sample tube for manipulation within the ACA. Due to cleanliness concerns, a sample tube is not to directly contact the EE of the SHA. The sample tube consists of a passive ball lock mechanism with two states, engaged or disengaged. The engaged state has the balls pushed outward into a groove to “lock” the sample tube into a sheath or bit. The disengaged state allows the balls to retract to support sample tube removal from a sheath or bit via the SHA. With the glove attached to a sample tube, a multi-stage ball-lock activation process is required for sample tube manipulation. To manipulate a sample tube, the EE tube gripper first extends its plunger into a glove which ball locks the two together. With the tube gripper and glove locked together, the tube gripper plunger continues to extend, which pushes on the glove plunger. Depending on the amount of tube gripper plunger travel, the glove can be engaged or disengaged from a sample tube. Continued extension of the tube gripper plunger eventually results in the glove plunger pushing on the sample tube plunger, thereby disengaging the sample tube ball lock allowing for sample tube removal from a sheath or bit. Retraction of the tube gripper plunger provides the opposite effect and allows for sample tube ball lock engagement into a sheath or bit.
Ram
Gripper (Closed)
Hermetic Seal in Sample Tube Kicker

130
Dispense, Volume, Tube Assembly The DVT assembly consists of hermetic seal dispensers (D), a volume station (VS), sample tubes (ST) with gloves in a sheath, and a sample tube parking lot (STPL), all integrated to a single mounting plate (Figure 18). There are seven hermetic seal dispensers, with each dispenser containing seven seals in a stack protected by a cover when not in use (Figure 20). A cover is only removed when a sample tube, with an acquired sample inside, is ready to retrieve a hermetic seal from a dispenser. Covers remain installed otherwise to minimize hermetic seal exposure to the environment and maintain cleanliness. The seal dispenser uses a two-stage passive ball lock mechanism to allow for the advancement of a single hermetic seal for dispensing into a sample tube, while also preventing the remaining seals in a stack from falling out. The SHA brings a sample tube into a dispenser which activates the ball-lock mechanism, and results in release of a hermetic seal into a sample tube. Once a seal is dispensed into a sample tube, refer to [8] for seal activation details at the sealing station. Volume assessment is conducted via the SHA bringing a sample tube into contact with the volume probe to a prescribed load limit. From this operation, the amount of sample material collected can be determined, while minimizing potential damage to a sample. A cover protects the volume probe when not in use (Figure 21). Covers utilize a passive ball lock mechanism to lock and unlock from the dispensers, volume station, and the cover parking lots. Three sample tube storage locations exist on the DVT similar to those on the STSA. A Sample Tube Parking Lot (STPL) is a modified sample tube storage sheath that allows for a sample tube to be stored without a glove. This capability allows for standalone glove operations in the ACA.
Figure 17. STSA Assembly (bottom view with glove bottom flanges visible).
Figure 18. DVT Assembly

131
Figure 19. Cross-Section of Sample Tube and Glove in a Sheath.
Left: Figure 20. Hermetic Seal Dispenser Cross-Section. Right: Figure 21. Volume Station Cross-Section.
Assembly and Test Program Three ACA units were assembled to support ground testing and flight operations: an Engineering Model (EM), Flight Model 1 (FM1), and Flight Model 2 (FM2). The EM unit was assembled first, consisting of flight-like stations, and was used for early ground testing of the flight hardware design, including algorithm development of station interactions for flight software purposes. Successful first-time end-to-end operations were conducted on the EM ACA in an Earth ambient environment. The EM unit was moved into a thermal vacuum chamber where it is currently part of an SCS testbed for full end-to-end testing at Mars pressure and temperature using analog samples. This testbed is known as QMDT, or Qualification Model Dirty Testing, where dirty testing is conducted to allow for evaluation of hardware life and performance through dust interaction. Drilling into rocks generates a lot of dust, which can be monitored to understand where it goes, and how well the mechanisms continue to operate over time in that environment. This testbed is as flight-like as possible, utilizing a QM (Qualification Model) Corer attached to an QM Turret on an EM RA, with the EM ACA. The FM1 ACA was assembled after the EM ACA and was the first ACA to be exposed to 3-axis random vibration and thermal vacuum functional testing. Since station interaction sequences were not developed in time for FM1 functional testing, only range of motion and aliveness checks were performed for active mechanisms, and no passive mechanisms were tested, which would require robotic manipulation via the SHA. The functional check-outs were conducted before and after vibration testing, as well as at cold temperatures (-110°C and -70°C) and Mars pressure (between 5 and 10 torr) in a thermal vacuum chamber to verify functionality. Heat-to-use operations were verified below -70°C for wet lubricated mechanisms. Upon the completion of ACA-level testing, the FM1 ACA was installed in the flight Rover to support Assembly, Test, and Launch Operations (ATLO) testing with the flight vehicle. This testing included random vibration and functional testing of the Rover in thermal vacuum at Mars pressure and temperature and is part of validation for flight readiness. During the Rover thermal vacuum test campaign, limited station interaction was performed on the FM1 ACA to validate force and position sensing of ACA hardware via flight avionics, which was the only opportunity with the flight vehicle at Mars conditions prior to launch. Since the entire Sampling and Caching System was available on the Rover during thermal vacuum testing, bit exchange operations were conducted, which allowed for the flight RA to dock with the FM1 BC and the Corer to remove and return bits to the carousel. The opportunity to test this functionality on the flight vehicle
Sample Tube
Sheath
Sample Tube Ball-Lock in Sheath
Glove Cover
Hermetic Seal Stack (7
Advancing Mechanism for Seal Dispensing
Volume Probe

132
was a significant risk reduction effort; therefore, the flight bits were installed in the FM1 BC just prior to delivery to ATLO. While the FM1 ACA was in ATLO testing, the FM2 ACA was being assembled. The FM1 and FM2 ACA units were intended to be identical, but this did not occur due to findings from the FM1 ACA thermal vacuum test. A modification to the linear stage mechanism on the FM2 SHA was implemented to improve robustness over temperature and life. Because of this improvement, the FM2 SHA was designated the flight unit, and ultimately the decision was made to upgrade the FM2 ACA to flight as well. This decision was not made lightly and would mean that the FM2 ACA would not participate with the flight Rover at environments until actual launch and surface operations at Mars. This was deemed acceptable for the following reasons: 1) ACA units are interchangeable in the Rover at the three bipod interfaces, with no mass impact or structural feature differences between the FM1 and FM2 units, 2) the FM2 ACA was exposed to a complete environmental test program at the ACA-level, which included 3-axis random vibration and thermal vacuum functional testing which incorporated full end-to-end sequences (with the exception of bit exchange and sample acquisition operations), and 3) after the FM2 ACA is installed in the flight Rover in ATLO, a ground test was conducted that included an end-to-end functional test within the ACA using a non-flight sample tube, hermetic seal and seal dispenser hardware, which exercised/verified force and position sensing using flight avionics. Because the FM1 BC had been verified in the Rover thermal vacuum test with the flight bits installed, and is interchangeable between ACA units, the FM1 BC was designated the flight unit. Removal of the BC from the ACA is required as part of Rover integration/de-integration, so an interface break is necessary regardless. As a result, the eventual flight ACA will be a mix of FM1 and FM2 ACA hardware. Maintaining a consistent test flow and history was critical for understanding mechanism life as well as for documentation/configuration management purposes. Due to PP and CC constraints on SIH and SHH items, additional STSA and DVT assemblies were required to support ground testing and not compromise cleanliness of the flight hardware. In addition to an EM and QM STSA and DVT assembly, an ATLO flight model was developed to support Rover level activities in ATLO, including environmental testing, while a sterile flight model was established for flight with extensive PP and CC oversight to ensure stringent cleanliness constraints are being adhered to. To verify functionality of the sterile flight model hardware prior to flight, a test program was conducted that exercised sample tube interactions with sheaths and bits, as well as seal dispensing at both ambient and Mars temperature and pressure conditions. The sterile flight model assemblies were also exposed to a 3-axis random vibration test for launch dynamics verification. Because of the stringent cleanliness requirements that had to be maintained for the hardware, clean tents and special handling requirements were implemented. At the completion of the test campaign, the hardware went through a final cleaning operation followed by bake-out. The sterile flight model hardware is integrated into the Rover as late as possible prior to launch, directly from the bake-out, and requires a clean air purge within the ACA volume up to the moment of launch to maintain cleanliness. Functional testing once integrated in the Rover is prohibited to avoid compromising cleanliness. As a result of this limitation, the QM STSA and DVT assembly will be exposed to the flight bake-out as well followed by testing at Mars pressure and temperature in QMDT to verify functionality and performance by similarity.
Challenges The ACA has had to overcome a number of significant design and test challenges, including volume constraints, tight tolerances, hardware cleanliness and operational issues. As a result, quite a bit of planning and re-planning was necessary to ensure requirements could be met, and the right tests were conducted. Being flexible is key when working in this mode. Having two ACA flight models, FM1 and FM2, and the ability to swap hardware between the two, allowed for some flexibility. As previously noted, the final flight ACA configuration is a combination of FM1 and FM2 ACA stations.
133
SHA reachability and Z-stage travel constraints were a significant driver of the ACA configuration. From initial flight concept to final configuration, the ACA went through well over 50 different configuration layouts. The ACA had to fit within the defined volume in the Rover, while preventing ACA stations from interfering with each other, particularly during robotic operations. SHA geometry was dictated by the ACA volume in the Rover, with link lengths maximized to allow for motion within the Rover with clearances to structure of approximately 10 mm. Placement of the SHA on the CCMD was the result of ensuring the SHA could successfully reach all ACA stations and operate with sufficient position accuracy and force margin. This placement required the SHA to flip (invert) in the Rover, meaning the SHA would fully extend and rotate back on itself in the opposite direction at the elbow joint, extending the reachable workspace in the available volume. While the SHA Z-stage extends below the Rover bellypan during operations, it must fit within the Rover volume for launch through landing which limits overall available travel. The resulting SHA Z-stage travel drives ACA station and component heights to ensure sufficient clearances exist during robotic operations. A hermetically sealed tube on a glove on the EE results in the largest stack-up on the SHA requiring the largest Z-travel, while maintaining approximately 10 mm of clearance between the top of the seal and bottom of the ACA stations. In a few locations, clearance is reduced to as low as 4 mm, which is the result of design maturity of ACA hardware within existing constraints. Analysis and test verified acceptability of these close clearances. Because of SHA-driven hardware height limitations, sample tube, glove, and cover ball lock mechanisms were constrained such that their required spring forces could not be achieved with a single spring solution in the available volume. As a result, nested compression springs were implemented that are counter wound to avoid unwanted interaction (i.e., intertwining). In addition, the sample tube ball lock mechanism could not support a sufficient length-over-diameter (L/D) ratio for close clearance sliding components, which increases the chances of wedging/jamming. The glove and cover mechanism designs achieved adequate L/D ratios, minimizing their risk of issues. During hardware testing, sample tube ball lock mechanisms exhibited jamming in the ball lock mechanisms, which was mitigated by the addition of sputtered moly-disulfide dry film lubrication to hardware that was previously bare within the assembly to reduce friction that was attributed to a number of failures. Follow-on testing showed no issues across environments, providing confidence in the corrective action implemented. SHA operations were conducted from the start using flight software to ensure the hardware and software worked in sync, as well as ensured fault protection and positioning required to operate the SHA within the ACA volume limits were in place to protect the hardware. While this is beneficial for proving out hardware/software behavior, this introduced a number of challenges since the ACA was operated using Actuator Electrical Ground Support Equipment (AEGSE) versus the flight avionics Rover Motor Control Assembly (RMCA) during ACA-level testing. Behavior differences between controllers existed that impacted position error during operation. For example, if a motor gets bogged down and needs more current to reach a position, the RMCA will allow a temporary increase (i.e., boost) in current that allows a motor to reach position within about ±1 hall count. While AEGSE attempted to match the RMCA boost current behavior, significant position errors occurred during hard stop calibration activities affecting functionality. Therefore, two operational modes were developed for the AEGSE to achieve similar position accuracy as the RMCA for all functional activities: boost current was disabled to accommodate hard stop calibration, while boost current was enabled for nominal functions. Force control response was impacted when using flight software for SHA operations. Response times for force control were unexpectedly high as a result of filters on the force torque sensor signal causing force overshoots. Additional force overshoots occurred as the motor controller accelerated the motor through the speed range where the motor detent brake interacts with the motor to avoid erratic behavior. The combined overshoots reduce force limits, which results in a reduction of the SHA-to-station interaction operational margin by approximately 10%, as well as more occurrences of force overshoot nuisance faults. Software updates were made prior to launch to correct these overshoots, regaining operational margin required for surface operations.
134
While ensuring the ACA functions properly has been a challenge on Earth, this is only exacerbated by having to operate in a Mars environment where extreme temperature differences as well as exposure to, and operations within, a dusty environment are commonplace. With an operating range of -110°C to +50°C, this can result in significant CTE effects and/or gradients, especially due to heat-to-use conditions at cold, that need to be accounted for to ensure proper fits and functionality. Testing at Mars temperatures was conducted to verify hardware functionality and performance, which identified a number of issues. One example is significant drag increases at cold temperatures due to Teflon spring-energized seals used in dynamic applications, which are implemented in a number of locations within the BC. Ultimately, the springs were removed from the seal, leaving the Teflon jacket, which still exhibited too much drag on its own. Therefore, the jacket was cut to allow for expansion and contraction significantly reducing drag, while not detrimentally affecting the performance of the seal. These changes were successfully validated by test. Using spring-energized seals in a dynamic application over a large temperature range, and particularly cold, must be evaluated closely for potential signs of fit or drag issues due to CTE. Because of cold temperature exposure, all of the wet lubricated mechanisms require heating for operation, with a minimum allowable heat-to-use temperature of -70°C used for ground testing. Braycote 600 and 601EF are used in various ACA mechanisms, which were found to contribute to high drag conditions impacting performance at cold temperatures (starting below approximately -40°C). The SHA and EE both contain high life linear motion mechanisms where cold temperature testing revealed operational issues resulting in warmer heat-to-use temperatures being prescribed. These changes are implemented to preserve mechanism life and/or to support mechanism functionality with appropriate force/torque margins for operations on Mars. During ACA testing in thermal vacuum at Mars pressure and temperature, a number of sample tubes failed to insert properly into bits and sheaths at -110°C. These failures did not occur during Earth ambient testing using the exact same hardware prior to thermal vacuum. An investigation identified two key findings. The first was related to the tight clearances between the tube and sheath/bit, which were required for proper ball lock mechanism functionality. However, system errors due to factors such as tolerances, deflections, controller errors, etc. exceeded the clearances of the mating hardware. In addition, the geometry of the hardware included non-axisymmetric features which offered catch opportunities due to the tight clearances and resulting machining. As a result, the compliant mechanism on the EE struggled to compensate. Performing lateral offsets prior to sample tube insertions favorably aligned tube features with the bits and sheaths resulting in successful operations. While the operational fix was successful, being mindful of what a compliant mechanism is being asked to do within a very constrained design might lead one to different implementation strategies. The second key finding was related to a critical hardware configuration that was incorrectly modified for testing. The EE contains a cable bundle that exits the force-torque sensor and was strain relieved with specific tie-downs such that the cabling would not affect EE operations, including at cold temperatures where stiffness could increase by about a factor of two. For the thermal vacuum test, thermocouple (TC) wires were routed along the EE cable bundle and tied down in a few locations. The TC wires were added just before the thermal vacuum test and therefore not part of any ambient testing prior to environments. As a result, the EE RCCM ended up being stiffer than the intended design point at cold temperature, which contributed to tube insertion failures. The test was actually stopped to allow for correction of this issue once identified. The cable bundle tie downs with the TCs were removed and the test continued successfully. When instrumenting hardware for a test, be very careful that the introduction of test components (i.e., TCs and their respective cabling) will not impede expected functionality of the hardware under test. Friction values were found to be much higher than expected during testing with hardware that had been exposed to both stringent precision cleaning and the high temperature bake-out at 350°C in air for 1 hour (for combustion cleaning). This was determined during FM2 ACA testing using non-flight sample tubes and gloves that had been processed flight-like (cleaning and bake-out) and failures in the ball lock mechanisms were observed. This was the first opportunity to test hardware processed in a flight-like manner. The final flight hardware cleaning and bake-out processes were developed concurrently with hardware development.

135
While development testing had been conducted early on to validate the cleaning and bake-out efficacy, the overall process was not 100% flight-like, and may account for the discrepancy in findings. A detailed investigation of the hardware from FM2 ACA testing yielded a number of findings. The stringent precision cleaning operation cleaned the surfaces so well that higher friction was exhibited between sliding surfaces even during assembly operations. Inspection of components from the suspect sample tubes identified that the bare 440C balls in the ball lock mechanisms had significantly oxidized, resulting in surface changes contributing to higher friction. In addition, moly-disulfide dry film lubrication on ball lock mechanism surfaces had degraded. Pin-on-disk tribometer testing was conducted using flight-like material combinations, which confirmed friction increases of 1.5 to 2 times (reaching up to approximately 0.4) as a result of the bake-out. Per analysis, this increase in friction could be detrimental to proper mechanism functionality, as observed in test. This finding was very late in the project; therefore, a quick solution had to be identified and implemented. Ultimately, two corrective actions were implemented. The 350°C bake-out in air for a minimum of 1 hour was reduced to a 150°C bake-out in vacuum for 24 hours, which eliminated the adverse material affects previously observed. Concurrently, methods to reduce friction in the ball lock mechanisms were assessed. As a result, the balls within the ball-lock mechanisms for the sample tubes, covers, and dispensers were modified with the addition of a sputtered moly-disulfide dry film lubrication to help reduce friction. Pin-on-disk tribometer testing of these modifications showed a significant decrease in friction with results less than 0.1 (details of tribology findings in work for publication). Implementing this change actually addressed a few concerns identified through design and test, such as the aforementioned L/D concern in the sample tube ball lock mechanisms, and a concern with worn dry film lubricated surfaces observed in the seal dispensers after test. Validation of these changes using both flight-like and the flight hardware was performed over environments without issues. With the change in the bake-out criteria, additional cleaning steps were implemented as required for PP and CC compliance just prior to the bake-out. Tight tolerances were used throughout the ACA, on the order of microns in a number of passive mechanism locations required to ensure position accuracy could be achieved with SHA interactions. Working in microns meant a lot of manufacturing challenges and discrepancies. Verification of tolerances was critical to ensure hardware was acceptable to use and required very precise CMM (coordinate measuring machine) inspection (on the order of less than 1 micron in some cases, and typically less than 3 microns). When working with tolerances so tight, verifying assembly-level dimensions may be warranted vs. relying on piece part inspection data. This became apparent for hermetic seals which contain piece parts designed in 5 micron increments as required to meet sealing requirements. It was unknown that hermetic seal components were expanding during seal assembly. This issue was not identified until hermetic seals failed to dispense successfully into sample tubes during test. Root cause was identified as fit issues where the seal was too large to fit within a sample tube. Seal-to-tube pairing takes into account a number of factors, but ultimately the seal has to fit in the sample tube. Inspection of hermetic seal assemblies yielded larger diameters for the components that must fit within a tube which had been CMM inspected previously. Therefore, all hermetic seals were reinspected at the assembled state using optical measurement equipment in the cleanroom to not compromise hardware cleanliness. With this information, the flight hermetic seals were assessed against the flight sample tubes to ensure sufficient clearances exist for dispensing, with ideal pairing arrangements identified for surface operations. Dust accumulation on hardware can become a significant problem during operations. Accommodating anticipated dust in the ACA during operations resulted in designs either attempting to provide a path for dust to exit if possible, or the implementation of seals to prevent dust intrusion in the first place to protect sensitive mechanisms (i.e., bearings, screw mechanisms, etc.). Standalone dirty development testing was conducted on ACA hardware that will be exposed to significantly dusty environments during the mission. This testing included the BC exterior mechanisms (i.e., docking assembly and upper door release), which will not only be exposed to the dusty environment for the duration of the mission, but also susceptible to debris strikes during the Rover landing event. These mechanisms exhibited robustness to excessively dusty conditions. Dirty testing in the QMDT venue revealed significant dust accumulation on critical sample tube and glove surfaces. While some dust accumulation on sample tube surfaces was expected and
136
accommodated for in station designs and/or operations, excessive dust accumulation on sample tube and glove surfaces after removal from a bit post-sample acquisition can detrimentally impact operations. Therefore, operational dust mitigation efforts are being developed for validation in QMDT to ensure robust solutions are available for the flight hardware should an issue exist on Mars.
Summary The ACA is a complex assembly of mechanisms required to perform a number of functions to meet Mars 2020 science objectives. A number of challenges existed for the development, assembly, and test of the ACA. Detailed test campaigns were completed to validate the flight hardware and software prior to integration onto the Rover, which identified a number of issues that were addressed as quickly as possible to not impact the mission. After the launch of Mars 2020, the remaining ACA units will continue to provide critical ground-based learning opportunities to improve the robustness of operations on Mars.
Acknowledgements This work was performed at the Jet Propulsion Laboratory, California Institute of Technology, under a contract with the National Aeronautics and Space Administration. The Sample Handling Assembly (SHA) was provided by Maxar, Pasadena, CA under contract with JPL. Reference herein to any specific commercial product, process, or service by trade name, trademark, manufacturer, or otherwise, does not constitute or imply its endorsement by the United States Government or the Jet Propulsion Laboratory, California Institute of Technology. Copyright 2020 California Institute of Technology. U.S. Government sponsorship acknowledged. Designing and developing the ACA, as well as the subsequent assembly and testing, relied on a significant number of people who dedicated many long hours to make the ACA a reality. It would be impossible to list everyone on the ACA team; however, listed here are the hardware/station leads and critical ACA staff: Nick Haddad, Grayson Adams, Erich Brandeau, Rebecca Perkins, Kayla Andersen, Sarah Sherman, Pavlina Karafillis, Brad Kobeissi, Suzie Kellogg, Will Green, Jeff Seiden, Jesse Grimes-York, Sean O’Brien, Sivan Kenig, Eric Roberts, Alex Bielawiec, Ken Glazebrook, Ed Dorantes, and Mary Magilligan. In addition, Louise Jandura, Keith Rosette, Matt Robinson, Richard Rainen, Don Sevilla, Matt Orzewalla, Mark Balzer, and Justin Kaderka have made substantial contributions towards making the ACA a success.
References 1. https://mars.nasa.gov/mars2020/mission/overview 2. Barletta, A. “Design and Development of a Robust Chuck Mechanism for the Mars 2020 Coring Drill.”
Proceedings of the 45th Aerospace Mechanisms Symposium, (2020). 3. Chrystal, K. “Percussion Mechanism for the Mars 2020 Coring Drill.” Proceedings of the 45th Aerospace
Mechanisms Symposium, (2020). 4. Szwarc, T., Parker, J., Kreuser, K. “STIG: A Two-Speed Transmission Aboard the Mars 2020 Coring
Drill.” Proceedings of the 45th Aerospace Mechanisms Symposium, (2020). 5. LoSchiavo, M., Phillips, R., Mikhaylov, R., Braunschweig, L. “Mars 2020 Maxon Commercial Motor
Development from Commercial-Off-the-Shelf to Flight-Qualified Motors, Gearboxes, and Detent Brakes: Overcoming Issues and Lessons Learned.” Proceedings of the 45th Aerospace Mechanisms Symposium, (2020).
6. Drake, S. “Using Compliance in Lieu of Sensory Feedback for Automatic Assembly.” Diss. Massachusetts Institute of Technology, (1977).
7. Grimes-York, J. “Sealing Station Mechanisms for the Mars 2020 Rover’s Sample Caching Subsystem.” Proceedings of the 45th Aerospace Mechanisms Symposium, (2020).
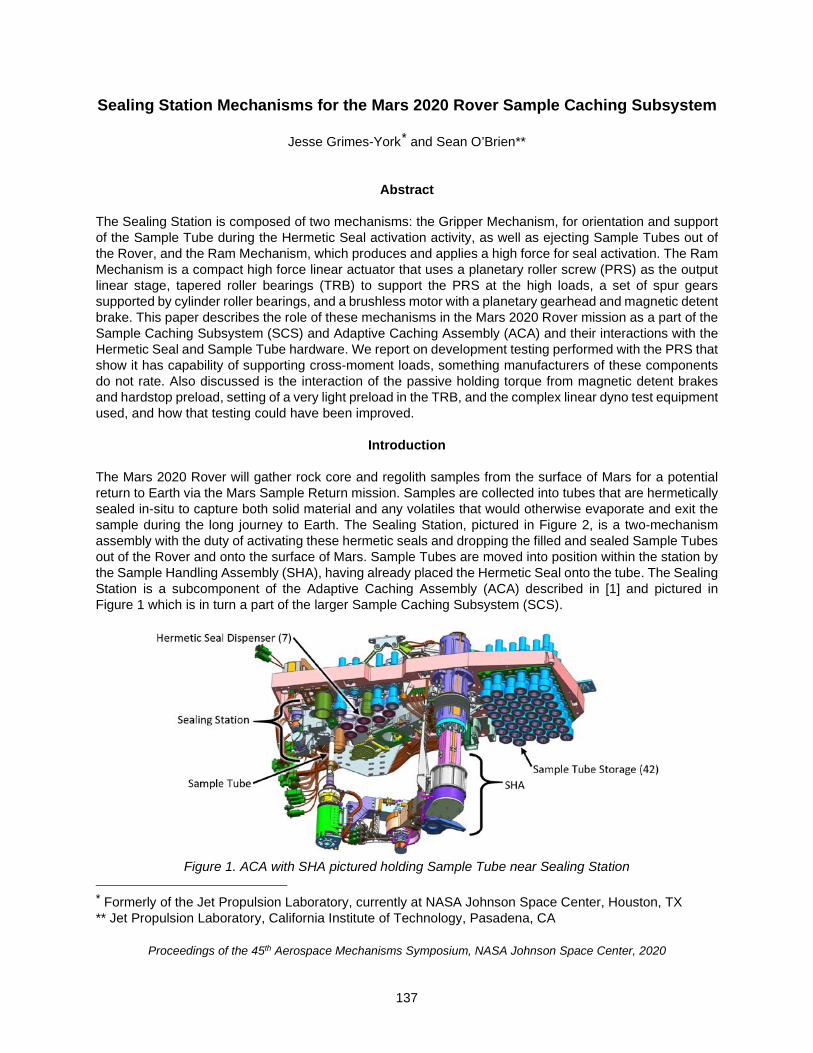
137
Sealing Station Mechanisms for the Mars 2020 Rover Sample Caching Subsystem
Jesse Grimes-York* and Sean O’Brien**
Abstract The Sealing Station is composed of two mechanisms: the Gripper Mechanism, for orientation and support of the Sample Tube during the Hermetic Seal activation activity, as well as ejecting Sample Tubes out of the Rover, and the Ram Mechanism, which produces and applies a high force for seal activation. The Ram Mechanism is a compact high force linear actuator that uses a planetary roller screw (PRS) as the output linear stage, tapered roller bearings (TRB) to support the PRS at the high loads, a set of spur gears supported by cylinder roller bearings, and a brushless motor with a planetary gearhead and magnetic detent brake. This paper describes the role of these mechanisms in the Mars 2020 Rover mission as a part of the Sample Caching Subsystem (SCS) and Adaptive Caching Assembly (ACA) and their interactions with the Hermetic Seal and Sample Tube hardware. We report on development testing performed with the PRS that show it has capability of supporting cross-moment loads, something manufacturers of these components do not rate. Also discussed is the interaction of the passive holding torque from magnetic detent brakes and hardstop preload, setting of a very light preload in the TRB, and the complex linear dyno test equipment used, and how that testing could have been improved.
Introduction The Mars 2020 Rover will gather rock core and regolith samples from the surface of Mars for a potential return to Earth via the Mars Sample Return mission. Samples are collected into tubes that are hermetically sealed in-situ to capture both solid material and any volatiles that would otherwise evaporate and exit the sample during the long journey to Earth. The Sealing Station, pictured in Figure 2, is a two-mechanism assembly with the duty of activating these hermetic seals and dropping the filled and sealed Sample Tubes out of the Rover and onto the surface of Mars. Sample Tubes are moved into position within the station by the Sample Handling Assembly (SHA), having already placed the Hermetic Seal onto the tube. The Sealing Station is a subcomponent of the Adaptive Caching Assembly (ACA) described in [1] and pictured in Figure 1 which is in turn a part of the larger Sample Caching Subsystem (SCS).
Figure 1. ACA with SHA pictured holding Sample Tube near Sealing Station
* Formerly of the Jet Propulsion Laboratory, currently at NASA Johnson Space Center, Houston, TX ** Jet Propulsion Laboratory, California Institute of Technology, Pasadena, CA
Proceedings of the 45th Aerospace Mechanisms Symposium, NASA Johnson Space Center, 2020

138
The primary mechanism of the Sealing Station is the Ram Mechanism, which is responsible for pushing the Hermetic Seal’s ferrule into the ‘sealed’ position. The Ram Mechanism is composed of a Planetary Roller Screw (PRS), as the output linear stage, supported by a Tapered Roller Bearing (TRB) pair and driven by spur gears and a brushless motor. The secondary mechanism is the Gripper, which orients and supports the Sample Tube during the high force seal activation, alleviating the Sample Handling Assembly (SHA) of these requirements. The Gripper additionally performs the Sample Tube drop-off function, to eject the Sample Tube from the Rover. The Gripper has a rotational joint that moves half of the Sample Tube support structure, allowing ingress/egress of the Sample Tube. Figure 2 shows steps in this sequence. The Ram Mechanism is a high force density device tested to a capability of ~21 kN for a stroke of 16 mm in a 3.3-kg package (Ram Mechanism only; total station mass is 5.5 kg). In this paper we will show the method for setting preload in the tapered roller bearings, development testing of the PRS linear-to-rotary component, for compatibility with this application and for a loading scenario past the vendor’s recommended limit for these components. Additionally, dyno testing to these high forces across warm and cold temperatures is presented with recommendations for how this could be performed more simply for future applications. An Engineering Model, a Qualification Unit, and Flight Unit have all been designed, assembled, tested, and integrated into their respective higher-levels of assembly, the ACA. The Mars 2020 Rover is scheduled for launch in July of 2020 and landing on the surface of Mars in February of 2021. The hardware described in this paper will be used during the surface mission portion of the mission.
Figure 2. (left) Sealing Station with Sample Tube during Seal Activation (upper right) prior to seal
activation Ram motion the ferrule is shown in the un-activated position. (lower right) end of seal activation Ram motion the ferrule has been pushed into final position.

139
Figure 3. The Hermetic Seal assembly shown separate from the Sample Tube and prior to seal activation.
The ferrule expands the knife edge outward as it is pushed through the smaller diameter of the ramp profile in the seal cup. Ferrule shown in staring position.
Hermetic Seal & Sample Tube Design The Hermetic Seal is composed of two major components: the seal cup and the ferrule, held together by the ferrule retainer, shown in Figure 3. A retaining spring holds the Hermetic Seal in place inside the Sample Tube. The spring washer permits the ferrule to only move deeper into the Seal Cup, thus retaining the ferrule after assembly and throughout launch. The seal cup has a knife edge feature that, upon activation, is pressed against the inner wall of the Sample Tube creating a hermetic seal (< 1 × 10⁻⁸ cc He/sec). The knife edge is coated with gold, which acts to fill in scratches in the interior wall of the Sample Tube caused by the rock core as it is ingested during coring. The interior of the seal cup has a ramp profile opposite the exterior knife edge, which is sized and shaped to expand the knife edge out radially, into the tube wall. The geometry of this ramp profile, ferrule to seal cup to tube interference, lubricant and materials selection was a considerable challenge but is not the focus of this paper. The notable aspects of this seal for the purposes of seal activation and the Ram Mechanism is that the ferrule must be pushed 3.5 mm further into the seal cup ramp after insertion into the sample tube in order to create the hermetic seal, a task that requires up to 7300 N. Also of note, this load must be reacted within the Sealing Station as the SHA, the robotic arm moving the Sample Tube from station to station within the ACA, cannot support loads of this magnitude. Figure 4 shows a successful seal activation performed by the SCS during ground testing.
Figure 4. CT scan image of Sample Tube with Rock Core Sample and activated Hermetic Seal. The
Hermetic Seal was successfully activated by the EM Sealing Station integrated to the EM SCS.

140
Mechanism Designs Ram Mechanism The output function of this mechanism is to push the ferrule of the Hermetic Seal into the seal cup; a stroke distance of ~3.5 mm with a load of up to 7300 N. Additional stroke length, 16 mm total, is required to retract the Ram away from the Sample Tube and Hermetic Seal to allow for ingress/egress of the tube. Ferrule depth in the cup upon seal activation is determined by the Ram contacting its extension hardstop. The Ram Tip geometry is designed to control this depth, targeting the middle of a ~2-mm positional band, where any position within this range results in a successful Hermetic Seal activation. This stroke range allows for variation in piece part dimensional variation between the 45 Sample Tubes flown on the mission, and dust accumulation.
Figure 5. Cross Section view of Ram/Sealing Mechanism showing details of the gear transmission.
Output force is produced by a PRS where the screw is the translating element and the PRS nut is driven in rotation. The screw is a 15-mm pitch diameter with a 5-mm pitch and a 5-start thread, a catalog item that is only modified to replace steels with stainless steels. The screw rotation is restricted by two cam follower bearings running in tracks, see Figure 5. The PRS nut is driven and supported by a spur gear that is in turn supported by a pair of tapered roller bearings. The output gear is driven by an idler gear supported on a cylinder roller bearing, which is in turn driven by a pinion gear mounted to a gear motor. The gear motor is described in [2]. The Ram mechanism has been shown, in test, to be capable of producing ~21 kN, for an input torque of about 7.8 Nm at the pinion gear, across its qualification temperature range of -70 to +70°C. Lubrication throughout the geartrain is accomplished with Braycote 600 EF grease applied by grease-plating, at a 10% grease-to-solvent level, with additional grease, 30% void-volume fill, applied directly to the rollers of the TRB and cylinder roller bearing. All geartrain elements are CRES except for the roller cages in the TRB and cylinder roller bearing which are silver plated 4340 steel. Sensing of Ram position is accomplished by Hall sensors at the motor. The only other telemetry available for this mechanism, and the station as a whole, is motor current. An example of this telemetry can be seen in Figure 6 where the distinct Hermetic Seal activation force profile is plainly visible. The mechanism is designed to be robust to contacting hardstops in either direction at full force and uses the retract hardstop for position zeroing. Stowing of the Ram for launch and rover traversing is accomplished by pressing the Ram against the extension hardstop, up against the Gripper, where it has the added benefit of restraining

141
the flexurized portion of the gripper output, refer to Figure 7 for the gripper flexure. A holding force of 2900 N is maintained by a passive magnetic detent brake located at the motor. The Ram Mechanism is not required to produce high output load while simultaneously overcoming startup drag, especially at low temperatures. The first motion of the mechanism is to un-stow and retract, unloaded, to allow the tube ingress prior to any high force actuation. Test data shows that by this time any start-up drag from cold grease is overcome. If the mechanism is ever required to begin operation where high load is required immediately, it can move backwards away from the load, “warming up” the mechanism before proceeding forward under high load.
Figure 6. Telemetry of Hermetic Seal Activation on the FM1 Sealing Station during ground testing at 20°C Gripper Mechanism The Gripper is a much lower force mechanism compared to the Ram but serves the important role of supporting and locating the Sample Tube during the high force seal activation activity. The SHA is incapable of supporting loads much higher than about 300 N while seal activation can require as much as 7300 N. The actuated motion of the Gripper allows the Sample Tube to be brought into, and out of the Sealing Station. The Gripper’s second primary function is to eject the tube out of the rover to the Martian surface. The ACA can return a sealed sample tube to storage and eject it later as mission operators choose. The Sample Tube interface design is highly constrained as it must interact with a large variety of hardware throughout the SCS on the Mars 2020 mission in addition to interacting with the Mars Sample Return mission. The seal activation function differs from all others in the mission, giving rise to different design constraints for ingress/egress than for Sample Tube insertion into a Coring Bit, Sample Tube Storage Sheath, or Seal Dispenser.
Figure 7. View of Gripper Mechanism showing details of the gear transmission and flexurized output.

142
During the Seal Activation sequence, the Sample Tube enters the Sealing Station laterally at an elevation higher than its seated position. The Gripper closes around it, enclosing but not squeezing, and the tube is pulled down by the SHA, until the tube bearing race is seated against the top of the Gripper with a preload of about 50 N. Because of position accuracy challenges with the SHA in the Martian thermal environment there can be residual load between the Sample Tube and the Sealing Station due to deflection in the SHA’s end effector, which features a remote center of compliance mechanism. Because of this residual load the Gripper must exert a torque high enough to center the tube under the Ram, and hold it there passively, necessitating the need for a passive brake described later. The Ram moves to activate the seal, retracts, then the Gripper and tube reverse the ingress motions to extract the now sealed Sample Tube. For tube drop-off a similar ingress procedure is used, after which the SHA detaches from the tube leaving it in the Sealing Station. The Gripper then opens, allowing the tube to fall to the surface of Mars. To prevent the tube from sticking in the non-moving half of the Gripper, a kicker mounted to the gripper rotational output motivates the tube out of the Gripper. To prevent the tube from sticking to the moving half of the Gripper output, the Ram extension hardstop is used as a lateral guide to ensure the tube remains on center of the egress path. Rotary motion of the gripper output is accomplished through a spur gear set supported by angular contact bearings, which are in turn driven by a motor with a planetary gearhead and a magnetic detent brake. The motor is described in [2]. The gripper output, green in Figure 7, is positioned to rotate into the closed position just above the supportive shelf meant for reacting seal activation forces from the ram. This gap is intended to prevent jamming of the mechanism. The output is flexurized to allow the gap to close while still controlling rotation. The flexures permit vertical motion of the gripper output, allowing the high seal activation loads to be reacted by the static gripper housing as well as preventing the output shaft, colored magenta in Figure 7, and bearings from being in the ram load path. The rotational axis of the gripper output shaft and the bore of the gripper, used for tube locating, and tube support features are offset from one another, making the mechanism self-closing during seal activation and tube seating.
Figure 8. Hardstop/detent interaction plots for theoretical cases. Blue line depicts active motor torque at mechanism output with variation due to the passive detent brake. Grey line depicts the passive holding torque of the mechanism, see also Figure 9. Orange line depicts reacted torque from hardstop contact
and preload. The Gripper uses a passive magnetic detent brake to maintain a preload between the Gripper output and the Gripper housing during both launch, rover traverse accelerations, and loads during seal activation. The interaction of the detent step size and the hardstop stiffness is an important design element that was not well understood until flight hardware testing. For high hardstop stiffness relative to the detent step size it may be nearly impossible to guarantee preload against the hardstop. To ensure preload, it is desirable to have a relatively soft hardstop to ensure that the detents can “catch” the reacted preload. See Figure 8. The intersection of orange and blue is the maximum torque at which the motor, with detent brake, can push into the hardstop, denoted by a red mark. When the motor is powered off, system load follows the orange

143
line down to where it intersects the grey line. The hardstop acts as a spring, pushing the geartrain backwards giving it momentum which can cause it to move past the first orange and grey intersection. The system may come to rest at any of the green dots or it may completely unload. Figure 8 left shows a system with a soft hardstop relative to the detent step size, where ensuring preload when motor power is removed is easier than where. Conversely, Figure 8 right shows a system with a stiff hardstop. The Ram Mechanism more closely resembles the left plot, while the Gripper more closely resembles the right. During testing of the Gripper, it was observed to back drive for certain commanded preload positions, which are now avoided.
Figure 9. Convention for stable and un-stable nodes for a rotational system with magnetic detent brake. Circle markers indicate un-stable nodes, where, while the system torque is zero, any small perturbation
will result in significant motion to the stable node indicated by the square markers. The motor hall sensor locations are centered on the stable nodes.
Component Development Testing
Roller Screw Component Development Testing At the start of mechanism design, the PRS was selected because it offers a higher load capacity density than ball screws or lead screws with a high efficiency. Packaging of the screw and nut and supporting elements for each proved difficult, as the manufacturers of these components recommend that cross-moment loading and radial loads be prevented between them. In the pursuit of a smaller mechanism package a prototype mechanism was built and tested to determine if omitting screw support was viable for this application. A view of the PRS nut is visible in Figure 14. First, a characterization test was performed to measure the loads during a 2X worst case aligned seal activation using the test equipment shown in Figure 10. With Hermetic Seals being a limited resource the test setup was reconfigured to replicate these observed loads without them with the test equipment shown in Figure 12. More cycles were executed on this prototype than is expected to ever be used on the flight unit, to an axial load near to that of the flight units max capability, and to a cross-moment ranging from matching the flight expected load to 4X that, see Figure 11 and Figure 13. Both lubricated and non-lubricated ram tips were used, and each was tested past 1X life. No degradation in the performance of the mechanism PRS was observed. The need for additional support of the screw is not required for this application, and the PRS is shown to have a non-zero cross moment load capacity, contrary to the limit specified in the manufacturers catalogs [3][4][5]. These tests were not intended to extensively characterize the cross-moment capacity, only to evaluate compatibility for this specific application. Critical to these results and this application is the high axial load relative to the cross-moment levels tested, and the large diameter of the supporting bearings, since the axial force acts as a restorative force, balancing the cross moment. This application of the PRS has a very low total life cycle count of just a few hundred, at most, load cycles where eccentric loading can occur. A higher cycle count application may not be compatible with supporting the PRS screw in this fashion and would warrant further development testing.
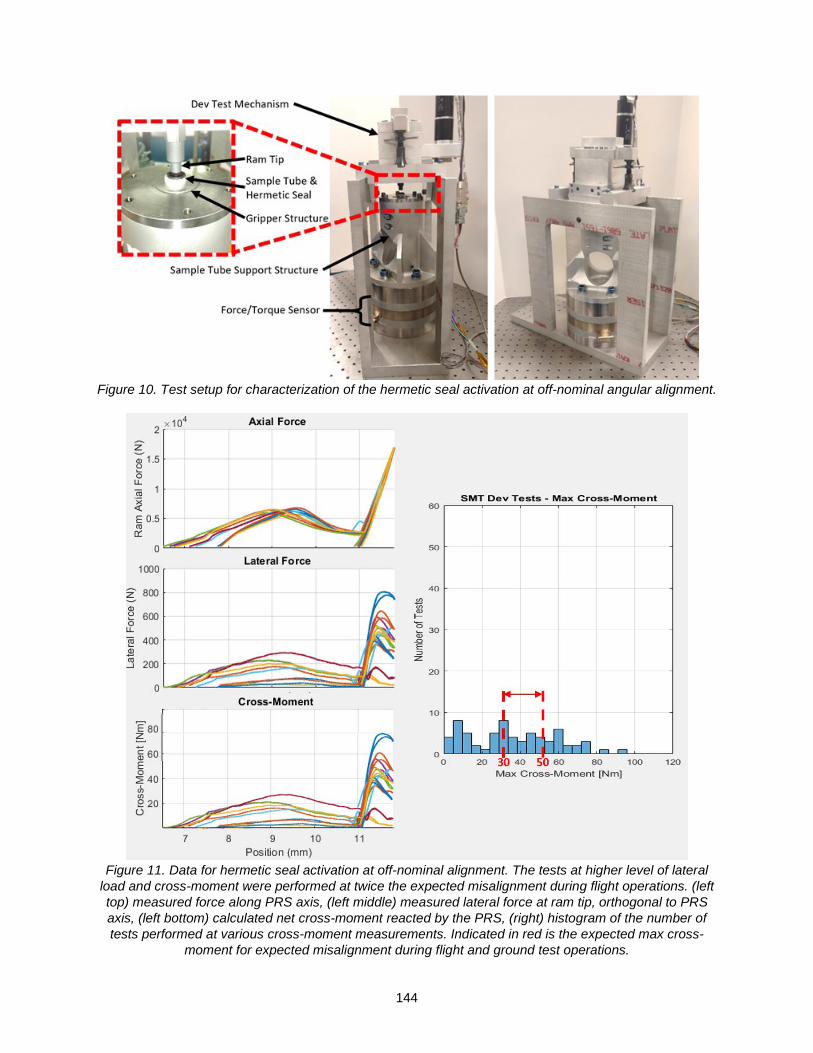
144
Figure 10. Test setup for characterization of the hermetic seal activation at off-nominal angular alignment.
Figure 11. Data for hermetic seal activation at off-nominal alignment. The tests at higher level of lateral
load and cross-moment were performed at twice the expected misalignment during flight operations. (left top) measured force along PRS axis, (left middle) measured lateral force at ram tip, orthogonal to PRS axis, (left bottom) calculated net cross-moment reacted by the PRS, (right) histogram of the number of tests performed at various cross-moment measurements. Indicated in red is the expected max cross-
moment for expected misalignment during flight and ground test operations.

145
Figure 12. Test setup for reproducing flight-like loading conditions on the PRS in the Ram Mechanism.
Load levels, misalignment levels, and ram tip lubricant were varied across tests. Push plates were single use components due to the fact that each of the 45 hermetic seals contact the ram only once.
Figure 13. Data for tests performed on the test setup shown in Figure 12. (left top) measured force along PRS axis, (left middle) measured lateral force at ram tip, orthogonal to PRS axis, (left bottom) measured
net cross-moment reacted by the PRS, (right) histogram of the number of tests performed at various cross-moment measurements. Indicated in red is the expected max cross-moment for expected
misalignment. 1.25X life was performed and no degradation in performance was observed, nor any detrimental wear on the components.
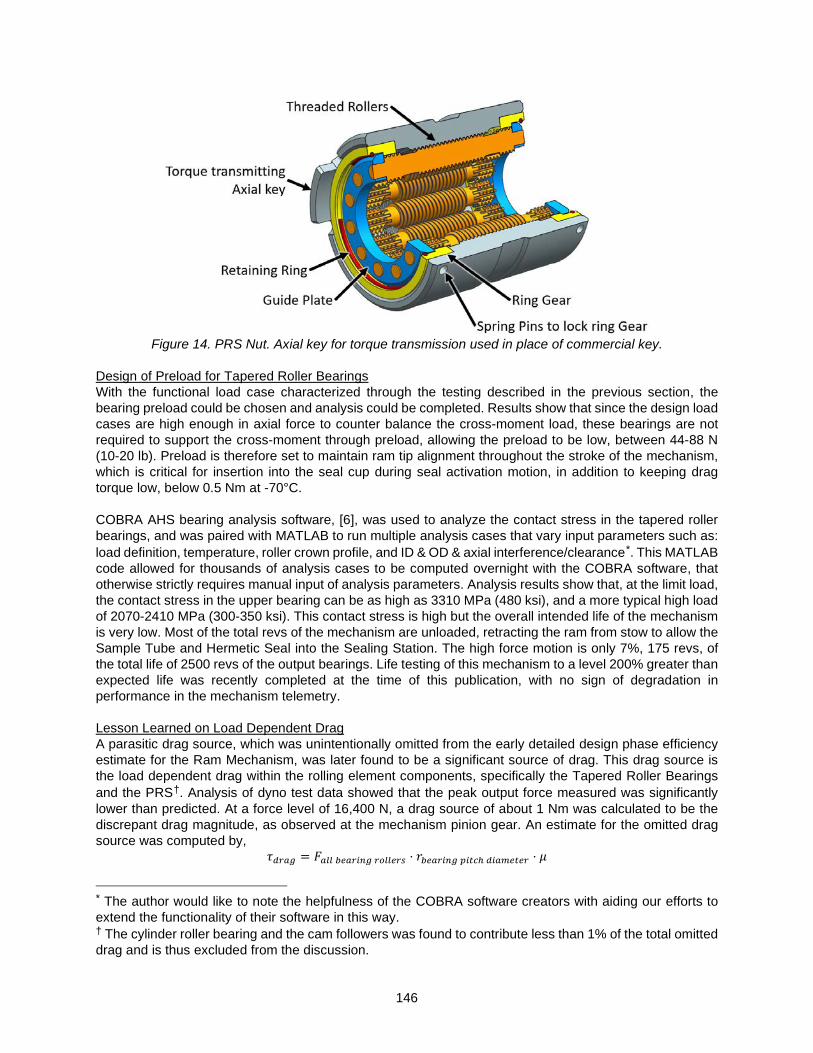
146
Figure 14. PRS Nut. Axial key for torque transmission used in place of commercial key.
Design of Preload for Tapered Roller Bearings With the functional load case characterized through the testing described in the previous section, the bearing preload could be chosen and analysis could be completed. Results show that since the design load cases are high enough in axial force to counter balance the cross-moment load, these bearings are not required to support the cross-moment through preload, allowing the preload to be low, between 44-88 N (10-20 lb). Preload is therefore set to maintain ram tip alignment throughout the stroke of the mechanism, which is critical for insertion into the seal cup during seal activation motion, in addition to keeping drag torque low, below 0.5 Nm at -70°C. COBRA AHS bearing analysis software, [6], was used to analyze the contact stress in the tapered roller bearings, and was paired with MATLAB to run multiple analysis cases that vary input parameters such as: load definition, temperature, roller crown profile, and ID & OD & axial interference/clearance*. This MATLAB code allowed for thousands of analysis cases to be computed overnight with the COBRA software, that otherwise strictly requires manual input of analysis parameters. Analysis results show that, at the limit load, the contact stress in the upper bearing can be as high as 3310 MPa (480 ksi), and a more typical high load of 2070-2410 MPa (300-350 ksi). This contact stress is high but the overall intended life of the mechanism is very low. Most of the total revs of the mechanism are unloaded, retracting the ram from stow to allow the Sample Tube and Hermetic Seal into the Sealing Station. The high force motion is only 7%, 175 revs, of the total life of 2500 revs of the output bearings. Life testing of this mechanism to a level 200% greater than expected life was recently completed at the time of this publication, with no sign of degradation in performance in the mechanism telemetry. Lesson Learned on Load Dependent Drag A parasitic drag source, which was unintentionally omitted from the early detailed design phase efficiency estimate for the Ram Mechanism, was later found to be a significant source of drag. This drag source is the load dependent drag within the rolling element components, specifically the Tapered Roller Bearings and the PRS†. Analysis of dyno test data showed that the peak output force measured was significantly lower than predicted. At a force level of 16,400 N, a drag source of about 1 Nm was calculated to be the discrepant drag magnitude, as observed at the mechanism pinion gear. An estimate for the omitted drag source was computed by,
𝜏𝜏𝑑𝑑𝑑𝑑𝑑𝑑𝑑𝑑 = 𝐹𝐹𝑑𝑑𝑎𝑎𝑎𝑎 𝑏𝑏𝑏𝑏𝑑𝑑𝑑𝑑𝑏𝑏𝑏𝑏𝑑𝑑 𝑑𝑑𝑟𝑟𝑎𝑎𝑎𝑎𝑏𝑏𝑑𝑑𝑟𝑟 ⋅ 𝑟𝑟𝑏𝑏𝑏𝑏𝑑𝑑𝑑𝑑𝑏𝑏𝑏𝑏𝑑𝑑 𝑝𝑝𝑏𝑏𝑝𝑝𝑝𝑝ℎ 𝑑𝑑𝑏𝑏𝑑𝑑𝑑𝑑𝑏𝑏𝑝𝑝𝑏𝑏𝑑𝑑 ⋅ 𝜇𝜇
* The author would like to note the helpfulness of the COBRA software creators with aiding our efforts to extend the functionality of their software in this way. † The cylinder roller bearing and the cam followers was found to contribute less than 1% of the total omitted drag and is thus excluded from the discussion.

147
Where the friction factor, 𝜇𝜇, was varied between a typical range of rolling element bearings of 0.0025 to 0.005. For friction values of 0.0021 to 0.0035, the increased drag corrects the mechanism efficiency prediction to match test data for the 3 flight units tested. The TRB was the significant contributor to this drag source as the radius of the bearing is much larger than other components in the mechanism. The TRB has an OD of 68 mm and contributed ~87% of the load dependent drag, while the PRS has a pitch diameter of 15 mm and contributed ~13%.
Assembly Setting Preload in Tapered Roller Bearings Preload is set in the Tapered Roller Bearing pair by a two-step procedure, where a drag torque to preload relationship is established, and then the preload is set and locked based solely by the drag torque measurement. A load cell is used during the measurements in the first step, see Figure 15, that is not included in the final design and is thus removed for the second step. Due to the placement of the gear between the two opposing bearings, preload was not controlled by precise grinding of the ring widths. Preload is controlled by the installation of the two-piece retainer installed after the preload-to-drag torque relationship has been established, and from this relationship, a target drag torque is established. The retainer is adjusted to achieve the desired drag, corresponding to the desired preload range, and locked into place. The installation torque of this threaded retainer is very low and prone to backing out if not retained in some additional way. To lock this retainer in place, the preload between the retainer and housing threads is increased by installing a second retainer close to, but not touching the first retainer; a gap size of 0.25 to 0.5 mm (10 to 20 thousandths of an inch) is used. The two retainers are then pulled toward one another by installing small screws at a standard preload and with a standard secondary retention method (Arathane 5753 for this mission subsystem). Installation of the small screws does affect the final preload in the bearings and must be accounted for and corrected in the final installation step. The fully installed retainer is capable of resisting at least 56 Nm (500 in-lb) whereas it was installed by hand with less than 1 Nm. Between the characterization measurements and the retainer installation the drag torque measurements have a different characteristic shape. The characterization measurements are much smoother than with the flight retainer. This inconsistency is due to the change in bearing clamp. The permanent retainer is threaded and is thus oriented by those threads, which imposes an alignment on the bearing race such that both may not be perfectly square to the rotational axis. Additionally, it is much more rigid than the characterization test setup where a ball bearing is used to intentionally eliminate this kinematic constraint, see Figure 15.
Figure 15. (left) Test configuration for characterizing preload to drag relationship. (right) retainer and lock.

148
Testing Dyno Testing Equipment Dyno testing of the Ram Mechanism involved custom built equipment to apply up to 28 kN of resistive force across the full stroke of the mechanism, while also capable of being reduced to zero force, and physically mounted to an access port on the side of a thermal chamber. The linear dyno equipment was placed outside of the thermal chamber both for access of the operator to vary the resistive load and to place the load and position sensors in a room temperature environment. See the hardware pictured in Figure 16. A compound lever system is used to amplify a force applied by the user via a threaded rod and nut. This force squeezes on a rectangular cross-section shaft applying a friction force, resisting motion of the coupled mechanism. The mechanism’s intended high force output applies a compressive load to the dyno equipment requiring good support of the shaft to ensure good motion and preventing binding or buckling of the shaft. Two bushings are used to support the linear brake shaft as well as the load cell shaft while couplers eliminate over constraints on each shaft.
Figure 16. Linear brake equipment used for thermal dyno testing of the Ram Mechanism.
Lesson Learned with Linear Dyno One unforeseen issue with this hardware was that the compliance in the brake pad material used at the interface of the rectangular cross-section shaft and the compound levers. This COTS high friction brake and clutch lining material while appearing somewhat metallic and feeling metallic to the touch is in fact significantly less stiff compared to steel or aluminum. A compression of 0.76 mm (0.030 in) at the brake pad for a resistive sliding force of nearly 20 kN is amplified at the user input to about 7.6 cm (3 in). This meant that to sweep the resistive load from zero to maximum the nuts must be moved up to 10 cm (4 in) along the threaded rod on the left and right side. A test can take be as short as about 15 seconds of mechanism motion time, requiring the operator to turn the nuts very quickly, which proved very difficult and introduced high irregularity of test conditions. The hardware was re-worked to thin the brake pad to reduce total deflection, giving the effect of increasing the operator ability to apply a changing load throughout the

149
brief tests. But even with this fix the rate of successful tests was less than 100% and required several re-tests to achieve a good sweep of resistive force from low to high or stall. What could be better than the Linear Dyno? Given the less than satisfying experience with this dyno equipment we suggest a simpler approach: a spring box. The spring box would consist of a spring mounted shaft supported by bushings that is pushed by the mechanism. Bushings prevent the shaft from binding under the high compressive load. The springs, a stack of Belleville washers, and should be sized to provide some stroke, ~4-8 mm would be enough for this application and reach full displacement at a force above the predicted peak force of the mechanism. A load cell would be placed between the mechanism and the spring box shaft to measure forces. The short stroke of the spring box, an obvious difference to the linear brake, can be mounted in various locations within the mechanism stroke to characterize points of interest. For the Ram Mechanism the stroke of interest is the end of travel where ferrule-to-ram interaction happens. The rest of travel is unloaded, thus, not necessitating high force dyno testing in these locations. The spring box would be a much simpler and quicker to design and fabrication alternative to the linear dyno as well as simpler to operate. Such a spring box was used in early development testing successfully; however, it was not selected because it lacks bi-directionality and the ability to apply load across the whole stroke of the mechanism. Requirements that lead to the much more complex linear dyno. The lesson learned here is that because this application did not require high force dyno testing across the full stroke length, the spring box alternative should have been selected.
Figure 17 Flight Sealing Station

150
Conclusion In this paper the two mechanisms are presented to document the hardware and the function they fulfill as a part of the Mars 2020 rover, launching later this year. The Ram Mechanism is a compact, high force linear actuator, while the Gripper Mechanism is a lower torque system featuring a unique flexurized output for interacting with the Sample Tube. The Ram Mechanism uses a PRS rarely used in spacecraft mechanisms and is not rated for any amount of cross-moment loading. While extensive characterization testing has not been performed in this body of work, we show that the PRS indeed has capacity for cross-moment loads, making it a more robust component than previously understood. Also used in the Ram Mechanism are cylinder and tapered roller bearings, again, rarely used in spaceflight mechanisms. We describe the method used for installing a low preload via its threaded retainer by characterizing the drag to preload relationship prior to the installation of the retainer. Despite the low preload, the locking nature of the retainer holds it securely. The relative step size of the magnetic detent brake to the mechanism hardstop resulted in conditions that would not allow for preload to be maintained against the hardstop. The presented understanding of the interaction allows for the problem to be avoided. We present the linear dyno, a mechanism for a high force linear thermal dyno testing, that worked moderately well for its intended purpose. Because of the low stiffness of friction pad material, the mechanism was more difficult to operate than intended. The simpler alternative, a spring box, could have been used in this application to save time and effort during schedule sensitive thermal dyno testing.
Acknowledgements The authors would like to thank the entire SCS team and all the other unsung heroes at JPL. A special thanks goes to the ACA I&T team and SCS Leadership. Big, complex missions don’t fly without wonderful, talented motivated people like you all. Semper Gumby. The work was carried out at the Jet Propulsion Laboratory, California Institute of Technology, under a contract with the National Aeronautics and Space Administration.
References 1. Silverman, Milo, Justin Lin. “Mars 2020 Adaptive Caching Assembly: So Many Challenges”
Proceedings of the 45th Aerospace Mechanisms Symposium, (2020). 2. LoSchiavo, Michael, Robin Phillips, Rebecca Mikhaylov, Lynn Braunschweig. “Mars 2020 Maxon
Commercial Motor Development from Commercial-Off-the-Shelf to Flight-Qualified Motors, Gearboxes, and Detent Brakes: Overcoming Issues and Lessons Learned” Proceedings of the 45th Aerospace Mechanisms Symposium, (2020).
3. SKF Roller Screw Catalog. <https://www.skf.com/binary/82-153959/14489-EN---Roller-screw-catalogue.pdf> accessed Jan 24, 2020
4. Nook Precision Screw Catalog, <http://www.nookindustries.com/Content/media/NOOK-Screw-Catalog.pdf> accessed January 24, 2020
5. Rolvis Roller Screw Catalog <http://www.nookindustries.com/Content/media/NOOK-Screw-Catalog.pdf> accessed January 24, 2020
6. J.V. Poplawski & Associates, COBRA AHS bearing analysis software <http://www.bearingspecialists.com/software.asp> accessed January 24, 2020

151
Design and Development of a Robust Chuck Mechanism for the Mars 2020 Coring Drill
Anthony Barletta*
Abstract The Sampling and Caching Subsystem (SCS) onboard the Mars 2020 rover includes a coring drill that can perform coring, abrasion, and regolith collection operations. The coring drill requires a chuck mechanism to allow for the changing of the bits needed to perform sampling. The chuck mechanism must be capable of securely connecting a bit under drilling, rover slip, and pullout loads, but also readily release a bit after application of these loads. The Mars 2020 chuck consists of a ball lock mechanism that allows for robust engagement and release of bit assemblies that are preloaded to ensure a secure, stiff connection between the bit assembly and the rest of the corer. To prevent jamming, the chuck incorporates rollers to preload the ball lock. The rollers are mounted onto a flexured cam that minimizes changes in internal mechanism loads that result from thermally induced dimensional changes, further mitigating the potential for jamming. The chuck mechanism is moved between engaged, disengaged, and loose chuck positions by rotating the cam with a gearmotor that incorporates a magnetic detent brake that prevents inadvertent mechanism motion under design loads. Ongoing testing is occurring on the qualification model in a dirty environment while coring and abrading rocks in a Mars representative environment.
Introduction and Previous Flight Heritage Mars 2020 is a Mars surface mission planned for launch in the summer of 2020, with a planned landing date of February 2021 in Jezero Crater. A major objective of the mission is to collect core and regolith samples for potential return to Earth by future missions as part of a Mars sample return campaign. The Mars 2020 rover will carry a coring drill, also known simply as the corer, to collect these samples. More details concerning the corer can be found in [1] and [2]. The chuck mechanism acts as the interface with the various bit assemblies needed to perform coring, abrasion, and regolith sample collection operations. The location of the chuck mechanism within the overall Mars 2020 coring drill as well as views of its internal components can be seen in Figure 2. The Mars 2020 chuck can be described as a preloaded ball lock mechanism that interfaces with sleeves on the bit assemblies and is able to accept and engage these bit assemblies regardless of their relative clocking about the central axis of the chuck and corer. Design and development were carried out at the Jet Propulsion Laboratory, California Institute of Technology, under a contract with the National Aeronautics and Space Administration (80NM0018D0004).
Figure 1: Mars 2020 Coring Drill Chuck with coring bit installed.
* Jet Propulsion Laboratory, Pasadena, CA; [email protected]
Proceedings of the 45th Aerospace Mechanisms Symposium, NASA Johnson Space Center, 2020
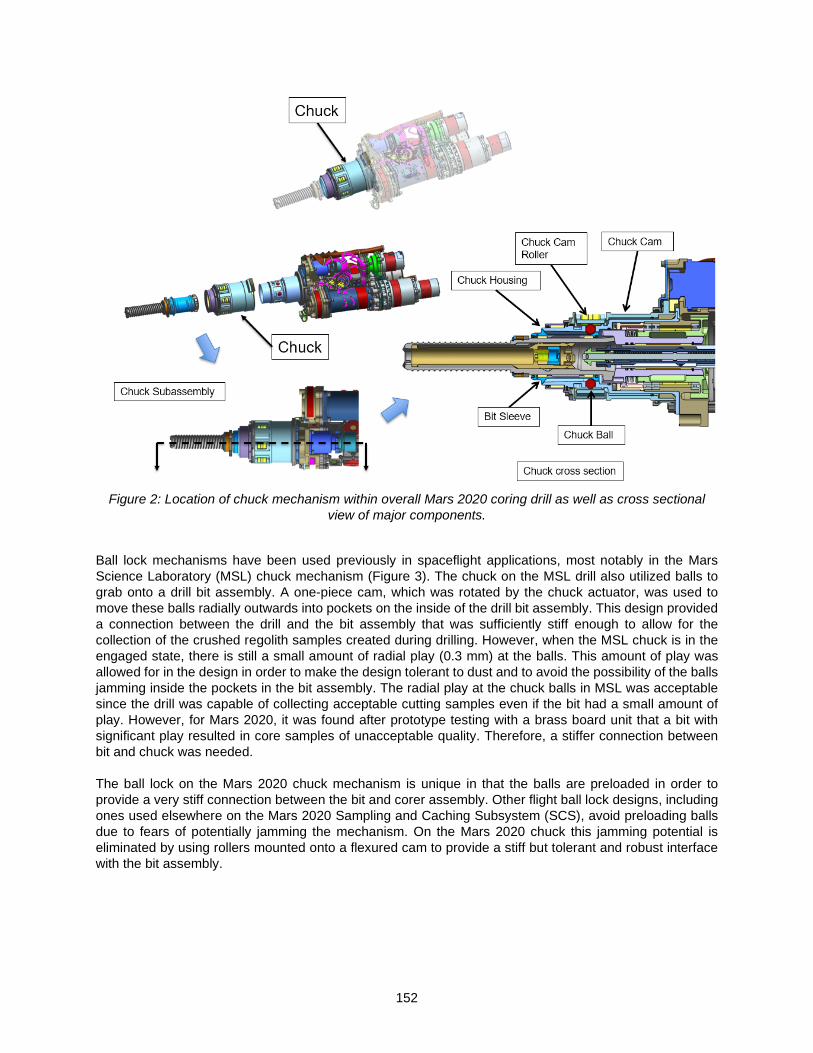
152
Figure 2: Location of chuck mechanism within overall Mars 2020 coring drill as well as cross sectional
view of major components.
Ball lock mechanisms have been used previously in spaceflight applications, most notably in the Mars Science Laboratory (MSL) chuck mechanism (Figure 3). The chuck on the MSL drill also utilized balls to grab onto a drill bit assembly. A one-piece cam, which was rotated by the chuck actuator, was used to move these balls radially outwards into pockets on the inside of the drill bit assembly. This design provided a connection between the drill and the bit assembly that was sufficiently stiff enough to allow for the collection of the crushed regolith samples created during drilling. However, when the MSL chuck is in the engaged state, there is still a small amount of radial play (0.3 mm) at the balls. This amount of play was allowed for in the design in order to make the design tolerant to dust and to avoid the possibility of the balls jamming inside the pockets in the bit assembly. The radial play at the chuck balls in MSL was acceptable since the drill was capable of collecting acceptable cutting samples even if the bit had a small amount of play. However, for Mars 2020, it was found after prototype testing with a brass board unit that a bit with significant play resulted in core samples of unacceptable quality. Therefore, a stiffer connection between bit and chuck was needed. The ball lock on the Mars 2020 chuck mechanism is unique in that the balls are preloaded in order to provide a very stiff connection between the bit and corer assembly. Other flight ball lock designs, including ones used elsewhere on the Mars 2020 Sampling and Caching Subsystem (SCS), avoid preloading balls due to fears of potentially jamming the mechanism. On the Mars 2020 chuck this jamming potential is eliminated by using rollers mounted onto a flexured cam to provide a stiff but tolerant and robust interface with the bit assembly.

153
Figure 3: Overview of chuck ball lock design used on the Mars Science Laboratory (MSL). The MSL
chuck allowed for a small amount of play of the bit assembly even when fully chucked. This play resulted from ~0.3 mm of radial ball travel that was permitted when the bit was engaged. This play was
intentionally included so as to allow for dust accumulation and to accommodate part dimensional and positional deviations, and was permissible for MSL since a stiff bit-to-drill connection was not a
requirement.
Design Requirements
The Mars 2020 corer chuck mechanism had several requirements that led to a design unique from those used on previous missions and applications. The chuck needs to allow for the exchange of bit assemblies for different sampling activities and to increase overall sampling possible during the mission. It also needs to be able to retain a bit under various high load cases, including rover slip and bit pullout. To ensure high quality samples, especially during coring, the chuck needs to provide a stiff restraint of bit assemblies to the corer to minimize excessive play of the bit during sampling. At the same time, some degree of compliance is needed to accommodate bit exchange operations. While providing a secure, stiff connection between the bit and coring drill, the chuck also needs to be resistant to jamming, which could prevent removal of the bit and severely hamper mission operations. Another requirement was the ability to fully release a bit without the application of an external load from another part or mechanism. This requirement is needed since the corer will launch with a bit already installed in the chuck. After landing, the chuck needs to be able to disengage, release, and discard this bit onto the surface. The chuck had to satisfy all these requirements over a range of temperatures and be tolerant to deviations in part and assembly dimensions.

154
Mechanism Architecture For the Mars 2020 chuck design, it was decided to still use a variation of a ball lock. Ball locks such as that used in MSL have proven flight heritage, and such a design is compact, simple, strong, and places few restrictions on bit orientation during the mating and demating operations. Each bit assembly consists of a bit contained within a sleeve (see Figure 4). The chuck mechanism holds onto the bit via this sleeve. Balls in the chuck assembly are preloaded onto a concave surface on the bit sleeve. Due to the contact angle at the chuck balls, this preloading causes the sleeve to be pulled further into the chuck until contact occurs between the front of the chuck housing and a spherical surface at the front of the bit sleeve. Preload exists both between the chuck balls and sleeve and between the chuck housing and sleeve, stiffly restraining the sleeve and therefore bit within the chuck. The preload torque to apply onto the cam is chosen based off anticipated side loads during sampling operations, these anticipated loads being informed by measured loads from prototype testing.
Figure 4: Fully assembled flight chuck mechanism (left) with major components indicated and a model
illustrating the interface between the chuck mechanism and a bit. The chuck is a ball lock mechanism that holds onto a bit via preloading of a sleeve on the bit assembly against balls and the front of the chuck
housing.
The chuck is unique on Mars 2020 in that it is the only ball lock mechanism on the subsystem where the balls are purposely preloaded. Elsewhere on the Mars 2020 SCS, ball locks are designed so as not to load the balls in order to avoid jamming. Rather than not loading the balls, which would result in an unacceptably loose bit-to-chuck connection, the corer chuck mitigates jamming potential by using rollers and flexures. Preloading of the chuck balls and bit sleeve is accomplished via rollers mounted on a rotating cam. When the cam is rotated in the proper direction, the rollers will make contact with the balls, pushing the balls down towards the chuck centerline and onto the bit sleeve. To release a bit, the cam is rotated in the opposite direction, separating the rollers from the balls and removing preload from the sleeve. After sufficient cam rotation, the balls are free to move radially out of their holes in the housing enough to allow the bit sleeve to be removed from the chuck. Cam internal geometry is such that in the chuck’s disengaged position the balls are free to move out of their holes enough to allow for bit removal but are still sufficiently captured to prevent them from falling completely out of their respective holes. Rotation of the chuck cam is accomplished via an actuator acting through a segmented gear mesh (Figure 5 and Figure 6). The chuck actuator incorporates a magnetic detent brake acting through a staged planetary

155
gear train. The magnetic detent brake resists rotation of the actuator output under an externally applied torque, thereby resisting cam rotation under externally applied loads on the chuck and bit. More details on the chuck actuator design and implementation can be found in [3].
Figure 5: (Left) CAD view of chuck actuator interfacing with mechanism via segmented gear. (Right) View of chuck mechanism engaged with bit sleeve. Note the exposed gear mesh between the chuck actuator
output pinion and segmented gear. Segmented gear is fastened to the cam.
Figure 6: Detail view of mesh between chuck actuator output pinion and segmented gear. Note the
hardstop surfaces on either side of the segmented gear which serve to limit angular motion of the cam relative to the rest of the corer. A housing cover part (not shown) is installed over the volume occupied by
this gear mesh.
Cam Rollers To allow for preloading of the chuck balls while avoiding the possibility of jamming, the balls are pushed down onto the bit sleeve using rollers mounted on the chuck cam. The use of cam rollers allows for a rolling contact that effectively reduces the friction that develops at the cam and ball interface. The use of rolling contacts is common in mechanisms to avoid the potential for jamming or binding which might otherwise occur for sliding contacts.

156
Rollers were chosen primarily to mitigate the potential for jamming. Jamming will occur if the torque applied by the actuator cannot overcome the frictional forces developed within the chuck mechanism in its preloaded, engaged state. The use of rollers significantly reduces the friction present at the interface with the chuck balls. The rollers are mounted onto flexures machined into the cam. These flexures provide a compliant connection between the rollers and cam, allowing for better load distribution amongst the balls as well as reducing changes in preload due to temperature induced dimensional changes and part and assembly dimensional deviations.
Figure 7: Cross sectional detail views of cam rollers, both in the engaged and disengaged states.
Flexures and Load Distribution Another concern with preloading balls is the potential for uneven load distribution amongst the balls. The number of balls in the chuck was determined by performing an analysis for contact stress under off-nominal load cases such as rover slip and bit pull out. The goal of the analysis was to determine the minimum number of balls needed to avoid brinelling at the balls and interfacing parts. The analysis indicates that six balls is the minimum needed to react all design loads without yielding assuming a fairly even and predictable load distribution. However, once machining and other errors are accounted for, the load distribution is unlikely to be even or predictable and could result in very high loads being applied to a small number of balls. To mitigate high ball loading, the cam rollers were mounted onto flexures cut into the cam. The flexures allow for a small amount of compliance at the cam rollers, allow them to take up any difference in relative radial position due to machining and assembly errors. This helps to spread the load more evenly amongst

157
the balls, resulting in lower maximum ball loads. The flexures were sized so as to provide enough compliance to spread out loads amongst the balls but be stiff enough to allow for a very stiff bit-to-chuck connection to obtain good quality cores. The cam also includes hardstop pins which serve to limit total flexure travel. Under pure tensile axial loading on the bit, the cam rollers will move radially out under the action of the balls being pushed outward by the bit sleeve. The hardstop pins serve to limit the radial deflection of the flexures for such cases so as to prevent plastic deformation. These pins are captured in the cam by cap that is bolted onto the cam front.
Figure 8: Detailed CAD view of the flexures on the Mars 2020 chuck cam. The cam rollers used to
preload the balls that restrain the bit assembly are mounted onto the flexures via roller pins. The flexures are sized so as to provide a stiff bit-to-corer connection at drilling loads while allowing the bit assembly to contact an internal load shunt at high off nominal side loads. Flexure deflections are limited by hardstop
pins to prevent yielding under pullout loading.
Figure 9: View of the chuck cam with integral flexures. The cam is machined as one piece using standard
manufacturing processes including milling, drilling, turning, and band saw cutting. Despite the complex shape of the flexures, there was no need to utilize electrical discharge machining (EDM).
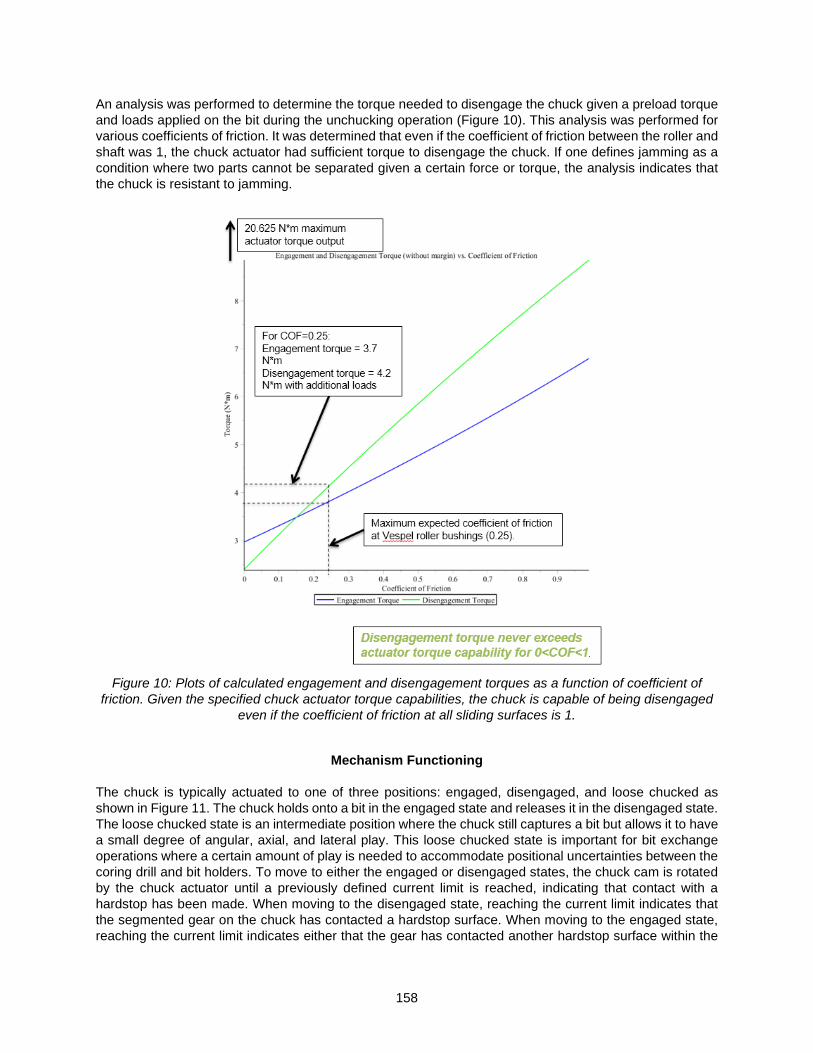
158
An analysis was performed to determine the torque needed to disengage the chuck given a preload torque and loads applied on the bit during the unchucking operation (Figure 10). This analysis was performed for various coefficients of friction. It was determined that even if the coefficient of friction between the roller and shaft was 1, the chuck actuator had sufficient torque to disengage the chuck. If one defines jamming as a condition where two parts cannot be separated given a certain force or torque, the analysis indicates that the chuck is resistant to jamming.
Figure 10: Plots of calculated engagement and disengagement torques as a function of coefficient of
friction. Given the specified chuck actuator torque capabilities, the chuck is capable of being disengaged even if the coefficient of friction at all sliding surfaces is 1.
Mechanism Functioning
The chuck is typically actuated to one of three positions: engaged, disengaged, and loose chucked as shown in Figure 11. The chuck holds onto a bit in the engaged state and releases it in the disengaged state. The loose chucked state is an intermediate position where the chuck still captures a bit but allows it to have a small degree of angular, axial, and lateral play. This loose chucked state is important for bit exchange operations where a certain amount of play is needed to accommodate positional uncertainties between the coring drill and bit holders. To move to either the engaged or disengaged states, the chuck cam is rotated by the chuck actuator until a previously defined current limit is reached, indicating that contact with a hardstop has been made. When moving to the disengaged state, reaching the current limit indicates that the segmented gear on the chuck has contacted a hardstop surface. When moving to the engaged state, reaching the current limit indicates either that the gear has contacted another hardstop surface within the

159
corer or that the cam rollers are preloaded onto the chuck balls, depending on whether a bit is inserted into the chuck. During flight, no operations are planned to occur that would involve actuating the chuck to the engaged state without a bit present within the mechanism. In addition to these three states, the chuck can be commanded to any intermediate position. For example, during bakeout, the chuck was in an “almost engaged” position with a bit installed. This position was chosen so as to avoid preloading the bushings in the cam rollers during the high temperatures (~114° C) of bakeout, which could result in creep in the bushing material. The use of intermediate chuck positions has also been explored for use in recovery operations for a bit stuck in rock.
Figure 11: Illustration of three major chuck states: 1) engaged, 2) loose, and 3) disengaged. A bit
assembly is fully restrained and preloadd within the chuck in the engaged state, this is the position the chuck is in during sampling operations. In the loose chucked state, the bit assembly is still restrained within the chuck but is not preloaded and has some lateral, angular, and axial play. This play in the bit
assembly is important in allowing for robust and reliable bit exchange that can accommodate for dimensional and positional deviations. The bit assembly is fully released when the chuck is actuated to
the disengaged state.
Testing and Results
Several iterations of the chuck mechanism were assembled and tested, including three flightworthy units. Various tests to characterize chuck performance and verify capabilities were conducted at the mechanism and corer level. Some of more noteworthy tests conducted and their results are summarized here. Loose chuck bit assembly play measurement As previously mentioned, some degree of axial, angular, and lateral play is needed in the bit assembly during bit exchange operations while in the loose chuck state. Measurement of this play in the assembled flight units was accomplished using a test bit with an affixed laser pointer. By measuring how much the light from this laser moved on a screen when the chuck was actuated from engaged to loose, it was possible to calculate what play was allowed. Subsequent bit exchange tests on a qualification unit confirmed that the play allowed for by the chuck enabled nominal functionality.

160
Bit Pullout Static Test When sizing the components within the chuck, one of the major driving load cases was bit pullout. This covers a situation where a bit is stuck in the rock and the full margined pullout load capability of the corer feed mechanism is applied on the bit. When including anticipated pullout load needed to free a bit, force margin, and potential feed actuator torque overages, this pullout load sums up to 6514 N. To verify the capability to react this high load, one of the flight chuck units was subjected to a static test to verify that it could retain a bit under high pullout loads without damage. Figure 12 includes plots of the applied forces during this static test. After the static test, the chuck mechanism retained full functionality with no detrimental yielding on any parts observed.
Figure 12: Plots of force data during a static test of a Mars 2020 coring drill chuck. The applied forces represented the worst case loading for the chuck, which is pull out on a bit with maximum applied load from the coring drill feed mechanism. The lower plot is a magnified view of the force data with further
detail of the loads actually reached. After the static test, the chuck mechanism retained full functionality with no detrimental yielding on any parts observed.
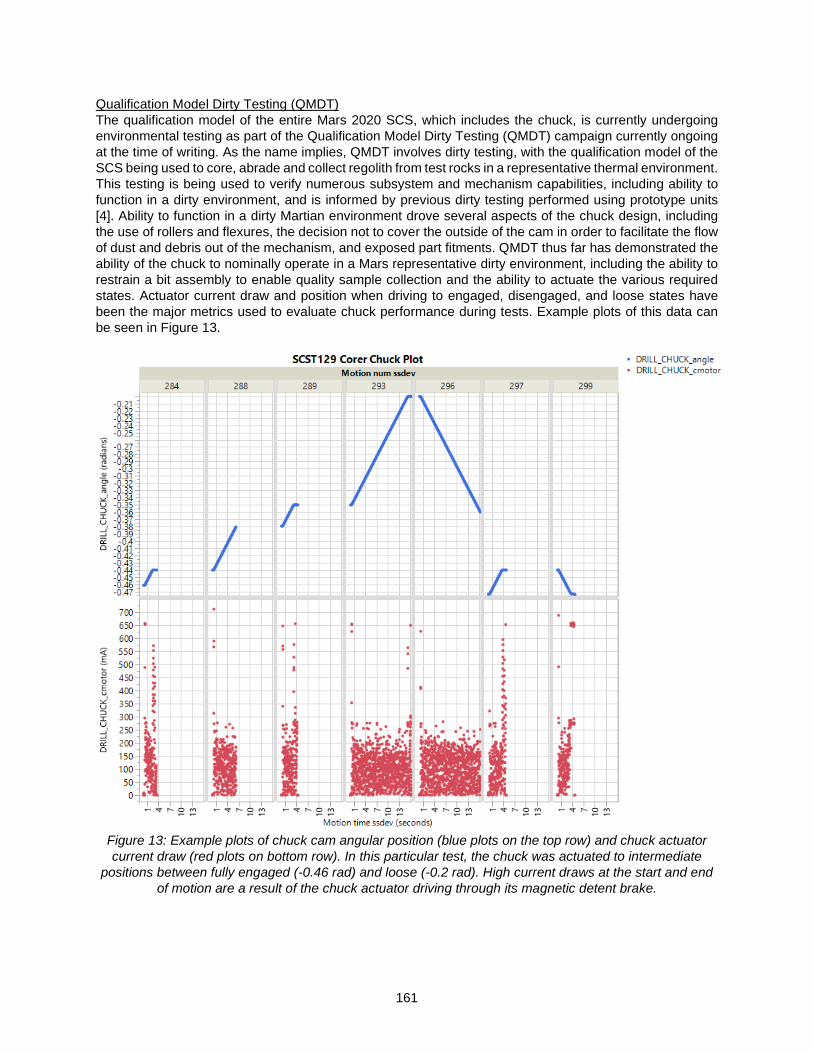
161
Qualification Model Dirty Testing (QMDT) The qualification model of the entire Mars 2020 SCS, which includes the chuck, is currently undergoing environmental testing as part of the Qualification Model Dirty Testing (QMDT) campaign currently ongoing at the time of writing. As the name implies, QMDT involves dirty testing, with the qualification model of the SCS being used to core, abrade and collect regolith from test rocks in a representative thermal environment. This testing is being used to verify numerous subsystem and mechanism capabilities, including ability to function in a dirty environment, and is informed by previous dirty testing performed using prototype units [4]. Ability to function in a dirty Martian environment drove several aspects of the chuck design, including the use of rollers and flexures, the decision not to cover the outside of the cam in order to facilitate the flow of dust and debris out of the mechanism, and exposed part fitments. QMDT thus far has demonstrated the ability of the chuck to nominally operate in a Mars representative dirty environment, including the ability to restrain a bit assembly to enable quality sample collection and the ability to actuate the various required states. Actuator current draw and position when driving to engaged, disengaged, and loose states have been the major metrics used to evaluate chuck performance during tests. Example plots of this data can be seen in Figure 13.
Figure 13: Example plots of chuck cam angular position (blue plots on the top row) and chuck actuator current draw (red plots on bottom row). In this particular test, the chuck was actuated to intermediate
positions between fully engaged (-0.46 rad) and loose (-0.2 rad). High current draws at the start and end of motion are a result of the chuck actuator driving through its magnetic detent brake.

162
Challenges and Lessons Learned Several challenges were encountered during the design of the chuck mechanism as summarized here. Hertzian contact stresses Hertzian contact stresses generated during high load cases were a major driving factor in material selection and component design. These high contact stresses required the selection of high strength materials, such as Maraging 300 steel, and platings, such as electroless nickel, for parts such as the chuck balls, rollers, and bit sleeve. Contact stresses also played a role in the selection of the number and size of chuck balls. A higher number of balls would lessen the amount of load reacted per ball but would also increase contact stresses due to the smaller radius of each ball. High contact stresses also drove the material and surface treatment selection in the bit sleeve assemblies. The geometry of the cam rollers was also optimized so as to minimize contact stresses, specifically by adding a concave race to the central portion of the rollers which preload against the balls.
Figure 14: Detail view of cam rollers and concave central races. The rollers preload against the balls at these races. A concave race was added to each roller so as to minimize the Hertzian contact stresses
generated under worst case loads such as would occur during rover slip or bit pullout. Flexure design The design of the cam flexure mounts for the rollers was a highly iterative process, requiring multiple finite element analyses and design changes to optimize stresses and deflections in the flexures. Constraints on flexure geometry included limitations imposed by manufacturing processes, total size envelope allocated for the overall chuck mechanism, number of balls needed in chuck, and stresses developed under worst case loads. Contamination control accommodations Contamination control requirements placed restrictions on the type of bearings and lubricants that could be used in the mechanism. Fortunately, since no high-speed rotations occur in the chuck mechanism, the use of ball bearings and grease lubricants was avoided. Instead, plain bearings were used throughout. To accommodate dimensional changes due to temperature and material differences, the larger plain bearings had a split cut into them to minimize changes in fitment. Chuck actuator design and implementation Challenges were also encountered in the design and implementation of the actuator, particularly regarding the use of a magnetic detent brake and the issues this caused in controlling actuator torque output. The great advantage of a magnetic detent brake is that it is a passive brake. Whereas an active mechanism such as a solenoid or toothed brake would introduce an additional potential point of failure, a passive detent brake does not pose such an issue. However, when applying torque, the actuator must overcome this detent in addition to producing the needed torque output. This complicates the controlled application of torque into the mechanism and results in potentially high overages in the torque delivered versus what is desired.
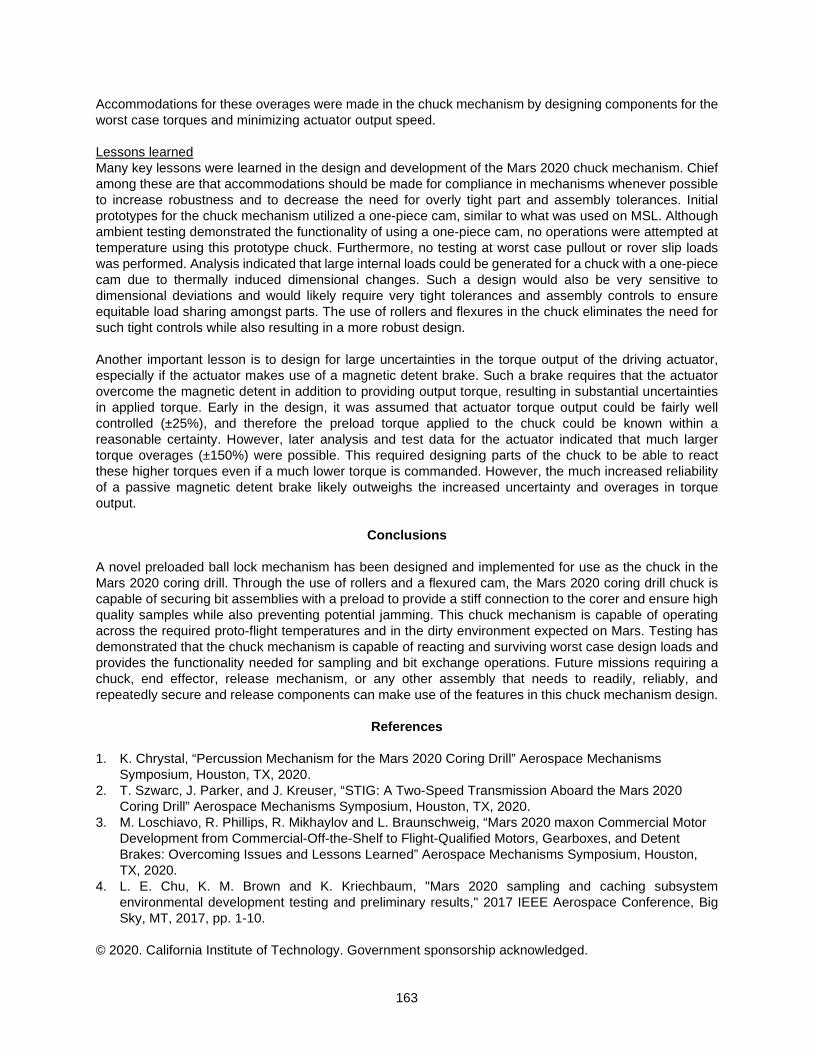
163
Accommodations for these overages were made in the chuck mechanism by designing components for the worst case torques and minimizing actuator output speed. Lessons learned Many key lessons were learned in the design and development of the Mars 2020 chuck mechanism. Chief among these are that accommodations should be made for compliance in mechanisms whenever possible to increase robustness and to decrease the need for overly tight part and assembly tolerances. Initial prototypes for the chuck mechanism utilized a one-piece cam, similar to what was used on MSL. Although ambient testing demonstrated the functionality of using a one-piece cam, no operations were attempted at temperature using this prototype chuck. Furthermore, no testing at worst case pullout or rover slip loads was performed. Analysis indicated that large internal loads could be generated for a chuck with a one-piece cam due to thermally induced dimensional changes. Such a design would also be very sensitive to dimensional deviations and would likely require very tight tolerances and assembly controls to ensure equitable load sharing amongst parts. The use of rollers and flexures in the chuck eliminates the need for such tight controls while also resulting in a more robust design. Another important lesson is to design for large uncertainties in the torque output of the driving actuator, especially if the actuator makes use of a magnetic detent brake. Such a brake requires that the actuator overcome the magnetic detent in addition to providing output torque, resulting in substantial uncertainties in applied torque. Early in the design, it was assumed that actuator torque output could be fairly well controlled (±25%), and therefore the preload torque applied to the chuck could be known within a reasonable certainty. However, later analysis and test data for the actuator indicated that much larger torque overages (±150%) were possible. This required designing parts of the chuck to be able to react these higher torques even if a much lower torque is commanded. However, the much increased reliability of a passive magnetic detent brake likely outweighs the increased uncertainty and overages in torque output.
Conclusions A novel preloaded ball lock mechanism has been designed and implemented for use as the chuck in the Mars 2020 coring drill. Through the use of rollers and a flexured cam, the Mars 2020 coring drill chuck is capable of securing bit assemblies with a preload to provide a stiff connection to the corer and ensure high quality samples while also preventing potential jamming. This chuck mechanism is capable of operating across the required proto-flight temperatures and in the dirty environment expected on Mars. Testing has demonstrated that the chuck mechanism is capable of reacting and surviving worst case design loads and provides the functionality needed for sampling and bit exchange operations. Future missions requiring a chuck, end effector, release mechanism, or any other assembly that needs to readily, reliably, and repeatedly secure and release components can make use of the features in this chuck mechanism design.
References 1. K. Chrystal, “Percussion Mechanism for the Mars 2020 Coring Drill” Aerospace Mechanisms
Symposium, Houston, TX, 2020. 2. T. Szwarc, J. Parker, and J. Kreuser, “STIG: A Two-Speed Transmission Aboard the Mars 2020
Coring Drill” Aerospace Mechanisms Symposium, Houston, TX, 2020. 3. M. Loschiavo, R. Phillips, R. Mikhaylov and L. Braunschweig, “Mars 2020 maxon Commercial Motor
Development from Commercial-Off-the-Shelf to Flight-Qualified Motors, Gearboxes, and Detent Brakes: Overcoming Issues and Lessons Learned” Aerospace Mechanisms Symposium, Houston, TX, 2020.
4. L. E. Chu, K. M. Brown and K. Kriechbaum, "Mars 2020 sampling and caching subsystem environmental development testing and preliminary results," 2017 IEEE Aerospace Conference, Big Sky, MT, 2017, pp. 1-10.
© 2020. California Institute of Technology. Government sponsorship acknowledged.

164

165
Percussion Mechanism for the Mars 2020 Coring Drill
Kyle Chrystal*
Abstract The Mars 2020 rover includes a Sampling & Caching Subsystem that is required to acquire core samples of hard rocks and to abrade rocky surfaces flat and smooth in order to facilitate surface science. Hard, high strength rocks exhibit brittle failure modes, and can be drilled and chiseled efficiently using percussive impacts. The coring drill percussion mechanism was designed to provide those impacts with variable output force and to be used with various drill bits. A unique hammering mechanism, using a base-driven hammer, powered by a conventional rotary actuator driving a Scotch yoke, was designed to robustly provide the required function in a Martian environment for a life exceeding 2 million impacts.
Introduction The coring drill, also called the “corer,” is the sampling tool on the turret at the end of the rover’s robotic arm. The primary functions of the corer are to drill into the surface with a coring bit to generate a rock core sample and to abrade the surface with an abrasion bit. The abrasion bit creates a spot-faced surface that allows other turret-mounted instruments to perform contact surface science. Hard rocks are not generally worked by cutting. They are usually either fractured apart (a brittle failure of the rock) by some form of chiseling or spalling or they are ground down when abraded by a harder material than the rock. A practical method for fracturing chips from a rocky surface is to use a percussive impact to chisel chips from the parent rock. Such impacts would deliver high force, short duration impulses to the rock. The force magnitude of the impulse must be large enough to cause a large enough stress to break the rock apart and the short duration of the impulse precludes the entire drill from having to react large forces. By breaking the rock with many short duration impulses, large forces can be reacted by only a very small subset of hardware and the time-average reaction required to hold the drill bit against the rock can be on the order of 100 N or less. This method is also practical for space flight applications because it enables low powered actuators (order 50 W to 100 W) to produce loads sufficient to fracture hard rocks. The percussion mechanism uses an oscillating hammer to produce the impacts required for the corer to drill and abrade hard rocks effectively. The mechanism is situated near the center of the drill, above an anvil that combines rotational motion and percussive impact forces and transfers them both to an interchangeable drill bit. The bit is held into the front of the drill by a chuck and it is free to spin and translate along the drill axis to do rotary-percussive drilling. When the hammer contacts the anvil, typically at velocities up to 3 m/s, the mutual deformation of the contacting surfaces creates a local compressive stress in each part. The stress gradient in the anvil causes a wave to travel at the speed of sound down the axis of the anvil, into the bit, and finally from the carbide bit teeth into the rock, causing portions of the rock to be chipped off from the parent rock. The subject of this paper is the mechanism that creates this hammer motion and performs the percussion function.
*Jet Propulsion Laboratory, California Institute of Technology; [email protected]
Proceedings of the 45th Aerospace Mechanisms Symposium, NASA Johnson Space Center, 2020
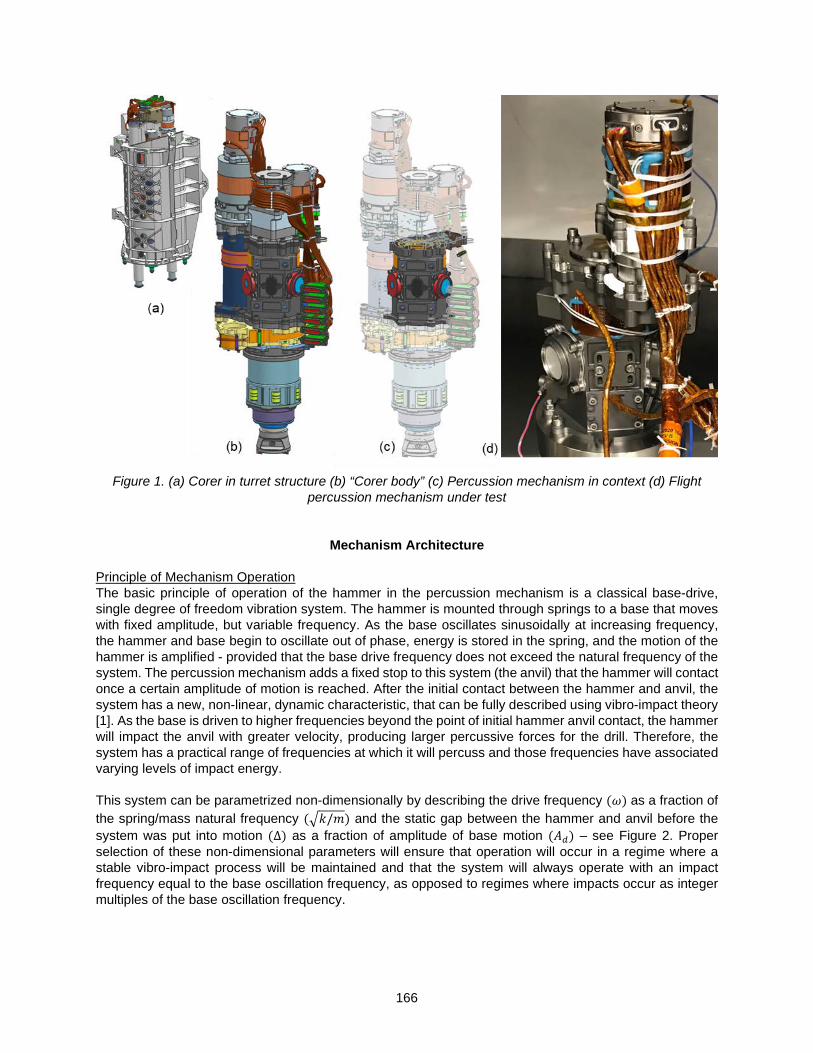
166
Figure 1. (a) Corer in turret structure (b) “Corer body” (c) Percussion mechanism in context (d) Flight
percussion mechanism under test
Mechanism Architecture Principle of Mechanism Operation The basic principle of operation of the hammer in the percussion mechanism is a classical base-drive, single degree of freedom vibration system. The hammer is mounted through springs to a base that moves with fixed amplitude, but variable frequency. As the base oscillates sinusoidally at increasing frequency, the hammer and base begin to oscillate out of phase, energy is stored in the spring, and the motion of the hammer is amplified - provided that the base drive frequency does not exceed the natural frequency of the system. The percussion mechanism adds a fixed stop to this system (the anvil) that the hammer will contact once a certain amplitude of motion is reached. After the initial contact between the hammer and anvil, the system has a new, non-linear, dynamic characteristic, that can be fully described using vibro-impact theory [1]. As the base is driven to higher frequencies beyond the point of initial hammer anvil contact, the hammer will impact the anvil with greater velocity, producing larger percussive forces for the drill. Therefore, the system has a practical range of frequencies at which it will percuss and those frequencies have associated varying levels of impact energy. This system can be parametrized non-dimensionally by describing the drive frequency (𝜔𝜔) as a fraction of the spring/mass natural frequency (𝑘𝑘/𝑚𝑚) and the static gap between the hammer and anvil before the system was put into motion (Δ) as a fraction of amplitude of base motion (𝐴𝐴𝑑𝑑) – see Figure 2. Proper selection of these non-dimensional parameters will ensure that operation will occur in a regime where a stable vibro-impact process will be maintained and that the system will always operate with an impact frequency equal to the base oscillation frequency, as opposed to regimes where impacts occur as integer multiples of the base oscillation frequency.
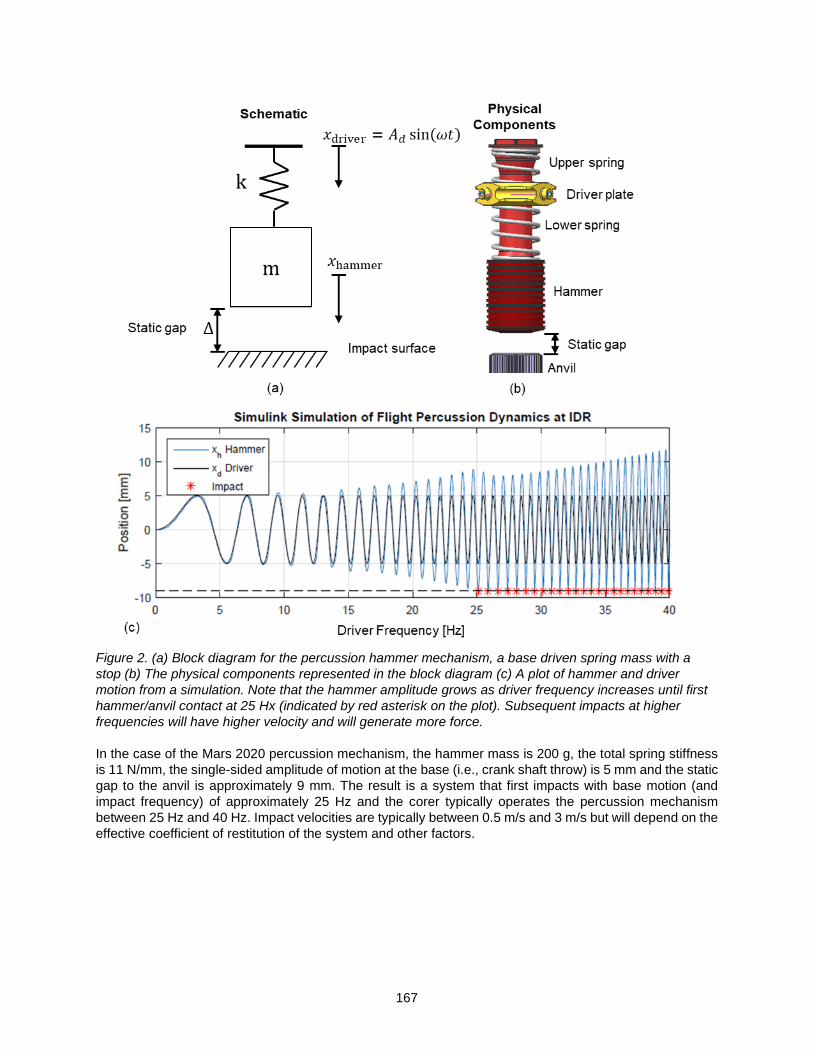
167
Figure 2. (a) Block diagram for the percussion hammer mechanism, a base driven spring mass with a stop (b) The physical components represented in the block diagram (c) A plot of hammer and driver motion from a simulation. Note that the hammer amplitude grows as driver frequency increases until first hammer/anvil contact at 25 Hx (indicated by red asterisk on the plot). Subsequent impacts at higher frequencies will have higher velocity and will generate more force. In the case of the Mars 2020 percussion mechanism, the hammer mass is 200 g, the total spring stiffness is 11 N/mm, the single-sided amplitude of motion at the base (i.e., crank shaft throw) is 5 mm and the static gap to the anvil is approximately 9 mm. The result is a system that first impacts with base motion (and impact frequency) of approximately 25 Hz and the corer typically operates the percussion mechanism between 25 Hz and 40 Hz. Impact velocities are typically between 0.5 m/s and 3 m/s but will depend on the effective coefficient of restitution of the system and other factors.

168
Figure 3. Percussion mechanism architecture – rotating and oscillating elements

169
The percussion mechanism itself can be divided into the rotary portion of the mechanism and the oscillating portion, with a Scotch yoke performing the conversion from rotational motion to translation. See Figure 3 for a mechanism cross-section with the rotary and oscillating portions clearly delineated. Rotary Portion of the Mechanism – actuator, gears, and bearings The rotating components of the mechanism consist of a gear motor which drives a gear train in the mechanism with the final element being the crank shafts that push the diver plate up and down. The actuator output has an attached pinion spur gear that turns a mating gear. The mating gear is screwed to the end of a part that combines a hollow shaft and a bevel gear and this shaft is supported in the mechanism housing by an angular contact bearing pair, arranged back-to-back, with spacers. The bevel gear meshes with three synchronized bevel pinions which are attached to the crank shafts. Each bevel pinion / crank shaft assembly is also supported by an angular contact bearing pair, arranged back-to-back. Transition from Rotary to Oscillatory - three Scotch yokes The transition between the rotary and oscillating parts of the mechanism is accomplished by the three Scotch yokes – see Figure 4 for details. A spherical roller, which is a 3/8-in (9.5-mm) diameter Grade 10 440C ball with a precision hole added, is placed on each crank shaft and is free to spin on the crank shaft pin in a plain bearing arrangement. The crank pin to roller ball interface is grease filled with Castrol Braycote Micronic 600 EF. As the crank turns, the spherical roller spins on the crank pin and also rolls back and forth in a cylindrical groove on the side of the driver plate while pushing the driver plate up and down. Three cranks arranged 120° apart from one another fully define the height and attitude of the driver plate, except for rotation about the axis of hammering motion, so no overturning moment is carried by the roller and the driver plate needs no additional linear guidance. This arrangement balances loads and minimizes sources of friction and drag. Anti-rotation rollers consist of solid Vespel crowned rollers that ride in a plain-bearing arrangement directly on a stub shaft that is integrally machined into the sides of the driver plate in between each groove. These provide very loose guidance by preventing the driver plate from rotating in-plane, which would be an incidental motion.
Figure 4. (a) A conventional Scotch yoke which is the means of converting rotation into translation in the percussion mechanism (b) Vertical section view through bevel pinion, crank shaft, roller ball, and driver plate (c) Horizontal section through divider plate showing three cranks and anti-rotation rollers in guides
Oscillating Portion of the Mechanism – driver plate / springs / hammer The oscillating portion of the mechanism consists of the driver plate, springs, hammer shaft, hammer, hammer bushings and the guide shaft – see again Figure 3. The driver plate only pushes against the springs as it oscillates, but it has a large clearance hole in the center to allow it to move up and down along the axis of hammer motion without contacting the hammer shaft. Two springs are arranged one on top of and the other below the driver plate and are captured and preloaded between the hammer and hammer shaft, so
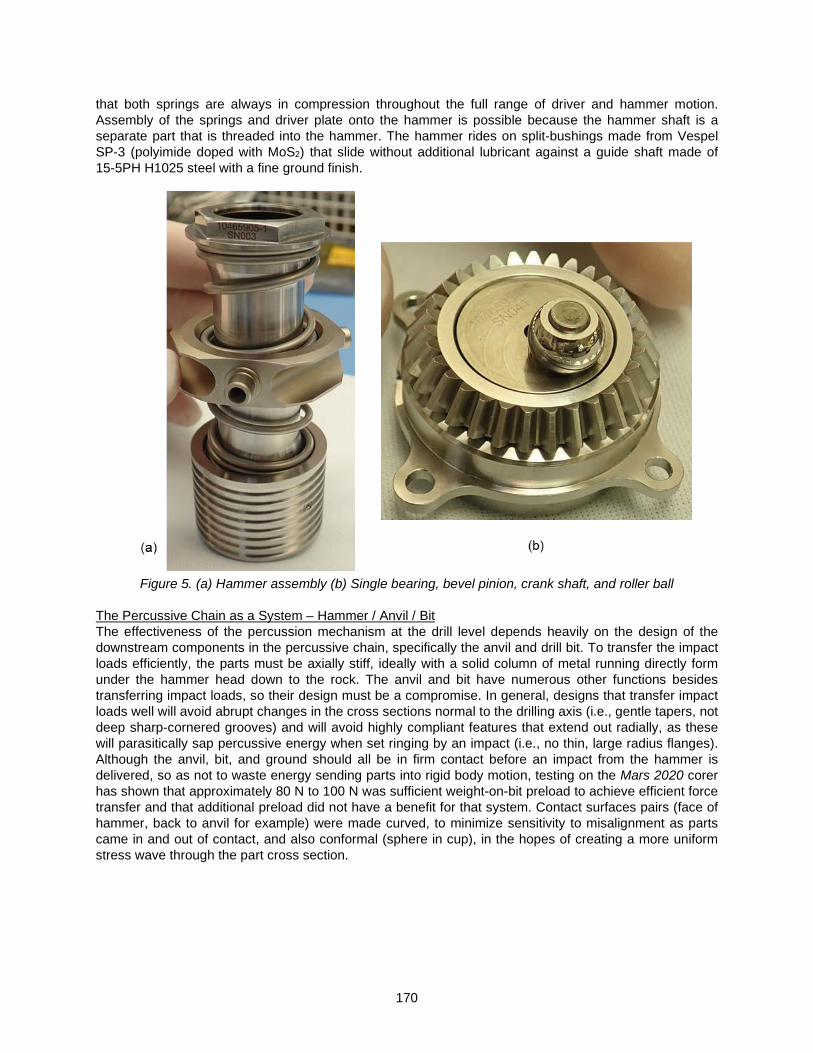
170
that both springs are always in compression throughout the full range of driver and hammer motion. Assembly of the springs and driver plate onto the hammer is possible because the hammer shaft is a separate part that is threaded into the hammer. The hammer rides on split-bushings made from Vespel SP-3 (polyimide doped with MoS2) that slide without additional lubricant against a guide shaft made of 15-5PH H1025 steel with a fine ground finish.
Figure 5. (a) Hammer assembly (b) Single bearing, bevel pinion, crank shaft, and roller ball
The Percussive Chain as a System – Hammer / Anvil / Bit The effectiveness of the percussion mechanism at the drill level depends heavily on the design of the downstream components in the percussive chain, specifically the anvil and drill bit. To transfer the impact loads efficiently, the parts must be axially stiff, ideally with a solid column of metal running directly form under the hammer head down to the rock. The anvil and bit have numerous other functions besides transferring impact loads, so their design must be a compromise. In general, designs that transfer impact loads well will avoid abrupt changes in the cross sections normal to the drilling axis (i.e., gentle tapers, not deep sharp-cornered grooves) and will avoid highly compliant features that extend out radially, as these will parasitically sap percussive energy when set ringing by an impact (i.e., no thin, large radius flanges). Although the anvil, bit, and ground should all be in firm contact before an impact from the hammer is delivered, so as not to waste energy sending parts into rigid body motion, testing on the Mars 2020 corer has shown that approximately 80 N to 100 N was sufficient weight-on-bit preload to achieve efficient force transfer and that additional preload did not have a benefit for that system. Contact surfaces pairs (face of hammer, back to anvil for example) were made curved, to minimize sensitivity to misalignment as parts came in and out of contact, and also conformal (sphere in cup), in the hopes of creating a more uniform stress wave through the part cross section.

171
Requirements Development
The percussion mechanism functional requirements are derived from the planned set of sampling operations which specify operation type and number (i.e., 43 cores, 74 abrasions) and the distribution of those operations across a range of representative rocks (the “rock suite”) of varying hardness. The percussion mechanism must provide enough impact force to allow the drill bits to penetrate these materials and must have enough life to complete the mission and both output force and life must be sufficiently margined. At the same time, excessive conservatism is not possible due to tight constraints on available actuator power and the volume and mass that can be accommodated by a largely heritage robotic arm. There is an interesting force-life entanglement that emerges when the additional requirement of drill bit lifetime is brought into consideration. Impact force, Rate-Of-Penetration (ROP) into the rock (i.e., “speed” of drilling), and drill bit lifetime are all closely related because insufficient impact force will not allow the drill bit teeth to chisel the rock effectively. This in turn causes the bit to do too much rotating in place without much rock being chipped away (low ROP) and with weight-on-bit applied during this rotation, the bit teeth will be continually ground against the rock and will wear down quickly. Therefore, in order to allow drill bits to meet their required lifetime, the percussion mechanism must output a sufficient impact force to keep the bits effectively chiseling at all times (when drilling hard rocks). This is measured by proxy using ROP. The result was that the percussion mechanism nominal required output force level (“1x” force) was set by finding the minimum percussion output level (frequency) that would allow a drill bit to successfully complete a 2x life test without falling below a minimum ROP. Then percussion output forces were measured across the operational frequency range using a “percussion dyno” (see next section). Force margins could now be computed by comparing the output force levels measured on the dyno at the max operating frequency and at the frequency previously established by the bit life test as “1x” force (i.e., the lowest percussion frequency that could pass a 2x bit life test). Finally, a life distribution across percussion output levels was derived based on taking all the planned sampling operations and assigning each of them a percussion level that should achieve a reasonable ROP, and therefore an associated duration for each activity. The result of this was a total 1x percussion mechanism life of 2.3 million impacts distributed across five percussion frequencies/impact force levels. This nominal lifetime is equivalent to 21.5 hours of continuous percussing. Due to the mechanism containing a dry-sliding interface (hammer bushing on hammer guide shaft) and JPL Design principles, a 3X life test was conducted and completed successfully with over 7.2 million impacts performed in the test. The approach to deriving force and life requirements described above was designed to be appropriately conservative and philosophically in-line with normal NASA and JPL mechanism design practices, but several non-linear affects complicate the true interpretation of the margins. Drill bit life and drilling efficiency are highly non-linear responses to varying impact force, due to the nature of brittle failure and rock material properties. Simply stated, doubling impact forces will not produce a doubling of drill bit lifetime, and in fact probably results in a greater than linear increase in bit life to a point at which effective chiseling is no longer the dominant factor in bit wear.
Development Program – Combining Theory, Analysis and Testing
A combination of tools and techniques were used to respond to the unusual mechanism requirements and difficulty in sizing the output. Several generations of prototypes were built in the course of the development and these proved to be invaluable for developing the requirements, the design of the mechanism, validating analyses, and for interacting with other teams and specialists who needed particular test data. The basic parameters for the mechanism were initially based on iterative use of a numerical simulation (Simulink) to achieve a target impact velocity and impact energy. Subsequent research found mathematical models of vibro-impact systems that provided tremendous insight into the non-linear dynamics of the mechanism [1]. These models allowed the design to be altered in response to other changes to the Sampling & Caching Subsystem in a predictable way without relying exclusively on guess and check
172
simulation. For example, when a change to the core sample tube dimensions rippled through the bit and then the entire corer, the hammer needed to grow in diameter to a degree that maintaining its mass was not possible. The entire system was successfully rescaled with some other parameters changed to reduce the sensitivity of first impact frequency to anvil position using the referenced theory. With basic design parameters such as hammer mass, spring stiffness, driver amplitude and frequency, and the static gap to the stop determined, three dimensional FEA was now needed to determine the level of force that impacts of a given velocity would produce. LS-Dyna is an FEA tool with an explicit solver that is capable of accurately simulating dynamic stresses and large-scale motions and it was used extensively in the design of this system [2]. Parts in the impact chain (hammer, anvil, bit) have many required features that are detrimental to efficient transfer of force to the rock. In the Mars 2020 Corer, peak force under the hammer is reduced by 50% by the time it transits the percussive chain and reaches the end of the bit. This knockdown would be far worse without design changes and compromises made possible by LS-Dyna simulations. LS-Dyna provided tremendous general insight that primarily facilitated general changes in direction (i.e., this area thicker or thinner, this par heavier or lighter) but in many cases it was also used as for stress analysis of parts that were driven primarily by operational percussion loads – although there was an expectation that these parts had large margins (e.g. unlimited fatigue life). Beginning early in the project, hardware testing was used to improve mechanism performance and durability, and to validate the simulations. Impacts from the percussion mechanism have a peak force magnitude exceeding 40 kN and a typical impulse duration is 50 microseconds. A “percussion dyno” was built using a piezoelectric load washer (Kistler 9041A) and charge amplifier that had the necessary stiffness and frequency bandwidth to measure these impacts. A sampling rate of about 200 kHz was used to ensure an accurate measurement of peak impact force could be made. Extensive functional testing was also done using the percussion mechanism in a complete coring drill. Multiple generations of percussion mechanisms cored and abraded hundreds of rocks. The data gathered from this testing was used to correlate percussion output level to the rate of penetration in various rocks. That test data, combined with requirements for drill bit life, was used to create the force output and life duration margin story. A combination of testing in rocks, dyno measurements, and LS-Dyna analysis were used to verify and validate the design.
Mechanism Function
Mechanism operation consists of simply driving the actuator to the required speed to achieve the intended percussion frequency and force level output. The hammer will first begin to impact the anvil around 25 Hz, depending on the precise anvil position†. Impact peak force will increase as the actuator speeds up and the hammer impact frequency is increased. The maximum output frequency is 40 Hz and it is primarily intended for special use. The mechanism functions the same with the actuator rotating in either direction, and nominal operation calls for the life to be accumulated approximately equally in both directions for the purposes of wear leveling, particularly the flanks of the gear teeth. Vibration produced by hammer and shock loads due to hammer/anvil impacts have a few uses for Mars 2020 beyond coring and abrading. Vibrations from the percussion mechanism can be used to help transport powder that is collected by special regolith bits and to free the root piece of a core that is improperly broken off from the parent rock (so called “mushrooms” that extend below the mouth of the sample tube). The most extreme special use of percussion is to “self-clean” the turret. Because the drill is designed to safely allow the hammer to impact the anvil with no drill bit present (or with a bit in the chuck but no weight-on-bit applied) the percussion will be used at the 40 Hz max output setting to apply an enveloping dynamic environment for the turret post-landing that should either remove any Earth spores still present on the turret, or ensure that they will not be able to be dislodged during future sampling activities. This guarantees these spores would not contaminate a Martian surface sample with Earth life.
† The anvil is separate from the drill body by a spring that is intended to isolate the corer (particularly nearby spindle bearings) from the rebound shock loads from impacts – therefore the anvil to hammer static gap will depend slightly on weight-on-bit preload.

173
When the mechanism is operating, the oscillating hammer creates a sine-vibration environment for other parts of the coring drill and other turret mounted instruments, even when no impacting is occurring. This environment becomes much more pronounced during impacting, when a maximum of 6.2 g’s of acceleration between 34 and 42 Hz is experienced by neighboring actuators and parts on the turret.
Mechanism Advantages
The Mars 2020 percussion mechanism has several unique features and advantages compared to similar extraterrestrial sampling technologies. Variable Output Force The ability to drill with a wide range of impact force makes it unique from the most common and highest heritage space drill percussion mechanisms which are typically of a cam and spring type. These mechanisms often use a helical cam to push a hammer back against a spring until the end of the cam profile is reached and then the hammer is shot forward by the spring and into the anvil or bit. Examples of mechanism that use this type of percussion are the lunar drills used by the Apollo astronauts [3] and the HP3 instrument on the InSight mission to Mars [4]. Also, the vast majority of handheld commercial rotary hammer drills also have a single fixed level of percussion output. On Mars 2020, variable output force was a derived requirement that flowed from a science requirement specifying the quality for core samples (essentially how intact the collected cores should be). Variable percussion output enables soft rocks to be cored with the minimum required force, thereby improving core quality, without foregoing the ability to penetrate hard rocks using higher levels of force. Variable output force has the additional benefits including improving the power efficiency of the corer by not using only the power required for a given operation, lessening the harshness of the operational environment and therefore accumulated damage/fatigue for neighboring turret components, and generally creating a more flexible tool for the overall sampling system by providing ancillary functions described in the Mechanism Function section. The MSL SA-SPaH drill also had a percussion mechanism capable of variable output force, but it was a very different type of mechanism that used a voice-coil actuator to provide hammering function. Although both systems have similar capabilities, there are also some advantages to the Mars 2020 percussion mechanism design, as compared to the MSL voice coil percussion. High Level Output Compared to MSL It was understood early in the project that creating a Mars 2020-sized core by cutting an annulus into a rock was going to require a more powerful drill than MSL used simply due to shear volume of rock to be removed and face area of the cut. Force dyno testing from MSL show impact forces with a maximum value of 6 kN under the drill bit. By contrast, the Mars 2020 drill can deliver more than 15 kN under the bit. Partially this is due to a more powerful actuator that was used for the Mars 2020 Percussion, but there is also reason to believe that the improvements in the cross section of the percussive part chain have also contributed to the higher force output. Measurements taken directly under the hammer of the Mars 2020 percussion show peak impact force values of approximately 40 kN as measured by a Kistler 9041A load washer. Due to the higher output forces achieved by the Mars 2020 percussion, significantly larger ROP values (roughly a factor of 5 or greater) were achieved when comparing each system in equal strength rocks – this should enable significantly longer bit life. Simple, Robust Parts Bear Impact Loads The MSL voice coil uses a very unique and highly efficient actuator to directly create linear hammer motion. However, with the MSL heritage architecture of a wound wire coil and permanent magnet pair there is a challenging durability problem where the coil must be connected to a driver by wires that must move with the striker and therefore subjected to high-cycle bending fatigue. The Mars 2020 percussion system has the advantage that the hammer and its assembly are essentially simple steel lumps and springs which are generally easier to design for tolerance to repeated shock loads and to meet the life requirement by fatigue analysis. This was a major reason for opting to develop a different style mechanism for Mars 2020 as opposed to simply re-sizing the MSL mechanism.

174
Conventional Actuator and Avionics Another distinction between the MSL percussion and Mars 2020 is the use of a conventional brushless DC motor/gearbox actuator as compared to a voice coil. This allows the Mars 2020 percussion to be driven at a range of speeds using very conventional avionics, software, and control system techniques. Essentially, the mechanism could leverage the whole system up to an actuator output shaft that was already in place for the numerous other actuators on board the rover. This more common actuator and avionics architecture might also make the Mars 2020 style percussion mechanism more accessible to other projects.
Testing Results
For the Mars 2020 Verification & Vallidation campaign, a dedicated Life Test Unit percussion mechanism was built and successfully passed a 3x life test at the mechanism level. In the mechanism-only arrangement, the mechanism is placed on the percussion dyno and is tested across the qualification temperature range (-70°C to +70°C) and percussion life frequency distribution. In addition, a percussion mechanism in a complete Qualification Model (QM) corer has passed a 1x accelerated life test and is now in the process of completing a comprehensive life test performing sampling operations on rocks in the qualification environment. All units undergo a mechanism-level test for approximately one hour in the dyno configuration to ensure workmanship. At the end of the test, force data is collected across the operational frequency range for characterization purposes. Figure 6 shows example data from this type of dyno test, taken on the Life Test Unit. The mechanism is driven at speeds from 28 Hz to 40 Hz in 1 Hz increments and held at each speed for 3 seconds, thereby gathering approximately 80 to 120 consecutive impacts at each speed. This process is repeated for both actuator rotation directions. Each impact produces a complex force-time profile starting when the initial stress wave arrives and continuing for several impact durations as the load cell and surrogate anvil, which are preloaded to a rigid base plate, ring down. The peak value of force from the initial blow is taken as the “peak force” and statistics for each operational speed/frequency are based on those values.
Challenges and Lessons Learned
The requirements of a long-life percussion mechanism for use on Mars present major design challenges. High wear sliding interfaces have the extra complication that the precise loads experienced are difficult to define and understand and although conservatism of design can solve the problem to a degree, gaining insight into the actual capabilities of the design through extensive prototype testing proved invaluable. Fatigue failures were also a challenge for the hammer assembly parts, owing to the large number of harsh shock load cycles the hammer assembly must cope with. The long time it takes to complete life tests in relevant environments underscore the general lesson – take great care in designing features such a sliding wear interfaces or points susceptible to fatigue failure that can only be proven out by lengthy life tests. Design of these areas calls for extra conservatism, extra time spent reducing uncertainty in the loads, and early and environmentally relevant testing that is possible only with hardware rich development.

175
Figure 5. Typical results from a force dyno test performed at the mechanism level (force measured under
the hammer). (a) Peak impact force statistics gathered from 3 seconds of operation at each frequency from 28 Hz to 40 Hz. (b) By using the time stamp from each peak force point, the frequency of impacts
can be calculated independent of actuator telemetry. Results show that impact occur at a very consistent rate given that the hammer is driven through a spring and that each individual impact has a number of
uncontrolled parameters in terms of the motion and orientation of the contacting parts.
Challenge: Achieving Durability in the Crank Shaft and Roller The interface between the crank shaft pin and roller ball is a grease filled plain bearing that will experience as many cycles as there are hammer impacts. The estimation of the loads experienced by the interface is complicated by the fact that the load is shared by three crank shafts with an unknown load distribution and that it bears a cyclic load due to the oscillating inertia of the hammer assembly combined with hammer impact loads, although the impact loads should be smoothed by the springs. In retrospect, more attention should have been paid early in the design better understand the loads at this interface and thus properly

176
size the members and select materials, finishes, and clearances to better reflect tribological best practices. Early prototypes experienced a variety of failures at this interface, both with roller bores wearing and enlarging to unacceptable sizes and with crank pins wearing severely and, in some cases, breaking off completely as a result of the drastic reduction to their cross section by wear. A redesign attempted to reduce the bearing load associated with the highest percussion output level to below 3.45 MPa (500 psi). Very often such plain bearing pairs use a hard shaft in a bearing that is made from a copper-based, chemically dissimilar metal and usually the bearing is softer and will preferentially wear. Such systems are good when a number of common assumptions are true that do not apply to this mechanism – specifically that the parts are serviceable and that petroleum-based lubricants will be used. The strategy adopted for this design was to simply create the longest lasting (slowest wearing) possible design by making both parts as hard as possible, reasonably similar in hardness, and also by reducing the starting clearance between the parts to the smallest comfortable value, to minimize impact loads between the roller and shaft when the driver plate changes direction. The final design increased the overall size of the parts from 3.175 mm (.125 in) shaft to 4.7625 mm (.1875 in) and 6.35 mm (.25 in) roller ball size to 9.525 mm (.375 in). The shaft was made significantly harder by the addition of a 75 µm (.003 in) thick nitride case approximately 65 to 68 HRC so as to balance the high hardness of the ball, which would be made from a Grade 10 440C ball, 58 HRC minimum. Shaft to bore clearances of approximately 7.6 µm (.0003 in) on diameter were achieved by manufacturing balls with several graded bore sizes. The shaft and bore both had 0.2 µm (8 µin) surface finishes specified. As before, the bearing was filled with Castrol Micronic Braycote 600EF grease and disassembly at the end of a 3x life test showed some grease was still present between the parts. Challenge: Hammer bushing wear and retention Development prototypes failed to achieve acceptable levels of wear life in the hammer bushings and a threaded retainer that was used to capture the upper bushing catastrophically failed shortly after 1x life. Many brute force attempts were made to improve the retainer – to pin it in place, to drill point it and drive set screws through the hammer shaft into the retainer, and to peen it into place. LS-Dyna analysis showed that the loads in this region were very high and, more importantly, the back of the hammer shaft experiences a large load reversal when the traveling compression wave from the impact encounters the end of the part and starts a tensile wave in the reverse direction. The small volume of the region did not lend itself to robust fastening features, perhaps besides welding, which was not attempted. The solution was to eliminate any sort of bushing retainer altogether and capture the bushing in a blind groove. To enable this simplification, a change in bushing material had to happen at the same time, so that the bushing could be designed to be installed into this groove. A split bushing made from DuPont Vespel® SP-3 (MoS2 impregnated) was sufficiently flexible that it could be wound in on itself and inserted past the shoulder of the groove (see Figure 8) and as it turned out the Vespel® SP-3 was also slightly slower wearing than the prior metal/polymer composite bushing, a Glacier Garlock Bearings (now “GGB”) DP4®. A key take-away for other percussion mechanisms is to reduce or eliminate small parts whenever possible that might not easily be able to grow to accommodate high loads, and particularly to expect high reversing loads at the back end of the hammer or striker. Challenge: High drag during cold operation The initial flight design called for 10% to 15% grease fill in all ball bearings. All the bearings have a phenolic retainer impregnated with Castrol Brayco 815Z oil and use Castrol Braycote 600EF grease. Although much early life testing was done on prototype units, including some cold testing, none had gone below -40°C. The first tests at the minimum qualification temperature of -70°C showed that the mechanism could not reliably start from cold and the actuator would sometimes stall at the 10 A current limit, equivalent to 0.75 N·m [6.6 lbf·in] of torque at the actuator output shaft.

177
Figure 6. (a, b) Heavily worn crank shaft pins from early prototype. Wear was so severe in some cases
that the pin became too thin and broke off. (c) Comparison of the design after improvements were introduced to reduce wear between the roller ball and crank shaft pin
After a comprehensive investigation that eliminated all other sources of drag, the bearings were found to be the cause of the large increase in drag at -70°C. The solution was to drastically reduce the grease fill to approximately 3%, and thus ultimately reduce the drag to acceptable levels. Improved warm up routines were also devised that eliminated starts and stops until the mechanism had gradually accelerated and then run for about 1 minute. The mechanism life tests mentioned above were all conducted using this reduced grease fill and at the end of the test there was no sign of bearing performance degradation. The lesson here is well worn, but worth repeating: early life testing in a relevant environment is invaluable and the increase in the viscosity of Braycote 600EF grease is extremely non-linear in the -50°C to -70°C range. A large number of bearings and relatively low-torque actuator (relative to power) in this mechanism exacerbated the sensitivity to the thickening of the grease.
Conclusions
A percussion mechanism that will enable the Mars 2020 coring drill to core and abrade hard rocks in the Martian environment was successfully designed, built, and tested and is scheduled to arrive on the surface of Mars in February 2021 and begin operation soon thereafter. The novel mechanism, with a conventional rotary actuator drive, a base-driven hammer, and triple Scotch yoke architecture made it possible to perform variable output force percussing whilst subjecting only a simple and robust subset of mechanism hardware to the large, dynamic impact loads.
Acknowledgement The research was carried out at the Jet Propulsion Laboratory, California Institute of Technology, under a contract with the National Aeronautics and Space Administration (80NM0018D0004).

178
Figure 7. Hammer bushing and retainer. (a) Original GGB DP4 bushing wore quickly and (b) Bushing retainer failed catastrophically soon after 1X life. (c) LS-Dyna analysis revealed the severity of compression / tension reversing loads at the top end of the hammer shaft. (d) The best retainer was no retainer but instead to keep the bushing in a blind groove, which was enabled by (e) A Vespel SP-3 split bushing that could be installed into the blind groove and exhibited better wear performance.
References [1] V. I. Babitsky, Theory of Vibro-Impact Systems and Applications, Berlin: Springer-Verlag, 1998. [2] A. Siddens, "Validation and Predictions of Explicit Dynamics Simulations for the M2020 Percussion
Drill," in Spacecraft Launch Vehicle Dynamic Environments Workshop, El Segundo, 2018. [3] Y. Bar-Cohen and K. Zacny, Drilling in Extreme Evironments, Darmstadt: Wiley, 2008. [4] T. G. M. S. S. e. a. Spohn, "The Heat Flow and Physical Properties Package (HP3) for the InSight
Mission," Space Science Review, no. 214, 2018.

179
STIG: A Two-Speed Transmission Aboard the Mars 2020 Coring Drill
Timothy Szwarc*, Jonathan Parker** and Johannes Kreuser+
The coring drill, part of the Sampling & Caching Subsystem (SCS) aboard the Mars 2020 rover, demands a wide range of drill bit torque and speed capabilities during sample acquisition operations. The two driving operating points are high speed, low torque for rotary-percussive coring, as well as low speed, high torque for separating the rock core sample from its parent rock. The spindle twin-input transmission (STIG) allows these and other operating points to be reached with an actuator of substantially less peak power and maximum current draw than that of a single-speed actuator. Rather than containing gearing of its own, the transmission interfaces to an actuator with two outputs of different gear ratios, allowing the transmission to select one of the two of the outputs to be coupled to the drill bit. This paper describes the design, capabilities, and challenges associated with the transmission and the dual-output actuator.
Introduction
The Mars 2020 sampling tool, commonly referred to as the “corer” and shown in Figure 1, possesses three methods of surface interaction. The corer takes its name from its ability to core and retain acquired rock core samples 13 mm in diameter and 76 mm in length. An abrading bit allows for the removal of the several mm of weathered exterior surface from rock, in patches 50 mm in diameter. Operation of the abrading bit requires similar torque to that of coring, although the bit is rotated at a much lower speed. Finally, a regolith bit allows for collecting and caching surface dirt. This bit operates at low torque and low speed to allow powder to flow into the bit from an opening on the bit’s side. Generating cores typically requires speeds and torques at the bit of 200 rpm and 2.5 Nm, respectively. Following bit penetration into the rock, core breakoff and retention are performed by misaligning the eccentric sample tube and the drill bit in which the tube is contained [1]. This operation, which fractures rock in shear, requires as much as 28 Nm in the test rock suite used by the mission, although the speed of core break can be arbitrarily low. Providing margined capability at the core breakoff and coring operating points in the absence of a transmission would require an actuator with a 400 W peak operating point. Assuming a gearhead with a single ratio capable of providing coring speed, the driving electronics would need to provide about 500% more electrical current than is currently possible on the rover in order to provide sufficient torque for core breakoff. An actuator coupled to a transmission with suitable ratios would require a peak power of 200 W and no alterations to electronics. Therefore, a transmission was determined to be the preferred solution. The resulting spindle twin-input gearing (STIG) transmission and associated dual output actuator allow for two modes of operation that differ by a gear ratio of 16.
Mechanism Architecture The dual-output spindle actuator provides motion at its low- and high-gearing output simultaneously. These outputs, which are offset in different planes along the actuator output axis, are shown in Figure 2. More detail on this actuator is provided in a later section of this paper. STIG interfaces with one actuator output at a time and couples that motion to the coring, abrading, or regolith bit. The STIG interface to the actuator, including a specific STIG part named the selector which translates axially to access one of the two actuator outputs, is shown in Figure 3. The completed STIG assembly is shown in Figure 4.
* Jet Propulsion Laboratory, California Inst. of Technology, Pasadena, CA; [email protected] ** Sierra Nevada Corp., Durham, NC; [email protected] + CEROBEAR GmbH, Herzogenrath, Germany; [email protected]
Proceedings of the 45th Aerospace Mechanisms Symposium, NASA Johnson Space Center, 2020
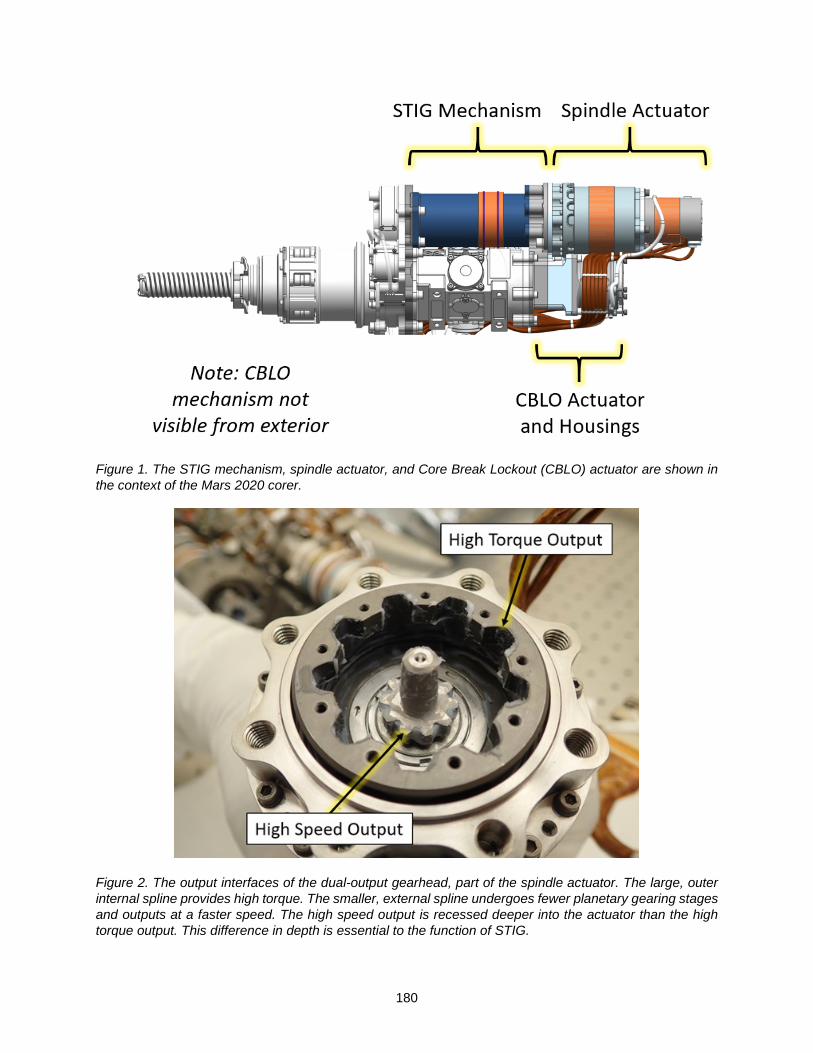
180
Figure 1. The STIG mechanism, spindle actuator, and Core Break Lockout (CBLO) actuator are shown in the context of the Mars 2020 corer.
Figure 2. The output interfaces of the dual-output gearhead, part of the spindle actuator. The large, outer internal spline provides high torque. The smaller, external spline undergoes fewer planetary gearing stages and outputs at a faster speed. The high speed output is recessed deeper into the actuator than the high torque output. This difference in depth is essential to the function of STIG.
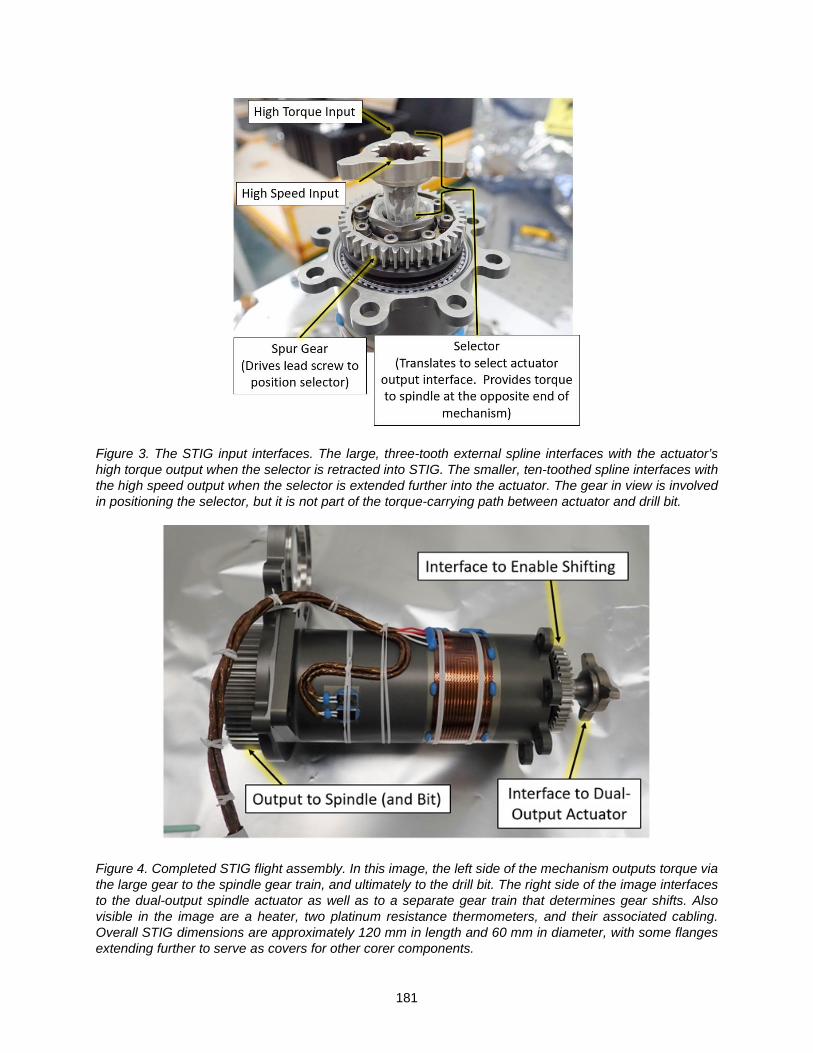
181
Figure 3. The STIG input interfaces. The large, three-tooth external spline interfaces with the actuator’s high torque output when the selector is retracted into STIG. The smaller, ten-toothed spline interfaces with the high speed output when the selector is extended further into the actuator. The gear in view is involved in positioning the selector, but it is not part of the torque-carrying path between actuator and drill bit.
Figure 4. Completed STIG flight assembly. In this image, the left side of the mechanism outputs torque via the large gear to the spindle gear train, and ultimately to the drill bit. The right side of the image interfaces to the dual-output spindle actuator as well as to a separate gear train that determines gear shifts. Also visible in the image are a heater, two platinum resistance thermometers, and their associated cabling. Overall STIG dimensions are approximately 120 mm in length and 60 mm in diameter, with some flanges extending further to serve as covers for other corer components.

182
Rather than having an additional, dedicated actuator that determines the axial position of the selector, STIG references the position of a separate mechanism that is positioned according to whether drilling or core break operations are occurring. This aforementioned mechanism is named core break lockout (CBLO). The CBLO mechanism’s actuator output is attached to a single piece part containing both a lead screw and a spur gear. More detail about this actuator can be found in [2]. The lead screw/gear is shown in Figure 5.
Figure 5. CBLO actuator and combined lead screw/spur gear output piece part. The lead screw drives a mechanism that interacts with the sample tube. The gear (via an idler) connects to STIG, allowing the selector to interface to the proper dual-output actuator interface. The CBLO lead nut is extended during core break operations, allowing the CBLO mechanism to interact with the sample tube and fix it rotationally, enabling shear of the rock core sample as the drill bit rotates with high torque. During other operations such as drilling, CBLO is retracted to avoid contact with the sample tube. As the lead screw operates during CBLO motion, the spur gear on the same piece part mounted to the actuator output rotates, which is an input to STIG. Figure 6 provides an overall schematic for the STIG architecture. This gear does not provide torque to the drill bit, rather, it acts in translating the STIG selector axially so that the selector interfaces with the desired output of the spindle actuator. The task of STIG is to use knowledge of the CBLO mechanism’s position to place the selector at the appropriate output of the spindle actuator, in order to provide the appropriate torque and speed to the bit.

183
Figure 6. STIG utilizes the position of the CBLO actuator to determine which output of the spindle is connected to the coring bit. Other bits may be used as well. During core break, CBLO extends into the sample tube, fixing it rotationally. Core break torque is applied to the bit, creating eccentric motion and shear forces in the rock core.
Mechanism Function
Figure 7 shows the STIG design in detail, with several piece parts and features labeled. STIG’s lead screw is not directly attached to the selector. Rather, the lead screw and selector are connected by a spring that is preloaded in a state of compression. This use of this preloaded spring has several advantages. First when the selector is moved to a given position, there is 37 N of force holding the selector in place. This force is sufficient to prevent relative motion between the selector and other drill components during the roughly 6 G accelerations produced by rotary-percussive coring and abrading, keeping the selector fully engaged with the intended spindle actuator output. More detail about the corer’s percussion mechanism is available in [3]. This preload also allows the selector to be held in place while in the launch stow configuration. In addition, the spring can be further compressed past its preload once the selector reaches the end of its travel in either direction. This allows CBLO to be commandable to four different positions, with two positions mapping to each of the two spindle actuator outputs. For example, CBLO can be positioned in the drilling state, which positions the selector in the high speed mode. But if CBLO continues to retract in order to perform a homing operation, whereby a non-rotating part of the CBLO mechanism seats into a groove in a spindle piece part and locks out motion, the STIG lead screw can be further retracted. The STIG spring will be further compressed, but the selector remains in place and mated with the high speed actuator output. Conversely, while the selector remains fully engaged with the spindle actuator high torque interface, CBLO can either be fully extended to interface with the sample tube during core break operations, or only partially extended in order to provide breakoff torque to the bit without locking out the tube, which could be useful in recovering from a situation where a bit becomes stuck in the rock.

184
Figure 7. STIG parts in detail. Red parts translate axially (and in some cases, rotate). Magenta parts rotate without translating. The selector (dark blue) is supported on its right side by the spindle actuator (not shown) and on its left side by a bushing mounted to corer structure (not shown). The right end of the output shaft is supported by splines that ride on the outside of the selector and on its left side by corer structure (not shown). Finally, the spring provides the ability to shift gears while being agnostic to particular clockings of the selector and actuator outputs. As the STIG lead screw retracts, in the example of a shift from high torque to high speed, the selector initially tracks the motion of the lead screw due to the preloaded spring. This simultaneous motion continues until the selector’s high speed splines contact the splines of the actuator high speed output. Due to the differences in acutator output gearing ratios and differences in backlash, no assumptions are made about the relative clocking of the splines of the two output interfaces before a shift. The lead screw continues to retract while the selector is prevented from moving, further compressing the spring. Once the lead screw reaches its intended positon, the spindle is slowly rotated until the splines align, allowing the selector to translate under the force of the spring preload into the fully-mated state. It is possible that friction between the contacting axial faces of the actuator and selector is capable of sustaining torque, so the selector may rotate with the actuator instead of remaining in place rotationally and waiting for spline alignment. In order to guarantee successful mating, a previous benefit of the STIG spring is utilized, namely, the ability for CBLO to travel to two locations for a given STIG gear. By driving CBLO into its homing state and locking the STIG/spindle gear train, relative motion can be enforced between STIG and the actuator. When the splines align and the selector moves axially into the mated position, a stall will be detected by the actuator as it attempts to drive a locked gear train. At that point, the gear shift is guaranteed to be complete and CBLO can be extended to unlock the gear train without moving STIG out of the high speed gear. The motion of the spring and a shifting example are shown step-by-step in Figure 8. A similar sequence of events is used to attain high torque gearing, whereby CBLO locks the tube rotationally to initiate a stall between the spindle actuator and the gear train.

185
Figure 8. STIG is shown shifting from high torque to high speed.
A: STIG in in high torque mode, with the the selector interfacing with the spindle actuator’s high torque output. Note that some corer components that provide support to stig components are not shown in the images. B: The lead screw and attached components begin retracting (moving right). The selector follows. C: The lead screw and attached components continue to their final position, but are agnostic to the fact that the selector had bottomed out on the high speed spindle output and stopped translating. A spring is compressed during this difference in axial travel between the lead screw and selector. D: The actuator is rotated. At some point, the high speed splines align. The dotted line represents the extent of the splines in this cross section before actuator rotation. E: The selector is immediately pushed toward, and interfaces with, the high speed output. The spring partially relaxes. The corer is now in the homing configuration and STIG is in high speed.

186
Mechanism Advantages The STIG mechanism has several features that make it well-suited for its function within the coring drill. Simple and Robust Shifting Algorithm Initiating a gear shift with STIG is essentially two steps. The STIG lead screw is positioned according to the desired dual-output actuator ratio. Then the spindle actuator is rotated until a stall is sensed. Because a spring is used in series between the lead screw and the selector, there is no need for alignment of the spindle actuator outputs before initiating a shift. In other words, it is not necessary to ensure that the selector can shift out of one gear and directly into the other. Instead, the spring preload force pulls the selector out of one interface and into a neutral zone, and lightly loads the selector against the desired actuator output until alignment occurs at a later time. Without the spring, loss of position knowledge during a rover fault would be extremely problematic, as no force sensor is in place to allow a hunt-and-peck style of shifting. No Need for a Dedicated Gear Selection Actuator Because of the connection between the STIG and CBLO lead screws, the STIG gear cannot be chosen independently of the corer’s CBLO position and independently of operations related to the sample tube. This interconnectivity allows for STIG to be incorporated into the corer without the need for a dedicated gear selection actuator. Although it may initially appear that this would limit the number of corer configurations possible (one CBLO position while STIG interfaces with the high speed spindle output, one CBLO position while STIG interfaces with the high torque spindle output), two STIG configurations map to four CBLO positions. The STIG spring allows this mapping. Full Functionality in Both Output Rotational Directions STIG retains the ability to provide motion in either rotational direction to the bit at either torque level by avoiding the use of ratchets or impact drivers. This ability greatly benefits sampling operation algorithms and fault recoveries. For example, the bit can be rotated in the non-drilling direction while being retracted from a borehole, reducing the chance of becoming stuck. Additionally, if the bit becomes stuck during high torque breakoff, the bit can be rotated with high torque in the opposite direction to alleviate a jam. No Sacrificial Components A pressure of single digit MPa is all that is sustained by the axial faces of the selector and actuator during a shift. Contact geometry at the interface is planar. Because of the low contact pressure and presence of wet lubrication (Braycote 600EF), there is no need for a clutch. Mechanism life is not expected to be driven by any sliding interface. As mentioned earlier, an actuator stall indicates the completion of a gear shift. So during a shift and prior to said stall, spindle speeds may be kept very low. Because of these low speeds and the low axial pressure applied to the parts, no debris generation is expected. The slow spindle speeds used while seeking a stall are necessary before commanding high speed motion that could otherwise damage the splines without full engagement.
Dual-Output Spindle Actuator The dual-output actuator consists of a four-stage planetary gearbox, with a unique concentric output shaft arrangement. A cross section can be seen in Figure 9. Several challenging requirements included a bit-seizure fault load case of 68 Nm on the high speed shaft, which is approximately 10X the nominal operating torque load, while minimizing mass, overall envelope size and maintaining low overall drag torque over a wide operational temperature range of -70°C to +70°C. A typical gearbox design would use ball bearings to support the planet gears in the first stage and increment up to higher capacity bearings as the stages progress to the output stage. The spindle gearbox used a ball bearing first stage, while the second and fourth stages required a larger size ceramic hybrid needle roller bearing to handle the bit-seizure case and the high loads of the low-speed output shaft. The third stage utilized a smaller sized roller bearing to minimize mass and overall size. Traditional approaches to support
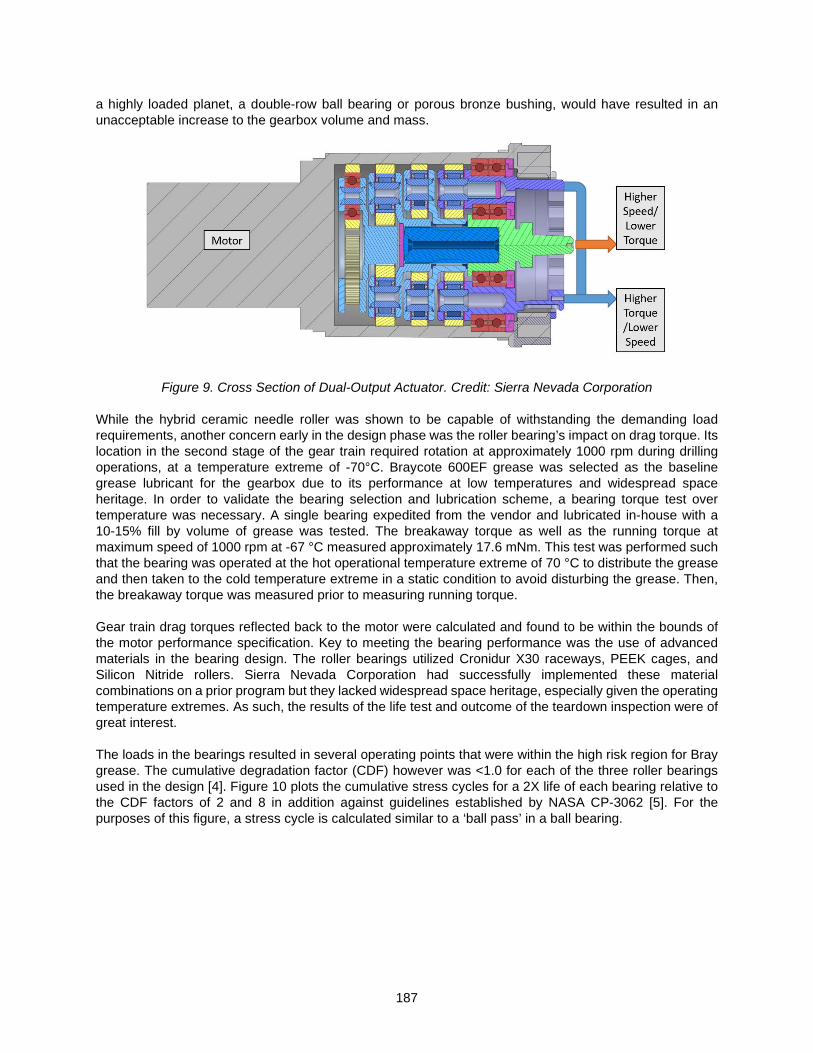
187
a highly loaded planet, a double-row ball bearing or porous bronze bushing, would have resulted in an unacceptable increase to the gearbox volume and mass.
Figure 9. Cross Section of Dual-Output Actuator. Credit: Sierra Nevada Corporation While the hybrid ceramic needle roller was shown to be capable of withstanding the demanding load requirements, another concern early in the design phase was the roller bearing’s impact on drag torque. Its location in the second stage of the gear train required rotation at approximately 1000 rpm during drilling operations, at a temperature extreme of -70°C. Braycote 600EF grease was selected as the baseline grease lubricant for the gearbox due to its performance at low temperatures and widespread space heritage. In order to validate the bearing selection and lubrication scheme, a bearing torque test over temperature was necessary. A single bearing expedited from the vendor and lubricated in-house with a 10-15% fill by volume of grease was tested. The breakaway torque as well as the running torque at maximum speed of 1000 rpm at -67 °C measured approximately 17.6 mNm. This test was performed such that the bearing was operated at the hot operational temperature extreme of 70 °C to distribute the grease and then taken to the cold temperature extreme in a static condition to avoid disturbing the grease. Then, the breakaway torque was measured prior to measuring running torque. Gear train drag torques reflected back to the motor were calculated and found to be within the bounds of the motor performance specification. Key to meeting the bearing performance was the use of advanced materials in the bearing design. The roller bearings utilized Cronidur X30 raceways, PEEK cages, and Silicon Nitride rollers. Sierra Nevada Corporation had successfully implemented these material combinations on a prior program but they lacked widespread space heritage, especially given the operating temperature extremes. As such, the results of the life test and outcome of the teardown inspection were of great interest. The loads in the bearings resulted in several operating points that were within the high risk region for Bray grease. The cumulative degradation factor (CDF) however was <1.0 for each of the three roller bearings used in the design [4]. Figure 10 plots the cumulative stress cycles for a 2X life of each bearing relative to the CDF factors of 2 and 8 in addition against guidelines established by NASA CP-3062 [5]. For the purposes of this figure, a stress cycle is calculated similar to a ‘ball pass’ in a ball bearing.

188
Figure 10: Mean Compressive Stress Cycles. Credit: Sierra Nevada Corporation Folloiwng the qualification test program, the actuator met all performance specifications. The testing included static loading, which subjected the roller bearing to an estimated 3476 MPa (504 ksi) max hertzian contact stress prior to any operation, random vibration testing, shock testing, and concluded with a 2X life test. The life test consisted of 10 thermal cycles, the first five cycles tested the high-speed output, while the next five cycles tested the low-speed output. The number of revolutions at each torque level were distributed evenly among four different temperatures (-70°C, -55°C, +25°C, +70°C).
Figure 11: (Left) Inner race of roller bearing (X30) post life test. (Right) cage and rollers, post life test. Credit: Sierra Nevada Corporation

189
A post-life teardown of the gearbox revealed the bearing races showed signs of use, however nothing atypical was observed. On both inner and outer races of the roller bearings, the contact zone was evident by a visibly darker band visible in Figure 11. The grease within the PEEK cages around the rollers was darker, but still wet with adequate lubricant for proper operation. The PEEK cages appeared in good condition as well, maintaining their integrity.
STIG Testing Results
The assembled qualification model corer has completed a 1x life test program of actuator/gear train rotations and gear shifts. At the time of writing, the unit has also performed approximately 20% of a life’s worth of coring and drilling operations. This testing will continue. The flight model corer has completed dyno testing, completed thermal-vac testing, and has been integrated to the flight rover. There it has performed basic operations, such as shifting gears. Figure 12 shows performance data for the flight unit taken across the protoflight temperature range during testing. >100% margins were proven for drilling and core breakoff operating points. Drilling operations were performed while connected to a dynamometer. Core break operating points were measured quasi-statically against a load cell, since that operation can be performed arbitrarily slow in flight.
Challenges and Lessons Learned Several challenges were encountered during the design of STIG. Shift Energy Compensation Spring preload allows for shifting into gear without pre-alignment of selector and actuator output splines. However, energy on the order of 0.3 J is stored and released once the splines align rotationally. This energy manifests in the form of axial velocity of the selector of about 2.5 m/s. Accommodations must be made for this kinetic energy; allowing the selector to dissipate energy via impact with the actuator output interface (specifically, at the termination of the depth of the selector’s internal splines) was not acceptable. Damping was considered, for example with piston seals, but the large range of interference fits that would be encountered over the operating temperature range of the mechanism on Earth and on Mars and over the life of these seals meant that constant friction coefficients could not be guaranteed. A compact absorber spring of high stiffness was designed and incorporated in order to release energy into other STIG parts with a load path to corer structure. The absorber spring, along with a few small parts contained within it, surround the selector and can be impacted without blocking the selector’s interfaces to the spindle actuator. This particular load path also included the transmission’s output bearings, whose truncation loads of 3 kN became the limiting factor for maximum impact forces. The design of the absorber spring was made difficult by the need to absorb a fixed amount of energy in a small packaging volume. As the spring geometry became more complex to reduce stresses, increases to tolerances were necessary to allow the part to remain machinable. Given that the spring needs to flex in order to absorb energy, stresses are quite sensitive to tolerances in part thickness. A great deal of iteration was used in the design of the absorber spring. Figure 13 shows the absorber spring final design, which stores energy through torsional and radial flexing. Qualification model testing has shown the bearings to be capable of sustaining the 3 kN max loads without impacting bearing performance.

190
Figure 12. Torque and current data from the corer in the high-speed gear at drilling speed (top) and in the high torque gear measured statically against a load cell (bottom), for positive and negative directions of spindle rotation. Data was collected at and between -70 °C and +50 °C, the protoflight temperature requirements of the corer body based on the Jezero Crater landing site.

191
Figure 13. The absorber spring has a height of about 25 mm and a diameter of about 19 mm. The bottom end is threaded for installation into the output shaft that surrounds the selector. The top end includes a feature where a two-piece split collar and retaining ring are placed. Contact with the selector is made at this collar during impact. Regions of highest stresses are found at the round holes that terminate each slot. When designing a transmission that utilizes spring preload to drive gear changes, it was found to be essential to study all off-nominal releases of energy and to plan for shifts occurring prior to planned state changes. For example, lead-in chamfers on the selector, designed to aid in engagement of splines during shifting, made it possible for the selector to rotate and backdrive the spindle actuator due to axial forces sustained during shifting. Were backdriving of the selector to occur before the STIG lead screw reached its end of travel, the selector could be accelerated and small parts used to load the STIG spring would see impact loads against each other. These parts demanded a great deal of structural analysis and design iteration before this load case was deemed to be safe. When shifting in the high torque direction, the selector impacts corer structure. Although the compliance of that structure is less than that of the absorber spring, the direct path of the load to structure means that acceptable loads were substantially higher. Therefore, designing parts for impact here required less iteration than that of the absorber spring. Shunting loads to structure is preferable to a load path that includes small or fragile mechanism components whose designs are driven by other requirements. Force Uncertainty in Coupled Lead Screws An additional lesson learned was the need to plan for large force uncertainty when using two lead screws geared together and driven by one actuator. Due to large differences in lead screw diameter (6 mm vs 31 mm, for the CBLO and STIG lead screw, respectively), the linear force output to input torque relations of the lead screws are quite different. Potential small changes in observed actuator current could be due to noise; overcoming a small amount of unplanned drag in the large, low-output force ratio lead screw; or forces of several kilonewtons in the smaller, high-output force ratio lead screw. While testing a prototype

192
concept, a piece of ground support equipment that did not provide clearance for the full range of travel of the high output CBLO lead screw nearly led to the generation of forces capable of severely damaging the corer. This fault was prevented by an operator E-stop press. The late addition of a spring in the CBLO mechanism allowed for these high forces to be eliminated in a specific jamming fault case of concern.
Conclusions When coupled to a dual-output actuator, STIG provides a compact approach to gear shifting. In the case of the corer, by leveraging the position of a different mechanism, STIG does not require the addition of an additional actuator specifically tasked with gear selection. STIG, through the use of spindle actuator stalls, provides feedback that gear shifts have completed and splines are in full contact. No additional sensors are required. STIG retains the ability to provide motion in either direction in either gear, by avoiding the use of ratchets and impact drivers. When designing mechanisms similar to STIG that use a spring to allow gear shifts to be agnostic to actuator output spline positions, care must be taken to plan for energy dissipation. Coupled lead screws of different sizes are an additional challenge, due to their tendency to obscure large force generation. Testing of STIG, along with the core break lockout mechanism continues in the qualification model test program at JPL. Launch is planned for July of 2020.
Acknowledgement
Except where noted otherwise, this work was carried out at the Jet Propulsion Laboratory, California Institute of Technology, under a contract with the National Aeronautics and Space Administration (80NM0018D004). © 2020. All rights reversed.
References
1. Myrick., T., US Patent No. 6,550,549, "Core Break off Mechanism” 2. LoSchiavo et. al. “Mars 2020 maxon Commercial Motor Development from Commercial-Off-the-Shelf
to Flight-Qualified Motors, Gearboxes, and Detent Brakes: Overcoming Issues and Lessons Learned”. Proceedings of the 45th Aerospace Mechanisms Symposium. 2020.
3. Chrystal, Kyle. “Percussion Mechanism for the Mars 2020 Coring Drill”. Proceedings of the 45th Aerospace Mechanisms Symposium. 2020.
4. Lo, C.J., et al., “Use of Cumulative Degradation Factor Prediction and Life Test Result of the Thruster Gimbal Assembly Actuator for the Dawn Flight Project”, NASA CR-2009-215681
5. Conley, P.L. and Bohner, J.J., “Experience with Synthetic Fluorinated Fluid Lubricants”, Proc. 24th Aerospace Mech. Symp., NASA CP-3062, Kennedy Space Center, FL (1990)

193
Development of the Next Generation Battery Cell Isolation Switch
Ruben Betancourt* and Michel Knight*
Abstract EBAD’s NEA Battery Cell Isolation Switches (BCIS) have been used to isolate the electrical circuit of a lithium-ion cell within the battery due to safety or performance concerns. Previous testing has shown that there are limitations to the capability of the heritage design under extreme thermal environments and low actuation input current. For example, if a BCIS was functioned at low temperatures and low actuation current there was a possibility of the device not meeting the actuation requirements. This limitation led to the design of the next generation BCIS as described in this paper. The next generation NEA BCIS was designed to be able to operate under the most extreme environments and lowest current that our customers have requested. This was validated with a combination of analysis and testing.
Introduction BCIS Design Description The BCIS is an electromechanical switch that serves two basic functions. The first is that it is used to interconnect lithium ion battery cells, which requires the BCIS to conduct a continuous current up to 400 amps. EBAD has three BCIS product lines: the NEA8020 series with a 135-amp current carrying capability, the NEA8030 series with a 250-amp current carrying capability, and the NEA8040 series with a 400-amp current carrying capability. The different models operate in a similar manner but are scaled depending on the current carrying capability. A cross section of a typical 8030 BCIS is shown in Figure 1. The components on the right side are the high current carrying components which conduct the power output by the batteries. Prior to activation of the BCIS, the electrical terminals T1 and T2 form a closed circuit and conduct the high current, while T3 remains electrically isolated. The second function of the BCIS is to isolate a battery cell from other battery cells. When a battery shows signs of degradation, the BCIS may be utilized to divert the flow of electrical power between sets of terminals to isolate the degrading battery cell. On the left side of Figure 1 is the release mechanism portion of the BCIS, which provides the switching mechanism. The BCIS utilizes a set of internal spools which are restrained by wire, which is then attached to a fuse wire (T4 to T5). The switching function is initiated by the application of a minimum activation current of 1.5 A for a duration of up to 230 ms, across the fuse wire circuit. The current causes the fuse wire to break and release the restraining wire that holds two spool halves together. This allows a preloaded spring assembly to push a plunger forward, which creates a closed circuit between T1 and T3, and electrically isolates T2. Related to this switching function, the BCIS must meet a set of requirements which include:
• Commutation time less than ~10 msec (varies by customer) o Defined as the time required to switch the circuit from T1-T2 to T1-T3
• Make-Before-Break time of <1 ms o Defined as the time all electrical terminals (T1, T2, T3) are in electrical contact
* Ensign-Bickford – NEA Electronics Inc., Moorpark, CA
Proceedings of the 45th Aerospace Mechanisms Symposium, NASA Johnson Space Center, 2020

194
Figure 1: NEA BCIS 8030 Family
Design Development Background At the 2019 European Space Mechanisms And Tribology Symposium (ESMATS), a summary of lessons learned during Qualification testing of the heritage design was presented. The presentation discussed how the BCIS had failed to actuate properly, and the details can be found in the ESMATS archive (Titled “Bypass Switches – A Case Study in Test Like You Fly Merits”). To summarize the results, the failure investigation found that there were multiple causes for this anomaly.
1. A low actuation current (less than 3 amps) leads to an undesirable condition that could affect the performance of the BCIS.
2. At temperatures less than ambient, the likelihood of an anomaly increases. The reason that these two causes led to a failure was because they led to a potential negative force margin on the split spool actuation device within the BCIS. Force margin is defined as the ratio between the separating force and the resistive force. In this case, it is specifically the ratio between the restraining wire separating force and the fuse wire resistive force, including all frictional forces. If the restraining wire separating force is greater than the resistive forces caused by the interaction between the restraining wire loop and fuse wire, then the restraining wire can unwind resulting in successful actuation. The heritage design used a restraining wire with a 0.014-in (0.36-mm) diameter, which corresponded to a separation force of approximately 0.44 lbf (2 N). In most cases, this force was sufficient to separate the restraining wire from the fuse wire, leading to a successful actuation, but the causes 1 and 2 listed above, combined with production lot variation, led to a possible condition where the restraining wire would not separate from the fuse wire or the separation would be delayed. This paper discusses the design iterations and lessons learned during the design and qualification of the improved BCIS design, specifically within the release mechanism portion of the BCIS.
Design Development The development of the improved BCIS started with a set of basic requirements:
1. The design improvements should not affect the envelope of the existing design 2. The improved design should be able to withstand the most extreme environments and conditions
that have been requested by our customers 3. The electrical performance of the BCIS should remain unchanged
Spool
Restraining Wire
Fuse wire
Plunger High Current Carrying Components
T2 T3 T1
Release Mechanism
T4 & T5
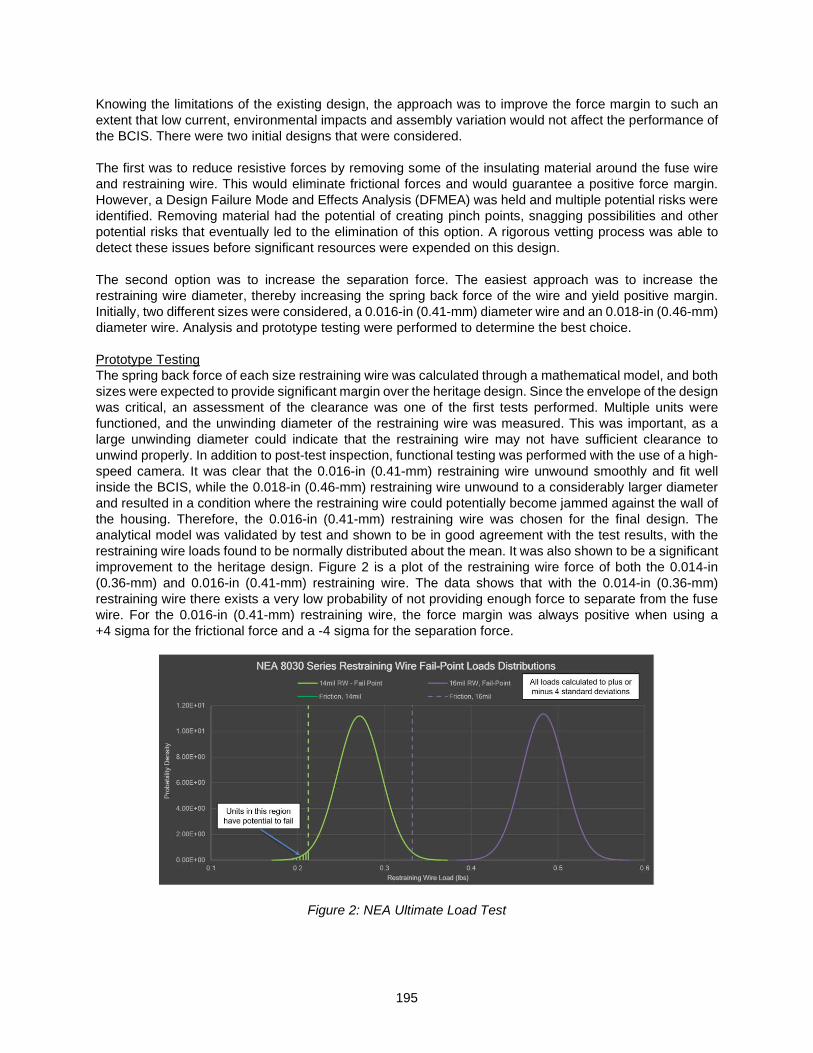
195
Knowing the limitations of the existing design, the approach was to improve the force margin to such an extent that low current, environmental impacts and assembly variation would not affect the performance of the BCIS. There were two initial designs that were considered. The first was to reduce resistive forces by removing some of the insulating material around the fuse wire and restraining wire. This would eliminate frictional forces and would guarantee a positive force margin. However, a Design Failure Mode and Effects Analysis (DFMEA) was held and multiple potential risks were identified. Removing material had the potential of creating pinch points, snagging possibilities and other potential risks that eventually led to the elimination of this option. A rigorous vetting process was able to detect these issues before significant resources were expended on this design. The second option was to increase the separation force. The easiest approach was to increase the restraining wire diameter, thereby increasing the spring back force of the wire and yield positive margin. Initially, two different sizes were considered, a 0.016-in (0.41-mm) diameter wire and an 0.018-in (0.46-mm) diameter wire. Analysis and prototype testing were performed to determine the best choice. Prototype Testing The spring back force of each size restraining wire was calculated through a mathematical model, and both sizes were expected to provide significant margin over the heritage design. Since the envelope of the design was critical, an assessment of the clearance was one of the first tests performed. Multiple units were functioned, and the unwinding diameter of the restraining wire was measured. This was important, as a large unwinding diameter could indicate that the restraining wire may not have sufficient clearance to unwind properly. In addition to post-test inspection, functional testing was performed with the use of a high-speed camera. It was clear that the 0.016-in (0.41-mm) restraining wire unwound smoothly and fit well inside the BCIS, while the 0.018-in (0.46-mm) restraining wire unwound to a considerably larger diameter and resulted in a condition where the restraining wire could potentially become jammed against the wall of the housing. Therefore, the 0.016-in (0.41-mm) restraining wire was chosen for the final design. The analytical model was validated by test and shown to be in good agreement with the test results, with the restraining wire loads found to be normally distributed about the mean. It was also shown to be a significant improvement to the heritage design. Figure 2 is a plot of the restraining wire force of both the 0.014-in (0.36-mm) and 0.016-in (0.41-mm) restraining wire. The data shows that with the 0.014-in (0.36-mm) restraining wire there exists a very low probability of not providing enough force to separate from the fuse wire. For the 0.016-in (0.41-mm) restraining wire, the force margin was always positive when using a +4 sigma for the frictional force and a -4 sigma for the separation force.
Figure 2: NEA Ultimate Load Test
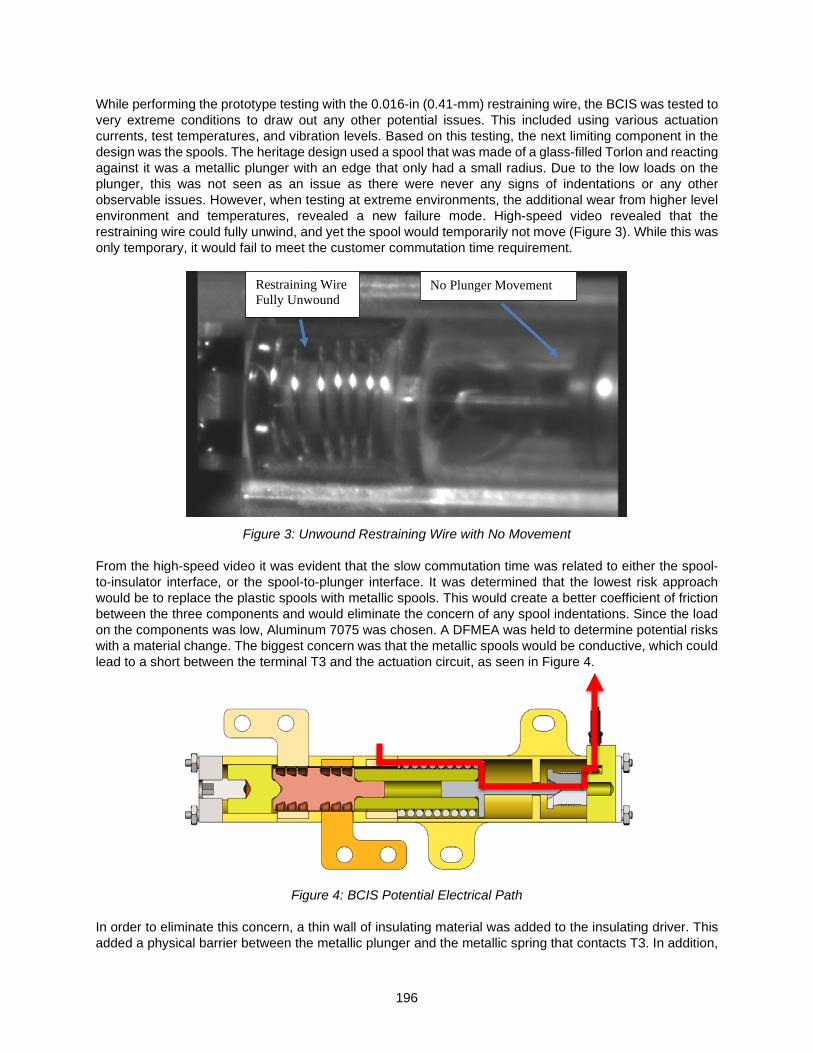
196
While performing the prototype testing with the 0.016-in (0.41-mm) restraining wire, the BCIS was tested to very extreme conditions to draw out any other potential issues. This included using various actuation currents, test temperatures, and vibration levels. Based on this testing, the next limiting component in the design was the spools. The heritage design used a spool that was made of a glass-filled Torlon and reacting against it was a metallic plunger with an edge that only had a small radius. Due to the low loads on the plunger, this was not seen as an issue as there were never any signs of indentations or any other observable issues. However, when testing at extreme environments, the additional wear from higher level environment and temperatures, revealed a new failure mode. High-speed video revealed that the restraining wire could fully unwind, and yet the spool would temporarily not move (Figure 3). While this was only temporary, it would fail to meet the customer commutation time requirement.
Figure 3: Unwound Restraining Wire with No Movement
From the high-speed video it was evident that the slow commutation time was related to either the spool-to-insulator interface, or the spool-to-plunger interface. It was determined that the lowest risk approach would be to replace the plastic spools with metallic spools. This would create a better coefficient of friction between the three components and would eliminate the concern of any spool indentations. Since the load on the components was low, Aluminum 7075 was chosen. A DFMEA was held to determine potential risks with a material change. The biggest concern was that the metallic spools would be conductive, which could lead to a short between the terminal T3 and the actuation circuit, as seen in Figure 4.
Figure 4: BCIS Potential Electrical Path In order to eliminate this concern, a thin wall of insulating material was added to the insulating driver. This added a physical barrier between the metallic plunger and the metallic spring that contacts T3. In addition,
Restraining Wire Fully Unwound
No Plunger Movement

197
a proprietary coating called Magnaplate® HCR was applied to the spools. This provided three benefits. The first is that Magnaplate® HCR has high dielectic strength, meaning that it will isolate the metallic spools from any other metallic components. The second benefit is that Magnaplate HCR increases the hardness of the aluminum spools to above 50 Rockwell C, which is harder than the plunger. It is ideal for the spools to be harder than the plunger, as this prevents the plunger from digging into the spools and preventing or slowing release. A stress analysis was performed and showed that the stress remained well below the material capability for the spools and plunger (Figure 5). Testing was also performed to validate the results. The testing showed that the spool and plunger combination could sustain loads over 900 lbf (4000 N), while the load during use was expected to be on the order of 44 lbf (2 N).
Figure 5: FEA of the Spool and Plunger
The final benefit is that Magnaplate® HCR is self-lubricating, with a published coefficient of friction of 0.35 when used in combination with aluminum. Since the plunger is stainless steel, it is likely that the actual coefficient of friction between the plunger and Magnaplate coating is less. A cross-section of the final design is shown in Figure 6. The design meets the primary design requirement of fitting within the initial envelope and it has passed all initial development tests.
Figure 6: Final BCIS Design
Test Results
As of the end of 2019, the unit has successfully completed prototype and development testing. The development testing included the following:
• 40+ actuations o Actuation Current = 1.5 amps and greater

198
o Temperature = -70°C to +130°C • Vibration Testing:
o Sine Vibration: Up to 110G o Random Vibration: Up to 56 Grms
• Shock Input o 2300G from 1300 Hz to 10000 Hz
• Thermal Shock: o -62°C to +137°C o 10 cycles
Qualification testing will be conducted in April 2020 and is expected to be completed by May 2020. The expected qualification sequence is in Table 1.
Table 1: Qualification Test sequence
Conclusions and Lessons Learned
1. EBAD has developed an updated NEA BCIS design that is insensitive to extreme environments and actuation conditions (within reason)
2. During the initial phase of a program, parallel paths should be chosen to reduce the impact of unforeseen risks
3. Perform mini design reviews, DFMEAs, etc. early and often to prevent spending resources on risky design concepts
4. The force margin on even the smallest components should be determined

199
A Fast-Acting, Self-Energized, Low-Cost Valve for Air Cannons
Lee E. Brown*
Abstract A novel pneumatic valve has been developed to control pressurized air for an air cannon. It offers very rapid opening time, is self-energized when opened, self-locking when closed, and is of relatively low cost. The valve uses a variation on the classic four-bar linkage which enables the valve to be self-locking against pressure when closed, yet self-energized and opens very rapidly when the valve mechanism is tripped. The valve has been tested and has been used in the field to test munitions fuzes.
Background
Air cannons have long been used for dynamic testing of electronics and mechanisms. These air cannons are used to simulate high-G environments such as artillery fire or high-speed impacts. They can also be used to propel electromechanical devices past objects of interest, such as testing munitions fuzes against specific types of targets. The use of air instead of chemical propellants greatly simplifies these kinds of tests and greatly reduces the cost of such testing.
The key component in any air cannon is the means by which the high pressure air is controlled. A very rapid rise in pressure is needed to accelerate the projectile to the desired muzzle velocity within the shortest possible barrel length.
The oldest means of obtaining a very rapid pressure rise is through the use of a burst disk. A burst disk is a membrane designed to fail at a specified air pressure and thus achieve a sudden release of air into the cannon’s chamber. Burst disks are capable of controlling very high pressures and are usually designed with scoring or grooves that give fairly repeatable failure pressures.
The drawback to burst disks is that they must be replaced after each shot which is time consuming. High pressure burst disks are often precision machined elements which adds to the cost per shot. At lower pressures metal or plastic foils are employed; however, they tend to operate with less consistency and thus higher variations in projectile velocity.
More recently, electromechanical pneumatic valves have been tried in lieu of burst disks. These valves avoid the per-shot expense of burst disks but the initial purchase price of valves capable of handling high pressures can be quite high. Electromechanical valves also offer substantially longer pressure rise times than do burst disks and longer barrels are necessary unless some sort of retarding mechanism is used to hold the projectile in the chamber until peak pressure is achieved.
Requirements
In the spring of 2015 Electronics Development Corporation undertook the development of a 75-mm bore air cannon to be used for the testing of munitions fuzes. The design goal for the 75-mm air cannon is to propel a 1-kg projectile with a muzzle velocity of at least 75 m/s. It must use the shortest possible barrel length and be very easy to operate. Low cost, both for cost of acquisition and cost per shot is also a factor.
* Electronics Development Corporation, Columbia, MD; [email protected]
Proceedings of the 45th Aerospace Mechanisms Symposium, NASA Johnson Center, 2020

200
It was decided that this air cannon should use a portable air compressor or “shop air” in the range of 400 to 800 kPa. Early experimentation with burst disks showed that metal foil disks yielded erratic results at these pressures and they tend to shed foil debris which causes serious problems for some types of electronic fuzes. Conventional electromechanical pneumatic valves were ruled out due to slow opening times.
Given the drawbacks noted above, Electronics Development Corporation elected to develop a novel type of pneumatic valve that offers fast pressure rise times comparable to burst disks yet be simple and inexpensive. This valve is self-locking against pressure when closed yet be self-energized when opening.
Design
The schematic design of the air canon is shown in Figure 1. Pressure is supplied by a 75 L pressure vessel with a 50 mm diameter opening. The valve inlet and outlet apertures are also 50-mm diameter. Downstream of the valve the aperture increases to 75-mm diameter for the breech and the barrel.
Figure 1: Schematic Arrangement of air cannon
The valve’s components are arranged as shown in Figure 2. The valve consists of an inlet and an outlet aperture, a flapper element, the flapper linkage, and an impact absorber. A pneumatic actuation cylinder and a trip lever are mounted on the rear of the valve and may be seen in Figure 3.
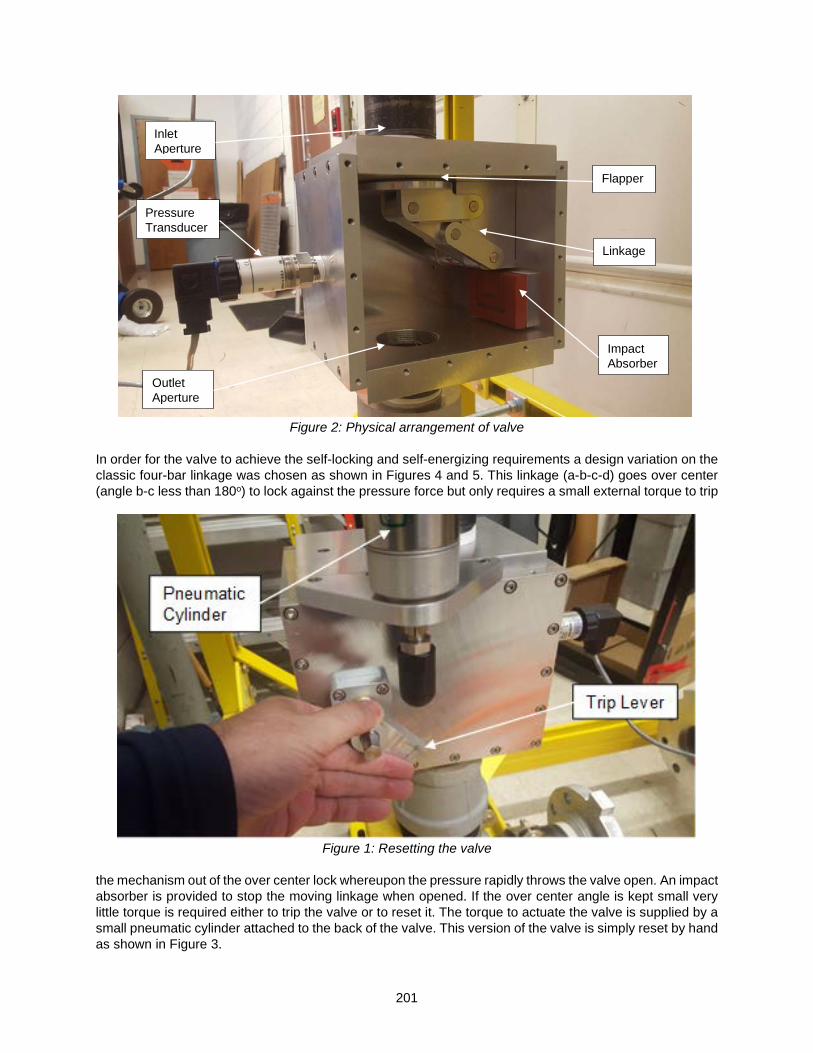
201
Figure 2: Physical arrangement of valve
In order for the valve to achieve the self-locking and self-energizing requirements a design variation on the classic four-bar linkage was chosen as shown in Figures 4 and 5. This linkage (a-b-c-d) goes over center (angle b-c less than 180o) to lock against the pressure force but only requires a small external torque to trip
Figure 1: Resetting the valve
the mechanism out of the over center lock whereupon the pressure rapidly throws the valve open. An impact absorber is provided to stop the moving linkage when opened. If the over center angle is kept small very little torque is required either to trip the valve or to reset it. The torque to actuate the valve is supplied by a small pneumatic cylinder attached to the back of the valve. This version of the valve is simply reset by hand as shown in Figure 3.
Impact Absorber
Linkage
Flapper
Inlet Aperture
Outlet Aperture
Pressure Transducer
202
Figure 4: Valve in Closed position
Figure 5: Valve in open position
203
Testing
A sample pressure curve is shown in Figure 6. Of note is the rapid pressure rise time of ~10 ms. While this is not quite as fast as a burst disk it is much faster than the majority of electromechanical pneumatic valves of similar aperture. The 75-L pressure vessel completely empties in ~200 ms.
Figure 6: Sample pressure curve
Live fire tests with 1-kg dummy test projectiles showed that the desired muzzle velocity of 75 m/s is easily achieved at ~250 kPa pressures using a 3-m barrel. 100 m/s is possible using the full 400 kPa max operating pressure.
Field Use The first field use of the finished 75 mm air cannon was testing prototype munitions fuzes by mounting them into test projectiles and shooting them past targets of interest. Figure 7 shows one of the test setups (note the barrel in the foreground.) This testing required hundreds of shots to be fired in as rapid a succession as possible. The valve held up extremely well with no misfires or other mechanical deficiencies. No adjustments to the valve were required throughout the testing.

204
Figure 7: Use in the field
Conclusions
The valve for the 75-mm air cannon has met or exceeded all requirements. The over center four-bar linkage is surprisingly robust, needing no adjustment over the course of hundreds of shots. The valve can be manufactured at a relatively low cost as the parts are simple and few tight tolerances are required.
It bears noting that this valve design is not limited to use on air cannons. The design is easily scalable and could potentially be used in any application which requires the rapid venting of a pressurized fluid.

205
Development of a Low-Shock Separation Nut Out of the Pyrotechnic Class
Sebastien Perez*, Frederic Miralles* and François Degryse*
Introduction About Pyroalliance Pyroalliance is the European leader and a world-class player in pyrotechnics and mechanisms, delivering innovative and cost-effective solutions tailored to our customers’ critical requirements. With more than a half-century of experience as a manufacturer of state-of-the-art pyrotechnic and mechanical equipment, Pyroalliance addresses the requirements of cutting-edge industries, including Aerospace, Defense and Energy. We leverage our proven expertise and innovative mindset to develop products that combine the performance and reliability needed to perform critical functions for our customers’ systems. Facts and figures:
• Counting over 240 collaborators, Pyroalliance is operating from two locations. The headquarters is at Les Mureaux (Region of Paris) and the second site is located in Toulon (Southeast France)
• Pyroalliance is 90% owned by ArianeGroup, the remaining 10% belonging to the company OEA Inc.
• The company has reached 40 million Euros turnover in 2018, representing a 15% growth compared to 2017
• Exporting in more than 15 countries, Pyroalliance is pursuing its international growth Low-Shock Separation nuts By adapting the design of its Pyrotechnics Nuts, Pyroalliance overcomes the preconceived notions and changes the game by claiming its products are Ultra Low Shock. Pyroalliance has been designing and producing Pyrotechnic Nuts as well as Hold and Release Mechanisms for decades. Those are dedicated to maintain satellites on dispensers as well as antennas and booms on satellites. To date, Pyroalliance has delivered more than 6000 of those with a track record of 100% operational success. Indeed pyrotechnic nuts provide major operational benefits thanks to their very high energy density, very high standard of proven reliability, speed of execution (milliseconds scale) and ideal synchronicity when several nuts are to be activated simultaneously (typical situation when satellites are held on a satellite dispenser). Recent market surveys show that:
• Separation Nuts require a growing capability to reduce levels of shocks on the payloads, what is considered as an attractive feature for sensitive payloads, combined with an ability to ensure synchronicity;
• Despite of their performance, a growing number of actors of the New Space are reluctant to use equipment classified as pyro for operational reasons.
Understanding those challenges, Pyroalliance presents hereafter its recent achievements in those areas.
* Pyroalliance, Les Mureaux, France; [email protected], [email protected], [email protected]
Proceedings of the 45th Aerospace Mechanisms Symposium, NASA Johnson Space Center, 2020

206
Separation Nut Background Pyroalliance designs, manufactures and delivers separation nuts or complete Hold and Release Mechanisms meeting the requirements of various mission profiles. However, each design is based on the same principles which have cumulated decades of flight heritage .
Figure 1. Pyroalliance separation nuts – Principle
Functioning principle: The pyro-initiators make the pressure increase inside the sealed chamber, until the release piston can translate. When shifted, the release piston, due to its inner geometry, allows the radial expansion of the thread segments and, consequently, the release of the screw. At the same time, the ejection pin moves and ensures that the screw cannot remain or move back to its initial location. Pyroalliance separation nuts are fully resettable on both Pyroalliance sites or customer facilities using cold gas (non pyro gas). The Spring allows resetting the parts in the initial position when actuated by cold gas. Before delivery, 100% of our separation nuts are controlled using cold gas actuation in a test set reflecting the extreme operational conditions of the mission (temperature and pre-load at release). The heritage design has the following main advantages:
• Outstanding reliability figures (>1 – 5x10⁻⁵) despite extreme operational conditions; the simple design made of only a few parts and the motorization margins driven by the pyrotechnics are the key features enabling such level of reliability
• Extremely low actuation time / actuation time standard deviation: the actuation time of Pyroalliance separation nuts remains below 2 ms cumulating both contributions of pyrotechnic and mechanical actuations. Then, the actuation time standard deviation is well below 1 ms which is particularly suited for multi-point release.
On top of those advantages, Pyroalliance recently started to implement some adaptations to this heritage design in order to meet new emerging market requirements. They aim at :
• Reducing the level of shock induced on the holding structures during the release • Performing the necessary steps to make the device Out of Class (non pyro).
Pyroalliance is curently working on implementing those adaptations while preserving all assets of the heritage design.
Release piston
Combustion chamber
Thread segment
Ejector
Separator
Spring
Housing
Base
Initiator

207
Pyroalliance achievements First analysis When analyzing the separation nut heritage design, Pyroalliance made the assessment that there were three main contributors to the induced shock:
• Pyrotechnic shock due to the initiator actuation • Strain energy stored in the screw during the preload and freed during the release • Kinetic energy stored in the release piston during the release and further distributed during
following shocks of the piston with other mechanical parts.
Table 1 summarizes the different contributors of the shock and quantifies their respective impact. The considered design is the heritage M10 separation nut (screw diameter: 10 mm / 0.39 inch).
Table 1. Shock contributors assessement – M10 separation nut heritage design
Shock source Nature Shock contribution*
Initiator actuation Pyrotechnic 10% (tested with NASA Standard Initiator / Space Standard Initiator)
Screw release of the preload Mechanical 5% (preload: 20 kN ; screw length: 100 mm ; screw material:
stainless steel) Impact of the release piston Mechanical 85%
*Note: Several tests / analysis have been performed in order to quantify the impact of each contributor. Pyroalliance found out that the shock was mainly caused by the impact of the release piston at the end of his stroke once the threaded segments are expanded. As an example, the sketch on Figure 2 presents the characteristic of the piston collision using the M10 separation nut. The velocity of the piston at the time of the impact has been captured using a high-speed camera.
Figure 2. M10 separation nut – Collision characteristics
Impact characteristics• Release piston mass: 50g• Release piston velocity: 30 m/s• Kinetic energy: 22.5 J

208
Addition of a damping system Based on those findings, Pyroalliance designed a specific damping system made of a dedicated damping material and located after the release at the end of the release piston stroke. This system allows performing a progressive braking of the release piston without degrading the reliability of the global system. Furthermore, this damping system is fully compliant with respect to LEO space requirements:
• Outgassing compliant with NASA / ESA Standards • Tested on the temperature range [-60°C;+80°C] without any performance degradation • Compatible with a 10 years storage duration without any performance degradation (tested
through accelerated aging).
Pyroalliance has performed several tests with the addition of the damping system. The shock configuration is composed of an aluminum plate of 1m×1m×5mm receiving the separation nut test assembly. Four accelerometers are distributed on a 100-mm-diameter circle around the separation nut.
Figure 3. Shock test configuration – M10 separation nut
209
The results are presented on the Figure 4.
Figure 4. Shock Response Spectrum - Addition of the damping system
These results have been measured on Pyroalliance own shock test lab configuration. A comparison of the shock with / without damping system has been performed in the exact same configuration considering several units. The induced shock has been reduced by a factor 4 on the frequency band [1000 Hz; 10000Hz]. Furthermore, the damping system brings similarly better results on the entire frequency range. Tests have also been performed on a spacecraft mockup at customer level. The accelerometers were located on the spacecraft side close to the cup / cone interface. The results measured by the customer were the following:
- 4000 gSRS @2000Hz with the heritage design (without damping); - 1000 gSRS @2000Hz with the addition of the damping system.
The shock reduction by a factor 4 measured on the shock test lab configuration has therefore also been verified with the same ratio at customer level. Pyroalliance is pursuing this effort to improve the damping system and reduce the shock induced by the separation nuts with a target of 500 gSRS @2000Hz on a spacecraft configuration. Out of classification European procedure In the context of aerospace industry, Pyroalliance is turning toward technologies which contain pyrotechnics and its condensed power while being as safe as other non pyrotechnic devices. In order to be classified as non-dangerous good regarding the law (c.f French transport regulation law: Recommandations relatives au transport des marchandises dangereuses ST/SG/AC.10/1/Rev.20), Pyroalliance will conduct several tests to demonstrate that an unpackaged separation nut equipped with pyro-initiators satisfies the 6 criteria in Table 2.
1·101
1·102
1·103
1·104
g
21·10 31·10 41·10HzSRS MAXIMAX (Q=10) - Shock comparison - M10 separation nut
separation nut without damping systemseparation nut with damping system

210
Table 2. European criteria – non dangerous goods transport regulation
Criterion Content Status Sensor type
Property when functioning
1 Surface temperature
When actuated, external surfaces of the product shall not reach a temperature higher than 65°C (149°F). A transient 200°C (392°F) peak remains acceptable.
Checked (measured
through tests) Thermocouple
2 Integrity
Neither rupture nor movement of any parts of the item, or the item itself, should occur beyond a 1-meter range in any direction. If the integrity can be affected by the fire exposure, tests under fire can be requested.
To be checked under fire exposure
High speed Camera
3 Low noise No audible effect above 135 dB at one meter from the item in any direction. To be checked Sonometer
4 Arc and flames
No electric arc, no flame should occur able to inflame material such as a sheet of paper whose density is 80 ± 10 g/m2 in contact with the item.
To be checked High speed camera
5 Fumes
No production of fumes, emanations or dust should occur which would reduce the visibility by 50% in a 1-meter-cube chamber. The luxmeter is located at 1 meter from a constant light.
To be checked Luxmeter
Others
6 Inviolability
To make the item safe to manipulate even in case of untimely firing, the design shall ensure that the pyrotechnic initiators can not be unscrewed from the separation nut, as a warrant of inviolability and safety for operators and users.
Compliance of design options to be confirmed
by regulation authorities
Conception requirement
Note 1: If no fumes are observed during tests performed for previous criteria, criterion 5) can be exempted. Note 2: The regulation authorities can determine that a packaged item is more dangerous than an unpackaged one and can request tests with packaging. Pyroalliance is in the process of verifying all of those 6 criteria until mid-2020 in order to submit the file and request the EU out of class certification. Finally, Pyroalliance objective will be to transpose the EU out of class certification to US regulation of goods by contacting US DoT.
Conclusion While preserving all assets of the heritage design of its separation nuts (very high reliability and extremely fast actuation time), Pyroalliance is currently working and quickly progressing on bringing new advantages to its products:
• With the addition of a new damping system, Pyroalliance has already reduced the level of induced shock by a factor 4 compared to its heritage design. As a next step, Pyroalliance is now targeting to reach a shock below 500 gSRS @2000Hz measured on a small spacecraft configuration
• Besides Pyroalliance aims at delivering separation nuts out of the pyrotechnic classification (EU / US regulation laws) by mid-2020.

211
Lubricant Degradation in High-Load, High-Cycle Actuator Test Using Heritage Harmonic Drives for the Multi-Angle Imager for Aerosols Instrument
M. Michelle Easter*
Abstract
The Multi-Angle Imager for Aerosols (MAIA) instrument features a pushbroom spectropolarmetric camera on a two-axis gimbal, which is actuated throughout the mission duration for multi-angle imaging, target revisiting, and inflight calibration. Each gimbal axis is driven by an existing design Mini Dual Drive Actuator (MDDA), which features a duplex brushless DC motor and redundant size 10 pancake Harmonic Drive (HD) gearset within its drive outputs. As the size 10 pancake assembly is no longer available from Harmonic Drive, LLC, units were acquired from long-term flight storage. Due to the load and speed profiles, as well as the continuous operation required of the actuators, an endurance test was conducted to verify acceptability of the mechanism for the application, based on fatigue life. Approaching the two-life milestone, the test failed due to breakdown of the Braycote 601EF lubricant, with a final apparent overall gearbox efficiency of 7%. Disassembly and SEM inspection revealed two distinct flavors of degraded and polymerized lubricant, tooth and race wear, material adhesion onto rolling wave generator bearing surfaces, and non-trivial amounts of corrosion. Due to the dither behavior and relatively high loads, it seemed breakdown due to high contact stress was the likely culprit. This led to the decision to change the drive output subassembly lubricant from Braycote 601EF grease and Bray Oil 815Z, to Rheolube 2000 grease and Nye Synthetic Oil 2001. Since the motors were already built using Braycote, and the lot of Harmonic Drives (HD) and duplex bearings had already been processed with Braycote, testing to verify compatibility and re-wettability of the two lubricants began. Meanwhile, a complete disassembly and inspection was performed, down to the individual bearing-ball level. The inspection revealed corrosion within the Wave Generator bearings, even on inner diameters of inner races that were bonded onto the Wave Generator hubs, despite having been stored in hydrocarbon oil. Specialized inspection also brought the black oxide coating application of the HD circular splines into the spotlight, just as chemical analysis revealed an unexpected presence of copper in the degraded lubricant. Black oxide, old adhesive, and corrosion were removed from the HD assemblies, they were processed with Pennzane-based lubricant, and the endurance test began again. This paper provides recommendations regarding use of mechanisms from long term storage, even if stored in seemingly ideal conditions, and documents a discovery process unique to work with heritage hardware. Also addressed is a performance comparison between Braycote 601EF and Rheolube 2000, as well as the Pin on Disc Test results regarding their compatibility along with evidence that, contrary to prevailing belief, it is possible to functionally rewet with Pennzane hardware that was once processed with Braycote.
Introduction MAIA Instrument The Multi-Angle Imager for Aerosols (MAIA) mission objectives are to assess the impact of mixtures of airborne particulate matter of different sizes and compositions on human health, and to collect multi-angle spectropolarmetric imagery over targets of interest with respect to air quality and climate research. The MAIA instrument is class 3, and features a pushbroom spectropolarmetric camera on a two-axis gimbal, which is actuated throughout the mission for multi-angle imaging, target revisiting, and inflight calibration.
* Jet Propulsion Laboratory, California Institute of Technology, Pasadena, CA
Proceedings of the 45th Aerospace Mechanisms Symposium, NASA Johnson Space Center, 2020

212
There are several heritage aspects of MAIA which are reminiscent of the Multi-angle Imaging SpectroRadiometer (MISR) mission, which has been using a multi- angle imaging approach to image aerosols in the atmosphere, imaging targets from nine angles, using nine cameras, since the year 2000. The reduction of the number of cameras required from nine for MISR to one for MAIA, is largely thanks to the Bi-Axis Gimbal Assembly (BGA), which articulates the MAIA camera to achieve multi-angle pointing. A key heritage item in the MAIA instrument design is the Mini Dual Drive Actuator (MDDA), which is a single-fault tolerant electromechanical device, used by MISR as its Cover Actuator, and as the North and South Calibration Plate Actuators. It also flew on Cloudsat and Galaxy Evolution Explorer (GALEX). The MDDA is valued largely due to its redundancy, providing the high-reliability desired to produce necessary mission-critical motions. The single-string Mini Uni-Drive Actuator was used on Mars Pathfinder for the High Gain Antenna Gimbal Actuators. Its design was inspired by the Standard Dual Drive Actuator, originally designed at JPL by Doug Packard. [1] The MAIA MDDAs will marry the applications of the Mars Pathfinder gimbal operation and the multi-angle imaging of MISR, with one MDDA driving each of the two axes of the MAIA BGA.
Figure1. Mini Dual Drive Actuator
However, the MAIA project seemed to be in luck, as there existed a set of spare Harmonic Drive units in flight storage, which had been originally purchased by the Cloudsat project. The Cloudsat actuator build had occurred just following MISR in the 1990s, and used the MDDA as its Reflector Mechanism. As fate would have it, the lot of flight spare size 10 pancake HDs had been preserved in their original heat-sealed packaging, locked away in flight stores since their receipt in 1995, as delivered by their namesake manufacturer who, at that time, was operating under a different ownership than the Harmonic Drive LLC of today. Flight spare duplex output bearings were also identified, as well as spare Duplex Motors, which would end up getting sent back to Ducommun Technologies, their original manufacturer, to be rewound and have bonds, wires, and Hall sensors replaced, for the new MAIA application. MAIA Actuation and the Endurance Test In flight, the two MAIA MDDAs will drive two slightly different load and speed profiles, with sweeps as well as stop and stare motions, dependent on the axis for which they are designated and the mode of operation of the instrument. The nominal expected output loads are around half of the maximum load rating of the size 10 HD, which is documented at 5.1 Nm (45 in-lb), and the application was one of continuous use throughout the mission life. Even with heritage and redundancy, no other MDDA application was similar enough to avoid some testing. This called for the execution of a new test, with the intention of verifying the fatigue life of the mechanism and its endurance with the MAIA operational profiles. For simplicity, a hybridized profile was created, to capture both the higher loads and the requirement for repeated gear tooth engagement of the off-track axis profile, and the higher speed and larger rotational

213
output distance required of the on-track axis. The profile was conservative, and yielded a series of test events to be repeated in cycles, each with a 2.3 Nm (20 in-lb) continuous applied output load being driven at a speed of eight degrees per second, with dither frequencies requiring direction changes every 1.5, 6.5, or 16 seconds. The test would run for three times longer than one mechanical life, with a total runtime of almost 700 hours, equating to approximately 13.5 million equivalent Wave Generator input revolutions. Additionally, since the updated MAIA Duplex motors were specified to have a minimum stall torque of 184 mNm (26 in-oz), and the HD gear ratio is 244:1, a risk to be addressed was that the actuator could easily exceed the 5.1 Nm (45 in-lb) momentary peak (ratchet) torque rating of the size 10 HDs. Although test records could not be located, the memory remained of the earlier completion of static, sustained no-ratchet verification testing up to a 11.3 Nm (100 in-lb) output load, completed for the MISR program. Thus, passing this test before, after, and throughout the three times life program would also be a success criteria for the Endurance Test campaign at large. The element of the MDDA most susceptible to wear due to fatigue is the HD output gearing. One of the two redundant drive output subassemblies served as the test article, shown in Figure 2. The HD was to be grease plated using Braycote 601EF and the duplex bearings with Braycote 600EF, both using Brayco 815Z oil, reflecting the heritage grease plating and packing method. The unit was mounted into a simple dynamometer fixture, driven by a brushed test motor, loaded with a brake, along with an input torque transducer and output transducer measuring torque and speed. The simplicity of the setup was intended to allow for continuous operation, to be monitored by a chart recorder, and checked on periodically by engineering.
Figure 2. Endurance Test Article, the MDDA Drive Output Subassembly
The HDs, and a spare lot of the necessary 440C duplex output bearings, were pulled from flight storage and taken to the cleanroom for cleaning and inspection. The Wave Generator subassemblies had been delivered with their AISI 52100 bearings and 304 CRES spacers bonded onto the Wave Generators hubs, and, per the original source control drawing, a black oxide coating had been applied to the ductile iron circular splines and the AISI 1144 Stressproof Steel® Wave Generators per MIL-DTL-13924. Everything was heavily coated with a layer of a lightweight water-displacing hydrocarbon oil. Similar to the HDs, the Timken duplex bearings were still sealed in their original packaging, also covered in hydrocarbon oil. The HDs were partly disassembled, leaving the bonded Wave Generator subassemblies intact, and ultrasonically cleaned using acetone, followed by Vertrel XF, and a final oven bake. They were inspected under 15x magnification by engineering and quality and, after receiving passing inspection results, the units were immediately grease plated using Braycote 601EF (10% by mass) and Vertrel (90% by mass), re-inspected, and sealed in moisture barrier bags under dry nitrogen gas purge. The same process was followed for inspecting and processing the duplex bearings, using Braycote 600EF, and all of the packages were stored in the cleanroom to await further assembly steps. When the Drive Output subassembly was completed, a layer of Braycote 601EF was applied to each of the Wave Generator bearings as required to obtain 100% ball coverage, which was manually run-in while also adding 12 drops of Brayco 815Z Oil to
214
each bearing (each of which also contains a phenolic retainer). Braycote 601EF was manually added onto all circular and Flexspline teeth, with excess removed after assembly.
Endurance Failure
The First Life The test began with completion of start-up torque measurements of the Drive Output subassembly, and an average value of 11.1 mNm (1.57 in-oz) was observed, landing nicely within the acceptance criteria of <14.1 mNm (2.0 in-oz), per the original size 10 HD source control drawing. The required sustained static output load of 11.3 Nm (100 in-lb) was maintained for 60 seconds with no ratcheting behavior observed, in both directions. The subsequent running portion of the test kicked off, and for the first 27 hours, the input torque required to drive the output torque load of 2.3 Nm (20 in-lb), alternating directions every 6.5 seconds at a rate of 8.0 deg/s, was an average of 38.1 mNm (5.4 in-oz). The input torque dropped to 35.7 mNm (5.05 in-oz) (-6.5%), shown in the left panel of Figure 3, corresponding with an increase in speed of 0.58 deg/s (+6.7%) across a 52 minute period. The speed returned to its approximate initial condition (there was no speed controller in the configuration) starting around ~170 hours, and the input torque increased, to around 41.7 mNm (5.9 in-oz). Then, in the final 16.5 second dither time test event, at around 210 hours, the output speed dropped to about 87% of its starting value, and the input torque increased to a maximum of 45.2 mNm (6.4 in-oz), about 18% higher than the starting value. However, after about 30 hours, the speed and input torque seemed to level back out, ending with an average input torque of ~38.1 mNm (5.4 in-oz) and an output rate of about 8.0 deg/s. The first life was complete, reaching over 250 hours of as-run test time. Despite the variation along the way, the consistent starting and ending input torque and speed measurements seemed like indicators of a successful first life. The startup torque was re-measured, and an average value of 4.8 mNm (0.68 in-oz), still defined as passing, was observed. The sustained 11.3 Nm (100 in-lb) no-ratchet test was successful again, and life two was ahead.
Figure 3. Comparison of input torque observed over the initial 45 hours of the first and second lives.
The Death March At the onset of life two, the average input torque was back down to 35.7 mNm (5.06 in-oz), which corresponded nicely to the run-in value seen after the first life settled. As shown in Figure 3 and, although the speed was around 12% higher than it was at the close of the previous test, the lower measured torque reduced concern associated with the higher speed, and the test proceeded. Both measured values climbed slowly to 38.1 mNm (5.4 in-oz) and 9.0 deg/s over the course of the following 75 hours. Then, another change appeared with about a 0.5 deg/s speed drop over a half hour period, accompanied by an input torque increase to 41 mNm (5.8 in-oz).

215
This marked the beginning of the roller coaster ride to come. Speed increased, then decreased, then increased again over the following 15 hours, reaching a local high of 9.77 deg/s. After another 10 hours, the speed had dropped back down to 8.4 deg/s. The input torque followed the pattern of increasing with the speed decreases, and vice versa, over this 56.4 hour run with a 16 second direction change timing. At the profile end, input torque was an average of 43.4 mNm (6.15 in-oz). After this, the death march began. At the start of each event type to follow, as well as in between, the motor voltage was readjusted to obtain the desired speed, and the input torque would swell in response and subside again as the speed would drop back down, like a snake swallowing prey (or a system without speed control). The effect of one such adjustment can be seen in the middle of the 1.5 second dither time test event in the shaded center panel of Figure 4. After 34 hours, the system stopped cycling, and the measured input torque seemed to change exclusively in the uphill direction, until it reached an average of almost 72 mNm (10.2 in-oz), or double the observed value at the start of life two. See Figure 4 and Figure 5.
Figure 4. Output Speed Variation Figure 5. Input Torque Variation Observed During the Second Life Observed During the Second Life
In the final stretch of life two, a marathon run with a 6.5-second dither time delay was embarked upon. The speed had dropped from the initially set value, but seemed to settle out at just over 7.0 deg/s, which lasted almost 15 hours. Then, things declined. Over a three hour period, the speed dropped from 7.0 to 4.5 deg/s, which was the lowest yet observed speed, shown in Figure 6, and the input torque increased to the highest yet seen value of 91.1 mNm (12.9 in-oz), shown in Figure 7. The passing of 5 more hours brought hope, then another 5 hours brought despair. When it seemed like the system had settled itself at 4.5 deg/s and a drag torque of just over 84.7 mNm (12 in-oz), the motor voltage was driven back up to obtain the desired output speed.
Figure 6. Output Speed Degradation in Figure 7. Input Torque Increase in the
the Final 6.5 Second Dither Time Test Event Final 6.5 Second Dther Time Test Event
This time, when the speed was increased to the desired value, the system faught harder than before. Input torque climbed quickly, exceeding previous test maximums, as seen in the far right of Figures 6 & 7. In

216
addition to the behavior was a simultaneous temperature spike of 10°C on the test article housing in under a half hour, with no change to the ambient environment. When the data for both lives was concatenated, as shown in Figure 8, it was clear that this final 6.5 second dither time test event showed unacceptable performance. The test was halted for further assessment.
Figure 8. From Top to Bottom, Measured Motor Current, Speed, Housing Temperature, Input Torque and
Output Torque from the Endurance Test, Throught the Final 6.5 Second Dither Time Test Event The Final Surrender For the endurance test that had been completed, data had been logged at 1 Hz. It was decided to perform a final test run with a higher sample frequency, holding the output speed to the 8.0 deg/s target value, and running with a 16-second dither time delay under the full 2.3 Nm (20 in-lb) load. This one last batch of data was desired before the unit was to be disassembled, never to be run in the same configuration again. This final run followed the pattern of the input torque and speed rising and falling in terrifying opposition, growing increasingly worse as time processed. The test reached a climax when the input torque values climbed to a whopping 141 mNm (20 in-oz), where it sat for about 26 hours, with the speed continuing to descend throughout. Then, the system turned a strange corner. The input torque dropped, about 40 minutes before which the titanium housing temperature climbed 5 degrees Celsius in about 20 minutes. The output speed experienced a major noise reduction at the onset of this temperature increase, and proceeded to exceed 10 deg/s, the highest value observed yet. A few blips followed, before the input torque necked down to 77.7 mNm (11 in-oz). See Figure 9. After seven hours, the rollercoaster ride ended, as the motor began to stall. See Figure 10 for the full test dataset. The time had definitely come for disassembly. Beforehand, the start-up torque and no-ratchet torque tests were conducted. The no-ratchet torque was successful again, and the start-up torque test pushed the acceptable limits, with a peak measured value of 24.7 mNm (3.5 in-oz).
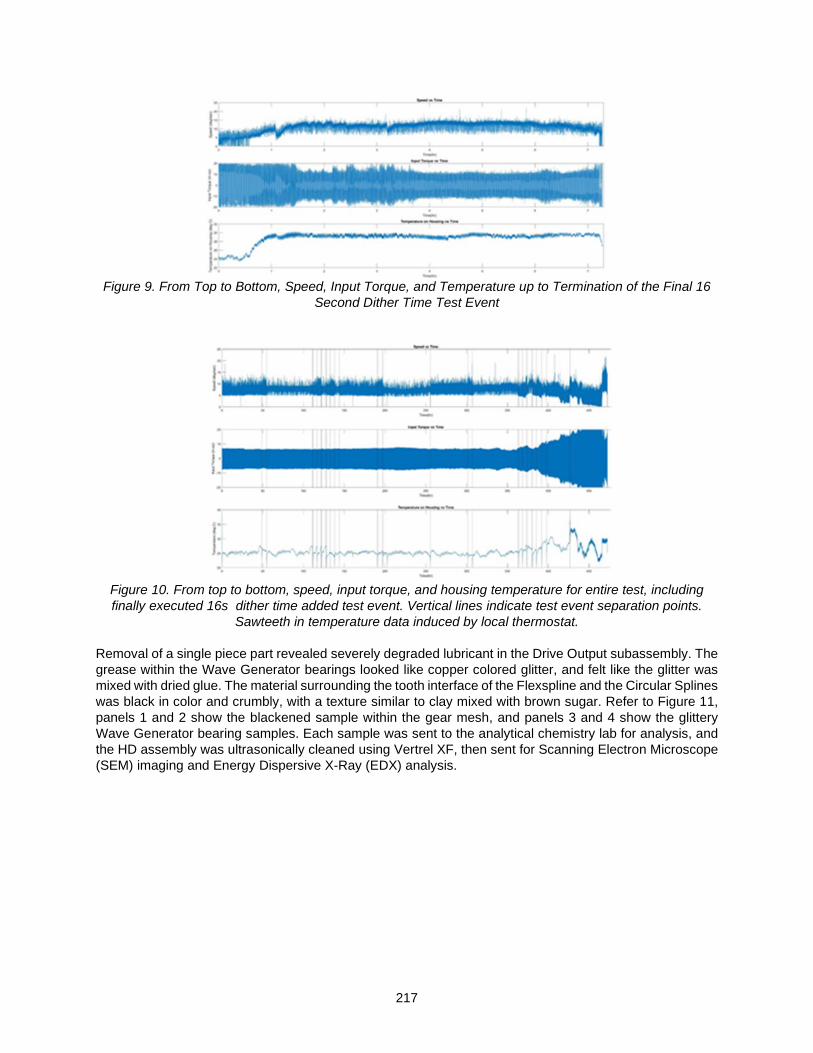
217
Figure 9. From Top to Bottom, Speed, Input Torque, and Temperature up to Termination of the Final 16
Second Dither Time Test Event
Figure 10. From top to bottom, speed, input torque, and housing temperature for entire test, including finally executed 16s dither time added test event. Vertical lines indicate test event separation points.
Sawteeth in temperature data induced by local thermostat. Removal of a single piece part revealed severely degraded lubricant in the Drive Output subassembly. The grease within the Wave Generator bearings looked like copper colored glitter, and felt like the glitter was mixed with dried glue. The material surrounding the tooth interface of the Flexspline and the Circular Splines was black in color and crumbly, with a texture similar to clay mixed with brown sugar. Refer to Figure 11, panels 1 and 2 show the blackened sample within the gear mesh, and panels 3 and 4 show the glittery Wave Generator bearing samples. Each sample was sent to the analytical chemistry lab for analysis, and the HD assembly was ultrasonically cleaned using Vertrel XF, then sent for Scanning Electron Microscope (SEM) imaging and Energy Dispersive X-Ray (EDX) analysis.

218
Figure 11. Panel 1: Drive Output Subassembly After Removal of Dynamic Spline, Showing Output Tetth of Flexspline, and Static Spline. Panel 2: Dark, Crumbly Material Gathered in the Static Spline Feature
During Disassembly. Panel 3: Wave Generator Subassembly with Flexspline Installed. Panel 4: Opened Drive Output Subassembly Before Distrubance of HD Components
The HD showed wear on all teeth, biased with the worst damage on the dynamic spline tooth interface, and on most Wave Generator bearing surfaces. Damage on the teeth and bearing races was aligned with the line of action of the bearings. SEM revealed wear to the Flexspline teeth, shown in Panel 4 of Figure 12, which corresponded with Dynamic Circular Spline tooth wear, shown in Panel 1 of Figure 12. The Flexspline had been slipping on the wave generator bearing outer races, with polymerized grease product in between, and as a result, damage was seen on the inner diameter of the Flexspline (shown in Panel 2 of Figure 12) and the outer diameters of the bearing outer races (shown in Panel 5 of Figure 12). Flexspline material was removed at that interface, combined with the bearing grease product, and redeposited onto the Wave Generator bearing balls (see Panel 3 of Figure 12) and ball tracks.
Figure 12. Panel 1: Dynamic Spline tooth wear. Panel 2: Damaged Flexspline, input side inner diameter-
damage pattern reflects ball track load path. Panel 3: Flexspline material adhesion onto bearing ball (increased chromium & nickel seen as dark patches via EDX). Inset shows representative “normal” ball surface at similar scale. Panel 4: Flexspline output side tooth wear. Panel 5: Damaged bearing outer
race- pattern reflects ball track load path.

219
Raman spectroscopy of the samples revealed the coppery hue to be due to iron oxide, and EDX SEM results showed increased concentrations of oxygen on the bearing races and ball surfaces. Both results indicated the presence of corrosion. X-Ray Fluorescence (XRF) detected the presence of iron, chromium, nickel, and copper in both grease samples. Iron, the Circular Spline material, and chromium and nickel, constituent materials of the Flexspline, corresponded with the worn teeth observed on both via the SEM inspection. The presence of copper was an unexpected discovery.
Table 1. Anion Content for Harmonic Drive Braycote Samples, Expressed as Microgram Anion in the Water Extract used in Sonication, per gram of Braycote (ppm).
Sample Amount (mg) Fluoride (ppm) Chloride (ppm) Control – New Braycote
601EF 27.51 < 0.88 4.60
Braycote 601EF – Bearing Sample
26.54 45.5 < 2.3
Braycote 601EF – Tooth Sample
25.76 110 3.38
Anion levels measured using Ion Chromatography in the blackened tooth grease sample and the glittery bearing grease sample are shown in Table 1. Extremely high fluoride levels in both samples, especially in the tooth sample, indicated Braycote degradation had occurred. The higher Fluoride level in the tooth sample seemed due to the higher stress experienced by the grease at that interface, due to the sliding interaction between the HD spline teeth. The Braycote had clearly polymerized and the grease performance and appearance, with the wear patterns along the ball paths of the splines and bearings, were reminiscent of failures described by Conley and Bohner in their report on early perfluoropolyalkylether (PFPE) lubricant testing. [2] It seemed the continuous operation of the HD at a load which was 45% of its maximum rated value, along with the dither-like motion profile, were too much for the Braycote to handle. The severe degradation of the Braycote, especially in the high-shear HD sliding gear mesh, and the presence of the notorious Lewis acids in the samples (higher at the tooth interface) seemed consistent with the summary of PFPE breakdown under high stress by Herman and Davis. [3] The conclusion was drawn that breakdown of Braycote occurred due to the high loads and cycles, and polymerization of the grease caused lubricant starvation of the assembly, increasing the rate of wear to the splines and bearing components. The rollercoaster effect apparent in the input torque and output speed test data appeared to demonstrate the effect of the generation of the friction polymer and its reaction with oxides to produce metallic fluorides to act as in situ solid lubricants (yielding a momentary improvement in performance), followed by the effect of these fluorides as catalysts to accelerate the PFPE breakdown (resulting in subsequent drops in performance). [3]
Path to Resolution Due to the status of the MAIA program, it was too late for load reductions, and the MDDA design similarly could not be changed. The decision was made to change lubricants for the Drive Output Subassembly from PFPE Braycote (Braycote 601EF and Brayco 815Z) to hydrocarbon-based Pennzane products (Rheolube 2000 and Nye Synthetic Oil 2001) to leverage its increased lifetime capability. While known to demonstrate an increased lifetime and a decreased wear rate, use of Pennzane lubricants is also known to reduce cold temperature performance, due to its increase in viscosity with reducing temperature. [4] The in-flight thermal environment for the MDDA would be benign, operating nominally somewhere between 0°C to 30°C, so obtaining adequate performance in flight was not at risk, but demonstrating torque margin at the more extreme cold temperatures required in ground testing was. Additionally, no experience could be referenced using Pennzane with ductile nodular cast iron for flight, so material compatibility needed to be established. Furthermore, the Duplex Motors used for the MDDAs had

220
already been built and delivered with Braycote 600EF, and, since no appropriate seals existed in the MDDA design, a cross-contamination question was raised regarding the potential impact of migration of one lubricant into the region of the actuator where the other was located. Finally, there was extreme uncertainty whether the part lubricated with Bray could be reliably relubricated with Pennzane due to differences in wetting characteristics. Three tests were executed to provide confidence in: (a) the compatibility of the Pennzane with the HD component materials, (b) the ability to maintain MDDA performance in the event of cross-contamination due to lubricant migration, and (c) the ability of the MDDA to achieve 100% torque margin against a 5.1 Nm (45 in-lb) requirement at the MAIA coldest operational test temperature of -20°C. For (a), an accelerated test would be completed, running the Drive Output Subassembly with the updated Pennzane lubricants, after which inspection and chemical grease analysis would be completed. Regarding item (b), a Pin-On-Disc test was to be completed using a mixture of Rheolube 2000 and Braycote 600EF. Finally to address (c), cold temperature testing would be completed to evaluate the trade between maximizing the Pennzane grease and oil fill amounts and minimizing the cold temperature input drag. Rewetting & Initial Accelerated Test The entire lot of HD units and Duplex bearings had been cleaned, inspected, and processed with Braycote lubricants together, and thus, it had to be removed from all of them, including their phenolic retainers. The units were all sent to the Laboratory for Applied Tribology at JPL, to be cleaned and re-processed. To remove the Braycote, the parts were placed into a vapor degreaser, where they sat for several days, followed by ultrasonic agitation, both using Vertrel XF. The Wave Generator subassemblies still remained intact, with bearings and spacers bonded onto the Wave Generators. Their disassembly was discussed, but concerns that were presented regarding potential damage to the irreplaceable flexible bearings during the disassembly and reassembly process prevailed. Some patches of corrosion were visible on the Wave Generator bearing races, which were removed using Scotchbrite. The HD and the duplex bearings were then grease plated using a 10% Rheolube 2000 and 90% Heptane by mass solution. An additional grease fill of Rheolube 2000 with a mass of 0.1151 g was added to the Wave Generator bearings, resulting in 0.0027 g of Rheolube mass applied per each of the 42 bearing balls shared across the pair of bearings. In this configuration, the HD was reassembled into the Drive Output Subassembly along with a similarly prepared Duplex bearing pair, and the accelerated test was conducted using the Endurance Test fixture. The test article drove a 3.4 Nm (30 in-lb) load in the clockwise direction for 72 hours consecutively at a rate of 16 deg/s. No significant change resulted in input torque nor in speed across this test. The near-constant input torque measured across the test gave confidence in the ability to re-wet the assembly with Pennzane and to subsequently perform well under an aggressive set of initial conditions. After completion of the 72 hours, the test article was disassembled, revealing the Pennzane inside to have a normal consistency, but to be grey in color. The grease sample was sent to the analytical chemistry lab to look for any signs of a potential impending lubricant breakdown. The gray color of the lubricant was verified to be primarily iron and chromium, with a small amount of titanium (the housing material), by XRF imaging. Fourier Transform Infrared spectroscopy (FTIR) was performed to determine that no significant changes had occurred in the bulk grease chemistry, and there was no evidence of oxidation in the sample. The Direct Analysis in Real Time - Mass Spectrometry (DART-MS) method showed no significant change in the molecular weight of the sample when compared to a comparable new, un-tested sample as well. Overall, the accelerated test yielded a passing result, verifying that the HD and the duplex bearing pair had been successfully rewetted, and the Pennzane lubricants could be trusted to be materially compatible with the HD. Pennzane Cold Testing The components were cleaned using Heptane to remove the Pennzane, and re-coated with a fresh Rheolube 2000/Vertrel XF 10/90 mass ratio grease plate layer. This time a Nye Synthetic Oil 2001/ Rheolube 2000 slurry with a 50/50 mass ratio was also applied to the Wave Generator bearings and a 70/30 oil/grease ratio applied to the duplex bearings. The duplex bearings received 0.077 g of slurry to each

221
of the two bearings. A total of 0.11 g of the 50/50 mass ratio slurry was added to each Wave Generator bearing. The HD and duplex bearings were then reinstalled into the Drive Output Subassembly, which was installed into the Endurance Test fixture. The system was run with no applied load at speeds of 8.0 and 4.5 deg/s and temperatures of -20°C, -8°C, and 30°C. Startup torque tests were also conducted over temperature. The results of this testing are shown in the panels indicated as “Cold Test 1”, of Figure 13. Another test was run with updated ratios, to understand the effect of reducing the oil percentage while increasing overall mass of applied slurry. The Nye Synthetic Oil 2001/Rheolube 2000 ratio this time was 39/61 by mass for the Wave Generator Bearings, and 36/64 for the duplex bearings. The resultant drag and startup torque values obtained over temperature are shown in the panels indicated as “Cold Test 2”, of Figure 13. See Table 2 for lubricant parameters related to both Cold Tests.
Figure 13. Test Data from the Cold Tests Conducted to Define Grease & Oil Fill Quantities.
The second tested lubricant configuration was chosen due to the improved performance, combined with the additional slurry mass of the assembly. The desire for a higher slurry mass was to minimize any future risk of lubricant starvation. The drag torque values were acceptable, thanks to the high-torque output of the re-wound Duplex motors, and the relatively high current available from the instrument power bus.
Table 2. Lubricant Application Parameters for Cold Tests 1 & 2. Cold Test
Item Nye Synthetic Oil 2001/Rheolube 2000 Ratio (% mass)
Slurry Mass per Bearing (g)
1 Wave Generator Bearings 50/50 0.11 1 Duplex Output Bearings 70/30 0.077 2 Wave Generator Bearings 39/61 0.137 2 Duplex Output Bearings 36/64 0.115

222
Pin-On-Disc Testing To address the concern of cross-contamination damage due to potential inter-mixing of Pennzane and Braycote, Pin-On-Disc testing was conducted with a 50/50 by mass mixture of Braycote 600EF and Rheolube 2000. The test was conducted at a 0.77 m/s rate in one rotational direction, with a pin pressure of 500 MPa. The result is shown in Figure 14. An increase in the coefficient of friction (CoF) was seen at the test onset, which settled relatively quickly after about 200 m, staying constant until around 3.5 km. After this, the measurement noise and the CoF both increased and fluctuated slightly until the test was completed after 7.5 km of pin travel through the lubricant mixture. The test demonstrated that there would be no significant detriment to performance with a potential long-term mixing of the Rheolube and the Braycote. A Final Lubrication with an Unexpected Twist The results of the Pennzane accelerated test, cold testing, and Pin-On Disc testing all gave the green light to reattempt the Endurance Test with the new lubricant configuration. A final spare, un-used and un-designated HD remained, and was selected to be the first to receive the new treatment. The unit was cleaned first with the vapor degreaser and Vertrel XF to remove the Braycote 601EF, then reprocessed using a 10/90 by mass Rheolube 2000/Heptane grease plate, followed by a 40/60 by mass Nye Synthetic Oil 2001/Rheolube 2000 slurry fill process. When the HD was installed into the Drive Output Subassembly, a small piece of debris was found in the Wave Generator bearing lubricant, accompanied by a crunchy feeling upon bearing rotation. The unit was re-cleaned, re-inspected, and received an additional abrasive touch-up to remove some newly found corrosion. New lubricant was applied, and a similar result occurred with a mysterious grease discoloration discovered upon higher-level assembly of the HD, accompanied by more bearing crunch.
Figure 14. Pin-On-Disc Results for 50/50 by Mass Braycote 600EF/Rheolube 2000 Lubricant on 440C
(58-62 HRC) Substrate in a Uni-Directional Test Configuration with a Pin Pressure of 500 MPa and Rate of 0.77 m/s.
Thus the time had come to completely disassemble the Wave Generator subassemblies, down to the individual ball level, for inspection. Each bearing was pressed off of the Wave Generator, preserving serialization between the two sets of bearing components. This revealed a significant amount of corrosion, on the bearing balls and races, and along ball paths. The source of the crunchiness was confirmed. The corroded surfaces were abraded as much as possible, the components were cleaned with boiling deionized water followed by Heptane, reassembled into bearings, which were re-bonded onto the Wave Generators. The Wave Generator assemblies were then re-grease plated and filled, as before. The coppery appearance of the bearing sample had been due to high levels of iron oxide, according to the Raman spectroscopy results. It was highly likely that similar high levels of corrosion hiding in the corners of the Wave Generator bearings in the previously failed Endurance Test helped accelerate the PFPE degradation, readily able to help produce the high Lewis acid fluoride contents seen in Table 1.

223
All the while, a simultaneous deeper inspection of the Circular Splines revealed that their black oxide coatings did not demonstrate the expected physical properties. Namely, it seemed unnaturally thick for a hot black oxide conversion coating, and instead could be scraped off with a dental pick, turning to powder in the process and revealing a bare surface. It appeared to be a room-temperature, or cold, black oxide application, which is a deposited layer of copper selenium as opposed to a conversion coating, which is not included in the MIL-C-13924 specification as an acceptable black oxide application process. This understanding of the black oxide type provided the clue to the rogue copper discovered in the previous XRF grease analysis results. The cold temperature black oxide coating had been slowly scraped into the grease by the sliding tooth action during the Endurance Test, and, in addition to generating debris in the tooth mesh grease, it was certainly not performing as a corrosion inhibitor for the Circular Splines, as it was intended. This meant the Circular Splines had to be abraded as well, to remove all of the undesirable black oxide coating. After this was completed, the units were re-cleaned with Heptane, re-grease plated, and slurry filled as before. This time, when the completely renovated HD was reassembled into the Drive Output subassembly, rotation was smooth, and lubricant was clean. See Figure 15 for Circular Spline images before, during, and after cleaning and re-assembly.
Figure 15. Panel 1: Harmonic Drive with Room Temperature Black Oxide on Circular Splines, Dynamic
Spline Shown, Installed into Drive Output Subassembly, with Braycote 601EF at Tooth Interface. Panel 2: Clean Circular Splines with Black Oxide Removed. Panel 3: Clean Harmonic Drive Circular Spline,
Dynamic Spline shown, Installed into Drive Output Subassembly, with Rheolube 2000 at Tooth Interface. The Final Endurance Test The new Pennzane lubricant configuration needed to be vetted by running it through a successful Endurance Test. A refined test profile was created, reducing the loads and varying them based on the three dither timings. The target speed was reduced to be the flight maximum value of 7.75 deg/s, instead of 8.0 deg/s. Cycle counts were scrutinized, and the definition of an actuator mechanical life was reduced from 4.5 to 3.7 million input revolutions. The test would be run for a total of two time one life instead of three times, reflecting a hesitation against over-conservatism, since the JPL standard policy calls for a 2x mechanical life test for wear-life limited elements. This brought the required total HD input revolutions for a successful test declaration down from 13.5 to 7.4 million. The fixture was also modified to include a pulley and weights at the output, such that the brake would be used to apply different bi-directional output drag loads, and the pulley system would simulate the uni-directional load of the flight anti-backlash mechanism, present in the BGA design to facilitate pointing accuracy. A simple control system was also implemented, with a speed controller and position-based sensor feedback to make the testing automatic and consistent.

224
Figure 16. Harmonic Drive Lifting Efficiency vs. Time during the Final Endurance Test
Initial startup torque values were low with an average measured value of 6.0 mNm (0.86 in-oz), compared to the 11.1 mNm (1.57 in-oz) for the Braycote 601EF initial measurement. Variations seen in input torque and output speed across this test series were due to operator error in tuning of the bi-directional applied load and speed setting. Despite some setting errors, the telltale sign of the success of the Pennzane Endurance Test was the slight but steady increase in the HD lifting efficiency over the total 400 hour period. Corresponding with the increase in efficiency over the two times one mechanical life, the final measured startup torque after test completion had actually reduced from 6.0 mNm (0.86 in-oz) to 5.1 mNm (0.72 in-oz). The test was finally over.
Conclusions The long standing controversial relationship between Pennzane and Braycote was challenged by the MAIA MDDA application. The Pennzane ability to functionally rewet hardware that had previously been processed with PFPE lubricant was demonstrated by the completion of the accelerated 72 hour test. The test showed no change in the efficiency over its duration, despite the aggressive load and speed profile. This indicated that the Pennzane effectively lubricated the rolling and sliding surfaces of the HD and Duplex bearings, and maintained this effectivity for 72 consecutive hours in one direction. Post-test chemical analysis showed no indications of any impact to the lubricant itself due to the operational profile. Thermal testing also showed the re-wettability to persist over temperature. The Pin-On-Disc test results gave confidence regarding the chemical compatibility of the lubricants over a long life, and their ability to lubricate effectively despite their intermixing. These test results gave the MAIA project the confidence to proceed with the unconventional solution of changing to Pennzane-based lubricants in the middle of the program, resulting in an MDDA assembly that has a Braycote lubricated motor, and rewetted Pennzane output gearing, all in one package. The relatively uncommon process of pulling flight hardware from storage to revamp for a new flight application provided challenges to the team. The long-term storage conditions, bagged and sealed in hydrocarbon oil, proved to be inadequate for the 52100 HD Wave Generator bearings over the two decades the units were shelved. To reliably use this inherited hardware, a full disassembly, down to the individual bearing-ball level, and detailed chemical and abrasive cleaning was required in order to locate and eliminate all of the hidden locations of the corrosion that had developed over time. For certain components to be used from long-term storage, a similar total disassembly and detailed inspection is recommended, even if the assemblies appear to be acceptable by external visual inspection. Specifically, those that use materials that are sensitive to corrosion, such as 52100 steel, and are inherently difficult to inspect due to hidden geometry, such as bearing assemblies. Trust, instead, that corrosion is sneaky and will wait hiding in a crevice or shadow, to ruin hardware performance when least expected. Finally, the black oxide surprise turned out to be another unexpected result of using hardware from long term storage. The HD units used for the MAIA project were originally received in the 1990s, at a time when
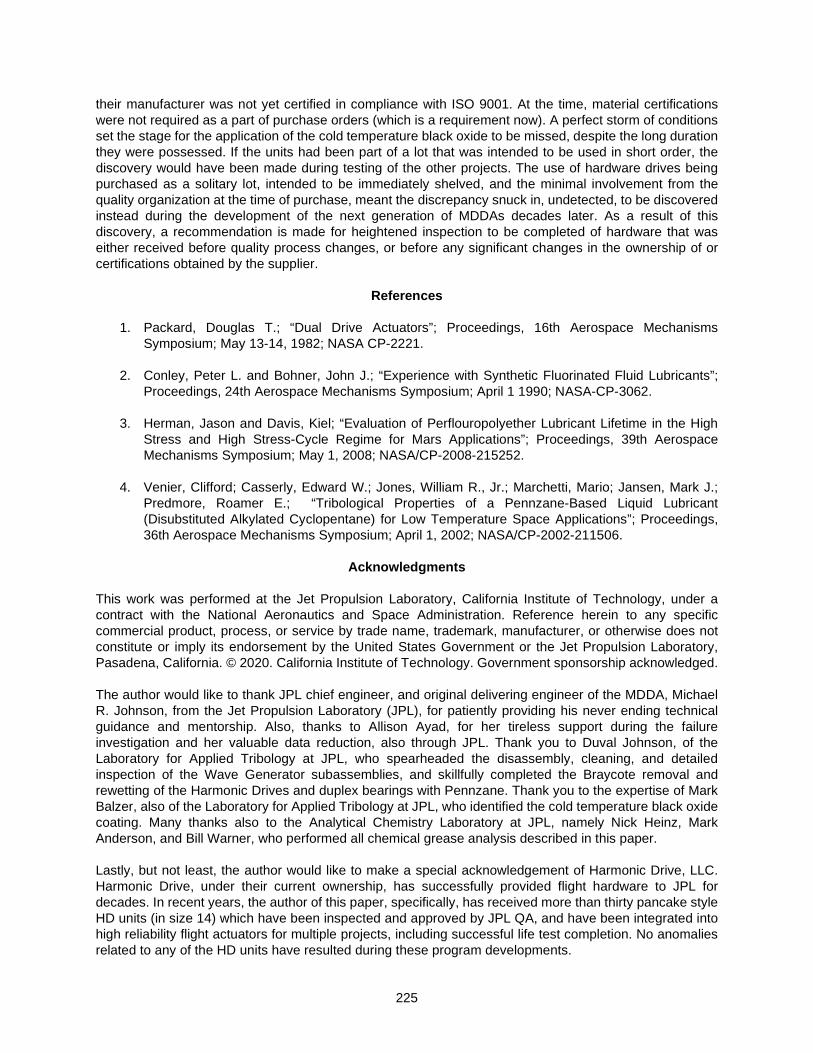
225
their manufacturer was not yet certified in compliance with ISO 9001. At the time, material certifications were not required as a part of purchase orders (which is a requirement now). A perfect storm of conditions set the stage for the application of the cold temperature black oxide to be missed, despite the long duration they were possessed. If the units had been part of a lot that was intended to be used in short order, the discovery would have been made during testing of the other projects. The use of hardware drives being purchased as a solitary lot, intended to be immediately shelved, and the minimal involvement from the quality organization at the time of purchase, meant the discrepancy snuck in, undetected, to be discovered instead during the development of the next generation of MDDAs decades later. As a result of this discovery, a recommendation is made for heightened inspection to be completed of hardware that was either received before quality process changes, or before any significant changes in the ownership of or certifications obtained by the supplier.
References
1. Packard, Douglas T.; “Dual Drive Actuators”; Proceedings, 16th Aerospace Mechanisms Symposium; May 13-14, 1982; NASA CP-2221.
2. Conley, Peter L. and Bohner, John J.; “Experience with Synthetic Fluorinated Fluid Lubricants”; Proceedings, 24th Aerospace Mechanisms Symposium; April 1 1990; NASA-CP-3062.
3. Herman, Jason and Davis, Kiel; “Evaluation of Perflouropolyether Lubricant Lifetime in the High
Stress and High Stress-Cycle Regime for Mars Applications”; Proceedings, 39th Aerospace Mechanisms Symposium; May 1, 2008; NASA/CP-2008-215252.
4. Venier, Clifford; Casserly, Edward W.; Jones, William R., Jr.; Marchetti, Mario; Jansen, Mark J.;
Predmore, Roamer E.; “Tribological Properties of a Pennzane-Based Liquid Lubricant (Disubstituted Alkylated Cyclopentane) for Low Temperature Space Applications”; Proceedings, 36th Aerospace Mechanisms Symposium; April 1, 2002; NASA/CP-2002-211506.
Acknowledgments
This work was performed at the Jet Propulsion Laboratory, California Institute of Technology, under a contract with the National Aeronautics and Space Administration. Reference herein to any specific commercial product, process, or service by trade name, trademark, manufacturer, or otherwise does not constitute or imply its endorsement by the United States Government or the Jet Propulsion Laboratory, Pasadena, California. © 2020. California Institute of Technology. Government sponsorship acknowledged. The author would like to thank JPL chief engineer, and original delivering engineer of the MDDA, Michael R. Johnson, from the Jet Propulsion Laboratory (JPL), for patiently providing his never ending technical guidance and mentorship. Also, thanks to Allison Ayad, for her tireless support during the failure investigation and her valuable data reduction, also through JPL. Thank you to Duval Johnson, of the Laboratory for Applied Tribology at JPL, who spearheaded the disassembly, cleaning, and detailed inspection of the Wave Generator subassemblies, and skillfully completed the Braycote removal and rewetting of the Harmonic Drives and duplex bearings with Pennzane. Thank you to the expertise of Mark Balzer, also of the Laboratory for Applied Tribology at JPL, who identified the cold temperature black oxide coating. Many thanks also to the Analytical Chemistry Laboratory at JPL, namely Nick Heinz, Mark Anderson, and Bill Warner, who performed all chemical grease analysis described in this paper. Lastly, but not least, the author would like to make a special acknowledgement of Harmonic Drive, LLC. Harmonic Drive, under their current ownership, has successfully provided flight hardware to JPL for decades. In recent years, the author of this paper, specifically, has received more than thirty pancake style HD units (in size 14) which have been inspected and approved by JPL QA, and have been integrated into high reliability flight actuators for multiple projects, including successful life test completion. No anomalies related to any of the HD units have resulted during these program developments.

226

227
Multi-Mission Deployable Boom: Spring Mechanism Design, Failure Investigation, and Resolution
Christine A. Gebara* and Paul D. Lytal*
Abstract As more ambitious missions are being pursued to better understand Earth and our Solar System, aerospace mechanisms and deployable structures are being approached in new fashions. NASA’s Jet Propulsion Laboratory is developing two low Earth orbit satellites that will use radar instruments to better understand temporal changes in the Earth’s surface. Both the Surface Water Ocean Topography (SWOT) and the NASA-ISRO Synthetic Aperture Radar (NISAR) spacecraft utilize large carbon fiber deployable antennae to conduct such science. These large antennae have been designed with similar mechanisms. During testing of the spring mechanisms that deploy the antennae, a hardware failure was found. The source of the hardware failure was traced back to the custom torsion springs used within the mechanism. Because of the mechanism volume constraints, the springs were designed with high aspect ratio rectangular cross sections to maximize the spring constant for the mechanism. Ultimately, a failure investigation and testing campaign led to spring mechanisms that have been successfully integrated into both spacecraft.
Introduction
NASA’s Jet Propulsion Laboratory (JPL) is currently developing two earth orbiting satellites. The Surface Water Ocean Topography (SWOT) mission will conduct the first global survey of Earth’s surface water. The NASA-ISRO Synthetic Aperture Radar (NISAR) mission will study temporal changes to Earth’s land and ice-sheets using advanced radar techniques. Both missions serve to better understand how the Earth is changing over time using radar-based instruments. The SWOT mission is a collaboration with the French, Canadian, and UK Government Space Agencies and will launch from Vandenberg Air Force Base on a SpaceX Falcon 9 Rocket in 2021. NISAR is a partnership between NASA and the Indian Space Research Organization (ISRO) and will launch in 2022 from Satish Dhawan Space Center on an Indian Geosynchronous Satellite Launch Vehicle.
Figure 1. A) SWOT with hinge locations shown on one mast B) NISAR with hinge locations shown.
Both SWOT and NISAR use deployable radar reflector mast designs developed at JPL. These deployable masts, while different in geometry, have similar components and sub-assemblies. Both masts are constructed from bonded Invar and carbon fiber composite structures and employ analogous flight
* NASA Jet Propulsion Laboratory, Pasadena, CA
[email protected]; [email protected] Proceedings of the 45th Aerospace Mechanisms Symposium, NASA Johnson Space Center, 2020
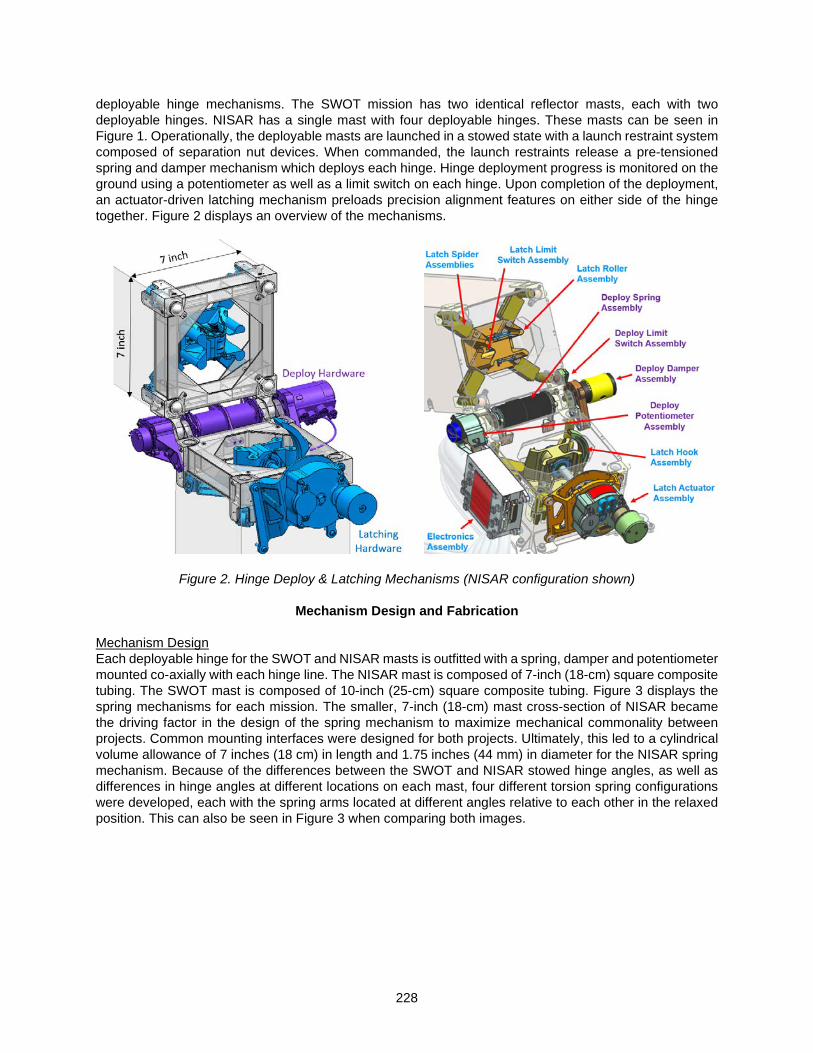
228
deployable hinge mechanisms. The SWOT mission has two identical reflector masts, each with two deployable hinges. NISAR has a single mast with four deployable hinges. These masts can be seen in Figure 1. Operationally, the deployable masts are launched in a stowed state with a launch restraint system composed of separation nut devices. When commanded, the launch restraints release a pre-tensioned spring and damper mechanism which deploys each hinge. Hinge deployment progress is monitored on the ground using a potentiometer as well as a limit switch on each hinge. Upon completion of the deployment, an actuator-driven latching mechanism preloads precision alignment features on either side of the hinge together. Figure 2 displays an overview of the mechanisms.
Figure 2. Hinge Deploy & Latching Mechanisms (NISAR configuration shown)
Mechanism Design and Fabrication Mechanism Design Each deployable hinge for the SWOT and NISAR masts is outfitted with a spring, damper and potentiometer mounted co-axially with each hinge line. The NISAR mast is composed of 7-inch (18-cm) square composite tubing. The SWOT mast is composed of 10-inch (25-cm) square composite tubing. Figure 3 displays the spring mechanisms for each mission. The smaller, 7-inch (18-cm) mast cross-section of NISAR became the driving factor in the design of the spring mechanism to maximize mechanical commonality between projects. Common mounting interfaces were designed for both projects. Ultimately, this led to a cylindrical volume allowance of 7 inches (18 cm) in length and 1.75 inches (44 mm) in diameter for the NISAR spring mechanism. Because of the differences between the SWOT and NISAR stowed hinge angles, as well as differences in hinge angles at different locations on each mast, four different torsion spring configurations were developed, each with the spring arms located at different angles relative to each other in the relaxed position. This can also be seen in Figure 3 when comparing both images.

229
A) B)
Figure 3. View of A) NISAR and B) SWOT spring mechanisms The spring mechanism is required to meet JPL design requirements for mission critical spring design. As such, springs are required to have a minimum no test yield factor of safety (FS) of 1.50 and an ultimate FS of 1.65. Furthermore, JPL design principles impose a minimum mechanism torque margin of 100% in worst case environments at end of life. These driving requirements meant the torsion springs needed to produce a minimum deployment-direction torque of 28 inch-pounds (3.2 N-m) at hinge closure. A standard round wire 17-7 precipitation-hardened stainless-steel torsion spring would not produce adequate torque in the volume available without violating mission critical factors of safety. Alternative materials such as Elgiloy and MP35N were considered, but all of the vendors considered for fabrication of these springs had a significantly higher volume of experience working with 17-7 stainless steel and developmental risk was deemed higher with these alternative materials. Therefore, a geometric solution was developed: a rectangular cross section spring to maximize the moment of inertia within the available volume. After developmental fabrication test runs, the spring wire height-to-width ratio selected for the spring cross section was 3.88:1. This value was determined to be the highest ratio achievable with available CNC spring winding manufacturing capabilities. Spring manufacturing still included many challenges given the propensity of the spring wire to rotate about the axis of the wire during winding and inconsistencies in spring back resulting in non-uniform torsion spring inner and outer diameters. The CNC spring winding configuration is shown in Figure 4. Guide support features were added to the flight spring mandrel design to prevent twist about the axis of the spring wire at either end of each spring.
Figure 4. Torsion Spring on CNC Coiling Machine The rectangular cross section caused early manufacturing issues for the flight units. The springs did not initially meet axial length requirements. Further the wire was prone to unexpected twisting during winding. The initial inclination of the team was to attempt to relax the overall spring length requirement, but that would have had significant ripple impacts into the mature design of the hinge and mast structures. To address length requirement non-compliance, the initially baselined spring with 29 coils was modified to a baseline design of 27 coils. With this change, the spring design violated JPL design requirements minimum factor of safety requirements. Reducing the number of windings increased the stress in the spring. In consultation with JPL materials experts, material coupon testing for the flight lot of material was conducted

230
to establish higher strength allowables for the flight lot of material to address the slight negative strength margins. Ultimately, the final flight springs were successfully manufactured with a variation of less than 0.007 inch (178 µm) in diameter and 0.012 inch (305 µm) in length across twenty-eight units. The torsion spring design that was developed met all requirements, as verified via tensile test witness coupons of the material, destructive winding testing, dye penetrant inspection, and other verification techniques.
Figure 5. Cross section of NISAR Spring Mechanism
Once the spring mechanism design solution was reached, prototype units were built. A prototype test program was successfully completed prior to flight hardware fabrication to reduce risk of issues in the flight hinge and latching mechanism development. The prototype test program included both ambient and thermal functional testing and thermal characterization testing on a flight-like hinge fixture. The prototype program did not include vibrational testing or life testing due to programmatic constraints. The lack of these prototype tests prevented design issues described in the next section from being uncovered prior to the qualification test program.
Mechanism Integration and Hardware Failure Hardware Failure Upon successful completion of the prototype test program, fabrication of qualification, flight spare, and flight piece parts ensued. Seven SWOT spring mechanisms were assembled with a qualification unit slated for thermal testing to characterize torque output at the worst case cold, ambient, and hot qualification temperatures. The qualification unit was of a SWOT design but was deemed similar to the NISAR design. Therefore, a single qualification unit was used for both missions. Thermal life testing was conducted after the qualification unit had undergone vibrational testing. Thermal test temperatures and vibrational test levels were set to encompass the environments for both missions. During thermal testing, the spring was wound and unwound manually through its operational range of motion using a rotary turn table. Torque output and rotary angle were tracked with a transducer and encoder, respectively. At the qualification hot temperature, hardware failure was observed. From repeated torsion springs cycling (winding and unwinding), fragmented Teflon Foreign Object Debris (FOD) was generated. This can be seen in Figure 6. The source of the FOD was determined to be from two glass-filled Teflon sleeve bearings in contact with the inner diameter of each spring inside the mechanism. The spring mechanism continued to function and torque performance was not measurably altered by the fragmentation. Upon further investigation it was determined that the sleeve bearing had begun to fail prior to hot thermal testing.

231
Figure 6. Image of spring mechanism during thermal testing with evidence of hardware failure circled After the failure, the qualification spring mechanism was disassembled. The root cause was identified to be invalid analytical model simplification. The analytical model simplified the torsion spring geometry as a cylinder with uniform inner diameter. The real rectangular cross section torsion springs had slight variations in the inner diameter between coils, with sharp cutting edges presented to the Teflon bushings during cycling. Therefore, the contact stress in the real hardware at the cutting edge was substantially higher than in the idealized analytical model. In addition, the sleeve bearing had been designed with a helical cut along the axis of the bearing, designed to allow radial compliance as the torsion spring inner diameter changes during winding/unwinding operations. However, the helical cut also drastically reduced axial stiffness of the part. As such, when the spring coils moved axially during winding, the edges of the bushing began to contact each other and plastically deform. These failures can be seen in Figure 7. This failure resulted in the opening of a JPL Problem Failure Report. As such, a technical team was assembled to oversee the investigation and resolution of the failure. Because of the multi-mission applicability of the hardware design, the team was composed of representatives from both the SWOT and NISAR projects. Any resulting actions needed to be approved by both missions. There was programmatic motivation to utilize as much of the existing hardware as possible.
Figure 7. Images of Teflon sleeve bearings after thermal testing Mechanisms Modification Ultimately, a solution was developed that replaced the Teflon sleeve bearing with a grease-plated 440C stainless steel sleeve bearing with modified geometry. Over 400 functional cycles and 20 disassembly procedures of the qualification mechanisms were carried out during the hardware failure. Table 1 summarizes the test campaign that was conducted to find a new sleeve bearing design. The fundamental approach was to change one parameter at a time from the original bushing design and evaluate its effect on the health of the component and test performance until an acceptable solution was found. An acceptable solution had to simultaneously meet mechanism torque performance needs as well as avoid significant FOD generation or damage to the bushing through three times the planned number of flight unit life cycles.
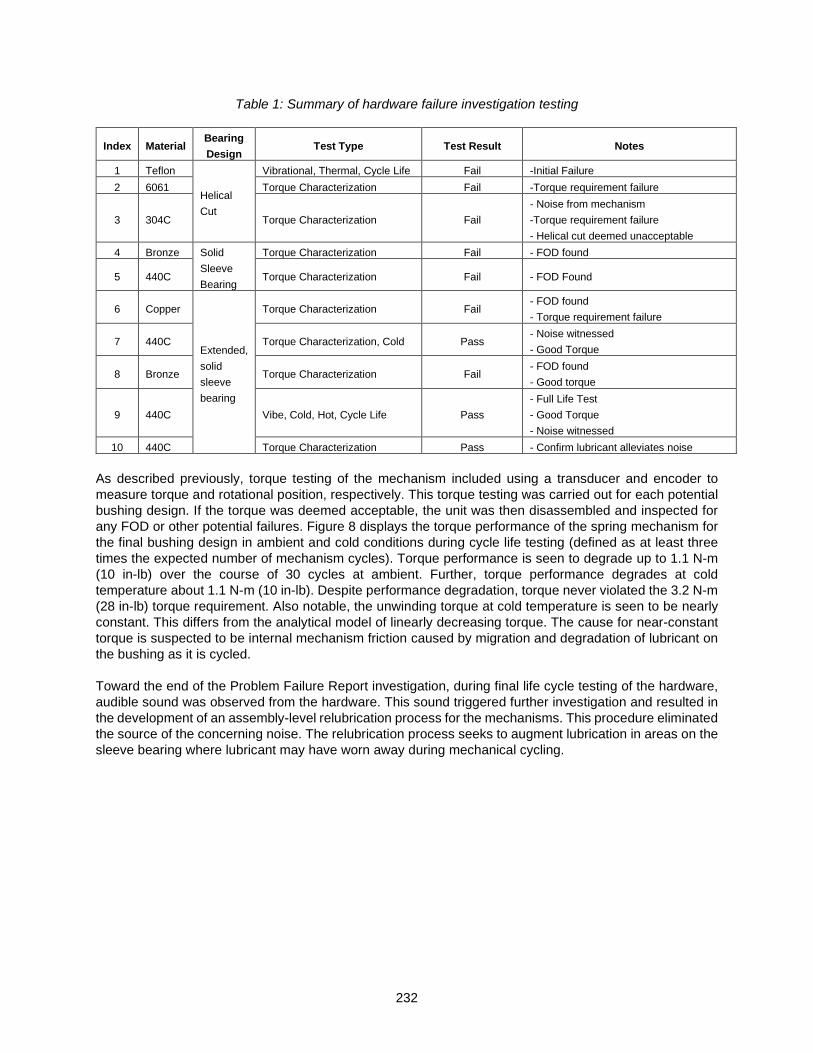
232
Table 1: Summary of hardware failure investigation testing
Index Material Bearing Design
Test Type Test Result Notes
1 Teflon
Helical Cut
Vibrational, Thermal, Cycle Life Fail -Initial Failure 2 6061 Torque Characterization Fail -Torque requirement failure
3 304C Torque Characterization Fail - Noise from mechanism -Torque requirement failure - Helical cut deemed unacceptable
4 Bronze Solid Sleeve Bearing
Torque Characterization Fail - FOD found
5 440C Torque Characterization Fail - FOD Found
6 Copper
Extended, solid sleeve bearing
Torque Characterization Fail - FOD found - Torque requirement failure
7 440C Torque Characterization, Cold Pass - Noise witnessed - Good Torque
8 Bronze Torque Characterization Fail - FOD found - Good torque
9 440C Vibe, Cold, Hot, Cycle Life Pass - Full Life Test - Good Torque - Noise witnessed
10 440C Torque Characterization Pass - Confirm lubricant alleviates noise
As described previously, torque testing of the mechanism included using a transducer and encoder to measure torque and rotational position, respectively. This torque testing was carried out for each potential bushing design. If the torque was deemed acceptable, the unit was then disassembled and inspected for any FOD or other potential failures. Figure 8 displays the torque performance of the spring mechanism for the final bushing design in ambient and cold conditions during cycle life testing (defined as at least three times the expected number of mechanism cycles). Torque performance is seen to degrade up to 1.1 N-m (10 in-lb) over the course of 30 cycles at ambient. Further, torque performance degrades at cold temperature about 1.1 N-m (10 in-lb). Despite performance degradation, torque never violated the 3.2 N-m (28 in-lb) torque requirement. Also notable, the unwinding torque at cold temperature is seen to be nearly constant. This differs from the analytical model of linearly decreasing torque. The cause for near-constant torque is suspected to be internal mechanism friction caused by migration and degradation of lubricant on the bushing as it is cycled. Toward the end of the Problem Failure Report investigation, during final life cycle testing of the hardware, audible sound was observed from the hardware. This sound triggered further investigation and resulted in the development of an assembly-level relubrication process for the mechanisms. This procedure eliminated the source of the concerning noise. The relubrication process seeks to augment lubrication in areas on the sleeve bearing where lubricant may have worn away during mechanical cycling.
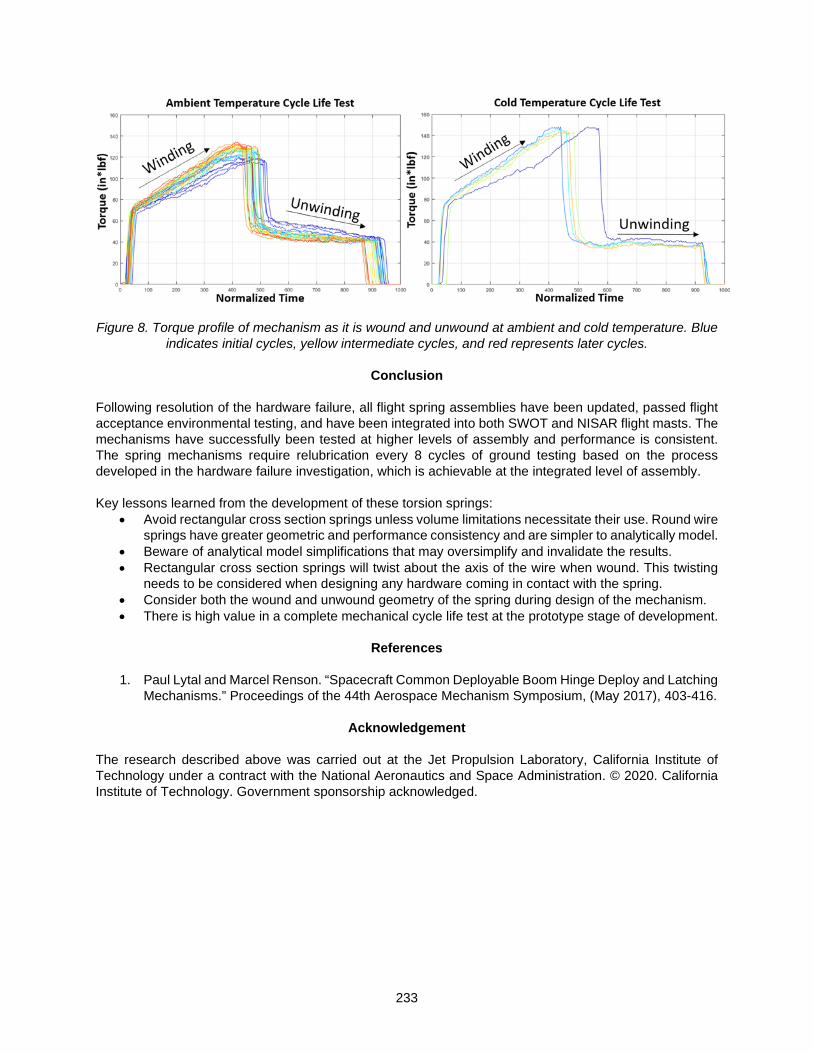
233
Figure 8. Torque profile of mechanism as it is wound and unwound at ambient and cold temperature. Blue indicates initial cycles, yellow intermediate cycles, and red represents later cycles.
Conclusion
Following resolution of the hardware failure, all flight spring assemblies have been updated, passed flight acceptance environmental testing, and have been integrated into both SWOT and NISAR flight masts. The mechanisms have successfully been tested at higher levels of assembly and performance is consistent. The spring mechanisms require relubrication every 8 cycles of ground testing based on the process developed in the hardware failure investigation, which is achievable at the integrated level of assembly. Key lessons learned from the development of these torsion springs:
• Avoid rectangular cross section springs unless volume limitations necessitate their use. Round wire springs have greater geometric and performance consistency and are simpler to analytically model.
• Beware of analytical model simplifications that may oversimplify and invalidate the results. • Rectangular cross section springs will twist about the axis of the wire when wound. This twisting
needs to be considered when designing any hardware coming in contact with the spring. • Consider both the wound and unwound geometry of the spring during design of the mechanism. • There is high value in a complete mechanical cycle life test at the prototype stage of development.
References
1. Paul Lytal and Marcel Renson. “Spacecraft Common Deployable Boom Hinge Deploy and Latching
Mechanisms.” Proceedings of the 44th Aerospace Mechanism Symposium, (May 2017), 403-416.
Acknowledgement The research described above was carried out at the Jet Propulsion Laboratory, California Institute of Technology under a contract with the National Aeronautics and Space Administration. © 2020. California Institute of Technology. Government sponsorship acknowledged.

234

235
NSI Performance Improvement through the use of Automation
Jason Kozmic*, Bill Gratzl* and Hobin Lee*
Abstract
Chemring Energetic Devices has transferred the manufacture of the NASA standard initiator (NSI) from its Torrance, CA facility to its Downers Grove, IL facility and performed re-qualification of the manufacturing process. As part of the transfer effort, the use of automation has been introduced into the process to eliminate operations historically performed by hand which has led to reduced cryogenic function time variability, increased manufacturing throughput, and safer handling of the energetics.
Introduction The NASA Standard Initiator (NSI) along with Chemring’s commercial equivalent (PC-23) is a two (2) pin electrically activated, hot-wire, electro-explosive device which provides a source of pyrotechnic energy used to initiate a variety of space mechanisms for use on both satellite and launch vehicle applications. Mechanisms include pyrotechnic valves, separation nuts/ bolts, cable/ bolt cutters, pin pullers and many others. The reliable initiation of these one-time use mechanisms is often mission critical leading, to stringent test requirements being levied upon the manufacture and acceptance of the NSI. Electrically activated initiators are conceptually simple devices but possess manufacturing sensitivities that can have significant effects on the final performance. A typical electric initiator is depicted in Figure 1 and consists of a glass to metal sealed header (with receptacle), a bridgewire welded across the header pins, energetic ignition mix (ZPP typical) consolidated onto the bridgewire, and a welded closure output. When an electrical stimulus is applied to the header pins (5 amps, 20 ms typical) the current heats the thin bridgewire which in turn heats the consolidated ignition mix. Once the ignition mix reaches its auto-ignition temperature the energetics undergo a self-sustaining reaction which produces heat, gas, and hot particles. These thermal outputs are used to ignite secondary energetics in an energetic train/cartridge or can be used perform work in a device without any additional booster.
Figure 1. Cross Section of NASA Standard Initiator (NSI)
* Chemring Energetic Devices, Downers Grove, IL; [email protected]
Proceedings of the 45th Aerospace Mechanisms Symposium, NASA Johnson Space Center, 2020
Glass to Metal Seal w/ Receptacle
Electrical Bridgewire
Energetic Mix (ZPP)
Welded Closure
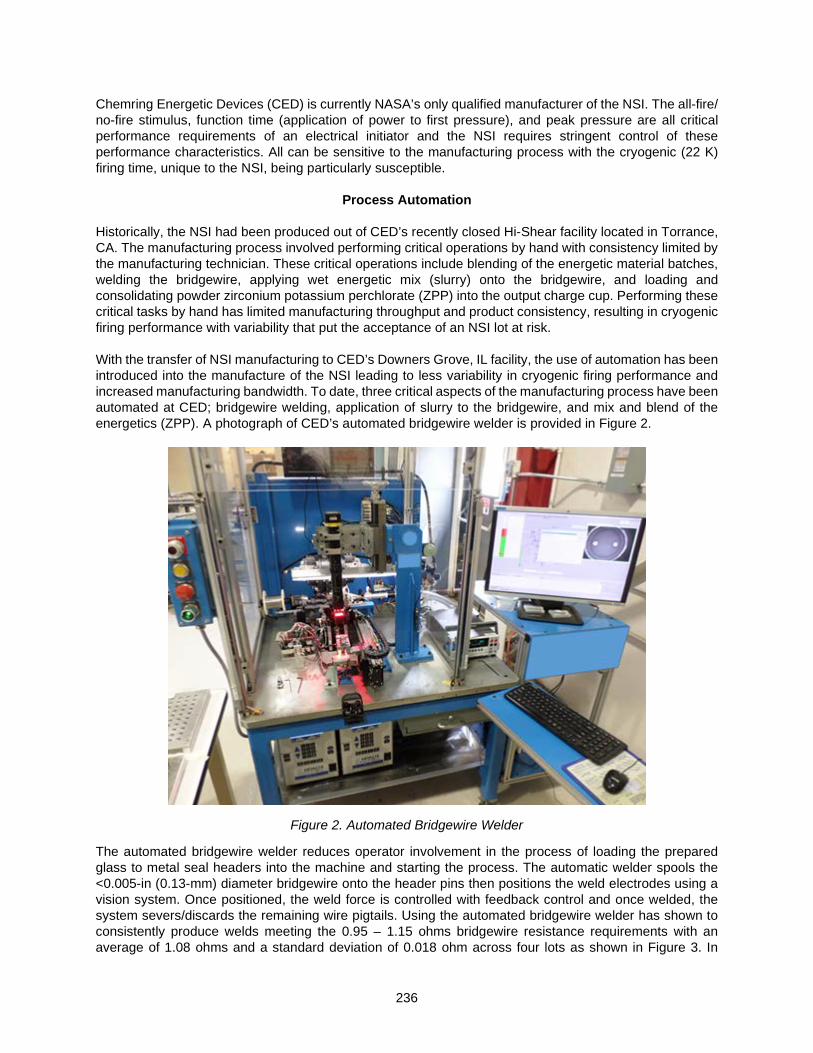
236
Chemring Energetic Devices (CED) is currently NASA’s only qualified manufacturer of the NSI. The all-fire/ no-fire stimulus, function time (application of power to first pressure), and peak pressure are all critical performance requirements of an electrical initiator and the NSI requires stringent control of these performance characteristics. All can be sensitive to the manufacturing process with the cryogenic (22 K) firing time, unique to the NSI, being particularly susceptible.
Process Automation Historically, the NSI had been produced out of CED’s recently closed Hi-Shear facility located in Torrance, CA. The manufacturing process involved performing critical operations by hand with consistency limited by the manufacturing technician. These critical operations include blending of the energetic material batches, welding the bridgewire, applying wet energetic mix (slurry) onto the bridgewire, and loading and consolidating powder zirconium potassium perchlorate (ZPP) into the output charge cup. Performing these critical tasks by hand has limited manufacturing throughput and product consistency, resulting in cryogenic firing performance with variability that put the acceptance of an NSI lot at risk. With the transfer of NSI manufacturing to CED’s Downers Grove, IL facility, the use of automation has been introduced into the manufacture of the NSI leading to less variability in cryogenic firing performance and increased manufacturing bandwidth. To date, three critical aspects of the manufacturing process have been automated at CED; bridgewire welding, application of slurry to the bridgewire, and mix and blend of the energetics (ZPP). A photograph of CED’s automated bridgewire welder is provided in Figure 2.
Figure 2. Automated Bridgewire Welder
The automated bridgewire welder reduces operator involvement in the process of loading the prepared glass to metal seal headers into the machine and starting the process. The automatic welder spools the <0.005-in (0.13-mm) diameter bridgewire onto the header pins then positions the weld electrodes using a vision system. Once positioned, the weld force is controlled with feedback control and once welded, the system severs/discards the remaining wire pigtails. Using the automated bridgewire welder has shown to consistently produce welds meeting the 0.95 – 1.15 ohms bridgewire resistance requirements with an average of 1.08 ohms and a standard deviation of 0.018 ohm across four lots as shown in Figure 3. In

237
contrast, the previous hand welding operation involved a technician cutting the wire to length and positioning the wire for welding and securing in place by hand using a hold-down fixture. The extra touch time introduces the potential to damage the thin bridgewire (nicks, dings, etc.) which can affect bridge resistance and create hot spots that can cause no-fire failures when 1A/1W is applied for 5 minutes. Additionally, this process can result in unit to unit variability in the configuration of the welded bridgewire, not present in automated process, which can influence how energetics interface with the bridgewire and ultimately affect cryogenic function times (see Figure 5). While the end quality of the hand bridgewire weld (resistance, all-fire/ no-fire performance) is similar to that of the automated process, the automated process significantly increases the first pass yield reducing the need to rework or scrap in-process hardware. In conjunction with bridgewire welding, the interface between the bridgewire and the energetics as well as the amount of energetic material applied to the bridgewire have significant effects on the cryogenic function time. Historically the application of wetted energetics (“slurry”) directly to the bridgewire has been performed by hand and been difficult to precisely control. The Downers Grove manufacturing line has implemented an automated application process which controls the rate and duration of slurry application, tightly controlling the amount and condition of the slurry applied to the bridgewire. The process has averaged 5.2 mg with 0.6 mg standard deviation across four lots as shown in Figure 3.
Figure 3. Automated Process Consistency (Mean w/ Standard Deviation Error Bars)
Bridgewire welding and application of slurry to the bridgewire are critical operations controlling the all-fire/ no-fire current, output pressure performance of the initiator between –162°C and +149°C as well as the function time performance at cryogenic temperatures as low as 22 K. The automated processes have demonstrated significant improvement in the function time variability at the cryogenic conditions. A comparison illustrating the effects of process automation is presented in Figure 4. A single blended lot of ZPP (lot 13-44352) was manufactured using four methods; hand welded with a hand slurry application using the documented Torrance method, hand welded with a hand slurry application using a Downers Grove developed method, hand welded with automated slurry application, and both automated welding and slurry application. These groups were then tested at both 77 K and 22 K. The data demonstrates higher average function times and wider variability when loaded with the heritage hand operations. By implementing either an improved hand or automated slurry application process to the
0
0.2
0.4
0.6
0.8
1
1.2
DJA DJB DJC MTW
BRID
GEW
IRE
RESI
STAN
CE, O
HMS
Bridge Resistance Consistency
0
0.001
0.002
0.003
0.004
0.005
0.006
DJA DJB DJC MTW
APPL
IED
SLU
RRY,
GRA
MS
Slurry Consistency

238
heritage hand welding process, the average function times and the variability were shown to decrease, which indicates the inherent variability of the hand process. These batches still produced flyers which resulted in standard deviations similar to the hand process, which were attributable to inconsistency in the hand welding operation. By adding the automated bridgewire weld process to the automated slurry application process, the flyers were eliminated and both average and standard deviation cryogenic function times was significantly improved.
Figure 4. Effect of Process Automation on ZPP L/N 13-44352
The ZPP lot (13-4432) depicted in Figure 4 was deemed not suitable for loading into production NSIs during batch acceptance testing due to function time variability which is required to have an average of less than 1 ms and a 3-sigma limit less than 3 ms. Historically when a blended ZPP lot failed to meet batch acceptance testing, the ZPP lot was scrapped and a new lot blended. The results presented in Figure 4, indicate the root cause of the cryogenic function time failure was not the raw material but the process. The test units built with the same ZPP lot, but with the automated processes produced acceptable results, indicating the lot to be suitable for production. Cryogenic function times of NSI test lots spanning 2013 through 2017, manufactured at both CED’s Torrance facility (using hand operations) and CED’s Downers Grove facility (with automated bridgewire welding and slurry application) is presented in Figure 5. Data shows that lots loaded at CED’s Downers Grove facility (DG) had function times (0.43 ms and 0.44 ms mean with 0.19 and 0.23 ms standard deviation) which were faster and tighter than the most consistent lot ever fabricated at CED’s Torrance Facility (0.59 ms mean with 0.25 ms standard deviation manufactured

239
in 2013) and had significantly tighter performance when compared to routine production lots loaded in 2016 and 2017.
Figure 5. Cryogenic Function Time Comparison
In addition to improved cryogenic firing performance, the implementation of automation has allowed CED to increase manufacturing throughput. The automated bridgewire welder allows CED to bridge 100 initiator headers in roughly an hour and a half which previously took two days when this operation was performed by hand. Automated slurry application has increase capacity from approximately 200 pieces per day to 200 pieces in 30 minutes of application time. This increased capability allows CED to reduce lead time of the NSI and other initiators. Automation has also helped CED to manufacture initiators in a safer manner than previously possible at its Torrance facility. The advantage of ZPP as an initiating material, its high sensitivity and rapid self-sustaining reaction, also makes it dangerous to blend as a raw material. The blending of the ZPP raw materials (fine granular zirconium and potassium perchlorate) had historically been done by hand at a remote facility by specific, highly trained technicians. The hand blending operation previously put the technician in close proximity to the volatile raw ingredients and exposes them to a lethal amount of energetics. Chemring is committed to improving safety and has developed automated energetic blending capability, depicted in Figure 6. It ensures no personnel are present in proximity to the raw materials during blending. Once a blend is completed the equipment dispenses and seals the ZPP into 7-gram velostat pucks for safe handling. ZPP batches blended using the automated energetic blend equipment have passed required differential scanning calorimetry /thermogravimetry analysis (DSC/ TGA) and heat of explosion testing (HOE) required to accept a batch as well as meet cryogenic function time requirements required to be suitable for production NSI manufacture. Along with automating the blend process, CED is currently working to load NSIs using a robotic manipulator. The robotic manipulator will remotely load ZPP into the NSI charge cup, consolidate it to a feedback-controlled pressure, then confirm and log ZPP charge weights on a piece part basis. Qualification of this
0
0.5
1
1.5
2
2.5
3
3.5
4
4.5
0 20 40 60 80 100 120 140
Func
tion
Tim
e (m
s)
-420F Function Time Results for ZPPfor test units built at TR and DG
TR, Dec 2016"
TR May 2017"
DG July 2017"
TR circa 2013"
TR May 2017"
DG July 2017"
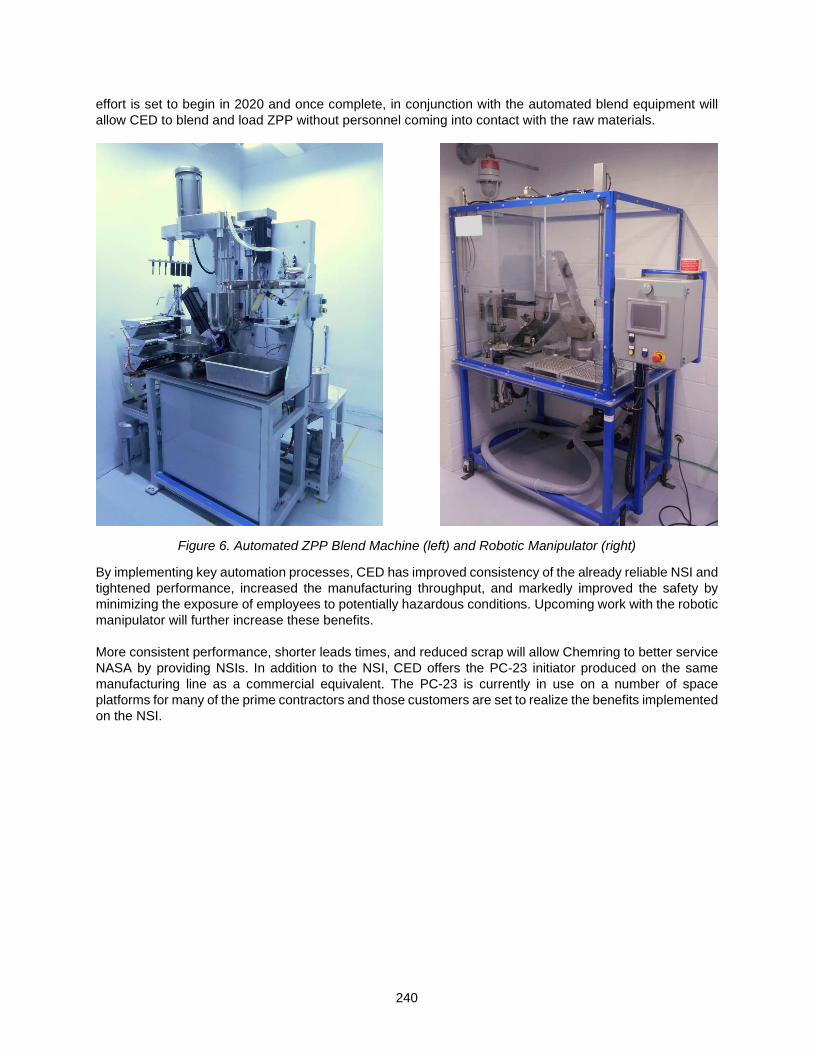
240
effort is set to begin in 2020 and once complete, in conjunction with the automated blend equipment will allow CED to blend and load ZPP without personnel coming into contact with the raw materials.
Figure 6. Automated ZPP Blend Machine (left) and Robotic Manipulator (right)
By implementing key automation processes, CED has improved consistency of the already reliable NSI and tightened performance, increased the manufacturing throughput, and markedly improved the safety by minimizing the exposure of employees to potentially hazardous conditions. Upcoming work with the robotic manipulator will further increase these benefits. More consistent performance, shorter leads times, and reduced scrap will allow Chemring to better service NASA by providing NSIs. In addition to the NSI, CED offers the PC-23 initiator produced on the same manufacturing line as a commercial equivalent. The PC-23 is currently in use on a number of space platforms for many of the prime contractors and those customers are set to realize the benefits implemented on the NSI.

241
Microvibrations Modelling and Measurement on Sentinel 4 UVN Calibration Assembly using a Piezoelectric 6 Component Force Dynamometer
Benoît Marquet*, Jean-Yves Plesseria*, Jérôme Jacobs* and Christof Sonderegger**
Abstract The Sentinel 4 (S4) Ultraviolet Visible Near-infrared (UVN) instrument is a high-resolution spectrometer embarked on the MTG-S platform. The radiometric accuracy of the UVN instrument relies on regular in-orbit re-calibrations using the Calibration Assembly (CAA). This CAA mechanism is comprised of a multi-functional wheel containing calibrated diffusers. Positioning is via a stepper motor and, as the instrument is mounted on the MTG-S platform, it is imperative that the resultant microvibrations and torques are controlled as the MTG IRS instrument is incredibly sensitive to them. To this end, CSL has developed a Simulink model that inputs a motion profile to simulate the real-world mechanisms, generating the torques and microvibrations at the satellites center of gravity. To validate this prediction, a specially designed Kistler dynamometer allows the actual forces and torques exported by the CAA qualification model to be measured.
Measuring with Piezoelectric Dynamometers Microvibrations consist of extremely small accelerations with very low intensities. Measuring them is a very challenging task and methods for properly doing so have only become available in the past few years. Piezoelectric force sensors and dynamometers are ideally suited for this purpose. Their incredibly high span-to-resolution ratio of greater than 100000 is a particular advantage. Thus, it is possible to measure dynamic force changes down to 0.01 N, even when the object being measured weighs more than 10 kg. The static weight can be “eliminated” by resetting the charge amplifier (this acts like a tare function, effectively re-zeroing the scale). In addition, the very high stiffness of piezoelectric force sensors permits natural frequencies of 1000 Hz or more. To optimize the system, the measurement setup itself is also highly important. As can be seen in Fig. 1, the dynamometer needs to be mounted on a vibration-isolated table to prevent structure-borne sound and external vibrations affecting the results. These external influences can severely distort measurements as the dynamometer, and the mass of the object being measured, can generate a large acceleration themselves. With a correct set-up, the interference signal can reach levels below 0.01 N or 0.003 Nm (RMS; 3…350 Hz).
* Centre Spatial de Liège, Université de Liège, Angleur, Belgium; [email protected] ** Kistler Instrumente AG, Winterthur, Switzerland; [email protected]
Proceedings of the 45th Aerospace Mechanisms Symposium, NASA Johnson Space Center, 2020
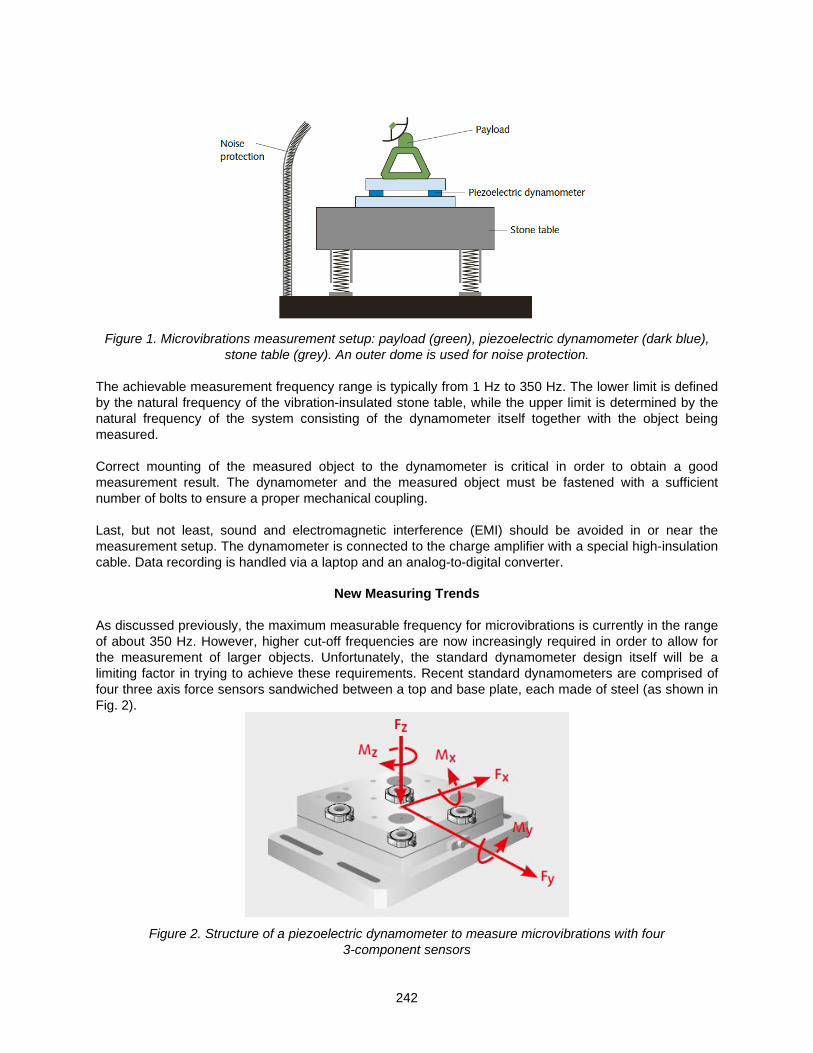
242
Figure 1. Microvibrations measurement setup: payload (green), piezoelectric dynamometer (dark blue),
stone table (grey). An outer dome is used for noise protection.
The achievable measurement frequency range is typically from 1 Hz to 350 Hz. The lower limit is defined by the natural frequency of the vibration-insulated stone table, while the upper limit is determined by the natural frequency of the system consisting of the dynamometer itself together with the object being measured. Correct mounting of the measured object to the dynamometer is critical in order to obtain a good measurement result. The dynamometer and the measured object must be fastened with a sufficient number of bolts to ensure a proper mechanical coupling. Last, but not least, sound and electromagnetic interference (EMI) should be avoided in or near the measurement setup. The dynamometer is connected to the charge amplifier with a special high-insulation cable. Data recording is handled via a laptop and an analog-to-digital converter.
New Measuring Trends As discussed previously, the maximum measurable frequency for microvibrations is currently in the range of about 350 Hz. However, higher cut-off frequencies are now increasingly required in order to allow for the measurement of larger objects. Unfortunately, the standard dynamometer design itself will be a limiting factor in trying to achieve these requirements. Recent standard dynamometers are comprised of four three axis force sensors sandwiched between a top and base plate, each made of steel (as shown in Fig. 2).
Figure 2. Structure of a piezoelectric dynamometer to measure microvibrations with four
3-component sensors
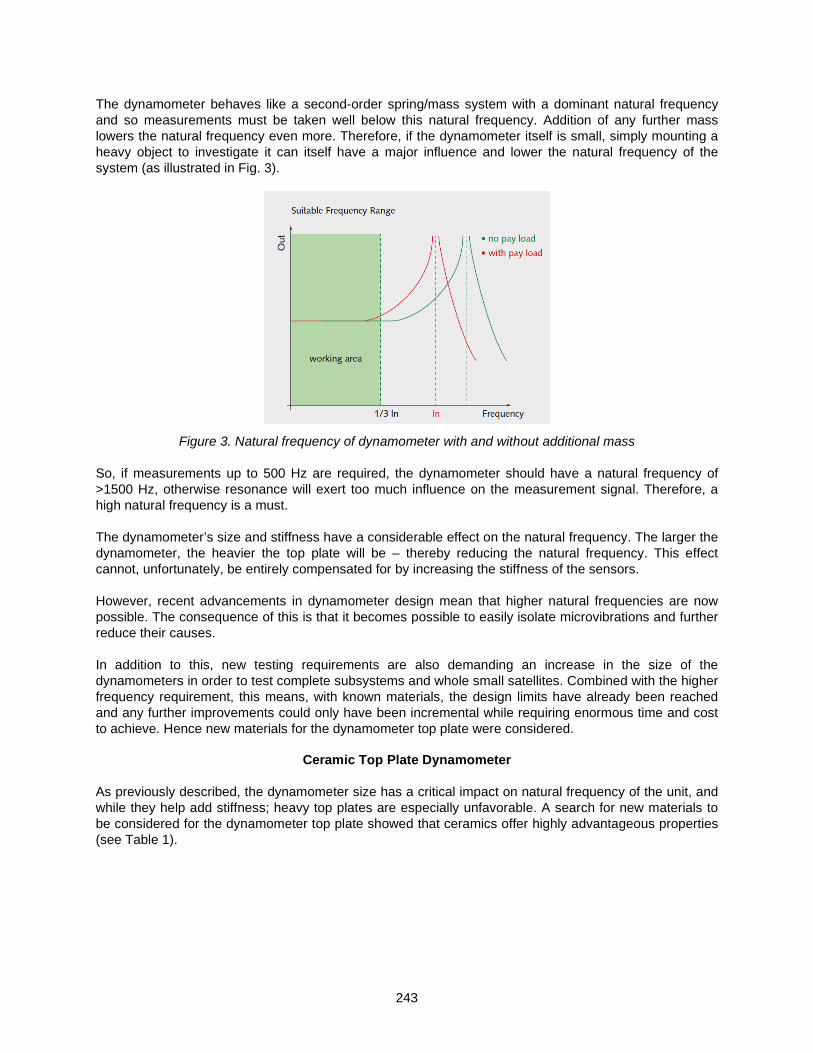
243
The dynamometer behaves like a second-order spring/mass system with a dominant natural frequency and so measurements must be taken well below this natural frequency. Addition of any further mass lowers the natural frequency even more. Therefore, if the dynamometer itself is small, simply mounting a heavy object to investigate it can itself have a major influence and lower the natural frequency of the system (as illustrated in Fig. 3).
Figure 3. Natural frequency of dynamometer with and without additional mass
So, if measurements up to 500 Hz are required, the dynamometer should have a natural frequency of >1500 Hz, otherwise resonance will exert too much influence on the measurement signal. Therefore, a high natural frequency is a must. The dynamometer’s size and stiffness have a considerable effect on the natural frequency. The larger the dynamometer, the heavier the top plate will be – thereby reducing the natural frequency. This effect cannot, unfortunately, be entirely compensated for by increasing the stiffness of the sensors. However, recent advancements in dynamometer design mean that higher natural frequencies are now possible. The consequence of this is that it becomes possible to easily isolate microvibrations and further reduce their causes. In addition to this, new testing requirements are also demanding an increase in the size of the dynamometers in order to test complete subsystems and whole small satellites. Combined with the higher frequency requirement, this means, with known materials, the design limits have already been reached and any further improvements could only have been incremental while requiring enormous time and cost to achieve. Hence new materials for the dynamometer top plate were considered.
Ceramic Top Plate Dynamometer As previously described, the dynamometer size has a critical impact on natural frequency of the unit, and while they help add stiffness; heavy top plates are especially unfavorable. A search for new materials to be considered for the dynamometer top plate showed that ceramics offer highly advantageous properties (see Table 1).
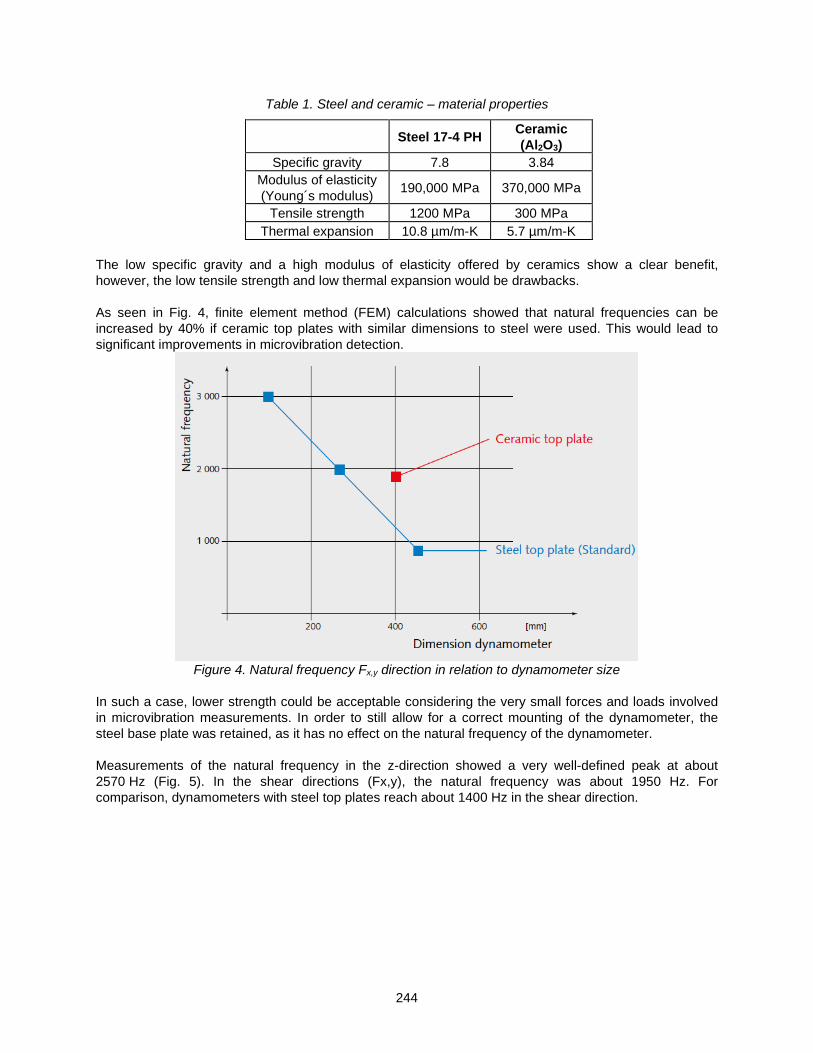
244
Table 1. Steel and ceramic – material properties
Steel 17-4 PH Ceramic (Al2O3)
Specific gravity 7.8 3.84 Modulus of elasticity (Young´s modulus) 190,000 MPa 370,000 MPa
Tensile strength 1200 MPa 300 MPa Thermal expansion 10.8 µm/m-K 5.7 µm/m-K
The low specific gravity and a high modulus of elasticity offered by ceramics show a clear benefit, however, the low tensile strength and low thermal expansion would be drawbacks. As seen in Fig. 4, finite element method (FEM) calculations showed that natural frequencies can be increased by 40% if ceramic top plates with similar dimensions to steel were used. This would lead to significant improvements in microvibration detection.
Figure 4. Natural frequency Fx,y direction in relation to dynamometer size
In such a case, lower strength could be acceptable considering the very small forces and loads involved in microvibration measurements. In order to still allow for a correct mounting of the dynamometer, the steel base plate was retained, as it has no effect on the natural frequency of the dynamometer. Measurements of the natural frequency in the z-direction showed a very well-defined peak at about 2570 Hz (Fig. 5). In the shear directions (Fx,y), the natural frequency was about 1950 Hz. For comparison, dynamometers with steel top plates reach about 1400 Hz in the shear direction.

245
Figure 5. Natural frequency in Fz direction, Ceramic top plate dynamometer type Z21492
However, after further investigation, the low thermal expansion proved to be a problem; despite the FEM calculation, a full validation of this behavior was not possible. So, an extended investigation with experimental specimens was undertaken to ensure that the difference in thermal expansion, between a steel base plate and an Al2O3 top plate, would not lead to fractures in the latter because of its special structural design. Effects of Dynamometer mounting The dynamometer must be mounted on a stiff base, ideally a stone table or steel table (min 10x more mass than dynamometer with test object). Essential is also proper mounting. The dynamometer must be screwed with four screws on the stiff, flat and clean base. Incorrect mounting affects natural frequency heavily. The effect of different incorrect mounting was measured at Kistler in our test lab. The dynamometer was mounted on a stiff base plate and excited with an impulse hammer in Z–direction.

246
Figures 6 and 7. Test set up for natural frequency measurements
Table 2. Configurations for natural frequency measurements
Figure 8: Configuration 5 is recommended. In the summary below, it clearly shows the highest
natural frequency.
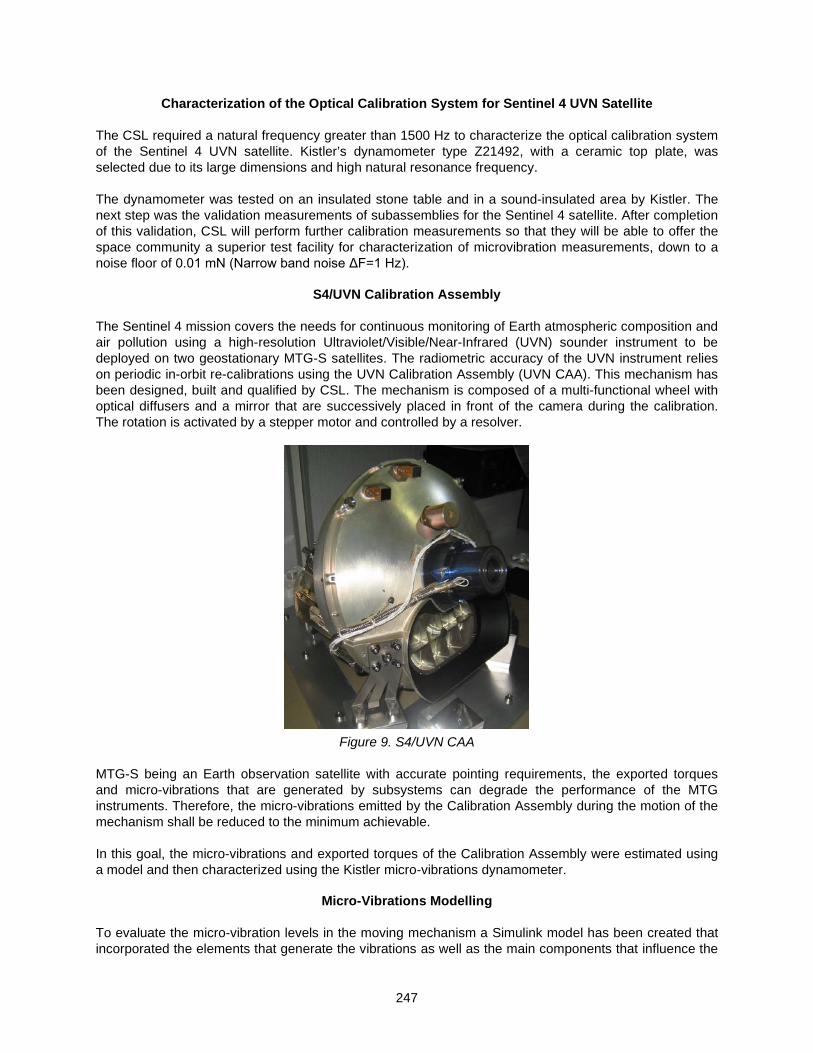
247
Characterization of the Optical Calibration System for Sentinel 4 UVN Satellite The CSL required a natural frequency greater than 1500 Hz to characterize the optical calibration system of the Sentinel 4 UVN satellite. Kistler’s dynamometer type Z21492, with a ceramic top plate, was selected due to its large dimensions and high natural resonance frequency. The dynamometer was tested on an insulated stone table and in a sound-insulated area by Kistler. The next step was the validation measurements of subassemblies for the Sentinel 4 satellite. After completion of this validation, CSL will perform further calibration measurements so that they will be able to offer the space community a superior test facility for characterization of microvibration measurements, down to a noise floor of 0.01 mN (Narrow band noise ΔF=1 Hz).
S4/UVN Calibration Assembly The Sentinel 4 mission covers the needs for continuous monitoring of Earth atmospheric composition and air pollution using a high-resolution Ultraviolet/Visible/Near-Infrared (UVN) sounder instrument to be deployed on two geostationary MTG-S satellites. The radiometric accuracy of the UVN instrument relies on periodic in-orbit re-calibrations using the UVN Calibration Assembly (UVN CAA). This mechanism has been designed, built and qualified by CSL. The mechanism is composed of a multi-functional wheel with optical diffusers and a mirror that are successively placed in front of the camera during the calibration. The rotation is activated by a stepper motor and controlled by a resolver.
Figure 9. S4/UVN CAA
MTG-S being an Earth observation satellite with accurate pointing requirements, the exported torques and micro-vibrations that are generated by subsystems can degrade the performance of the MTG instruments. Therefore, the micro-vibrations emitted by the Calibration Assembly during the motion of the mechanism shall be reduced to the minimum achievable. In this goal, the micro-vibrations and exported torques of the Calibration Assembly were estimated using a model and then characterized using the Kistler micro-vibrations dynamometer.
Micro-Vibrations Modelling To evaluate the micro-vibration levels in the moving mechanism a Simulink model has been created that incorporated the elements that generate the vibrations as well as the main components that influence the

248
transmission of vibrations in the mechanism. The elements that generate the micro-vibrations are: • The stepper motor • The bearing • The friction
The main elements that influence the transmission of the vibrations are: • The stepper motor controller • The transfer function from the motor to the spacecraft interface; • The lever effect from the spacecraft interface to the spacecraft Center of Gravity (CoG).
Figure 10. Micro-vibrations Simulink model
The stepper motor controller is a Simulink block that takes in input the motion that the motor should follow as well as the micro-stepping parameters and transforms it into the sine wave that will be the current input of the stepper motor. The stepper motor is another Simulink block that takes in input the current of the two phases and that generates the output torque of the motor. The modelling also takes into account the detent torque of the stepper motor. The next block of the simulation is the output shaft. This block simulates the behavior of the driving shaft by modelling the resistive torque on the shaft. That includes the friction in the bearing and the rotation inertia of the multi-functional wheel. This block can also take into account some cyclic resistive torque generated by imperfect balls or track. The last block is the exportation of the results in the MATLAB workspace. The results of the Simulink computation are composed of the torques and forces generated by the assembly at the motor location. After the simulation, a Matlab script is ran in the workspace to take into account for the mechanical transfer function from the motor interface to the Calibration Assembly interface. The input transfer functions were previously recovered from the FEM analysis. Once the temporal results are obtained in MATLAB, a frequency analysis is carried out to identify the exported torques and micro-vibrations in different frequency bands. The final result of the analysis is a temporal response of the injected micro-vibrations at the spacecraft CoG.
Micro-Vibrations Optimization Using the produced model, an optimization analysis was carried out to reduce the micro-vibrations exported to the spacecraft. The driving of the stepper motor can be tuned by multiple parameters. The main parameters are the maximum current injected in the motor and the motion profile. These parameters have been analyzed to reduce the micro-vibrations to the minimum achievable.

249
The first optimization performed was determining the impact of the input current as well as the sensitivity to the detent torque of the stepper motor. It was found that the micro-vibrations created by the stepper motor were primarily affected by the ratio between the holding torque (proportional to input current) and the detent torque. The higher the ratio, the lower the micro-vibrations level. The second analysis performed was determining the impact of the driving profile on the generated micro-vibrations. A micro-stepping strategy was introduced to reduce the exported micro-vibrations but even with a perfect input signal, the micro-vibrations induced by the stepper motor cannot be erased. It was evaluated that having more than 64 µsteps / step does not improve the micro-vibrations behavior. A specific input current profile was also suggested to, in theory; remove the non-uniformity of the output torque and so to provide a constant output torque during the motion. This profile was working well in simulations even in open-loop conditions with external perturbations. But it was evaluated incompatible with the actual electronic control system due to cross use of table lookup with other subsystems. Following the rejection of an advanced current profile, more common profiles were evaluated including a constant velocity profile, a constant acceleration profile and a jerk profile. For a jerk-based profile, a full motion is divided in 7 parts: 4 transitions phases (Tt), 2 constant acceleration phases (Ta) and 1 constant velocity phase (Tv). By tweaking the transition and acceleration phases, the motion profile could be tuned and optimized to reduce the exported micro-vibrations during a complete motion. It was found that the best profile to reduce the micro-vibrations is a jerk profile that tends to a constant velocity profile. Tuning the acceleration part of the jerk profile allowed reducing the micro-vibrations during the transient part of the curve.
Figure 11. Jerk and Acceleration definition
Micro-Vibrations Setup
Once the sensitivity analysis and optimization performed on the Simulink model was complete, it was required to compare the results with physical measurements. Therefore, a test campaign has been performed using the Kistler dynamometer developed for this application. Fig. 12 shows the CAA mounted on the micro-vibrations table.

250
Figure 12. UVN CAA mounted on µVib table
The table is capable of recording the forces in three axes as well as the torques around the three axes with a high sensitivity as described in the first part of this article. Being very sensitive, a favorable environment is required to avoid impacting the measurements. The two main noise contributors are the acoustic and the seismic environment. Since a characterization of Flight Models was foreseen, it required working in ISO5 environment which creates additional acoustic noise due to continuous airflow. However, CSL is equipped with vacuum chambers located in ISO5 environment which allows reducing the acoustic noise by closing the chamber during the measurement. Furthermore, each vacuum chamber is equipped with a very stable optical bench that is decoupled from environmental vibrations thanks to a heavy seismic mass. The environment noises shown in Tables 3 and 4 were reached, with the instrument installed on the dynamometer, in Focal 5 and Focal 2 that are two vacuum chambers at CSL. The measurements are from 0 to 500Hz.
Table 3. RMS Noise in Focal 2
Axis Noise Focal 2 Fx 2.9E-2 N rms Fy 2.9E-2 N rms Fz 3.7E-2 N rms Mx 3.8E-3 Nm rms My 3.2E-3 Nm rms Mz 1.2E-3 Nm rms
Table 4. RMS Noise in Focal 5
Axis Noise Focal 5 Fx 3.5E-2 N rms Fy 4.9E-2 N rms Fz 1.7E-1 N rms Mx 4.4E-3 Nm rms My 2.1E-3 Nm rms Mz 2.2E-3 Nm rms
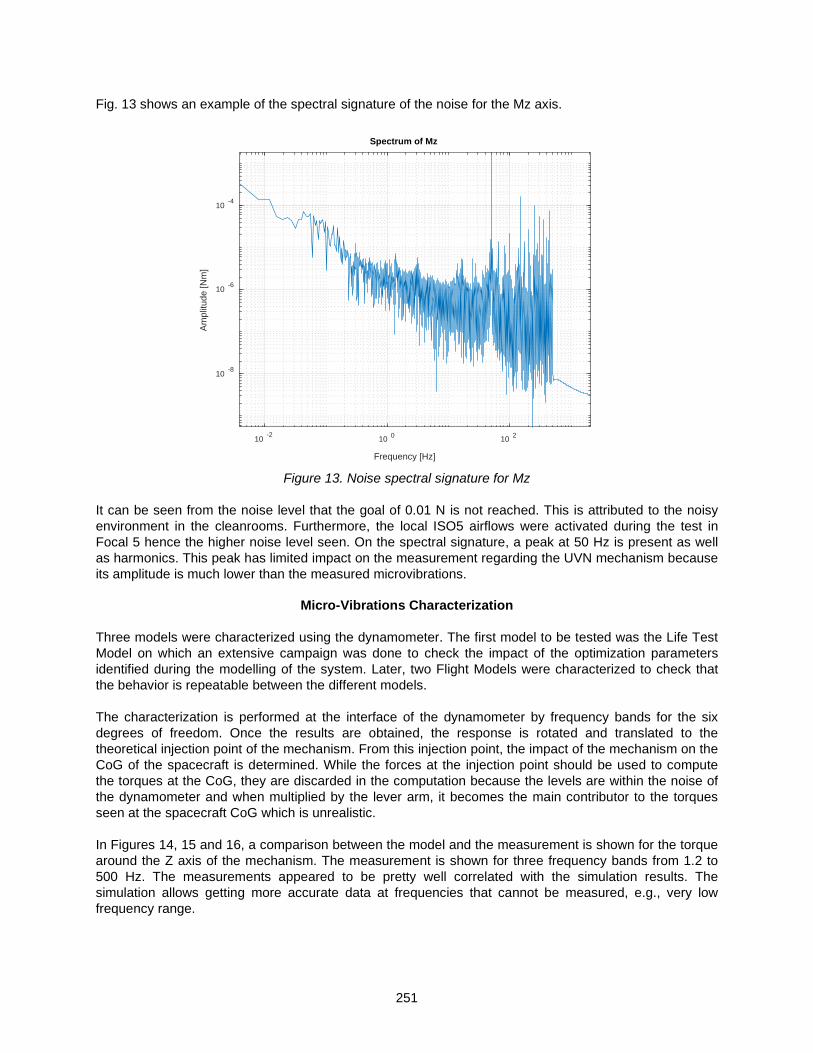
251
Fig. 13 shows an example of the spectral signature of the noise for the Mz axis.
10 -2 10 0 10 2
Frequency [Hz]
10 -8
10 -6
10 -4Am
plitu
de [N
m]
Spectrum of Mz
Figure 13. Noise spectral signature for Mz
It can be seen from the noise level that the goal of 0.01 N is not reached. This is attributed to the noisy environment in the cleanrooms. Furthermore, the local ISO5 airflows were activated during the test in Focal 5 hence the higher noise level seen. On the spectral signature, a peak at 50 Hz is present as well as harmonics. This peak has limited impact on the measurement regarding the UVN mechanism because its amplitude is much lower than the measured microvibrations.
Micro-Vibrations Characterization Three models were characterized using the dynamometer. The first model to be tested was the Life Test Model on which an extensive campaign was done to check the impact of the optimization parameters identified during the modelling of the system. Later, two Flight Models were characterized to check that the behavior is repeatable between the different models. The characterization is performed at the interface of the dynamometer by frequency bands for the six degrees of freedom. Once the results are obtained, the response is rotated and translated to the theoretical injection point of the mechanism. From this injection point, the impact of the mechanism on the CoG of the spacecraft is determined. While the forces at the injection point should be used to compute the torques at the CoG, they are discarded in the computation because the levels are within the noise of the dynamometer and when multiplied by the lever arm, it becomes the main contributor to the torques seen at the spacecraft CoG which is unrealistic. In Figures 14, 15 and 16, a comparison between the model and the measurement is shown for the torque around the Z axis of the mechanism. The measurement is shown for three frequency bands from 1.2 to 500 Hz. The measurements appeared to be pretty well correlated with the simulation results. The simulation allows getting more accurate data at frequencies that cannot be measured, e.g., very low frequency range.

252
Figure 14. Simulated (blue) vs measured (green) µVib
Figure 15. Simulated (blue) vs measured (green) µVib
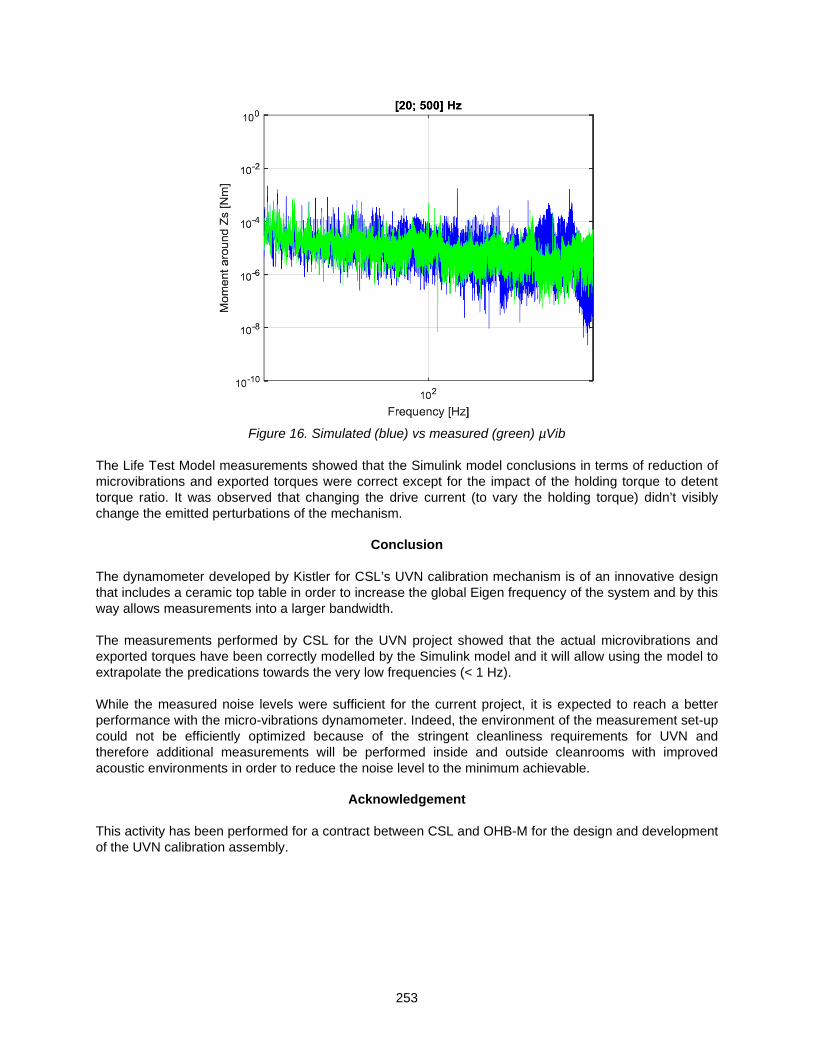
253
Figure 16. Simulated (blue) vs measured (green) µVib
The Life Test Model measurements showed that the Simulink model conclusions in terms of reduction of microvibrations and exported torques were correct except for the impact of the holding torque to detent torque ratio. It was observed that changing the drive current (to vary the holding torque) didn’t visibly change the emitted perturbations of the mechanism.
Conclusion The dynamometer developed by Kistler for CSL’s UVN calibration mechanism is of an innovative design that includes a ceramic top table in order to increase the global Eigen frequency of the system and by this way allows measurements into a larger bandwidth. The measurements performed by CSL for the UVN project showed that the actual microvibrations and exported torques have been correctly modelled by the Simulink model and it will allow using the model to extrapolate the predications towards the very low frequencies (< 1 Hz). While the measured noise levels were sufficient for the current project, it is expected to reach a better performance with the micro-vibrations dynamometer. Indeed, the environment of the measurement set-up could not be efficiently optimized because of the stringent cleanliness requirements for UVN and therefore additional measurements will be performed inside and outside cleanrooms with improved acoustic environments in order to reduce the noise level to the minimum achievable.
Acknowledgement This activity has been performed for a contract between CSL and OHB-M for the design and development of the UVN calibration assembly.

254
255
Lubrication Concept Evaluated for Geared Actuators under Starved Conditions
Erik Nyberg*, Jonny Hansen** and Ichiro Minami*
Abstract Lubricant starvation leads to the risk of a shift in the lubrication regime from (elasto)hydrodynamic towards boundary conditons. Effective tribofilm formation is essential to limit surface damages in these conditions, but additive technology for space-grade lubricants is lacking. This work evaluates the feasibility of a novel type of multifunctional ionic liquid lubricant, for use with multiply alkylated cyclopentane (MAC). Actuator gearboxes are operated under starved conditions in nitrogen atmosphere to evaluate the effectiveness of the tribofilm forming lubricant (designated P-SiSO). The effectiveness of P-SiSO was evaluated from macro to micro scale in both surface and sub-surface analysis by use of microscopy (optical, interferometric, SEM) and X-ray microtomography (XMT), and mechanisms of effective lubrication are discussed.
Introduction Conditions faced in robotic space exploration missions pose significant challenges to lubrication of complex mechanisms. Geared actuators operated in low temperatures require extensive preheating before startup [1], but once in operation they may suffer from lubricant starvation due to limited resupply of lubricant to the contact [2]. In vacuum conditions, native oxide layers quickly wear out and if the lubricant does not form a protective tribofilm, there is high risk of seizure. Perfluoropolyethers (PFPE) and multiply alkylated cyclopentanes (MAC) are heritage lubricants used in space applications. They both have benefits and drawbacks; the main benefit being outstanding resistance to outgassing, but their tribofilm forming properties are problematic. PFPE forms iron fluourides in tribocontacts, which prevents seizure but eventually degrades the system autocatalytically [3]. MAC on the other hand is a neat hydrocarbon, and is not generally tribochemically active. Additives are possible, but finding effective additives that are miscible and non-volatile is challenging, and few options are currently available. As space exploration missions are demanding increasing performance of mechanisms, new solutions are urgently required. This paper aims to establish the feasibility of using hydrocarbon-mimicking silicate forming ionic liquid (P-SiSO) as tribo-improving additive in MAC. Recent work on P-SiSO In our previous work [4], we described the molecular design of a hydrocarbon-mimicking synthetic lubricant composed of a tetraalkylphosphonium cation and trimethylsilalkylsulfonate anion, and found that it provides excellent lubricating performance under boundary lubrication conditions [5] as well as elastohydrodynamic conditions [6]. The hydrocarbon-mimicking structure enables miscibility with a range of hydrocarbon base fluids, while the ionic structure of P-SiSO enables reduced volatility. Surface analysis has shown that the excellent performance correlates with formation of a novel type of tribofilm, mainly based on silicate. Preliminary studies in vacuum tribometers and outgassing tests [7] have produced positive results and therefore the next step is to evaluate the lubricant under increasingly realistic configurations.
Materials and Methods In this work, P-SiSO was evaluated in commercial off-the-shelf (COTS) geared actuators. Sintered metal gears, reduced lubricant fill, and reduced temperatures was employed to provoke lubricant starved
* Luleå University of Technology, Luleå, Sweden; [email protected] ** Scania CV AB, Södertälje, Sweden
Proceedings of the 45th Aerospace Mechanisms Symposium, NASA Johnson Space Center, 2020

256
conditions and accelerate damages. The main focus of the experiment is on the lubricants ability to limit surface and subsurface damage in the gears operated in lubricant starved conditions. Concept lubricant A concept lubricant was prepared by dissolving 0.4 wt% of a hydrocarbon-mimicking ionic liquid (tetraalkylphosphonium trimethylsilaalkylsulfonate) [4] in multiply alkylated cyclopentane. Adequate performance with regards to thermal vacuum outgassing and solubility was recently demonstrated by the this lubricant [8], which we hereafter designate as P-SiSO. Two reference lubricants were employed during this work; Synthetic Oil 2001a, a multiply alkylated cyclopentane supplied by Nye Lubricants, Inc. (Fairhaven, MA), and Fomblin Z25, a perfluoropolyether supplied by Solway S.A. (Brussels, Belgium). The reference lubricants are designated as MAC and PFPE respectively. Neat tetraalkylphosphonium trimethylsilaalkylsulfonate was synthesized by Nisshinbo Holdings Inc. (Tokyo, Japan). Actuator Gearbox Lubrication The geared actuators consist of a planetary gearbox (GP32) and a DC-motor (RE30) with encoder and servo controller (ESCON 36/2), all acquired from Maxon Motor AG, (Sachseln, Switzerland). The gearboxes are 3-stage planetary gearboxes with 51:1 gear ratio, with max continous torque rating of 4.5 Nm. The servo controller can provide a maximum continous current of 2 A at 25 V, which corresponds to a max continous torque of 2.6 Nm, ensuring that the sintered steel gears are not mechanically overloaded. The gearboxes are dissasembled and cleaned, before relubricated with the test lubricants, as shown in Figure 1(a-b). The amount of lubricant applied is significantly reduced in order to provoke starved conditions; the original grease fill of 1.6 g is replaced with 0.060 g of test lubricant (5 µl to each planet gear and 15 µl to output bearing). After applying the test lubricant the gearbox is rotated under zero load at low speed (5 min at 800 rpm followed by 5 min at 4000 rpm) to achieve a consistent lubricant distribution within the gearbox. Geared Actuator Test Rig (GATR) A custom made geared actuator test rig (GATR), shown in Figure 1(c-d), was designed and manufactured for the purpose of evaluating the lubricants in a component scale experiment. In this setup, the actuator is mounted in a refrigerated chamber filled with N2 gas. The main purpose is to subject the actuator gearboxes to operation in lubricant-starved and oxygen-reduced conditions in order to perform post test damage evaluation and boundary film analysis. The GATR is equipped with a dynamometer and temperature sensors in order to monitor effects on gearbox efficicency and temperature evolution while running the actuator against a braking torque. The efficiency is defined as the ratio of electrical power input, 𝑃𝑃𝑖𝑖𝑖𝑖, to mechanical power output, 𝑃𝑃𝑜𝑜𝑜𝑜𝑜𝑜. The power input can be determined by motor speed, current, and torque constant, while power ouput is determined by output speed and applied brake torque.
Figure 1. (a) Dissasembled 3-stage planetary gearbox. (b) Procedure of applying lubricant to planet gear.
(c) Atmospheric chamber enclosing actuator and sensors. (d) Overview of Geared Actuator Test Rig.
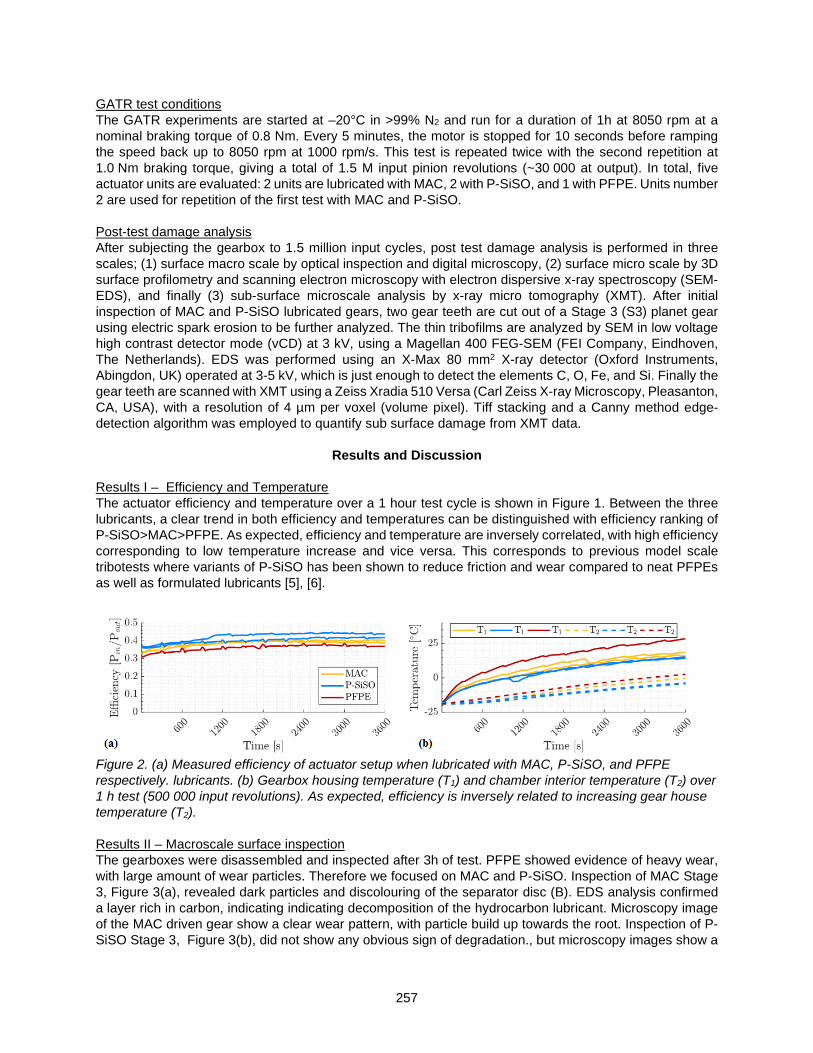
257
GATR test conditions The GATR experiments are started at –20°C in >99% N2 and run for a duration of 1h at 8050 rpm at a nominal braking torque of 0.8 Nm. Every 5 minutes, the motor is stopped for 10 seconds before ramping the speed back up to 8050 rpm at 1000 rpm/s. This test is repeated twice with the second repetition at 1.0 Nm braking torque, giving a total of 1.5 M input pinion revolutions (~30 000 at output). In total, five actuator units are evaluated: 2 units are lubricated with MAC, 2 with P-SiSO, and 1 with PFPE. Units number 2 are used for repetition of the first test with MAC and P-SiSO. Post-test damage analysis After subjecting the gearbox to 1.5 million input cycles, post test damage analysis is performed in three scales; (1) surface macro scale by optical inspection and digital microscopy, (2) surface micro scale by 3D surface profilometry and scanning electron microscopy with electron dispersive x-ray spectroscopy (SEM-EDS), and finally (3) sub-surface microscale analysis by x-ray micro tomography (XMT). After initial inspection of MAC and P-SiSO lubricated gears, two gear teeth are cut out of a Stage 3 (S3) planet gear using electric spark erosion to be further analyzed. The thin tribofilms are analyzed by SEM in low voltage high contrast detector mode (vCD) at 3 kV, using a Magellan 400 FEG-SEM (FEI Company, Eindhoven, The Netherlands). EDS was performed using an X-Max 80 mm2 X-ray detector (Oxford Instruments, Abingdon, UK) operated at 3-5 kV, which is just enough to detect the elements C, O, Fe, and Si. Finally the gear teeth are scanned with XMT using a Zeiss Xradia 510 Versa (Carl Zeiss X-ray Microscopy, Pleasanton, CA, USA), with a resolution of 4 µm per voxel (volume pixel). Tiff stacking and a Canny method edge-detection algorithm was employed to quantify sub surface damage from XMT data.
Results and Discussion Results I – Efficiency and Temperature The actuator efficiency and temperature over a 1 hour test cycle is shown in Figure 1. Between the three lubricants, a clear trend in both efficiency and temperatures can be distinguished with efficiency ranking of P-SiSO>MAC>PFPE. As expected, efficiency and temperature are inversely correlated, with high efficiency corresponding to low temperature increase and vice versa. This corresponds to previous model scale tribotests where variants of P-SiSO has been shown to reduce friction and wear compared to neat PFPEs as well as formulated lubricants [5], [6].
Figure 2. (a) Measured efficiency of actuator setup when lubricated with MAC, P-SiSO, and PFPE respectively. lubricants. (b) Gearbox housing temperature (T1) and chamber interior temperature (T2) over 1 h test (500 000 input revolutions). As expected, efficiency is inversely related to increasing gear house temperature (T2). Results II – Macroscale surface inspection The gearboxes were disassembled and inspected after 3h of test. PFPE showed evidence of heavy wear, with large amount of wear particles. Therefore we focused on MAC and P-SiSO. Inspection of MAC Stage 3, Figure 3(a), revealed dark particles and discolouring of the separator disc (B). EDS analysis confirmed a layer rich in carbon, indicating indicating decomposition of the hydrocarbon lubricant. Microscopy image of the MAC driven gear show a clear wear pattern, with particle build up towards the root. Inspection of P-SiSO Stage 3, Figure 3(b), did not show any obvious sign of degradation., but microscopy images show a

258
blue and purple region above and below the pitch line of the driven gear, indicating tribofilm formation. Regardless of MAC or P-SiSO, the driven gear showed more signs of wear than the driver gear.
Figure 3. Inspection of Stage 3 components. (a) MAC show visible lubricant degradation (confirmed by EDS) on stage 3 separator disc. Microscope image indicate wear above and below pitch line. (b) No sign of lubricant degradation in P-SiSO case. Worn area color shift indicates formation of boundary film. Results III – Surface micro scale and elemental analysis Figure 4 displays the surface topography of the driven gears seen in Figure 3, together with a topography map of an unworn tooth. In the case of MAC and P-SiSO, the measurement was made after cutting the teeth so that the full size of the gear could be scanned. Despite this, very little data is recorded below the pitch line. Above the pitch line, the MAC shows an elliptic region that covers about 1/3 of the gear, whereas the case of P-SiSO is limited to the edges of the gear. The MAC topography has likely also been severly worn below the pitch line, but the large height differential over the gear profile makes it difficult to capture the effect on surface roughness in this area.
Figure 4.Gear surfaces as seen by 3d profilometry in 10x objective. Wear patterns of MAC and P-SiSO are compared with New (unworn) surface. Dedendum is mostly out of range because of gear involute profile, but tendency of high wear by MACis seen. Regions I and II are selected for 50x objective evaluation. Increasing the magnification provides insight to the active wear and damage mechanisms. In Figure 5(a) the MAC surface show signs of scuffing, with adhered particles and abrasive marks. In contrast, Figure 5(b)

259
show a surface where the original sintered pores remain, but the load bearing patches between pores are very smooth. A surface roughness profile (avoiding pores) reveal that the surface parameters are significantly improved compared to the unworn reference, as well as the MAC or PFPE (not shown).
Figure 5. Regions I-II of MAC and P-SiSO respectively, with roughness profiles and parameters along x profile. (a) MAC surface show evidence of partial seizures (scuffing). (b) P-SiSO produce smooth contact patches and retains the porous structure of the unworn sintered material. Region II (P-SiSO) was analyzed by SEM-EDS investigate the lubrication mechanism. A patchy tribofilm is clearly visible when using the low voltage high current detector (vCD). However, the EDS analysis could not confirm the presence of silicate. When comparing to a SRV model tribotest, shown in the top right inset of Figure 6(b), it is clear that the tribofilms have a similar visible appearance. The EDS spectra also show similarities in terms of Fe/O/C proportions, but Si is lacking in the analyzed gear surface. Possibly, the gear tribofilm is too thin to be detectable by EDS, even at the low accelerating voltages of 3-5 keV used.
Figure 6. SEM-EDS analysis of P-SiSO driven gear Region II. (a) Overview indicate gear surface is covered with tribofilm. (b) Gear tribofilm compared to P-SiSO tribofilm generated in ball-on-flat SRV tribotest. Results IV – Sub-surface micro scale analysis The analysis is limited to ~1 mm3 of the gear teeth located at the x-coordinate corresponding to the center of the worn region in Figure 4. The colormap show the frequency of detected edges in the y-z plane. The gray scale refers to the density of the material; bright regions correspond to metal (dense) and dark regions to pores (air). Addendum (i) and dedendum (ii) regions on the driven (N) and driver (R) side of the gear are chosen for comparison. Figure 7(a) show adhered metal, confirming scuffing at region (Nii). Interstingly, in the same region there are also sub-surface edges detected, which indicates risk of sub-surface cracks. The

260
subset images show possible crack formations at x-coordinate X1–4. Figure 7(b) shows significantly less activity in the colormap produced by the edge detection algorithm, indicating lower risk of sub-surface cracks. High friction is usually detrimental to sub-surface cracking. In starved lubrication conditions, the efficiency improvement of P-SiSO over MAC is likely attributed to surface friction, and therefore it is reasonable to assume less sub-surface cracking.
Figure 7. XMT analysis indicates potential sub-surface cracking. Driven side dedendum (Nii) is critical region. (a) MAC show severe scuffing with large particles adhered at Nii, and evidence of subsurface cracks in the same region (b) P-SiSO show less overall detected edges, and no evidence of scuffing.
Conclusions
• A hydrocarbon mimicking ionic liquid combined with multiply alkylated cyclopentane (P-SiSO) was evaluated in geared actuators under starved lubrication conditions in N2 atmosphere.
• P-SiSO significantly reduced surface and sub-surface damage, while increasing gearbox efficiency. • P-SiSO covered the gear with a thin tribofilm, comparison with model tribotest indicates silicate. • Surface roughness was clearly improved by P-SiSO, which likely improves (micro-)EHL conditions. • XMT is well suited for damage analysis of sintered metal gears. The porous structure is susceptible
to sub-surface cracking, which can be distinguished by XMT over the entire gear volume.
Acknowledgements The "Austrian COMET-Program" in the frame of K2 XTribology (project no. 849109) and The Taiho Kogyo Research Foundation (TTRF) through the 2019 First Research Grant provided funding of this work.
References [1] K. S. Novak, Y. Liu, C.-J. Lee, and S. Hendricks, “Mars Science Laboratory Rover Actuator Thermal Design,”
in 40th International Conference on Environmental Systems, 2010, pp. 1–11. [2] D. Suffern and J. Parker, “Developmental Bearing and Bushing Testing for Mars Gearboxes,” Aerosp. Mech.
Symp., vol. 44, pp. 529–541, 2018. [3] D. J. Carré, “Perfluoropolyalkylether Oil Degradation: Inference of FeF3 Formation on Steel Surfaces under
Boundary Conditions,” ASLE Trans., vol. 29, no. 2, pp. 121–125, 1986. [4] E. Nyberg, C. Y. Respatiningsih, and I. Minami, “Molecular design of advanced lubricant base fluids:
hydrocarbon-mimicking ionic liquids,” RSC Adv., vol. 7, no. 11, pp. 6364–6373, 2017. [5] E. Nyberg, J. Mouzon, M. Grahn, and I. Minami, “Formation of Boundary Film from Ionic Liquids Enhanced by
Additives,” Appl. Sci., vol. 7, no. 5, p. 433, 2017. [6] J. Hansen, M. Björling, I. Minami, and R. Larsson, “Performance and mechanisms of silicate tribofilm in heavily
loaded rolling/sliding non-conformal contacts,” Tribol. Int., vol. 123, pp. 130–141, 2018. [7] ECSS, “Thermal vacuum outgassing test for the screening of space materials (ECSS-Q-ST-70-02C),” 2008. [8] E. Nyberg, L. Pisarova, N. Dörr, F. Pagano, A. Igartua, and I. Minami, “Silicate-Forming Triboimprovers for
Multiply Alkylated Cyclopentane Base Fluids,” in 22nd International Colloquium Tribology, 2020, p. 1.
261
Development of a Universal and Scalable Mechanism Control Electronics Configured to Application Solely by Parameter and Software Configuration
Udo Rapp* and Juan Camilo Garcia Hernandez*
Abstract
Modern motor-driven high-precision mechanisms require dedicated control electronics in order to achieve their individual function, e.g., position, velocity or acceleration control. The development of Mechanism Control Electronics (MCE) is therefore often driven by necessary engineering development or optimization tasks for this individual function rather than by economic and life-cycle requirements. The new concept of a universal Mechanism Control Electronics, co-funded by the German Space Agency (DLR), breaks up with the engineering optimization approach as generally applied to each specific project and demonstrates that one electronics unit is able to serve numerous mechanism applications at minimized adaptation need. With the presented development of a new control electronics, a versatile light-weight, low-power, low-volume and low-cost solution applicable to a large variety of different mechanism control requirements could be realized.
Introduction
In the past decades, several generations of Mechanism Control Electronics have been developed at Airbus Defence and Space, including Solar Array Drive Electronics, Antenna Pointing Electronics for LEO/GEO as well as Mechanism Control Electronics for various science scanning and pointing applications. Each of these drive electronics has been a highly integrated unit with strong regard to volume/mass and power budget and was adapted to the specific mechanisms and system requirements in order to optimize the equipment function to the dedicated customer needs. The new concept breaks with the optimization for each single application and transfers all operation modes, control loops and telecommand/telemetry functions into software instead. In addition, the interfaces to spacecraft and to the mechanism are implemented fully flexible to be universal for different mechanism/actuator types and for different spacecraft bus interfaces. This paper describes the collection of versatility requirements and the development performed on the different Mechanism Drive Electronic modules with the resulting Electronics Demonstrator Model. The "Application Summary and Conclusion" section contains the present status of the Universal Mechanism Control Electronics and describes its flexibility with respect to the mechanism motor characteristics, command/telemetry interface and specific function.
* Airbus Defence and Space GmbH, Friedrichshafen, Germany
[email protected], [email protected] Proceedings of the 45th Aerospace Mechanisms Symposium, NASA Johnson Space Center, 2020

262
Requirements Analysis The development work was started with a requirements analysis to determine the key requirements enabling a Control Electronics to become a universal Mechanism Control Electronics. These requirements include the following major technical key aspects: Primary power bus variability: Capability to operate at all standard primary power bus voltages,
i.e., 28V unregulated up to 50V regulated bus.
Power Drive capability: DC/DC Converter and motor amplifier shall be scaled to comply with the majority of space mechanisms. An open architecture for equipment with higher power demand shall be granted.
Command/Telemetry variability: The unit shall operate at all typical interface topologies, i.e., Mil-Std-1553B, RS-422, SpaceWire, ML16/DS16, etc. Eventual hardware modifications for interface-adaptation shall be kept to an absolute minimum.
Operational Mode Control: Handling of mechanism operational modes (e.g., standby, movement, autonomous functions) shall be completely handled in software.
Current- and Motion-Control Loops: Transfer of all motor current-, torque-, position-, velocity-control loops into real-time-operating software. Bandwidth target above 100 kHz (bandwidth to be distributed to all control loops)
Mechanism Actuator Interface: Interface to brushless-DC Motors, brushed-DC motors, Linear Actuators or Stepper Motors at only minor and pre-defined hardware adaptation
Motor Filtering/Damping: Motor mechanical characteristics differ significantly with respect to motor type (stepper/BLDC/DC) as well as the motor electrical characteristics. It is mandatory that the universal MCE either allows proper EMC filtering / damping for a high range of motors or, as an alternative, facilitate adaptation to specific motor characteristics.
Position-Sensor Interface: Interface provision to analog and digital, incremental and absolute optical encoders. Interface to reference switches, external and motor internal Hall Sensors.
Open Architecture: Clearly defined interfaces to open the universal Mechanism Control Electronics to other or new mechanism and interface types.
Requirement Summary: One universal Mechanism Control Electronics shall be capable to serve at least 90% of mechanism targets (major application bandwidth) without or with minimized non-recurring effort in hardware adaptation. The open architecture shall allow the adaptation to the other 10% of upcoming mechanism applications.
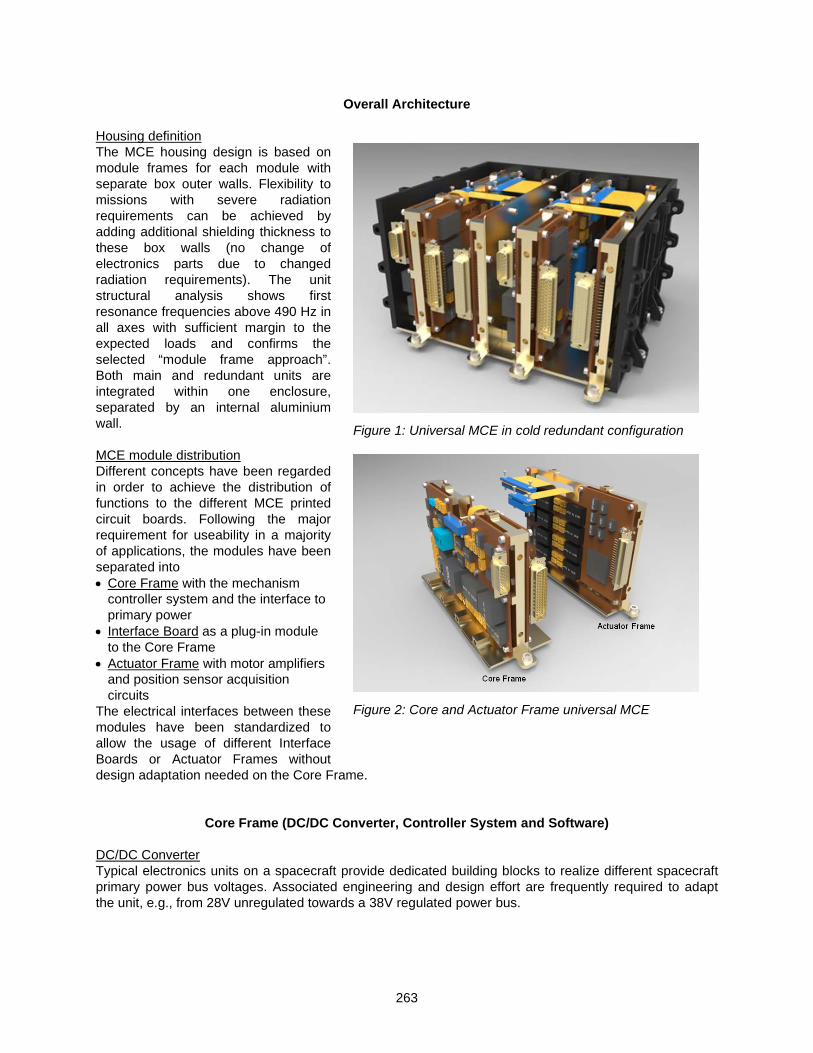
263
Figure 1: Universal MCE in cold redundant configuration
Figure 2: Core and Actuator Frame universal MCE
Overall Architecture Housing definition The MCE housing design is based on module frames for each module with separate box outer walls. Flexibility to missions with severe radiation requirements can be achieved by adding additional shielding thickness to these box walls (no change of electronics parts due to changed radiation requirements). The unit structural analysis shows first resonance frequencies above 490 Hz in all axes with sufficient margin to the expected loads and confirms the selected “module frame approach”. Both main and redundant units are integrated within one enclosure, separated by an internal aluminium wall. MCE module distribution Different concepts have been regarded in order to achieve the distribution of functions to the different MCE printed circuit boards. Following the major requirement for useability in a majority of applications, the modules have been separated into • Core Frame with the mechanism
controller system and the interface to primary power
• Interface Board as a plug-in module to the Core Frame
• Actuator Frame with motor amplifiers and position sensor acquisition circuits
The electrical interfaces between these modules have been standardized to allow the usage of different Interface Boards or Actuator Frames without design adaptation needed on the Core Frame.
Core Frame (DC/DC Converter, Controller System and Software) DC/DC Converter Typical electronics units on a spacecraft provide dedicated building blocks to realize different spacecraft primary power bus voltages. Associated engineering and design effort are frequently required to adapt the unit, e.g., from 28V unregulated towards a 38V regulated power bus.

264
In order to avoid this adaptation from program to program, the Core Frame primary bus interface has to be able to cope with an enveloping input voltage range from 22V up to 52V without the need of any commissioning or adjustment need. A new converter architectural concept has been established, which combines the MCE EMC input filter together with sequential converters for actuator power and internal supply. The galvanic isolation is maintained by this converter concept. Mechanism Controller System Field Programmable Gate Arrays (FPGA) with hard-coded firmware (VHDL) are frequently used in Mechanism Control Electronics to combine the specific mechanism control and sensor acquisition interfaces with intelligent mechanism mode control and interface handling. In most cases, the motor current controller or sensor analog acquisition circuits are kept analog and are adjusted for different motor and sensor characteristics. For a universal Mechanism Control System, it is mandatory to consequently transfer unit operational functions and parameters into software, together with actuator control loops and motor current controller. The selected architecture achieving a standardized controller concept is depicted in Figure 3. This complete architecture has been introduced into one FPGA embedded system and completes the Core Frame together with the DC/DC Converter defined above.
Figure 3: Mechanism Controller System of Universal MCE
Besides the logic blocks for command/telemetry interfaces and the actuators and sensor interfaces, the major constituent is a dedicated processor system consisting of two processors plus a Floating Point Unit (FPU). An ARM-M1 processor is responsible for the mechanism functions and operation, whereas the NanoProcessor together with the FPU performs all control loop tasks in virtual real-time. The overall processing performance is 23 MIPs, 10 MFLOPs (32-bit-float) plus 1.11 MFLOPs (trigonometric) which allows a control-loop bandwith of >100 kHz that can be distributed to current, position and velocity control.

265
Software The universal MCE software has been developed following a software layer model. This allows introduction of new mechanism operational modes as well as additional real-time control loop tasks without need of full software re-development. Basic operational modes are available but additional user-defined modes can be added without restrictions. Figure 4 shows the functional distribution of software modules and control loops to the two processor systems and the interface of new modes/control-loop functions and parameters to the MCE software. The basic software blocks within the ARM M1 Processor and within the nanoProc remain unchanged for all MCE appications.
Memory / FPU / Trigonometric / Timers / Interfaces / Actuators / Sensors / ...
ARM M1 Processor
nanoProc
- Interface TMTC- Mode Control- S/W Up-/Down-load- FDIR- ...
All real-time tasks:- Control Loops- Hardware Supervision- Actuator-Control- Sensor read-out- ...
ModeParameters
ControlParameters
NewModes
NewRealtime-
Tasks
0RUN
1WAIT
2DECELLERAT
E
3SEEK
4STOP
STOP CMD
Modeswitch <> 5
Start position reached
End position reached ?
STOP CMD
Modeswitch <> 5
Modeswitch <> 5
STDBY
MODE 1..4
MODE 5
STDBY CMD
Step 1:Determine Modes of Operation and Control Loop in Simulink
Step 2:Transfer into ARM-S/Wand realtime Tasks
Step 3:Upload to universal MCE,Validation in Equipment
Figure 4: Distribution of Software to the two processors
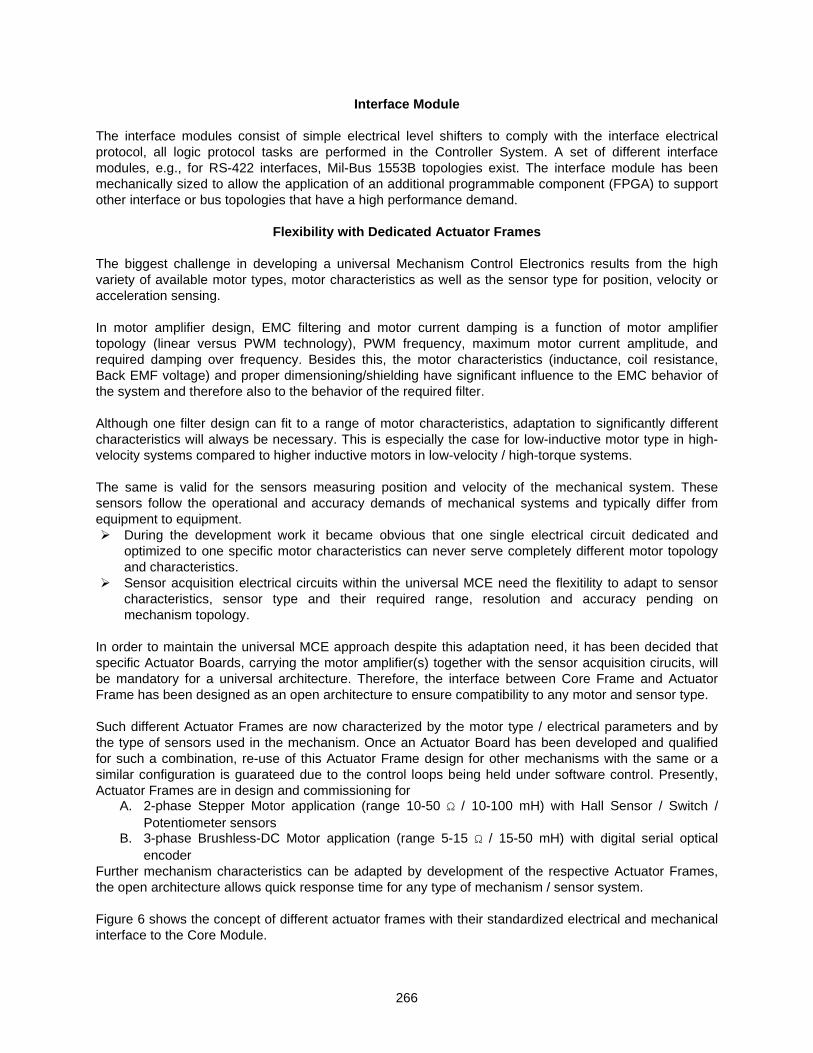
266
Interface Module The interface modules consist of simple electrical level shifters to comply with the interface electrical protocol, all logic protocol tasks are performed in the Controller System. A set of different interface modules, e.g., for RS-422 interfaces, Mil-Bus 1553B topologies exist. The interface module has been mechanically sized to allow the application of an additional programmable component (FPGA) to support other interface or bus topologies that have a high performance demand.
Flexibility with Dedicated Actuator Frames
The biggest challenge in developing a universal Mechanism Control Electronics results from the high variety of available motor types, motor characteristics as well as the sensor type for position, velocity or acceleration sensing. In motor amplifier design, EMC filtering and motor current damping is a function of motor amplifier topology (linear versus PWM technology), PWM frequency, maximum motor current amplitude, and required damping over frequency. Besides this, the motor characteristics (inductance, coil resistance, Back EMF voltage) and proper dimensioning/shielding have significant influence to the EMC behavior of the system and therefore also to the behavior of the required filter. Although one filter design can fit to a range of motor characteristics, adaptation to significantly different characteristics will always be necessary. This is especially the case for low-inductive motor type in high-velocity systems compared to higher inductive motors in low-velocity / high-torque systems. The same is valid for the sensors measuring position and velocity of the mechanical system. These sensors follow the operational and accuracy demands of mechanical systems and typically differ from equipment to equipment. During the development work it became obvious that one single electrical circuit dedicated and
optimized to one specific motor characteristics can never serve completely different motor topology and characteristics.
Sensor acquisition electrical circuits within the universal MCE need the flexitility to adapt to sensor characteristics, sensor type and their required range, resolution and accuracy pending on mechanism topology.
In order to maintain the universal MCE approach despite this adaptation need, it has been decided that specific Actuator Boards, carrying the motor amplifier(s) together with the sensor acquisition cirucits, will be mandatory for a universal architecture. Therefore, the interface between Core Frame and Actuator Frame has been designed as an open architecture to ensure compatibility to any motor and sensor type. Such different Actuator Frames are now characterized by the motor type / electrical parameters and by the type of sensors used in the mechanism. Once an Actuator Board has been developed and qualified for such a combination, re-use of this Actuator Frame design for other mechanisms with the same or a similar configuration is guarateed due to the control loops being held under software control. Presently, Actuator Frames are in design and commissioning for
A. 2-phase Stepper Motor application (range 10-50 Ω / 10-100 mH) with Hall Sensor / Switch / Potentiometer sensors
B. 3-phase Brushless-DC Motor application (range 5-15 Ω / 15-50 mH) with digital serial optical encoder
Further mechanism characteristics can be adapted by development of the respective Actuator Frames, the open architecture allows quick response time for any type of mechanism / sensor system. Figure 6 shows the concept of different actuator frames with their standardized electrical and mechanical interface to the Core Module.

267
UniversalCore-Module
Collection ofActuator-ModulesSelect
Motor-/Sensor-Type
Figure 6: Different Actuator Frames can be connected to the universal Core Module
Application Summary and Conclusion The concept for the Universal Mechanism Control Electronics and its development has been performed at Airbus Defence and Space GmbH supported by the German Space Agency (DLR). The combination of a Core Frame provides a universal primary power interface and sufficient processing power for most mechanism applications. Together with standardized control/data interfaces and mechanism characteristics, the goal to serve a high number of different mechanisms with one architecture has been sucessfully reached. The universal MCE provides a platform that can be configured in short term in software / parameters and by adaptation of the approriate Actuator Frame. Figure 7 shows the workflow for adaptation of the universial MCE to mechanism types and mechanism characteristics.
Development Status and First Integration Results Two models of the universal MCE have been built using the developed technology. One of these models concentrated on validation of electrical design and performance validation with BLDC and DC motors in different control loop scenarios. The second model already implements the mechanical modular architecture in the final MCE housing, the environmental analysis for thermal, structural and radiation have been performed on this model. Control Loops for BLDC and DC motors in complex motion profiles have been tested successfully and the first demonstration of these models with different mechanism types is planned for the AMS 2020 symposium.

268
Uni
vers
al M
echa
nic
Cont
rol E
lect
roni
cs,
conf
igur
ed fo
r spe
cific
app
licat
ion
Actuator Frame
Flex
ible
SC
Pow
er-I/
F 22
V - 5
2V
Data
/Con
trol
I/F
Type
„s
tand
ard-
1"
Soft
war
e fu
nctio
ns
&
cont
rol l
oop
para
met
ers
Data
/Con
trol
I/F
Type
„s
tand
ard-
2"
Data
/Con
trol
I/F
Type
„s
peci
fic“
Step
per A
ctua
tor
Type
„st
anda
rd 1
"
Mec
hani
sm 1
Sens
or „
Hall-
Effe
ct“
Step
per A
ctua
tor
Type
„st
anda
rd 2
"
Mec
hani
sm 2
Sens
or „
Pote
ntio
met
er“
BLDC
Act
uato
r Ty
pe „
stan
dard
1"
Mec
hani
sm 3
Sens
or „
Enco
der“
Any
Actu
ator
Ty
pe „
spec
ific
1"
Spec
ific
Mec
hani
sm
Sens
or „
Any“
sele
ct
sele
ct sele
ct
stan
dard
plug
-in
Core
Fra
me
Sele
ctio
n of
I/F-
Boar
ds Sele
ctio
n of
Actu
ator
Fra
mes
sele
ct sele
ct sele
ct
sele
ct
SADM
,2-
phas
e / 3
-pha
se
SADM
BLD
C(t
rack
ing
/ low
noi
se)
MW
IIn
stru
men
t Sca
nnin
g M
echa
nism
MW
HSSc
anni
ng w
ith c
ompl
ex p
rofil
e
Line
ar A
ctua
tor S
yste
m
XAA,
Dat
a Do
wnl
ink
Poin
ting
Mec
hani
sm S
tepp
er
Spec
ific
Actu
ator
Sys
tem
Wid
e Ra
nge
of
Mec
hani
cal S
yste
ms
Sele
ctio
n of
I/F-
plug
-in a
nd A
ctua
tor F
ram
e,Ad
apta
tion
of S
oftw
are
and
Cont
rol L
oop
Para
met
ers
Figure 7: Adaptation flow of Universal MCE to mechanism targets

269
Eddy Current Effects in Spacecraft Mechanisms
Emilia Wegrzyn*, Claudia Allegranza**, Thomas Adam***, Florian Liebold*** and René Seiler***
Abstract
The mastering of electromagnetic design features in spacecraft mechanisms, including desired or undesired effects due to eddy currents, has become a promising area for a model-based design and development approach. In this frame, multiphysics type investigations have been performed on a simplified experimental test set-up and on flight representative reaction wheel assemblies. The test results have been successfully correlated with simulation output obtained from basic linearized models up to transient nonlinear representations of eddy current effects in complex geometries. The impact of critical parameters like the electrical conductivity of materials as a function of temperature has been particularly studied.
Introduction and Motivation Many actuators used in spacecraft applications are based on electromagnetic principles for their function and operation. In this overall context, eddy currents in electromagnetic devices may have a desired effect, for instance when creating a resistive torque in speed regulators (or dampers) as used for controlling the deployment of solar arrays or other spacecraft appendages. In many other cases (e.g. reaction wheel assemblies involving electric motors), eddy currents are associated with losses and/or motion resistance, which are normally undesired and to be minimized [1]. However, in comparison to other industrial sectors, space mechanisms are often used for very specialized and one-of-a-kind tasks, relying on very few hardware prototypes and limited testing in the course of their development. Therefore, the understanding & optimization of electromagnetic design features in their interaction with other physical effects has become a very important objective, which has been the main motivation for the research presented in this paper.
Theoretical Framework Eddy currents have been subject of theoretical elaborations and experiments since the 19th century when Michael Faraday and Léon Foucault were working on this topic. They may be regarded as loops of electric current induced within conductive materials by a varying external magnetic field. When considering a disk rotating in an air gap between the pole pieces of a magnet, the resulting torque grows with the angular speed of the disk, which may be approximated by Eq. 1 within a limited speed range [2]:
𝑇𝑇 = 𝜋𝜋 𝑏𝑏 𝑐𝑐2𝑎𝑎2
2∙ 1 − 𝑟𝑟2 𝑎𝑎2
(𝑟𝑟2−𝑐𝑐2) ∙ 𝜎𝜎 𝐵𝐵2 𝜔𝜔 (Eq. 1)
T … resistive torque due to eddy currents [Nm] ω … angular speed of the disk [rad/s] σ … electrical (bulk) conductivity of the disk material [S/m] B … magnetic flux density (average) in the air gap [T] a, b, c, r … geometric parameters [m]
In fact, the resistive torque has been shown to grow linearly (according to Eq. 1) at low speeds only, levelling before reaching a maximum at medium speeds and finally decreasing at higher speeds [2].
* Surrey Space Centre, Guildford, United Kingdom ** ATG Europe, Noordwijk, The Netherlands *** European Space Agency (ESA/ESTEC), Noordwijk, The Netherlands
Proceedings of the 45th Aerospace Mechanisms Symposium, NASA Johnson Space Center, 2020

270
When eddy currents flow in a spinning metallic disk, they generate their own magnetic field that counteracts the external (source) magnetic field. At sufficiently high speeds, the resulting total magnetic field significantly reduces, and, hence, the eddy current related torque stays well below the linear growth observed at low speeds [3]. Furthermore, a basic model according to Eq. 1 may assume the disk material to feature a constant electrical conductivity. However, as the temperature rises due to Joule heating, the disk’s electrical conductivity decreases (in an approximately linear fashion, acknowledging the temperature coefficient of resistance). For many metals, this coefficient exceeds 0.004/K, and therefore even small temperature changes considerably reduce the electrical conductivity. Joule heating reduces the eddy currents in the spinning disk (by Ohm’s law). The consequences are manifold: Lower eddy currents decrease the resulting Lorentz forces and thus the resistive torque. However, they also generate a lower counteracting magnetic field that causes the total magnetic field to be higher again. Hence, assuming constant speed, the spinning disk system will reach a steady-state equilibrium governed by Maxwell’s equations together with the relevant thermodynamic and mechanical effects and boundary conditions. In the following paragraphs, the analytical and experimental study with focus on the evolution of the resistive torque vs. speed is outlined.
Modelling and Simulation of a Simplified Case In the frame of the study, modelling and simulation has been performed using the software tools ANSYS Maxwell® and COMSOL Multiphysics®, with controlled modification of the parameters under investigation. The model geometry has matched the relevant parts of the eddy current test bench described in the following paragraph. The size of the air gap has been parameterized for easy adjustment of the geometry. Furthermore, the disk thickness has been varied. Figure 1 shows the meshed geometry in ANSYS Maxwell® including the materials used.
Figure 1 – Model configuration & mesh in ANSYS Maxwell® Many transient (time-domain) simulation runs have been carried out to study the sensitivity to parameter changes (in particular, disk thickness, disk material & air gap dimension), across the full speed range (0…4000 rpm). The following model parameters have been used for the simulation runs:
Air gap (i.e. distance between the permanent magnets): 20…80 mm (in 10 mm steps) Materials of the sample disks: aluminum, copper & stainless steel Thickness of the sample disks: 2 & 3 mm
Permanent Magnets (NdFe35)
Vacuum Variable Air Gap
Magnet Assembly (iron)
Spinning Disk (aluminum, copper,
stainless steel)

271
Serving as an example, Figure 2 shows the simulation results in terms of resistive torque vs. disk speed. It represents a case with a 2-mm copper disk in a 40-mm air gap. As already indicated above, a linear trend is observed in the low speed range (here: below approx. 1000 rpm). At higher speeds and up to 3000 rpm, the torque increases with a lower gradient. After passing a maximum, the torque starts decreasing in the upper speed range. As suggested by theory, at high speeds the induced eddy currents give rise to a secondary magnetic field that opposes the primary one. Whilst at low speeds this effect remains small, the counteracting magnetic field becomes significant and eventually leads to a drop of the resistive torque. In order to confirm this effect, among others, a dedicated test bench was created.
Figure 2 – Resistive torque vs. speed (simulation results for 2-mm copper disk, 40-mm air gap)
Eddy Current Test Bench The experimental objectives of the Eddy Current Test Bench (ECTB) have been to measure the resistive torque and Joule heating (due to eddy current dissipation) as a function of the speed of the rotating disk (driven by a brushless DC motor). Measured values have been correlated with results obtained from two independent models of the test setup (in Maxwell and COMSOL), as well as a simplified analytical model. The ECTB has been designed such that the parameters of Equation 1 are easily tweaked (e.g., air gap size, disk thickness and disk material). When the influence of disk thickness was to be measured, individual disks of identical material and geometry (apart from thickness) have been compared. When the influence of disk material was to be measured, disks of identical geometry have been compared. A simplified geometry has facilitated the experiments as it has minimized the effect of unknown and unpredictable factors that would otherwise have influenced the test bench results. The ECTB has been designed to provide a constant magnetic field using a variable air gap magnet. The main components of the ECTB (as shown in Figure 3) are:
Rotating disk (of different materials and thicknesses) Motor drive assembly (brushless DC motor with casing, drive electronics and torque transducer) Variable air gap magnet assembly Translation stages (for the variable air gap magnet assembly), including baseplate
-0.18-0.16-0.14-0.12
-0.1-0.08-0.06-0.04-0.02
00 1000 2000 3000 4000
Torq
ue [N
m]
Speed [rpm]

272
Figure 3 - ECTB experimental test setup
One of the key results of the investigation has been the measurement of the eddy current related torque (see Figure 4) over a speed range sufficiently wide to observe the predicted torque drop at high speeds. The orange curve represents directly measured resistive torque due to eddy currents (by subtracting the measured non-magnetic loss torque from the total measured torque). The curves obtained through the Maxwell and COMSOL models are shown in green and blue, respectively. As explained below, different conductivity values have also been introduced into the models.
Figure 4 - Correlated results of eddy current related torque (2-mm copper disk, 40-mm air gap) From a multiphysics point of view, the mechanical, electromagnetic as well as thermodynamic effects are strongly intertwined in the case studied. Joule heating (eddy currents dissipating in the disk) has been shown to directly depend on the torque. Figure 5 (left side) presents data for a configuration of the ECTB for which the air gap has been minimized to 35 mm (reaching motor limits), in order to maximize the measured torque and Joule heating.
0.00
0.02
0.04
0.06
0.08
0.10
0.12
0.14
0.16
0.18
0 1000 2000 3000 4000 5000
Torq
ue [N
m]
Speed [rpm]
EC measurement
Maxwell - 100% sigma
Maxwell - 86% sigma
COMSOL - 100% sigma
COMSOL - 86% sigma
Linear model
Maximum Torque
Low speed region (approx. linear)
Medium speed region (nonlinear rise to maximum torque)
High speed region (torque reduction)
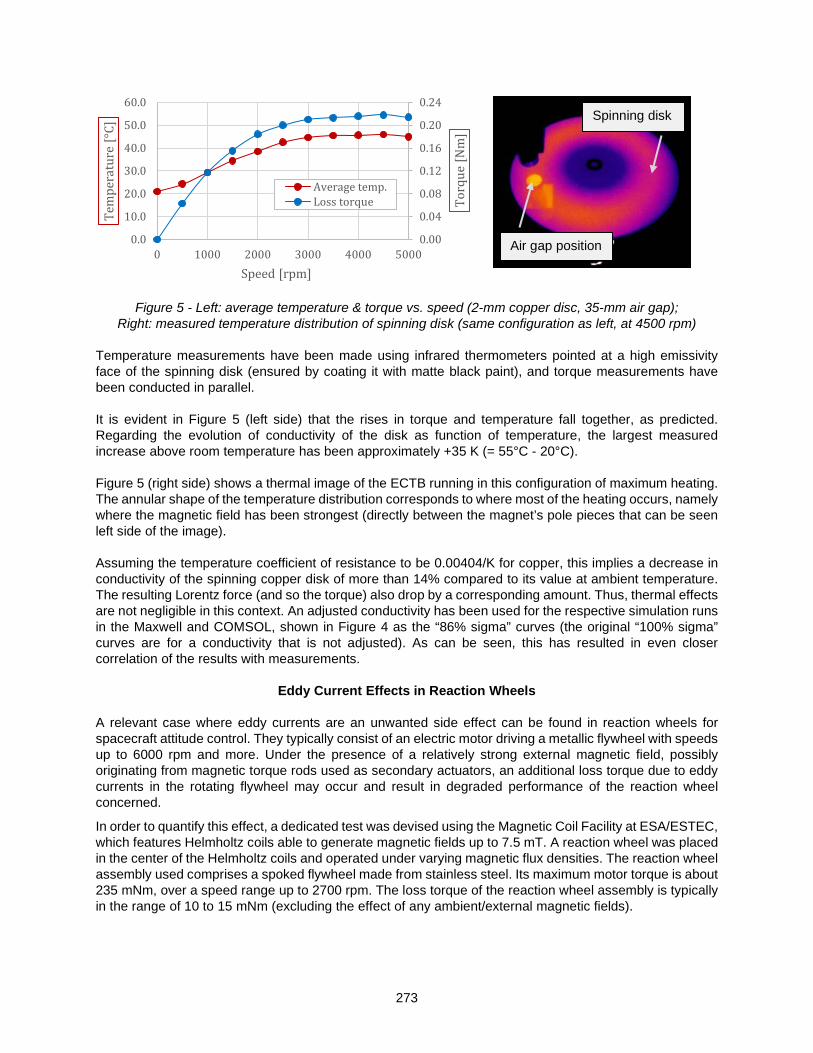
273
Figure 5 - Left: average temperature & torque vs. speed (2-mm copper disc, 35-mm air gap); Right: measured temperature distribution of spinning disk (same configuration as left, at 4500 rpm)
Temperature measurements have been made using infrared thermometers pointed at a high emissivity face of the spinning disk (ensured by coating it with matte black paint), and torque measurements have been conducted in parallel. It is evident in Figure 5 (left side) that the rises in torque and temperature fall together, as predicted. Regarding the evolution of conductivity of the disk as function of temperature, the largest measured increase above room temperature has been approximately +35 K (= 55°C - 20°C). Figure 5 (right side) shows a thermal image of the ECTB running in this configuration of maximum heating. The annular shape of the temperature distribution corresponds to where most of the heating occurs, namely where the magnetic field has been strongest (directly between the magnet’s pole pieces that can be seen left side of the image). Assuming the temperature coefficient of resistance to be 0.00404/K for copper, this implies a decrease in conductivity of the spinning copper disk of more than 14% compared to its value at ambient temperature. The resulting Lorentz force (and so the torque) also drop by a corresponding amount. Thus, thermal effects are not negligible in this context. An adjusted conductivity has been used for the respective simulation runs in the Maxwell and COMSOL, shown in Figure 4 as the “86% sigma” curves (the original “100% sigma” curves are for a conductivity that is not adjusted). As can be seen, this has resulted in even closer correlation of the results with measurements.
Eddy Current Effects in Reaction Wheels A relevant case where eddy currents are an unwanted side effect can be found in reaction wheels for spacecraft attitude control. They typically consist of an electric motor driving a metallic flywheel with speeds up to 6000 rpm and more. Under the presence of a relatively strong external magnetic field, possibly originating from magnetic torque rods used as secondary actuators, an additional loss torque due to eddy currents in the rotating flywheel may occur and result in degraded performance of the reaction wheel concerned.
In order to quantify this effect, a dedicated test was devised using the Magnetic Coil Facility at ESA/ESTEC, which features Helmholtz coils able to generate magnetic fields up to 7.5 mT. A reaction wheel was placed in the center of the Helmholtz coils and operated under varying magnetic flux densities. The reaction wheel assembly used comprises a spoked flywheel made from stainless steel. Its maximum motor torque is about 235 mNm, over a speed range up to 2700 rpm. The loss torque of the reaction wheel assembly is typically in the range of 10 to 15 mNm (excluding the effect of any ambient/external magnetic fields).
0.00
0.04
0.08
0.12
0.16
0.20
0.24
0.0
10.0
20.0
30.0
40.0
50.0
60.0
0 1000 2000 3000 4000 5000
Torq
ue [N
m]
Tem
pera
ture
[°C]
Speed [rpm]
Average temp.Loss torque
Air gap position
Spinning disk
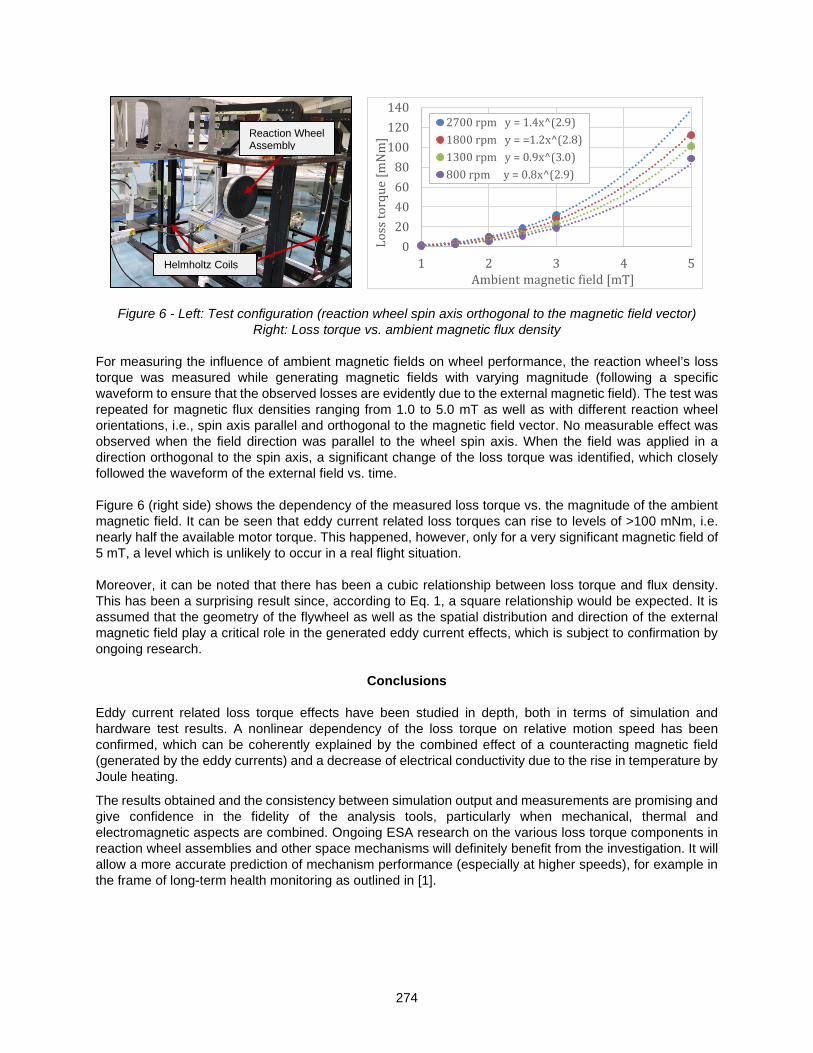
274
Figure 6 - Left: Test configuration (reaction wheel spin axis orthogonal to the magnetic field vector) Right: Loss torque vs. ambient magnetic flux density
For measuring the influence of ambient magnetic fields on wheel performance, the reaction wheel’s loss torque was measured while generating magnetic fields with varying magnitude (following a specific waveform to ensure that the observed losses are evidently due to the external magnetic field). The test was repeated for magnetic flux densities ranging from 1.0 to 5.0 mT as well as with different reaction wheel orientations, i.e., spin axis parallel and orthogonal to the magnetic field vector. No measurable effect was observed when the field direction was parallel to the wheel spin axis. When the field was applied in a direction orthogonal to the spin axis, a significant change of the loss torque was identified, which closely followed the waveform of the external field vs. time. Figure 6 (right side) shows the dependency of the measured loss torque vs. the magnitude of the ambient magnetic field. It can be seen that eddy current related loss torques can rise to levels of >100 mNm, i.e. nearly half the available motor torque. This happened, however, only for a very significant magnetic field of 5 mT, a level which is unlikely to occur in a real flight situation. Moreover, it can be noted that there has been a cubic relationship between loss torque and flux density. This has been a surprising result since, according to Eq. 1, a square relationship would be expected. It is assumed that the geometry of the flywheel as well as the spatial distribution and direction of the external magnetic field play a critical role in the generated eddy current effects, which is subject to confirmation by ongoing research.
Conclusions Eddy current related loss torque effects have been studied in depth, both in terms of simulation and hardware test results. A nonlinear dependency of the loss torque on relative motion speed has been confirmed, which can be coherently explained by the combined effect of a counteracting magnetic field (generated by the eddy currents) and a decrease of electrical conductivity due to the rise in temperature by Joule heating.
The results obtained and the consistency between simulation output and measurements are promising and give confidence in the fidelity of the analysis tools, particularly when mechanical, thermal and electromagnetic aspects are combined. Ongoing ESA research on the various loss torque components in reaction wheel assemblies and other space mechanisms will definitely benefit from the investigation. It will allow a more accurate prediction of mechanism performance (especially at higher speeds), for example in the frame of long-term health monitoring as outlined in [1].
020406080
100120140
1 2 3 4 5
Loss
torq
ue [m
Nm
]
Ambient magnetic field [mT]
2700 rpm y = 1.4x^(2.9)1800 rpm y = =1.2x^(2.8)1300 rpm y = 0.9x^(3.0)800 rpm y = 0.8x^(2.9)
Reaction Wheel Assembly
Helmholtz Coils

275
Acknowledgments The authors gratefully acknowledge the cooperation and support by many technical groups at ESA/ESTEC, in particular by the colleagues of the AOCS & Pointing Systems Section, the EMC & Harness Section, the Materials & Processes Section, the Metrology Laboratory and the Mechanical Workshop.
References
1. Bojiloff, D., Häfner, T. & Seiler, R.: “Health Monitoring for Spacecraft Reaction Wheels”, Proc. of the 17th European Space Mechanisms and Tribology Symposium, Hatfield, Sept. 2017.
2. Smythe, W. R.: "On Eddy Currents in a Rotating Disk", AIEE Electrical Engineering Transactions, Volume: 61, Issue: 9, September 1942.
3. Gay, Sebastien E.: “Contactless Magnetic Brake for Automotive Applications”, PhD Thesis, May 2005.

276

277
Recovery and Operational Best Practices for Reaction Wheel Bearings
Michael J. Dube*, Jeff Fisher**, Stuart Loewenthal+ and Peter Ward++
Abstract
Left unaddressed, the observation of sustained high torque signatures in bearing applications ultimately leads to failure. This paper describes vacuum bearing testing of 40 motors fitted with R4 angular contact bearings with 52% and 54% race curvatures, in all steel and hybrid configurations, running in different lubrication regimes. Testing was intended to identify any differences in bearing performance attributed to operation and configuration, and evaluate approaches to recovering bearings in distress with the goal of restoring bearing performance. This paper will present data and describe approaches employed, including resting and heating, that have in some cases resulted in successful bearing recovery, avoiding the onset of hard failure and restoring performance for varying periods of time. Data addressing performance differences between motors equipped with all steel R4 bearings with 52% and 54% curvatures, as well as, performance differences between all steel bearings and their hybrid counterparts will be presented.
Introduction
Over the past decade, there have been several reaction wheel assembly (RWA) in-service bearing related failures. The Kepler spacecraft, launched in March 2009, experienced failures of two of its RWAs in 2012 and 2013 [1]. The Thermosphere Ionosphere Mesosphere Energetics and Dynamics (TIMED) satellite suffered an RWA failure in 2007. The Dawn space probe experienced failures of one of its reaction wheels in 2010 and another in 2012, and when a third reaction wheel stopped working in 2017, Dawn resorted to its hydrazine thrusters for attitude control [2]. Similarly, the Far Ultraviolet Spectroscopic Explorer (FUSE) spacecraft experienced three bearing-related RWA failures [3]. In the commercial sector, a second generation Globalstar satellite failed to spin up one of its RWAs, despite high torque commands. This event was attributed to a stuck bearing, and shortly after regaining control with the three remaining RWAs, a second RWA exhibiting a similar torque signature failed [4]. Efforts to maintain reaction wheel performance and extended life have included attempts at bearing recovery employing techniques such as rest, increasing temperature, and reversing direction. These actions have had limited success with reliance on the remaining reaction wheels as the only recourse. This approach suffers from the potential for similar life-threatening bearing related issues. As a result, the NASA Engineering and Safety Center initiated a multi-year assessment that included an extensive bearing test program to evaluate the failure modes and effectiveness of potential on-orbit recovery techniques for R4 bearings experiencing high torque arising from cage instabilities and lubricant depletion leading to failure. This investigation is one of the most comprehensive efforts of its kind with 40 test motors fitted with R4 angular contact duplex bearings in all stainless steel and hybrid (ceramic balls) configurations, tested in hard vacuum at 3 different test speeds and 2 different temperatures. Motors incorporating R4 bearings with 52% and 54% race curvatures were included because there is anecdotal evidence that tight ball-race curvatures can lead to early failure, a claim that to the best of our understanding has never been documented. In addition, the testing performed in this investigation and its associated findings are of value to designers of bearings for scanners, gimbals, and other rotary spacecraft actuators.
* NASA Langley Research Center, Hampton, VA ** Fisher Aerospace, Sunnyvale, CA + Lockheed Martin Space (retired), Sunnyvale, CA ++ The Aerospace Corporation, El Segundo, CA
Proceedings of the 45th Aerospace Mechanisms Symposium, NASA Johnson Space Center, 2020

278
R4 Bearing Life-Testing
The initial test plan envisioned testing 40 brushless DC motors in thermal vacuum bell jar chambers that were available at NASA Marshall Space Flight Center (MSFC) [5]. The large number of motors selected was an attempt to obtain statistically relevant life-test data while discerning any effects on bearing life attributed to race curvature, speed, temperature, and mode of operation. Additionally, we were interested in evaluating the differences in performance between all steel and hybrid (ceramic balls) bearings. Motor Selection Motor selection was driven by the size of the bell jars and the chiller plates that they could accommodate. Our focus was placed upon procuring vacuum compatible test motors that could easily incorporate our ABEC-7, angular contact, R4 size, 440C bearings and accommodate the existing test rigs at NASA MSFC. Special vacuum and cleanroom processes were imposed on the motor structural parts and windings, as well as, the capability to set the same bearing preload regardless of race curvature or ball material (steel or ceramic). We approached a high-volume production motor supplier willing to accommodate our custom requirements and selected 3-phase brushless DC motors with encoders to provide accurate speed control. Shaft and housing were modified for our R4 test bearings to establish proper fits over a test temperature range from ambient to 60°C. The bearings were preloaded with a wave washer that could be adjusted for each motor to meet the target bearing preload of 2.9 ± 0.23 kg (6.5 ± 0.50 lb) using a force gauge. The 2.9-kg preload approximates the mean contact stress of approximately 8.55e8 Pa (124 ksi) of flight RWA steel bearings (Figure 1). The motors had strip heaters with thermocouples mounted on the rear portion of the housing.
Figure 1. Test motor showing component parts (strip heaters and bearings not shown).
Lubrication There was an expectation that the test motors would have extremely long lifetimes if the bearings were nominally lubricated [6]. In an attempt to minimize test time, the bearings were lubricated with a minimal amount of Nye Synthetic Oil 2001. The procedure used to effect this outcome involved immersing an oil lubricated bearing in an oil-solvent mixture followed by evaporation of the solvent until a very small meniscus was observed as determined visually under a microscope (Figure 2). This procedure was referred to as 7% lubricant slosh. The final bearing weights were measured and the variation found to be acceptable and typical of bearing to bearing variation in the field. One exception to performing this procedure was motor 40 which received a 3% lubricant slosh where a meniscus was not observed. This exception was to

279
reproduce the lubrication condition present in a prototype test that was run previously in an all steel configuration.
Figure 2. Oil meniscus present in R4 Bearing after 7% lubricant slosh (Nye Synthetic Oil 2001/heptane).
Figure 3. Test motors mounted on chiller plate and installed in bell jar.
Phase I Testing The motors were divided into three sets, mounted on chiller plates, and each set placed in a vacuum bell jar (Figure 3). Two bell jars labeled Bell Jars #1 and #2 contained 16 motors each and had all steel bearings, while a third bell jar labeled Bell Jar #3 contained 8 motors and had hybrid bearings. Each bell jar contained motors possessing both 52% and 54% bearing curvatures. Phase I testing consisted of all motors running

280
at 60°C and 314 rad/s (3000 rpm). These conditions were selected to accelerate the test and introduce a large number of bearing revolutions and associated stress cycles on the lubricant by operating in the boundary lubrication regime. Current from the DC test motors was converted to bearing torque to track and trend the health of the bearings. The baseline torque was comprised of bearing plus motor torque, and was recorded at the beginning of the life test and monitored throughout the testing with any observed increases in torque attributed to bearing drag since the motor torque was constant over time. Phase II Testing Phase II testing was initiated shortly after the failure of motor 22 (52% curvature) which took place at 436 million revolutions (Figure 4). The temperature control for Bell Jars #1 and #2 was first lowered to a plate temperature of 45°C, temporarily, to avoid any potential damage due to dropping the temperature too quickly, then adjusted to 25°C resulting in motor temperatures ranging from 26-28°C. The final plate temperature of 25°C was selected to operate the motors at a temperature more typical of RWAs in flight. At this point, the motors with all steel bearings were categorized into two groups based on curvature and the operating mode of each group subcategorized and adjusted as follows: 1.) 105 rad/s (1000 rpm) no zero crossings, 2.) 105 rad/s (1000 rpm) with zero crossings, 3.) 52.4 rad/s (500 rpm) no zero crossings, 4.) 52.4 rad/s (500) rpm with zero crossings. The motors with hybrid bearings were allowed to continue running at 314 rad/s (3000 rpm) and 60°C until they achieved ~5.3 billion revolutions where the temperature and speed on the hybrid motors was adjusted to 27-29°C and 105 rad/s (1000 rpm), respectively, with pairs running with and without zero crossings. A summary of the testing configuration is shown in Figure 5. The speed was reduced periodically to 31.4 rad/s (300 rpm) on all motors then ramped up to set speed in order to estimate the coulombic and viscous components of friction comprising the total torque. The viscous component was extrapolated to 314 rad/s (3000 rpm) for the motors running at 105 rad/s (1000) and 52.4 rad/s (500 rpm). This measurement was useful in tracking the state of lubrication in the bearings over time since the viscous component of friction would slowly decrease while the coulombic friction would increase, providing an indication that the lubricant was being depleted. Microphones were added to detect any noise associated with cage instabilities. In some cases, as the bearings reached end of life, the total torque would suddenly step-up (Figure 6) with the bell jar microphones recording an increase in the background noise. One example where the background sound amplitude increased 12 to 20 dB in the 1400 to 2400 Hz range, a signature indicative of a bearing experiencing dry cage instability, is shown in Figure 7.
Figure 4. Motor 22 torque signature at point of failure in phase I testing (436 million revolutions).
Results
The testing described in this paper has been running for over 4 years. There have been four 440C and two hybrid bearing failures and one motor with 440 C bearings fully recovered. Hybrid motor 40 testing was suspended when its torque versus speed curve showed no viscous response. All of the steel bearing failures, occurred at less than 1.4 billion revolutions, whereas the hybrid bearing failures in motors 33 and 36 occurred at greater than 5.3 billion revolutions, a significant finding in this work. It is important to note
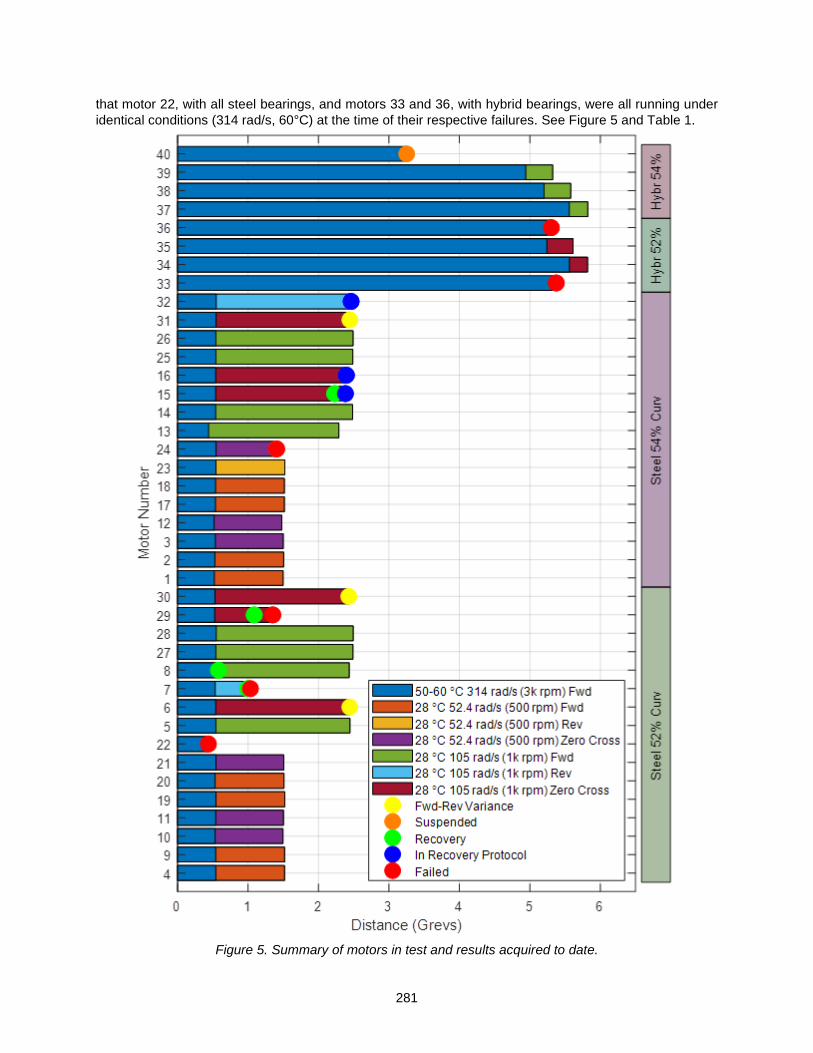
281
that motor 22, with all steel bearings, and motors 33 and 36, with hybrid bearings, were all running under identical conditions (314 rad/s, 60°C) at the time of their respective failures. See Figure 5 and Table 1.
Figure 5. Summary of motors in test and results acquired to date.
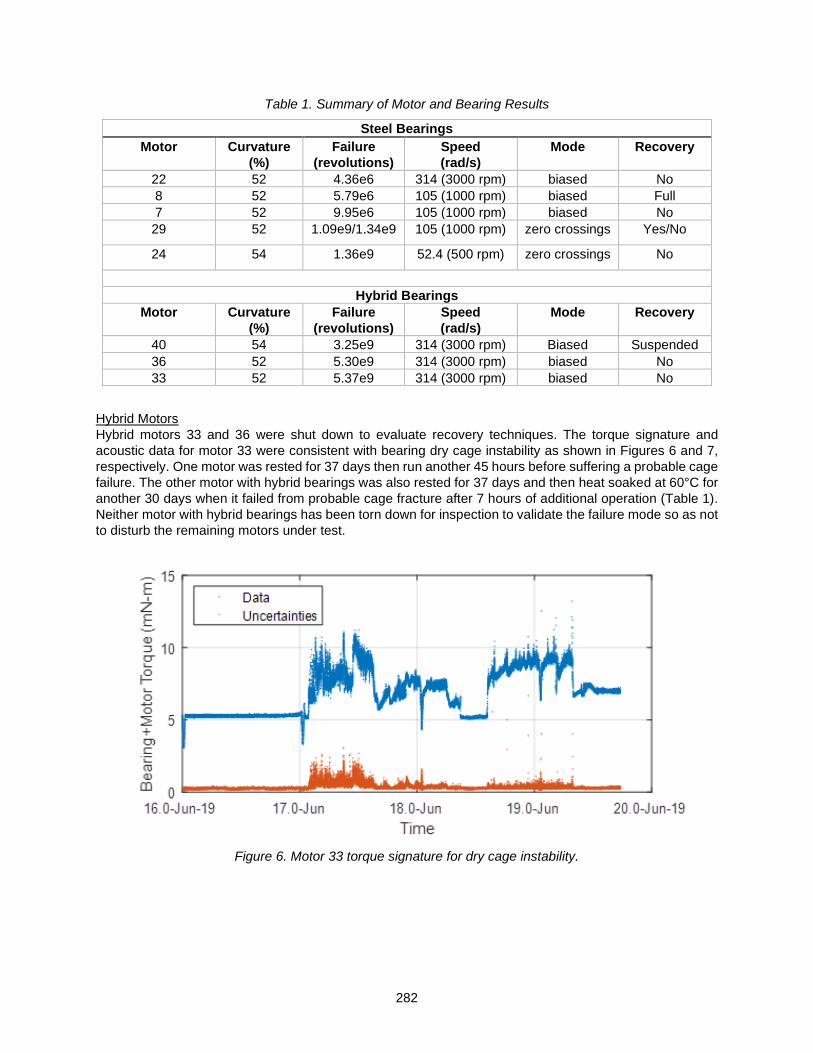
282
Table 1. Summary of Motor and Bearing Results
Steel Bearings Motor Curvature
(%) Failure
(revolutions) Speed (rad/s)
Mode Recovery
22 52 4.36e6 314 (3000 rpm) biased No 8 52 5.79e6 105 (1000 rpm) biased Full 7 52 9.95e6 105 (1000 rpm) biased No 29 52 1.09e9/1.34e9 105 (1000 rpm) zero crossings Yes/No
24 54 1.36e9 52.4 (500 rpm) zero crossings No
Hybrid Bearings
Motor Curvature (%)
Failure (revolutions)
Speed (rad/s)
Mode Recovery
40 54 3.25e9 314 (3000 rpm) Biased Suspended 36 52 5.30e9 314 (3000 rpm) biased No 33 52 5.37e9 314 (3000 rpm) biased No
Hybrid Motors Hybrid motors 33 and 36 were shut down to evaluate recovery techniques. The torque signature and acoustic data for motor 33 were consistent with bearing dry cage instability as shown in Figures 6 and 7, respectively. One motor was rested for 37 days then run another 45 hours before suffering a probable cage failure. The other motor with hybrid bearings was also rested for 37 days and then heat soaked at 60°C for another 30 days when it failed from probable cage fracture after 7 hours of additional operation (Table 1). Neither motor with hybrid bearings has been torn down for inspection to validate the failure mode so as not to disturb the remaining motors under test.
Figure 6. Motor 33 torque signature for dry cage instability.
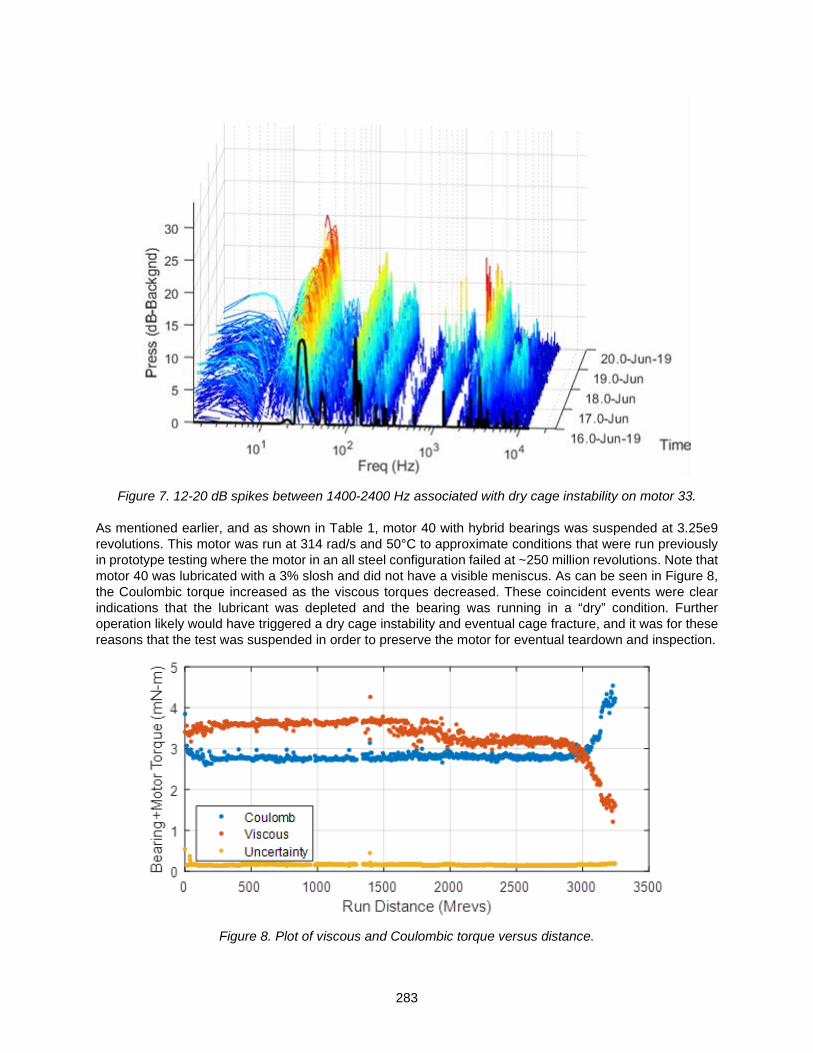
283
Figure 7. 12-20 dB spikes between 1400-2400 Hz associated with dry cage instability on motor 33.
As mentioned earlier, and as shown in Table 1, motor 40 with hybrid bearings was suspended at 3.25e9 revolutions. This motor was run at 314 rad/s and 50°C to approximate conditions that were run previously in prototype testing where the motor in an all steel configuration failed at ~250 million revolutions. Note that motor 40 was lubricated with a 3% slosh and did not have a visible meniscus. As can be seen in Figure 8, the Coulombic torque increased as the viscous torques decreased. These coincident events were clear indications that the lubricant was depleted and the bearing was running in a “dry” condition. Further operation likely would have triggered a dry cage instability and eventual cage fracture, and it was for these reasons that the test was suspended in order to preserve the motor for eventual teardown and inspection.
Figure 8. Plot of viscous and Coulombic torque versus distance.

284
Steel Motors The same recovery techniques were applied to motors 7 and 29 with all steel bearing configuration and which failed at approximately 1 billion revolutions. They were rested 37 days at ambient and then heat soaked. Motor 7 reversed direction 5 times and was rested for a total of 227 days with no signs of improvement. Motor 29 was rested for 37 days then heat soaked unpowered at 60°C for an additional 30 days with the motor recovering for approximately 260,000 revs before failing again. Remarkably, motor 8 with all steel bearings showed high torques at 579 M revs and was rested at ambient for 37 days. It then recovered fully, and is currently healthy at 2.2 B revs while performing zero speed crossings (Figure 9).
Figure 9. Typical day before failure (blue), failure event (orange), restart (gold) and recovery (purple).
Motors in Recovery Protocol Motor 15 exhibited anomalous torque spikes at 2.23 billion revolutions, was rested for 42 days, and recovered for 30 days upon which time torque spikes were observed again and the motor rested and subjected to a heat soak. Motor 16 also exhibited torque spikes at 2.28 billion revolutions at which time it was shut down and rested. Motors 15 and 16 were not considered failures as recovery was attempted. In contrast, motor 32 exhibited behavior consistent with dry cage instability and was shut down and subjected to a 37-day rest period. Motors 15, 16, and 32 all possessed 54% curvature. The results of the recovery protocol imposed on motors 15, 16, and 32 were not yet available at the time of writing this paper as shown in Figure 5.
Figure 10. Film thickness versus temperature at 314 rad/s and 105 rad/s.

285
Conclusions
The testing described in this paper will continue since only 6 of the 40 test motors have failed. Post-test inspection to confirm failure modes will also be performed. At this point in the investigation, some key preliminary findings have emerged (Figure 5 and Table 1): 1) Of the four 440C and two hybrid bearing failures, five of the six failed motors had bearings with 52%
race curvature suggesting that tight curvatures, while improving load capacity, may possess shorter life. It has long been suspected that tight curvatures can lead to torque irregularities adversely affecting bearing lubricant life [7]. While our results are preliminary, this study may be the first to quantitatively confirm this point.
2) To date, only one out of the four motors that failed with all steel bearings occurred at 52.4 rad/s (500 rpm). The other three failures occurred at 105 rad/s (1000 rpm). Of the 16 motors that have been running at 105 rad/s (1000 rpm), three are currently in recovery protocol, three have failed, and one has fully recovered. There has been only one motor failure out of the 15 motors running at 52.4 rad/s (500 rpm). Although, bearings running at the 105 rad/s (1000 rpm) had roughly twice the running distance at the time of failure as their 52.4 rad/s (500 rpm) counterparts, it is interesting to point out that the failures of motors that were running at 105 rad/s (1000 rpm) occurred at total revolutions less than currently observed for the 14 motors still running at 52.4 rad/s (500 rpm). Bearings running at 52.4 rad/s (500 rpm) have less favorable lubricant film thickness and should theoretically fail sooner.
3) Hybrid bearings exhibited smoother, steadier torque signatures and achieved longer lives compared to the 440C bearings. Of particular note, motor 22 with 52% curvature and all steel configuration failed at 436 million revolutions while running under the same conditions as motors 33 and 36 with hybrid bearings which failed at 5.37 and 5.30 billion revolutions, respectively, providing a direct comparison between the performance of steel bearings and hybrid bearings of equivalent curvature.
4) All hybrid motors achieved an excess of 5 billion revolutions with only two failures, while the remaining 5 hybrid motors are still running. One motor with hybrid bearings, motor 40 (Figure 8), was suspended prior to the onset of failure in order to prevent dry cage instability and eventual cage failure. It is important to note that prior to initiating phase I motor 40 was previously run in prototype testing in an all steel configuration at 105 rad/s (1000 rpm) and 30°C where it failed ~250 million revolutions and resulted in a broken cage due to dry cage instability. While the conditions of operation differed, the 314 rad/s (3000 rpm) and 50°C conditions selected for motor 40 in phase I and phase II testing approached the same lubrication regime affording an indirect comparison of motors with steel bearings versus hybrid bearings (Figure 10).
References
1. Kampmeier, J. L., Larsen, R. J., Miglorini, L.F., Larson, K.A., “Reaction Wheel Performance Characterization Using the Kepler Spacecraft as a Case Study”, 2018 Space Operations Conference, 28 May-1 June, 2018, Marseille, France.
2. Bruno, D., “Contingency Mixed Actuator Controller Implementation for the Dawn Asteroid Rendezvous Spacecraft,” AIAA 2012-5289, AIAA SPACE 2012 Conference & Exposition, 11-13 September 2012, Pasadena, CA.
3. Sahnow, D. J. et al, “Operations with the New FUSE Observatory: Three-Axis Control with One Reaction Wheel,” SPIE Proceedings, Vol. 6266, July 2006.
4. Hacker, J. M., Goddard, J. L., and Lai, P. C., “Globalstar Second Generation Hybrid Attitude Control On Orbit Experience,” AAS 14-454, 24th AAS/AIAA Space Flight Mechanics Meeting, Santa Fe, NM, 26-30 January, 2014.
5. McMurtrey, Ernest L., Lubrication Handbook for the Space Industry. Part A: Solid Lubricants. Part B: Liquid Lubricants. NASA TM-86556, December 1985.
6. Jones, William R; Jr., Jansen, Mark J., ”Lubrication for Space Applications,” NASA CR-2005-213424, 2005.

286
7. Loewenthal, Stuart L., “Two Gimbal Bearing Case Studies,” Proceedings of the 22nd Aerospace Mechanisms Symposium, May 1988, NASA CP-2506.

287
Laboratory Studies of Spacecraft Fluid Lubricant Mobility and Film Thickness
Peter Frantz*, James Helt* and Steve Didziulis*
Abstract Spacecraft mechanisms often rely upon very small amounts of lubricant to survive in the harsh conditions of space. In critical applications, thin oil films must provide both low drag and longevity, with ball bearings in some devices lasting hundreds of billions of loaded mechanical cycles. Our lab has developed several unique test facilities to measure the physical properties of thin liquid lubricant films, and to monitor their performance in realistic bearing level tests, such as ball bearings operating up to 6000 rpm. To understand and optimize lubricant performance, our groups strategy is to correlate bearing level test data with the chemical-physical properties of the lubricant and counter-body interfaces as they evolve during operation. This talk will provide an overview of our capabilities and highlight some unique aspects of thin film rheology and additive function.
Introduction During the acquisition phase of spacecraft mechanisms, we are often asked to estimate the assets usable lifetime. Similarly, during operation we are asked to assist with extending mechanism life by critically assessing telemetry data that informs to the state of the lubricant. In both cases, mechanism life is usually determined by the life of the lubricant in the critical rolling and sliding interfaces. Once the lubricant is depleted, friction and wear lead to deteriorating performance and failure. This separates space mechanisms from many terrestrial applications, where lubricant may often be reapplied until failure occurs by other processes, such as rolling contact metal fatigue. For spacecraft mechanisms, retention of lubricant is of paramount importance. When managing these mechanisms during operations, we periodically estimate the relative quantity of oil to monitor component health. Bearing drag torque, which is typically proportional to spin motor current, can be separated into three terms: 1) a “Coulombic” term, due to sliding and interfacial slip, 2) a hysteresis term, due to losses in compression of the Hertzian contact, and 3) a viscous term, due to displacement of the lubricant in the ball path. This final term, the viscous drag torque, has been shown to scale with viscosity to the 2/3 power[1]. Viscosity decreases with increasing temperature according to a model with functional form similar to the Arrhenius Equation[2, 3]. Taken together, over small changes in temperature, we find that the dependence of viscous drag on temperature is approximately linear, with the constant of proportionality referred to as the viscous coefficient (Q). This value is used as a relative measure of the lubricant in the critical interfaces of a spinning bearing. It is usually large at beginning of life, and tends towards zero late in life. Thus, it can be used as an indicator of bearing health. When monitoring this value in a large population of similar high-speed mechanisms, we have found that (after lubricant run in) the value remains nearly constant for most of life. As the lubricant is depleted, the value gradually falls to zero. If there are two bearings in the component, we find that Q initially falls to half of its saturation value, and then later falls to near zero. A graphic representation of this process is shown in Figure 1 for a typical mechanism. For the first 14 years of operation of this hypothetical mechanism, the viscous coefficient (Q) hovered around 0.2 mA/°F. During the 7h year, the Q value fell to approximately 0.1 mA/°F, and three years later it fell to near zero. At that point, retainer chatter and instability may begin to occur. The late stage behavior is interpreted as sequential starvation of the two bearings. The first one becoming depleted of oil at 7 years, indicated by the viscous drag falling to half of its original value. The
* The Aerospace Corporation, El Segundo, CA
Proceedings of the 45th Aerospace Mechanisms Symposium, NASA Johnson Space Center, 2020

288
second bearing was depleted at 10 years, where the viscous drag fell to near zero. After the onset of depletion sporadic relubrication events occur due to increased bearing disturbances and temperature. Perhaps the most interesting observation of Figure 1, however, is the relative stability through most of life. Models of lubricant degradation and loss typically imply gradual consumption of oil, yet our observations show a stable quantity at the rolling and sliding interfaces until rapid loss late in life. This trend in Q is interpreted as being due to our imperceptibility of the total amount of lubricant in the bearing, much of which is not actively engaged in the critical interfaces. While this bulk oil is gradually consumed or lost, the oil in the interfaces is maintained at a constant level that is controlled by the combination of mechanical and surface forces acting on the oil. These forces are assumed to be constant during spacecraft operations, so the prevailing thought is that the oil volume does not change and is sustained in balance with oil reserves resting outside the active tribological interfaces. For example, this may be in the form of grease reserves that are channeled to the sides of the ball path.
Figure 1. A graphic representation of the trends in viscous coefficient that are often observed in high-
speed spinning devices. A simplified model of the geometry is shown in Figure 2. The Hertzian contact between the ball and the race creates a capillary, which draws oil into a meniscus. At some distance from the contact are reserves of oil (held in grease thickener), and this oil migrates between these two bodies by creeping in a thin film across the bearing surfaces (balls, races, retainer). In addition to the capillary forces of the two bodies, the oil will be subject to mechanical forces (such as centrifugal acceleration) and other surface forces (such as thermocapillarity due to temperature gradients from localized heating). The direction and magnitude of lubricant creep will depend on the balance of these forces.
Figure 2. Schematic of an idealized ball/race contact and its relationship with lubricant reserves
0.00
0.05
0.10
0.15
0.20
0.25
0 2 4 6 8 10 12 14
Abso
lute
Val
ue o
f Visc
ous S
lope
Operational Lifetime (Yrs)
Typical Viscous Slope Trend
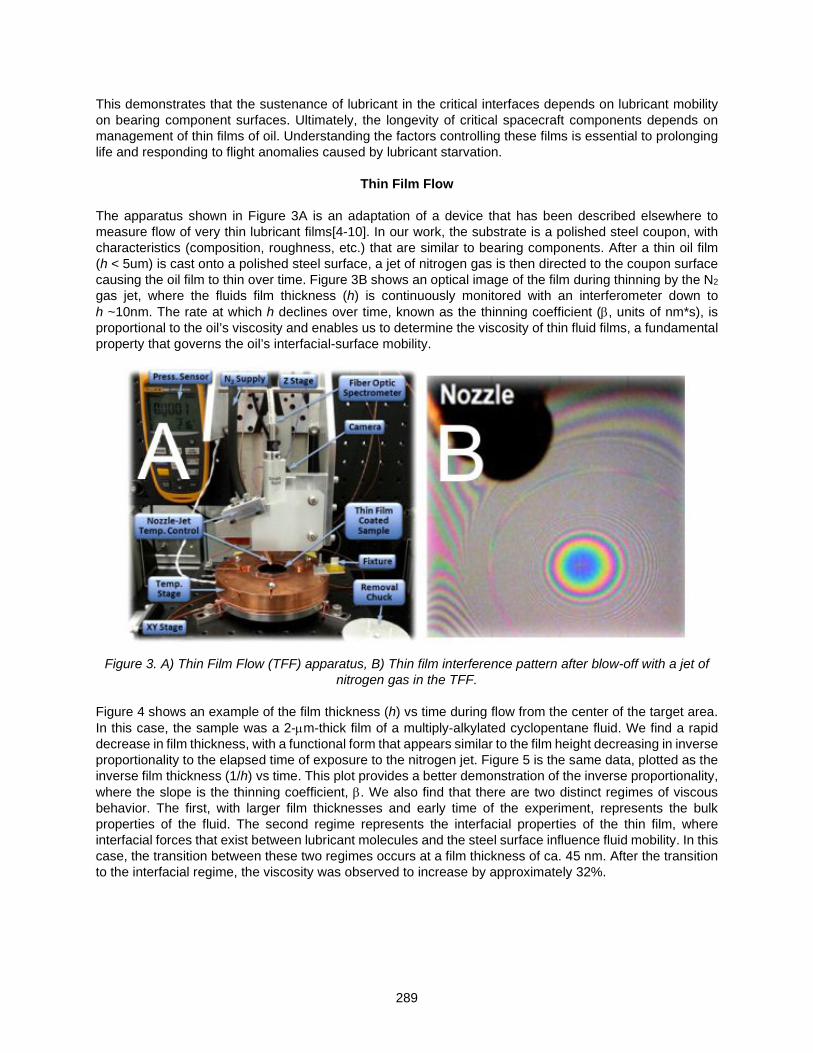
289
This demonstrates that the sustenance of lubricant in the critical interfaces depends on lubricant mobility on bearing component surfaces. Ultimately, the longevity of critical spacecraft components depends on management of thin films of oil. Understanding the factors controlling these films is essential to prolonging life and responding to flight anomalies caused by lubricant starvation.
Thin Film Flow
The apparatus shown in Figure 3A is an adaptation of a device that has been described elsewhere to measure flow of very thin lubricant films[4-10]. In our work, the substrate is a polished steel coupon, with characteristics (composition, roughness, etc.) that are similar to bearing components. After a thin oil film (h < 5um) is cast onto a polished steel surface, a jet of nitrogen gas is then directed to the coupon surface causing the oil film to thin over time. Figure 3B shows an optical image of the film during thinning by the N2 gas jet, where the fluids film thickness (h) is continuously monitored with an interferometer down to h ~10nm. The rate at which h declines over time, known as the thinning coefficient (β, units of nm*s), is proportional to the oil’s viscosity and enables us to determine the viscosity of thin fluid films, a fundamental property that governs the oil’s interfacial-surface mobility.
Figure 3. A) Thin Film Flow (TFF) apparatus, B) Thin film interference pattern after blow-off with a jet of
nitrogen gas in the TFF. Figure 4 shows an example of the film thickness (h) vs time during flow from the center of the target area. In this case, the sample was a 2-µm-thick film of a multiply-alkylated cyclopentane fluid. We find a rapid decrease in film thickness, with a functional form that appears similar to the film height decreasing in inverse proportionality to the elapsed time of exposure to the nitrogen jet. Figure 5 is the same data, plotted as the inverse film thickness (1/h) vs time. This plot provides a better demonstration of the inverse proportionality, where the slope is the thinning coefficient, β. We also find that there are two distinct regimes of viscous behavior. The first, with larger film thicknesses and early time of the experiment, represents the bulk properties of the fluid. The second regime represents the interfacial properties of the thin film, where interfacial forces that exist between lubricant molecules and the steel surface influence fluid mobility. In this case, the transition between these two regimes occurs at a film thickness of ca. 45 nm. After the transition to the interfacial regime, the viscosity was observed to increase by approximately 32%.

290
Figure 4. Plot of film oil film thickness vs time during blow-off using the TFF
Figure 5. Plot of the data shown in Figure 4, using reciprocal of film thickness on the y-axis to show the
inverse proportionality with time These changes in viscosity and flow rate are important, because the process of resupply to the tribological contacts may be slowed as lubricant consumption proceeds and the scarcity of free oil leads to reduced oil film thicknesses.
Tribometry and Viscosity of Worn Lubricant Films Another significant reduction in oil mobility during operational use may be caused by changes in oil composition. As the lubricant is worn in a tribological contact due to mechanical stresses and chemical reactions, some molecules are broken into smaller components while others are polymerized into larger

291
molecular weight varieties. The lower molecular weight products may evaporate more readily, and the larger products tend to accumulate in the vicinity of the contacts. This occurs with potential increases in the effective viscosity, and may affect both resupply of the contact and elasto-hydrodynamic film thickness. To study the effects of lubricant degradation and changing composition on surface flow in the contact region, we have mechanically worn the lubricant using a ball on disk tribometer in a vacuum chamber. This in-house developed instrument, shown in Figure 6, uses steel coupons similar to those shown above [7, 9, 11]. A multiply-alkylated cyclopentane oil with phosphate additives was used at 24°C and background pressure of 5 x 10⁻⁶ torr. With a load of 2.6 N, the contact stress was approximately 580 MPa and the diameter of the Hertzian contact area was 0.6 mm. The rotational speed was 90 rpm (boundary conditions). However, in some cases, a lateral oscillation was applied to lift the contact into EHD conditions.
Figure 6. High vacuum ball-on-disk tribometer
After running under vacuum for 30 hr, samples were transferred to the TFF apparatus for measurements of viscosity. Three separate tests are shown in the top of Figure 7. The first two (Un88 and Un89) were performed at low speed, and Un 90 at high speed. In each case the contact path is visible as a distinct line in the oil film, caused by a defect in the otherwise gradual topography of the film thickness due to pinning and scalloping. After blowing with nitrogen gas for over 1 hour, the displaced oil film patterns are shown in the bottom of Figure 7. In the two low speed examples, we find distinct regions of impeded oil flow that range from 3.1 to 5.2 mm across. These tracks are much larger than the diameter of the Hertzian contact, so they are not caused by changes in the substrate surface roughness. Instead they are related to the size of the ball/flat meniscus, where products of the lubricant degradation have been carried from the Hertzian contact and deposited in the region of oil reflow. In the high-speed case (Un90), bands of impeded oil flow are not easily detected and is likely because the EHD contact was not sufficiently stressful on the lubricant to create substantial wear and lubricant degradation polymerization products.

292
Figure 7. TFF measurements of oil mobility after wear in the high vacuum tribometer
During the thinning experiments shown in Figure 7, the film thickness was monitored interferometrically and plotted in Figure 8. Here, we compare the unworn base oil (green diamonds) with the low speed (red triangles and blue circles) and high speed (purple squares) test results. The results after the high-speed tests are within the experimental uncertainty of the unworn base oil tests. There are no detectable effects of running under EHD conditions for the times and pressures that were used. However, the impeded flow after the boundary tests are clearly seen in the lower slope (higher viscosity). Another distinguishing feature is that the slope continued to decrease as the film thickness reduced further in the later portions of the test. This implies that viscosity continued to increase with reduced thickness. Another observation is that the onset of interfacial flow increased from 100 nm with the unworn film to over 180 nm after low-speed testing and is due to the presence of much larger molecular weight species formed during degradation-polymerization. Figure 9 provides a helpful visualization of the distribution of worn lubricant products in the vicinity of the contact. The image on the left shows the contact spot on the ball after testing, and the image on the right shows the sliding contact band on the coupon disk. The Hertzian contact spot, the zone of intimate contact between the ball and flat is at the center of the ring on the left-hand image. The “butterfly wing” lobes are caused by residue in the path of oil flow due to compression of the oil film on the surfaces and distortion of the oil meniscus caused by the dynamics of the sliding contact. The inlet zone of the contact is to the right, and the outlet is on the left. The reflow of oil in this pattern with each ball pass on the disk causes wear products to be swept from the Hertzian contact zone and deposited throughout the area covered by the base of the meniscus on the flat and the cap of the meniscus on the ball (details below). This results in adlayers of polymerized lubricant in the areas where oil flow is necessary for resupply of oil to the contact. Deposits of polymeric residue may impede flow of oil to the contact, reducing the volume of oil in the inlet zone, resulting in reduced EHD film thickness.

293
Figure 8. Results from measurements of oil mobility after wear in the high vacuum tribometer
Figure 9. Optical micrographs of the ball and coupon surfaces after wear in the tribometer, showing
patterns of lubricant wear product deposition
Film Stability and Wetting Tests
Resupply of oil to the active tribological contacts also depends on the stability and wettability of the fluid on the substrate. These, too, can depend on composition and film thickness. Thin film stability tests have been done to quantitatively evaluate wetting versus dewetting behavior by monitoring static evolution of a thin fluid film (h ~3 µm) deposited on a surface (e.g. 440C, 52100, SiOx). This is highly instructive for multi-component systems, such as formulated Pennzane oils, where additives can have an interfacial preference and modify the interfacial landscape (γsl, the surface tension at the solid/liquid interface). Each wetting test was conducted on two oxygen plasma cleaned 440C steel coupons[10]. Each test fluid was drop cast onto a coupon at room temperature. The fluids were cast from 100 µl of heptane solution that was diluted to 2.5% by volume. The drop cast technique preserves the test fluid stoichiometry and enhances diffusion for a uniform film that is close to its thermodynamically equilibrium state. Once applied,

294
the coupon is covered with a petri dish to allow time for stabilization. After 15 minutes, the dish is removed to allow the solvent to evaporate. Two photos are then acquired every 15 minutes with the coupon at room temperature. The coupon is then placed on a hot plate at 40°C for 15 minutes and then photographed again. Figure 10 shows time dependent results for three different lubricant component samples. The top row shows thin film stability of a phosphate additive commonly used in aerospace mechanisms. After 15 minutes, there are numerous localized regions of dewetting across the surface. This fluid does not maintain a stable fluid on clean 440C steel. The second row shows the time sequence of a thin film of unformulated MAC oil. Dewetting is initiated at the edges of the coupon at room temperature, and the film rapidly retracts at 40°C. A thin film of MAC oil, formulated with the phosphate additive, is shown in the third row. Here, we find that the film is stable at all temperatures that were tested. It is evident that the additives are essential to maintain a stable film of oil in the laboratory environment.
Figure 10. Photographs of steel coupons during oil wettability tests
Oil Meniscus Evolution To help prolong the life of moving mechanisms, the lessons learned regarding mobility of lubricants must be ultimately applied to models of the supply rate of oil to the ball/race interface. The ultimate objective is to devise and test strategies for sustaining oil and promoting oil resupply at the critical ball/race interfaces. These efforts are guided by a theoretical model of oil uptake from the surrounding surfaces. As oil is drawn into the meniscus via surface tension and capillary forces, it fills the volume defined by a cylindrically symmetric annulus, with measurable base (b), waist, and cap (a) radii. A time interval optical microscopic imaging system was constructed to record images of a physical contact while the oil is flooding the meniscus.[8, 12] This system enables dynamic volume measurements over long periods of time. A screenshot of the meniscus analysis system is shown in Figure 11. Here, the meniscus profile, meniscus
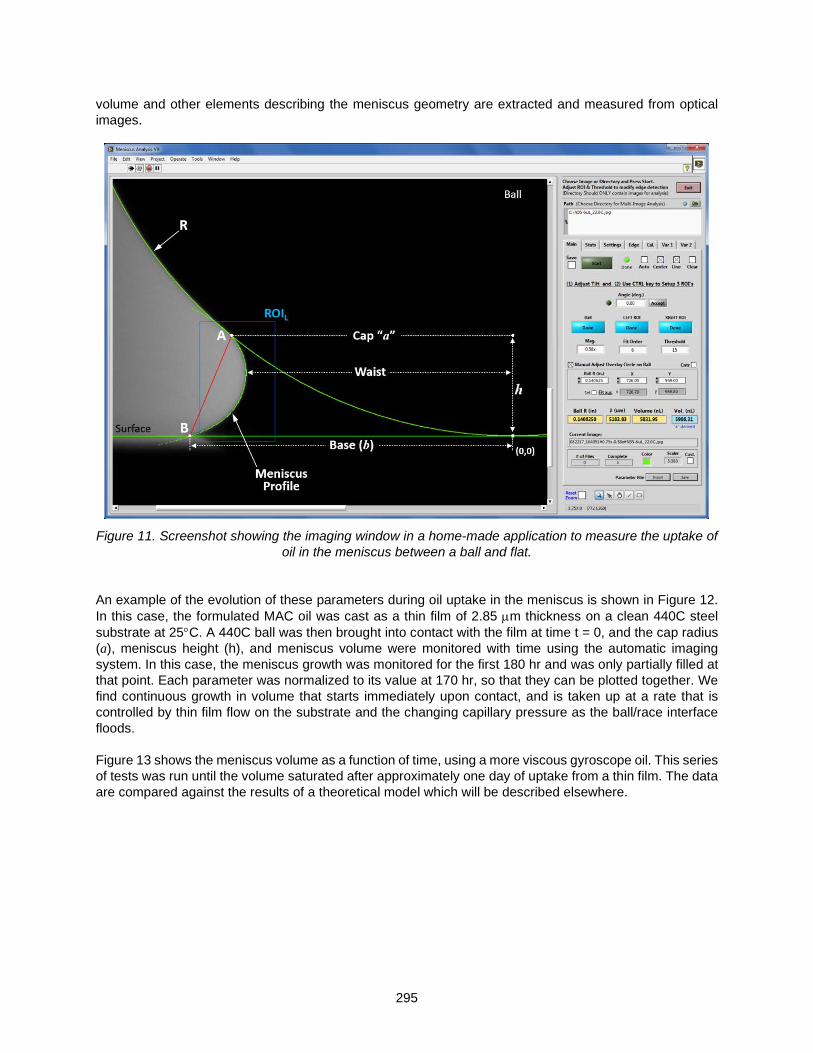
295
volume and other elements describing the meniscus geometry are extracted and measured from optical images.
Figure 11. Screenshot showing the imaging window in a home-made application to measure the uptake of
oil in the meniscus between a ball and flat. An example of the evolution of these parameters during oil uptake in the meniscus is shown in Figure 12. In this case, the formulated MAC oil was cast as a thin film of 2.85 µm thickness on a clean 440C steel substrate at 25°C. A 440C ball was then brought into contact with the film at time t = 0, and the cap radius (a), meniscus height (h), and meniscus volume were monitored with time using the automatic imaging system. In this case, the meniscus growth was monitored for the first 180 hr and was only partially filled at that point. Each parameter was normalized to its value at 170 hr, so that they can be plotted together. We find continuous growth in volume that starts immediately upon contact, and is taken up at a rate that is controlled by thin film flow on the substrate and the changing capillary pressure as the ball/race interface floods. Figure 13 shows the meniscus volume as a function of time, using a more viscous gyroscope oil. This series of tests was run until the volume saturated after approximately one day of uptake from a thin film. The data are compared against the results of a theoretical model which will be described elsewhere.

296
Figure 12. Three different geometric parameters of an MAC oil meniscus are shown as the capillary
between a ball and flat is flooded with oil from a thin film on the flat
Figure 13. Time evolution of a ball/flat oil meniscus flooded by a thin film on the flat substrate
Effects of Composition on Oil Film Thickness
Changes in oil composition and mobility can ultimately affect the thickness and starvation of a protective oil film in the rolling contacts of high-speed bearings. The results above show the effective increase in viscosity of oil in the vicinity of a tribological contact due to polymerization. These results show the effects of changes in mobility due to deposition of lubricant degradation products, and illustrates that these products remain in the active tribological contacts. This would alter the molecular weight distribution as the mechanism ages, skewing it to heavier molecules and higher effective viscosity. To study the potential effects of aging on lubricant film thickness in spacecraft mechanisms, we have conducted EHD film thickness measurements on operating angular contact bearings using lubricants of similar chemical constituents and various molecular weights.
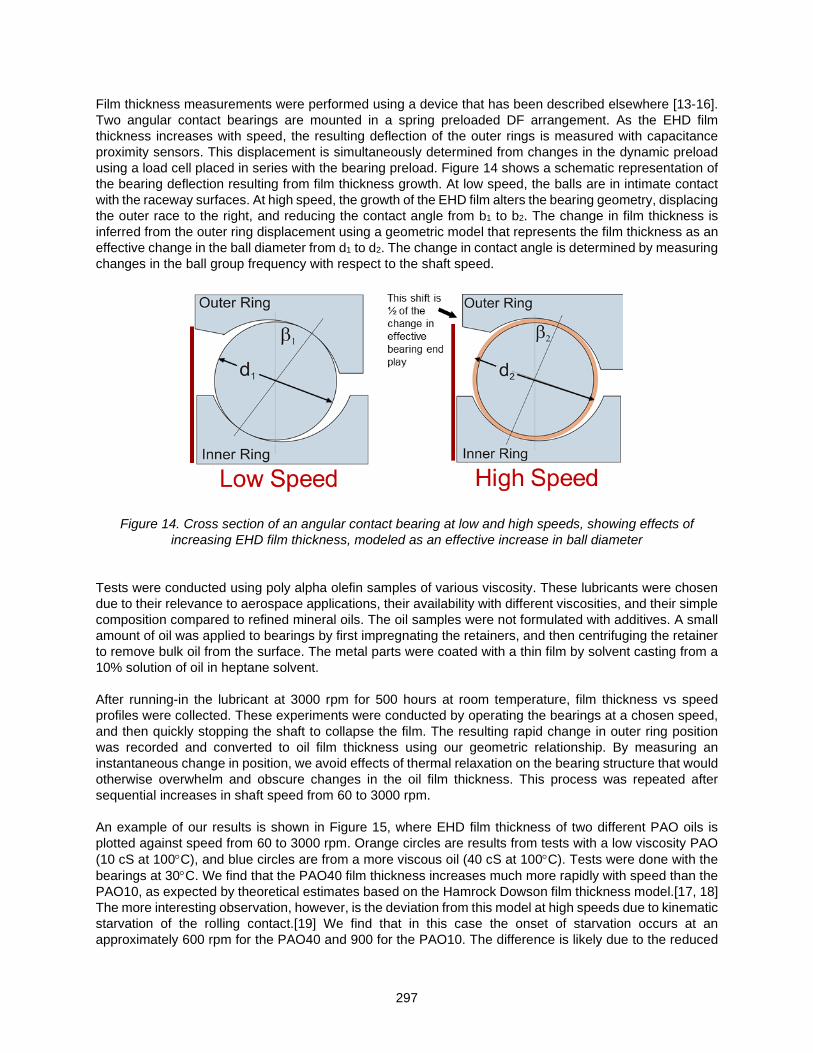
297
Film thickness measurements were performed using a device that has been described elsewhere [13-16]. Two angular contact bearings are mounted in a spring preloaded DF arrangement. As the EHD film thickness increases with speed, the resulting deflection of the outer rings is measured with capacitance proximity sensors. This displacement is simultaneously determined from changes in the dynamic preload using a load cell placed in series with the bearing preload. Figure 14 shows a schematic representation of the bearing deflection resulting from film thickness growth. At low speed, the balls are in intimate contact with the raceway surfaces. At high speed, the growth of the EHD film alters the bearing geometry, displacing the outer race to the right, and reducing the contact angle from b1 to b2. The change in film thickness is inferred from the outer ring displacement using a geometric model that represents the film thickness as an effective change in the ball diameter from d1 to d2. The change in contact angle is determined by measuring changes in the ball group frequency with respect to the shaft speed.
Figure 14. Cross section of an angular contact bearing at low and high speeds, showing effects of
increasing EHD film thickness, modeled as an effective increase in ball diameter Tests were conducted using poly alpha olefin samples of various viscosity. These lubricants were chosen due to their relevance to aerospace applications, their availability with different viscosities, and their simple composition compared to refined mineral oils. The oil samples were not formulated with additives. A small amount of oil was applied to bearings by first impregnating the retainers, and then centrifuging the retainer to remove bulk oil from the surface. The metal parts were coated with a thin film by solvent casting from a 10% solution of oil in heptane solvent. After running-in the lubricant at 3000 rpm for 500 hours at room temperature, film thickness vs speed profiles were collected. These experiments were conducted by operating the bearings at a chosen speed, and then quickly stopping the shaft to collapse the film. The resulting rapid change in outer ring position was recorded and converted to oil film thickness using our geometric relationship. By measuring an instantaneous change in position, we avoid effects of thermal relaxation on the bearing structure that would otherwise overwhelm and obscure changes in the oil film thickness. This process was repeated after sequential increases in shaft speed from 60 to 3000 rpm. An example of our results is shown in Figure 15, where EHD film thickness of two different PAO oils is plotted against speed from 60 to 3000 rpm. Orange circles are results from tests with a low viscosity PAO (10 cS at 100°C), and blue circles are from a more viscous oil (40 cS at 100°C). Tests were done with the bearings at 30°C. We find that the PAO40 film thickness increases much more rapidly with speed than the PAO10, as expected by theoretical estimates based on the Hamrock Dowson film thickness model.[17, 18] The more interesting observation, however, is the deviation from this model at high speeds due to kinematic starvation of the rolling contact.[19] We find that in this case the onset of starvation occurs at an approximately 600 rpm for the PAO40 and 900 for the PAO10. The difference is likely due to the reduced
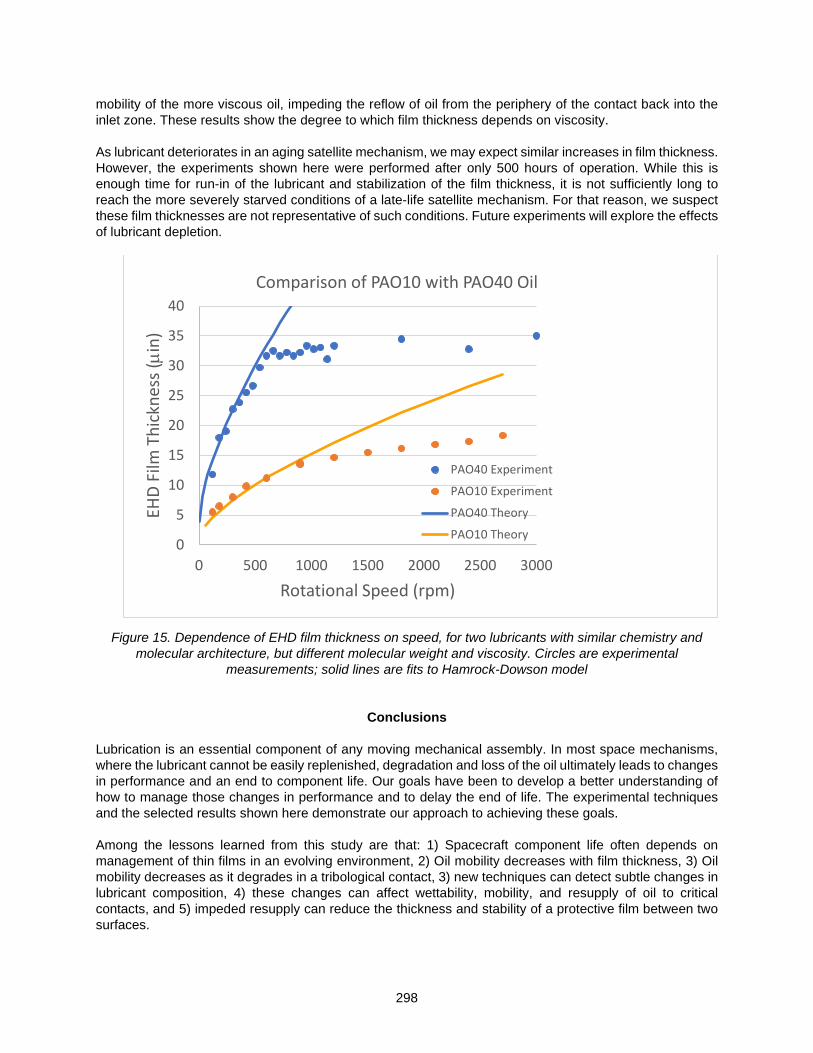
298
mobility of the more viscous oil, impeding the reflow of oil from the periphery of the contact back into the inlet zone. These results show the degree to which film thickness depends on viscosity. As lubricant deteriorates in an aging satellite mechanism, we may expect similar increases in film thickness. However, the experiments shown here were performed after only 500 hours of operation. While this is enough time for run-in of the lubricant and stabilization of the film thickness, it is not sufficiently long to reach the more severely starved conditions of a late-life satellite mechanism. For that reason, we suspect these film thicknesses are not representative of such conditions. Future experiments will explore the effects of lubricant depletion.
Figure 15. Dependence of EHD film thickness on speed, for two lubricants with similar chemistry and molecular architecture, but different molecular weight and viscosity. Circles are experimental
measurements; solid lines are fits to Hamrock-Dowson model
Conclusions
Lubrication is an essential component of any moving mechanical assembly. In most space mechanisms, where the lubricant cannot be easily replenished, degradation and loss of the oil ultimately leads to changes in performance and an end to component life. Our goals have been to develop a better understanding of how to manage those changes in performance and to delay the end of life. The experimental techniques and the selected results shown here demonstrate our approach to achieving these goals. Among the lessons learned from this study are that: 1) Spacecraft component life often depends on management of thin films in an evolving environment, 2) Oil mobility decreases with film thickness, 3) Oil mobility decreases as it degrades in a tribological contact, 3) new techniques can detect subtle changes in lubricant composition, 4) these changes can affect wettability, mobility, and resupply of oil to critical contacts, and 5) impeded resupply can reduce the thickness and stability of a protective film between two surfaces.
0
5
10
15
20
25
30
35
40
0 500 1000 1500 2000 2500 3000
EHD
Film
Thi
ckne
ss (µ
in)
Rotational Speed (rpm)
Comparison of PAO10 with PAO40 Oil
PAO40 Experiment
PAO10 Experiment
PAO40 Theory
PAO10 Theory
299
References
1. Palmgren, A. and B. Snare, Influence of Load and Motion on the Lubrication and Wear of Rolling Elements. Inst. Of Mech. Eng., 1957. 79: p. 454-458.
2. Helt, J.M., Density, Dynamic and Kinematic Viscosity of Bearing Lubricating Oils and Additives. 2019, The Aerospace Corporation: El Segundo, CA.
3. Messaâdi, A., et al., A New Equation Relating the Viscosity Arrhenius Temperature and the Activation Energy for Some Newtonian Classical Solvents. Journal of Chemistry, 2015. 2015(3): p. 12 pages.
4. Deryagin, B.V. and V.V. Karasev, The Study of the Boundary Viscosity of Organic Liquids by the Blow-off Method. Russian Chemical Reviews, 1988. 57(7): p. 634-647.
5. Scarpulla, M.A., C.M. Mate, and M.D. Carter, Air shear driven flow of thin perfluoropolyether polymer films. The Journal of Chemical Physics, 2003. 118(7): p. 3368-3375.
6. Berendsen, C.W.J., et al., Rupture of Thin Liquid Films Induced by Impinging Air-Jets. Langmuir, 2012. 28(26): p. 9977-9985.
7. Helt, J.M., High-Vacuum Tribometry Tests of Fluid Lubricants on Bearing Steels. 2013, The Aerospace Corporation: El Segundo, CA.
8. Helt, J.M. and P.F. Frantz, Investigating the Reflow of Gyroscope Lubricant SRS160 on Bearing Surfaces: Analysis Methods and Techniques. 2013, The Aerospace Corporation: El Segundo, CA.
9. Helt, J.M., High vacuum tribometry tests of fluid lubricants on bearing steels, in ACS National Meeting. 2014: San Francisco CA.
10. Helt, J.M., Procedure for Separating Pennzane Oil from Formulated Oils and Rheolube Based Greases. 2016, The Aerospace Corporation: El Segundo, CA.
11. Helt, J.M. and J.J. Kirsch, High Vacuum Tribometer for Fluid Lubricated Bearing Material Testing: Part 1 – Instrument Design. 2010, The Aerospace Corporation: El Segundo, CA.
12. Didziulis, S., J. Helt, and P. Frantz, Laboratory Studies of Spacecraft Fluid Lubricants, in ACS National Meeting. 2019: San Diego CA.
13. Ward, P.C., A.R. Leveille, and P.P. Frantz, Measuring the EHD Film Thickness in a Rotating Ball Bearing, in Proceedings of the 39th Aerospace Mechanisms Symposium. 2008: NASA Marshall Space Flight Center.
14. Helt, J.M., EHD Bearing Test Unit: Final Design. 2016, The Aerospace Corporation: El Segundo, CA.
15. Helt, J.M., EHD Bearing Test Unit: Setup & Operation Overview. 2017, The Aerospace Corporation: El Segundo, CA.
16. Helt, J.M., EHD Bearing Test Unit: Automated Test and Analysis Framework. 2018, The Aerospace Corporation: El Segundo, CA.
17. Dowson, D. and G.R. Higginson, Elasto-hydrodynamic lubrication the fundamentals of roller and gear lubrication. 1966.
18. Hamrock, B.J. and D. Dowson, Isothermal Elastohydrodynamic Lubrication of Point Contacts: Part III—Fully Flooded Results. Journal of Tribology, 1977. 99(2): p. 264-275.
19. Coy, J.J. and E.V. Zaretsky, Some Limitations in Applying Classical EHD Film Thickness Formulas to a High-Speed Bearing. Journal of Tribology, 1981. 103(2): p. 295-301.

300

301
Efficacy of Lead Naphthenate for Wear Protection in High Vacuum Space Mechanisms
Jason T. Galary*
Abstract The purpose of this research is to investigate the efficacy of lead naphthenate as a wear additive in a multi-alkylated cyclopentane (MAC) fluid for use in high vacuum space mechanism applications. The use of lead naphthenate in MAC lubricants has a spaceflight history of over thirty years. However, despite the history of use for this additive in a variety of rolling and sliding applications, little is known or understood about the tribochemical process by which these additives function. This research looks at the performance of this additive in simulated contact tests using SRV (Sliding in Atmospheric and Vacuum Conditions), as well as a scuffing test performed in a mixed rolling/sliding contact. In addition, application simulation tests are being performed including high vacuum spiral orbit tribometry (SOT) and vacuum angular contact ball bearing testing. This test program evaluates the additive in both a mixed film and boundary lubrication contact under vacuum and atmospheric conditions to better understand how the additive functions on a metal surface. This report of the test programs current progress will include high vacuum bearing life testing, boundary/mixed lubrication scuffing wear, outgassing, and SOT. The results of this work will help the design engineer understand how materials, including lubricants, play a critical role in the performance and life of space mechanisms in demanding high vacuum environments. A greater understanding of the relationship between lead content and tribological performance will be developed along with further understanding of the tribochemical degradation process. Data gathered from wear testing and application simulation work will provide mechanism design engineers with a better understanding of the tribological performance of this lubricant additive.
Introduction and Background Lead naphthenate has been used heavily as an anti-wear and extreme pressure additive in multi alkylated cyclopentane lubricants for high vacuum space mechanisms. The additive consists of a centralized lead ion that is bonded with the oxygen atoms of two carboxylate groups each attached to naphthenate aromatic rings. The naphthenate aromatic hydrocarbon rings provide solubility of the lead naphthenate in different hydrocarbon oils, but the way the additive reacts with steel and protects against wear in various lubrication regimes is still not fully understood. The historical use of lead naphthenate originates from industrial gears and bearings where it was used an extreme pressure additive over fifty years ago. Over the last thirty years, it has gained a lot of spaceflight history although there are still many questions regarding its efficacy, primarily how does it function in various lubrication regimes, the effects of different metallurgy, and how environmental pressure effect its performance. With the increasing number of space mechanisms being developed and launched as well as the increasing length of mission time required, it is critical to have a robust design with high reliability. To improve the reliability, it is necessary to have long lives for all of the components in the design. This will require that the lubricants used for space mechanisms must also improve. The use of lead naphthenate additive in multi alkylated cyclopentane fluids is a proven additive package with spaceflight history but in order to develop
* Nye Lubricants, Inc., Fairhaven, MA
Proceedings of the 45th Aerospace Mechanisms Symposium, NASA Johnson Space Center, 2020

302
and advance the lubrication technology for high vacuum space mechanisms, additional understanding of its tribological performance is needed to facilitate innovations. When considering how to research the efficacy of lead naphthenate and how it functions as a tribofilm, it is important to look at various methodologies to characterize its performance. In the beginning stages, this is easiest performed by using simulated contact testing. In this respect, an SRV makes the best choice as it is very flexible regarding the contact mechanics and environmental conditions. The availability of SOT testing is somewhat limited but a Mini Traction Machine (MTM) can be used in a manner to simulate the same type of application conditions with a ball running in an orbital pattern on a disc with a mixture of rolling/sliding. While the MTM cannot currently run in a vacuum condition, it can be used to understand the fundamental complexities of lead naphthenate operating in a rolling/sliding mixed application. When this is combined with the vacuum/atmospheric testing on the SRV, the performance of the lead naphthenate can be made clearer.
In more recent research done on lead naphthenate using the SRV and other sliding tribometers, results have typically been inconclusive regarding the efficacy of this additive to protect a lubricated contact. The standard SRV testing includes conditions that could be inappropriate for evaluating many anti-wear additives including lead naphthenate. This includes the sliding speed which would create a thicker film preventing the additive function from being studied. The contact stress is also much higher in standard ASTM tests which will influence how the tribofilms are created and in the case of lead naphthenate, the higher contact stresses will create additional wear which will react and consume available lead naphthenate making it unavailable to create a protective tribofilm. From the authors previous research [7], the following was determined: In oscillatory testing, Lead Naphthenate had better anti-wear performance at lower temperatures (~20°C) and increasing the amount of lead directly reduced the wear rate. Under high vacuum conditions, the samples with lead naphthenate offered twice the wear protection with 440C performing the best. At higher temperatures (75°C) the wear rate was almost double for the samples with a higher content of lead across all experiments. The 75°C testing in pure oscillatory sliding on 52100 steel, showed that samples with lead naphthenate in an atmospheric environment performed worse as the concentration of lead increased. However, when in a vacuum environment, as the concentration increased the wear rate decreased. In 440C testing, samples with lead offered up to twice the wear protection over the neat samples in a vacuum environment. In mixed rolling/sliding experiments, Lead Naphthenate had better anti-wear performance at high temperatures and increasing the amount of lead directly reduced the wear rate. At lower temperatures (50°C) in the counter-rotation wear test, lead naphthenate offered three times the wear protection when in a 3% concentration and eleven times the protection for 5% lead compared to the neat MAC fluid. At higher temperatures (150°C) in the counter-rotation wear test, lead naphthenate offered five times the wear protection when in a 3% concentration and twenty times the protection for 5% lead compared to the neat MAC fluid. There appears to be is a transition point between 3% and 5% lead naphthenate where the available lead can react with both the surface and worn metal to create a strong lead anti-wear tribofilm. This tribofilm that is created is between 2-4µm thick and while it will cause an overall increase in friction at the surface, the wear of the contact is greatly reduced. Previous Lessons Learned from AMS 2018:
- The additive function of lead naphthenate is a combination of physical absorption through rubbing or pressure and chemisorption.
- Depending on the mechanics in the contact (sliding versus rolling), the effect of temperature had a significant influence. This appears to indicate that higher concentrations of lead would be required for more severe applications involving pure sliding and/or high temperatures as the lead is consumed faster through reaction with surface layer steel oxides and sublayers.
- In rolling and mixed contacts, lead naphthenate creates a strong tribofilm on the steel surface that aids in protecting from wear but at the same time will increase the friction in the contact.
- The formation and durability of lead naphthenate tribofilm is dependent on the environment with higher performance coming under vacuum conditions. It is also believed the lack of oxygen
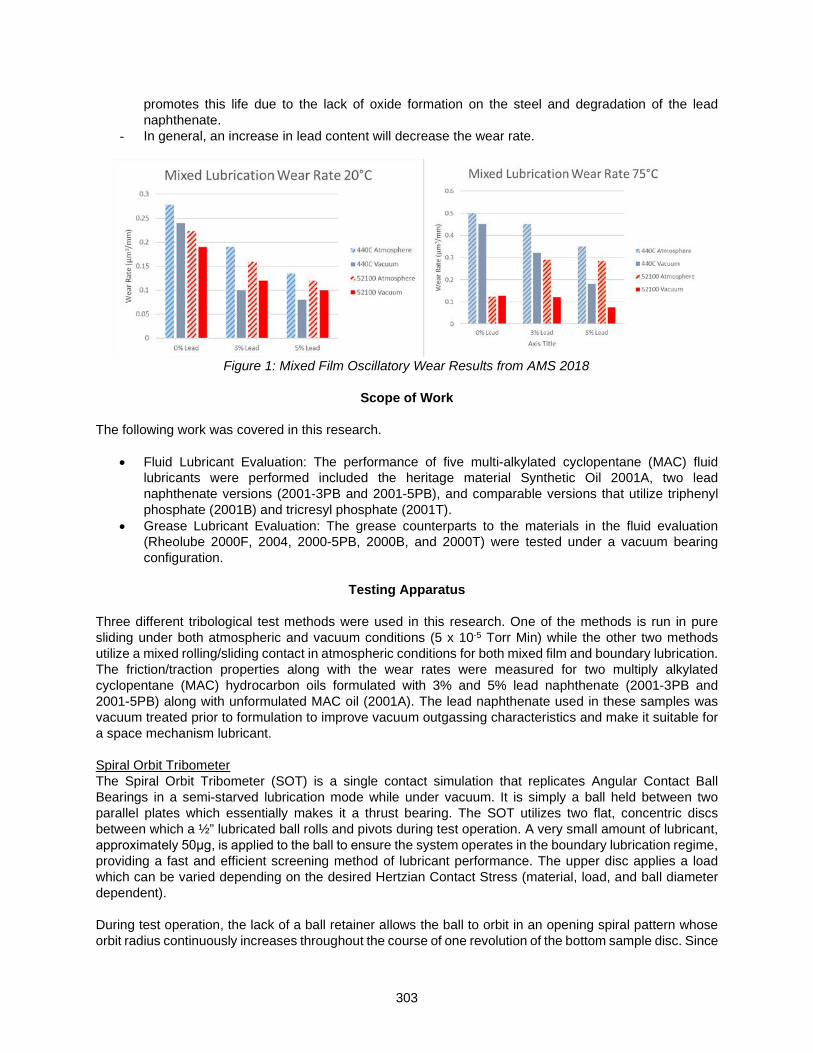
303
promotes this life due to the lack of oxide formation on the steel and degradation of the lead naphthenate.
- In general, an increase in lead content will decrease the wear rate.
Figure 1: Mixed Film Oscillatory Wear Results from AMS 2018
Scope of Work
The following work was covered in this research.
• Fluid Lubricant Evaluation: The performance of five multi-alkylated cyclopentane (MAC) fluid lubricants were performed included the heritage material Synthetic Oil 2001A, two lead naphthenate versions (2001-3PB and 2001-5PB), and comparable versions that utilize triphenyl phosphate (2001B) and tricresyl phosphate (2001T).
• Grease Lubricant Evaluation: The grease counterparts to the materials in the fluid evaluation (Rheolube 2000F, 2004, 2000-5PB, 2000B, and 2000T) were tested under a vacuum bearing configuration.
Testing Apparatus
Three different tribological test methods were used in this research. One of the methods is run in pure sliding under both atmospheric and vacuum conditions (5 x 10⁻⁵ Torr Min) while the other two methods utilize a mixed rolling/sliding contact in atmospheric conditions for both mixed film and boundary lubrication. The friction/traction properties along with the wear rates were measured for two multiply alkylated cyclopentane (MAC) hydrocarbon oils formulated with 3% and 5% lead naphthenate (2001-3PB and 2001-5PB) along with unformulated MAC oil (2001A). The lead naphthenate used in these samples was vacuum treated prior to formulation to improve vacuum outgassing characteristics and make it suitable for a space mechanism lubricant. Spiral Orbit Tribometer The Spiral Orbit Tribometer (SOT) is a single contact simulation that replicates Angular Contact Ball Bearings in a semi-starved lubrication mode while under vacuum. It is simply a ball held between two parallel plates which essentially makes it a thrust bearing. The SOT utilizes two flat, concentric discs between which a ½” lubricated ball rolls and pivots during test operation. A very small amount of lubricant, approximately 50μg, is applied to the ball to ensure the system operates in the boundary lubrication regime, providing a fast and efficient screening method of lubricant performance. The upper disc applies a load which can be varied depending on the desired Hertzian Contact Stress (material, load, and ball diameter dependent). During test operation, the lack of a ball retainer allows the ball to orbit in an opening spiral pattern whose orbit radius continuously increases throughout the course of one revolution of the bottom sample disc. Since

304
there is no retainer, if this orbit was left unchecked, it would result in the ball orbiting out of the two parallel sample discs, causing the two plates to contact each other. Fortunately, as the ball reaches the completion of each revolution, it is pushed back into its original orbit radius by contacting what is known as the guide plate. The test is initiated with the sample ball touching the guide plate, which sets the initial orbit radius, and is adjustable. The guide plate is oriented in a position such that it contacts the center of the ball on each revolution. Attached to the guide plate is a charge amplifier force transducer. This force transducer measures the reactionary force required for the ball to be scrubbed back into its initial orbit diameter. This location throughout the orbit is identified as the scrub region. As the lubricant becomes consumed or degrades, this force will naturally increase.
Figure 2. Spiral Orbit Tribometer mechanisms, Image courtesy of Spiralab
Vacuum Bearing Testing: The apparatus used for these experiments tests a single angular contact ball bearing. The system operates at a vacuum level better than 5.0 x 10⁻⁷ Pa, from 1 to 500 RPM, up to 200°C, and loads to 450 N. The system uses dead weight loading and either a heat lamp or band heater. The system also measures cross bearing electrical resistance, which is used to monitor the operating regime. Bearing torque, load, chamber pressure, and cross bearing resistance are recorded using a data acquisition system. The system uses a single SKF 7204 1219 (52100 steel) angular contact bearing. The bearing has an outside diameter of 47 mm, a bore of 20 mm, eleven 12.7 mm balls and a steel retainer. The bearing is mounted in a fixture that holds the outer race and rotates the inner race. Temperature information is gathered from a thermocouple mounted just below the inner race. Wear Testing: Three different wear rates were calculated including a mixed film in pure sliding, mixed film (rolling/sliding), and boundary (rolling/sliding). A normalized wear rate for all these tests were calculated to compare materials tested. The wear rate will indicate the volume of wear (µm3) over a distance traveled (in millimeters) which will normalize the data in the case of premature failures. For the pure sliding test, the ASTM D-5707 SRV Coefficient of Friction test was used. For both the mixed film and boundary testing in a rolling/sliding contact, a custom experimental method using a Mini Traction Machine (MTM) (as show in Figure 3) was used [1][2][4][7][13]. In the MTM, the ball and disc are driven independently which allows any combination of rolling and sliding. The measurement of friction force is done through a load cell that is attached to the bearing housing of the ball motor shaft.

305
Figure 3. Schematic of Mini Traction Machine, image courtesy of PCS Instruments The experimental method using the MTM utilized a ball-on-disc configuration. In the MTM, the ball and disc are driven independently which allows any combination of rolling and sliding. The measurement of friction force is done through a load cell that is attached to the bearing housing of the ball motor shaft. In previous work by the author and when considering other scuffing tests, it was noted that most simulations use a load stage progression [5,6,13]. This can be seen in the FZG (Forschungsstelle fur Zahnrader und Getriebebau), 4-Ball EP (Extreme Pressure), SRV, OK Load Test, and Timken tests. The testing in this work is done using progressive speed as opposed to progressive load stages. On benefit of this approach is that the higher sliding speeds will allow for a more aggressive wear rate to help differentiate the efficacy of the additives. However, the primary reason for using the progressive speed approach is the fact that in a test where the contact stress increases at every stage, the size of contact patch will also increase at every stage. This leads to fresh nascent metal being exposed at every stage. This new area of contact has not yet developed a tribofilm when it comes into contact, so it is more likely to have aggressive wear. Therefore, tests run in a progressive load methodology will typically have failures at the step increase and have lower repeatability. The experimental testing methodology is as follows [1,7]: The testing apparatus is assembled and filled with oil for the experiment. The temperature of the oil is then heated to 150oC while the ball and disc are rotated at a slow speed while not in contact. This continues for 30 minutes to allow for any chemical absorption of the additives on the surfaces. After this, there is a 10-minute run-in period with a Hertzian contact stress of 1.25 GPa and a Sliding to Rolling Ratio (SRR) of 1. Once the run-in has completed, a progressive speed test starts with running stages for 1 minute and rest stages for 30 seconds. The SRR is varied at each stage in order to maintain the entrainment speed for each stage but increase the sliding speed at the contact. The test continues until either all stages (51) are completed (maximum speed for MTM) or scuffing wear and seizure occurs. Samples The test plates for the SOT were machined from 440C stainless steel with a surface roughness of <0.05 microns. Balls used were 12.7-mm or 7.14-mm 440C stainless steel depending on the contact stress requirements. For the vacuum bearing tests, SKF 7204 Angular contact ball bearings made from 52100 steel were used. In the SRV testing, AISI 52100 steel balls and discs were used with a Young’s Modulus of 210 GPa and a Poisson ratio of 0.30. The balls had a 10-mm diameter with a roughness (Ra) of 25 nm and a Rockwell hardness of 62 HRC. The 24mm discs are vacuum arc re-melted and had a hardness of 58 HRC with a lapped surface that has a roughness (Rz) of 500 nm. All the tests were run in duplicate and with a maximum Hertzian contact stress of 2.12 GPa and a sliding speed of 300 mm/s. The experimental MTM test used AISI 52100 steel balls and discs were with a Young’s Modulus of 210 GPa and a Poisson ratio of 0.30. The balls had a 19.05-mm diameter with a roughness (Rq) of 10 nm and a Rockwell hardness

306
of 62.5. The discs had a hardness of 60.5 and a roughness (Rq) of 11 nm. All the tests were run in duplicate and with a maximum Hertzian contact stress of 1.25 GPa.
Procedures Sample Preparation All test specimens are ultrasonically cleaned in heptane followed by acetone. For the SOT testing, the fluid lubricants were plated via the preparation of a solution of lubricant diluted into an appropriate solvent. This solution was then applied directly to a rotating ball and the solvent allowed to evaporate from the surface. This left the fluid lubricant on the ball’s surface. The lubricant plating method allows for the application of very small amounts of lubricant. The application of grease was done by rubbing the ball between cleanroom grade polyethelye sheets until and even coating of lubricant was applied. The target amount of applied lubricant for both fluids and greases were 50 μg. The contact area for the SRV was coated with 5 ml of lubricant while the MTM specimens were fully flooded.
Results and Discussion SRV (Sliding in Atmospheric and Vacuum Conditions) The results in Tables 1-3 and Figure 4 are from the experiment on the MAC with 0%, 3%, and 5% lead naphthenate when tested in a boundary lubricating regime, at 20°C on the SRV under both atmospheric and vacuum conditions. These plots illustrate the wear rate of each material which is determined by the total wear volume (µm3) per millimeter traveled in the test. The wear volumes were measured using an Ametek 3D Optical Profilometer.
Table 1: Wear Performance for MAC fluid with 0% Lead at 20°C
Table 2: Wear Performance for MAC fluid with 3% Lead at 20°C
Table 3: Wear Performance for MAC fluid with 5% Lead at 20°C
Material Temp (°C) Environment Specimen Avg Wear Scar (mm2) Disc Wear Volume (μm3) Wear Rate (μm3/mm)0% Lead 20 Atmosphere 440C 1.302 599,972 0.280% Lead 20 Vacuum 440C 1.294 518,400 0.240% Lead 20 Atmosphere 52100 1.499 481,018 0.220% Lead 20 Vacuum 52100 1.420 410,400 0.19
Material Temp (°C) Environment Specimen Avg Wear Scar (mm2) Disc Wear Volume (μm3) Wear Rate (μm3/mm)3% Lead 20 Atmosphere 440C 2.409 410,400 0.193% Lead 20 Vacuum 440C 1.942 216,000 0.103% Lead 20 Atmosphere 52100 1.950 342,356 0.163% Lead 20 Vacuum 52100 1.820 259,200 0.12
Material Temp (°C) Environment Specimen Avg Wear Scar (mm2) Disc Wear Volume (μm3) Wear Rate (μm3/mm)5% Lead 20 Atmosphere 440C 1.468 291,600 0.145% Lead 20 Vacuum 440C 1.259 172,800 0.085% Lead 20 Atmosphere 52100 1.389 259,200 0.125% Lead 20 Vacuum 52100 1.242 216,000 0.10

307
Figure 4: Boundary Lubrication Wear Rate at 20°C
In atmospheric conditions, the wear rates for 52100 steel was consistently lower than the 440C. Under vacuum conditions, all of the samples had lower wear rates than the atmospheric tests, the samples with lead had almost half the wear than neat oils, and the amount of lead made a small difference in the wear. When looking at the average wear scar there is no correlation to the disc wear volume of the wear rate. Until recently, most published papers used the average wear scar to compare efficacy of wear additives and performance in testing. Using this measurement simply gives you a dimension of the worn area with no indication of how much material was removed. The results from this study as well as those presented by St. Pierre [9] have illustrated that two-dimensional wear measurements cannot be relied on to understand what is going on in a mechanism or tribological contact. By using 3D profilometry, a deeper understanding of what is going on can be attained. The results in Tables 4-6 and Figure 5 are for the multiply alkylated cyclopentane with 0%, 3%, and 5% lead naphthenate when tested in a boundary lubricating regime, at 75°C on the SRV under both atmospheric and vacuum conditions.
Table 4: Wear Performance for MAC fluid with 0% Lead at 75°C
Table 5: Wear Performance for MAC fluid with 3% Lead at 75°C
Table 6: Wear Performance for MAC fluid with 5% Lead at 75°C
Material Temp (°C) Environment Specimen Avg Wear Scar (mm2) Disc Wear Volume (μm3) Wear Rate (μm3/mm)0% Lead 75 Atmosphere 440C 1.437 1,080,000 0.500% Lead 75 Vacuum 440C 1.786 972,000 0.450% Lead 75 Atmosphere 52100 1.513 263,796 0.120% Lead 75 Vacuum 52100 1.826 276,480 0.13
Material Temp (°C) Environment Specimen Avg Wear Scar (mm2) Disc Wear Volume (μm3) Wear Rate (μm3/mm)3% Lead 75 Atmosphere 440C 1.449 972,000 0.453% Lead 75 Vacuum 440C 1.824 691,200 0.323% Lead 75 Atmosphere 52100 1.346 622,811 0.293% Lead 75 Vacuum 52100 1.236 259,200 0.12
Material Temp (°C) Environment Specimen Avg Wear Scar (mm2) Disc Wear Volume (μm3) Wear Rate (μm3/mm)5% Lead 75 Atmosphere 440C 3.003 756000 0.355% Lead 75 Vacuum 440C 1.874 388800 0.185% Lead 75 Atmosphere 52100 3.335 612415 0.285% Lead 75 Vacuum 52100 1.842 162000 0.08
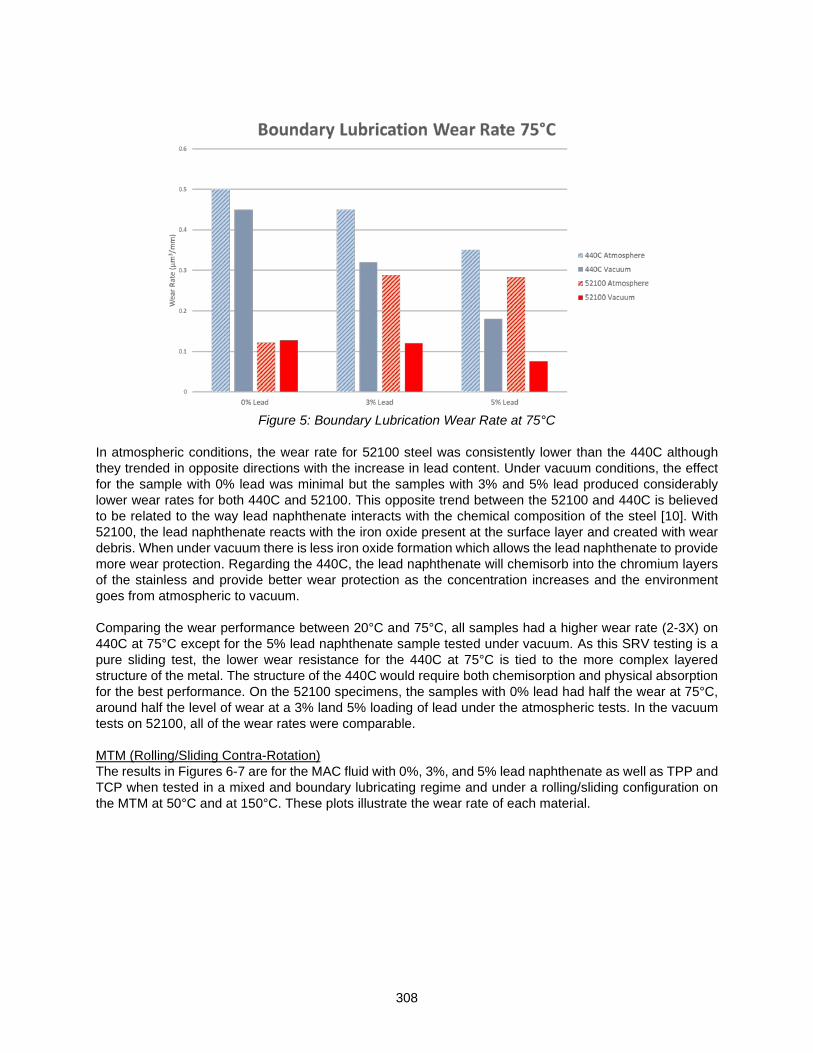
308
Figure 5: Boundary Lubrication Wear Rate at 75°C
In atmospheric conditions, the wear rate for 52100 steel was consistently lower than the 440C although they trended in opposite directions with the increase in lead content. Under vacuum conditions, the effect for the sample with 0% lead was minimal but the samples with 3% and 5% lead produced considerably lower wear rates for both 440C and 52100. This opposite trend between the 52100 and 440C is believed to be related to the way lead naphthenate interacts with the chemical composition of the steel [10]. With 52100, the lead naphthenate reacts with the iron oxide present at the surface layer and created with wear debris. When under vacuum there is less iron oxide formation which allows the lead naphthenate to provide more wear protection. Regarding the 440C, the lead naphthenate will chemisorb into the chromium layers of the stainless and provide better wear protection as the concentration increases and the environment goes from atmospheric to vacuum. Comparing the wear performance between 20°C and 75°C, all samples had a higher wear rate (2-3X) on 440C at 75°C except for the 5% lead naphthenate sample tested under vacuum. As this SRV testing is a pure sliding test, the lower wear resistance for the 440C at 75°C is tied to the more complex layered structure of the metal. The structure of the 440C would require both chemisorption and physical absorption for the best performance. On the 52100 specimens, the samples with 0% lead had half the wear at 75°C, around half the level of wear at a 3% land 5% loading of lead under the atmospheric tests. In the vacuum tests on 52100, all of the wear rates were comparable. MTM (Rolling/Sliding Contra-Rotation) The results in Figures 6-7 are for the MAC fluid with 0%, 3%, and 5% lead naphthenate as well as TPP and TCP when tested in a mixed and boundary lubricating regime and under a rolling/sliding configuration on the MTM at 50°C and at 150°C. These plots illustrate the wear rate of each material.

309
Figure 6: Mixed Film Scuffing Wear Rate Comparison
Figure 7: Boundary Scuffing Wear Rate Comparison
From these results, we can see that there is a transition point in the concentration of lead in these MAC fluids and how it reacts with the surface metal to form an anti-wear tribofilm. It should be noted, that this phenomenon was not seen in the SRV testing. It is believed that the aggressive sliding in the SRV test creates an entirely separate wear mechanism that prevents the lead naphthenate from reacting with the surface and building a strong tribofilm. In the MTM testing, there is a mixed rolling/sliding which will promote a tribofilm to be created in a fashion similar to gears and bearings that have a proper run-in process. This would agree and confirms work done by Carre et al [11] where it was found in ball bearing test data that lead naphthenate reacts with metal wear particles to create lead-containing surface coatings.

310
Spiral Orbit Tribometry The results in Figure 8 are for the MAC with 0%, 3%, and 5% lead naphthenate as well as TPP and TCP when tested in a pure rolling SOT test under boundary lubrication conditions. The Rheolube 2000F is a polytetrafluoroethylene (PTFE) thickened version of the MAC with 0% lead. In these SOT tests, the TPP outperformed the TCP and lead based additives in relative life. As the SOT does not provide adequate conditions to form tribofilms on the surface of the contacts in the test, the TPP is expected to have performed well due to the decomposition of TPP which creates a multilayered solid film on iron or iron oxide [14]. The results for the TCP and the formulations containing lead were slightly surprising but this is expected to tie to the restrictions of the mechanics in this test to create tribofilms and fully simulate a bearings performance. In all of the SOT testing, the Synthetic Oil 2001A (or 2000F grease version) that contained no additives performed the best which is believed to be a combination of the structure of the MAC oil itself, inability for wear additives to create a tribofilms under these test conditions, degradation of the anti-wear additives, and viscous friction.
Figure 8: SOT Normalized Lifetimes
High Vacuum Bearing Testing The results in Figure 9-10 are for the MAC with 0%, 3%, and 5% lead naphthenate as well as TPP and TCP when tested in angular contact ball bearings under boundary lubrication conditions. The grease versions were also tested with Rheolube 2004 containing 3% lead. All of the greases were thickened with sodium soap. In these bearing tests, the TPP outperformed the TCP similar to the relative life testing performed on the SOT. In bearing tests on both the oil samples and grease versions, the addition of lead naphthenate increased the wear in the bearing which will shorten the lifespan. These results correlate to what was seen in the SOT testing where the lead was not an effective anti-wear additive for these rolling contacts in vacuum.

311
Figure 9: Vacuum Bearing Wear Test on Oils
Figure 10: Vacuum Bearing Wear Test on Greases
In these vacuum bearing tests, the Synthetic Oil 2001A that contained no additives performed the best which is believed to be a combination of the structure of the MAC oil itself, inability for wear additives to create a tribofilms under these test conditions (no mechanical run-in or chemisorption before the test), degradation of the anti-wear additives, and viscous friction.
Conclusions In previous studies done on lead naphthenate using the SRV and other sliding tribometers, results have typically been inconclusive regarding the efficacy of this additive to protect a lubricated contact. The standard SRV testing includes conditions that could be inappropriate for evaluating many anti-wear additives including lead naphthenate. This includes the sliding speed which would create a thicker film preventing the additive function from being studied. The contact stress is also much higher in standard ASTM tests which will influence how the tribofilms are created and in the case of lead naphthenate, the
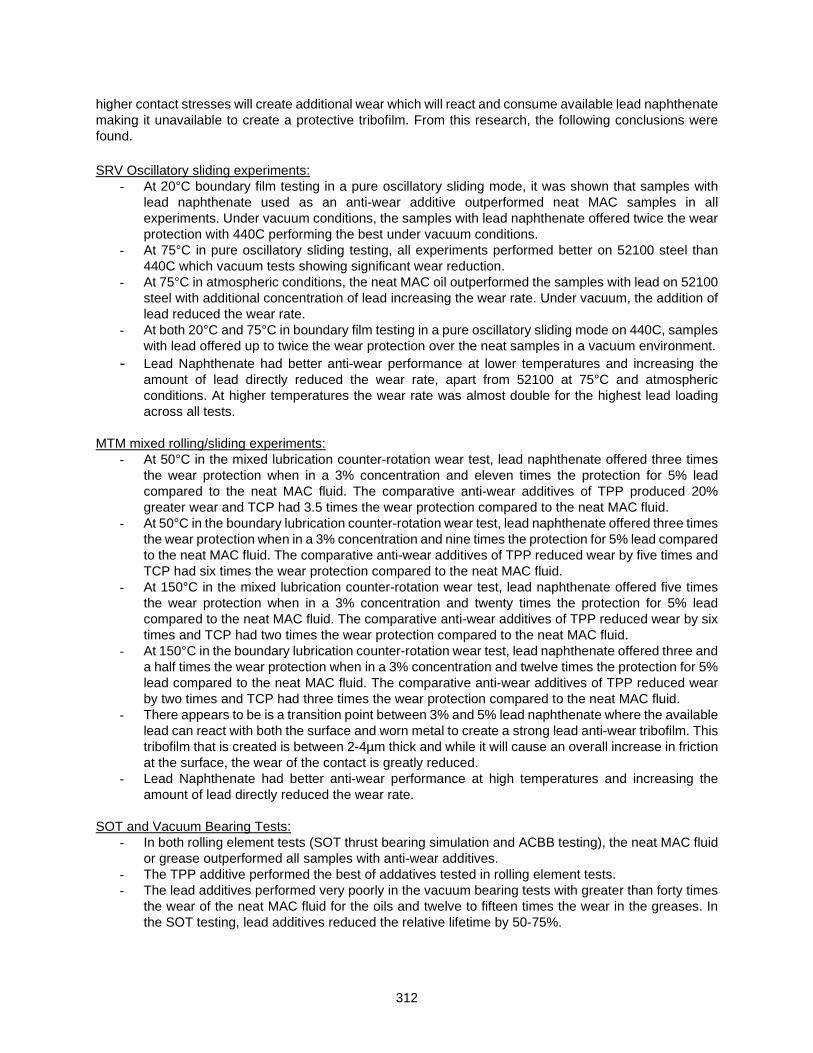
312
higher contact stresses will create additional wear which will react and consume available lead naphthenate making it unavailable to create a protective tribofilm. From this research, the following conclusions were found. SRV Oscillatory sliding experiments:
- At 20°C boundary film testing in a pure oscillatory sliding mode, it was shown that samples with lead naphthenate used as an anti-wear additive outperformed neat MAC samples in all experiments. Under vacuum conditions, the samples with lead naphthenate offered twice the wear protection with 440C performing the best under vacuum conditions.
- At 75°C in pure oscillatory sliding testing, all experiments performed better on 52100 steel than 440C which vacuum tests showing significant wear reduction.
- At 75°C in atmospheric conditions, the neat MAC oil outperformed the samples with lead on 52100 steel with additional concentration of lead increasing the wear rate. Under vacuum, the addition of lead reduced the wear rate.
- At both 20°C and 75°C in boundary film testing in a pure oscillatory sliding mode on 440C, samples with lead offered up to twice the wear protection over the neat samples in a vacuum environment.
- Lead Naphthenate had better anti-wear performance at lower temperatures and increasing the amount of lead directly reduced the wear rate, apart from 52100 at 75°C and atmospheric conditions. At higher temperatures the wear rate was almost double for the highest lead loading across all tests.
MTM mixed rolling/sliding experiments:
- At 50°C in the mixed lubrication counter-rotation wear test, lead naphthenate offered three times the wear protection when in a 3% concentration and eleven times the protection for 5% lead compared to the neat MAC fluid. The comparative anti-wear additives of TPP produced 20% greater wear and TCP had 3.5 times the wear protection compared to the neat MAC fluid.
- At 50°C in the boundary lubrication counter-rotation wear test, lead naphthenate offered three times the wear protection when in a 3% concentration and nine times the protection for 5% lead compared to the neat MAC fluid. The comparative anti-wear additives of TPP reduced wear by five times and TCP had six times the wear protection compared to the neat MAC fluid.
- At 150°C in the mixed lubrication counter-rotation wear test, lead naphthenate offered five times the wear protection when in a 3% concentration and twenty times the protection for 5% lead compared to the neat MAC fluid. The comparative anti-wear additives of TPP reduced wear by six times and TCP had two times the wear protection compared to the neat MAC fluid.
- At 150°C in the boundary lubrication counter-rotation wear test, lead naphthenate offered three and a half times the wear protection when in a 3% concentration and twelve times the protection for 5% lead compared to the neat MAC fluid. The comparative anti-wear additives of TPP reduced wear by two times and TCP had three times the wear protection compared to the neat MAC fluid.
- There appears to be is a transition point between 3% and 5% lead naphthenate where the available lead can react with both the surface and worn metal to create a strong lead anti-wear tribofilm. This tribofilm that is created is between 2-4µm thick and while it will cause an overall increase in friction at the surface, the wear of the contact is greatly reduced.
- Lead Naphthenate had better anti-wear performance at high temperatures and increasing the amount of lead directly reduced the wear rate.
SOT and Vacuum Bearing Tests:
- In both rolling element tests (SOT thrust bearing simulation and ACBB testing), the neat MAC fluid or grease outperformed all samples with anti-wear additives.
- The TPP additive performed the best of addatives tested in rolling element tests. - The lead additives performed very poorly in the vacuum bearing tests with greater than forty times
the wear of the neat MAC fluid for the oils and twelve to fifteen times the wear in the greases. In the SOT testing, lead additives reduced the relative lifetime by 50-75%.

313
Lessons Learned: - The additive function of lead naphthenate is a combination of physical absorption through
rubbing/pressure and chemisorption. Bearing or test run-in has been shown to be critical to the generation of proper tribofilms and extending the life of the lubricated contact.
- Depending on the mechanics in the contact (sliding versus rolling), the effect of temperature had a significant effect. This appears to indicate that higher concentrations of lead would be required for more severe applications involving pure sliding and/or high temperatures as the lead is consumed faster through reaction with surface layer steel oxides and sublayers.
- The formation and durability of the lead tribofilm is dependent on the environment with higher performance coming under vacuum conditions. It is also believed the lack of oxygen promotes this life with reduced oxide formation on the steel and degradation of the lead naphthenate.
Acknowledgements I would like to thank the team at Nye Lubricants specifically Melissa Larochelle, Paul Moses, Richie Raithel, and Mason Wood for the tribology testing and profilometry.
References
[1] Jason Galary. Mechanochemically Created Tribofilms and the Mechanics of Rolling Wear. Ph.D. thesis, University of Massachusetts at Dartmouth, 2019.
[2] H Blok. Gear wear as related to viscosity of oil. JT Burwell, Jr., American Society of Metals, Ohio, pages 199-277, 1950.
[3] HC Mougey and JO Almen. Extreme pressure lubricants. Proc. API, Refining Div, pages 76-94, 1931. [4] FF Musgrave. The development and lubrication of the automotive hypoid gear. J. Inst. Pet, 32:32-
44, 1946. [5] Jason T Galary. Synthetic gear lubricants go green. Gear Solutions, 8(84):24 31, 2010. [6] Jason Galary. Study of wear properties of environmentally friendly lubricants for gearing applications
as a function of film thickness transition. In Environmentally Considerate Lubricants. ASTM International, 2014.
[7] Jason T Galary. Efficacy of Lead Naphthenate for Wear Protection in Mixed Lubrication Regime. Proceedings of the 44th Aerospace Mechanisms Symposium, 2018.
[8] Bernard J Hamrock and Duncan Dowson. Ball bearing lubrication: the elastohydrodynamics of elliptical contacts. 1981.
[9] St. Pierre, Nicole. “Use of 3D Optical Profilometry to Differentiate Between Additive Chemistry” STLE Annual Meeting, 2017
[10] Didziulis, Stephen V., and Paul D. Fleischauer. "Chemistry of the extreme-pressure lubricant additive lead naphthenate on steel surfaces." Langmuir 7.12 (1991): 2981-2990.
[11] Carre, D. J., P. A. Bertrand, and J. R. Lince. Lead naphthenate additive tribochemistry in hydrocarbon oils. No. TR-2002 (8565)-2. AEROSPACE CORP EL SEGUNDO CA LAB OPERATIONS, 2001.
[12] Peterangelo, Stephen C., et al. "Improved additives for multiply alkylated cyclopentane‐based lubricants." Lubrication Science 25.1 (2008): 31-41.
[13] Marc Ingram, Clive Hamer, and Hugh Spikes. A new scuffing test using contra-rotation. Wear, 328:229 240, 2015.
[14] Mangolini, Filippo, Antonella Rossi, and Nicholas D. Spencer. "Influence of metallic and oxidized iron/steel on the reactivity of triphenyl phosphorothionate in oil solution." Tribology international 44.6 (2011): 670-683.

314

315
Bearing Anomaly for the Sentinel 6 Supplemental Calibration System
Gale Paulsen*, Dylan Van Dyne*, Fredrik Rehnmark*, Phil Chu*, and Ted Iskenderian**
Abstract The Supplemental Calibration System (SCS) was designed to rotate an elliptical reflector for the Sentinel 6 Advanced Microwave Radiometer (AMR). By rotating the reflector, the system can perform calibrations by comparing the reflection from space to the reflection from an onboard calibration target. During the qualification testing of the SCS, a flaw was discovered that resulted in apparent brinelling of bearings that support the rotating reflector. An extensive investigation ensued to determine the root cause of the problem. Though the most likely root causes of the presumed brinelling ended up being the result of undersized bearing clamp rings and thermal mismatch, there were requirements that drove these design choices. This paper describes the design of the bearing assembly, requirements that drove the design, and documents a challenging investigation filled with ambiguous test results.
Introduction and Assembly Overview Sentinel 6 is a spacecraft designed to continue the long-term continuity of satellite altimetry for sea surface height. This mission is a multi-agency collaboration between ESA, EU, EUMETSAT, NASA-JPL, NOAA, and CNES [1]. One of the upgrades to the Sentinel 6 microwave radiometer is a calibration system capable of maintaining measurement accuracy to within a few centimeters over the life of the mission [2]. To achieve
this accuracy, the microwave radiometer is equipped with a Supplemental Calibration System (SCS). This system helps correct signal drift by directing the radiometer signal to two different calibration targets of known temperatures. It is the design and testing of this system, which is the focus of this paper. The SCS is mounted to the Reflector Support Assembly (RSA). It is shown as a blue assembly in Figure 1. Elements that comprise the SCS include
a rotating Secondary Mirror (Figure 2); a stationary Space View Mirror to provide a “cold” calibration target; a Warm Calibration Target (WCT) to provide a “warm” calibration target; a structure to support the SCS components and to interface to the RSA; a Standard Dual Drive Actuator (SDDA) (Figure 3) to rotate the Secondary Mirror; a Launch Lock Mechanism to support the mirror during exposure to the launch environment; and a Feed Horn (not shown) to direct the microwaves to a wave guide assembly. In the standard operating mode, the system is positioned in its “science position” where it is collecting information on sea surface height. In this case, the Secondary Mirror is directed at the larger reflector on the RSA. To maintain signal accuracy, the system is required to perform a calibration approximately once every five
* Honeybee Robotics Spacecraft Mechanisms Corporation, Ensign Bickford Industries, Altadena, CA ** Jet Propulsion Laboratory, California Institute of Technology, Pasadena, CA
Proceedings of the 45th Aerospace Mechanisms Symposium, NASA Johnson Space Center, 2020
Figure 1. SCS location on the Sentinel 6 Spacecraft

316
days. When the calibration sequence is executed, the Secondary Mirror simply rotates to a hard stop at the WCT position and then returns to a hard stop at its nominal science position. During this process, the Secondary Mirror sweeps past the Space View Mirror, thus collecting the information required to correct for drift in the microwave radiometer signal. The stroke required to rotate from the science position to the WCT position (hard stop to hard stop) is approximately 120°.
Driving Requirements
The primary requirements that drove the design of the SCS bearing and housing materials and arrangement are shown in Table 1. Preliminary Design Review (PDR) and Critical Design Review (CDR) values are shown to highlight changes in requirement values as the development progressed. Each of these requirements had impacts on the system design for different reasons. Program and design choices made to meet these requirements ultimately resulted in the production of this paper.
Table 1. Driving requirements for the SCS bearing assembly
Requirement PDR Value CDR Value Implication
Schedule February 2017 July 2017 Relatively short development time
Mass < 12.4 kg < 15.4 kg All Aluminum structure
Mass of High Melting Point Materials
(Titanium) Not Fully Defined < 1200 g Aluminum structure
preferred
Qual Temperature Range (Op and Non-
Op the same) -45°C to +55°C -45°C to +70°C Routine
engineering design
Mirror Positioning over Temperature Range
<0.2/0.2/0.2 mm in each axis and 0.05/0.05/0.08
degrees including all launch and in-flight
effects.
<0.2/0.2/0.2 mm in each axis and 0.05/0.05/0.08
degrees including all launch and in-flight
effects.
Press fits required on both inner and
outer races
First Frequency Mode > 100 Hz > 100 Hz
Mass Sensitivity. More mass on
mechanism requires more
mass on structure.
In the case of mass, the PDR requirement of <12.4 kg was late to flow down which subsequently resulted in a system well over mass allocation. The resultant mass at PDR was 14.2 kg Current Best Estimate (CBE) with 16.3 kg including Mass Growth Allowance (MGA). At PDR, it was apparent that the 12.4 kg requirement was going to be a significant challenge to meet going into CDR. A compromise was achieved by increasing the mass allocation to 15.4 kg, and the design was scrubbed to enter the CDR with a CBE mass of 12.8
Figure 2. SCS Components

317
kg. The estimated MGA brought the total to 13.7 kg. The estimated MGA was validated when the assembly’s mass ended up at approximately 13.4 kg. This final mass even included a deviation after CDR that added more mass to the interface plate between the SCS and the RSA to increase the stiffness of the interface.
A limit on the use of high melting point materials limited the mass of titanium that could be used in the design. For thermal reasons, a titanium bracket was used as an installation bracket for the microwave feedhorn. The mass of this bracket was only around 150 g. Other titanium parts throughout the design added roughly another 150 g for a total titanium mass of 300 g. In hindsight, there was room in the mass allocation to add titanium mass to other areas such as bearing shafts and housings. However, adding more cantilevered mass to the design reduced the natural frequency of the system. Also, preliminary test results, described later, provided confidence in the design choices made through CDR.
At PDR, the qualification temperature range defined was relatively benign; ranging from -45°C to +55°C. Prior to CDR, this range was extended with the upper limit moving to +70°C. Nevertheless, the thermal environment was not considered a huge obstacle for the mechanism.
Alignment of the mirror over the temperature range ultimately played into tolerancing and fits on the SCS bearing assembly. The temperature range over which the positioning requirement applied was reduced from qualification to Flight Acceptance (FA) temperatures. This change was a mitigation approach to reduce the preload stresses in the bearing by reducing the magnitude of interference fits across the temperature range.
Meeting the first mode requirement was by far the most challenging part of this design effort. Margin of 20 Hz above the first mode frequency was designed into the system to ensure the SCS could meet the 100 Hz first mode requirement once integrated into the larger system. The mass of mechanisms and mirrors made 120+ Hz a difficult target. This is because the cantilevered nature of this system drove the center of gravity away from the interface (Figure 3). This led to a constant battle between function, mass, and stiffness. Additional design challenges came from a relatively high random vibration requirement at the SCS interface which started at 16.8 grms, but later reduced to 14.1 grms shortly before CDR.
Risk Reduction Effort
To proactively reduce risk, Brassboard versions of the thin section bearing assemblies were designed, procured, assembled, and tested. The primary objective of this effort was to reduce uncertainty in the drag torque of the bearing assembly across the operating temperature range. This was important because the control approach for this mission was to perform open loop control over the rotation of the Secondary Mirror using a fixed voltage input into the motor, and science was sensitive to the rotational velocity of the Secondary Mirror. Because of this, a requirement on the velocity was written to specify an operational band that ranged from 1.5 deg/s to 2.9 deg/s. Predictions on velocity prior to PDR showed little margin compared to the velocity requirements over the operating temperature range of the system (Figure 5). With so little margin against velocity, predictions on friction were important to validate.
The Brassboard assembly consisted of the output bearing assembly, input bearing assembly, torque transducer, motor and structure (Figure 4). Configuration of the output bearing assembly (designed to support the mass of the Secondary Mirror) was a back to back duplex pair of angular contact bearings with a spring preloaded outrigger radial bearing to help support moment loads. A back to back duplex pair of angular contact bearings were also selected for the input bearing assembly. In this case, these bearings were separated by match ground spacers. Requirements on the input bearing assembly were much more benign because this assembly did not have to support the mass or position requirements of the cantilevered
Figure 3. Center of Gravity of SCS

318
reflector. In the final SCS configuration, the input assembly simply supported a pinion gear that was mated with a gear on the output assembly. Gears were not included in the Brassboard assemblies.
Figure 4. Brassboard test assembly.
The test plan for the Brassboard was designed to measure the sensitivity of the design to the thermal environment, including thermal gradients across the bearing races. Multiple tests were performed at room temperature and qualification hot and cold temperatures to measure bearing drag (Figure 6). Additional data were collected during one of the thermal ramps where a relatively large (~12°C) gradient was enforced across the bearing races. For these analyses, ORBIS bearing analysis software [3] was used to predict bearing stresses and drag over the temperature range. Overall, results were very promising as predictions were within 0.1 Nm for most cases. This torque corresponds to less than 0.1 mNm at the motor which puts the value within the noise of the system. Viscosity for the Braycote lubricant was estimated using supplier data and the model defined by ASTM-D341 to interpolate over temperature.
Figure 5. Predicted velocity as a function of temperature for two different gearbox efficiencies
Development and testing of the Brassboard provided a lot of value going into CDR. Test results corroborated bearing drag predictions to within reason and the bearing assembly was proven to perform within specification over the temperature range with no anomalous behavior. From an assembly standpoint,
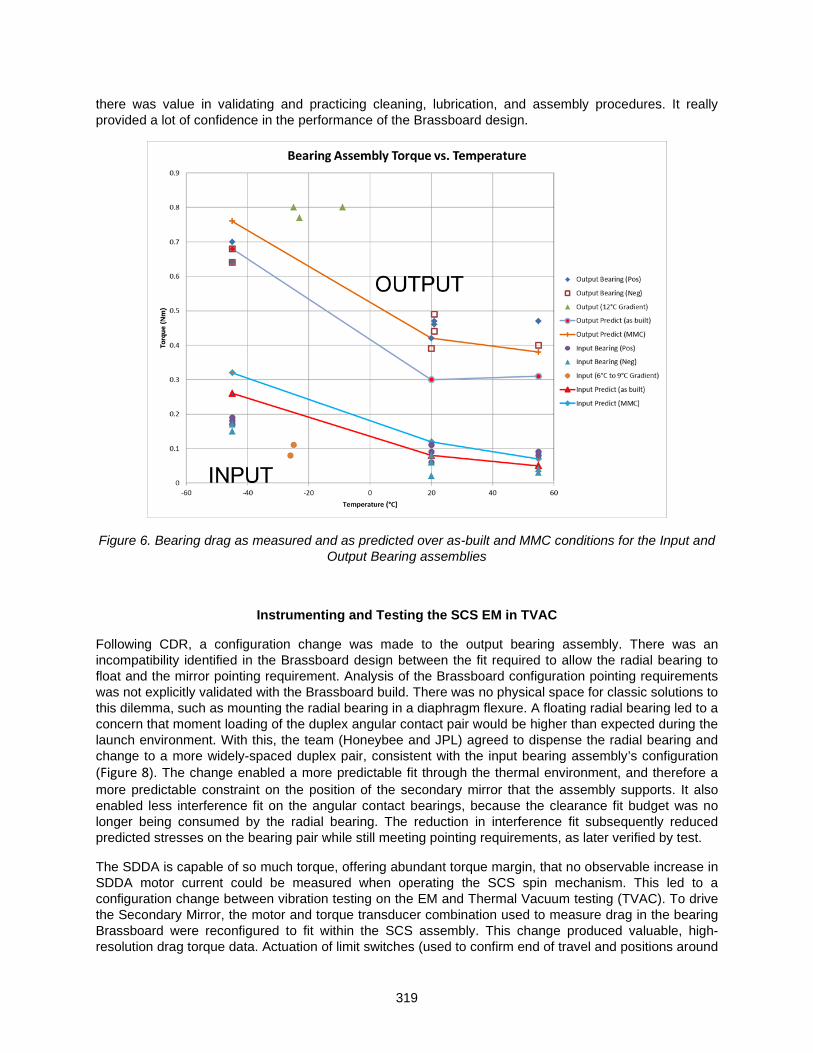
319
there was value in validating and practicing cleaning, lubrication, and assembly procedures. It really provided a lot of confidence in the performance of the Brassboard design.
Figure 6. Bearing drag as measured and as predicted over as-built and MMC conditions for the Input and Output Bearing assemblies
Instrumenting and Testing the SCS EM in TVAC
Following CDR, a configuration change was made to the output bearing assembly. There was an incompatibility identified in the Brassboard design between the fit required to allow the radial bearing to float and the mirror pointing requirement. Analysis of the Brassboard configuration pointing requirements was not explicitly validated with the Brassboard build. There was no physical space for classic solutions to this dilemma, such as mounting the radial bearing in a diaphragm flexure. A floating radial bearing led to a concern that moment loading of the duplex angular contact pair would be higher than expected during the launch environment. With this, the team (Honeybee and JPL) agreed to dispense the radial bearing and change to a more widely-spaced duplex pair, consistent with the input bearing assembly’s configuration (Figure 8). The change enabled a more predictable fit through the thermal environment, and therefore a more predictable constraint on the position of the secondary mirror that the assembly supports. It also enabled less interference fit on the angular contact bearings, because the clearance fit budget was no longer being consumed by the radial bearing. The reduction in interference fit subsequently reduced predicted stresses on the bearing pair while still meeting pointing requirements, as later verified by test.
The SDDA is capable of so much torque, offering abundant torque margin, that no observable increase in SDDA motor current could be measured when operating the SCS spin mechanism. This led to a configuration change between vibration testing on the EM and Thermal Vacuum testing (TVAC). To drive the Secondary Mirror, the motor and torque transducer combination used to measure drag in the bearing Brassboard were reconfigured to fit within the SCS assembly. This change produced valuable, high-resolution drag torque data. Actuation of limit switches (used to confirm end of travel and positions around
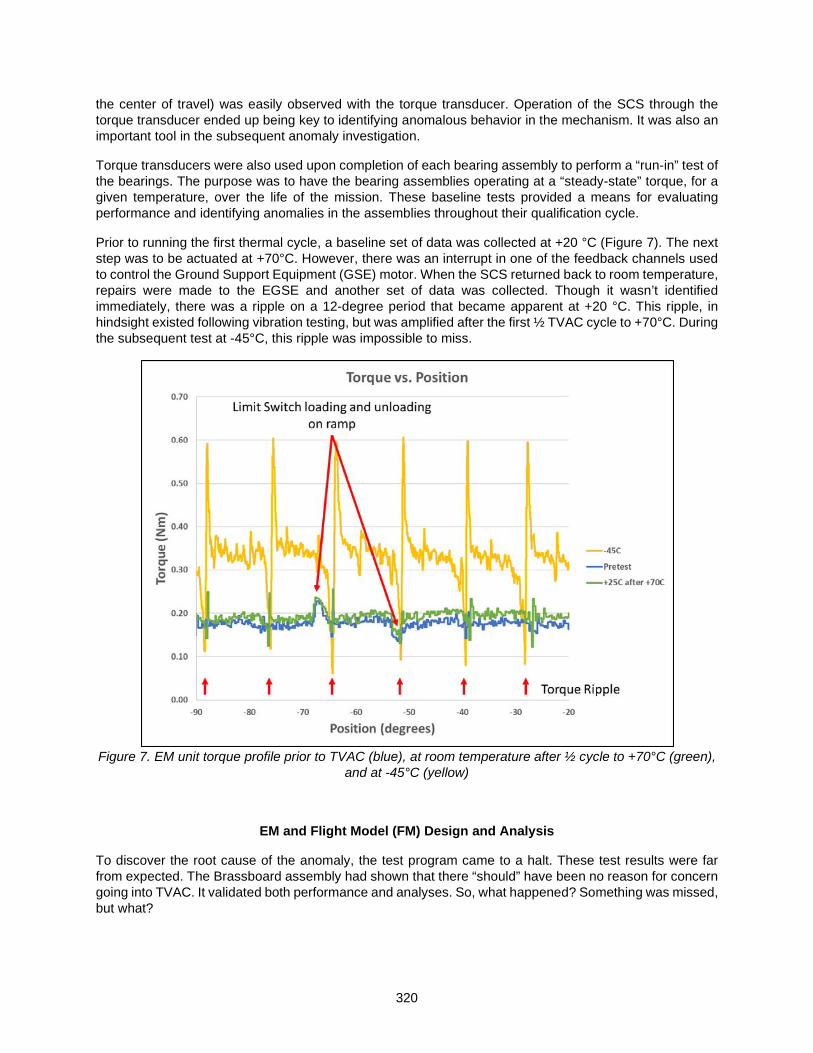
320
the center of travel) was easily observed with the torque transducer. Operation of the SCS through the torque transducer ended up being key to identifying anomalous behavior in the mechanism. It was also an important tool in the subsequent anomaly investigation.
Torque transducers were also used upon completion of each bearing assembly to perform a “run-in” test of the bearings. The purpose was to have the bearing assemblies operating at a “steady-state” torque, for a given temperature, over the life of the mission. These baseline tests provided a means for evaluating performance and identifying anomalies in the assemblies throughout their qualification cycle.
Prior to running the first thermal cycle, a baseline set of data was collected at +20 °C (Figure 7). The next step was to be actuated at +70°C. However, there was an interrupt in one of the feedback channels used to control the Ground Support Equipment (GSE) motor. When the SCS returned back to room temperature, repairs were made to the EGSE and another set of data was collected. Though it wasn’t identified immediately, there was a ripple on a 12-degree period that became apparent at +20 °C. This ripple, in hindsight existed following vibration testing, but was amplified after the first ½ TVAC cycle to +70°C. During the subsequent test at -45°C, this ripple was impossible to miss.
Figure 7. EM unit torque profile prior to TVAC (blue), at room temperature after ½ cycle to +70°C (green),
and at -45°C (yellow)
EM and Flight Model (FM) Design and Analysis
To discover the root cause of the anomaly, the test program came to a halt. These test results were far from expected. The Brassboard assembly had shown that there “should” have been no reason for concern going into TVAC. It validated both performance and analyses. So, what happened? Something was missed, but what?

321
Figure 8. Cross-section view showing bearing mount geometry
Bearing analysis was performed using Orbis [1]. For all load cases, predicted contact stresses were lower than the applicable operating and non-operating limits per GSFC-STD-7000A for 440C steel bearings (335 ksi (2310 MPa) and 400 ksi (2760 MPa), respectively, for non-quiet applications). Alignment across the temperature range was achieved by controlling the maximum interference between the bearing races and mounting surfaces (shaft and housing). Unloaded balls were predicted for the launch load cases at the 3-sigma level but none were predicted at the 1-sigma level. Areas of concern were identified at instrument CDR and closed out with additional analysis. There is still uncertainty related to these aspects of the design, which are not easily modeled. None have been ruled out as contributing factors to the torque spikes observed during thermal testing. Neither has any been singled out as the single root cause.
The driving load case for non-operational contact stress is launch vibration. Static equivalent loads were generated for design purposes for 3 cases: Random X, Random Y and Random Z (all 3 sigma). A single enveloping load case was constructed using the maximum components and a factor of safety of 1.3 was applied to the load (Table 2). A 1-σ load case was also constructed.
Table 2. Enveloping static equivalent load case for launch vibration (3 σ and 1 σ), including 1.3 FoS
Case Fx (lbf) Fy (lbf) Fz (lbf) Fyy (in-lbf) Fzz (in-lbf) 3 sigma 397 539 390 1755 1246 1 sigma 132 180 130 585 415
Bearing analyses presented at CDR predicted healthy load margins (~0.9) against contact stress allowables when subjected to the 3-sigma enveloping load case. This is consistent with static load ratings from the manufacturer (Table 3). Unloaded balls were indicated but no truncation. No unloading was indicated for the 1 σenveloping load case. Contact stress maps for the 3-σand 1-σ load cases are presented in Fig. 9.
Table 3. Bearing Load Ratings from Manufacturer
Silverthin Part #
Physical Specifications Static Load Ratings
Dynamic Load Ratings
Bore Dia.
Outside Dia.
Pitch Dia. Width Ball
Dia. No. Balls
Contact Angle Radial Axial Radial Axial
in in in in in deg lbf lbf lbf lbf SSB040BU5Z 4.0 4.625 4.313 0.313 0.156 58 30 3310 5890 1400 2100
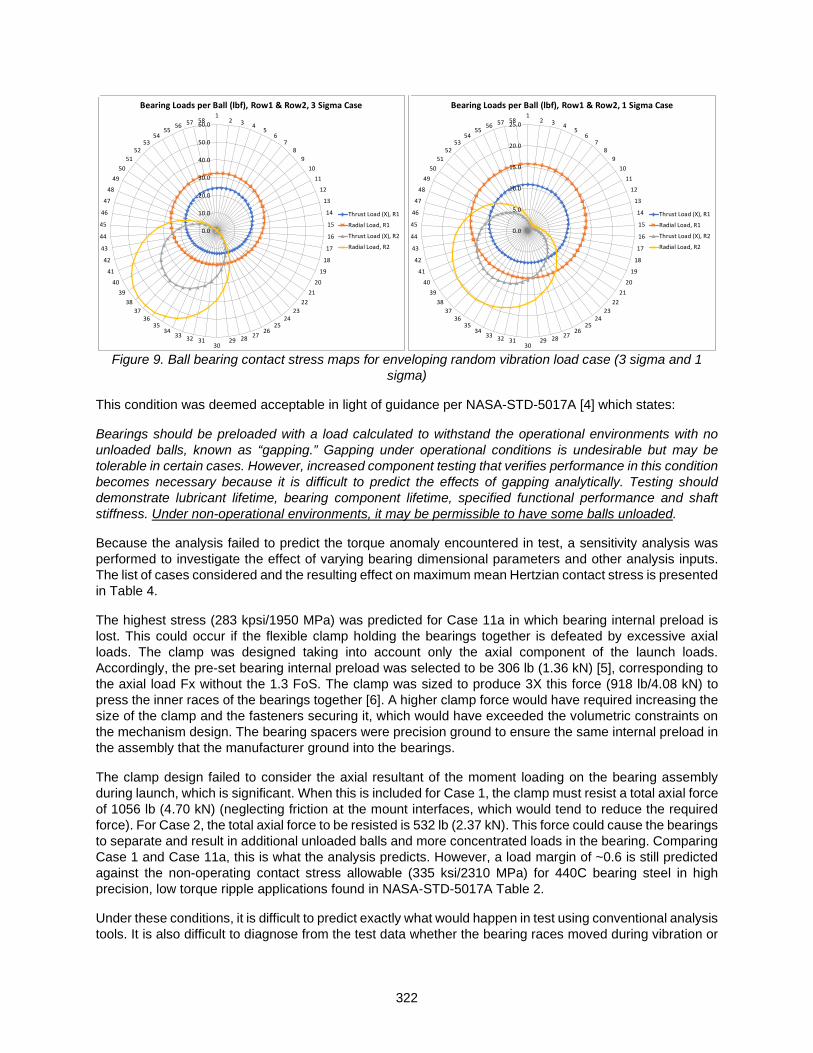
322
Figure 9. Ball bearing contact stress maps for enveloping random vibration load case (3 sigma and 1
sigma)
This condition was deemed acceptable in light of guidance per NASA-STD-5017A [4] which states:
Bearings should be preloaded with a load calculated to withstand the operational environments with no unloaded balls, known as “gapping.” Gapping under operational conditions is undesirable but may be tolerable in certain cases. However, increased component testing that verifies performance in this condition becomes necessary because it is difficult to predict the effects of gapping analytically. Testing should demonstrate lubricant lifetime, bearing component lifetime, specified functional performance and shaft stiffness. Under non-operational environments, it may be permissible to have some balls unloaded.
Because the analysis failed to predict the torque anomaly encountered in test, a sensitivity analysis was performed to investigate the effect of varying bearing dimensional parameters and other analysis inputs. The list of cases considered and the resulting effect on maximum mean Hertzian contact stress is presented in Table 4.
The highest stress (283 kpsi/1950 MPa) was predicted for Case 11a in which bearing internal preload is lost. This could occur if the flexible clamp holding the bearings together is defeated by excessive axial loads. The clamp was designed taking into account only the axial component of the launch loads. Accordingly, the pre-set bearing internal preload was selected to be 306 lb (1.36 kN) [5], corresponding to the axial load Fx without the 1.3 FoS. The clamp was sized to produce 3X this force (918 lb/4.08 kN) to press the inner races of the bearings together [6]. A higher clamp force would have required increasing the size of the clamp and the fasteners securing it, which would have exceeded the volumetric constraints on the mechanism design. The bearing spacers were precision ground to ensure the same internal preload in the assembly that the manufacturer ground into the bearings.
The clamp design failed to consider the axial resultant of the moment loading on the bearing assembly during launch, which is significant. When this is included for Case 1, the clamp must resist a total axial force of 1056 lb (4.70 kN) (neglecting friction at the mount interfaces, which would tend to reduce the required force). For Case 2, the total axial force to be resisted is 532 lb (2.37 kN). This force could cause the bearings to separate and result in additional unloaded balls and more concentrated loads in the bearing. Comparing Case 1 and Case 11a, this is what the analysis predicts. However, a load margin of ~0.6 is still predicted against the non-operating contact stress allowable (335 ksi/2310 MPa) for 440C bearing steel in high precision, low torque ripple applications found in NASA-STD-5017A Table 2.
Under these conditions, it is difficult to predict exactly what would happen in test using conventional analysis tools. It is also difficult to diagnose from the test data whether the bearing races moved during vibration or
0.0
10.0
20.0
30.0
40.0
50.0
60.01
2 3 45
67
89
1011
12
13
14
15
16
17
18
19
2021
2223
2425
26272829
30313233
3435
3637
3839
40
41
42
43
44
45
46
47
48
4950
5152
5354
5556 57 58
Bearing Loads per Ball (lbf), Row1 & Row2, 3 Sigma Case
Thrust Load (X), R1
Radial Load, R1
Thrust Load (X), R2
Radial Load, R2
0.0
5.0
10.0
15.0
20.0
25.01
2 3 45
67
89
1011
12
13
14
15
16
17
18
19
2021
2223
2425
26272829
30313233
3435
3637
3839
40
41
42
43
44
45
46
47
48
4950
5152
5354
5556 57 58
Bearing Loads per Ball (lbf), Row1 & Row2, 1 Sigma Case
Thrust Load (X), R1
Radial Load, R1
Thrust Load (X), R2
Radial Load, R2
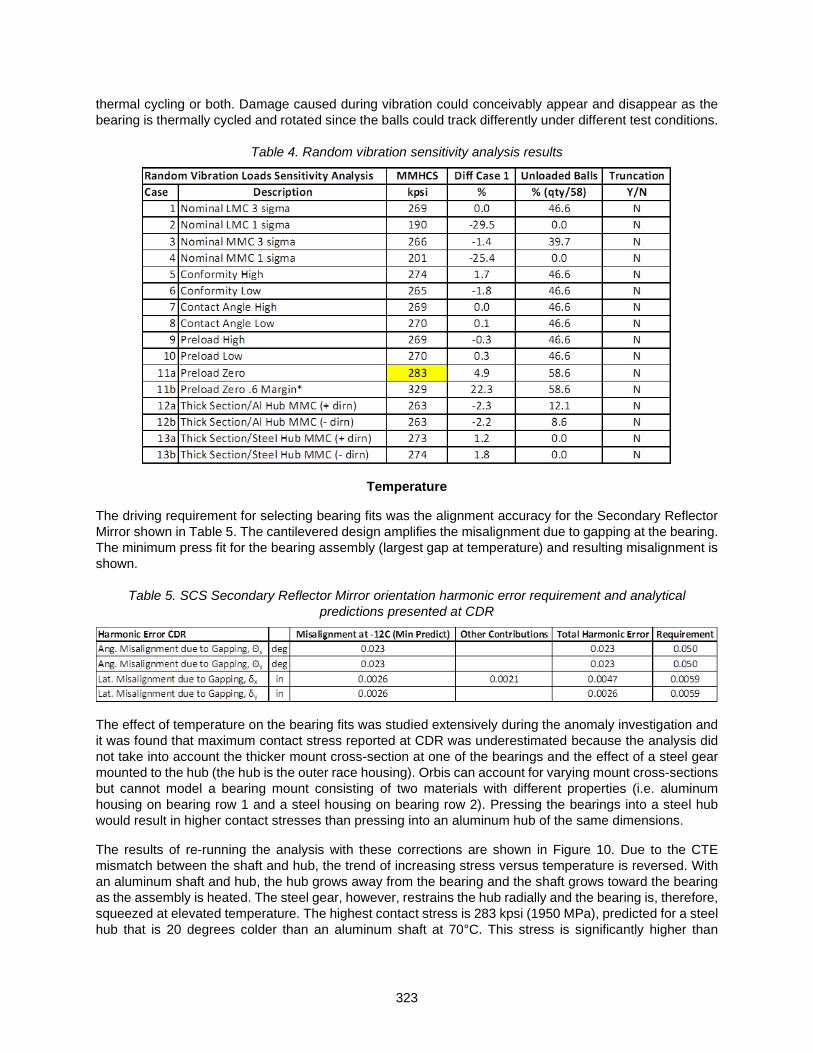
323
thermal cycling or both. Damage caused during vibration could conceivably appear and disappear as the bearing is thermally cycled and rotated since the balls could track differently under different test conditions.
Table 4. Random vibration sensitivity analysis results
Temperature
The driving requirement for selecting bearing fits was the alignment accuracy for the Secondary Reflector Mirror shown in Table 5. The cantilevered design amplifies the misalignment due to gapping at the bearing. The minimum press fit for the bearing assembly (largest gap at temperature) and resulting misalignment is shown.
Table 5. SCS Secondary Reflector Mirror orientation harmonic error requirement and analytical predictions presented at CDR
The effect of temperature on the bearing fits was studied extensively during the anomaly investigation and it was found that maximum contact stress reported at CDR was underestimated because the analysis did not take into account the thicker mount cross-section at one of the bearings and the effect of a steel gear mounted to the hub (the hub is the outer race housing). Orbis can account for varying mount cross-sections but cannot model a bearing mount consisting of two materials with different properties (i.e. aluminum housing on bearing row 1 and a steel housing on bearing row 2). Pressing the bearings into a steel hub would result in higher contact stresses than pressing into an aluminum hub of the same dimensions.
The results of re-running the analysis with these corrections are shown in Figure 10. Due to the CTE mismatch between the shaft and hub, the trend of increasing stress versus temperature is reversed. With an aluminum shaft and hub, the hub grows away from the bearing and the shaft grows toward the bearing as the assembly is heated. The steel gear, however, restrains the hub radially and the bearing is, therefore, squeezed at elevated temperature. The highest contact stress is 283 kpsi (1950 MPa), predicted for a steel hub that is 20 degrees colder than an aluminum shaft at 70°C. This stress is significantly higher than

324
temperature-induced operational stress reported at CDR but comparable to the random vibration case 11a in Table 4 with zero preload.
Figure 10. Effect of temperature on max mean Hertzian contact stress in the bearing assembly (bearing
installed at 20C) The alignment analysis was also corrected for the effects of the thicker sections and steel gear. At cold temperature, the misalignment would be increased because the steel gear would restrain the hub from compressing the outer race. The resulting misalignment predictions, even at a worst case, are shown in Table 6. The requirement is satisfied in both cases.
Table 6. Corrected mirror alignment analysis. (Case 19b Thick Section/Steel Hub)
In consideration of these results, a lesson learned is that for a mechanism using thin section bearings with a combination of tight accuracy, significant loads and temperature variability, design constraints should be loosened to allow mounting of the bearing in a material with matching CTE. Moreover, when the bearing is designed and analyzed as a rigidly preloaded system, it should truly be rigidly clamped if you are to truly trust the analysis. Otherwise, analysis results may overlook effects which are difficult or impossible to model accurately. The modification of the bearing configuration between the Brassboard and the EM/FM1/FM2 is not believed to have been detrimental to the design. In fact, it was expected to be beneficial because the change reduced predicted bearing stresses. Had the Brassboard experienced the vibration environment, it too may have experienced similar behaviors.
Root Cause Investigation
The process of the bearing anomaly investigation was informed by a fishbone diagram (Figure 12), which lays out all reasonable causes for the drag torque spikes in the SCS bearing assembly. The diagram is color-coded to indicate the status of each possible cause. Green indicates that the cause has been exonerated, yellow indicates that the cause cannot be exonerated until disassembly and inspection of the bearing assembly, and red indicates that the cause is implicated in causing the anomaly.
The top branch of the fishbone diagram concerns the bearings themselves. Manufacturing defects, poor design, inadequate analysis, or over-testing could all cause the anomalous torque spikes. The hardness of
150
170
190
210
230
250
270
290
-50 -30 -10 10 30 50 70
Max
Mea
n Be
arin
g Co
ntac
t Str
ess
(ksi)
Shaft Temperature (C)
Effect of Temperature on Max. Mean Hertzian Contact Stress in Bearing
CDR
Thick Section/Al Hub
Thick Section/Al Hub 20 deg DeltaT
Thick Section/Steel Hub
Thick Section/Steel Hub 20 degDeltaT

325
the bearings was exonerated by measuring the hardness of a set of bearings from the same lot as the bearings in the EM unit. Tests resulted in an average hardness of 57.6 on the Rockwell Hardness Scale C (HRC), which was considered in-family with the specified requirement of 58-60 for the 440C stainless steel bearings.
Bearing analysis via Orbis 3.0 indicated that an angular misalignment of 0.00028 in (7 µm) could introduce localized Maximum Mean Hertzian Contact Stress (MMHCS) greater than 335 ksi (2310 MPa). Both a coordinate measuring machine (CMM) and computed tomography (CT) (Figure 11) scans were used to evaluate this condition. CMM measurements showed a 0.0004-in (10-µm) difference across the bearing diameter while computerized tomography (CT) scans did not show any signs of misalignment. However, the CT scans only had a voxel resolution of 0.002 in (51 µm), which is not fine enough to detect the potential misalignment. The CMM measurements could only be made on the SCS secondary mirror attached to the output shaft. The alignment was only considered conditionally exonerated until the bearings could be inspected after a tear-down procedure on the EM unit.
Quality issues with the bearing could include (but are not limited to) poor workmanship, damaged components, or out-of-specification material. A review was conducted of all quality systems involved with the procurement, assembly, and testing of the bearings. Contingent on future disassembly and inspection, the bearing quality was believed to be adequate.
Poorly designed clamp rings or uncontrolled tolerance stack-ups between inner and outer bearing ring spacers in the output bearing assembly could result in Brinelling behavior. Manufacturing errors on bearing ring spacers could reduce preload and result in gapping during test events which could also damage the races. Either result could create the observed torque spikes. All inspection points and assembly measurements were reviewed to confirm that the as-built tolerance stack-up was nominal. Shimming and grinding procedures were confirmed to produce the desired preload, which was measured indirectly (by measuring the gap between the clamp and shaft/hub) during assembly of the bearings. Review of the clamp design analysis with a high-fidelity Finite Element Analysis (FEA) model confirmed good correlation with the load vs. deflection curves seen in in the as-built assembly. Bearing set running torque was measured during assembly and aligns closely with values predicted in Orbis. Axial acceleration endured by the bearing set during Protoflight
vibration testing was measured to be 30% less than predicted, indicating additional overhead on bearing design safety factors. Status of manufacturing errors as the root cause is labeled as Conditionally Exonerated until the bearing set can be disassembled, allowing for closer inspection and more precise measurement (disassembly of the EM bearing assembly has not occurred at this time).
Over-testing of the bearings could of course impart greater loads on the bearings than their design intended. A detailed review of all test parameters and instrumentation was conducted in relation to the Environmental Requirements Document (ERD). The review concluded that all parameters adhered correctly to the ERD and all measurements were taken with calibrated instruments. This cause was exonerated.
The analysis performed to generate the bearing design was conditionally implicated in causing the bearing torque spikes. Analysis was performed with three different suites of specialized bearing software (Bearings
Figure 11. CT scan of output bearing
assembly
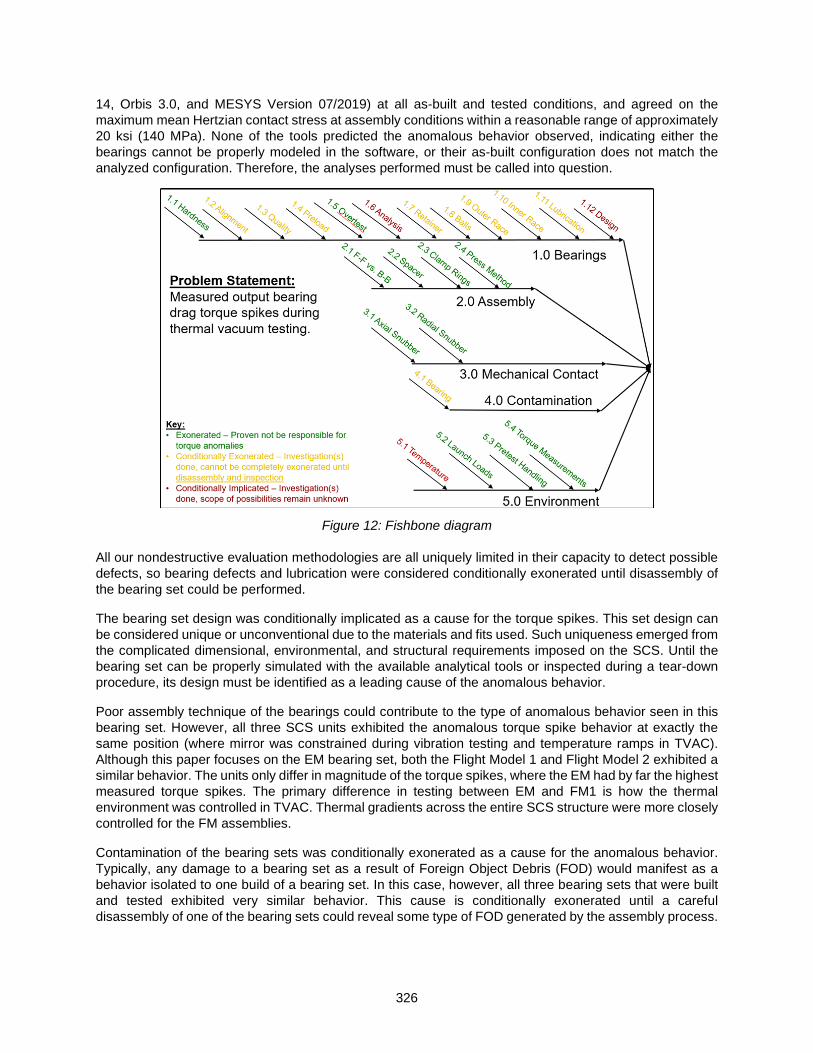
326
14, Orbis 3.0, and MESYS Version 07/2019) at all as-built and tested conditions, and agreed on the maximum mean Hertzian contact stress at assembly conditions within a reasonable range of approximately 20 ksi (140 MPa). None of the tools predicted the anomalous behavior observed, indicating either the bearings cannot be properly modeled in the software, or their as-built configuration does not match the analyzed configuration. Therefore, the analyses performed must be called into question.
Figure 12: Fishbone diagram
All our nondestructive evaluation methodologies are all uniquely limited in their capacity to detect possible defects, so bearing defects and lubrication were considered conditionally exonerated until disassembly of the bearing set could be performed.
The bearing set design was conditionally implicated as a cause for the torque spikes. This set design can be considered unique or unconventional due to the materials and fits used. Such uniqueness emerged from the complicated dimensional, environmental, and structural requirements imposed on the SCS. Until the bearing set can be properly simulated with the available analytical tools or inspected during a tear-down procedure, its design must be identified as a leading cause of the anomalous behavior.
Poor assembly technique of the bearings could contribute to the type of anomalous behavior seen in this bearing set. However, all three SCS units exhibited the anomalous torque spike behavior at exactly the same position (where mirror was constrained during vibration testing and temperature ramps in TVAC). Although this paper focuses on the EM bearing set, both the Flight Model 1 and Flight Model 2 exhibited a similar behavior. The units only differ in magnitude of the torque spikes, where the EM had by far the highest measured torque spikes. The primary difference in testing between EM and FM1 is how the thermal environment was controlled in TVAC. Thermal gradients across the entire SCS structure were more closely controlled for the FM assemblies.
Contamination of the bearing sets was conditionally exonerated as a cause for the anomalous behavior. Typically, any damage to a bearing set as a result of Foreign Object Debris (FOD) would manifest as a behavior isolated to one build of a bearing set. In this case, however, all three bearing sets that were built and tested exhibited very similar behavior. This cause is conditionally exonerated until a careful disassembly of one of the bearing sets could reveal some type of FOD generated by the assembly process.

327
The environments experienced by the bearing sets appeared to be the catalyst for creating and/or exacerbating the torque spikes. Vibration loads, bulk temperature changes, and temperature gradients across the bearing assembly, in particular, are conditionally implicated in causing the torque spikes. Pretest handling was exonerated because functional tests performed after assembly did not result in detectable torque spike behavior.
Table 7: Summary of bearing anomaly tests
Test Index
Test Name Test Unit
Environment Results
1 Pre TVAC Torque Measurement
EM Room Average measured torque aligned with predicted, small (~0.02 Nm) periodic torque spikes observed
2 TVAC Qual 1st Cycle Hot
EM +70°C, Vacuum Torque spike magnitude increased to ~0.05 Nm from predicted drag torque
3 TVAC Qual 1st Cycle Room
EM Room Torque spike magnitude appears to be permanently increased at the same locations
4 TVAC Qual 1st Cycle Cold
EM -45°C, Vacuum Torque spike magnitude increased to ~0.30 Nm from predicted drag torque
5 TVAC Qual 2nd Cycle Hot
EM +70°C, Vacuum Torque spike magnitude appears to be permanently increased to ~0.30 Nm from predicted
6 TVAC Qual 3rd Cycle Hot, Offset
EM +70°C, Vacuum Performing hot TVAC cycle with bearing set rotated 6° from nominal position creates new spike location
7 TVAC Qual 3rd Cycle Room, Offset
EM Room Torque spike magnitude appears to be permanently created at the new locations
8 TVAC Qual 3rd Cycle Cold, Offset
EM -45°C, Vacuum New torque spikes still present, no apparent increase to magnitude (~0.05 Nm)
9 TVAC Qual 3rd Cycle Room, Offset
EM Room Torque spikes are permanently created following TVAC cycles, not exacerbated at cold
10 Post Vibe Torque Measurement
FM1 Room Small torque spikes observed in data, on the order of 0.02 Nm in magnitude
11 Bearing Run-in Test (200 cycles)
EM Room Torque spikes diminished in magnitude, from ~0.20 Nm to ~0.05 Nm, 6° spikes are no longer present
12 Pre TVAC Torque Measurement
BB Room Brassboard unit exhibits torque spikes with ~0.04 Nm magnitude
13 TVAC Qual Cycle Hot BB +70°C, Vacuum Torque spike magnitude increased to ~0.10 Nm 14 TVAC Qual Cycle Room BB Room Torque spikes appear permanently increased from previous hot
cycle 15 Pre TVAC Torque
Aluminum Gear EM Room Torque spikes (~0.06 Nm) still present in bearings with steel
gear replaced with aluminum stand-in 16 TVAC Qual Cycle Hot EM +70°C, Vacuum Torque spikes increased to ~0.10 Nm with aluminum gear 17 TVAC Qual Cycle Room EM Room Torque spikes permanently increased, average running torque
also increased 18 TVAC Qual Cycle Cold EM -45°C, Vacuum Torque spikes still present, no noticeable change in magnitude 19 TVAC Qual Cycle Room EM Room Torque spikes still present, no noticeable change in magnitude,
running torque in-line with pre hot cycle 20 TVAC Qual Cycles
Repeat at Hot EM Room & +70°C,
Vac Repeated tests with steel gear reinstalled at hot and room temperature shows no significant change to torque spike magnitude
The test program includes over 20 discrete thermal vacuum tests meant to collect data on the bearing sets’ anomalous behavior and find a root cause. The types of tests run were informed by various hypotheses developed between Honeybee and JPL during the investigation. Table 7 summarizes the tests performed.

328
For the sake of brevity, only the plots from a selection of these tests are shown in accordance with their potential to cause the anomalous behavior.
Conclusions
The anomaly in the SCS bearing assembly has been humbling, but interesting. A Brassboard assembly was built and tested to provide validation of the design concept and tools. Deviations to the design were made between the Brassboard and EM/FM designs that were expected to reduce stresses in the bearing assembly. Test results have shown that there was design oversight in the process used for the SCS bearing assembly. The root cause investigation eliminated several potential contributors or reasons for the anomaly. However, the team is still left with questions.
• Did the anomaly occur during vibration testing, but only appear during TVAC due to some shift in the position of the ball track?
• Is the anomaly a function of temperature or temperature gradients only? If so, why isn’t drag in the system unexpectedly high for the full stroke of the mechanism? Average drag actually remained reasonably consistent with predictions.
• Is friction between the bearing and the shaft and housing too large to ensure the intended clamping over the temperature range, given the CTE mismatch?
• Was the problem with the clamp stiffness? If so, this would indicate that the anomaly occurred during vibration testing as non-rigid clamps would only reduce stresses during thermal cycling.
There are currently no plans in place to perform more tests, inspections, disassembly, or otherwise to find the true root of the problem for this assembly. However, there are some good lessons learned, or good reminders of lessons that have been learned previously by others. These are true particularly for thin section bearings which can be more sensitive to design parameters.
• Fundamentally sound designs should be the starting point. In this case, use matching CTE materials, “rigid” clamps, and avoid mixed material designs that are difficult to model (e.g. the gear in the SCS assembly was restricting the growth of the housing).
• Question requirements if they are dictating solutions that are difficult to analyze and push back if necessary.
If the opportunity exists to pursue this investigation further there are more tasks that could be performed to help identify the root cause. These include disassembly of the EM to inspect the raceways; and assembly and test (both vibration and TVAC) of a few more units with changes to specific variables such as clamp stiffness, housing and shaft friction, and CTE mismatch.
Acknowledgments
This research was carried out at the Jet Propulsion Laboratory, California Institute of Technology, under a contract with the National Aeronautics and Space Administration (80NM0018D0004), subcontract 1531184.
References
1. ESA 2000-2019, “Sentinel-6 Mission.” https://sentinel.esa.int/web/sentinel/missions/sentinel-6. Accessed December 23, 2019.
2. ESA 2000-2019, “Sentinel-6 / Jason-CS.” https://directory.eoportal.org/web/eoportal/satellite-missions/content/-/article/jason-cs. Accessed December 23, 2019.
3. Halpin, Jacob, D., “Ball Bearing Analysis with the ORBIS Tool,” Proceedings of the 43rd Aerospace Mechanisms Symposium, NASA Ames Research Center, May 4-6, 2016.
4. NASA Technical Standard. “Design and Development Requirements for Mechanisms.” NASA-STD-5017A w/CHANGE 1. 2016-05-31.
5. Singer, H., “Space Vehicle Mechanisms: Elements of Successful Design,” ed. Conley, P., John Wiley & Sons, 1998. Ch. 12, p. 305.
6. Videira, et al. “Design, Assembly and Preloading of Ball Bearings for Space Applications – Lessons Learned and Guidelines for Future Success.” Proceedings of ESMATS. Noordwijk, The Netherlands. 25-27 September 2013.

329
Parker Solar Probe MAG Boom Design, Analysis and Verification
Weilun Cheng*, Calvin Kee* and John Wirzburger*
Abstract
For the “hottest and coolest” mission to the Sun, FIELDS is the science instrument suite on the Parker Solar Probe (PSP) spacecraft that measures the magnetic fields in the solar corona during close approach to the Sun. The FIELDS instrument suite features five electric antennas and three magnetometers. The MAGnetometer (MAG) boom accommodates all three magnetometers and one of the electric antennas, the V5 antenna. The unique PSP sun shield – known as Thermal Protection System (TPS) – generates an umbra for the spacecarft and instruments so that the temperature environment is manageable during close approach to the Sun. The cone-shaped umbra tapers off towards the bottom of the spacecraft. With the tip of the deployed boom 3.5 meters away from the bottom of the spacecraft, the umbra imposed a tighter alignment requirement for the deployed boom than the instrument pointing requirement. This paper describes the design, development and verification of the Mag boom. Included are the dynamic analyses of boom deployment using Adams software, and the verification of the final on-orbit boom deployed position using the V5 antenna, solar limb sensors, and spacecraft attitude maneuvers.
Introduction
Parker Solar Probe is a mission to touch the sun. It is the first-ever mission to get as close as 6.16 million kilometers to the sun. The mission is planned for seven years, including 24 orbits around the sun using seven Venus flybys to gradually reduce the perihelion distance relative to the sun. The spacecraft is about the size of a small car. The thermal protection system on top of the spacecraft is made from a 11.43-cm-thick carbon-composite structure which can withstand temperatures of up to 1,400 degrees Celsius and beyond. There are four major investigations for the mission: 1) Fields Experiment (FIELDS) is designed to measure magnetic fields in the solar corona; 2) Integrated Science Investigation of the Sun (ISOIS) will make observations of energetic electrons, protons, and heavy ions that are accelerated to high energies; 3) Wide-field Imager for Solar Probe (WISPR) will take images of the solar corona and inner heliosphere, solar wind, shocks and other structures as they approach and pass the spacecraft; 4) Solar Wind Electrons Alphas and Protons (SWEAP) Investigation will count the most abundant particles in the solar wind and measure their properties such as velocity, density, and temperature. This paper focusses on the magnetometer boom that accommodates four of the FIELDS instruments.
MAG Boom Description The Parker Solar Probe Mag boom measures 3.5 meters long. It has two saloon-door style hinges, two composite boom segments, four instruments, two connector brackets, and one harness bundle, weighing a total of 9.02 kg. It was restrained to the spacecraft with two launch locks, the +Z lock and the -Z lock. The two boom segments were made from a layup of M55J/RS3C uni-directional carbon-fiber cyanate ester pre-preg. 6AL-4V Titanium end fiitings were bonded to the boom segments with Henkel Hysol EA-9360 adhesive. The four instruments included two Fluxgate Magnetometers (MAGi and MAGo), one Search Coil Magnetometer (SCM), and one V5 antenna. They were all populated on the outward segment of the boom assembly to allow maximum distance from the spacecraft while staying within TPS shadow, the umbra. Each instrument came with a harness pigtail that connected to either of the two connector brackets based on where each instrument was located. This arrangement allowed last-minute instrument replacement, if
* Johns Hopkins University Applied Physics Laboratory, Laurel, MD [email protected], [email protected], [email protected]
Proceedings of the 45th Aerospace Mechanisms Symposium, NASA Johnson Space Center, 2020

330
there was a need, without disturbing the test verified harness bundle loops and restraints across both hinge joints. There was a G-10 spacer, coated with BR-127 ESD, placed under the shoulder hinge to thermally isolate the deployed boom from the spacecraft. See Figure 1 for MAG boom description, and Figure 2 for deployed boom and umbra.
Figure 1. MAG Boom Assembly Description Figure 2. Deployed Boom and Umbra
TiNi FC3 frangibolts were used as the release actuators for both +Z lock and –Z lock. Each lock assembly used a Viton pad as a shock damper. There was also a preloaded spring plunger at the +Z lock to provide a push-off force at the separation interface during deployment. To maintain Mag boom magnetic cleanliness, the plunger was installed on the launch lock housing that mounted on the spacecraft. There was no spring plunger at the –Z lock since the outward boom was preloaded at the –Z lock. The boom spring-back force after frangibolt firing was much higher than the push off force from the plunger. On orbit, after firing the +Z lock and –Z lock in sequence manually, the Mag boom swung away from the spacecraft and deployed toward the bottom of the spacecraft. It went through a transient phase of over-travel and under-travel and settled to the final position. The final Mag boom position was controlled by the hinge holding torque. Similarly designed hinges were used on multiple previous APL missions with excellent, successful heritage [1]. Figure 3 illustrates the Mag boom deployment sequence.
Figure 3. MAG Boom Deployment Sequence

331
Ground Test Verification In the early program phase, an Engineering Model (EM) boom was built to demonstrate the design concept, the hinge performance, the harness routing scheme, the boom deployment transient behavior and the deployment settling time. Multiple standalone in-air deployment tests on an air-bearing table sucessfully demonstrated the Mag boom performance. Qualification level environmental tests performed using the EM boom validated the structure and thermal design margins, and also demonstrated compliance with the alignment requirements. Figure 4 lists the EM boom test sequence, including hinge test, bond joint strength test, boom segment bend test, boom assembly tests, as well as alignment verifications.
Figure 4. EM Boom Test Sequence
The Flight Model (FM) boom was built under extreme control for maintaining magnetic cleanliness. Only magnetic-clean certified tools were allowed in the designated Mag boom work area. Acceptance level environment tests validated the FM boom workmanship. Standalone in-air deployment testing using flight frangibolt actuators verified the boom deployment sequence and deployed boom alignment. Figure 5 shows the FM Mag boom standalone deployment test. Figure 6 lists the FM boom test flow.
Figure 5. Flight Boom Deployment Test

332
Figure 6. FM Boom Test Flow
After integrating to the spacecraft, the Mag boom was included in some spacecraft level tests, including pop-and-catch followed by partial walk out, mass property, vibration, acoustic, thermal balance, and full walk out tests. Figure 7 lists the Mag boom related spacecraft level test flow.
Figure 7. FM Boom Related Spacecraft Test Flow
The spacecraft full boom walk out test was performed to verify that the full boom range movement, plus over travel motion, was free of obstruction from Multi-Layer Insulation (MLI) blankets, harnesses, tapes, and other surrounding components. With the spacecraft lifted in the air and the boom positioned below the spacecraft, the test introduced a major safety concern. The final test approach was to maneuver the boom using extension rods so operators could avoid working under the suspended load. The test procedure was rehearsed several times using the EM boom and a spacecraft mock up. The final full walkout test was successfully performed on the spacecraft with no abnormal findings. See Figure 8.

333
EM Boom Practice Spacecraft on GSE Dolly FM Boom Test
Figure 8. Boom Full Walkout Test on Spacecraft
Dynamic Analysis of the Mag Boom Deployment Deployment Analysis Background The Mag boom assembly mechanical deployment was demonstrated and verified at various phases, from the engineering model stage to flight model stage. The critical verification was the final, flight-like integration level, flight model stage where all flight components including harness, harness connectors, harness holdowns, thermal blankets and micro-meteoroid shielding were assembled onto the Mag boom, along with mass simulators in place of flight instruments. Test verification of deployment was the confirmation of the two Mag boom arms swinging out and settling into their design positions, which were validated with precision alignment measurements. In the preliminary design phase, a boom-deployment analytical model was built using Adams multi-body dynamics software. The model was not very detailed in complexity, but was sufficient to provide an indication whether or not the dual-arm Mag boom concept would work for the Program. The deployment simulation based on this model provided a level of confidence that the sweep of the arms would not impact the spacecraft, and that the torque at the hinges would be adequate to deploy the Mag boom to its intended position. Another Adams model was built in the later phase, after the final flight-like integration and testing phase, to closely represent the final flight deployment test behavior of the Mag boom. The objectives of generating a test-verified model were to observe the dynamic effect of deployment of the Mag boom on the spacecraft, and to have the capability of running various scenarios of spacecraft maneuvers in orbit and other dynamics related predictions or validations. The Adams model can provide a validation, or at least an indication, of the dynamic measurements received from the spacecraft.

334
Description of Adams Model The primary Mag boom assembly geometry was imported into the Adams model. The analytical model consisted of the shoulder hinge, the inner boom, the elbow hinge, the outer boom, the primary launch lock and snubber, the secondary launch lock, and the four instruments that mount on the outer boom (Figure 9). Harness and blankets were included as smeared masses on the two boom segments. The flight-like Mag boom that was installed on the deployment, gravity-negated table was weighed so that the Adams model mass could be adjusted to match. All the components in the Adams model were treated as rigid bodies, each having its own mass moment-of-inertia and center-of-mass. Since the Mag boom in the deployment test was oriented with hinge axis being vertical, and the booms were supported on the deployment table with compressed air bushings, it was assumed in the Adams model that gravity was negated.
Figure 9. Adams Multi-Body Dynamics Model of Mag boom
There were three boundary constraints in the Adams model. The shoulder hinge bracket which tied the Mag boom to the spacecraft was fixed in 6 degrees-of-freedom (DOF). The primary launch-lock bracket on the inner boom, close to the elbow hinge, held the other stowed end of Mag boom in 6 DOF. The secondary launch-lock bracket at the tip of the Mag boom was also fixed in 6 DOF. These launch-lock constraints were timed to be removed in the solver in order to release and deploy the Mag boom. A preload force was applied at the snubber between the booms when the outer boom folded over the inner boom in the stowed configuration. The force was derived from a flexible Nastran static analysis of the Mag boom. This force was a timed reaction between the two booms, and as the outer boom moved apart from the inner boom, the force went to zero. Hard stops in the rotations of the shoulder and elbow hinges were modeled as stiff impact-contacts. To provide the work required to open each hinge, a spring torque was applied at the shaft of the hinge. This torque was not defined as a typical Adams built-in torsion spring with a stiffness and a preload. Because of the nature of the “saloon-door” hinge, which was sprung in both directions, an equation had to be derived to apply this reversing torque that was based on the angle of the hinge brackets. There was a minimum torque designed into each hinge of approximately 2.26 N·m, where the minima of the torque curve was situated, and that minima corresponded to the angle of the settling position of each boom. A damper was designed into the hinge to reduce the overtravel of the hinges and to absorb some energy before the hinges impacted their hardstops (Figure 10). The components of the damper were included in the multi-body simulation, and to account for the activation of the damper, a rotational spring-damper function was modeled that applied the damping only when the damper brackets had rotated with respect to each other. Friction was also included in the hinge modeling.

335
Figure 10. Components of a Mag Boom Hinge as Modeled in Adams
Comparison of Deployment Test and Simulation Spring torque, damping, boom kick-off preload and contact stiffness-penetration were adjusted and a simulation that had a close representation of the deployment behavior and duration was progessively developed and established. The main correlation goals for the Adams model were to generate the same deployment shapes, and to complete the deployment close to the same duration as the deployment test. Figure 11 shows the Mag boom on the deployment platform and the Adams model prior to actuation of the release mechanism. Figure 12 through Figure 15 capture the major deployment shapes of the Mag boom. Figure 16 shows the final position of the Mag boom after release and settling from its oscillation. The simulation appeared to capture most of the dynamic behavior, in particular the overtravel of each hinge, the trajectory of each arm due to the multiple joints of the boom, and the max swing during oscillation. It was noted, while tuning the parameters, that the time of the shapes in the analysis tended to be quicker in the early part of the deployment, and then ended up taking a longer time to settle. The presumption was that the Adams model did not take into account the air resistance on the Mag boom surface, the friction between the air bearing and the platform, and the additional weight of the air bearings and hoses, all of which would increase the response time in the simulation. At the end, where the settling time took longer in the simulation, the lack of air resistance was not impeding the oscillation of the Mag boom. Overall, the Adams simulation was deemed sufficient to describe the dynamic behavior of the Mag boom deployment as it closely followed what was seen in the test. As in the test, the simulation showed that the sweep and reach of the arms would not cause any impact events with the spacecraft.
Figure 11. Mag boom Test Configuration and Adams Model Prior to Release
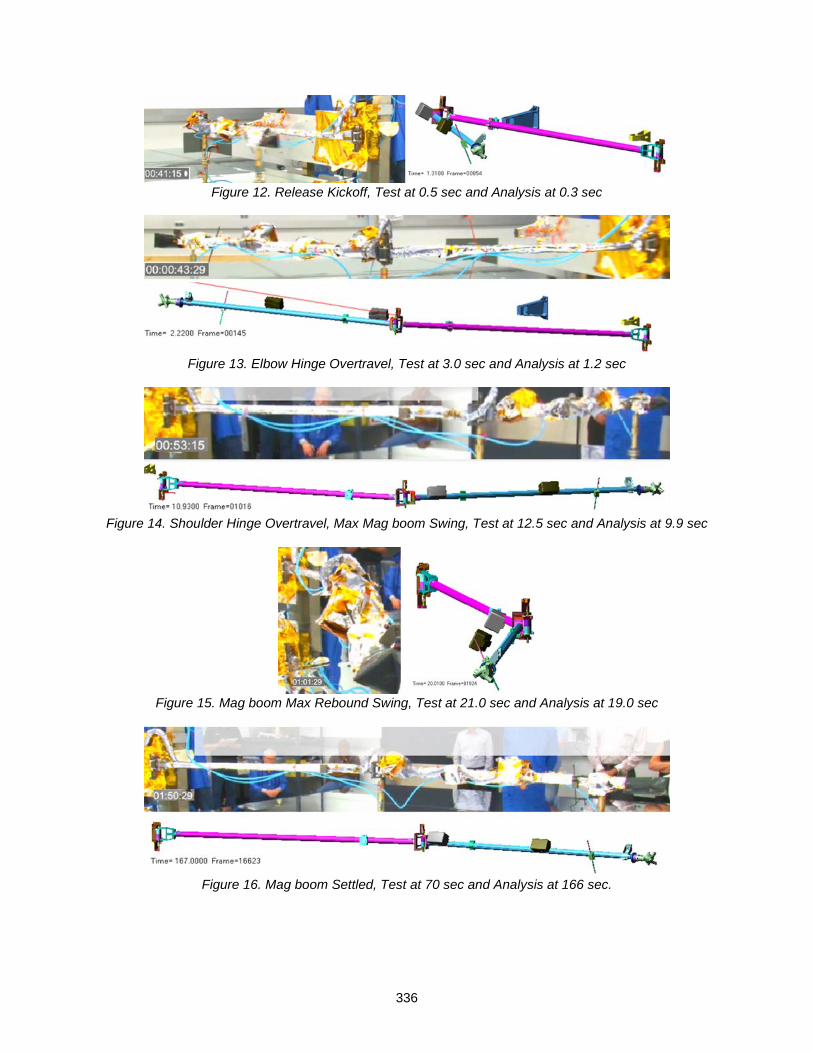
336
Figure 12. Release Kickoff, Test at 0.5 sec and Analysis at 0.3 sec
Figure 13. Elbow Hinge Overtravel, Test at 3.0 sec and Analysis at 1.2 sec
Figure 14. Shoulder Hinge Overtravel, Max Mag boom Swing, Test at 12.5 sec and Analysis at 9.9 sec
Figure 15. Mag boom Max Rebound Swing, Test at 21.0 sec and Analysis at 19.0 sec
Figure 16. Mag boom Settled, Test at 70 sec and Analysis at 166 sec.

337
Prediction of On-orbit Deployment Effect on Spacecraft The Adams model of the Mag boom was integrated with a representative PSP spacecraft, matching the geometry, mass, moments of inertia, and center of mass of the spacecraft bus (Figure 17). The objectives were to observe how the analytical deployment affected the attitude of the spacecraft, and whether the behavior of the Mag boom and the spacecraft would couple together to cause an impact scenario.
Figure 17. Mag boom Integrated on Spacecraft
Figure 18. Mag Boom Deployment and Effect on Spacecraft
Figure 18 illustrates the Mag boom deployment and its effect on the spacecraft. As the Mag boom unfurled, the spacecraft showed very small changes in attitude. When the fully outstretched boom swept toward the

338
rear of the spacecraft, there was a larger moment offset from the spacecraft, which caused it to rotate off its original attitude. The largest angle off the spacecraft axis was seen when the Mag boom reached its maximum overtravel after sweeping past the spacecraft axis. The angle was determined to be 12 deg, and after approximately 12 oscillations, the Mag boom motion damped out, and the spacecraft attitude settled at 7.6 deg (Figure 19). It was found that the spacecraft angular velocity during the deployment was at a max of 2.6 deg/sec (0.045 rad/sec).
Figure 19. Attitude of Spacecraft Off-Axis was Max 12 deg and Settled at 7.6 deg, while Max Angular
Rate was 2.6 deg/s
On-orbit Deployment and Final Position Verification On-orbit deployment of the magnetometer boom began on Flight Day 2, just after 24 hours post launch. Many factors influenced the decision to deploy the boom so quickly after orbit insertion including the blockage of thrusters that needed to be commissioned prior to a trajectory correction maneuver one week after launch, and diminishing data rates as the vehicle traversed farther from Earth. The on-orbit deployment verification consisted of three significant parts: confirmation of the fracturing of the intermediate frangibolt prior to detonating the primary frangibolt for boom motion, confirmation of the primary frangibolt fracturing causing boom motion, and final verification of the position of the magnetometers.
Intermediate Frangibolt Detection Frangibolt heating for the Mag boom Hinge Release +Z Tall Side on the primary side was initiated with temperature and timing cut-offs to prevent continuous current draws in the case of a failure. Proper actuation of this frangibolt would not result in boom motion, as the actual deployment consists of rupturing two frangibolts. Even with the nominal plan of heating the frangibolt through both the primary and secondary paths, it was desirable to confirm the breaking of the first frangibolt prior to releasing the second frangibolt.
Without motion of the magnetometer boom, it was unlikely that the science magnetometer on the boom could be used for verification of the fracturing of this first frangibolt. Looking at other possible sensors capable of detecting such an event, PSP is equipped with a Northrop Grumman Scalable Space Inertial Reference Unit. This inertial measurement unit consists of four low noise hemispherical resonator gyros as well as four accelerometers, enabling sensing of both rotational and translational motion of the spacecraft. Additionally, each set of four sensors is arranged in a tetrahedral, allowing for redundant sensing of events; that is, a glitch on a single sensor can be distinguished from an actual event that would be observable on multiple sensors [2].

339
As shown in Figure 20, when the temperature of the frangibolt reached its fracture temperature near 70°C at time 75 seconds, an impulsive disturbance was observed across all four gyros. This is indicative of the frangibolt breaking and imparting its energy on the spacecraft. While this is not a guarantee of proper actuation, this disturbance level is significantly above the observed quiescent noise floor and the close proximity to the stated fracture temperature is a strong indication. The absence of a disturbance when the redundant current path was exercised reinforces that conclusion or leads one to a double fault scenario, seeing both paths would have not properly activated the frangibolt.
Figure 20. +Z Mag Frangibolt Actuation, Gyro Rate Time Histories During ground testing, some activation signatures were sufficiently small that they were unobservable in the time histories directly. For those cases, the method of using shock spectrums proved to be sufficient. By analyzing how the frequency content in the gyro measurements changed over time, one could discern the impulsive event as a release of energy across a broad spectrum of frequencies. The on-orbit activation of the +Z Mag frangibolt is shown in Figure 21. The in-flight signature was similar to ground test spectrums.
Figure 21. +Z Mag Frangibolt Actuation, Gyro Rate Shock Spectrum
With positive confirmation of the +Z Tall Side frangibolt released, it was deemed safe to proceed with the full boom deployment.
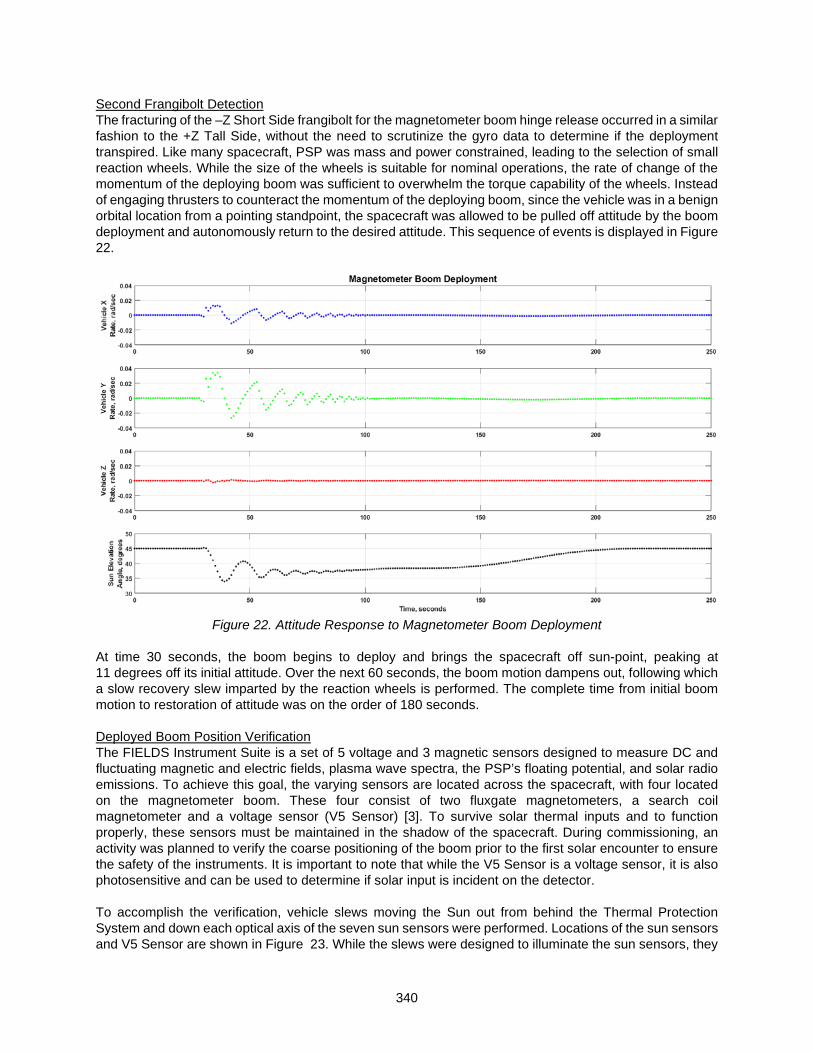
340
Second Frangibolt Detection The fracturing of the –Z Short Side frangibolt for the magnetometer boom hinge release occurred in a similar fashion to the +Z Tall Side, without the need to scrutinize the gyro data to determine if the deployment transpired. Like many spacecraft, PSP was mass and power constrained, leading to the selection of small reaction wheels. While the size of the wheels is suitable for nominal operations, the rate of change of the momentum of the deploying boom was sufficient to overwhelm the torque capability of the wheels. Instead of engaging thrusters to counteract the momentum of the deploying boom, since the vehicle was in a benign orbital location from a pointing standpoint, the spacecraft was allowed to be pulled off attitude by the boom deployment and autonomously return to the desired attitude. This sequence of events is displayed in Figure 22.
Figure 22. Attitude Response to Magnetometer Boom Deployment
At time 30 seconds, the boom begins to deploy and brings the spacecraft off sun-point, peaking at 11 degrees off its initial attitude. Over the next 60 seconds, the boom motion dampens out, following which a slow recovery slew imparted by the reaction wheels is performed. The complete time from initial boom motion to restoration of attitude was on the order of 180 seconds. Deployed Boom Position Verification The FIELDS Instrument Suite is a set of 5 voltage and 3 magnetic sensors designed to measure DC and fluctuating magnetic and electric fields, plasma wave spectra, the PSP’s floating potential, and solar radio emissions. To achieve this goal, the varying sensors are located across the spacecraft, with four located on the magnetometer boom. These four consist of two fluxgate magnetometers, a search coil magnetometer and a voltage sensor (V5 Sensor) [3]. To survive solar thermal inputs and to function properly, these sensors must be maintained in the shadow of the spacecraft. During commissioning, an activity was planned to verify the coarse positioning of the boom prior to the first solar encounter to ensure the safety of the instruments. It is important to note that while the V5 Sensor is a voltage sensor, it is also photosensitive and can be used to determine if solar input is incident on the detector.
To accomplish the verification, vehicle slews moving the Sun out from behind the Thermal Protection System and down each optical axis of the seven sun sensors were performed. Locations of the sun sensors and V5 Sensor are shown in Figure 23. While the slews were designed to illuminate the sun sensors, they

341
were not sufficiently large to illuminate a correctly positioned magnetometer boom, nor the bar of the V5 Sensor. Nominal shadow patterns are presented in Figure24. Absence of a Sunlight signature on the V5 Sensor during the slewing profile would indicate the boom was positioned correctly in the umbra, behind the spacecraft. Temperature data was also monitored during the slews. Confirmation of the proper attitude profile was performed using star trackers, gyros, and sun sensors. Following the on-orbit execution of the slews, Guidance and Control analysts and FIELDS scientists reviewed the data collected and determined that the coarse alignment of the magnetometer boom was nominal, inside the umbra of the Thermal Protection System. This has now been corroborated by three separate solar encounters where no ill effects of solar intrusion on the boom have been noted.
Figure 23. Placement of the V5 Sensor and Sun Sensors
Figure24. Shadowed region at the V5 Sensor

342
Conclusions The Parker Solar Probe thermal protection system umbra created a unique alignment reqirement for the MAG boom. Multiple G-negated boom standalone deployment tests with both EM boom and flight boom validated boom alignment accuray and repeatbility. The ADAMS model analysis provided a prediction on boom deployment motion, angles, and settling time in space. The on-orbit boom position verfication using V5 instrument, solar limb sensors, and slewing the spacecraft confirmed a successful boom deployment to the nominal position.
Lessons Learned
• Prior to PSP, all APL saloon-door style hinge deployables were deployed with one hinge line at a time. Deploying two hinge lines at the same time had not been previously performed. With PSP bi-fold Mag boom experience, it is proven that deploying a Mag boom with two hinge lines at the same time is feasible.
• Add a position indicator at each hinge joint to provide a positive indication of the final deployed position.
• Plan to provide as many blanket grounding points as possible. For the Mag boom, there were 34 grounding points available. However, for the two Flexgate magnetometers alone, there were 64 ground lugs to be grounded. Needless to say, there were boom blankets and SCM blanket ground lugs that need to be attached also. It was a big effort to figure out how to attach all the blanket ground lugs.
• Always include safety engineers in the deployment test planning at the beginning. For the full boom walk out test on the spacecraft, there were a lot of safety concerns. Final test strategy was approved by both APL and GSFC safety engineers.
• Future efforts to correlate an Adams model to a test setup should include ground-based and ambient characteristics. Such as air resistance, frictions and drags from ground support equipment sources.
• Ground tests should include all teams responsible for in-flight monitoring. This will allow the teams first-hand knowledge on how data was collected and how to properly interpret the data that feeds into the analysis.
Acknowledgments We would like to acknowledge the support of the APL PSP project management and that of our sponsor, the NASA Goddard Space Flight Center, along with APL Space Exploration Sector line management. We would also like to thank mechanical engineers of NASA Goddard Space Flight Center 5430 branch who loaned us the GSFC air-bearing tables for deployment testing of the PSP Mag boom.
References
1. W. Cheng, et al, Solar Array and High Gain Antenna Deployment Mechanisms of the STEREO
Observatory, AIAA 2007-6096 (2007)
2. Northrop Grumman. (2016). Scalable SIRU Family. Retrieved from Northrop Grumman: https://www.northropgrumman.com/MediaResources/MediaKits/Satellite/Documents/SIRU_Family.pdf
3. S. D. Bale, et al, “The FIELDS Instrument Suite for Solar Probe Plus. Measuring the Coronal Plasma and Magnetic Dield, Plasma Waves and Turbulence, and Radio Signatures of Solar Transients,” Space Sci. Rev. 204, 49–82 (2016).
343
Development of a Low-Shock Payload Fairing Jettison System
Boris Halter*, Josef Zemann*, Simon Wieser*, Beatrice Burkhart*, Mathias Burkhalter*, Alberto Sánchez** and Oliver Kunz*
Abstract
Today’s robust and reliable separation and jettison systems safely actuate and execute the separation of the payload fairing from the launcher. However, shock-loads are exported from the pyrotechnic separation event. Furthermore, the verification of new or adapted fairings is typically carried out by extensive and costly test campaigns due to the installation of full-scale components in vacuum chambers. In recent years, there is an increasing demand from the launcher primes and satellite suppliers to improve the payload comfort and to simplify the verification process. Following this need, RUAG Space is developing within the ESA-funded Future Launcher Preparatory Program a low-shock separation and jettison system applicable to currently used and future PLFs. The concept is based on a simple and reliable low-weight system for a controlled separation using hinges and actuators to rotate and jettison the PLF halves. This paper describes the developed concept and the mechanisms for the rotation and jettison. The focus is on the event of separation and jettison, excluding the method for fixation of the fairing during launch and the initial release. The paper shows the advantages of the novel design and explains the verification activities performed to prove the system.
Introduction RUAG Space is a leading supplier of products for the space industry in Europe and has as well a growing presence in the United States. RUAG Space develops, designs and builds payload fairings for several launch vehicles of different classes, having decades of experience in reliable and robust technical solutions with 100% mission success. Furthermore, RUAG Space is developing and manufacturing high reliable mechanisms for spacecrafts and launchers, as the herewith in this paper presented separation system. One of the key events in a satellite launch is the separation and jettison of the payload fairing (PLF) from the launcher. In the following a short overview of the state-of-the-art separation system’s main characteristics is given. The central reasons for the use of current fairing separation systems, based on pyrotechnic solutions, include:
• High efficiency: the pyrotechnic separation system provides a high ratio of separation force versus system weight.
• After PLF separation only a small section of the interface ring remains on the launcher as the pyro cords are typically encapsulated inside the PLF frame rings that are broken for separation. This influences positively the fuel consumption of the mission.
• Simple and compact design: pyrotechnic systems are not only compact, but also have a simple design compared to other mechanical systems; less parts are included and no movable joints or interfaces are needed, increasing the reliability of these systems.
• Flight-proven reliability and large heritage of the solutions: the large heritage of the pyrotechnic solutions with thousands of successful separations makes them a safe and reliable system consisting of only few components and fail-safe solutions.
* RUAG Space Spacecraft, Zürich, Switzerland ** RUAG Space Launchers, Zürich, Switzerland
Proceedings of the 45th Aerospace Mechanisms Symposium, NASA Johnson Space Center, 2020

344
The need for a new separation system development is linked to the drawbacks of the current systems: • A relatively high shock load during the separation event is transferred to the rest of the launcher
structure, including the payload. This necessitates that all the components attached to the PLF, including the rest of the launcher and payload, are dimensioned to sustain this load case.
• The fairing separation typically takes place at over 80 km of altitude, at the last layers of the atmosphere, with conditions similar to vacuum. For ground testing, however, the reaction forces from the pyrotechnic separation system are affected by the air resistance, driving the long-term clearances. For this reason, the pyrotechnic separation systems typically need to be tested in vacuum conditions to be fully representative of the separation event. Today there are few locations worldwide where this test can be carried out due to the size of the test items, structures over 20 meters in height. One of them is NASA’s Glenn Research Plum Brook Station in Sandusky, OH.
• Complexity of triggering: a drawback is the demand in accuracy to synchronize the horizontal and vertical separation systems in order to control the clearance.
Figure 1: RUAG fairing test at NASA Glenn Research Center Plum Brook in Sandusky, OH [1] The main focus of the new developments described in this paper is to overcome the above drawbacks of the pyrotechnic based separation systems used today. The system under development is designed to cover the separation of different PLF classes with low shock, enabling on-ground testing while ensuring the reliability and robustness of current pyrotechnic based solutions. The envisioned system consists of a scalable horizontal and vertical separation system (HSS & VSS, not part of this paper), compatible with a passive jettison system using hinges and actuators that once triggered, rotates and pushes away both PLF halves in a controlled maneuver. The focus of this paper is on the developed mechanisms of the passive jettison system.
System Description The within this paper presented mechanisms are developed for the payload fairing’s passive rotation and jettison after the HSS and VSS release. The system consists of two independent components:
• Pneumatic Actuators: to provide the kinetic energy for the PLF rotation. • Preloaded Hinges: define the PLF rotation axis and provide the jettison kick-off energy.

345
The functioning principle of the PLF separation system under development includes three phases as visible in Figure 2:
1. Low shock actuated horizontal and vertical separation system (HSS and VSS), which are not part of this paper.
2. Passive PLF rotation: actuators push the PLFs to a controlled rotation, guided by the hinges. 3. Passive PLF jettison: the hinges release the connection of the PLF to the launcher at a given angle.
Additionally, a jettison energy is implemented to the PLFs by pre-loaded springs, in order to ensure clearance.
Figure 2: Separation System Principle
This approach has several advantages: • Signals do not need to be synchronized: Due to the use of passive systems, there is only a single
triggering signal to release the HSS and VSS and initiate the fully passive separation. • Modular: The separation and jettison systems are independent, which allows individual customization
or even replacement of each sub-system for a different product without affecting the other subsystem. Additionally, the actuators and hinges can be outlined and tested independently.
• Scalable: The solution under development and described here is meant for small and medium size fairing and may also be applicable to larger firings as well, keeping the same working principle and thus reducing the development effort.
• On-ground testable: The non-pyrotechnic separation is slower than pyro-based separations. As a result, the friction with air becomes less dominant, which makes ambient verification possible.
• Simpler modelling: The functioning principle allows for a simpler kinematic modelling. • Low shock: The kinetic energy for the jettison is not provided by an instant impulse but by a continuous
force from the actuator and the springs inside the hinges. • Clearance control: the entirely guided rotation allows a higher control of the clearance to the launch
vehicle. In the following paragraphs the selection and development of the actuators and hinges for the separation system are described separately.
Actuators Given the system concept described above, the actuators need to provide the thrust to overcome the apex of the fairing half shells against the launcher’s acceleration loads and provide the kinetic energy to reach separation. Commercial off the shelf gas springs have been chosen as passive actuators.
Spring Loaded Hinges
PLF Half Shell
HSS
VSSPneumatic Actuators
Jettison Spring Force
CoG CoG
1) HSS & VSS Separation 2) Rotation 3) Disengagement and Jettison
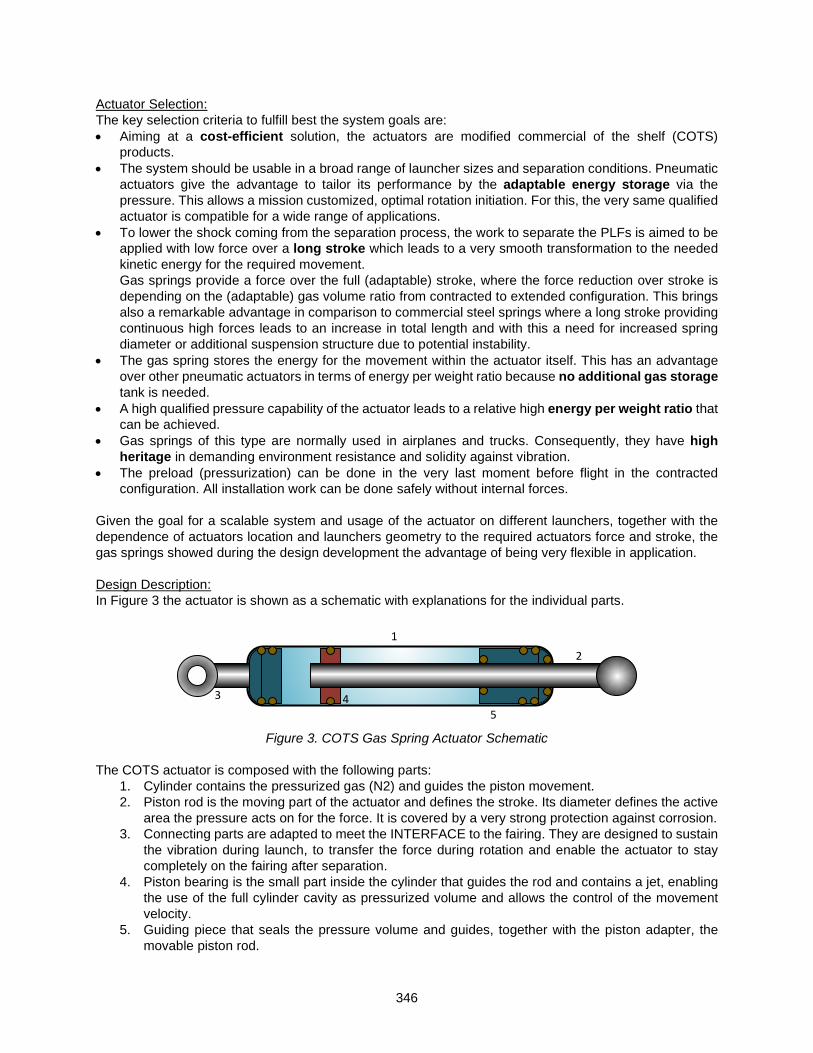
346
Actuator Selection: The key selection criteria to fulfill best the system goals are: • Aiming at a cost-efficient solution, the actuators are modified commercial of the shelf (COTS)
products. • The system should be usable in a broad range of launcher sizes and separation conditions. Pneumatic
actuators give the advantage to tailor its performance by the adaptable energy storage via the pressure. This allows a mission customized, optimal rotation initiation. For this, the very same qualified actuator is compatible for a wide range of applications.
• To lower the shock coming from the separation process, the work to separate the PLFs is aimed to be applied with low force over a long stroke which leads to a very smooth transformation to the needed kinetic energy for the required movement. Gas springs provide a force over the full (adaptable) stroke, where the force reduction over stroke is depending on the (adaptable) gas volume ratio from contracted to extended configuration. This brings also a remarkable advantage in comparison to commercial steel springs where a long stroke providing continuous high forces leads to an increase in total length and with this a need for increased spring diameter or additional suspension structure due to potential instability.
• The gas spring stores the energy for the movement within the actuator itself. This has an advantage over other pneumatic actuators in terms of energy per weight ratio because no additional gas storage tank is needed.
• A high qualified pressure capability of the actuator leads to a relative high energy per weight ratio that can be achieved.
• Gas springs of this type are normally used in airplanes and trucks. Consequently, they have high heritage in demanding environment resistance and solidity against vibration.
• The preload (pressurization) can be done in the very last moment before flight in the contracted configuration. All installation work can be done safely without internal forces.
Given the goal for a scalable system and usage of the actuator on different launchers, together with the dependence of actuators location and launchers geometry to the required actuators force and stroke, the gas springs showed during the design development the advantage of being very flexible in application. Design Description: In Figure 3 the actuator is shown as a schematic with explanations for the individual parts.
Figure 3. COTS Gas Spring Actuator Schematic
The COTS actuator is composed with the following parts:
1. Cylinder contains the pressurized gas (N2) and guides the piston movement. 2. Piston rod is the moving part of the actuator and defines the stroke. Its diameter defines the active
area the pressure acts on for the force. It is covered by a very strong protection against corrosion. 3. Connecting parts are adapted to meet the INTERFACE to the fairing. They are designed to sustain
the vibration during launch, to transfer the force during rotation and enable the actuator to stay completely on the fairing after separation.
4. Piston bearing is the small part inside the cylinder that guides the rod and contains a jet, enabling the use of the full cylinder cavity as pressurized volume and allows the control of the movement velocity.
5. Guiding piece that seals the pressure volume and guides, together with the piston adapter, the movable piston rod.
12
3 45

347
An important difference of the selected gas spring versus other pneumatic actuators is that the full cylinder is used as pressurized volume. The total amount of energy, the piston force and the force reduction over the stroke can be adjusted towards the systems requirement by the ratio between cylinder diameter, influencing the amount of energy, and piston diameter, influencing the force of the actuator. Depending on these parameters, a force reduction from beginning of stroke to end of stroke of less than 15% can be achieved without increasing the total size of the actuator. For pressurization a non-flammable, non-explosive and non-toxic gas is needed. For this the inert gas Nitrogen (N2) is chosen, which meets all these requirements and is easy to purchase. In collaboration with the supplier, the actuator is tailored to the needs of the project. These adaptions include:
• Material adaptions to meet ECSS standards2 as coating for the housing and sealing for bearing elements.
• Construction of a pressure inlet valve adapter. The actuator is to be pressurized on launch site, right before launch, enabling easy and save mounting after PLF closure.
• Pressure sensor adapter in order to surveille the pressure processing. The sensor is mainly implemented for this project phase to verify the performance of the actuator. During the vibration and life testing the sensor provided important knowledge about the sealing qualities under external loads and the pressure behavior when exposed to temperature gradients and lifetime tests. As the sensor is also already qualified, the sensor can be used to monitor flight data or be omitted for standard implementation during flight to reduce the mass.
Together with the supplier customization, the interface to the fairing was constructed. They are constructed to fulfill the following requirements:
• The interface has to sustain the internally stored energy for the rotation during all phases before separation
• All vibration loads during launch before separation need to be accommodated by the interface. • The interface needs to provide to the actuator the required degree of freedom to allow a smooth
movement without jamming. • After PLF separation, the actuator is to be separated from the launcher and gets jettisoned with the
PLF. • The concept needs to be adaptable to different launcher classes.
The interface brackets, designed to fulfill these requirements, comprise two different adapters for the PLF and launcher interface. Whereas on the PLF side an eye bearing provides the needed free moving space but close connection to hold the actuator at the payload shell, a ball joint on the launcher side prevents the actuator from jamming and releases the actuator after the stroke of the actuator has been reached. In Figure 4, the actuator with the interface brackets for the implementation to a PLF is shown. In addition to the analysis of the bracket’s load sustainability, an analysis has been run showing that the fairing can accommodate the actuator’s loads during launch and separation. A focus has been on the fairing’s deformation caused by the actuator’s force. It has been found that the deformation is negligible for the developed system as clearance towards possible fairing breathing is ensured during the rotation phase before jettison. The interface brackets have been designed and analysis for a medium launch vehicle. For the qualification campaign, described in the next section, the full set-up, including the interface joints, has been tested.

348
Figure 4: Actuator I/F schematic
Characterization and Qualification: Using a gas spring as the actuator brings the difficulty of a changing pressure and resulting force with changing temperature. Pressurization needs to be adapted in a way to have the required force at separation, but the actuator needs to sustain a possible high temperature increase. Thus, the characterization and qualification campaign enveloped a broad range of temperatures, for different launcher classes and different missions. This temperature range includes possible low temperatures when the actuators are installed near a cryo stage of the launcher as well as the temperature increase caused by air friction during launch. The qualification campaign (including lifetime and thermal characterization) has been performed on different COTS actuator sizes, applying full mechanical and thermal loads as per medium launch vehicles PLF qualification requirements. As a result, a fully qualified pneumatic actuator at low mass and broad application possibilities has been found. Lesson Learned: One of the lessons from testing is that the material for the sealing is critical in terms of heat capability and sustainability to the vibrations loads during launch. Dedicated testing has been performed to select a suitable material enveloping the range of temperature, the range of pressure and the high vibration load requirements.
Hinges The hinges guide the PLF during the rotation and provide the kick-off force to jettison the PLF halves. Two hinges are used per PLF half shell to ensure a balanced guidance of the PLF during rotation and enabling separation in the launcher’s rotational accelerated cases by avoiding high moments. The hinge’s main functions include the following:
• Provide the mechanical interface during the fairing rotation phase. • Transform the actuators forces to rotational movement of the fairing. • Guide the fairing during rotation with low friction. • Accommodate external forces during rotation. • Disconnect the mechanical connection at a given angle. • Provide a kick-off energy to jettison the PLF halves ensuring clearance. • Provide the correct force direction for the kick-off.
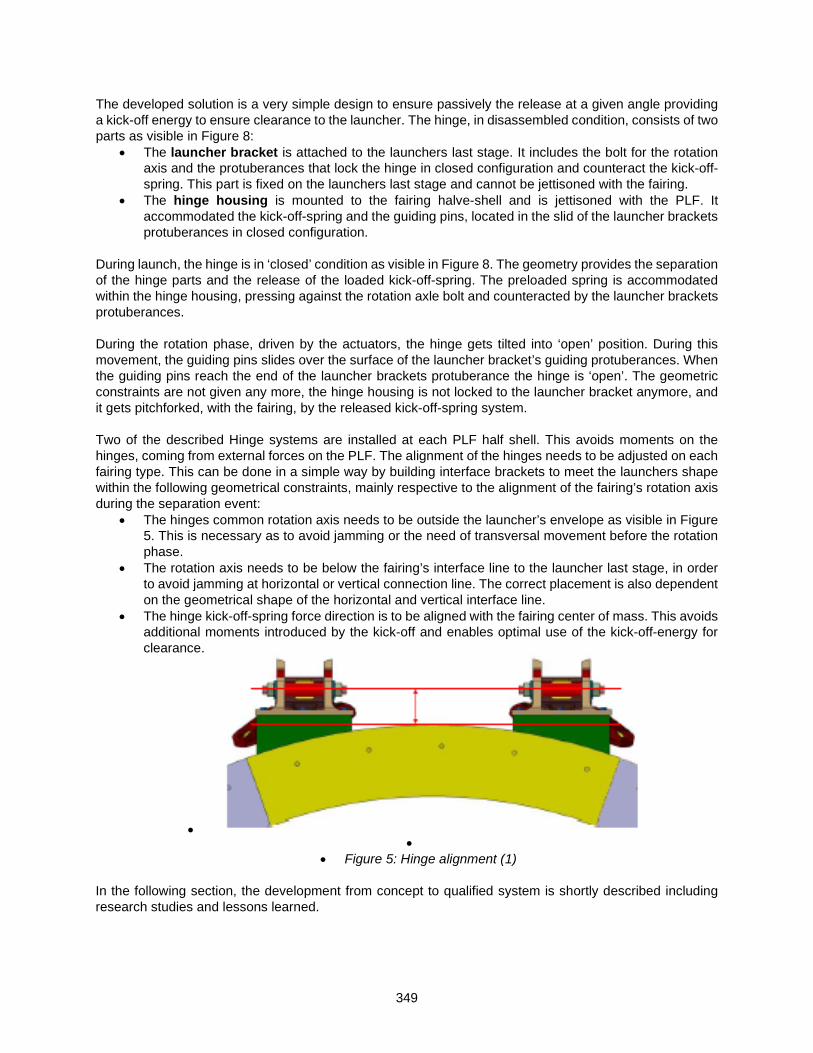
349
The developed solution is a very simple design to ensure passively the release at a given angle providing a kick-off energy to ensure clearance to the launcher. The hinge, in disassembled condition, consists of two parts as visible in Figure 8:
• The launcher bracket is attached to the launchers last stage. It includes the bolt for the rotation axis and the protuberances that lock the hinge in closed configuration and counteract the kick-off-spring. This part is fixed on the launchers last stage and cannot be jettisoned with the fairing.
• The hinge housing is mounted to the fairing halve-shell and is jettisoned with the PLF. It accommodated the kick-off-spring and the guiding pins, located in the slid of the launcher brackets protuberances in closed configuration.
During launch, the hinge is in ‘closed’ condition as visible in Figure 8. The geometry provides the separation of the hinge parts and the release of the loaded kick-off-spring. The preloaded spring is accommodated within the hinge housing, pressing against the rotation axle bolt and counteracted by the launcher brackets protuberances. During the rotation phase, driven by the actuators, the hinge gets tilted into ‘open’ position. During this movement, the guiding pins slides over the surface of the launcher bracket’s guiding protuberances. When the guiding pins reach the end of the launcher brackets protuberance the hinge is ‘open’. The geometric constraints are not given any more, the hinge housing is not locked to the launcher bracket anymore, and it gets pitchforked, with the fairing, by the released kick-off-spring system. Two of the described Hinge systems are installed at each PLF half shell. This avoids moments on the hinges, coming from external forces on the PLF. The alignment of the hinges needs to be adjusted on each fairing type. This can be done in a simple way by building interface brackets to meet the launchers shape within the following geometrical constraints, mainly respective to the alignment of the fairing’s rotation axis during the separation event:
• The hinges common rotation axis needs to be outside the launcher’s envelope as visible in Figure 5. This is necessary as to avoid jamming or the need of transversal movement before the rotation phase.
• The rotation axis needs to be below the fairing’s interface line to the launcher last stage, in order to avoid jamming at horizontal or vertical connection line. The correct placement is also dependent on the geometrical shape of the horizontal and vertical interface line.
• The hinge kick-off-spring force direction is to be aligned with the fairing center of mass. This avoids additional moments introduced by the kick-off and enables optimal use of the kick-off-energy for clearance.
• •
• Figure 5: Hinge alignment (1) In the following section, the development from concept to qualified system is shortly described including research studies and lessons learned.

350
Development: In a preliminary development study, the principle of the hinge was developed and a functional verification was run with a modifiable demonstrator model, shown in Figure 6, to prove the concept functionality. The hinge for the demonstration model is designed to have a broad range of adjustable functional parameters as to accommodate different springs and featuring an adaptable spring force and stroke length to vary the kick-off energy. The demonstrator consists of a fairing dummy, down scaled from a large launch vehicle. The dummy was constructed with adaptable mass distribution, in order to simulate possible design changes on the fairing for the new separation system as well as asymmetric mass distribution to assess the robustness of the system by test. Only one hinge has been attached to the demonstrator, allowing to investigate and test occurrence of jamming due to asymmetric actuator force introduction.
Figure 6: Early stage hinge during concept testing on the demonstrator model
The demonstrator test verified the principle of the system as well as the concept of the hinges. Several test variations in terms of initiated force direction, energy variation of actuator and kick-off-spring were conducted and showed the high robustness for the new jettison system. By varying a broad range of parameters, the concept also proved to be scalable to the use for different launcher classes with low additional work. Lesson Learned and Research: Along with the successful verification of the hinge’s principle and initial correlation to analysis, those tests showed that an improvement of the tribological behavior of the hinge’s gliding surfaces was necessary, i.e., the kick-off plunger to the axle and the suspension to the guiding pin. Consequently, a dedicated trade off and testing campaign was conducted to find a suitable material combination which ensures a low friction and avoids abrasion, jamming or cold welding. Three different material combinations, including a bearing, were selected by a tradeoff and tested extensively for gliding movement with high forces towards each other. The involved materials for the gliding surfaces are aluminum with Ematal coating and stainless steel. For the counter-acting surface three different materials and corresponding coatings were tested:
• Material 1: Titanium with Dicronite coating • Material 2: Stainless steel with fiber reinforced plastic composite bearing • Material 3: Stainless steel with Teflon-filled coating

351
A hinge dummy has been built simulating the internal loads by the preloaded kick-off-spring and external loads, simulating forces and moments on the hinge caused by the separation actuators and the launchers vertical and rotational acceleration at separation. In Figure 7 the results in terms of friction are presented.
Figure 7: Material Test for the Gliding Surfaces; Test Set-up and Results Material 1 was discarded due to the high friction increase occurred at high loads. In contrast, both materials 2 and 3 achieved the test success criteria of low friction and wear. Comparing material 2 and 3, combination 2 required additional parts (bearings), making the design more complex. In addition, material 3 also performed to high loads without change of the friction coefficient and no degradation was seen after exhaustive lifetime testing. As a result, the gliding surfaces material selection process was completed by the selection of material 3. In addition to the material selection, the interfacing geometry of the hinge dummy for the material tests were built similar to the qualification model hinges, including a preceding analysis for the hinge tolerances to ensure that no jamming occurs in the full temperature range due to different material expansion. This allowed preliminary functional tests to verify the concept against jamming in case of lateral or torsional external loads on the hinge dummy set-up, including life-time tests for the material and surfaces. Subsequently, dedicated flight model hinges were designed, built and tested to qualification loads according to the customer requirements for a middle launch vehicle (MLV) PLF. The campaign included thermal tests, vibration and lifetime. In Figure 8 the fully qualified hinge is shown, mounted on an MLV fairing with dedicated adapter brackets. The generic layout of the hinge allows the use on several different types of launchers. The only part needing additional design work are the INTERFACE adapter brackets to align with the fairings and upper stage curvature with the above described geometrical constraints. Additionally, the hinge is outlined to be scalable, the size is adaptable to accommodate forces from different launcher classes, if required.
1

352
Figure 8: Hinges for MLV PLFs
Full Scale Test One of the advantages of the system is the possibility to test under ambient conditions without the need to use a vacuum chamber. To verify the functionality and correlation to the analysis, a full-scale separation test on an MLV fairing has been performed. Figure 9 shows the test set-up at RUAG Space premises in Zürich/Switzerland. For this test, the fully qualified mechanisms (hinges and actuators), from the qualification campaigns as described above have been used.
Figure 9: Image of the PLF during rotation of the full-scale test
For several separations runs, tracing the fairings movement with high-speed camera targets and accelerometers at different failure modes and degradation cases, the separation and jettison hinge and

353
actuator system have demonstrated to be a simple and robust system with repeatable and predictable results. Figure 10 shows the trajectory of the fairing during and after rotation and jettison for several test runs with varying energy. The picture shows the movement of the hinge in radial (y) and gravitational (-x) direction, captured and tracked with a high-speed camera. The movement is robust against the variables that reduce performance of actuators and spring kick-off spring energy and can be adjusted very accurately.
Figure 10: Full scale test trajectory
Each run showed similar rotation behavior, accelerations, trajectory and rotational speed. The test outcome comparison to FEM prediction results showed good correlation, considering the prediction of the effect of air resistance. Besides the repeatability and good FEM correlation of the rotation and jettison system, the methodology and procedure to test in ambient air by tracking the trajectory and accelerations has proven to be a reliable methodology to verify the system for future separation tests on different launchers.
Conclusion This paper summarizes the activities carried out by RUAG Space within the Future Launchers Preparatory Programme – separation and jettison project. In the frame of this project, a low-shock jettison system has been developed based on the functional principle of a rotation, disengagement and jettison by means of passive gas springs actuators and spring loaded hinges. Qualification models of the mechanisms have been built and qualification testing has been successfully completed on component level and on system level in a full-scale test (TRL 6). An extensive test campaign was carried out to verify the suitability and prove the advantages of the newly developed technologies with regards to simplicity and verification efforts. Additionally, a full-scale test has been successfully conducted for the validation of the separation analysis model proven functionality of the technologies developed. Overall, the test results are proving the functionality of the new jettison system.
Acknowledgements The authors would like the thank the European Space Agency (ESA) and in particular the Future Launchers Preparatory Programme for supporting and granting a part of the investigation shown in this proceeding, in the frame of the Contract No. 4000121430-17-F-JLV.

354
References
1. European Space Agency, 2012. ARIANE 5 fairing separation system undergoes testing. http://www.esa.int/spaceinimages/Images/2012/06/After_separation2 (accessed 28.01.2020)
2. ESA Standards: ECSS-Q-ST-70C rev2: Materials, mechanical parts and processes 3. Sanchez A., Halter B., Gerngross T., RUAG’s development of a modular low-shock jettison system,
International Astronautic Conference IAC-19, October 2019, Washington, USA 4. Caldirola L., Schmid B., Cattaneo M., Schiaffini A., 2017. Test HDRM” development for separation
performance verification.. In European Space Mechanisms and Tribology Symposium. 5. Arianespace, 2014. VEGA User's manual issue 4. Online, available in
http://www.arianespace.com/wp-content/uploads/2015/09/Vega-Users-Manual_Issue-04_April-2014.pdf (accessed on the 04.06.2019).

355
Deployment Mechanism for an Earth Re-Entry Foldable Cloth Decelerator
Carl E. Kruger*
Abstract
Adaptable Deployable Entry and Placement Technology (ADEPT) is a NASA technology development project that uses a folded, 3D woven carbon fabric decelerator to serve both as thermal protection and primary structure. A sounding rocket test flight, with a 3U Cubesat sized payload, was used to evaluate ADEPT’s in-space deployment performance and supersonic stability. Size, mass and complexity limits dictated a solely mechanical mechanism to deploy the folded cloth decelerator surface. This paper describes the design constraints, system design components, hardware development, testing, flight test execution, and flight test results of the deployment mechanism used by this “Nano-ADEPT” [1].
Introduction ADEPT is a technology development project that uses a foldable carbon fabric “skirt” to serve as the primary drag surface for an entry vehicle decelerator. The carbon fabric acts as an aerodynamic surface to provide drag while also being able to withstand the high temperatures of re-entry. Using a folding design allows a larger decelerator to be packaged within any given launch vehicle’s payload envelope. For small spacecraft missions, a small version of ADEPT (sub-1m) could be used to provide a lower heating entry environment while still fitting within common secondary payload accommodations. This ADEPT Sounding Rocket One (SR-1) project focused on subsystem level testing of a 0.8-meter (Nano-ADEPT class) decelerator. Eight gores of a multi-layer, woven carbon fabric are sewn together with carbon thread to form a faceted 70° “cone shaped” aeroshell. A wind tunnel test (Fig. 1) was used to characterize the deflected fabric shape as a function of aero load, angle of attack, and cloth tension. Arc jet testing (Fig. 2) exposed carbon cloth samples and seams to heating rates and heat loads expected for a Mars mission. Lastly, a sounding rocket test was executed to investigate spacecraft re-entry stability as the vehicle decelerated from Mach 2.8 to Mach 0.8.
Figure 1. ADEPT Fabric Deflection Wind Tunnel Test Figure 2. ADEPT ArcJet Heating Test
* NASA Ames Research Center, Moffett Field, CA
Proceedings of the 45th Aerospace Mechanisms Symposium, NASA Johnson Space Center, 2020

356
Flight Concept of Operations
The ADEPT SR-1 vehicle was designed for the following concept of operations: It would be launched to an altitude of approximately 100 km (62 mi) in the payload module of an UP Aerospace SpaceLoft XL sounding rocket. Shortly before apogee, ADEPT SR-1 would be ejected by a spring-loaded sabot assembly in a “tail first” orientation, so that as it fell to earth, it would re-enter nose first. Approximately 40 seconds after being ejected (to reduce risk of re-contact), the on-board timing circuit would command the carbon fabric decelerator to deploy. SR-1 would reach a peak Mach number of 3, at approximately 70 km (43 mi) altitude with no significant heating. Supersonic and subsonic stability would be determined using recorded accelerations, body rates, and orientation references for stability analysis at a later time. A hard impact of 25 m/s would be attenuated with crushable material. Data stored on hardened SD cards would be recovered from the impact site (no telemetry was used).
Design Constraints
The deployment mechanism design was constrained by mass, volume, and Center of Gravity (CG) limitations. An internal volume with dimensions of 10 cm x 10 cm x 30 cm (to simulate a possible 3U CubeSat payload) was reserved in the center of the vehicle (for this demonstration flight, this payload area housed batteries, electronics, sensors, and impact attenuation foam). The external boundary was defined by the 25.4-cm (10-in) internal diameter of the UP Aerospace launch vehicle payload module (Fig. 3). The deployment mechanism, including the cloth and ribs, was limited to the space between these two volumes. The overall length of the vehicle was constrained by the need to avoid high-speed flow impingement on the aft payload as the wake expands off the aeroshell shoulder.
Figure 3. ADEPT SR-1 Prototype within Simulated Payload Volume
Cloth shape and mass properties were constrained. For aerodynamic purposes, cloth deflections were required to be limited, and similar to those characterized in the wind tunnel test. The ribs and struts had to lock into position when fully deployed so the cloth maintained a constant tension during re-entry. In order to maintain stability during flight, the vehicle’s CG location and Mass Moment of Inertia (MMoI) were closely tracked and adjusted.
ADEPT generally employs a rigid nose cap, which is used to cover the central payload as well as the deployable aeroshell when it is in the stowed position. In a typical high-heating re-entry environment, such as for Venus, it would carry a traditional thermal protection system, however for SR-1 a metallic nose cap was sufficient. As the carbon cloth skirt transitions from a stowed configuration to a fully open shape, the cloth must slide underneath the nose, and the nose cap must contact the cloth securely at the end of travel to prevent gaps that could allow hot gases to enter the payload region.
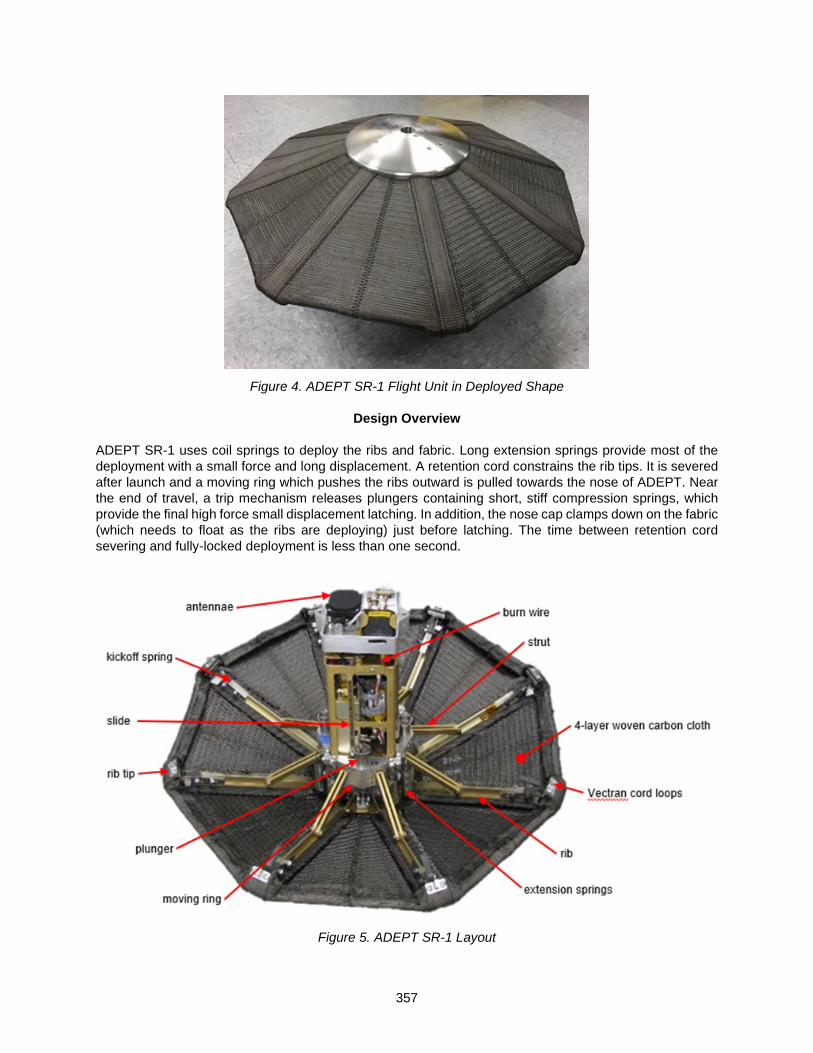
357
Figure 4. ADEPT SR-1 Flight Unit in Deployed Shape
Design Overview
ADEPT SR-1 uses coil springs to deploy the ribs and fabric. Long extension springs provide most of the deployment with a small force and long displacement. A retention cord constrains the rib tips. It is severed after launch and a moving ring which pushes the ribs outward is pulled towards the nose of ADEPT. Near the end of travel, a trip mechanism releases plungers containing short, stiff compression springs, which provide the final high force small displacement latching. In addition, the nose cap clamps down on the fabric (which needs to float as the ribs are deploying) just before latching. The time between retention cord severing and fully-locked deployment is less than one second.
Figure 5. ADEPT SR-1 Layout

358
Framework The basic mechanism works like an umbrella, with rigid ribs and struts. The carbon cloth is attached to the eight ribbed structure resembling an umbrella frame. The cloth is secured at the tips of the ribs and the cloth rests on the ribs. It is not attached at the center, so the tension in the cloth distributes evenly over the eight gores as the ribs are deployed.
Figure 6. ADEPT Prototype Showing Deployment
A moving ring containing the anchorage for the eight struts slides along the axis of the vehicle on four linear slides. As the ring moves from the tail toward the nose, the struts push the ribs out to a 70-degree angle. Unlike a conventional umbrella where the struts meet at a small ring, the SR-1 design employs a much larger square-shaped moving ring which encircles the 3U Cubesat payload volume. The ribs pivot from the nose of the spacecraft and are pushed outwards by struts located 1/3 of the way along the ribs (Fig. 7).
Figure 7. ADEPT SR-1 Ribs and Struts

359
Figure 8. ADEPT SR-1 Centerbody with Moving Ring and Nose Cap
Cloth Considerations The three-dimensional woven carbon cloth used on SR-1 is not strictly part of the deployment mechanism, but its properties are important to understand. The carbon cloth used for this version of ADEPT is a four-layer version, which demonstrated suitable folding behavior and tensioning ability (the cloth is stiff and becomes too thick to fold in 6- and 8- layer weaves). Eight triangular shaped gores are stitched together using carbon thread to form an eight sided “pyramid”. A carbon cord is threaded through pockets at the trailing edge, to provide a defined trailing edge shape and tension. As mentioned earlier, the cloth is free to float at the nose (Fig. 9). It is clamped at the underside of each rib tip (Fig. 10).
Figure 9: ADEPT Floating Cloth under Nose Cap Figure 10: ADEPT Rib Tips with Kickoff Springs
Rib retention and release When stowed, the eight ribs are parallel with the body axis, so there is no mechanical advantage for the long travel springs at the beginning of travel. For this reason, spring steel “kickoff springs” were added to each rib tip to initiate rib movement. These push the rib tips away from the centerbody far enough to initiate rib movement. The rib tips are sculpted to guide the cloth into a trailing edge geometry that matches the

360
projects’ CFD model. In order to increase the vehicle’s Ixx (rotational inertia about the central axis) to facilitate spin stabilization, the rib tips are stainless steel. ADEPT SR-1 is secured in the stowed condition by looping Vectran cord through hooks on all eight rib tips (Fig. 11). The Vectran is threaded through a pair of redundant spring-loaded Nichrome hot wire cord cutters [2].
Figure 11: Vectran Cord Loop and Nichrome Burn Wire Assembly
Motive force springs The project decided against using a motor and gearbox due to packaging, complexity and power budget reasons. Precluding an electric gearmotor to drive the umbrella open led to the use of springs as the deployment motive force. However, meeting the cloth tension requirement of 17.5 N/cm (10 lbf/in) derived from the wind tunnel testing required high force as the cloth was close to full deployment. This is contrary to the properties of extension and compression springs, which have their highest force at their largest displacement and a much smaller force when approaching their free height.
The mechanism designed to solve this conundrum uses two sets of springs to affect the required displacement and large final force. Eight pairs of long extension springs are used to provide the gross movement of the moving ring. A second set of stiff compression springs are triggered near the end of the range of motion, to create the necessary high force to tension the cloth and lock the ribs into position. The stiff compression springs also provide the motion to pull the nose cap firmly against the cloth and clamp it at full deployment.
Figure 12. ADEPT Prototype showing Long-Travel Extension Springs
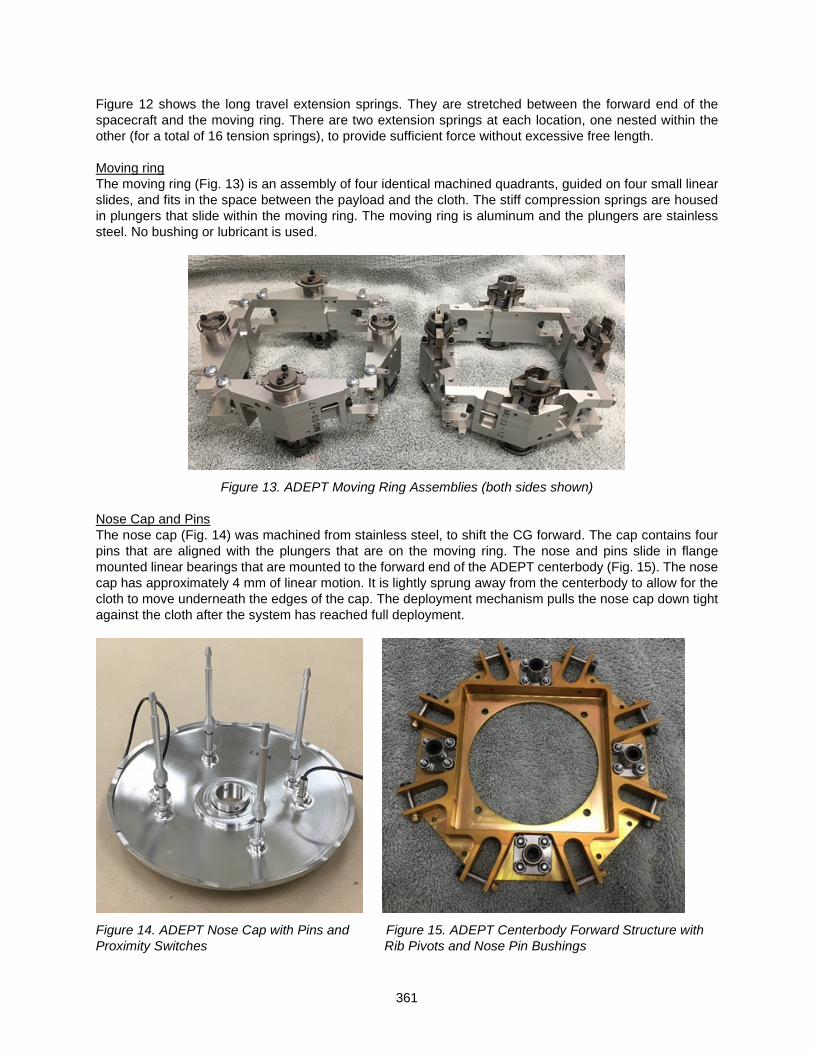
361
Figure 12 shows the long travel extension springs. They are stretched between the forward end of the spacecraft and the moving ring. There are two extension springs at each location, one nested within the other (for a total of 16 tension springs), to provide sufficient force without excessive free length.
Moving ring The moving ring (Fig. 13) is an assembly of four identical machined quadrants, guided on four small linear slides, and fits in the space between the payload and the cloth. The stiff compression springs are housed in plungers that slide within the moving ring. The moving ring is aluminum and the plungers are stainless steel. No bushing or lubricant is used.
Figure 13. ADEPT Moving Ring Assemblies (both sides shown)
Nose Cap and Pins The nose cap (Fig. 14) was machined from stainless steel, to shift the CG forward. The cap contains four pins that are aligned with the plungers that are on the moving ring. The nose and pins slide in flange mounted linear bearings that are mounted to the forward end of the ADEPT centerbody (Fig. 15). The nose cap has approximately 4 mm of linear motion. It is lightly sprung away from the centerbody to allow for the cloth to move underneath the edges of the cap. The deployment mechanism pulls the nose cap down tight against the cloth after the system has reached full deployment.
Figure 14. ADEPT Nose Cap with Pins and Figure 15. ADEPT Centerbody Forward Structure with Proximity Switches Rib Pivots and Nose Pin Bushings
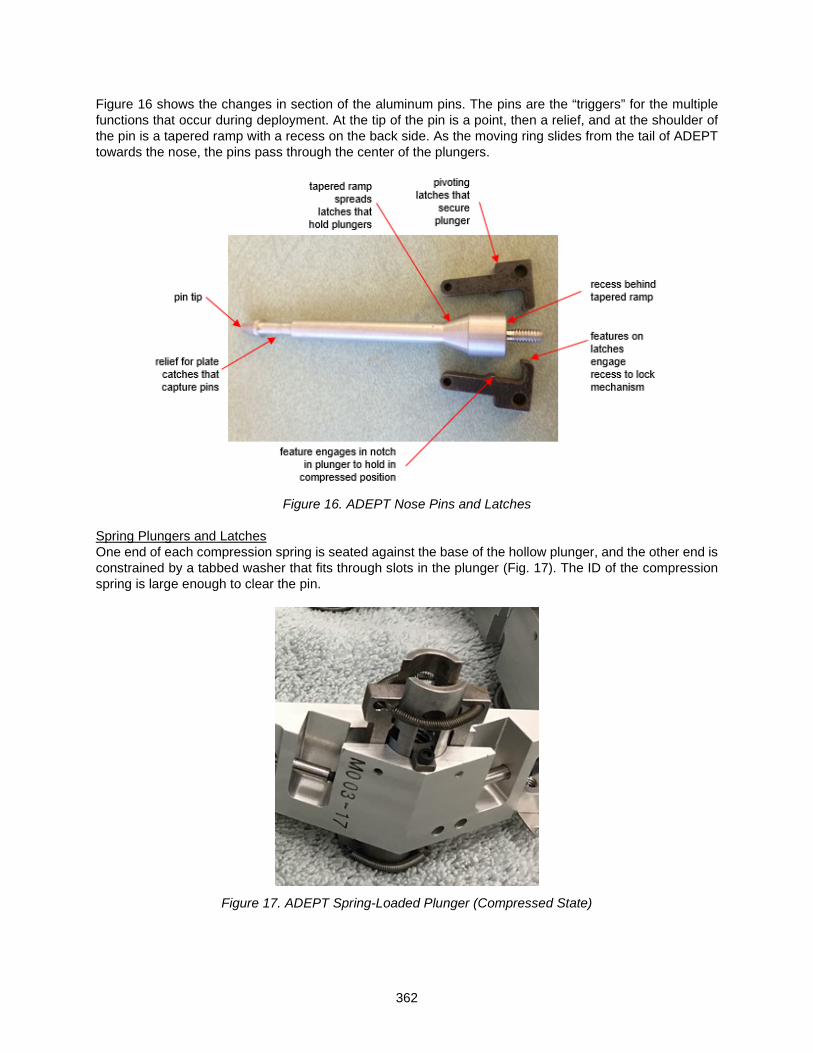
362
Figure 16 shows the changes in section of the aluminum pins. The pins are the “triggers” for the multiple functions that occur during deployment. At the tip of the pin is a point, then a relief, and at the shoulder of the pin is a tapered ramp with a recess on the back side. As the moving ring slides from the tail of ADEPT towards the nose, the pins pass through the center of the plungers.
Figure 16. ADEPT Nose Pins and Latches
Spring Plungers and Latches One end of each compression spring is seated against the base of the hollow plunger, and the other end is constrained by a tabbed washer that fits through slots in the plunger (Fig. 17). The ID of the compression spring is large enough to clear the pin.
Figure 17. ADEPT Spring-Loaded Plunger (Compressed State)
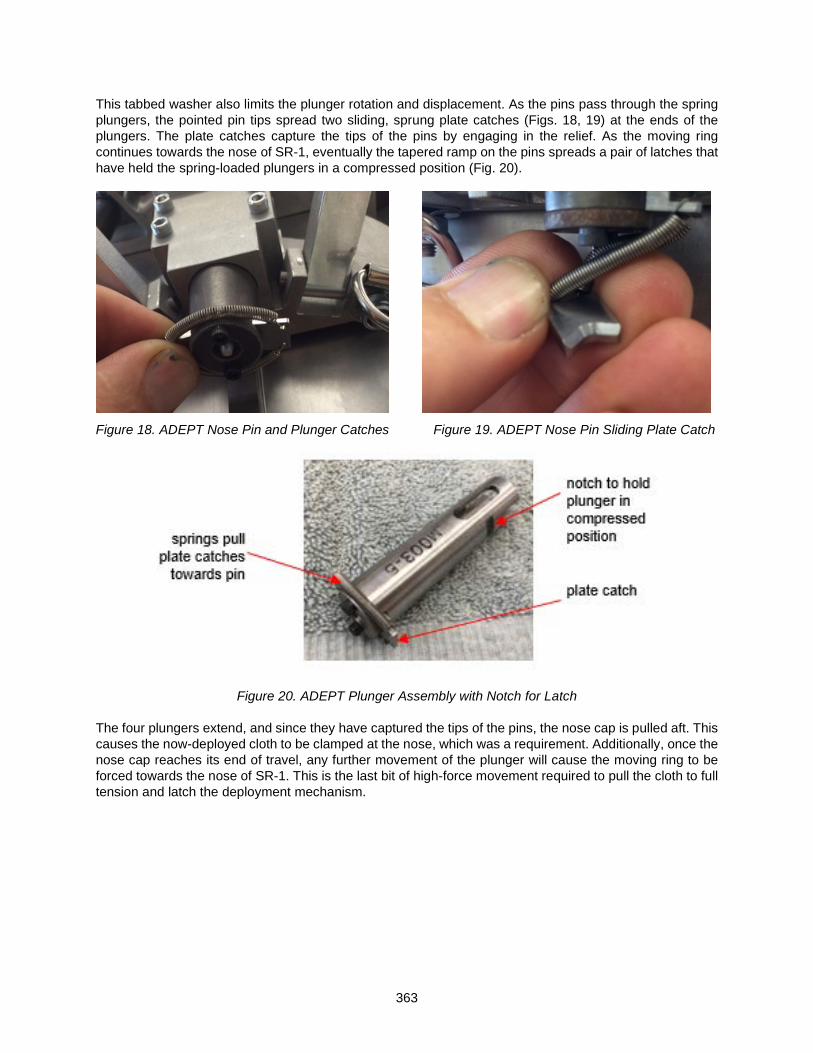
363
This tabbed washer also limits the plunger rotation and displacement. As the pins pass through the spring plungers, the pointed pin tips spread two sliding, sprung plate catches (Figs. 18, 19) at the ends of the plungers. The plate catches capture the tips of the pins by engaging in the relief. As the moving ring continues towards the nose of SR-1, eventually the tapered ramp on the pins spreads a pair of latches that have held the spring-loaded plungers in a compressed position (Fig. 20).
Figure 18. ADEPT Nose Pin and Plunger Catches Figure 19. ADEPT Nose Pin Sliding Plate Catch
Figure 20. ADEPT Plunger Assembly with Notch for Latch
The four plungers extend, and since they have captured the tips of the pins, the nose cap is pulled aft. This causes the now-deployed cloth to be clamped at the nose, which was a requirement. Additionally, once the nose cap reaches its end of travel, any further movement of the plunger will cause the moving ring to be forced towards the nose of SR-1. This is the last bit of high-force movement required to pull the cloth to full tension and latch the deployment mechanism.

364
Figure 21. ADEPT Moving Ring Quadrant- Plunger in Latched (left) and Triggered (right) States
Once the plungers have reached their full end of travel, the two latches that released the plungers are pulled back against the pins and capture the backside of the large diameter tapered ramp section of the pins (Fig. 22). This is the primary “locking” mechanism that prevents the moving ring from moving under aero load (the secondary locking mechanism is when the tips of the nose cap pins are captured).
Figure 22: ADEPT Plunger Assembly, Latched in Fully Deployed Position
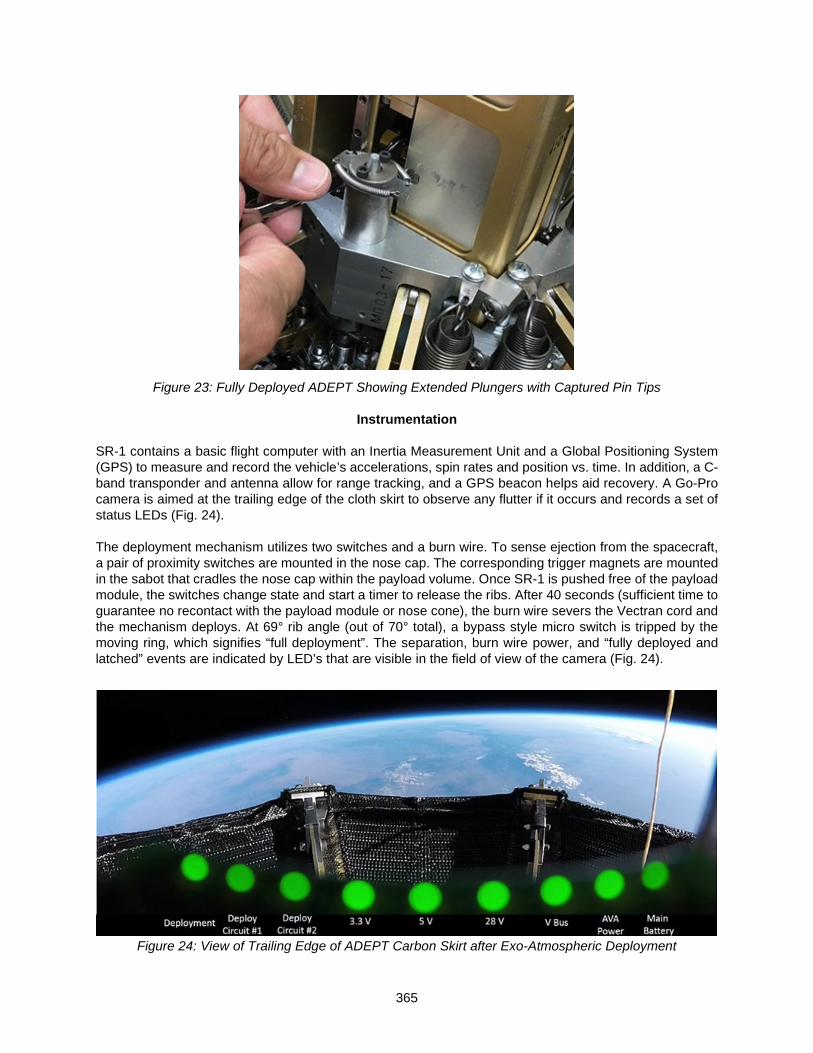
365
Figure 23: Fully Deployed ADEPT Showing Extended Plungers with Captured Pin Tips
Instrumentation
SR-1 contains a basic flight computer with an Inertia Measurement Unit and a Global Positioning System (GPS) to measure and record the vehicle’s accelerations, spin rates and position vs. time. In addition, a C-band transponder and antenna allow for range tracking, and a GPS beacon helps aid recovery. A Go-Pro camera is aimed at the trailing edge of the cloth skirt to observe any flutter if it occurs and records a set of status LEDs (Fig. 24).
The deployment mechanism utilizes two switches and a burn wire. To sense ejection from the spacecraft, a pair of proximity switches are mounted in the nose cap. The corresponding trigger magnets are mounted in the sabot that cradles the nose cap within the payload volume. Once SR-1 is pushed free of the payload module, the switches change state and start a timer to release the ribs. After 40 seconds (sufficient time to guarantee no recontact with the payload module or nose cone), the burn wire severs the Vectran cord and the mechanism deploys. At 69° rib angle (out of 70° total), a bypass style micro switch is tripped by the moving ring, which signifies “full deployment”. The separation, burn wire power, and “fully deployed and latched” events are indicated by LED’s that are visible in the field of view of the camera (Fig. 24).
Figure 24: View of Trailing Edge of ADEPT Carbon Skirt after Exo-Atmospheric Deployment

366
Testing
This dual spring mechanism design was extensively tested thru multiple prototypes, from a single plunger of printed plastic, through a 360-degree demonstration unit, culminating in the fabrication and testing of two flight units. The nested pairs of long travel extension springs were vibration tested at the component level, in their extended position, to check for possible resonance at launch vibration levels. The entire SR-1 was also vibration tested after electronics installation. Sine sweeps and three axis random vibration tests were performed on the stowed SR-1 to simulate the launch environment, followed by a full functional check. Functional testing of the mechanism (separate from integrated testing after the electronics were installed) included: 1) full deployment within 10 seconds of restraint release, 2) verification of full deployment via rib angle measurement, 3) verification of deployment diameter of 0.7m, 4) measurement of gore deflections under known pressure loads using a vacuum bag (Fig. 25), 5) full deployment confirmation via limit switch, and 6) plunger assemblies latched/locked after deployment.
Figure 25: Cloth Deflection Measurement Test using Vacuum Bag
During a simulated payload ejection, the onboard Inertia Measurement Unit was used to estimate SR-1’s tip-off rates with respect to the payload module. Both stowed and deployed configurations were tested for CG location and radial offset, plus Mass Moments of Inertia.
The soft goods presented a significant challenge in that the cloth is stiff and develops a “memory” after prolonged storage. ADEPT was shipped to the launch provider months in advance of the SR-1 flight, so it was important to be sure the cloth would unfold after long storage. The damping effect of the stiff cloth forced the cloth tension to be at the lower end of the allowable range. Adjusting for maximum cloth tension sometimes prevented the mechanism from reaching full travel and latching, so a balance was required to meet deflection limits while achieving full deployment. Long-storage tests of 85 and 90 days were used to ensure that SR-1 would still deploy. Other than some non-deployments due to long storage at high cloth tension targets, the deployment mechanism went through hundreds of cycles without other issues. To prevent possible contamination of the carbon cloth, initially no lubricant was used on the rib and strut pivots. No lubricant was used on the plunger or catch assemblies. The linear slides and linear bushings were pre-lubricated by the manufacturer.

367
Lessons Learned
Many design decisions were limited by the project budget. Pivots were simply aluminum holes rotating on steel shoulder bolts. The selected springs were chosen from commercial, off the shelf hardware, rather than custom made for optimal length/spring rate. There were no binding issues associated with the SR-1 shortcut of nesting the two long-travel extension springs. One of the spring steel kickoff springs broke during testing and some lost their shape. The heat treat shop had trouble reaching 48-50 Rockwell hardness, and suspected the spring steel was 1075 and not 1095 as indicated on the material certifications. An alternative to a flexible spring steel design, or more rigorous material certification, could prevent this. The carbon fabric was prone to unravelling at the edges of the gores, since it has no edge treatment. Carbon fibers would occasionally get caught in the linkage joints (Fig. 26). This was mitigated as best as possible by trimming any stray fibers before each stow.
Figure 26: Carbon Cloth Fibers Trapped in Joint Figure 27: Wear at Pivot Joints
SR-1 easily met its mass target of 25 kg (payload mass target of 15 kg). The entire spacecraft weighed 10.9 kg (24 lb). 0.61 kg (1.34 lb) of tungsten ballast was required at the front of the payload volume to meet axial (forward) CG location requirements. There is plenty of opportunity to wring weight from the design, especially the ribs, rib tips, and moving ring. Additional antennae and connectors were required aft of the burn wire assembly, which made the repetitive threading of the Vectran cord (required during testing) difficult. Aft mounted antennae or interfaces may be a regular necessity. Design for accessibility would be helpful because of the need for repeated system testing. After repeated deployments during testing (50+), the mechanism began to fail to reach full deployment and latch. A small amount of Polytetrafluoroethylene (PTFE) grease was applied to the rib and strut joints, which helped (Fig. 27). For more repeatable deployment, the extra cost and complexity of bushings at the pivot joints and plungers would be useful. The Nichrome burn wire assemblies performed flawlessly. This very simple system was well suited for the SR-1 application.

368
Conclusions
ADEPT was launched from White Sands Missile Range on September 12, 2018. It was recovered after its planned hard landing and inspection showed that the decelerator deployed and fully latched (Fig. 28). The on-board video recovered from SR-1 showed a fully deployed shape and an illuminated deployment indicator LED. Analysis of SR-1’s flight data showed angle of attack oscillations, but that it was stable from Mach 2.8 to Mach 0.8.
Figure 28: Post-flight ADEPT Recovery
Of the ADEPT SR-1 Success Criteria related to the deployment mechanism, Criteria D was defined as: “ADEPT achieves fully deployed and locked configuration prior to reaching 80 km (49.7 mi) altitude on descent.” This was verified by evidence from the onboard GoPro video. Of the ADEPT SR-1 Key Performance Parameters related to the deployment mechanism, Parameter 1 called for: “Exo-atmospheric deployment to an entry configuration of the 1m- class ADEPT.” This was met with a confirmed, fully locked deployment to 70° rib cone angle prior to entry, as evidenced by the onboard GoPro video, and post-recovery inspection. This mechanism proved successful and was well suited for our specific ADEPT case: an Earth re-entry aero-stability demonstration of a small diameter vehicle, with minimal heating and a low cloth tension requirement. Larger applications of the ADEPT concept, or entry environments with high heating or dynamic pressure, may require a motorized deployment design.
References
1. Smith, B., Cassell, A., Kruger, C., Venkatapathy, E., Kazemba, C., Simonis, K. “Nano-ADEPT: An Entry System for Secondary Payloads.” IEEE Aerospace Conference, June 2015.
2. Thurn, Adam “Nichrome Burn Wire Release Mechanism for CubeSats.” Proceedings of the 41st Aerospace Mechanisms Symposium, May 16-18, 2012.

© 2020 Lockheed Martin Corporation 369
Lessons Learned During the Development, Qualification, and Production of the MM Solar Array
Thomas B. Pace*
Abstract
The Multi-mission Modular Solar Array (MM Solar Array) is Lockheed Martin’s fourth generation flex array. The MM Solar Array was designed to be a high-powered solar array, 7.5-12.5 kW and higher per Wing (15-25 kW and higher with 2 Wings per spacecraft), that is easily configurable for a number of different missions. The prime objectives during the design process were a finished product that was cost-effective, easy to manufacture, and modular. Like previous generations of Lockheed Martin flex arrays, the MM Solar Array Z-folds the blanket and stows it between two rectangular composite structures that protect the blanket during ascent on the launch vehicle. Once on orbit, the MM Solar Array deploys in two phases. During phase one of the deployment, the launch locks are released, and hinges move the MM Solar Array away from the vehicle and position the blanket for deployment. During phase two of the deployment, motorized actuators are energized and the mast is deployed, which in turns pulls the Z-folded blanket open. At the end of the deployment, two blanket tensioning mechanisms are engaged. These mechanisms ensure the blanket behaves as a planar membrane throughout the life of the vehicle, thus creating a stiff structure that can survive vehicle engine and thruster firings. Once deployed, the MM Solar Array measures approximately 23 meters (75 feet) from the base of the solar array to the tip. One of the bigger design challenges with the MM Solar Array was to survive an orbit-raising maneuver, i.e., an apogee engine burn, with two 23-meter (75-foot) long MM Solar Arrays fully deployed on opposite sides of the vehicle. The structure and the hinges of the MM Solar Array had to be designed to survive this high loading condition. During the development, qualification, and production of the MM Solar Array many lessons were learned. In composite manufacturing, a critical lesson regarding cure profiles and how small variations can adversely change the behavior of a composite structure were learned. In mechanisms, proper handling of spring-driven devices so as not to damage the device were learned. In test, a simple but important lesson was learned on establishing the correct test temperatures for a thermal cycle test of a complicated mechanical assembly. Also in test, the degradation of the strength of composite structures at cold temperatures was investigated. In the supply chain realm, lessons were learned about how one supplier might interpret what was thought to be a clear requirement completely differently than another supplier. During failure investigations, an important lesson was learned about obtaining an independent perspective of the failure at hand. Some positive lessons were also learned, such as getting manufacturing and tooling involved early in the design process led to a smooth manufacturing process. Another positive lesson was that re-qualification of a heritage mechanism is a good idea, especially if the mechanism has not been built in over 15 years. The lessons learned in the development, qualification, and production of the MM Solar Array resulted in a cost-efficient and manufacturable solar array design that can be easily configured for any number of high-powered missions. Four MM Solar Array Wing Assemblies are currently in-orbit on two different vehicles. The launch of Wings 5 & 6 is scheduled for early 2020.
* Lockheed Martin Space, Sunnyvale, CA; [email protected]
Proceedings of the 45th Aerospace Mechanisms Symposium, NASA Johnson Space Center, 2020
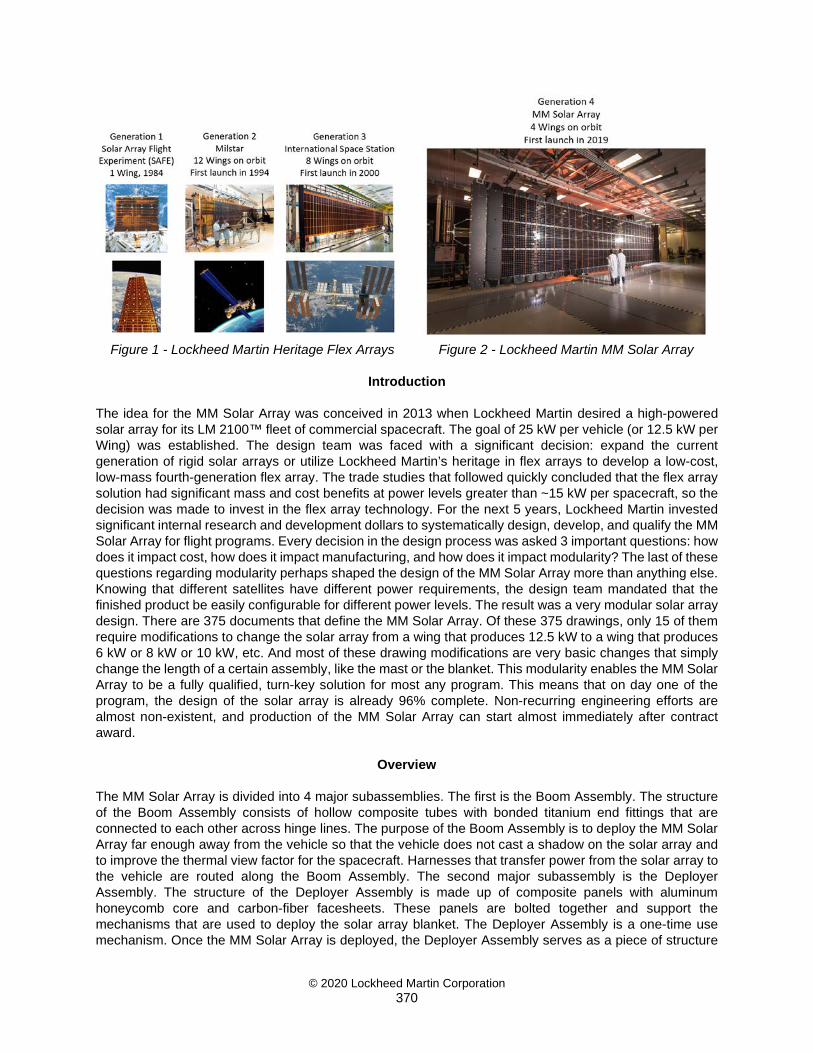
© 2020 Lockheed Martin Corporation 370
Figure 1 - Lockheed Martin Heritage Flex Arrays Figure 2 - Lockheed Martin MM Solar Array
Introduction
The idea for the MM Solar Array was conceived in 2013 when Lockheed Martin desired a high-powered solar array for its LM 2100™ fleet of commercial spacecraft. The goal of 25 kW per vehicle (or 12.5 kW per Wing) was established. The design team was faced with a significant decision: expand the current generation of rigid solar arrays or utilize Lockheed Martin’s heritage in flex arrays to develop a low-cost, low-mass fourth-generation flex array. The trade studies that followed quickly concluded that the flex array solution had significant mass and cost benefits at power levels greater than ~15 kW per spacecraft, so the decision was made to invest in the flex array technology. For the next 5 years, Lockheed Martin invested significant internal research and development dollars to systematically design, develop, and qualify the MM Solar Array for flight programs. Every decision in the design process was asked 3 important questions: how does it impact cost, how does it impact manufacturing, and how does it impact modularity? The last of these questions regarding modularity perhaps shaped the design of the MM Solar Array more than anything else. Knowing that different satellites have different power requirements, the design team mandated that the finished product be easily configurable for different power levels. The result was a very modular solar array design. There are 375 documents that define the MM Solar Array. Of these 375 drawings, only 15 of them require modifications to change the solar array from a wing that produces 12.5 kW to a wing that produces 6 kW or 8 kW or 10 kW, etc. And most of these drawing modifications are very basic changes that simply change the length of a certain assembly, like the mast or the blanket. This modularity enables the MM Solar Array to be a fully qualified, turn-key solution for most any program. This means that on day one of the program, the design of the solar array is already 96% complete. Non-recurring engineering efforts are almost non-existent, and production of the MM Solar Array can start almost immediately after contract award.
Overview
The MM Solar Array is divided into 4 major subassemblies. The first is the Boom Assembly. The structure of the Boom Assembly consists of hollow composite tubes with bonded titanium end fittings that are connected to each other across hinge lines. The purpose of the Boom Assembly is to deploy the MM Solar Array far enough away from the vehicle so that the vehicle does not cast a shadow on the solar array and to improve the thermal view factor for the spacecraft. Harnesses that transfer power from the solar array to the vehicle are routed along the Boom Assembly. The second major subassembly is the Deployer Assembly. The structure of the Deployer Assembly is made up of composite panels with aluminum honeycomb core and carbon-fiber facesheets. These panels are bolted together and support the mechanisms that are used to deploy the solar array blanket. The Deployer Assembly is a one-time use mechanism. Once the MM Solar Array is deployed, the Deployer Assembly serves as a piece of structure

© 2020 Lockheed Martin Corporation 371
that supports the overall solar array. The third major subassembly is the Blanket Container Assembly. Like the Deployer Assembly, the Blanket Container Assembly utilizes composite panels with aluminum honeycomb core and carbon-fiber facesheets. The purpose of the Blanket Container Assembly is to protect the Blanket Assembly during launch, position the Blanket Assembly for deployment once on orbit, and provide tension to the blanket during its on-orbit life. The fourth major subassembly is the Blanket Assembly. The structure of the Blanket Assembly consists of a thin film of Kapton. The solar cells are bonded to the Kapton in segments called panels. Panels are then connected to each other via hinge pins and Z-folded in the Blanket Container Assembly to create the Blanket Assembly.
Deployment
The MM Solar Array deploys in two phases. The first phase of the deployment starts when the low-shock non-pyro release mechanisms that hold down the solar array to the vehicle are released. Once these 8 release devices are fired, 3 hinge lines deploy the Boom Assembly and Deployer Assembly. A fourth hinge line rotates the Blanket Container Assembly and positions it for deployment of the Blanket Assembly. The end of phase one of the deployment is achieved when all four hinge lines lock out.
Figure 3 – Stowed Configuration Figure 4 – First Stage Deployment Phase two of the MM Solar Array deployment consists of deploying the Blanket Assembly. Like previous generations of Lockheed Martin flex arrays, the Blanket Assembly is deployed using a central backbone called a mast. The mast is a deployable composite structure that is connected to the outermost panel of the Blanket Assembly. When power is applied to the actuators, the mast is deployed and as it deploys, it pulls the z-folded blanket open. At the end of the mast’s travel, tensioning devices called the Tension Mechanisms are engaged. The Tension Mechanism is a constant force negator spring device that is mounted to the static structure of the MM Solar Array. A cable is wrapped around a central spool of each Tension Mechanism and then connected to the most inboard panel of the Blanket Assembly. As the mast nears its end of travel, the Tension Mechanism pays out a short length of this cable, thus applying a known tension to the blanket. The Tension Mechanism transforms the Blanket Assembly into a tensioned membrane, which is important to the satellite’s guidance and control because if the blanket is not tensioned,

© 2020 Lockheed Martin Corporation 372
then control of the satellite is compromised as it is very difficult to operate a vehicle that has two 23-meter (75-foot) long “floppy” appendages. For the remainder of the mission, the Tension Mechanism is left in this “partially deployed” state, where it can pay out more cable or retract some cable while maintaining a constant force. This is important because the Blanket Assembly will expand and contract as the temperature changes, especially as the vehicle goes into and out of the Earth’s eclipse.
Figure 5 – Fully Deployed MM Array in the Background, Stowed MM Array in the Foreground

© 2020 Lockheed Martin Corporation 373
Figure 6 - Stowed MM Solar Array
Figure 7 - First Stage Deployment: Four Hinge Lines Deploy Boom Assembly, Deployer
Assembly, and Blanket Container Assembly
Figure 8 - First Stage Deployment Complete

© 2020 Lockheed Martin Corporation 374
Figure 9 - Start of Blanket Deployment Figure 10 - Second Stage Deployment Complete
Orbit Raising
Lockheed Martin’s commercial satellite heritage has been to deploy the solar arrays once all orbit raising maneuvers have been completed. With rigid solar arrays, power generation during this orbit raising phase is possible because when stowed, rigid solar arrays still have solar cells that can be illuminated by the Sun (the entire outboard panel can generate power during orbit-raising). However, the MM Solar Array does not have any exposed solar cells when stowed. This means that the MM Solar Array must be deployed as soon as separation from the launch vehicle occurs. The result is that vehicle orbit raising maneuvers must be done with 23-meter (75-foot) long deployed solar arrays on either side of the vehicle. The vehicle’s orbit raising engine drove significant stiffness and moment-loading design requirements into the Boom Assembly and hinges, but the highest load was seen prior to the last engine firing when the vehicle was at its lightest mass.

© 2020 Lockheed Martin Corporation 375
Figure 11 - Orbit Raising with Deployed MM Solar Arrays
Lessons Learned Overview
During the design, development, qualification, and production of the MM Solar Array, many valuable lessons were learned. Lessons learned were plentiful during development and qualification, but some of the most important lessons were learned during the production of the flight MM Solar Arrays. Some lessons were still being learned during the production of the fifth and sixth MM Solar Arrays.
Thermal Testing of Complex Assemblies
The Deployer Assembly is a complex subassembly of the MM Solar Array. It contains structural panels made from carbon-fiber facesheets with aluminum honeycomb core, precision mechanisms such as the drive actuators, large aluminum sleeves that guide the mast during deployment, and the mast itself. The mast of the MM Solar Array is a composite lenticular strut that is based on work originally done by Dr. George Herzl, a co-founder of the Aerospace Mechanisms Symposia. When deployed the mast is in a stress-free state. But when stowed, i.e., flattened and wrapped up around a drum, the mast is in its most stressed state. The Mast is in its stowed state during thermal cycling of the Deployer Assembly. Before starting the qualification thermal cycle test of the Deployer Assembly, the hot and cold temperature extremes needed to be established for the test. A thermal model was used to determine the temperature extremes that would be experienced by each part of the Deployer Assembly during the mission. The analysis showed that the structural panels of the Deployer Assembly were the driving components, so the thermal extremes of the Deployer Assembly thermal cycle test were established based on these panel temperatures. Once this assessment was complete, it was noted that the drive actuators would have to be removed from this test because they contained circuit cards with electronic components that could not survive the planned temperature extremes (during flight, heaters are used to maintain the temperature of these circuit cards). However, the team forgot to assess whether any other parts of the Deployer Assembly had any temperature restrictions. Instead, the team went forward with the qualification thermal cycle test and every remaining component in the Deployer Assembly was tested to the predicted temperature extremes of the structural panels. Upon completion of the test, the mast was unrolled and deformities in the mast were observed. Further investigation revealed that the deformities were caused by subjecting the stowed mast, i.e., the stressed structure, to a hot temperature extreme that was above the glass transition temperature of the composite resin. Certain members of the team were aware of this limitation, but this was not communicated to the team member that wrote the test plan. There are multiple lessons learned in this example. The first is that a stressed composite structure should not be thermal cycled above its glass transition temperature. Two is that the limitations of all components in complex assemblies must be known prior to beginning a thermal cycle test or any other test. And three is that all members of the team should be involved in establishing the thermal extremes for a thermal cycle test of a complex assembly.
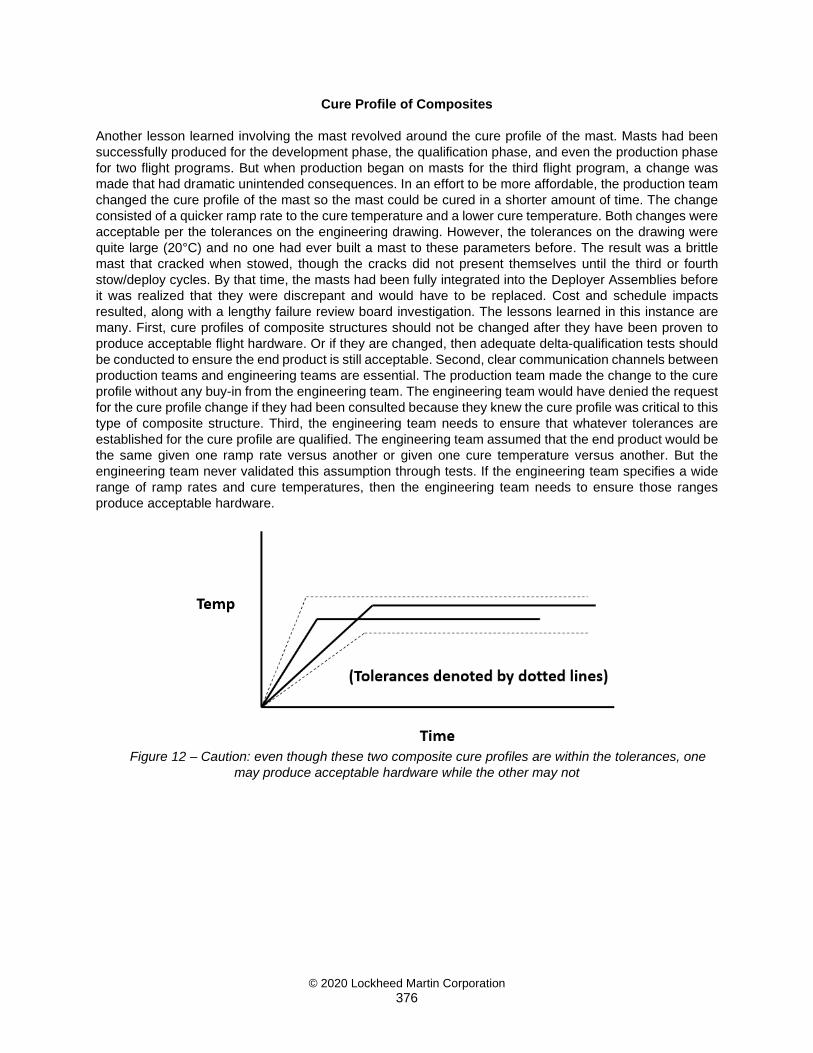
© 2020 Lockheed Martin Corporation 376
Cure Profile of Composites
Another lesson learned involving the mast revolved around the cure profile of the mast. Masts had been successfully produced for the development phase, the qualification phase, and even the production phase for two flight programs. But when production began on masts for the third flight program, a change was made that had dramatic unintended consequences. In an effort to be more affordable, the production team changed the cure profile of the mast so the mast could be cured in a shorter amount of time. The change consisted of a quicker ramp rate to the cure temperature and a lower cure temperature. Both changes were acceptable per the tolerances on the engineering drawing. However, the tolerances on the drawing were quite large (20°C) and no one had ever built a mast to these parameters before. The result was a brittle mast that cracked when stowed, though the cracks did not present themselves until the third or fourth stow/deploy cycles. By that time, the masts had been fully integrated into the Deployer Assemblies before it was realized that they were discrepant and would have to be replaced. Cost and schedule impacts resulted, along with a lengthy failure review board investigation. The lessons learned in this instance are many. First, cure profiles of composite structures should not be changed after they have been proven to produce acceptable flight hardware. Or if they are changed, then adequate delta-qualification tests should be conducted to ensure the end product is still acceptable. Second, clear communication channels between production teams and engineering teams are essential. The production team made the change to the cure profile without any buy-in from the engineering team. The engineering team would have denied the request for the cure profile change if they had been consulted because they knew the cure profile was critical to this type of composite structure. Third, the engineering team needs to ensure that whatever tolerances are established for the cure profile are qualified. The engineering team assumed that the end product would be the same given one ramp rate versus another or given one cure temperature versus another. But the engineering team never validated this assumption through tests. If the engineering team specifies a wide range of ramp rates and cure temperatures, then the engineering team needs to ensure those ranges produce acceptable hardware.
Figure 12 – Caution: even though these two composite cure profiles are within the tolerances, one
may produce acceptable hardware while the other may not

© 2020 Lockheed Martin Corporation 377
Hinge Springs
The next lesson learned involved the springs used in the hinges. During the first phase of deployment of the MM Solar Array, four hinge lines are deployed to position the MM Solar Array for deployment of the Blanket Assembly. During qualification of the hinges, the springs used in the hinges were procured from a supplier that specialized in producing springs. But for the flight units, the procurement team changed the supplier of the springs to a general machine shop to save cost. This machine shop delivered discrepant springs that were fabricated from the wrong material. But the discrepancy was not realized until after two sets of hinges had been built, tested, and installed on the flight MM Solar Arrays. Major cost and schedule impacts resulted and several work-arounds had to be implemented to meet critical vehicle need dates. Some basic but important lessons were learned from this event. First, communication between the engineering team and the procurement teams is important. The responsible engineer was not consulted on the supplier change for the springs. If he had been, he would not have approved the change. Second, if it is important that a product like a spring be procured from a specific source, then engineering should create a source-control drawing that specifies the approved suppliers.
Hinge Studs
Another lesson learned involving hinges revolved around a part of the hinge called the stud. This small machined part contains a threaded end with an undercut feature. The callout on the undercut was “R .015 undercut to minor dia. of thd”, i.e., undercut with a radius of 0.015 inch (0.38 mm) to the minor diameter of the thread. Even though this part and parts like it had been successfully fabricated for over 20 years, a supplier used to produce studs for the MM Solar Array hinges misinterpreted this undercut callout. This supplier interpreted the callout to be undercut 0.015 inch (0.38 mm) from the minor diameter. The result was a neck on the part that was too small (see Figure 9). During assembly of one of the hinges, the threaded part snapped off when a nut was torqued to it. This discrepancy was noted after multiple sets of hinges had been built, tested, and integrated into flight MM Solar Arrays. Major cost and schedule impacts resulted and several work-arounds had to be implemented to meet critical vehicle need dates. In the end, the flight drawing was updated to explicitly call-out the minor thread dimension and show the undercut to that dimension. The lesson learned here is that even if the part has been successfully produced by multiple suppliers for over 20 years, design engineers should always assess their drawings for any ambiguity because if there is any ambiguity in the drawings, then someone may misinterpret it.
Figure 13 - Correct Hinge Stud Undercut Versus Incorrect Undercut

© 2020 Lockheed Martin Corporation 378
Figure 14 - Old Hinge Stud Undercut Callout Versus New Callout (dimensions in inches)
Tension Mechanism
The next set of lessons learned involve the Tension Mechanism, which was discussed in some detail in the Deployment section. As discussed there, the Tension Mechanism contains a cable wrapped around a spool. One end of the cable is swaged to a threaded stud while the other end of the cable is secured to the spool. The spool is connected to a constant force negator spring so as a result, the negator spring is constantly trying to retract the cable around the spool. During assembly of the Tension Mechanism and during installation of the Tension Mechanism on the MM Solar Array, care must be taken to ensure that uncontrolled retractions of the cable do not occur. If uncontrolled retractions occur, then the threaded stud at the loose end of the cable can be uncontrollably slammed into parts of the Tension Mechanism and damage the mechanism. Damage was most often seen in the form of broken strands in the cable. In order to prevent these uncontrolled retractions, 3D-printed plastic parts were used as shop aids to restrain the motion of the cable. The lesson learned is that proper tooling is required to prevent unintended motion of spring-loaded mechanisms. One other valuable lesson learned regarding the Tension Mechanism involved the decision to build a dedicated qualification unit. The Tension Mechanism design is largely unchanged from a heritage mechanism that has been performing nominally on-orbit for many years. Due to this successful heritage, the design team was tempted to not build a dedicated qual unit and jump straight into acceptance build and test. However, it was suggested to the team that since the product had not been built in over 15 years, it would be prudent to build a dedicated qualification unit. This decision turned out to be the right one because as requirements evolved, the design changed and delta-qualification tests were required to qualify these changes. The fact that a dedicated qualification unit existed made it easy to conduct these delta-qualification tests.
Figure 15 - Tension Mechanism with Restraining Tool (red part)

© 2020 Lockheed Martin Corporation 379
Tooling
One of the good lessons learned from the MM Solar Array experience was to get the production team and the tooling team involved early in the program. When these teams are involved early, they can get a head-start on what tools will be needed to most effectively assemble and test the product. By working alongside the design engineers, proper tooling can be designed and fabricated in time to support the flight builds. Often, a program may get to a certain part of the build and find that they forgot to build a critical tool or fixture, or a critical tool or fixture is not designed correctly. By engaging with the production and tooling teams early, the MM Solar Array team avoided this common pitfall. One of the most complex pieces of tooling was the system used to offload the MM Solar Array during deployment tests, called the Rail Offload System. The Rail Offload System had to meet several challenging requirements. It had to accommodate the entire 23-meter (75-foot) length of the MM Solar Array. It had to accommodate a lateral motion of about 3 meters (10 feet) to allow the hinges to open during the first stage deployment. It had to be as low friction as possible to simulate zero gravity. And it had to offload each major subassembly in the MM Solar Array. The Boom Assembly, Deployer Assembly, and Blanket Container Assembly were offloaded using one link to the Rail Offload System, but the Blanket Assembly required each of the 30 panels in the Blanket Assembly to be individually linked to the Rail Offload System. This was the biggest challenge because when the Blanket Assembly is in its stowed configuration, the Blanket Assembly is less than 2.54-cm (1-inch) thick. The challenge was to develop a solution to be able to package 30 panel offloads in such a small space. The solution had 3 major parts to it. One was that thin offload trolleys were used. Two was that two tracks were used, one to offload the odd-numbered panels and one to offload the even-numbered panels. By doing this, the offload trolleys for adjacent panels could nest within each other, thus saving space in the stowed configuration. And three was that it turned out that the 30 offloads did not have to fit in a 2.54-cm (1-inch) wide space. It was acceptable for the offload cables to have a slight angle to them when the Blanket Assembly was stowed as long as there was some compliance built into the offload cable.
Figure 16 - Blanket Assembly Rail Offload System

© 2020 Lockheed Martin Corporation 380
Moment Test at Cold Temperatures
Long after all qualification tests had been completed and flight MM Solar Arrays were getting ready to be delivered to the vehicle, a question was asked regarding moment testing at cold temperatures. The concern was raised by an analyst who asked the team “I know you tested your composite boom tubes at ambient temperatures but how did they perform when they were tested at cold temperatures?” The team did not have an answer for this question. The team followed standard protocol for a composite boom tube, which consisted of fabricating the tube, bonding in the titanium end fitting, thermal cycling the tube to the hottest and coldest temperature predicts plus margin, and then proof-loading each tube. However, the proof load test was always done at ambient temperature. No cold temperature moment testing was ever conducted, even on the qualification unit. But the design of the MM Solar Array relies on the strength of a single boom tube that connects the entire array to the vehicle. And this single tube sees a very high moment load at the time the vehicle’s liquid apogee engine (LAE) fires to raise the orbit of the vehicle (recall from an earlier section of this paper that the MM Solar Arrays are fully deployed prior to firing the LAE). And this tube could be cold at the time the LAE fires. Knowing that there is some reduction in the strength of bond lines and composite structures at cold temperatures, there was suddenly an urgent need to fabricate a flight coupon and moment test it at cold temperatures. A coupon was fabricated and subjected to the appropriate moment load at temperatures as low as -64˚C. Several different load cycles were conducted to simulate the different loads that the boom would experience as the LAE is fired at different times during orbit raising. The results were that the boom tube passed every test and the late-breaking concern was laid to rest. The lesson learned here is that critical bonded structural joints should be tested at temperature extremes to ensure they will survive this environment. However, the costs of such a test can be prohibitive so care needs to be taken when identifying critical joints. A side lesson learned from this experience is that it is a good idea to include bolts in bonded joints where possible, a.k.a. chicken fasteners. Most composite tubes rely on the strength of the bond line that bonds in the end fitting. But if bolts are also present in this joint, then the strength of the joint is increased. The MM Solar Array was originally designed with bolts in these bonded joints as an added measure of margin. One question that was never answered by the cold moment test is “what is the reduction in strength of a boom tube that is tested at ambient temperature versus a boom tube that is tested at cold temperature?” Is there a 10% reduction in strength? 25% reduction? 50% reduction? The team had hoped to answer this question by breaking a boom tube at ambient and then breaking one at cold. But due to budget constraints, there was only enough funding to build one tube and verify that it would survive the worst-case moment at the worst-case temperature, i.e., a qualification load of 618 Nm (5471 in-lb) at a qualification temperature of -64˚C. Further research in this area would be prudent to determine the actual percent reduction in strength at cold temperatures.
Figure 17 - Critical MM Solar Array Joint Figure 18 – Boom Tube Test Article

© 2020 Lockheed Martin Corporation 381
Obtain Independent Perspectives During the first deployment of the fifth flight MM Solar Array, an anomalous behavior was noted at the very end of the deployment. The behavior manifested as a sudden jerk of the blanket followed by ripples of the blanket along its length. The deployment successfully completed to lock-out, but this behavior was not nominal, so an investigation was started. The team investigated many possible causes and converged upon what they thought was the likely root cause, i.e., that a bracket was undersized and not allowing a bar to be smoothly pulled out of this bracket. The team was in complete agreement that this was the likely root cause and was about to implement some trouble-shooting steps when it was suggested to the team that they solicit some outside input from a group of independent observers. It was not long before the group of independent observers were able to convince the team that an undersized bracket could not have caused this anomaly. Further inspection of photographs of the hardware revealed the true root cause, i.e., the presence of a burr on the bracket. Inspection of the actual hardware confirmed the presence of the burr on this bracket and only this bracket. All other brackets had been properly deburred. During deployment, the burr behaved like a hook and momentarily grabbed onto the bar. As the force of the deployment overcame the burr, it suddenly released the bar, causing the sudden jerk in the deployment motion. The obvious lesson here is to ensure all burrs are removed from interfaces that move relative to one another. But a more important lesson is that schedule pressures sometimes cause teams to want to quickly determine root cause and move on to the next step. If this team had done that, the evidence of the burr would have been destroyed and root cause may never have been determined. Teams must learn to take a breath and ensure that root cause has been conclusively determined before moving to the next step in the process. Another lesson learned is that it is always valuable to get an independent assessment of an anomaly from a trusted expert. The independent experts in this case were able to see the issue from a different perspective and challenge the assumptions that the team made to determine the wrong root cause. The independent experts were able to offer a more plausible root cause that upon further investigation turned out to be the correct root cause.
Figure 19 – Burr on Bracket

© 2020 Lockheed Martin Corporation 382
Conclusion Many lessons were learned during the development, qualification, and production of the MM Solar Array. The MM Solar Array has been successfully qualified to AIAA S-111 for Solar Cells and AIAA S-112 for Solar Panels, including continuous monitoring of the solar cells during the 1.5X thermal life cycle test. All mechanisms on the MM Solar Array have met the requirements of AIAA S-114 for Moving Mechanical Assemblies. Four Wings are currently flying on two commercial satellites that were launched in February and April of 2019 and two more Wings are set to fly on another commercial satellite in early 2020. As its name suggests, the Multi-mission Modular Solar Array stands ready to support multiple missions and is looking forward to powering the next generation of high-powered Lockheed Martin satellites.
Figure 20 - MM Solar Array Integrated to Vehicle
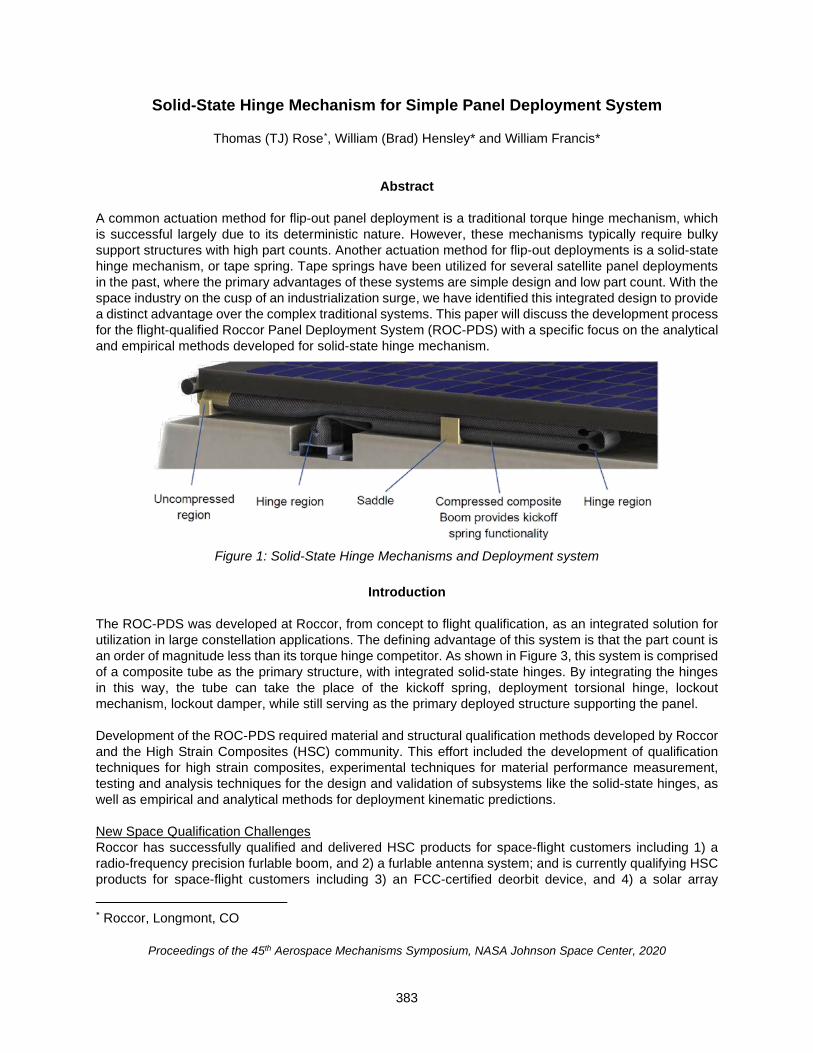
383
Solid-State Hinge Mechanism for Simple Panel Deployment System
Thomas (TJ) Rose*, William (Brad) Hensley* and William Francis*
Abstract A common actuation method for flip-out panel deployment is a traditional torque hinge mechanism, which is successful largely due to its deterministic nature. However, these mechanisms typically require bulky support structures with high part counts. Another actuation method for flip-out deployments is a solid-state hinge mechanism, or tape spring. Tape springs have been utilized for several satellite panel deployments in the past, where the primary advantages of these systems are simple design and low part count. With the space industry on the cusp of an industrialization surge, we have identified this integrated design to provide a distinct advantage over the complex traditional systems. This paper will discuss the development process for the flight-qualified Roccor Panel Deployment System (ROC-PDS) with a specific focus on the analytical and empirical methods developed for solid-state hinge mechanism.
Figure 1: Solid-State Hinge Mechanisms and Deployment system
Introduction
The ROC-PDS was developed at Roccor, from concept to flight qualification, as an integrated solution for utilization in large constellation applications. The defining advantage of this system is that the part count is an order of magnitude less than its torque hinge competitor. As shown in Figure 3, this system is comprised of a composite tube as the primary structure, with integrated solid-state hinges. By integrating the hinges in this way, the tube can take the place of the kickoff spring, deployment torsional hinge, lockout mechanism, lockout damper, while still serving as the primary deployed structure supporting the panel. Development of the ROC-PDS required material and structural qualification methods developed by Roccor and the High Strain Composites (HSC) community. This effort included the development of qualification techniques for high strain composites, experimental techniques for material performance measurement, testing and analysis techniques for the design and validation of subsystems like the solid-state hinges, as well as empirical and analytical methods for deployment kinematic predictions. New Space Qualification Challenges Roccor has successfully qualified and delivered HSC products for space-flight customers including 1) a radio-frequency precision furlable boom, and 2) a furlable antenna system; and is currently qualifying HSC products for space-flight customers including 3) an FCC-certified deorbit device, and 4) a solar array
* Roccor, Longmont, CO
Proceedings of the 45th Aerospace Mechanisms Symposium, NASA Johnson Space Center, 2020
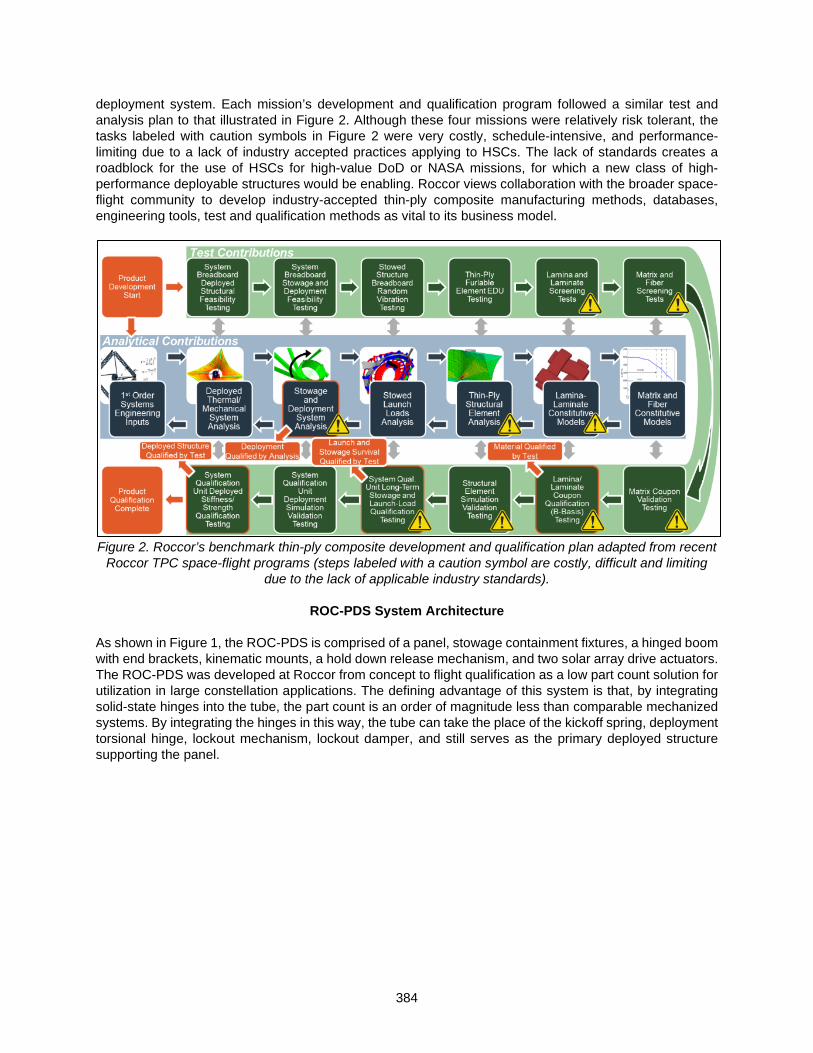
384
deployment system. Each mission’s development and qualification program followed a similar test and analysis plan to that illustrated in Figure 2. Although these four missions were relatively risk tolerant, the tasks labeled with caution symbols in Figure 2 were very costly, schedule-intensive, and performance-limiting due to a lack of industry accepted practices applying to HSCs. The lack of standards creates a roadblock for the use of HSCs for high-value DoD or NASA missions, for which a new class of high-performance deployable structures would be enabling. Roccor views collaboration with the broader space-flight community to develop industry-accepted thin-ply composite manufacturing methods, databases, engineering tools, test and qualification methods as vital to its business model.
Figure 2. Roccor’s benchmark thin-ply composite development and qualification plan adapted from recent
Roccor TPC space-flight programs (steps labeled with a caution symbol are costly, difficult and limiting due to the lack of applicable industry standards).
ROC-PDS System Architecture
As shown in Figure 1, the ROC-PDS is comprised of a panel, stowage containment fixtures, a hinged boom with end brackets, kinematic mounts, a hold down release mechanism, and two solar array drive actuators. The ROC-PDS was developed at Roccor from concept to flight qualification as a low part count solution for utilization in large constellation applications. The defining advantage of this system is that, by integrating solid-state hinges into the tube, the part count is an order of magnitude less than comparable mechanized systems. By integrating the hinges in this way, the tube can take the place of the kickoff spring, deployment torsional hinge, lockout mechanism, lockout damper, and still serves as the primary deployed structure supporting the panel.
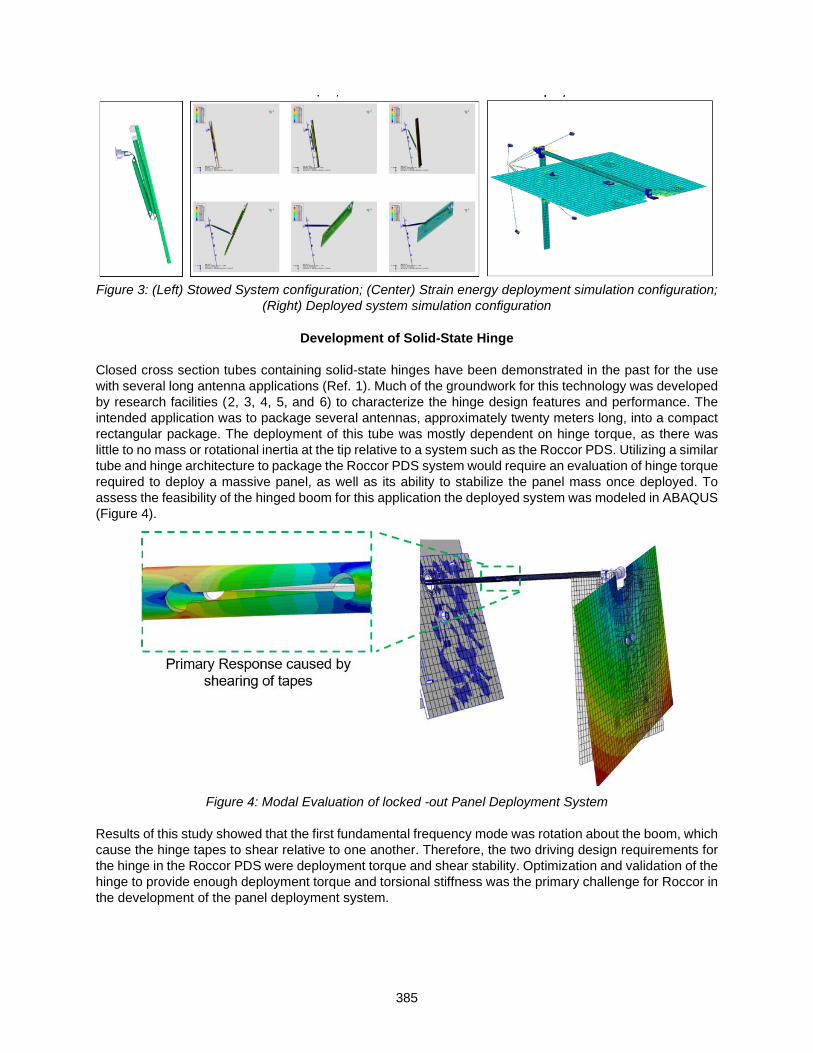
385
Figure 3: (Left) Stowed System configuration; (Center) Strain energy deployment simulation configuration;
(Right) Deployed system simulation configuration
Development of Solid-State Hinge Closed cross section tubes containing solid-state hinges have been demonstrated in the past for the use with several long antenna applications (Ref. 1). Much of the groundwork for this technology was developed by research facilities (2, 3, 4, 5, and 6) to characterize the hinge design features and performance. The intended application was to package several antennas, approximately twenty meters long, into a compact rectangular package. The deployment of this tube was mostly dependent on hinge torque, as there was little to no mass or rotational inertia at the tip relative to a system such as the Roccor PDS. Utilizing a similar tube and hinge architecture to package the Roccor PDS system would require an evaluation of hinge torque required to deploy a massive panel, as well as its ability to stabilize the panel mass once deployed. To assess the feasibility of the hinged boom for this application the deployed system was modeled in ABAQUS (Figure 4).
Figure 4: Modal Evaluation of locked -out Panel Deployment System
Results of this study showed that the first fundamental frequency mode was rotation about the boom, which cause the hinge tapes to shear relative to one another. Therefore, the two driving design requirements for the hinge in the Roccor PDS were deployment torque and shear stability. Optimization and validation of the hinge to provide enough deployment torque and torsional stiffness was the primary challenge for Roccor in the development of the panel deployment system.

386
Hinge Geometry and Design The geometry of the hinge cutout in the foldable tube system was derived to both maximize torque output and reduce the high stress concentration areas that result from complex curvatures near the fold. By creating a narrow slit in the boom, the cross section effectively becomes two tape springs, which are commonly used in deployable structures for solar array applications. At the ends of the slit, however, the transition area must accommodate deformations to go from flattened tape springs to a full tube cross section. To avoid large strain areas due to the complexity of this transition area, a circular cutout was introduced. This cutout simply removes this difficult transition area.
Figure 5: Foldable Hinge Geometry
In the hinge cutout, there are several dimensions and material properties that effect the overall performance. These dimensions include the hinge length “L”, slot width “w”, end cutout diameter “d”, tube diameter “D”. The material properties of thickness, density, and modulus (viscoelastic and elastic contributions) must be accounted for to fully characterize hinge performance.
Verification of Solid-State Hinge Design of the solid-state hinge for the ROC-PDS required verification testing and analysis of material allowable limits, hinge torque output, and torsional stiffness. For this, several testing methods had to be developed by Roccor to investigate the properties and effects of interest such as; material bending limits, hinge performance, and performance degradation due to long term holds. Material Testing for Thin laminate Bending As detailed in reference 7 the column bend test was developed to combine the attributes of both the platen (Ref. 8) and LD-FPBT (Ref. 9) into a simple test method intended to measure the moment-curvature relationship of a given HSC laminate. Testing is done by fixing a laminate sample into two identical “arms” that are then pinned into clevis mounts attached to a load frame. When the load frame compresses the fixture, the arms rotate about the pins requiring the sample to curve between the two arms. Using geometry, the moment-curvature relationships can be found using methods and equations detailed in Ref. 7. From this testing we can obtain the allowable bending curvatures, and relative strains, for a given laminate. For the ROC-PDS the laminate architecture selected contained a combination of Astroquartz and carbon fibers cured in a thermoset epoxy resin matrix. Testing was conducted on coupons cut at four orientations (0°, 45°, 90°, and 135°), and testing was conducted to obtain both the quasi-static load failure as well as the long-term hold failure curvatures (Figure 7). Results from ultimate testing were plotted on a polar chart for visualization of “allowable failure”. The average failure of each laminate orientation is utilized to create a polar curve fit “allowable failure” value to be used in analytical failure investigations of the stowed and deploying boom structure. Results from

387
relaxation testing were used to develop a custom viscoelastic relaxation curve using the Prony series method.
Figure 6: Column Bend Test Fixture Geometry [10,11]
Figure 7: Material Testing of composite hinge material.
Figure 8: (Left) Curvature allowable values; (Right) Laminate Prony series output
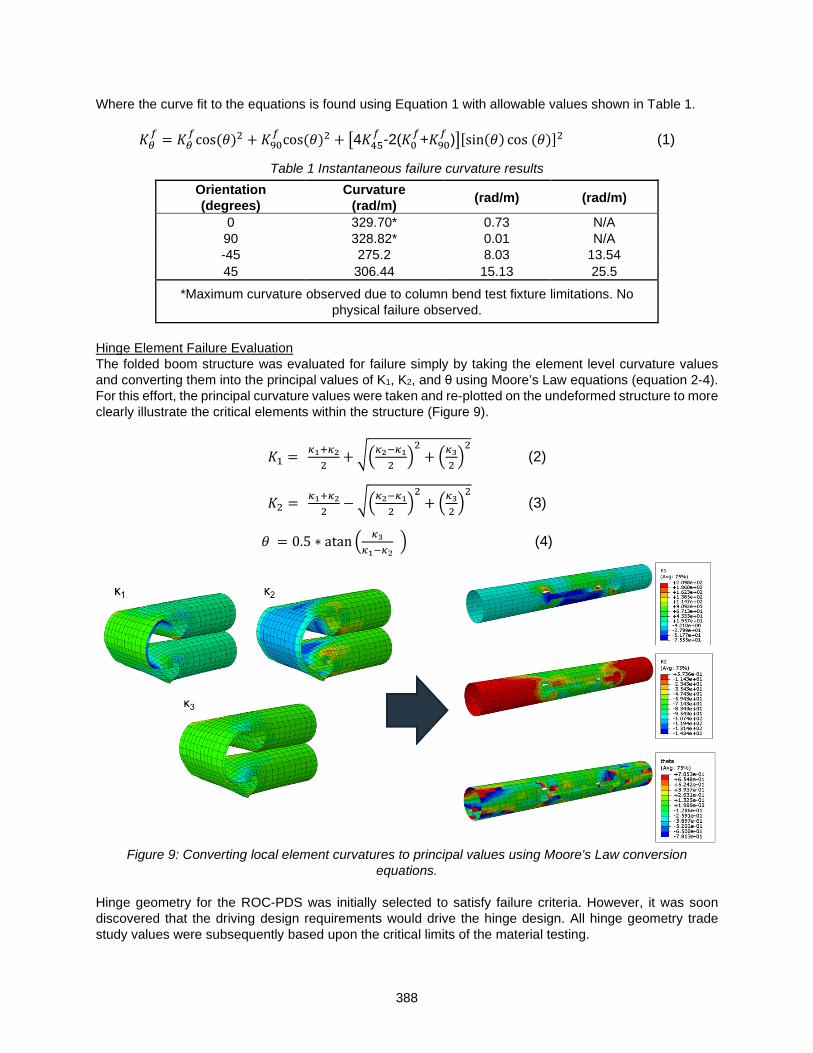
388
Where the curve fit to the equations is found using Equation 1 with allowable values shown in Table 1.
𝐾𝐾𝜃𝜃𝑓𝑓 = 𝐾𝐾𝜃𝜃
𝑓𝑓cos(𝜃𝜃)2 + 𝐾𝐾90𝑓𝑓 cos(𝜃𝜃)2 + 4𝐾𝐾45
𝑓𝑓 -2(𝐾𝐾0𝑓𝑓+𝐾𝐾90
𝑓𝑓 )[sin(𝜃𝜃) cos (𝜃𝜃)]2 (1)
Table 1 Instantaneous failure curvature results Orientation (degrees)
Curvature (rad/m) (rad/m) (rad/m)
0 329.70* 0.73 N/A 90 328.82* 0.01 N/A -45 275.2 8.03 13.54 45 306.44 15.13 25.5
*Maximum curvature observed due to column bend test fixture limitations. No physical failure observed.
Hinge Element Failure Evaluation The folded boom structure was evaluated for failure simply by taking the element level curvature values and converting them into the principal values of K1, K2, and θ using Moore’s Law equations (equation 2-4). For this effort, the principal curvature values were taken and re-plotted on the undeformed structure to more clearly illustrate the critical elements within the structure (Figure 9).
𝐾𝐾1 = 𝜅𝜅1+𝜅𝜅22
+ 𝜅𝜅2−𝜅𝜅12
2
+ 𝜅𝜅322 (2)
𝐾𝐾2 = 𝜅𝜅1+𝜅𝜅22
− 𝜅𝜅2−𝜅𝜅12
2
+ 𝜅𝜅322 (3)
𝜃𝜃 = 0.5 ∗ atan 𝜅𝜅3𝜅𝜅1−𝜅𝜅2
(4)
Figure 9: Converting local element curvatures to principal values using Moore's Law conversion
equations. Hinge geometry for the ROC-PDS was initially selected to satisfy failure criteria. However, it was soon discovered that the driving design requirements would drive the hinge design. All hinge geometry trade study values were subsequently based upon the critical limits of the material testing.

389
Hinge Torsional Stiffness Trade Study Torsional stability of the hinge was shown to be a driving design factor of the ROC-PDS. To address what design parameters would affect the torsional stability of the hinge most a model was developed. The model that was used to evaluate the hinges torsional stiffness was conducted using ABAQUS explicit dynamic solver, where the hinge section was fixed in all directions at one end and a pure moment was applied at the tip of the boom about the tube axis (Figure 10).
Figure 10: Torsional Stiffness trade study model setup
It was expected that the diameter of the end circle cutout controlled by the “d” variable shown in Figure 5 would be the primary driver of torsional stability due to it producing the smallest effective torsional cross section. This evaluation was conducted to evaluate the effects of both length and diametric cutout of the end cutouts. The curvature results were also compared to the material allowable values were then evaluated using the methods described earlier.
Figure 11: Initial torsional stiffness evaluation based on hinge geometry and material allowable prediction Results of this investigation showed both that the risk of material failure due to torsional inputs was very low, and that the primary concern was geometric buckling behaviors. However, these buckling behaviors occur at least an order of magnitude beyond any operational load cases, so this risk was retired. The design output from this investigation was that minimizing the end cutout geometry and using a short slot cutout length result in the stiffest hinge geometry. Hinge Torque Output Trade Study Based on standard practice at Roccor with deployable structures, it is required that any deployment hinge provide enough torque to deploy the system, from any static position within the deployment, with a factor
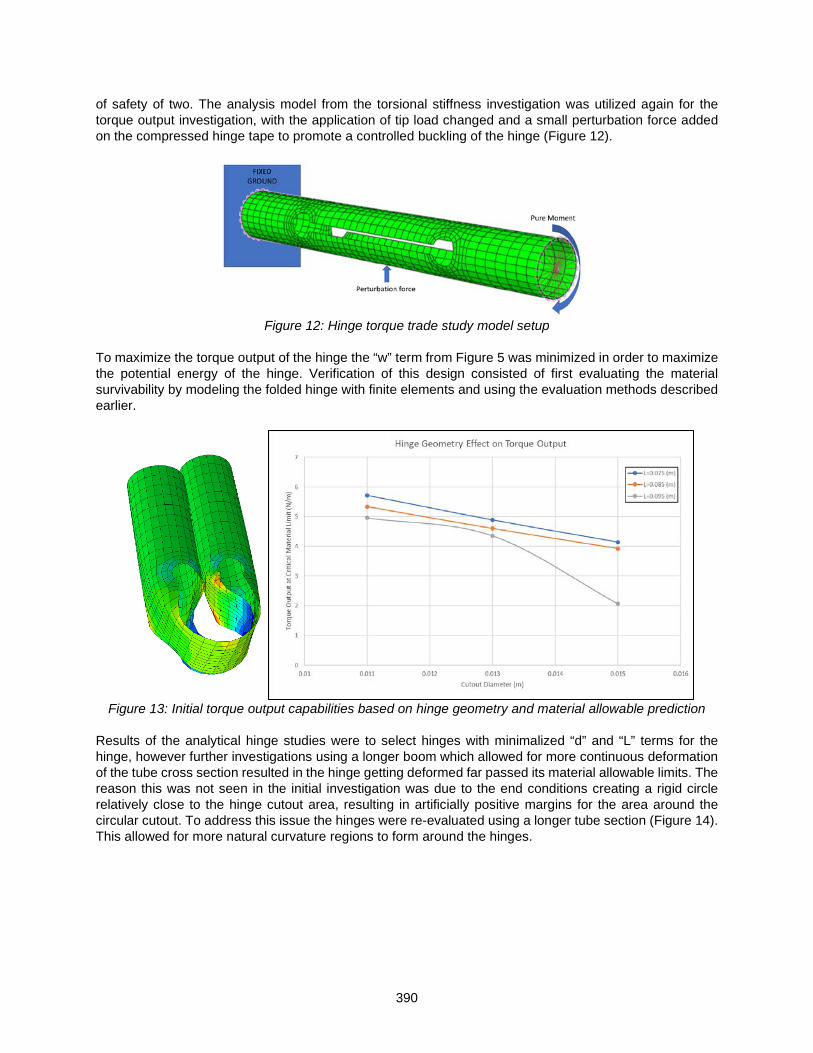
390
of safety of two. The analysis model from the torsional stiffness investigation was utilized again for the torque output investigation, with the application of tip load changed and a small perturbation force added on the compressed hinge tape to promote a controlled buckling of the hinge (Figure 12).
Figure 12: Hinge torque trade study model setup
To maximize the torque output of the hinge the “w” term from Figure 5 was minimized in order to maximize the potential energy of the hinge. Verification of this design consisted of first evaluating the material survivability by modeling the folded hinge with finite elements and using the evaluation methods described earlier.
Figure 13: Initial torque output capabilities based on hinge geometry and material allowable prediction
Results of the analytical hinge studies were to select hinges with minimalized “d” and “L” terms for the hinge, however further investigations using a longer boom which allowed for more continuous deformation of the tube cross section resulted in the hinge getting deformed far passed its material allowable limits. The reason this was not seen in the initial investigation was due to the end conditions creating a rigid circle relatively close to the hinge cutout area, resulting in artificially positive margins for the area around the circular cutout. To address this issue the hinges were re-evaluated using a longer tube section (Figure 14). This allowed for more natural curvature regions to form around the hinges.

391
Figure 14: Lengthened hinge geometry trade analysis model
This effect was exacerbated by the ability for the full ROC-PDS system to seat itself into a system low energy state (Figure 15), where the local curvatures around the hinge often resulted in negative margin. Analysis results did not conclude with a geometric result which closed for this case, however a design alteration to the overall system was devised to add rigidity to the local area and hold the hinge open. This design feature is known as a “power band” and is the topic of another study paper currently in progress at Roccor.
Figure 15: (Left) High curvatures in full system analysis; (Right) hinge shift into low energy state.
Hinge Torque and Long-term Storage Testing Full-scale hinged boom testing was used to validate the analysis results and determine the properties of the hinges where analytical techniques were unable to predict the behavior of this complex system. The primary test used was hinge torque testing under ambient temperatures and operational temperature extremes. This was coupled with long-term storage testing to evaluate material survivability and viscoelastic effects on strain energy relaxation. A torque test fixture was developed and qualified to accurately measure the hinge output torque. This fixture is shown in Figure 16; the fixture uses torque cells to measure the output torque of each hinge as the boom is slowly allowed to deploy, resulting in a semi-static torque measurement. This fixture was qualified and validated by measuring the torque output of an easily modelled metallic leaf spring.

392
Figure 16: Structural testing of integrated solid-state HSC hinge
The primary resistive torque in this design was due to a flat, flexible electrical harness inside the boom. The behavior of this harness depends intimately on the boundary conditions supplied by the boom, so testing of the harness alone proved impossible. Instead, the hinge torque was measured with and without the harness, and the harness torque was derived by comparing these two torque curves. These values were then used to derive and show deployment torque margin. A typical torque curve derived from this testing is shown below in Figure 17.

393
Figure 17 Typical hinge torque of proximal hinge (left) and distal hinge (right). Later tests at operational temperature extremes were enabled by constructing a thermal chamber around the torque test hardware. This testing was both used to directly verify the torque margin and validate the analytical predictions. The impacts of the viscoelasticity on the deployment kinematics were also a key risk, and due to a lack of standardized test methods and stress relaxation failure models these impacts are very difficult to analytically model. Long-term storage testing was therefore used to simulate the impact of storage before deployment. Full-length booms were stowed in the anticipated storage shape, as shown in Figure 18, and the time-temperature superposition relationship was used to reduce the storage time required from years to days.
Figure 18 Long-term storage testing
During and after storage the boom was inspected for damage. The corners of each hinge were at particular risk of stress rupture during long-term storage, so these areas were subjected to extra scrutiny. Detailed images of these areas are shown in Figure 19. After storage at elevated temperature the kick-off force, hinge torque, and final boom geometry was measured. These measured values were fed into the analytical model to better predict the deployment of the hinged boom after storage.

394
Figure 19 Inspection of the proximal hinge (left) and distal hinge (right).
The results of this testing were then used to validate the analytical model, show compliance with requirements, and provide knock-down factors for post-storage deployments. In particular, the requirements for long-term storage survival and deployment torque margins were verified directly through test.
Final Boom Laminate Architecture Features At the culmination of the development program, there were several design features resulting from detailed analysis and testing efforts done at Roccor. First, the hinges were strengthened by “power bands” in order to keep the slit from collapsing when the system is required to be compressed beyond the material limits of the hinge deformation. Next, the “razor backs” were added which are localized areas with adjusted thickness used to tune the required torque output of the hinge tapes to develop the required strain energy balance for the deployment. Last, the “lateral lines”12 were added in the boom, which are a localized laminate change which is utilized to tune the kickoff energy of the system. All these features were developed using the methods described in the previous section for material allowable calculations, as well as physical testing for validation of concepts and verification against flight qualification environments.
Figure 20: ROC-PDS boom design features
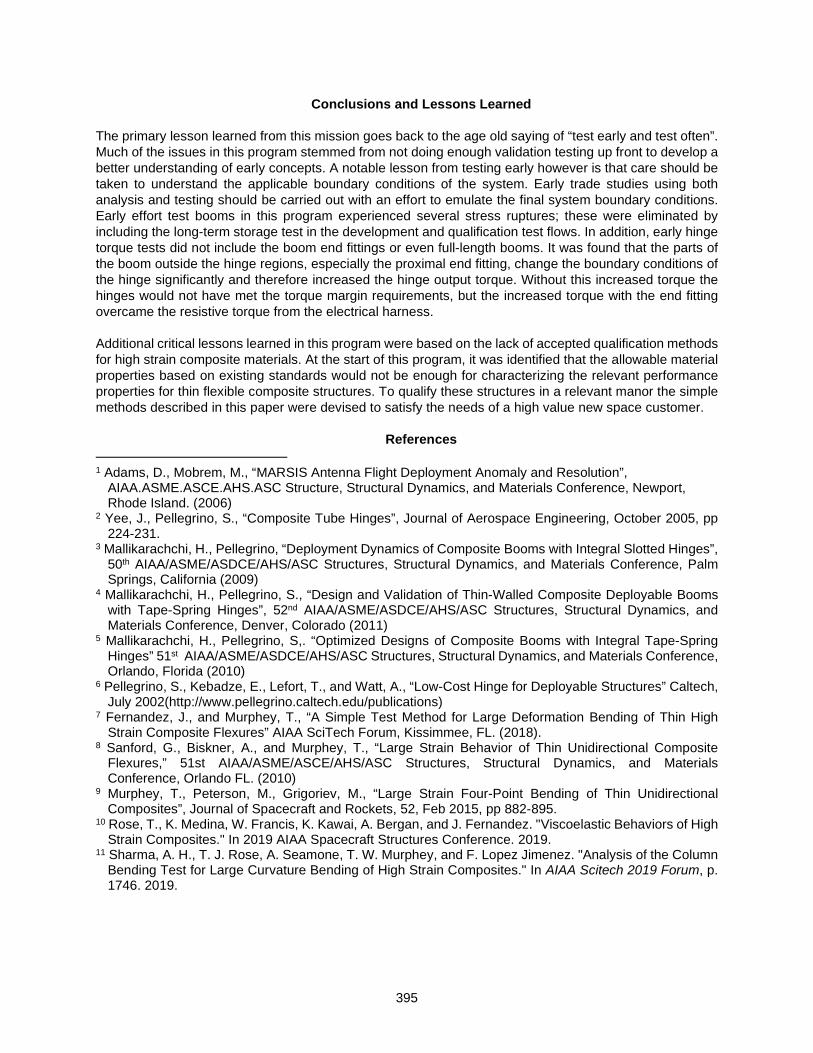
395
Conclusions and Lessons Learned The primary lesson learned from this mission goes back to the age old saying of “test early and test often”. Much of the issues in this program stemmed from not doing enough validation testing up front to develop a better understanding of early concepts. A notable lesson from testing early however is that care should be taken to understand the applicable boundary conditions of the system. Early trade studies using both analysis and testing should be carried out with an effort to emulate the final system boundary conditions. Early effort test booms in this program experienced several stress ruptures; these were eliminated by including the long-term storage test in the development and qualification test flows. In addition, early hinge torque tests did not include the boom end fittings or even full-length booms. It was found that the parts of the boom outside the hinge regions, especially the proximal end fitting, change the boundary conditions of the hinge significantly and therefore increased the hinge output torque. Without this increased torque the hinges would not have met the torque margin requirements, but the increased torque with the end fitting overcame the resistive torque from the electrical harness. Additional critical lessons learned in this program were based on the lack of accepted qualification methods for high strain composite materials. At the start of this program, it was identified that the allowable material properties based on existing standards would not be enough for characterizing the relevant performance properties for thin flexible composite structures. To qualify these structures in a relevant manor the simple methods described in this paper were devised to satisfy the needs of a high value new space customer.
References
1 Adams, D., Mobrem, M., “MARSIS Antenna Flight Deployment Anomaly and Resolution”, AIAA.ASME.ASCE.AHS.ASC Structure, Structural Dynamics, and Materials Conference, Newport, Rhode Island. (2006)
2 Yee, J., Pellegrino, S., “Composite Tube Hinges”, Journal of Aerospace Engineering, October 2005, pp 224-231.
3 Mallikarachchi, H., Pellegrino, “Deployment Dynamics of Composite Booms with Integral Slotted Hinges”, 50th AIAA/ASME/ASDCE/AHS/ASC Structures, Structural Dynamics, and Materials Conference, Palm Springs, California (2009)
4 Mallikarachchi, H., Pellegrino, S., “Design and Validation of Thin-Walled Composite Deployable Booms with Tape-Spring Hinges”, 52nd AIAA/ASME/ASDCE/AHS/ASC Structures, Structural Dynamics, and Materials Conference, Denver, Colorado (2011)
5 Mallikarachchi, H., Pellegrino, S,. “Optimized Designs of Composite Booms with Integral Tape-Spring Hinges” 51st AIAA/ASME/ASDCE/AHS/ASC Structures, Structural Dynamics, and Materials Conference, Orlando, Florida (2010)
6 Pellegrino, S., Kebadze, E., Lefort, T., and Watt, A., “Low-Cost Hinge for Deployable Structures” Caltech, July 2002(http://www.pellegrino.caltech.edu/publications)
7 Fernandez, J., and Murphey, T., “A Simple Test Method for Large Deformation Bending of Thin High Strain Composite Flexures” AIAA SciTech Forum, Kissimmee, FL. (2018).
8 Sanford, G., Biskner, A., and Murphey, T., “Large Strain Behavior of Thin Unidirectional Composite Flexures,” 51st AIAA/ASME/ASCE/AHS/ASC Structures, Structural Dynamics, and Materials Conference, Orlando FL. (2010)
9 Murphey, T., Peterson, M., Grigoriev, M., “Large Strain Four-Point Bending of Thin Unidirectional Composites”, Journal of Spacecraft and Rockets, 52, Feb 2015, pp 882-895.
10 Rose, T., K. Medina, W. Francis, K. Kawai, A. Bergan, and J. Fernandez. "Viscoelastic Behaviors of High Strain Composites." In 2019 AIAA Spacecraft Structures Conference. 2019.
11 Sharma, A. H., T. J. Rose, A. Seamone, T. W. Murphey, and F. Lopez Jimenez. "Analysis of the Column Bending Test for Large Curvature Bending of High Strain Composites." In AIAA Scitech 2019 Forum, p. 1746. 2019.

396

© 2020 Sierra Nevada Corporation 397
Mars 2020 Motor Bearing Failure, Investigation and Response
David Suffern*, Jeff Mobley* and Stephen Smith*
Abstract The prime movers in each joint of the external robotic arm of NASA Jet Propulsion Laboratory’s (JPL) Mars 2020 rover are planetary gearmotors containing a brushless DC motor and brake assembly, designated as M45S. Qualification life testing was performed at multiple levels of assembly in an effort to retire risk to the program. A significant failure occurred within the motor in the process of executing a life test at the gearmotor level of assembly. The combination of bearing retainer, lubrication scheme, test temperatures, and long life led to a stall failure of the M45S front bearing at 78 million revolutions, not satisfying the life test requirement of 105.2 million motor revolutions, which is double the expected life. Ultimately, increasing the minimum life test temperature from -70°C to -55°C allowed for successful qualification of the robotic arm joints with the baseline bearing configuration. Details of the requirements, design, life test, test failure investigation, response, and lessons learned will be presented.
Application and Requirements
Reliable performance of the two-meter-long robotic arm carried by the Mars 2020 rover, shown in Figure 1, is central to the success of this mission. Each joint of this robotic arm is driven by a M45S motor and brake assembly. The M45S was incorporated into three different planetary gearmotor designs covering multiple applications: shoulder and elbow (ShEl), wrist and turret (WAT), and feed. The ShEl and WAT gearmotors were then further integrated into harmonic drive mechanisms in the robotic arm. Each application has unique load and life requirements based on the estimated robotic arm usage and travel. Of these, the ShEl application provides the enveloping requirement for mission life at 52.6 million motor revolutions, resulting in a margined life test requirement of 105.2 million motor revolutions.
Figure 1 – Robotic Arm of the Mars 2020 Rover (Courtesy of NASA/JPL-Caltech)
* Sierra Nevada Corporation, Durham, NC; [email protected]
Proceedings of the 45th Aerospace Mechanisms Symposium, NASA Johnson Space Center, 2020
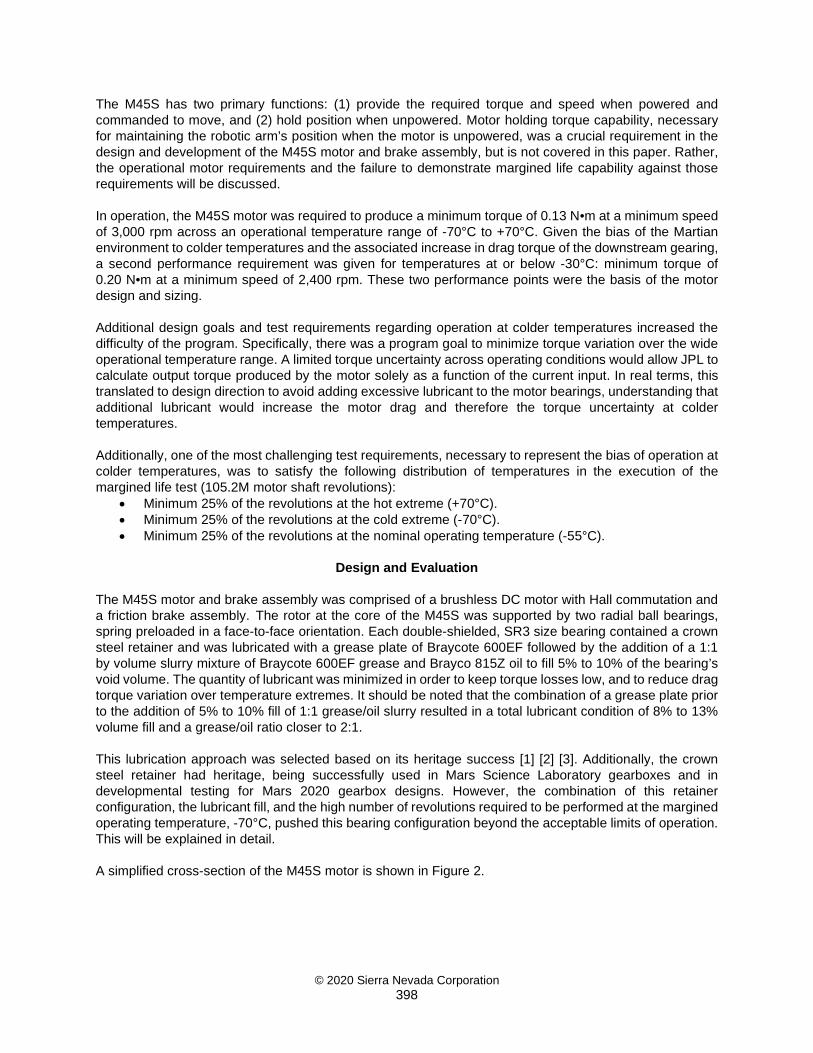
© 2020 Sierra Nevada Corporation 398
The M45S has two primary functions: (1) provide the required torque and speed when powered and commanded to move, and (2) hold position when unpowered. Motor holding torque capability, necessary for maintaining the robotic arm’s position when the motor is unpowered, was a crucial requirement in the design and development of the M45S motor and brake assembly, but is not covered in this paper. Rather, the operational motor requirements and the failure to demonstrate margined life capability against those requirements will be discussed. In operation, the M45S motor was required to produce a minimum torque of 0.13 N•m at a minimum speed of 3,000 rpm across an operational temperature range of -70°C to +70°C. Given the bias of the Martian environment to colder temperatures and the associated increase in drag torque of the downstream gearing, a second performance requirement was given for temperatures at or below -30°C: minimum torque of 0.20 N•m at a minimum speed of 2,400 rpm. These two performance points were the basis of the motor design and sizing. Additional design goals and test requirements regarding operation at colder temperatures increased the difficulty of the program. Specifically, there was a program goal to minimize torque variation over the wide operational temperature range. A limited torque uncertainty across operating conditions would allow JPL to calculate output torque produced by the motor solely as a function of the current input. In real terms, this translated to design direction to avoid adding excessive lubricant to the motor bearings, understanding that additional lubricant would increase the motor drag and therefore the torque uncertainty at colder temperatures. Additionally, one of the most challenging test requirements, necessary to represent the bias of operation at colder temperatures, was to satisfy the following distribution of temperatures in the execution of the margined life test (105.2M motor shaft revolutions):
• Minimum 25% of the revolutions at the hot extreme (+70°C). • Minimum 25% of the revolutions at the cold extreme (-70°C). • Minimum 25% of the revolutions at the nominal operating temperature (-55°C).
Design and Evaluation
The M45S motor and brake assembly was comprised of a brushless DC motor with Hall commutation and a friction brake assembly. The rotor at the core of the M45S was supported by two radial ball bearings, spring preloaded in a face-to-face orientation. Each double-shielded, SR3 size bearing contained a crown steel retainer and was lubricated with a grease plate of Braycote 600EF followed by the addition of a 1:1 by volume slurry mixture of Braycote 600EF grease and Brayco 815Z oil to fill 5% to 10% of the bearing’s void volume. The quantity of lubricant was minimized in order to keep torque losses low, and to reduce drag torque variation over temperature extremes. It should be noted that the combination of a grease plate prior to the addition of 5% to 10% fill of 1:1 grease/oil slurry resulted in a total lubricant condition of 8% to 13% volume fill and a grease/oil ratio closer to 2:1. This lubrication approach was selected based on its heritage success [1] [2] [3]. Additionally, the crown steel retainer had heritage, being successfully used in Mars Science Laboratory gearboxes and in developmental testing for Mars 2020 gearbox designs. However, the combination of this retainer configuration, the lubricant fill, and the high number of revolutions required to be performed at the margined operating temperature, -70°C, pushed this bearing configuration beyond the acceptable limits of operation. This will be explained in detail. A simplified cross-section of the M45S motor is shown in Figure 2.

© 2020 Sierra Nevada Corporation 399
Figure 2 – Simplified M45S Motor Cross-Section (Brake omitted for clarity)
The rotor magnets overhang the rear of the stator to allow efficient Hall sensor commutation. This overhang increased the load on the front motor bearing due to the magnetic forces attempting to self-center the rotor within the stator. As a result, Hertzian contact stresses were expected to be higher [0.99 GPa (144 ksi)] in the front bearing and lower [0.80 GPa (116 ksi)] in the rear bearing. These are reasonable values for a long life application. The bearing lubrication film parameter (λ), a ratio of the lubrication film thickness to the composite roughness of the contacting surfaces between the ball and raceway, was calculated using COBRA-AHS analysis software across temperatures ranging from -70°C to +70°C and speeds ranging from 1,500 rpm to 7,100 rpm. The analysis indicated a mixed boundary condition λ of 1.7 at slower speeds and higher temperatures, and a hydrodynamic (HD) condition (λ >3) for higher speeds and colder temperatures [4] [5]. The lubricant’s viscosity is a function of temperature and increases at colder temperatures. This increase in viscosity inherently increases the lubrication film thickness, which in general, results in longer bearing life as the lubricant is able to insulate the bearing elements from direct contact [6]. However, a simple extrapolation of lubricant viscosity going cold may be insufficient for understanding impact on bearing life. As will be shown in Figure 10, the lubricant ceases to function effectively when approaching its pour point, resulting in starvation effects that dramatically reduce bearing life. In addition to Hertzian contact stress and the lubrication film parameter, lubricant stress cycles are used in evaluating bearing life. These are defined as the number of times a ball passes across a given spot on the raceway, a function of the bearing’s pitch diameter, ball diameter, and quantity of balls. See Eq. 1 in reference [2] for calculation details and an example in reference [5]. The lubricant stress cycles for the bearings in the M45S motor were 469 million for the margined life requirement of 105.2 million motor revolutions. Published and other available data summarizing acceptable limits of Hertzian contact stress and lubricant stress cycles indicated that the M45S design was exceeding limits of proven lubricant life, but not in an area of known failure [3] [7]. The data indicates that at least 30-60 million lubricant stress cycles could be expected for contact stresses around 1.0 GPa (145 ksi), with failure to be expected beyond 600 million lubricant stress cycles. Being between the limits of proven success and known failure, bearing lubricant life was identified as a significant program risk throughout the design phase. In response, the bearing balls were coated with titanium carbide (TiC), shown to quadruple the life of the perfluoropolyether (PFPE) lubricant at Hertzian contact stresses of 1.0 GPa or less [8]. Concurrent with the M45S design effort, developmental bearing life testing was being performed on similar bearings being used
Stator
Rotor
Hall Effect Sensors Motor Housing
Preload Spring
Rear Bearing Front Bearing

© 2020 Sierra Nevada Corporation 400
on a separate Mars 2020 contract to supply gearboxes. This testing was intended to demonstrate bearing life capability in the low cycle count, high load regime [2]. Unfortunately, it was not possible to adapt that test setup to encompass the speeds or cycle count required for the M45S motor design. Consequently, demonstration of M45S bearing life was deferred until its design verification (DV) life testing.
Performance and Life Test Results M45S Performance The goal to minimize torque variation over temperature was a significant program concern and drove the decision not to implement a higher bearing lubricant fill. Performance testing was completed and proved that the chosen motor design, including bearing lubrication, performed consistently across the entire operational temperature range. The net motor torque constant, including viscous losses from lubrication, across a temperature range of -70°C to +70°C resulted in a torque uncertainty of ±0.005 N•m at the 0.200 N•m output torque level at constant speed. This value was within the original program goal of ±0.009 N•m. With respect to torque uncertainty concerns, the chosen design and lubrication scheme proved highly effective. Life Testing and Results Identified early in the program as an area of risk, the lubricant life was ultimately tested during the M45S DV life test, which exposed the unit to twice the expected life, or 105.2 million motor revolutions. This life test, completed in early 2019, had been delayed due to other M45S design and integration challenges. These delays postponed the retirement of the bearing life risk. As a result, within six weeks of finishing the M45S DV life test, two of the M45S gearmotor life tests (ShEl DV and WAT DV) were completed or stopped due to anomalous conditions. This timing afforded the opportunity for near-concurrent visual inspection of motor bearings experiencing the same operational temperature environment, but different total motor revolutions with various speed and load combinations. The revolution count and condition of the M45S motor bearings from these three initial life tests were compared for similarities and differences, shown in Table 1.
Table 1 – Results of Life Tests Ending in Early 2019
Life Test Motor Revs / % of 2X Life
Temperature Distribution
Post-Life Performance
Visual Bearing Condition
M45S Motor-only 105M / 100% 25% min. @ -70°C 25% min. @ -55°C 25% min. @ +70°C
Acceptable Poor
WAT Gearmotor 66M / 100% Acceptable Marginal
ShEl Gearmotor 78M / 74% N/A – Stalled Very Poor / Damaged Figure 3 provides a visual comparison of the condition of the front bearing from the M45S motor of each of these three units, with the following observations:
• Motor-Only: Slightly rough rotation; dry, powdery, dark wear debris; retainer ball pockets worn • WAT: Rough rotation; clumped, dark wear debris • ShEl: Very rough rotation; retainer periodically caught under balls; nearly empty of any lubricant or
wear debris; damage to retainer visible
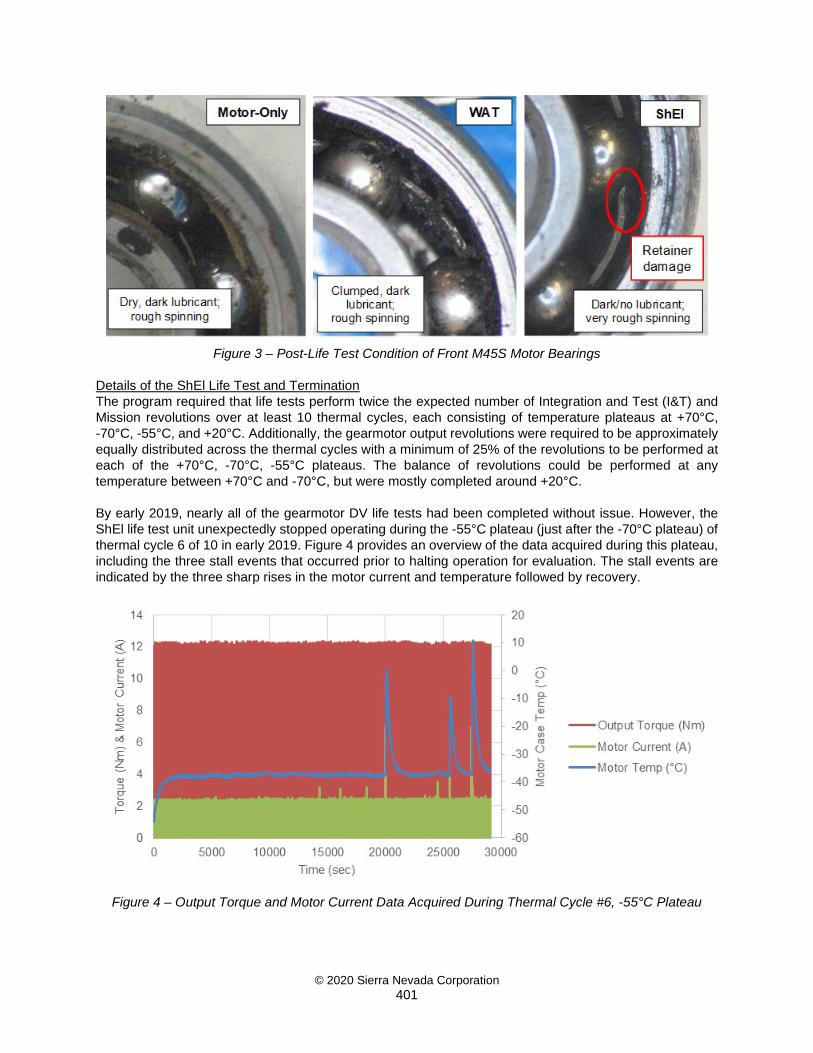
© 2020 Sierra Nevada Corporation 401
Figure 3 – Post-Life Test Condition of Front M45S Motor Bearings Details of the ShEl Life Test and Termination The program required that life tests perform twice the expected number of Integration and Test (I&T) and Mission revolutions over at least 10 thermal cycles, each consisting of temperature plateaus at +70°C, -70°C, -55°C, and +20°C. Additionally, the gearmotor output revolutions were required to be approximately equally distributed across the thermal cycles with a minimum of 25% of the revolutions to be performed at each of the +70°C, -70°C, -55°C plateaus. The balance of revolutions could be performed at any temperature between +70°C and -70°C, but were mostly completed around +20°C. By early 2019, nearly all of the gearmotor DV life tests had been completed without issue. However, the ShEl life test unit unexpectedly stopped operating during the -55°C plateau (just after the -70°C plateau) of thermal cycle 6 of 10 in early 2019. Figure 4 provides an overview of the data acquired during this plateau, including the three stall events that occurred prior to halting operation for evaluation. The stall events are indicated by the three sharp rises in the motor current and temperature followed by recovery.
Figure 4 – Output Torque and Motor Current Data Acquired During Thermal Cycle #6, -55°C Plateau

© 2020 Sierra Nevada Corporation 402
Figure 5 provides detailed data of the first stall event as it occurred, with the following explanation: • Per the automated profile, the unit began execution of 80 seconds of operation in the CW direction. • After approximately 15 seconds of operation against the prescribed torque of approximately 6.6
N•m, the measured output speed of the unit unexpectedly dropped to 0 rpm and the motor current jumped to the 7 A current limit.
• The unit remained in this state for approximately 60 seconds, until the automated profile removed power from the motor. The motor remained off for 15 to 20 seconds, as planned.
• The automated profile initiated operation in the CCW direction. • Operation then proceeded nominally for the next 80 to 90 minutes until a second stall event was
encountered with the same signature as the first (reference Figure 4). Note, some initial torque noise is visible on the graph and is associated with the cogging effects of the hastily stopped hysteresis brake dynamometer.
All three stall events were readily identified by the sharp increase in motor housing temperature associated with Joule heating from the motor current being at its 7 A limit.
Figure 5 – Detailed Data Acquired during First Stall Event of ShEl DV in Life Cycle 6 of 10
Test Failure Investigation
The team first needed to determine whether the stall was due to an anomaly within the unit under test (UUT) or the mechanical or electrical ground support equipment (MGSE / EGSE). The life test setup was more complicated than most due to the requirements to apply resistive torque and axial load simultaneously, while supporting the UUT in the thermal chamber and recording data as noted. The complexity of the test setup presented multiple opportunities for the root cause to be found in the MGSE / EGSE. A block diagram of the complicated ShEl life test setup is shown in Figure 6, with data acquired from components identified in the orange boxes.

© 2020 Sierra Nevada Corporation 403
Figure 6 – Block Diagram of Complex ShEl DV Life Test Setup
The following describes the sequence of the investigation to determine the source of the ShEl DV unit life test anomaly:
1. To determine if the EGSE was responsible, the team attempted to recreate the stall event while recording the current of each motor phase and the voltage of each Hall sensor with an oscilloscope. Result: stall was recreated and oscilloscope data indicated EGSE was performing nominally.
2. The performance of the motor’s brake was characterized to ensure it was not inadvertently engaging and stopping the motor. Result: motor brake performance was verified to be nominal.
3. Thermal chamber was taken to ambient temperature and a recreation of the stall event was again attempted in a manner that would allow a determination of the source of the anomaly: MGSE or UUT. Result: stall was recreated and there was no wind-up or tension in the MGSE test setup to indicate that it was causing any issues.
4. UUT was disconnected from all MGSE and a Startup Sensitivity health check was attempted to verify the motor was able to initiate rotation at a current value in family with prior health checks. The UUT failed to rotate with up to 2.8 A applied, when far less current was generally needed to initiate rotation. This provided convincing evidence that the source of the stall was within the UUT itself.
5. JPL performed a computed tomography (CT) scan on the motor and discovered that the source of the stall condition was within the front motor bearing; the crown steel bearing retainer jammed under a ball, as shown in Figure 7.
Figure 7 – CT Scan of Front M45S Bearing within ShEl Life Test Unit (Courtesy of NASA/JPL-Caltech)

© 2020 Sierra Nevada Corporation 404
The UUT was returned and disassembled at SNC. The interior condition of the motor, particularly the front bearing, was evaluated by both SNC and JPL personnel. The following observations were made regarding the condition of the ShEl gearbox and motor:
• No significant anomalies were found within the ShEl gearbox. • No significant anomalies were found within the M45S brake assembly. • In disassembly of the motor, the rear bearing rotated smoothly and residual, dark, and slightly wet
lubricant remained. • A significant amount of wear debris was present on both sides of the front motor bearing: motor
rotor and motor pinion. See Figure 8. • The front bearing rotated roughly and caught occasionally. Two fingers of the ball retainer were
visibly damaged. The bearing was very dry and empty of both lubricant and wear material (appeared to have been ejected into motor rotor and motor pinion areas). The inner (piloting) diameter of the crown steel retainer included a rolled burr. Further inspection found that this inner diameter was measurably enlarged, allowing radial movement of the retainer to the point where the outer diameter of the retainer could contact the inner diameters of the outer race. Additionally, there were indications that the retainer spine contacted the interior surface of the bearing shield, indicating that the retainer ball pockets had worn to allow excessive axial movement of the retainer. See Figure 9 for the appearance of this damaged front bearing.
Figure 8 – Wear Debris Surrounding the M45S Front Motor Bearing from ShEl DV Unit
Figure 9 – Interior Inspection and Retainer Observations on M45S Front Motor Bearing from ShEl DV Unit
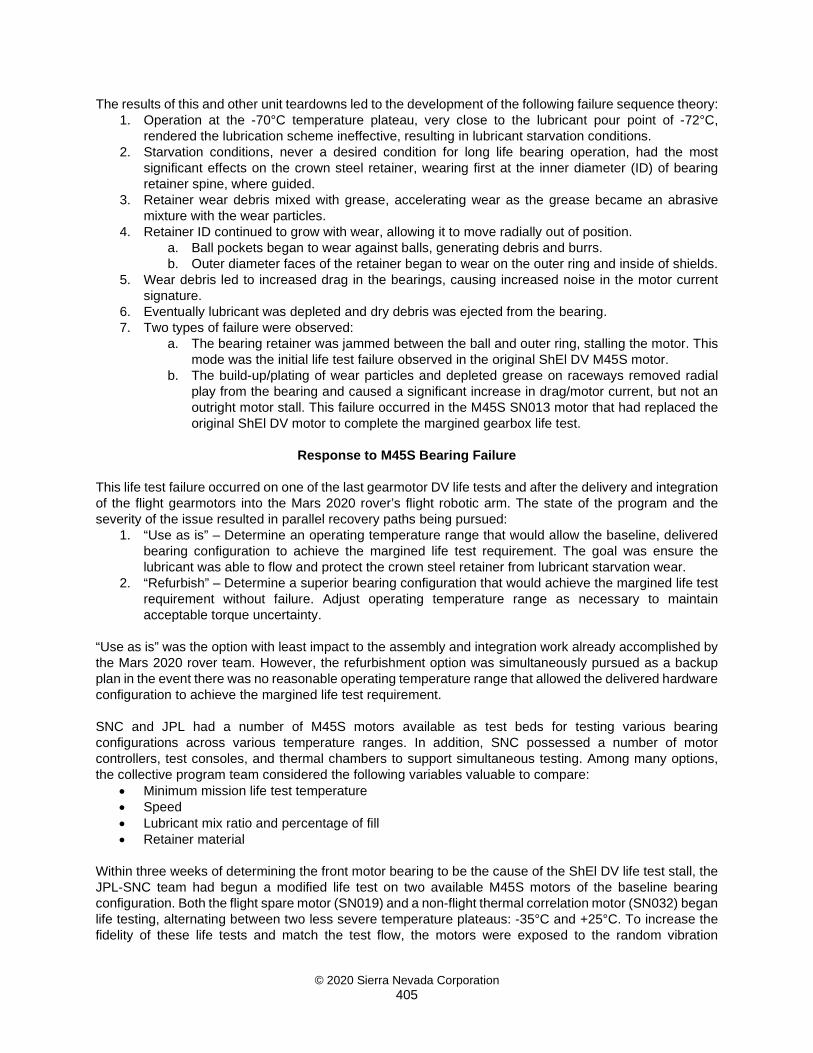
© 2020 Sierra Nevada Corporation 405
The results of this and other unit teardowns led to the development of the following failure sequence theory: 1. Operation at the -70°C temperature plateau, very close to the lubricant pour point of -72°C,
rendered the lubrication scheme ineffective, resulting in lubricant starvation conditions. 2. Starvation conditions, never a desired condition for long life bearing operation, had the most
significant effects on the crown steel retainer, wearing first at the inner diameter (ID) of bearing retainer spine, where guided.
3. Retainer wear debris mixed with grease, accelerating wear as the grease became an abrasive mixture with the wear particles.
4. Retainer ID continued to grow with wear, allowing it to move radially out of position. a. Ball pockets began to wear against balls, generating debris and burrs. b. Outer diameter faces of the retainer began to wear on the outer ring and inside of shields.
5. Wear debris led to increased drag in the bearings, causing increased noise in the motor current signature.
6. Eventually lubricant was depleted and dry debris was ejected from the bearing. 7. Two types of failure were observed:
a. The bearing retainer was jammed between the ball and outer ring, stalling the motor. This mode was the initial life test failure observed in the original ShEl DV M45S motor.
b. The build-up/plating of wear particles and depleted grease on raceways removed radial play from the bearing and caused a significant increase in drag/motor current, but not an outright motor stall. This failure occurred in the M45S SN013 motor that had replaced the original ShEl DV motor to complete the margined gearbox life test.
Response to M45S Bearing Failure
This life test failure occurred on one of the last gearmotor DV life tests and after the delivery and integration of the flight gearmotors into the Mars 2020 rover’s flight robotic arm. The state of the program and the severity of the issue resulted in parallel recovery paths being pursued:
1. “Use as is” – Determine an operating temperature range that would allow the baseline, delivered bearing configuration to achieve the margined life test requirement. The goal was ensure the lubricant was able to flow and protect the crown steel retainer from lubricant starvation wear.
2. “Refurbish” – Determine a superior bearing configuration that would achieve the margined life test requirement without failure. Adjust operating temperature range as necessary to maintain acceptable torque uncertainty.
“Use as is” was the option with least impact to the assembly and integration work already accomplished by the Mars 2020 rover team. However, the refurbishment option was simultaneously pursued as a backup plan in the event there was no reasonable operating temperature range that allowed the delivered hardware configuration to achieve the margined life test requirement. SNC and JPL had a number of M45S motors available as test beds for testing various bearing configurations across various temperature ranges. In addition, SNC possessed a number of motor controllers, test consoles, and thermal chambers to support simultaneous testing. Among many options, the collective program team considered the following variables valuable to compare:
• Minimum mission life test temperature • Speed • Lubricant mix ratio and percentage of fill • Retainer material
Within three weeks of determining the front motor bearing to be the cause of the ShEl DV life test stall, the JPL-SNC team had begun a modified life test on two available M45S motors of the baseline bearing configuration. Both the flight spare motor (SN019) and a non-flight thermal correlation motor (SN032) began life testing, alternating between two less severe temperature plateaus: -35°C and +25°C. To increase the fidelity of these life tests and match the test flow, the motors were exposed to the random vibration
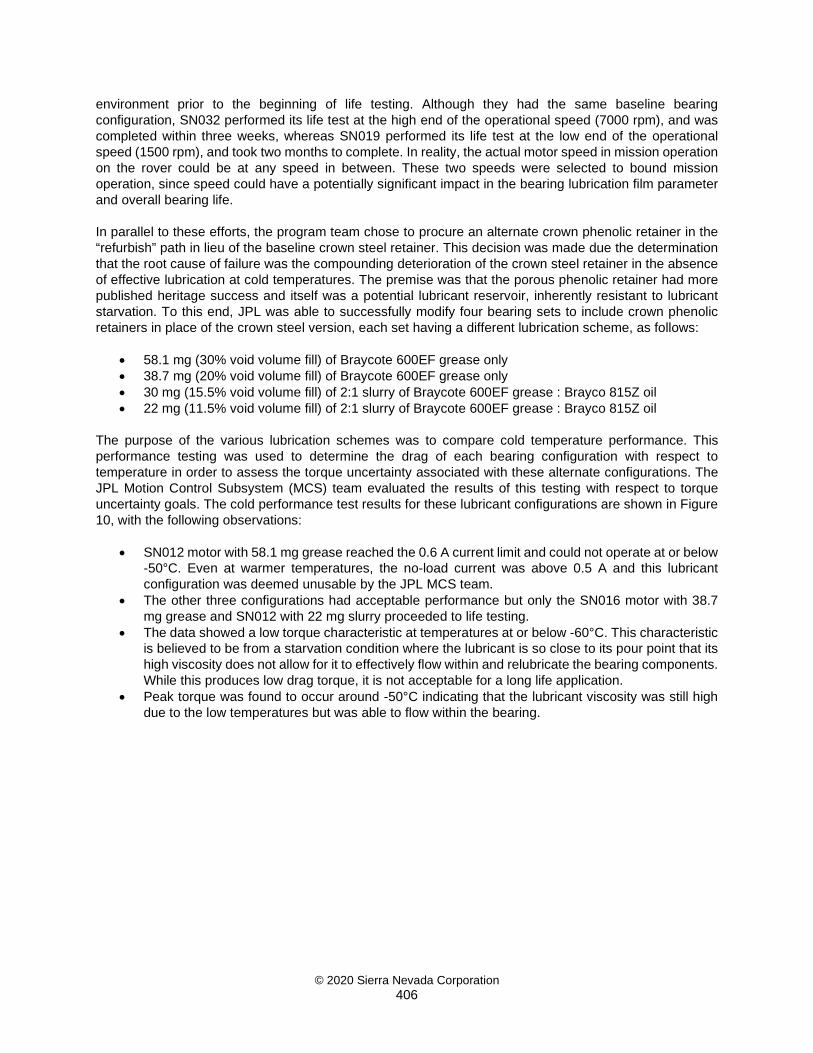
© 2020 Sierra Nevada Corporation 406
environment prior to the beginning of life testing. Although they had the same baseline bearing configuration, SN032 performed its life test at the high end of the operational speed (7000 rpm), and was completed within three weeks, whereas SN019 performed its life test at the low end of the operational speed (1500 rpm), and took two months to complete. In reality, the actual motor speed in mission operation on the rover could be at any speed in between. These two speeds were selected to bound mission operation, since speed could have a potentially significant impact in the bearing lubrication film parameter and overall bearing life. In parallel to these efforts, the program team chose to procure an alternate crown phenolic retainer in the “refurbish” path in lieu of the baseline crown steel retainer. This decision was made due the determination that the root cause of failure was the compounding deterioration of the crown steel retainer in the absence of effective lubrication at cold temperatures. The premise was that the porous phenolic retainer had more published heritage success and itself was a potential lubricant reservoir, inherently resistant to lubricant starvation. To this end, JPL was able to successfully modify four bearing sets to include crown phenolic retainers in place of the crown steel version, each set having a different lubrication scheme, as follows:
• 58.1 mg (30% void volume fill) of Braycote 600EF grease only • 38.7 mg (20% void volume fill) of Braycote 600EF grease only • 30 mg (15.5% void volume fill) of 2:1 slurry of Braycote 600EF grease : Brayco 815Z oil • 22 mg (11.5% void volume fill) of 2:1 slurry of Braycote 600EF grease : Brayco 815Z oil
The purpose of the various lubrication schemes was to compare cold temperature performance. This performance testing was used to determine the drag of each bearing configuration with respect to temperature in order to assess the torque uncertainty associated with these alternate configurations. The JPL Motion Control Subsystem (MCS) team evaluated the results of this testing with respect to torque uncertainty goals. The cold performance test results for these lubricant configurations are shown in Figure 10, with the following observations:
• SN012 motor with 58.1 mg grease reached the 0.6 A current limit and could not operate at or below -50°C. Even at warmer temperatures, the no-load current was above 0.5 A and this lubricant configuration was deemed unusable by the JPL MCS team.
• The other three configurations had acceptable performance but only the SN016 motor with 38.7 mg grease and SN012 with 22 mg slurry proceeded to life testing.
• The data showed a low torque characteristic at temperatures at or below -60°C. This characteristic is believed to be from a starvation condition where the lubricant is so close to its pour point that its high viscosity does not allow for it to effectively flow within and relubricate the bearing components. While this produces low drag torque, it is not acceptable for a long life application.
• Peak torque was found to occur around -50°C indicating that the lubricant viscosity was still high due to the low temperatures but was able to flow within the bearing.
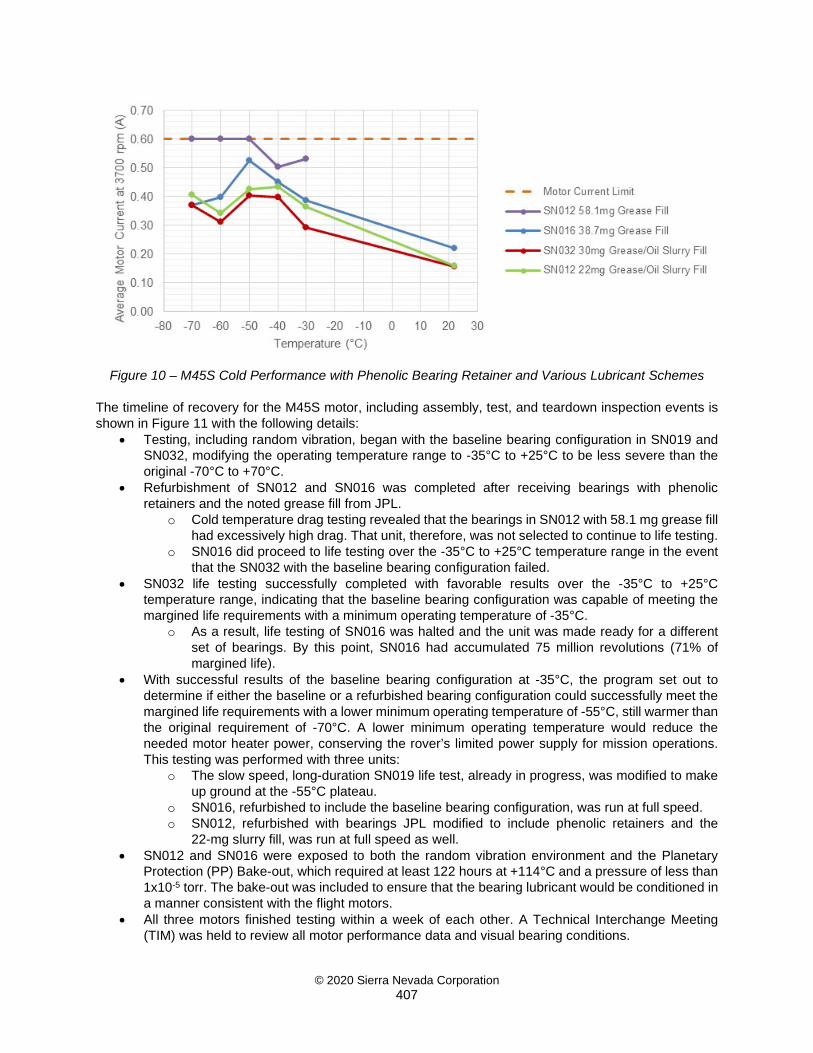
© 2020 Sierra Nevada Corporation 407
Figure 10 – M45S Cold Performance with Phenolic Bearing Retainer and Various Lubricant Schemes
The timeline of recovery for the M45S motor, including assembly, test, and teardown inspection events is shown in Figure 11 with the following details:
• Testing, including random vibration, began with the baseline bearing configuration in SN019 and SN032, modifying the operating temperature range to -35°C to +25°C to be less severe than the original -70°C to +70°C.
• Refurbishment of SN012 and SN016 was completed after receiving bearings with phenolic retainers and the noted grease fill from JPL.
o Cold temperature drag testing revealed that the bearings in SN012 with 58.1 mg grease fill had excessively high drag. That unit, therefore, was not selected to continue to life testing.
o SN016 did proceed to life testing over the -35°C to +25°C temperature range in the event that the SN032 with the baseline bearing configuration failed.
• SN032 life testing successfully completed with favorable results over the -35°C to +25°C temperature range, indicating that the baseline bearing configuration was capable of meeting the margined life requirements with a minimum operating temperature of -35°C.
o As a result, life testing of SN016 was halted and the unit was made ready for a different set of bearings. By this point, SN016 had accumulated 75 million revolutions (71% of margined life).
• With successful results of the baseline bearing configuration at -35°C, the program set out to determine if either the baseline or a refurbished bearing configuration could successfully meet the margined life requirements with a lower minimum operating temperature of -55°C, still warmer than the original requirement of -70°C. A lower minimum operating temperature would reduce the needed motor heater power, conserving the rover’s limited power supply for mission operations. This testing was performed with three units:
o The slow speed, long-duration SN019 life test, already in progress, was modified to make up ground at the -55°C plateau.
o SN016, refurbished to include the baseline bearing configuration, was run at full speed. o SN012, refurbished with bearings JPL modified to include phenolic retainers and the
22-mg slurry fill, was run at full speed as well. • SN012 and SN016 were exposed to both the random vibration environment and the Planetary
Protection (PP) Bake-out, which required at least 122 hours at +114°C and a pressure of less than 1x10⁻⁵ torr. The bake-out was included to ensure that the bearing lubricant would be conditioned in a manner consistent with the flight motors.
• All three motors finished testing within a week of each other. A Technical Interchange Meeting (TIM) was held to review all motor performance data and visual bearing conditions.

© 2020 Sierra Nevada Corporation 408
Figure 11 – Timeline of M45S Motor Recovery Assembly, Test, and Teardown Events
In the TIM, the decision was made to proceed with the baseline bearing configuration for the qualification and flight mechanisms, provided the minimum mission life test temperature was increased from -70°C to -55°C. Furthermore, since the M45S was capable of meeting performance requirements at colder temperatures and the concern was regarding reduced mechanism life, it was recommended that the power allocation for robotic arm motor heating be in proportion to the expected life of each joint. This allocation would conserve limited rover power resources while maximizing overall robotic arm life. Practically, this means that a joint that is expected to experience minimal revolutions could be operated colder than a joint that is expected to experience the most revolutions. Additionally, it was recommended that heater power continue to be used as available to maximize life, not just to achieve a minimum -55°C operating temperature. Motor performance was acceptable for all five of the M45S recovery test configurations. A summary of the variables tested and the outcome of those tests are shown in the matrix of configurations and environments in Table 2:
Table 2 – M45S Motor Bearing Recovery Test and Results Matrix
Motor SN
Retainer / Lubricant
I&T Temperature / Motor Revolutions
Mission Temperature / Motor Revolutions
Total Revs
Speed (rpm)
Visual Cond.
SN032 Crown Steel 1
-33°C +25°C 106M 7000 OK 53.0M 52.8M
SN016 Crown Phenolic 2
-33°C +25°C 76M 7000 Good 42.4M 33.1M
SN012 Crown Phenolic 3
-70°C +25°C +70°C -55°C -35°C +25°C 106M 7000 Good 1.86M 3.88M 1.79M 39.3M 29.5M 29.9M
SN016 Crown Steel 1
-70°C +25°C +70°C -55°C -35°C +25°C 106M 7000 OK 1.86M 3.87M 1.79M 39.2M 29.4M 29.8M
SN019 Crown Steel 1
-70°C +25°C +70°C -55°C -35°C +25°C 105M 1500 OK 1.85M 3.85M 1.81M 39.2M 29.4M 29.3M
1 Baseline Lubrication: Grease Plate of Braycote 600EF Grease with 5% to 10% fill with 1:1 slurry by volume of Braycote 600EF grease and Brayco 815Z oil
2 No grease plate. Filled with 38.7 mg Braycote 600EF Grease, or ~20% fill 3 No grease plate. Filled with 22 mg of 2:1 slurry of Braycote 600EF grease: Brayco 815Z oil, or
~11.5% fill

© 2020 Sierra Nevada Corporation 409
Figure 12 is a comparison of the post-life test condition of the front motor bearing from various units: • Left: Original M45S DV motor-only life test with mission temperatures of -70°C to +70°C. Bearing
spun roughly and the lubricant/wear debris was dry and dark. • Center: M45S SN016 full-speed baseline bearing life test with modified mission temperatures of
-55°C to +25°C. Bearing spun smoothly and lubricant was still present and slightly discolored around the retainer ball pocket areas.
• Right: M45S SN012 full-speed life test with modified mission temperatures of -55°C to +25°C and a phenolic retainer with 22 mg grease/oil slurry fill. Bearing spun smoothly and lubricant was plentiful and minimally discolored.
Figure 12 – Post-Life Condition of Front M45S Bearings
Conclusions and Lessons Learned
Conclusions While the end-of-life condition of the bearings with phenolic retainers was superior to those with baseline crown steel retainers, the level of risk and schedule impact associated with replacing bearings installed in flight motors was deemed too significant. Multiple life tests confirmed that increasing the minimum mission life test temperature from -70°C to -55°C resulted in the baseline bearing configuration meeting the margined life requirements. The team planned to implement this change in minimum operating temperature by allocating the motor heating power budget proportionally based on the life requirement of each M45S motor application. By October 2019, the robotic arm joint assemblies, using SNC gearmotors containing the M45S motor with the baseline bearing configuration, were qualified for flight after successfully completing their margined life tests utilizing an increased minimum mission life test temperature of -55°C, providing additional confidence in the chosen solution. Lessons Learned
• Programs should evaluate the appropriateness of applying a 15°C thermal uncertainty margin in combination with the 2X margin on required revolutions during life testing, especially when the temperature margin results in a significant viscosity change in the lubricant.
• Given the -72°C pour point of Brayco 815Z oil, operation at -70°C resulted in a starvation condition. Future work should evaluate newer lubricant formulations with lower pour points if long duration operation at -70°C is unavoidable.
• Bearing drag testing over temperature may be useful as a means of determining the low-end temperature limit for effective wet lubrication. Bearing drag normally increases with decreasing temperature, but drag torque was shown to decrease below this low-end temperature limit as the lubricant cannot flow and the bearing operates in a lubricant starvation condition.

© 2020 Sierra Nevada Corporation 410
• Bearing lubricant life depends on many factors in addition to industry accepted Hertzian contact stress and lubricant stress cycles. A developmental life test of the flight configuration of bearings is recommended as early as possible to ensure success while accounting for as many other variables as possible: bearing retainer design and material, lubricant fill, test temperature and duty cycle, film thickness at design speed(s), etc.
• Engineering should identify and resolve conflicting design requirements early in the program: low drag torque and long life requirements are potentially in conflict with a wet lubrication scheme.
• In this design and environment, phenolic retainers would have provided longer life than crown steel retainers.
Acknowledgements
The authors wish to express appreciation to the Motion Control Subsystem (MCS) team at JPL for their collaboration in this investigation and resolution. Specific contributors of importance were Mark Balzer, Andrew Kennett, and Alex Ferreira. This work was performed for the Jet Propulsion Laboratory, California Institute of Technology, under the Prime Contract NNN12AA01C between Caltech and NASA under subcontract number Subcontract 1541135. Government sponsorship acknowledged.
References
1. Herman, J. and Davis, K., “Evaluation of Perfluoropolyether Lubricant Lifetime in the High Stress and High Stress-Cycle Regime for Mars Applications”, Proc. 39th Aerospace Mech. Symp., NASA CP-2008-215252, Huntsville, AL (2008)
2. Suffern, D. and Parker, J., “Developmental Bearing and Bushing Testing for Mars Gearboxes”, Proc. 44th Aerospace Mech. Symp., NASA/CP-2018-219887, Cleveland, OH (2018)
3. Conley, P. L. and Bohner, J. J., “Experience with Synthetic Fluorinated Fluid Lubricants”, Proc. 24th Aerospace Mech. Symp., NASA CP-3062, Kennedy Space Center, FL (1990)
4. Zaretsky, E. V. “Lubricant Effects on Bearing Life,” NASA-TM-88875, December 1986 5. Mobley, J.; Robertson, M.; Hodges, C., “Extended Life Testing of Duplex Ball Bearings”, Proc. 43rd
Aerospace Mech. Symp., NASA/CP-2016-219090, Santa Clara, CA (2016) 6. Zaretsky, E. V., “STLE Life Factors for Rolling Bearings.” STLE SP-34, Park Ridge, IL, 1999. 7. Lo, C. J., et al., “Use of Cumulative Degradation Factor Prediction and Life Test Result of the
Thruster Gimbal Assembly Actuator for the Dawn Flight Project.” NASA/CR-2009-215681. 8. Jones, W. R., et al., “The Effect of Stress and TiC Coated Balls on Lubricant Lifetimes Using a
Vacuum Ball-on-Plate Rolling Contact”, Proc. 33rd Aerospace Mech. Symp., NASA/TM-1999-209055, Pasadena, CA (1999)

411
Mars 2020 maxon Commercial Motor Development from Commercial-Off-the-Shelf to Flight-Qualified Motors, Gearboxes, and Detent Brakes: Overcoming Issues
and Lessons Learned
Michael LoSchiavo*, Robin Phillips**, Rebecca Mikhaylov* and Lynn Braunschweig**
Abstract Building on previous collaborations, maxon and the Jet Propulsion Laboratory (JPL) established a partnership to modify Ø20-mm & Ø32-mm Commercial-Off-The-Shelf (COTS) BrushLess Direct Current (BLDC) flat motors and a Ø22-mm planetary gearbox. The commercial design was modified to meet the requirements for the Mars 2020 rover, a Class B [1] interplanetary mission operating in the Martian surface environment, while maintaining as much of the industrial heritage as possible. Numerous issues encountered during development were successfully addressed, and qualification of the design and acceptance testing for the 10 Flight Model (FM) actuators installed on the Mars 2020 rover was completed on time for the rover assembly schedule.
Mars 2020 Overview and Previous Missions maxon brushed motors have significant flight heritage on JPL Mars missions. The Mars Pathfinder Sojourner rover contained 11 brushed direct current (DC) motors based on the RE16 design [2]. The Mars Exploration Rovers (MER), Spirit and Opportunity, each utilized 39 maxon brushed DC motors, based on modified commercial “RE” series designs. At the end of the Opportunity rover’s mission, all of the drive wheel motors were still functioning, having survived 5111 Sols (Martian day/night thermal cycles), with each motor completing ~9 × 10⁷ revolutions. Spare MER motors (4× RE20 and 5× RE25) were also used as part of the Phoenix lander. maxon has continued to develop brushed motors for the Martian applications Interior Exploration using Seismic Investigations, Geodesy and Heat Transport (Insight) mission and ExoMars mission by modifying newer commercial designs, however, these designs were not viable options for Mars 2020 due to the brush sensitivity to a pyroshock environment. Mars 2020 is the first step in a potential multimission approach to a Mars Sample Return mission and future human exploration of Mars [3,4]. The primary objective of the Mars Science Laboratory (MSL) and its Curiosity rover is to search for habitablity. Mars 2020 [5] and its Perseverance rover will seek signs of past life and collect Martian cores for possible later collection and return to Earth. The Mars 2020 project maximized the use of build-to-print hardware to reduce development risk and much of the project utilizes a large amount of spare MSL hardware (specifically the cruise and descent stages). Mars 2020 also levied design constraints to remain within the MSL footprint in terms of mass, volume, and power on major components, such as the rover chassis, which houses the Sample Caching System (SCS), and large robotic arm. The SCS is one of the most advanced robotic systems ever developed for planetary exploration, pushing more robotic Degrees of Freedom (DOFs) into a smaller volume than has previously been achieved. Within the SCS, the Adaptive Caching Assembly (ACA) and Coring Drill [6,7,8,9,10] requires complex mechanisms that need gearmotors smaller in volume than any equivalent hardware developed for MSL. Additionally, solenoid brake channels in the motor controller were traded for additional sensor channels, which required any new motors to utilize a passive holding torque mechanism. Tasked with Mars 2020’s mission objective to drill, capture, and store core samples along with volume constraints from the MSL
* Jet Propulsion Laboratory, California Institute of Technology, Pasadena, CA ** maxon international ag, Sachseln, Switzerland
Proceedings of the 45th Aerospace Mechanisms Symposium, NASA Johnson Space Center, 2020

412
rover, the project required new actuators that then needed to be baselined from proven/existing technologies to meet the launch schedule. The Curiosity rover had major actuator development issues, which contributed to the launch slipping from 2009 to 2011. The development of several new motors was highlighted as a major reason for the actuator schedule slips [4,11]. The JPL Mars 2020 actuator team considered the lessons learned from the earlier rover mission and decided to leverage an existing COTS design to reduce the flight hardware schedule risk. maxon has an extensive catalog of motors for industrial use and has proven flight heritage from the MER mission that, with suitable modifications, the motor designs are robust for space applications. maxon COTS flat motors were utilized in the SCS testbeds and baselined in the original derivation of the system volume and functional requirements. A close collaboration between maxon and JPL was essential in developing an up-screened COTS-to-robust, flight flat motor mounted on a $2B mission. Two motor types, referred to here as M20 and M32 (with 20 and 32 being the COTS motor diameter in millimeters), were based on existing maxon COTS products and chosen to meet the project envelope constraints (Figure 1). The M20 gearmotor includes an integrated gearbox (Figure 1). Additionally, a detent module was added to the M32 to provide a passive holding torque to a static motor. When the motor is spinning above a minimum speed, the inertia is sufficient to overcome any subtractive/additive torques from each detent step, with no significant performance reduction from the motor.
Figure 1. Top Left: M32 motor cut-away showing detent brake; Top Right: M20 FM gearmotor;
Bottom: Exploded view of M20 gearmotor
Mars 2020 Mechanism Descriptions The SCS includes a rotary percussive drill located on the turret at the end of the large robotic arm and the sample tube processing plant internal to the rover (the ACA, Figure 2). A 3-DOF arm in the processing plant passes the tubes and samples to multiple science stations and hermetically seals the tubes. Additionally, a bit carousel passes tubes and bits between the internal ACA and the external drill. Several of the mechanisms in the SCS subsystem are driven using the M32 detent motors described in this paper, which are mated to three different torque amplifying planetary gearboxes to provide a family of actuators (named

413
SHACD, SAS, and Chuck), designed and manufactured by Sierra Nevada Corporation in Durham, NC. The motors provide the active driving torque and holding torque for the following applications: the 3-DOF Sample Handling Assembly (SHA), which consists of a linear stage and two rotary (shoulder/elbow) joints; the tube gripper and sealing ram within the tube sealing station of the ACA; the central rotating axis of the bit carousel; the mechanism that shifts the coring drill between high-speed drilling and high-torque core break-off modes; and the opening and closing of the chuck at the end of the drill. All of these mechanisms are single-string devices performing a serial task in the sequence of capturing a rock core sample. The M20 gearmotor utilized similar modifications as developed in the M32 design effort into the smaller motor diameter for the most volume constrained component of the ACA, the end effector. This component is mounted to the end of the SHA and physically grabs the sample tube for transport within the ACA.
Figure 2. The Adaptive Caching Assembly (ACA)
The end effector has some of the strictest planetary protection and handling requirements ever levied on a mechanism. The Mars Helicopter technology demonstrator mounts to the underbelly of the rover in its stowed configuration and has a one-time actuation of the deployment arm. A summary of the four new designs utilizing the M20 and M32 motors for 10 flight locations on the rover are listed in Table 1.
Table 1. Gearmotor assignments
Application Gearmotor Name Motor SHA Elbow SHACD M32 SHA Linear SHACD M32 SHA Shoulder SHACD M32 Bit Carousel SHACD M32 Tube Drop-off SHACD M32 Sealing Station SAS M32 Core-Break Lock Out SAS M32 Helicopter Deployment Arm SAS M32 Chuck Chuck M32 End Effector DEE (M20) M20

414
Mars 2020 Specific Requirements There are several key and driving requirements derived from the Mars environment and mission requirements:
1. The mission objective to look for compounds that provide evidence of life on Mars levied strict Contamination Control and Planetary Protection handling, design, and assembly constraints, including: reducing organic materials used for assembly and treating them to minimize outgassing and deposition on crucial components, cleaning all surfaces to prevent contamination from migrating due to handling, and eliminating/reducing viable compounds from spores and organic materials from Earth.
2. The actuators located on the extremities of the rover arm are subjected to wide diurnal temperature changes, which is highly stressing on electronic components and bonded materials.
3. In addition to pyrotechnic release devices, the rotary percussive drill generates an environment that can be defined as a combination of a random vibration, sine vibration, and pyroshock. This environment varies depending on several factors, including the hardness of the rock being drilled into, the percussion frequency used for drilling, and the weight-on-bit applied. Ref. [7] contains more information on the coring drill. The dynamic environment fatigues components and can amplify natural modes in hardware, which then couples with fatigue induced from extreme thermal cycling.
maxon Catalog Flat Motor and Gearbox Design
maxon has 50 years of experience designing and manufacturing brushed and brushless DC electric motors, gearboxes (both planetary and spur), feedback devices, and control electronics. The brushless DC motors are offered in several families of types, covering both ironless winding and iron-core winding types. The iron-core winding types are in turn divided into external and internal rotor families where the rotor mounted permanent magnets are respectively outside or inside the windings. Both the M20 and M32 motors are
derived from maxon’s “flat motor” family (Figure 3), which are of the BLDC external rotor type. For industrial applications, compared to other BLDC types, the flat motors represent a simple, low-cost design that delivers high torque in a short (but large diameter) envelope. When operated without a housing in Earth atmosphere conditions, the exposed spinning outer rotor also enables excellent convective cooling and hence high continuous power ratings.
maxon’s flat motor family covers various diameters (14, 20, 32, 45, 60, and 90 mm), all of which share the same basic design. A large-diameter rotor provides the structural support and acts as a magnet return for a ring magnet. This rotor is supported by two ball bearings housed in a flange/bearing support structure. The bearings are preloaded by use of a spring. A stator sheet stack is wrapped with magnet wire and mounted to the bearing support structure while being electrically connected to a printed circuit board (PCB), which also holds three Hall sensors that detect the main magnet position. maxon has the industrial heritage for the flat motor design, which has been built several million times, including over 1 million units for commercial truck exhaust gas cleaning systems, an application that provides real world proof of the robustness of the basic design.
Flight Fidelity Modifications to the Catalog Designs It was known from previous maxon work that commercial motor designs usually require some modifications to allow reliable operation in a Martian environment, in particular, the wide temperature range cycling,
Figure 3. maxon flat motor standard features
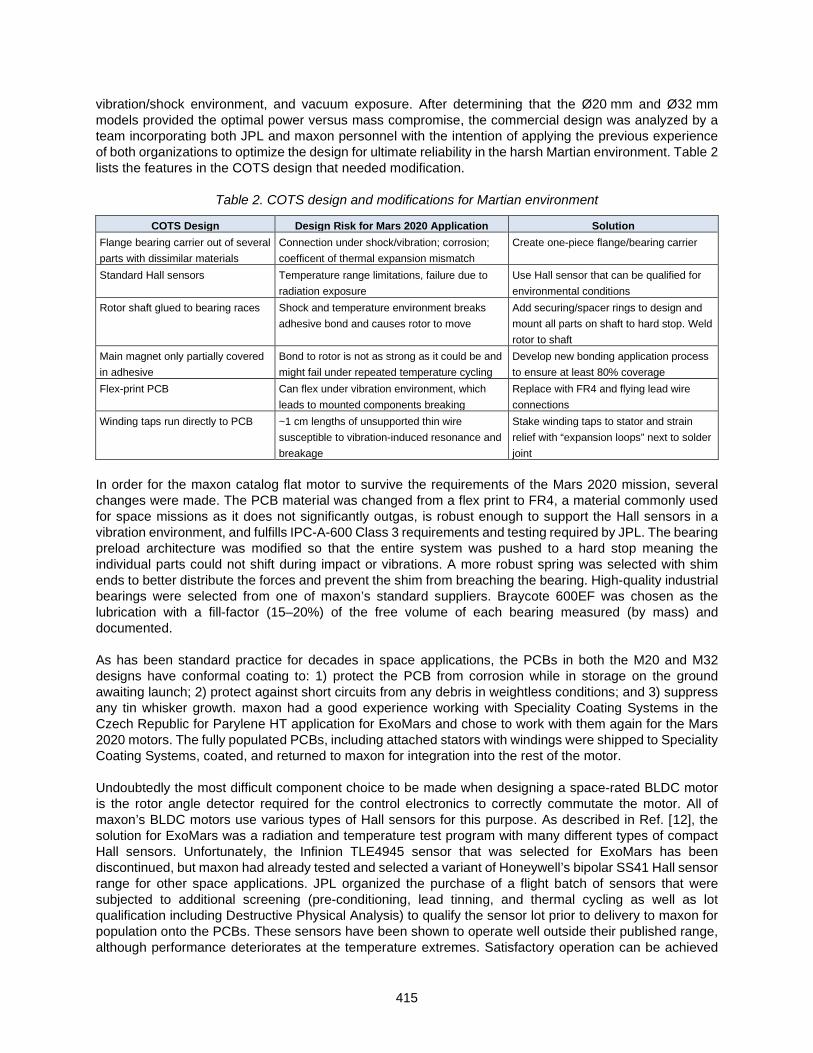
415
vibration/shock environment, and vacuum exposure. After determining that the Ø20 mm and Ø32 mm models provided the optimal power versus mass compromise, the commercial design was analyzed by a team incorporating both JPL and maxon personnel with the intention of applying the previous experience of both organizations to optimize the design for ultimate reliability in the harsh Martian environment. Table 2 lists the features in the COTS design that needed modification.
Table 2. COTS design and modifications for Martian environment
COTS Design Design Risk for Mars 2020 Application Solution Flange bearing carrier out of several parts with dissimilar materials
Connection under shock/vibration; corrosion; coefficent of thermal expansion mismatch
Create one-piece flange/bearing carrier
Standard Hall sensors Temperature range limitations, failure due to radiation exposure
Use Hall sensor that can be qualified for environmental conditions
Rotor shaft glued to bearing races Shock and temperature environment breaks adhesive bond and causes rotor to move
Add securing/spacer rings to design and mount all parts on shaft to hard stop. Weld rotor to shaft
Main magnet only partially covered in adhesive
Bond to rotor is not as strong as it could be and might fail under repeated temperature cycling
Develop new bonding application process to ensure at least 80% coverage
Flex-print PCB Can flex under vibration environment, which leads to mounted components breaking
Replace with FR4 and flying lead wire connections
Winding taps run directly to PCB ~1 cm lengths of unsupported thin wire susceptible to vibration-induced resonance and breakage
Stake winding taps to stator and strain relief with “expansion loops” next to solder joint
In order for the maxon catalog flat motor to survive the requirements of the Mars 2020 mission, several changes were made. The PCB material was changed from a flex print to FR4, a material commonly used for space missions as it does not significantly outgas, is robust enough to support the Hall sensors in a vibration environment, and fulfills IPC-A-600 Class 3 requirements and testing required by JPL. The bearing preload architecture was modified so that the entire system was pushed to a hard stop meaning the individual parts could not shift during impact or vibrations. A more robust spring was selected with shim ends to better distribute the forces and prevent the shim from breaching the bearing. High-quality industrial bearings were selected from one of maxon’s standard suppliers. Braycote 600EF was chosen as the lubrication with a fill-factor (15–20%) of the free volume of each bearing measured (by mass) and documented. As has been standard practice for decades in space applications, the PCBs in both the M20 and M32 designs have conformal coating to: 1) protect the PCB from corrosion while in storage on the ground awaiting launch; 2) protect against short circuits from any debris in weightless conditions; and 3) suppress any tin whisker growth. maxon had a good experience working with Speciality Coating Systems in the Czech Republic for Parylene HT application for ExoMars and chose to work with them again for the Mars 2020 motors. The fully populated PCBs, including attached stators with windings were shipped to Speciality Coating Systems, coated, and returned to maxon for integration into the rest of the motor. Undoubtedly the most difficult component choice to be made when designing a space-rated BLDC motor is the rotor angle detector required for the control electronics to correctly commutate the motor. All of maxon’s BLDC motors use various types of Hall sensors for this purpose. As described in Ref. [12], the solution for ExoMars was a radiation and temperature test program with many different types of compact Hall sensors. Unfortunately, the Infinion TLE4945 sensor that was selected for ExoMars has been discontinued, but maxon had already tested and selected a variant of Honeywell’s bipolar SS41 Hall sensor range for other space applications. JPL organized the purchase of a flight batch of sensors that were subjected to additional screening (pre-conditioning, lead tinning, and thermal cycling as well as lot qualification including Destructive Physical Analysis) to qualify the sensor lot prior to delivery to maxon for population onto the PCBs. These sensors have been shown to operate well outside their published range, although performance deteriorates at the temperature extremes. Satisfactory operation can be achieved

416
between -100°C and +200°C. Radiation testing showed no failures after exposure to γ-radiation (absorbed doses of 300 J/kg for 64h). maxon’s flight heritage from the MER mission does not include gearboxes, however, maxon gained considerable experience during the ExoMars development [13] and qualification program. The program demonstrated that although COTS planetary gearboxes, in particular those developed for high-temperature “downhole” oil and gas industry applications, can be easily modified for space applications, significant lifetime problems arise when switching to vacuum-rated lubricants such as Braycote 601EF. ExoMars development work had shown that using a slurry of grease and oil as previously described for Harmonic Drive applications [14] partially mitigated this lubricant issue. The root cause of the lifetime issues is that Braycote 601EF is fundamentally unsuitable for lubricating sliding (as opposed to rolling) surfaces. In order to achieve the lifetime requirements for the ExoMars drill drive, the COTS design sliding motion between each planetary gear and its shaft/axis was converted to rolling motion by the addition of needle bearings, which was then used as the basis for the Mars 2020 gearbox (Figure 4).
Figure 4. Exploded view of M20 planetary gearbox stage
Given the mission-critical nature of the M20 application, the JPL and maxon review teams decided that excessive residual risk remained in connections between sun gears and planetary carriers as well as between the planet axes pins and the carriers. In the COTS design, these connections are press fitted and welded, however, due to the hardened nature of the materials used for the axes and sun gears, the welds always exhibited surface cracks. This is an accepted compromise for industrial applications (and is not known to have ever caused a field failure), but due to the extreme Martian diurnal temperature cycling, this was considered to present an unacceptable risk of weld failure followed by axial movement of the components. The sun gear and planetary carriers’ connection was easily solved by combined these into a one-piece part (by using shaping manufacturing techniques). The problem of how to secure the axes was solved by adding a cage to the design. Both the cage and the planetary carrier have blind (vented) holes that the axes are pressed into, without requiring any further retaining mechanism. The cage is pressed onto an axial hard stop on the planetary carrier and is then cold formed (swaged) into position. The resultant design is then both weld- and adhesive-free and enables a free choice of gear and axes materials and hardening processes. No part involved more complexity to manufacture than the combined ring gear and motor flange for the M20 gearmotor. For industrial products, gearbox ring gears and motor flanges are usually screwed together on a large diameter thread and then either glued or welded. In the case of the M20, however, the gearmotor needs to fit inside a ring of springs, which requires a star shape pattern of wires to be precisely oriented relative to the mounting lugs on the front of the gearbox. The disadvantage of the standard assembly method is that the large diameter thread does not allow a precise angular orientation of the gearbox to the motor. The solution to this problem was to combine the flange and the ring gear into one piece. This had

417
the additional advantage of allowing shorter and lower mass assembly and also eliminated any unreliability in the connection. The decision required a significant reordering of the assembly sequence, but this did not cause any further problems. The manufacturing of the part itself, performed within maxon, involved a number of challenges to address, in particular the deburring of the bottom of the ring gear teeth after shaping, which required an external supplier for an electrochemical machining step and another external supplier for sand blasting the many detailed features on the motor flange.
Flight Design Issues Investigated Detent Design Two versions of the M32 motor were designed, with different detent strengths, each sharing components except for the magnets generating the field. The axially charged magnet in the two designs had different lengths, creating a 10 mN•m detent and a 20 mN•m detent, with the larger length baselined to enable the same housing to be used for both motor types. The step size of 24 detents per revolution was chosen to correspond to the total commutation state changes of the motor design. When paired with a gearbox, the detent size produces holding torque at a small angle at the gearmotor output. The Hall sensors measure the edge field of the 4-pole pair continuous ring NdFeB magnet. The Hall sensors are on the output side of the motor for maxon’s flat series designs, which is the same side as the detent mechanism module. When the detent was added to the motor, the performance of the detent mechanism did not match the strength of the standalone unit and motor switching error was encountered. Measurement of the magnetic field revealed the single axial magnet had significant stray flux in the vicinity of the Hall sensor, causing the switching error and reduced detent strength (Figure 5).
Figure 5. Left: Compensation magnet measurements for stray flux; Right: Computed Tomography (CT)
scan cross section of final assembly Two corrections were made. First, a compensation magnet axially charged in the opposite direction was added to the detent magnet stack, strengthening the field through the detent wheel. Second, the axial gap between the edge of the rotor cap ring magnet and the Hall sensor was reduced by shimming each motor individually after measuring subassembly dimensions. The change in axial gap increased the magnetic field strength and hence the signal-to-noise ratio in the Hall sensor.

418
Low-Quantity Grease Dosing For the M20 gearmotor, JPL required rapid acceleration to the commanded speed without an excessive current draw over the entire specified temperature range. This is a problem due to the high viscosity of Braycote at low temperatures. The standard quantities of grease used per gearbox stage by maxon for COTS products are determined by the requirement to deliver the longest possible lifetime with standard environmental conditions. The use of Braycote required the standard quantities to be reassessed. A series of tests were performed with gearboxes built using differing quantities of grease. In each case, high frequency resolution data of the start-up current draw was collected. It was necessary to reduce the grease load by a factor of 10 compared to the standard dose in order to obtain acceptable start-up performance. Subsequent life testing demonstrated that the required life (low compared to industrial applications) could still be achieved. For the flight units, application using the grease plating method was used to ensure the low quantity of grease was uniformly distributed, a process that is unnecessary for industrial applications, where only manual dosing with a syringe at defined locations is sufficient. The mechanism driven by the M20 actuator has a limited linear stroke. The cold drag performance of the actuator had significant transience in the first 5 seconds of motion; this large variation in torque production was outside the system-level requirements for controllability. JPL tested three actuators at several low temperatures in order to characterize the start-up current as a function of temperature. Figure 6 shows a knee in the drag happening between -30°C and -40°C for this gearbox. The actuator still exhibited margined torque production at the -70°C operation temperature limit, but due to controllability and other friction effects in the mechanism at -70°C, the heater was modified to increase the low-end operating temperature.
Figure 6. M20 drag current temperature dependence
Shock and Motor Bearings The M32 motor was tested (along with the mating gearboxes) to withstand a pyroshock environment simulated by a tunable beam. The pyroshock spectrum had a peak level at 3,000-g with a knee frequency at 1,600 Hz. After testing, the motor operated with a significant rattle, a noise equated to that of a coffee grinder. Although CT scans did not reveal gross damage in the assembly, several other non-destructive tests, including a noise frequency analysis and rotating shaft deflection test, indicated motor bearings as the damaged component. The frequency analysis had peaks at the motor bearing inner ring frequency that would scale with motor speed and the deflection test had a signature reminiscent of dimples in the raceway allowing up to 0.0127 mm of deflection. The motor bearings were disassembled and inspected. The motors’ front bearing inner ring, outer ring, and balls were deformed in both directions from the tunable beam test (Figure 7). The back bearing did not have any damage.

419
Figure 7. Damaged motor bearings from shock event
The g-level induced by pyroshock was initially analyzed with respect to the brittle components and solder/strain relief only, and did not consider the spring/mass system of the bearing/rotor combination. A design change between COTS and flight had the front bearing hard mounted in both directions, allowing the back bearing to float, resulting in the front bearing absorbing all of the energy of the accelerated rotor. The M32 motors are used in multiple locations across the Mars 2020 rover and any changes would cause a significant project schedule impact. In most locations, the pyroshock requirement was over specified; the hardware was requalification tested to the new pyroshock requirements. The motor, and subsequent gearmotor tests, all passed the new pyroshock exposure and long rotational life requirements. There remained a single location where the motor had exposure to the high pyroshock environment but with a short rotational life. With the project considering the risk, the solution was to use the damaged motor to qualify a deployable device with high shock and limited motor rotational life. The qualification demonstrated that the damaged motor could achieve the limited revolutions needed. The flight unit was delivered and the mechanism underwent qualification at the next level of assembly. The pyrotechnic deployment was demonstrated four times and did not produce a “coffee-grinder” motor, showing that the either the requirement or tunable beam test was over conservative. In both solution cases, no changes to the flight motor were made. Overheating Concern The coil-to-coil resistance for the M32 and M20 motors are 14 ohms and 28 ohms, respectively. Additionally, the copper wire is wound around two PEEK stator caps at each end of the stator lamination stack, which provides thermal isolation from the bulk stator mass. The current driving the motor causes significant Joule heating due to the high resistance, quickly increasing the temperature of the low mass of copper wire insulated from the stator, which can lead to thermal runaway. The overheating worsens as the current reaches 1A. Due to design principle requirements to demonstrate 2×torque at operational temperature limits, hot dynamometer tests are the highest risk activities to perform on the ground. The M32 has an additional thermal risk due to the detent mechanism; the larger holding torque design was roughly equal to the nominal performance of the motor, so twice as much current is needed during slow speeds (where the rotor has no signifcant inertia to carry it over the detent peaks) compared to fast speeds. A thermally instrumented unit was used to create a thermal model to understand this interaction. Guidelines for operation early on in the Mars 2020 design and qualification program were related to current input and time—a current profile could be estimated, the heat input was analyzed to confirm no overheat condition was achieved, and then a wait period was enforced in order to ensure the test article reached steady state.

420
The mechanism testing and subsequent system-level testing had sequences and current profiles that could not be predicted. The solution was to use a simplified thermal model on both the rover and control electrical ground support equipment (EGSE), which was the same implementation used on the MER rovers. The model is supplied with a case temperature from a platinum resistance thermometer (PRT) and the current telemetry feeds the Joule heating. The thermal protection watches for nodes and can shut down motion if temperatures rise above certain limits.
Acceptance and Qualification Testing An acceptance test program was implemented to determine JPL acceptability of the M32 and M20 motors. The acceptance testing centered on workmanship and functional performance of each unit, whereas a qualification program subjects designated units to the gambit of JPL-margined dynamic and thermal environments and life tests to verify that the design of units from the same production and manufacturing lots would meet the mission requirements. Qualification was completed at the gearmotor level, with some actuators further qualified at the mechanism level. Portions of the M20 gearmotor qualification testing were completed at maxon using their testing facilities, where feasible. The residual tests were completed at JPL due to infrastructure availability as well as long-duration (life test) activities outside of the scope of maxon’s contractual effort. All M32 FM units were subjected to the acceptance tests listed in Table 3, with defined criteria when appropriate. No-load characterization was used as a functional check to confirm the specific motor was performing as expected and within family for the M32 flight motors.
Table 3. M32 motor acceptance tests
Notes: CW = clockwise; CCW = counter-clockwise The M20 motor was subjected to similar acceptance testing (Table 4) prior to integration into the M20 gearmotor.
M32 Motor Acceptance Test Test Conditions Acceptance Criteria Dielectric strength 500V AC, 60 Hz for 60 ±5 seconds I < 1 mA Insulation resistance (R) 500V DC, for 60 ±5 seconds R > 100 MΩ Electrical bonding N/A R (flange to housing) < 25 mΩ
R (flange to shaft) < 100Ω Run-in 60 seconds CW and 60 seconds CCW at 28V N/A Hall effect Integrated Non-Linearity (INL) sensor
Maxon defined test <10° INL (target <7.5°)
Natural cogging torque (T) harmonic magnitude
CW and CCW over two revolutions, speed 2 rpm T = Detent Value (10 or 20 mN•m) ± 10%
Powered torque ripple plot Powered in direction of motion, powered opposite direction of motion
N/A (characterization only), validates torque is produced at all rotor positions
Load 12V/20V/28V, CW and CCW, ambient temperature Motor torque constant = 50 mN•m/A ± 10% Start-up sensitivity CW only, 22°C /+70°C /-70°C N/A (characterization only) No load 28V, CW only, 22°C /+70°C /-70°C /22°C N/A (characterization only) “Launch” random vibration
Frequency (Hz) Protoflight/Design
Verification (Qual/PF) Test Level
20 0.15 g2/Hz 30–90 0.5 g2/Hz
166–450 0.08 g2/Hz 2,000 0.0040 g2/Hz Grms 10
(in all 3 axes, 1 min each)
N/A (exposure only)

421
Table 4. M20 motor acceptance tests
The acceptance tests listed in Table 5 were completed at the M20 gearmotor level, which included thermal environment exposure at non-operational temperature limits of -135°C.
Table 5. M20 gearmotor acceptance tests
The majority of the M32 and M20 hardware subjected to acceptance testing met performance requirements and were accepted as meeting flight fidelity. JPL accepted the risk of qualifying the M20 actuator post delivery of the flight units due to the schedule criticality of needing the flight hardware assembly. Tests completed by JPL to fully qualify the design (Table 6) exposed an actuator to the flight acceptance test (with the exception of 2 minutes per axis random vibration exposure) and then completed a long-duration thermal bakeout, pyroshock, and humidity exposure. The gearmotors underwent a long-duration thermal vacuum bakeout to replicate the maximum expected exposure the assembled mechanisms may be subjected to in order to meet Planetary Protection requirements. The gearmotors were also subjected to 40 hours of accelerated corrosion exposure in an 80°C/80% relative humidity environment meant to simulate any corrosion that may occur in the gearbox while exposed to the Earth’s atmosphere before launch. The gearmotor was then subject to the rotary life test. A separate motor-only unit was subjected to the thermal life test.
M20 motor Acceptance Test Test Conditions Acceptance Criteria Dielectric strength 500V AC, 60Hz for 60 ±5 seconds I < 1 mA Insulation resistance 500V DC, for 60 ±5 seconds R > 100 MΩ Electrical bonding N/A R (flange to housing) < 25 mΩ; R (flange to shaft) < 100Ω Run-in 60 sec CW and 60 sec CCW at 28V N/A Hall effect (INL) sensor Maxon defined test <10° INL Torque ripple CW and CCW over one revolution N/A (characterization only), validates torque is produced
at all rotor positions No load 24V, CW and CCW, 22°C N/A (characterization only)
M20 Gearmotor Acceptance Test Test Conditions Acceptance Criteria Run-in 7.5 minutes CW and 7.5 minutes CCW at 24V N/A Back drive torque Ramp to 75 mN•m, CW only Static holding torque: > 50 mN•m No load 24V, CW only, STP N/A (characterization only) “Launch” random vibration
Frequency (Hz) Protoflight/Design
Verification (Qual/PF) Test Level
20 0.15 g2/Hz 30–90 0.5 g2/Hz
166–450 0.08 g2/Hz 2,000 0.0040 g2/Hz Grms 10
(in all 3 axes, 1 min each)
N/A (exposure only)
Non-operational thermal One thermal cycle from +113°C to -135°C Two thermal cycles from +70°C to -135°C
Restrain static holding torque (T > 50 mN•m)
Operational thermal Start-up sensitivity No load Load
Each test performed at +70°C/22°C/-70°C CW only
24V, CW only 12V/20V/28V, CW and CCW
Gearmotor torque constant = 1620 N•m/A ± 10%
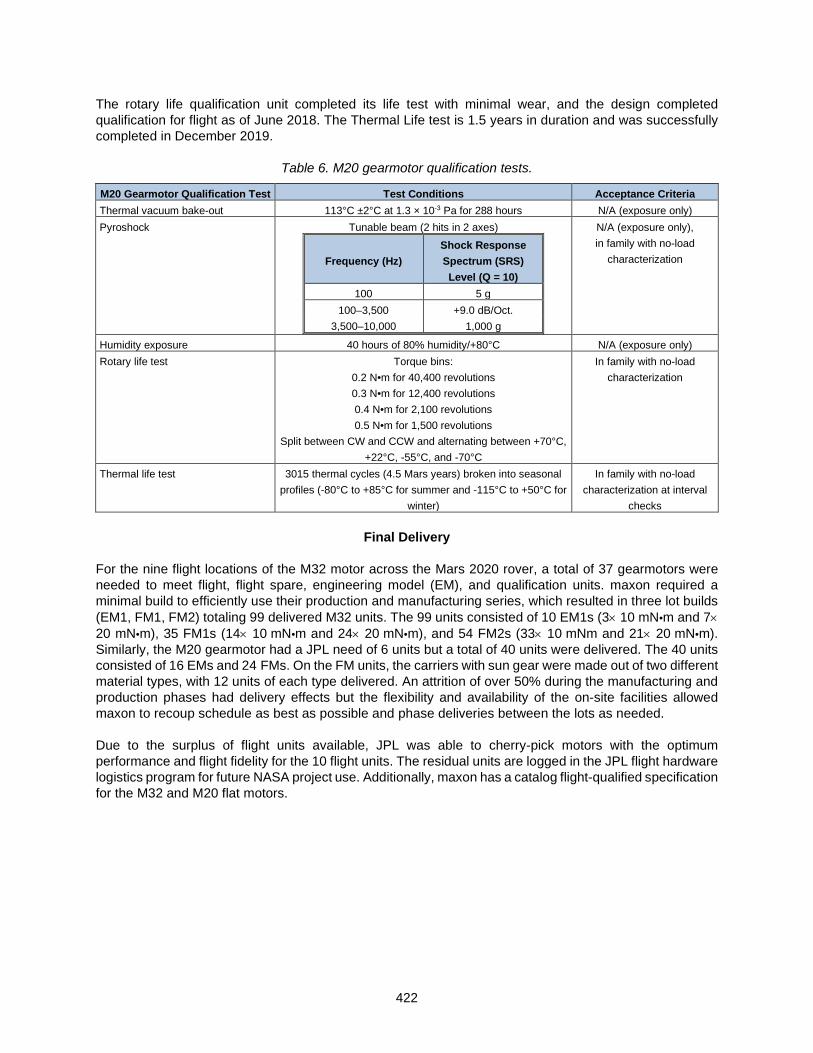
422
The rotary life qualification unit completed its life test with minimal wear, and the design completed qualification for flight as of June 2018. The Thermal Life test is 1.5 years in duration and was successfully completed in December 2019.
Table 6. M20 gearmotor qualification tests.
M20 Gearmotor Qualification Test Test Conditions Acceptance Criteria Thermal vacuum bake-out 113°C ±2°C at 1.3 × 10⁻³ Pa for 288 hours N/A (exposure only) Pyroshock Tunable beam (2 hits in 2 axes)
Frequency (Hz) Shock Response Spectrum (SRS) Level (Q = 10)
100 5 g 100–3,500 +9.0 dB/Oct.
3,500–10,000 1,000 g
N/A (exposure only), in family with no-load
characterization
Humidity exposure 40 hours of 80% humidity/+80°C N/A (exposure only) Rotary life test Torque bins:
0.2 N•m for 40,400 revolutions 0.3 N•m for 12,400 revolutions 0.4 N•m for 2,100 revolutions 0.5 N•m for 1,500 revolutions
Split between CW and CCW and alternating between +70°C, +22°C, -55°C, and -70°C
In family with no-load characterization
Thermal life test 3015 thermal cycles (4.5 Mars years) broken into seasonal profiles (-80°C to +85°C for summer and -115°C to +50°C for
winter)
In family with no-load characterization at interval
checks
Final Delivery For the nine flight locations of the M32 motor across the Mars 2020 rover, a total of 37 gearmotors were needed to meet flight, flight spare, engineering model (EM), and qualification units. maxon required a minimal build to efficiently use their production and manufacturing series, which resulted in three lot builds (EM1, FM1, FM2) totaling 99 delivered M32 units. The 99 units consisted of 10 EM1s (3× 10 mN•m and 7× 20 mN•m), 35 FM1s (14× 10 mN•m and 24× 20 mN•m), and 54 FM2s (33× 10 mNm and 21× 20 mN•m). Similarly, the M20 gearmotor had a JPL need of 6 units but a total of 40 units were delivered. The 40 units consisted of 16 EMs and 24 FMs. On the FM units, the carriers with sun gear were made out of two different material types, with 12 units of each type delivered. An attrition of over 50% during the manufacturing and production phases had delivery effects but the flexibility and availability of the on-site facilities allowed maxon to recoup schedule as best as possible and phase deliveries between the lots as needed. Due to the surplus of flight units available, JPL was able to cherry-pick motors with the optimum performance and flight fidelity for the 10 flight units. The residual units are logged in the JPL flight hardware logistics program for future NASA project use. Additionally, maxon has a catalog flight-qualified specification for the M32 and M20 flat motors.

423
Conclusions and Lessons Learned Detent Design Although the detent brake worked well and the add-on module that was designed proved capable of passing all qualification tests, this solution adds mass and complexity. In parallel, work was carried out by maxon to make rotors with segmented magnets (rather than a one-piece ring magnet) and then shape the magnetic field from those magnets to create the necessary detent. Making magnetic field simulations that correctly predicted the obtained detent was difficult, which resulted in initial prototypes delivering insufficient torque. Follow-up prototypes achieved the targeted 10 mNm. The greatest difficulty encountered was fixing the individual magnets to the rotor so that they were not susceptible to breaking under shock impacts. Eventually it was decided that this presented too much risk, especially to the schedule if several attempts were needed to find a workable solution. Despite not being chosen for the flight design, with further development this is likely to be a more reliable (because of fewer parts) and compact solution that should be investigated further. Overheating Concern The overheating concern has led to significant efforts in both analysis and implementation to reduce the motor wire temperature below the allowable limits. For past missions, protecting the motors from overheating entailed installing a PRT on the case and operating under the assumption that the housing temperature is well coupled to the wire temperature. Due to the outer rotating design of the Mars 2020 motors, there is no external location that is thermally coupled. However, a potential solution for both ground testing and thermal model validation would be to implement a thermocouple (TC) directly into the windings at the time of assembly and provide a path for those thermocouples to be monitored, either through traces in the board or holes in the board that can be routed to the channel for the lead wires. These thermocouples can be set to a GSE thermal alarm or act like a switch. The TCs can monitor concurrently while running the thermal model in multiple atmospheric environments to better ground the model in demonstrated performance. An additional improvement to the design could be to thermally couple the wires to the stator lamination stack instead of suspended between two PEEK end caps. Teamwork between a Government-Funded Science Institution and a Commercial Company A close collaboration between maxon and JPL was essential in developing the flight units, as it required a combination of maxon’s decades of experience with industrial motor and gearbox design and JPL’s decades of institutional experience in spacecraft design. For such a collaboration to work, it is necessary for both sides to understand each other’s motivations and methodologies. Commercial companies (especially those with limited previous space experience) need to understand that organizations like JPL can (and do) place significant resources into issues that may be of no importance in an industrial setting, which is a result of decades of hard learnt lessons where a single small failure can terminate a mission. The space environment is very unforgiving of design or manufacturing errors, which may never be noticed in a standard Earth-based application. The education of contractor staff on this history is a critical part of gaining acceptance for the space science mission method of working. In turn, government-funded institutions need to understand how industrial manufacturing companies, such as maxon, usually have the goal of using their limited engineering resources as efficiently as possible to keep the production lines filled with products that receive repeat orders. Thus, one-off high engineering resource developments are often viewed as a disturbance to the series production goals of the company; however, this can be partially mitigated by presenting the work as subsidized technology development and being as open as possible in helping the commercial company obtain a marketing effect by publicizing the work. Final Thoughts During the three-year collaboration, significant resources were required from both organizations to resolve the problems encountered and complexity involved in developing the Mars 2020 actuators. Even when the basis of the design was a commercial product, the issues encountered highlight the importance of allowing

424
sufficient time in mission planning for solution development. It was pivotal for JPL and maxon to leverage experts at each location to address critical problems (along with using a 9-hour time difference between Luzern and Los Angeles to accomplish an 18-hour project work day). Both the M20 and M32 designs have been successfully qualified. The M32 designs were integrated into three different, separately sourced gearboxes and passed all qualification testing. The two versions of the M32 motor are implemented into nine locations on the Mars 2020 rover and the M20 is integrated into a single location. Flight model hardware has been built, acceptance tested, integrated into the target gearboxes and mechanisms, and installed on the Mars 2020 rover awaiting launch to Mars in July 2020 (Figure 8).
Figure 8. maxon hardware installed on Mars 2020
Acknowledgements
The successful collaboration and delivery of the maxon flight motors to Mars 2020 would not be possible without many individuals at JPL and maxon over the three-year effort. In addition, the authors would like to thank their families who endured years of middle-of-the-night teleconferences and nights away on international trips. The research was carried out at the Jet Propulsion Laboratory, California Institute of Technology, under a contract with the National Aeronautics and Space Administration.
425
References
1. NASA Procedural Requirements, NPR 8705.4 (2004), https://nodis3.gsfc.nasa.gov/npg_img/N_PR_8705_0004_/N_PR_8705_0004_.pdf.
2. Braun, David and Don Noon, “Long Life” DC brush motor for use on the Mars Surveyor Program, 32nd Aerospace Mechanisms Symposium (1998).
3. See graphic on page 2 of Ref. [5], or this direct link: https://mars.nasa.gov/imgs/2013/07/mars-exploration-timeline-07-2016-hpfeat2.png.
4 Office of Inspector General, NASA’s Mars 2020 Project, Report no. IG-17-009 (2017), https://oig.nasa.gov/docs/IG-17-009.pdf.
5. NASA, Mars 2020 Mission Overview, available at: https://mars.nasa.gov/mars2020/mission/overview/. 6. Szwarc, Timothy, Jonathan Parker, and Johannes Kreuser, STIG: A Two-Speed Transmission Aboard
the Mars 2020 Coring Drill, 45th Aerospace Mechanisms Symposium (2020). 7. Chrystal, Kyle, Percussion Mechanism for the Mars 2020 Coring Drill, 45th Aerospace Mechanisms
Symposium (2020). 8. Barletta, Anthony, Design and Development of a Robust Chuck Mechanism for the Mars 2020 Coring
Drill, 45th Aerospace Mechanisms Symposium (2020). 9. Silverman, Milo and Justin Lin, Mars 2020 Rover Adaptive Caching Assembly: So Many Challenges,
45th Aerospace Mechanisms Symposium (2020). 10. Grimes-York, Jesse and Ken Glazebrook, Sealing Station Mechanisms for the Mars 2020 Rover Sample
Caching Subsystem, 45th Aerospace Mechanisms Symposium (2020). 11. Brown, Adrian, Mars Science Laboratory: the technical reasons behind its delay, The Space Science
Review (2009), http://www.thespacereview.com/article/1319/1. 12. Phillips, Robin R., M. Palladino, and C. Courtois, Development of Brushed and Brushless DC Motors
for use in the ExoMars Drilling and Sampling Mechanism, Aerospace Mechanisms Symposium (2012). 13. McCoubrey, R., et al., Canada’s Suspension and Locomotion Subsystem for ExoMars 2018, 65th
International Astronautical Congress, Toronto, Canada (2014). 14. Herman, Jason and Kiel Davis, Evaluation of Perflouropolyether Lubricant Lifetime in the High Stress
and High Stress-Cycle Regime for Mars Applications, 39th Aerospace Mechanisms Symposium (2008).

426

427
Mars 2020 Center Differential Pivot Restraint: Flexurized Spring System Providing Compliance for Rover Mobility Deployment Prior to Landing
Matthew Cameron* and Kevin Liu*
Abstract
The Center Differential Pivot Restraint (CDPR) for the Mars 2020 mission is designed to constrain motion of the rover differential and to dampen out the load response during rover’s mobility deployment event in Entry, Descent, and Landing (EDL) phase of the mission. For Mars 2020, it was required to redesign the mechanism to save minimum 33% of the mass from the previous Mars Science Laboratory (MSL) design. The new mechanism architecture used a monolithic spring-like flexure to act as the system compliance, resulting in 50% mass savings from the MSL design. Along the design and prototype testing process, several mechanism design principles were re-affirmed as well as lessons learned about potential race conditions.
Introduction The Mars 2020 mission is designed to land and traverse a newly improved rover on Mars to gather soil samples that could be returned to Earth for detailed study. During the EDL portion of the mission, the rover is lowered from the sky crane via three bridle connections while the rover’s mobility subsystem’s rocker/bogie suspension on both sides of the rover deploys in preparation for surface touchdown (Fig. 1). During this deployment event, the CDPR absorbs and dampens out the induced load into the rover at the chassis top deck interface in the event when the side-to-side suspension deployment becomes asymmetric. Same as that of the MSL mission, the CDPR is mounted on the top deck of the rover chassis and located directly aft of the rover differential assembly (Fig. 2).
As improved upon the previous MSL CDPR [1], completely new design and architecture for the Mars 2020 CDPR were achieved by maintaining the same functionality, while reducing the restraint’s mass by 50%. From conceiving the initial design in November 2015, through multiple design reviews and prototype testing, to completing flight integration and qualification testing around early January 2020, the entire cradle-to-grave process spanned over a 39-month period. This paper discusses details of the new Mars 2020 design and mechanism features, its development process, key improvements from the previous MSL mission, and the design validation testing campaign; highlighting key lessons learned throughout the design and testing process.
Mars 2020 vs. MSL Design
The design for Mars 2020 CDPR is composed of a spring-like flexure, constrained by a pyro pin-puller attached to the mobility differential on one end and a shoulder bolt to a bracket bolted to the rover chassis top deck on the other end (Fig. 2). Details of its design and the deployable mechanism are presented in a later section. For brevity and scope of this paper, see [1] for complete details of MSL’s CDPR design. In both designs, the mechanism’s function is the same and is described in three phases: (1) rover mobility deployment response dampening and motion constrain during EDL, (2) CDPR mechanism deployment, and (3) remaining deployed for the remainder of surface operations. Major similarities of CDPR between the two missions include how each deployable is constrained to the differential as well as the main passive element in the deployment mechanism.
* Jet Propulsion Laboratory, California Institute of Technology, Pasadena, CA
Proceedings of the 45th Aerospace Mechanisms Symposium, NASA Johnson Space Center, 2020
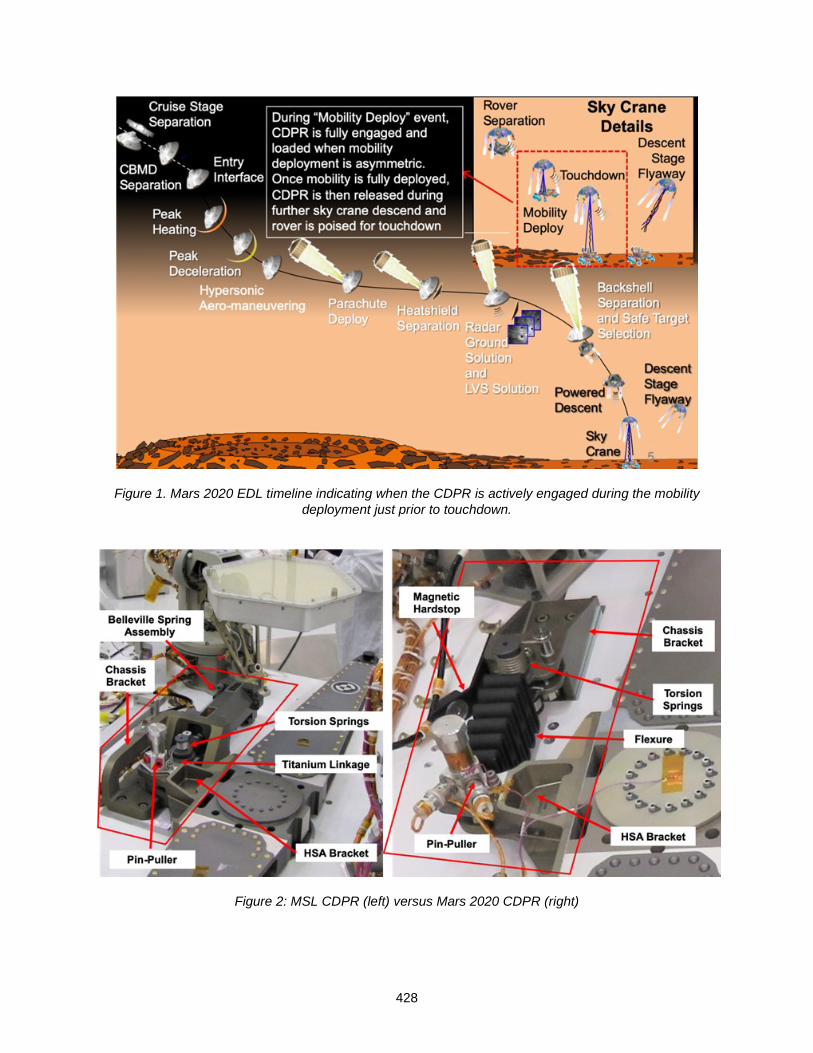
428
Figure 1. Mars 2020 EDL timeline indicating when the CDPR is actively engaged during the mobility deployment just prior to touchdown.
Figure 2: MSL CDPR (left) versus Mars 2020 CDPR (right)
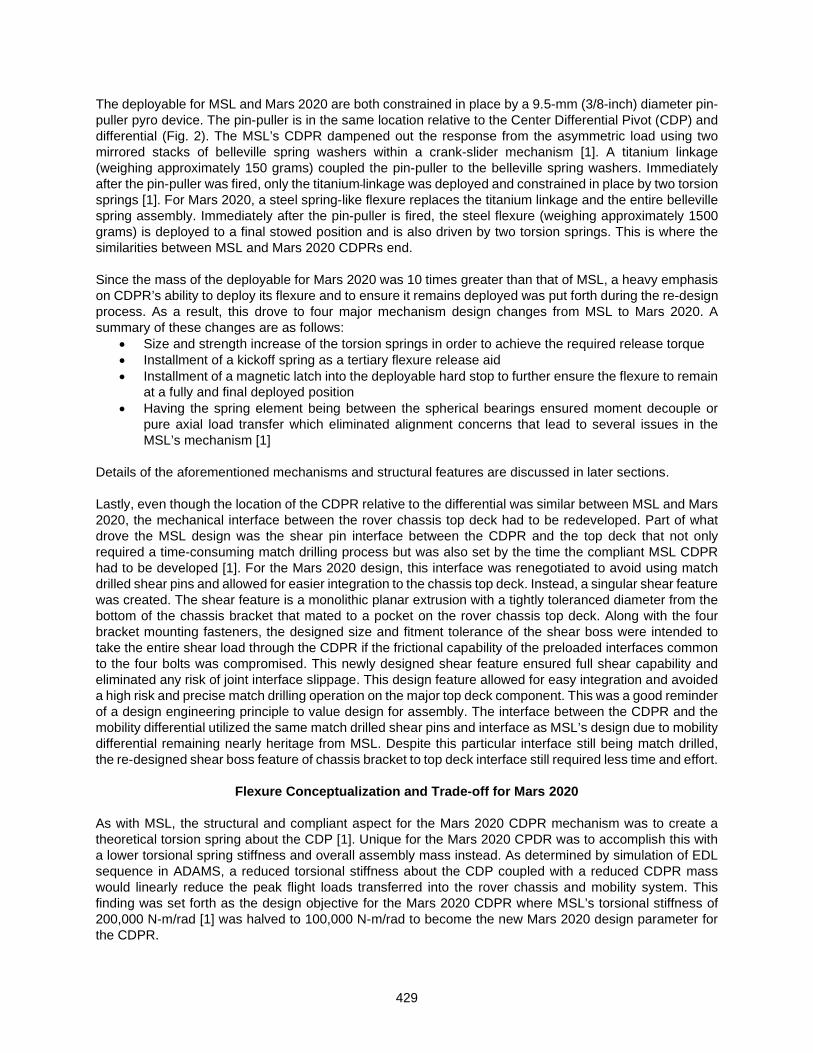
429
The deployable for MSL and Mars 2020 are both constrained in place by a 9.5-mm (3/8-inch) diameter pin-puller pyro device. The pin-puller is in the same location relative to the Center Differential Pivot (CDP) and differential (Fig. 2). The MSL’s CDPR dampened out the response from the asymmetric load using two mirrored stacks of belleville spring washers within a crank-slider mechanism [1]. A titanium linkage (weighing approximately 150 grams) coupled the pin-puller to the belleville spring washers. Immediately after the pin-puller was fired, only the titanium linkage was deployed and constrained in place by two torsion springs [1]. For Mars 2020, a steel spring-like flexure replaces the titanium linkage and the entire belleville spring assembly. Immediately after the pin-puller is fired, the steel flexure (weighing approximately 1500 grams) is deployed to a final stowed position and is also driven by two torsion springs. This is where the similarities between MSL and Mars 2020 CDPRs end. Since the mass of the deployable for Mars 2020 was 10 times greater than that of MSL, a heavy emphasis on CDPR’s ability to deploy its flexure and to ensure it remains deployed was put forth during the re-design process. As a result, this drove to four major mechanism design changes from MSL to Mars 2020. A summary of these changes are as follows:
• Size and strength increase of the torsion springs in order to achieve the required release torque • Installment of a kickoff spring as a tertiary flexure release aid • Installment of a magnetic latch into the deployable hard stop to further ensure the flexure to remain
at a fully and final deployed position • Having the spring element being between the spherical bearings ensured moment decouple or
pure axial load transfer which eliminated alignment concerns that lead to several issues in the MSL’s mechanism [1]
Details of the aforementioned mechanisms and structural features are discussed in later sections. Lastly, even though the location of the CDPR relative to the differential was similar between MSL and Mars 2020, the mechanical interface between the rover chassis top deck had to be redeveloped. Part of what drove the MSL design was the shear pin interface between the CDPR and the top deck that not only required a time-consuming match drilling process but was also set by the time the compliant MSL CDPR had to be developed [1]. For the Mars 2020 design, this interface was renegotiated to avoid using match drilled shear pins and allowed for easier integration to the chassis top deck. Instead, a singular shear feature was created. The shear feature is a monolithic planar extrusion with a tightly toleranced diameter from the bottom of the chassis bracket that mated to a pocket on the rover chassis top deck. Along with the four bracket mounting fasteners, the designed size and fitment tolerance of the shear boss were intended to take the entire shear load through the CDPR if the frictional capability of the preloaded interfaces common to the four bolts was compromised. This newly designed shear feature ensured full shear capability and eliminated any risk of joint interface slippage. This design feature allowed for easy integration and avoided a high risk and precise match drilling operation on the major top deck component. This was a good reminder of a design engineering principle to value design for assembly. The interface between the CDPR and the mobility differential utilized the same match drilled shear pins and interface as MSL’s design due to mobility differential remaining nearly heritage from MSL. Despite this particular interface still being match drilled, the re-designed shear boss feature of chassis bracket to top deck interface still required less time and effort.
Flexure Conceptualization and Trade-off for Mars 2020
As with MSL, the structural and compliant aspect for the Mars 2020 CDPR mechanism was to create a theoretical torsion spring about the CDP [1]. Unique for the Mars 2020 CPDR was to accomplish this with a lower torsional spring stiffness and overall assembly mass instead. As determined by simulation of EDL sequence in ADAMS, a reduced torsional stiffness about the CDP coupled with a reduced CDPR mass would linearly reduce the peak flight loads transferred into the rover chassis and mobility system. This finding was set forth as the design objective for the Mars 2020 CDPR where MSL’s torsional stiffness of 200,000 N-m/rad [1] was halved to 100,000 N-m/rad to become the new Mars 2020 design parameter for the CDPR.

430
The reduction in effective torsional stiffness and mass reduction did come with a trade-off, however. The linear spring of the CDPR would be less stiff, yet still had the same amount of time to dampen out the resultant load at the center of the differential. While the load to dampen out from an asymmetric deployment would start-off lower, the more compliant linear spring would not be able to dampen out as much load as the MSL CDPR. This resulted in a higher load at the time of pin-puller firing for the Mars 2020 compared to MSL. From worst case ADAMS models with the softer Mars 2020 restraint system, the peak load (torque about the CDP axis or rover z-axis as denoted by “Mz”) at the time of release was roughly 56% higher, but still within the capability of the pin-puller (Fig. 3).
Figure 3. Moment about CDP of MSL vs. Mars 2020 showing the maximum torque through the CDP at
the time of CDPR pin-puller firing: (a) MSL loads showing an initial higher peak mobility deployment load and a lower pin-puller firing load, (b) Mars 2020 loads showing an initial lower peak mobility deployment
load and a higher pin-puller firing load. Flexure Design and Development With the target torsional stiffness about the CDP set, the design and placement of the spring-like flexure that would act as the damper for the CDPR was the first component of the CDPR to be fully prototyped and tested. The flexure design began with a simple cantilever beam concept. The multi-looped feature was then implemented and modeled by placing several cantilever beams in series to form a linear spring. In the early design phase, a MATLAB optimization program was created to determine the placement and sizing of the flexure in order to minimize mass while also achieving the target equivalent torsional stiffness about the CDP. A structurally optimum and mass efficient location of the flexure was determined to be the same as that of MSL; having the pin-puller attaching to the flexure 180.5 mm aft of the CDP axis. After this optimization determining rough sizing of flexure dimensions, the design transitioned to higher fidelity Finite Element Analysis (FEA) modeling to close in on a more final design of the flexure. There were challenges in the initial design of the flexure to strike a balance between required material strength and structural buckling margin as well as target flexure compliance. To begin, Maraging 300 steel was selected as candidate material for the flexure due to its superior strength properties and high strength vs. stiffness ratio as material strength was the first design constraint to satisfy followed by structural compliance. To arrive to the first prototype design, extensive analytical iterations via FEA were performed in order to meet a rather narrow design window of stress, buckling, and stiffness requirements. Findings from the structural analysis indicated that peak stress magnitudes and distribution as well as overall flexure stiffness are highly sensitive to the width of the flexure loops followed by stem of the loops (Fig. 6). Prior to Detailed Design Review (DDR), a flexure prototype out of the flight material specification and same lot of flight material was subjected to a series of structural characterization testing. Objectives of this testing was to statically characterize the flexure’s uniaxial tension and compression stiffness at room temperature and qualification level hot (+40°C) and cold (-55°C) temperature up to CDPR’s flight limit load (FLL). A final test would be conducted to determine the flexure’s tensile residual strength capability at room temperature.
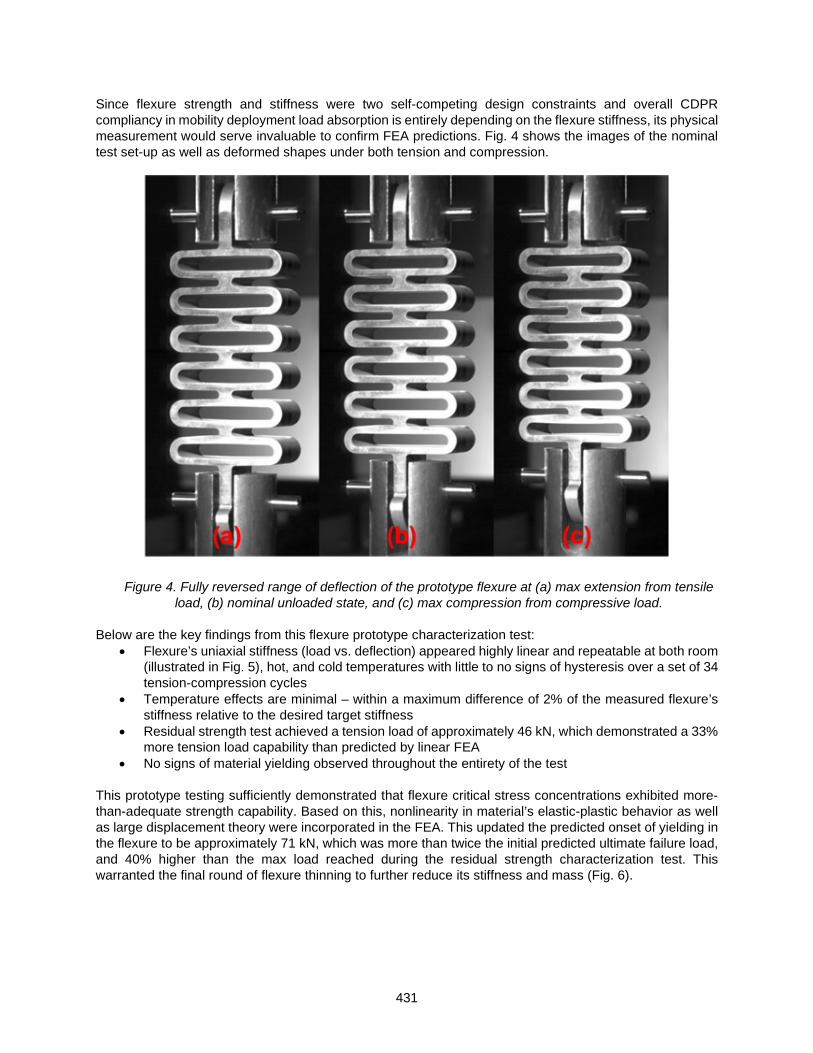
431
Since flexure strength and stiffness were two self-competing design constraints and overall CDPR compliancy in mobility deployment load absorption is entirely depending on the flexure stiffness, its physical measurement would serve invaluable to confirm FEA predictions. Fig. 4 shows the images of the nominal test set-up as well as deformed shapes under both tension and compression.
Figure 4. Fully reversed range of deflection of the prototype flexure at (a) max extension from tensile load, (b) nominal unloaded state, and (c) max compression from compressive load.
Below are the key findings from this flexure prototype characterization test:
• Flexure’s uniaxial stiffness (load vs. deflection) appeared highly linear and repeatable at both room (illustrated in Fig. 5), hot, and cold temperatures with little to no signs of hysteresis over a set of 34 tension-compression cycles
• Temperature effects are minimal – within a maximum difference of 2% of the measured flexure’s stiffness relative to the desired target stiffness
• Residual strength test achieved a tension load of approximately 46 kN, which demonstrated a 33% more tension load capability than predicted by linear FEA
• No signs of material yielding observed throughout the entirety of the test This prototype testing sufficiently demonstrated that flexure critical stress concentrations exhibited more-than-adequate strength capability. Based on this, nonlinearity in material’s elastic-plastic behavior as well as large displacement theory were incorporated in the FEA. This updated the predicted onset of yielding in the flexure to be approximately 71 kN, which was more than twice the initial predicted ultimate failure load, and 40% higher than the max load reached during the residual strength characterization test. This warranted the final round of flexure thinning to further reduce its stiffness and mass (Fig. 6).
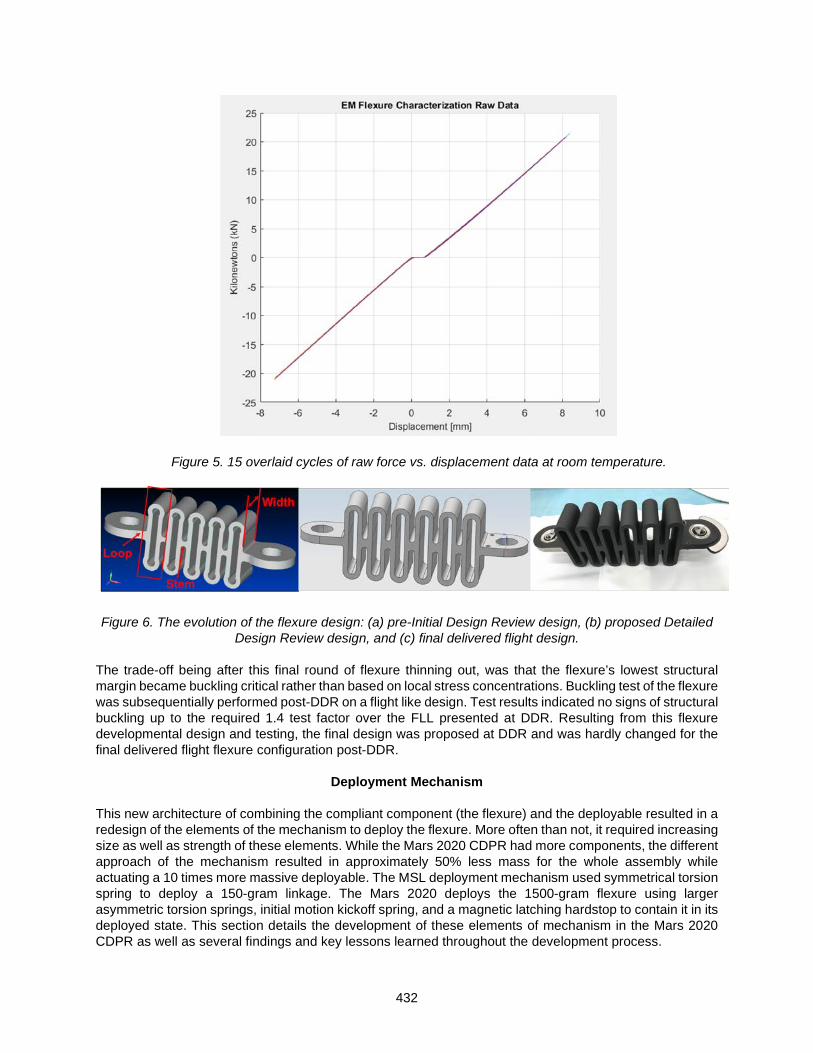
432
Figure 5. 15 overlaid cycles of raw force vs. displacement data at room temperature.
Figure 6. The evolution of the flexure design: (a) pre-Initial Design Review design, (b) proposed Detailed Design Review design, and (c) final delivered flight design.
The trade-off being after this final round of flexure thinning out, was that the flexure’s lowest structural margin became buckling critical rather than based on local stress concentrations. Buckling test of the flexure was subsequentially performed post-DDR on a flight like design. Test results indicated no signs of structural buckling up to the required 1.4 test factor over the FLL presented at DDR. Resulting from this flexure developmental design and testing, the final design was proposed at DDR and was hardly changed for the final delivered flight flexure configuration post-DDR.
Deployment Mechanism
This new architecture of combining the compliant component (the flexure) and the deployable resulted in a redesign of the elements of the mechanism to deploy the flexure. More often than not, it required increasing size as well as strength of these elements. While the Mars 2020 CDPR had more components, the different approach of the mechanism resulted in approximately 50% less mass for the whole assembly while actuating a 10 times more massive deployable. The MSL deployment mechanism used symmetrical torsion spring to deploy a 150-gram linkage. The Mars 2020 deploys the 1500-gram flexure using larger asymmetric torsion springs, initial motion kickoff spring, and a magnetic latching hardstop to contain it in its deployed state. This section details the development of these elements of mechanism in the Mars 2020 CDPR as well as several findings and key lessons learned throughout the development process.

433
Torsion Springs The main components to deploy the flexure are the torsions springs. At the time of DDR, it was required to show by design twice the needed torque to deploy the flexure to overcome mechanism frictional losses in dynamic environments. For Mars 2020, each torsion spring increased in size and strength compared to the MSL CDPR torsion springs. These larger torsion springs led to a design challenge of how to positively capture the two free ends of these larger torsion springs. For MSL, the torsion spring ends were manually bent to route the spring wire end through a hole in the titanium linkage. For larger Mars 2020 torsion springs, the spring wire was fabricated out of a stronger stainless-steel material and from spring wire nearly twice the diameter. There was concern if one could manually bend the spring wire accurately and without damaging the spring wire. Thus, it was chosen to have the vendor make the torsion spring with prescribed bends at each end. The style of bends at the end of the torsion spring to route through the flexure was inspired from linkage rods found in automotive engines. There are two 90° bends at one end of the torsion spring and are routed through a hole in flexure. Then once the torsion spring is installed on its arbor, each torsion spring would be positively captured. The size and position of the pass-through holes in the flexure and the torsion spring bends were designed together to achieve this positive retention of torsion spring end in the flexure. In the end, this design proved to be easy to implement and less susceptible to damaging the hardware with a manual bending process. See Fig. 7 for photos of wire end bends of each torsion spring.
Figure 7. Views of torsion spring ends: (a) upper torsion spring, (b) lower torsion spring and the travel limiters are protruding through the chassis bracket clevis with set gaps to the back shelf on the flexure.
There were design space limitations on the lower of the two torsion springs, which resulted in an asymmetrical design. As a torsion spring is preloaded, the effective spring diameter is decreased and the overall spring length is increased. The lower torsion spring had a fixed height from the confined space between the chassis bracket bottom and top deck. There was concern that the lower torsion spring could get too long when the flexure is in its stowed state. The upper torsion spring did not have the same height limitations and could have more loops and delivery more torque for the same deflection. The combination of the two asymmetric springs surpassed the DDR requirement of 100% torque margin, roughly 66% of the combined delivered torque came from the upper torsion spring. However, the fault case of only the lower torsion spring acting was enough still to deploy the flexure. To verify this release redundancy capability, various prototype and Dynamic Test Model (DTM) tests have indeed demonstrated that the mechanism could still deploy fully without the upper, stronger, torsion spring contributing to the deployment.

434
Initial Motion Kickoff Spring To adhere to flight mechanism design principles, a kickoff spring to aid in the initial deployment of the flexure was required to be added after DDR. This leaf spring, also made out of corrosion resistant steel (CRES), was placed within the clevis gap of the CDPR’s bracket connected to the aft of the differential, the Horizontal Swing Arm (HSA) bracket. With its preload, the spring was designed to exert a force on the flexure lug to minimally displace the flexure approximately 9.5 mm, or the diameter of the pin-puller pin. Prototype testing yielded two findings: first that the leaf spring did not need conditioning, but that the end interfacing with the flexure was digging into the paint of the flexure and causing the paint to shed. Two actions were taken from this lesson learned: (1) incorporate a slight curvature on the kickoff spring end contacting the flexure for a smooth point of contact, and (2) mask the potential contact area of the kickoff spring and flexure lug side to avoid any flexure paint scraping. Lastly, a coating of dry-film lubricate was applied to minimize friction of the contact surface on the kickoff spring. See Fig. 8 for the kickoff spring configuration with the flexure in the stowed position. The addition of this spring had several benefits for designing a flight mechanism. Not only did it add extra deployment force for the mechanism, but also fail-safe capability in a fault case to ensure the mechanism functions as intended if the larger and more capable upper torsion spring functionally or structurally fails. This more robust fault case configuration significantly boosted confidence that the CDPR will work as required for the critical separation prior to touchdown on the Martian surface. All these benefits are an important lesson learned of why it is flight design principle to have an initial motion spring for a deployable.
Figure 8. Views of initial kickoff spring: (a) view of kickoff spring attached to the HSA bracket, (b) view
inside the bracket clevis where the spring interfaces with the bare flexure lug. Travel Limiters With the new Mars 2020 design, the larger height and length of the flexure as well as the rotational degrees of freedom in the spherical bearings at two ends of the flexure introduced a few close clearance concerns in the mechanism. At nominal (when flexure is engaged or not yet released), the 10.3 mm vertical clearance between the chassis top deck and flexure was found insufficient in the event if the flexure pitches downward when it exits out of the HSA bracket during deployment. During testing without the torsional springs, there was a roll rotational degree of freedom in the flexure, which allowed flexure contact with the chassis bracket due to residual rotations from the spherical bearings at two ends of the flexure. To address these concerns of interference, features on the chassis bracket were implemented to adapt four (4) vertical travel limiters at the clevis region of the chassis bracket. Two of them are opposite of and vertically aligned with each other with one above and below the flexure lug that control the vertical up-and-down pitch. The remaining two are located at two sides of the center lower limiter and are designed to control the roll of the flexure. These travel limiters are fabricated out of Nitronic 60 for material compliancy and high surface wear capability and are designed in pin-like shapes with spherical tips, which were also coated with dry-film lubricant. A back fin extrusion on the flexure end lug common to the chassis bracket was added as contact region for the travel limiters. See Fig. 7 for configuration of its design.

435
It was another lesson learned about the contribution of torsion spring preload to the flexure’s pitch and roll angles. The flexure to chassis bracket contact from flexure roll was found after DDR with the chassis bracket already fabricated. Therefore, it was a considerable challenge to accommodate the additional roll limiters at this stage of hardware development. When having larger springs attach to hardware with degrees of freedom, the influence on the hardware’s orientation from spring preload should be accounted for. Magnetic Hardstop Similar to how the kickoff spring added additional fail-safe margin and a fault case to the deployment, the magnetic latching hardstop had similar additional benefits for the final deployed position. Due to the larger flexure deployable, there was close clearance concern to the surrounding hardware after deployment, namely the aft bridle tower and its surrounding harnessing on the chassis top deck. A final deployment angle of 40° was chosen to split the difference between the minimum rotation needed by the flexure to clear the range of motion of the differential and aft bridle tower. From initial testing, there was concern that with the initial hardstop design induced a substantial amount of flexure rebound due to its stiff nature stemming from a C-channel profile design. After initial contact with the hardstop, the flexure would then require three re-contacts with the hardstop to come to a complete rest. Around the DDR, the hardstop went through two major redesigns. First, the structural shape was made to be a standard aluminum sheet metal profile. The final design was the same sheet profile with a bore feature added to house the magnet and its casing (Fig. 9). This diving-board like design added significant compliancy such that the hardstop would dampen out the initial contact of the flexure and reduced the amount of flexure rebound after initial contact. However, during developmental tests, this elastically compliant hardstop rotated nearly 8° over the planned 40° rotational travel for the final deployed position. This exceedance approached the close clearance to the aft bridle tower but did not violate the clearance margin. It was deemed acceptable after being closely monitored at flight level functional testing.
Figure 9. Development of the hardstop: (a) initial stiffer C-channel profile, (b) DDR sheet metal design, (c)
thinner profile with a feature to house the magnet in the final magnetic hardstop. As a second function, the hardstop is to restrain the deployed flexure once it’s deployed such that the rover differential is completely free to rotate. This hardstop design utilized the flexure’s Maraging 300 steel magnetic properties to make a magnetic latch. The magnetic force of this latch would be added to the residual capability of the torsion springs. The magnet to be used is of the same material as other magnets on Mars 2020, Grade N42 Neodymium. There was concern about the likelihood of magnet fracture due to its brittle nature directly from impact of the flexure to hardstop contact. To address this, a protective stainless-steel housing was incorporated. For securement, a ring magnet design was chosen to allow a fastener to run through the magnet and housing and the magnet was to be potted inside the assembled housing (Fig. 10). Several lessons were learned in the prototyping of the magnet housing. The magnet housing is two separate pieces that when mated together there is a void that would fit the ring magnet. To have the

436
magnetic latch work, a magnetic flux circuit with the magnet housing and flexure needs to be closed. Most flight acceptable CRES are austenitic, with the exception of 400 series CRES, which is a ferritic CRES. It was learned that the part of the housing in contact with the magnet should also be the part that is closest to the flexure when the flexure is in contact to the hardstop. This piece of the housing should also be a ferritic steel to complete the magnetic flux circuit from the magnet, through the ferritic housing component, through the flexure, and return to the magnet (Fig. 10). This is what produced the latching force. The top of the magnet housing should be an austenitic CRES. Otherwise, the magnetic flux would short through the top part of the magnet housing and not through the flexure. The final design called out the back part of the magnet housing to be 410 CRES and the top part to be 303 CRES. This allowed the magnetic latching force to flow from the magnet through the flexure. The delivered magnetic holding force for the flight unit was measured to be an average of 24.4 N.
Figure 10. Cross section of the magnet in its CRES housing with the flexure against the hardstop. Also showing the magnetic flux circuit, which produces the holding force of the magnetic latch.
There was a lesson learned that while magnetic latches could be used, some permanent magnet materials cannot tolerate higher temperatures. To comply with mission planetary protection requirements, this neodymium magnet would have seen temperatures during vacuum bakeout such that the magnet could have lost some of its residual magnetic strength. As a result, the magnet and its housing were excluded from vacuum bakeout as well as parts of other non-functional tests that went over +80°C. Planetary protection requirements were satisfied with other methods rather than a vacuum bakeout. In future magnetic latches, it is recommended that the magnet can withstand higher temperatures without any risk of losing magnetic strength over the whole non-operational temperature range.
CDPR Design Validation and Verification (V&V) Testing Since the Mars 2020 CDPR was non-MSL heritage, this new assembly was subjected to a full design V&V campaign that involved a series of functional and structural testing at various level of build integration. As of January 2020, all testing was completed. Rather than presenting the entirety of this lengthy test campaign, two (2) significant tests and some key lessons learned are highlighted. For a complete summary of the test programs in order of execution (including the prototype testing during the engineering development phase), see Table 1 and Table 2 at the end of this section. Engineering Model (EM) “Dirty” Testing When the CDPR mechanism is fully actuating, in the power decent stage of EDL, there is a lot of Martian regolith that could get kicked up and lodged into the numerous controlled gaps within the mechanism. This raised a concern that the deployment of the flexure could be hindered by this “dirty” condition. To address
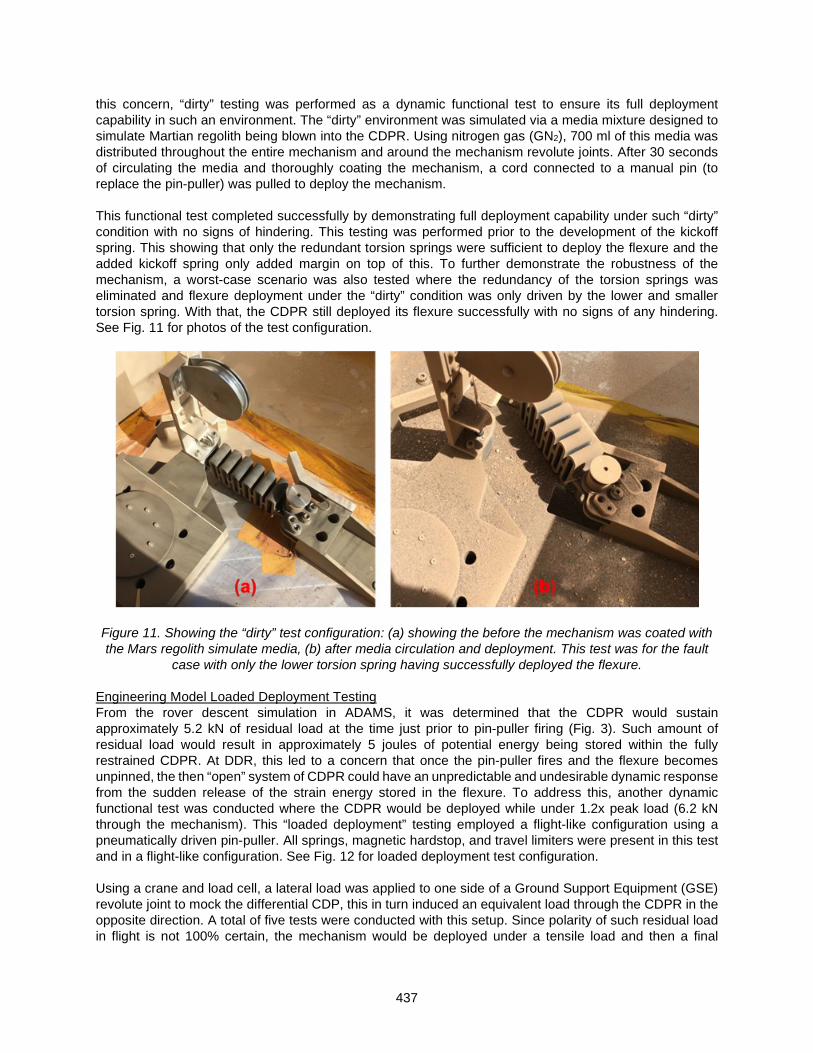
437
this concern, “dirty” testing was performed as a dynamic functional test to ensure its full deployment capability in such an environment. The “dirty” environment was simulated via a media mixture designed to simulate Martian regolith being blown into the CDPR. Using nitrogen gas (GN2), 700 ml of this media was distributed throughout the entire mechanism and around the mechanism revolute joints. After 30 seconds of circulating the media and thoroughly coating the mechanism, a cord connected to a manual pin (to replace the pin-puller) was pulled to deploy the mechanism. This functional test completed successfully by demonstrating full deployment capability under such “dirty” condition with no signs of hindering. This testing was performed prior to the development of the kickoff spring. This showing that only the redundant torsion springs were sufficient to deploy the flexure and the added kickoff spring only added margin on top of this. To further demonstrate the robustness of the mechanism, a worst-case scenario was also tested where the redundancy of the torsion springs was eliminated and flexure deployment under the “dirty” condition was only driven by the lower and smaller torsion spring. With that, the CDPR still deployed its flexure successfully with no signs of any hindering. See Fig. 11 for photos of the test configuration.
Figure 11. Showing the “dirty” test configuration: (a) showing the before the mechanism was coated with the Mars regolith simulate media, (b) after media circulation and deployment. This test was for the fault
case with only the lower torsion spring having successfully deployed the flexure.
Engineering Model Loaded Deployment Testing From the rover descent simulation in ADAMS, it was determined that the CDPR would sustain approximately 5.2 kN of residual load at the time just prior to pin-puller firing (Fig. 3). Such amount of residual load would result in approximately 5 joules of potential energy being stored within the fully restrained CDPR. At DDR, this led to a concern that once the pin-puller fires and the flexure becomes unpinned, the then “open” system of CDPR could have an unpredictable and undesirable dynamic response from the sudden release of the strain energy stored in the flexure. To address this, another dynamic functional test was conducted where the CDPR would be deployed while under 1.2x peak load (6.2 kN through the mechanism). This “loaded deployment” testing employed a flight-like configuration using a pneumatically driven pin-puller. All springs, magnetic hardstop, and travel limiters were present in this test and in a flight-like configuration. See Fig. 12 for loaded deployment test configuration. Using a crane and load cell, a lateral load was applied to one side of a Ground Support Equipment (GSE) revolute joint to mock the differential CDP, this in turn induced an equivalent load through the CDPR in the opposite direction. A total of five tests were conducted with this setup. Since polarity of such residual load in flight is not 100% certain, the mechanism would be deployed under a tensile load and then a final
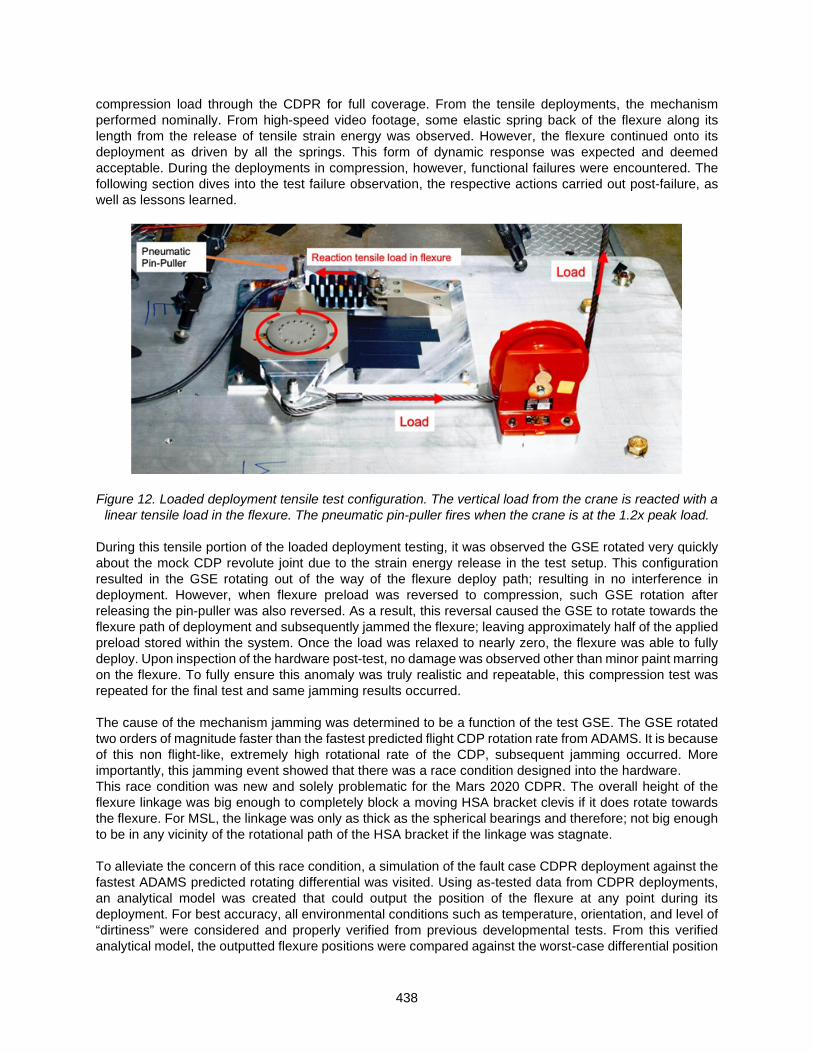
438
compression load through the CDPR for full coverage. From the tensile deployments, the mechanism performed nominally. From high-speed video footage, some elastic spring back of the flexure along its length from the release of tensile strain energy was observed. However, the flexure continued onto its deployment as driven by all the springs. This form of dynamic response was expected and deemed acceptable. During the deployments in compression, however, functional failures were encountered. The following section dives into the test failure observation, the respective actions carried out post-failure, as well as lessons learned.
Figure 12. Loaded deployment tensile test configuration. The vertical load from the crane is reacted with a linear tensile load in the flexure. The pneumatic pin-puller fires when the crane is at the 1.2x peak load.
During this tensile portion of the loaded deployment testing, it was observed the GSE rotated very quickly about the mock CDP revolute joint due to the strain energy release in the test setup. This configuration resulted in the GSE rotating out of the way of the flexure deploy path; resulting in no interference in deployment. However, when flexure preload was reversed to compression, such GSE rotation after releasing the pin-puller was also reversed. As a result, this reversal caused the GSE to rotate towards the flexure path of deployment and subsequently jammed the flexure; leaving approximately half of the applied preload stored within the system. Once the load was relaxed to nearly zero, the flexure was able to fully deploy. Upon inspection of the hardware post-test, no damage was observed other than minor paint marring on the flexure. To fully ensure this anomaly was truly realistic and repeatable, this compression test was repeated for the final test and same jamming results occurred. The cause of the mechanism jamming was determined to be a function of the test GSE. The GSE rotated two orders of magnitude faster than the fastest predicted flight CDP rotation rate from ADAMS. It is because of this non flight-like, extremely high rotational rate of the CDP, subsequent jamming occurred. More importantly, this jamming event showed that there was a race condition designed into the hardware. This race condition was new and solely problematic for the Mars 2020 CDPR. The overall height of the flexure linkage was big enough to completely block a moving HSA bracket clevis if it does rotate towards the flexure. For MSL, the linkage was only as thick as the spherical bearings and therefore; not big enough to be in any vicinity of the rotational path of the HSA bracket if the linkage was stagnate. To alleviate the concern of this race condition, a simulation of the fault case CDPR deployment against the fastest ADAMS predicted rotating differential was visited. Using as-tested data from CDPR deployments, an analytical model was created that could output the position of the flexure at any point during its deployment. For best accuracy, all environmental conditions such as temperature, orientation, and level of “dirtiness” were considered and properly verified from previous developmental tests. From this verified analytical model, the outputted flexure positions were compared against the worst-case differential position

439
from ADAMS models for the deployment. Results indicated that flexure contact would only occur if the worst-case initial differential offset and rotational rate are increased by a factor of 2.6 while the CDPR is in this fault case configuration. This was determined to be sufficient margin against extreme environmental cases that the CDPR would win the race condition.
Table 1 – EM prototype and developmental testing matrix in order of execution
Test Type Test Objective(s) Outcomes
EM Flexure Characterization
Characterize stiffness at operational/non-operational qualification temperatures and tensile residual strength of the first flexure prototype
Successful, no anomalies
EM Thermal Functional Testing
Demonstrate full deployment mechanism capability at operational/non-operational qualification temperatures in both nominal and fault configuration
Successful, no anomalies
EM Dirty Testing Demonstrate full deployment mechanism capability while in a dirty environment from regolith kicked up during powered descent of EDL
Successful, no anomalies
Flight-like Flexure Characterization and Buckling
Characterize stiffness and buckling capability up to 1.20x and 1.40x FLL, respectively, at room temperature and respective operational temperatures.
Successful, no anomalies
Loaded Deployment Testing
Demonstrate full deployment mechanism capability under 1.20x FLL
Anomaly: jamming observed during compressively loaded deployment, identified race condition in CDPR deployment.
Magnet Thermal Testing
Characterize thermal effects on magnet installed in the hard stop
Successful, confirmed thermal concerns for neodymium
Table 2 – DTM and FM V&V test matrix in order of execution
Test Type Test Objective(s) Outcomes
DTM and FM Flexure Characterization Characterize spring rate of DTM and FM Flexure to 1.2x and 1.0x FLL, respectively at operational/non-operational temperatures.
Successful, no anomalies
DTM and FM Vacuum Bakeout Thermally eliminate contamination and outgas any volatiles prior to launch
Successful, no anomalies
DTM CDPR Random Vibration (assembly level) Demonstrate structural capability against protoflight launch environment
Successful, no anomalies
DTM Thermal Functional Testing Demonstrate full deployment mechanism capability at operational/non-operational qualification temperatures in both nominal and fault configuration
Successful, no anomalies
FM Thermal Functional Testing Demonstrate full deployment mechanism capability at operational/non-operational hot/cold flight acceptance temperatures
Successful, no anomalies
FM CDPR Random Vibration (Power Decent Vehicle Level)
Demonstrate structural capability against protoflight launch environment
Successful, no anomalies
DTM Mobility Deploy Demonstrate full dampening of the resultant load during rover asymmetric mobility deployment and full CDPR deployable functionality in earth gravity
Successful, no anomalies
DTM Rover Chassis and Differential Qualification Static Test
Structurally qualify the entirety of CDPR by demonstrating strength capability up required 1.20x FLL
Successful, no anomalies
DTM Rover Chassis and Differential Qualification Static Test – CDPR Deployment
Demonstrate full deployment mechanism capability under required 1.20x FLL
Successful, no anomalies

440
As a worthy note, through this race condition analysis of CDPR deployment fault case, the kickoff spring made the deployment time approximately 33% faster than if there was only the lower torsion spring available to drive the deployment. Such a finding reaffirmed that incorporating an initial motion spring (the kickoff leaf spring) is a great sound design principle. This loaded deployment test was repeated in January 2020 as the last part of the DTM rover chassis and differential design qualification static testing campaign. The CDPR was loaded to 1.2x the limit loads in tension. The flexure was deployed in this configuration using a flight-like pin-puller. No jamming occurred and the same expected dynamics response of the flexure from the strain energy release was observed, resulting in a successful test.
Summary For the Mars 2020 mission, a new CDPR achieved similar functionality as the MSL design, while using only half the mass for the structural mechanism by using a new mechanism architecture. The MSL crank-slider mechanism, which was sensitive to misalignment and structural concerns, was replaced with a two-force member spring-like flexure that doubled as providing compliance for the system and as the deployable. This flexure proved to have verified robust design. It was repeatable at temperature and did not require any conditioning. However, this larger deployable required the torsion springs and other hardware of the mechanism to deploy the flexure to be increased in size and strength in order to actuate this larger deployable for the Mars 2020 CDPR. Having the flexure double as the spring dampener and the deployable had the benefit of eliminating the required alignment precision from the MSL CDPR, but also introduced new close clearances and race conditions. The biggest lesson learned was to not have race condition potential in a deployable mechanism. It was a large amount of engineering effort to properly show that the mechanism would win this race condition. The analysis on the race condition reaffirmed an important design principle, to always have a simple initial motion spring integrated into a deployable mechanism. Future mechanism could utilize the design of the CDPR flexure to create a tunable linear spring while ensuring the design does not have the same race condition concerns that were learned from.
Acknowledgements This research was carried out at the Jet Propulsion Laboratory, California Institute of Technology, under a contract with the National Aeronautics and Space Administration. © 2020. California Institute of Technology. Government sponsorship acknowledged.
References
1. Jordan, E. 2012, Mars Science Laboratory Differential Restraint: The Devil is in the Details, Proceedings of the 41st Aerospace Mechanisms Symposium, Jet Propulsion Laboratory, May 16-18, 2012

441
Astrobee Free-Flyer Nozzle Mechanism
Earl Daley*
Abstract This paper describes the development and design of the Astrobee Free-Flyer propulsion nozzle assemblies. As will be illustrated in this paper, the Free-Flyer nozzles are thrust control devices used to propel the Astrobee Free-Flyer robot autonomously inside the International Space Station (ISS). The development process, design evolution, and prototyping methods, are described. Key design features are discussed in greater detail to highlight how a seemingly simple design can present surprisingly large challenges. Several lessons learned are given.
Introduction The Astrobee project provides free-flying robots (referred to as “Bees”), charging station, software, and ground control operations to the ISS for crew support and guest science research. The Free-Flyers are 31.8-cm (12.5-inch) cubes, battery-powered, air-propelled free-flying robots designed for use within the ISS (Fig 1). Two Free-Flyers (Bees Bumble and Honey) were launched in 2019 along with the charging station (called the “Dock”) and are installed in the Japanese Experiment Module Kibo. A third Bee, Queen, is also on station in storage. Working autonomously or via remote control by astronauts, flight controllers, or researchers on the ground, the robots are designed to complete tasks such as taking inventory, documenting onboard experiments with their built-in cameras or working together to move cargo throughout the station. In addition, the system serves as a research platform that can be outfitted and programmed to carry out experiments in microgravity [1]. Currently, Bumble is going through its commissioning phase and has successfully completed mapping the Japanese Experiment Module in preparation for autonomous operation.
Figure 1. Astrobee Free Flyers and Dock in the ISS
* NASA Ames Research Center, Mountain View, CA
Proceedings of the 45th Aerospace Mechanisms Symposium, NASA Johnson Space Center, 2020

442
Free-Flyer Propulsion System The nozzles are part of the Free-Flyer propulsion system which is comprised of two modules located on opposite sides of the Free-Flyer (Fig. 2). Air is drawn into the propulsion module by a centralized centrifugal fan which pressurizes a plenum (~1.5 in-H2O (0.37 kPa)). Thrust is produced when the pressurized air is exhausted through one of its six nozzles that are located around the plenum. For a constant impeller speed, the thrust from each of the twelve nozzles has fixed direction with magnitude controlled by adjusting the nozzle open area.
Figure 2. Free-Flyer Propulsion Module The key propulsion requirements are: 1. provide holonomic control in 6-Degrees-Of-Freedom, i.e., the ability to produce instantaneous thrust in
any direction and torque about any axis, 2. produce 0.6-N max thrust on at least one motion axis, and 3. keep noise below 65 dBA at max thrust. The two propulsion modules can be replaced by astronauts and are designed to be interchangeable. Their impellers rotate at the same speed and, because they are on opposite sides, their gyroscopic moment and drag torques are cancelled. The impeller speed is adjustable to trade thrust performance vs. reduced power and noise. The propulsion layout (dual impellers feeding pressurized air to multiple thrust nozzles) is conceptually similar to what was employed by the NASA Ames Personal Satellite Assistant project in 2003. Novel features of the Astrobee Free-Flyer propulsion system include low acoustic noise with high thrust, asymmetric nozzle layout which reduces the total nozzle count while maintaining 6-DOF maneuverability, modular design, and variable thrust control.
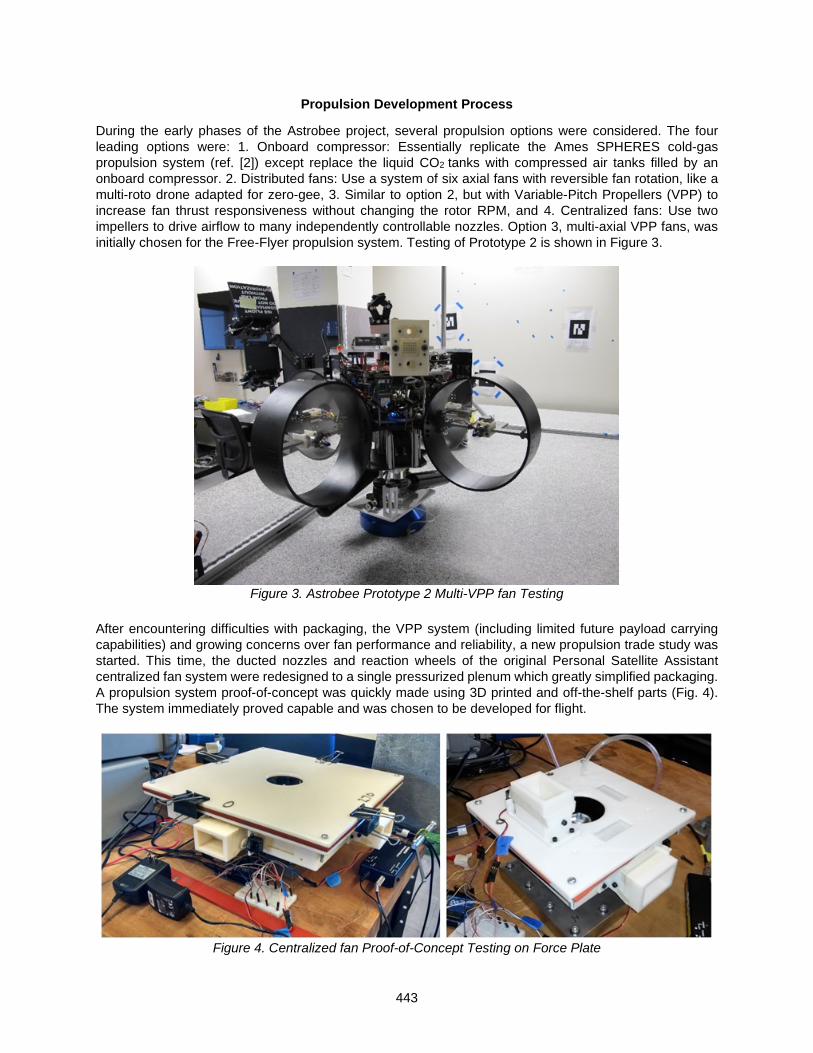
443
Propulsion Development Process
During the early phases of the Astrobee project, several propulsion options were considered. The four leading options were: 1. Onboard compressor: Essentially replicate the Ames SPHERES cold-gas propulsion system (ref. [2]) except replace the liquid CO2 tanks with compressed air tanks filled by an onboard compressor. 2. Distributed fans: Use a system of six axial fans with reversible fan rotation, like a multi-roto drone adapted for zero-gee, 3. Similar to option 2, but with Variable-Pitch Propellers (VPP) to increase fan thrust responsiveness without changing the rotor RPM, and 4. Centralized fans: Use two impellers to drive airflow to many independently controllable nozzles. Option 3, multi-axial VPP fans, was initially chosen for the Free-Flyer propulsion system. Testing of Prototype 2 is shown in Figure 3.
Figure 3. Astrobee Prototype 2 Multi-VPP fan Testing
After encountering difficulties with packaging, the VPP system (including limited future payload carrying capabilities) and growing concerns over fan performance and reliability, a new propulsion trade study was started. This time, the ducted nozzles and reaction wheels of the original Personal Satellite Assistant centralized fan system were redesigned to a single pressurized plenum which greatly simplified packaging. A propulsion system proof-of-concept was quickly made using 3D printed and off-the-shelf parts (Fig. 4). The system immediately proved capable and was chosen to be developed for flight.
Figure 4. Centralized fan Proof-of-Concept Testing on Force Plate
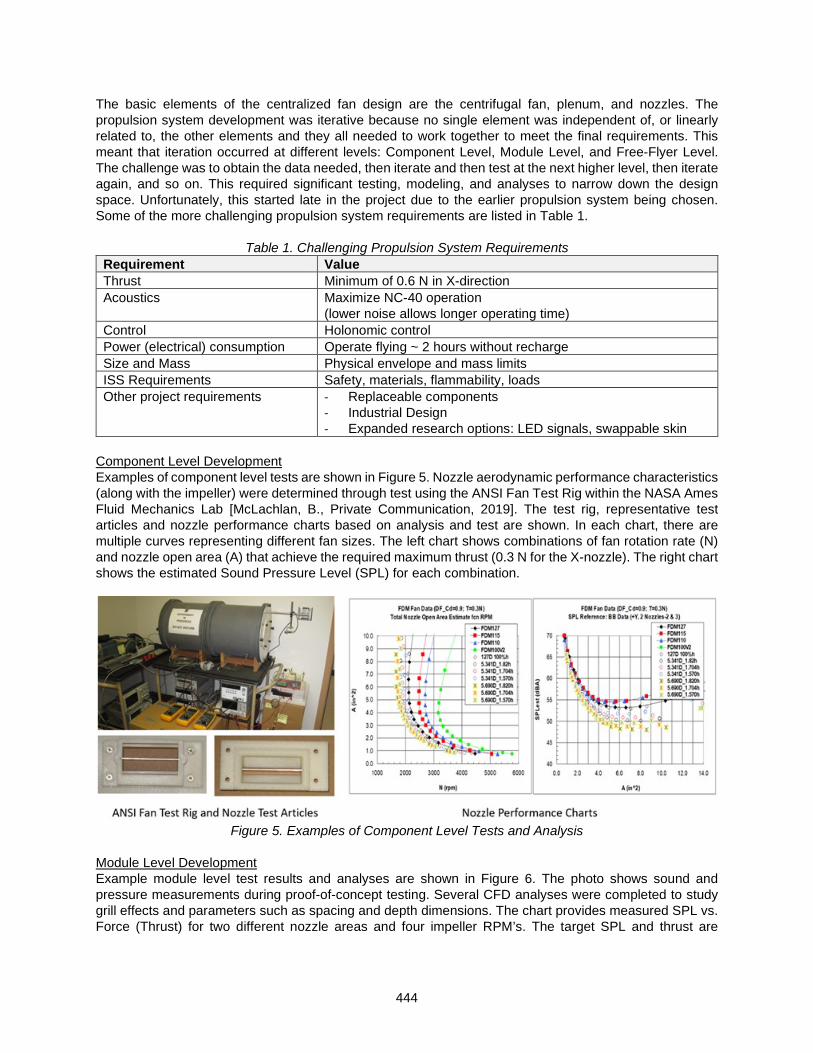
444
The basic elements of the centralized fan design are the centrifugal fan, plenum, and nozzles. The propulsion system development was iterative because no single element was independent of, or linearly related to, the other elements and they all needed to work together to meet the final requirements. This meant that iteration occurred at different levels: Component Level, Module Level, and Free-Flyer Level. The challenge was to obtain the data needed, then iterate and then test at the next higher level, then iterate again, and so on. This required significant testing, modeling, and analyses to narrow down the design space. Unfortunately, this started late in the project due to the earlier propulsion system being chosen. Some of the more challenging propulsion system requirements are listed in Table 1.
Table 1. Challenging Propulsion System Requirements Requirement Value Thrust Minimum of 0.6 N in X-direction Acoustics Maximize NC-40 operation
(lower noise allows longer operating time) Control Holonomic control Power (electrical) consumption Operate flying ~ 2 hours without recharge Size and Mass Physical envelope and mass limits ISS Requirements Safety, materials, flammability, loads Other project requirements - Replaceable components
- Industrial Design - Expanded research options: LED signals, swappable skin
Component Level Development Examples of component level tests are shown in Figure 5. Nozzle aerodynamic performance characteristics (along with the impeller) were determined through test using the ANSI Fan Test Rig within the NASA Ames Fluid Mechanics Lab [McLachlan, B., Private Communication, 2019]. The test rig, representative test articles and nozzle performance charts based on analysis and test are shown. In each chart, there are multiple curves representing different fan sizes. The left chart shows combinations of fan rotation rate (N) and nozzle open area (A) that achieve the required maximum thrust (0.3 N for the X-nozzle). The right chart shows the estimated Sound Pressure Level (SPL) for each combination.
Figure 5. Examples of Component Level Tests and Analysis
Module Level Development Example module level test results and analyses are shown in Figure 6. The photo shows sound and pressure measurements during proof-of-concept testing. Several CFD analyses were completed to study grill effects and parameters such as spacing and depth dimensions. The chart provides measured SPL vs. Force (Thrust) for two different nozzle areas and four impeller RPM’s. The target SPL and thrust are
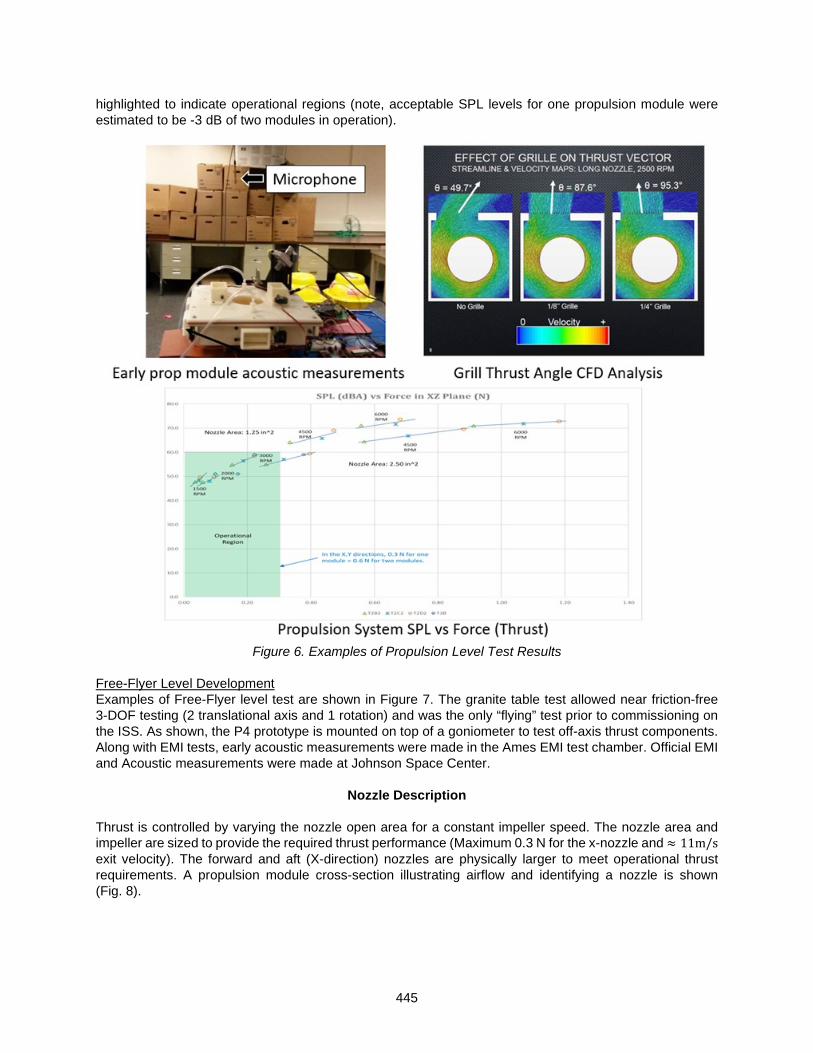
445
highlighted to indicate operational regions (note, acceptable SPL levels for one propulsion module were estimated to be -3 dB of two modules in operation).
Figure 6. Examples of Propulsion Level Test Results
Free-Flyer Level Development Examples of Free-Flyer level test are shown in Figure 7. The granite table test allowed near friction-free 3-DOF testing (2 translational axis and 1 rotation) and was the only “flying” test prior to commissioning on the ISS. As shown, the P4 prototype is mounted on top of a goniometer to test off-axis thrust components. Along with EMI tests, early acoustic measurements were made in the Ames EMI test chamber. Official EMI and Acoustic measurements were made at Johnson Space Center.
Nozzle Description Thrust is controlled by varying the nozzle open area for a constant impeller speed. The nozzle area and impeller are sized to provide the required thrust performance (Maximum 0.3 N for the x-nozzle and ≈ 11m/s exit velocity). The forward and aft (X-direction) nozzles are physically larger to meet operational thrust requirements. A propulsion module cross-section illustrating airflow and identifying a nozzle is shown (Fig. 8).

446
Figure 7. Example of Free-Flyer Level Tests
Figure 8. Propulsion Module X-Section

447
Nozzle open area is adjusted by two gear synchronized flappers that are driven by an off-the-shelf hobby style RC servo (Fig. 9). The two flappers provide the benefit of dimensional compactness relative to a single flapper design. The Nozzle grill and divider (made of one-piece 3D printed Ultem 9085) provides flow straightening. Nozzle open area is determined by the flapper angle as shown in Figure 10 (flapper rotation from closed to full open is 64 degrees).
Figure 9. Free-Flyer Nozzle
Figure 10. Nozzle Open Area
Figure 11 shows a few of the nozzle design iterations with left to right going from the earliest prototype to final flight design respectively. The initial proof of concept nozzle incorporated a single flapper which provided the desired thrust performance but was physically too large in the flow direction to fit the available space. To address that issue, a geared dual flapper design was developed to minimize thickness while providing an acceptable level of flow efficiency. To reduce development time, the first two nozzles were made from 3D printed ABS material. The middle nozzle was an attempt to make a 3D printed “Flight” nozzle (shown is an X-Nozzle), which proved problematic (see Lessons Learned).

448
Figure 11. Nozzle Iterations
Nozzle Development Issues Several nozzle development issues are expanded on. Nozzle Issue: Flapper Slipping Once calibrated, the flapper drive elements (consisting of clamps, gears and shafts) must not slip over the life of Astrobee. However, slipping was observed during early prototype tests. The required flapper shaft torque is 10 in-lb (1.1 N-m) (which includes a 5X slip factor). Slipping can occur at two joints (Fig. 12): 1. the flapper to the shaft, and 2. the press fit gear to the shaft. In torque tests, the integrated flapper clamps worked well and were not considered the problem. The press-fit gear did slip at low torques.
Figure 12. Flapper slip locations

449
Options to increase the torque limits of the titanium shaft to bronze gear included:
1. Increase press-fit interference The nominal fit is ANSI FN2 providing 0001-in (0.025-mm) interference. Torque values as low as 3.68 in-lb (0.416 N-m) were measured in tests. The interference was increased to the point that bronze shavings were observed but with little additional torque benefit.
2. Add adhesives Loctite 7649 primer with Loctite 609 retaining compound were tried. Even though the measured torque values were higher than those without adhesive, the decision was made to include option 3 for consistently higher results.
3. Knurl the shaft Knurls are commonly used for small plastic gears on metal shafts (The cold flow of plastic material into various topographical feature can result in a more constant or increase in torsional strength over time [3]). Also, referencing a common home remedy for slipping where a center punch is used to provide mechanical interlock, a straight knurl on the shaft was considered as an option. The bronze gear would not plastically flow into the knurl, but it could essentially be broached while press-fit to provide an additional mechanical interlock. Several different knurls were tested along with and without Loctite adhesives. The measured torque values were all above 12 in-lb (1.4 N-m) (highest being 21 in-lb (2.4 N-m)). Because of the consistent results, the knurl and Loctite adhesives are used on the flight nozzles. Figure 13 shows the two shafts and Boston gears prior to assembly. The gear in the right image was first press-fit onto the flapper shaft and then removed to show how the bronze gear is cold worked by the shaft knurl.
Figure 13. Knurled shafts for improved torque
Nozzle Issue: Acoustic Noise and Vibrations Initial nozzle prototypes generated noise that was noticeably loud and annoying. The Free-Flyer’s operating time on the ISS is limited by the maximum noise produced, so it was critical to minimize all acoustic noise sources. The following tasks were completed to reduce nozzle generated noise:
1. Select the best servo The servo was quickly discovered to be the primary noise source. The noise occurred as the servo feedback continuously adjusted to hold a position, with the noise being louder under load. It was observed the noise was different for different servos. The following test was used to select the best servo: With the servo stalled (by commanding it past its limits) measure a) housing temperature, b) current draw, c) time before failure, and d) a qualitative noise judgement. Seven different servos
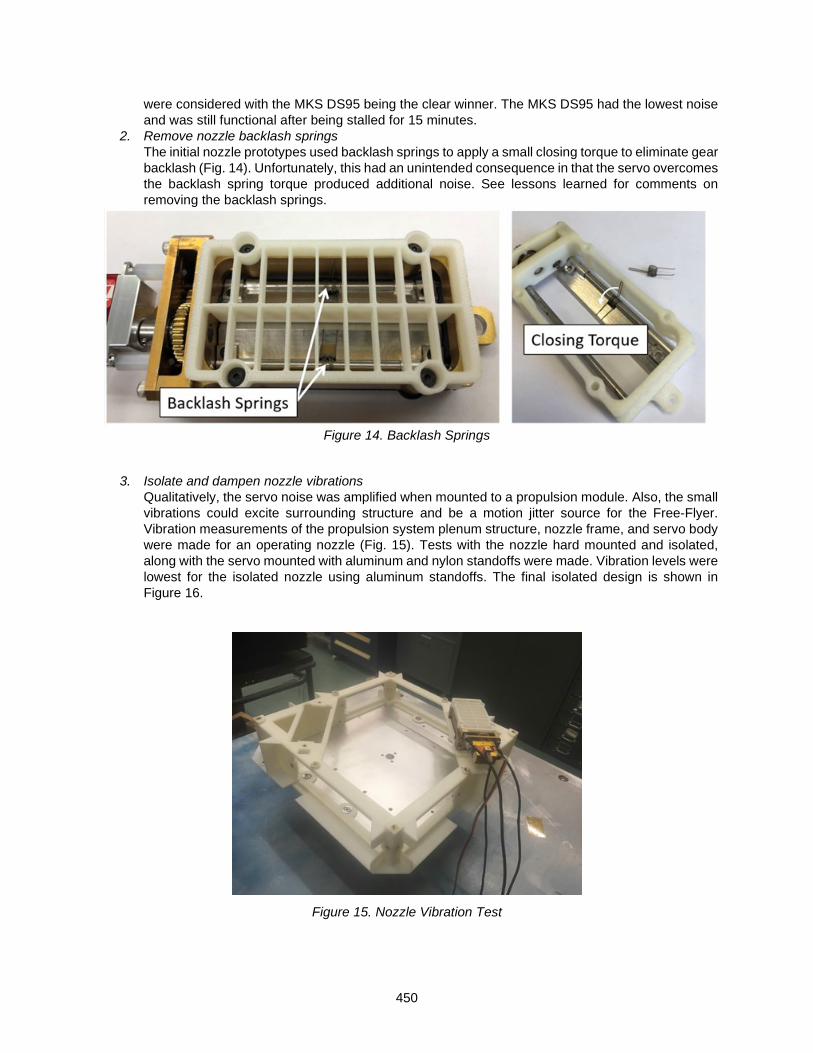
450
were considered with the MKS DS95 being the clear winner. The MKS DS95 had the lowest noise and was still functional after being stalled for 15 minutes.
2. Remove nozzle backlash springs The initial nozzle prototypes used backlash springs to apply a small closing torque to eliminate gear backlash (Fig. 14). Unfortunately, this had an unintended consequence in that the servo overcomes the backlash spring torque produced additional noise. See lessons learned for comments on removing the backlash springs.
Figure 14. Backlash Springs
3. Isolate and dampen nozzle vibrations Qualitatively, the servo noise was amplified when mounted to a propulsion module. Also, the small vibrations could excite surrounding structure and be a motion jitter source for the Free-Flyer. Vibration measurements of the propulsion system plenum structure, nozzle frame, and servo body were made for an operating nozzle (Fig. 15). Tests with the nozzle hard mounted and isolated, along with the servo mounted with aluminum and nylon standoffs were made. Vibration levels were lowest for the isolated nozzle using aluminum standoffs. The final isolated design is shown in Figure 16.
Figure 15. Nozzle Vibration Test
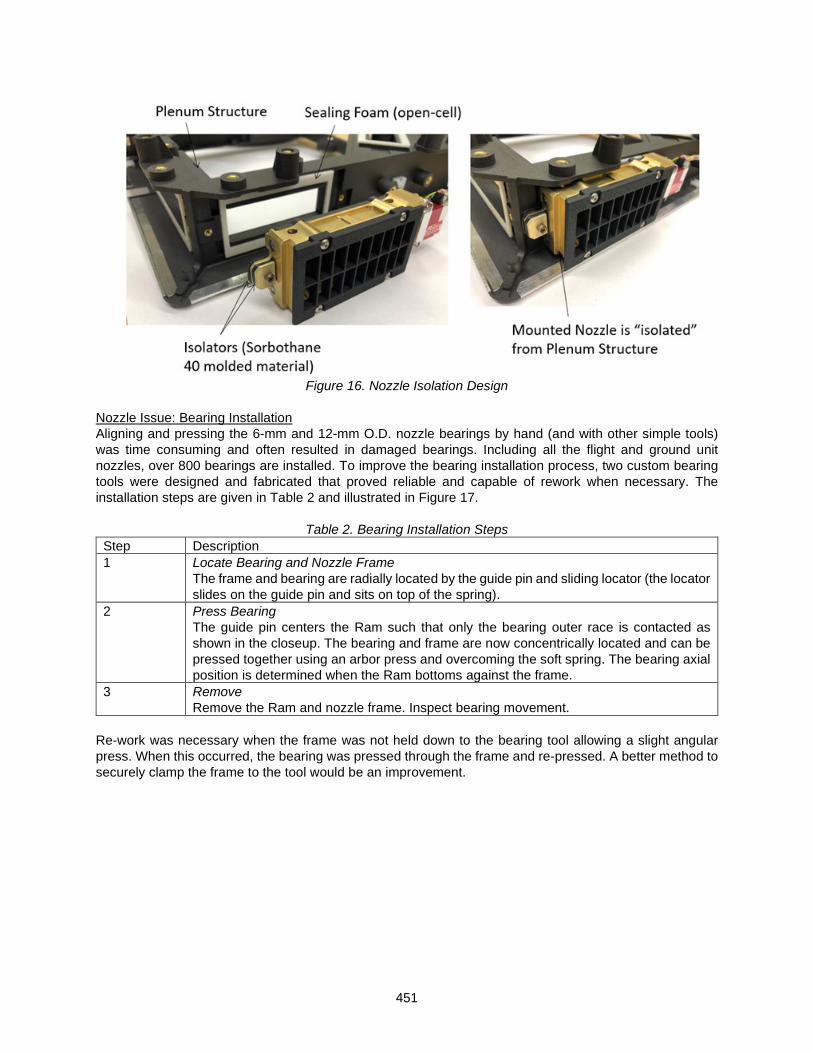
451
Figure 16. Nozzle Isolation Design
Nozzle Issue: Bearing Installation Aligning and pressing the 6-mm and 12-mm O.D. nozzle bearings by hand (and with other simple tools) was time consuming and often resulted in damaged bearings. Including all the flight and ground unit nozzles, over 800 bearings are installed. To improve the bearing installation process, two custom bearing tools were designed and fabricated that proved reliable and capable of rework when necessary. The installation steps are given in Table 2 and illustrated in Figure 17.
Table 2. Bearing Installation Steps Step Description 1 Locate Bearing and Nozzle Frame
The frame and bearing are radially located by the guide pin and sliding locator (the locator slides on the guide pin and sits on top of the spring).
2 Press Bearing The guide pin centers the Ram such that only the bearing outer race is contacted as shown in the closeup. The bearing and frame are now concentrically located and can be pressed together using an arbor press and overcoming the soft spring. The bearing axial position is determined when the Ram bottoms against the frame.
3 Remove Remove the Ram and nozzle frame. Inspect bearing movement.
Re-work was necessary when the frame was not held down to the bearing tool allowing a slight angular press. When this occurred, the bearing was pressed through the frame and re-pressed. A better method to securely clamp the frame to the tool would be an improvement.

452
Figure 17. Bearing Installation Tool
Lessons Learned Several lessons learned are expanded on. Lessons Learned: Limitation of 3D printed plastic parts Significant use was made of 3D printed plastic parts during nozzle development and Astrobee development in general. 3D printed materials make up 32% of a flight Free-Flyer dry mass (the materials include: Ultem 9085, Windform XT 2.0, SOMOS Watershed XC 11122). 3D printed test articles and early prototypes reduced development time and helped catch errors in the design. Partly due to the success the team had using 3D printed materials and their lightweight properties, the initial flight nozzles were designed to incorporate 3D printed flappers and nozzle frames (Fig. 11). However, when significant issues with outside vendor part quality and assembly reliability issues were discovered, those parts were changed to a more traditional machined aluminum. The inlet and grill dividers are the only flight nozzle parts made from 3D printed plastic. The Astrobee hardware is classified as non-critical. That meant the 3D printed material strength requirements are driven by the project’s goal to have a reliable and long-lasting robot, and not the more rigorous fracture critical material requirements. There are no released NASA standards for materials and parts made of 3D printed plastic (A committee is working on NASA-STD-6030 for Additive Manufacturing, which included 3D printed plastic, but it is not yet released). A significant effort was required to develop 3D printed plastic standard processes, analysis assumptions, and best practices to assure a level of strength and quality. And in some cases, alternatives to 3D printed plastic should have been explored. A good example is the Free-Flyer painted bezel shown in Figure 1 and Figure 18. A simple design change would have allowed the part to be easily machined thereby eliminating the additional labor cost necessary to fill and smooth the Ultem 9085 raw surface in preparation for painting.

453
Figure 18. Free-Flyer 3D printed plastic painting
Lessons Learned: Backlash Testing Gear backlash affects nozzle open area and associated thrust for a given command input. It’s worse for small nozzle openings since the backlash error is proportionally greater for a smaller open area. It wasn’t clear how accurate the open area needed to be during the early development phases. The aerodynamic forces acting on the flappers should pre-loading the gear train and reduce backlash. However, flapper binding was observed on some early nozzle prototypes (which could act in the opposite direction of the aerodynamic forces) and the decision was made to add a nozzle backlash spring to eliminate all sources of error. A custom 0.012-in (0.30-mm) diameter 302/304 CRES torsion spring with 0.04 in-lb (4.5 mN-m) of torque was added as shown in Figure 14. The spring torque is applied to close the flappers and help minimize leakage when fully closed (minimizing leaks was another early concern). The torque direction would minimize the required servo torque since the plenum and airflow pressures are trying to open the flappers. Two issues developed that focused attention on the backlash springs. The first was the nozzle servo noise as discussed earlier. The backlash spring made the servo noise much worse. The second was the discovery of broken backlash springs on the Prototype 4 (P4) Granite Table Testing shown in Figure 7. Small 0.012-in (0.30-mm) diameter spring pieces floating in the ISS cabin would be an obvious safety concern. The decision was made to try operating P4 without the nozzle springs. The P4 testing had been successful and going on long enough that any adverse changes to the Free-Flyer could be measured. The tests showed no change without the springs and the servo noise was noticeably lower. The backlash spring was removed from the design (however, the flapper still has a notch for the spring due to fabrication schedule constraints). The backlash springs were added because of uncertainty in the required nozzle opening accuracy and nozzle function. As it turned out, the springs were added to solve a theoretical concern that wound up causing a real problem. It was fortunate that the design was not impacted when they were removed.

454
Concluding Remarks
This paper describes how complex the nozzle design was for something that overall is rather simple. It’s typical that designs quickly become boxed in by competing requirements and practicality. But the added dependency of full system test to feedback the next design iteration made this more difficult and schedule critical. The original project plan included four (4) granite table “flying” prototypes (Free-Flyer Level prototypes). The prototype (iterative) philosophy was a good choice for this development. However, because the centralized fan wasn’t the original propulsion system choice, it wasn’t until Prototype 4 (P4) that it could be fully tested and provide valuable data for the next iteration. The centralized fan propulsion system has proven itself capable and a high-performance option for intra-vehicular robots. Future centralized fan propulsion designs can be scaled and optimized. The Astrobee Free-Flyers serve both as a feasibility demonstration and reference design for future mission-critical intra-vehicular robot systems. References [1] website https://www.nasa.gov/astrobee [2] website https://www.nasa.gov/spheres [3] Malloy, Robert A., Plastic Part Design for Injection Molding, Hanser/Gardner Publications, Cincinnati,
OH (1994).

455
Major Design Choices and Challenges that Enabled the Success of the Ejectable Data Recorder System
Jeff Hagen*, Michael Burlone* and Kristina Rojdev*
Abstract
The Ejectable Data Recorder (EDR) subsystem was added to the Crew Module (CM) of the Ascent Abort 2 (AA-2) test flight due to a risk that the communications architecture would be insufficient to downlink all the data to the ground during the test flight. Since the EDR subsystem was a secondary system for data collection, AA-2 management enabled the team to take a different approach to hardware development that was more agile-like. This paper discusses key design decisions, technical challenges, and lessons learned that enabled the success of the EDR system during its flight on July 2, 2019.
Background The successful Ascent Abort 2 (AA-2) test flight on July 2, 2019 demonstrated the Orion Launch Abort System (LAS) performance during the maximum dynamic pressure phase of the launch (Figure 1). In order to reduce costs, the test used an aerodynamically and structurally representative boilerplate substitute for the Orion spacecraft Crew Module (CM), which was not equipped with a parachute recovery system. Rather, the CM was discarded several miles off shore at the conclusion of the test. Although data from the developmental flight instrumentation (DFI) system was returned via high data rate telemetry link, the risk of interruption in the telemetry justified the development of a backup data recording system. The CM splashed down into the ocean after the launch and was not intended to be recovered. Thus, the data recorders were ejected after completion of the LAS test phase of the flight, but prior to water impact of the CM. Then, the data recorders were independently retrieved via water recovery operations.
Figure 1. AA-2 launch.
The Ejectable Data Recorder (EDR) subsystem had three major functions: record the data, eject the payloads and provide the location of the payloads so that they could be retrieved. These functions were implemented through a dual string redundant system that consisted of a US Air Force AN/ALE-47 flare and chaff dispenser system, a breakout box that contained the computer for the recording capability and routed power and data, and a payload (Figure 2) with a memory device and a beacon. The details of this design
* NASA Johnson Space Center, Houston, TX; [email protected]
Proceedings of the 45th Aerospace Mechanisms Symposium, NASA Johnson Space Center, 2020

456
will be presented at the IEEE Aerospace Conference in March 20201. This paper expands upon the previous paper with focus on key design decisions and a non-traditional development process at NASA that enabled success of the EDR subsystem, within the constraints of limited resources and a compressed schedule.
Figure 2. Six of the twelve flight payloads near completion.
Aggressive cost and schedule limits for the AA-2 program, exacerbated by the late addition of the EDR subsystem, forced development to proceed along an accelerated path with resource limitations that did not allow for a typical process of developing requirements, defining environments, and analytically validating design solutions. With an incomplete set of requirements, engineering judgment guided the identification of design parameters with the most uncertainty, and/or highest risk of not converging on an acceptable solution. These parameters were pursued with demonstration testing as early as possible in the development process, which provided the necessary evidence regarding those requirements with the highest sensitivity to the design parameters. Requirements definition matured concurrently with testing progress. The design was explicitly driven to maximize potential for large margins in parameters with high uncertainty and low sensitivity. The design also allowed for radical redundancy – twelve data recorders were flown, but only one needed to be recovered to obtain the full flight data set.
Unique Challenges The principal challenge was to determine how to eject a recorder from the CM. Detailed knowledge of the local environments at the time of ejection was not available, but the ejection system needed to ensure confidence in successful retention and separation of the data recorder payloads during the anticipated tumbling of the CM during uncontrolled flight. Due to the cost and schedule constraints of the project, making use of an off the shelf solution was preferable to a new development. Early on it was recognized that the US Air Force AN/ALE-47 flare and chaff dispenser system had many features that seemed to be congruent with the EDR objectives. The standard ALE-47 dispenser system required an enhanced capability in two critical aspects. The anticipated flight vibration environment of the CM during the test flight greatly exceeded certified limits of the ALE-47 system. In addition, the ALE-47 system was designed for dispensing passive decoy payloads and did not have provisions for separable power and data connections between the payloads and host vehicle. Thus, modifications to the ALE-47 system were required to meet these needs for the AA-2 test flight. Bounded by the standard capabilities of the ejection system, the defined characteristics of the payload data storage and beacon electronics, and the requisite operational environments, the dominant aspect of the payload design was the balance of packaging the components into the available mass and volume limits of the standard ALE-47 cartridge, while still maintaining adequate robustness. Not only did multiple electronics need to fit within the volume allotted by the cartridge, but the mass was constrained by the need for sufficient buoyancy to ensure the payloads would float in the ocean with adequate stability for antenna pointing, yet have sufficient structural integrity to survive the water impact at a terminal velocity of approximately 150 mph.

457
Ejection System Concept In the ALE-47 system, the payloads were packaged into cartridges that function similar to a mortar tube (Figure 3). Crimping of the open end of the aluminum cartridge case restrains an aluminum closeout plate (cap) that retains the payload in the cartridge until ejection. A specially designed machine performs the crimping operation, which guarantees that the payload has no residual gap and cannot move within the cartridge. An electrically initiated pyrotechnic squib installed in the base of the cartridge provides the propelling gas that forces the payload and closeout plate through the restraining crimps and out of the cartridge. A plastic piston assembly installed in the bottom end of the cartridge ensures that the combustion gasses from the squib do not leak past the payload and negate the propelling force, analogous to the function of the wadding in a shot gun shell.
Figure 3. The figure on the left shows the components for assembling the payload into the cartridge and
the figure on the right shows the pass thru plugs installed into the payload interface. The cartridges were packaged into a magazine that constituted the operational load element of the system, and were installed on the vehicle by sliding into the muzzle of the ALE-47 dispenser after installation of the pyrotechnic squibs (Figure 4). The modularity of the dispenser and magazine system enables installation of as many as 30 cartridges of varying sizes with payload cross sections ranging from 1” x 1” up to 2” x 2.5”. Only six of the largest size cartridges required for the AA-2 EDR payload can fit in each dispenser, which leaves 24 of the electrical squib contacts in the dispenser breech plate unused and dead faced against the cartridge bases.
Figure 4. The figure on the left shows the payload packaged inside the cartridge and the cartridge being installed in the magazine. The first on the right shows the assembled dispenser next to the breakout box
installed in the forward bay area of the CM.

458
Two independent ejection systems were mounted in the forward bay parachute compartment of the AA-2 CM, pointing in opposite directions (Figure 5).
Figure 5. EDR ejections. Figure on the left is an artist rendering and the first on the right is an image from
the actual flight.
Risk Definition Risks were based on perceived probability and consequences, but also ranked according to the expediency or difficulty of accomplishing closure. Tests that could be conducted rapidly and efficiently received schedule preference in order to identify pitfalls as soon as possible. The principle risks identified were as follows:
• Functionality of the COTS ejection system and EDR unique payload • Adequate separation performance of the ejection system in the poorly characterized post-test flight
environment • Mechanical survival of the payload during flight, ejection, and impact environments • Recording of the data stream and storage of the data in the payloads • Separation of the power and data connections of the payload through the ejection system • Packaging of the payload elements • Buoyancy and stability of the payload • Location and recovery of the payloads • Survival of the system in the flight vibration and shock environment • Payload battery performance and survivability • Beacon activation
Critical Developmental and Risk Reduction Testing
Project resource limitations drove testing concepts to prioritize low-cost approaches using existing or readily available, and often non-traditional, assets to the fullest possible extent. One of the earliest tests was performed using an aircraft and recovery boat to drop and recover inert simulated payload shapes into open water. The simulated payload shapes were constructed from a prototype syntactic foam mixture and were dropped from an altitude well in excess of that necessary for the payloads to reach terminal velocity. This testing proved that syntactic foam provided sufficient protection to the payload. This test was followed by an ejection from the ALE-47 dispenser using inert simulated payloads. With the data from this initial testing and multiple iterations of design and 3D printing, the team began to close on a payload design that encompassed the volumetric, buoyancy, and structural constraints.
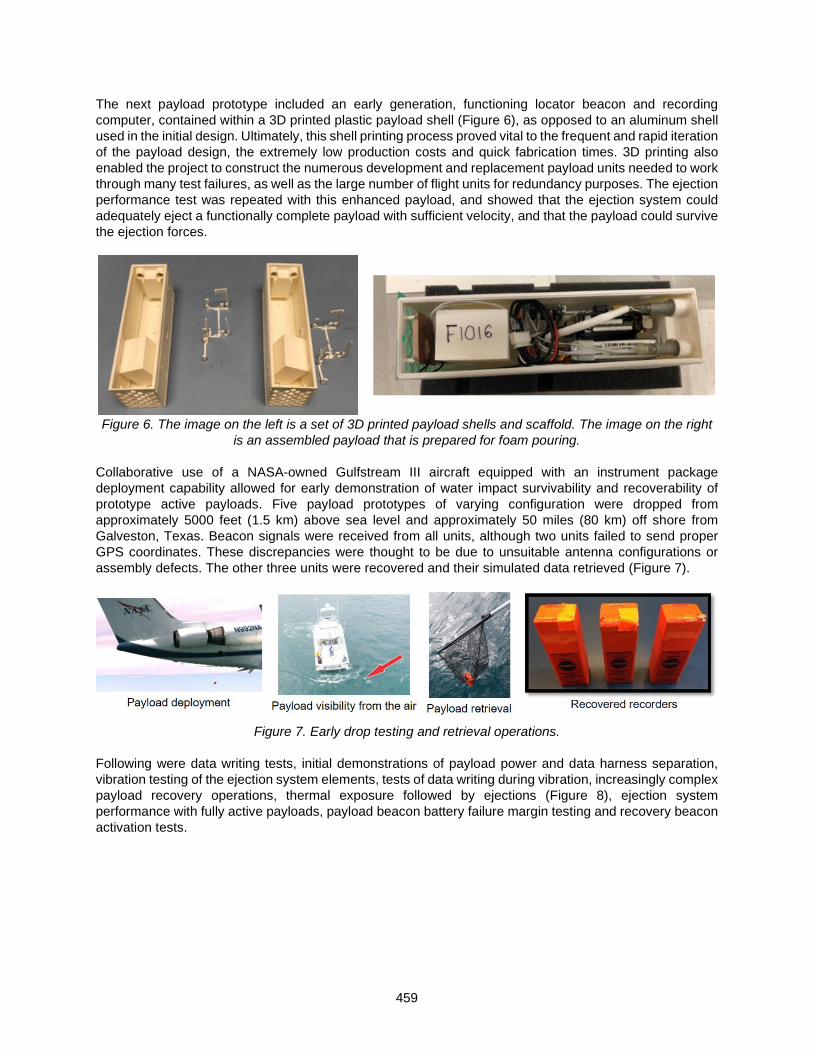
459
The next payload prototype included an early generation, functioning locator beacon and recording computer, contained within a 3D printed plastic payload shell (Figure 6), as opposed to an aluminum shell used in the initial design. Ultimately, this shell printing process proved vital to the frequent and rapid iteration of the payload design, the extremely low production costs and quick fabrication times. 3D printing also enabled the project to construct the numerous development and replacement payload units needed to work through many test failures, as well as the large number of flight units for redundancy purposes. The ejection performance test was repeated with this enhanced payload, and showed that the ejection system could adequately eject a functionally complete payload with sufficient velocity, and that the payload could survive the ejection forces.
Figure 6. The image on the left is a set of 3D printed payload shells and scaffold. The image on the right
is an assembled payload that is prepared for foam pouring. Collaborative use of a NASA-owned Gulfstream III aircraft equipped with an instrument package deployment capability allowed for early demonstration of water impact survivability and recoverability of prototype active payloads. Five payload prototypes of varying configuration were dropped from approximately 5000 feet (1.5 km) above sea level and approximately 50 miles (80 km) off shore from Galveston, Texas. Beacon signals were received from all units, although two units failed to send proper GPS coordinates. These discrepancies were thought to be due to unsuitable antenna configurations or assembly defects. The other three units were recovered and their simulated data retrieved (Figure 7).
Figure 7. Early drop testing and retrieval operations.
Following were data writing tests, initial demonstrations of payload power and data harness separation, vibration testing of the ejection system elements, tests of data writing during vibration, increasingly complex payload recovery operations, thermal exposure followed by ejections (Figure 8), ejection system performance with fully active payloads, payload beacon battery failure margin testing and recovery beacon activation tests.
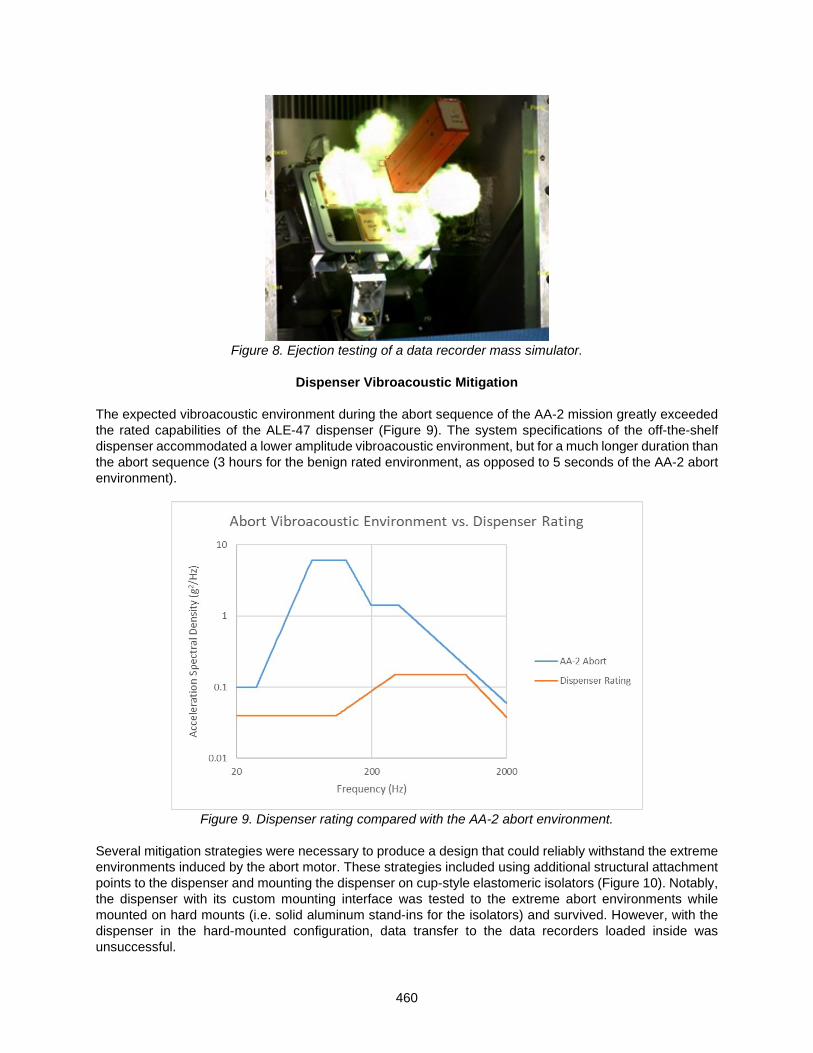
460
Figure 8. Ejection testing of a data recorder mass simulator.
Dispenser Vibroacoustic Mitigation
The expected vibroacoustic environment during the abort sequence of the AA-2 mission greatly exceeded the rated capabilities of the ALE-47 dispenser (Figure 9). The system specifications of the off-the-shelf dispenser accommodated a lower amplitude vibroacoustic environment, but for a much longer duration than the abort sequence (3 hours for the benign rated environment, as opposed to 5 seconds of the AA-2 abort environment).
Figure 9. Dispenser rating compared with the AA-2 abort environment.
Several mitigation strategies were necessary to produce a design that could reliably withstand the extreme environments induced by the abort motor. These strategies included using additional structural attachment points to the dispenser and mounting the dispenser on cup-style elastomeric isolators (Figure 10). Notably, the dispenser with its custom mounting interface was tested to the extreme abort environments while mounted on hard mounts (i.e. solid aluminum stand-ins for the isolators) and survived. However, with the dispenser in the hard-mounted configuration, data transfer to the data recorders loaded inside was unsuccessful.
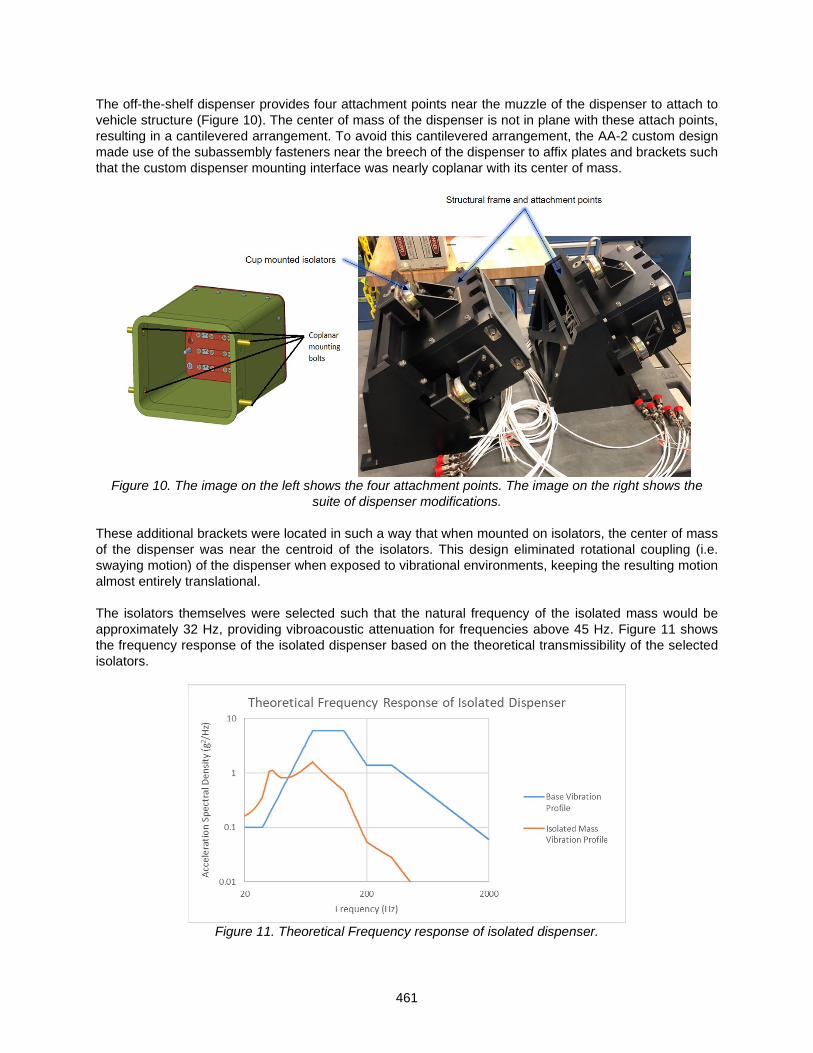
461
The off-the-shelf dispenser provides four attachment points near the muzzle of the dispenser to attach to vehicle structure (Figure 10). The center of mass of the dispenser is not in plane with these attach points, resulting in a cantilevered arrangement. To avoid this cantilevered arrangement, the AA-2 custom design made use of the subassembly fasteners near the breech of the dispenser to affix plates and brackets such that the custom dispenser mounting interface was nearly coplanar with its center of mass.
Figure 10. The image on the left shows the four attachment points. The image on the right shows the
suite of dispenser modifications. These additional brackets were located in such a way that when mounted on isolators, the center of mass of the dispenser was near the centroid of the isolators. This design eliminated rotational coupling (i.e. swaying motion) of the dispenser when exposed to vibrational environments, keeping the resulting motion almost entirely translational. The isolators themselves were selected such that the natural frequency of the isolated mass would be approximately 32 Hz, providing vibroacoustic attenuation for frequencies above 45 Hz. Figure 11 shows the frequency response of the isolated dispenser based on the theoretical transmissibility of the selected isolators.
Figure 11. Theoretical Frequency response of isolated dispenser.

462
Even with the isolators, the dispenser experienced a vibroacoustic environment above its rated values for frequencies below 200 Hz. However, with the customized mounting arrangement of the dispenser and brief exposure to the abort loads, the system design passed qualification testing and was ultimately successful in the AA-2 Mission.
Lessons Learned During Vibroacoustic Testing Cartridge Crimp Failure An early vibration test had a failure of the crimped cartridge to contain the ejectable data recorders. Ideally, the contents of the cartridge would be preloaded in a manner that resulted in no backlash or motion of the contents of the cartridge. However, an error in the crimping procedure resulted in a free displacement of the recorder between .007 in (0.18 mm) and .044 in (1.1 mm) within the cartridge. Even this small motion was enough to produce significant impact loads on the crimp feature, which was defeated. During the test, the lids came off the cartridges, and due to the asymmetric friction resistance of the piston seal (i.e. higher force needed to push seal in than to pull out), the vibration motion “ratcheted” the piston and data recorder out of the enclosed cartridge. Recalibration of the crimping machine at the cartridge loading vendor’s facility, along with inclusion of a felt spacer and a bead of RTV sealant as used in the standard cartridge configurations, resolved the loose fit issue such that this failure did not reoccur (Figure 12).
Figure 12. Cartridge crimp failure during vibration testing.
Dispenser Isolator Failure Another test failure occurred on the dispenser when an erroneously entered test profile was programmed to the shaker table, which resulted in the destruction of the isolators. After the failure occurred, it was determined that the erroneous profile differed from the intended profile as shown in Figure 13. The 32 Hz frequency is notable since that is the system’s natural frequency based on dispenser mass and isolator stiffness.

463
Figure 13. Figure on the left shows the erroneously tested vibration profile. The images on the right show
the resultant cup isolator following the test. Curiously, the grms value of the erroneous profile that destroyed the isolators was 17% lower than the grms value of the intended profile (29 grms vs. 35 grms), even though the isolators were proven to survive the intended profile when tested on a later date. In this case, the erroneous profile exceeded the intended profile in the most crucial frequency range, the low frequency domain, which included the system’s natural frequency of 32 Hz (Figure 14). Applying the isolators’ transmissibility to calculate the frequency response of the isolated dispenser creates a clearer picture of why the erroneous profile was an over-test.
Figure 14. Dispenser frequency response to erroneously tested vibration profile.
As before, the grms value does not tell the full story. The frequency response of the isolated mass shows only a slight increase in grms when comparing the erroneous profile to the intended one (12.1 grms and 10.9 grms, respectively). The true significance of the exceedance in the low frequency is not apparent until examining the rms displacement, instead of the rms acceleration. Acceleration values resulting from oscillating motion are linearly proportional to displacement amplitude and proportional to the square of the oscillation frequency. This means, for example, that for a body
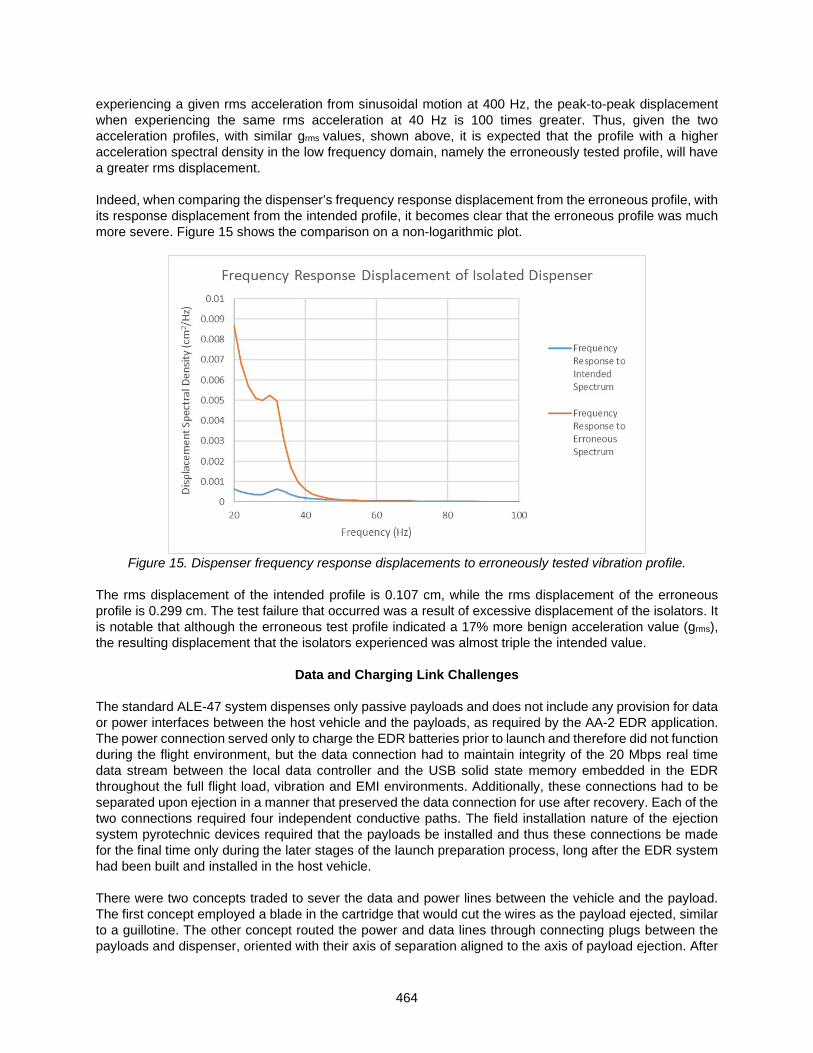
464
experiencing a given rms acceleration from sinusoidal motion at 400 Hz, the peak-to-peak displacement when experiencing the same rms acceleration at 40 Hz is 100 times greater. Thus, given the two acceleration profiles, with similar grms values, shown above, it is expected that the profile with a higher acceleration spectral density in the low frequency domain, namely the erroneously tested profile, will have a greater rms displacement. Indeed, when comparing the dispenser’s frequency response displacement from the erroneous profile, with its response displacement from the intended profile, it becomes clear that the erroneous profile was much more severe. Figure 15 shows the comparison on a non-logarithmic plot.
Figure 15. Dispenser frequency response displacements to erroneously tested vibration profile.
The rms displacement of the intended profile is 0.107 cm, while the rms displacement of the erroneous profile is 0.299 cm. The test failure that occurred was a result of excessive displacement of the isolators. It is notable that although the erroneous test profile indicated a 17% more benign acceleration value (grms), the resulting displacement that the isolators experienced was almost triple the intended value.
Data and Charging Link Challenges The standard ALE-47 system dispenses only passive payloads and does not include any provision for data or power interfaces between the host vehicle and the payloads, as required by the AA-2 EDR application. The power connection served only to charge the EDR batteries prior to launch and therefore did not function during the flight environment, but the data connection had to maintain integrity of the 20 Mbps real time data stream between the local data controller and the USB solid state memory embedded in the EDR throughout the full flight load, vibration and EMI environments. Additionally, these connections had to be separated upon ejection in a manner that preserved the data connection for use after recovery. Each of the two connections required four independent conductive paths. The field installation nature of the ejection system pyrotechnic devices required that the payloads be installed and thus these connections be made for the final time only during the later stages of the launch preparation process, long after the EDR system had been built and installed in the host vehicle. There were two concepts traded to sever the data and power lines between the vehicle and the payload. The first concept employed a blade in the cartridge that would cut the wires as the payload ejected, similar to a guillotine. The other concept routed the power and data lines through connecting plugs between the payloads and dispenser, oriented with their axis of separation aligned to the axis of payload ejection. After
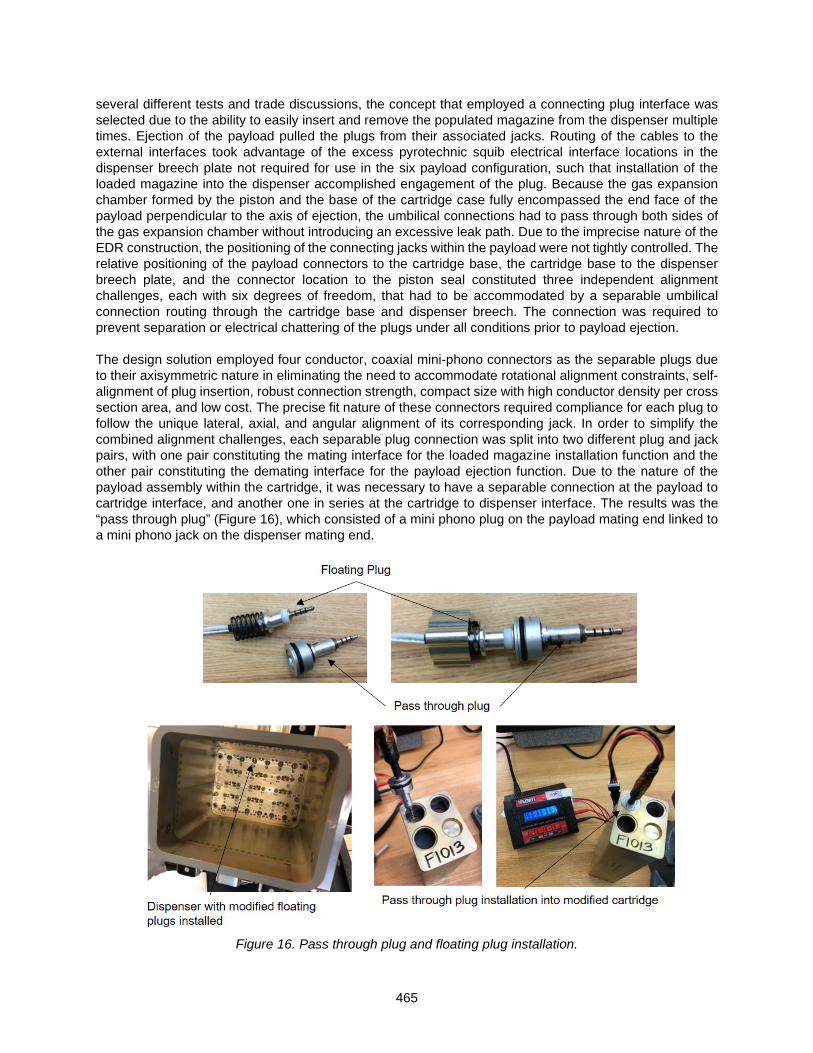
465
several different tests and trade discussions, the concept that employed a connecting plug interface was selected due to the ability to easily insert and remove the populated magazine from the dispenser multiple times. Ejection of the payload pulled the plugs from their associated jacks. Routing of the cables to the external interfaces took advantage of the excess pyrotechnic squib electrical interface locations in the dispenser breech plate not required for use in the six payload configuration, such that installation of the loaded magazine into the dispenser accomplished engagement of the plug. Because the gas expansion chamber formed by the piston and the base of the cartridge case fully encompassed the end face of the payload perpendicular to the axis of ejection, the umbilical connections had to pass through both sides of the gas expansion chamber without introducing an excessive leak path. Due to the imprecise nature of the EDR construction, the positioning of the connecting jacks within the payload were not tightly controlled. The relative positioning of the payload connectors to the cartridge base, the cartridge base to the dispenser breech plate, and the connector location to the piston seal constituted three independent alignment challenges, each with six degrees of freedom, that had to be accommodated by a separable umbilical connection routing through the cartridge base and dispenser breech. The connection was required to prevent separation or electrical chattering of the plugs under all conditions prior to payload ejection. The design solution employed four conductor, coaxial mini-phono connectors as the separable plugs due to their axisymmetric nature in eliminating the need to accommodate rotational alignment constraints, self-alignment of plug insertion, robust connection strength, compact size with high conductor density per cross section area, and low cost. The precise fit nature of these connectors required compliance for each plug to follow the unique lateral, axial, and angular alignment of its corresponding jack. In order to simplify the combined alignment challenges, each separable plug connection was split into two different plug and jack pairs, with one pair constituting the mating interface for the loaded magazine installation function and the other pair constituting the demating interface for the payload ejection function. Due to the nature of the payload assembly within the cartridge, it was necessary to have a separable connection at the payload to cartridge interface, and another one in series at the cartridge to dispenser interface. The results was the “pass through plug” (Figure 16), which consisted of a mini phono plug on the payload mating end linked to a mini phono jack on the dispenser mating end.
Figure 16. Pass through plug and floating plug installation.

466
The connectors of each pass through plug were embedded in a two-part shell capable of accommodating the compliance necessary to ensure alignment of the assembly, such that the plug was fully seated and the shell adequately aligned, in order to seal in the ejection gas generated by the pyrotechnic charge. This plug and jack pair constituted the demating interface for the ejection function of the connectors. Oversized holes in the piston and piston seal accommodated alignment compliance between the installed pass through plug assembly and piston assembly. A layer of compliant seal material (rubber sheet), sandwiched between the upper surface of the piston and the lower end of the payload, provided a seal against leakage of the expansion gas without requiring a tight fit between the pass through plugs and associated holes in the piston and piston seals. Phono plug assemblies (the “floating plug”) installed in the dispenser breech plate, in place of the squib electrical interface pins, constituted the mating interface for the magazine installation function of the connectors (Figure 16). Within the dispenser, a compression spring at each connection provided enough force to guarantee full insertion of the connections once the payloads were fully seated, and allowed for flexure of the connectors to accommodate any misalignment (Figure 17).
Figure 17. Dispenser to payload pass through plug interface.
The original intent was to limit the payload installation into the vehicle to a single cycle, but unanticipated challenges with the software of the data recording and payload beacon activation forced an extended test campaign with numerous installation and removal cycles. The environmental test plan of vibration, thermal, and ejection tests also required a larger number of payload installation and removal cycles than originally envisioned. The repeatable and simple nature of this connector concept proved both vital to testing, but also problematic. The inherent nature of the coaxial plugs caused a variety of adverse connector pin shorting conditions during insertion and removal that required development of detailed and rigorous operational procedures to avoid damage to the payloads. Although initial data integrity testing appeared successful at the component level, early development tests of data writing during vibration encountered anomalies with data integrity. Initial diagnostic efforts focused on the apparent association with the vibration environment, but further testing revealed that intermittent data writing failures existed when using the fully integrated system configuration in any environment. Signal diagnostic testing uncovered that although data had been successfully transmitted and the combined connection had excellent conductivity on all lines, when operating at the high frequency and low signal strength of the USB 2.0 standard, the fully assembled data connection had a net impedance sufficient to cause intermittent failure of the data signal. Upon comparison of the coaxial phono plug connector with traditional USB connectors that have individual, parallel signal paths, it was realized that the closely spaced concentric geometry of the coaxial contacts in the phono plug created a capacitance between adjacent
467
connector rings. With the positive and negative high frequency data channels placed on adjacent rings, this capacitance resulted in an impedance at the high frequency of the data signal sufficient enough to block the low voltage signal when combined with other losses in the complete system. By reordering the USB channels through the connector such that the ground channel of the USB DC power bus was placed on the ring between the two data channels, the capacitance effect was disrupted and the impedance problem eliminated.
Beacon Activation and Battery Maintenance Challenges
Since it was necessary to avoid premature emission of radio signals and draining of battery capacity, the locator beacon was not activated until the payload was ejected. Due to the extended period of dormancy from final battery charge until payload ejection, it was necessary to minimize the power draw of the ejection detection system in the payload. The EDR payloads included a custom designed activation circuit for the ejection detection and battery charging functions. The coaxial nature of the phono plugs was susceptible to brief shorting between adjacent conductors during insertion and removal, which in combination with peculiarities in the activation circuit design, led to a couple of challenging problems uncovered during later phases of testing. Early versions of the activation design involved means of detecting severance of the USB data connection circuit via cross connections to the battery charging circuit. This cross coupling resulted in numerous permanent failures of the payloads during testing, particularly to the COTS flash drives used for data recording. Eventually it proved impossible to eliminate the failures with the original concept. A new system of detecting payload ejection was developed. This method sensed the severance of a short circuit between terminals protruding from the side of the payload and shorted through contact with the wall of the aluminum cartridge prior to ejection. This late design change succeeded in eliminating the flash drive failures due to problematic coupling of the charging and data circuits. Due to inadequate voltage specification of certain components in the activation circuit, another consequence of crossing conductors during coaxial plug insertion and removal was a propensity to damage the activation circuit or battery, which accumulated over repeated cycles. Delayed understanding of the issue precluded redesign for properly sized components. Thus, the vulnerability was mitigated through procedural safeguards and rigorous monitoring. A final redesign was undertaken to completely replace the activation circuit with an optically sensed circuit for detecting payload ejection. While this completely resolved all of the remaining risks for operational damage or premature battery drain of the payloads, the very late introduction in the schedule precluded the opportunity for full adequate testing of this design. In the end, a mixture of both redesigned versions of the payloads was flown in order to balance these conflicting risks without disrupting the flight schedule.
Conclusions The most challenging development issues were related to the custom designed payload activation circuit and the software for writing data to the flash drives. Ironically, neither of these had been considered noteworthy risk items at the beginning and had assumed to be within the scope of routine developments. In hindsight, the one noteworthy improvement to the development process would have been earlier acceptance of the need for a change of design concept for these two items and better integration between mechanical and electrical aspects of the design process in the crucial early phases. In operation, the EDR system performed almost flawlessly. It met all critical schedule milestones up to and including flight, and without disruption to the overall AA-2 development and launch preparation schedule. During the mission, all 12 data recorder payloads ejected exactly as planned and were successfully recovered ahead of the anticipated timeline. Data was successfully retrieved from all units and ultimately proved to be a perfect recording of the telemetry stream on 11 of the units, with the only flaw being limited disruption of the data on one of the payloads. The data loss was an intermittent issue with one of the data

468
channels of the breakout box noted during testing, but accepted due to the impracticality of repair and protection of massive redundancy. Other than the noted issues with early versions of the payload beacon activation circuit and data writing software, the programmatic and operational performance of the system fully validated the selected design choices and development philosophy of the EDR subsystem.
References
1. Rojdev, K., Hagen J., Burlone, M., Petri, D., Jackowski, A., et al., “An Ejectable Data Recorder Subsystem for the Ascent Abort-2 Test Flight of the Orion Launch Abort System,” Proceedings of the IEEE Aerospace Conference, Big Sky, March 7-14, 2020.

469
Design and Test of the Orion Crew Module Side Hatch
Lance Lininger* and Kyle Gotthelf**
Abstract The Orion spacecraft is a critical component of NASA’s Artemis program to establish a permanent human presence on the lunar surface and further enable future crewed missions to Mars. As a result of traumatic lessons learned from the Apollo and space shuttle programs, NASA has established thorough crew safety requirements that were particularly challenging to implement for the Orion Crew Module side hatch. This paper describes the background and evolution of the side hatch design, the features used to address the crew safety requirements, the testing challenges in preparation for the Artemis 1 mission, and lessons learned.
Introduction
Due to four decades of hard-learned crew safety lessons (Apollo 1 command module fire, space shuttle Challenger, and space shuttle Columbia), NASA established requirements to make Orion the safest and most reliable human-rated spacecraft ever built. However, these requirements when coupled with the long Orion mission durations, introduced some significant challenges with the side hatch design (see Figure 1 for the location of the side hatch on the Orion Crew Module).
Figure 1. Orion Crew Module
Specific side hatch changes from Apollo/space shuttle include (also see Table 1):
• Introduction of the NASA-STD-5017 mechanisms design standard for crewed missions (based on AIAA-S-114)
• More conservative structural/force/torque margins • Implementation of redundancies (where possible) • Higher factor on mechanism life cycle verifications (4X for crewed missions) • Longer mission duration • Higher cabin pressure • Lower leak rate
* Lockheed Martin Space, Littleton, CO; [email protected] ** Honeybee Robotics, Longmont, CO
Proceedings of the 45th Aerospace Mechanisms Symposium, NASA Johnson Space Center, 2020

470
Table 1. Side Hatch Key Driving Requirements Comparison, Apollo vs. Orion
Requirement Apollo Orion Cabin Pressure 44.8 kPa 106.9 kPA Max Leak Rate ~2.3 kg / day (estimated) 0.68 kg / day
Crew member size/strength Average Male range 1% female to 99% Male Seal Redundancy Single seal Redundant Seals
Hatch Size 0.64 m2 0.79 m2 Hatch Opening Cycle Life Records uncertain 1180 cycles
Mission Duration 14 days > 21 days NASA-STD-5017 (AIAA-S-114
derivative) applicability Didn’t exist Yes
As a starting point, trade studies were conducted to identify the design solutions that were most likely to meet these requirements. Past crew hatch designs were examined from Gemini, Apollo, space shuttle, and ISS. After numerous reviews and discussions, it was determined that a highly modified version of the Apollo hatch was best suited for Orion. Figures 2 and 3 show the Apollo and Orion side hatch designs with key components.
Figure 2. Apollo Side Hatch

471
Figure 3. Orion Artemis 1 Side Hatch
Orion Side Hatch Design Details The side hatch contains the following key components:
• Aluminum structural panel: An initial trade was performed on a flat vs. curved structure (Apollo used a curved structure). Due to the more stringent sealing requirements, it was decided that a flat hatch structure would be used on Orion (to improve sealing tolerances and reduce cost). It was also theorized at the time this would simplify the latch train kinematics (latches wouldn’t have to transmit loads over a three-dimensional curved surface), although this turned out to be a negative aspect of the design later in development testing.
• Latches: Two latch trains (“A” train and “B” train, 17 latches total) are used to compress the perimeter seals and retain the hatch to the spacecraft structure. Due to increased strength margins and higher pressures required on Orion, the latches were scaled-up significantly over Apollo (see Figure 4). The latches are over-center mechanisms, linked together through a series of linkages and bell cranks. Ideally, as hatch pressure loads increase this should drive the latches farther over center into the hardstops (see Figure 5). Rigging of the latches is critical. In a perfectly rigged hatch, all the latches would be overcenter and contacting the hardstops simultaneously. However, even with designed-in adjustable rigging features, it is extremely difficult to achieve the desired hardstop conditions due to the many part tolerances and the interactive nature of the latch linkages.

472
Figure 4. Apollo vs. Orion Latch Size
Figure 5. Latch Over-Center Action
• Deployment hinges: 4-bar linkage design (Figure 6). The opening motion is optimized to provide the desired final hatch position needed for crew emergency egress, while also providing an appropriate closed position for sealing.
Figure 6. Side Hatch Hinge
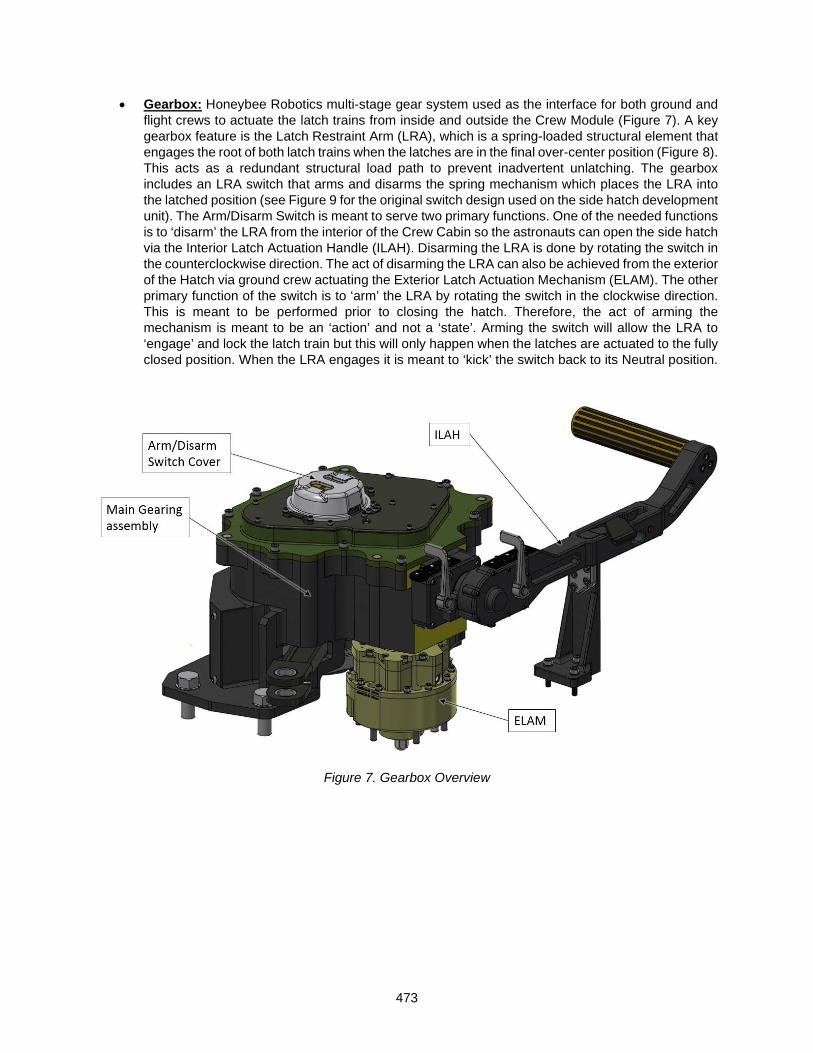
473
• Gearbox: Honeybee Robotics multi-stage gear system used as the interface for both ground and flight crews to actuate the latch trains from inside and outside the Crew Module (Figure 7). A key gearbox feature is the Latch Restraint Arm (LRA), which is a spring-loaded structural element that engages the root of both latch trains when the latches are in the final over-center position (Figure 8). This acts as a redundant structural load path to prevent inadvertent unlatching. The gearbox includes an LRA switch that arms and disarms the spring mechanism which places the LRA into the latched position (see Figure 9 for the original switch design used on the side hatch development unit). The Arm/Disarm Switch is meant to serve two primary functions. One of the needed functions is to ‘disarm’ the LRA from the interior of the Crew Cabin so the astronauts can open the side hatch via the Interior Latch Actuation Handle (ILAH). Disarming the LRA is done by rotating the switch in the counterclockwise direction. The act of disarming the LRA can also be achieved from the exterior of the Hatch via ground crew actuating the Exterior Latch Actuation Mechanism (ELAM). The other primary function of the switch is to ‘arm’ the LRA by rotating the switch in the clockwise direction. This is meant to be performed prior to closing the hatch. Therefore, the act of arming the mechanism is meant to be an ‘action’ and not a ‘state’. Arming the switch will allow the LRA to ‘engage’ and lock the latch train but this will only happen when the latches are actuated to the fully closed position. When the LRA engages it is meant to ‘kick’ the switch back to its Neutral position.
Figure 7. Gearbox Overview

474
Figure 8. Gearbox Latch Restraint Arm (as viewed from outside the hatch)
Figure 9. Original LRA Switch Design on the Development Hatch

475
• Counterbalance assembly: Moog Inc. hydraulic/pneumatic actuator which provides the motive force to open the hatch in both normal and emergency egress conditions once the hatch latch trains are disengaged (Figure 10).
Figure 10. Counterbalance Assembly
Initial Design and Analysis
The Artemis 1 mission (which is uncrewed) did not originally include a full fidelity side hatch but rather a structural simulator for the flight. It was decided late in the Artemis 1 design schedule to add a full fidelity side hatch to reduce technical risk prior to Artemis 2 (first crewed mission). This decision accelerated the side hatch schedule by approximately one year which introduced obvious programmatic challenges. Due to these schedule constraints the design team had to be judicious on the level of detail in the Finite Element Model (FEM) and kinematic analyses. In order to meet the Critical Design Review and the development testing milestones, the initial analysis of the hatch design was limited to standard FEM/stress modeling and rigid-body kinematic studies of the latch trains which all showed positive results with significant margins. There was a plan to do a more in-depth flex-body analysis to examine the complete interactions of the structure and latch trains, however this couldn’t be completed in time. The CDR was held successfully (with many independent NASA and LM reviewers) and so after numerous meetings with management, it was agreed the team should proceed into development testing to validate the design.
Development Testing
As typical for a mechanical system of this complexity, the team started tests at a subcomponent level. Numerous structural and life tests were conducted on the latch mechanisms, including individual latches and a small connected set of 4 latches. The static load test of a single latch is summarized in Figure 11. This test was intended to be an ultimate load test, and the actual capability was at least 2X the anticipated strength (the test was stopped due to limitations of the test fixture). This gave the team confidence that the latches were very structurally robust to react the pressure loads and would easily meet the more stringent NASA structural requirements. The test also validated the over-center action of the latch (at an individual latch level).
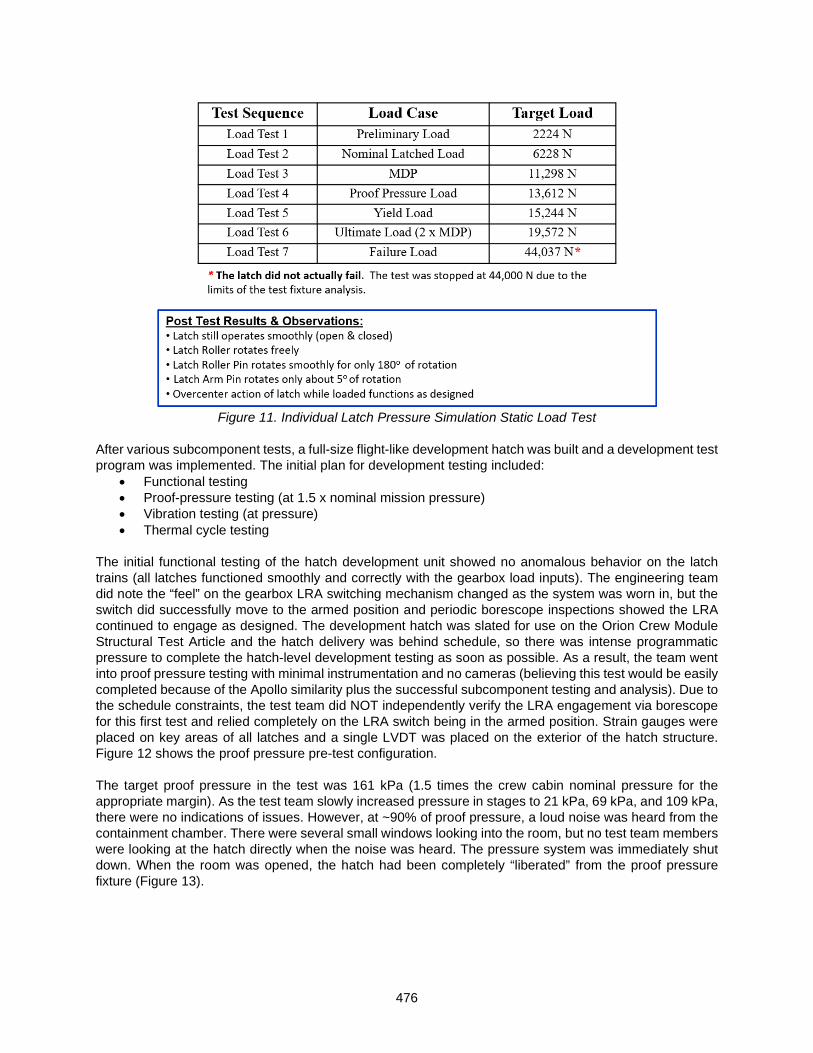
476
Figure 11. Individual Latch Pressure Simulation Static Load Test
After various subcomponent tests, a full-size flight-like development hatch was built and a development test program was implemented. The initial plan for development testing included:
• Functional testing • Proof-pressure testing (at 1.5 x nominal mission pressure) • Vibration testing (at pressure) • Thermal cycle testing
The initial functional testing of the hatch development unit showed no anomalous behavior on the latch trains (all latches functioned smoothly and correctly with the gearbox load inputs). The engineering team did note the “feel” on the gearbox LRA switching mechanism changed as the system was worn in, but the switch did successfully move to the armed position and periodic borescope inspections showed the LRA continued to engage as designed. The development hatch was slated for use on the Orion Crew Module Structural Test Article and the hatch delivery was behind schedule, so there was intense programmatic pressure to complete the hatch-level development testing as soon as possible. As a result, the team went into proof pressure testing with minimal instrumentation and no cameras (believing this test would be easily completed because of the Apollo similarity plus the successful subcomponent testing and analysis). Due to the schedule constraints, the test team did NOT independently verify the LRA engagement via borescope for this first test and relied completely on the LRA switch being in the armed position. Strain gauges were placed on key areas of all latches and a single LVDT was placed on the exterior of the hatch structure. Figure 12 shows the proof pressure pre-test configuration. The target proof pressure in the test was 161 kPa (1.5 times the crew cabin nominal pressure for the appropriate margin). As the test team slowly increased pressure in stages to 21 kPa, 69 kPa, and 109 kPa, there were no indications of issues. However, at ~90% of proof pressure, a loud noise was heard from the containment chamber. There were several small windows looking into the room, but no test team members were looking at the hatch directly when the noise was heard. The pressure system was immediately shut down. When the room was opened, the hatch had been completely “liberated” from the proof pressure fixture (Figure 13).
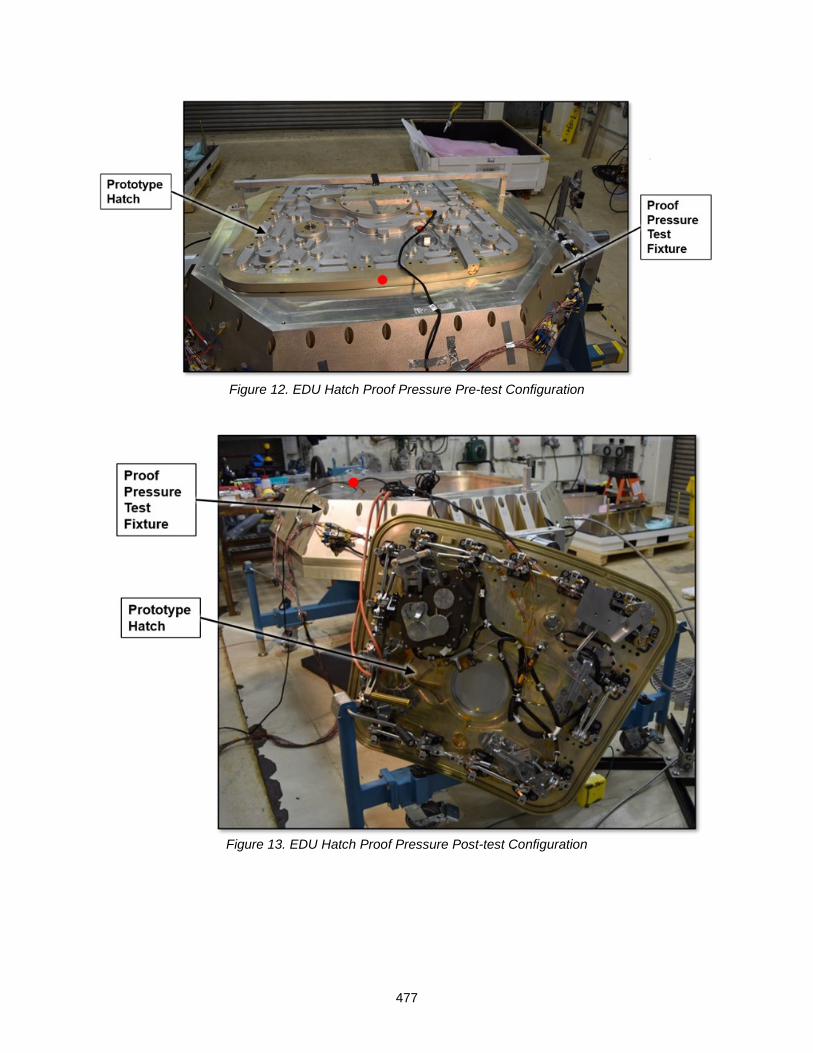
477
Figure 12. EDU Hatch Proof Pressure Pre-test Configuration
Figure 13. EDU Hatch Proof Pressure Post-test Configuration

478
Development Test Failure Investigation
The investigation began at once, starting with a fishbone failure diagram. The team arrived at more than 50 possible root cause contributors. An initial look at the latch strain gauges did show non-linearity near the point of failure (see Figure 14). The latches shouldn’t behave this way for two key reasons, namely that they are supposed to act as over-center mechanisms, and that the engaged LRA should be a backup structural path to prevent latches from backdriving. These were the leading root cause theories, but it was evident that more analysis was needed along with additional testing with improved instrumentation.
Figure 14. B-Train Latch Strain Gauge Data from Test Failure
The originally planned flex-body analysis was given new urgency. Numerous meetings were held with both NASA and Lockheed Martin expert analysts, and several models were built using various software tools (MSC ADAMS, MSC NASTRAN, ABAQUS). The best (although limited) results came from the ADAMS model (Figure 15). In this case, the CAD model was used to generate a complete 17 latch kinematic assembly. Flexibility was added to key members that reacted high loads through the use of 1-D springs where stiffness values were analytically derived from the FEM. Latches were modeled using a bushing element at the roller contact region. Latch stiffness values were derived from the latch subcomponent testing. Finally, the structure was modeled using FEM derived enforced displacements at each latch location. This model was continually updated as the development testing continued, however full correlation was never achieved. The model could show general trends but it wasn’t able to duplicate specific loads or deflections of the latch trains as seen in testing. This was due to the hundreds of parts and joints, each with different friction and stiffness values. When combined with the complex pressure-induced deflections of the hatch structure, it became clear that the model would be of limited use. Therefore, the team continued to focus on an empirical approach.

479
Figure 15. ADAMS Model of Hatch Mechanisms
A design of experiments study was implemented to isolate all variables which resulted in nine additional pressure tests. Many more strain gauges were added to the prototype, particularly in the gearbox, on the linkages connecting the latches, and on the hatch structure. More LVDTs were added plus numerous Go-Pro cameras inside and outside the pressure vessel to monitor latch movements. The first retest was intended to be a repeat of the initial test conditions, but with slower pressure application and more careful monitoring of all instrumentation. The gearbox LRA was confirmed to be engaged via borescope for this first retest. Interestingly, the hatch reached proof pressure and the latch non-linearities didn’t recur. This immediately suggested that the LRA had not been engaged for the first test, despite the LRA switch being in the correct position. A second retest was performed, this time with the LRA purposely in the disengaged position. The latch strain gauges showed the same non-linearity as in the initial test. Furthermore, the hardstop gaps on most latches increased as the pressure increased (indicating the latches were not acting as traditional overcenter mechanisms). Later tests focused on the rigging procedure for the latch positions. In the original failed test, small gaps were allowed at the latch hardstops (again with the belief that pressure should only drive the latches into the hard stops). The rigging procedure was updated to reduce and mostly eliminate the hard stop gaps. Subsequent proof pressure testing with the improved rigging was successful, even with the gearbox LRA purposely disengaged, which demonstrated the LRA could still function as a redundant hatch retention feature. Both the analytical model and the detailed test instrumentation supported a fundamental conclusion that as pressure increases on the hatch, it bows the flat structure like a balloon which caused the distance between latches to decrease. Since the linkages connecting the latches are rigid, this defeated the over-center mechanisms, allowing them to release (see Figure 16).

480
Figure 16. Latch Movement Due to Hatch Pressure
It was also noted the test configuration had several components purposely left out as they weren’t deemed relevant (hinges, thermal isolator brackets, and counterbalance guiderail parts were not installed). These components slightly stiffen the hatch structure and would have decreased pressure deflections (following the Test Like You Fly philosophy is important).
At the conclusion of the investigation the root cause was determined to have 3 primary contributors:
1. Hatch structural deformations under pressure-induced latch and linkage loads that counteracted the latch overcenter loads, which caused the latches to move back “undercenter.”
2. Inadequate latch train rigging
3. The gearbox LRA was not engaged despite the LRA switch appearing to function correctly. This was due to a design issue found within the switch mechanism.
Gearbox LRA Switch Mechanism
In hindsight, it was fortuitous that the LRA switch wasn’t functioning properly. If it had functioned, the LRA would have prevented the latch trains from backdriving, thus giving false confidence in the latch train rigging procedure and essentially eliminating fault tolerance of the hatch retention system. Nevertheless, it was necessary to understand root cause of the LRA switch issue and resolve it.
It is important to note that the LRA is not directly coupled to the Arm/Disarm Switch. Therefore, the LRA could engage without noticeable motion of the switch due to complicated cam features inside the ELAM not operating as intended. Corrective actions to address these issues were implemented in the Artemis 1 design. The switch functionality did not change except that the Neutral state was removed as it was not needed and only added confusion. The main improvement came by moving the arm/disarm mechanism from the ELAM and into the Gearbox Lid. This allowed for a direct coupling between the LRA and an added ‘Status Indicator’ that was used to show engagement status. The status indicator displays green when the LRA is engaged and red when disarmed (see Figure 17). Table 2 summarizes the relationship between the switch state, status indicator, and LRA condition. It is important to note that this improvement can only be verified by personnel inside the Crew Module. Since the Artemis 1 mission is uncrewed, an additional layer of redundancy was implemented via a lockout pin installed from the outside of the closed hatch which guarantees a locked position of the LRA. Further improvements for LRA status have been implemented in the Artemis 2 design to give ground crew and astronauts definitive feedback on proper engagement.
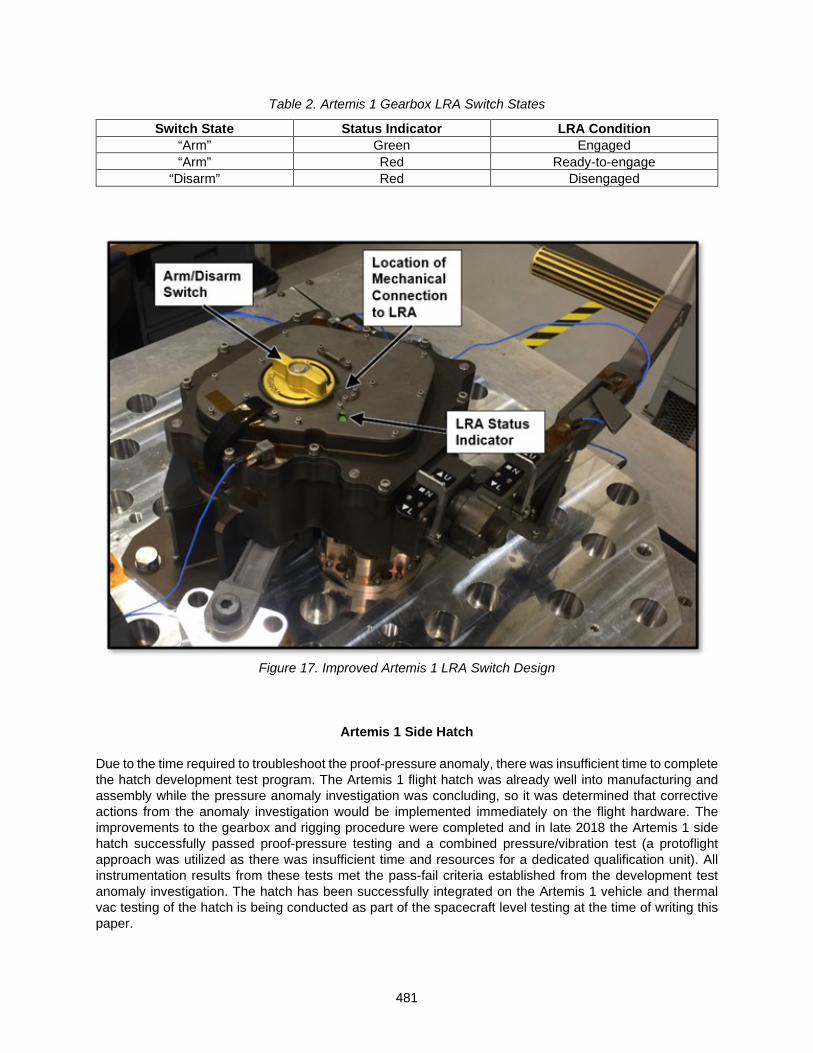
481
Table 2. Artemis 1 Gearbox LRA Switch States
Switch State Status Indicator LRA Condition “Arm” Green Engaged “Arm” Red Ready-to-engage
“Disarm” Red Disengaged
Figure 17. Improved Artemis 1 LRA Switch Design
Artemis 1 Side Hatch
Due to the time required to troubleshoot the proof-pressure anomaly, there was insufficient time to complete the hatch development test program. The Artemis 1 flight hatch was already well into manufacturing and assembly while the pressure anomaly investigation was concluding, so it was determined that corrective actions from the anomaly investigation would be implemented immediately on the flight hardware. The improvements to the gearbox and rigging procedure were completed and in late 2018 the Artemis 1 side hatch successfully passed proof-pressure testing and a combined pressure/vibration test (a protoflight approach was utilized as there was insufficient time and resources for a dedicated qualification unit). All instrumentation results from these tests met the pass-fail criteria established from the development test anomaly investigation. The hatch has been successfully integrated on the Artemis 1 vehicle and thermal vac testing of the hatch is being conducted as part of the spacecraft level testing at the time of writing this paper.

482
Lessons Learned
Specific lessons learned (and relearned) during the Orion Side Hatch development:
• Accurate modeling of complex mechanisms with many parts (especially where flex-body effects exist) may not be possible or feasible. Use analysis results cautiously and test early.
• Beware of using pre-existing designs without thoroughly understanding the effects of your requirements (the Apollo-like latch trains were more sensitive to pressure-deflections from the new flat Orion hatch structure). Additional independent analysis in the early design stages could have identified the pressure deflection failure mode.
• Think ahead to possible failure scenarios during testing and ensure that sufficient instrumentation is used to help identify and characterize the failure modes should they occur. Still/video cameras should be used even for simple structural tests.
• For complex mechanical systems, beware that successful subcomponent tests can impart false confidence for higher level assembly tests.
• Ensure that rigging (adjustment) procedures for complex assemblies are well documented with clear pass/fail criteria on critical dimensions and features.
• Ensure that the method for verifying the state of mission-critical mechanical functions is reliable (the gearbox latch restraint arm state was not properly established during hatch development testing).
Conclusion
The Orion side hatch completed a development test program that identified deficiencies in the design which have been corrected for the first uncrewed Artemis 1 mission. The flat structure design (originally thought to be an improvement over the Apollo curved structure design for seal leak rates and latch mechanism performance) introduced new pressure-deflection problems that would have reduced system reliability without correction. The gearbox inspection and hatch rigging procedures were updated which resulted in a successful completion of the Artemis 1 side hatch protoflight testing, and successful delivery/integration into the spacecraft.
Acknowledgements
• Lockheed Martin Orion Mechanisms team
o Paige Carr, Bill Chastain, James Beat, John Lawlor, Doug Harrison • NASA Orion Mechanisms Team
o Joseph Anderson, Brent Evernden, Oscar Guzman
References
• Evernden, B, Guzman, O., “ORION - Crew Module Side Hatch: Proof Pressure Test Anomaly Investigation”, NASA Technical Reports Server (2018)
• Walkover, L, Hart, R, Zosky, E, “The Apollo Command Module Side Access Hatch System,” Aerospace Mechanisms Symposium, 4 (1969), 157-167

483
Design, Development, Testing, and Flight of the Crew Dragon Docking System
Jaret Matthews, Caitlin Driscoll*, Edward Fouad*, Andrew Welter*, Marc Jarmulowicz** and Jessica Ipnar**
Abstract
On March 3, 2019 10:51 UTC, the SpaceX Crew Dragon Demo 1 spacecraft successfully docked to the International Space Station (ISS) on the Node 2 Forward International Docking Adapter (IDA). The SpaceX developed docking system successfully accommodated the misalignments and relative rates between Crew Dragon and ISS, and ultimately attenuated the kinetic energy following contact. This was the first successful docking of a Commercial Crew program vehicle to the International Space Station. The successful Demo 1 flight was the culmination of years of development. This paper describes the SpaceX docking system, and a sample of the lessons learned through simulation, test and inspection.
Figure 1: The Demo 1 Crew Dragon System on Approach to ISS
Introduction
The SpaceX docking system is comprised of several mechanisms. The soft capture system (SCS) allows for Crew Dragon to compensate for misalignments with ISS resulting from navigation and control errors and provides the initial (soft) attachment to the station. The SCS also is responsible for bringing the capsule to rest with respect to ISS, decelerating it from an initial approach speed at contact with ISS of 8 cm/s. The SCS consists of a ring with three coarse alignment petals, each with embedded passive soft capture latches. The SCS petals and passive soft capture latches are derived from the NASA Docking System design.
* Space Exploration Technologies, Hawthorne, CA; [email protected] ** Dynamic Concepts, Inc., Huntsville, AL; [email protected]
Proceedings of the 45th Aerospace Mechanisms Symposium, NASA Johnson Space Center, 2020

484
Figure 2: The SpaceX Docking System conducting a joint interface acceptance test; soft capture ring
shown in the deployed state The SCS is deployed forward of Crew Dragon via a hexapod – a minimally constrained, six-legged arrangement of two-force struts. As the soft capture ring/petal elements make contact with the IDA, forces travel down the rigid struts and are converted into torques by a moment arm connected to a passive rotary spring damper, also referred to as attenuator arm. The rotary spring damper reacts the contact torque with caged helical compression springs and a rotary eddy current damper. The soft capture system passively attenuates the contact loads and allows the soft capture ring to move in six degrees of freedom (6-DoF), permitting it to align with the passive IDA interface. Assuming sufficient alignment is achieved, the soft capture latch pawls jump over corresponding striker plates on the IDA and soft capture is achieved. Two plungers on each soft capture petals are depressed when capture is achieved, triggering a change in microswitch state. If capture is not achieved, Crew Dragon will perform its failed capture response and safely retreat from the ISS. Following successful soft capture and cessation of relative motion, the soft capture ring is retracted via three linear dual-wound actuators. As the linear actuators are driven up they cause the rotary spring dampers to rotate down and thereby return the soft capture ring to the stowed height. Following soft capture ring retraction, twelve hard capture hooks, derived from the NASA Docking System hook design, connect to corresponding passive hooks on the IDA. The hard capture hooks each contain a cam mechanism that draws the hooks down and compresses a seal that runs around the circumference of the docking system. Ready to hook switches provide the indication that the hooks are in a position to successfully latch onto the IDA passive hooks. Finally, two umbilical dual-wound actuators mate power and data connectors to ISS. Following a successful hard mate operation, the vestibule between Dragon and ISS is pressurized and the hatches opened to allow for transfer of crew and cargo. To undock, the passive capture latches are moded to a “ready to release” state such that they no longer provide load retention capability. The umbilicals are retracted and the hard capture hooks opened, freeing Dragon from the ISS and allowing GNC to take control to move Dragon away from the ISS. Contingency release mechanisms, Non-Explosive Actuators (NEAs) on the soft capture latches and Frangibolts on the hard capture hooks, are present in the event that release via the nominal actuators fails. Notably, the hard capture hooks are also utilized to retain the nosecone during launch and re-entry. This protects docking system and other nearby components for reuse. The SpaceX docking system is a highly performing and efficient spacecraft mechanism. Its weight is approximately 4% of the Dragon 2 mass. It has low power draw and was designed and qualified for five-flight reusability with minimal maintenance.

485
The SpaceX docking system is a well understood mechanism, which has been computer modeled, simulated, and test correlated to a high degree. The system has been modeled in NASA’s Trick software framework, so that this simulation can easily interface with other NASA docking simulations. At many levels of individual components (springs/dampers), sub-systems (soft capture latches, hard capture hooks, rotary attenuator arms), and full docking systems, the simulation has been correlated to match test data from both SpaceX and NASA testing. The correlation of the simulation extends to a wide variety of mass properties in the Crew Dragon class, at a wide range of contact conditions and velocities.
Figure 3: The SpaceX Docking System Operations Overview
Figure 4: SpaceX Docking System Subassembly Overview
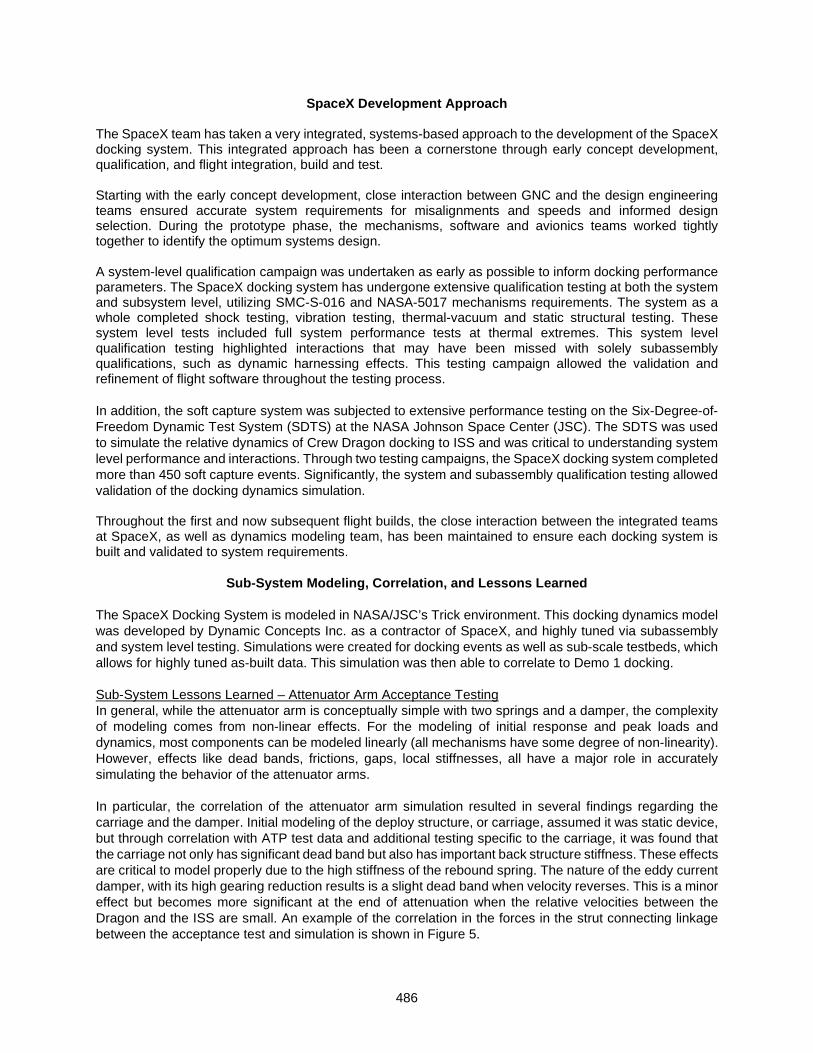
486
SpaceX Development Approach
The SpaceX team has taken a very integrated, systems-based approach to the development of the SpaceX docking system. This integrated approach has been a cornerstone through early concept development, qualification, and flight integration, build and test. Starting with the early concept development, close interaction between GNC and the design engineering teams ensured accurate system requirements for misalignments and speeds and informed design selection. During the prototype phase, the mechanisms, software and avionics teams worked tightly together to identify the optimum systems design. A system-level qualification campaign was undertaken as early as possible to inform docking performance parameters. The SpaceX docking system has undergone extensive qualification testing at both the system and subsystem level, utilizing SMC-S-016 and NASA-5017 mechanisms requirements. The system as a whole completed shock testing, vibration testing, thermal-vacuum and static structural testing. These system level tests included full system performance tests at thermal extremes. This system level qualification testing highlighted interactions that may have been missed with solely subassembly qualifications, such as dynamic harnessing effects. This testing campaign allowed the validation and refinement of flight software throughout the testing process. In addition, the soft capture system was subjected to extensive performance testing on the Six-Degree-of-Freedom Dynamic Test System (SDTS) at the NASA Johnson Space Center (JSC). The SDTS was used to simulate the relative dynamics of Crew Dragon docking to ISS and was critical to understanding system level performance and interactions. Through two testing campaigns, the SpaceX docking system completed more than 450 soft capture events. Significantly, the system and subassembly qualification testing allowed validation of the docking dynamics simulation. Throughout the first and now subsequent flight builds, the close interaction between the integrated teams at SpaceX, as well as dynamics modeling team, has been maintained to ensure each docking system is built and validated to system requirements.
Sub-System Modeling, Correlation, and Lessons Learned The SpaceX Docking System is modeled in NASA/JSC’s Trick environment. This docking dynamics model was developed by Dynamic Concepts Inc. as a contractor of SpaceX, and highly tuned via subassembly and system level testing. Simulations were created for docking events as well as sub-scale testbeds, which allows for highly tuned as-built data. This simulation was then able to correlate to Demo 1 docking. Sub-System Lessons Learned – Attenuator Arm Acceptance Testing In general, while the attenuator arm is conceptually simple with two springs and a damper, the complexity of modeling comes from non-linear effects. For the modeling of initial response and peak loads and dynamics, most components can be modeled linearly (all mechanisms have some degree of non-linearity). However, effects like dead bands, frictions, gaps, local stiffnesses, all have a major role in accurately simulating the behavior of the attenuator arms. In particular, the correlation of the attenuator arm simulation resulted in several findings regarding the carriage and the damper. Initial modeling of the deploy structure, or carriage, assumed it was static device, but through correlation with ATP test data and additional testing specific to the carriage, it was found that the carriage not only has significant dead band but also has important back structure stiffness. These effects are critical to model properly due to the high stiffness of the rebound spring. The nature of the eddy current damper, with its high gearing reduction results is a slight dead band when velocity reverses. This is a minor effect but becomes more significant at the end of attenuation when the relative velocities between the Dragon and the ISS are small. An example of the correlation in the forces in the strut connecting linkage between the acceptance test and simulation is shown in Figure 5.

487
Figure 5: Attenuator Arm ATP Correlation, Test Flight Example Arm Data vs. Simulation
Sub-System Lessons Learned – Latch Acceptance Testing The soft capture passive latch model was derived from a high-fidelity dynamics model, based upon CAD geometry of the latch hardware. The Trick model of the latch did not attempt to simulate every possible degree of freedom but used lookup table data to emulate the nominal behavior of the latch when compressing during docking. The latch model included effects due to the unique geometry of the striker, which is not smooth, and produces force spikes during nominal docking. These effects can be seen below in Figure 6. An important lesson learned was the effect that the significant striker geometry had on latching dynamics, as well as the overall complexity of the latch design and dynamics.
Figure 6: Latch Forces vs. Time, Latch ATP Test data and Simulation data
System Modeling, Correlation, and Lessons Learned
System Modeling and Correlation The Sub-System ATP testing was critical to successfully modeling the SpaceX Docking System behavior when tested at the SDTS facility at JSC. The Six Degree of Freedom Test System facility at NASA’s Johnson Space Center enables soft capture, attenuation, and retraction testing of docking systems in a controlled environment.
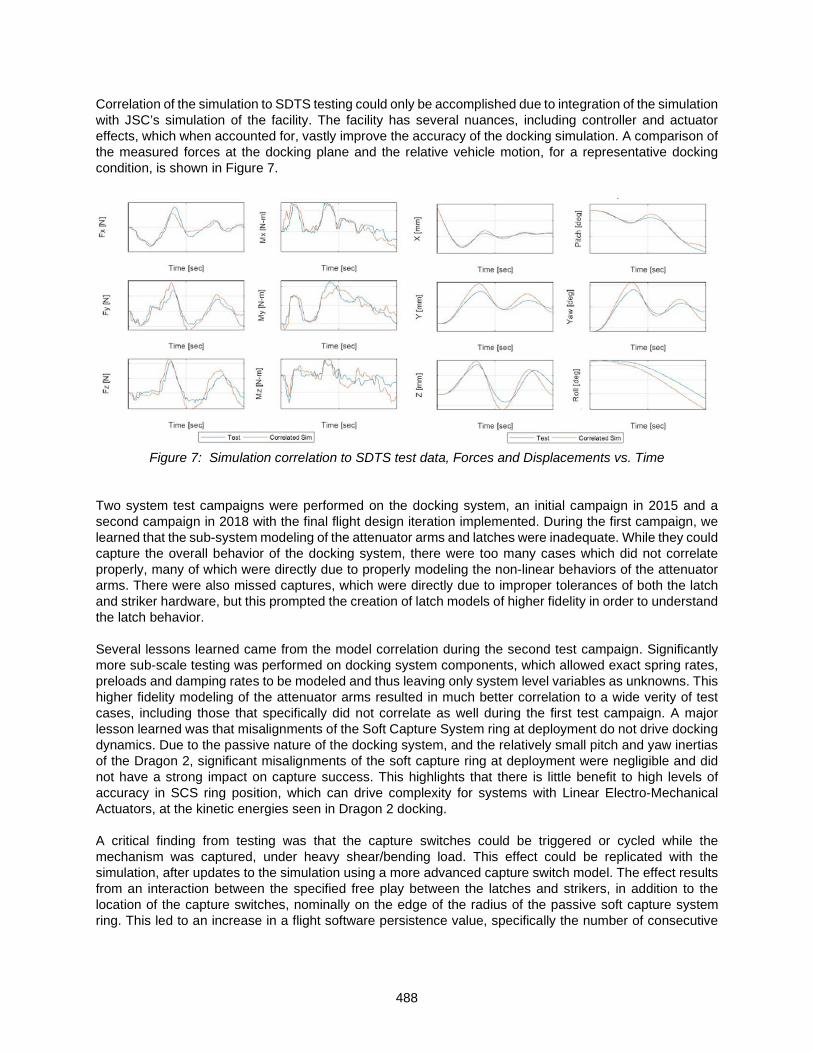
488
Correlation of the simulation to SDTS testing could only be accomplished due to integration of the simulation with JSC’s simulation of the facility. The facility has several nuances, including controller and actuator effects, which when accounted for, vastly improve the accuracy of the docking simulation. A comparison of the measured forces at the docking plane and the relative vehicle motion, for a representative docking condition, is shown in Figure 7.
Figure 7: Simulation correlation to SDTS test data, Forces and Displacements vs. Time
Two system test campaigns were performed on the docking system, an initial campaign in 2015 and a second campaign in 2018 with the final flight design iteration implemented. During the first campaign, we learned that the sub-system modeling of the attenuator arms and latches were inadequate. While they could capture the overall behavior of the docking system, there were too many cases which did not correlate properly, many of which were directly due to properly modeling the non-linear behaviors of the attenuator arms. There were also missed captures, which were directly due to improper tolerances of both the latch and striker hardware, but this prompted the creation of latch models of higher fidelity in order to understand the latch behavior. Several lessons learned came from the model correlation during the second test campaign. Significantly more sub-scale testing was performed on docking system components, which allowed exact spring rates, preloads and damping rates to be modeled and thus leaving only system level variables as unknowns. This higher fidelity modeling of the attenuator arms resulted in much better correlation to a wide verity of test cases, including those that specifically did not correlate as well during the first test campaign. A major lesson learned was that misalignments of the Soft Capture System ring at deployment do not drive docking dynamics. Due to the passive nature of the docking system, and the relatively small pitch and yaw inertias of the Dragon 2, significant misalignments of the soft capture ring at deployment were negligible and did not have a strong impact on capture success. This highlights that there is little benefit to high levels of accuracy in SCS ring position, which can drive complexity for systems with Linear Electro-Mechanical Actuators, at the kinetic energies seen in Dragon 2 docking. A critical finding from testing was that the capture switches could be triggered or cycled while the mechanism was captured, under heavy shear/bending load. This effect could be replicated with the simulation, after updates to the simulation using a more advanced capture switch model. The effect results from an interaction between the specified free play between the latches and strikers, in addition to the location of the capture switches, nominally on the edge of the radius of the passive soft capture system ring. This led to an increase in a flight software persistence value, specifically the number of consecutive

489
control cycles where the capture switch is not pressed to initiate the failed capture response, to account for this affect and prevent false negatives during the mission. The high accuracy of the simulation meant that properly modeling the gravity off-loader became significant. To better replicate the on-orbit dynamics, the SCS ring has an off-loader which reacts the force of gravity from the SCS ring. However, this somewhat simple device can have significant frictions and stictions which become difficult to model for each unique run. A lesson learned from SDTS testing is to improve the repeatability of the gravity off-loader and fully characterize its behavior to aid in model correlation. Flight Reconstruction The Demo 1 test flight mission was reconstructed with the docking simulation and the flight telemetry. The simulation had good correlation to the flight contact and attenuation dynamics, as well as the retraction and hard capture dynamics. Figure 8 compares the Flight Telemetry of the Attenuator Arm Encoders to the simulated encoders for capture.
Figure 8: Flight Attenuator Arm Telemetry vs. Simulation vs. Time For undocking, there were two principal sources used for correlation, the Ready to Hook switches, and the calculated Dragon velocity. The ready to hook switch states were used to verify the hook dynamics and overall Dragon separation state. The calculated Dragon velocity was used to verify the forces separating the Dragon from the ISS. Notably, there appeared to be little to no seal stiction (expected given the seal lubrication), and the latches provided nearly no restraining force, resulting in significant departure velocity when the hard capture hooks cleared. Properly modeling the hooks and their motion, in order to determine when there is clearance for departure, is a critical lesson to modeling undocking.
Qualification Testing Failures and Lessons Learned There were many lessons learned across the various test campaigns, several of which manifested as test failures. These early testing lessons learned led to design updates and delta qualification testing before the successful Demo 1 flight test and ultimately a more reliable system. A subset of these failures and their corrective actions are outlined below.

490
Figure 9: (Left): The SpaceX undergoes dynamic testing on the NASA JSC Six-Degree-of-Freedom
Dynamic Test System. (Right): The SpaceX Docking System prepared to enter thermal vacuum testing to perform system level qualification tests.
TVAC Harnessing Failure During system level thermal vacuum testing, there was a loss of signal from the controllers during the soft capture deploy sequence. To troubleshoot, the vacuum chamber was opened, and it was determined that the connectors to the soft capture latch controllers had sheared. Subscale testing was performed, and it was determined that the overwrap material of the harness, a rubber-like material, was stiffening the harness in vacuum, which caused it to shear. By replacing this overwrap material with a more flexible material, this condition was eliminated. This provides a valuable lesson learned in harnessing material selection, especially in dynamic mechanisms operating at a wide temperature range.
Figure 10: Harness Connector Sheared during Deployment

491
Microswitch Testing Defects Microswitches are used throughout the SpaceX docking system as position indicators. In addition to the soft capture petal switches, which are used to declare capture, and the ready to hook switches, which indicate when the IDA hard capture plane has been contacted, switches are used within the attenuator arms and the hard capture hooks to indicate the mechanism state. During system and sub-scale testing, microswitch failures were observed. Investigation revealed fracture of internal components to the microswitch caused during shock events. These failures lead to the selection of a different series of microswitches with fully potted internals that were more robust to shock events. This was an important lesson learned in assessing the robustness of commercial of the shelf components to shock induced failures. Additionally, it was found that the harness stiffness was such that was subject to fatigue failure modes, even from the most careful of handling. A less stiff harness material was used to prevent this failure mode. This was an important lesson in selecting harness potting materials that are robust to nominal handling.
Figure 11: Fracture of Ceramic Contact Pin in Shock (left) and undamaged switch (center); harness
damage (right)
Inspection Lessons Learned
In addition to thoroughly testing hardware, the SpaceX docking system has gone through intensive inspection campaigns. Visual inspections and tear downs are a critical component of qualification campaign. SpaceX has also greatly increased its use of Computerized Tomography (CT) inspections. This allows hardware internals to be inspected without a tear down that inherently changes the condition. CT inspection of hardware has proven to be an immense resource for both failure investigations as well as identifying potential failure modes. Two examples of SpaceX’s use of CT scanning are outlined. It is important to note that CT scans do provide radiation dosage to active components. A dosimeter scanned with a development unit can estimate this dosage to determine impact on the unit’s usable life. Retaining Ring Vendor Verification After qualification testing, the eddy current damper was CT scanned, though it performed nominally during the campaign. The scan revealed a significant defect: a retaining ring had become dislodged from its groove. If settled in a slightly different position, this retaining ring could become stuck in the gearbox, causing the damper to jam. This led to additional development testing, where it was discovered that only improperly seated retaining rings were at risk of becoming dislodged; properly seated retaining rings survived qualification environments as indicated by pre-and-post environment CT scanning. Through this discovery, SpaceX worked with the vendor to implement robust quality control practices on retaining ring install. CT scan videos are stored for future evaluation, which proves useful if a different failure mode was discovered: videos can be reviewed without requiring hardware to be removed and re-scanned. This was an example where CT scanning enabled discovery of a potential problem without experiencing a dramatic

492
failure; CT scanning of both vendor and internal assembled components can be utilized as a very informative and robust quality control tool.
Figure 12: Dislodged Retaining Ring Harness Failure During an acceptance test, an intermittent connection was noted on one of the power and data buses. The problem was isolated to one connection. The controller was removed and tested and no anomalies noted, which led to additional investigation of the harnessing. It was found that ‘wiggling’ the harness could cause the bus to disconnect. The harness was CT scanned to identify the root cause: improper insulation on one wire allowed the cabling to ‘bird cage’, which could then short against the connector. The insulation was not properly adhering to the cable, which would allow the insulation to pull off the cable and induce this condition. CT scanning provides extremely clear indications of this root cause. This issue could have been easily written off as a single workmanship issue; however, through CT scan it was identified that this was not an isolated incident but cable adhesion susceptibility; and through further testing the faulty cable lots were identified and contained. This is another example where CT scanning can be a valuable investigation tool when failures occur.
Figure 13: CT Scan images showing ‘bird caging’ of cable which had its insulation improperly adhered
and pulled up. This allowed the cable to short against the connector housing
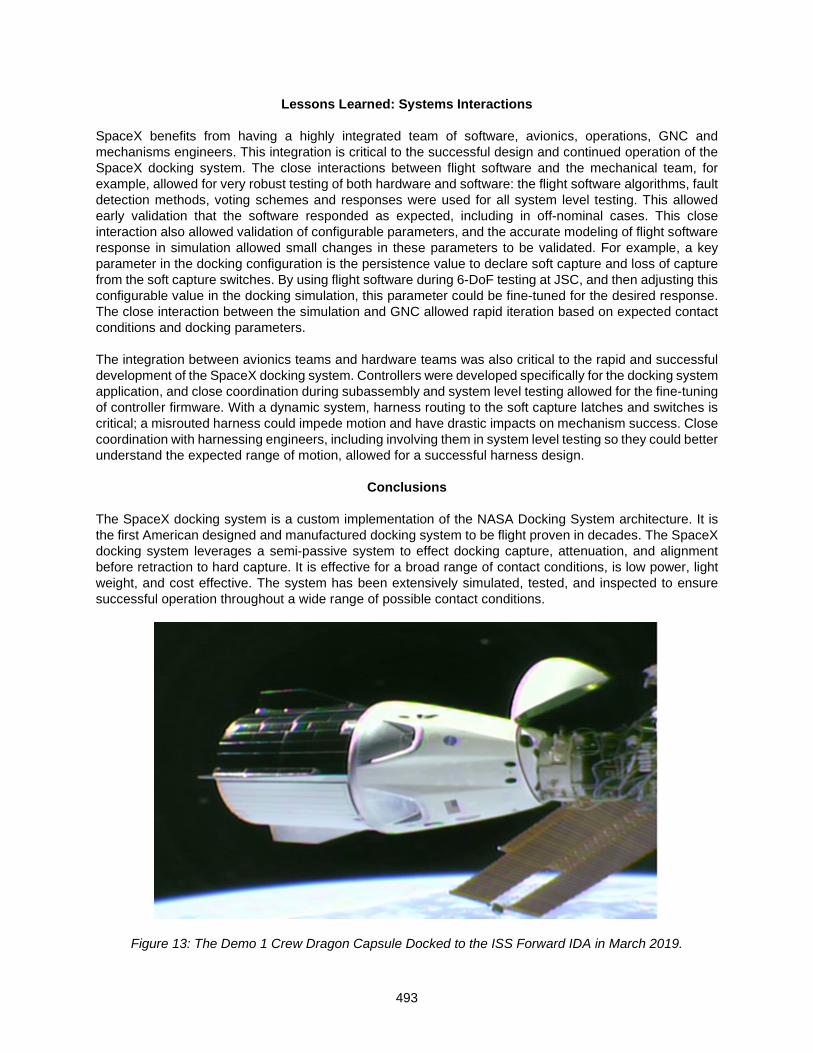
493
Lessons Learned: Systems Interactions
SpaceX benefits from having a highly integrated team of software, avionics, operations, GNC and mechanisms engineers. This integration is critical to the successful design and continued operation of the SpaceX docking system. The close interactions between flight software and the mechanical team, for example, allowed for very robust testing of both hardware and software: the flight software algorithms, fault detection methods, voting schemes and responses were used for all system level testing. This allowed early validation that the software responded as expected, including in off-nominal cases. This close interaction also allowed validation of configurable parameters, and the accurate modeling of flight software response in simulation allowed small changes in these parameters to be validated. For example, a key parameter in the docking configuration is the persistence value to declare soft capture and loss of capture from the soft capture switches. By using flight software during 6-DoF testing at JSC, and then adjusting this configurable value in the docking simulation, this parameter could be fine-tuned for the desired response. The close interaction between the simulation and GNC allowed rapid iteration based on expected contact conditions and docking parameters. The integration between avionics teams and hardware teams was also critical to the rapid and successful development of the SpaceX docking system. Controllers were developed specifically for the docking system application, and close coordination during subassembly and system level testing allowed for the fine-tuning of controller firmware. With a dynamic system, harness routing to the soft capture latches and switches is critical; a misrouted harness could impede motion and have drastic impacts on mechanism success. Close coordination with harnessing engineers, including involving them in system level testing so they could better understand the expected range of motion, allowed for a successful harness design.
Conclusions
The SpaceX docking system is a custom implementation of the NASA Docking System architecture. It is the first American designed and manufactured docking system to be flight proven in decades. The SpaceX docking system leverages a semi-passive system to effect docking capture, attenuation, and alignment before retraction to hard capture. It is effective for a broad range of contact conditions, is low power, light weight, and cost effective. The system has been extensively simulated, tested, and inspected to ensure successful operation throughout a wide range of possible contact conditions.
Figure 13: The Demo 1 Crew Dragon Capsule Docked to the ISS Forward IDA in March 2019.

494
References 1. McFatter, J., K. Keiser, and T. Rupp, “NASA Docking System Block 1: NASA’s New Direct Electric
Docking System Supporting ISS and Future Human Space Exploration” Proceedings of the 44th Aerospace Mechanisms Symposium, NASA Glenn Research Center, May 16-18, 2018
2. NASA Docking System Interface Definitions Document (IDD), JSC 65795, Revision J

495 Approved for public release. OTR 2020-00294
Highlights of the Next-Generation AIAA Moving Mechanical Assemblies Standard
Brian W. Gore* and Leon Gurevich*
Abstract
Over the past several years, an effort has been under way to transform the previously released AIAA S-114 (2005) standard (Moving Mechanical Assemblies for Space and Launch Vehicles) into a more modern set of requirements to complement the way many space acquisition programs have evolved. A joint government/industry committee of mechanisms-minded subject matter experts was formed, and the previous standard was reviewed cover-to-cover by that committee for opportunities to make it reflect modern-day philosophies. The actual standard, tentatively designated AIAA S-114A, has not yet been released as of the publication of this paper, since it is currently making its way through final formatting and the approval process, but this paper discusses the most significant changes in a general way as a preview of what will be seen in the final release.
Introduction
15 years…that is a long time! Uber and Lyft did not exist to deliver us door-to-door yet. Instagram and Snapchat had not yet taken over our teenagers’ lives. Even the ubiquitous iPad was still 5 years away! But that is how long it has been since the AIAA standard “Moving Mechanical Assemblies for Space and Launch Vehicles” was first released. New technologies and products, better methodologies, and smarter, more innovative ways of performing testing and analysis have all come along in that time, creating the need for a more up-to-date set of requirements to design, build, and test moving mechanical assemblies. This paper includes a qualitative description of the update process and the more significant changes that resulted and will be found in the new Moving Mechanical Assemblies (MMA) standard, tentatively and likely designated as AIAA S-114A. After concurrence was received from AIAA to move forward with the update, the authors sent out invitations to government and industry stakeholders in the mechanisms expertise area to participate on a committee of such subject matter experts. That committee’s charter was to approve by consensus the changes best suited for incorporation into the updated standard, such that it would be the best compromise of cost-effective requirements and guidelines to produce robust MMAs for space and launch vehicle applications. Much of the MMA standard’s material in the form of requirements has been retained since there was already significant sound work done by the previous committee that produced the 2005 version of the standard. However, that committee did run short on time to address some shortcomings, specifically in the testing section. As a result, the testing section was a top priority in this update effort. It has been reformatted and rewritten, with a goal of emulating the format of SMC-S-016 (also TR-RS-2014-00016, or formerly MIL-STD-1540C), “Test Requirements for Launch, Upper Stage, and Space Vehicles” (References 1, 2, and 3). Moreover, a completely new approach to calculating force/torque margin is presented in this new revision. It specifies reduced margins over certain characteristic resistances that are more predictable or repeatable, but maintains the original margins for variable resistances such as friction. A detailed explanation of the process, and even a working example, are included in the new version of the standard.
* The Aerospace Corporation, El Segundo, CA; [email protected]; [email protected]
Proceedings of the 45th Aerospace Mechanisms Symposium, NASA Johnson Space Center, 2020
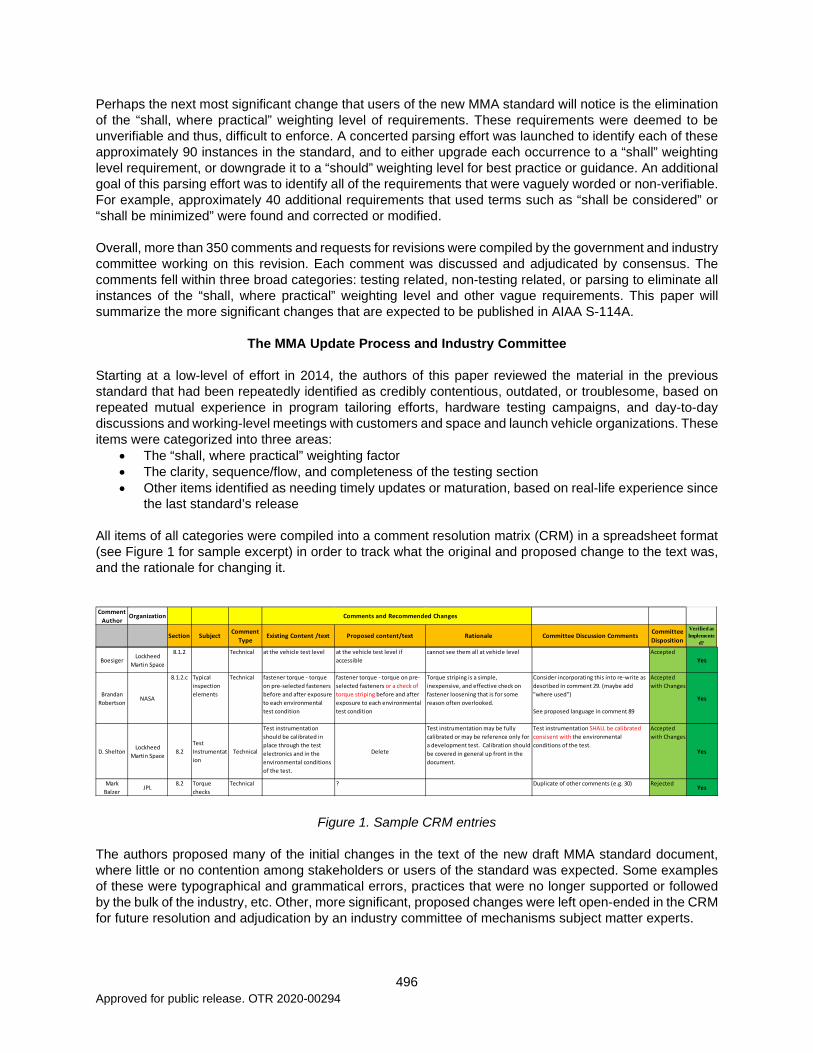
496 Approved for public release. OTR 2020-00294
Perhaps the next most significant change that users of the new MMA standard will notice is the elimination of the “shall, where practical” weighting level of requirements. These requirements were deemed to be unverifiable and thus, difficult to enforce. A concerted parsing effort was launched to identify each of these approximately 90 instances in the standard, and to either upgrade each occurrence to a “shall” weighting level requirement, or downgrade it to a “should” weighting level for best practice or guidance. An additional goal of this parsing effort was to identify all of the requirements that were vaguely worded or non-verifiable. For example, approximately 40 additional requirements that used terms such as “shall be considered” or “shall be minimized” were found and corrected or modified. Overall, more than 350 comments and requests for revisions were compiled by the government and industry committee working on this revision. Each comment was discussed and adjudicated by consensus. The comments fell within three broad categories: testing related, non-testing related, or parsing to eliminate all instances of the “shall, where practical” weighting level and other vague requirements. This paper will summarize the more significant changes that are expected to be published in AIAA S-114A.
The MMA Update Process and Industry Committee Starting at a low-level of effort in 2014, the authors of this paper reviewed the material in the previous standard that had been repeatedly identified as credibly contentious, outdated, or troublesome, based on repeated mutual experience in program tailoring efforts, hardware testing campaigns, and day-to-day discussions and working-level meetings with customers and space and launch vehicle organizations. These items were categorized into three areas:
• The “shall, where practical” weighting factor • The clarity, sequence/flow, and completeness of the testing section • Other items identified as needing timely updates or maturation, based on real-life experience since
the last standard’s release
All items of all categories were compiled into a comment resolution matrix (CRM) in a spreadsheet format (see Figure 1 for sample excerpt) in order to track what the original and proposed change to the text was, and the rationale for changing it.
Figure 1. Sample CRM entries
The authors proposed many of the initial changes in the text of the new draft MMA standard document, where little or no contention among stakeholders or users of the standard was expected. Some examples of these were typographical and grammatical errors, practices that were no longer supported or followed by the bulk of the industry, etc. Other, more significant, proposed changes were left open-ended in the CRM for future resolution and adjudication by an industry committee of mechanisms subject matter experts.
Comment Author
Organization
Section Subject Comment Type
Existing Content /text Proposed content/text Rationale Committee Discussion Comments Committee Disposition
Verified as Implemente
d?
Comments and Recommended Changes
BoesigerLockheed
Martin Space
8.1.2 Technical at the vehicle test level at the vehicle test level if accessible
cannot see them all at vehicle level AcceptedYes
Brandan Robertson
NASA
8.1.2.c Typical inspection elements
Technical fastener torque - torque on pre-selected fasteners before and after exposure to each environmentaltest condition
fastener torque - torque on pre-selected fasteners or a check of torque striping before and after exposure to each environmentaltest condition
Torque striping is a simple, inexpensive, and effective check on fastener loosening that is for some reason often overlooked.
Consider incorporating this into re-write as described in comment 29. (maybe add "where used")
See proposed language in comment 89
Accepted with Changes
Yes
D. SheltonLockheed
Martin Space8.2
Test Instrumentation
Technical
Test instrumentation should be calibrated in place through the test electronics and in the environmental conditions of the test.
Delete
Test instrumentation may be fully calibrated or may be reference only for a development test. Calibration should be covered in general up front in the document.
Test instrumentation SHALL be calibrated consisent with the environmentalconditions of the test.
Accepted with Changes
Yes
Mark Balzer
JPL8.2 Torque
checksTechnical ? Duplicate of other comments (e.g. 30) Rejected
Yes

497 Approved for public release. OTR 2020-00294
Invitations were sent out as a call for participation on the industry committee to meet on a regular basis and adjudicate all identified CRM items. These invitations were sent to a wide variety of spacecraft, payload, and launch vehicle contractors, as well as government and general interest participants, as requested by AIAA, who also requested representation from academia, but no such individuals could be identified as specifically concerned with the subject matter of this standard. Once invitations had been accepted by a quorum of the aforementioned categories, regular periodic teleconferences were set up to discuss the CRM items and help adjudicate each one. Based on a preponderance of participation on those teleconferences, the recognized MMA Committee on Standards included the following individuals and organizations:
• Brian Gore The Aerospace Corporation (Co-Chair/Author) • Leon Gurevich The Aerospace Corporation (Co-Chair/Author) • Mark Balzer Jet Propulsion Laboratory • Ed Boesiger Lockheed Martin Corporation • Ray McVey Raytheon (retired) • Mike Pollard Lockheed Martin Corporation • Brandan Robertson NASA Johnson Space Center • Adam Sexton Ball Corporation • Tim Woodard The Aerospace Corporation
Invitations were tentatively accepted by individuals at Boeing, ULA, and Northrop Grumman, but their participation in the periodic teleconferences was limited. From early 2018 through April 2019, on approximately 2-week intervals, the committee met and discussed each of the CRM items, as well as contributed their organizations’ concerns and additional CRM items to the list as the effort progressed. By the conclusion of the adjudication effort there were 136 Parsing items, 93 Testing items, and 117 Non-Testing (or “other”) items (346 total) that were dispositioned as either accepted or rejected in the new standard.
The Most Significant Changes The three most significant changes in the updated MMA standard are the removal of the “shall, where practical” weighting factor, a newly revamped testing section, and a significantly modified method to calculate force/torque margin. These changes are described in greater detail in the following sections. Elimination of “Shall, Where Practical” During the pre-committee phase of the document review, the standard was examined for all instances of the “shall, where practical” weighting level requirement. These instances were added as line items on a CRM tab labeled Parsing. Because of numerous program tailoring exercises where feedback was received from organizations unsure about how to treat these – are they real/actual requirements to be traced in a database or not? – the authors attempted to address each one on its own merit and either upgrade it to a strict “shall” requirement, or reduce it to a “should” type of guideline for recommended engineering practice. Each of these items was then discussed during the industry committee telecons, and a consensus was reached for each one. Overall, there were approximately 85 items designated at the “shall, where practical” weighting level in the 2005 version of the standard. Of those, only about 13 were upgraded to the “shall” weighting level, about 26 were downgraded to the “should, preferred, may” weighting level, 32 were absorbed and modified into the new testing section requirements, and 14 were removed entirely for being out of scope, not applicable, or covered by other requirements.
One should note that a simple comparison count of the number of “shall” requirements in the old vs. new standards is not meaningful, largely because of the reformatting of the testing section, in which many requirements are repeated at the unit, subsystem, and/or vehicle level of assembly, which was not delineated in that fashion in the old version.

498 Approved for public release. OTR 2020-00294
Testing Section During the previous update to the standard in 2005, AIAA deadlines limited the MMA Committee on Standards focus on the testing section. As a result, much of the previously existing material was still held over from the boiler plate language found in the (even then) decades-old processes and philosophies. With the current standard update, the testing area was the first area of emphasis to modernize, making it more usable and valuable to the engineers who employ it. A realization was made by the authors that many of the same programs that have this MMA standard levied as a set of requirements also have other testing standards levied at the same time, such as those listed in References 1-4. Since the authors (and a compendium of MMA standard users on government programs) were most familiar with References 1 and 2, many of the same outline, structure, and philosophical elements found in those testing standards were duplicated in the new MMA standard where it made logical sense. For example, the previous version of the MMA standard did not give any guidance or direction regarding which tests were intended to be performed at each level of assembly. To remedy this, the new MMA testing section mimics that of Reference 2, with separate Unit Level, Subsystem Level, and Vehicle Level test subsections. It was noted that one of the more referenced features in the testing standards is a table or matrix that indicates what testing should be done at which level. In order to assist the user even further in this area, a similar table was constructed for the MMA standard, and is shown in Figure 2. With this table, one can see at a glance the required tests (and those requiring a formal evaluation to be conducted to determine if they are required) for each level of assembly, as well as for the test type (qualification, proto-qualification, or acceptance). Users of the standard will also notice that the slate of typical MMA tests have been broken down into broad categories such as Performance tests, Environmental Exposure tests, and “Special” tests. Another omission in previous versions of MMA standards is any guidance regarding the flow of a testing program, and in what order these required tests should be performed. Many programmatic, personnel, or resource limitations can dictate the order of some testing flows, but there was no default or recommended order. As such, recommended test flows were added to the standard, with an example shown in Figure 3 that illustrates a typical test flow sequence one might employ for an MMA at the Unit Level. Additional, similar test sequences are provided in the standard for Subsystem and Vehicle Levels of assembly as well. These sequences provide not only a default recommended order by which to conduct a test program, but also provide respective reference paragraphs in the document for more detail on each particular test. The reference paragraphs attempt to provide test-specific requirements as well as background information, such as the purpose of the test or other nuances that may help perform or set up a particular test. A simple color-coding scheme also identifies which tests may only be applicable for qualification or acceptance programs specifically.
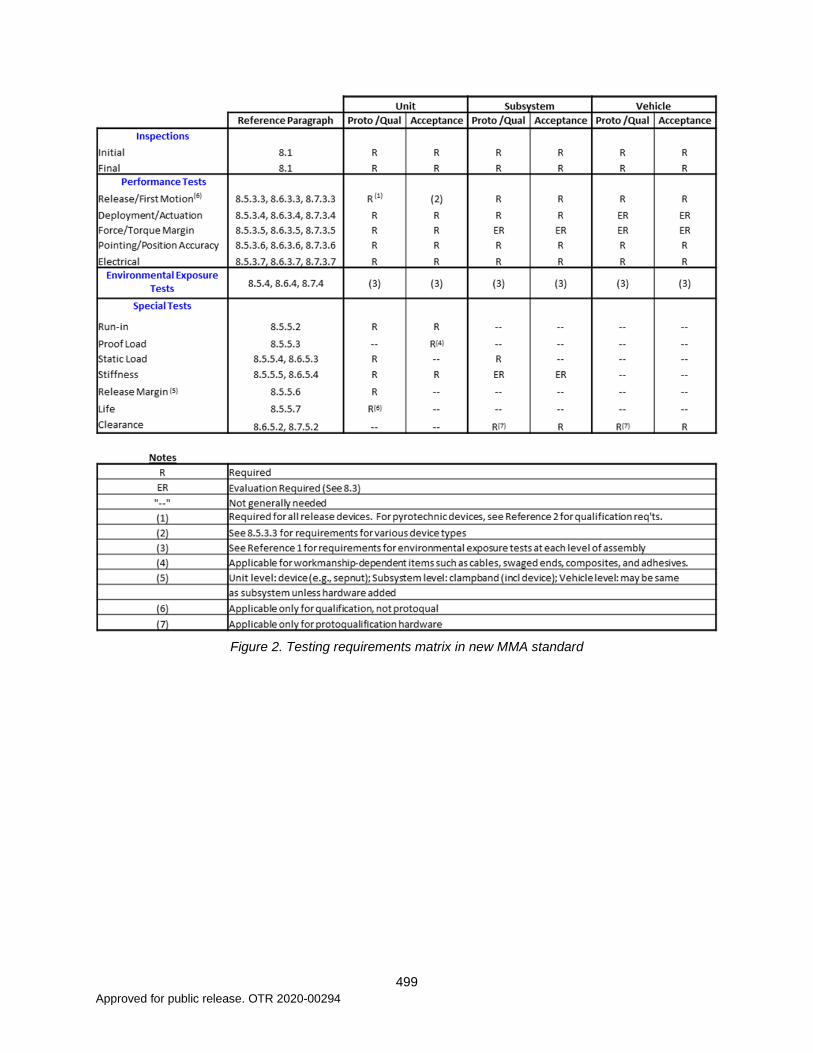
499 Approved for public release. OTR 2020-00294
Figure 2. Testing requirements matrix in new MMA standard

500 Approved for public release. OTR 2020-00294
Figure 3: Typical MMA test sequence at unit level
Torque/Force Margin Approach In this discussion, references to “torque margin” also apply to linear motion, with “force” simply replacing “torque.” This subject may be the biggest change in the new MMA standard, and one that will likely take the most adjustment with respect to the traditional approach for experienced MMA engineers. This new approach to calculating torque margin was first widely discussed around the time of the previous AIAA MMA standard release, but the aforementioned AIAA deadline prevented any further committee discussions on the matter. Furthermore, this approach has already been published in its basic form in NASA’s MMA standard, Reference 5, but there were some modifications and accommodations made in this AIAA MMA Standard update. The basic premise was that there are at least three different types of resistive forces that MMAs encounter – those that are relatively predictable and repeatable, those that are variable and harder to predict initially or over life, and those that are purely the result of an induced acceleration. Examples of the first kind, or “fixed” resistances, are a return or fail-safe spring, fluid pressure in a valve, etc. Examples of the second kind, or “variable” resistances, are coulomb friction, cable harness bending stiffness, etc. Examples of the third kind, or “acceleration-dependent” resistances, are those produced by rotary motion, launch vehicle acceleration, etc. In the new torque margin calculation approach, which resembles the method in which stress or mass margins are calculated, each resistive torque carries with it a different uncertainty factor. Traditionally, with a torque margin requirement of 100%, all resistive torques were assigned an uncertainty factor of 2.0. In the new approach, the uncertainty factor is a function of the “variable” or “fixed” nature as described above, as well as of the method by which its value is obtained, such as by analysis, testing on an engineering model or qualification article, or testing on an actual flight unit. Figure 4 shows the minimum torque/force margin factors used in this new approach.

501 Approved for public release. OTR 2020-00294
Figure 4: Minimum Torque/Force Margin Factors
Before discussing the new calculation method and equation(s), it is also worthwhile to mention that there are now five different types of torque/force margins identified, with the requirements of each needing to be satisfied as appropriate for a given MMA or subsystem:
• Static Torque/Force Margin – a measure of the excess torque available to overcome resistance to impending motion
• Constant Velocity Torque/Force Margin – a measure of the excess torque available to maintain motion
• Holding Torque/Force Margin – a measure of the excess torque available to maintain position in the presence of external disturbances
• Dynamic Torque/Force Margin – a measure of the excess torque available to accelerate a body by a given amount
• Stepper Motor Margin – a measure of the excess pull-in torque at the drive rate available to overcome friction loads seen at the motor
The new single equation used to calculate the torque/force margin is shown in Equation 1: Torque Margin = Τavail
ΣΚfixΤfix +ΣΚvarΤvar+ΣΚaccΤacc − 1 (1)
where - Tavail is the minimum available torque generated by the driving or holding component (e.g., spring,
motor). - Tfix terms are the individual maximum “fixed” resisting torques that are not strongly influenced by
effects of friction, temperature, cycles, etc. (e.g., motor detent torque, vehicle maneuver-induced torque, return spring torque, unbalanced pressure load limited by relief mechanisms).
- Tvar terms are the individual maximum “variable” resisting torques whose values may change with environmental conditions and cycles (e.g., friction torque, wire harness torque due to flexing or long term set).
- Tacc is the torque required to achieve the specified acceleration of the driven component. - Kfix, Kvar, and Kacc are the fixed, variable, and acceleration torque/force margin factors applied to
each individual resisting torque/force term in Equation 1 prior to summation. As mentioned earlier, torque/force margins are now calculated in the same manner as stress, strength, and mass margins. As such, the requirement for static torque margin is no longer 100%, but that it be positive (> 0), after the appropriate uncertainty factors are applied. All terms in Equation 1 may not be used in all MMA applications, and further guidance for each type of margin is provided in the standard.
502 Approved for public release. OTR 2020-00294
For stepper motor torque margin, engineers are given a choice to use either a step stability analysis or a pull-in torque margin analysis. The step stability analysis is stated as preferred, but the pull-in torque method is also acceptable, only when certain conditions are met. Equation 2 shows the pull-in torque margin calculation method.
Pull-in torque margin = Pull−in torque at drive rateKvar ∗ Total friction load seen by motor
− 1 (2) When choosing the step stability analysis method instead, Equation 2 can be re-written to take the form of Equation 3 Pull-in torque at drive rate = [1 + Pull-in Torque Margin] ∗ [Total friction load seen by motor] (3) Step stability is achieved when the left side of Equation 3 is greater than the right side. In the step stability analysis, the value of the [1+ Pull-in Torque Margin] term is increased until the motor goes unstable. The value from the last stable case is then used to calculate the stepper motor margin.
Summary and Path Forward A multi-year effort has culminated with a finished draft of a newly updated AIAA Moving Mechanical Assemblies standard. The most significant changes have been discussed herein. These include the elimination of the “shall, where practical” requirement weighting level, a completely new testing section that mirrors other industry testing standards, and a more realistic approach to calculating torque/force margins. There are a host of other changes which were not highlighted in this paper, but which the authors and industry committee members believe will make a more robust and meaningful set of MMA requirements for space and launch vehicle programs in the future. As of the submission of this paper (January 2020), the draft document is making its way through at least two approval processes, one by The Aerospace Corporation to replace the Mission Assurance Baseline callout of the previous MMA standard, and the other by the AIAA. It is anticipated that these will be completed sometime in 2020.
References 1. SMC-S-016, Air Force Space Command, Space and Missile Systems Center Standard, “Test
Requirements for Launch, Upper Stage, and Space Vehicles,” September 2014. 2. TR-RS-2014-00016, The Aerospace Corporation, Technical Report, “Test Requirements for Launch,
Upper-Stage, and Space Vehicles,” June 2014. 3. MIL-STD-1540C, Department of Defense, Military Standard, “Test Requirements for Launch, Upper-
Stage, and Space Vehicles,” September 1994. 4. GSFC-STD-7000, NASA Technical Standard, “General Environmental Verification Standard (GEVS),”
April 2013. 5. NASA-STD-5017A, NASA Technical Standard, “Design and Development Requirements for
Mechanisms,” July 2015.
Acknowledgements The authors wish to acknowledge Rebecca McKenna of The Aerospace Corporation’s Enterprise Mission Engineering Department, whose unwavering positive support allowed a long-term, low-level effort to complete this work despite continually shifting and competing priorities.

503
Micro-Vibration Attenuation Using Novel Flexible Pivot Design
Luc Blecha*, Yoël Puyol*, Simon Hayoz*, Martin Humphries** and Fabrice Rottmeier*
Abstract
Flexible pivots present numerous advantages such as no wear, no particle generation and predictable torque. In addition, the patented design presented in this paper adds high stiffness tunability, large angle, nearly constant radial stiffness over the entire range of motion, and infinite life capability. A design optimization software has been developed to generate within a few hours custom flexible pivot designs matching specific application requirements such as pivot angle, torsional, radial, axial, bending stiffness, maximal stress, and buckling factors. The flexible pivot design is an enabling technology for many applications and in particular for ultra-stable pointing mechanisms. A novel concept of an ultra-stable pointing mechanism using a flexible pivot is presented. It is shown with a simple Nastran model that the micro-vibration impact on pointing mirror stability can be theoretically decreased by 3 to 8 orders of magnitude in the 50-200 Hz frequency range, and by more than 9 orders of magnitude above 200 Hz in comparison with a design using ball bearings. The achieved pointing accuracy makes the need of a fine pointing mechanism unnecessary. The total mass, volume and costs can thus be drastically reduced in comparison to the existing solution today on the market that uses coarse and fine pointing mechanisms. A fully functional and motorized breadboard has been built and showed full hemispherical pointing range.
Large-Angle Flexible Pivot Design The principle of the Large-Angle Flexible Pivot is based on controlled deformation of structures in pure bending within their elastic limit. The flexible pivot consists of two interface rings connected by flexible elements (Figure 1). The first ring is the stator and the second is the rotor. A first set of flexible elements connect the stator ring to a central cylinder. These spokes are composed of a thin elongated blade connected to another smaller blade called T-bars as they are forming a T-shape. The T-bars are connected to the stator. From the central cylinder, connecting members connect the first central cylinder to an outer ring by means of another set of T-bars. From the outer ring, the structure is symmetrical. The outer ring is thus connected to another central ring on the rotor side by connecting members and T-bars. Finally, the second central ring is connected to the rotor ring by a set of spokes and a fourth set of T-bars. This is a so-called two-stage design that can achieve a rotation of ±70° for infinite life conditions and higher angular range with reduced life.
* Almatech SA, Lausanne, Switzerland; [email protected] ** SpaceMech Ltd., Bristol, UK
Proceedings of the 45th Aerospace Mechanisms Symposium, NASA Johnson Space Center, 2020

504
Figure 1. Design Overview of the Almaflex
The number of spokes, connecting members and T-bars can be adjusted to the need of the application. For example, if a larger rotation angle is needed, the blade can be positioned at 120 degrees instead of 90 degrees. The number of spokes and connecting members would thus be 3 instead of 4. The number of stages can also be increased which will increase the range of rotational angle. The number of thin blades, and spokes can also be increased to raise the torsional stiffness. This is used in oscillating applications to reach high natural rotational eigenfrequencies. All these applications are documented in a world patent1.
A) B)
Figure 2: A) View of a 3 stage outside-inside design with parallel spokes and connecting members to increase stiffness B) a 3 stage outside-outside design for very large rotational angles.

505
The advantage of this unique flexible element configuration is that the stiffness in each degree of freedom can be tuned almost independently from the other direction. In particular, the T-bars drive the radial stiffness whereas the total height of the blades drives the axial one. The rotation of the flexure is driven by spokes for approximately one half of the full range while the other half is provided by the connecting members. This decoupling feature is particularly useful for stiffness optimization considering in-orbit operations, launch locking, gravity sag adjustments and can easily be verified via non-linear Finite Element analysis. The fully symmetrical design guarantees no geometrical center shift and, combined with T-bars compliance, a smooth thermo-elastic behavior.
Custom Design for Each Application The Almaflex design is a family of designs that can be optimized to specific performances. The Large Angle Flexible Pivot (LAFP) is the result of an optimization in response to the European Space Agency (ESA) CTP specifications. A software tool called FlexOptim has been developed to efficiently find an optimized design within the Almaflex design family that matches best the application requirements. Rotational angle, applied loads, and launch configuration are given as input to FlexOptim as well as stiffness requirements for radial, axial, torsional and bending cases. The optimization process starts with a baseline set of variables and associated boundaries defining the initial geometry. A set of constants defining material properties and weighting factors are also input. Depending on the configuration during launch: locked or not, a set of design forces is retained for the optimization process. According to the requirements, variables and constants given as input, constraints are generated and cover geometry consistency, targeted stiffness, angle, stress limit and buckling factors. The optimization process starts from the initial set of variables. The optimization process is done in two steps. Optimization loops are performed using analytical formulas that calculate axial, radial, bending and torsional stiffness as well as the stresses and buckling factors. Consistency of these formulas has been correlated with finite element analysis during process development. The optimization aims at minimizing torsional stiffness, volume, and the deviation between targeted and computed rotation angles while maximizing buckling factors and stress performances. In a second step, a complete finite element loop is performed to evaluate the requirements. Correction factors between FE analysis and analytical approach are then computed and considered in the next analytical iterations. The optimal solution is reached when convergence of these correction factors is met. The generic flow logic of the optimization algorithm is shown in Figure 3.
Figure 3: Optimization methodology

506
Manufacturing constraints are considered by the specification maximal blade length, minimal blade thickness, and allowable range for blade length to height ratio. In addition, specified allowable stress and elastic modulus shall represent achievable values by the end product. To this end, a fatigue test campaign has been set up. Establishment of Wohler curve for titanium grade 5 is currently underway for an ESA CTP project. The preliminary results have shown that the LAFP maximal number of cycles is highly dependent on the manufacturing process (see reference 5 for further details). By selecting the adequate process, 309 million cycles could be achieved without failure. Once the fatigue tests are finished, failure probability analysis will be carried out based on the Wohler curves to identify the maximal safe operation of the LAFP. The optimization tool used in FlexOptim to minimize or maximize the objective functions is MIDACO2,3,4 (Mixed Integer Distributed Ant Colony Optimization). MIDACO is a metaheuristic optimizer developed by ESA based on the behavior of ants looking for food around their hill, so its basis of functioning is the exploration of the available space for the variables and the storage of the current best solution. The constraints are handled by using an oracle penalty method. As shown on Figure 4, different levels of exploration can be observed and finally a smaller area around the optimal solution is investigated.
Figure 4: Example of optimization results from MIDACO
Once the optimum geometry fulfils the customer’s requirements, the new set of geometry variables are sent automatically to a 3D design software that updates the design.
A Large Family of Designs Based on the optimization method described above, different designs have been established for a variety of applications. Some of them have been selected to show the different possible design and their main characteristics are shown in Table 1.

507
Table 1: Main characteristics of some selected applications
Design identification D1 D2 D3 D4 Characteristics Unit Application Pointing Pointing Slow Scan Rapid scan Payload configuration Supported on
both ends Supported on
both ends Supported on
both ends Supported on
both ends Launch configuration Launch lock Launch lock Launch lock Launch lock Payload mass kg 2 4 1.2 3.0 Flex material Titanium PEEK Titanium Stainless
Steel Rotation angle Degrees ±8.5 ±45 ±70 ±45 Torsional stiffness Nm/rad 0.33 0.45 0.98 27.3 Axial stiffness N/m 160000 103000 580000 592000 Radial stiffness N/m 160000 114000 132000 422000 Radial to torsional stiffness ratio
Rad/m2 474800 252400 134000 15500
External diameter mm 47 52 100 172 Overall height mm 10 23 45 40 Flex mass kg 0.080 0.027 0.269 0.627
The different designs are shown in the Figure 5.
Design D1 Design D2
Design D3 Design D4
Figure 5: Different achievable design listed in Table 1, represented respecting their relative size

508
PEEK material is used in design D2. This material is very interesting as it is relatively stiff, has good mechanical strength chemical stability, and very good fatigue behavior at the current testing stage. The fatigue stress to Young’s modulus ratio, which indicates the ability of a material to deform without fatigue rupture, is 2 to 3 times higher than titanium. A very compact design with large angle is thus achievable, while maintaining high radial to torsional stiffness ratio. In addition, it is very light. Design D3 is a high-end application for large angle application. The total range of rotational angle is 140 degrees (± 70 degrees), while maintaining lifetime above 100 million cycles with applicable safety margin. The stress and torsional stiffness have been minimized. Center shift is also kept below 10 microns on the entire range of motion. More details on this design can be found in Reference 5. Design D4 has been developed for a high-frequency oscillatory application that uses the elastic energy as storage. In this application, a cog-free motor is exciting the first torsional mode of the flex with synchronized impulse, which compensates the material damping loss. At each oscillation, the range of motion is increased to reach a maximal oscillation of 90 degrees peak-to-peak (±90 degrees). As the energy stored in the movement is proportional to the flexure’s stiffness and to the angular range of motion squared, high stiffness and large angle shall be targeted. In this application, the total elastic energy is 8.4 J per flexure. It is worth noticing from Table 1 that the LAFP design optimization process is able to achieve very different design goals. For example, in design D1, the application required a relatively small rotational angle. The benefits of the Almaflex design family are the absence of tribological effects thus no wear nor particle generation, and a stable, predictable behavior all-along lifetime. In addition, one unique feature is that the radial stiffness is kept nearly constant during the full rotation. Only 17% stiffness drop is observed between the radial stiffness at 0° rotation and 70°. This feature is essential for micro-vibration isolation.
Micro-Vibration – A Pointing Disturbance One of the applications of large angle flexible pivot is precision pointing mechanism, such as laser communication terminal, scanner, and flip mirrors. Pointing from a platform to a 1 m diameter target that is distant of 1000 km (Low Earth Orbit) requires a pointing accuracy and stability that is at least a fraction of 1 µrad, typically 0.1 µrad. Such stability requirement may apply to Earth observation satellite, and laser communication between space and ground. For intersatellite laser communication link, the stability requirement is more stringent as the distance between satellites is generally larger, and diameters of target optics are smaller. To achieve a pointing stability of 0.1 µrad or smaller, understanding the micro-vibration effect on pointing stability is essential. There are sources of vibration noise on each platform. These sources are coming from different moveable parts such as a shutter, solar array drive, reaction wheels, and cryo-coolers. Each of these mechanisms has a micro-vibration signature. Reaction wheels are one of the noisiest equipment. As shown in Figure 6, reaction wheels typically generate low vibration noise at low frequencies and high noise at frequencies above 200 Hz.

509
Figure 6: Example of micro-vibration noise specification of reaction wheels for MTG
On the other hand, cryo-coolers generate most of their micro-vibration noise at frequencies around 50 Hz and less at higher frequencies. Note that the level of micro-vibration from cryo-coolers is generally smaller than those of reaction wheels, even at 50 Hz.
Figure 7: Example of micro-vibration noise spectrum for cryo-coolers on MTG
The different sources of micro-vibration add up at the pointing mechanism interface. The micro-vibrations are then transmitted to the mirror by the pointing mechanism which disturb the pointing stability. Translation vibration of the mirror are generally not a concern as it does not affect pointing stability. On the other hand, rotational vibration of the mirror has a direct effect on the pointing stability. The transfer function between the pointing mirror and the pointing mechanism’s interface to the spacecraft is thus key. In case of a stiff pointing mechanism using ball bearings, the structure transfer function has a first amplification peak at its first structural eigenfrequency, which is typically between 140 Hz for spacecraft decoupling requirement and below 1000 Hz. Below the first eigenfrequency, micro-vibrations are either transmitted to the mirror integrally for frequencies far below the peak or amplified for the ones near
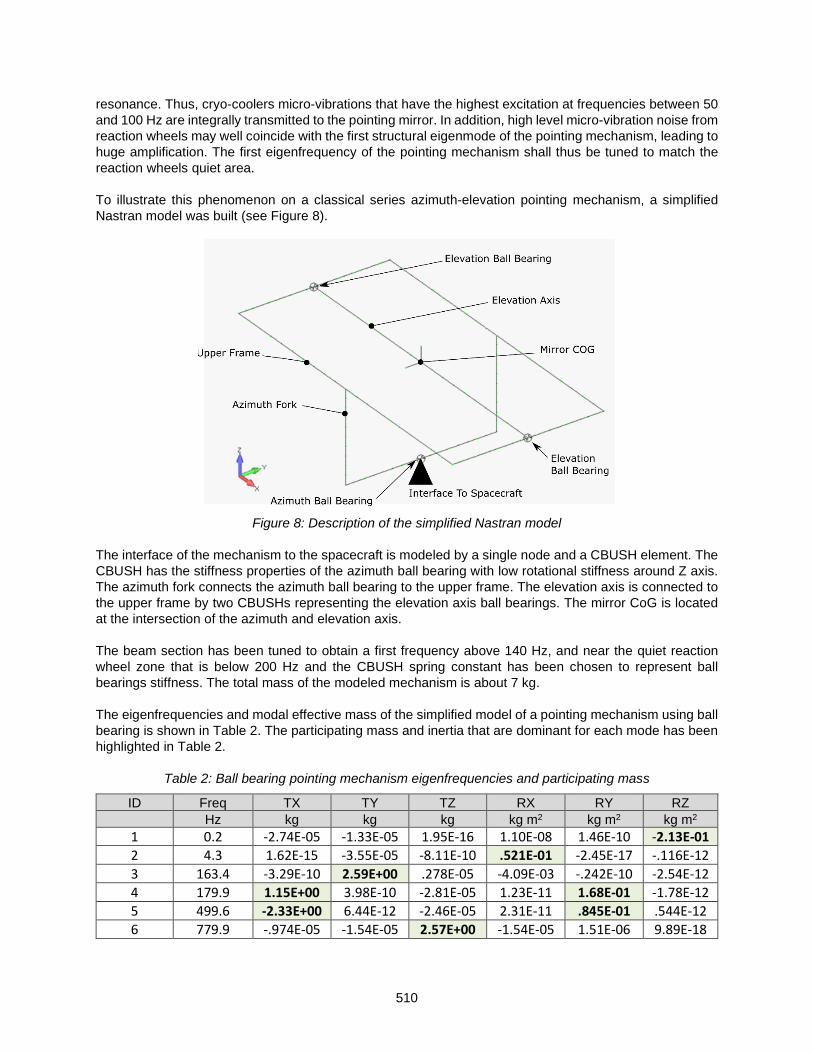
510
resonance. Thus, cryo-coolers micro-vibrations that have the highest excitation at frequencies between 50 and 100 Hz are integrally transmitted to the pointing mirror. In addition, high level micro-vibration noise from reaction wheels may well coincide with the first structural eigenmode of the pointing mechanism, leading to huge amplification. The first eigenfrequency of the pointing mechanism shall thus be tuned to match the reaction wheels quiet area. To illustrate this phenomenon on a classical series azimuth-elevation pointing mechanism, a simplified Nastran model was built (see Figure 8).
Figure 8: Description of the simplified Nastran model
The interface of the mechanism to the spacecraft is modeled by a single node and a CBUSH element. The CBUSH has the stiffness properties of the azimuth ball bearing with low rotational stiffness around Z axis. The azimuth fork connects the azimuth ball bearing to the upper frame. The elevation axis is connected to the upper frame by two CBUSHs representing the elevation axis ball bearings. The mirror CoG is located at the intersection of the azimuth and elevation axis. The beam section has been tuned to obtain a first frequency above 140 Hz, and near the quiet reaction wheel zone that is below 200 Hz and the CBUSH spring constant has been chosen to represent ball bearings stiffness. The total mass of the modeled mechanism is about 7 kg. The eigenfrequencies and modal effective mass of the simplified model of a pointing mechanism using ball bearing is shown in Table 2. The participating mass and inertia that are dominant for each mode has been highlighted in Table 2.
Table 2: Ball bearing pointing mechanism eigenfrequencies and participating mass
ID Freq TX TY TZ RX RY RZ Hz kg kg kg kg m2 kg m2 kg m2
1 0.2 -2.74E-05 -1.33E-05 1.95E-16 1.10E-08 1.46E-10 -2.13E-01 2 4.3 1.62E-15 -3.55E-05 -8.11E-10 .521E-01 -2.45E-17 -.116E-12 3 163.4 -3.29E-10 2.59E+00 .278E-05 -4.09E-03 -.242E-10 -2.54E-12 4 179.9 1.15E+00 3.98E-10 -2.81E-05 1.23E-11 1.68E-01 -1.78E-12 5 499.6 -2.33E+00 6.44E-12 -2.46E-05 2.31E-11 .845E-01 .544E-12 6 779.9 -.974E-05 -1.54E-05 2.57E+00 -1.54E-05 1.51E-06 9.89E-18

511
The first two modes are the ones associated with the azimuth and elevation rotation axes. As these modes are controlled by the elevation and azimuth motors, they are not a concern in the micro-vibration analysis. The 3rd mode is a translational mode in Y direction and takes place at 163 Hz. The 4th and 5th modes are due to the bending of the azimuth fork and combine a translation in X and a rotation around Y. Finally, the 6th mode is a translational mode in Z direction. A frequency response (SOL111) analysis is carried out with a unit acceleration excitation in each translational and rotational direction. The X, Y, Z displacements and angles of the mirror center of gravity are monitored giving 36 transfer functions of the mechanism. The responses that are the most detrimental to the pointing stability are the Y rotation (elevation) due to X-translation excitation, and Y rotation due to Y-rotation excitation (see Figure 9).
Figure 9: Ball bearing pointing mechanism response on elevation axis rotation (Y-rotation) for a X-translational (left) and a Y-rotational (right) unit acceleration excitation
Figure 9 shows that even though the mirror is perfectly balanced, micro-vibration at the base of a stiff pointing mechanism will be amplified by the structural mode and lead to rotation of the mirror around elevation axis. These perturbations cannot be compensated by drive electronics as they are taking place above the control frequency bandwidth. In addition, the prediction of the induced movement can be difficult, as the mode shape is playing a key role. In an optimistic approach, where the mirror is perfectly balanced and the first main mode located in a rather quiet micro-vibration frequency range where acceleration is 0.001 m/s2, the micro-vibration-induced motion around the elevation axis is on the order of 1 µrad for X translation excitation. On top of this, the motion due to Y rotation excitation shall be added as well as all the noise coming from the mechanism ball bearings and the induced motion from unbalanced mass. In these conditions, it is difficult to reach the stability requirement of 0.1 µrad or smaller.
Passive Damping of Micro-vibration A simple way to reduce the micro-vibration effects on the mirror pointing stability is to introduce compliance in the system. The goal is to control and lower the rotational eigenfrequencies of the pointing mechanism below micro-vibration excitation frequencies from the spacecraft but still above control loop frequencies. A pointing mechanism with such low resonance frequency is passively damping the micro-vibration thanks to the natural transfer function decay observed above resonance frequency. Compliance is efficiently introduced in the mechanism using flexible pivots. A novel concept of a pointing mechanism has been developed to cover a full hemispherical pointing range. A fully functional, and motorized breadboard has been built to verify the functional and range requirement and is shown in Figure 10. The beauty of this concept is that it replaces the traditional coarse and fine pointing mechanism
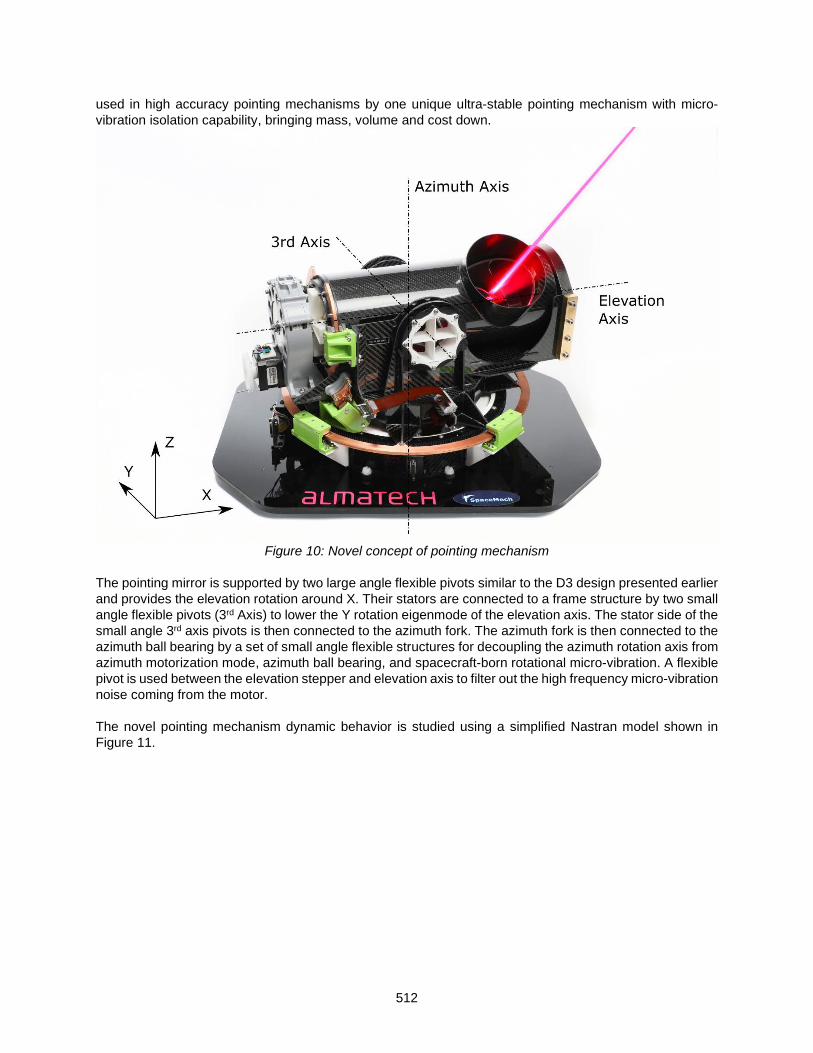
512
used in high accuracy pointing mechanisms by one unique ultra-stable pointing mechanism with micro-vibration isolation capability, bringing mass, volume and cost down.
Figure 10: Novel concept of pointing mechanism
The pointing mirror is supported by two large angle flexible pivots similar to the D3 design presented earlier and provides the elevation rotation around X. Their stators are connected to a frame structure by two small angle flexible pivots (3rd Axis) to lower the Y rotation eigenmode of the elevation axis. The stator side of the small angle 3rd axis pivots is then connected to the azimuth fork. The azimuth fork is then connected to the azimuth ball bearing by a set of small angle flexible structures for decoupling the azimuth rotation axis from azimuth motorization mode, azimuth ball bearing, and spacecraft-born rotational micro-vibration. A flexible pivot is used between the elevation stepper and elevation axis to filter out the high frequency micro-vibration noise coming from the motor. The novel pointing mechanism dynamic behavior is studied using a simplified Nastran model shown in Figure 11.

513
Figure 11: Simplified Nastran model of the novel pointing mechanism
The exact same structural properties have been used for the novel concept using flexible pivots as in the ball bearing version presented previously. The notable difference is that the axial, radial, bending and torsional stiffness of the flexible connection have been tuned to lower the first eigenmodes. Table 3 shows the eigenfrequencies of the first 12 modes together with their participating mass and inertia. Table 3: Novel concept pointing mechanism using flexible pivots eigenfrequencies and participating mass
ID Freq TX TY TZ RX RY RZ Hz kg kg kg kg m2 kg m2 kg m2
1 0.2 7.51E-10 1.78E-10 8.90E-29 1.21E-16 1.52E-20 4.53E-02 2 0.4 1.90E-11 2.13E-27 2.41E-10 2.62E-28 3.53E-02 7.38E-22 3 4.3 2.76E-28 1.28E-09 6.58E-19 .272E-02 3.35E-27 3.73E-26 4 20.6 7.84E-25 1.22E+00 1.51E-16 6.98E-10 5.15E-29 5.45E-25 5 20.6 1.01E-15 2.92E-17 1.19E+00 3.55E-19 7.84E-23 5.34E-30 6 29.2 1.20E+00 3.56E-25 1.16E-15 2.19E-27 6.93E-12 2.24E-25 7 46.9 7.46E-11 1.96E-11 1.71E-25 1.64E-17 9.07E-21 2.82E-12 8 47.6 3.96E-12 2.01E-28 3.08E-11 4.42E-28 1.81E-11 7.78E-31 9 180.6 5.94E-20 5.47E+00 9.60E-12 2.09E-05 5.75E-28 2.96E-24
10 362.4 5.51E+00 9.92E-21 2.97E-10 5.12E-22 6.80E-07 1.35E-24 11 839.4 2.97E-17 1.26E-02 5.11E-07 1.34E-02 7.56E-24 1.03E-24 12 870.8 3.06E-10 9.74E-10 5.44E+00 1.08E-09 8.22E-17 7.64E-32
Modes number 1 and 3 are the same ones as those of Table 2, and are rotational modes around azimuth and elevation axes. Mode number 2 is a new mode introduced by the 3rd axis which will greatly help to damp Y rotations of the mirror under perturbations coming from the spacecraft interface. Modes 4, 5 and 6 are translational modes of the elevation axis. Thanks to the low radial and axial stiffness of the large-angle flexible pivot, it is possible to lower these modes below the excitation frequencies of cryo-coolers while keeping them well above typical controller frequency and avoid control issues.
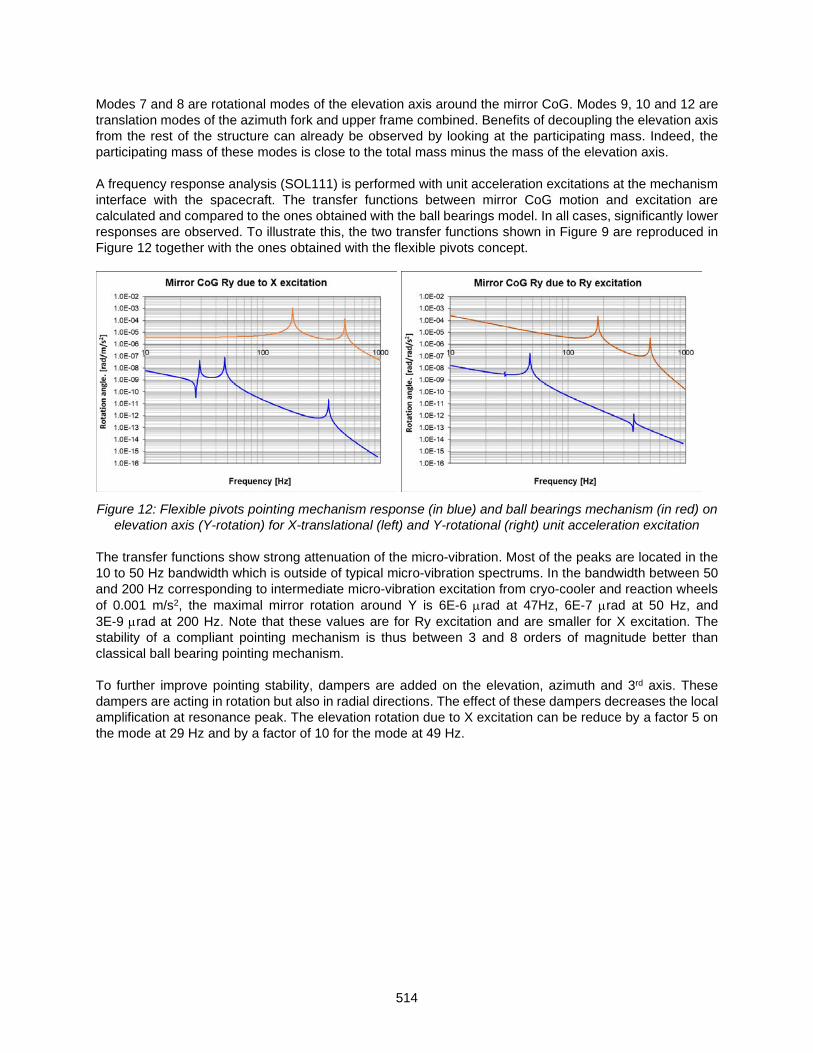
514
Modes 7 and 8 are rotational modes of the elevation axis around the mirror CoG. Modes 9, 10 and 12 are translation modes of the azimuth fork and upper frame combined. Benefits of decoupling the elevation axis from the rest of the structure can already be observed by looking at the participating mass. Indeed, the participating mass of these modes is close to the total mass minus the mass of the elevation axis. A frequency response analysis (SOL111) is performed with unit acceleration excitations at the mechanism interface with the spacecraft. The transfer functions between mirror CoG motion and excitation are calculated and compared to the ones obtained with the ball bearings model. In all cases, significantly lower responses are observed. To illustrate this, the two transfer functions shown in Figure 9 are reproduced in Figure 12 together with the ones obtained with the flexible pivots concept.
Figure 12: Flexible pivots pointing mechanism response (in blue) and ball bearings mechanism (in red) on
elevation axis (Y-rotation) for X-translational (left) and Y-rotational (right) unit acceleration excitation The transfer functions show strong attenuation of the micro-vibration. Most of the peaks are located in the 10 to 50 Hz bandwidth which is outside of typical micro-vibration spectrums. In the bandwidth between 50 and 200 Hz corresponding to intermediate micro-vibration excitation from cryo-cooler and reaction wheels of 0.001 m/s2, the maximal mirror rotation around Y is 6E-6 µrad at 47Hz, 6E-7 µrad at 50 Hz, and 3E-9 µrad at 200 Hz. Note that these values are for Ry excitation and are smaller for X excitation. The stability of a compliant pointing mechanism is thus between 3 and 8 orders of magnitude better than classical ball bearing pointing mechanism. To further improve pointing stability, dampers are added on the elevation, azimuth and 3rd axis. These dampers are acting in rotation but also in radial directions. The effect of these dampers decreases the local amplification at resonance peak. The elevation rotation due to X excitation can be reduce by a factor 5 on the mode at 29 Hz and by a factor of 10 for the mode at 49 Hz.
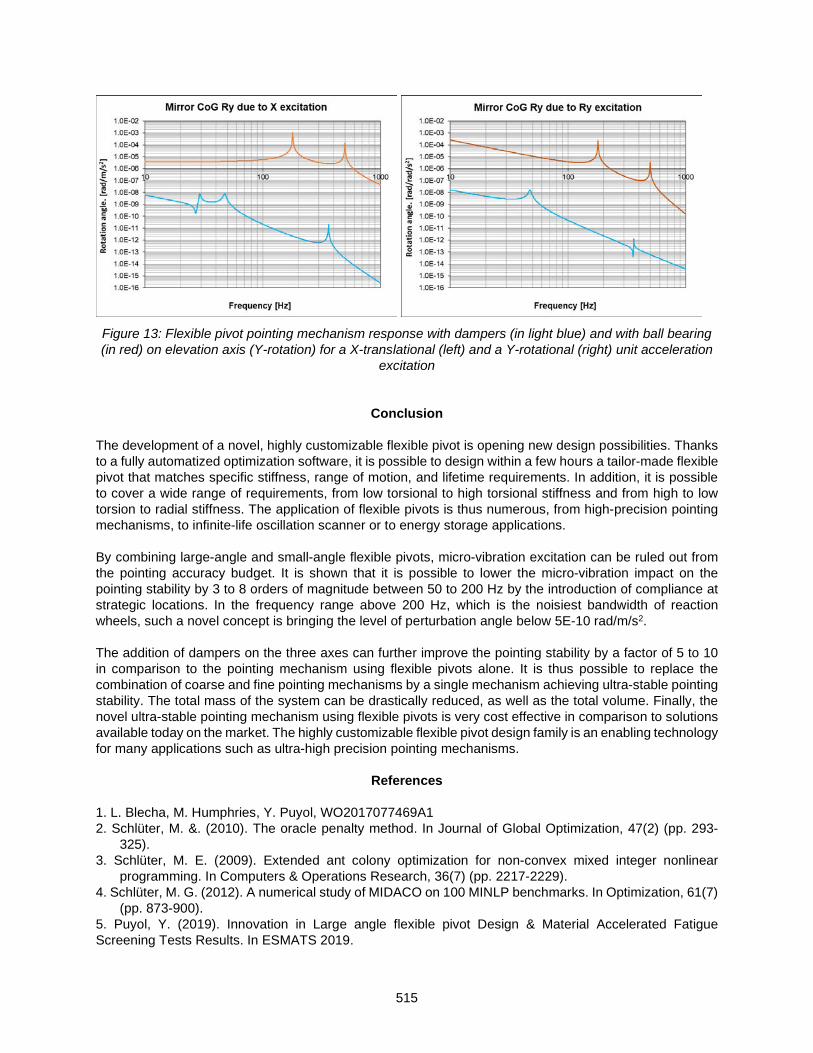
515
Figure 13: Flexible pivot pointing mechanism response with dampers (in light blue) and with ball bearing (in red) on elevation axis (Y-rotation) for a X-translational (left) and a Y-rotational (right) unit acceleration
excitation
Conclusion The development of a novel, highly customizable flexible pivot is opening new design possibilities. Thanks to a fully automatized optimization software, it is possible to design within a few hours a tailor-made flexible pivot that matches specific stiffness, range of motion, and lifetime requirements. In addition, it is possible to cover a wide range of requirements, from low torsional to high torsional stiffness and from high to low torsion to radial stiffness. The application of flexible pivots is thus numerous, from high-precision pointing mechanisms, to infinite-life oscillation scanner or to energy storage applications. By combining large-angle and small-angle flexible pivots, micro-vibration excitation can be ruled out from the pointing accuracy budget. It is shown that it is possible to lower the micro-vibration impact on the pointing stability by 3 to 8 orders of magnitude between 50 to 200 Hz by the introduction of compliance at strategic locations. In the frequency range above 200 Hz, which is the noisiest bandwidth of reaction wheels, such a novel concept is bringing the level of perturbation angle below 5E-10 rad/m/s2. The addition of dampers on the three axes can further improve the pointing stability by a factor of 5 to 10 in comparison to the pointing mechanism using flexible pivots alone. It is thus possible to replace the combination of coarse and fine pointing mechanisms by a single mechanism achieving ultra-stable pointing stability. The total mass of the system can be drastically reduced, as well as the total volume. Finally, the novel ultra-stable pointing mechanism using flexible pivots is very cost effective in comparison to solutions available today on the market. The highly customizable flexible pivot design family is an enabling technology for many applications such as ultra-high precision pointing mechanisms.
References 1. L. Blecha, M. Humphries, Y. Puyol, WO2017077469A1 2. Schlüter, M. &. (2010). The oracle penalty method. In Journal of Global Optimization, 47(2) (pp. 293-
325). 3. Schlüter, M. E. (2009). Extended ant colony optimization for non-convex mixed integer nonlinear
programming. In Computers & Operations Research, 36(7) (pp. 2217-2229). 4. Schlüter, M. G. (2012). A numerical study of MIDACO on 100 MINLP benchmarks. In Optimization, 61(7)
(pp. 873-900). 5. Puyol, Y. (2019). Innovation in Large angle flexible pivot Design & Material Accelerated Fatigue Screening Tests Results. In ESMATS 2019.

516
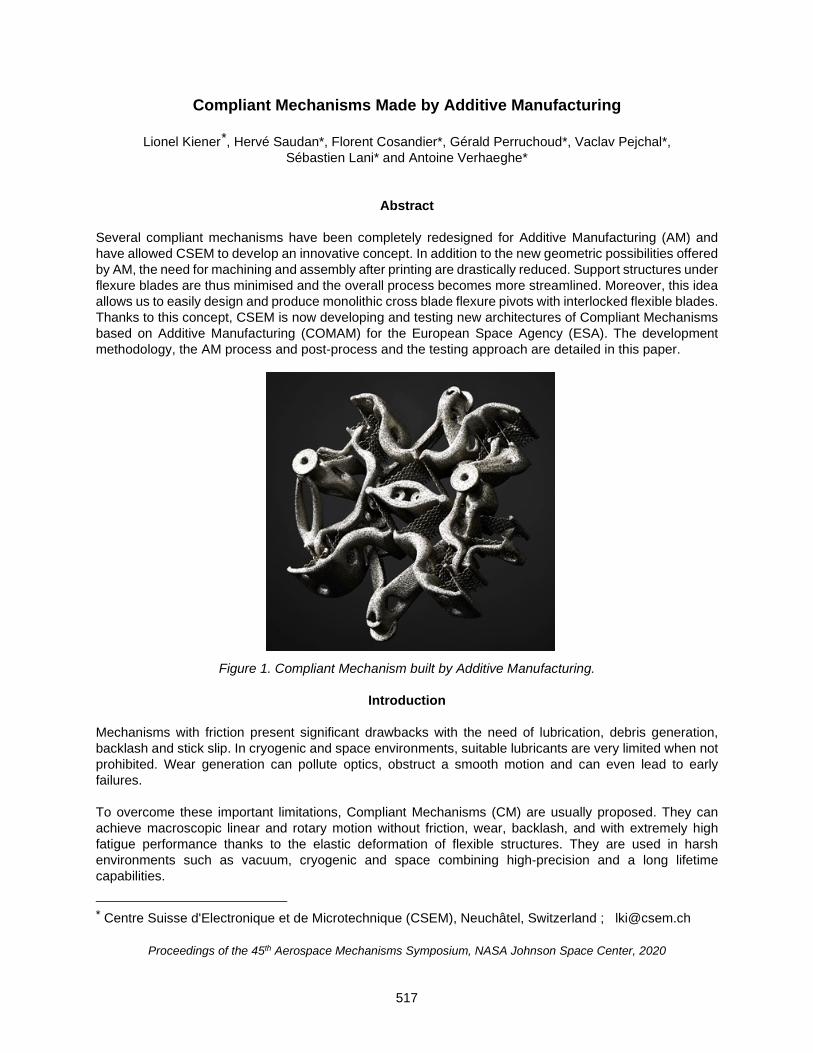
517
Compliant Mechanisms Made by Additive Manufacturing
Lionel Kiener*, Hervé Saudan*, Florent Cosandier*, Gérald Perruchoud*, Vaclav Pejchal*, Sébastien Lani* and Antoine Verhaeghe*
Abstract Several compliant mechanisms have been completely redesigned for Additive Manufacturing (AM) and have allowed CSEM to develop an innovative concept. In addition to the new geometric possibilities offered by AM, the need for machining and assembly after printing are drastically reduced. Support structures under flexure blades are thus minimised and the overall process becomes more streamlined. Moreover, this idea allows us to easily design and produce monolithic cross blade flexure pivots with interlocked flexible blades. Thanks to this concept, CSEM is now developing and testing new architectures of Compliant Mechanisms based on Additive Manufacturing (COMAM) for the European Space Agency (ESA). The development methodology, the AM process and post-process and the testing approach are detailed in this paper.
Figure 1. Compliant Mechanism built by Additive Manufacturing.
Introduction
Mechanisms with friction present significant drawbacks with the need of lubrication, debris generation, backlash and stick slip. In cryogenic and space environments, suitable lubricants are very limited when not prohibited. Wear generation can pollute optics, obstruct a smooth motion and can even lead to early failures. To overcome these important limitations, Compliant Mechanisms (CM) are usually proposed. They can achieve macroscopic linear and rotary motion without friction, wear, backlash, and with extremely high fatigue performance thanks to the elastic deformation of flexible structures. They are used in harsh environments such as vacuum, cryogenic and space combining high-precision and a long lifetime capabilities.
* Centre Suisse d'Electronique et de Microtechnique (CSEM), Neuchâtel, Switzerland ; [email protected]
Proceedings of the 45th Aerospace Mechanisms Symposium, NASA Johnson Space Center, 2020

518
To date, the extreme complexity of compliant mechanisms has required highly sophisticated and expensive manufacturing methods, the gold standard being the Wire Electro-Discharge Machining (WEDM) from a bulk material block with consecutive large material losses and very long and delicate machining procedures. Moreover, the assembly has actually to be realized with many precautions to ensure a very precise positioning between all parts. Today, this paradigm is questioned by the possibilities offered by AM technologies, notably the metallic powder bed processes such as the Selective Laser Melting (SLM). While the largest part of the research presently reported is focused on developing and optimizing designs of what could be described as “structural or massive parts”, little work has been published up to now to determine the limits related to the manufacturing of thin, flexible structures used in compliant mechanisms [1]. After more than 30 years of successful developments using compliant mechanisms produced by conventional manufacturing methods, CSEM demonstrated in 2016 the feasibility of high performances compliant structures made by AM [2]. Over the last few years, CSEM has acquired an expertise in the computerized optimization of such mechanisms for AM and has proceeded further by inventing a totally new design concept: interlocked lattice flexures. This new type of compliant structure geometry and arrangement is such that the flexure elements cross, but never touch each other, even when deformed. This new architecture – made only possible by AM technologies – creates the opportunity to develop completely new flexure topologies but also to improve existing ones, as demonstrated with the example of a redesigned C-flex type pivot (patent US 3073584) illustrated in Figure 2.
Figure 2. Example of the redesign of a C-flex type pivot with interlocked flexure blades.
Compliant Mechanisms Heritage
CSEM is active in the design and development of very high performance flexural elements and mechanisms for more than 30 years. Notable examples for space applications are the HAFHA flexural pivot and the Corner Cube Mechanism which is currently operated in the IASI instrument on board MetOp satellites, to date with more than 1 billion cycles (linear stroke of ±15 mm) achieved in 14 years. Two flight models of Corner Cube Mechanism has also been delivered last year for the infrared sounder onboard two Meteosat Third Generation satellites. Another example is the CLUPI linear Focus Mechanism for ExoMars rover. Other mechanisms (e.g., Slit Mask, tip-tilt and chopper) have been developed and produced for ground based telescopes as well as for the airborne SOFIA telescope.
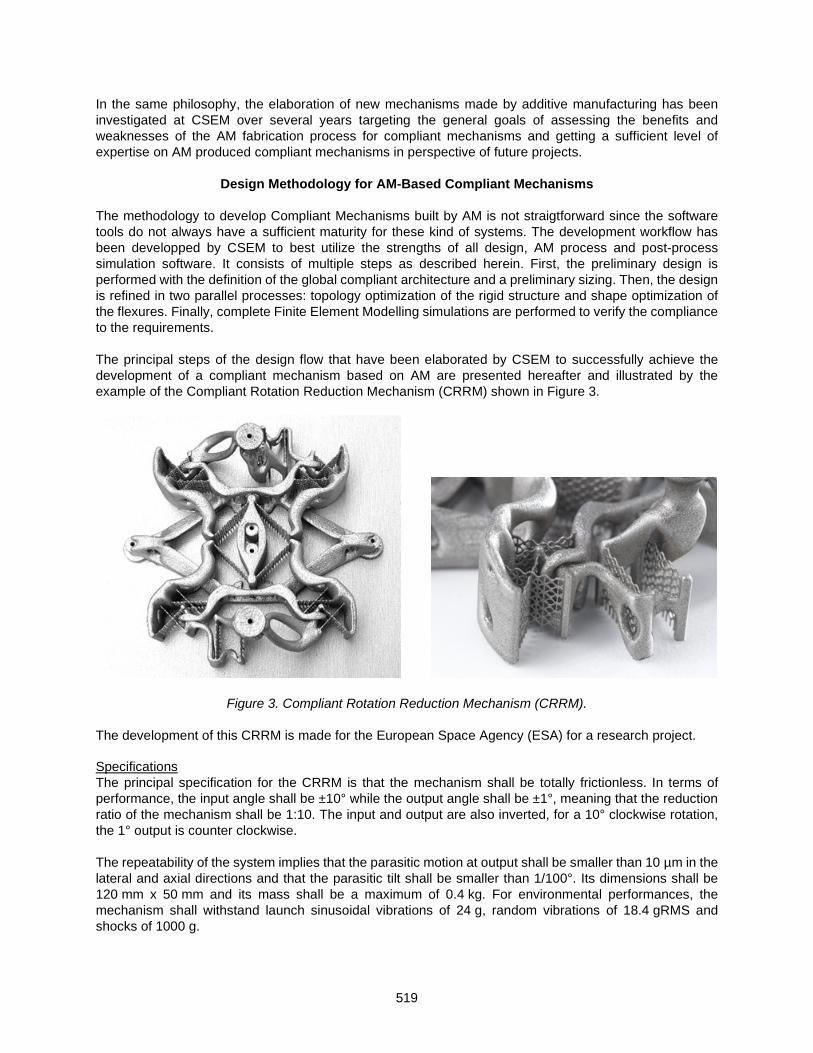
519
In the same philosophy, the elaboration of new mechanisms made by additive manufacturing has been investigated at CSEM over several years targeting the general goals of assessing the benefits and weaknesses of the AM fabrication process for compliant mechanisms and getting a sufficient level of expertise on AM produced compliant mechanisms in perspective of future projects.
Design Methodology for AM-Based Compliant Mechanisms The methodology to develop Compliant Mechanisms built by AM is not straigtforward since the software tools do not always have a sufficient maturity for these kind of systems. The development workflow has been developped by CSEM to best utilize the strengths of all design, AM process and post-process simulation software. It consists of multiple steps as described herein. First, the preliminary design is performed with the definition of the global compliant architecture and a preliminary sizing. Then, the design is refined in two parallel processes: topology optimization of the rigid structure and shape optimization of the flexures. Finally, complete Finite Element Modelling simulations are performed to verify the compliance to the requirements. The principal steps of the design flow that have been elaborated by CSEM to successfully achieve the development of a compliant mechanism based on AM are presented hereafter and illustrated by the example of the Compliant Rotation Reduction Mechanism (CRRM) shown in Figure 3.
Figure 3. Compliant Rotation Reduction Mechanism (CRRM). The development of this CRRM is made for the European Space Agency (ESA) for a research project. Specifications The principal specification for the CRRM is that the mechanism shall be totally frictionless. In terms of performance, the input angle shall be ±10° while the output angle shall be ±1°, meaning that the reduction ratio of the mechanism shall be 1:10. The input and output are also inverted, for a 10° clockwise rotation, the 1° output is counter clockwise. The repeatability of the system implies that the parasitic motion at output shall be smaller than 10 µm in the lateral and axial directions and that the parasitic tilt shall be smaller than 1/100°. Its dimensions shall be 120 mm x 50 mm and its mass shall be a maximum of 0.4 kg. For environmental performances, the mechanism shall withstand launch sinusoidal vibrations of 24 g, random vibrations of 18.4 gRMS and shocks of 1000 g.

520
Preliminary design and trade-off The preliminary design activity of an AM-based compliant mechanism can be divided into two phases. The first one consists in conventional pre-design activities. The flexure topologies and the overall physical architecture forming the basis of the design are defined, involving the analytical pre-sizing of various alternatives. A pre-design example of the CRRM is given in Figure 4.
Figure 4. Architecture and pre-design of the CRRM. Design for Additive Manufacturing This pre-design is then considered under the perspective of the manufacturing process, i.e., Selective Laser Melting (SLM). The following aspects are choosen during this phase:
• optimum build-up orientation, • identification of the critical geometries, • geometry of interfaces; fixation areas, positionning features, reference surfaces, • AM process strategy (support material and its future separation from the part).
This is performed by taking into account support structure minimization in critical locations – where post-AM machining could be difficult if not impossible, post-process strategy (thermal treatment before/after removal) and separation from the build plate. These activities are realized in accordance with the general design rules for AM and the specific rules for compliant structures which have been developed at CSEM. The manufacturability of the design should then be assessed. This is done thanks to SLM process simulation software. A post-processing sequence, including thermal & mechanical post-processes and a verification strategy is defined in accordance with the specific requirements for compliant structures, such as temporary fixation of mobile stages and the addition of features for metrology. Detailed design The detailed design comprises two main phases:
• Topology optimization of the rigid structure, • Shape optimization of the compliant structure, i.e., the flexure blades.
Rigid structures optimization A topology optimization of the rigid structure is performed on the initial design in order to improve its mechanical characteristics, especially the overall rigidity, together with a mass reduction. The workflow is the following:
1. Definition of the design and non-design spaces, where the design space is the part of the item where the optimization solver will be active. The non-design spaces are mainly the interfaces and other peculiar locations which need to be conserved as defined in the preliminary design. See Figure 5

521
2. The boundary conditions and the load cases are defined. 3. The optimization parameters are defined. 4. The results are interpreted. 5. A shape smoothing and/or rebuild is performed at the end as illustrated in Figure 6 6. A final finite element analysis with the new shape is performed to ensure fulfilling the requirements.
Figure 5. Definition of the design spaces for the CRRM.
Figure 6. Result of the topological optimization (left); design example after smoothing (right). Flexure blades optimization The compliant structure shall be optimized separately to ensure an optimum solution with regard to performances, but also to ease as much as possible the manufacturing and the post-treatments, mainly the removal from the build plate. The need to include support structures while producing thin flexure blades by AM is a critical aspect that must be taken into account while designing CM. The support structure is minimized and the attachment points of the support structure to the flexure are weakened in order to make its removal easier. The separation is performed when the part is cut off from the build plate. This concept has been successfully tested with several designs.
Top viewOutput(in pink)
Fixed interface(in grey)
Bottom viewInput (in light red)

522
As no single solution allows for simultaneously optimizing the rigid and the flexible part of the mechanism [3, 4], a dedicated procedure is devoted to this task. Lattice flexure blades While looking for the most appropriate design for flexure blades, CSEM innovated with a lattice structure (patent pending) having the main advantages of:
• Lowering the bending stiffness while maintaining a sufficient thickness for manufacturing, • Avoiding internal support structure thanks to the overhang angle, • Ability to be interlocked to form a pivot.
We start by defining a unitary lattice cell from which the whole blade pattern will be generated applying symmetry operations. Then, this unitary cell is geometrically parametrized. Next, a large number of different cells are generated using a Monte Carlo method. Some rules must be respected regarding the manufacturing and integrity of the structure. Therefore, only the designs that are compliant to those rules are considered. For these remaining solutions, an objective function is defined based on different mechanical parameters with dedicated weighting factors. Example of such parameters are transverse stiffness and stresses. Another criterion to be assessed is the constancy of the section area along the longitudinal axis of the leaf spring. The goal is to select a lattice that has a cross-sectional surface as constant as possible in order to avoid having a polygonal effect, to maintain a constant curvature of the leaf spring and to mimic at best the behaviour of a plain leaf spring. Finally, one of the remaining designs is selected as candidate for the final, detailed design, as shown in Figure 7.
Figure 7. Stress distribution for one particular design (left); optimal lattice leaf spring pattern (right). Interlocked lattice flexible structures Thanks to these optimized lattice structures as well as the opportunities given by AM, interlocked lattices flexures as illustrated in Figure 8 can be proposed. This architecture forms a monolithic rotational pivot with a high axial stiffness and which can be additively build with very little support structure.
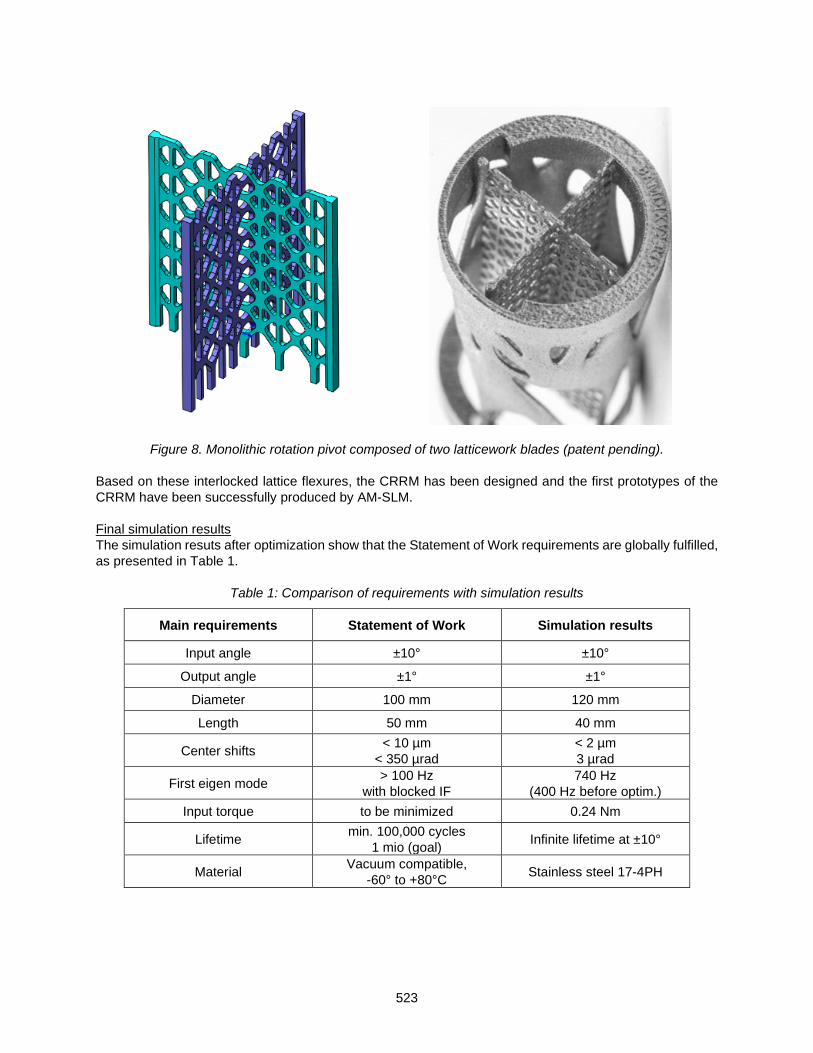
523
Figure 8. Monolithic rotation pivot composed of two latticework blades (patent pending). Based on these interlocked lattice flexures, the CRRM has been designed and the first prototypes of the CRRM have been successfully produced by AM-SLM. Final simulation results The simulation resuts after optimization show that the Statement of Work requirements are globally fulfilled, as presented in Table 1.
Table 1: Comparison of requirements with simulation results
Main requirements Statement of Work Simulation results
Input angle ±10° ±10°
Output angle ±1° ±1°
Diameter 100 mm 120 mm
Length 50 mm 40 mm
Center shifts < 10 µm < 350 µrad
< 2 µm 3 µrad
First eigen mode > 100 Hz with blocked IF
740 Hz (400 Hz before optim.)
Input torque to be minimized 0.24 Nm
Lifetime min. 100,000 cycles 1 mio (goal) Infinite lifetime at ±10°
Material Vacuum compatible, -60° to +80°C Stainless steel 17-4PH

524
Manufacturing Manufacturing assessment The additive manufacturing assessment has been made with the help of the Amphyon software tool, which simulates the Selective Laser Melting (SLM) process to give information about the internal stresses generated during layer manufacturing. These stresses could be responsible for macroscopic deformations of the parts as shown in Figure 9.
Figure 9. Manufacturing layer by layer thermo-mechanical simulation.
Based on these simulations, this tool generates a pre-deformed 3D geometry of the part to overcome these deformations with the aim of having a geometry that conforms to the nominally designed shape. Based on preliminary tests with thin and flexible structures, the residual deformations were in the range of 0.1 mm.
Material, process and post-process testing
The preliminary material, process and post-process test results have already been presented during ESMATS 2017 [3]. During the current COMAM project, these results have been consolidated with new tests such as residual stresses, dissolved gases, tensile, hardness, roughness, general corrosion, stress corrosion cracking and fatigue. In parallel, the microstructure was verified as well. These tests are performed on representative samples which have been additively manufactured in a high-strength stainless steel 17-4PH. They have seen the same post-processing treatments as foreseen for the final mechanism (i.e., Hot Isostatic Pressing (HIP), solution annealing and age hardening). In complement, the entire COMAM mechanism will be tested following the classical space approach with performance, vibrations, shock and thermal cycling. The first results are presented in the next chapter Mechanisms testing. Tensile test results Ten tensile samples machined out of AM-built cylinders were characterised. At room temperatures, measured values of Yield strength (Rp0.2) and Ultimate tensile strength (UTS) were very similar for all tested samples and varied from 1280 to 1330 MPa and 1380 to 1450 MPa for yield strength and UTS, respectively (Figure 10). For comparison, typical values for extruded forms are Rp0.2: 1070 MPa and UTS 1170 MPa. The yield strength was slightly higher at 1410 MPa and 1440 MPa for samples tested at -40°C while UTS remained relatively unchanged. Measured Young’s modulus E is between 190-210 GPa.

525
Elongation at failure exhibited the highest degree of variation from 1.2 to 6 %. Fractography revealed the presence of lack-of-fusion defects in the specimen with the lowest elongation (1.2%). For the rest of the samples tested at room temperature, necking occurred outside the measured gauge length, which contributed to the overall spread in measured elongations. At low temperature (-40°C), the ductility remains relatively high reaching nearly 7%.
Figure 10. Left: stress-strain curves of six tensile tests performed at room temperature;
right: hardness measurement results. Hardness test results Micro-hardness was measured on both ends of tensile samples after machining from cylinders. HV0.3 results lie within 450 and 500 which is a spread in values typical for micro-hardness measurements (ca. 10%). HV0.3 between 450 and 500 corresponds to approximately 48 HRC which is near the upper end of expected hardness values of 17-4 PH for this thermal condition. Roughness test results The surface quality has been measured with a surface roughness tester on the fatigue test samples. No mechanical process has been performed on the surface. The mean Ra value is 8 µm (±1.5 µm) and is independent of the direction of printing and of the thermal treatments performed after printing. Compared to surfaces obtained by machining, this value could be seen as much higher but the roughness is only an indicative value. The fatigue test results are much more important with regard to the behavior of the compliant mechanism. Fatigue test results The fatigue behavior of this material has already been defined during a previous activity at CSEM with an alternate bending fatigue test bench. Additional fatigue tests have been carried out to consolidate the results, including the lattice flexure blades. The results indicate that the values of these AM-flexure blades are comparable to the results previously obtained by CSEM [2].

526
Mechanisms testing Cleanliness assessment The whole build plate was thoroughly cleaned after SLM in order to remove unfused metal particles and other potential contaminants before the HIP treatment. During the cleaning process performed in ultrasonic (US) bath, cavitation was visibly very homogenous, which indicates optimum US exposure. A significant amount of metallic particles was collected. In total 0.55 g for a total build mass of 1251 kg, representing 0.044%. This process was repeated after HIP to see if more unfused particles could be removed. Here, only few particles have been collected for a total mass of 0.03 gram. They can be classified in four catergories: raw powder, round dark particles, flakes (probably contaminants during HIP process) and a few bigger particles which should be partially melted powder agregates, as shown in Figure 11.
Figure 11. Collected particles after HIP. Metrology A combination of 2D optical metrology and 3D laser scan has been performed in order to evaluate the global build plate deformations which are mainly due to the stress generated during the SLM and thermal post-processes (HIP, solution annealing and age hardening). The metrology has been performed first after SLM, then after HIP and finaly after SA-AH (still to be done at the time of writing). The comparisons are done first with the 3D CAD model, then between the step before and the actual state. The first results are shown in Figure 12. More work is ongoing to assess the impact of these deformation on performance.
Figure 12. Left: global deformation of the build plate after SLM. Right: overview of the deformation for one
mechanism. Scale in mm.

527
Next Steps The next step of the COMAM project is the final metrology measurements following the thermal treatments and the machining. This will be followed by performance measurements, vibration, shock and thermal cycling testing. The performance measurements will be compared with the simulation results to validate the design and ensure the compliance with the requirements.
Conclusions We have described CSEM’s methodology developed to design, optimize and verify the development of an innovative compliant mechanism made by additive manufacturing. We have surpassed challenges and pushed this technology forward to implement innovative solutions. The ESA COMAM project is ongoing. The next steps are the manufacturing of two Elegant Breadboard Models followed by the test campoaign; performance, vibration, shocks, thermal cycles and lifetime. In parallel, the testing of the characterization samples is in progress. CSEM continues to work on the ultimate goal to have a global tool for the optimization of compliant mechanisms. In parallel, functionalization of AM parts has been demonstrated and further projects will bring new examples of adding electrical, thermal and optical features.
References 1. Merriam, Ezekiel G., Stiffness Reduction Strategies for Additively Manufactured Compliant
Mechanisms, All Theses and Dissertations. Paper 5873, 2016.
2. Saudan, H., Vaideeswaran, K., Kiener, L. & Dadras, M. (2016). Additive Manufactured Metallic Flexible Structures, a focus on Manufacturing Strategies, Material Analysis and Fatigue Verification. In Proc. European Conference on Spacecraft Structures, Materials and Environmental Testing, Toulouse, France, 27-30 Sept. 2016.
3. Saudan, H., Kiener, L., Perruchoud, G., Vaideeswaran, K. & Dadras, M. (2017). Additively
manufactured and topologically optimized compliant mechanisms: technological assessment approach, latest achievements and current work in progress. In Proc. 17th European Space Mechanisms & Tribology Symposium, Hatfield, United Kingdom, 20-22 Sept. 2017.
4. Saudan, H., Kiener, L., Perruchoud, G., Vaideeswaran, K., Dadras, M. & Cochet, F. (2018). Compliant mechanisms and space grade product redesign based on Additive Manufacturing. In Proc. SPIE 10706, Advances in Optical and Mechanical Technologies for Telescopes and Instrumentation III, 107062T.

528
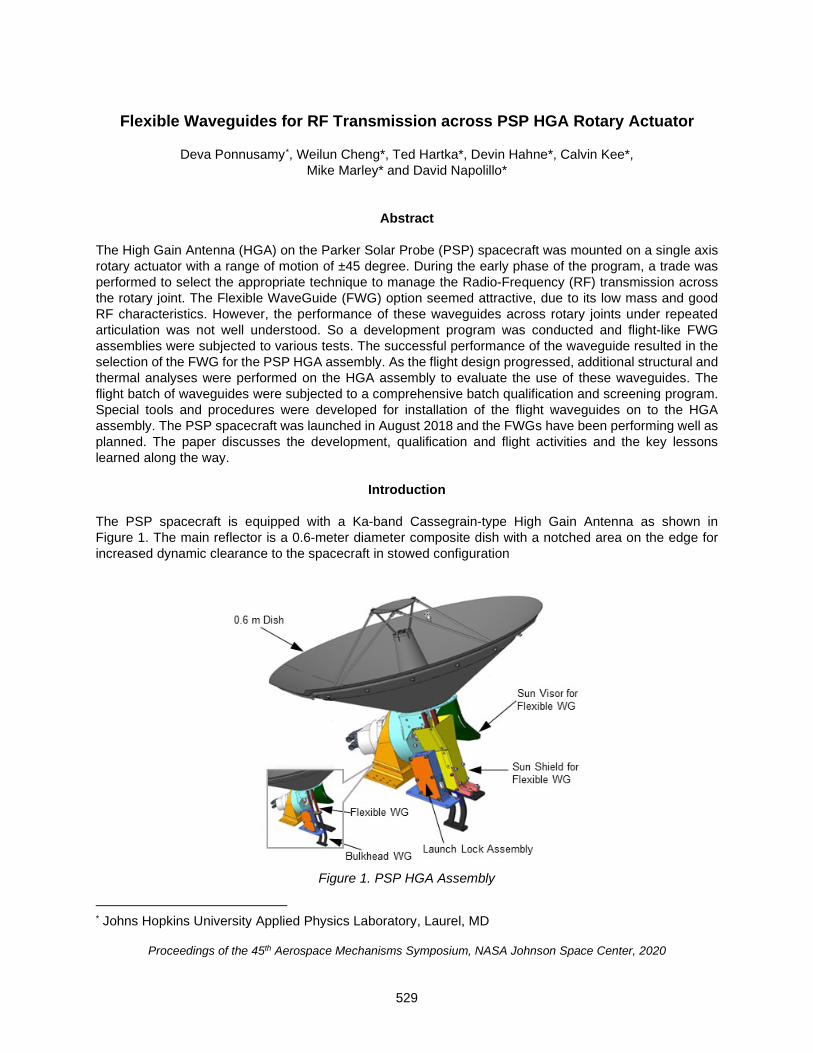
529
Flexible Waveguides for RF Transmission across PSP HGA Rotary Actuator
Deva Ponnusamy*, Weilun Cheng*, Ted Hartka*, Devin Hahne*, Calvin Kee*, Mike Marley* and David Napolillo*
Abstract The High Gain Antenna (HGA) on the Parker Solar Probe (PSP) spacecraft was mounted on a single axis rotary actuator with a range of motion of ±45 degree. During the early phase of the program, a trade was performed to select the appropriate technique to manage the Radio-Frequency (RF) transmission across the rotary joint. The Flexible WaveGuide (FWG) option seemed attractive, due to its low mass and good RF characteristics. However, the performance of these waveguides across rotary joints under repeated articulation was not well understood. So a development program was conducted and flight-like FWG assemblies were subjected to various tests. The successful performance of the waveguide resulted in the selection of the FWG for the PSP HGA assembly. As the flight design progressed, additional structural and thermal analyses were performed on the HGA assembly to evaluate the use of these waveguides. The flight batch of waveguides were subjected to a comprehensive batch qualification and screening program. Special tools and procedures were developed for installation of the flight waveguides on to the HGA assembly. The PSP spacecraft was launched in August 2018 and the FWGs have been performing well as planned. The paper discusses the development, qualification and flight activities and the key lessons learned along the way.
Introduction The PSP spacecraft is equipped with a Ka-band Cassegrain-type High Gain Antenna as shown in Figure 1. The main reflector is a 0.6-meter diameter composite dish with a notched area on the edge for increased dynamic clearance to the spacecraft in stowed configuration
Figure 1. PSP HGA Assembly
* Johns Hopkins University Applied Physics Laboratory, Laurel, MD
Proceedings of the 45th Aerospace Mechanisms Symposium, NASA Johnson Space Center, 2020

530
The reflector assembly is mounted on a single axis rotary actuator with a range of motion of ±45 degree. This system required two RF channels for receive and transmit across this rotary joint, and accordingly the HGA assembly was designed to accommodate two FWGs connecting the feed assembly to the RF module inside the spacecraft through the bulkhead waveguide. The use of the FWG was explored and validated by a development program which consisted of detailed analysis and extensive testing. The structural, thermal and life cycle characteristics of the waveguide were evaluated with specially developed tests and techniques. This program also experienced a process issue during the flight batch qualification. In coordination with the manufacturer, Custom Microwave, the root cause was quickly identified and an improved process was employed, resulting in a robust component.
Trade Study The PSP HGA actuator had a relatively small range of motion and a low life cycle requirement of 110 cycles but was required to fit within a tight mass budget and envelope. A trade study was performed to identify the most suitable RF transmission technique. The RF requirement precluded the use of a flexible coaxial cable. The options considered for this trade were an RF Rotary Joint and an FWG. The waveguide considered for this application was electroformed Ni-Co waveguide. This type of flexible waveguide is highly elastic and is capable of repeated cycling in bending without permanent deformation. The PSP RF system required a WR-34 waveguide and the flexible length was chosen in consultation with the vendor to minimize bending stresses while limiting launch loads due to vibration environment. The RF rotary joint is an electromechanical device consisting of a rotor assembly mounted to the stator through duplex bearing pairs. The part considered for this trade was a standard WR-34 joint with waveguide interfaces at input and output. These devices have good RF performance and spaceflight heritage. Both options were evaluated for mass, volume, alignment requirement and heritage for the proposed usage.
− The mass of each waveguide was 40 grams. The mass of each RF rotary joint was 300 grams and the two waveguides were mounted to a bracket of mass 250 grams. The total mass of the RF joint system was 850 grams compared to 80 grams for the FWGs.
− The FWG option required a much smaller envelope than the rotary joint assemblies. Accommodation of two of the rotary joints along with the routing of the waveguides required a larger envelope. This envelope was particularly significant for the PSP mission since the volume available for HGA accommodation was very limited. One of the unique features of the PSP spacecraft is a Thermal Protection Shield (TPS), which was a sandwich panel made up a carbon-carbon composite facesheets and a carbon foam core. During close flybys of the Sun, the spacecraft is oriented with the TPS facing the Sun so as to protect all spacecraft components within the umbra of the TPS. This need to fit within the umbra of the TPS imposed severe restrictions on the envelope.
− RF rotary joints consist of preloaded duplex bearing pairs and require very tight alignment with the actuator axis. Any misalignment due to installation or on-orbit thermal deformations would impact the RF performance of the rotary joint as well as the actuator mechanical performance. The FWGs can tolerate higher misalignments relative to the rotary axis.
− The cold operational temperature of the RF joint is driven by the bearing lubrication which is typically about -40°C for wet lubricated systems. The flexible waveguide can be operated at much lower temperatures.
− RF rotary joints have been used successfully for thousands of cycles on multiple space missions. The FWG considered for this application has extensive flight heritage but its primary function was to accommodate misalignments. There are a few instances of FWGs used on one-time deployment mechanisms. However, there is very limited information on the use of flexible waveguides for cyclic operations in space over the life of the mission.

531
The FWG seemed better on every criterion except heritage. So a development testing program was implemented to evaluate the FWG for PSP requirements. The FWG performed successfully in these tests and was chosen for the HGA assembly. The development test details are discussed later in this paper.
Flexible Waveguide
The flexible waveguide considered for this application is made by Custom Microwave. Inc. of Longmont, CO. The flexible part of the waveguide is Ni-Co alloy and is manufactured by electroforming. This waveguide was built to length specified by JHUAPL. The interior of the waveguide is coated with silver to improve RF performance. The development test article had copper flanges that were attached to the waveguide by soldering. Operational high temperature of the waveguide was limited to +180°C due to this soldered joint. The exterior of the waveguide was nickel plated. During the development phase, the qualification temperature range was -125°C to +100°C and the development article successfully survived these temperatures. However, by the time the flight articles were procured the qualification temperature limit had changed to -105°C to +170°C. At this time the manufacturer had improved processes available, but the program decided to stay with the qualified version of the waveguide, since the revised temperature was still within specifications. The first batch of flight waveguides were identical to the development article and was tested to the revised temperature limits. During thermal cycling some discoloration was observed at the soldered joint, along with significant degradation in RF performance. Investigation by the manufacturer determined that this was due to a processing defect that resulted in incomplete removal of the flux from the solder, and this was also confirmed by radiography. This problem was further exacerbated by the higher revised qualification temperature. The manufacturer proposed waveguides with electroformed flange joints, which were considered superior to the soldered joint. After a thorough review of all options it was decided to change the waveguide configuration to the electroformed flange joint as proposed by the manufacturer. The program also decided to switch the exterior finish to black paint instead of nickel plating to lower the temperature of the middle section during operation.
Figure 2. WR-34 Flexible Waveguide
The flight waveguide was made up of electroformed Ni-Co flexible section with the copper flanges attached by the electroforming process. The interior surfaces were silver plated and the exterior surfaces were painted with BR-127 black paint. Following a successful batch qualification and acceptance program, these waveguides were installed to flight HGA assembly. The development and flight waveguides are shown in Figure 2.
Waveguide Analyses and Tests The FWG was subjected to a comprehensive evaluation program that included testing in three phases, development test, flight batch qualification test and acceptance tests. These tests consisted of environmental tests and mechanical functional tests. The condition of the FWG was monitored by RF

532
performance tests, nondestructive examination and visual inspection. Following is a brief description of the various inspection and test techniques employed in the test program. Resistance Torque and Flex Life Cycle Resistance torque was measured over the range of motion on a torque test rig as shown in Figure 3. The maximum resistance torque was less than 30 mN-m and did not have an influence on the torque margin. The resistance torque was also considered as a good measure of the uniformity of the waveguide thicknesses and was viewed as an indicator of consistency and process control.
Figure 3. Resistance Torque and Life Cycle Test
The stresses induced due to the ±45-degree motion were well below the elastic limit, yet life tests were performed to ensure that cyclic loading does not cause any damage or performance degradation. The cycling test was performed at ambient, hot and cold temperatures, in ambient GN2 atmosphere (Figure 4). The test article was flexed inside a thermal chamber by a drive system made up of a motor and a torque sensor. The flight batch qualification unit was subjected to 330 cycles, equally divided between ambient, +170°C and -105°C. The resistance torque was monitored to observe any trend. Structural Evaluation The key structural feature of the FWG is the thin, corrugated Ni-Co wall of the waveguide that allows it to flex. The waveguide length was chosen to minimize the elastic stresses due to the cyclic motion. The long unsupported length also meant lower resonance frequencies and higher load due to launch environments. One particular area of interest was the natural frequency of the waveguide in its launch configuration. The intent was to not have the waveguide resonances couple with the spacecraft frequencies. In the launch configuration, the high gain antenna is stowed at 45°, which put the waveguides in a gentle curvature (Figure 5).

533
Figure 4. Life Cycle Test at Temperature Extremes
During the development phase, a set of six waveguides with soldered flanges were subjected to low-level sine sweep from 5 Hz to 500 Hz, to determine the natural frequencies in the off-axial directions. The waveguides were mounted on test blocks that flexed the waveguides by 45 degrees flange-to-flange, as in launch configuration. A miniature, single-axis teardrop accelerometer was attached to the middle of each waveguide, aligned in the direction of the test axis. There was a concern that the accelerometer attachment might by itself influence the resonance of the waveguide. To address this, the test was repeated on one of the waveguides with a non-contact laser vibrometer. There was no difference in the resonance values or amplification measured by the accelerometer and the vibrometer. All subsequent tests only used an accelerometer. The natural frequencies in the narrow section direction ranged from 51 Hz to 60 Hz, and the wide section direction ranged from 60 Hz to 65 Hz. Because of the curvature of the waveguide in the launch configuration, the waveguide is somewhat preloaded and therefore stiffer in the wide direction, which led to a higher natural frequency when compared to the narrow direction. The variation in natural frequencies between waveguides was attributed to minute variations in wall thickness due to the electroforming process control. Regardless, the minimum resonant frequency was 51 Hz, which was well separated from the spacecraft frequencies, and would pose no problems with over-amplification of its acceleration responses during launch vibration.
Figure 5. Vibration Test in 45 Degree Bend Configuration

534
Sine vibration was performed to qualify the strength of the FWG for its expected flight levels, 15 G in the spacecraft lateral axes and 20 G in spacecraft thrust axis. Any resonance response was limited to 36 G according to its mass-acceleration limit load. The strength verification was accomplished by applying a sinusoidal vibration at the qualification level in the frequency range less than resonance so that the acceleration load approximated a static loading. All waveguides passed this test and demonstrated the capability to handle expected launch loads. The maximum response recorded was 37 G after notching (Figure 6). Random vibration testing was performed on the FWGs to the protoflight levels. The development and flight batch qualification waveguides were exposed to a random vibration input of 6.3 Grms in the wide section direction, and the maximum overall response recorded was 16.8 Grms (Figure 6). At 3σ, the acceleration response would be 50.4 Grms, indicating that the waveguide could withstand loads higher than the design limit of 36 g. In spite of the large responses seen in the tests, the waveguide is relatively light (40 grams), and therefore the load supported in its own structure during vibration is less than 22 N.
Figure 6. Vibration Test Responses
Another area of interest was to assess the tolerance of the FWG to axial loads, either due to installation misalignments or on-orbit thermal mismatch. The maximum estimated extension with margin, due to all possible sources was about 0.7 mm. One of the development model waveguides was subjected to 300 cycles of extension on a Universal Testing Machine and the load was monitored. For this extension, the waveguide was within the elastic limit and the load at maximum extension remained stable at 1.42 N. The waveguide was also subjected to compression, the waveguide flexed slightly to accommodate this with very little change in load. Thermal Concern A few thermal concerns with the use of the flexible waveguide were identified during the development phase of this program. They were further explored through analysis and test, resulting in design changes to both the HGA and the FWG. One of the key concerns was that the geometry of the FWG could cause the middle section of the waveguide to become very hot. The waveguide had a relatively small cross-section and a large distance between the middle section and the flanges. The flexible part of the waveguide was very thin, and the corrugated path of this section created an effective conductive length that was several times the actual length of the waveguide assembly. Given that thermal resistance increases with length and decreases with area, the middle of the waveguide was thus strongly thermally isolated, in spite of being made from Ni-Co metal alloy. Even if flange temperatures were to be controlled, there still could be a very high temperature in the center of the waveguide due to power dissipation during RF transmission. Adding to the concern with the middle temperature of the waveguide was the fact that this portion of the waveguide could be exposed

535
to sunlight, depending on HGA position. At certain times in the mission the sun exposure could occur at 0.7 AU, which would effectively double the solar flux on the waveguide. This was especially concerning given the optical properties of the nickel-plated exterior surface of the waveguide. Metals inherently have low emissivity, and do not radiate heat easily to space. Metals can get very hot in the sun if not properly sunk to another boundary temperature. The typical values for absorptivity-to-emissivity ratio for nickel from various sources was around 10 (0.4 / 0.04). This optical property, coupled with the high solar flux and relatively high resistance to the flange, would result in high temperatures in the center of the waveguide. The other key thermal issue with the waveguide was the temperature of the flanges. The HGA itself was allowed to run relatively hot with a design limit of 160°C and this caused waveguide flange temperatures as high at 160°C. Thermal Analysis Analysis of the flex waveguide in Thermal Desktop software showed very high temperatures for the middle portions of the waveguide due to high thermal resistance between the middle of the waveguide and the flanges. A detailed model of the waveguide was created to estimate the temperature of the middle section with higher fidelity (Figure 7). This model showed temperatures around 400°C depending on the dissipation estimates. The temperature at the middle of the waveguide for the given flange boundary conditions and a high heat dissipation of 1.7 W was 416°C. Despite the high temperature at the middle, the model still showed the flange areas at reasonable temperatures. The high temperature was not of particular concern from the waveguide material point of view, but could cause severe degradation or possible loss of the silver coating at 425°C. Hence it was decided to perform a test to verify the high temperature phenomenon.
Figure 7. RF Induced Waveguide Temperature - Prediction Thermal Test A test was developed using a development waveguide in a vacuum chamber. This test used a Direct Current (DC) voltage to apply dissipation across the waveguide. During different configurations of the test, the temperature was measured with thermocouples and with an Infrared (IR) camera. Both methods were prone to high errors, the thermocouples at high temperature, and the IR camera on a low emissivity surface. However, the test was more to gain a general understanding of the issue, not necessarily to completely quantify the temperatures. The setup for the test in a thermal vacuum chamber is shown in Figure 8. In this setup a thermocouple (TC) was placed in the middle of the FWG to get a direct measurement of the temperature. In another set up this TC was removed and photos were taken with an IR camera. The red and black wires attached to the flanges of the waveguide were connected to a power supply and used to run current through the waveguide and simulate the dissipation from an RF signal.

536
The test showed results that were somewhat consistent with the analysis. Temperatures in the testing were not quite as high, however there was a concern that TC adhesion to the WG could have been affected at the high test temperature and results might not have been completely accurate. The highest observed temperature of the waveguide TC during testing was 276°C. Temperature measurements were also done with the IR camera and the IR image is shown in Figure 8. This clearly showed the relatively cold temperature at the flanges and increase in temperature towards the middle. The testing was considered successful since it confirmed high temperatures predicted by analysis and also showed that the predictions were conservative relative to the test. The test also demonstrated that flange temperatures would stay close to their interface temperatures and would not overheat due to the dissipation in the waveguide. RF testing after the thermal vacuum test showed no degradation to the waveguide characteristics. Despite the fact that the test showed generally positive results, concern remained that additional heat on the waveguide from the sun could still result in excessive temperatures. For this reason, sun shields and a sun visor were added to the HGA assembly to prevent direct exposure of the waveguides to the sun, without interfering with the waveguide or the swept volume. Another takeaway from the test was the significance of the RF dissipation and the desire to run RF power through the HGA assembly during the HGA level thermal balance testing. This testing was completed but is beyond the scope of this discussion.
Figure 8. RF Induced Waveguide Heating - Measurement
The exterior finish on the flight waveguides was changed from Ni plating to black paint and this further reduced the temperature of the middle section. The thermal cycling limits for the flight waveguides were established based on the flange temperatures. The waveguides were supported in the free-state and RF performance evaluated pre- and post- thermal cycling. As explained earlier, the upper temperature of the development model was underestimated. But this was revised prior to the flight article batch tests as the thermal design matured. Also due to the criticality of the thermal environment and the issues experienced with soldered waveguides, the flight batch qualification article was subjected to a conservative 200 thermal cycles. The thermal cycling limits of the various models were as follows: Development tests: 6 cycles, -125°C to +100°C Qualification tests: 200 cycles, -105°C to +170°C Acceptance test: 7 cycles, -105°C to +170°C Waveguide Status and Performance Monitoring The condition of the waveguide was monitored at every stage of the test program to detect any degradation. This was done by visual inspection of exterior, inspection of interior with borescope, CT-scan, and RF tests.
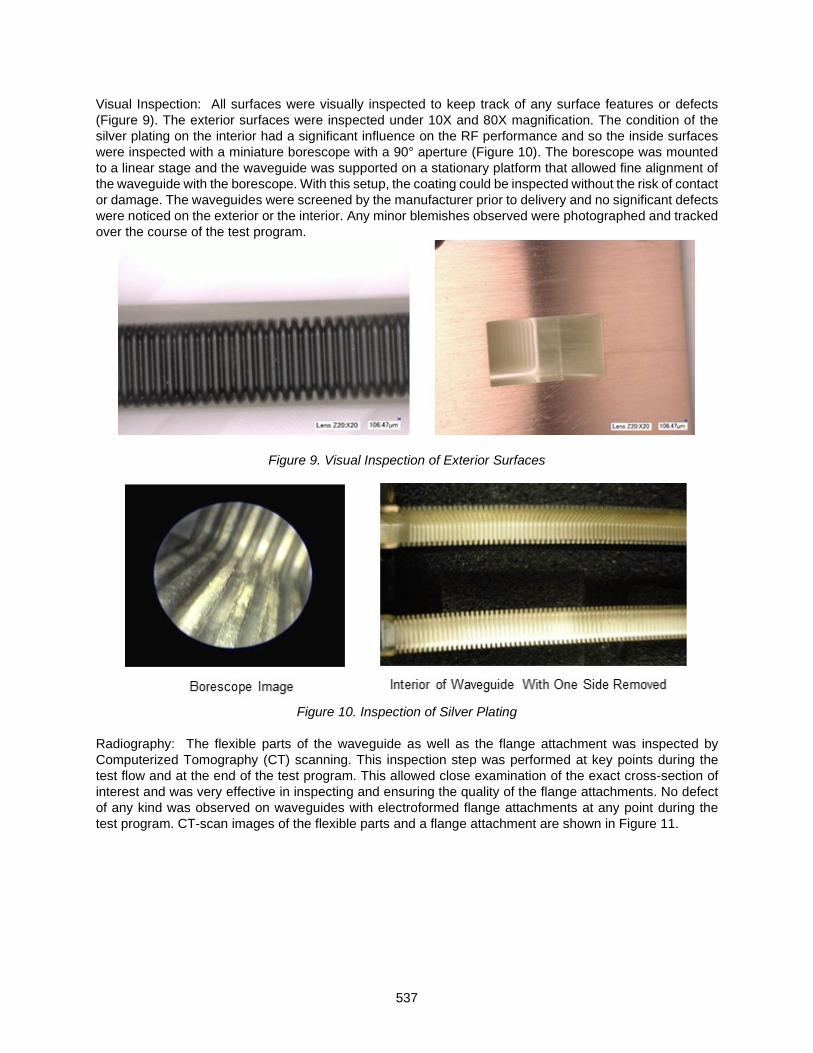
537
Visual Inspection: All surfaces were visually inspected to keep track of any surface features or defects (Figure 9). The exterior surfaces were inspected under 10X and 80X magnification. The condition of the silver plating on the interior had a significant influence on the RF performance and so the inside surfaces were inspected with a miniature borescope with a 90° aperture (Figure 10). The borescope was mounted to a linear stage and the waveguide was supported on a stationary platform that allowed fine alignment of the waveguide with the borescope. With this setup, the coating could be inspected without the risk of contact or damage. The waveguides were screened by the manufacturer prior to delivery and no significant defects were noticed on the exterior or the interior. Any minor blemishes observed were photographed and tracked over the course of the test program.
Figure 9. Visual Inspection of Exterior Surfaces
Figure 10. Inspection of Silver Plating
Radiography: The flexible parts of the waveguide as well as the flange attachment was inspected by Computerized Tomography (CT) scanning. This inspection step was performed at key points during the test flow and at the end of the test program. This allowed close examination of the exact cross-section of interest and was very effective in inspecting and ensuring the quality of the flange attachments. No defect of any kind was observed on waveguides with electroformed flange attachments at any point during the test program. CT-scan images of the flexible parts and a flange attachment are shown in Figure 11.

538
Figure 11. CT-Scan of Flexible Waveguide with Electroformed Flange
RF Test: RF performance was evaluated by measuring the insertion loss and Voltage Standing Wave Ratio (VSWR) across the entire WR-34 frequency range of 22 GHz to 33 GHz. This test was performed with the waveguide held in the straight and 45 degree bent positions. Typical RF performance results are shown in Figure 12.
Figure 12. RF Characterization of Waveguide

539
Test Program Development Tests During the development phase, two waveguides were subjected to a very detailed development test program. The successful performance in these tests is what lead to the selection of waveguides for the PSP program. The development program was as follows:
1. Waveguide visually inspected at 80X; no significant defects observed 2. RF performance characterized in straight and 45 degree bent configuration and was acceptable 3. Resistance torque was measured; maximum resistance torque at 45 degree was less than
30 mN-m. 4. Waveguides were subjected to 400 flex cycles at ambient temperature between -45 degree and
+45 degree and following this cycling, were visually inspected and characterized a. No change in resistance torque after life cycle test b. Visual inspection at 80X showed no new damages or degradation of existing surface
blemishes c. No changes noticed in RF performance for either article
5. Waveguides were subjected to sine survey and random vibration; following vibration testing, the waveguides were visually inspected and characterized
a. Visual inspection under 10X did not show any issues 6. Waveguides exposed to two thermal cycles between -125°C and +100°C; at each temperature
extreme, waveguides were subjected to 100 bend cycles between -45 deg and +45 deg a. Visual inspection under 10X did not show any issues for either article b. No changes in RF performance for either article
Batch Qualification The flight batch of the waveguides were subjected to a test program consisting of batch qualification test on one waveguide and acceptance testing on all flight and spare components. The first round of tests was performed on waveguides with soldered flanges and resulted in failures of some of the soldered joints as described earlier. The program described in this section was performed on the waveguides with electroformed flanges. Prior to the delivery of the waveguides the manufacturer performed 7 thermal cycles between -105°C to +170°C and RF characterization. The qualification program was as follows:
1. Visual Inspection (20X to 80X) of exterior and inspection of silver coating on interior with borescope 2. RF performance test 3. Radiography 4. Vibration Testing - sine sweep, sine vibration and random vibration (Protoflight)
a. Visual Inspection showed no damage b. No changes noticed in RF performance post vibration
5. Bend resistance measurement and 330 flex cycles over ±45° (110 @ ambient, 110 @+170°C and 110 @ -105°C)
a. Visual Inspection showed no damage b. No changes noticed in RF performance post mechanical function test
6. Thermal Cycling (200 cycles between -105°C and +170°C) a. Visual Inspection showed no damage b. No changes noticed in RF performance over the course of thermal cycling
7. Radiography - no defect observed post thermal cycling (Figure 10) 8. Removal of side wall and visual inspection of the interior; silver coating was found to be in good
condition (Figure 10) Acceptance Test Five flight waveguides were subjected to the following tests:
1. Visual Inspection (20X to 80X) 2. RF performance test
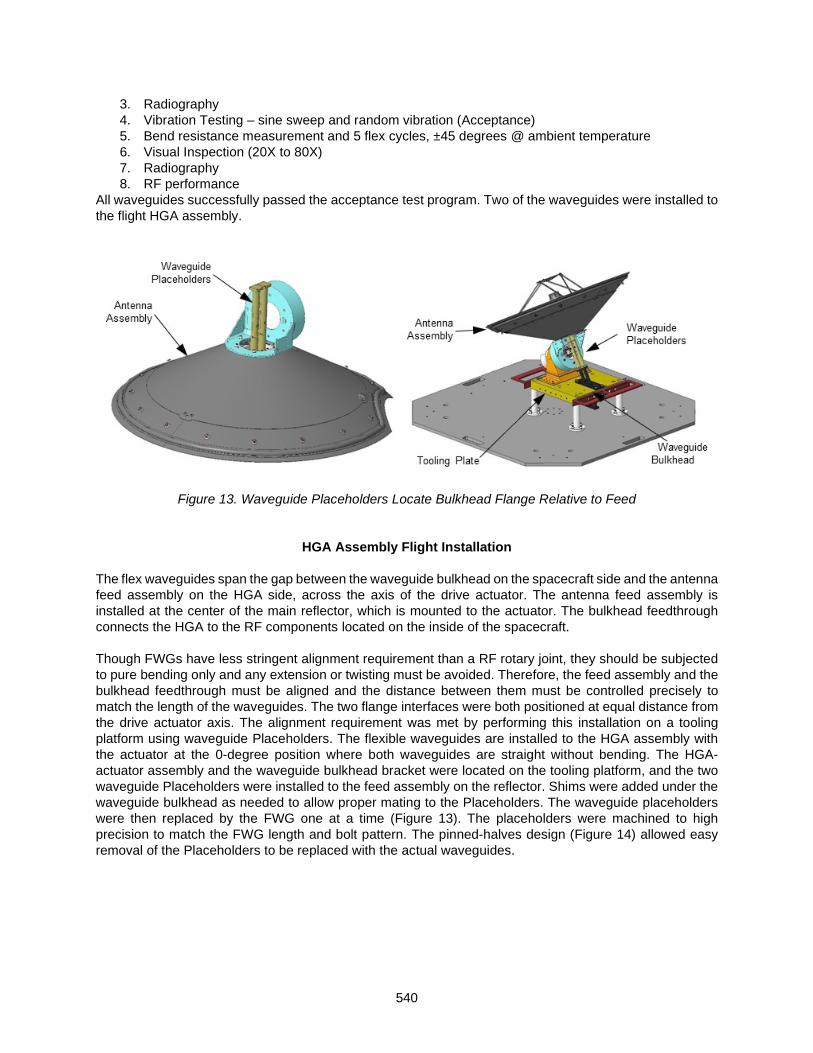
540
3. Radiography 4. Vibration Testing – sine sweep and random vibration (Acceptance) 5. Bend resistance measurement and 5 flex cycles, ±45 degrees @ ambient temperature 6. Visual Inspection (20X to 80X) 7. Radiography 8. RF performance
All waveguides successfully passed the acceptance test program. Two of the waveguides were installed to the flight HGA assembly.
Figure 13. Waveguide Placeholders Locate Bulkhead Flange Relative to Feed
HGA Assembly Flight Installation
The flex waveguides span the gap between the waveguide bulkhead on the spacecraft side and the antenna feed assembly on the HGA side, across the axis of the drive actuator. The antenna feed assembly is installed at the center of the main reflector, which is mounted to the actuator. The bulkhead feedthrough connects the HGA to the RF components located on the inside of the spacecraft. Though FWGs have less stringent alignment requirement than a RF rotary joint, they should be subjected to pure bending only and any extension or twisting must be avoided. Therefore, the feed assembly and the bulkhead feedthrough must be aligned and the distance between them must be controlled precisely to match the length of the waveguides. The two flange interfaces were both positioned at equal distance from the drive actuator axis. The alignment requirement was met by performing this installation on a tooling platform using waveguide Placeholders. The flexible waveguides are installed to the HGA assembly with the actuator at the 0-degree position where both waveguides are straight without bending. The HGA-actuator assembly and the waveguide bulkhead bracket were located on the tooling platform, and the two waveguide Placeholders were installed to the feed assembly on the reflector. Shims were added under the waveguide bulkhead as needed to allow proper mating to the Placeholders. The waveguide placeholders were then replaced by the FWG one at a time (Figure 13). The placeholders were machined to high precision to match the FWG length and bolt pattern. The pinned-halves design (Figure 14) allowed easy removal of the Placeholders to be replaced with the actual waveguides.

541
Figure 14. Exploded View of Waveguide Placeholders
To maintain the relationship between the bulkhead waveguide and the reflector assembly, a handling fixture was used during transportation and handling (Figure 15). All mounting interfaces between the HGA assembly and the tooling plate or handling fixture were designed with a nominal shim that could be adjusted as required during installation. The detailed integration and handling procedures using the associated tooling and fixtures ensured that the waveguides were installed with utmost care to avoid undesirable loading.
Figure 15. Shimming Opportunities
Lessons Learned
Several valuable technical, procedural and philosophical lessons were learned over the course of this task. Following is a brief description of the key lesson learned:
• Electroformed flexible waveguide made out of Ni-Co alloy, is a viable alternative to RF rotary joints and coaxial cables, under certain situations.
• End flange attachment technique has a significant influence on RF losses. • All aspects of new product should be thoroughly examined, not just the characteristics of interest.
While our program was primarily focused on the flexibility and life cycle, the only issues we faced were related to flange attachment.
• Early testing during development phase greatly enhances confidence. • The thermal cycling test is very critical to evaluate flexible waveguides. Detailed thermal analysis
can be very effective in predicting the effect of RF transmission on waveguide temperature.

542
• Superior technical options when available should be given due consideration and not be dismissed just due to lack of heritage.
• Laser vibrometers and miniature teardrop accelerometers can be effectively used in vibration testing of flexible parts without influencing dynamic performance.
• Borescopes can be used to inspect silver coatings on the inside of waveguides; this was validated by RF tests and destructive inspection.
• CT scan is an effective tool to inspect soldered flange joints. RF performance can be directly correlated to defective joints observed by CT scanning.
Figure 16. HGA Assembly on PSP Spacecraft
Summary
The PSP HGA assembly successfully used two flexible waveguides for RF transmission across the actuator rotary joint (Figure 16). The analysis and test programs were effective in proving the suitability of the FWG for on-orbit cyclic operations. They were also effective in detecting some latent process defects and resulted in the use of an improved waveguide with superior RF performance. The PSP spacecraft was launched in August 2018 and has completed three close encounters with the sun so far. All aspects of the HGA and the RF system are performing well as planned.
Acknowledgement
The authors would like to thank the members of the JHUAPL Space Simulation Lab for their support of this task over a period spanning several years, Perry Malouf of JHUAPL for performing RF tests, and finally Clency Lee Yow and his team at Custom Microwave, Inc. for their support.
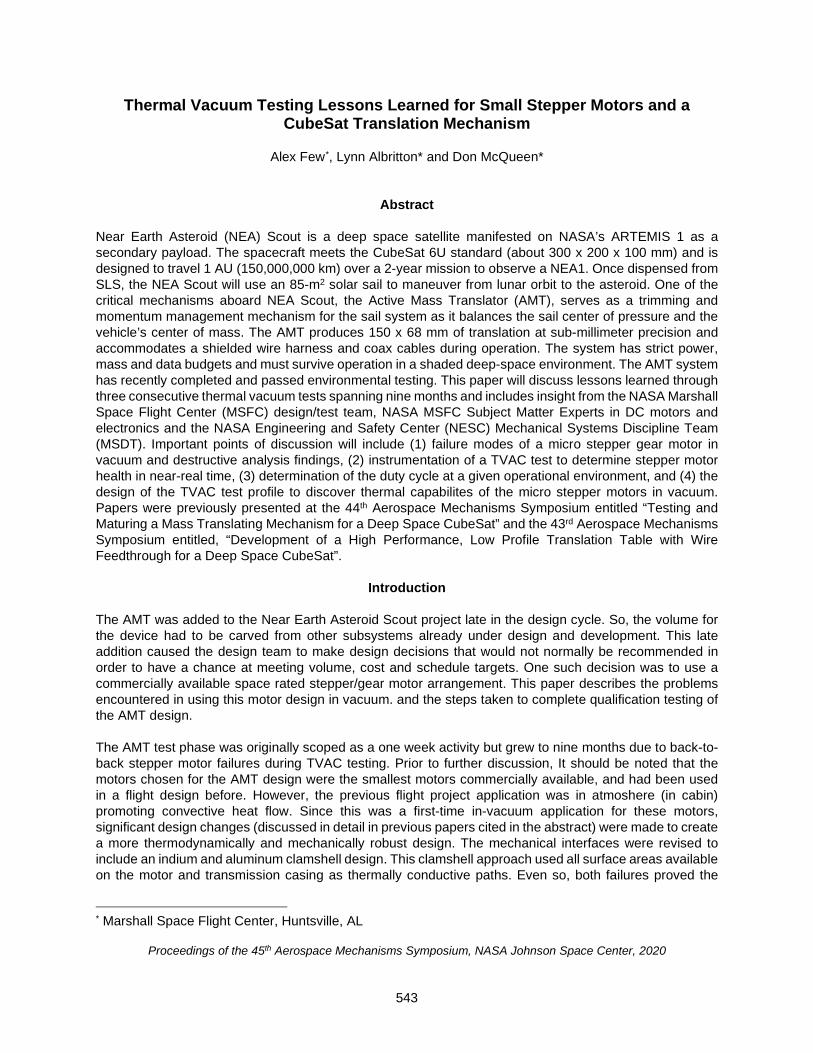
543
Thermal Vacuum Testing Lessons Learned for Small Stepper Motors and a CubeSat Translation Mechanism
Alex Few*, Lynn Albritton* and Don McQueen*
Abstract
Near Earth Asteroid (NEA) Scout is a deep space satellite manifested on NASA’s ARTEMIS 1 as a secondary payload. The spacecraft meets the CubeSat 6U standard (about 300 x 200 x 100 mm) and is designed to travel 1 AU (150,000,000 km) over a 2-year mission to observe a NEA1. Once dispensed from SLS, the NEA Scout will use an 85-m2 solar sail to maneuver from lunar orbit to the asteroid. One of the critical mechanisms aboard NEA Scout, the Active Mass Translator (AMT), serves as a trimming and momentum management mechanism for the sail system as it balances the sail center of pressure and the vehicle’s center of mass. The AMT produces 150 x 68 mm of translation at sub-millimeter precision and accommodates a shielded wire harness and coax cables during operation. The system has strict power, mass and data budgets and must survive operation in a shaded deep-space environment. The AMT system has recently completed and passed environmental testing. This paper will discuss lessons learned through three consecutive thermal vacuum tests spanning nine months and includes insight from the NASA Marshall Space Flight Center (MSFC) design/test team, NASA MSFC Subject Matter Experts in DC motors and electronics and the NASA Engineering and Safety Center (NESC) Mechanical Systems Discipline Team (MSDT). Important points of discussion will include (1) failure modes of a micro stepper gear motor in vacuum and destructive analysis findings, (2) instrumentation of a TVAC test to determine stepper motor health in near-real time, (3) determination of the duty cycle at a given operational environment, and (4) the design of the TVAC test profile to discover thermal capabilites of the micro stepper motors in vacuum. Papers were previously presented at the 44th Aerospace Mechanisms Symposium entitled “Testing and Maturing a Mass Translating Mechanism for a Deep Space CubeSat” and the 43rd Aerospace Mechanisms Symposium entitled, “Development of a High Performance, Low Profile Translation Table with Wire Feedthrough for a Deep Space CubeSat”.
Introduction
The AMT was added to the Near Earth Asteroid Scout project late in the design cycle. So, the volume for the device had to be carved from other subsystems already under design and development. This late addition caused the design team to make design decisions that would not normally be recommended in order to have a chance at meeting volume, cost and schedule targets. One such decision was to use a commercially available space rated stepper/gear motor arrangement. This paper describes the problems encountered in using this motor design in vacuum. and the steps taken to complete qualification testing of the AMT design. The AMT test phase was originally scoped as a one week activity but grew to nine months due to back-to-back stepper motor failures during TVAC testing. Prior to further discussion, It should be noted that the motors chosen for the AMT design were the smallest motors commercially available, and had been used in a flight design before. However, the previous flight project application was in atmoshere (in cabin) promoting convective heat flow. Since this was a first-time in-vacuum application for these motors, significant design changes (discussed in detail in previous papers cited in the abstract) were made to create a more thermodynamically and mechanically robust design. The mechanical interfaces were revised to include an indium and aluminum clamshell design. This clamshell approach used all surface areas available on the motor and transmission casing as thermally conductive paths. Even so, both failures proved the
* Marshall Space Flight Center, Huntsville, AL
Proceedings of the 45th Aerospace Mechanisms Symposium, NASA Johnson Space Center, 2020
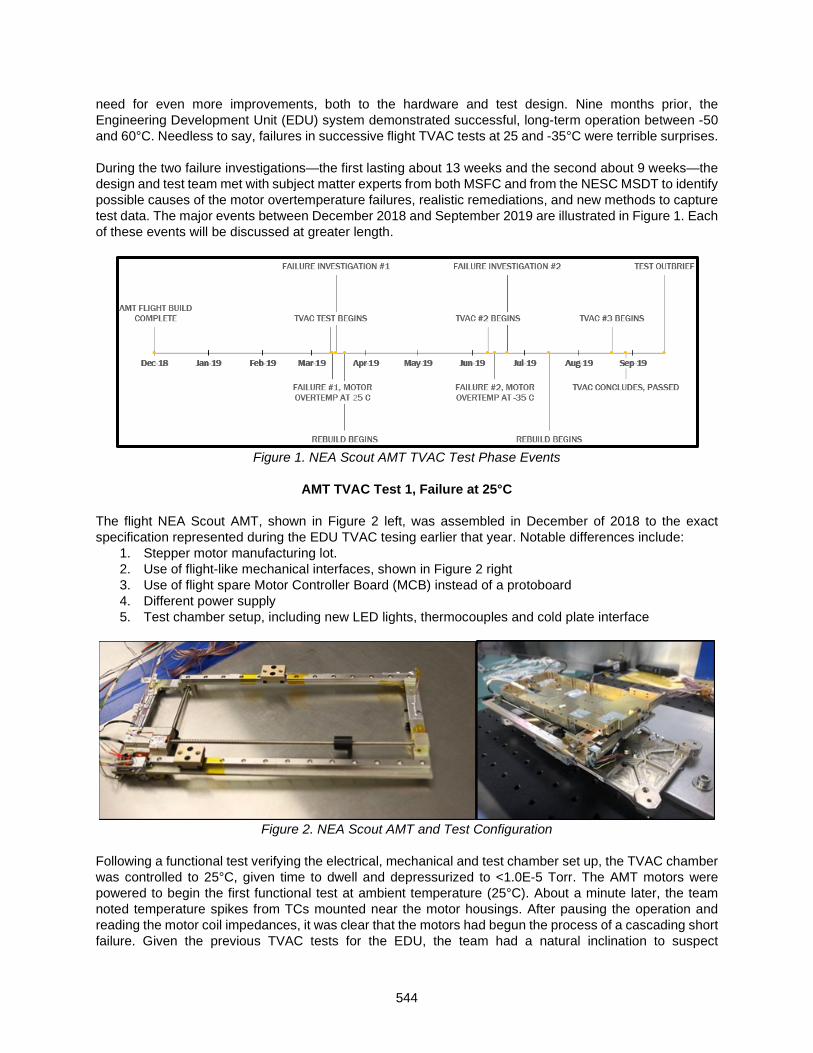
544
need for even more improvements, both to the hardware and test design. Nine months prior, the Engineering Development Unit (EDU) system demonstrated successful, long-term operation between -50 and 60°C. Needless to say, failures in successive flight TVAC tests at 25 and -35°C were terrible surprises. During the two failure investigations—the first lasting about 13 weeks and the second about 9 weeks—the design and test team met with subject matter experts from both MSFC and from the NESC MSDT to identify possible causes of the motor overtemperature failures, realistic remediations, and new methods to capture test data. The major events between December 2018 and September 2019 are illustrated in Figure 1. Each of these events will be discussed at greater length.
Figure 1. NEA Scout AMT TVAC Test Phase Events
AMT TVAC Test 1, Failure at 25°C
The flight NEA Scout AMT, shown in Figure 2 left, was assembled in December of 2018 to the exact specification represented during the EDU TVAC tesing earlier that year. Notable differences include:
1. Stepper motor manufacturing lot. 2. Use of flight-like mechanical interfaces, shown in Figure 2 right 3. Use of flight spare Motor Controller Board (MCB) instead of a protoboard 4. Different power supply 5. Test chamber setup, including new LED lights, thermocouples and cold plate interface
Figure 2. NEA Scout AMT and Test Configuration
Following a functional test verifying the electrical, mechanical and test chamber set up, the TVAC chamber was controlled to 25°C, given time to dwell and depressurized to <1.0E-5 Torr. The AMT motors were powered to begin the first functional test at ambient temperature (25°C). About a minute later, the team noted temperature spikes from TCs mounted near the motor housings. After pausing the operation and reading the motor coil impedances, it was clear that the motors had begun the process of a cascading short failure. Given the previous TVAC tests for the EDU, the team had a natural inclination to suspect
2
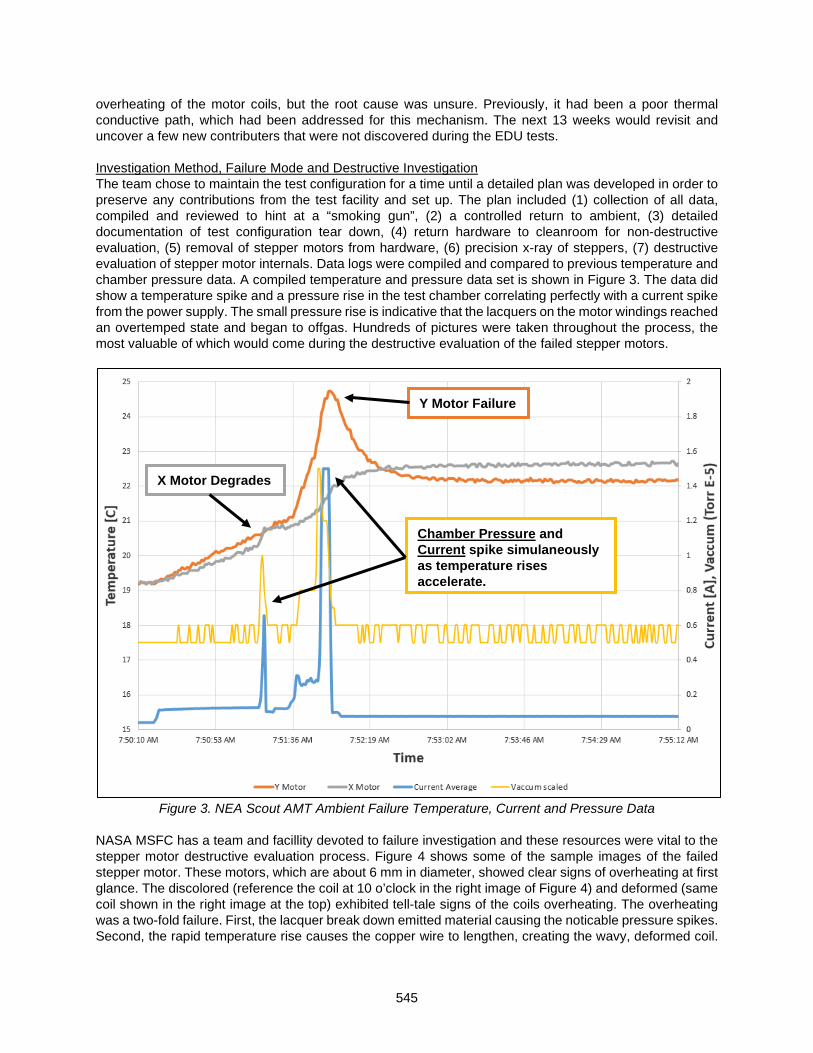
545
overheating of the motor coils, but the root cause was unsure. Previously, it had been a poor thermal conductive path, which had been addressed for this mechanism. The next 13 weeks would revisit and uncover a few new contributers that were not discovered during the EDU tests.
Investigation Method, Failure Mode and Destructive Investigation The team chose to maintain the test configuration for a time until a detailed plan was developed in order to preserve any contributions from the test facility and set up. The plan included (1) collection of all data, compiled and reviewed to hint at a “smoking gun”, (2) a controlled return to ambient, (3) detailed documentation of test configuration tear down, (4) return hardware to cleanroom for non-destructive evaluation, (5) removal of stepper motors from hardware, (6) precision x-ray of steppers, (7) destructive evaluation of stepper motor internals. Data logs were compiled and compared to previous temperature and chamber pressure data. A compiled temperature and pressure data set is shown in Figure 3. The data did show a temperature spike and a pressure rise in the test chamber correlating perfectly with a current spike from the power supply. The small pressure rise is indicative that the lacquers on the motor windings reached an overtemped state and began to offgas. Hundreds of pictures were taken throughout the process, the most valuable of which would come during the destructive evaluation of the failed stepper motors.
Figure 3. NEA Scout AMT Ambient Failure Temperature, Current and Pressure Data NASA MSFC has a team and facillity devoted to failure investigation and these resources were vital to the stepper motor destructive evaluation process. Figure 4 shows some of the sample images of the failed stepper motor. These motors, which are about 6 mm in diameter, showed clear signs of overheating at first glance. The discolored (reference the coil at 10 o’clock in the right image of Figure 4) and deformed (same coil shown in the right image at the top) exhibited tell-tale signs of the coils overheating. The overheating was a two-fold failure. First, the lacquer break down emitted material causing the noticable pressure spikes. Second, the rapid temperature rise causes the copper wire to lengthen, creating the wavy, deformed coil.
Y Motor Failure
X Motor Degrades
Chamber Pressure and Current spike simulaneously as temperature rises accelerate.
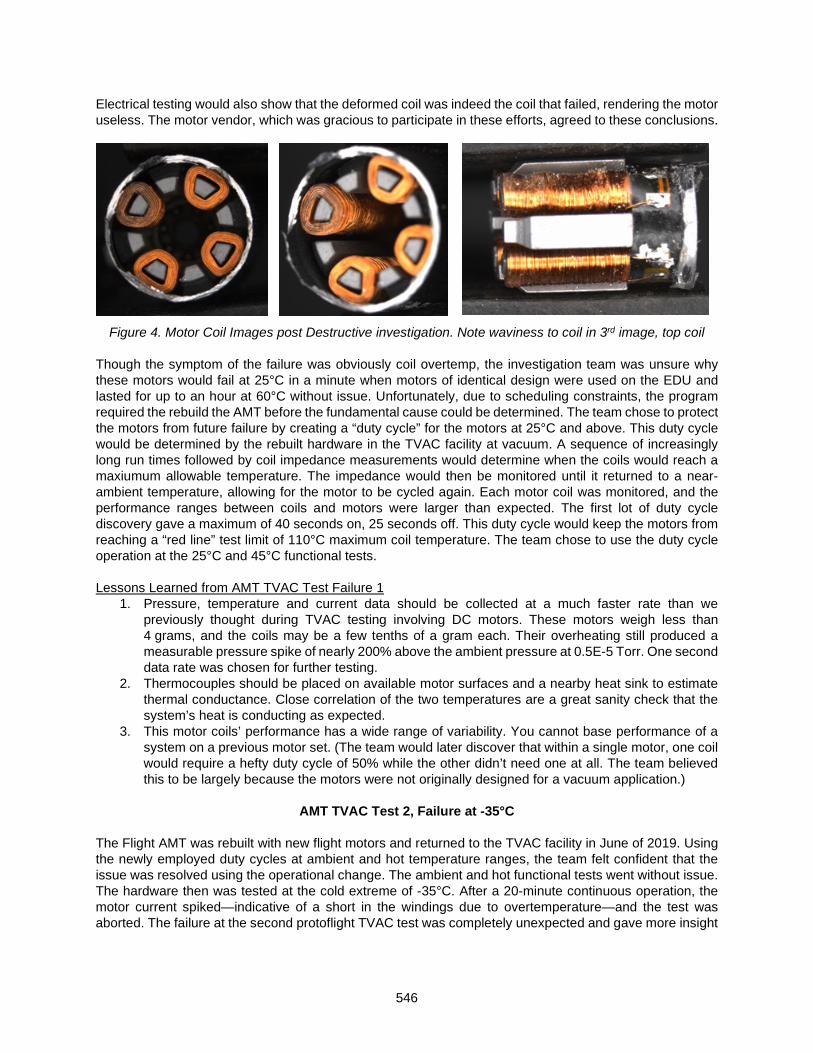
546
Electrical testing would also show that the deformed coil was indeed the coil that failed, rendering the motor useless. The motor vendor, which was gracious to participate in these efforts, agreed to these conclusions.
Figure 4. Motor Coil Images post Destructive investigation. Note waviness to coil in 3rd image, top coil
Though the symptom of the failure was obviously coil overtemp, the investigation team was unsure why these motors would fail at 25°C in a minute when motors of identical design were used on the EDU and lasted for up to an hour at 60°C without issue. Unfortunately, due to scheduling constraints, the program required the rebuild the AMT before the fundamental cause could be determined. The team chose to protect the motors from future failure by creating a “duty cycle” for the motors at 25°C and above. This duty cycle would be determined by the rebuilt hardware in the TVAC facility at vacuum. A sequence of increasingly long run times followed by coil impedance measurements would determine when the coils would reach a maxiumum allowable temperature. The impedance would then be monitored until it returned to a near-ambient temperature, allowing for the motor to be cycled again. Each motor coil was monitored, and the performance ranges between coils and motors were larger than expected. The first lot of duty cycle discovery gave a maximum of 40 seconds on, 25 seconds off. This duty cycle would keep the motors from reaching a “red line” test limit of 110°C maximum coil temperature. The team chose to use the duty cycle operation at the 25°C and 45°C functional tests. Lessons Learned from AMT TVAC Test Failure 1
1. Pressure, temperature and current data should be collected at a much faster rate than we previously thought during TVAC testing involving DC motors. These motors weigh less than 4 grams, and the coils may be a few tenths of a gram each. Their overheating still produced a measurable pressure spike of nearly 200% above the ambient pressure at 0.5E-5 Torr. One second data rate was chosen for further testing.
2. Thermocouples should be placed on available motor surfaces and a nearby heat sink to estimate thermal conductance. Close correlation of the two temperatures are a great sanity check that the system’s heat is conducting as expected.
3. This motor coils’ performance has a wide range of variability. You cannot base performance of a system on a previous motor set. (The team would later discover that within a single motor, one coil would require a hefty duty cycle of 50% while the other didn’t need one at all. The team believed this to be largely because the motors were not originally designed for a vacuum application.)
AMT TVAC Test 2, Failure at -35°C
The Flight AMT was rebuilt with new flight motors and returned to the TVAC facility in June of 2019. Using the newly employed duty cycles at ambient and hot temperature ranges, the team felt confident that the issue was resolved using the operational change. The ambient and hot functional tests went without issue. The hardware then was tested at the cold extreme of -35°C. After a 20-minute continuous operation, the motor current spiked—indicative of a short in the windings due to overtemperature—and the test was aborted. The failure at the second protoflight TVAC test was completely unexpected and gave more insight
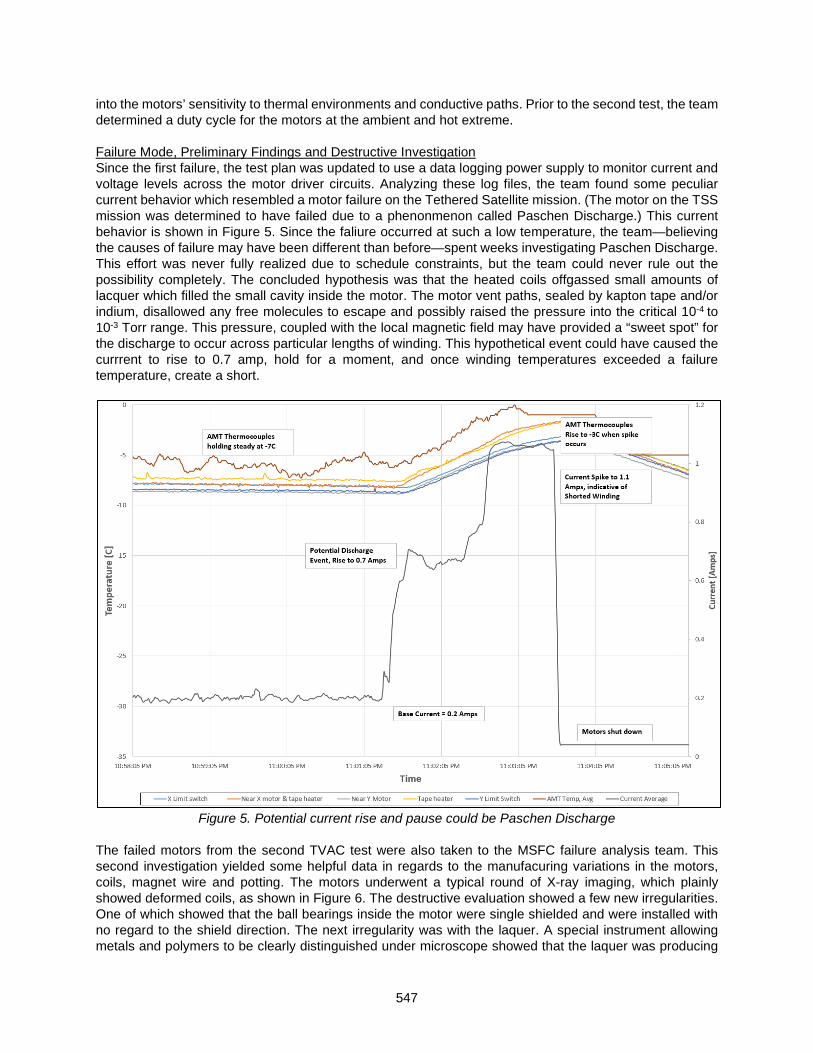
547
into the motors’ sensitivity to thermal environments and conductive paths. Prior to the second test, the team determined a duty cycle for the motors at the ambient and hot extreme. Failure Mode, Preliminary Findings and Destructive Investigation Since the first failure, the test plan was updated to use a data logging power supply to monitor current and voltage levels across the motor driver circuits. Analyzing these log files, the team found some peculiar current behavior which resembled a motor failure on the Tethered Satellite mission. (The motor on the TSS mission was determined to have failed due to a phenonmenon called Paschen Discharge.) This current behavior is shown in Figure 5. Since the faliure occurred at such a low temperature, the team—believing the causes of failure may have been different than before—spent weeks investigating Paschen Discharge. This effort was never fully realized due to schedule constraints, but the team could never rule out the possibility completely. The concluded hypothesis was that the heated coils offgassed small amounts of lacquer which filled the small cavity inside the motor. The motor vent paths, sealed by kapton tape and/or indium, disallowed any free molecules to escape and possibly raised the pressure into the critical 10-4 to 10-3 Torr range. This pressure, coupled with the local magnetic field may have provided a “sweet spot” for the discharge to occur across particular lengths of winding. This hypothetical event could have caused the currrent to rise to 0.7 amp, hold for a moment, and once winding temperatures exceeded a failure temperature, create a short.
Figure 5. Potential current rise and pause could be Paschen Discharge
The failed motors from the second TVAC test were also taken to the MSFC failure analysis team. This second investigation yielded some helpful data in regards to the manufacuring variations in the motors, coils, magnet wire and potting. The motors underwent a typical round of X-ray imaging, which plainly showed deformed coils, as shown in Figure 6. The destructive evaluation showed a few new irregularities. One of which showed that the ball bearings inside the motor were single shielded and were installed with no regard to the shield direction. The next irregularity was with the laquer. A special instrument allowing metals and polymers to be clearly distinguished under microscope showed that the laquer was producing

548
very large bubbles/voids in random areas. Figure 7 shows an image of a few bubbles or voids formed in the lacquer, either due to testing or remnant of manufacturing processes. This image, amongst others collected, also gave insight that the coil/stator design was not suitable for sustained use in vacuum. The most prominent detail noticed at this investigation was with the potting and mounting of the coils to the stator. The team assumed the coils were potted to the stator, but a coil was accidentally damaged and became detached from the stator. Upon further analysis, it became clear that each coil was potted to the stator in a single location, with a single dab of adhesive which was not especially thermally conductive. An example of this potting location is shown in Figure 8.
Figure 6. Deformed Stepper Motor Coil under X-ray
Figure 7. Coils under high magnification showing some evidence of voids in insulation

549
Figure 8. Potting location for coil to stator
The potting underdesign and presence of voids in wire insulation were clear signs that these motors were not well suited for a vacuum environment operation. The conductive paths from the windings to the motor casing were undersized, and the magnet wire had thin insulation. These findings paired with the manufacturing variance of the potting and insulation thickness made it clear that the motors would have to complete a more enhanced thermal acceptance testing to choose the more robust motors from a particular lot. Only after completing these tests could the motors be integrated into the flight hardware for an AMT subsystem TVAC test. The details of the acceptance and burn-in testing will be covered in the next section. Lessons Learned from AMT TVAC Test Failure 2
1. Motors intended for vacuum use should use coilwire with thicker vacuum compatible insualtion. Some vendors will twice or thrice dip their products for vacuum application.
2. Magnet wire defects such as thin insulation and voids/bubbles can be susceptible to first time-wide temperature swings (such as a first time run in vacuum).
3. Motor coils should be potted on all available surfaces to maximize thermal conduction. These motors, though advertised as vacuum rated, were contacting the stator in a single, potted location. This potting was analyzed and had little to no thermal conductive properties. The team’s thermal analyst would have assumed these coils to be relying on radiative cooling alone.
4. When using small (<15 mm) DC motors, or any motor from a non-flight rated vendor, a detailed motor thermal model should be developed to estimate a steady state temperature or a first cut duty cycle. Buy some motors, break them open, and figure out how the heat is conducting to the surface.
5. Acceptance testing in vacuum at the motor level is a must. Again, buy extra motors in case of failures.
6. Motors may be susceptible to discharge-related failures if the insulation offgasses due to rising temperatures.
Motor Conditioning and Burn-in Test Method
An initial effort was made to determine a method to recreate a Paschen Discharge. Exploring the variables that factor into achieving this effect led to the realization that the conditions could not be duplicated. Focus turned instead to preventive tactics. Ultimately every motor failure traced back to coil temperature, either by causing off-gassing that created an atmosphere to carry a discharge, or by outright melting the wire coatings, resulting in a short. This points to the wire coatings as the weakest link, and coating inconsistency between batches as one of the hurdles. A two-part approach was planned. First, develop a conditioning and vetting test series. Second, determine duty cycles to prevent coil overheating.

550
The conditioning tests were designed to gradually “burn in” the motors by incrementally heating and allowing to cool in vacuum. Coil temperatures would gradually approach but be kept below manufacturer’s rated value. This would theoretically allow “bubbles” in the wire coatings to work their way out gradually through softened coating material without leaving permanent damage. A duty cycle is determined as the amount of time the motor is allowed to run in a specific environment before forcing a rest/recovery period. The run and rest times were, in this case, selected to limit the coil maximum temperature, and cool to a minimum temperature selected by the team before running again. Determining duty cycles were actually a by-product of the conditioning test series, and were established and recorded along the way. This testing would also demonstrate each motor’s individual capability to survive operation in a vacuum environment. Overall performance during the test series would be used as a basis for ranking flight motor candidates. A sample of the motors final duty cycle is shown in Figure 9.
Figure 9. Duty cycles for AMT flight motor candidates at 25°C and 35°C.
The four motor candidates shown above were from the exact same vendor lot and were run with the same max allowable coil temps and cool down targets, but the duty cycles ranged from 36% to 57% at 25°C and 30% to 48% at 35°C. The previous use of thermocouples to monitor coil temperature was insufficient for closely monitoring the coil temperature due to the thermal lag through the motor casing, indium, and clamshell bracket to the thermocouple. Instead, the team turned to resistance measurements. Coil temperature correlates to motor impedance. Resistance of the coils was measured while the motor was off, and immediately being energized. Resistance-based temperature measurement was calculated for each coil, and verified against the chamber temperature prior to start of testing. More on this method is discussed in “Testing and Maturing a Mass Translating Mechanism for a Deep Space CubeSat” from the 44th Aerospace Mechanisms Symposium. For all motors not previously used in a vacuum, a standard vacuum bake-out was performed to reduce the amount of material that would offgas during the duty cycle and burn in testing. Test plan Three vacuum chamber temperatures were selected for duty cycle determination: room temperature (25°C), max operational tempature (45°C), and a mid value (35°C). Motors were mounted in a flight-like manner, wrapped in indium and installed in EDU chassis; no drive train hardware was included, allowing the motors to freely rotate. Maximum coil temperature and minimum cool-down temperatures were selected, and resistance was determined corresponding to each temperature. Two voltages were selected, the first being at the low-end of controller capability, the second at expected mission level. In this mission case, it was 9.8-12.0 V. Multiple voltages were selected to test the sensitivity of the coil maximum

551
temperatures to voltage supply. During testing, the team noticed that the motors actually ran hotter at a lower voltage. This was because the motor driver would send a higher current at the lower voltage, which was counter to intial assumptions. The assumed most favorable conditions were selected for the initial test, being lower voltage and coolest temperature. A duty cycle was determined, and then a total of 15 minutes of run time was performed at that duty cycle. The voltage was increased and the test repeated. Then chamber temperature was increased, and the test repeated for both voltages, and the entire series run again at the third chamber temperature. A duty cycle was recorded for each specific motor at the given voltage and chamber temperature in which it was determined, so that each motor had six duty cycles established. At the end of this series, the motor was considered “conditioned”. Duty Cycle Discovery Method
• Run motor for a few seconds • Measure and record all coil resistances immediately after operation ends. Recommend to have a
multimeter in the loop of the driver circuit. • Continue to monitor resistance until reading is below the cool-down value.
o Note that cooling in vacuum is asymptotic in nature. o Cooling to within 5-10°C of ambient gives a good restart point for the following cycles
• Run motor a few seconds longer than the previous run, depending on motor performance trends. o If the motor max coil temp is below maximum allowable, the following cycle can be longer o If the motor max temp is met or exceeded, either reduce the run time or extend the cool
down time. Again, note that extending the cool down time is more time expensive than reducing the on time.
• Continue until three runs are made with the same runtime, cool-down, and resistance values. This indicates a steady state duty cycle.
A sample of the Duty cycle discovery data is shown in Figure 10. The data shown in Figure 10 is extensive, but still reduced from the total data set (a sample of which is shown in Figure 11) the team used to finalize a duty cycle for flight operations. The most pertinent data is the red and green boxes, which show the increasing run and cool down times as the approach a final value. For the left sample, this time was about 20 second run time, followed by a 55 second cool down. The right sample had a 35 second run time and a 70 second cool down. The teal line shows the duty cycle as a percentage of run vs. cool down time. Note the differences between the two identical motors, further indicating some thermal differences resulting from manufacturing variance. A final data point of note is the light green line, showing the current draw during a duty cycle. The upward sloping nature during each on cycle is indicative of the heating coil. As the coil temp rises, the resistance does as well. The motor driver hardware sends more current as a response. The peaks of the green line during a cycle could be charted to give a maximum coil temp trend. The peaks remained horizontal for this data set, hinting that the coil temperature maximums were holding constant across the cycles. If the peaks were rising gradually, the coil temp could be assumed to be rising as well and the duty cycle could be adjusted accordingly. The same is true if the peaks were falling, except the coil temps would be decreasing and the duty cycle could be adjusted in kind.

552
Figure 10. Duty Cycle Data for two Stepper Motors
Motor Burn-in Following a duty cycle discovery run in a vacuum environment, the motors were run per the discovered duty cycle until 15 minutes of motor run time had occurred. Resistances and times for run and cool-down were recorded to verify that a long duration cycling would not overtemp the motor coils. This burn in time was used to help coil insulation material offgas at a slower, more controlled rate, and reduce any opportunity for an arcing event to occur. Further, the burn in time would reduce the thermal shock to the insualtion and reduce the risk of voids forming in the insulation.
AMT TVAC Test 3, Passed
The final flight TVAC test plan included even more data capturing requirements: (1) Local temperatures on AMT logged at 1 Hz, (2) Chamber control temperature taken logged at 1 Hz, (3) Chamber pressure logged at 1 Hz, (4) Motor circuit current and voltage data logged at 5 Hz, (5) Control Board Memory and Commands logged at 1 Hz and (6) Motor Winding impedances taken immediately after operation termination. These data sets were combined into a master data set where temperature, current, pressure, and operation speeds could be compared at each thermal cycle. An example of the combined sets is shown in Figure 11.
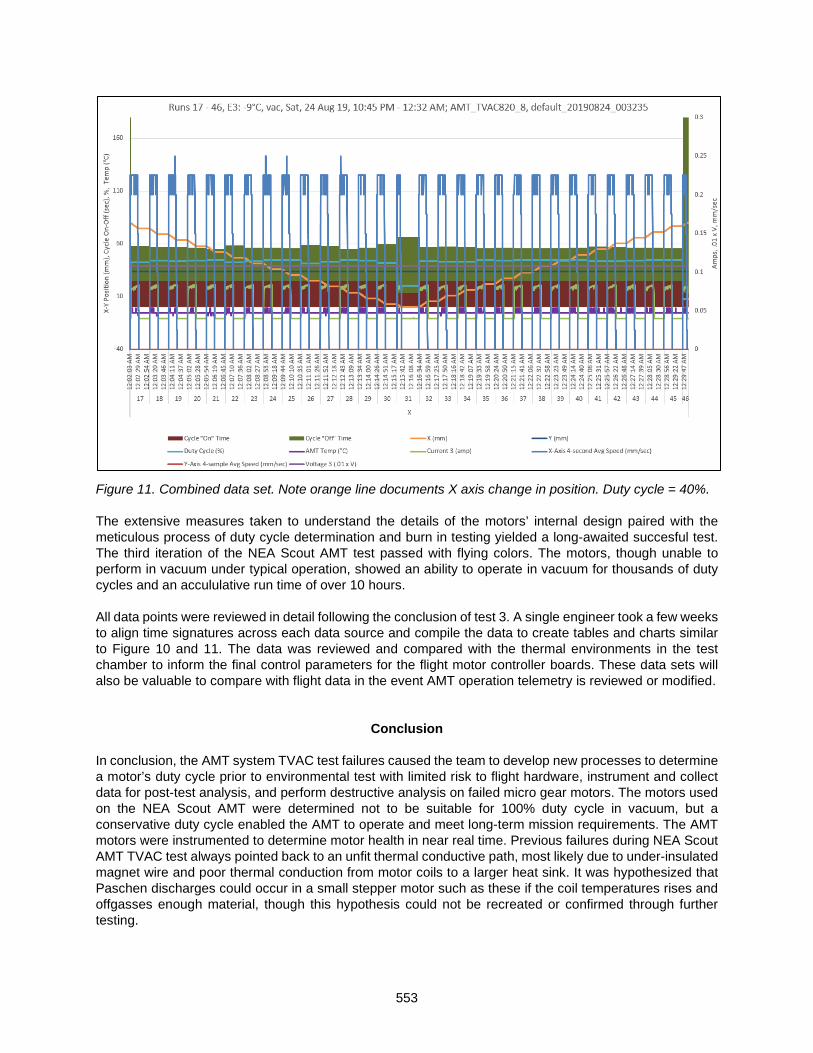
553
Figure 11. Combined data set. Note orange line documents X axis change in position. Duty cycle = 40%. The extensive measures taken to understand the details of the motors’ internal design paired with the meticulous process of duty cycle determination and burn in testing yielded a long-awaited succesful test. The third iteration of the NEA Scout AMT test passed with flying colors. The motors, though unable to perform in vacuum under typical operation, showed an ability to operate in vacuum for thousands of duty cycles and an accululative run time of over 10 hours. All data points were reviewed in detail following the conclusion of test 3. A single engineer took a few weeks to align time signatures across each data source and compile the data to create tables and charts similar to Figure 10 and 11. The data was reviewed and compared with the thermal environments in the test chamber to inform the final control parameters for the flight motor controller boards. These data sets will also be valuable to compare with flight data in the event AMT operation telemetry is reviewed or modified.
Conclusion
In conclusion, the AMT system TVAC test failures caused the team to develop new processes to determine a motor’s duty cycle prior to environmental test with limited risk to flight hardware, instrument and collect data for post-test analysis, and perform destructive analysis on failed micro gear motors. The motors used on the NEA Scout AMT were determined not to be suitable for 100% duty cycle in vacuum, but a conservative duty cycle enabled the AMT to operate and meet long-term mission requirements. The AMT motors were instrumented to determine motor health in near real time. Previous failures during NEA Scout AMT TVAC test always pointed back to an unfit thermal conductive path, most likely due to under-insulated magnet wire and poor thermal conduction from motor coils to a larger heat sink. It was hypothesized that Paschen discharges could occur in a small stepper motor such as these if the coil temperatures rises and offgasses enough material, though this hypothesis could not be recreated or confirmed through further testing.

554
Major Lessons Learned 1. A Commercial off the Shelf (COTS) non space-qualified motor could be used for flight purposes if
proper motor conditioning and duty cycling is determined in a comparable space environment 2. Any COTS non space-qualified motor should be destructively analyzed prior to use to accurately
create a thermal model. 3. TVAC tests including DC motors should log motor temperature, power supply current, power supply
voltage and chamber pressure at 1 second resolution, at minimum. 4. Motor internal pressure could increase to a pressure range suitable for arcing, discharging or
ionizing if magnet wire insualtion breaks down due to overtemperature conditions, leading to failure.
References
1. McNutt, L.; Johnson, L.; Clardy, D.; Castillo-Rogez, J.; Frick, A.; and L. Jones. “Near-Earth Asteroid Scout.” AIAA Space 2014 Conference; 4-7 Aug. 2014; San Diego, CA; United States.
2. Few, A.; “Development of a High Performance, Low Profile Translation Table with Wire Feedthrough for a Deep Space CubeSat.” 43rd Aerospace Mechanisms Symposia; 4-6 May 2016; San Jose, CA.; United States.
3. Few, A.; Lockett, T.; Wilson, R.; Boling, D.; and Loper, E.; “Testing and Maturing a Mass Translating Mechanism for a Deep Space CubeSat.” 44rd Aerospace Mechanisms Symposia; 16-18 May 2018; Cleveland, OH.; United States.

555
Design and Development of the GPM Solar Array Drive Assembly, Orbital Performance, and Lessons Learned
Alejandro Rivera*, Glenn Bock*, Alphonso Stewart**, Jon Lawrence**, Daniel Powers**,
Gary Brown** and Rodger Farley+
Abstract
The Global Precipitation Measurement (GPM) core spacecraft is a NASA/JAXA joint mission launched in 2014. Developed in-house at NASA GSFC, its deployable appendages include two large solar arrays each driven by a single axis solar array drive assembly and a gimbal equipped high gain antenna. Lessons learned from the Tropical Rainfall Measuring Mission (TRMM) –Y Solar Array Drive Assembly (SADA) anomaly and Lunar Reconnaissance Orbiter’s (LRO’s) thermal testing, influenced the design of the GPM Solar Array Drive Assemblies. This paper describes the TRMM anomaly, design and development aspects of the GPM SADA, its on-orbit health and performance, and finally techniques and orbital maintenance maneuvers followed by the Flight Operations Team to minimize drag, actuator cycles, and extend the life of the actuators and the mission itself.
Introduction
The GPM core spacecraft is a joint mission between the National Aeronautics and Space Administration (NASA) of the United States and the Japan Aerospace Exploration Agency (JAXA). It is a Low Earth Orbit (LEO) spacecraft launched on February 27, 2014 with a circular 407 km altitude and 65-degree inclination orbit selected to provide full global precipitation coverage updated every 24 hours. GPM succeeds the TRMM spacecraft launched in November 1997 that measured precipitation over tropical and subtropical regions, from the Mediterranean Sea (35° north latitude) to the southern tip of South Africa (35° south latitude). Measurements from GPM core, however, provide even greater coverage—between the Arctic Circle (65° north latitude) and the Antarctic Circle (65° south latitude). These measurements, combined with those from other polar-orbiting satellites in the GPM constellation, currently provide global precipitation datasets every three hours. This integrated approach and unified dataset helps advance scientists' understanding of Earth's water and energy cycle, produces enhanced forecasts of hurricanes, floods, and droughts, and helps enhance Earth’s climate models.
Figure 1. The GPM Core (left) and TRMM (right) Satellites
_________________________ * KBR Inc – Space Engineering Division, Greenbelt, MD ** NASA Goddard Space Flight Center, Greenbelt, MD + NASA Goddard Space Flight Center, Greenbelt, MD (Ret.)
Proceedings of the 45th Aerospace Mechanisms Symposium, NASA Johnson Space Center, 2020
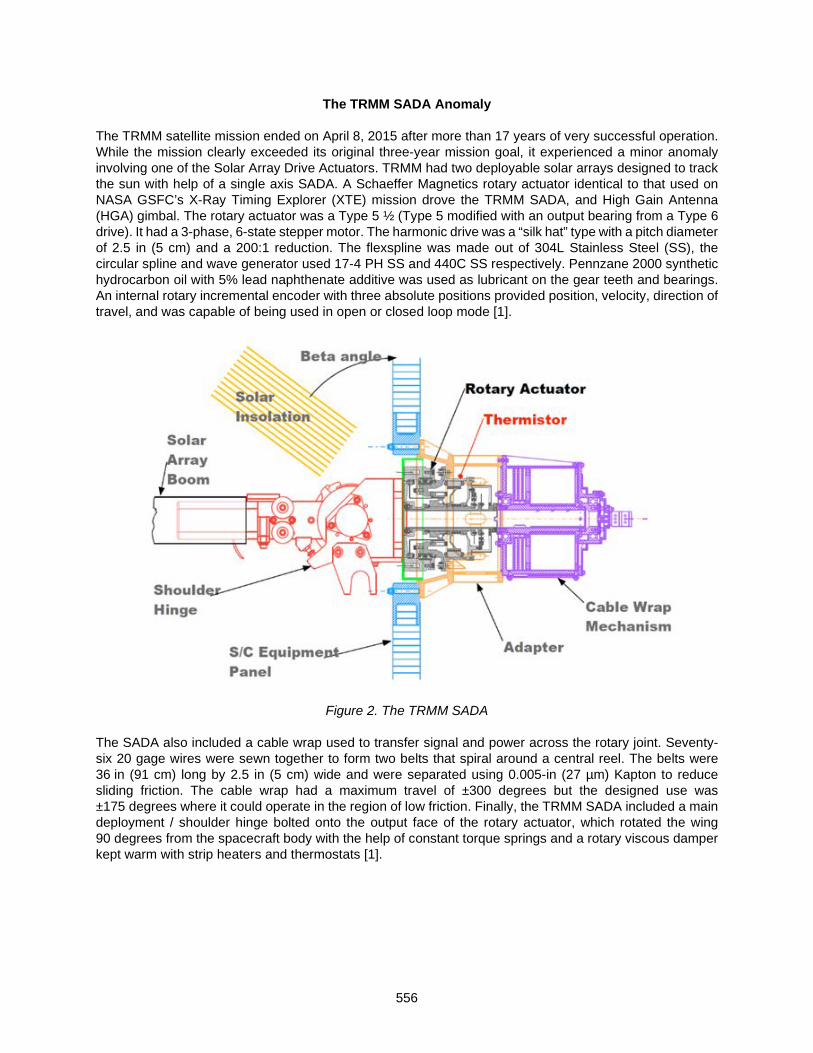
556
The TRMM SADA Anomaly The TRMM satellite mission ended on April 8, 2015 after more than 17 years of very successful operation. While the mission clearly exceeded its original three-year mission goal, it experienced a minor anomaly involving one of the Solar Array Drive Actuators. TRMM had two deployable solar arrays designed to track the sun with help of a single axis SADA. A Schaeffer Magnetics rotary actuator identical to that used on NASA GSFC’s X-Ray Timing Explorer (XTE) mission drove the TRMM SADA, and High Gain Antenna (HGA) gimbal. The rotary actuator was a Type 5 ½ (Type 5 modified with an output bearing from a Type 6 drive). It had a 3-phase, 6-state stepper motor. The harmonic drive was a “silk hat” type with a pitch diameter of 2.5 in (5 cm) and a 200:1 reduction. The flexspline was made out of 304L Stainless Steel (SS), the circular spline and wave generator used 17-4 PH SS and 440C SS respectively. Pennzane 2000 synthetic hydrocarbon oil with 5% lead naphthenate additive was used as lubricant on the gear teeth and bearings. An internal rotary incremental encoder with three absolute positions provided position, velocity, direction of travel, and was capable of being used in open or closed loop mode [1].
Figure 2. The TRMM SADA
The SADA also included a cable wrap used to transfer signal and power across the rotary joint. Seventy-six 20 gage wires were sewn together to form two belts that spiral around a central reel. The belts were 36 in (91 cm) long by 2.5 in (5 cm) wide and were separated using 0.005-in (27 µm) Kapton to reduce sliding friction. The cable wrap had a maximum travel of ±300 degrees but the designed use was ±175 degrees where it could operate in the region of low friction. Finally, the TRMM SADA included a main deployment / shoulder hinge bolted onto the output face of the rotary actuator, which rotated the wing 90 degrees from the spacecraft body with the help of constant torque springs and a rotary viscous damper kept warm with strip heaters and thermostats [1].

557
Figure 3. Sun’s View of TRMM SADA at high beta angle
An initial TRMM/XTE SADA rotary actuator qualification unit partial 1000-hr life test revealed that no signs of deterioration could be detected by any of the tests designed to monitor health (threshold voltage, output torque). But post-test inspection revealed significant amount of wear in the bearing to flexspline interface and the gear teeth. The 304L flexspline inner diameter had galled with the 440C bearing outer race, the inner race had slipped down the wave generator plug, and the Pennzane 2000 oil was no longer present [1]. As detailed in Reference 1, a series of changes were made and then a combined TRMM/XTE SADA life test that covered 1.1x full TRMM life (11 million output degrees of travel) was successfully completed. The TRMM –Y side array, was always on the sun, or warm side (TRMM performed routine yaw maneuvers to keep one spacecraft side toward the sun) and experienced temperatures greater than life test for substantial periods, while the +Y SADA on the cold side of the spacecraft, operated within predicted limits. Unfortunately, there was no operational way to reduce temperatures as the major heat input was from direct sun on the –Y SADA output flange and via conduction from the inboard boom and shoulder hinge. The excessive temperature resulted in increased (exponential) vaporization of lubricants, which are required for good lubrication of bearings and harmonic drive for proper actuator life. The original 1000-hour life test had proven that internal degradation may not be apparent from telemetry, i.e., there may be no warning until catastrophic failure so SADA could halt at some random position without notice. In September 2002 the –Y SADA showed first indication of impending failure as it was stuck during slew-to-feather for ~ 2 minutes. Prior to jamming, the SADA was also missing steps every 14 seconds during normal tracking (Figure 5). The TRMM team then decided to discontinue sun tracking and park the –Y SADA at the feathered horizontal position as a precaution to avoid the possibility of that array becoming stuck in a non-preferred position, which could have resulted in excessive drag.
Figure 4. –Y SADA operated hotter than expected during mission

558
Figure 5. –Y SADA Anomaly: Prior to jamming for ~2 min, actuator was missing steps during tracking
This lack of sun tracking with the -Y solar array led to slightly less available power, but still allowed sufficient power for nominal operations of all working instruments. In 2003, the TRMM team had to decide whether the +Y SADA could reliably be expected to continue operating normally until fuel considerations forced controlled reentry to be initiated. An anomaly investigation resulted in thorough lubricant loss, thermal and life analyses being performed. Key aspects taken into account included the fact that the most critical temperatures are at the harmonic drive wave generator bearing / flex spline / circular spline interface, and the outboard motor bearing. Thermal analysis assumed thermal conductivity value across ball bearings taking advantage of oil meniscus spanning each ball/race interface. As lubricant is driven off, meniscus supports less heat flow, creating higher thermal resistance and thus higher temperatures.
Figure 6. TRMM SADAs Lubricant Loss Analysis
This can lead to a runaway condition where balls eventually run dry. It is then possible that the –Y SADA lost lubricant and the dry running may have generated particles. Stainless steel wear particles generated can become ferro- magnetic due to work hardening. They can then be attracted to motor magnets and may clog the small air gap between coils and magnets. Without torque multiplication at the output, the motor may permanently jam. Another source of possible failure was the precipitation of lead naphthenate high-
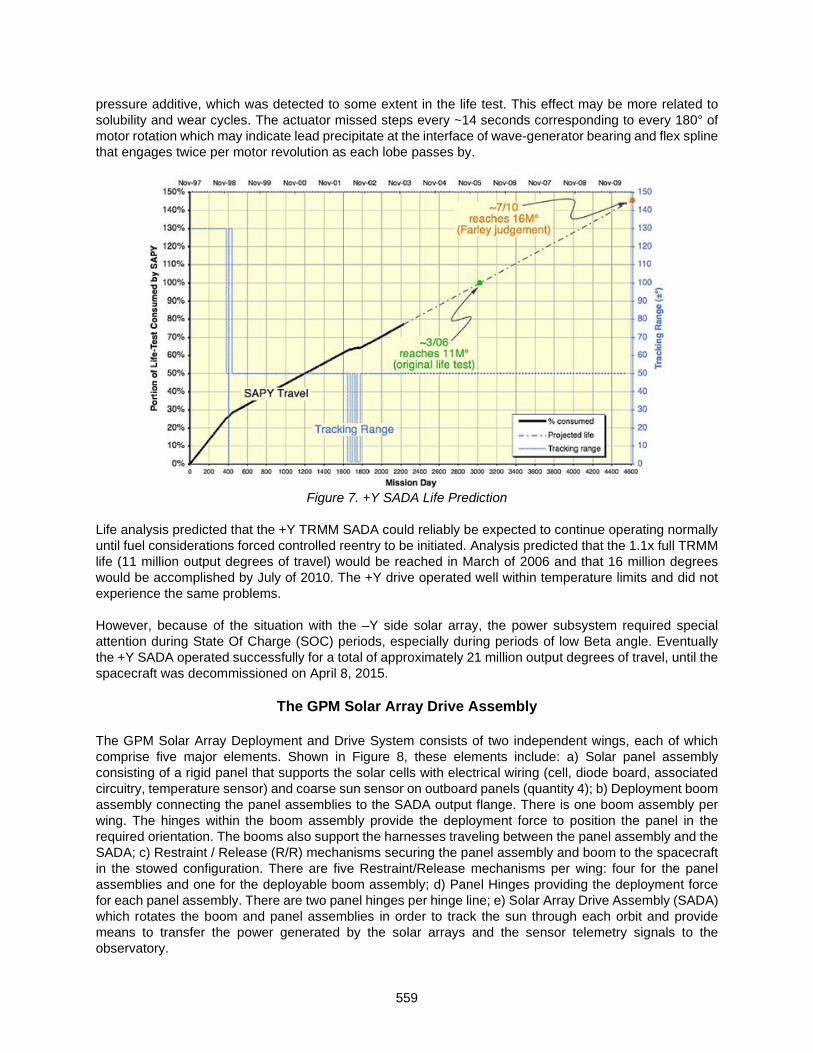
559
pressure additive, which was detected to some extent in the life test. This effect may be more related to solubility and wear cycles. The actuator missed steps every ~14 seconds corresponding to every 180° of motor rotation which may indicate lead precipitate at the interface of wave-generator bearing and flex spline that engages twice per motor revolution as each lobe passes by.
Figure 7. +Y SADA Life Prediction
Life analysis predicted that the +Y TRMM SADA could reliably be expected to continue operating normally until fuel considerations forced controlled reentry to be initiated. Analysis predicted that the 1.1x full TRMM life (11 million output degrees of travel) would be reached in March of 2006 and that 16 million degrees would be accomplished by July of 2010. The +Y drive operated well within temperature limits and did not experience the same problems. However, because of the situation with the –Y side solar array, the power subsystem required special attention during State Of Charge (SOC) periods, especially during periods of low Beta angle. Eventually the +Y SADA operated successfully for a total of approximately 21 million output degrees of travel, until the spacecraft was decommissioned on April 8, 2015.
The GPM Solar Array Drive Assembly The GPM Solar Array Deployment and Drive System consists of two independent wings, each of which comprise five major elements. Shown in Figure 8, these elements include: a) Solar panel assembly consisting of a rigid panel that supports the solar cells with electrical wiring (cell, diode board, associated circuitry, temperature sensor) and coarse sun sensor on outboard panels (quantity 4); b) Deployment boom assembly connecting the panel assemblies to the SADA output flange. There is one boom assembly per wing. The hinges within the boom assembly provide the deployment force to position the panel in the required orientation. The booms also support the harnesses traveling between the panel assembly and the SADA; c) Restraint / Release (R/R) mechanisms securing the panel assembly and boom to the spacecraft in the stowed configuration. There are five Restraint/Release mechanisms per wing: four for the panel assemblies and one for the deployable boom assembly; d) Panel Hinges providing the deployment force for each panel assembly. There are two panel hinges per hinge line; e) Solar Array Drive Assembly (SADA) which rotates the boom and panel assemblies in order to track the sun through each orbit and provide means to transfer the power generated by the solar arrays and the sensor telemetry signals to the observatory.

560
Figure 8. The GPM Solar Array Deployment and Drive System
The design of the GPM SADA was driven mostly by structural, thermal, and life / Number of cycles considerations: structural as it had to help meet the 0.6 Hz minimum fundamental frequency for the largest Solar Arrays every built at NASA Goddard with a inertial load of 255 kg-m2; thermal as it had to ensure the actuator was kept within its acceptable temperature limits to prevent the issues that caused the TRMM –Y SADA anomaly we previously described; and life as it had a requirement of 17,500 cycles ~ 8,750,000°. The GPM Solar Array Drive Assembly consists of 4 main subsystems: electro-mechanical (rotary actuator), structural (actuator output & Harmonic Drive (HD), spacecraft and hinge interface plates), thermal (radiators, hinge interface plate, and thermal tube), and harness management (cable wrap). The rotary actuator designed and manufactured by Sierra Nevada Corporation’s (SNC) Durham, NC facility, is comprised of a three-phase redundant stepper motor with a 200:1 reduction, a Size 25 T-Cup harmonic drive gearbox, with position feedback provided by integral redundant coarse and fine optical encoders. The actuators provide positioning within the SADA. The GPM SADA actuator has two hard stops limiting travel to ±125° and it uses a SuperDuplex™ thin section output bearing lubricated with Pennzane 2001-3PbNp oil and 2000-3PbNp grease. GPM’s structural, thermal, and life requirements were considerably more severe than previous NASA missions that had used this same type of SNC rotary actuator (SDO, LRO).
Figure 9. The GPM Solar Array Drive Assembly
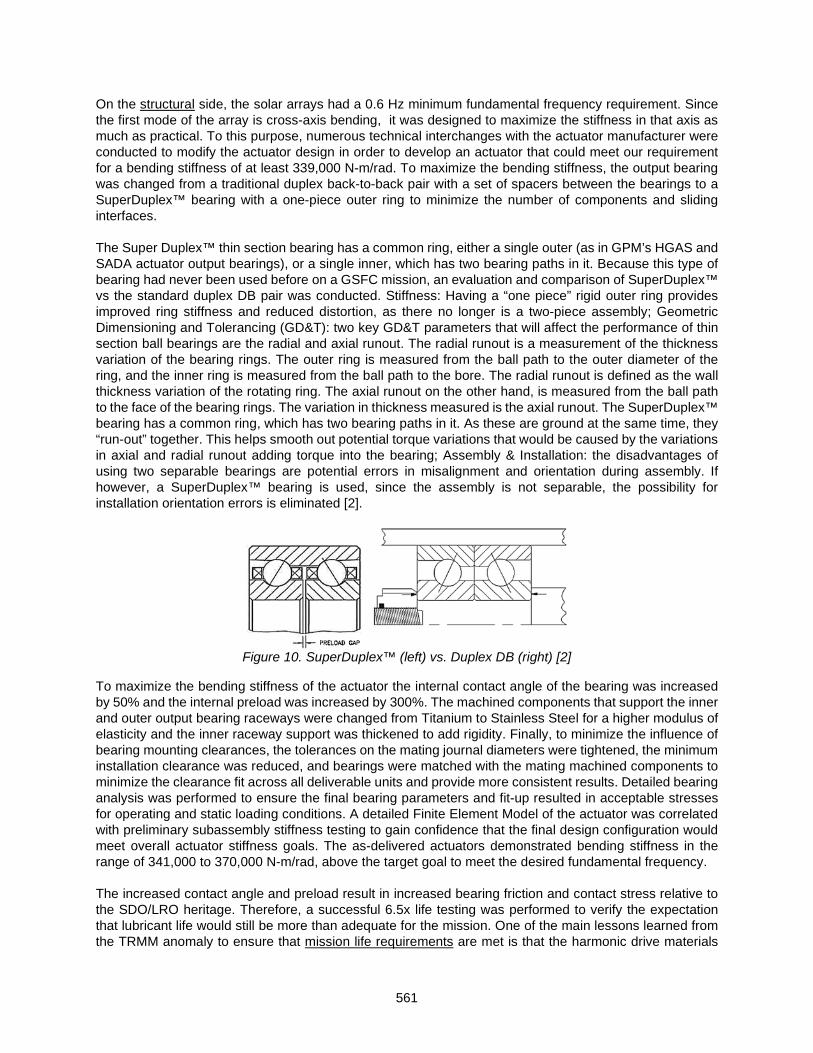
561
On the structural side, the solar arrays had a 0.6 Hz minimum fundamental frequency requirement. Since the first mode of the array is cross-axis bending, it was designed to maximize the stiffness in that axis as much as practical. To this purpose, numerous technical interchanges with the actuator manufacturer were conducted to modify the actuator design in order to develop an actuator that could meet our requirement for a bending stiffness of at least 339,000 N-m/rad. To maximize the bending stiffness, the output bearing was changed from a traditional duplex back-to-back pair with a set of spacers between the bearings to a SuperDuplex™ bearing with a one-piece outer ring to minimize the number of components and sliding interfaces. The Super Duplex™ thin section bearing has a common ring, either a single outer (as in GPM’s HGAS and SADA actuator output bearings), or a single inner, which has two bearing paths in it. Because this type of bearing had never been used before on a GSFC mission, an evaluation and comparison of SuperDuplex™ vs the standard duplex DB pair was conducted. Stiffness: Having a “one piece” rigid outer ring provides improved ring stiffness and reduced distortion, as there no longer is a two-piece assembly; Geometric Dimensioning and Tolerancing (GD&T): two key GD&T parameters that will affect the performance of thin section ball bearings are the radial and axial runout. The radial runout is a measurement of the thickness variation of the bearing rings. The outer ring is measured from the ball path to the outer diameter of the ring, and the inner ring is measured from the ball path to the bore. The radial runout is defined as the wall thickness variation of the rotating ring. The axial runout on the other hand, is measured from the ball path to the face of the bearing rings. The variation in thickness measured is the axial runout. The SuperDuplex™ bearing has a common ring, which has two bearing paths in it. As these are ground at the same time, they “run-out” together. This helps smooth out potential torque variations that would be caused by the variations in axial and radial runout adding torque into the bearing; Assembly & Installation: the disadvantages of using two separable bearings are potential errors in misalignment and orientation during assembly. If however, a SuperDuplex™ bearing is used, since the assembly is not separable, the possibility for installation orientation errors is eliminated [2].
Figure 10. SuperDuplex™ (left) vs. Duplex DB (right) [2]
To maximize the bending stiffness of the actuator the internal contact angle of the bearing was increased by 50% and the internal preload was increased by 300%. The machined components that support the inner and outer output bearing raceways were changed from Titanium to Stainless Steel for a higher modulus of elasticity and the inner raceway support was thickened to add rigidity. Finally, to minimize the influence of bearing mounting clearances, the tolerances on the mating journal diameters were tightened, the minimum installation clearance was reduced, and bearings were matched with the mating machined components to minimize the clearance fit across all deliverable units and provide more consistent results. Detailed bearing analysis was performed to ensure the final bearing parameters and fit-up resulted in acceptable stresses for operating and static loading conditions. A detailed Finite Element Model of the actuator was correlated with preliminary subassembly stiffness testing to gain confidence that the final design configuration would meet overall actuator stiffness goals. The as-delivered actuators demonstrated bending stiffness in the range of 341,000 to 370,000 N-m/rad, above the target goal to meet the desired fundamental frequency. The increased contact angle and preload result in increased bearing friction and contact stress relative to the SDO/LRO heritage. Therefore, a successful 6.5x life testing was performed to verify the expectation that lubricant life would still be more than adequate for the mission. One of the main lessons learned from the TRMM anomaly to ensure that mission life requirements are met is that the harmonic drive materials
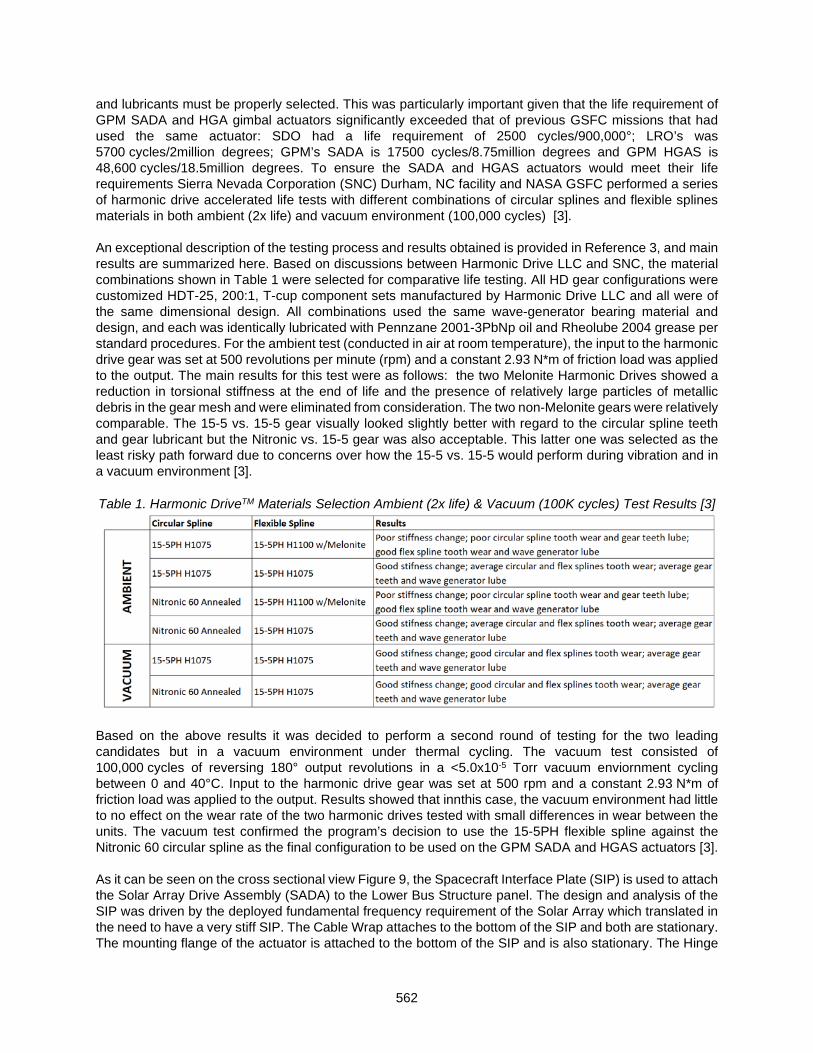
562
and lubricants must be properly selected. This was particularly important given that the life requirement of GPM SADA and HGA gimbal actuators significantly exceeded that of previous GSFC missions that had used the same actuator: SDO had a life requirement of 2500 cycles/900,000°; LRO’s was 5700 cycles/2million degrees; GPM’s SADA is 17500 cycles/8.75million degrees and GPM HGAS is 48,600 cycles/18.5million degrees. To ensure the SADA and HGAS actuators would meet their life requirements Sierra Nevada Corporation (SNC) Durham, NC facility and NASA GSFC performed a series of harmonic drive accelerated life tests with different combinations of circular splines and flexible splines materials in both ambient (2x life) and vacuum environment (100,000 cycles) [3]. An exceptional description of the testing process and results obtained is provided in Reference 3, and main results are summarized here. Based on discussions between Harmonic Drive LLC and SNC, the material combinations shown in Table 1 were selected for comparative life testing. All HD gear configurations were customized HDT-25, 200:1, T-cup component sets manufactured by Harmonic Drive LLC and all were of the same dimensional design. All combinations used the same wave-generator bearing material and design, and each was identically lubricated with Pennzane 2001-3PbNp oil and Rheolube 2004 grease per standard procedures. For the ambient test (conducted in air at room temperature), the input to the harmonic drive gear was set at 500 revolutions per minute (rpm) and a constant 2.93 N*m of friction load was applied to the output. The main results for this test were as follows: the two Melonite Harmonic Drives showed a reduction in torsional stiffness at the end of life and the presence of relatively large particles of metallic debris in the gear mesh and were eliminated from consideration. The two non-Melonite gears were relatively comparable. The 15-5 vs. 15-5 gear visually looked slightly better with regard to the circular spline teeth and gear lubricant but the Nitronic vs. 15-5 gear was also acceptable. This latter one was selected as the least risky path forward due to concerns over how the 15-5 vs. 15-5 would perform during vibration and in a vacuum environment [3]. Table 1. Harmonic DriveTM Materials Selection Ambient (2x life) & Vacuum (100K cycles) Test Results [3]
Based on the above results it was decided to perform a second round of testing for the two leading candidates but in a vacuum environment under thermal cycling. The vacuum test consisted of 100,000 cycles of reversing 180° output revolutions in a <5.0x10⁻⁵ Torr vacuum enviornment cycling between 0 and 40°C. Input to the harmonic drive gear was set at 500 rpm and a constant 2.93 N*m of friction load was applied to the output. Results showed that innthis case, the vacuum environment had little to no effect on the wear rate of the two harmonic drives tested with small differences in wear between the units. The vacuum test confirmed the program’s decision to use the 15-5PH flexible spline against the Nitronic 60 circular spline as the final configuration to be used on the GPM SADA and HGAS actuators [3]. As it can be seen on the cross sectional view Figure 9, the Spacecraft Interface Plate (SIP) is used to attach the Solar Array Drive Assembly (SADA) to the Lower Bus Structure panel. The design and analysis of the SIP was driven by the deployed fundamental frequency requirement of the Solar Array which translated in the need to have a very stiff SIP. The Cable Wrap attaches to the bottom of the SIP and both are stationary. The mounting flange of the actuator is attached to the bottom of the SIP and is also stationary. The Hinge

563
Interface Plate (HIP) on the other hand is mounted on the top of the actuator output and it rotates with it. The HIP provides an interface between the actuator and the shoulder hinge. It blocks the sun from the actuator output, and it also provides some bending stiffness. The design of the thermal radiator from the structural point of view was driven by the minimum fundamental frequency requirement of 100 Hz. SADA structural design was both simple and effective. The solar array loads travel through the shoulder hinge and the HIP to the output of the actuator, and then out to the lower bus structure through the SIP. The cable wrap inertial loads are transferred to the SIP via the cable wrap housing. The following load cases were analyized using finite element analysis: 22 Gs in X,Y,Z (Mass Acceleration Curve loads); 2050 N shear, 440 N axial, 290 N-m moment (Combined Qual Limit Loads); 55°C and -15°C (thermal stress). Stress analysis showed positive margins of safety on yield and ultimate for all components.
Figure 11. Cross Section View of SADA Finite Element Model
A superb thermal design was of critical importance for the succesful operation of the SADA which had to handle the thermal load due solar cell power, motor, and solar impingement. On top of the previously described issues experienced during the TRMM mission, the GPM SADA thermal design was also driven by lessons learned from the LRO mission. During the LRO observatory level testing it was discovered that the rotary actuators were exceeding their temperature limits as the power loses (P=I2R) within the solar array harness were very significant and dumping heat direclty into the actuator. Modifications to the LRO SADA during and after thermal vacuum testing, such as adding radiators and removing Multi-Layer Insulation blankets still did not resolve the issues. This resulted in LRO having to make major changes to the on-orbit solar array operations to ensure functionality of the actuators. Furthermore, GPM had close to two times the solar array harness power as LRO and 3 times the mission life. Due to this, the GPM SADA underwent a significant design effort to accommodate the motor power, harness heating, and extreme environment.
Table 2. Key thermal requirements
The actuator design could not be modified due to contract with the vendor. Thermal design was then focused around the rest of the SADA components. Coatings and tapes were applied on the Hinge Interface Plate, Cable Wrap Housing / end plate, spools, as shown in Figure 12. A large radiator was attached to the

564
edge of the Spacecraft Interface Plate as shown in Figure 9. The cable wrap was modified to absorb / reject the heat generated within the harness: an aluminum thermal tube extends into the actuator quil shaft to isolate the harness from the quill shaft; the Cable Wrap housing is directly attached to the Interface Plate instead of the actuator’s accessory flange for direct heat path to the radiator; a 3-piece Titanium spool is used to isolate the Cable Wrap bearings from harness heat, minimize bearing gradients, and minimize thermal expansion loads into the Cable Wrap bearings; heat straps going from the Cable Wrap housing to the lower bus structure were added to help stabilize any transient temperature swings, and provide a stable, well-characterized heat sink; the Cable Wrap bearings use Pennzane lubricant instead of Braycote. This was consistent with the actuator bearings to ensure no cross contamination of lubricants. Also, Pennzane has more restrictive temperature limits but longer life than Braycote.
Figure 12. GPM SADA Thermal Design
The Cable Wrap (CW) acts as the harness management device. It allows electrical & power signal wires to pass across the rotational joint with no relative harness motion external to the housing. The CW Mechanism is driven by actuator motion / rotation of the Solar Array. Both are connected using an Oldham type coupling with the female portion attached to the actuator quill shaft, and the male side attached to the cable wrap spool subassembly. This coupling design allows for positional, linear, and angular misalingments between the CW and the Actuator and transmits torque without placing side loads to either shaft. Invidivual wires are sewn together to form two belts that spiral around a central rotating spool. This ribbon portion of the harness is clamped to both the rotating spool and the CW housing as shown in Figure 13. By “mechanically grounding” the ribbon harnessing to the housing and rotating spool, in addition to “mechanically grounding” the round bundle to the S/A boom, all motion of the harness occurs within the Cable Wrap housing as “winding & unwinding” in a spiral motion about the rotating spool [4].
Figure 13. GPM Cable Wrap Transversal Section [4]

565
These two arm spiral wrap transitions to a round bundle to pass through the actuator quill shaft, and communicates 166 wires (132 power & 34 signal) across the rotary joint to the Solar Array. The two main belts are separated by a .25-mm (0.010-in) thick sheet of Kapton which minimizes the sliding friction between the belts and their Dacron stiches. The GPM Cable Wrap has a rotation capability of ±178° (where it either winds completely on the inner diameter or out on the outer diameter) in excess of the ±120° requirement to minimize the bending stresses on the belts and allow it to operate in the ‘sweet spot’ region of low friction. Harnessing is clamped to a 3-piece spool assembly (for ease of manufacturing) made out of Titanium. The spool is supported by two radial bearings slip fit to the housing and spool end fittings. The forward bearing is axially constrained whereas the aft one is not, to allow for spool assembly tolerance stack-up and thermal growth. Bearing inner races are clamped to the spool end fittings and forward bearing outer race is clamped to the CW housing. Because there is a 20°C gradient across the bearing races a problem arises due to the differences in Coefficients of Thermal Expansion (CTE) between the bearing races (Stainless Steel 440C), CW housing (Al-6061-T6), and the CW spool (Ti-6Al-4V) which required a 0.0005 – 0.0008 in (13 – 20 µm) radial play [4].
Figure 14. Cable Wrap Radial Bearings [4]
Over large temperature gradients such as the ones that the CW experiences, the clearances between the components in contact with the bearing can be eliminated and excessive loads could be transmitted into the bearing, loads which could potentially cause brinelling of the its races. For of this reason it is very important to make sure the right tolerancing is used at the inner and outer race interfaces. A thorough bearing thermal stress analysis was performed that took into consideration the compression of the bearings’ outer race due to the CTE mismatch (6061-T6 vs. SS440C) at this interface; contraction of the bearing’s outer race bore (where it contacts the ball) due to this mismatch and associated loss of radial play; and loss of radial play across entire temperature range (0 – 60°C) due to a 20°C temperature gradient between inner and outer race. Since there was interest in looking at possible interferences due to thermal growth because of CTE mismatches that could generate stresses on the bearing, the worst scenario for this condition was chosen: max. spool Outer Diameter (OD) vs. min bearing Inner diameter (ID) and min CW housing ID vs. maximum bearing OD. Analysis showed that even after loss of radial play the highest mean contact Hertzian Stress that the bearing balls saw was 6.5*108 Pa which was well below the 2.4*109 Pa that would cause brinelling on the races.
SADA On-Orbit Performance The GPM Core Observatory as seen in Figure 8 operates in a near circular orbit of approximately 407 km with a 65-degree inclination. It is a three-axis stabilized spacecraft, nadir pointing for instrument observation of the Earth and its atmosphere, with the X-axis aligned with the velocity vector. Depending on Solar Beta angle, GPM flips 180 degrees in yaw such that it flies with either the +X or –X axis forward. However, since it has thrusters on both sides, it can execute maneuvers in both orientations without slewing. GPM’s orbit

566
was chosen to optimize science data capture for the platform’s Dual-frequency Precipitation Radar (DPR) and GPM Microwave Imager instruments and provide coordination with GPM Mission partner satellites. Both the Semi-Major Axis and Eccentricity requirement tolerance allowes for the geodetic height (HGT) of the Core Observatory to be maintained within 397 km to 419 km for effective DPR operation and minimize the altitude variation per latitude crossing over the life of the mission. The inclined (65 degrees) non-sun-synchronous orbit allows the observatory to sample precipitation across all hours of the day from the Tropics to the Arctic and Antarctic Circles, and expand on the observations performed by TRMM, the Core Observatory’s predecessor. The Flight Operations Team (FOT) manages the fuel usage based on an orbital maintenance plan derived from these parameters [5].
Table 3. GPM Core Spacecraft Orbit Parameters [5]
Maintaining the orbit to these constraints required the FOT to perform orbit maintenance maneuvers as the orbit experienced changes due to predictable Earth perturbations and the impact of flying in a variable drag environment while optimizing fuel usage and actuator cycles. The first type of maneuver was a prograde delta-V maneuver in the velocity direction to boost GPM up into a higher orbit. This is referred to as a drag-makeup maneuver and is used to increase the SC’s altitude after atmospheric drag has caused orbit to decay down to the bottom of the required control box. The second is due to the eccentricity requirement. GPM has a tight eccentricity requirement such that orbit remains very near circular. They only way eccentricity can be fixed is by preforming a maneuver, however if the SC is already at the top of the required control box then it can’t go up any higher, and a retrograde maneuver must be done. These are done on an as needed basis. Solar activity is a key factor. During periods of high activity the atmosphere expands, resulting in higher drag and faster orbital decay. The opposite takes place when it is low.
Figure 15: GPM Mission Solar Array Tracking Profiles vs Beta Angle
Hence, per pre-launch analysis, the mission was expecting to plan and perform orbit maintenance maneuvers as frequently as once a week during high solar activity, and as infrequently as every eight weeks during low solar activity. Indeed, for the first few months post-launch, maneuvers were performed once a week in the higher drag conditions as predicted. The solar array tracking profile used during this period was Profile G as shown in Figure 15. During the on-orbit check-out phase the senior engineers determined that the solar arrays performance was more than adequate to recharge the batteries and provide power to the bus, thus a few of the solar array feathering profiles were tested on board to optimize the input power and drag induced. After a few months of testing, the low drag profile known as Profile K was selected in August of 2014. This change, coupled with the solar flux dropping slowly as the mission months passed, allowed for the maneuver frequency to slowly change from once a week to roughly once a month [5]. The periods of extreme low solar activity with low drag allows for more orbital eccentricity growth between maneuvers. And for any one maneuver during this time (constrained by an upper altitude limit), the eccentricity cannot be reduced sufficiently. Hence the Drag Make-Up maneuvers required to maintain the Semi-Major Axis within tolerances were both too infrequent and of insufficient size to control the eccentricity.

567
The FOT needed to develop an option that would allow GPM to control eccentricity growth without violating the geodetic height requirements, or at least one that would minimize loss of science for the remainder of the prime mission. Solution proposed was to increase GPM’s drag area profile by unfeathering the solar arrays panels. Similar to how the array profile was changed during early orbit check out to reduce drag, the FOT could change the array profile to one that could create sufficient drag needed to lower the spacecraft’s geodetic height faster than the growth of the eccentricity. The benefit would be that no additional maneuvers would be required to maintain orbit requirements. The predicted analysis showed that using the largest drag profile, profile G, the eccentricity requirement could be maintained for several months. Hence, as shown in Figure 16, in August 2016 the Tracking Profile was changed back to G [5].
Figure 16. -Y and +Y SADA Tracking Profiles used since launch date
When using Profile G, trending was showing the SA profile induced additional cycles on the SA actuators, thus putting an unnecessary strain and risk to the spacecraft. Pre-launch analysis predicted that 3-years into the mission the Solar Arrays would cycle (out and back) around 18,000 times per wing. This was seen as unnecessary and so a switch was made to profile K. Due to the switching from the Profile G to the Profile K control table early after launch the +Y gimbal had only reached just under 5000 cycles, and the -Y gimbal had reached just under 9000 cycles. While the FOT trending of the systems shows no signs of motor degradation or slippage, the concern for staying on Profile G indefinitely was that the result in a large number of cycles could potentially lead to a solar array drive failure before the fuel projected mission end of life [5]. The concern was prompted from lessons learned from GPM’s predecessor TRMM. Returning to the G Profile to increase drag was resulting in a faster increase in the number of cycles which increased the chance of solar array drive failure before fuel ran out. The rate can be observed in Figure 16, where the green trend represents the number of cycles that would have been encountered if continuous tracking had been used since launch and the red trend is what was actually used when the FOT switched between G and K with G being the portion with higher slope. While the orbit requirements were being maintained under Profile G, in addition to the increased number of cycles, Profile G was discovered to cause hardware concerns with the solar arrays at certain beta angles as sunlight was able to reach parts of the SC that had not previously when solar arrays were fixed, resulting to temperature spikes on SADA [5]. The decision to move away from Profile G was finally aided by the fact that while the increase in drag helped in maintaining the requirements for the first eight months after implementation, future predictions showed that the continual drop in solar activity would ultimately result in repeated violations of the mission requirements starting in early spring of 2017. Therefore, in May of 2017, the tracking profile was switched back to Profile K and continued since. This current profile maximizes the amount of feathering, aimed to reduce the drag caused by the large solar panels during flight by strategically positioning the two wings alternatively depending on the beta angle variations. Feathering the wings minimizes the projected area in
G
G
K
K
K
K
G
G
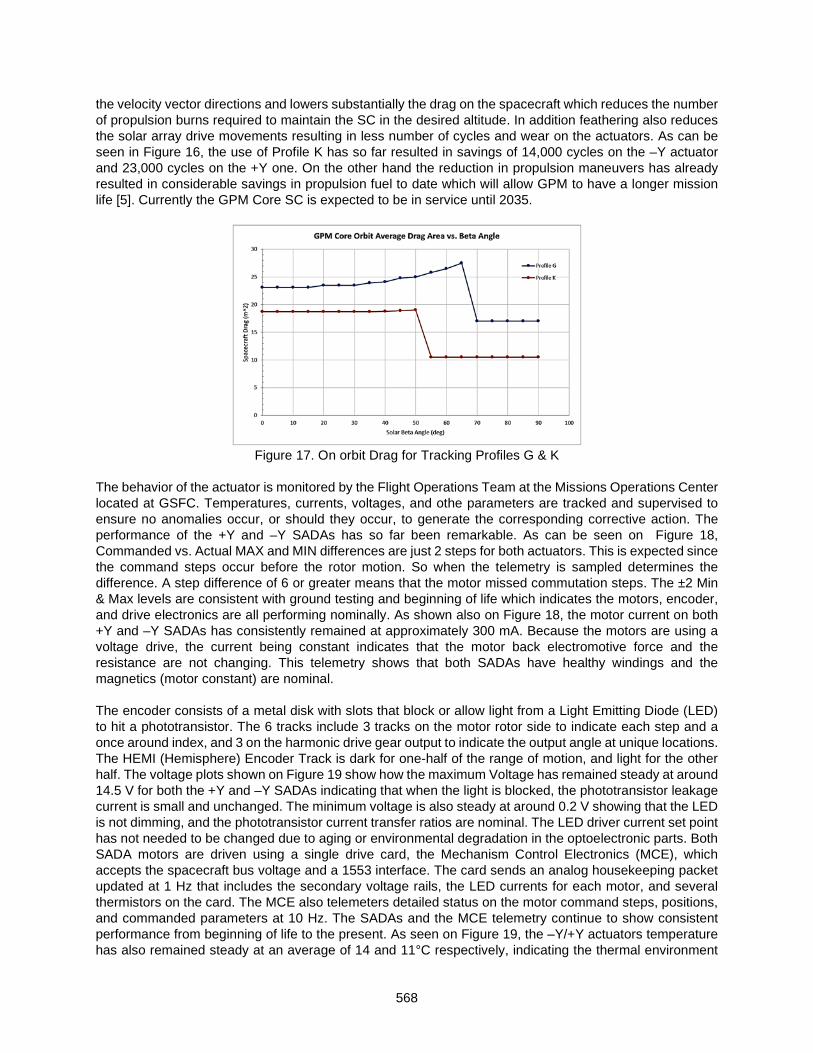
568
the velocity vector directions and lowers substantially the drag on the spacecraft which reduces the number of propulsion burns required to maintain the SC in the desired altitude. In addition feathering also reduces the solar array drive movements resulting in less number of cycles and wear on the actuators. As can be seen in Figure 16, the use of Profile K has so far resulted in savings of 14,000 cycles on the –Y actuator and 23,000 cycles on the +Y one. On the other hand the reduction in propulsion maneuvers has already resulted in considerable savings in propulsion fuel to date which will allow GPM to have a longer mission life [5]. Currently the GPM Core SC is expected to be in service until 2035.
Figure 17. On orbit Drag for Tracking Profiles G & K
The behavior of the actuator is monitored by the Flight Operations Team at the Missions Operations Center located at GSFC. Temperatures, currents, voltages, and othe parameters are tracked and supervised to ensure no anomalies occur, or should they occur, to generate the corresponding corrective action. The performance of the +Y and –Y SADAs has so far been remarkable. As can be seen on Figure 18, Commanded vs. Actual MAX and MIN differences are just 2 steps for both actuators. This is expected since the command steps occur before the rotor motion. So when the telemetry is sampled determines the difference. A step difference of 6 or greater means that the motor missed commutation steps. The ±2 Min & Max levels are consistent with ground testing and beginning of life which indicates the motors, encoder, and drive electronics are all performing nominally. As shown also on Figure 18, the motor current on both +Y and –Y SADAs has consistently remained at approximately 300 mA. Because the motors are using a voltage drive, the current being constant indicates that the motor back electromotive force and the resistance are not changing. This telemetry shows that both SADAs have healthy windings and the magnetics (motor constant) are nominal. The encoder consists of a metal disk with slots that block or allow light from a Light Emitting Diode (LED) to hit a phototransistor. The 6 tracks include 3 tracks on the motor rotor side to indicate each step and a once around index, and 3 on the harmonic drive gear output to indicate the output angle at unique locations. The HEMI (Hemisphere) Encoder Track is dark for one-half of the range of motion, and light for the other half. The voltage plots shown on Figure 19 show how the maximum Voltage has remained steady at around 14.5 V for both the +Y and –Y SADAs indicating that when the light is blocked, the phototransistor leakage current is small and unchanged. The minimum voltage is also steady at around 0.2 V showing that the LED is not dimming, and the phototransistor current transfer ratios are nominal. The LED driver current set point has not needed to be changed due to aging or environmental degradation in the optoelectronic parts. Both SADA motors are driven using a single drive card, the Mechanism Control Electronics (MCE), which accepts the spacecraft bus voltage and a 1553 interface. The card sends an analog housekeeping packet updated at 1 Hz that includes the secondary voltage rails, the LED currents for each motor, and several thermistors on the card. The MCE also telemeters detailed status on the motor command steps, positions, and commanded parameters at 10 Hz. The SADAs and the MCE telemetry continue to show consistent performance from beginning of life to the present. As seen on Figure 19, the –Y/+Y actuators temperature has also remained steady at an average of 14 and 11°C respectively, indicating the thermal environment
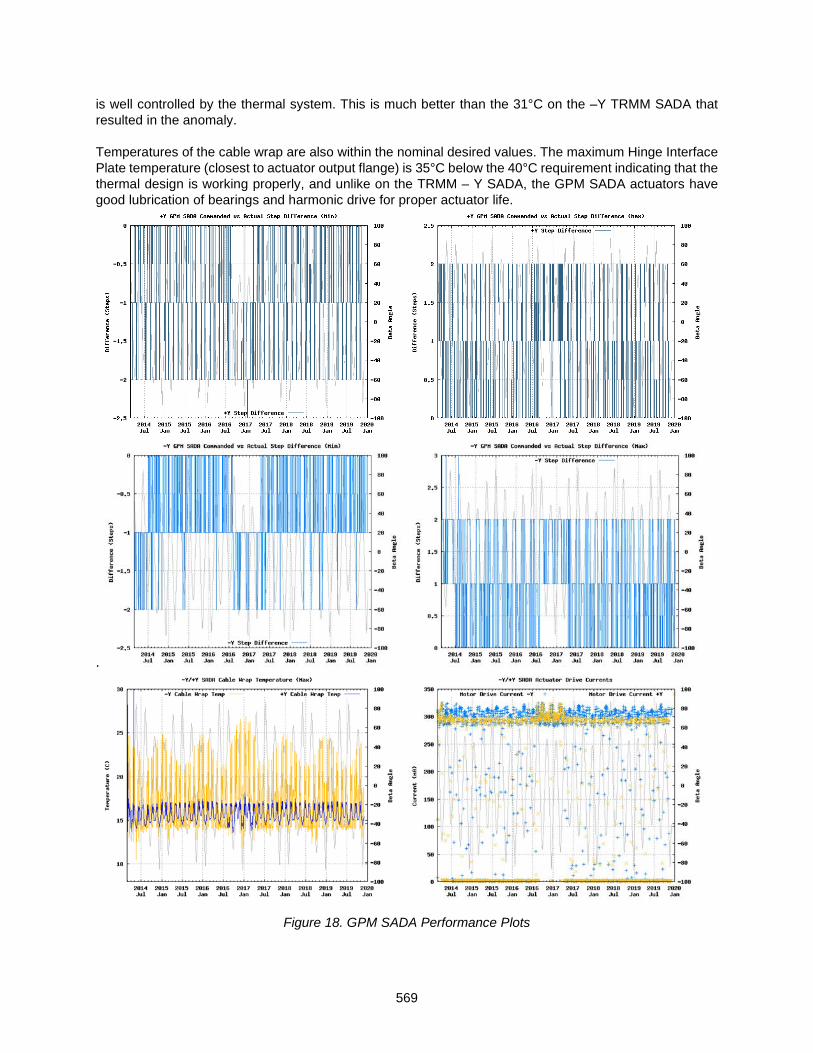
569
is well controlled by the thermal system. This is much better than the 31°C on the –Y TRMM SADA that resulted in the anomaly. Temperatures of the cable wrap are also within the nominal desired values. The maximum Hinge Interface Plate temperature (closest to actuator output flange) is 35°C below the 40°C requirement indicating that the thermal design is working properly, and unlike on the TRMM – Y SADA, the GPM SADA actuators have good lubrication of bearings and harmonic drive for proper actuator life.
.
Figure 18. GPM SADA Performance Plots

570
Figure 19. GPM SADA Performance Plots

571
Lessons Learned
For scenarios where a high actuator bending stiffness is required, the use of SuperduplexTM bearings with a high contact angle and preload mounted with a very tight slip fit can be advantageous. A thorough harmonic drive accelerated life-testing program with different combinations of circular splines and flexible splines materials can help select the right combination that provides the desired actuator life. Ensuring proper lubrication of the actuator bearings and harmonic drive is critical to the life of the SADA. Performing a detailed thermal analysis including all heat sources such as internal power, I2 R Joule heating (including harness going through the quill shaft), environmental loads, etc., is critical to the success of the design. This is because lubricant temperatures need to be within their operating ranges, otherwise critical components such as the harmonic drive wave generator bearing / flex spline / circular spline interface and the outboard motor bearing would prematurely fail. These heating loses can be very significant dumping heat directly into the actuator and potentially increasing lubricant depletion. To this effect, the use of a ‘thermal tube’ in the quill shaft helps conduct the majority of the heat away from the actuator. Having a robust thermal design with oversized radiators, actuator output sunshades, and redundant heaters is always beneficial. Testing of different Solar Array tracking profiles that allow maximization of the amount of feathering helps reduce the number of propulsion burns required to maintain the SC in the desired altitude as well as reduce the SADA number of cycles and wear on the actuator.
Acknowledgements The success of the GPM SADA would have never been possible without the outstanding support of NASA Goddard Space Flight Center’s electro-mechanical, mechanical, and thermal engineering branches’ personnel and supporting contractors. The authors would like to thank everyone for their remarkable efforts. Special recognition to Sierra Nevada Corporation’s (SNC) Durham, NC facility for being so accommodating and cooperative.
References 1. Farley, R. E. and Ngo, S. “Development of the Solar Array Deployment and Drive System for the XTE
Spacecraft”, Proceedings of the 29th Aerospace Mechanisms Symposium, NASA Johnson Space Flight Center, May 1995, pp. 268-282.
2. Habibvand, A., “Super Duplex Bearing vs. Simplex Duplex Bearing Technical Memorandum”, Industrial Tectonics Bearings Corporation, Rancho Dominquez, CA, May 1998.
3. Mobley, J. and Parker, J. “Harmonic DriveTM Gear Material Selection and Life Testing”, Proceedings of the 41st Aerospace Mechanisms Symposium, Jet Propulsion Laboratory, May 2012, pp. 39-52.
4. Ward, J., “GPM SADA Cable Wrap Mechanical Design Details”, NASA GSFC, Greenbelt, MD, July 2009.
5. Patano, S. et al, “GPM Orbital Maintenance Planning and Operations in Low Solar Activity Environment”, 2018 SpaceOps Conference, Marseille, France, May 2018.

572

573
Two-Axis Antenna Pointing Mechanism Qualification for Juice Mission Dual-Band Medium Gain Antenna
Jorge Vázquez*, Mikel Prieto*, Jon Laguna* and Antonio Gonzalez*
Abstract
JUICE is an ESA mission travelling to Jupiter to get information from the Jovian environment. The Medium Gain Antenna will be used in the Telemetry, Tracking and Command Subsystem of the satellite and serve as the communication antenna during close-to-sun phases. It is a dual band antenna (X and Ka band) with a two-axis high accuracy pointing mechanism, which serves also as a deployment actuator. The antenna is fixed to the spacecraft panel by means of two hold-downs. In this paper, a subsystem description and brief summary of the qualification campaign is presented, along with main lessons learned and test conclusions.
Introduction
The Medium Gain Antenna Major Assembly (MGAMA) is a medium-gain dual-axis steerable antenna assembly that provides the main uplink and downlink communications between the JUICE spacecraft and Earth. The MGAMA will work on the following bands:
• A 2-way X-Band link • A 2-way Ka-Band link
Based on BEPI-Colombo and SolO heritage, the main challenges of the design are due to the nature of the mission. Some of them are:
• High temperature range in the Antenna Pointing Mechanism (APM), due to the combination of hot environment during cruise phase of the mission (up to +150ºC in the APM) and very cold environment in the science phase (-90ºC in some parts of the mechanism).
• Dedicated output shaft support with a double full duplex bearing and a dedicated flexible coupling configuration to get high torsional stiffness and adequate structural strength without overloading internally the gearhead motor.
• High accuracy required, on the order of 0.02º, with an Inductosyn sensor for fine position feedback in the rotation axis. For the reference acquisition, travel-to-end-stop strategy is implemented in the electronics.
• High solar radiation and contamination requirements, with a dedicated thermal protection shield design based on an MLI blanket.
• Very stringent heat flux requirement from the antenna to the spacecraft.
• Low mass.
• Need of 358º angular range for elevation axis.
* Sener Aeroespacial, Getxo, Spain [email protected]
Proceedings of the 45th Aerospace Mechanisms Symposium, NASA Johnson Space Center, 2020

574
Design Description
Main characteristics of the antenna are presented in Table 1.
Table 1. Medium Gain Antenna Main characteristics
Transmit and Recieve bands X band and Ka band (dual) Peak Gain (X-band) 28.6 dBi Uplink - 30 dBi Downlink
Peak Gain (Ka-band) 39.8 dBi Uplink - 39.3 dBi Downlink RF Power handling 50W (X band) - 20W (Ka Band)
Main Reflector diameter 510 mm Antenna type Axially Displaced Ellipse Antenna
RF transmission element Waveguide Deployment angle 180º
Azimuth pointing range 210º Elevation pointing range 358º
Mechanism temperature range -40º +150ºC Accuracy (both axis) 0.02º
Sensor type Inductosyn Stepper motor type Permanent Magnet 2-Phase 6-Pole
Power conssumption (per axis) < 5W at ambient temperature Total weight (including mechanism) 27.4 kg
The main components of the antenna are presented in Figure 1.
Figure 1. Medium Gain Antenna 3D view with main components

575
• The ARA (Antenna Reflector Assembly), represented in purple in Figure 1, is in charge of supporting the radiating elements of the antenna, and includes the 510-mm Main Reflector, Sub Reflector, ARA Bracket, Feed and struts for supporting the Sub Reflector.
• The Boom assembly is composed of the structural components that grant support of the ARA and connect ARA with the APM, allowing the ARA pointing and deploying.
• The APM is responsible for the pointing and deploying of the MGAMA components and contains the only permanent interface with the spacecraft.
• The HDRM 1 connects the output of the APM to the spacecraft panel to protect the mechanism from excessive loading when in launch conditions. The ARA is fixed by HDRM2.
• The Radiofrequency Chain is composed of two waveguide sections (X-band and Ka-band waveguides) in charge of connecting the feed in the ARA with the rotatory joint in the APM. They are supported to the boom by means of calibrated blades.
Pointing Mechanism The pointing mechanism from MGAMA is a dual-axis gimbal providing azimuth and elevation steering capability. The azimuth axis is driven by the gearhead motor (GHM) geared to a rotating bracket supporting the elevation actuator which is linked to the MGAMA boom. Both are based on stepper motors with planetary reducers geared to the corresponding output brackets. An integrated X/Ka dual-band and dual-axis Rotary Joint Assembly (RJA) routes the RF energy through the APM in both transmit and receive directions. The APM components are shown in Figure 2.
Figure 2. APM 3D view (left) and APM Protoflight model (right) The actuator is based on a gearhead motor connected to a pinion with an elastic coupling in between to isolate the low speed stage from bending moments and shear forces. The pinion is actuating on the wheel (ouput shaft) where an antibacklash gear has been incorporated to eliminate play between the teeth.

576
The pinion, main gear and antibacklash wheel are made of non-magnetic material, with dry lubrication (sputtered MoS2) and hardening coating on the external surface to increase the pitting resistance. In the inside of the gearhead motor, as it can be sealed and temperature is conveniently controlled by means of dedicated heaters, wet lubrication has been selected (Braycote 601). This combination of dry and wet lubrication made it possible to get adequate tribological behavior of the mechanism components while avoiding lube loss due to evaporation or wet lubricant issues in very cold conditions. The anti-backlash wheel consists of an outer geared ring which is connected to the center shaft by means of 6 calibrated blades. These blades allow a deformation of 0.4º (0.5 mm at the teeth) between the central and outer part of the wheel. The center shaft is connected to the APM main shaft whereas the outer ring is preloaded to the pinion to get the backlash reduction. In Figure 3 there is a 3D view of the spur gear and the anti-backlash design.
Figure 3. Main Gear 3D view
The feedback of the position is obtained by means of an inductosyn sensor. The Inductosyn transducer is a position sensor made of two plates with square wave patterns printed on them, which become the primary (excitation in rotor) and secondary (sin/cos patterns in the stator) of an electrical transformer. The phase between the input and output varies in the relative movement, resulting in a 180º phase change for a displacement of a coil angular range (360º/Number of poles).
Figure 4. Inductosyn sensor

577
Twist Capsule The harness is a complex subsystem in these mechanisms due to the huge amount of lines to be tranferred from the stator to the rotor. For this purpose, in azimuth axis, a goose-neck coil supports a metal foil which goes from the external fixed part to the cable drum (internal rotating part). The foil alternates areas for engaging (meshing) and areas for fixation by dedicated brackets. This configuration uses the transfer of inner drum to external housing by bending and requires some means to guarantee that the harness does not slide with respect to the inner drum when unwrapping from the internal drum to the external one. In order to avoid sliding in the internal drum and get proper alignment in the external support, meshing teeth and slots were implemented in the current twist capsule and support elements. In order to guarantee the initial allocation of the twist capsule foil with respect to the teeth pattern, the gap at the slots on the extreme positions is reduced to match exactly the dimension of the teeth. Several iterations on breadboards were done to refine the concept, and the cable attachment before and after the twist capsule were validated by test. The torque behavior of the twist capsule creates a single direction torque which helps to absorb gaps and backlash. The final proposed solution is the one implemented in Solar Orbiter and Bepi-Colombo HGAMA that was successfully qualified. The arrangement of the cables in the twist capsule intends to isolate the noisy signals from sensitive ones. In this sense the inductosyn sensor signals from the azimuth stator disk are separated from the rotor excitation and the high current motor lines. For the elevation twist capsule, only two twisted-shielded pair cables (inductosyn excitation main and redundant) shall travel from stator to rotor. In this twist capsule, spiral configuration is used, with cable configured as a long spiral that is wrapped more in the internal drum or the external one, depending on the shaft position. The total number of turns shall be selected carefully in order to provide the required motion without undesired cable entrapment. The surfaces of the internal drum in contact with the harness shall be soft and corner-free in order to allow sliding between coils.
Figure 5. Harness arrangement (left) and azimuth twist capsule (right) Hold Down and Release Mechanism (HDRM) The MGAMA is fixed to the spacecraft panel during launch environment by means of two HDRMs. The HDRM 1 is located close to the APM and the HDRM 2 just below the ARA. In this HDRM the movable plate is merged with the ARA bracket and the fixed support is separated into three different pieces. The central

578
one only supports the Non-Explosive Actuator (NEA) and the cone, whereas the other two support a pair of spheres (female) each. In both the NEA support and the sphere support there are blades that provide high stiffness in lateral and vertical axis and some flexibility in longitudinal direction (boom axis) to absorb thermoelastic distortions. By integrating the HDRMs with the boom and ARA, a low mass was achieved and considerable reduction of loads transferred to the contact surfaces. The combination of spheres and central cone and proper selection of the distance between these components was done to optimize strength and stiffness of the complete subsystem. Figure 6 presents the HDRMs location in the MGAMA.
Figure 6. HDRMs location in the MGAMA
Figure 7 shows the release process. When the rod of the NEA is released, the spring raises the bolt up to the point where the rod makes contact with the upper surface of the hole in the central cone, acting as an end stop for the bolt+rod assembly. The rod remains inside this cavity to avoid any clash of the movable part with the fixed assembly during deployment.
Figure 7. Release sequence

579
Mechanism analysis One of the key analysis for the proper dimensioning of the actuator is the torque budget. For this purpose, the combination of the angular speed and acceleration of the spacecraft together with the motion profile characteristics shall be considered. By the calculation of the angular speed (Eq.1) and acceleration (Eq.2) of the antenna movable part and also the acceleration of its center of gravity (Eq.3), the overall force (Eq.4) and moment (Eq.5) on the APM can be obtained.
Figure 8 shows the axis convention system together with a 3D plot of the torque as a function of azimuth and elevation angle.
Figure 8. Axis convention system and torque in both axis as a function of AZ-El angles The performance analysis has been executed in MATLAB/Simulink with the Dynamic Performance Model, which includes a multibody definition of the antenna with SimMechanics and the main non-linearities and disturbances (e.g. friction, twist-capsule or backlash).
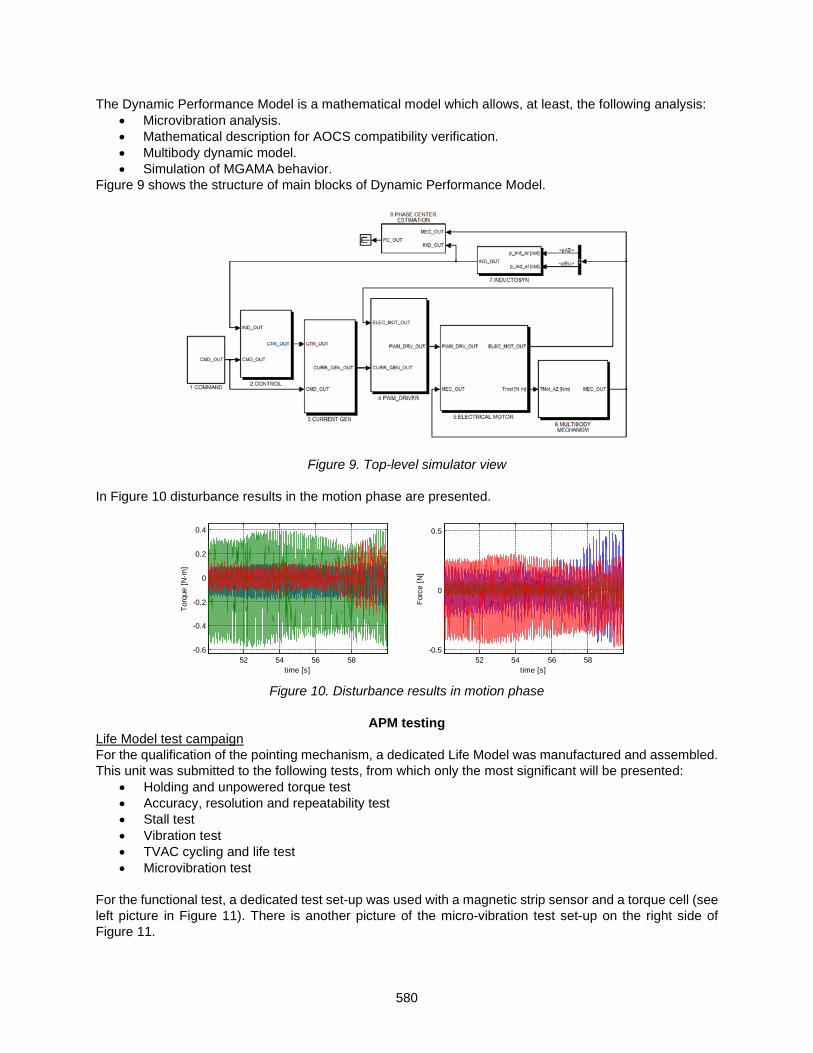
580
The Dynamic Performance Model is a mathematical model which allows, at least, the following analysis: • Microvibration analysis. • Mathematical description for AOCS compatibility verification. • Multibody dynamic model. • Simulation of MGAMA behavior.
Figure 9 shows the structure of main blocks of Dynamic Performance Model.
Figure 9. Top-level simulator view In Figure 10 disturbance results in the motion phase are presented.
Figure 10. Disturbance results in motion phase
APM testing
Life Model test campaign For the qualification of the pointing mechanism, a dedicated Life Model was manufactured and assembled. This unit was submitted to the following tests, from which only the most significant will be presented:
• Holding and unpowered torque test • Accuracy, resolution and repeatability test • Stall test • Vibration test • TVAC cycling and life test • Microvibration test
For the functional test, a dedicated test set-up was used with a magnetic strip sensor and a torque cell (see left picture in Figure 11). There is another picture of the micro-vibration test set-up on the right side of Figure 11.
52 54 56 58-0.6
-0.4
-0.2
0
0.2
0.4
time [s]
Torq
ue [N
·m]
52 54 56 58-0.5
0
0.5
time [s]
Forc
e [N
]

581
.
Figure 11. Test set-up for APM functional (left) and micro-vibration (right) test The accuracy, resolution and repeatibility test was performed in a differential sequence, making small movements, which were always a discrete number of steps (on the order of 0.1º) and monitoring the commanded and the real movement. The error curve obtained show very good values with accuracy on the order of 0.02º and some wave error across the angular range. Figure 12 shows the accuracy test results for Juice Life Model.
• The orange curve plots the difference between the magnetic sensor and the inductosyn. • The blue curve plots the difference between two consecutive samples measured by the
inductosyn • The red curve represents the difference between two consecutive samples measured by the
magnetic sensor.
Figure 12. APM Life Model accuracy curve before life test During the micro-viration test the exported torques and forces were measured to characterize the mechanism (Figure 13).
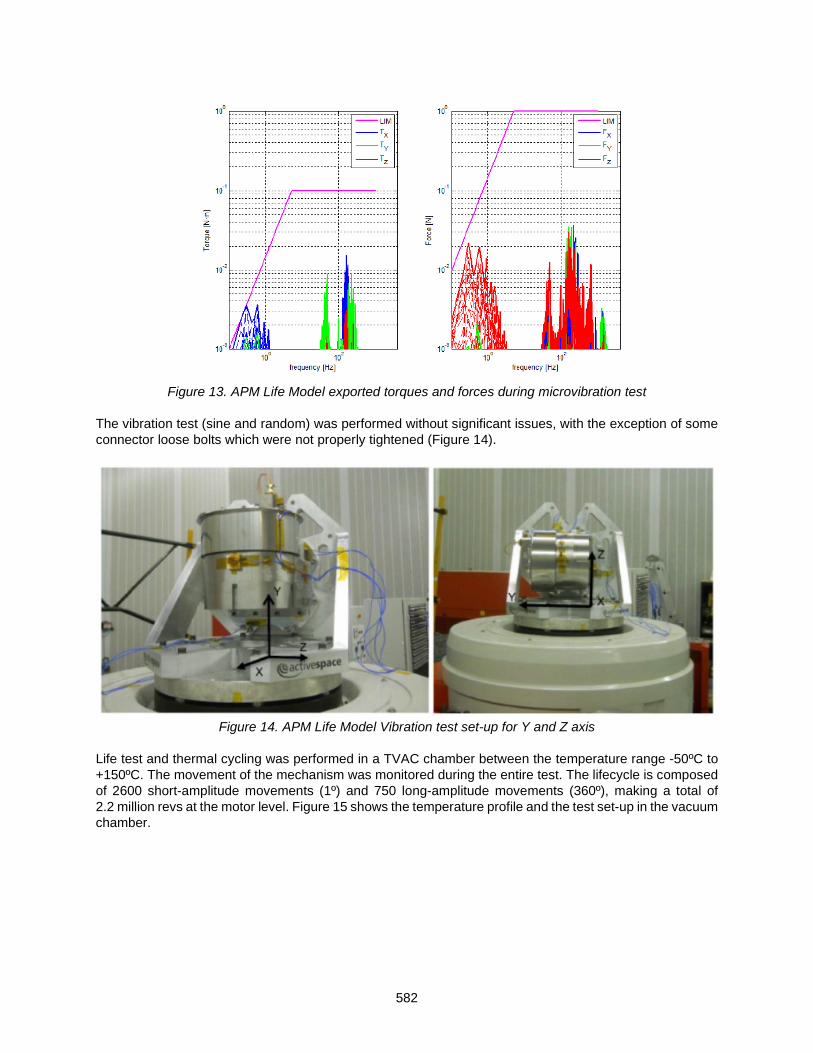
582
Figure 13. APM Life Model exported torques and forces during microvibration test
The vibration test (sine and random) was performed without significant issues, with the exception of some connector loose bolts which were not properly tightened (Figure 14).
Figure 14. APM Life Model Vibration test set-up for Y and Z axis
Life test and thermal cycling was performed in a TVAC chamber between the temperature range -50ºC to +150ºC. The movement of the mechanism was monitored during the entire test. The lifecycle is composed of 2600 short-amplitude movements (1º) and 750 long-amplitude movements (360º), making a total of 2.2 million revs at the motor level. Figure 15 shows the temperature profile and the test set-up in the vacuum chamber.

583
Figure 15. APM Life Model Life test temperature profile (top) and test set-up (bottom) After the life test, the accuracy, repeatibility and resolution test was performed again to check that there had not been any significant degradation in the performance of the pointing function of the actuator (Figure 16).
Figure 16. APM Life Model accuracy curve after life test

584
The final status of the internal components of the APM was very good in general terms. Even if some local depletion of MoS2 was found in some areas, the general status of the teeth flanges was acceptable with no pitting or surface degradation evidence. Figure 17 shows a picture of the final status of the pinion, antibacklash wheel and main gear teeth.
Figure 17. Gears status after life test Protoflight model test campaign After the succesful test campaign with the Life Model, the Protoflight model assembly, integration and test was performed. As usual, functional, vibration and TVAC tests were performed and there were no significant issues. Some pictures are shown in Figure 18.
Figure 18. APM Protoflight model vibration test (left) and TVAC test (right) Another key point in the APM test campaign was the magnetic characterization. For this test, a special facility located at Airbus Friedrichshafen was used. Magnetic deperming was performed with a magnetic moment measurement before and after to confirm that the reduction was effective. After this process, a total magnetic moment of 136 mA/m2 (combined value in the 3 axes X Y Z) was obtained. Magnetic susceptibility was also measured. Figure 19 shows a picture of this test.
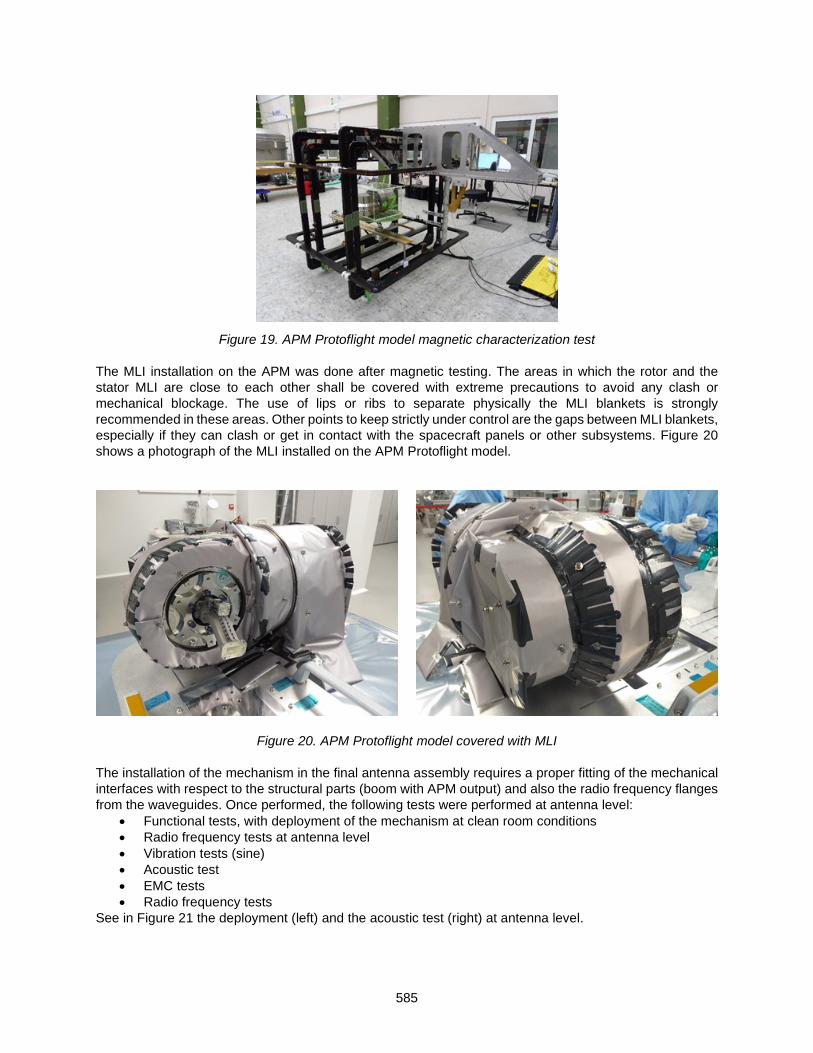
585
Figure 19. APM Protoflight model magnetic characterization test
The MLI installation on the APM was done after magnetic testing. The areas in which the rotor and the stator MLI are close to each other shall be covered with extreme precautions to avoid any clash or mechanical blockage. The use of lips or ribs to separate physically the MLI blankets is strongly recommended in these areas. Other points to keep strictly under control are the gaps between MLI blankets, especially if they can clash or get in contact with the spacecraft panels or other subsystems. Figure 20 shows a photograph of the MLI installed on the APM Protoflight model.
Figure 20. APM Protoflight model covered with MLI The installation of the mechanism in the final antenna assembly requires a proper fitting of the mechanical interfaces with respect to the structural parts (boom with APM output) and also the radio frequency flanges from the waveguides. Once performed, the following tests were performed at antenna level:
• Functional tests, with deployment of the mechanism at clean room conditions • Radio frequency tests at antenna level • Vibration tests (sine) • Acoustic test • EMC tests • Radio frequency tests
See in Figure 21 the deployment (left) and the acoustic test (right) at antenna level.

586
Figure 21. MGAMA Functional (left) and Acoustic Test (right)
Conclusions During the development and qualification phase of the JUICE MGAMA, a two-axis pointing mechanism for high accuracy applications and severe thermal environments has been developed. A qualification test campaign has been performed, from which the following conclusions have been extracted:
• Combination of wet lubrication in the areas that can be sealed and dry lubrication in the areas that cannot is a valid approach, if the temperatures on the oil can be maintained in the temperature range between -40ºC and +150ºC.
• For proper behavior of the dry lubrication it is very important to control the degradation of the MoS2 layer by avoiding excessive pitting stress on it. Better to avoid this lubrication in gears with very high torques in relation to the pitch of the teeth.
• The MLI on mechanisms can help to control the temperatures and reduce the heat flux onto the spacecraft, but the MLI definition and installation shall be done carefully with a detailed design of the blanket’s configuration. Improvisation during mechanism MLI installation is not allowed.
• For mechanisms with magnetic cleanliness requirements, deperm is mandatory. However, some misbalance of the magnets of the motors and the stainless steel present in some components may increase the minimum magnetic moment above the required value if this is below 150 mA/m2.
• When the mechanism size and weight is comparable to the panel to which it is attached, the acoustic test in replacement of random is the best approach to avoid overstressing the components in a non-realistic manner.
References
1. P. Campo, A. Barrio “Development Of A High Temperature Antenna Pointing Mechanisms For Bepi-
Colombo Planetary Orbiter”. ESMATS 2013.
2. P. Campo, A. Barrio, F. Martin “Testing of Bepi Colombo Antenna Pointing Mechanism”. ESMATS 2015.
3. J. Vázquez, I. Pinto, I. Gabiola, I. Ibargoyen, F. Martín “Antenna Pointing Mechanisms for Solar Orbiter High and Medium Gain Antennas”. ESMATS 2015