SIRC Symposium Proceedings 2011
139
Symposium 2011 The 2011 SIRC Symposium is supported by The Lloyd’s Register Educaonal Trust The Lloyd’s Register Educaonal Trust (The LRET) is an independent charity working to achieve advances in transportaon, science, engineering and technology educaon, training and research worldwide for the benefit of all.
Transcript of SIRC Symposium Proceedings 2011
Symposium 2011The 2011 SIRC Symposium is supported by The Lloyd’s Register Educa+onal TrustThe Lloyd’s Register Educa+onal Trust (The LRET) is an independent charity working to achieveadvances in transporta+on, science, engineering and technology educa+on, training and researchworldwide for the benefit of all.

Seafarers International Research Centre Symposium Proceedings (2011)
Seafarers International Research Centre (SIRC) Cardiff University
52 Park Place Cardiff
CF10 3AT
Tel: +44 (0)29 2087 4620 Fax: +44 (0)29 2087 4619
[email protected] www.sirc.cf.ac.uk
ISBN: 1-900174-39-1

Table of Contents
Foreword (Prof Helen Sampson) i
Introductory Address (Mr Thomas Thune Andersen) ii
Programme Overview: Day One (Prof Helen Sampson) vi
Programme Overview: Day Two (Prof Helen Sampson) viii
Training and Technology: Findings from the Questionnaire Study (Tang, L. & Sampson, H.)
1
Living and Working Conditions in the Large Yacht Sector (Bailey, N., Ellis, N. & Sampson, H.) 21
Seafarers and Growing Environmental Concerns: To Comply or Not to Comply – Choices and Practices (Abou-Elkawam, M.)
33
Fatalities at Sea (Ellis, N., Sampson, H. & Wadsworth, E.) 46
Managing Health and Safety Through the Supply Chain: A Case Study of Supply Chain Influence in the Shipping Industry (Walters, D., Bhattacharya, S. & Xue, C.)
66
The Health and Self-medication Practices of Seafarers (Acejo, I., Sampson, H., Turgo, N. & Wadsworth, E.)
89
Personalities, Policies, and the Training of Officer Cadets (Gould, E.)
108

i
Foreword
Professor Helen Sampson
The Seafarers International Research Centre (SIRC) is a policy-related Centre which
undertakes research on the human and organisational aspects of the shipping industry.
Academic staff at the Centre are drawn primarily from Social Science disciplines and some
originally worked in the maritime industry as officers. The Centre produces a range of work
intended to be of benefit to the broad maritime sector. This work is largely funded by the
sector and is published in a variety of forms which are designed to be accessible to
stakeholders and policy makers.
Across the Centre a range of work has been produced in relation to: regulation; education and
training; human resource management; the management of risk; seafarer and vessel
casualties; health and welfare; industrial relations; and work processes. The Centre’s success
is built upon the support of key stakeholders within the maritime ‘community’. Across the
sector organisations have: commissioned projects; provided ‘core-funding’ for the Centre;
facilitated research access; and provided funding for events such as this which, in 2011, has
been generously supported by The Lloyd’s Register Educational Trust (The LRET) to which
we are grateful.
The SIRC Symposium is held every two-years with the intention of feeding back our research
findings to those across the sector who may find them of benefit. It attracts an international
audience from a wide range of organisations. This year we will have ‘delegates’ from sixteen
countries including India, Myanmar, Singapore and the Philippines and we will have
representatives from a wide range of industry organisations. Some organisations are primarily
focussed upon seafarers’ welfare, some upon health and safety, some upon the operation of
ships, some upon the representation of seafarers, and some upon the regulation of the sector.
Whatever the reason for taking an interest in our work, however, we hope that the papers
presented will be of use, and that our research might impact, if only in small ways, upon the
improvement of policies and practices in the industry, most particularly those which effect
seafarers’ health, safety and welfare.

ii
Introductory Address
Mr Thomas Thune Andersen, Lloyd’s Register Ladies, gentlemen and industry colleagues,
Let me start by saying how delighted I am to be here today, speaking at a forum that has done
much to progress merchant shipping's understanding of the events and trends that affect the
safety of our people and protect the environments in which they work.
It seems our industry has been talking about the importance of improving the safety of our
mariners since the beginning of commercial shipping. Yet, despite the steady advances in
maritime safety, the topic never grows old, precisely because the lives of our friends and
family members are as valuable as ever.
This is why we must remain vigilant and continue our collective search for new and
innovative ways to keep our people safe.
I am pleased to see that our colleague, Dr Lijun Tang, will speak this afternoon about training
and new technology. His is the first of several presentations during this symposium that will
highlight the unique challenges within the people, plant and process triangle that is the key to
improving workplace safety across all industry.
Gaining greater understanding of the relationship between our employees, our systems and
our assets must be at the centre of efforts to make them safer, just as it must receive
significant investments from organisations whose business it is to keep people safe.
As past beneficiaries of awards from the Lloyd's Register Educational Trust, you as alumni of
Cardiff University and members of SIRC probably will be aware of my organisation's
charitable status, and our public-benefit mandate. We take that mandate very seriously.
As the newly appointed Chairman, I believe it is not enough for the members of Lloyd's
Register Group to be satisfied with achieving industry standards for safety.

iii
We must aspire to a higher, Lloyd's Register safety standard for ourselves and our clients, and
in doing so potentially create a new benchmark for industry. We are not there yet, but we
recognise where we need to be and are putting the pieces in place.
It will require a steadfast commitment to training and the type of multi-disciplinary research
and development that ensures we will remain on the leading edge of the new technologies.
And as ensuring industrial safety demands the commitment of all parties, it will require us to
continue to share the global best practices and the knowledge we have accumulated as one of
the world's first independent risk-management firms.
The merchant fleet
There will always be critics, and some criticism is justified -- even productive -- but there is
ample evidence of positive signs with regard to safety and the merchant fleet. Port State
Control figures clearly show that total ship detentions are falling around the world; the PSC
regime has also led to a global decline in the number of flag-states that are black-listed.
What this means is that the quality of the ships we are asking our people to work on has
significantly improved in the past decade. But there is no question we must do more. There
are still too many commercial vessels in operation that you and I would not want our sons
and daughters to work on. And the construction and maintenance of quality ships are only
parts of our safety challenge, significant though they may be.
Ask 10 different people about our collective progress in making the merchant fleet a safer
place to work and you are likely to get 10 different answers. While the reports will vary, this
much we know: people are still getting hurt in the same ways they have always been hurt.
They are still being hurt while working in confined spaces, they are still falling from heights
and they are still being injured when being transferred from vessel to vessel. There thus
remains much room for improvement.

iv
People, plant and process
The effectiveness of any modern business enterprise depends on critical interactions between
people, technology and processes. Creating a strong safety culture is no different.
In the wider process industries, where high-risk, capital-intensive assets are equally common,
we know that the human element has played a major role in 70-90% of recent major
incidents, from the Exxon Valdez and the Texas City Refinery fire, to Buncefield and the
Deepwater Horizon.
Yet you would be hard pressed to find any company that earmarks up to 90% of its safety-
related resources towards understanding the influence that the human element has on
workplace safety performance.
Here, there appears to be a fundamental disconnect. We tend to rely on new technology and
systems to drive operational efficiency, and therefore improved safety -- and to some extent
this has delivered the desired results. But I firmly believe that the next meaningful
incremental advances in workplace safety will result from a greater understanding of the
influence of the human element.
Over the past 20 years, the energy and transportation sectors have made significant advances
in the quality of the assets they build and operate. They are not yet perfect, but they are
clearly safer by design.
Similarly, the management systems we have developed and adopted -- from quality and
environmental standards, to health and safety -- have greatly improved the way we operate.
Because there are limits to how much more we can squeeze from better technology and
systems, I believe understanding the human factor is the next frontier where significant
advances in workplace safety will be found.
Improving safety is fundamentally reliant on the human element involved in operations.
Maintenance, inspection and operational tasks are all performed by people and so rely on the
constant execution of skilled behaviour by the workforce.

v
Training and a commitment to developing new technologies -- and usable interfaces for those
technologies -- are part of the solution. Dr Tang will undoubtedly elaborate on that later. But
it is self-evident that having the best infrastructure in the world means little if your people
don't now how to operate and maintain it.
Similarly, having a highly qualified workforce means little if the size of that workforce and
the resources they have at their disposal does not match the required levels of activity,
increasing the temptation to cut corners, often at the expense of safety.
Encouraging a healthy safety culture within your company is therefore one of the keys to
reducing the risk of accidents and incidents. And this starts from the top. The ability of any
staff to identify hazards is wasted if they are discouraged from reporting them.
Fully understanding the influence of the human factor can be a complex assignment. At a
minimum, it involves: identifying the tasks that are critical to managing safety; demonstrating
leadership in attaining those goals; learning to effectively design jobs, processes and
procedures; ensuring competence; managing workloads; encouraging two-way
communications; learning and improving; and a dedication to effective change-management.
It may require a company, organisation or industry to shift priorities or change the way they
look at things. But it is a new perspective that all companies would be well-counselled to
explore.
It is often said that people are our most valuable assets. This is undoubtedly true; but we also
need to recognise that, of people, plant and process, our people now hold the keys to assuring
their own safety.
And we, as the leaders of industry, have a duty to provide the interfaces that are fit for
purpose to ensure that our people are competent to perform their tasks safely, and to
encourage trust and learning by resisting the temptation to attribute blame.
Thank-you
vi
Programme Overview: Day One
Professor Helen Sampson
Variety is the key word that characterises this year’s SIRC symposium. Whilst there is some
research which is well-advanced in the Centre, and as such may be familiar, this year we also
report on some new studies undertaken in 2010/11 and some long-standing individual pieces
of work undertaken by PhD students.
Our first paper reports on the latest stage of an established study funded by The Lloyd’s
Register Educational Trust (The LRET). In its first phase this research, on training and new
technology, focussed closely on the introduction on a new piece of shipboard equipment,
known as AIS1. Over a period of several years the study demonstrated that there were
decreasing numbers of errors in the data transmitted, via AIS, by vessels. This indicated that
seafarers’ knowledge of the shipboard AIS equipment had improved over time. The second
phase of the study has sought to establish in some detail the kinds of training seafarers
receive in relation to new shipboard equipment more generally, how adequate such training is
perceived to be, who it is provided by, and on what terms. As such, it is based upon the
administration of a large-scale questionnaire to serving seafarers. At today’s event we will
report how it is that seafarers currently learn about new equipment on board, when they
receive any training associated with such equipment, and how they would ideally like to learn
about new shipboard technology. More detailed findings from the questionnaire will be
presented on line, in a full report, before the end of 2011.
Moving away from the cargo sector, our second paper reports on some of the findings from a
study conducted in collaboration with the Professional Yachtsmen’s Association (PYA). The
research considers the living and working conditions of yacht crew including those members
working in both operational and hospitality jobs. This is a sector in which we have not
previously undertaken any work at SIRC, and as such, the research completed in 2010, broke
new ground. It was quickly apparent, however, that whilst there are some considerable
differences in the quality of life for yacht crew members and seafarers aboard cargo vessels
(particularly in relation to isolation and shore-leave), there are also many similarities in their 1 Automatic Identification System

vii
experiences including: long working hours, limited space, noise, vibration, and fatigue. The
paper presents selected findings from the research which was again questionnaire-based. A
full report of the study is available through the PYA (www.pya.org).
The final paper of the afternoon, deals with a topic of widespread concern and significance.
For some years now, Captain Mohab Abou-Elkawam has been undertaking a PhD
considering pollution and the perspective of seafarers on pollution controls and regulation. As
a SIRC-Nippon Foundation Fellow2, Captain Abou-Elkawam has conducted a series of
interviews with seafarers with the objective of gaining a penetrating understating of their
values and priorities vis a vis the environment and the imperatives of vessel operation. In this
paper he conveys a strong sense of these. They are important if the efforts of policy makers
are to be effective in this area.
2 SIRC has been awarded a grant by The Nippon Foundation to support people with a social science or maritime- related background (including former seafarers) through a programme of post-graduate level research which has the potential to culminate in the award of a PhD. The objective of the funding is to support the development of an international network of social scientists focussing on ‘human-related’ work in the maritime sector. There are currently twenty SIRC-Nippon Foundation fellows and eight alumni from the programme. For further details of their backgrounds and research please visit the SIRC-Nippon Foundation Fellowships website at www.sirc.cf.ac.uk -> Nippon Fellows.

viii
Programme Overview: Day Two
Professor Helen Sampson
As with the sessions on the first day of the SIRC symposium, today’s papers begin by
reporting recent analysis of data collected in the course of established research projects.
These projects may be familiar to those of you who remain in touch with the work of the
Centre, however the specific findings reported here will be ‘new’ to all members of the
audience as they have not been reported previously. Later in the morning we will see a
transition to research which has had less exposure, to date, as we discuss the health and self-
medication of seafarers and the challenges of cadet training.
In the first paper we revisit data collected from Maritime Administrations concerning seafarer
injuries and deaths (these data were originally collected as part of The LRET-funded study of
Risk Perception that many of you will be familiar with). At the previous symposium we
presented a paper which outlined the difficulties, for any serious researcher, in interpreting
and analysing injury data of this type. We also suggested that datasets for fatalities at sea
were likely to be more robust. This was a consequence of an assumption that there would be a
lower incidence of under-reporting in conjunction with deaths. This year we revisit the data
considering fatalities alone and building upon the 2000-2005 dataset with additional data for
the years 2005-10.
Whilst under-reporting of fatalities may be considered to be less likely than the under-
reporting of injuries it remains a strong possibility in connection with some Flag State
administrations. This is not the main problem that is faced when attempting to construct
‘fatality rates’ for seafarers, however. The main difficulty to be overcome, is the absence of
data relating to the numbers of seafarers employed on the vessels registered with any given
Flag State. The absence of this information prevents the calculation of rates, as such, thereby
inhibiting our capacity to make comparisons between sea, and land-based, industries,
between Flag States, and over periods of time. The collection of data on seafarer numbers is
seen as desirable in a number of quarters, however, the widespread collection of such data
remains unlikely in the foreseeable future. In the absence of such data the need to consider

ix
fatality rates over time, and across administrations/flags remains pressing. This paper,
therefore, proposes two alternative methods for calculating seafarer death rates based upon
our relative confidence in the prevalence and coverage of the Lloyd’s Register World Fleet
Statistics. In theory, should administrations collect and collate fatality data a little more
effectively in the future it should be possible to calculate rates based upon tonnage and upon
vessel numbers (using the World Fleet Statistics) which would allow us to compare
administrations with each other and also produce trends over time.
The second paper, is presented by Professor Walters. It reports on data collected as part of an
established study of the ways in which the management of health and safety may extend
down the supply chain. This research has been funded by the Institution of Occupational
Safety and Health (IOSH) and it encompasses work in three sectors, of which maritime
transport is one. The paper reports some very early findings based upon the study of one (of
two) maritime sector case studies. The reported case study focuses upon tankers involved in
the transport of oil and oil-based cargoes. It indicates clearly how in some sectors of the
maritime trade pressures from charterers (in this case oil majors) may have been brought to
bear on vessel operators in relation to the daily practice of health and safety management. In
these early stages of study, it leaves the issue of the extent to which such pressures are
positive or negative as an open question.
The penultimate paper of the symposium discusses the health and self-medication practices of
seafarers. Seafarers typically demonstrate a so-called ‘healthy worker effect’ because they are
subject to medical screening that eliminates most unhealthy workers from the workplace.
Nevertheless in some areas, ship operators complain that medical repatriations remain too
high presenting a significant cost and jeopardising company profits. There are also anecdotal
reports that seafarers engage in considerable self-medication at sea. These, (alongside
incidents such as the collision of the COSCO Busan with the Oakland Bay Bridge when a
pilot was found to be under the heavy influence of a cocktail of prescription drugs) have
encouraged us to explore this issue in further detail. Thus, in 2010 we administered a self-
complete questionnaire to over 1,000 seafarers. Our intention was to compare the data
collected by the SIRC team with other data available about land-based populations. We
anticipated that we would see the impact of medical screening with seafarers appearing to be
remarkably healthy (the so-called ‘healthy worker effect’). We also anticipated that seafarers
would be likely to under-report health problems and unhealthy lifestyle behaviours for fear of

x
negative consequences. In this context, significant findings would seem to include: higher
rates of smoking amongst seafarers at sea than when they are at home and higher levels of
smoking than identified in a UK land-based sample; the consumption of alcohol aboard ‘dry’
[alcohol free] ships; and relatively high levels of stomach problems resulting in the self-
prescription of indigestion remedies.
Finally, we may have saved the best for last, as Elizabeth Gould presents her work on UK
cadets. This research was originally undertaken as part of a PhD thesis which can be viewed
in full via the SIRC website (www.sirc.cf.ac.uk). Dr Gould’s work provides us with a
considerable insight into the lives and experiences of UK-based cadets and provides us with a
better understanding of what motivates them, what inspires them, and what may ultimately
deter them from progressing with their training/employment plans.
We very much hope that you enjoy the papers presented at the SIRC 2011 symposium.
1
Training and Technology: Findings from the Questionnaire Study
Tang, L. & Sampson, H.
Abstract This paper reports some of the early findings from a questionnaire administered to seafarers as part of a study of training associated with the introduction of new technology. These findings relate to: seafarers’ perceptions of their own knowledge of a selection of equipment on the bridge and in the engine room, their preferred training methods in relation to new shipboard technology and the learning activities that have contributed to their knowledge of existing ‘new’ equipment.
Introduction
Technological innovation has underpinned social and industrial transformation, in general,
and the shipping industry in particular. It makes it possible to operate bigger, faster, safer,
and more specialised ships with fewer people on board. In the last few decades, a range of
new equipment developed as a result of technological innovation has been introduced aboard
ships. This includes ARPA, GMDSS, AIS, ECDIS, and automated engine and cargo control
systems.
Inevitably, the introduction of new technology demands new skills of shipboard personnel. In
relation to new technology the literature indicates that these are best developed as a
consequence of education and training. Over the past two decades, a large body of research
literature has repeatedly confirmed that training increases productivity in both the
manufacturing and service sectors (e.g. Barrett and O’Connell, 2001; Bartel, 1994; Dearden
et al., 2000; Trucotte and Rennison, 2004; Zwick, 2006). More specifically there are
indications that training is important in relation to the introduction of Information and
Communications Technology (ICT). Having analysed the 1999 Canadian Workplace and
Employer Survey data, Trucotte and Rennison (2004) found strong evidence that use of ICT
was positively associated with higher productivity. They further discovered that the
productivity increase associated with ICT use was enhanced when more workers received
ICT training.

2
In the shipping industry, training and technology is also a much discussed topic, though often
the indications are that training in this area is lacking. A recent survey of British seafaring
officers’ perceptions of shipboard technology suggests that while, in general, officers
embrace new technology, they are greatly concerned about the sufficiency of relevant
training and an over-dependence on technology (Allen, 2009). Furthermore, several Maritime
Accident Investigation Branch (MAIB) reports have suggested that inappropriate use of
shipboard technology, due to poor training, has caused accidents. Lack of familiarity with the
shipboard ECDIS equipment, for example, was a contributory factor in several accidents,
including the groundings of Pride of Canterbury and CFL Performer (MAIB, 2008a; 2009).
Similarly, the inappropriate use of ARPA radar was identified as a factor leading to the
collision between Costa Atlantica and Grand Neptune (MAIB, 2008b). In another incident
where the vessel Prospero made contact with a jetty, ship officers’ inadequate knowledge of
the vessel’s podded propulsion system was found to be a contributory factor (MAIB, 2007).
In the wake of the introduction of AIS, studies monitoring its usage found that seafarers
appeared to be insufficiently familiar with AIS which led to transmission of erroneous
information (Bailey, 2005; Bailey et al., 2008; Harati-Mokhtari et al., 2007; Norris, 2007). In
the face of such information researchers, commentators, and policy makers have
recommended the provision of adequate training on, and sufficient familiarisation with, new
technology/equipment (Bailey, 2005; Gray, 2008; Grey, 2008; Hadnett; 2008; Harati-
Mokhtari et al., 2007; IMO, 2003; Lloyd’s List, 2007; Norris, 2007). It remains unclear,
however, to what extent such calls have been met and, in part, this paper seeks to address this
question.
The Study
This paper reports some of the early findings from a questionnaire administered to seafarers
as part of a study on new technology being undertaken under the auspices of The Lloyd’s
Register Educational Trust research unit at SIRC1.
New technology is likely to be applied on the bridge and in the engine room and deck officers
and engineers are the major operators and users on board any vessel. It is also generally
1 A full report will be available online later in 2011 (Sampson and Tang, forthcoming).

3
officers and engineers who require related training. Therefore, the target population for the
questionnaire was deck officers and engineers.
Before designing the questionnaire, a pilot study, which involved thirteen interviews with
seafarers and college lecturers, was carried out. Its aim was to identify issues to be explored
in the questionnaire. We also did an extensive review of the literature on ICT adaptation and
training in other contexts (such as schools and business firms). This gave us a better
understanding of training and technology in general, which was of help in designing the
questionnaire. At various stages of the design process, we consulted people with seafaring
experience, and we also piloted an early version of the questionnaire. All these measures
helped us to refine the questionnaire.
In the process of questionnaire distribution, we utilised 27 seafarer centres in 14 countries.
One advantage of this approach, compared with distribution through training centres/colleges
or shipping companies, is that seafarers visiting centres are less likely to be under direct
influence of their employers and/or immediate training environments, and are more likely to
be able to reflect on their learning experiences. A number of port chaplains kindly helped us
to distribute questionnaires to seafaring officers visiting their ports. Our researchers also went
to several big centres to administer questionnaire distribution and collection. Via these efforts
we achieved a broad and varied distribution which produced a diverse sample of seafarers.
However, this is not a random sample in the strict sense of the term which limits the extent to
which we can generalise from the findings.
Sample Characteristics
Our sample consisted of 1,007 seafarers. These were roughly divided between engine officers
(524) and navigation (deck) officers (478) 2. In terms of hierarchy (see Figure 1), the sample
included 405 senior officers (including captains, chief officers, chief and second engineers),
and 597 junior officers (including second and third officers, third and fourth engineers,
electricians, and cadets)3.
2 Five respondents did not specify their rank. 3 Because cadets were in the transitional stage and they had very limited experience, they were not included in the analysis for this paper.

4
Overall, respondents represented 52 countries. To facilitate analysis, we divided them into six
groups the largest of which were single nationality groups: Filipino; Indian; Chinese;
European; ASEAN; and Others. Figure 2 shows the sample distribution in relation to these
six groups.
Figure 1: Sample Distribution by Rank
Figure 2: Sample Distribution by Nationality
Approximately fifty percent of respondents were working aboard container vessels and a
quarter were working on bulk carriers. To facilitate analysis, we grouped ships into five main
groups: container; bulk; tanker; general cargo; and others. The percentage of each group is
8.39.8
12.2 12.5
4.6
10.8 11.2 10.5
7.6 7.9
3.9
0.502468
101214
32.8
25.3
17.8
12.5
7.9
3.7
0
5
10
15
20
25
30
35
Philippines Europe India China Other ASEAN

5
shown in Figure 3. The age range of the sample was from 17 to 69. They were divided into
four age groups, the details of which are shown in Table 1.
Figure 3: Sample Distribution by Ship Type
Table 1: Age Distribution
Age group Frequency Percent
Below 30 349 34.7
30s 301 29.9
40s 210 20.9
50 and above 138 13.7
Unspecified 9 0.9
Knowledge of Specific Equipment
In the questionnaire, deck officers were asked to indicate how much they felt they knew
about specific pieces of equipment on the bridge: AIS; GPS; RADAR/ARPA; GMDSS; and
ECDIS. Overall, and as one might hope, they appeared to feel confident in operating such
equipment, and the majority self-reported ‘good’ or ‘excellent’ knowledge. Further analysis
indicated that respondents did not have equal confidence in relation to all the specified
equipment, however. Their knowledge of ARPA/RADAR was reported to be the best,
45.6
27.3
12.8
7.8 6.5
0
5
10
15
20
25
30
35
40
45
50
Container Bulk Tanker General cargo Other

6
followed by that of AIS and GPS. Confidence with ECDIS was reported to be the lowest of
the five items specified and more than 30 percent of deck officers reported either ‘zero’ or
‘basic’ knowledge of it4 (for details, see Figure 4).
We further interrogated these findings to establish whether or not any significant variations
between groups of seafarers were present.
When senior and junior officers were compared, no significant difference was found with
regard to four pieces of equipment: AIS, GPS, RADAR/ARPA, and ECDIS. Regarding
GMDSS, however, senior officers reported better knowledge than junior officers, as Figure 5
shows.
Figure 4: Knowledge Levels of Bridge Equipment
4 NB: ECDIS has not been universally installed on all vessels.
Zero Basic Good Excellent
AIS 0 6.9 65.4 27.7
GPS 0 7.4 64.1 28.5
ARPA/RADAR 0 4.1 60 36
GMDSS 0 13 65.9 21
ECDIS 9.3 21 50.5 19.2
0
10
20
30
40
50
60
70

7
Figure 5: GMDSS Knowledge Level by Rank
Engineer respondents were asked to state their knowledge of engine room machinery
including the main engine manoeuvring and control system (ME) and the oily water separator
(OW). While the majority of engineers expressed confidence in operating both pieces of
equipment, they reported a better knowledge of oily water separators (see Figure 6).
Figure 6: Knowledge Levels of Engine Room Machinery
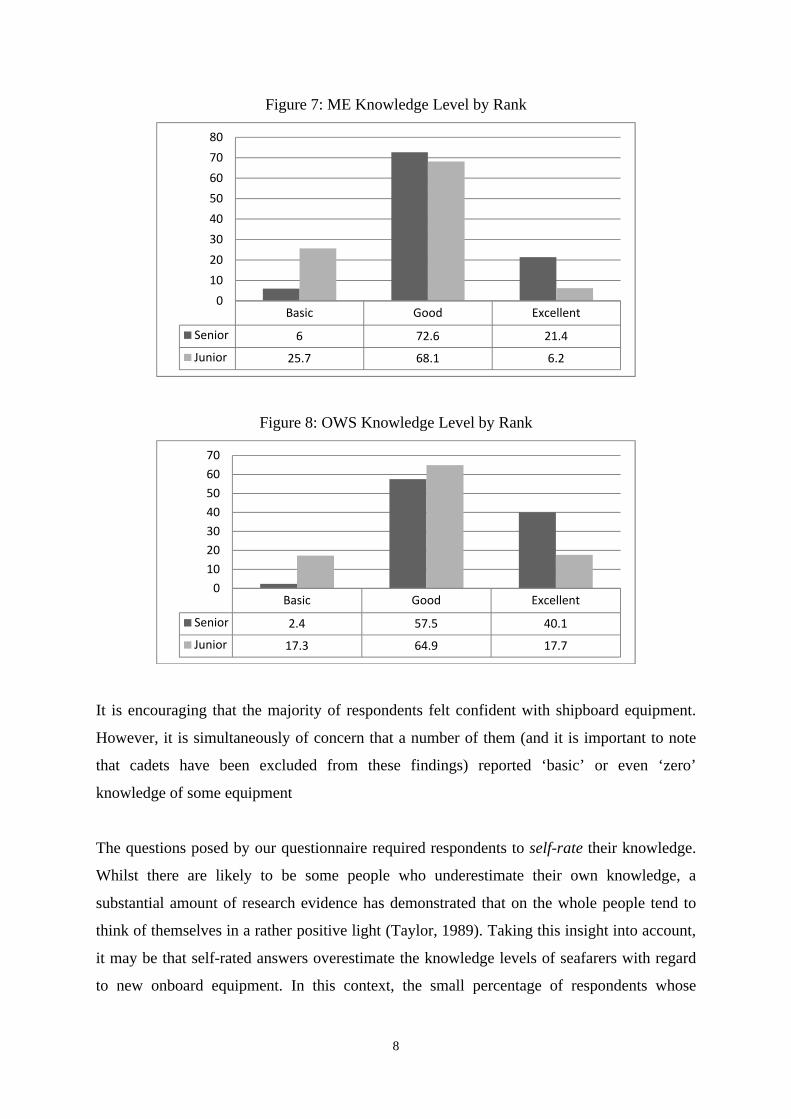
In the engine room, rank was found to have an impact. Senior engine officers reported a
better knowledge of both pieces of equipment than junior ones (see Figure 7 and Figure 8).
Because rank is strongly related to age and sea time, seniority in terms of the latter two were
also likely to predict better knowledge.
Basic Good Excellent
Senior officers 8.5 66.7 24.9
Junior officers 16.5 65.4 18.1
01020304050607080
Zero Basic Good Excellent
ME 0 16.7 70.1 13.1
OW 0.4 10.4 61.3 27.9
0
10
20
30
40
50
60
70
80
8
Figure 7: ME Knowledge Level by Rank
Figure 8: OWS Knowledge Level by Rank
It is encouraging that the majority of respondents felt confident with shipboard equipment.
However, it is simultaneously of concern that a number of them (and it is important to note
that cadets have been excluded from these findings) reported ‘basic’ or even ‘zero’
knowledge of some equipment
The questions posed by our questionnaire required respondents to self-rate their knowledge.
Whilst there are likely to be some people who underestimate their own knowledge, a
substantial amount of research evidence has demonstrated that on the whole people tend to
think of themselves in a rather positive light (Taylor, 1989). Taking this insight into account,
it may be that self-rated answers overestimate the knowledge levels of seafarers with regard
to new onboard equipment. In this context, the small percentage of respondents whose
Basic Good Excellent
Senior 6 72.6 21.4
Junior 25.7 68.1 6.2
01020304050607080
Basic Good Excellent
Senior 2.4 57.5 40.1
Junior 17.3 64.9 17.7
010203040506070

9
answers indicated a lack of confidence may be of some concern. This is particularly the case
given the ‘safety-critical’ nature of the shipping industry.
Preferred training methods
In the course of the questionnaire, we asked seafarers which training methods they would
recommend in relation to different pieces of equipment. With regard to bridge equipment, in
general, deck officers tended to express a preference for onshore training and onboard
training delivered by instructors, as shown in Figure 9. Thus, instructor led training methods5
were favoured. Interview data with seafarers supported this finding (see Tang, 2009 for a
fuller account of interviews conducted for this research). Other research indicates that
instructors may be favoured by learners in some contexts because they posses not only in-
depth knowledge of the subject, but also training and mentoring skills. The guidance from
instructors can also save learners time and effort in finding relevant information and solving
problems.
Figure 9: Preferred Training Methods of Deck Officers
5 NB: ‘Onshore training’ can generally be presumed to be understood by seafarers as formal training courses ashore. For the purpose of this paper it is therefore categorised as ‘instructor-led’.
onshore training onboard CBT
onboard training by instructors
self-learning learning from colleagues
AIS 27.1 12 29.5 20 11.4
GPS 28.9 10.4 32.8 14.9 13
ARPA 55.6 8.1 23.6 3.2 9.5
GMDSS 60.6 6.2 23.5 3.8 5.9
ECDIS 47.8 7.8 32.3 6.9 5.2
0
10
20
30
40
50
60
70

10
Whilst there was a general preference for instructor-led training, the responses of deck
officers were more nuanced than this implies in as much as they gave varying responses in
relation to the five specified pieces of equipment. While the preferred training method for
ARPA/RADAR, GMDSS, and ECDIS was onshore training, respondents indicated that
onboard training was their favoured option for training in relation to AIS and GPS. The
difference is likely to reflect the different technical characteristics of the equipment.
ARPA/RADAR, GMDSS, and ECDIS are more complicated than AIS and GPS. Information
acquisition and interpretation associated with GPS and AIS is relatively straightforward,
compared with the skill required to read and make correct use of ARPA/RADAR and ECDIS
displays. Research relating to ICT implementation suggests that formal training is more
appropriate with regard to some pieces of equipment than others (Sharma and Yetton, 2007).
Technologies characterised by high technical complexity are associated with high knowledge
barriers and in this situation, formal training is more effective in helping learners overcome
these (Robey et al., 2002). This could explain why deck officers felt that onshore training was
the most beneficial for more complicated equipment, even though attending such training is
often associated with the loss of leave time. In contrast with regard to less complicated
technology such as AIS and GPS, seafarers might feel that onboard training, though brief, is
sufficient, and can be put into immediate practice.
Respondents were also more likely to display a preference for other forms of learning, such
as ‘self-learning’, ‘learning from colleagues’ and ‘onboard CBT’ for AIS and GPS than they
were for the other three pieces of equipment. This further suggests that the operation of AIS
and GPS may be regarded as less complicated than ECDIS, ARPA/RADAR, and GMDSS by
seafarers and thus produces a lower demand for formal training.
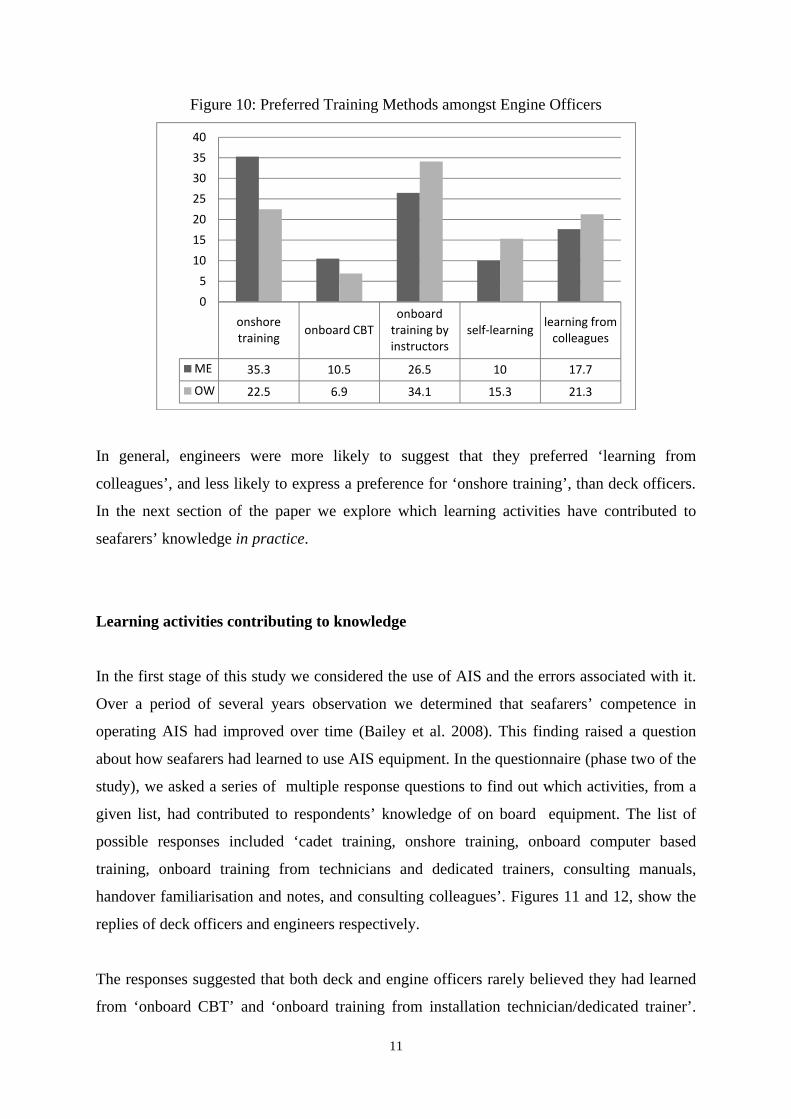
Engineer respondents’ preferences for learning about engine room machinery repeated the
pattern found amongst deck officers. Overall, they also favoured instructor-led training
methods. With regard to the main engine, ‘onshore training’ was the most favoured method
of training, while ‘onboard training delivered by an instructor’ was the preferred training
format for oily water separators. Arguably, this indicates that the latter was regarded as less
complex in terms of its operation than the former. Perhaps as a result, engineer respondents
were also more likely to suggest a preference for ‘self-learning’ and ‘learning from
colleagues’ in relation to oily water separators than in relation to the main engine.
11
Figure 10: Preferred Training Methods amongst Engine Officers
In general, engineers were more likely to suggest that they preferred ‘learning from
colleagues’, and less likely to express a preference for ‘onshore training’, than deck officers.
In the next section of the paper we explore which learning activities have contributed to
seafarers’ knowledge in practice.
Learning activities contributing to knowledge
In the first stage of this study we considered the use of AIS and the errors associated with it.
Over a period of several years observation we determined that seafarers’ competence in
operating AIS had improved over time (Bailey et al. 2008). This finding raised a question
about how seafarers had learned to use AIS equipment. In the questionnaire (phase two of the
study), we asked a series of multiple response questions to find out which activities, from a
given list, had contributed to respondents’ knowledge of on board equipment. The list of
possible responses included ‘cadet training, onshore training, onboard computer based
training, onboard training from technicians and dedicated trainers, consulting manuals,
handover familiarisation and notes, and consulting colleagues’. Figures 11 and 12, show the
replies of deck officers and engineers respectively.
The responses suggested that both deck and engine officers rarely believed they had learned
from ‘onboard CBT’ and ‘onboard training from installation technician/dedicated trainer’.
onshore training onboard CBT
onboard training by instructors
self-learning learning from colleagues
ME 35.3 10.5 26.5 10 17.7
OW 22.5 6.9 34.1 15.3 21.3
05
10152025303540

12
They most commonly suggested that they had learned from ‘consulting manuals’. This may
seem inevitable given the requirement for manuals to be available on board regardless of the
time of day or night whereas this cannot be said of colleagues or trainers. The response
highlights the importance of manuals. As such, the user friendliness of manuals can be seen
as a concern, especially when they are not written in seafarers’ first languages.
Notwithstanding the importance of manuals, however, they cannot be seen as a substitute for
formal training (IMO, 2003). As mentioned earlier in relation to much equipment, seafarers
preferred instructor-led training methods. Ideally and in this context, the role of manuals
should be supportive: they should serve to provide well-trained seafarers with a constantly
available reference and an additional means for obtaining specific information.
Figure 11: Learning Activities Contributing to Knowledge of Deck Officers
Cadet training
Onshore training
Onboard CBT
Onboard training
from technician/t
rainer
Consulting manuals
Hand-over familiarisati
on
Consulting colleagues
AIS 22.0 34.0 23.9 26.3 74.4 31.6 32.8
GPS 35.2 32.8 24.2 24.4 76.6 36.6 40.4
ARPA 44.2 65.0 24.0 23.8 70.6 35.9 39.8
GMDSS 38.3 77.8 25.5 22.4 63.4 29.6 39.3
ECDIS 26.8 68.2 26.8 20.4 64.2 33.0 40.2
0.0
10.0
20.0
30.0
40.0
50.0
60.0
70.0
80.0
90.0
Onboard training
from technician
/trainer
Hand-over familiarisa
-tion

13
Figure 12: Learning Activities Contributing to Knowledge of Engine Officers
Learning about equipment via formal training was another route identified by respondents.
More deck officers stated that onshore training contributed to their knowledge of
ARPA/RADAR, GMDSS, and ECDIS, than said that onshore training contributed to their
understanding of AIS and GPS. This seems to suggest that formal onshore training is
focussed more on ARPA/RADAR, GMDSS, and ECDIS.
Engineers similarly highlighted the contribution that onshore training had made to their
knowledge of the main engine manoeuvring system whilst fewer identified on shore training
as important in relation to the operation of the oily water separator. This difference
corresponds once again with the relative technical complexity of the equipment: onshore
training had made a greater contribution to knowledge about the more complex equipment
and had made less of a contribution to knowledge about simpler technology.
The analysis of the responses to questions about individual pieces of equipment suggested
that nationality and rank made a difference. When we combined the answers to the questions
about the learning activities that had contributed to knowledge of the five individual pieces of
equipment we found a marked rank and nationality effect. Overall, junior deck officers were
more likely than their senior counterparts to suggest that ‘cadet training’ had contributed to
their knowledge of bridge equipment. Given that some pieces of equipment were introduced
Cadet training
Onshore training
Onboard CBT
onboard training
from technician/
trainer
Consulting manuals
Hand-over familiarisatio
n
Consulting colleagues
ME 38.2 38 23.5 28.4 72.2 34 38.5
OW 35.4 30 25.6 26.5 76.8 35.7 39.4
0102030405060708090
Hand-over familiarisa
-tion

14
relatively recently and so will only have been covered by more recent cadet training courses
this is entirely as we would expect. However, nationality variations were less predictable.
In terms of nationality (for detailed information see Appendix One), Chinese and ASEAN
deck officers were the most likely to state that ‘cadet training’ had contributed to their
knowledge of the equipment on the bridge whereas Filipinos were the least likely to suggest
that this was the case. In contrast, Filipinos were the most likely group of respondents to
suggest that ‘onboard CBT’ had contributed to their knowledge of bridge equipment, while
Europeans, Chinese and Indians were far less likely to do so. As a group, Indian seafarers
were the most likely to suggest that ‘onshore training’ had contributed to their knowledge of
bridge equipment, and the least likely to do so were Chinese seafarers. Filipino and Chinese
seafarers were also more likely than seafarers of other nationalities to state that ‘handover
familiarisation and notes’ had contributed to their knowledge of the equipment on the bridge.
Arguably, the nationality differences point to several things. Firstly, Chinese deck officers
seemed more likely to get something out of their cadet training in relation to developing an
understanding of modern bridge equipment than other groups. However, there may be other
explanations for this. For example it might be that Chinese seafarers had fewer opportunities
to attend onshore training and therefore relied more on cadet training than other groups. In
another question which asked respondents about the adequacy of training provision in their
companies, Chinese respondents turned out to be the group who were the most likely to say it
was ‘inadequate’. While this question is not the focus of the paper, it nevertheless serves to
shed light on the nationality differences here and to highlight the extent to which training
issues are complex and interconnected. It further serves as a reminder that there may be
several contributory explanations for patterns of response and that we should remain open to
the idea that the most obvious explanations may not always be the strongest explanations. In
this context it is worth considering the responses of Filipino seafarers in a little more detail.
In a separate study of seafarers’ perceptions of onboard CBT (Ellis et al. 2005) Filipino
seafarers were identified as having a more positive view of CBT than other nationalities. One
possible interpretation of this was that seafarers found the quality of the internationally
supplied computer-based training modules superior in comparison with locally provided
tuition. Thus it is conceivable that Filipino seafarers express a preference for CBT because of
the poor standard of alternative training provision, a notion which would be supported by the
tendency for Filipinos to be less likely than other groups to highlight cadet training as

15
contributing to their knowledge of equipment. Finally, in relation to differences between
groups of seafarers of different nationality, both Chinese and Filipino deck officers appeared
to gain more from the effective use of handovers in terms of getting familiar with
navigational equipment.
We also combined the answers given by engineers to questions in relation to two pieces of
equipment –the main engine and the oily water separator. When considered in combination it
became clear that senior engineers were more likely to suggest that ‘handover familiarisation’
and ‘consulting manuals’ had contributed to their knowledge of the two pieces of equipment
than junior engineers (see Appendix Two). To make sense of this finding, two questions in
the questionnaire which are not featured in this paper are worth mentioning. One was about
the duration of handovers. Responses to this question indicated that senior officers had longer
handover periods than juniors. This could explain why senior seafarers are more likely to
state that they have contributed to their knowledge of equipment. The other question related
to the action they usually took when not familiar with equipment. In response to this question
senior respondents were slightly more likely to choose ‘consulting manuals’ than their more
junior colleagues. This may be interpreted as suggesting that where there is a willingness to
spend time reading manuals, seafarers can find that they have the capacity to enhance
knowledge. The analysis also revealed that senior engineers were slightly more likely to
suggest that ‘onshore training’ had contributed to their knowledge of the two pieces of
equipment, than their more junior colleagues. This may indicate that senior engineers had
more onshore training opportunities than junior ones, indeed our interview data do suggest
that, perhaps for obvious reasons, companies prioritise senior officers in their training
provision.
In terms of nationality (see Appendix Three), like their deck officer counterparts, Chinese
engineers were most likely to feel that ‘cadet training’ had contributed to their knowledge.
while Europeans and Filipinos were the least likely groups to do so. Similarly Filipino
engineers, like their deck officer counterparts, were more likely to state that their
understanding had improved as a consequence of ‘onboard CBT’, and Chinese, European,
and Filipino engineers were more likely than other nationalities to suggest that ‘handover
familiarisation and notes’ had contributed to their knowledge of engine room equipment.

16
Conclusion
Effective and sufficient training helps to harness the benefit of technology in enhancing
productivity (Trucotte and Rennison, 2004). In contrast, however, a lack of training coupled
with the introduction of technology can result in serious accidents. This may be particularly
the case with regard to the operation of ships. Shipping can be seen to be a ‘safety critical’
industry where small operational errors have potentially great consequences.
In terms of seafarers’ own assessments of their knowledge of new onboard equipment, the
questionnaire study found that while the majority of respondents were confident about their
understanding , there was nevertheless a small percentage of seafarers who reported that their
knowledge with regards to specific items was either ‘zero’ or ‘basic’ indicating a perceived
need for training.
Deck officers’ self-reported knowledge levels did not vary significantly with rank. By
contrast, engineers’ self-reported knowledge levels in relation to engine room machinery
were likely to vary with rank and experience.
In terms of preferred forms of training, both deck and engine officers stated that when
learning about new shipboard equipment they would favour instructor-led training methods.
They were more likely to desire onshore training for technically more complex equipment
and to prefer onboard instructor-led training for relatively simple equipment. In practice,
respondents did tend to receive more onshore training on the most complex equipment.
However, they did not seem to get the onboard training on simple equipment that they would
like, but largely relied on manuals instead.
The means via which seafarers had already acquired their knowledge of equipment was to a
certain extent affected by nationality. This is likely to reflect the relative strengths and
weaknesses of training provision in different regions and also regional training provision by
companies.
17
Acknowledgments
We gratefully acknowledge the support of The Lloyd's Register Educational Trust (The
LRET) in supporting this work. We also wish to thank the seafarer respondents and those
who provided help in designing, piloting, and distributing the questionnaire.
The Lloyd's Register Educational Trust (The LRET) is an independent charity working to
achieve advances in transportation, science, engineering and technology education, training
and research worldwide for the benefit of all.
References
Allen, P. (2009) ‘Perceptions of Technology at Sea amongst British Seafaring Officers’, Ergonomics 52(10): 1206-1214.
Bailey, N. (2005) ‘Training, Technology and AIS: Looking beyond the Box’, Proceedings of the Seafarers International Research Centre’s Fourth International Symposium. Cardiff: SIRC.
Bailey, N., Ellis, N. and Sampson, H. (2008) Training and Technology Onboard Ship: How Seafarers Learned to Use the Shipboard Automatic Identification System (AIS). Cardiff: SIRC.
Barret, A. and O’Connell, P.J. (2001) ‘Does Training Generally Work? The Returns to In-Company Training’, Industrial and Labour Relations Review 54(3): 647-663.
Bartel, A. (1994) ‘Productivity Gains from the Implementation of Employee Training Programs’, Industrial Relations 33(4): 411-425.
Dearden, L., Reed, H. and van Reenen, J. (2000) ‘Who Gains when Workers Train? Training and Corporate Productivity in a panel of British Industries’, Working Paper of The Institute for Fiscal Studies.
Ellis, N., Sampson, H., Aguado, J.D., Baylon, A., Del Rosario, L., Lim, Y.F. and Veiga, J. (2005) What Seafarers Think of CBT. Cardiff: SIRC.
Gray, B. (2008) ‘Too Much Technology Can Hinder Human Safety’, Lloyd’s List, September 25.
Grey, M. (2008) ‘Time for Familiarisation Needed’, Lloyd’s List, August 28th.
Hadnett, E. (2008) ‘A Bridge Too Far?’, The Journal of Navigation 61(2): 283-289.
18
Harati-Mokhtari, A., Wall, A., Brooks, P. and Wang, J. (2007) ‘Automatic Identification System (AIS): Data Reliability and Human Error Implications’, The Journal of Navigation 60(3): 373-389.
IMO (2003) ‘Issues to Be Considered When Introducing New Technology Onboard Ship’, MSC/Circ. 1091.
Lloyd’s List (2007) ‘A Question of Competence’, Lloyd’s List, March 23rd.
MAIB (2007) Report on the Investigation of the Loss of Control of Product Tanker Prospero. MAIB Report No 24/2007.
MAIB (2008a) Report on the Investigation into the Grounding of CFL Performer. MAIB Report No 21/2008.
MAIB (2008b) Report on the Investigation of a Close-Quarter Situation between Costa Atlantica and Grand Neptune. MAIB Report No 20/2008.
MAIB (2009) Report on the Investigation into the Grounding of Pride of Canterbury. MAIB Report No 2/2009.
Norris, A. (2007) ‘AIS Implementation – Success of Failure’, The Journal of Navigation 60(1): 1-10.
Robey, D., Ross, J.W. and Boudreau, M. (2002) ‘Learning to Implement Enterprise Systems: An Exploratory Study of the Dialectics of Change’, Journal of Management Information Systems 19(1): 17-46.
Sharma, R. and Yetton P. (2007) ‘The Contingent Effects of Training, Technical Complexity, and Task Interdependence on Successful Information Systems Implementation’, MIS Quarterly 31(2): 219-238.
Tang, L. (2009) ‘Training and Technology: Potential Issues for Shipping’, Seafarers International Research Centre Symposium Proceedings. Cardiff: SIRC.
Turcotte, J. and Rennison, L.W. (2004) ‘Productivity and Wages: Measuring the Effect of Human Capital and Technology Use from Linked Employer-Employee Data’, Department of Finance Working Paper.
Zwick, T. (2006) ‘The Impact of Training Intensity on Establishment Productivity’, Industrial Relations 45(1): 26-46.

19
Appendix One
Kruskas-Wallis Test Ranks
Nationality Mean Rank
Cadet training (deck officers) Philippines 156.22
India 185.76
China 222.50
Europe 181.10
ASEAN 232.04
Other 171.50
Onshore training (deck officers) Philippines 187.27
India 191.48
China 118.27
Europe 170.65
ASEAN 134.96
Other 202.09
Onboard CBT (Deck officers) Philippines 219.45
India 164.88
China 163.96
Europe 140.59
ASEAN 188.71
Other 185.38
Handover familiarisation and notes (Deck officers) Philippines 213.58
India 140.11
China 201.04
Europe 157.21
ASEAN 150.67
Other 181.83

20
Appendix Two
Kruskas-Wallis Test Ranks
Rank Mean Rank
Onshore training (Engineers) Senior officers 238.49
Junior officers 215.31
Consulting manuals (Engineers) Senior officers 249.12
Junior officers 206.21
Handover familiarisation and notes (Engineers) Senior officers 244.88
Junior officers 209.84
Appendix Three
Kruskas-Wallis Test Ranks
Nationality
Mean Rank
Cadet training (Engineers) Philippines 202.57
India 225.16
China 337.65
Europe 194.47
ASEAN 258.90
Other 229.61
Onboard CBT (Engineers) Philippines 257.48
India 216.02
China 228.68
Europe 209.00
ASEAN 187.25
Other 206.24
Handover familiarisation and notes (Engineers) Philippines 238.92
India 180.90
China 268.69
Europe 242.08
ASEAN 211.60
Other 196.86

21
Living and Working Conditions in the Large Yacht Sector
Bailey, N., Ellis, N. & Sampson, H.
Abstract The large yacht sector is an economically important and growing sector of the maritime industry. This paper reports on the living and working conditions for crew onboard these vessels. The findings are based on research undertaken by the Seafarers International Research Centre (SIRC) on behalf of the Professional Yachtsmen’s Association (PYA), and in light of the Maritime Labour Convention (MLC) 2006. Specifically, the paper reports on terms and conditions of employment, standards of accommodation, hours of work and rest, and areas of concern to seafarers. Tentative comparisons are also drawn between the large yacht sector and the merchant navy.
Introduction
The large yacht sector is associated with luxury, opulence, extreme wealth and exotic
locations. With some 6,000 yachts registered worldwide (Errico, 2010), varying in length
from 24 metres to 150 metres plus, it is a substantial and growing industry. It was claimed by
Hughes in 1993 that “Superyachts are a $2 billion a year industry”, and it is reported that
demand for such yachts has grown at a rate of 500% a year over the last decade (BBC, 2008).
Despite the economic downturn, in 2010 twenty eight superyachts (i.e. yachts 24m +) were
sold at a value in excess of 300 million Euros (Liveyachting, 2010). At the extreme end of the
market mega-yachts can cost in the region of $4-500 million. In 2009/10 the UK sector of the
industry alone, involved in design, building, refit, supply chain and service provision,
employed some 3,500 employees and was reported to be valued at £420 million - a growth of
3% on the previous year (BMF, 2010). While the Mediterranean, the Balearics and Florida
have traditionally been the central hubs of superyacht activity and operation, growing
markets and yachting activity are now reported to also be developing in the Gulf region,
China and South America (Liveyachting, 2010).
Amongst the huge wealth and glamour of this sector are the thousands of workers that
operate and maintain these boats and provide hotel services for owners and guests. This paper
reports on the findings of a questionnaire survey that examines the working and living
conditions of such workers.

22
The survey was a commissioned study by the Professional Yachtsmen’s Association (PYA)
and undertaken by the Seafarers International Research Centre (SIRC) in response to the
International Labour Organisation’s (ILO) Maritime Labour Convention (MLC) 2006. The
convention sets minimum standards for size and design of crew accommodation which
superyachts typically do not meet. The argument presented by the PYA was that the
standards were primarily intended for workers aboard merchant ships whose working life is
very different to those aboard yachts, and further, that to require yachts to meet these
standards would be highly damaging to this lucrative and flourishing industry. Thus the
survey was designed to provide independent and impartial evidence as to what living and
working conditions aboard superyachts are actually like.
Methods
The staff at SIRC in consultation with the PYA developed a questionnaire to examine living
and working conditions. This was then made available online on 2nd July 2010 and links to
the site were distributed by the PYA to its members, and others, via crew agencies,
management companies and various media outlets. After one month the 1,503 responses
posted were analysed by staff at SIRC and a report of the findings produced. This paper gives
a brief overview of those findings.1
Findings
The Respondents
Completed questionnaires were received from 1,503 individuals. The sample was notably
skewed towards senior officers with 44% of the sample being captains and further 8% chief
engineers. Similarly the sample was largely comprised of men (85%), and the majority of
respondents reported being single (65%). The average age of respondents was 39 years old,
and most were from OECD countries, including 41% from the UK. The average time worked
1 For the full report see: www.pya.org
23
in the yacht sector was 12 years. Very few individuals were members of a trade union with
93% indicating that they were not.
The Boats and their Crews
Respondents worked on both motor (83%) and sail (17%) yachts. Individuals worked on a
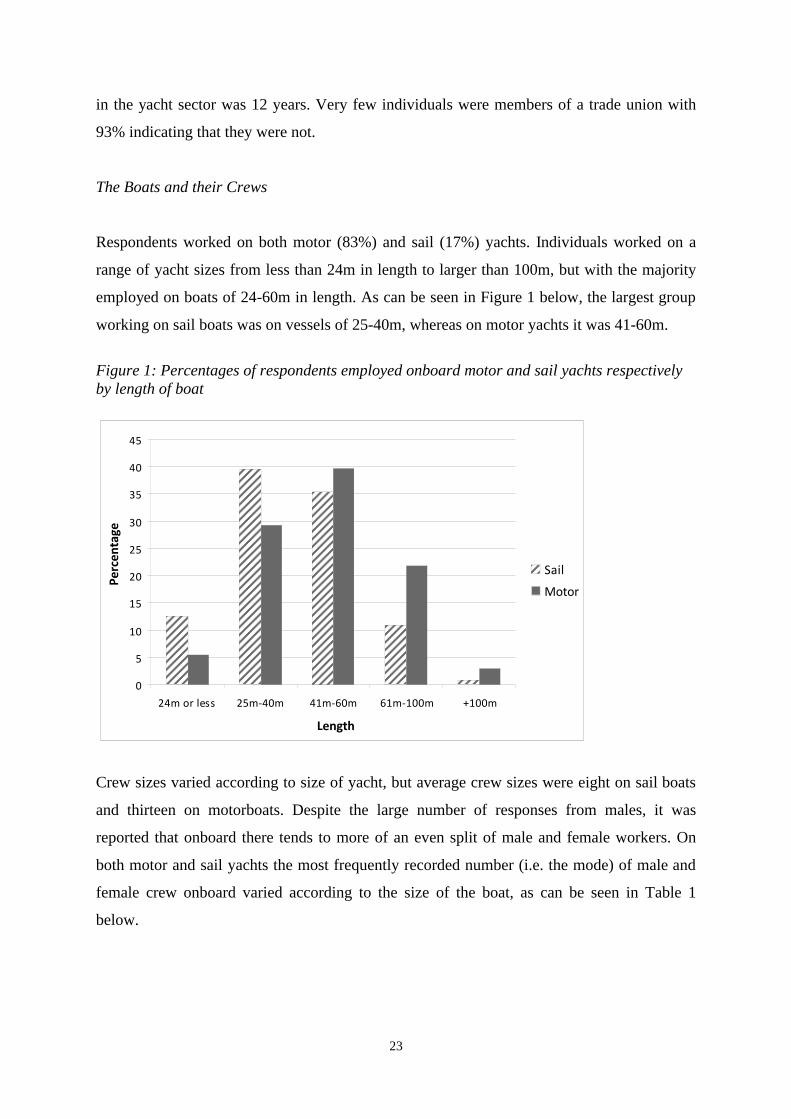
range of yacht sizes from less than 24m in length to larger than 100m, but with the majority
employed on boats of 24-60m in length. As can be seen in Figure 1 below, the largest group
working on sail boats was on vessels of 25-40m, whereas on motor yachts it was 41-60m.
Figure 1: Percentages of respondents employed onboard motor and sail yachts respectively by length of boat
0
5
10
15
20
25
30
35
40
45
24m or less 25m-40m 41m-60m 61m-100m +100m
Length
Perc
enta
ge
Sail
Motor
Crew sizes varied according to size of yacht, but average crew sizes were eight on sail boats
and thirteen on motorboats. Despite the large number of responses from males, it was
reported that onboard there tends to more of an even split of male and female workers. On
both motor and sail yachts the most frequently recorded number (i.e. the mode) of male and
female crew onboard varied according to the size of the boat, as can be seen in Table 1
below.

24
Table 1: Crew sizes (n=mode figure) and distribution by gender SAIL MOTOR Length (metres) Female Male Total Female Male Total 24-40 2 3 5 2 3 5 41-60 3 6 9 4 6 10 61-100 4 8 12 5 12 17 100+ 19 22 41 10 30 40
These figures include both permanent crew and additional crew employed for the season. The
majority of yachts worked on were privately owned (59%), while 41% of respondents worked
on commercially owned boats. The boats were registered under some 45 different flags,
although there were three main groupings: Cayman Islands (44%), UK (17%), and Isle of
Man (7%).
Terms and Conditions of Employment
The majority of respondents (61%) had permanent contracts. For those who reported being on
fixed term contracts the average length of contract was 1.44 years. The principal currencies
for payment were US dollars and Euros. Those paid in Euros tended to be slightly better paid
than those in dollars, although this is clearly subject to variation with changes in exchange
rates. For those paid in Euros the most common salary was in the range of 5-7,000 Euros per
month. Although basic salaries were good, for most, their employers did not make any
national insurance contributions (77%) or pension contributions (94%). On average these
workers were entitled to 41 days paid annual leave, including public holidays.
Working Hours
Working hours varied according to whether the boat was at sea or in port and crucially
whether there were guests onboard. As can be seen from Figure 2 below, crew worked fewest
hours when in port without guests (on average 8.6 hours per day) by comparison the busiest
times were at sea with guests onboard (on average 14.3 hours per day).

25
Figure 2: Hours worked in port and at sea, with and without guests onboard
0
2
4
6
8
10
12
14
16
No Guest Guest
Hour
s In Port
At Sea
The period that guests were onboard varied considerably but on average those on motorboats
tended to have guests onboard more frequently than those on sail boats. For those on
motorboats the average time that guests were reported to have been onboard over the
preceding eight weeks was 19.3 days, whereas for sail boats this was 14.8 days. That is,
approximately a third and quarter of the time respectively. Length of boat was also a clear
predictor of the amount of time guests were reported to stay onboard, with larger boats
having guests onboard more frequently. On average boats spent more than three quarters of
their time in port and just 23% of their time at sea.
Figure 3 shows the mean number of days spent at sea during the last twelve months for
different lengths of both sail and motor yachts.
It can be seen that, in general, larger boats and sail boats were more likely to spend longer
times at sea.

26
Figure 3: Average number of days spent at sea by type of boat and boat length
0
20
40
60
80
100
120M
ean
No
of d
ays
at s
ea in
la
st 1
2 m
on
ths
24m orless
25m-40m 41m-60m 61m-100m
+100m
Length of boat
Motor
Sail
Likewise length of boat was a clear indicator of whether individuals were likely to report
having adequate rest, with those on larger boats more likely to give an affirmative response.
When not working, and in port, individuals reported being able to get ashore regularly,
although the extent of this varied and was dependent upon whether there were guests
onboard. When there were no guests onboard 99% of respondents said they could get ashore
at least weekly; of these, 88% could get ashore on a daily basis and 33% of them could go
ashore several times a day. Moreover two thirds of respondents stated that they could stay
ashore for more than six hours.
With guests onboard there was less opportunity to get ashore, but 58% still reported that they
could get ashore weekly, and of these 15% could do so several times a week and 9% several
times a day. Eighteen percent indicated that they could not get off while guests were onboard.
Those that could get ashore said they could typically do so for one to six hours.
Importantly time ashore was usually in places considered glamorous and offering good access
to facilities such as cafes /bars, restaurants, and cinema /theatre, etc.
This contrasts sharply with life aboard a merchant vessel. For instance, Kahveci (2007), in a
study into port base welfare facilities, reported that 64% (i.e. 2,160) of 3,375 seafarers

27
surveyed had not had shore leave in the previous eight weeks. Moreover, when they had
enjoyed shore leave, it was said to last about two hours and seafarers tended to stay in the
port area.
Accommodation onboard
A notable feature of the crew accommodation aboard these luxurious yachts was the fact that
the majority had to share a cabin (64%) and of these 43% shared with a member of the
opposite sex and only half (51%) of these had any choice over the matter. Consequently of
those that did share a cabin 53% reported that they objected to doing so, at least ‘sometimes’.
On the positive side 85% of cabins had en-suite bathrooms. Nonetheless when asked their
preference, as a first choice, 79% of respondents expressed a preference for a single en-suite
cabin. However, in terms of their second choices more respondents expressed a preference
for a single cabin without en-suite facilities (40%) than a double cabin with en-suite
facilities (35%). It appears therefore that greater importance was attached to having a single
cabin than en-suite facilities for many respondents.
While the majority (59%) were happy with the standard of their cabins, less than half (48%)
were satisfied with cabin sizes. By comparison 29% reported that they were unhappy about
the standard of the cabins and 21% with the size. The rest were neither satisfied nor
unsatisfied. Facilities within cabins varied, as can be seen in Figure 4. Most respondents had
access to a wardrobe and drawers, as well as TV, radio and internet within the cabins.
However, less than half had access to a table / desk, and only about a fifth had comfortable
seating in their cabins.

28
Figure 4: Percentage reporting facilities provided in cabin
0102030405060708090
100
Wardrob
e
Drawers
Intern
et TVRad
ioDesk
Seatin
g
Perc
enta
ge
The Attractions of the Yachting Lifestyle
Individuals that responded to the survey made clear that they had a real enthusiasm for the
work which rewarded them with a good salary, allowed them to work in a ‘luxurious
context’, and allowed access to places and facilities ashore and onboard associated with a
glamorous lifestyle. Moreover it was reported that there was good camaraderie amongst
crews as individuals took pleasure and pride in their work. The following comments are
typical of those made by respondents.
I love the sea…the camaraderie along with the special places we visit on magnificent vessels makes it a great lifestyle (#296, Cpt.)
There is nothing else out there that comes close. Travel, interesting places, out-going people and I love boats (#482, Chief Engineer)
Downsides of the Yachting Lifestyle
When given the option to suggest possible improvements a number of issues were mentioned
and accommodation was the most frequent. Specifically respondents complained that there
was often a lack of storage space, that noise was an issue, communal space for crews was
reported to often be very limited, and more generally individuals expressed their

29
dissatisfaction with the lack of privacy. A number of these features are captured in the
following comments.
[I]t would be nice to be able to have a good space to escape, to be able to store your belongings, write a letter or to actually sleep without hearing the crew mess. Although it is the owner’s yacht, I feel that there is too much emphasis on their accommodations... The two forward cabins have NO portholes & we have 2 x 3 berth cabins as well and the Captain’s Cabin is on the LOWER crew deck (so the owner can have more space) this jeopardizes the yacht’s SAFETY (#538, Head Chef)
I would rather have my own cabin with shared or private facilities than sharing a cabin with another crew member. (#1074, Deck hand)
Other areas mentioned as a cause of dissatisfaction were as follows:
• Long working hours when guests were onboard. As stated previously (see Figure 2),
when guests were onboard crews could work up to 14 hours a day. This compares
unfavourably to Merchant Navy crews on car carriers who, on average, are reported to
work 11 hours per day (Kahveci & Nichols, 2006). However when there were no guests
onboard, working hours onboard yachts were reported to reduce to an average of 8.6
hours per day.
• A degree of bullying / harassment from owners and captains. Eleven percent of
respondents reported having experienced such behaviour often or more frequently.
In a study for the UK Government in 2008 (Fevre et al, 2009), 7% of respondents
reported harassment, 1% reported sexual harassment and 7% reported having experienced
discrimination. Thus the figures for the yachting sector could be seen as high.
• A lack of formal employment regulation meaning individuals felt insecure in their
employment. We can but speculate, but it would not seem unreasonable to argue that this
point is related to the above issue of harassment.
• It was also felt that there was room to improve the terms and conditions of employment
with better leave and the inclusion of social security and pension provision. With
reference to the latter, the limited available evidence suggests that in the Merchant Navy
more seafarers may receive some form of pension contribution. The Shiptalk survey of

30
2007/8, for instance, indicates that 30% of respondents in the Merchant Navy received
pension contributions (Shiptalk, 2008). Similarly a 2006 study (Shiptalk, 2008) of
seafarers in the car carrier sector claimed that of the 276 ratings surveyed, 68% of those
working on nationally flagged ships, 28% of those on FOC ships with ITF agreements,
and 20% of those on FOC ships without an ITF agreement, received pension
contributions.
Generally there were differences in responses between men and women, and dependent upon
type and length of boat worked on. Typically men, those on motorboats and those working on
larger boats, reported more favourable conditions.
In summary, the yachting sector is an important and growing industry. It provides workers
with the opportunity to travel, earn reasonable salaries and to participate in a lifestyle marked
by luxury and glamour. However despite the obvious enthusiasm conveyed by workers in this
sector there are clearly areas for improvement in terms of formalising working conditions and
providing better accommodation.
Conclusion
As discussed in the introduction the reason for the study was to identify the living and
working conditions for crew in the large yacht sector in relation to the MLC (2006).
The study provided key insights into living and working conditions in this sector. It revealed
a complex and varied situation that largely related to type and size of boat, but was also
influenced by factors like gender, and position held onboard. As was stated earlier, the
sample of respondents was skewed towards male senior officers and so we can assume that
the conditions presented may be more favourable than would be obtained from a more
balanced sample.
There was a general enthusiasm for working in the sector that related to pay, travel, and
participating in a sector of the maritime industry associated with luxury in terms of the
vessels worked on, and time spent in glamorous locations. However there were a number of
areas where it was generally agreed that improvements could be made.

31
Terms and conditions of employment were generally seen to be good with the majority of
workers (61%) on permanent contracts; although concern was expressed that lack of
employment regulation in this sector meant workers felt insecure in their jobs. It was also
felt that better provision could be made in terms of contributions to crew pensions.
A clear benefit of the occupation was seen to be access to a wide range of facilities both
onboard and ashore. This contrasts sharply with conditions in the Merchant Navy where
seafarers have very limited facilities onboard and get little opportunity to get ashore or to
partake of shore based facilities.
Despite the opportunity to spend time ashore, crew still spend extended times onboard and
typically have to share their cabins, often with individuals of a different gender – which
around half objected to. There were further complaints about limited space for both storage
and recreation and many experienced issues with noise.2
References
BBC, (2008) ‘Crew crisis as super-yacht industry booms’. BBC News. Downloaded 25/2/11 at www.news.bbc.co.uk/1/hi/business/7450985.stm (18.06.2008) BMF, (2010) British Marine Federation Survey. Downloaded 25/2/11 at www.britishmarime.co.uk/upload_pub/ SYIUK2101resultsfinal.pdf Errico, J. (2010) Working on Yachts and Superyachts. (Third Edition) Two Moon Bay. Fevre, R., Nichols, T., Prior, G., Rutherford, I. (September 2009) ‘Fair Treatment at Work Report: Findings from the 2008 survey’, Employment Relations Research Series No 103 BIS Department for Business Innovation and Skills published on line at http://www.berr.gov.uk/files/file52809.pdf Hughes, G. (1993) ‘The self, signification and the superyacht’. Leisure Studies 12: 253-265. Kahveci, E. (2007) Port based welfare services for seafarers. SIRC: Cardiff University. Kahveci, E. and Nichols, T. (2006) The Other Car Workers. Basingstoke: Palgrave MacMillan.
2 As a consequence of lobbying by the sector (especially the PYA) the ILO has recognised that the application of the MLC to Large Yachts is an issue, and has allowed for a sliding scale of substantial equivalents.

32
Liveyachting (2010) ‘Superyacht Industry Shows Signs of Recovery With the Increase in Sales Volume’, www.liveyachting.com: downloaded 25/2/11 (March 19, 2010). Shiptalk (2008) Life at Sea Survey: Seafarer Salaries & Employment Benefits Survey Report, Gateshead: Shiptalk Ltd.

33
Seafarers and Growing Environmental Concerns: To Comply or Not to Comply – Choices and Practices
Abou-Elkawam, M. Abstract
This paper reports on my tracking of the mobility and multiplicity of seafarers’ perceptions in their journey from the normality of ‘dumping at sea’ practices to more responsible environmental behaviours. It focuses, in part, on how seafarers perceive the marine pollution and their aspirations to protect their own countries’ marine and coastal environments. The arguments presented in this paper are based on a wider qualitative study that involved talking to seafarers worldwide in different work settings (i.e. shipping companies) and working onboard fleets trading in various parts of the world. Whilst marine pollution is depicted by seafarers as a ‘beast’ that needs mitigation, they are still divided on the optimum way forward. They assign some blame for pollution to new entrants to the profession, to uneducated, untrained, or ignorant seafarers, to some shipping companies, and even to some countries for not adopting appropriate or adequate environmental programmes to protect their marine and coastal environments. Such themes emerged from the data gathered by conducting qualitative semi-structured interviews with seafarers from different countries, companies, and areas of trade. Moreover, interviewees in this study are frequently resorting to ‘demographic based’ backgrounds prioritising how preventing marine pollution from ships could save their countries’ coasts, beaches and shorelines and how this would reflect on their national economy and children’s health. This paper aims to trace the source of what could be termed ‘environmental integrity’ perceptions and to contribute in uncovering the motivations, interests and difficulties faced by seafarers in relation to compliance practices with MARPOL as an exemplary marine environmental convention.
1.0 Introduction
This paper highlights the perceptions and compliance practices of seafarers when interacting
with one of the pioneer and major marine environmental conventions which has been in force
for more than quarter of a century (i.e. prevention of pollution from ships known as
MARPOL). Such perceptions can significantly open a communication window to policy
makers to verify the impacts of compliance and enforcement difficulties on the perceptions
and actions of regulatees in such an exemplary globalised industry. Throughout this paper I
argue that seafarers are continuously evaluating (often critically) and using their job’s
extremely mobile nature to monitor the status of the marine and coastal environments in
various parts of the world. Further, this continuous monitoring of the compliance levels of
countries, companies and peers, creates and establishes a set of perceptions which might

34
govern and direct their own short and long term environmental behaviour and compliance
practices.
2.0 Methodology and Methods
The arguments presented in this paper are based on a wider qualitative study that involved
talking to seafarers worldwide in different work settings (i.e. shipping companies) and trading
in various parts of the world. The semi-structured interviews conducted with seafarers
aimed - among other issues - to verify the difficulties regarding MARPOL compliance
requirements (focusing on Annex I – oil) among active seafarers. The main aims of this wider
study could be summarised in the following:
- To identify how involved parties view the pollution problem differently in order to
fully appreciate the compliance dynamics and to, eventually, seek ways to address
them;
- To verify the impacts of different implementation and enforcement levels in various
geographic and organisational arenas on the perceptions and environmental practices
of seafarers (i.e. compliance to MARPOL).
To achieve these aims, a set of carefully designed interviews (total of 40) were conducted
with seafarers from various parts of the world whilst their tanker ships were in port or at a
Maritime Education and Training Institution. The shipping companies varied between
national flags and 2nd registers to open registers - also known as flag of convenience countries
- and voyage patterns ranged between coasters to deep sea going vessels. Respondents
presented three main types of perceptions in relation to the marine pollution and compliance
problems namely ‘economic-based’ perceptions, ‘value-based’ perceptions, and
‘socio/political-based’ perceptions. Such perceptions, in many cases, acted as barriers to
being able to comply with MARPOL even when the vast majority of respondents were
clearly willing to. The following sections present and discuss the data coded under the main
types of characterisations, perceptions, and practices, focusing on the implications of the
formation of such established perceptions on the environmental practices not only for
seafarers, but also to shipping companies and countries as well. For the sake of clarity,
compliance with MARPOL was chosen to depict clearly the problems faced by seafarers in
35
their daily attempts to fulfil the statutory requirements of this major environmental
convention in force for almost three decades. This is presented in the form of different
themes/barriers to sound compliance practice resulting from seafarers’ experiences with
issues regarding marine pollution in different shipping companies operating in different
geographic areas, while facing different environmental priorities adopted by state parties
worldwide.
3.0 The Economic/Cost Barrier This was one of the most prominent barriers to sound environmental compliance detected
amongst seafarers in this study. In order to interpret and understand the implementation and
enforcement difficulties encountered by different countries, seafarers adopted a dominant
preconception that differentiates between affluent European countries and developing
countries. They often linked the political will of nations to protect their waters from pollution
with the availability of economic resources. Doing this, they reported how many affluent
nations they visited are performing better than less developed counties on the MARPOL
enforcement front. However, when some respondents observed high levels of pollution in the
territorial waters of some affluent Gulf nations, and lack of compliance to MARPOL
requirements for providing port reception facilities in many EU ports, this triggered
frustration and ambivalence about the actual reasons behind what they perceived as
institutional ‘passivity’ or lack of political will to protect the marine environment. An
experienced Middle Eastern Chief Engineer working onboard a ship trading between the Gulf
and European ports contends:
…in our areas…I mean the developing countries regions…our seas have no respect...have no
value…even the Europeans when they come to our waters…they do whatever they like.
This respondent is referring to the scarcity of oil dumping, monitoring, and surveillance
capabilities, in developing countries due to the lack of political will of such nations - as he
perceives - to protect their waters. The argument is that seafarers experiencing such national
and/or institutional practices tend to become complacent - as evidenced from this study - in
their own MARPOL compliance activities asking questions such as: “no one cares here! why
should I care ?”. However, the problem takes a slightly different form in the EU region as

36
interpreted by a European Chief Officer (trading in EU waters only) when explaining his
views about non-compliance practices:
…a lot of us have to deal with the fact that maybe some of these companies have a
prohibitive cost …they don’t want to pay the cost…and the seafarers are finding it….very
difficult to get rid of certain waste products…the only place you can get rid of it in the
continent (Europe) is in the barges….but for a charge and not cheap either…..
This senior ranked officer, while reporting the non-existence of such facilities in many of the
ports his ship visits, interpreted also that one of the reasons may be the very high cost that
certain shipping companies incur to use the port reception facilities (for discharging oily
waste). Such an established ‘prohibitive’ economic barrier was utilised by some respondents
trading in this area as a justification for their own oil dumping activities at sea in breach of
MARPOL.
3.1 The Regulatory Enforcement Barrier This dominant perception tends to develop among seafarers having sailed for a number of
years and interacting with different countries adopting different environmental priorities. In
other words seafarers cannot ignore the different levels of rigor countries adopt in enforcing
MARPOL. In the context of regulatory compliance and enforcement, scholars contend that
any regulated entity weighs the marginal costs of compliance with its marginal benefits. Such
benefits often relate to the accepted value of fines avoided, which in turn is a function of the
probability of inspections conducted, the likelihood of a violator being found, and the
magnitude of penalty imposed (Brehm and Hamilton 1996). The scarce literature focusing on
regulating marine pollution on the international level suggests that maritime policy makers
(mainly at the International Maritime Organisation - IMO) had to choose between
‘effectiveness oriented’ and ‘compliance oriented’ information. The former is mainly used to
assess whether regime members (i.e. state parties) are achieving regime goals, while the latter
is to assess whether particular actors are fulfilling regime commitments (Mitchell 1994, 2003;
Mitchell 1995, 1998; Raftopoulos 2001). Initial observation of IMO’s policy concerning
MARPOL compliance deficiencies shows an inclination towards the ‘compliance oriented’
notion. This notion is stipulated by responding to the rise of environmental protection
demands with amending the convention and adding new protocols, despite many state actors

37
still failing to fulfil the basic treaty requirements (e.g. providing adequate port reception
facilities mandated by the classic Annex I) either due to inadvertence or in-capacitance (Levy
et al. 1993; Mattson 2006a).
Focusing on the case of MARPOL compliance, previous research argues that many
governments - while being member parties of the convention - are either unwilling or unable
to fulfil their obligations according to the convention (Brookman 2002; Mattson 2006b;
Sahatjian 1998). Such practices by governments intermingled with corporate economic
determinism and micro-situational difficulties on board ships (e.g. difficulties in dealing with
overboard discharge monitoring equipment), elicits, as this study suggests, the development
and establishment of a set of salient perceptions among seafarers as a social and professional
group. Perceptions raise many doubts about the seriousness of these key actors (i.e. governing
bodies and state parties to MARPOL) and whether they are genuinely pursuing
environmental goals or just accommodating contemporary political agendas. Being
influenced by such perceptions and experiences, many seafarers build up a significant level of
distrust regarding the intentions of global policy making institutions governing the marine
pollution agenda. The argument is that this distrust is not yielding significant improvements
in compliance practices with the growing body of marine environmental regulations
mandated by international governing bodies such as the IMO. Moreover, amongst all these
tensions, when contemporary seafarers feel the ‘global’ cry to protect ‘the environment’ they
feel more committed and stressed especially if they face any prohibitive barriers to comply.
These types of ‘global’ stressors are discussed below.
3.2 The ‘Globality’ Factor / Barrier This section discuses the political and environmental priorities/pressures as perceived and
voiced by seafarers representing a set of ‘global’ factors affecting their general understanding
of marine pollution and compliance problems. In this context, many participants stressed the
importance of the power of politicians and the importance of a country’s political will to
materialise and enforce the globally adopted marine environmental conventions. Because no
questions were explicitly posed on this topic, interviewees who talked about issues of ‘global’
environmental concerns did so autonomously. Many seafarers from various nationalities and
shipping companies commented on the importance of ‘global’ political agendas and various
regional and local levels of implementation and enforcement of the MARPOL convention.

38
This unanticipated theme (at the beginning of the study) may be considered as another source
of stress and pressure - as discussed below – for a transnational workforce in a globalised
industry.
In contrast to policy makers, seafarers are often observed to evaluate the effectiveness of
marine environmental conventions and especially the MARPOL convention in their own
way. Interestingly, they are engaged in their own evaluation of the attitudes and behaviours of
countries, shipping companies, and their peers in relation to MARPOL daily compliance.
Their tool for this evaluation is by simply observing the sea water parameters and coastal
areas in their own countries and comparing this with different coastal waters and ports of the
world in terms of which is more polluted. Following these comparisons and observation
autonomous tasks, it is clear from the data analysis that many respondents are also falling
under the influence of ‘global’ public discourses intermingling issues such as ‘global
warming’ and green house gas ‘GHG’ emissions with marine pollution problems in a rather
confused way. In their accounts, seafarers are also ambivalent about the role of the shipping
industry in protecting the marine and coastal environments. This ‘confused’ perception is
expressed clearly by an Asian Second Officer when asked about the reasons behind
protecting the marine environment in general:
Well, it is what we know at the moment about the global warming…that is the main issue I
think…there are so many phenomena happening because of this global warming…
However, along similar lines, a Nordic Master in the same company summarises the ‘global’
pressure he feels with this explicit account:
…the more talk out there about the environment…the more you feel the pressure to
apply…and you don’t want to do things that will result in a pollution…you want to behave as
good as you can….
This perceived ‘global’ pressure is seen by most respondents (from all nationalities
contributing to this study) as being dynamically progressing during recent years and some
respondents go as far as speculating that it is going to be harder in the years to come. This
theme is clear from the account of an experienced Chief Engineer referring to criminalisation
of seafarers in the aftermath of any pollution incidents:

39
…regarding these incidents or accidents that are happening…and I can say things are going
to be harder in the days to come as we have all these environmental issues ….all these rules
and regulations coming in...
In this context, my argument is that adding a global ‘macro’ socio/political stressor to the
‘micro’ situational compliance atmosphere on board ships represents significant pressure on
individual seafarers as they try to fulfil perceived social and professional roles. A view
supported by previous shore-based regulatory compliance studies which argued that this
multiplicity of social and professional commitments can lead to a significant level of stress on
regulatees potentially affecting their professional performance, especially when they try to
pursue, simultaneously, incompatible goals (Haines and Sutton 2003).
3.3 The National Theme Interestingly, amidst all the above mentioned tensions, many seafarers have chosen a
‘national’ self representation when asked about their feedback regarding compliance levels
with marine environmental regulations. For example, some European respondents are
claiming that their care for the environment was due to their native countries’ culture and
how they were brought up and taught how to preserve the environment in their childhood. In
employing such a position they are acknowledging their countries’ efforts for environmental
protection, in general concluding by showing their national superiority in environmental
issues. This can be seen, on the one hand, from the explicit account of a Nordic Chief
claiming his country’s superiority in environmental protection:
…for example (country name)…we divide our garbage to glass, paper…what do nine million
people do…we do our best…but you think what are they doing in (another densely populated
developing country name)… nothing….
On the other hand Asian and Middle Eastern seafarers reported their despair of the lenient
environmental policies adopted by their countries regarding the protection of the marine and
coastal environments (i.e. territorial waters, beaches, ports etc.). The account of an Arab
Chief Engineer depicts the state of the marine environment in some Arab countries and the
associated feelings of despair:

40
… I feel great pain when I see our Arab countries’ ports…the pollution in it can be easily
seen with your bare eyes. It is a disgrace …
This account - and many others - depicts these general feelings of victimisation that could be
sensed in many interviews with seafarers from less developed countries. It is clear that such
feelings contribute, to a large extent, to the establishment of ‘interest based’ perceptions that
negatively impact on environmental practices of seafarers in various geographic areas. In
other words it elicits negative perceptions that may lead to a general feeling of despair - as
sensed from the account - among seafarers witnessing such persistent pollution especially
when this pollution is observed in their own countries. My argument is that these
evaluating/monitoring processes ultimately result in more dumping activities in these sea
areas belonging to such countries, which end up to be perceived by seafarers as
environmental pariahs.
To explore these issues further, differences between developed and developing countries
were explored in the literature in an attempt to locate the links between seafarers’ socio-
demographic variables and their behaviours towards the marine environment. This was
explored in a more holistic approach about differences between developed and developing
countries citizens’ behaviours toward the environment in general. Some of the existing
literature suggests that; in developed nations the government and industry’s rising level of
environmental concern are mainly due to public perception and demand for corrective and
preventive actions. The case of developing countries differs as pro-environmental behaviours
are mainly emerging from government and Non Governmental Organisations (NGOs) rather
than from the public at large (Rice 2006). Bearing in mind the internationalised structure of
ships’ crews in the contemporary shipping industry, and within the context of different
behaviours towards the environment, a very relevant study by Inglehart (1995) implied that
the inhabitants of such poorer countries are less likely to demonstrate concern and pro-
environmental behaviour. This study also tried to identify the links between sound
environmental behaviours and demographic variables, beliefs, values and religiosity
(Inglehart 1995).
In this context recent studies identified some pivotal elements affecting a person’s
engagement in Environmental Responsible Behaviour (ERB). This person must feel that their

41
efforts make a difference, and avoid the feelings of helplessness which depress pro-
environmental behaviours (Kaplan 2000). This body of literature also suggests that there are
differences between peoples’ perceptions of the environment within a certain country and
between countries. Such comparative studies provided some explanations to different
seafarers’ perceptions about marine pollution and compliance problems, which proved to be
helpful in studying seafarers’ environmental compliance practices.
3.4 The Shipping Companies’ Theme/Barrier Ship Masters, in this study, clearly perceive themselves as targets of contradictory coercive
environmental policies adopted by their shipping companies. They, while positioned in
command of their ships, strongly feel that they are being remotely managed much more than
ever with the rise of environmental concerns and the resultant regulatory instruments. Such
instruments usually mandate certain compliance elements on shipping companies who try - at
times - to evade and/or to reduce the cost of their implementation by adopting implicit
dumping policies across their fleets. These evading policies can be popular among seafarers
especially when they are overworked, fatigued or when they feel over regulated. The
feedback of a European Master when asked about new environmental policies of his
company exemplifies the feeling of ‘over regulation’:
I can tell you…I don’t need it….because I have the feeling inside to protect the
environment… […]...for myself …the ISM code guide the company….for good guys never
necessary…now we have the paper work growing and growing……I can’t manage anymore...
the company just adds to our agony with this array of environmental stuff….
Along similar lines, some shipping companies, taking advantage of the insecure employment
situation and deregulation of the maritime industry, keep switching between ‘complete
control’ and ‘semi-autonomy’ management models causing more confusion and stress to
ships’ Masters. Other companies (the ones mainly flagged at open register countries for their
lenient taxation and labour laws- also known as flag of convenience countries - FOCs), for
example, are reported to put the ship’s Master in the position of “handle the situation
Captain” (quote by one Master) in relation to oily waste disposal which is widely perceived
as a deceptive form of “responsible autonomy” by Masters (Willmott 1993). Similar
experiences re-emerge from the accounts of ships’ Masters and other members of staff during

42
interviews affecting their understanding of their daily compliance tasks on board ships.
Following this, it is reasonable to argue that such experiences lead to the establishment of
salient negative perceptions regarding compliance practices, and contribute to the building up
of an un-healthy environmental culture on board ships.
Taking this point further, it is clear, on the one hand, that corporate and management
environmental strategies in some shipping companies (mainly FOCs) compel concentrated
and stressful work experiences among seafarers. It clearly disrupts the basic social aspirations
of seafarers as humans and as professionals amidst the ‘global’ cry to preserve/protect the
environment for future generations. This resulted in accounts and feelings of tension, anxiety,
contradiction, confusion and distrust, explicitly and implicitly expressed in this study’s data.
On the other hand, EU national flagged ships are a clear example of corporate regulation
which achieved many of its goals. However, the question still remains: was the intent to
produce seagoing staff that are competent and committed to corporate strategies; or to
produce staff identities that are only receptive to managerial? For example, in this study,
Masters of EU flagged ships perceived the ‘quasi-autonomy’ given to them by management
as ‘trust and liberation’, while Masters of FOC ships interpreted any form of autonomy as a
‘trap’ that could lead to ‘self-incrimination’ in case of polluting the marine environment
either intentionally or accidentally.
4.0 Conclusion Within the context of enhancing environmental compliance to marine environmental
conventions, seafarers viewed dumping pollutants overboard as a non professional as well as
a non ethical act. However, as professionals in the current competitive shipping market, they
neither enjoy being autonomous (through their involvement in power relations and regulatory
discipline), nor fully alienated from the professional values from which they derive their
environmental practices and around which they articulate their personal and ethical desires.
Trying to cope with such demands not only creates a conflict between seafarers’ personal
interests (professional excellence) and being ‘compliant’ to MARPOL as an example of an
established marine environmental convention, but also with a set of growing ‘global’
environmental values dominating today’s world. As a result, seafarers as a global work force

43
appear to suffer from ambivalence regarding MARPOL compliance practices, especially
when being employed by a very cost-conscious industry in a volatile labour market (Donn
and Morris 2001; Wu and Winchester 2005). According to this study, shipping companies
tend to mask their dominant commercial ethos by embedding it in counter-norms and
unwritten policies rather than in formal management control systems (Bloor and Dawson
1994; Kosmala and Herrbach 2006).
This research suggests that one of the major challenges for seafarers is trying to fill in the gap
between compliance demands, professional practice, and personal interests which require all
stake holders to fulfil their social and legal obligations. While most shipping companies are
largely driven by their economic revenue and competitiveness agendas, some are choosing to
force their seagoing staff to solve waste disposal problems in the most, as they term it,
‘economic’ way possible. At the same time, many countries have also chosen to limit their
investment in providing ‘adequate’ reception facilities as per MARPOL requirements (both
developed and developing as reflected from respondents’ accounts), or to provide proper
surveillance for their coastal and territorial waters. These implementation and enforcement
difficulties clearly reflect on seafarers’ understanding of the whole marine pollution issue.
On micro-situational and daily compliance levels, one of the findings of this study is the
detected struggle in seafarers’ accounts that their persistent attempts in trying to link a sense
of trustworthiness to higher ranks on board, is mixed with fears of disappointing them. In
doing this, they are attempting to avoid being overwhelmed with helpless feelings in relation
to their personal aspirations (i.e. to stop polluting the marine environment). On a wider level,
seafarers are clearly influenced by ‘global’ environmental discourses which seem to have
added pressures to their personal and professional demands. The data provides evidence of
their attempts to balance between one’s satisfaction of doing a ‘good and professional’ job,
with the potential guilt resulting from committing ‘back stage’ or environmental non-
responsible behaviours as demanded by their corporate masters.
From the above discussion, I may argue that the established perceptions presented by
experienced and new entrants to the seafaring profession in relation to countries, companies
and peers are, to a large extent, a result of global, managerial and micro-situational
compliance experiences. Such experiences -at times- force the regulatees to re-interpret the
whole environmental legislative process in the maritime sphere and question its legitimacy.
44
A more in-depth understanding of such perceptions may aid the maritime policy makers to
reconsider their compliance monitoring systems associated with current and future marine
environmental conventions. However, so far, for seafarers, it is clear that they are continuing
their attempts to protect the beautiful ocean from the pollution beast.
References Bloor, G. and Dawson, P. 1994. Understanding Professional Culture in Organizational Context. Organization Studies 15(2), pp. 275-295. Brehm, J. and Hamilton, J. T. 1996. Noncompliance in environmental reporting: Are violators ignorant, or evasive, of the law? American Journal of Political Science 40(2), pp. 444-477. Brookman, C. S. 2002. IMO environmental regulations - Is there a case for change to the standard entry-into-force requirements? Marine Technology 39(4), pp. 232-238. Choucri, N. ed. 1993. Global Accord: Environmental Challenges & International Responses. Cambridge, MA: MIT Press. Donn, C. and Morris, R. 2001. Global Competition and Shipping Industrial Relations: Australia and the US Compared doi:10.1111/1472-9296.00017. Journal of Industrial Relations 43(3), pp. 261-276. Haines, F. and Sutton, A. 2003. The engineer's dilemma: A sociological perspective on juridificaton and regulation. Crime, Law and Social Change 39(1), pp. 1-22. Inglehart, R. 1995. Public Support for Environmental Protection: Objective Problems and Subjective Values in 43 Societies. Political Science and Politics 28(1), pp. 57-72. Kaplan, S. 2000. New Ways to Promote Pro-environmental Behavior: Human Nature and Environmentally Responsible Behavior. Journal of Social Issues 56(3), pp. 491-508. Kosmala, K. and Herrbach, O. 2006. The ambivalence of professional identity: On cynicism and jouissance in audit firms. Human Relations 59(10), pp. 1393-1428. Levy, M. et al. 1993. Improving the Effectivness of International Environmental Agreements. In: Haas, P. et al. eds. Istitutions of the Earth: Sources of Effective International Environmental Protection. Camridge:MA: MIT Pres. Mattson, G. 2006a. MARPOL 73/78 and Annex I: an assessment of its effectiveness.(International Convention for the Prevention of Pollution from Ships). Journal of International Wildlife Law & Policy 9(2), p. 175(120). Mattson, G. 2006b. MARPOLMARPOL 73/78 and Annex I: an assessment of its effectiveness.(International Convention for the Prevention of Pollution from Ships). Journal of International Wildlife Law & Policy. p. 175(120).

45
Mitchell, R. 1994. Intentional Oil Pollution at Sea: Environmental Policy and Treaty Compliance. Cambridge: MA: MIT Press. Mitchell, R. 2003. Of Course International Institutions Matter: But When and How? In: Biermann, F. et al. eds. .Global Environmental Change and the Nation State. Potsdam, Germany: Potsdam Institute for Climate Impact Research, pp. 24-35. Mitchell, R. B. 1995. Lessons from intentional oil pollution.Environment. p. p10(12) Mitchell, R. B. 1998. Sources of Transparency: Information Systems in International Regimes. International Studies Quarterly 42(1), pp. 109-130. Raftopoulos, E. 2001. "Relational Governance" for marine pollution incidents in the Mediterranean: Transformations, development and prospects. International Journal of Marine and Coastal Law 16(1), pp. 41-76. Rice, G. 2006. Pro-environmental behavior in Egypt: Is there a role for Islamic environmental ethics? Journal of Business Ethics 65(4), pp. 373-390. Sahatjian, L. ed. 1998. International Oil Spill Conference. APA Willmott, H. 1993. Strength is Ignorance; Slavery is Freedom: Managing Culture in Modern Organizations. Journal of Management Studies 30(4), pp. 515-552. Wu, B. and Winchester, N. 2005. Crew study of seafarers: a methodological approach to the global labour market for seafarers. Marine Policy 29(4), pp. 323-330. Young, O. 1999. The Effectiveness of International Environmental Regimes: Causal Connections and Behavioral Mechanisms. Cambridge. Massachusetts: MIT Press. Young, O. R. 2002. Evaluating the success of international environmental regimes: where are we now? Global Environmental Change 12(1), pp. 73-77.

46
Fatalities at Sea
Ellis, N., Sampson, H. & Wadsworth, E.
Abstract
There are many problems with the available data relating to seafarer fatalities such as poor recording, limited coverage, and a lack of reliable and robust information on overall seafarer populations. These issues mean that it is often impossible to produce accurate fatality rates using traditional methods, such as fatalities per number of seafarers. This paper therefore presents fatality rates using alternative measures which rely on data which is more readily available in the industry, such as the number of vessels and tonnage.
Introduction
It is often suggested that, relative to other occupations, seafaring is a dangerous profession,
and although the overall number of fatalities has dropped compared to levels at the turn of the
century, recent studies show that fatality rates are still much higher for seafarers than for
those in other occupations (Roberts, 2008; Rodriguez and Formoso, 2007; Roberts, 2002a;
Roberts, 2002b; Roberts and Hansen, 2002; Li and Wonham, 2001; Nielsen and Roberts,
1999; Larsson and Lindquist, 1992). For example, Rodriguez and Formoso (2007) reported
that fatality rates in the Spanish maritime transport industry were nearly six times higher than
for the general population. Similarly, Hansen (1996) found that mortality rates for Danish
seafarers were 11 times higher than comparable shore based workers. Others have found even
higher rates, with Roberts (2002a) reporting that UK seafarers were 26.2 times more likely to
have a fatal accident at work compared to shore based workers in the UK.
All of these studies, however, have limitations. The calculation of fatality rates such as these
requires reliable, accurate information about both the number of fatalities and the overall
number of seafarers. Although many administrations record generally reliable data on
fatalities, because of the serious nature of such incidents, those with smaller fleets and flags
of convenience do not always do so (Li and Wonham, 2001; Nielsen and Roberts, 1999;
Jepsen, 1991). Some authors have also voiced concern over possible under-reporting of
fatalities (Nielsen and Roberts, 1999; Larsson and Lindquist, 1992).

47
In the calculation of fatality rates the numbers of seafarers in the group from which the
fatalities derive is as important in establishing an accurate ‘rate’, as the numbers of fatalities
per se. Obtaining accurate information about the overall number of seafarers associated with
a register (flag) is, however, highly problematic. Although there are administrations which do
consistently record and publish accurate and reliable data about their seafarer population, for
example Denmark (see Danish Maritime Authority, 2009), this is very much the exception
rather than the rule. More often than not these data are not available at all or, if they are
available, there is significant concern about their accuracy (Roberts, 2008). This stems, in
particular, from the ways administrations attempt to ‘count’ seafarers. For example, Li and
Wonham (2001) suggest that in many cases records of employment or lists of ‘qualified’
seafarers (i.e. lists of certificates for seafarers) are used to provide these data. However, these
will include seafarers who are on leave and those that are working ashore (Li and Wonham,
2001), as well as, in some instances, those no longer working in the industry, leading to
seafarer numbers being artificially high and not representing those actually working at sea.
Artificially high numbers of seafarers will produce artificially low fatality rates for the
industry. There are inevitably, as a result, significant doubts over many of (even) the most
recently reported seafarer fatality rates.
Partly due to these problems, perhaps, many studies have focused only on individual or a
small number of national fleets, and frequently cover different time periods (Li and Wonham,
2001; Nielsen and Roberts, 1999). Only one study has compared fatality rates for different
vessel types (see Nielsen, 1999), but this too was limited to a single national fleet. This
limited focus and poor coverage, coupled with the widespread problems concerning data on
overall seafarer numbers, has made it is impossible to examine and compare rates across the
industry as a whole, across administrations, or by vessel types.
There are, however, other ways of presenting accident rates. For example fatality rates can be
presented in relation to ‘exposure’, such as kilometres travelled (predominantly used in the
non-maritime transport industry), or in terms of years worked. For example, Roberts and
Hansen (2002) reported an accident rate of 37.8 per 100,000 seafarer years for British
merchant ships. Similarly Hansen, et al., (2008) found an accident rate of 84 accidents per
1,000 years onboard ship in a study of Danish cargo ships (note, this figure includes non-fatal
accidents). On the face of it, this is a better unit of measurement as it takes into account how
much exposure a person has to the risk of an accident. For example, although there is a high

48
number of accidents in the road transport sector, there is also a high level of mileage covered.
However, for the maritime industry such exposure data, for example, hours worked, is
frequently not readily available, and where it is, can often be unreliable (Evans, 2003). This
has lead to some authors using questionable measures to calculate such information (for
example, Roberts and Hansen 2002).
The aim of this paper, therefore, is to try to address some of these difficulties. In addition to
trying to collect data on seafarer fatalities from a number of administrations worldwide for all
vessel types, the paper focuses on considering alternative ways of calculating fatality rates.
Two possibilities are considered: rates by vessel (as opposed to seafarer) numbers, and rates
by gross tonnage. The advantage of these approaches over the more traditional rates by
seafarer numbers or exposure levels is that they do not rely on ‘population’ data from
administrations which, as we have described, may be collected in varying ways or may not be
collected at all. Rather, both these alternative rates are based on reliable and accurate data
which are publicly available from the Lloyd’s Register World Fleet Statistics (Lloyd’s
Register Fairplay, 2010). The paper also briefly touches on fatality rates by ship type, a
measure which, to date, has attracted relatively little attention and has not been looked at for
multiple administrations.
Methods
Accident data were originally obtained as part of an earlier study conducted by The Lloyd’s
Register Educational Trust Research Unit (The LRETRU1), Cardiff, which collected data
from Maritime Administrations worldwide. Initially the top 30 administrations (as defined by
the volume of gross tonnage) were approached and asked if they collected data on accidents
involving vessels under their flag and/or occurring in their national waters. Twenty six
Administrations responded and of these 25 indicated that they did collect such data. These
Administrations were then asked if they would be willing to share these data for the period of
2000 to 2005 with The LRETRU for academic research purposes. After lengthy negotiations,
sixteen administrations provided accident data, with seven of the datasets including
1 The Lloyd's Register Educational Trust (The LRET) is an independent charity working to achieve advances in transportation, science, engineering and technology education, training and research worldwide for the benefit of all.

49
information on accidents that involved personnel onboard2. As part of a separate initiative,
these data were updated in 2011 when the seven administrations were again asked to provide
accident data, with four administrations providing the information to date. We are still in the
process of collecting further data from the other three administrations.
The seven administrations that provided detailed data were additionally asked if they could
provide information about the overall number of seafarers employed. Four provided these
data for the complete period of study (2000-2010). As anticipated, the sources of this
information varied, with one being a national register of employment, whereas another was
compiled from the number of articles of agreement signed by national seafarers (i.e.
contracts). As noted in the introduction, and in common with other studies, these differences
seriously undermine the construction of comparable fatality rates.
Inclusion Criteria
The sampling criteria for the seafarer data were similar to those used by Roberts (2008),
Roberts and Hansen (2002) and Nielsen (1999) and included those that worked onboard
merchant vessels, including officers, ratings, cadets, and other crew such as stewards and
catering staff. Non-crew members, such as passengers, visitors to the vessel, and other non-
working individuals, were excluded. Those seafarers that were recorded as missing were
included as fatalities, as in the Roberts and Hansen (2002) study.
In terms of vessels, a number of ship types were excluded from the current analysis. These
included non-merchant ships such as fishing vessels, non-commercial pleasure craft, and
vessels that worked only in port or on inland water networks, such as barges and tugs. A full
list of vessel types excluded is shown in Appendix 1.
For each of the Administrations, only vessels flying the national flag were included.
Ship Type Coding
The vessel types which seafarers were sailing upon, as listed in Administrations’ datasets,
were re-grouped using Lloyd’s Register World Fleet Statistics, Level 3, ship type definitions
(see Appendix 1). There are 24 separate ship types under the Level 3 definitions which have 2 For full details of methods used to collect accident data from the Maritime Administrations, see Ellis (2007).

50
been combined into five broad categories: Tankers, Bulk Carriers, Cargo Vessels, Passenger/
General Cargo Vessels, and Other (including offshore industry vessels). For full details of
how the vessel types were combined see Appendix 1.
Results
Table 1 shows the range and nature of the data that were provided by each of the
administrations. In terms of the factors relating to the key exclusion criteria, only five
administrations supplied information about whether the fatalities were crew members or
passengers. In addition, although six administrations provided information about the flag of
the vessels involved, in one case, this was only partial. Furthermore, only four
administrations provided the overall seafarer numbers data needed to calculate fatality rates
per number of seafarers.
Looking at the coverage of the datasets in general, only four of the seven Administrations
provided data for the full 10 year period. Although they all provided ship type information,
two only gave partial data. Very few kept seafarer demographic and job-related information
(i.e. age, rank) and only two provided information about the nationality of seafarers. All
Administrations did, however, provide details of the type of incident that occurred to the
vessel (i.e. collision, sinking).

51
Table 1: Data Provided by each of the Seven Administrations
Administration A B C D E F G
Years Covered 2000-2005
2000-2005
2000, 2001, 2003, 2004, 2007, 2008,
2009
2005-2010
2001-2005
2000-2011
2000-2009
Ship Type ü ü ü Partial ü Partial ü
Flag ü ü ü û ü Partial (2006-
2010 only) ü Gross tonnage ü û ü û ü ü ü Age of Vessel ü û ü û ü ü ü Vessel Incident Type ü ü ü ü ü ü ü Fatality or Injury ü ü ü ü ü ü ü Crew or Passenger ü ü ü û û ü ü Seafarer Nationality ü û û û û ü û
Seafarer Rank ü û û û û ü ü Age of Seafarer û û û û û ü ü Cause of casualty ü û û ü û û ü Overall seafarer numbers (2000-2010)
û û (2000-2005
only) ü ü
û (2000-2005
only) ü ü
Fatality rates by administration per 100,000 seafarers
Looking initially at the standard measure of fatality rates (per number of seafarers), it was
only possible to calculate these rates for the four Administrations that provided overall
numbers of seafarers. Table 2 shows fatality rates per 100,000 seafarers, a similar unit to that
used by Roberts (2008) in his study of UK seafarers.
Table 2: Fatality Rates per 100,000 Seafarers Split by Year and Administration
Admin 2000 2001 2002 2003 2004 2005 2006 2007 2008 2009 Mean B 34.11 0.00 5.87 65.43 0.00 0.00 17.57 C 38.01 4.10 0.00 14.04 F 16.75 42.77 19.63 26.38 G 21.32 21.58 12.72 3.99 11.95 8.22 11.89 35.81 17.30 16.45 16.12 Mean 31.15 10.79 9.29 34.71 5.35 4.11 14.32 39.29 12.31 16.45 17.78
Mean fatality rates for all Administrations varied between 4.11 seafarer deaths per 100,000
seafarers for 2005 and 39.29 seafarer deaths per 100,000 seafarers for 2007. Mean rates by
administration (across years) varied between 14.04 seafarer deaths per 100,000 for
Administration C and 26.38 seafarer deaths per 100,000 for Administration F. Rates for each
administration by year are shown in Figure 1.

52
Figure 1: Fatality Rates per 100,000 Seafarers Split by Year and Administration
For Administration B there is a very apparent spike in 2003. This was due to the total loss of
a vessel where all crew were killed (n=11). Such cases where there is a total loss are
problematic for fatality rates, and some researchers suggest that multiple deaths should be
treated as single incidents in order to get more consistent and reliable rates (see O’Connor
and O’Connor, 2006).
Looking at the general pattern of rates, although there were a number of years where data
were missing for Administration C, where they were present the rate was generally lower
than those for Administration F and G, which had similar rates. Figure 1 also seems to
suggest that the Administration C fatality rate falls over time. However, the missing years
make it impossible to say whether this is a consistent trend, and thus any such claims should
be made cautiously.
Fatality rates by administration per 100 vessels
Next, two alternative fatality rates were calculated. This was possible for all five of the
Administrations that provided flag and crew/passenger information for their fatality data.
Table 3 shows the first of these rates, fatalities per 100 vessels.
0
10
20
30
40
50
60
70
2000 2001 2002 2003 2004 2005 2006 2007 2008 2009
Years
B
C
F
G
Administration
Fat
alit
ies
per
100
,000
sea
fare
rs

53
Table 3: Fatality Rates per 100 Vessels Split by Year and Administration
Admin 2000 2001 2002 2003 2004 2005 2006 2007 2008 2009 Mean A 1.09 0.84 1.64 2.25 1.76 1.18 1.46 B 1.15 0.00 0.22 2.60 0.00 0.00 0.66 C 0.63 0.00 0.00 0.07 0.07 0.00 0.14 0.13 F 0.44 1.16 0.53 0.96 0.77 G 0.31 0.31 0.29 0.09 0.26 0.18 0.26 0.66 0.32 0.38 0.31 Mean 0.79 0.29 0.72 1.23 0.52 0.45 0.35 0.63 0.29 0.49 0.67
Overall mean rates for all Administrations varied from 0.29 seafarer deaths per 100 vessels in
2001 and 2008 to 1.23 seafarer deaths per 100 vessels in 2003. The mean rates by
Administration (across years) varied from 0.13 seafarer deaths per 100 vessels in
Administration C to 1.46 seafarer deaths per 100 vessels in the Administration A. These rates
are shown in Figure 2.
Figure 2: Fatality Rates per 100 Vessels Split by Year and Administration
Although only covering the period 2000-2005, the fatality rate for Administration A can be
seen to be much higher those than for other Administrations (except in 2003 where a spike in
the rate for Administration B can be seen again). Administration C, as before, has the lowest
fatality rate, with Administration F and G showing slightly higher levels.
0
0.5
1
1.5
2
2.5
3
2000 2001 2002 2003 2004 2005 2006 2007 2008 2009
Years
A
B
C F G
Administration
Fat
alit
ies
per
100
ves
sels

54
Fatality rates by administration per 1,000,000 gross tonnes
An alternative method for calculating seafarer fatality rates could rely on gross tonnage. We
therefore calculated the mean fatality rates for the different Administrations using gross
tonnage as the ‘denominator’ (see Table 4).
Table 4: Fatality Rates per 1,000,000 GT Split by Year and Administration
2000 2001 2002 2003 2004 2005 2006 2007 2008 2009 Mean A 0.45 0.33 0.61 0.83 0.65 0.42 0.55 B 0.94 0.00 0.14 1.52 0.00 0.00 0.43 C 0.34 0.00 0.00 0.03 0.03 0.00 0.05 0.06 F 1.32 3.57 1.73 3.89 2.63 G 0.56 0.51 0.38 0.09 0.27 0.18 0.25 0.60 0.27 0.50 0.36 Mean 0.57 0.21 0.38 0.61 0.24 0.20 0.78 1.40 0.66 1.48 0.81
In terms of gross tonnage, overall mean rates for all Administrations varied between 0.20
seafarer deaths per 1,000,000 gt in 2005 and 1.48 seafarer deaths per 1,000,000 gt in 2009.
The mean rates by Administration were again lowest for Administration C (0.06 per
1,000,000 GT) and, in this case, highest for Administration F (2.63 per 1,000,000 GT). Rates
in terms of gross tonnage are shown in Figure 3.
Figure 3: Fatality Rates per 1,000,000 GT Split by Year and Administration
0 0.5
1 1.5
2 2.5
3 3.5
4 4.5
2000 2001 2002 2003 2004 2005 2006 2007 2008 2009
Years
A
B
C F G
Administration
Fat
alit
ies
per
1,0
00,0
00 g
ross
to
nn
es

55
Looking at fatality rates in terms of tonnage it is clear that although data are only present for
2006 onwards, the fatality rate for Administration F is considerably higher than those for the
other Administrations.
Comparing fatality rates
In order to compare the three types of fatality rates, Figure 4 presents the rates together for
each Administration3.
Figure 4: Fatality Rates Using the Three Different Measures
3 The four Administrations where it was possible to calculate all three rates are presented here; the other, where only two rates were possible, is in Appendix 2.

56
Looking at the four Administrations for which all three rates could be calculated, the
alternative rates (i.e. fatalities by vessel number or tonnage) follow a similar pattern to that of
the standard fatality rate (per number of seafarers) for all of the Administrations. In addition,
the Administration with the lowest mean overall rate per number of seafarers, Administration
C, also has the lowest mean overall rates by both vessel numbers and gross tonnage.
Administration F, the Administration with the highest overall rate per number of seafarers
also showed the highest rates for the two alternative measures, particularly that per 1,000,000
GT. These consistencies, both in terms of patterns over time and relative levels between
Administrations, suggest that the alternative rates presented here are viable ways of
considering fatality rates.
However, there are some specific issues which require further consideration in relation to any
future development of this ‘measure’. In our sample of five Administrations, four had similar
numbers of vessels on their register (an average of 1,526 vessels per fleet). One had
approximately one third of this number of ships registered with it however. When it came to
tonnage the variation was far greater with just two of the Administrations registering similar
volumes of tonnage and with the largest register (by tonnage) having 24 times more
registered tonnage than the smallest. These variations inevitably impact upon the calculation
of fatality rates. We are currently in the very early stages of considering ways this might be
dealt with, for example by using the information available about vessel numbers and tonnage
together with details of crew sizes. Refining the approach in this way might allow it to be of
greater use in making cross-register comparisons.
Unsurprisingly, within the overall patterns there are a number of Administration-specific
differences. For example, the Administration F’s rate by tonnage is markedly higher than the
rates presented by vessel or seafarer numbers, reflecting the composition of the fleet which
contains a large number of mainly low tonnage vessels. However, for Administration G’s
fatality rates in terms of both tonnage and the number of vessels are higher than fatalities per
number of seafarers. For Administration B and C the three rates are generally similar,
although for Administration B the spike in 2003 is apparent in all three measures, with per
vessel measure highest and the per seafarers measure lowest

57
Fatality rates by ship type
Previous research has paid little attention to differences in fatality rates by ship type.
Although this is very much a work in progress for this project, Table 5 shows ship type
fatality rates per 100 vessels for all five of the Administrations in combination.
Table 5: Fatality Rates Per 100 Vessels by Ship Type Split by Year
Tankers Bulk Carriers Cargo
Vessels
Passenger/ General Cargo
Other (Inc Offshore Industry
Vessels) 2000 0.35 0.00 0.54 2.01 0.11 2001 0.23 0.42 0.64 0.29 0.00 2002 0.66 3.16 0.19 1.16 1.27 2003 0.34 0.40 0.72 1.61 1.58 2004 0.46 0.38 0.74 1.06 0.43 2005 0.61 1.43 0.69 0.85 0.13 2006 1.70 2.94 0.20 0.36 0.00 2007 0.67 0.00 0.29 0.22 1.06 2008 0.16 0.33 0.84 0.00 0.09 2009 0.16 0.00 2.39 0.00 0.09
Mean 0.53 0.91 0.72 0.76 0.48
Looking at fatality rates across the years, we find fairly similar rates across all the vessel
types. However, excluding the other category (as being too heterogeneous to compare), bulk
carriers have the highest mean rate of fatalities (0.91) and with tankers the lowest (0.53).
Fatality rates per 100 vessels by ship type (excluding others) are shown in Figure 5.
Figure 5: Fatality rates per 100 vessels by ship type split by year
0
0.5
1
1.5
2
2.5
3
3.5
2000 2001 2002 2003 2004 2005 2006 2007 2008 2009Fat
alit
ies
per
100
ves
sels
Years
Tankers Bulk Carriers Cargo Vessels Passenger/ General Cargo
58
Looking at the fatality rates for each of the ship types across the years, no particular vessel
type has a consistently higher rate of fatalities although average fatality rates per ship type do
vary. There are a number of years where the accident rate for a particular ship type rises
dramatically. For example, bulk carriers in 2002 and 2006, where the accident rates are 3.16
and 2.94 fatalities per 100 vessels respectively. However, both of these spikes may be seen as
anomalous: while there were only one and three fatalities for those years respectively, there
were also particularly low numbers of vessels (total number of bulk carriers registered) in
those years. Considering rates such as these over a longer period of time and for a greater
number of registers would allow us a better insight into the overall patterns of fatality by ship
type potentially ‘ironing out’ some of the effects of anomalous years/data.
Discussion
An important criticism of many previous studies of fatality rates in the maritime industry is
that they often present rates calculated using questionable (and variable) baseline data on
overall numbers of seafarers. The aim of this paper has been to try to suggestive alternative
ways of dealing with these issues by: first, collecting data from a number of Administrations
worldwide; and second considering alternative ways of calculating fatality rates. Although,
as anticipated, we have encountered a number of difficulties in terms of the availability and
content of the Administration data, we have nevertheless presented three different measures
of fatality rates across a number of Administrations in the hope of stimulating discussion and
a greater awareness of the issue across the sector.
It should, of course, be stressed that the lack of usable data was not the result of any
unwillingness to cooperate on the part of the maritime Administrations. Rather the issue is
one of what Administrations record and how they record it. For example, many of the
Administrations’ datasets which we examined (10 of the 16 provided) did not include
information about accidents occurring to individuals, instead focussing on vessels alone.
Where details about accidents involving those onboard were included, these were often
sparse. For instance, two datasets had to be excluded from this study because, although the
number of fatalities that occurred per incident was recorded, there was no indication of
whether these were to crew or to passengers onboard the vessel. Similarly the flag of the
vessel that the fatality occurred on was only recorded in 5 of the 7 cases. This information is
crucial to the accuracy, reliability and comparability of the rates. Unless the issue of poor

59
recording is addressed by Administrations worldwide it will continue to hamper efforts to
produce global fatality rates. However, the impetus for Administrations to do this will need to
come from the international legislative bodies such as the International Maritime
Organisation (IMO) and the International Labour Organisation (ILO), so that global standards
can be agreed upon.
The calculation of reliable fatality rates, however, is not solely dependent on what is recorded
within accident data. As discussed earlier, the present study also found that for most
Administrations there was a lack of available data relating to total numbers of seafarers (the
information which is also required to calculate standard fatality rates). Even where these data
were available, their source was often questionable in terms of its reliability and
comparability across Administrations. For example, while one Administration provided data
from official employment statistics, another’s source was records of certification.
Furthermore, most sources raise the additional issue of whether a seafarer is ‘active’, i.e.
working at sea, or not.
To address this the study looked at alternative ways by which fatality rates could potentially
be calculated using data which is much more consistent and readily available in the maritime
industry, i.e. statistics on the world fleet. Rates were presented by number of vessels and by
gross tonnage. Although this approach has yet to be refined a comparison of these rates with
the traditional measure suggested that measuring fatality rates in these ways could
conceivably provide an alternative and viable approach that allows for the inclusion of more
Administrations worldwide.
The paper also briefly considered differences in fatality rates across vessel types. These data
are preliminary. However, they represent a first step in an exercise which would provide
insight into the types of vessel where safety could usefully be improved.
We suggested at the outset that seafaring has always been, and continues today to be, a
relatively dangerous occupation. This study has highlighted the current difficulties in
calculating reliable and globally comparable fatality rates in the industry. However, if a “gold
standard” minimum data set could be internationally agreed, this would allow not only for the
calculation of accurate fatality rates, but also for the targeting of interventions to improve
safety where they are needed most. This would significantly improve the industry’s ability to

60
reduce the relative danger of seafaring. However, until the time when such standardised
recording practices are agreed upon the alternative measures presented here do seem to
suggest a potentially viable alternative to traditional seafarer population-based fatality rates.
Acknowledgements
We gratefully acknowledge the role of The Lloyd's Register Educational Trust (The LRET)
in supporting this work, and for allowing us to use data collected as part of a previous project
funded by them.
The Lloyd's Register Educational Trust (The LRET) is an independent charity working to
achieve advances in transportation, science, engineering and technology education, training
and research worldwide for the benefit of all.
References
Danish Maritime Authority (2009) Marine Accidents 2009. The Danish Maritime Authority: Copenhagen.
Ellis, N . (2007) 'Accident and incident data', SIRC Symposium, Cardiff University, July, ISBN 1-900174-31-6.
Evans, A. W. (2003). ‘Accidental fatalities in transport’ Journal of the Royal Statistical Society 166(2): 253-260.
Hansen, H.L. (1996) Surveillance of deaths on board Danish merchant ships, 1986-1993: implications for prevention. Journal of Occupational and Environmental Medicine, Vol. 53, 269-275.
Hansen, H. L., L. H. Laursen, et al. (2008). "Major differences in rates of occupational accidents between different nationalities of seafarers." International Maritime Health. 59(1-4): 7-18.
Jepsen, J.R. (1991) Arbejsmilj og helbred I den maritime erhverv. Nordisk. Medicin, Vol 106, 301-304.
Larsson, T. J. and C. Lindquist (1992). ‘Traumatic fatalities among Swedish seafarers 1984-1988’, Safety Science 15(3): 173-182.
Li, K.X. and Wonham, J. (2001) ‘Safety and Maritime Employment’. In: Li, K.X. and Wonham, J. (2001) The role of Statistics non Maritime Employment and Safety: A legal and Economic Study. China: Dalian Maritime University Press. 99-129.

61
Lloyd’s Register Fairplay (2010) World Fleet Statistics. Redhill: Lloyd’s Register –Fairplay Ltd.
Nielsen, D. (1999). ‘Deaths at sea - A study of fatalities on board Hong Kong-registered merchant ships (1986-95)’, Safety Science 32(2-3): 121-141.
Nielsen, D. and S. E. Roberts (1999) ‘Fatalities among the world’s merchant seafarers (1990–1994)’, Marine Policy 23(1): 71-80.
O'Connor, P. J. and O'Connor, C. N. (2006) ‘Work-related maritime fatalities’, Accident Analysis & Prevention 38(4): 737-741.
Roberts, S. E. (2002a) ‘Hazardous occupations in Great Britain’, Lancet 360(9332): 543-544.
Roberts, S. E. (2002b) ‘Mortality from disease among seafarers in British merchant shipping (1976-1995)’ International Maritime Health 53(1-4): 43-58.
Roberts, S. E. (2008) ‘Fatal work-related accidents in UK merchant shipping from 1919 to 2005’ Occupational Medicine (London) 58(2): 129-137.
Roberts, S. E. and H. L. Hansen (2002). ‘An analysis of the causes of mortality among seafarers in the British merchant fleet (1986-1995) and recommendations for their reduction’ Occupational Medicine (London) Jun; 52(4): 195-202.
Rodriguez, J. L. and J. A. F. Formoso (2007). ‘Work-Related Accidents in the Maritime Transport Sector.’ The Journal of Navigation 60: 303-313.

62
Appendix 1
Lloyd’s Register World Fleet Statistics Ship Types (WFS, 2009) –Vessel Types Coding Including Combined Categories
Level 5 Level 4
Level 3 (As used for initial
coding of vessel type)
SIRC Ship Type Codings
LNG Tanker LNG Tanker Liquefied Gas Tankers CNG Tanker LPG Tanker LPG Tanker LPG/ Chemical Tanker LPG Barge, propelled CO2 Tanker C02 Tanker Molten Sulphur Tanker Chemical Tanker Chemical Chemical Tanker Parcels Tanker Chemical Tanker Barge, propelled Chemical/ Products Tanker
Chemical/ Oil Products Tanker Chemical/ Products Tanker Barge, propelled Wine Tanker Wine Tanker Vegetable Oil Tanker Vegetable Oil Tanker Edible Oil Tanker Edible Oil Tanker Beer Tanker Beer Tanker Latex Tanker Latex Tanker Fruit Juice Tanker Fruit Juice Tanker Shuttle Tanker
Crude Oil Tanker
Oil Crude Oil Tanker Crude/Oil Products Tanker Products Tanker
Oil Products Tanker Tanker (unspecified) Products Tanker Barge, propelled Asphalt/Bitumen Tanker Bitumen Tanker Coal /Oil Mixture Tanker Coal /Oil Mixture Tanker Water Tanker Water Tanker Other Liquids Water Tanker Barge, propelled Molasses Tanker Molasses Tanker Glue Tanker Glue Tanker Alcohol Tanker Alcohol Tanker Caprolactam Tanker Caprolactam Tanker Bulk Carrier Bulk Carrier Bulk Dry Bulk Carriers Bulk Carrier, Laker Only Bulk Carrier (with Vehicle Decks) Bulk Barge, propelled Ore Carrier Ore Carrier Bulk/Oil Carrier (OBO) Bulk/Oil Carrier Bulk Dry/Oil Ore/Bulk/Products Carrier Ore/Oil Carrier Ore/Oil Carrier Bulk Cargo Carrier, self discharging Self Discharging Bulk Carrier Self Discharging Bulk Dry Bulk Cargo Carrier, self discharging, Laker Bulk Cargo Barge, self discharging, propelled Cement Carrier Cement Carrier Other Bulk Dry Bulk Cement Barge, propelled Wood Chips Carrier, self unloading Wood Chips Carrier Urea Carrier Urea Carrier Aggregates Carrier Aggregates Carrier Limestone Carrier Limestone Carrier Refined Sugar Carrier Refined Sugar Carrier Powder Carrier Powder Carrier General Cargo Ship (with Ro-Ro facility) General Cargo Ship General Cargo
Cargo Vessels
Open Hatch Cargo Ship General Cargo/ tanker (Container/oil/buIk - COB ship) General Cargo /tanker

63
General Cargo Ship General Cargo Barge, propelled Palletised Cargo Ship Palletised Cargo Ship Deck Cargo Ship Deck Cargo Ship
General Cargo/Passenger Ship Passenger/General Cargo Ship Passenger/General Cargo Passenger/ General Cargo
Container Ship (Fully Cellular) Container Ship Container
Cargo Vessels
Container Ship (Fully Cellular with Ro-Ro Facility) Container Barge, propelled Passenger/Container Ship Passenger/Container Ship Refrigerated Cargo Ship Refrigerated Cargo Ship Refrigerated Cargo Ro-Ro Cargo Ship Ro-Ro Cargo Ship Ro-Ro Cargo Rail Vehicles Carrier Car Carrier Vehicles Carrier Vehicles Carrier Container/Ro-Ro Cargo Ship Container/Ro-Ro Cargo Ship Landing Craft Landing Craft Passenger/Ro-Ro Ship (Vehicles) Passenger/Ro-Ro Cargo Ship Passenger/Ro-Ro Cargo
Passenger/ General Cargo
Passenger/Ro-Ro Ship (Vehicles/Rail) Passenger/Landing Craft Passenger/Landing Craft Passenger/Cruise Passenger (Cruise) Ship Passenger Passenger Ship Passenger Ship Livestock Carrier Livestock Carrier Other Dry Cargo
Cargo Vessels
Barge Carrier Barge Carrier Barge Carrier, semi submersible Heavy Load Carrier Heavy Load Carrier Heavy Load Carrier, semi submersible Yacht Carrier, semi submersible Nuclear Fuel Carrier Nuclear Fuel Carrier Nuclear Fuel Carrier (with Ro-Ro facility) Pulp Carrier Pulp Carrier Factory Stem Trawler Trawler Fish Catching
REMOVED FROM ANALYSIS
Stem Trawler Trawler Fishing Vessel Fishing Vessel Fish Factory Ship Fish Factory Ship Other Fishing Fish Carrier Fish Carrier Live Fish Carrier (Well Boat) Live Fish Carrier Fish Farm Support Vessel Fishing Support Vessel Fishery Patrol Vessel Fishery Research Vessel Fishery Support Vessel Seal Catcher Seal Catcher Whale Catcher Whale Catcher Kelp Dredger Kelp Dredger Pearl Shells Carrier Pearl Shells Carrier Crew/Supply Vessel Platform Supply Ship Offshore Supply Others (Inc offshore industry
vessels) Pipe Carrier Platform Supply Ship Anchor Handling Tug Supply Offshore Tug/Supply Ship Offshore Tug/Supply Ship Offshore Support Vessel Offshore Support Vessel Other Offshore Diving Support Vessel Accommodation Ship Drilling Ship Drilling Ship Pipe Layer Crane Vessel Pipe Layer Pipe Layer Production Testing Vessel Production Testing Vessel FPSO, Oil FPSO FPSO, Gas Well Stimulation Vessel Well Stimulation Vessel Standby Safety Vessel Standby Safety Vessel FSO, Oil FSO (Floating, Storage, Offloading) FSO, Gas Trenching Support Vessel Trenching Support Vessel Pipe Burying Vessel Pipe Burying Vessel Research Survey Vessel Research Vessel Research

64
Tug Tug Towing/Pushing Pusher Tug Bucket Dredger Dredger Dredging Cutter Suction Dredger Grab Dredger Suction Dredger Dredger (unspecified) Water Jet Dredger Hopper/Bucket Dredger Hopper Dredger Hopper/Grab Dredger Hopper/Suction Dredger Hopper/Dredger (unspecified) Hopper, Motor Motor Hopper Other Activities Stone Carrier Crane Ship Crane Ship Pile Driving Vessel Icebreaker Icebreaker Icebreaker/ Research Cable Repair Ship Cable Layer Cable Layer Incinerator Waste Disposal Vessel Waste Disposal Vessel Effluent carrier Fire Fighting Vessel Fire Fighting Vessel Pollution Control Vessel Pollution Control Vessel Patrol Vessel Patrol Vessel Crew Boat Crew Boat Training Ship Training Ship Utility Vessel Utility Vessel Search & Rescue Vessel Search & Rescue Vessel Pilot Vessel Pilot Vessel Salvage Ship Salvage Ship Buoy Tender Buoy/Lighthouse Vessel Buoy & Lighthouse Tender Lighthouse Tender Supply Tender Supply Tender Mooring Vessel Mooring Vessel Work/Repair Vessel Work/Repair Vessel Hospital Vessel Hospital Vessel Tank Cleaning Vessel Tank Cleaning Vessel Trans Shipment Vessel Trans Shipment Vessel Anchor handling Vessel Anchor Hoy Rocket Launch Support Ship Rocket Launch Support Ship Log Tipping Ship Log Tipping Ship Exhibition Vessel Leisure Vessels Theatre Vessel Mission Ship Bulk Dry Storage Ship Dry Storage Bulk Cement Storage Ship Mining Vessel Mining Vessel Wind Turbine Vessel Wind Turbine Vessel Wind Turbine Installation Vessel Wind Turbine Installation Vessel (semi sub) Bunkering Tanker Bunkering Tanker Vessel (function unknown) Vessel (function unknown) Sailing Vessel Sailing Vessel

65
Appendix 2
Fatality Rates For Administration A Using Two Different Measures (Per 100 Vessel, and Per 1,000,000 GT)
Administration A
0
0.5
1
1.5
2
2.5
2000 2001 2002 2003 2004 2005
Years
Per 1000 seafarers
Per 100 vessels
Per 1000000 GTFata
litie
s

66
Managing Health and Safety Through the Supply Chain: A Case Study of Supply Chain Influence in the Shipping Industry
Walters, D., Bhattacharya, S. & Xue, C.
Abstract This paper presents the findings of a preliminary and on-going study on the role of supply chain relations in influencing the desire of tanker operating companies and their seafarers to institute and operationalise health and safety management arrangements on board their vessels. It does so by investigating the perceptions of the seafarers and the managers of these companies concerning the influence of oil company requirements on health and safety management on board their ships and the vetting, monitoring and inspection arrangements made to ensure compliance. It sets these findings in the wider context of regulating OHS management at sea and evaluates the contribution of this form of private regulation towards supporting improved OHS management performance and compliance with international regulatory requirements. In so doing it tests some of the conclusions and postulates that emerged from a previous study concerning the operation of supply chain influences on arrangements for managing occupational health and safety more widely, and contextualises them within the discourse on the effective regulation of OHS management at sea. It is however a report that concerns only part of an ongoing investigation and as such, as the paper makes clear, its conclusions are tentative and subject to further research.
Introduction
Two years ago I presented a paper at the SIRC Symposium exploring some of the links
between modern business practices in relation to supply chains and their possible effects on
managing health and safety at work. It was based on a study funded by the Institution of
Occupational Safety and Health (IOSH), that Philip James and I had just completed, in which
we had reviewed the available literature on these effects and drawn up some postulates
concerning the role of supply chain relationships in supporting or undermining occupational
health and safety (OHS) management practices especially among suppliers (Walters and
James 2009). As I made clear in the 2009 presentation, our findings at the time were based
almost entirely on the previous research of others and it was therefore important to test our
postulates with further empirical research. For the last year or so we have been engaged in a
study that is intended to achieve this. This work is ongoing and not yet complete. However,
in this paper I would like to present some of our preliminary findings that are particularly
relevant to the maritime sector.

67
While we were undertaking the original study, I had become separately aware of the apparent
significance of an example of supply chain influences on health and safety management in
the maritime industry. This was largely as a result of the investigations of Syamantak
Bhattacharya who was then one of my research students, and who had been studying the
implementation of the ISM Code on board tankers (Bhattacharya 2009). As a result of an
interest that both Syamantak and I had shared in exploring these insights further, because of
the importance of the industry in the globalised economy and the well-known challenges that
it presents for regulatory intervention in OHS management, Helen Sampson and I decided we
would make the maritime industry one of the sectors for further investigation of supply chain
effects. In addition, our research team has looked at these effects in construction and in the
food industry. In this paper however, I want to discuss some of our preliminary findings on
experiences in the maritime sector, based on data originally collected by Bhattacharya and
also on that collected more recently by Xue both of whom are my co-authors. We must stress
from the outset that this is a work in progress and the study is not yet complete.
We begin by defining what we mean by supply chains and why we think they might be
important influences on OHS management generally and with reference to the maritime
industry particularly. We do this by briefly summarising the evidence found in the previous
study concerning such influences and by enumerating the key postulates that emerged from a
consideration of this evidence. We next outline the challenges to OHS management in the
sector, highlighting the potential role of supply chain relationships in either supporting or
undermining OHS management strategies on board ships. We then turn to the part of our
current investigation that we have recently completed, which is concerned with seafarers’
experience of the influences of the requirements of major oil companies on OHS
management on board the ships carrying their products. We outline the methods we used to
collect our data on the experiences of seafarers and then try to set these findings in the wider
context of regulating OHS management at sea and evaluate the contribution of this form of
private regulation towards supporting improved OHS management performance and
compliance with international regulatory requirements. In so doing we are also able to test
some of the conclusions and postulates that emerged from the previous study concerning the
operation of supply chain influences on arrangements for managing occupational health and
safety, and contextualise them within the discourse on the effective regulation of OHS
management at sea.

68
Finally, since this is a preliminary account of an on-going study we will outline the further
work we need to undertake in order to complete the study.
What are supply chains and why might they be important in OHS?
Supply chains (or value chains) describe relationships involved in procurement and delivery
of goods and services. They may involve simple buyer/supplier relationships between two
entities or more commonly, quite long and complex chains or networks of transactional
relationships involving numerous organisations involved in various business relationships
between production and use. Business organisations are frequently simultaneously involved
in a host of transactions in which they may be buyers in some and suppliers in others. While
both private and public sector organisations have always required suppliers and been
themselves suppliers of products and services, as economic globalisation and modern
business methods associated with the globalised economy have grown in prominence, so too
has the interest in supply chain management and the price and delivery demands dominating
transactions between organisations. Current business and organisational practices such as
downsizing, outsourcing, just in time management and lean production have further served to
increase the importance of supply chains within business relations and the national and global
economies in which they occur.
Supply chains are normally hierarchical with an uneven distribution of power within them,
which provides potential for dominant actors to influence the behaviour of others in the
business relationships involved. As businesses increasingly try to manipulate features of
supply chains to improve their profitability, efficiency and market position, the question of
what happens to the health and safety conditions of workers affected by these strategies has
become the focus of some attention and debate among OHS practitioners, regulators and
regulatory scholars. As we discovered in our previous study, current discourse on these
consequences reveals two very different effects. In summary, the previous study of nearly
200 publications in which we found these effects demonstrated both positive and negative
influences of supply chain pressures on preventive health and safety arrangements. Thus, on
the negative side, the vast majority of studies demonstrate that such pressures often act to
generate ‘indirect’ adverse effects (Quinlan et al., 2001; Quinlan and Bohle, 2009). For
example, in an Australian investigation of the experiences of those working under sub

69
contract/outsourcing arrangements in four sectors, child care, hospitality, transport and
building which found that these arrangements were associated with increased economic
competition, as well as work disorganisation, regulatory failure and a divided workforce,
leading the researchers to conclude that in ‘any organisation where outsourcing has become
common, OHS standards deteriorate....’ (Mayhew et al,1996). Many other studies in, for
example, the food, textiles and transport industries detail similar effects, as do the majority of
studies of outsourcing in the public and third sectors (Walters and James, 2009; Walters and
James, 2011; Cunningham et al., 2011).
Meanwhile, on the positive side, as these authors also show, such evidence relating to how
supply chain relationships can detrimentally impact on health and safety standards, somewhat
paradoxically, occasionally also points to the existence of a potential for them to be used to
enhance, rather than undermine, health and safety standards within supplier (and purchaser)
organisations. For it also suggests that scope exists for powerful supply chain actors to use
the market power at their disposal to improve such management. They might do so for
example, by laying down requirements as to how it is undertaken and by taking action to
monitor and enforce compliance with these requirements. Examples of such practices have
come to feature significantly in discourse around public/private regulatory strategies to
improve labour standards, including those on health and safety in globalised production and
also, more specifically, to improve OHS management in industries such as construction.
However, as Walters and James (2009 and 2011) have argued, for such potential to be
realised a set of conditions apply. These include:
a) the extent to which the OHS management arrangements made by suppliers, create
implications for their effective supply of whatever goods or services were required of them
by buyers; and
b) the extent to which relevant external pressures are exerted by legislative provisions,
regulatory agencies and others.
That is, attempts by buyers to influence supplier health and safety management are likely to
be more effective where they are supported by adequate monitoring and penalty regimes; and
occur within a relatively collaborative and trust based supply relationship. These kinds of
supply relationships are mostly found where buyers and suppliers have worked together,

70
satisfactorily, for a relatively long period, the wider institutional context is supportive of them
and again, where there is some form of public or private regulatory scrutiny in place.
Conversely, buyer attempts to influence supplier health and safety management are less
successful where they: (a) clash with the business interests of suppliers and (b) where
suppliers regard the risks of failing to comply with them to be relatively low.
The nature of supply chain relationships and the behavioural dynamics within them are
further likely to be crucially affected by the characteristics of the goods and services provided
through supply chains, the objectives and wider business interests of buyers and sellers, as
well as the distribution of power between them, and the institutional (including regulatory)
context within which buyer-supplier relations are developed.
The significance of supply chains in the maritime industry
Taking these postulates into account, we turn our attention to the maritime industry. Here we
find an industry in which there has been an increased focus on the externalization of the
supply of services. This is, of course, mainly because of its role in the logistics of supply
internationally and its critical position in this respect has caused major transformations in the
way in which the industry is structured and organized. At the same time, it continues to be
one of the most hazardous industries for the workers involved, with occupationally related
mortality, illness and injury rates at levels as high as those in land-based sectors such as
construction and agriculture (if not even higher). However, unlike these land-based activities,
the global nature of maritime activity means it takes place, for the most part, in situations that
are largely beyond the reach of conventional regulatory inspection.
The industry is complex and fragmented, its vessels and the companies that own or manage
them often have distinct features according to their trade. In recent decades it has undergone
major transformations in its efforts to improve its competitiveness. These have been driven
largely by the price and delivery demands of clients worldwide, and have profoundly affected
the nature of ownership and management of shipping, the origins of the maritime labour force
and its recruitment and management in the sector as well as ship design and the design and
location of port facilities. It would be surprising indeed if such transformation had not also

71
had a significant impact on experiences of work and its management in the industry,
including that of the management of health and safety at sea. Given this situation we
reasoned it was an ideal case in which to test some of our previous postulates concerning
both the positive and negative effects of supply chain relations on OHS management.
For our purposes, one of the most interesting elements of change in the modern maritime
industry concerns that occurring in relationships between clients, shipping companies and the
seafarers that crew the ships carrying clients’ goods from port to port around the world.
These are precisely the kinds of change that the previous review of research on land-based
industries demonstrated to be responsible for significant effects on health and safety
management and outcomes. In this respect shipping operators typify the ‘porous
organisations’ it identified in land-based examples, where the demands of clients
superimpose upon relations between employers and employees and come to dominate
concerns about the management of work. As such they are powerful and growing influences
on the nature of working conditions and the work environment. While they may lead to work
intensification and poorer working conditions, as is the case elsewhere there is also the
possibility that, in certain circumstances these influences may contribute to the improvement
of arrangements for health and safety management and the working conditions of the
seafarers involved. We wished to examine both these sets of circumstances in the present
study.
Aims of the study
The broad aim of the study was to discover more about the nature of supply chain relations,
and the ways and circumstances in which they might affect health and safety at sea. The
specific aim of this paper however, is to consider the application of the postulates we have
derived from the previous general review, in one sub-sector of the industry in which we have
some reason to believe these influences may have positive effects on OHS management –
namely the petrochemical tanker trade. Here we are concerned with describing the systems in
operation to achieve this, their strengths and limitations and especially the experiences and
attitudes of seafarers and ship operating company managers in relation to them.

72
Methods
We have examined supply chain leadership and management practices relating to health and
safety and their effects on board ships in the petrochemical tanker sector because we already
had some information on these effects from Bhattacharya’s (2009) previous fieldwork on the
implementation of the ISM code. We were able to revisit this field work, which had been
carried out in 2006, on board four ships managed by two major ship operating companies,
and explore his data with more detailed specific focus on seafarers’ experiences of the
influences of the OHS management requirements of the oil companies to which their ships
were chartered. In addition we were able to use data collected by Xue in the course of his
more recent (2009-2010) fieldwork on board four tankers operated by two Chinese shipping
companies to investigate the same influences. In each case we have tried to explore the
operation of such influences on arrangements for health and safety management on board
ships, from the perspective of both officers and ratings, and to examine responses to these
issues from the management of the ship operating companies.
In the course of their combined fieldwork Bhattacharya and Xue interviewed nearly 120
seafarers while sailing with them on board eight different vessels. They also interviewed 23
shore based managers in the four companies responsible for operating these vessels. Among
other things, these interviews sought information on ship operating company strategies in
relation to OHS management and the seafarers’ experiences of them on board ships. This
included especially the experience of the operation of systems to implement the ISM Code,
covering reporting and communication systems for safety management, inspection practices
and audit and review, as well as the involvement of the seafarers themselves in securing good
practice on board the tankers on which they sailed. It needs to be stressed that the main focus
of their fieldwork, the research questions they set out to address and the instruments they
used to gather data, did not directly concern supply chain influences. In both cases these
matters were raised by respondents in response to wider questions on the influences on
shipboard management arrangements for OHS, and although the questions respondents were
asked were different in both studies, there were substantial overlaps in the responses they
elicited. In the analysis presented here we have focused solely on the material volunteered by
respondents concerning supply chain influences on health and safety management practices.
73
Our findings on the effects of supply chains
Oil and chemical tankers normally carry hazardous cargoes and are therefore subject to
particularly stringent requirements concerning their safe transport. In this account we want to
focus not so much on these requirements, as on the influences on the will and capacity of ship
operators and their crews to implement them.
With their capacity to choose which ships to employ, charterers have the opportunity to be
highly influential in the way that ships are operated. The oil sector has arguably advanced
furthest along this road, due to the small number of large players in the sector. The oil majors
claim to account for some 20-30% of the market, with the other 70-80% being served by
independent tanker operators. Through their representative organisation, the Oil Companies
International Marine Forum (OCIMF), the oil majors are able to present their views within
the IMO and other regulatory and legislative arenas. The independents are similarly
represented by INTERTANKO.
To be able to compete for contracts with the oil majors, either directly or indirectly, tanker
companies must ensure their ships are maintained and operated at a level dictated by the oil
majors, including with respect to arrangements for the management of health and safety on
board. The situation is quite complex, but generally the dominance of the oil majors is much
in evidence in the sector. Vessels and the companies that operate them are vetted and
required to meet rigorous standards concerning a matrix of procedural and manning
requirements that influence the management of OHS among other things. Inspections are
performed according to standard report formats developed by the OCIMF (see below) and
provide each oil company’s vetting department with the information necessary to apply its
criteria for the selection and/or continued use of tankers and their operating companies.
Tanker vetting inspections are usually carried out during unloading operations, with the prior
agreement of the ship owners and operators, and include access to confidential documents
relating to the vessel’s maintenance and classification. Where a fleet operation fails to meet
the required standards, even if it is the result of the lower performance of only one owner’s
ships, it may result in the entire fleet being denied business. Oil Majors carry out vetting
primarily to protect themselves and their business, to be seen to be exercising due diligence
and to provide the necessary paper trails in the event of an accident. Their investment in the
management of the vetting process is considerable.
74
In addition safety management issues with relevance to the berths at refineries where tankers
load and unload their cargoes are also significant. Since many of these will be owned and/or
operated by major petrochemical companies they are further able to require contractual safety
management standards from tanker operating companies in relation to these too.
As well as producing technical and operational guidelines for the sector, OCIMF has
developed a common ship inspection report programme (SIRE). Launched in 1993 as a
response to concerns of sub-standard shipping, SIRE is presented as a ‘risk assessment’ tool.
Using a standard inspection guide, information is entered into a database enabling potential
charterer’s access to up-to-date inspection information concerning oil tankers (OCIMF,
2010). Since its introduction, more than 180,000 inspection reports have been submitted to
SIRE. On average Programme Recipients access the database at a rate of more than 8,500
reports per month. OCIMF members appoint the inspectors who make these reports.
In addition to the SIRE inspection system, the Tanker Management and Self Assessment
(TMSA) programme claims to provide a best practice guide to ship operations and means by
which the determination of a quality ship operator can be undertaken. It offers ‘a
comprehensive tool to help ship operators measure and improve their management systems’.
As well as providing instruction and methods to encourage ship operators to assess their
safety management systems against key performance indicators and develop continuous
improvement, it provides an on-line tool enabling them to share their results with those who
might request them for the purposes of their own internal vetting. The advantages to oil
companies of the implementation of such a tool are obvious, as is the business necessity on
the part of such tanker companies to ensure they comply with the requirements of the
scheme. According to the latest OCIMF Annual Report (2010) the TMSA programme
continues to grow, with more than 1,200 companies now registered to submit reports.
There are 576 SIRE inspectors accredited under the Programme. The majority (463) are
accredited to inspect larger tankers (Category 1 ships) while a few (8) are accredited for small
tankers (Category 2 ships) and others (105) for inspecting various additional kinds of vessels
including barges, vessels utilised for towing vessels carrying petroleum products, and vessels
carrying packaged cargoes (Category 3 ships). They are selected by OCIMF member
organizations and are required to familiarise themselves with the inspection processes by
attending SIRE inspections in the company of SIRE accredited inspectors, prior to attending

75
an OCIMF SIRE Inspector Training Course. Following the course they must complete a
written examination and successful candidates are then further audited during an inspection
before being accredited as inspectors. The SIRE accreditation process is cyclical and each
accreditation period runs for three years. There are 28 SIRE auditing inspectors who,
according to OCIMF (2010) are at the heart of the SIRE inspector accreditation programme.
They are experienced inspectors, who collectively audit approximately 150 SIRE inspectors
each year.
It is also worth noting that external supply chain influences in the petro-chemical tanker trade
are by no means limited to the activities of OCIMF, SIRE and the TMSA programme. For
example, in relation to chemical tankers, since the 1990s, the Chemical Distribution Institute
(CDI), a non-profit making organisation funded by the chemical industry founded in 1994,
has aimed to ensure the development and the preservation of an inspection system for
transport and storage of bulk liquid chemicals (CDI, 2011). The CDI-Marine Scheme was
created to improve the safety and quality performance of bulk liquid chemical shipping. It
now provides annual inspection reports on the world fleet of chemical and liquid petroleum
gas tankers, in which over 600 ship operators and 3000 ships participate (ibid, 2008). Ships
having a CDI-Marine Scheme report on its database are also listed on EQUASIS (the
European Quality Shipping Information System) used by Port State Control authorities and
chemical terminals acknowledge the CDI standards so that if a ship passes the CDI
inspection, it will be able to call at their berths.
Our further analysis of Bhattacharya’s (2006) data and that collected more recently by Xue
shows that both ship operating company managers and seafarers take these supply chain
influences very seriously indeed. It does so in several ways. To begin with, there was a view
shared by the seafarer respondents that these kinds of inspections enhanced the adherence to
safety management arrangements on board ships, making their ships safer. This effect was
clearly welcomed by seafarers of all ranks.
We have several types of inspections from PSC, Terminal, Harbour Master, also
audit internal as well as external, and from the P&I Club and on and on. They are all
important. You can’t start cargo operation without Terminal or Harbour Master’s
approval, deficiencies pointed out by PSC don’t help either; we need insurance cover

76
from the P&I Clubs but on the whole you’ll have to say that ships are safer due to Oil
Majors – Captain (our italics)
‘My last ship as a cadet I was on a bulk carrier. We had nothing like this. It was a
good ship but we never heard of such inspection. I think Oil Major Inspection makes
this ship safer than bulk carriers’ — Junior officer
‘There are many Oil Major Inspections on this ship and lots of stores and safety
equipments are coming. But I am happy to have inspection – it is good for my safety.’
— Rating
It was also a view held by the representatives of company management:
‘Tankers are better managed because they have so many extra inspections. Who takes
interest in bulk carriers? We have (equivalent bulk charterer) but they don’t get
excited about safety although we all know bulk carriers are probably far weaker in
construction and take a lot of beating (subject to damage during cargo operation). Our
tanker ship-owners have to allocate a higher level of budget for safety but the same
cannot be expected from the bulk carrier ship-owners’ — Manager
And as one of the Marine Superintendents from the Chinese operating companies put it when
talking about the impact of oil company inspections:
‘In terms of the safety consciousness, oil companies go a step ahead. Actually, this is
good for safety. It was strict and for the purposes of safety, for everybody. — Marine
Superintendent
In the case of the operating company managers, this view was often accompanied by a sense
that the nature of the business relationship involved was not an equal one and the company
had little choice but to follow terms dictated by the oil companies with which they did
business:
‘Oil Majors are brilliant. Due to their inspection safety is enhanced yes, but there is
also a lot of dominance. We always have to please them. Each inspector has his own

77
peculiarities and not all are reasonable. We have to stay prepared for such mad
demands. Since TMSA they now have control even over us in the office. They can
say how to run our ships, how to manage store supply, which courses we should
conduct in-house, how many additional safety equipments should be placed on our
ships and so on’— Manager
Seafarers also felt considerable pressure to ensure successful outcomes from these
inspections. This was evident in responses from the seafarers across the full range of ships
from which data was collected and among officers and ratings alike:
‘There is a lot of pressure to pass oil major inspections….if inspections fail the
company will be in trouble — Motorman
‘…..the loss will be huge if the ship does not pass oil major inspection — Chief
officer
A second officer from one of the Chinese vessels explained that on his ship:
We expect those oil majors’ inspection; meanwhile, we also fear these companies’
inspection. Their inspection was very strict. They would inspect from the major part
to tiny point, the glove you wore, the torch you used. The inspection was very strict.
This was what we were hoping (for safety). But as seafarers, we also feared (these
inspections), since their inspection included hundreds of items. The inspection was
very much detailed.— Second officer
It was further clear that the source of this pressure came from the concerns of the operating
company and the seafarers were in little doubt of the importance with which this was
regarded by company management:
‘Once the discharge port gets fixed the office informs us if they plan to hold Oil
Major Inspection. On most occasions we get two weeks to prepare and even the
superintendent may also fly down. You need to witness the tremendous pressure from
office to pass inspections. Many reminder emails fly’ — Captain

78
These feelings were confirmed in the responses from the ship operating company
management, where there was a similar concern:
‘We have no choice – we have to pass them. Effectively they give us our wages. Our
principles expect us to pass – simple. I dread to imagine their reaction if we ever have
to convey the news of failing. You know they can always withdraw the ships from our
management by giving us just one month’s notice... I’ll have to look for another job
then’ — Manager
And:
‘If we fail [Oil Major Inspections] – disaster! Right from MD to clerks we start
dancing. Last year on ship X we had too many observations which effectively meant
that the ships could no longer carry their cargo. While that ship had problems but the
issue is that our reputation gets tainted as owners. Immediately after that we had more
stringent inspections across our fleet ’ — Manager
The business dependency on their oil company charters that was felt by operating company
managers dominated Bhattacharya’s interviews with them (it was mentioned in nine of the
ten interviews he conducted with these managers). The sense that the profitability of their
business depended on them doing the oil companies’ bidding was reflected strongly in their
comments:
‘When we go to any terminal [non- Oil Major] or even charter our ships to non Oil
Majors we still need to be inspected and passed by them. Such is their reach in this
sector. The whole [oil] industry is run by them – you can’t do business without their
approval’ Manager
In the Chinese companies, there was a similar strong sense of business dependency:
Now it was the cargo-owner market. There were no other choices. If your ship doesn’t
accept inspection, it doesn’t have cargoes to carry and you company goes into
bankruptcy’— Marine superintendent

79
It was also clear that respondents felt this dependency on approval from the oil majors went
further than merely affecting the direct relationship between the company and the oil majors.
The pervasive influence of the major oil companies affecting the ship operator’s relationships
with other potential charters. As the captain of one of the Chinese ships explained with
reference to the vessel on which the researcher was sailing:
Even if your ship is contracted to carry cargoes by the shipper, the ship would not be
allowed to call at X’s (names a major oil company) berth if the ship did not receive
and pass its inspection. Like this ship, it is chartered by Y (names a small Chinese
Petrochemical company). In the contract terms, it is stated that the ship must pass X’s
(names a major oil company) inspection since the charterer has cargo with this oil
major. It is also the case with other oil majors. If the ship failed to pass (oil major)
inspections, the charter party might be cancelled or hire would be deducted —
Captain
It was clearly the case that such concerns had been successfully transferred to the crews of
vessels. This was so with regard to the financial benefits of doing the right thing by the oil
companies generally, and in the case of the crews on board the Chinese ships, in the most
frequently mentioned aspect of their relations with the oil companies, seafarers pointed out
that good results from the inspections improved the freight rate for their employers and were
specifically linked to their own pay and bonuses:
‘There was a reward and punishment scheme in the company. For example, if your
ship passed the oil majors’ inspection, you would be rewarded. If it failed….the bonus
for those who were responsible for the identified deficiencies would be deducted —
Second officer
They were quite specific about these consequences, which were an obvious worry for them:
If it was OK, the inspection was passed, the company rewarded 200 RMB to me. If it
failed (because it received) one ‘high risk’, 1000 RMB will be deducted. If there were
just minor deficiencies….100 to 200 RMB — Second officer

80
While such compensation may seem a positive development, studies from other sectors (see
for example those reviewed by Walters and James 2009) indicate such managerial initiatives
can also be interpreted as exploitive of labour through leading to work intensification and
adding to stress resulting from this, as well as to stress associated with payment systems.
Indeed in the present study the seafarers repeatedly identified the inspection process as ‘a
source of stress’. As one of the captains pointed out:
‘When an inspection gets fixed, immediately we start getting reminder emails with a
long list of suggestions from the managers... They expect us to do everything. They
copy and paste the same defects we had informed them earlier [reminding us what to
do]. It is pressurising.’ – Captain.
Whatever the psychosocial pressures on seafarers resulting from such arrangements, there
was a strong measure of agreement between them and their managers concerning the
importance with which the oil company inspections were viewed and the consequent degree
of preparation they required. Both managers and seafarers believed that these kinds of
inspections required a lot of preparation, that this was necessary and it was worthwhile going
to some lengths to ensure they were adequately prepared in advance of an inspection:
‘We take the initiative to ensure that the ships are in order. Sometimes just to show
that they are important we even visit the ship. If appropriate we also coordinate an
unannounced drug and alcohol test at the time of the inspection – just to demonstrate
our diligence. There is always a lot of preparation for Oil Major Inspection’ —
Manager
‘We need a lot of preparation before Oil Major, sometime for days in advance we
need to start working on the inspection’. ’ — Captain
‘We stop all regular maintenance jobs when we hear about Oil Major Inspections. The
Chief Mate tells us do this, do that. Maybe sometime stencil this, [apply] fresh colour
on the valves, clean the stores, maybe grease the mooring wires. Before oil major we
would go through all the items in detail ….. we must solve all problems before
inspections’ — Rating

81
In this latter case, it may be that abandoning regular maintenance tasks to ensure a successful
inspection outcome may cause subsequent additional work pressures, when ‘normal’ work
patterns are resumed and regular maintenance tasks now require additional work as a
consequence of their neglect.
There was also a direct effect on the form and content of the safety management system, with
a willingness on the part of the ship operating companies to alter the SMS in response to the
requirements of the inspection:
Nowadays, the revision of the SMS is directed by the syllabus of the oil majors. Since
the oil majors’ inspection syllabus has often been changed, the SMS was led by their
change. Since their syllabus kept changing, we must track and follow their revision
and its latest requirement. — Company quality and safety manager
Similarly, crews were well aware of the need to inform the company concerning changes that
may be needed in the SMS indentified during an inspection:
Through the oil majors’ inspection, we found that some things might not be in the
SMS, then we would report to the company to revise the SMS.— Chief officer
Another measure of the seriousness with which seafarers regarded the inspections instigated
by the oil companies was reflected in the way they rated their significance in comparison
with other forms of inspection and monitoring of arrangements for OHS management on
board ships. In terms of comparison with the internal company auditing and review of these
arrangements, there was little question which form of inspection was treated more seriously:
‘Oil Major Inspections mean a wider scope of inspection than others. They are so
thorough that it is never possible for us to hide anything. We have to prepare very
thoroughly ’ — Senior Officer
Some seafarers also found the types of inspection required by oil companies more
demanding, thorough and requiring of compliance than the regulatory inspections to which
their vessels were subject under the requirements of Port State Control (PSC). This was the
case regardless of the parts of the world in which they sailed and despite the knowledge that

82
failure to satisfy public regulatory inspection via PSC could mean that their ship might be
subject to detention.:
‘Compared to PSC these people are more organised, more thorough’ — Captain
‘We didn’t feel special in the PSC inspection. After the oil major’s inspection we felt
that it was simple to deal with the PSC inspection. We felt (that we) had confidence
— Second Officer
‘The strictness and thoroughness is more than PSC’ — Chief Officer
Altogether then, the data emerging from the shipboard interviews is unequivocal in the extent
to which it confirms the powerful influence of the oil company requirements on safety
management practice on board vessels in the tanker trade. While to some extent we can
assume that the companies on whose vessels we were allowed to sail in order to collect this
data represent best case situations in terms of health and safety management, it seems likely
that the dominance of the major oil companies would lead to a fairly widespread occurrence
of similar findings. As such, the relationship described fits closely with the postulates derived
from the earlier review. Specifically, the tanker trade is comparatively highly regulated by
maritime industry standards, largely because of the economic, human and environmental
consequences associated with accidents and loss. There is therefore substantial external
pressure on both buyers and suppliers in the sector. This comes from regulatory provisions
and agencies, but even more significantly, from others potentially affected by the economic,
environmental and human consequences of failure. As well as the potentially expensive
losses experienced by both ship operators and their oil company charterers as the result of
ship safety failures that lead to major incidents, the reputational risks associated with these
high profile events ensure an exceptional degree of vigilance is practiced by buyers in the
maintenance of supply chain influences on safety practices on board tankers. Equally, while
the systematic OHS management arrangements made by ship operators in response to these
pressures, may create cost implications for the carriage of the goods in the sector, neither the
ship operators or their charterers see such costs as significant in comparison with the
potential costs of failures. Price and delivery pressures are therefore unlikely to influence the
actions of ship operator management towards non-application or circumvention of such
arrangements. Furthermore, it is obvious that the practices we have just described in the

83
tanker trade are made possible because they fit with the objectives and wider business
interests of the oil companies and ship operators (buyers and sellers) in the supply chain in
the sector, as well as reflecting the distribution of power in the chain.
Even more specifically important for the maintenance of the effectiveness of these influences
however are the arrangements for their monitoring and auditing through SIRE inspections,
the quality of which is further assured by audit. As we argued previously, research has
already demonstrated that attempts to influence supplier health and safety management are
likely to be more effective where adequate monitoring and penalty regimes support them; and
when they occur within a relatively collaborative and trust based supply relationship. Thus, in
the tanker trade we have described the development of a leadership initiative from the head of
the supply chain – in this case, the association of major oil companies whose dominant
market position has enabled them to set up an association (OCIMF), through which they are
able to influence practices of safety management on board tankers to their own requirements.
This they do in part through the TMSA scheme they have set up and made available to ship
operators and through monitoring compliance with their standards through the system of
vetting inspections undertaken by SIRE accredited inspectors and the like. Moreover, they
are able to audit the quality of this system through the intervention of a small group of
experienced inspectors whose task it is to inspect the inspections. SIRE reports are made
available to companies belonging to OCIMF who can use them to ascertain standards of
compliance among ship operators, and thereby help them to decide which company will
receive their business. Thus, further ensuring strong market incentives for involvement of
both themselves and the ship operators in the scheme and an institutional, context within
which longer-term buyer-supplier relations are developed.
Therefore, in these scenarios there is no clash between the supply chain influences on OHS
and the business interests of ship operators, but the business risks of failing to comply with
them are widely regarded by suppliers to be substantial and significant. It is the arrangements
for monitoring compliance that really focuses the attention of operating companies and their
seafarers. The requirement of external inspection of safety arrangements on board ships is
clearly a significant presence in their minds — as are the consequences associated with
failing to satisfy such inspection. As a consequence, their focus on achieving good results
during these inspections and demonstrating they are meeting the requirements of their oil
company charterers in terms of safety management procedures is paramount.

84
However this does not of course necessarily mean that such influence leads to improved
health and safety outcomes. Some cautionary words are in order here.
While the experiences of the company management and seafarers presented in this paper
clearly demonstrate the influence of supply chain requirements on the adoption,
implementation and operation of safety management systems on board ships, it does not
necessarily follow that such systems and the practices they require are of themselves entirely
beneficial to the promotion and maintenance of improved health, safety and well-being
among seafarers. Nor does it imply that the procedures that companies and seafarers adopt in
order to demonstrate compliance for the purposes of external inspection are entirely
beneficial either.
It is not the purpose of this paper to present a detailed account of the limitations of the
systems approach to managing occupational health and safety on board ships. Nevertheless it
needs to be acknowledged that since the introduction of the ISM Code more than a decade
ago, there have been numerous studies that have failed to demonstrate its widespread
effectiveness (see for example, Anderson, 2003; Bailey 2006; International Maritime
Organisation, 2006; Knudsen 2009). These accounts have pointed to the over-
bureaucratisation of safety arrangements as one reason for the limited adoption of good
practices and the growth of an appropriate ‘safety culture’ on board ships. Indeed, in his
wider study of the operation of the ISM Code, from which some of the data used in this paper
has been drawn, Bhattacharya (2009) noted significant limitations in the application and
effectiveness of safety management systems on board ships that his subjects ascribed to such
over-bureaucratisation. While, there are many physical and operational aspects of shipboard
safety that can be observed by inspectors during their inspections, the inspection practices
described in the present paper also clearly contribute to the bureaucratisation of safety on
board ships and are regarded as doing so by both company management and crews:
‘The oil majors are too much paper work’ — Manager
‘Oil Majors spend a whole day on the ship, often from nine in the morning till six in
the evening. First they come to my office where they check each and every logbook
and file. That takes nearly four to six hours. ’ — Captain

85
‘I check the bridge chart correction, passage planning, echo sounder logbook,
GMDSS logbook and many, many others on the bridge. I also have to check the old
records to ensure that the records are also correct. All the old logbooks should also be
in order. There is a lot of preparation before an oil major inspection, mostly
paperwork’ — Junior officer
It is also of course, obviously the case that while companies and their seafarers may put
enormous effort into preparing their vessels and SMS for the scrutiny of inspection, this does
not necessarily mean that they will keep up such efforts once the inspection has been passed.
As two Chinese seafarers put it:
‘Now the main issue in the management is to deal with the oil majors inspection.
After the inspection, it happened that the work became tardy, and the work would not
be as serious as the time before external inspection.’ — Second officer
‘After inspection, for a certain period of time, the (bad) situation was resumed. Pump
man
In addition, like many such inspections, they are focused on the signs and manifestations of
safety on board ships rather than those of health and well-being among seafarers. Since much
of the current concern about the organisation of work and the work environment experienced
by seafarers is addressed to its effects on their health and wellbeing, it is not obvious how
such inspections aid its improvement (see for example, Bloor et al 2000). Indeed, given the
obvious stress caused to seafarers by the need to be found compliant with the stringent
requirements of such inspection it is possible that they actually contribute to increasing the
psycho-social risks experienced by seafarers and in this sense worsen their health outcomes.
Conclusions and further work
In conclusion then, as a preliminary finding we note that relations in the supply chain in the
petrochemical tanker industry both meet and confirm the potential identified in a previous
review of the literature. In that review, it was argued that provided certain postulates apply,
such supply chain relations may act to support the implementation of safety management

86
practices among suppliers and to do so in a manner that overcomes competing tendencies to
circumvent OHS management arrangements in pursuit of price and delivery demands. At the
same time it is by no means entirely clear whether the methods employed in the inspection
and vetting procedures, or the strong business case for the seriousness with which they are
taken necessarily result in improved health and safety of the seafarers involved. Further work
is required in the sector to explore some of the possible contradictions here.
Moreover, as we have further noted, the conditions found in the petrochemical tanker trade
are by no means universal in the shipping industry and to gain a better picture of the effects
of supply chain relations more generally in the industry we need to extend our attention to
other trades and forms of supply chain influence within the industry.
Therefore, as well as further work in the tanker trade, we are currently undertaking a second
case study focusing attention on the supports and constraints relating to the transferability of
such supply chain management strategies to other trades in the sector. To this end, we have
obtained the co-operation of shipping operators involved in shipment of cargoes other than
petrochemicals (in this case containerized goods and bulk products) and we will explore their
relations with their charterers from the perspective of the supply chain influence on health
and safety, using essentially the same techniques as those involved in the tanker study
reported here. In this way it is intended, through an examination of the same elements of
external and internal influence on the systematic management of health and safety, within the
supply chain of labour and services in this second example of maritime supply chain
relationships, to compare and contrast experiences in very different supply chain situations in
the same industry. As a result, we will be well placed to not only test the key postulates
identified in the previous study concerning the role of supply chain relationships in
influencing health and safety management, but also gain a better understanding concerning
(a) the conditions for positive or negative effects of such strategies on seafarer safety and
health; and (b) the role of critical external and internal drivers in influencing the direction of
these effects and sustaining them in the maritime industry more generally.
We have also noted that while the influence of the heads of supply chains is a significant
influence on the adoption and application of safety management practices in the
petrochemical tanker trade, it does not necessarily follow that such practices are themselves
always ideal means to promote the practical and useful engagement of seafarers in the

87
operation of risk management on board ships, or improvement in their health and well-being
as well as in their safety. Moreover, the processes available to heads of supply chains in the
petrochemical sector to achieve such influence may themselves promote particular kinds of
safety management practice — because for example, they are easier/more convenient to
inspect than others. This may serve to skew management approaches to seafarer health and
well-being in the sector. Here again, such conclusions are highly tentative at the present time
and require greater investigation. It is anticipated that the fieldwork currently underway in
this and other sectors of the industry will help shed some further light on these issues.
References Anderson, P. (2003) Cracking the Code: The relevance of the ISM Code and its impact on shipping practices, The Nautical Institute, London. Bailey, N. (2006) Risk perception and safety management systems in the global maritime industry, Policy and Practice in Health and Safety, 4 (2): 59-75. Bhattacharya, S. (2009) The Impact of the ISM Code on the Management of Occupational Health and Safety in the Maritime Industry. PhD thesis Cardiff University, UK. Bloor, M., Thomas, M and Lane, T. (2000) Health risks in the global shipping industry: an overview, Health, Risk and Society, 2 (3): 329-40. Chemical Distribution Institute (CDI) Inspection process http://www.cdi.org.uk/InspectionProcess.aspx accessed 28.06/11. Cunningham I., James P. and Walters, D (2011) Social care outsourcing in Britain and its potential occupational health consequences, Policy and Practice in Health and Safety, 9 (1): 79-93. International Maritime Organisation (2006) IMO (2006). Assessment of the Impact and Effectiveness of Implementation of the ISM Code. Maritime Safety Committee, 81st session, dated: 10-19 May 2006. Knudsen, F. (2009) Paperwork at the service of safety? Workers’ reluctance against written procedures exemplified by the concept of ‘seamanship’ Safety Science, 47: 295–303. Mayhew, C. Quinlan, M. and Bennett. L (1996) The effects of subcontracting on occupational health and safety, UNSW Studies in Australian Industrial Relations, No. 38 Sydney: University of New South Wales. OCIMF (2010) OCIMF Annual Report 2010, London. Oil Companies International Marine Forum

88
Quinlan M, Mayhew, C and Bohle, P (2001) The global expansion of precarious employment, work disorganisation, and consequences for occupational health: A review of recent research. International Journal of Health Services; 31 (2): 335-414. Quinlan M and Bohle P. (2009) Over-stretched and unreciprocated commitment: Reviewing research on the OHS effects of downsizing and job insecurity. International Journal of Health Services, 39 (1): 1-44. Walters, D and James, P (2009) Understanding the Role of Supply Chains in Influencing Health and Safety at Work. Leicester: IOSH. Walters D and James P. (2011) What motivates employers to establish preventive management arrangements within supply chains? Safety Science, 49 (7): 988-994.

89
The Health and Self-medication Practices of Seafarers∗
Acejo, I., Sampson, H., Turgo, N. & Wadsworth, E.
Abstract This paper reports on the findings from a questionnaire administered to active seafarers in 2010/11. The questionnaire was designed to cover a broad range of subjects relating to seafarer health, medication, and self-medication practices. The analysis of the data remains in the early stages and in this account we limit ourselves to an overview of some of the early findings. Introduction
As with most elements of contemporary life, the world of the seafarer has been dramatically
altered as a result of developments in the twentieth and twenty-first centuries. Seafarers have
witnessed the introduction of technology on board which has transformed their work and the
nature of their communications with shore-based personnel. Ports have altered radically and
seafarers rarely go ashore, so quickly do their vessels ‘turn around’ (Kahveci 1999; Sampson
and Wu 2003).
In the course of such transformation, there have been developments which have undoubtedly
benefitted seafarers such as the introduction of email (Kahveci 2007) and the mobile phone,
allowing seafarers to remain in closer contact with family and friends. However,
technological developments have also brought with them some unwelcome changes in the
nature of work at sea some of which have been identified as being associated with increased
stress and dissatisfaction (Sampson and Wu 2003). In the light of concerns about seafarer
health and welfare a number of researchers have written about fatigue, weight problems,
occupational accidents, disturbed sleep, stressors, common diseases and alcohol and cigarette
consumption amongst seafarers (Allen et al. 2008; Grey 2000; Reyner and Baulk 1998;
∗ We would like to acknowledge the assistance provided to us by Dr Lijun Tang and Mr Neil Ellis in data collection and the warm reception accorded to us by officials and staff of the different seafarers’ centres we visited both in the UK and Germany throughout the study. Without their warm welcome and critical collaboration, this project would not have been made possible. Lastly, we express our sincerest gratitude to all seafarers who participated in the study. We thank them for their precious time. This study is funded by the Seafarers International Research Centre, Cardiff University.
90
Sampson and Thomas 2003; Smith et al. 2003; Telegraph 2007, 2009; Wadsworth et al. 2006,
2008; Wickramatillake 1998).
However, one of the difficulties associated with any study of seafarer health is that ‘sick’
seafarers are regularly excluded from the working population via the conduct of medical
examinations.
In the Philippines (the largest single supplier of seafarers to the modern cargo fleet) such
examinations precede every individual contract and may exclude individuals on a variety of
grounds including positive test results for HIV, Hepatitis B and C, raised liver enzymes,
raised blood pressure, insulin dependent diabetes, and a host of common medical conditions.
Seafarers may also find that they fail their medicals as a result of their excess weight or other
lifestyle considerations.
A little closer to home, in the UK, seafarers are required to present themselves for a medical
fitness evaluation undertaken by an approved doctor every two years. The MCA guidance
relating to the medical fitness examination states that:
As a general principle the approved doctor should be satisfied in each case that no
disease or defect is present which could either be aggravated by working at sea, or
represent an unacceptable health risk to the individual seafarer, other crew members
or the safety of the ship.
It continues:
Apart from the purely medical aspects, the occupational circumstances which apply at
sea should be fully considered, especially in any borderline case. Particular factors
which should be taken into account are:
a) the potentially hazardous nature of seafaring, which calls for a high standard of
health and continuing fitness;
b) the restricted medical facilities likely to be available on board ship. Few ships carry
doctors, medical supplies are limited and there will be delay before full medical
treatment is available;

91
c) the possible difficulty of providing/replacing required medication. As a rule, a
seafarer should not be accepted for service if the loss of a necessary medicine could
precipitate the rapid deterioration of a medical condition;
d) the confined nature of life on board ship and the need to be able to live and work in
a closed community;
e) the limited crew complements which mean that illness of one crew member may
place a burden on others or impair the safe and efficient working of the ship;
f) the potential need for crew members to play a role in an emergency or emergency
drill, which may involve strenuous activity in adverse conditions;
g) since many seafarers will need to join and leave ships by air, they should be free
from any condition which precludes air travel or could be seriously affected by it,
such as pneumothorax or conditions which predispose to barotrauma (MCA 2011).
Such criteria allow for seafarers suffering from a very broad range of medical conditions
(including mental health problems) to be ‘screened out’ of the workplace and as such
seafarers typify the phenomenon of the ‘healthy worker’ (Oldenburg et al. 2010; Roberts
2005; Roberts and Jaremin 2010).
In terms of research there are two major implications arising from the stringent application of
medical standards to seafarers. Firstly it is extremely difficult for research to indentify
occupational health issues associated with seafaring as any study of seafarers will not reveal
unhealthy seafarers but rather the converse (all sick seafarers having been ‘grounded’).
Secondly it is likely that seafarers will be extremely wary of reporting health issues as they
will fear the consequences of ‘discovery’. If they reveal a hidden health problem to a
researcher and if this is subsequently exposed to their employer they risk repatriation and the
end of their prospects for a career at sea.
In undertaking this research, we therefore anticipate that there will be significant under-
reporting of medical conditions by seafarers. We also anticipate that seafarers may underplay
any lifestyle issues that could compromise their employment status (such as drinking).
Furthermore, we expect this population to be relatively healthy, because clinically unwell
individuals will not have been allowed on board. Indeed, it has been established that even
healthy seafarers may be excluded from the workforce on the grounds that their medical
histories (for example the removal of a single kidney leaving a fully functioning healthy

92
kidney) present a higher risk of future illness (Schepers and Dahl 2010). This background
should be given due consideration in the interpretation of the data presented throughout.
Methods
To understand the health and self-medication practices of seafarers, questionnaires were
distributed to seafarers visiting UK and German ports from a wide range of ship types. Ports
visited include Felixstowe, Liverpool, Southampton, Immingham, Bristol and Cardiff in the
UK and Hamburg in Germany. Questionnaire distribution was mostly undertaken in
seafarers’ centres and if it was possible and permitted, some questionnaires were also
distributed onboard ships. The questions were in English which for obvious reasons limited
the participation of some seafarers from countries where English is not spoken extensively.
The sample
A total of 1,026 seafarers completed a questionnaire. The mean age of respondents was 33.87
years. The youngest was 16 years old and the oldest was 72. The sample was overwhelmingly
male. One thousand and four male seafarers and just 22 female seafarers completed a
questionnaire. More than half of the respondents were in a couple (603 – 58.8%).
Disaggregated into six categories, respondents were either married (553 – 53.9%), single 403
(39.3%), living with partners (50 – 4.9%), separated (10 – 1.0%), divorced (8 – 0.8%) or
widowed (2 – 0.2%). The average years spent working at sea was 9.65 years, with one year
being the shortest and 46 years the longest time served.

93
There were 21 different kinds of ship type identified by participants in the study. However,
the majority of the seafarers who took part in the study were working aboard container
vessels; (59% - 605) and the second most common ship type was bulk carriers (12.2% - 125).
The average crew size aboard the vessels on which participants worked was 20.85. The
smallest reported crew was four and the largest was 44. The mean dead weight tonnage
(DWT) of the ships aboard which respondents served was 46,367.14 with 1,000 being the
minimum and 181,000, the maximum.
The study was conducted over ten months, commencing in July 2010 and ending in April
2011. We visited UK and German ports and were based in seafarers’ centres for most of the
day, 10:00 am – 9:00 pm, to distribute questionnaires to visiting seafarers. Some 63
nationalities were involved in the study with Filipinos and Indians being the most represented
with 182 (17.7%) and 162 (15.8%) participants, respectively (see Table 2 for complete data).
Table 1. Characteristics of the sample
Frequency (%), SD, MinMax Total respondents 1026 Average age 33.9 10.4 (SD), 16-72 MinMax Sex
Male 1004 97.9 Female 22 2.1
Status In a couple 603 58.8 Not in a couple 423 41.2
Average years at sea 9.65 8.8 (SD), 1-46 MinMax Vessel types
Container 605 59 Bulk carrier 125 12.2
Average crew size 20.9 5.7 (SD), 4-44 MinMax Average deadweight tonnage 46,367 1,000 - 181,000 MinMax
Source: SIRC Study 2011

94
There were 49 shipboard jobs (posts) described by respondents. However closer scrutiny
reveals that most commonly respondents were able bodied seamen (140 – 13.6%) and
ordinary seamen (107 – 10.4%). Overall, ratings made up the largest group of respondents
(50.4 %), followed by junior officers (261 – 25.4%), senior officers (221 – 21.5%) and petty
officers (27 – 2.6%).
Findings
Perceived health status
Seafarers were asked to describe their health over the past 12 months. The response
categories they were offered were as follows: ‘very good’, ‘good’, ‘fair’, ‘bad’ and ‘very bad’.
In the analysis, these were then grouped into three categories: ‘good’ (both very good and
good); ‘fair’, and ‘poor’ (both bad and very bad). As anticipated very few seafarers stated that
their health had been poor over the previous twelve months. Just fourteen participants (1.4%)
Table 2. Nationality groups
N Frequency Filipino
182 17.7
Indian
162 15.8 Other
181 17.6
Northern, Western and Southern Europeans 127 12.4 Eastern Europeans,
and Russians 253 24.7 Others (including Middle Easterns, Africans and Small Islanders) 121 11.8 Tota
1026 100 Source: SIRC Study 2011
Table 3. Distribution of seafarers by rank
N Frequency (%)Ratings 517 50.4Petty officers 27 2.6Junior officers 261 25.4Senior officers 221 21.5Total 1026 100Source: SIRC Study 2011

95
reported poor health with the vast majority of respondents stating that their health had been
‘good’ (87%). One seafarer reported that he had been unable to work for 180 days due to
sickness/injury in the last 12 months (due to a fall he sustained while working onboard),
another one reported 120 days of being unable to work. In total there were 25 seafarers who
reported more than 10 days when they were unable to work in the last twelve months. On
average, seafarers had 2.79 days of sickness whilst on leave and 2.20 days whilst onboard.
Perceived levels of stress
In terms of perceived stress, we asked seafarers to describe how stressful they found life on
board and ashore separately. We offered them five response categories to choose from as
follows: ‘not at all stressful’; ‘mildly stressful’; ‘moderately stressful’; ‘very stressful’;
‘extremely stressful’. A marked difference was identified between the stress levels of
respondents whilst on leave and whilst at work. Less than half of the sample described their
life at home as ‘not stressful’ (44.7%) while more than half (51.2%) described their life at
home as ‘mild/moderately stressful’. Only a few reported that life at home was
‘very/extremely stressful’ (4.1%). In contrast, the vast majority of respondents described life
at sea as ‘mild/moderately stressful’ (75%) or ‘very/extremely stressful’ (12.8%). Obviously,
there will be cultural factors at play here in terms of both definitions of ‘stress’ and the
willingness to ‘own up’ to being stressed. Compared with the Bristol and Cardiff study data,
however, seafarers described less extreme stress at work than the land-based sample (12.8%
vs 20%) (see Table 5) although levels of high stress (described as ‘very’ and ‘extremely’
stressful) amongst senior officers were closest to the average for the land-based sample
standing at 18.3% (see Table 6).
Table 4. Perceived health status
N Frequency (%)Good 893 87.5 Fair 114 11.2 Poor 14 1.4Total 1021 100
Source: SIRC Study 2011

96
In the study, senior officers reported the highest levels of stress compared to petty officers,
junior officers and ratings. We might speculate that such stress is likely to relate to fears of
criminalisation, pressures associated with regular inspection, threats of piracy, and changes in
the nature of the work of senior officers which has become more paper-based and perceived
to be less about ‘seamanship’ (Sampson and Wu 2003).
Alcohol consumption
In terms of alcohol consumption, the reported levels are not high when compared with land-
based consumption amongst British male workers for whom an average weekly consumption
of 17.54 units has been reported (Smith et al. 2000; Smith et al. 2004a; 2004b), or indeed
fishermen in Andalusia who are reported to consume an average of 16.6 units per week
(Novalbos et al. 2008). Furthermore, average levels of consumption (1.61 units of alcohol per
week on board, 1.92 per week in port and 4.97 units whilst on leave) were well below the
medical guidelines for maximum ‘safe’ amounts.
Table 5. Perceived levels of stress (share to total)
General stress (on leave) Bristol and Cardiff StudyNot stressful 45 19 Mild/moderately stressful 51 75 Very/extremely stressful 4 6
Work stress (onboard)Not stressful 12 9Mild/moderately stressful 75 71 Very/extremely stressful 13 20
Source: SIRC Study 2011
Table 6. Perceived levels of stress by rank (share to total)
Not at all stressfulMild/moderately
stressful Very/extremely
stressful Total
Ratings 12.1 78.1 9.8 100 Petty officers 14.8 77.8 7.4 100 Junior officers 12.0 73.4 14.7 100 Senior officers 12.3 69.4 18.3 100
Source: SIRC Study 2011

97
A change in the overall culture at sea has been noted by some authors who suggest that there
has been “a reduction over time in the culture of heavy alcohol consumption amongst
seafarers” (Roberts 2005, p. 41). They further argue that the introduction of ‘dry [alcohol free]
ships’ has played a part in this cultural ‘shift’ (Roberts 2005). Our data would suggest that
this is only partially correct, however, as 8.2% of the seafarers reported drinking once a week
or more whilst actually on board ‘dry ships’.
Further to this, we found that average weekly consumption levels on board were almost five
times greater aboard non-dry ships than aboard dry ships (2.60 for non-dry vessels as
compared with 0.65 units per week on board dry vessels). As shown in Table 9, these
differences were less notable for consumption during port stays (in port average consumption
of 1.78 aboard dry ships compared with 2.07 aboard non-dry ships), and patterns of alcohol
consumption whilst ‘on leave’ were reversed. Those who sailed aboard dry ships reported a
higher average consumption on leave (5.48 units per week) than those aboard non-dry ships
(4.41 units per week).
Table 7. Alcohol consumption (in units per week)
Mean units of alcohol per week SD, MinMaxCardiff-Bristol Study 17.54SIRC Study
Onboard 1.61 3.2 (SD), 0-30 MinMaxIn port 1.91 3.4 (SD), 0-40 MinMaxOn leave 4.97 9.7 (SD), 0-120 MinMax
Source: SIRC Study 2011
Table 8. Frequency of alcohol consumption in dry and non-dry ships
N Less than once a week Once a week or moreDry ship 550 91.8 8.2Non-dry ship 464 54.5 45.5
Source: SIRC Study 2011

98
When we interrogated the data a little more closely, however, a slightly different picture
emerged. We considered the average weekly alcohol consumption of the seafarers who stated
that they drank once a week or more on both dry (alcohol free) and non-dry ships (n=41 and
n=173 respectively). Aboard alcohol free (dry) ships we found that those drinking once a
week or more reported an average consumption of 2.37 units per week. This contrasted with
an average consumption of 3.52 units per week on non-dry ships (see Table 10). Thus when
we consider the difference between the more regular drinkers aboard alcohol free and non-
dry ships instead of a five-fold difference we find that, on average, seafarers aboard non-dry
ships drink less than double the amount that more regular drinkers aboard alcohol free ships
consume. In due course (in future publications) we will look further into these consumption
levels more fully to consider their implications.
In relation to alcohol consumption, nationality, socio-cultural norms and religious values play
a part which is not insignificant. When the results for alcohol consumption are considered in
relation to nationality we find that seafarers from northern and western Europe top the
‘consumption league’ with 2.02 units per week when onboard, 2.96 units when in port and
9.68 units when on leave.
Table 9. Average alcohol consumption in units per week
Onboard In port On leaveDry ship 0.65 1.78 5.48 Non-dry ship 2.6 2.07 4.41 Total 1.61 1.92 4.97
Source: SIRC Study 2011
Table 10. Average alcohol consumption between non-regular and regular drinkers
Less than once a week Once a week or more Dry ship 0.42 2.37 Non-dry ship 1.61 3.52
Source: SIRC Study 2011

99
By contrast, Filipinos, the single largest block of respondents in this study, had an average
consumption when on leave of just 3.16 units per week. Amongst Europeans, British
seafarers have the highest mean alcohol consumption amounting to 22 units per week (higher
than the most comparable land-based data we have access to) which may help to explain why
the UK’s Institute of Alcohol Studies 2008 survey shows that between 2001and 2005
seafarers had the second highest alcohol-related mortality rate in the UK (after bar staff). In
relation to alcohol consumption the variations by nationality are so considerable that
comparisons with land-based populations are best made within single nationality groups
(British seafarers being compared with comparable land-based British workers for example).
Our limited capacity for single nationality comparisons (limited only to British respondents)
would appear to suggest that alcohol consumption amongst seafarers may be higher than
amongst comparable land-based populations of workers. However there are insufficient data
to be conclusive in relation to this point.
Smoking
Just over a third of the seafarers (34.5%) who took part in the study smoked. This compares
with 44% of seafarers reported to be smokers in a recent French study (Fort et al. 2009) but is
higher than rates reported for the UK land-based population (24%) in recent studies in
Cardiff and Bristol (Smith et al. 2000; Smith et al. 2004a, 2004b).
Table 11. Average alcohol consumption per nationality grouping
% On board In port On leaveFilipinos 18 1.88 1.77 3.16Indians 16 1.44 1.55 3.73Other Asians 18 1.46 1.5 3.24Northern, Western and Southern Europeans 12 2.02 2.96 9.68Eastern Europeans, Baltic and Russians 25 1.47 1.72 4.78Others (including Middle Easterns, Africans and Small Islanders) 12 1.51 2.37 6.12Total 1026
Source: SIRC Study 2011

100
Amongst smokers in our sample, an average of 11.43 manufactured (i.e. not hand-rolled)
cigarettes were consumed per day. When manufactured and hand-rolled cigarettes were
considered in combination we found an average consumption of 13.55 cigarettes per day. It
was notable however that seafarers’ cigarette consumption was reported to increase whilst
they were on board ship. Fifty-eight per cent of seafarers reported that they smoked more at
sea than when they were on vacation.
As with alcohol consumption there are once again considerable variations across different
nationality groups. Europeans consume more cigarettes than any other group of seafarers: In
the study, an average consumption of 22 cigarettes per day was reported by western and
eastern European seafarers. Filipinos and “other Asians” smoked an average of less than half
of this amount, averaging a consumption of seven and eight cigarettes per day, respectively.
The combined reported consumption of alcohol and cigarettes could have implications for the
development of some forms of cardiovascular disease amongst seafarers and pose
“unequivocal risk factors for ischemic stroke” (Mukamal 2006, p. 201). It is also claimed that
the frequency of hearing loss in smokers is higher than for non-smokers (Mohammadi et al.
Table 12. Percentage of smokers
N Frequency (%) Cigarettes per dayNon-Smokers 667 65
Smokers 352 35 13.55 (average), 1-60 Min/MaxStandard Deviation 12.03
Total 1019
Source: SIRC Study 2011
Table 13. Comparison of smoking habits
N Relative frequency More cigarettes at sea 200 58.1
More cigarettes on leave 40 11.6 About the same amount for both periods 104 30.2 Total 344 100
Source: SIRC Study 2011

101
2009, p. 452). Thus the implications of both smoking and drinking behaviours can be serious
and these issues require further future attention.
Symptoms
As well as finding out about alcohol and cigarette consumption we also asked seafarers
whether they had been diagnosed as suffering from a number of specified chronic conditions
in the last 12 months (see Table 14 for the list of chronic conditions).
Almost a quarter of respondents (22.7%) indicated that they had been diagnosed with at least
one of these. High blood pressure appeared to be the most prevalent condition (9.2%)
followed by high cholesterol (8.8%). In most cases, and as anticipated due to the
aforementioned ‘healthy worker effect’, seafarers compared well with land-based populations
of similar workers in relation to most of the specified conditions. This seems to suggest that
in many cases seafarers with diagnosed chronic health problems are successfully excluded
from the workforce.
Table 14. List of chronic conditions
Chronic conditionsAngina High cholesterol level DiabetesStroke Heart attackHigh blood pressure Nervous trouble or depression Asthma Emphysema BronchitisCancer
Source: SIRC Study 2011

102
We further asked seafarers to indicate, from of a list of specified health problems, which they
had suffered from in the last 12 months* (see Table 16 for a complete list).
The majority of seafarers (66.8%) reported that they had not experienced any of these
problems in the past 12 months. The remaining 340 respondents (33.3%) reported that they
had suffered from at least one condition. Of these conditions, indigestion or stomach trouble
was the most prevalent (10.1%), followed by persistent skin trouble (6.5%), arthritis or
rheumatism (5.9%) and recurring backache (5.9%). In relation to common recurrent health
problems which may or may not have been diagnosed by a physician, seafarers suffer
disproportionately from indigestion and stomach ‘trouble’. That is to say that although far
* This was regardless of whether or not a medical diagnosis was made.
Table 15. Diagnosed chronic conditions
N Frequency (%)None 792 77.3One or more 233 22.7Total 1025 100
Most prevalent chronic conditions:High blood pressure 94 9.2High cholesterol level 90 8.8
Source: SIRC Study 2011
Table 16. List of recurring conditions
Recurring conditions Bronchitis Arthritis or rheumatism Sciatica, lumbago or recurring backache Persistent skin trouble Asthma Hay fever Recurring stomach trouble or indigestion Being constipated all or most of the time Piles Persistent foot trouble Trouble with varicose veins Nervous trouble or persistent depression Persistent trouble with your gums or mouth
Source: SIRC Study 2011
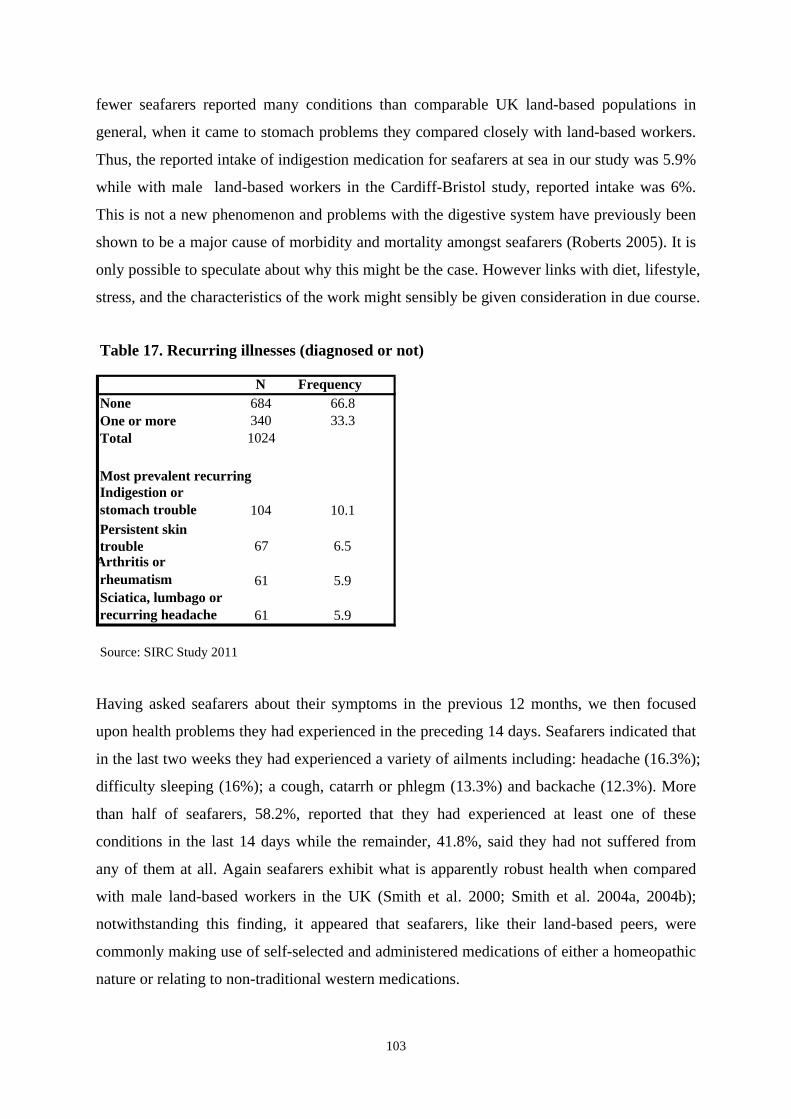
103
fewer seafarers reported many conditions than comparable UK land-based populations in
general, when it came to stomach problems they compared closely with land-based workers.
Thus, the reported intake of indigestion medication for seafarers at sea in our study was 5.9%
while with male land-based workers in the Cardiff-Bristol study, reported intake was 6%.
This is not a new phenomenon and problems with the digestive system have previously been
shown to be a major cause of morbidity and mortality amongst seafarers (Roberts 2005). It is
only possible to speculate about why this might be the case. However links with diet, lifestyle,
stress, and the characteristics of the work might sensibly be given consideration in due course.
Having asked seafarers about their symptoms in the previous 12 months, we then focused
upon health problems they had experienced in the preceding 14 days. Seafarers indicated that
in the last two weeks they had experienced a variety of ailments including: headache (16.3%);
difficulty sleeping (16%); a cough, catarrh or phlegm (13.3%) and backache (12.3%). More
than half of seafarers, 58.2%, reported that they had experienced at least one of these
conditions in the last 14 days while the remainder, 41.8%, said they had not suffered from
any of them at all. Again seafarers exhibit what is apparently robust health when compared
with male land-based workers in the UK (Smith et al. 2000; Smith et al. 2004a, 2004b);
notwithstanding this finding, it appeared that seafarers, like their land-based peers, were
commonly making use of self-selected and administered medications of either a homeopathic
nature or relating to non-traditional western medications.
Table 17. Recurring illnesses (diagnosed or not)
N Frequency None 684 66.8
One or more 340 33.3 Total 1024
Most prevalent recurring Indigestion or
stomach trouble 104 10.1 Persistent skin trouble 67 6.5
Arthritis or rheumatism 61 5.9Sciatica, lumbago or recurring headache 61 5.9
Source: SIRC Study 2011

104
Medication and Self-medication
Self-medication was prevalent amongst seafarers, with 63% (650) of respondents claiming to
have taken at least one non-prescribed medicine or herbal remedy at sea in the last 12 months.
The same thing could be said when they were on leave, with 58.8% (603) claiming to have
taken self-medication. The most common self-medication drugs taken when at sea were
vitamins or supplements (53.2%) and painkillers (26.3%).
The high intake of self-prescribed painkillers amongst seafarers could result in health
complications. As Wazaify et al observe, “increasing availability of non-prescription
medicines may encourage patients to believe that there is a drug treatment for every ailment.
Furthermore, the use of such products may delay/mask the diagnosis of serious illness” (2005,
p. 170). While the high level of vitamin consumption amongst seafarers, (53.2%, compared to
the general population figure of 29%, Smith et al. 2004a, 2004b), could be read as a sign of
their commitment to their wellbeing, as an attempt to manage their health as consumers
(Stasio et al. 2008; Nichter and Thompson 2006), or as their way of undergoing a process of
‘responsibilization’ in terms of their health and safety (Gray 2009), it might also reflect
seafarer concerns about the essentially unhealthy diet and lifestyle at sea. Thus these findings
warrant further consideration.
At sea and on leave, the most frequently prescribed medications were pain killers (12.9% at
sea, 9.3% on leave), followed by blood pressure tablets (5.9% at sea, 6.3% on leave),
Table 18. Recent medical conditions
N Frequency (%)None 429 41.8One or more 597 58.2Total 1026
Most prevalent recent medical conditions:Headache 167 16.3Difficulty sleeping 164 16A cough, catarrh or phlegm 136 13.3Backache or pains in the back 126 12.3A cold or flu 113 11
Source: SIRC Study 2011

105
respectively. The fact that the consumption of prescribed pain killers increases aboard vessels
may relate to the physical nature of many shipboard jobs. Similarly we might speculate that
the increase in the intake of blood pressure tablets ashore, on leave, might indicate that
seafarers do not have access to regular blood pressure medication at sea and/or are hiding the
need for medication whilst at work.
Conclusion
Life and work at sea is potentially more difficult and challenging than life and work ashore.
Nevertheless, when seafarers struggle with the workplace environment, either physically or
emotionally, they are likely to be excluded (or they may self-exclude) from the workforce. In
the course of this research, seafarers, as expected, generally reported that they were in good
health, though areas of concern relate to the incidence of high blood pressure, stomach
problems, and high cholesterol amongst seafarers. Stress, may be one the most challenging
aspects of life and work at sea, particularly for senior officers. Such stress does not just have
the potential to affect the health and wellbeing of seafarers, it also directly bears upon their
productivity and hence, economic output in general. Stress levels amongst land-based
workers are also considerable and in the UK, where long hours are often worked, they would
seem to be even higher than for seafarers as a general occupational group. It will be necessary,
in the future, to clarify the position vis a vis comparisons between worker groups of the same
nationality (i.e. land-based and sea-based). However, we note that, in recent years, the overall
cost of stress at work has been estimated to be in the range of 20 billion Euros in the
European Union, and more than 150 billion dollars in the US, mainly for health care and
treatment costs, absenteeism, and turnover (Lazuras 2009, p. 1075). This should be a
Table 19. Self-medication at sea and on leave
N Share to total (%) N Share to total (%)None 375 36.6 422 41.2One or more 650 63.5 603 58.8Total 1025 1025
Common drugs at sea:Vitamins or supplements (53%)Painkillers (26%)
Source: SIRC Study 2011
AT SEA ON LEAVE

106
compelling economic incentive for ship operators and manning agencies to look for ways of
mitigating the stress levels of seafarers.
References Allen, P. et al. 2008. Seafarers' fatigue: a review of the recent literature. International Maritime Health 59(1-4), pp. 81-92.
Fort, E. et al. 2009. Alcohol and nicotine dependence in French seafarers. International Maritime Health 60(1-2), pp. 18-28.
Gray, G. C. 2009. The responsibilization strategy of health and safety: neo-liberalism and the reconfiguration of individual responsibility for risk. British Journal of Criminology 49, pp. 326-342.
Grey, M. 2000. On the lookout for signs of fatigue. The Sea. January-February. pp. 4-5.
IAS. 2011. Institute of Alcohol Studies - Factsheets [Online]. London: Available at: http://www.ias.org.uk/index.html [Accessed: June 2 2011].
Kahveci, E. 1999. Fast turnaround ships and their impacts on crews. Cardiff: Seafarers International Research Centre - Cardiff University.
Kahveci, E. 2007. Port based welfare services for seafarers. Cardiff: Seafarers International Research Centre - Cardiff University.
Lazuras, L. et al. 2009. Perceived occupational stress, affective, and physical well-being among telecommunication employees in Greece, Social Science and Medicine 68, pp. 1075-1081.
MCA. 2011. Seafarer Medical Examination System and Medical and Eyesight Standards [Online]. London: Available at: http://www.pml-solas.org.uk/forms/ msn1765.pdf [Accessed: June 18, 2011].
Mohammadi, S. et al. 2009. Cigarette smoking and occupational noise-induced hearing loss. European Journal of Public Health 20(4), pp. 452-455.
Mukamal, K. J. 2006. The effects of smoking and drinking on cardiovascular disease and risk factors. Health Risks 29(3), pp. 199-202.
Nichter, M. and Thompson, J. J. 2006. For my wellness, not just my illness: North Americans' use of dietary supplements. Culture, Medicine and Psychiatry 30, pp. 175-222.
Novalbos, J. et al. 2008. Occupational health in the Andalusian fisheries sector. Occupational Medicine 58, pp. 141-143.
Oldenburg, M. et al. 2010. The risk of coronary heart disease of seafarers on vessels sailing under German flag. International Maritime Health 61(3), pp. 123-128.

107
Roberts, S. E. 2005. World related mortality from gastrointestinal diseases and alcohol among seafarers employed in British merchant shipping from 1939 to 2002. International Maritime Health 56(1), pp. 29-47.
Roberts, S. E. and Jaremin, B. 2010. Cardiovascular disease mortality in British merchant shipping and among British seafarers ashore in Britain. International Maritime Health 61(3), pp. 107-116.
Reyner, L. and Baulk, S. 1998. Fatigue in ferry crews: a pilot study. Cardiff: Seafarers International Research Centre - Cardiff University.
Sampson, H. and Thomas, M. 2003. The social isolation of seafarers: causes, effects, and remedies. International Maritime Health 54(1-4), pp. 58-67.
Sampson, H. and Wu, B. 2003. Compressing time and constraining space: the contradictory effects of ICT and containerization on international shipping labour. Internationaal Instituut voor Sociale Geschiedenis 48(Supplement), pp. 123-152.
Schepers, B. and Dahl, E. 2010. Seafarer with solitary, well-functioning kidney - fit for service at sea without restrictions? International Maritime Health 62(3), pp. 185-187.
Smith, A. et al. 2000. The scale of occupational health: the Bristol stress and health at work study. HSE Books.
Smith, A. et al. 2003. Fatigue offshore: phase 2. the short sea and coastal shipping industry. Cardiff: Seafarers International Research Centre - Cardiff University.
Smith, A. P. et al. 2004(a). The scale and impact of illegal drug use by workers. HSE Books.
Smith, A. P. et al. 2004(b). The scale and impact of psychotropic medication use by workers. HSE Books.
Stasio, M. J. et al. 2008. Over-the-counter medication and herbal or dietary supplement use in college: dose frequency and relationship to self-reported distress. Journal of American College Health 56(5), pp. 535-547.
Telegraph 2007. Let's pull together. Nautilus UK Telegraph. July. p. 24.
Telegraph 2009. Research will take fatigue to a new level. Nautilus UK Telegraph. July. pp. 24-25.
Wadsworth, E. J. K. et al. 2006. Patterns of fatigue among seafarers during a tour of duty. American Journal of Industrial Medicine 49, pp. 836-844.
Wadsworth, E. J. K. et al. 2008. Fatigue and health in a seafaring population. Occupational Medicine 58(3), pp. 198-204.
Wazaify, M. et al. 2005. Societal perspectives on over-the-counter (OTC) medicines. Family Practice 22, pp. 170-176.
Wickramatillake, H. D. 1998. Infectious diseases among seafarers. Cardiff: Seafarers International Research Centre - Cardiff University.

108
Personalities, Policies, and the Training of Officer Cadets
Gould, E. Abstract This paper outlines a study into UK Merchant Navy Officer cadetship which used questionnaire and interview data gathered from deck and engineering cadets in 2004 and 2005. The study took place in the context of a declining UK shipping fleet and seafaring workforce, and the absence of research into the views of cadets themselves. Its initial purpose was to understand cadets’ experiences of training at sea; these varied with each unique combination of voyage, ship, officers and crew. As the study progressed the impact of the Tonnage Tax policy on their experience was observed. The paper highlights key findings from the study including the ambivalence which characterised cadetship; it considers cadets’ views on the personal characteristics and attitudes which they felt aided adaptation to life at sea: and, policy related external factors that made that adaptation more difficult.
Introduction
This paper outlines research on the experience of UK Merchant Navy Officer Cadets; their
views on how they came to take up training; their experiences of life at sea and the ship as a
training environment; and their hopes and fears for a future at sea. In presenting this work I
outline the origins and conduct of the study and highlight the key findings. For this audience,
who may be directly involved in the selection and training of officer cadets, or who have an
acute interest in securing highly competent and well motivated Officers, I have focussed on
the extent to which ‘successful’ cadetship can be attributed to the disposition, the character of
the individual cadet, and the extent to which external factors that are beyond the control of
the individual cadet may lead to cadet ‘attrition’. The key message from this paper is that
effort is best directed not at finding ‘the perfect cadet’, but on addressing external factors that
lead to attrition.
The Origins of the Study
When this study began in late 2001, the concerns of both Government and the Industry over
the decline of the UK merchant shipping industry in terms of the ownership and registration
of shipping tonnage, and of the shipping workforce, were already well documented (Ledger
109
and Roe, 1992; DETR, 1998; Brownrigg et al, 2001). Concern over the British seafarer
workforce could be classified as: a decline in numbers of active seafarers (DETR, 1998); the
increasing age of those seafarers (NUMAST, 2004); a decline in the numbers of Junior
Officers recruited into the service; and, reductions in the numbers of Officer cadets training
in the UK; in 1975 this number was 2,315, reaching a low in 1987 of 162, although
recovering in the 1990s to between 400 and 500 (NUMAST, 2004).
Looking specifically at this last issue, the numbers of Officer cadets training in the UK, it
became clear that there was no current research on the views of cadets themselves as to how
they saw their cadetships and their futures as Merchant Navy Officers. Hill’s excellent study
commissioned by the National Maritime Board into the factors affecting joining, serving and
leaving the Merchant Navy had involved trainees, but was already thirty years old (Hill,
1972); gathering the views of contemporary cadets on their training and prospects therefore
became the starting point for this study.
The Conduct of the Study
Access to cadets themselves was through three companies, approached on the advice of Tony
Lane at that time the Director of SIRC, and anonymised in the research as Ace Marine, Star
Shipping and Ocean XL. Preserving the confidentiality of the companies and of the cadets
who took part in the study was extremely important: a number of cadets interviewed,
particularly those who were critical of their training experiences, expressed concern that their
views could be traced back to them, and they needed considerable reassurance that this could
not happen. Equally, cadets were keen that the issues they raised were highlighted to the
wider shipping industry, and this Symposium paper is one way of fulfilling their wishes.
The co-operation from the companies was more than could have been hoped for, and through
them questionnaires were sent out to all the cadets both deck and engineering who were in
training with the three companies concerned; this totalled 400. 120 questionnaires were
returned and from those, 36 cadet interviews were conducted. The interviews were carried
out in three colleges identified in the research only as A, B, and C, and again sincere thanks
are due to the administrative and academic staff who organised rooms and contacted cadets
on my behalf. Without their help the research would not have been feasible.

110
The questionnaire and the interviews generated a wealth of data on how Officer cadets found
themselves on their training programmes; their views on shipboard life; and how they saw
their futures at sea. In the interviews, each one lasting between 60 and 90 minutes, most
cadets spoke articulately and in detail about their experiences; this openness was to a degree
unexpected, particularly as the majority of cadets involved in the study were young men who
are not characterised as the most forthcoming of interviewees.
Key Findings of the Study
Calling and Tradition
The two recurrent explanations offered by cadets of what drew them to a career at sea were
firstly, their positive experiences of the sea as a natural environment – sea-based leisure
activities such as surfing or yachting, or simply growing up by the sea; and secondly, having
a tradition of the sea and of seafaring in the family. The dominance of these two themes will
come as no surprise to this audience and is consistent with Hill’s study already mentioned
(Hill, 1972), and in surveys carried out by Nautilus - UK since this study began (NUMAST,
2004). What is perhaps more surprising is that family tradition remains a strong determinant
when information on a career at sea is so much more widely available than was once the case.
The Attraction of Difference
The study found that for most cadets entry into training was a positive process in which they
saw the Merchant Navy as having specific attractions for them; this finding was in marked
contrast to the studies of the 1970s (Hill,1972; Hopwood, 1973). The opportunity to travel
and see the world was the career attraction selected most frequently in the questionnaire
responses by both deck and engineering cadets, together with the attraction of good pay. For
the young people involved in this study, a seafaring career offered the promise of adventure,
the attraction of something exciting and different, but within a traditional and well recognised
occupation. Rather in the way cadets applied their enjoyment of sea-related sports to
seafaring, so they associated the adventure found in leisure travelling with seafaring.
Although it was cadets’ expectation that they would experience the excitement of leisure
travel as seafarers, it became clear as they talked about their experiences of planned training

111
at sea, that this was not always the case, partly a result of changes in the practices of
seafaring. As Sampson and Wu (2003) noted, a seafarer today may in his working life see
less of the world not only than his nineteenth century counterpart, but also his counterpart of
the 1960s and 1970s, where longer periods of shore leave allowed seafarers to see and
experience different countries and cultures.
The Attraction of Money
Although the prospect of a good salary was a career attraction, when pay was discussed in
the interview conversations it was primarily in relation to the uncertainties of securing
employment post-certification, and also in connection with what cadets described as ‘the
money-trap’. The fact that deck cadets in particular did not see their training as giving them
transferable skills did not add to the confidence of cadets in their overall job prospects. The
concerns expressed by cadets in relation to: securing a job once they had ‘got their ticket’; to
skills transferability; and to the money trap, were suggestive of uncertainty and mixed
emotions best described as ambivalence; ambivalence is returned to as a key aspect of the
cadet experience.
The Extremes: David and Robert
Cadets talked about their experiences with the full gamut of emotions including humour,
excitement, sadness and, anger. It might have been expected that the cadets willing to
participate in the study might have strong views about cadetship, either positive or negative;
however the study revealed all shades of cadet experience from the rewarding to the deeply
distressing. For illustrative purposes I describe a cadet at each extreme of the cadet
experience.
The study showed that there were cadets who were enticed by the life at sea, whose overall
experience of training was rewarding and who looked forward with enthusiasm and
excitement to a future at sea: David (pseudonym) is an example of a cadet whose enthusiasm
for a career at sea was infectious – as he said, “It’s got all the benefits for me!”. David saw
before him a career of difference in which he could pursue a love of the sea, and an
enjoyment of the ocean environment. He saw it as giving him access to an occupation with a
longstanding and distinctive tradition and to also continue his own family tradition of

112
seafaring. David’s planned training at sea had given him the opportunity of shore leave in
other countries, and he had enjoyed the experience of a multiethnic workplace. He was in his
own words ‘pretty chuffed’ about the levels of responsibility he had already been given, and
valued the promise of responsible and worthwhile work. In the interviews with David he felt
that life at sea offered the potential for good pay and career progression.
There were others however who were so disenchanted that they left training altogether, with
the consequent feelings of failure and disappointment, and there were cadets whose accounts
of planned training at sea were disturbing by any standards. Robert (pseudonym) was a cadet
who displayed such profound disillusion that he abandoned training altogether. Once at sea
he found the pressures of the physical confinement and the restricted diet, the total character
of shipboard life in which working and non-working life became inextricably interlinked,
and, the distance from family and friends, all to be oppressive. He found these features to be
magnified by what he perceived as hostile and unsupportive attitudes from those involved in
his training at sea, and initiation processes which he interpreted as ones of unnecessary
humiliation.
Ambivalence
Joseph Conrad the novelist, most famed for his short story ‘Heart of Darkness’ and himself a
Master Mariner wrote:
“...there is nothing more enticing, disenchanting, and enslaving than the life at sea”.
(Conrad, 1900/1974:14)
This notion of the paradoxical nature of seafaring, at once enticing and disenchanting was
found to be a key element of the cadet experience. Even David, the most positive of cadets,
displayed ambivalence in his thoughts about the future: would he relish a seafaring life in
years to come when he had a family and had perhaps become desensitized to the excitement
of the ocean? Even Robert, whose experience of shipboard life, was so negative that he
decided to leave training, expressed regret about his decision: his final comment on leaving
training was: “I always hoped that I’d do a job that I’ll have all my heart in . . .”; for him,
this was not to be seafaring, and there was ambivalence in his regret that seafaring would
never be for him the meaningful occupation that he had looked for.
113
All the cadets in this study expressed ambivalence in varying degrees to shipboard life and to
a future at sea; ambivalence was revealed through the mixed emotions, the tensions and the
uncertainties they experienced as individuals. The study suggested that the cadet experience
of transition into adulthood and into working life would seem to be more extreme than that of
their peers in other forms of higher education; this increased challenge was seen as a
consequence of the inescapable nature of the separation from home; of the limited nature of
communications whilst away at sea; of the lack of peer contact; and, of the unique and
committing nature of day to day life at sea.
Managing Cadetship
Much of the study focused on the ways in which cadets learned to manage the challenges of
cadetship and the findings revealed a range of approaches that were undoubtedly shaped by
their individual disposition, their personality characteristics. However, there were external
factors that also played their part in the ambivalence expressed by cadets. For those involved
with the selection and training of Officer cadets this finding is important as it suggests that no
matter how much an individual cadet may be suited to life at sea, there are external factors
that can lead to attrition. Whilst some of the external factors are integral to the very nature of
seafaring and have to be accommodated by the individual, some are within the control of
companies themselves. In the remainder of this paper, I will focus on ‘personalities and
policies’ as the title of the paper suggests, and consider what cadets saw as the characteristics
that suited an individual to life at sea, and how they saw the negative external factors that had
a bearing on the cadet experience, and which were within company control.
Looking for Mr (or Miss) Perfect: The Ideal Officer Cadet
Entering the world of work is for most young people an experience that takes them from the
familiar to the unfamiliar (Evans and McCloskey, 2001); this is particularly pronounced
where the job is not visible or easily accessed by those outside the occupation, as is the case
with seafaring. Cadets soon found that life at sea was altogether different from anything they
had previously experienced, as the deck cadet in the following interview extract discovered:

114
Interviewee: “Mainly they just don’t tell you what you’re getting yourself in to . . . and then when you go to sea … you’ve never been to sea before, you don’t know what it’s like, you don’t know what you’re getting yourself into, what people are going to be like. All the boys from my area . . . they’ve all been about boats and worked on boats before. But then going away on a ship, it’s different. It’s just a different way of life. Sometimes it’s a big shock … it was so, so, so different… “Oh my God, what’s happened?” It’s quite challenging when you first start . . .”
Stephen- Deck Cadet Assembling prior information about the job can only prepare an individual to a limited extent:
one cadet commented that although he began his training with expectations based on
information acquired from his family he never, by his own admission, “really thought it
through”, and even if he had, it was only when he “stepped on that ship” that the
implications of being at sea became meaningful for him:
Interviewee: “I imagined – I don’t know really because I never really, to be honest with you, never really thought it through…I never thought about how I would feel about going away for 4 to 5 months at a time. It never entered my head until I stepped on that ship… I never thought anything really through, to be honest with you. I think that’s why it was so difficult at the start.”
Stuart - Deck Cadet
All the cadets interviewed in this study showed insight into the complexity of shipboard
relationships, the variety of ways in which this complex web of relationships showed itself,
and how it could be handled. For some, adaptation to life at sea appeared to be effortless as
the following interview extracts suggest:
Interviewee: “I mean I’m a very relaxed person anyway [LAUGHS], so I just kinda slide in and have a few jokes, sit down, have a chat, have a beer, you know? It was good…you’ve gotta get on with other people and so, it was alright. You’ve gotta work with these people, ‘cos there’s such a small number of people… that’s just how I am. It just it goes straight over the top of my head to be honest [LAUGHS]. Nothing really fazes me… ‘cos when you’re on a ship, living in a confined space, you’re eating with the same people every day, working, well every day, working with them every day, socialising with them, you know? You’ve gotta work kind of at a short-term relationship…
David - Deck Cadet

115
Interviewee: “You’ve definitely gotta be able to just take everything. It’s gotta be water off a duck’s back. I mean, you share it with the same people for five and a half months, you know? You’re living with your family for five and a half months and can you honestly say you haven’t had an argument for five and a half months? . . . even with your mates or anything like that. [On ship] you can’t just turn around and say, “I’m not talking to you now” because it’s a professional thing as well.”
Josh - Deck Cadet
One seventeen year-old engineering cadet, describing how he conducted himself aboard ship,
cheerfully dismissed my suggestion that his attitude displayed considerable maturity:
Interviewee: “I think you’ve gotta be able to work out that if something goes wrong, there’s no point in you getting all wound up about it, you’ve just gotta get on with it and like put your head down and do it and then when it’s over, have a laugh about it. But like I don’t see any point in, if something doesn’t go the way you want, sort of kicking and screaming and throwing a hissy fit about something. I don’t think there’s any need for that, especially when you’ve gotta sort of work in close confines with the person, every day seeing ‘em.”
(Interviewer: “That’s a lot for a seventeen year old to kind of adjust to, do you think?”)
Interviewee: “Nah, it’s alright, it’s normal. You just get on with it, it’s not, it’s nothing too strenuous [LAUGHS]. I dunno, if you don’t like it, quit. If you don’t think you’re cut out for it, quit [LAUGHS].”
Angus- Engineer Cadet, and interviewer
For other cadets, adaptation appeared to require more effortful adjustment. One female deck
cadet explained the effort required in containing her natural exuberance. Singing and sporting
a pink polo shirt were clearly not accepted behaviour by the Captain of her first training
vessel:
Interviewee: “Within forty eight hours he’d (the Captain) told me off for “joviality”, just cos I’d been smiling and going [ACTION], “Good morning,” or something, and he was just like, “There’s nothing for you to be happy about, what are you happy about?”. He just went mental at me. He’d heard me singing on deck, he went mental at me. So then he told me I was the worst form of sea life. He told me that I was female therefore I had more to

116
prove. I was wearing track suit bottoms and trainers and a, sort of, polo shirt, which is generally the norm for what you’d wear on a supply vessel. The problem was the polo shirt was pink and he didn’t like it. So all these things before we’d left Aberdeen. So we’d just, we’d let go of the ropes and I’d gone down to my cabin and phoned my Mum in floods of tears, “Mum, this is gonna be a nightmare,” And my Mum was just like, “No, you’ve got to be strong, get over it.” And I did. After that it was a challenge. I took it as a challenge to keep him happy, “Yes sir, no sir, three bags full sir”.”
Charlotte - Deck Cadet
For this cadet, the traditional expectations of the Captain had to be managed as part of her
initiation into life at sea and she found that she had to contain her natural high spirits.
However there were others for whom the accommodation to shipboard life was clearly very
difficult:
Interviewee: “…you’re stuck with people that, you know, you don’t necessarily get on well with and, like you’re, you’re like a caged, a caged rat, you know, stuck on a steel tub going from one horrible port to another [LAUGHS]. And it’s just, it really is not life, it, really, it’s just . . . ”
Sam - Deck Cadet
This sense of confinement and oppression for some cadets became overwhelming: ‘Robert’
referred to earlier, talked of his desperation in the following way:
Interviewee: “Have you seen Master and Commander? I’d recommend you to watch it. It’s, it’s a recent film which has come out and I saw it and actually I have complete parallels with one of the guys who, actually, he committed suicide, ‘cos he jumps overboard with a cannonball - and its set in a different time period but I actually, I could actually see parallels with his mindset but if, I dunno, if you’re stronger or weaker if you actually have the, the nerve to, to go from that height? But and I, I felt that, nothing, for me personally, I, I don’t have that inclination, but I imagine that for someone who gets so upset it’d be quite, quite easy to just jump off the back of the ship. Generally I would, I would imagine there are cases of it because there are certain environments that you can’t, can’t escape, really, there’s no, you know, you are, you’re there for that period and, to endure it. And for me, I mean I, I feel, I, I’m fairly tough to, to accept it and my feeling was, OK, endure it, you’ve only got - I mean I had the days marked off, for however many I had to go and I’d cross them off and look forward to that, every day [LAUGHS]. But the one thing for me was mainly reading and just trying to do, trying to do the job as best as I could, really.”
Robert - Deck Cadet

117
Despite the way in which ‘Robert’ distances himself from the character in the film who
commits suicide, and emphasises the fact that he himself is ‘fairly tough’ and can accept and
endure his sea trip, I understood him to be saying as directly as he could, that he had at times
felt suicidal.
There is an implication in many of these comments above that innate personality
characteristics determine the ease with which cadets adapt to the intensity of shipboard life;
quite simply, that some individuals are suited to it, and some are not. One cadet who resigned
from training during the first year, in unhappy circumstances, raised directly the question of
whether personality is the key determinant to accepting shipboard life very directly:
Interviewee: “That’s, that’s a big, a big question that, maybe my, my personality wasn’t suited to the job, sort of thing.”
Robert - Deck Cadet
Cadets had their own views on what they saw as a successful approach to negotiating
shipboard relations and the demands of being both a trainee and a seafarer: keeping out of the
way; biting your tongue; not making waves; and, trying to keep the peace, were all phrases
used by cadets in the interviews.
Interviewee: “Yeah, kind of, you know, you just accept it and get on with it. There’s not much really, that you can really do about it, you just accept it. You’re basically the lowest. You should work your way up. Accept it, accept what you get, you know. You’re gonna get trodden on, just accept it and move on. There’s not really much you can do about it.”
Stuart - Deck Cadet Interviewee: “I mean it’s just part and parcel of the job. I mean if there’s anything about you that can be laughed at or made fun of, it’s done. But, but you don’t get away with anything. If you do something stupid, then it’s passed round the whole ship and they’re laughing at you… It’s all done in good fun, good humour . . . erm, and with regards to anything and everything … everything’s just up for ridicule.”
Ian - Deck Cadet
Accepting the tough initiation into the traditional occupational culture of seafaring was seen
by some cadets as evidence of maturity, of successfully completing a rite of passage, and of
their ability to adapt to being part of the wider social group: As Hill in his study reported,

118
acceptance of one’s position on board, and commitment to the occupational culture was seen
by the seafarer: “… as though he has passed through an initiation ceremony and has
successfully crossed the threshold into manhood.” (Hill, 1972:58).
Interestingly, the questionnaire data showed a different approach with the cadets who felt that
‘keeping one’s head down’ was the way to get the best out of life at sea outnumbered twofold
by those who felt that it best to be assertive. Of those who felt assertiveness to be the best
tactic, the majority (70%) considered themselves to be assertive rather than under-confident.
‘Standing up for yourself’ was a recurrent phrase:
Interviewee: “You’ve got to be quite strong mentally, ‘cos otherwise, you’re away from home and that, and you have to be able to stand on your own two feet … you’ve got to be able to put your opinion across without offending … you’ve got to be very assertive ‘cos otherwise you just get walked all over . . . ‘cos if you give an inch, they’ll take a mile and walk all over you and before you know it, they’ll be dumping all sorts of work and stuff on you. You’ve got, you’ve got to stand up for yourself. Well that’s how I get by anyway and I think people have got more respect for you if you stand up for yourself, ‘cos you know where you stand with people.”
Brett - Deck Cadet
Planned training at sea provided the opportunity for cadets to learn to negotiate the complex
web of shipboard relationships not only as newcomers to seafaring but also as future officers.
Much of the effort is placed on ‘self-management’ in which cadets, often as the only trainee
on board, have to find their own ways of ‘getting by’, and inevitably the natural disposition
and personal resources of the cadets themselves played a significant part in this.
However attributing successful cadetship solely to individual attitudes such as ‘nothing fazes
me’ or ‘its water off a duck’s back’, to characteristics such as assertiveness, to a personal
calling or of a strong family tradition, could lead to the conclusion that failure to complete
training is the responsibility of the individual, a consequence of an ‘unsuitable personality’.
To take this view would be to underestimate the external factors that could lead a cadet who
was well suited to a career at sea to abandon training. These factors related to environments
that were not conducive to learning; the research showed that there were cadets who
experienced what they saw as unsupportive and unsuitable training placements at sea; these
were seen as being related to the training element of the Tonnage Tax, the Minimum Training

119
Obligation (MTO). The MTO was the object of direct criticism, with cadets suggesting that
companies had no real intention of employing them once qualified, seeking only to benefit
financially from the MTO.
Given that ships, as with most workplaces, do not have training as their prime purpose, it is
unsurprising that cadets encountered very variable levels of support and interest in their
learning needs from qualified seafarers; attitudes ranged from the enthusiastic and genuinely
helpful through the indifferent to the openly hostile. There was evidence that some seafarers,
particularly those less qualified, resented cadets as a threat to their own jobs; this resentment,
stemming no doubt from an unpredictable job market, was seen in accounts given by a
number of cadets. Cadets also described environments where alcohol fuelled tensions
between those on board; some found this particularly disturbing and difficult to handle.
There is a temptation to attribute the variation in support, as with the response to cadetship,
simply to personality differences - undoubtedly there will be individuals who relish their
teaching role more than others. However, there are underlying factors which have little to do
with individual predilections. MNTB Guidance (2006) emphasises the importance of officers
and crew having a proper understanding of the nature of cadet training and the roles which
they are expected to fulfil. This has implications for their own training and continuing
professional development in order to support cadets with up to date advice and guidance.
This research did not involve officers but their perspective on the support given to them to
deliver their training responsibilities would have complemented the data from this study. In
the interview extract below a deck cadet indicates the lack of involvement/interest in the
completion of his Portfolio:
Interviewee: “The Captain on the first ship did say at the start, “Right, I want you to know, you’re to complete the Portfolio.” In the requirements it says that he should really be looking at every couple of weeks or something but he only signed it right at the end, when we’d finished, you know, when we were signing off. And that was it, so I mean to be quite honest, if it wasn’t for the fact that we knew that we had to, you know, get the section one completed and we actually went ahead and did it, I don’t think, you know, we’d have gotten any of it done, really. You know? There was certainly no push to, you know, to get it finished which again I think was due to the lack of understanding of, you know, what was required.”
Richard - Deck Cadet

120
Related to the understanding needed by shipboard officers to support the training needs of
cadets were issues of language and communication: For those officers with limited
proficiency in the English language, the training of English speaking cadets could be seen as
an added burden in already pressured jobs, a possible consequence of companies’ enthusiasm
for taking on cadets through the Tonnage Tax scheme. The Merchant Navy Training Board
(MNTB) offers a weighted list of the factors that need to be taken into account in assessing
the suitability of ships for onboard training. Weighted factors attempt to introduce a degree of
objectivity into the process of deciding what is a suitable ship for on board training: one
factor relates to the working language of the ship (MNTB, 2006:17); the more the use of
English is limited as the working language of the ship, suggest the MNTB, the closer the
scrutiny of the vessel concerned should be as a suitable training environment. In some cases
the lack of understanding of their training needs was attributed by cadets directly to language
difficulties; the comment below is taken from a account of sea time that was generally
disturbing:
Interviewee: “I did all my work, which was for the NVQ section on Officer of the Watch but erm because of the language barrier I, I couldn’t understand a word they were saying.”
Sam - Deck Cadet In the interview extract below the cadet refers to language difficulties in which the ‘very
limited knowledge of English’ which the cadet ascribed to the Chief Officer was seen as
potentially compromising his training:
Interviewee: “We have this Portfolio that needed completed and some of the things, we literally didn’t have a clue what it was asking us. And the biggest problem, as well, was, certainly on the first ship, he was an older Russian Chief Officer, who had very limited knowledge of English and we showed him the Portfolio and he really did not understand what exactly was written. And in some cases, you know, he was signing the, the Portfolio on what we had told him and it would really nasty or, you know er, trying to get ahead. We could of said it was anything, you know? It coulda been ‘clean your cabin,’ or something like that, when it was meant to be ‘anchoring’, or something. But you know, they, they really didn’t have any idea what the English was for it, you know.”
Richard - Deck Cadet

121
Sampson and Zhao (2003) observed a fear amongst seafarers that a lack of fluency in English
may give the impression to their superiors that they are less than competent in other aspects
of their job. Their observation takes on a different complexion for UK cadets for whom
fluency in English is not the issue, but rather the lack of fluency in the senior officers who
ultimately have power over the successful completion of their Portfolio. For the cadets who
found themselves on ships where very little English was spoken there is little doubt that this
impaired the quality of their learning experience, and may have contributed to their
abandonment of training and/or their lack of confidence in their own competence. The
comments of the cadet reported below expand on the language issue and also raise, in his
own words, the need for ‘equilibrium’ between the responsibilities of cadets to get on with
the work, and the responsibilities of the supporting organisations to ensure that placements
are suitable; as a cadet representative of NUMAST, this cadet had a particular interest in the
extent of trade union support for cadets:
Interviewee: “I’ll pick up on things I hear of from other cadets and I, I’ll take it back to just sort of NUMAST and then take it back to the class and we have a discussion.”
(Interviewer: “And what, what, what sort of things would that be, around that pay issue?”)
Interviewee: “Yeah about the pay issue, about the standard of ships and stuff like that. Some of the cadets go on really bad standard ships and some of them, one of my mates, went on a ship where they were all black African. There was no white British people at all. Not a racist thing. It was just the fact that that none of them spoke English and even the Captain was a black African and he’s a, a white British cadet on this ship and [LAUGHS] and he had to get [LAUGHS], he came back after Phase Two at sea and he had no Portfolio finished, cos they didn’t understand the Portfolio scheme and you couldn’t get any Portfolio finished, cos they couldn’t read the English.” I kind of felt that that was one of the big issues that we took up with them - that it’s a bit ridiculous this, having to be a necessity to fill in your Portfolio, but then the company’s sending you on a ship where you can’t get anything done. So you have to sort of have a, an equilibrium between the company being sensible and sending you on a, a, on a normal ship and you being sensible and getting on with your work. You can’t be getting on with your work if they [LAUGHS], if the ship doesn’t know what it’s supposed to be doing, So just, it’s just really weird things that people I don’t think have ever really taken the time to think about. Just kind of say, “Well, there’s a ship, send a cadet on it.” and not really thinking so much of it.”
Dan - Deck Cadet and interviewer

122
During the successive phases of planned training at sea, cadets are expected to ‘achieve and
develop professional competence over time’ and to demonstrate this through the completion
of the Training Portfolio. The study found that whilst cadets emphasised the importance of
the Portfolio and the need to complete it as documentary evidence of their learning, there was
a stronger focus from those interviewed, on the actuality of being able to perform the task.
Cadets recognised that competent seamanship was not synonymous with simply getting the
tasks in the Portfolio ‘ticked off’. There was concern expressed by some cadets that when
tested as responsible officers, their skills would be shown to be deficient; they were very
aware that the consequences of poor seamanship cannot be concealed. Cadets’ concerns over
their competence may have been as much about their confidence as it was about a working
knowledge of the technical tasks; however confidence is a necessary component of
competence, and for some cadets the training process did not appear to have given them the
confidence required.
But will there be a job at the end of this?
The focus in this paper has been on how the training environment of the ship can impact on
attrition in a way that is beyond the control of the individual. However, the research also
revealed the effects of another external factor- seafaring as a global workforce- that restricted
job opportunities for cadets as Junior Officers and which should not go unmentioned in this
paper.
Anxiety about securing employment post-qualification was clearly articulated by cadets who
felt that they had been let down on two counts: firstly, that they had been led to believe that
there was a good job market for qualified UK Officers – and they no longer saw this as being
the case; secondly, they believed that the Minimum Training Obligation (MTO) component
of the Tonnage Tax had increased the numbers of cadets funded by companies who had no
intention of keeping them on as qualified officers, and this was a source of some resentment.
‘You’ve not got a definite job, you’ve not got a definite future’, said one final year cadet who
was about to qualify as a deck officer. Historically, life in the Merchant Navy would have
never offered certainty of employment (Hope, 2001), but it was clear from interviews with
cadets that most had expected a ‘definite future’ when they started their cadet training but

123
many had since come to fear that they might not find a job – and not one at a salary they felt
worthwhile.
Criticisms of the Tonnage Tax from the cadets in this study related to employment prospects
and the belief that cadets were taken on with no real intention by companies of offering them
a job after qualifying. The comment below is from a cadet who resigned from training:
Interviewee: “The Tonnage Tax as well, I mean, the Government created training opportunities, like they usually do, but no real jobs. I mean there’s no, no necessity that they’ve got to give us jobs at the end of this. I mean if they had some sort of clause that would force them to.”
Sam - Deck Cadet
A fellow cadet had continued his cadetship despite experience of difficult placements at sea
but was also concerned about poor employment prospects which he attributed to the Tonnage
Tax:
Interviewee: “This is the big problem, this Tonnage Tax, it’s creating a lot of Third Officers with tickets but no experience, you know? Certainly I don’t know of any one British Officer at the minute that they employ, you know? ... it just seems that they are grabbing the benefits of Tonnage Tax and then throwing everybody out, and that I think that really should be something to be addressed.”
Neil – Deck Cadet There were a number of cadets in this study who displayed cynicism towards the MTO
component of the Tonnage Tax, suggesting that cadets had suffered under the initiative whilst
companies had benefited:
Interviewee: “They’ll tell me at the end of the day whether my company wants to keep me on, or whether they can offer me work, or whether they can just let me go. It’s quite uncertain. It’s the same with a lot of the boys in the class. They’re employed by companies that are now foreign crewed, they’re the only Brits on the ship and at the end of the day the companies they work for won’t be taking on Brit officers at the end of the day. They get Tonnage Tax relief for having cadets, and they just want that, and then once their cadetships finish, that Tonnage Tax relief goes and away they go.”
John - Deck Cadet

124
The training element of the Tonnage Tax is not without its problems, and concerns that it has
not achieved what was intended have been recognised (Gekara, 2008). The anxieties
expressed by the cadets in this study over their employment prospects would seem to have
had substance, and to have added to the external challenges faced during their training.
In Conclusion
For those involved in the training of cadets, there is an important message from this research:
No matter how resilient the individual, how well they learn to adapt to shipboard life and the
demands of what I describe in the study as a ‘total occupation’, the workplace can fail even
the most enthusiastic of cadets. A poor training environment can mean ineffective learning
with consequences not just for the individual but for the industry as a whole. Lack of
employment opportunities post-qualification adds a further challenge for aspiring young
Officers.
Acknowledgements
This research would not have been possible without the co-operation of cadets, companies
and colleges for which I am extremely grateful. The research was supervised by Professors
Bloor and Sampson, and by Dr Michelle Thomas; they have my deepest thanks. SIRC
administrative staff provided welcome support throughout.
References
Brownrigg, M., G. Dawe, M. Mann and P. Weston. 2001. Developments in UK shipping: the tonnage tax. Maritime Policy Management. Vol.23. No.3. 213-223.
Conrad, J. 1900 /1974. Lord Jim. London: Penguin Books.
Department of the Environment, Transport and the Regions (DETR). 1998. British Shipping: Charting a New Course. London: HMSO.

125
Evans R.N. and G. McCloskey. 2001. Rationale for Career Education. Journal of Industrial Teacher Education.Vol.39.No.1.30-42. Gekara, V.O. 2008, Globalisation, State Strategies and the Shipping Labour Market. The UK's Response to Declining Seafaring Skills. Unpublished PhD thesis. Cardiff: SIRC.
Hill, J.M.M. 1972. The Seafaring Career. A Study of the Forces Affecting Joining, Serving and Leaving the Merchant Navy. London: The Centre for Applied Social Research, The Tavistock Institute of Human Relations.
Hope, R. 2001, Poor Jack. The Perilous History of the Merchant Seaman, London: Chatham Publishing. Hopwood, W.H. 1973. Some Problems Associated with the Selection and Training of Deck and Engineer Cadets in the British Merchant Navy. In Fricke, P. (Ed), Seafarer and Community. London: Croom Helm. 97-117.
Ledger, G. and M. Roe. 1992. The decline of the UK Merchant fleet: an assessment of government policies in recent years. Maritime Policy Management. Vol. 19(3). 239-251.
Merchant Navy Training Board (MNTB). 2006. Planned Training at Sea. Guidance for Companies and Seagoing Officers. London: MNTB.
National Union of Marine, Aviation and Shipping Transport Officers (NUMAST). 2004. Staying the Course - A NUMAST Report on cadet recruitment and retention. London: NUMAST. Sampson, H. and B. Wu. 2003, Compressing Time and Constraining Space: The Contradictory Effects of ICT and Containerization on International Shipping Labour. International Review of Social History. Vol. 48 Supplement. 123-152. Sampson, H. and M. Zhao. 2003. Multilingual crews: communication and the operation of ships. World Englishes. Vol. 22. No. 1.31-43.

SIRC Staff 2011
Michael [email protected]
Tel: +44 (0)29 2087 4620
Tel: +44 (0)29 2087 4620
Maria [email protected]
Tel: +44 (0)29 2087 4742
Helen [email protected]
Tel: +44 (0)29 2087 4475
Tel: +44 (0)29 2087 4620
Nick [email protected]
Tel: +44 (0)29 2087 4740
Louise [email protected]
Tel: +44 (0)29 2087 6429
Neil [email protected]
Tel: +44 (0)29 2087 4740
Nelson [email protected]
Tel: +44 (0)29 2087 4161
Seafarers International Research Centre (SIRC), Cardiff University, 52 Park Place, Cardiff, CF10 3ATTel: +44 (0)29 2087 4620 Fax: +44 (0)29 2087 4619
Email: [email protected] Web: www.sirc.cf.ac.uk
Associate Researchers
Marlene [email protected]
Tel: +44 (0)29 2087 4620
Sarah [email protected]
Tel: +44 (0)29 2087 4620
David [email protected]
Tel: +44 (0)29 2087 0013
Victor [email protected]
Tel: +44 (0)29 2087 4620
Maragtas [email protected]
Tel: +44 (0)29 2087 4620
Lijun [email protected]
Tel: +44 (0)29 2087 4161
Emma [email protected]
Tel: +44 (0)29 2087 6599
Iris [email protected]
Tel: +44 (0)29 2087 4161
Michelle [email protected]
Tel: +44 (0)29 2087 4620
Bernardo [email protected]
Tel: +44 (0)29 2087 4620