
Symposium Proceedings - National Building Research ...
386
-
Upload
khangminh22 -
Category
Documents
-
view
2 -
download
0
Transcript of Symposium Proceedings - National Building Research ...


Advisor
Eng. (Dr) Asiri Karunawardena, Director General, NBRO
Symposium Organizing Committee
Plnr. Kishan Sugathapala, Director, Human Settlements Planning & Training Division, NBRO
Mr. K. N. Bandara, Director, Geotechnical Engineering & Testing Division, NBRO
Ms. A. A. S. V. Dias, Director, Environmental Studies & Services Division, NBRO
Mrs. S. Muthurathne, Director, Building Materials Research & Testing Division, NBRO
Dr. H. A. G. Jayathissa, Senior Scientist, Landslide Research & Risk Management Division,
NBRO
Mr. Clarence Perera, Consultant, NBRO
Plnr. Eshi Wijegunarathne, Scientist, NBRO
Formatting & Design
Plnr. W. K. C. Kumarasiri, Scientist, NBRO
Copyright © January 2018
National Building Research Organisation
ISBN: 978-955-0283-11-8
This views expressed in this information product are those author(s) and do not necessary reflect the view or polices of NBRO.
“Investing in Disaster Risk Reduction for Resilience”, NBRO, 2018, Colombo, Sri Lanka

FOREWORD
The 8th Annual NBRO Symposium on “Investing in Disaster Risk Reduction for Resilience - IDR3”, is organized by National Building Research Organisation (NBRO) as a tradition to disseminate the outcome of NBRO’s R & D and other related studies, with a special reference to contemporary requirement of the country, that is, investing on DRR in view of building disaster resilience.
The ongoing trend of rising disaster losses and damages points to one clear message: much greater investment in DRR for resilience is required. This investment must identify and assess risk, reduce risk and ensure that residual risk is managed as efficiently as possible and promotehazard-resilient recovery and reconstruction. It requires commitments of finance, know-how, and human resources on the part of governments, the private sector, civil society, and the international community in a wide array of legislative, policy, planning, institutional, financial, and capacity-building instruments and mechanisms. Such investments in disaster risk reduction (DRR) prior to disasters saves lives, reduces losses, and is far more cost effective than funding response after disasters.
This year, the theme of the symposium on ‘Investing in Disaster Risk Reduction for Resilience’ is in line with the priority for actions in Sendai Framework 2015 - 2030. It emphasizes that the public and private investment in disaster risk prevention and reduction through structural and non-structural measures are essential to enhance the economic, social, health and cultural resilience of persons, communities, countries and their assets, as well as the environment.
This publication seeks to stimulate, secure and sustain this investment in resilience. The papers inside the publication show that there is an extensive array of disaster risk management tools and mechanisms available to identify, assess, mitigate and monitor the risk. We hope this publication will inspire governments and other development partners, to paint their visions of a disaster resilient future.
The International stakeholder institutions, National Institute for Land & Infrastructure Management (NILIM) of Japan, Norwegian Geotechnical Institute (NGI), and Asian Disaster Preparedness Center (ADPC), have played active roles to make this symposium a success.
Eng. (Dr.) Asiri Karunawardena Director General National Building Research Organisation

CONTENT
Foreword
RISK IDENTIFICATION
1. Analysis of Hazard Situation in Badulla District – Outcome of Building Surveyunder Landslide Risk Mapping Project
1
Dhanushka Jayathilake, Chanchala de Silva
2. Assessing the Predictive Power of Existing Landslide Hazard ZonationMethodology: A Case Study - Rathnapura and Kalutara Districts
10
RMSD Rajapaksha, MAK Kumari, HKDWMIUK Hapuhinna
3. Characterization of Nawalapitiya landslide, in the Kandy District 15
DGED Lakmali, L Palamakubure, KN Bandara
4. Detailed investigation of road cutting failure-case study from Dehiovita-Deraniyagala-Nooriya road (B093) in Kegalle district
26
JPDRK Jayalath, DIU Jayawardhane, D Ihalagedara, HML Indrathilake
5. Determination of Site Specific Landslide Susceptibility Based on Decision-Making Criteria
35
PHE Dulanjalee, HAG Jayathissa, HML Indrathilake
6. Development of Investigation Mechanism to Identify Flood Prone Areas; CaseStudy at Bulathsinhala DSD
42
S Jayaprakash, AGD Tharika, Dayan Munasinghe, WKC Kumarasiri
7. Further Sedimentological and Morphological Evidence for Paleozoic Glaciationin the Sri Lankan Gondwana Fragment
51
JDSN Siriwardana, Kapila Dahanayake
8. Investigation of Megahakewula ground cavities using ground penetration radar 59
DMCP Bandara, WMSH Barammane, MMCUB Moremada
9. Landslide Risk Identification in Kandy District, 2014 and 2016 Events 67
NC Weerasinghe, NIC Peiris

10. Mechanism of the Unpredicted Slope Failures in Residual Soil under Extreme Weather Condition: A Case Study on Athwelthota Landslide in the Kalutara District
75
EMNH Ekanayake, LAL Kithmini, WAKS Ariyakumara, SB Harankahawa
11. Real-Time Data Processing & Forecasting Model to Predict Disasters Situation (Landslides) Based On Physical Properties
82
HR Maduranga, BMRK Balasuriya, WDMS Amarasena, MB Dissanayake
12. Relationship between width of a landslide and soil overburden thickness 89
EASN Wimalawardhana, DMDIK Ariyarathna, HMD Madushan, HML Indrathilake
13. Two Dimensional Electrical Resistivity Tomography for Subsurface Cavity Detection
94
LAAW Wimalsinghe, MKC Jayamali, MMCUB Moremada
RISK ASSESSMENT
14. Damage and loss assessment of Landslide Disasters in Sri Lanka - A case study based on Landslide Disasters in May 2017
102
WKC Kumarasiri
15. Landslide Flow Path Assessment for Susceptibility Mapping at a Regional Scale
108
PHE Dulanjalee
16. Risk Assessment of Residential Units in Landslide Prone Areas of Badulla District, Sri Lanka
116
LJ Prasanna, S Sutharshan
17. Road cut stability assessment; Kegalle- Bulathkohupitiya road 6 -10 km 126
DMDIK Ariyarathna, EASN Wimalawardhana, HMD Madushan, NC Weerasinghe
RISK MITIGATION
18. Risk Mitigation in Areas Showing Early Signs of Landslide; A Case Study at ‘Sobasiripura’, Hanwella
134
VGD Gangani, DMDS Dissanayake, PRC Ariyarathna, KN Bandara
19. Stability analysis of the failure at Meethotamulla waste fill 142
SHS Jayakody, GWN Galhena, N Vasanthan, Asiri Karunawardane, SAS Kulathilaka
20. Stabilization of Cut Slopes Using Soil Nailing Technique: A Case Study at Nugagahapura Housing Scheme, Colombo 05
153
MHM Harshani, PGN Amali, JU Nimal, PRC Ariyarathna, KN Bandara
MONITORING & RISK MANAGEMENT
21. Adequacy of legal framework enacted in Sri Lanka with respect to the chemical disaster management associated with industries and related facilities
159
KG Kaushalya, SV Dias
22. Back analysis of slope failure at Walipanna, Southern Express Way 174
Nirmanthi Idirimanna, N Vasanthan, SAS Kulathilake
23. Improvement of Indoor Environmental Quality (IEQ) in Office Buildings by using Mechanical and Phytoremediation Methods
182
HDS Premasiri, HD Kumarapeli
24. Role of Human-Computer Interaction in Disaster Management 188
NMT De Silva
25. Utilization of Waste Sludge Produced from Aluminum Extrusion Industry as a Partial Replacement Material for Clay in Clay Bricks
195
GYDK Silva, SSK Muthurathne
RISK COMMUNICATION
26. Application of the web based GIS in the development of landslide hazard information system (LHIS)
204
S Jayaprakash, Dhanushka Jayathilake, Aruna Bandara
27. Determination of Chrysotile Fiber Levels in the Air Associated with Chrysotile-Cement Roofing Sheet Manufacturing, Handling and Usage in Sri Lanka
213
HSD Premasiri, KLG Kaushalya, DMMR Dissanayake, PD Liyanarachchi
28. Impacts due to proposed ponds rehabilitation works in the Jaffna city region 225
WBWMRPD Aluwihare, WDBC Abeywickrama, Lasanda Padmasiri, Nanthini Vasanthan, KN Bandara

COMMUNITY PREPAREDNESS FOR RESPONSE
29. A Review on Donor Driven Housing Constructions in Post Disaster Reconstruction Projects - A Case Study on Kegalle Resettlement Programme, Sri Lanka
234
PA Vijekumara
30. Determination of the Impact of Anthropogenic Influence on Water Resource Health of Pinga Oya Watershed
241
SV Dias, SAMS Dissanayake, HTJ Seneviratne, KMSK Rajapaksha, VDW Sumanasekara
31. Evaluation of Community Based Landslide Early Warning System; Application for Udawaththa Landslide in Hanguranketha
259
KGS Lakmini, JDSN Siriwardane, HMBB Wijekoon, JM Hettiarachchi, CN Subasinghe, BGS Kumara, HAG Jayathissa
32. Identification of Drought Preparedness Framework (DPF) for drought situations in Sri Lanka
266
AGD Tharika, PHNC Manike, EE Wijegunarathne
33. Resettlement of Population at High Risk of Natural Disasters in Sri Lanka 276
PHCS Rathnasiri
SMART AND SUSTAINABLE BUILT ENVIRONMENT
34. A review on using cellulose fibres with improved durability as an alternative to asbestos fibres in Sri Lankan context
289
RLP Ramasinghe, GLM Ariyadasa, KGNT Gamage, SU Adikary
35. Assessment of Planning, Design and Construction of Evacuation Centres 296
MSN De Zoysa
36. A standard Procedure for Condition Assessment of Buildings and Structures 303
GBMA Basnayake
37. Cement Free Lime and Concrete Mixtures for the Conservation of Ancient Structures
312
GYDK Silva, SSK Muthurathne
38. Development of GIS Based Noise Dispersion Map as a Model to Estimation of Road Noise Levels
323
HDS Premasiri, PD Liyanaarachchi, NKPMM Perera
39. Flood Resilient Housing for Sustainable Development 330
MSN De Zoysa
40. Integration of Fire Safety Aspects in the High-Rise Development of Sri Lanka: Reality or Rhetoric?
339
WG Winson Gnanatheepan, SMRS Subhasinghe
41. Thermal and Environmental Performance Strategies to Design of Buildings 348
DS Munasinghe
42. Utilization of textile waste in the manufacturing of cement based products 362
GKBM Gannoruwa, GLM Ariyadasa, SSK Muthurathne, SMA Nanayakkara

RISK IDENTIFICATION
Analysis of Hazard Situation in Badulla District - Outcome of Building Survey under Landslide Risk
Mapping Project
Dhanushka Jayathilake1, Chanchala de Silva1
1Scientist, National Building Research Organisation, Sri Lanka
Abstract
Occurrence of devastating landslides has become more frequent in Sri Lanka resulting in high number of victims and considerable socio-economic impacts. Landslides may create further devastation in future due to prevailing global climate change. Hence, identification of landslide prone areas with high risk potential and implementation of proper and effective landslide mitigation interventions to minimize the risk, have become an essential priority need. In order to make risk management programs more meaningful and cost effective those programs should target risk reduction in high-risk settlements through a comparative assessment of risk potential.
Keywords: Landslide, Exposure map, Building survey, Element at risk
1. Introduction
National Building Research Organisation (NBRO) has been preparing landslide hazard zonation maps since 1992. Landslide hazard mapping in Sri Lanka may be considered as a unique experience and in this context, it is perhaps the first comprehensive attempt to generate maps of human settlements and infrastructure on 1: 10,000 scales conjointly with other nature maps.
Landslide Risk Assessment and Risk Profile Development Program is implemented by National Building Research Organisation (NBRO) with the financial assistance of United Nations Development Program and Government of Sri Lanka. This project was initiated to meet the outcome-1 of the Sri Lanka Comprehensive Disaster Management Programme (SLCDMP) 2014-2018. These risk profiles and risk maps prepared by NBRO will increase the capacity of national and sub-national level agencies in assessing the disaster risk and making decisions for short, medium and long-term disaster management.
1

Landslide hazard maps delineate areas according to the associated degree of hazard. Risk map is prepared based on hazard assessment already being prepared under Landslide Hazard Zonation Mapping Project. Risk map is meant by the zoning map that includes the possible damages to human lives and properties due to occurrence of landslide. The risk map will lead to further investigations and migratory actions which could be planned. In fact, such maps serve as a tool to guide investments in development and utilization of lands susceptible to landslides.
Therefore, NBRO has launched a project that focuses on the development risk assessment which can guide the decision makers in planning agencies such as Urban Development Authority and National Physical Planning Department.
Household survey is conducted under landslide risk mapping project, for very high and high-risk areas identified through landslide exposure map. The divisional level risk profiles are prepared using the data and information collected through this survey. Survey is carried out by using four (04) types of questionnaires for households, institutions, religious places and schools. Grama Niladhari Officers of respective Grama Niladhari Divisions have surveyed 24,419 buildings in Badulla district.
2. Objectives
• To make aware the people in landslide prone areas on risks faced by them to take preventive measures.
• To develop “elements at risk database” that takes into consideration the characteristics and use of the buildings and the characteristics of the inhabitants.
• To take decisions regarding timely interventions before, during and after a disaster.
• To be the foundation for community risk assessment and to identify possible short-, medium- and long-term risk reduction measures.
• To provide the risk information for decision making in planning and investment and minimize exposure to landslide.
• To enhance dissemination of landslide early warning.
3. Methodology
In this study, spatial distribution of vulnerable buildings located in very high and high landslide hazard area are being identified using the Landslide Hazard Zonation maps. Through the survey, maps are being prepared for the settlements located within the lowest administrative units called Grama Niladhari Divisions (GNDs), while demarcating spatial distribution of most vulnerable buildings. For this purpose, it is decided to prepare 3 types of maps with different scales to obtain a clear understanding of spatial distribution of vulnerable buildings.
There were two main challengers to overcome for successful implementation of the building survey. First challenge is find correct spatial data of GN boundary. We were unable to find spatial data for accurate GN boundary which are perfectly match with actual administrative areas. Second challenge was to aware GN officers to read and understand spatial data (Maps). Methodology of the building survey have been
2

designed to implement the survey by overcoming these issues. The process of map preparation and questionnaire survey explained in under this section.
3.1. Training survey enumerators (GN Officers)
The first step of the process was to conduct a training for survey enumerators. One of the objective of the training programs is to biuld awareness among the people in landslide prone areas on risks faced by them to take preventive measures. On other hand training was conducted to introduce exposure maps and categorization of questionnaires (households, institutions, religious places and schools) which were used throughout the survey.
3.2. Verification of Grama Niladhari Boundaries
Before going to preparation of maps there were some issues regarding demarcation of Grama Niladhari (GN) boundaries. On first day of introduction of maps, some Grama Niladhari officers had some problems with the GN boundaries. Then we realized that it is needed to verify GN boundaries before going to prepare the maps. The process was re organized and conducted another workshop with the support of GN officers to verify the GN boundaries.
In this workshop we used the GN boundary from Survey Department as source layer for the verification. Satellite images were used to identify correct boundary of GN divisions. Most of these physical boundaries laid along the natural features such as streams, rivers, forest or manmade features like roads. So, we used those feature layers to identify their exact boundaries.
3.3. Preparation of Exposure Maps
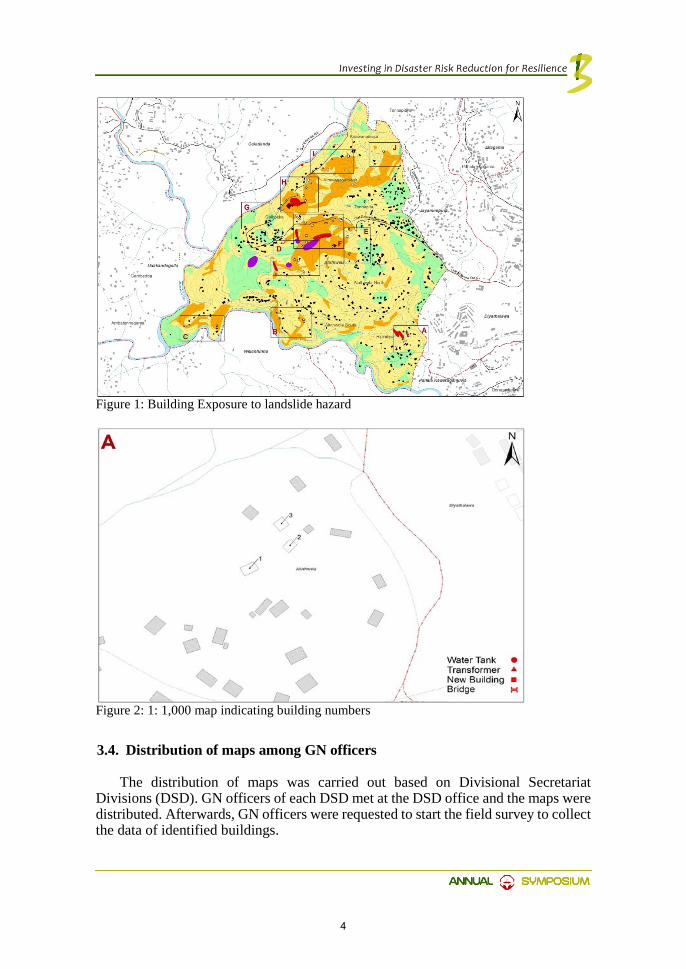
After finalizing the boundaries, the maps were prepared for each GND. There were 4 types of maps indicating vulnerable buildings which were needed to survey. First map was compiled using Landslide Hazard Zonation Map & building layers. Those maps indicate the exposure of the buildings to landslide hazard of the area.
This map included identified vulnerable buildings based on the high hazard zones and also other data like hazard zone description, topographic data, infrastructure data etc. When ground data collection is ongoing it is difficult to identify the each and every vulnerable building. For this purpose, we clustered identified vulnerable buildings and prepared 1: 1,000 scale maps (figure 1) to ease the field data collection work. Clustered vulnerable buildings indicated in a grid to have easy identification in the map. One exposure map had several grids depending on the number of vulnerable buildings and maps were separately printed with all the grids indicating grid numbers.
After identification of vulnerable building clusters, we numbered all the buildings in hazards areas in order to refer the number in filling the questionnaires. The numbers were presented with the 1:1,000 scale map (figure 2).
3
3.4. Distribution of maps among GN officers
The distribution of maps was carried out based on Divisional Secretariat Divisions (DSD). GN officers of each DSD met at the DSD office and the maps were distributed. Afterwards, GN officers were requested to start the field survey to collect the data of identified buildings.
Figure 1: Building Exposure to landslide hazard
Figure 2: 1: 1,000 map indicating building numbers
4

3.5. Monitoring & Supervision
Field data collection was done under the direct supervision of NBRO officers. At the first stage of data collection some GN officers had difficulties in identification of spatial distribution of buildings. Therefore, NBRO officers always provided their support for the issues those were encountered within the ground data collection.
Above calculation was done based on 1:10,000 scale Landslide Hazard Zonation
Map. In this survey we have used 4 type of hazard categories which are considered as high & medium hazard classes. The table presented the number of vulnerable buildings with reference to their hazard zone.
Number of Buildings Located on Landslide Hazard Zones
No Divisional Secretariat Divisions
Landslides are most likely to
occur
Landslides are to be expected
Landslides have been occurred in past
Subsidence and rock
fall Total
1 Hali Ela 251 3417 298 264 4230 2 Badulla 79 2978 74 105 3236 3 Kandaketiya 29 975 40 11 1055 4 Soranathota 124 1365 46 15 1550 5 Bandarawela 77 1585 71 0 1733 6 Haldummulla 103 2250 77 190 2620 7 Haputale 98 1672 89 69 1928 8 Ella 53 1384 118 102 1657 9 Passara 47 974 69 50 1140
10 Uva Paranagama 215 3819 118 68 4220
11 Welimada 93 1782 125 7 2007 12 Meegahakivula 1 235 0 0 236
Total 1170 22436 1125 881 25612
Table 1: Number of buildings according to hazard category in Badulla district
5
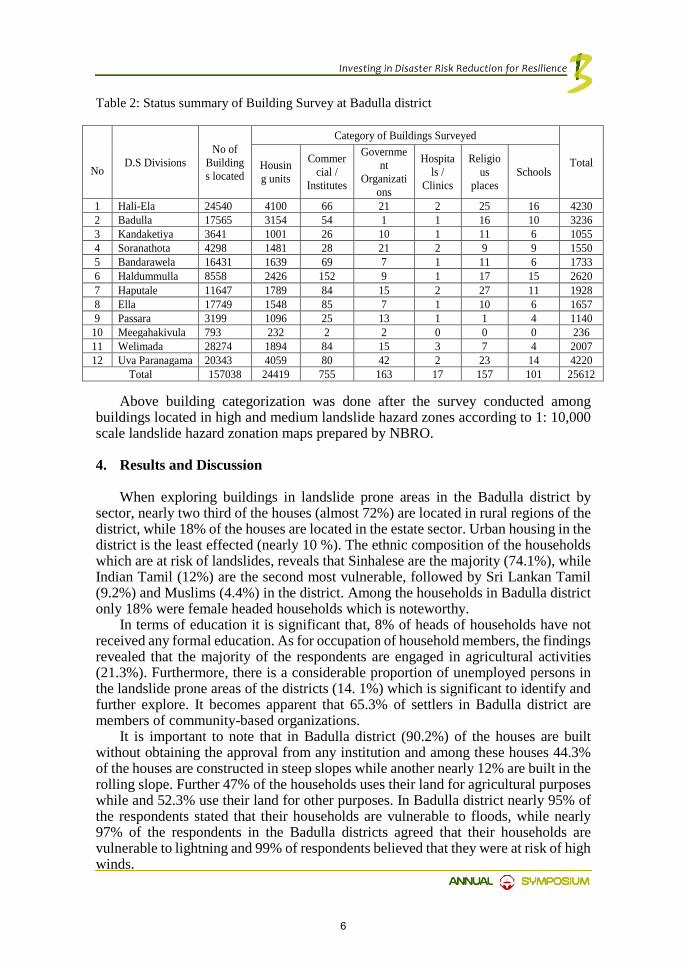
Table 2: Status summary of Building Survey at Badulla district
Above building categorization was done after the survey conducted among buildings located in high and medium landslide hazard zones according to 1: 10,000 scale landslide hazard zonation maps prepared by NBRO.
4. Results and Discussion
When exploring buildings in landslide prone areas in the Badulla district by sector, nearly two third of the houses (almost 72%) are located in rural regions of the district, while 18% of the houses are located in the estate sector. Urban housing in the district is the least effected (nearly 10 %). The ethnic composition of the households which are at risk of landslides, reveals that Sinhalese are the majority (74.1%), while Indian Tamil (12%) are the second most vulnerable, followed by Sri Lankan Tamil (9.2%) and Muslims (4.4%) in the district. Among the households in Badulla district only 18% were female headed households which is noteworthy.
In terms of education it is significant that, 8% of heads of households have not received any formal education. As for occupation of household members, the findings revealed that the majority of the respondents are engaged in agricultural activities (21.3%). Furthermore, there is a considerable proportion of unemployed persons in the landslide prone areas of the districts (14. 1%) which is significant to identify and further explore. It becomes apparent that 65.3% of settlers in Badulla district are members of community-based organizations.
It is important to note that in Badulla district (90.2%) of the houses are built without obtaining the approval from any institution and among these houses 44.3% of the houses are constructed in steep slopes while another nearly 12% are built in the rolling slope. Further 47% of the households uses their land for agricultural purposes while and 52.3% use their land for other purposes. In Badulla district nearly 95% of the respondents stated that their households are vulnerable to floods, while nearly 97% of the respondents in the Badulla districts agreed that their households are vulnerable to lightning and 99% of respondents believed that they were at risk of high winds.
No
D.S Divisions No of
Buildings located
Category of Buildings Surveyed
Total Housing units
Commercial /
Institutes
Government
Organizations
Hospitals /
Clinics
Religious
places Schools
1 Hali-Ela 24540 4100 66 21 2 25 16 4230 2 Badulla 17565 3154 54 1 1 16 10 3236 3 Kandaketiya 3641 1001 26 10 1 11 6 1055 4 Soranathota 4298 1481 28 21 2 9 9 1550 5 Bandarawela 16431 1639 69 7 1 11 6 1733 6 Haldummulla 8558 2426 152 9 1 17 15 2620 7 Haputale 11647 1789 84 15 2 27 11 1928 8 Ella 17749 1548 85 7 1 10 6 1657 9 Passara 3199 1096 25 13 1 1 4 1140
10 Meegahakivula 793 232 2 2 0 0 0 236 11 Welimada 28274 1894 84 15 3 7 4 2007 12 Uva Paranagama 20343 4059 80 42 2 23 14 4220
Total 157038 24419 755 163 17 157 101 25612
6
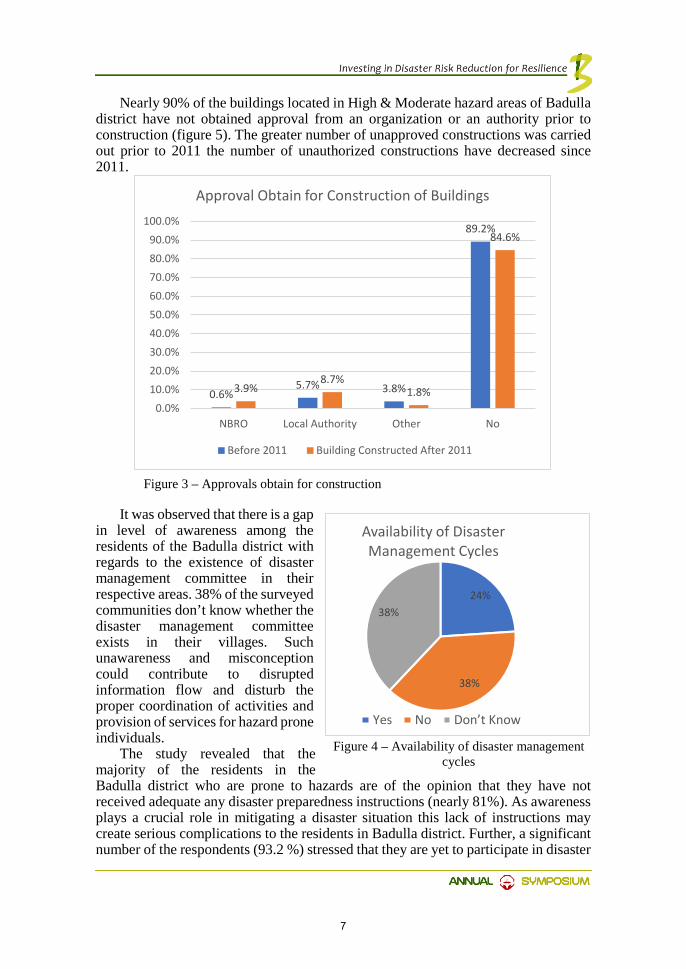
Nearly 90% of the buildings located in High & Moderate hazard areas of Badulla district have not obtained approval from an organization or an authority prior to construction (figure 5). The greater number of unapproved constructions was carried out prior to 2011 the number of unauthorized constructions have decreased since 2011.
Figure 3 – Approvals obtain for construction
It was observed that there is a gap in level of awareness among the residents of the Badulla district with regards to the existence of disaster management committee in their respective areas. 38% of the surveyed communities don’t know whether the disaster management committee exists in their villages. Such unawareness and misconception could contribute to disrupted information flow and disturb the proper coordination of activities and provision of services for hazard prone individuals.
The study revealed that the majority of the residents in the Badulla district who are prone to hazards are of the opinion that they have not received adequate any disaster preparedness instructions (nearly 81%). As awareness plays a crucial role in mitigating a disaster situation this lack of instructions may create serious complications to the residents in Badulla district. Further, a significant number of the respondents (93.2 %) stressed that they are yet to participate in disaster
0.6%5.7% 3.8%
89.2%
3.9%8.7%
1.8%
84.6%
0.0%10.0%20.0%30.0%40.0%50.0%60.0%70.0%80.0%90.0%
100.0%
NBRO Local Authority Other No
Approval Obtain for Construction of Buildings
Before 2011 Building Constructed After 2011
24%
38%
38%
Availability of Disaster Management Cycles
Yes No Don’t Know
Figure 4 – Availability of disaster management cycles
7
management activities in the last three years. Considering the number of hazard prone houses in the area it is a must to conduct disaster management activities with the active participation to allow for the communities in hazard prone area to identify and mitigate the issues and problems that they might encounter in a disaster. And the lack of such activities is major gap in empowering the hazard prone masses.
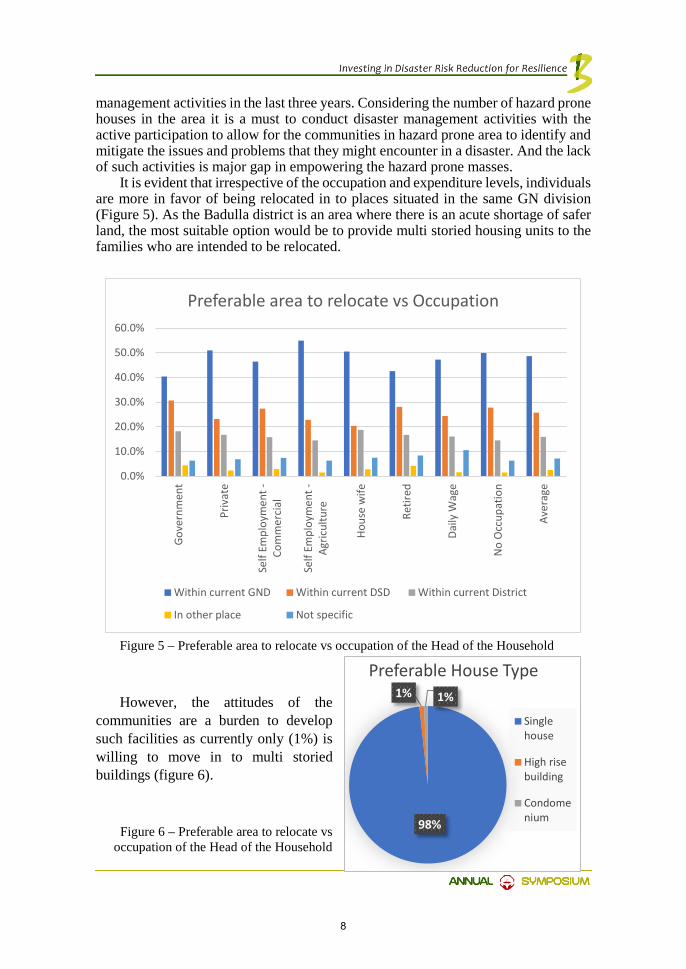
It is evident that irrespective of the occupation and expenditure levels, individuals are more in favor of being relocated in to places situated in the same GN division (Figure 5). As the Badulla district is an area where there is an acute shortage of safer land, the most suitable option would be to provide multi storied housing units to the families who are intended to be relocated.
Figure 5 – Preferable area to relocate vs occupation of the Head of the Household
However, the attitudes of the communities are a burden to develop such facilities as currently only (1%) is willing to move in to multi storied buildings (figure 6).
Figure 6 – Preferable area to relocate vs occupation of the Head of the Household
0.0%
10.0%
20.0%
30.0%
40.0%
50.0%
60.0%
Gove
rnm
ent
Priv
ate
Self
Empl
oym
ent -
Com
mer
cial
Self
Empl
oym
ent -
Agric
ultu
re
Hous
e w
ife
Retir
ed
Daily
Wag
e
No
Occ
upat
ion
Aver
age
Preferable area to relocate vs Occupation
Within current GND Within current DSD Within current District
In other place Not specific
98%
1% 1%
Preferable House Type
Singlehouse
High risebuilding
Condomenium
8

Figure 7 – Preferable area to relocate vs occupation of the Head of the Household
5. Conclusion & Recommendations
The level of risk awareness among the vulnerable communities. Community Based Disaster Management Concept should be implemented all over the district. The conventional awareness programme models should be modified increasing the participation of the communities at risk. Participatory methods such as creating historical time lines, hazards maps, spatial maps, conducting transect walks could be used to improve the participation of the communities, which would improve the awareness of the communities regarding the risk of hazards.
Change the perception on landslide risk. Disaster preparedness instructions should be given to change the existing risk perception of the residents in the district so that the communities may accurately understand the level of risk they are actually facing and take appropriate measures to reduce the risks.
Start the regular program to make aware school children of the area about disaster management. This will help to increase the level of awareness and also help to change the perception on landslide risk.
63%75%
68% 72% 68%77% 77%
30%21%
26% 23% 27%17% 18%
6% 4% 6% 5% 6% 7% 5%
0%10%20%30%40%50%60%70%80%90%
Government Private SelfEmployment -Commercial
SelfEmployment -
Agriculture
Retired Daily Wage NoOccupation
Preferable Resettlement Option vs Occupation of the HH
Constructed house Land and money to contruct house Not specific
9

Assessing the Predictive Power of Existing Landslide Hazard Zonation Methodology: A Case Study -
Rathnapura and Kalutara Districts
RMSD Rajapaksha1, MAK Kumari1, HKDWMIUK Hapuhinna1
1 Scientist, National Building Research Organisation, Sri Lanka
Abstract
Landslides are one of the major natural hazards experienced in Sri Lanka due to torrential rainfalls resulted by cyclones and monsoons. Because of these devastating incidents, huge economic and human losses have been recorded annually. To overcome the damage caused by landslides, disaster risk reduction methods have been developed. Landslide Hazard Zonation Maps are one of the effective non-structural risk reduction method used in Sri Lanka for this purpose. Determination of predictive power of the existing landslide hazard mapping methodology is a timely important matter to verify the accuracy and improvements in the current methodology. Accordingly, this study considered the predictive power of the 1:10,000 scale zonation maps for Kalutara and Ratnapura districts. The study was based on the landslides occurred in May, 2017 due to the rainfall occurred by monsoon and cyclone ‘Mora’. The study output showed that 62.5% of the landslides analyzed in Kalutara district fall into the high hazard categogy whilst 37.5% had medium hazard level. From the analyzed incidents in the Kalutara district, none of them categorized into the low hazard level indicating that the prediction power of the existing map is 100%. In Ratnapura district, 62.96% of incidents fall into the high hazard category and 29.62% for medium hazard category. For the low hazard category, it was 7.40%. For Ratnapura district prediction power of the current methodology is 92.58%
Keywords: Landslide Hazard Zonation; predictive power
1. Introduction
Among the diverse types of natural hazards experienced by Sri Lanka, landslides are the most disastrous phenomenon occurs due to torrential rainfall
10
conditions. Consequently, the study of landslides has become a nationally and globally recognized research area due to the escalation in their occurrence and consequent socio-economic impacts.
Landslides are defined as the movement of a mass of rock, debris or earth down a slope as a result of both natural and human induced factors (Cruden, 1991). Monsoon rainfalls often come together with extreme cyclone conditions, and as they trigger slides, the majority of the landslides experienced in Sri Lanka can be categorized as the rainfall induced landslides. Among the 25 districts in Sri Lanka, Badulla, Galle, Gampaha, Hambantota, Kalutara, Kandy, Kegalle, Kurunegala, Matale, Matara, Monaragala, NuwaraEliya and Ratnapura districts are identified as landslide-prone areas. It is about 30% of the total land are occupied by about 38% of the total population of Sri Lanka.
In past consecutive years, Sri Lanka experienced severe landslide tragedies with increased and loss of lives and property damages. Unlike in 2016, landslides in 2017 occurred in five districts namely Kalutara, Galle, Ratnapura, Matara and Kegalle. These incidents killed 225 people while 13 were reported to be missing. Among these districts Kalutura and Ratnapura were the most affected where 101 and 80 deaths were reported. As a result the mitigation of landslide susceptible areas using appropriate and cost effective mitigation methods has gained wide attention.
Landslides can be treated by both structural and non-structural risk reduction measures. Preparation of landslide hazard zonation maps (LHZM) is one of the vital nonstructural risk reduction measures which can be used very effectively. In Sri Lanka, landslide hazard zonation maps have been prepared in three scales, 1:10,000 and 1:50,000 and 1:5000.
1:10,000 LHZM are developed using six terrain factors, namely, bedrock geology and geological structures, soil cover, slope range and category, hydrology and drainage, land use and management and landform. 1200 landslides occurred in Badulla and Nuwara Eliya districts were used to develop the current methodology and weightages for each factor was done based on the expert knowledge.
LHZ maps are utilized by both government and non-government stakeholders for decision making processes in national and local levels. Hence determination of predictive power of the existing landslide hazard mapping methodology is a timely important matter to verify the accuracy and for the improvements in the current methodology.
2. Study Area
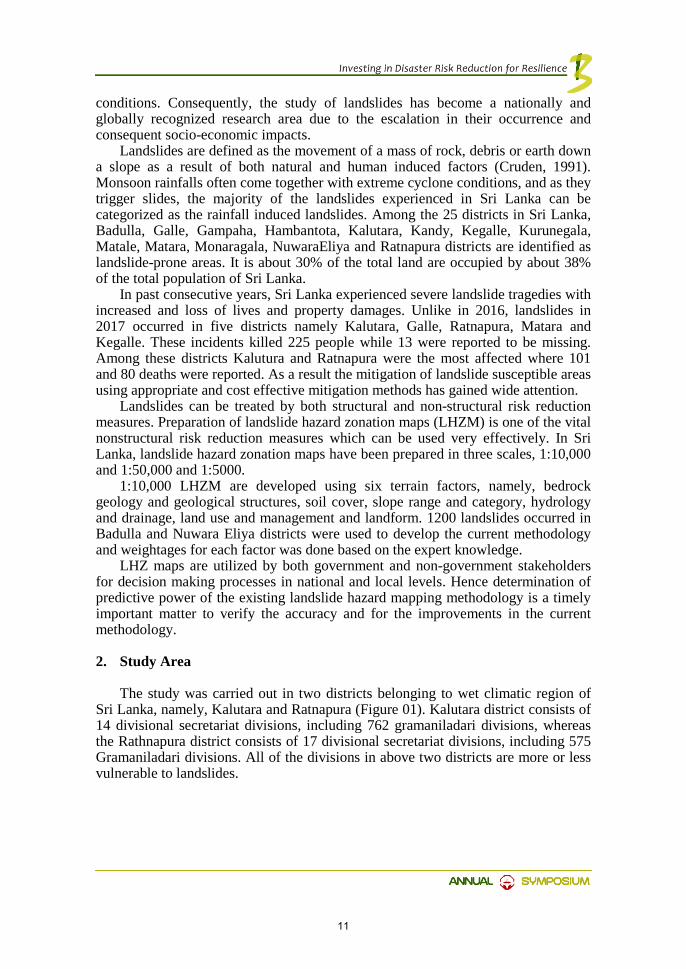
The study was carried out in two districts belonging to wet climatic region of Sri Lanka, namely, Kalutara and Ratnapura (Figure 01). Kalutara district consists of 14 divisional secretariat divisions, including 762 gramaniladari divisions, whereas the Rathnapura district consists of 17 divisional secretariat divisions, including 575 Gramaniladari divisions. All of the divisions in above two districts are more or less vulnerable to landslides.
11

Fig. 01: Map of the study area
3. Data collection and analysis
Landslides recorded during May, 2017 were selected for this study. GPS points of the landslide initiation areas were collected from the 24 landslides in Kalutara district and 27 landslides in Ratnapura district. Selections of landslides were done considering their length and width parameters to obtain only large landslides.
Each landslide was then plotted on the 1:10,000 scale landslide hazard zonation maps to identify the respective hazard categories (Figure 02). Based on the hazard categories, the predictive power for the each district was determined. In this study hazard 3 and 4 were considered as the high hazard category and 3 as the medium category.
4. Results and discussion
In Kalutara district, out of 24 landslides recorded in the year 2017, 62.5% falls into high hazard category, remaining 37.5% falls into medium hazard category. None of the failures falls into low hazard category (Figure 3a).. In Rathnapura district, 62.9% falls into high hazard category, 29.6% falls into medium hazard and the remaining 7.4% falls into the low hazard category (Figure 3b).
12

Fig. 02: Map of distribution of landslides in hazard zonation maps
For the both districts the obtained predictive values are nearly same and higher than 80% showing that the accuracy of the current LHZM methodology is high. The terrain factors used for the methodology and the weightages assigned for each of them are well matched for the Sri Lankan context.
Fig. 03: Distribution of landslides in hazard categories (a) Kalutara district, (b) Ratnapura district
13

5. Limitations of the study
• Number of landslides with the GPS in the initiation areas was limited. • Unavailability of landslide hazard zonation maps in some of the landslide
locations. • Limited number of landslides were taken for the study since recorded cutting
failures were excluded (LHZM does not predict the cutting failures)
6. Conclusion
Prediction power for the Kalutara district for the hazard in category 3 and 4 is 100% where as it is 92.5% for the Ratnapura district.
Findings of the study indicate that the accuracy of the current LHZM methodology is high for the selected two districts.
7. Recommendation
The current study is carried out only for two districts which is having same terrain conditions similar to the districts which were used for developing the mapping methodology. Therefore, predictive power of these maps should be carried out in districts which have different terrain conditions to evaluate the overall accuracy. Acknowledgements
We convey our extended gratitude to the National Building Research Organisation including Director General and all the staff for the encouragement given to us.
References
[1] Chung, C. J. F., & Fabbri, A. G. (1999). Probabilistic prediction models for landslide hazard mapping. Photogrammetric engineering and remote sensing, 65(12), 1389-1399.
[2] Dahal, R. K., Hasegawa, S., Nonomura, A., Yamanaka, M., Dhakal, S., & Paudyal, P. (2008). Predictive modelling of rainfall-induced landslide hazard in the Lesser Himalaya of Nepal based on weights-of-evidence. Geomorphology, 102(3), 496-510.
[3] Lee, S., Choi, J., & Min, K. (2002). Landslide susceptibility analysis and verification using the Bayesian probability model. Environmental Geology, 43(1), 120-131.
[4] Van Westen, C. J., Rengers, N., &Soeters, R. (2003). Use of geomorphological information in indirect landslide susceptibility assessment. Natural Hazards, 30(3), 399-419.
[5] Guzzetti, F., Reichenbach, P., Ardizzone, F., Cardinali, M., & Galli, M. (2006). Estimating the quality of landslide susceptibility models. Geomorphology, 81(1), 166-184.
14
Characterization of Nawalapitiya landslide, in the Kandy District
DGED Lakmali1, L Palamakubure1, 2 and KN Bandara3
1Landslide Research and Risk Management Division, National Building Research Organization 2Department of Geology, University of Peradeniya, Sri Lanka,
3Geotechnical Engineering Division, National Building Research Organization.
Abstract
Recognition of the potential movement and the identification of type and causative factors of this movement are important in the development of procedures for the prevention or correction of a landslide. Nawalapitiya landslide in the Kandy district that occurred in 1980s and was dormant for more than two decades. In the year 2014, it started to show tensional cracks and a creep type movement again. One main scarp and two minor scarps have been formed during heavy precipitation in October 2014. Several boreholes were drilled and three inclinometers, three extensometers and a pipe strain gauge were installed to determine the direction, rate and mechanism of the movement, geometry of the slip surface, the extents affected and to monitor the landslide triggering factors. Hourly displacement readings from extensometers have been taken since 10th October 2014. Pipe strain gauge readings in 25 channels were recorded daily using an automatic electrical data logger. The data were downloaded twice a month since 4th November 2014. Continuous hourly groundwater level measurements were done using an electrical water level logger since 31st October 2015. A two dimensional stability model of the landslide was developed using the Slope/W software.
Results revealed that the landslide is a circular earth failure that occurred in the colluvium. Beside the main tensional crack in the crown region another two sets of minor scarps were observed 45 m and 62 m down slope from the main tensional crack towards the toe region. Inclinometers and extensometer data indicated that, three separate landslide masses are moving at three different displacement rates. Rainfall and the corresponding rise of the pore water pressure have been identified as the main triggering factors.
Key words: Land slide Extensometer; Inclinometer; Electric data logger
15
1. Introduction
According to landslide researchers, it is pointed out that landslides are mainly geologically controlled (Yokota, 1998 and Maeda, 1996). Lithology, intensity of the joint pattern, the structure of the rock, steepness of the hill slope, and the depth of the weathering rock are major geological factors contributing to sliding. Beside the geological factors, high intensity of rainfall in hilly areas also plays a major role in landslide occurrences in Sri Lanka. Many potential landslides have been identified in hilly areas of Sri Lanka. Nawalapitiya landslide that occurred in 1980s is one such major landslide event. It had been successfully mitigated at that time. The cause for this landslide has been identified as the poor land use management of a tea state located above the steep scarp.
In 2014, the same area started to show tensional cracks and a creep type movement in downslope direction, and now this area has been identified as a potential landslide area. People living in the crown region of the landslide, are at a risk and if this landslide happens again, it can naturally dam the Mahaweli River which is flowing through valley along the toe region of the landslide. The main road and railway tracks are also located close to site making this situation more hazardous.
This landslide site is located at the end of an escarpment slope and the landslide area mainly consists of two geological layers, a colluvium and the bed rock. The colluvium which is resting above the bed rock mainly consists of silty clay. Thickness of the colluvium at the crown region of the landslide is around 20 m and it gradually reduces up to about 6 m towards the toe region of the landslide. Bed rock beneath the colluvium is nearly horizontal and the lithologies of the bed rock are Khondalite, Marble, Hornblende Biotite Gneiss, Quartzofeldspathic Gneiss and Garnet Biotite Gneiss. This landslide is a circular earth failure that occurs in the colluvium. Beside the main tensional crack in the crown region another two sets of minor scarps were observed 45 m and 62 m from the main tensional crack towards the toe region.
In order to mitigate this situation, systematic monitoring of the Nawalapitiya landslide movement was required and in October 2014 landslide monitoring instruments were installed at the landslide area. To fulfill this objective, three inclinometers, three monitoring wells, three extensometers and one pipe strain gauge have been installed at the affected area. To obtain above mentioned items, instruments such as inclinometers, extensometers, pipe strain gauge can be used. At the Nawalapitiya potential landslide site, two extensometers were installed. One at the head of the landslide and the other one at the right boundary of the landslide. Three inclinometers and one pipe strain gauge along the landslide axis. Also three piezometers have been installed side by side to the landslide axis at a depth of 15 m.
The disastrous situation that is landslide can be mitigating by proper systematic monitoring. In order to do that, reliable and accurate information needs to be obtained on following items (Yoshizawa, 1988);
i. Geometry of the sliding surface of the landslide,
ii. Moving direction of the land slide, iii. Moving rate of the each individual land masses, iv. Behavior of the landslide movement accordingly to the ground water level
fluctuation, v. Expanding rate of the landslide boundary
16

vi. Geology and the soil condition of the area, vii. Rainfall monitoring,
viii. Mechanism of the landslide movement etc,
Extensometers measure the relative movement of two points on the ground. Hence one end of an extensometer is installed at a stationary ground near the landslide boundary while the other end is installed on the moving mass of the landslide. It is the important to install the extensometer parallel to the moving direction of landslide, hence the general pattern of the movement need to be known. The degree of displacement depends on the geometry of the surface failure in relation to the wire of the extensometer (Corominas et al., 1999)
Inclinometers monitor the deformation of the soil, normal to the axis of the casing which provides a profile of subsurface horizontal deformation (Amarathunga and Bandara, 2010). The horizontal movement of the land cannot be measured directly using the inclinometer. The probe measures the tilt of the casing which can be converted to a horizontal movement using a mathematical equation.
To obtain more accurate and reliable readings it is essential to install combinations of these instruments. Combined use of inclinometer with extensometer is highly recommended (Corominas et al., 1999). Life time of an inclinometer is lesser when the landslide is highly active and the data will be lost after that, but it provides quality information landslide displacement profile, velocity and the position of the shear surface immediately after the installation. When it is installed combined with an extensometer which is operational under large displacements, the system will continue recording data even after the loss of the inclinometer.
At Nawalapitiya potential landslide, a combination of monitoring instruments was installed with the objective of determining the direction of the movement of the landslide, material moving rate, geometry of the slip surface, mechanism of the movement and the extents affected by the landslide and to monitor the landslide triggering factors.
2. Study Area
As shown in Fig.1, the study area is situated within the coordinates 173,800 m- 173,400 m East and 206,740 m- 206,820 m in North of the national grid system of Sri Lanka. Landslide axis orients 1010 in clockwise direction from North. AB13 main road from Kandy to Nawalapitiya lies across this study area along with two railway lines and there are two permanent building with in the landslide boundary. The total perimeter of the landslide is around 300 m and the total area of the landslide is around 5,000 m2
17
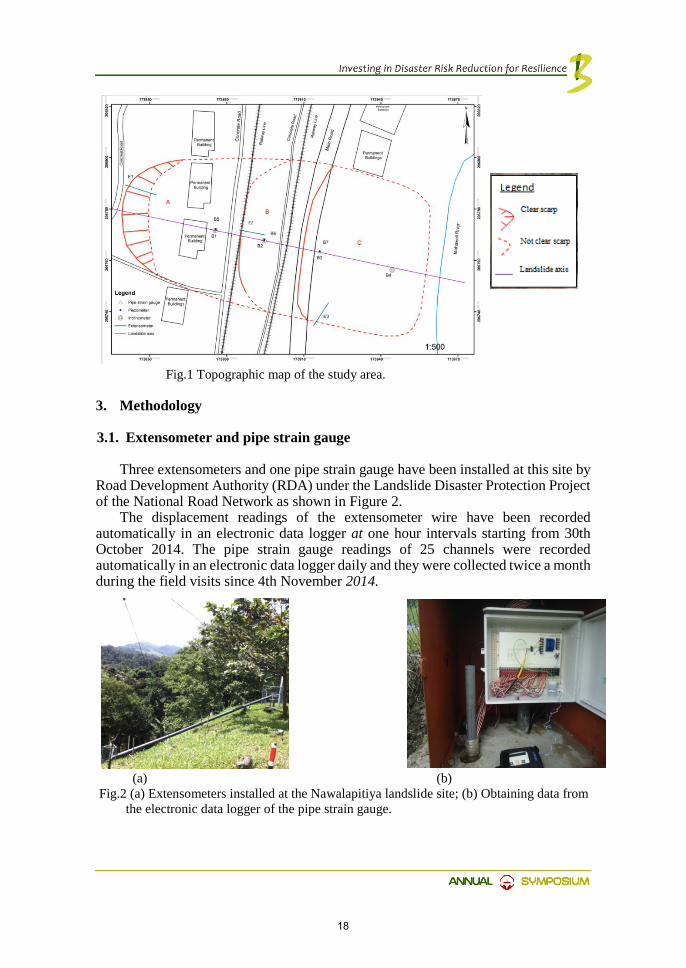
Fig.1 Topographic map of the study area.
3. Methodology
3.1. Extensometer and pipe strain gauge
Three extensometers and one pipe strain gauge have been installed at this site by Road Development Authority (RDA) under the Landslide Disaster Protection Project of the National Road Network as shown in Figure 2.
The displacement readings of the extensometer wire have been recorded automatically in an electronic data logger at one hour intervals starting from 30th October 2014. The pipe strain gauge readings of 25 channels were recorded automatically in an electronic data logger daily and they were collected twice a month during the field visits since 4th November 2014.
(a) (b) Fig.2 (a) Extensometers installed at the Nawalapitiya landslide site; (b) Obtaining data from
the electronic data logger of the pipe strain gauge.
18

3.2. Inclinometer
Three inclinometers have been installed below the potential zone of movement by Road Development Authority (RDA) under the Landslide Disaster Protection Project of the National Road Network as shown in the Figure 3. The bottom of the inclinometer does not translate. If the bottom of the inclinometer translates it will not be able to capture the total amount of movement. Three inclinometers I1, I2 and I3 are installed in the borehole no B1, B2 and B4 respectively as shown in Figure 1.2. The displacement readings are taken manually at every 0.5 m intervals using an inclinometer probe. This data is then processed and the cumulative displacement is presented relative to the first reading. The displacement is measured with reference to two directions; X-axis refers to the displacement in the downhill direction whereas Y-axis is perpendicular to the slope direction.
When taking the measurements, X+ side of the roller was set to the guide pipe groove of X+ and the inclinometer was inserted slowly to the bottom of the guide pipe. Then it was left 10-20 minutes to get adjusted to temperature being uniform. After confirming that the measurement is stable, cable was lifted up a uniform interval and inclination was measured at fixed 0.5m interval by referring to the scale on the cable. After that the inclinometer was taken out from the guide pipe and it was inserted again it into the guide pipe after rotating 1800 until it reaches the bottom position to take measurements of X- and the same procedure was repeated as X+. Then, the same procedure used for X axis was used to take measurements for Y+ and Y- of the Y-axis.
Determination of the landslide movement is important because the critical cross section should be positioned parallel to it. The horizontal displacement of the profile of the casing was determined using the data from the X-Y axes of the Inclinometer casing. The X axis was oriented in the direction of the slide movement during the installation and the Y axis direction was mutually perpendicular to it in a vertical plane.
(a) b)
19
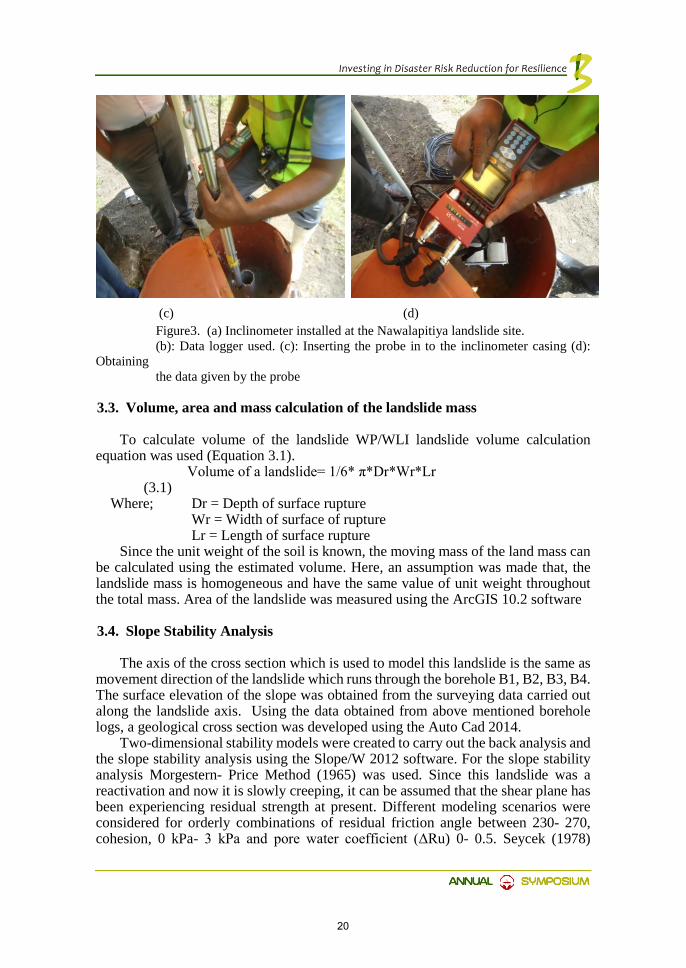
(c) (d) Figure3. (a) Inclinometer installed at the Nawalapitiya landslide site. (b): Data logger used. (c): Inserting the probe in to the inclinometer casing (d): Obtaining the data given by the probe
3.3. Volume, area and mass calculation of the landslide mass
To calculate volume of the landslide WP/WLI landslide volume calculation equation was used (Equation 3.1). Volume of a landslide= 1/6* π*Dr*Wr*Lr (3.1) Where; Dr = Depth of surface rupture
Wr = Width of surface of rupture Lr = Length of surface rupture
Since the unit weight of the soil is known, the moving mass of the land mass can be calculated using the estimated volume. Here, an assumption was made that, the landslide mass is homogeneous and have the same value of unit weight throughout the total mass. Area of the landslide was measured using the ArcGIS 10.2 software
3.4. Slope Stability Analysis
The axis of the cross section which is used to model this landslide is the same as movement direction of the landslide which runs through the borehole B1, B2, B3, B4. The surface elevation of the slope was obtained from the surveying data carried out along the landslide axis. Using the data obtained from above mentioned borehole logs, a geological cross section was developed using the Auto Cad 2014.
Two-dimensional stability models were created to carry out the back analysis and the slope stability analysis using the Slope/W 2012 software. For the slope stability analysis Morgestern- Price Method (1965) was used. Since this landslide was a reactivation and now it is slowly creeping, it can be assumed that the shear plane has been experiencing residual strength at present. Different modeling scenarios were considered for orderly combinations of residual friction angle between 230- 270, cohesion, 0 kPa- 3 kPa and pore water coefficient (ΔRu) 0- 0.5. Seycek (1978)
20

introduced the relationship of residual angle of internal friction, to plasticity index. To narrow down values for possible residual friction angle, this relationship was used
4. Results and Discussion
4.1. Geological Profile of the Landslide
Nawalapitiya landslide is located on an escarpment slope of a mountain. Data obtained from the borehole logs of this area indicates the presence of about 13m thick colluvium layer. The presence of erratic boulders and displaced rock fragments indicate that this colluvium layer is mainly composed of old landslide debris. Beneath the colluvium layer, 7 m thick residual soil layer is present. The maximum depth to the bedrock is 20.43 m at the B1 and minimum depth to the bedrock is 9 m according to log information of B4. The maximum depth to the bedrock is 20.43 m at the B1 and minimum depth to the bedrock is 9 m according to log information of B4. The bedrock mainly consists of five lithologies, namely; Khondalite, Garnet Hornblend Biotite Gneiss, Quartzo feldspathic gneiss, Biotite Gneiss and Marble.
Particle size analysis carried out for the soil samples collected near the slip surface indicates that, soil failure occurs at the silty sand soil layer. The percentage of clay particles is 0%. At some places it is lesser than 5%. Summary of the particle size analysis is given in the Appendix 1. Summary of the soil particle analysis is given in Table 4.1.
Table 1. Summary of the particle analysis test
Borehole Sample no Depth (m) Classification Liquid limit
Plastic limit
Plastic Index (IP)
B1 A113-015-1 13.00-3.45 SM 35 26 9 B2 A113-015-2 10.00-10.45 SM 38 30 8 B3 A113-015-3 8.40-8.85 SM - - -
4.2. Inclinometers and Pipe Strain Gauge
The maximum displacement rate shown by B1 and B4 are 0.005 mm/day and 0.14 mm/day respectively. The average displacement rate shown by B1 and B4 are 0.02 mm/month and 0.2 mm/month respectively. There is no significant movement along Y- direction in all three inclinometers. Figure 4 shows the cumulative displacement of inclinometer in B1. From this, depth to the slip surface can be read as 15 m-16 m below the earth surface. It does not show a well-developed slip surface, but it indicates some minor movements. From this figure, depth to the slip surface can be read as 5 m-6 m below the earth surface.
The maximum displacement rate shown by B1 and B4 are 0.005 mm/day and 0.14 mm/day respectively. The average displacement rate shown by B1 and B4 are 0.02 mm/month and 0.2 mm/month respectively. Overall displacement of the landslide mass is in mm scale. Hence, the movement of the landslide can be categorized under almost undetectable on a short time basis.
21

Figure 4. Cumulative displacement of the slip surface
4.3. Extensometer
Three extensometers were installed at Nawalapitiya named as E1, E2 and E3. Hourly displacement readings have been taken since 10th October 2014. These reading were recorded in an electronic data logger. The displacements shown by the extensometers are illustrated in Figure 5 and a summary of the extensometer readings are shown in Table 2. Since the temperature variation is not significant, temperature correction was not done. E1 is located at the main scarp facing downslope and it shows a maximum displacement of 1.1 mm. E2 is located at the poorly developed minor scarp facing downslope and shows negative displacement throughout the time. Readings obtained from this extensometer are not reliable since both ends of the extensometer are installed on the moving land. This can be the reason for the negative displacement values. E3 is located at the left flank facing the landslide axis. E2 shows positive values throughout the time with a maximum displacement of 0.6 mm. These readings do not show any fluctuation with the time.
Table 2 Summary of the extensometer readings and the direction from the true north in clockwise direction
Extensometer Installed date Maximum displacement (mm)
Displacement rate
(mm/month)
Direction
E1 10/30/2014 1.1 0.5 1010 E2 10/30/2014 -0.7 0 1010 E3 10/30/2014 0.6 0 280
29/1
1/20
14
13/1
2/20
14
23/1
2/20
14
4/1/
2015
20/0
1/20
15
10/2
/201
5
25/0
2/20
15
11/3
/201
5
25/0
3/20
15
25/0
4/20
15
30/0
5/20
15
22/0
6/20
15
13/1
2/20
14
23/1
2/20
14
4/1/
2015
20/0
1/20
15
10/2
/201
5
25/0
2/20
15
11/3
/201
5
25/0
3/20
15
25/0
4/20
15
30/0
5/20
15
-10
-5
0
5
10Cu
mul
iativ
e di
spla
cem
ent (
mm
) B1
B4
22

Figure 5. Displacement rates of extensometers
4.4. Groundwater Level and Rainfall
Groundwater levels in these piezometers were measured hourly and recorded using an electrical water level logger, since 31st October 2015 Groundwater levels in B5 and B6 show clear significant fluctuations throughout the time. The minimum depth to the water table obtained at borehole B5 is around 1 m, and in B6, it is 5.1 m. During this period, the maximum depth to the groundwater table is 5.6 m at B5 while it is 7.6 m at B6.
Unlike in B5 and B6, groundwater level in B7 does not show a significant fluctuation over the time. There is a possibility that groundwater infiltrate through the fractured Kondalite bedrock which reduced the ground water level. This can be the same reason for the unchanged groundwater levels in B7 even during the periods of high precipitation
4.5. Modelling with Fully Specified Slip Surface
The stability analysis was conducted using the residual shear strength values of the colluvium derived from the back analysis (C = 0, Phi = 25.75). For this, model of the landslide (Figure 4.15) was created with the fully specified slip surface, using the Slope/W software.
A piezometric line was developed to model the groundwater conditions corresponding to the recorded pore water level at each piezometer. Region A was divided in to 70 slices, and slope stability analysis was carried out using Morgenstrn- Price method.
FOS is calculated separately for each separate mass of the landslide. The summary of the resultant values are shown in the Table 3. When considering the results obtained for soil strength parameters from the laboratory experiment, it gives the FOS greater than 2.0.
30/1
0/20
14
30/1
1/20
14
30/1
/201
5
30/3
/201
5
30/4
/201
5
30/5
/201
5
30/1
0/20
14 30/1
1/20
14
30/1
2/20
14
30/1
/201
5
28/2
/201
5
-0.03
-0.02
-0.01
0
0.01
0.02
0.03
0.04
0.05
0.06
0.07Di
spla
cem
ent r
ate
(mm
/day
)E1E2E3
23

Table 3. Summary of the slope stability analysis Region FOS Weight Volume
A 1.30 730,000 kN 50,000 m3
B 0.762 440,000 kN 22,000 m³ C 0.658 280,000 kN 14,000 m³
Since the FOS values for region B and region C is lesser than 1, those masses can
be considered unstable. Since region A has permanent buildings, railway lines and a main road, the FOS value for region A need to be increased greater than 1.5 to be on the safe side.
Overall volume of the landslide is around 86,000 m3 and the total weight of the mass is around 1,450,000 kN.
Figure 6. Landslide Stability model of the Nawalapitiya landslide
5. Conclusion
Nawalapitiya landslide can be considered as a circular type soil failure. The landslide mass can be divided into three separate moving masses. Each mass moves at a different displacement rate. This landslide can be classified under the extremely slow velocity class ( Cruden and Varnes ,1996) based on the monitored movements.
The precipitation conditions and geological setting of this site favor the land instability. Rainfall and the corresponding rise of the pore water pressure can be identified as the main triggering factors
Railway quarters, both Nawalapitiya- Gampola main road and the railway are at risk due to this landslide. Therefore, proper landslide mitigation of the landslide is essential.
Controlling and reducing the water infiltration and/or the lowering the groundwater level will increase the Factor of Safety (FOS) of the site. Both structural and non-structural mitigation methods can be implemented and studies must be continued for mitigation analysis.
24
References
[1] Cruden,D.M., Varnes, D.J. (1996), Landslide Types and Processes, Special Report , Transportation Research Board, National Academy of Sciences, 247:36-75
[2] Dahanayaka, K. (2003). Landslides in the Sri Lankan Highlands. Department of Geolody, University of Peradeniya, Sri Lanka.
[3] Gunatilake, J., Iwao, Y. and Yamasaki, T. (2002). Relationship of the faulting to creep movement of Iwakura landslide in Saga, Japan. Journal of the Japan Landslide Society, 39, no. 2002, pp 212-223.
[4] Hussain, M. (2010). Analysis and behavior of preexisting landslides.Ph.D. Thesis, Universit of Illinois at Urbana-Champaign, USA, 308 p.
[5] Palamakumbure, L. (2016). Landslide Analysis Case Study Nawalapitiya. [6] Stark, T. D., Choi, H., and McCone, S. (2005a). Drained shear strength parameters
for analysis of landslides. J.Geotech.eoenviron. Eng. 131(5):575-588. [7] Tan, D. (2006), Seismic Slope Safety- Determination of Critical Slip Surface Using
Acceptability Criteria. Ph.D. Thesis, University of London, UK. [8] Tokyo Sokki Kenkyujoi co., Ltd., Operation Manual. Insertion-Type Inclinometer. [9] Varnes, D. J. (1978). Slope movement types and processes. In: Special Report 176:
Landslides: Analysis and Control (Eds: Schuster, R. L. & Krizek, R. J.). Transportation and Road Research Board, National Academy of Science, Washington D. C., 11-33.
25

Detailed investigation of road cutting failure-case study from Dehiovita-Deraniyagala-Nooriya road (B093) in
Kegalle district
JPDRK Jayalath1, DIU Jayawardhane1, D Ihalagedara1& HML Indrathilake2
1Scientist, National Building Research Organisation, Sri Lanka 2Senior Scientist, National Building Research Organisation, Sri Lanka
Abstract
Cutting failures have been identified to be one of the most frequent and widespread disasters in Sri Lanka. At present, improper road construction activities in the hill country cause cutting failures and in addition, lead to subsequent creating of unstable slopes that fail in time to come, making the scenario worse. Such kind of failures occurred in between 5/11 and 5/13 culverts along the Dehiovita-Deraniyagala-Nooriya road during the torrential and prolonged rain fall in May 2016 and May 2017. Rectification of cut is essential because this road is the main entree to Daraniyagala, Norriya areas as well as to minimize risk associated with nearby residents, their properties, and travellers, and further, to prevent road closure.
To make sound, cost- effective and most suitable rectification design, preliminary and detailed investigations are a must, enabling better understanding of the surface and subsurface profiles in the slope. The knowledge of geology and geomorphology of the area, together with resistivity measurements were used to obtain subsurface characteristics of the area and furthermore findings can be confirmed with drilling test.
Resistivity tomography survey revealed that topmost materials of upper slope above the road consisted of soft and almost wet soil and just below the road, uncompacted dumped materials of almost wet and clay-rich soil. Surficial weathering and subsurface weathering have led to clay and water filled cavities in subsurface. Also it can be suggested that there is a possibility for a slip surface to exist up to road level. As data gathered from preliminary and geophysical investigations, slow movements (creeping) of top most materials are possible along the slope, hence slope failure is possible with intense rain fall.
Keywords: Road cutting failure; resistivity imaginary survey; intense rainfall
26

1. Introduction
Cutting failures have been identified to be one of the most frequent and widespread manmade disasters in the mountainous terrains of Sri Lanka. Badulla, Galle, Hambantota, Kalutara, Kandy, Kegalle, Matale, Matara, NuwaraEliya, and Ratnapura districts located within the Central Highlands of Sri Lanka are the most affected districts. In the Highlands, highway road network plays a vital role in the transportation activities. At present, road construction activities in the hill country are taking place at a rapid rate. Such development works done without giving due consideration to excavation of slopes for construction or widening of roads may undermine the stability of slopes, and geological and geotechnical aspects of the underlying rocks. Over the last few years, human activities have significantly contributed towards increased road cutting failures in the Central Highlands mainly due to expansion of road networks as part of road development projects. Such occurrences may cause damage to lives, property and also create traffic jam.
1.1 Problem statement and objective
Dehiovita-Deraniyagala-Nooriya road (B093) is the main entree to Daraniyagala, Norriya areas from Kegalle-Awissawella road in Kegalle district. This road is going through hilly area hence is consisted of several road cuts and most of the cuts have failed following torrential and prolong rainfall that occur each year. Such kind of considerable road cutting failures occurred in between culvert No 5/11 and 5/13 three times during intense rain fall in May, November 2016 and May 2017 respectively. Rectification of this unstable road cut is very essential because this road is the main entree to Daraniyagala, Norriya areas and to minimize risk associated with nearby residents, their properties, and travelers.
To make sound, cost- effective and most suitable rectification design, preliminary and detailed investigations is a must facilitating better understanding of the surface and subsurface profiles in the slope. Due to the complexity of landslides/slope failure phenomena which requires a multidisciplinary approach, studying them can be based on a wide range of observations including geological and geomorphological mapping, geotechnical and geophysical investigations, geodetic surveys, satellite observations and meteorological data analysis (Perrone et al.2014)
Different geophysical techniques can be applied for the landslide investigation such as seismic, electrical tomography, magnetometry, gravimetry and thermometry. These techniques are provided with useful details of the landslide geometry reconstructions and the site hydrological characterization (Jongmans and Garambois 2007). Among the all geophysical techniques electrical resistivity tomography is the widely applied technique for landslide investigation as if, it measures the electrical resistivity values and their spatial distribution in the subsoil and it provides the geometry like lateral extension and thickness of the landslide, detecting the sliding surfaces, and categorized high water content areas.
Therefore main objective of this study is to obtain better subsurface characterization of the affected slope by applying 2D electrical resistivity survey together with knowledge of geology and geomorphology of the area to make sound, cost- effective and most suitable rectification design for road cutting failure.
27

1.2 Study area
The case study was carried out in between 5/11 and 5/13 culvert along the Dehiovita-Deraniyagala-Nooriya road which was categorized as a B grade type (B029) road. The covered area of the study area is about 1.62 hectares and it belongs to Dikalla gramaniladhari divison, Dehiovita Divisional Secretariat Division. Fig 1 shows location of study area on 1:50,000 scale topographic map published by Survey Department of Sri Lanka (sheet no. 67) According to the landslide hazard zonation map, in 1:10000 scale compiled by National Building Research Organisation, the study area belongs to region of modest level of landslide hazard exist (Fig 2).
Fig.1. Topography and location map of study area (Source: Survey department of Sri Lanka) The area being almost entirely in the wet zone of the country, climatic
conditions are marked by a high rainfall and a moderate temperature regime. Study area belongs to the central hill region of the country, and according to the National Atlas of Sri Lanka is situated within middle part of NE dipping slope in a ridge directing SW-NW. The elevation difference within the area is 70 m, with average uniform slope angle varied in-between 300-350 range above the road and 180-250 below the road. Study area lies within the Highland Complex which is mainly composed of high grade metamorphic rocks of Charnockitic gneiss according to Geological/Structural map of Sri Lanka in 1:10000 scale published by Geological Survey and Mines Bureau (Fig 3).
28

(a) (b)
Fig.2.(a) Landslide hazard zonation map of study area (Published by National Building Research Organisation); (b) Geology map of study area (Source: Geological Survey and Mines Bureau)
2. Materials and Methods
As the request made by divisional secretary (DS) and Road Development Authority (RDA) of Dehiovita, preliminary geological investigations of study area was carried out on 29th of May 2016, 2nd of February 2017 and 26th of May 2017 respectively.Topographic survey of the study area was carried out to obtain contour map with 1m contour interval and the survey plan by using total station. Cross sections at identified critical locations were also prepared for analysis by using AutoCAD software.The geological mapping of the study area was carried out and contour map with 1m contour interval was used to prepare Geological Map. Electrical Resistivity Tomography Survey (ERT) was conducted to identify ground resistivity variations beneath the affected area. ABEM TERRAMETER LS instrument was used in this investigation. ERT can be effectively used to obtain continuous information to a greater depth thus number of boreholes required for such investigations can be minimized and most critical locations can be selected for further investigations (i.e. for drilling).
2.1 2D Electrical Resistivity Tomography method
Electrical Resistivity Tomography Survey (ERT) is a geoelectrical method commonly applied to obtain 2D and 3D high resolution images of the resistivity subsurface patterns in areas of complex geology (Griffiths and Baker 1993). Different electrode configurations can be used are pole-pole, dipole-dipole, Wenner and Schulumberger. Field procedure includes the use of a multi-electrodes are connected at a fixed distance according to a specific electrode configuration. Those electrodes are used both for the injection of the current (I) in the subsoil and the measurement of the voltage (V). From the current (I) and voltage (V) values, an apparent resistivity (pa) value can be calculated by using Eq. (1).
pa= k V /I
29
Where, k is the geometric factor which depends on the arrangement of the four electrodes. Resistivity meter normally give a resistance value, R=V/I, so in practice the apparent resistivity value is calculated by using Eq. (2)
pa =k R These values are positioned at pseudo-depths according to a geometrical
reconstruction (Edwards 1997), which results in a pseudo-section representing an approximate picture of the true subsurface resistivity distribution (Hack 2000). To obtain an electrical resistivity tomography, the apparent resistivity values must be inverted by using Res2Dinv which is the best known and most applied inversion algorithm (Loke and Baker 1996; Loke et al.2003) based on a smoothness-constrained least square method. The development of algorithms for the inversion of apparent resistivity data (Loke et al.2003) made it easier to analyze the data and generate 2D and 3D images useful for the obtain information on the geometry of a landslide body (i.e. the slide material thickness, the location of areas characterized by a higher water content, the presence of potentially unstable areas, slip surface, etc.).
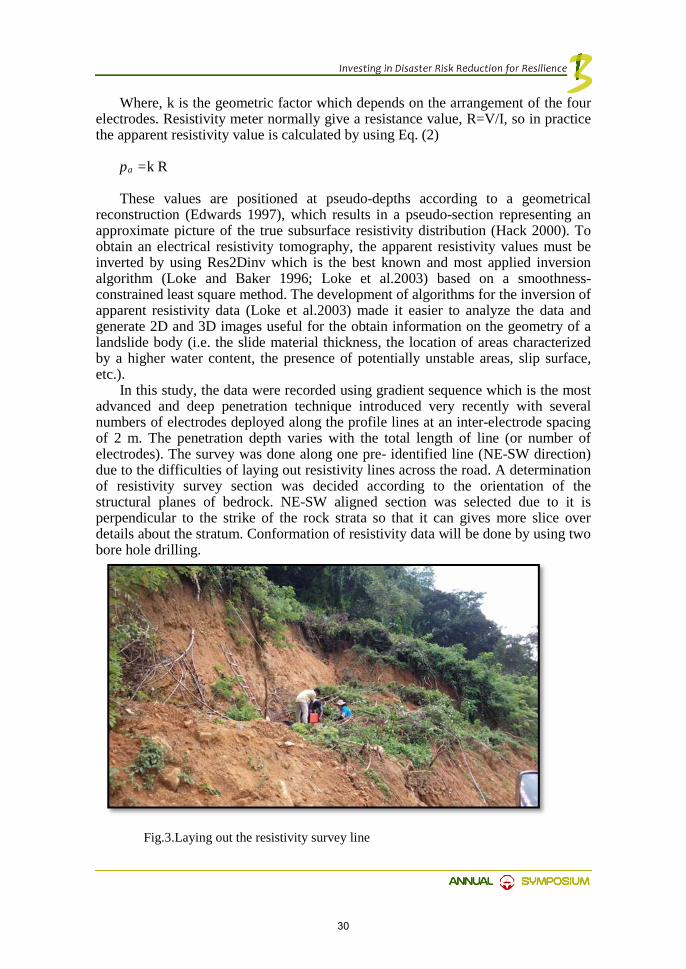
In this study, the data were recorded using gradient sequence which is the most advanced and deep penetration technique introduced very recently with several numbers of electrodes deployed along the profile lines at an inter-electrode spacing of 2 m. The penetration depth varies with the total length of line (or number of electrodes). The survey was done along one pre- identified line (NE-SW direction) due to the difficulties of laying out resistivity lines across the road. A determination of resistivity survey section was decided according to the orientation of the structural planes of bedrock. NE-SW aligned section was selected due to it is perpendicular to the strike of the rock strata so that it can gives more slice over details about the stratum. Conformation of resistivity data will be done by using two bore hole drilling.
Fig.3.Laying out the resistivity survey line
30

3. Results and Discussion
3.1 Preliminary investigation and Geological mapping
The studied road cutting failure was extending 100-110 m length along the road with maximum and minimum cut height was about 8.5m and 2.5 m respectively (Fig. 3). The continuous tension crack with the length 60-65 m and clearly visible 0.5 to 1.0 m subsidence and 0.75 m maximum width, could be observed at a 25-45 m distance along the slope from crown of the failed cut [Fig. 4(a)]. There were very prominent 6 No of dry valleys that could be observed within the slope and gully erosion along those valleys was clearly visible. Culverts on the road have been constructed across three of valleys and some of the culverts were built by deviating/obstructing natural valley path. Toe of the studied slope was ending with a wet stream and after that paddy fields could be observed.
The appearance of a spring could be observed from toe of the back cut of Ajith Kumara’s house during the field investigation [Fig. 4(b)]. Minor scale tension cracks could be observed on retaining walls which were constructed to stabilize road cut and also some of the houses located below the road. These minor cracks can be identified mainly due to construction failures and improper land use practices. The ground water table is very close to the surface, as per the observation taken from nearby dug wells [Fig. 4(c)]. As the worst scenario, if this cutting failure will extend further as a slope failure, it will affect apart from road users, also the seven houses located below the road, which could be identified as vulnerable community. If it is, the road will also be totally blocked or heavily damaged.
(a) (b) (c) Fig.4.(a) Appeared hole on the road and observed tension crack; (b) Appeared spring from the back cut; (c) Observed dug well in study area
Geological formations associated with the study area were investigated by
physical observations of the rock outcrops located on upper slope. According to the lithological and mineralogical observations made with rock outcrop the major rock type is Charnockitic gneiss.
31

Table 1. Geological data collected at the study area Type Foliation Joint plane 1 Joint plane 2 Weathering
condition Charnockitic gneiss
N480W/90 S N50E/72W density 5/m
N890W/800N density 5/m
Fresh to moderate
According to the geological/structural data of the bed rock outcrop, investigated
slope is in an escarpment slope with uniform slope angle varied from 300 to 350. But in SE part of the area especially near to the crown of the cut is almost flat and upper slope is having the angle ranging from 100 to 450. The lower part below the road is having an angle that varied from 100 to 350 and ending up in a paddy field. According to the stereo net analysis, it can be concluded that scattered boulders near to the crown of the slope are due to wedge failures. As a regional scale, geomorphologically study area is laid in a broad valley and axis of the valley was running through mainly Mr. Ajith Kumara’s house.
3.2 Topographic map
The contour plan of the study area is shown by Fig.5.
Fig.5.Topographic map of the study area
32

3.3 2D Electrical resistivity tomography imaging
The knowledge of geology and geomorphology of the area, together with resistivity measurements provides better interpretation for the ERTs obtained from the survey of this study.The profile in Fig. 6 shows 12.5 m penetration depth and that is mainly controlled by the electrode configuration and longest distance between current electrodes. This section is nearly 76 m in length along the ground surface and alignment from starting point to end point is northeast (NE) to southwest (SW).
Resistivity distribution of subsurface strata along this section shows a significant variation of resistivity at different depths along the profile line. The resistivity range at these locations lies between 1 to 8000 Ωm, indicating very wide variation in soil matrix and water saturation.
Resistivity distribution along this section indicates the unsaturated formation represented by high resistivity (>750 Ωm), near surface around 36 m along the line and bottom of the profile. The presence of bedrock exposure near to crown area of the upper slope indicated by the presence of very high resistivity (>2500 Ωm) and it was confirmed by geological mapping. Local high resistivity in the profile, near surface around 36 m-40 m along the line is due to the presence of scattered boulders.
According to the profile, the surficial weathering processes started in between 16 m to 36 m and 44 m to 50 m distances along the line and resistivity values indicate that surficial materials consisted of soft and almost wet soil. It is making a cave underneath the surface and it is probably filled with clay materials, because clayey formation is represented by a resistivity of less than 10 Ωm in between 44 m to 48 m along the line. There is no bedrock encountered within 12.5 m penetration depth after 62 m along the line and resistivity profiles indicated that subsurface materials consisted of soft and almost wet soil. This may be due to the dumped soil/colluvium soil as data gathered from field investigation. Dashed line on tomography represents the probability of sliding surface.
Fig.6. Trace of the electrical resistivity tomography
Surface and subsurface weathering
Clay filled deep weathering/cavity Water bearing subsurface
Moderately weathered rock
Fresh bed rock
Possible slip surface
33

4. Conclusion
ERT is a very useful tool in studying landslides, because it provides details upon specific geoelectrical heterogeneity of the investigated zone and thus, upon its lithological variations. The ERT results allowed mapping of the weathering material at depth.
As data gathered from initial field investigations, geological survey, and the results of the resistivity tomography survey, slow movements (creeping) of top most materials (including unstable scattered boulders) are possible along the upper slope which may led to be a slope failure during prolong and torrential rainfall.
Resistivity tomography survey revealed that topmost materials of upper slope above the road consisted of soft and almost wet soil. The lower slope which is below the road is having uncompact dumped materials of almost wet and clay rich soil. A part from that surficial and subsurface weathering with water saturated formations could be clearly observed within the profile. There is a clear boundary with high resistivity materials around low resistivity materials at the middle area of the profile. This feature is considered as a suspicion of a deep weathered zone or a subsurface cavity like structure; however it should be confirmed by drilling test. Obtained borehole log is important to identify possible slip surface and other relevant subsurface conditions.
In this study, only one resistivity profile was obtained due to the difficulties of laying out the resistivity lines across the road which is considered as the limitation of this study. Therefore, data gathered from this profile, are only used to obtain some information about the subsurface and to decide the suitable locations for bore hole drilling.
Acknowledgments
The authors wish to acknowledge the Director General NBRO, Director and the staff of Landslide Research and Risk Management Division of NBRO.
References
[1] Edwards, L.S. (1977). A modified pseudo section for resistivity and induced-polarization. Geophys, 42, 1020-1036.
[2] Griffiths, D.H & Baker, R.D. (1993).Two dimensional resistivity imaging and modelling in areas of complex geology. J.Appl.Geophys, 29, 211-226.
[3] Hack, R. (2000). Geophysics for slope stability. Surv.Geophys, 21, 423-448. [4] Jongmans, D & Garambois, S.(2007). Geophysical investigation of landslides: a review.
Bull Soc. Geol. Fr, 178(2), 101-112. [5] Loke, M.H & Baker, R.D. (1996). Rapid least-squares inversion of apparent resistivity
pseudosections by quasi-Newton method. Geophys. Prospect, 44, 131-152. [6] Loke, M.H., Acworth, I., & Dahlin, T. (2003). A comparison of smooth and blocky
inversion methods in 2D electrical imaging surveys. Exploration Geophysics, 34, 182-187.
[7] Perrone, A., Piscitelli, S.,& Lapenna, V.(2014). Electrical resistivity tomography technique for landslide investigation: A review. J.Earth-Science Reviews, 135,65-82.
[8] Wimalasinghe, L.A.A.W., Moremada, M.M.C.U.B., & Bandara, R. M. S. (2016). Proceedings of the NBRO International Symposium.
34

Determination of Site Specific Landslide Susceptibility Based on Decision-Making Criteria
PHE Dulanjalee1, HAG Jayathissa2, HML Indrathilake2
1Scientist, National Building Research Organisation, Sri Lanka 2Senior Scientist, National Building Research Organisation, Sri Lanka
Abstract
Evaluation of site specific landslide susceptibility for deciding risk reduction strategies is mainly based on expert judgement taken at field observations. Hence, the judgements are always subjective and strongly dependent upon the knowledge and experience of the expert. Therefore, availability of a systematic approach for site specific landslide susceptibility assessment is an important aspect on consistence decision-making. Further, it will enhance the clarity and transparency of the investigation process addressing the site-specific concerns and issues. Such guidelines and criteria will assist the investigator in preparing technical reports in an efficient and effective way and would pave the way to the relevant accreditation.
The paper introduces technically guided criteria for landslide site investigations, cutting failure and rock fall analysis filling the present gaps in field data collection and subjective decision-making. Landslide site investigation guide is primarily based on landslide hazard mapping methodology developed by the National Building Research Organization in 1995. It evaluates the effect of six major terrain factors over the occurrence of landslides. In addition, important ground instability features are integrated in to the present evaluation criteria. Based on the availability and intensity of various instability features, total weight obtained from the procedure is multiplied by a factor to obtain the final scores. Final susceptibility category is evaluated relating the total weight with the standard hazard level ranges in landslide hazard methodology. The criteria for rock fall and cutting failure analysis provide a comprehensive guidance to collect a consistent set of field data required for decision making. Although the methodology is straightforward and minimizes subjectivity, the decision criterion neither totally avoids nor totally replaces the expert judgment of an investigator.
Keywords:Landslide susceptibility mapping, Rockfall, Cutting failure
35

1. Introduction
Landslides are one of the major natural hazards, account each year for enormous live and property damage in terms of direct and indirect cost. Analysis of Landslide susceptibility potential is a key concern in deciding possible risk reduction strategies. Mostly, site specific landslide susceptibility assessments are made based on the expert judgement, and hence the decisions are very subjective and may vary within a wide range creating controversial arguments and challenging in legal process. Therefore, availability of a systematic decision making criterion will help to reduce the subjectivity and enhance the transparency of the decisions.
Present preliminary landslide site investigation procedure practiced by National Building Research Organisation (NBRO), is based on the study of regional and site specific terrain characteristics (slope angle, soil characteristics, geology, and hydrology) and observed landslide instability features. After a thorough observation and investigation of all these terrain factors, final conclusions are made based on the fuzzy analysis of the expert. Therefore, the conclusions made by the expert investigator will directly depend on his/her knowledge, experience, commitment and decision making abilities.
The main objective of proposing this approach for landslide site investigation is to introduce technically guided criteria which support the investigator in his judgements. Furthermore, the criterion introduced to collect field data for cutting failures and rockfall guides to assemble the data which are essential in investigations. Field application of the criteria has been initiated to verify its validity and for necessary future modifications.
2. Methodology
This criterion is directly based on the landslide hazard mapping methodology developed by National Building Research Organisation in 1995. The method considers six major terrain factors (geology and bedrock structures, slope, hydrology, soil type and thickness, landuse and management and landform) which are crucial to the occurrence of landslides. It is a weight assigning process and weightages were decided based on extensive field studies, statistical analysis and expert judgements after studying around 2000 landslides in Badulla and NuwaraEliya districts (Table 1). The methodology attempts to determine the initiation areas of possible future failures, assigning weight for each terrain factor based on sub factor and/or factor class existing within the interested area. An area is then declared to be susceptible when the terrain conditions at a site are comparable to the areas where landslides have occurred in the past.
36

Table 1.Relative weightings for major factors, sub factors and factor classes based on the NBRO model (NBRO User Manual, 1995)
Major factors Sub factors Sub factor elements (factor classes) Linguistic rating (x) and Scores (z)
x z
20 Bedrock Geology
& Geological structures
Lithology 8
Marble very low 0 Weathered rock low 1 All others medium 3 Charnockite, Granulite or bedrock not exposed high 5 Quartzite very high 8
Amount of dip 4 & type of slope
Dip & scarp 71-90 very low 0 Dip & scarp 56-70 low 1 Dip 11-30, scarp 46-55 & all intermediate slopes medium 2 Dip 0-10, scarp 31-45 high 3 Dip 31-55, scarp 0-30 very high 4
Major factors Sub factors Sub factor elements (factor classes) Linguistic rating (x) and Scores (z)
x z
20 Bedrock Geology
& Geological structures
Deviation 6 angle (degrees)
Angle 26-120 very low 0 Angle 11-25 or 121-155 low 2 Angle 156-180 high 4 Angle 0-10 very high 6
Other 2 Discontinuities
To be decided on case to case basis very low 0
very high 2
10 Type of natural
soil and their thickness
Soil cover (m) 10
Bare bedrock very low 0 Colluvium <1, Residual <2 low 2 Colluvium 1-3, Residual 2-8 medium 8 Colluvium 3-8, Residual >8 high 9 Colluvium >8, Residual >8 very high 10
25
Slope range & category
Slope range 25 & category (degrees)
Slope category I (>40) very high 25 Slope category II (31-40) high 16 Slope category III (17-31) medium 13 Slope category IV (11-17) low 7 Slope category V (0-10) very low 5
20
Hydrology & Drainage
Relief 5 amplitude (m)
Relief >350 Very low 1 Relief 0-170 medium 2 Relief 170-350 very high 5
Hydrological 4 map unit area (sq. km)
Area 0-0.07 or > 0.5 very low 1 Area 0.07-0.2 medium 2 Area 0.2-0.5 very high 4
Hydrological 4 map unit shape (form factor)
0.6-1.0 very low 1 0.3-0.6 medium 2
< 0.3 very high 4
Drainage density 5 (km/sq. km) with or without soil cover
With >5 or without >10 very low 1 With 3-5 or without 6-10 medium 2
With 0-3 or without <6 very high 5
Proximity to 2 water bodies
To be decided on case to case basis very low 0 medium 1 very high 2
15 Land use &
Management
Land use 15 & Management
JT1, JC, JQ, JWb, W1, S1 very low 3 JT2,JR,JWp,HP,HK,HM,HW,W2,W3,W4, S2,S4 medium 8 HA, G1, G2, S3, N1, N2, N3, N4 very high 15
10 Landform Landform
10
F11,F12,F31-35,F43,F91-92, F94,A10-13, X1,X2 very low 1 F51,F52,F54-58,X13,X14 high 5 F61,F62,F71-74,F81-83, F92,X11,X15 very high 10
37

Weight values for factors such as bed rock geology and geological structures, type of natural soil cover and its thickness, slope angle, landuse and management, and landform are directly assigned based on the mapping methodology. While assigning of weight values for some data is straightforward, calculation of influence of geological structures needs a more systematic approach. Therefore, it is vital to collect necessary data of the structural attitudes and plot them with respect to the direction of North.
Hydrology and drainage evaluation of landslide hazard methodology is a complex practice. It considers catchment-wise hydrological analysis with hydrological parameters (form factor, hydrological map unit, and drainage density). Therefore, due to the calculation difficulty in the field, hydrological parameters are addressed in a different manner without changing its total score of 20 in the scoring system (Table 02). The total weight for the considered area can then be obtained by summation of the assigned weight of each factor.
Table 2. Sub factors considered under hydrology and drainage analysis
Sub factor & Score Description Score Surface Drain Condition
(06) Well drained 0 Moderately drained 4 Poorly drained 6
Proximity to streams/ valleys/ water bodies (03)
Distance <20m 3 21m< Distance<40m 2 Distance >41m 1
Ground water Flow (06) Recharge zone 2 Intermediate zone 4 Discharge zone (Ground water seeps/Springs)
6
Upper slope length up to the catchment boundary (05)
Length <20m 2 21m <Length <50m 3 51m <Length <100m 4 Length >101m 5
Unlike in landslide susceptibility zonation process where susceptibility is
evaluated in areas where landslides or potential landslide features have not yet been identified, site specific landslide investigations are conducted for the areas where instability features have already been initiated. Therefore, it is of paramount importance to consider the influence of instability features to the analysis (Table 03). Depending on various instability features and its intensity, a multiplication factor is introduced based on expert judgement to multiply the total weight calculated from the above six terrain factors. It is defined as if one of the instability features mentioned in the Table 03 is present with level of low, the multiplication factor is 1.5. When few of them present with low, multiplication factor is 1.5 to 2. Multiplication factor of 2 is defined if one instability feature is present with a level of medium or above. If two or more instability features are present with a level of medium or above, the multiplication factor 3 is defined.
38

Table 3. Other Observations (Landslide history/Potential instability features) Condition Availability
None Low Medium High Old landslide scars Recent landslides Ground subsidence Tension cracks Ground heaving Rocks or movement of boulders, small isolated failures or collapses
Leaning/tilting of trees telephone/electricity poles, retaining walls or fences
Condition Availability None Low Medium High
Tilting or cracking of concrete floors/walls and foundations. Soil moving away from foundations
Springs, seeps, or saturated ground in areas that have not typically been wet before. Sudden oozing of new springs and sudden dry out of existing springs, muddy water from existing springs
Sudden decrease in water levels in a creek (small stream)/tanks or any other water bodies
Finally, susceptibility of the site is determined with respect to the criterion
defined by the mapping methodology based on the final total weight (Table 04). Table 4.Hazard potential based on final total score
Criterion Susceptibility Range
Susceptibility Potential
Total score <40 1 Landslide Not Likely to occur (LR) 40 < Total score < 55 2 Modest level of landslide hazard exists (MR) 55 < Total score < 70 3 Landslides are to be expected (HR) Total score >70 4 Landslides most likely to occur (HR)
In addition to the determination of general susceptibility potential, analysis of
stereographic projection is proposed to identify the possible failure mechanisms if the failure may be attributed to the structural attitudes of the bedrock. Further, danger zones along flow path and depositional areas should be identified to demarcate the risk areas in providing final conclusions and recommendations.
Cutting failure data collection guide includes the site observations which are essential component in determining the hazard potential and decision making. Here, total cut height, cut angle, soil type, height of the soil portion, upper slope angle and drainage and distance between the cut and building are the major concerning factors. The rock presence, rock type, weathering grade, discontinuities and orientations should be considered and final conclusions should be made based on the contribution of all these terrain factors.
39

Rockfall data collection procedure includes the data of bedrock and discontinuity attitudes. By performing a stereographic projection, failure mechanism can be determined.
3. Discussion
Landslide decision making guide provides a comprehensive analysis of landslide susceptibility potential. As it follows the rating system of landslide hazard mapping procedure, assigning weights is straightforward and many of the factor weights can be easily assigned.
A deviation from typical mapping procedure is encountered in assigning scores to hydrology and drainage factor. Sub factors and rating of hydrology and drainage, mainly considered the surface and subsurface hydrology, which are favorable in enhancing the landslide potential. Scores and limiting ranges are assigned based on the expert judgement. Site surface drain condition is a decisive factor in determination of failure potential. Proximity to streams, valleys or water bodies emphasizes the ground water condition and the flow pattern of the site. Upper slope length up to the catchment boundary is extensive, the catchment area of the site increase. In addition to the surface drainage, groundwater flow considered according to the zones of recharge zone, intermediate zone and discharge zone. This comprehensive hydrological analysis provides a precise rating of drainage condition of the site.
Landslide history and potential instability features are important symptoms of a site in evaluating the hazard potential and providing recommendations. In this criterion, recent and old landslides, landslide symptoms (tension cracks, ground heaving, ground subsidence, leaning/tilting of trees telephone/electricity poles, retaining walls or fences etc.) are considered as the landslide symptoms. The total weight calculated from landslide mapping methodology resembles the initiation potential based on the site terrain condition. But, availability of landslide instability features must increase the landslide potential and therefore, the total score will be multiplied by a factor depending on the intensity level. This multiplication may cause the final score even over the value of 100, indicating highest potential for failure.
There are several advantages of following the decision making criterion. It provides a direct pathway to collect data consistently which is a prime requirement of landslide susceptibility analysis. When following a proper guide to collect field data losing of important data will be minimized. In addition, it will assist the investigator preparing the reports in an effective, efficient and consistent way. However, the criteria may need future modifications through field verification and calibration of the defined weights to confirm the validity.
4. Conclusion
The criterion developed under the present study for the investigation of landslides potential fulfills the present gaps in field data collection and subjective decision-making in site specific landslide investigation process. It simply supports to maintain consistent decisions, keeping tight data collection and analysis framework and delivering a quantitative output limiting the subjectivity. Although
40
this approach is straight forward and minimize subjectivity, the decision criterion neither totally avoid nor totally replace the expert judgment of the investigator.
References
[1] Barron, I & Supper, R. (2013): Application and reliability of techniques for landslide site investigation, monitoring and early warning – outcomes from a questionnaire study. Nat. Hazards Earth Syst. Sci., 13, 3157–3168.
[2] Bogaard, T. & Greco, R. (2014). Hillslope hydrological modelling for landslides prediction. Hydrol. Earth Syst. Sci., 18, 4185–4188.
[3] Dulanjalee, P.H.E., Rockfall Risk Assessment and Mitigation Strategies for Road Constructions: A Case Study in Thennekumbura – Ragala Road, Sri Lanka. Proceedings of NBRO Symposium 2016., 151-157.
[4] Geotechnical stability assessment guidelines City Development Planning and Environment Directorate, City of GoldCoast, 2016
[5] Jayathissa, G., Schröder, D. (2009): Integration of deviation and dip angle concepts using GIS in landslide hazard zonation in Sri Lanka. Geospatial crossroads at GI forum 2009, proceedings of the Geoinformatics forum, Salzburg, Austria.
[6] Jayathissa, G., Schröder, D., Fecker, E. (2009): Geological structures in GIS based landslide hazard zonation. Second International Summer School and Conference for Applied Geo-informatics for Society and Environment (AGSE 2009), Stuttgart University of Applied Sciences, Germany.
[7] Lato, M., Bobrowsky, P., Roberts, N., Bean, S., Powell, S., McDougall, S., M-A. Brideau, Stead, D., and VanDine, D. (2016). Site Investigations, analysis, monitoring &treatment, Canadian Technical Guidelines and Best Practices related to Landslides: a national initiative for loss reduction.
[8] User Manual (1995), Landslide Hazard Mapping in Sri Lanka, Landslide Hazard Mapping Project SRL89/001.
[9] Van Asch,Th.W.J., Buma,J., Van Beek,L.P.H, A view on some hydrological triggering systems in landslides, In Geomorphology, Volume 30, Issues 1–2, 1999, Pages 25-32
41
Development of Investigation Mechanism to Identify Flood Prone Areas; Case Study at Bulathsinhala DSD
S Jayaprakash1 AGD Tharika1 Dayan Munasinghe1 WKC Kumarasiri1
1 Scientist, National Building Research Organisation, Sri Lanka
Abstract
In the recent past years Sri Lanka experienced negative effects of flood disaster which menace social, physical, economic, and environment sectors. As per statistical records people who live beside river banks are highly vulnerable to flood. They suffer from flood disaster once a year or many times in some years. Responsible authorities face many difficulties when identifying communities prone to flood in order to implement resettlement programs or flood mitigation programs. So, the aim of the research is to develop an investigation mechanism to identify flood prone areas, in the case of Bulathsinhala DSD. Research employed technical and community based approaches to identify the inundation locations and their physical properties based on riverine flooding scenarios.
In order to derive the flooding extent and inundation depth, flood frequency analysis was done using annual maximum water level from regarded river gauges. By using the derived water levels for different return periods, inundation locations were identified through the GIS based terrain analysis based on Digital Elevation Model along with set of raster analysis tools. To verify the results of the analysis Community based participatory approach was employed. This approach collects information on yearly and monthly frequency of flood, extent of inundation and flood levels. The result of each method was revealed through series of detailed maps (as GIS layers) and summarized table, that showing the location of low lying areas in terms of derived heights, water level from the river gauge stations. Keywords: Flood, Investigation Mechanism.
42

1. Introduction
In the opinion of C. A. Doswell “A flood is defined as water overflowing into land that usually is dry. Flooding is often thought of as a result of heavy rainfall, but floods can arise in a number of ways that are not directly related to ongoing weather events” (Doswell, 2003).When looking back into recent years, Sri Lanka face to flood situation in an unprecedented rate. It was recorded 415,600 people were affected in 12 districts, of which approximately 30% are children according to UNICEF. Furthermore 213 deaths and 76 missing were recorded according to the Disaster Management Center. Over 3,000 houses were destroyed and 21,000 were partially damaged. Just over 3,400 people remain temporarily displaced in 73 safe locations in affected districts. (DMC, 2017)
Since flood situation is increasing in an alarming proportion, it is worthy to investigate flood inundation area in order to identify families who live with risk. Accordingly, the first objective is to develop a modeling framework to analyze flood prone areas and second objective is to investigate the applicability of proposed model with reference to Bulathsinhala DSD. Since flood is a hazardous issue in most of countries, and flood situation occurs suddenly with the heavy rainfall, people are unable to take immediate actions to evacuate from the flood. At this point identification of flood prone areas is worthy in planning practices. It enables responsible parties to get precautionary actions for flood prone areas.
2. Research Design
2.1. Introduction to the Study Area
Bulathsinhala Divisional Secretariat Division (DSD) area is located in Kaluthara district, Sri Lanka. Total population of 71457 live within the area. There are about 19 364 number of total families available and among them 15 098 number of families affected to the disaster situation in 2017. It implies that 77% families are affected to disaster situation in 2017. (Madawa, 2017). Kalu ganaga and Kuda ganaga flow through the Bulathsinhala DSD. People who live either side of the river banks of above rivers are frequently exposed to flood hazard. Especially the lower part of the area and paddy cultivation are most vulnerable to flooding. Nevertheless, those areas are the most vulnerable areas within Kaluthara district as well. In the recent years the negative impacts were severe than previous years. According to the DMC records it was
Figure 1: Location of Bulathsinhala DSD
43

recorded; 65 deaths, 187883 affected people, 50482 affected families, 1324 damaged houses and 407 destroyed houses in Kaluthara District (NOM, 2017). According to the statistical data of Disaster Management Center, Bulathsinhala DSD is one of the most damaged DSD in Kaluthara district by the severe flood situation.
As above Figure 1 and 2, Kalu Ganga flows through the upper part (north) of the Bulathsinhala DSD and Kuda Ganaga flows through middle of the Bulathsinhala DSD. Kalu Ganga named as the second largest river in country. Its catchment area is located in a highest rainfall area of the country and has undulating morphology. The average annual rainfall is 4000mm & leads to 4000m3 of annual flow. River basin has steep gradient in upper part & mild gradient in lower part, dropping from 2250m MSL to 16m within the first 36km of the river. Between Ratnapura & Kalutara, 6 major tributaries joined the river and Kuda Ganga which flows through the middle part of Bulathsinhala DSD is also one of them. In the opinion of Wickramasinghe, there are several reasons for the flooding of either side of the Kalu Ganga and Kuda Ganga: Catchment area is within the wet zone and rainfall is high in the area, gradient differences in the river basin (steep gradient in upper part), the gradient of the riverbed is only 0.15 m per km from Ratnapura, inadequacy to provide higher velocity to the river flow, the ‘bottleneck’ in Ellagawa area - narrow gap retains the water. (P.Wickramagamage, 2011)
Consequently, it is worthwhile to investigate a mechanism to identify flood prone areas within the Bulathsinhala DSD. Then only settlement patches which highly vulnerable to flood situations can be identified, enabling as a supportive component of a resettlement program or flood mitigation program.
Figure 2: Land Use of Bulathsinhala DSD
44

2.2. Methodology
2.3. Analysis
2.3.1. Flood frequency analysis
In order to relate the frequency of occurrence of the flood to its magnitude, flood frequency analysis was done based on the hydrological data (annual maximum water level in MSL) that derived from two river gauges at Ellagawa and Millakanda located within the study area.
First annual maximum water levels for each station were analyzed in easy fit model; the model gave the best fit frequency distribution method to proceed with the frequency analysis. Based on that results and considering the common frequency distribution model in hydrological analysis, Gumbel and log Pearson type 3 distribution models were implemented to analyze the tendency of the return period. Once derived the estimated return period for each model, those return period were plotted against the regarded water levels in river gauges. Finally, by using log curves, water levels were predicted for further return period. Following table 1 shows the estimated and theoretical return period based on Gumbel distribution model for available water levels at Ellagawa river gauge. Following figure 3 shows the inverse relationship between flood heights (water level) and return period, it means that higher the magnitude of the flood event (higher water level) lower will be the frequency of occurrence.
45

Water YearFlood Peaks in
CumecsGauge Height in
m MSLDate
Tp estimate (x-u)/& p therotical Gumbel11/12 246.50 7.89 10-07-12 1.02862986 -1.609014 0.00675225 1.00679815301/02 360.00 8.66 23-10-01 1.08405172 -1.022257 0.06207203 1.06617995400/01 432.00 9.05 26-09-01 1.14578588 -0.717143 0.128918891 1.14799872214/15 516.50 9.43 11-10-14 1.21497585 -0.423764 0.217033949 1.27719458403/04 548.00 9.69 24-09-04 1.29305913 -0.224267 0.286102553 1.40076141799/00 680.00 10.00 21-09-00 1.38186813 0.010436 0.37171855 1.59164336308/09 691.20 10.03 02-07-09 1.48377581 0.0339063 0.380350485 1.61381551404/05 690.00 10.03 06-09-05 1.60191083 0.0339063 0.380350485 1.61381551406/07 710.00 10.09 01-09-07 1.74048443 0.0808468 0.397589601 1.65999790405/06 750.00 10.21 22-06-06 1.90530303 0.174728 0.431846356 1.76008727612/13 825.00 10.44 02-11-12 2.10460251 0.3507551 0.494525691 1.97833991210/11 880.00 10.61 30-04-11 2.35046729 0.4798417 0.538546537 2.16706575915/16 990.00 10.94 18-05-16 2.66137566 0.7380148 0.619983748 2.63146640197/98 1000.00 10.97 05-11-97 3.06707317 0.7614851 0.626897386 2.68022780609/10 1100.00 11.28 21-05-10 3.61870504 0.996188 0.691228735 3.23864333513/14 1215.00 11.61 04-06-14 4.4122807 1.2543611 0.751820228 4.02933724507/08 1680.00 12.56 01-06-08 5.65168539 1.9819399 0.871271491 7.76828697698/99 1860.00 12.89 22-04-99 7.859375 2.2401131 0.899023175 9.90326244302/03 2620.00 14.04 19-05-03 12.8974359 3.1272899 0.957110491 23.3157249916/17 1622.96 14.24 28-06-17 35.9285714 3.2778377 0.962992448 27.02151163
Table 1: Return periods based on the Gumbel distribution method for existing hydrological data at Ellagawa
Figure 3: Charts relate flood height to its derived return period
Table 2: Estimated flood heights based on different return periods at Ellagawa river gauge
46

Further flood risk could be defined as the inverse of the flood Return Period which is also called the Recurrence Interval. If the risk is R (%) and the return Period is T (Years) risk can be express as R = 1/T *100. Following table 2 shows the risk in percentage for the estimated return periods.
Same procedures were applied for water level data from Millakanda river gauge to analyze the flood frequency distribution.
2.3.2. Raster base terrain analysis
Raster based terrain analysis was applied to extract the spatial extension of the flooding, particularly flood heights that based on different return periods which calculated from annual maximum water level for related river gauges in the study area. A GIS based approach was employed based on Arc GIs.
At first data that derived were from Survey Department such as contour lines (10 m interval), Spot heights, stream networks and MC boundary (1: 10,000scale) were used as main inputs. Then to model the topography of the area, DEM was generated through Topo to raster tool. Tool uses elevation information of contour lines & spot heights to model the terrain along with stream network to produce hydrological correct DEM through drainage enforcement algorithm. So, this interpolation ensures the connected drainage structure and correct representation of ridges and streams from input contour data of the area. Further fill tool was applied to remove the sinks (lower pixels) and peaks (higher pixels) that created due to the interpolation process of DEM (conversion of contours and spot heights vector formats into raster format).
Finally, possible inundation locations were derived with the help of the raster calculator based on the pixel depth of the DEM.
Following figure 5 shows the detail map of spatial extent of flood inundation area
based on the above-mentioned analysis.The accuracy of result of this analysis depends on the resolution (especially horizontal) of the DEM. For this analysis 10 m was considered as the minimum resolution by considering the contour interval (vector). Process of identification of the riverine flooding locations must take into consideration the hydraulic & hydrological system of the river & terrain. But this model applied only hydrological corrected DEM for the pre-identification of the low-lying area within the given short period of time.
DEM <= 8.88 DEM <= 10.26
Figure 4: Estimated flood heights based on different return periods at Ellagawa river gauge
Topo to Raster Contour
DEM
Spot height Stream network
Raster Calculator
Inundation location at each Return period
47

2.3.3. Field verification
This approach collects flood hazard information from experience of inhabitants of area. This is one of common method used to collect reliable input for any hazard assessment. Based on the extracted raster layers for different flood level, easily readable base maps were prepared for each GN to collect the right information within the limited time. These maps visualize the road networks, building, major land use patterns and other main utilities with regard boundary of the GN. Following figure shows the base map overlaid with flood layers and edited through the field verification.
Figure 5: detailed map of flood inundation area for bulthsinhala DSD
Figure 6: field verified flood hazard map (GN Level)
48
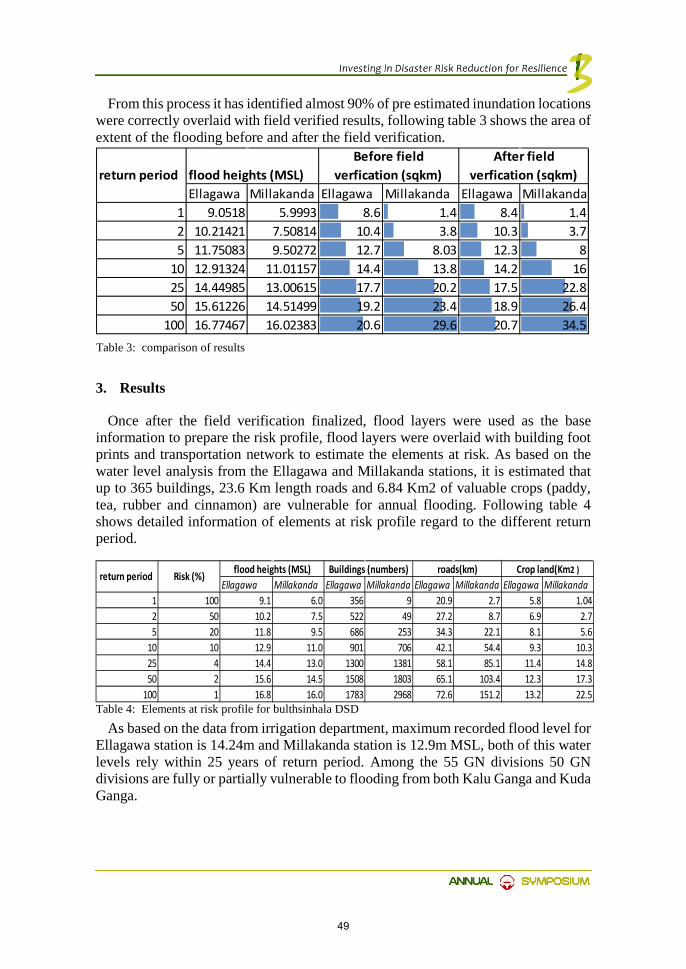
From this process it has identified almost 90% of pre estimated inundation locations were correctly overlaid with field verified results, following table 3 shows the area of extent of the flooding before and after the field verification.
3. Results
Once after the field verification finalized, flood layers were used as the base information to prepare the risk profile, flood layers were overlaid with building foot prints and transportation network to estimate the elements at risk. As based on the water level analysis from the Ellagawa and Millakanda stations, it is estimated that up to 365 buildings, 23.6 Km length roads and 6.84 Km2 of valuable crops (paddy, tea, rubber and cinnamon) are vulnerable for annual flooding. Following table 4 shows detailed information of elements at risk profile regard to the different return period.
As based on the data from irrigation department, maximum recorded flood level for Ellagawa station is 14.24m and Millakanda station is 12.9m MSL, both of this water levels rely within 25 years of return period. Among the 55 GN divisions 50 GN divisions are fully or partially vulnerable to flooding from both Kalu Ganga and Kuda Ganga.
Table 4: Elements at risk profile for bulthsinhala DSD
Ellagawa Millakanda Ellagawa Millakanda Ellagawa Millakanda Ellagawa Millakanda1 100 9.1 6.0 356 9 20.9 2.7 5.8 1.042 50 10.2 7.5 522 49 27.2 8.7 6.9 2.75 20 11.8 9.5 686 253 34.3 22.1 8.1 5.6
10 10 12.9 11.0 901 706 42.1 54.4 9.3 10.325 4 14.4 13.0 1300 1381 58.1 85.1 11.4 14.850 2 15.6 14.5 1508 1803 65.1 103.4 12.3 17.3
100 1 16.8 16.0 1783 2968 72.6 151.2 13.2 22.5
Crop land(Km2 )flood heights (MSL) Buildings (numbers)return period roads(km)Risk (%)
flood heights (MSL)Ellagawa Millakanda Ellagawa Millakanda Ellagawa Millakanda
1 9.0518 5.9993 8.6 1.4 8.4 1.42 10.21421 7.50814 10.4 3.8 10.3 3.75 11.75083 9.50272 12.7 8.03 12.3 8
10 12.91324 11.01157 14.4 13.8 14.2 1625 14.44985 13.00615 17.7 20.2 17.5 22.850 15.61226 14.51499 19.2 23.4 18.9 26.4
100 16.77467 16.02383 20.6 29.6 20.7 34.5
Before field verfication (sqkm)
After field verfication (sqkm)return period
Table 3: comparison of results
49
References
[1] Bandara, R. (2005). Landslides in Sri Lanka. Vidurava, Vol: 22(No: 02), Pp. 09-13. [2] DMC. (2017). SITUATION REPORT . DMC. [3] Doswell, C. A. (2003). Flooding. University of Oklahoma. [4] Ganepola, P. (2009). Permanent Shelter Strategy for Landslide Affected Families in
Nuwara Eliya District. NBRO Symposium 2009. [5] Hewawasam, L. (2005). Safer Cities 12, Demonstration Housing Construction for
Landslide and Flood Prone Areas, A case study from Ratnapura, Sri Lanka. Asian Disaster Preparedness Center.
[6] Madawa. (2017, 11 24). Officer, Bulathsinhala Divisional Secretariat Office. (A.G.D.Tharika, Interviewer)
[7] NOM. (2017). Sri Lanka Floods in 2017. National Organisation for Mitigation. [8] P.Wickramagamage. (2011). Evolution of the Kalu Ganga - Bolgoda Ganga. [9] Singh, A. K. (2010). Landslide management: concept and philosophy. Disaster
Prevention and Management, Vol. 19(No. 1), pp. 119-134. doi:10.1108
50

Further Sedimentological and Morphological Evidence for Paleozoic Glaciation in the Sri Lankan Gondwana Fragment
JDSN Siriwardana1 & K Dahanayake2
1Scientist National Building Research Organisation, Sri Lanka
2University of Peradeniya, Sri Lanka
Abstract
Sri Lankan Precambrian terrain represents one of the Gondwana Fragments where earlier sedimentological studies have shown the occurrence of varved peat/sand sedimentary sequences. Palynological studies of sediments have indicated a Permo-Triassic age for these sediments. These are associated with layers of pentagonal and flat pebbles showing orientations in a particular direction. Such occurrences are observed in isolated basinal structures located on terrains underlain by Precambrian gneisses, quartzite and marble. The occurrence of rock flour on these basement rocks bear evidence of grinding by the glaciers. Morphological features characteristic of glacial activity observed in areas of occurrence of glacial sediments are cols, horns, drumlins, roches moutonnees, hanging valleys, glacial lakes and erratic boulders commonly of pentagonal shape. These features were compared with those of known glacial regions and the results are very convincing. Keywords: Gondwana fragment, Glacial topography, Precambrian age
1. Introduction
A glacier is essentially a huge mass of ice resting on land or floating in the sea next to land. Moving extremely slowly, a glacier acts similarly to an immense river of ice, often merging with other glaciers in a stream-like manner. Evidence for probable Paleozoic glaciation is reported for the first time from Sri Lanka by Dahanayake and Dasanayake in 1981. Rhythmic sequences containing clay/peat, sand, gravel and pebble layers occur in valleys underlain by Precambrian metamorphic rocks in and around the village of Weuda of the Kurunegala district in the North West of Sri Lanka. Varve-like sediments and disc-shaped striated pentagonal pebbles characterize these sequences. Some general observations are made for the sections studied. Occurrence of pebbles, mostly flattened and pentagonal
51

in shape, quartzitic or quartzofeldspathic in composition, in non-striated unsorted sediment. Polished and striated surfaces are rarely observed in pebbles.
And also they were observed in sandy layers, the grains are mostly angular, poorly sorted and are associated with unweathered feldspar grains. At that area a hard sandy ferruginous crust is observed frequently as top and bottom layers of peaty beds. Differential weathering helps to clearly observe this feature in the field. Rhythmic varve-like light and dark coloured sandy and clay/peat inter-layering is observed. Cross-bedding occurs in sandy beds, as well as the presence of detraital silicatets and glacier rock flour is observed.
2. Methodology
Soil samples were collected from selected locations of Marshy lands in Hanthana area in Kandy district, near Gregory lake, Kande ela reservoir and Nanu-oya area in Nuwara Eliya district. Several samples were taken from each location representing different places of the marshy land and also different layers from each soil profile. Soil samples were kept in the oven under 600C in 24 hours and it were dried well. Then samples were separated using cone and cave method and one portion was weighted using electronic balance (XT220A-PRECISA) and reserved for sieve analysis. A sieve analysis is a procedure used to assess the particle size distribution of a granular material. A typical sieve analysis involves a nested column of sieves with wire mesh cloth.
3. Results
Glaciers have played an important role in the shaping of landscapes. Their ability to erode soil and rock, transport sediment, and deposit sediment is extraordinary. Due to the process of glacial erosion and deposition there were many glacial landforms were created. Most of the glacial related landforms were observed in the field are as follows.
Col is a saddle-like narrow depression formed by two headward eroding cirques that reduce an arête. A Col like feature was observed in Hanthana mountains which were located in the hill country of Sri Lanka. (Figure 1- a,b)
Fig. 1. (a) Col created by Alpine glaciations; (b) Col like feature observed in Hanthana mountains in the central highlands of Sri Lanka.
(a)
(b)
52

Another erosional feature observed in the Nuwara Eliya district, in the central highlands of the Sri Lanka is tarn, also known as a glacial lake. This is especially one that collects in a cirque basin behind risers of rock material or in an ice gouged depression. (Figure 2 – a,b)
Fig. 2. (a) Glacial lake in Kyrgyz Tien-shan; (b) Ancient glacial lake found in Nuwara Eliya district named Gregory lake.
Hanging valleys also can be observed as an erosional feature of a glacier. Similar kind of Hanging valley was observed associated with Nuwara Eliya district in the central highlands of Sri Lanka. Hanging Valleys carved by tributary glaciers that are left standing high above the primary valley floor. (Figure 3 – a,b)
Fig. 3. (a) Hanging valley created by Alpine glaciations; (b) Similar landform observed in Hatton area in the central highlands of Sri Lanka.
Another characteristic glacial feature was observed in central highlands of Sri Lanka. This will called an Adam’s peak and is usually having a shape of a horn. Horn is a pyramidal, sharp-pointed peak that results when several cirques glaciers gorge an individual mountain summit from all sides. (Figure 4 –a,b)
(a)
(b)
(a) (b)
53
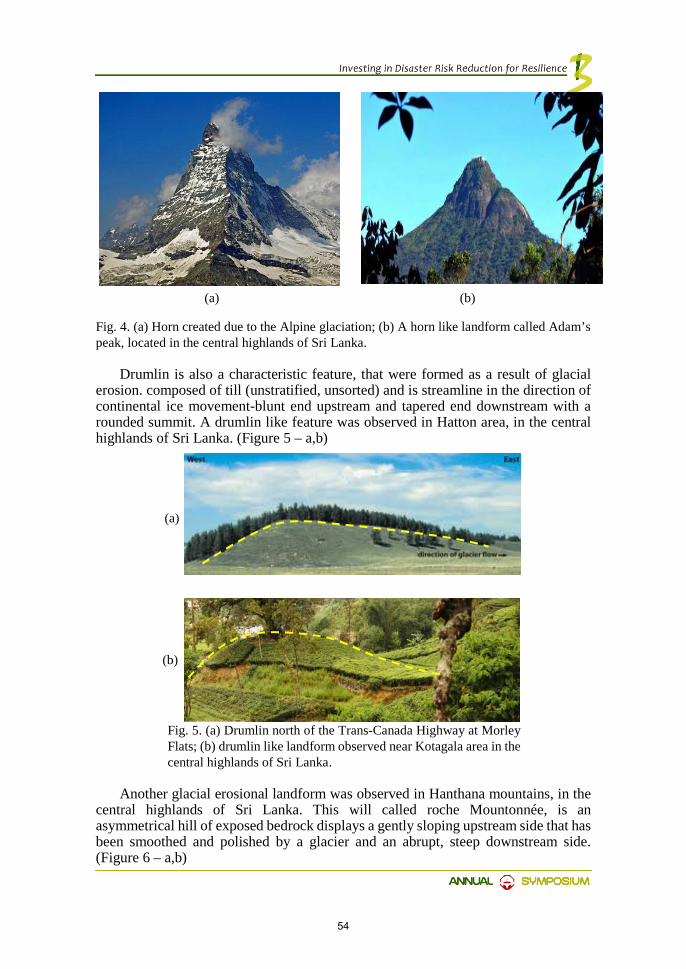
Fig. 4. (a) Horn created due to the Alpine glaciation; (b) A horn like landform called Adam’s peak, located in the central highlands of Sri Lanka.
Drumlin is also a characteristic feature, that were formed as a result of glacial erosion. composed of till (unstratified, unsorted) and is streamline in the direction of continental ice movement-blunt end upstream and tapered end downstream with a rounded summit. A drumlin like feature was observed in Hatton area, in the central highlands of Sri Lanka. (Figure 5 – a,b)
Fig. 5. (a) Drumlin north of the Trans-Canada Highway at Morley Flats; (b) drumlin like landform observed near Kotagala area in the central highlands of Sri Lanka.
Another glacial erosional landform was observed in Hanthana mountains, in the central highlands of Sri Lanka. This will called roche Mountonnée, is an asymmetrical hill of exposed bedrock displays a gently sloping upstream side that has been smoothed and polished by a glacier and an abrupt, steep downstream side. (Figure 6 – a,b)
(a) (b)
(a)
(b)
54

Fig. 6. (a) Diagram showing Roche Mountonnée; (b) Mountonnée like landform observed in Hanthana mountains in the Kandy district.
U-Shaped valleys occur in post glaciation conditions where the continual freeze and thaw has weathered away the rock walls. Many u-shaped valleys were recognized in central highlands of Sri Lanka and this may due to the Paleozoic glaciation. (Figure 7 – a,b)
Fig. 7. (a) Hunza valley created by glacial movement; (b) Similar U-Shaped valley observed in Hatton area in the central highlands of Sri Lanka.
Another characteristic feature that can created due to the erosion of glaciers is glacial erratic. Erratics are an unique rock carried by a glacial formation that deviates in size and or type relative to the native area. This type of ancient glacial erratic were found in the Hanthana mountains region, in Kandy district. (Figure 8 – a,b)
(a)
(b)
(a) (b)
55
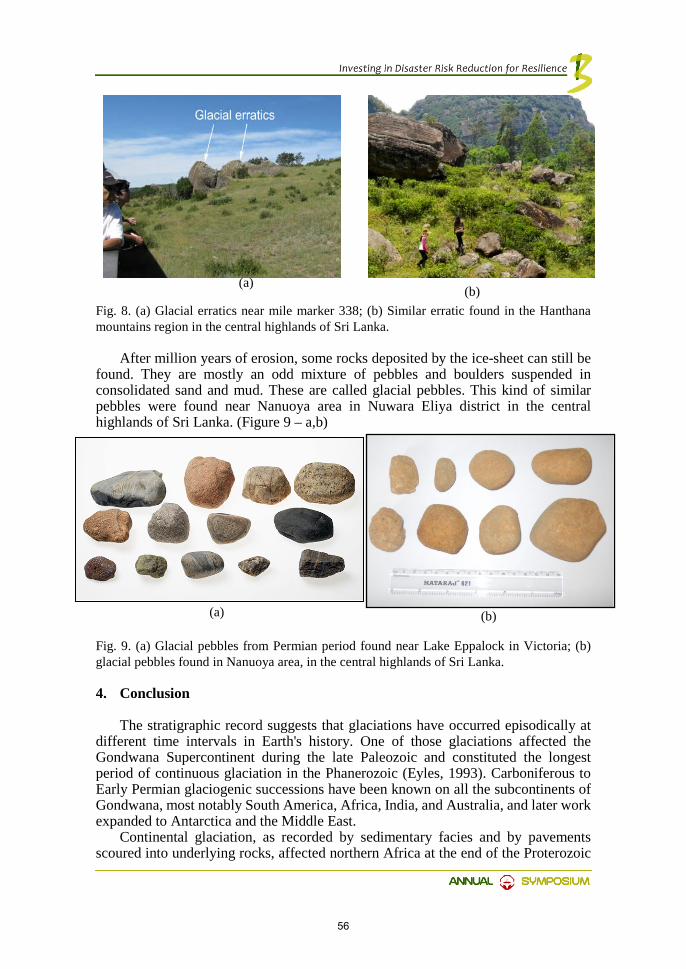
Fig. 8. (a) Glacial erratics near mile marker 338; (b) Similar erratic found in the Hanthana mountains region in the central highlands of Sri Lanka.
After million years of erosion, some rocks deposited by the ice-sheet can still be found. They are mostly an odd mixture of pebbles and boulders suspended in consolidated sand and mud. These are called glacial pebbles. This kind of similar pebbles were found near Nanuoya area in Nuwara Eliya district in the central highlands of Sri Lanka. (Figure 9 – a,b)
Fig. 9. (a) Glacial pebbles from Permian period found near Lake Eppalock in Victoria; (b) glacial pebbles found in Nanuoya area, in the central highlands of Sri Lanka.
4. Conclusion
The stratigraphic record suggests that glaciations have occurred episodically at different time intervals in Earth's history. One of those glaciations affected the Gondwana Supercontinent during the late Paleozoic and constituted the longest period of continuous glaciation in the Phanerozoic (Eyles, 1993). Carboniferous to Early Permian glaciogenic successions have been known on all the subcontinents of Gondwana, most notably South America, Africa, India, and Australia, and later work expanded to Antarctica and the Middle East.
Continental glaciation, as recorded by sedimentary facies and by pavements scoured into underlying rocks, affected northern Africa at the end of the Proterozoic
(a) (b)
(a) (b)
56
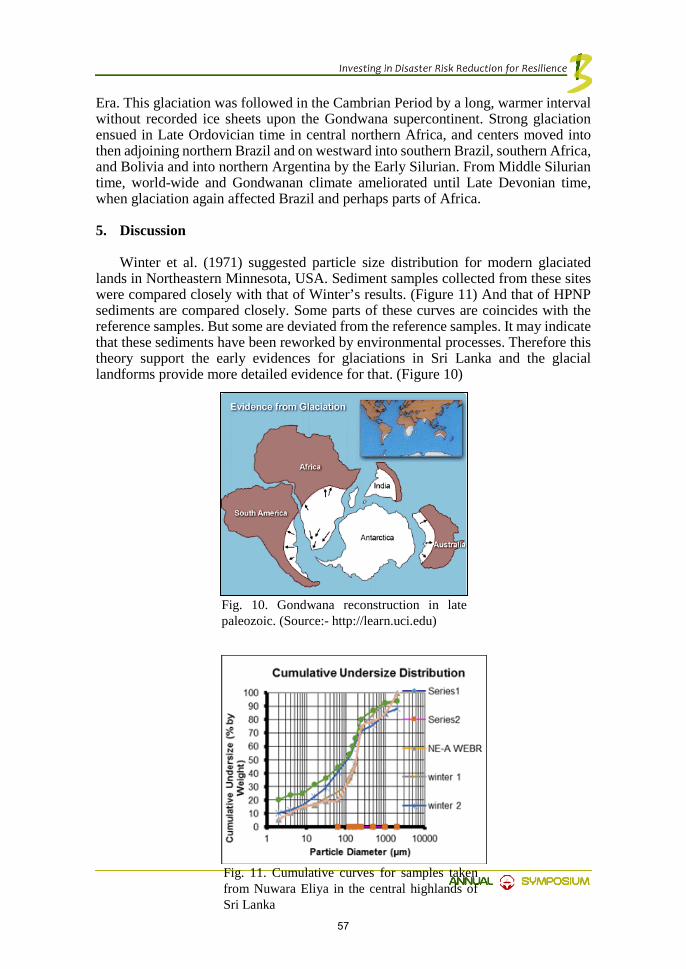
Era. This glaciation was followed in the Cambrian Period by a long, warmer interval without recorded ice sheets upon the Gondwana supercontinent. Strong glaciation ensued in Late Ordovician time in central northern Africa, and centers moved into then adjoining northern Brazil and on westward into southern Brazil, southern Africa, and Bolivia and into northern Argentina by the Early Silurian. From Middle Silurian time, world-wide and Gondwanan climate ameliorated until Late Devonian time, when glaciation again affected Brazil and perhaps parts of Africa.
5. Discussion
Winter et al. (1971) suggested particle size distribution for modern glaciated lands in Northeastern Minnesota, USA. Sediment samples collected from these sites were compared closely with that of Winter’s results. (Figure 11) And that of HPNP sediments are compared closely. Some parts of these curves are coincides with the reference samples. But some are deviated from the reference samples. It may indicate that these sediments have been reworked by environmental processes. Therefore this theory support the early evidences for glaciations in Sri Lanka and the glacial landforms provide more detailed evidence for that. (Figure 10)
Fig. 10. Gondwana reconstruction in late paleozoic. (Source:- http://learn.uci.edu)
Fig. 11. Cumulative curves for samples taken from Nuwara Eliya in the central highlands of Sri Lanka
57

Acknowledgements
I would like to forward my sincere gratitude to my supervisor Prof. Kapila Dahanayake, Professor Emeritus, Department of Geology, University of Peradeniya for his encouragement and valuable guidance throughout my research project.
My sincere thanks are offered to Dr. Jagath Gunathilake, Former head of the Department, Department of Geology, University of Peradeniya for the kind co-operation to this research project.
My sincere thanks also offered to Dr. A. Pitawala, former Head of the Department, Department of Geology, University of Peradeniya for the kind co-operation to this research project.
My sincere thanks also offered to Prof. Rohana Chandrajith, Professor in Geology, Department of Geology, University of Peradeniya for his support and constant guidance to my research project.
References
[1] Ahmad, S., 2004. Morphometric characteristics of glaciers in Indian Himalayas. Asian Journal of Water Environments and Pollution. 1. 109-118.
[2] Boulton, G.S., 1978. Boulder shapes and grain size distribution of debris as indicators of transport paths through a glacier and till genesis. Sedimentology. 25. 773–799.
[3] Dahanayake, K. and Dasanayake, D.M.S.N., 1981. Glacial sediments from Weuda Sri Lanka. Sedimentary Geology. 30. 1-14.
[4] Dahanayake, K., Jayasena, H.A.H, Singh, B.K.,Tiwari, R.S., and Tripathi, A., 1989. A Permo-Triassic (?) Plant microfossil assemblage from Sri Lanka. Review of Paleobotany and Palynology, 58 : 197-203.
[5] Dutta,P.,(2002)Gondwana Lithostratigraphy of Peninsular India.Gondwana Research,5(2),540-553.
[6] Premarathna, D.M.U.A.K. and Jayasena, H.A.H., 2009. Paleozoic glacial sediments of Sri Lanka obliterated by neotectonic events? Weuda deposits revisited. Journal of Geological Society of Sri Lanka. 13. 105-111.
58

Investigation of Megahakiula ground cavities using ground penetration radar
DMCP Bandara1, WMSH Barammane1 & MMCUB Moremada2
1 Scientist, National Building Research Organisation, Sri Lanka 2Senior Scientist, National Building Research Organisation, Sri Lanka
Abstract
Marble and calc-gniess rock terrains in Sri Lanka contain underground cavities. Cavities in the ground may causes for sinkholes and settling. An easy and quick method for investigation of ground cavities is therefore required. In the present context, ground penetration radar (GPR) survey gives the most accurate results in ground surveying within a short period of time. GPR survey can be used to investigate large area. However, it is difficult to interpret and identify underground features using GPR survey because it produces the interference between layers with different electromagnetic impedance. Megahakewula is a Marble and Calc-gneiss rich terrain in Sri Lanka. Due to the presence of these rocks, land subsidence is more prominent in this area. In this study, the depth and the size of the ground cavities were investigated. The GPR survey was conducted at a survey distance of 120 m. According to the GPR survey two cavities and a highly jointed area can be identified within this study.
Keywords: Ground cavities; Sinkholes; Ground Penetration Radar; Electromagnetic impedance
1. Introduction
Ground cavities can be form by gradually removal of slightly soluble bedrocks like Limestone and Marble by percolating water. Lowering of the water table and collapse of cave roof can be happened.
Ground cavities may cause several settling and sinkholes. In urban areas, the potential for settling and sinkholes due to ground cavities significantly affect the safety of superstructures and threaten human life more than in sparsely populated areas (Benedetto and Pensa, 2007; Brinkmann et al.,2008) Therefore, investigation of ground cavities in urban areas are more important to prevent subsidence and settlements related to ground cavities.
59

In investigating ground cavities, cone penetration test (CPT), bore hole drilling methods (BHDM), and standard penetration method (SPT) gives good results. These methods are more time consuming and incur high urban ground disturbances. In-situ penetration method can damage sewage lines, pipe lines, underground telecommunication lines and underground power supply lines. Therefore, it is required to usea non-disturbing ground penetration method to conduct underground investigations in urban distributed areas within a short time period. Ground penetration radar (GPR) is a method developed to perform the above requirement. The GPR produce only the depths and positions of the anomalies in the ground. The difficulty in standing with GPR survey is identifying cause of the anomaly.
A land subsidence case was recorded in D1 off main canal at C5+250 km of Komarika scheme, Wellewela area in Megahakiula Divisional Secretariat in the Badulla District on September 2017. This area is highly cultivated in that reason identifying this cavity formation is very important for the process of improving the irrigation system in the area.
In this study, depth and the length of the cavities were identified using GPR survey. This paper, document the procedure and the result of the experimental study and theoretical analysis of the electromagnetic wave reflection of a cavity.
2. Study area
Study area was D1 off main canal at C5+250 km of Komarika scheme, Wellewela area in Megahakiula Divisional Secretariat in the Badulla District. GPS location of the area according to WGS84 datum is 7°3’2’’N 81°3’53’’E (Figure 01)
Fig. 01. Location map of the study area (Google map)
60

2.1. Geology of the area
Fig. 2. Geological map of the study area (geology map published by Geological Survey and Mines Bureau)
According to the geology map published by Geological Survey and Mines Bureau(GSMB) (Figure 02), the study area contains marble rock; hence this area is more favourable for cavity formation.
3. Ground penetration radar
Ground penetration radar (GPR) has commonly been adopted to investigate geological structures and buried objects by detecting the interface between layers with different dielectric properties (Gutierrez et al., 2011). The GPR system consists of an antenna and control unit, as shown in (Figure 03)
Fig. 3. Measurement system of the ground penetrating radar T and R are the transmitter and receiver respectively (Hong et al., 2017)
The electromagnetic (EM) wave, which is emitted from the transmitter (T), is
reflected at and is gathered by the receiver (R). The reflected electromagnetic wave is then monitored and saved by the control unit in the time domain (Rial et al., 2009)
61

The depth of the interface which corresponds to half of the travel distance of the electromagnetic wave, is calculated as,
𝐷𝐷 = 𝑐𝑐∆𝑡𝑡
2√ƙ (1)
where, c is the velocity of the electromagnetic wave in a vacuum (2.998 × 10⁸𝑚𝑚/𝑠𝑠) ∆t is the travel time of the electromagnetic wave, and ƙ is the dielectric constant of the ground
In the practical GPR survey, the representative dielectric constants, which are summarized in Table 1 (ASTM D6432) are commonly adopted as input values to evaluate the depth of the interface. Table 01. representative dielectric constants according to the evaluation of the depth of the interfaces
Material Dielectric constant Air 1 Fresh water 81 Sand(dry) 4_6 Sand(saturated) 25 Silt(saturated) 10 Clay(saturated) 8-12 Limestone(dry) 7-9 Dolomite 6-8 Quartz 4 asphalt 3-5
The electromagnetic wave is partially reflected according to the reflection
coefficient (R*), which indicate the ratio between the amplitude of the reflected electromagnetic wave and the amplitude of the incident electromagnetic wave.
Fig. 4. Typical propagation characteristics of the electromagnetic wave
62
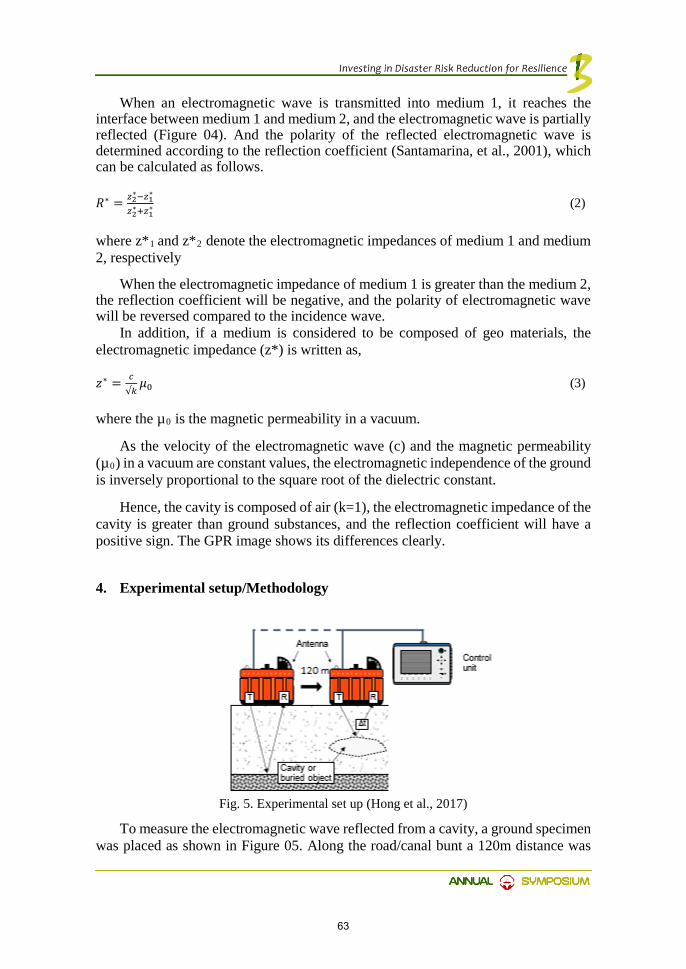
When an electromagnetic wave is transmitted into medium 1, it reaches the interface between medium 1 and medium 2, and the electromagnetic wave is partially reflected (Figure 04). And the polarity of the reflected electromagnetic wave is determined according to the reflection coefficient (Santamarina, et al., 2001), which can be calculated as follows. 𝑅𝑅∗ = 𝑧𝑧2
∗−𝑧𝑧1∗
𝑧𝑧2∗+𝑧𝑧1
∗ (2) where z*1 and z*2 denote the electromagnetic impedances of medium 1 and medium 2, respectively
When the electromagnetic impedance of medium 1 is greater than the medium 2, the reflection coefficient will be negative, and the polarity of electromagnetic wave will be reversed compared to the incidence wave.
In addition, if a medium is considered to be composed of geo materials, the electromagnetic impedance (z*) is written as, 𝑧𝑧∗ = 𝑐𝑐
√𝑘𝑘𝜇𝜇0 (3)
where the µ0 is the magnetic permeability in a vacuum.
As the velocity of the electromagnetic wave (c) and the magnetic permeability (µ0) in a vacuum are constant values, the electromagnetic independence of the ground is inversely proportional to the square root of the dielectric constant.
Hence, the cavity is composed of air (k=1), the electromagnetic impedance of the cavity is greater than ground substances, and the reflection coefficient will have a positive sign. The GPR image shows its differences clearly.
4. Experimental setup/Methodology
Fig. 5. Experimental set up (Hong et al., 2017)
To measure the electromagnetic wave reflected from a cavity, a ground specimen was placed as shown in Figure 05. Along the road/canal bunt a 120m distance was
63
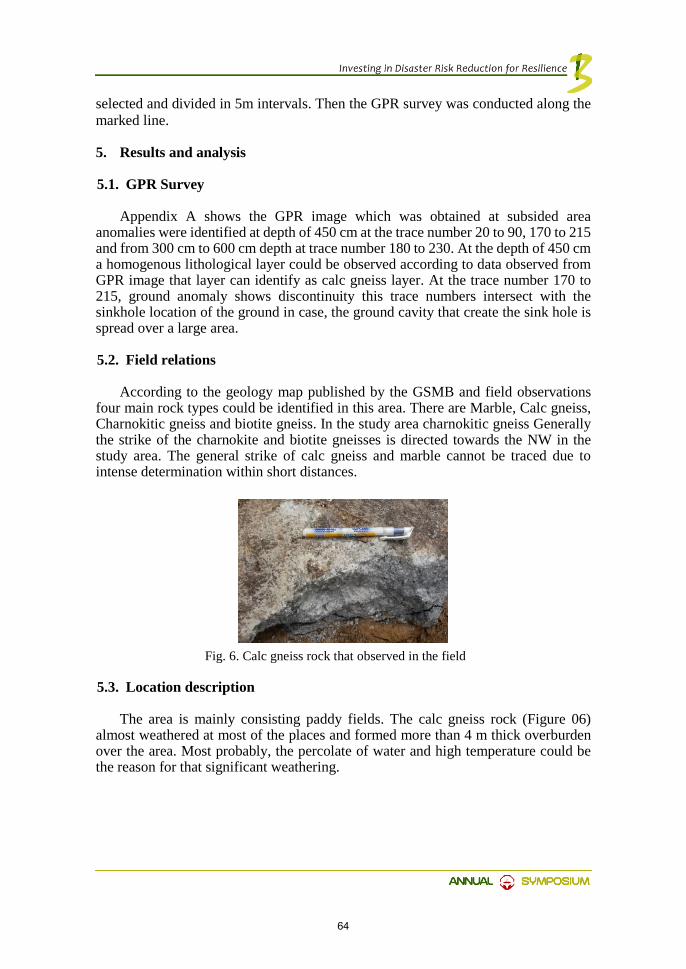
selected and divided in 5m intervals. Then the GPR survey was conducted along the marked line.
5. Results and analysis
5.1. GPR Survey
Appendix A shows the GPR image which was obtained at subsided area anomalies were identified at depth of 450 cm at the trace number 20 to 90, 170 to 215 and from 300 cm to 600 cm depth at trace number 180 to 230. At the depth of 450 cm a homogenous lithological layer could be observed according to data observed from GPR image that layer can identify as calc gneiss layer. At the trace number 170 to 215, ground anomaly shows discontinuity this trace numbers intersect with the sinkhole location of the ground in case, the ground cavity that create the sink hole is spread over a large area.
5.2. Field relations
According to the geology map published by the GSMB and field observations four main rock types could be identified in this area. There are Marble, Calc gneiss, Charnokitic gneiss and biotite gneiss. In the study area charnokitic gneiss Generally the strike of the charnokite and biotite gneisses is directed towards the NW in the study area. The general strike of calc gneiss and marble cannot be traced due to intense determination within short distances.
Fig. 6. Calc gneiss rock that observed in the field
5.3. Location description
The area is mainly consisting paddy fields. The calc gneiss rock (Figure 06) almost weathered at most of the places and formed more than 4 m thick overburden over the area. Most probably, the percolate of water and high temperature could be the reason for that significant weathering.
64

5.3.1. Sink hole
Fig. 7. (a),(b)Sinkhole formed at the canal path
Due to the collapse of cavity roof, about 5-meter long 3-meter width 4-meter deep
sinkhole has been formed along the south west directed canal path. With the profile of this sinkhole, overburden can be clearly identified. It is about 4-meter thick Reddish Brown color slightly sandy Clay soil.
5.4. Chemical reactions
Slightly acidic percolating water can dissolve the marble and calc gneiss rocks. The relevant chemical reaction is shown below, CaCO3(s)+H2O(l) Ca(HO)2(aq)+H2(g)
6. Summary and Conclusions
For acceptable results of investigation of ground cavities using GPR survey the characteristics of the electromagnetic wave must be identified. The experiment result shows that there are two cavities present in the study area; one is at trace number 30 to 90 at 450 cm depth from the ground surface and the other one is at trace number 180 to 210. It also occurs at the same depth as above. In trace number 150-230, another significant anomaly can be identified up to 600cm. This indicates rock joints. Up to 150 cm depth image shows there is a road fill/canal bunt.
Acknowledgement
This work was supported by the National Building and Research Organization (NBRO), Sri Lanka.
(a) (b)
65
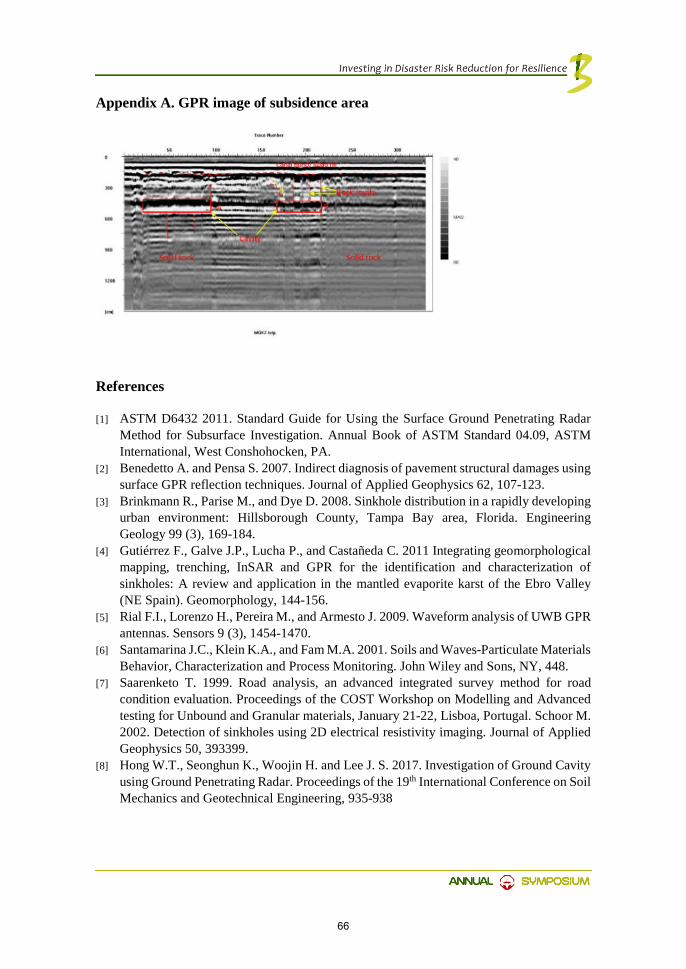
Appendix A. GPR image of subsidence area
References
[1] ASTM D6432 2011. Standard Guide for Using the Surface Ground Penetrating Radar Method for Subsurface Investigation. Annual Book of ASTM Standard 04.09, ASTM International, West Conshohocken, PA.
[2] Benedetto A. and Pensa S. 2007. Indirect diagnosis of pavement structural damages using surface GPR reflection techniques. Journal of Applied Geophysics 62, 107-123.
[3] Brinkmann R., Parise M., and Dye D. 2008. Sinkhole distribution in a rapidly developing urban environment: Hillsborough County, Tampa Bay area, Florida. Engineering Geology 99 (3), 169-184.
[4] Gutiérrez F., Galve J.P., Lucha P., and Castañeda C. 2011 Integrating geomorphological mapping, trenching, InSAR and GPR for the identification and characterization of sinkholes: A review and application in the mantled evaporite karst of the Ebro Valley (NE Spain). Geomorphology, 144-156.
[5] Rial F.I., Lorenzo H., Pereira M., and Armesto J. 2009. Waveform analysis of UWB GPR antennas. Sensors 9 (3), 1454-1470.
[6] Santamarina J.C., Klein K.A., and Fam M.A. 2001. Soils and Waves-Particulate Materials Behavior, Characterization and Process Monitoring. John Wiley and Sons, NY, 448.
[7] Saarenketo T. 1999. Road analysis, an advanced integrated survey method for road condition evaluation. Proceedings of the COST Workshop on Modelling and Advanced testing for Unbound and Granular materials, January 21-22, Lisboa, Portugal. Schoor M. 2002. Detection of sinkholes using 2D electrical resistivity imaging. Journal of Applied Geophysics 50, 393399.
[8] Hong W.T., Seonghun K., Woojin H. and Lee J. S. 2017. Investigation of Ground Cavity using Ground Penetrating Radar. Proceedings of the 19th International Conference on Soil Mechanics and Geotechnical Engineering, 935-938
66

Landslide Risk Identification in Kandy District, 2014 and 2016 Events
NC Weerasinghe1 & NIC Peiris1
1 Senior scientist, National Building Research Organisation, Sri Lanka
Abstract
Landslides have been identified as one of the most frequent and widespread natural disaster that can lead to huge damage to life and property in the mountainous terrains of Sri Lanka. Landslide Risk Reduction (LRR) has become a challenging task for geologists. Identification of site specific vulnerabilities, elements at risk and landslide risk is the grass root level involvement of the LRR.
The study was based on landslides occurred in Kandy district during adverse monsoonal rainfall events; 2014 December and 2016 May to identify the spatial distribution of incidents within the area, type of failures, and site specific elements at risk. It reveals that ground instabilities are densely accumulated into Western part of the district. 7% were natural landslides whereas 68% were manmade ground instabilities. 1519 number of elements; houses, community structures, facilities and services (buildings, access roads, schools, and hospitals) was at high risk. 1277 number of elements was proposed for resettlement in safer locations whereas 1509 number of those was proposed for other applications of LRR activities.
Keywords: Cutting failure; Landslide risk reduction; elements at risk
1. Introduction
In the top seven landslide prone districts, Kandy has been hit by numerous landslides and slope failures due to prolonged torrential rainfall during NE and SW monsoonal period, dense population, rapid urbanization, unauthorized construction and encroaching communities sloping lands. The Central Highlands is mainly underlain by well foliated, banded and highly jointed metamorphic rock formations. Such terrains are highly susceptible to failure along their natural planes of weakness. Scarp slopes often have thick accumulations of colluvium where deep seated rotational type landslides can easily occur. Rock falls are common in, steeper slopes, bedrock exposed at cliffs and escarpments. Cuts in slopes often remove the support and allow large chunks of rock and soil to slide.
67

It is important to identify landslide hazard, vulnerability, and risk in LRR activities; mitigation, preparedness and prevention to avoid and limit the potential risk. Mitigations; resettlement, application of retaining structures, turf, slope modification, improving surface and subsurface drainage lessen or limit the adverse impacts of landslides. Early warning, response and evacuation are preparedness whereas activities to prevent outright avoidance of adverse are prevention.
Many landslides hit the Kandy district during adverse rainfall events in Dec 2014 and May 2016. As per requests made by District secretariat and Divisional secretariats of Kandy district regarding reported sites, NBRO conducted preliminary geological investigations under the coordination of AGAs accompanied by disaster relief officer and followed their priorities. Cut slope failures at 18 locations along Kandy-Mahiyangana (A 26) road due to the 2014 event have been stabilized under CRIP project and more locations have been proposed for mitigation. Also mitigations are being carried out in 18 no of schools in the district to ensure school safety. Community Based Landslide Early Warning Projects will be introduced for selected communities. 50 no of lands were selected within the Kandy district to resettle the families in high landslide risk areas. Proposals are being established to engage in housing construction for these communities which will help in the prevention of future disasters.
2. Study Area
The study was concentrated mainly on 815 locations of already landslide incidents occurred in the Kandy district during the rainfall events of December 2014 and May 2016.
3. Methodology
The information needed for the study and analysis were obtained from the preliminary landslide investigation reports issued by Kandy district office of NBRO regarding those incidents. 3.1 Spatial and Statistical distribution of landslides in Kandy District
Spatial distribution of incidents will highlight the trend of occurrence with respect to the area. Analysis data on both spatial and statistical distribution of landslides in the district is used to identify the areas needing implementation of preparedness, preventive and mitigation actions and procedures.
3.2 Type of Failures
Recorded ground instabilities were categorized into landslide (LS), slope failures (SF), cutting failures (CF), rock fall (RF), structural/ construction failures (STR), and other type of failures (0). Potential landslides (PLS) are identified by using landslide signs; appearing of tensional cracks on grounds, subsidence along the cracks, cracks on wall developing bottom to top and floor of buildings, tilting of trees and posts, sudden appearing of muddy water springs at toe of slopes and disappearing of water spring at top of slopes, death of trees, displacement of boulders and etc. Identification of PLS are very important in
68

landslide risk reduction due to these areas are highly vulnerable for future landslides.
3.3 Identification of Landslide Risk
Disaster Risk (DR) is the likelihood or probability of a hazard striking a vulnerable community, causing injury, damage and loss (Fig. 01.) (DR = Hazard x Exposure x Vulnerability /Capacity). Identification of hazards and vulnerability, monitoring and management of risk are integral to sustainable resilient developments. Elements at risk are people, household and community structures, community facilities and services (buildings, access roads, bridges, schools, and hospitals), livelihood and economic activities (jobs, crops, livestock, and equipment) and the environment. For that reason, it is very important to understand site specific landslide risk in disaster risk reduction.
Site specific levels of risk were determined for post failure locations based on the decision making criteria such as field observations (geological, hydrological and geomorphological features and landslide symbols), and collaboration with expert opinions.
Fig. 1.Risk is the overlay of hazard and vulnerability
4. Results and Discussion
According to the table 01, 815 number of ground instabilities were investigated. 803 number of reports was issued to District Secretariat and Divisional secretariats. 1519 number of houses, buildings and other infrastructures was at High Risk (HR) whereas 1411 number of those was at Medium Risk (MR). 1277 number of dwellings was proposed to resettle. 1509 number of buildings and roads was recommended for implementation of other LRR activities to live with landslides.
RISK
VULNERABILITY
HAZARD
69

Table 1. Statistical data extracted from landslide investigation reports
DSD No of
Ground Incidents
Risk Level LRR Activity
HR MR Resettled Mitigation/ Preparedness
Akurana AKU 16 18 28 18 36 Delthota DEL 30 106 173 106 173 Doluwa DOL 19 55 41 54 19 Ganga Ihala Korale GIK 48 258 68 251 60
Gangawata Korale GWK 169 155 168 103 131
Hatharaliyadda HAT 10 11 95 11 54 Harispaththuwa HRS 52 53 75 38 133 Kundasale KUN 47 26 53 18 48 Medadumbara MDB 61 93 71 85 106 Minipe MNP 12 29 12 9 35 Panvila PAN 23 77 15 41 34 Pasbage PAS 23 106 43 100 55 Pathadumbara PDM 32 25 49 14 56 Tumpane TUM 11 7 15 5 14 Pathahewaheta PHT 13 137 18 136 17 Poojapitiya PJP 12 4 10 4 6 Ududumbara UDD 31 97 138 96 136 Udunuwara UDN 67 88 169 71 145 Udapalatha UDP 54 106 110 103 130 Yatinuwara YTI 85 68 60 14 121
Total 815 1519 1411 1277 1509
4.1 Distribution of Landslides in Kandy District
According to Fig. 2, incidents are densely accumulated in Western part of the district that comprises of mountainous terrains as well as highly populated areas. Fig. 3. shows that, ground failures is significantly higher in Gangawata Korale whereas that is noticeably lower in Thumpane, Poojapitiya, Hatharaliyadda, and Minipe than in other divisions.
4.2 Type of Failures
Fig. 4. shows that out of recorded incidents, 68% are cutting failures whereas only 6% and 1% are landslides and rock falls correspondingly. Moreover, 13, 9, and 3 percentages of them are slope failures, other and structural failures respectively.
70

Fig. 2. Spatial distribution of the landslides Fig. 3. Statistical distribution of landslide incidents in Kandy district
According to Fig. 5, the highest percentage of cutting failures is recorded in
Gangawata Korale DSD. Unauthorized constructions/ developments, encroachment of sloping land with rapidly urbanization and dense population are causing induced man-made ground instabilities. Landslides are prominent in Doluwa, Delthota, Gangaihala Korale, Pasbage korale, and Ududumbara. About half of the landslides are large scale potential landslides. Such deep seated potential landslides are due to higher thickness of talas deposits at toe of escarpments in the central highlands. 9% of rock falls are recorded in Panvila, Medadumbara and Ududumbara due to detachment of rock blocks from highly jointed metamorphic rocks.
020406080
100120140
Distribution of no of incidents
2014 2016
71

Fig. 4. Distribution of different types of ground failures
Fig. 5. No of different types of ground failures Vs DSDs
4.3 Identification of Risk
According to Fig. 6, higher number of elements is at risk in Gangaihala Korale, Pasbage Korale, Delthota, Doluwa, Pathahewaheta and Ududumbara due to potential landslides whereas 103 of families had been resettled in safer locations in Gangawata Korale due to cutting failures. Rapid urbanization and associated growth of unauthorized and densely populated communities in hazardous locations, such as steep slopes, are powerful drivers in a cycle of landslide risk accumulation. Frequently, it is the most socioeconomically vulnerable group who inhabit landslide-prone slopes.
0
2
4
6
8
10
12
14
16OLSSFRFCFx10
9%
6%
13%
68%
1%3%
OLSSFCFRFSTR
72

Fig. 6. No of families and properties proposed to be resettled and applied landslide risk reduction measures
5. Conclusion and Recommendations
Based on the results of the present study, the following conclusions about the ground instabilities in Kandy district induced by monsoonal rainfall events in Dec 2014 and Jan 2016 are made. • Landslides were scattered into Western part of the district. • 7% were natural landslides whereas 68% were manmade ground instabilities.
• Gangawata Korale DSD is highly vulnerable for cutting failures. • 25 large potential landslide areas where tragic landslides can occur with an
adverse rainfall event were identified in Gangaihala Korale, Pasbage Korale, Delthota, Doluwa, Medadumbara, Ududumbara area.
• 1277 number of buildings/infrastructures was resettled whereas 1509 number of those was proposed for the application of landslide risk reduction measures.
• It should be further encouraged to design and construct landslide resilient buildings and developments on slope lands through the building approval process to minimize the man-made ground instabilities especially within the Gangawata Korale and Yatinuwara DSDs.
• Community based landslide early warning projects should be implemented for communities at medium risk for living with landslides.
• Landslide vulnerable areas where implementation of LRR is practically not applicable should be declared as Landslide High Risk Sensitive Areas.
Type of Failure LS SF CF RF STR O % of Failure 6% 13% 68% 1% 3% 9%
0
50
100
150
200
250
AKU DEL DOL GIK GWK HAT HRS KUN MDB MNP PAN PAS PDM TUM PHT PJP UDD UDN UDP YTI
18
106
54
251
103
11
38
18
85
9
41
100
145
136
4
96
71
103
14
Resttled
LRR
73
• It is proposed to update landslide hazard zonation maps including possible landslide debris flow and rock fall paths.
Acknowledgements
I extend my appreciation to the members of the staff, Kandy District Office, Landslide Research and Risk Management Division of National Building, who helped me in data collection.
References
[1] Arambepola, N., 2014. Basic Disaster Management Definitions & Terms MSc. Lecture Notes, Asian Disaster Preparedness Center, Bangkok, Thailand
[2] Cooray, P.G., 1974. The Precambian of Sri Lanka: A historical review. Precambian Research.
[3] Cooray, P.G., 1984. An Introduction to the Geology of Sri Lanka (Ceylon), 2nd revised edn, National Museums Department, Colombo.
[4] Dahanayake, K., 1995. Mechanism of Landslides in the Central, Highlands Handbook on Geology and Mineral Resources of Sri Lanka, GEOSAS-II, Colombo.
[5] Jayalath, D.R.K., et. al. (2016). Landslide Situation on Mid of May in Kegalle District, Sri Lanka, Symposium Proceedings, NBRO International Symposium.
[6] NBRO., 1995. Landslide hazard mapping in Sri Lanka. User manual, landslide hazard mapping project, SRL 89/001.
[7] Weerasinghe, N.C., Dahanayake, K., & Jayathissa., G. (2015). Influence of Topography and Geological Structures on road-cut failures in Central Highlands, Sri Lanka, International Conference on Geotechnical Engineering, Colombo.
74
Mechanism of the Unpredicted Slope Failures in Residual Soil under Extreme Weather Conditions: A Case Study
on Athwelthota Landslide in the Kalutara District EMNH Ekanayake1, LAL Kithmini, WAKS Ariyakumara1 & SB
Harankahawa1
1Scientist, National Building Research Organisation, Sri Lanka
Abstract
The extremely high incessant rainfall within a short period from the 25th night till morning of 26th May 2017 triggered several landslides in Kalutara district. One catastrophic landslide occurred in Athwelthota caused nine deaths and severe damages to infrastructures in the area. Kalawana – Baduraliya road and the Palan Ganga were blocked with the debris and Athwelthota Gangaramaya temple was partially destroyed by the sliding mass. The mechanism of the landslide was studied based on field observations, rainfall data, stereo net analysis, landslide hazard zonation maps, geology maps and satellite images. The study revealed that the landslide was initiated as two separate branches in the escarp-slope covered with natural vegetation. Then the slide had taken place along the valley in the direction approximately N200E. Stereo net analysis revealed that a circular failure has occurred in the residual soil and the intact underlying weathered rock on the escarp- slope. Tensional cracks were identified in the right side of the crown with a very thick overburden which has a potential for another landslide. Since the affected area is susceptible to future landslides, it must be declared as a restricted zone to prevent further damages to life and property. As the Kalawana-Baduraliya main road lies across this landslide area, proper mitigation measures must be taken without delay to prevent the possible future damages to the road. Keywords: landslide, circular failure, residual soil, tensional cracks, mitigation
75
1. Introduction
Unprecedented rainfall received during a short period of time during 25th and 26th of May, 2017 caused occurrence of several landslides in Kalutara District. This tragic event caused severe damages including human deaths, injuries and damages to infrastructure mainly in Bulathsinghala and Palindanuwara Divisional Secretariat. Athwelthota village in Athewelthota Grama Niladari division of Palindanuwara Divisional Secretariat had experienced a cumulative rainfall of more than 241 mm as confirmed based on the data from automated rain gauge (R43) of National Building Research Organization (NBRO) situated at Baduraliya on 26th May. The catastrophic landslide occurred in Athwelthota on 26th May 2017 due to the high intensity of rainfall caused 9 deaths and severe damage to infrastructure. Due to this landslide 07 houses were fully damaged while 17 houses are at high risk and 06 houses are at medium risk presently. Kalawana – Baduraliya road and Palan Ganga were blocked with the debris and Athwelthota Gangaramaya temple was partially destroyed by the landslide.
2. Study Method
The selected study area was subjected to several field visits to observe geological, geomorphological, hydrogeological and lithological characteristics of the area. Rainfall data from NBRO rain gauge were collected to find the cumulative rainfall in the region experienced at the time of the disaster. The landslide hazard zonation maps, lithology maps and satellite images were further used to study the landslide.
3. Observations
3.1. Geomorphological features
According to the 1:10000 scale landslide hazard zonation map prepared by National Building Research Organisation for the Palindanuwara DS, the landslide has initiated in the medium risk zone (Figure 1). Athwelthota landslide has taken place on an escarp slope inclined towards north direction with 450-500 slope angle. Natural vegetation cover could be observed at the crown region of the landslide (Figure 2a & 2b). Landslide has initiated as two separate branches and then the flow path had an average direction of N200E taking the direction of an existing valley. Left branch of the crown region has an average direction of N300E where the right side is towards N450W. At present stream path can be observed on the two main branches of the landslide. Toe of the landslide laid on the Palan Ganga which had added huge amount of debris to the river flow. Width of the widest part (toe) of the landslide is about 150 m while the length of the landslide is nearly about 450 m.
76

Fig. 1. Landslide area shown in 1:10000 scale landslide hazard zonation map
(a) (b) Fig. 2. Satellite map of Athwelthota landslide (a) before the landslide (b) after the landslide
77
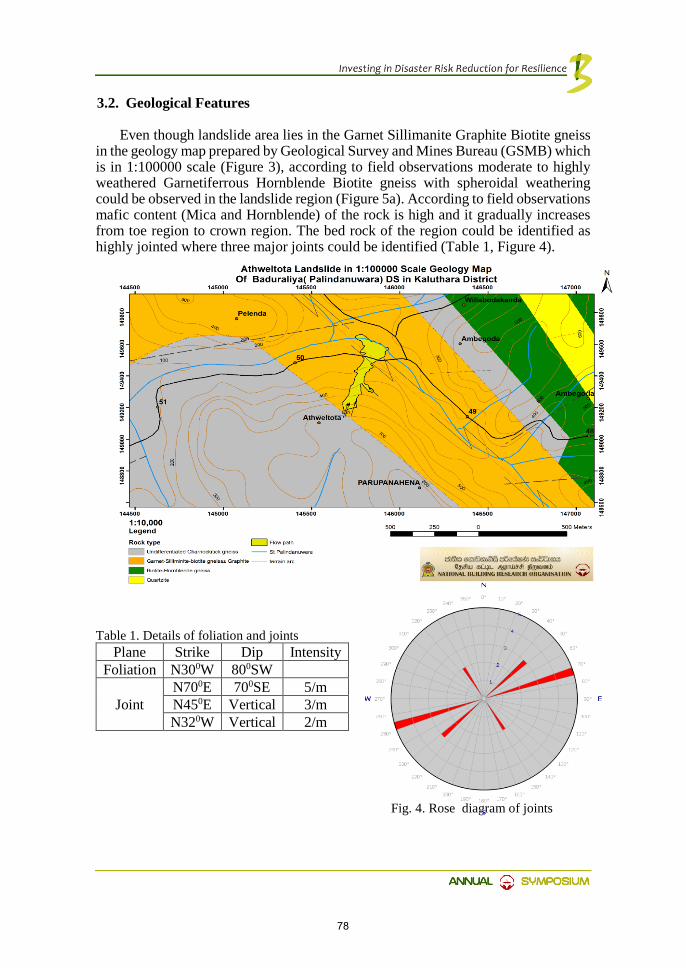
3.2. Geological Features
Even though landslide area lies in the Garnet Sillimanite Graphite Biotite gneiss in the geology map prepared by Geological Survey and Mines Bureau (GSMB) which is in 1:100000 scale (Figure 3), according to field observations moderate to highly weathered Garnetiferrous Hornblende Biotite gneiss with spheroidal weathering could be observed in the landslide region (Figure 5a). According to field observations mafic content (Mica and Hornblende) of the rock is high and it gradually increases from toe region to crown region. The bed rock of the region could be identified as highly jointed where three major joints could be identified (Table 1, Figure 4).
Fig. 3. Geology map of landslide region
Table 1. Details of foliation and joints
Fig. 4. Rose diagram of joints
Plane Strike Dip Intensity Foliation N300W 800SW
Joint N700E 700SE 5/m N450E Vertical 3/m N320W Vertical 2/m
78
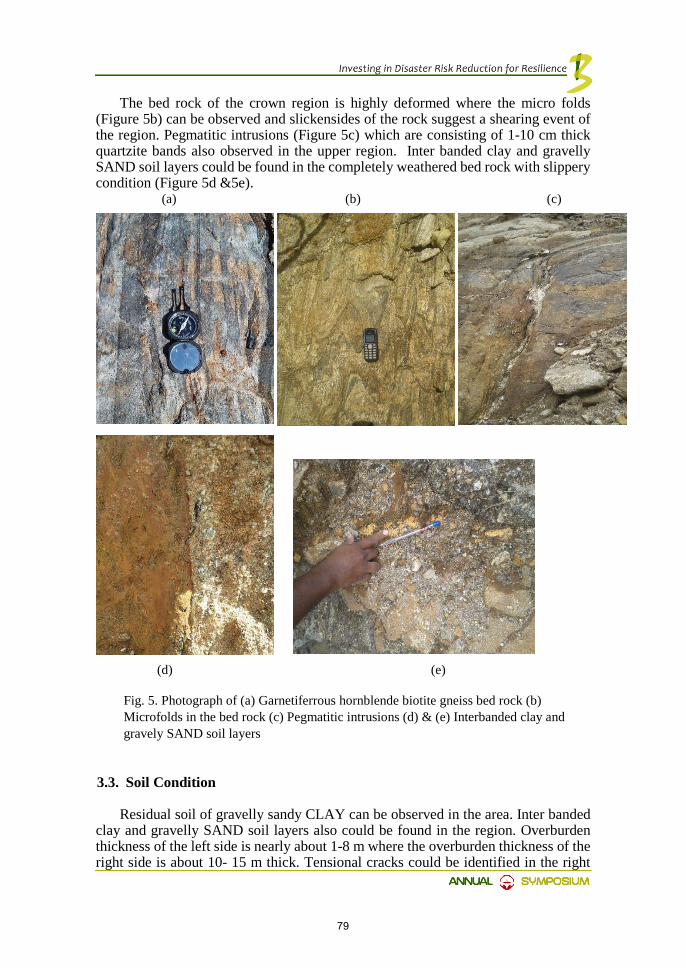
The bed rock of the crown region is highly deformed where the micro folds (Figure 5b) can be observed and slickensides of the rock suggest a shearing event of the region. Pegmatitic intrusions (Figure 5c) which are consisting of 1-10 cm thick quartzite bands also observed in the upper region. Inter banded clay and gravelly SAND soil layers could be found in the completely weathered bed rock with slippery condition (Figure 5d &5e).
(a) (b) (c) (d) (e)
Fig. 5. Photograph of (a) Garnetiferrous hornblende biotite gneiss bed rock (b) Microfolds in the bed rock (c) Pegmatitic intrusions (d) & (e) Interbanded clay and gravely SAND soil layers
3.3. Soil Condition
Residual soil of gravelly sandy CLAY can be observed in the area. Inter banded clay and gravelly SAND soil layers also could be found in the region. Overburden thickness of the left side is nearly about 1-8 m where the overburden thickness of the right side is about 10- 15 m thick. Tensional cracks could be identified in the right
79
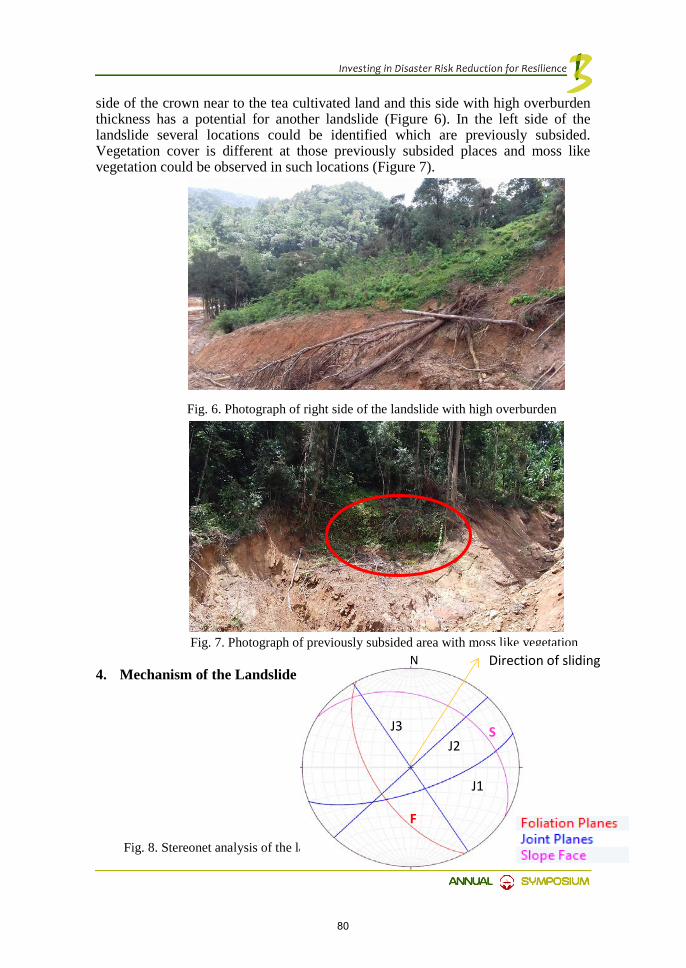
side of the crown near to the tea cultivated land and this side with high overburden thickness has a potential for another landslide (Figure 6). In the left side of the landslide several locations could be identified which are previously subsided. Vegetation cover is different at those previously subsided places and moss like vegetation could be observed in such locations (Figure 7).
Fig. 6. Photograph of right side of the landslide with high overburden
Fig. 7. Photograph of previously subsided area with moss like vegetation
4. Mechanism of the Landslide
Fig. 8. Stereonet analysis of the landslide
Direction of sliding N
J1
J3 J2
S
F
80

According to stereo net projection (Figure 8) bed rock is dipping into the slope and therefore, sliding is difficult through the foliation plane. But there is a near vertical intersection (J3) dipping in to the slope and which is nearly parallel to the strike of the foliation plane. So that toppling is more likely to occur in the direction of sliding. Also, there is a conjugate joint set J2 and J3 therefore intact rock can separate along J2, J3 and foliation plane. Therefore, circular failure in residual soil and weathered intact rocks occur along the escarpment slope is the most possible explanation based on the stereo net analysis of the Athwelthota landslide.
Slip surface has created through highly weathered bed rock with residual soil and the moderately weathered bed rock. With the high intensity of unexpected rainfall residual soil and highly weathered bed rock have failed. Perch water table may have created due to the presence of clay layers and high mafic mineral concentration also responsible for forming this type of weaker zones in the bed rock.
Degree of weathering varies from residual soil in the upper part of the slope to slightly weathered rock at greater depth. For these conditions, the sliding surface will lie predominantly in the weaker materials in the upper part of the slope, and in the stability analysis it is necessary to use different strength parameters for the upper and lower portions of the sliding surface. Because the degree of degradation of weathered rock tends to be highly variable, the strength of the rock mass will also be variable and can be difficult to measure.
5. Conclusions and recommendations
Athwelthota landslide has taken place in a zone recognized as a medium risk zone in 1:50000 Landslide Hazard Zonation map prepared by NBRO. It suggests that under extreme weather condition landslide medium risk zones can be converted into high risk zone. Therefore, new threshold values should introduce into the Hazard Zonation map considering the rainfall intensity. Geological structures and mineralogical characters in the bed rock should also be considered in this respect.
Area must be declared as a reservation zone in order to prevent possible further damages to life and property, because the area is susceptible for future landslides. Mitigation measures must be taken to prevent future damages to the Kalawana- Badureliya road. Erecting of a boulder barrier parallel to the main road would be a suitable initial solution to minimize the landslide impact.
Acknowledgements Authors wish to thank N.K. Weerasekara, Scientist and
J.A.C.W.Wickramasinghe, Management Assistant of National Building Research Organisation, Asanka Gallage, Management Assistant of Palindanuwara Divisional Secretariat, Villagers of Athwelthota GN division and all staff members of Kalutara Site Office, National Building Research Organisation for the support given to conduct the research.
References [1] Cruden, D. (1991). A simple definition of a landslide. Buletin of the International Association of
Engineering Geology, 43(1), pp.27-29 [2] Mampitiyaarachchi, C.D., Bandara, K.N., Bandara, R.M.S., & Indrathilake, H.M.L. (2016)
Hillside Debris Flows in Sri Lanka: A Case Study at Aranayake, Proceedings of NBRO International Symposium, Colombo.
81
Real-Time Data Processing & Forecasting Model to Predict Disasters Situation (Landslides) Based On
Physical Properties
HR Maduranga1, BMRK Balasuriya2, WDMS Amarasena3& MB Dissanayake4
1 Senior Engineer, National Building Research Organisation, Sri Lanka
2 Senior Scientist, National Building Research Organisation, Sri Lanka 3 Engineers, MCs Batch-2015, University of Peradeniya
4 Senior Lecturer, University of Peradeniya
Abstract
The global economy continues to face complex challenges due to the rapid development that does not align with sustainable or green development concepts which will end up with significant negative impacts on human well-being resulting in numerous casualties and fatalities. The landslide losses can be considered as one of the main challenges which has increased in parallel to the increase in anthropogenic activities continued on unstable hill slopes.
This research has focused on the utilization of integrated applications which connect several sensor modules to capture data real-time basis and timely identification and monitoring of “ground water level” and “rain fall intensity” in landslide susceptible areas. Although ground water level is often a primary controlling factor in land sliding, modelling of ground water table is difficult due to the complex internal geology in most landslides. Therefore, it is required to identify different approaches to locate the ground water table and other dependant factors. Also the transmission of collected data over mobile communication platforms is a critical factor to conduct slope stability analysis at the centralized data store with the support of historical data patterns. These paper present landslide locations proposed monitoring details and developed sensor modules to capture the real-time data.
Keywords: Ground water level; Landslide monitoring; Rain fall intensity;
82
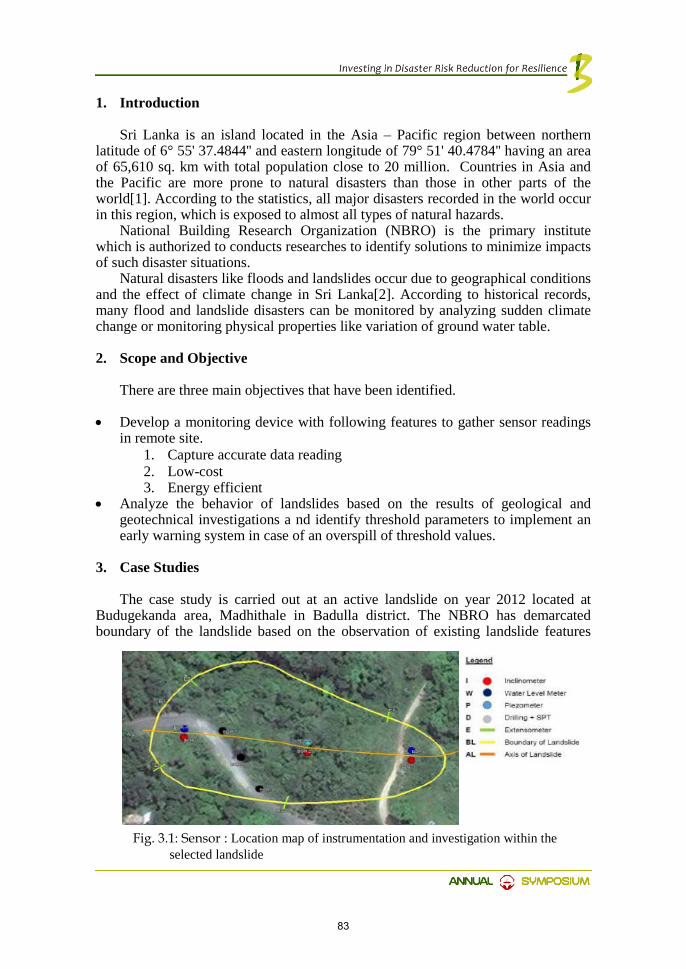
1. Introduction
Sri Lanka is an island located in the Asia – Pacific region between northern latitude of 6° 55' 37.4844'' and eastern longitude of 79° 51' 40.4784'' having an area of 65,610 sq. km with total population close to 20 million. Countries in Asia and the Pacific are more prone to natural disasters than those in other parts of the world[1]. According to the statistics, all major disasters recorded in the world occur in this region, which is exposed to almost all types of natural hazards.
National Building Research Organization (NBRO) is the primary institute which is authorized to conducts researches to identify solutions to minimize impacts of such disaster situations.
Natural disasters like floods and landslides occur due to geographical conditions and the effect of climate change in Sri Lanka[2]. According to historical records, many flood and landslide disasters can be monitored by analyzing sudden climate change or monitoring physical properties like variation of ground water table.
2. Scope and Objective
There are three main objectives that have been identified.
• Develop a monitoring device with following features to gather sensor readings in remote site.
1. Capture accurate data reading 2. Low-cost 3. Energy efficient
• Analyze the behavior of landslides based on the results of geological and geotechnical investigations a nd identify threshold parameters to implement an early warning system in case of an overspill of threshold values.
3. Case Studies
The case study is carried out at an active landslide on year 2012 located at Budugekanda area, Madhithale in Badulla district. The NBRO has demarcated boundary of the landslide based on the observation of existing landslide features
Fig. 3.1: Sensor : Location map of instrumentation and investigation within the selected landslide
83

such as tensional cracks, subsidence, upheaval and direction & extent of debris flow of the ground surface.
The axis of landslide has been determined according the direction of flow path of the debris flow. The proposed locations of instrumentations and detail geotechnical investigations were conducted based on the characteristics & parameters of the exiting landslide (refer Figure 3.1).Subsurface information of the landslide was collected by advancing of borehole investigation with collection of continuous soil and rock samples. The properties of continuous soil samples were used to determine the assumed depth of slip surface.
The actual depth of slip surface will be determined by manual monitoring of inclinometer installed within the landslide. The ground water level within the landslide will be automatically recorded in locally developed automatic water level sensor. The extent of surface tension cracks will be observed using extensometers installed across the boundary of landslide. The piezometer installing within the landslide will be used to observe the behavior of ground water pressure at the specific depths.
The threshold values for real time data processing & forecasting model are determined using the data collected by monitoring activities and the results of detailed geotechnical investigation carried out at the study area.
4. Measurements
“Ground water level” and “Rain intensity” are the main two parameters which are going to be captured at the initial stage of the research presented. Ground water
level shall be monitored using high quality pressure sensor units/gauges, with a ceramic pressure chip sensor - and a measurement range of 0-30 psi [3]. The detail construction of the pressure sensor is shown in Figure. 4.1.
Rain sensor module is an easy tool for rain detection and to measure rain intensity. It can be used as a switch when raindrop falls through the raining board (refer Fig. 4).
Following are the pre-requests to
be catered in parallel to the borehole installation.
Fig 4.1: Sensor details
84

Step 1: Place the selected pressure sensor at the bottom of the bore hole after the insulating as shown in Figure 4.2.
Step 2: Place the Rain fall intensity sensor at a suitable location to monitor rainfall intensity.
Step 3: Install an Arduino module, similar to the sample shown in Figure 4.3 to the proposed system. The Arduino module (Programmed Microcontroller) is configured as an integrated circuit box which is used to place the data collection logic for both the sensors.
All the analog data readings will be converted to digital data stream using Analog to Digital conversion module.
Step 4: To meet the requirements of real-time monitoring of the changes in ground water table in a given area, an
intelligent network system is used to collect the required information continuously. The monitoring system developed using sensor technologies on top of the GSM Network.
There are three possible transmitting methods that can be used to transfer digitized data stream to central data store in real-time.
Those are, 1. Transfer data via GPRS Technology [5] 2. Transfer data via Wi-Fi Technology [7] 3. Transfer data via SMS. However, most suitable transmission method has to be finalized case by case,
based on the network availability in sensor deployed area.
5. Module Developed For Capturing Sensor Data
According to the NBRO monitoring requirement, the module was developed (Refer Figure 5.1) with a real time clock, Arduino Pro mini programming board to capture the data, SD card for record the data and lithium battery for power supply. The module is designed to be cost effective and energy efficient considering the difficulty to provide main power supply to the site location.
This application running on the device captured data recorded in a text file inside the SD card for a one hour interval. The recorded typical data is given in the Figure 5.2.Before installing the pressure sensor, it was calibrated using the water head and captured data using the device and calibration given in Figure 5.3.
Fig. 4.2: Placement of sensors
Fig. 4.3: Arduino module
85

y = 2.8325x - 1138.9R² = 0.999
-50
0
50
100
150
200
250
300
350
400
350 400 450 500 550
Wat
er L
evel
(cm
)
Sensor Analog Value (ADC)
Preser senser Claribration
Fig. 5.3 Pressure sensors Calibration
Battery
Arduino Pro Mini Board
Sensor Connection Port
SD Card
Fig. 5.2 Data recording Format
Fig. 5.1 New Device setup
86

6. System Setup
Fig. 6. Real-time landslide monitoring process
The System consist of six stages of data analysing stages as shown in figure 6.
7. Data Processing Method
Machine learning is the data processing method which is going to be used for analysing sequence of observations usually ordered in time.
Prediction of the future behaviour is based on the collected past data and observed behaviour pattern (Figure 7). However, traditional methods of time-series analysis are mainly concerned with decomposing the variation of a series st into trend and seasonal effects. Definition of these terms can be given as follows.
Trend: This is a long-term change in the mean level. Ex: an increasing trend.
Seasonal Effect: Many time series (water level readings) exhibit variation which is seasonal (Ex. monthly) in period. The measure and the removal of such variation bring to de-seasonalized data.
Irregular fluctuations: After trend and cyclic variations have been removed from a set of data, we are left with a series of residuals, which may or may not be completely random. There are many potential benefits of feature selection:
• Facilitating data visualization • Reducing the measurement and storage. • Reducing training and utilization
Fig. 7 Pattern analysis
Online Data Store Selection Pre-Processing
Transformation
Interpretation/Evaluation
DATA Mining
Knowledgebase
Real Time Processing
Predicted Landslide Location
Disaster Alarm
Real-time Landslide monitoring Process
87

8. Conclusion
This paper presents the developed hardware using sensor technologies to automate the task of landslide monitoring and early warning by measuring ground water level on a real time bases. The developed system is designed considering the low-cost, energy efficient and accurate ground water level reading which can be used for further analysis.
The collected data will be used to derive forecasting model to predict disasters situation. The forecasting model can be develop further of this project after gathering required history data which is being collected at installed sites. GSM Network connectivity impacts this proposed application as a primary limitation as it is being used to push sensor reading to centralize data store in real-time basis.
9. References
[1] U. N. ESCAP IDD, “Disasters in Asia and the Pacific: 2015 Year in Review Typhoon Koppu approaching the Philippines in October 2015,” no. October, 2015.
[2] National Building Reaserch Organisation, NBRO INTERNATIONAL SYMPOSIUM 2016. 2016. [3] B. Protection, “Zhuang Eric â€TM s Store DC 5V 1 / 8NPT Thread Pressure Sensor Stainless
Steel Pressure Transmitter,” pp. 1–13, 2017. [4] MC Measurement Computing, “Data Acquisition Handbook,” A Ref. DAQ Analog Digit. Signal
Cond., 2012. [5] V. Manual, “SIM800 Series_AT Command Manual_V1.09 Document Title: SIM800 Series AT
Command Manual,” 2015. [6] Digi Inc, “Arduino UNO Reference Design,” p. 2, 2013. [7] S. Hosseyni, E. N. Bromhead, J. Majrouhi Sardroud, M. Limbachiya, and M. Riazi, “Real-time
landslides monitoring and warning using RFID technology for measuring ground water level,” WIT Trans. Built Environ., vol. 119, no. May 2011, pp. 45–54, 2011.
88

Relationship between width of a landslide and soil overburden thickness
EASN Wimalawardhana1, DMDIK Ariyarathna1, HMD Madushan1 &
HML Indrathilake2
1Scientist, National Building Research Organisation, Sri Lanka 2Senior Scientist, National Building Organisation, Sri Lanka
Abstract
Landslides are recurrent natural hazards that had very often impacted economy and human habitats in the country long time. In the recent past, particularly in 2016 and 2017, many human and property losses have been recorded in the Kegalle, Rathnapura, Kalutara and Matara districts. When consider landslide vulnerable areas, a landslide body can be divided mainly into three parts; landslide initiation area, flow path and deposition area. Both people and the property in such areas are directly vulnerable to the landslide disaster.
As per requests made by District Secretariats and Divisional Secretariats of the Rathnapura and Kegalle districts, National Building Research Organisation (NBRO) conducted preliminary geological investigations in 20 areas of reported major landslide incidents. The study revealed that though the rainfall is the main triggering factor for landslides in Sri Lanka, not all slopes made unstable by rainfall alone. There are other important causative factors such as thickness of the overburden soil which influences sliding. The present study which was mainly focused on the correlating the slides with the ratio between thickness of the overburden soil and width of landslide. It was found that, the overburden soil thickness to landslide width ratio is approximately 0.15. Making use of this finding must be further investigated and clarified in view of future interpretation of potential landslides.
Keywords: Overburden thickness; width of the landslide
1. Introduction
Sri Lanka is an island in Indian Ocean which lies on southeast part of the Indian subcontinent. Its land extent is about 65610 km2 and its climate include two monsoon periods as north-east monsoon and south-west monsoon according to the
89

geomorphology and orientation in Indian Ocean. In this climate setting, Sri Lankan people have faced few natural disasters such as floods, landslides, droughts, lightening and storms. Based on the information available in Ministry of Disaster Management for the period of 1974-2004, affected peoples in above disaster and they are clearly identified these disaster as the most common disaster in Sri Lanka. But in the past ten years landslide is a most well- known disaster in Sri Lanka.
Ten districts of the country
have been declared as landslide prone district by NBRO namely Kalutara, Galle, Hambantota, Nuwara-Eliya, Matale, Kandy, Kegalle, Rathnapura, Matara and Badulla. A catastrophic landslide event was experienced due to prolonged rainfall during May 2016/2017 in the Kegalla and Rathnapura districts. It caused the
loss of lives and damaged to properties, infrastructures and the environment. In the year 2016/2017, the Landslide Research and Risk Management Division
of NBRO had investigated landslide prone areas in those districts. According to the causative factors, size, nature of the failures, and influence of man-made activities, the investigated sites have been categorized in to landslide, slope failure, cutting failure, rock falls and subsidence by using visual observations in identified landslide risk areas such as tension cracks, Overburden thickness, terrain geometry, bedrock properties, etc [7].
In these investigations, affected areas should be clearly identified. For the purpose of identification of affected area, knowing about the direct relationship between overburden soil thickness and width of the failure is the most important point.
Affected area of a landslide can be categorized in to three major parts, namely rupture area or initiation area, flow path and deposition area [7]. Size of the flow path and deposition area mainly depend on the thickness of the overburden soil and width of the landslide in the initiation or rupture area [3]. Therefore, getting relationship of these two parameters are more important to predict the risk level or affecting area of the potential landslide.
Fig. 1. Map of the landslide prone District in Sri Lanka
90
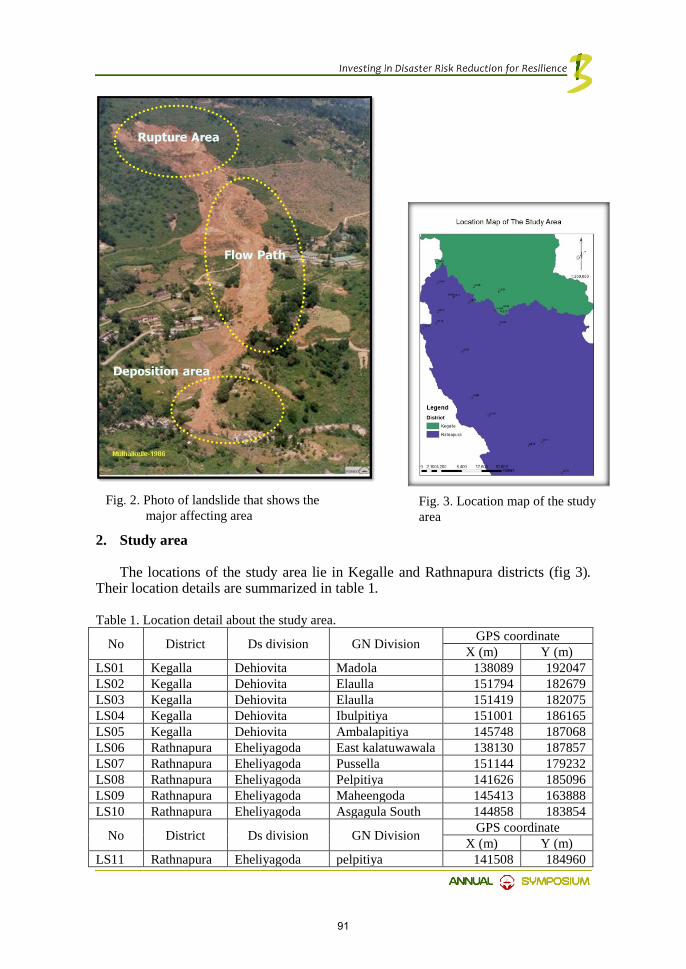
2. Study area
The locations of the study area lie in Kegalle and Rathnapura districts (fig 3). Their location details are summarized in table 1.
Table 1. Location detail about the study area.
No District Ds division GN Division GPS coordinate X (m) Y (m)
LS01 Kegalla Dehiovita Madola 138089 192047 LS02 Kegalla Dehiovita Elaulla 151794 182679 LS03 Kegalla Dehiovita Elaulla 151419 182075 LS04 Kegalla Dehiovita Ibulpitiya 151001 186165 LS05 Kegalla Dehiovita Ambalapitiya 145748 187068 LS06 Rathnapura Eheliyagoda East kalatuwawala 138130 187857 LS07 Rathnapura Eheliyagoda Pussella 151144 179232 LS08 Rathnapura Eheliyagoda Pelpitiya 141626 185096 LS09 Rathnapura Eheliyagoda Maheengoda 145413 163888 LS10 Rathnapura Eheliyagoda Asgagula South 144858 183854
No District Ds division GN Division GPS coordinate X (m) Y (m)
LS11 Rathnapura Eheliyagoda pelpitiya 141508 184960
Fig. 2. Photo of landslide that shows the major affecting area
Fig. 3. Location map of the study area
91

LS12 Rathnapura Eheliyagoda Karadana North 137920 179509 LS13 Rathnapura Eheliyagoda Karadana North 135213 178445 LS14 Rathnapura Eheliyagoda Mapotha 138175 181856 LS15 Rathnapura Nivithigala Pebotuwa 164285 148040 LS16 Rathnapura Nivithigala Pahala Karawita 157234 153742 LS17 Rathnapura Nivithigala Horangala 160164 154592 LS18 Rathnapura Kuruwita Pathberiya 150174 182187 LS19 Rathnapura Ayagama Ayagama 148894 160101 LS20 Rathnapura Kiriella Hadukanda 143311 173516
3. Methodology
As per the requests made by district and divisional secretariats Kegalle and Rathnapura districts, NBRO conducted preliminary geological investigation of the reported landslide incidents during 2016 and 2017 years. Among them 20 incidents of landslides (slope failures) were selected for this study. Thickness of the overburden soil and width of the landslide in the rupture area were measured and overburden soil thickness to landslide width ratio were calculated.
4. Results & discussion
According to the results of table 2anf fig. 4, average value of overburden soil thickness to landslide width ratio value is 0.146 (0.15). This value can deviate by 0.05 (+/- 0.05). Table 2. Calculation of overburden soil thickness to landslide width ratio for each landslide.
No width of landslide (m) Overburden thickness (m) Ob. thick/width
LS01 5 1.00 0.200 LS02 15 2.50 0.167 LS03 36 4.50 0.125 LS04 35 4.00 0.114 LS05 42 6.50 0.155 LS06 25 3.50 0.140 LS07 15 2.50 0.167 LS08 50 7.00 0.140 LS09 15 2.50 0.167 LS11 28 4.50 0.161 LS12 47 5.00 0.106 LS13 25 3.50 0.140 LS14 22 3.00 0.136
No width of landslide (m) Overburden thickness (m) Ob. thick/width LS15 25 3.00 0.120 LS16 20 4.00 0.200 LS17 20 3.00 0.150 LS18 75 7.50 0.100 LS19 22 3.00 0.136 LS20 39 6.00 0.154
Average 0.146
92
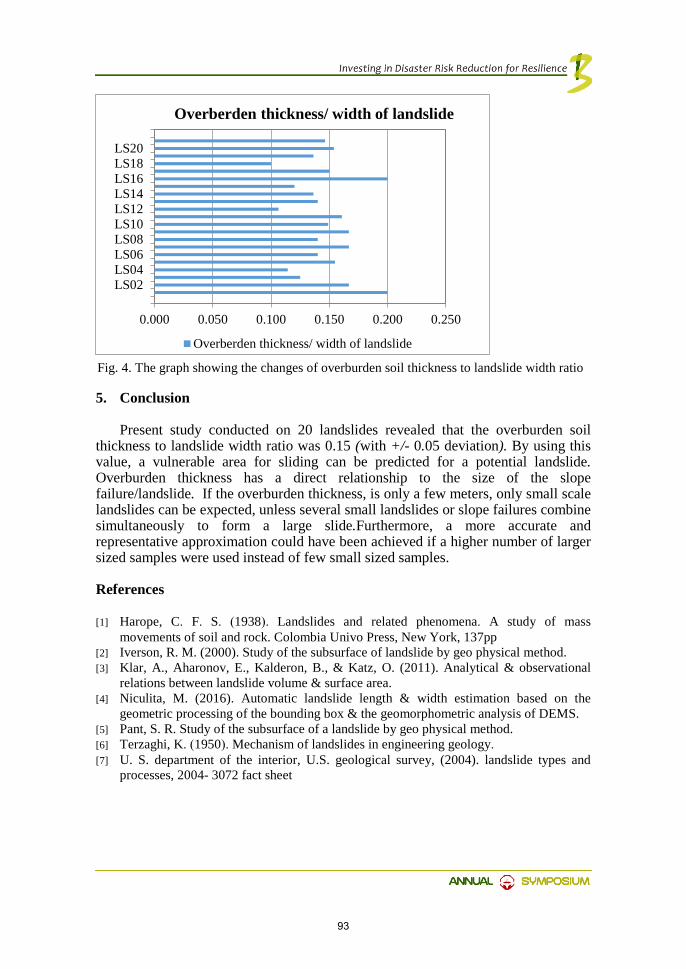
5. Conclusion
Present study conducted on 20 landslides revealed that the overburden soil thickness to landslide width ratio was 0.15 (with +/- 0.05 deviation). By using this value, a vulnerable area for sliding can be predicted for a potential landslide. Overburden thickness has a direct relationship to the size of the slope failure/landslide. If the overburden thickness, is only a few meters, only small scale landslides can be expected, unless several small landslides or slope failures combine simultaneously to form a large slide.Furthermore, a more accurate and representative approximation could have been achieved if a higher number of larger sized samples were used instead of few small sized samples.
References
[1] Harope, C. F. S. (1938). Landslides and related phenomena. A study of mass movements of soil and rock. Colombia Univo Press, New York, 137pp
[2] Iverson, R. M. (2000). Study of the subsurface of landslide by geo physical method. [3] Klar, A., Aharonov, E., Kalderon, B., & Katz, O. (2011). Analytical & observational
relations between landslide volume & surface area. [4] Niculita, M. (2016). Automatic landslide length & width estimation based on the
geometric processing of the bounding box & the geomorphometric analysis of DEMS. [5] Pant, S. R. Study of the subsurface of a landslide by geo physical method. [6] Terzaghi, K. (1950). Mechanism of landslides in engineering geology. [7] U. S. department of the interior, U.S. geological survey, (2004). landslide types and
processes, 2004- 3072 fact sheet
0.000 0.050 0.100 0.150 0.200 0.250
LS02LS04LS06LS08LS10LS12LS14LS16LS18LS20
Overberden thickness/ width of landslide
Overberden thickness/ width of landslide
Fig. 4. The graph showing the changes of overburden soil thickness to landslide width ratio
93
Two Dimensional Electrical Resistivity Tomography for Subsurface Cavity Detection
LAAW Wimalsinghe1, MKC Jayamali2 & MMCUB Moremada3
1Scientist, National Building Research Organisation 2Research Officer, Gem and Jewellery Research and Training Institute
3Senior Scientist, National Building Research Organisation
Abstract
The presence of weak zones or cavities in subsurface carbonate rocks causes severe problems during foundation design for high raise building. These features could be potentially dangerous and several incidents associated with a collapse of buildings due to the subsidence phenomena had been reported. Some area around Kandy city contains underground marble rocks which could make underground solution cavities and voids. In this study, proposed Asiri hospital premises, Kandy was selected as the study area since it is affected by subsurface cavity formation. Objectives of this study were to detect subsurface cavities or related feature in carbonate rocks for foundation alterations. In this context, electrical resistivity sounding as a geophysical method is used as a cost-effective solution for investigating subsurface caves, voids, and shallow weathered zones. 2-D electrical resistivity survey had been carried along fourteen profiles using Pole–Pole array in the area. The data after the field survey were processed using Res2dinv software with the settings of inversion parameters considering the response physical common karstic features in the area. The subsurface fill cavity, boulder, and discontinuity were detected in some part of the studied area. 2-D Electrical resistivity tomography is an indirect method, and therefore, results require to be validated with borehole records. Validation shows a good correlation with available borehole records and pile log records in determining the subsurface of carbonate formation. 2-D electrical resistivity method based analysis can be considered as a practical method for the mapping of karst features, subsurface condition up to a greater depth and as a cost-effective indirect method.
Keywords: Subsurface Cavity Detection; Electrical Resistivity
94

1. Introduction
Voids and cavities in subsurface calcium carbonate rocks cause severe problems during construction process (Sum et al., 1996) in major development projects. A subsurface cavity can be defined as all subsurface features cavities, caves, caverns, voids, karst, and sinkholes (Owen, 1983). Most of the natural cavities are formed by dissolution in carbonates i.e.; Limestone, Marble and dolomite and evaporates i.e.; salt, gypsum, and anhydrite. Karst topography is the feature which is formed by dissolution of subsurface material made by downward percolating meteoric water (Benito et al., 1995).
Sinkholes are a common karst topographic feature which is developed as a result of the dissolution of limestones reacted with acidic polluted water (Al-Zarah, 2007). With time, groundwater penetrated through weak zones such as joints in limestone will grow channels and voids (Elawadi, 2003). This process can reach a hazardous stage, where the roof of the cavity will no longer sustain the weight of the over-burden and structures on the surface. That may cause negative and disastrous effects on building structures on the ground and give rise to variable geotechnical hazards like ground subsidence, collapsing of surface structures and propagating cracks and fissures in the surface buildings (Elawadi, 2003). Therefore, detection and delineation of subsurface cavities prior to construction in such area is essential.
The common and expensive method used earlier to locate cavities was drilling, whereas, nowadays more effective and economic solutions such as geophysical surveys are used together with limited drilling at the critical locations for more efficient target verification and mapping. Demarcation of underground cavities and shallow weathered zone using geophysical methods has a widespread application in the recent days (Vachiratienchai et al., 2010). Electrical Resistivity Tomography (ERT) is one of the more frequently used geophysical methods in exploring the subsurface conditions. It offers a rapid and economical imaging of the shallow subsurface with a satisfactory resolution.
Kandy city area is undergoing rapid development in infrastructure and housing facilities (Fig. 1). During the primary construction process, few subsurface cavities have been reported at different locations and depths resulting high losses of grout in piling. This area are underlined by marble and dolomitic Rocks, where due to the availability of sub-surface cavities or related features increase in development activities geotechnical problems have been reported as a result of host carbonate rock solution process. When the carbonate rocks are wetted during agricultural activities, groundwater exploitation, waste disposal and even during rain storms, dissolution takes place followed by ground subsidence due to either the removal of salts from the rocks or the rearrangement of soil particles in loose sediments (van Schoor, 2002).
The presence of subsurface cavities and sinkholes in the locality of the construction site of the proposed Asiri Hospital Premises close to Kandy city, at Mulgampola had been reported to National Building Research Organisation. Therefore, the prime objective of this study is to demarcate the extent of weathered surface layers and investigate subsurface caverns or related structures as a rock mass for proceeding piling work at the site, by applying non-destructive surface ERT method. Imaging such subsurface hazards was requested by structural engineers for designing alteration of pile depths and any other improvements of
95

foundations as they found water loss and grout loss in some of piles at the site during constructions.
2. Study area
The study area covers about 0.84hec and its lies within the Latitude of 7.2742940 to 7.2743760 and Longitude of 80.6106730 to 80.6121520. Altitude of the studied area varies around 470 m from the mean sea level. The study area is located in Gatambe Grama Niladari Division in Kandy Municipal council area. The study area is characterized by high grade metamorphic rocks and it consists of quartzite and marble with sedimentary origin (Fig 1.). Resistivity Survey line arrangement is illustrate in Fig 2.
Fig 1. Location map of the study area in the Kandy
Fig 2. Resistivity Survey line arrangement
96

3. The 2-D Electrical Resistivity Tomography (ERT) method
The 2-D ERT method has popular applications in environmental, engineering and shallow subsurface investigations (van Schoor, 2002). It is based on assumption that various entities like minerals, solid bedrock, sediments, air and water filled structures have detectable electrical resistivity contrast relative to the host medium (Pánek et al., 2010). In this study, significant resistivity contrasts between hard carbonate bedrock, the intercalated cavities and weak subsurface zones could be detected.
Fig 3. Most common electrode arrays
The ERT method involves defining subsurface resistivity distribution by taking
ground surface measurements; it is based on Ohm’s law. The principle of ERT technique consists of the application of constant direct current imposing into the ground via two current electrodes and measuring the resulting voltage at two potential electrodes. The method is based on the multi-electrode and multicable system. Each of the electrodes alternatively acts as a current and potential electrode. The position of current and potential electrodes during the measurement is dependent on the chosen geometry of electrode arrays. Most frequently used arrays are the dipole-dipole, Wenner, pole-pole and Schlumberger arrays (Fig. 3). Each electrode configuration has specific advantages and disadvantages, based on the penetration depth and the horizontal resolution. In this study, the Pole- pole configuration has been utilized because it provides quite deep penetration, reliable stability and ability to detect both horizontal and vertical subsurface features. The configuration is based on the fixed spacing between potential electrodes while the spacing between current electrodes is logarithmically increased for a number of dipole lengths (Fig. 3). Then the spacing between potential electrodes is increased in order to obtain more deep penetration.
4. Data acquisition
The 2-D ERT data were acquired along fourteen profiles in the most probable cavity affected areas in the proposed site (Fig. 2). Pole-Pole electrode array had
97

been utilized and the unit electrode spacing was 2.5m and 5 m along all the acquired profiles. The total length of survey was 1167m (Fig. 2). Then the concatenate option from RES2DINV (Loke and Barker, 1996) inversion software was used to gather different segments into one profile. The data acquisition was arranged considering at least one profile across or very close to cavity features aiming to obtain typical resistivity evidence. The whole measurement was carried out along the possible profiles in the study area after scattering some water to ensure a wet surface condition, which is favored for getting good coupling between electrodes and ground for signal quality.
Generally, the data obtained during ERT field measurements are initially presented as apparent resistivity pseudo-sections, which give an approximate picture of the subsurface resistivity. Before the inversion process, to obtain a true model representing the continuous distribution of calculated electrical resistivity in the subsurface, the data were concatenated and the noise and spiky values were edited. Then, inversion procedure was applied using RES2DINV software, which is based on the regularized least-squares optimization method (Loke et al., 2003).
5. Results
The surveyed area is almost flat because of site preparation. But in some profiles, the topographic difference was considered in the inverted profiles. After adjusting the input data and choosing the optimum inversion parameters, a few iterations were enough to get the inverted resistivity models representing the subsurface distribution until the depth was greater than 15.0 m from the ground surface. The obtained information about the shallow subsurface along the resistivity cross-sections was interpreted based on high and low resistivity values, and its relation to the known features in the surveyed area (Fig. 4).
a.) b.)
c.) d.)
98

Fig. 4. Inverted 2-D resistivity sections in the study area. (a) to (m) are the inverted section along line 1-14 respectively.
5.1. Calibration
Resistivity imagines line number 4 (Chainage 62.5m to 139.5m of grid A1) was selected for calibration of ground resistivity ranges for the site with reference to available pile drilling logs and available samples. Therefore, it was assumed that the resistivity range found in P144, P170 and P201 piles are representing solid rock. Used resistivity profile for calibration is presented in Fig. 4 (n) and summarized table with resistivity ranges and matched subsurface layers represented in table 2.
e.)
h.) g.)
f.)
k.)
j.) i.)
l.)
99

Fig. 5 Resistivity profile for calibration (Line 04) Table 2: Summary of subsurface materials and matching of ground resistivity ranges using resistivity line 4
Pile No Material P144 P170 P201 Remarks
Sandy Clay Soil
3 to 33 Ω.m
13 to 78 Ωm
33 to 51 Ω.m
These values are within the range of common resistivity values.
Quartzite 3 to 78 Ω.m
- - Quartzites present as veins. When considering the geological experience, fissures (usually filled with water as the ground water level is above the veins), weathered materials could associate with veins. Therefore, ground resistivity is in lower ranges than common values of solid Quartzite rock.
Crystalline Limestone (Marble)
78 to 90 Ω.m
78 to 90 Ω.m
78 to 90 Ω.m
As per the gathered details from the piling logs, there was no evidence of water loss, Bentonite loss or grout loss found. Therefore, ground resistivity > 90ohm.m in Marble rock could be assigned to solid enough Marble rock.
Investigation of the inverted 2-D ERT profiles (Fig. 4) revealed the following
features: The inverted resistivity data represent the resistivity distribution to a maximum
depth of about 90m. When considering resistivity imagine results, following generalized ground resistivity values can be adapted based on site calibration. The shallow highly weathered vein Quartzite layer was detected with relatively low resistivity values (less than 40ohm.m) at variable depths based on the degree of weathering and/or the surface irregularities of the underneath layer (Fig. 4). The low resistivity values of the weathered layer could be referred to the wet conditions from the surface construction activities. Ground resistivity range less than 40ohm.m that found below the marked bedrock line of each profile could be considered as Marble or related rock consisting high amount of ground water or silt/clay filled caverns or fracture lines. Ground resistivity range greater than 40 ohm.m below the marked bed rock line of each profile could be considered as relatively solid Marble or related rock.
The hard Marble bedrock can be investigated clearly with variable surface topography. It has higher resistivity values (>40 ohm. m), and extends almost to the end of the investigated depths (Fig. 4). Along with some profiles, it is possible to
100
trace shallow weathered zones below the quartzite vein and above the hard marble layer. Such feature is also characterized by low resistivity values (Fig. 4). It is considered as a preliminary stage of formulating different cavity and/or sinkhole in carbonate rocks. The occurrence of subsurface cavities can be traced along the surveyed lines at different places (marked as low resistivity material zone in Fig.4). Such features are extending up to 20m depth, and have little or no extension at the surface. The depth to the solid and hard marble bedrock (marked as higher resistivity material zone in Fig. 4) can be traced clearly along with all the surveyed lines.
6. Conclusion
The ER survey of a proposed construction site revealed several low resistivity regions which were interpreted as usually filled with water as the ground water level is above the veins. A shallow boring programme involving the anomalous portion of the surveyed area revealed numerous cavities and verified the resistivity measurements’ overall accuracy. The synthetic model and the field survey results demonstrated the efficacy of Pole-Pole array ERT method in subsurface cavity mapping. It is recommended to conduct a borehole along the line 4 to the depth of 30m to correlate obtained resistivity ranges with rock mass strength parameters like Rock Quality Designation values (RQD). The drilling result validated cavity location and existence delineated by the ER technique and lent credence to its applicability in karst terrain. It is recommended that cement-based grout should be injected into the subsurface cavities to improve the strength of subsurface materials and reduce permeability prior to the construction to avoid settlements.
7. References
[1] Benito, G., Perez del Campo, P., Gutierrez-Elorza, M. & Sancho, C.(1995). Natural and human-induced sinkholes in gypsum terrain and associated environmental problems in NE Spain. Environmental Geology,Vol: 25, 156-164.
[2] Elawadi, E. A.(2003). Cavity detection by integrated geophysical methods. PhD. Thesis, Kyushu University, Japan.
[3] Loke, M. & Barker, R.(1996). Rapid least-squares inversion of apparent resistivity pseudosection by a quasi-Newton method. Geophysical Prospecting, Vol: 44, 131-152.
[4] Loke, M.H., Acworth, I. & Dahlin, T.(2003). A comparison of smooth and blocky inversion methods in 2D electrical imaging surveys. Exploration Geophysics. Vol: 34, 182-187.
[5] Owen, T.E.(1983). Detection and mapping of tunnels and caves. Developments in Geophysical Exploration Methods-5, 161-258.
[6] Sum, C. W., Othman, J. & Loganathan, P.(1996). Geotechnical problems in limestone terrain with emphasis on cavities and sinkholes. Seminar Geologi dan Sekitarn, UKM, Puri Pujangga, Bangi, 102-117.
[7] Vachiratienchai, C., Songkhun, B. & Weerachai, S.(2010). A hybrid finite difference finite element method to incorporate topography for 2D direct current (DC) resistivity modeling. Physics of the Earth and Planetary Interiors 183,426-433.
[8] Van Schoor, M.(2002). Detecting of sinkholes using 2D electrical resistivity imaging. Journal of Applied Geophysics,Vol: 50, 393-399.
101
RISK ASSESSMENT
Damage and loss assessment of Landslide Disasters in Sri Lanka - A case study based on Landslide Disasters in May 2017
WKC Kumarasiri1
1Scientist, National Building Research Organisation, Sri Lanka
Abstract
Out of 25 administrative districts in Sri Lanka thirteen (13) districts are considered as prone to landslides. These landslide prone areas cover approximately 30% (19,500 km2) of the total land area of the island, and it is occupied by about 38% (7.6 million) of the population of Sri Lanka. In in May 2017, South West monsoon was activated, and some areas in the Ratnapura, Kalutara, Galle, Matara and Habanthota districts received more than 500 mm rainfall within 24 hours. Due to this heavy rainfall, 35 major landslides were recorded and Landslide rapid assessment was conducted with expert consultation. Drone surveys were conducted on each landslide location to extract basic information of the landslides and to identify damage to property, agriculture & infrastructure. According to rapid assessment, gross damage and loss to all the sectors is LKR 1.08 billion. This rapid damage assessment will guide to estimate the loss due to landslides and to identify initial investment required for recovery process.
Keywords: Landslide, Damage and loss assessment
1. Introduction
South-west monsoon activated over Sri Lanka from May 2017 and a very low upper air wind convergence was formed over the eastern sea of Sri Lanka which was absorbing westerly winds. As a result of this, heavy rains were received on 25th of May by the South-western watersheds in the country. Large amounts of rains fell within 12 hours in SW regions including Namunuthanna (619 mm), Bulathsinghela (419 mm), Morawaka (406 mm) and Walasmulla (437 mm) leading to riverine foods of the Kalu, Nilwala and Gin rivers.
2017 Sri Lanka floods and landslides resulted from a heavy southwest monsoon, beginning around 18 to 19 May 2017. Flooding and landslides were worsened by the arrival of the precursor system to Cyclone Mora, causing flooding and landslides throughout Sri Lanka during the final week of May 2017. Landslides and floods together affected 15 districts, resulted the loss of 208 lives and 78 persons were reported to be missing. As of 3rd June, 698,289 people were affected, while 11,056
102

houses were partially damaged and another 2,093 houses completely destroyed. According to Disaster Management Center, about 600,000 people were displaced due to the floods.
The flooding and landslides severely affected Sri Lanka's Western Province, Sabaragamuwa Province, Southern Province and part of Central Province. The worst-affected districts were Kalutara, Matara, Galle, Kegalle and Ratnaputra. In Kalutara, flooding of the Kalu River also triggered several mudflows. Agalawatte, a town within Kalutara District, reported 47 deaths and 62 people missing as of 29 May, with many areas made inaccessible by landslides. Ratnaputra District had recorded 79 deaths by 30 May.
National Building Research Organisation (NBRO) is the national focal point for landslide risk management in Sri Lanka. As the technical agency functioning under the purview of the Ministry of Disaster Management, NBRO carried out a rapid damage and loss assessment of the landslides in Ratnapura, Kalutara, Galle, Kegalle, Colombo and Matara districts. The objective of this assessment was to conduct a rapid assessment of loss and damage to lives and property, caused by landslides.
2. Methodology of damage & loss assessment
Assessment methodology had been developed to assess the landslide loss & damage of the landslide events occurred in May 2017. This methodology will cater for further development of landslide vulnerability curves for the landslide risk profile development program. Methodology for landslide damage & loss assessment is in Figure 1.
Settlements in Sri Lanka are classified as urban, rural and estate by the Department of Census and Statistics based on their social, economic, and political characteristics. This classification is important to understand the characteristics of the housing stock, land use, and settlement conditions. Based on the principal construction materials, the houses are further classified into three categories, as permanent, semi-permanent and improvised. The definitions for settlement types and housing categories are provided in Table 1 and Table 2 below:
Fig. 1. Landslide damage & loss assessment methodology
103
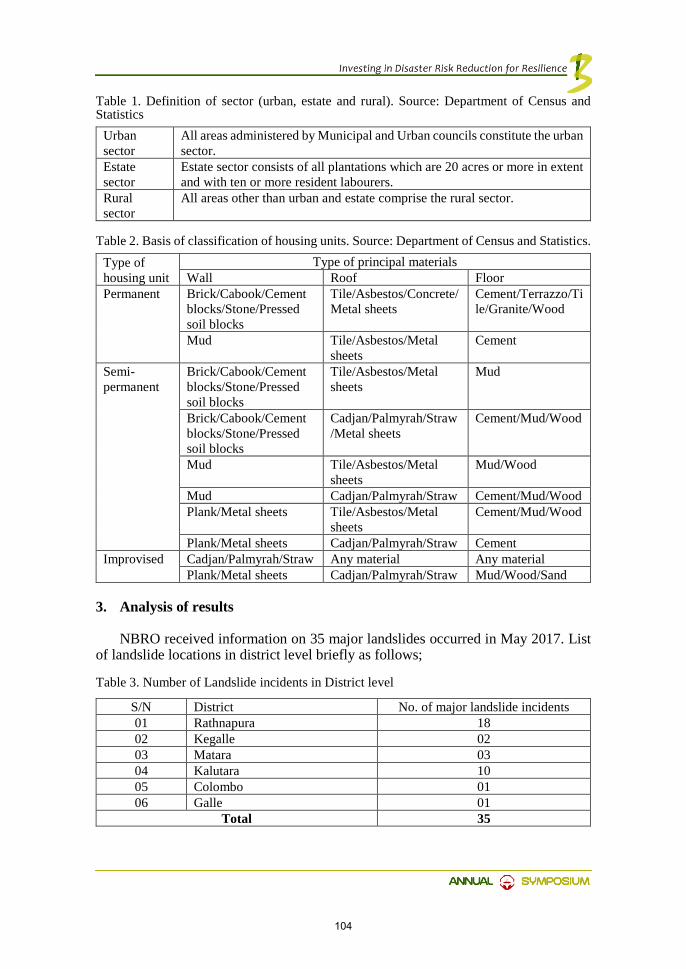
Table 1. Definition of sector (urban, estate and rural). Source: Department of Census and Statistics
Urban sector
All areas administered by Municipal and Urban councils constitute the urban sector.
Estate sector
Estate sector consists of all plantations which are 20 acres or more in extent and with ten or more resident labourers.
Rural sector
All areas other than urban and estate comprise the rural sector.
Table 2. Basis of classification of housing units. Source: Department of Census and Statistics. Type of housing unit
Type of principal materials Wall Roof Floor
Permanent Brick/Cabook/Cement blocks/Stone/Pressed soil blocks
Tile/Asbestos/Concrete/Metal sheets
Cement/Terrazzo/Tile/Granite/Wood
Mud Tile/Asbestos/Metal sheets
Cement
Semi-permanent
Brick/Cabook/Cement blocks/Stone/Pressed soil blocks
Tile/Asbestos/Metal sheets
Mud
Brick/Cabook/Cement blocks/Stone/Pressed soil blocks
Cadjan/Palmyrah/Straw/Metal sheets
Cement/Mud/Wood
Mud Tile/Asbestos/Metal sheets
Mud/Wood
Mud Cadjan/Palmyrah/Straw Cement/Mud/Wood Plank/Metal sheets Tile/Asbestos/Metal
sheets Cement/Mud/Wood
Plank/Metal sheets Cadjan/Palmyrah/Straw Cement Improvised Cadjan/Palmyrah/Straw Any material Any material
Plank/Metal sheets Cadjan/Palmyrah/Straw Mud/Wood/Sand
3. Analysis of results
NBRO received information on 35 major landslides occurred in May 2017. List of landslide locations in district level briefly as follows;
Table 3. Number of Landslide incidents in District level
S/N District No. of major landslide incidents 01 Rathnapura 18 02 Kegalle 02 03 Matara 03 04 Kalutara 10 05 Colombo 01 06 Galle 01
Total 35
104
Based on received information to landslide loss & damage assessment, 225 deaths and 30 missing people were reported from landslide impacted areas. Overall property and crop damages recorded from above districts were assessed based on following conditions. • Considered average area of a building was taken as 160m2 and its construction
cost as LKR 35,000.00. Recorded number of Fully Damaged and Partially Damaged Buildings were 100 and 76 respectively. Total lost for property was then estimated as LKR 985,600,000.00.
• Recorded devastated areas of plantation crops (Tea, Rubber and Coconut) were 36 ha, 21 ha and 1 ha respectively. We considered their expected yields as 1500 kg/ha/year, 2800 kg crepe/year/ha and 7000 Nuts/ha and unit prices as LKR 600/kg, LKR 300/kg and LKR 50/nut respectively. Total lost for plantation crops was then estimated as LKR 50,152,600.00.
• Recorded devastated forest area was 22 ha and we considered its unit price as LKR 920,000/ha. Total lost for forest area was estimated as LKR 20,672,400.00.
• Recorded devastated home garden area was 7 ha and its total lost was estimated as LKR 4,741,030.00
• Recorded devastated paddy area was 3 ha. Its expected yield was taken as 3763 kg/ha/year/season and its unit price as LKR 40/kg. Total lost for paddy sector was estimated as LKR 983,798.72
• Recorded devastated transport infrastructure area was 4,425 m2 which included roads (concrete, cement, tar and gavel). Total lost was estimated as LKR 15,522,390.00 Based on above valuations, the gross estimated direct loss and damage resulted
by the landslides disaster on May 2017 in all the sectors in above mentioned districts was LKR 1,077,672,218.72 (LKR 1.08 billion).
4. Conclusion
Government of Sri Lanka responded to the problem of landslide affected houses and relocations due to landslide risk using two methods. In the first method, houses which were affected by landslide or other disaster within a safe land will be paid compensation payments through insurance. In the second method, GoSL will provide a housing reconstruction grant of LKR 1.2 Mn for reconstruction for a house fully or partially damaged by landslides, or relocated due to high risk. This will be supplemented by provision of a plot of land in a low risk area or else, a land grant of LKR 400,000. A further LKR 120,000 per plot (30% of the land value) is required for site preparation and basic infrastructure provision in green field sites, whereas this may be lower in instances where voluntary relocation takes place. This model is being currently implemented in locations affected by 2016 landslides. In the estate sector, affected households will be provided with 7 perches of land instead of the land grant. Purchase of land and a house in a safe location up to the value of LKR 1.6 Mn is another alternative as per the guidelines of NBRO. Post disaster construction and development guidelines have to be developed to enhance “Built Back Better” development within the country.
105
The losses include loss of rental income incurred by owners of damaged houses, cost of emergency shelter support in the form of maintenance of welfare centers, construction of transitional shelters and emergency shelter repairs and provision of tents, provision of emergency cash grants and rental allowance for fully damaged and relocated houses.
Recovery and reconstruction strategies include:
• Provision of sustainable emergency shelter assistance to affected households including rental and repair grants and construction of transitional shelters for the most vulnerable
• Establishing a comprehensive housing and data management system to ensure an updated inventory of housing and assets to be used in development planning, assessment and verification of damage during disasters and designing assistance packages.
• Medium term housing reconstruction support in the form of in-situ housing reconstruction and repair in low flood risk locations with insurance compensation topped up with grants for vulnerable households and concessionary loans administered through the Ministry of Housing and Construction at the rate of: LKR 800, 000 for fully damaged, LKR 200, 000 for partially damaged houses. Construction to be implemented through the home owner driven approach.
• Medium term housing reconstruction grant of LKR 1,200,000 per house affected or at high risk of landslides, LKR 400,000 land grant or alternative land for relocation as per the existing government policy. LKR 120,000 is also estimated as a land preparation and basic infrastructure cost. Construction modality can be owner driven, community driven or through the military as appropriate. Purchase of a house and land up to a value of LKR 1,600,000 in a safe location is also permitted.
• Residual housing reconstruction needs including upgrading of damaged improvised and semi- permanent housing as permanent housing including build back better principles, and reconstructing permanent housing to the size which existed prior to the disaster inclusive of build back better standards in the long term, through self-recovery or access to sustainable housing financing options in the long term.
• Revision of land use plans incorporating land zonation within the national development plan, based on multi hazard maps, revision, and enforcement of construction planning and building regulations in the districts targeted by this PDNA.
Technical support to home owners and builders engaged in housing reconstruction through NBRO, NHDA and Technical staff from the Divisional Secretariats to ensure adherence to minimum DRR standards developed by NBRO and build back better principles.
Early recovery activities will be implemented by District and Divisional
Secretariats with the facilitation of the National Disaster Relief Services Centre, the UN and humanitarian agencies. Reconstruction will be implemented by the National Housing Development Authority under the Ministry of Housing and Construction and the Ministry of Hill Country New Villages, Infrastructure and Community
106

Development in Plantations sector. The process needs to collaborate with the National Building Research Organisation, National Disaster Relief Services Centre of the Ministry of Disaster Management, and the respective Local Government Authorities, District and Divisional Secretariats.
References
[1] CIC Institute of agribusiness. (November 2010), Cost of production for selected vegetables, pulses and grains. Handbook, Department of Agriculture
[2] Ministry of Mega Polis and Western Development and NBRO (2016), Consultancy services for conducting a detailed flood risk assessment for Colombo metropolitan region
[3] Petrucci, O. & Gullà, G.,( 2009). A simplified method for assessing landslide damage indices. Natural Hazards, 52(3), pp.539–560.
[4] Priyantha, N.A.A (2010). “Guidelines for construction of low volume concrete roads in Sri Lanka” MS thesis, Department of Civil Engineering, University of Moratuwa.
[5] R.L. Senanayake, U.R. Sangakkara, D.K.N.G. Pushpakumara and P. Stamp (2009), Vegetation Composition and Ecological Benefits of Home Gardens in the Meegahakiula Region of Sri Lanka. Tropical Agricultural Research Vol. 21
107

Landslide Flow Path Assessment for Susceptibility Mapping at a Regional Scale
PHE Dulanjalee1
1 Scientist, National Building Research Organisation, Sri Lanka
Abstract
Landslide flow path prediction is important for determining the flow route and the depositional area, which are essential elements for producing landslide hazard maps. It is a key component in risk assessment and design of remedial measures against rapid landslides. Flow-R model, which is developed for flow path assessment of gravitational hazards was applied to model the landslide run-out based on the major input of a digital elevation model (DEM). The major aspect of flow path modelling is to define the potential source areas and asses the spreading areas.
Major landslide incidents namely, Meeriyabedda area in Badulla and Aranayaka area in Kegalle were studied as the cases for the model. Potential source areas were identified on the basis of DEM and the defined data set of slope, water input, flow accumulation and curvature. Spreading area assessment was based on the flow directions algorithms and the energy based algorithms which determine the run-out distance. Source areas and the run-out results obtained by the model were matched with the available landslide inventory data set of the area and the moderate to high hazard zones of the landslide hazard map. Model parameters were determined based on calibrating the model with the surveyed landslide boundaries. The model is capable of predicting the source areas and spreading based on the landslide inventory map of the area. Although the approach has its limitations of lacking the local controlling factors, a good consistency between the simulation results and positioning in the landslide hazard map was observed.
Keywords: Landslide flow path, Digital elevation model, Land slide flow accumulation
108
1. Introduction
Every year, debris flows and related landslide process cause huge damages in mountainous regions and pose significant threat to inhabited areas. Therefore, the development of indicative susceptible map of flow path and run out spreading is important in identification of hazardous zones and in decision making to minimize the socio-economic impacts during a disaster.
Nature of the debris flows and other landslide process majorly depend on the variability of the terrain, properties of the debris material or soil and the steepness of slope. Based on the characteristics of the source and the depositional area two kinds of debris flows can be distinguished as confined and unconfined debris flows (Lorente et al. 2003). Confined debris flows develop within the surface depressions or channels and unconfined debris flows occur from open slope terrain on hill slopes not previously incised. Unconfined debris flows typically associates with unconsolidated sediments; steep slope and scarce plant cover (Holmgren, 1994).
Physical modeling of debris flows and run out areas is difficult because of the complexity of the phenomenon and the variability of the controlling factors. The occurrence of debris flows is majorly controlled by the factors such as gradient, geological setting, substratum type and debris availability. But, it is strongly influenced by the variable factors such as precipitation and heavy snow melt events (Blahat et al. 2010).
Flow-R (Flow path assessment of gravitational hazards at a regional scale) provides a quick assessment of debris flow susceptibility at a regional scale with the minimum data requirement (Horton et al. 2013). The model identifies the potential source areas and delimits the zones of path of propagation based on the DEM and terrain physical factors.
In this study, GIS based approaches incorporating an index-based detection of source areas and flow spreading is assessed by Flow-R model in two different contexts: Aranayaka area in Kegalle district and Meeriyabedda area in Badulla district of Sri Lanka with the aim of predicting the possible source areas and to assess the potential landslide flow paths.
2. Flow R Model
Flow-R is a numerical model with the software capability of limited requirement of data set and the capability of customization of parameters. The model inputs and the algorithms compile by graphical user interface (GUI) with Matlab compiler. It is originally developed for debris flows, but now its applicability is proven for other process such as rock falls, floods and avalanches (Horton et al. 2013).
Modeling approach of Flow-R has two different approaches. Initially, potential source areas are identified by the DEM and the user defined data sets. Then the spreading is assessed by the probabilistic and energy approaches (Blahat et al. 2010). The mass of the source is not taken into consideration because of the difficulty in assessing the volume at a regional scale and changes in mass due to the erosion and the deposition. Each algorithm is constrained to work on a grid basis and the input spatial data information is in ASCII file format.
109
2.1. Identification of source areas
The source areas are identified based on the combination criteria of slope gradient, water input and sediment availability. For each criterion, a grid is generated containing three possible values for each cell: possible source excluded or ignored.
The possible source option means that according to the selected criterion, the cell is a potential source area. The ignored option means that there is no evidence if the cell is a source or not, so no decision is fixed. The excluded option means that the cell cannot be a debris flow source area. In combining the grids established for the different criteria, a cell is selected as a source area (Horton et al. 2013).
2.2. Slope
The slope angle is a decisive factor in determining the triggering of debris flow (Blahat et al. 2010). Generally, the debris flows occur when the slope gradient is above 150 (Takahashi 1981).
2.3. Water input (Flow Accumulation)
Debris flows occur in the water converges with the concave morphology. In most distributed hydrological models water input is considered as the upslope contributing area (flow accumulation). By analysing the past events two curves were defined for extreme events and rare events combining the work of Rickenmann and Zimmermann (1993) on the extraordinary 1987 event in Switzerland.
2.4. Sediment availability (Curvature)
Curvature is a potential morphological characteristic to debris flow occurrence. Debris flows occurs when the curvature is concave (Horton et al. 2013). Although this feature is used to identify the gullies, there is no defined threshold. The limits should be adopted based on the aerial photograph analysis or by on case basis.
2.5. Spreading area assessment
Debris flow spreading is mathematically estimated by two types of algorithms. Path which the debris flow will follow is determined by the flow direction algorithms and other algorithm will define the runout distance.
2.6. Flow direction algorithm
Flow direction algorithm defines the flow from one cell to neighbouring eight cells. Several flow direction algorithms are defined in the Flow-R model but few of them area relevant to debris flow modelling. There are different conditions defined in the model and the flow direction algorithm only defines if it further flows or if it stops. The D8 algorithm provides convergent but unrealistically straight flow and limited spreading (Blahat et al. 2010).
110

The multiple flow direction approach results too much of spreading, therefore,
The Holmgren (1994) algorithm (Equation 1) adds a parameter to the multiple flow direction algorithm as an exponent x to lower the convergent of the flow.
αβ ∈> x0tan [1]
Where i,j are the flow directions, pfdi the susceptibility proportion in direction i,
tanβi the slope gradient between the central cell and the cell in direction i respectively.
2.7. Runout distance calculation
Runout distance calculation is an energy based approach that defines if a part of a debris flow can potentially reach another cell. Energy based approaches control the distance reached by the debris flow and the divergence.
In the initial source area assessment, the source mass is unknown. Therefore, runout distance is calculated based on the unit energy balance (Equation 2), a constant loss function and a maximum threshold values. 𝐸𝐸𝑘𝑘𝑘𝑘𝑘𝑘𝑘𝑘 = 𝐸𝐸𝑘𝑘𝑘𝑘𝑘𝑘𝑘𝑘−1 + ∆𝐸𝐸𝑃𝑃𝑃𝑃𝑃𝑃𝑘𝑘 − 𝐸𝐸𝑙𝑙𝑃𝑃𝑙𝑙𝑙𝑙𝑘𝑘 [2]
Where, i is time step, Ekin is kinetic energy, ∆Epot is change in potential energy and Eloss is constant energy loss.
3. Study Areas
The study areas are Meeriyabedda area in Badulla district and Aranayaka area in kegalle district of Sri Lanka (Fig. 1).
The study area Meeriyabedda is located in the south-eastern part of Badulla district. The area comprises of plateaus of several mountain ranges with complex and corrugated morphology. Prominent rock types of the area are Charnokitic gneiss and Khondalite.
The study area Aranayaka in Kegalle district is located in the eastern part of Kegalle district, with the elevation ranges from 250m to 1800m MSL with mountainous topography. Predominant rock types of the area are Charnokitic gneisses and Garnet biotite gneisses.
Both study areas geologically belongs to the highland series with the different kind of structural features.
The study areas commonly experience heavy rains during the monsoon periods and the landslides recorded within these areas are higher in this period. Sloping terrain conditions and the favorable morphology incorporated with the intense rainfall caused the most triggered and fatal slides of Meeriyabedda landslide and Aranayaka landslide in those study areas.
∑=
= 8
1)(tan
)(tan
j
jj
xifdiPβ
β
111

4. Data and Methodology
Flow-R model requires several data sets to model the initiation and the spreading of the landslide. Major input is the DEM and 10m DEM was used for the both study areas. DEM was generated by 1:10,000 scale contour data from the Survey Department of Sri Lanka. Slope, flow accumulation and curvature layers were derived from the DEM and all data were converted into ASCII format. All data preparation were done in ArcGIS environment
Fig.1. Locations of the selected study areas Flow-R model, compiled as a GUI, was used to model the initiation and the
flow path of both study areas. Model parameters were selected based on the literature data of previous studies and the comparison with the model output with the field data and landslide boundaries.
Landslide inventory maps of the study areas prepared during the field investigations were used to verify the initiation of the landslides. Air surveyed boundaries of Meeriabedda and Aranayaka were used to verify the model outputs.
5. Results and Discussion
Parameter selection is a crucial criterion during the model setup. In both case studies, parameter selection was done based on the literature data and the model output comparing with the existing landslide inventory. Propagation parameter for source area selection, Holmgren’s exponential parameter was set to 4 established by
112
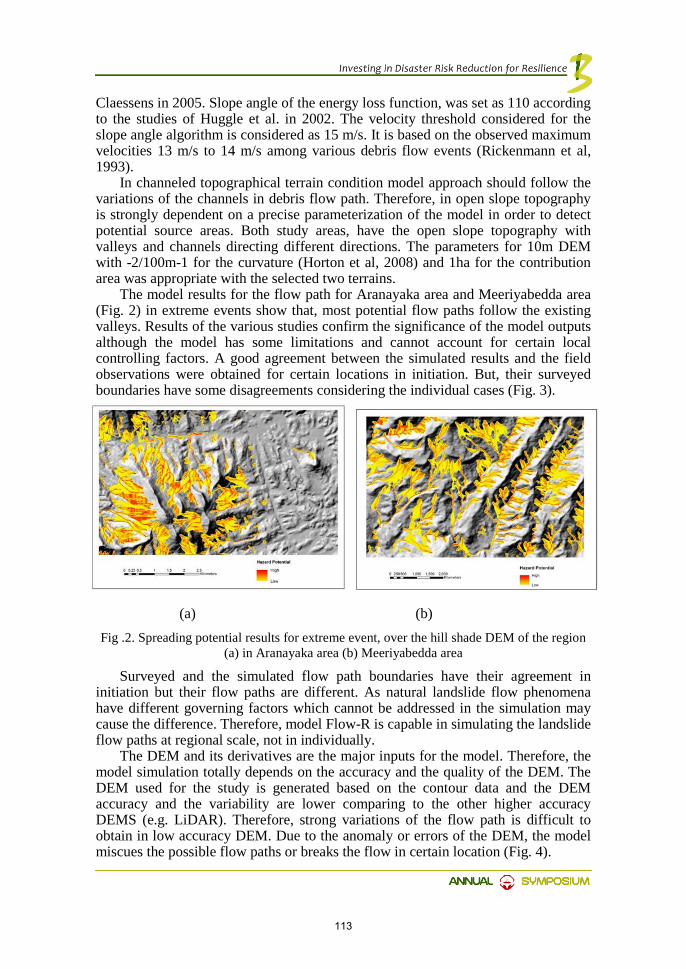
Claessens in 2005. Slope angle of the energy loss function, was set as 110 according to the studies of Huggle et al. in 2002. The velocity threshold considered for the slope angle algorithm is considered as 15 m/s. It is based on the observed maximum velocities 13 m/s to 14 m/s among various debris flow events (Rickenmann et al, 1993).
In channeled topographical terrain condition model approach should follow the variations of the channels in debris flow path. Therefore, in open slope topography is strongly dependent on a precise parameterization of the model in order to detect potential source areas. Both study areas, have the open slope topography with valleys and channels directing different directions. The parameters for 10m DEM with -2/100m-1 for the curvature (Horton et al, 2008) and 1ha for the contribution area was appropriate with the selected two terrains.
The model results for the flow path for Aranayaka area and Meeriyabedda area (Fig. 2) in extreme events show that, most potential flow paths follow the existing valleys. Results of the various studies confirm the significance of the model outputs although the model has some limitations and cannot account for certain local controlling factors. A good agreement between the simulated results and the field observations were obtained for certain locations in initiation. But, their surveyed boundaries have some disagreements considering the individual cases (Fig. 3).
(a) (b) Fig .2. Spreading potential results for extreme event, over the hill shade DEM of the region
(a) in Aranayaka area (b) Meeriyabedda area
Surveyed and the simulated flow path boundaries have their agreement in initiation but their flow paths are different. As natural landslide flow phenomena have different governing factors which cannot be addressed in the simulation may cause the difference. Therefore, model Flow-R is capable in simulating the landslide flow paths at regional scale, not in individually.
The DEM and its derivatives are the major inputs for the model. Therefore, the model simulation totally depends on the accuracy and the quality of the DEM. The DEM used for the study is generated based on the contour data and the DEM accuracy and the variability are lower comparing to the other higher accuracy DEMS (e.g. LiDAR). Therefore, strong variations of the flow path is difficult to obtain in low accuracy DEM. Due to the anomaly or errors of the DEM, the model miscues the possible flow paths or breaks the flow in certain location (Fig. 4).
113

Fig .3. Comparison of the model output vs the surveyed landslide boundary (a) Aranayaka
landslide (b) Meeriyabedda landslide In run out modelling source area detection is possible for certain cases by the
simulation. Accuracy of the spreading extent is chiefly governed by the quality of the DEM. In addition, local controlling factors such as lithology, landuse and weathering grade of the soil layers have a greater influence over the spreading. Although lithology and landuse are considered as inputs in the model, it does not have much influence over final output.
Fig .4. Due to an anomaly or an error of the DEM, model misses a certain part of the flow path
114

Landslide flow paths derived from the analyses have a good agreement between the landslide hazard maps of the area. Initiation of the flow paths are located in the moderate and high landslide hazard zones of the landslide hazard map (Fig. 5).
(a) (b)
Fig .5. Landslide hazard map with flow path (a) Aranayaka area (b) Meeriyabedda area
6. Conclusion
Flow-R model is capable of predicting the landslide source areas and spreading at regional scale. Although the approach has its limitations of lacking the local controlling factors and specific conditions, a good consistency between the simulation results and field inventory map of landslide hazard map could be observed in landslide initiation. DEM quality has a greater influence over the runout modeling as the DEM and its derivatives are the key inputs which defines the terrain morphology. However, additional factors, such as the lithological and geological setting and weathering grade have to be considered in order to accommodate a strong variation
References
[1] Blahat J, Horton P, Sterlacchini S, Jaboydoff M (2010) Debris flow hazard modeling on medium scale: Valtellina di Tirano, Italy. Natural Hazard Earth System Science. 10: 2379-2390.
[2] Holmgren P (1994) Multiple flow direction algorithms for runoff modeling in grid
based elevation models: An emperical evaluation. Hydrological Processes. 8(4): 324-327.
115

Risk Assessment of Residential Units in Landslide Prone
Areas of Badulla District, Sri Lanka
LJ Prasanna1 & S Sutharshan1
1Scientist, National Building Research Organisation, Sri Lanka
Abstract
Occurrence of landslides and their reactivation have become a frequent natural phenomenon in the hill country of Sri Lanka causing severe damages to life and property. Landslide hazard mapping project was launched to predict the zones that are susceptible for sliding during the rainy season incorporating rainfall intensity and duration. Spatial distribution of buildings locate in high landslide hazard prone areas are being identified through 1:10,000 scale landslide hazard maps developed for the Grama Niladari Divisions in Sri Lanka. A building survey was carried out on residential units, commercial/institutions, religious places and schools, which are located in high landslide hazard prone areas. This paper presents the challenges found from the risk assessment in residential units located in landslide prone areas of Badulla District that contribute to protect against landslide hazard and reducing landslide disaster risks. The empirical evidence revealed ten pertinent issues; livelihood of the families rely on lands in landslide prone areas; designing of houses without professional support; housing units built without the support of professionals; construction of houses without approval obtained from relevant authorities; construction of houses without obtaining landslide risk assessment report; construction of houses on steep slope (>31°) terrain; change of land morphology for construction of houses; presence of tell-tale landslide signs at the vicinity of houses; having no drainage system to discharge rain water; and Of those who change the land morphology for construction, only a minor share of houses are constructed with rightly protected bund.
Keywords: Landslide; risk buildings; building survey; residential units
1. Introduction
Landslides in Sri Lanka are normally associated with intense monsoon and inter-monsoon rains. Many of the natural hill slopes that are considered as safe in the past are now recording landslides due to human interventions. (Disaster Management Centre, 2012). Of the 65,000 Sq.km of land extent of Sri Lanka, nearly 20,000 Sq km
116

encompassing 10 districts are prone to landslides. It is about 30% of Sri Lanka's land area and spread into districts; Badulla, Nuwara Eliya, Kegalle, Ratnapura, Kandy, Matale, Kaluthara, Mathara, Galle and Hambantota. Highest impacts to the landslides have been reported in Badulla, Nuwara Eliya, Kandy and Rathnapura Districts. Badulla district is one of the most landslide prone district in Sri Lanka. All the Divisional Secretariat Divisions in Badulla District is vulnerable for landslide hazard. 348 landslide incidents are reported in Badulla District since 2006 to 2015 (Siriwardana, 2016).
The National Building Research Organisation (NBRO) is the national focal point for landslide risk management in Sri Lanka functioning under the purview of Ministry of Disaster Management. NBRO is carrying out landslide hazard mapping project covering 10 landslide prone districts in Sri Lanka to identify areas susceptible to landslide hazard. Landslide risk profile development project is implemented since 2016. The objective of this project is to develop Divisional Secretariat level landslide risk profiles and to develop a spatial database of risk communities which will be incorporated into development planning process. Spatial distribution of buildings located in high landslide hazard area are being identified using 1;10,000 scale landslide hazards maps prepared for the Grama Niladari Divisions. A building survey was carried out on housing units, commercial/institutions, religious places and schools, which are in very high and high landslide hazard prone areas of the Badulla District. Purpose of the survey is to collect information on characteristics of the inhabitants, characteristics and use of the buildings etc. Within this context, the scope of this paper is to explore the challenges found from the risk assessment in residential units located in landslide prone areas of Badulla District that contribute to protect against landslide hazard and reducing landslide disaster risks.
2. Assessment of buildings at risk
Risk assessment is an essential component in disaster risk management. The purpose of a risk assessment is to define the nature of the risk, answer questions about characteristics of potential hazards (such as frequency, severity), and identify vulnerabilities of communities and potential exposure to given hazard events. Risk assessment includes the process of risk analysis and risk evaluation. Risk analysis generally contains; analyze the risk, identify and measure the frequency, magnitude, and type of hazard and the vulnerability and exposure of the elements at risk (Asian Disaster Preparedness Center, 2006). Buildings are one of the main groups of elements at risk for hazardous event. It comprises the inhabitants and the properties accommodate in the buildings. Behavior of a building under a hazard event, determines whether the inhabitants in the building might be injured or killed by the occurrence of hazardous phenomena. Defining the characteristics of the building is important in order to assess the potential losses and degree of damage of buildings that are exposed to a certain type of hazard.
Elements at risk are the population, properties, economic activities, including public services, or any other defined values exposed to hazards in a given area. The interaction of elements at risk and hazard defines the exposure and the vulnerability of the elements-at risk. Although elements at risk information may be derived from existing data sources such as census data, there is always a need to collect additional information to characterize the elements at risk for estimating the vulnerability. For
117
collecting information on building types, construction materials, land ownership, and the checking of urban land use, normally stratified samples are taken, as it is often too time consuming to do a complete house-by-house survey (Westen. et.al, 2011). The procedure adopted to obtain the elements at risk varies for local and regional scale analysis. Identifying the elements at risk of landslide and vulnerability assessment need the exact spatial distribution of buildings in the study area, as well as the socio-economic information like the number of stories, possession of properties, economic values etc. All of the data considered as elements at risk are basically extracted from cadastral data and participatory GIS procedures (Gaprindashvili. et.al, 2014). Building information can be obtained in several ways. Ideally, it is available as building footprint maps, also be derived from databases. If such data are not available, building footprint maps can be generated using screen digitisation from high-resolution images, or through automated building mapping using high-resolution multispectral satellite images and LiDAR (Corominas, 2013). Literature review was carried out on methods employed in earlier studies to assess the characteristics of the buildings and socio-economic status of the inhabitants reside in buildings expose to hazards. From the above literatures methods employed to acquire socio-economic information of both the buildings and inhabitants accommodate in risk buildings are; 1) stratified samples 2) house-by-house survey 3) participatory GIS procedures 4) building footprint maps. After reviewing those methods, this study applied house-by-house questionnaire survey method for data collection because of; (1) limitations in GIS-based approaches in relation to availability, quality, and scale of the digital data (2) non availability of spatial reference in available census data (3) advantage of using house-by-house questionnaire survey for accurate data collection directly from the occupants.
3. Study area and method of study
This study was carried out in Badulla District, Sri Lanka. Badulla District is located to the East of the Central highlands in the Uva Province. Badulla town, the capital of Badulla district is located 220 Km away from Colombo. Landslide hazard maps available for 362 GN divisions in the Divisional Secretariat Divisions of Badulla, Bandarawela, Hali-Ela, Haldumulla, Haputale, Kandaketiya, Migahakivula, Passara, Soranatota, Uva Paranagama and Welimada. Study was carried out in 25,612 buildings locate in 362 GN divisions of 12 DS Divisions in Badulla District.
This study adopted house-by-house questionnaire survey as a method of data collection. Although house-by-house survey method is very time consuming and expensive, house-by-house survey was carried out in order to ensure the accuracy of data collection. Questionnaire survey is good instrument when all desired information of the researchers is received in the form of data. Survey is the most widely used data gathering technique in the social science and related applied fields. Survey may produce information that is inherently statistical in nature. This study utilized primary data collected through questionnaire survey among the buildings that are located in landslide hazard zones; (1) landslides are most likely to occur, (2) landslides are to be expected, (3) landslides have been occurred in past, and (4) subsidence & rock fall. The survey questionnaire consisted of both open and closed questions. Open-ended questions provided space which allowed the researcher to fill in the response exactly as was given by the respondent. Closed-ended questions had pre-selected responses
118

to the questions (Darkwa, 2006). The questionnaire is divided into seven main sections: (i) general information (ii) demographic profile of the households (iii) land use and of characteristics of housing units (iv) construction guidelines followed to build the house (v) disaster impacts (vi) disaster preparedness (vii) disaster risk reduction measures. Prior to field work, a pilot survey was conducted in the study area to identify the possible problems that may arise from the questions during the field survey. After the pilot survey, the questionnaire was then modified and rearranged by incorporating the experience gathered. The questionnaire survey has been conducted by the Grama Niladari (GN), of the respective GN Division. A guide book was designed and distributed among the survey enumerators and GNs were provided with a special training for conducting the survey.
The collected quantitative data were checked and then entered into the spread sheet in the Statistical Package for Social Science (SPSS), the same statistical software has been used to present descriptive statistics including percentage, mean, and frequency from the collected data.
Fig. 1. Map of Sri Lanka showing Badulla District
Sri Lanka’s Census of Population and Housing-2012 revealed, total of 211,178 housing units locate among 15 Divisional Secretariat Divisions of Badulla District (Department of Census and Statistics, 2012). Approximate 24,419 housing units locate in very high and high landslide hazard prone areas of 12 Divisional Secretariat Divisions contributed to the survey. The minimum number of housing units surveyed is 236 housing unit from Meegahakivula Divisional Secretariat Division. While maximum number of housing units surveyed is 4230 from Hali-Ela Divisional Secretariat Division.
119

4. Findings and discussion
4.1. Socio-economic status of the head of household
Table 1. Socio-economic status of the head of household Characteristics Number of head
of household Percent of total head
of household Gender • Male 19237 82% • Female 4210 18%
Age • 15-29 613 2.6% • 30-40 4051 17.4% • 41-50 5480 23.5% • 51-64 8354 35.9% • 75 and over 4789 20.5%
Education • Primary education 6594 29.0% • Passed Grade 8 5848 25.7% • Completed Ordinary Level 5799 25.5% • Completed Advanced Level 2247 9.9% • Diploma 119 0.5% • Degree 410 1.8% • No schooling 1728 7.6%
Occupation • Government 2653 12.3% • Private 4140 19.2% • Self- employment - commercial 3299 15.3% • Self- employment - agriculture 4594 21.3% • House wife 320 1.5% • Retired 1715 8% • Daily wage 1776 8.3% • No occupation 3028 14.1%
Among the interviewed respondents, majority (82%) of the head of households are male. Female-headed households account for 18%. About 43.5% of the head of households are of 15-50 age group while 35.9% are from 51-64 age group and 20.5% are from 75 and over (Table 1). It indicates, in the event of disaster there are considerable number of active heads of households, who can engage in disaster preparedness activities. It is noted 51-64 age category is the most vulnerable age group with a percentage of 35.9%.
Occupation of the head of households who live in landslide prone areas, it is clear that the majority (21.3%) of head of household engage in agriculture, 19.2% of head of household engage in private sector employment. Furthermore, 12.3% are employees of the government sector. 14.1% of heads of households are unemployed. Only 8.3% of head of household engage in work for daily wage. Majority of head of
120

household engage in agriculture indicates livelihood of the considerable number of families rely on lands in landslide prone areas. In majority (86.2%) of the housing units only one family reside, followed by 12.6 % are two families housing units, and 1.2 % are three family housing units.
4.2. Year of construction and professional support to build the house
House construction period range from the year 1669 to 2017. The mean year of house construction is 1985. Of those housing units surveyed, 10911 housing units have been constructed between 1669 to 1990, and 4606 housing units have been constructed between 1991 to 2000. At the same time, 4609 housing units have been constructed between 2001 to 2010 and 2377 housing units have been constructed between 2011 to 2017.
Professional support is vital in identification of appropriate designs and incorporating disaster resilient features in housing construction. Of those housing units surveyed, majority (66.2%) of the housing units are not built with the support obtained from professionals. Only 11.3% has employed professional services in building the house.
4.3. Designer of the house
A well designed and built house is a house that supports the lifestyle of the dweller and a well-constructed house protects the lives of the occupants. Use of hazard resilient engineering design and construction practices are essential when constructing houses in disaster prone areas. The result implies, majority (41.7%) of the houses have been designed by the house owners themselves. While 23.3% of houses have been designed by masons. 20.0% of the houses have been designed by the government, private and other organizations. Only 10.7% of houses have been designed by Architect/Draftsman.
4.4. Approval for construction
Prior to construction, it is essential that the house plan should be submitted to the local authority, whom shall confirm to the planning and building regulations and grant approval. However, only 18.2% of houses have been constructed with the approval obtained from local authority/NBRO/other agencies. While, over three-fourths (89.9%) of houses have been constructed without obtaining approval from relevant authorities. In 2011, the Ministry of Disaster Management in Sri Lanka issued circular with regard to National Building Research Organisation’s clearance for building construction in landslide prone areas. As per the circular, obtaining clearance for construction in ten landslide prone district, viz., Badulla, Galle, Hambantota, Kalutara, Kandy, Kegalle, Matale, Matara, Nuwara Eliya and Ratnapura is a mandatory requirement. However, it was found out of 2428 houses constructed between 2011 and 2017, only 107 houses have obtained approval from National Building Research Organization (NBRO). Further it is noted, 125 houses which were constructed prior to 2011obtained approval from the NBRO.
121

4.5. Type of wall
Generally, buildings are constructed either with a load-bearing wall or columns structure wall. In landslide prone areas it is recommended that the house should be constructed as a reinforced concrete frame structure with masonary walls between columns. However, 86.2% of housing units have been constructed with load bearing walls. While only 9.6% of housing units have been constructed as columns structure walls. This shows, that a majority of the housing units have little resistance to being destroyed/damaged by the impact of landslide hazard.
4.6. Type of the terrain and change of land morphology
Type of terrain and slope angle are the two important factors governing the suitability of land for housing. For the purpose of assessment of landslide potential, the type of terrain is classified as; steep slope, rolling terrain, gentle slope and flat. Of these categories of type of terrain, about 42.0% of the houses are located on steep slope (>31°) terrain, 39.5% of housing units locate within the gentle slope (5°-11°) terrain, while 11.0% of the houses are located on rolling terrain. At the same time, minor share (4.1%) of houses are located on flat terrain.
Of those housing units surveyed, inhabitants in 48.4% of the houses stated that the land morphology was changed for construction of the house. While, land morphology of the 37.7% of the houses were not changed for construction and 13.9% of the respondents in the housing units don’t know whether the land morphology was changed for the construction of house.
4.7. Nature of the cut in the event of land morphology changed
Houses built on hill slopes are not only vulnerable to landslides but also other hazards. Therefore, houses shall be located essentially outside any land susceptible to landslides and sufficiently away from any unstable or vulnerable areas. Adequate safe space shall be provided between the house and the toe of the cut slope. The safe distance (d) between the house and the toe of cut slope depends on the height of cut and whether the cut slope is supported with a retaining wall. If the slope is stabilized with a retaining wall, the distance (d) should be equal to the height of the retaining wall or house. Of those who change the land morphology for construction, nature of the cut in 24.6% of the housing units are unprotected and 11.1% are rightly protected but devoid from standard while only 7.5% are rightly protected bund.
4.8. Presence of warning signs of landslides in the vicinity of the house
The location that is been selected for the house construction is recognized to be free from any landslide risks or free of any signs or features that are indicative of landslide threats or slope instability. According to the survey, no landslide signs can be observed in 65.4 % of housing units. However, cracks on buildings appear in 10.7% of housing units and record of early subsidence/landslide/rock falls can be observed in 13.0% of housing units. At the same time, in 17.9% of housing units, more than one tell-tale landslide signs can be observed in the vicinity of the house.
122

4.9. Actions taken to discharge water
Most of the landslides in Sri Lanka have occurred when heavy storms and prolonged rainfall have been experienced. There will be a reduction in the strength of soil as a result of surface erosion of the soil on a slope due to heavy storms and prolonged rainfall. Therefore, it is extremely important to manage both surface and subsurface drainage of a slope. It must be ensured that natural drainage, stability and environment of the land and surrounding area are not adversely affected during and after construction. Of those housing units surveyed, 34.9% of housing units have no drainage system available. While only 24.6% of housing units have systematic drainage system and 34.4% of housing units have a drainage system, but not sufficient.
4.10. Take precautionary measures to face landslide during last three years
It is important to notice 93.2% of the respondents in Badulla district responded that they have not taken precautionary measures to face landslide during last three years. Only a small proportion of (Nearly 9%) had participated in such activities. Soranathota DS Division has the highest percentage of taken precautionary measures to face landslide during last three years, which is 14%.
4.11. Availability of disaster management committee in the village
Sri Lanka Disaster Management Act No.13 of 2005 provides the legal basis to Disaster Management Centre for establishing village disaster management committees for the 1) Early warning dissemination 2) Search and rescue and evacuation 3) Shelter and relief management 4) Health and first aid 5) Water and sanitation 6) Patrolling and vigilance by the Disaster Management Centre. When asked about the availability of a disaster management committee in the village 24.5% of the interviewed respondents from the Badulla district stated that their respective village has a committee while (nearly 38%) stated the non-existence of a village disaster management committee. Further 37.9% stated that they are not aware of the existence of a village disaster management committee. Soranathota DS Division had the highest percentage (Nearly 55%) of having a village disaster management committee while Kandekatiya DS Division has the lowest percentage of 3.3%.
5. Conclusion
Findings of the risk assessment in residential units located in landslide prone areas of Badulla District reveals number of challenges contribute to protect against landslide hazard and reducing landslide disaster risks. The main issues that have emerged are discussed in the paper while highlighting the ways of overcoming the identified challenges. The main challenges emerged are;
1) Livelihood of the families rely on lands in landslide prone areas. 2) Majority of the houses are not designed by professionals and over three-fourths of houses constructed without obtained approval from relevant authorities. 3) Only minor share of housing units built with the support of professionals. 4) Majority of the houses not obtain clearance for construction in landslide prone areas. 5) Nearly half share of
123

houses are located on steep slope (>31°) terrain. As a result, these houses have high potential of landslides. 6) Nearly half share of the houses is constructed after changing land morphology. 7) Presence of warning signs of landslides can be observed in the vicinity of the nearly two-third of the houses. 8)
Majority of housing units have no drainage system available to discharge rain water. 9) Of those who change the
land morphology for construction, only minor share of houses is constructed with rightly protected bund. 10) Inhabitants in nearly three fourth of the housing units do not receive instructions on disaster preparedness.
In this context, this paper suggests some recommendations to overcome these issues. Table 2 highlights the proposed recommendations to overcome the issues to protect against landslide hazard and reducing landslide disaster risks.
Table 2. Suggestions to overcome issues to make resilient built environment against landslide hazard
No Issues Recommendation for overcome the issues 1 Nearly half share of houses are
located on steep slope (>31°) terrain
Formulate and practice risk-based land use plans with adequate coordination between sector-specific agencies engaged with land management.
2 Majority of housing units have no drainage system available to discharge rain water
Execute a well-planned surface water drainage plans with the application of community knowledge and site specific technical investigations.
3 Majority of the houses not obtain clearance for construction in landslide prone areas
Build local citizen awareness on obtaining approvals for erection of buildings and the need of incorporating disaster resilience in planning, designing and construction.
4 Over three-fourths of houses constructed without obtained approval from relevant authorities
Formulate procedures to monitor all the existing developments at specified intervals to ensure construction is in accordance with approved plans.
5 Nearly half share of the houses is constructed after changing land morphology
Organise educational and training programmes for practitioners and laymen on construction compliance with regulations and resilient construction practices.
6 Of those who change the land morphology for construction, only minor share of houses is constructed with rightly protected bund
Introduce a methodology to obtain certificate of conformity to prove necessary technical inputs obtained from engineering professionals for safer building construction practices adopted.
7 Only minor share of housing units built with the support of professionals
Share know-how through public campaigns and demonstrations on hazard resilient engineering design and construction practices when building houses.
8 Inhabitants in nearly three fourth of the housing units do not receive instructions on disaster preparedness
Develop preparedness plans, early warning systems and hold regular public preparedness drill to enhance the knowledge and ability of the local community to predict, prepare, and respond and to cope with the effect of disasters.
124

9 Majority of the villagers not aware of the existence of a village disaster management committee in their village
Establish village disaster management committees in a systematic manner to undertake village level hazard, vulnerability and capacity assessments, preparation of response and evacuation plans, and identification of micro projects on mitigation.
10 Presence of warning signs of landslides can be observed in the vicinity of the nearly two-third of the houses
Enhance capacity of the residents to decide what needs to be done in order to prevent and protect themselves from landslides.
Acknowledgements
Authors wish to convey their gratitude to Director, Human Settlements Planning and Training Division of NBRO for the insightful comments and encouragement given. The authors would like to thank Dr. Rathnaweera and Mr. Clerance Perera for their careful reading and critiques. Authors also wish to acknowledge with gratitude the cooperation and assistance extended by staff of the Human Settlements Planning and Training Division of the National Building Research Organisation.
References
[1] Asian Disaster Preparedness Center. (2006). Community based disaster risk management for local authorities. Thailand.
[2] Corominas, et al. (2013). Recommendations for the quantitative analysis of landslide risk. [3] Disaster management centre, & UNDP. (2012). Hazard profiles of Sri Lanka. Colombo. [4] Department of census and statistics, Sri Lanka. (2012). Census of population and housing. [5] Gaprindashvili, G., Guo, J., Daorueang, P., Xin, T., & Rahimy, P. (2014). A new statistic
approach towards landslide hazard assessment. International Journal of Geosciences. [6] Siriwardana, S.S.A.D. (2016). The impact of landslides on settlement development
process in Sri Lanka (Special reference on Haldumulla Divisional Secretariat). [7] Westen, C.J. V., Alkema, D., Damen,M.C.J., Kerle, N., & Kingma, N.C. (2011). Multi-
hazard risk assessment distance education course, Guidebook. United Nations University.
125

Road Cut Stability Assessment; Kegalle- Bulathkohupitiya Road 6 -10 Km
DMDIK Ariyarathna1, EASN Wimalawardhana1, HMD Madushan1 &
NC Weerasinghe2 1Scientist, National Building Research Organisation, Sri Lanka
2Senior Scientist, National Building Organisation, Sri Lanka
Abstract
In mountain terrains of Sri Lanka, road networks play a vital role in remote areas for transportation, public network and all kinds of socio- economic activities. There is a major concern about the stability soil cut slopes along the roads in these hilly regions. Any kind of failure may lead to disruption in traffic, loss of lives and properties. The unplanned excavations of slopes for widening purpose may undermine the stability of the slopes. Slope failure has been identified as one of the most frequent disasters that can be lead to huge loss of properties and lives in rainy season.
Roadside cutting failures have become common in the Kegalle district with the introduction of new road pathways and development of old roads. There are many landslides, cutting failures and failure of rock blocks reported in monsoon season due to heavy rainfall. For the purpose of widening the road, it is impractical to expand the road from sloping direction. The present study incorporates the stability analysis of road cut slopes along the Bulathkohupitiya- Kegalle road (A21) in Kegalle district, Sri Lanka. This road is becoming narrower at the stretch between 6km to 16km. Based on field observations and variations in geological and geotechnical conditions, several locations were chosen for detailed study including soil tests done in the laboratory. Geo-slope (slope/w) 2004 version was used for slope stability analysis. In this study, stable roadside cut slope angles according to main soil types in the region and possible proactive countermeasures for slope stabilization will be introduced.
Keywords: Road cutting failure; stability analysis
126

1. Introduction
In order to widen the road, the existing rock and soil layers have to be removed and the slopes should be redesigned to minimize failures. Roadside rock and soil failures can be expected before, during and after the development. Only failure of soil slope is considered in this study. It may be a cutting failure, slope failure or a landslide. These failures are triggered by number of external factors, such as rainfall, tectonic forces, weathering and erosion process and compounded anthropogenic factors in the high relief mountain terrain [5]. Slope failures are, may be or may not be initiated with cutting failures but can further extend along the upper slope. Therefore, size of a slope failure is greater than a cutting failure and less than a landslide. Many of these failures, which occur in the residual soil and weathered rock zones, are directly or indirectly controlled by relict discontinuities [4].
Study area is consisted with the metamorphic rock bands and there is a change along the soil profiles forming the slope due to the changes inherited from variable nature in mineralogical structure in the parent rock and weathering under tropical conditions with high rainfall. Rainfall is the major triggering factor. Rainfall leads to development of perched water table and it results in a decrease of shear strength of residual soil and due to this effect stability of soils is lost and failures are occurred [1].
From Kegalle to Bulathkohupitiya, the right hand side of the road is sloping downwards to the valley while rock and soil layers exist at the left hand side of the road. Deep cuts were done at number of locations in residual soil strata for the development of Kegalle- Bulathkohupitiya road. This study is mainly focused on identifying the possible modes of failures in road cuts to propose suitable safe angle as a suitable remedial measure.
2. Study area
The location of the study area lies in Kegalle district, Kegalle - Bulathkohupitiya road which is running about 150m to 280m MSL in Bulathkohupitiya and Kegalle divisional secretariat.
Fig. 1. Location map of the study area
127
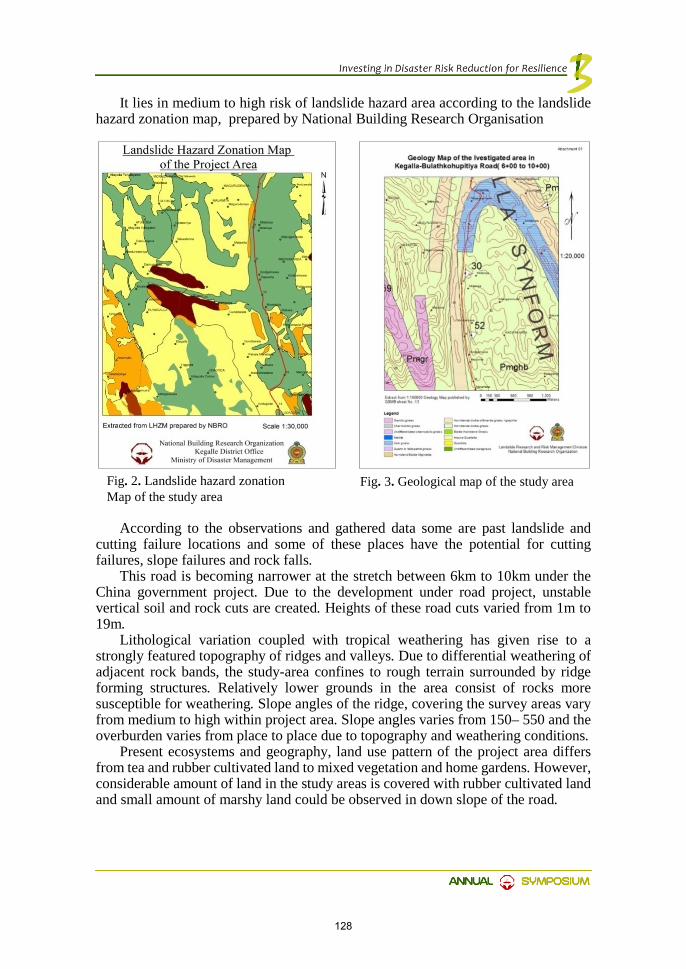
It lies in medium to high risk of landslide hazard area according to the landslide hazard zonation map, prepared by National Building Research Organisation
According to the observations and gathered data some are past landslide and
cutting failure locations and some of these places have the potential for cutting failures, slope failures and rock falls.
This road is becoming narrower at the stretch between 6km to 10km under the China government project. Due to the development under road project, unstable vertical soil and rock cuts are created. Heights of these road cuts varied from 1m to 19m.
Lithological variation coupled with tropical weathering has given rise to a strongly featured topography of ridges and valleys. Due to differential weathering of adjacent rock bands, the study-area confines to rough terrain surrounded by ridge forming structures. Relatively lower grounds in the area consist of rocks more susceptible for weathering. Slope angles of the ridge, covering the survey areas vary from medium to high within project area. Slope angles varies from 150– 550 and the overburden varies from place to place due to topography and weathering conditions.
Present ecosystems and geography, land use pattern of the project area differs from tea and rubber cultivated land to mixed vegetation and home gardens. However, considerable amount of land in the study areas is covered with rubber cultivated land and small amount of marshy land could be observed in down slope of the road.
Fig. 2. Landslide hazard zonation Map of the study area
Fig. 3. Geological map of the study area
128

3. Geological setting
The area examined in detail falls in the 1: 100,000 scale sheet no.13 published by Geological Survey and Mines Bureau in the year 1996 (fig. 3). The general geology of the area shows the dominant rock types are hornblende biotite gneiss, quartz or feldspathic gneiss and calc gneiss 200-300m thick Calc gneiss rock bands, quartz or feldspathic gneiss and hornblend biotite gneiss rock extended over few kilometers around the area and these rocks represent Kegalle synformal structure in survey areas. The lithological layering is mainly extended in nearly N150W to N400E direction with an average value of dipping 300to 650in 6+00 to 10+00. According to the structural properties of bed rock road is running along the escarp slope and intermediate slope.
4. Methodology
Field investigation were carried out to study attitude of excavated slopes and measurements of discontinuities. A preliminary geological investigation was carried out to identify old and potential landslide, slope failure and cutting failure locations. Eight undisturbed soil samples were collected from four different locations along the Kegalle- Bulathkohupitiya road to find soil parameters; moisture content, grain size distribution, soil type, dry unit weight, cohesion and friction angle.
Fig 4. Photos of the soil sampling
Stability analysis for cut slopes in two situations; before and after development was performed using Spencer method in Geo Slope family Slope/W (2004) software.
5. Results and discussion
5.1. Field observation
According to field observations, colour of the soil varied from reddish to yellowish brown, yellowish to whitish brown, reddish brown and yellowish brown. Mineralogical changes of soil are caused the variation of the colour in soil. They are non-plastic in nature. Bush type vegetation cover could not be observed on the surface of these soil cuts due to low percentage of clay particles and steep slope angle of the terrain. This slope is more favourable for erosion and failure of the soil cuts.
129

5.2. Sieve Analysis
According to the fig. 5, more than 75% of particles are sand particles whereas clay particles are less than 5%. Soil particles are varied within a narrow range. Hence, Soil type is the silty SAND residual soil.
5.3. Soil Parameters
Table 1. Soil layer property values (Direct shear (consolidated drained) and consolidated undrained triaxial compression test)
According to table 1 and field observations, there are 3 major types of layers
could be identified within soil cuts; upper most soil layer, completely weathered rock layer and moderately weathered bed rock layer.
5.4. The slope stability analysis
The analysis were performed for 4 cross sections at 4 locations; before the excavation (for road development- past situation -a) and after the excavation (present situation -b).
Fig. 5. Grain size analysis for soil samples (sieve analysis results)
Fig. 6. Stability analysis of the slope section in chainage 6+570 km
130
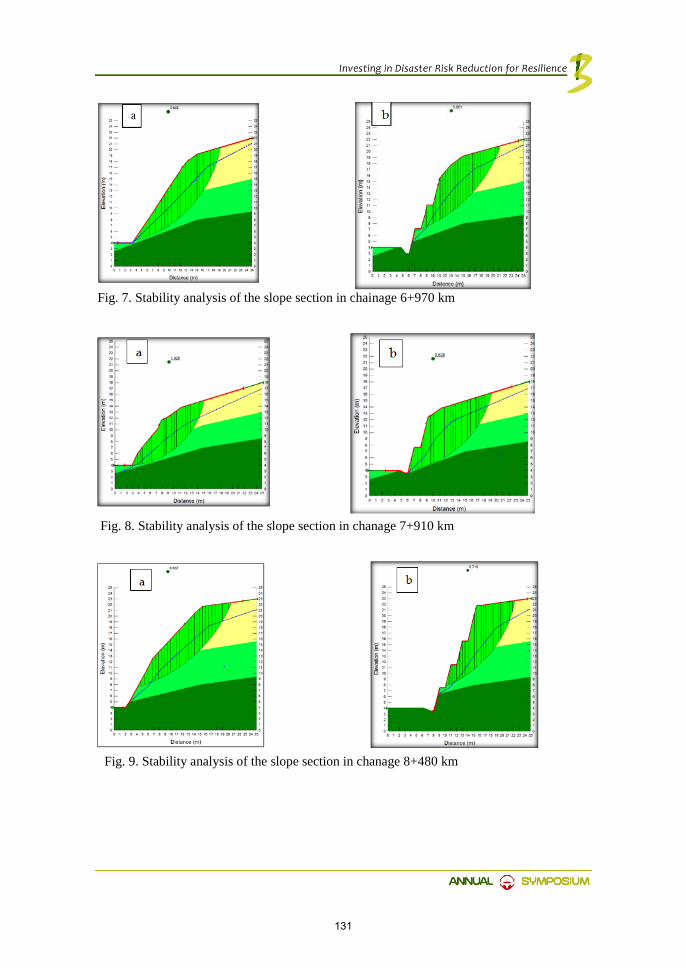
Fig. 7. Stability analysis of the slope section in chainage 6+970 km
Fig. 8. Stability analysis of the slope section in chanage 7+910 km
Fig. 9. Stability analysis of the slope section in chanage 8+480 km
131
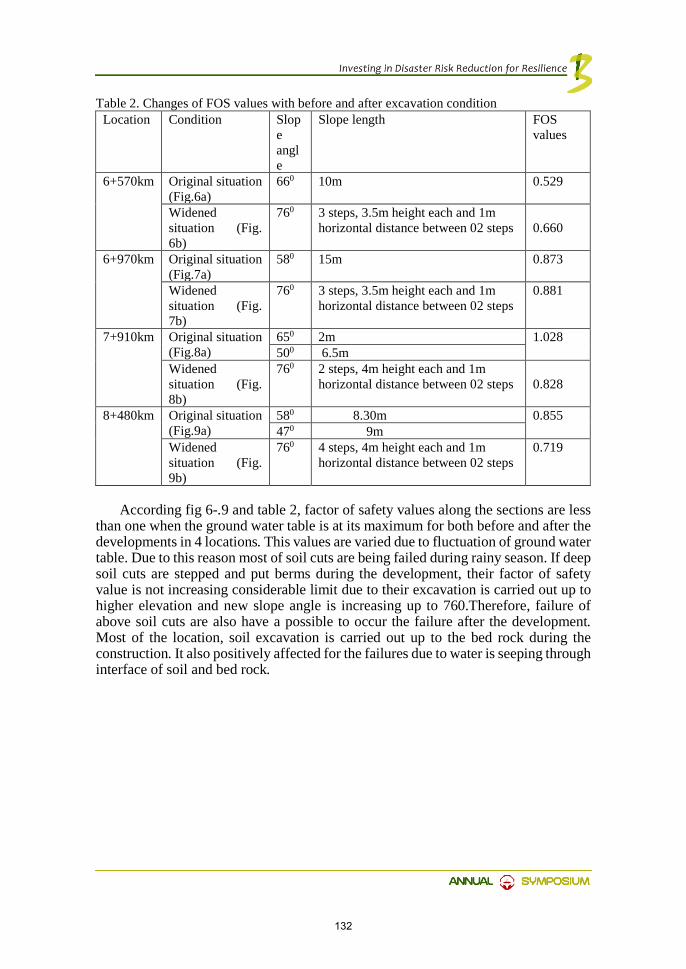
Table 2. Changes of FOS values with before and after excavation condition Location Condition Slop
e angle
Slope length FOS values
6+570km Original situation (Fig.6a)
660 10m 0.529
Widened situation (Fig. 6b)
760 3 steps, 3.5m height each and 1m horizontal distance between 02 steps
0.660
6+970km Original situation (Fig.7a)
580 15m 0.873
Widened situation (Fig. 7b)
760 3 steps, 3.5m height each and 1m horizontal distance between 02 steps
0.881
7+910km Original situation (Fig.8a)
650 2m 1.028 500 6.5m
Widened situation (Fig. 8b)
760 2 steps, 4m height each and 1m horizontal distance between 02 steps
0.828
8+480km Original situation (Fig.9a)
580 8.30m 0.855 470 9m
Widened situation (Fig. 9b)
760 4 steps, 4m height each and 1m horizontal distance between 02 steps
0.719
According fig 6-.9 and table 2, factor of safety values along the sections are less
than one when the ground water table is at its maximum for both before and after the developments in 4 locations. This values are varied due to fluctuation of ground water table. Due to this reason most of soil cuts are being failed during rainy season. If deep soil cuts are stepped and put berms during the development, their factor of safety value is not increasing considerable limit due to their excavation is carried out up to higher elevation and new slope angle is increasing up to 760.Therefore, failure of above soil cuts are also have a possible to occur the failure after the development. Most of the location, soil excavation is carried out up to the bed rock during the construction. It also positively affected for the failures due to water is seeping through interface of soil and bed rock.
132

5.5. Proposed mitigation measures to minimized the risk
According to fig. 10, factor of safety values can be increased by reshaping the slope and decreasing the ground water level. It clearly shows that, combination of above to factors are more effective other than use a one method.
6. Conclusion
Major soil type in the study area is silty sand and these soil type is morefavourable for the erosion and rotational type failures are possible. In present condition, failures of soil cuts are to be expected during the intensive rainfall. Reshaping the soil cuts are not sufficient to prevent these failures. Therefore, mitigation methods such as decreasing the ground water level and improvement of drainage system with reshaping can be used to minimize the failure.
References
[1] Dharmasena, R.K.N., & Kulathilaka S.A.S. (2015). Stabilization of cut slopes in highways by surface drainage & vegetation.
[2] GEO- SLOPE Intenational Ltd. (2004). SLOPE/W user mannual. [3] Singh, et al. (2013). A stability assessment of a hill slope – an analytical and numerical
approach International Journal of Earth Sciences and Engineering. [4] Shuib, M.K., Taib, S.H., Abdullah, M., (2006). Discontinuity controlled cut slopes
failures on weathered low grade metamorphic rocks along the east west highway, Grik to Jeli.
[5] Umrao, R.K., Singh, R., Ahmad, M., Singh, T.N. (2011). Stability analysis of cut slopes using continuous slope mass rating & kinematic analysis in Rudra Orayag district, Uttarakhand.
Fig. 10. Analysis of mitigation measures in chanage 6+570km. (c). Reshaping the slope- FOS value: 0.953 (d). decreasing the ground water level- FOS value: 0.999 (e). Reshaping and decreasing the ground water table- FOS value: 1.555
133
RISK MITIGATION

Risk Mitigation in Areas Showing Early Signs of Landslide; A Case Study at ‘Sobasiripura’, Hanwella
VGD Gangani1, DMDS Dissanayake2, PRC Ariyarathna3, KN Bandara4
1Scientist, National Building Research Organisation, Sri Lanka 2Engineer, National Building Research Organisation, Sri Lanka
3Senior Engineer, National Building Research Organisation, Sri Lanka 4Director, Geotechnical Engineering Division, National Building Research Organisation, Sri Lanka
Abstract
Sri Lanka being a tropical country, triggering factor of almost all the landslides is rain. Two major monsoonal seasons and inter-monsoonal seasons result rain induced landslides in hilly areas all around the country. Some landslides can be identified by early signs and be mitigated to reduce the risk of sliding. The occurrence of landslide at ‘Sobasiripura’, Hanwella was identified by the formation of tension cracks after a heavy rain which continued for two days. After the first sign of instability, NBRO started the field investigations as the first step of the process of risk mitigation. Stability analysis was carried out using Geo Studio; SLOPE/W software considering several possible mitigation measures. Installation of Horizontal Gravity Drains and providing adequate surface drain system were recommended as mitigation measures after considering the results of stability analysis. Site monitoring was carried out simultaneously to the mitigation works and significant draw down of Ground Water Table was encountered with the functioning of Horizontal Gravity Drains.
Keywords: Landslide; Risk Mitigation; Horizontal Gravity Drains
1. Introduction
Sri Lanka is a small tropical island lying on the Indian Ocean in the world’s perspective. As an island nation, Sri Lanka has to face the emerging problems with the population growth of the country as the current population is not less than 20 million. As a result, the land use patterns have been changed over decades and each and every land in urban areas have become industrial or residential lands. Even landslide prone areas have been occupied and the number of people living with
134

landslide risk has significantly increased. Also with the recent changes in rainfall patterns and increase of rainfall intensity within the region, the need of landslide risk mitigation is an essential task in disaster management. Therefore, awareness towards the identification of early signs of landslides and implementing mitigation measures has become one of the major concerns in the country.
National Building Research Organisation (NBRO) has played the major role in landslide risk reduction in last three decades. NBRO has been engaged in the landslide mitigation project at ‘Sobasiripura’, Hanwella after the identification of the particular landslide on July 2016. ‘Sobasiripura’ is a village proposed by National Housing Development Authority (NHDA). With the identification of early signs of the landslide, NBRO was requested to carry out initial landslide investigations. From that point onwards, enhancing the awareness of people living in landslide affected area, carrying out geotechnical investigations and laboratory testing, designing of mitigation measures, implementing mitigation measures and monitoring system were carried out by NBRO.
2. Methodology
The first sign of instability and cracks developing in the sloping terrain located above the ‘Sobasiripura’ housing scheme were identified by the village community, after a heavy rain which continued for two days. As per the request made by National Housing Development Authority (NHDA), a technical team from NBRO visited the site and carried out preliminary assessments. The awareness of village community was increased by informing about the possible extreme events. Geotechnical investigations and laboratory testings were done in order to identify mechanical properties of soil. Triggering factor of this landslide was identified as upsurge of ground water table. Hence, immediate actions were taken to install water level meters at the site and to measure the ground water level within the landslide area. Analysis was done using Geo Studio: SLOPE/W software and suitable counter measures were identified in order to stabilize the slope.
3. Geotechnical Investigation & Installation of Water Level Meters
After identifying the possible landslide boundary by the geotechnical specialists, borehole investigations were carried out within the identified boundary. Geotechnical investigations were carried out with the objective of providing information on subsurface condition including soil types, stratification, geology and bedrock properties for designing of mitigation measures. Accordingly, five number of (5 Nos.) boreholes ( BH1- BH 5) were drilled at site while conducting Standard Penetration Tests (SPT) at every 1.0 m intervals down to bedrock level. Continuous samples in soil and rock were collected in order to carry out laboratory testing to determine the soil/rock properties. After identifying the sub surface profile by drilling, five water level meters were installed at each borehole location for measurement of ground water levels. Locations of the boreholes are shown in Figure 1.
135

Fig. 1. Mitigation plan with Landslide boundary and Borehole locations
136
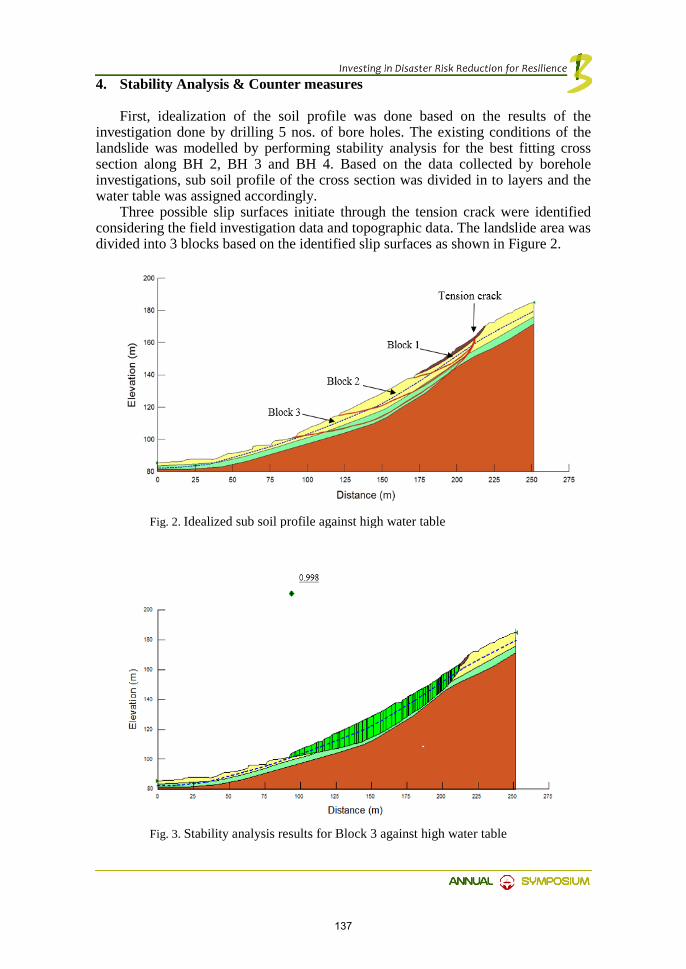
4. Stability Analysis & Counter measures
First, idealization of the soil profile was done based on the results of the investigation done by drilling 5 nos. of bore holes. The existing conditions of the landslide was modelled by performing stability analysis for the best fitting cross section along BH 2, BH 3 and BH 4. Based on the data collected by borehole investigations, sub soil profile of the cross section was divided in to layers and the water table was assigned accordingly.
Three possible slip surfaces initiate through the tension crack were identified considering the field investigation data and topographic data. The landslide area was divided into 3 blocks based on the identified slip surfaces as shown in Figure 2.
Fig. 2. Idealized sub soil profile against high water table
Fig. 3. Stability analysis results for Block 3 against high water table
137

According to Figure 2, Block 1 indicates the loose soil in top region while Block 3 represents the slip surface identified in borehole investigation. Block 2 was selected considering the possibility of an intermediate slip. The minimum Factor of Safety (FoS) was determined against a high water table within the landslide body.
According to the analysis results, Block 3 is in equilibrium condition with a FoS of 0.998 as shown in Figure 3. The results are shown in Table 1.
Table 1. Safety Factors against high water table
Condition FoS Block 1 Block 2 Block 3
1 High water table 1.114 1.025 0.998 Hence, it is treated as Block 3 is critical and the counter measures to be
concentrated for mitigating the whole area indicated as Block 3. According to the analysis, the FoS will be significantly reduced with the rise of
ground water table. As per the monitoring work done in the field, it was identified that an upsurge of water table is possible after a heavy rain. Several counter measures were addressed in the stability analysis considering high water table. Main concern is to avoid excess rain water infiltration by providing surface drains and to reduce ground water level by providing Horizontal Drains. The types of counter measures and resulting safety factors are presented in Table 2. Table 2. Counter measures and resulting safety factors
Option Counter measure Effect FoS Block 1 Block 2 Block 3
1 Surface drains 1 m drop of WT 1.207 1.105 1.076 2 Horizontal drains 3 m drop of WT 1.268 1.219 1.195
3 Surface drains + Horizontal drains (3m drop)
4 m drop of WT 1.291 1.273 1.256
According to the analysis results, the FOS for the critical slip surface can be
significantly increased by lowering the water table. Rainfall infiltration is limited to a certain depth below ground level and hence, horizontal drains have a little role in minimizing infiltration (Raharjo et al, 2003). Therefore, providing surface drainage is essential together with horizontal drains. A FoS greater than 1.25 can be accepted as safe and Option 3 can be taken as the best combination of countermeasures since it will ensure the reduction of rain water infiltration and ground water table at the same time.
5. Mitigation Works and Monitoring
Based on the outcome of the investigations and the analyses, NBRO proposed to implement several counter measures as follows. The proposed mitigation plan is shown in Figure 1.
• Sealing of tension cracks to reduce infiltration of rainwater and in prevention of excess pore water pressure building up within the sliding mass.
138
• Minimizing the infiltration of rain water during the rainy season by developing the surface drainage system together with catch pits and culverts.
• Maintaining the ground water table at a lower level by providing additional sub surface drainage through horizontal drains.
• Monitoring the functionality of surface and horizontal drains and measuring water levels in the water level meters especially during rainy season.
Among the proposed mitigation measures, sealing tension cracks and installing horizontal gravity drains were done as the first priority. According to the similar studies, horizontal drains were found to be most effective when located at the base of a slope (Raharjo, et al. 2003). Accordingly, four numbers of horizontal drains were drilled at the toe region with 50 m length and in 5 m intervals. A huge water flow was released through the horizontal drains just after drilling. The maximum water flow was recorded about 200 l/min initially and few hours later the rate of flow was reduced to about 30 l/min. A continuous water flow was recorded through these horizontal drains at the toe and hence, it is prefigured that a ground aquifer is connected with horizontal drains. Unlike other mitigation sites, considerable seepage was occurred around the horizontal drains in this site due to the silty nature of soil. Those places were let to be sealed naturally rather than providing cement mortar plugs.
Two sets of horizontal drains were located in the upper region of the slope. But those drains are of no real significance as long as the drains in the toe region are in function. The horizontal drains in the upper region are appeared to be intercepting perched water tables forming with heavy rains. Monitoring of water levels is done to ensure the reduction of water table after implementing mitigation works. The measured water levels and the rainfall intensity of the region are presented in Figure 4. According to the monitoring results, the water table has been eventually reduced to the lowest drain level and rainfall have not cause the water table to rise much above once the it has been established at the lowest level.
Significant draw down in ground water level was encountered with the functioning of horizontal drains. Therefore, it is prefigured that the ground water trapped inside the soil mass is released with time.
6. Conclusion
Main trigger of this landslide is the development of pore water pressure of soil profile and loss of matrix suction of soil during the rainy season. Upsurge of ground water level is possible due to heavy rainfalls and is highly likely to destabilize the slope. Hence it is essential to provide adequate drainage within landslide body. It is an effective measure to install horizontal gravity drains to release the trapped ground water inside the landslide body. Provisions were made to improve the surface drainage system and sub-surface drainage system as the mechanism of reducing rain water infiltration and increasing the rate of drainage within the landslide body.
Final objective of the mitigation measures is to reduce the risk of damaging human lives and properties due to the possible landslides by identifying the early signs of landslide. Awareness of people living with the landslide is also need to be fulfilled together with the mitigation measures.
139
Acknowledgements
Special thank goes to Mr. R. M. S. Bandara, the Director of Landslide Research & Risk Mitigation Division, for the expertise provided for the project.
References
[1] Cai, F., Ugai, K., Wakai, A., & Li, Q. (1998). Effects of Horizontal Drains on slope stability under rainfall by three dimensional finite element analysis. Computers and Geotechnics 23, 255-275.
[2] Edmund, C., & Choi, M. (1983). Seepage Around Horizontal Drains in Hill Slopes. ASCE, 1363-1368.
[3] Raharjo, H., Hritzuk, K. J., Leong, E., & Rezaur, R. (2003). Effectiveness of horizontal drains for slope stability. Engineering Geology 69, 295-308.
[4] Yamasaki, T. (2007). Plan of emergency landslide investigations and mitigation measures. The Japanese Geotechnical Society, Vol 49, No 9.
140

Fig.
4. W
ater
leve
ls a
nd ra
infa
ll in
the
regi
on
141

Stability analysis of the failure at Meethotamulla waste fill
SHS Jayakody1, GWN Galhena1, N Vasanthan2, Asiri Karunawardane3, SAS Kulathilaka4
1Engineer, National Building Research Organisation, Sri Lanka 2Senior Engineer, National Building Research Organisation, Sri Lanka
3Director General, National Building Research Organisation, Sri Lanka 4Senior Professor, University of Moratuwa, Sri Lanka
Abstract
Open dumping can be identified as the commonly adopted waste disposal method in Sri Lanka. The first ever waste slide in Sri Lanka happened at Meethotamulla waste fill site, which had been a low-lying marshy land. This slope failure occurred on 14th April 2017 which claimed the lives of many people, and caused the destruction of houses and infrastructure. Therefore, analyzing the stability of a waste fill is vital to take precautionary actions and also to implement mitigation measures. Numerical model analysis was conducted to determine the cause of failure at Meethotamulla waste slide and to assess the stability of the waste fill along the failure section and as well as other sections. The analysis was performed using GeoStudio 2016 Software package and the Spencer’s method was used as the actual slip surface geometry of the failure was non circular in shape. To facilitate the analysis, underlain soil profiles and properties at the site were taken from geotechnical investigation report prepared by National Building Research Organisation (NBRO). However, engineering properties of waste materials were determined by reviewing literature. The results indicate that the failure predicted by the model conforms to the actual failure condition. The waste fill had been in a marginally stable condition prior to the rain spell. It was shown that the failure has developed through the soft soil. The additional increase in weight caused by the infiltration of rainwater could have caused the instability in soft soil underneath resulting failure in the waste fill. Based on the results obtained from the analysis for different sections, the immediate risk areas of failure were marked. On-site tests were carried out subsequently to determine the actual engineering properties of waste to develop a more optimized long-term counter measures for the Meethotamulla waste fill.
Keywords: Meethotamulla; waste fill, failure, stability analysis
142

1. Introduction
Meethotamulla waste fill site which is located at close proximity to Colombo city had been used for waste dumping for more than 20 years before the catastrophic failure that occurred on 14th April 2017. This waste slide happened making it the first ever waste slide experienced by Sri Lanka claiming the lives of people, destruction of houses and infrastructure. It was estimated that the maximum height of the waste fill was in the range of 45 – 50 m and occupied an area of 78,000 m2 at the time of the failure.
The on-site investigations revealed that this waste fill is an unregulated open fill where waste of all forms is dumped. It is important to note that, the waste appeared to be poorly compacted with no or thin cover of soil while waste material is dumped on bare soft soils without any bottom liner. It will be shown subsequently that the failure occurred through the weak soft soil.
Closure and Rehabilitation of Meethotamulla waste fill site is a contemporary essential. In order to determine the long-term counter measures for the Meethotamulla waste fill, it is needed to have the actual engineering properties of the waste.
2. Objectives
The study comprises of the following objectives: • To establish the factors and conditions that have triggered the failure • To determine engineering properties of waste material • To assess the stability condition of the waste fill after the failure • To analyse and report future risk of failure and • To determine the probable cause of failure
3. Methodology
3.1. Study of underlain soil profiles and properties at the site
The most appropriate subsurface profiles were determined from the field observations and borehole investigations carried out by NBRO in year 1998 and 2012. The strength parameters and the unit weight for soil layers were estimated from borehole investigation data, and past experiences related to same type of materials existing in Sri Lanka. Table 01: Shear strength parameters considered for sub-soil layers of the waste fill site
Soil Type Notation ϒ (kN/m3)
φ' / φu
(deg)
C' / Cu (kPa)
Loose silt/sand/gravel 16 28 5
Sandy Clay 16 25 20
Peat 14 0 10
Medium dense sandy silt/ silty sand 17 30 10
Completely weathered rock 20 38 10
143

3.2. Study of the waste fill and its engineering properties
The properties of the waste fill under wet condition were considered in the stability analysis. The waste materials in landfills are greatly heterogenic in nature due to their composition, degree of compaction, decomposition etc. Therefore, respective shear strength parameters significantly differ over the waste fill. The shear strength decreases if the waste contains excess moisture, especially in upper part of waste fill (Yamawaki, Omine, Doi, & Kawasaki). Considering above facts and with appropriate assumptions, the waste was categorized into four layers of varying thicknesses: Waste Fill (WF) – fresh waste in the top-most layer, Upper Waste (UW) - underlain by fresh waste, Intermediate Waste (IW) - followed by upper waste and partially decomposed and Lower Waste (LW) – immediately above the existing ground which is fully decayed (Stark, 2008).
The unit weights of the waste fill layers had to be accurately assigned in order to obtain a realistic model. To this end, average unit weight values were assigned to different waste layers by considering the assumed variations of compaction effect, cover soil content of the layers, overburden stress applied on each layer and the moisture content.
Since no actual shear strength parameters are available for waste material in Sri Lanka, the shear strength parameters for the analysis were obtained from published literature on engineering properties of waste materials. According to the following details given by Dixon, Russell and Jone (2005), shear strength parameters were selected for the different waste layers in the study. a. Corresponding to very low stress (0 kP ≤ σ < 20 kPa) where the Waste behaviour
can be described as being only cohesive. In this case, Cu = 20 kPa b. Corresponding low to moderate stresses (20 kPa ≤ σ < 60 kPa). In this case,
C'= 0kPa and ø' ≈ 38˚ c. Corresponding to higher stresses (σ ≥ 60 kPa). In this case, C' = 20 kPa and
ø' ≈ 30˚ The corresponding shear strength parameters and unit weight used in the stability
analysis are given in Table 02.
Table 02 : Shear strength parameters considered for waste fill under wet condition based on literature
Waste Type Notation ϒ(kN/m3) φ' (deg) C'/Cu(kPa)
Waste 4 (WF) 5.0 0 20
Waste 3 (UW) 6.5 38 0
Waste 2 (IW) 8.0 30 20
Waste 1 (LW) 9.5 30 20
144

3.3. On-site tests were carried out to determine the actual waste properties
Direct Shear test This test was carried out by an apparatus especially fabricated for direct shear
tests at solid waste dumping sites. A waste portion having dimensions of 30 cm × 30 cm × 15 cm was cut out from the surface of the waste deposit carefully (Fig. 1). If a cutout sample block contained plastics or wood pieces sticking out, it was shaped neatly by cutting off such ends with a grinder. After shaping the edges, shear box which has the same dimensions was inserted and testing was done to measure the shear resistance of waste materials. (Shintaro Miyamoto, 2012)
Fig. 1. Direct Shear Testing on the waste dump Repose angle test
The repose angle test is designed to investigate the slope stability of waste fills. A backhoe was deployed on site to pile up the waste. In this study, the slope angle of the front side of the backhoe bucket was chosen for the measurement of the repose angle after avalanching (Fig. 2). This is because the scattering of waste by the backhoe bucket tends to cause slippage of the waste on the front side of the bucket, and hence the slope can be deemed as taking the repose angle after avalanching. (Atsushi Yamawaki, 2017)
Fig. 2. Repose Angle Test on the waste dump
145
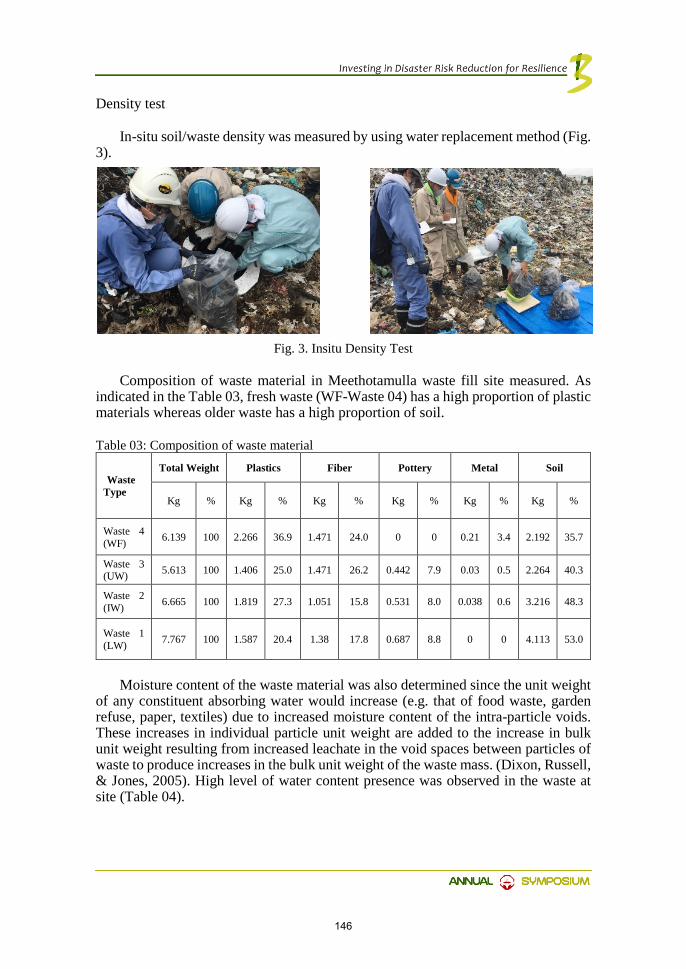
Density test
In-situ soil/waste density was measured by using water replacement method (Fig. 3).
Fig. 3. Insitu Density Test
Composition of waste material in Meethotamulla waste fill site measured. As
indicated in the Table 03, fresh waste (WF-Waste 04) has a high proportion of plastic materials whereas older waste has a high proportion of soil. Table 03: Composition of waste material
Waste Type
Total Weight Plastics Fiber Pottery Metal Soil
Kg % Kg % Kg % Kg % Kg % Kg %
Waste 4 (WF) 6.139 100 2.266 36.9 1.471 24.0 0 0 0.21 3.4 2.192 35.7
Waste 3 (UW) 5.613 100 1.406 25.0 1.471 26.2 0.442 7.9 0.03 0.5 2.264 40.3
Waste 2 (IW) 6.665 100 1.819 27.3 1.051 15.8 0.531 8.0 0.038 0.6 3.216 48.3
Waste 1 (LW) 7.767 100 1.587 20.4 1.38 17.8 0.687 8.8 0 0 4.113 53.0
Moisture content of the waste material was also determined since the unit weight
of any constituent absorbing water would increase (e.g. that of food waste, garden refuse, paper, textiles) due to increased moisture content of the intra-particle voids. These increases in individual particle unit weight are added to the increase in bulk unit weight resulting from increased leachate in the void spaces between particles of waste to produce increases in the bulk unit weight of the waste mass. (Dixon, Russell, & Jones, 2005). High level of water content presence was observed in the waste at site (Table 04).
146
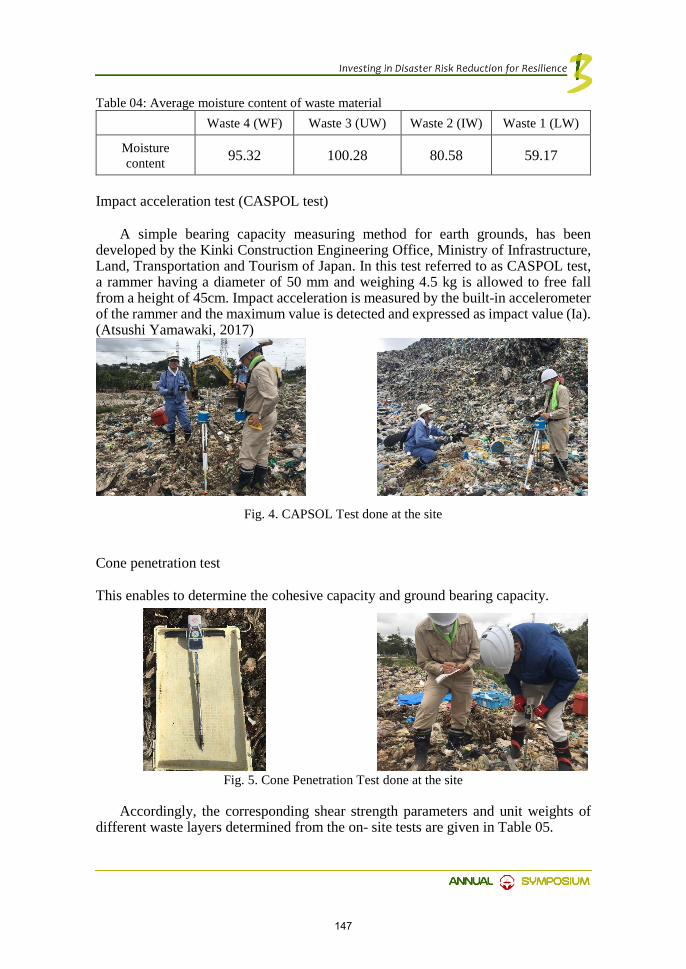
Table 04: Average moisture content of waste material Waste 4 (WF) Waste 3 (UW) Waste 2 (IW) Waste 1 (LW)
Moisture content 95.32 100.28 80.58 59.17
Impact acceleration test (CASPOL test)
A simple bearing capacity measuring method for earth grounds, has been developed by the Kinki Construction Engineering Office, Ministry of Infrastructure, Land, Transportation and Tourism of Japan. In this test referred to as CASPOL test, a rammer having a diameter of 50 mm and weighing 4.5 kg is allowed to free fall from a height of 45cm. Impact acceleration is measured by the built-in accelerometer of the rammer and the maximum value is detected and expressed as impact value (Ia). (Atsushi Yamawaki, 2017)
Fig. 4. CAPSOL Test done at the site
Cone penetration test
This enables to determine the cohesive capacity and ground bearing capacity.
Fig. 5. Cone Penetration Test done at the site Accordingly, the corresponding shear strength parameters and unit weights of
different waste layers determined from the on- site tests are given in Table 05.
147

Table 05: Shear strength parameters determined for waste fill based on on-site tests
Waste Type Notation ϒ(kN/m3) φ' C'(kPa)
Waste 4 (WF) 4.2 37 4
Waste 3 (UW) 8.8 37 4
Waste 2 (IW) 9.2 41 4.9
Waste 1 (LW) 10.2 35.7 9.7
1.1 Analysis to assess the stability of the waste fill
The stability along 4 different cross sections was modelled covering all the critical areas of the waste fill site (Fig. 6). The most suitable profiles for the different cross sections of the waste fill were developed based on the visual observations and the expert judgment. Although, several factors such as pre-failure slope geometry, strength parameters of the waste materials and subsoil, drainage conditions of the site, erosion, weathering etc may have contributed to the failure, only pre-failure slope geometry, strength properties of waste material and subsurface soil, and the maximum possible water table were considered as the primary factors in the stability analysis.
The stability analysis was carried out using GeoStudio 2016 from Geo Slope. The Spencer method was used in the analysis as the actual slip surface geometry of the failure was non circular in shape.
Fig. 6. Cross sections selected for the stability analysis
148

2. Results and Discussion
2.1 Model validation (for assumed waste parameters)
The applicability of the model was checked by carrying out an analysis for the full cross-section along Section B-B. The assumed profile of waste material and sub surface soil is presented in Fig. 7.
The results indicated that the instability occurs at the Right Hand Side (RHS) of the section B-B (where exactly the failure took place) and further, the failure predicted by the model confirmed to the actual failure condition (Fig. 8). Therefore, the model was found to be capable of analysing the section with the assigned parameters of the sub-soil and waste.
Fig. 7. Assumed profile for the stability analysis for Section B-B Fig. 8. Resulted failure surface from the stability analysis (shear strength parameters for the
waste fill based on the literature)
2.2 Stability Analysis
The calculated Factor of Safety values for the critical slip surfaces for each cross section are summarized in Table 06.
149

Table 06: Factor of Safety for the critical slip surfaces of the waste fill Section Remarks Factor of
safety A – A At the time of failure 0.807 B – B At the time of failure - RHS 0.932
At the time of failure - LHS (direct opposite to failed area)
1.338
C – C At the time of failure 0.813 D – D At the time of failure 1.276
The results clearly show that low factor of safety value of 0.807 and 0.932 correspond to the failed sections A- A and B-B respectively. In addition, the factor of safety of 0.813 calculated for the section C-C revealed that it is also at an unstable condition. Therefore, if the load imposed on the slope C-C is increased by further waste dumping or due to rapid rainwater infiltration, it may become unstable and collapse.
According to the results, Section D-D and LHS of the Section B-B stay at stable condition relative to the other sections with higher factor of safety greater than 1.25.
From the results of stability analysis, it can be stated that the waste sections containing fresh garbage with higher fill height and greater slope angles underlain by very soft/soft soils are prone to higher risk of failure especially under wet condition. In contrary, the risk of failure is comparatively low for waste fills with older waste due to its decomposition, and low fill height and low slope angles. Also it was underlain with medium stiff sub soil and drainage conditions were better.
2.3 Model validation (for waste parameters determined by test results)
The same cross section (Section B-B) was modelled to search the critical failure surface passing through the toe by using the waste parameters determined by the on-site tests (Table 05). Failure predicted by the model is very close to the actual results. Therefore, it can be said that the actual parameters determined by the on-sites tests are reliable.
Fig. 9. Resulted failure surface from the stability analysis (shear strength parameters for the waste fill based on the on-site test results)
150

3. Conclusion
It is vital to conduct an extensive field reconnaissance to identify parameters such as; existing height and slope of the landfill, observed slip surface (whether it failed through the waste or it passed through the waste and other materials), pore pressure conditions in the landfill, unit weight, whether intermediate soil cover layers were used or not, recent history of fill placement, rainfall and eyewitness accounts (Stark, 2008) as accurately as possible to ascertain the probable cause of failure.
The reason for the resulted significant high frictional resistance from the on-site tests could be due to the presence of entangled fibrous materials and plastics in high proportions. This causes steep slopes at Meethotamulla and many other unregulated waste fills to remain safe for years. Sites situated at flat ground and ground containing fibrous material are hardly prone to failure (Yamawaki, Omine, Doi, & Kawasaki). Strength of undrain soil plays a very important role in the stability. Daily cover soils play an important role in controlling the amount and distribution of precipitation that enters waste (Dixon, Russell, & Jones, 2005). The absence of daily cover soils and drainage system resulted in high moisture content in waste.
The waste fill had been in a marginally stable condition prior to the rain spell. The additional rise of weight caused by the infiltration of the rainwater could have initiated the instability in soft soil underneath resulting in failure of the waste fill. Increase in water table and the decrease in shear strength in upper layer of the waste fill due to excessive moisture could have been the other contributory factors for the failure. As a consequence, a lateral movement of the peat layer in the direction of houses and a significant ground upheaving has taken place at the toe region. The houses/other built structures in the toe region were severely damaged. Further, the movements in the toe area had blocked the drainage canal passing through causing minor flood situation in the Eastern side.
Acknowledgements
The authors acknowledge all NBRO officers who were involved in this assessment and wish to thank Mr. Atsushi Yamawaki, Dr. Kiyoshi Omine, and Dr. Youichi Doi for their guidance on carrying out the onsite tests.
References
[1] Atsushi Yamawaki, Y. D. (2017). Slope stability and bearing capacity of landfills and simple on-site test methods. Waste Management & Research, 730–738.
[2] Dixon, N., Russell, D., & Jones, V. (2005). Engineering properties of municipal solid waste.
[3] Shintaro Miyamoto, K. O. (2012). Shear property of solid waste materials by in-situ direct shear test. XII International Symposium on Environmental Geotechnology, Energy and Global Sustainable Development. Los Angeles, CA.
[4] Stark, N. H.-S. (2008). Back-Analyses of Landfill Slope Failures. International Conference on Case Histories in Geotechnical Engineering.
[5] Yamawaki, A., Omine, K., Doi, Y., & Kawasaki, M. (n.d.). Slope Stability of Solid Waste Layers inside and outside of Japan.
151

152

Stabilization of Cut Slopes Using Soil Nailing Technique: A Case Study at Nugagahapura Housing Scheme,
Colombo 05
MHM Harshani1, NPG Amali1, JU Nimal2, PRC Ariyarathna3& KN Bandara4
1Engineer, National Building Research Organisation, Sri Lanka 2Project Manager, National Building Research Organisation, Sri Lanka
3Senior Geotechnical Engineer, National Building Research Organisation, Sri Lanka 4Director, Geotechnical Engineering Division, National Building Research Organisation,
Sri Lanka
Abstract
At present, soil nailing technique is increasingly practiced in Sri Lanka for reinforcing unstable slopes because it lacks construction constraints compared to other techniques used. Particularly, for the slopes with limited working space and high inclination, this technique is one of the best applications, which provide the land to gain required safety margin for long term stability. Under the supervision of National Building Research Organisation, soil nailing was used to stabilize an unstable cut slope at Nugagahapura Housing scheme in Kirulapone area within the Colombo Municipal Council limits. The project proved to be one of the most successful examples for implementing this technology where the available working area was minimal due to congestion of houses at the crest and at the toe of the unstable slope. During implementation, it was necessary to face a multitude of technical and socio-economic challenges such as hanging houses over the crest, sewerage pits close to the cut, frequent localized instabilities and the need for using couplers in difficulties of handling soil nails. However, the solutions provided and experience gained was highly useful also in view of implementing similar projects in the future. The experience gained could be well utilized in making aware the relevant sector, relevant institutions and professionals, so that similar problems encountered in future can be successfully dealt with.
Keywords: soil nailing; reinforcing; rectification
153
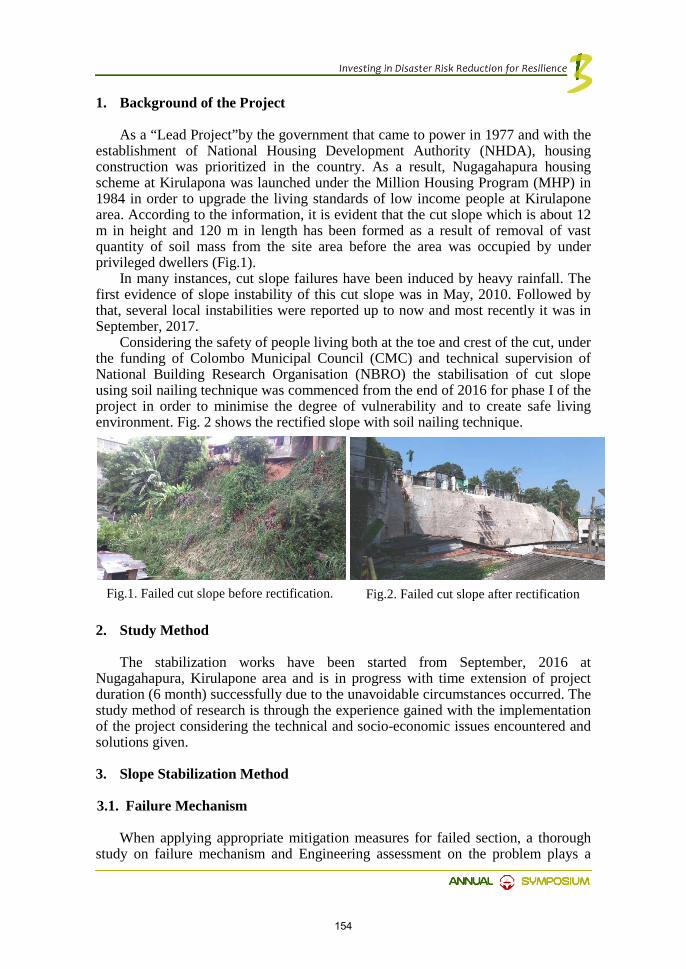
1. Background of the Project
As a “Lead Project”by the government that came to power in 1977 and with the establishment of National Housing Development Authority (NHDA), housing construction was prioritized in the country. As a result, Nugagahapura housing scheme at Kirulapona was launched under the Million Housing Program (MHP) in 1984 in order to upgrade the living standards of low income people at Kirulapone area. According to the information, it is evident that the cut slope which is about 12 m in height and 120 m in length has been formed as a result of removal of vast quantity of soil mass from the site area before the area was occupied by under privileged dwellers (Fig.1).
In many instances, cut slope failures have been induced by heavy rainfall. The first evidence of slope instability of this cut slope was in May, 2010. Followed by that, several local instabilities were reported up to now and most recently it was in September, 2017.
Considering the safety of people living both at the toe and crest of the cut, under the funding of Colombo Municipal Council (CMC) and technical supervision of National Building Research Organisation (NBRO) the stabilisation of cut slope using soil nailing technique was commenced from the end of 2016 for phase I of the project in order to minimise the degree of vulnerability and to create safe living environment. Fig. 2 shows the rectified slope with soil nailing technique.
2. Study Method
The stabilization works have been started from September, 2016 at Nugagahapura, Kirulapone area and is in progress with time extension of project duration (6 month) successfully due to the unavoidable circumstances occurred. The study method of research is through the experience gained with the implementation of the project considering the technical and socio-economic issues encountered and solutions given.
3. Slope Stabilization Method
3.1. Failure Mechanism
When applying appropriate mitigation measures for failed section, a thorough study on failure mechanism and Engineering assessment on the problem plays a
Fig.1. Failed cut slope before rectification. Fig.2. Failed cut slope after rectification
154

vital role as the decision made on mitigation measure directly affects the lives and properties of stakeholders because site is situated in a sensitive (highly populated) area.
According to the geological perspective, the soil exposure in cut is mainly lateritic soil with silt and clay pockets observed as white spots and no bed rock exposure is present. Further the ground water table is at a lower elevation; hence it is obvious that no effect of water table during dry season and under that unsaturated condition of soil mass cut slope remains stable without any collapse. But with intensive rain experienced in this area, due to the presence of silt and clay spots in lateritic residual formation, the saturation of clay/silt causes decrease in shear strength of soil as a result of loosing matric suction developed in unsaturated condition during dry season. The unsatisfied safety factor of slope developed leads to mainly a cutting failure here.
According to the observations the crown of failure surface has been extended beyond the limit of houses at the crest and the debris accumulated up to the houses at the toe endangering the human lives. Consequently this critical situation was mitigated by a proper stabilisation method considering the all restraints accompanied with this area especially.
3.2. Stability analysis
At the design stage of the project, stability analysis was carried out using Geoslope SLOPE/W software with Morgenstern-Price method. The critical section of failed surface was analysed applying drained soil parameters and assuming three soil layers. The several approaches of mitigation measures were analysed for the selection of most suitable measure which satisfies the requirement of safety margin, durability as well as socio - economic aspect.
Mitigation method was chosen so that the stabilized cut slope meet safety requirement (safety margin), after accessing the present state of stability of cut. It is identified that improvement of proper drainage system which carry water paths away from the slope area is the most prominent along with an appropriate structural measure. Accordingly soil nailing technique along with drainage improvement is the feasible option considering the reasons such as less working space in highly populated area, stability and durability.
3.3. Soil nailing technique in related to the project
Stabilisation of cut slopes using soil nailing technique is abundantly used nowadays as it enhances the shear resistance of soil against slope failure and pullout resistance at the interface between grout and surrounding soil mass. Soil nails provide best solution for less working space with this type of congested environment rather than choosing a gravity wall to resist the failure of high cut slope ( approx. 12 m).
The designed soil nailing surface comprises of improvement of surface drainage system in order to divert runoff water from the slope area using three cascade drains, a cut-off drain, a toe drain and a lead away drain. And also short and long horizontal drains are constructed within soil nailing surface to lower the ground water table and to release pore water pressure built up behind the wall to achieve
155

required safety margin. Accordingly, a section of soil nailing design consists of 12 m long nails in top four rows and 10 m long nails in bottom four rows with application of full face shotcrete (Fig.3).
Fig.3. Typical section for soil nails arrangement
4. Problems Encountered during Construction of soil nailing
The project met with several technical and socio-economic challenges during its project duration and solutions taken would be very much helpful for implementation of future similar projects. Some of the problems can be discussed as follows:
At the very beginning of the project, access to the site is the one of the main challenge faced and the debris accumulated at the toe, supported by sand bags and other lateral props adopted as the working platform providing toe support during construction period as well as to facilitate the safe machine and man movement. Here also the same stabilisation sequence of top to bottom approach was adopted without removing the vegetation cover of whole section which can be addressed to unexpected failures. Hence carrying out construction activities segment by segment gradually was processed as usual while construction time.
As the area is highly populated, the crest of the slope consists of series of hanging houses with soakage pits (nearly 8 numbers) situated almost near to the edge of the crest. Initially two options were considered to overcome this design issue: new steel structure design to support hanging houses without disturbing to existing houses as the first option, and other option is to demolish the problematic segments of particular houses with the consent of the owners of residences. As the construction of a steel structure on this slope was found to be very complex and not also economical, finally with the permission of owners of the houses, demarcated parts of those hanging houses were demolished and soakage pits were replaced by a common sewerage pit for the successful implementation of design of the project (Fig.4 (a)). Compacted quarry dust fill was used in those voids created by soakage pits above the slope and nails were installed through some of those fills with provision of casings.
156

(a) (b) Fig.4. (a) After demolishing of hanging parts of houses at the crest (b) Finished end of soil nailing construction
With time, the slope became almost vertical (approx. 80˚) due to further collapsing of soil mass and erosion. Hence, the original design angle of 75˚could not be maintained and not practicable. Consequently, the design was revised for the factor of safety for the existing angle considering the impossibility of acquiring land to maintain original design angle.
As previously stated, the site is located in very populated area with less space and the safety aspect, the coupling of soil nails was allowed only in lower nails (for the bottom three rows), only if the practical difficulty of handling of soil nails of10 m long was occurred. Those couplers were used not to be in the same plane with the nearest nail and placed alternatively (6 m and 4 m lengths of nail coupling). Another decision made was using wet mix shotcrete over dry mix shotcrete application on slope in order to minimise the disturbance to the people nearby by avoiding the environmental pollution with dust dispersed.
(a) (b) Fig.5. (a) Hanging houses at the crest and protected excavated slope by a polythene cover (b) Cut-off drain and safety fence construction at the crest of the slope
157

Temporary evacuation of vulnerable people surrounding the cut slope was done whenever necessary to ensure the safety of the people. During the rainy time, the first priority was maintaining proper draining of stormwater within the site area by covering the excavated slope with thick polythene sheets in order to prevent infiltration of water into the soil mass (Fig.5. (a)) and introducing temporary drainage path to ensure proper drainage system. Fig.5. (b) shows the permanent construction for cut-off drain at the crown area of slope.
Several times cracks were appeared both in the side of non-excavated face of slope and on the slope under the hanging houses. The unexcavated soil mass was gradually removed from the site with care in order to avoid the propagation of cracks and finally to prevent occurring of massive failures.
One of the biggest challenge and responsibility is to ensure short term safety of the people living nearby residences while the construction time taking appropriate actions anytime necessary. And the safety at site was maintained giving first priority other than any work. Considering the long term safety of the people living near to the crest, safety fence made of woven wire mesh was proposed and designed to ensure safety requirements considering the steepness and considerable height (approx. 12 m) of rectified slope.
5. Conclusion
When considering this project, community liaising was prominent above all others in the path for successful completion of the project. This project ultimately would benefit the community in this area assuring their safe living environment in the long term.The challenges and problems encountered during implementation of project are presented in this case study in order to make aware the professionals involved in similar projects so as which would no longer disturbances.
Acknowledgements
The authors would like to express their gratitude to all personnel who contributes their immense commitment to particular project by leading it towards the success.
References
[1] National Building Research Organisation. (2015). Design report for stabilisation of cut slope at Nugagahapura housing scheme.
[2] Yongmin Kim, Sungjune Lee, SangseomJeong, Jaehong Kim (2013). The effect of pressure-grouted soil nails on the stability of weathered soil slopes (pg. 1).
[3] Chia-Cheng Fan, Jiun-Hung Luo (2008). Numerical study on the optimum layout of soil–nailed slopes (Pg. 1).
158

MONITORING & RISK MANAGEMENT
Adequacy of legal framework enacted in Sri Lanka with respect to the chemical disaster management associated
with industries and related facilities KLG Kaushalya1 & SV Dias2
1 Engineer/ Scientist, National Building Research Organisation, Sri Lanka 2 Director, Environmental Studies & Services Division, National Building Research
Organisation, Sri Lanka Abstract
SLCDMP has identified chemical accidents as a type of emerging key disasters under its scope encompassing 8 management strategies with primary focus on ‘Policy legal and institutional framework’. Potential disaster risk of chemical accidents cannot be just ignored because at present more than 20,000 industries and facilities are using more wide range of chemicals in manufacture of products for a wide range of uses. Several releases of toxic chemicals into the environment from industries in the past did not catch due attention of authorities as most of them were limited to conventional type incident management. In many cases systematic hazard assessment was lacking with poor transparency on information to public on overall situation. Incidents related to chemical disaster repeatedly highlighted numerous gaps in current DM process and the requirement of sound legal framework on management of disasters associated with chemical accidents. This study investigates the gaps in current legislative framework in chemical disaster management considering that these gaps as a potential factor contributing to chemical disaster risk. Current legislative documents and regulations enacted in Sri Lanka that are directly and indirectly relevant to chemical disaster risk were analysed to study the degree of inclusion of the DM strategies during chemical related industrial process life cycle. The information gathered from the analysis of 19 legislatives were subjected to matrix analysis while narrating qualitatively the degree of inclusion of DM depending on the rank for a given legislative over the complete DM cycle. The results show that all legislations have inadequately addressed the DM aspect of chemical accidents, some inadequacies in the DM process was observed with special emphasis on siting of industrial facilities, estimating potential risks, absence of chemical inventories and hazard assessment documents, poor risk communication. The preliminary findings portrayed range of gaps in existing policy and legislative framework in the DM cycle of chemical accidents requiring serious attention by Disaster Management Ministry to negate future risk associated. Keywords: Chemical Disaster Management Cycle; Adequacy in legislations;
159
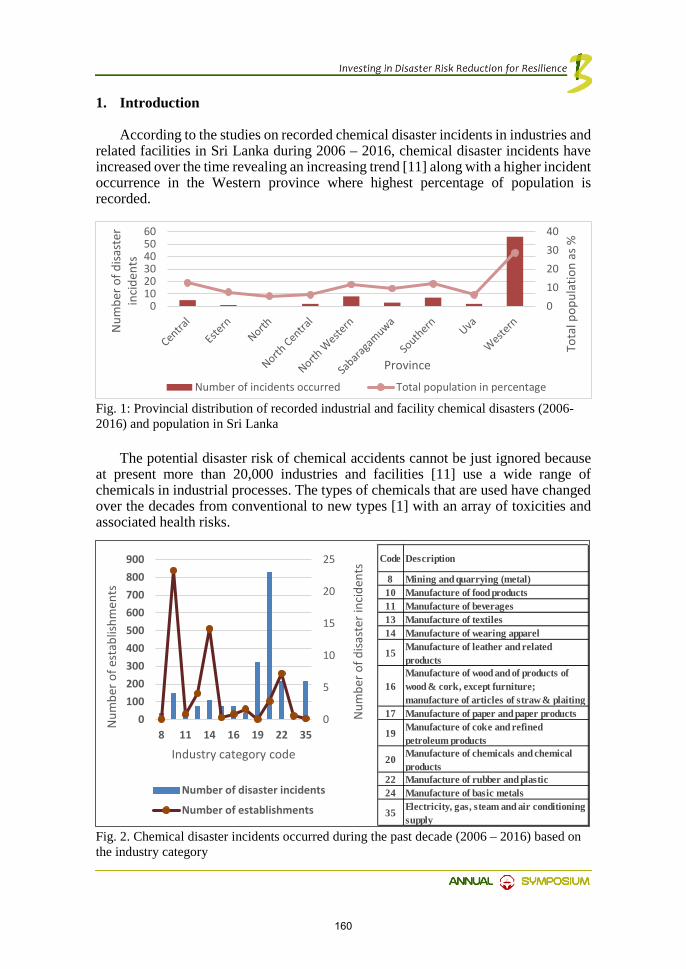
1. Introduction
According to the studies on recorded chemical disaster incidents in industries and related facilities in Sri Lanka during 2006 – 2016, chemical disaster incidents have increased over the time revealing an increasing trend [11] along with a higher incident occurrence in the Western province where highest percentage of population is recorded.
The potential disaster risk of chemical accidents cannot be just ignored because
at present more than 20,000 industries and facilities [11] use a wide range of chemicals in industrial processes. The types of chemicals that are used have changed over the decades from conventional to new types [1] with an array of toxicities and associated health risks.
010203040
0102030405060
Tota
l pop
ulat
ion
as %
Num
ber o
f disa
ster
in
cide
nts
Province
Number of incidents occurred Total population in percentage
Fig. 1: Provincial distribution of recorded industrial and facility chemical disasters (2006-2016) and population in Sri Lanka
0
5
10
15
20
25
0100200300400500600700800900
8 11 14 16 19 22 35
Num
ber o
f disa
ster
inci
dent
s
Num
ber o
f est
ablis
hmen
ts
Industry category code
Number of disaster incidents
Number of establishments
Code Description
8 Mining and quarrying (metal)10 Manufacture of food products11 Manufacture of beverages13 Manufacture of textiles14 Manufacture of wearing apparel
15 Manufacture of leather and related products
16Manufacture of wood and of products of wood & cork, except furniture; manufacture of articles of straw & plaiting
17 Manufacture of paper and paper products
19 Manufacture of coke and refined petroleum products
20 Manufacture of chemicals and chemical products
22 Manufacture of rubber and plastic 24 Manufacture of basic metals
35 Electricity, gas, steam and air conditioning supply
Fig. 2. Chemical disaster incidents occurred during the past decade (2006 – 2016) based on the industry category
160
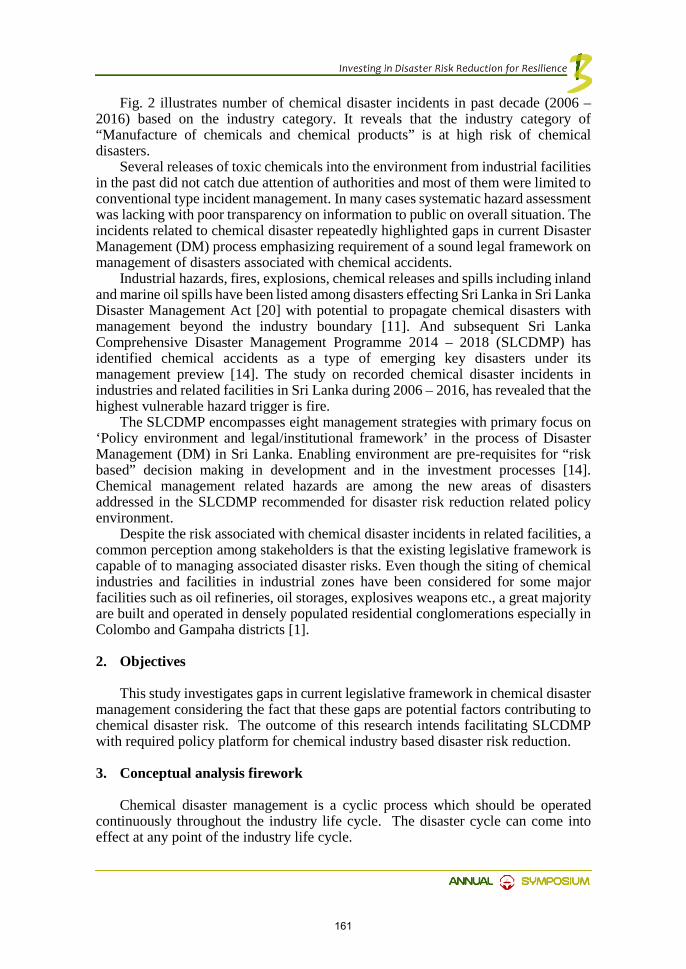
Fig. 2 illustrates number of chemical disaster incidents in past decade (2006 – 2016) based on the industry category. It reveals that the industry category of “Manufacture of chemicals and chemical products” is at high risk of chemical disasters.
Several releases of toxic chemicals into the environment from industrial facilities in the past did not catch due attention of authorities and most of them were limited to conventional type incident management. In many cases systematic hazard assessment was lacking with poor transparency on information to public on overall situation. The incidents related to chemical disaster repeatedly highlighted gaps in current Disaster Management (DM) process emphasizing requirement of a sound legal framework on management of disasters associated with chemical accidents.
Industrial hazards, fires, explosions, chemical releases and spills including inland and marine oil spills have been listed among disasters effecting Sri Lanka in Sri Lanka Disaster Management Act [20] with potential to propagate chemical disasters with management beyond the industry boundary [11]. And subsequent Sri Lanka Comprehensive Disaster Management Programme 2014 – 2018 (SLCDMP) has identified chemical accidents as a type of emerging key disasters under its management preview [14]. The study on recorded chemical disaster incidents in industries and related facilities in Sri Lanka during 2006 – 2016, has revealed that the highest vulnerable hazard trigger is fire.
The SLCDMP encompasses eight management strategies with primary focus on ‘Policy environment and legal/institutional framework’ in the process of Disaster Management (DM) in Sri Lanka. Enabling environment are pre-requisites for “risk based” decision making in development and in the investment processes [14]. Chemical management related hazards are among the new areas of disasters addressed in the SLCDMP recommended for disaster risk reduction related policy environment.
Despite the risk associated with chemical disaster incidents in related facilities, a common perception among stakeholders is that the existing legislative framework is capable of to managing associated disaster risks. Even though the siting of chemical industries and facilities in industrial zones have been considered for some major facilities such as oil refineries, oil storages, explosives weapons etc., a great majority are built and operated in densely populated residential conglomerations especially in Colombo and Gampaha districts [1].
2. Objectives
This study investigates gaps in current legislative framework in chemical disaster management considering the fact that these gaps are potential factors contributing to chemical disaster risk. The outcome of this research intends facilitating SLCDMP with required policy platform for chemical industry based disaster risk reduction.
3. Conceptual analysis firework
Chemical disaster management is a cyclic process which should be operated continuously throughout the industry life cycle. The disaster cycle can come into effect at any point of the industry life cycle.
161

In a chemical disaster, existence of a source and an initiator will generate a causative factor (source for hazard) and a hazard is triggered under poor safety management leading to harmful effects. Therefore, all the stages in chemical disaster incident path should intervene with industry chemical disaster management, starting from the hazard source to recovery until satisfactory disaster risk reduction is reached. Despite the fact that all industries are covered by ordinances of industrial safety and National Environmental Act and the relevant regulations, at present the respective DM intervention is largely limited to response in a chemical accident event and recovery. Fig. 3 illustrates current common DM intervention in an industry with chemical disaster incident without prevention management.
A conceptual legislation analysis framework was developed considering four important areas important in the management of chemical disaster risk. at various stages of the industry life cycle a) Spatial planning and development, b) Industry life cycle, c) Vital common facilities with special reference to chemical disaster risks associated, and d) Intervention of DM cycle. Integrating these the conceptual framework given in fig. 5 was developed.
Fig. 3. DM intervention in an Industry chemical disaster incident without disaster prevention management
Fig. 4. Disaster management cycle
162
4. Methodology
Several acts, policies, regulations, programs, plans and guidelines declared in Sri Lanka were screened using screening criteria considering their relevancy at Industry life cycle and DM intervention, and once with direct/ indirect relevancy to chemical disaster management were selected. Relevant legislative attributes pertinent to spatial planning and development, industry life cycle management, and DM cycle were derived considering various stages relevant to industry life cycle and chemical disaster management cycle. Legal aspects pertinent to industrial chemicals (raw materials, products, by products)/ facility management at various stages of its life cycle, siting, regional planning and development, industrial process, common facilities such as hazardous waste disposal, transportation of dangerous chemicals and decommissioning etc. were considered in the preparation of the legislation analysis framework (Fig. 5). A total of 57 attributes with reasonable representation of key factors related to chemical disaster management were derived (Table 1).
Fig. 6 gives the list of referent documents based on their relevance to chemical disaster management sectors. Total of 19 documents pertinent to current National legislation for chemical disaster management were extracted having sufficient relevancy as decided by expert judgement. The documents were categorized into five main sectors namely Spatial Planning and Development (SPD), Industrial Process Safety (IPS), Common Facility Management (CFM), Environmental Management (EM), and Chemical Disaster Management (CDM).
Fig. 5. Conceptual framework for chemical disaster legislation analysis
163
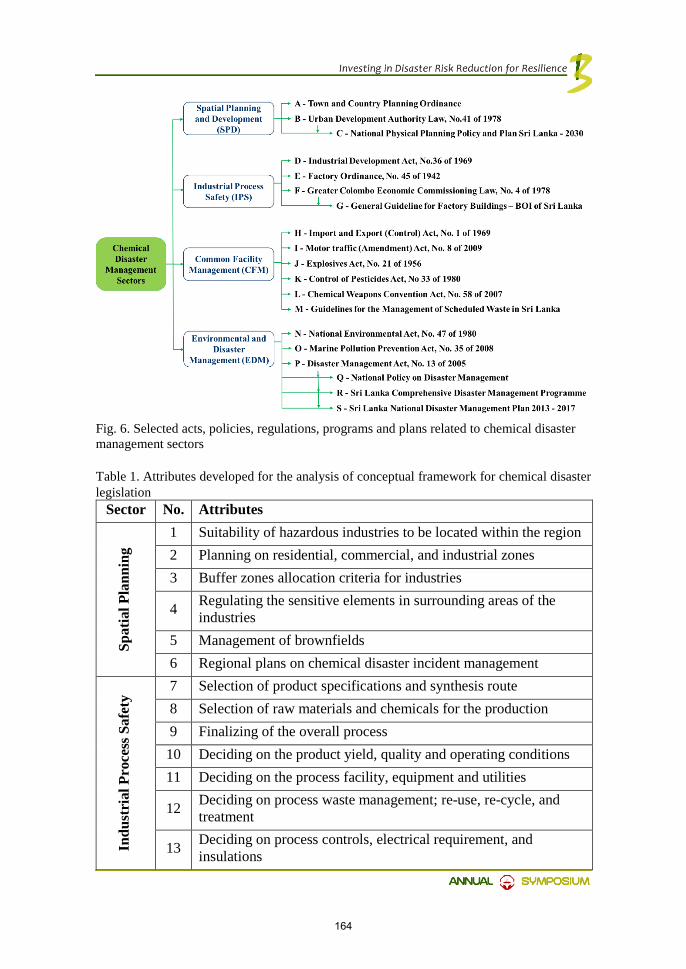
Table 1. Attributes developed for the analysis of conceptual framework for chemical disaster legislation
Sector No. Attributes
Spat
ial P
lann
ing
1 Suitability of hazardous industries to be located within the region 2 Planning on residential, commercial, and industrial zones 3 Buffer zones allocation criteria for industries
4 Regulating the sensitive elements in surrounding areas of the industries
5 Management of brownfields 6 Regional plans on chemical disaster incident management
Indu
stri
al P
roce
ss S
afet
y
7 Selection of product specifications and synthesis route 8 Selection of raw materials and chemicals for the production 9 Finalizing of the overall process
10 Deciding on the product yield, quality and operating conditions 11 Deciding on the process facility, equipment and utilities
12 Deciding on process waste management; re-use, re-cycle, and treatment
13 Deciding on process controls, electrical requirement, and insulations
Fig. 6. Selected acts, policies, regulations, programs and plans related to chemical disaster management sectors
164

14 Deciding on site requirement and selection of the site 15 Deciding on buffer zone requirement and allocation 16 Maintenance of the buffer zone & controlling sensitive elements 17 Effect of sensitive elements located within the buffer zones 18 Selection of the transportation routes 19 Adequacy of access paths 20 Planning on chemical transportation medium and safety 21 Planning on chemical storage facilities and safety 22 Planning on chemical handling and safety 23 Planning on fire safety 24 Planning on natural hazards safety 25 Planning on chemical/ manmade hazards safety 26 Planning on indoor air quality, ventilation and lighting 27 Planning on noise and vibration within the factory environment 28 Assessment of process safety failures risk 29 Assessment of physical safety of the facility 30 Assessment of natural disaster risks of the facility 31 Commissioning of the facility 32 Operation and the maintenance of the facility
33 Waste management of the facility; facilitating, monitoring, and regulating
34 Planning on modifications & assessing effects of modifications 35 Commissioning the modifications and maintaining 36 Safety in decommissioning of the facility 37 Management of decommissioning waste
Com
mon
faci
lity
Man
agem
ent
38 Managing bulk storage facilities of chemicals 39 Deciding on usage of chemicals 40 Management of waste treatment facilities 41 Prohibition/ restriction of extremely dangerous chemical usage
42 Management of hazardous waste disposal yards; facilitating, monitoring, and regulating
43 Transportation media of dangerous chemicals, products, & wastes
E n v 44 Assessing environmental impacts of industries
165
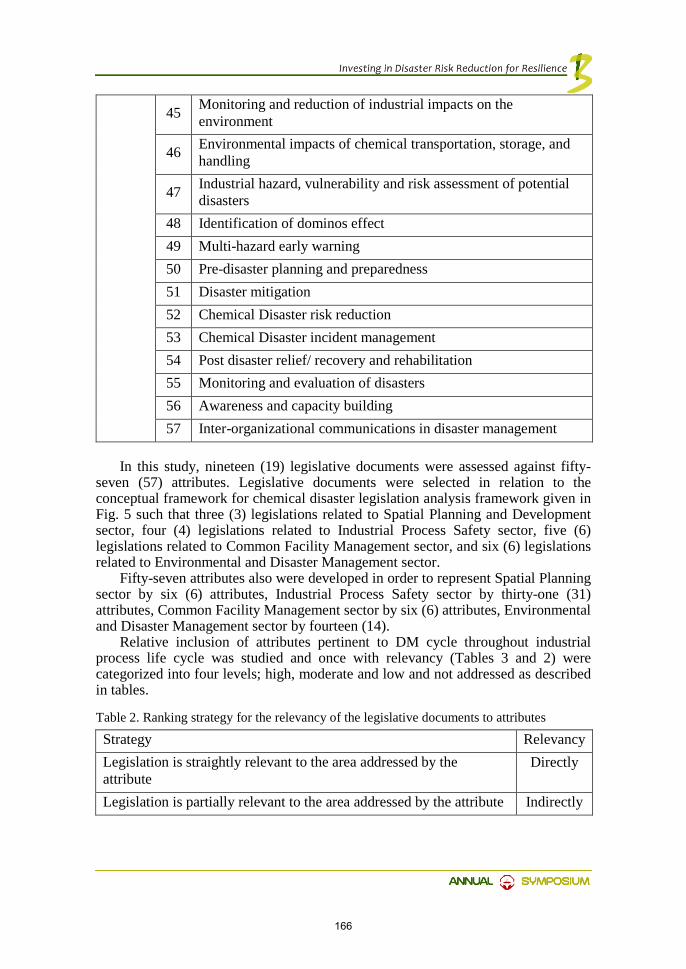
45 Monitoring and reduction of industrial impacts on the environment
46 Environmental impacts of chemical transportation, storage, and handling
47 Industrial hazard, vulnerability and risk assessment of potential disasters
48 Identification of dominos effect 49 Multi-hazard early warning 50 Pre-disaster planning and preparedness 51 Disaster mitigation 52 Chemical Disaster risk reduction 53 Chemical Disaster incident management 54 Post disaster relief/ recovery and rehabilitation 55 Monitoring and evaluation of disasters 56 Awareness and capacity building 57 Inter-organizational communications in disaster management
In this study, nineteen (19) legislative documents were assessed against fifty-
seven (57) attributes. Legislative documents were selected in relation to the conceptual framework for chemical disaster legislation analysis framework given in Fig. 5 such that three (3) legislations related to Spatial Planning and Development sector, four (4) legislations related to Industrial Process Safety sector, five (6) legislations related to Common Facility Management sector, and six (6) legislations related to Environmental and Disaster Management sector.
Fifty-seven attributes also were developed in order to represent Spatial Planning sector by six (6) attributes, Industrial Process Safety sector by thirty-one (31) attributes, Common Facility Management sector by six (6) attributes, Environmental and Disaster Management sector by fourteen (14).
Relative inclusion of attributes pertinent to DM cycle throughout industrial process life cycle was studied and once with relevancy (Tables 3 and 2) were categorized into four levels; high, moderate and low and not addressed as described in tables.
Table 2. Ranking strategy for the relevancy of the legislative documents to attributes
Strategy Relevancy Legislation is straightly relevant to the area addressed by the attribute
Directly
Legislation is partially relevant to the area addressed by the attribute Indirectly
166

Table 3. Ranking strategy for the inclusion assessment of the legislative documents related to attributes
Strategy Rank The attribute is widely included by the legislation Comprehensively Included The attribute is partially included by the legislation Moderately Included The attribute is only identified by the legislation Poorly Included The attribute is not even identified by the legislation Not Included
5. Results and discussion
The outcome of the analysis is presented in a matrix (Table 4) and interpretation was given according to the legend given in Table 5. The nineteen (19) legislative documents were grouped into main sectors of Chemical Disaster Management based on their relevancy. Accordingly, the relevant legislations under each sector are classified further into four (4) levels depending on degree of inclusion of particular attribute in a given legislation as comprehensively included (CI), moderately included (MI), poorly included (PI), and not included (NI). Further, in order to present overall picture on level of inclusion of a given attribute in directly and indirectly relevant legislations two additional columns were introduced L1 and L2 (L1: level of inclusion in legislations considered as directly relevant and L2: level of inclusion in all legislations) respectively.
For example, the SPM column represents the analysis summery of three (3) relevant legislations and IPS, CFM, and EDM columns represent the analysis summery of four (4), Six (6) and six (6) relevant legislations respectively. Accordingly, each value of the matrix represents the number of legislations which have included the considered attribute with respect to level of inclusion under specific sub column under the given section of Chemical Disaster Management. For example, the first zero (0) in the matrix refers that no legislation out of three which are considered directly relevant to the Spatial Planning and Development sector (SPD) had included the first attribute within it.
167

CI MI PI NI CI MI PI NI CI MI PI NI CI MI PI NI1 0 0 0 3 0 0 0 4 0 0 0 6 0 0 0 6 Not Included Not Included2 0 0 0 3 0 0 0 4 0 0 0 6 0 0 0 6 Not Included Not Included3 0 0 0 3 0 0 1 3 0 0 0 6 0 0 1 5 Not Included Poorly Included4 0 0 0 3 0 0 0 4 0 0 0 6 0 0 1 5 Not Included Poorly Included5 0 0 0 3 0 0 0 4 0 0 0 6 0 0 0 6 Not Included Not Included6 0 0 0 3 0 0 0 4 0 0 0 6 0 0 0 6 Not Included Not Included7 0 0 0 3 0 0 1 3 0 0 1 5 0 0 0 6 Poorly Included Poorly Included8 0 0 0 3 0 0 1 3 0 0 1 5 0 0 0 6 Poorly Included Poorly Included9 0 0 2 1 0 0 1 3 0 0 1 5 0 0 0 6 Poorly Included Poorly Included10 0 0 0 3 0 0 1 3 0 0 0 6 0 0 0 6 Poorly Included Poorly Included11 0 0 0 3 0 1 0 3 0 0 0 6 0 0 0 6 Moderately Included Moderately Included12 0 0 1 2 0 1 1 2 0 1 0 5 0 0 1 5 Moderately Included Moderately Included13 0 0 1 2 0 1 0 3 0 0 0 6 0 0 0 6 Moderately Included Moderately Included14 0 0 3 0 0 0 1 3 0 0 0 6 0 0 0 6 Poorly Included Poorly Included15 0 0 0 3 0 0 1 3 0 0 0 6 0 1 0 5 Poorly Included Moderately Included16 0 0 0 3 0 0 1 3 0 0 0 6 0 1 0 5 Poorly Included Moderately Included17 0 0 1 2 0 0 0 4 0 0 0 6 0 0 1 5 Not Included Poorly Included18 0 0 2 1 0 0 0 4 0 0 1 5 0 0 0 6 Not Included Poorly Included19 0 0 1 2 0 0 0 4 0 0 0 6 0 0 0 6 Not Included Poorly Included20 0 0 0 3 0 0 0 4 0 2 3 1 0 1 0 5 Not Included Moderately Included21 0 0 0 3 0 1 0 3 0 1 5 0 0 1 0 5 Moderately Included Moderately Included22 0 0 0 3 0 1 0 3 0 1 4 1 0 1 1 4 Moderately Included Moderately Included23 0 0 0 3 0 2 0 2 0 1 1 4 0 4 0 2 Moderately Included Moderately Included24 0 0 0 3 0 0 1 3 0 0 0 6 0 4 0 2 Poorly Included Moderately Included25 0 0 0 3 0 1 0 3 0 0 0 6 0 0 4 2 Moderately Included Moderately Included26 0 0 0 3 0 2 0 2 0 0 0 6 0 1 0 5 Moderately Included Moderately Included27 0 0 0 3 0 2 0 2 0 0 0 6 0 1 0 5 Moderately Included Moderately Included28 0 0 0 3 0 0 1 3 0 0 0 6 0 0 0 6 Poorly Included Poorly Included29 0 0 0 3 0 0 2 2 0 0 0 6 0 0 0 6 Poorly Included Poorly Included30 0 0 0 3 0 0 0 4 0 0 0 6 0 0 4 2 Not Included Poorly Included31 0 0 1 2 0 0 1 3 0 0 0 6 0 0 0 6 Poorly Included Poorly Included32 0 0 0 3 0 1 0 3 0 0 0 6 0 0 0 6 Moderately Included Moderately Included33 0 0 0 3 0 0 2 2 0 1 0 5 0 1 0 5 Poorly Included Moderately Included34 0 0 0 3 0 1 1 2 0 0 0 6 0 0 0 6 Moderately Included Moderately Included35 0 0 1 2 0 0 1 3 0 0 0 6 0 0 0 6 Poorly Included Poorly Included36 0 0 0 3 0 0 1 3 0 0 0 6 0 0 0 6 Poorly Included Poorly Included37 0 0 0 3 0 0 0 4 0 0 1 5 0 0 1 5 Not Included Poorly Included38 0 0 0 3 0 0 0 4 0 0 0 6 0 0 0 6 Not Included Not Included39 0 0 0 3 0 0 1 3 0 0 0 6 0 0 0 6 Not Included Poorly Included40 0 0 0 3 0 0 0 4 0 1 0 5 0 0 1 5 Moderately Included Moderately Included41 0 0 0 3 0 0 1 3 0 3 0 3 0 0 0 6 Moderately Included Moderately Included42 0 0 0 3 0 0 1 3 0 4 0 2 0 1 0 5 Moderately Included Moderately Included43 0 0 0 3 0 0 0 4 0 1 0 5 0 0 0 6 Moderately Included Moderately Included44 0 2 0 1 0 0 0 4 0 0 0 6 0 1 1 4 Moderately Included Moderately Included45 0 0 0 3 0 0 0 4 0 0 0 6 0 0 1 5 Poorly Included Poorly Included46 0 0 0 3 0 0 0 4 0 1 0 5 0 0 0 6 Not Included Moderately Included47 0 0 0 3 0 0 0 4 0 0 0 6 0 0 4 2 Poorly Included Poorly Included48 0 0 0 3 0 0 0 4 0 0 0 6 0 0 4 2 Poorly Included Poorly Included49 0 0 0 3 0 0 0 4 0 0 0 6 0 0 4 2 Poorly Included Poorly Included50 0 0 0 3 0 0 0 4 0 0 0 6 0 0 4 2 Poorly Included Poorly Included51 0 0 0 3 0 0 0 4 0 0 0 6 0 0 4 2 Poorly Included Poorly Included52 0 0 0 3 0 0 0 4 0 0 0 6 0 0 4 2 Poorly Included Poorly Included53 0 0 0 3 0 0 0 4 0 0 0 6 0 0 4 2 Poorly Included Poorly Included54 0 0 0 3 0 0 0 4 0 0 0 6 0 0 4 2 Poorly Included Poorly Included55 0 0 0 3 0 0 0 4 0 0 0 6 0 0 4 2 Poorly Included Poorly Included56 0 0 0 3 0 0 0 4 0 0 0 6 0 0 4 2 Poorly Included Poorly Included57 0 0 0 3 0 0 0 4 0 0 0 6 0 0 4 2 Poorly Included Poorly Included
EDM
IPS
CFM
EDM (6 legislations)
Number of legislations included Level of inclusion based on directly
relevant legislations (L1)
Level of inclusion with respect to all
analyzed legislations (L2)
SP
Attribute SectorSPD
(3 legislations)IPS
(4 legislations)CFM
(6 legislations)
Table 4. Final analysis - matrix
168
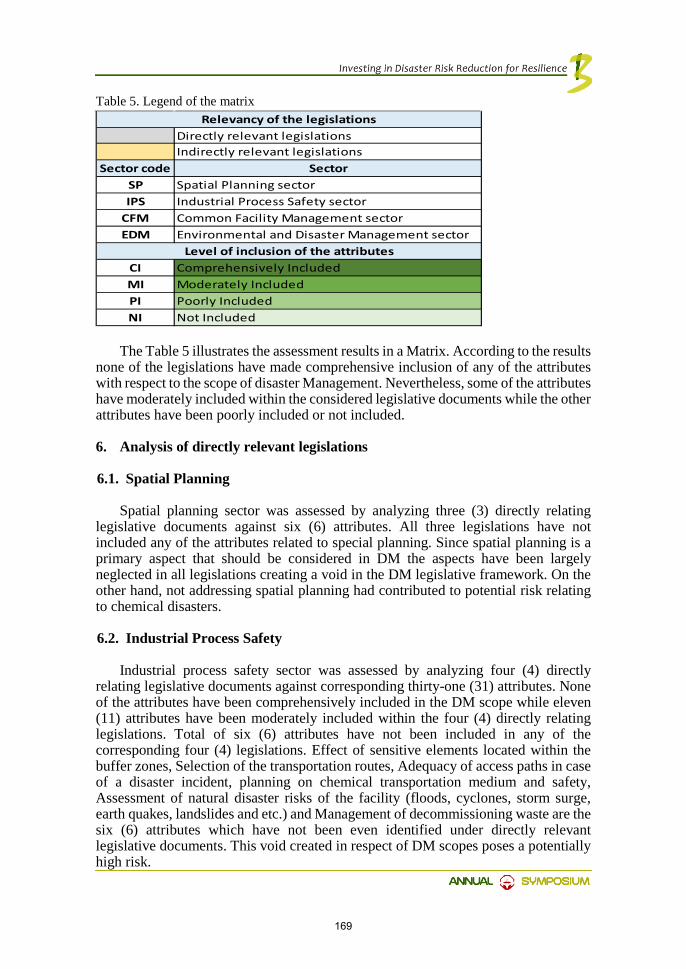
The Table 5 illustrates the assessment results in a Matrix. According to the results
none of the legislations have made comprehensive inclusion of any of the attributes with respect to the scope of disaster Management. Nevertheless, some of the attributes have moderately included within the considered legislative documents while the other attributes have been poorly included or not included.
6. Analysis of directly relevant legislations
6.1. Spatial Planning
Spatial planning sector was assessed by analyzing three (3) directly relating legislative documents against six (6) attributes. All three legislations have not included any of the attributes related to special planning. Since spatial planning is a primary aspect that should be considered in DM the aspects have been largely neglected in all legislations creating a void in the DM legislative framework. On the other hand, not addressing spatial planning had contributed to potential risk relating to chemical disasters.
6.2. Industrial Process Safety
Industrial process safety sector was assessed by analyzing four (4) directly relating legislative documents against corresponding thirty-one (31) attributes. None of the attributes have been comprehensively included in the DM scope while eleven (11) attributes have been moderately included within the four (4) directly relating legislations. Total of six (6) attributes have not been included in any of the corresponding four (4) legislations. Effect of sensitive elements located within the buffer zones, Selection of the transportation routes, Adequacy of access paths in case of a disaster incident, planning on chemical transportation medium and safety, Assessment of natural disaster risks of the facility (floods, cyclones, storm surge, earth quakes, landslides and etc.) and Management of decommissioning waste are the six (6) attributes which have not been even identified under directly relevant legislative documents. This void created in respect of DM scopes poses a potentially high risk.
Directly relevant legislationsIndirectly relevant legislations
Sector code SectorSP Spatial Planning sectorIPS Industrial Process Safety sector
CFM Common Facility Management sectorEDM Environmental and Disaster Management sector
CI Comprehensively IncludedMI Moderately IncludedPI Poorly IncludedNI Not Included
Relevancy of the legislations
Level of inclusion of the attributes
Table 5. Legend of the matrix
169

6.3. Common Facility Management
Common facility management sector was assessed by analyzing six (6) directly relating legislative documents against six (6) attributes. None of the attributes have been comprehensively included while four (4) attributes have been moderately included within the six (6) directly relating legislations. Total of two (2) attributes have not been included in considered six (6) legislations which are managing bulk storage facilities of chemicals, and deciding on usage of chemicals. However, it is noteworthy that in limited number of industries and facilities the bulk storage of chemical has been considered in DM scope (storage and transportation of petroleum products in refineries, thermal power plants, port, filling stations, storage stations, air ports, railway and bus and etc.) potential risk associated in future industrial development could require addressing this aspect in a comprehensive manner in order to manage potential risks.
6.4. Environmental and Disaster Management
Environmental and disaster management sector was assessed by analyzing six (6) directly relating legislative documents against fourteen (14) attributes. None of the attributes have been comprehensive included covering the DM scope. Many have been poorly included while only one (1) attribute (Assessing environmental impacts of industries) has been moderately included within the six (6) directly relating legislations. One (1) attribute out of fourteen (14) has been even not included in considered six (6) legislations which is the Environmental risks of chemical transportation, storage, and handling. The low inclusion of relevant DM scope in Environment Risks poses a disaster risk on sensitive elements in the environment in multiple ways.
6.5. Overall analysis
6.5.1. Spatial Planning
Two other indirectly relevant legislative documents related to Industrial Process Safety (IPS) and Environmental and Disaster Management (EDM) sectors have poorly included two of the attributes out of six (6), resulting rest of the four (4) attributes with 100% non-inclusion in the analyzed legislations.
The analysis emphasizes that regional planning aspects such as locating industries and facilities prone to chemical hazards have been considered very much lightly in studied legislations. The analysis further suggests emphasis of zonal planning for siting industries and facilities prone to chemical hazards in legislations, planning residential, commercial and other sensitive developments in the neighborhood of such facilities, management of brownfields, and Regional plans on chemical disaster incident management are the four attributes that have not been even identified under any of the analyzed legislative documents.
Nevertheless, the authors keep findings non-conclusive as inclusion of in DM scope in complementary spatial plans such as Western Region Megapolis Development Plan and other Provincial Development plans in the country have not been considered for this study.
170

6.5.2. Industrial Process Safety
Analysis shows that few in the considered nineteen (19) legislations have both moderately and poorly included the corresponding thirty-one (31) attributes. The analysis found that Inclusion of DM scope in legislations pertinent to industrial process safety sector has been comparatively high. Corresponding higher inclusion has resulted from relatively good industrial safety and occupational health legislations framework in the country.
6.5.3. Common Facility Management
The overall analysis found that corresponding attributes have been included either poorly or moderately in at least one out 19 nineteen (19) legislative documents analyzed, the study finds comparatively higher inclusion of DM scope in the Management of hazardous waste and facilities in the legislative framework.
6.5.4. Environmental and Disaster Management
As per the overall analysis, one indirectly relevant legislative document has poorly included the corresponding attributes for Environmental impacts of chemical transportation, storage, and two (2) attributes with moderate inclusions. Since the “poorly inclusion” indicates only the identification of an attribute within a legislative document, balance twelve (12) attributes out of fourteen (14) can be considered as not included properly within any of the analyzed legislation emphasizing the need of serious attention on Environmental and Disaster Management sector with respect to chemical disaster management aspects.
6.6. Final analysis
Only twenty-two (22) attributes have been moderately included out of the total of fifty-seven (57) leading to a considerable gap in thirty-five (35) attributes. More importantly none of the attributes have comprehensive inclusion in any of the analyzed legislative documents creating space for improvements in areas of all the attributes. As all four (4) considered sectors in chemical disaster management are equally important to ensure a sustainable management of chemical disasters, identified gaps in all four sectors must be equally addressed.
7. Conclusion
The analysis shows substantial lapses in the current legislative framework when addressing the disasters related to chemical accidents in industries and facilities. The areas highlighted were spatial planning aspects, process design with adequate safety protocols including minimizing dominos effect, technological interventions to use less toxic chemicals, defining siting criteria with sufficient safety and barriers to control propagation of hazard outside the facility boundaries, control of development activities attracted by the industrial establishments, Proper legislative framework considering these aspects can largely prevent the risk.
171

The derived 57 attributes under 4 categories is a key outcome in this work and could serve as a basis for development of overall policy/legislative framework.
Further, category based “Chemical Disaster Risk Assessment” can be developed including all the areas highlighted by fifty-seven (57) attributes considered in this study with the incorporation of all four chemical disaster management sectors in order to introduce it to the industries to be used as a management tool.
References
American Chemical Society. (2017). CAS Assigns the 100 Millionth CAS Registry Number® to a Substance Designed to Treat Acute Myeloid Leukemia. Retrieved from CAS A Division of the American Chemical Society: http://www.cas.org/news/media-releases/100-millionth-substance [1] CHEMICAL WEAPONS CONVENTION. (2001, November 20). Sri Lanka:
DEPARTMENT OF GOVERNMENT PRINTING,. [2] Control of Pesticides Act, No 33 of 1980. (1980, September 5). Sri Lanka: Government
Publication Burea. [3] Department of Census and Statistics, Sri Lanka . (2015). Annual Survey of Industries
Final report 2013. Printing Division - Department of Census and Statistics . [4] Explosives Act, No. 21 of 1956. (1956, February 17). Sri Lanka: DEPARTMENT OF
GOVERNMENT PRINTING. [5] Factories Ordinance, No. 45 of 1942. (1950, January 01). Parliament of The Democratic
Socialist Republic of Sri Lanka. Sri Lanka: Government Publications Bureau. [6] General Guidelines for Factory Buildings. (2011, February). Sri Lanka: BOARD OF
INVESTMENT OF SRI LANKA. [7] Greater Colombo Economic Commission Law No. 4 of 1978. (1978, January 31). Sri
Lanka: Government Publication Bureau. [8] IMPORTS AND EXPORTS (CONTROL) ACT, No. 1 OF 1969. (2010, November 22).
Sri Lanka: DEPARTMENT OF GOVERNMENT PRINTING,. [9] Industrial Development Act, No. 36 of 1969. (1970, January 29). Parliament of The
Democratic Socialist Republic of Sri Lanka. Sri Lanka: Government Publications Bureau. [10] Kaushalya, G. K., Premasiri, S. H., & Dias, S. V. (2016). Impacts of Chemical Disasters
on the Neighbouring Environment with a Special Reference to Siting. Symposium Proceedings of NBRO International Symposium 2016 - Risk Awareness and Future Challengers (pp. 193 - 202). Colombo: National Building Research Organisation.
[11] Kaushalya, K. L., Premasiri, H. D., & Dias, S. V. (2016). Distribution of Recorded Chemical Disaster Incidents during the Past Decade in Sri Lanka. Symposium Proceedings of NBRO International Symposium 2016 - Risk Awareness and Future Challengers (pp. 185-192). Colombo: National Building Research Organisation.
[12] Marine Pollution Prevention Act, No. 35 of 2008. (2008, October 23). DEPARTMENT OF GOVERNMENT PRINTING.
[13] Ministry of Disaster Management. (2014, March). Sri Lanka Comprehensive Disaster Management Programme (SLCDMP) 2014 - 2018. Ministry of Disaster Management.
[14] Motor traffic (Amendment) Act, No. 8 of 2009. (2009, March 11). Sri Lanka: DEPARTMENT OF GOVERNMENT PRINTING.
[15] National Environmental Act, No. 47 of 1980. (1980). Sri Lanka: DEPARTMENT OF GOVERNMENT PRINTING.
[16] National Physical Planning Policy and Plan Sri Lanka - 2030. (2012, March 3). Sri Lanka: DEPARTMENT OF GOVERNMENT PRINTING.
172
[17] National Policy on Disaster Management. (2010, December 28). Sri Lanka: DEPARTMENT OF GOVERNMENT PRINTING.
[18] ResearchGate GmbH - 2008-2018 . (2017, 12 20). Risk Management Cycle (source: Integral Risk Management Cycle, FOCP 2003) . Retrieved from ResearchGate: https://www.researchgate.net/figure/281629962_Risk-Management-Cycle-source-Integral-Risk-Management-Cycle-FOCP-2003
[19] Sri Lanka Disaster Management Act, No. 13 of 2005. (2005, May 13). Parliament of The Democratic Socialist Republic of Sri Lanka. Sri Lanaka: Government Publications Bureau.
[20] Sri Lanka National Disaster Management Plan 2013 - 2017. (2011, October 31). Sri Lanka: DEPARTMENT OF GOVERNMENT PRINTING.
[21] Town and Country Planning Ordinance. (1946, August 1). Sri Lanka: DEPARTMENT OF GOVERNMENT PRINTING.
[22] Urban Development Authority Law, No.41 of 1978. (1978, October 1). Sri Lanka: DEPARTMENT OF GOVERNMENT PRINTING.
173

Back analysis of slope failure at Welipanna, Southern Express Way
IAND Idirimanna1, N Vasanthan2& SAS Kulathilake3
1Engineer, National Building Research Organisation 2Senior Engineer, National Building Research Organisation
3Professor, Department of Civil Engineering, University of Moratuwa, Sri Lanka
Abstract
Slope failures due to excessive rainfall are a common geotechnical hazard in tropical countries where residual soils are abundant. These soils possess significant matric suctions in dry seasons and are in a stable state. Heavy infiltration of rainwater causes destruction of matric suctions, development of perched water table and rise of ground water table. Thus shear strength is reduced causing slopes to fail. In order to understand the mechanism of these slope failures it is necessary to model it with a reasonable accuracy. Sri Lankan residual soil formed by weathering of metamorphic rocks have significant abrupt variations in engineering characteristics due to variations in mineralogical composition of the parent rock and weather under humid heavy rainfall conditions. Joints in the parent rock are present as relict joints in the parent rock adding further complications. A failure occurred in a cut slope at Welipanna in Southern expressway after few days of rain. Infiltration of rainfall was modelled using the SWCC and permeability function derived for the soil obtained from the site. In view of the many uncertainties present a parametric analysis was done considering the presence of systems of relict joints and possible defects in the surface drainage system. The results also revealed that if the drainage is in perfect working order this failure would not have occurred. The infiltration model revealed that the rise of ground water table is quite significant at toe of the slope. Hence it is recommended to have sub horizontal drains at the toe level even if the ground water table is found to be lower than the toe level in general.
Keywords: Slope stability; Matric Suction; Unsaturated soil; Infiltration.
1. Introduction
Rainfall-induced slope failure creates one of the most common geotechnical hazards in tropical regions such as Sri Lanka. The intense rainfall is the major
174

triggering factor under these conditions. Safety margins of these slopes are high during the periods of dry weather due to the prevailing matric suctions. The pore water pressure distribution with depth prior to the rainfall is hydrostatic below the ground water table and negative above it in the unsaturated soil mass. As a result of heavy rainfall, significant infiltration takes place and soil at the surface is getting nearly saturated. With rainfall of greater intensity perched water table conditions can also develop. The wetting front that progresses downwards with the prolonged rainfall will cause a rise of the ground water table. Towards the toe of the slope the infiltration would cause much greater destruction of the matric suction profile and greater rise of ground water table. These events would lead to a significant reduction in the safety margins of the slope and could trigger a failure.
A rainfall induced slope failure occurred in a cut slope at chain edge of 42+340 to 42+400 in Welipanna in the southern expressway. After prolong rainfall that continued for several days in western part of the country, the slope became unstable and collapsed on 2nd November 2012. The slope is formed of residual soils where the parent rock is metamorphic. Due to weathering under high ambient temperature and high rainfall conditions and the differences in the mineralogical structure in the parent rock the weathered product is highly variable. Rocks with no or slight weathering were embedded in a matrix of soil (boudinage structures). Five different joint systems were identified in the rocks in the area and adversely oriented relict joints filled with water under high pressure were identified during the rectification process. The failure was back analysed by simulating the events that have taken place preceding the failure.
2. Back analysis of slope failure
2.1. Preparation of Infiltration model
The rainfall data over a week preceding the failure was gathered from rain gauge stations closest to the location as Bombuwala and Baddegama. For the analysis, actual peak rainfall measured on five days preceding the failure at each rain gauge stations have been idealized and was applied under appropriate slope boundary conditions. Rainfall was not extreme during the failure, but prolonged with low intensity, where maximum recorded rainfall was 7mm/hr.
Based on the information gathered in the borehole investigation, the sub soil is found to be a Sandy Silt. The initial cut profile of the slope and surface drainage arrangements are known. Although there were boudinage structures identified during the rectification process, the slope was modeled to be made of a uniform residual soil in this study.
Hydraulic characteristics of; permeability function and soil water characteristic curve (SWCC) were obtained through laboratory tests done by Vasanthan (2016). The graphs are shown in Figure 1 and Figure 2 respectively. The matric suction profile that prevailed prior to the rainfall event could not be obtained. As such, the negative pore water pressures were given a cutoff value of 100 kN/m2.
175
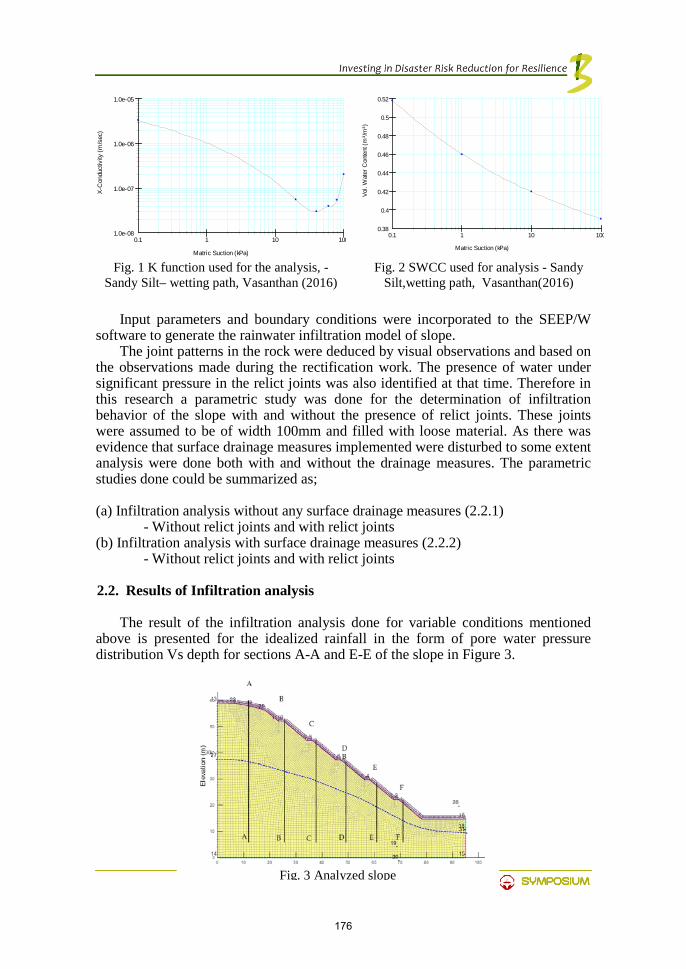
Fig. 3 Analyzed slope
Fig. 1 K function used for the analysis, -
Sandy Silt– wetting path, Vasanthan (2016) Fig. 2 SWCC used for analysis - Sandy
Silt,wetting path, Vasanthan(2016)
Input parameters and boundary conditions were incorporated to the SEEP/W software to generate the rainwater infiltration model of slope.
The joint patterns in the rock were deduced by visual observations and based on the observations made during the rectification work. The presence of water under significant pressure in the relict joints was also identified at that time. Therefore in this research a parametric study was done for the determination of infiltration behavior of the slope with and without the presence of relict joints. These joints were assumed to be of width 100mm and filled with loose material. As there was evidence that surface drainage measures implemented were disturbed to some extent analysis were done both with and without the drainage measures. The parametric studies done could be summarized as;
(a) Infiltration analysis without any surface drainage measures (2.2.1)
- Without relict joints and with relict joints (b) Infiltration analysis with surface drainage measures (2.2.2)
- Without relict joints and with relict joints
2.2. Results of Infiltration analysis
The result of the infiltration analysis done for variable conditions mentioned above is presented for the idealized rainfall in the form of pore water pressure distribution Vs depth for sections A-A and E-E of the slope in Figure 3.
X-
Con
duct
ivity
(m/s
ec)
Matric Suction (kPa)
1.0e-08
1.0e-05
1.0e-07
1.0e-06
0.1 1001 10
Vol.
Wat
er C
onte
nt (m
³/m³)
Matric Suction (kPa)
0.38
0.4
0.42
0.44
0.46
0.48
0.5
0.52
0.1 1001 10
176

2.2.1. Infiltration analysis without any surface drainage measures
Analyses were done for the two conditions; with and without relict joints. The
result of the analysis shows that as rainfall continues the matric suction values are gradually diminished approaching zero and the process extends to greater depths. Water reaching deeper levels cause a rise of ground water table and this effect is more prominent towards bottom levels of the slope.
The response of the slope when relict joints are not present is illustrated in Figure 4 and the response when there are relict joints is presented in Figure 5. It is evident that the loss of matric suction and rise of ground water table is more significant where the relict joins are present. This is due to the highly permeable loose filling material in the relict joints. That facilitates the penetration of water into the deeper levels of the slope without getting stagnant at the surface. When relict joins are not present, the excess rainfall that could not infiltrate further would contribute to runoff. The presence of water trapped under high pressure in relict joints was confirmed when water oozed out during the drilling for soil nailing in the
Fig. 4 Pore water distribution vs depth in sections A-A and E-E for the slope without surface drainage measures – Without Relict joints
Fig. 5 Pore water distribution vs depth in sections A-A and E-E for the slope without surface drainage measures – With Relict joints
Pore Water Pressure - A-A
Y (m
)
Pore-Water Pressure (kPa)
0
10
20
30
40
50
60
-50-100 0 50 100 150 200 250 300 350
Pore Water Pressure - E-E
Y (m
)
Pore-Water Pressure (kPa)
0
10
20
30
-50-100 0 50 100 150 200 250
Pore Water Pressure - A-A
Y (m
)
Pore-Water Pressure (kPa)
0
10
20
30
40
50
60
-50-100 0 50 100 150 200 250 300 350
Pore Water Pressure - E-E
Y (m
)
Pore-Water Pressure (kPa)
0
10
20
30
-50-100 0 50 100 150 200 250
177

rectification. (Dhramasena et al 2015).This emphasizes that, the modeling of the presence of relict joints is a significant feature in the analysis.
2.2.2. Infiltration Analysis When Surface Drainage Measures are Present
The surface drainage of the cut slope had been enhanced by providing concrete paved berm drains on each berm and cascade drains for free flowing of water runoff from upper slope. Further, the slope is covered with grass to control the erosion and minimize infiltration.
The influence of said drainage measures were modeled with the software SEEP/W by incorporating a 100mm thick layer of very low permeability 10-20 m/s over the berms simulating the concrete cover and a 100mm thick layer of low permeability 10-7m/s over the slope surface simulating the vegetation cover. The changes in the pore pressure regime for the Section A-A and Section E-E for the case without relict joints is presented in Figure 6 and for the case with relict joints is presented in Figure 7 respectively.
Figure 6: Pore water distribution vs depth in sections A-A and E-E for slope without relict joints and with surface drainage improvement (Permeability of vegetation layer = 10-7 m/s)
Figure 7: Pore water distribution vs depth in sections A-A and E-E for slope with relict joints and with surface drainage improvement (Permeability of vegetation layer = 10-7 m/s)
Pore Water Pressure - A-A
Y (m
)
Pore-Water Pressure (kPa)
0
10
20
30
40
50
60
-50-100 0 50 100 150 200 250 300 350
Pore Water Pressure - E-E
Y (m
)
Pore-Water Pressure (kPa)
0
10
20
30
-50-100 0 50 100 150 200 250
Pore Water Pressure - A-A
Y (m
)
Pore-Water Pressure (kPa)
0
10
20
30
40
50
60
-50-100 0 50 100 150 200 250 300 350
Pore Water Pressure - E-E
Y (m
)
Pore-Water Pressure (kPa)
0
10
20
30
-100 0 100 200
178

2.2.3. Slope Stability Analysis
An analysis of the stability of the slope at the end of each day was done using SLOPE/W software after incorporating the pore water pressure distributions obtained from the seepage analysis. Direct shear tests performed on undisturbed samples obtained from a location behind the scar, initially after full saturation and subsequently at different levels of saturation while measuring the matric suction (Vasanthan 2016). The saturated shear strength parameters are presented in Table 1. Parameters of filling material in relict joints deduced based on the experiences on similar soils are presented in Table 2. A φb value of 33o was used based on the studies done by Vasanthan (2016). Table 1: Shear strength parameters of the soil profile
. Table 2: Shear strength parameters of the filling material in relict joints
Analyses were done using the GEOSLOPE SLOPEW (2007) software with the
Spencer’s method considering circular shaped slope failures through the grid and radius approach as it yielded kinematically feasible failure surfaces.
The Mohr Coulomb shear strength relationship developed for an unsaturated soil (Fredlund et.al.,1978) was incorporated in the SLOPE/W analysis.
( ) ( ) bwaanf uuuc φφστ tantan −+′−+′=
Where,f-shear strength of unsaturated soil; c/-effective cohesion; (σn−ua)- net normal stress; φ/- effective angle of internal friction; (ua−uw) -matric suction and φb-angle indicating the rate of increase in shear strength relative to the matric suction. The factor of safety (F) is defined as;
m
fFττ
=
2.3. Results of slope stability analysis
The variations in the pore pressure regime obtained under different conditions in the parametric analysis is incorporated in the stability analysis and variation of factor of safety as the rainfall prolonged is graphically presented in Figure 8.
The corresponding critical failure surfaces are presented in Figure 9.
Soil type Unit Weight (γeff) Effective Cohesion (c′) Friction angle (φ′)
Sandy Silt 19 kN/m³ 10 kPa 33 °
Filing material Unit Weight (γeff) Effective Cohesion (c′) Friction angle (φ′)
Loose fill 12 kN/m³ 2 kPa 15 °
179
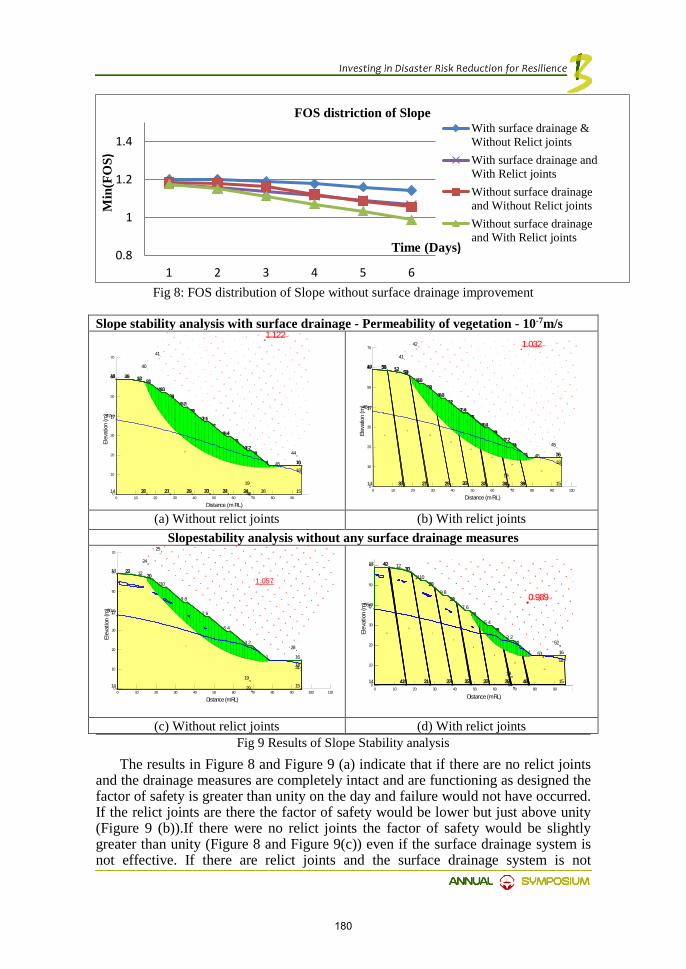
Fig 8: FOS distribution of Slope without surface drainage improvement
Slope stability analysis with surface drainage - Permeability of vegetation - 10-7m/s
(a) Without relict joints (b) With relict joints
Slopestability analysis without any surface drainage measures
(c) Without relict joints (d) With relict joints Fig 9 Results of Slope Stability analysis
The results in Figure 8 and Figure 9 (a) indicate that if there are no relict joints and the drainage measures are completely intact and are functioning as designed the factor of safety is greater than unity on the day and failure would not have occurred. If the relict joints are there the factor of safety would be lower but just above unity (Figure 9 (b)).If there were no relict joints the factor of safety would be slightly greater than unity (Figure 8 and Figure 9(c)) even if the surface drainage system is not effective. If there are relict joints and the surface drainage system is not
0.8
1
1.2
1.4
1 2 3 4 5 6
Min
(FO
S)FOS distriction of Slope
With surface drainage &Without Relict jointsWith surface drainage andWith Relict jointsWithout surface drainageand Without Relict jointsWithout surface drainageand With Relict joints
Time (Days)
1
2
3
4
5
6
7
8
9
10
11
12
13
1
23
45
67
89
1011
1213
14 15
16
17
18
19
20
21
22
23 2425 2627
28
29 30
31
32
33
3435
36
37 38
39
40
41
44
45
46
47
48 49 50 515253
54555657
58596061
626364
656667
68
69 70
1.122
Distance (m RL)0 10 20 30 40 50 60 70 80 90
Elev
atio
n (m
)
0
10
20
30
40
50
60
70
12
3
4
5
6
7
8
9
10
11
12
13
14
15
16
17
18
19
20
21
22
23
24
25
26
271
23
45
67
89
1011
1213
14 15
16
17
18
19
20
21
22
23 2425 2627
28
29 30
31
32
33
3435
36
37 3839
40
41
42
45
46
47
48
49 5051 52 53545556
57585960
61626364
65666768
69707172
7374
75 76
1.032
Distance (m RL)0 10 20 30 40 50 60 70 80 90 100
Elev
ation
(m)
0
10
20
30
40
50
60
70
1
1
23
45
67
89
1011
1213
14 15
16
17
18
19
20212223
24
25
28
29
30
31
Distance (m RL)0 10 20 30 40 50 60 70 80 90 100 110
Elev
atio
n (m
)
0
10
20
30
40
50
60
70
1
2
3 4
5 6
7
8
9
10
11 12
13
14
15
1
23
45
67
89
1011
1213
14 15
16
17
18
19
20
21
22
23
24
25
26
27
28
29
30
31
32
33
34
35
36
37
38
39
40
41
42
43
44
4546
47 52
53
54
550.989
Distance (m RL)0 10 20 30 40 50 60 70 80 90 1
Elev
atio
n (m
)
0
10
20
30
40
50
60
1.057
180
effective the factor of safety would be lower than unity on that day and would indicate failure (Figure 8 and Figure 9(d)). The critical failure surface corresponding to this situation is quite close to the actual failure. Actual failure occurred at a height of around 20 m damaging berm drains at three levels and cascade drains and the failure surface was quite shallow. The predicted failure surface was also quite shallow and started from a height of 22m damaging berm drains at three levels.
3. Conclusion
A back analysis was done on the slope failure that took place at Welipenna in the Southern Expressway. The slope was formed of a Sandy Silt which was the product of the insitu weathering of the parent metamorphic rock. The presence of relict joints were evident and incorporated into the analysis. The boudinage structures encountered in the rectification work were not included in the analysis. There were some indications on the defects in the surface drainage system. The antecedent matric suction/pore pressure distribution at the triggering rainfall event was also not known. As such, the back analysis had to be performed in the form of a parametric study. However, the characteristics of the unsaturated soils such as; Permeability function, SWCC and shear strength parameters were incorporated into the analysis.
The parametric analysis was done for the cases; With and without a proper surface drainage system. For each case analyses were done for both the presence of relict joints and the absence of relict joints. Relict joint were considered to be filled with a loose material. The antecedent matric suction was given an upper value of 100 kN/m2.
The results of the analysis revealed the diminishing of the matric suction, development of perched water table and rise of ground water table as rainfall prolongs. The rise of ground water table at the toe of the slope was quite dominant. These destructive effects were greater when the relict joints are present and when the surface drainage system is not effective. The factor of safety on the day of failure reached a value less than unity when the relict joints are present and there are defects in the surface drainage system.
This highlights the importance of close monitoring of the surface drainage systems installed and paying prompt attention to any maintenance requirements. The modeling of infiltration process under different conditions revealed that the rise of ground water table is quite significant at the toe of the wall. Therefore when natural slopes are excavated into steeper profiles for construction of highways it isrecommended to have a series of sub horizontal drains at the toe level even if the ground water table is found to be lower than the toe level in general.
References [1] Dharmasena, U.K.N.P., Bandara, K.N and Kulathilaka, S.A.S.,(2015) , “Back Analysis
and Rectification of a Failed Cut Slope in the Southern Expressway”, ICGE-Colombo-2015 Organized by SLGS, Colombo, Sri Lanka. pp 543-546
[2] Fredlund, D.G., Morgenstern, N.R and Widger R.A, (1978) “The shear strength of unsaturated soils.” Canadian geotechnical journal, 15, pp. 313-321
[3] Vasanthan, N., (2016), “Establishment of fundamental characteristics of some unsaturated Sri Lankan residual soils”, Thesis submitted in partial fulfillment of the requirements for the degree of Master in Engineering, University of Moratuwa.
181

Improvement of Indoor Environmental Quality (IEQ) in Office Buildings by using Mechanical and
Phytoremediation Methods
HDS Premasiri2, HD Kumarapeli1
1Scientist, National Building Research Organisation, Sri Lanka
2Senior Scientist, National Building Research Organisation, Sri Lanka
Abstract
Indoor Air Quality (IAQ) in office buildings is a major concern due to its impacts on health & comfort, wellbeing and productivity of the building occupants since they spend more than 90% of their time in indoor environment. Poor IAQ result increased risk of occupant illness and related health syndromes. Many international organizations on indoor environmental quality have developed guideline to maintain comfort levels pertinent to indoor environment quality for building occupants, but such guideline is not available for Sri Lanka. Due to unavailability of national IEQ guidelines, lack of awareness on application of international guidelines and reluctance to invest to maintain better IEQ, many office buildings have not considered IEQ in the design and construction stages. As a result, occupants in most of the existing offices are exposed to - varying discomfort levels and array of indoor air quality problems leading to uncomfortable working conditions as well as health impacts. The objective of this paper is to highlight importance of improved IEQ at office premises to sustain acceptable comfort levels with respect to air quality by implementing cost effective simple operational strategies depending on specific situations.
As a pilot study, we have selected several office spaces in the head office of NBRO (National Building Research Organization and measured the Indoor Air Quality levels. Then the simple operational techniques such as introduction of ventilation fans, improve the air condition system performance and placing green plants for phytoremediation depending on the condition and location of the space were applied to identify areas with poor IAQ. The IAQ levels were measured before and after application of improvement measures to assess its effectiveness. The result indicates that the IAQ levels have been improved reaching required IAQ quality norm recommended for existing office buildings by American Society of Heating,
182

Refrigerating and Air-Conditioning Engineers (ASHRAE) Standard 62.1. The results further express that, even though the building design and construction does not fully comply with the Indoor environmental quality guideline recommendations, the IAQ levels can be improved with low cost operational techniques such as phyto remediation and forced ventilation to sustain healthy indoor environment in office buildings.
Keywords: Indoor, Environment Quality, phytoremediation, office buildings
1. Introduction
The quality of indoor air in offices and other workplaces is important not only for occupants’ comfort but also for their health. Poor indoor air quality (IAQ) has been tied to symptoms like headaches, fatigue, irritation of the eyes, nose and throat, sinus problems, congestion, dizziness etc. These are commonly reported symptoms among the workplace occupants in air-conditioned buildings. In addition, the complains on allergy, asthma, cold and infectious diseases are common in these buildings. Some of those symptoms are common to “Sick Building Syndrome” which arises due to poor indoor air quality as well as other indoor environment conditions. Some of these impacts, do not cause immediate symptoms but can lead to cancer in long term exposure. [1] Poor indoor air quality also affect on day to day activities of worker’s, their efficiency and productivity which even may lead to significant health-care expenses; more sick leave and less performance. The cost to provide better IAQ in nonindustrial workplaces are estimated to be high to overcome these situations [2].
Many factors affect the deterioration of Indoor Air Quality in office and commercial buildings. These includes poor ventilation, thermal conditions, humidity levels, use of pollutant sources and other activities in or near a building that can affect the fresh air circulation into the building. Sometimes, specific contaminants like dust from construction or renovation, pesticides or other airborne chemicals may cause poor IAQ.
There are guidelines and standards setup in many countries and organizations to manage IAQ in office buildings during the designing and construction. Such guidelines and standards include ventilation conditions, indoor air pollutant levels, thermal comfort levels and other environment conditions to manage healthy environment conditions for occupants. The Indoor Air Quality Guideline established by American Society of Heating, Refrigerating and Air-Conditioning Engineers (ASHRAE) Standard 62.1, is the most commonly used guideline worldwide for acceptable IAQ in office and commercial buildings. Countries such as Germany, Singapore and many other use their own standards and guidelines to maintain comfort levels pertinent to IAQ. Since there are no comprehensive guidelines developed and practice in Sri Lanka, most of office and commercial buildings in build environment has encounter a wide array of IAQ issues.
Most of office and commercial buildings in Sri Lanka use Air conditioner systems to maintain thermal comfort of the occupants, but have not considered other indoor Environment Quality factors such as Indoor Air Quality, lighting and ventilation condition…etc. As a result, especially the air pollutant levels in office and commercial buildings are unhealthy mainly due to poor ventilation system and use of materials and equipment with high pollutant emission. [3] Indoor air quality in
183
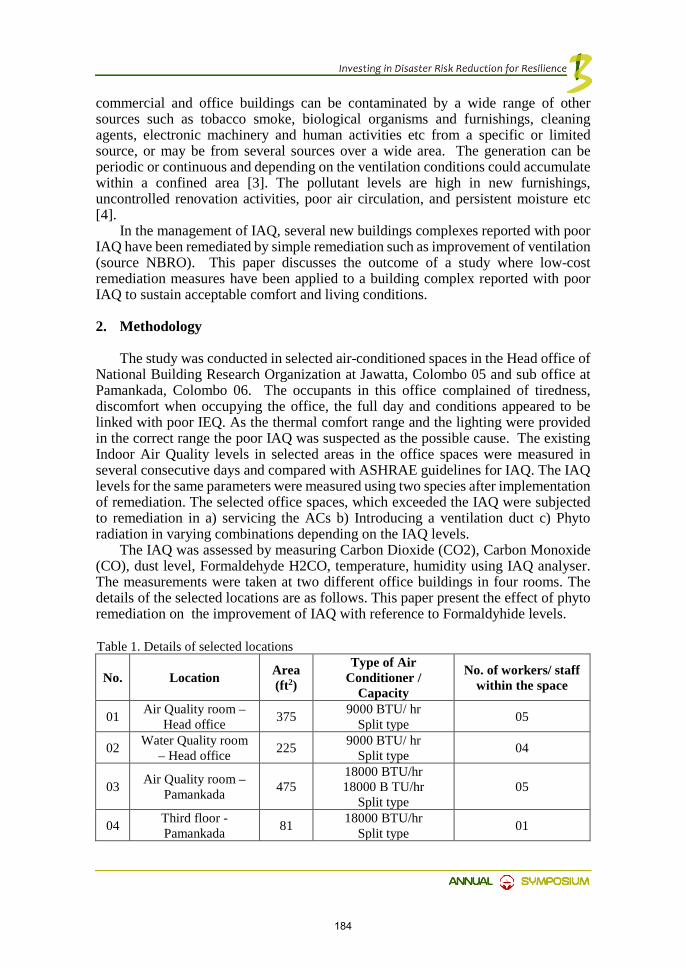
commercial and office buildings can be contaminated by a wide range of other sources such as tobacco smoke, biological organisms and furnishings, cleaning agents, electronic machinery and human activities etc from a specific or limited source, or may be from several sources over a wide area. The generation can be periodic or continuous and depending on the ventilation conditions could accumulate within a confined area [3]. The pollutant levels are high in new furnishings, uncontrolled renovation activities, poor air circulation, and persistent moisture etc [4].
In the management of IAQ, several new buildings complexes reported with poor IAQ have been remediated by simple remediation such as improvement of ventilation (source NBRO). This paper discusses the outcome of a study where low-cost remediation measures have been applied to a building complex reported with poor IAQ to sustain acceptable comfort and living conditions.
2. Methodology
The study was conducted in selected air-conditioned spaces in the Head office of National Building Research Organization at Jawatta, Colombo 05 and sub office at Pamankada, Colombo 06. The occupants in this office complained of tiredness, discomfort when occupying the office, the full day and conditions appeared to be linked with poor IEQ. As the thermal comfort range and the lighting were provided in the correct range the poor IAQ was suspected as the possible cause. The existing Indoor Air Quality levels in selected areas in the office spaces were measured in several consecutive days and compared with ASHRAE guidelines for IAQ. The IAQ levels for the same parameters were measured using two species after implementation of remediation. The selected office spaces, which exceeded the IAQ were subjected to remediation in a) servicing the ACs b) Introducing a ventilation duct c) Phyto radiation in varying combinations depending on the IAQ levels.
The IAQ was assessed by measuring Carbon Dioxide (CO2), Carbon Monoxide (CO), dust level, Formaldehyde H2CO, temperature, humidity using IAQ analyser. The measurements were taken at two different office buildings in four rooms. The details of the selected locations are as follows. This paper present the effect of phyto remediation on the improvement of IAQ with reference to Formaldyhide levels. Table 1. Details of selected locations
No. Location Area (ft2)
Type of Air Conditioner /
Capacity
No. of workers/ staff within the space
01 Air Quality room – Head office 375 9000 BTU/ hr
Split type 05
02 Water Quality room – Head office 225 9000 BTU/ hr
Split type 04
03 Air Quality room – Pamankada 475
18000 BTU/hr 18000 B TU/hr
Split type 05
04 Third floor - Pamankada 81 18000 BTU/hr
Split type 01
184
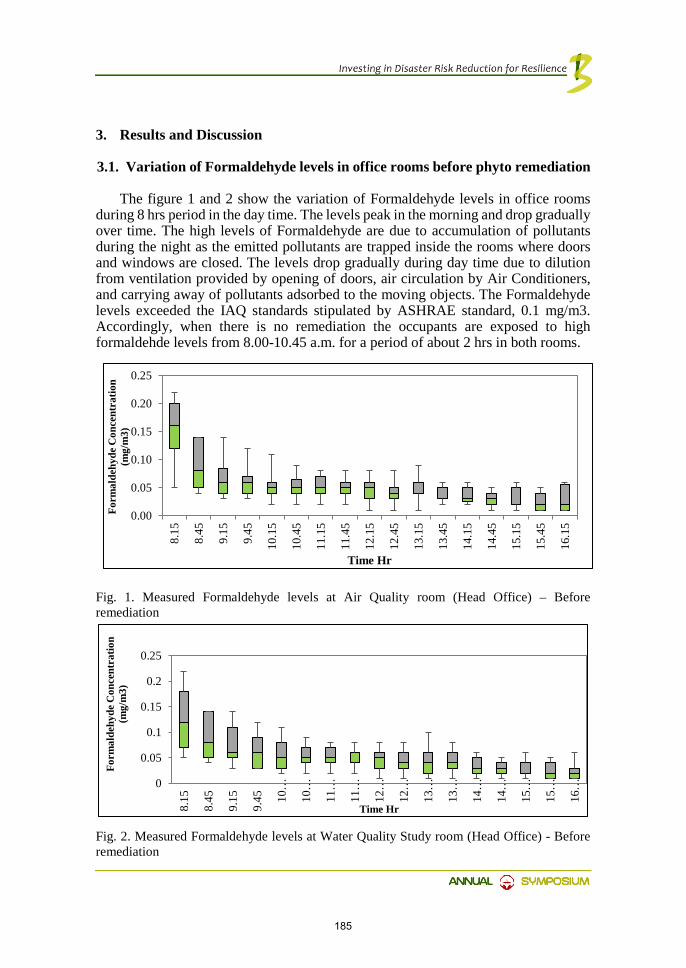
3. Results and Discussion
3.1. Variation of Formaldehyde levels in office rooms before phyto remediation
The figure 1 and 2 show the variation of Formaldehyde levels in office rooms during 8 hrs period in the day time. The levels peak in the morning and drop gradually over time. The high levels of Formaldehyde are due to accumulation of pollutants during the night as the emitted pollutants are trapped inside the rooms where doors and windows are closed. The levels drop gradually during day time due to dilution from ventilation provided by opening of doors, air circulation by Air Conditioners, and carrying away of pollutants adsorbed to the moving objects. The Formaldehyde levels exceeded the IAQ standards stipulated by ASHRAE standard, 0.1 mg/m3. Accordingly, when there is no remediation the occupants are exposed to high formaldehde levels from 8.00-10.45 a.m. for a period of about 2 hrs in both rooms.
Fig. 1. Measured Formaldehyde levels at Air Quality room (Head Office) – Before remediation
Fig. 2. Measured Formaldehyde levels at Water Quality Study room (Head Office) - Before remediation
0
0.05
0.1
0.15
0.2
0.25
8.15
8.45
9.15
9.45 10
…
10…
11…
11…
12…
12…
13…
13…
14…
14…
15…
15…
16…
Form
alde
hyde
Con
cent
ratio
n(m
g/m
3)
Time Hr
0.00
0.05
0.10
0.15
0.20
0.25
8.15
8.45
9.15
9.45
10.1
5
10.4
5
11.1
5
11.4
5
12.1
5
12.4
5
13.1
5
13.4
5
14.1
5
14.4
5
15.1
5
15.4
5
16.1
5
Form
alde
hyde
Con
cent
ratio
n (m
g/m
3)
Time Hr
185

3.2. Variation of Formaldehyde levels in office rooms with Phyto remediation
The figure 3a, 3b and 4 show the variation of Formaldehyde levels when phytoremediation is introduced, the Ivy and Snake plant respectively. The results show significant reduction in Formaldehyde levels in all treatments, and all measurements were below the standard levels for Formaldehyde stipulated by the ASHRAE standard. The snake plant has been more effective in removing Formaldehyde than the Ivy plant. The outcome of the experiment suggests that simple Phyto remediation measures have been able bring down the Formaldehyde concentrations in the office rooms below harmful levels ensuring safe IAQ environment for occupants during the office hours.
Fig. 3a. Measured Formaldehyde levels at Air Quality Study room (Head Office) – After introducing Ivy plant
Fig. 3b. Measured Formaldehyde levels at Air Quality Study room (Head Office) – After introducing Snake plant
0.00
0.04
0.08
0.12
0.16
0.20
8.15
8.45
9.15
9.45
10.1
5
10.4
5
11.1
5
11.4
5
12.1
5
12.4
5
13.1
5
13.4
5
14.1
5
14.4
5
15.1
5
15.4
5
16.1
5
Form
alde
hyde
C
once
ntra
tion
(mg/
m3)
Time (hr)Without Plant With IVY plant
0.000.020.040.060.080.100.120.140.160.18
8.15
8.45
9.15
9.45
10.1
5
10.4
5
11.1
5
11.4
5
12.1
5
12.4
5
13.1
5
13.4
5
14.1
5
14.4
5
15.1
5
15.4
5
16.1
5
Form
alde
hyde
C
once
ntra
tion
(mg/
m3)
Time (hr)Without Plant With Snake Plant

Fig. 4. Measured Formaldehyde levels at Water Quality Study room (Head Office) – After introducing Ivy plant
4. Conclusion
The introduction of simple phytoremediation measures has been very much successful in reducing Formaldehyde levels and keeping IAQ within ASHRAE standard during office hours. It is clearly evident that introducing phytoremediation is more effective in improving the air quality level than other physical interventions such as introduction of more air conditioners and etc. However, full ventilation of office room with open windows and doors accompanied with farced fan ventilation can be effective as an additional measure to keep the IAQ well within the stipulated norms.
This study will be continued to investigate the effect of other physical interventions and the other phytoremediation plants.
References
[1]. Breath of Fresh Air: Improving Indoor Air Quality at Your Workplace [2]. Premasiri H D S, Varnakulasingam J, Dissanayake D M M R, Liyanarachchi P D,
Importance of Ventilation in Management of Indoor Air Quality in Air Conditioned Commercial and Office Buildings
[3]. Occupational Safety and Health Administration (OSHA), Indoor Air Quality and Environmental Protection Agency (EPA), An Office Building Occupants Guide to Indoor Air Quality
[4]. American Society of Heating, Refrigerating and Air-Conditioning Engineers. (2010, January 23). Ventilation for Acceptable Indoor Air Quality. ASHRAE STANDARD 62.1. Atlanta, Georgia, America. Retrieved September 2016.
[5]. Building Materials and Indoor Air Quality, From Hal Levin & Associates, Santa Cruz, California.
187
00.020.040.060.08
0.10.12
.15
.45
.15
.45
.15
.45
.15
.45
.15
.45
.15
.45
.15
.45
.15
.45
.15
mal
dehy
de C
once
ntra
tion
(mg/
m3)
186

Role of Human-Computer Interaction in Disaster Management NMT De Silva1
1Scientist, National Building Research Organisation, Sri Lanka
Abstract
Disaster management is a growing concern around the world as disasters never stop happening. It is a very time critical task. Therefore, decision makers, relief workers and victims all have to act immediately during a disaster. Planning and management of these emergencies are challenging. When disaster strikes, coordination of all the parties related to the disaster such as rescuers, decision-makers, with the government is a key factor. Human-Computer Interaction (HCI) is a key technology which can contribute to obtaining data from field and in the preparation, coordination, analysis and deployment in disaster management activities.
This paper reports on HCI trends and applicability to support for disaster management, and presents a short overview of the challenges of HCI in emergency scenarios in view of incorporating HCI as a concept into the disaster risk management effort of NBRO in the future.
Keywords: HCI; Disaster Management; Computer Systems
1. Introduction
Disasters can be categorized as natural disasters like landslides, floods, earthquakes, volcanoes etc. and man-made disasters like industrial disasters, radiation contamination, and terrorist attacks,. Disaster management has a cycle of three phases – Before (Planning, Preparation, and Mitigation), During (Response) and After (Rehabilitation and Reconstruction) (Arnaudov). In Sri Lanka, many types of natural disasters strike from time to time although man-made disasters are not a common prevalence. Present effort on lowering disaster risk on lives and property in the country is overwhelming where computers play a major role.
In modern day disaster management, most activities ranging from hazard identification, mapping, preparedness, hazard monitoring, early warning and awareness building are facilitated by computers. Time of most supercomputers in the developed countries now is dedicated to disaster management and weather prediction work whereas purpose-built laptop computers with alloy casings permit disaster
188

professionals their use in rugged terrains and extreme conditions. Ordinary computers on the other hand, serve in all disaster management activities, making them more efficient, time saving and reliable. Then, making computer systems more user-friendly and human interractive in the context of disaster mangement is very important to get the best out of the computers today.
Human-Computer Interaction (HCI) is the study of how people interact with computers. It includes multiple disciplines, such as computer science, cognitive science, and human-factors engineering. It has been remarkably developed over the past decade and the latest HCI concepts and tools are very interesting. These enhanced concepts can be successfully used in disaster management to support the first respondents and decision makers in their difficult tasks.
2. Requirements in Computerized Disaster Management Systems
When applying HCI in disaster management context, attention has to be given to features such as confidentiality, data integrity, availability, and reliability etc. According to the nature of data, confidentially level has to be maintained and data should be kept safe and should be unavailable to unauthorized access. Call Centre established in Disaster Management Centre is a good example where call operators on 24X7 duties receive information on disasters from individuals by telephone and simultaneously enter information as data onto computers. A typical Call Centre facilitates many telephone operators to receive emergency calls, record voice data if necessary and enter relevant data in computers linked by a network with data storage. The hands-free telephone operation and dedicated software of computers enable these operators to work efficiently and HCI concepts play an important role in the design of a Call Centre. In a disaster situation, informants are disturbed and as a result, information they provide is usually incoherent, but the operators are trained so that they with utmost patience obtain useful information as much as possible and keep on record. A well-trained operator can keep a telephone conversation with an informant going as long as needed to obtain useful information about an emergency so that the staff on duty can then take a swift response action. In this instance, confidentiality and data integrity is maintained to a very high degree.
Also, high availability of these systems is a must and downtime is always critical. Often, systems are likely to fail when the demand is high. Therefore, systems should be built considering the overload on communication channels during critical incidents due to high public demand and systems should be highly available irrespective of the climatic conditions or geographical area. Rainfall being the main triggering factor to landslides in Sri Lanka the uninterrupted operation of automated rain gauge network is the most critical factor in landslide early warning. The Landslide Early Warning Centre at NBRO should continuously receive rainfall data and feedback signals of ground movement detection sensors and the computers with data acquisition and simulation software at the Centre enable the staff issuing timely warnings and evacuation orders. Instruments should be highly reliable and the Centre computers should detect any instrument malfunctioning. Dedicated communication channels enable continuous data transfer to the Centre even during emergencies when other communication channels become overloaded.
Furthermore, interoperability plays a key role in Disaster Management Systems as they have to be well integrated into the overall rescue effort. The tsunami warning
189

tower network established along the coastal belt of the country can be activated using satellite communication or by a mobile radio transmitter. In major disasters, exchange of data for effective disaster response is critical. Hence the use of a standard data interchange formats should be encouraged in these systems. Sahana, the open source free software developed in Sri Lanka following the great tsunami in the Indian Ocean in 2004 provides a very useful platform of data exchange for effective disaster response and although never seemed to be fully utilized in Sri Lanka, it is used frequently by many countries at times of disaster.
Scalability is another important concern in the discussed context. It is the ability of a computer application to function well when its context change in size or volume in order to meet a user’s need. A system built for relief and rescue has to be scalable to handle severe disasters with reasonably low latency to remain functional and useful in such critical conditions. Similarly, a system should be able to scale adequately by the type of disaster being serviced.
In the disaster management context, systems should not have a steep learning curve. It need not be sophisticated. The main concern for the system is being easily usable and informative. The term usable, includes user-friendliness, accessibility to the volunteers, victims and their families. Sahana is a good example, as it can be accessed globally through almost any computer with internet connection. Sahana can facilitate on-line information exchange between for instance recipients of aid in need and the aid givers – donors and transporters; between rescuers and hospitals, or between victims and their families. Sahana is not too difficult software to handle and hence, it can be a great help when tracing missing persons after a disaster. Strong HCI study may lead to developing such systems or applications enabling even small children to interact with smart screens, tabs or mobile phones at times of disasters. However, as disaster management process involves challenging and critical tasks those systems should be designed in a way not to slow down the whole process or distract from the main task (Shukla &Asundi, 2012), (Flentge, Weber, &Ziegert).
3. Challenges in the Design of HCI in Disaster Management Context
There are number of issues which have to be taken into account when designing human-computer interfaces for disaster management applications. The following were identified as the main challenges and these need to be addressed with novel concepts to handle disastrous situations effectively.
3.1 Reduction of complexity
Disaster management should have an effective decision-making process in extremely complex situations. According to the size of the disaster, there is large number of organizations involved in the process and strong time pressure is exerted. Therefore, well-designed user interfaces are important to reduce the complexity. Also, it is important to share a common representation of the disastrous situation between the involved parties. However, designing simple interfaces to handle complex time-critical tasks is a huge challenge.
190

3.2 Priority of the primary task
Information systems designed for disaster management should not distract stakeholders from the primary task of the disastrous situation, and interaction devices have to be chosen according to the primary task. For an example, rescue workers should have wearable devices which recognize their movements, speech, facial expressions without disturbing their primary rescue tasks. Therefore, it is absolutely necessary to understand the primary tasks of each actor and model an approach which selects a suitable interaction method.
3.3 Heterogeneity of the involved actors and technologies
There are many parties involved in disastrous situations, professionals, voluntary helpers, victims, governments etc… They all have different experiences and different capabilities. Therefore, developed user interfaces have to support all involved parties with different backgrounds. Also, these involving parties have different technological systems and this will create a huge challenge of interoperability and ad-hoc integration of these systems. Thus, flexible and adaptive user interfaces are needed.
3.4 Security and Privacy
Information security and data privacy are important issues to be considered in disaster management systems. Privacy and non-repudiation have to be guaranteed in these systems. However, authored actors may have access to sensitive information that is not to be disclosed to other participants. (Flentge, Weber, &Ziegert) (Shukla &Asundi, 2012).
4. Novel Concepts and Applications in HCI
The complexity of the current working environment of disaster management encourages new tools, technologies, and concepts to support situations with difficulty. The following discusses some innovative technologies in HCI and their applications in disaster situations.
4.1 Multimodal Interaction
A multimodal interface acts as a facilitator of human-computer interaction via two or more modes of inputs such as speech, gesture, facial expressions. The number of supported input modes, their types and the way they work together may vary widely from one multimodal system to another. Following are some important multimodal interactions.
4.1.1 Emotion Recognition Multimodal Systems
People have the ability to identify emotional state based on the observations about one's face, body, and voice. Research in multimodal systems has been conducted to allow the inferring of one's emotional state based on various behavioral signals. In disaster management context, emotion recognition may provide valuable clues about
191
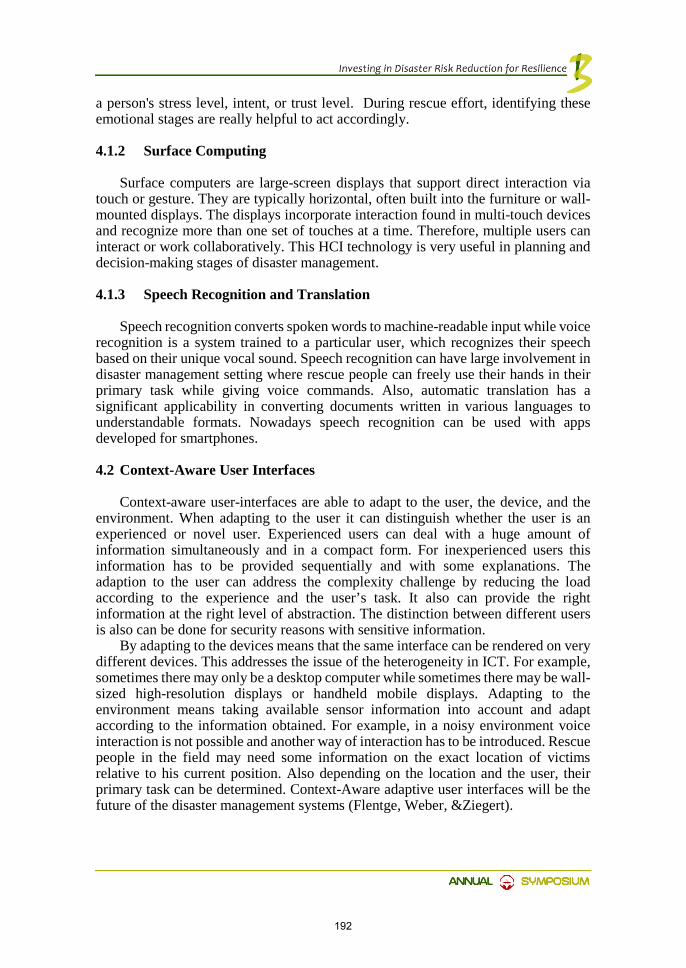
a person's stress level, intent, or trust level. During rescue effort, identifying these emotional stages are really helpful to act accordingly.
4.1.2 Surface Computing
Surface computers are large-screen displays that support direct interaction via touch or gesture. They are typically horizontal, often built into the furniture or wall-mounted displays. The displays incorporate interaction found in multi-touch devices and recognize more than one set of touches at a time. Therefore, multiple users can interact or work collaboratively. This HCI technology is very useful in planning and decision-making stages of disaster management.
4.1.3 Speech Recognition and Translation
Speech recognition converts spoken words to machine-readable input while voice recognition is a system trained to a particular user, which recognizes their speech based on their unique vocal sound. Speech recognition can have large involvement in disaster management setting where rescue people can freely use their hands in their primary task while giving voice commands. Also, automatic translation has a significant applicability in converting documents written in various languages to understandable formats. Nowadays speech recognition can be used with apps developed for smartphones.
4.2 Context-Aware User Interfaces
Context-aware user-interfaces are able to adapt to the user, the device, and the environment. When adapting to the user it can distinguish whether the user is an experienced or novel user. Experienced users can deal with a huge amount of information simultaneously and in a compact form. For inexperienced users this information has to be provided sequentially and with some explanations. The adaption to the user can address the complexity challenge by reducing the load according to the experience and the user’s task. It also can provide the right information at the right level of abstraction. The distinction between different users is also can be done for security reasons with sensitive information.
By adapting to the devices means that the same interface can be rendered on very different devices. This addresses the issue of the heterogeneity in ICT. For example, sometimes there may only be a desktop computer while sometimes there may be wall-sized high-resolution displays or handheld mobile displays. Adapting to the environment means taking available sensor information into account and adapt according to the information obtained. For example, in a noisy environment voice interaction is not possible and another way of interaction has to be introduced. Rescue people in the field may need some information on the exact location of victims relative to his current position. Also depending on the location and the user, their primary task can be determined. Context-Aware adaptive user interfaces will be the future of the disaster management systems (Flentge, Weber, &Ziegert).
192

4.3 Biometry
Biometry refers to the automatic identification or verification of living persons using their physical or behavioral characteristics. Some features such as face, fingerprints, hand, handwriting, iris, retinal, vein, Deoxyribonucleic acid (DNA) and voice can be considered as inputs. Biometric technologies are useful to find out missing or dead people after disaster strikes. This technology also can be used for authentication, security management of user privileges, profile management of user roles and preferences (Gouin&Lavigne, 2010).
4.4 3D interfaces
In the planning phase of the disaster management process, virtual and augmented reality systems are well suitable for training purposes. It provides a platform to conduct mission rehearsals in the environment in which they will operate, in particular in hostile urban settings. With those technologies, many environments and action scenarios could be simulated. The technology enables interaction with three-dimensional data and improves overall situational awareness. Having plans for action and safety procedures and having trained to perform that action is an essential component of preparedness. So, scenarios can be developed using 3D interfaces and those can be used for training (Arnaudov).
4.5 Virtual Assistant / Virtual Advisor
A virtual assistant or advisor is a computer-generated character that simulates a conversation, provide guidance and triggers alerts as required. A virtual assistant incorporates natural-language understanding, dialogue control, domain knowledge and a visual appearance that changes according to the content of the dialogue. In disaster management context, virtual assistants will be growing in importance in terms of providing a natural and contextual interface between the user and an AI engine that will perform automated reasoning and knowledge management activities on the situation with the available information.
4.6 Smart Room Environments
Smart room environment is a space that enables better collaboration, more creative thinking, quicker decision making and increased productivity. Most of the above-discussed technologies are available in smart rooms. These environments will be equipped with a number of physical devices such as large group displays, high-end analyst workstations, multi-touch tables, digital dashboards, video conferencing, multiple cameras and microphones, motion detectors, biometric authentication.
From a user experience and a capability perspective, smart room environments could provide adaptive user interfaces, speech recognition, speech record, shared situation awareness, shared collaboration awareness and supporting the collaborative decision process (Gouin&Lavigne, 2010).
193

5. Future of Disaster Management Systems with HCI
HCI holds significant potential for future use in Disaster Management. Other than above, advanced HCI concepts and techniques such as visual analytics, smart lenses, advanced interface widgets, intelligent/contextual desktops, surface computing collaboration, and wearable displays are also used in disaster management.
Currently, there are many types of research being carried out for future advancement in HCI. The concept of the Context-aware user interface is one of that which would heavily support in future multimodal 3D Human-Computer Interaction systems. It can be used to reduce the time pressure in decision making and execution of commands.
In future, disaster management field will be benefited with novel HCI technologies such as pervasive sensor networks which lively give field conditions, Synthetic Environments with live data synthesized in a virtual environment to explore response strategies, adaptive user interfaces, advanced mixed reality with multimodal interactions, advanced HCI widgets and many more.
References
[1] Arnaudov, S. (n.d.). Disaster Management and 3D User Interfaces. [2] Fitrianie, S., Poppe, R., Bui, T., Chi, A., Datcu, D., Dor, R., . . .Zwiers, J. (2007). A
Multimodal Human-Computer Interaction Framework for Research into Crisis Management. 4th International ISCRAM Conference.
[3] Flentge, F., Weber, S. G., &Ziegert, T. (n.d.). Designing Context-Aware HCI for Collaborative Emergency Management.
[4] Gouin, D., &Lavigne, V. (2010). Trends in Human-Computer Interaction to Support Future Intelligence Analysis Capabilities. 16th International Command and Control Research and Technology Symposium. Canada.
[5] Group, H. a., & Group, I. (2003). Human Computer Interaction and Information Managemt Research Needs.
[6] Jan Willem Streefkerk, M. N. (June 2014). HCI Challenges for Community-Based Disaster Recovery.
[7] Shukla, M. M., &Asundi, J. (2012). Considering emergency and disaster management systems from a software architecture perspective. Int. J. System of Systems Engineering, 129-141.
194
Utilization of Waste Sludge Produced From Aluminium Extrusion Industry as a Partial Replacement Material for
Clay in Clay Bricks GYDK Silva1, SSK Muthurathne2
1Engineer, National Building Research Organisation, Sri Lanka 2Director, Building Materials Research and Testing Division, National Building Research
Organisation, Sri Lanka
Abstract
In this research project, sludge generated in the anodizing process of aluminium extrusion industry was partially incorporated in clay bricks and brick properties were studied. XRF analysis was carried out to observe the composition of sludge and it revealed that anodizing sludge contained small percentages of heavy metals such as Cr and Fe. Five sets of bricks were prepared by varying the sludge content from 0-20% and fired at 900˚C. Fired bricks were tested for their physical and mechanical properties namely, dry density, weight loss on ignition, water absorption and compressive strength. Based on the test results observed, sludge incorporated bricks were lighter in weight when compared with normal brick samples. However, due to the presence of finer sludge material, water absorption was higher in sludge incorporated bricks but were within the limits specified by Sri Lankan standards. Compressive strength of sludge incorporated bricks were lower when compared with normal bricks. Bricks with 5% sludge content exhibited characteristics close to 0% sludge bricks. Therefore, considering the properties of the bricks, it can be concluded that 5% sludge content could be used as a partial replacement material for manufacturing bricks without significantly affecting existing properties of normal clay bricks.
1. Introduction
Aluminium extrusion industry is one of the most important industries catering the construction needs of the country. In order to meet the market demand, large quantity of aluminium extrudates are being fabricated in aluminium factories. During anodizing process of aluminium extrusion, aluminium sludge is formed which is
195

considered as a waste material. Waste aluminium sludge contains small quantities of heavy metals (Cr, Fe, Ni, Cu, Zn and Sn). Aluminium waste sludge is currently dumped as a land fill material as well as incinerated in kilns in cement manufacturing. Due to the presence of heavy metals in the sludge, dumping as a landfill material is creating environmental issues such as ground water pollution. Therefore, disposal of this aluminium sludge without any adverse effect to the environment is considered as a challenge among aluminium extrusion industries.
Burnt clay bricks are widely used as a construction material for different construction requirements. Although cement blocks are available in the market, use of clay bricks as a construction materials is still preferred due to its inherent qualities. Clay bricks are manufactured mainly using clay and due to the lack of quality clay materials as well as high firing temperatures used, it is difficult to manufacture clay bricks to meet the market demand. Extraction of clay from clay deposits creates environmental issues requiring enforcement of laws to control the clay extraction.
In this research project, waste aluminium sludge was partially mixed with clay to produce clay bricks. The properties of sludge incorporated bricks were studied with comparison to control samples. The suitability of waste aluminium sludge as a partial replacement material for clay brick manufacturing was studied during this research project.
2. Materials and Methods
2.1 Literature Survey
Literature survey was carried out to study the outcomes of previous research carried out related to this research project. A study was carried out by Seyed Mostafa Khezri et al. (Seyed Mostafa Khezri, 2010) on using anodizing aluminium sludge for brick manufacturing. According to that study, combination of 40% with clay possessed best quality when compared with ordinary bricks. It further stated that apart from eco friendliness, bricks were lighter and cheaper when compared with normal bricks.
A research project was carried by Ahmed M. Hassanain et al. (Badr El-Din E. Hegazy, 2012) on manufacturing bricks from water treatment sludge and rusk husk ash. Clay was completely substituted with water treatment sludge and rice husk ash. Three different sludge ratios were used and each brick series was fired at three different temperatures. It was revealed that the bricks manufactured with 75% of sludge displayed superior physical and mechanical properties when compared with other mix proportions.
A study carried out by Chih-Huang Weng et al. (Chih-Huang Weng, 2003) on utilization of waste water treatment sludge as brick materials. The results showed that the sludge proportion and brick firing temperature were the key parameters in determining performance of sludge incorporated bricks. Bricks were prepared by
196

varying sludge content up to 20% and it was found that optimum sludge content for manufacturing bricks was 10% and firing temperature was 880-960˚C
Another research project carried out by K. Y. Chiang et al. (K. Y. CHIANG, October 2009) on using water treatment plant sludge and agricultural waste to produce light weight building bricks. Results indicated that 40 % of rice husk ash incorporated bricks fired at 1100 ˚C possessed light weight properties and relatively high strength compared to other mixes.
2.2 Materials
Aluminium anodizing sludge was obtained from one of the aluminium extrusion factories in Sri Lanka. It was found that approximately 10-20 tonnes of waste sludge per month is being generated during extrusion process. Aluminium sludge is white in color and when discharged from the factory, it is highly plastic in nature due to high water content. Nature of the sludge discharged from factory in given in figure 1(a) and (b).
(a) (b) Fig.1. Aluminium Sludge
Clay was obtained from one of the clay pits. It was found that for manufacturing bricks, two materials types are being used. Clay bricks were manufactured using a combination of clay and sand materials. Therefore, sampling of clay and sand was done for the research from clay pits.
2.3 Material properties
In order to observe the behaviour of sludge, material properties of sludge were studied. Material properties namely, composition and moisture content were studied. XRF technique was used for the analysis of sludge composition. Loose bulk density and moisture content of clay and sand were also tested.
197

2.4 Brick Properties
Five brick series were prepared by varying sludge content from 0-20% (5% increments for each series). Clay and sand were mixed in 1:3 by volume for each series of bricks. For each brick series, 30% of water by weight of the mix was added and manually mixed for the preparation of sludge incorporated clay mixes. Moulded bricks were allowed to dry in ambient temperature for 3 days followed by oven drying at 110 ˚C for 24 hrs. Firing of bricks was carried out at 900˚C for a period of 8 hours for all brick series.
Fired bricks were tested for the physical and mechanical properties namely, dry density, weight loss on ignition, water absorption and compressive strength according to standard procedures. Figure 2 (a) and (b) represents moulded bricks and fired bricks of different mix proportions.
(a) (b) Fig. 2. Moulded bricks (a) and fired bricks (b)
3. Results
3.1 Material properties
Table 1 illustrates XRF analysis results of aluminium sludge sample.
198

Table 1. XRF results of sludge sample
Table 2 represents physical properties of sludge, clay and sand materials. (BS EN
1097-6 Tests for mechanical and physical properties of aggregates, part 2: physical properties, 2000)
Table 2. Physical properties of materials
Test/Test Parameter Material Type
Aluminium Sludge (dried) Clay Sand
Loose bulk density (kg/m3)
- 1090 1320
Moisture Content (%) 78 27 12
3.2 Brick properties
3.2.1 Brick density
Brick density tests were carried out before and after firing of clay bricks. Brick density results of the five brick sets were tabulated in table 3. (Specification for common burnt clay building bricks, SLS 39, 1978). Graphical representation of brick density results were illustrated in figure 3. Table 3. Density results of bricks
Brick Series ID Sludge content (%)
Avg. Brick Density (before firing) (kg/m3)
Avg. Brick Density (After firing) (kg/m3)
01 0 1789.1 1721.4 02 5 1667.2 1612.4 03 10 1681.3 1532.8 04 15 1713.2 1488.6 05 20 1555.1 1414.7
199
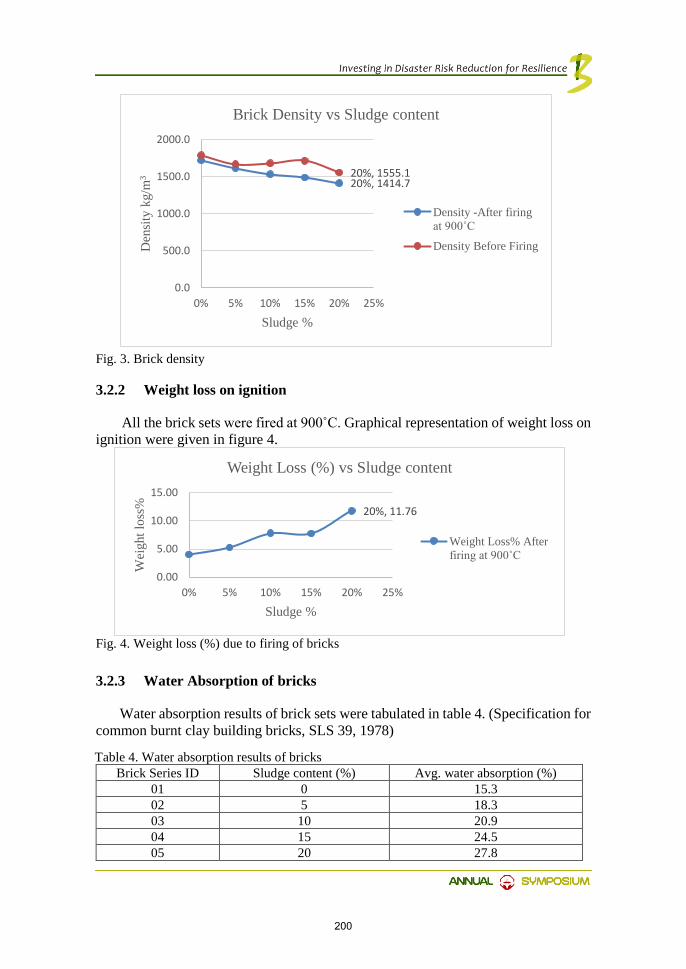
Fig. 3. Brick density
3.2.2 Weight loss on ignition
All the brick sets were fired at 900˚C. Graphical representation of weight loss on ignition were given in figure 4.
Fig. 4. Weight loss (%) due to firing of bricks 3.2.3 Water Absorption of bricks
Water absorption results of brick sets were tabulated in table 4. (Specification for common burnt clay building bricks, SLS 39, 1978)
Table 4. Water absorption results of bricks Brick Series ID Sludge content (%) Avg. water absorption (%)
01 0 15.3 02 5 18.3 03 10 20.9 04 15 24.5 05 20 27.8
20%, 1414.720%, 1555.1
0.0
500.0
1000.0
1500.0
2000.0
0% 5% 10% 15% 20% 25%
Den
sity
kg/
m3
Sludge %
Brick Density vs Sludge content
Density -After firing at 900˚C
Density Before Firing
20%, 11.76
0.00
5.00
10.00
15.00
0% 5% 10% 15% 20% 25%
Wei
ght l
oss%
Sludge %
Weight Loss (%) vs Sludge content
Weight Loss% After firing at 900˚C
200
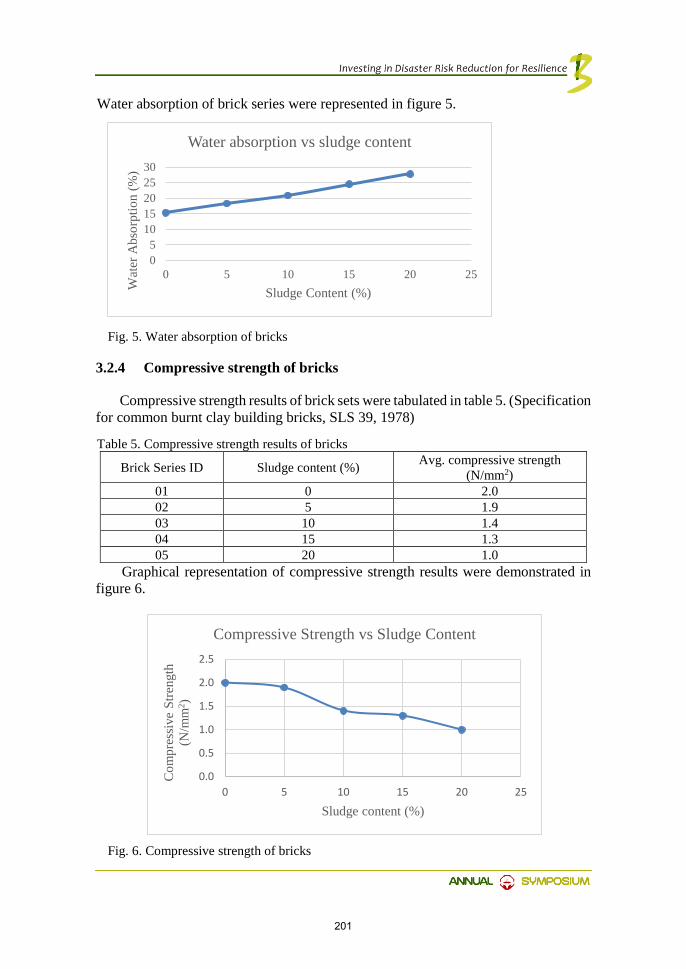
Water absorption of brick series were represented in figure 5.
Fig. 5. Water absorption of bricks
3.2.4 Compressive strength of bricks
Compressive strength results of brick sets were tabulated in table 5. (Specification for common burnt clay building bricks, SLS 39, 1978)
Table 5. Compressive strength results of bricks
Brick Series ID Sludge content (%) Avg. compressive strength (N/mm2)
01 0 2.0 02 5 1.9 03 10 1.4 04 15 1.3 05 20 1.0
Graphical representation of compressive strength results were demonstrated in figure 6.
Fig. 6. Compressive strength of bricks
05
1015202530
0 5 10 15 20 25
Wat
er A
bsor
ptio
n (%
)
Sludge Content (%)
Water absorption vs sludge content
0.0
0.5
1.0
1.5
2.0
2.5
0 5 10 15 20 25
Com
pres
sive
Stre
ngth
(N
/mm
2 )
Sludge content (%)
Compressive Strength vs Sludge Content
201
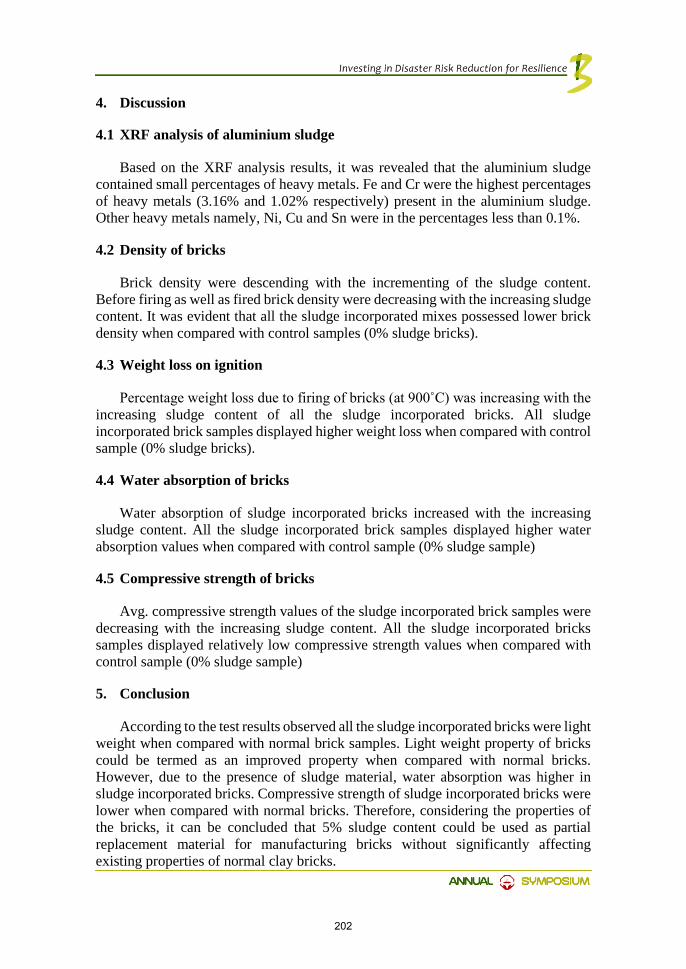
4. Discussion
4.1 XRF analysis of aluminium sludge
Based on the XRF analysis results, it was revealed that the aluminium sludge contained small percentages of heavy metals. Fe and Cr were the highest percentages of heavy metals (3.16% and 1.02% respectively) present in the aluminium sludge. Other heavy metals namely, Ni, Cu and Sn were in the percentages less than 0.1%.
4.2 Density of bricks
Brick density were descending with the incrementing of the sludge content. Before firing as well as fired brick density were decreasing with the increasing sludge content. It was evident that all the sludge incorporated mixes possessed lower brick density when compared with control samples (0% sludge bricks).
4.3 Weight loss on ignition
Percentage weight loss due to firing of bricks (at 900˚C) was increasing with the increasing sludge content of all the sludge incorporated bricks. All sludge incorporated brick samples displayed higher weight loss when compared with control sample (0% sludge bricks).
4.4 Water absorption of bricks
Water absorption of sludge incorporated bricks increased with the increasing sludge content. All the sludge incorporated brick samples displayed higher water absorption values when compared with control sample (0% sludge sample)
4.5 Compressive strength of bricks
Avg. compressive strength values of the sludge incorporated brick samples were decreasing with the increasing sludge content. All the sludge incorporated bricks samples displayed relatively low compressive strength values when compared with control sample (0% sludge sample)
5. Conclusion
According to the test results observed all the sludge incorporated bricks were light weight when compared with normal brick samples. Light weight property of bricks could be termed as an improved property when compared with normal bricks. However, due to the presence of sludge material, water absorption was higher in sludge incorporated bricks. Compressive strength of sludge incorporated bricks were lower when compared with normal bricks. Therefore, considering the properties of the bricks, it can be concluded that 5% sludge content could be used as partial replacement material for manufacturing bricks without significantly affecting existing properties of normal clay bricks.
202
Further studies are expected to be carried out to investigate the leachability of metals from sludge incorporated bricks to the environment.
Acknowledgement
The authors wish to express their heartfelt gratitude to BMRTD, NBRO working staff for the encouragement and the support given by them during this research project.
References
[1] Badr El-Din E. Hegazy, H. A. (2012). Brick Manufacturing From Water Treatment Sludge And Rice Husk Ash. Australian Journal of Basic and Applied Sciences, 453-461.
[2] (2000). BS EN 1097-6 Tests for mechanical and physical properties of aggregates, part 2: physical properties.
[3] Chih-Huang Weng, D.-F. L.-C. (2003). Utilization of sludge as brick materials. Advances in Environmental Research 7, 679–685.
[4] K. Y. CHIANG, P. H. (October 2009). Novel Lightweight Building BricksManufactured from Water Treatment Plant Sludge and AgriculturalWaste. Journal of Residuals Science & Technology, Vol. 6, No. 4, 185-191.
[5] Seyed Mostafa Khezri, M. K. (2010). Use of aluminium anodizing sludge cake in manufacture of bricks. Journal of Food, Agriculture & Environment, 1158-1161.
[6] (1978). Specification for common burnt clay building bricks, SLS 39.
203

RISK COMMUNICATION

Application of the web based GIS in the development of landslide hazard information system (LHIS)
S Jayaprakash1, Dhanushka Jayathilake1 & Aruna Bandara21Scientist, National Building Research Organisation, Sri Lanka
2Lecturer, University of Moratuwa, Sri Lanka
Abstract
National building Research Organisation is in the process of collecting household information of buildings which are located in landslide risk areas in identified ten districts of Sri Lanka.
The purpose of data collection is to develop a detailed geospatial database of elements at risk in landslide prone areas of the country. The geospatial database enables sharing of the information & data among any stakeholder who directly or indirectly related to landslide risk management of the country, regardless of time or location.
One of the main challenges the NBRO is facing is sharing the information with its stakeholders. The currently used methods such as printed materials and conventional websites inherit the limitations in the accessibility to the information and the volume and the quality of the information. To address this issue, the NBRO applied to upcoming Web GIS technology in sharing the geospatial information with its stakeholders.
This Research is focused on the applicability of Web GIS technology in sharing geospatial information on Landslide Hazard areas and the affected settlements. In this case study, the Web GIS technology is used to integrate the spatial data of landslide hazard and risk, buildings, roads, hydrology and administrative boundaries with the linkages to non-spatial data and share them through an interactive web interface. The new system opened users a 24 hours access to the spatial information of the target areas and make decisions based on up to date information base. Through the system the users gain the access to information such as the population exposed to landslide hazard, conditions of buildings, evacuation routes, magnitude of risk and This paper presents the process the NBRO adapted to develop the system, an evaluation between commercial and open source applications, and the improvements of the quality of the shared data through the new system.
Keywords: Landslides, Hazard, Risk, Spatial data, Web based GIS, Database
204
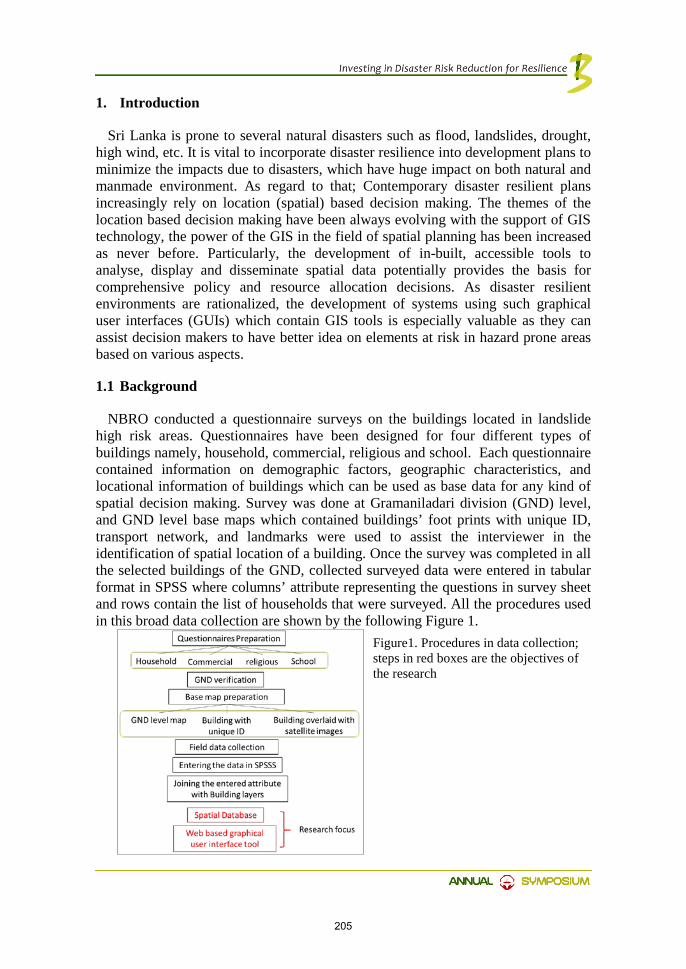
1. Introduction
Sri Lanka is prone to several natural disasters such as flood, landslides, drought, high wind, etc. It is vital to incorporate disaster resilience into development plans to minimize the impacts due to disasters, which have huge impact on both natural and manmade environment. As regard to that; Contemporary disaster resilient plans increasingly rely on location (spatial) based decision making. The themes of the location based decision making have been always evolving with the support of GIS technology, the power of the GIS in the field of spatial planning has been increased as never before. Particularly, the development of in-built, accessible tools to analyse, display and disseminate spatial data potentially provides the basis for comprehensive policy and resource allocation decisions. As disaster resilient environments are rationalized, the development of systems using such graphical user interfaces (GUIs) which contain GIS tools is especially valuable as they can assist decision makers to have better idea on elements at risk in hazard prone areas based on various aspects.
1.1 Background
NBRO conducted a questionnaire surveys on the buildings located in landslide high risk areas. Questionnaires have been designed for four different types of buildings namely, household, commercial, religious and school. Each questionnaire contained information on demographic factors, geographic characteristics, and locational information of buildings which can be used as base data for any kind of spatial decision making. Survey was done at Gramaniladari division (GND) level, and GND level base maps which contained buildings’ foot prints with unique ID, transport network, and landmarks were used to assist the interviewer in the identification of spatial location of a building. Once the survey was completed in all the selected buildings of the GND, collected surveyed data were entered in tabular format in SPSS where columns’ attribute representing the questions in survey sheet and rows contain the list of households that were surveyed. All the procedures used in this broad data collection are shown by the following Figure 1.
Figure1. Procedures in data collection; steps in red boxes are the objectives of the research
205
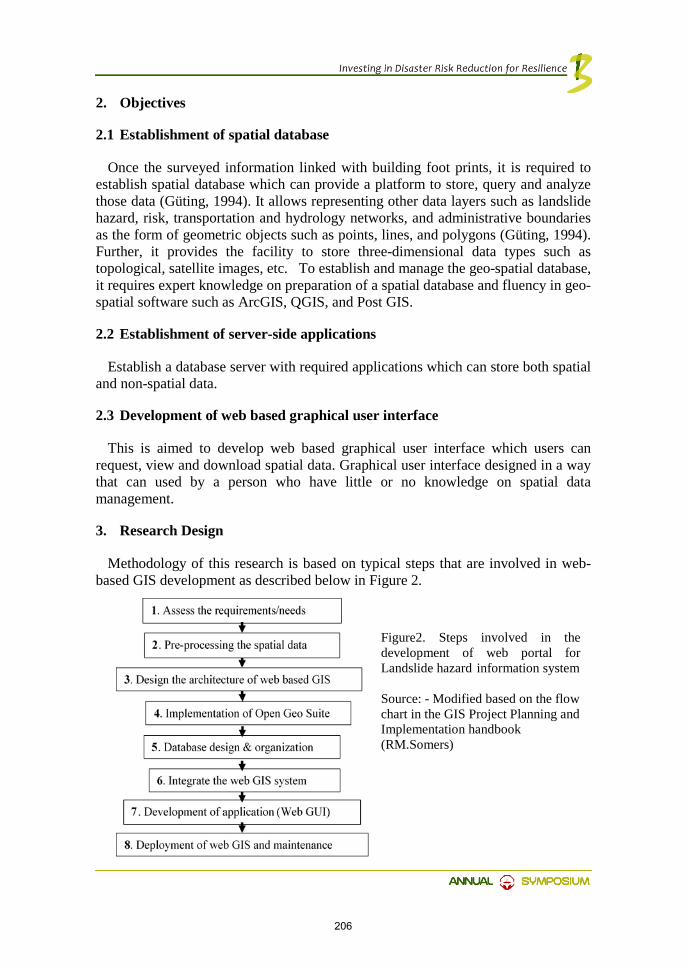
2. Objectives
2.1 Establishment of spatial database
Once the surveyed information linked with building foot prints, it is required to establish spatial database which can provide a platform to store, query and analyze those data (Güting, 1994). It allows representing other data layers such as landslide hazard, risk, transportation and hydrology networks, and administrative boundaries as the form of geometric objects such as points, lines, and polygons (Güting, 1994). Further, it provides the facility to store three-dimensional data types such as topological, satellite images, etc. To establish and manage the geo-spatial database, it requires expert knowledge on preparation of a spatial database and fluency in geo- spatial software such as ArcGIS, QGIS, and Post GIS.
2.2 Establishment of server-side applications
Establish a database server with required applications which can store both spatial and non-spatial data.
2.3 Development of web based graphical user interface
This is aimed to develop web based graphical user interface which users can request, view and download spatial data. Graphical user interface designed in a way that can used by a person who have little or no knowledge on spatial data management.
3. Research Design
Methodology of this research is based on typical steps that are involved in web-based GIS development as described below in Figure 2.
Figure2. Steps involved in the development of web portal for Landslide hazard information system Source: - Modified based on the flow chart in the GIS Project Planning and Implementation handbook (RM.Somers)
206
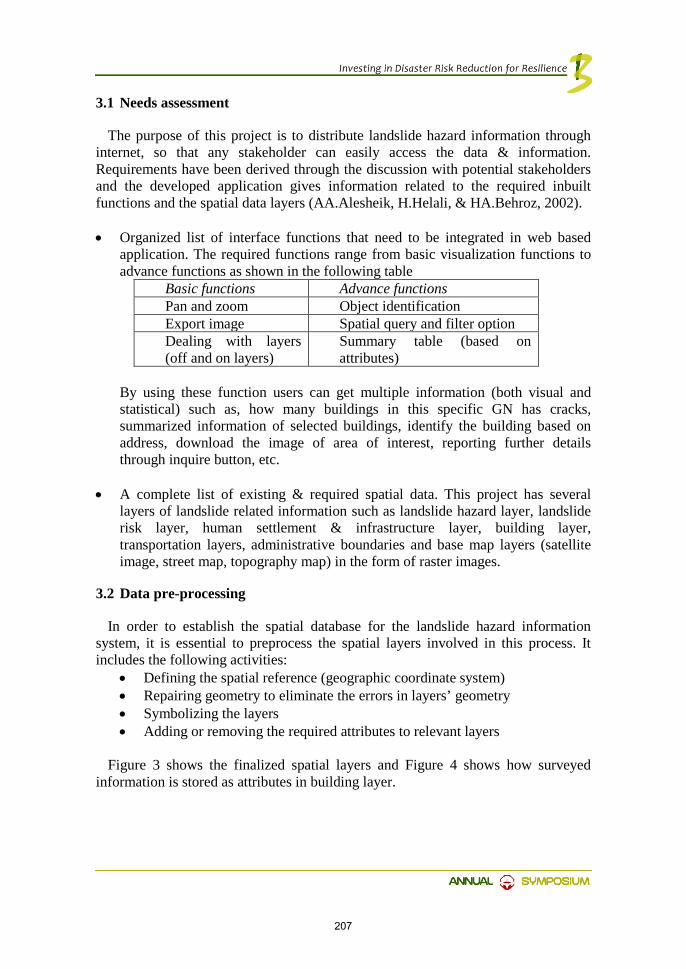
3.1 Needs assessment
The purpose of this project is to distribute landslide hazard information through internet, so that any stakeholder can easily access the data & information. Requirements have been derived through the discussion with potential stakeholders and the developed application gives information related to the required inbuilt functions and the spatial data layers (AA.Alesheik, H.Helali, & HA.Behroz, 2002).
• Organized list of interface functions that need to be integrated in web based
application. The required functions range from basic visualization functions to advance functions as shown in the following table
Basic functions Advance functions Pan and zoom Object identification Export image Spatial query and filter option Dealing with layers (off and on layers)
Summary table (based on attributes)
By using these function users can get multiple information (both visual and statistical) such as, how many buildings in this specific GN has cracks, summarized information of selected buildings, identify the building based on address, download the image of area of interest, reporting further details through inquire button, etc.
• A complete list of existing & required spatial data. This project has several
layers of landslide related information such as landslide hazard layer, landslide risk layer, human settlement & infrastructure layer, building layer, transportation layers, administrative boundaries and base map layers (satellite image, street map, topography map) in the form of raster images.
3.2 Data pre-processing
In order to establish the spatial database for the landslide hazard information system, it is essential to preprocess the spatial layers involved in this process. It includes the following activities:
• Defining the spatial reference (geographic coordinate system) • Repairing geometry to eliminate the errors in layers’ geometry • Symbolizing the layers • Adding or removing the required attributes to relevant layers
Figure 3 shows the finalized spatial layers and Figure 4 shows how surveyed information is stored as attributes in building layer.
207
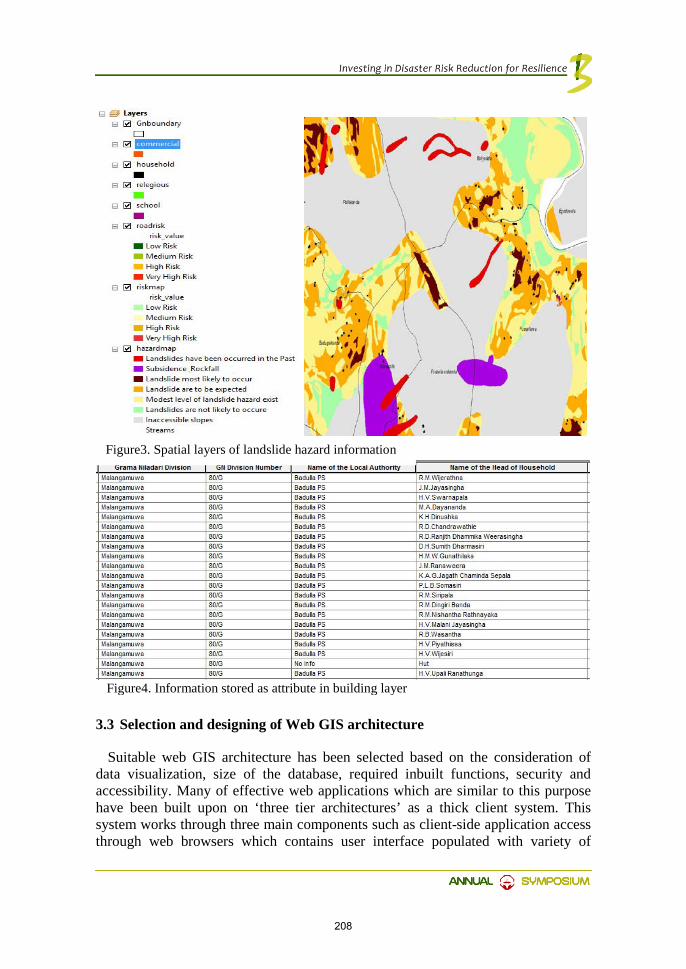
3.3 Selection and designing of Web GIS architecture
Suitable web GIS architecture has been selected based on the consideration of data visualization, size of the database, required inbuilt functions, security and accessibility. Many of effective web applications which are similar to this purpose have been built upon on ‘three tier architectures’ as a thick client system. This system works through three main components such as client-side application access through web browsers which contains user interface populated with variety of
Figure3. Spatial layers of landslide hazard information
Figure4. Information stored as attribute in building layer
208
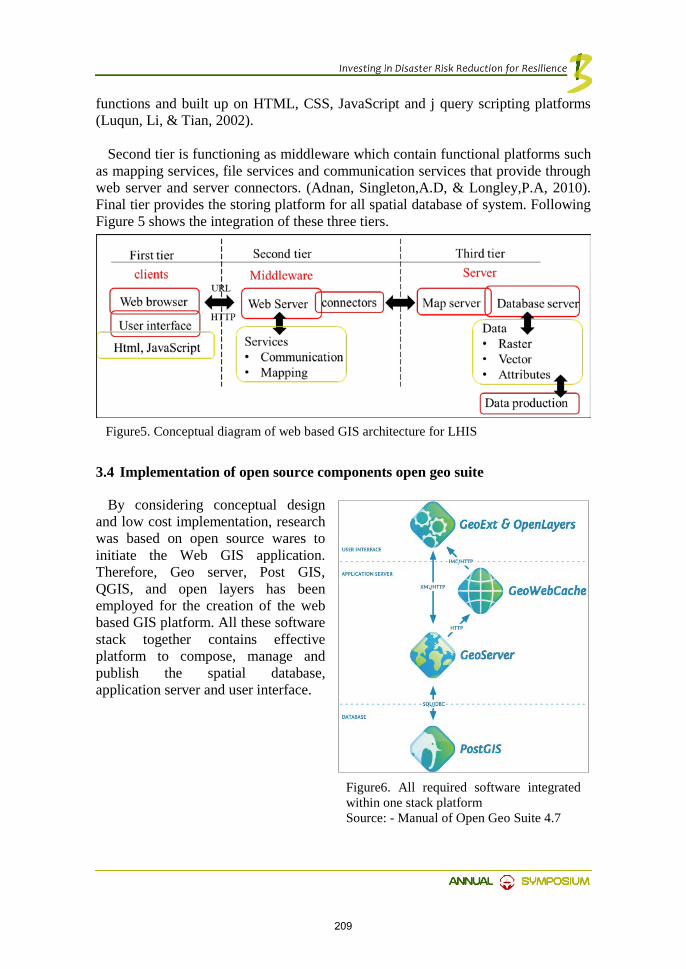
functions and built up on HTML, CSS, JavaScript and j query scripting platforms (Luqun, Li, & Tian, 2002).
Second tier is functioning as middleware which contain functional platforms such as mapping services, file services and communication services that provide through web server and server connectors. (Adnan, Singleton,A.D, & Longley,P.A, 2010). Final tier provides the storing platform for all spatial database of system. Following Figure 5 shows the integration of these three tiers.
3.4 Implementation of open source components open geo suite
By considering conceptual design and low cost implementation, research was based on open source wares to initiate the Web GIS application. Therefore, Geo server, Post GIS, QGIS, and open layers has been employed for the creation of the web based GIS platform. All these software stack together contains effective platform to compose, manage and publish the spatial database, application server and user interface.
Figure6. All required software integrated within one stack platform Source: - Manual of Open Geo Suite 4.7
Figure5. Conceptual diagram of web based GIS architecture for LHIS
209
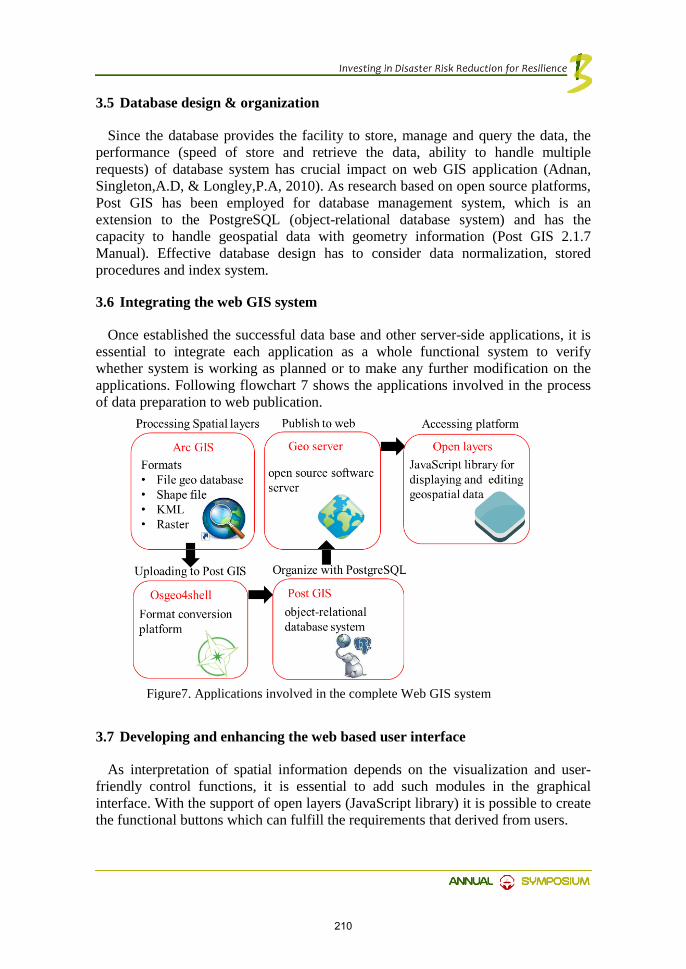
3.5 Database design & organization
Since the database provides the facility to store, manage and query the data, the performance (speed of store and retrieve the data, ability to handle multiple requests) of database system has crucial impact on web GIS application (Adnan, Singleton,A.D, & Longley,P.A, 2010). As research based on open source platforms, Post GIS has been employed for database management system, which is an extension to the PostgreSQL (object-relational database system) and has the capacity to handle geospatial data with geometry information (Post GIS 2.1.7 Manual). Effective database design has to consider data normalization, stored procedures and index system.
3.6 Integrating the web GIS system
Once established the successful data base and other server-side applications, it is essential to integrate each application as a whole functional system to verify whether system is working as planned or to make any further modification on the applications. Following flowchart 7 shows the applications involved in the process of data preparation to web publication.
3.7 Developing and enhancing the web based user interface
As interpretation of spatial information depends on the visualization and user-friendly control functions, it is essential to add such modules in the graphical interface. With the support of open layers (JavaScript library) it is possible to create the functional buttons which can fulfill the requirements that derived from users.
Figure7. Applications involved in the complete Web GIS system
210
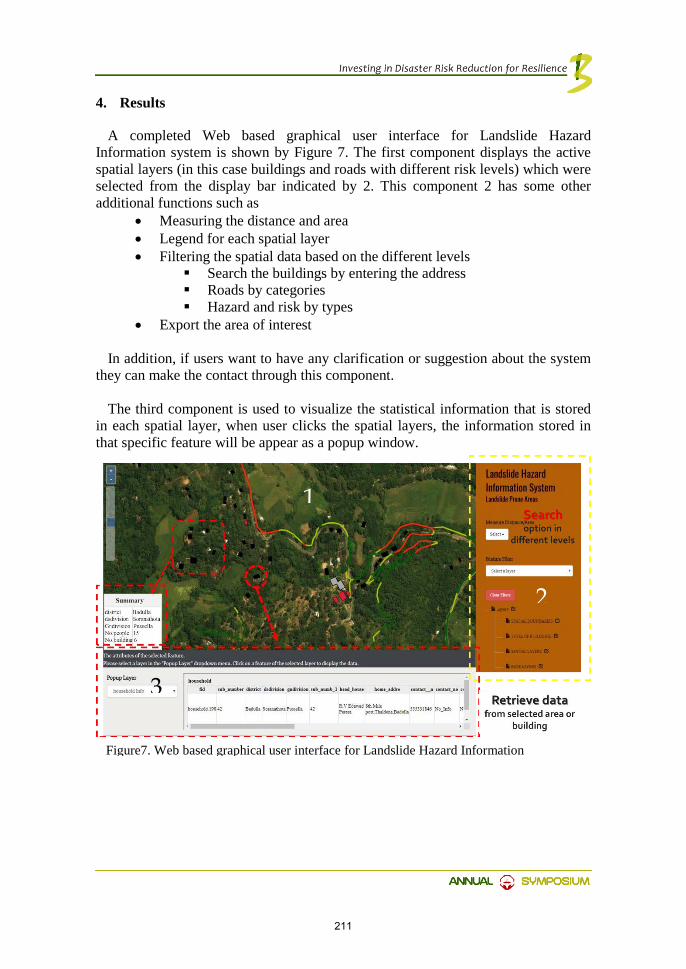
4. Results
A completed Web based graphical user interface for Landslide Hazard Information system is shown by Figure 7. The first component displays the active spatial layers (in this case buildings and roads with different risk levels) which were selected from the display bar indicated by 2. This component 2 has some other additional functions such as
• Measuring the distance and area • Legend for each spatial layer • Filtering the spatial data based on the different levels
Search the buildings by entering the address Roads by categories Hazard and risk by types
• Export the area of interest
In addition, if users want to have any clarification or suggestion about the system they can make the contact through this component.
The third component is used to visualize the statistical information that is stored
in each spatial layer, when user clicks the spatial layers, the information stored in that specific feature will be appear as a popup window.
1
2
3
Figure7. Web based graphical user interface for Landslide Hazard Information
211

References
[1] AA.Alesheik, H.Helali, & HA.Behroz. (2002). Web GIS; Technologies and its applications. Geospatial Theory, Processing and Applications, (p. 9). Ottawa. Retrieved September 2017, from
a. http://citeseerx.ist.psu.edu/viewdoc/download?doi=10.1.1.120.9250&rep=rep1&type=pdf
[2] Adnan, M., Singleton,A.D, & Longley,P.A. (2010, February 10). Developing Efficient Web-based GIS Applications. pp. 8-14.
[3] Bandara, R. (2005). Landslides in Sri Lanka. Vidurava, Vol: 22(No: 02), Pp. 09-13. [4] Ganepola, P. (2009). Permanent Shelter Strategy for Landslide Affected Families in
Nuwara Eliya District. NBRO Symposium 2009. [5] Güting, R. (1994). An Introduction to Spatial Database Systems. VLDB Journal, 3, 357-
399. Retrieved from http://dna.fernuni-hagen.de/papers/IntroSpatialDBMS.pdf [6] Hewawasam, L. (2005). Safer Cities 12, Demonstration Housing Construction for
Landslide and Flood Prone Areas, A case study from Ratnapura, Sri Lanka. Asian Disaster Preparedness Center.
[7] Luqun, L., L. J., & T. Y. (2002). The Study on web GIS Architecturre Based on JNLP. Symbosium on Geospatial Theory,Processings and Applications, 6. Retrieved from http://citeseerx.ist.psu.edu/viewdoc/download?doi=10.1.1.123.6596&rep=rep1&type=pdf
[8] RM.Somers. (n.d.). ADVANCED GEOGRAPHIC INFORMATION SYSTEMS. GIS Project Planning and Implementation, p. 6.
[9] Singh, A. K. (2010). Landslide management: concept and philosophy. Disaster Prevention and Management, Vol. 19(No. 1), pp. 119-134. doi:10.1108
212

Determination of Chrysotile Fiber Levels in the Air Associated with Chrysotile-Cement Roofing Sheet Manufacturing, Handling and Usage in Sri Lanka
HDS Premasiri2, KLG Kaushalya1, DMMR Dissanayake1 & PD Liyanarachchi1
1 Scientist, National Building Research Organisation, Sri Lanka 2 Senior Scientist, National Building Research Organisation, Sri Lanka
Abstract Asbestos is a natural mineral represent two group of fibrous minerals with six
different types and properties. Some types of these mineral fibers have high commercial designation due to high tensile strength, flexibility, resistance to chemical and thermal degradation, high electrical resistance and ability to be woven etc. Due to these properties of asbestos mineral, is attractive in a broad variety of industrial applications. The commercial use type of asbestos is mainly being made using Chrysotile (white), Amosite (brown) and Crocidolite (blue) fibers. However, these asbestoses fiber course heath risk depending on the type and the level of exposure. Due to the high health risk, Amosite (brown) and Crocidolite (blue) type of asbestos are banded to use for industrial application. However, Chrysotile (white) asbestos fiber is still used since its health risk is much low compared to other fiber in the group and it is the only asbestos type imported to Sri Lanka in order to use in Chrysotile-Cement Roofing Sheet Manufacturing industry. The Chrysotile (white) asbestos also can cause several health risks depending on the level of exposure. Therefore, the ability of Chrysotile fiber to disperse into the air acts as a major factor in determination of extents of the risk. This study was to assess air born fibers level representing 3 different stages in the Chrysotile-cement roof sheet production industry. The stages are at production factory environment, construction & demolition site environment and household environment. The sampling, identification and counting of fiber were done in compliance with the methodology given under the MDHS39/4 asbestos fibers in air - Sampling and evaluation by Phase Contrast Microscopy (PCM). The measured exposure levels fiber in all three studies are much below the threshold limit stipulated by OSHA Standard of Permissible Exposure Limit (PEL)] which is 0.1 Fiber per cubic centimetre. Out of 3 stages, household environment has recorded the lowest levels and the Construction sites show the highest values of Chrysotile (white) asbestos. Keywords: Chrysotile fiber; Exposure; Chrysotile-cement roofing sheets
213

1. Introduction
Asbestos is a natural mineral represent a group of two types with six different unique fibrous minerals with different properties. All these are naturally occurring silicates and all have their eponymous asbestiform crystal habit in common. That is long (roughly 1:20 aspect ratio – ratio between the diameter and the length of the crystal fiber), thin fibrous crystals, with each visible fiber composed of millions of microscopic "fibrils" that can be released by abrasion and other processes [1]. However, it is important to stress that the two mineral families of the asbestos are chemically and mineralogical distinct.
Asbestos have high commercial designation due to high tensile strength,
flexibility, resistance to chemical and thermal degradation, high electrical resistance and ability to be woven etc. Due to these properties of asbestos mineral, it is attractive in a broad variety of industrial applications [13]. Asbestos is used for the manufacture of a variety of asbestos based products including asbestos-cement (AC) sheets, AC pipes, brake shoes, brake linings, textiles and ropes. Now, AC industry is by far the largest user of asbestos fiber worldwide accounting for about 95% of all uses. Asbestos is also incorporated into friction materials like brake linings and clutch pads, jointing and gaskets, asphalt coats and sealants and other similar products. Later on, the commercial use of asbestos has mainly been made using the Chrysotile (white), Amosite (brown) and Crocidolite (blue) fibers [5].
Due to the high health risk, Amosite (brown) and Crocidolite (blue) type asbestos are banded to use for industrial application. The Chrysotile (white) asbestos fiber is still used since its health risk is low compared to other fiber in the group. Chrysotile is the most commonly encountered form of asbestos and it is a soft, curly, fibrous silicate mineral. The material has physical properties which make it desirable for inclusion in building materials such as Cement and Roofing materials while it is used for other purposes such as Gaskets, Insulation, Brake pads, Brake linings and Joint compound as well [6].
Fig. 1. Classification of Asbestos fiber types
214

Chrysotile fiber is the only asbestos type which is imported to Sri Lanka and use in Chrysotile-cement roof and ceiling sheet product industry over decades [4], though few other roofing options are available such as clay tiles [10], and Amano sheets. This has resulted mainly due to properties of Chrysotile - Cement roof sheets (Table 1).
The production of Chrysotile-cement roofing and ceiling materials in the country had started in 1950’s and currently the production is carried out in 4 factories, and of them, many are located in the Western Province of the country. The sheets are manufactured in the corrugated form for roof sheets and as flat sheets for ceilings. The Chrysotile mineral fiber is long, thin, strong and heat-resistant. They are microscopic and do not readily dissolve or breakdown as individual fibers. But the Chrysotile fibers may have a possibility of becoming air borne during the manufacturing process in working environment [11]. Table 1. Properties of roofing materials
Property Clay tiles Chrysotile-Cement roof sheets
Amano sheets
Tensile strength Moderate High Low Water absorption Moderate Moderate Low Decaying and corrosion Low decaying Low decaying High corrosion Durability Moderate Very high Low Heat resistant Very high Moderate Low Cost per unit area High Moderate Low
Source: Study on Airborne Chrysotile Fiber in Roofing Industry in Sri Lanka - 2016
Chrysotile fibers are very thin, lightweight fiber and become airborne easily during the handling alone process of the Chrysotile-Cement roof sheet production, sheet handling, cutting, drilling and dismantling etc. Stages with high possibility to fibers to be airborne during manufacturing process are listed as below (within the factory premises).
• Fiber transportation to the factory and unloading • Fiber transportation within the factory • Fiber storage at the factory • Raw material processing – fiber bags opening/ fiber crushing/ fiber, cement and
Water mixing • Chrysotile-Cement roof sheet storage – Final Product • Chrysotile-Cement roof sheet transportation • Dry stage waste recycling – Sheet crushing
When the fiber becomes airborne, it can easily be transfer to the human body
through the respiratory system. Depending on their size and dimensions, inhaled fibers can penetrate the respiratory tract to the distal airways and into the alveolar spaces [15]. The critical determinants of fiber bioactivity and toxicity include not only fiber dimensions, but also shape, surface reactivity, crystallinity, chemical composition, and presence of transition metals. Fibers can be cleared by several
215
mechanisms, including the mucociliary escalator, engulfment, and removal by macrophages, or through splitting and chemical modification. Bio persistence of long asbestos fibers can lead to inflammation, granuloma formation, fibrosis, and cancer. Given the known cytotoxic and carcinogenic properties of asbestos fibers, toxicity of fibrous nanomaterials is a topic of intense study.
The first inclusion of Asbestos in a list of harmful industrial substances has been occurred in British – 1902 followed by France and Italy as well. Publication of Asbestos Industry Regulations has started in UK -1931 followed by U.S. about ten years later. Chrysotile, when compared to numerous mineral fibers, has appreciably greater solubility and less bio persistence due to the curly nature of the fiber, whereas amphiboles are considerably more persistent and hence have a greater potential for carcinogenicity [2]. These fibers can cause scarring and inflammation in the lungs, which can affect breathing and lead to serious health problems, also it can cause lung cancers and mesothelioma and may cause asbestosis and other nonmalignant lung and pleural disorders, including pleural plaques pleural thickening, and benign pleural effusions.
Since, asbestos in air is a major cause of adverse effects on the health of general public and industrial workers, it is very important to have an idea on how much of fibers in our breathing atmosphere. Then based on the exposure levels it can be take attempt to control of work place and ambient exposure. This could be achieved by proper work practices, engineering controls and monitoring etc. enforcement of effective government policies and regulations are implemented while self-practices by the industry management, including the adoption of good management practices during planning, design and operations are also ensure the sustainable development. Continued health surveillance will add to further reinforcement to controlled usage theory. Hence, this study has been carried out to assess air born fibers level represent three different stages in the Chrysotile-cement roof sheet production industry.
2. Scope and Objectives
The objective of the study is to measure airborne Chrysotile fibers in each scenarios of manufacturing, handling and utilizing of Chrysotile-Cement roof sheet. Therefore, the study was categorized into three sub objectives such as,
Examine, • Chrysotile fiber levels in working environment in Chrysotile-cement roofing
sheets production factories • Level of fibers that may be released into the air from cement whilst handling,
dismantling and installing Chrysotile-cement roofing tiles • Suspended Chrysotile fibers levels in the air within the household indoor
environment
216

3. Methodology
3.1 Selection of Sampling sites and sampling locations
3.1.1 Study 1: Production Factories
Hatschek technology is used in all four Chrysotile fiber roofing sheets manufacturing factories in Sri Lanka. Therefore, two factories out of those were selected for the investigation.
• Factory 1 – located in Rathmalana area, Western province • Factory 2 – located in Ja-ella area, Western Province
In each selected industry, 5 sampling locations were selected for the measurement
of Chrysotile fiber count by considering the manufacturing processes and points with potential for fiber to become airborne. The sampling locations are given bellow,
Storage area : 1 sample Bag opener : 2 samples (working area and worker) Raw material mixing : 1 sample Finished sheets storage : 1 sample Subtotal : 5 samples per factory Total : 10 samples from both factories
Table 2. General information of the selected factories General Information Factory 1 Factory 2
Company establishment In 1955 In 1962 Factory commencement In 2009 In 2012 Production technology Hatschek technology Hatschek technology Fiber importing countries Russia, Kazakhstan, Brazil Russia, Kazakhstan
Production Details Ingredient ratio Chrysotile 8%
Cement 90-92% +water Chrysotile 8% Cement 90-92% +water
Raw material usage Cement 300 tons/day Chrysotile 24 tons/day Water as per the requirement
Cement 420 tons/day Chrysotile 34 tons/day Water as per the requirement
Production capacity 300 tons/day (70,000 m2/day) 420 tons/day (98,000 m2/day)
Waste generation - slurry 50 wheelbarrows/day 100% recycled
< 2 tons/week 100% recycled
Damaged sheets < 0.5% < 0.7% Working hours 24 hrs. as 3 shifts of 8 hrs. 24 hrs. as 3 shifts of 8 hrs. Surrounding area Mixed residential area Mixed residential area
Source: Study on Airborne Chrysotile Fiber in Roofing Industry in Sri Lanka - 2016
217

3.1.2 Study 2: Utilization sites (Households)
Ten houses were selected for the investigation within Colombo and suburb areas where Chrysotile – cement roofing sheets had been used for the roof without a ceiling. Selected ten houses had different roofing ages and different natures of buildings. In each selected house, 2 sampling locations were selected for the measurement. Common area : 1 sample (living room, etc.) Other regularly used area : 1 sample (bedroom, etc.) Subtotal : 2 samples per house Total : 20 samples from all ten houses
Table 3. General information of selected Houses House No. 1 2 3 4 5 6 7 8 9 10 Area Nugegoda Colombo 5 Pannipitiya Ragama Polhengoda Roof age (years) 20 5 10 18 1 12 1 3 1 2
Source: Study on Airborne Chrysotile Fiber in Roofing Industry in Sri Lanka - 2016
3.1.3 Study 3: Handling sites (Construction and Demolition sites)
Due to the difficulties in finding demolition sites, all five-selected site were construction sites with Chrysotile-Cement Roofing sheets cutting activities. In each selected site, 3 sampling locations were selected for the measurement. Cutting area : 2 samples (working area and worker) Storage area : 1 sample Subtotal : 3 samples per construction site Total : 15 samples from all five construction sites
Table 4. General information of construction sites Site Cons. site 1 Cons. site 2 Cons. site 3 Cons. site 4 Cons. site 5 Area Narahenpita Malabe Thalangama Pannipitiya Hiripitiya
Source: Study on Airborne Chrysotile Fiber in Roofing Industry in Sri Lanka - 2016
3.2 Sample collection and analysis
Air samples were collected from selected locations as per the method stipulated in MDHS39/4 for the determination of asbestoses fiber in atmosphere at work place. Sampling duration varied from 4 – 8 hrs. in study 1 and study 3 depending on the duration of working shifts while the sampling of houses was carried out for 8 hrs. in order to represent exposure of resident. The air flow rate of the pumps was maintained at 2 ltr/min throughout the sampling period. The sample analysis was carried out according to the methodology given in NIOSH 7400 (Phase Contrast Microscopy - PCM) which fulfills the requirements of MDHS39/4 methodology – “The asbestos fibers in air - Sampling and evaluation by Phase Contrast Microscopy (PCM)” by NBRO team with the collaboration of Life & Environment Co., Ltd, Thailand.
218

4. Results and Discussion
There are several global standards for the permissible exposure levels of asbestos fibers in working environment under occupational safety standards. But a permissible exposure level of asbestos fibers in residential environment has not been defined. Therefore, one standard level is used in comparison of the result of all three studies.
Table 5. Global Standards on asbestos fiber exposure levels
Reference sources Stipulated threshold limits (Chrysotile fiber /ml)
1 OSHA (Occupational Safety and Health Administration – USA)
0.1
2 The Mine Safety and Health Administration of the United States Department of Labor
2
3 NIOSH (National Institute for Occupational Safety and Health - USA)
0.1
4 ACGIH (The American Conference of Governmental Industrial Hygienists)
0.1
Source: Study on Airborne Chrysotile Fiber in Roofing Industry in Sri Lanka - 2016
OSHA (Occupational Safety and Health Administration) Standard of Permissible Exposure Limit (PEL) for asbestos is one of the internationally-recognized safety thresholds which is employed in various countries as their Threshold limit. Hence 0.1 fiber per cubic centimeter air as a time weighed average (air averaged over an 8-hour shift of a 40-hour workweek) is used as the Threshold limit for the study. All the measurements are given in fiber per cubic centimeter (Fiber/cc) as an average value over volume. Therefore, the result can be in decimals.
Measured chrysotile fiber levels of each sample collected in industry premises are presented in Table 6.
Table 6. Measured fiber levels in industry premises Sample No. Sampling Result
Fiber/cc Exposure
Location Category 1 M1 Factory 1 Raw material stores Static 0.0241 Below the limit 2 M2 Bag opening area Static 0.0231 Below the limit 3 M3 Bag opening area Personal 0.0365 Below the limit 4 M4 Mixing area Static 0.0423 Below the limit 5 M5 Final product stores Static 0.0191 Below the limit 6 R1 Factory 2 Raw material stores Static 0.0157 Below the limit 7 R2 Bag opening area Static 0.0398 Below the limit 8 R3 Bag opening area Personal 0.0169 Below the limit 9 R4 Mixing area Static 0.0205 Below the limit 10 R5 Final product stores Static 0.0084 Below the limit
Source: Study on Airborne Chrysotile Fiber in Roofing Industry in Sri Lanka - 2016
219

The measured chrysotile fiber levels in all locations within the industry premises were below the threshold limits for Chrysotile fiber exposure stipulated by OSHA, NIOSH and ACGIH as shown in figure 2. However, it indicates that fiber levels in industry 1 are relatively high compared to industry 2 except the location of bag opening area. Both factories show a trend of high fiber exposure levels in mixing area while a relatively low fiber exposure levels in Final Product stores. Result of personal sample done at the bag opening area of production factory 2, shows comparatively a low value where the personal involvement closest to the bag opener was at about 3 meters away from the bag opener while the result of the personal sample done at bag opening area of production factory 1 shows relatively a high value. These changes would be due to the changes of operating practices of two industries.
Measured chrysotile fiber levels of each sample collected in construction site are
presented in Table 7.
Table 7. Measured fiber levels in construction site area Sample No. Sampling Result
Fiber/cc Exposure
Location Category 1 1C1 Cons.
site 1 Cutting area Static 0.0374 Below the limit
2 1C2 Cutting area Personal 0.0662 Below the limit 3 1C3 Storage Static 0.0630 Below the limit 4 2C1 Cons.
site 1 Cutting area Static 0.0421 Below the limit
5 2C2 Storage Static 0.0353 Below the limit 6 2C3 Cutting area Personal 0.0325 Below the limit 7 3C1 Cons.
site 1 Cutting area Static 0.0421 Below the limit
8 3C2 Storage Static 0.0353 Below the limit 9 3C3 Cutting area Personal 0.0325 Below the limit 10 4C1 Cons.
site 1 Cutting area Static 0.0149 Below the limit
11 4C2 Storage Static 0.0251 Below the limit 12 4C3 Cutting area Personal 0.0464 Below the limit 13 5C1 Cons.
site 1 Cutting area Static 0.0388 Below the limit
14 5C2 Storage Static 0.0104 Below the limit 15 5C3 Cutting area Personal 0.0325 Below the limit
Source: Study on Airborne Chrysotile Fiber in Roofing Industry in Sri Lanka – 2016
00.010.020.030.040.05
Rawmaterialstores
Bagopening
area
Bagopeningarea -
Personal
Mixingarea
Finalproductstores
Chr
ysot
ile fi
ber l
evel
(F
iber
/cc)
ProductionFactory 1ProductionFactory 2
Fig. 2. Results of measured fiber levels in production factories
220
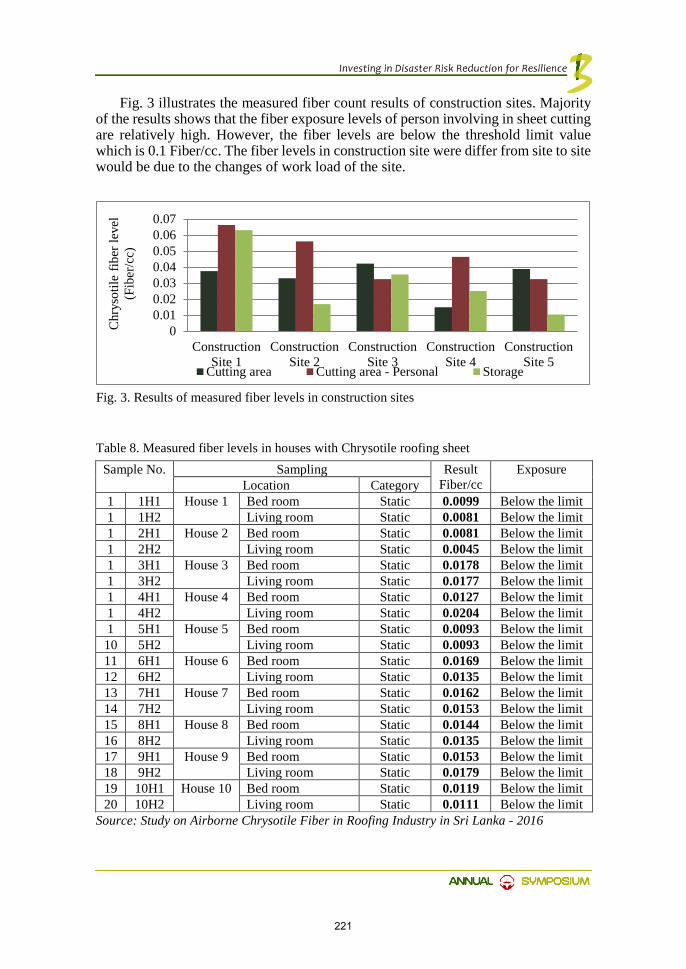
Fig. 3 illustrates the measured fiber count results of construction sites. Majority of the results shows that the fiber exposure levels of person involving in sheet cutting are relatively high. However, the fiber levels are below the threshold limit value which is 0.1 Fiber/cc. The fiber levels in construction site were differ from site to site would be due to the changes of work load of the site.
Table 8. Measured fiber levels in houses with Chrysotile roofing sheet Sample No. Sampling Result
Fiber/cc Exposure
Location Category 1 1H1 House 1 Bed room Static 0.0099 Below the limit 1 1H2 Living room Static 0.0081 Below the limit 1 2H1 House 2 Bed room Static 0.0081 Below the limit 1 2H2 Living room Static 0.0045 Below the limit 1 3H1 House 3 Bed room Static 0.0178 Below the limit 1 3H2 Living room Static 0.0177 Below the limit 1 4H1 House 4 Bed room Static 0.0127 Below the limit 1 4H2 Living room Static 0.0204 Below the limit 1 5H1 House 5 Bed room Static 0.0093 Below the limit 10 5H2 Living room Static 0.0093 Below the limit 11 6H1 House 6 Bed room Static 0.0169 Below the limit 12 6H2 Living room Static 0.0135 Below the limit 13 7H1 House 7 Bed room Static 0.0162 Below the limit 14 7H2 Living room Static 0.0153 Below the limit 15 8H1 House 8 Bed room Static 0.0144 Below the limit 16 8H2 Living room Static 0.0135 Below the limit 17 9H1 House 9 Bed room Static 0.0153 Below the limit 18 9H2 Living room Static 0.0179 Below the limit 19 10H1 House 10 Bed room Static 0.0119 Below the limit 20 10H2 Living room Static 0.0111 Below the limit
Source: Study on Airborne Chrysotile Fiber in Roofing Industry in Sri Lanka - 2016
00.010.020.030.040.050.060.07
ConstructionSite 1
ConstructionSite 2
ConstructionSite 3
ConstructionSite 4
ConstructionSite 5
Chr
ysot
ile fi
ber l
evel
(F
iber
/cc)
Cutting area Cutting area - Personal Storage
Fig. 3. Results of measured fiber levels in construction sites
221

Measured fiber count results of houses are presented in table 8 and figure 4. Majority of the results shows that the fiber levels are comparatively high in bed rooms than living rooms. This may be due to the ventilation conditions in living rooms compared to the bed rooms. All the fiber levels are well below the threshold limit, which is 0.1 Fiber/cc.
According to the outcomes of the study, the chrysotile exposure levels at all
measured locations were much below the OSHA (Occupational Safety and Health Administration) Standard of Permissible Exposure Limit (PEL) for asbestos as illustrated in Fig. 5.
The figure 6 illustrates the distribution of ambient fiber levels of Chrysotile fibers
with respect to the three stages consider in the study. In comparison, fiber levels in Household environment shows the lowest levels while Construction sites show the
0
0.005
0.01
0.015
0.02
0.025
Chr
ysot
ile fi
ber l
evel
(F
iber
/cc) Bed
roomLivingroom
Fig. 4. Results of measured fiber levels in houses with Chrysotile roofing sheet
0
0.02
0.04
0.06
0.08
0.1
0.12
M1
M3
M5
R2
R4
1H1
2H1
3H1
4H1
5H1
6H1
7H1
8H1
9H1
10H
11C
11C
32C
23C
13C
34C
25C
15C
3
Chr
ysot
ile fi
ber l
evel
(Fib
er/c
c)
Sample Code Observed fiber levelsThreshold value (Fiber/cc)
Fig. 3. Ambient fiber levels of Chrysotile fibers at sampling locations
222

high values. The fiber levels within industry premises shoes in-between values of households and construction sites. The management and operational practices of industry due to the safety and environmental regulations would be the reason behind to maintain of fiber levels at lower level in industry premises. Whereas there is no any regulation or good practices used to control in construction sites. Therefore, due to the lack of knowledge and unsafe handling of chrysotile fiber sheets in construction site, the possibility to fiber become airborne is high. Therefore, relatively high level of fiber was recorded in Construction site.
The Fig. 6 illustrates the distribution of ambient fiber levels of Chrysotile fibers
with respect to three studies. It clearly shows that the ambient fiber levels are much below the OSHA (Occupational Safety and Health Administration) Standard of Permissible Exposure Limit (PEL) for asbestos in all three studies which is 0.1 Fiber per cubic centimeter.
5. Conclusion
The occupational safety and environmental regulations that enforced in industry would leads to maintain the chrysotile fiber levels below the relevant standards and Permissible Exposure Limit (PEL).
Household environment shows the lower levels of airborne fibers indicates that the ability to become fiber to airborne is minimum once it binds with cement in chrysotile – cement roofing sheet production.
The risk of fibers to be airborne is higher in construction and demolition sites, due to disturbance of bonding between fiber and cement by drilling, cutting, braking of roofing sheets. The condition will be worst due to the lack of awareness of the contractors and workers who engage in construction and demolition site work.
Enhancing the awareness of involving personals and introducing advanced technologies, use of Personal Protective Equipment (PPE) and changing handling practices etc. could be minimized the fiber to airborne in chrysotile – cement roofing sheet handling sites.
00.010.020.030.040.050.060.07
Factories Houses Construction sites
Chr
ysot
ile fi
ber l
evel
(F
iber
/cc)
Fig. 4. Distribution of ambient fiber levels of Chrysotile fibers
223

References [1] James, E. A., & Brooke, T. M. (1997, July). Asbestos Revisited. Scientific American, pp.
70-75. [2] Savinis & Kane, L.L.C. (2016). What the Asbestos Industry Knew. Retrieved June 5,
2016, from Savinis & Kane, L.L.C.: http://www.sdklaw.com/Asbestos-Disease/What-The-Asbestos-Industry-Knew.shtml
[3] Gee, D., & Greenberg, M. (n.d.). Late lessons from early warnings: the precautionary principle 1896–2000.
[4] Asbestos Information Centre. (n.d.). Asbestos Related Diseases & Health Risks. Retrieved August 29, 2016, from Asbestos Information Centre: http://www.aic.org.uk/asbestos-related-diseases/
[5] Malcolm Ross, R. P. (2003). History of asbestos discovery and use and asbestos-related disease in context with the occurrence of asbestos within the ophiolite complexes. Retrieved June 2, 2016, from Ophiolite Concept and the Evolution of Geological Thought: https://books.google.lk/books?id=eYHEEWhye94C&pg=PA447&redir_esc=y#v=onepage&q&f=false
[6] McGill Jurnel of Medicine. (2007, July). Asbestos: mining exposure, health effects and policy implications. (K. Luus, Ed.) Retrieved June 7, 2016, from NCBI: https://www.ncbi.nlm.nih.gov/pmc/articles/PMC2323486/
[7] Mesothelioma Center. (2016, August 15). Types of Asbestos. Retrieved August 29, 2016, from Asbestos.com: https://www.asbestos.com/asbestos/types/
[8] Meurant, G. (1978). Asbestos and Disease. Retrieved July 7, 2016, from https://books.google.lk/books?id=ARKaW4uP9BgC&printsec=frontcover&source=gbs_ge_summary_r&cad=0#v=onepage&q&f=false
[9] Morinaga, K. (2003). Asbestos in Japan. Retrieved June 2, 206, from https://web.archive.org/web/20110719043338/http://www.hvbg.de/e/asbest/konfrep/konfrep/repbeitr/morinaga_en.pdf
[10] Costa, W., & A.L.M.Mauroof. (2005). Properties of Flat Clay Roof Tiles in Sri Lanka. Institution of Engineers Sri Lanka.
[11] Asbestos Standard For General Industry. (1995). Retrieved September 14, 2016, from United States Department of Labor: https://www.osha.gov/Publications/osha3095.html
[12] National Cancer Institute. (2009, May 1). Asbestos Exposure and Cancer Risk. Retrieved July 10, 2016, from National Cancer Institute: http://www.cancer.gov/about-cancer/causes-prevention/risk/substances/asbestos/asbestos-fact-sheet
[13] Cooper, Hart, Leggiero, & Whitehead, PLCC. (2001, May 6). Asbestos News. Retrieved July 14, 2016, from http://www.asbestos-attorney.com/pilot3-1.htm
[14] U.S. Department of Health and Human Services. (2005). Asbestos CAS No. 1332-21-4 . Retrieved May 30, 2016, from Asbestos New 2-13-09: https://web.archive.org/web/20110608211238/http://ntp.niehs.nih.gov/ntp/roc/eleventh/profiles/s016asbe.pdf
[15] E. Kovalevskiy, Institute of Occupational Health, Moscow, “Concept of Implement of the State Policy for the Elimination of Disaster Related Exposure to Asbestos”
[16] National Building Research Organisation. (2017, January 17). Study on Airborne Chrysotile Fiber in Roofing Industry in Sri Lanka.
224
Impacts Due To Proposed Ponds Rehabilitation Works In The Jaffna City Region
WBWMRPD Aluwihare1, WDBC Abeywickrama1, Lasanda Padmasiri2,
Nanthini Vasanthan3 and KN Bandara4
1 Scientist, National Building Research Organisation, Sri Lanka 2 Engineer, National Building Research Organisation, Sri Lanka
3 Senior Engineer, National Building Research Organisation, Sri Lanka 4Director, Geotechnical Engineering Division, National Building Research Organisation,
Sri Lanka
Abstract
Due to lack of maintenance over several decades, fresh water ponds in the Jaffna city region have been mostly abandoned. Continuous inflow of debris, unplanned land use practices and illegal encroachments of nearby lands to the ponds too, have spoiled the ponds. Since rainfall is the major source to groundwater and surface water bodies in the Jaffna peninsula, it is important to retain the rain water in the ponds as far as possible to meet the water requirements of the communities. Therefore, rehabilitation of the ponds is an urgent need in the area.
In addition to rainwater recharge, an interconnected cavity network in the underlying limestone of the area also contributes to recharge of the ponds. Therefore, it is important to study the hydrogeology and groundwater dynamics of the ponds and surrounding areas prior to rehabilitation commences. This paper describes the basic hydrogeology of the Jaffna city region, field & laboratory investigations conducted and recommendations for rehabilitation of the ponds in an environmentally friendly manner. Keywords: Jaffna fresh water Ponds, Karst structure, Rehabilitations
1. Introduction
The topography of Jaffna Municipal Council (JMC) area and immediate surrounds is almost flat and is prone to flooding in monsoons. The ground strata underneath constitute of limestone of different sedimentary deposits. The drainage system consists of number of ponds combined with a network of drainage channels. Some of the ponds are natural formations, being local depressions in the area, while
225

some of them are manmade for religious purposes, and for irrigation or domestic purposes.
Originally, Jaffna city region consists of considerable number of ponds, but with the urbanization process people have encroached upon the ponds areas and some have been filled completely with garbage and sediments. Further some of the existing ponds are also subjected to encroachment. Reportedly, the total pond area has shrunk by about 20% in the last 80 years.
During this research study, hydrogeology of the Jaffna peninsula was studied and method was proposed to rehabilitate the filled pond to improve to water storage within peninsula.
1.1 Hydrogeology of the area
While 90% of Sri Lanka basement is underlain by late Proterozoic high grade metamorphic rocks, northern part of the country including Jaffna peninsula is mainly composed of Miocene Sedimentary limestone. Miocene Limestone terrain is sedimentary rocks formed during the Miocene period with the formation of Cauvery Basin in between India and Sri Lanka. The history of which dates back to the Miocene period, when the entire island lay submerged. Hence some layers are richly fossiliferous. The limestone, said to be thicker than about 80 m, is underlain by a thick sandstone formation. Limestone is a grey yellow and white in colour, organogenic, porous (reef limestone), and is typically a compact, hard, partly crystalline rock.
Further it consists of calcium carbonate that is soluble in the rain water containing carbon dioxide. As the soluble parts disappear, the remaining parts form caverns, as shown in Fig. 1. After rain, infiltration happens into the thin, well-drained soil and moves down into those rock openings and then into the zone of saturation. The water generally occurs within secondary openings along bedding planes and fractured that have been enlarged by solution of the limestone.
Fig. 1.Block diagram showing the prominent solution cavities that are underlain by Jaffna peninsula
Water Course
226
1.2 Hydrological existence of ponds
The water storage in Jaffna Municipal Council is characterized by a set of manmade ponds, channels which interconnected those ponds, tunnels and dug wells. Rainfall is the major source for ponds in Jaffna peninsula. Beyond that water filled cavities described above are recharged the ponds within the peninsula.
However with the rapid development and lack of maintenance of ponds siltlayer has deposited above the cavities. That layer blocks the water path from cavities to ponds and this cause to minimize the capacity of ponds.
2. Background
It was realized that the recent observations have shown that the siltation and heavy pollution of surface water storages in ponds in Jaffna City Region have lead for several environmental and socio economic issues as well as they are against the aesthetic view of the region. Lack of maintenance over a several decades, continuous inflow of debris and soil subsequently settling over the basement of ponds as thick bed have led to deteriorate the freshwater ponds in the Jaffna city region. This has accelerated due to rapid and unplanned human settlement, bad land use practices and illegal encroachments of nearby lands of ponds.
This thick sediment deposits while reducing the capacity of the ponds, appeared to have blocked the groundwater circulation in to the ponds through the cavities in the limestone.
3. Scope of the study
The study targeted the addressing of prevailing issues in rehabilitation of total of 47 ponds by dredging of sedimentary beds deposited over ponds basements situated within the Jaffna City Region limits and its outskirts. In this regard, the following criteria were considered:
i. Estimation of the thickness, geotechnical and hydrological parameters of sediments in ponds before the commencement of dredging works.
ii. Seeking the possibilities in loss of water due to dredging of sediments.
4. Objective
The main objective of this project was to to determine the thickness of sediments deposited over the basement of ponds and to propose a method statement for dredging along with a proper sequence without harming the natural rechargeable and / or retention mechanism of pond water.
5. Methodology
5.1 Determination of thickness of silt layer
The thickness of the silt layer was determined by auger drilling at the most representative locations within each pond. As shown in figure 2 (a) floating barge was used as a platform to carry out the test for wet ponds. The lithology (presence of
227

sediment type & its thickness) of all the testing points were initially established by visual inspections of soil samples.
In addition, borehole was drilled at a suitable location near by each and every pond (outside) to study the hydro-geological existence in relation to the underground aquifers. Reduce levels of all auger points and water levels of each pond were taken as shown in Fig 2 (b) and converted to Mean Sea Level (MSL).
Fig. 2. (a) Augering using a floating barge; (b) Level surveying of ponds
5.2 Determination of the properties of silt layer
Particle size distribution tests were performed on soil sample collected at each and every pond. Accordingly, wet sieving and hydrometer analysis were used to classify the soil encountered at the site.
Further, one auger hole out of five was selected and used for the field permeability test to determine permeability of silt layer in each pond. In this regard, rising head test method was conducted. Variable head were measured at the various time intervals after commencement of test. Then graph of head ratio vs. time in minute were drawn in a semi log scale and permeability of soil was calculated using following equation.
𝑙𝑙𝑙𝑙 𝐻𝐻1𝐻𝐻2 =
𝑘𝑘𝑘𝑘𝐴𝐴
𝑥𝑥 (𝑇𝑇2 − 𝑇𝑇1)
Where, k – Permeability of soil F – Intake factor A – Cross sectional area of borehole casing H1 – Variable head measured at time t1 after commencement of test H2 – Variable head measured at time t2 after commencement of test
Representative curves for particle size distribution test for the soil tested at the
selected dry and wet ponds are presented in Fig. 3 and Fig. 4 respectively. The soil was classified according to the British Soil Classification System (BSCS).
(a) (b)
228
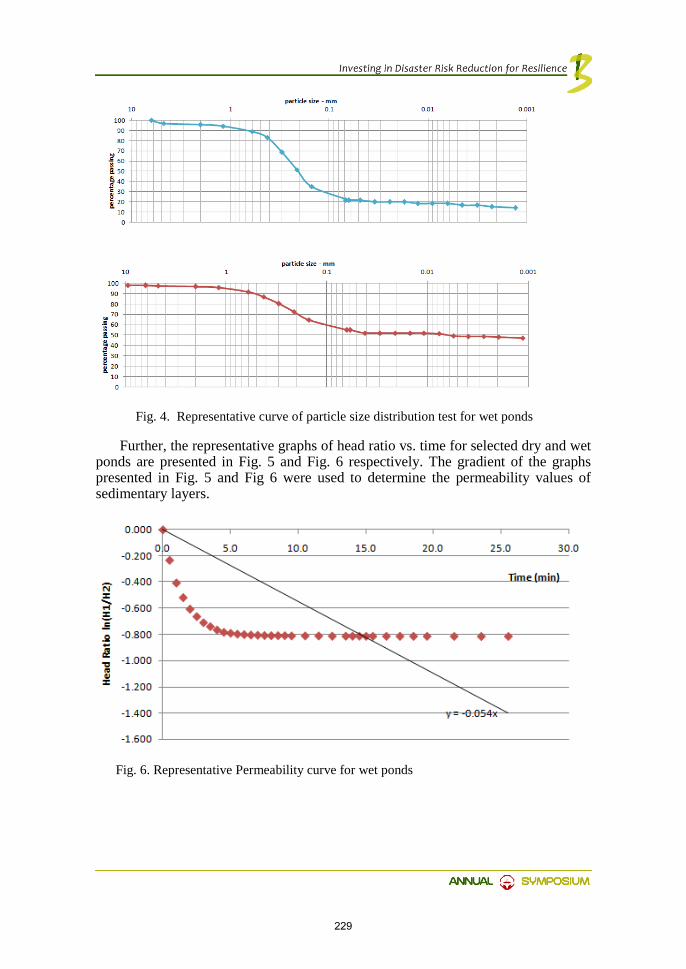
Further, the representative graphs of head ratio vs. time for selected dry and wet
ponds are presented in Fig. 5 and Fig. 6 respectively. The gradient of the graphs presented in Fig. 5 and Fig 6 were used to determine the permeability values of sedimentary layers.
Fig. 3. Representative curve of particle size distribution for dry pond
Fig. 4. Representative curve of particle size distribution test for wet ponds
Fig. 6. Representative Permeability curve for wet ponds
229
6. Impacts on Dredging of Sedimentary Beds Deposited over Ponds Basements
Results of the study as summarized in Table 1 have clearly shown that the hydrogeological connectivity of ponds with the underlying limestone aquifer may vary. Consequently, following interpretations were made.
Augur water Level (AWL) always represents the piezometric level of the particular silt layer, where the auger hole was terminated, which may be hydrogeologically connected with the limestone aquifer. Accordingly, when Pond Water Level and Auger Water Level are not in the same level, there is no hydro- geological conductivity of Pond water with Limestone aquifer.
Different water levels when recorded with Ponds and bore holes reveals that there is no hydro-geological connectivity of pond water with limestone aquifer. In this regard, Ground Water Level is isolated from Pond Water Level. Therefore, it can be concluded that due to the presence of silt layer, aquifer may have been sealed from the surface water of some of the ponds given in Table 1.
In case when the Ground Water Level (GWL) becomes equal to Pond Water Level (PWL), there is a hydrological connection with Limestone aquifers. However, in the case if they are at different levels, such connectivity does not exist. This may be due to the type and level of excavation of manmade ponds, which may not extend up to water bearing solution cavities. However, the literature on regional geological setting of Jaffna peninsula and local geological setting within the study area must be critically considered in order to finalize the dredging options stated above. In this regard, results of bore holes and prevailing geological settings clearly prove that all the ponds are directly resting over the solid limestone basement rock and hence basements of all the ponds can be assumed to be within limestone rock.
230

1 Sinna kulam 6.95E-07 Semipervious Clayey SAND 0.00 - 2.00 2.00 0.755 0.670 Pond 0.085 Dry2 Nedun kulam (At Moor Street) 3.63E-06 Semipervious Sandy SILT 0.50 - 1.85 1.35 0.107 0.785 BH 0.678 1.1003 Vannan kulam 9.17E-07 Semipervious Sandy CLAY 2.00- 3.70 1.70 1.415 1.120 Pond 0.295 Dry4 Uppu kulam 1.44E-06 Semipervious Sandy SILT 0.00 -2.00 2.00 -0.746 -0.670 BH 0.076 0.5605 Illanthai kulam 1.50E-06 Semipervious Sandy CLAY 0.00 -1.50 1.50 1.110 0.950 Pond 0.160 Dry6 Vannan kulam Silty GRAVEL 3.50 -3.70 0.20 1.875 0.900 Pond 0.975 Dry9 Marava kulam 4.45E-06 Semipervious Sandy SILT 0.00 -2.30 2.30 -1.278 -1.570 Pond 0.292 Dry
11 Moondu kulam 2.91E-06 Semipervious Sandy SILT 0.00-3.00 3.00 1.271 1.010 Pond 0.261 0.30050 Neernochchithalvu kulam 1.89E-06 Semipervious Sandy SILT 0.00 -2.00 2.00 0.691 0.820 BH 0.129 Dry12 Thevari kulam 3.90E-06 Semipervious Sandy CLAY 0.00 -1.80 1.80 2.444 2.113 Pond 0.331 0.50014 Kannathiody kulam 1.30E-05 Semipervious Sandy SILT 0.50 -1.00 0.50 -0.421 -0.780 Pond 0.359 2.20015 Kat kulam 8.09E-07 Semipervious Sandy SILT 0.00 -0.85 0.85 0.968 0.948 Pond 0.020 1.25016 Thamarai kulam 1.04E-05 Semipervious Sandy SILT 0.50 -1.00 0.50 3.899 4.673 BH 0.774 1.60017 Vannan kulam 2.61E-06 Semipervious Sandy SILT 0.00 -1.35 1.35 5.602 5.960 BH 0.358 1.25018 Rajali kulam 2.62E-07 Semipervious Silty SAND 1.50 -1.70 0.20 0.554 0.528 Pond 0.026 1.60019 Nachchimar kovil kulam 9.41E-07 Semipervious Sandy CLAY 0.00 -1.50 1.50 -1.987 -2.090 Pond 0.103 1.40020 Anjuthan kulam 4.68E-07 Semipervious Sandy SILT 1.00 -3.00 2.00 -2.117 -2.138 Pond 0.021 Dry22 Ariya kulam 3.80E-06 Semipervious Sandy CLAY 0.50 -2.00 1.50 -0.465 -0.990 Pond 0.525 1.30023 Piaramanakattu kulam 3.82E-06 Semipervious Sandy SILT 0.45-4.00 3.55 -1.308 -1.340 Pond 0.032 0.20024 Pillaiyarkovil kulam 4.23E-06 Semipervious Sandy SILT 2.00 -4.00 2.00 2.822 2.122 Pond 0.700 0.40025 Pandara kulam 4.53E-06 Semipervious Sandy SILT 0.00-2.00 2.00 2.045 1.890 Pond 0.155 0.25026 Nayanmarkaddu kulam 9.77E-08 Semipervious Sandy SILT 1.50 -2.30 0.80 -0.550 -0.770 Pond 0.220 -0.19827 Pirappan kulam 1.11E-06 Semipervious CLAY 0.00 -1.80 1.80 -0.902 -0.010 BH 0.892 Dry28 Pura kulam 1.80E-07 Semipervious Sandy SILT 0.00 -1.80 1.80 2.275 1.766 Pond 0.509 0.35031 Makkiya kulam 2.48E-06 Semipervious Gravely SILT 0.00 -0.75 0.75 3.532 3.450 Pond 0.082 Dry32 Nariyankundu kulam 6.18E-06 Semipervious Sandy SILT 0.00 -1.20 1.20 Dry 2.010 BH 2.010 Dry33 Mudali kulam 2.95E-06 Semipervious Silty SAND 0.00 -1.50 1.50 -2.273 -2.290 Pond 0.017 0.80034 Vannan kulam (At Grand Bazzar) 1.79E-06 Semipervious Organic CLAY 0.50 -2.50 2.00 6.205 6.016 Pond 0.189 1.00035 Vatta kulam 1.79E-06 Semipervious Sandy SILT 1.50 -2.00 0.50 -2.558 -3.304 Pond 0.746 -0.07736 Pullu kulam 8.11E-07 Semipervious Sandy CLAY 0.00 -1.90 1.90 1.809 1.574 Pond 0.235 0.65037 Paal kulam 2.26E-06 Semipervious Sandy CLAY 0.00 -3.50 3.50 -0.747 -0.840 Pond 0.093 -0.27238 Nadun kulam (At Ariyalai) 3.04E-06 Semipervious Clayey SAND 0.50 -2.00 1.50 1.376 1.130 Pond 0.246 -0.16430 Veeramakal ikulam 7.82E-06 Semipervious Sandy SILT 0.00 -0.80 0.80 0.751 -0.520 Pond 1.271 Dry40 Kombayak kulam 2.70E-06 Semipervious Silty SAND 0.00 -2.00 2.00 3.184 3.066 Pond 0.118 0.02541 Kallu kulam 4.25E-06. Semipervious Sandy SILT 1.50 -1.80 0.30 1.227 1.252 BH 0.025 1.50042 Sinnapalli sinna kulam 3.60E-06 Semipervious Silty SAND 0.00 -0.65 0.65 -3.582 -4.670 Pond 1.088 1.85043 Sinnapalli periya kulam 2.97E-06 Semipervious Silty SAND 0.00-1.00 1.00 -2.951 -2.861 BH 0.090 1.15044 Thurumpan kulam 3.70E-06 Semipervious Silty SAND 0.00 -2.00 2.00 0.451 -1.046 Pond 1.497 0.04239 Pasaiyoor kulam 5.94E-07 Semipervious Sandy SILT 0.00 -1.10 1.10 -0.872 -0.660 BH 0.212 Dry46 Neeraviyadi kulam 8.09E-07 Semipervious Sandy SILT 0.00 -1.25 1.25 3.983 3.881 Pond 0.102 -0.30047 Yamnaa eni 9.00E-06 Semipervious Organic SILT 0.00 -1.70 1.70 1.436 1.614 BH 0.178 4.00048 Cheddiyorthodda kulam 1.00E-06 Semipervious Sandy SILT 2.00 -3.50 1.50 3.319 3.160 Pond 0.159 -0.23545 Paanan kulam 1.96E-06 Semipervious Sandy SILT 0.00 -2.00 2.00 -0.173 -0.776 Pond 0.603 -0.04060 Nanthavil kulam 9.82E-06 Semipervious Sandy CLAY 0.00 -1.50 1.50 0.272 -0.168 Pond 0.440 1.56062 Vannan kulam(Oddumadum) 1.39E-05 Semipervious Sandy SILT 0.00 -2.00 2.00 2.068 2.848 BH 0.780 1.30058 Poothavarayan kulam 1.24E-05 Semipervious Sandy SILT 0.00 -1.50 1.50 1.049 0.994 Pond 0.055 0.80063 Vilathi kulam 5.76E-06 Semipervious Sandy SILT 0.00 -3.50 3.50 0.192 0.705 BH 0.513 -0.160
Pond ID
Water heightin pond
Pond Name Soil Type Depth range ThicknessRecorded
higher Water level at Level
Difference
Permeability Pond Water
MSL
Borehole
Table 1. Details of Ponds
231

During the rainy period, all the ponds have been serving as water retention ponds, which have also been controlling the flooding in Jaffna with their cascade arrangement. During the drought, the ponds may be recharged from the limestone aquifers, with the high water yielding capacity of limestone aquifers since the porosity of limestone is over 50%.
Lack of maintenance over a period several decades, continuous transportation of debris which also includes eroded soil directly depositing over the basement of the ponds has lead for formation of a thick silt layer over the basements of ponds. This could have been accelerated due to rapid and unplanned human settlement, land use practices and illegal encroachments of nearby lands of ponds. This thick semi pervious to pervious sediment layer would have been totally interrupted the mechanism of water retention during rains and water recharging from limestone aquifers during droughts blocking the hydro-geological conductivity to maintain the equilibrium of water environment.
The sedimentary layers found within the ponds basement are limited to each and every ponds and they do not represent the historical evidence of depositional environment of entire Jaffna region. During the rainy sessions, sediments are transported to the ponds along connecting canals of ponds as well as direct surface run-off. Accordingly, the lateral and vertical stratigraphy of sediments are variable with the position of canals and other flow paths in association with each and every pond. Therefore, considering the geological setting, mechanism and physical existence of ponds sediments, complete removal of all the sedimentary layers (silt beds) can be done through a safe dredging procedure. In this regard, considering the results of geotechnical investigation, laboratory testing and analysis, calculations etc. complete dredging can be recommended for each and every pond. Because of the semi pervious nature silt layers, they do not act as a hard pan in holding water or act as a impervious filter against pollution.
In this regard, a proper dredging sequence has to be followed based on the lateral and vertical variations of pond sediments. A suitable dredging sequence has to be established under the guidance of an experienced and qualified professional on lake dredging works.
Considering the degree of sensitivity of the ponds environment, manual dredging is highly recommended since utilization of heavy dredging equipment may damage the subsurface cavity system creating large openings leading for unexpected incidences to be incurred with massive water ingress from limestone aquifer and possible ground water pollution through large openings due to such over excavation in vice versa.
Dredging must always be done in association with a community group who has to be at the site on full time basis liaising with people, monitoring environmental implications, pollutions etc. while the dredging is in progress. This may help to avoid creating unnecessary unrest among the public concerned.
Dredging works shall be commenced from a pond situated at a less populated area without dewatering and all the dredging works must be undertaken under the full time supervision of a geotechnical expert. Exact dredging depth and sequence have to be decided by a geotechnical expert and lake dredging expert based on the actual subsurface geological condition encountered during the dredging works since the present study was conducted with the use of Four to Five numbers of auger holes per
232
pond, which is not adequate enough for this kind of decision. The results of this proposed work could be utilized for the rest of pond rehabilitation works.
A separate project shall be established in order to avoid possible ground water contamination due to unplanned human activities such as garbage dumping, diverting sewerage canals into ponds, encroaching and blocking buffers of ponds and canals.
References [1] Monroe James S. and Wilcander Reed., The Changing Earth. (2009). Fifth Edition.
339-342 [2] Cooray, P.G., (1984). “An Introduction to the Geology of Sri Lanka (Ceylon)”. 2nd
Edition, National Museums of Sri Lanka Publication, Colombo, 126-130,192-194 [3] Panabokke, C.R. and Perera, A.P.G.R.L. (2005). Groundwater resources of Sri Lanka. …..Water Resources Board, Colombo, Sri Lanka. [4] Senarath, D.C.H. (1990). Two case studies in estimation of groundwater recharge. ….Groundwater.monitoring and management. In: Proceedings of the Dresden ….symposium, March, 1987. IAHS …...publication, no. 173, 1990. [5] W.D. Joshua, M. Thushyanthy and N. Nanthagoban., (2012) Seasonal variation of water ….table and.groundwater quality of the karst aquifer of the Jaffna Peninsula-Sri Lanka. ….Journal of the National Science.Foundation of Sri Lanka
233

COMMUNITY PREPAREDNESS FOR RESPONSE

A Review on Donor Driven Housing Constructions in Post Disaster Reconstruction Projects – A Case Study on
Kegalle Resettlement Programme, Sri Lanka PA Vijekumara1
1Scientist, National Building Research Organisation, Sri Lanka
Abstract
Destruction to the countries’ housing stock is one of the most visible and striking effects of any major disaster. The famous strategy to recover the affected houses is resettlement of victims in a new settlement. The major challenges of this strategy is how the resettlement activities should be carried out within the given short period. To rebuild the nation after a disaster, Government adopts different reconstruction strategies. Different reconstruction strategies give different outcomes. Identifying the most suited and applicable strategy for each situation is of utmost importance in order to provide better assistance to the victims and to reduce future vulnerabilities, to improve long-term sustainability and environmental degradation. “Donor Driven” approach is the quickest way to rebuild the houses after a disaster. The major issue of using such approach is that, reconstruction agencies have failed to achieve its effectiveness and created housing that does not respond to the needs of the victims.
However, National Building Research Organisation (NBRO) implemented this approach in a way to reach its effectiveness and achieved the successfulness in resettlement of disaster victims after the 2016 landslide disaster in Kegalle, Sri Lanka. This paper discusses the approach used in the process and presents the effectiveness of the process assessed through a questionnaire survey.
Keywords: Donor Driven Housing; Disaster Reconstruction; Resettlement; Housing
1. Introduction
One of the major challenges after a disaster is how the reconstruction activitiesshould be undertaken. There are two distinct concepts used for disaster housing reconstruction namely, the “Donor Driven” and “Owner Driven” approaches. Both of these approaches were used in Kegalle district resettlement programme which was implemented after the 2016 landslide disaster. The 2016 tragedy in the Kegalle
234
district of Sri Lanka, has affected 36121 peoples from 9983 families and has caused 158 fully damages and 1631 partially damages to the district housing stock. The situation resulted in displacement of nearly 2000 families, who have been evacuated to safer locations due to prevailing high landslide risk. These displaced and at-risk families were resettled as per the Government of Sri Lanka (GOSL) decision to treat the prevailing risk and give a permanent shelter option to the displaced families. Donor Driven housing construction is a one out of two approaches used in resettling those affected houses.
This paper analysis the interventions of National Building Research Organisation in the creation of effective donor driven housing construction approach and outcomes of those interventions are discussed.
2. Methodology
First a comprehensive literature review has been carried out on disaster reconstruction. Wasanthagama resettlement village of Aranayaka, Kegalle district of Sri Lanka, has been selected as the case study for this study. A detailed questionnaire survey was carried out on reconstruction activities in order to identify the effectiveness of the process adopted.
3. Literature
Donor-Driven Reconstruction also is referred to as contractor-driven reconstruction. In this model, homeowners are minimally involved in design or construction, if at all. Houses are designed by the donor or its consultant and built by a contractor hired by the donor (USAID, 2012). As literature stated, Donor Driven approach were widely implemented in disaster resettlement of Sri Lanka, after the great Tsunami hit on December 26, 2004. However, previous studies have shown several disadvantages of “Donor Driven” approach in resettlement projects. After the Tsunami disaster, government of Sri Lanka started the rebuilding of affected building with the support of non-governmental organizations. According to Keraminiyage K, (2008), there were two types of resettlement/reconstructions programmes in tsunami reconstruction process in Sri Lanka. They are; Home Owner-driven housing reconstruction (In-Situ) and Donor-driven housing reconstruction (Relocation). As stated by Ismail, D (2014), community participation, poorly funded reconstruction, preliminary assessment, lack of coordination, corruption and absence of Build back better/safer, policies, quality of works, land issues, cost overruns and a shortage of technical staff are some of the the main factors affecting to the failure of disaster resettlement/reconstructions where donor driven approach were mainly used.
As explained by Keraminiyage K, (2008) donors were unable to complete the number of units pledged due to challenges of the construction industry, complexity of work, high inflation, raw material and labour rates etc. The absence of a technical quality control system in the donor driven housing programmes was another major issue. It resulted in inferior quality houses being built and funded by donors. Some of those houses were demolished and reconstructed, wasting both time and money.
According to a study conducted by Sadiqi "Wardak" (2012) in Tsunami relocating site in Trincomalee, it has been identified that the construction work at this site encountered two major problems: 1) the site was perceived to be ready for new
235

construction, but in reality it required major pre-construction preparation work, and 2) there were six different international non-governmental organisations (NGOs) involved in construction programmes, each adopting diverse approaches, varying house designs and different time frames. However, this initiative led to great community anxiety and delays in construction implementation due to lack of community participation. Both the new site and the design of the houses to be placed upon it did not meet the socio-economic and cultural needs of the affected community. Therefore, at the time this research is being conducted these houses still remained unoccupied and the beneficiaries had no desire to return to live in them. Sadiqi further reveals that, in another Donor Driven case in Sri Lanka, many construction plans included indoor toilets and kitchens, both of which were considered unhygienic and culturally inappropriate, and thus, in many cases indoor kitchens were transformed into storage facilities. Moreover, cultural traditions and norms related to the most acceptable placement of fundamental housing elements such as walls, doors and windows have been ignored.
According to a study conducted by Vithanagama, R. et al. (2015) in Kananke Watta Tsunami resettlement, in Matara District, Sri Lanka, it has been identified that all of the relocated families were unhappy with the low quality of their new houses, which they blamed on shoddy workmanship and sub-optimal material used by the contractors who built the houses. The lack of communication between the displaced families, the government, and the IFRC was identified as a primary cause of the inferior quality of housing in Kananke Watta.
Apart from the local studies, there are studies conducted on use of Donor Driven approach in globally also. In Gujarat India, following 2001 earthquake, Barenstein J., 2006 founds that contractor based approach was infamous, where only 22.8 percent of the beneficiaries were satisfied. A small scale community participation in Duzne, Turkey after 1999 earthquake also shows its advantages compared to the majority of non-community based approach (Arslan, H, Unlu, A., 2006). In comparison with donor-driven resourcing, the owner-driven/community-driven approach is empowering and participatory, and thus was popular in post-tsunami reconstruction in Indonesia among NGOs, such as the United Nations High Commissioner for Refugees (UNHCR) (2006), the United Nations Children’s Fund (UNICEF) (Jaspars et al., 2007), and World Vision (Bailey et al., 2008), which consider community redevelopment and participation as being among their main objectives.
As a summery to the above discussion, scholarly works on Donor Driven disaster reconstruction/resettlement programmes in Sri Lanka and globally shows several flaws. It can be summarized following factors are as main issues of the donor driven approach.
Table 1. Issues of the donor driven approach
No. Author Issues of the donor driven approach
01 Ismail, D (2014) Lack of community participation Poorly funded reconstruction Lack of preliminary assessment lack of coordination Corruption in the process Lack of proper policies
236

No. Author Issues of the donor driven approach
Poor quality of works Cost overruns and a shortage of technical staff
02 Keraminiyage K, (2008)
Complexity of work Lack of system to control the high raw material and labor supply Absence of a technical quality control system
03 Sadiqi "Wardak" (2012)
lack of community participation Ignorance of socio-economic and cultural needs of the affected community
Vithanagama, R et al. (2015)
low quality of their new houses Lack of communication between the displaced families and government
In comparison of owner driven approach over the donor driven approach, many
scholars have emphasized that owner driven approach has many advantages in post disaster housing reconstruction. However, owner driven approach also has several drawbacks where donor driven approach could be addressed.
Homeowner-driven reconstruction may: i. Take longer. When the homeowner is driving the process, it is difficult to control
the pace of the reconstruction. This may be due to lack of capacity among the family members.
ii. Result in some unfinished houses. If the financial subsidy and homeowner’s funds are not sufficient to complete the house, the homeowner may not finish it during the grant period.
iii. Result in some houses that are not disaster-resistant. If the financial subsidy and the homeowner’s funds are not sufficient to complete the house in a manner which is disaster-resistant, the homeowner and builder may not produce a disaster-resistant house. In addition, corruption or lack of will may reduce construction quality. (USAID, 2012)
And thus, the Donor Driven approach cannot be simply evaded in the disaster reconstruction process, where multiple options are needed due to its complex nature. The decision on which approached to be used, should be decided upon the results of socioeconomic and need-capacity assessments. Considering all the above findings, it was designed to adopt following mechanism which has addressed most of the issues in donor driven disaster reconstruction approach.
4. The New Mechanism for Donor Driven Approach
“Samasara Kanda” settlement in Aranayaka divisional secretariat division, is the major affected settlement in the Kegalle district with 2016 tragedy. 56 families of the settlement were directly affected. Their houses and one or more family members were buried by the landslides. Most of these families became female headed or single parent families after landslide. With this prevailing conditions, government decided to resettle and reconstruct their houses through the donor driven housing construction
237

approach. NBRO as the main technical assistant of the programme, mechanism and guidelines were developed to be followed by the donors in reconstruction process.
Once the donors were identified, donors were made aware on programme concepts and objectives. The Kegalle resettlement programme was designed to meet the concepts of “Construction of Core House”, “Resilient construction” and “Build Back Better”. Therefore, donors were asked to accompany with above programme concepts. Subsequently, set of guidelines were issued to be followed such as required minimum features of a house plan, house plan approval, material selection and construction quality assurance and etc. According to the programme guidelines, donors can build houses with NBRO house plans. If a donor wish to build the houses with their own plans, it was compulsory to obtain the NBRO approval before the proceeding the construction. In the NBRO approval, minimum core house features and resilient features were checked. When the donor plans were not up to the programme standards, donor was asked to incorporate minimum features to its house design in order to issue the approval.
All the main construction materials (Sand, Cement, Cement Blocks, Steel, Timber, Roofing Sheet and Paints) were tested in NBRO laboratories in order to ensure its quality. Construction of houses were supervised periodically by the NBRO and beneficiaries were allowed to be part of the construction process. Several housing options (house plans) were given to beneficiaries in order to select best suited design for their household. All plans were flexible for minor changes as per the beneficiaries’ requirements. Donors were asked to make minor alteration as requested by the beneficiaries.
5. Evaluation of the Approach
A questionnaire survey was performed in the Wasanthagama resettlement where 56 families have been resettled. This paper analyses only the physical aspect of the house construction which the donor driven approached has constantly failed to achieve. To evaluate the dwellers’ views to gain an overall satisfied output, the dwellers’ views were gained on their permanent residences while covering the twelve most salient factors and conditions generally associated with housing programmes.
1) Plot size of the land 2) Lighting and ventilation 3) Quality of the building materials 4) Quality of workmanship 5) Orientation of the house 6) Level of privacy 7) Ease of cleaning / maintenance 8) Availability of space for livelihood 9) Provision for alterations/ expansion 10) Sanitary facilities 11) Aesthetics 12) Overall house design and facilities provided
The quantitative data was collected and data was entered and analyzed using
version 22 of Statistical Package of Social Sciences (SPSS).
238

Table 2. Satisfaction of the Dwellers Factors Satisfied Dissatisfied Plot size of the land 53% 47% Lighting and ventilation 65% 35% Quality of the building materials 73% 27% Quality of workmanship 68% 32% Orientation of the house 100% 0% Level of privacy 93% 7% Ease of cleaning / maintenance 93% 7% Availability of space for livelihood 53% 47% Provision for alterations/ expansion 47% 53% Sanitary facilities 87% 13% Aesthetics 80% 20% Overall house design and facilities provided 100% 0%
According to the survey analysis, a majority of respondents are of the opinion that they are satisfied with the plot size of the land allocated (53%). However, a substantial percentage of the respondents (47%) are dissatisfied with the plot size of their lands. Each relocated family were given a ten (10) perch land with a house of 650 Sq. ft. Majority of these families engaged in agricultural activities as their way of livelihood. Now, with 10 perch land they have lost their way of income generation. Therefore, when inquired about the satisfaction regarding availability of space for livelihood in the settlement 47% expressed their dissatisfaction. Although, the new settlement provided minimum space for livelihood activities, all respondents (100%) are satisfied with the location of the new settlement in terms of accessibility to livelihood options and workplace.
With regard to the satisfaction of the new housing units, majority of the respondents (65%) were satisfied with lighting and ventilation of the house. 73% of the beneficiaries were satisfied with the materials used in building while 68% respondents were satisfied with workmanships of the new housing units. With respect to the orientation and privacy of the new housing units, majority of respondents (100% and 93% respectively) were satisfied.
It should also be pointed out that the majority (93%) of the respondents were satisfied with the Ease of cleaning / maintenance of the new housing units. On the other hand, 87% of respondents were satisfied with the sanitary facilities in the new housing setting. And again, majority (80%) of the respondents are happy with aesthetics appearance of the given house.
It is important to mention here is that all the respondents (100%) are satisfied with overall house design and facilities provided within the new settlement.
6. Conclusion
Several catastrophic natural disasters occurred in Sri Lanka in past decades have caused extensive damages to many human settlements. Donor driven approach is one out of main two approaches used to reconstruct the houses after a disaster in local and global context. As literature stated, donor driven approach has several draw backs when compared to other approaches and has recorded minimum successfulness.
However, NBRO has taken a new approach to implement the donor driven approach after the catastrophic disaster in Kegalle district, Sri Lanka in 2016. This
239

paper tried to review the approach used in resettlement programme and drive a better conclusion on use of donor driven approach in a new and more appropriate way.
According to the analysis of survey results, the new approach has been able to minimize most of the issues identified in literature in the use of donor driven approach. Mainly, NBRO could achieve the success in donor driven approach through;
i. Preliminary assessment of the given situation and plan the process by addressing the past issues.
ii. Development of reconstruction policies and guidelines at the early stage of the process and mainstream those at the right time in the right place.
iii. Establishment of essential mechanisms such as;
a) Stakeholder coordination/communication mechanism b) Mechanism for implementation of policies and guidelines c) Mechanism for community participation in the reconstruction
process d) Mechanism for construction monitoring and quality control
References
[1] Barenstein, J.D., (2006). Housing Reconstruction in Post-Earthquake Gujarat: AComparative Analysis. Overseas Development Institute (ODI). Humanitarian practice network (HPN).
[2] Keraminiyage, K. P., Amaratunga, R. D. G., Haigh, R. P. (2008, February 11-15). Post tsunami recovery capacity gaps in Sri Lanka. CIB W89 International Conference on Building Education and Research (BEAR), Kandalama, Sri Lanka.
[3] Ratnayake, R. M. G. D., Rameezdeen, R. (2008, February 11-15). A comparative study of donor driven vs. owner driven post disaster housing reconstruction. Proceedings of the CIB International Conference on Building Education and Research, Kandalama, Sri Lanka.
[4] Sadiqi "Wardak", Zabihullah, Coffey, Vaughan, & Trigunarsyah, Bambang (2012) Rebuilding housing after a disaster : factors for failure. In Yamada, Fumihiko & Kakimoto, Ryuji (Eds.) Proceedings of 8th Annual International Conference of the International Institute for Infrastructure, Renewal and Reconstruction (IIIRR), Kumamoto University, Kumamoto, Japan, pp. 292-300.
[5] Vithanagama, R., Mohideen, A., Jayatilaka, D., Lakshman, R. (2015). Planned Relocations in the Context of Natural Disasters: The Case of Sri Lanka. Centre for Migration Research and Development Colombo, Sri Lanka.
[6] U.S. Agency for International Development, (2012). Building Back Housing in Post-Disaster Situations – Basic Engineering Principles for Development Professionals. Washington, DC 20523
240
Determination of the Impact of Anthropogenic Influence on Water Resource Health of Pinga Oya Watershed
SV Dias1, SAMS Dissanayake2, HTJ Seneviratne3, KMSK Rajapaksha3, VDW Sumanasekara3
1 Director, Environmental Studies & Services Division, National Building Research Organisation, Sri Lanka
2 Senior Scientist, National Building Research Organisation, Sri Lanka 3 Scientist, National Building Research Organisation, Sri Lanka
Abstract
Anthropogenic activities poses a substantial influence on the healthiness of water resources in almost all river basins in Sri Lanka. Pinga Oya watershed, a hydrologically significant watershed in the Upper Mahaweli Catchment Area is currently under a rapid decline of its water resources due to a range of largely unregulated anthropogenic activities.
Studying the extent of anthropogenic influence on ecosystem processes in a watershed is important for wise management of water resources. Metaphorical analysis approach was used to conceptualize and analyse an array of qualitative data to estimate anthropogenic influences on water resources impairment, considering the fact that their influences to change the flux dynamics of constituents in watershed ecosystem (land and water) change the stream water quality. Metaphorical analysis derived 20 attributes under four categories representing anthropogenic influences interfering with watersheds ecosystem processes. Expert judgment was used to assign scores and to rank 20 influencing attributes, healthy and stress full respectively. Final scores were then computed under four anthropogenic influences categories using entropy analysis method. The entropy method mathematically estimate quotient of anthropogenic influence on constituent fluxes. The resulting water resource impairment in stream segments was determined by response indicators, water quality and biological integrity represented by individual water quality indicator parameters and two indices, namely, CCME Water Quality Index and ecological indicator (aquatic macro invertebrates as a surrogate taxa). Respective scores of anthropogenic influences were then compared with water resource health response indicators for each stream segment.
Results showed that all stream segments and associated watersheds are under anthropogenic stress with impairment of water resources. Healthy resiliences to protect water resources were very much limited and confined to few conventional
241

means. Notably high stressor and water resource impairment scores were obtained for Kurugoda Oya downstream, main stream section of Pinga Oya (downstream) and the responsible anthropogenic influences were unplanned urban centers and settlements with largely unregulated waste management. Relatively low stressor and water resource impairment scores were obtained in Hunan Oya stream segment, but the corresponding watershed showed notable land degradation. The analysis further showed that water resources in all stream segments are threatened by a diversity of anthropogenic stressor influences with widespread land degradation. Unplanned urban settlements are pollution hot spots for predominant downstream water resources impairment while loss of natural habitats and land and stream bank erosion are common in entire watershed. The approach and the outcome of the study portrays strength of watershed metaphor approach in assessing anthropogenic influences and the water resources impairment responses. As the approach accounts both negative and positive human influences the watershed metaphor model merits it performance as a decision tool in watershed restoration and safeguarding impaired water resources. Key words: Watershed Metaphor Model; CCME Water Quality index; Entropy Analysis Method
1. Introduction
Anthropogenic activities significantly influence surface water quality and aquatic ecosystems of watersheds globally, as the quality of receiving water is constantly affected by human activities within watersheds through point sources and non-point sources alike. Since streams and river water in watersheds have multiple uses such as domestic, industrial, and irrigation purposes with acceptable quality , it is vital to control and regulate healthiness of these resources (Wang, 2001; Xiao-long et al., 2007).
Mahaweli River drains the largest volume of water amounting to one seventh of Sri Lanka’s total runoff and its catchment occupies approximately 15 percent of the islands’ land surface (Hewawasam, 2010). It’s uppermost part, the Upper Mahaweli Catchment (UMC) is utmost significant for sustainable water resources in the country as it act as a combined watershed for more than 1,000 feeder streams which radially distribute water to rest of the island. A series of multipurpose reservoirs for hydropower generation, drinking water, ecosystem conservation, and much needed agricultural water for the dry zone are accomplished by water drained from UMC (Herath et al, 2004; Breuste & Dissanayake, 2013). Protection of highest level of naturalness although was a priority consideration in National Physical Plan (National Physical Planning Department, 2017), this fragile watershed is under heavy degradation due to numerous anthropogenic influences over decades. The natural landscapes (forest cover) which once protected vulnerable slopes have now disappeared with transformation in to a wide range of land uses from degraded lands, monoculture plantation, short-term agricultural crops and human settlements with low resilience infrastructure, unplanned urban centers with poor resilience features. These transformed landscapes have frequently encroached steep slopes, ecologically fragile stream riparian buffers and etc.
The state of degradation has made the natural state of water resources in this watershed at risk of serious impairment threatening its long-term sustainability and
242

suitability failing to support many stringent water uses. (Herath et al., 2004; Breuste & Dissanayake, 2013). Despite, systematic studies to evaluate extent of anthropogenic influence on water resources’ health and response of water resource healthiness lacks greatly in many watersheds of country including UMC area, and Pinga Oya is no exception.
1.1. Indicators to determine water resources health and anthropogenic stressors
The indicators to monitor human influences and healthiness of water resources are numerous. They are supposed to reflect anthropogenic influences (the degree of stress imposed on water resources) and the ecosystem healthiness (resilience) in order to define the environmental status quo. (Pasquaud et al., 2013) and to reflect healthiness of water resources.
1.1.1. Indicators of anthropogenic influences and methods of analysis
Due to the complex nature of anthropogenic influences on ecosystem resilience in watersheds, indicators assessing the anthropogenic influences are largely semi quantitative. Methodologies such as Delphi Method, Leopold Metrix Method, etc. warrant greater freedom for expert judgment to assign scores depending on the degree of interference, both negative and positive which is placed on the natural ecosystem processes (Helmer et al, 1975). As such Watershed Metaphor Model, a conceptual model, developed based on Metaphorical analysis (Moser, 2000) by Dias et al, 2016 which assesses system resilience with respect to flux of constituents in various phases of ecosystem under diverse anthropogenic influences was found effective in analyzing anthropogenic influences, and the resultants stream water healthiness responses. In this method, the anthropogenic influences on fluxes of material constituents and associated water resources healthiness are assessed considering both natural and anthropogenic mechanisms on material constituent’s fluxes under four categories (Fig.1).
Fig. 1. Four categories of anthropogenic influences in Watershed metaphor model (Dias et al, 2016)
Artificial Resiliences: Anthropogenic resilience features with high flux assimilation capacity (wastewater treatment plants, storage systems)
Anthropogenic flux stressor influence: Processes that change flux dynamics, by introducing new fluxes or increasing or decreasing existing fluxes in ecosystem with special reference to stream water eg: Human waste, solid waste, industrial wastewater etc.
Anthropogenic spatial stressor influence: stress due to spatially built features by occupying 3D-space, surface, and ground and above ground on land, riparian areas and in water, and stress imposed on flux dynamics due to spatial interference: houses, roads, agriculture, storm water drains, tunnels, dams and reservoirs and etc.
Natural Resiliences: Existing natural ecosystem features, natural fluxes, high resilience system with high self-assimilation capacity for constituent fluxes (natural land: forests, riparian: stream vegetation and stream: stream water).
INFLUENCES
243

As most of the environmental issues are real world problems, allowing expert judgement in weighting method is well-meaning, however since obtaining reliable unbiased weights are difficult using only these types of methods, objective analysis methods which uses mathematical models to determine scores on relative importance among the weighted attributes prioritize the quotient of attributes of the given influence. One such method is Entropy Analysis Method, introduced by C. E. Shannon, and is applied in various scientific fields such as environment science, engineering, technology, social sciences and economics (Lotfi and Fallahnejad, 2010: Su et al, 2017).
1.1.2. Water resources healthiness indicators
Water quality indicators The healthiness of water resources can be interpreted by individual water quality
indicators, a group of indicators, or by integrating them in to a logically defined water quality index (WQI). WQI is one of the most effective ways to describe the quality of water and has capability to integrate several water quality parameters into one single quantifiable value that can be easily communicated to a wide range of water sector stakeholders. (CCME, 1999). Further, the index can be used as an overall indicator of streams pollution assimilation status and the degree of stream healthiness to support aquatic life and water uses. Biological integrity indicators
Diversity and distribution of aquatic species (biological integrity) in surface waters depend on a range of physical and chemical factors and in-stream and riparian habitats. They are important to understand actual impact status and habitat degradation that is not fully captured by periodical measurement of water quality. A certain aquatic species recognized as biological indicators have been found sensitive enough to respond to anthropogenic stressors and distinguish it from natural dynamics of water quality (Pasquaud et al. 2013; Wang, 2001). Aquatic macro invertebrate assemblages are one of such biological indicators which are commonly used as a surrogate taxa to assess the biological integrity of aquatic ecosystems. Their ability to be responsive and display varied tolerance levels to local dynamics in physical habitats and water chemistry have made them a reliable diagnostic tool in determining the overall health of water resources worldwide (Petty & Freund, 2007). Stream Invertebrate Grade Number Average Level (SIGNAL) is a widely used biotic index developed to generate indicative scores aquatic biological integrity.
1.2. Objective
This paper analyses how complexly articulated anthropogenic processes interfere with ecosystem fluxes in Pinga Oya, and the response of water resource healthiness in terms of water quality and biological integrity.
244

2. Methodology
2.1. Delineation of Pinga Oya watershed and selection of stream segments for analysis
The study area of this research is Pinga Oya watershed in the Polgolla watershed with a land area of 114 Sq. km. Average annual rainfall of the study site is 1929 mm while Pinga Oya discharges approximately 0.53 m3/s volume of water to the Mahaweli River. Pinga Oya is comprised of three hydrologically connected stream segments namely, Owissa Oya, Hunan Oya and Kurugoda Oya. Owissa Oya stream segment represents upper main stream stem and Kurugoda Oya and Hunan Oya join the main stream stem at close quarters in the downstream area of the Pinga Oya (Fig. 2). Fig. 2 Pinga Oya watershed: Note a)land degradation and settlement distribution in entire watershed following the dentric drainage network, in low elevations on fragile stream riparian land parcels b)Dense human settlements and urban land parcels in Akurana,
245

Ankumbura, Ambetenna and Katugasstota area c)Green vegetation in higher elevations (Source: Google Earth [12.10.2017])
2.2. Analysis of water resources health of Pinga Oya watershed
In order to capture both real-time and long term impairment impacts of water resources health, water quality and macro invertebrate indicators of aquatic ecological health were monitored.
2.2.1. Monitoring water quality
Water samples were collected from 10 locations, Owissa Oya (upper most part of the main stream stem), Hunan Oya, Kurugoda Oya and the lower most part of the main stream stem of the Pinga Oya from January, 2017 to June, 2017 on monthly basis (Fig. 3) and analyzed for 12 major water quality indicator parameters (pH, Electrical Conductivity, Turbidity, Total Suspended Solids, Ammonia, Nitrite, Nitrate, Total Phosphate, Total Hardness, Dissolved Oxygen, Biochemical Oxygen Demand, Feacal and Total Coliform). Sampling locations were selected representing different levels of anthropogenic influences with respect to organic pollution, nutrient pollution, erosion and feacal pollution.
2.2.2. Macro invertebrate indicator for monitoring aquatic ecological health
The sampling was conducted at selected six sampling sites; L10, L6, L5, L7, L4 and L2). Macro invertebrates at each sampling site were sampled using a standard hand held D Net. Ten time fixed efforts (one-minute) were employed to sample the macro invertebrate taxa in a 10m stream stretch at each selected location. Samples collected from all ten efforts were composited into a one sample and all the individuals were live picked and sorted at site. The sorted individuals were identified to the taxonomic level of Order using standard identification guides (Bouchard, 2004).
2.3. Detailed analytical framework of the study
The study encountered a comprehensive analysis and used several information and data sources and methodologies widely accepted in analysis of both qualitative and quantitative data. The Fig. 4 gives the detailed analytical framework used in the study.
Fig. 3. Water quality sampling location plan
246
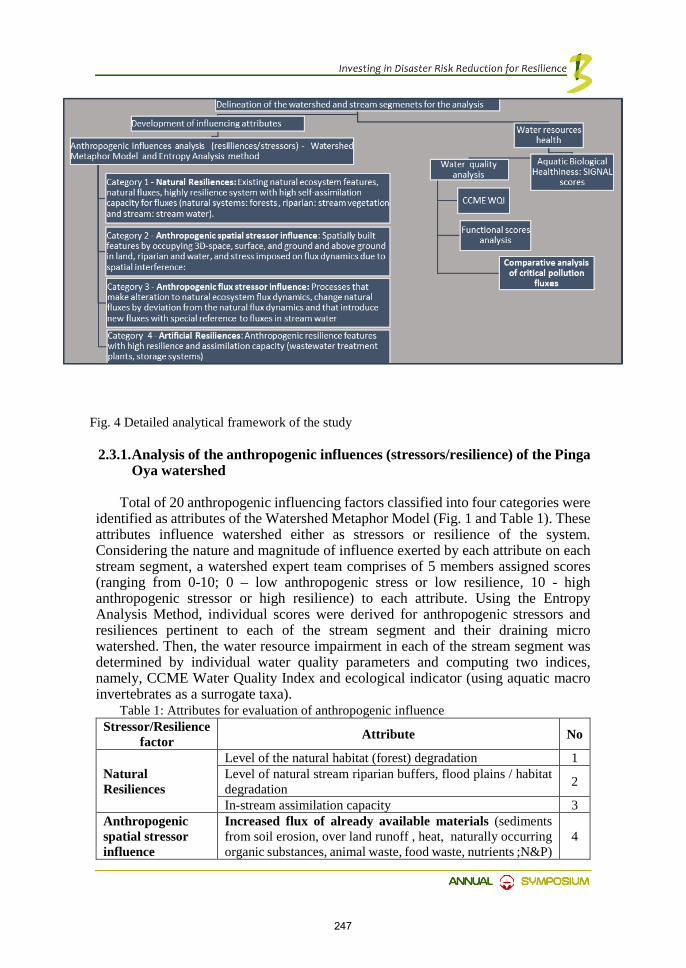
Fig. 4 Detailed analytical framework of the study
2.3.1. Analysis of the anthropogenic influences (stressors/resilience) of the Pinga Oya watershed
Total of 20 anthropogenic influencing factors classified into four categories were identified as attributes of the Watershed Metaphor Model (Fig. 1 and Table 1). These attributes influence watershed either as stressors or resilience of the system. Considering the nature and magnitude of influence exerted by each attribute on each stream segment, a watershed expert team comprises of 5 members assigned scores (ranging from 0-10; 0 – low anthropogenic stress or low resilience, 10 - high anthropogenic stressor or high resilience) to each attribute. Using the Entropy Analysis Method, individual scores were derived for anthropogenic stressors and resiliences pertinent to each of the stream segment and their draining micro watershed. Then, the water resource impairment in each of the stream segment was determined by individual water quality parameters and computing two indices, namely, CCME Water Quality Index and ecological indicator (using aquatic macro invertebrates as a surrogate taxa).
Table 1: Attributes for evaluation of anthropogenic influence Stressor/Resilience
factor Attribute No
Natural Resiliences
Level of the natural habitat (forest) degradation 1 Level of natural stream riparian buffers, flood plains / habitat degradation 2
In-stream assimilation capacity 3 Anthropogenic spatial stressor influence
Increased flux of already available materials (sediments from soil erosion, over land runoff , heat, naturally occurring organic substances, animal waste, food waste, nutrients ;N&P)
4
247
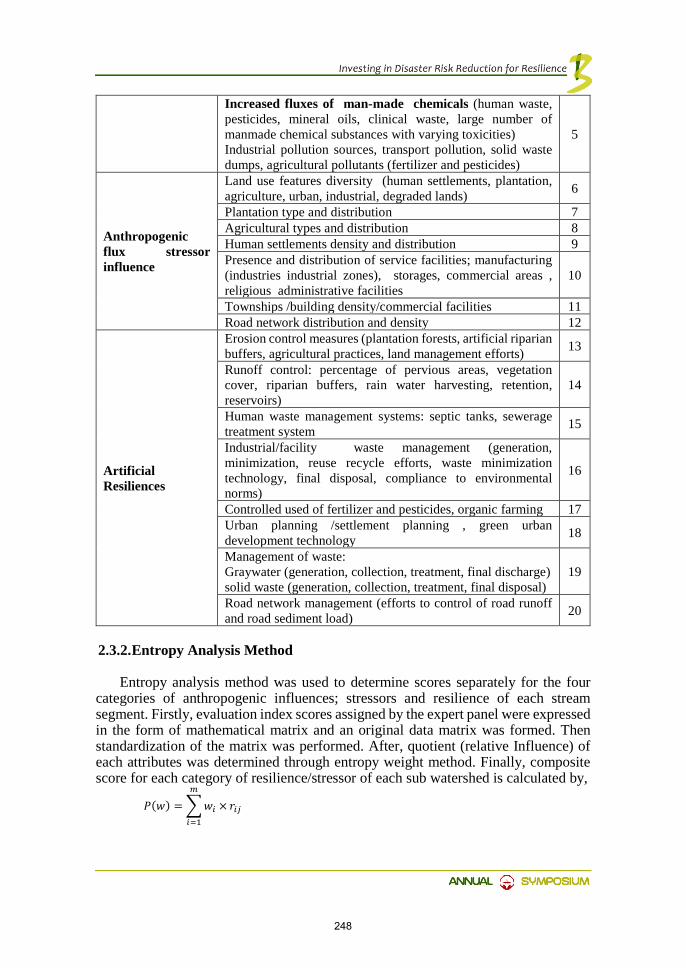
Increased fluxes of man-made chemicals (human waste, pesticides, mineral oils, clinical waste, large number of manmade chemical substances with varying toxicities) Industrial pollution sources, transport pollution, solid waste dumps, agricultural pollutants (fertilizer and pesticides)
5
Anthropogenic flux stressor influence
Land use features diversity (human settlements, plantation, agriculture, urban, industrial, degraded lands) 6
Plantation type and distribution 7 Agricultural types and distribution 8 Human settlements density and distribution 9 Presence and distribution of service facilities; manufacturing (industries industrial zones), storages, commercial areas , religious administrative facilities
10
Townships /building density/commercial facilities 11 Road network distribution and density 12
Artificial Resiliences
Erosion control measures (plantation forests, artificial riparian buffers, agricultural practices, land management efforts) 13
Runoff control: percentage of pervious areas, vegetation cover, riparian buffers, rain water harvesting, retention, reservoirs)
14
Human waste management systems: septic tanks, sewerage treatment system 15
Industrial/facility waste management (generation, minimization, reuse recycle efforts, waste minimization technology, final disposal, compliance to environmental norms)
16
Controlled used of fertilizer and pesticides, organic farming 17 Urban planning /settlement planning , green urban development technology 18
Management of waste: Graywater (generation, collection, treatment, final discharge) solid waste (generation, collection, treatment, final disposal)
19
Road network management (efforts to control of road runoff and road sediment load) 20
2.3.2. Entropy Analysis Method
Entropy analysis method was used to determine scores separately for the four categories of anthropogenic influences; stressors and resilience of each stream segment. Firstly, evaluation index scores assigned by the expert panel were expressed in the form of mathematical matrix and an original data matrix was formed. Then standardization of the matrix was performed. After, quotient (relative Influence) of each attributes was determined through entropy weight method. Finally, composite score for each category of resilience/stressor of each sub watershed is calculated by,
𝑃𝑃(𝑤𝑤) = 𝑤𝑤𝑖𝑖 ×𝑚𝑚
𝑖𝑖=1
𝑟𝑟𝑖𝑖𝑖𝑖
248

Where, P (w) is the composite score, wi is the entropy weight (relative influence), and rij is the standardization value of the ith evaluation objective and jth stream segment.
The calculated score for resilience of each stream segment increases with the resilience of the stream segment (1: low resilience and 10: high resilience). However, the calculated score for the anthropogenic stressors were considered as negative values since they indicate the stress imposed on the stream segment (-1: low stress and -10: high stress).
2.3.3. Calculation of Water Quality Index: CCME Water Quality Index
Water quality data gathered during the study period were used to calculate CCME water quality index (CCME, 2001). The CCME water quality index is based on combination of three significant factors: (1) Scope (F1): the number of variables whose objectives are not met, (2.) Frequency (F2): the frequency with which the objectives are not met, and (3.) Amplitude (F3): the amount by which the objectives are not met. F1, F2 and F3 were calculated.
The CCME WQI is then calculated by:
CCME WQI = 100 −𝐹𝐹12 + 𝐹𝐹22 + 𝐹𝐹32
1.732
CCME Water Quality Index compares observations to a benchmark, where the benchmark may be a water quality standard or site specific background concentration. In this study, stream water quality of Dunumadallawa forest reserve, local reference site with minimum anthropogenic disturbance, was used as the benchmark to calculate water quality index. The 75th percentile of the reference sites’ water quality data was used as benchmark condition for each parameter tested. (EPA, 2000) The resultant values range between 0 – 100, where 0 represents the “poorest” water quality and 100 represents the “best” water quality. The WQI values are then converted into ranking using the categorization scheme presented in Table 2. Table 2: CCME WQI categorization scheme
Excellent: (95-100)
Water quality is protected with a virtual absence of threat or impairment; conditions very close to natural or pristine levels. These index values can only be obtained if all measurements are within objectives virtually all of the time.
Good: (80-94)
Water quality is protected with only a minor degree of threat or impairment; conditions rarely depart from natural or desirable levels.
Fair: (65-79)
Water quality is usually protected but occasionally threatened or impaired; conditions sometimes depart from natural or desirable levels.
Marginal: (45-64)
Water quality is frequently threatened or impaired; conditions often depart from natural or desirable levels.
Poor: (0-44)
Water quality is almost always threatened or impaired; conditions usually depart from natural or desirable levels.
249

2.3.4. Calculation of Aquatic ecological indicator (Macro invertebrates as surrogate taxa): SIGNAL Index
SIGNAL (Stream Invertebrate Grade Average Levels) scores (Chessmann, 2003a; Chessmann, 2003b) were calculated from the aquatic macroinvertebrate data gathered during the study period using following equation. The method gives a unique sensitivity grade, ranging from 0 (extreme pollution tolerant) to 10 (extreme pollution sensitive), to each macro invertebrate taxa (Chessmann, 2003b). It also have a weighting system based on the observed abundance of individuals belonging to each taxa (Chessmann, 2003b) and both sensitivity grade of each observed taxa and weight factor are used to calculate the SIGNAL Score.
SIGNAL Index = ∑ (Sensitivity grade of each taxa x Weight factor for abundance) ∑ Weight factor
The SIGNAL value of the local reference site with minimal anthropogenic disturbance; Dunumadallawa Forest reserve was used as the health benchmark (Seneviratne et al, 2016).
3. Results and Discussion
3.1. Spatial variation of anthropogenic influence scores derived from the entropy analysis and water resources health of Pinga Oya watershed
The Fig. 5 shows anthropogenic influence scores derived from the entropy analysis. Resilience scores are plotted in positive direction and stressor scores are plotted in negative direction. Scores for existence of resilience features are comparatively low in Pinga Oya and Kurugoda Oya and high in Hunan Oya, while scores for anthropogenic stressors are substantially high in Pinga Oya and Kurugoda Oya. Accordingly, lower stream segment of Pinga Oya and Kurugoda Oya are under heavy anthropogenic influence, and their draining watersheds suffer from heavy land degradation, unplanned settlements development, and urban land parcels with poor waste management, The two stream segments have little resilience features to assimilate pollutant fluxes and to protect water resources.
Fig. 5 Spatial distribution of anthropogenic influence scores
-100%
-60%
-20%
20%
60%
100%
Pinga Oya KurugodaOya
HunnanOya
OwissaOya
Res
ilien
ce/s
tres
s sc
ore
Natural ResiliencesArtificial ResiliencesAnthropogenic spatial stressor influenceAnthropogenic flux stressor influence
250
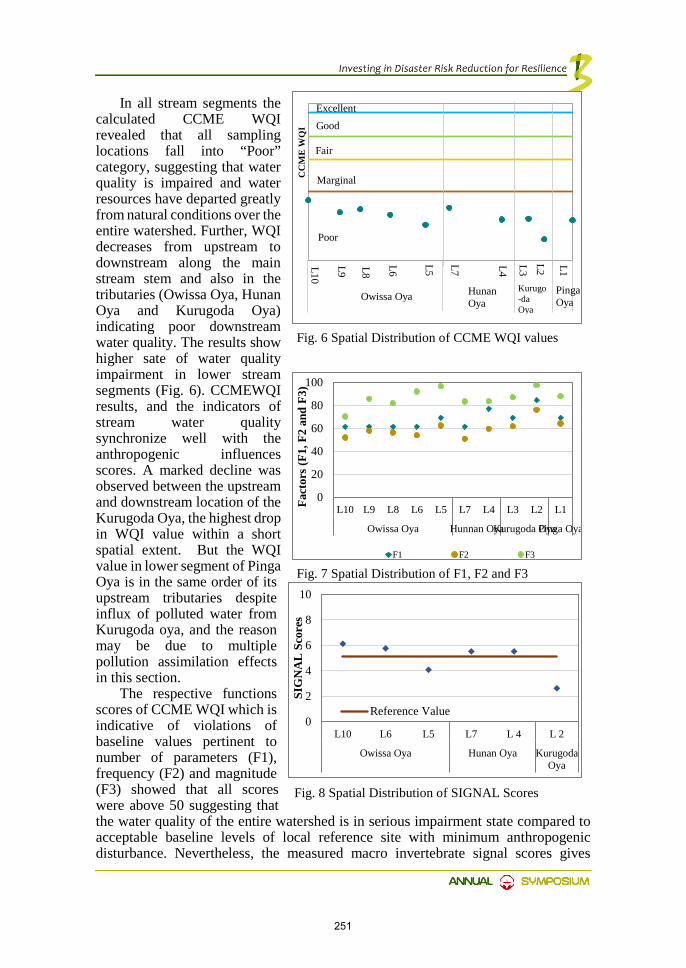
In all stream segments the calculated CCME WQI revealed that all sampling locations fall into “Poor” category, suggesting that water quality is impaired and water resources have departed greatly from natural conditions over the entire watershed. Further, WQI decreases from upstream to downstream along the main stream stem and also in the tributaries (Owissa Oya, Hunan Oya and Kurugoda Oya) indicating poor downstream water quality. The results show higher sate of water quality impairment in lower stream segments (Fig. 6). CCMEWQI results, and the indicators of stream water quality synchronize well with the anthropogenic influences scores. A marked decline was observed between the upstream and downstream location of the Kurugoda Oya, the highest drop in WQI value within a short spatial extent. But the WQI value in lower segment of Pinga Oya is in the same order of its upstream tributaries despite influx of polluted water from Kurugoda oya, and the reason may be due to multiple pollution assimilation effects in this section.
The respective functions scores of CCME WQI which is indicative of violations of baseline values pertinent to number of parameters (F1), frequency (F2) and magnitude (F3) showed that all scores were above 50 suggesting that the water quality of the entire watershed is in serious impairment state compared to acceptable baseline levels of local reference site with minimum anthropogenic disturbance. Nevertheless, the measured macro invertebrate signal scores gives
Fig. 6 Spatial Distribution of CCME WQI values
L10
L9 L8
L6 L5 L7 L4 L3L2 L1
CC
ME
WQ
I
ExcellentGood
Fair
Marginal
Poor
Owissa Oya Hunan Oya
Kurugo-da Oya
Pinga Oya
0
2
4
6
8
10
L10 L6 L5 L7 L 4 L 2
Owissa Oya Hunan Oya KurugodaOya
SIG
NA
L S
core
s
Reference Value
0
20
40
60
80
100
L10 L9 L8 L6 L5 L7 L4 L3 L2 L1
Owissa Oya Hunnan OyaKurugoda OyaPinga Oya
Fact
ors (
F1, F
2 an
d F3
)
F1 F2 F3
Fig. 8 Spatial Distribution of SIGNAL Scores
Fig. 7 Spatial Distribution of F1, F2 and F3
251

somewhat different interpretation as only L2 in Kurugoda Oya and L5 in Owissa Oya depicted notable deviations from the reference stream health. The low SIGNAL Scores in these locations corresponds with the CCME Water Quality Index it is an indicative of critical aquatic habitat quality deterioration and existence of potential pollution pulses in the periphery of these locations. However, it is noteworthy that SIGNAL measurements are not done for Pinga Oya.
3.2. Comparative analysis of critical pollution fluxes in different stream segments
3.2.1. Erosion impact – Dissolved and Total Suspended Solids (TSS)
Fig. 9 Spatial variation of Total Suspended Solids
Fig. 10 Spatial variation of EC
Erosion is a common phenomenon in watersheds with heavy degradation. The TSS and EC are indicatives of suspended and dissolved fraction of river load. It is high when watersheds are subjected to erosion. The levels shoots during peak rainfall and usually high during initial rainfall events. Suspended Solids include a variety of materials, such as silt from land and stream bank erosion, urban and agricultural runoff, etc. Variation in TSS and EC are observed in all stream segments. Both
0
20
40
60
80
100
120
Pinga Oya Kurugoda Oya Hunan Oya Owissa Oya
TSS
(mg/
L)
Mean
0
100
200
300
400
500
600
700
800
Pinga Oya Kurugoda Oya Hunan Oya Owissa Oya
EC
(µS/
cm)
Mean
252

Kurugoda Oya and Owissa Oya had peak Suspended Solids due to heavy erosion from land degradation, unplanned urban centers with poor land and waste management. The high TSS and EC levels in stream water contributes to a greater fraction in “poor” category CCME WQI and is a key water resource impairment in degraded land parcels with high erosivity.
3.2.2. Stream aeration and Oxygen sag conditions
Fig. 11 Spatial variation of measured mean DO, Maximum saturation level of DO and the DO sagging percentage
Fig. 12 Spatial variation of BOD
Oxygen saturation level is a principal factor that decides the healthiness of water resources. The ability of water for self-aeration and amount of degradable organic content decide the water’s Oxygen saturation level. In running waters, high saturation levels are indicative of good water resources health and provide favorable environment and rich aquatic biodiversity. As the stream water in Pinga Oya drains a watershed with relatively high slope gradient and the ambient temperatures are comparatively low, the stream water are expected to have high saturation value from ample aeration and low temperatures.(Kannel, 2007; Wang et al, 2003; Wijekoon and Herath, 2001). But, measured values show a higher sag of Oxygen levels from the saturation levels despite relatively low BOD, indicating organic pollution sources.
0
1
2
3
4
5
Pinga Oya KurugodaOya
Hunan Oya Owissa Oya
BO
D (m
g/L
)
Mean
2
4
6
8
10
Pinga Oya KurugodaOya
Hunan Oya Owissa Oya
DO
(mg/
L)
Oxygen sag Max. saturation Measured Mean
253

The rapid degradation of organic matter and consuming Dissolved Oxygen for Oxidation is reflected in corresponding DO and BOD values.
3.2.3. Pollution hazard due to human waste (FC/TC)
Fig. 13 Spatial variation of FC
Fig. 14 Spatial variation of TC
The FC and TC counts, indicative of fluxes of human waste, show clear evidences of critical sate of pollution from human waste almost in the entire stream network. The level of flux is tremendously high in Kurugoda Oya, and Owissa Oya, and comparatively low in Hunan Oya stream segment. The scores of human stressor levels and the level of human waste indicators show a very good match highlighting that unplanned human settlements, urban pockets occupying stream riparian strips with unacceptably poor waste management has been the primary cause of increased fluxes of human waste in stream water. Further, Ammonia and Nitrates too are high in the entire watershed, they are indicators of water pollution with human waste in residential watersheds with poor waste management as well as pollution from agricultural practices.
0
100,000
200,000
300,000
400,000
500,000
600,000
Pinga Oya KurugodaOya
Hunan Oya Owissa Oya
FC/1
00m
L
Mean
0
500,000
1,000,000
1,500,000
2,000,000
2,500,000
3,000,000
3,500,000
4,000,000
4,500,000
Pinga Oya KurugodaOya
Hunan Oya Owissa Oya
TC
/100
mL
Mean
254
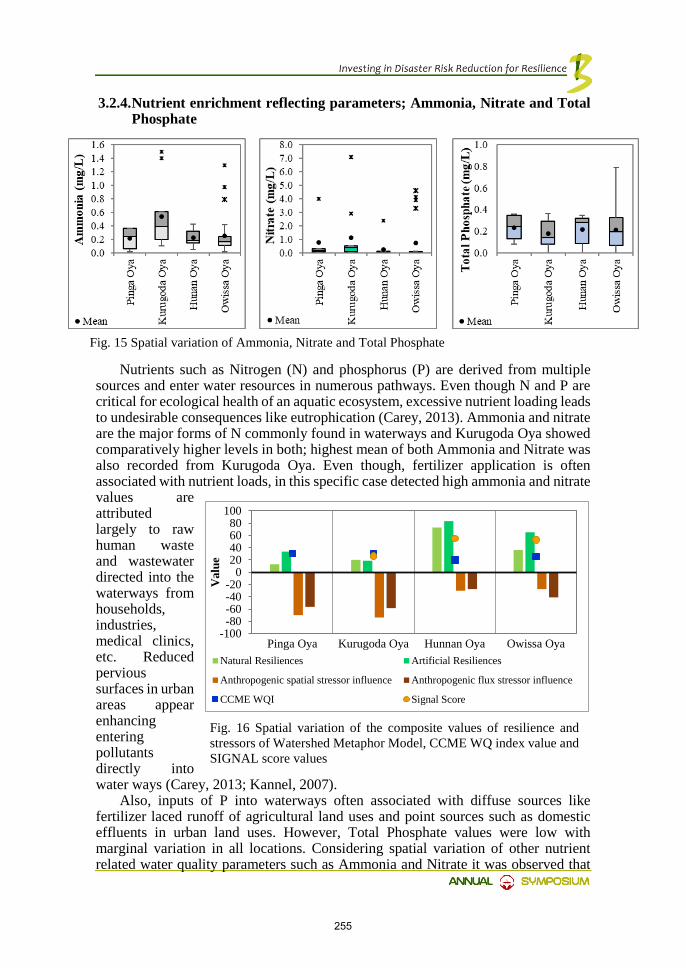
3.2.4. Nutrient enrichment reflecting parameters; Ammonia, Nitrate and Total Phosphate
Fig. 15 Spatial variation of Ammonia, Nitrate and Total Phosphate
Nutrients such as Nitrogen (N) and phosphorus (P) are derived from multiple sources and enter water resources in numerous pathways. Even though N and P are critical for ecological health of an aquatic ecosystem, excessive nutrient loading leads to undesirable consequences like eutrophication (Carey, 2013). Ammonia and nitrate are the major forms of N commonly found in waterways and Kurugoda Oya showed comparatively higher levels in both; highest mean of both Ammonia and Nitrate was also recorded from Kurugoda Oya. Even though, fertilizer application is often associated with nutrient loads, in this specific case detected high ammonia and nitrate values are attributed largely to raw human waste and wastewater directed into the waterways from households, industries, medical clinics, etc. Reduced pervious surfaces in urban areas appear enhancing entering pollutants directly into water ways (Carey, 2013; Kannel, 2007).
Also, inputs of P into waterways often associated with diffuse sources like fertilizer laced runoff of agricultural land uses and point sources such as domestic effluents in urban land uses. However, Total Phosphate values were low with marginal variation in all locations. Considering spatial variation of other nutrient related water quality parameters such as Ammonia and Nitrate it was observed that
-100-80-60-40-20
020406080
100
Pinga Oya Kurugoda Oya Hunnan Oya Owissa Oya
Val
ue
Natural Resiliences Artificial Resiliences
Anthropogenic spatial stressor influence Anthropogenic flux stressor influence
CCME WQI Signal Score
Fig. 16 Spatial variation of the composite values of resilience and stressors of Watershed Metaphor Model, CCME WQ index value and SIGNAL score values
255

variation was higher in the stream segments which have a higher pressure from the direct human sources but not necessarily by agriculture as generally presumed. This pattern is also visible in the spatial variation of Feacal Coliform emphasizing higher influence of human settlements and urban development with poor human waste management on water resources impairment.
Composite values generated for stressors and resiliences of the Watershed Metaphor Model corresponds well with the stream health indicator parameters (Fig.16). The overall picture suggests that the attributes utilized in each category of the Watershed Metaphor Model are well adaptable in evaluation of stream segment health impairment.
4. Conclusion
The analysis shows that natural resilience features to assimilate pollution fluxes have greatly diminished in the entire watershed as result of degradation of forest cover, riparian vegetation and wide spread land degradation, etc. The spatial stressors imposed by occupying land with impervious structures such as buildings, storm water canals, roads, etc. have resulted peak fluxes of pollutants in to the steams during runoff events increasing river pollution load while decreasing the stream health. Increased sediment loads due to erosion, untreated human waste and wastewater from various anthropogenic activities are key sources responsible for pollution fluxes such as organic pollutants, suspended and dissolved matter, feacal matter, Nitrogen and Phosphorus to result serious water quality degradation, especially in lower stream segments. Complete absence or marginal presence of artificial resilience interventions, particularly with respect to planning human settlements, urban areas, maintaining vegetation buffer strips, management of overland runoff, etc. had imposed direct impact forcing on water resource health making water unsuitable for many uses.
The composite scores generated for anthropogenic influences closely correlated with individual water quality parameters and CCME WQI, but, the correlation is comparatively low for SIGNAL score. The higher pollution assimilation capacity has been noted in lower segments of Pinga Oya, suggesting that multiple assimilation factors (dilution, retention and decay, etc.) had induced some degree of reduction to pollution load entering the downstream Polgolla Reservoir. The analysis shows clearly that current state of planning and development in ecologically fragile areas declared by NPP has failed to meet its objectives pertinent to the Pinga Oya watershed and has damaged its natural resiliences and ecosystem stability in multiple ways making the watershed highly vulnerable to watershed degradation and pollution of water resources.
Through this study the importance of national level watershed management efforts is emphasized further, as protection of fragile upper watershed of the country to safeguard water resource health is essential. The metaphorical analysis approach of assessing the anthropogenic stressors on the water resources has shown its adaptability in accommodating a wide range of information for precise estimation of causes and impacts of water resources healthiness and can be taken as the basis for further development integrating updated data for watershed restoration and managing healthy water resources and sustaining uses.
256

References
[1] Bouchard, R.W., Jr. (2004) “Guide to aquatic macroinvertebrates of the Upper Midwest” Water Resources Center, University of Minnesota, St. Paul, MN. 208
[2] Breuste, J. & Dissanayake, L., (2013) Socioeconomic and Environmental Change of Sri Lanka’s Central Highlands. In A. Borsdorf, ed. Investigating the mountains. Austrian Academy of Sciences.
[3] Carey R. O., Hochmuth G. J., Martinez C. J., Boyer T. H., Dukes M. D., Toor G. S., Cisar G. L., (2013) Evaluating nutrient impacts in urban watersheds: Challenges and research opportunities, Environmental Pollution, 173, 138-149
[4] CCME, Canadian water quality guidelines for the protection of aquatic life: CCME Water Quality Index 1.0, User’s manual. In: Canadian Environmental quality guidelines, (1999), Canadian Council of Ministers of the Environment.
[5] Chessman B. C. (2003 a) “New sensitivity grades for Australian river macroinvertebrates”, Marine and Freshwater Research, 54, 95-103
[6] Chessman B. C. (2003 b) “SIGNAL 2 – A Scoring System for Macro-invertebrate (‘Water Bugs’) in Australian Rivers”, Monitoring River Heath Initiative Technical Report no 31, Commonwealth of Australia, Canberra.
[7] Dias SV, Wickramasinghe WMS, Seneviratne HTJ, Rajapaksha KMSK, Apsara SS, Dissanayake SAMS, (2016) Application of the Ecosystem Resilience Metaphor Model in the Analysis of Factors Influencing Urban Stream Health Proceedings of the NBRO international Symposium on Risk Awareness and Future Challenges, National Building Research Organisation, Colombo, Sri Lanka, pp. 235-243.
[8] EPA, Nutrient Criteria Technical Guidance Manual: Rivers and Streams (2000), United States Environmental Agency.
[9] Helmer O, Linstone HA,Turroff M, editors. Delphi Method:Techniques and Applications.Mass:Addison-Wesley; 1975.
[10] Herath G. B.B, Rathnayake U. R., P.G.N., (2004). URBAN POLLUTION INTO POLGOLLA RESERVOIR. In Proceedings of the Peradeniya University Research Sessions. p. 94.
[11] Hewawasam T, (2010), Effect of land use in the upper Mahaweli catchment area on erosion, landslides and siltation in hydropower reservoirs of Sri Lanka, J.Natn.Sci.Foundation Sri Lanka, 38 (1): 3-14
[12] Kannel P.R., Lee S., Lee Y., Kanel S. R., Khan S. P., (2007) Application of Water Quality Indices and Dissolved Oxygen as Indicators for River Water Classification and Urban Impact Assessment, Environ Monit Assess 132:93–110
[13] Lotfi F. H. and Fallahnejad R. (2010) Imprecise Shannon’s Entropy and Multi Attribute Decision Making, Entropy, 12, 53-62
[14] Moser K. S., 2000, Metaphor Analysis in Psychology – Method, Theory and Fields of Application, Forum for Qualitative Research Volume 1, No. 2, Art.21
[15] National Physical Planning Department (2017) Government of Sri Lanka, accessed 18 November 2017 <http://www.nppd.gov.lk/index.php?option=com_content&view=article&id=49&Itemid=56&lang=en>
[16] Pasquaud, S. et al., (2013). Strength and time lag of relationships between human pressures and fish-based metrics used to assess ecological quality of estuarine systems. Estuarine, Coastal and Shelf Science, 134, pp.119–127
[17] Petty, T. & Freund, J.G., (2007). Response of Fish and Macroinvertebrate Bioassessment Indices to Water Chemistry in a Mined Appalachian Watershed Response of Fish and Macroinvertebrate Bioassessment Indices to Water Chemistry in a Mined Appalachian Watershed. Environmental Management, 39, pp.707–720.
[18] Seneviratne HTJ, Sumanasekara VDW, Rajapakshe KMSK, Liyanarachchi PD, Wickramasigha WMS, Dias SV, Dissanayake SAMS, (2016) Determination of stream health of Polgolla Watershed using aquatic macro invertebrates as an ecological indicator, Proceedings of the NBRO international Symposium on Risk Awareness and Future Challenges, National Building Research Organisation, Colombo, Sri Lanka, pp. 272-280.
[19] Su F., Kaplan D., Li L., Li H., Song F. and Liu H., (2017) Identifying and Classifying Pollution
257

Hotspots to Guide Watershed anagement in a Large Multiuse WatershedInt. J. Environ. Res. Public Health, 14, 260
[20] Wang, X., (2001). Integrating water-quality management and land-use planning in a watershed context. Journal of Environmental Management, 61, pp.25–36.
[21] Wang H. , Hondzo M., Xu C., Poole V. , Spacie A., (2003) Dissolved oxygen dynamics of streams draining an urbanized and an agricultural catchment, Ecological Modelling 160 ,145/161
[22] Wijekoon W. B. M.M.W., H.G.B.B., (2001). Source Identification and Pollution Assessment in Mahawell River around Kandy City Area. In Proceedings of the Annual Research Sessions, University of Peradeniya. p. 75
[23] Xiao-long, W. et al., (2007). Identification of anthropogenic influences on water quality of rivers in Taihu watershed. Journal of Environmental Sciences, 19, pp.475–481.
258
Evaluation of Community Based Landslide Early Warning System; Application for Udawaththa Landslide
in Hanguranketha KGS Lakmini1, JDSN Siriwardane1, HMBB Wijekoon1, JM Hettiarachchi1,
CN Subasinghe1, BGS Kumara1 & HAG Jayathissa2
1Scientist, National Building Research Organization 2Senoir Scientist, National Building Research Organization
Abstract
Udawaththa landslide is one of the large known recently activated landslide located in Hanguranketha Secretarial Division of Nuwara Eliya District. Boundary of the landslide crown, body and the depositional area goes through three Grama Niladari Divisions namely Udakanda, Udawaththa East and Udawaththa West. Major triggering event for the activation of this landslide was an intense rainfall, which was about 150mm/day. The slide is still in an active condition, even during a moderate rainfall event.
Slope of this area is varying from 25 to 55 degrees towards North-West direction at the crown and the associated valley is at N 150 W direction. The area consists with highly fractured quartzite bedrock, and 5-6 m thick sandy residual soil overburden with silts and gravels. Appeared tensional cracks were about 3 cm opening spreading along 430 m width in the crown of the landslide, which is at Udakanda Grama Niladari Division. Length of this landslide is about 770 m and settlements were abundant in the depositional area. With the activation of this slide Hanguranketha – Galauda main access road was obstructed and thirty-eight families living along the flow path and depositional area of the landslide in Udawaththa West Grama Niladari Division were threatened.
As in many such cases, application of costly structural mitigation or resettlement of vulnerable communities would be an ideal and permanent solution. However, the communities should have an intermediate solution until such lengthy measures are taken. In this context, establishment of nonstructural, risk communication mechanism such as Community Based Landslide Early Warning System and Preparedness Planning can be considered as practically feasible one of the risk reduction measures.
The approaches for the establishment of community based landslide early warning and preparedness planning were mainly derived from four elements: risk
259
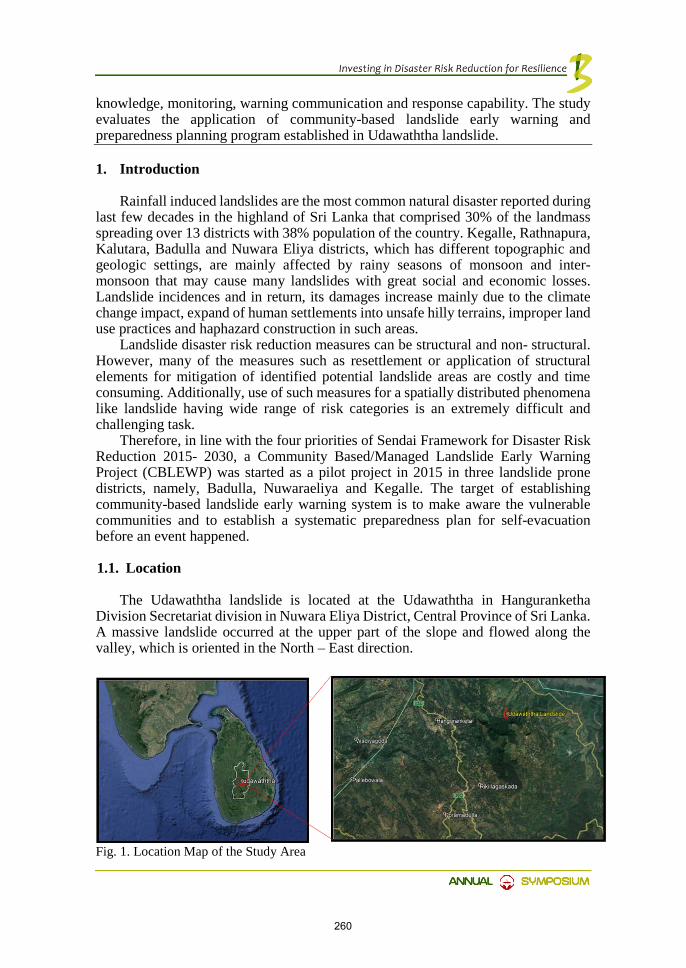
knowledge, monitoring, warning communication and response capability. The study evaluates the application of community-based landslide early warning and preparedness planning program established in Udawaththa landslide.
1. Introduction
Rainfall induced landslides are the most common natural disaster reported during last few decades in the highland of Sri Lanka that comprised 30% of the landmass spreading over 13 districts with 38% population of the country. Kegalle, Rathnapura, Kalutara, Badulla and Nuwara Eliya districts, which has different topographic and geologic settings, are mainly affected by rainy seasons of monsoon and inter-monsoon that may cause many landslides with great social and economic losses. Landslide incidences and in return, its damages increase mainly due to the climate change impact, expand of human settlements into unsafe hilly terrains, improper land use practices and haphazard construction in such areas.
Landslide disaster risk reduction measures can be structural and non- structural. However, many of the measures such as resettlement or application of structural elements for mitigation of identified potential landslide areas are costly and time consuming. Additionally, use of such measures for a spatially distributed phenomena like landslide having wide range of risk categories is an extremely difficult and challenging task.
Therefore, in line with the four priorities of Sendai Framework for Disaster Risk Reduction 2015- 2030, a Community Based/Managed Landslide Early Warning Project (CBLEWP) was started as a pilot project in 2015 in three landslide prone districts, namely, Badulla, Nuwaraeliya and Kegalle. The target of establishing community-based landslide early warning system is to make aware the vulnerable communities and to establish a systematic preparedness plan for self-evacuation before an event happened.
1.1. Location
The Udawaththa landslide is located at the Udawaththa in Hanguranketha Division Secretariat division in Nuwara Eliya District, Central Province of Sri Lanka. A massive landslide occurred at the upper part of the slope and flowed along the valley, which is oriented in the North – East direction.
Fig. 1. Location Map of the Study Area
260

1.2. General geology of the area
Geologically nine-tenth of Sri Lanka is made up of highly crystalline, non-fossiliferous rocks of Precambrian age, whereas the rest, mainly the north to north-western portion consists of Miocene sedimentary formations. As literature dictates, the Precambrian crystalline rocks of Sri Lanka can be categorized into three major and one subordinate lithostratigraphic units (Kroner et al). Namely, 1. Highland Complex (HC) 2. Wanni Complex (WC) 3. Vijayan Complex (VC) 4. Kadugannawa Complex (KC)
All these units represent the crust’s various depth levels; hence the name crustal units are also used. Depending on the crustal depth the mineral content also changes from the Complex to the Complex. The study area falls under the Highland Complex, previously known as the Highland Series (HS). The portion consists of metamorphosed sediments and charnockitic gneisses, which extends through the island from south-west to north-east. The HC is the oldest crustal unit of all the main four units with a protolith age of about 2 to 2.8 Ga, and a metamorphic age of about 550 Ma, which means that HC was under deeper crustal levels while its formation.
The HC comprises of highest grade metamorphic rocks (Granulite facies), with temperatures going up to about 8000C to 9000C, and pressures of 8 to 10 kbar. But at some scattered locations, it is possible to find extremely high-temperature rocks as well, where temperatures may go up to about 1050 0C.
Under the Granulite facies almost all the hydrous minerals become anhydrous, hence, more dry minerals like garnet, pyroxene and sillimanite can be expected. In HC, meta sediments such as marble, quartzite and charnokite can be found predominantly which accounts for about 60% of the HC. A local rock variety called khondalite also is present in the HC. Apart from that, some meta-igneous rocks, like metadiorites, also can be observed. Some calc-silicate rocks such as wollastonite can also be seen in the HC.
The study area belongs to the Highland Complex and the dominant rock types in the area are Charnokitic Biotite Gneiss rock mainly impure Quartzite and Calc Gneiss. Bedrock is mainly overlain by residual soil with varying thickness at the upper slope area where the landslide initiated and then, gradually change to colluvium soil along the down slope. Solid rock outcrops are visible along the embankment slope of the pre- existing road level.
2. Methodology
Initially, almost all the landslide investigation reports done by NBRO within the Nuwareliya district have been studied and most suitable sites for establishing CBLEW systems have been selected. Then, the sites were revisited and reinvestigated for the feasibility, and they were characterized based on site selection criteria developed for the project. Later, qualitative risk assessment was carried out considering geological, geomorphological and geotechnical factors, and socio-economic and cultural factors of the vulnerable communities in Udakanda, Udawaththa West and Udawaththa East Grama Niladari Divisions. Under this study
261

other than the appearance of early landslide symptoms, geology and geological structures, soil type, and slope inclination, social factors such as communities’ knowledge about landslide and their capacity to protect themselves from landslide impacts were studies.
Based on the above assessment, a comprehensive awareness program was conducted to the vulnerable community in the three Grama Niladari Divisions to impart knowledge and understanding of landslides and its impact. The program included the understanding of simple definition of landslide and its description, mechanism of occurrence, factors that make a slope susceptible to fail and trigger, early landslide symptoms, damage zones, importance of catchment based management plan, and both the structural and non-structural risk reduction techniques including early warning system with warning levels. Then, a community risk map (susceptible area and vulnerable communities) with a preparedness plan (location of rain gauges, evacuation routes, evacuation centers) was prepared by the community itself, but verified by respective Geologists. During the process, the program tried to identify the key people, with high capability of handling a disaster situation, as community leaders. Further, manual rain gauges demarcated with warning levels were distributed to the community leaders after preparing the community map by the community of Udawaththa area. Locations for installation of rain gauges were determined based on community distribution and risk category, and three rain gauges were distributed throughout these three Grama Niladari Divisions. Rainfall thresholds that were defined by NBRO (75-99mm/day- Watch; 100-149 mm/day- Alert; 150 mm/day or above/ 75 mm/hour; Evacuation) are given to the vulnerable community for self-decision making. Finally, a special meeting was conducted for the selected community leaders (response team) to educated them for their special responsibility such as operating, monitoring and maintaining of rain gauge, data recording into a special format provided by NBRO, functioning of early warning system, decision making process with communicating with NBRO and dissemination of final warning message to vulnerable community.
It is planned to prepare a comprehensive risk map with a preparedness plan based on the community risk map, and to install it in an open area within the vulnerable community. This map will include roads, important locations such a Temples, landslide susceptible areas and safe areas, locations of houses, locations of rain gauges, evacuation routes and evacuation centers, as per the operational manual. Furthermore, the siren and an evacuation drill will be introduced to the landslide vulnerable community in Udawaththa area to familiarize with the emergency situation. Additionally, automated extensometers with moisture sensor that will be linked to the web based monitoring system with a siren will be installed in this area to have redundant systems for early warnings. To ensure that all the steps are running correctly, frequent field inspections are planned to have a better understanding and interaction with the community to facilitate operational and maintenance feasibility. Additionally, community leaders who received the rain gauges have kept responsible for sending monthly rainfall records to NBRO.
262

(a) (b) Fig. 2. (a) Conducting Lecture (b) Presentation of Community Map
(a) (b)
3. Discussion and Conclusion
The main intention of the study is to reduce the landslide risk of the vulnerable community living in Udawaththa area by sharing knowledge and understanding among relevant experts and the communities in accordance with the Sendai Framework for Disaster Risk Reduction 2015- 2030. To achieve this task, a combination of socio-technical approach is applied in Udawaththa landslide in Hanguranketha. Establishment of comprehensive CBLEW system helped to aware the vulnerable communities and to diminish their misconception about landslide, and to enhance the safety and confidence of the people living in this area. This is also considered as low cost and most practical method that can be used to reduce the risk of communities since the decisions are taken and the real time activity is done by the vulnerable community rather than waiting from the decisions by officers away from the site. However, during the process, some advantages and disadvantages can be identified.
Fig. 3. (a) Introducing manual Rain gauge (b) manual rain gauge installed at the site
263

Even though most of the community members in Udawaththa area are interested and actively participated to the project activities, it is found some members who are not cooperative with it. Mostly, young people and women are the main players of the activity and their dynamic participations is highly encouraging.
After the awareness and the completion of the program, it appears that many have understood the impact of haphazard land-use practices, and the necessity of their involvement to improve the drainage within the catchment. Increase of knowledge about landslides, especially the early landslide symptoms, and direct contacts with the NBRO has drastically increased the confidence of the people to communicate with the officers and to take correct decisions in correct time for their own safety. However, it is observed that communities are reluctant to record the rain fall into the given format due to lack of knowledge and experience of data recording and documentation. Therefore, to get the best benefit, apart from the community involvement, it is crystal clear that close monitoring by NBRO officers is a vital task to perform the program effectively anywhere in the country.
Acknowledgement
Our deep gratitude is conveyed to Dr. H. A. G. Jayathissa, Senior Scientist, Landslide Research and Risk Management Division, National Building Research Organisation, Colombo for the continuous guidance, constructive criticism, and the enthusiastic and encouraging support given during the research study.
Secondly we are very much thankful to Grama Niladhari of Udawatta area and Disaster Relief Officer of the Hanguranketha Divisional Secretariat, who helped to successfully establish a Community Based Landslide Early Warning System in the project area.
Our special thanks go to Divisional Secretary of Hanguranketha Divisional Secretariat for his help to conduct the awareness programmes among disaster affected community in the Udawatta area.
Finally, we wish to thank all the staff members of the Nuwara Eliya District office of the National Building Research Organization, for the support given throughout the community based landslide early warning project.
Reference
[1] Anderson, M. G., and E. A. Holcombe. 2006. “Sustainable Landslide Risk Reduction in
Poorer Countries.” Proceedings of the Institution of Civil Engineers—Engineering Sustainability 159: 23–30.
[2] Benson, C., and J. Twigg. 2004. “Measuring Mitigation Methodologies for Assessing Natural Hazard Risks and the Net Benefits of Mitigation—A Scoping Study.” ProVention Consortium, Geneva.
[3] Cooray, P.G., 1984. An introduction to the Geology of Sri Lanka (Ceylon), National Museums of Sri Lanka publication. 340pp.
[4] Ganderton, P. 2005. “Benefit–Cost Analysis of Disaster Mitigation: Application as a Policy and Decision-Making Tool.” Mitigation and Adaptation Strategies for Global Change 10: 445– 65
264

[5] Holcombe, E. A., S. Smith, E. Wright, and M. G. Anderson. 2011. “An Integrated
Approach for Evaluating the Effectiveness of Landslide Hazard Reduction in Vulnerable Communities in the Caribbean.” Natural Hazards. doi:10.1007/ s11069-011-9920-7.
[6] Mahmoud, M., Y. Liu, H. Hartmann, S. Stewart, T. Wagener, D. Semmens, R. Stewart, H. Gupta, D. Dominguez, F. Dominguez, D. Hulse, R. Letcher, B. Rashleigh, C. Smith, R. Street, J. Ticehurs, M. Twery, H. van Delden, R. Waldick, D. White, and L. Winter. 2009. “A Formal Framework for Scenario Development in Support of Environmental Decision-Making.” Environmental Modelling and Software 24: 798–808
[7] Mahmoud, M., Y. Liu, H. Hartmann, S. Stewart, T. Wagener, D. Semmens, R. Stewart, H. Gupta, D. Dominguez, F. Dominguez, D. Hulse, R. Letcher, B. Rashleigh, C. Smith, R. Street, J. Ticehurs, M. Twery, H. van Delden, R. Waldick, D. White, and L. Winter. 2009. “A Formal Framework for Scenario Development in Support of Environmental Decision-Making.” Environmental Modelling and Software 24: 798–808.
[8] Twigg, J. 2004. “Disaster Risk Reduction: Mitigation and Preparedness.” Development and Emergency Programming Good Practice Review 9.
265
Identification of Drought Preparedness Framework (DPF) for Drought Situations in Sri Lanka
AGD Tharika1, PHNC Manike 1& EE Wijegunarathne1
1Scientist, National Building Research Organisation, Sri Lanka
Abstract
Recent drought situation records in Sri Lanka confirm the nation’s current and increasing vulnerability to natural hazards. Drought impacts are more severe when they directly impact the social life and the environment. Further, droughts impact adversely on the country’s major economic sectors such as agriculture, energy, and tourism. Although the situation is critical at present, appropriate policies or preparedness frameworks for drought mitigation are not available in Sri Lanka to address the drought situation effectively. Most actions taken by the government and other organizations are short term solutions rather than long term solutions. The long term interventions to drought can help to be better prepared to cope with future drought situations. This paper presents an appropriate Drought Preparedness Framework (DPF) which could provide long term sustainable solutions for the drought situation in Sri Lanka and further investigates the applicability of DPF with the concept of drought resilient society. It enables any society who faced to drought situations to live with drought in the future. Keywords: Drought; Drought Preparedness Framework; Drought Resilient Society
1. Introduction
Drought is a serious issue occurring in an unprecedented rate during the recent past in Sri Lanka. According to statistical records more than 1 million people in 15 districts suffer from the impacts of drought per annum (DMC, 2017). According to Disaster Management Center of Sri Lanka, the severe drought prevailing at present has negatively affected the cultivation of paddy and other crops which were cultivated only in 35% of the originally planned total land extent. Access to safe drinking water has become a challenge in 22 out of 25 districts in Sri Lanka because of the prevailing drought. Capacity of irrigation and hydro power generation also has reduced due to the drought situation, and according to the statistical data of Irrigation Department reservoirs carry only less than 50% of water required for Maha cultivation (DMC, 2017).
266

Many of the policies in Sri Lanka address only the other disasters such as flood and landslides. Institutions which are responsible for drought planning do not implement any kind of drought preparedness framework. As a developing country, it is worthy to adopt a drought preparedness framework that would help to accomplish long term sustainability. In order to address this issue, the research gap identified is, investigation of drought preparedness frameworks for suitability for application to drought situation in Sri Lanka. Therefore, objective of the research is to study drought preparedness frameworks which are available in the international context, and formulate new drought preparedness framework which will be suitable to drought situations in Sri Lanka. The formulated drought preparedness framework was analysed through the drought resilience society concepts which were adopted in international context.
2. Research Design
The study focused on secondary data analysis which is available in international context. Therefore, the study reviewed several drought preparedness frameworks and resilience society concepts which had been implemented successfully in the real situations.
2.1. The concept of Drought
Drought is a “dry period which is deficient in precipitation; duration and geographical extent can be quite different”. It may be series of days without having rain / wet season with a below normal precipitation (Frederisken, 1992). Similarly Tallaksen described in his research about drought in different manner “a sustained and regionally extensive occurrence of below average natural water availability, and can thus be characterized as a deviation from normal conditions of variables such as precipitation, soil moisture, groundwater and stream flow “(Tallaksen, 2004). Drought is a slow motion natural disaster and impacts of the drought can be severe than expected. Drought affects both human life and natural environment in a negative way. Drought is a complex phenomenon that has extreme consequences on human life, food insecurity and natural resources degradation. It leads to shortage of water, affecting agriculture, with social consequences such as starvation, hunger, and migration. According to the Food and Agriculture Organization, drought has been causing food emergencies in most of the developing countries (Nations, 2016).
Drought occurrences are natural phenomena that vary temporally (Seasonal and annual) and spatially (Tadesse, 2016). Agriculture, water, energy and biodiversity/ wildlife/ forestry and tourism are the most vulnerable sectors. Other sectors such as infrastructure, urban settlement, and health are also vulnerable to drought (Assessment of drought resilience frameworks in the Horn of Africa, 2016). Mainly four types of drought can be identified, namely meteorological drought, agricultural drought, hydrological drought and socio - economic drought. There is a strong relationship among these four types of drought. Once it begins with meteorological drought, other three occur consequently when rainfall is in lower level than usual condition. Most literature identifies the relationship among these drought situations as shown by the following figure (Tadesse, 2016). The severity and suddenness of drought impact vary considerably. The primary factors determining the level of
267

impacts are: Source of water supply, Categories of water user, Level of water -Utilization, Water Quality, Institutional ((NDRSC), 2011).
Moreover, literature has revealed that the key reasons that caused a drought as rainfall or precipitation deficiency, human causes, drying out of surface water flow and global warming.
Unfortunately effects of drought have become mushroomed in an unprecedented proportion around the world during last decades. It is because of the onset of the climate change. According to the literature, it
has been revealed that negative impacts could affect both the environment and socio economics sectors. (WSDEN, 2007).
2.1.1. Drought situation in Sri Lanka
In Sri Lanka drought is a natural hazard that occurred once in 10 years in the past, once in 4 years lately and now, once in a year. Apart from the major drought which occurs annually, there are regional level droughts as well. As an example, wet zone of the central hilly area experiences drought and that has caused a reduction of tea, rubber cultivations and other agricultural crops. Droughts in years 2001, 2002, 2004, have brought about enormous misfortunes to the economy and employment. In 2001, it was assessed that 1,000,000 individuals in Sri Lanka were influenced, while in 2002 the figure had reached 557,000. In 2004, harvest in an expected cultivation land of 52, 651 ha in 7 districts was harmed (K. A. U. S. Imbulana, et al., 2006). An expected 520,000 individuals across eight areas (Eastern, North Central, North Western, Northern, Sabaragamuwa, Uva, Central and
Figure 2: Drought Situation in Sri Lanka Source: Disaster Management Centre
268

Western) were influenced by drought starting at 13 October 2016. The Government has allocated US$140,000 and 159 water trucks to 22 regions. Somewhere in the range of 60 schools have been closed because of water deficiencies, influencing 26,000 school children. (OCHA, 2017). As of 19th September 2017, 1,927,069 people were estimated to be affected by the drought across 17 districts, according to the Disaster Management Centre (DMC, 2017).
2.1.2. Drought Management in Sri Lanka
Drought management is lacking in Sri Lankan context and in most of the times short term remedial actions have been taken to minimize the negative impacts of drought. Currently, several government and semi - governmental agencies are responsible for drought management in Sri Lanka. Such as Ministry of Agriculture and Water Resource, Department of Irrigation, Mahaweli Development Authority, Water Supply and Drainage Board, National Disaster Relief Center, and Water Resource Board. However, they do not follow a drought management plan to minimize the negative impacts of drought situations. National Disaster Relief Services Centre (NDRSC) stated that they had distributed water pumps, water tanks, and water purification equipment, etc. among the drought-striken places in Sri Lanka and Rs. 3,235,038.86 was given to Monaragala, Kilinochchi, Ampara, Jaffna, Mannar, Puttalam, Kandy, Polonnaruwa, Kurunegala, and Kegalla districts to provide drinking water to drought affected families. (NDRSC), 2011). Taking action after a disaster situation is more costly as well as ineffective. Above mentioned institutions, just take several actions as post drought mitigation actions. As per the report published by World Food Programme with collaboration with Disaster Management Center, stated the actions taken by above mentioned institutions as post disaster actions for drought. None of the mentioned organizations have a drought preparedness framework in order to build up drought resilient society.
If there is a drought preparedness framework, it will be very much supportive for the people who face drought situation usually since DPF achieves long term sustainability. In this context, the National Climate Change Policy of Sri Lanka has been developed to provide guidance and directions for all the stakeholders to address the adverse impacts of climate change efficiently and effectively. Nevertheless it was not possible to find out any resilient preparedness framework for pre drought situations in Sri Lanka.
2.1.3. Drought Preparedness Frameworks
Ana Paula et al. has mentioned in their research that a drought preparedness plan help to minimize the risk of the droughts. It will reduce economic cost and other costs related to the drought situation. (Ana Paula et al., 2013). World Bank also stated in their report the importance of a disaster preparedness framework and they had given key steps for disaster risk management. Drought preparedness can increase the adaptive capacity of people and it will secure the people’s life style. Effectiveness and efficiency of the drought preparedness framework depend on scale and severity of the drought. Public and institutional coordination and
269
involvement should be there when implementing drought preparedness plan. (Wilhite et al., 2010)
From the literature, it was possible to find several drought management plans which had been implemented in Asian and European countries successfully. Since the Sri Lankan context is different from those contexts, it is worthwhile to investigate a drought preparedness framework which can be implemented within the Sri Lankan context. Wlhite et al. have described 10 steps which can be followed as a drought preparedness framework. This consists with 10 steps as mentioned below. (Wilhite et al., 2010). It has more focused on risk assessment and mitigation tools. First four steps brought right responsible parties together in the process and suggest to gather relevant and adequate data in order to take effective decisions. Such as “appoint a drought task force, state the purpose and objectives of the drought preparedness plan, seek stakeholder participation and resolve conflict, inventory resources and identify groups at risk”. With the completion of above steps, it is recommended to formulate drought preparedness plan. Having collaboration between policy makers and scientists is really essential for step 6 and 7. Step 8 is to get public participation on prepared drought preparedness plan. It enables to have better understanding of real situation of the drought. Educational programmes conduct through step 9. Step 10 is to revise and evaluate the drought planning process to assure the effectiveness of it.
Nevertheless above DPF addresses more or less all the steps. Accordingly there should be another step which can be recommended to take necessary actions as preventive measures for the revised plan.
In the opinion of Frederisken, drought preparedness framework consists of seven key steps and the author had identified three components of the drought management to understand the drought situation clearly in the local context. This framework clearly describes all aspects of drought management plan and institutional responsibilities. (Frederiksen, 1992), such as
1. Define the available resource 2. Define the demand 3. Describe possible shortfalls in supply 4. Describe the management measures for potential events 5. User and public involvement 6. Securing legislation agreements, rules and procedures 7. Drought management event plan
When compared the DPF which was proposed by Wilhite is complex than the above mentioned DPF. Nevertheless Frederisken proposed several steps which should be done before appointing a task force team. Hence, it necessary to identify the available resources, which is legally acquired, physically delivered and suitable quality to the use. Next step is to investigate the demand for them by prioritizing the type of uses. As a next step, identify shortfalls in supply is really worthy in a DPF for sound preparation.
Ilpyo Honga et al. revealed in their research, a drought preparedness plan which consist with mainly three steps. (Ilpyo Honga,et al., 2016)
1. Drought Watch & Forecast 2. Drought Impact Assessment & Drought Management 3. Preventive Drought Response
270

These three steps address meteorological and hydrological drought in a proper manner. Significance of this framework is, it indicates institutional responsibilities throughout the drought preparedness process. Nevertheless complexity is in a lower level in this DPF.
Tadesse proposed 3 pillars of drought preparedness framework which consist with;
1. Drought monitoring and early warning system 2. Vulnerability and risk Assessment 3. Drought preparedness, Mitigation and Response
This DPF acts as summery of all above mentioned DPFs’. It narrows down lengthy steps of a DPF. Since the complexity of lengthy steps is in a higher level, it enables understanding of the process of drought preparedness framework in a successful way.
Ultimate goal of a drought preparedness framework is to achieve a drought resilient society. Thus it is important to study the drought resilient concepts as described below.
2.1.4. Drought Resilient Society Concepts
Since most of the studies focus on agricultural sector, Tadesse proposed drought resilient society concept which addresses the whole society. Accordingly, the study focused on Tadess’s drought resilient society concept.
This concept
addresses key aspects like nature of the drought, socio – economic and environment. It puts people at the center of the analysis. It switched several strategies to have a drought resilient society. Moreover institutional capacity and policy measures are discussed clearly.
Since many key aspects are indicated with the concept, it is important to expand the concept by adding steps of proposed drought preparedness plan. It enables to implement successfully.
Figure 3: Drought Resilient Society Concept Source: United Nations Office for Disaster Risk Reduction (UNISDR, 2009)
Drought Resilient Society
Society exposed to a natural hazard: Extended period of unusually low precipitation
Drought management policy implemented
Drought awareness & preparedness
Society resilient to drought
Authorities aware and accountable to vulnerable populations Appropriate land tenure arrangement Incentives for preparedness
Political capital
Policies to enhance social adaptive capacity at both local and national scale
Appropriate relationships with international economy
Drought management policies implemented
Impact mitigated
Soci
etal
Res
pons
e to
livin
g w
ith ri
sk
Nat
ure
Envi
ronm
enta
l Gov
erna
nce
Envi
ronm
enta
l Gov
erna
nce
Cultu
re o
f pr
even
tion,
Ear
ly
war
ning
syste
m
Lessons learned
271
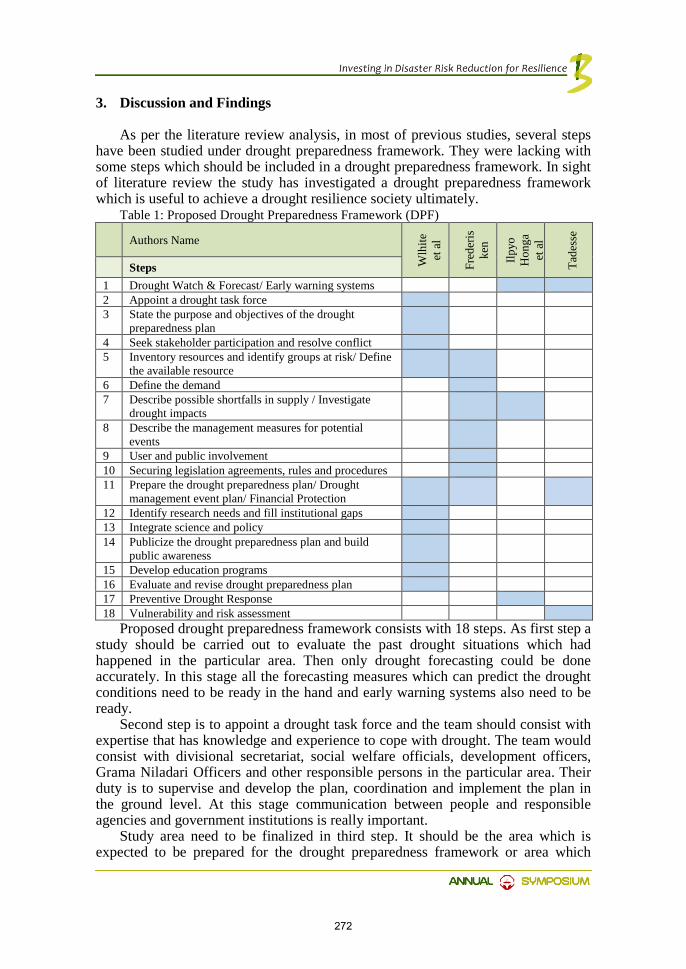
3. Discussion and Findings
As per the literature review analysis, in most of previous studies, several steps have been studied under drought preparedness framework. They were lacking with some steps which should be included in a drought preparedness framework. In sight of literature review the study has investigated a drought preparedness framework which is useful to achieve a drought resilience society ultimately.
Table 1: Proposed Drought Preparedness Framework (DPF)
Authors Name
Wlh
ite
et a
l
Fred
eris
ken
Ilpyo
H
onga
et
al
Tade
sse
Steps 1 Drought Watch & Forecast/ Early warning systems 2 Appoint a drought task force 3 State the purpose and objectives of the drought
preparedness plan
4 Seek stakeholder participation and resolve conflict 5 Inventory resources and identify groups at risk/ Define
the available resource
6 Define the demand 7 Describe possible shortfalls in supply / Investigate
drought impacts
8 Describe the management measures for potential events
9 User and public involvement 10 Securing legislation agreements, rules and procedures 11 Prepare the drought preparedness plan/ Drought
management event plan/ Financial Protection
12 Identify research needs and fill institutional gaps 13 Integrate science and policy 14 Publicize the drought preparedness plan and build
public awareness
15 Develop education programs 16 Evaluate and revise drought preparedness plan 17 Preventive Drought Response 18 Vulnerability and risk assessment
Proposed drought preparedness framework consists with 18 steps. As first step a study should be carried out to evaluate the past drought situations which had happened in the particular area. Then only drought forecasting could be done accurately. In this stage all the forecasting measures which can predict the drought conditions need to be ready in the hand and early warning systems also need to be ready.
Second step is to appoint a drought task force and the team should consist with expertise that has knowledge and experience to cope with drought. The team would consist with divisional secretariat, social welfare officials, development officers, Grama Niladari Officers and other responsible persons in the particular area. Their duty is to supervise and develop the plan, coordination and implement the plan in the ground level. At this stage communication between people and responsible agencies and government institutions is really important.
Study area need to be finalized in third step. It should be the area which is expected to be prepared for the drought preparedness framework or area which
272

could be expected to face to the drought in near future. At this stage appointed team need to have appropriate knowledge / idea about the purpose and objectives of the assigned task.
In the next step, involvement of public and all officials are really important to the process. It is aimed to take clear cut image and resolve conflict areas. Next step is to prepare a resource profile for the selected area. Here, quality aspect of water resources should be carefully recorded. Resources which are included in the resource profile must be legally acquired, physically delivered and be of suitable quality to the use. Then, demand analysis should be done for the recorded resources. It needs to focus in all aspects like agriculture into livestock, aquaculture, permanent crops and annual crops, industrial and urban etc. Here, seasonal variation should be added in to the account.
By analyzing demand and supply of available recorded resources shortfalls in supply can be analyzed. “Managing the resources to best accommodate shortfall in meeting demand under a given drought event calls for sounds preparation”. This is the most critical stage of the drought preparedness framework. If any sector miscount, consequences could be unpredicted. As the next step it is important to establish certain measures which can address to certain shortfalls.
Public involvement is needed for the success of drought management, and it is dependent on the understanding and support of the public. Here, experts should give knowledge to the public and secure the responsibilities rather than emotional participation. Having standing legislations is necessary for effective emergency measures. These legislations should be specific to the case / drought. This is the most trusting thing which helps to keep everyone aware of the dated actions and the enforcement provisions.
Identifying research needs and institutional gaps helps to prevent future drawbacks of the Drought Preparedness Framework (DPF). If evaluating and monitoring is accompanied in an efficient and effective manner, gaps of the process could be identified easily. As the next step it is needed to have a proper communication plan among all institutions. It would help the task force team to manage all relevant groups and get involvement of their resources in an effective manner.
Public have the authority to get to know on the development plans which may affect to their life styles. To assure transparency, all necessary information which is taken by the team should go to the society. Here the team can use media, leaflets, newspapers and etc. Getting feedback from the public is also really important at this step. Developed education program could be carried out prior to step fourteen.
Next step is to evaluate the proposed DPF. Evaluation helps to identify gaps of the DPF and then it can be revised according to the experts’ knowledge. Separate committee who have the expert knowledge need to be appointed for the evaluation and revision of the DPF. Preventive measures should be identified at this stage by considering the revised plan. Those preventive measures should be responsive to the drought.
Proposed Drought Preparedness Framework (DPF) is for minimizing the risk of drought and making community resilient to the drought. At this point, there should be an expert team who is responsible to assess the risk and vulnerability of the drought. These recorded data and analyzed data could be really worthy when updating or revising the future DPF.
273

3.1. Applicability of DPF with Drought Resilience Society Concept.
Drought preparedness framework (DPF) needs to consider livelihood approach that is cross sectorial and puts people in to the center. Therefore, ultimate aim of the Drought Preparedness Framework (DPF) is to make a drought resilient society. In order to achieve such it is worthwhile to investigate the applicability of DPF in the drought resilient society concept which proposed by Tadesse as mentioned in the literature. Formulated DPF then can be integrated to the concept of drought resilient society.
Figure 4: Proposed Drought Resilient Society and Drought Preparedness Framework
Drought Resilient Society
274
4. Conclusion and Recommendations
The ultimate aim of the research is to investigate the applicability of proposed Drought Preparedness Framework (DPF) to drought situations in Sri Lanka. Key objective of the study is to investigate the suitability of Drought Preparedness Framework as a guideline to minimize the impacts of the drought.
As identified in the previous studies, research findings revealed some common steps of drought management plans. By considering previous studies the study has proposed a new Drought Preparedness Framework (DPF) which consists of eighteen steps. Then the study checked the applicability of DPF with the concepts of drought resilient society.
As a future work, the study recommends investigating institutions and institutional capacities which would be responsible to each step of the proposed DPF, and to narrow down the proposed DPF by including strategies which can be implemented at ground level.
References
[1]. (NDRSC), N. D. (2011). Performance Report – 2011 (As at 31/08/2011). Colombo: National Disaster Relief Services Centre (NDRSC). [2]. Ana Paula et al. (2013). Drought preparedness in Brazil. Weather and Climate Extremes, 95-106. [3]. DMC. (2017, November). Disaster Management Center. Retrieved from http://www.dmc.gov.lk/index_english.htm [4]. Frederiksen, H. D. (1992). Planning for Drought: An Essential Action. In H. D. Frederiksen, Drought Planning and Water Efficiency Implications in Water Resource Management (pp. 7-37). Washington: The International Bank for Reconstruction and Development/THE WORLD BANK. [5]. Frederisken, H. D. (1992). Planning for Drought; an Essential Action. In H. D. Frederisken, Drought Planning and Water Resource Management (pp. 7-37). USA. Ilpyo Honga,et al. (2016). National drought management framework for drought preparedness. Korea. [6]. Jayamaha, G. (1975). An Analysis of droughts in Sri Lanka. Meteorological Department. K. A. U. S. Imbulana, et al. (2006). Sri Lanka national Water Development Project. [7]. Management, M. o. (2017). Initial Rapid Assessment for Drought in Sri Lanka. Ministry of Disaster Management. [8]. Nations, F.-U. (2016). Drought Risk Management. Rome, Italy. [9]. Nugraha, H. (2015). Geomorphometric characteristics of landslides in the Tinalah. The 5th Sustainable Future for Human Security (SustaiN 2014) (pp. 578-586). Procedia Environmental Sciences. [10]. OCHA. (2017, May). Relief web. Retrieved from https://reliefweb.int/disaster/dr-2016-000139-lka [11]. Tadesse, T. (2016). Drought Risk Management and Enhancing Resilience in Africa, Country Club and Resort - Strategic Framework for Drought Management and Enhancing Resilience in Africa. Namibia. [12]. UNDP. (2016). Drought Hazard Profile of Sri Lanka. [13]. UNISDR. (2009). A drought resilient society takes societal behavior, vulnerability factors, and consequences into consideration. [14]. Wilhite et al. (2010). Drought Preparedness Planning: Building Institutional Capacity. [15]. World Bank. (2013). Water Resources Planning and Adaptation to Climate Variability and Climate Change in Selected River Basinsin North east Brazil. Final Report on a Non Lending Technical Assistance program (P123869). Washington DC. World Bank. [16] WSDEN, W. S. (2007). DROUGHT MANAGEMENT PLAN REPORT - Including Agricultural, Drought Indicators and Climate Change Aspects. Luxembourg.
275

Resettlement of Population at High Risk of Natural Disasters in Sri Lanka
PHCS Rathnasiri1
1Scientist, National Building Research Organisation, Sri Lanka
Abstract
Sri Lanka is a country that has been frequently affected by natural disasters for consecutive years since recent past. Although, the resettlement of people living in areas at high-risk of natural disasters could be a vital option to effective disaster risk reduction preventing their exposure for such devastating events; an adequate consideration has not been made in Sri Lanka to execute such a strategy until recently. However, proper mechanism to execute resettlement programs is yet to be established. Thus, this research study attempts to discuss the execution of resettlement programs for disaster risk reduction in Sri Lankan context, addressing key issues of a resettlement mechanism that include: identification of need for resettlement under comprehensive disaster risk reduction approach, institutional setup, settlement planning and development, etc. The research method adopted was the consultation of experts or policy makers who are involved in the area of disaster management in Sri Lanka. Key findings include: standardization of the comprehensive planning approaches for disaster risk reduction making provisions for identification of need for resettlement and plan for execution; testing the execution of resettlement programs under Disaster Management Centre, National Building Research Organization and respective local authority centred approach; and undertake comprehensive settlement development approach with the involvement of mandated agencies for settlements planning and development. Further emphasized were the necessity to execute sub-programs within the resettlement process itself to address issues of livelihood development, impacts on other communities, and community participation. In addition, it was found to be important that the formulation of contingency plan to evacuate communities who will be identified for resettlement in an emergency disaster situation making necessary interventions that include risk monitoring, early warning and evacuation systems development, and prevention of development of risk factors in high hazard areas, and that, eventually, the formulation of specific policy to guide the execution of preventive resettlement programs Keywords: Disaster impacts; human settlements; disaster risk reduction; resettlement; resettlement mechanism; key issues
276

1. Introduction
The occurrence of natural disasters resulting from climate change and the consequent need for greater disaster management have gained global attention among governments and climate experts. It has been well established that as the climate continues to change, natural disasters are increasingly likely to occur at higher magnitude around the globe (Bulkeley, 2013). Then, governments of countries and regions that are vulnerable to natural disasters should place the highest priority on necessary interventions for Disaster Risk Reduction (DRR). Or else, these disasters could destroy long-term development efforts, affecting the lives of people, within a shorter period. Resettlement of people who are living in areas at high risk of natural disasters to safer areas could be a vital option for effective DRR, if there is no any other cost-effective option to reduce the risk of disaster on such people, and thereby to protect their lives (Correa et al., 2011).
1.1. Resettlement need for Disaster Risk Reduction in Sri Lanka
Sri Lanka is a country frequently affected by natural disasters that could be due to its climatic condition with the location as a tropical country, especially being an island in the Indian Ocean exposing to Bay of Bengal. As revealed by the Disaster Management Centre (DMC) of Sri Lanka and the United Nations Development Programme (UNDP) (2009), frequently occurring natural disasters in Sri Lanka are lighting, landslides, floods, fire, droughts and extreme wind conditions. Further to their analysis, it could consider that the frequency of occurrences of natural disasters has been increased in recent past. Further, as discussed in the National Physical Planning Policy (NPPP) of Sri Lanka 2030, more than two thirds of the population of Sri Lanka is exposed for natural disaster conditions (National Physical Planning Department [NPPD], 2006). Thus, resettlement of people who are living in areas at high risk of natural disasters to safer areas will be a vital option to consider in the pre-disaster management phase, which focuses mainly on DRR before the occurrence of a disaster event; through mitigation, prevention and enhancing community preparedness (Carter, 2008). Then, resettlement will be a disaster preventive strategy to reduce exposure to natural disasters and thereby to prevent risk on lives and properties.
1.2. Issue in concern
Although, the Government of Sri Lanka (GoSL) has not made an adequate attention earlier to consider the execution of resettlement of people in the pre-disaster phase, a priority has given to undertake the resettlement of people exposed for high disaster conditions with the disaster events that prevailed in May 2016, which claimed 210 lives affecting around 500,000 people in the country. In this, it had decided to execute resettlement of 1682 houses in Kegalle district of Sri Lanka consisting of houses directly affected by landslides and majority of them as identified as high risk for landslides (Ministry of National Policies and Economic Affairs and Ministry of Disaster Management [MDM], 2016). Further, GoSL has considered to resettle around another 15000 families that have been identified as living at high risk of landslides and it is being discussed to execute the resettlement under the government
277
funds that estimated as Sri Lankan Rupees 21.0 billion (Department of National Planning, Sri Lanka, personal communication, August 4, 2017).
However, such resettlement attempts may fail due to unavailability of a proper mechanism for execution addressing key issues, whereas several post disaster resettlement efforts have failed already in Sri Lanka. Vijekumara and Karunasena (2016) attribute the adverse effects of resettlement programs on resettled communities to several factors: inadequate planning and implementation mechanisms; inadequate focus on socio-economic conditions; lack of consideration for basic community needs; lack of community participation in the process; inadequate consideration of livelihood development for resettled families; vulnerability of resettlement areas to further disasters; and inability to prevent further development on evacuated lands at risk. In that context, this research study mainly attempted to study on key issues of the resettlement mechanism and how the GoSL could address those key issues for the successful resettlement of people living in areas at high-risk for natural disasters in the pre-disaster management phase.
1.3. Methodology
The research was mainly a qualitative study consisting of two major components; first, the literature review and second, the empirical analysis. The review of literature was conducted to review theoretical discussion and empirical studies of resettlement programs in global context in order to identify key issues that should be addressed for a successful execution of resettlement programs. The empirical analysis was conducted to find out how key issues of the resettlement mechanism could be addressed successfully in Sri Lankan context with special reference to existing provisions for execution and view of policy makers or experts who are directly involved in the areas of disaster management in Sri Lanka. Views of policy makers or expertise were obtained through interviews and the data gathered through interviews were analyzed using content analysis, which is a commonly used qualitative research technique to understand text data organizing them into meaningful categories through coding (Hsieh & Shannon, 2005). In this, key issues to address in the preventive resettlement mechanism were considered as codes where interview questions were also framed to address each key issue. Finally, findings were opened up for the discussion to conclude on how key issues of preventive resettlement mechanism could be addressed successfully in Sri Lankan context.
Although, this study is conducted in policy level decision making for executing resettlement of people living in areas at high risk for natural disasters in Sri Lanka, it will specifically be related to resettlement of people living in areas at high risk for landslide disasters whenever necessary, as landslides have been the most frequent and most devastating natural events that are occurring in Sri Lanka since the recent past and the priority of the government to resettle people living in areas at high risk for landslides.
1.4. Resettlement: Theoretical and Empirical Perspectives
Relocation and resettlement are two inter-related terms that have been used frequently in the context of community displacement and restoration of livelihoods and communities, particularly as a result of development projects (Ferris, 2012). The
278
term relocation refers to “the physical process of moving people and can be either temporary or permanent and either voluntary or forced” (Ferris, 2012, p.11); the term resettlement refers to “a process to assist the displaced persons to replace their housing, assets, livelihoods, land, access to resources and services and to restore their socioeconomic and cultural conditions” (The World Bank [WB], 2016, para. 3). Thus, planned relocation could be understood as resettlement. Further, the United Nations High Commissioner for Refugees (UNHCR) has defined resettlement “as a component of planned relocation, [resettlement] means: the process of enabling persons to establish themselves permanently in a new location, with access to habitable housing, resources and services, measures to restore/recover assets, livelihoods, land, and living standards, and to enjoy rights in a non-discriminatory manner” (UNHCR, 2014, p.10).
Accordingly, planned resettlement could be understood as housing programs, which aim to provide permanent and habitable housing; with access to resources and services, for people who are displaced or subject to displacement. However, special attention is required in resettlement to restore assets, livelihoods and living standards of displaced households, in order to safeguard the rights of vulnerable people and ensure their long-term well-being. Frequent causes for involuntary resettlement include: imminent civil rights violations or wartime violence, in which case the purpose of resettlement would be to safeguard lives in a community; declaration of specific land extents of settlements for development projects, particularly for public investment programs; or vulnerability of settlements to natural disasters which is the primary concern of this research study (Badri et al., 2006; Ferris, 2012).
One significant resource in planning a preventive resettlement program for those at risk from natural disasters were provided by the examination of development-induced resettlement. Such resettlement programs have mainly been called involuntary resettlement, where people of a community whose properties are being acquired for the purpose of public investment have no option except to rebuild their lives, livelihoods, and all other socio-economic networks elsewhere. Therefore, involuntary resettlement affects the resettled community significantly unless their socio-economic needs are adequately addressed (Asian Development Bank [ADB], 1998; WB, 2004). As per the involuntary resettlements policies discussed by both ADB (1998) and WB (2004): community should be adequately compensated and assisted in order for them to restore their socio-economic status, at least to ensure the situation they had before the resettlement; community should be consulted about the resettlements and compensation options since the beginning of the process; as well as, it should be considered to mitigate potential socio-cultural and economic impacts on host community and resettlers should be integrated properly in the host community; especially, social and cultural facilities should be supported to meet the additional demand; further, resettlement program should be implemented to assist all the social groups affected by the proposed project despite the legal title to the land or any other vulnerability such as, women headed families, indigenous peoples or ethnic minorities; finally, entire cost component of the resettlement including compensations should be borne by the total cost of the proposed project. Thus, implementation of such involuntary resettlement programs under widely recognized policies to ensure requirements of the vulnerable community and provision to bear the associated cost through the proposed development project itself could be
279

considered as vital provisions for the successful implementation protecting rights of affected people.
3.1. Resettlement for disaster prevention
Resettlement for DRR is the prime concern of this research study and a major consideration in the context of climate change, but still less attention has been paid in global context from implementation point of view (Ferris, 2012). Especially, when there is no any other feasible option to mitigate disaster risk associated with people and properties, the resettlement will be the only option that could perform to protect lives of people, preventing their exposure to potential disaster conditions. In addition, the resettlement perform in the pre-disaster management phase is called as preventive resettlement (Correa et al., 2011). Thus, the preventive resettlement will be a vital tool for many countries, whose countries are exposed to natural disaster conditions, in order to protect lives of people living in high-risk areas. In this regard, people who were possessing of adequate resources may resettle by themselves, but government intervention will be vital to resettle remaining people to safer areas, who could be considered as most vulnerable people in the community in terms of socially and economically. Thus, unlike development-induced resettlement, the preventive resettlement will be a prime responsibility of a respective government. As discussed by Correa et al. (2011), for many cases, resettlements have been considered in the post-disaster reconstruction phase in order to resettle survivors from disaster events, aftermath the major damages were caused for lives and properties. However, even such resettlement programs have been failed in most of the cases with the requirement to plan and implement within a shorter period as an emergency response activity (Badri et al., 2006). As discussed by Chan (1995), resettlement for disaster risk reduction have not been widely accepted option among disaster vulnerable people as less attention that had been paid to address socio economic needs of resettled communities, causing resettlement efforts to fail significantly within a shorter period. Another reason for such inadequate attention could be the lack of funding with the state to implement preventive resettlement programs. However, it will be vital to perform preventive resettlement; as far as, associated benefits of it are concerned. In this, protecting the lives of people is the immense benefit, and from government point of view, it can reduce the expenditure on performing emergency responses and providing relief services during and post disaster management phases. Further, implementation of a well-planned resettlement programs could provide opportunities to ensure economic development of disaster vulnerable people; providing new employment opportunities, easy access for education and health facilities, and supply of adequate physical infrastructures, where it could lead the local economic development as well (Badri et al., 2006; Correa et al., 2011; Chan, 1995).
Thus, resettlement will be a complex process by nature where multidisciplinary approach is required to follow considering physical, social, cultural, economic, environmental, political, and as well as administrative aspects (Correa et al., 2011). Therefore, a comprehensively developed mechanism will be required to direct proper planning and implementation of resettlement programs.
280

3.2. Planning and implementation mechanism of preventive resettlement
Correa (2011) has discussed resettlement efforts made in several Latin American countries include: Argentina, Brazil, Guatemala and Colombia, with reference to different alternatives adopted by each case for the execution of resettlement programs successfully. Again, Badri et al. (2006) have discussed key issues that should be addressed in a successful resettlement plan having studied several resettlement best practices in four Asian countries: Bangladesh, China, Nepal and Vietnam. Further, Ferris (2012) has discussed about preliminary understandings for resettlement of population with the especial focus on protecting the rights of communities, who will be relocated due to impacts of the climate change. Accordingly, eleven key issues could be identified that should be addressed in a comprehensive preventive resettlement mechanism for successful execution as discussed in the table 1. Thus, experts or policy makers who are involving in the area of disaster management in Sri Lanka was consulted to obtain their views and suggestions that could be adopted to address key issues of the preventive resettlement mechanism in Sri Lankan context.
Table 1. Key Issues of a Preventive Resettlement Mechanism that should address for Successful Execution
No. Issue Description
1
Identification of need for resettlement under comprehensive DRR planning approaches
Provisions for hazard and disaster risk assessment, identification of mitigation measures and evaluate by cost effectiveness, resettlement need and plan for execution with the agreement of stakeholders including disaster vulnerable communities
2 Arranging Institutional setup
For planning, implementation and coordination. Key agency to take the overall responsibility with expertise knowledge in housing and resettlement, and allocating necessary resources. Assign specific tasks among mandated agencies, and communication and coordination system between stakeholders
3 Settlement planning and development
Integrate with land use planning system for long-term sustainability ensuring access for basic services, infrastructures, creating employment opportunities. Further, identification and acquisition of safer lands, layout planning and designing, management of high risk areas should be undertaken adhering to land use planning principles and regulations
4 Housing and compensation options
Introduce different housing and compensation options to assist most vulnerable people. Community involvement in the construction process introducing specific programs such as assisted self-housing program. Compensations to purchase a house in the market and partially subsidizing housing cost introducing repayment plan depending on their socioeconomic vulnerabilities could be considered
5 Livelihood development or restoration
Ensure access for employment opportunities or income sources. Investments could be considered, where resettlers could engage
281

6
Eliminate adverse impacts on other communities that could be caused by resettlement
Necessary intervention to avoid socioeconomic impacts on host communities and communities remain at original settlements of resettlers. Ensure their access for services and livelihood activities while attempting to minimize sociocultural issues
7 Community participation and management
Community participation should be ensured throughout the process since the comprehensive DRR programs making necessary awareness on risk conditions and agreement on resettlement options integrating their socioeconomic and cultural context. Grievance system is one of the vital component to make available. Especial needs of socially disadvantaged groups should be addressed
8 Assurance of funding Ensure access for required funding at the planning stage
9
Contingency program to evacuate people at risk in an emergency disaster situation until the resettlement is completed
Community preparedness, system to risk monitoring, evacuate and management of vulnerable communities in case of an emergency. Specific measures such as providing assistance to identified communities for resettlement to live with relatives or rent a house could be considered
10 Rehabilitation of land at risk
Necessary interventions to ensure that no more settlements will be developed on risk lands that were owned or used by resettlers. Acquisition and convert the use of such high-risk lands for forest reserve or public parks could be considered
11 Legal provisions and policy directives
To undertake DRR programs including execution of preventive resettlement
4. Execution of preventive resettlement in Sri Lanka: Empirical Analysis
With reference to existing provisions in Sri Lanka to address key issues of the preventive resettlement mechanism which has been described in table 1, it could be concluded that the lack of provisions made under the comprehensive DRR approaches to identify the need of preventive resettlement and plan for the execution as a main reason for not undertaking preventive resettlement programs. Especially, such comprehensive approaches have not recognised how to protect lives of people who are exposed for high disaster conditions and whenever there are no cost-effective alternatives to mitigate the risk. However, an adequate framework exists in the country; especially legal and policy directives to undertake DRR activities, comprehensive planning approach for DRR, institutional setup, system for land use planning and funding mechanism for DRR activities, that could be adopted to execute preventive resettlement addressing key issues of the executing mechanism (MDM, 2014; MDM, 2010; GoSL, 2005; MDM & DMC, 2005; Ministry of Disaster Management and Human Rights, 2006; NPPD, 2006; NPPD, 2011; GoSL, 1978; Urban Development Authority, 2016). But, several inadequate practices were recorded even with reference to the ongoing resettlement program that is being implemented in Kegalle district of Sri Lanka to resettle people at risk of landslides that had initiated in post May 2016 disaster events: such as, lack of key agency to take the overall responsibility; none of mandated agencies for land use planning are
282

involved to guide settlement planning and development; specific measures are not recorded for livelihood development or restoration; no consideration for addressing impacts on host communities and communities remain at the original settlement of the resettlers; lack of provisions for community participation in the process; and lack of clear solution to acquire and rehabilitate high risk land that are owned by resettlers (Ministry of National Policies and Economic Affairs & MDM, 2016; Presidential Secretariat, Sri Lanka, personal communication, June 14, 2016 & September 22, 2016; Asian Disaster Preparedness Centre & NBRO, 2017; ).
In that context, empirical analysis was conducted to identify how key issues of the preventive resettlement mechanism could be addressed in Sri Lankan context with the consultation of experts or policy makers who are involved in the area of disaster management in Sri Lanka.
4.1. Results
The summery on the prescribed measures to address each of the key issues of the preventive resettlement mechanism in Sri Lankan context are briefly described in the table 2. Table 2. Prescribed Measures to Address Key Issues of the Preventive Resettlement Mechanism in Sri Lankan Context as Discussed by Experts or Policy Makers
Issue 1. Identification of resettlement need under comprehensive DRR approaches • Develop a SOP to undertake comprehensive DRR approaches • Strengthen the scientific approach in decision making for DRR Issue 2. Institutional setup The main discussion was on who should take the overall responsibility of preventive resettlement coordinating with mandated agencies for specific activities. Following three options were mainly agreed by interviewees; • DMC and NBRO based approach • Establishment of a separate authority • Respective local authority based approach Issue 3. Settlement planning and development Following settlement planning and development considerations were suggested; • Need for comprehensive settlement planning and development approach • Development of new settlements on identified safer lands ensuring access for basic
needs, integrating with other settlements • Make resettlement in close proximity to urban areas • Attempt to ensure real development of affected people and contribute to local
economic development • Develop planning and building guidelines for resettlement and legalize them in order
to standardize the system • Obtain necessary planning clearance and adhere to prevailing planning and building
regulations including NPPP and NPP 2030 Then, discuss agencies that should take the responsibility in settlement planning and development; • UDA or NHDA as the key agency for planning and development for resettlement
housing under the guidance of NPPD • NBRO to guide on resilient planning and designing aspect Issue 4. Housing and compensation options
283
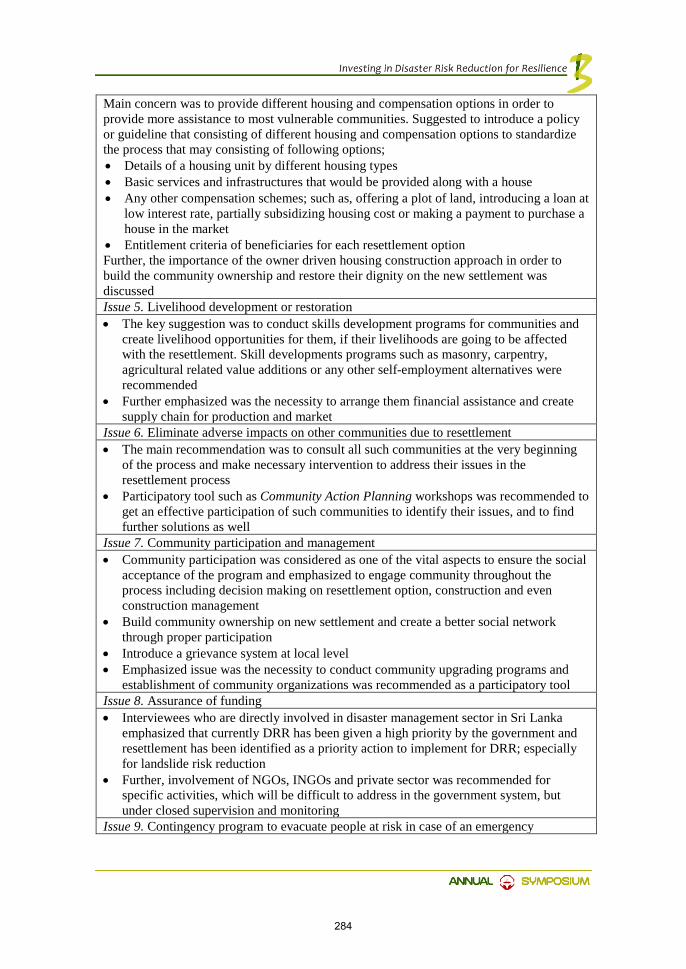
Main concern was to provide different housing and compensation options in order to provide more assistance to most vulnerable communities. Suggested to introduce a policy or guideline that consisting of different housing and compensation options to standardize the process that may consisting of following options; • Details of a housing unit by different housing types • Basic services and infrastructures that would be provided along with a house • Any other compensation schemes; such as, offering a plot of land, introducing a loan at
low interest rate, partially subsidizing housing cost or making a payment to purchase a house in the market
• Entitlement criteria of beneficiaries for each resettlement option Further, the importance of the owner driven housing construction approach in order to build the community ownership and restore their dignity on the new settlement was discussed Issue 5. Livelihood development or restoration • The key suggestion was to conduct skills development programs for communities and
create livelihood opportunities for them, if their livelihoods are going to be affected with the resettlement. Skill developments programs such as masonry, carpentry, agricultural related value additions or any other self-employment alternatives were recommended
• Further emphasized was the necessity to arrange them financial assistance and create supply chain for production and market
Issue 6. Eliminate adverse impacts on other communities due to resettlement • The main recommendation was to consult all such communities at the very beginning
of the process and make necessary intervention to address their issues in the resettlement process
• Participatory tool such as Community Action Planning workshops was recommended to get an effective participation of such communities to identify their issues, and to find further solutions as well
Issue 7. Community participation and management • Community participation was considered as one of the vital aspects to ensure the social
acceptance of the program and emphasized to engage community throughout the process including decision making on resettlement option, construction and even construction management
• Build community ownership on new settlement and create a better social network through proper participation
• Introduce a grievance system at local level • Emphasized issue was the necessity to conduct community upgrading programs and
establishment of community organizations was recommended as a participatory tool Issue 8. Assurance of funding • Interviewees who are directly involved in disaster management sector in Sri Lanka
emphasized that currently DRR has been given a high priority by the government and resettlement has been identified as a priority action to implement for DRR; especially for landslide risk reduction
• Further, involvement of NGOs, INGOs and private sector was recommended for specific activities, which will be difficult to address in the government system, but under closed supervision and monitoring
Issue 9. Contingency program to evacuate people at risk in case of an emergency
284

• Discussed the necessity to immediate evacuation of families exposed to high disaster risk conditions providing temporary shelters or any other suitable arrangement at the beginning of the process
• Introduce proper risk monitoring plan for families who are not necessary to evacuate immediately, but prepare to evacuate before a disaster event
• Further, emphasized was the necessity to strengthen existing emergency evacuation system, which is mainly operated by the DMC
Issue 10. Rehabilitation of land at risk The main discussion was to take necessary actions to prevent development of risk factors on such high disaster vulnerable areas in the future. Following options were mainly discussed; • Acquire risky lands and convert them to forest reserves • Introduce a permit system to use the land by original owners, but only for a purpose of
forestry or any other cultivation as recommended • Formulate strict regulations and closed monitoring system for such lands vulnerable for
high disaster conditions ensuring no more settlements are developed • Aware all technical agencies not to make any development activity on such areas Issue 11. Legal provisions and policy directives Mainly discussed was that the existing legal provisions by the Sri Lanka Disaster Management Act is adequate in order to develop a preventive resettlement approach as a DRR option. However, emphasized the necessity to formulate a specific policy to guide the mechanism of executing preventive resettlement programs to standardize the process that would minimize several anomalies in practice at ground level
5. Conclusion
One of the main idea was the necessity to standardise the comprehensive planning approaches for DRR of the country making provisions for identification of need for resettlement and plan for execution. In case of arranging the institutional setup, the main issue was who should take the overall responsibility in executing preventive resettlement programs once the need for resettlement was identified by respective technical agencies; NBRO in case of landslides, that was a main deficiency of Kegalle resettlement effort. Accordingly, there were three major opinions to consider that include: the combination of DMC and NBRO; establish a separate authority exclusively to undertake the preventive resettlement programs; and respective local authority centred approach. In case of settlement planning and development, the necessity to consider sustainability of such new settlements undertaking comprehensive development approach on safer lands that suit for human settlements were stressed. For this, involvement of the mandated agencies for settlement planning and development; mainly UDA and NHDA, was considered as vital under the overall guidance of NPPD to ensure the compliance with NPPP and NBRO to ensure the resilient development, which was another key deficiency of Kegalle case. Interviewees discussed the importance of the development of clear-cut policy on housing and compensation packages emphasising entitlement criteria for each package. Further, emphasis the necessity to include sub-programs for livelihood development, address issues on other community that could be caused by resettlement and community participation and management as vital components that has been not considered in Kegalle resettlement effort adequately. Although allocation of necessary funding for DRR and resettlement will not be an issue with the priority of
285

the government, the importance of the involvement of NGOs and INGOs in the process of the resettlement was discussed. In case of addressing the issue of contingency planning for emergency evacuation of identified communities for the resettlement until the resettlement is completed, the necessity to enhance the capacity of current emergency evacuation system was stressed introducing proper risk monitoring, early warning and evacuation systems with especial intervention to community preparedness. However, immediate evacuation of communities living in most dangerous areas for disasters was stressed. In case of rehabilitation of risk lands that were owned by resettlers, the necessity to introduce a system to prevent development of risk factors again on such hazardous areas was stressed. Finally, the necessity to formulate a specific policy to guide the execution of preventive resettlement mechanism was emphasized in order to standardize the process and procedure all over the country considering current and future need.
6. Recommendations
With reference to key deficiencies of the existing system to adopt preventive resettlement approach and measures discussed by interviewees, three major recommendations could be made for the development of proper preventive resettlement mechanism in Sri Lanka as discussed below; 1. Standard Operating Procedure (SOP) should be developed to guide the
formulation of comprehensive plans for DRR having undertaken research studies and consultations of key stakeholders with special attention to: defining of disaster prone areas; vulnerability and risk assessment for natural disasters; identification of DRR measures and final measure through cost effectiveness assessment that include need for resettlement; planning and implementation; and monitoring and evaluation.
2. In case of arranging a key institutional setup to undertake the overall responsibility for the execution of landslides related preventive resettlement, the combination of DMC, NBRO and respective local authority centered approach could be tested. This is the combination of two approaches proposed by interviewees, and that could be considered as; more feasible approach, as possibility to form utilizing existing institutions; and more effective, as it represents national level planning and resources allocation, district level resettlement need assessment and guiding for resilient development into local level execution. In this, DMC is to make necessary provisions and resources allocation under comprehensive planning with the coordination of NCDM and NBRO, which is to assess resettlement need performing risk assessment and provide technical expertise on resilient settlement development, where local authority is to implement the resettlement within their respective local authorities with the consultation of key agencies mandated for land use planning, infrastructure provisions, local administration and any other local level agencies as per the necessity.
3. Development of a specific policy to guide the execution of preventive resettlement programs that may include: key stages by different activities; institutional arrangement with clear-cut responsibilities; resettlement and compensation options; defining risk communities that needed to be resettled; criteria of selecting beneficiaries by different resettlement option; broader land use zoning plan to
286
guide areas where resettlement could be taken place; building regulations; and regulation and monitoring system of risk lands owned by resettlers. Along with above key recommendations, necessary interventions to be made for
addressing several more recommendations that include: development of scientific base for disaster risk assessment, identification of DRR measures and evaluation of cost effectiveness of such measures; enactment of necessary by-laws for construction; development of contingency plans for the emergency evacuation of communities that are selected for the resettlement; and research on appropriate use of the land at high risk for disasters that are owned by resettlers.
Acknowledgements
This paper is based on the thesis that was financially supported by Korea International Cooperation Agency (KOICA) as part of 2016 KOICA Global Fellowship Program (CIAT).
References
[1] Asian Development Bank. (1998). Handbook on Resettlement: A Guide to Good Practice. Retrieved fromhttp://indr.org/wp-content/uploads/2013/02/Handbook_on_Resettlement.pdf
[2] Asian Disaster Prepardnes Centre, & National Building Research Organisation. (2017). Minutes of the District Level Disaster Management Committee; Kegalle District, 25th July 2017, Sri Lanka Community Landlside Risk Management Project.
[3] Bulkeley, H. (2013). Cities and Climate Change. Oxon: Routledge. [4] Badri, S.A., Asgary, A., Eftekhari, A.R., & Levy, J. (2006). Post-disaster resettlement,
development and change: a case study of the 1990 Manjil earthquake in Iran. Disasters, 30(4), 451-468. Retrieved from http://citeseerx.ist.psu.edu/viewdoc/download?doi=10.1.1.462.6103&rep=rep1&type=pdf
[5] Carter, W.N. (2008). Disaster Management: A Disaster Manager’s Handbook. Manila: Asian Development Bank. Retrieved from https://www.think-asia.org/bitstream/handle/11540/5035/disaster-management-handbook.pdf?sequence=1
[6] Correa, E., Ramirez, F., & Sanahuja, H. (2011). Population at Risk: A Resettlement Guide. Washington, DC: The World Bank and Global Facility for Disaster Risk and Recovery. Retrieved from http://documents.worldbank.org/curated/en/612501468045040748/pdf/653550WP0Box360settlement0guide0150.pdf
[7] Correa, E. (Ed.). (2011). Preventive Resettlement of Populations at Risk of Disaster: Experiences from Latin America. Washington, DC: The World Bank. Retrieved from http://www.zaragoza.es/contenidos/medioambiente/onu/issue07/1115-eng-res1.pdf
[8] Chan, N.W. (1995). Flood disaster management in Malaysia: an evaluation of the effectiveness of government resettlement schemes. Disaster Prevention and Management, 4(4), 22-29. MCB University Press. Retrieved from http://www.emeraldinsight.com/doi/pdfplus/10.1108/09653569510093405
[9] Disaster Management Centre, & United Nations Development Program in Sri Lanka. (2009). Sri Lanka National Report on Disaster Risk, Poverty and Human Development Relationship. Retrieved from http://www.preventionweb.net/english/hyogo/gar/background-papers/documents/Chap3/Asia-overview/Sri-Lanka-DRAFT-march-09.pdf
287

[10] Disaster Management Centre, & Ministry of Disaster Management of Sri Lanka (2005). Towards a Safer Sri Lanka: Road Map for Disaster Risk Management. Retrieved from http://www.adrc.asia/documents/dm_information/srilanka_plan02.pdf
[11] Ferris, E. (2012). Protection and Planned Relocations in the Context of Climate Change. Geneva: Division of International Protection, UNHCR. Retrieved from https://www.brookings.edu/wp-content/uploads/2016/06/protection-climate-change-ferris.pdf
[12] Government of Sri Lanka. (1978). Urban Development Authority Law no. 41 of 1978. Retrieved from Urban Development Authority of Sri Lanka web site: http://www.uda.gov.lk/attachments/act/uda_law_act_no_41_of_1978.pdf
[13] .(2005). Sri Lanka Disaster Management Act no. 13 of 2005. Retrieved from Ministry of Disaster Management of Sri Lanka web site: http://www.disastermin.gov.lk/web/images/pdf/DMACTNO13_E.pdf
[14] Hsieh, H.F., & Shannon, S.E. (2005). Three approaches to qualitative content analysis. Qualitative Health Research, 15 (9), 1277-1288. Retrieved from http://journals.sagepub.com/doi/pdf/10.1177/1049732305276687
[15] Ministry of National Policies and Economic Affairs, & Ministry of Disaster Management. (2016). Sri Lanka Post-Disaster Needs Assessment: Floods & Landslides 2016. Retrieved from http://documents.worldbank.org/curated/en/872611496221419957/pdf/115335-WP-PUBLIC-pda-2016-srilanka.pdf
[16] Ministry of Disaster Management and Human Rights of Sri Lanka. (2006). Towards a Safer Sri Lanka: Road Map for Disaster Risk Management, Volume 2: Project Proposals. Retrieved from http://www.dmc.gov.lk/Publications/Road_Map_Volume_2.pdf
[17] Ministry of Disaster Management of Sri Lanka. (2014). Sri Lanka Comprehensive Disaster Management Program; 2014-2018. Retrieved from Ministry of Disaster Management of Sri Lanka web site:http://www.disastermin.gov.lk/web/images/pdf/slcdmp%20english.pdf
[18] . (2010). National Policy on Disaster Management. Retrieved from Ministry of Disaster Management of Sri Lanka web site: http://www.disastermin.gov.lk/web/images/pdf/dm%20policy%20full%20ver.pdf
[19] National Physical Planning Department of Sri Lanka. (2011). The functions of the NPPD. Retrieved from National Physical Planning Department web site: http://www.nppd.gov.lk/index.php?option=com_content&view=article&id=46&Itemid=27&lang=en
[20] . (2006). National Physical Planning Policy and Plan: 2006 – 2030. Final draft. Retrieved fromhttp://uvastrategy.wikispaces.com/file/view/NPPP.pdf
[21] The World Bank. (2004). Involuntary Resettlement Sourcebook. Washington, DC: The World Bank. Retrieved from http://documents.worldbank.org/curated/en/206671468782373680/pdf/301180v110PAPE1ettlement0sourcebook.pdf
[22] . (2016).Involuntary Resettlement. Retrieved from http://web.worldbank.org/WBSITE/EXTERNAL/TOPICS/EXTSOCIALDEVELOPMENT/EXTINVRES/0,,menuPK:410241~pagePK:149018~piPK:149093~theSitePK:410235,00.html
[23] United Nations High Commissioner for Refugees. (2011). UNHCR Resettlement Handbook. Geneva: UNHCR. Retrieved from http://www.unhcr.org/46f7c0ee2.pdf
288

SMART AND SUSTAINABLE BUILT ENVIRONMENT

A review on using cellulose fibers with improved durability as an alternative to asbestos fibers in Sri
Lankan context
RLP Ramasinghe1, GLM Ariyadasa1, KGNT Gamage1, SU Adikary2
1Engineer, National Building Research Organisation, Sri Lanka 2Department of Materials Science and Engineering, Faculty of Engineering, University of
Moratuwa, Sri Lanka
Abstract
The quest for alternative fibers to asbestos fibers for roofing sheets has made the use of more renewable resources in construction industry a necessity. Plant-based cellulose fibres are low cost renewable materials which can be found in abundant supply in many countries. This paper presents a summary of research progress on discovery of alternative fibers to asbestos for cement-based composites in National Building Research Organization (NBRO), Sri Lanka. Drawbacks associate with cellulose fibers in cement matrix are discussed. Measures to enhance the durability properties of cement-based composites containing plant-based cellulose fibres are appraised. Significant part of the paper is introducing methods: how to improve the durability of cellulose fibres in cement-based composites. Then, applications and recommendations for future work are presented which is more suitable to Sri Lanka.
Keywords: asbestos fibers, cellulose fibers, roofing sheets, coir fibers, palmyrah fibers, fiber-cement composite, durability, embrittlement
1. Introduction
In the early 1970s a global effort was initiated to legislate for the removal ofasbestos reinforcement from a wide range of products. In Sri Lanka, white Chrysotile asbestos used to produce roofing and ceiling materials in the country, over decades as the main production of asbestos. However, over the past two decades, the use of asbestos fibers has been forbidden in the production of fiber cement board in many of developed countries, those carcinogenic fibers are still used in many of developing countries. Since the early 1970s after recognition of asbestos hazard on human health, a global effort was initiated to replace asbestos fibers from construction products.
289

Depending on properties, effectiveness and cost, a wide variety of natural and synthetic fibers such as Bagasse, Wheat, Kraft pulp, Sisal, Jute, Steel, Glass, Acrylic and Polyvinyl Alcohol fibers have been used as asbestos alternatives in production of fiber-cement boards.(Coutts, 2005; Khorami, Ganjian, & Srivastav, 2016)
NBRO has also been carried out researches to find suitable alternative fibers to asbestos fibers. Previous studies carried out by NBRO have been studied on using coir fiber and glass fiber and their drawbacks. As a consequence, NBRO has moved on to cellulose fibers as a low cost fiber reinforcement with the object of overcoming the durability problem found in incorporating cellulose fibers in cement matrix.
2. Literature Review
Asbestos fibers were the major constituent of the fiber cement composites for building materials. At the moment, new reinforcing fibers were being sought as alternatives to asbestos in this class of building material. Those countries that recognised the need to legislate against the use of asbestos, on health grounds, have proved to be the ones that have achieved the most advances with respect to asbestos substitution and have thus avoided, in most cases, a downturn in the fibre cement business.
Fiber cement board is one of the known construction products that can be used as an internal/external wall as well as materials for roofing. Due to the identification of health hazards associated with asbestos, researchers have focused on cellulose fibers to exploit the position of asbestos in building materials. Cellulose fibers exhibit a set of important advantages, such as wide availability at relatively low cost, bio renewability, ability to be recycled, biodegradability, non-hazardous nature, zero carbon footprint, and interesting physical and mechanical properties (low density and well-balanced stiffness, toughness and strength)(Ardanuy, Claramunt, & Toledo Filho, 2015; Satyanarayana, Arizaga, & Wypych, 2009). Cellulose fibers can be found in a wide variety of morphologies – diameter, aspect ratio, length and surface roughness – and form – mainly strands, pulp or staple. Moreover, their surface can be easily modified in order to have a more hydrophilic or hydrophobic character or to attach functional groups (Faruk, Bledzki, Fink, & Sain, 2012). Although brittle building materials have been reinforced with cellulose fibers since ancient times, the concept of cellulose fibers reinforcement in cement-based materials was developed in 1940s, when these fibers were evaluated as potential substitutes for asbestos fibers. Nowadays, the need for sustainable, energy efficient construction materials has oriented extensive research on alternative materials to produce environmentally friendly construction products. Applications of cellulose fiber cement composites are basically addressed to the non-structural building of thin walled materials, mainly thin-sheet products for partitions, building envelope or ceilings flat sheets, roofing tiles and pre-manufactured components in general. Cellulosic fiber cement composites exhibit improved toughness, ductility, flexural capacity and crack resistance compared with non-fiber-reinforced cement-based materials. The major advantage of fiber reinforcement is the behaviour of the composite after cracking has started, as the fibers bridge the matrix cracks and transfer the loads. The post cracking toughness may allow more intensive use of such composites in building. Despite all the aforementioned advantages, the industrial production of cement-based composites reinforced with cellulose fibers is currently limited by the long-term
290
durability of these materials. The durability problem is associated with an increase in fiber fracture and a decrease in fiber pull-out due to a combination of the weakening of the fibers by alkali attack, fiber mineralization due to the migration of hydration products to lumens, and space and volume variation due to their high water absorption (Ardanuy et al., 2015).
However, there are serious research works have been carried out within the last decade using cellulose fibers as an alternative to the asbestos fibers on roofing materials. There are researches carried out by NBRO to find alternative fibre to roofing materials.
Pathirana et.al. (C.I.Mathew, D.H.M.S.Bandara, & J.S.Pathirana, 1987) introduced coir fiber as an alternative fibre to Asbestos in 1987. In this study, the authors present their approach in obtaining the most suitable cement-sand design mix. Materials used for the construction of the sheet: sand, clean coir fiber and masonary cement. Coir fiber used as the reinforcement of the sheet. In corrugated non-reinforced and reinforced sheets, the strength due to the presence of the coir fiber increased by as much as 4%. But the sheet was brittle comparatively to the more established Asbestos cement sheets. And the durability of the sheet is in suspect due to the presence of organic material (coir fiber) in it and the long term effects of cement on the fiber. But this can be accepted as a low cost building material.
Afterwards, Ariyadasa et.al. (Ariyadasa, Muthurathne, & Adikari, 2017) introduced glass fiber corrugated roofing sheet in cement matrix. In this study Glass fibre reinforced fly ash -cement roofing tiles were fabricated using three different forms of coal fly ash (CFA) such as CFA as it is, CFA particle sizes below 75μm and below 45μm. The separated CFA was used to replace cement 30% by weight and those matrices were reinforced by Alkali Resistant (AR) glass fibres as 1% and 2% by weight. The corrugated roof tiles have dimensions of 490×250×8mm and they were hand cast using ordinary vibration. Physical and mechanical tests were performed after 28 days of aging. The glass fibre reinforced fly ash-cement roofing tiles are promising as a roofing material in both CFA as it is form and CFA sieved form due to the comparable transverse strength with Calicut clay tile, comparable dry density with asbestos sheet, lower water absorption compared to asbestos sheets and non-asbestos sheet and lower thermal conductivity compared to Calicut clay tiles and asbestos sheets.
3. Discussion
The main drawback associated with cellulose fiber cement composites is the low durability of the cellulose fibers in cement matrix. When manufacturing composite materials, compatibility of the matrix and the fibres is also a problem, and various methods of increasing the adhesion between the matrix and the fibres have been investigated. Such drawbacks inherited with cellulose fiber cement composites will be further discussed in this paper.
As is known, the majority of the cellulose cement composites are based on ordinary Portland cement (OPC). This agglomerate hardens by hydration of anhydrous compounds giving rise to calcium silicate hydrate (CSH gel), ettringite and calcium hydroxide or portlandite. This excess of water evaporates during the curing step leading to porous network cement. This porosity is one of the causes of the lack of durability of the cement pastes, given that it allows the access of water which can
291

contain different dissolved substances (chloride or sulfate salts or acids among others) or gases from the outside into the inside of the cement material. Furthermore, depending on climatic conditions, the pore network may be dry, semi-saturated and saturated (in humid weather with >65% relative humidity). Under these conditions, the interstitial water dissolves calcium hydroxide to form a buffered solution of pH > 13. Many studies have related the presence of this calcium hydroxide with the degradation of cellulose fibers, and thus with the loss of durability of the cellulose fiber reinforced cement-based composites (Ardanuy, Claramunt, García-Hortal, & Barra, 2011; Mohr, Biernacki, & Kurtis, 2006; Romildo D Toledo Filho, Scrivener, England, & Ghavami, 2000; Tonoli et al., 2011). Mohr et.al.(Mohr, Nanko, & Kurtis, 2005) recognized the following sequence of damage which occurs in the cellulose fibers when the composite is subjected to various wet–dry cycles: (a) loss of adherence between the fiber and the matrix after the second wet–dry cycle; (b) re precipitation of the hydrated compounds within the void space at the former fiber– cement interface during the first ten wet–dry cycles; (c) full mineralization, and thus the embrittlement of the cellulose fibers after ten wet–dry cycles.
The two main strategies are mainly suggested by the researchers for improving the durability of the cellulose-fiber reinforced cement based composites. One possibility is to modify the composition of the matrix in order to reduce or remove the alkaline compounds. The second technique is to modify the fibers with chemical or physical treatments to increase their stability in the cementitious matrix (Ardanuy et al., 2015). Some of these treatments suggest the use of chemical reagents and could be complex to apply in industrial processes. For this reason it is important to look for simple and most suitable strategies which can be easily implemented in Sri Lanka.
3.1. Modifying the matrix
There are basically two treatments that have been introduced for removing or reducing the portlandite content in the matrix such as adding pozzolanic compounds or the carbonation process.
The pozzolanic reaction is done during the hydration process between the calcium hydroxide and the amorphous silica, producing hydrated calcium silicate, a very stable salt. The reaction as follows: (Ardanuy et al., 2015)
3Ca++ + 2H2SiO42- + 2OH- + H2O Ca3[H2Si2O7](OH)2.3H2O
Eq.1
In OPC, the amorphous silica content is insufficient to transform all the portlandite existing into CSH gel. This excess of portlandite is desirable for stainless-steel-reinforced concretes, where the durability depends mainly on the alkalinity of the medium. However, this alkalinity is the main drawback associated with the cellulose fiber composites, which require the portlandite to be reduced or removed from the medium. Therefore, it is essential to add extra pozzolanic compounds to the cement paste in order to promote the transformation of portlandite into CSH gel. There are several pozzolanic additions have been recomended, such as microsilica or silica fume, metakaolin, blast furnace slag or fly ash among others. Depending on the reactivity, it will modify the matrix in different manner (de Almeida Melo Filho, de Andrade Silva, & Toledo Filho, 2013; Mohr, Biernacki, & Kurtis, 2007; Romildo
292

Dias Toledo Filho, de Andrade Silva, Fairbairn, & de Almeida Melo Filho, 2009; Romildo D Toledo Filho, Ghavami, England, & Scrivener, 2003).
The second way of modification of matrix is accelerated carbonation process as another type of alternative for increasing the durability of the cellulose fiber cement composites which has been studied. Carbonation allows the quick reaction of Ca(OH)2 with carbon dioxide (CO2) resulting in CaCO3. This process also has an impact on the mechanical properties of the composites, increasing strength and reducing the specific energy and water absorption. This process is usually done in humidity chambers with enriched CO2 atmospheres. One interesting possibility which has been less studied is performing this accelerated carbonation under supercritical carbon dioxide (SC-CO2) processing conditions (Almeida, Tonoli, Santos, & Savastano, 2013; Shao, Wan, & He, 2011; Soroushian, Won, & Hassan, 2012; Romildo D Toledo Filho et al., 2003; Tonoli, Santos, Joaquim, & Savastano, 2010).
3.2. Modifying the fibers
The other approach for improving the durability of cellulose fiber cement composites consists in the physical or chemical modification of the fibers with the aim of optimizing the fiber–matrix adhesion and making them less sensitive to the matrix composition and environmental humidity.
A cheap and simple method successfully used by researchers to obtain more durable cellulose fiber cement composites is the hornification of cellulose fibers (Ardanuy et al., 2011; Claramunt, Ardanuy, García-Hortal, & Tolêdo Filho, 2011). Hornification is an irreversible effect which occurs on fibers subjected to drying and rewetting cycles principally. Hornificated fibers have obtained higher dimensional stability and lower water retention values. The other method is refinement of fibers (Tonoli, Santos, et al., 2010). The improved surface contact area after refining contributes to the enhanced adhesion of the sort fibers, despite the increase of the composite rigidity caused by a supposed mineralization or embrittlement of microfibrils after aging (Tonoli, Savastano, et al., 2010).
The surface modification of fiber using chemicals also have been identified as a better way of improving the durability of cellulose fibers in cement matrix. On the other hand, Toledo Filho et.al. (Romildo D Toledo Filho et al., 2003) analyzed the effect of immersion of long sisal fibers in slurried silica fume prior to their incorporation in the matrix. They found that it was an effective method for improving the strength and toughness of the composites with time. The presence of silica fume in the fiber–matrix interface performed to create a zone of low alkalinity around the fiber which delayed or prevented the degradation of the fiber by alkaline attack or mineralization through the migration of calcium products.
Among the above mentioned modification methods for improving the durability of fiber cement matrix, it is important to select most appropriate method to Sri Lanka for production of industrial scale roofing sheets which to the low income societies can afford.
There are number of factors affecting mechanical properties of fiber matrix composites: fibre selection – including type, harvest time, extraction method, aspect ratio, treatment and fibre content, matrix selection, interfacial strength, fibre dispersion, fibre orientation, composite manufacturing process and porosity. Fiber
293
type is commonly categorised based on its origin: plant, animal or mineral. Therefore, it is important to select a cellulose fiber type which available in Sri Lanka. Moreover, coir and palmyrah fibers are widely available plant fibers in Sri Lanka.
4. Conclusion
This review presents the researches done in last few years based on cellulose fiber cement composites and basically the strategies to improve fiber–matrix bonding and composite durability. According to the researches carried out by NBRO, coir fiber modified corrugated roofing sheets acquired low durability whilst the glass fiber modified corrugated roofing sheets possessed high cost. As a consequence, NBRO would wish to introduce cellulose fiber modified corrugated sheets using widely available cellulose fiber type in Sri Lanka by elimination the durability problem associated with cellulose fiber in cement matrix.
Acknowledgement
The authors wish to express their heartfelt gratitude to BMRTD, NBRO and the working staffs for the encouragement and the support given by them during this research project.
References
[1] Almeida, A., Tonoli, G., Santos, S., & Savastano, H. (2013). Improved durability of vegetable fiber reinforced cement composite subject to accelerated carbonation at early age. Cement and Concrete Composites, 42, 49-58.
[2] Ardanuy, M., Claramunt, J., García-Hortal, J. A., & Barra, M. (2011). Fiber-matrix interactions in cement mortar composites reinforced with cellulosic fibers. Cellulose, 18(2), 281-289.
[3] Ardanuy, M., Claramunt, J., & Toledo Filho, R. D. (2015). Cellulosic fiber reinforced cement-based composites: a review of recent research. Construction and building materials, 79, 115-128.
[4] Claramunt, J., Ardanuy, M., García-Hortal, J. A., & Tolêdo Filho, R. D. (2011). The hornification of vegetable fibers to improve the durability of cement mortar composites. Cement and Concrete Composites, 33(5), 586-595.
[5] Cook, D., Pama, R., & Weerasingle, H. (1978). Coir fibre reinforced cement as a low cost roofing material. Building and Environment, 13(3), 193-198.
[6] Coutts, R. S. (2005). A review of Australian research into natural fibre cement composites. Cement and Concrete Composites, 27(5), 518-526.
[7] Almeida Melo Filho, J., de Andrade Silva, F., & Toledo Filho, R. D. (2013). Degradation kinetics and aging mechanisms on sisal fiber cement composite systems. Cement and Concrete Composites, 40, 30-39.
[8] Faruk, O., Bledzki, A. K., Fink, H.-P., & Sain, M. (2012). Biocomposites reinforced with natural fibers: 2000–2010. Progress in Polymer Science, 37(11), 1552-1596.
[9] Khorami, M., Ganjian, E., & Srivastav, A. (2016). Feasibility Study on Production of Fiber Cement Board Using Waste Kraft Pulp in Corporation with Polypropylene and Acrylic Fibers. Materials Today: Proceedings, 3(2), 376-380.
294
[10] Mohr, B., Biernacki, J., & Kurtis, K. (2006). Microstructural and chemical effects of wet/dry cycling on pulp fiber–cement composites. Cement and Concrete Research, 36(7), 1240-1251.
[11] Mohr, B., Biernacki, J., & Kurtis, K. (2007). Supplementary cementitious materials for mitigating degradation of kraft pulp fiber-cement composites. Cement and Concrete Research, 37(11), 1531-1543.
[12] Mohr, B., Nanko, H., & Kurtis, K. (2005). Durability of kraft pulp fiber–cement composites to wet/dry cycling. Cement and Concrete Composites, 27(4), 435-448.
[13] Satyanarayana, K. G., Arizaga, G. G., & Wypych, F. (2009). Biodegradable composites based on lignocellulosic fibers-An overview. Progress in Polymer Science, 34(9), 982-1021.
[14] Shao, Y., Wan, S., & He, Z. (2011). Manufacturing of cellulose fiber reinforced cement composites using carbon dioxide curing. Paper presented at the Procc: 16th International Conference on Composite Structures-ICCS, Porto, Portugal.
[15] Soroushian, P., Won, J.-P., & Hassan, M. (2012). Durability characteristics of CO 2-cured cellulose fiber reinforced cement composites. Construction and Building Materials, 34, 44-53.
[16] Toledo Filho, R. D., de Andrade Silva, F., Fairbairn, E., & de Almeida Melo Filho, J. (2009). Durability of compression molded sisal fiber reinforced mortar laminates. Construction and Building Materials, 23(6), 2409-2420.
[17] Toledo Filho, R. D., Ghavami, K., England, G. L., & Scrivener, K. (2003). Development of vegetable fibre–mortar composites of improved durability. Cement and Concrete Composites, 25(2), 185-196.
[18] Toledo Filho, R. D., Scrivener, K., England, G. L., & Ghavami, K. (2000). Durability of alkali-sensitive sisal and coconut fibres in cement mortar composites. Cement and Concrete Composites, 22(2), 127-143.
[19] Tonoli, G., Santos, S., Joaquim, A., & Savastano, H. (2010). Effect of accelerated carbonation on cementitious roofing tiles reinforced with lignocellulosic fibre. Construction and Building Materials, 24(2), 193-201.
[20] Tonoli, G., Santos, S., Savastano, H., Delvasto, S., de Gutiérrez, R. M., & de Murphy, M. d. M. L. (2011). Effects of natural weathering on microstructure and mineral composition of cementitious roofing tiles reinforced with fique fibre. Cement and Concrete Composites, 33(2), 225-232.
[21] Tonoli, G., Savastano, H., Fuente, E., Negro, C., Blanco, A., & Lahr, F. R. (2010). Eucalyptus pulp fibres as alternative reinforcement to engineered cement-based composites. Industrial crops and products, 31(2), 225-232.
[22] Ariyadasa, L. M., Muthurathne, S. S. K., & Adikari, S. U. (2017). Development of thermally insulated and light weight roofing materials using fly ash-cement composites. (Master of Science), University of Moratuwa
[23] C.I.Mathew, D.H.M.S.Bandara, & J.S.Pathirana. (1987). Coir Fiber Reinforced Cement Corrugated Roofing Sheets as Possible Low-cost Building Material. National Building Research Organization.
295

Assessment of Planning, Design and Construction of Evacuation Centres
MSN de Zoysa1
1Scientist, National Building Research Organisation, Sri Lanka
Abstract
During the past few decades, the number of communities affected by natural disasters increased considerably. In the post-disaster situations, providing immediately a temporary shelter which fulfils the basic shelter, safety, sanitary, privacy, etc. requirements of the people is the first step of the recovery process. Generally, authorities often use public places or buildings such as schools, temples, etc. as temporary evacuation centres. In this context, the Government of Sri Lanka identified the importance and the immediate requirement of constructing evacuation centres to evacuate disaster affected communities in emergencies.
Establishing evacuation centres for the first time in the Sri Lankan context was not an easy task. Therefore, it was required to identify the nature of the project and streamline the planning, design and construction phases of the project to ended up the project with expected outcomes. This paper presents the salient details of this project and then, proposes suitable assessment criteria that can be referred to, in formulating future projects of similar nature.
Keywords: Evacuation centres, planning, designing, construction
1. Introduction
National Building Research Organisation (NBRO) with the financial assistance of Rs. 90 million from the Asian Development Bank (ADB) constructed 3 evacuation centres, one each in Divisional Secretariat Divisions of Aranayaka, Badulla and Wattala. Keeping in line with the policy of the government of Sri Lanka to give highest priority to save the lives of people while maintaining the social welfare measures to minimize the suffering of disaster victims, the Ministry of Disaster Management recognized and initiated action on addressing disaster management holistically. As an immediate solution after a disaster, schools, temples, etc. are turned into makeshift evacuation centres to accommodate the disaster affected families. On the other hand, accommodation of disaster affected families in schools and temples causes various socio-economic issues and interrupts the functioning of such public places. As a result, for the first time in Sri Lanka three evacuation centres were constructed to shelter the disaster victims.
296

Features of a constructed evacuation centre include a community hall to accommodate nearly 120 individuals and facilities such as an office room, store room, area for common food preparation, wash room facilities, play area for children and sufficient parking space available for anticipated number of vehicles. Floor area of an evacuation centre is about 6084 sq.ft. Length of the evacuation centre is 127 feet and the width is 62 feet. These evacuation centres
were designated for its primary purpose to serve as a temporary dwelling for evacuees of flood and landslide disaster and in other calamities.
2. Building types
Evacuation Centre is a provisional safe space providing the basic conditions to shelter people affected by the disaster, while the community moves to a temporary shelter. (Red Cross, 2013)
With unexpected disaster situations, the relevant authorities in each and every country provide necessary facilities for the evacuees temporarily until they are resettled in permanent locations / houses. According to the literature, following table summarizes the different types of buildings that can be converted into evacuation centres in disaster situations and advantages and disadvantages of them. Table 1. Building Types
No. Type of building Advantages Disadvantages
01 Sports centres / parks
Can accommodate a large number of people, Can easily provide sanitary facilities, Adequate accessibility
Serves as a basic shelter (tent, etc.), Cannot function as a totally enclosed space, Adequate accessibility
02 Schools / institutions
Can easily find in the area very close to the affected community, Can provide basic infrastructure, Have a management structure
Disruption to the educational activities, Hosted families could be forced to leave the shelter at a short notice
No. Type of building Advantages Disadvantages
03 Religious buildings
Close to the affected communities, Can accommodate a large number of people, Have a relationship with the
Disruption to the religious activities, Difficult to provide water and other sanitary facilities sufficiently,
Fig. 1. Evacuation Centre - Aranayaka
297
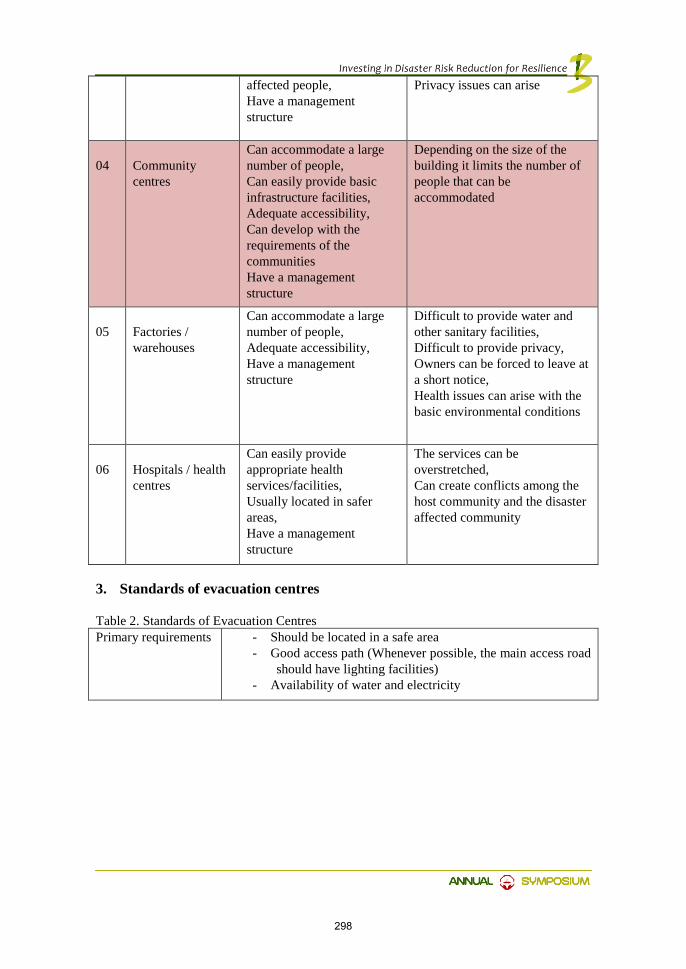
affected people, Have a management structure
Privacy issues can arise
04 Community centres
Can accommodate a large number of people, Can easily provide basic infrastructure facilities, Adequate accessibility, Can develop with the requirements of the communities Have a management structure
Depending on the size of the building it limits the number of people that can be accommodated
05 Factories / warehouses
Can accommodate a large number of people, Adequate accessibility, Have a management structure
Difficult to provide water and other sanitary facilities, Difficult to provide privacy, Owners can be forced to leave at a short notice, Health issues can arise with the basic environmental conditions
06 Hospitals / health centres
Can easily provide appropriate health services/facilities, Usually located in safer areas, Have a management structure
The services can be overstretched, Can create conflicts among the host community and the disaster affected community
3. Standards of evacuation centres
Table 2. Standards of Evacuation Centres Primary requirements - Should be located in a safe area
- Good access path (Whenever possible, the main access road should have lighting facilities)
- Availability of water and electricity
298

Basic functions - Common gathering space (- 20 sq.ft. per person – short term - 40 sq.ft. per person – long term)
- Washroom facilities (- 01 toilet per 20 people - 01 wash basin per 10 people)
- Office - Store room - Food preparation area (Out-door) - Childcare centre - First-aid unit - Parking
Garbage facilities - Maximum distance of 100m from the shelter
Common areas / spaces
- Recreation areas - Area for general meetings - Space for religious activities - Additional land should be added if the community has been
involved in agricultural or livestock activities
Socio-cultural considerations
- Social and cultural considerations should be taken into account when preparing the community shelter. In this regard, the involvement of the displaced community is essential
- The general layout of the community shelter should be culturally acceptable in order to meet the needs of structures / patterns of families and the community in the best possible way (Red Cross,2013)
Other than the above main criteria, the following factors also should be considered in assessing suitability of an evacuation centre; • Provide necessary washroom facilities for people with disabilities and / or
elderly. • Provide protected shelters and with enough space and privacy for children,
pregnant women, etc. • Ensure appropriate lighting in common areas, such as washrooms, cooking
areas where necessary. • Ensure that the common facilities (health unit, school, administration, etc.) are
easily accessible to all community members, including those with limited mobility. (Red Cross,2013)
• Some common protection risks in community shelters are: • Violence: the act or threat of physical or psychological aggression. • Coercion and exploitation: forcing someone to do something against their will,
abusing their state of vulnerability, powerlessness, trust or access to resources and humanitarian aid. (Red Cross, 2013)
• Deprivation and neglect: prevent someone from having access to the services they need, whether deliberately or not, directly or indirectly. (Red Cross,2013)
• In order to promote the protection within a community shelter, some specific activities can be performed. (Red Cross,2013)
- Conduct periodic assessments in order to understand the security situation in the shelter and identify potential threats.
299

- Establish contact with local authorities / police. - Disseminate information on security issues. - Establish a security subcommittee.
4. Summary
The following table gives observations made on the 3 evacuation centres against the proposed assessment criteria.
Consideration Item
Ara
naya
ka
Bad
ulla
Wat
tala
Planning
Site is free from natural hazards Access path Availability of water Availability of electricity Distance to the nearest town Distance to the nearest hospital / healthcare centre
Distance to educational facilities Garbage removing facilities
Design
Building orientation (sun-path, wind direction, etc.)
Indoor common gathering with minimum floor area requirement per person
Washroom facilities according to the standards
Office - for administrative purposes Store room Outdoor food preparation area
Childcare centre
First aid unit
Standards of building heights
Natural ventilation systems
Disable access
Parking
Planning building regulations (UDA)
Privacy
Socio-cultural impacts
Environmental sustainability
Sub-structure (resilience)
Super structure (resilience)
Construction Sub-structure (design and resilience)
300

R.C.C. Columns and beams (resilience)
Site supervision
Labour force
Quality of the work
Legend
Symbol Description Considered Sufficient Not considered Insufficient Made changes with the site conditions Made changes with the budgetary allocations (Included in the original proposal)
5. Conclusion
Construction project is not only a combination of structures and regulations. It is a well-prepared combination of planning, design and construction.
In the planning process, the macro context of the project should be critically analysed before starting to design. This macro context analysis helps to define the need of the project and to create a better approach to the building design. The design procedure of a project can be divided into two as;
1) Architectural design &
2) Structural design In the architectural design, the macro contextual analysis should be studied and
detail it in a micro context. In this process it should capture the major requirements of the project, and the entire design must reflect its own identity to the relevant project according to the standards.
Both in architectural and structural design stages, analysis should be critical and design decisions should be made to make the dwelling sustainable. Especially in community based design projects like evacuation centres, the design should be economically feasible, environmentally friendly and socially agreed. Other than that, safety, sanitary, privacy and the building resilience must be the most important factors.
The three evacuation centres mentioned in the paper were designed before finalizing the site selection process. And all the designs were done for hypothetical sites with normal ground conditions. Therefore, after the site selection, several design changes had to be done in both architectural designs and structural designs. Two of such changes are given below as examples.
1) At Badulla, the given site was a sloping land. Therefore, it was decided to change the given design and redesign the evacuation centre into two levels to avoid or minimize the environmental impacts.
2) At Wattlala, plinth level of the building had to be increased according to the flood level of the selected location.
At the end, all these changes caused considerable construction delays in the project.
301

Finally, the paper highlights that, to ensure the success of the project, planning, design and construction procedures should be proceeded under a well-managed scheme for a better final outcome, and the assessment criteria proposed by this paper should be referred to make evacuation centre construction projects a success.
References
[1] HM Government. (2014). Evacuation and Shelter Guidance. [2] Kilci, F., Kara, B.Y. & Bozkaya, B. (2015). Locating temporary shelter areas after an
earthquake: A case for Turkey. [3] Laijun Zhao, Huiyong Li, Yan Sun, Rongbing Huang, Qingmi Hu, JiajiaWang & Fei
Gao. (2017). Planning Emergency Shelters for Urban Disaster Resilience: An Integrated Location-Allocation Modeling Approach.
[4] Paul, J.A. & MacDonald, L. (2016). Location and capacity allocations decisions to mitigate the impacts of unexpected disasters.
[5] Red Cross. (2013). Community Shelter Guidelines – Accommodation Centres in Existing Buildings.
[6] Wright, K. & Johnston, D. (2010). Post-earthquake sheltering needs: How loss of structures and services affects decision making for evacuation. Proceedings of the 2010 New Zealand Society for Earthquake Engineering Conference.
302
A standard Procedure for Condition Assessment of Buildings and Structures
GBMA Basnayake 1 1Engineer/Scientist, National Building Research Organisation, Sri Lanka
Abstract
With the ongoing construction boom in Sri Lanka, we may be optimistic as to its future. However, recent incidents of buildings collapsing highlight the need for a comprehensive procedure for the construction industry to guarantee and maintain the quality of building construction. Such procedure will positively impact on the development of the country and will also help the construction industry to expand.
Assessing the quality of every structure being built is costly and unnecessary. Collection of data about reported incidents of construction failures will provide us with the information on issues we need to address. Construction failures may occur due to various reasons, of which some may be common in the country. Most common reasons are design failures, impacts of adjacent constructions, improper maintenance of buildings, poor workmanship and adding extra load after constructions.
This paper proposes a suitable sequence to carry out investigations and reporting on the condition of buildings and structures by skilled persons with the guidance of professionals, which would ultimately propound a suitable mechanism to conduct such assessments for the benefit of the society and aid local government authorities. Further, this will prevent wasting of resources in unnecessary demolishing and reduce the need for relocation.
Key words: Structural failures; Condition Assessment; Structural Assessment
1. Introduction
National Building Research Organisation (NBRO) under the Ministry of Disaster Management provides engineering solutions through research to reduce the impacts of potential disasters. In the wake of recent incidents of building collapses, NBRO received many requests for investigation the condition of buildings and structures and their structural integrity which NBRO as a duty, performed diligently.
However, building collapses happen due to various reasons such as design failures, adverse impacts of adjacent constructions, and improper maintenance of buildings, poor workmanship and adding loads above design values, etc. As a
303

national institute under the Disaster Management Ministry, NBRO contemplates establishing a standard procedure to assess the condition of buildings and structures and issue corresponding reports with pertinent recommendations as a Disaster Risk Reduction measure.
Therefore, professional engineering guidelines are summarized in this paper including several questions need to be raised and structural concepts that should be considered during an evaluation of any condition that may leads to a significant structural failure or a building collapse, i.e. complete or substantial loss of structural integrity such that the building cannot be occupied or utilized for its intended purpose. Professional engineers, building regulatory officials and owners as well as NBRO staff will find this standard procedure on condition assessment of buildings and structures invaluable.
2. Literature Review
2.1. Background
2.1.1. Current issues related to structural damages/failures in Sri Lanka
Currently, many factors contribute to the prevalence of structural damage or failures of buildings in Sri Lanka. Ordinary people tend to disregard the safety of their buildings because they are unaware of the importance of assuring the safety of buildings by a professional. They do not seem to get the idea that a structure that looks fine today can collapse tomorrow. Structural failures are more common in illegal and unauthorized buildings, especially in urban areas. Persons who are illegally occupying state land in densely packed under-privileged settlements often build unsafe dwellings putting many people’s lives in danger. This is encouraged by the fact that they cannot get their unauthorized buildings approved by authorities. Some others add more space to their houses haphazardly. Often some people construct buildings without considering how construction activities affect stability in adjacent buildings. Large buildings that recently collapsed making headlines were the result of businessmen who tried to save as much money as possible by either poor construction or illegal construction. In all these cases it is the ignorance of people that caused them to make these deadly mistakes. A coordinated effort by the government to raise awareness of the danger of unsafe construction is necessary. The support of law enforcement agencies in cracking down on illegal construction and violation of proper standards will help discourage bad practices in construction.
2.1.2. Available guidelines on building assessment
The American Society of Civil Engineers (ASCE) Committee on Structural Condition Assessment and Rehabilitation of Buildings prepares standards in three areas; structural condition assessment, assessment of the building envelope and assessment of buildings for seismic considerations. The relevant standard is ASCE 11-90 Standard Guideline for Structural Condition Assessment of Existing Buildings. ASCE 11-90 provides guidelines and a methodology for assessing the structural condition of existing buildings constructed of concrete, metals, masonry and wood. The standard prepared as a guideline in that provides general guidance to
304
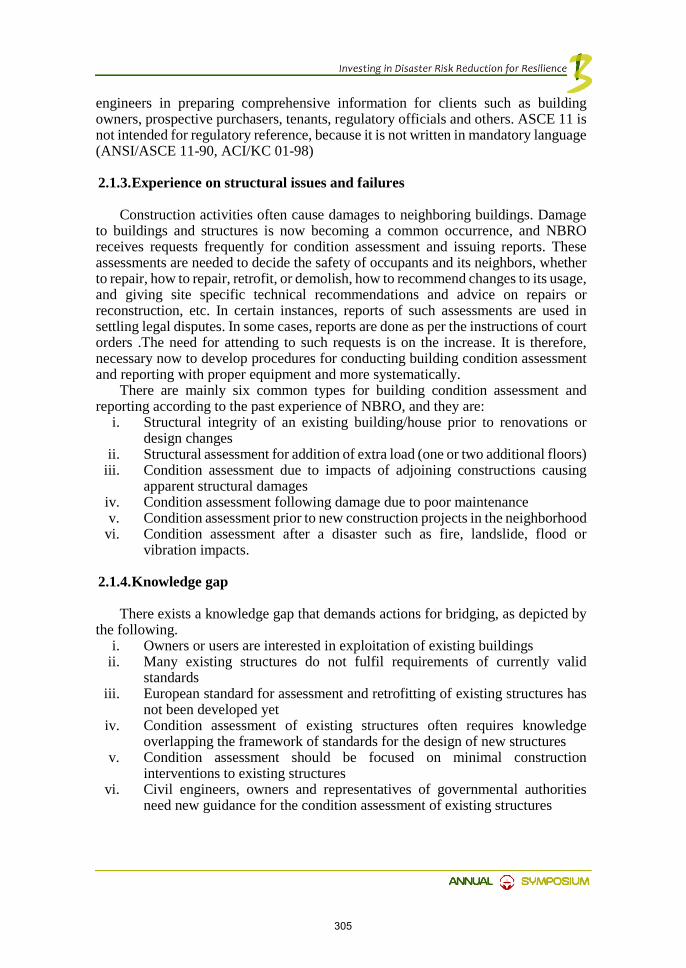
engineers in preparing comprehensive information for clients such as building owners, prospective purchasers, tenants, regulatory officials and others. ASCE 11 is not intended for regulatory reference, because it is not written in mandatory language (ANSI/ASCE 11-90, ACI/KC 01-98)
2.1.3. Experience on structural issues and failures
Construction activities often cause damages to neighboring buildings. Damage to buildings and structures is now becoming a common occurrence, and NBRO receives requests frequently for condition assessment and issuing reports. These assessments are needed to decide the safety of occupants and its neighbors, whether to repair, how to repair, retrofit, or demolish, how to recommend changes to its usage, and giving site specific technical recommendations and advice on repairs or reconstruction, etc. In certain instances, reports of such assessments are used in settling legal disputes. In some cases, reports are done as per the instructions of court orders .The need for attending to such requests is on the increase. It is therefore, necessary now to develop procedures for conducting building condition assessment and reporting with proper equipment and more systematically.
There are mainly six common types for building condition assessment and reporting according to the past experience of NBRO, and they are:
i. Structural integrity of an existing building/house prior to renovations or design changes
ii. Structural assessment for addition of extra load (one or two additional floors) iii. Condition assessment due to impacts of adjoining constructions causing
apparent structural damages iv. Condition assessment following damage due to poor maintenance v. Condition assessment prior to new construction projects in the neighborhood
vi. Condition assessment after a disaster such as fire, landslide, flood or vibration impacts.
2.1.4. Knowledge gap
There exists a knowledge gap that demands actions for bridging, as depicted by the following.
i. Owners or users are interested in exploitation of existing buildings ii. Many existing structures do not fulfil requirements of currently valid
standards iii. European standard for assessment and retrofitting of existing structures has
not been developed yet iv. Condition assessment of existing structures often requires knowledge
overlapping the framework of standards for the design of new structures v. Condition assessment should be focused on minimal construction
interventions to existing structures vi. Civil engineers, owners and representatives of governmental authorities
need new guidance for the condition assessment of existing structures
305

3. Objective
As the objective of the paper, an attempt is made for the establishment of a proper sequence on condition assessment and reporting in view of creating safe buildings in a disaster-free environment with expert knowledge that NBRO possesses.
4. Methodology
Condition assessments are technical inspections by competent assessors to evaluate the physical state of building elements and services and to assess the maintenance needs of the facility. The process of the assessment is based on the experience in building assessment with common issues of the structural damages and failures. It consists of systematically analyzing information and data regarding a building in order to determine its structural adequacy. Accordingly, the way of assessment, scope of the investigations, testing and other assessment methods, and the format of the report of the condition assessment are determined.
Building condition assessment and reporting incorporates physical examinations; physical testing and sampling at site and sample testing in laboratories; investigation into causal factors of damage, detailed analysis of data, and systematic reporting, presented together with technical recommendations. In this work, less objective procedures and more subjective procedures are involved in examination, testing and analysis. The obtaining ISO 17020: Accreditation of Inspection Bodies is therefore, recommended for NBRO as a recognition for condition assessment and reproting of buildings and structures.
4.1. The basic steps of condition assessment
The proposed basic steps of condition assessment are categorized as a). Preliminary assessment,) Detailed assessment, and c) Report preparation and these steps described as the following figure. These have been drafted with the knowledge acquired and experience gained while conducting condition assessment over the years at NBRO and by referring to works of other researchers and professionals in the field. The proposed systemic condition assessment procedure is further focused to the achievement of accreditation by NBRO according to ISO/IEC 17020: Conformity assessment – Requirements for the operation of various types of bodies performing inspection, and hence the procedure has been structured to fulfil such requirements of accreditation in future.
306
[ANSI/ASCE 11-90, ASI/KC 01-98, Pielert, MilanHolicky 2013 ] Fig. 1: Schematic flow diagram of a condition assessment
307

4.2. Report Format and Decision
The report on condition assessment and possible interim reports (if required) should include clear conclusions with regard to the objective of the assessment based on careful reliability assessment and cost of repair or upgrading. The report shall be concise and clear. A prescribed report format is indicated below in the clause 5.
Temporary intervention may be recommended and proposed by the engineer if required immediately. The engineer should indicate a preferred solution as a logical follow-up to the whole assessment in every case.It should be noted that the client in collaboration with the relevant authority should make the final decision on possible interventions, based on engineering assessment and recommendations. The engineer performing the assessment might have, however, the legal duty to inform the relevant authority if the client does not respond in a reasonable time. In the case of heritage structures, minimization of construction interventions is required in rehabilitation and upgrades, but sufficient reliability should also be guaranteed. When dealing with the preservation of heritage buildings, it may be difficult to propose construction interventions that respect all requirements for preservation of the heritage value.
If the degree of reliability is still too low, one might decide to:
• accept the present situation for economical reasons; • reduce the load on the structure; • repair the building; • start demolition of the structure.
The first decision may be motivated by the fact that the cost for additional
reliability is much higher for existing structure than for a new structure. This argument is sometimes used by those who claim that a higher reliability should be generally required for a new structure rather than for an existing one. However, if human safety is involved, economical optimization has a limited significance.
Above-mentioned condition assessment procedure should be repeated if the necessity arises to conduct a follow-up assessment again. The proposed procedure can be repeatedly applied over and over again according to subsequent needs of condition assessment.
308

5. Prescribed Structure of the report
The prescribed structure of the report is shown in the figure 2 as below. [ANSI/ASCE 11-90, IBC 2009, Periodic Structural 2012] Fig. 2: Prescribed structure of the report
309

6. Conclusion
A Condition Assessment Report, which might also be referred to as an Engineer’s Report is a planning tool used to determine a building or structure’s structural condition by analyzing and evaluating foundation, framing, other construction systems, and their associated construction details and providing recommendations for corrective treatments, as applicable.
A Structural Assessment Report may be a stand-alone document or it may be a component of a larger planning document, such as a Condition Assessment Report, Historic Structures Report, or Preservation Plan.
However, a Condition Assessment Report should not be perceived as structural design, although one can provide associated preliminary information; specific engineering solutions to identified structural deficiencies are the purpose of structural plans and specifications created by a registered Chartered / Structural Engineer.
As with other preservation planning documents, a Condition Assessment Report should be organized so that it provides necessary information in a manner understandable by the end user, who may not be an expert in the field.
7. Recommendations
Recommendations for corrective measures, including conceptual level design solutions for stabilization and/or repair, and project prioritization or necessary sequencing are necessary together when reporting on Condition Assessment of Buildings and Structures.
In future, the need for condition assessment of buildings and structures will increase and therefore, a proper assessment procedure should be established in which the NBRO can take a lead role. Further, more advanced and sophisticated equipment will become necessary for taking physical measurements quickly, taking location coordinates using a GPS, capturing of visual images on electronic media using GPS enabled cameras or drone cameras for 3-D modeling, inspections by closed circuit television, bore scopes or fiberscopes where access is difficult, infrared scanning for thermal stress and for recording of vibration levels.
NBRO already carries out damage & loss assessment surveys following disasters. In future, the need will arise for different types of assessments such as, asbestos surveys; audits on building safety, health and amenity, building functionality, building utilization, and building occupancy, and in addition, audits on the compliance to building codes and town planning codes. It will be necessary now for NBRO to prepare in advance to meet these future needs.
310
References
[1] ANSI/ASCE 11-90, Guideline for Structural Condition Assessment of Existing Buildings, American Society of Civil Engineers, New York.
[2] Guide to Damage Assessment and Repair of Concrete Structures (ASI/KC 01-98) [3] Pielert, J., Baumert,C., and Green, M., “ASCE Standards on Structural Condition
Assessment and Rehabilitation of Buildings.” [4] Milan Holický“ Basics for assessment of existing structures”, Klokner Institute, Czech
Technical University in Prague (2013), Šolínova 7, 166 08 Prague 6, Czech Republic [5] International Building CodeIBC, (2009) by International Code Council (ICC) [6] Periodic Structural Inspection of Existing Buildings “guidelines for Structural
Engineers” by Buildings and Construction Authority , Jan. 2012 [7] Dan Eschenasy, P.E., F.SEI Gus Sirakis, P.E. Bharat Gami, RA, “Protection of Existing
Buildings during Construction” 2016 Build Safe, Live Safe Conference.
311
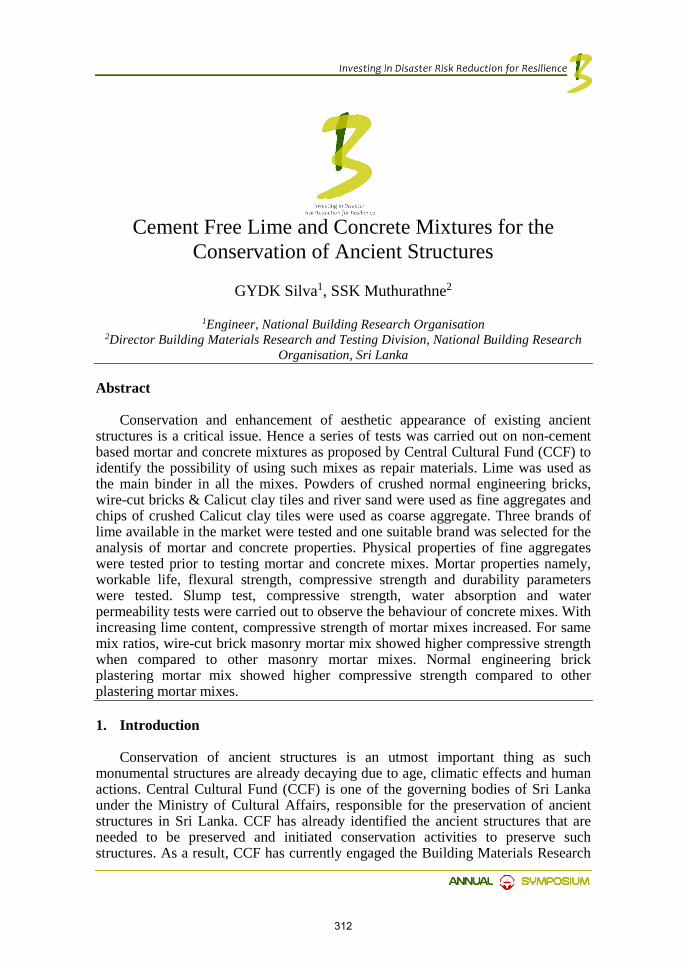
Cement Free Lime and Concrete Mixtures for the Conservation of Ancient Structures
GYDK Silva1, SSK Muthurathne2
1Engineer, National Building Research Organisation 2Director Building Materials Research and Testing Division, National Building Research
Organisation, Sri Lanka
Abstract
Conservation and enhancement of aesthetic appearance of existing ancient structures is a critical issue. Hence a series of tests was carried out on non-cement based mortar and concrete mixtures as proposed by Central Cultural Fund (CCF) to identify the possibility of using such mixes as repair materials. Lime was used as the main binder in all the mixes. Powders of crushed normal engineering bricks, wire-cut bricks & Calicut clay tiles and river sand were used as fine aggregates and chips of crushed Calicut clay tiles were used as coarse aggregate. Three brands of lime available in the market were tested and one suitable brand was selected for the analysis of mortar and concrete properties. Physical properties of fine aggregates were tested prior to testing mortar and concrete mixes. Mortar properties namely, workable life, flexural strength, compressive strength and durability parameters were tested. Slump test, compressive strength, water absorption and water permeability tests were carried out to observe the behaviour of concrete mixes. With increasing lime content, compressive strength of mortar mixes increased. For same mix ratios, wire-cut brick masonry mortar mix showed higher compressive strength when compared to other masonry mortar mixes. Normal engineering brick plastering mortar mix showed higher compressive strength compared to other plastering mortar mixes.
1. Introduction
Conservation of ancient structures is an utmost important thing as such monumental structures are already decaying due to age, climatic effects and human actions. Central Cultural Fund (CCF) is one of the governing bodies of Sri Lanka under the Ministry of Cultural Affairs, responsible for the preservation of ancient structures in Sri Lanka. CCF has already identified the ancient structures that are needed to be preserved and initiated conservation activities to preserve such structures. As a result, CCF has currently engaged the Building Materials Research
312

and Testing Division (BMRTD) of NBRO to produce cement-free mortar and concrete mixtures as repair materials for the conservation of historic structures.
It has been identified that cement-based mortar and concrete mixtures are stronger and durable than the ancient structures and studies have established that existing historic structures become vulnerable to further deterioration when repair works are being carried out using cement-based mortar and concrete mixtures. Therefore, the repair materials that are to be used for the conservation projects should possess different qualities when compared with existing historic structures in order to properly preserve the existing structures.
The purpose of this project was to identify materials and mix proportions that could be used for repair works of historic structures so as to preserve such iconic structures for a longer period of time.
2. Method
2.1. Introduction
A literature survey was carried out to study the previous work carried out related to this project (Jeanne Marie Teutonico, 1994), (B.Sickels-Taves, 1989). Mix proportion details and relevant raw material details were submitted by CCF. Initial field visiting was carried out to observe the raw material preparation techniques as well as sources of materials. Analysis of raw materials as well as mix proportions submitted by CCF was tested in this project to observe the behavior of cement free mixes to be used as repair materials for conservation of ancient structures.
2.2. Material properties
Raw materials namely, lime, river sand, Calicut clay tile (powder and chips), normal engineering brick powder, and wire-cut brick powder were submitted by CCF. Three lime brands were submitted by CCF and in order to evaluate lime properties, and tests for strength (flexural and compressive), setting time, fineness and soundness were carried out (BS EN 459-2 Building Lime, 2001). Based on the lime brand results, one lime brand was selected for testing of mortar and concrete mixes specified by CCF. Fine aggregate properties namely, sieve analysis, loose bulk density, organic impurities, specific gravity and water absorption were carried out. Calicut tile chips (coarse aggregate) properties namely, sieve analysis, loose bulk density, aggregate impact value, flakiness index, specific gravity and water absorption were also tested.
2.3. Mortar properties
Based on the lime test results, one lime brand (Kesara lime) was selected for testing mortar mixes. Mortar properties namely strength (flexural and compressive), workable life were tested according to standard procedures. Laboratory developed method was used to assess the durability of selected mortar mixes.
313

2.4. Lime concrete properties
Two lime based concrete mixes were proposed by CCF. Concrete properties namely, slump, compressive strength, water absorption and water permeability parameters were tested as per standard procedures.
3. Results
3.1. Material properties
3.1.1. Lime results
Test results of the lime brands were summarized in Table 1.
Table 1: Test results of lime brands Test/ Test parameter Lime Brand
Kesara S.E.C. Inmine Avg. Compressive Strength-28 days (N/mm2)
0.22 0.36 0.56
Avg. Flexural Strength-28days (N/mm2) 0.14 0.15 0.22
Fineness 0.2mm retained % 3.1 36.7 53.0 0.09mm retained % 62.6 46.1 40.1
Soundness (mm) -nil- -nil- -nil-
3.1.2. Fine aggregate results
Sieve analysis results of river sand and other fine aggregate types submitted by CCF are illustrated in Figure 1 & 2 respectively. (SLS 1397 Specification for fine aggregate for concrete and mortar, 2010)
Fig. 1. Grading curve of river sand
0
20
40
60
80
100
120
0.0 0.1 1.0 10.0 100.0
Perc
enta
ge P
assi
ng (%
)
Sieve Size (mm)Grading Curve for Fine Aggregate
RiverSand
Coarsegraded fineaggregateat 0.500mm sievelevel
314

Fig. 2. Grading curves of fine aggregates.
Physical properties of powder types were given in Table 2. Table 2: Test results of fine aggregates
Material
Loose bulk density (kg/m3)
Specific gravity (on oven-dried basis)
Specific gravity (on S.S.D. basis)
Water absorption (%)
River sand 1570 2.91 2.92 0.2 Engineering brick powder
1170 2.43 2.51 3.3
Wire-cut brick
1020 2.47 2.56 3.7 Calicut tile
1110 2.24 2.38 6.2
3.1.3. Coarse aggregate results
Grading curve of Calicut tile chips were given in Figure 3. (BS EN 12620 : Aggregate for concrete, 2002)
0.00
20.00
40.00
60.00
80.00
100.00
120.00
1.0 10.0 100.0
Pass
ing
Perc
enta
ge (%
)
Sieve Size (mm)Grading Curve for Coarse Aggregate
Calicuttile chipsSpecifiedlimits
315
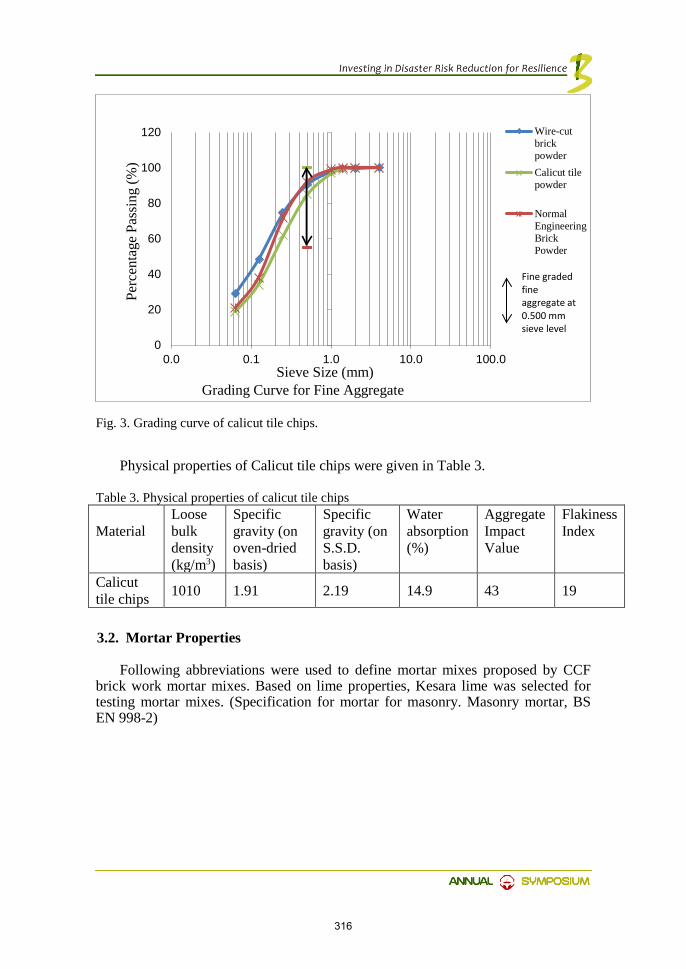
Fig. 3. Grading curve of calicut tile chips.
Physical properties of Calicut tile chips were given in Table 3.
Table 3. Physical properties of calicut tile chips Material
Loose bulk density (kg/m3)
Specific gravity (on oven-dried basis)
Specific gravity (on S.S.D. basis)
Water absorption (%)
Aggregate Impact Value
Flakiness Index
Calicut tile chips 1010 1.91 2.19 14.9 43 19
3.2. Mortar Properties
Following abbreviations were used to define mortar mixes proposed by CCF brick work mortar mixes. Based on lime properties, Kesara lime was selected for testing mortar mixes. (Specification for mortar for masonry. Masonry mortar, BS EN 998-2)
0
20
40
60
80
100
120
0.0 0.1 1.0 10.0 100.0
Perc
enta
ge P
assi
ng (%
)
Sieve Size (mm)Grading Curve for Fine Aggregate
Wire-cutbrickpowderCalicut tilepowder
NormalEngineeringBrickPowder
Fine gradedfine aggregate at 0.500 mm sieve level
316
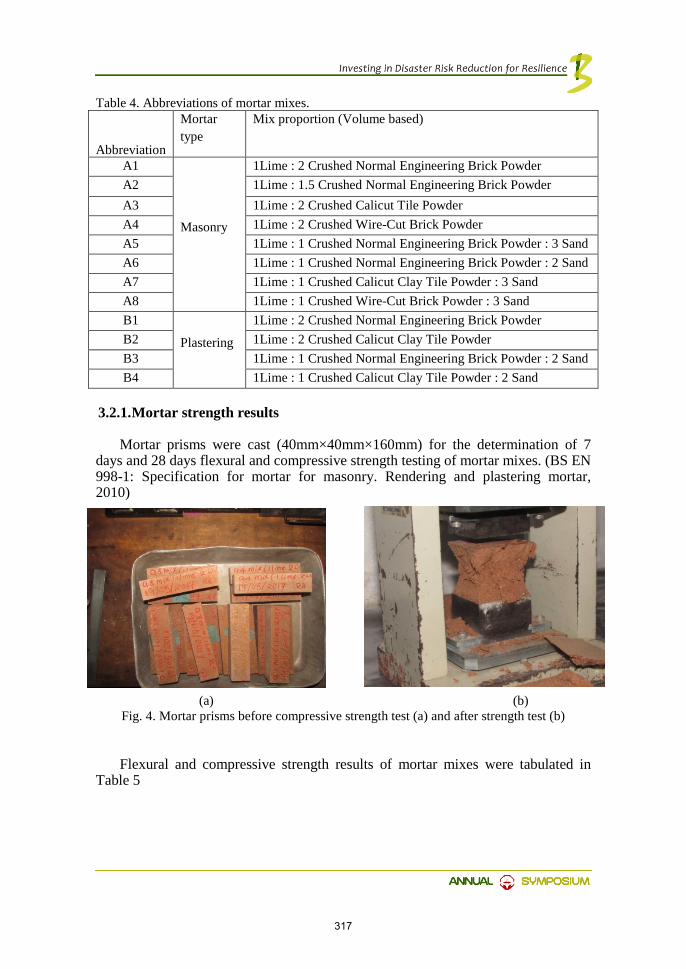
Table 4. Abbreviations of mortar mixes.
Abbreviation
Mortar type
Mix proportion (Volume based)
A1
Masonry
1Lime : 2 Crushed Normal Engineering Brick Powder
A2 1Lime : 1.5 Crushed Normal Engineering Brick Powder A3 1Lime : 2 Crushed Calicut Tile Powder A4 1Lime : 2 Crushed Wire-Cut Brick Powder A5 1Lime : 1 Crushed Normal Engineering Brick Powder : 3 Sand A6 1Lime : 1 Crushed Normal Engineering Brick Powder : 2 Sand A7 1Lime : 1 Crushed Calicut Clay Tile Powder : 3 Sand A8 1Lime : 1 Crushed Wire-Cut Brick Powder : 3 Sand B1
Plastering
1Lime : 2 Crushed Normal Engineering Brick Powder B2 1Lime : 2 Crushed Calicut Clay Tile Powder B3 1Lime : 1 Crushed Normal Engineering Brick Powder : 2 Sand B4 1Lime : 1 Crushed Calicut Clay Tile Powder : 2 Sand
3.2.1. Mortar strength results
Mortar prisms were cast (40mm×40mm×160mm) for the determination of 7 days and 28 days flexural and compressive strength testing of mortar mixes. (BS EN 998-1: Specification for mortar for masonry. Rendering and plastering mortar, 2010)
(a) (b) Fig. 4. Mortar prisms before compressive strength test (a) and after strength test (b)
Flexural and compressive strength results of mortar mixes were tabulated in Table 5
317
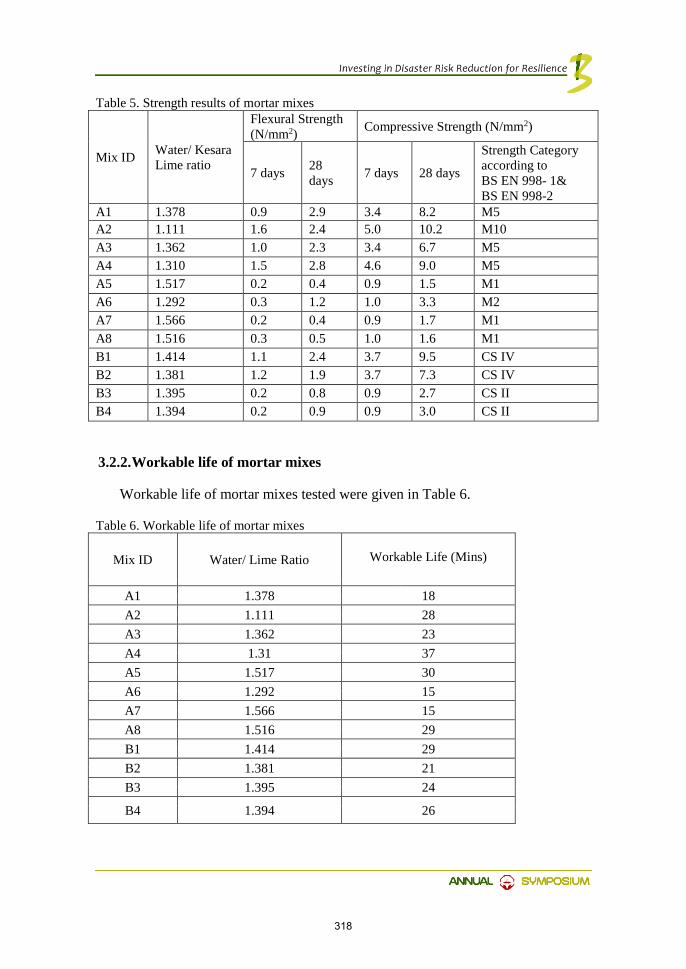
Table 5. Strength results of mortar mixes
Mix ID Water/ Kesara Lime ratio
Flexural Strength (N/mm2) Compressive Strength (N/mm2)
7 days 28 days 7 days 28 days
Strength Category according to BS EN 998- 1& BS EN 998-2
A1 1.378 0.9 2.9 3.4 8.2 M5 A2 1.111 1.6 2.4 5.0 10.2 M10 A3 1.362 1.0 2.3 3.4 6.7 M5 A4 1.310 1.5 2.8 4.6 9.0 M5 A5 1.517 0.2 0.4 0.9 1.5 M1 A6 1.292 0.3 1.2 1.0 3.3 M2 A7 1.566 0.2 0.4 0.9 1.7 M1 A8 1.516 0.3 0.5 1.0 1.6 M1 B1 1.414 1.1 2.4 3.7 9.5 CS IV B2 1.381 1.2 1.9 3.7 7.3 CS IV B3 1.395 0.2 0.8 0.9 2.7 CS II B4 1.394 0.2 0.9 0.9 3.0 CS II
3.2.2. Workable life of mortar mixes
Workable life of mortar mixes tested were given in Table 6. Table 6. Workable life of mortar mixes
Mix ID Water/ Lime Ratio Workable Life (Mins)
A1 1.378 18 A2 1.111 28 A3 1.362 23 A4 1.31 37 A5 1.517 30 A6 1.292 15 A7 1.566 15 A8 1.516 29 B1 1.414 29 B2 1.381 21 B3 1.395 24
B4 1.394 26
318
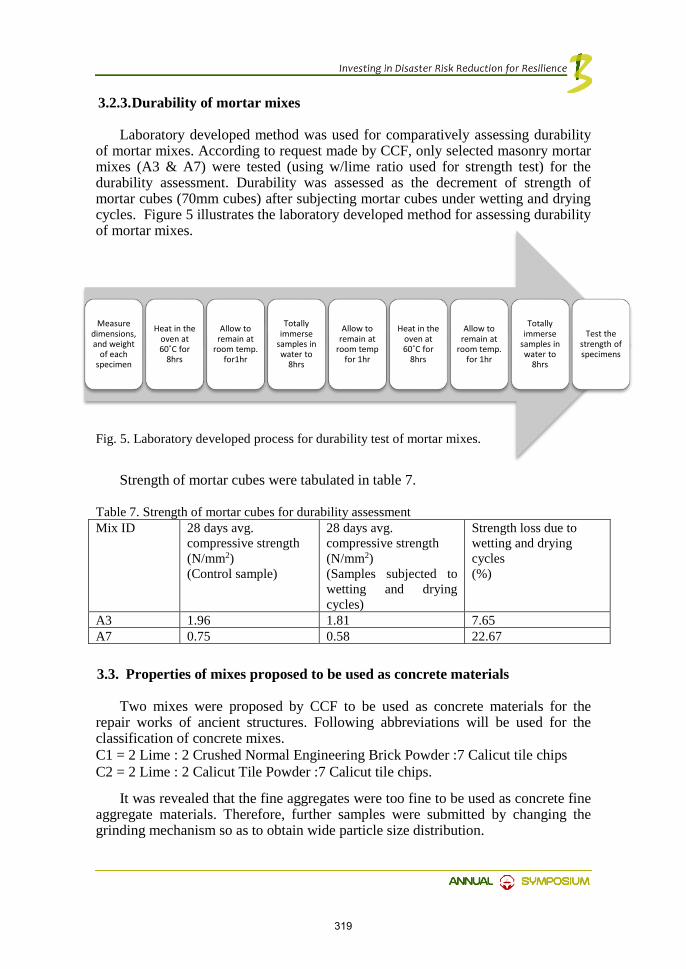
3.2.3. Durability of mortar mixes
Laboratory developed method was used for comparatively assessing durability of mortar mixes. According to request made by CCF, only selected masonry mortar mixes (A3 & A7) were tested (using w/lime ratio used for strength test) for the durability assessment. Durability was assessed as the decrement of strength of mortar cubes (70mm cubes) after subjecting mortar cubes under wetting and drying cycles. Figure 5 illustrates the laboratory developed method for assessing durability of mortar mixes.
Fig. 5. Laboratory developed process for durability test of mortar mixes.
Strength of mortar cubes were tabulated in table 7.
Table 7. Strength of mortar cubes for durability assessment Mix ID 28 days avg.
compressive strength (N/mm2) (Control sample)
28 days avg. compressive strength (N/mm2) (Samples subjected to wetting and drying cycles)
Strength loss due to wetting and drying cycles (%)
A3 1.96 1.81 7.65 A7 0.75 0.58 22.67
3.3. Properties of mixes proposed to be used as concrete materials
Two mixes were proposed by CCF to be used as concrete materials for the repair works of ancient structures. Following abbreviations will be used for the classification of concrete mixes. C1 = 2 Lime : 2 Crushed Normal Engineering Brick Powder :7 Calicut tile chips C2 = 2 Lime : 2 Calicut Tile Powder :7 Calicut tile chips.
It was revealed that the fine aggregates were too fine to be used as concrete fine aggregate materials. Therefore, further samples were submitted by changing the grinding mechanism so as to obtain wide particle size distribution.
Measure dimensions, and weight
of each specimen
Heat in the oven at 60˚C for
8hrs
Allow to remain at
room temp. for1hr
Totally immerse
samples in water to
8hrs
Allow to remain at
room temp for 1hr
Heat in the oven at 60˚C for
8hrs
Allow to remain at
room temp. for 1hr
Totally immerse
samples in water to
8hrs
Test the strength of specimens
319
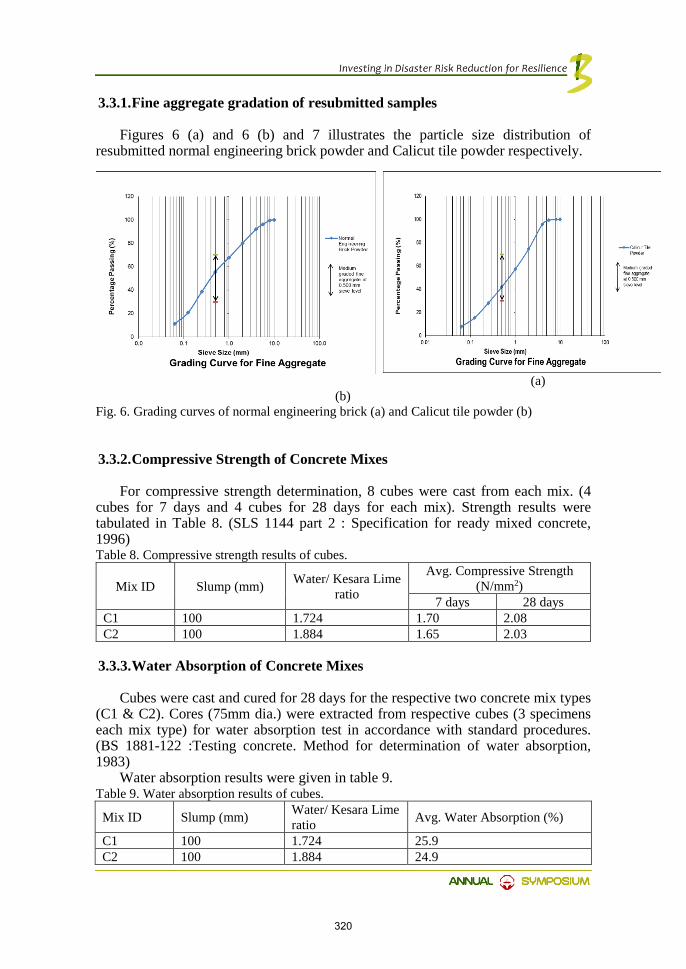
3.3.1. Fine aggregate gradation of resubmitted samples
Figures 6 (a) and 6 (b) and 7 illustrates the particle size distribution of resubmitted normal engineering brick powder and Calicut tile powder respectively.
(a) (b) Fig. 6. Grading curves of normal engineering brick (a) and Calicut tile powder (b)
3.3.2. Compressive Strength of Concrete Mixes
For compressive strength determination, 8 cubes were cast from each mix. (4 cubes for 7 days and 4 cubes for 28 days for each mix). Strength results were tabulated in Table 8. (SLS 1144 part 2 : Specification for ready mixed concrete, 1996) Table 8. Compressive strength results of cubes.
Mix ID Slump (mm) Water/ Kesara Lime ratio
Avg. Compressive Strength (N/mm2)
7 days 28 days C1 100 1.724 1.70 2.08 C2 100 1.884 1.65 2.03
3.3.3. Water Absorption of Concrete Mixes
Cubes were cast and cured for 28 days for the respective two concrete mix types (C1 & C2). Cores (75mm dia.) were extracted from respective cubes (3 specimens each mix type) for water absorption test in accordance with standard procedures. (BS 1881-122 :Testing concrete. Method for determination of water absorption, 1983)
Water absorption results were given in table 9. Table 9. Water absorption results of cubes.
Mix ID Slump (mm) Water/ Kesara Lime ratio Avg. Water Absorption (%)
C1 100 1.724 25.9 C2 100 1.884 24.9
320

3.3.4. Water Permeability of Concrete Mixes
Cubes were cast and cured for 28 days for the respective two concrete mix types (C1 & C2). Cubes (3 nos. for each type) were subjected to water penetration test according to standard procedures. (BS EN 12390-8 : Testing hardened concrete. Depth of penetration of water under pressure, 2000)
However, cubes were unable to withstand the water pressure and failed as soon as cubes were subjected to water pressure.
4. Conclusion
4.1. Lime
According to the lime results, it was decided to use the low strength lime brand so as to observe the behavior of mortar and concrete mixes. However, all the lime brands displayed low strength values when compared to cement.
4.2. Aggregate
4.2.1. Fine aggregates
Grading curves revealed that all fine aggregate types except river sand, complied with the limits specified for (0/1) sized fine graded category according to SLS 1397:2010.
River sand sample complied with the limits specified for (0/4) sized coarse graded category, except at 8.0 mm sieve level.
Coarse aggregate sample tested was in conformity with the limits specified for 5mm- 20 mm graded coarse aggregate in BS 882: 1992, except at 5.0mm sieve level.
4.2.2. Coarse Aggregate
Grading curve revealed that the calicut tile sample was in conformity with the limits specified for 5mm- 20 mm graded coarse aggregate in BS 882: 1992, except at 5.0 mm sieve level.
4.3. Mortar Mixes
Strength and workable life of mortar mixes were low when compared with cement based mortars. Sand involved mortar mixes show less strength values when compared with other mortar mixes.
Based on the strength results of durability of masonry mortar mixes, strength loss of A3 mix was low compared with A7 mix. Therefore, high durability could be expected from A3 mix when compared with A7 mix type.
321

4.4. Concrete Mixes
Strength of mixes proposed by CCF to be used as concrete materials showed significantly low compressive strength (28 days) results when compared with normal concrete mixes. C1 mix exhibited slightly higher strength values compared to C2 mix. Both C1 and C2 mixes could not be recommended to be used for high strength requirements.
Water absorption and water permeability results could be used as indicators to predict the durability of concrete mixes. Although water permeability of both mixes displayed poor resistance to water penetration, water absorption of C2 mix was comparatively low when compared with C1 mix. Therefore, it could be predicted that C2 mix has higher durability when compared with C1 mix.
Acknowledgement
The authors wish to express their heartfelt gratitude to BMRTD, NBRO working staff for the encouragement and the support given by them during this consultancy testing project.
References [1] B.Sickels-Taves, L. (1989). Selecting mortar for historic preservation projects. The
Aberdeen Group. [2] (1983). BS 1881-122 :Testing concrete. Method for determination of water absorption. [3] (2000). BS EN 12390-8 : Testing hardened concrete. Depth of penetration of water
under pressure. [4] (2002). BS EN 12620 : Aggregate for concrete. [5] (2001). BS EN 459-2 Building Lime. [6] (2010). BS EN 998-1: Specification for mortar for masonry. Rendering and plastering
mortar. [7] Jeanne Marie Teutonico, I. M. (1994). The SmeatonProject: Factors Affecting the
properties of Lime-Based Mortars. New york: Association for preservation technology(APT).
[8] (1996). SLS 1144 part 2 : Specification for ready mixed concrete. [9] (2010). SLS 1397 Specification for fine aggregate for concrete and mortar. [10] (BS EN 998-2). Specification for mortar for masonry. Masonry mortar. 2016. [11] (n.d.). The Smeaton Project: .
322
Development of GIS Based Noise Dispersion Map as a Model
to Estimation of Road Noise Levels
HDS Premasiri1, PD Liyanaarachchi2, NKPMM Perera2
1 Senior Scientist, National Building Research Organisation, Sri Lanka 2 Scientist, National Building Research Organisation, Sri Lanka
Abstract
According to the World Health Organization (WHO), noise is second only to air pollution in the impact it has on health. Road traffic and related noise is a major source of annoyance and impairment to health in urban areas as well as rural areas. Noise Modelling is the process used for theoretically estimating noise levels within a region of interest under a specific set of conditions. The specific set of conditions for which the noise is being estimated will be a fixed representation or 'snapshot' of a physical environment of interest.
In our study, noise calculation method is used for the prediction of noise levels by road network. It is a Java-program that calculates noise levels in dB (A) at a given distance from a road due to road traffic on a straight road without barriers or obstacles. Then the predicted levels were incorporated with interfaces to GIS packages to developed maps. The Important input data are the number of vehicles and vehicle type, the mean speed and the distance from to the road. Model validation of the predicted noise level was done by manually measuring noise data by Noise meter in existing Kottawa – Athurugiriya section of the Outer Circular Highway. According to the results, the noise prediction and mapping methodology is highly acceptable to assess the prediction of noise levels. This indicates that noise calculated by the Java-program and interface with ArcGIS software can be used simply to assess noise contribution by road traffic. These predictions are used in an increasing range of decision-making applications to be made regarding some future change to an environmental noise field. Keywords: Noise Prediction Model; highway; Vehicle fleets
1. Introduction
The current expansion of road traffic has brought serious problems in urban areas. One of the major impacts due to road transport is increase of noise pollution
323

that cause annoyance and weakening of health in urban residential. It is a major cause, not only of hearing loss, but also of heart disease, learning problems in children and sleep disturbance. According to World Health Organization, exposure to environmental noise can have a number of adverse health effects. Noise pollution caused by automobiles has become an enormous social problem and will become more serious in the future as it is persistent and increasing.
In the present contest in Sri Lanka, high traffic conditions are observed in urban city areas as well as in rural areas especially in morning and evening times. Also new roads and highways have been planned and constructed to cater this rapidly increasing traffic volume. These situation leads to the increase in noise levels around the roads. It was shown in some baseline studies, the road side noise levels conducted in Sri Lanka indicates that the reported noise level close to the main road were 72 dB to 78 dB which are relatively high levels. However, the noise levels generated by road traffic would be reduced when moving away from the road. In order to evaluate probable effects of traffic noise on people, it is necessary to have an accurate prediction method. When considering the prediction method, best way is using ambient noise prediction models.
Investigators have performed a large amount of work in traffic noise prediction and established various influential steady-state calculation models, such as the FHWA highway traffic noise prediction model in the United States (Rochat and Fleming, 2002), the CRTN model in the United Kingdom (Department of Transport and Welsh Office UK, 1988), the RLS90 model in Germany (Road Construction Section of the Federal Ministry for Transport, 1990).
Although all of the above models can predict the equivalent noise level Leq or the time average noise level LAT over a given period of time. In practice, environmental noise models will often be more complex, involving a multiple complex transmission paths, to multiple locations of interest, expert’s knowledge, building height, knowledge of different kind of advanced software like Auto CAD and terrain conditions. In these more complex scenarios, the environmental noise model is repetitiously calculated for each sound source via each transmission path to each and every receiver location. The total sound level at each position is then calculated by summing the contribution of each source and transmission path.
Because of that, simple methods are used for the noise prediction like, Noise prediction equations and Java programs. When considering about the equations, most of the times it can handle only vehicle traffic data on the selected road. But selected Java programme can process the percentage of vehicle type, traffic data, road surface condition like easily collected data. Then resulted predicted noise level from the java programme incorporated with the Arc GIS to produce the acceptable simple low cost noise model. This is often accomplished within a Geographic Information System (GIS) framework by combining spatially referenced data on land cover and road geography with associated traffic flows input to model the emission and propagation of noise from source.
2. Material and Method
In this study, Java noise prediction calculator was to make made the noise level predictions. (The screenshot of the java-program of the traffic noise calculator is given in figure 1.). The method can compute Leq1h: hourly A-weighted equivalent
324
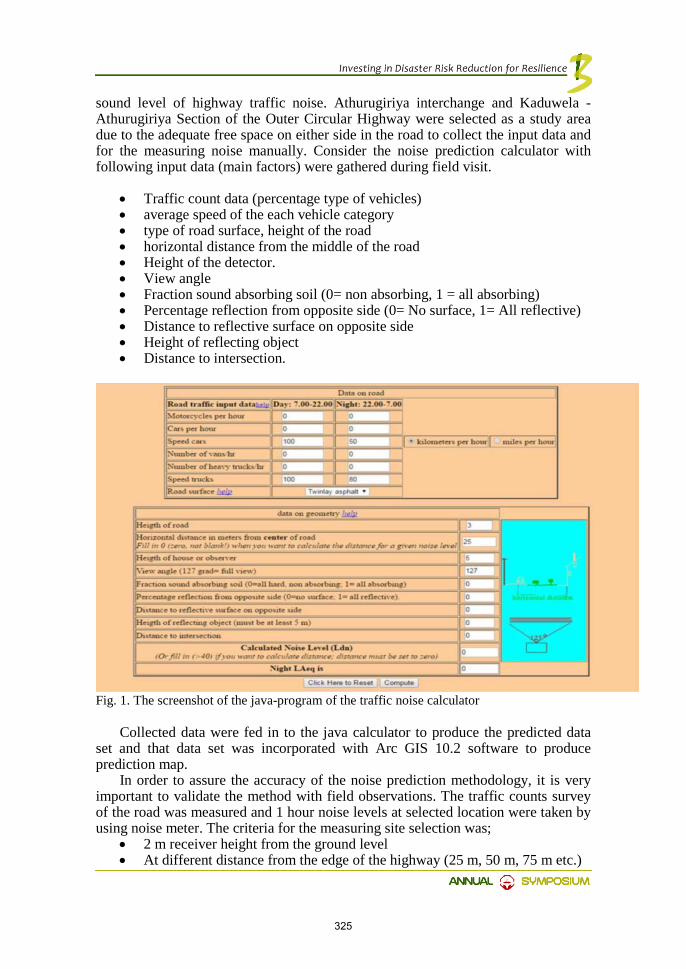
sound level of highway traffic noise. Athurugiriya interchange and Kaduwela - Athurugiriya Section of the Outer Circular Highway were selected as a study area due to the adequate free space on either side in the road to collect the input data and for the measuring noise manually. Consider the noise prediction calculator with following input data (main factors) were gathered during field visit.
• Traffic count data (percentage type of vehicles) • average speed of the each vehicle category • type of road surface, height of the road • horizontal distance from the middle of the road • Height of the detector. • View angle • Fraction sound absorbing soil (0= non absorbing, 1 = all absorbing) • Percentage reflection from opposite side (0= No surface, 1= All reflective) • Distance to reflective surface on opposite side • Height of reflecting object • Distance to intersection.
Fig. 1. The screenshot of the java-program of the traffic noise calculator
Collected data were fed in to the java calculator to produce the predicted data set and that data set was incorporated with Arc GIS 10.2 software to produce prediction map.
In order to assure the accuracy of the noise prediction methodology, it is very important to validate the method with field observations. The traffic counts survey of the road was measured and 1 hour noise levels at selected location were taken by using noise meter. The criteria for the measuring site selection was;
• 2 m receiver height from the ground level • At different distance from the edge of the highway (25 m, 50 m, 75 m etc.)
325
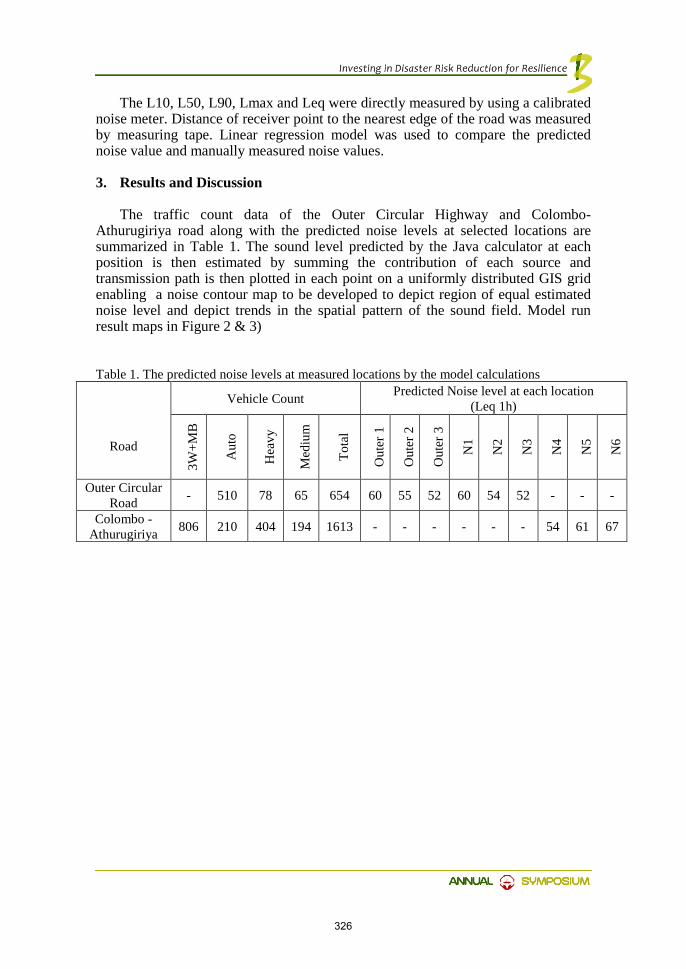
The L10, L50, L90, Lmax and Leq were directly measured by using a calibrated noise meter. Distance of receiver point to the nearest edge of the road was measured by measuring tape. Linear regression model was used to compare the predicted noise value and manually measured noise values.
3. Results and Discussion
The traffic count data of the Outer Circular Highway and Colombo-Athurugiriya road along with the predicted noise levels at selected locations are summarized in Table 1. The sound level predicted by the Java calculator at each position is then estimated by summing the contribution of each source and transmission path is then plotted in each point on a uniformly distributed GIS grid enabling a noise contour map to be developed to depict region of equal estimated noise level and depict trends in the spatial pattern of the sound field. Model run result maps in Figure 2 & 3)
Table 1. The predicted noise levels at measured locations by the model calculations
Road
Vehicle Count Predicted Noise level at each location (Leq 1h)
3W+M
B
Aut
o
Hea
vy
Med
ium
Tota
l
Out
er 1
Out
er 2
Out
er 3
N1
N2
N3
N4
N5
N6
Outer Circular Road - 510 78 65 654 60 55 52 60 54 52 - - -
Colombo - Athurugiriya 806 210 404 194 1613 - - - - - - 54 61 67
326
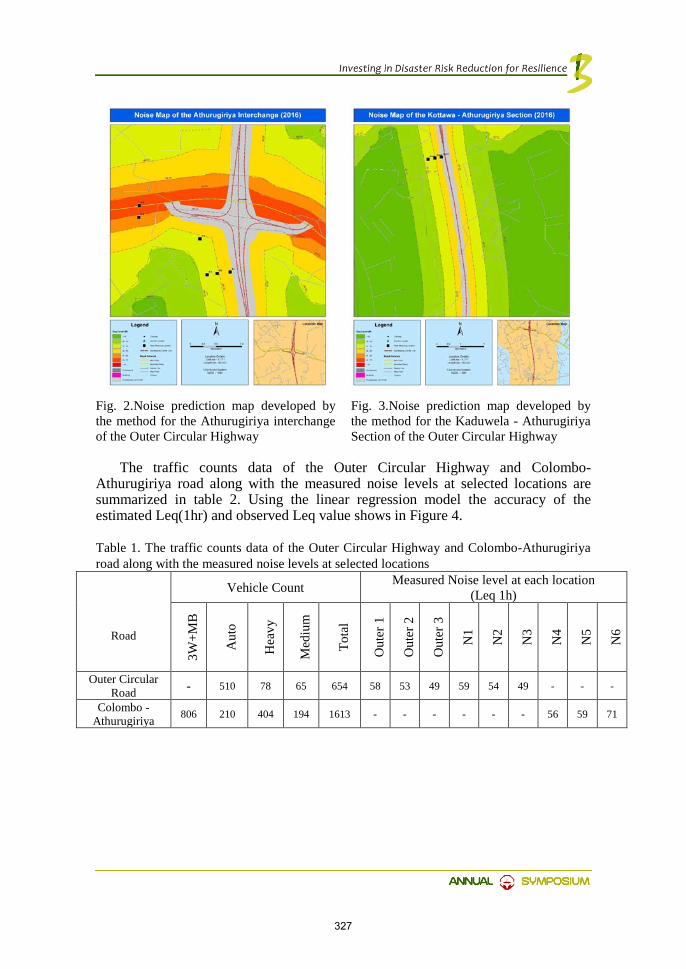
Fig. 2.Noise prediction map developed by the method for the Athurugiriya interchange of the Outer Circular Highway
Fig. 3.Noise prediction map developed by the method for the Kaduwela - Athurugiriya Section of the Outer Circular Highway
The traffic counts data of the Outer Circular Highway and Colombo-
Athurugiriya road along with the measured noise levels at selected locations are summarized in table 2. Using the linear regression model the accuracy of the estimated Leq(1hr) and observed Leq value shows in Figure 4.
Table 1. The traffic counts data of the Outer Circular Highway and Colombo-Athurugiriya road along with the measured noise levels at selected locations
Road
Vehicle Count Measured Noise level at each location (Leq 1h)
3W+M
B
Aut
o
Hea
vy
Med
ium
Tota
l
Out
er 1
Out
er 2
Out
er 3
N1
N2
N3
N4
N5
N6
Outer Circular Road - 510 78 65 654 58 53 49 59 54 49 - - -
Colombo - Athurugiriya 806 210 404 194 1613 - - - - - - 56 59 71
327
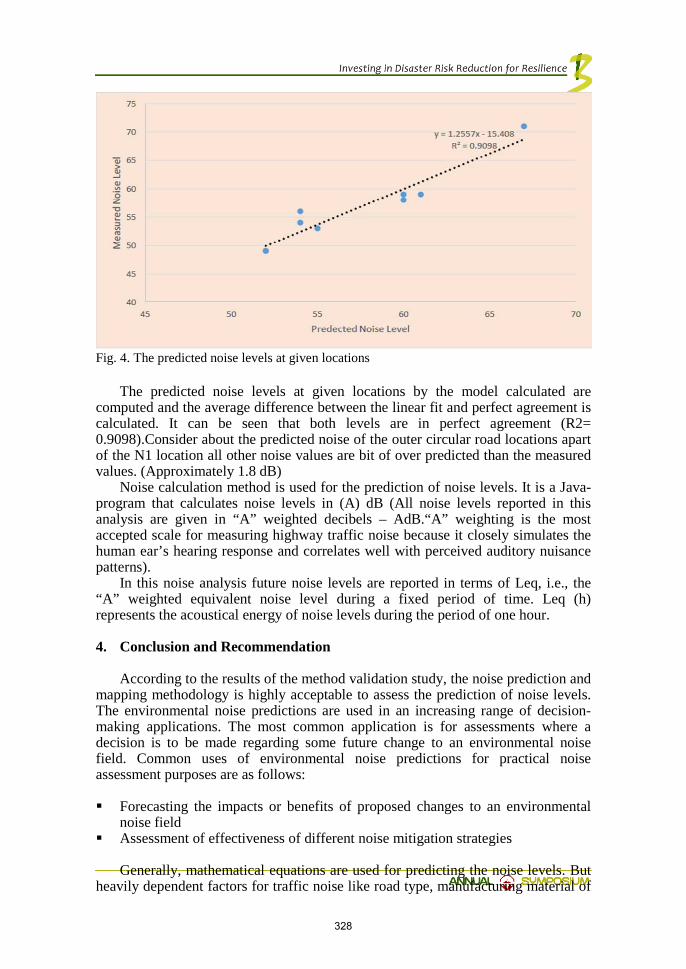
Fig. 4. The predicted noise levels at given locations
The predicted noise levels at given locations by the model calculated are
computed and the average difference between the linear fit and perfect agreement is calculated. It can be seen that both levels are in perfect agreement (R2= 0.9098).Consider about the predicted noise of the outer circular road locations apart of the N1 location all other noise values are bit of over predicted than the measured values. (Approximately 1.8 dB)
Noise calculation method is used for the prediction of noise levels. It is a Java-program that calculates noise levels in (A) dB (All noise levels reported in this analysis are given in “A” weighted decibels – AdB.“A” weighting is the most accepted scale for measuring highway traffic noise because it closely simulates the human ear’s hearing response and correlates well with perceived auditory nuisance patterns).
In this noise analysis future noise levels are reported in terms of Leq, i.e., the “A” weighted equivalent noise level during a fixed period of time. Leq (h) represents the acoustical energy of noise levels during the period of one hour.
4. Conclusion and Recommendation
According to the results of the method validation study, the noise prediction and mapping methodology is highly acceptable to assess the prediction of noise levels. The environmental noise predictions are used in an increasing range of decision-making applications. The most common application is for assessments where a decision is to be made regarding some future change to an environmental noise field. Common uses of environmental noise predictions for practical noise assessment purposes are as follows:
Forecasting the impacts or benefits of proposed changes to an environmental
noise field Assessment of effectiveness of different noise mitigation strategies
Generally, mathematical equations are used for predicting the noise levels. But
heavily dependent factors for traffic noise like road type, manufacturing material of
328

the road are not accounted in these equations. In this study, all these factors are included in Java Calculator for noise prediction level.
This Java calculator considers the various factors like road surface condition, average speed of the vehicles and Traffic data for calculating the noise levels. Therefore, this modal can be used for normal roads and not only for the highway roads.
Sri Lanka doesn’t have noise regulations for highways and the available industrial noise regulation (Extraordinary Gazette No. 924/12- Thursday, May 23, 1996) would not apply for highway noise regulations except at construction stage. Therefore, establishment of local noise regulation levels establishment is highly essential for Sri Lanka.
5. Reference
[1] Lee, E., Jerrett, M., Ross, Z., Coogan, P. and Seto, E. (2017). Assessment of traffic-related noise in three cities in the United States.
[2] Morley, D. and Gulliver, J. (2017). Methods to improve traffic flow and noise exposure estimation on minor roads.
[3] Gulliver, J., Morley, D., Vienneau, D., Fabbri, F., Bell, M., Goodman, P., Beevers, S., Dajnak, D., J Kelly, F. and Fecht, D. (2017). Development of an open-source road traffic noise model for exposure assessment.
[4] Ko, J., Chang, S. and Lee, B. (2017). Noise impact assessment by utilizing noise map and GIS: A case study in the city of Chungju, Republic of Korea.
329

Flood Resilient Housing for Sustainable Development MSN de Zoysa1
1 Scientist, National Building Research Organisation, Sri Lanka
Abstract
From the early stages of the civilization, floods are among the most destructive and common natural hazards causing extensive damage to infrastructure, and the economy and devastation of human settlements. Prevalence of high rainfall as well as human activities increase the flood hazard. During the past few decades extreme weather conditions affected the lives of thousands of people and many people lost their lives. Due to the above reasons, the amount of flood affected communities are increasing and it directly affects the development process of the country. Other than that, flood is a natural process that cannot be ceased to occur. Therefore, it is necessary to promote the importance of a resilient culture among the people to minimize the damage in flood prone areas. Further, it is important to identify flood mitigation strategies and introduce them to the general public to make them aware from the floods. Also these developments should be safe, economically feasible, environment friendly and socially agreed, sustainable developments. Keywords: Flood, flood mitigation strategies, resilient culture
1. Introduction
Sri Lanka is a tropical country located in the Indian Ocean which has two monsoon seasons. The South-West monsoon activates in the months from March to August and North-East monsoon activates in the months from September to February, and fulfils the water requirement of the entire country.
Flood can be identified as "the condition in which that land is submerged in water which is normally used to be dry." (Khan, 2017)
Floods can occur due to several reasons around the world.
1.1. Types of Floods 1) Flash floods 2) Coastal floods 3) Urban floods 4) River (fluvil) floods 5) Ponding (Pluvial floods)
330

1.1.1. Flash Floods
The "speed" is the key word in flash floods. In areas with steep slopes, heavy rain can cause a riverbed that held very little or no water at first, to suddenly brim with fast flowing water. The rain water is collected on the slopes, then flows downhill gathering speed and all the water comes together in the riverbed. The water level rises very fast. The water flows over the river banks and floods the area. It will happens fast, it rains heavily.
The area covered by water in a flash flood is relatively small compared to other types of floods. The amount of water that covers the land is usually not very large, but is so concentrated on a small area that it can rise very high.
1.1.2. Coastal Floods
A coastal flood is created when the coastal zone is flooded by the sea. Generally it happens with a severe storm and the wind storm pushes the water up and creates high waves. When those high waves move inlands, the flood starts. The water level drops and rises with the tide is a very characteristic of a coastal flood.
At high tide the water may flow in and low tide it may recede again. When a sea defence is breached low tide is the time to repair the breach. Once it overtops and breaches the defences, the sea enters fast, but slows down when it spreads over a large area.
1.1.3. Urban Floods
Urban flooding is specific in the fact that the cause is lack of drainage in an urban area. As there is little open soil that can be used for water storage nearly all the precipitation needs to be transported to surface water or the sewage system. High intensity rainfall can cause flooding when the city sewage and draining canals do not have the necessary capacity to drain away the amounts of rain that are falling. Water may even enter the sewage system in one place and then get deposited somewhere else in the city on the streets.
Urban floods are great disturbance of daily life in the city. The economic damages are high, but the number of causalities is usually very limited, because of the nature of the flood. The water slowly rises on the city streets. When the city is on a flat terrain, the flow speed is also slow.
1.1.4. River Flood
Rainfall over an extended period and extended area can cause major rivers to overflow their banks. The water can cover enormous areas. Downstream areas may be affected, even when they did not receive much rain themselves.
With large rivers the process is relatively slow. The rain water enters the river in many ways. Some rain will fall to the river directly, but that alone doesn’t make the river rise high. A lot of rain water will run off the surface when the soil is saturated or hard. It will flow to small rivers that flow to larger rivers and these larger rivers flow into even larger rivers. In this way all the rain that fell in a large area (catchment area) comes together in this one very large river. When there is a lot of
331
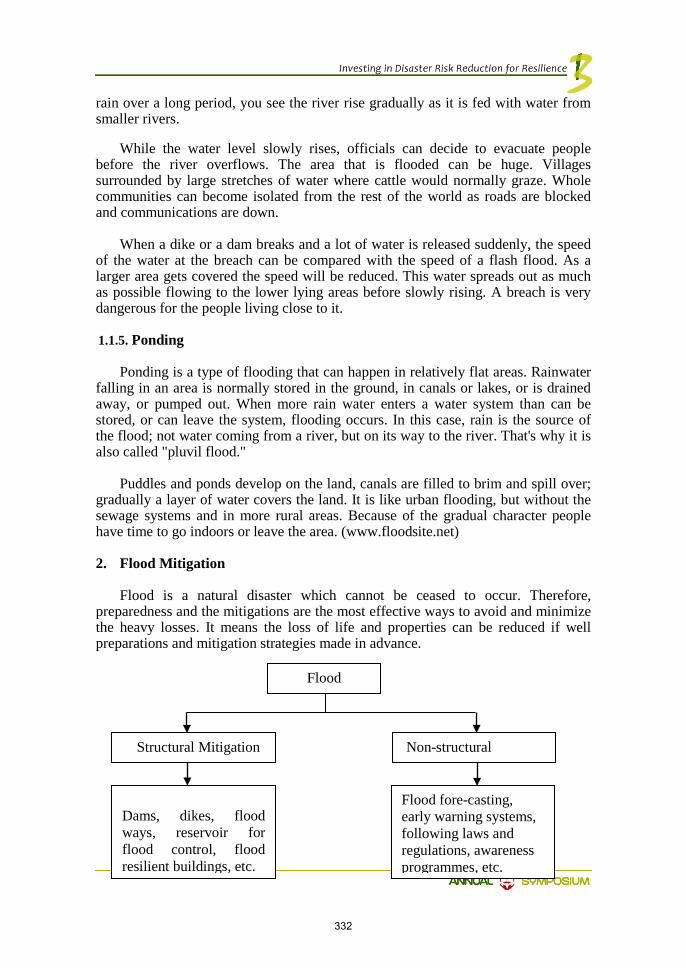
rain over a long period, you see the river rise gradually as it is fed with water from smaller rivers.
While the water level slowly rises, officials can decide to evacuate people
before the river overflows. The area that is flooded can be huge. Villages surrounded by large stretches of water where cattle would normally graze. Whole communities can become isolated from the rest of the world as roads are blocked and communications are down.
When a dike or a dam breaks and a lot of water is released suddenly, the speed
of the water at the breach can be compared with the speed of a flash flood. As a larger area gets covered the speed will be reduced. This water spreads out as much as possible flowing to the lower lying areas before slowly rising. A breach is very dangerous for the people living close to it.
1.1.5. Ponding
Ponding is a type of flooding that can happen in relatively flat areas. Rainwater falling in an area is normally stored in the ground, in canals or lakes, or is drained away, or pumped out. When more rain water enters a water system than can be stored, or can leave the system, flooding occurs. In this case, rain is the source of the flood; not water coming from a river, but on its way to the river. That's why it is also called "pluvil flood."
Puddles and ponds develop on the land, canals are filled to brim and spill over;
gradually a layer of water covers the land. It is like urban flooding, but without the sewage systems and in more rural areas. Because of the gradual character people have time to go indoors or leave the area. (www.floodsite.net)
2. Flood Mitigation
Flood is a natural disaster which cannot be ceased to occur. Therefore, preparedness and the mitigations are the most effective ways to avoid and minimize the heavy losses. It means the loss of life and properties can be reduced if well preparations and mitigation strategies made in advance.
Flood
Non-structural
Structural Mitigation
Dams, dikes, flood ways, reservoir for flood control, flood resilient buildings, etc.
Flood fore-casting, early warning systems, following laws and regulations, awareness programmes, etc.
332
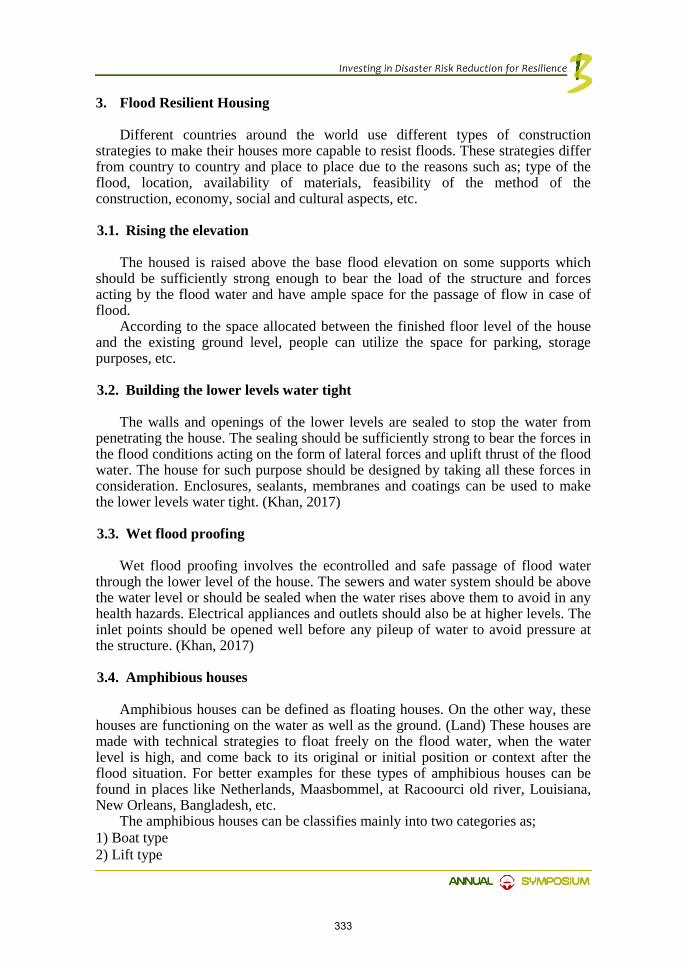
3. Flood Resilient Housing
Different countries around the world use different types of construction strategies to make their houses more capable to resist floods. These strategies differ from country to country and place to place due to the reasons such as; type of the flood, location, availability of materials, feasibility of the method of the construction, economy, social and cultural aspects, etc.
3.1. Rising the elevation
The housed is raised above the base flood elevation on some supports which should be sufficiently strong enough to bear the load of the structure and forces acting by the flood water and have ample space for the passage of flow in case of flood.
According to the space allocated between the finished floor level of the house and the existing ground level, people can utilize the space for parking, storage purposes, etc.
3.2. Building the lower levels water tight
The walls and openings of the lower levels are sealed to stop the water from penetrating the house. The sealing should be sufficiently strong to bear the forces in the flood conditions acting on the form of lateral forces and uplift thrust of the flood water. The house for such purpose should be designed by taking all these forces in consideration. Enclosures, sealants, membranes and coatings can be used to make the lower levels water tight. (Khan, 2017)
3.3. Wet flood proofing
Wet flood proofing involves the econtrolled and safe passage of flood water through the lower level of the house. The sewers and water system should be above the water level or should be sealed when the water rises above them to avoid in any health hazards. Electrical appliances and outlets should also be at higher levels. The inlet points should be opened well before any pileup of water to avoid pressure at the structure. (Khan, 2017)
3.4. Amphibious houses
Amphibious houses can be defined as floating houses. On the other way, these houses are functioning on the water as well as the ground. (Land) These houses are made with technical strategies to float freely on the flood water, when the water level is high, and come back to its original or initial position or context after the flood situation. For better examples for these types of amphibious houses can be found in places like Netherlands, Maasbommel, at Racoourci old river, Louisiana, New Orleans, Bangladesh, etc.
The amphibious houses can be classifies mainly into two categories as; 1) Boat type 2) Lift type
333

Both of these two types of structures have their own characteristics to resist from the floods. Some of the most important characteristics can be mentioned as follows;
3.4.1. Boat type
• Free to move both vertical direction as well as the horizontal direction. • The floor of the house should be water tight, so the water does not enter to
the house from the base. • The house is provided with some anchor system for stopping the house to
dislocate with the flow of water from its original position.
3.4.2. Lift type
• Free to move in only vertical direction in a controlled way along with the rising water level in a flood situation. The house restrained to move in horizontal direction by guiding columns at the corners.
• The house remain on ground surface until the flood water stands lifting it up by buoyant forces.
4. Flood risk mitigation strategies in vernacular dwellings in Sri Lanka
When considering the historical and past records of the natural disasters in Sri Lanka, it can be identified that the people are always affected by both annual and seasonal floods occurred due to extreme weather conditions.
Therefore, people used to apply different types of flood mitigation strategies for their dwellings.
According to the Character on the built vernacular heritage, 1999;"Vernacular building is a traditional and natural way by which communities house themselves. It is a continuing process including necessary changes and continuous adaptation as a response to social and environmental constraints."
According to the literature, it can be identified that, in Sri Lanka most commonly used mitigation strategy for flood is rising the elevation of the dwellings.
5. Flood resilient model house at Pannala.
Under the R & D programme, NBRO designed several types of disaster resilient model houses for different types of disasters such as floods, landslides, high winds, tsunami, etc. But, at Pannala, NBRO decided to select a house in a flood prone area which did not incorporate any resilient features. And then decided to convert the selected house into a flood resilient house.
Based on the literature survey for flood mitigation strategies, it can be categorized into several parameters as follows;
5.1. Location
In the normal procedure in designing a building, the historical records of the site about any hazards occurred or about the hazards can occur in the future should be
334

studied. But in this study, the owners of the house located their house near the tributary of “Maa Oya.” (About 5m away from the bank of the tributary)
Due to the high rainfall and the annual floods in the area, the selected site is affected by floods every year. According to the collected data, it identified the annual flood level as 1'-6" and the seasonal flood level as 3'-6".
5.2. Building form and orientation
According to the literature, L, H, U or any irregular shapes should be avoided from the buildings in flood prone areas. Also, due to the velocity of the floods, it is recommended to design the shorter facade of the building facing to the flood direction and longer facades parallel to the flood direction.
At the beginning of the construction project, the owners of the house built only the living area and the kitchen parallel to the canal. (1'-6" higher than the existing ground level) Therefore, it was decided to add two more bed rooms to the house parallel to the living area and the kitchen. Due to that design decision, that, only the shorter facade of the house faces to the flood direction. Therefore, it helps to reduce the damage which can occur in a flood.
Not only the plan form of the house,
but also the sectional form acts a major role in building resilience. The literature highlights, in the houses in flood prone areas, should increase the plinth level of the houses above the annual flood level of the area and increase the elevation of at least one bed room of the house at least 1'-0" above the recorded highest flood level of the area.
By considering the above resilient design strategies, it was decided to design the two new bed rooms on stilts, 1'-0" above recorded highest flood level of the area. (4'-6" above the existing ground
level) Therefore, the owners of the house can use the upper level (two bed rooms) in a flood situation as a safer place.
Also more openings were located on the wall facing the canal and also designed an opening on the parallel wall to flow the water easily in a flood situation, without
Fig. 1. House plan
Fig. 2. Section
Fig. 3. Side elevation
335

making any damage to the building structure. Further, because the upper part of the house designed on stilts, it also helps to avoid the disturbance to the flow path of the water. Also, the people can use the space between the floor (upper level) and the ground level for storage purposes.
5.3. Sub-structure, Super structure / Structural elements
At the beginning of the project, the house owners did not consider about any structural mitigations. Therefore, it decided to incorporate 8" x 8" R.C.C. structural columns to the house. Also it decided to add a R.C.C. lintel on the top level of the door and window frames and connect the structural columns, with the lintel, to function the structural elements as a single unit.
The upper level of the house has 8" x 8" R.C.C. structural columns and uses ICC pre-cast floor slabs for the floor of the two bed rooms. That decision reduced 27% of the construction cost of the flooring.
Specially during the monsoon seasons, floods are usually accompanied by
winds. Therefore, roof anchoring is also became as a considerable factor. For this purpose, it was decided to connect the vertical reinforcements of the structural columns to the roof structure to create a stronger connection between walls, columns, beams and the roof.
Fig. 4. Column to lintel connection detail
Fig. 5. Floor slab detail
Fig. 6. Wall plate on structure Fig. 7. Reeper to rafter connection
336
Hazard Resilient Construction Manual (NBRO,2015)
6. Conclusion
In the present context in Sri Lanka, flood became one of the most destructive natural hazards, and it disturbs to the activity pattern of the people and causes the loss of lives as well as properties, affects the economy of the country and disturbs the entire development process of the country. Hence the GoSL has to allocate a considerable amount of the money for resettlement, compensation, etc. during each and every year.
Damage to the dwellings from floods can be a result of strong lateral forces on the structure. Therefore, increasing the strength of the entire structure of the dwelling and positioning the openings strategically can help to minimize the damage to the house.
Further, identifying the nature of the hazard, context, and applying suitable architectural and structural design mitigation strategies and introducing them to the general public to create a resilient culture can be mentioned as the most effective ways in the flood mitigation process.
Fig. 8. Corrugated cement sheet connection detail
Fig. 9. Connection with deformed bar
337
References
[1] Ahmad, S., Khan, M.K. & Saqib, M. (2016). Flood Resilient Houses. Journal of Construction Engineeing, Technology & Management.
[2] Alam, J. & Muzzammil, M. (2011). Flood Disaster Preparedness in Indian Scenario: International Journal on Recent Trends in Engineering and Technology.
[3] Dilhani, K.A.C. & Jayaweera, N. (2016). A study of flood risk mitigation strategies in vernacular dwellings of Rathnapura, Sri Lanka, Built-environment:Sri Lanka – Research Journal of the Sri Lanka Institute of Architects.
[4] Khan, M.K. & Ahmad, S. (2017). Flood Resilient Buildings: a Requirement for Sustainable Development in Flood Prone Areas, International Journal on Emerging Technologies.
[5] NBRO. (2015). Hazard Resilient Construction Manual. [6] Saqib, M., Alam, J. & Muzzammil, M. (2014). Flood Resilient Houses in Indian
Environment. [7] www.floodsite.net
338

Integration of Fire Safety Aspects in the High-Rise Development of Sri Lanka: Reality or Rhetoric?
WG Winson Gnanatheepan1 & SMRS Subhasinghe2
1Scientist, National Building Research Organisation, Sri Lanka
Abstract
High rise buildings have become a rapidly growing concept within Colombo Municipal Council Area and its suburbs. According to the Condominium Management Authority more than 100 high-rise condominiums have been built within Colombo and suburbs during the last decade which ultimately led to the rapid change in the Colombo’s skyline. Vertical development is considered as the most suitable solution where land is scarce and expensive. On the other hand, it is difficult to control risks and handle emergencies in high rise buildings. Buildings often considered as live assets are integrated with the day to day lives of the inhabitants. Therefore, buildings should be designed and built in a manner such that the building occupants would feel safe and comfortable to occupy the building. Experts say that apart from above aspects that a building must perform according to an acceptable performance level and pattern, during its economic life. This means that the building must be functional, fit for the purpose and also it should cater to equitable accessibility for all, accommodating users of all shapes, sizes and abilities. So far Sri Lanka has not experienced a major disaster due to lack of design integrity for fire compliance measures in place. But in any case, if such a disaster happens are we ready to face them? This research paper scrutinizes the safety level of the Sri Lanka’s high rise buildings whether are they really safe or safety level is confined to the book only.
Keywords: Buildings; Condominium; Colombo; Design; High Rise; Safety.
339

1. Introduction
1.1. Background
Scarcity of land, growing population and intensifying urbanization had resulted in development of high rises in urban areas. Consequently high rise development has become an inevitable component in the urban areas. High rise development is also considered as a way to control urban sprawl. But in the various avenues of urban scenario, vertical development could also be considered as notorious and having unpleasant outcomes.
High rise building could be defined as a building with small footprint, small roof area and very tall facades. Need of special engineering systems due to its height is the major difference between conventional low rise and high rise buildings. Further experts also define high rise as a structure where the height can have a significant impact on emergency evacuation.
Experts consider that social issues such as crime, mental breakdowns, sustainability, social capital, networking, participation confidence and engineering issues such as structural failures, overloading of infrastructures, integration of safety aspects into design, wind resistance, fire protection and building security as major issues associated with the high-rise development. Addressing the kind of risks that are associated with high-rise structures during its life time, and risks of safety problems are usually associated with unknown disasters.
There is a rising concern about the fire safety of the high rise buildings which needs appropriate plans to combat such potential fire incidents. Fire safety plans should be developed using a holistic approach. In most of the high rise buildings utility lines and the exit stairs are located close by and incase of any emergency fire situation evacuation of the people might be in danger. Further high rise buildings should be designed by providing enough evacuation time to the occupants during an emergency situation. Absence of the standardized building code in Sri Lanka is also a major drawback to regulate the construction industry of the island.
The statistics of Condominium Management Authority reveals that every year averagely 60-70 new condominium certificates have been issued during last decade. This trend will probably increase within the Colombo metro region and suburbs due to the high agglomeration of activities. Hence it is necessary to evaluate the fire safety aspects into the high rise design and their subsequent implementation and management.
340

1.2. Objectives
To determine integration level of safety aspects in the high-rise development of Sri Lanka by comparing with the international standards and case studies.
2. Literature Review
The use of a building has considerable influence on its security and fire life safety needs. There are different types of high-rise buildings classified according to their primary use. High-Rise Security and Fire Life Safety book written by Geoff Craighead addresses the following types of high rise buildings;
i. Office buildings: An office building is a “structure designed for the conduct of
business, generally divided into individual offices and offering space for rent or lease”.
ii. Hotel buildings: “The term ‘hotel’ is an all-inclusive designation for facilities that provide comfortable lodging and generally, but not always food, beverage, entertainment, a business environment and other ‘away from home’ services”. There are also hotels that contain residences. Known as hotel-residences, this type of occupancy considered as mixed-use buildings which is addressed below.
iii. Residential and apartment buildings: A residential building contains separate residences where a person may live or regularly stay. Each residence contains independent cooking and bathroom facilities and may be known as an apartment, a residence, a tenement, or a condominium. An apartment building is “a building containing more than one dwelling unit”. “Apartment buildings are those structures containing three or more living units with independent cooking and bathroom facilities, whether designated as apartment houses, condominiums, or garden apartments”.
iv. Mixed-use buildings: A mixed-use building may contain offices, apartments, residences, and hotel rooms in separate sections of the same building. Hotel residences are another type of mixed-use occupancy. “The hotel residences trend is notably different from its predecessors such as fractional/time share hotel units, which are not wholly owned, or condo hotels, which are wholly owned hotel rooms without, for example, kitchens. Not only do hotel residences have kitchens and everything else an owner would expect in a typical abode, they also include amenities such as maid and room service, plus restaurants, spas and gyms. Typically, the residences are on the top floors of hotels”.
In addition to the above, there are other high-rise occupancies that include
banking and financial institutions, day-care occupancies, detention and correctional facilities, educational institutions, government agencies, hospital and health care facilities, library and museum collections, lodging or rooming houses and residential board and care facilities. Also, a fairly recent development has been of vertical shopping malls in Asian cities such as Bangkok, Kuala Lumpur, and Singapore.
In addition, there are two types of structures commonly associated with buildings that technically are classified as high-rises but usually are not required to conform to high-rise building laws, codes, and standards. These structures are (1) buildings used
341
solely as open parking structures and (2) buildings where all floors above the high-rise height limit are used for open parking.
Fire life safety involves minimizing the possible danger to life and property from various threats, including that of fire. Fire and life safety, fire safety, and life safety are synonymous terms commonly in use in high-rise structures.
High-rise buildings differ from lowrise buildings in terms of fire safety aspects
on the followings;
1. The existence of multiple, occupied floors, one on top of another, usually means a higher concentration of occupants and therefore more property, hence, a greater potential fuel load of the building.
2. The probability of a large uncontrolled fire moving upward is of concern in a high-rise building because of its vertical nature.
3. The more individuals assembled in one location at any one time, the more likely it is that some of these people could be injured or killed, particularly by an incident occurring close to them.
4. Depending on the location of an emergency, there may be a delay in reaching the area to provide assistance. For example, a medical emergency that occurs on the uppermost floor of a skyscraper will require considerably more travel time for the responding medical team than a similar incident occurring in a building lobby.
5. Evacuation of occupants when an emergency occurs is hampered by the fact that large numbers of people cannot all leave the structure at once via elevators and emergency exit stairwells. (High-rises have never been designed for total evacuation—i.e., the capacity for all occupants to evacuate all at once from a building to an outside area of refuge or safety).
6. Access by the fire department—from both outside and inside the building—maybe restricted. According to the International Fire Service Training Association (IFSTA), external access may be limited by the following: • Setback of the building from public access roads and driveways,
landscaping, berms, and fountains and surfaces covering under-building or subterranean parking garages that will not support the weight of fire fighting vehicles. These factors may restrict the proximity to the building that fire department aerial ladder apparatus can attain.
• External features of the structure such as decorative walls, sunscreens, and building offsets (where an upper floor is set back from the floors beneath it) may inhibit the use of aerial ladders.
• Fire department aerial ladders have a limited reach. “The usual height limitation for aerial ladder operations is about 75 feet [23 meters].
Hence, the fire safety aspects of the high rise building should be integrated with
its design considering number of floors, use of the building, possible maximum number of occupants at a time and time needed for fire brigade’s access to the site. In addition the evacuation exits should be designed to cater the evacuation of maximum number of occupants at a time. Sri Lanka’s high rises have not faced any major fire incidents yet but it is essential examine whether the high rises of the country are resistant to fire disasters.
342

3. Methodology
4. Case study
According to the China Fire Safety Journal (8), fire safety measurements in construction industry can be divided in to four categories as following; Fire scenario, fire automatic suppression scenario, behavioural scenario of the building occupants and scenario of fire department intervention.
Elements of fire scenario and fire automatic suppression scenario for vertical development
Table 1. Elements of fire scenario and fire automatic suppression scenario Fire scenario Fire automatic suppression scenario
Size and type of use of building Initial condition of fire sprinklers Lining material of wall and celling Ventilation condition
Initial condition of fire detection and alarm system
Location of fire origin Initial condition of smoke control system Behaviour scenario table shows (Table 2) behaviour of occupants in response to
the onset of fire and the intervention of fire and rescue services in the case of building
343

fires. Importantly mobility, awareness and role of responsibilities of the occupants also considered as major role as apartment safety in international level according to Fire Safety Journal China.
Table 2.Elements of behaviour scenario Behavioural scenario of the building occupants Scenario of fire department intervention Personality trial Familiarity with lay out Social Features Knowledge and experience Power of movement Position and consciousness Powers of observation and judgement
Response time Intervention time Number of trapped occupants Required water flow rate Flashover time Number of firefighters
But the researches and observations carried out on the Sri Lanka’s high-rise
development reveals that above aspects have not been considered in the country’s vertical development scenario.
4.1. Bashundhara city commercial building at Dhaka (9)
Bashundhara City, the first giant commercial complex in Bangladesh and being said to be one of the largest in South Asia, was built in 2004 and is located in the centre of Dhaka. It mainly consists of a shopping mall and an office tower. In 2009, a fire from a short circuit broke out on 18th floor of the office tower and spread through 14th to 20th floors (except 16th floor) resulting in the large fire disaster involving seven dead and ten injured. Fire only burnt the office tower and did not spread to the shopping mall,
Initial fire safety options
• Bashundhara City had organized its own security team. The team had been highly appreciated for its disaster prevention ability and in case of a fire, it was supposed to work without help of the public fire service.
• The official fire service was made more than an hour after the fire was initially discovered. Since the fire broke out from an upper floor, the public fire service could not put out the fire from outside of the building. Reasons for the failure
• It took time to enter the building through the emergency stairs as doors were
locked. • The fireplug could not be used because it was installed inside of an office. Under
these adverse conditions, effective firefighting was almost impossible. • The building was not equipped with a sprinkler system but it had smoke detectors
and fire alarms. Although the detectors and the alarms worked when the fire broke out, the security team reportedly failed to respond immediately because the detectors and the sensors had repeated errors before the day of the fire
344

• A great amount of wooden panels were used as interior finishing which is said to be the cause to accelerate the spread of fire
• The fire hose was installed only in an office area on the standard floor, not compartmented by fire-rated walls
• There were gaps between the curtain wall and the floor, but the gaps were not done with preventing from fire spread.
• There was no space such as a hall or a hallway to separate the elevator from the office where the fire broke out, so the securities directly faced to the fire immediately after the door opened and were killed instantly
• The official fire service was made more than an hour after the fire was initially discovered. Since the fire broke out from an upper floor, the public fire service could not put out the fire from outside of the building.
4.2. Apartment house (Japan Garden City) fire (9)
A fire in which seven people died and ten were injured. Japan Garden City, a luxurious high-rise apartment house located near the centre of Dhaka. The apartment house is said to be one of the largest apartment houses in Dhaka. The fire occurred in 17-story apartment house with 2 residential units on each level. The fire is considered to have broken out in the room on 11thfloor caused by a short circuit of electric wiring when no one was in the room. It is said that fire service suspects a lot of combustible materials in the room could be one of the causes of rapid fire growth within the room of fire origin.
This case could be considered as a successful fire evacuation because after the fire broke out, almost all people in the building escaped safely with the help of wailing alarm and rescue efforts by a large number of firefighters.
However a family of seven people living on the 14thfloor failed to escape from the fire. They tried to evacuate by heading upstairs, but could not go out onto the roof because the evacuation door on the top floor was locked. This situation can be considered as poor knowledge that they have to react on a fire situation.
Initial fire safety options
• Building was installed with fireplugs but the firefighters could not use them because power supply was intentionally cut off for safety after the fire broke out.
• The fire service reported that the building had fire alarms but sprinkler was not installed at the time of fire. Reasons for the failure
• The building does not have fire door/shutters at the entrances of staircases. Therefore, both smoke and fire easily went up through the staircases.
• The evacuation routes for two-way escape were not secured. • The building was not equipped with adequate smoke-extraction system. • The door to the roof was locked.
345
5. Recommendations for the Sri Lanka’s high-rise development
• It has been identified that most of the lower class and middle class apartments in Colombo region do not have such a fire prevention measure according to observations. Therefore it is important to have fire prevention equipment such as sprinklers in the apartments.
• Developers should be mandated to use flame-retardant material for interior finishing. Using cheaper materials cause to fire easily. Therefore, developers must use standardise materials for interior designing at least for the residential area.
• High rise apartments in Sri Lanka are constructed without providing enough space to evacuate in an emergency situation. Therefore, a lobby should be incorporated in the design around the elevators aiming the fire prevention. The policy makers should pay more attention about these situations.
• It is really important to take actions to reinstall both vertical and horizontal fire protections for the apartments in Colombo before major disaster happen.
• Secure more than one evacuation routes including setting up balconies and outdoor stairways. This should be incorporated in the design as well.
• Install natural smoke-extraction system in sufficient size. • Train the residents take the key with them when escape to avoid any lockdown
situations. • Regular training should be given to the occupants of the buildings, the security
officers, building cleaners, and others who work in the structure on how to report and respond to fires and comparable emergencies.
6. Conclusion
Sri Lanka’s construction industry is continuously blooming since the end of the war in 2009. But it is very much debatable how such buildings are meeting the minimum safety standards. Even though most of the developers are constructing the buildings with necessary prior approvals, still how safety standards are being reviewed during construction and occupation is questionable. Therefore, Sri Lanka should develop a building code to regulate its construction industry by incorporating all the safety aspects including fire. This could be done through a cabinet task force consist of multi-disciplinary professionals. This code should be developed by reviewing the level of standards maintained by other developed countries in the construction industry. Further enforcement of this particular code should be made legalized through a parliament bill and implemented through UDA. Hence, Sri Lanka should act fast before experiencing a large building fire related disaster.
346

References
[1] Ministry of education and national institute of education. (2006). Learning ot live with landslides natural hazards and disasters.
[2] Disaster management centre, & UNDP. (2009). Sri Lanka national report on disaster risk, Poverty and human development relationship. Colombo.
[3] Bandara, R. M. S. (2005). Landslides in Sri Lanka. Vidurava, Vol: 22 (No: 02). [4] Vijekumara, P.A &Weerasinghe, W.A.I.A. (2016). Permanent shelter options for Kegalle
district landslide victims. NBRO International Symposium. [5] Westen, C.J. V., Alkema, D., Damen,M.C.J., Kerle, N.,&Kingma, N.C. (2011). Multi-
hazard risk assessment distance education course, Guide book. United Nations University. [6] Corominas, et al.(2013). Recommendations for the quantitative analysis of landslide risk. [7] Department of census and statistics, Sri Lanka. (2012). Census of population and housing
– 2012. [8] Xin, J., & Huang C., (2013). Fire risk analysis of residential building based on scenario
clusters and its application in fire risk management, Fire safety journal 62 (72-78) [9] Sugahara, S., Yoshioka, H., &Barua, S., (2011). Case studies of high-rise building fires in
Dhaka City with reference to building fire code of Japan, Fire science and technology, Vol.30 No.3(Special Issue) (69-80)
347

Thermal and Environmental Performance Strategies to Design of Buildings
DS Munasinghe1
1Scientist, National Building Research Organisation, Sri Lanka
Abstract
Buildings are the living spaces of human beings where they usually gather for many times of the day. Well designed spaces create more security, comfort and convention spaces for the users. It has many advantages in all the processes of the building construction, users and other equipment designers as well. With this situation standardization of the buildings are development of the country. Housing & Town Improvement Ordinance, No 19 of 1915, Town & Country Planning Ordinance, No 13 of 1946 and Urban Development Authority Law, No 41 of 1978 describe the building codes which are being practiced currently in the country and these codes were developed by taking of British standards into consideration. However, these legislations do not follow the building standardization regulations. Due to this nonobligated issue, different types of buildings were created disregarding the standards.
By integration, Performance-Risk Indicators (PRI from the perspectives of functional, technical, and indoor environmental performances, will be strengthened to facilate the assessment of the current state of building performance with risk concerns for users’ health and safety. (Khalil, N et al, 2016)
Research study modelled the building design strategies through computer modeling and identified the suitable design strategies for different zones in the country. ASHRAE standard comfort conditions were considered in the development of computer modeling.
Keywords: Thermal performance; Thermal physics
1. Introduction
Buildings are the liveable place for people for their different activities; residence, commercial, recreational, industrial and so on. Also, buildings are constructed for ensuring the safety of the space for particular activities. Natural disasters such as floods, landslides, cyclones, lightning, etc., occur due to natural phenomenon and sometimes they are triggered by man-made unplanned activities. Therefore,
348

buildings should be developed to minimise the natural hazard impacts. As an example, if a building were made in flood prone areas, the foundation should be raised more than the flood level. The proposed building system should support to achieve safer conditions with limited alteration. The complete system was analysed based on external conditions required to achieve a safer building.
Thermal performance of the building is not widely discussed in building construction. A building system should be providing physical comfort to occupants or dwellers. (Souza, 2013) A common benefit came from the Heating Ventilation Air conditioning (HVAC) systems by reducing the operational cost of the building. In the long run, the building is benefited and building is the most comfortable location for the identified activities.
Table 1. Building Performance Indicators
2. Building Performance
Building performance depends on various aspects of a building. These aspects for the performance analysis can be characterized as follows; (Khalil, Kamaruzzaman, & Baharum, 2016) (Table 1)
• Technical Performance (Heat Insulation, Fire) • Functional Performance (Functionality, Applicability, Adaptability) • Social Performance (Comfort, Health, Safety ) • Economic Performance (Life-Cycle cost, Cash flow, Market value) • Environmental Performance (Energy use, Material use)
In these, technical performance, functional performance and indoor
environmental performance have been found appropriate for assessing both technical and social aspects in meeting demand for reducing risk to buildings; Performance-Risk Indicator - PRI (Khalil, Kamaruzzaman, & Baharum, 2016). Following table shows the PRI indicators that were used to assess buildings.
Indicators Technical Performance Functional Performance Indoor Environmental
Performance Design of building fittings Structural stability Information technology
system operation Electrical services Plumbing services Fire prevention services Materials & internal
finishes Roof Lift
Spaces Orientation Infrastructure Access/ Entrance Circulation area Ergonomic building facilities Adequacy of building
signature Emergency exits Building related illness/ sick
building syndrome Amenities
Cooling (Thermal Comfort) Artificial lighting (Visual
Comfort) Natural lighting (Visual
Comfort) Waste reduction Building ventilation Acoustic comfort (Noise) Level of cleanness
349
3. Environmental Performance of the Building
Environmental performance is a useful tool for assessment of buildings. The common environmental performance tool is green building rating systems, currently practiced for the assessment of buildings by which means achieved the current standards of HVAC systems. A useful method of categorizing green design tools was proposed by Gowri; the subsets are knowledge-based methods, rating scheme and performance-based tools. (Gowri K, 2004). In here, knowledge based tools are usually manuals, guidelines, or other reference materials such as Energy Star or green building advisor. Building rating schemes are designed with of checklists, frameworks, and calculators used to quantify a building’s sustainability profile. These include popular tools like leadership in energy and environmental Design (LEED), Building Research Establishment Environment Assessment Method (BREEAM) and National Australian Building Environmental Rating System (NABERS). (Gowri K, 2004) Green Building Council of Sri Lanka (GBSL) also developed a Green SL® rating system for assessing the environmental performance of the buildings. The performance based tools include life cycle assessment methods and energy simulation tools for calculating building energy consumption and environmental emission such as SimaPro and GaBi. (Gowri K, 2004). ASHRAE standards were commonly practiced in different countries and modified ratings were also practiced. (A.P. Melo, 2014) (Petar Blanusa, 2007) (Doris Hooi Chyee Toea, 2013)
4. Thermal Performance of a building
The thermal performance of the building is linked to thermal physics. (De Souza, 2012) Thermal comfort of the building means that condition of mind which expresses satisfaction with the thermal environment and is assessed by subjective evaluation.
Thermal performance consists of two main parameters; personal parameters and environmental parameters. Personal parameters mean personal choice; activities (Table 02) and clothing pattern (Table 03). Environmental parameters mean building envelope and HVAC; air temperature, mean radiant temperature, air speed and humidity. The thermal physics theories give the design background for the particular building. Thermal performance was calculated through the computer modelling and software programmes due to its complexity.
4.1. Personal Thermal Comfort Parameters
Activity and clothing are discussed under the personal thermal comfort parameter section. The human activities are measured as Metabolic rate (M) means the rate of transformation of chemical energy into heat and mechanical works by metabolic activities within an organism, usually expressed in terms of unit area of the total body surface or met units.
1 met = 58.2 W/m2 (Which is equal to the energy produced per unit surface area of an average person,
seated at rest) (ANSI/ASHRAE standard 55-2004)
350

The following table shows a few metabolic rates for identifying activities;
Table 2.Different Metabolic Rates for Activities Activity Metabolic rate Met Unit W/m^2 Sleeping 0.7 40 Standing, relaxed 1.2 70 Car driving 1.2 - 2.0 60- 115 Walking at 0.9 m/s 2.0 115 Cooking 1.6-2.0 95- 115 Playing basketball 5.0- 7.6 290 - 440
(Source: ANSI/ ASHRAE Standard 55-2004)
Clothing insulation is also measured for thermal comfort analysis of the building. According to the ANSI/ ASHRAE Standard 55-2004 stated some of clothing insulations as follows; (Table 03)
Table 3.Clothing insulation Ensemble Description Clo Trousers + short-sleeved shirt 0.57 Long sleeved coveralls + t-shirt 0.72 Sweat pants+ sweat shirt 0.74 Trousers + long sleeved shirt+ suit jacket 0.96 Insulated overalls + long sleeved thermal underwear (+bottoms) 1.37
(1 Clo = 0.155 m2.K/W
Source: ANSI/ASHRAE Standard 55-2004, Thermal Environmental Condition for Human Occupancy
4.2. Thermal Comfort Indices
People make many alterations to their building to achieve a more comfort condition of the building. Changing clothing pattern, activities, and air movement are the short term activities, and redesign of the building, and landscaping are longer term activities to achieve a comfort condition of the buildings. As per the ASHRAE standards 55-2004 an equation for determining the comfort temperature of the building is; 𝑡𝑡𝑜𝑜𝑜𝑜 = 18.9 + 0.255 × 𝑡𝑡𝑜𝑜𝑜𝑜𝑜𝑜 (1)
where;
toc = Operative Comfort Temperature
tout =mean outside temperature of the month ( C)
As an example, if the mean outside temperature of the month is 30C; then the comfort temperate of the building is 26.55 C.
351
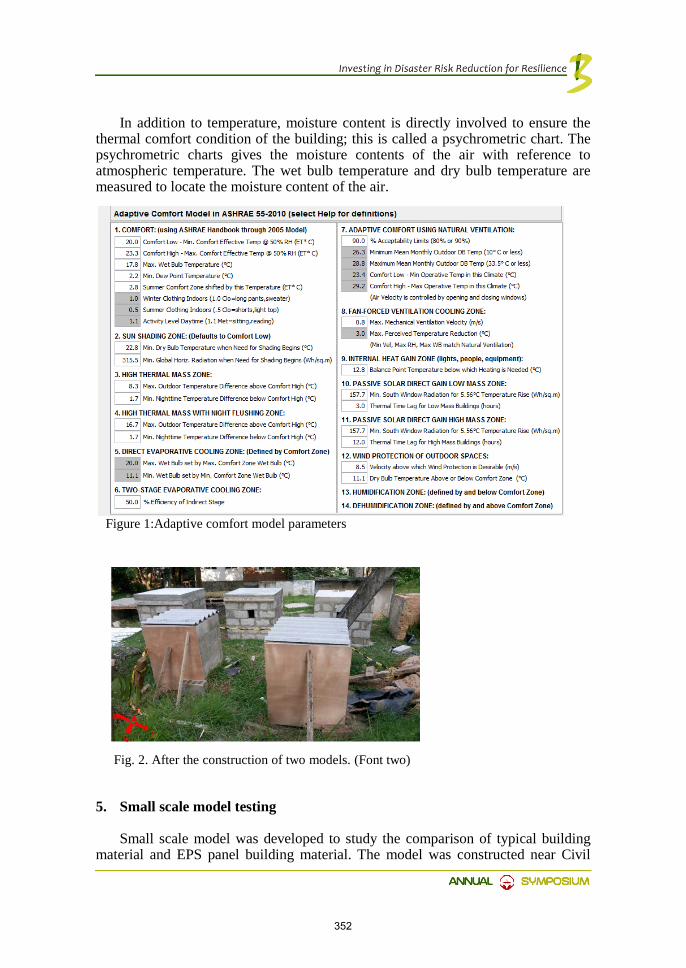
In addition to temperature, moisture content is directly involved to ensure the thermal comfort condition of the building; this is called a psychrometric chart. The psychrometric charts gives the moisture contents of the air with reference to atmospheric temperature. The wet bulb temperature and dry bulb temperature are measured to locate the moisture content of the air.
5. Small scale model testing
Small scale model was developed to study the comparison of typical building material and EPS panel building material. The model was constructed near Civil
Fig. 2. After the construction of two models. (Font two)
Figure 1:Adaptive comfort model parameters
352

Engineering Department, University of Moratuwa. The model size was designed, LWH, 820 mm x 800 mm x 1000 mm. Two models were constructed; one is cement block with asbestos sheet and second one is EPS wall panel with asbestos. 75 mm thick EPS walls were used to construct the model. Following figure illustrate the constructed models.
After completed the models, data logger was installed to measure the temperature variations of the different walls. Following figure shows the measurement taken locations of two models;
Fig. 3: Measurement Taken Locations
Measurement locations:
- North Inner and Outer walls
- East Inner and Outer walls
- Center of the model
- Outside the models Temperature measurements were taken 18 days from 9th April to 27th April,
2016 in 5 minutes intervals. During this period, total rainfall received was 93 mm, average highest temperature was 34° C and Average lowest temperature was 25° C.
5.1. Temperature Variation over day at the center of Each Models
The temperature variation at the center of the models was analyzed. In here, data was plotted as hourly variation and get the trend lines of each data. Three data sources were used to analysis this variations;
- Center of EPS model temperature (CenterEPS) – T1
- Center of Cement block model temperature (CenterCement) – T2
- Surrounding environment temperature (Envi) – T3
353

The trend lines of the data represent around 80% data and based on the data, following observations can be made.
- Before the sun rise, EPS model center temperature and Cement Model center temperature were equal; T1=T2
- With sun rise, temperature was increasing in surrounding environment and EPS center temperature increased more than the Cement Model Center temperature; T1>T2
- With sun set, temperature is decreasing in surrounding environment and EPS center temperature decreased lower than the Cement Model Center Temperature; T1<T2
5.2. Temperature variation over a day in North & East Direction Wall Inner temperature variation
Temperature variation of North and East direction walls in EPS Model was analyzed. Data was plotted as hourly variation and get the trend lines of each data. Three data sources were used to analysis this variations;
- East Inner Wall EPS model temperature (EastEPSInner) – T4
- North Inner Wall EPS model temperature (NorthEPSInner) – T5
- Surrounding environment temperature (Envi) – T3
354

Trend lines were developed and 80% of data were represented on these trend lines. Following figure illustrates the values of North & East Direction Walls inner temperature variations and trend lines.
Following observations can be made by considering the above figure.
- Before the sun rise, EPS model East & North wall temperature were almost equal; T4=T5
- With sun rise, temperature was increasing in surrounding environment and EPS East Inner wall temperature increased more than EPS North wall Inner temperature; T4>T5
- With sun set, temperature is decreasing in surrounding environment and EPS East Inner Wall temperature was decreasing and it will be equal to EPS North Inner wall temperature;
5.3. Temperature variation over a day in East Direction Inner Walls temperature variation of EPS & Cement Models
Temperature variation of East direction walls in EPS Model and Cement Model were analyzed. Data was plotted as hourly variation and get the trend lines of each data. Three data sources were used to analysis this variations;
- East Inner Wall EPS model temperature (EastEPSInner) – T4
355
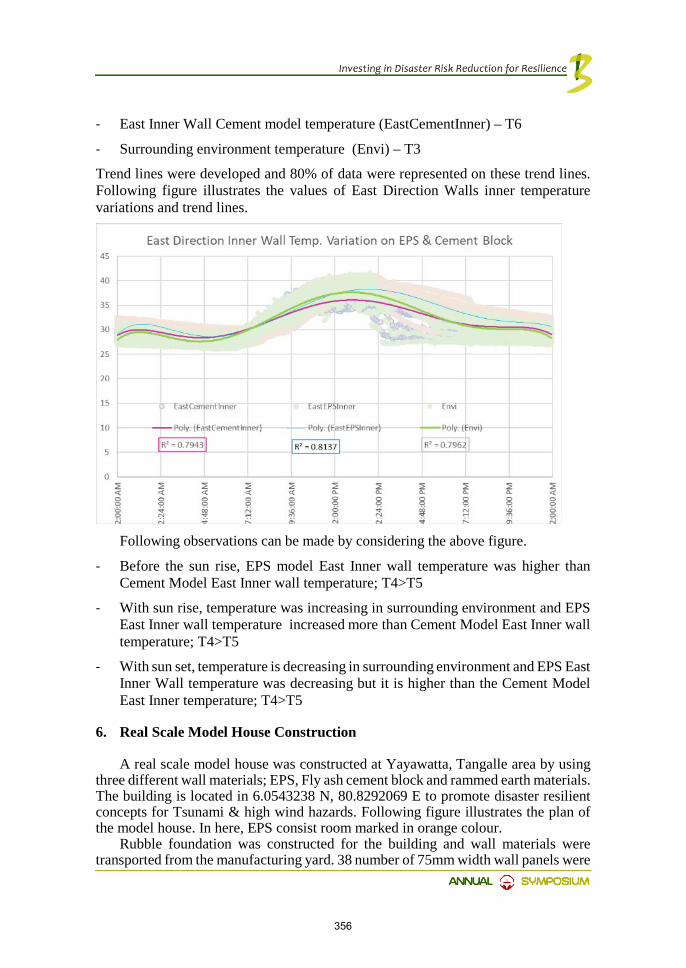
- East Inner Wall Cement model temperature (EastCementInner) – T6
- Surrounding environment temperature (Envi) – T3
Trend lines were developed and 80% of data were represented on these trend lines. Following figure illustrates the values of East Direction Walls inner temperature variations and trend lines.
Following observations can be made by considering the above figure.
- Before the sun rise, EPS model East Inner wall temperature was higher than Cement Model East Inner wall temperature; T4>T5
- With sun rise, temperature was increasing in surrounding environment and EPS East Inner wall temperature increased more than Cement Model East Inner wall temperature; T4>T5
- With sun set, temperature is decreasing in surrounding environment and EPS East Inner Wall temperature was decreasing but it is higher than the Cement Model East Inner temperature; T4>T5
6. Real Scale Model House Construction
A real scale model house was constructed at Yayawatta, Tangalle area by using three different wall materials; EPS, Fly ash cement block and rammed earth materials. The building is located in 6.0543238 N, 80.8292069 E to promote disaster resilient concepts for Tsunami & high wind hazards. Following figure illustrates the plan of the model house. In here, EPS consist room marked in orange colour.
Rubble foundation was constructed for the building and wall materials were transported from the manufacturing yard. 38 number of 75mm width wall panels were
356

used to construct the room (130 sqft). The panels were arranged vertically and a ring beam was constructed at 10ft height for ensuring the disaster resilience of the building. The following figure shows the wall panels arrangements. However, wall panels can be pasted as interlocked method and it can be raised upto 15~20ft.
Phasing of panel is quite simple and easy. High performance concrete was used as paste for fixing the panels. Un-skilled labours were used to construct above model house and they completed the model house within 1.5 days.
The challenging tasks happened at the field were;
- Transporting the Panels to the site:- the panels should be transported to the site with care. Beside cement sheets, panel corners can be damaged while transporting and it will result to paste “putty” for finishing.
- Cutting and reshaping the panels: A machine is required to cut the panels to right sizes. This can be avoided by designing the building with reference to size of the panels. It is essential to use water while cutting the panels to avoid the dust.
- Applying pre designed window and door frames: Concrete door and window frames were fixed to the building. It was necessary to drill and insert hooks while fixing these concrete door and windows.
6.1. Wall panel arrangements
There was a restriction for wall arrangement in the model house. A ring beam has to be constructed around the walls to increase the safety of the model house. Therefore, wall panels were arranged differently than usual arrangement. Firstly panels were vertically arranged and at the top ring beam was constructed. After the beam, 6’ wall panels were located. Following figure shows the wall panel arrangements in the room. Roof was built with non-asbestos sheets.
Fig. 4. Real Scale Model House
357
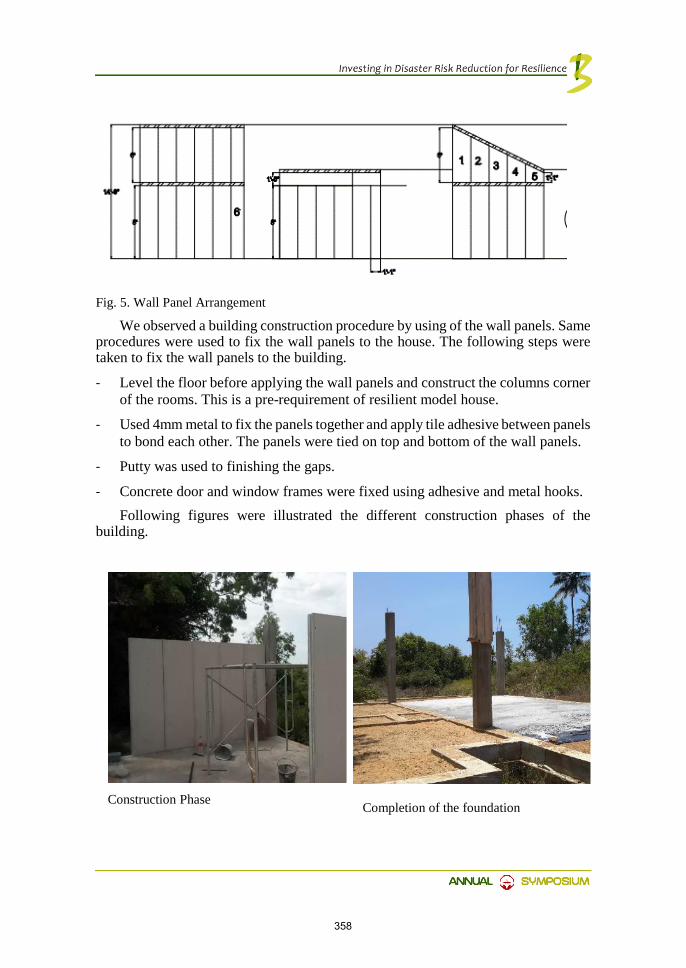
Fig. 5. Wall Panel Arrangement
We observed a building construction procedure by using of the wall panels. Same procedures were used to fix the wall panels to the house. The following steps were taken to fix the wall panels to the building.
- Level the floor before applying the wall panels and construct the columns corner of the rooms. This is a pre-requirement of resilient model house.
- Used 4mm metal to fix the panels together and apply tile adhesive between panels to bond each other. The panels were tied on top and bottom of the wall panels.
- Putty was used to finishing the gaps.
- Concrete door and window frames were fixed using adhesive and metal hooks. Following figures were illustrated the different construction phases of the
building.
Construction Phase
Completion of the foundation
358

Construction phase.
Model house: without plastering.
Thermal images were captured inside and outside of the model house and can be described as follows. Direct sunlight is faced to east wall of the building outside wall temperature is increasing. At that moment, outside wall when temperature was 40°C. However, when we capture the inside temperature it was 27°C. In addition, outside and inside concrete frame temperature was 38°C and 29 °C. The concrete frame and ring beam is acting as a thermal bridge to the room. Concrete lowers temperature was almost equal, 32°C.
Actual Image, the red coloured area was captured by thermal camera.
Thermal image of the area. (2017/04/08: 9.00 am): In here we can see higher temperature (41~43 C) at the outer surface of the material
359
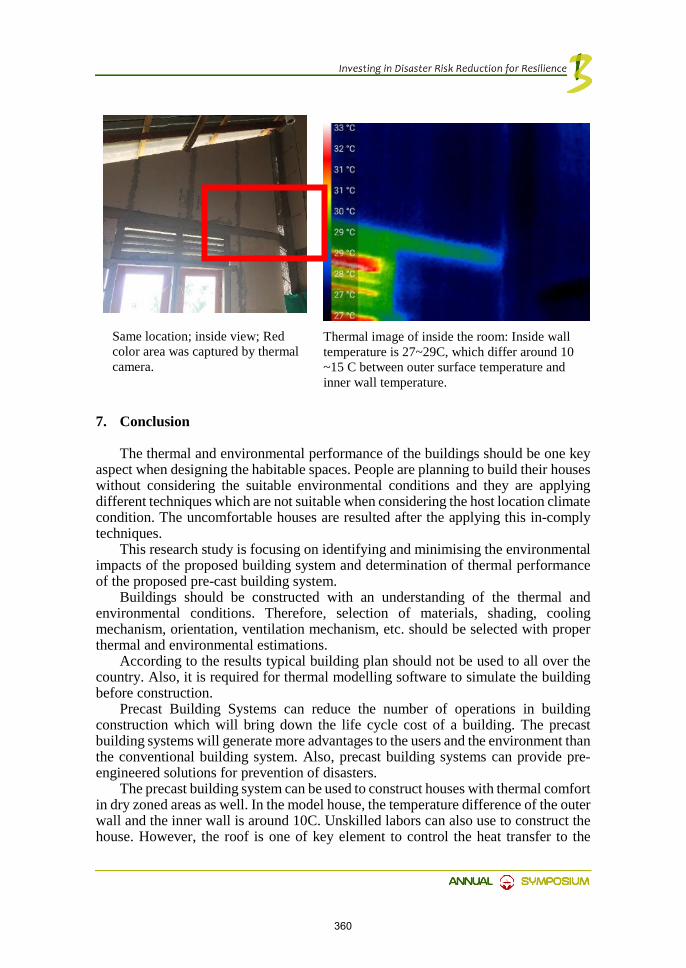
Same location; inside view; Red color area was captured by thermal camera.
Thermal image of inside the room: Inside wall temperature is 27~29C, which differ around 10 ~15 C between outer surface temperature and inner wall temperature.
7. Conclusion
The thermal and environmental performance of the buildings should be one key aspect when designing the habitable spaces. People are planning to build their houses without considering the suitable environmental conditions and they are applying different techniques which are not suitable when considering the host location climate condition. The uncomfortable houses are resulted after the applying this in-comply techniques.
This research study is focusing on identifying and minimising the environmental impacts of the proposed building system and determination of thermal performance of the proposed pre-cast building system.
Buildings should be constructed with an understanding of the thermal and environmental conditions. Therefore, selection of materials, shading, cooling mechanism, orientation, ventilation mechanism, etc. should be selected with proper thermal and environmental estimations.
According to the results typical building plan should not be used to all over the country. Also, it is required for thermal modelling software to simulate the building before construction.
Precast Building Systems can reduce the number of operations in building construction which will bring down the life cycle cost of a building. The precast building systems will generate more advantages to the users and the environment than the conventional building system. Also, precast building systems can provide pre-engineered solutions for prevention of disasters.
The precast building system can be used to construct houses with thermal comfort in dry zoned areas as well. In the model house, the temperature difference of the outer wall and the inner wall is around 10C. Unskilled labors can also use to construct the house. However, the roof is one of key element to control the heat transfer to the
360

house. Applying of thermal resistant layer is one of key requirement to control the temperature.
An evaluation method is required to ascertain the thermal and environmental performance of the buildings using available techniques. This research study is based on a specific material, EPS wall panels, which was used for constructing a building system. Testing of thermal material properties and computer simulation of a building was discussed to achieving the thermal and environmental performance. Finally, thermal images were used to clarify the results.
The EPS panels were tested in two levels; small scale and real scale. The small-scale model was constructed at the University of Moratuwa premises and was collected the temperature data for 14 days. The real scale model was constructed in Yayawatta, Tangalle area for testing the different types of wall materials; EPS, rammed earth and bottom ash block, apply to the building. The small-scale model was tested with same size cement block model which was constructed closer to tested model.
The design concepts were considered which is required to achieve the thermal comfort condition on every building. These concepts were analysed and describe the spatial variation over the country and based on the percentage of thermal comfort achievement can determine the suitable strategies for constructing buildings.
8. Further Studies
Intra and inter environment has a significant relationship to the thermal comfort level of the building. It is required to have city assessment of thermal comfort conditions to achieve better living space. How different land use types were evolving to solve the comfort conditions? City planning strategies to control the thermal comfort levels are to be studied.
References
[1] A.P. Melo, M. S. (2014). Building energy performance assessment: Comparison betweenASHRAE standard 90.1 and Brazilian regulation. Energy and Buildings, 372-383.
[2] De Souza, C. B. (2012). Studies into the use of building thermal physics to inform design decision making. Automation in Construction. Wales, UK.
[3] Doris Hooi Chyee Toea, T. K. (2013). Development of an adaptive thermal comfort equation for naturally ventilated buildings in hot–humid climates using ASHRAE RP-884 database. Frontiers of Architectural Research, 278-291.
[4] Khalil, N., Kamaruzzaman, S. N., & Baharum, M. R. (2016). Ranking the indicators of building performance and the users' risk via analytical hierachy process (AHP): case of Malaysia. Ecological Indicators (pp. 567-576). Science Direct (http://dx.doi.org/10.1016/j.ecolind.2016.07.032).
[5] Milne, M. (2016). ENERGY DESIGN TOOLS:. Retrieved November 28, 2016, from http://www.energy-design-tools.aud.ucla.edu/climate-consultant/request-climate-consultant.php
[6] Olesen, B. W. (2007). The philosophy behind EN 15251: Indoor environmental criteria for design and calculation of energy performance of buildings. Energy and Buildings, 39, 740-749.
[7] Petar Blanusa, W. P. (2007). Comparison between ASHRAE and ISO thermal transmittance calculation methods. Energy and Buildings 39, 374-384.
[8] Shi, X., & Yang, W. (2013). Performance-driven architectural design and optimization technique from a perspective of architects. Automation in Construction, http://dx.doi.org/10.1016/j.autcon.2013.01.015, 125-135.
[9] Souza, C. B. (2013). Studies into the use of building thermal physics to inform design decision making. Automation in Construction 30, 81-93.
361

Utilization of textile waste in the manufacturing of cement based products
GKBM Gannoruwa1, GLM Ariyadasa1, SSK Muthurathne1,
SMA Nanayakkara2
1Engineer, National Building Research Organisation, Sri Lanka 2Department of Civil Engineering, University of Moratuwa, Sri Lanka
Abstract
Sri Lankan apparel industry generates fabric off cuts, approximately 44,100 tons per year and major portion of fabric off cuts are considered as a waste material. This research focuses on utilization of shredded polyester spandex fabric offcuts in the cement matrix to make cement based products like partition panels, ceiling sheets, paving blocks, masonry blocks etc. Experimental investigation was carried out to find the optimum shredded fabric content to achieve the acceptable compressive strength and flexural strength of the cement paste-fabric mix. Various admixture such as polycarboxylic ether based super-plasticizers and methyl cellulose were used to improve the workability and strength properties of mix. The particle size of shredded fabric samples was less than 10mm. At 28% of fabric content (by volume) and water:cement (W/C) ratio of 0.6 led to poor bonding between fabric and the matrix. Hence, W/C ratio was reduced by using polycarboxylic ether based super-plasticizers and methyl cellulose (C) viscosity modifier. For each admixture, mortar prisms were cast with 26%, 28% and 30% of fabric contents at 0.5 W/C ratio except methyl cellulose at which W/C ratio was 0.6. 7 and 28 days flexural and compressive strengths were compared with standard mortar mix.
Admixture C (viscosity modifier) incorporated sample showed highest flexural and compressive strengths at 28% fabric content and the values were 8.9MPa and 24.0MPa respectively. Considerable strength gain was not observed with the reduction of W/C ratio, with superplasticizer admixtures.
Even though, methyl cellouse is a viscosity modifying admixture, it delivered comparably higher strength even at 0.6 W/C ratio compared with the other two water reducing admixtures at which the W/C ratio was 0.5.
Keywords: Polyester spandex; textile waste; cement
362

1. Introduction
Sri Lankan apparel industry generates fabric off cuts (approximately 44,100 tons per year (Steve Evans, 2017) and major portion of fabric off cuts are considered as a waste material. There are no well-established textile recycling facilities in Sri Lanka, hence some of the synthetic waste is being sent to cement manufacturers where it is incinerated as fuel in the cement kiln (Steve Evans, 2017). Consequently, the textile waste ends up being burned or illegally dumped in the landfills. If there is a possibility to use fabric waste as a material for construction industry it will lessen the fabric waste disposal issue.
Spandex is a segment polymer containing segmented polyurethane which has superior stretch and elastic recoverability. Polyester spandex is a type of fabric which shows elastic properties and contains 70-80% polyester and 20-30% spandex.
Effective utilization of polyester spandex fabric waste as reinforcing filler in the production of cement based products was considered in this study. Use of textile fabrics in cement based products are expected improve thermal insulation and lightweight attributes while satisfying the requirements of relevant industrial standards.
In the past studies on fabric cement composites, the reinforcement has been done in the form of short fibres or randomly dispersed on the matrix. From the experiment done by Saverio et al. (Saverio Spadea, 2015) showed that Nylon fibres can be safely used as reinforcement in cement matrix with transformation of a brittle failure mode to more ductile failure mode. Alessandro et al (Alessandro P. Fantilli, 2017) used wool fibres, treated or not with the atmospheric plasma and they indicated that those can improve the performance of cementitious mortar and increase the sustainability of such building material. In the study done by Francesco et al. (Francesco Asdrubali, 2015), panels made of recycled denim fibres showed acoustic performance, good sound absorption and insulation properties. The other studies describe the performance of composites with the fibres in the form of textile structures, like directional, woven or nonwoven fabrics (Selvaraj, 2015). Aspiras et al. (Aspiras F.F, 1995) concluded that composite produced from a mixture of textile waste cuttings, cement and water has a potential uses for ceilings, walls or wooden board substitute which looks like concrete but can be cut or nailed like wood.
The randomly dispersed fibres allow significant improvements on the flexural strength and ductility of the cement composites, but these improvements are limited by the short length of the fibres and the maximum quantity that it is possible to mix with the cement matrix.
In the composites reinforced with textile structures, apart from the improvements on the flexural strength, there is also a significant enhancement of the tensile strength and ductility under tensile deformation (Saverio Spadea, 2015).
In concrete applications fabric may not be conceived as either an aggregate or reinforcement (Aspiras F.F, 1995). Compressive strength of the concrete can gradually reduce with the increment of percentage of incorporated fabric materials. Strength decreases due to the reduction of cohesiveness in the concrete matrix, and for another reason being calcium silicate hydrate formation is not fully around the fine or coarse aggregate and partially formed on the waste fabric. Selveraj et al discovered on recycled waste cloth in Concrete has high affinity to water, thus a special water proof coating is necessary. (Selvaraj, 2015)
363

2. Methodology
2.1 Sampling of materials
Shredded form of polyester spandex samples were collected from one manufacturer and randomly selected samples were used for testing.
2.2 Material properties
Material properties were tested prior to casting test specimens. Particle density of Ordinary Portland Cement and shredded spandex were measured according to SLS 1144 Part 2 (SLS1144, 1996). Particle size distribution of shredded spandex was measured by mechanical sieving.
2.3 Tests carried out
Cement paste samples with shredded spandex were prepared by varying the mix proportion to study the dispersion of shredded spandex in a cement matrix. Cement (OPC), shredded spandex (passing through 10mm sieve) and admixture were used to prepare specimens of 100 mm x 100 mm x 10 mm. Nine mix proportions considered are given in Table 1.
Mortar prisms were cast for different 14 mix proportions by changing Water/Cement ratio, fabric content and admixture type. Table 2 gives the details of the mix proportions. Cast prisms were tested for flexural strength and compressive strength according to BSEN 196-1 (BSEN196-1, 2005).
Water content was altered to get the required consistency of fabric-cement mix. As a higher water content was required to achieve a homogeneous mix, water reducing admixtures were used to lower the W/C ratio to 0.5. Then a viscosity modifying admixture was added to prevent segregation of fabric particles from cement paste during jolting for compaction of the sample. Polycarboxylic ether based super-plasticizers were used as water reducing admixtures and methyl cellulose admixture was used as a viscosity modifying agent.
3. Results and discussion
3.1 Particle density
Density of ordinary Portland cement was found to be 3276 kg/m3 and that of shredded spandex was 1386 kg/m3.
3.2 Particle size distribution
Test results of particle size distribution of shredded spandex samples were shown in Figure 1. Shredded form of polyester spandex particles is shown in Figure 2.
364

According to the results obtained by sieve analysis, majority of polyester spandex particles (72%) were passed through the 5mm sieve and retained on the 1.18mm sieve. 3.3 Dispersion of fabric particles in cement paste
According to the visual observations on samples (Figure 3) cast (100x100x10mm) with cement, spandex and water, dispersion of shredded polyester spandex particles in a cement paste was reasonable. Polycarboxylic ether based super-plasticizers improved homogeneity of the cement- fabric mixture, but there was a tendency to segregate fabric particles from cement paste during compaction. Methyl cellulose based admixture improved the homogeneity of the mixture while preventing segregation. Table 1 indicates mix proportions used to observe dispersion of fabric particles in cement paste.
Table 1. Mix proportions of samples
Mix ID W/C Fabric % by volume F16/0.53 0.53 16 F16/0.72 0.72 16 F23/0.72 0.72 23 F23/0.78 0.78 23 F28/0.72 0.72 28 F28/0.78 0.78 28 Cement/0.53 0.53 0 Cement/0.72 0.72 0 Cement/0.78 0.78 0
Fig. 1. Grading curve for sieve analysis of shredded polyester spandex
Fig. 2. Shredded form of polyester spandex particles
365
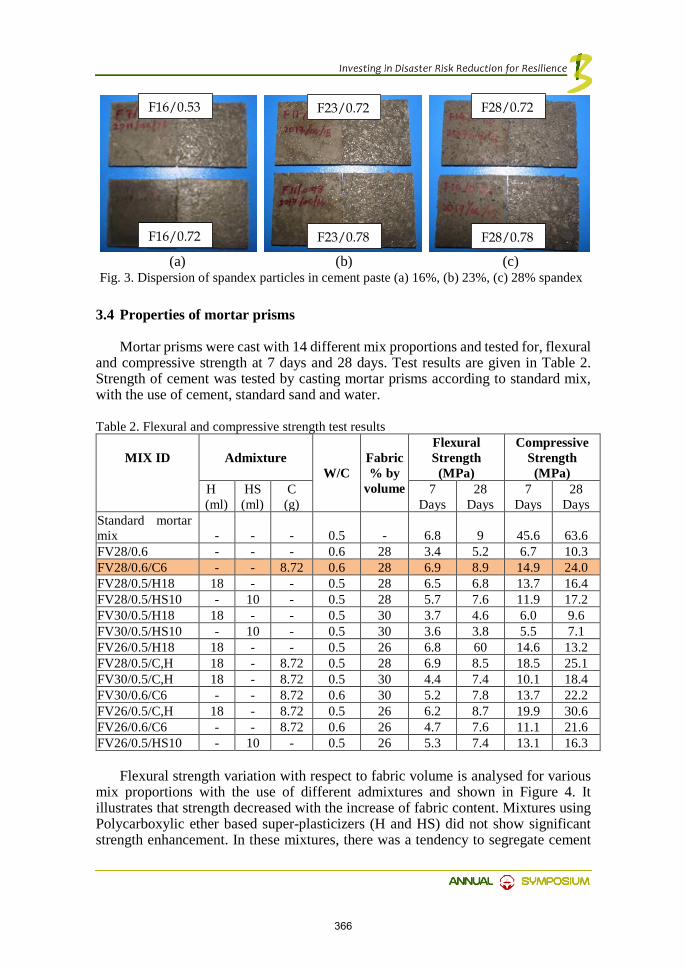
… (a) (b) (c) Fig. 3. Dispersion of spandex particles in cement paste (a) 16%, (b) 23%, (c) 28% spandex
3.4 Properties of mortar prisms
Mortar prisms were cast with 14 different mix proportions and tested for, flexural and compressive strength at 7 days and 28 days. Test results are given in Table 2. Strength of cement was tested by casting mortar prisms according to standard mix, with the use of cement, standard sand and water.
Table 2. Flexural and compressive strength test results
MIX ID
Admixture
W/C
Fabric % by
volume
Flexural Strength (MPa)
Compressive Strength (MPa)
H (ml)
HS (ml)
C (g)
7 Days
28 Days
7 Days
28 Days
Standard mortar mix
-
-
-
0.5
-
6.8
9
45.6
63.6
FV28/0.6 - - - 0.6 28 3.4 5.2 6.7 10.3 FV28/0.6/C6 - - 8.72 0.6 28 6.9 8.9 14.9 24.0 FV28/0.5/H18 18 - - 0.5 28 6.5 6.8 13.7 16.4 FV28/0.5/HS10 - 10 - 0.5 28 5.7 7.6 11.9 17.2 FV30/0.5/H18 18 - - 0.5 30 3.7 4.6 6.0 9.6 FV30/0.5/HS10 - 10 - 0.5 30 3.6 3.8 5.5 7.1 FV26/0.5/H18 18 - - 0.5 26 6.8 60 14.6 13.2 FV28/0.5/C,H 18 - 8.72 0.5 28 6.9 8.5 18.5 25.1 FV30/0.5/C,H 18 - 8.72 0.5 30 4.4 7.4 10.1 18.4 FV30/0.6/C6 - - 8.72 0.6 30 5.2 7.8 13.7 22.2 FV26/0.5/C,H 18 - 8.72 0.5 26 6.2 8.7 19.9 30.6 FV26/0.6/C6 - - 8.72 0.6 26 4.7 7.6 11.1 21.6 FV26/0.5/HS10 - 10 - 0.5 26 5.3 7.4 13.1 16.3
Flexural strength variation with respect to fabric volume is analysed for various mix proportions with the use of different admixtures and shown in Figure 4. It illustrates that strength decreased with the increase of fabric content. Mixtures using Polycarboxylic ether based super-plasticizers (H and HS) did not show significant strength enhancement. In these mixtures, there was a tendency to segregate cement
F28/0.72
F28/0.78
F23/0.72
F23/0.78
F16/0.53
F16/0.72
366

paste from spandex particles during jolting which was applied for compaction. Sample using Methyl cellulose (C) showed better homogeneity in the cast prisms.
Use of shredded polyester spandex in cement paste with admixture showed improvement in flexural properties, hence it can be stated that shredded fabric behaves as reinforcement in the mixture.
(a) (b)
Fig. 4. Flexural strength (a) 7 days (b) 28 days As shown in Figure 5 optimum compressive strength was achieved at 28% fabric
content by volume.
(a) (b)
Fig. 5. Compressive strength (a) 7 days (b) 28 days
Normally cementitious products show brittle failure under compression load, but failure pattern observed for polyester spandex embedded samples were different from conventional failure pattern. These samples did not show sudden failure and separation of particles under compression. Failure patterns under flexural test and compression test were shown in Figure 6 and 7.
367
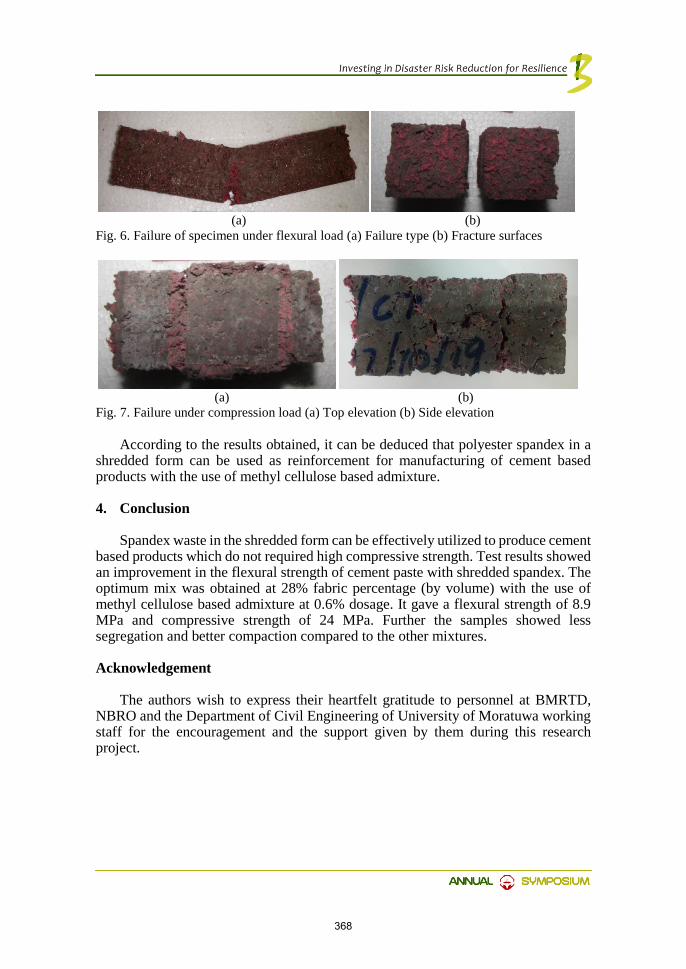
(a) (b)
Fig. 6. Failure of specimen under flexural load (a) Failure type (b) Fracture surfaces
(a) (b)
Fig. 7. Failure under compression load (a) Top elevation (b) Side elevation
According to the results obtained, it can be deduced that polyester spandex in a shredded form can be used as reinforcement for manufacturing of cement based products with the use of methyl cellulose based admixture.
4. Conclusion
Spandex waste in the shredded form can be effectively utilized to produce cement based products which do not required high compressive strength. Test results showed an improvement in the flexural strength of cement paste with shredded spandex. The optimum mix was obtained at 28% fabric percentage (by volume) with the use of methyl cellulose based admixture at 0.6% dosage. It gave a flexural strength of 8.9 MPa and compressive strength of 24 MPa. Further the samples showed less segregation and better compaction compared to the other mixtures.
Acknowledgement
The authors wish to express their heartfelt gratitude to personnel at BMRTD, NBRO and the Department of Civil Engineering of University of Moratuwa working staff for the encouragement and the support given by them during this research project.
368

References [1] Alessandro P. Fantilli, S. S. (2017). The use of wool as fiber-reinforcement in cement-
based mortar. Construction and Building Materials, 562-569. [2] Aspiras F.F, M. J. (1995). Utilization of Textile Waste Cuttings as Building Material.
Materials Processing Technology, 379-384. [3] BSEN196-1. (2005). Methods of Testing Cement, Part 1: Determination of Strength.
British Standards Institution. [4] Francesco Asdrubali, F. D. (2015). A review of unconventional sustainable building
insulation materials. Sustainable Materials and Technologies, 1-17. [5] Saverio Spadea, I. F. (2015). Recycled nylon fibers as cement mortar reinforcement.
Construction and Building Materials, 200-209. [6] Selvaraj, R. (2015). Study on Recycled Waste Cloth in Concrete. International Journal
of Research & Technology, 891-895. [7] SLS1144. (1996). Specification for Ready-Mixed Concrete, Part 2: Test Methods. Sri
Lanka Standards Institution. [8] Steve Evans, C. P. (2017). Trans Textile Project Report. United Kingdom: Center for
Industrial Sustainability.
369