ESAP Proceedings ESAP Proceedings - UQ eSpace
283
ESAP Proceedings ESAP Proceedings V Value Ch Ethiopi P.O.Bo Ethi Lives hains a Proce Ethiopian ian Society ox 62863, A opian Socie stock an as Pathw eedings of n Society o In Addis Ab of Animal Addis Ababa ety of Anima nd Econ ways for the 21 th Ann f Animal Pr baba, Ethio Production a, Ethiopia al Productio nomic G r Devel nual Confe roduction opia, Augus n on 2014 Growth opmen erence of th (ESAP) Hel st 28‐30, 201 h: nt he ld 13
-
Upload
khangminh22 -
Category
Documents
-
view
3 -
download
0
Transcript of ESAP Proceedings ESAP Proceedings - UQ eSpace
E
SAP Pro
ceedin
gs
E
SAP Pro
ceedin
gs
VValue Ch
EthiopiP.O.Bo
Ethi
Liveshains a
ProceEthiopian
ian Society ox 62863, A
opian Socie
stock anas Pathw
eedings of n Society oIn Addis Ab
of Animal Addis Ababa
ety of Anima
nd Econways for
the 21th Annf Animal Prbaba, Ethio
Productiona, Ethiopia
al Productio
nomic Gr Devel
nual Conferoduction opia, Augus
n
on 2014
Growthopmen
erence of th (ESAP) Helst 28‐30, 201
h: nt
he ld 13

Ethiopian Society of Animal Production 2014
i
Ethiopian Society of Animal Production 2014
Livestock and Economic Growth:
Value Chains as Pathways for Development
Proceedings of the 21th Annual Conference of the Ethiopian Society of Animal Production (ESAP)
held in Addis Ababa, Ethiopia, Augest 28‐30 2013
Ethiopian Society of Animal Production (ESAP) P.O.Box 80019, Addis Ababa, Ethiopia
Addis Ababa April 2014
Ethiopian Society of Animal Production 2014
ii
Published April 2014 Copyright © 2014 by Ethiopian Society of Animal Production (ESAP), Addis Ababa, Ethiopia The views and interpretations expressed in these proceedings are entirely those of the authors and should not be attributed in any manner to Ethiopian Society of Animal Production (ESAP). The whole or part of this document can be duplicated in any form with prior consent of Ethiopian Society of Animal Production (ESAP). Ethiopian Society of Animal Production (ESAP) P.O.Box: 62863 Addis Ababa Ethiopia Tel: 251‐11‐115‐547‐498 Email: [email protected] Website: www. Esap‐ethiopia.org
Members of Executive Committee Dr Getachew Gebru (MARIL, Ethiopia), President
Ato Belachew Hurissa (Elemtu Integrated Milk Industry), Vice President
Dr Daniel Temesgen (PARD,Ethiopia), Secretary
Dr Zelalem Yilma (Heifer International on EADD), Assistant Secretary
Dr Million Tadesse (EIAR, Holeta), Editor‐in‐ Chief
Diriba Geleti (EIAR‐Debre Zeit), Associate Editor‐ in‐ Chief
Dr Mekonnen Hailemariam (AAU, School of Veterinary Medicine), Associate Editor‐ in‐Chief
Ato Binyam Kassa (EIAR, Holeta), Accountant
W/ro Adey Melese (EIAR, Holeta), Treasurer
W/rt Fanos Mekonnen (ILRI‐LIVES), Public Relations
Correct Citation: Ethiopian Society of Animal Production (ESAP) 2014. Livestock and Economic Growth: Value Chains as Pathways for Development. Proceedings of the 21 th Annual Conference of the Ethiopian Society of Animal Production (ESAP) held in Addis Ababa, Ethiopia, August 28‐30, 2014. ESAP, Addis Ababa 299 pp.
Ethiopian Society of Animal Production 2014
iii
Table of Contents Sheep Meat Value Chains of Ethiopia: Researchable Constraints and Prospects for
“best‐bet” InterventionsTadelle Dessie and Grum Gebreyesus ......................................... 1
Livestock and Irrigation Value Chains for Ethiopian Smallholders (LIVES) Project, Dirk Hoekstra, Azage Tegegne, Berhanu Gebremedhin, Aklilu Bogale and Yasin Getahun .. 13
Value Chain Efficiency Improvement: an approach for Reduction of GHG Emission from Livestock and as an Adaptation to Climate Change,Million Tadesse1, Tadesse Sori, Solomon Abegaze, Solomon Mengistu ..................................................................... 17
Animal Feed and Nutrition
Meat Characteristics and Economic Benefits of Feeding Different Proportions of Ficus sur (cv. Forssk.) Fruits Mixed with Maize Grain in Pigs, Diriba Diba, Yoseph Mekasha, Mengistu Urge, Adugna Tolera and Mitiku Eshetu ................................................. 22
Meat Characteristics and Economic Benefit of Hararghe Highland Sheep
Supplemented with Ficus sur (cv. Forssk.) Fruits at Different Proportion with Oat
GrainDiribaDiba, Yoseph Mekasha, Mengistu Urge and Adugna Tolera ........................... 33
Effect of Planting Pattern and Cutting Height on Dry Matter Yields of P. purpureum mixed pasture with D. Uncinatum at Bako, western Ethiopia,Diriba Diba, Adugna Tolera, Lemma Gizachew and Diriba Geleti ................................................ 43
Performance of Fodder Oat (Avena sativa L.) Genotypes for Yield and Yield Attributes in the Highland of Bale ,Dawit Abate and Mulusew Fikere .......................... 59
Body Weight Change and Carcass Characteristics of Abergelle Goats Supplemented with Treated Acacia Saligna (Labill) H.L.Wendi. leavesShumuye Belay and Yayneshet Tesfay ......................................................................................................................................... 66 Feed Intake and Growth Performance and Economic Returns of Horro Lambs Fed Natural Pasture Hay Supplemented with Graded Levels of Dried Vernonia Amygdalina Leaves and Sorghum Grain Mixture, Firisa Woyessa, Adugna Tolera and Diriba Diba ................................................................................................................................. 75 Evaluating the Economic Profitability of Afar Rams Supplemented with Graded Levels of Mixtures of Protein and Energy Sources: In Case of Alamata Woreda, Tesfay Hagos and Solomon Melaku ......................................................................................... 86 Evaluation Of Sugar Syrup As A Partial Substitute For Maize In Broilers’ Ration, Kiros Abebe, Getachew Animut, Mengistu Urge ....................................................................... 95
Ethiopian Society of Animal Production 2014
iv
Animal Production
Characterization of Livestock Production Systems and feed resource availabilityin Horro District, Ethiopia, G. Duguma, T. Jembere, K. Degefa, W. Temesgen, A. Kumsa, J. Wamatu and A. Duncan Urge ................................................................................................. 105 Dairy Cattle Management Practices in Urban and Peri‐urban Areas of Northern Ethiopia, Gebrekidan Tesfay and Zeleke Mekuriaw ............................................................... 118 On‐farm Growth Performance Evaluation of Farta Sheep under the Existing Farmers Management at Estie District of Amhara National Regional State, Ethiopia, Agraw Amane, Yeshewas Ferede,Tewodros Bimrew .............................................. 135
Body Weight Estimation using Linear Body Measurement for Washera, Farta and their Crossbred Sheep in Western Highlands of Amhara Region, Ethiopia, Shigdaf Mekuriaw, Zeleke Mekuriaw, Mengistie Taye and Aynalem Haile ........................................ 145 Assessment of Goat Production and Marketing System in Daro‐Labu Distrct of Western Hararghe Zone of Oromia Regional State, Ethiopia, Dereje Tsegaye, Berhanu Belay and Aynalem Haile ......................................................................................... 158 Comparative Evaluation of the Fattening Performance of Fogera and Adet Old Oxen at Andassa Livestock Reseach Center, Ethiopia, Adebabay Kebede, Addisu Bitew, Tewodros Bimrew, Asresu Yitayew, Yihalem Denekew,Yeshiwas Ferede and Getinet Zeleke ..... .................................................................................................................................................... 171
Gender and Urban Dairy Production System: the Case of Debre Zeit Town, Ethiopia, Million Tadesse, Adey Melesse, Azage Tegegne, and Kasahun Melesse .............. 182 Urban Dairy Production system, the case of Ada’a LibenWoreda Dairy and Dairy Products Marketing Association, Million Tadesse, Kassahun Melesse, Adey MelesseandAzage Tegegne ....................................................................................................... 193 Effect of Locally Available Spices on the Microbial Quality, Consumer Acceptability and Shelf Life of Ayib: the Case of Garlic (Allium sativum) and Ginger (Zinger officinale), Meron Regu, Zelalem Yilma and Eyassu Seifu ................................................... 205
Reproduction and Breeding
Factors Affecting Reproductive Performance of Pure Jersey Cattle at Adea Berga Dairy Research Center in the Central Highlands of Ethiopia, Direba Hunde, Gábor Mészáros, Getnet Asefa, Zewde Wendatir, Rahel Nebyu, Tadelle Dessieand Johan Sölkner ...... ................................................................................................................................................... 226 Fertility of Cattle after Timed Artificial Insemination, Sex Control and Fresh Embryo Transfer, Million Tadesse ........................................................................................ 243
Ethiopian Society of Animal Production 2014
v
Assessment of Reproductive and Productive Performance of Dairy Cattle Breeds in Three Districts of East Shoa Zone, Central Ethiopia, Kefelegn Seyoum, Ashenafi Mengistu, Kassahun Melesseand Adey Melesse ...................................................................... 256
On‐ Farm Reproductive Performance Evaluation of Farta Sheep at Estie District of Amhara National Regional State, Ethiopia, Agraw Amane, Shigdaf Mekuriaw and Mengistea Taye ........................................................................................................................ 264
Ethiopian Society of Animal Production 2014
vi
Plenary

Ethiopian Society of Animal Production 2014
vii
Ethiopian Society of Animal Production 2014
1
Sheep Meat Value Chains of Ethiopia: Researchable Constraints and Prospects for “best‐bet” Interventions
Tadelle Dessie and Grum Gebreyesus ILRI, PO Box 5689, Addis Ababa, Ethiopia
Background
Ethiopia is a home to 77 million people; 32 million are classified as poor living on less than USD 1 per day. With a population of 48 million small ruminants (FAOStat, 2010), Ethiopia has one of the largest populations in sub‐Saharan Africa. Sheep (24 million) are the second most important species in Ethiopia (CSA, 2008).Diverse sheep breeds and ecotypes are kept in different regions and ecologies of Ethiopia from the mountainous highlands to the arid pastoral lowland areas. Nine indigenous sheep breeds have been identified by phenotypic and molecular characterization methods (Gizaw et al., 2007). Sheep are mostly kept by smallholders and the rural poor, including women headed households. They contribute substantially to the livelihoods of Ethiopian smallholder households as a source of income, food (meat and milk), and non‐food products like manure, skins and wool. They also serve as a means of risk mitigation during crop failures, property security, monetary saving and investment in addition to many other socio‐economic and cultural functions (Tibbo, 2006). At the farm level, sheep contribute up to 63% to the net cash income derived from livestock production in the crop–livestock production system. In the lowlands, sheep together with other livestock are a mainstay of pastoral livelihoods (Negassa and Jabbar, 2008). The annual meat production from small ruminants is relatively small compared to the number of heads. The average annual offtake rate and carcass weight per slaughtered animal for the years 2000–2007 were estimated at 32.5% and 10.1 kg, respectively (FAO 2009); the lowest among sub‐Saharan African countries. Negassa and Jabbar (2008) reported an even lower sheep offtake rate of only 7% in the Ethiopian highlands.Reasons attributed for the apparent low productivity are absence of well‐planned/appropriate breeding programs, lack of technical capacity, inadequate and poor quality feeds, diseases leading to high lamb mortality, and underdeveloped markets in terms of infrastructure and market information. As the market systems are typically informal, individual producers have little bargaining power. Furthermore, sheep and goats generally receive little policy or investment attention. Although technologies to address many of the most common constraints are at hand, a key constraint is the lack of models of suitable and acceptable organizational strategies for producer groups that could facilitate access to services and markets. Research is, therefore, required to develop and test input and market service delivery options and models. Moreover, the institutional and organizational arrangements that would provide sustainable delivery and uptake of the available health management, feeding and genetic improvement technologies through effective public–private partnerships in which governmental support services and private partners are integral part of value addition process.The complex and interrelated researchable constraints to transforming the small‐scale livestock production systems in general has prompted a change on research approaches from the conventional piece‐meal approach to a more integrated one. ILRI
Ethiopian Society of Animal Production 2014
2
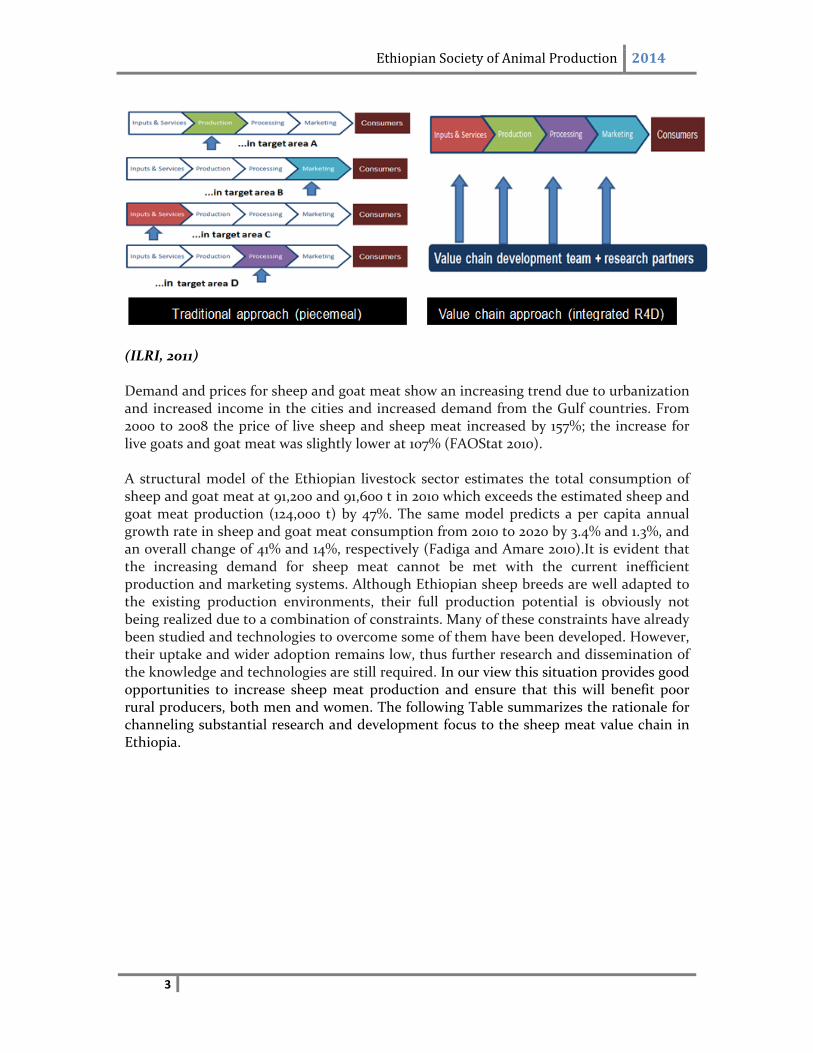
and its partner centers under the Consultative Group for International Agricultural Research (CGIAR) have embraced the spirit of this ongoing change process to propose a bold new approach for organizing and conducting research on small‐scale livestock production systems in selected countries. To this end, ILRI has Background proposals for the CGIAR Research Program on Livestock and Fish under the theme “More milk, meat and fish by and for the poor”(CRP 3.7). The CGIAR Research Program 3.7 will be testing the hypothesis that increased access to animal source foods by the poor, especially women and children, can be achieved at scale by strengthening carefully selected meat, milk and fish value chains in which the poor can capture a significant share of the benefits. Technologies and lessons generated through this focused approach will be applicable in broader regional and global settings.This research program will adopt new approach that relies on two key principles: focus and new partnerships that together allow us to take more responsibility for the impact. To improve focus, ILRI and the participating CGIAR centers agreed to concentrate collective efforts on just nine animal‐product value chains in eight countries, replacing our conventional approach of more piece‐meal research across scattered sites. This will allow us to integrate our research in a holistic manner to generate the solutions that will transform the selected value chains and produce more food. The Ethiopian sheep meat value chain is among the nine animal‐products value chains targeted by the CRP 3.7 and its implementation will be led by ILRI.This paper aims at reviewing and communicating the identified supply constraints and prospects of implementing “best bet” interventions to transform the sheep meat value chain in Ethiopia based on baseline planning studies for the CRP 3.7 and drawing on the experiences of an on‐going ICARDA/ILRI/BOKU Community‐based Sheep Breeding project and the ILRI IPMS project. Why value‐chain approach to livestock research and development? Constraints to improving productivity in small‐scale systems comprise a complex mix of technological, infrastructural, organizational and institutional or policy dimensions that impede delivery, access and uptake of potential solutions. Both sets of constraints must be addressed to achieve the significant increases in production targeted; solutions for each individually are necessary but insufficient conditions. The concept “value chain” can be generally defined as the set of actors, transactions, information flows, and institutions that enable value to be delivered to the customer. A value chain approach to research and development takes into account the entire value chain of a certain commodity in an area/region as the unit of intervention with all its components previously accounted for as independent unit(s) of research and development focus in the traditional approach. In the past, the trend in agricultural research, both at the international and national systems has tended to be fragmentary, with a piecemeal approach, addressing a particular constraint – often at the production level. The result has often been that overcoming one barrier simply results in the emergence of another constraint that hinders real progress. However, recently an integrated value‐chain approach is being strongly advocated for focused impact. There is a paradigm shift in agricultural research in favor of research for development (R4D) integrated to transform selected value chains for selected commodities in selected target country/region). Diagram: Traditional (piecemeal) R&D approach versus value‐chain R4D approach
Ethiopian Society of Animal Production 2014
3
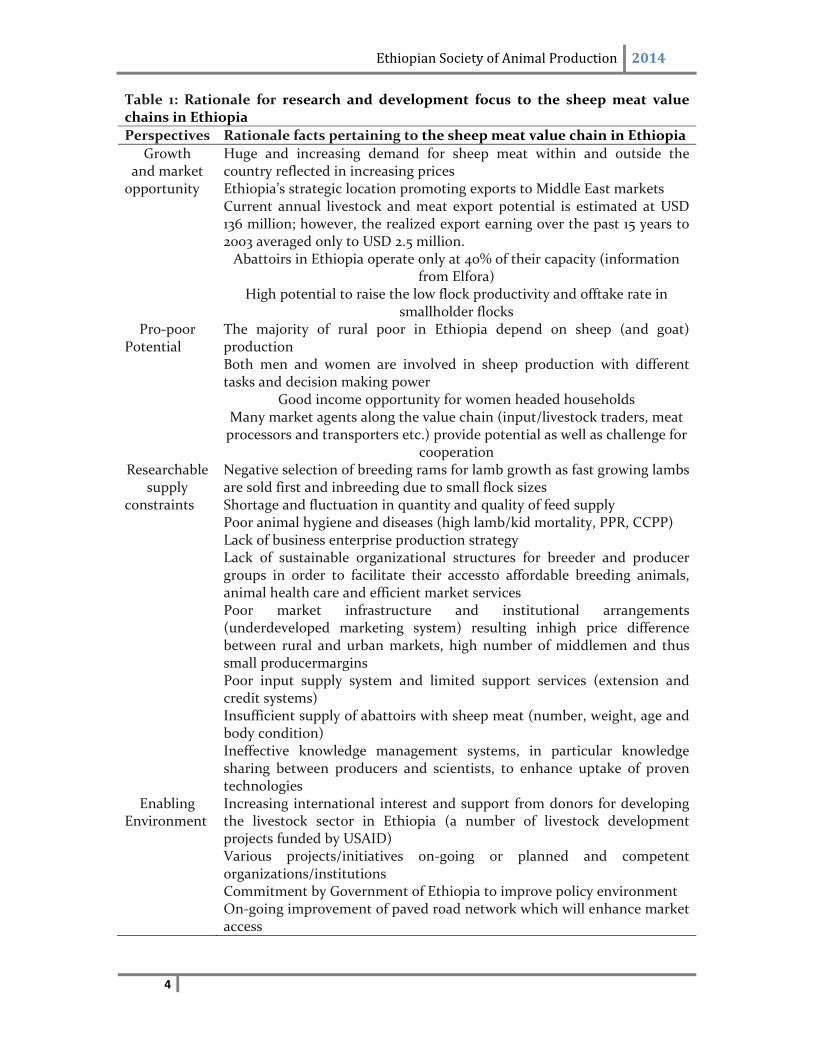
(ILRI, 2011) Demand and prices for sheep and goat meat show an increasing trend due to urbanization and increased income in the cities and increased demand from the Gulf countries. From 2000 to 2008 the price of live sheep and sheep meat increased by 157%; the increase for live goats and goat meat was slightly lower at 107% (FAOStat 2010). A structural model of the Ethiopian livestock sector estimates the total consumption of sheep and goat meat at 91,200 and 91,600 t in 2010 which exceeds the estimated sheep and goat meat production (124,000 t) by 47%. The same model predicts a per capita annual growth rate in sheep and goat meat consumption from 2010 to 2020 by 3.4% and 1.3%, and an overall change of 41% and 14%, respectively (Fadiga and Amare 2010).It is evident that the increasing demand for sheep meat cannot be met with the current inefficient production and marketing systems. Although Ethiopian sheep breeds are well adapted to the existing production environments, their full production potential is obviously not being realized due to a combination of constraints. Many of these constraints have already been studied and technologies to overcome some of them have been developed. However, their uptake and wider adoption remains low, thus further research and dissemination of the knowledge and technologies are still required. In our view this situation provides good opportunities to increase sheep meat production and ensure that this will benefit poor rural producers, both men and women. The following Table summarizes the rationale for channeling substantial research and development focus to the sheep meat value chain in Ethiopia.
Ethiopian Society of Animal Production 2014
4
Table 1: Rationale for research and development focus to the sheep meat value chains in Ethiopia
Perspectives Rationale facts pertaining to the sheep meat value chain in Ethiopia
Growth and market opportunity
Huge and increasing demand for sheep meat within and outside the country reflected in increasing prices Ethiopia’s strategic location promoting exports to Middle East markets Current annual livestock and meat export potential is estimated at USD 136 million; however, the realized export earning over the past 15 years to 2003 averaged only to USD 2.5 million. Abattoirs in Ethiopia operate only at 40% of their capacity (information
from Elfora) High potential to raise the low flock productivity and offtake rate in
smallholder flocks Pro‐poor
Potential The majority of rural poor in Ethiopia depend on sheep (and goat) production Both men and women are involved in sheep production with different tasks and decision making power
Good income opportunity for women headed households Many market agents along the value chain (input/livestock traders, meat processors and transporters etc.) provide potential as well as challenge for
cooperation Researchable
supply constraints
Negative selection of breeding rams for lamb growth as fast growing lambs are sold first and inbreeding due to small flock sizes Shortage and fluctuation in quantity and quality of feed supply Poor animal hygiene and diseases (high lamb/kid mortality, PPR, CCPP) Lack of business enterprise production strategy Lack of sustainable organizational structures for breeder and producer groups in order to facilitate their accessto affordable breeding animals, animal health care and efficient market services Poor market infrastructure and institutional arrangements (underdeveloped marketing system) resulting inhigh price difference between rural and urban markets, high number of middlemen and thus small producermargins Poor input supply system and limited support services (extension and credit systems) Insufficient supply of abattoirs with sheep meat (number, weight, age and body condition) Ineffective knowledge management systems, in particular knowledge sharing between producers and scientists, to enhance uptake of proven technologies
Enabling Environment
Increasing international interest and support from donors for developing the livestock sector in Ethiopia (a number of livestock development projects funded by USAID) Various projects/initiatives on‐going or planned and competent organizations/institutions Commitment by Government of Ethiopia to improve policy environment On‐going improvement of paved road network which will enhance market access
Ethiopian Society of Animal Production 2014
5
Research and supporting actions
The constraints listed in the Table 1 are based on the experiences of an on‐going ICARDA/ILRI/BOKU Community‐based Sheep Breeding project and the ILRI IPMS (Improving Production and Market Success of Ethiopian Farmers) project. Further engagement and discussion of the various stakeholders along the value chain are required to refine and prioritize the major barriers and opportunities for increasing sheep flock productivity and meat production and supporting research and development actions.Like many other livestock production systems in the developing world, major constraints at input and production level include lack of access to breeding rams with proven genetic attributes (breeding value), inadequate feeding at critical production stages and poor healthcare, inefficient healthcare services (disease control and prevention measures), lack of access to inputs and supportive institutional/organizational and knowledge systems. These preliminary analyses from the ongoing projects underline the need for the platform research approach that will allow potential interventions to search for technology solutions across the sheep meat value chains in Ethiopia. Not surprisingly, the share of the retail value captured by sheep producers is small and could be increased by developing and organizing the sheep markets in all important aspects—market access, structure, and transparency in transactions and price information. One root of the problem is the failure of producers to coordinate and collaborate with each other to increase their bargaining power by supplying more quantities to the buyers at the time of peak demand. But it is difficult for such collective action to spontaneously occur in the traditional rural sheep keeping communities. Innovations in rural organizations and cooperation among different market players (producers, traders, fatteners, abattoirs, and retailers) are needed. Variable product quality of both live animals and meat are additional drawbacks to satisfying qualities that are demanded by the domestic and export markets; although both offer better prices, they are also increasingly demanding higher product safety and quality consistency. For example, the export markets, which mainly trade in sheep carcasses, demand more rigorous meat inspection systems, thus cold chains are prerequisites to accessing such markets. Combined, these constraints limit the sheep producers’ capacity to maximaize benefit from their sheep production and to invest further in this industry.Studies by IPMS and the community‐based sheep‐breeding project across different regions in Ethiopia showed that women share responsibilities with men in the production of sheep and are mainly responsible for feeding, maintaining hygiene and day to day management. Children are often responsible for supervising the grazing during rainy season. However, men dominate the marketing of sheep and control the income from sales. It was found that the workload of women and children may increase due to market‐oriented development of the commodity, but men tend to benefit more in terms of income obtained. The following table summarizes the key development challenges, knowledge gaps and recommended focus areas of possible intervention regarding the sheep meet value chains in Ethiopia.
Ethiopian Society of Animal Production 2014
6
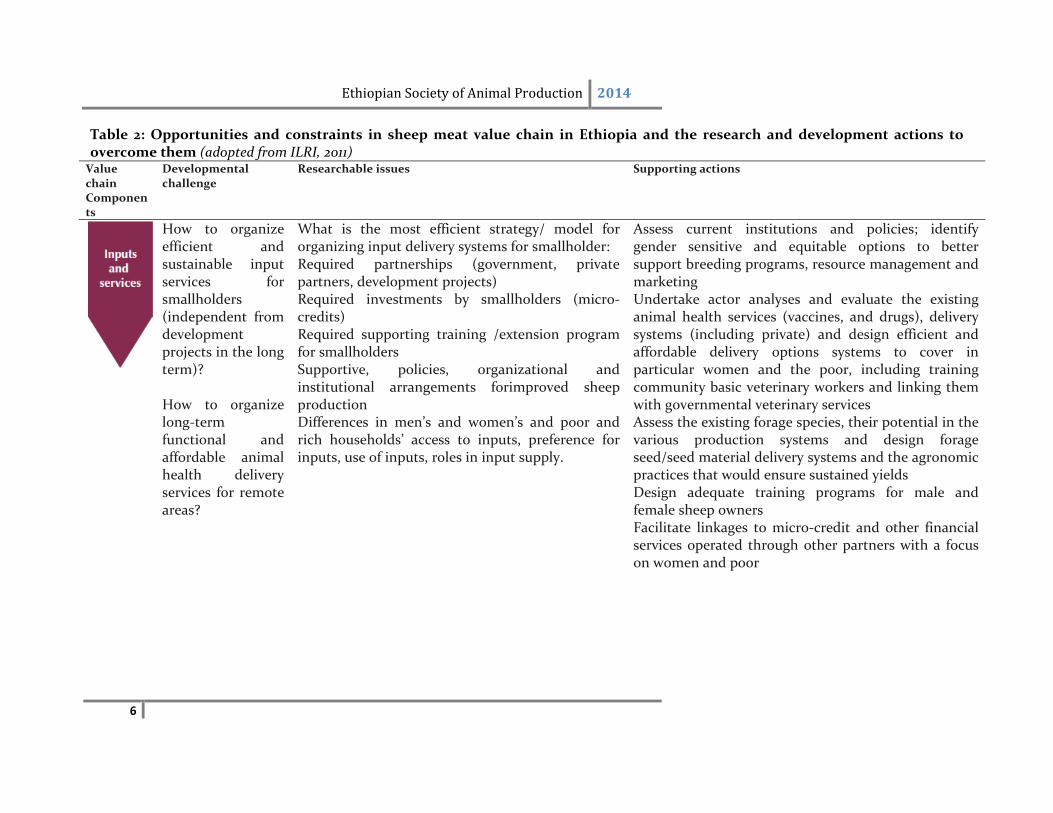
Table 2: Opportunities and constraints in sheep meat value chain in Ethiopia and the research and development actions to overcome them (adopted from ILRI, 2011) Value chain Components
Developmental challenge
Researchable issues Supporting actions
How to organize efficient and sustainable input services for smallholders (independent from development projects in the long term)? How to organize long‐term functional and affordable animal health delivery services for remote areas?
What is the most efficient strategy/ model for organizing input delivery systems for smallholder: Required partnerships (government, private partners, development projects) Required investments by smallholders (micro‐credits) Required supporting training /extension program for smallholders Supportive, policies, organizational and institutional arrangements forimproved sheep production Differences in men’s and women’s and poor and rich households’ access to inputs, preference for inputs, use of inputs, roles in input supply.
Assess current institutions and policies; identify gender sensitive and equitable options to better support breeding programs, resource management and marketing Undertake actor analyses and evaluate the existing animal health services (vaccines, and drugs), delivery systems (including private) and design efficient and affordable delivery options systems to cover in particular women and the poor, including training community basic veterinary workers and linking them with governmental veterinary services Assess the existing forage species, their potential in the various production systems and design forage seed/seed material delivery systems and the agronomic practices that would ensure sustained yields Design adequate training programs for male and female sheep owners Facilitate linkages to micro‐credit and other financial services operated through other partners with a focus on women and poor
Ethiopian Society of Animal Production 2014
7
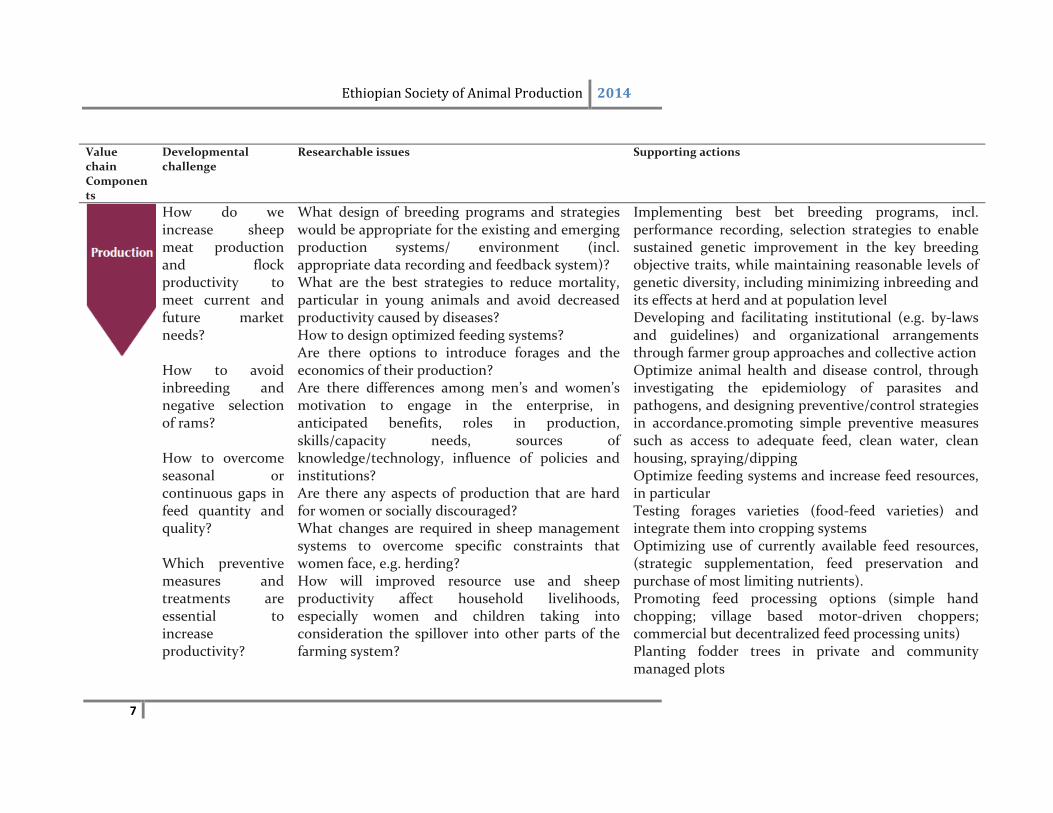
Value chain Components
Developmental challenge
Researchable issues Supporting actions
How do we increase sheep meat production and flock productivity to meet current and future market needs? How to avoid inbreeding and negative selection of rams? How to overcome seasonal or continuous gaps in feed quantity and quality? Which preventive measures and treatments are essential to increase productivity?
What design of breeding programs and strategies would be appropriate for the existing and emerging production systems/ environment (incl. appropriate data recording and feedback system)? What are the best strategies to reduce mortality, particular in young animals and avoid decreased productivity caused by diseases? How to design optimized feeding systems? Are there options to introduce forages and the economics of their production? Are there differences among men’s and women’s motivation to engage in the enterprise, in anticipated benefits, roles in production, skills/capacity needs, sources of knowledge/technology, influence of policies and institutions? Are there any aspects of production that are hard for women or socially discouraged? What changes are required in sheep management systems to overcome specific constraints that women face, e.g. herding? How will improved resource use and sheep productivity affect household livelihoods, especially women and children taking into consideration the spillover into other parts of the farming system?
Implementing best bet breeding programs, incl. performance recording, selection strategies to enable sustained genetic improvement in the key breeding objective traits, while maintaining reasonable levels of genetic diversity, including minimizing inbreeding and its effects at herd and at population level Developing and facilitating institutional (e.g. by‐laws and guidelines) and organizational arrangements through farmer group approaches and collective action Optimize animal health and disease control, through investigating the epidemiology of parasites and pathogens, and designing preventive/control strategies in accordance.promoting simple preventive measures such as access to adequate feed, clean water, clean housing, spraying/dipping Optimize feeding systems and increase feed resources, in particular Testing forages varieties (food‐feed varieties) and integrate them into cropping systems Optimizing use of currently available feed resources, (strategic supplementation, feed preservation and purchase of most limiting nutrients). Promoting feed processing options (simple hand chopping; village based motor‐driven choppers; commercial but decentralized feed processing units) Planting fodder trees in private and community managed plots
Ethiopian Society of Animal Production 2014
8
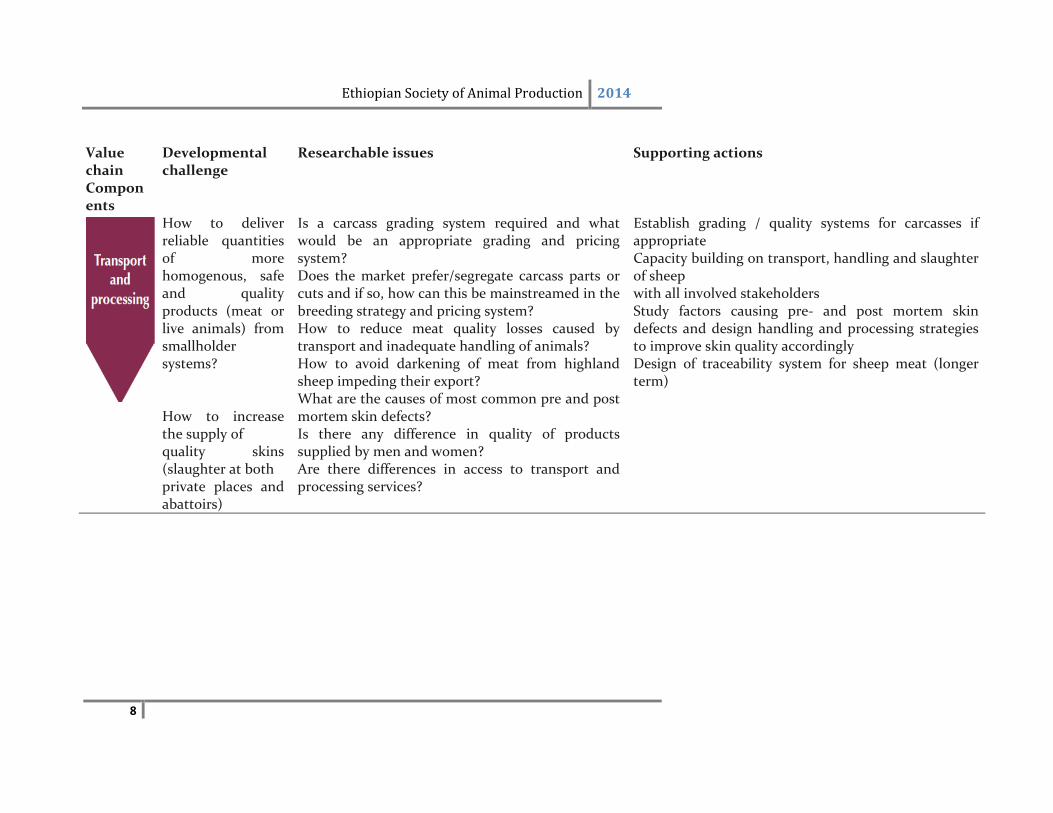
Value chain Components
Developmental challenge
Researchable issues Supporting actions
How to deliver reliable quantities of more homogenous, safe and quality products (meat or live animals) from smallholder systems? How to increase the supply of quality skins (slaughter at both private places and abattoirs)
Is a carcass grading system required and what would be an appropriate grading and pricing system? Does the market prefer/segregate carcass parts or cuts and if so, how can this be mainstreamed in the breeding strategy and pricing system? How to reduce meat quality losses caused by transport and inadequate handling of animals? How to avoid darkening of meat from highland sheep impeding their export? What are the causes of most common pre and post mortem skin defects? Is there any difference in quality of products supplied by men and women? Are there differences in access to transport and processing services?
Establish grading / quality systems for carcasses if appropriate Capacity building on transport, handling and slaughter of sheep with all involved stakeholders Study factors causing pre‐ and post mortem skin defects and design handling and processing strategies to improve skin quality accordingly Design of traceability system for sheep meat (longer term)
Ethiopian Society of Animal Production 2014
9
Value chain Components
Developmental challenge
Researchable issues Supporting actions
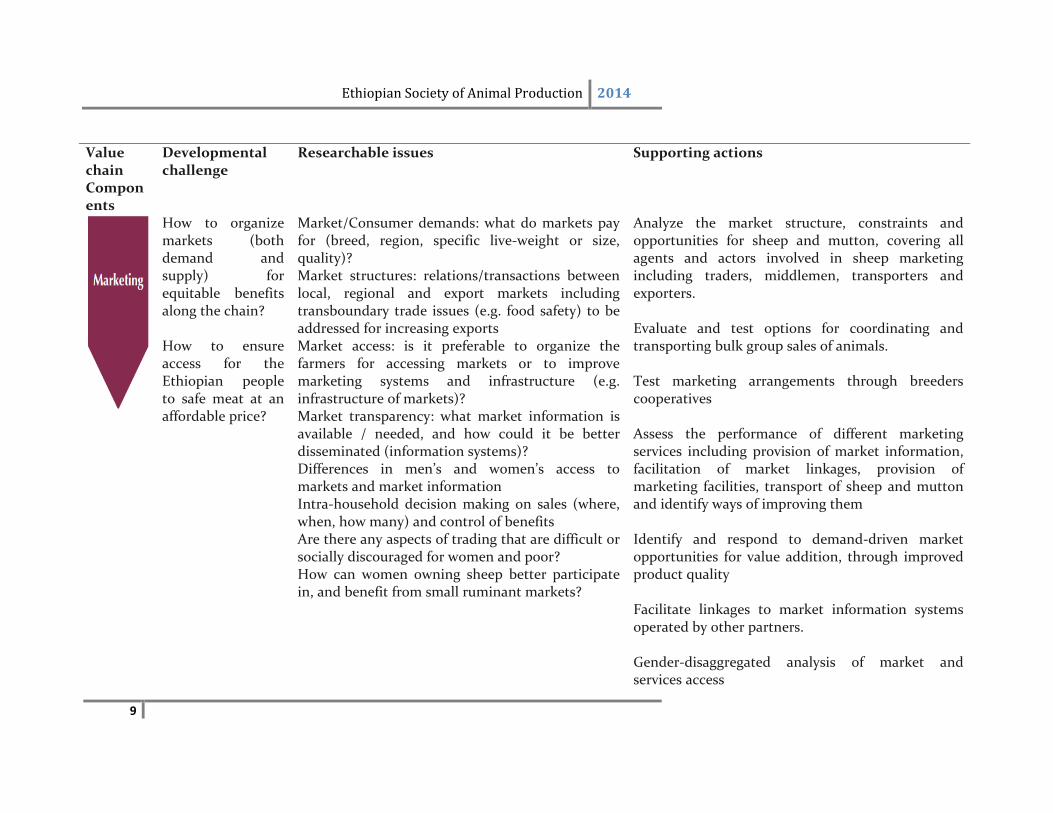
How to organize markets (both demand and supply) for equitable benefits along the chain? How to ensure access for the Ethiopian people to safe meat at an affordable price?
Market/Consumer demands: what do markets pay for (breed, region, specific live‐weight or size, quality)? Market structures: relations/transactions between local, regional and export markets including transboundary trade issues (e.g. food safety) to be addressed for increasing exports Market access: is it preferable to organize the farmers for accessing markets or to improve marketing systems and infrastructure (e.g. infrastructure of markets)? Market transparency: what market information is available / needed, and how could it be better disseminated (information systems)? Differences in men’s and women’s access to markets and market information Intra‐household decision making on sales (where, when, how many) and control of benefits Are there any aspects of trading that are difficult or socially discouraged for women and poor? How can women owning sheep better participate in, and benefit from small ruminant markets?
Analyze the market structure, constraints and opportunities for sheep and mutton, covering all agents and actors involved in sheep marketing including traders, middlemen, transporters and exporters. Evaluate and test options for coordinating and transporting bulk group sales of animals. Test marketing arrangements through breeders cooperatives Assess the performance of different marketing services including provision of market information, facilitation of market linkages, provision of marketing facilities, transport of sheep and mutton and identify ways of improving them Identify and respond to demand‐driven market opportunities for value addition, through improved product quality Facilitate linkages to market information systems operated by other partners. Gender‐disaggregated analysis of market and services access
Ethiopian Society of Animal Production 2014
10
Value chain Components
Developmental challenge
Researchable issues
Supporting actions
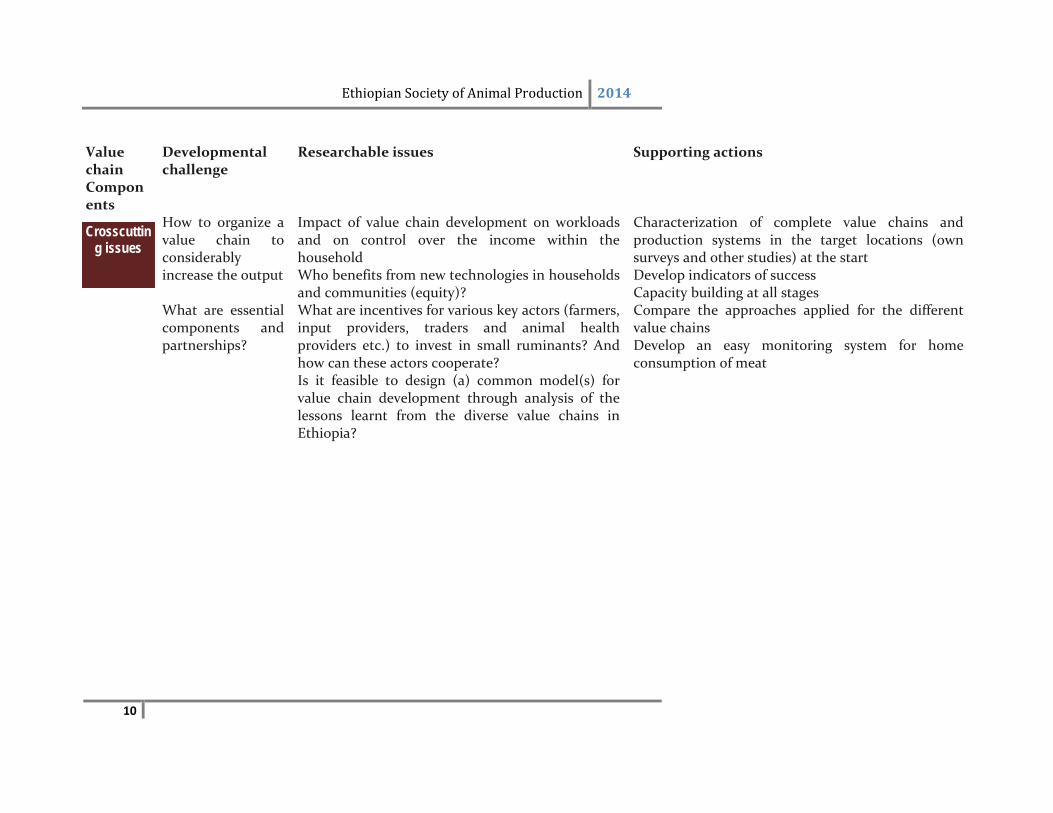
How to organize a value chain to considerably increase the output What are essential components and partnerships?
Impact of value chain development on workloads and on control over the income within the household Who benefits from new technologies in households and communities (equity)? What are incentives for various key actors (farmers, input providers, traders and animal health providers etc.) to invest in small ruminants? And how can these actors cooperate? Is it feasible to design (a) common model(s) for value chain development through analysis of the lessons learnt from the diverse value chains in Ethiopia?
Characterization of complete value chains and production systems in the target locations (own surveys and other studies) at the start Develop indicators of success Capacity building at all stages Compare the approaches applied for the different value chains Develop an easy monitoring system for home consumption of meat
Crosscutting issues
Ethiopian Society of Animal Production 2014
11
Conclusion
The sheep meet value chain in Ethiopia has a pro‐poor potential for intervention as majority of the rural poor in Ethiopia depend on sheep (and goat) production and both men and women are involved in sheep production with different tasks and decision‐making power. Huge and increasing demand for sheep meat within and outside the country reflected in increasing prices and Ethiopia’s strategic location promoting exports to Middle East markets present huge potential for the sheep meat value chain to boom. However, technology and supply constraints including negative selection of breeding rams for lamb growth as fast growing lambs are sold first and inbreeding due to small flock sizes, shortage and fluctuation in quantity and quality of feed supply and poor animal hygiene and diseases, among others, present challenges to realizing the untapped potential. Most of these challenges can, however, be addressed through research geared towards development tailored to the specific needs of each actor along the value chain. An integrated value‐chain approach is being strongly advocated for focused impact in agricultural research and development interventions.
References
CSA (Central Statistical Agency), 2008. Summary and Statistical Report of the 2007 Population and Housing Census, Addis Ababa, Ethiopia.114pp.
Fadiga M. and Amare S., 2010. Exploring Alternatives to the Middle‐East Meat Market for Ethiopia. Evidence from Simulation Models. Paper presented at the 8th International Conference on the Ethiopian Economy organized by the Ethiopian Economics Association in Addis Ababa on 24–26, 2010.
FAO. 2009. The state of food and agriculture, 2009: Livestock in the balance. FAO (Food and Agricultural Organization of the United Nations). Rome, Italy.
FAO Stat, 2010. FAO (Food and Agricultural Organization of the United Nations). Rome, Italy. http://faostat.fao.org.
Gizaw S., Lemma S., Komen H., Van Arendonk, J.A.M., 2007. Estimates of genetic parameters and genetic trends for live weight and fleece traits in Menz sheep. Small Rumin. Res. 70, 145 – 153.
ILRI (International Livestock Research Institute), 2011. Background proposals for the CGIAR Research Program on Livestock and Fish. Submited to the CGIAR by ILRI on behalf of ICARDA, World Fish Center and CIAT. © 2011 International Livestock Research Institute (ILRI)
Negassa A. and Jabbar M. 2008. Livestock ownership, commercial off‐take rates and their determinants in Ethiopia.Research Report 9. ILRI (International Livestock Research Institute),
Ethiopian Society of Animal Production 2014
12
Nairobi, Kenya. 52 pp. Tibbo M., 2006. Productivity and health of indigenous sheep breeds and crossbreds in the Central Ethiopian highlands, PhD Thesis, Swedish University of Agricultural Sciences, Uppsala, Sweden.
Ethiopian Society of Animal Production 2014
13
Livestock and Irrigation Value Chains for Ethiopian Smallholders (LIVES) Project Dirk Hoekstra, Azage Tegegne, Berhanu Gebremedhin, Aklilu Bogale and Yasin Getahun
LIVES,ILRI, PO Box 5689, Addis Ababa, Ethiopiawww.lives‐ethiopia.org
Background
“Livestock and Irrigation Value‐chains for Ethiopian Smallholders” (LIVES) is a six year initiative (2012‐2018) designed by ILRI (The International Livestock Research Institute), IWMI (The International Water Management Institute) and their national partners; the Ministry of Agriculture (MoA), the Ethiopian Institute of Agricultural Research (EIAR), and Regional Bureaus of Agriculture and Livestock Agencies of Amhara, Tigray, Oromia and SNNP Regional States. LIVES is funded by the Department of Foreign Affairs, Trade and Development (DFATD) of Canada.The project capitalizes on the success of “Improving Productivity and Market Success of Smallholders in Ethiopia” (IPMS) project, the predecessor of this project, which wasfunded by CIDA. The project aims at supporting the GoE’s efforts to transform the smallholder subsistence agricultural sector to a more market‐oriented smallholder sector to contribute to the new Growth Transformation Plan (GTP). The project is aligned with this Government strategy and complements GTP, AGP and other programs of the government of Ethiopia. The goal of the project is to contribute to enhanced income and gender equitable wealth creation for smallholders and other value chains actors through increased and sustained market‐off‐take of high value livestock and irrigated crop commodities. The Objectives of the Project are:
1. To improve the capacity of livestock and irrigation value chain actors and of the support services at different administrative (kebele to national) levels to develop selected value chains and respond to emerging challenges and opportunities;
2. To improve generation, access, flow and use of knowledge relevant to the value chains within and amongst the different administrative (kebele to national) levels;
3. To facilitate the promotion and dissemination of principles and good practices in developing value chains.
4. To facilitate the identification, targeting and promotion of improved technologies and organizational and institutional innovations to develop the value chains of selected high‐value livestock and irrigated crop commodities;
5. To generate knowledge through action‐oriented research and synthesis of lessons learnt about value‐chain development;
LIVES focuses on high value, market‐oriented livestock and irrigated fruits, vegetables and fodder crops; and makes efforts to transform smallholders from subsistence to marketoriented agricultural ventures. LIVESsupports the development of improved, competitive, sustainable and equitable value chains for selected livestock and irrigated crop commodities in clusters of districts (woredas)in 10 zones of the four regions: Amhara, Oromia, SNNPR and Tigray. Within these clusters of 31 districts, it is expected that value chain actors ‐767 peasant associations‐ engaged in production and processing of selected commodities, are targeted. Of the aforementioned smallholder producers, 20% are expected to be female‐headed households. At the end of the project, over 5000 staff in the selected districts, zones and regions are expected to have increased their skills and knowledge to support market oriented agriculture development. Entrepreneurial
Ethiopian Society of Animal Production 2014
14
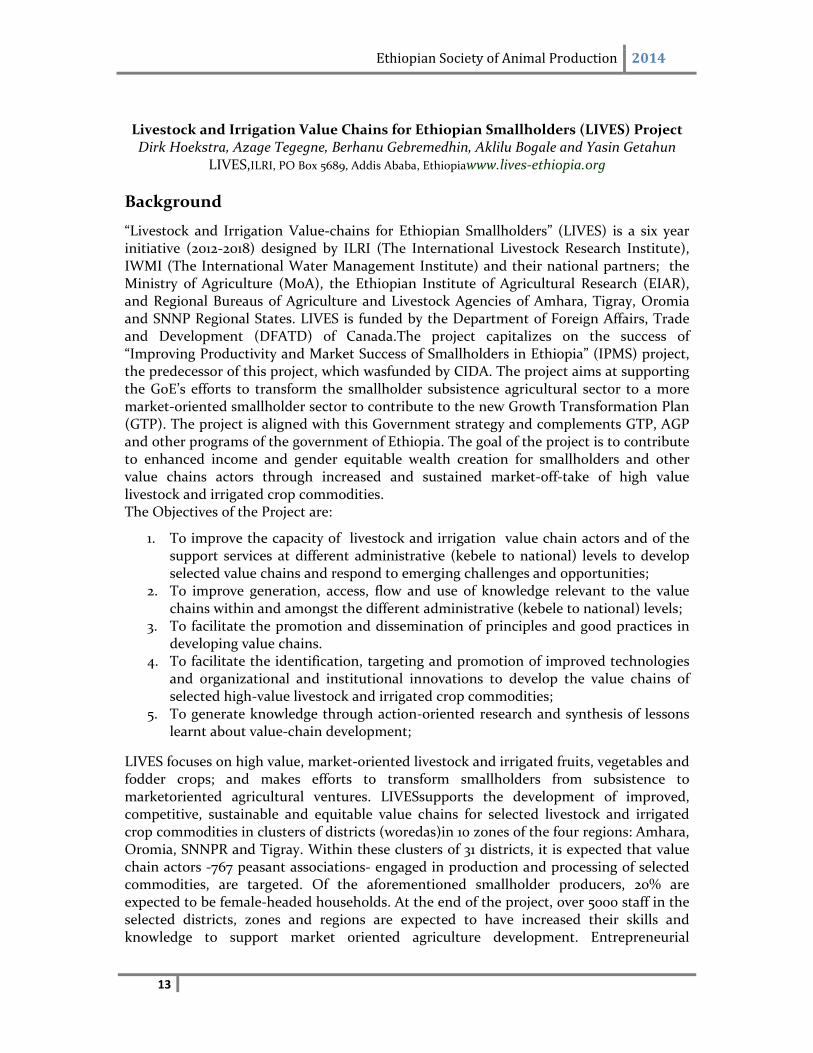
households (estimated at10‐15% of the households targeted) are given particular attention to improve their market oriented production system, including quality standards. The project designs and promotes appropriate value chain interventions and linkagesthrough a participatory process in its project sites. Each of the 10 zones targets a maximum of four priority commodities from livestock and irrigated agriculture.
Areas of intervention
The project has five major pillars: Capacity building, Knowledge Management, promotion, Value Chain Development, and Action Research/documentation. Forall project interventions and activities, gender equity/equality and environmental sustainability are major crosscutting issues.For capacity development, the project and partner institutions provide support to formal and informal trainings on selected technologies, methods and approaches to develop skills of trainers and supervisors in participatory market‐oriented agricultural development for livestock and irrigated agriculture. Regular coaching and mentoring activities of innovative farm households and other value chain actors is adopted as a key strategy of the capacity development efforts of the project. The project has started to support MSc level education for about 100 public sector staff. The candidates are expected to be engaged in research topics that will contribute to the project activities and objectives. Upon finalization of their studies, these candidates are expected to fill capacity gaps of key partner institutions in targeted districts, zones and regions and another 100 staff from research institutions will be supported for relevant thesis research. Focusing on its gender lens, the project emphasizes and practices couples (husband and wife) involvement in skill development, coaching/mentoring and promotion activities, giving 50% quota for female MSc fellowship candidates from the project sites. The project works towards ensuring access and control of productive resources and services by women in Male Headed and Female Headed Households as well. Capturing, storing and sharing knowledge generated from/during various interventions helps ‘fuel’ the value chain development process and complement capacity development interventions in project target areas. Therefore, LIVES focuses on key knowledge management interventions such
Ethiopian Society of Animal Production 2014
15
as establishment of knowledge centers at district and zonal levels to benefit key public sector staff, support the facilitation of field days, seminars, study tours and learning events, including irrigated crop and livestock platforms, to enhance knowledge sharing and scale out/up of lessons learnt. The use of ICT based interventions such as audiovisual materials; computers and internet are given priority by the project to capture, share and promote knowledge across partner institutions and stakeholders. This venture contributes for the advancement of knowledge management efforts of the office of agriculture, Livestock and Irrigation Agencies and other offices that are aligning with the extension and research tiers at zonal and district levels.To reach value chain actors and service providers outside the project’s target areas, LIVES delivers promotional activities in nearby zones and districts with similar development potentials. Priority is given to AGP and Household Asset Building Program (HABP) districts and zones. Furthermore, promotional activities are planned to be carried out mainly targeting strategic partners in Ethiopia [especially professional societies] and beyond. So far, the key promotional interventions include the upgrading and popularizing the Ethiopian Agricultural Portal (www.eap.gov.et) and the distribution of project findings through audiovisual, print and other digital tools. LIVES works to introduce and promote organizational and institutional innovations and improved technologies to develop the selected commodity value chains by mainly capitalizing on innovation systems and value chain approaches tested and validated during IPMS’s intervention and used by other project partners. Unlike past interventions, the focus of the LIVES Project is on “longer” value chains at the district and regional levels, instead of district level value chains (“short” value chains) only. Longer value chains have a wider geographic range and involve more productive smallholders and larger input suppliers and wholesalers. The longer value chains targeted include large urban centers at some distance from production zones. These value chains have greater volume of product demand; greater long‐term sustainability associated with that larger demand, and increased opportunity for niche market and product differentiation allowing potentially greater value addition. On the inputs and services side, these value chains also offer greater diversity of improved technologies and services that LIVES interventions require. To make such value chains attractive (create economies of scale) to regional and national level public and private agribusinesses, linkages are created with clustered Districts. As a result, clusters of districts are targeted and support provided to administrative zone.Key value chain actors include; producers of agricultural inputs and outputs as well as traders and processors at village, district, zonal, regional and national levels. Important service providers include the public research and extension sector, which do technology development, capacity building, and knowledge generation and dissemination. Offices of Agriculture are also involved in input supply and services e.g. supply of seeds, pumps, artificial insemination, veterinary services and others. The involvement of communities, cooperatives, farmers and the private sector in producing inputs and providing services is also emerging.Key livestock value chain interventions in LIVES include; the development of improved input/service supply system to improve genetic potential of animals, in particular through community‐based breeding of sheep and goats; hormone assisted mass insemination, and village‐based pullet production for poultry. Interventions on improved fodder production and feeding systems, animal health delivery (the involvement of paravets, use of diagnostic toolkits and animal diseases decision support systems for veterinarians, and the distribution and use of thermo‐stable vaccines for Newcastle disease, and Peste des Petit Ruminants (PPR).
Ethiopian Society of Animal Production 2014
16
Another important component of LIVES project is documentation and monitoring of the project interventions since the results will be used as a source of learning grounds by project partners. At the same time, the documented and analyzed lessons will provide evidence for development of staff and policy makers to scale out interventions beyond the project area. Project lessons and results are documented through strategic diagnostic, action and impact studies by project staff, in partnership with regional, national and international research institutes. The research planning, design and implementation process in LIVES encourages carrying out of proper gender analysis, environmental analysis and generation of knowledge and lessons through gender sensitive diagnostic, action and impact research across targeted intervention areas. The results of these studies are to be published and disseminated widely over the years.To meet its envisaged objective of bringing gender balanced and environmentally sustainable increment of the income for smallholders, LIVES actively works in partnership with regional bureaus of agriculture, regional research institutes, livestock development agencies, offices of agriculture at zonal and district levels and universities. Project staffs are deployed at federal, regional and zonal levels to work along focal persons from partner institutions at different levels.
Ethiopian Society of Animal Production 2014
17
Value Chain Efficiency Improvement: an approach for Reduction of GHG Emission from Livestock and as an Adaptation to Climate Change
Million Tadesse1 1, Tadesse Sori2, Solomon Abegaze3, Solomon Mengistu1 1Ethiopian institute of Agricultural Research
2Ministry of Livestock, 3Institute of biodiversity
Background Livestock are an essential part of the biological basis for world food security and contribute to the livelihoods of over a thousand million people. A diverse resource base is critical for human survival and well‐being and a contribution to the eradication of hunger: Livestock genetic resources are crucial in adapting to changing socio‐economic and environmental conditions, including climate change. Livestock is a significant contributor to the GDP of Ethiopia and is the main source of income for a large part of the society. Simultaneously, a large chunk of GHG emissions originates in the livestock sector and the sector will expand in line with population growth. On the other hand, climate change affects livestock production and productivity both directly and indirectly. The direct effects include temperature and other climate factors on animal growth, milk production and reproduction. The indirect effects include climatic influences on availability of water and the quantity and quality of feedstuffs such as pasture, forage, grain and the severity and distribution of livestock diseases and parasites. As part of its Climate‐Resilient Green Economy initiative, the Government of Ethiopia has identified an efficient livestock sector among the three ‘green economy’ initiatives for fast‐track implementation. Purpose of the Livestock Initiative The purpose of the livestock initiative is to lower emissions from the livestock sector by about 45 Mt CO2e per year in 2030 by stabilizing cattle herd numbers, with no sacrifice in projected economic output. This makes the Livestock Efficiency Initiative one of the top‐five opportunities for significant emissions reduction in Ethiopia and offers further socio‐economic benefits.As a sector, livestock holds nearly 20% of the estimated total potential to reduce GHG emissions in Ethiopia, 45 Mt CO2e per year in 2030. This makes it the second most important source of emission reductions after the efficient stoves initiative. Like stoves, livestock is also part of everyday life for most of the population (70%), so that success here in combining environmental sustainability and economic development is crucial to meet the country’s development goals and build acceptance of the CRGE/green growth strategy. Ethiopia’s livestock sector is fragmented but the central animals are clearly cattle, which are used for meat, dairy products, as draught animals, and are treated as financial assets. Given current practices, the cattle population is likely to increase from today’s around 51 million to more than 90 million in 2030, thereby almost, reaching the cattle carrying capacity of the country and doubling emissions from the livestock sector. Work of the Ministry of Agriculture and the Environmental Protection Authority indicates that the same economic output could be achieved while limiting the cattle population to around 51 million by 2030. The required interventions would centre on increasing cattle‐specific value chain efficiency, promotion of low emitting animals consumption (poultry, small
Ethiopian Society of Animal Production 2014
18
ruminant, camel, apiculture), and mechanisation of land practices such as ploughing and tillage.
Cattle value chain efficiency improvement
As GHG emission related to Animal is negatively correlated with productivity and production the sub‐initiative is aimed to lower the growth of the cattle population by 17 million heads through increased productivity and productionefficiency across the animal value chain of small holder farmers and pastoralists. In Ethiopia’s’ Livestock production context, dominated by small holder, the production and reproductive performance of the Animal in any measurement are too low: poor feed conversion efficiency, poor daily weight gain, low milk and meat yield, low off‐take rate, low conception and calving rate, longer calving intervals, high mortality etc. are some of the features. The production and productivity gap of small holder is much lower than the potential so that it is clear production and productivity will increase through utilization of appropriate improved technology such as; improved feed and feeding, improved breed, improved health services, improved range management, improved market efficiency, improved husbandry practices and improved management.
Intensification and improvement of the aforementioned techniques inevitably leads to culling unproductive animals and reduced head count, which gives chance to farmers and pastoralists shifting to better management of fewer productive Animals. As this shift enhances market‐oriented production system, it automatically leads to increased off‐take rate at early age, which means quality live animal and meat for both export and domestic market. Increasing off‐take rate is the core target of this lever in decreasing GHG emission per animal and decreased number of animals; and increasing socio‐economic growth of the country in general and small holders in particular. These levers have a combined abatement potential of 17 Mt CO2e in 2030(5 from pastoralist and 12 from smallholder farmers). The Cattle value chain efficiency improvementsub‐initiative is further divided into five financeable programmes:
1. Smallholder dairy‐oriented aggregation: Smallholder dairy‐oriented aggregation will reduce the need for milking cows by introducing more productive cross‐breeds and uniting smallholders in cooperatives to allow for the management of such cross‐breeds. It will reach an estimated 9% of the Ethiopian herd. Its abatement potential equals to roughly 6 Mt CO2e, assuming the cross‐breeds will emit around 1.5 tons CO2e per year/head.
2. Commercial dairy development: Commercial dairy development will reduce the need for milking cows by introducing productive exotic breeds and supporting commercial dairy production and processing. It will reach an estimated 1% of the Ethiopian herd. Its abatement potential equals to roughly 1 Mt CO2e, assuming the exotic breeds emit about 1.8 tons CO2e per year/head.
3. Pastoralist cattle value chain efficiency: The pastoralist cattle value chain efficiency programme will attempt to stabilize the number of cattle in pastoralist areas through increasing per animal productivity (by improving breed productivity through selection and providing better inputs) and increasing off‐take. The program will be linked to commercial feedlot program through established marketing groups who will collect and supply male animals (not needed for breed including culled females)
Ethiopian Society of Animal Production 2014
19
to highland commercial feedlot program. The programme will reach half of the pastoralist herd project at about 20 million heads in 2030. Its abatement potential equals to roughly 5 Mt CO2e, assuming the newly more productive animals emissions increase by about 5%.
4. Improvement of smallholder fattening: The improvement of smallholder fattening programme will train smallholders in adequate fattening of their cattle before off‐take. This will significantly increase the meat per animal brought on the market and therefore reduce the amount of cattle needed. About 50% of the smallholder herd is assumed to be reached with this programme. Its abatement potential equals to roughly 4 Mt CO2e assuming a minimal increase from emission per year of fattened animals.
5. Commercial feedlot development: Commercial feedlot development will strengthen current feedlot facilities, establish new facilities, and improve current feedlot management. This will effectively lower the fattening period and increase the meat obtained per animal introduced to feedlots (mostly pastoralist male animals). Half of the pastoralist bulls are assumed to be reached with this programme (5% of entire projected herd). Its abatement potential equals to roughly 0.60 Mt CO2e assuming a minimal increase per year of more intensively fattened animals.
Ethiopian Society of Animal Production 2014
20
Animal Feed and Nutrition

Ethiopian Society of Animal Production 2014
21
Ethiopian Society of Animal Production 2014
22
Meat Characteristics and Economic Benefits of Feeding Different Proportions of Ficus sur (cv. Forssk.) Fruits Mixed with Maize Grain in
Pigs Diriba Diba1, Yoseph Mekasha2, Mengistu Urge2, Adugna Tolera3 and Mitiku Eshetu2
1Wollega University, College of Agriculture and Natural Resources, Departement of AnimalScience P.O.Box 395
2Haramaya University, School of Animal and Range Sciences, Department of Animal Science;P.O.Box 138, Dire Dawa
3Hawassa University, College of Agriculture, Department of Animal and Range ScienceP.O.Box 05 *Corresponding author: [email protected]
Abstract
Twenty growing Yorkshire piglets of 27.9 kgs average initial weight were used to investigate the effect of different proportions of ground Ficus Sur Fruits (FSF) mixed with ground maize grain (MG) on carcass characteristics and profitability. The experiment involved four treatments each replicated five times. The treatment diets used in the experiment were: T1 (100%FSF + 18.02% protein supplement (NSC+SBM)), T2 (67% FSF+33%MG+ 18.01% protein supplement (NSC+SBM), T3 (33%FSF +67% MG + 18.00% protein supplement (NSC+SBM)), T4 (100% MG+18.01% protein supplement (NSC+SBM)). Except for the slaughter weight, which significantly (P<0.01) increased with increase in maize grain level in the diets, all the rest primal cuts and carcass measurements including backfat thickness did not differ (P>0.03) among. Lungs has shown significant differences (P<0.01) among the treatments. The rest internal organs were with only numerical difference (P<0.03) and this was consistent with appendages. The marginal rate of return for partial budget analysis showed that all the treatments resulted in profit margin and the profitability was highest for maximum level of Ficus sur fruits in the diets. It is, therefore, concluded that substitution of Ficus sur fruits with maize grain in the diets of pigs can bring the most economic benefits and comparable meat yield.
Key words: meat characteristics, Ficus sur fruits, maize grain, piglets
Introduction
Before a decade the relative proportion of pigs as compared to other livestock classes in Ethiopia was very low (25,000 heads) as reported by FAO (2004). However, the current policy direction; increased number of foreigners’ population in the country and economic merits of pigs have created opportunities for swine production and marketing. Accordingly, many private piggery farms were producing sizeable figure of swine.The productivity and overall merits of swine for such low‐income country is becoming more attractive for investment and job opportunities. High prolificacy/fecundity, short gestation periods (short generation interval), fast growth rates, early maturity, wider appetite; sustaining themselves on poor quality feeds with high feed conversion efficiency are some of the merits reported for pigs in relation to the other livestock classes (Lekule and Kyvsgaard, 2003).However, the availability and cost of feed is one of the main concerns in animal nutrition including pigs. As pigs are non‐ruminants, fiber proportion in their diet as source of energy is very limited and they mainly depend on cereal crops
Ethiopian Society of Animal Production 2014
23
like maize. This forces them to compete for food with man where most farmers are maintaining their family at subsistence level. In such situations, the use of naturally available indigenous feed resources like Ficus sur fruits would be very important. The fruit is widely distributed in different regional states of the currently and consumed by all classes of livestock regardless of the species difference. However, the nutritional merits of Ficus sur fruits as livestock feed has not been studied. Thus, this experiment was conducted with the hypothesis that feeding the fruits to growing Yorkshire piglets as source of energy may result in reasonable carcass yield and economic returns. The main objective of this paper is, therefore, to investigate the effect of dried and ground Ficus sur fruits on carcass characteristics and profitability of piglets.
Material and Methods
Study site
This experiment was conducted at Haramaya University pig production and training center. It is located at 9o 26’N latitude and 42o3’E longitude. Its altitude is about 1980 m.a.s.l. and located at 520 km east from the capital, Addis Ababa.The mean annual rainfall of the study area is about 870 mm with a range of 560‐1260 mm, and the mean maximum and minimum temperatures are 23.4oC and 8.25oC, respectively (Haramaya University Meteorological Station report, 2012).
Animals management
Twenty uniform growing male weaned Yorkshire pigs with initial live body weight of 27.9+1.39kgs (mean + SEM) were selected from the Haramaya University pig production and training center for this experiment. All animals were dewormed with ivermectin injection and vaccinated against foot and mouth (FMD) diseases with FMD vaccine, topically sprayed with diazinone against mange mites’ external parasite before conducting the experiment. This was continued with three weeks interval until the end of the experiment as necessary. The health or welfare of the animals was well maintained until the end of the experiment. They were housed and handled in individual pen until the end of the experiment (90 days).
Feeding management
Experimental diets were composed of dried and ground Ficus sur fruits (FSF) mixed at different proportion with ground maize grain (MG). The treatment diets were used as energy supplements while the animals were kept on iso‐nitrogenous level (18% CP across all). As the requirement of the piglets increase with increase in their live body weight daily offer of the diets was adjusted in two weeks intervals based on their fortnight weight without affecting the dietary proportions already formulated (DeRouchey et al.,2008; Kim et al., 2000a; Kim et al., 2000b and Lee et al., 2000). The diets were mixed to maintain uniformity of the diet composition among all treatment groups. The piglets had free access for clean water.Soybean meal (SBM) and noug seed cake (NSC) were used as protein supplement in this particular experiment as they jointly provide sufficient amount of the essential amino acid (EAA), lysine, metheonine and tryptophan, which are very determinant in pig nutrition (NPB, 1996). Recommended levels of protein were used for grower and finisher rations as 18% CP and 1% lysine for early growing phase and 16% CP and 0.80% lysine for late growing phase (Kim et al., 2000). Feed refusals were recorded
Ethiopian Society of Animal Production 2014
24
daily throughout the experiment. The animals were adapted for 5 days, which was followed by 90 days actual data collection.
Treatment and design of the experiment
The different dietary treatments fed to piglets were given in Table 1. Twenty uniform live body weight animals were randomly assigned to each of the four treatment diets independent of the blocks. In this regard, the experiment was arranged in randomized complete block design (RCBD).
Table1: The Ficus sur and maize grain dietary treatments fed to piglets
Treatment Protein supplement (NSC+SBM) (g)
Energy Supplements (g DM)
Ficus sur (g) Maize grain (g) Total CP (%)
T1 337.59+181.35 837.00 0 18.02 T2 306.9+167.4 560.79 276.21 18.01 T3 279.0+150.66 276.21 560.79 18.00 T4 244.13+139.5 0.00 837.00 18.01
The model used in this experiment is:
Model: yijk=µ +τi +βj + εijk where, µ=overall mean of the population
τi= The ith treatment effect βj= The jth block effect and
εijk=random error associated with yij
Chemical analysis of the experimental diets
The chemical analysis of the feed samples was performed in Haramaya University Animal Nutrition laboratory. During the feeding periods, feed sample was taken each day and accumulated in separate bag. At the end of the feeding trial, the feed in the bag was thoroughly mixed and ample sample was taken for chemical analysis in the laboratory.The samples were partially dried in forced draft oven at 65oC to constant weight for 48 hours. The dried sample were ground to pass 1mm Wiley mill sieve size and labeled for easy identification. After the ground sample is equilibrated with the air at room temperature in the laboratory, hot weighing technique was employed. The chemical analysis for each sample was run in two replicates. When the results of the two replicates were not similar, the mean result was accepted provided that the result of the two replicates did not vary by more than 5%.The DM and ash contents of the feed samples were determined following AOAC (1995). The proximate composition of the feeds was analyzed following the AACC (2000) or AOAC methods. The N content of the samples was determined by the micro‐Kjeldahl method and CP was calculated as N X 6.25.
Carcass evaluation
At the end of the feeding period, the animals were subjected to overnight fasting. The slaughter weight (W1) was taken before severing with long knife into their heart for killing. After the complete evacuation of blood, the dead body was reweighed (W2) to calculate the amount of blood by subtracting the dead body weight (W2) from slaughter
Ethiopian Society of Animal Production 2014
25
weight (W1). This method was chosen due to the fact that pigs were energetic and their blood could not be taken safely into a given container. The weights of different carcass components, visceral parts and appendages were taken using digital balance as given in Tables 4, 5, and 6. After removing offal, the carcass was cut first into two halves (left and right) and then made into different cuts. During slaughtering process, data were carefully recorded on empty body weight (EBW), hot carcass weight (HCW), back fat thickness, rib/loin‐eye‐area, picnic shoulder, buzzton butt, ham, loin, and belly using already prepared formats. The hot carcass weight was taken immediately after evisceration. Back fat thickness (cm): was measured as average of first rib, last rib and last lumbar vertebra fat thickness (in cm) using transparent ruler. Regarding the rib‐eye area (REA), both the right and left halves were cut between the 10th and 11th ribs perpendicular to the backbone to measure the cross section of the rib‐eye muscle. The rib‐eye muscle was traced first on transparency paper then on graph paper and the area was measured by using transparent ruler and then the dimensions calculated and multiplied by the number of squares. Picnic shoulder: it was separated from the buzzton butt by making straight cut, dorsal to the shoulder joint approximately 1.5 cm from the dorsal edge of the blood bone on the loin side at an appropriate right angle with the belly side. Buzzton but: this was the part which was left after separation from the picnic shoulder. Total shoulder was the joint weight of picnic shoulder and buzzton butt. Ham: it was taken from the hind leg or thigh of carcass from the hook up ward on the live animals. This was removed by cutting at the anterior edge of the symphysis at right angle to the side. Loin: a part of quadrupt situated on both side of vertebral column between ribs and hip bone. Belly: was removed from the loin by making nearly straight cut that extends from a point that is ventral to but not more than 3 inches from longissimus dorsi on the shoulder end to a point on the leg end ventral to but not more than 1.5 inch from tender loin. Dressing percentage was calculated as HCW divided by SW. Carcass pH: measurements of pH were taken at an hour postmortem on carcasses; immediately after the hot carcass temperature fall and balanced to environmental temperature. The pH was measured in the sample taken from longissimus dorsi muscle of carcasses using the WP80 TPS meter in conjunction with a C64‐1 combination glass electrode. All the experimental animals were slaughtered within three consecutive days.
The partial budget analysis
The partial budget analysis was performed to evaluate the profitability of feeding Yorkshire piglets with dried and ground Ficus sur fruits mixed with different proportions of ground maize grain. The analysis was made by considering all the variable costs of inputs used in the execution of the experiment such as pig prices, feed price and labor expenses. For selling price estimation, immediately after the animals were slaughtered for carcass evaluation, the dressed carcass weight was recorded. Then the price of a kilo of pork from at least three pig/pork selling farms was assessed and the average was taken.
Ethiopian Society of Animal Production 2014
26
The price for a kilo of pork was multiplied with carcass yield (in killograms) of that particular animal (experimental unit). The difference between sale and purchase prices was taken as total return (TR) in this profitability analysis. The calculations for the following economic parameters were done according to Upton (1979) and Edward (2011): NR= TR‐TVC; MRR=∆NR/∆TVC; Where NR= net return; TR= total return; TVC= total variable cost; MRR= marginal rate of return.
Statistical Analyses
The data on carcass characteristics were stratified into treatment and block and analyzed using the General Linear Model (GLM) of SAS software 9.1.3 version (SAS, 2008). Means were compared using Tukey honestly significant difference test and declared significant at (P<0.05).
Results and Discussion
Chemical composition of the experimental diets
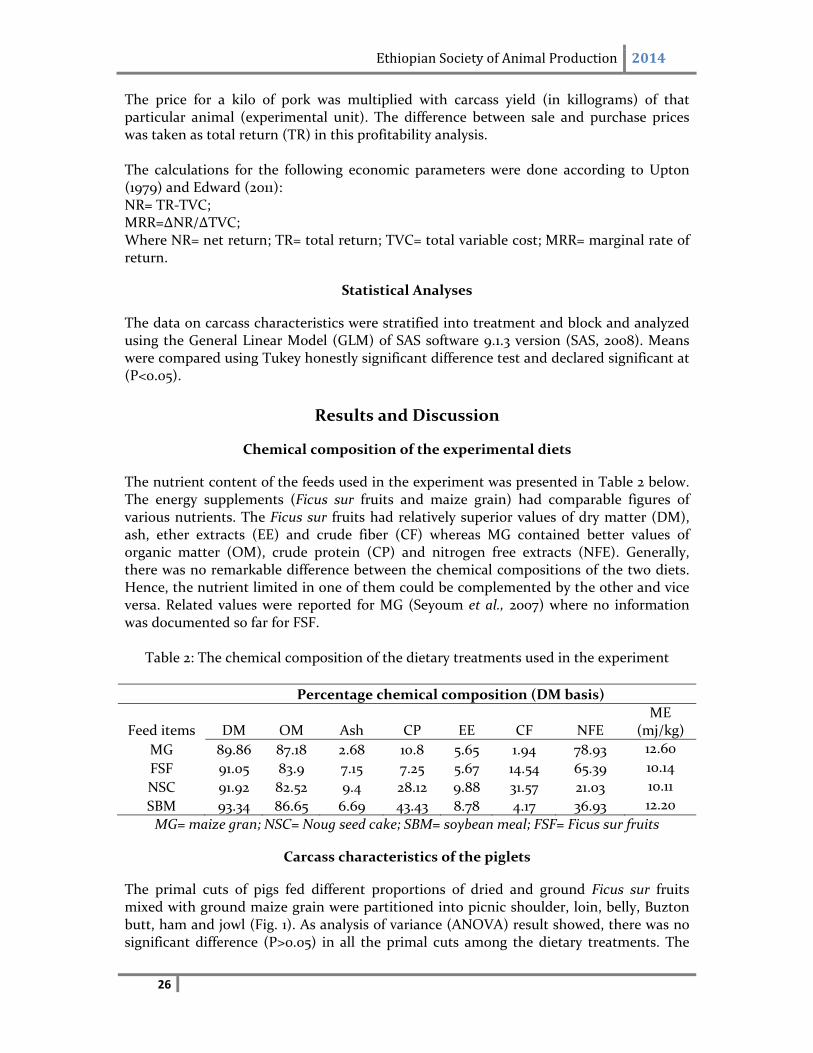
The nutrient content of the feeds used in the experiment was presented in Table 2 below. The energy supplements (Ficus sur fruits and maize grain) had comparable figures of various nutrients. The Ficus sur fruits had relatively superior values of dry matter (DM), ash, ether extracts (EE) and crude fiber (CF) whereas MG contained better values of organic matter (OM), crude protein (CP) and nitrogen free extracts (NFE). Generally, there was no remarkable difference between the chemical compositions of the two diets. Hence, the nutrient limited in one of them could be complemented by the other and vice versa. Related values were reported for MG (Seyoum et al., 2007) where no information was documented so far for FSF.
Table 2: The chemical composition of the dietary treatments used in the experiment
Percentage chemical composition (DM basis)
Feed items DM OM Ash CP EE CF NFE ME
(mj/kg)
MG 89.86 87.18 2.68 10.8 5.65 1.94 78.93 12.60
FSF 91.05 83.9 7.15 7.25 5.67 14.54 65.39 10.14
NSC 91.92 82.52 9.4 28.12 9.88 31.57 21.03 10.11
SBM 93.34 86.65 6.69 43.43 8.78 4.17 36.93 12.20
MG= maize gran; NSC= Noug seed cake; SBM= soybean meal; FSF= Ficus sur fruits
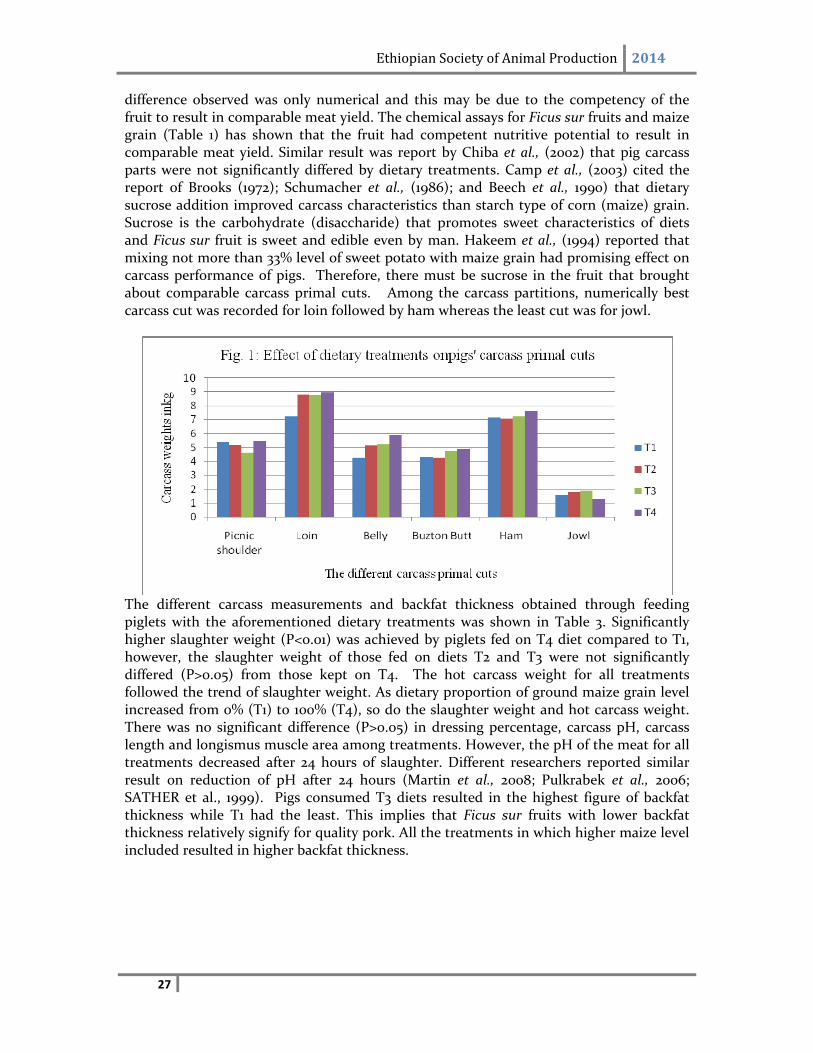
Carcass characteristics of the piglets
The primal cuts of pigs fed different proportions of dried and ground Ficus sur fruits mixed with ground maize grain were partitioned into picnic shoulder, loin, belly, Buzton butt, ham and jowl (Fig. 1). As analysis of variance (ANOVA) result showed, there was no significant difference (P>0.05) in all the primal cuts among the dietary treatments. The
Ethiopian Society of Animal Production 2014
27
difference observed was only numerical and this may be due to the competency of the fruit to result in comparable meat yield. The chemical assays for Ficus sur fruits and maize grain (Table 1) has shown that the fruit had competent nutritive potential to result in comparable meat yield. Similar result was report by Chiba et al., (2002) that pig carcass parts were not significantly differed by dietary treatments. Camp et al., (2003) cited the report of Brooks (1972); Schumacher et al., (1986); and Beech et al., 1990) that dietary sucrose addition improved carcass characteristics than starch type of corn (maize) grain. Sucrose is the carbohydrate (disaccharide) that promotes sweet characteristics of diets and Ficus sur fruit is sweet and edible even by man. Hakeem et al., (1994) reported that mixing not more than 33% level of sweet potato with maize grain had promising effect on carcass performance of pigs. Therefore, there must be sucrose in the fruit that brought about comparable carcass primal cuts. Among the carcass partitions, numerically best carcass cut was recorded for loin followed by ham whereas the least cut was for jowl.
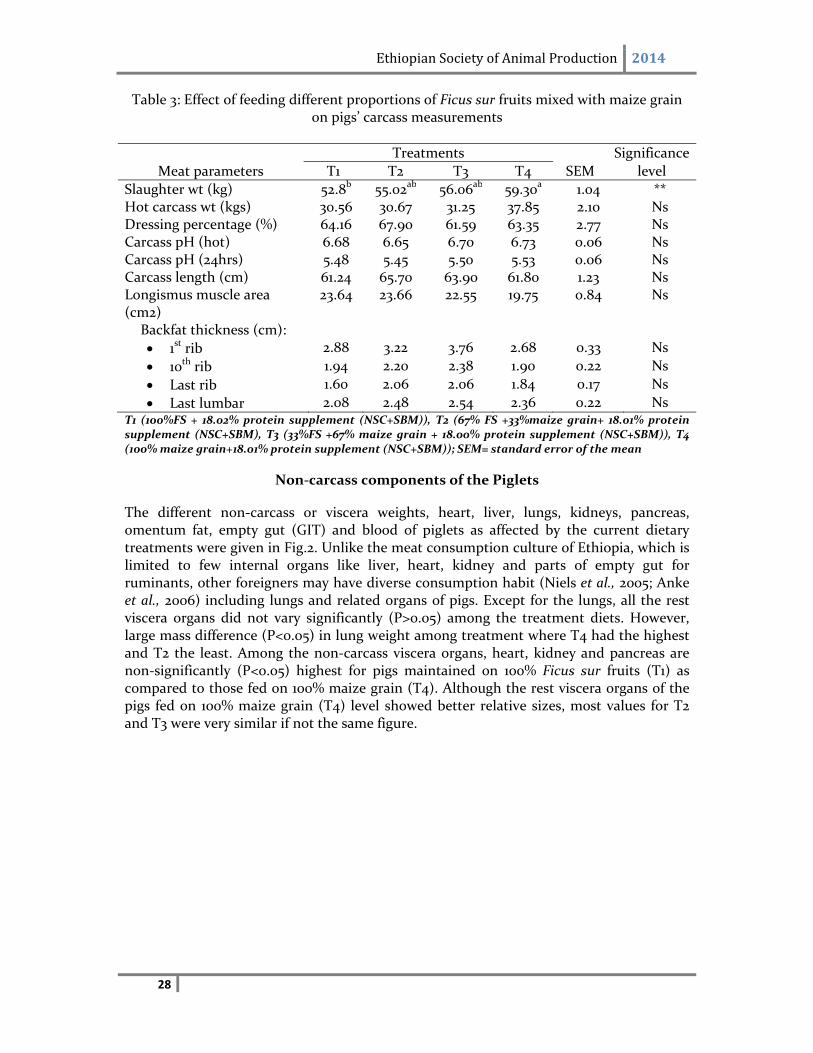
The different carcass measurements and backfat thickness obtained through feeding piglets with the aforementioned dietary treatments was shown in Table 3. Significantly higher slaughter weight (P<0.01) was achieved by piglets fed on T4 diet compared to T1, however, the slaughter weight of those fed on diets T2 and T3 were not significantly differed (P>0.05) from those kept on T4. The hot carcass weight for all treatments followed the trend of slaughter weight. As dietary proportion of ground maize grain level increased from 0% (T1) to 100% (T4), so do the slaughter weight and hot carcass weight. There was no significant difference (P>0.05) in dressing percentage, carcass pH, carcass length and longismus muscle area among treatments. However, the pH of the meat for all treatments decreased after 24 hours of slaughter. Different researchers reported similar result on reduction of pH after 24 hours (Martin et al., 2008; Pulkrabek et al., 2006; SATHER et al., 1999). Pigs consumed T3 diets resulted in the highest figure of backfat thickness while T1 had the least. This implies that Ficus sur fruits with lower backfat thickness relatively signify for quality pork. All the treatments in which higher maize level included resulted in higher backfat thickness.
Ethiopian Society of Animal Production 2014
28
Table 3: Effect of feeding different proportions of Ficus sur fruits mixed with maize grain on pigs’ carcass measurements
Treatments Significance
Meat parameters T1 T2 T3 T4 SEM level
Slaughter wt (kg) 52.8b 55.02ab 56.06ab 59.30a 1.04 ** Hot carcass wt (kgs) 30.56 30.67 31.25 37.85 2.10 Ns Dressing percentage (%) 64.16 67.90 61.59 63.35 2.77 Ns Carcass pH (hot) 6.68 6.65 6.70 6.73 0.06 Ns Carcass pH (24hrs) 5.48 5.45 5.50 5.53 0.06 Ns Carcass length (cm) 61.24 65.70 63.90 61.80 1.23 Ns Longismus muscle area (cm2)
23.64 23.66 22.55 19.75 0.84 Ns
Backfat thickness (cm):
1st rib 2.88 3.22 3.76 2.68 0.33 Ns
10th rib 1.94 2.20 2.38 1.90 0.22 Ns
Last rib 1.60 2.06 2.06 1.84 0.17 Ns
Last lumbar 2.08 2.48 2.54 2.36 0.22 Ns T1 (100%FS + 18.02% protein supplement (NSC+SBM)), T2 (67% FS +33%maize grain+ 18.01% protein supplement (NSC+SBM), T3 (33%FS +67% maize grain + 18.00% protein supplement (NSC+SBM)), T4 (100% maize grain+18.01% protein supplement (NSC+SBM)); SEM= standard error of the mean
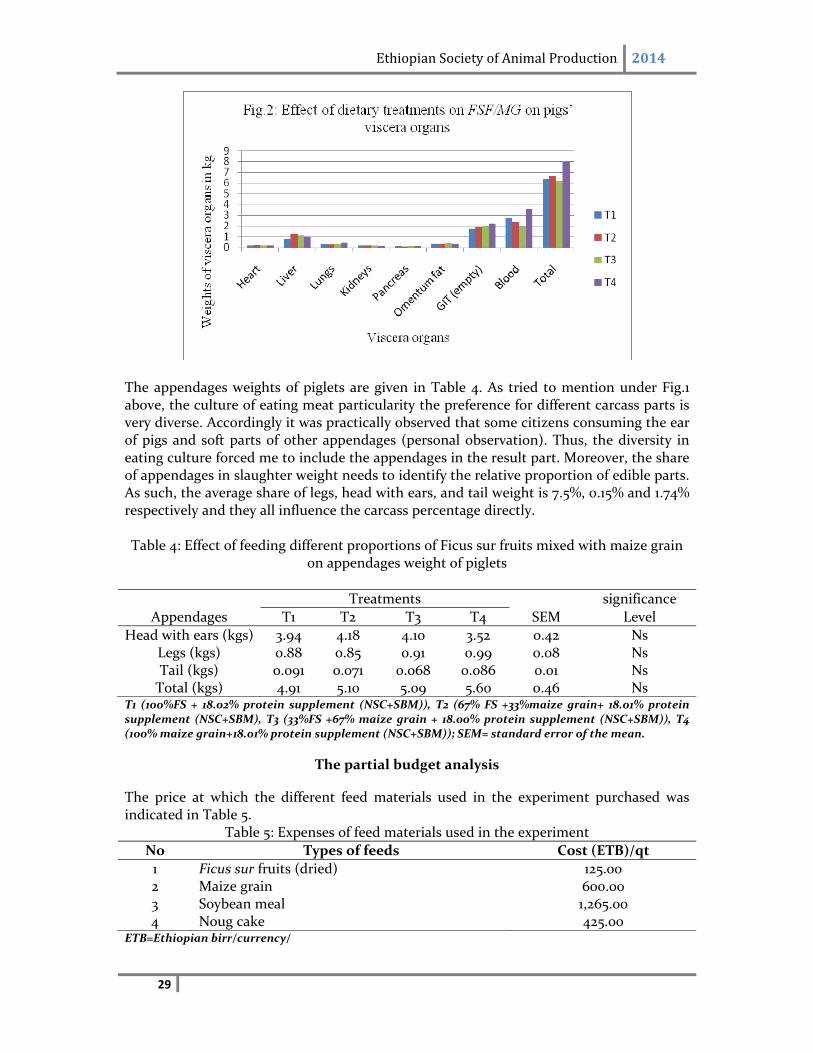
Non‐carcass components of the Piglets
The different non‐carcass or viscera weights, heart, liver, lungs, kidneys, pancreas, omentum fat, empty gut (GIT) and blood of piglets as affected by the current dietary treatments were given in Fig.2. Unlike the meat consumption culture of Ethiopia, which is limited to few internal organs like liver, heart, kidney and parts of empty gut for ruminants, other foreigners may have diverse consumption habit (Niels et al., 2005; Anke et al., 2006) including lungs and related organs of pigs. Except for the lungs, all the rest viscera organs did not vary significantly (P>0.05) among the treatment diets. However, large mass difference (P<0.05) in lung weight among treatment where T4 had the highest and T2 the least. Among the non‐carcass viscera organs, heart, kidney and pancreas are non‐significantly (P<0.05) highest for pigs maintained on 100% Ficus sur fruits (T1) as compared to those fed on 100% maize grain (T4). Although the rest viscera organs of the pigs fed on 100% maize grain (T4) level showed better relative sizes, most values for T2 and T3 were very similar if not the same figure.
Ethiopian Society of Animal Production 2014
29
The appendages weights of piglets are given in Table 4. As tried to mention under Fig.1 above, the culture of eating meat particularity the preference for different carcass parts is very diverse. Accordingly it was practically observed that some citizens consuming the ear of pigs and soft parts of other appendages (personal observation). Thus, the diversity in eating culture forced me to include the appendages in the result part. Moreover, the share of appendages in slaughter weight needs to identify the relative proportion of edible parts. As such, the average share of legs, head with ears, and tail weight is 7.5%, 0.15% and 1.74% respectively and they all influence the carcass percentage directly.
Table 4: Effect of feeding different proportions of Ficus sur fruits mixed with maize grain
on appendages weight of piglets
Treatments significance
Appendages T1 T2 T3 T4 SEM Level
Head with ears (kgs) 3.94 4.18 4.10 3.52 0.42 Ns Legs (kgs) 0.88 0.85 0.91 0.99 0.08 Ns Tail (kgs) 0.091 0.071 0.068 0.086 0.01 Ns Total (kgs) 4.91 5.10 5.09 5.60 0.46 Ns
T1 (100%FS + 18.02% protein supplement (NSC+SBM)), T2 (67% FS +33%maize grain+ 18.01% protein supplement (NSC+SBM), T3 (33%FS +67% maize grain + 18.00% protein supplement (NSC+SBM)), T4 (100% maize grain+18.01% protein supplement (NSC+SBM)); SEM= standard error of the mean.
The partial budget analysis
The price at which the different feed materials used in the experiment purchased was indicated in Table 5.
Table 5: Expenses of feed materials used in the experiment
No Types of feeds Cost (ETB)/qt
1 Ficus sur fruits (dried) 125.00 2 Maize grain 600.00 3 Soybean meal 1,265.00 4 Noug cake 425.00
ETB=Ethiopian birr/currency/
Ethiopian Society of Animal Production 2014
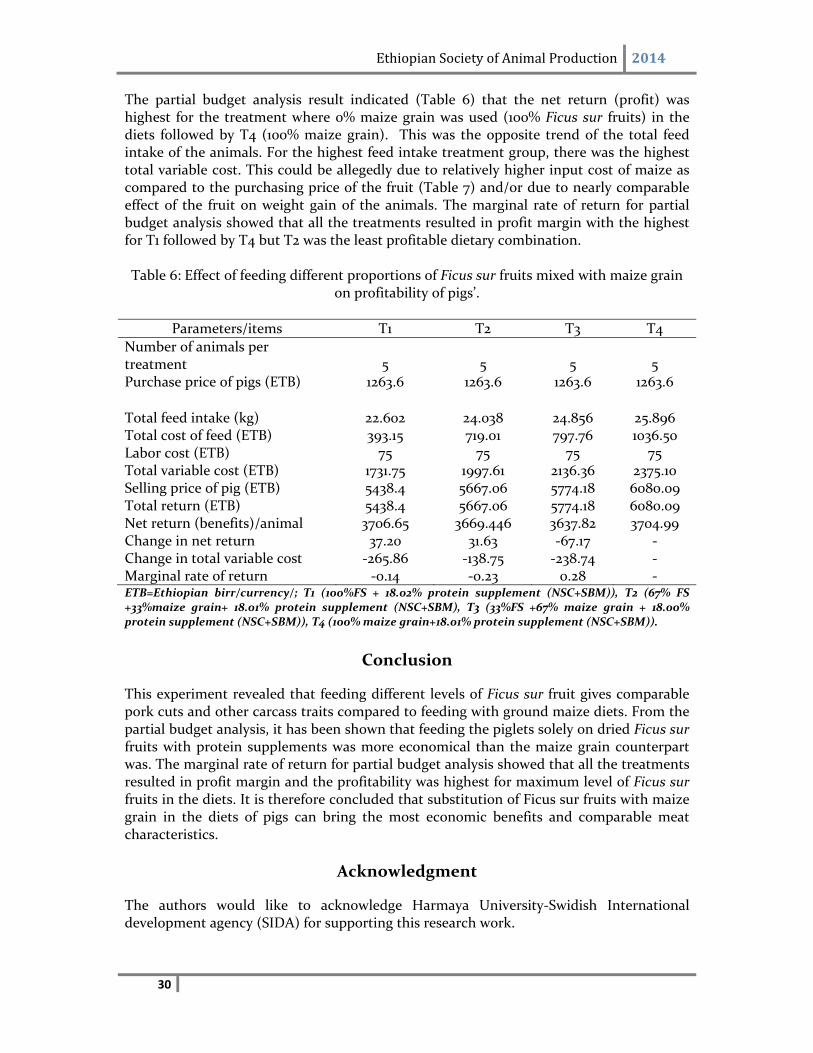
30
The partial budget analysis result indicated (Table 6) that the net return (profit) was highest for the treatment where 0% maize grain was used (100% Ficus sur fruits) in the diets followed by T4 (100% maize grain). This was the opposite trend of the total feed intake of the animals. For the highest feed intake treatment group, there was the highest total variable cost. This could be allegedly due to relatively higher input cost of maize as compared to the purchasing price of the fruit (Table 7) and/or due to nearly comparable effect of the fruit on weight gain of the animals. The marginal rate of return for partial budget analysis showed that all the treatments resulted in profit margin with the highest for T1 followed by T4 but T2 was the least profitable dietary combination. Table 6: Effect of feeding different proportions of Ficus sur fruits mixed with maize grain
on profitability of pigs’.
Parameters/items T1 T2 T3 T4
Number of animals per treatment 5 5 5 5 Purchase price of pigs (ETB) 1263.6 1263.6 1263.6 1263.6
Total feed intake (kg) 22.602 24.038 24.856 25.896 Total cost of feed (ETB) 393.15 719.01 797.76 1036.50 Labor cost (ETB) 75 75 75 75 Total variable cost (ETB) 1731.75 1997.61 2136.36 2375.10 Selling price of pig (ETB) 5438.4 5667.06 5774.18 6080.09 Total return (ETB) 5438.4 5667.06 5774.18 6080.09 Net return (benefits)/animal 3706.65 3669.446 3637.82 3704.99 Change in net return 37.20 31.63 ‐67.17 ‐ Change in total variable cost ‐265.86 ‐138.75 ‐238.74 ‐ Marginal rate of return ‐0.14 ‐0.23 0.28 ‐ ETB=Ethiopian birr/currency/; T1 (100%FS + 18.02% protein supplement (NSC+SBM)), T2 (67% FS +33%maize grain+ 18.01% protein supplement (NSC+SBM), T3 (33%FS +67% maize grain + 18.00% protein supplement (NSC+SBM)), T4 (100% maize grain+18.01% protein supplement (NSC+SBM)).
Conclusion
This experiment revealed that feeding different levels of Ficus sur fruit gives comparable pork cuts and other carcass traits compared to feeding with ground maize diets. From the partial budget analysis, it has been shown that feeding the piglets solely on dried Ficus sur fruits with protein supplements was more economical than the maize grain counterpart was. The marginal rate of return for partial budget analysis showed that all the treatments resulted in profit margin and the profitability was highest for maximum level of Ficus sur fruits in the diets. It is therefore concluded that substitution of Ficus sur fruits with maize grain in the diets of pigs can bring the most economic benefits and comparable meat characteristics.
Acknowledgment
The authors would like to acknowledge Harmaya University‐Swidish International development agency (SIDA) for supporting this research work.
Ethiopian Society of Animal Production 2014
31
Reference
AACC, 2000. American Association of Cereal Chemists: Approved Methods. St. Paul, MN, AACC No. 86‐06, 40.70.
Anke H. H. Kristina A. & Kerstin L. M, 2006. Performance, carcass and technological meat quality of pigs in indoor and outdoor production systems. Acta Agriculturae Scand Section A, 2006; 56: 55_64
AOAC international, 1995. Official method of analysis, 16th edition. AOAC international, Gaithersburg, MD
Camp L. K., Southern4 L. L. and Bidner T. D., 2003. Effect of carbohydrate source on growth performance, carcass traits, and meat quality of growing‐finishing pigs. J. Anim. Sci. 2003. 81:2488–2495
Chiba L.L, Kuhlers D.L., Frobish L.T., Jungst1 S.B., Huff‐Lonergan E.J., Lonergan S.M. and Cummins K.A., 2002. Effect of dietary restrictions on growth performance and carcass quality of pigs selected for lean growth efficiency. Department of Animal and Dairy Sciences, Auburn University, Auburn University, AL 36849‐5415, USA
DeRouchey J. Robert M., Goodband D., Mike D. Tokach, Jim L. N. And Steve S. D., 2008. Nursery Swine Nutrient Recommendations and Feeding Management. National Swine Nutrition Guide. Kansas State University, USA Edward A. E., 2011. Marginal Analysis: An Economic Procedure for Selecting Alternative Technologies/Practices1. Florida Cooperative Extension Service, Institute of Food and Agricultural Sciences, University of Florida, Gainesville, FL.
Food and Agricultural Organizations of the United nations (FAO), 2001. Bulletin of Statistics. Vol.2, No.1. Food and Agriculture Organization of the United Nations.
Food and Agricultural Organizations of the United Nations (FAO), 2004. Livestock sector brief. Livestock information, sector analysis and policy branch. FAO, Italy.
Hakeem A. Fashina‐Bombata a, Oladipo Amos Fanim, 1994. The effects of dietary replacement of maize with sun dried sweet potato meal on performance, carcass characteristics and serum metabolites of weaner grower pigs. Short communication.Animal Feed Science and Technology 47 (1994) 165‐170
Kim Y.G., Jin J., Kim J.D, Kim J.H., and In Han K., 2000a. Effects of phase feeding on growth performance, nutrient digestibility and nutrient excretion of growing barrows and gilts. Asian‐Aus.J.Anim.Sci.vol.13, No.6:795‐801
Ethiopian Society of Animal Production 2014
32
Kim Y.G., Jin J., Kim J.D, Kim J.H., and In Han K., 2000b. Effects of phase feeding on growth performance, nutrient digestibility and nutrient excretion of growing barrows and gilts. Asian‐Aus.J.Anim.Sci.vol.13, No.6:802‐810
Lee J.H., Kim J.D., Kim J.H., Jin J. and In Han K., 2000. Effect of phase feeding on the growth performance, nutrient utilization and carcass characteristics in finishing pigs. Asian‐Aus.J.Anim.Sci.vol.13, No.8:1137‐1146
Lekule F. P. and Niels C. K., 2003. Improving pig husbandry in tropical resource‐poor communities and its potential to reduce risk of porcine cysticercosisSokoine University of Agriculture, P.O. Box 3004, Morogoro, Tanzania
Martin D., Elena M., Elena G., Javier V. and Jorge R., 2008. Effect of dietary conjugated linoleic acid and monounsaturated fatty acids on productive, carcass and meat quality traits of pigs. Livestock Science 117 (2008) 155–164
National Pork Board (NPB), 1996. Feed purchasing manual. NPB, Des Moines, IA.
Niels, O., KARIN, S., GUNILLA, L. & JOHN E, H., 2005. Meat quality of fully or partly outdoor reared pigs in organic production Danish Institute of Agricultural Sciences, Research Centre Foulum, Tjele, Denmark Acta Agriculturae Scand Section A, 2005; 55: 106_/112
Pulkrabek J., J.Pavlik and Valis, L., 2006. Pig carcass quality and pH1 values of meat. Czech J. Anim. Sci., 49, 2004 (1): 38–47 Sather, A.P. and Squires, E.J., 1999. Effects of castration on live performance, carcass yield, and meat quality of male pigs fed wheat or corn based diets'. Journal of Muscle Food 10 (1999) 245‐259
Seyoum Bediye, Zinash Sileshi and Dereje Fekade, 2007. Chemical composition and nutritive values of Ethiopian feeds. Research report 73. Ethiopian Institute of Agricultural Research (EIAR), addis Ababa.
Statistical Analysis System (SAS), 2008. The Little SAS® Book: A Primer, Fourth Edition, version 9.1.3. Statistical analysis system institute Inc., NC. USA.
Ethiopian Society of Animal Production 2014
33
Meat Characteristics and Economic Benefit of Hararghe Highland Sheep Supplemented with Ficus sur (cv. Forssk.) Fruits at Different
Proportion with Oat Grain DiribaDiba1*, Yoseph Mekasha2, Mengistu Urge2 and Adugna Tolera3
1Wollega University, College of Agriculture and Natural Resources, Department of AnimalScience;
P.O.Box 395, Nekemte 2Haramaya University, School of Animal and Range Sciences, Department of Animal
Science;P.O.Box 138 Dire Dawa 3Hawassa University, College of Agriculture, Department of Animal and Range
Sciences;P.O.Box 05 *Corresponding author: [email protected]
Abstract
This experiment was conducted in Haramaya University to evaluate the feeding value of dried and ground fig fruits on carcass yield and economic benefit of Hararghe highland sheep as compared to ground oats grain. Thirty lambs with mean initial live body weights of 13kgs and SEM of 1.2Kgs were grouped into five different diet treatments. The experiment was laid out in a randomized complete block design (RCBD) with six replications. The result showed that except numerical difference between the treatments, no significant effect was observed on all of the carcass component and most of the edible and non‐edible viscera organs. Hence, comparable result was achieved by feeding Ficus sur fruits to the animals as compared to oat grain. Feeding the same lambs with natural pasture hay supplemented with 100% Ficus sur fruits can result in 440.94 birr profit compared to 10.68 birr for oat grain according to this experiment based on current price.
Key words: Ficus sur fruits, oats grain, carcass, lambs
Introduction
Ethiopia is one of the top ranking countries in Africa and among the first ten in the world in terms of livestock genetic resources (NABC, 2010). Among other livestock classes, the total population of sheep and goats were reported to be 26 and24 million, respectively (IGAD, 2009). livestock play remarkable role in the livelihoods of the populations The largest proportions of the crops production utilize livestock inputs in terms of traction power and manure as a fertilizer. In areas where mixed farming (crops and livestock production) are jointly undertaken, farmers use livestock for coping with adverse situations during crises of crop failure by selling animals and their products. Research reports (Lemma and Diriba, 1998; Adugna, 2007) have shown that natural pasture and crop residues are major sources of animal feeds in Ethiopia. However, the pasture land accounts only for 20% of total land area in the country (FAO, 2004) being encroached by crop cultivation.According to the report of CSA (2010), green fodder (grazing) is the major type of feed (about 58.6%) followed by crop residues (29.1%). Hay and agro‐industrial by‐products are also used as animal feeds comprising only about 7.35
Ethiopian Society of Animal Production 2014
34
and 0.83% of the total feeds, respectively. Nevertheless, fodder availability, is very much limited in quantity and quality. Low quality and quantity of natural pasture and crop residues and escalating price of agro‐industrial by‐products undermines the use of these by‐products as animal feed by smallholder farmers. There is a need to focus on naturally available indigenous feed resources like Ficus sur fruit to be used as energy supplement to poor quality natural pasture and crop residues. The genus Ficus comprises about 750 species, with about 100 species in Africa, 500 species in tropical Asia and Australia, and 150 species in tropical America (Lumbile&Mogotsi, 2008). The species in Ethiopia is named as Ficussur (Cv. Forssk.) or commonly named as fig. It is widely distributed in Amhara, Oromia, Tigray and SPNNR. In Ethiopia, the fruit of fig tree has been used as feed for centuries by different classes of livestock in different parts of the country. During dry seasons when the fruits ripen and livestock are freely released after crop harvest, the fig fruit becomes important natural concentrate supplements for animals and the body weight of many lambs and kids are visually observed to increase and reach market weight relatively in short period (personal observation). Despite the above fact, the contribution of this plant as feed has not been studied yet and properly documented except few reports on its potential as any wild food (Demel et al, 2004) and shade for coffee production (Diriba et al., 2011). There is no empirical information concerning its use as feed for livestock. Moreover, there is no information on the performance of animals consuming the feed. This indicates that there is lack of documented information on its potential as livestock feed, and its role on animals’ performances. Therefore, this study was aimed to evaluate the feeding value of fig fruits on carcass yield and economic benefit of Hararghe highland sheep as compared to oats grain.
Materials and Methods
Study site
This experiment was conducted at Haramaya University pig production and training center. It is located at 9o 26’N latitude and 42o3’E longitude. The site is situated at about 1980 m.a.s.l. and located at 520 km east of the capital city, Addis Ababa. The mean annual rainfall of the study area is about 870 mm with a range of 560‐1260 mm, and the mean maximum and minimum temperatures are 23.4oC and 8.25oC, respectively (Haramaya University Meteorological Station, 2012).
Animals and Management
A total of 30yearling intact male Hararghe highland sheep uniform in body weight were purchased from Kulubi open market. Upon purchasing, the animals were transported to Haramaya University and quarantined for 3‐weeks where they were sprayed with accaricides against external parasites; treated with ivermectin injection against internal parasites and penistrep against Pneumonia disease. The animals, after the healthy and appropriate ones are selected for the experiment, were ear‐tagged for ease of identification. Then they were moved to sheep farm and made to adapt to experimental feeds for 2‐weeks before the commencement of the actual experiment, which lasted for 90 days. Six lambs per each of the five treatment feeds were assigned at random in individual pen furnished with feeder and waterer. All the animals were maintained healthy until the end of the feeding trial.
Ethiopian Society of Animal Production 2014
35
Feeding Management
During the study, sheep were offered measured quantity of dietary treatments, sun dried and ground Ficus sur fruits and provided with a basal diet of natural pasture hay ad libitum. Clean tap water was provided in a bucket and changed so often. The amount of supplement and basal diet offered and refused was measured and recorded every day before the next day’s feed. The basal diet, natural pasture hay, was adjusted every 3‐days to ensure 20% refusal. NRC (1985) recommends a diet with crude protein of 15‐17% for growing lambs of 20‐30kgs live body weight. On the other hand, other researchers like Rocha et al. (2004) reported that diets with more than 14%crude protein content resulted in higher blood serum‐urea content and hence declared “wastage”. The rationing of the diets in this experiment was in agreement with that of NRC (1985) since most of the tropical natural pastures are low in their crude protein content. For similar live weight of local sheep (20 kg), Ajebu et al (2008) fed 350g of Desmodium Intortum and different parts of Enset supplement with wheat straw basal diet and obtained moderate body weight gain of lambs. Other researchers (Adugna and SundstØl, 2000) fed 0, 150g, 300g and 450g graded levels of Desmodium intortum hay supplement to maize stover harvested at different maturity stages as a basal diets to local lambs and recorded modest body weight gain at 300 and 450g Desmodium intortum supplement. Hence, the treatments prepared below were in line with the above works and the safest possible combination that secures the dietary welfare of the animals. In addition to the above NRC recommendations, this study treatments were formulated with due consideration to the previous studies conducted on Hararghe highland sheep; which was different concentrate mixtures offered at 150 g, 250 g and 350 g (low, medium and high) levels on DM basis with ad libitum basal diets of urea treated maize stover ( Hirut et al., 2011) . They reported that the medium to high‐level concentrate mix supplementation having 14.4 to 17.1% crude protein resulted in 54.4g and 63.3g weight gain per day, respectively. The treatments below are set to be iso‐nitrogenous, 15.44% each, with varied proportions of F.sur fruits and ground oat grain. All the sheep had free access to pure water.
Treatments
The different dietary treatments used in the experiments are, T1 (ad libitum natural pasture hay NPH) + 225g NSC); T2 (NPH + 210 NSC+ 300g Ficus sur fruits); T3 (NPH +190g NSC +201g Ficus sur fruits +99g oat grain); T4 (NPH +170g NSC + 99g Ficus sur fruits + 201g oat grain); T5 (NPH +150g NSC +300g oat grain).
Experimental Design
The experiment was laid out in a randomized complete block design (RCBD) with 5 treatments and 6 replications each. Initial body weight of the animals was considered for blocking so that higher initial body weight difference between blocks but lower difference within blocks was maintained. The animals were randomly allocated to treatments independent of the block. The model employed for the experiment was shown here under:
Model: Yijk=µ +τi +βj + εijk where, µ=overall mean of the population
τi= The ith treatment effect βj= The jth block effect and
εijk=random error associated with yij
Ethiopian Society of Animal Production 2014
36
Chemical analysis of the diets used in the experiment
The chemical analysis of the feed samples was performed in Haramaya University Animal Nutrition laboratory. During the feeding periods, feed sample was taken each day and bulked in separate bag. At the end of the feeding trial, the feed in the bag was thoroughly mixed and sample was taken for chemical analysis in the laboratory. The samples were partially dried in forced draft oven at 65oC to constant weight for 48 hours. The dried sample were ground to pass 1mm Wiley mill sieve size and labeled for easy identification. After the ground sample is equilibrated with the air at room temperature in the laboratory, hot weighing technique was employed. The chemical analysis for each sample was run in two replicates. When the results of the two replicates were not similar, the mean result was accepted provided that the result of the two replicates did not vary by more than 5%.The DM and ash contents of the feed samples were determined following AOAC (1995). The NDF, ADF and ADL were determined based on the method described by VanSoest and Robertson (1985). Hemicelluloses and cellulose were calculated as NDF‐ADF and ADF‐(ADL+ADF ash), respectively. The ME (mj/kg) of the diets was estimated according to John Moran (2005). The N content of the samples was determined by the micro‐Kjeldahl method and CP calculated as N X 6.25.
Carcass evaluation
At the end of feeding trial, all the sheep were fasted overnight, weighed and slaughtered in three days. On slaughtering, the animals were killed by severing their jugular vein and carotid artery with knife. Their blood was taken in separate container and weighed. During slaughtering process, data were carefully recorded on blood, skin, tongue, head, hot carcass, heart, liver with gall bladder, kidneys, lung with trachea, penis, testis, tail, spleen, fat (omental, intestinal and kidney), feet, and empty gut. Digital balance was used for weighing the organs. The empty body weight (EBW), was calculated as the difference between slaughter weight (SW) and gut content. Total edible offal components (TEOC) was the sum total weight of blood, heart, liver with gall bladder, kidneys, empty gut, testis, tail, and fat (omental, intestinal and kidney). Total non‐edible offal component (TNEOC) was considered as the sum of the weight of head, lung with trachea, skin, spleen, penis, gut content and feet. Dressing percentage was calculated as HCW divided by SW and/or HCW divided by EBW. Regarding the rib‐eye area (REA), both the right and left halves were cut between the 12th and 13th ribs perpendicular to the backbone to measure the cross section of the rib‐eye muscle. The rib‐eye muscle was traced first on transparency paper then on graph paper and the area was measured by calculating the area of each square on the graph paper and multiplying by the number of the squares in the area.
The partial budget analysis
The partial budget analysis was performed to evaluate the profitability of feeding Hararghe highland sheep fed with dried and ground Ficus sur fruits mixed in replacement proportions with ground oats grain as supplemented with noug seed cake (NSC) protein sources. This profitability analysis was made by considering the use of dietary treatments as feed for the animals. The analysis was performed considering the main input costs such as sheep/lambs prices, feed price and labour expenses. The prices of the feed varied according to their source and supply. However, the input cost was calculated based on intake of each experimental unit. The saling price estimation for grown lambs was made on the basis of sheep marketing experience. Accordingly three experienced individuals
Ethiopian Society of Animal Production 2014
37
were selected and allowed to estimate the selling price independently in a way that one person cannot influence the attitude of the other. One animal had an opportunity to be estimated three times and the average was considered in this analysis. The difference between sale and purchase prices was taken as total return (TR) in this profitability analysis. The calculation for the following economic parameters was done according to Upton (1979 and Edward (2011) : NR= TR‐TVC; MRR=∆NR/∆TVC; Where NR= net return; TR= total return; TVC= total variable cost; MRR= marginal rate of return.
Statistical analysis
The data from carcass characteristics were analyzed using general linear model of the SAS software 9.1.3 version according to the statistical analysis system guide (SAS, 2008). The compare those means which were significantly differed, the mean separation was made adjusting with Tukey honestly significant difference test. The partial budget analysis was made using descriptive statistics with due consideration of variable costs of the project. Table 1: chemical composition of the feeds used in the experiment
Feed DM OM Ash CP NDF ADF Hemicell Cellulose ADL ME
(mj/kg)
Ficus 91.05 83.90 7.15 7.25 31.93 17.66 14.27 13.02 4.64 10.14
Oats 91.21 87.51 3.70 7.8 39.78 21.65 18.13 16.78 4.87 11.12
NSC 91.92 82.52 9.40 34.5 36.33 29.75 6.57 23.20 6.55 10.11
Grass 91.8 82.59 9.21 6.21 74.61 49.81 24.80 41.43 8.38 7.23
Result and Discussion
Edible carcass components
The different carcass components of Hararghe highland lambs fed different proportions of dried and ground Ficus sur (fig) fruits mixed with ground maize grain at different levels was given in Fig. 2. Even though numerically different figures of the carcass component were recoded between the control (T1) and treatment diets (T2, T3, T4 and T5) as well between the treatment diets themselves, the analysis of variance did not declare significant difference (P>0.03) for all of them. This means neither Ficus sur fruits nor did oats bring much difference on carcass performance over the control diets (p>0.03). This also implies that the indigenous Ficus sur fruits have remarkable contribution to the carcass yield of Hararghe highland sheep (lambs) as compared to oats grain diets. The reason why the control diets approached those of treatment diets may, in one way, be the optimized provision of protein supplement (good source of nitrogen) that allegedly supported the rumen microbes to proliferate and attack the basal feed under T1, the control diet (Krebs et al, 2007;Ben Salem et al., 2002). No treatments showed uniform trend either in ascending or descending order. As shown in figure 2 below there was increasing trend of the carcass percentage from T1 to T4 except for T5 which was a little lower than T4.
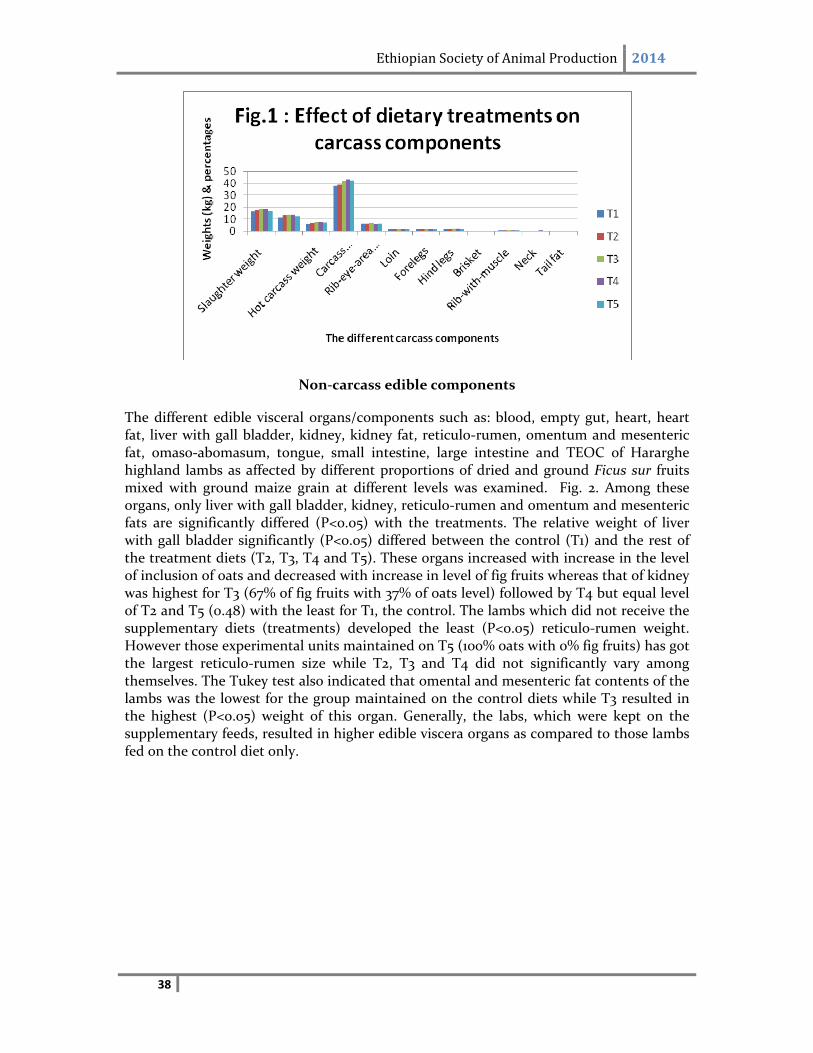
Ethiopian Society of Animal Production 2014
38
Non‐carcass edible components
The different edible visceral organs/components such as: blood, empty gut, heart, heart fat, liver with gall bladder, kidney, kidney fat, reticulo‐rumen, omentum and mesenteric fat, omaso‐abomasum, tongue, small intestine, large intestine and TEOC of Hararghe highland lambs as affected by different proportions of dried and ground Ficus sur fruits mixed with ground maize grain at different levels was examined. Fig. 2. Among these organs, only liver with gall bladder, kidney, reticulo‐rumen and omentum and mesenteric fats are significantly differed (P<0.05) with the treatments. The relative weight of liver with gall bladder significantly (P<0.05) differed between the control (T1) and the rest of the treatment diets (T2, T3, T4 and T5). These organs increased with increase in the level of inclusion of oats and decreased with increase in level of fig fruits whereas that of kidney was highest for T3 (67% of fig fruits with 37% of oats level) followed by T4 but equal level of T2 and T5 (0.48) with the least for T1, the control. The lambs which did not receive the supplementary diets (treatments) developed the least (P<0.05) reticulo‐rumen weight. However those experimental units maintained on T5 (100% oats with 0% fig fruits) has got the largest reticulo‐rumen size while T2, T3 and T4 did not significantly vary among themselves. The Tukey test also indicated that omental and mesenteric fat contents of the lambs was the lowest for the group maintained on the control diets while T3 resulted in the highest (P<0.05) weight of this organ. Generally, the labs, which were kept on the supplementary feeds, resulted in higher edible viscera organs as compared to those lambs fed on the control diet only.
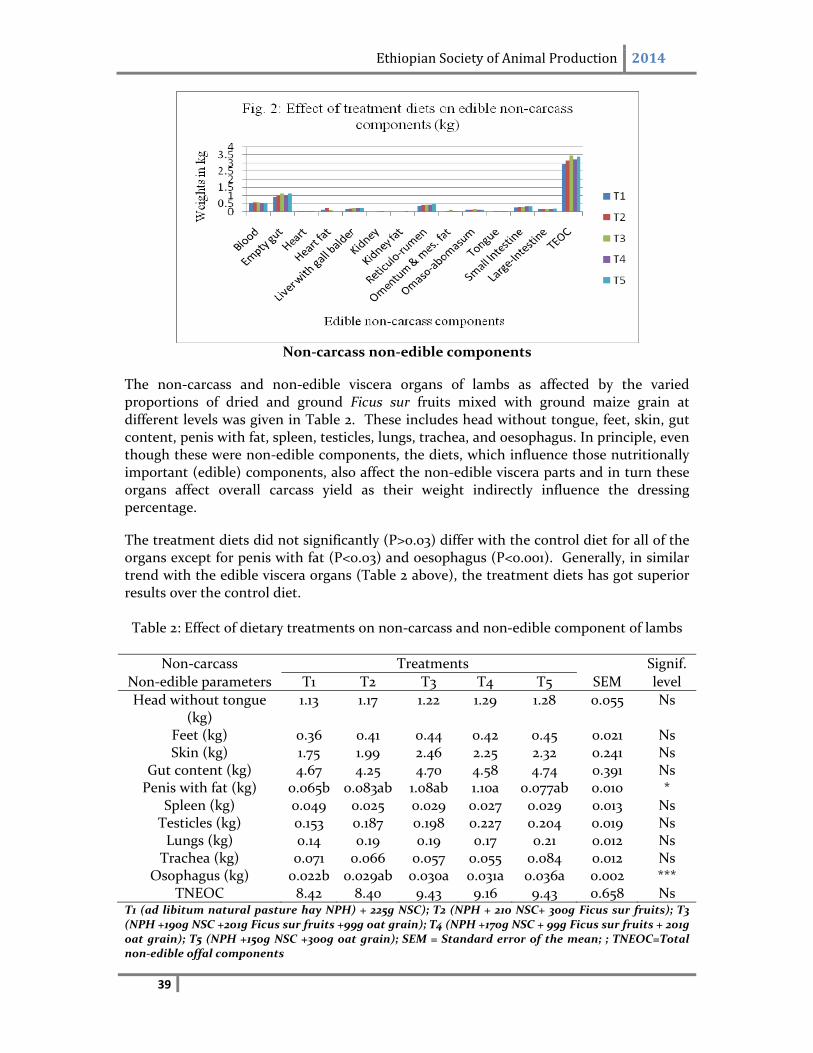
Ethiopian Society of Animal Production 2014
39
Non‐carcass non‐edible components
The non‐carcass and non‐edible viscera organs of lambs as affected by the varied proportions of dried and ground Ficus sur fruits mixed with ground maize grain at different levels was given in Table 2. These includes head without tongue, feet, skin, gut content, penis with fat, spleen, testicles, lungs, trachea, and oesophagus. In principle, even though these were non‐edible components, the diets, which influence those nutritionally important (edible) components, also affect the non‐edible viscera parts and in turn these organs affect overall carcass yield as their weight indirectly influence the dressing percentage.
The treatment diets did not significantly (P>0.03) differ with the control diet for all of the organs except for penis with fat (P<0.03) and oesophagus (P<0.001). Generally, in similar trend with the edible viscera organs (Table 2 above), the treatment diets has got superior results over the control diet. Table 2: Effect of dietary treatments on non‐carcass and non‐edible component of lambs
Non‐carcass Treatments Signif.
Non‐edible parameters T1 T2 T3 T4 T5 SEM level
Head without tongue (kg)
1.13 1.17 1.22 1.29 1.28 0.055 Ns
Feet (kg) 0.36 0.41 0.44 0.42 0.45 0.021 Ns Skin (kg) 1.75 1.99 2.46 2.25 2.32 0.241 Ns
Gut content (kg) 4.67 4.25 4.70 4.58 4.74 0.391 Ns Penis with fat (kg) 0.065b 0.083ab 1.08ab 1.10a 0.077ab 0.010 *
Spleen (kg) 0.049 0.025 0.029 0.027 0.029 0.013 Ns Testicles (kg) 0.153 0.187 0.198 0.227 0.204 0.019 Ns Lungs (kg) 0.14 0.19 0.19 0.17 0.21 0.012 Ns Trachea (kg) 0.071 0.066 0.057 0.055 0.084 0.012 Ns
Osophagus (kg) 0.022b 0.029ab 0.030a 0.031a 0.036a 0.002 *** TNEOC 8.42 8.40 9.43 9.16 9.43 0.658 Ns
T1 (ad libitum natural pasture hay NPH) + 225g NSC); T2 (NPH + 210 NSC+ 300g Ficus sur fruits); T3 (NPH +190g NSC +201g Ficus sur fruits +99g oat grain); T4 (NPH +170g NSC + 99g Ficus sur fruits + 201g oat grain); T5 (NPH +150g NSC +300g oat grain); SEM = Standard error of the mean; ; TNEOC=Total non‐edible offal components
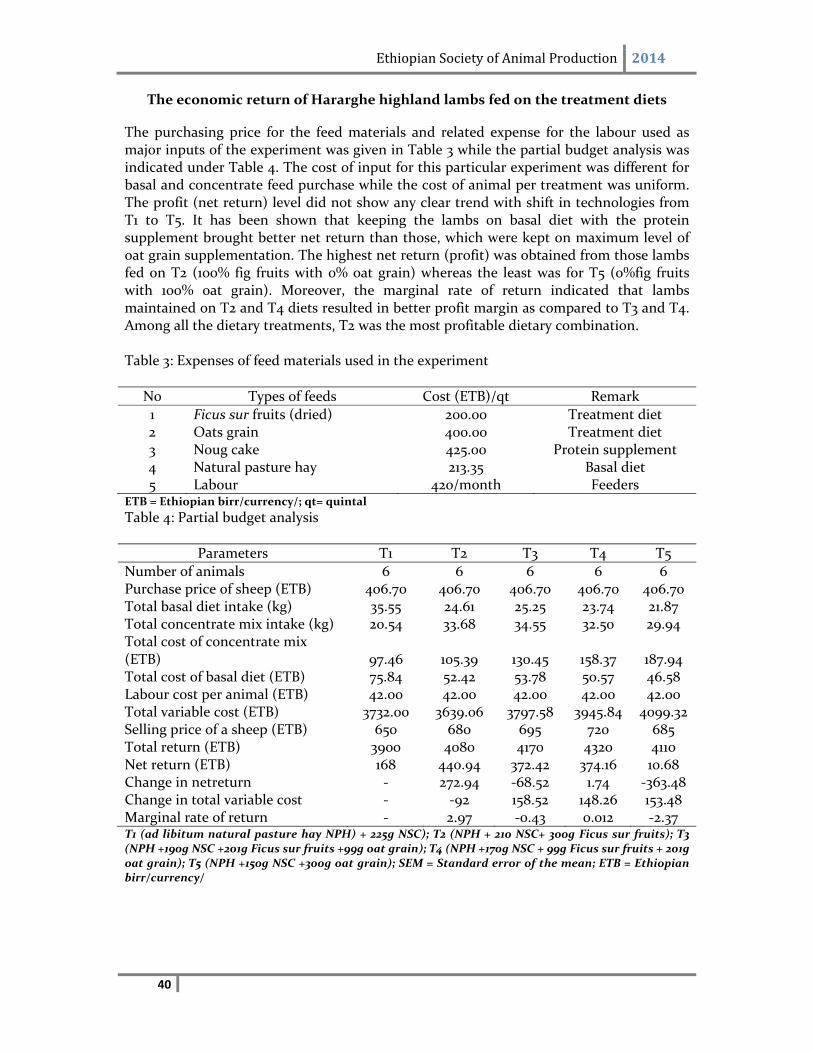
Ethiopian Society of Animal Production 2014
40
The economic return of Hararghe highland lambs fed on the treatment diets
The purchasing price for the feed materials and related expense for the labour used as major inputs of the experiment was given in Table 3 while the partial budget analysis was indicated under Table 4. The cost of input for this particular experiment was different for basal and concentrate feed purchase while the cost of animal per treatment was uniform. The profit (net return) level did not show any clear trend with shift in technologies from T1 to T5. It has been shown that keeping the lambs on basal diet with the protein supplement brought better net return than those, which were kept on maximum level of oat grain supplementation. The highest net return (profit) was obtained from those lambs fed on T2 (100% fig fruits with 0% oat grain) whereas the least was for T5 (0%fig fruits with 100% oat grain). Moreover, the marginal rate of return indicated that lambs maintained on T2 and T4 diets resulted in better profit margin as compared to T3 and T4. Among all the dietary treatments, T2 was the most profitable dietary combination. Table 3: Expenses of feed materials used in the experiment
No Types of feeds Cost (ETB)/qt Remark
1 Ficus sur fruits (dried) 200.00 Treatment diet 2 Oats grain 400.00 Treatment diet 3 Noug cake 425.00 Protein supplement 4 Natural pasture hay 213.35 Basal diet 5 Labour 420/month Feeders
ETB = Ethiopian birr/currency/; qt= quintal
Table 4: Partial budget analysis
Parameters T1 T2 T3 T4 T5
Number of animals 6 6 6 6 6 Purchase price of sheep (ETB) 406.70 406.70 406.70 406.70 406.70 Total basal diet intake (kg) 35.55 24.61 25.25 23.74 21.87 Total concentrate mix intake (kg) 20.54 33.68 34.55 32.50 29.94 Total cost of concentrate mix (ETB) 97.46 105.39 130.45 158.37 187.94 Total cost of basal diet (ETB) 75.84 52.42 53.78 50.57 46.58 Labour cost per animal (ETB) 42.00 42.00 42.00 42.00 42.00 Total variable cost (ETB) 3732.00 3639.06 3797.58 3945.84 4099.32 Selling price of a sheep (ETB) 650 680 695 720 685 Total return (ETB) 3900 4080 4170 4320 4110 Net return (ETB) 168 440.94 372.42 374.16 10.68 Change in netreturn ‐ 272.94 ‐68.52 1.74 ‐363.48 Change in total variable cost ‐ ‐92 158.52 148.26 153.48 Marginal rate of return ‐ 2.97 ‐0.43 0.012 ‐2.37 T1 (ad libitum natural pasture hay NPH) + 225g NSC); T2 (NPH + 210 NSC+ 300g Ficus sur fruits); T3 (NPH +190g NSC +201g Ficus sur fruits +99g oat grain); T4 (NPH +170g NSC + 99g Ficus sur fruits + 201g oat grain); T5 (NPH +150g NSC +300g oat grain); SEM = Standard error of the mean; ETB = Ethiopian birr/currency/
Ethiopian Society of Animal Production 2014
41
Conclusion
As the statistical/analytical comparisons showed no significant differences were observed between the levels of Ficus sur fruits and oats grain mixture on all of the carcass components and most of the edible viscera and non‐edible organs of the lambs. Hence, comparable result was achieved by feeding Ficus sur fruits to the animals. This means that the indigenous Ficus sur fruits have similar potential to the carcass yield of Hararghe highland sheep (lambs) as compared to oats grain diets. Feeding the Hararghe highland lambs with natural pasture hay supplemented with 100% Ficus sur fruits can result in 440.94 birr profit according to this experiment with current input prices.
Acknowledgement
We would like to thank Harmaya University and the Swedish International Agency for development (SIDA) for securing the budget for this experiment.
References
Adugna Tolera, 2007. Feed resources for producing export quality meat and livestock in Ethiopia. Examples from selected woredas from Oromia and SNNP regional states. Hawassa University, Ethiopia.
Adugna T. and SundstØl F. 2000. Supplementation of graded levels of Desmodium intortum hay to sheep feeding on maize stover harvested at different stages of maturity: feed intake, digestibility and body weight change. Animal Feed Science and Technology, 85: 239‐257
Ajebu N., Adugna T., Lars O. Eik, and Sundstøl F., 2008. The supplementary value of different parts of enset (Ensete ventricosum) to sheep fed wheat straw and Desmodium intortum hay. Livestock Science 119: 22–30; ELSEVIER
Ben Salem H., Nefzaoui A. and Ben Salem L., 2002. Supplementation of Acasia Cyanophylla lindl forage‐based diets with barley or shrubs from arid areas (opuntia ficus indica f. inermis and Atriplex nummularia L.) on growth and digestibility in lambs. Animal feed Science and Technology 96:15‐30
Connolly L., 2000. Economic performance in Irish sheep production. Sheep production Department; Teagasc Research Centre ,Athenry, Co. Galway.
Demel T., Feyera S., Maclachlan, M., Million B., and Barklund, P., 2010. Edible wild plants in Ethiopia. Addis ababa university press, Ethiopia, pp575
Muleta D., Arthurson, V. Hjort K., Jaderlund L. and Granhall U., 2011. Socioeconomic benefits of shade trees in coffeeproduction systems Bonga and Yayu‐hurum areas. Jimma University, Ethiopia.
Ethiopian Society of Animal Production 2014
42
Food and Agricultural Organization of the united nations (FAO), 2004. Livestock sector brief: Livestock information, sector analysis and policy branch. FAO Rome, Italy.
Hirut, Y., Solomon M. and Mengistu U., 2011. Effect of concentrate supplementation on live weight change and carcass characteristics of Hararghe Highland sheep fed a basal diet of urea‐treated maize stover. Journal of Livestock Research for Rural Development. [email protected]
IGAD Livestock Policy Initiative. 2009. The Contribution of Livestock to the Economies of IGAD Member States. Study Findings, Application of the Methodology in Ethiopia and Recommendations for Further Work. IGAD LPI Working Paper No. 02 – 10
Moran J., 2005. How energy is measured. In: TROPICAL DAIRY FARMING. Feeding Management for Small Holder Dairy Farmers in the Humid Tropics. National Library of Australia Cataloguing‐in‐Publication entry. PP30
Krebs G.L., Howard D.M. and Dods K., 2007. Feeding Acasia Saligna with sheep and goats with or without the addition of urea or polyethylene glycol. Asian‐Aust. J.Anim. Sci. vol. 20, No 10: 1551‐1556
Gizachew L. and Geleti D., 1998 Research on feed resources of western Ethiopian. In: Beyene Seboka and Abera Deressa (eds.). Agricultural research and Technologies transfer attemptsin West Wollega. Proceedings of the third generation transfer and gap analysis workshop 12‐14.
Lumbile, A.U. & Mogotsi, K.K., 2008. Ficus sur Forssk. [Internet] Record from Protabase. Louppe, D., Oteng‐Amoako, A.A. & Brink, M. (Editors). PROTA (Plant Resources of Tropical Africa / Ressources végétales de l’Afrique tropicale), Wageningen, Netherlands.
Netherlands‐African Business Council (NABC), 2010. Livestock in Ethiopia and opportunity analyses for Dutch investment. Fact Sheet: Livestock Ethiopia, September, 2010
NRC (National Research Council), 1985. 'Nutrient requirements of sheep (6th edn).' Subcommittee on Sheep Nutrition, Committee on Animal Nutrition, Board on Agriculture, National Research Council. (National Academy Press: Washington, D.C., USA)
SAS (Statistical Analysis System), 2008. The Little SAS® Book: A Primer, Fourth Edition, version 9.1.3. Statistical analysis system institute Inc., NC. USA.
Ethiopian Society of Animal Production 2014
43
Effect of Planting Pattern and Cutting Height on Dry Matter Yields of P. purpureum mixed pasture with D. Uncinatum at Bako, western
Ethiopia Diriba Diba1*, Adugna Tolera2, Lemma Gizachew3 and Diriba Geleti4
1*Department of Animal Sciences, College of Agriculture and Natural Sciences,Wollega University P.O.Box 395, Nekemte, Ethiopia.
2 Department of Animal and Range Sciences, College of Agriculture, Hawassa University, P.O.Box 05, Awassa, Ethiopia.
3Food and Agricultural Organization (FAO), Addis Ababa, Ethiopia 4Ethiopian Institute of Agricultural Research (EIAR); Debrezeit, Ethiopia
*Corresponding author, Diriba Diba, email: [email protected]
Abstract The experiment was conducted for two years to determine optimum cutting heights and appropriate planting patterns of P. Purpureum/D. uncinatum mixed pasture that maximize component species dry matter (DM) yield, agronomic and major nutritional parameters. Cutting height of three levels (20 cm, 30 cm, 40 cm) with two levels of planting pattern (alternate row and same row) were arranged in randomized complete block design (RCBD) to evaluate the aforementioned parameters. The DM yield of the legume was influenced more by planting patterns than cutting height. The alternate row strips resulted in higher DM yield (P<0.05), leaf to stem ratio (LSR) (P<0.05), and number of root nodules (P<0.01) both in the first and second year. Similarly, DM yield, (P<0.05) total DM yield (P<0.05) and leaf to stem ratio (P<0.001) of the grass were higher (P<0.05‐0.001) in alternate row system of planting. The mixed stand grass components were found to have higher CP content than the sole stand. In both harvesting cycles cutting at the lowest stubble height resulted in highest DM yield and tillering ability of the grass and total DM yield of the mixture. At this cutting regime, crude protein content was low while the fiber content of the grass was higher. However, to compromise the DM yield and nutritive value of the P. Purpureum/Desmodium mixture, the combination of either of the cutting heights, 20cm and 30cm with alternate row strips appear to be more important according to this experiment.
Key words: cutting height, dry matter yields, D. uncinatum, planting patterns, P. purpureum,
Introduction
The main sources of feed for livestock in Ethiopia are natural pasture and crop residues, which are of poor nutritional quality and insufficient in supply. In such situations, reliable and sustainable animal production can hardly be anticipated (Lemma et al., 1991). In addition, tropical grasses are low in their crude protein (CP) content more likely related to low soil nitrogen (N) level, which is a major limitation to pasture productivity (Whiteman, 1980) leading to protein deficiency in the diet (Giller and Wilson, 1991). Most of the predominant native grass species in mid‐altitude areas of western Oromia share the above features and are of poor grazing value (Lemma and Diriba, 1998). Rapid physiological maturity and low indigenous legume proportions (IAR 1998) further undermine their potential to supply sufficient nutrients for grazing animals as it limits intake and
Ethiopian Society of Animal Production 2014
44
digestibility. The robust forage crops like Napier grass (P. purpureum) are very important as it gives high yields from a small plot of land (Tarawali et al., 1995). Its leafy nature, considerable plant height, high tillering and re‐growth potential makes it a highly productive fodder crop per unit area of land as compared to other grasses species (Whiteman, 1980; Mwangi, 1994). Flexibility on utilization, its palatability, and greenness over long period of the dry season enhanced its acceptance by many farmers in the western part of Oromia region. However, like the other tropical grasses, the issue of nutrient density is a subject of concern. Grass biomass yield alone is not enough to support optimum livestock production and productivity. The practice of growing the mixtures of two or more species of fodder crops is suggested by many scientists as cited by Neal (1981), Warburton (1915) reviewed and advocated the advantages of growing legume/grass mixtures even at early times. Quite often grass/legume mixtures give reasonable herbage yields of good nutritive value without the need for high N dressings. In Kenya, mixture of Napier and Guinea grass with D.uncinatum have been shown to produce higher DM and CP yields compared to pure or sole grass stand (Webster et al., 1980). Management options like cutting height of P. purpureum, and planting pattern of the legume in grass mixture, on the other hand, is highly correlated with DM yields, rate of re‐growth and persistency (Webster et al., 1980). The objective of this study is, therefore, to identify cutting height and planting patterns that can give a satisfactory compromise between the DM yield, some agronomic charcteristics and nutritive value of the P. purpureum grass and D. uncinatum legume mixed pasture.
Materials and Methods
Location: A mixture of D.uncinatum and P. purpureum was established at Bako Agricultural Research Center (BARC) located at 9o6'N latitude and 37o 09' E longitude in east Wollega zone of Oromiya regional state, western Ethiopia in 2004/2005 cropping season. BARC is situated at a distance of 260kms west of Addis Ababa. Its altitude is 1650 m. above sea level. The months of rainy seasons at this area are from March to October with the peak of the rainfall in July. Mean annual temperature is 20oC with mean maximum temperature of 27oC and mean minimum 13oC (BARC meteorological Station summary report, 2005).
Treatment and experimental design
The effect of planting patterns (same row and alternate row) and cutting heights (20cm, 30cm, 40cm) on the yield and chemical composition of the mixture was studied. Thus two by three factorial combinations in Randomized Complete Block design (RCBD) was used to manage the impact of factors in the experiment.
Establishment of the plots
P. purpureum stem cutting (accession number ILRI‐14389) and seeds of D.uncinatum were established in early June 2004 under rain fed system. Starter fertilizers of 1:1 ratio DAP to Urea; 200kg/hectare of each were applied during establishment year (Chadhokar, 1978) whereas no fertilizer was applied in the second year. The grass was cut in to pieces constructing three nodes, where two of the nodes were put in well prepared soil whereas the remaining node left above the ground for propagation (Skerman and Riveros, 1989). The within row and between row distances from plants was 0.5m and 0.75m respectively (Khan, 2002). The legume component was intercropped simultaneously with the grass in
Ethiopian Society of Animal Production 2014
45
the same row and alternate row planting patterns at seed rate of 14kgs per hectare for the legume. The land was well prepared to help the relatively fine seeds of D.uncinatum contact the soil.
Dry Matter Yields (DMY)
During harvesting, forage samples were cut manually using sickles when the upper plant height reached 90‐120cm height ranges (IIRR, 1998; Tessema et al, 2002). The heights of cutting were different for the component species according to the treatments imposed. One middle row of grass‐legume mixture was harvested from a known area of that particular row at different cutting stubble height from each replication and fresh weight was recorded. A fresh biomass representative sample weighing 300g was randomly taken. After chopping the samples, they were transferred to a known weight paper bags, dried in forced draught oven at a temperature of 1050C for 24 hours and reweighed to get the DM content and yield per hectare. The DM yield per hectare is calculated based on the fresh biomass harvested from that row and converting that single row area in proportion to hectare.
Data recording procedures
Date of Emergence (DE): The dates on which nearly more than 50 % legume seedlings emerged and 50% of the grasses vegetatively propagated were recorded. Plant heights of the legumes (HT): Fromeach plot, ten different plants of different heights were randomly taken and the distance from ground level to the tip of the stem was recorded, summed up and divided for ten selected plants to get the average value. No of branches of the legumes (NOB): Ten different legume plants were randomly taken from each plot, number of branches per each plant were counted and summed up and divided by ten to get the average number of branches per plant. Leaf to stem ratio (LSR): From each plot, 300g fresh biomass weights were taken and splited in to leaf and stem. The fresh weights of the separated leaf and stem were recorded on the field using field balance, transferred to known weight paper bags and put in a forced drought oven at 105oC. After 24 hours the samples were taken from the oven; reweighed and the weight of the dried leaf was divided to the weight of their respective stem to get leaf to stem ratio for each treatment in the replication. Re‐growth intervals (RI): The dates on which the first and the second cuts made were recorded. The time range between these periods shows the Re‐growth interval. Root nodules count (RNC): Five plants of Desmodium were taken from each plot. Their surrounding was carefully dag down and the root nodules attached to the different root branches were counted and recorded, summed up and divided by five to get number of root nodules per plant. Number of Desmodium Seedling (NOS): Soon after harvesting, a quadrant of 0.5m x 0.5m thrown randomly on to each plot and the number of Desmodium seedlings within this quadrant were counted. This was repeated three times and the mean value was taken and multiplied by four to determine the amount of seedlings per square meter.
Ethiopian Society of Animal Production 2014
46
Date of vegetative propagation (DVP): The dates on which nearly more than 50% of the grasses vegetatively propagated were recorded. No of tillers of the grass (NT): Immediately after harvesting, live tillers of ten bunch of grass stubble were counted, summed up and divided by ten to get the average number per plant. Number of nodes per plant (NON): Ten different plants were randomly taken; number of nodes per each plant were counted, added together and divided by ten to get the average value per plant for every plot. Length of internodes (ITL): Ten different plants were randomly taken; length of internodes per each plant were measured using metric tape, added together and divided by ten to get the average length of internodes per plant. Basal circumference (BC): Immediately after harvesting, ten live stubble bunches were randomly taken from all plots of elephant grass. Two diameters (wider and narrower) were measured using a ruler and their average was taken for every selected stubble in the plot. The average value obtained was multiplied with pie (π) to get the basal circumference for each treatment.
Forage chemical analysis
This was performed at International Livestock Research Institute (ILRI), Addis Ababa. DM and ash were determined following AOAC (1995). NDF, ADF and ADL were determined based on the method described by Van Soest et al. (1985). Hemicelluloses and cellulose were calculated as NDF‐ADF and ADF‐(ADL+ADF ash), respectively. The N content of the samples was determined by the micro‐Kjedal method and CP was calculated as N X 6.25. From the analysis of minerals, namely, Ca and P, wet ashing procedure was used for the preparation of the mineral solution (FAO, 1980). From each sample replicate of 0.5‐g oven dry sample was taken in a 75‐ml volumetric flash and was digested with 4.0‐ml of concentrated H2SO4 on a hot plate at approximately 270oC. Repeatedly small quantity of Hydrogen peroxide was added until the digesta remained clear. After cooling, it was diluted to 50‐ml with pure water. Calcium was determined using flame‐photometer with air acetyl flame. But phosphorus was determined using spectrophotometer, which was based on the reaction of ammonium molybdate, and reduced to molybdenum by ascorbic acid.
Statistical Analysis
Mean DM yield components, agronomic parameters and chemical composition data for both grass and legume were used for the statistical analysis. General Linear Model Procedure of the SAS system computer software was employed for the analysis of variance (SAS, 1996). Mean comparison was made using LSD and the data were tested at a maximum of 5% significance levels.
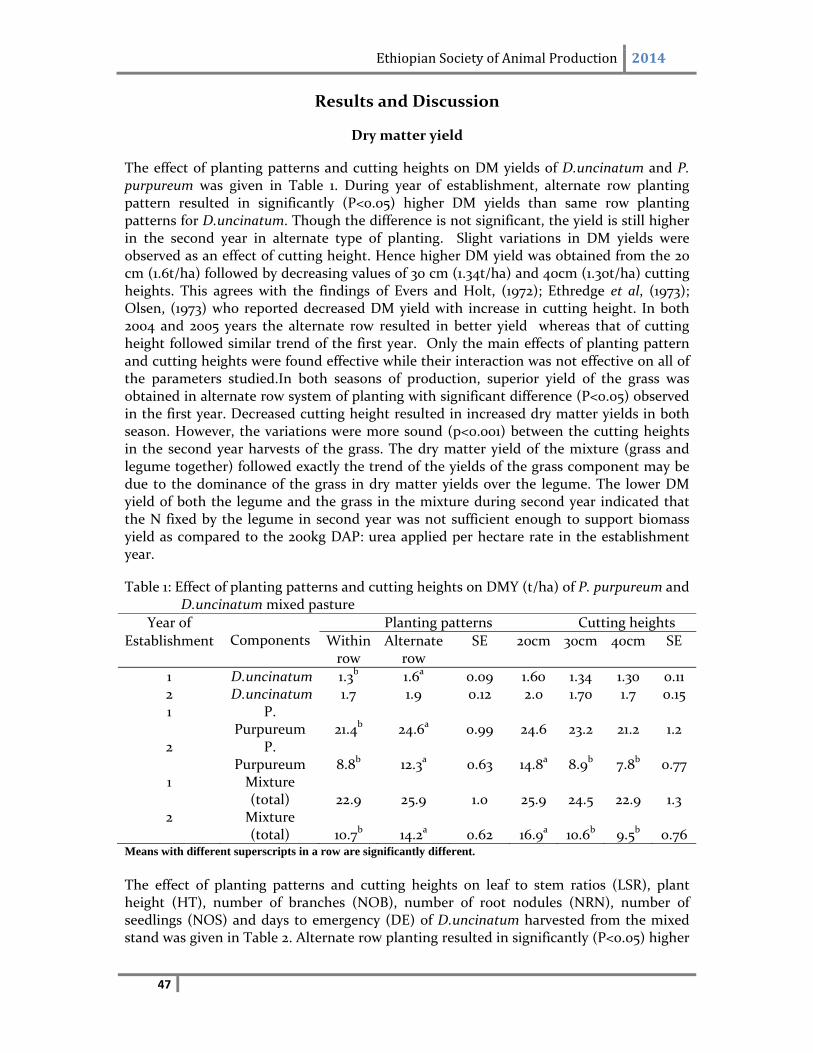
Ethiopian Society of Animal Production 2014
47
Results and Discussion
Dry matter yield
The effect of planting patterns and cutting heights on DM yields of D.uncinatum and P. purpureum was given in Table 1. During year of establishment, alternate row planting pattern resulted in significantly (P<0.05) higher DM yields than same row planting patterns for D.uncinatum. Though the difference is not significant, the yield is still higher in the second year in alternate type of planting. Slight variations in DM yields were observed as an effect of cutting height. Hence higher DM yield was obtained from the 20 cm (1.6t/ha) followed by decreasing values of 30 cm (1.34t/ha) and 40cm (1.30t/ha) cutting heights. This agrees with the findings of Evers and Holt, (1972); Ethredge et al, (1973); Olsen, (1973) who reported decreased DM yield with increase in cutting height. In both 2004 and 2005 years the alternate row resulted in better yield whereas that of cutting height followed similar trend of the first year. Only the main effects of planting pattern and cutting heights were found effective while their interaction was not effective on all of the parameters studied.In both seasons of production, superior yield of the grass was obtained in alternate row system of planting with significant difference (P<0.05) observed in the first year. Decreased cutting height resulted in increased dry matter yields in both season. However, the variations were more sound (p<0.001) between the cutting heights in the second year harvests of the grass. The dry matter yield of the mixture (grass and legume together) followed exactly the trend of the yields of the grass component may be due to the dominance of the grass in dry matter yields over the legume. The lower DM yield of both the legume and the grass in the mixture during second year indicated that the N fixed by the legume in second year was not sufficient enough to support biomass yield as compared to the 200kg DAP: urea applied per hectare rate in the establishment year.
Table 1: Effect of planting patterns and cutting heights on DMY (t/ha) of P. purpureum and D.uncinatum mixed pasture
Year of Components
Planting patterns Cutting heights
Establishment Within row
Alternate row
SE 20cm 30cm 40cm SE
1 D.uncinatum 1.3b 1.6a 0.09 1.60 1.34 1.30 0.11 2 D.uncinatum 1.7 1.9 0.12 2.0 1.70 1.7 0.15 1 P.
Purpureum 21.4b 24.6a 0.99 24.6 23.2 21.2 1.2 2 P.
Purpureum 8.8b 12.3a 0.63 14.8a 8.9b 7.8b 0.77 1 Mixture
(total) 22.9 25.9 1.0 25.9 24.5 22.9 1.3 2 Mixture
(total) 10.7b 14.2a 0.62 16.9a 10.6b 9.5b 0.76 Means with different superscripts in a row are significantly different.
The effect of planting patterns and cutting heights on leaf to stem ratios (LSR), plant height (HT), number of branches (NOB), number of root nodules (NRN), number of seedlings (NOS) and days to emergency (DE) of D.uncinatum harvested from the mixed stand was given in Table 2. Alternate row planting resulted in significantly (P<0.05) higher
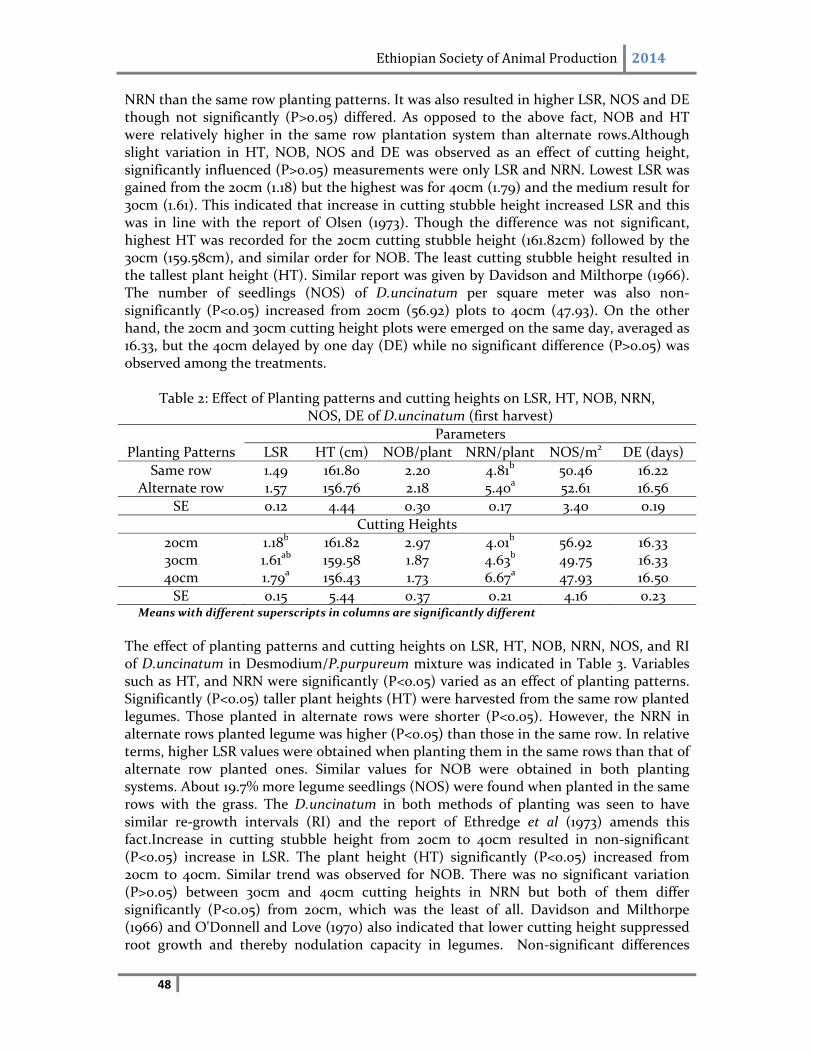
Ethiopian Society of Animal Production 2014
48
NRN than the same row planting patterns. It was also resulted in higher LSR, NOS and DE though not significantly (P>0.05) differed. As opposed to the above fact, NOB and HT were relatively higher in the same row plantation system than alternate rows.Although slight variation in HT, NOB, NOS and DE was observed as an effect of cutting height, significantly influenced (P>0.05) measurements were only LSR and NRN. Lowest LSR was gained from the 20cm (1.18) but the highest was for 40cm (1.79) and the medium result for 30cm (1.61). This indicated that increase in cutting stubble height increased LSR and this was in line with the report of Olsen (1973). Though the difference was not significant, highest HT was recorded for the 20cm cutting stubble height (161.82cm) followed by the 30cm (159.58cm), and similar order for NOB. The least cutting stubble height resulted in the tallest plant height (HT). Similar report was given by Davidson and Milthorpe (1966). The number of seedlings (NOS) of D.uncinatum per square meter was also non‐significantly (P<0.05) increased from 20cm (56.92) plots to 40cm (47.93). On the other hand, the 20cm and 30cm cutting height plots were emerged on the same day, averaged as 16.33, but the 40cm delayed by one day (DE) while no significant difference (P>0.05) was observed among the treatments.
Table 2: Effect of Planting patterns and cutting heights on LSR, HT, NOB, NRN,
NOS, DE of D.uncinatum (first harvest)
Parameters
Planting Patterns LSR HT (cm) NOB/plant NRN/plant NOS/m2 DE (days)
Same row 1.49 161.80 2.20 4.81b 50.46 16.22 Alternate row 1.57 156.76 2.18 5.40a 52.61 16.56
SE 0.12 4.44 0.30 0.17 3.40 0.19
Cutting Heights
20cm 1.18b 161.82 2.97 4.01b 56.92 16.33 30cm 1.61ab 159.58 1.87 4.63b 49.75 16.33 40cm 1.79a 156.43 1.73 6.67a 47.93 16.50
SE 0.15 5.44 0.37 0.21 4.16 0.23 Means with different superscripts in columns are significantly different
The effect of planting patterns and cutting heights on LSR, HT, NOB, NRN, NOS, and RI of D.uncinatum in Desmodium/P.purpureum mixture was indicated in Table 3. Variables such as HT, and NRN were significantly (P<0.05) varied as an effect of planting patterns. Significantly (P<0.05) taller plant heights (HT) were harvested from the same row planted legumes. Those planted in alternate rows were shorter (P<0.05). However, the NRN in alternate rows planted legume was higher (P<0.05) than those in the same row. In relative terms, higher LSR values were obtained when planting them in the same rows than that of alternate row planted ones. Similar values for NOB were obtained in both planting systems. About 19.7% more legume seedlings (NOS) were found when planted in the same rows with the grass. The D.uncinatum in both methods of planting was seen to have similar re‐growth intervals (RI) and the report of Ethredge et al (1973) amends this fact.Increase in cutting stubble height from 20cm to 40cm resulted in non‐significant (P<0.05) increase in LSR. The plant height (HT) significantly (P<0.05) increased from 20cm to 40cm. Similar trend was observed for NOB. There was no significant variation (P>0.05) between 30cm and 40cm cutting heights in NRN but both of them differ significantly (P<0.05) from 20cm, which was the least of all. Davidson and Milthorpe (1966) and O'Donnell and Love (1970) also indicated that lower cutting height suppressed root growth and thereby nodulation capacity in legumes. Non‐significant differences
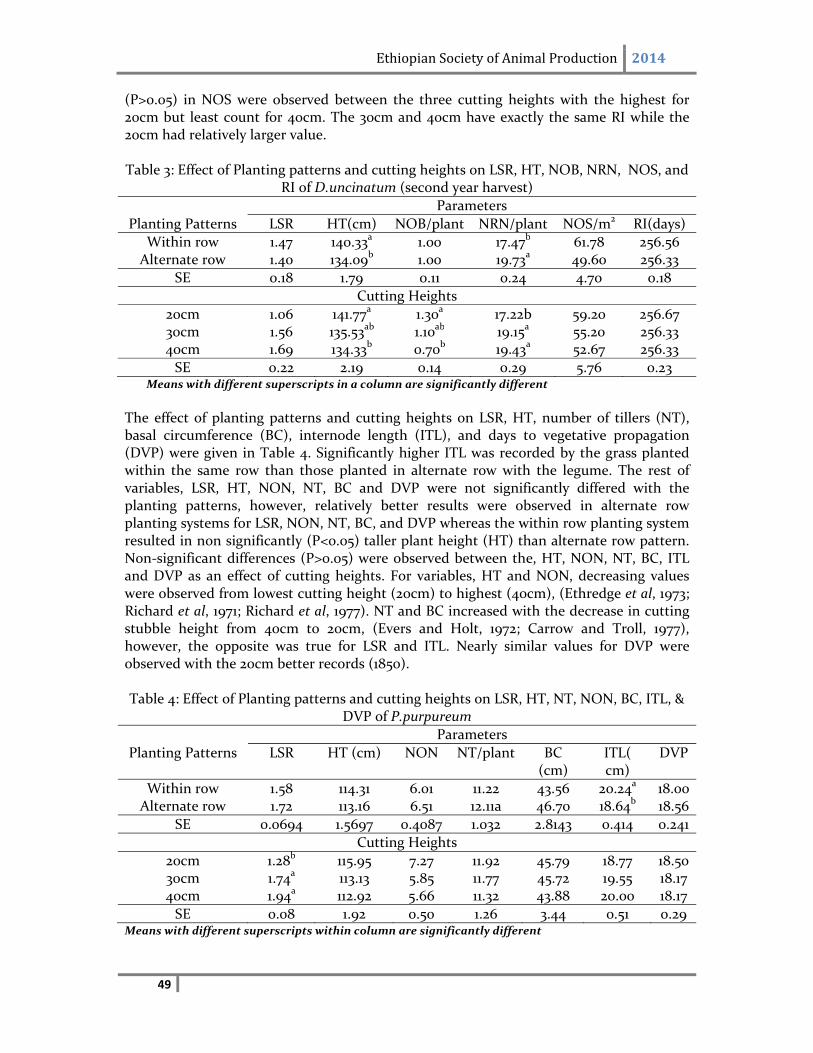
Ethiopian Society of Animal Production 2014
49
(P>0.05) in NOS were observed between the three cutting heights with the highest for 20cm but least count for 40cm. The 30cm and 40cm have exactly the same RI while the 20cm had relatively larger value.
Table 3: Effect of Planting patterns and cutting heights on LSR, HT, NOB, NRN, NOS, and
RI of D.uncinatum (second year harvest)
Parameters
Planting Patterns LSR HT(cm) NOB/plant NRN/plant NOS/m2 RI(days)
Within row 1.47 140.33a 1.00 17.47b 61.78 256.56 Alternate row 1.40 134.09b 1.00 19.73a 49.60 256.33
SE 0.18 1.79 0.11 0.24 4.70 0.18
Cutting Heights
20cm 1.06 141.77a 1.30a 17.22b 59.20 256.67 30cm 1.56 135.53ab 1.10ab 19.15a 55.20 256.33 40cm 1.69 134.33b 0.70b 19.43a 52.67 256.33
SE 0.22 2.19 0.14 0.29 5.76 0.23 Means with different superscripts in a column are significantly different
The effect of planting patterns and cutting heights on LSR, HT, number of tillers (NT), basal circumference (BC), internode length (ITL), and days to vegetative propagation (DVP) were given in Table 4. Significantly higher ITL was recorded by the grass planted within the same row than those planted in alternate row with the legume. The rest of variables, LSR, HT, NON, NT, BC and DVP were not significantly differed with the planting patterns, however, relatively better results were observed in alternate row planting systems for LSR, NON, NT, BC, and DVP whereas the within row planting system resulted in non significantly (P<0.05) taller plant height (HT) than alternate row pattern. Non‐significant differences (P>0.05) were observed between the, HT, NON, NT, BC, ITL and DVP as an effect of cutting heights. For variables, HT and NON, decreasing values were observed from lowest cutting height (20cm) to highest (40cm), (Ethredge et al, 1973; Richard et al, 1971; Richard et al, 1977). NT and BC increased with the decrease in cutting stubble height from 40cm to 20cm, (Evers and Holt, 1972; Carrow and Troll, 1977), however, the opposite was true for LSR and ITL. Nearly similar values for DVP were observed with the 20cm better records (1850).
Table 4: Effect of Planting patterns and cutting heights on LSR, HT, NT, NON, BC, ITL, &
DVP of P.purpureum
Parameters
Planting Patterns LSR HT (cm) NON NT/plant BC (cm)
ITL( cm)
DVP
Within row 1.58 114.31 6.01 11.22 43.56 20.24a 18.00 Alternate row 1.72 113.16 6.51 12.11a 46.70 18.64b 18.56
SE 0.0694 1.5697 0.4087 1.032 2.8143 0.414 0.241
Cutting Heights
20cm 1.28b 115.95 7.27 11.92 45.79 18.77 18.50 30cm 1.74a 113.13 5.85 11.77 45.72 19.55 18.17 40cm 1.94a 112.92 5.66 11.32 43.88 20.00 18.17
SE 0.08 1.92 0.50 1.26 3.44 0.51 0.29 Means with different superscripts within column are significantly different
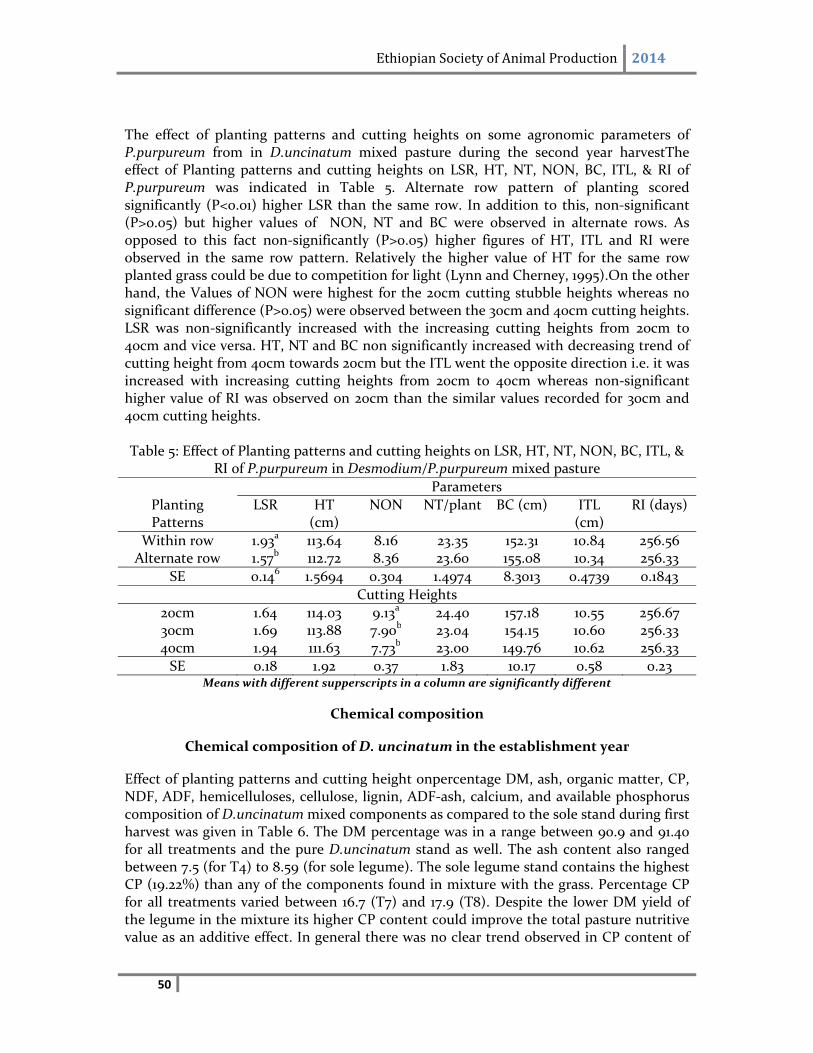
Ethiopian Society of Animal Production 2014
50
The effect of planting patterns and cutting heights on some agronomic parameters of P.purpureum from in D.uncinatum mixed pasture during the second year harvestThe effect of Planting patterns and cutting heights on LSR, HT, NT, NON, BC, ITL, & RI of P.purpureum was indicated in Table 5. Alternate row pattern of planting scored significantly (P<0.01) higher LSR than the same row. In addition to this, non‐significant (P>0.05) but higher values of NON, NT and BC were observed in alternate rows. As opposed to this fact non‐significantly (P>0.05) higher figures of HT, ITL and RI were observed in the same row pattern. Relatively the higher value of HT for the same row planted grass could be due to competition for light (Lynn and Cherney, 1995).On the other hand, the Values of NON were highest for the 20cm cutting stubble heights whereas no significant difference (P>0.05) were observed between the 30cm and 40cm cutting heights. LSR was non‐significantly increased with the increasing cutting heights from 20cm to 40cm and vice versa. HT, NT and BC non significantly increased with decreasing trend of cutting height from 40cm towards 20cm but the ITL went the opposite direction i.e. it was increased with increasing cutting heights from 20cm to 40cm whereas non‐significant higher value of RI was observed on 20cm than the similar values recorded for 30cm and 40cm cutting heights.
Table 5: Effect of Planting patterns and cutting heights on LSR, HT, NT, NON, BC, ITL, &
RI of P.purpureum in Desmodium/P.purpureum mixed pasture
Parameters
Planting Patterns
LSR HT (cm)
NON NT/plant BC (cm) ITL (cm)
RI (days)
Within row 1.93a 113.64 8.16 23.35 152.31 10.84 256.56 Alternate row 1.57b 112.72 8.36 23.60 155.08 10.34 256.33
SE 0.146 1.5694 0.304 1.4974 8.3013 0.4739 0.1843
Cutting Heights
20cm 1.64 114.03 9.13a 24.40 157.18 10.55 256.67 30cm 1.69 113.88 7.90b 23.04 154.15 10.60 256.33 40cm 1.94 111.63 7.73b 23.00 149.76 10.62 256.33
SE 0.18 1.92 0.37 1.83 10.17 0.58 0.23 Means with different supperscripts in a column are significantly different
Chemical composition
Chemical composition of D. uncinatum in the establishment year
Effect of planting patterns and cutting height onpercentage DM, ash, organic matter, CP, NDF, ADF, hemicelluloses, cellulose, lignin, ADF‐ash, calcium, and available phosphorus composition of D.uncinatum mixed components as compared to the sole stand during first harvest was given in Table 6. The DM percentage was in a range between 90.9 and 91.40 for all treatments and the pure D.uncinatum stand as well. The ash content also ranged between 7.5 (for T4) to 8.59 (for sole legume). The sole legume stand contains the highest CP (19.22%) than any of the components found in mixture with the grass. Percentage CP for all treatments varied between 16.7 (T7) and 17.9 (T8). Despite the lower DM yield of the legume in the mixture its higher CP content could improve the total pasture nutritive value as an additive effect. In general there was no clear trend observed in CP content of
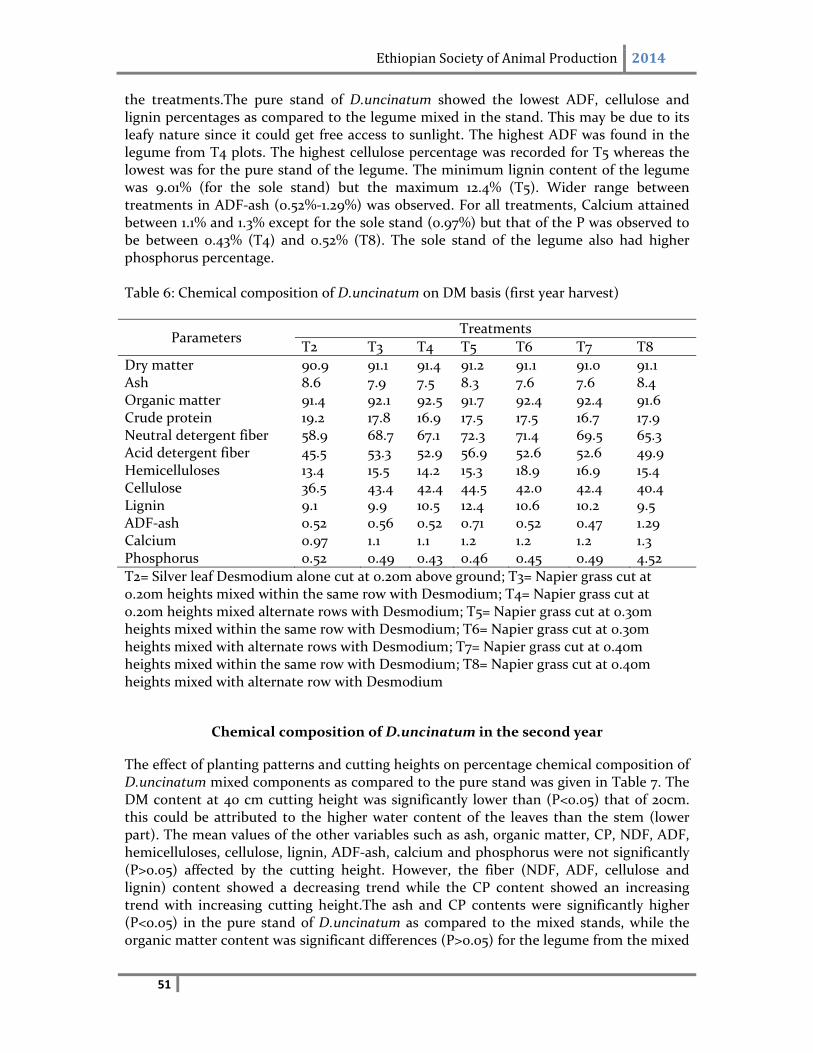
Ethiopian Society of Animal Production 2014
51
the treatments.The pure stand of D.uncinatum showed the lowest ADF, cellulose and lignin percentages as compared to the legume mixed in the stand. This may be due to its leafy nature since it could get free access to sunlight. The highest ADF was found in the legume from T4 plots. The highest cellulose percentage was recorded for T5 whereas the lowest was for the pure stand of the legume. The minimum lignin content of the legume was 9.01% (for the sole stand) but the maximum 12.4% (T5). Wider range between treatments in ADF‐ash (0.52%‐1.29%) was observed. For all treatments, Calcium attained between 1.1% and 1.3% except for the sole stand (0.97%) but that of the P was observed to be between 0.43% (T4) and 0.52% (T8). The sole stand of the legume also had higher phosphorus percentage. Table 6: Chemical composition of D.uncinatum on DM basis (first year harvest)
Parameters Treatments
T2 T3 T4 T5 T6 T7 T8
Dry matter 90.9 91.1 91.4 91.2 91.1 91.0 91.1 Ash 8.6 7.9 7.5 8.3 7.6 7.6 8.4 Organic matter 91.4 92.1 92.5 91.7 92.4 92.4 91.6 Crude protein 19.2 17.8 16.9 17.5 17.5 16.7 17.9 Neutral detergent fiber 58.9 68.7 67.1 72.3 71.4 69.5 65.3 Acid detergent fiber 45.5 53.3 52.9 56.9 52.6 52.6 49.9 Hemicelluloses 13.4 15.5 14.2 15.3 18.9 16.9 15.4 Cellulose 36.5 43.4 42.4 44.5 42.0 42.4 40.4 Lignin 9.1 9.9 10.5 12.4 10.6 10.2 9.5 ADF‐ash 0.52 0.56 0.52 0.71 0.52 0.47 1.29 Calcium 0.97 1.1 1.1 1.2 1.2 1.2 1.3 Phosphorus 0.52 0.49 0.43 0.46 0.45 0.49 4.52
T2= Silver leaf Desmodium alone cut at 0.20m above ground; T3= Napier grass cut at 0.20m heights mixed within the same row with Desmodium; T4= Napier grass cut at 0.20m heights mixed alternate rows with Desmodium; T5= Napier grass cut at 0.30m heights mixed within the same row with Desmodium; T6= Napier grass cut at 0.30m heights mixed with alternate rows with Desmodium; T7= Napier grass cut at 0.40m heights mixed within the same row with Desmodium; T8= Napier grass cut at 0.40m heights mixed with alternate row with Desmodium
Chemical composition of D.uncinatum in the second year
The effect of planting patterns and cutting heights on percentage chemical composition of D.uncinatum mixed components as compared to the pure stand was given in Table 7. The DM content at 40 cm cutting height was significantly lower than (P<0.05) that of 20cm. this could be attributed to the higher water content of the leaves than the stem (lower part). The mean values of the other variables such as ash, organic matter, CP, NDF, ADF, hemicelluloses, cellulose, lignin, ADF‐ash, calcium and phosphorus were not significantly (P>0.05) affected by the cutting height. However, the fiber (NDF, ADF, cellulose and lignin) content showed a decreasing trend while the CP content showed an increasing trend with increasing cutting height.The ash and CP contents were significantly higher (P<0.05) in the pure stand of D.uncinatum as compared to the mixed stands, while the organic matter content was significant differences (P>0.05) for the legume from the mixed
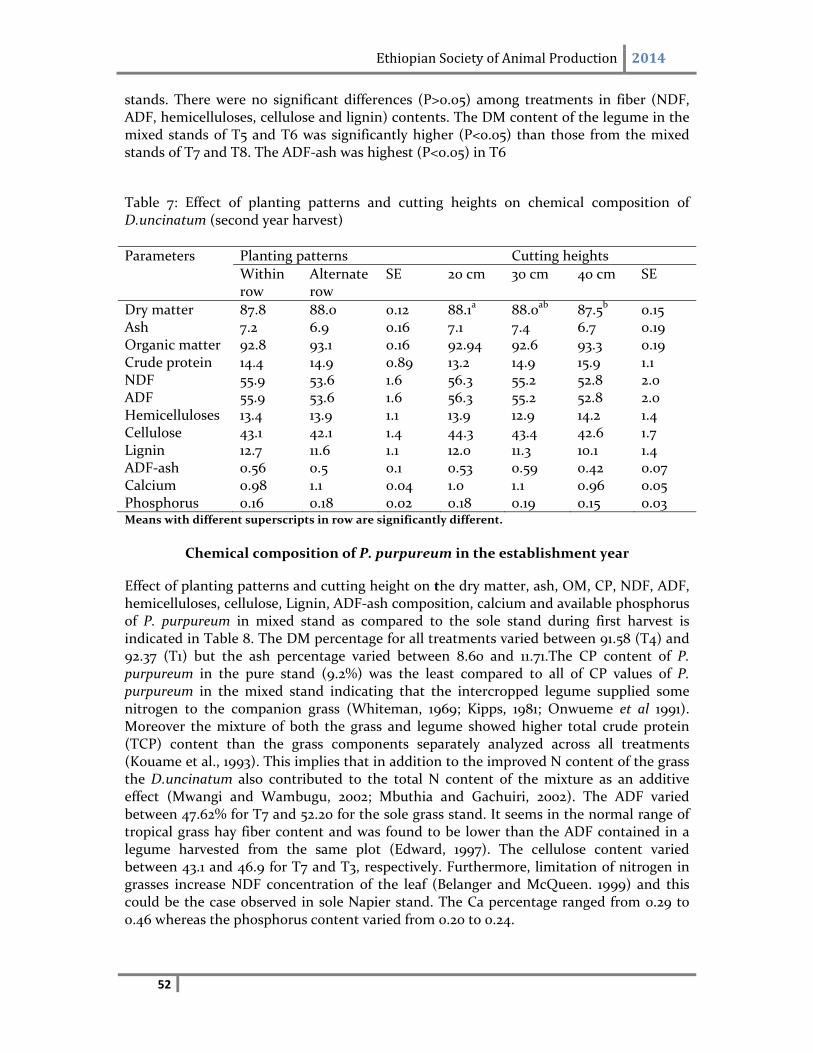
Ethiopian Society of Animal Production 2014
52
stands. There were no significant differences (P>0.05) among treatments in fiber (NDF, ADF, hemicelluloses, cellulose and lignin) contents. The DM content of the legume in the mixed stands of T5 and T6 was significantly higher (P<0.05) than those from the mixed stands of T7 and T8. The ADF‐ash was highest (P<0.05) in T6
Table 7: Effect of planting patterns and cutting heights on chemical composition of D.uncinatum (second year harvest)
Parameters Planting patterns Cutting heights
Within row
Alternate row
SE 20 cm 30 cm 40 cm SE
Dry matter 87.8 88.0 0.12 88.1a 88.0ab 87.5b 0.15 Ash 7.2 6.9 0.16 7.1 7.4 6.7 0.19 Organic matter 92.8 93.1 0.16 92.94 92.6 93.3 0.19 Crude protein 14.4 14.9 0.89 13.2 14.9 15.9 1.1 NDF 55.9 53.6 1.6 56.3 55.2 52.8 2.0 ADF 55.9 53.6 1.6 56.3 55.2 52.8 2.0 Hemicelluloses 13.4 13.9 1.1 13.9 12.9 14.2 1.4 Cellulose 43.1 42.1 1.4 44.3 43.4 42.6 1.7 Lignin 12.7 11.6 1.1 12.0 11.3 10.1 1.4 ADF‐ash 0.56 0.5 0.1 0.53 0.59 0.42 0.07 Calcium 0.98 1.1 0.04 1.0 1.1 0.96 0.05 Phosphorus 0.16 0.18 0.02 0.18 0.19 0.15 0.03 Means with different superscripts in row are significantly different.
Chemical composition of P. purpureum in the establishment year
Effect of planting patterns and cutting height on the dry matter, ash, OM, CP, NDF, ADF, hemicelluloses, cellulose, Lignin, ADF‐ash composition, calcium and available phosphorus of P. purpureum in mixed stand as compared to the sole stand during first harvest is indicated in Table 8. The DM percentage for all treatments varied between 91.58 (T4) and 92.37 (T1) but the ash percentage varied between 8.60 and 11.71.The CP content of P. purpureum in the pure stand (9.2%) was the least compared to all of CP values of P. purpureum in the mixed stand indicating that the intercropped legume supplied some nitrogen to the companion grass (Whiteman, 1969; Kipps, 1981; Onwueme et al 1991). Moreover the mixture of both the grass and legume showed higher total crude protein (TCP) content than the grass components separately analyzed across all treatments (Kouame et al., 1993). This implies that in addition to the improved N content of the grass the D.uncinatum also contributed to the total N content of the mixture as an additive effect (Mwangi and Wambugu, 2002; Mbuthia and Gachuiri, 2002). The ADF varied between 47.62% for T7 and 52.20 for the sole grass stand. It seems in the normal range of tropical grass hay fiber content and was found to be lower than the ADF contained in a legume harvested from the same plot (Edward, 1997). The cellulose content varied between 43.1 and 46.9 for T7 and T3, respectively. Furthermore, limitation of nitrogen in grasses increase NDF concentration of the leaf (Belanger and McQueen. 1999) and this could be the case observed in sole Napier stand. The Ca percentage ranged from 0.29 to 0.46 whereas the phosphorus content varied from 0.20 to 0.24.
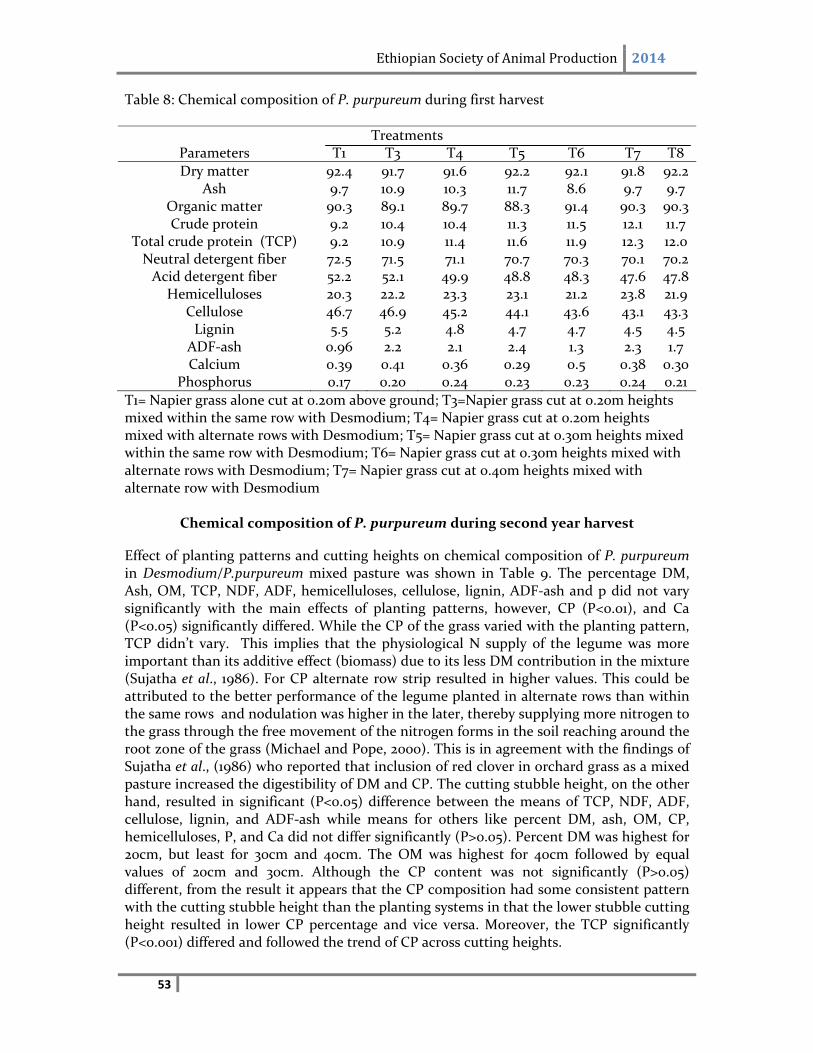
Ethiopian Society of Animal Production 2014
53
Table 8: Chemical composition of P. purpureum during first harvest
Treatments Parameters T1 T3 T4 T5 T6 T7 T8
Dry matter 92.4 91.7 91.6 92.2 92.1 91.8 92.2 Ash 9.7 10.9 10.3 11.7 8.6 9.7 9.7
Organic matter 90.3 89.1 89.7 88.3 91.4 90.3 90.3 Crude protein 9.2 10.4 10.4 11.3 11.5 12.1 11.7
Total crude protein (TCP) 9.2 10.9 11.4 11.6 11.9 12.3 12.0 Neutral detergent fiber 72.5 71.5 71.1 70.7 70.3 70.1 70.2 Acid detergent fiber 52.2 52.1 49.9 48.8 48.3 47.6 47.8
Hemicelluloses 20.3 22.2 23.3 23.1 21.2 23.8 21.9 Cellulose 46.7 46.9 45.2 44.1 43.6 43.1 43.3 Lignin 5.5 5.2 4.8 4.7 4.7 4.5 4.5
ADF‐ash 0.96 2.2 2.1 2.4 1.3 2.3 1.7 Calcium 0.39 0.41 0.36 0.29 0.5 0.38 0.30
Phosphorus 0.17 0.20 0.24 0.23 0.23 0.24 0.21
T1= Napier grass alone cut at 0.20m above ground; T3=Napier grass cut at 0.20m heights mixed within the same row with Desmodium; T4= Napier grass cut at 0.20m heights mixed with alternate rows with Desmodium; T5= Napier grass cut at 0.30m heights mixed within the same row with Desmodium; T6= Napier grass cut at 0.30m heights mixed with alternate rows with Desmodium; T7= Napier grass cut at 0.40m heights mixed with alternate row with Desmodium
Chemical composition of P. purpureum during second year harvest
Effect of planting patterns and cutting heights on chemical composition of P. purpureum in Desmodium/P.purpureum mixed pasture was shown in Table 9. The percentage DM, Ash, OM, TCP, NDF, ADF, hemicelluloses, cellulose, lignin, ADF‐ash and p did not vary significantly with the main effects of planting patterns, however, CP (P<0.01), and Ca (P<0.05) significantly differed. While the CP of the grass varied with the planting pattern, TCP didn’t vary. This implies that the physiological N supply of the legume was more important than its additive effect (biomass) due to its less DM contribution in the mixture (Sujatha et al., 1986). For CP alternate row strip resulted in higher values. This could be attributed to the better performance of the legume planted in alternate rows than within the same rows and nodulation was higher in the later, thereby supplying more nitrogen to the grass through the free movement of the nitrogen forms in the soil reaching around the root zone of the grass (Michael and Pope, 2000). This is in agreement with the findings of Sujatha et al., (1986) who reported that inclusion of red clover in orchard grass as a mixed pasture increased the digestibility of DM and CP. The cutting stubble height, on the other hand, resulted in significant (P<0.05) difference between the means of TCP, NDF, ADF, cellulose, lignin, and ADF‐ash while means for others like percent DM, ash, OM, CP, hemicelluloses, P, and Ca did not differ significantly (P>0.05). Percent DM was highest for 20cm, but least for 30cm and 40cm. The OM was highest for 40cm followed by equal values of 20cm and 30cm. Although the CP content was not significantly (P>0.05) different, from the result it appears that the CP composition had some consistent pattern with the cutting stubble height than the planting systems in that the lower stubble cutting height resulted in lower CP percentage and vice versa. Moreover, the TCP significantly (P<0.001) differed and followed the trend of CP across cutting heights.
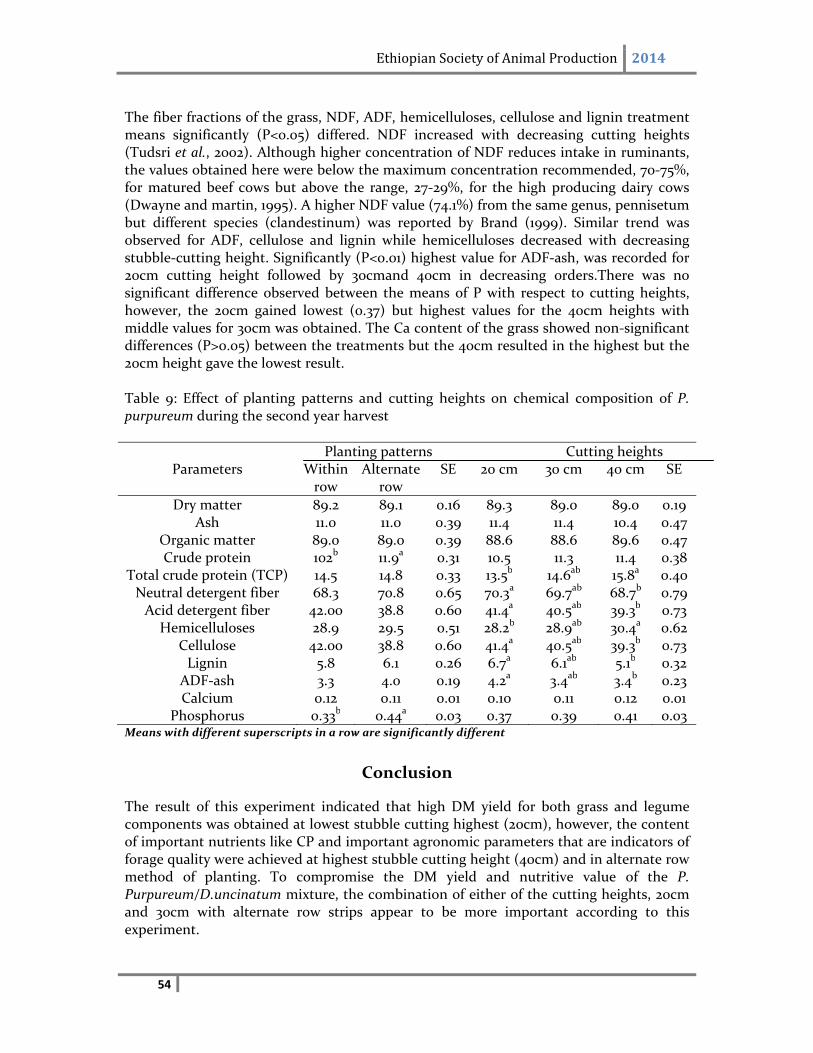
Ethiopian Society of Animal Production 2014
54
The fiber fractions of the grass, NDF, ADF, hemicelluloses, cellulose and lignin treatment means significantly (P<0.05) differed. NDF increased with decreasing cutting heights (Tudsri et al., 2002). Although higher concentration of NDF reduces intake in ruminants, the values obtained here were below the maximum concentration recommended, 70‐75%, for matured beef cows but above the range, 27‐29%, for the high producing dairy cows (Dwayne and martin, 1995). A higher NDF value (74.1%) from the same genus, pennisetum but different species (clandestinum) was reported by Brand (1999). Similar trend was observed for ADF, cellulose and lignin while hemicelluloses decreased with decreasing stubble‐cutting height. Significantly (P<0.01) highest value for ADF‐ash, was recorded for 20cm cutting height followed by 30cmand 40cm in decreasing orders.There was no significant difference observed between the means of P with respect to cutting heights, however, the 20cm gained lowest (0.37) but highest values for the 40cm heights with middle values for 30cm was obtained. The Ca content of the grass showed non‐significant differences (P>0.05) between the treatments but the 40cm resulted in the highest but the 20cm height gave the lowest result. Table 9: Effect of planting patterns and cutting heights on chemical composition of P. purpureum during the second year harvest
Planting patterns Cutting heights Parameters Within
row Alternate
row SE 20 cm 30 cm 40 cm SE
Dry matter 89.2 89.1 0.16 89.3 89.0 89.0 0.19 Ash 11.0 11.0 0.39 11.4 11.4 10.4 0.47
Organic matter 89.0 89.0 0.39 88.6 88.6 89.6 0.47 Crude protein 102b 11.9a 0.31 10.5 11.3 11.4 0.38
Total crude protein (TCP) 14.5 14.8 0.33 13.5b 14.6ab 15.8a 0.40 Neutral detergent fiber 68.3 70.8 0.65 70.3a 69.7ab 68.7b 0.79 Acid detergent fiber 42.00 38.8 0.60 41.4a 40.5ab 39.3b 0.73
Hemicelluloses 28.9 29.5 0.51 28.2b 28.9ab 30.4a 0.62 Cellulose 42.00 38.8 0.60 41.4a 40.5ab 39.3b 0.73 Lignin 5.8 6.1 0.26 6.7a 6.1ab 5.1b 0.32
ADF‐ash 3.3 4.0 0.19 4.2a 3.4ab 3.4b 0.23 Calcium 0.12 0.11 0.01 0.10 0.11 0.12 0.01
Phosphorus 0.33b 0.44a 0.03 0.37 0.39 0.41 0.03 Means with different superscripts in a row are significantly different
Conclusion
The result of this experiment indicated that high DM yield for both grass and legume components was obtained at lowest stubble cutting highest (20cm), however, the content of important nutrients like CP and important agronomic parameters that are indicators of forage quality were achieved at highest stubble cutting height (40cm) and in alternate row method of planting. To compromise the DM yield and nutritive value of the P. Purpureum/D.uncinatum mixture, the combination of either of the cutting heights, 20cm and 30cm with alternate row strips appear to be more important according to this experiment.
Ethiopian Society of Animal Production 2014
55
Acknowledgement
The authors acknowledge the technical assistants of feeds & nutrition research division at Bako Agricultural Research Center for their assistance in data collection.
Reference
AOAC., 1995. Official method of analysis (12th edn). Association of Official Agricultural Chemists. Washington D.C., U.S.A.
Belanger, G. and McQueen R.E., 1999. Leaf and stem nutritive value of thimothy grown with varying nitrogen nutrition in spring and summer. Can. J.Plant Sci.79:223 229
Carrow R.N. and Troll J., 1977. Cutting height and Nitrogen effects on improved perrenial grasses in monostand and polystand communities. Agron. J. Am.soc. Agron. Pub.69:1, PP: 5‐10
Chadhokar P.A., 1978. Effect of rate and frequency of nitrogen application on DM yield and nitrogen concentration of para grass (Brachiaria mutica). Trop. Grassl. 12: 127‐132
Davidson, J.L and Milthorpe, F.L., 1966. Leaf growth in Dactylis glomerata following defoliation.Ann. Bot., New series 30: 173‐184.
Dwayne, R.B. and David, R.Martins., 1995. Quality related characteristics of forages. In: editions of Robert F.Barnes, Darrell F.Miller and C.Jerry Nelson. FORAGES: The Science of Grassland Agriculture, Volume II, Lowa State University. Ames, Lowa, U.S.A. Edaward, B., 1997. Forage quality: Fiber and energy. Extension service, West Virginia University, U.S.A
Evers, G.W. and Holt, E.C., 1972. Effect of Defoliation treatments on morphological characteristics and carbohydrate reseves in Klein grass (P.coloratum L.). Agron. J. Am. Soc. Agron. Pub. 64:1 PP:17‐20
Ethredge, J.E., Beaty, R. and Lawrence Roger M., 1973. Effect of clipping height, clipping frequency, and rates of nitrogen on yield and energy content of costal Bermuda grass. American Society of Agronomy Publication. 65:5, pp:717 – 719. Giller, K.E and Wilson, K.J., 1991. Nitrogen Fixation in Tropical Cropping Systems. CAB International, Wallingford, UK. Hamphreys, L.R., 1978. Tropical pasture and fodder crops. Burnt Mill, harlow, England. International Institute of Rural Reconstruction (IIRR).. 1998. Sustainable agriculture extension manual for eastern and southern Africa.. Nairobi, Kenya.
Ethiopian Society of Animal Production 2014
56
Khan, Z. R., 2002. Push‐Pull technology for the poor African farmer: Improving Livelihood of resource poor farmers. International Centers for insect Physiology and ecology, (MPRTC). Mbita, Kenya.
Kipps, M.S., 1981. Production of field crops: A textbook of agronomy. Six editions. Virginia Polytechnique Insitute. P 655, New York, U.S.A.
Gizachew L. Tadesse A. and Ayallew L., 1991. Evaluation of different grass‐legume mixture in the mid‐altitude sub humid zone of Ethiopia. Ethiopian Society of Animal Production (EASP) third annual conference, Addis Ababa,Ethiopia.
Gizachew L. and Geleti D., 1998. Research on feed resources of western Ethiopian. In: Beyene Seboka and Abera Deressa edtns. Agricultural research and Technologies transfer attemptsin West Wollega. Proceedings of the third generation transfer and gap analysis workshop 12‐14. Mbuthia E.W. and Gachuiri C.K., 2002. Effect of inclusion of high protein forage legumes and molasses in P. purpureumilage: silage quality and voluntary DM intake by sheep. LRNP news letter. Kenya Agricultural research Institute, Nairobi, Kenya. McDowell, L.R. and Valle. G.. 2000. Major minerals in forages. In: Given, D.I.,E.Owen, R.F.E. Axford and H.M.Omed (eds.): Forage Evaluation in Ruminant Nutrition. CAB International press, Wallingford, UK.
Mwangi, D.M., 1994. Survey on feeds, feeding and livestock management in central Kenya. In: proceedings of the 2nd KARI scientific conference. KARI (Kenya Agricultural research Institute), Nairobi, Kenya.
Mwangi D.M. and Wambugu C., 2002. Forage legume technologies: Participatory experiences with framers and community –based organizations in Central Kenya. In: Rangnekar D. and Thorpe W. (eds). 2002. Smallholder dairy production and marketing Opportunities and constraints. Proceedings of a South‐South workshop held at NDDB, Anand, India, and ILRI (International Livestock Research Institute), Nairobi, Kenya.
Michael J.O. and Pope N.V., 2000. Nitrogen fertilizer movement in soil as influenced by nitrogen rate and timing in irrigated wheat. Division S‐8 Nutrient management and Soil and plant analysis. Plant Sci.Dep., Univ. of Arizona, Tucson, U.S.A.
Mureithi J.G. and Thorpe W., 1995. The effect of supplementation with Leucaena leucocephala and maize barn on voluntary food intake, digestability, live‐weight and milk yield of Bos indicus x Bos Taurus dairy cows and rumen fermentation in steers offered P. purpureum ad libitum in the semi‐humid tropics. Animal Science. 60: 13‐23.
Neal,C. Stoskpf. 1981. Understanding crop production. Reston, Virginia, U.S.A
Ethiopian Society of Animal Production 2014
57
O'Donnell J.L. and Love, J.R., 1970. Effect of time and height of cut on rooting activity of Merion Kentucky blue grass as measured by radioactive phosphorus up take. Ag. J., Am. soc. Ag. Pub., 58:5
Onwueme I.C. and Sinha, T.D., 1991. Field crop production in tropical Africa: Principles and Practices. Technical Center for Agricultural and Rural Cooperation. PP‐480
Olsen, F.J., 1973. Effect of cutting management on D. intortum (Mill.)/ Setaria sphacelata (schumach) mixtures. Agron., J., AM. J. Agron. Pub. 65:5, PP:714‐716
Reddy, V.C. and Naik, G., 1999. Effect of intercrops o0f annual forages legumes and nitrogen levels on the performance of hybrid Napier. Legume Research, 22 (40): PP:275‐276.
Reeves M., Fulkerson W.J. and Kellaway R.C., 1996. Forage quality of Kikuyu (Pennisetum clandestinum): The effect of time of defoliation and nitrogen fertilizer application and in comparison with perennial ryegrass (lolium perene). Aust. J. of Agri. Res.47:1349‐1359
Richard H. Hart, Carlson, G.E. and McCloud, D.E., 1971. Cumulative effects of cutting management on forage yields and Tiller densities of tall fescue and orchard grass. Agron. J., Am.soc. Agron. Pub. 63:6, PP: 895‐898.
Richard H. H., Thompson III, A.J. and Hungerford, W.E., 1977. Crown Vetch‐grass mixtures under frequent cutting: yields and nitrogen equivalent values of crown vetch cultivars. Ag.J., Am.Soc. Ag.Pub. 69:2 PP: 287‐290
Statistical Analysis System (SAS), 1996. Guide to personal computers. Version6.12. Cary, NC: Statistical Analysis System (SAS) Institute.
Sollenberger, Lynn E. and Cherney Debbie J.R., 1995. Evaluating Forage production and quality. In: editions of Robert F.Barnes, Darrell F.Miller and C.Jerry Nelson. Sujatha, P., Allen, V.G. Fontenot, J.P. and McClure, W.H., 1986. Yield, chemical composition and digestibility by sheep of orchard grass fertilized with different rates of Nitrogen and Sulphur or assoaiated red clover. Journal of Animal Science. 62: 813‐821 Skerman, P.J.; Cameron, d.G. and Reveros, F., 1989. Tropical Forage legumes. Food and Agricultural Organization of the UN (FAO). Rome, Italy. Tarawali S.A., Tarawali G., Larbi A. and Hanson J., 1995. Method for evaluation of legumes, grasses and fodder trees for use as livestock feed. ILRI manual 1.ILRI (International Livestock Research Institute), Nairobi, Kenya.
Ethiopian Society of Animal Production 2014
58
Tessema Z., Baars, R.M.T. and Yami, A., 2002. Effect of plant height at cutting, source and fertilizer level on yield and nutritional quality of P. purpureum (P. purpureum (L.) Schumach). African Journal of Range & Forage science 27:117‐124
Tudrsi, S., Jorgensen, S.T., Riddach, P. and Pookpakdi, A., 2002. Effect of cutting height and dry season closing date on yield and quality of five P. purpureum cultivars in Thailand. J. Tropical grasslands 36,248‐252
Van Soest, P.J., and Robertson, J.B. 1985. Analysis of forages and fibrous foods. A laboratory manual for animal science 613, Cornell University, U.S.A. VanSoest P.J., Robertson J.B. and Lewis B.A. 1991. Methods for dietary fibre, neutral detergent fibre, and non‐starch polysaccharides in relation to animal nutrition. Journal of Dairy Science 74:3583‐3597
Webster C.C. and P.N.Wilson, 1980. Agriculture in the tropics. Second edition, New York, U.S.A.
Whiteman, P.C. (1969). The effects of close grazing and cutting on the yield, persistence and nitrogen content of four tropical legumes with Rhodes grass at Samford, southeastern Queensland. Australian Journal of Experimental Agriculture9(38), 287‐294.
Whiteman P.C., 1980. Tropical Pasture Science. Oxford University Press. New York, U.S.A
Ethiopian Society of Animal Production 2014
59
Performance of Fodder Oat (Avena sativa L.) Genotypes for Yield and Yield Attributes in the Highland of Bale
*Dawit Abate and Mulusew Fikere Sinana Agricultural Research Center P.O.Box 208, Bale‐Robe, Ethiopia
*Corresponding author: E‐mail: [email protected]
Abstract
The study was conducted to evaluate fodder oat genotypes for yield and yield attributes for four years (2007/08‐2010/11) under four locations of Bale highlands. Eleven fodder oats genotypes were evaluated in Randomized Complete Block Design (RCBD) with three replications with the objective to evaluate oat genotypes for yield and yield attributes and to test their adaptation performance in the highlands of Bale. It was observed that, most of the yield and yield related parameters were significantly different among the tested genotypes. The results revealed that genotype 79AB384 performed better for most important yield parameters. This genotype produced the maximum forage dry matter (DM) yield (10.3 t/ha) and seed yield (2870 kg/ha) showing the yield advantage of 19.4 and 24.5 % over the checks respectively. The analysis of variance for DM yield showed that 48% of the total sum of square was attributed to environmental effect. The genotypic and GEI (Genotype*Environment*Interaction) effect explained 4.7 and 18.7% respectively. The stability test also indicated that genotype 79AB384, CVmn79988385 and CS2 (1563CR) were found more stable in dry matter yield and well adapted to the tested environments. Hence, genotypes 79AB384, CVmn79988385 and CS2 (1563CR) proved to be better performances among eleven genotypes tested under Bale highland conditions. Furthermore, similar breeding/selection activities on fodder oats and other forage varieties should be carried out to evaluate and develop varieties/ genotypes with good yield performance and widely adapted to different agro‐ecologies of Ethiopia.
KEY WORDS: Fodder oats, Avena sativa, herbage yield, Bale highland
Introduction
The highlands of Bale are characterized by crop‐livestock mixed farming systems. Because of the steady conversion of grazing lands into crop fields shortage of feed in quantity and quality is becoming the major challenge to improve livestock production and productivity (Solomon Bogale, 2004). Considering this pressing need for livestock, it is very important for farmers to integrate cultivated forages such as fodder oats in to the farming system. Fodder oat (Avena sativa L.) is one of the potential annual fodder crop commonly cultivated in the highland agro‐ecologies of Ethiopia. It is well adapted to wide range of soils and relatively tolerant to moisture stress, water logging and frost. Oats can be a good source of animal feed in the dry season if harvested at the right stage of growth, cured and stored as hay. So far, some oat varieties were recommended for fodder production in the Bale highlands. Fodder cultivars have to produce large amounts of digestible green fodder of good quality and resistant to potential plant diseases that can limit fodder yield in the production areas.
Ethiopian Society of Animal Production 2014
60
Oat genotypes could vary in forage yield performance and adaptation to specific situation. Crop yield is a product of the genotype and the environment in which the crop has been grown. Environment for crop cultivation cannot be changed but genotype can be modified by hybridization and bio‐tech methods to suit the local soil and climatic conditions. This indicates that the genetic variability in crops is important for development of varieties suitable for diverse agro‐climatic zones. Evaluation of the performance of genotypes across diverse environmental conditions is important for selecting superior cultivars for the target environment. Hence, this study was designed to evaluate oat genotypes for yield and yield attributes and to test their adaptation performance in the highland agro‐ecology of Bale.
Materials and Methods
The experiment was carried out from 2007/08 to 2010/11 at four locations via, Sinana Agricultural Research Center (SARC), Robe, Agarfa and Lower Dinsho of Bale highlands. Sinana Agricultural Research Center is found at an altitude of 2400 m.a.s.l. The mean annual rainfall is 563‐1018 mm with minimum and maximum temperature of 7.9 and 24.3°C, respectively. The other experimental sites were Robe, Agarfa and Lower Dinsho with an altitude of 2400 – 2600 m.a.s.l, respectively. The farming systems of the area are classified as a mixed cereal‐livestock production system. The soil types of the study area are mainly clay in texture (dark brown Vertisols) with slightly acidic reaction (SARC, 2008). There are two distinct seasons ‘Ganna’ (extending from March to July) and ‘Bona’ (extending from July to December) which are allows double cropping. Bimodal rainfall condition is a common phenomenon, especially in the study sites.A total of eleven oats genotypes including one adapted check were evaluated in the present study. The experiment was laid down in randomized complete block design (RCBD) with three replicats using a plot size 2.4 x 1.5 m with eight rows. Seed rate of 80 kg/ha was applied. Seeds were planted in rows spaced 30 cm apart. DAP fertilizer was applied at the rate of 100 kg/ha at the time of sowing. Weeds were kept at minimum by hand weeding. Data was recorded on stand percentage, plant height (cm), days to dough stage, leaf to stem ratio, dry matter yield (t/ha), days to seed maturity and seed yield (kg/ha).
Statistical analysis
Means, mean square of errors (MSE) and percent coefficients of variation (CV%) for all agronomic traits were analyzed using the Proc GLM (SAS 1998). Genotype treatment means were compared using Least Significant Difference (LSD) test at 5% level of probability (Steel and Torrie, 1980). Stability analysis was performed using regression analysis to determine genotypic stability. Correlation coefficients among the agronomic and yield traits were also calculated by International Rice Research Institute (IRRI) stat computer program (IRRI Stat, 2003).
Results and Discussions
Mean values of yield and yield attributes
The mean value of agronomic and yield parameters of 11 fodder oats genotypes tested across 16 environments are showed in the Table 1 below. The analysis result showed that there were significant differences (P<0.05) among oat genotypes with respect to agronomic and yield parameters. There was a significant difference in fodder yields of
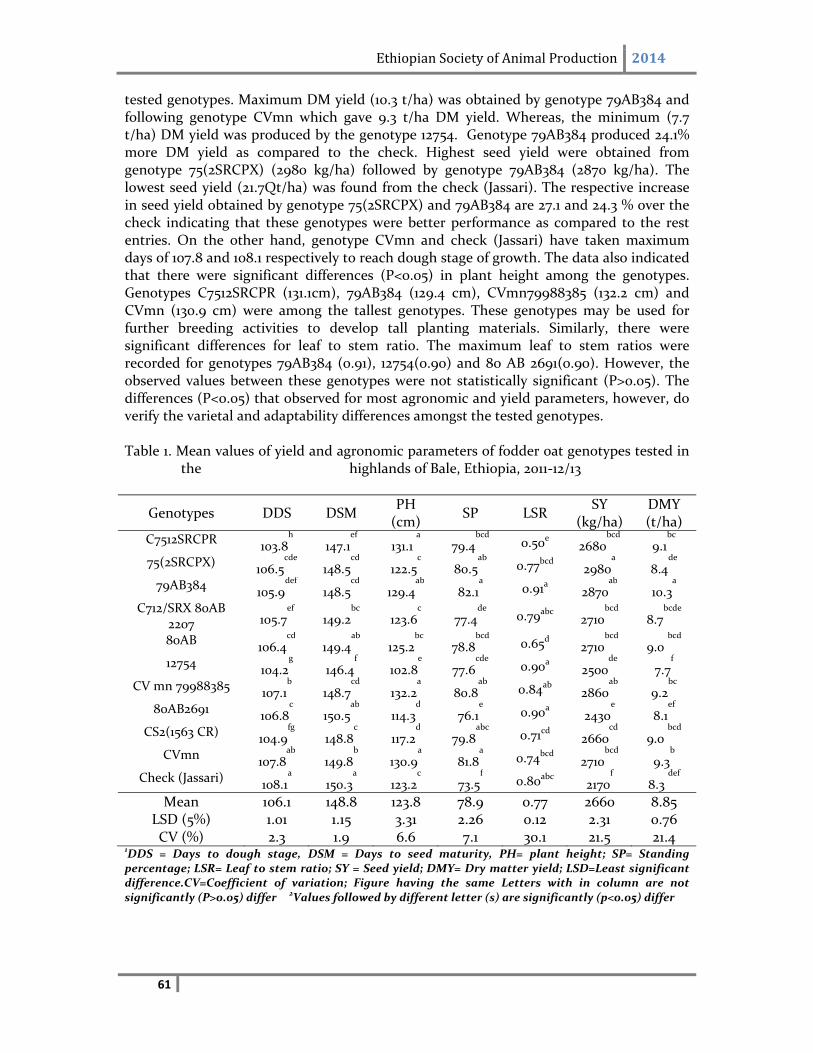
Ethiopian Society of Animal Production 2014
61
tested genotypes. Maximum DM yield (10.3 t/ha) was obtained by genotype 79AB384 and following genotype CVmn which gave 9.3 t/ha DM yield. Whereas, the minimum (7.7 t/ha) DM yield was produced by the genotype 12754. Genotype 79AB384 produced 24.1% more DM yield as compared to the check. Highest seed yield were obtained from genotype 75(2SRCPX) (2980 kg/ha) followed by genotype 79AB384 (2870 kg/ha). The lowest seed yield (21.7Qt/ha) was found from the check (Jassari). The respective increase in seed yield obtained by genotype 75(2SRCPX) and 79AB384 are 27.1 and 24.3 % over the check indicating that these genotypes were better performance as compared to the rest entries. On the other hand, genotype CVmn and check (Jassari) have taken maximum days of 107.8 and 108.1 respectively to reach dough stage of growth. The data also indicated that there were significant differences (P<0.05) in plant height among the genotypes. Genotypes C7512SRCPR (131.1cm), 79AB384 (129.4 cm), CVmn79988385 (132.2 cm) and CVmn (130.9 cm) were among the tallest genotypes. These genotypes may be used for further breeding activities to develop tall planting materials. Similarly, there were significant differences for leaf to stem ratio. The maximum leaf to stem ratios were recorded for genotypes 79AB384 (0.91), 12754(0.90) and 80 AB 2691(0.90). However, the observed values between these genotypes were not statistically significant (P>0.05). The differences (P<0.05) that observed for most agronomic and yield parameters, however, do verify the varietal and adaptability differences amongst the tested genotypes. Table 1. Mean values of yield and agronomic parameters of fodder oat genotypes tested in
the highlands of Bale, Ethiopia, 2011‐12/13
Genotypes DDS DSM PH (cm)
SP LSR SY
(kg/ha) DMY (t/ha)
C7512SRCPR 103.8
h
147.1ef
131.1 a
79.4bcd
0.50e 2680bcd
9.1bc
75(2SRCPX)
106.5cde
148.5cd
122.5c
80.5ab
0.77bcd 2980a
8.4de
79AB384
105.9def
148.5cd
129.4ab
82.1a
0.91a 2870ab
10.3a
C712/SRX 80AB
2207 105.7ef
149.2bc
123.6c
77.4de
0.79abc 2710bcd
8.7bcde
80AB 106.4
cd
149.4ab
125.2bc
78.8bcd
0.65d 2710bcd
9.0 bcd
12754
104.2g
146.4f
102.8e
77.6cde
0.90a 2500de
7.7f
CV mn 79988385
107.1b
148.7cd
132.2a
80.8ab
0.84ab 2860ab
9.2bc
80AB2691
106.8c
150.5ab
114.3d
76.1e
0.90a 2430e
8.1ef
CS2(1563 CR)
104.9fg
148.8c
117.2d
79.8abc
0.71cd 2660cd
9.0 bcd
CVmn
107.8ab
149.8b
130.9a
81.8a
0.74bcd 2710bcd
9.3b
Check (Jassari)
108.1a
150.3a
123.2c
73.5f
0.80abc 2170f
8.3 def
Mean 106.1 148.8 123.8 78.9 0.77 2660 8.85 LSD (5%) 1.01 1.15 3.31 2.26 0.12 2.31 0.76 CV (%) 2.3 1.9 6.6 7.1 30.1 21.5 21.4
1DDS = Days to dough stage, DSM = Days to seed maturity, PH= plant height; SP= Standing percentage; LSR= Leaf to stem ratio; SY = Seed yield; DMY= Dry matter yield; LSD=Least significant difference.CV=Coefficient of variation; Figure having the same Letters with in column are not significantly (P>0.05) differ 2Values followed by different letter (s) are significantly (p<0.05) differ
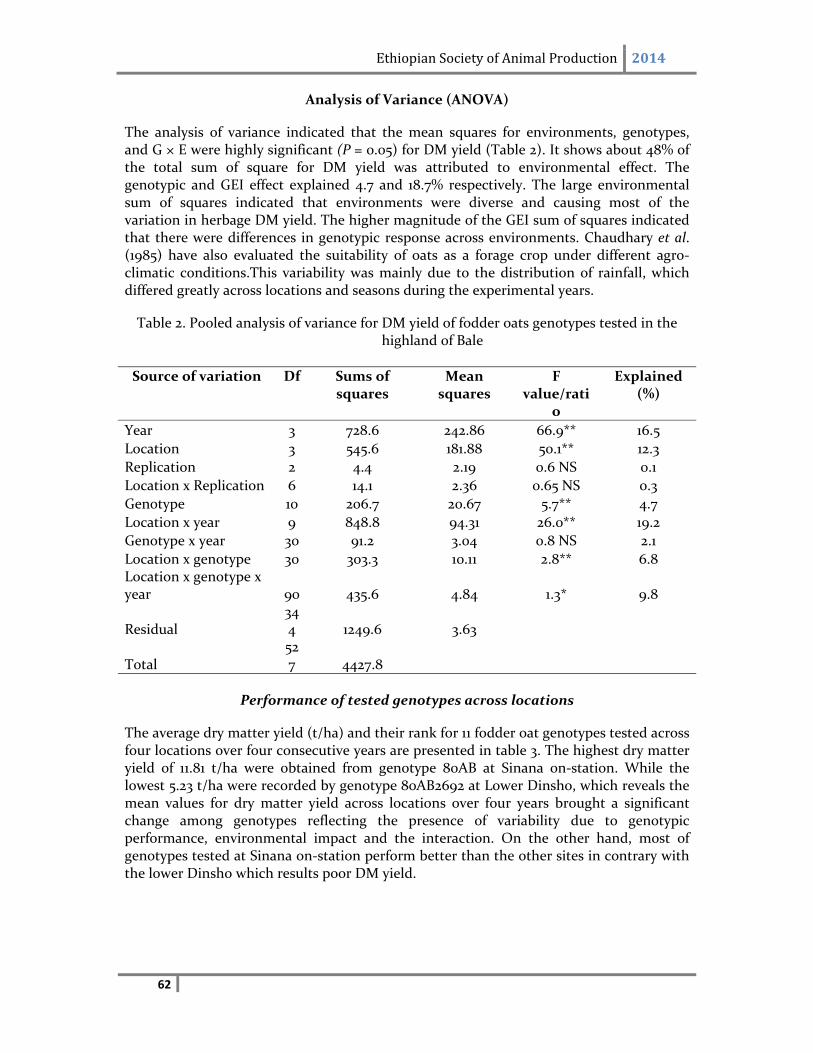
Ethiopian Society of Animal Production 2014
62
Analysis of Variance (ANOVA)
The analysis of variance indicated that the mean squares for environments, genotypes, and G × E were highly significant (P = 0.05) for DM yield (Table 2). It shows about 48% of the total sum of square for DM yield was attributed to environmental effect. The genotypic and GEI effect explained 4.7 and 18.7% respectively. The large environmental sum of squares indicated that environments were diverse and causing most of the variation in herbage DM yield. The higher magnitude of the GEI sum of squares indicated that there were differences in genotypic response across environments. Chaudhary et al. (1985) have also evaluated the suitability of oats as a forage crop under different agro‐climatic conditions.This variability was mainly due to the distribution of rainfall, which differed greatly across locations and seasons during the experimental years.
Table 2. Pooled analysis of variance for DM yield of fodder oats genotypes tested in the highland of Bale
Source of variation Df Sums of squares
Mean squares
F value/rati
o
Explained (%)
Year 3 728.6 242.86 66.9** 16.5
Location 3 545.6 181.88 50.1** 12.3
Replication 2 4.4 2.19 0.6 NS 0.1
Location x Replication 6 14.1 2.36 0.65 NS 0.3
Genotype 10 206.7 20.67 5.7** 4.7
Location x year 9 848.8 94.31 26.0** 19.2
Genotype x year 30 91.2 3.04 0.8 NS 2.1
Location x genotype 30 303.3 10.11 2.8** 6.8 Location x genotype x year 90 435.6 4.84 1.3* 9.8
Residual 344 1249.6 3.63
Total 527 4427.8
Performance of tested genotypes across locations
The average dry matter yield (t/ha) and their rank for 11 fodder oat genotypes tested across four locations over four consecutive years are presented in table 3. The highest dry matter yield of 11.81 t/ha were obtained from genotype 80AB at Sinana on‐station. While the lowest 5.23 t/ha were recorded by genotype 80AB2692 at Lower Dinsho, which reveals the mean values for dry matter yield across locations over four years brought a significant change among genotypes reflecting the presence of variability due to genotypic performance, environmental impact and the interaction. On the other hand, most of genotypes tested at Sinana on‐station perform better than the other sites in contrary with the lower Dinsho which results poor DM yield.
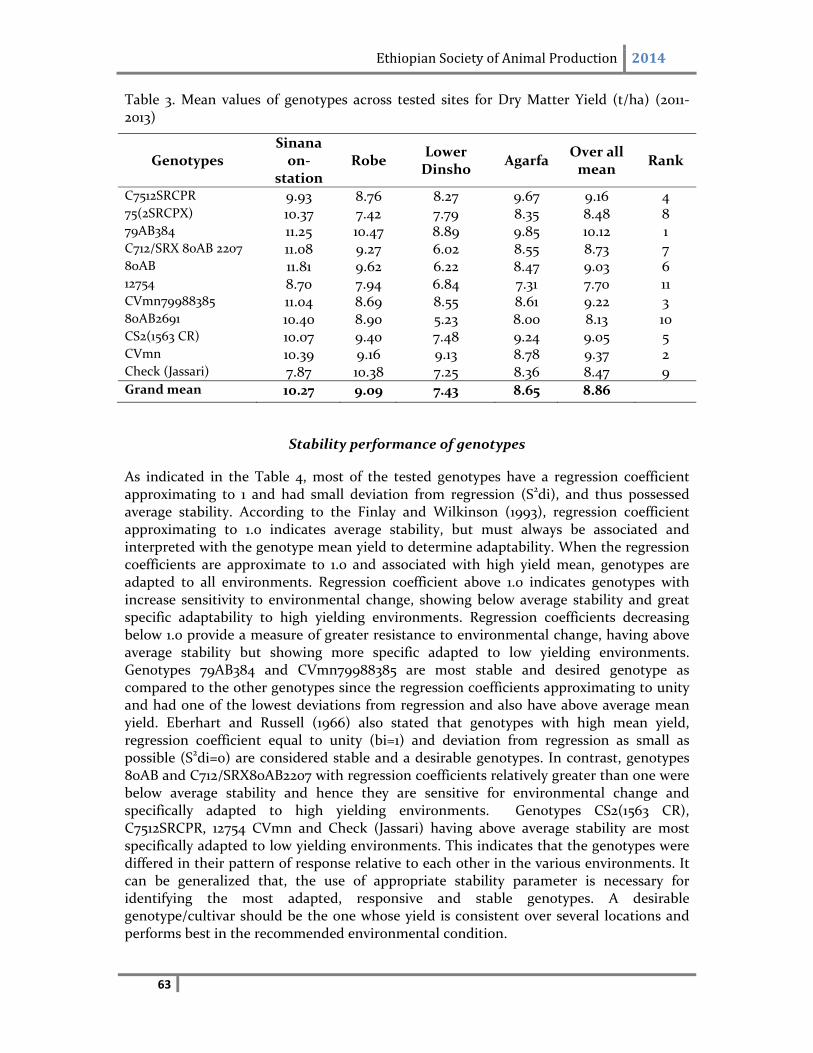
Ethiopian Society of Animal Production 2014
63
Table 3. Mean values of genotypes across tested sites for Dry Matter Yield (t/ha) (2011‐2013)
Genotypes Sinana on‐
station Robe
Lower Dinsho
Agarfa Over all mean
Rank
C7512SRCPR 9.93 8.76 8.27 9.67 9.16 4 75(2SRCPX) 10.37 7.42 7.79 8.35 8.48 8 79AB384 11.25 10.47 8.89 9.85 10.12 1 C712/SRX 80AB 2207 11.08 9.27 6.02 8.55 8.73 7 80AB 11.81 9.62 6.22 8.47 9.03 6 12754 8.70 7.94 6.84 7.31 7.70 11 CVmn79988385 11.04 8.69 8.55 8.61 9.22 3 80AB2691 10.40 8.90 5.23 8.00 8.13 10 CS2(1563 CR) 10.07 9.40 7.48 9.24 9.05 5 CVmn 10.39 9.16 9.13 8.78 9.37 2 Check (Jassari) 7.87 10.38 7.25 8.36 8.47 9 Grand mean 10.27 9.09 7.43 8.65 8.86
Stability performance of genotypes
As indicated in the Table 4, most of the tested genotypes have a regression coefficient approximating to 1 and had small deviation from regression (S2di), and thus possessed average stability. According to the Finlay and Wilkinson (1993), regression coefficient approximating to 1.0 indicates average stability, but must always be associated and interpreted with the genotype mean yield to determine adaptability. When the regression coefficients are approximate to 1.0 and associated with high yield mean, genotypes are adapted to all environments. Regression coefficient above 1.0 indicates genotypes with increase sensitivity to environmental change, showing below average stability and great specific adaptability to high yielding environments. Regression coefficients decreasing below 1.0 provide a measure of greater resistance to environmental change, having above average stability but showing more specific adapted to low yielding environments. Genotypes 79AB384 and CVmn79988385 are most stable and desired genotype as compared to the other genotypes since the regression coefficients approximating to unity and had one of the lowest deviations from regression and also have above average mean yield. Eberhart and Russell (1966) also stated that genotypes with high mean yield, regression coefficient equal to unity (bi=1) and deviation from regression as small as possible (S2di=0) are considered stable and a desirable genotypes. In contrast, genotypes 80AB and C712/SRX80AB2207 with regression coefficients relatively greater than one were below average stability and hence they are sensitive for environmental change and specifically adapted to high yielding environments. Genotypes CS2(1563 CR), C7512SRCPR, 12754 CVmn and Check (Jassari) having above average stability are most specifically adapted to low yielding environments. This indicates that the genotypes were differed in their pattern of response relative to each other in the various environments. It can be generalized that, the use of appropriate stability parameter is necessary for identifying the most adapted, responsive and stable genotypes. A desirable genotype/cultivar should be the one whose yield is consistent over several locations and performs best in the recommended environmental condition.
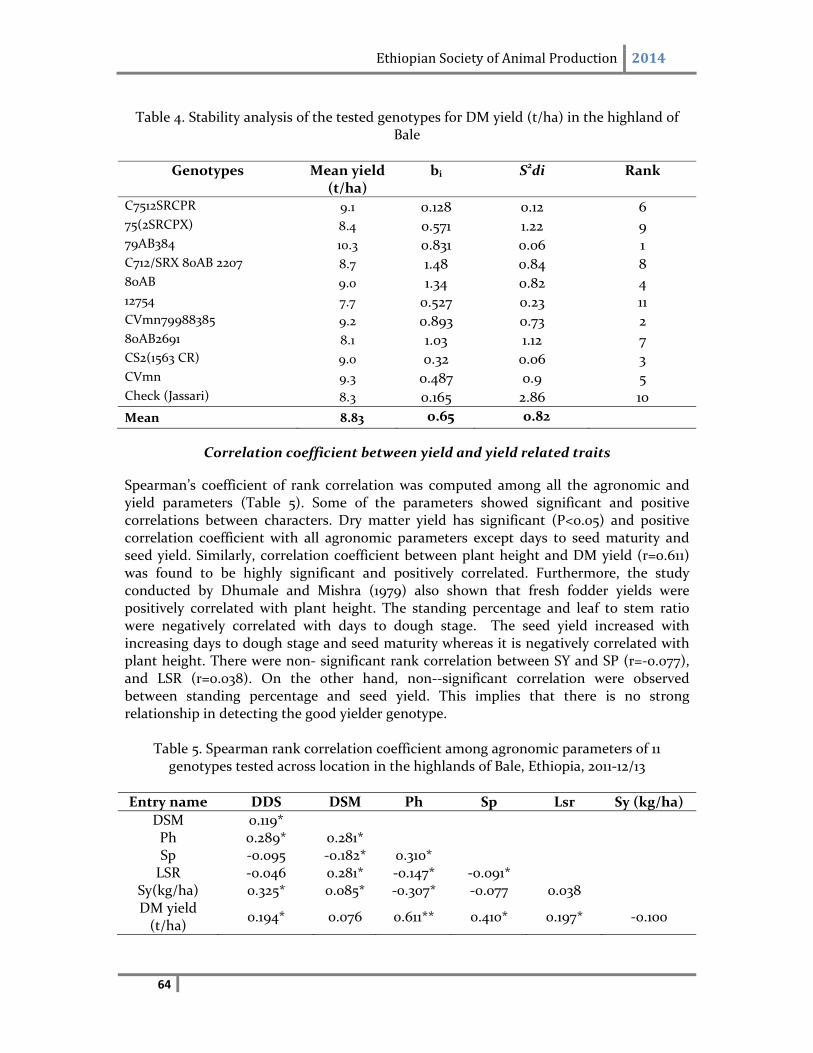
Ethiopian Society of Animal Production 2014
64
Table 4. Stability analysis of the tested genotypes for DM yield (t/ha) in the highland of
Bale
Genotypes Mean yield (t/ha)
bi S2di Rank
C7512SRCPR 9.1 0.128 0.12 6 75(2SRCPX) 8.4 0.571 1.22 9 79AB384 10.3 0.831 0.06 1 C712/SRX 80AB 2207 8.7 1.48 0.84 8 80AB 9.0 1.34 0.82 4 12754 7.7 0.527 0.23 11 CVmn79988385 9.2 0.893 0.73 2 80AB2691 8.1 1.03 1.12 7 CS2(1563 CR) 9.0 0.32 0.06 3 CVmn 9.3 0.487 0.9 5 Check (Jassari) 8.3 0.165 2.86 10
Mean 8.83 0.65 0.82
Correlation coefficient between yield and yield related traits
Spearman’s coefficient of rank correlation was computed among all the agronomic and yield parameters (Table 5). Some of the parameters showed significant and positive correlations between characters. Dry matter yield has significant (P<0.05) and positive correlation coefficient with all agronomic parameters except days to seed maturity and seed yield. Similarly, correlation coefficient between plant height and DM yield (r=0.611) was found to be highly significant and positively correlated. Furthermore, the study conducted by Dhumale and Mishra (1979) also shown that fresh fodder yields were positively correlated with plant height. The standing percentage and leaf to stem ratio were negatively correlated with days to dough stage. The seed yield increased with increasing days to dough stage and seed maturity whereas it is negatively correlated with plant height. There were non‐ significant rank correlation between SY and SP (r=‐0.077), and LSR (r=0.038). On the other hand, non‐‐significant correlation were observed between standing percentage and seed yield. This implies that there is no strong relationship in detecting the good yielder genotype.
Table 5. Spearman rank correlation coefficient among agronomic parameters of 11 genotypes tested across location in the highlands of Bale, Ethiopia, 2011‐12/13
Entry name DDS DSM Ph Sp Lsr Sy (kg/ha)
DSM 0.119* Ph 0.289* 0.281* Sp ‐0.095 ‐0.182* o.310* LSR ‐0.046 0.281* ‐0.147* ‐0.091*
Sy(kg/ha) 0.325* 0.085* ‐0.307* ‐0.077 0.038 DM yield (t/ha)
0.194* 0.076 0.611** 0.410* 0.197* ‐0.100
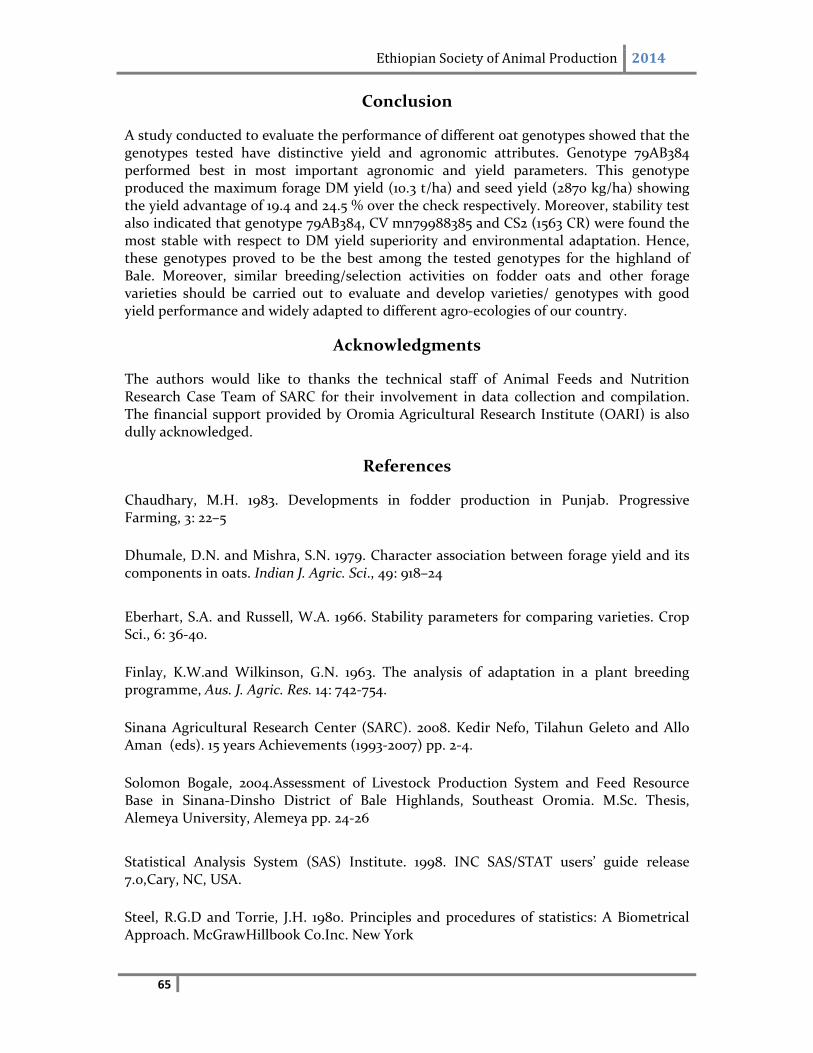
Ethiopian Society of Animal Production 2014
65
Conclusion
A study conducted to evaluate the performance of different oat genotypes showed that the genotypes tested have distinctive yield and agronomic attributes. Genotype 79AB384 performed best in most important agronomic and yield parameters. This genotype produced the maximum forage DM yield (10.3 t/ha) and seed yield (2870 kg/ha) showing the yield advantage of 19.4 and 24.5 % over the check respectively. Moreover, stability test also indicated that genotype 79AB384, CV mn79988385 and CS2 (1563 CR) were found the most stable with respect to DM yield superiority and environmental adaptation. Hence, these genotypes proved to be the best among the tested genotypes for the highland of Bale. Moreover, similar breeding/selection activities on fodder oats and other forage varieties should be carried out to evaluate and develop varieties/ genotypes with good yield performance and widely adapted to different agro‐ecologies of our country.
Acknowledgments
The authors would like to thanks the technical staff of Animal Feeds and Nutrition Research Case Team of SARC for their involvement in data collection and compilation. The financial support provided by Oromia Agricultural Research Institute (OARI) is also dully acknowledged.
References
Chaudhary, M.H. 1983. Developments in fodder production in Punjab. Progressive Farming, 3: 22–5
Dhumale, D.N. and Mishra, S.N. 1979. Character association between forage yield and its components in oats. Indian J. Agric. Sci., 49: 918–24
Eberhart, S.A. and Russell, W.A. 1966. Stability parameters for comparing varieties. Crop Sci., 6: 36‐40.
Finlay, K.W.and Wilkinson, G.N. 1963. The analysis of adaptation in a plant breeding programme, Aus. J. Agric. Res. 14: 742‐754.
Sinana Agricultural Research Center (SARC). 2008. Kedir Nefo, Tilahun Geleto and Allo Aman (eds). 15 years Achievements (1993‐2007) pp. 2‐4.
Solomon Bogale, 2004.Assessment of Livestock Production System and Feed Resource Base in Sinana‐Dinsho District of Bale Highlands, Southeast Oromia. M.Sc. Thesis, Alemeya University, Alemeya pp. 24‐26
Statistical Analysis System (SAS) Institute. 1998. INC SAS/STAT users’ guide release 7.0,Cary, NC, USA.
Steel, R.G.D and Torrie, J.H. 1980. Principles and procedures of statistics: A Biometrical Approach. McGrawHillbook Co.Inc. New York
Ethiopian Society of Animal Production 2014
66
Body Weight Change and Carcass Characteristics of Abergelle Goats Supplemented with Treated Acacia Saligna (Labill) H.L.Wendi. leaves
1Shumuye Belay and 2Yayneshet Tesfay 1Abergelle Agricultural Research Centre, P.O. Box 44, Abi‐Adi.
2Department of Animal, Rangeland, and Wildlife Sciences, Mekelle University
Abstract A study was conducted to evaluate the effect of treatedAcacia saligna leaves on body weight change and carcass characteristics of Abergelle goats.The experiment was executed in Aberegelle Agricultural Research Centre goat farm in the northern Ethiopia. Four treatments namely grass hay as a control (T1), air dried (T2), water soaked (T3) and wood ash soaked Acacia Saligna leaves (T4) each included at 300 g head‐1 day‐1 were used as supplement. Feed intake was measured daily and live weight gain recorded weekly. Measurements were taken on empty body weight, hot carcass weight, dressing percent, rib eye muscle area and other offal components. The average daily body weight gains for the supplemented goats ranged from 21.91‐34g day‐1where as goats fed on sole grass hay showed a mean daily body weight gain of 8.2g day‐1. Dressing percentage on slaughter weight base, empty body weight base and rib eye muscle area were similar among the treatments. The hot carcass weight of goats received both T2 and T3 significantly differed (P<0.001) from the control group. Edible offal components such as liver, genital fat and blood of the supplemented goats were exhibited a significance difference (P<0.05) as compared to the control group. Numerically, the weights of all edible offal components were heavier for goats supplemented in air‐dried A.saligna leaves as compared to the other treatments. However, non‐edible offal components had not any significant difference (P>0.05) among the treatments. Generally, goats supplemented with air‐dried A. saligna leaves showed higher body weight and carcass value compared with the other treatments. Key words: Empty body weight; Gut fill; Offal; Rib eye area; Supplement
Introduction
Animal feed shortage problems mainly occurred in arid and semi‐arid areas especially during the dry season. In those areas animals are fed commonly on crop residues and grazing lands which have low nutritional value and digestibility. Woodward and Reed (1989) reported that Phyllodes are valuable seasonally when other forages are scarce due to astringent taste. It is also due to the presence of condensed tannin, which may limit feeding value and apparently have low or moderately low digestibility at least in some situations Michaelides (1979) which results low body weight gain. A.saligna appears to have fairly good potential as an animal fodder plant if the phyllodes, young shoots, pods and seeds, are selected and either fresh or dry, are protein‐rich and non‐toxic and palatable to both sheep and goats (Maslin and McDonald, 2004). Replacement of A. saligna leaves up to 40% in growing lambs diet improved growth performance traits and dressing percentage (Mousa, 2011). Feeding of A.saligna leaves in the dried form could increase the utilization of nutrients with the increasing of growth performance of lambs as compared to fresh leaves (Tamir and Asefa, 2009). To increase the feed intake of animals, different feed improvement mechanisms such as urea and molasses treatment, ensiling
Ethiopian Society of Animal Production 2014
67
process, calcium hydroxide and wood ash soaking, chopping and drying are being practiced to decrease the anti‐nutritional factors. These pre‐treatments ways are not only to increase feed intake but also to increase palatability, digestibility and nutritional value of the feed. Sheep consumed A. saligna leaves treated with polyethylene glycol were gained better weight than those fed untreated (Ben salem et al., 1998). Therefore, this research was aimed at evaluating live body weight changes and carcass characteristics of Abergelle goats fed on fixed level of air dried, water and wood ash soaked A. saligna leaves and grass hay as basal diet.
Material and methods
Description of the Study area
The study was conducted in Tanqua Abergelle district (13o 14' 06" N latitude and 38o 58' 50" E longitude) in the central zone of Tigray Regional State in northern Ethiopia. The study area is categorized as hot to warm sub‐moist lowland (SM1‐4) sub‐agro ecological zone with an altitude of 1300‐1500 m.a.s.l. The mean annual rainfall ranges from 400 to 600 mm and annual temperature ranges from 28 to 42oC. The dominant soil type includes vertisols and silt loam soils with dwarf shrub vegetation dominated by acacia species.The area has also huge number of livestock population especially goats.
Preparation of experimental feeds
The A. saligna leaves used in this experiment were harvested from 3‐5 year old stand growing in an enclosure, which is the property of Abergelle Agricultural Research Centre in Tigray region of northern Ethiopia. A total of 474 kg leaves were harvested by hand plucking and the leaves excluding twigs and petioles were harvested from all branches of the plant and mixed thoroughly. The collected leaves were mixed thoroughly and divided into three equal parts (air dried, water soaked and wood ash solution soaked leaves). According to Ben Salem et al. (2005) one kg fresh leaf was soaked in 6L of wood (A. etbaica) ash solution for 48 hours. The leaves were washed with water to remove the dusty materials and alkalinity. About 316 kg (158 kg for each) fresh leaves were soaked both in water and wood ash solution for 48 hours. The remaining 158 kg of fresh leaves were dried only in air.
Experimental animals and treatments
A total of 20 Abergelle intact male goats aged 14‐18 months and weighed 16.11 2.47 kg (meanstandard deviation) were purchased from Yechilla town and near by areas. . Ages of the experimental goats were estimated by asking the owners and by their dentition. The goats were grouped according to their initial body weight that ranges from 17.7‐19 kg in block one, 16.6‐17.5kg block two, 15.5‐16.5kg block three, 14.8‐15.4kg block four and 13.5‐14.4kg block five that is in to five blocks of four goats in each block in a randomized complete block design . Initial body weight was measured after overnight fasting of the experimental goats at the end of two weeks adaptation period. The treatments comprised of native grass hay alone provided on ad libitum basis (T1); grass hay plus 300 g DM air dried A. saligna leaves (T2); grass hay plus 300 g DM water soaked A. saligna leaves (T3); and grass hay plus 300 g DM wood ash solution soaked A. saligna leaves (T4). The inclusion of a fixed amount of A. saligna leaves is based on previous recommendations (Tamir and Asefa, 2009; Mousa, 2011).
Ethiopian Society of Animal Production 2014
68
Live weight change
Live weights of the experimental goats were measured in the morning time before feeding and watering with the help of spring balance weekly. The live weight gain was recorded every week during the 90 days experimental period and was calculated as follow; Live weight gain (LWG) =Final weight‐ Initial weight Number of days
Feed conversion efficiency : Feed conversion efficiency was calculated as the proportion of daily live weight gain to daily DM intake
Carcass parameters
From each treatment group, five goats were taken and fasted overnight and empty weighed before slaughtering. During slaughtering, goats were suspended head down; the oesophagus tied off to cease the blood flow, the jugular vein severed using a kitchen knife and then the blood was collected in a container and weighed with the help of electronic sensitive balance. The skin was flayed cautiously to avoid adherence of fat and muscle tissue to the skin. The skin with legs below the four fetlock joints, head (with horn, and ear), tongue, testicles, penis, lung (with oesophagus and trachea), heart, liver, gall bladder, spleen, pancreas, abdominal fat, gut fill and empty gut were separately measured. The entire gastro‐intestinal tract content (gut) was removed and divided into the following sections, namely oesophagus, reticulum, rumen, omasum, abomasums, small and large intestine and every part were weighed and then the internal content were emptied, the weight of the empty gut was recorded. The hot carcass weight was measured with the help of spring balance to the nearest 0.5 kg after head and offal were removed. The empty body weight is the weight of the goat excluding the gut fill. The dressing percentage was calculated as proportion of hot carcasses weight or empty body weight to slaughter body weight. The carcass was divided into two parts: hind and fore quarter between 9th and 10th ribs. The four ribs from (10th to 13th) were chilled overnight in deep freezer and the rib eye muscle (longissimus dorsi) area was measured at the 11th and 12th rib site (Jones and William, 1993). The rib‐eye area value was taken as the mean of the left and right sides. The cross sectional area of the rib eye muscle area was marked out first on transparent plastic paper after it was cut at the 11th and 12th ribs perpendicularly to the backbone. The transparent plastic paper was attached to 0.25 cm2 square paper, which was used to calculate the number of squares within the traced transparent plastic paper manually. The area of the squares that fell within the tracer paper was then counted on both sides and the average of the two sides was used to calculate the rib‐eye muscle area. The empty body weight is the weight of the goat excluding the gut fill and was calculated with the following formula;
Empty body weight = Slaughter weight‐ Gut fills Therefore, the dressing percentage was calculated as proportion of hot carcasses weight or
empty body weigh to slaughter body weight that is; Dressing percentage=Hot carcasses weight x100 and = Hot carcasses weight x100
Slaughter body weight Empty body weight
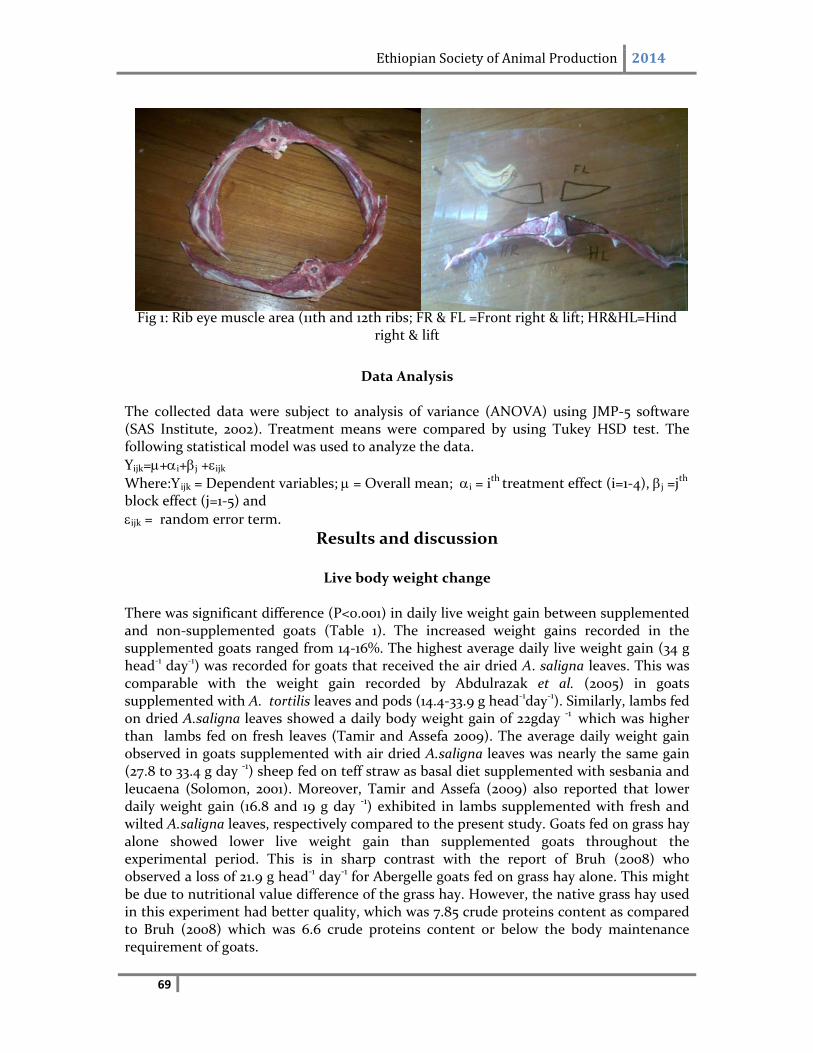
Ethiopian Society of Animal Production 2014
69
Fig 1: Rib eye muscle area (11th and 12th ribs; FR & FL =Front right & lift; HR&HL=Hind right & lift
Data Analysis
The collected data were subject to analysis of variance (ANOVA) using JMP‐5 software (SAS Institute, 2002). Treatment means were compared by using Tukey HSD test. The following statistical model was used to analyze the data.
Yijk=+i+j +ijk Where:ijk = Dependent variables; = Overall mean; i = i
th treatment effect (i=1‐4), j =jth
block effect (j=1‐5) and
ijk = random error term.
Results and discussion
Live body weight change
There was significant difference (P<0.001) in daily live weight gain between supplemented and non‐supplemented goats (Table 1). The increased weight gains recorded in the supplemented goats ranged from 14‐16%. The highest average daily live weight gain (34 g head‐1 day‐1) was recorded for goats that received the air dried A. saligna leaves. This was comparable with the weight gain recorded by Abdulrazak et al. (2005) in goats supplemented with A. tortilis leaves and pods (14.4‐33.9 g head‐1day‐1). Similarly, lambs fed on dried A.saligna leaves showed a daily body weight gain of 22gday ‐1 which was higher than lambs fed on fresh leaves (Tamir and Assefa 2009). The average daily weight gain observed in goats supplemented with air dried A.saligna leaves was nearly the same gain (27.8 to 33.4 g day ‐1) sheep fed on teff straw as basal diet supplemented with sesbania and leucaena (Solomon, 2001). Moreover, Tamir and Assefa (2009) also reported that lower daily weight gain (16.8 and 19 g day ‐1) exhibited in lambs supplemented with fresh and wilted A.saligna leaves, respectively compared to the present study. Goats fed on grass hay alone showed lower live weight gain than supplemented goats throughout the experimental period. This is in sharp contrast with the report of Bruh (2008) who observed a loss of 21.9 g head‐1 day‐1 for Abergelle goats fed on grass hay alone. This might be due to nutritional value difference of the grass hay. However, the native grass hay used in this experiment had better quality, which was 7.85 crude proteins content as compared to Bruh (2008) which was 6.6 crude proteins content or below the body maintenance requirement of goats.
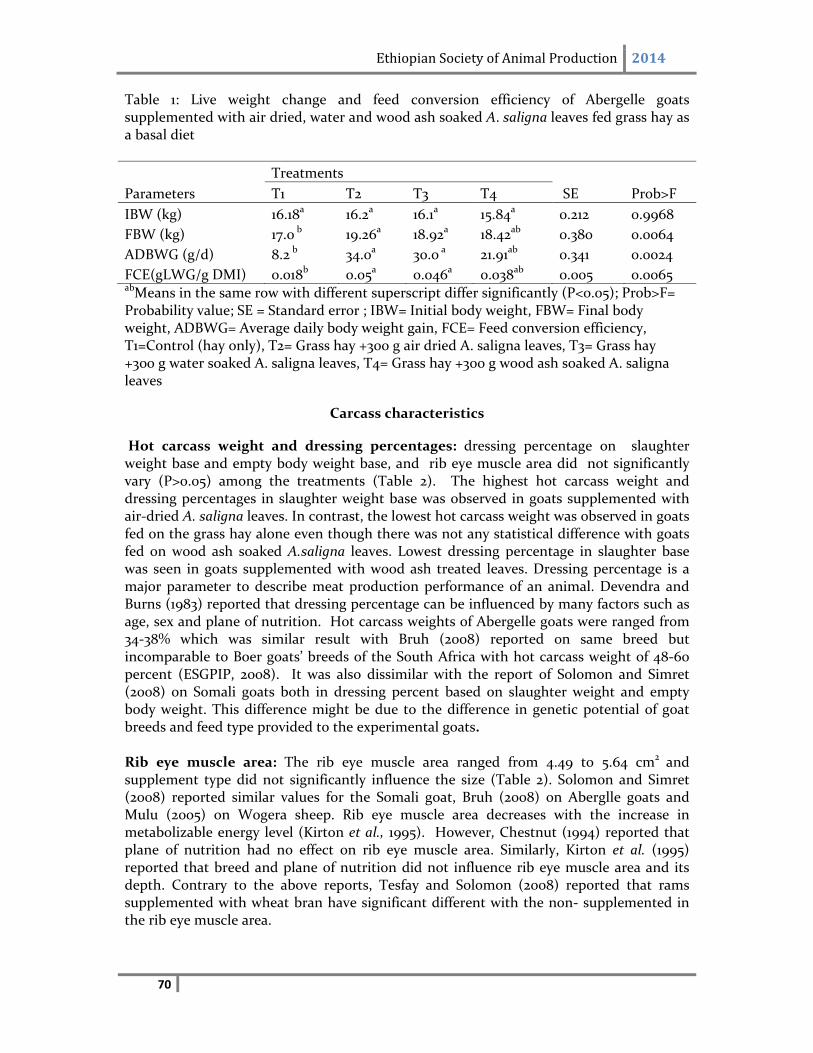
Ethiopian Society of Animal Production 2014
70
Table 1: Live weight change and feed conversion efficiency of Abergelle goats supplemented with air dried, water and wood ash soaked A. saligna leaves fed grass hay as a basal diet
Parameters
Treatments
SE Prob>F T1 T2 T3 T4
IBW (kg) 16.18a 16.2a 16.1a 15.84a 0.212 0.9968
FBW (kg) 17.0 b 19.26a 18.92a 18.42ab 0.380 0.0064
ADBWG (g/d) 8.2 b 34.0a 30.0 a 21.91ab 0.341 0.0024
FCE(gLWG/g DMI) 0.018b 0.05a 0.046a 0.038ab 0.005 0.0065 abMeans in the same row with different superscript differ significantly (P<0.05); Prob>F= Probability value; SE = Standard error ; IBW= Initial body weight, FBW= Final body weight, ADBWG= Average daily body weight gain, FCE= Feed conversion efficiency, T1=Control (hay only), T2= Grass hay +300 g air dried A. saligna leaves, T3= Grass hay +300 g water soaked A. saligna leaves, T4= Grass hay +300 g wood ash soaked A. saligna leaves
Carcass characteristics
Hot carcass weight and dressing percentages: dressing percentage on slaughter weight base and empty body weight base, and rib eye muscle area did not significantly vary (P>0.05) among the treatments (Table 2). The highest hot carcass weight and dressing percentages in slaughter weight base was observed in goats supplemented with air‐dried A. saligna leaves. In contrast, the lowest hot carcass weight was observed in goats fed on the grass hay alone even though there was not any statistical difference with goats fed on wood ash soaked A.saligna leaves. Lowest dressing percentage in slaughter base was seen in goats supplemented with wood ash treated leaves. Dressing percentage is a major parameter to describe meat production performance of an animal. Devendra and Burns (1983) reported that dressing percentage can be influenced by many factors such as age, sex and plane of nutrition. Hot carcass weights of Abergelle goats were ranged from 34‐38% which was similar result with Bruh (2008) reported on same breed but incomparable to Boer goats’ breeds of the South Africa with hot carcass weight of 48‐60 percent (ESGPIP, 2008). It was also dissimilar with the report of Solomon and Simret (2008) on Somali goats both in dressing percent based on slaughter weight and empty body weight. This difference might be due to the difference in genetic potential of goat breeds and feed type provided to the experimental goats. Rib eye muscle area: The rib eye muscle area ranged from 4.49 to 5.64 cm2 and supplement type did not significantly influence the size (Table 2). Solomon and Simret (2008) reported similar values for the Somali goat, Bruh (2008) on Aberglle goats and Mulu (2005) on Wogera sheep. Rib eye muscle area decreases with the increase in metabolizable energy level (Kirton et al., 1995). However, Chestnut (1994) reported that plane of nutrition had no effect on rib eye muscle area. Similarly, Kirton et al. (1995) reported that breed and plane of nutrition did not influence rib eye muscle area and its depth. Contrary to the above reports, Tesfay and Solomon (2008) reported that rams supplemented with wheat bran have significant different with the non‐ supplemented in the rib eye muscle area.
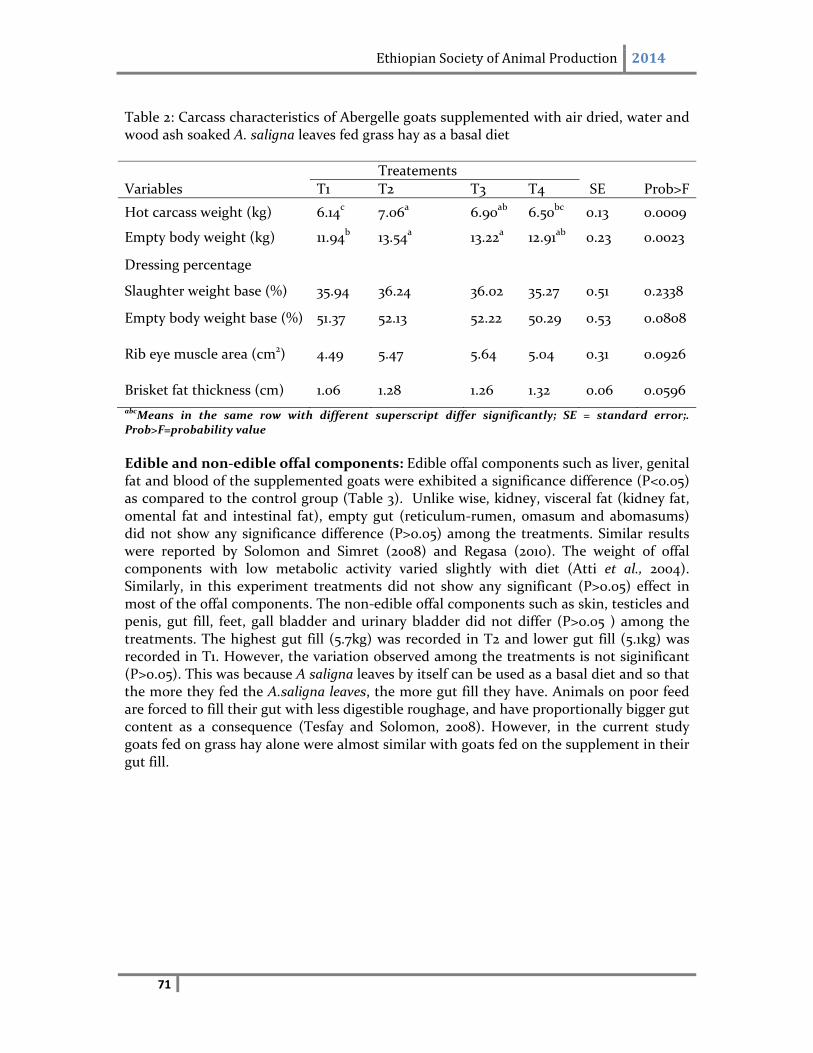
Ethiopian Society of Animal Production 2014
71
Table 2: Carcass characteristics of Abergelle goats supplemented with air dried, water and wood ash soaked A. saligna leaves fed grass hay as a basal diet
Treatements
Variables T1 T2 T3 T4 SE Prob>F
Hot carcass weight (kg) 6.14c 7.06a 6.90ab 6.50bc 0.13 0.0009
Empty body weight (kg) 11.94b 13.54a 13.22a 12.91ab 0.23 0.0023
Dressing percentage
Slaughter weight base (%) 35.94 36.24 36.02 35.27 0.51 0.2338
Empty body weight base (%) 51.37 52.13 52.22 50.29 0.53 0.0808
Rib eye muscle area (cm2) 4.49 5.47 5.64 5.04 0.31 0.0926
Brisket fat thickness (cm) 1.06 1.28 1.26 1.32 0.06 0.0596
abcMeans in the same row with different superscript differ significantly; SE = standard error;. Prob>F=probability value
Edible and non‐edible offal components: Edible offal components such as liver, genital fat and blood of the supplemented goats were exhibited a significance difference (P<0.05) as compared to the control group (Table 3). Unlike wise, kidney, visceral fat (kidney fat, omental fat and intestinal fat), empty gut (reticulum‐rumen, omasum and abomasums) did not show any significance difference (P>0.05) among the treatments. Similar results were reported by Solomon and Simret (2008) and Regasa (2010). The weight of offal components with low metabolic activity varied slightly with diet (Atti et al., 2004). Similarly, in this experiment treatments did not show any significant (P>0.05) effect in most of the offal components. The non‐edible offal components such as skin, testicles and penis, gut fill, feet, gall bladder and urinary bladder did not differ (P>0.05 ) among the treatments. The highest gut fill (5.7kg) was recorded in T2 and lower gut fill (5.1kg) was recorded in T1. However, the variation observed among the treatments is not siginificant (P>0.05). This was because A saligna leaves by itself can be used as a basal diet and so that the more they fed the A.saligna leaves, the more gut fill they have. Animals on poor feed are forced to fill their gut with less digestible roughage, and have proportionally bigger gut content as a consequence (Tesfay and Solomon, 2008). However, in the current study goats fed on grass hay alone were almost similar with goats fed on the supplement in their gut fill.
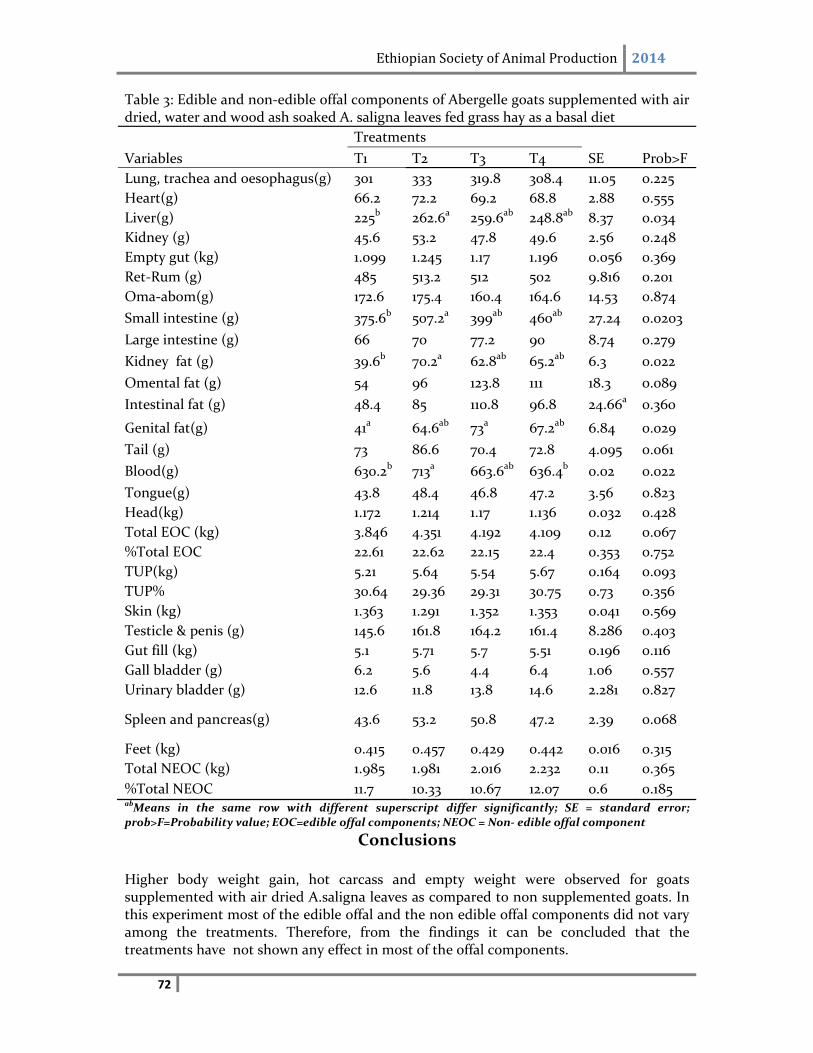
Ethiopian Society of Animal Production 2014
72
Table 3: Edible and non‐edible offal components of Abergelle goats supplemented with air dried, water and wood ash soaked A. saligna leaves fed grass hay as a basal diet
Treatments
Variables T1 T2 T3 T4 SE Prob>F
Lung, trachea and oesophagus(g) 301 333 319.8 308.4 11.05 0.225
Heart(g) 66.2 72.2 69.2 68.8 2.88 0.555
Liver(g) 225b 262.6a 259.6ab 248.8ab 8.37 0.034
Kidney (g) 45.6 53.2 47.8 49.6 2.56 0.248
Empty gut (kg) 1.099 1.245 1.17 1.196 0.056 0.369
Ret‐Rum (g) 485 513.2 512 502 9.816 0.201
Oma‐abom(g) 172.6 175.4 160.4 164.6 14.53 0.874
Small intestine (g) 375.6b 507.2a 399ab 460ab 27.24 0.0203
Large intestine (g) 66 70 77.2 90 8.74 0.279
Kidney fat (g) 39.6b 70.2a 62.8ab 65.2ab 6.3 0.022
Omental fat (g) 54 96 123.8 111 18.3 0.089
Intestinal fat (g) 48.4 85 110.8 96.8 24.66a 0.360
Genital fat(g) 41a 64.6ab 73a 67.2ab 6.84 0.029
Tail (g) 73 86.6 70.4 72.8 4.095 0.061
Blood(g) 630.2b 713a 663.6ab 636.4b 0.02 0.022
Tongue(g) 43.8 48.4 46.8 47.2 3.56 0.823
Head(kg) 1.172 1.214 1.17 1.136 0.032 0.428
Total EOC (kg) 3.846 4.351 4.192 4.109 0.12 0.067
%Total EOC 22.61 22.62 22.15 22.4 0.353 0.752
TUP(kg) 5.21 5.64 5.54 5.67 0.164 0.093
TUP% 30.64 29.36 29.31 30.75 0.73 0.356
Skin (kg) 1.363 1.291 1.352 1.353 0.041 0.569
Testicle & penis (g) 145.6 161.8 164.2 161.4 8.286 0.403
Gut fill (kg) 5.1 5.71 5.7 5.51 0.196 0.116
Gall bladder (g) 6.2 5.6 4.4 6.4 1.06 0.557
Urinary bladder (g) 12.6 11.8 13.8 14.6 2.281 0.827
Spleen and pancreas(g) 43.6 53.2 50.8 47.2 2.39 0.068
Feet (kg) 0.415 0.457 0.429 0.442 0.016 0.315
Total NEOC (kg) 1.985 1.981 2.016 2.232 0.11 0.365
%Total NEOC 11.7 10.33 10.67 12.07 0.6 0.185 abMeans in the same row with different superscript differ significantly; SE = standard error; prob>F=Probability value; EOC=edible offal components; NEOC = Non‐ edible offal component
Conclusions
Higher body weight gain, hot carcass and empty weight were observed for goats supplemented with air dried A.saligna leaves as compared to non supplemented goats. In this experiment most of the edible offal and the non edible offal components did not vary among the treatments. Therefore, from the findings it can be concluded that the treatments have not shown any effect in most of the offal components.
Ethiopian Society of Animal Production 2014
73
Acknowledgement
The authors would like to thank for Rural Capacity Building Project (RCBP) and Tigray Agricultural Research Institute for their financial support.
Reference
Abdulrazak, S.A., Fujihara, T., Ondiek J.K., Ørskov E.R. 2005. Nutritive evaluation of some Acacia tree leaves from Kenya. Anim. Feed Sci. Technol. 85, 89‐98.
Atti, N., Rouissi, H. and Mahouachi, M. 2004. The effect of dietary crude protein level on growth, carcass and meat composition of male kids in Tunisia. Small Ruminant Research 54: 89‐97
Ben Salem, H., Nefzaoui, A. and Ben Salem, L. 1998. Intake, digestibility, urinary excretion of purine derivatives and growth by sheep given fresh, air‐dried or polyethylene glycol ‐ treated foliage of Acacia cynophylla Land. Animal Feed Science and Technology.78: 297‐311.
Ben Salem H., Sourour Abidi. Makkar H.P.S., and Nefzaoui, A. 2005. Wood ash treatment a cost‐effective way to deactivate tannins in Acacia cyanophylla Lindl. foliage and to improve digestion by Barbarine sheep, J.anim. feedsc.and Technol.122:93‐108
Bruh Weldemarim. 2008. Supplementation with dried foliages of selected indigenous browses: effects on feed intake, digestibility, body weight gain and carcass characteristics of Abergelle goats offered hay. MSc.Thesis, Haramaya University, Ethiopia.
Chestnut, D.M.B. 1994. Effect of lamb growth rate and growth pattern on carcass fat leaves. Anim. Prod. 58: 77‐85.
Devendra, C. and Burns, M. 1983. Goat Production in the Tropics Common wealth Agricultural Bureaux, Farnham Royal, England.
ESGPIP (Ethiopia sheep and goat productivity improvement program). 2008. Sheep and goat production hand book. Ethiopia ministry of Agriculture and Rural, Ethiopia. Jones, D.R. and William, C.S. 1993. Beef Carcass grading and Evaluation, Food science and nutrition department. University of Missouri Extension.
Kirton, A. H., Bennett, L.G., Dobbie, L. J., Mercer, K.G., Duganzich, M.D. 1995. Effects of sire breed ( southern down, Sufflock) Sex and growth path on carcass composition of cross‐ bred lambs. J. Agric. Res. 38: 105‐114.
Ethiopian Society of Animal Production 2014
74
Maslin and McDonald. 2004 .In the Acacia Search Report: for more information on acacia search http:www.world wattle.com/infogallery/utilization/acacia search Mulu Mogos. 2005. Effect of feeding different levels of brewery dried grain on live weight gain and carcass characteristic of Wogera sheep on hay a basal diet. MSc thesis Alemaya University, Ethiopia.
Michaelides, E.D. 1979. Mini‐monograph on, Acacia cyanophylla Technical Consultation on Fast‐Growing Plantation Broad leaved Trees for Mediterranean and Temperate Zones. Lisbon, Portugal, pp.16‐20.
Mousa, M.R.M. 2011. Effect of feeding acacia as supplements on the nutrient digestion, growth performance, carcass traits and some blood constituents of Awassi lambs under the conditions of North Sinai. Asian J. Anim. Sci., 5:102‐117.
Regasa Begna, 2010. Effect of feeding different levels of dried and ensiled Taro (Colocasia esculenta) leaves on the performance of Sheko yearling rams in Bench Maji Zone of Ethiopia. MSc.thesis, Mekelle University.
SAS Institute Inc. 2002. JMP‐5 Statistical Software, Version 5.Cary, NC, USA.
Solomon Melaku. 2001. Evaluation of selected multipurpose trees as feed supplements in tef (Eragrostis tef) straw based feeding of Menz sheep. PhD. Thesis, Humboldt University, Berlin Germany. p.194.
Solomon Melaku and Simret Betsha. 2008. Bodyweight and carcass characteristics of Somali goats fed hay supplemented with graded levels of peanut cake and wheat bran mixture. Trop Anim Health Prod; 40 (7):553‐560.
Tamir, B. and Asefa, G. 2009. Effects of different forms of Acacia saligna leaves inclusion on feed intake, digestibility and body weight gain in lambs fed grass hay basal diet. Anim. Feed Sci. Technol. 153, 39‐47.
Tesfay Hagos and Solomon Melaku. 2008. Feed intake, digestibility, body weight and carcass parameters of Afar rams fed tef (Eragrostis tef) straw supplemented with graded levels of concentrate mix. Trop Anim Health Prod. 41:599‐606
Woodward, A. and Reed, J.D. 1989. The influence of polyphenolics on the nutritive value of browse: A summary of research conducted at ILCA. ILCA Bulletin. No.35: 2‐11.
Ethiopian Society of Animal Production 2014
75
Feed Intake and Growth Performance and Economic Returns of Horro Lambs Fed Natural Pasture Hay Supplemented with Graded Levels of
Dried Vernonia Amygdalina Leaves and Sorghum Grain Mixture Firisa Woyessa1*, Adugna Tolera2 and Diriba Diba1
1Departement of Animal Science, College of Agriculture and Natural Resources, Wollega University, P. O. Box 395, Nekemte, Ethiopia. [email protected]
2Department of Animal and Range Sciences, College of Agriculture, Hawassa University, P.O. Box 05, Hawassa, Ethiopia. [email protected]
Corresponding author: Firissa Woyessa, email: [email protected]
Abstract
This study was undertaken with the objectives of evaluating the effect of dried and ground Vernonia (V. amygdalina) leaves and ground sorghum (S. bicolor) grain mixture supplementation on feed conversion efficiency, growth performance, and economic benefits of Horro lambs fed a basal diet of natural pasture hay. A mixture of 33% Vernonia leaf meal and 67% sorghum grain was used as a supplement. The feeding trial was conducted using twenty male Horro lambs with initial average live weight of 15.4 ±0.58 (mean ± SD). The lambs were grouped into four blocks of five animals based on initial body‐weight and randomly assigned to the treatment diets. The four treatments were: Treatment 1 (T1; control, hay ad libitum alone), Treatment 2 (T2; hay ad libitum + 150 g), Treatment 3 (T3; hay ad libitum + 300 g), and Treatment 4 (T4; hay ad libitum + 450 g) supplements. The feeding experiment lasted 90 days. The total dry matter intake and organic matter intake for T3 and T4 was higher (P < 0.01) than that of T1. The crude protein intake for T4 was the highest while those in T1 were the lowest. The body weight gain for lambs fed hay only were lower (P < 0.01) than the other treatment groups while the highest (P < 0.01) weight gain was recorded for T3 and T4. Feeding vernonia leaves at T3 and T4 could increase the utilization of nutrients with highest growth performance of lambs compared to the others. Lambs supplemented 300 g/d had higher net income as compared to the other supplemented and non‐supplemented ones suggesting that supplementation of natural pasture hay with 300 g/d of the mixture is potentially more profitable and economically beneficial than the other supplement feeds. Key words: lambs, Vernonia, feed intake, body weight change
Introduction
Sheep is the second most populous and important livestock species in Ethiopia, which is estimated to be 26 million (CSA, 2008). Sheep serve as a source of cash income. They also serve as a source of quality protein. .Since sheep rearing in most production system takes short time to produce meat, farmers always aim to have sheep that can give the maximum possible lean meat in the shortest possible time. In this regard, Horro lambs have good merits for increased body weight gain post weaning (Kassahun, 2000). However, the existing natural pasture couldn’t support these sheep to manifest their genetic potential to the optimum. Ewnetu (1999) indicated average daily live weight gain of 60.3+1.9g when lambs grazing natural pasture were supplemented with 150‐200 g/day of protein
Ethiopian Society of Animal Production 2014
76
concentrate diets. This implies that protein supplementation plays important role in the growth performance, overall productivity, and profitability of the sheep flock. Therefore, it is especially important to consider how indigenous browse species or herbages and other agricultural products/concentrate supplements can be used to advance the performance of sheep so that the benefits of the farmers may be optimized both in quality meat production and in income perspectives (Lester, 2006). Tree and shrub legumes are important in producing large quantities of forage because of their deep‐root systems and with correct management can produce green feed for much of the dry season. So indigenous multipurpose trees and legume forages such as Vernoniaamygdalina can be used as an alternative protein supplement because of their green leaves and sustainability, but their potential as forage has been subject of little research (Aynalem and Taye, 2008). Foliage from this plant is commonly available from nurseries, gardens or backyard and farmlands. Sorghum grain is one of the energy source concentrates that can be used as human and animal feed. Feeding sorghum grain to lambs and kids improves growth performance of the animals and allows the producer more easily monitor the health and condition of animals. In general, grain‐fed livestock grow faster, become fleshier and tolerate the effects of internal parasites better (NRC, 1996). The research hypothesis is that indigenous multipurpose browse species such as V. amygdalina can serve as an alternative protein supplement because of their green fodder production capability, sustainability, low cost and accessibility. Therefore, this research was prepared with the following objectives.
To study the effect of dried and ground Vernonia (V. amygdalina) leaves and ground sorghum (Sorghum bicolor) grain mixture on body weight change and feed conversion efficiency of Horro lambs
To evaluate the economic benefits of Horro lambs fed natural pasture hay supplemented with graded level of Vernonia amygdalina leaves and Sorghum grain mixture
Material and Methods
Description of the Study Area
The study was conducted at Nekemte town of East Wollega Zone, Oromiya Regional State, located at 332 km west of Addis Ababa.Nekemte is located at 906’N latitude and 3709’ E longitude, with average altitude of 1950 m.a.s.l according to ADO (2010). A unimodal rainfall pattern and annual total rainfall of 1244 mm and the minimum and maximum air temperature of 15oC and 28oC, respectively characterize the area. The rainy season occurs from April to September and maximum rainfall is received in the months of June, July and August( ADO (2010).
Experimental feed and feeding management
Natural pasture hay was bought form Holeta town and nearby markets which were produced by farmers of the area. It was regarded as low quality hay. Graded levels of green Vernonia amygdalina leaves (33%) and ground sorghum grain (67%) were used as supplements in the experiment. Vernonia leaves were collected by local peoples by cutting the branch of the tree at facilitate the way of harvesting the pure leaves around Nekemte
Ethiopian Society of Animal Production 2014
77
town the place where experiment take place in December and January of the year. After collection it was putted on plastic to minimize mix with other materials. The Vernonia leaves were air dried and crushed into pieces by homemade mortar and pestle, commonly used by the community in the area, until it becomes powder to thoroughly mix with ground sorghum grain to minimize selection by the animals. Natural pasture hay was offered ad libtum for experimental sheep. The supplements, ground Vernonia leaves and sorghum grain mixture were offered in two equal portions at 10:00 h in the morning and 14:00 h in the afternoon. The experimental sheep had free access to drinking water.
Experimental animals and management
Twenty yearlings male Horro lambs with initial average live weight of 15.38 ±0.58 (mean ± SD) were purchased from Nekemte livestock market. The age of the animals were estimated to be around one year based on the dentition and information from the owners. The animals were acclimatized to the environment for one month and during this period they were de‐wormed against internal parasites and sprayed against external parasites. They were penned individually and offered ad libtium natural pasture hay and supplemented with dried Vernonia amygdalina leaves and ground sorghum grain mixture.
Experimental design and treatments
A randomized complete block design was used for the experiment. At the end of the acclimatization period, the animals were grouped into four blocks of five animals based on initial live‐weight and randomly assigned to treatment diets. The four treatments include: Treatment 1 (T1; control, no supplement), Treatment 2 (T2; hay ad lib + 150g /animal supplement), Treatment 3 (T3; hay ad lib + 300 g/animal supplement), and Treatment 4 (T4; hay ad lib + 450g//animal supplement). One animal from each block was assigned to each treatment, which gives a total of five animals per treatment.
Measurement and observation
Feed intake
Feed offered to the experimental animals and corresponding refusals were recorded daily throughout the experimental period to determine daily feed intake. Samples of feed offered are collected from each treatment diet, while samples of refusal are taken from each sheep daily per treatment over the experimental period. This was pooled over the experimental period and sub‐sampled for analysis. Experimental sheep had free access to drinking water. Body weight change: Data on live weight change was taken every ten days. The lambs were fasted for 12h over night before weighing for data collection on BW. The average daily BW gain for each sheep was determined as a difference between the final and initial BW divided by the total number of actual feeding days. Feed conversion efficiency (FCE), which is the measure of feed utilization, was calculated as unit of body weight gain per unit of feed consumed.
Chemical analysis
Representative samples of daily feed offered and refused were collected, weighed and separately stored. It was kept in a room with adequate natural ventilation until the end of
Ethiopian Society of Animal Production 2014
78
the experimental period.Then the feed samples were thoroughly mixed, sub sampled and taken to the Holleta Agricultural Research Center Nutrition Laboratory for chemical analysis.The dry matter (DM), organic matter (OM) and nitrogen (N) of sample of feed offered and refused and feaces were analysed by using AOAC (1990) method. Neutral detergent fiber (NDF), acid detergent fiber (ADF), and acid detergent lignin (ADL) in the samples of feeds that were offered, and from refusals and feaces were determined by the method of Van Soest and Robertson (1985). The N was determined by Kjeldhal technique and the crude protein (CP) content was calculated by multiplying N content with 6.25. In vitro organic matter digestibility was determined using procedures out lined (Tilley and Terry, 1963).
Statistical analysis
The analyses of variance (ANOVA) on (feed intake, digestibility and body weight change was run using the General Linear Model procedure of Statistical Analysis System (SAS) (2004). The statistical model used for the experiment was as described below: Yijk = μ + i + j + eijk Where: Yij = the observation in the ith treatment and jth block; μ = the overall mean; �i = the ith treatment effect and j = the jth block effect; eijk = the random error associated with Yijk
Partial budget analysis
Partial budget analysis was employed to determine the profitability of feedlot growth rate of sheep with protein and energy supplementation. The economic analysis includes calculation of variable costs and benefits. Purchase price of each experimental sheep, feeds and other costs were recorded. Therefore, the selling price of each experimental sheep was determined by inviting well‐experienced sheep dealers who know the prevailing market price of different size of sheep in Nekemte town. For the calculation of variable costs, the expenditures on various feed stuffs were taken into consideration. Net income (NI) were calculated as the amount of money left when total variable costs (TVC) subtracted from the total returns (TR) NI = TR‐TVC The changes in net income (∆ NI) were calculated as the difference between changes in total return (∆ TR) and the change in total variable costs (∆TVC). ∆ NI= ∆TR‐∆TVC The marginal rate of return (MRR) that measures the increase in net income (∆NI) associated with each additional unit of expenditure (∆ TVC) were calculated as MRR= (∆ NI/∆ TVC)*100
Results and Discussion
Chemical composition of experimental feeds
The chemical composition of experimental feeds is shown in Table 1.The natural pasture hay had low CP (5.5%) and high NDF (76.3%), ADF (39.7%) and ADL (7.8%) contents. The high fiber content and low CP content of the natural pasture hay could be explained by different factors affecting the nutritive value of natural pasture hay. These factors could be varietal differences, location or climate, fertility of the land, stage of maturity at harvest, morphological fractions (e.g. leaf to steam ratio), harvesting and transporting practices, length and condition of storage time (Archimede et al, 2000; Ru and Fortune, 1999 and
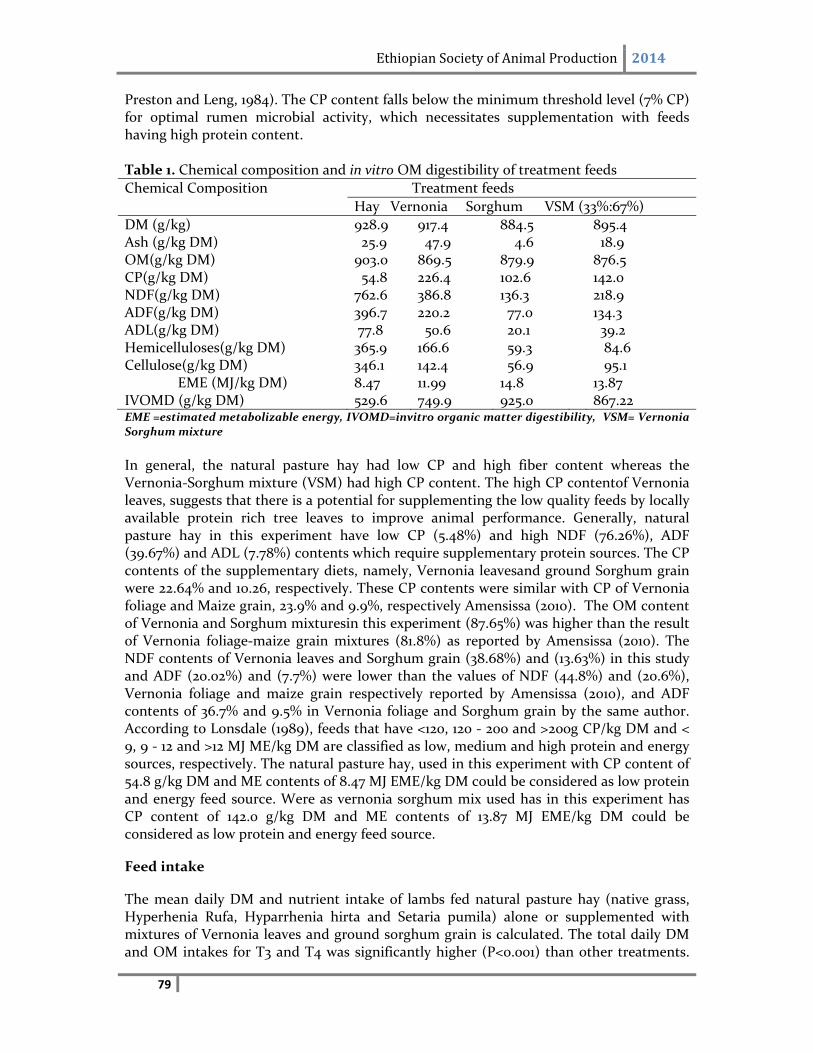
Ethiopian Society of Animal Production 2014
79
Preston and Leng, 1984). The CP content falls below the minimum threshold level (7% CP) for optimal rumen microbial activity, which necessitates supplementation with feeds having high protein content. Table 1. Chemical composition and in vitro OM digestibility of treatment feeds
Chemical Composition Treatment feeds
Hay Vernonia Sorghum VSM (33%:67%)
DM (g/kg) 928.9 917.4 884.5 895.4 Ash (g/kg DM) 25.9 47.9 4.6 18.9 OM(g/kg DM) 903.0 869.5 879.9 876.5 CP(g/kg DM) 54.8 226.4 102.6 142.0 NDF(g/kg DM) 762.6 386.8 136.3 218.9 ADF(g/kg DM) 396.7 220.2 77.0 134.3 ADL(g/kg DM) 77.8 50.6 20.1 39.2 Hemicelluloses(g/kg DM) 365.9 166.6 59.3 84.6 Cellulose(g/kg DM) 346.1 142.4 56.9 95.1
EME (MJ/kg DM) 8.47 11.99 14.8 13.87 IVOMD (g/kg DM) 529.6 749.9 925.0 867.22 EME =estimated metabolizable energy, IVOMD=invitro organic matter digestibility, VSM= Vernonia Sorghum mixture
In general, the natural pasture hay had low CP and high fiber content whereas the Vernonia‐Sorghum mixture (VSM) had high CP content. The high CP contentof Vernonia leaves, suggests that there is a potential for supplementing the low quality feeds by locally available protein rich tree leaves to improve animal performance. Generally, natural pasture hay in this experiment have low CP (5.48%) and high NDF (76.26%), ADF (39.67%) and ADL (7.78%) contents which require supplementary protein sources. The CP contents of the supplementary diets, namely, Vernonia leavesand ground Sorghum grain were 22.64% and 10.26, respectively. These CP contents were similar with CP of Vernonia foliage and Maize grain, 23.9% and 9.9%, respectively Amensissa (2010). The OM content of Vernonia and Sorghum mixturesin this experiment (87.65%) was higher than the result of Vernonia foliage‐maize grain mixtures (81.8%) as reported by Amensissa (2010). The NDF contents of Vernonia leaves and Sorghum grain (38.68%) and (13.63%) in this study and ADF (20.02%) and (7.7%) were lower than the values of NDF (44.8%) and (20.6%), Vernonia foliage and maize grain respectively reported by Amensissa (2010), and ADF contents of 36.7% and 9.5% in Vernonia foliage and Sorghum grain by the same author. According to Lonsdale (1989), feeds that have <120, 120 ‐ 200 and >200g CP/kg DM and < 9, 9 ‐ 12 and >12 MJ ME/kg DM are classified as low, medium and high protein and energy sources, respectively. The natural pasture hay, used in this experiment with CP content of 54.8 g/kg DM and ME contents of 8.47 MJ EME/kg DM could be considered as low protein and energy feed source. Were as vernonia sorghum mix used has in this experiment has CP content of 142.0 g/kg DM and ME contents of 13.87 MJ EME/kg DM could be considered as low protein and energy feed source.
Feed intake
The mean daily DM and nutrient intake of lambs fed natural pasture hay (native grass, Hyperhenia Rufa, Hyparrhenia hirta and Setaria pumila) alone or supplemented with mixtures of Vernonia leaves and ground sorghum grain is calculated. The total daily DM and OM intakes for T3 and T4 was significantly higher (P<0.001) than other treatments.
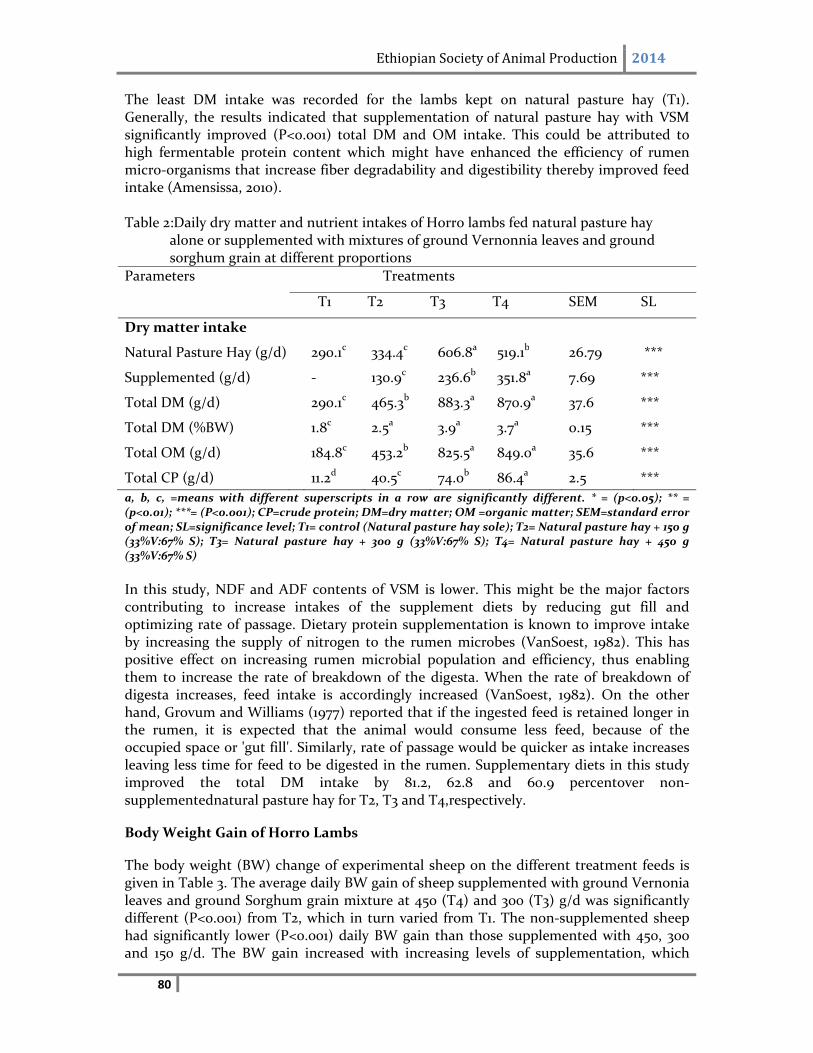
Ethiopian Society of Animal Production 2014
80
The least DM intake was recorded for the lambs kept on natural pasture hay (T1). Generally, the results indicated that supplementation of natural pasture hay with VSM significantly improved (P<0.001) total DM and OM intake. This could be attributed to high fermentable protein content which might have enhanced the efficiency of rumen micro‐organisms that increase fiber degradability and digestibility thereby improved feed intake (Amensissa, 2010). Table 2:Daily dry matter and nutrient intakes of Horro lambs fed natural pasture hay
alone or supplemented with mixtures of ground Vernonnia leaves and ground sorghum grain at different proportions
Parameters Treatments
T1 T2 T3 T4 SEM SL
Dry matter intake
Natural Pasture Hay (g/d) 290.1c 334.4c 606.8a 519.1b 26.79 ***
Supplemented (g/d) ‐ 130.9c 236.6b 351.8a 7.69 ***
Total DM (g/d) 290.1c 465.3b 883.3a 870.9a 37.6 ***
Total DM (%BW) 1.8c 2.5a 3.9a 3.7a 0.15 ***
Total OM (g/d) 184.8c 453.2b 825.5a 849.0a 35.6 ***
Total CP (g/d) 11.2d 40.5c 74.0b 86.4a 2.5 ***
a, b, c, =means with different superscripts in a row are significantly different. * = (p<0.05); ** = (p<0.01); ***= (P<0.001); CP=crude protein; DM=dry matter; OM =organic matter; SEM=standard error of mean; SL=significance level; T1= control (Natural pasture hay sole); T2= Natural pasture hay + 150 g (33%V:67% S); T3= Natural pasture hay + 300 g (33%V:67% S); T4= Natural pasture hay + 450 g (33%V:67% S)
In this study, NDF and ADF contents of VSM is lower. This might be the major factors contributing to increase intakes of the supplement diets by reducing gut fill and optimizing rate of passage. Dietary protein supplementation is known to improve intake by increasing the supply of nitrogen to the rumen microbes (VanSoest, 1982). This has positive effect on increasing rumen microbial population and efficiency, thus enabling them to increase the rate of breakdown of the digesta. When the rate of breakdown of digesta increases, feed intake is accordingly increased (VanSoest, 1982). On the other hand, Grovum and Williams (1977) reported that if the ingested feed is retained longer in the rumen, it is expected that the animal would consume less feed, because of the occupied space or 'gut fill'. Similarly, rate of passage would be quicker as intake increases leaving less time for feed to be digested in the rumen. Supplementary diets in this study improved the total DM intake by 81.2, 62.8 and 60.9 percentover non‐supplementednatural pasture hay for T2, T3 and T4,respectively.
Body Weight Gain of Horro Lambs
The body weight (BW) change of experimental sheep on the different treatment feeds is given in Table 3. The average daily BW gain of sheep supplemented with ground Vernonia leaves and ground Sorghum grain mixture at 450 (T4) and 300 (T3) g/d was significantly different (P<0.001) from T2, which in turn varied from T1. The non‐supplemented sheep had significantly lower (P<0.001) daily BW gain than those supplemented with 450, 300 and 150 g/d. The BW gain increased with increasing levels of supplementation, which
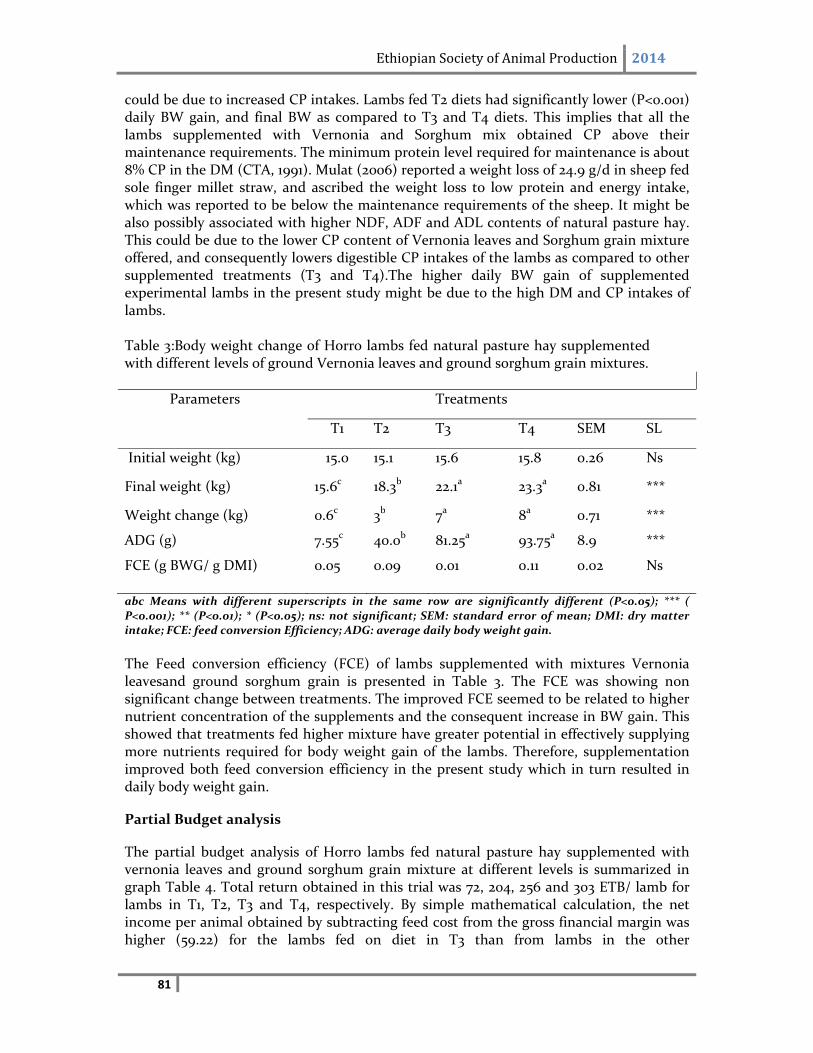
Ethiopian Society of Animal Production 2014
81
could be due to increased CP intakes. Lambs fed T2 diets had significantly lower (P<0.001) daily BW gain, and final BW as compared to T3 and T4 diets. This implies that all the lambs supplemented with Vernonia and Sorghum mix obtained CP above their maintenance requirements. The minimum protein level required for maintenance is about 8% CP in the DM (CTA, 1991). Mulat (2006) reported a weight loss of 24.9 g/d in sheep fed sole finger millet straw, and ascribed the weight loss to low protein and energy intake, which was reported to be below the maintenance requirements of the sheep. It might be also possibly associated with higher NDF, ADF and ADL contents of natural pasture hay. This could be due to the lower CP content of Vernonia leaves and Sorghum grain mixture offered, and consequently lowers digestible CP intakes of the lambs as compared to other supplemented treatments (T3 and T4).The higher daily BW gain of supplemented experimental lambs in the present study might be due to the high DM and CP intakes of lambs. Table 3:Body weight change of Horro lambs fed natural pasture hay supplemented with different levels of ground Vernonia leaves and ground sorghum grain mixtures.
abc Means with different superscripts in the same row are significantly different (P<0.05); *** ( P<0.001); ** (P<0.01); * (P<0.05); ns: not significant; SEM: standard error of mean; DMI: dry matter intake; FCE: feed conversion Efficiency; ADG: average daily body weight gain.
The Feed conversion efficiency (FCE) of lambs supplemented with mixtures Vernonia leavesand ground sorghum grain is presented in Table 3. The FCE was showing non significant change between treatments. The improved FCE seemed to be related to higher nutrient concentration of the supplements and the consequent increase in BW gain. This showed that treatments fed higher mixture have greater potential in effectively supplying more nutrients required for body weight gain of the lambs. Therefore, supplementation improved both feed conversion efficiency in the present study which in turn resulted in daily body weight gain.
Partial Budget analysis
The partial budget analysis of Horro lambs fed natural pasture hay supplemented with vernonia leaves and ground sorghum grain mixture at different levels is summarized in graph Table 4. Total return obtained in this trial was 72, 204, 256 and 303 ETB/ lamb for lambs in T1, T2, T3 and T4, respectively. By simple mathematical calculation, the net income per animal obtained by subtracting feed cost from the gross financial margin was higher (59.22) for the lambs fed on diet in T3 than from lambs in the other
Parameters Treatments
T1 T2 T3 T4 SEM SL
Initial weight (kg) 15.0 15.1 15.6 15.8 0.26 Ns
Final weight (kg) 15.6c 18.3b 22.1a 23.3a 0.81 ***
Weight change (kg) 0.6c 3b 7a 8a 0.71 ***
ADG (g) 7.55c 40.0b 81.25a 93.75a 8.9 ***
FCE (g BWG/ g DMI) 0.05 0.09 0.01 0.11 0.02 Ns
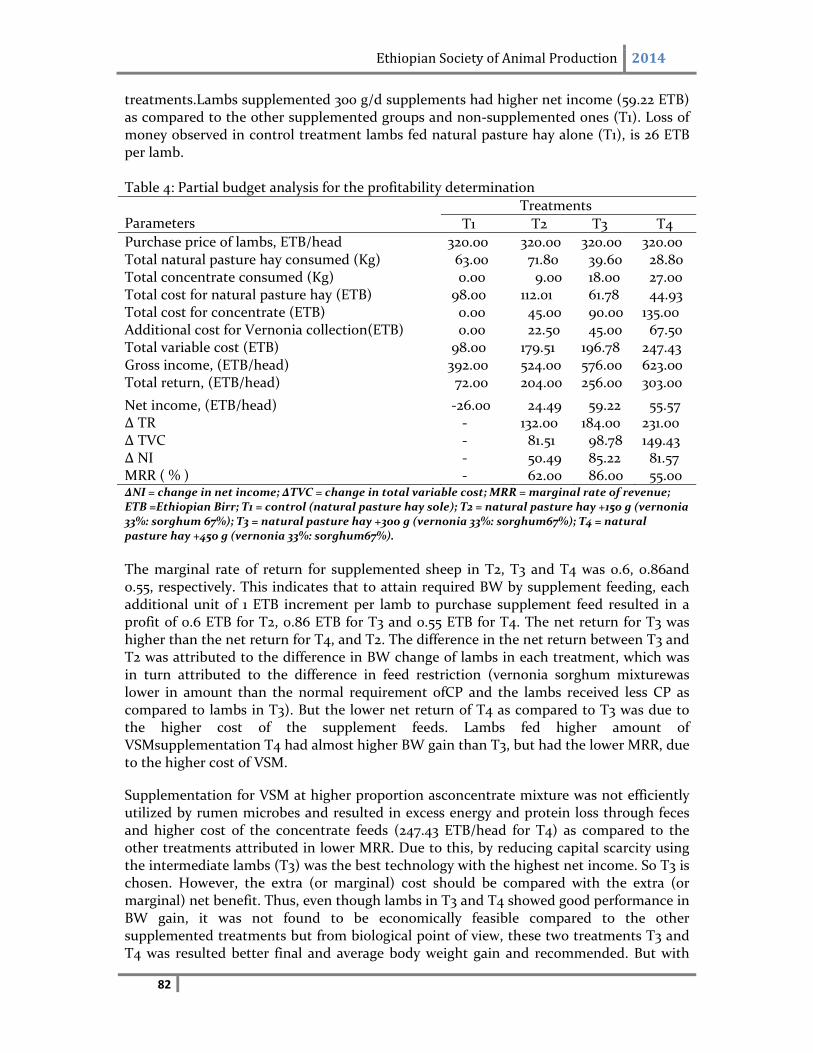
Ethiopian Society of Animal Production 2014
82
treatments.Lambs supplemented 300 g/d supplements had higher net income (59.22 ETB) as compared to the other supplemented groups and non‐supplemented ones (T1). Loss of money observed in control treatment lambs fed natural pasture hay alone (T1), is 26 ETB per lamb. Table 4: Partial budget analysis for the profitability determination
Parameters
Treatments
T1 T2 T3 T4
Purchase price of lambs, ETB/head 320.00 320.00 320.00 320.00 Total natural pasture hay consumed (Kg) 63.00 71.80 39.60 28.80 Total concentrate consumed (Kg) 0.00 9.00 18.00 27.00 Total cost for natural pasture hay (ETB) 98.00 112.01 61.78 44.93 Total cost for concentrate (ETB) 0.00 45.00 90.00 135.00 Additional cost for Vernonia collection(ETB) 0.00 22.50 45.00 67.50 Total variable cost (ETB) 98.00 179.51 196.78 247.43 Gross income, (ETB/head) 392.00 524.00 576.00 623.00 Total return, (ETB/head) 72.00 204.00 256.00 303.00
Net income, (ETB/head) ‐26.00 24.49 59.22 55.57 Δ TR ‐ 132.00 184.00 231.00 Δ TVC ‐ 81.51 98.78 149.43 Δ NI ‐ 50.49 85.22 81.57 MRR ( % ) ‐ 62.00 86.00 55.00 ΔNI = change in net income; ΔTVC = change in total variable cost; MRR = marginal rate of revenue; ETB =Ethiopian Birr; T1 = control (natural pasture hay sole); T2 = natural pasture hay +150 g (vernonia 33%: sorghum 67%); T3 = natural pasture hay +300 g (vernonia 33%: sorghum67%); T4 = natural pasture hay +450 g (vernonia 33%: sorghum67%).
The marginal rate of return for supplemented sheep in T2, T3 and T4 was 0.6, 0.86and 0.55, respectively. This indicates that to attain required BW by supplement feeding, each additional unit of 1 ETB increment per lamb to purchase supplement feed resulted in a profit of 0.6 ETB for T2, 0.86 ETB for T3 and 0.55 ETB for T4. The net return for T3 was higher than the net return for T4, and T2. The difference in the net return between T3 and T2 was attributed to the difference in BW change of lambs in each treatment, which was in turn attributed to the difference in feed restriction (vernonia sorghum mixturewas lower in amount than the normal requirement ofCP and the lambs received less CP as compared to lambs in T3). But the lower net return of T4 as compared to T3 was due to the higher cost of the supplement feeds. Lambs fed higher amount of VSMsupplementation T4 had almost higher BW gain than T3, but had the lower MRR, due to the higher cost of VSM.
Supplementation for VSM at higher proportion asconcentrate mixture was not efficiently utilized by rumen microbes and resulted in excess energy and protein loss through feces and higher cost of the concentrate feeds (247.43 ETB/head for T4) as compared to the other treatments attributed in lower MRR. Due to this, by reducing capital scarcity using the intermediate lambs (T3) was the best technology with the highest net income. So T3 is chosen. However, the extra (or marginal) cost should be compared with the extra (or marginal) net benefit. Thus, even though lambs in T3 and T4 showed good performance in BW gain, it was not found to be economically feasible compared to the other supplemented treatments but from biological point of view, these two treatments T3 and T4 was resulted better final and average body weight gain and recommended. But with
Ethiopian Society of Animal Production 2014
83
regard to economic profitability the results of this study suggested that supplementation of natural pasture hay with 300g/d VSMis potentially more profitable and economically beneficial than the other supplement feeds.
Conslusion
The Supplementation of Horro lambs with Vernonia leaves and ground sorghum grain mixture at 450g (T4) and 300g (T3) per day on DM bias improved final BW gain and average daily WG. Lambs supplemented 300g/d with mixtures of 67% Sorghumand 33% Vernonia had higher net income (59.22 ETB) as compared to the other supplemented groups and non‐supplemented ones (T1). Thus the economic profitability of this study suggested that supplementation of natural pasture hay with 300g/d VSMis found to be more profitable and economically beneficial than the other supplement feeds.
Acknowledgement
The authors appreciate the cooperation of Holetta Agricultural Research Center Nutrition Laboratory Staffs for their responsive services.
References
Agricultural Development Office Report of Guto Gida Woreda( ADORGW), 2010. Annual reports of agricultural operation
Amensissa Eresso, 2010. Effect of supplementation of dried “Grawa” (vernonia amygdalina) foliage and crushed maize grain mixtures on feed intake, digestibility and body weight change of Horro sheep fed natural pasture hay. MSc. Thesis. Haramaya University Ethiopia. Pp.35‐47.
Association of Analytical chemists (AOAC), 1990. Official methods of analysis, 15th edition Association of Analytical Chemists (AOAC). In C,Artington, Verginia, USA. Archimede H., Boval M. and Alexandre G., 2000. Effect of regrowth age on intake and digestion of Digitaria decumbens consumed by Black‐Belly sheep. Animal Feeds Science and Technology. ELSEVIER Science. Aynalem Haile and Taye Tolemariam, 2008. The feed values of indigenous multipurpose trees for sheep in Ethiopia: the case of vernonia amygdalina, buddleja polystachya and maesa lanceolata.Berhanu Belay and Aynalem Haile, 2009.Factors affecting growth performance of sheep under village managementconditions in the south western part of Ethiopia. Central Statistical Authority (CSA), 2008. Summary and Statistical Report of the 2007 Population and Housing Census, Addis Ababa, Ethiopia. 114Pp.
Ewenetu Ermias, 1999. Between and with in breed variation in feed intake and fat deposition, and genetic association of these with some production traits in Menz and Horro sheep. Msc thesis presented to the school of graduate studies of Alemaya University. Pp. 149.
Ethiopian Society of Animal Production 2014
84
Grovum, W.L. and J.V.William, 1977. Rate of passage of digesta in sheep. The effect of food intake on mathematical prediction of the kinetics of digesta in the reticulo‐rumen and intestines. Br. J. Nutr. 38: 425‐436.
Kassahun Awgichew, 2000. Comparative performance evaluation of Horro and Menz sheep of Ethiopia under grazing and intensive feeding conditions. PhD dissertation. Animal Science. Unverisity of Wales, Uk. 173p.
Kaitho, R.J., 1997. Nutritive value of browses as protein supplements to poor quality roughages. PhD Thesis. Wageningen Agricultural University, The Netherlands. 70p.
Lester Brown, R., 2006. Moving up the food chain efficiently. In: Out Growing the Earth. Ch.3. Earth policy organization, Washington, DC. http://www.earth.policy.org/Books/Ote3. Retrieved on July 20, 2007.
Lonsdale C., 1989. Raw Materials for Animal Feed Compounders and Farmers. Chalcombe Publications. 88p. McDonald, P., R.A. Edwards, J.F.D. Greenhangh and C.A. Morgan, 2002. Animal Nutrition. 6th ed. Prentice Hall, London. pp 583‐59. Mengistu, W., 2001. Prickly pear cactus (Opuntia ficus‐indica) as feed to ruminants. MSc. Thesis presented to Swedish University of Agricultural Science, Uppsala. 88p.
Ministry of Agriculture ( MoA), 1999. Live Stock Development Technical Report. A National Workshop on Live Stock Development. Animal and Fisheries Resources and Health Technology Development and Regulatory Main Department, MoA (Ministry of Agriculture), Addis Ababa, Ethiopia. 11‐14 March 1999.
Mulat Alem, 2006. Effects of Supplementing Different Protein Sources on Feed intake and Live Weight Gain of Local Sheep Fed on Finger Millet (Eleucine coracana) Straw Basal Diet. MSc. Thesis. Alemaya University Ethiopia. Pp
NRC, 1996. Nutrient requirement of sheep. Sixth revised ed. National Academy press, Washington, DC (USA).
Preston, T.R. and R.A. Leng, 1984. Supplementation of diets based on fibrous residues and by‐products. pp. 373‐409. In: F. Sundstol and E. owen (eds.). Straw and other fibrous byproducts feed. Elsevier Publishing Company. Amsterdam.
Ru Y.J and J.A.Fortue, 1999. Sward characteristics and nutritive value of two cultivars of subterranean clover. Asian‐Aus. J. Anim. Scie. Vol. 12; No. 8; 1192‐1199.
Tesfay Hagos, 2007. Supplementation of Afar Rams with Graded Levels of Mixtures of Protein and Energy Sources: Effects on Feed Intake, Digestibility, Live Weight and CarcassParameters. An MSc.Thesis Presented to School of Graduate Studies, Haramaya University, Ethiopia. .
Tikabo, G., 2004. Survey on cactus pear (Opuntia ficus indica) in Enderta Wereda, Southern Tigray and effect of wilting and different levels of cactus inclusion on feed
Ethiopian Society of Animal Production 2014
85
utilization in sheep. An MSc Thesis Presented to the School of Graduate Studies of Alemay University.52p.
Tilley, J.M.A. and Terry, R.A, 1963. A two stage technique for invitro digestion of forage crops. Journal of the British Grassland society 18:104.
Van Soest, P.J., 1982. Nutritional Ecology of the Ruminant, O and B books Corvallis, Oregon, USA.
Van Soest,P.J., 1967. Development of Comparative system of feed analysis and its application to forages. J.of Anim. Sci. 26: 119‐128.
Van Soest, P.J. and Robertson, J.B., 1985. Analysis of forage and fibrous foods. A laboratory manual for Animal Science 613 cornell university, Ithaca, New York, USA.
Yoseph Mekasha, 1999. Impact of Feed Resource on Productive and Reproductive Performance of Dairy Cows in the Urban and Peri urban Dairy Production System in the Addis Ababa Milk Shed Area and Evaluation of Non‐conventional Feed Resources Using Sheep. MSc. Thesis. Haramaya University Ethiopia. PP‐118.
Ethiopian Society of Animal Production 2014
86
Evaluating the Economic Profitability of Afar Rams Supplemented with Graded Levels of Mixtures of Protein and Energy Sources: In Case
of Alamata Woreda Tesfay Hagos1 and Solomon Melaku2
1Tigray Agricultural Research Institute (TARI), P.O.B. 492, Mobile: +251‐914‐733958Tele. +
251‐34‐4407901, E‐mail [email protected], Mekelle, Ethiopia 2Haramaya University Department of Animal Sciences, P.O.Box 138, Dire‐Dawa, Ethiopia
Abstract
The experiment was conducted at Alamata district, Southern Zone of Tigray, Ethiopia, to investigate the effect of supplementation with mixture of protein and energy sources on the feed intake, live weight gain and economic advantage of the Afar rams. For this study twenty yearling male fat‐tailed Afar rams weighing 18.23 + 1.76 (mean + SD) kg was used. The experimental design was a randomized complete block design (RCBD) with four treatments and five replications. The rams were fed a basal diet of teff (Eragrostis tef) straw alone (T1), and supplemented with graded levels of concentrate mixtures offered at 150 (T2), 250 (T3) and 350 (T4) g DM/day/head. The composition of the ingredients in the concentrate mixture were at the ratio of (2:1:1) of wheat bran (WB), noug seed cake (NSC) and sesame seed cake (SSC), respectively. The animals were housed in individual pens and daily offered teff straw, water, and salt block comprising of sodium chloride ad libitum. The result indicated that there were significantly higher (P<0.001) total DM intake in the supplemented than the control treatment. Teff straw intake was observed to reduce as the level of supplementation increased. There was significant difference (P<0.01) in CP intake among all treatments. CP intake increased as level of supplementation increased. Similarly, there was significantly higher (P<0.001) daily body weight gain in the supplemented sheep than in the control ones. There was body weight loss of ‐2 g/day for the control, while body weight gain was observed in all supplemented treatments. In general, level of supplementation had an effect on feed intake, body weight change and economic advantage and its effect was relatively more pronounced in sheep supplemented with the medium level of supplement. Animals in the control group could not maintain. The medium level of concentrate supplementation resulted in a higher profit margin than the other levels of supplementation and the control treatment. It was concluded that supplementation of teff straw with 250 g DM/ day/ head with concentrate mixture used in this study is potentially more profitable and economically recommended to fatten Afar rams.
Keywords:Afar rams, Body weight, Concentrate mix, Feed intake, Teff straw, economic profitability, Alamata, Tigray, Ethiopia
Ethiopian Society of Animal Production 2014
87
Introduction
Despite a large population and the contribution of the national sheep flock to the export earnings of the country and the livelihoods of households in rural and peri urban areas; their productivity is very limited. The causes for low productivity of sheep are multifaceted and include poor veterinary services, inadequate quantity and quality of feed. Among these limiting factors, poor feed supply and feeding system is the most important.Extensive sheep production under the traditional communal grazing/ browsing system is widely practiced in the country. Pasture and crop residues are the main feed supply to sheep in Ethiopia and such types of feeds rarely satisfy the maintenance requirements of animals. Most of the dry forages in Ethiopia (68% of feedstuffs) have crude protein (CP) levels below 7% and neutral detergent fiber (NDF) of >55% (Seyoum and Zinash, 1995), which indicates poor nutritive value not capable of meeting microbial requirements (Van Soest, 1994). Besides, the steady increase in human population puts much of the grazing and browsing areas under arable farming for food crops production, which further aggravate the scarcity of feed resources. Therefore, there is a need for supplementary feeding to meet their nutrient requirements, even for maintenance (Stobbs and Thompson, 1975). Migongo ‐ Bake and Hansen (1987) reported that in semi‐ arid and tropical ecosystems, the quality of forages decreases greatly during the dry season, leading to substantial weight loss of animals. This phenomenon requires the alleviation of nutrients deficiency in animals through implementing different feed utilization strategies. One of the feasible methods of improving the nutritive value of crop residues could be through strategic concentrate feed supplementation with energy and/or protein sources, which can increase digestibility, nutrient supply and intake (Preston and Leng, 1987) Hence, there is a need to search for alternative feed resources, which could supplement the poor quality roughage feeds to enhance productivity of livestock. Since nowadays, the number of oil extracting and flour milling industries are expanding in the different parts of Ethiopia, thus the approach that seems worthy of pursuing is to use agro‐industrial by‐products and other suitable feeds which are not directly consumed by human beings, but that can be fed to animals to obtain a valuable product. These include agro‐industrial by‐products of flour milling such as wheat bran, oil seed cakes such as noug seed (Guizotia abyssinica) cake, sesame seed (Sesamum indicum L.) cake, etc. Eventhough, these agro‐industrial by‐products are produced in large quantities throughout the year in various parts of Ethiopia; there is generally scarce information on their nutritive and supplementary value as mixtures in ruminant feeds. Therefore, this study was conducted with the objectives to determine responses of Afar ram in feed intake and assess how body weight change and economic advantage were influenced by supplemented with graded levels of mixtures of noug seed cake, sesame seed cake and wheat bran.
Material and Methods
Experimental Site and Animals
The experiment was carried out at Alamata Agricultural Research Center, Ethiopia located at 39o 35’E and 12o 15’N and at an altitude of1600 m above sea level, receives a bimodal rainfall with annual mean precipitation of 533 mm. Teff, sorghum and maize are the major crops growing in the study area. Twenty yearling male fat‐tailed Afar rams weighing 18.23
Ethiopian Society of Animal Production 2014
88
+ 1.76 kg (mean + SD), housed in individual pens were used and offered teff straw as basal diet. The study lasted for 115 days, consisting of 18 days of adaptation period, 7 days of digestion trial and 90 days of feeding trial.
Experimental Design, Treatments and Feeding Management
The experiment was conducted using a randomized complete block design (RCBD) with four treatments and five replications. The animals were blocked based on their initial body weight into five blocks of four animals and treatment diets were randomly assigned to each animal in the block in such a way that each animal within the block had equal chance of receiving one of the treatment diets.The rams were fed a basal diet of teff (Eragrostis tef) straw alone (T1), and supplemented with graded levels of concentrate mixtures offered at 150 (T2), 250 (T3) and 350 (T4) g DM/day/head. The compositions of the ingredients in the concentrate mixture were at the ratio of (2:1:1) of wheat bran (WB), noug seed cake (NSC) and sesame seed cake (SSC), respectively. Teff straw, water, and salt blocks comprising sodium chloride were offered ad libitum daily in individual pens through out the experimental period. The supplement feeds were offered in two equal portions twice a day at 0800 h and 1600 h.
Measurements and Observation
Initial body weight of the experimental animals was measured at the beginning of the study by two consecutive weighing after overnight fasting. Feed conversion ratio was measured as proportion of daily total DM intake to daily body weight change.
Chemical Analysis
Representative samples of daily feed offers, refusals and feces were ground to pass through a 1 mm sieve screen size. The ground samples were analyzed for contents of DM, ash, and N using the procedure of AOAC (1990). The neutral detergent fiber (NDF), acid detergent fiber (ADF), and acid detergent lignin (ADL) were analyzed following the procedure of Van Soest et al., (1991). The CP was computed as N x 6.25.
Partial Budget Analysis
Partial budget analysis was performed to evaluate the economic advantage of the different treatments by using the procedure of Upton (1979). The partial budget analysis involved calculation of the variable costs and benefits. The price of rams purchased was in the range of 120 and 140 ETB and the average purchased price of 130 ETB was used for the partial budget analysis. The selling price difference of rams in each treatment before and after the experiment was considered as total return (TR) in the analysis. For the calculation of the variable costs, the expenditures incurred on various feedstuffs were taken into consideration. The partial budget method measures profit or losses, which are the net benefits or differences between gains and losses for the proposed change and includes calculating net return (NR), i.e., the amount of money left when total variable costs (TVC) are subtracted from the total returns (TR): NR = TR‐TVC Total variable costs include the costs of all inputs that change due to the change in production technology. The change in net return (ΔNR) were calculated by the difference between the change in total return (Δ TR) and the change in total variable cost (Δ TVC),
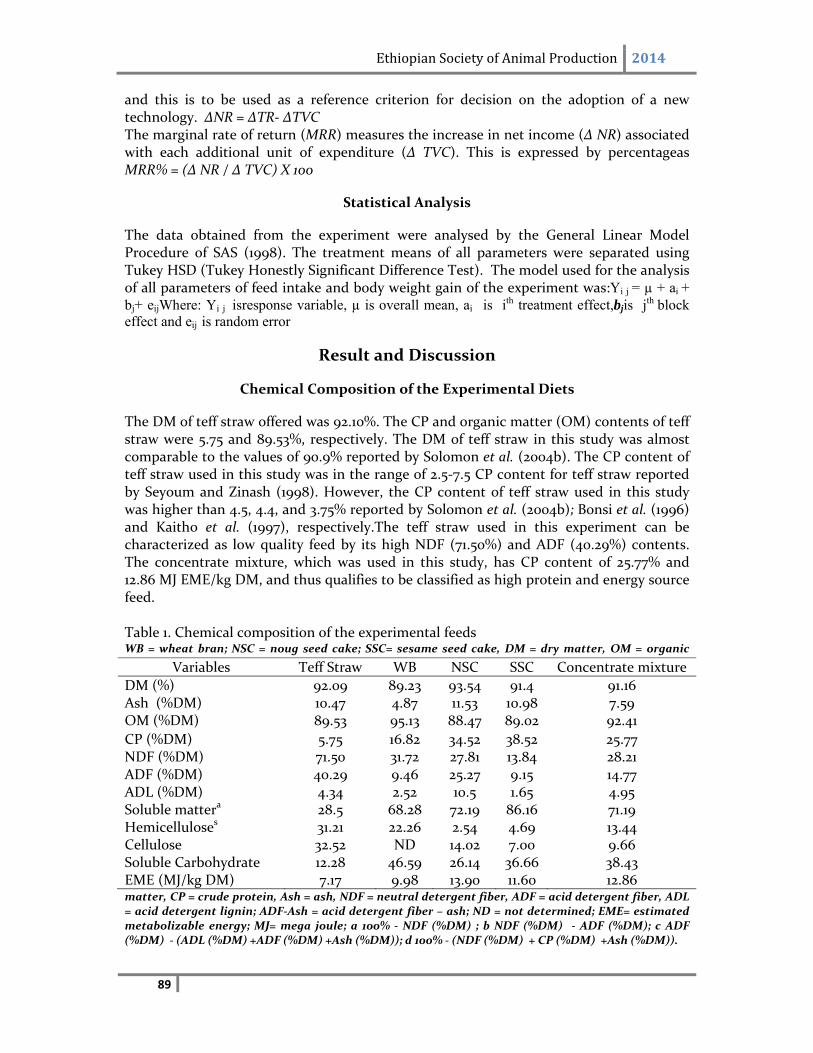
Ethiopian Society of Animal Production 2014
89
and this is to be used as a reference criterion for decision on the adoption of a new technology. ΔNR = ΔTR‐ ΔTVC The marginal rate of return (MRR) measures the increase in net income (Δ NR) associated with each additional unit of expenditure (Δ TVC). This is expressed by percentageas MRR% = (Δ NR / Δ TVC) X 100
Statistical Analysis
The data obtained from the experiment were analysed by the General Linear Model Procedure of SAS (1998). The treatment means of all parameters were separated using Tukey HSD (Tukey Honestly Significant Difference Test). The model used for the analysis of all parameters of feed intake and body weight gain of the experiment was:Yi j = µ + ai + bj+ eijWhere: Yi j isresponse variable, µ is overall mean, ai is ith treatment effect,bjis jth block effect and eij is random error
Result and Discussion
Chemical Composition of the Experimental Diets
The DM of teff straw offered was 92.10%. The CP and organic matter (OM) contents of teff straw were 5.75 and 89.53%, respectively. The DM of teff straw in this study was almost comparable to the values of 90.9% reported by Solomon et al. (2004b). The CP content of teff straw used in this study was in the range of 2.5‐7.5 CP content for teff straw reported by Seyoum and Zinash (1998). However, the CP content of teff straw used in this study was higher than 4.5, 4.4, and 3.75% reported by Solomon et al. (2004b); Bonsi et al. (1996) and Kaitho et al. (1997), respectively.The teff straw used in this experiment can be characterized as low quality feed by its high NDF (71.50%) and ADF (40.29%) contents. The concentrate mixture, which was used in this study, has CP content of 25.77% and 12.86 MJ EME/kg DM, and thus qualifies to be classified as high protein and energy source feed. Table 1. Chemical composition of the experimental feeds WB = wheat bran; NSC = noug seed cake; SSC= sesame seed cake, DM = dry matter, OM = organic
matter, CP = crude protein, Ash = ash, NDF = neutral detergent fiber, ADF = acid detergent fiber, ADL = acid detergent lignin; ADF‐Ash = acid detergent fiber – ash; ND = not determined; EME= estimated metabolizable energy; MJ= mega joule; a 100% ‐ NDF (%DM) ; b NDF (%DM) ‐ ADF (%DM); c ADF (%DM) ‐ (ADL (%DM) +ADF (%DM) +Ash (%DM)); d 100% ‐ (NDF (%DM) + CP (%DM) +Ash (%DM)).
Variables Teff Straw WB NSC SSC Concentrate mixture
DM (%) 92.09 89.23 93.54 91.4 91.16 Ash (%DM) 10.47 4.87 11.53 10.98 7.59 OM (%DM) 89.53 95.13 88.47 89.02 92.41
CP (%DM) 5.75 16.82 34.52 38.52 25.77 NDF (%DM) 71.50 31.72 27.81 13.84 28.21 ADF (%DM) 40.29 9.46 25.27 9.15 14.77 ADL (%DM) 4.34 2.52 10.5 1.65 4.95 Soluble mattera 28.5 68.28 72.19 86.16 71.19 Hemicelluloses 31.21 22.26 2.54 4.69 13.44 Cellulose 32.52 ND 14.02 7.00 9.66 Soluble Carbohydrate 12.28 46.59 26.14 36.66 38.43 EME (MJ/kg DM) 7.17 9.98 13.90 11.60 12.86
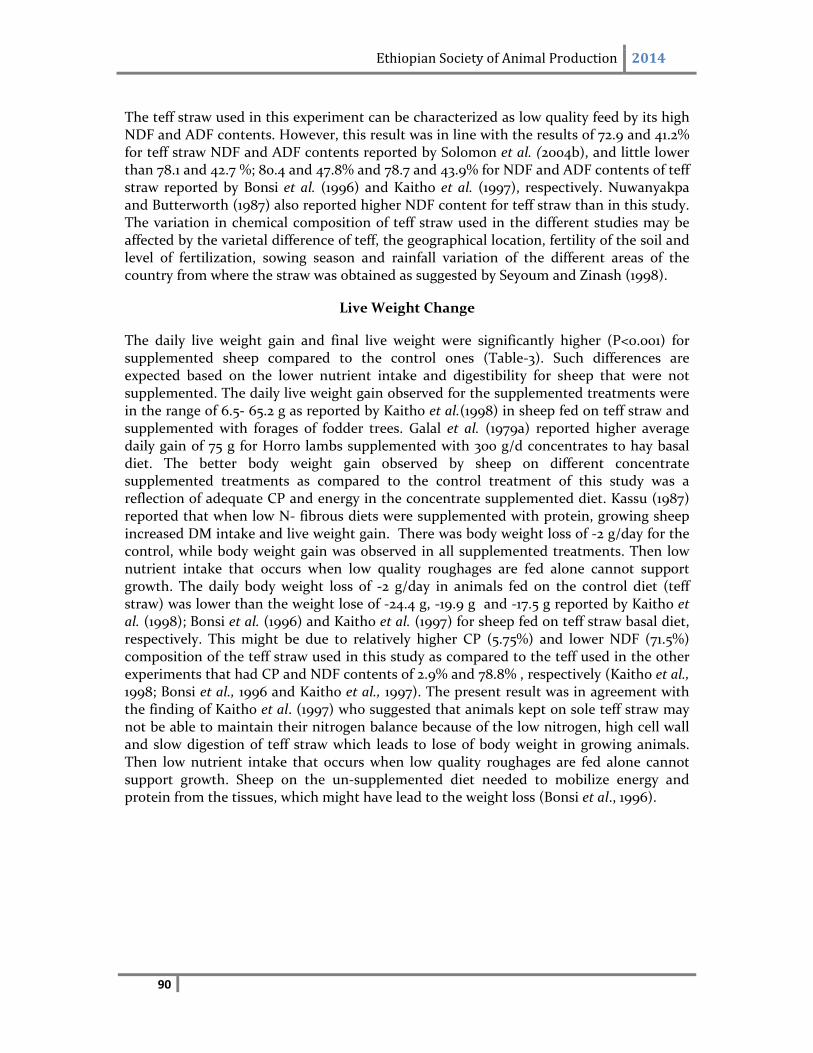
Ethiopian Society of Animal Production 2014
90
The teff straw used in this experiment can be characterized as low quality feed by its high NDF and ADF contents. However, this result was in line with the results of 72.9 and 41.2% for teff straw NDF and ADF contents reported by Solomon et al. (2004b), and little lower than 78.1 and 42.7 %; 80.4 and 47.8% and 78.7 and 43.9% for NDF and ADF contents of teff straw reported by Bonsi et al. (1996) and Kaitho et al. (1997), respectively. Nuwanyakpa and Butterworth (1987) also reported higher NDF content for teff straw than in this study. The variation in chemical composition of teff straw used in the different studies may be affected by the varietal difference of teff, the geographical location, fertility of the soil and level of fertilization, sowing season and rainfall variation of the different areas of the country from where the straw was obtained as suggested by Seyoum and Zinash (1998).
Live Weight Change
The daily live weight gain and final live weight were significantly higher (P<0.001) for supplemented sheep compared to the control ones (Table‐3). Such differences are expected based on the lower nutrient intake and digestibility for sheep that were not supplemented. The daily live weight gain observed for the supplemented treatments were in the range of 6.5‐ 65.2 g as reported by Kaitho et al.(1998) in sheep fed on teff straw and supplemented with forages of fodder trees. Galal et al. (1979a) reported higher average daily gain of 75 g for Horro lambs supplemented with 300 g/d concentrates to hay basal diet. The better body weight gain observed by sheep on different concentrate supplemented treatments as compared to the control treatment of this study was a reflection of adequate CP and energy in the concentrate supplemented diet. Kassu (1987) reported that when low N‐ fibrous diets were supplemented with protein, growing sheep increased DM intake and live weight gain. There was body weight loss of ‐2 g/day for the control, while body weight gain was observed in all supplemented treatments. Then low nutrient intake that occurs when low quality roughages are fed alone cannot support growth. The daily body weight loss of ‐2 g/day in animals fed on the control diet (teff straw) was lower than the weight lose of ‐24.4 g, ‐19.9 g and ‐17.5 g reported by Kaitho et al. (1998); Bonsi et al. (1996) and Kaitho et al. (1997) for sheep fed on teff straw basal diet, respectively. This might be due to relatively higher CP (5.75%) and lower NDF (71.5%) composition of the teff straw used in this study as compared to the teff used in the other experiments that had CP and NDF contents of 2.9% and 78.8% , respectively (Kaitho et al., 1998; Bonsi et al., 1996 and Kaitho et al., 1997). The present result was in agreement with the finding of Kaitho et al. (1997) who suggested that animals kept on sole teff straw may not be able to maintain their nitrogen balance because of the low nitrogen, high cell wall and slow digestion of teff straw which leads to lose of body weight in growing animals. Then low nutrient intake that occurs when low quality roughages are fed alone cannot support growth. Sheep on the un‐supplemented diet needed to mobilize energy and protein from the tissues, which might have lead to the weight loss (Bonsi et al., 1996).
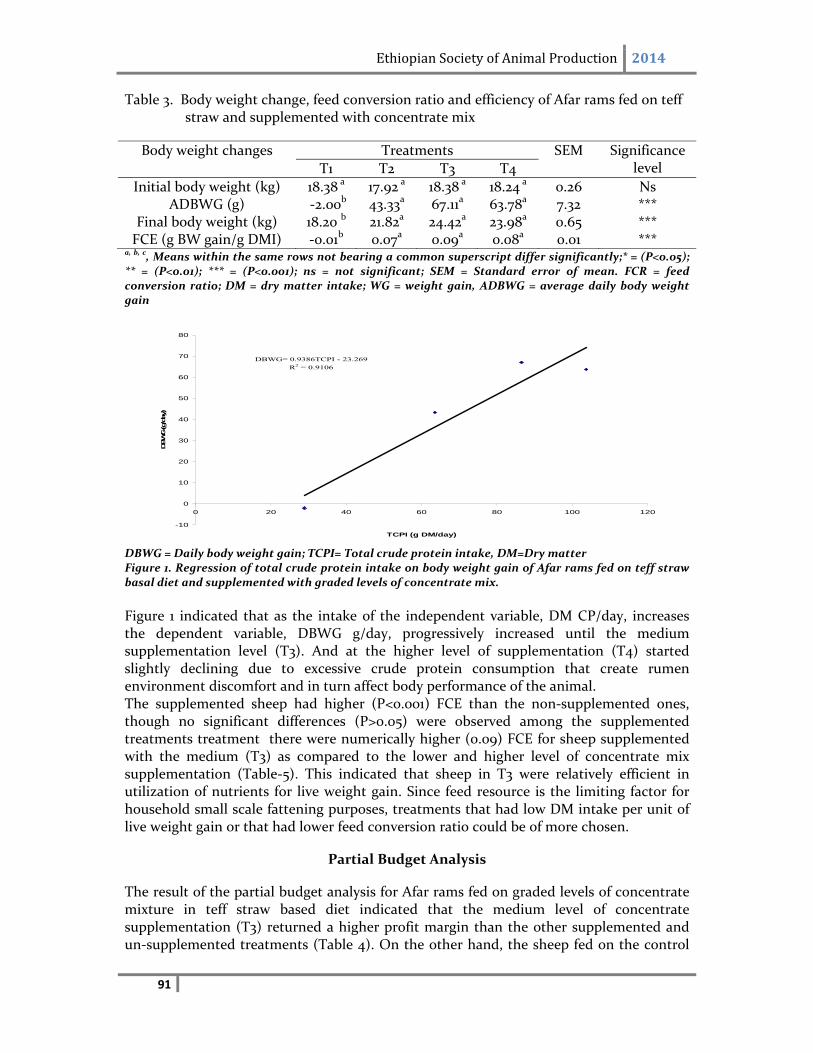
Ethiopian Society of Animal Production 2014
91
Table 3. Body weight change, feed conversion ratio and efficiency of Afar rams fed on teff straw and supplemented with concentrate mix
Body weight changes Treatments SEM Significance level T1 T2 T3 T4
Initial body weight (kg) 18.38 a 17.92 a 18.38 a 18.24 a 0.26 Ns ADBWG (g) ‐2.00b 43.33a 67.11a 63.78a 7.32 ***
Final body weight (kg) 18.20 b 21.82a 24.42a 23.98a 0.65 *** FCE (g BW gain/g DMI) ‐0.01b 0.07a 0.09a 0.08a 0.01 ***
a, b, c, Means within the same rows not bearing a common superscript differ significantly;* = (P<0.05); ** = (P<0.01); *** = (P<0.001); ns = not significant; SEM = Standard error of mean. FCR = feed conversion ratio; DM = dry matter intake; WG = weight gain, ADBWG = average daily body weight gain
DBWG= 0.9386TCPI - 23.269
R2 = 0.9106
-10
0
10
20
30
40
50
60
70
80
0 20 40 60 80 100 120
TCPI (g DM/day)
DBW
G (g/d
ay)
DBWG = Daily body weight gain; TCPI= Total crude protein intake, DM=Dry matter Figure 1. Regression of total crude protein intake on body weight gain of Afar rams fed on teff straw basal diet and supplemented with graded levels of concentrate mix.
Figure 1 indicated that as the intake of the independent variable, DM CP/day, increases the dependent variable, DBWG g/day, progressively increased until the medium supplementation level (T3). And at the higher level of supplementation (T4) started slightly declining due to excessive crude protein consumption that create rumen environment discomfort and in turn affect body performance of the animal. The supplemented sheep had higher (P<0.001) FCE than the non‐supplemented ones, though no significant differences (P>0.05) were observed among the supplemented treatments treatment there were numerically higher (0.09) FCE for sheep supplemented with the medium (T3) as compared to the lower and higher level of concentrate mix supplementation (Table‐5). This indicated that sheep in T3 were relatively efficient in utilization of nutrients for live weight gain. Since feed resource is the limiting factor for household small scale fattening purposes, treatments that had low DM intake per unit of live weight gain or that had lower feed conversion ratio could be of more chosen.
Partial Budget Analysis
The result of the partial budget analysis for Afar rams fed on graded levels of concentrate mixture in teff straw based diet indicated that the medium level of concentrate supplementation (T3) returned a higher profit margin than the other supplemented and un‐supplemented treatments (Table 4). On the other hand, the sheep fed on the control
Ethiopian Society of Animal Production 2014
92
diet (T1) had negative and lowest net return compared with the supplemented ones, which show loss of ‐18.35 ETB/head, this might be due to low quality of the teff straw that lead to body weight loss of ‐2 g/day / head. The net return from the supplemented experimental treatments was 4.09, 26.06, and 23.00 ETB/head with marginal rate of return (MRR) of 178.73, 215.70, and 174.86 for T2, T3, and T4, respectively. This means each additional unit per lamb cost increment resulted in 1 Birr and additional 1.79, 2.16 and 1.75 ETB benefit for T2, T3, and T4, respectively. Table 4. Partial budget analysis of experimental feeds
ΔNR = change in net return; ΔTVC = change in total variable cost; MRR = marginal rate of revenue
Lambs fed on the highest level of supplementation, T4, had almost similar body weight gain with lambs fed on supplementation level T3. However, it had the lowest MRR, this might be due to the higher quantity of concentrate consumption (350 g DM/ head /day) that was not efficiently utilized by rumen microbes and resulted in excess energy and protein loss through feces (Table 3) and higher cost of the concentrate mixture (29.77 ETB/head) as compared to the other treatments. Thus, eventhough lambs in T4 showed good performance in live weight gain, it was not found to be economically feasible compared to the other supplemented treatments.
Conclusions
The present result suggested that supplementation of Afar rams with concentrate mix had an effect on the feed intake, body weight change and economic advantage. The effects were relatively more pronounced for sheep supplemented with the medium level of concentrate mix.Teff straw alone cannot provide nutrients even to support maintenance requirements for growing Afar rams. The result of the partial budget analysis also indicated that the medium level of concentrate mix supplementation returned a higher profit margin than the other levels of supplementation. Thus, supplementation of teff straw with 250 g DM concentrate mixture is biologically more efficient, potentially more profitable; thus, economically recommended.
Parameters
Treatments
T1 T2 T3 T4
Purchase price of lambs (ETB/head) 130.00 130.00 130.00 130.00 Total teff straw consumed (kg/head) 46.70 46.24 45.47 34.45 Total mixed concentrate consumed (kg) 0.00 13.46 22.32 31.34 Cost for teff straw (ETB) 23.35 23.12 22.74 17.23 Cost for mixed concentrate (ETB) 0.00 12.79 21.20 29.77 Total feed cost (ETB) 23.35 35.91 43.94 47.00 Gross income (ETB/head) 135.00 170.00 200.00 200.00 Total return (ETB/head) 5.00 40.00 70.00 70.00 Net return (ETB/head) ‐18.35 4.09 26.06 23.00 Δ NR ‐ 22.44 44.41 41.35 Δ TVC ‐ 12.56 20.59 23.65 MRR (Ratio) ‐ 1.79 2.16 1.75 MRR (%) ‐ 178.73 215.70 174.86
Ethiopian Society of Animal Production 2014
93
Acknowledgments
Special thanks to my late major advisor, Dr. Solomon Melaku, for his unreserved advice and follow up throughout the study. The author is grateful to WIST/CIDA Canada project that totally funded the whole cost of the research. The Tigray Agricultural Research Institute (TARI), Humera Agricultural Research Center (HARC) Mekelle Soil Laboratory staff members and Bureau of agriculture and rural development of Alamata Woreda are appreciated for their continuous moral and material support during the conduct of the research project. My special thanks are due to the ILRI analytical Laboratory and Information Services staffs for their kind assistance and cooperation in the laboratory analysis and information search during the study period.
References
AOAC (Association of Official Analytical Chemist), 1990. Official Method of Analysis, 15th eds., Washington DC. 1298p.
Bonsi, M.L.KTuah, ., A.K. Osuji, P.O. Nsahlai V.I. and Umunna, N.N. 1996. The effect of protein supplement sources or supply pattern on the intake, digestibility, rumen kinetics, nitrogen utilization and growth of Ethiopian Menze sheep fed tefff straw. Animal Feed Science and Technology. 64: 11‐25.
Butterworth, M.H. and Mosi, A.K. 1985. The voluntary intake and digestibility of oat straw and maize stover by sheep supplemented with different levels of noug (Guizotia abyssinica) meal. Animal Feed Science and Technology. 24: 14‐17.
Galal, E.S.E., Awgichew, K. Kebede, B., Gojjam Y. and Donovan, P. B. O’. 1979a. A study of fattening Ethiopian sheep: 1. Performance of highland lambs under feed‐lot conditions. Eth. J. of Agric. Sci. 1(2): 93‐98.
Kaitho, R.J, Umunna, N.N. Nsahlai, I.V. Tamminga, S. Bruchem J.Van and Hanson, J. 1997. Palatability of wilted and dried multipurpose tree species fed to sheep and goats. Animal Feed Science Technology. 65: 151‐163
Kaitho, R.J., Umunna, N.N. Nsahlai, I.V. Tamminga S. and Van Bruchem, J. 1998. Effect of feeding graded levels of Leucaena leucocephala, Leucaena pallida, sesbania sesban and Chamaecytisus palmensis supplements to teff straw given to Ethiopian highland sheep. Animal Feed Science and Technology. 72: 355‐366 Kassu Yilala, 1987. Influence of inclusion of forage legume hay in basal diet of sorghum stover up on intake and digestibility by Bali sheep. In Farming systems Research report pp. 118‐122.
Migongo‐Bake, W and Hansen, M.R. 1987. Seasonal diets of camels, cattle, sheep and goats in a common range in Eastern Africa.
Ethiopian Society of Animal Production 2014
94
Nuwanyakpa, M. and Butterworth, M. 1987. Effect of urea, Molasses, molasses‐urea, noug cake and legume hay on the intake and digestibility of teff straw by highland sheep, utilization of agricultural by‐products as livestock feed in Africa; Proceeding of a Workshop held at Ryall’s hotel Blanyre African Research Network for Agricultural By‐products (ARNAB), Malawi.
Preston, Reg.T. and Leng, R.A. 1984. Supplementation of diets based on fibrous resides and by‐products. pp. 373‐409. In: Sundstøl, F. and E. Own (Editors), Straw and Other Fibrous by‐ Products as Feed. Development in Animal and Veterinary Sciences, 14.Elsevier, Amesterdam‐Oxford‐Newyork‐Tokyo.
Preston, T.R and Leng, R.A. 1987. Matching Livestock Production Systems to Available Resources. Penambul books. Armidale. Australia. SAS (Statistical Analysis System), 1998. SAS/STAT Guide to Personal Computers, Version 7. Statistical Analysis System Institute. Inc., NC. North Carolina, USA.
Seyoum Bediye and Zinash Sileshi, 1989. The composition of Ethiopian feed stuffs, Research report No. 6. Institute of agriculture research (IAR), Addis Ababa, Ethiopia. 33p.
Seyoum Bedeye and Zinash Sileshi. 1995. Chemical composition, in vitro digestibility and energy values of Ethiopian feed stuffs.In: Proceeding of the Third National Conference of the Ethiopian Society of Animal Production (ESAP), Addis Ababa, Ethiopia, 27‐29 April. IAR , Addis Ababa. pp. 307‐311
Solomon M., Peters K.J. and Tegegne, A. 2004b. Effects of supplementation with foliages of selected multipurpose trees, their mixtures or wheat bran on feed intake, plasma enzyme activities, live weight and scrotal circumference gains of Menz sheep. Livestock Production Science, 89: 253‐264
Stobbs, T.H. and Thompson, P.A.C. 1975. Milk production from tropical pastures. WId. Anim. Rev. 13:27‐3 1.
Ethiopian Society of Animal Production 2014
95
Evaluation Of Sugar Syrup As A Partial Substitute For Maize In Broilers’ Ration
Kiros Abebe, Getachew Animut, Mengistu Urge, School of Animal and Range Science, Haramaya University
Abstract
A study was conducted to evaluate sugar syrup as a partial substitute for maize on feed consumption, growth rate, feed conversion ratio, carcass yield and economic benefit of using sugar syrup in the ration of broilers.Three hundred day old Hubbard chicks were randomly distributed to five treatments each with three replications in CRD with 0, 7, 14, 21, and 28% of maize substituted by sugar syrup in T1, T2, T3, T4, and T5, respectively.The results indicated that there was no significant difference (P>0.05) in DM intake, body weight gain and mortality during the entire growth period. There was significant difference (P<0.05) in feed as well as protein and energy conversion ratios among the treatment groups during the whole growth period.Slaughter weight, eviscerated weight, drumstick‐thigh weight and percent as well as breast weight and percent did not show significant difference (P>0.05) among the treatment groups. But, eviscerated‐percentage showed significant difference (P<0.05) among the treatment groups. Abdominal fat weight and percent was greater for T1 and T2 as compared to T4 and T5. Birds in T4 and T5 scored higher in terms of total income from chicks’ sale to total feed cost ratio than those under T2, T1 and T3. Hence, increasing the substitution level of sugar syrup for maize increases profit. Therefore, it is recomended to substitute maize with sugar syrup up to 28% in formulating broilers’ ration without adverse effect on growth performance.
Key words: Broiler, Sugar syrup, Maize, Substitute
Introduction
One major problem of poultry production in Ethiopia is cereal grains are often difficult to obtain for poultry feeding as they form the stable diet of the people. Moreover, the price of cereals is also high (Amha, 1990). Even though sugar is not a large portion of diet; sugar byproducts could be an important energy source and the best alternative to grains for livestock if properly incorporated in the rations. Molasses, the major byproduct of the sugar industry is fed to cattle in many forms, but its use as poultry feed is limited (Ghurair and John, 2005). Instead, sugar syrup is an energy rich intermediate product of the sugar industry which is useful for feeding poultry (John, 2010). Since its energy value is almost the same as corn, it could be an economical substitute in poultry feeds (John, 2008). It adds aroma and palatability to the feed. Since the syrup contributes energy without the addition of lipids, the formation of cholesterol in egg and meat could be minimized. The feeding of grain has an effect on the viscosity of the gut. Most studies have also reported that a reduction in digesta viscosity is associated with improved performance (John, 2008). The incorporation of sugar syrup in the ration may alleviate the gut viscosity problem (John, 2008). This study was therefore conducted evaluate the effects of using different levels of sugar syrup as substitutes for maize in broilers’ ration, on feed intake,
Ethiopian Society of Animal Production 2014
96
growth rate, feed conversion ratio, and carcass yield characteristics of the broilers and also to determine the economic feasibility of using sugar syrup in the ration of broilers.
Material and methods
Experimental feeds: The feed ingredients used for ration formulation include sugar syrup, soybean meal, wheat short, maize, noug cake, limestone, lysine, vitamin premix and salt. Treatment rations were formulated by substituting maize with sugar syrup at the levels of 0, 7%, 14%, 21% and 28%. After formulating the whole ration the dry feed ingredients were mixed first. Then, sugar syrup was added to the ingredients on DM basis first by measuring in litter. After combination of the whole experimental feeds, each of the treatment diets were directly sun dried for about 1 hour to ease the storage. Rations were formulated to contain approximately 22% and 20% CP and 3100 kcal/kg and 3200 kcal/kg ME for starters and finishers phase, respectively (NRC, 1994).
Experimental design and treatments: Completely Randomized Design (CRD) with five treatments and three replicates was used in the study. Fifteen pens were used for the three hundred day old chicks which were randomly assigned to each pen. Management of experimental chicks: Three hundred day old Hubbard chicks (commercial broiler strains) were purchased from Debre Zeit Agricultural Research Center. Sugar syrup is a sticky fluid and was mixed with the other feed ingredients depending on the substitution level for maize in each treatment. The chicks were fed twice a day at 0730 and 1630 hours ad libitum. Water was also offered twice a day in the morning and afternoon. The chicks were also vaccinated against New Castle Disease and Gumboro. Data Collection Chemical analysis of feed ingredients: was done at Haramaya University Nutrition and Soil Laboratories by taking representative samples from each feed ingredient and experimental diets. Each ingredient and treatment rations were analyzed for DM, EE, CF and total ash contents using the Weende or Proximate analysis method of the AOAC (1990). The DM of sugar syrup was also determined using oven drying. Nitrogen (N) content of the feed ingredients was determined by Kjeldahl procedure. Ca and P content of the feeds were determined by atomic absorption spectrometer. CP was analyzed by multiplying the nitrogen (N) content of the feed with 6.25. Metabolizable energy (ME) content of the feed ingredients as well as experimental diets was determined by using the method of Wiseman (1987) as: ME (kcal/ kg DM) = 3951 + 54.4 EE ‐ 88.7 CF ‐ 40.80 Ash Measurements: Average dry matter intake (ADMI), body weight gain, feed conversion ratio, carcass yield, mortality percentage and economic benefits were measured to evaluate the differences among the treatment rations. Average DM, CP and ME intake was calculated by multiplying the total feed consumption by the respective DM, CP and ME contents of the starter and finisher rations. Body weight changes were assessed every week by weighing the chicks. Mean daily weight gain (ADG) was determined by dividing the average body weight gain by the number of experimental days. The average feed conversion ratio was expressed by dividing the average DM intake by mean body weight gain (g). Mortality was determined for each treatment as a percentage of total mortality at
Ethiopian Society of Animal Production 2014
97
the end of the whole experiment. At the end of the experiment, six broilers (three males and three females) were randomly picked from each replication for carcass evaluation. Dressing percentage was calculated as percent of live weight after bleeding and de‐feathering. Eviscerated percentage was calculated by removing the viscera, head, shank, trachea and lungs but with giblets (heart, liver, gizzard) and skin and expressed as percent of live weight. The abdominal fat and breast meat weight were measured individually and equated with percent live weight. Drumstick and thigh together were also measured and expressed as percent of the live weight. Partial budget analysis: was done according to Upton (1979) to determine the economic benefit of using sugar syrup as substitute to maize. The cost of sugar syrup and maize was 2 birr per liter and 4 birr per kilo gram, respectively. Total variable cost includes the cost of chicks, feeds and the supplemented vitamin premix during the whole experiment for each treatment groups. Total return (TR) was considered as the difference in sale and purchase price. The net income (NI) was expressed by subtracting total variable cost (TVC) from total return (TR). The change in net income (∆NI) was expressed as the difference between the changes in total return (∆TR) and total variable cost (∆TVC). The marginal rate of return (MRR) measures the increase in net income (∆NI) related to each additional unit of expenditure (∆TVC) and expressed in percentage. The sale of chicks’ to cost of feed ratio was also calculated to evaluate profitability and use efficiency of rations.
Statistical analysis: Data of the experiment was subjected to analysis of variance using the General Linear Model (GLM) procedure (SAS Institute, 2009). Differences among treatment means were compared using least significant difference (LSD) test.
Results and Discussion
Laboratory result showed that the energy content of sugar syrup and maize was 3752.98 and 3752.84 kcal/kg, respectively and its fiber content was zero. This makes sugar syrup to be an effective energy feed and a good potential substitute for maize in poultry ration.
Feed consumption: The effect of feeding different levels of sugar syrup as substitutes for maize on DM and nutrient intake of broilers during starter, finisher phases as well as the whole growth period is shown in Table 1. Treatment had no significant effect (P>0.05) on average daily and total DM, CP, and ME intakes during the starter, and finisher phases, and for the whole experimental period. This is an indication that substitution of maize by sugar syrup up to 28% did not have a significant effect on DM and nutrient intake by broilers. The mean total feed intake by Hubbard broiler strains during the whole experimental period (49 days) was 3850 g/bird with mean total body weight gain of 1386.83 g/bird.
Body weight gain: The growth rate of the experimental chicks during starter, finisher and the whole growth period is presented in Table 2. Body weight change and average daily weight gain were not affected (P>0.05) by treatment rations.
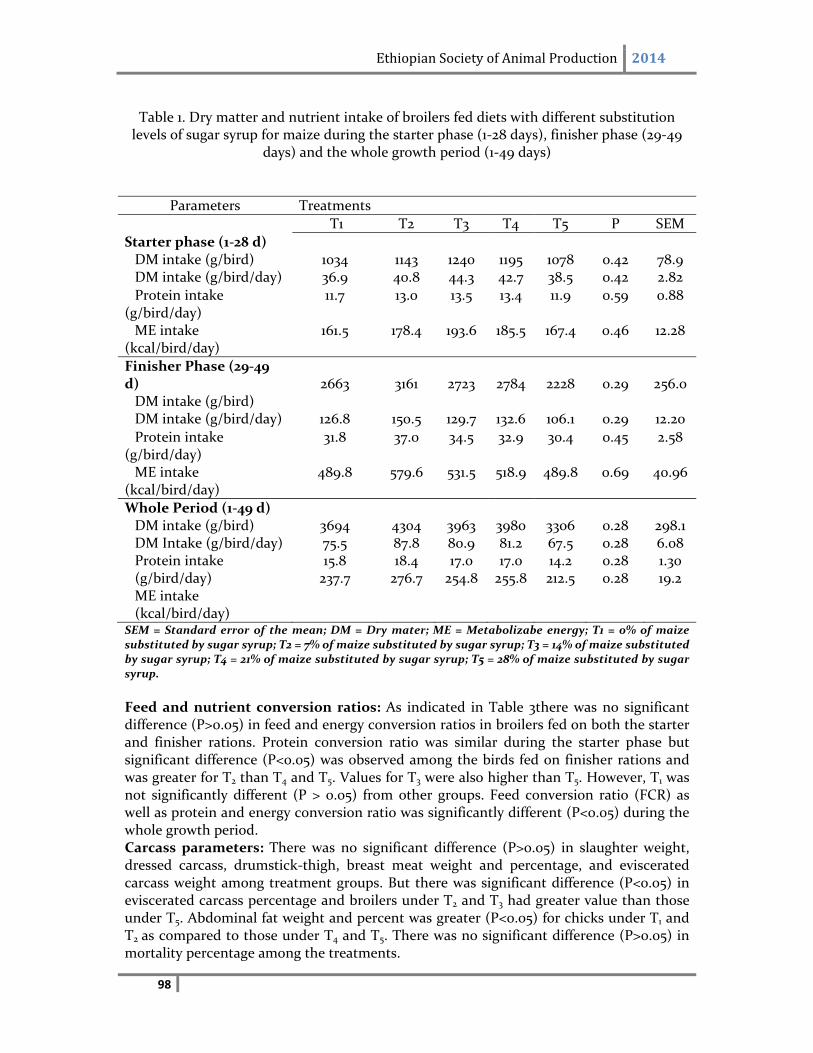
Ethiopian Society of Animal Production 2014
98
Table 1. Dry matter and nutrient intake of broilers fed diets with different substitution levels of sugar syrup for maize during the starter phase (1‐28 days), finisher phase (29‐49
days) and the whole growth period (1‐49 days)
Parameters Treatments
T1 T2 T3 T4 T5 P SEM
Starter phase (1‐28 d) DM intake (g/bird)
1034
1143
1240
1195
1078
0.42
78.9
DM intake (g/bird/day) 36.9 40.8 44.3 42.7 38.5 0.42 2.82
Protein intake (g/bird/day)
11.7 13.0 13.5 13.4 11.9 0.59 0.88
ME intake (kcal/bird/day)
161.5 178.4 193.6 185.5 167.4 0.46 12.28
Finisher Phase (29‐49 d) DM intake (g/bird)
2663
3161
2723
2784
2228
0.29
256.0
DM intake (g/bird/day) 126.8 150.5 129.7 132.6 106.1 0.29 12.20
Protein intake (g/bird/day)
31.8 37.0 34.5 32.9 30.4 0.45 2.58
ME intake (kcal/bird/day)
489.8 579.6 531.5 518.9 489.8 0.69 40.96
Whole Period (1‐49 d) DM intake (g/bird) DM Intake (g/bird/day)
3694 75.5
4304 87.8
3963 80.9
3980 81.2
3306 67.5
0.28 0.28
298.1 6.08
Protein intake (g/bird/day) ME intake (kcal/bird/day)
15.8 237.7
18.4 276.7
17.0 254.8
17.0 255.8
14.2 212.5
0.28 0.28
1.30 19.2
SEM = Standard error of the mean; DM = Dry mater; ME = Metabolizabe energy; T1 = 0% of maize substituted by sugar syrup; T2 = 7% of maize substituted by sugar syrup; T3 = 14% of maize substituted by sugar syrup; T4 = 21% of maize substituted by sugar syrup; T5 = 28% of maize substituted by sugar syrup.
Feed and nutrient conversion ratios: As indicated in Table 3there was no significant difference (P>0.05) in feed and energy conversion ratios in broilers fed on both the starter and finisher rations. Protein conversion ratio was similar during the starter phase but significant difference (P<0.05) was observed among the birds fed on finisher rations and was greater for T2 than T4 and T5. Values for T3 were also higher than T5. However, T1 was not significantly different (P > 0.05) from other groups. Feed conversion ratio (FCR) as well as protein and energy conversion ratio was significantly different (P<0.05) during the whole growth period. Carcass parameters: There was no significant difference (P>0.05) in slaughter weight, dressed carcass, drumstick‐thigh, breast meat weight and percentage, and eviscerated carcass weight among treatment groups. But there was significant difference (P<0.05) in eviscerated carcass percentage and broilers under T2 and T3 had greater value than those under T5. Abdominal fat weight and percent was greater (P<0.05) for chicks under T1 and T2 as compared to those under T4 and T5. There was no significant difference (P>0.05) in mortality percentage among the treatments.
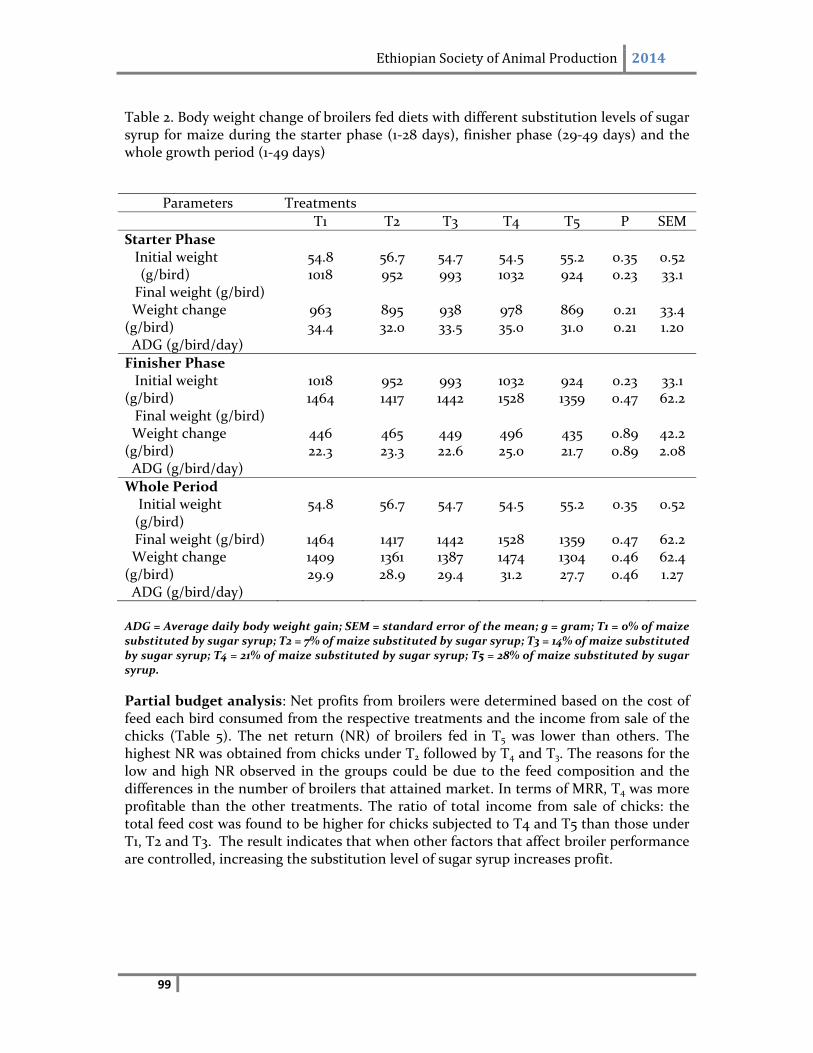
Ethiopian Society of Animal Production 2014
99
Table 2. Body weight change of broilers fed diets with different substitution levels of sugar syrup for maize during the starter phase (1‐28 days), finisher phase (29‐49 days) and the whole growth period (1‐49 days)
Parameters Treatments
T1 T2 T3 T4 T5 P SEM
Starter Phase Initial weight (g/bird) Final weight (g/bird)
54.8 1018
56.7 952
54.7 993
54.5 1032
55.2 924
0.35 0.23
0.52 33.1
Weight change (g/bird) ADG (g/bird/day)
963 34.4
895 32.0
938 33.5
978 35.0
869 31.0
0.21 0.21
33.4 1.20
Finisher Phase Initial weight
(g/bird) Final weight (g/bird)
1018 1464
952 1417
993 1442
1032 1528
924 1359
0.23 0.47
33.1 62.2
Weight change (g/bird) ADG (g/bird/day)
446 22.3
465 23.3
449 22.6
496 25.0
435 21.7
0.89 0.89
42.2 2.08
Whole Period Initial weight (g/bird)
54.8 56.7 54.7 54.5 55.2 0.35 0.52
Final weight (g/bird) 1464 1417 1442 1528 1359 0.47 62.2 Weight change (g/bird) ADG (g/bird/day)
1409 29.9
1361 28.9
1387 29.4
1474 31.2
1304 27.7
0.46 0.46
62.4 1.27
ADG = Average daily body weight gain; SEM = standard error of the mean; g = gram; T1 = 0% of maize substituted by sugar syrup; T2 = 7% of maize substituted by sugar syrup; T3 = 14% of maize substituted by sugar syrup; T4 = 21% of maize substituted by sugar syrup; T5 = 28% of maize substituted by sugar syrup.
Partial budget analysis: Net profits from broilers were determined based on the cost of feed each bird consumed from the respective treatments and the income from sale of the chicks (Table 5). The net return (NR) of broilers fed in T5 was lower than others. The highest NR was obtained from chicks under T2 followed by T4 and T3. The reasons for the low and high NR observed in the groups could be due to the feed composition and the differences in the number of broilers that attained market. In terms of MRR, T4 was more profitable than the other treatments. The ratio of total income from sale of chicks: the total feed cost was found to be higher for chicks subjected to T4 and T5 than those under T1, T2 and T3. The result indicates that when other factors that affect broiler performance are controlled, increasing the substitution level of sugar syrup increases profit.
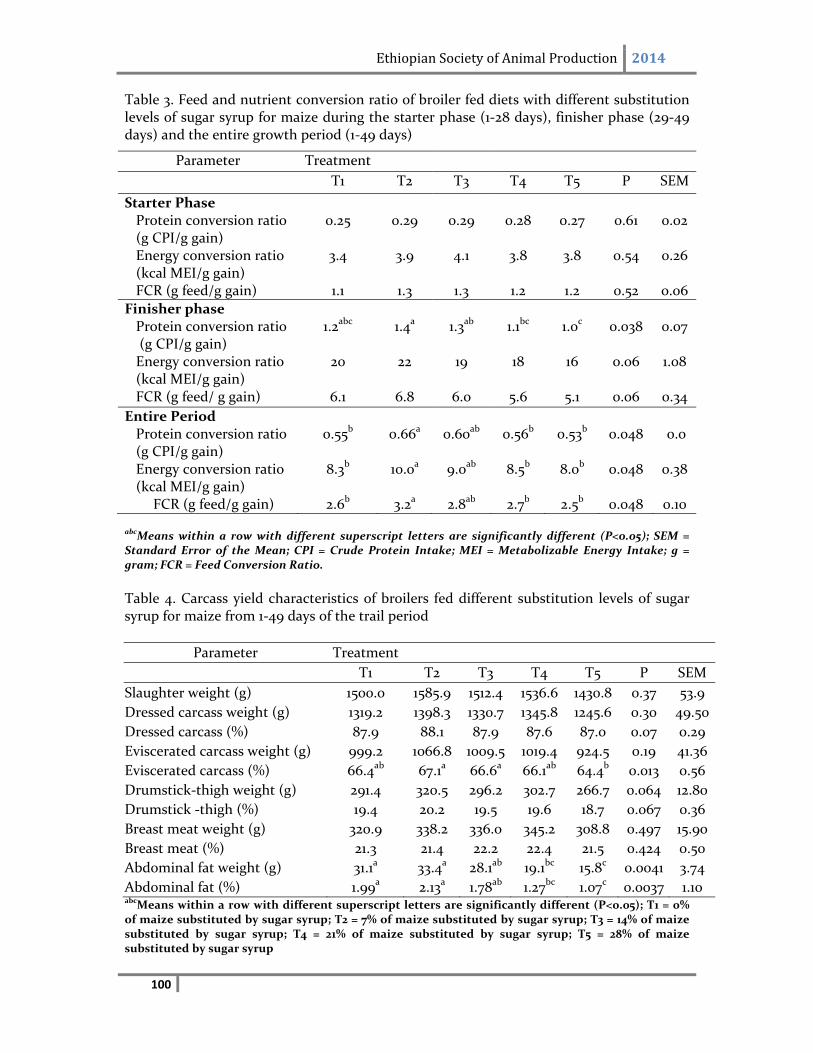
Ethiopian Society of Animal Production 2014
100
Table 3. Feed and nutrient conversion ratio of broiler fed diets with different substitution levels of sugar syrup for maize during the starter phase (1‐28 days), finisher phase (29‐49 days) and the entire growth period (1‐49 days)
Parameter Treatment
T1 T2 T3 T4 T5 P SEM
Starter Phase Protein conversion ratio (g CPI/g gain)
0.25 0.29 0.29 0.28 0.27 0.61 0.02
Energy conversion ratio (kcal MEI/g gain)
3.4 3.9 4.1 3.8 3.8
0.54 0.26
FCR (g feed/g gain) 1.1 1.3 1.3 1.2 1.2 0.52 0.06
Finisher phase Protein conversion ratio (g CPI/g gain)
1.2abc 1.4a 1.3ab 1.1bc 1.0c 0.038 0.07
Energy conversion ratio (kcal MEI/g gain)
20 22 19 18 16 0.06 1.08
FCR (g feed/ g gain) 6.1 6.8 6.0 5.6 5.1 0.06 0.34
Entire Period Protein conversion ratio (g CPI/g gain) Energy conversion ratio (kcal MEI/g gain)
0.55b
8.3b
0.66a
10.0a
0.60ab
9.0ab
0.56b
8.5b
0.53b
8.0b
0.048
0.048
0.0
0.38
FCR (g feed/g gain) 2.6b 3.2a 2.8ab 2.7b 2.5b 0.048 0.10
abcMeans within a row with different superscript letters are significantly different (P<0.05); SEM = Standard Error of the Mean; CPI = Crude Protein Intake; MEI = Metabolizable Energy Intake; g = gram; FCR = Feed Conversion Ratio.
Table 4. Carcass yield characteristics of broilers fed different substitution levels of sugar syrup for maize from 1‐49 days of the trail period
Parameter Treatment
T1 T2 T3 T4 T5 P SEM
Slaughter weight (g) 1500.0 1585.9 1512.4 1536.6 1430.8 0.37 53.9
Dressed carcass weight (g) 1319.2 1398.3 1330.7 1345.8 1245.6 0.30 49.50
Dressed carcass (%) 87.9 88.1 87.9 87.6 87.0 0.07 0.29
Eviscerated carcass weight (g) 999.2 1066.8 1009.5 1019.4 924.5 0.19 41.36
Eviscerated carcass (%) 66.4ab 67.1a 66.6a 66.1ab 64.4b 0.013 0.56
Drumstick‐thigh weight (g) 291.4 320.5 296.2 302.7 266.7 0.064 12.80
Drumstick ‐thigh (%) 19.4 20.2 19.5 19.6 18.7 0.067 0.36
Breast meat weight (g) 320.9 338.2 336.0 345.2 308.8 0.497 15.90
Breast meat (%) 21.3 21.4 22.2 22.4 21.5 0.424 0.50
Abdominal fat weight (g) 31.1a 33.4a 28.1ab 19.1bc 15.8c 0.0041 3.74
Abdominal fat (%) 1.99a 2.13a 1.78ab 1.27bc 1.07c 0.0037 1.10 abcMeans within a row with different superscript letters are significantly different (P<0.05); T1 = 0% of maize substituted by sugar syrup; T2 = 7% of maize substituted by sugar syrup; T3 = 14% of maize substituted by sugar syrup; T4 = 21% of maize substituted by sugar syrup; T5 = 28% of maize substituted by sugar syrup
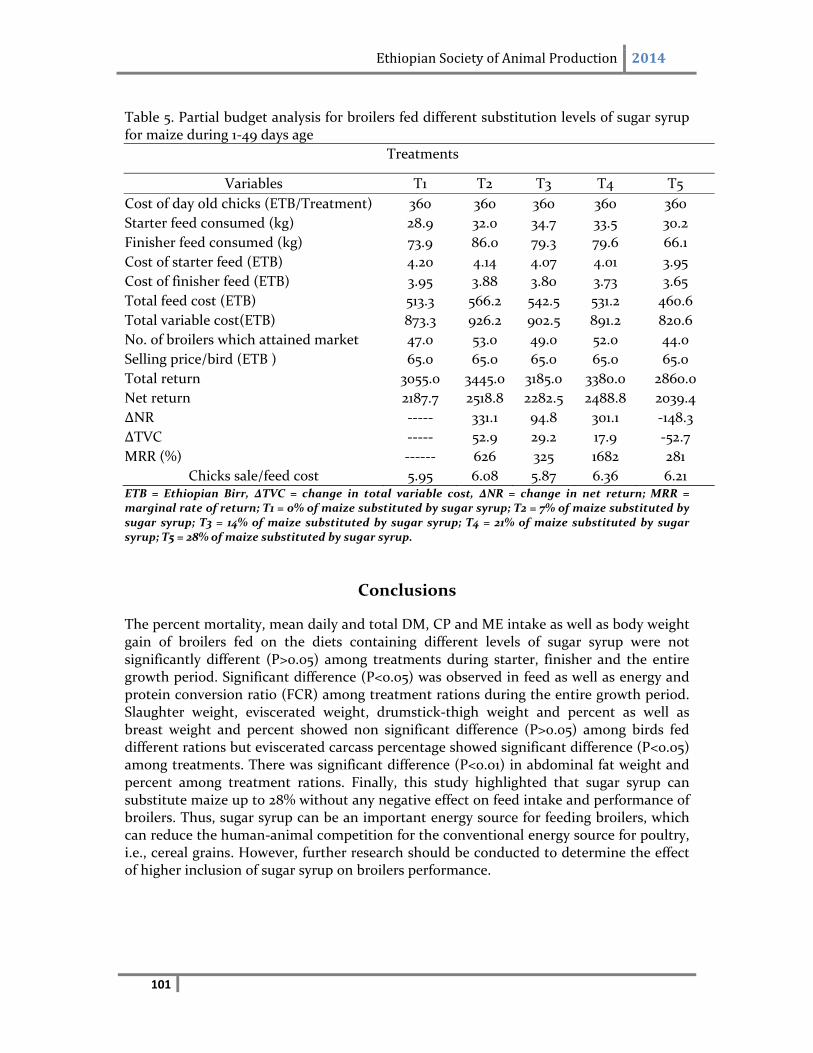
Ethiopian Society of Animal Production 2014
101
Table 5. Partial budget analysis for broilers fed different substitution levels of sugar syrup for maize during 1‐49 days age
Treatments
Variables T1 T2 T3 T4 T5
Cost of day old chicks (ETB/Treatment) 360 360 360 360 360
Starter feed consumed (kg) 28.9 32.0 34.7 33.5 30.2
Finisher feed consumed (kg) 73.9 86.0 79.3 79.6 66.1
Cost of starter feed (ETB) 4.20 4.14 4.07 4.01 3.95
Cost of finisher feed (ETB) 3.95 3.88 3.80 3.73 3.65
Total feed cost (ETB) 513.3 566.2 542.5 531.2 460.6
Total variable cost(ETB) 873.3 926.2 902.5 891.2 820.6
No. of broilers which attained market 47.0 53.0 49.0 52.0 44.0
Selling price/bird (ETB ) 65.0 65.0 65.0 65.0 65.0
Total return 3055.0 3445.0 3185.0 3380.0 2860.0
Net return 2187.7 2518.8 2282.5 2488.8 2039.4
∆NR ‐‐‐‐‐ 331.1 94.8 301.1 ‐148.3
∆TVC ‐‐‐‐‐ 52.9 29.2 17.9 ‐52.7
MRR (%) ‐‐‐‐‐‐ 626 325 1682 281
Chicks sale/feed cost 5.95 6.08 5.87 6.36 6.21 ETB = Ethiopian Birr, ΔTVC = change in total variable cost, ΔNR = change in net return; MRR = marginal rate of return; T1 = 0% of maize substituted by sugar syrup; T2 = 7% of maize substituted by sugar syrup; T3 = 14% of maize substituted by sugar syrup; T4 = 21% of maize substituted by sugar syrup; T5 = 28% of maize substituted by sugar syrup.
Conclusions
The percent mortality, mean daily and total DM, CP and ME intake as well as body weight gain of broilers fed on the diets containing different levels of sugar syrup were not significantly different (P>0.05) among treatments during starter, finisher and the entire growth period. Significant difference (P<0.05) was observed in feed as well as energy and protein conversion ratio (FCR) among treatment rations during the entire growth period. Slaughter weight, eviscerated weight, drumstick‐thigh weight and percent as well as breast weight and percent showed non significant difference (P>0.05) among birds fed different rations but eviscerated carcass percentage showed significant difference (P<0.05) among treatments. There was significant difference (P<0.01) in abdominal fat weight and percent among treatment rations. Finally, this study highlighted that sugar syrup can substitute maize up to 28% without any negative effect on feed intake and performance of broilers. Thus, sugar syrup can be an important energy source for feeding broilers, which can reduce the human‐animal competition for the conventional energy source for poultry, i.e., cereal grains. However, further research should be conducted to determine the effect of higher inclusion of sugar syrup on broilers performance.
Ethiopian Society of Animal Production 2014
102
References
Amha Kassahun, 1990. Evaluation of the nutritive and supplementary values of noug seed meal (Guizotia abyssinica) in commercial broiler chicks ration. M.Sc.Thesis Presented to the School of Graduate Studies of AUA, Alemaya. 123p. A.O.A.C. (Official methods of analysis (13th ed). Association of Official Analytical Chemists), 1990. Washington D.C. FAO, 2006. FAO statistical data base. Rome (Available athttp://faostat. Fao.org/default.aspx). Ghurair and John, 2005.Development of Sugar Based Animal Feed Supplements at Al Khaleej Sugar Co. Dubai, United Arab Emirates. SIT Paper #889. John, 2008. Sugar Syrup: the new energy feed for poultry. Al Khaleej Sugar Co, Dubai, United Arab Emirates. World poultry. vol.24. No.2. Http://www.worldpoultry.net. John, 2010. Sugar syrup a dietary energy feed. Kerala, India. WEB lab. Unggas UGM. John, 2011. Sugar syrup for poultry feeding Poultry industry,Kerala, India.. Melaku Woldeyohannes, 2011. The Effect of Egg Storage Temperature and Fumigation on Box Hatchability and Post – Hatching Performance of Two Strains of Broiler Chicks Reared in Hay – Box During Starter Phase. M Sc Thesis Presented to the School of Graduate Studies of Haramaya University, Ethiopia. 36p.
NRC (National Research Council), 1994. Nutrient requirements of poultry. 9th revised edition. National Academy Press, Washington, DC, USA.
SAS (Statistical Analysis Systems), 2009. SAS/STAT User’s Guide. Release 9.1.3 ed. SAS Institute Inc., Cary, NC.
Schumacher E, Elliott R, McMeniman N P and Griffiths I, 1986. Evaluation of raw sugar as an energy source for growing/fattening pigs. Proceedings Australia Society Animal Production 16, 359–362.
Upton, M., 1979. Farm Management in Africa, the Principal of Production and Planning, Oxford University Press, 380p.
Wiseman, J., 1987. Feeding of non‐ruminant animals. In Meeting nutritional requirement from available resources. Butter worth and Co. Ltd. London. pp. 9‐15.
Zena Kidane, 2011. Comparative Performance Evaluation of Hubbard Classic Hybrid Broilers Fed Ration Containing Imported or Local Protein Balancer. M Sc Thesis Presented to the School of Graduate Studies of Haramaya University, Ethiopia. 45‐47p.
Ethiopian Society of Animal Production 2014
103
Animal Production

Ethiopian Society of Animal Production 2014
104
Ethiopian Society of Animal Production 2014
105
Characterization of Livestock Production Systems and feed resource availabilityin Horro District, Ethiopia
G. Duguma, T. Jembere, K. Degefa, W. Temesgen, A. Kumsa, J. Wamatu and A. Duncan
Abstract
Characterization of livestock production systems and feed resource availability was carried out in Horro district of the Oromia Region using the feed assessment tool (FEAST) from July to September 2012. The objectives of the study were to assess feed resource availability and utilization. Participatory Rural Appraisal (PRA), key informant interview and individual interviews were conducted to collect data.. About 6.3 to 11.7 tons of crop residues/household is estimated tobe produced in the study area. Based on the study areas potential for crop production (both cereals and pulses) we encourage the wise utilization and conservation of crop residues. However, since most residues are of low nutritive value, convenient and affordable methods of improving residues should be sought.
Keywords: FEAST, Opportunities, Potential intervention, Seasonal Availability of Feeds
Introduction
Horro district is located in Horro Guduru Wollegga Zone of Oromia Regional State, Ethiopia. Livestock production is an important component of the mixed crop‐livestock system in the district. Horro cattle and Horro sheep breeds are indigenous to this area. Horro cattle are a multipurpose breed (draft power, milk and meat) and Horro sheep are known for their prolificacy and large size compared to other indigenous sheep breeds (Galal, 1983 and Duguma, 2010). The population size of both the Horro cattle and Horro sheep breeds are estimated to be 3 million each (Rege and Thawah, 1999 and Abegaz, 2002). Both species are owned and managed by resource poor smallholder farmers under traditional production systems. Productivity in terms of milk and meat is very low. Inadequate feeds particularly seasonal availability of feeds is one of the major factors contributing to the low productivity of livestock in the district (Mekonen, 2007). Cropping is expanding into swampy areas that used to be communal grazing lands with concomitant decline in grazing lands. One of the ways of improving livestock production and productivity is through improved feeding. To alleviate this, it is imperative to understand the feed resource base of a given area. Hence, the current survey was, therefore, conducted with the following objectives:
To assess feed resource availability and utilization within the context of the overall farming and livestock production systems
To characterize livestock production systems and analyzeof site‐specific feed interventions.
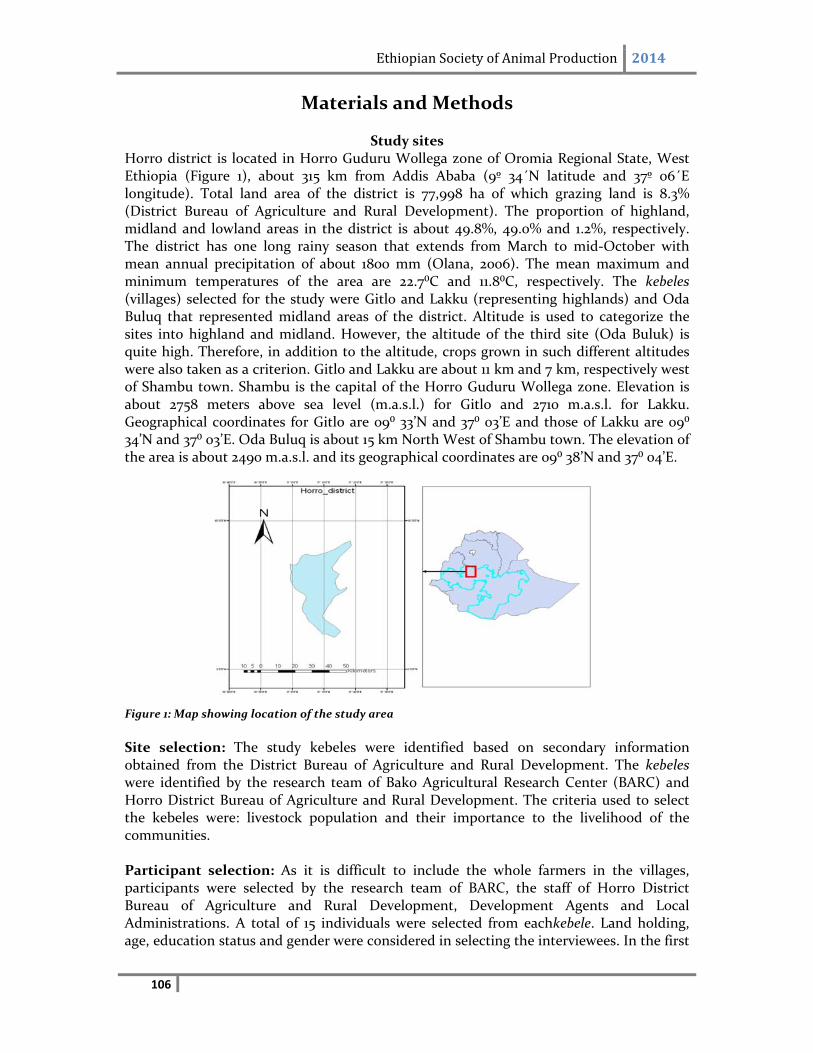
Ethiopian Society of Animal Production 2014
106
Materials and Methods
Study sites Horro district is located in Horro Guduru Wollega zone of Oromia Regional State, West Ethiopia (Figure 1), about 315 km from Addis Ababa (9º 34´N latitude and 37º 06´E longitude). Total land area of the district is 77,998 ha of which grazing land is 8.3% (District Bureau of Agriculture and Rural Development). The proportion of highland, midland and lowland areas in the district is about 49.8%, 49.0% and 1.2%, respectively. The district has one long rainy season that extends from March to mid‐October with mean annual precipitation of about 1800 mm (Olana, 2006). The mean maximum and minimum temperatures of the area are 22.7⁰C and 11.8⁰C, respectively. The kebeles (villages) selected for the study were Gitlo and Lakku (representing highlands) and Oda Buluq that represented midland areas of the district. Altitude is used to categorize the sites into highland and midland. However, the altitude of the third site (Oda Buluk) is quite high. Therefore, in addition to the altitude, crops grown in such different altitudes were also taken as a criterion. Gitlo and Lakku are about 11 km and 7 km, respectively west of Shambu town. Shambu is the capital of the Horro Guduru Wollega zone. Elevation is about 2758 meters above sea level (m.a.s.l.) for Gitlo and 2710 m.a.s.l. for Lakku. Geographical coordinates for Gitlo are 09⁰ 33’N and 37⁰ 03’E and those of Lakku are 09⁰ 34’N and 37⁰ 03’E. Oda Buluq is about 15 km North West of Shambu town. The elevation of the area is about 2490 m.a.s.l. and its geographical coordinates are 09⁰ 38’N and 37⁰ 04’E.
Figure 1: Map showing location of the study area
Site selection: The study kebeles were identified based on secondary information obtained from the District Bureau of Agriculture and Rural Development. The kebeles were identified by the research team of Bako Agricultural Research Center (BARC) and Horro District Bureau of Agriculture and Rural Development. The criteria used to select the kebeles were: livestock population and their importance to the livelihood of the communities. Participant selection: As it is difficult to include the whole farmers in the villages, participants were selected by the research team of BARC, the staff of Horro District Bureau of Agriculture and Rural Development, Development Agents and Local Administrations. A total of 15 individuals were selected from eachkebele. Land holding, age, education status and gender were considered in selecting the interviewees. In the first
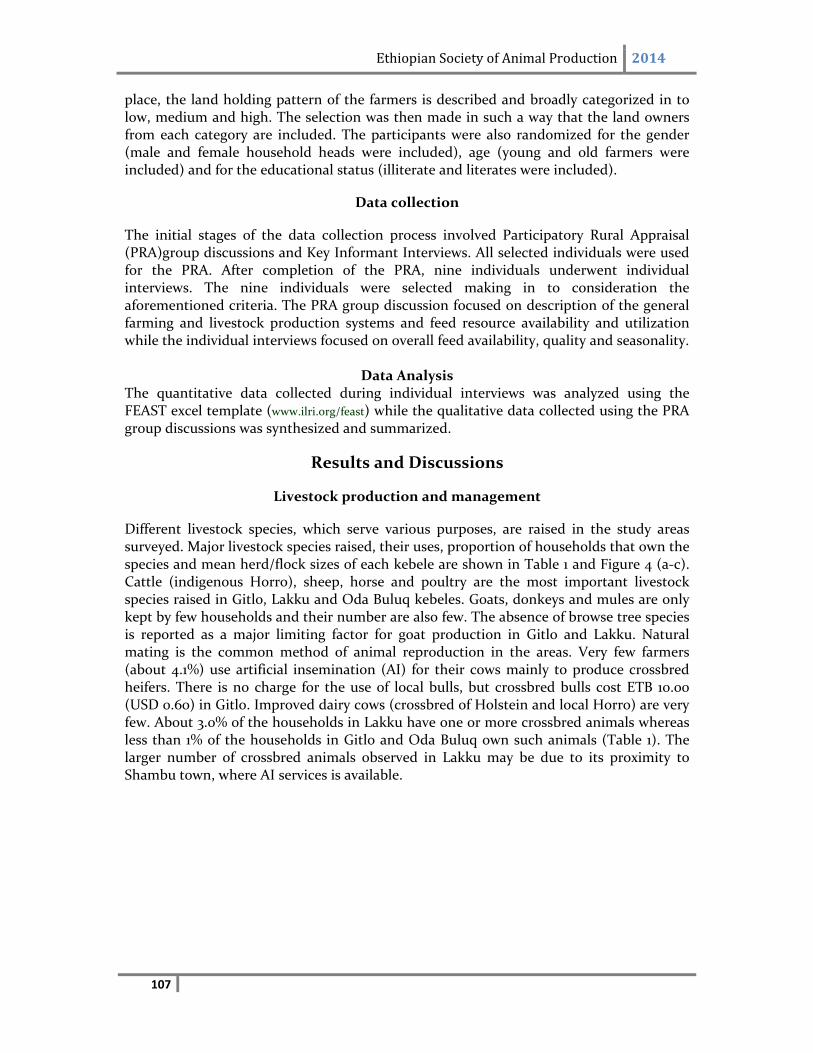
Ethiopian Society of Animal Production 2014
107
place, the land holding pattern of the farmers is described and broadly categorized in to low, medium and high. The selection was then made in such a way that the land owners from each category are included. The participants were also randomized for the gender (male and female household heads were included), age (young and old farmers were included) and for the educational status (illiterate and literates were included).
Data collection
The initial stages of the data collection process involved Participatory Rural Appraisal (PRA)group discussions and Key Informant Interviews. All selected individuals were used for the PRA. After completion of the PRA, nine individuals underwent individual interviews. The nine individuals were selected making in to consideration the aforementioned criteria. The PRA group discussion focused on description of the general farming and livestock production systems and feed resource availability and utilization while the individual interviews focused on overall feed availability, quality and seasonality.
Data Analysis The quantitative data collected during individual interviews was analyzed using the FEAST excel template (www.ilri.org/feast) while the qualitative data collected using the PRA group discussions was synthesized and summarized.
Results and Discussions
Livestock production and management
Different livestock species, which serve various purposes, are raised in the study areas surveyed. Major livestock species raised, their uses, proportion of households that own the species and mean herd/flock sizes of each kebele are shown in Table 1 and Figure 4 (a‐c). Cattle (indigenous Horro), sheep, horse and poultry are the most important livestock species raised in Gitlo, Lakku and Oda Buluq kebeles. Goats, donkeys and mules are only kept by few households and their number are also few. The absence of browse tree species is reported as a major limiting factor for goat production in Gitlo and Lakku. Natural mating is the common method of animal reproduction in the areas. Very few farmers (about 4.1%) use artificial insemination (AI) for their cows mainly to produce crossbred heifers. There is no charge for the use of local bulls, but crossbred bulls cost ETB 10.00 (USD 0.60) in Gitlo. Improved dairy cows (crossbred of Holstein and local Horro) are very few. About 3.0% of the households in Lakku have one or more crossbred animals whereas less than 1% of the households in Gitlo and Oda Buluq own such animals (Table 1). The larger number of crossbred animals observed in Lakku may be due to its proximity to Shambu town, where AI services is available.
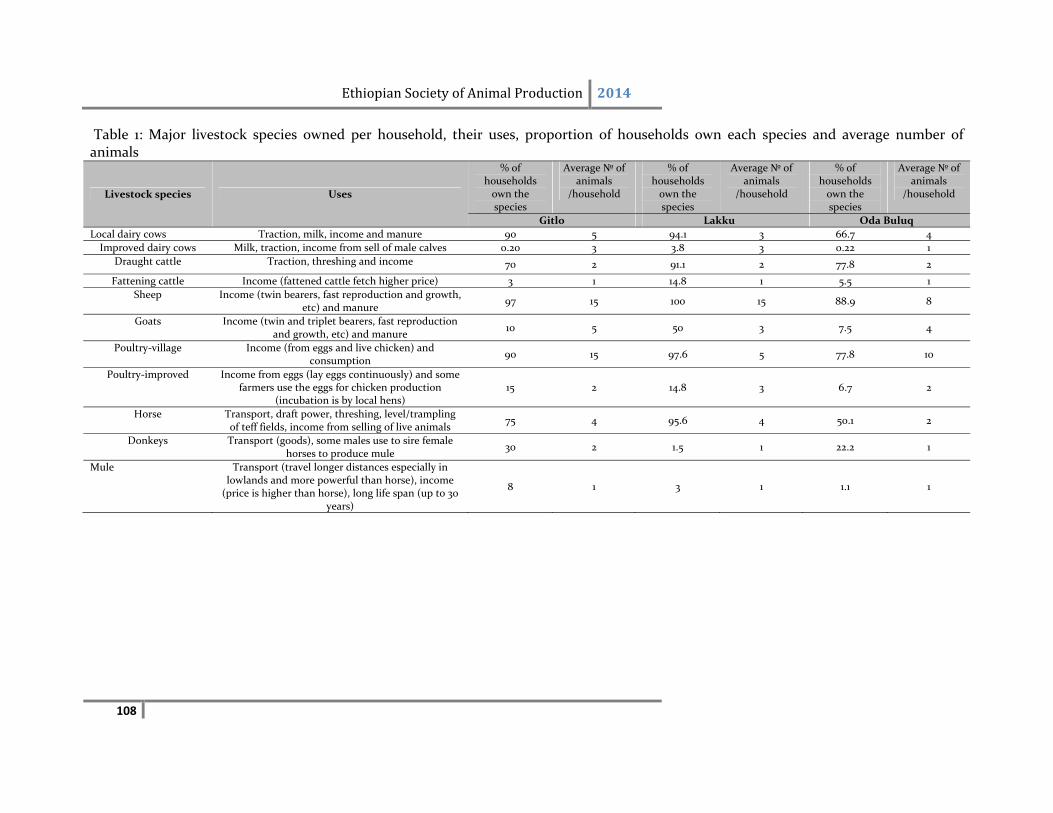
Ethiopian Society of Animal Production 2014
108
Table 1: Major livestock species owned per household, their uses, proportion of households own each species and average number of animals
Livestock species Uses
% of households own the species
Average № of animals
/household
% of households own the species
Average № of animals
/household
% of households own the species
Average № of animals
/household
Gitlo Lakku Oda Buluq
Local dairy cows Traction, milk, income and manure 90 5 94.1 3 66.7 4
Improved dairy cows Milk, traction, income from sell of male calves 0.20 3 3.8 3 0.22 1
Draught cattle Traction, threshing and income 70 2 91.1 2 77.8 2
Fattening cattle Income (fattened cattle fetch higher price) 3 1 14.8 1 5.5 1
Sheep Income (twin bearers, fast reproduction and growth, etc) and manure
97 15 100 15 88.9 8
Goats Income (twin and triplet bearers, fast reproduction and growth, etc) and manure
10 5 50 3 7.5 4
Poultry‐village Income (from eggs and live chicken) and consumption
90 15 97.6 5 77.8 10
Poultry‐improved Income from eggs (lay eggs continuously) and some farmers use the eggs for chicken production
(incubation is by local hens) 15 2 14.8 3 6.7 2
Horse Transport, draft power, threshing, level/trampling of teff fields, income from selling of live animals
75 4 95.6 4 50.1 2
Donkeys Transport (goods), some males use to sire female horses to produce mule
30 2 1.5 1 22.2 1
Mule Transport (travel longer distances especially in lowlands and more powerful than horse), income (price is higher than horse), long life span (up to 30
years)
8 1 3 1 1.1 1
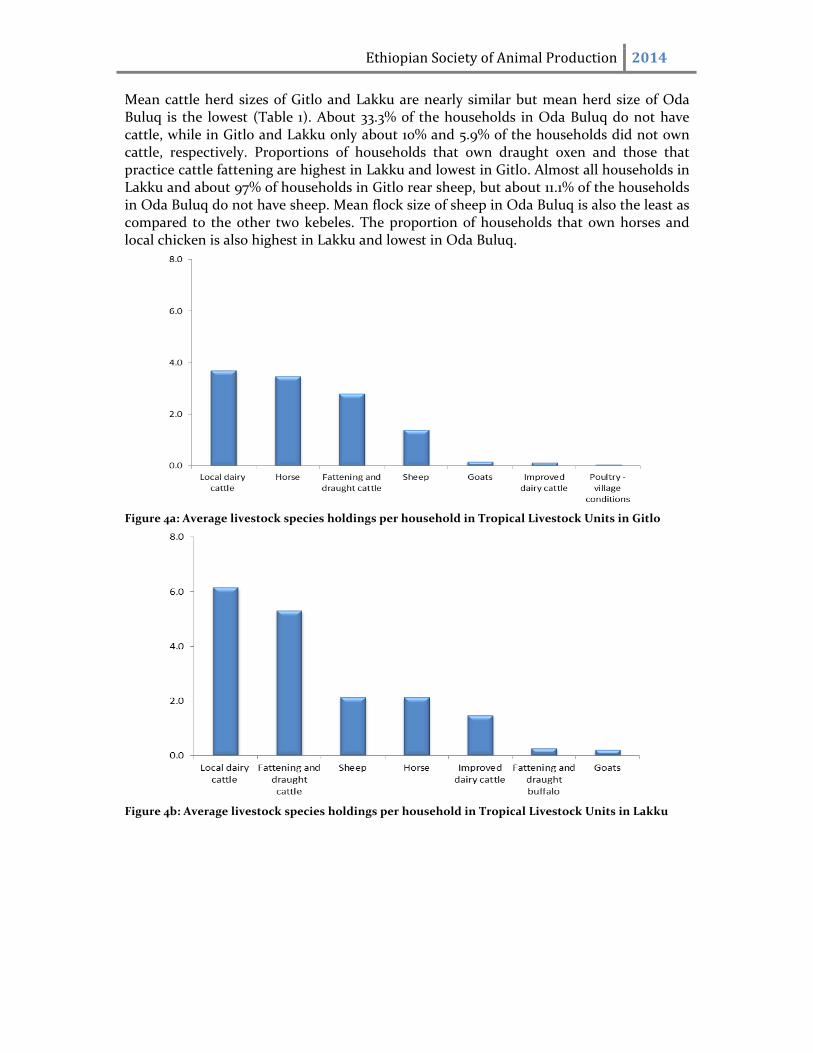
Ethiopian Society of Animal Production 2014
Mean cattle herd sizes of Gitlo and Lakku are nearly similar but mean herd size of Oda Buluq is the lowest (Table 1). About 33.3% of the households in Oda Buluq do not have cattle, while in Gitlo and Lakku only about 10% and 5.9% of the households did not own cattle, respectively. Proportions of households that own draught oxen and those that practice cattle fattening are highest in Lakku and lowest in Gitlo. Almost all households in Lakku and about 97% of households in Gitlo rear sheep, but about 11.1% of the households in Oda Buluq do not have sheep. Mean flock size of sheep in Oda Buluq is also the least as compared to the other two kebeles. The proportion of households that own horses and local chicken is also highest in Lakku and lowest in Oda Buluq.
Figure 4a: Average livestock species holdings per household in Tropical Livestock Units in Gitlo
Figure 4b: Average livestock species holdings per household in Tropical Livestock Units in Lakku
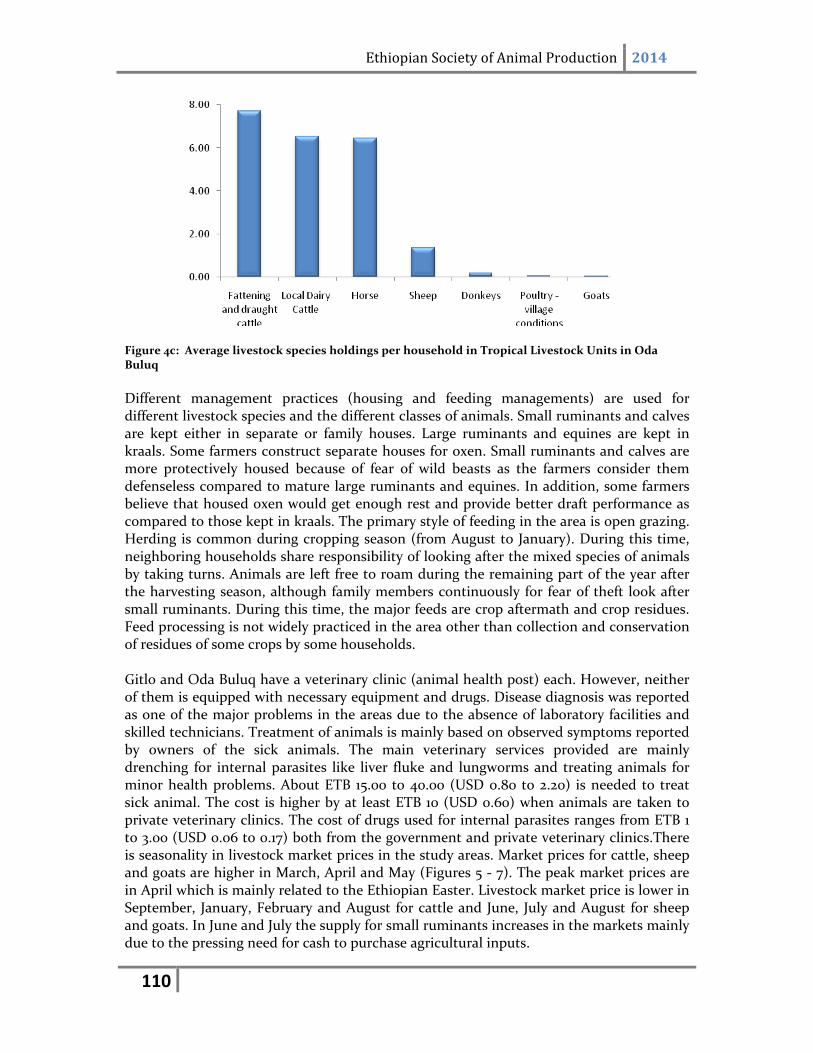
Ethiopian Society of Animal Production 2014
110
Figure 4c: Average livestock species holdings per household in Tropical Livestock Units in Oda Buluq
Different management practices (housing and feeding managements) are used for different livestock species and the different classes of animals. Small ruminants and calves are kept either in separate or family houses. Large ruminants and equines are kept in kraals. Some farmers construct separate houses for oxen. Small ruminants and calves are more protectively housed because of fear of wild beasts as the farmers consider them defenseless compared to mature large ruminants and equines. In addition, some farmers believe that housed oxen would get enough rest and provide better draft performance as compared to those kept in kraals. The primary style of feeding in the area is open grazing. Herding is common during cropping season (from August to January). During this time, neighboring households share responsibility of looking after the mixed species of animals by taking turns. Animals are left free to roam during the remaining part of the year after the harvesting season, although family members continuously for fear of theft look after small ruminants. During this time, the major feeds are crop aftermath and crop residues. Feed processing is not widely practiced in the area other than collection and conservation of residues of some crops by some households. Gitlo and Oda Buluq have a veterinary clinic (animal health post) each. However, neither of them is equipped with necessary equipment and drugs. Disease diagnosis was reported as one of the major problems in the areas due to the absence of laboratory facilities and skilled technicians. Treatment of animals is mainly based on observed symptoms reported by owners of the sick animals. The main veterinary services provided are mainly drenching for internal parasites like liver fluke and lungworms and treating animals for minor health problems. About ETB 15.00 to 40.00 (USD 0.80 to 2.20) is needed to treat sick animal. The cost is higher by at least ETB 10 (USD 0.60) when animals are taken to private veterinary clinics. The cost of drugs used for internal parasites ranges from ETB 1 to 3.00 (USD 0.06 to 0.17) both from the government and private veterinary clinics.There is seasonality in livestock market prices in the study areas. Market prices for cattle, sheep and goats are higher in March, April and May (Figures 5 ‐ 7). The peak market prices are in April which is mainly related to the Ethiopian Easter. Livestock market price is lower in September, January, February and August for cattle and June, July and August for sheep and goats. In June and July the supply for small ruminants increases in the markets mainly due to the pressing need for cash to purchase agricultural inputs.
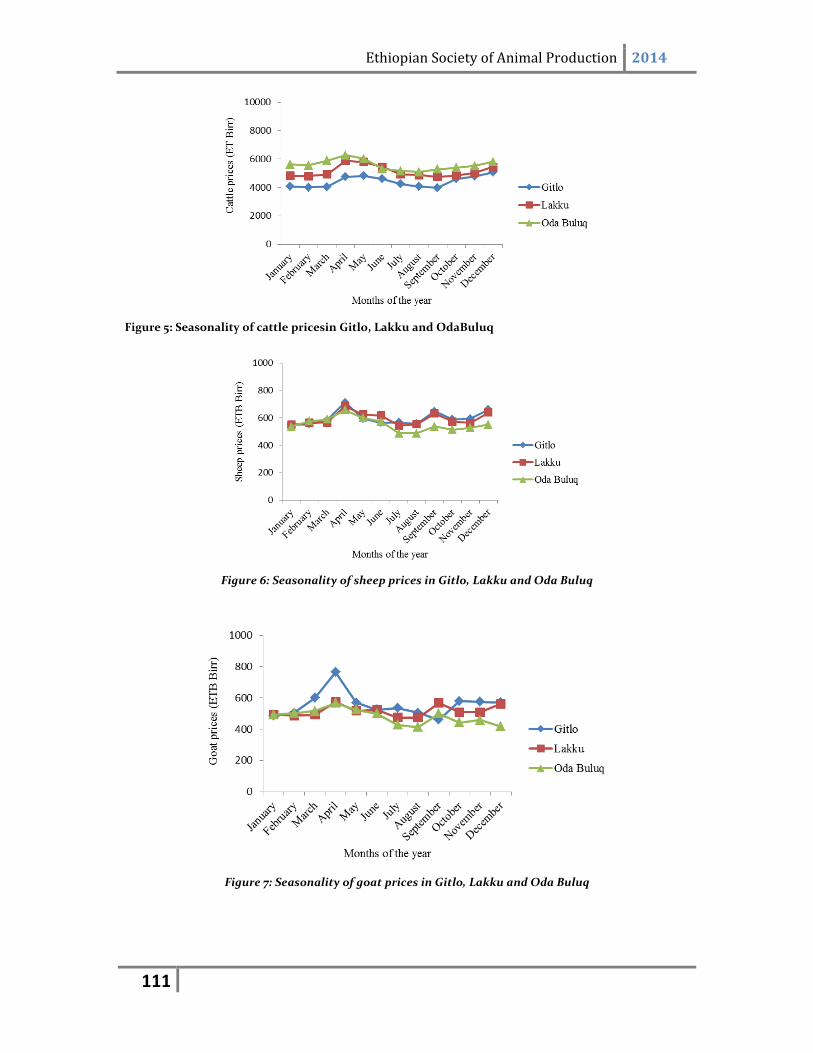
Ethiopian Society of Animal Production 2014
111
Figure 5: Seasonality of cattle pricesin Gitlo, Lakku and OdaBuluq
Figure 6: Seasonality of sheep prices in Gitlo, Lakku and Oda Buluq
Figure 7: Seasonality of goat prices in Gitlo, Lakku and Oda Buluq
Ethiopian Society of Animal Production 2014
112
Feed resources and seasonal availability
Major feed resources: Major feed resources are natural pasture, crop residues, crop aftermath, green fodder or hay prepared from natural pasture, in the order of importance. Naturally occurring green fodder material like weeds from cropping areas, roadsides and naturally occurring grasses also serve as sources of feeds. Grazing (natural pasture) is the most important feed sources in all the areas. Though plenty of crop residues are produced in the kebeles (about 6.3 to 11.7 tons of crop residues/household is estimated be produced) due to the fact that different crops are grown in the kebeles, it was reported that only few farmers conserve and use residues of some crops like tef, barley and wheat. Cultivation of improved forage crops and purchase of supplementary feeds are also not commonly practiced in the areas. Common beans (3%), maize grain (32%) and noug cake (65%) were some of the purchased supplementary feeds reported in Gitlo. Maize and tef grain, green fodder and natural pasture hay (the sum of all constitute less than 10% of the purchased supplementary feeds) were also reported as purchased supplementary feeds in Oda Buluq. However, no purchased feed was reported in Lakku other than mineral salt. Castrated sheep are fed with boiled common beans (faba beans) mixed with salt. Seasonality of feeds availability: Seasonality of feeds is shown in Figure 8 (a‐c) for Gitlo, Lakku and Oda Buluq, respectively. Natural pasture, the major feed resources in the area, serves almost year round. However, its availability is mainly lower in April, May and June in Gitlo and Lakku and in March, April and May in Oda Buluq. Crop residues assume the highest importance from November to July in all areas surveyed and particularly highest importance in Oda Buluq in February. Residues of tef, barley, pulse, noug and wheat are important feed sources during the dry season. In addition, maize stover is also reported as important animal feed in Oda Buluq area. Based on the harvesting index procedure, about 6.3, 8.7 and 11.68 tons of crop residues/household can be produced in Gitlo, Lakku and Oda Buluq kebeles, respectively. However, it was reported that most of these feed resources are not collected, conserved and properly utilized. Draught oxen and lactating cows are fed preferentially for better draught performance and better milk production. Weeds from cropping areas and roadsides are mainly provided to young calves during the dry season. It was also reported that some farmers offer crop residues (in rainy season) before they let their animals for grazing to avoid risk of bloating. According to respondents, no incidence of bloating happens if animals are offered some dry feeds like tef straw before they are out for grazing.
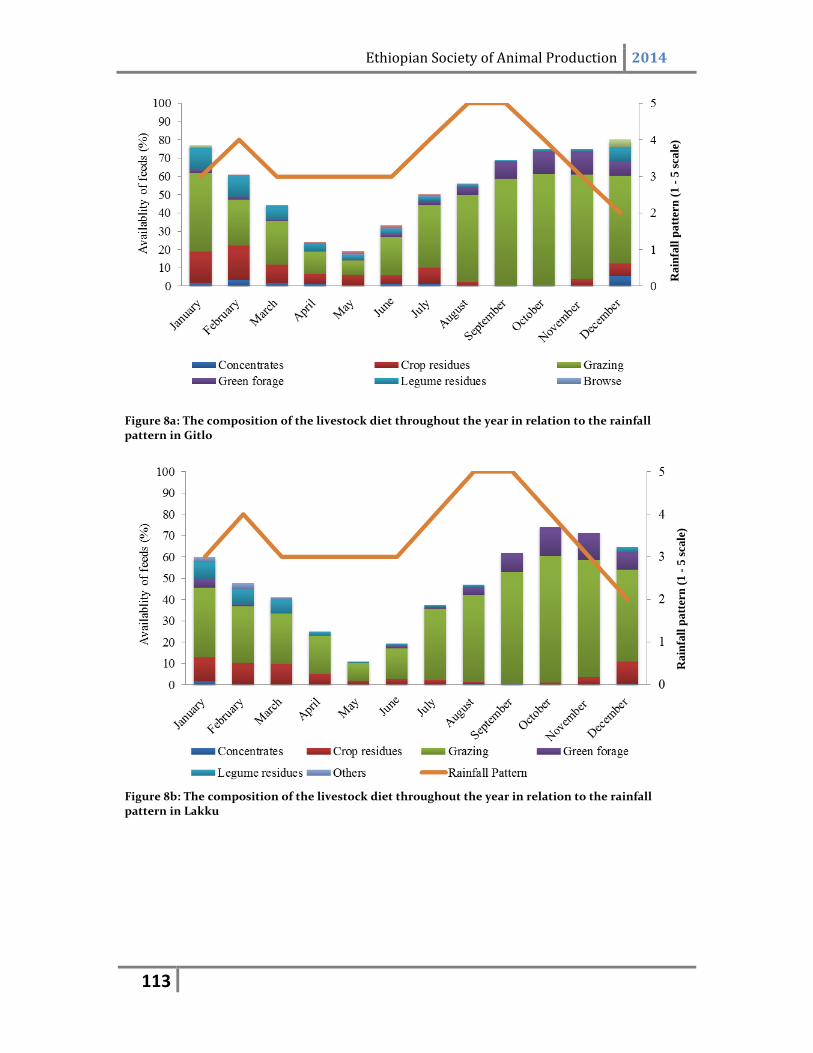
Ethiopian Society of Animal Production 2014
113
Figure 8a: The composition of the livestock diet throughout the year in relation to the rainfall pattern in Gitlo
Figure 8b: The composition of the livestock diet throughout the year in relation to the rainfall pattern in Lakku
Rai
nfa
ll p
atte
rn (
1 -
5 sc
ale)
R
ain
fall
pat
tern
(1
- 5
scal
e)
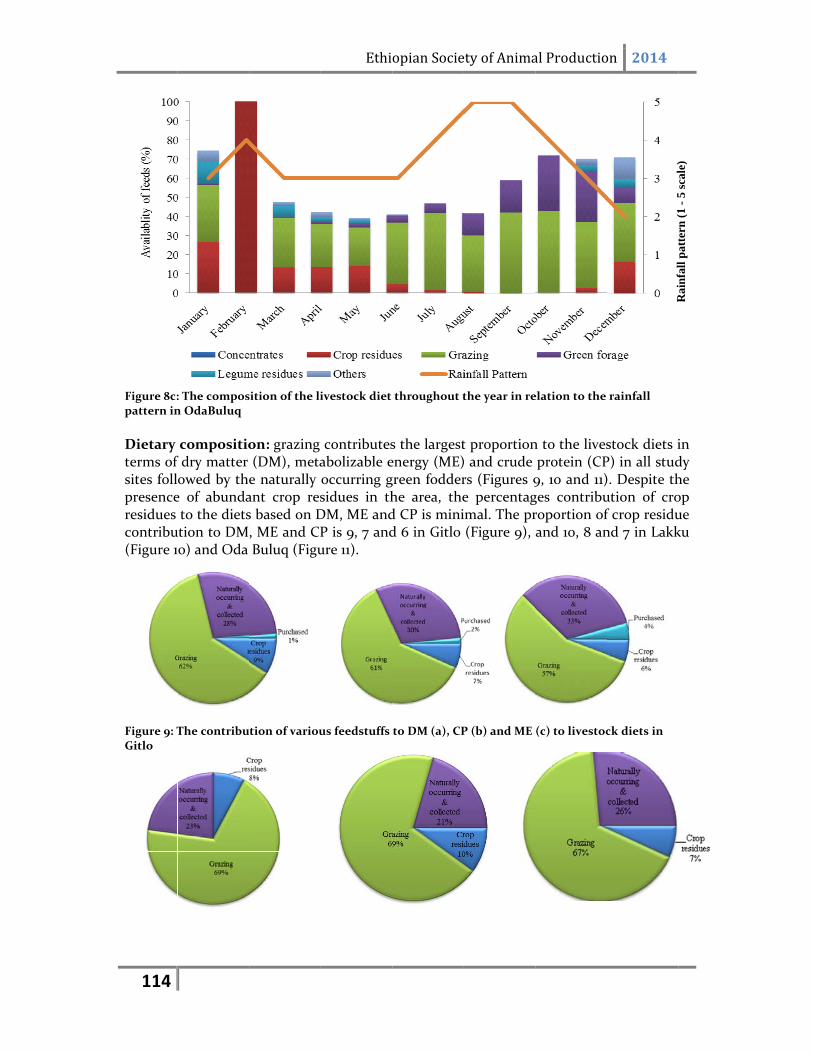
114
Figure 8c:pattern in
Dietary terms of sites follpresenceresidues contribu(Figure 1
Figure 9: TGitlo
: The composn OdaBuluq
compositiof dry matter owed by thee of abunda to the dietsution to DM 0) and Oda
The contribu
sition of the li
on: grazing (DM), metae naturally ant crop ress based on D, ME and CP Buluq (Figu
tion of variou
Ethi
ivestock diet
contributesabolizable e occurring gsidues in th DM, ME andP is 9, 7 andure 11).
us feedstuffs
opian Socie
throughout t
s the largest energy (ME)green fodderhe area, thed CP is minid 6 in Gitlo
to DM (a), CP
ety of Anima
the year in re
t proportion) and crude rs (Figures 9e percentagimal. The pr (Figure 9),
P (b) and ME
al Productio
elation to the
n to the lives protein (CP 9, 10 and 11)ges contriburoportion of and 10, 8 an
(c) to livestoc
on 2014
rainfall
stock diets iP) in all stud). Despite thution of crof crop residund 7 in Lakk
ck diets in
Ri
fll
tt(1
5l
)
in dy he op ue ku
Rai
nfa
ll p
atte
rn (
1 -
5 sc
ale)
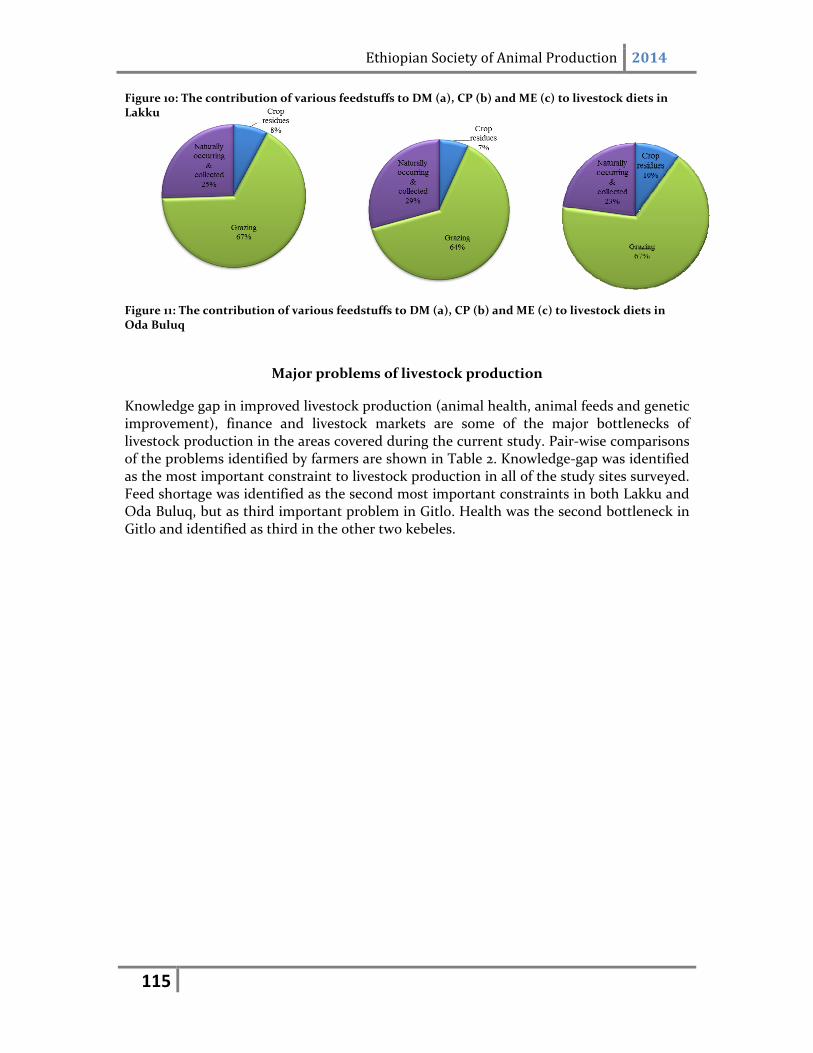
Ethiopian Society of Animal Production 2014
115
Figure 10: The contribution of various feedstuffs to DM (a), CP (b) and ME (c) to livestock diets in Lakku
Figure 11: The contribution of various feedstuffs to DM (a), CP (b) and ME (c) to livestock diets in Oda Buluq
Major problems of livestock production
Knowledge gap in improved livestock production (animal health, animal feeds and genetic improvement), finance and livestock markets are some of the major bottlenecks of livestock production in the areas covered during the current study. Pair‐wise comparisons of the problems identified by farmers are shown in Table 2. Knowledge‐gap was identified as the most important constraint to livestock production in all of the study sites surveyed. Feed shortage was identified as the second most important constraints in both Lakku and Oda Buluq, but as third important problem in Gitlo. Health was the second bottleneck in Gitlo and identified as third in the other two kebeles.
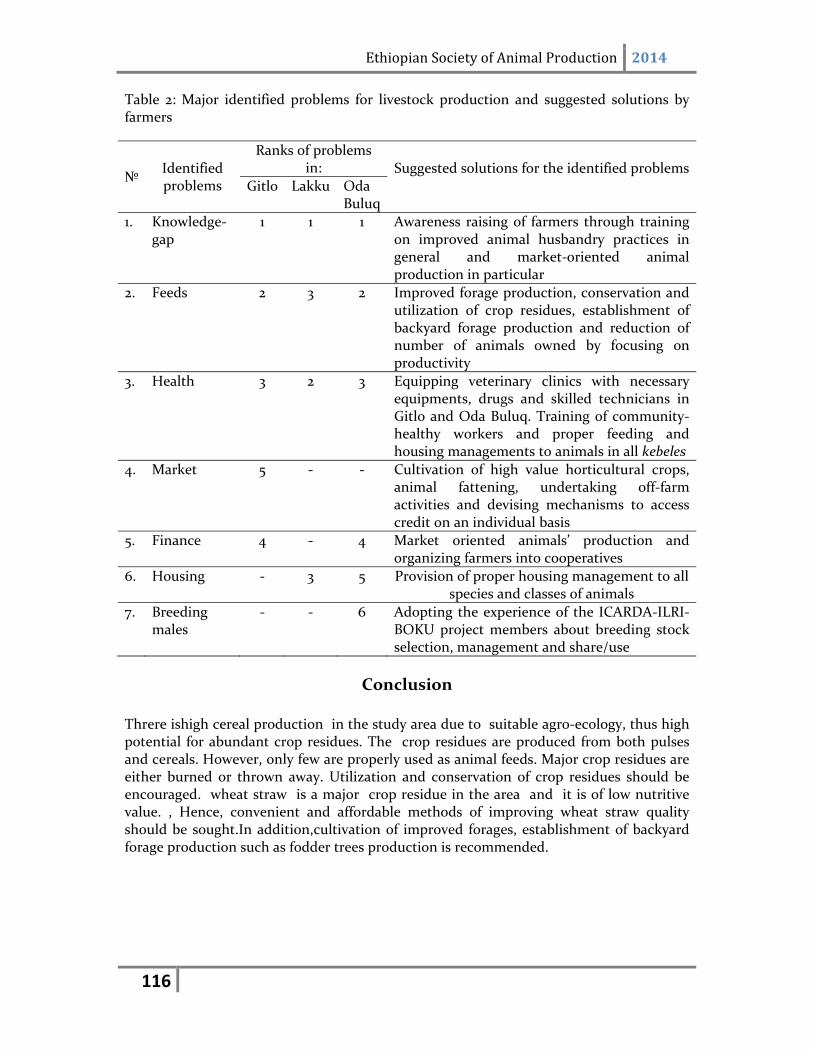
Ethiopian Society of Animal Production 2014
116
Table 2: Major identified problems for livestock production and suggested solutions by farmers
№ Identified problems
Ranks of problems in: Suggested solutions for the identified problems
Gitlo Lakku Oda Buluq
1. Knowledge‐gap
1 1 1 Awareness raising of farmers through training on improved animal husbandry practices in general and market‐oriented animal production in particular
2. Feeds 2 3 2 Improved forage production, conservation and utilization of crop residues, establishment of backyard forage production and reduction of number of animals owned by focusing on productivity
3. Health 3 2 3 Equipping veterinary clinics with necessary equipments, drugs and skilled technicians in Gitlo and Oda Buluq. Training of community‐healthy workers and proper feeding and housing managements to animals in all kebeles
4. Market 5 ‐ ‐ Cultivation of high value horticultural crops, animal fattening, undertaking off‐farm activities and devising mechanisms to access credit on an individual basis
5. Finance 4 ‐ 4 Market oriented animals’ production and organizing farmers into cooperatives
6. Housing ‐ 3 5 Provision of proper housing management to all species and classes of animals
7. Breeding males
‐ ‐ 6 Adopting the experience of the ICARDA‐ILRI‐BOKU project members about breeding stock selection, management and share/use
Conclusion
Threre ishigh cereal production in the study area due to suitable agro‐ecology, thus high potential for abundant crop residues. The crop residues are produced from both pulses and cereals. However, only few are properly used as animal feeds. Major crop residues are either burned or thrown away. Utilization and conservation of crop residues should be encouraged. wheat straw is a major crop residue in the area and it is of low nutritive value. , Hence, convenient and affordable methods of improving wheat straw quality should be sought.In addition,cultivation of improved forages, establishment of backyard forage production such as fodder trees production is recommended.
Ethiopian Society of Animal Production 2014
117
Acknowledgments
The authors greatly appreciate the support and collaboration of the management of Bako Agricultural Research Center. We wish to sincerely and greatly thank the smallholder farmers of Gitlo, Lakku and Oda Buluq kebeles for their cooperation in providing necessary information without reservation.
References
Galal, E.S.E., 1983. Sheep germplasm in Ethiopia. Animal Genetic Resources Information Bulletin, 1/83:4 – 12. Gemeda Duguma, 2011. Participatory definition of breeding objectives and implementation of community‐based sheep breeding programs in Ethiopia. PhD Thesis, University of Natural Resources and Life Sciences, Vienna, Austria. Gemeda Duguma, Kifle Degefa, Temesgen Jembere, Worku Temesgen, Aynalem Haile and Getachew Leggese, 2012. Value chain analysis of sheep in Horro district of Oromia Region, Ethiopia (unpublished data). Mekonnen A., 2007. Assessment of feed resources, feeding system and milk production in Horro district, Western Oromia. MSc Thesis, Hawassa University, Hawassa, Ethiopia. Olana, B.T., 2006. People and dams: Environmental and socio‐economic changes induced by a reservoir in Fincha’a watershed, western Ethiopia. PhD Thesis, Wageningen University, The Netherlands. Otte, M.J. and Chilonda, P., 2002. Cattle and small ruminant production systems in sub_Saharan Africa. A systematic review. Food and Agricultural Organization of the United Nations (FAO). 98pp. Rege, J.E.O. and Thawah, C.L. 1999. The state of African cattle genetic resources. II. Geographical distribution, charactorstics and uses of present‐ day breeds and strains. Animal Genetic Resources Information. 26:1‐25. Solomon Abegaz, 2002. Genetic evaluation of production, reproduction and survival in a flock of Ethiopian Horro sheep. PhD Thesis, University of the Free State, South Africa. Solomon Gizaw, van Arendonk, J.A.M., Komen, H., Windig, J.J. and Hanott, O. 2007. Population structure, genetic variation and morphological diversity in indigenous sheep of Ethiopia. Animal Genetics, 38:621 – 628.
Ethiopian Society of Animal Production 2014
118
Dairy Cattle Management Practices in Urban and Peri‐urban Areas of Northern Ethiopia
1Gebrekidan Tesfay and 2Zeleke Mekuriaw
1 Department of Animal Science, College of Agriculture and Environmental Sciences, Adigrat University, P.O. Box 50, Adigrat, Ethiopia
2 Department of Animal Science, College of Agriculture, Bahir Dar University, Bahir Dar, Ethiopia
Abstract
The purpose of this study was to explore dairy cattle management practices in urban and peri‐urban dairy production systems in central Tigray, northern Ethiopia. The data collected from 160 dairy owner households, selected by systematic random sampling, were analysed using simple descriptive statistics such as mean, percentage and chi‐square tests. The average cross bred (5.58±0.67), high‐grade breeds (7.16±1.15) and total herd (6.78±0.63) holding in urban area was significantly (P<0.05) higher than the peri‐urban areas with 3.88�0.38,2.40±0.68 and 4.83±0.29 for cross bred, high‐grade and total herd respectively. Nevertheless, the opposite was true for the average local dairy cattle holding, 1.92±0.288 in urban and 3.65±0.24 in peri‐urban. Majority of the urban dairy farmers depend on hay, crop residues and concentrates for feeding their dairy cattle. Peri‐urban dairy farmers rely on dry and green roughages but less on concentrate feeds. In the urban areas, pipe water was the most common water source for the dairy cattle. However, in the peri‐urban areas, the use of river was very high. Significantly (P<0.05) better watering frequency was observed in urban than peri‐urban areas. Veterinary service were siginificantly different from urban to peri‐urban ares with better access in urban areas(P<0.05). Waste management was relatively problematic in urban areas (36.25%) as compared to the peri‐urban areas (13.75%). Therefore, an appropriate feed and feeding, watering, health management, housing and breeding could be the management options to improve some of the existing problems.
Key words: dairy cattle, farm size, management practices, peri‐urban, Urban
Introduction
The urban and peri‐urban dairy cattle production has been developed in response to the fast growing demand for milk and milk products. Many countries in the world have experienced very vast development in dairy sector in or around the largest urban centers, responding immediately to the market demand and profiting from the lack of links between the rural producer and the urban consumer. In Ethiopia too, urban and peri‐urban dairy production systems are emerging as an important component of the milk production system (Azage and Alemu 1998). This system is contributing immensely towards filling in the large demand‐supply gap for milk and milk products in urban centers, where consumption of milk and milk products is remarkably high. However, little research efforts have been made in Ethiopia in general and in central Tigray in particular
Ethiopian Society of Animal Production 2014
119
on urban and peri‐urban areas as most of the efforts are directed towards rural agricultural activities. The few studies made so far are concentrated in and around Addis Ababa, capital city of the country. This has led to overlooking urban and peri‐urban dairying from incorporating to the country’s research agenda and to the overall agricultural development program. This picture has to be changed as urban dairying is becoming an important agricultural activity around major urban and peri‐urban centers far from Addis Ababa. Hence, in order to design relevant dairy development strategies and implement context specific interventions for future development of the urban and peri‐urban dairy production, characterization of the management practices of dairying are important. The scientific information regarding the aforementioned parameters helps as a starting point for further development endeavors in dairy enterprise. Therefore, the objective of this study was to identify the existing dairy cattle management practices in respect to urban and peri‐ urban areas in central zone of Tigray, Northern Ethiopia.
Material and Methods
Study area
The study was carried out in urban and peri‐urban areas of Adwa & Axum, which are located in central zone of Tigray region, Northern Ethiopia. The sites are located at 1006 & 1024 kilometers far from Addis Ababa, capital city of Ethiopia, respectively. Central Tigray Zone is one of the five zones in Tigray National Regional State. The zone approximately extends between 13015’ and 14039’ North latitude, and 380 34’ and 39025’ East longitude. The altitude of the zone mainly falls within the category of 2000 to 3000 meter above sea level. Large part of the zone receives mean annual rainfall ranging from 400 to 800mm. The mean monthly maximum and minimum temperature of the zone are 300c and 100c, respectively (NMSA, 1996). The zone has the largest human population (1,245,223) in the region (CSA, 2008).
Sampling technique
The study districts (Adwa and Aksum) were selected purposively based on their conducive agro‐ecological conditions for dairy production and large human population in the zone. A multi‐stage sampling technique was used for the study. First cattle holding households were identified in both urban and peri‐urban areas of Axum and Adwa. Dairy farms located within Axum and Adwa are considered as urban farms while those located around these major towns are considered as peri‐urban farms. Accordingly, smaller towns of Wukro, Dura, and Mahiber‐selam from Axum and Bete‐Hanis, Debre‐genet, Gendebta and Mariam‐shewito from Adwa have been considerd as peri‐urban farms. The small towns are found within a radius of 20km from the centers of the two larger towns. Urban and peri‐urban dairy farms in the study area were further categorized in to large (> 10 dairy cattle), medium (5‐10 dairy cattle) and small (<5 dairy cattle) according to the guideline of IRLI (1996). Finally, based on the sampling frame obtained from the district office of Agriculture, a total of 160 cattle holding households were chosen using systematic random sampling technique.Equally 80 cattle holding households from urban and 80 from peri‐urban were used for the study. Those that had large farm holding (> 10 dairy cattle) and medium farm holding (5‐10 dairy cattle) were only 21 and 48 households, respectively, in both urban and peri‐urban areas, Whereas the rest of the households had small farms
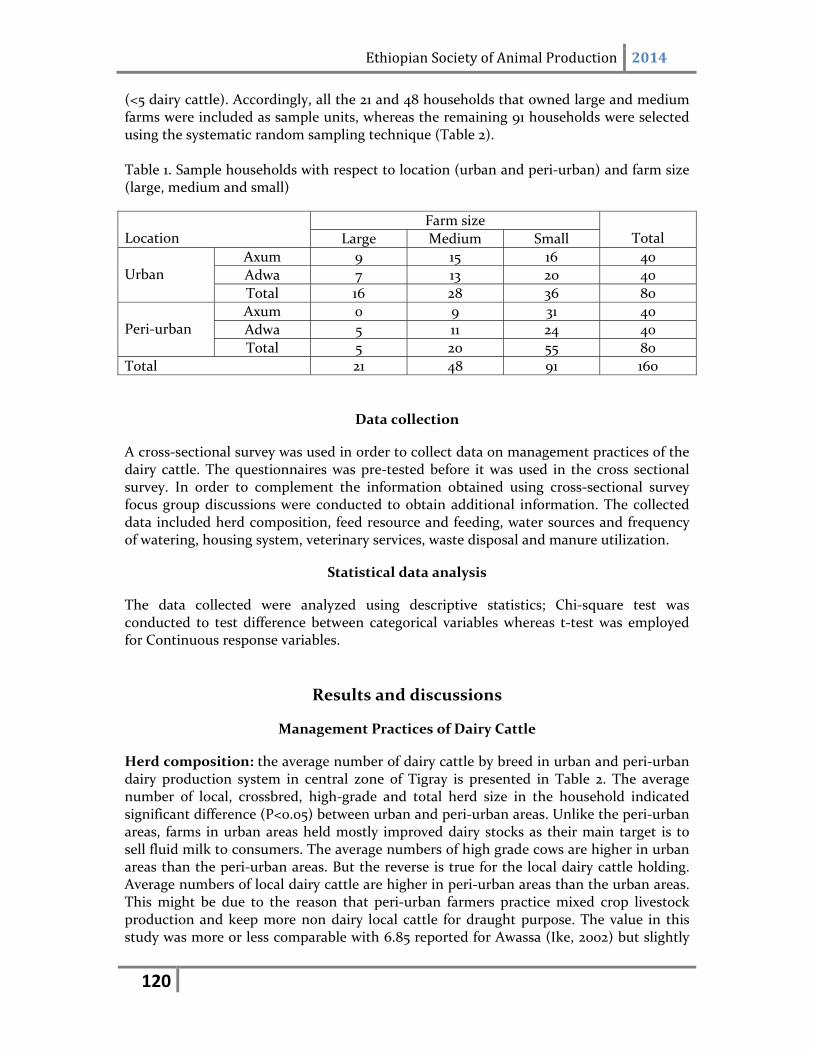
Ethiopian Society of Animal Production 2014
120
(<5 dairy cattle). Accordingly, all the 21 and 48 households that owned large and medium farms were included as sample units, whereas the remaining 91 households were selected using the systematic random sampling technique (Table 2). Table 1. Sample households with respect to location (urban and peri‐urban) and farm size (large, medium and small)
Location
Farm size Total Large Medium Small
Urban
Axum 9 15 16 40
Adwa 7 13 20 40
Total 16 28 36 80
Peri‐urban
Axum 0 9 31 40
Adwa 5 11 24 40
Total 5 20 55 80
Total 21 48 91 160
Data collection
A cross‐sectional survey was used in order to collect data on management practices of the dairy cattle. The questionnaires was pre‐tested before it was used in the cross sectional survey. In order to complement the information obtained using cross‐sectional survey focus group discussions were conducted to obtain additional information. The collected data included herd composition, feed resource and feeding, water sources and frequency of watering, housing system, veterinary services, waste disposal and manure utilization.
Statistical data analysis
The data collected were analyzed using descriptive statistics; Chi‐square test was conducted to test difference between categorical variables whereas t‐test was employed for Continuous response variables.
Results and discussions
Management Practices of Dairy Cattle
Herd composition: the average number of dairy cattle by breed in urban and peri‐urban dairy production system in central zone of Tigray is presented in Table 2. The average number of local, crossbred, high‐grade and total herd size in the household indicated significant difference (P<0.05) between urban and peri‐urban areas. Unlike the peri‐urban areas, farms in urban areas held mostly improved dairy stocks as their main target is to sell fluid milk to consumers. The average numbers of high grade cows are higher in urban areas than the peri‐urban areas. But the reverse is true for the local dairy cattle holding. Average numbers of local dairy cattle are higher in peri‐urban areas than the urban areas. This might be due to the reason that peri‐urban farmers practice mixed crop livestock production and keep more non dairy local cattle for draught purpose. The value in this study was more or less comparable with 6.85 reported for Awassa (Ike, 2002) but slightly
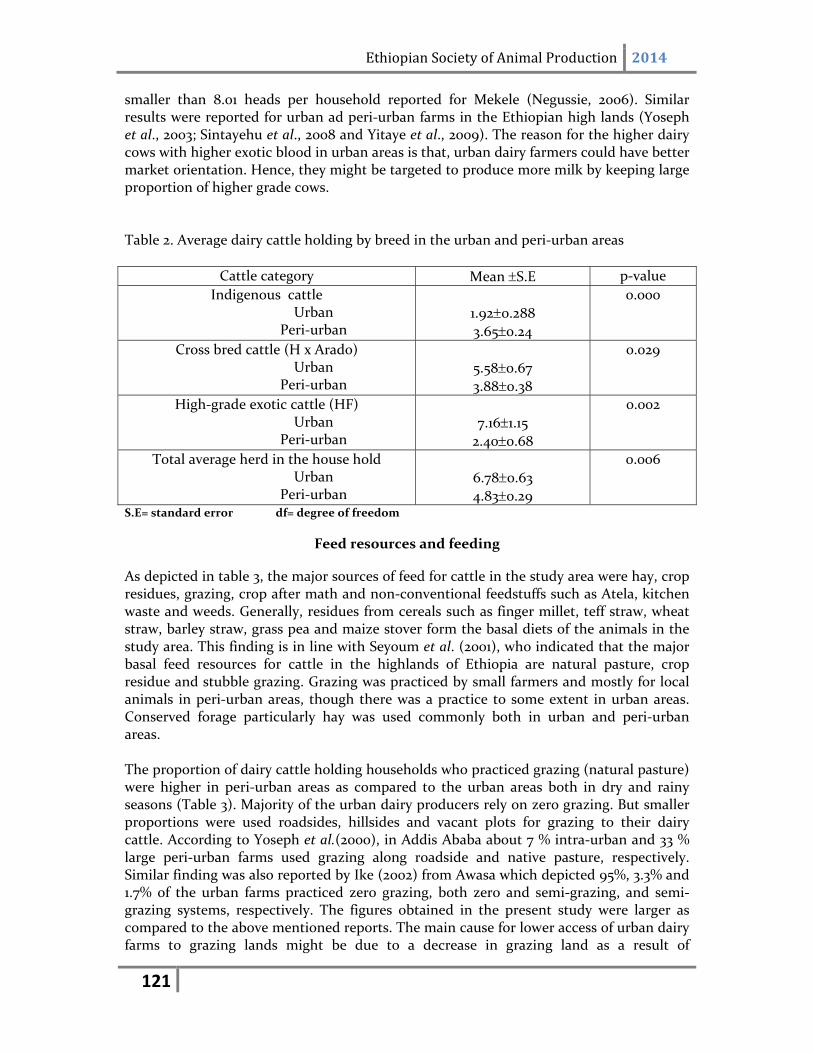
Ethiopian Society of Animal Production 2014
121
smaller than 8.01 heads per household reported for Mekele (Negussie, 2006). Similar results were reported for urban ad peri‐urban farms in the Ethiopian high lands (Yoseph et al., 2003; Sintayehu et al., 2008 and Yitaye et al., 2009). The reason for the higher dairy cows with higher exotic blood in urban areas is that, urban dairy farmers could have better market orientation. Hence, they might be targeted to produce more milk by keeping large proportion of higher grade cows. Table 2. Average dairy cattle holding by breed in the urban and peri‐urban areas
Cattle category Mean S.E p‐value
Indigenous cattle Urban
Peri‐urban
1.920.288 3.650.24
0.000
Cross bred cattle (H x Arado) Urban
Peri‐urban
5.580.67 3.880.38
0.029
High‐grade exotic cattle (HF) Urban
Peri‐urban
7.161.15 2.400.68
0.002
Total average herd in the house hold Urban
Peri‐urban
6.780.63 4.830.29
0.006
S.E= standard error df= degree of freedom
Feed resources and feeding
As depicted in table 3, the major sources of feed for cattle in the study area were hay, crop residues, grazing, crop after math and non‐conventional feedstuffs such as Atela, kitchen waste and weeds. Generally, residues from cereals such as finger millet, teff straw, wheat straw, barley straw, grass pea and maize stover form the basal diets of the animals in the study area. This finding is in line with Seyoum et al. (2001), who indicated that the major basal feed resources for cattle in the highlands of Ethiopia are natural pasture, crop residue and stubble grazing. Grazing was practiced by small farmers and mostly for local animals in peri‐urban areas, though there was a practice to some extent in urban areas. Conserved forage particularly hay was used commonly both in urban and peri‐urban areas.
The proportion of dairy cattle holding households who practiced grazing (natural pasture) were higher in peri‐urban areas as compared to the urban areas both in dry and rainy seasons (Table 3). Majority of the urban dairy producers rely on zero grazing. But smaller proportions were used roadsides, hillsides and vacant plots for grazing to their dairy cattle. According to Yoseph et al.(2000), in Addis Ababa about 7 % intra‐urban and 33 % large peri‐urban farms used grazing along roadside and native pasture, respectively. Similar finding was also reported by Ike (2002) from Awasa which depicted 95%, 3.3% and 1.7% of the urban farms practiced zero grazing, both zero and semi‐grazing, and semi‐grazing systems, respectively. The figures obtained in the present study were larger as compared to the above mentioned reports. The main cause for lower access of urban dairy farms to grazing lands might be due to a decrease in grazing land as a result of
Ethiopian Society of Animal Production 2014
122
urbanization.From the peri‐urban area, particularly Dura from Axum and Bete‐Haniss from Adwa had better access to pasture because of availability of pasture land near by these village towns, and therefore, practiced semi‐zero grazing. Farms found in intra‐towns both in Adwa and Axum had little access to grazing land. Hence, mainly depend on purchased hay and agro‐industrial by‐products. Hay was purchased immediately after the end of rainy season and stored in hay shed for feeding throughout the year, especially, in the urban areas. Animals, especially the local ones were allowed to graze on roadsides for some hours of the daytime, whereas crossbred and high‐grade animals particularly in the large and medium farms were kept indoors. In line with this, Negusie (2006) justified that the reason for dependence of almost all of the urban farms on hay was attributed not only to relatively better quality of the feed and less access to other feeds like natural pasture, improved forages and other crop residues due to less land to grow but also to a coping mechanism against feed shortage through the use of conserved feed.
Large quantities of crop residues, mainly stover and straw, were produced from the surrounding rural areas and were supplied to the larger towns and village towns. In dry season Stover was used by 82.5% and 72.5% of the respondents in urban and peri‐urban areas, respectively, as the main crop residue to feed animals (Table 3). Teff, barley, wheat and finger millet straws were stored around home to be used during critical feed shortage periods. In the peri‐urban areas, there was a clear variation in the use of hay and stover across the season. Hay and stover were consumed highly during the dry season (93.75% and 72.5%, respectively) as compared to the rainy season which was 35% and 7.5%, respectively. Crop residues are important sources of feeds in all crop‐livestock mixed farming systems. From the information obtained during group discussion, locally prepared concentrate feeds using pulse hulls and corn were also given to animals raised especially in urban areas. There were local milling factories on which farms depend to get wheat bran. Apart from the wheat bran, local retail traders also brought and sold formulated ration and noug cake from Humera and Bahir Dar. However, the quantity of concentrates supplied was not sufficient enough to satisfy the demand in the areas. In addition to the less availability, the costs of these kinds of feeds were not affordable for most of the farmers. The costs of concentrates were unaffordable for the majority of the dairy farmers particularly to the peri‐urban dairy farmers. regardless of this, large proportion of urban farms were using concentrates since they become conscious about the advantage of using concentrate feeds for increased milk yield. This indicated the existence of massive opportunity for local retailers to step up their trade and potential for investors to set up a feed processing plant. So that farmers could get the concentrate feeds near and increase the productivity of their dairy animals. Hence, the supply of dairy products to the high demand in the area could be optimized.
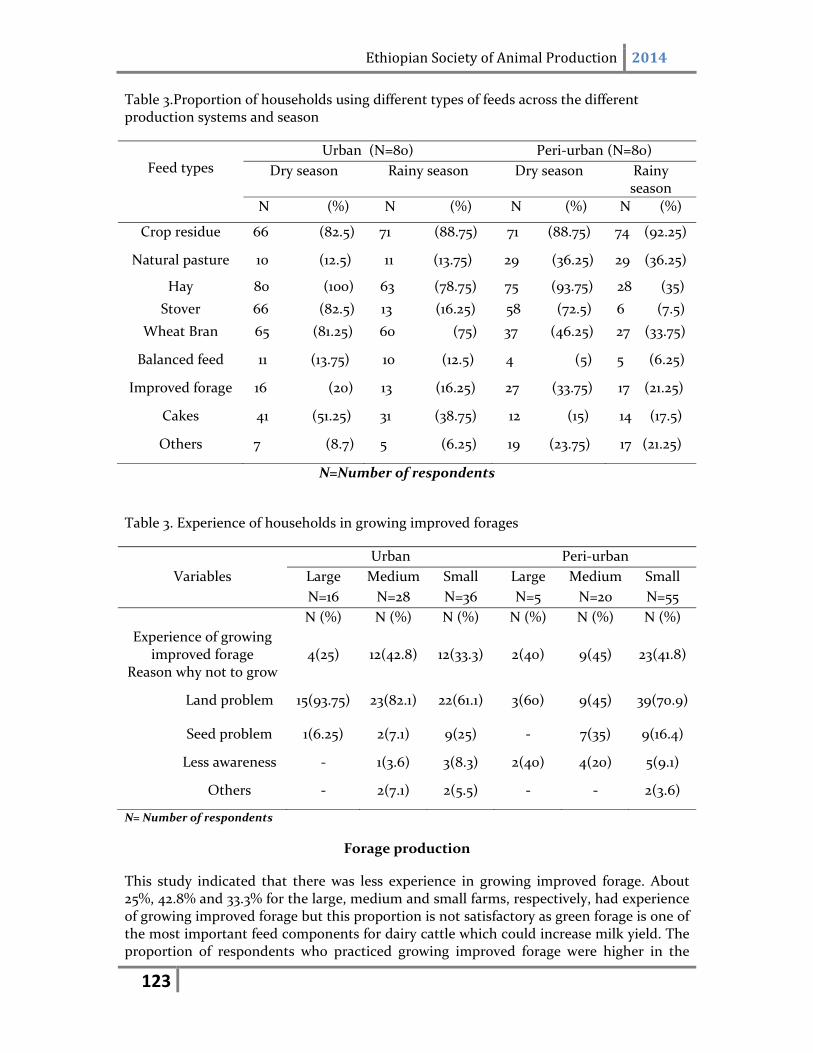
Ethiopian Society of Animal Production 2014
123
Table 3.Proportion of households using different types of feeds across the different production systems and season
Feed types
Urban (N=80) Peri‐urban (N=80)
Dry season Rainy season Dry season Rainy season
N (%) N (%) N (%) N (%)
Crop residue 66 (82.5) 71 (88.75) 71 (88.75) 74 (92.25)
Natural pasture 10 (12.5) 11 (13.75) 29 (36.25) 29 (36.25)
Hay 80 (100) 63 (78.75) 75 (93.75) 28 (35)
Stover 66 (82.5) 13 (16.25) 58 (72.5) 6 (7.5)
Wheat Bran 65 (81.25) 60 (75) 37 (46.25) 27 (33.75)
Balanced feed 11 (13.75) 10 (12.5) 4 (5) 5 (6.25)
Improved forage 16 (20) 13 (16.25) 27 (33.75) 17 (21.25)
Cakes 41 (51.25) 31 (38.75) 12 (15) 14 (17.5)
Others 7 (8.7) 5 (6.25) 19 (23.75) 17 (21.25)
N=Number of respondents
Table 3. Experience of households in growing improved forages
Urban Peri‐urban
Variables Large Medium Small Large Medium Small
N=16 N=28 N=36 N=5 N=20 N=55
N (%) N (%) N (%) N (%) N (%) N (%)
Experience of growing improved forage
4(25)
12(42.8)
12(33.3)
2(40)
9(45)
23(41.8)
Reason why not to grow
Land problem 15(93.75) 23(82.1) 22(61.1) 3(60) 9(45) 39(70.9)
Seed problem 1(6.25) 2(7.1) 9(25) ‐ 7(35) 9(16.4)
Less awareness ‐ 1(3.6) 3(8.3) 2(40) 4(20) 5(9.1)
Others ‐ 2(7.1) 2(5.5) ‐ ‐ 2(3.6)
N= Number of respondents
Forage production
This study indicated that there was less experience in growing improved forage. About 25%, 42.8% and 33.3% for the large, medium and small farms, respectively, had experience of growing improved forage but this proportion is not satisfactory as green forage is one of the most important feed components for dairy cattle which could increase milk yield. The proportion of respondents who practiced growing improved forage were higher in the
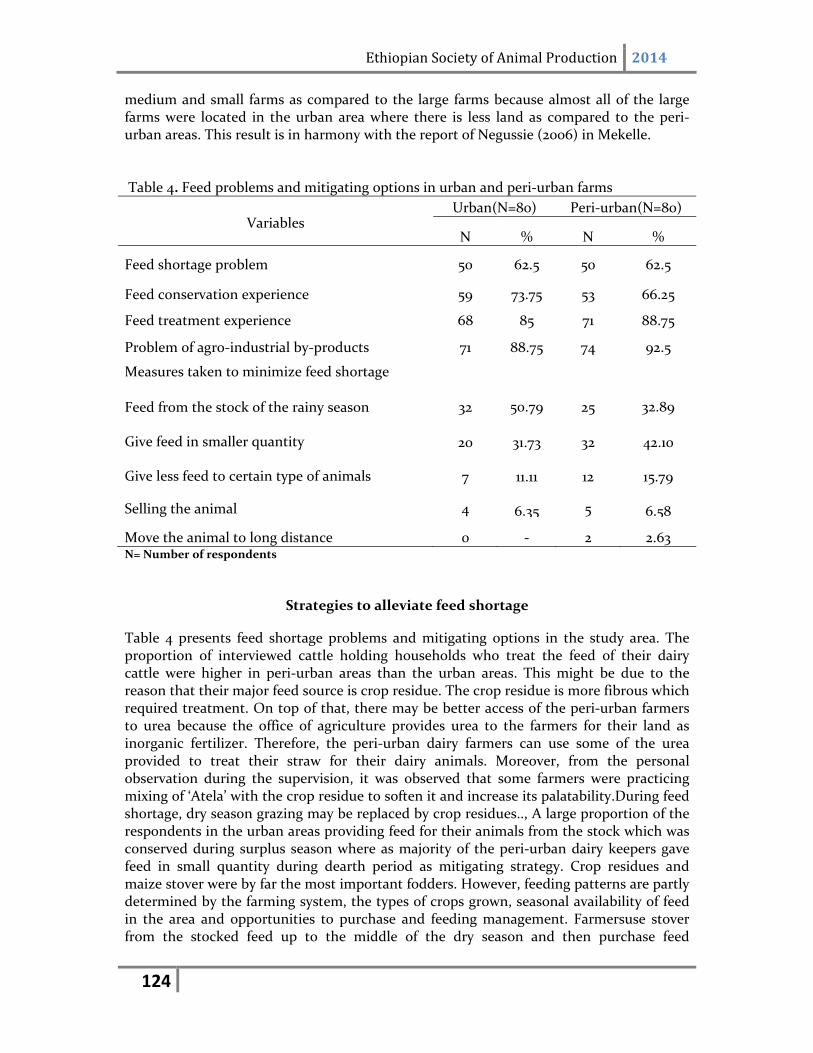
Ethiopian Society of Animal Production 2014
124
medium and small farms as compared to the large farms because almost all of the large farms were located in the urban area where there is less land as compared to the peri‐urban areas. This result is in harmony with the report of Negussie (2006) in Mekelle.
Table 4. Feed problems and mitigating options in urban and peri‐urban farms
Variables
Urban(N=80) Peri‐urban(N=80)
N % N %
Feed shortage problem 50 62.5 50 62.5
Feed conservation experience 59 73.75 53 66.25
Feed treatment experience 68 85 71 88.75
Problem of agro‐industrial by‐products 71 88.75 74 92.5
Measures taken to minimize feed shortage
Feed from the stock of the rainy season 32
50.79
25
32.89
Give feed in smaller quantity
20
31.73 32
42.10
Give less feed to certain type of animals 7
11.11
12
15.79
Selling the animal 4
6.35 5
6.58
Move the animal to long distance 0 ‐ 2 2.63 N= Number of respondents
Strategies to alleviate feed shortage
Table 4 presents feed shortage problems and mitigating options in the study area. The proportion of interviewed cattle holding households who treat the feed of their dairy cattle were higher in peri‐urban areas than the urban areas. This might be due to the reason that their major feed source is crop residue. The crop residue is more fibrous which required treatment. On top of that, there may be better access of the peri‐urban farmers to urea because the office of agriculture provides urea to the farmers for their land as inorganic fertilizer. Therefore, the peri‐urban dairy farmers can use some of the urea provided to treat their straw for their dairy animals. Moreover, from the personal observation during the supervision, it was observed that some farmers were practicing mixing of ‘Atela’ with the crop residue to soften it and increase its palatability.During feed shortage, dry season grazing may be replaced by crop residues.., A large proportion of the respondents in the urban areas providing feed for their animals from the stock which was conserved during surplus season where as majority of the peri‐urban dairy keepers gave feed in small quantity during dearth period as mitigating strategy. Crop residues and maize stover were by far the most important fodders. However, feeding patterns are partly determined by the farming system, the types of crops grown, seasonal availability of feed in the area and opportunities to purchase and feeding management. Farmersuse stover from the stocked feed up to the middle of the dry season and then purchase feed
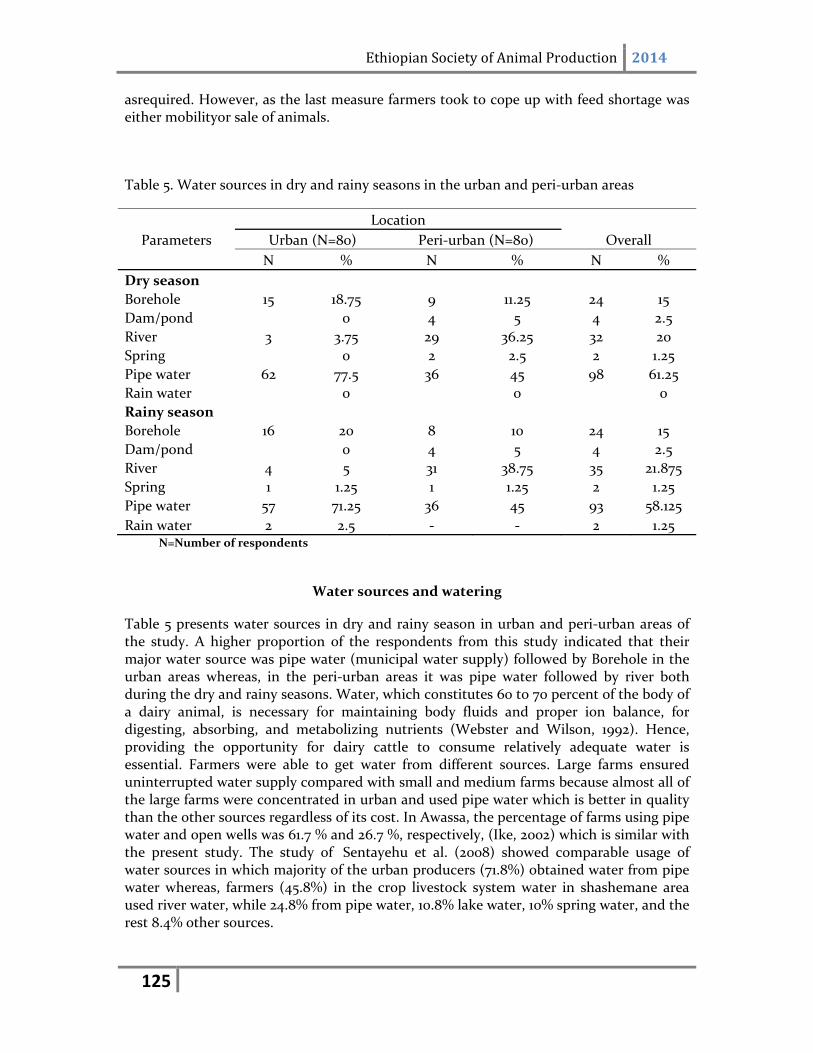
Ethiopian Society of Animal Production 2014
125
asrequired. However, as the last measure farmers took to cope up with feed shortage was either mobilityor sale of animals.
Table 5. Water sources in dry and rainy seasons in the urban and peri‐urban areas
Location
Parameters Urban (N=80) Peri‐urban (N=80) Overall
N % N % N %
Dry season
Borehole 15 18.75 9 11.25 24 15
Dam/pond 0 4 5 4 2.5
River 3 3.75 29 36.25 32 20
Spring 0 2 2.5 2 1.25
Pipe water 62 77.5 36 45 98 61.25
Rain water 0 0 0
Rainy season
Borehole 16 20 8 10 24 15
Dam/pond 0 4 5 4 2.5
River 4 5 31 38.75 35 21.875
Spring 1 1.25 1 1.25 2 1.25
Pipe water 57 71.25 36 45 93 58.125
Rain water 2 2.5 ‐ ‐ 2 1.25 N=Number of respondents
Water sources and watering
Table 5 presents water sources in dry and rainy season in urban and peri‐urban areas of the study. A higher proportion of the respondents from this study indicated that their major water source was pipe water (municipal water supply) followed by Borehole in the urban areas whereas, in the peri‐urban areas it was pipe water followed by river both during the dry and rainy seasons. Water, which constitutes 60 to 70 percent of the body of a dairy animal, is necessary for maintaining body fluids and proper ion balance, for digesting, absorbing, and metabolizing nutrients (Webster and Wilson, 1992). Hence, providing the opportunity for dairy cattle to consume relatively adequate water is essential. Farmers were able to get water from different sources. Large farms ensured uninterrupted water supply compared with small and medium farms because almost all of the large farms were concentrated in urban and used pipe water which is better in quality than the other sources regardless of its cost. In Awassa, the percentage of farms using pipe water and open wells was 61.7 % and 26.7 %, respectively, (Ike, 2002) which is similar with the present study. The study of Sentayehu et al. (2008) showed comparable usage of water sources in which majority of the urban producers (71.8%) obtained water from pipe water whereas, farmers (45.8%) in the crop livestock system water in shashemane area used river water, while 24.8% from pipe water, 10.8% lake water, 10% spring water, and the rest 8.4% other sources.
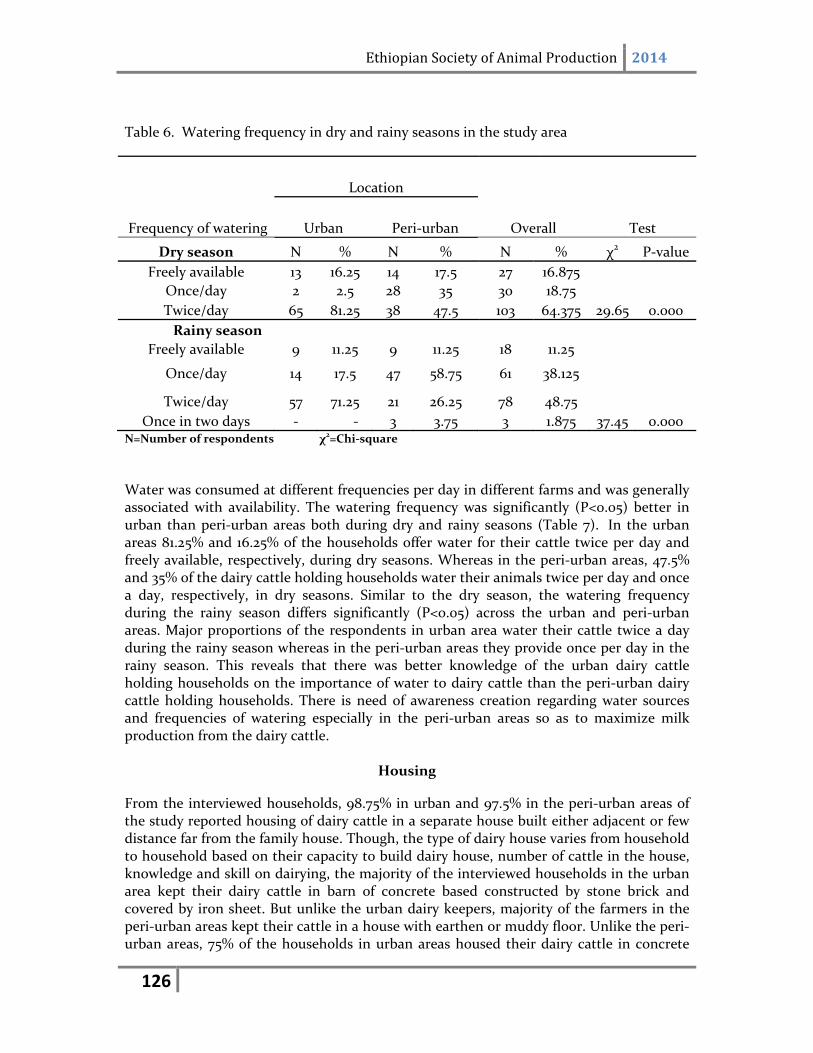
Ethiopian Society of Animal Production 2014
126
Table 6. Watering frequency in dry and rainy seasons in the study area
Frequency of watering
Location
Urban Peri‐urban Overall Test
Dry season N % N % N % χ2 P‐value
Freely available 13 16.25 14 17.5 27 16.875
Once/day 2 2.5 28 35 30 18.75
Twice/day 65 81.25 38 47.5 103 64.375 29.65 0.000
Rainy season
Freely available 9 11.25 9 11.25 18 11.25
Once/day 14 17.5 47 58.75 61 38.125
Twice/day 57 71.25 21 26.25 78 48.75
Once in two days ‐ ‐ 3 3.75 3 1.875 37.45 0.000 N=Number of respondents χ2=Chi‐square
Water was consumed at different frequencies per day in different farms and was generally associated with availability. The watering frequency was significantly (P<0.05) better in urban than peri‐urban areas both during dry and rainy seasons (Table 7). In the urban areas 81.25% and 16.25% of the households offer water for their cattle twice per day and freely available, respectively, during dry seasons. Whereas in the peri‐urban areas, 47.5% and 35% of the dairy cattle holding households water their animals twice per day and once a day, respectively, in dry seasons. Similar to the dry season, the watering frequency during the rainy season differs significantly (P<0.05) across the urban and peri‐urban areas. Major proportions of the respondents in urban area water their cattle twice a day during the rainy season whereas in the peri‐urban areas they provide once per day in the rainy season. This reveals that there was better knowledge of the urban dairy cattle holding households on the importance of water to dairy cattle than the peri‐urban dairy cattle holding households. There is need of awareness creation regarding water sources and frequencies of watering especially in the peri‐urban areas so as to maximize milk production from the dairy cattle.
Housing
From the interviewed households, 98.75% in urban and 97.5% in the peri‐urban areas of the study reported housing of dairy cattle in a separate house built either adjacent or few distance far from the family house. Though, the type of dairy house varies from household to household based on their capacity to build dairy house, number of cattle in the house, knowledge and skill on dairying, the majority of the interviewed households in the urban area kept their dairy cattle in barn of concrete based constructed by stone brick and covered by iron sheet. But unlike the urban dairy keepers, majority of the farmers in the peri‐urban areas kept their cattle in a house with earthen or muddy floor. Unlike the peri‐urban areas, 75% of the households in urban areas housed their dairy cattle in concrete
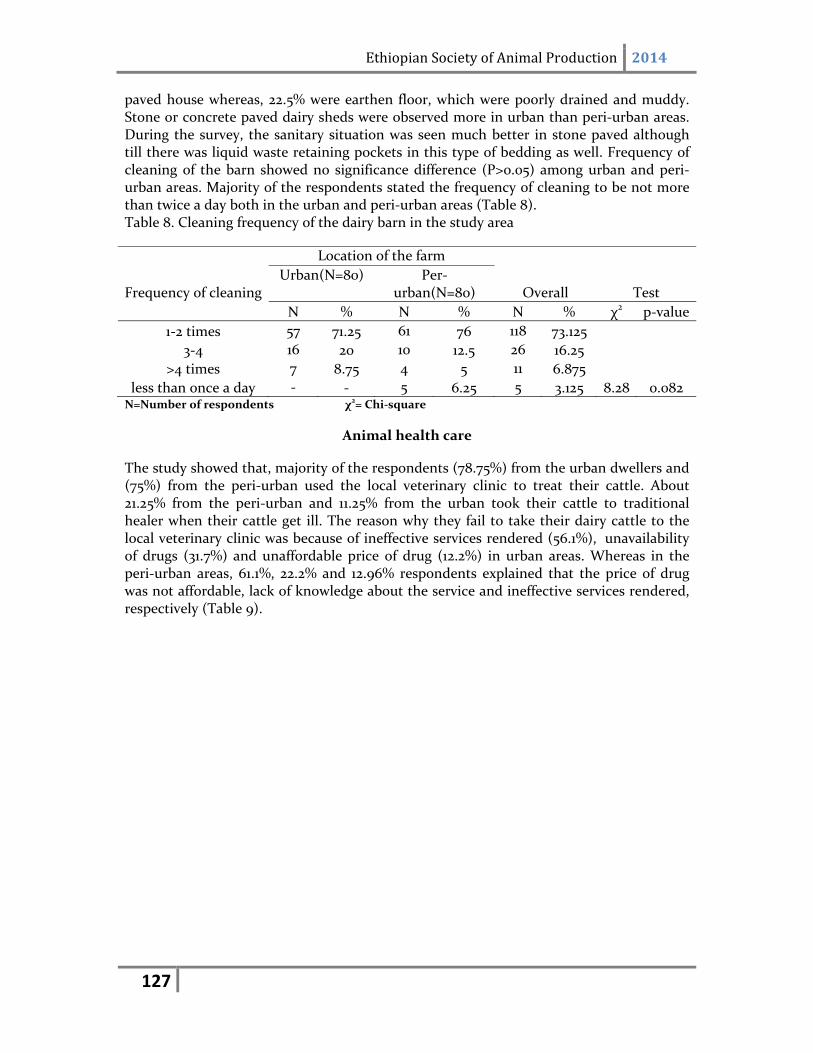
Ethiopian Society of Animal Production 2014
127
paved house whereas, 22.5% were earthen floor, which were poorly drained and muddy. Stone or concrete paved dairy sheds were observed more in urban than peri‐urban areas. During the survey, the sanitary situation was seen much better in stone paved although till there was liquid waste retaining pockets in this type of bedding as well. Frequency of cleaning of the barn showed no significance difference (P>0.05) among urban and peri‐urban areas. Majority of the respondents stated the frequency of cleaning to be not more than twice a day both in the urban and peri‐urban areas (Table 8). Table 8. Cleaning frequency of the dairy barn in the study area
Location of the farm
Frequency of cleaning Urban(N=80) Per‐
urban(N=80)
Overall Test
N % N % N % χ2 p‐value
1‐2 times 57 71.25 61 76 118 73.125
3‐4 16 20 10 12.5 26 16.25
>4 times 7 8.75 4 5 11 6.875
less than once a day ‐ ‐ 5 6.25 5 3.125 8.28 0.082 N=Number of respondents χ2= Chi‐square
Animal health care
The study showed that, majority of the respondents (78.75%) from the urban dwellers and (75%) from the peri‐urban used the local veterinary clinic to treat their cattle. About 21.25% from the peri‐urban and 11.25% from the urban took their cattle to traditional healer when their cattle get ill. The reason why they fail to take their dairy cattle to the local veterinary clinic was because of ineffective services rendered (56.1%), unavailability of drugs (31.7%) and unaffordable price of drug (12.2%) in urban areas. Whereas in the peri‐urban areas, 61.1%, 22.2% and 12.96% respondents explained that the price of drug was not affordable, lack of knowledge about the service and ineffective services rendered, respectively (Table 9).
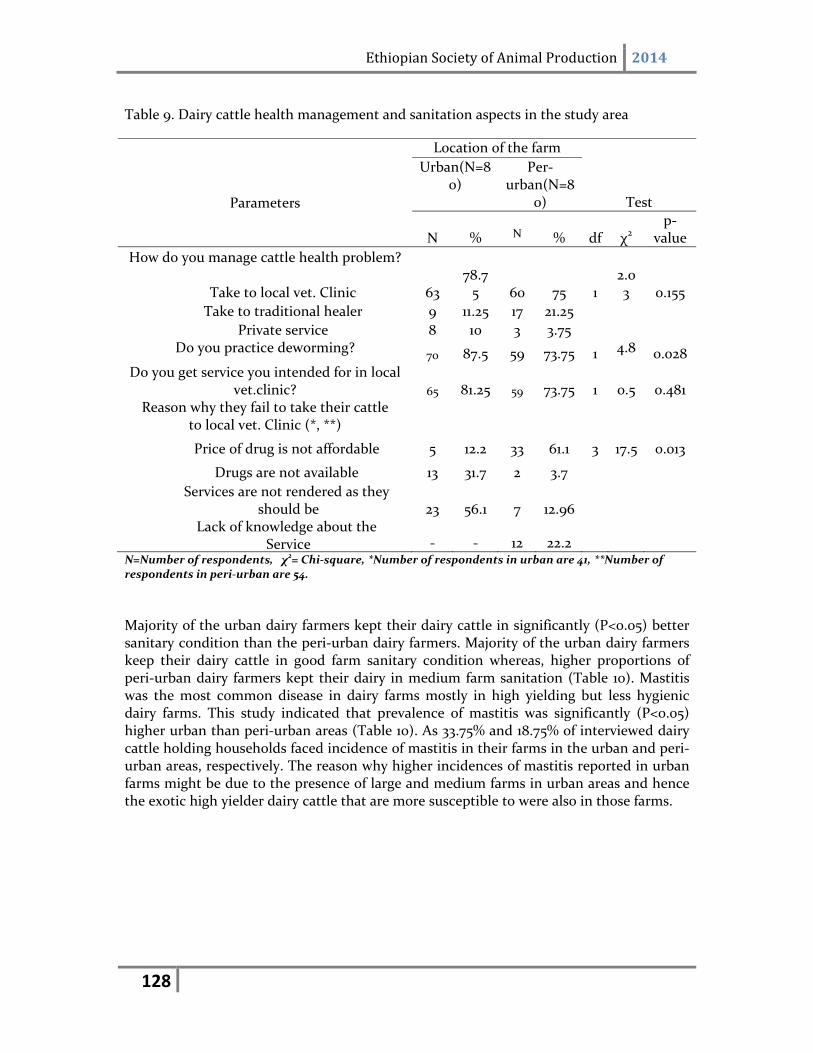
Ethiopian Society of Animal Production 2014
128
Table 9. Dairy cattle health management and sanitation aspects in the study area
Parameters
Location of the farm
Urban(N=80)
Per‐urban(N=8
0) Test
N %
N % df χ2
p‐value
How do you manage cattle health problem?
Take to local vet. Clinic 63 78.75 60 75 1
2.03 0.155
Take to traditional healer 9 11.25 17 21.25
Private service 8 10 3 3.75 Do you practice deworming?
70 87.5 59 73.75 1 4.8
0.028
Do you get service you intended for in local vet.clinic? 65 81.25 59 73.75 1 0.5 0.481
Reason why they fail to take their cattle to local vet. Clinic (*, **)
Price of drug is not affordable 5 12.2 33 61.1 3 17.5 0.013
Drugs are not available 13 31.7 2 3.7
Services are not rendered as they should be 23 56.1 7 12.96
Lack of knowledge about the Service ‐ ‐ 12 22.2
N=Number of respondents, χ2= Chi‐square, *Number of respondents in urban are 41, **Number of respondents in peri‐urban are 54.
Majority of the urban dairy farmers kept their dairy cattle in significantly (P<0.05) better sanitary condition than the peri‐urban dairy farmers. Majority of the urban dairy farmers keep their dairy cattle in good farm sanitary condition whereas, higher proportions of peri‐urban dairy farmers kept their dairy in medium farm sanitation (Table 10). Mastitis was the most common disease in dairy farms mostly in high yielding but less hygienic dairy farms. This study indicated that prevalence of mastitis was significantly (P<0.05) higher urban than peri‐urban areas (Table 10). As 33.75% and 18.75% of interviewed dairy cattle holding households faced incidence of mastitis in their farms in the urban and peri‐urban areas, respectively. The reason why higher incidences of mastitis reported in urban farms might be due to the presence of large and medium farms in urban areas and hence the exotic high yielder dairy cattle that are more susceptible to were also in those farms.
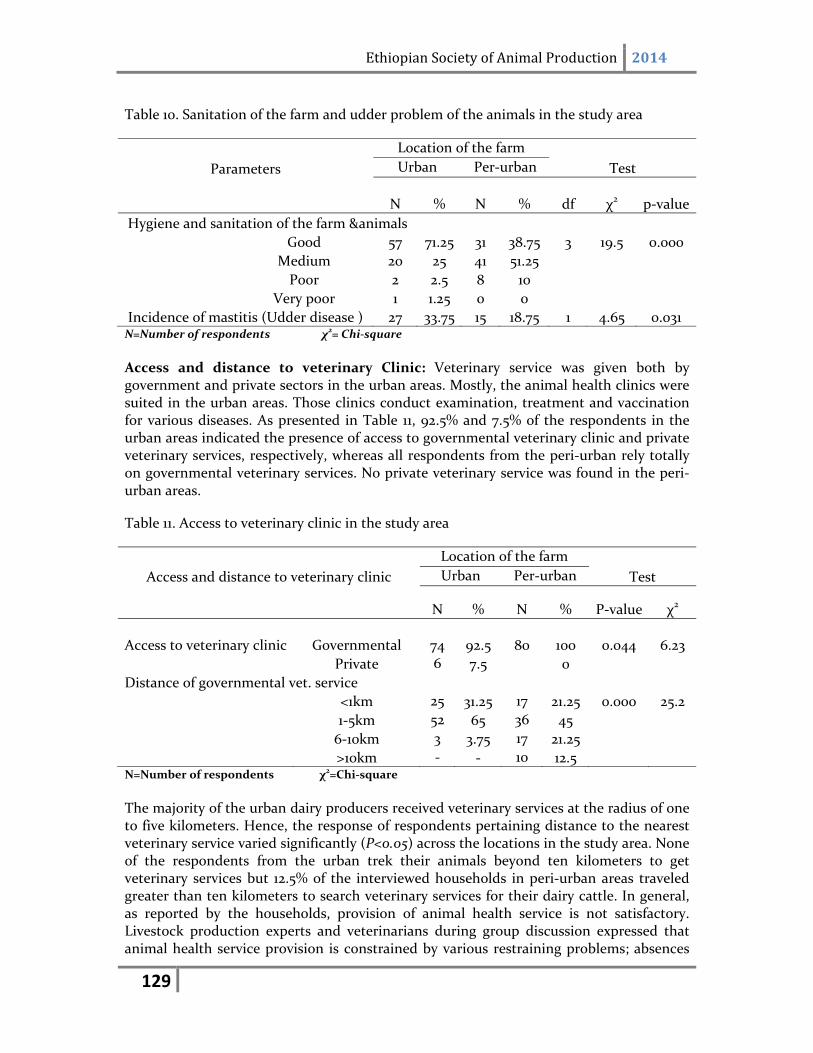
Ethiopian Society of Animal Production 2014
129
Table 10. Sanitation of the farm and udder problem of the animals in the study area
Parameters
Location of the farm
Urban Per‐urban Test
N % N % df χ2 p‐value
Hygiene and sanitation of the farm &animals
Good 57 71.25 31 38.75 3 19.5 0.000
Medium 20 25 41 51.25
Poor 2 2.5 8 10
Very poor 1 1.25 0 0
Incidence of mastitis (Udder disease ) 27 33.75 15 18.75 1 4.65 0.031 N=Number of respondents χ2= Chi‐square
Access and distance to veterinary Clinic: Veterinary service was given both by government and private sectors in the urban areas. Mostly, the animal health clinics were suited in the urban areas. Those clinics conduct examination, treatment and vaccination for various diseases. As presented in Table 11, 92.5% and 7.5% of the respondents in the urban areas indicated the presence of access to governmental veterinary clinic and private veterinary services, respectively, whereas all respondents from the peri‐urban rely totally on governmental veterinary services. No private veterinary service was found in the peri‐urban areas.
Table 11. Access to veterinary clinic in the study area
Location of the farm
Access and distance to veterinary clinic Urban Per‐urban Test
N % N % P‐value χ2
Access to veterinary clinic Governmental
74 92.5 80 100 0.044 6.23
Private 6 7.5 0
Distance of governmental vet. service
<1km 25 31.25 17 21.25 0.000 25.2
1‐5km 52 65 36 45
6‐10km 3 3.75 17 21.25
>10km ‐ ‐ 10 12.5 N=Number of respondents χ2=Chi‐square
The majority of the urban dairy producers received veterinary services at the radius of one to five kilometers. Hence, the response of respondents pertaining distance to the nearest veterinary service varied significantly (P<0.05) across the locations in the study area. None of the respondents from the urban trek their animals beyond ten kilometers to get veterinary services but 12.5% of the interviewed households in peri‐urban areas traveled greater than ten kilometers to search veterinary services for their dairy cattle. In general, as reported by the households, provision of animal health service is not satisfactory. Livestock production experts and veterinarians during group discussion expressed that animal health service provision is constrained by various restraining problems; absences
Ethiopian Society of Animal Production 2014
130
of enough animal health clinics and inadequate trained animal health professionals were among others. In addition, the existing animal health clinics are not well equipped with the necessary materials, equipment and drugs to provide services at their full potential. Farmer’s consciousness in maintaining animal health is negligible and this coupled with the above mentioned problems has reduced the efficiency of animal health service provision in both the urban and peri‐urban areas.
Breeding practices
Majority of the respondents, both in urban and peri‐urban areas, were aware of exploiting the advantages gained from proper breeding practices. But, the urban and peri‐urban areas differed significantly (P<0.05) in the magnitude of using the different breeding methods. In this study, cows were bred either by artificial insemination (AI), natural mating or combination of the two. About 77.21% from urban and 60% from the peri‐urban depended on AI service (Table 12) but 28.75% of the respondents from the peri‐urban rely on natural mating and this proportion was greater than those in the urban areas (8.86%). This might be due to the fact that dairy producers in urban had better awareness than the respondents in the peri‐urban areas in using AI services. The result obtained in this study was higher than reported by Negussie (2006) in Mekelle which stated that about 36 % and 33 % of the total farms solely depended on AI and natural service, respectively, to breed their cows.
Cost of AI per service was only 2 ETB and was reasonable as indicated by farmers using this breeding method. Whereas the cost of natural service by exotic breed bull ranged from ETB 30‐40 per service so the smallholder farmers could not afford this cost. But, local breed bull service was free of charge as cows breed while grazing at their pasture and the small farms especially in peri‐urban area practiced this kind of natural service. Hence, 28.75% from peri‐urban and 8.86% from the urban areas use natural service
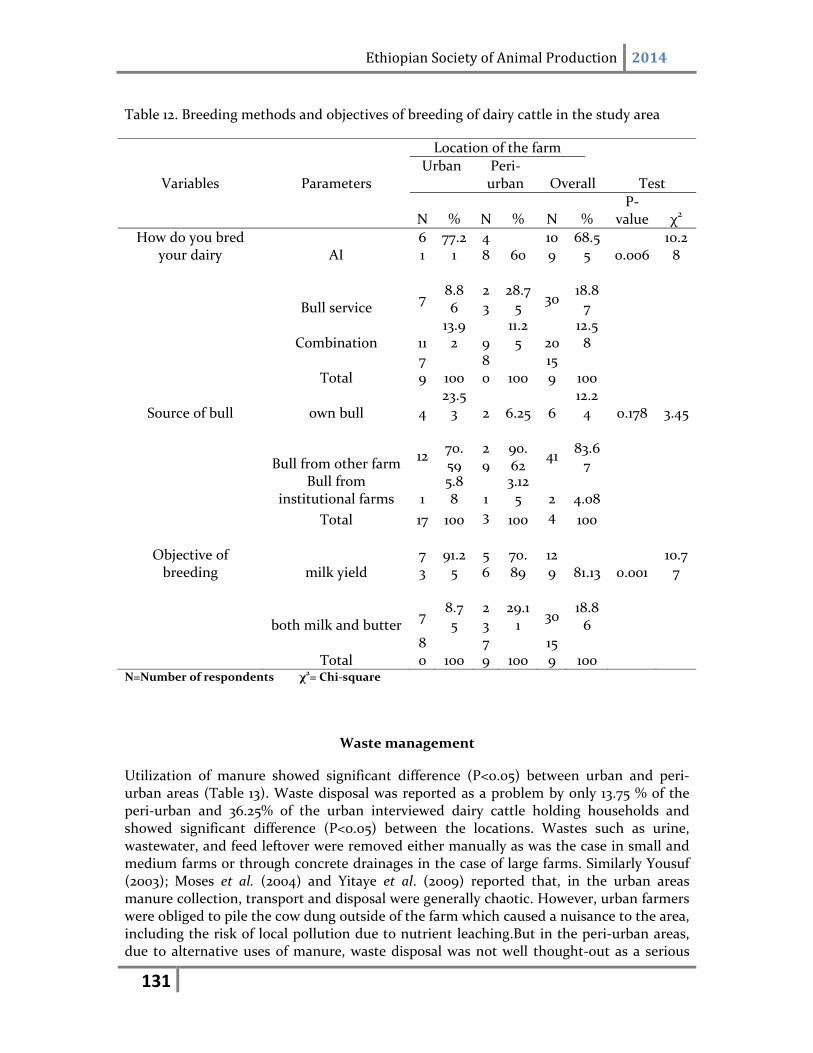
Ethiopian Society of Animal Production 2014
131
Table 12. Breeding methods and objectives of breeding of dairy cattle in the study area
Location of the farm
Variables Parameters Urban Peri‐
urban Overall Test
N % N % N % P‐
value χ2
How do you bred your dairy AI
61
77.21
48 60
109
68.55 0.006
10.28
Bull service
7
8.86
23
28.75
30
18.87
Combination 11
13.92
9
11.25
20
12.58
Total 79 100
80 100
159 100
Source of bull own bull 4
23.53
2 6.25
6
12.24 0.178 3.45
Bull from other farm
12
70.59
29
90.62
41
83.67
Bull from
institutional farms 1
5.88
1
3.125
2 4.08
Total 17 100 3 100 4 100
Objective of breeding milk yield
73
91.25
56
70.89
129 81.13 0.001
10.77
both milk and butter
7
8.75
23
29.11
30
18.86
Total 80 100
79 100
159 100
N=Number of respondents χ2= Chi‐square
Waste management
Utilization of manure showed significant difference (P<0.05) between urban and peri‐urban areas (Table 13). Waste disposal was reported as a problem by only 13.75 % of the peri‐urban and 36.25% of the urban interviewed dairy cattle holding households and showed significant difference (P<0.05) between the locations. Wastes such as urine, wastewater, and feed leftover were removed either manually as was the case in small and medium farms or through concrete drainages in the case of large farms. Similarly Yousuf (2003); Moses et al. (2004) and Yitaye et al. (2009) reported that, in the urban areas manure collection, transport and disposal were generally chaotic. However, urban farmers were obliged to pile the cow dung outside of the farm which caused a nuisance to the area, including the risk of local pollution due to nutrient leaching.But in the peri‐urban areas, due to alternative uses of manure, waste disposal was not well thought‐out as a serious
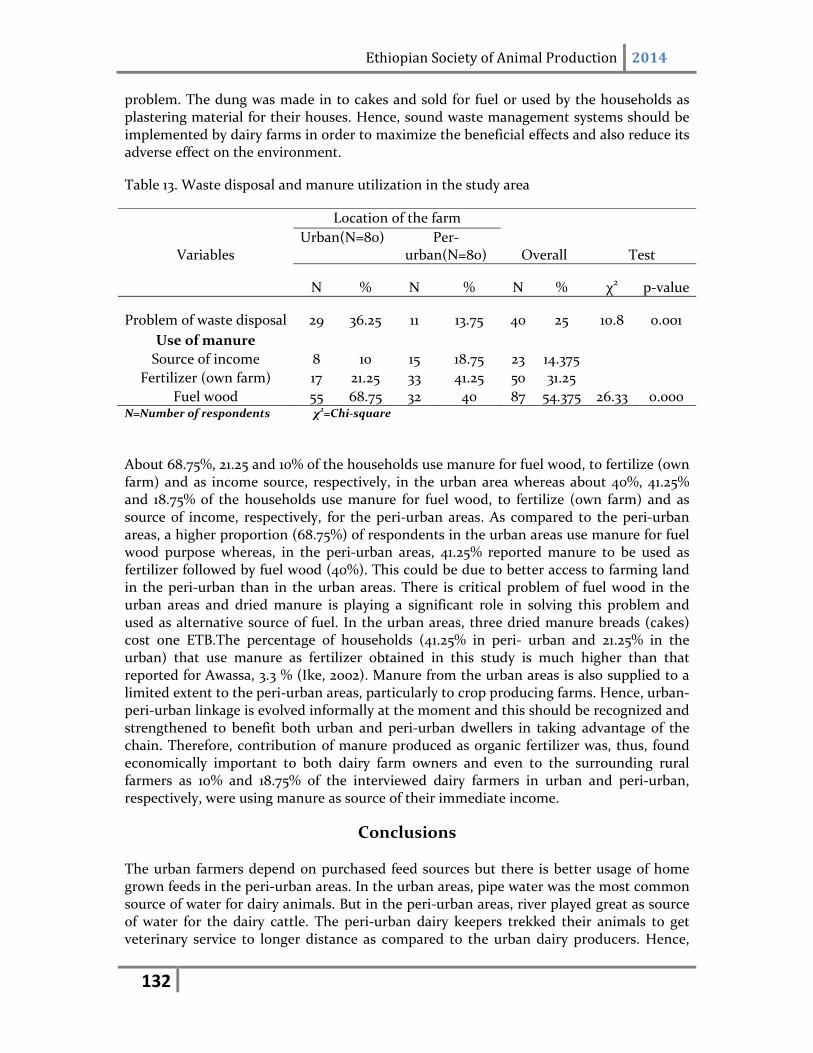
Ethiopian Society of Animal Production 2014
132
problem. The dung was made in to cakes and sold for fuel or used by the households as plastering material for their houses. Hence, sound waste management systems should be implemented by dairy farms in order to maximize the beneficial effects and also reduce its adverse effect on the environment.
Table 13. Waste disposal and manure utilization in the study area
Location of the farm
Variables Urban(N=80) Per‐
urban(N=80) Overall Test
N % N % N % χ2 p‐value
Problem of waste disposal 29 36.25 11 13.75 40 25 10.8 0.001
Use of manure
Source of income 8 10 15 18.75 23 14.375
Fertilizer (own farm) 17 21.25 33 41.25 50 31.25
Fuel wood 55 68.75 32 40 87 54.375 26.33 0.000 N=Number of respondents χ2=Chi‐square
About 68.75%, 21.25 and 10% of the households use manure for fuel wood, to fertilize (own farm) and as income source, respectively, in the urban area whereas about 40%, 41.25% and 18.75% of the households use manure for fuel wood, to fertilize (own farm) and as source of income, respectively, for the peri‐urban areas. As compared to the peri‐urban areas, a higher proportion (68.75%) of respondents in the urban areas use manure for fuel wood purpose whereas, in the peri‐urban areas, 41.25% reported manure to be used as fertilizer followed by fuel wood (40%). This could be due to better access to farming land in the peri‐urban than in the urban areas. There is critical problem of fuel wood in the urban areas and dried manure is playing a significant role in solving this problem and used as alternative source of fuel. In the urban areas, three dried manure breads (cakes) cost one ETB.The percentage of households (41.25% in peri‐ urban and 21.25% in the urban) that use manure as fertilizer obtained in this study is much higher than that reported for Awassa, 3.3 % (Ike, 2002). Manure from the urban areas is also supplied to a limited extent to the peri‐urban areas, particularly to crop producing farms. Hence, urban‐peri‐urban linkage is evolved informally at the moment and this should be recognized and strengthened to benefit both urban and peri‐urban dwellers in taking advantage of the chain. Therefore, contribution of manure produced as organic fertilizer was, thus, found economically important to both dairy farm owners and even to the surrounding rural farmers as 10% and 18.75% of the interviewed dairy farmers in urban and peri‐urban, respectively, were using manure as source of their immediate income.
Conclusions
The urban farmers depend on purchased feed sources but there is better usage of home grown feeds in the peri‐urban areas. In the urban areas, pipe water was the most common source of water for dairy animals. But in the peri‐urban areas, river played great as source of water for the dairy cattle. The peri‐urban dairy keepers trekked their animals to get veterinary service to longer distance as compared to the urban dairy producers. Hence,
Ethiopian Society of Animal Production 2014
133
establishing animal health clinics and equipping them with the necessary facilities, drugs and animal health professionals could be important to identify, control and monitor dairy cattle diseases and parasites in the study area particularly in the peri‐urban areas. Forage development strategies and feed conservations should be encouraged in peri‐urban whereas, establishing feed processing plants are recommended in urban areas. All these showed that, interventions need to correspond to the specific needs of the dairy farmers in urban and peri‐urban areas.
References
Azage Tegegne and Alemu G/Wold, 1998. Prospects for peri Urban Dairy Development in Ethiopia. In. Proceedings of 5th National Conference Of Ethiopia Society Of Animal Production (ESAP), 15‐17 1997, Addis Ababba. Ethiopia,pp 248.
Central Statistical Agency (CSA), 2008. The 2007 Population and Housing Census of Federal Democratic Republic of Ethiopia. Addis Ababa, Ethiopia.
Ike A., 2002. Urban dairying in Awassa, Ethiopia. MSc thesis, University of Hohenheim. Instititute of Animal production in the tropics and sub tropics. Stuttgart‐Hohenheim, Germany. 113p. ILRI (International livestock research Institute) Nairobi, Kenya. 462pp
ILRI, 1996. International livestock research institute. Annual project report. ILRI Addis Ababa, Ethiopia.
Moses, M., Ikiara, A., Karanja, M.and Davies, T.C., 2004. Collection, transportation and disposal of urban solid waste in Kenya. In: I.S.A. Baud, J. Post and C. Furedy (eds), Solid waste management and recycling: Actors, Partnerships and Policies in Hyderabad, India and Nairobi, Kenya, 2004, (Kluwer Academic Publishers, Dordrecht; The Netherlands), 61—92
National Meteorological Service Agency of Ethiopia (NMSA), 1996. Climatic and Agro climatic Resources of Ethiopia, volume 1, No. 1 Addis Ababa, Ethiopia.
Negussie Gebreslasie, 2006. Characterization And Evaluation Of Urban Dairy Production System In Mekelle City, Tigray Region, Ethiopia. MSc. Thesis, University of Hawassa, Awassa, Ethiopia.
Seyoum Bedeye, Getenet Assefa, Abate Tedla and Derege Fekadu, 2001. Present status and future direction in feed resources and nutrition research targeted for wheat based crop livestock production system in Ethiopia. pp 207‐226. In : P.C. Wall (ed.). Wheat and Weed: Food and Feed. Proceedings of two‐stakeholder workshop. CIMMYT, Mexico City. Improving the productivity of crop livestock production in wheat based farming systems in Ethiopia, Addis Ababa. 10‐11 October 2000.
Sintayehu Yigrem, Fekadu Beyene, Azage Tegegne and Berhanu Gebremedhin, 2008. Dairy production, processing and marketing systems of Shashemene–Dilla area, South Ethiopia. IPMS (Improving Productivity and Market Success) of Ethiopian Farmers Project Working Paper 9. ILRI (International Livestock Research Institute), Nairobi, Kenya. 62 pp.
Ethiopian Society of Animal Production 2014
134
Webster C.C and Wilson P.N., 1992. Agriculture in the tropics. Livestock improvement through health and hygiene. Longman Singapore publishers pvt ltd. pp528‐546
Yitaye Alemayehu, M Wurzinger, Azage Tegegne and Zollitsch, W. 2009. Handling, processing and marketing of milk in the north western Ethiopian highlands. Livestock Resaerch for Rural Development. Volume 21 (7) 2009
Yoseph Mekasha, Azage Tegegne and Alemu Yami and Umunna N, 2000. Feed resources and nutritional management of dairy herds in urban and peri‐urban dairy production systems in Ethiopia. Proceedings of the 7th conference of the Ethiopian Society of Animal Production, held in Addis Ababa, Ethiopia, 26‐27 May 1999. Ethiopian Society of Animal Production, Addis Ababa (Ethopia) ESAP, pp77‐88
Yoseph Mekasha, Azage Tegegne and Alemu Yami, 2003. Evaluation of the general farm characteristics& dairy herd structure in urban and peri‐urban dairy production system in the Addis Ababa milk shed. Proceedings of the 10th annual conference of the Ethiopian Society of Animal Production (ESAP), August 22‐24, 2002. Addis Ababa, Ethiopia, pp39‐144
Yousuf Kurtu, M. 2003. Certain aspects of the dairy systems in the Harar milkshed, Eastern Ethiopia, (unpublished PhD thesis, University of the Free State Bloemfontein).
Ethiopian Society of Animal Production 2014
135
On‐farm Growth Performance Evaluation of Farta Sheep under the Existing Farmers Management at Estie District of Amhara National
Regional State, Ethiopia Agraw Amane1, Yeshewas Ferede1,Tewodros Bimrew1
Andassa Livestock Research Center, P.O.Box 27, Bahir Dar, Ethiopia, [email protected]
Abstract
This study was conducted to evaluate on‐farm growth performance of Farta sheep under the existing farmers management. On‐farm growth performance data from 2010 to 2012 were collected and used for the study. The collected data were analyzed using general linear model..The least square mean birth weight, 30 days, 90 days, 180 days, 270 days, and 360 days weight obtained was 2.62±0.02, 6.80±0.10, 11.01±0.07, 13.89±.13, 15.02±0., and 20.35±0.8 kg, respectively. Birth weight was significantly (p<0.01) affected by birth year, birth season, parity of dam, sex of lamb and birth type. Where as birth year, parity of dam and birth type was significantly affected (p<0.01) 90 days weight. Birth year of lamb were significant (p<0.01) source of variation for 360 days weight. The mean average daily weight gain (in grams) from birth to 30 days, birth to 90 days, 90 to 180 days and birth to 360 days were 84.33±9.65,101.16±8.29, 95.20±8.71and 75.69±3.72, respectively. The effect of birth year, birth season, dam parity and birth type were significant (p<0.01) for growth rates from birth to 30 days. On the other hand, birth year, dam parity, lamb sex and birth type were significant (p<0.01) for growth rates from birth to 90 days of age. On‐farm breed information on growth and reproductive performance need to be supplemented by on‐station characterization of the breed to better understand the genetic variations and potential of the breed and design appropriate to breeding strategies. Finally, integrated efforts combining improving feeds and feeding health and participatory community‐ based breeding is needed.
Keywords: Farta sheep, Growth performance, On‐farm, Estie
Introduction
Ethiopia is endowed with a large number 22.3 million sheep populations and breed/type of 18 sheep due to its extreme variable agro climatic conditions and ecological systems that support large and very diverse animal genetic resources (CSA, 2010 and Tibbo, 2006). The majority of sheep are distributed throughout the country, and about 70% are found in the highlands (Mengistu, 2003). Farta sheep is one of the indigenous sheep breeds reared by the rural farmers in the mixed crop–livestock farming systems of northwestern highlands of Ethiopia (Lemma 2002). They are an important source of cash income and manure, social and cultural functions, a means of insurance against drought and other diversities. Locally available sheep breeds in our country are the result of natural selection for survival under feed scarcity and disease challenges (Markos, 2006). As a result, their productivity is low compared to temperate breeds. So, it is very essential to improve their productivity to satisfy the animal product demand of the large human population. Choice of breeds for improving the output from sheep should depend on the amount of information available
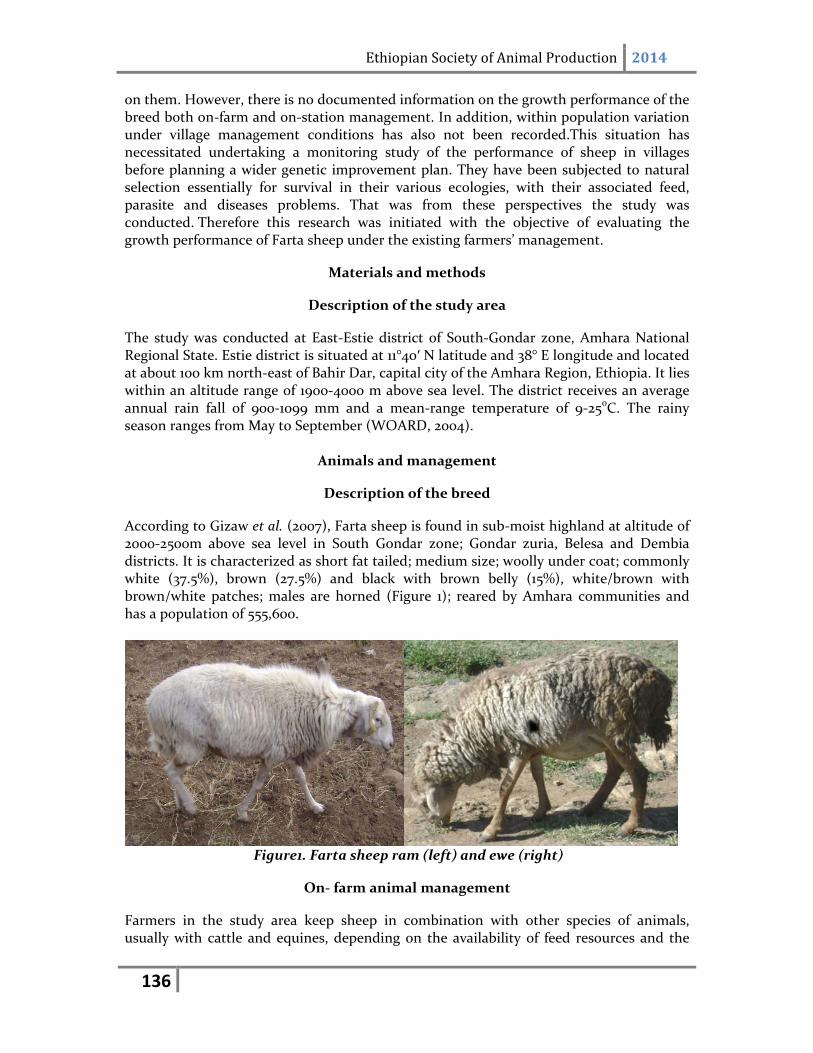
Ethiopian Society of Animal Production 2014
136
on them. However, there is no documented information on the growth performance of the breed both on‐farm and on‐station management. In addition, within population variation under village management conditions has also not been recorded.This situation has necessitated undertaking a monitoring study of the performance of sheep in villages before planning a wider genetic improvement plan. They have been subjected to natural selection essentially for survival in their various ecologies, with their associated feed, parasite and diseases problems. That was from these perspectives the study was conducted. Therefore this research was initiated with the objective of evaluating the growth performance of Farta sheep under the existing farmers’ management.
Materials and methods
Description of the study area
The study was conducted at East‐Estie district of South‐Gondar zone, Amhara National Regional State. Estie district is situated at 11°40′ N latitude and 38° E longitude and located at about 100 km north‐east of Bahir Dar, capital city of the Amhara Region, Ethiopia. It lies within an altitude range of 1900‐4000 m above sea level. The district receives an average annual rain fall of 900‐1099 mm and a mean‐range temperature of 9‐25oC. The rainy season ranges from May to September (WOARD, 2004).
Animals and management
Description of the breed
According to Gizaw et al. (2007), Farta sheep is found in sub‐moist highland at altitude of 2000‐2500m above sea level in South Gondar zone; Gondar zuria, Belesa and Dembia districts. It is characterized as short fat tailed; medium size; woolly under coat; commonly white (37.5%), brown (27.5%) and black with brown belly (15%), white/brown with brown/white patches; males are horned (Figure 1); reared by Amhara communities and has a population of 555,600.
Figure1. Farta sheep ram (left) and ewe (right)
On‐ farm animal management
Farmers in the study area keep sheep in combination with other species of animals, usually with cattle and equines, depending on the availability of feed resources and the
Ethiopian Society of Animal Production 2014
137
use or function of the animals. During crop harvesting times, sheep have access to grazing and crop aftermath while in dry season some farmers give supplementation for their sheep based on their physiological status. Breeding is year‐round and breeding rams run with the group flock to mate with any ewe in heat during the day. Rams are selected for mating based on their conformation (body size, colour and appearance) and sometimes based on maternal history (lamb survival, twining rate and general health). Ram lambs born in the flock and not needed for breeding would be sold or castrated before reaching breeding age. Since the start of data collection, internal and external parasite control has been carried out. Animals have been sprayed for external parasites when tick infestation is high (as per the need). Vaccination against pastuerolosis, anthrax and black leg has been given once a year.Sick animals were treated
Data Collection
On‐farm data, collected as part of the programme on “On‐farm monitoring of Farta sheep breed at Estie district of South Gondar Zone” undertaken from 2010 to 2012, were used for the study. Animals were identified by permanent plastic ear tags applied at birth or at purchase of the animal. The data was collected by trained enumerators. The enumerators were supervised and data crosschecking was done by researchers of Andassa Livestock Research Centre on a two‐month interval. Weights were taken every month using the Salter balance (50 kg capacity with 200 g precision) for lambs until they attained 6 months of age and on a two‐ month’s interval thereafter.
Data Analysis
The data were analysed using the General Linear Model procedures of SAS (2003). Tukey Kramer test was used to separate means of effects with three or more levels which were significant in the least squares analysis of variance (SAS 2002). For the analysis of the growth performance of the breed, the following model was used.
Yijklmn = µ + Gk + Sl +Tm+ Pl + Yn + eijklmnWhere: Yijklmn = the observation on Birth and
weight at different ages; = over all mean; Gk= Fixed effect of lamb sex (k = male, female); Sl = Fixed effect of lamb birth season (l = dry, wet); Pl = Fixed effect of dam parity (l= 1, 2, 3, 4, ≥5); Tm = Fixed effect of lamb birth type (m = single, multiple) Yn = Fixed effect of lamb birth year (n = 2010, 2011, 2012) and eijklmn = effect of random error Birth weight and postpartum ewe weight were included in the model as a covariate since they were not significant and removed from the model. Average daily weight gains (ADG) Average daily weight gains were calculated as follows: ADG = Weight at the end of period ‐ weight at the beginning of period Period in days 1) Average daily weight gain from birth to three months of age (ADG1) 2) Average daily weight gain from three month to six month of age (ADG2) 3) Average daily weight gain from birth to yearling age (ADG3)
Ethiopian Society of Animal Production 2014
138
Results and Discussion
Birth weight
The overall least square means birth weight obtained in the current study was 2.62±0.02 kg which is Comparable to the birth weight of Gumuz sheep, indigenous sheep in the cool highlandsand Horro sheep; but heavier than the birth weight of Menz sheep (Solomon, 2002; Hassen et al., 2002; Abegaz et al., 2002a and Solomon, 2007). The variation might be the difference in management practices at mating and pre‐parturition of the dam since the dam with good body condition at mating and during gestation fed their fetus better than others.
The analysis of variance showed that all the fixed factors considered affected birth weight significantly (p<0.01). Birth year was a significant (p<0.01) source of variation for lamb birth weight. Lambs born in the year 2010 were heavier than the other following years. The significant effect of year on birth weight indicated that variation in the quality and quantity of feed available for the dam at mating and pre‐partum as affected by decreasing the grazing land available due to land degradation, land slide and crop land expansion.
Parity of the dam affected birth weight of lambs significantly (p<0.01). Ewes with higher parities produced heavier lambs. This agrees with the findings of Gardner et al.(2007) and Gemeda et al.(2002) who reported the increase of lamb birth weight with dam age to six years of age. In contrast to the present study, Macedo and Hummel (2006) reported non‐significant effect of parity on birth weight of lambs. The heavier birth weight at late parities can be explained by the heavier dam weight and larger size at later parities and physiological imprint in the uterus during the first pregnancy which will facilitate relatively greater fetal growth in the subsequent pregnancies (Gardner et al., 2007). In addition, the reproductive organs of first parity ewes are also less developed to bear large foetus in which case the physiology adjusts the foetal size (Tibbo, 2006). Indeed, younger ewes are still growing and then there would have been a competition for nutrients between the foetus and the dam (Gemeda et al., 2002).The effect of type of birth was also significant, single born lambs were heavier than their multiple contemporaries (2.83±0.02 vs. 2.70±0.03, p<0.01). This agrees with the results reported by Gemeda et al.(2002), Gardner et al.(2007), Yilmaz et al.(2007) and could be because of the finite capacity of the maternal uterine space to gestate offspring (Gardner et al., 2007), as litter size increases individual birth weights decline (Mengistie et al., 2011).
Season of birth of lamb was found significant source of variation for birth weight where lambs born in the dry season were heavier than lambs born in the wet season (2.79±0.01kg vs. 2.72±0.01kg; p<0.0). The heavier lamb birth weight born in the dry season can be explained by the better feed availability in terms of quality and quantity at ewe mating and pregnancy period in wet season.Sex of lamb has significant effect (p<0.01) on lamb birth weight in that male lambs weighed heavier than females (2.72±0.03 vs. 2.62±0.02). This type of effect has been reported in the literature (Gemeda et al., 2002; Hassen et al., 2004; Gardner et al., 2007; Yilmaz et al., 2007;). The presence of a Y‐chromosome and the products of sry gene activation have sex specific effects on fetal growth. Males appear to grow faster than respective females in utero (Loos et al., 2001; Gardner et al., 2007). However, Hassen et al. (2002) reported non‐significant effect of sex on birth weight of lambs in the cool highlands of Ethiopia.
Ethiopian Society of Animal Production 2014
139
Weight at specific ages
Factors affecting weights of Farta sheep at different ages (at 30, 90, 180, 270 and 360 day’s age) are presented in Table 1. The least squares means and standard errors of 30 days, 90 days, 180 days, 270 days and 360 days weights were 6.80±0.10, 11.01±0.71, 13.89±0.59, 15.02±0.02, and 20.35±0.89 kg, respectively .90 days weight was similar to that of Gumuz sheep (Solomon, 2007) and Horro sheep (Abegaz et al., 2002a) but heavier than Menz sheep (Solomon, 2002; Tibbo et al., 2004) and Horro sheep (Tibbo et al., 2004). The heavier 90 days weight could be due to better mothering ability of the breed through milk production and supply as well as lamb care. Those figures obtained for 180 days weight was higher than Horro and Menz sheep under on station. The 360 days weight of this finding was higher than what was reported for Horro and Menz sheep (Tibbo et al., 2004; Markos, 2006) under on station. The heavier 180 and 360 days weight can be explained by better environmental adaptability of the breed such as for feed shortage and disease stress. The 360 days Weight obtained calls for further improvement of 360 days weights of the breed in order to achieve yearling marketable weight (around 30kg) for international as well as local market interest.Birth year was a significant source of variation (p<0.01) for 30 days, 90 days and 360 days weights. There was a decreasing trend in weight at all ages from 2010 to 2012; lambs born in 2010 were heavier than the other succeeding years. Tibbo et al. (2004) reported a significant effect of year of birth on weight of Horro and Menz sheep at three and twelve months of age. The significant effect of year on weight at different ages indicated that variation in the quality and quantity of feed available for the dam at mating, pre‐partum and lactation as affected by decreasing the grazing land available due to land degradation, land slide and crop land expansion. Birth season was also significant (p<0.01) source of variation for 180 days and 270 days weight of lambs. Lambs born in wet season were heavier than lambs born in dry season at 180 days (14.02±0.42 vs.13.80±0.52kg) and 270 days weight (16.8±0.7 vs 15.0±0.6). According to Tibbo (2006), season of birth significantly affected weight at all ages consistently. The heavier weights in lambs born in the wet season can be explained by the better feed availability in terms of quality and quantity for lactating ewes to feed their lambs.Dam parity was significant (p<0.01) source of variation at 30 and 180 days weight but its effect diminished thereafter (p>0.01). Lambs born from maiden ewes were the lowest in weight at 30 days and 90 days of age. This is because maiden ewes may produce less milk than average (Gemeda et al., 2002). The author also indicated that maiden ewes may put their lambs at disadvantage in two possible ways: they produce lambs with lower body weight and their mothering ability is poor as a result of lack of experience to care their lambs and poorly developed udder to produce and supply sufficient milk for their lambs. Gardner et al.(2007) reported that dams with higher parity produced heavier lambs at 90 days of age.Sex was an important source of variation (p<0.01) for only 180 days weight of lambs that males were superior over their female (14.80±0.46kg vs. 13.83±0.45kg). This result is comparable to Hassen et al. (2002) who reported the effect of sex after 5 months. Males appear to grow faster than respective females in uterus (Loos et al., 2001; Rastogi, 2001) and this may be attributed to the action of sex hormones in their endocrinological and physiological functions which play a major role in accelerating growth (Markos, 2006). Type of birth had significant (p<0.01) effect on 30 days weight where single born lambs were heavier than multiple born lambs at 30 days (6.92±0.1kg vs. 5.98±0.24kg) and 90 days weights (12.02±0.42kg vs. 10.97±0.64kg). This difference could be the singles are the sole
Ethiopian Society of Animal Production 2014
140
users of the milk from their dam (Markos, 2006). Generally in this study, its effect after three month was totally weakened which might be associated with the environmental adaptation and decreasing of maternal effect. Similarly, Benyi et al. (2006) reported that the superiority in weight and growth rate of the single‐born lambs increased only up to weaning and then declined such that after weaning multiple‐born had similar weight and growth rate as singles.
Growth rate
The least square means and standard errors of average daily weight gain (in grams) of at different ages considered are presented in Table 2. Pre‐weaning growth rate: The growth rates from birth to 30 days and birth to 90 days of age were 84.33±9.65 and101.16±8.29 gm, respectively. The difference in growth rate due to year effect was highly significant (p<0.01) for both ages considered. There was a yearly decreasing trend in average daily weight gain from year 2010 to 2012. A similar effect of year of birth was reported by Tibbo (2006). This difference of weight gain between years could partly be explained by the difference in the nutritional status of the dam, since up to weaning lambs are mostly dependent on their dam for their growth requirement. Season as a source of variation (p<0.01) for lamb growth rate from birth to 30 days; lambs born in wet season have higher average daily weight gain than those born in the dry season (88.33±8.65gm vs. 79.50±5.84gm) under on farm. Similarly, Markos (2006) reported that lambs born in the wet season have fast growth rate than in the dry seasons. The higher growth rate of lambs born in the wet season than in dry seasons might be because of seasonal variation in feed availability both in quantity and quality on natural pasture for the dam during lactation to produce and supply sufficient milk for their lambs.
Dam parity affected (p<0.01) pre‐weaning growth rate: from birth to 90 days age, lambs from the second and third parity dams grew faster (p<0.01) while those from first parity dams had the lowest growth rate. Similarly from birth to 90 days, lambs from second, third and fifth parity dams had significantly better (p<0.01) growth than lambs from first and sixth parity dams. This is consistent with literature (Tibbo, 2006), that lambs born from the second and third parity ewes had a significantly higher growth rate than those from maiden ewes. This could be due to the difference in milk supply and maternal care, since maiden ewes produce less milk than average and lack experience to take care of their lamb. Influence of superior maternal environment of older ewes (to some age actually) is expected to be translated into better lamb performance up to weaning.
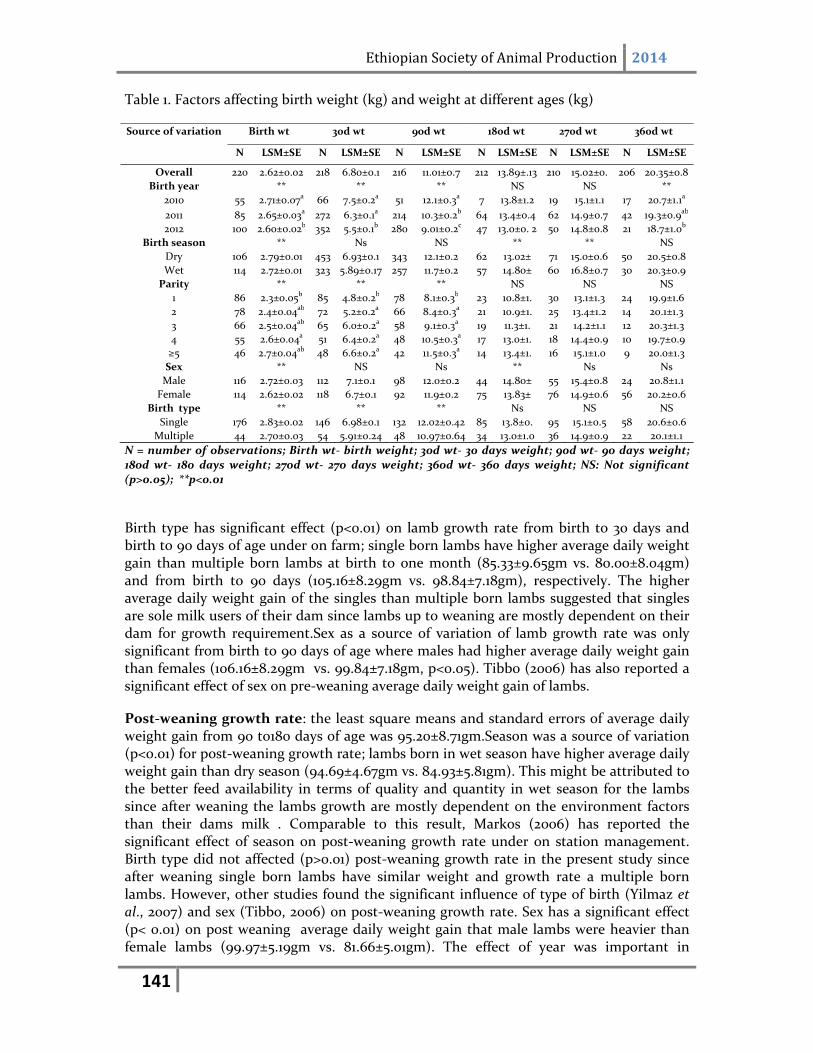
Ethiopian Society of Animal Production 2014
141
Table 1. Factors affecting birth weight (kg) and weight at different ages (kg)
Source of variation Birth wt 30d wt 90d wt 180d wt 270d wt 360d wt
N LSM±SE N LSM±SE N LSM±SE N LSM±SE N LSM±SE N LSM±SE
Overall 220 2.62±0.02 218 6.80±0.1 216 11.01±0.7 212 13.89±.13 210 15.02±0. 206 20.35±0.8
Birth year ** ** ** NS NS **
2010 55 2.71±0.07a 66 7.5±0.2a 51 12.1±0.3a 7 13.8±1.2 19 15.1±1.1 17 20.7±1.1a
2011 85 2.65±0.03a 272 6.3±0.1a 214 10.3±0.2b 64 13.4±0.4 62 14.9±0.7 42 19.3±0.9ab
2012 100 2.60±0.02b 352 5.5±0.1b 280 9.01±0.2c 47 13.0±0. 2 50 14.8±0.8 21 18.7±1.0b
Birth season ** Ns NS ** ** NS
Dry 106 2.79±0.01 453 6.93±0.1 343 12.1±0.2 62 13.02± 71 15.0±0.6 50 20.5±0.8
Wet 114 2.72±0.01 323 5.89±0.17 257 11.7±0.2 57 14.80± 60 16.8±0.7 30 20.3±0.9
Parity ** ** ** NS NS NS
1 86 2.3±0.05b 85 4.8±0.2b 78 8.1±0.3b 23 10.8±1. 30 13.1±1.3 24 19.9±1.6
2 78 2.4±0.04ab 72 5.2±0.2a 66 8.4±0.3a 21 10.9±1. 25 13.4±1.2 14 20.1±1.3
3 66 2.5±0.04ab 65 6.0±0.2a 58 9.1±0.3a 19 11.3±1. 21 14.2±1.1 12 20.3±1.3
4 55 2.6±0.04a 51 6.4±0.2a 48 10.5±0.3a 17 13.0±1. 18 14.4±0.9 10 19.7±0.9
≥5 46 2.7±0.04ab 48 6.6±0.2a 42 11.5±0.3a 14 13.4±1. 16 15.1±1.0 9 20.0±1.3
Sex ** NS Ns ** Ns Ns
Male 116 2.72±0.03 112 7.1±0.1 98 12.0±0.2 44 14.80± 55 15.4±0.8 24 20.8±1.1
Female 114 2.62±0.02 118 6.7±0.1 92 11.9±0.2 75 13.83± 76 14.9±0.6 56 20.2±0.6
Birth type ** ** ** Ns NS NS
Single 176 2.83±0.02 146 6.98±0.1 132 12.02±0.42 85 13.8±0. 95 15.1±0.5 58 20.6±0.6
Multiple 44 2.70±0.03 54 5.91±0.24 48 10.97±0.64 34 13.0±1.0 36 14.9±0.9 22 20.1±1.1
N = number of observations; Birth wt‐ birth weight; 30d wt‐ 30 days weight; 90d wt‐ 90 days weight; 180d wt‐ 180 days weight; 270d wt‐ 270 days weight; 360d wt‐ 360 days weight; NS: Not significant (p>0.05); **p<0.01
Birth type has significant effect (p<0.01) on lamb growth rate from birth to 30 days and birth to 90 days of age under on farm; single born lambs have higher average daily weight gain than multiple born lambs at birth to one month (85.33±9.65gm vs. 80.00±8.04gm) and from birth to 90 days (105.16±8.29gm vs. 98.84±7.18gm), respectively. The higher average daily weight gain of the singles than multiple born lambs suggested that singles are sole milk users of their dam since lambs up to weaning are mostly dependent on their dam for growth requirement.Sex as a source of variation of lamb growth rate was only significant from birth to 90 days of age where males had higher average daily weight gain than females (106.16±8.29gm vs. 99.84±7.18gm, p<0.05). Tibbo (2006) has also reported a significant effect of sex on pre‐weaning average daily weight gain of lambs.
Post‐weaning growth rate: the least square means and standard errors of average daily weight gain from 90 to180 days of age was 95.20±8.71gm.Season was a source of variation (p<0.01) for post‐weaning growth rate; lambs born in wet season have higher average daily weight gain than dry season (94.69±4.67gm vs. 84.93±5.81gm). This might be attributed to the better feed availability in terms of quality and quantity in wet season for the lambs since after weaning the lambs growth are mostly dependent on the environment factors than their dams milk . Comparable to this result, Markos (2006) has reported the significant effect of season on post‐weaning growth rate under on station management. Birth type did not affected (p>0.01) post‐weaning growth rate in the present study since after weaning single born lambs have similar weight and growth rate a multiple born lambs. However, other studies found the significant influence of type of birth (Yilmaz et al., 2007) and sex (Tibbo, 2006) on post‐weaning growth rate. Sex has a significant effect (p< 0.01) on post weaning average daily weight gain that male lambs were heavier than female lambs (99.97±5.19gm vs. 81.66±5.01gm). The effect of year was important in
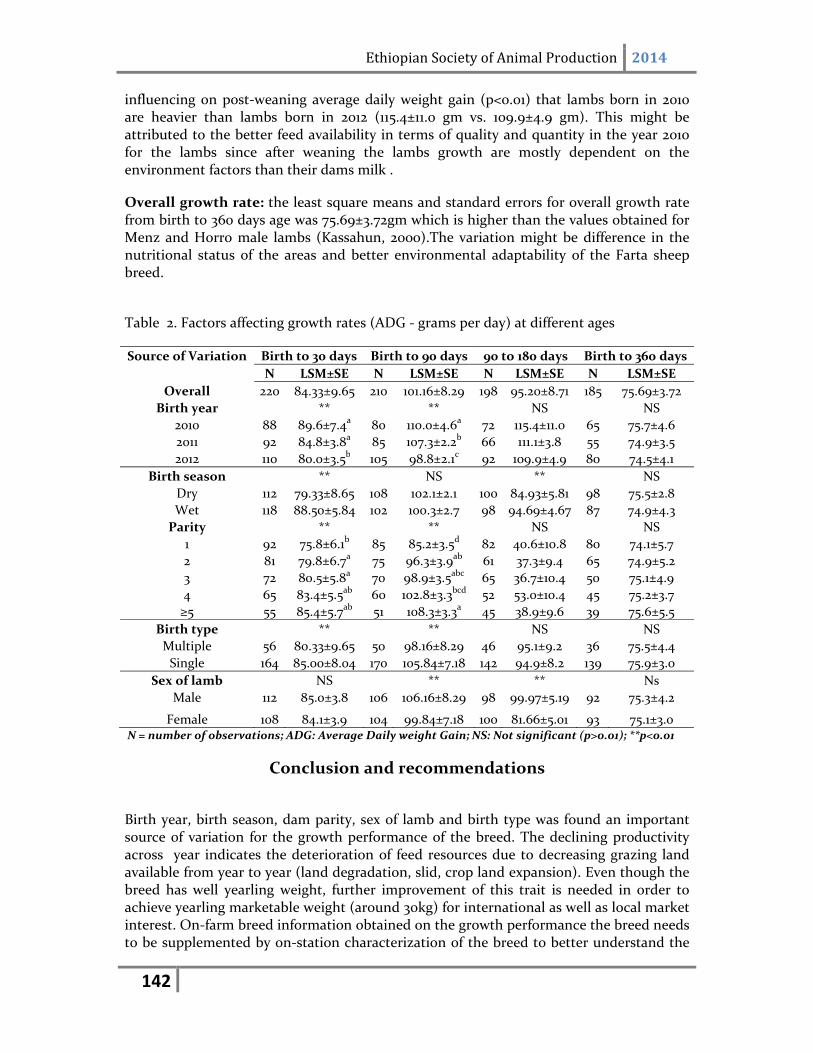
Ethiopian Society of Animal Production 2014
142
influencing on post‐weaning average daily weight gain (p<0.01) that lambs born in 2010 are heavier than lambs born in 2012 (115.4±11.0 gm vs. 109.9±4.9 gm). This might be attributed to the better feed availability in terms of quality and quantity in the year 2010 for the lambs since after weaning the lambs growth are mostly dependent on the environment factors than their dams milk .
Overall growth rate: the least square means and standard errors for overall growth rate from birth to 360 days age was 75.69±3.72gm which is higher than the values obtained for Menz and Horro male lambs (Kassahun, 2000).The variation might be difference in the nutritional status of the areas and better environmental adaptability of the Farta sheep breed.
Table 2. Factors affecting growth rates (ADG ‐ grams per day) at different ages
Source of Variation Birth to 30 days Birth to 90 days 90 to 180 days Birth to 360 days
N LSM±SE N LSM±SE N LSM±SE N LSM±SE
Overall 220 84.33±9.65 210 101.16±8.29 198 95.20±8.71 185 75.69±3.72
Birth year ** ** NS NS
2010 88 89.6±7.4a 80 110.0±4.6a 72 115.4±11.0 65 75.7±4.6
2011 92 84.8±3.8a 85 107.3±2.2b 66 111.1±3.8 55 74.9±3.5
2012 110 80.0±3.5b 105 98.8±2.1c 92 109.9±4.9 80 74.5±4.1
Birth season ** NS ** NS
Dry 112 79.33±8.65 108 102.1±2.1 100 84.93±5.81 98 75.5±2.8
Wet 118 88.50±5.84 102 100.3±2.7 98 94.69±4.67 87 74.9±4.3
Parity ** ** NS NS
1 92 75.8±6.1b 85 85.2±3.5d 82 40.6±10.8 80 74.1±5.7
2 81 79.8±6.7a 75 96.3±3.9ab 61 37.3±9.4 65 74.9±5.2
3 72 80.5±5.8a 70 98.9±3.5abc 65 36.7±10.4 50 75.1±4.9
4 65 83.4±5.5ab 60 102.8±3.3bcd 52 53.0±10.4 45 75.2±3.7
≥5 55 85.4±5.7ab 51 108.3±3.3a 45 38.9±9.6 39 75.6±5.5
Birth type ** ** NS NS
Multiple 56 80.33±9.65 50 98.16±8.29 46 95.1±9.2 36 75.5±4.4
Single 164 85.00±8.04 170 105.84±7.18 142 94.9±8.2 139 75.9±3.0
Sex of lamb NS ** ** Ns
Male 112 85.0±3.8 106 106.16±8.29 98 99.97±5.19 92 75.3±4.2
Female 108 84.1±3.9 104 99.84±7.18 100 81.66±5.01 93 75.1±3.0 N = number of observations; ADG: Average Daily weight Gain; NS: Not significant (p>0.01); **p<0.01
Conclusion and recommendations
Birth year, birth season, dam parity, sex of lamb and birth type was found an important source of variation for the growth performance of the breed. The declining productivity across year indicates the deterioration of feed resources due to decreasing grazing land available from year to year (land degradation, slid, crop land expansion). Even though the breed has well yearling weight, further improvement of this trait is needed in order to achieve yearling marketable weight (around 30kg) for international as well as local market interest. On‐farm breed information obtained on the growth performance the breed needs to be supplemented by on‐station characterization of the breed to better understand the
Ethiopian Society of Animal Production 2014
143
genetic variations and potential of the breed and design appropriate breeding strategies. Integrated efforts combining improving feeds and feeding, health and participatory community‐based breeding needed
Acknowledgement
The field research was fully financed by the Amhara Regional Agricultural Research Institute (ARARI) in Ethiopia. The author is greatly indebted to Mr. Eyasu Lakew in his support in data cross checking and data entry. The author is also interested to thank the Enumerators at the villages for their support in data collection. We are grateful to the staff of Andassa Research Centre of ARARI, for their interest in our research and support during the field work.
References
Abegaz, S., E. Negussie, G. Duguma and J. E. O. Rege, 2002a. Genetic parameter estimates for growth traits in Horro sheep. J. Anim. Breed. Genet. 119:35‐45. Benyi, K., Norris, D., Karbo, N. and Kgomo, K. A, 2006. Effects of genetic and environmental factors on preweaning and post‐weaning growth in West African crossbred sheep. Tropical Animal Health Production. 38, 547–554.
Central Statistical Agency of Ethiopia (CSA), 2010. The 2010 National Statistics‐ Agriculture. http://www.csa.gov.et/text_files/2006_national_statistics.htm (accessed on Oct., 2011) Gardner, D.S., Buttery, P.J., Daniel, Z. and Symonds, M.E, 2007. Factors affecting birth weight in sheep: maternal environment. Reproduction. 133(1), 297–307. Gemeda Duguma, Schoeman S. J., Cloete S. W. P. and Jordaan G. F, 2002. The influence of nongenetic factors on early growth traits in the Tygerhoek Merino lambs. Eth.J.Anim.Prod.2 (1)127‐141. Gizaw, S., J. A. M. Van Arendonk, H. Komen, J. J. Windig and O. Hanotte, 2007. Population structure, genetic variation and morphological diversity in indigenous sheep of Ethiopia. International Society for Animal Genetics, Animal Genetics, 38, 621–628. Hassen, Y., Sölkner, J., Gizaw, S. and Baumung, R., 2002. Performance of crossbred and indigenous sheep under village conditions in the cool highlands of central‐northern Ethiopia: growth, birth and body weights. Small Ruminant Research. 43, 195–202. Hassen, Y., Sölkner, J. and Fuerst‐Waltl, B., 2004. Body weight of Awassi and indigenous Ethiopian sheep and their crosses. Small Ruminant Research. 55, 51–56. Lemma, S., 2002. Phenotypic classification and description of indigenous sheep type in the Amhara National Regional State of Ethiopia. M.Sc. Thesis. University of Natal, Pietermarizburg. 104p.
Ethiopian Society of Animal Production 2014
144
Loos, R.J., Derom, C., Eeckels, R., Derom, R. and Vlietinck, R., 2001. Length of gestation and birth weight in dizygotic twins. Lancet. 358, 560–561 Macedo, R. and J. D.Hummel, 2006. Influence of parity on productive performance of Pelibuey ewes under intensive management in the Mexican dry tropics. Livestock Research for Rural Development 18(6). 8 p. Markos Tibbo, 2006. Productivity and health of indigenous sheep breeds and crossbreds in the central Ethiopian highlands. PhD dissertation. Department of Animal Breeding and Genetics, Faculty of Veterinary Medicine and Animal Sciences, Swedish University of Agricultural Science(SLU), Uppsala, Sweden.74p. Mengistie Taye, Girma Abebe, Sisay Lemma, Solomon Gizaw, Abebe Mekoya and Markos Tibbo, 2011. Reproductive Performances and Survival of Washera Sheep under Traditional Managment systems at Yilmanadensa and Quarit Districts of the Amhara National Regional State, Ethiopia. Journal of Animal Science and Veterinary Advances 10 (9): 1158‐1165. Mengistu, A, 2003. Country Pasture/Forage Resource Profiles, Ethiopia.http://www.fao.org/ag/AGP/AGPC/doc/Counprof/ Ethiopia/Ethiopia. Htm (Accessed on February 2007) Rastogi, R.G, 2001. Production performance of Barbados Blackbelly Sheep in Tobago, West Indies. Small Ruminant Research. 41, 171–175. Solomon Abegaz Guangul, 2007. In‐situ characterization of Gumuz sheep under farmers management in north‐western lowlands of Amhara region. MSc.Thesis, Haramaya University, Ethiopia. 108 p. Solomon Abegaz Kebede, 2002. Genetic evaluation of production, reproduction and survival in a flock of Ethiopian Horro sheep. PhD. dissertation submitted to the Faculty of Natural and Agricultural Sciences Department of Animal, Wildlife and Grassland Sciences University of the Free State. Bloemfontein. 118p. Tibbo, M., Ayalew, W., Awgichew, K., Ermias, E. and Rege, J.E.O, 2004. On‐station characterisation of indigenous Menz and Horro sheep breeds in the central highlands of Ethiopia. FAO/UNEP Animal Genetic Resources Information. 35, 61–74. Tibbo, M, 2006. Productivity and health of indigenous sheep breeds and crossbreds in the central Ethiopian highlands. Ph.D. dissertation. Department of Animal Breeding and Genetics, Faculty for Veterinary Medicine and Animal Sciences, Swedish University of Agricultural
Sciences (SLU), Uppsala, Sweden. 76p.
Woreda Office of Agriulture and Rurala Development, 2004. East Estie, North Gondar Ethiopia Yilmaz, O., Denk, H. and Bayram, D., 2007. Effects of lambing season, sex and birth type on growth performance in Norduz lambs. Small Ruminant Research. 68 (3), 336–339. Trop Anim Health Prod
Ethiopian Society of Animal Production 2014
145
Body Weight Estimation using Linear Body Measurement for Washera, Farta and their Crossbred Sheep in Western Highlands of Amhara
Region, Ethiopia Shigdaf Mekuriaw1 2, Zeleke Mekuriaw2, Mengistie Taye2 and Aynalem Haile3
1Andassa Livestock Research Center, P.O.Box 27, Bahir Dar, Ethiopia, [email protected]
2Bahir Dar University, P.O.Box 79, Bahir Dar, Ethiopia
3International Center for Agricultural Research in the Dry Areas, P.O.Box. 5466, Alepo, Syria
Abstract
The study was conducted in Farta and Lay Gaint districts of the Amhara Region.linear body measurement data were collected on Washera, Farta and their crossbred sheep. The fixed effects considered in this study were breed, district, sex, season and age group. The body weight data were analyzed using general linear model procedure of Statistical The least squares mean and standard errors of yearling weight for Washera, Farta and their crossbred sheep were 23.70±1.13kg, 20.08±0.73kg and 21.35±1.56kg, respectively. Washera sheep breed has higher value for body weight; wither at height and pelvic width than Farta and crossbred sheep. Washera sheep was much better in linear body measurements followed by crossbred sheep.
Key words: Washera, Farta, linear measurement, regression equation and crossbreds
Introduction
Knowing the body weight of a sheep is important for a number of reasons, related to breeding (selection), feeding, health care and for market age determination since it is an important growth and economic trait. However, this information is often lacking for sheep managed under small scale farming sector particularly in rural areas, due to lack of weighing scales among other factors. Furthermore, it has been found to be labour consuming and tiresome to lift‐up and measure body weight using spring balance. Thus designing and implementing simple and cheap measurement system is crucial for village‐based breeding program. Linear body measurements are simple and easily measured variables for estimating live weight with relatively lower costs with a high relative accuracy and consistency ((Tesfaye et al., 2009a; Cam et al., 2010); Sowande and Sobola, 2007 and Atta and EI Khidir, 2004). Strong relationship of linear body measurements with body weight and the importance of body measurements for the prediction of body weight have been documented by many authors (Atta and El khidir, 2004; Thiruvenkadan, 2005; Adeyinka, 2006; Afolayan et al., 2006; Fasae et al., 2006; Khan et al., 2006; Mengistie et al., 2010). The choice of the best fitted regression model was assessed using coefficient of determination (Zewduet al., 2009b). The differences in the coefficient of determination of the equations fitted between different dentition groups indicated that weight can be estimated using different equations for different age groups with different accuracies (Mengistieet al., 2010). Therefore the objective of this study was to estimate body weight using linear body measurements for Washera, Farta and their crossbreed sheep.
Ethiopian Society of Animal Production 2014
146
Material and Methods
Description of the study area
The study was conducted at Farta and Lay Gayint districts of South Gonder Zone of Amhara Region of Ethiopia. Farta district is situated at 11°40′ N latitude and 38° E longitude and located at about 100 km north‐east of Bahir Dar, capital city of the Amhara Region, Ethiopia. It lies within an altitude range of 1920‐4135 m above sea level. The district receives an average annual rain fall of 900‐1099 mm and a mean‐range temperature of 9‐25oC. The rainy season ranges from May to September (Abebaw and Melaku, 2009). The district’s major socio‐economic problem is food insecurity (Alemtsehay and Girma, 2006). Lay Gayint district is located 175km from Bahir Dar and lies between altitude ranges of 1300‐3500 m above seas level. It receives an annual average rain fall of 600‐1100 mm and mean minimum and mean maximum temperatures of 9 and 19oC respectively (ENMA, unpublished). It is characterized by drought, sever soil erosion, poor soil fertility, frost and shortage of arable land, crop disease and pest hail damage, landslide and feed shortage (South Gonder Zone BOA, 2008).
Flock management
Since the start of data collection, internal and external parasite control has been carried out. For internal parasites the animals have been de‐wormed three times a year (i.e. at the end of rainy season, at mid dry season and at the onset of rainy season). Animals have been sprayed for external parasites when tick infestation is high (as per the need). Vaccination against pasteurellosis, anthrax and black leg has been given once a year.
Data collection
The linear body measurement data were collected on Washera, Farta and their crossbreed sheep. The collected data were coded and entered into Microsoft EXCEL, 2007 software program of the computer for further analysis. Preliminary data analysis like normality test and screening of outliers were employed before conducting the main data analysis.
Data Analysis
The fixed effects fitted were the following: breed (Washera, Washera cross with Farta and Farta), district (Lay Gayint and Farta), sex (Male and Female), season of measurement (dry and wet) and age group group (i = 0, 1, 2, 3 and >4). The data were analyzed by SAS (2003). For analysis of variance of body weight and linear measurements the model was specified as follows: Yijkl = µ + Ai + Bj + Sk + Tl + eijkl. Where: Yijkl = the observed body measurements of the animal; µ = overall mean; Ai = the effect of age group (i = 0, 1, 2, 3 and >4); Bj= Fixed effect of breed (i = Washera, Farta and Washera*Farta); Sk = the effect of sex (k= male and female); Tl= the effect of season of measurement (l= wet and dry) and eijkl= random residual error.Pearson's correlation coefficients for each breed were estimated between body weight and other body measurements within sex and age group. Body weight was regressed on body measurementsthat had strong correlation with body weight. Accordingly for each breed within each sex and age group stepwise regression analysis was carried out using statistical package for social sciences (SPSS version 16.0, 2009)to
Ethiopian Society of Animal Production 2014
147
determine the best fitted regression equation. Simple and multiple prediction equations were developed for sex and age group. Moreover, the response variable, body weight was analyzed by using the following linear regressions analysis for each breed. Wi = a + b1x1 + b2x2 + b3x3 + b4x4 + b5x5 + ei. Where: Wi = the response variable; body weight; a= the interceptx1, x2,x3, ...,x5are the explanatory variables heart girth, body length, height at wither, pelvic width and ear length respectively; b1, b2, b3...b5 are regression coefficient of the variables x1, x2,x3... x6 and ei= the residual random error.
Results and Discussion
Body weight and linear body measurements
Least squares mean of body weight and other body linear measurements of Washera, Farta and their crossbreed sheep were presented in Table 1. The live body weight for sheep at one PPI (27.68 kg) is an indicator for improvement to achieve recommended body weight of 30 kg at yearling age (Markos, 2006) for commercial market purpose. Breed has a significant effect in all body measurements except heart girth, belly circumference and tail length (P>0.001). The result revealed that Washera sheep has higher body weight, wither height, height at pelvic, body condition, tail width and tail circumference but smaller horn length than Farta and crossbreed sheep (Table 1). This shows that Washera sheep breed has large body weight and large body size in comparison with Farta and crossbred sheep. This might be due to the genetic makeup effect on those measurements. Breed effects on body measurements were also reported by Zewdu et al. (2009b). The scrotal circumference of Washera and their crossbreed sheep (22.88±0.78 cm) was higher than Farta sheep (18.35cm). This shows that Washera and their crosses breed rams have more reproductive efficiency than Farta sheep ram as supported by Söderquist and Hulten (2006) in which scrotal circumference is an indirect measure of ram fertility and used to asses breeding soundness of ram.The district effect was highly significant (P>0.001) for all body measurements except body length, heart girth, belly circumference, pelvic width and scrotum circumference in which the sheep in Farta district has high value than in Lay Gayint district (Table 1). Such significant difference along with district could be attributed to differences in environment as well as management practices employed in the two districts. The effect of district on body measurements also reported by different literature (Fikrte 2008, Taye et al., 2010). Season has significant (p<0.001) effect on all body measurements except for chest depth, tail length, tail width, tail circumference, scrotal circumference and horn length. This is disagreement with a few studies have investigated the effect of season on testicular measurements in sheep (Rege et al., 2009b). Sex of animals had consistence effect on all considered body measurements except pelvic width and ear length (P<0.01). All parameters were higher (P<0.05) in males. The higher body weight and body measurement values in males than females observed in this study might be due to the hormonal difference in growth. This was supported by Mengistie et al. (2010) that the superiority in the weight of males over females could be a result of the hormonal differences in their endocrinological and physiological functions. In addition Sowande and Sobola (2007) reported that ewes have slower rate of growth and reach maturity at smaller size due to the effect of oestrogen in restricting the growth of the long bones of the body.Age group have consistently significant effect (P< 0.01) on body weight
Ethiopian Society of Animal Production 2014
148
and all considered linear body measurements. The trend in all body measurements and body weight increased with increase in age group class from 0PPI to 2PPI but there was no much difference in age group class of the 2PPI and more. This may be attributed to the faster growth rate of younger animals compared to the older ones (Tesfaye et al., 2010). Similar observation was made by Fikrte (2008) and Tesfaye et al. (2009b) that body weight and all the body measurements were significantly affected by age group. Scrotal circumference increases at advanced age group (Table 33 and 35). The influence of age group on scrotal circumference in sheep (Söderquist and Hulten, 2006) and Zewdu et al. (2010) in Horro and Bonga sheep were also reported.
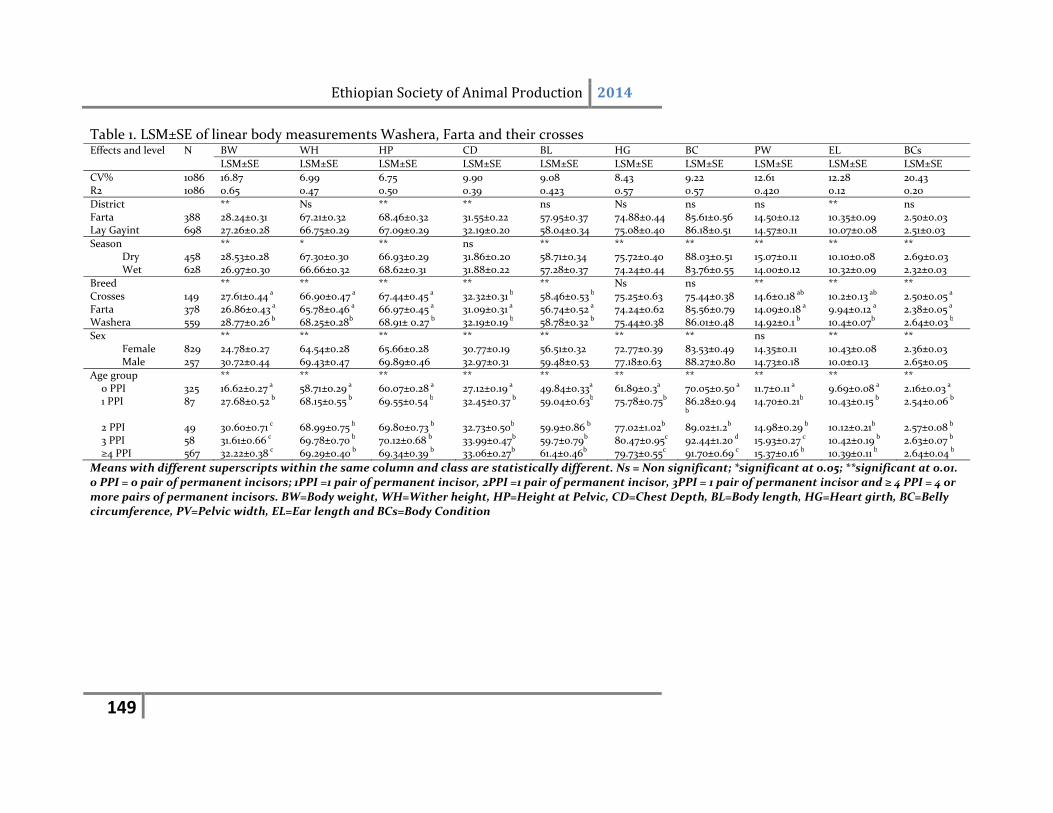
Ethiopian Society of Animal Production 2014
149
Table 1. LSM±SE of linear body measurements Washera, Farta and their crosses Effects and level N BW WH HP CD BL HG BC PW EL BCs
LSM±SE LSM±SE LSM±SE LSM±SE LSM±SE LSM±SE LSM±SE LSM±SE LSM±SE LSM±SE
CV% 1086 16.87 6.99 6.75 9.90 9.08 8.43 9.22 12.61 12.28 20.43 R2 1086 0.65 0.47 0.50 0.39 0.423 0.57 0.57 0.420 0.12 0.20
District ** Ns ** ** ns Ns ns ns ** ns Farta 388 28.24±0.31 67.21±0.32 68.46±0.32 31.55±0.22 57.95±0.37 74.88±0.44 85.61±0.56 14.50±0.12 10.35±0.09 2.50±0.03 Lay Gayint 698 27.26±0.28 66.75±0.29 67.09±0.29 32.19±0.20 58.04±0.34 75.08±0.40 86.18±0.51 14.57±0.11 10.07±0.08 2.51±0.03
Season ** * ** ns ** ** ** ** ** ** Dry 458 28.53±0.28 67.30±0.30 66.93±0.29 31.86±0.20 58.71±0.34 75.72±0.40 88.03±0.51 15.07±0.11 10.10±0.08 2.69±0.03 Wet 628 26.97±0.30 66.66±0.32 68.62±0.31 31.88±0.22 57.28±0.37 74.24±0.44 83.76±0.55 14.00±0.12 10.32±0.09 2.32±0.03
Breed ** ** ** ** ** Ns ns ** ** ** Crosses 149 27.61±0.44 a 66.90±0.47 a 67.44±0.45 a 32.32±0.31 b 58.46±0.53 b 75.25±0.63 75.44±0.38 14.6±0.18 ab 10.2±0.13 ab 2.50±0.05 a Farta 378 26.86±0.43 a 65.78±0.46 a 66.97±0.45 a 31.09±0.31 a 56.74±0.52 a 74.24±0.62 85.56±0.79 14.09±0.18 a 9.94±0.12 a 2.38±0.05 a Washera 559 28.77±0.26 b 68.25±0.28b 68.91± 0.27 b 32.19±0.19 b 58.78±0.32 b 75.44±0.38 86.01±0.48 14.92±0.1 b 10.4±0.07b 2.64±0.03 b
Sex ** ** ** ** ** ** ** ns ** ** Female 829 24.78±0.27 64.54±0.28 65.66±0.28 30.77±0.19 56.51±0.32 72.77±0.39 83.53±0.49 14.35±0.11 10.43±0.08 2.36±0.03 Male 257 30.72±0.44 69.43±0.47 69.89±0.46 32.97±0.31 59.48±0.53 77.18±0.63 88.27±0.80 14.73±0.18 10.0±0.13 2.65±0.05
Age group ** ** ** ** ** ** ** ** ** ** 0 PPI 325 16.62±0.27 a 58.71±0.29 a 60.07±0.28 a 27.12±0.19 a 49.84±0.33a 61.89±0.3a 70.05±0.50 a 11.7±0.11 a 9.69±0.08 a 2.16±0.03 a 1 PPI 87 27.68±0.52 b 68.15±0.55 b 69.55±0.54 b 32.45±0.37 b 59.04±0.63b 75.78±0.75b 86.28±0.94
b 14.70±0.21b 10.43±0.15 b 2.54±0.06 b
2 PPI 49 30.60±0.71 c 68.99±0.75 b 69.80±0.73 b 32.73±0.50b 59.9±0.86 b 77.02±1.02b 89.02±1.2b 14.98±0.29 b 10.12±0.21b 2.57±0.08 b 3 PPI 58 31.61±0.66 c 69.78±0.70 b 70.12±0.68 b 33.99±0.47b 59.7±0.79b 80.47±0.95c 92.44±1.20 d 15.93±0.27 c 10.42±0.19 b 2.63±0.07 b ≥4 PPI 567 32.22±0.38 c 69.29±0.40 b 69.34±0.39 b 33.06±0.27b 61.4±0.46b 79.73±0.55c 91.70±0.69 c 15.37±0.16 b 10.39±0.11 b 2.64±0.04 b
Means with different superscripts within the same column and class are statistically different. Ns = Non significant; *significant at 0.05; **significant at 0.01. 0 PPI = 0 pair of permanent incisors; 1PPI =1 pair of permanent incisor, 2PPI =1 pair of permanent incisor, 3PPI = 1 pair of permanent incisor and ≥ 4 PPI = 4 or more pairs of permanent incisors. BW=Body weight, WH=Wither height, HP=Height at Pelvic, CD=Chest Depth, BL=Body length, HG=Heart girth, BC=Belly circumference, PV=Pelvic width, EL=Ear length and BCs=Body Condition
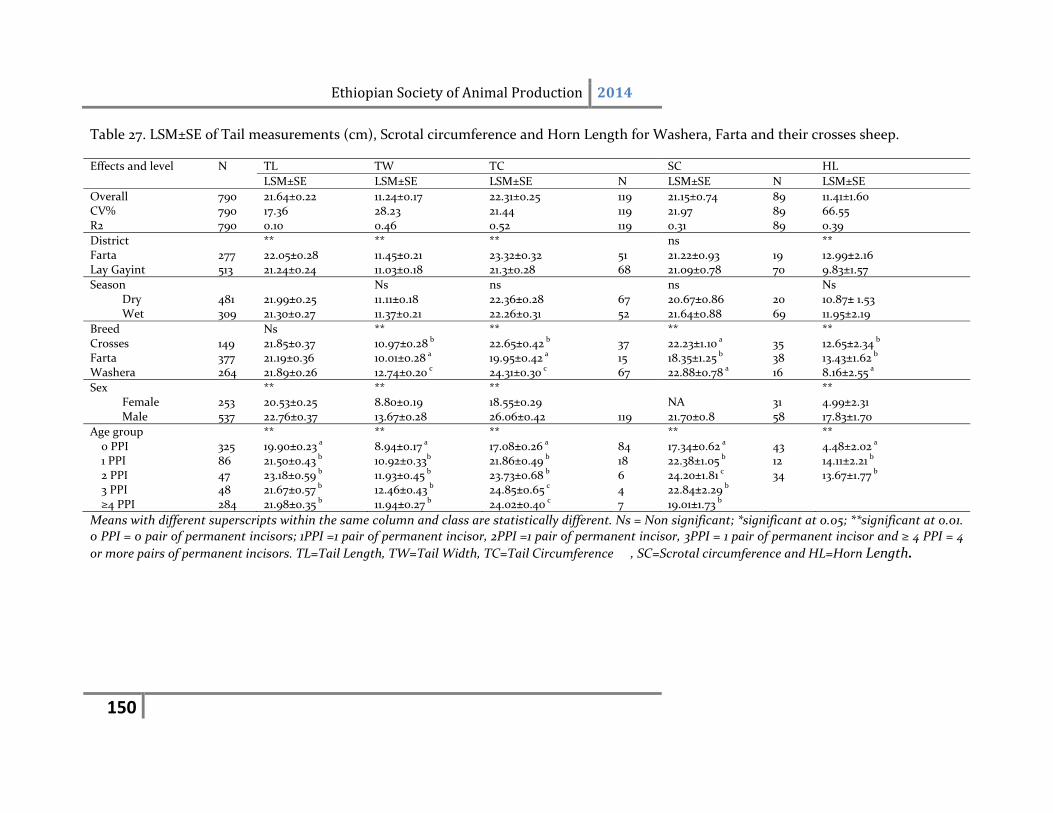
Ethiopian Society of Animal Production 2014
150
Table 27. LSM±SE of Tail measurements (cm), Scrotal circumference and Horn Length for Washera, Farta and their crosses sheep.
Effects and level N TL TW TC SC HL
LSM±SE LSM±SE LSM±SE N LSM±SE N LSM±SE
Overall 790 21.64±0.22 11.24±0.17 22.31±0.25 119 21.15±0.74 89 11.41±1.60 CV% 790 17.36 28.23 21.44 119 21.97 89 66.55 R2 790 0.10 0.46 0.52 119 0.31 89 0.39
District ** ** ** ns ** Farta 277 22.05±0.28 11.45±0.21 23.32±0.32 51 21.22±0.93 19 12.99±2.16 Lay Gayint 513 21.24±0.24 11.03±0.18 21.3±0.28 68 21.09±0.78 70 9.83±1.57
Season Ns ns ns Ns Dry 481 21.99±0.25 11.11±0.18 22.36±0.28 67 20.67±0.86 20 10.87± 1.53 Wet 309 21.30±0.27 11.37±0.21 22.26±0.31 52 21.64±0.88 69 11.95±2.19
Breed Ns ** ** ** ** Crosses 149 21.85±0.37 10.97±0.28 b 22.65±0.42 b 37 22.23±1.10 a 35 12.65±2.34 b Farta 377 21.19±0.36 10.01±0.28 a 19.95±0.42 a 15 18.35±1.25 b 38 13.43±1.62 b Washera 264 21.89±0.26 12.74±0.20 c 24.31±0.30 c 67 22.88±0.78 a 16 8.16±2.55 a
Sex ** ** ** ** Female 253 20.53±0.25 8.80±0.19 18.55±0.29 NA 31 4.99±2.31 Male 537 22.76±0.37 13.67±0.28 26.06±0.42 119 21.70±0.8 58 17.83±1.70
Age group ** ** ** ** ** 0 PPI 325 19.90±0.23 a 8.94±0.17 a 17.08±0.26 a 84 17.34±0.62 a 43 4.48±2.02 a 1 PPI 86 21.50±0.43 b 10.92±0.33b 21.86±0.49 b 18 22.38±1.05 b 12 14.11±2.21 b 2 PPI 47 23.18±0.59 b 11.93±0.45 b 23.73±0.68 b 6 24.20±1.81 c 34 13.67±1.77 b 3 PPI 48 21.67±0.57 b 12.46±0.43 b 24.85±0.65 c 4 22.84±2.29 b ≥4 PPI 284 21.98±0.35 b 11.94±0.27 b 24.02±0.40 c 7 19.01±1.73 b
Means with different superscripts within the same column and class are statistically different. Ns = Non significant; *significant at 0.05; **significant at 0.01. 0 PPI = 0 pair of permanent incisors; 1PPI =1 pair of permanent incisor, 2PPI =1 pair of permanent incisor, 3PPI = 1 pair of permanent incisor and ≥ 4 PPI = 4
or more pairs of permanent incisors. TL=Tail Length, TW=Tail Width, TC=Tail Circumference , SC=Scrotal circumference and HL=Horn Length.
Ethiopian Society of Animal Production 2014
151
Correlation between body weight and other linear body measurements
The Pearson's correlation coefficient of the body weight with linear body measurements of Washera, Farta and their crossbred sheep for different sex and age groups is presented in Table 2. Body weight was significantly correlated (P<0.01) with linear body measurements with correlation coefficient for overall sheep ranged from 0.25 for ear length to 0.86 for heart girth. Ear length showed negative correlation and non‐significant for all breed. The observed positive correlations between weight and other body measurements were suggest that either of these variables or their combination could provide a good estimate for predicting body weight as well as indirect selection criteria to improve live weight of sheep (Cam et al., 2010; Tesfaye et al., 2009b). The higher association of body weight with heart girth was possibly due to relatively larger contribution in body weight by heart girth (consisting of bones, muscles, and viscera) (Thiruvenkadan, 2005).
Of the body measurements, heart girth for Washera (0.85), Farta(0.80), their crossbreeds (0.88) had consistently showed the highest correlation coefficient with body weight. The result for heart girth is in line with litratures (Fasae et al., 2006; Solomon et al., 2008; Tesfaye et al., 2009). Horn length has high significant correlation coefficient with body weight for Farta and crossbreed sheep 0.70 and 0.65 respectively. Scrotal circumference had positive and strong correlation with body weight for pooled group of Washera (0.63), Farta (0.58) and Crossbreed sheep (0.62) which is in comparable with the report of Tesfaye et al. (2009) that scrotal circumference at all age groups has a correlation coefficient of 0.63 to 0.67 for Menz rams and 0.66 to 0.71 for Afar rams. Generally, the higher association of body weight with heart girth and belly circumference with body weight was possibly due to the comparatively bigger contribution in consisting of bones, muscles and viscera and other parts that have high influence on it. Previous studies also demonstrate that the higher association of body weight with heart girth was possibly due to relatively larger contribution in body weight by heart girth (Thiruvenkadan 2005; Taye et al., 2010). So, body weight prediction from heart girth and belly circumference would be a practical option with reasonable accuracy.
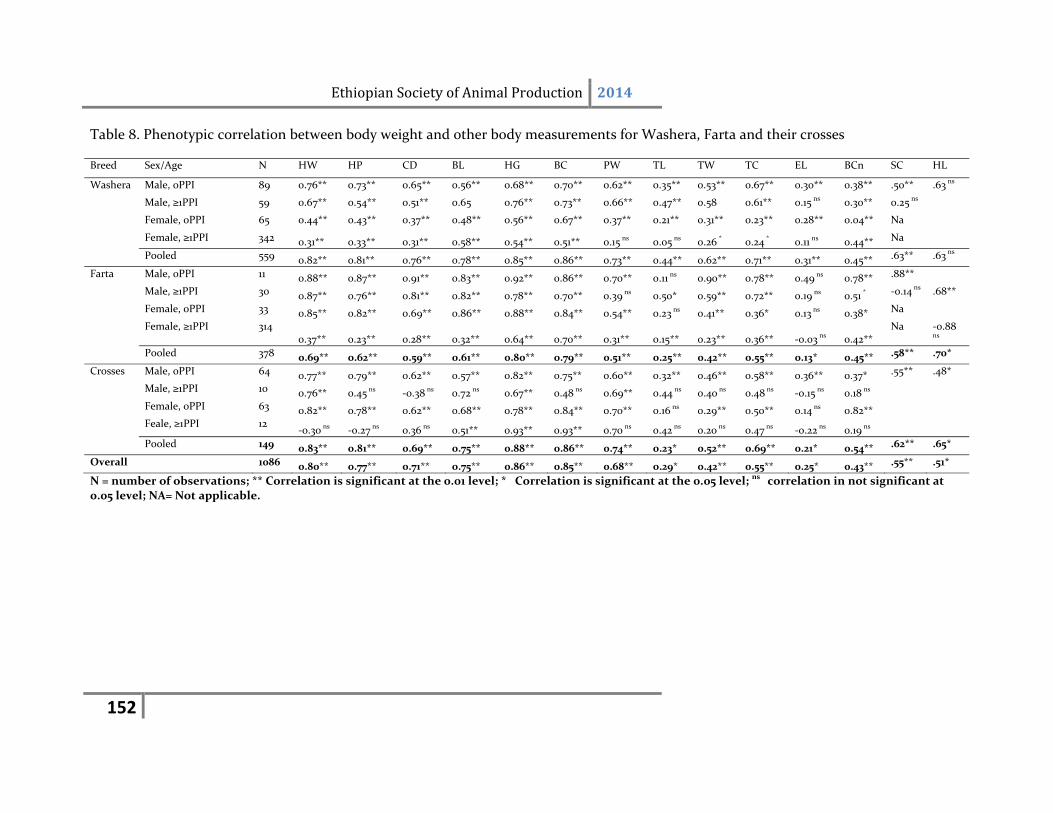
Ethiopian Society of Animal Production 2014
152
Table 8. Phenotypic correlation between body weight and other body measurements for Washera, Farta and their crosses
Breed Sex/Age N HW HP CD BL HG BC PW TL TW TC EL BCn SC HL
Washera Male, 0PPI 89 0.76** 0.73** 0.65** 0.56** 0.68** 0.70** 0.62** 0.35** 0.53** 0.67** 0.30** 0.38** .50** .63 ns
Male, ≥1PPI 59 0.67** 0.54** 0.51** 0.65 0.76** 0.73** 0.66** 0.47** 0.58 0.61** 0.15 ns 0.30** 0.25 ns
Female, 0PPI 65 0.44** 0.43** 0.37** 0.48** 0.56** 0.67** 0.37** 0.21** 0.31** 0.23** 0.28** 0.04** Na
Female, ≥1PPI 342 0.31** 0.33** 0.31** 0.58** 0.54** 0.51** 0.15 ns 0.05 ns 0.26 * 0.24 * 0.11 ns 0.44** Na
Pooled 559 0.82** 0.81** 0.76** 0.78** 0.85** 0.86** 0.73** 0.44** 0.62** 0.71** 0.31** 0.45** .63** .63 ns
Farta Male, 0PPI 11 0.88** 0.87** 0.91** 0.83** 0.92** 0.86** 0.70** 0.11 ns 0.90** 0.78** 0.49 ns 0.78** .88**
Male, ≥1PPI 30 0.87** 0.76** 0.81** 0.82** 0.78** 0.70** 0.39 ns 0.50* 0.59** 0.72** 0.19 ns 0.51 * ‐0.14 ns .68**
Female, 0PPI 33 0.85** 0.82** 0.69** 0.86** 0.88** 0.84** 0.54** 0.23 ns 0.41** 0.36* 0.13 ns 0.38* Na
Female, ≥1PPI 314 0.37** 0.23** 0.28** 0.32** 0.64** 0.70** 0.31** 0.15** 0.23** 0.36** ‐0.03 ns 0.42**
Na ‐0.88 ns
Pooled 378 0.69** 0.62** 0.59** 0.61** 0.80** 0.79** 0.51** 0.25** 0.42** 0.55** 0.13* 0.45** .58** .70*
Crosses Male, 0PPI 64 0.77** 0.79** 0.62** 0.57** 0.82** 0.75** 0.60** 0.32** 0.46** 0.58** 0.36** 0.37* .55** .48*
Male, ≥1PPI 10 0.76** 0.45 ns ‐0.38 ns 0.72 ns 0.67** 0.48 ns 0.69** 0.44 ns 0.40 ns 0.48 ns ‐0.15 ns 0.18 ns
Female, 0PPI 63 0.82** 0.78** 0.62** 0.68** 0.78** 0.84** 0.70** 0.16 ns 0.29** 0.50** 0.14 ns 0.82**
Feale, ≥1PPI 12 ‐0.30 ns ‐0.27 ns 0.36 ns 0.51** 0.93** 0.93** 0.70 ns 0.42 ns 0.20 ns 0.47 ns ‐0.22 ns 0.19 ns
Pooled 149 0.83** 0.81** 0.69** 0.75** 0.88** 0.86** 0.74** 0.23* 0.52** 0.69** 0.21* 0.54** .62** .65*
Overall 1086 0.80** 0.77** 0.71** 0.75** 0.86** 0.85** 0.68** 0.29* 0.42** 0.55** 0.25* 0.43** .55** .51*
N = number of observations; ** Correlation is significant at the 0.01 level; * Correlation is significant at the 0.05 level; ns correlation in not significant at 0.05 level; NA= Not applicable.
Ethiopian Society of Animal Production 2014
153
Prediction of body weight from other body measurements
Different regression models were developed for different breed with in sexes, age groups and for the pooled data (Table 5). Heart girth accounted for 85%, 80% and 88% of the highest variation in body weight for pooled data in Washera, Farta and their crossbred sheep, respectively. The finding of this result showed that heart girth (HG) alone can be used to predict body weight. Similarly, Mengistieet al. (2010) reported that under field conditions heart girth alone can be used to reduce complexity and bias that would come due to posture of animals when measuring. Therefore, body weight can be estimated for pooled Washera sheep Y= ‐18.25+0.61HG, for Farta sheep Y= ‐47.80+1.1HG and for crossbred sheep Y= ‐22.29 + 0.63HG under on farm management. Likewise, Kassahun (2000) found out that heart girth alone explains 83% and 81% of weight for Menz and Horro ram lambs and Mengistieet al. (2010) also reported that heart girth alone could provide a good estimate of predicting live weight of Washera sheep at different age groups in its home area. Further addition of height at wither improved the r‐squared value from 84% to 90% for all sheep in the study area. Despite better prediction of body weight from combinations of body measures, having these multiple variables to predict body weight posses a practical problem under field settings due to the higher labour and time needed for measurement and difficulty of proper animal restraint during measurement (Zewdu et al., 2009b; Tesfaye et al., 2009b). So for simplicity under farmer management condition, it is advisable to use the simple regression equation for body weight estimation using heart girth in this study.
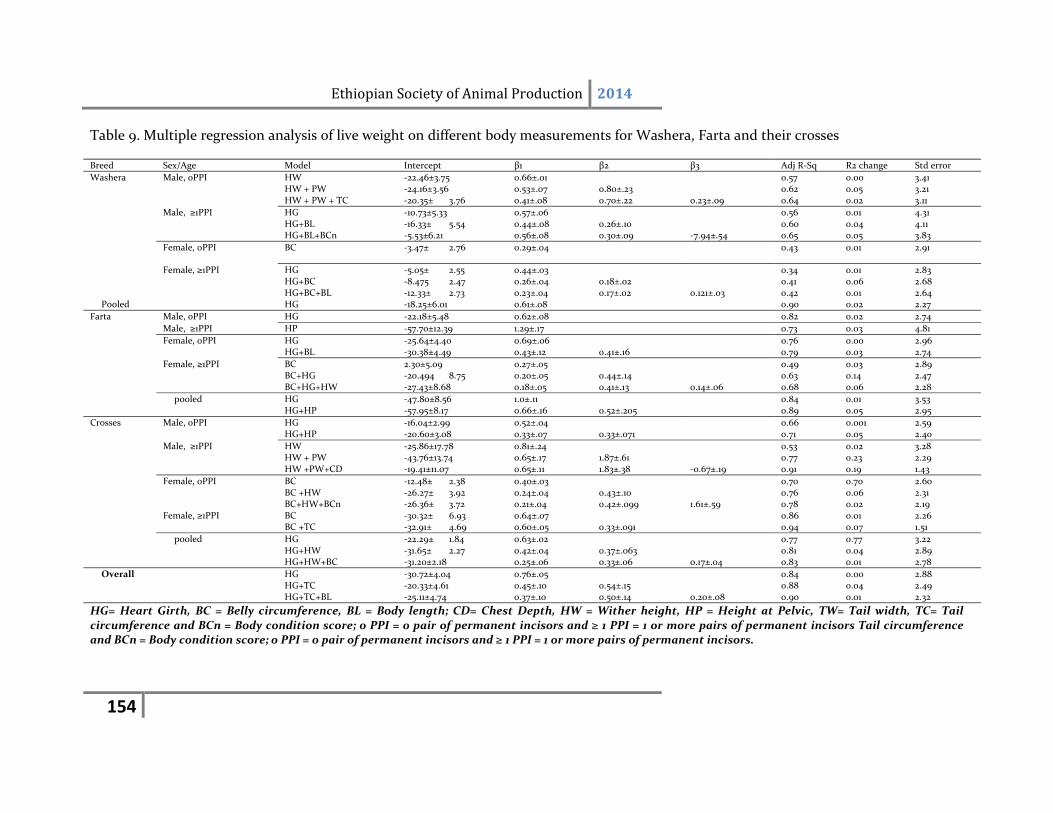
Ethiopian Society of Animal Production 2014
154
Table 9. Multiple regression analysis of live weight on different body measurements for Washera, Farta and their crosses
Breed Sex/Age Model Intercept β1 β2 β3 Adj R‐Sq R2 change Std error
Washera Male, 0PPI HW ‐22.46±3.75 0.66±.01 0.57 0.00 3.41 HW + PW ‐24.16±3.56 0.53±.07 0.80±.23 0.62 0.05 3.21 HW + PW + TC ‐20.35± 3.76 0.41±.08 0.70±.22 0.23±.09 0.64 0.02 3.11
Male, ≥1PPI HG ‐10.73±5.33 0.57±.06 0.56 0.01 4.31 HG+BL ‐16.33± 5.54 0.44±.08 0.26±.10 0.60 0.04 4.11
HG+BL+BCn ‐5.53±6.21 0.56±.08 0.30±.09 ‐7.94±.54 0.65 0.05 3.83
Female, 0PPI BC ‐3.47± 2.76 0.29±.04 0.43 0.01 2.91
Female, ≥1PPI HG ‐5.05± 2.55 0.44±.03 0.34 0.01 2.83 HG+BC ‐8.475 2.47 0.26±.04 0.18±.02 0.41 0.06 2.68 HG+BC+BL ‐12.33± 2.73 0.23±.04 0.17±.02 0.121±.03 0.42 0.01 2.64
Pooled HG ‐18.25±6.01 0.61±.08 0.90 0.02 2.27
Farta Male, 0PPI HG ‐22.18±5.48 0.62±.08 0.82 0.02 2.74
Male, ≥1PPI HP ‐57.70±12.39 1.29±.17 0.73 0.03 4.81
Female, 0PPI HG ‐25.64±4.40 0.69±.06 0.76 0.00 2.96 HG+BL ‐30.38±4.49 0.43±.12 0.41±.16 0.79 0.03 2.74
Female, ≥1PPI BC 2.30±5.09 0.27±.05 0.49 0.03 2.89 BC+HG ‐20.494 8.75 0.20±.05 0.44±.14 0.63 0.14 2.47 BC+HG+HW ‐27.43±8.68 0.18±.05 0.41±.13 0.14±.06 0.68 0.06 2.28
pooled HG ‐47.80±8.56 1.0±.11 0.84 0.01 3.53 HG+HP ‐57.95±8.17 0.66±.16 0.52±.205 0.89 0.05 2.95
Crosses Male, 0PPI HG ‐16.04±2.99 0.52±.04 0.66 0.001 2.59 HG+HP ‐20.60±3.08 0.33±.07 0.33±.071 0.71 0.05 2.40
Male, ≥1PPI HW ‐25.86±17.78 0.81±.24 0.53 0.02 3.28 HW + PW ‐43.76±13.74 0.65±.17 1.87±.61 0.77 0.23 2.29 HW +PW+CD ‐19.41±11.07 0.65±.11 1.83±.38 ‐0.67±.19 0.91 0.19 1.43
Female, 0PPI BC ‐12.48± 2.38 0.40±.03 0.70 0.70 2.60 BC +HW ‐26.27± 3.92 0.24±.04 0.43±.10 0.76 0.06 2.31 BC+HW+BCn ‐26.36± 3.72 0.21±.04 0.42±.099 1.61±.59 0.78 0.02 2.19 Female, ≥1PPI BC ‐30.32± 6.93 0.64±.07 0.86 0.01 2.26 BC +TC ‐32.91± 4.69 0.60±.05 0.33±.091 0.94 0.07 1.51
pooled HG ‐22.29± 1.84 0.63±.02 0.77 0.77 3.22 HG+HW ‐31.65± 2.27 0.42±.04 0.37±.063 0.81 0.04 2.89 HG+HW+BC ‐31.20±2.18 0.25±.06 0.33±.06 0.17±.04 0.83 0.01 2.78
Overall HG ‐30.72±4.04 0.76±.05 0.84 0.00 2.88 HG+TC ‐20.33±4.61 0.45±.10 0.54±.15 0.88 0.04 2.49 HG+TC+BL ‐25.11±4.74 0.37±.10 0.50±.14 0.20±.08 0.90 0.01 2.32
HG= Heart Girth, BC = Belly circumference, BL = Body length; CD= Chest Depth, HW = Wither height, HP = Height at Pelvic, TW= Tail width, TC= Tail circumference and BCn = Body condition score; 0 PPI = 0 pair of permanent incisors and ≥ 1 PPI = 1 or more pairs of permanent incisors Tail circumference and BCn = Body condition score; 0 PPI = 0 pair of permanent incisors and ≥ 1 PPI = 1 or more pairs of permanent incisors.
Ethiopian Society of Animal Production 2014
155
Conclusions
Washera sheep was better in linear body measurements followed by crossbred sheep. Linear body measurements except ear length and horn length were significantly and positively correlated to body weight in each breed. Regression analysis revealed those heart girth and belly circumferences are the variable which explained more variation than any other variables for pooled age groups in both sexes and breeds. So, body weight could be estimated from heart girth with reasonable level of accuracy using regression equation of Y= ‐18.25+0.61HG (R2 = 0.90), for Farta sheep using the equation Y= ‐47.80+1.1HG (R2 = 0.84) and for Crossbreed sheep using the equation Y= ‐22.29 + 0.63HG (R2 = 0.77) under on farm management system.In general, it was found that body weight could be predicted from body linear measurements with varying level of accuracy for different sex and age group in each breed. Based on their contribution for variation in body weight, parameters such as heart girth, belly circumference, body length, height at wither and tail circumference are the most important body measurements required for selection and breeding in Washera and Farta sheep as well for crosses including the chest depth.
References
Abebaw Nega and Solomon Melaku, 2008. Feed intake, digestibility and body weight change in Farta sheep fed hay supplemented with rice bran and/or noug seed (Guizotia abyssinica) meal. Trop Anim Health Prod (2009) 41:507–515. Aden Tekle, 2003. Evaluation of local sheep breed under traditional management around rural areas of Dire Dawa. An M.Sc Thesis presented to the School of Graduate Studies of Alemaya University of Agriculture, Dire Dawa, Ethiopia. Alemtsehay Aberra and Girma HaileMichael, 2006. Terminal evaluation report on Care‐Ethiopia's. Farta food security and support project (FFSSP) (2002‐2005), Addis Ababa, Ethiopia. Ajoy Mandal, Prasad H. Ashok Kumar, Roy R., Nagendra Sharma. 2007. Factors associated with lamb mortalities in Muzaffarnagari sheep. Small Ruminant Research 71: 273–279. Baker, R. L., Nagda, S., Rodriguez‐Zas, S. L., Southey, B. R., Audho, J. O., Aduda, E. O. and Thorpe, W., 2003. Resistance and resilience to gastro‐intestinal nematode parasites and
relationships with productivity of Red Maasai, Dorper and Red Maasai ✕ Dorper crossbred lambs in the sub‐humid tropics. Animal Science 76: 119‐136. Berhanu Belay and Aynalem Haile, 2011. Survivability of lambs under village management condition: The case around Jimma, Ethiopia. Livestock Research for Rural Development 23 (4). Fikrte Firew, 2008. On‐farm characterization of Blackhead Somali sheep breed and its production system in Shinile and Erer districts of Shinile zone. An M.Sc Thesis presented to the school of Graduate Studies of Hramaya University of Agriculture, Dire Dawa, Ethiopia.
Ethiopian Society of Animal Production 2014
156
Gemeda Duguma, Takele Kumsa, Berhanu Soboka, Dirriba Geleti and Yosef Kiros. 2002. Recommended research results for small ruminants in western Oromia. In: Firdissa E., Gemeda D., Shimelis D., Abebe Y., Gebregziabher Gebreyohannes and Tolessa D. (eds.). Oromia Agricultural research Institute (OARI: User’s Manual. OARI, Bako Agricultural Research Center, Oromia, Ethiopia. Pp. 92‐96. Gemeda Duguma, Takele Kumsa, Ulfina Galmessa, Solomon Abegaz and Gebregziabher Gebreyohannes, 2005. Mortality and Reported Clinical Signs in Horro Sheep at Smallholder Farms in East Wollega and West Shoa Zones, Ethiopia. Eth. J. Anim. Prod. 5(1): 33‐42. Kahsa Tadel Gebre. 2009. Estimates of economic values for important traits of two indigenous sheep breeds of Ethiopia. MSc. Thesis, BOKU – University of Natural Resources and Applied Life Sciences,Vienna, Austria. Lehloenya K. C., J.P.C. Greyling, L.M.J. Schwalbach, 2005. Reproductive performance of South African indigenous goats following oestrus synchronization and AI. Small Ruminant Research 57:115–120. Markos Tibbo, 2006. Productivity and health of indigenous sheep breeds and crossbreds in the central Ethiopian highlands. PhD dissertation. Department of Animal Breeding and Genetics, Faculty of Veterinary Medicine and Animal Sciences, Swedish University of Agricultural Science(SLU), Uppsala, Sweden.74p. Mengistie Taye, Girma Abebe, Solomon Gizaw, Sisay Lemma, Abebe Mekoya and Markos Tibbo, 2009a. Growth performances of Washera sheep under smallholder management systems in Yilmanadensa and Quarit districts, Ethiopia. Trop Anim Health Prod. DOI 10.1007/s11250‐009‐9473‐x. Mengistie Taye, Girma Abebe, Sisay Lemma, Solomon Gizaw, Abebe Mekoya and Markos Tibbo, 2011. Reproductive Performances and Survival of Washera Sheep under Traditional Managment systems at Yilmanadensa and Quarit Districts of the Amhara National Regional State, Ethiopia. Journal of Animal Science and Veterinary Advances 10 (9): 1158‐1165. Morris CA, Hickey SM and Clarke J., 2000. Genetic and environmental factors affecting lamb survival at birth and through to weaning. New Zealand Journal of Agricultural Research 43, 515‐524. Mukasa‐Mugerwa, E., A. Lahlou‐Kassi, D. Anindo, J. E. O. Rege, S. Tembely, Markos Tibbo, R.L. Baker, 2000. Between and within breed variation in lamb survival and the risk factors associated with major causes of mortality in indigenous Horro and Menz sheep in Ethiopia. Small Ruminant Research 37:1‐12. Mukasa‐Mugerwa, E., D. Anindo, S. Sovani, A. Lahlou‐Kassi, S. Tembely, J.E.O. Rege and R.L. Baker, 2002. Reproductive performance and productivity of Menz and Horro sheep lambing in the wet and dry seasons in the highlands of Ethiopia. Small Rumin. Res. 45:26‐271.
Ethiopian Society of Animal Production 2014
157
Nguti R., Janssen P., Rowlands G. J., Audho J. O. and Baker R. L., 2003. Survival of Red Maasai, Dorper and crossbred lambs in the sub humid Tropics. Animal Science 76: 3‐17. Roberts J.A. 2000. Frequency of the prolificacy gene in flocks of Indonesian thin tail sheep: a review. Small Ruminant Research 36: 215‐226. Purusothaman M R, Thiruvenkadan A K and Karunanithi K., 2008. Seasonal variation in body weight and mortality rate in Mecheri adult sheep. Livestock Research for Rural Development 20 (9). Reddy M P and Choudhuri P., 2000 Epidemiological studies on lamb mortality in certain sheep farms in Andhra Pradesh. Indian Veterinary Journal 77:542‐543. Riggio V., R. Finocchiaro and S. C. Bishop, 2008. Genetic parameters for early lamb survival and growth in Scottish Blackface sheep. J. Anim. Sci.86:1758‐1764. Shigdaf Mekuriaw, Asresu Yitayew, Mengistie Taye, Hailu Mazengia and Tewodros Bimerow, 2009. Traditional Sheep Production Systems in South Gonder zone of Amhara Region, Ethiopia. Proceedings of the 4th Annual Regional Confernce on Completed Livestock Research Activities. 14 to 16 september 2009. Sisay Lemma, 2002. Phenotypic classification and description of indigenous sheep type in the Amhara National Regional State of Ethiopia. M.Sc. Thesis, University of Natal, Pietermarizburg, South Africa. SPSS for windows, 2009. Statistical Package for Social Science (SPSS). Release 16.0. The Apasche software foundation. Solomon Abegaz Kebede and Gemeda Duguma, 2000. Genetic and phenotypic parameters of growth, reproductive and survival performance of Horro sheep at Bako Agricultural Research Center. Research fellowship report. International Livestock Research Institute (ILRI), Addis Ababa, Ethiopia. South Gonder Zone Agriculture and Rural Development Office, 2008. Socio‐Economic survey report from 2003‐2008 (un‐published). Southey B. R., Rodriguez‐Zas S. L. and. Leymaster K. A., 2001. Survival analysis of lamb mortality in a terminal sires composite population. Journal of Animal Science 79: 9, 2298‐2306. Yohannes Gojjam, Kassahun Awgichew and Thwaites, C.J. 2005. Factors Influencing Survival and Growth of the Ethiopian Horro Sheep. Ethiop. J. Agric. Sci. 18: 41‐51.
Ethiopian Society of Animal Production 2014
158
Assessment of Goat Production and Marketing System in Daro‐Labu Distrct of Western Hararghe Zone of Oromia Regional State, Ethiopia
Dereje Tsegaye1*, Berhanu Belay2 and Aynalem Haile3 1OromiaAgricultural Research Inistitute,Mechara Agricultural Research Center, P.O. Box 19,
Mechara, Ethiopia [email protected]
2Jimma University, P.O.Box 307, Jimma, Ethiopia 3ICARDA, P.O. Box 5466, Aleppo, Syria
Abstract
The study was designed to assess goat production system, indigenous goat husbandry practices and marketing system in different agro ecologies of Daro Labu district. An interview schedule was administerd to a total of 180 household goat owners taken at a random from each agro ecological zones (lowland, midland and highland). The study revealed that goats are important to economic and social livelihoods of smallholders in the district. The overall average number of goat per household (17.5±22.42) was higher than cattle (6.40±5.35) and sheep (1.56±1.83) which signifies higher preference of the community in favor of goats. There is a unique goat indigenous fattening practices using some local supplementary feedings which could be scaled up into country level at large. Goat marketing was traditional system in which price fixation is based on eye ball estimation and determined by the traders and involved a number of market actors.
Key words: agro‐ecologies, fattening, goat, Indigenous knowledge, production system
Introduction
The goat population of Ethiopia was estimated to be 21,884,222(CSA, 2009).The country holds 13.5% of the African goats’ population (FAO, 1991). Goat is maintained with a very little resource input under the traditional subsistence management system. Goats are important for diversifying production, creating employment, increasing income, building capital, contributing to human nutrition and reducing risk during crop failure, property security and investment (Workneh, 1992). They are particularly important in marginal agricultural land especially in arid and semi‐arid areas. Goat production is an integral part of all farming systems in all agro climatic conditions of Ethiopia (Workneh, 1992). Due to their grazing habits and physiological characteristics, they are able to browse on plants that would normally not be eaten by other livestock species. Sheep and goats are important in development because of their ability to convert forages and crops and household residues into meat, fiber, skins and milk. Thus, the presence of goats in mixed species grazing systems can lead to a more efficient use of the natural resource base and add flexibility to the management of livestock (Safilios‐R, 1983). Collecting and analyzing data on production situation, economically important performance traits and management practices under defined production conditions makes it possible to identify production prospects, as well as different management variables and their effects on the production process (Peters and Horpew, 1989; Endrias and Tsedeke, 2007). Despite the large size of the country’s goat population, the productivity per unit of animal and the contribution of this sector to the national economy is relatively low. This may be due to
Ethiopian Society of Animal Production 2014
159
different factors such as poor nutrition, prevalence of diseases, lack of appropriate breeding strategies, and poor understanding of the production system and local community interests. Knowing the existing production prospect in a given environment enables development actors to take appropriate measures and interventions in all aspect of production factors like health, husbandry, input supply and market channel. Production, marketing and input supply system related informations were scanty in far‐flung areas of western Hararghe especial in livestock sector in general. Therefore, the study was designed to generate information on goat production and marketing system and recommend away forward for better and efficient utilization of goat resources in the study area.
Materials and Methods
Study Area
The study was conducted in Daro‐labu District in Western Hararghe. The district comprises different farming systems which are mixed agriculture, agro pastoral and pastoral. The district is currently divided into two as Daro‐labu district representing highland and midland and Hawi‐gudina district representing the lowland. Daro‐labu is characterized as low annual rain fall distribution of 960mm and temperature ranging from 14oc to 26oc. The total surface area of the district is 434,280ha.The district is highest coffee producing wereda in western Hararghe. Very recently Daro‐labu district was alienated into two different districts (Daro‐labu and Hawwi‐gudina) as the Hawwi‐gudina represents totally lowland agro ecologies in terms of altitude and farming systems.
Data Collection
PRA and survey were employed to collect comprehensive information supported by some secondary data for this study. On the first phase focus group discussion (FGD) composed of community leaders, goat owners, traditional practitioners, female households and households of different ages was made with a check list prepared for the purpose and on the second phase a formal survey was undertaken using pretested structured questioner. The study district was stratified into three agro ecologies; lowland, midland and highland based on altitude and farming system. Kebeles, villages and households were considered in the sampling procedure. A total of 180 households (60 individual households in each agro ecology) having goat stock were sampled at random and interviewed.
Data Analsis
The data were analyzed using the computer software SPSS (Statistical Package for Social Science) version 16. ANOVA was run for all quantitative variables considered as a function of agro‐ecological zones.
Ethiopian Society of Animal Production 2014
160
Result and Discussion
Livestock Holdings
The farmers keep diversified species of animals and the species composition varies among agro‐ecologies (Table 5). The average number of goats per household was 34.0±32.02, 10.5 ±4.73 and 7.0±2.46) in lowland, midland and highland respectively. Number of goats, cattle and camel per household showed a significant variation (p<0.001) among agro ecologies (Table 5). The result is virtually similar with report of Kedija (2007) who stated numbers of cattle and camel per household as 5.69 ± 0.35 and 1.83±0.92, respectively in Mieso district. The number of goats per household was similar to the reports around Metema that has revealed 19.7 (Tesfaye, 2009). In contrary, number of goat per household in this study was higher than the study around Mieso area 6.03(Kedija, 2007), 7.0 Arsi‐Bale goats in rift valley areas and 6.0 heads of Keffa goats in south western parts of Ethiopia (FARM‐Africa, 1996). The higher goat number per household in the present study could be due to the farmers’ goat preference to sheep and large area enclosures in which goats can easily access for browsing. The higher goat number per household in the present study could be due to the farmers’ goat preference to sheep, availability of large area enclosures in which goats can easily access for browsing and consideration of only goat owning farmers in this study. Goat production is integrated with sorghum and drought resistant variety of maize cultivation in lowland areas to feed their large number family members. Major route of goat acquisition and disposal for both sexes in three agro ecologies is presented in Table 6. Farmers mainly possess male goats from their own farm (78.9%), purchase (8.3%) and a combination of farm and purchase sources (10.0%). Own farm (9.4%), purchasing (41.1%), and combination of the two (32.2%) and gift (9.4%) were the common routes for female acquisition.The major mode of exit of male goats from flock in the area was by combination of sale, death and slaughter (64.4%), sale (21.7%) and both sale and death (11.1%). Whereas sale (28.9%), both sale and death (26.1%) and combination of sale death and donation (37.2%) are the common mode of exit of female goat. In all the cases purchase of male goats and slaughter of female goats were not a usual practice in the process of goat acquisition and disposal respectively. Especially farmers did not practice slaughtering of breeding does for cultural reasons. It was also observed that donation of male goats as gift was not frequent. It has a cultural attitude that the donated animals have to be prolific and reproduce for the new family to which it was delivered so that it is away to express good luck.
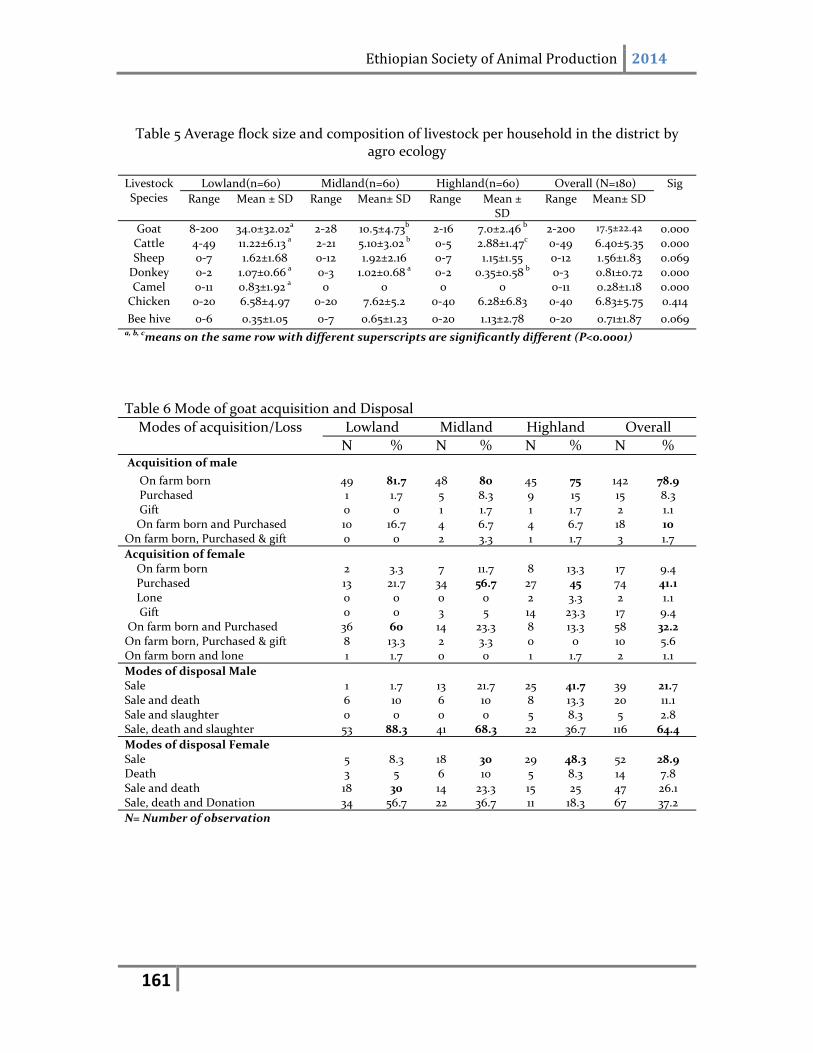
Ethiopian Society of Animal Production 2014
161
Table 5 Average flock size and composition of livestock per household in the district by agro ecology
Livestock Species
Lowland(n=60) Midland(n=60) Highland(n=60) Overall (N=180) Sig
Range Mean ± SD Range Mean± SD Range Mean ± SD
Range Mean± SD
Goat 8‐200 34.0±32.02a 2‐28 10.5±4.73b 2‐16 7.0±2.46 b 2‐200 17.5±22.42 0.000 Cattle 4‐49 11.22±6.13 a 2‐21 5.10±3.02 b 0‐5 2.88±1.47c 0‐49 6.40±5.35 0.000 Sheep 0‐7 1.62±1.68 0‐12 1.92±2.16 0‐7 1.15±1.55 0‐12 1.56±1.83 0.069 Donkey 0‐2 1.07±0.66 a 0‐3 1.02±0.68 a 0‐2 0.35±0.58 b 0‐3 0.81±0.72 0.000 Camel 0‐11 0.83±1.92 a 0 0 0 0 0‐11 0.28±1.18 0.000 Chicken 0‐20 6.58±4.97 0‐20 7.62±5.2 0‐40 6.28±6.83 0‐40 6.83±5.75 0.414
Bee hive 0‐6 0.35±1.05 0‐7 0.65±1.23 0‐20 1.13±2.78 0‐20 0.71±1.87 0.069 a, b, cmeans on the same row with different superscripts are significantly different (P<0.0001)
Table 6 Mode of goat acquisition and Disposal
Modes of acquisition/Loss Lowland Midland Highland Overall
N % N % N % N % Acquisition of male
On farm born 49 81.7 48 80 45 75 142 78.9 Purchased 1 1.7 5 8.3 9 15 15 8.3 Gift 0 0 1 1.7 1 1.7 2 1.1 On farm born and Purchased 10 16.7 4 6.7 4 6.7 18 10 On farm born, Purchased & gift 0 0 2 3.3 1 1.7 3 1.7
Acquisition of female On farm born 2 3.3 7 11.7 8 13.3 17 9.4 Purchased 13 21.7 34 56.7 27 45 74 41.1 Lone 0 0 0 0 2 3.3 2 1.1 Gift 0 0 3 5 14 23.3 17 9.4 On farm born and Purchased 36 60 14 23.3 8 13.3 58 32.2 On farm born, Purchased & gift 8 13.3 2 3.3 0 0 10 5.6 On farm born and lone 1 1.7 0 0 1 1.7 2 1.1
Modes of disposal Male Sale 1 1.7 13 21.7 25 41.7 39 21.7 Sale and death 6 10 6 10 8 13.3 20 11.1 Sale and slaughter 0 0 0 0 5 8.3 5 2.8 Sale, death and slaughter 53 88.3 41 68.3 22 36.7 116 64.4
Modes of disposal Female Sale 5 8.3 18 30 29 48.3 52 28.9 Death 3 5 6 10 5 8.3 14 7.8 Sale and death 18 30 14 23.3 15 25 47 26.1 Sale, death and Donation 34 56.7 22 36.7 11 18.3 67 37.2
N= Number of observation
Ethiopian Society of Animal Production 2014
162
Major Feed Resources and Feeding
Trees and shrubs are frequently browsed by goats when there is feed shortage and in dry and wet season seasons. Some of the common trees/shrubs used and preferred by goats in the area are “Wallensu (Erythrina abyssinica) Waddessa (Cordia africana), Hamarressa (Carewia bicolor), Hagamsa (Carissa edulis), Shiferaw (Moringa oleifera), Jirmee(Acacia poly acanthi), Biiqa (Combretum malle), Baddano (Balanites aegyptica ), Grar (Acacia spp), Ejersa (Oleo Africana), Ceeka(Celtis Africana), Xaxechaa (Rhus glutinosa), Obicha (Vernonia amygdalina) and Knin Zaaf (Azadirachta indica)”. Though these trees and shrubs are palatable and preferable by goats and other livestock species; they are declining over years due to deforestation for crop land expansion and fire wood, population pressure, overgrazing and bush encroachments. Therefore, the soil and water conservation schemes should maintain these shrubs to benefit from dual purpose advantages of the shrubs so that the browse can be used as forage and natural resource conservation. There was utilization of some non conventional feed sources like chat (Chata Indulis) left over (Garaba), sweet potato vines and maize at milking stage and crop tillers (chinki). Utilization of chat left over as animals feed is practiced throughout the year as chat is chewed by the family members all year round. Others like maize, sorghum, sweet potato and haricot bean residues are used in dry season after crop harvest; whereas crop tiller is available in wet season as indicated in Table 9. Different reports shows use of crop tillers as animal feed (Endrias and Tsedeke, 2007; Yeshitila, 2007; Deribe, 2009) around Alaba and Chat left over (Belete, 2009) around Goma district Jimma zone. (Workneh, 2000) also stated that leftover of chat provides a large amount of browse supplement for livestock, especially for goats. Use of these diverse feed resources is a means to cope up the feed scarcity in the households. The improvement of cereal crop residues preservation and management is suggested to improve the quality of feed and improve livestock productivity. About 97.8% of the respondent in the study area indicated that, the farmers supplement goat in all agro ecologies. Goat owners in Haraghe use a diverse feed supplements (concentrate) either in mixture or alone. Inclusion of salt with supplementary feeds is frequent by all of the households. Some of these supplementary feed resources are homemade grain (either fresh or roasted from maize, sorghum and haricot bean), chat left over, maize at milking stage, oilseed cake (Fagulo), “Abish/Marara/Yeast”, local products (Atela, Kitchen leftover), maize floor and boiled grains (i.e. maize, sweet potato, haricot bean) as shown in Table 10. The finding of the present study is in agreement with reports of Deribe (2009) in Alaba Woreda who reported use of chat garaba, maize, local product and kitchen leftover. Farmers practice preferential supplementation in which fattening goat (52.2%) has got priority to be supplemented, followed by lactating goat (20.8%).and 21.7% of the respondent supplement both fattening and lactating goats.
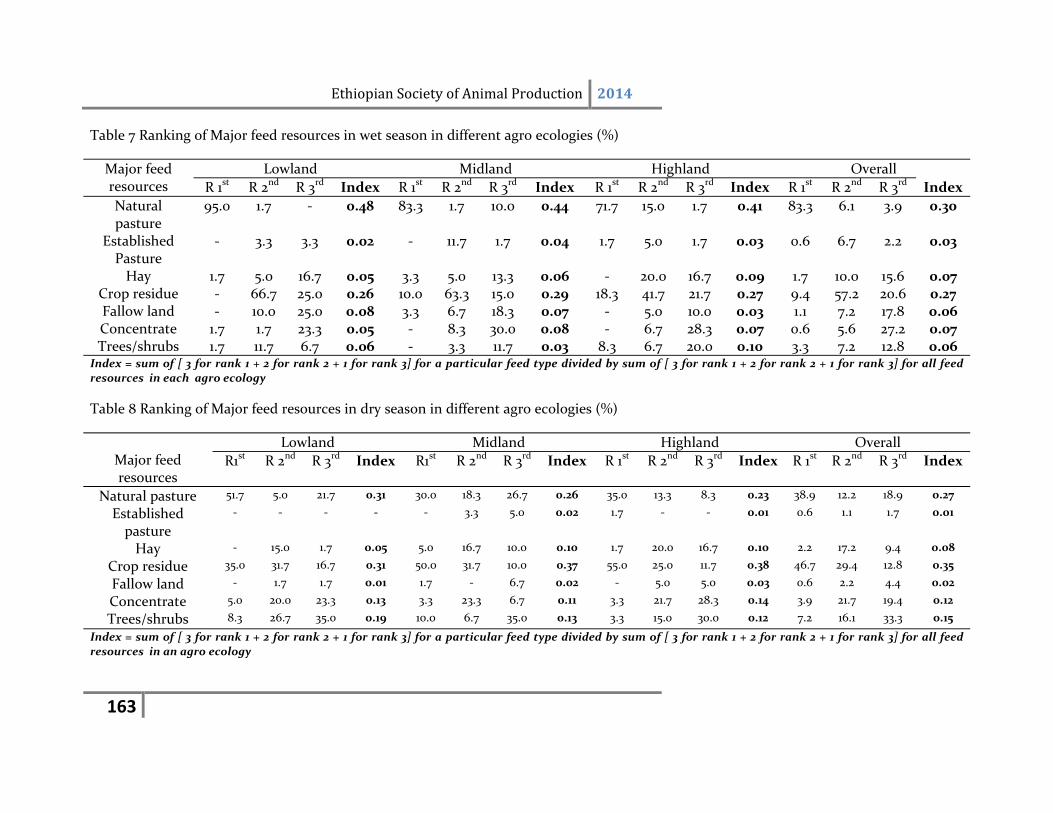
Ethiopian Society of Animal Production 2014
163
Table 7 Ranking of Major feed resources in wet season in different agro ecologies (%)
Major feed resources
Lowland Midland Highland Overall
R 1st R 2nd R 3rd Index R 1st R 2nd R 3rd Index R 1st R 2nd R 3rd Index R 1st R 2nd R 3rd Index
Natural pasture
95.0 1.7 ‐ 0.48 83.3 1.7 10.0 0.44 71.7 15.0 1.7 0.41 83.3 6.1 3.9 0.30
Established Pasture
‐ 3.3 3.3 0.02 ‐ 11.7 1.7 0.04 1.7 5.0 1.7 0.03 0.6 6.7 2.2 0.03
Hay 1.7 5.0 16.7 0.05 3.3 5.0 13.3 0.06 ‐ 20.0 16.7 0.09 1.7 10.0 15.6 0.07 Crop residue ‐ 66.7 25.0 0.26 10.0 63.3 15.0 0.29 18.3 41.7 21.7 0.27 9.4 57.2 20.6 0.27 Fallow land ‐ 10.0 25.0 0.08 3.3 6.7 18.3 0.07 ‐ 5.0 10.0 0.03 1.1 7.2 17.8 0.06 Concentrate 1.7 1.7 23.3 0.05 ‐ 8.3 30.0 0.08 ‐ 6.7 28.3 0.07 0.6 5.6 27.2 0.07 Trees/shrubs 1.7 11.7 6.7 0.06 ‐ 3.3 11.7 0.03 8.3 6.7 20.0 0.10 3.3 7.2 12.8 0.06
Index = sum of [ 3 for rank 1 + 2 for rank 2 + 1 for rank 3] for a particular feed type divided by sum of [ 3 for rank 1 + 2 for rank 2 + 1 for rank 3] for all feed resources in each agro ecology
Table 8 Ranking of Major feed resources in dry season in different agro ecologies (%)
Major feed resources
Lowland Midland Highland Overall
R1st R 2nd R 3rd Index R1st R 2nd R 3rd Index R 1st R 2nd R 3rd Index R 1st R 2nd R 3rd Index
Natural pasture 51.7 5.0 21.7 0.31 30.0 18.3 26.7 0.26 35.0 13.3 8.3 0.23 38.9 12.2 18.9 0.27
Established pasture
‐ ‐ ‐ ‐ ‐ 3.3 5.0 0.02 1.7 ‐ ‐ 0.01 0.6 1.1 1.7 0.01
Hay ‐ 15.0 1.7 0.05 5.0 16.7 10.0 0.10 1.7 20.0 16.7 0.10 2.2 17.2 9.4 0.08
Crop residue 35.0 31.7 16.7 0.31 50.0 31.7 10.0 0.37 55.0 25.0 11.7 0.38 46.7 29.4 12.8 0.35
Fallow land ‐ 1.7 1.7 0.01 1.7 ‐ 6.7 0.02 ‐ 5.0 5.0 0.03 0.6 2.2 4.4 0.02
Concentrate 5.0 20.0 23.3 0.13 3.3 23.3 6.7 0.11 3.3 21.7 28.3 0.14 3.9 21.7 19.4 0.12
Trees/shrubs 8.3 26.7 35.0 0.19 10.0 6.7 35.0 0.13 3.3 15.0 30.0 0.12 7.2 16.1 33.3 0.15
Index = sum of [ 3 for rank 1 + 2 for rank 2 + 1 for rank 3] for a particular feed type divided by sum of [ 3 for rank 1 + 2 for rank 2 + 1 for rank 3] for all feed resources in an agro ecology
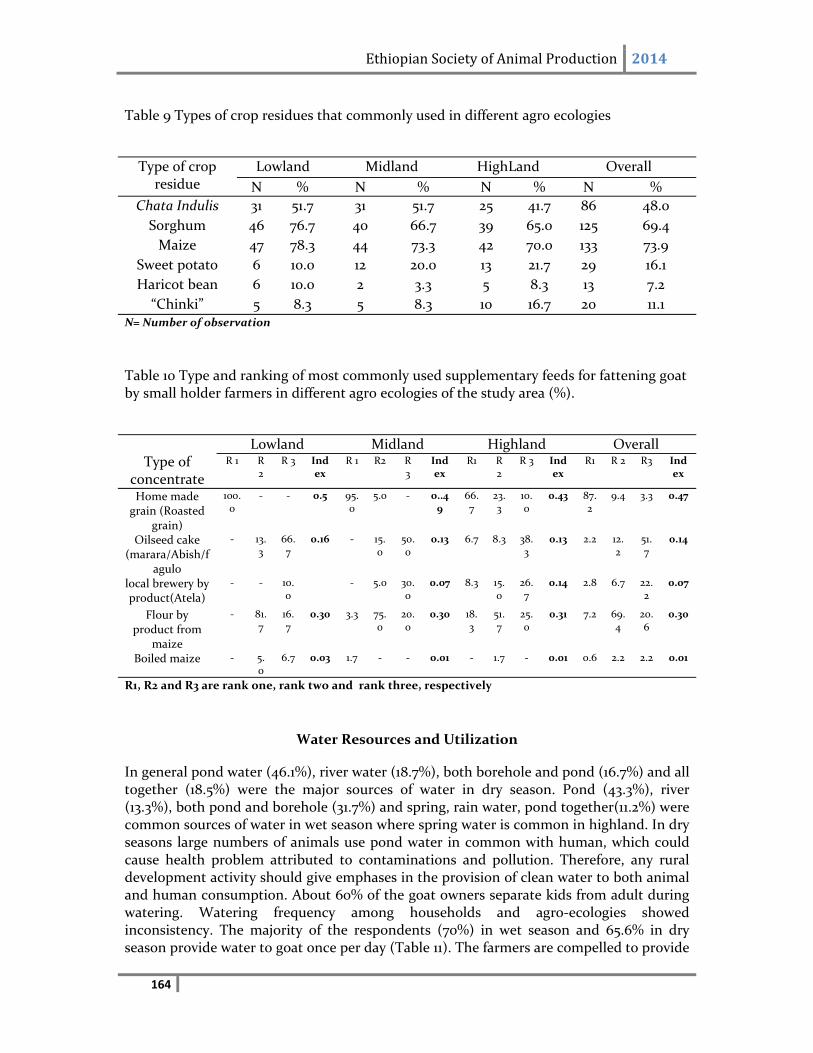
Ethiopian Society of Animal Production 2014
164
Table 9 Types of crop residues that commonly used in different agro ecologies
Type of crop residue
Lowland Midland HighLand Overall
N % N % N % N %
Chata Indulis 31 51.7 31 51.7 25 41.7 86 48.0
Sorghum 46 76.7 40 66.7 39 65.0 125 69.4
Maize 47 78.3 44 73.3 42 70.0 133 73.9
Sweet potato 6 10.0 12 20.0 13 21.7 29 16.1
Haricot bean 6 10.0 2 3.3 5 8.3 13 7.2
“Chinki” 5 8.3 5 8.3 10 16.7 20 11.1 N= Number of observation
Table 10 Type and ranking of most commonly used supplementary feeds for fattening goat by small holder farmers in different agro ecologies of the study area (%).
Type of
concentrate
Lowland Midland Highland Overall R 1 R
2 R 3 Ind
ex R 1 R2 R
3 Index
R1 R 2
R 3 Index
R1 R 2 R3 Index
Home made grain (Roasted
grain)
100.0
‐ ‐ 0.5 95.0
5.0 ‐ 0..49
66.7
23.3
10.0
0.43 87.2
9.4 3.3 0.47
Oilseed cake (marara/Abish/f
agulo
‐ 13.3
66.7
0.16 ‐ 15.0
50.0
0.13 6.7 8.3 38.3
0.13 2.2 12.2
51.7
0.14
local brewery by product(Atela)
‐ ‐ 10.0
‐ 5.0 30.0
0.07 8.3 15.0
26.7
0.14 2.8 6.7 22.2
0.07
Flour by product from
maize
‐ 81.7
16.7
0.30 3.3 75.0
20.0
0.30 18.3
51.7
25.0
0.31 7.2 69.4
20.6
0.30
Boiled maize ‐ 5.0
6.7 0.03 1.7 ‐ ‐ 0.01 ‐ 1.7 ‐ 0.01 0.6 2.2 2.2 0.01
R1, R2 and R3 are rank one, rank two and rank three, respectively
Water Resources and Utilization
In general pond water (46.1%), river water (18.7%), both borehole and pond (16.7%) and all together (18.5%) were the major sources of water in dry season. Pond (43.3%), river (13.3%), both pond and borehole (31.7%) and spring, rain water, pond together(11.2%) were common sources of water in wet season where spring water is common in highland. In dry seasons large numbers of animals use pond water in common with human, which could cause health problem attributed to contaminations and pollution. Therefore, any rural development activity should give emphases in the provision of clean water to both animal and human consumption. About 60% of the goat owners separate kids from adult during watering. Watering frequency among households and agro‐ecologies showed inconsistency. The majority of the respondents (70%) in wet season and 65.6% in dry season provide water to goat once per day (Table 11). The farmers are compelled to provide
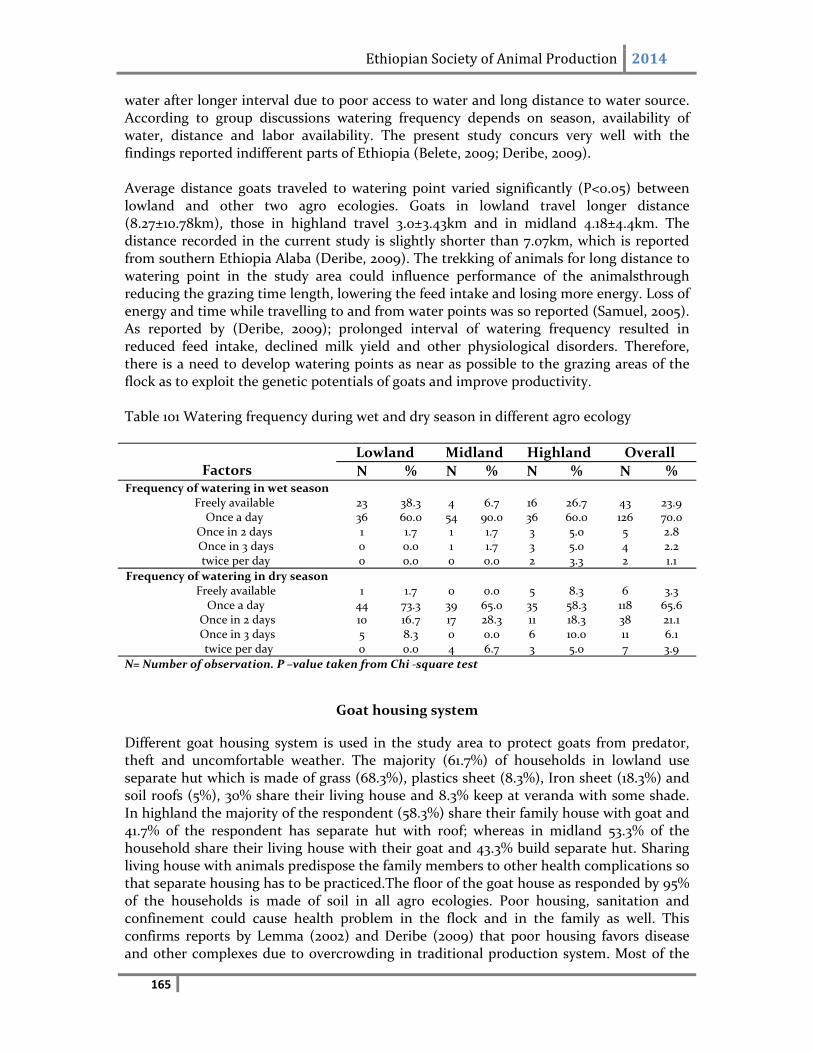
Ethiopian Society of Animal Production 2014
165
water after longer interval due to poor access to water and long distance to water source. According to group discussions watering frequency depends on season, availability of water, distance and labor availability. The present study concurs very well with the findings reported indifferent parts of Ethiopia (Belete, 2009; Deribe, 2009). Average distance goats traveled to watering point varied significantly (P<0.05) between lowland and other two agro ecologies. Goats in lowland travel longer distance (8.27±10.78km), those in highland travel 3.0±3.43km and in midland 4.18±4.4km. The distance recorded in the current study is slightly shorter than 7.07km, which is reported from southern Ethiopia Alaba (Deribe, 2009). The trekking of animals for long distance to watering point in the study area could influence performance of the animalsthrough reducing the grazing time length, lowering the feed intake and losing more energy. Loss of energy and time while travelling to and from water points was so reported (Samuel, 2005). As reported by (Deribe, 2009); prolonged interval of watering frequency resulted in reduced feed intake, declined milk yield and other physiological disorders. Therefore, there is a need to develop watering points as near as possible to the grazing areas of the flock as to exploit the genetic potentials of goats and improve productivity. Table 101 Watering frequency during wet and dry season in different agro ecology
Factors
Lowland Midland Highland Overall
N % N % N % N % Frequency of watering in wet season
Freely available 23 38.3 4 6.7 16 26.7 43 23.9 Once a day 36 60.0 54 90.0 36 60.0 126 70.0
Once in 2 days 1 1.7 1 1.7 3 5.0 5 2.8 Once in 3 days 0 0.0 1 1.7 3 5.0 4 2.2 twice per day 0 0.0 0 0.0 2 3.3 2 1.1
Frequency of watering in dry season Freely available 1 1.7 0 0.0 5 8.3 6 3.3 Once a day 44 73.3 39 65.0 35 58.3 118 65.6
Once in 2 days 10 16.7 17 28.3 11 18.3 38 21.1 Once in 3 days 5 8.3 0 0.0 6 10.0 11 6.1 twice per day 0 0.0 4 6.7 3 5.0 7 3.9
N= Number of observation. P –value taken from Chi ‐square test
Goat housing system
Different goat housing system is used in the study area to protect goats from predator, theft and uncomfortable weather. The majority (61.7%) of households in lowland use separate hut which is made of grass (68.3%), plastics sheet (8.3%), Iron sheet (18.3%) and soil roofs (5%), 30% share their living house and 8.3% keep at veranda with some shade. In highland the majority of the respondent (58.3%) share their family house with goat and 41.7% of the respondent has separate hut with roof; whereas in midland 53.3% of the household share their living house with their goat and 43.3% build separate hut. Sharing living house with animals predispose the family members to other health complications so that separate housing has to be practiced.The floor of the goat house as responded by 95% of the households is made of soil in all agro ecologies. Poor housing, sanitation and confinement could cause health problem in the flock and in the family as well. This confirms reports by Lemma (2002) and Deribe (2009) that poor housing favors disease and other complexes due to overcrowding in traditional production system. Most of the
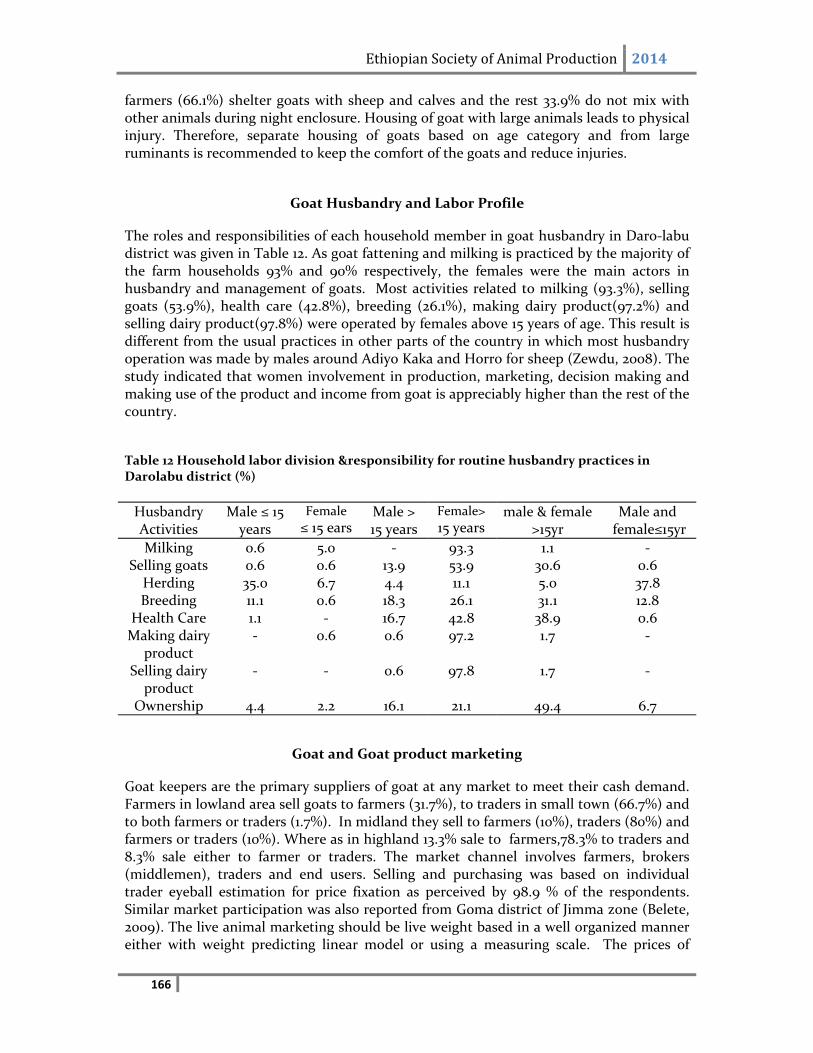
Ethiopian Society of Animal Production 2014
166
farmers (66.1%) shelter goats with sheep and calves and the rest 33.9% do not mix with other animals during night enclosure. Housing of goat with large animals leads to physical injury. Therefore, separate housing of goats based on age category and from large ruminants is recommended to keep the comfort of the goats and reduce injuries.
Goat Husbandry and Labor Profile
The roles and responsibilities of each household member in goat husbandry in Daro‐labu district was given in Table 12. As goat fattening and milking is practiced by the majority of the farm households 93% and 90% respectively, the females were the main actors in husbandry and management of goats. Most activities related to milking (93.3%), selling goats (53.9%), health care (42.8%), breeding (26.1%), making dairy product(97.2%) and selling dairy product(97.8%) were operated by females above 15 years of age. This result is different from the usual practices in other parts of the country in which most husbandry operation was made by males around Adiyo Kaka and Horro for sheep (Zewdu, 2008). The study indicated that women involvement in production, marketing, decision making and making use of the product and income from goat is appreciably higher than the rest of the country.
Table 12 Household labor division &responsibility for routine husbandry practices in Darolabu district (%)
Husbandry Activities
Male ≤ 15 years
Female
≤ 15 ears Male > 15 years
Female>
15 years male & female
>15yr Male and female≤15yr
Milking 0.6 5.0 ‐ 93.3 1.1 ‐ Selling goats 0.6 0.6 13.9 53.9 30.6 0.6 Herding 35.0 6.7 4.4 11.1 5.0 37.8 Breeding 11.1 0.6 18.3 26.1 31.1 12.8
Health Care 1.1 ‐ 16.7 42.8 38.9 0.6 Making dairy
product ‐ 0.6 0.6 97.2 1.7 ‐
Selling dairy product
‐ ‐ 0.6 97.8 1.7 ‐
Ownership 4.4 2.2 16.1 21.1 49.4 6.7
Goat and Goat product marketing
Goat keepers are the primary suppliers of goat at any market to meet their cash demand. Farmers in lowland area sell goats to farmers (31.7%), to traders in small town (66.7%) and to both farmers or traders (1.7%). In midland they sell to farmers (10%), traders (80%) and farmers or traders (10%). Where as in highland 13.3% sale to farmers,78.3% to traders and 8.3% sale either to farmer or traders. The market channel involves farmers, brokers (middlemen), traders and end users. Selling and purchasing was based on individual trader eyeball estimation for price fixation as perceived by 98.9 % of the respondents. Similar market participation was also reported from Goma district of Jimma zone (Belete, 2009). The live animal marketing should be live weight based in a well organized manner either with weight predicting linear model or using a measuring scale. The prices of
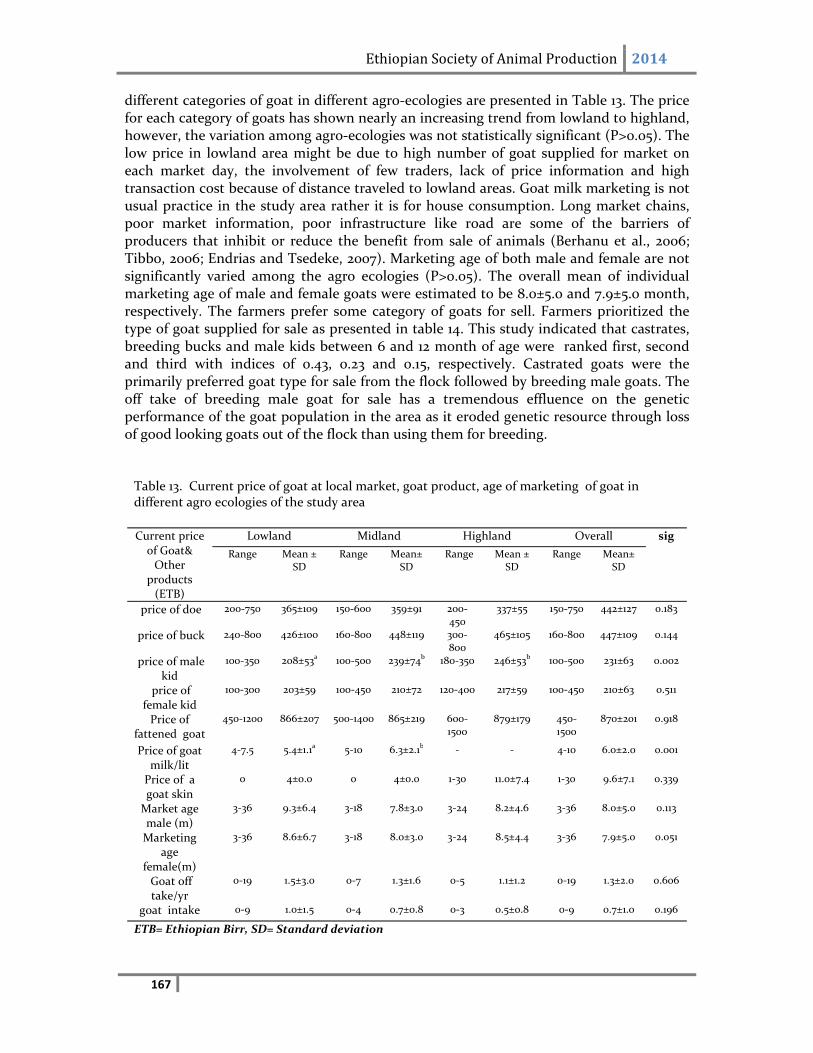
Ethiopian Society of Animal Production 2014
167
different categories of goat in different agro‐ecologies are presented in Table 13. The price for each category of goats has shown nearly an increasing trend from lowland to highland, however, the variation among agro‐ecologies was not statistically significant (P>0.05). The low price in lowland area might be due to high number of goat supplied for market on each market day, the involvement of few traders, lack of price information and high transaction cost because of distance traveled to lowland areas. Goat milk marketing is not usual practice in the study area rather it is for house consumption. Long market chains, poor market information, poor infrastructure like road are some of the barriers of producers that inhibit or reduce the benefit from sale of animals (Berhanu et al., 2006; Tibbo, 2006; Endrias and Tsedeke, 2007). Marketing age of both male and female are not significantly varied among the agro ecologies (P>0.05). The overall mean of individual marketing age of male and female goats were estimated to be 8.0±5.0 and 7.9±5.0 month, respectively. The farmers prefer some category of goats for sell. Farmers prioritized the type of goat supplied for sale as presented in table 14. This study indicated that castrates, breeding bucks and male kids between 6 and 12 month of age were ranked first, second and third with indices of 0.43, 0.23 and 0.15, respectively. Castrated goats were the primarily preferred goat type for sale from the flock followed by breeding male goats. The off take of breeding male goat for sale has a tremendous effluence on the genetic performance of the goat population in the area as it eroded genetic resource through loss of good looking goats out of the flock than using them for breeding.
Table 13. Current price of goat at local market, goat product, age of marketing of goat in different agro ecologies of the study area
Current price
of Goat& Other
products (ETB)
Lowland Midland Highland Overall sig
Range Mean ± SD
Range Mean± SD
Range Mean ± SD
Range Mean± SD
price of doe 200‐750 365±109 150‐600 359±91 200‐450
337±55 150‐750 442±127 0.183
price of buck 240‐800 426±100 160‐800 448±119 300‐800
465±105 160‐800 447±109 0.144
price of male kid
100‐350 208±53a 100‐500 239±74b 180‐350 246±53b 100‐500 231±63 0.002
price of female kid
100‐300 203±59 100‐450 210±72 120‐400 217±59 100‐450 210±63 0.511
Price of fattened goat
450‐1200 866±207 500‐1400 865±219 600‐1500
879±179 450‐1500
870±201 0.918
Price of goat milk/lit
4‐7.5 5.4±1.1a 5‐10 6.3±2.1b ‐ ‐ 4‐10 6.0±2.0 0.001
Price of a goat skin
0 4±0.0 0 4±0.0 1‐30 11.0±7.4 1‐30 9.6±7.1 0.339
Market age male (m)
3‐36 9.3±6.4 3‐18 7.8±3.0 3‐24 8.2±4.6 3‐36 8.0±5.0 0.113
Marketing age
female(m)
3‐36 8.6±6.7 3‐18 8.0±3.0 3‐24 8.5±4.4 3‐36 7.9±5.0 0.051
Goat off take/yr
0‐19 1.5±3.0 0‐7 1.3±1.6 0‐5 1.1±1.2 0‐19 1.3±2.0 0.606
goat intake 0‐9 1.0±1.5 0‐4 0.7±0.8 0‐3 0.5±0.8 0‐9 0.7±1.0 0.196
ETB= Ethiopian Birr, SD= Standard deviation
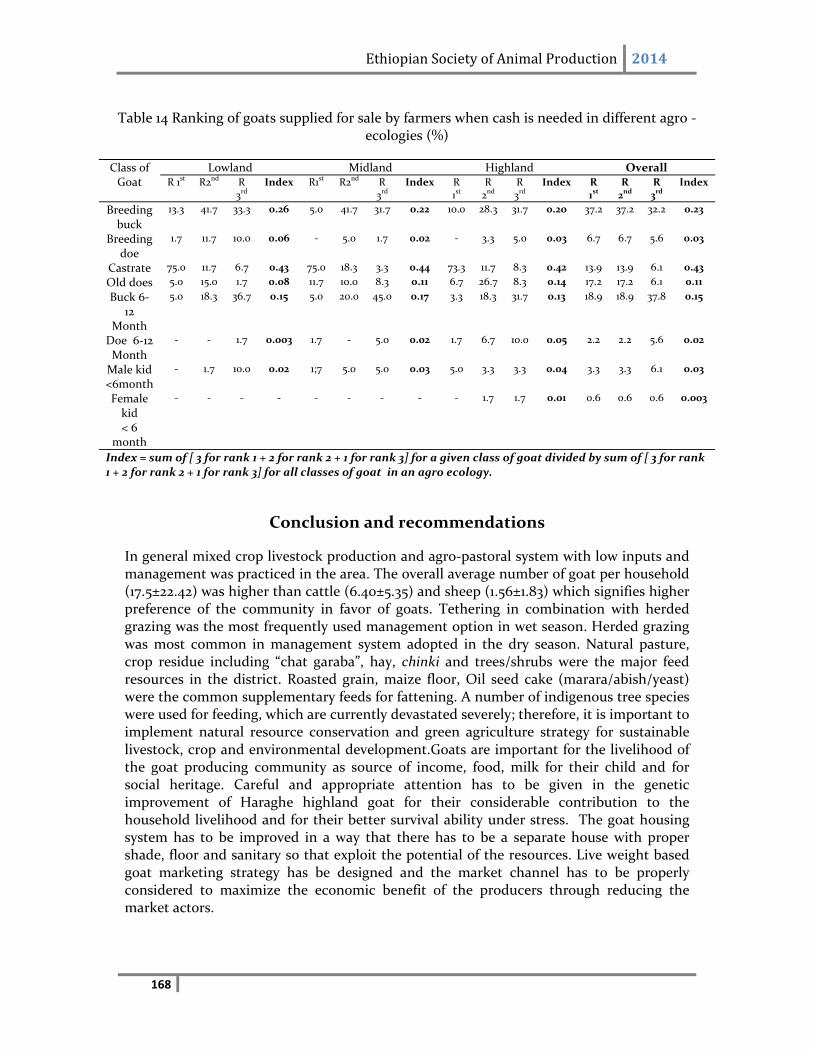
Ethiopian Society of Animal Production 2014
168
Table 14 Ranking of goats supplied for sale by farmers when cash is needed in different agro ‐
ecologies (%)
Class of Goat
Lowland Midland Highland Overall R 1st R2nd R
3rd Index R1st R2nd R
3rd Index R
1st R 2nd
R 3rd
Index R 1st
R 2nd
R 3rd
Index
Breeding buck
13.3 41.7 33.3 0.26 5.0 41.7 31.7 0.22 10.0 28.3 31.7 0.20 37.2 37.2 32.2 0.23
Breeding doe
1.7 11.7 10.0 0.06 ‐ 5.0 1.7 0.02 ‐ 3.3 5.0 0.03 6.7 6.7 5.6 0.03
Castrate 75.0 11.7 6.7 0.43 75.0 18.3 3.3 0.44 73.3 11.7 8.3 0.42 13.9 13.9 6.1 0.43
Old does 5.0 15.0 1.7 0.08 11.7 10.0 8.3 0.11 6.7 26.7 8.3 0.14 17.2 17.2 6.1 0.11
Buck 6‐12
Month
5.0 18.3 36.7 0.15 5.0 20.0 45.0 0.17 3.3 18.3 31.7 0.13 18.9 18.9 37.8 0.15
Doe 6‐12 Month
‐ ‐ 1.7 0.003 1.7 ‐ 5.0 0.02 1.7 6.7 10.0 0.05 2.2 2.2 5.6 0.02
Male kid <6month
‐ 1.7 10.0 0.02 1;7 5.0 5.0 0.03 5.0 3.3 3.3 0.04 3.3 3.3 6.1 0.03
Female kid < 6
month
‐ ‐ ‐ ‐ ‐ ‐ ‐ ‐ ‐ 1.7 1.7 0.01 0.6 0.6 0.6 0.003
Index = sum of [ 3 for rank 1 + 2 for rank 2 + 1 for rank 3] for a given class of goat divided by sum of [ 3 for rank 1 + 2 for rank 2 + 1 for rank 3] for all classes of goat in an agro ecology.
Conclusion and recommendations
In general mixed crop livestock production and agro‐pastoral system with low inputs and management was practiced in the area. The overall average number of goat per household (17.5±22.42) was higher than cattle (6.40±5.35) and sheep (1.56±1.83) which signifies higher preference of the community in favor of goats. Tethering in combination with herded grazing was the most frequently used management option in wet season. Herded grazing was most common in management system adopted in the dry season. Natural pasture, crop residue including “chat garaba”, hay, chinki and trees/shrubs were the major feed resources in the district. Roasted grain, maize floor, Oil seed cake (marara/abish/yeast) were the common supplementary feeds for fattening. A number of indigenous tree species were used for feeding, which are currently devastated severely; therefore, it is important to implement natural resource conservation and green agriculture strategy for sustainable livestock, crop and environmental development.Goats are important for the livelihood of the goat producing community as source of income, food, milk for their child and for social heritage. Careful and appropriate attention has to be given in the genetic improvement of Haraghe highland goat for their considerable contribution to the household livelihood and for their better survival ability under stress. The goat housing system has to be improved in a way that there has to be a separate house with proper shade, floor and sanitary so that exploit the potential of the resources. Live weight based goat marketing strategy has be designed and the market channel has to be properly considered to maximize the economic benefit of the producers through reducing the market actors.
Ethiopian Society of Animal Production 2014
169
Acknowledgement
This research was conducted with a financial support from Oromia Agricultural Research Institute (OARI). Wegreatly acknowledge the Institute.
Reference
Adebabay Kebede, 2009. Characterization of Milk Production Systems, Marketing and On‐ Farm Evaluation of the Effect of Feed Supplementation on Milk Yield and Milk Composition of Cows at Bure District, Ethiopia. An MSc Thesis Presented to the School of Graduate Studies of Bahir Dar University. Alemayehu Reda, 1993. Characterisation (Phenotypic)of Indigenous Goats and Goat Husbandry Practices in East and South‐Eastern Ethiopia. MSc thesis, Alemaya University of Agriculture, Ethiopia. 135 pp Belete S. 2009. Production and Marketing Systems of Small Ruminants in Goma District of Jimma Zone, Western Ethiopia. An MSc Thesis Presented to the School of Graduate Studies of Hawasa University college of agriculture, Hawasa. Berhanu G., D. Hoekstra and Azege T, 2006. Improving the Competitiveness of Agricultural Input Markets in Ethiopia: Experiences since 1991. Paper presented at the Symposium on Seed‐fertilizer Technology, Cereal productivity and Pro‐Poor Growth in Africa: time for New Thinking 26th Triennial Conference of the International Association of Agricultural Economics (IAAE), August 12– 18, 2006, Gold Coast, Australia. Central Statistical Authority CSA ( ). 2009. Ethiopian agricultural sample survey. Vol II. Report on livestock and livestock characteristics. CSA, Addis Ababa, Ethiopia Central Statistical Agency of Ethiopia ( CSA), 2008. the National Statistics. Dereje T. and Tesfaye L., 2008. Livestock Production System in Darolabu, Habro and Boke Districts of Western Hararghe Zone. Proceeding of the 16th Annual Conference of the Ethiopian Society of animal Production (ESAP).8‐10 Oct., Addis Ababa, Ethiopia. Deribe Gemiyu, 2009. On‐farm performance evaluation of indigenous sheep and goats in Alaba, Southern Ethiopia. An MSc Thesis Presented to the School of Graduate Studies of Hawasa University college of Agriculture, Hawasa. Endrias Geta and Tsedeke Kocho, 2006. Production and marketing of livestock in Wolaita and Dawuro zones, SNNPR. Paper presented in Annual Workshop of the Agricultural Economics Society. Ethiopia. An MSc Thesis Presented to the School of Graduate Studies of Haramaya University, Pp 41. Food and Agriculture Organization of the United Nations (FAO), 1991. Livestock and Livestock products, Quarterly Bulletin of Statistics. FAO,Rome ,Italy
Ethiopian Society of Animal Production 2014
170
FARM‐Africa, 1996. Goat Types of Ethiopia and Eritrea. Physical description and Management ystems. Published jointly by FARM‐Africa, London, UK& ILRI, Nairobi, Kenya. Kedija Husen, 2007. Characterization of milk production system and opportunity for market orientation: a case study of Mieso district, Oromia region, Ethiopia. An MSc Thesis Presented to the School of Graduate Studies of Haramaya University, Pp 61. Lemma S., 2002. Phenotypic classification and description of indigenous sheep types in the AmharaNational Regional State of Ethiopia. MSc thesis. University of Natal, Pietermaritzburg, South Africa Peters, K. J. and Horpew, T. 1989. Trends in on‐farm performance testing of cattle and sheep in sub‐ Saharan Africa. ILCA African Livestock Research (editor). Cattle and sheep performance testing insub‐Saharan Africa. Addis Ababa, Ethiopia. Proceeding of 5th Conference of ESAP. P.82‐90. Safilios‐R., C., 1983. Women in sheep and goat production and marketing. FAO Expert consultation on Women in Food Production. Rome, Italy. Samuel M., 2005. Characterization of livestock production system: of East Showa, Ethiopia; MSc. Thesis. 2005. Alemaya University. Alemaya. Tesfaye Tsegaye, 2009. Characterization of Goat production systems and on‐ farm evaluation ofthe growth performance of Grazing goats supplemented with different protein sources in Metemaworeda, Amhara region, Ethiopia. An MSc Thesis Presented to the School of Graduate Studies ofHaramaya University, Pp 41 Teshome A., 2006. Traditional utilization practices and condition assessment of the rangelands in rayitu district of bale zone, Ethiopia. MSc Thesis. HaramayaUniversity, Haramaya, Ethiopia. Tibbo, M., 2006. Productivity and health of indigenous sheep breeds and crossbreds in the central Ethiopian highlands. Faculty of Medicine and Animal Science Department of Animal Breeding & Genetics. Ph.D. dissertation.Swedish University of Agricultural Sciences, Uppsala, Sweden. pp11‐63 Workneh Ayalew, 1992. Preliminary Survey of Indigenous Goat Types and Goat Husbandry Practices in Southern Ethiopia. An MSc Thesis Presented to School of Graduate Studies of Alemaya University of Agriculture, Alemyaya, Ethiopia.170p Workneh A., 2000. Do smallholder farmers benefit more from crossbred (Somali x Anglo‐Nubian) than from indigenous goats? PhD Desrtation. Georg‐August University of Goettingen, Goettingen, Germany. Cuvillier Verlag, Goettingen Zewdu Edea, 2008. Characterization of Bonga and Horro indigenous Sheep breeds of smallholders for designing Community based breeding strategies In Ethiopia. An MSc Thesis Presented to the School of Graduate Studies of Haramaya University, Haramaya
Ethiopian Society of Animal Production 2014
171
Comparative Evaluation of the Fattening Performance of Fogera and Adet Old Oxen at Andassa Livestock Reseach Center, Ethiopia
Adebabay Kebede1, Addisu Bitew1, Tewodros Bimrew1, Asresu Yitayew1, Yihalem Denekew1, Yeshiwas Ferede1 and Getinet Zeleke2 1 Andassa Livestock Research Center
2 Amhara Regional Agricultural Research Institute
Abstract This study was conducted at Andassa Livestock Research Center to evaluate the fattening potential of two breeds of cattle and evaluate the economic feasibility of feed treatments. Twenty four, 12 Adet and 12 Fogera, old oxen were evaluated for a period of 90 days allotted to three different feeding levels. The experimental oxen were blocked by weight and randomly assigned to the different concentrate feeding levels. The experimental design involved 2 by 3 factorial arrangements with 2 level of breed and 3 level of feed. Hay was provided as a basic ration adlibitum. Dry matter intake, body weight, and body condition were recorded. Results indicated that except for total acid detergent fiber intake and total neutral detergent fiber intake, least square means were significant between treatments (P<0.01). Total TDMI per day was also highly significant between breeds and feeding levels (P<0.01). The feed conversion efficiency of the experimental animals was not significantly different (P>0.05) consistently between breed, treatment and the interaction between breed and feeding level. Final body weight and weight gain and average daily gain of experimental animals were highly significant between breeds (P<0.01). The Net return (ETB head‐1 per 90 days) for Fogera oxen was 2811.92, 4474.84 and 4799.76 for 2 kg, 4 kg and 6 kg concentrate feeding levels respectively.The Net return (ETB head‐1 per 90 days) of Adet oxen were 2849.92, 2561.84 and 1949.76 for 2 Kg, 4 kg and 6 kg concentrate feeding levels. The study indicated that the economical fattening period for Fogera cattle is 10 weeks. The results of this study indicated that Fogera oxen has higher fattening potential compared to Adet oxen in terms of weight gain, average daily gain and economics of fattening (gross return, net return and marginal rate of return). From the results of this study it is wise to recommend 2 Kg and 5.1 kg of concentrate ration supplementation per day for Adet and Fogera cattle breed respectively. Besides, given the same feeding regime, it is recommended that Fogera cattle should be fattened for 75 days excluding the adaptation period than the conventional 3 months.
Key words:Adet, Amhara Region, Fogera, Fattening Performance and Total Dry Matter Intake
Introduction
Cattle fattening has gained prominence as an important business project of the livestock industry in Ethiopia to make use of cheap, plentiful farm by‐products (Habitamuet al, 2008). Even though there is ample potential, beef production in Amhara region is characterized by its minimum investment and by the use of the indigenous cattle breed in mixed smallholder system. The potential to produce enough beef for the population and the neighboring countries is high. This potential is however, has remained unexploited for a number of reasons. Very low technology for beef enterprise, poor feeding and production system, endemic diseases and pests, poor marketing channels and lack of effective extension service have hindered increased production of beef in quantity and
Ethiopian Society of Animal Production 2014
172
quality.In few areas of the region there are remarkable fattening practices however, the fattening performance and economically fattening period for the defined breeds is not determined. For instance, Smallholder cattle fatteners of Tana corridor believe that Fogera cattle have low fattening potential than other highland zebu breeds despite it has never been approved through research. Besides, most fatteners of the region have little or no information about the minimum shortest period of fattening. Therefore, collecting information on animal performance on the farm makes it possible to identify production prospects, as well as different managements and their effects on the production process. It is also helpful in identifying problem areas enquiring more in‐depth assessment of cause‐effect relationships and production aspects in which improvements can be made. The objectives of the study were to evaluate the fattening potential of two breeds of cattle in Amhara region and evaluate the economic feasibility of feed treatments.
Materials and Methods Location and Study Area Description
This study was conducted at Andassa Livestock Research Center. The center is found about 22 km south of Bahir Dar city on the road to Tis Abay. It is located 11029’N latitude and 37029’E longitude with an elevation of 1730 m above sea level. The area has variable topography, which varies from a river valley plain to gentle slope grassland. In general, the area is characterized by dark clay soil, which is seasonally water logged in the rainy season and cracked when dry. The area receives about 1434 mm of rainfall annually. The mean annual temperature vary from a maximum of 29.5oC in March to a minimum of 8.8oC in January. The dominant vegetation of the area includes Cyndon, Hyperrhenia, Palspalum, Pennisetum, Setaria, Elusine, Eragrostis, Sporobolus, Andropogon and local Trifolium species (Yihalem, 1994).
Experimental Design and Treatments
Experimental animals were systematically grouped into two breeds/cattle types and three treatment groups based on their initial live weight, and were randomly assigned by ordering the initial weight of animals from lowest to highest and bringing similar or closest weights together and grouped into four replications using lottery method to the treatments resulting in Split Plot Design. The average weights of experimental animals under each feeding level were more or less similar. After two weeks of adaptation period, each animal were weighed using heart‐girth measurement at the beginning of the experiment and fortnightly thereafter. Average daily gains (g/d) were calculated as differences between final and initial body weights divided by 90 days of feeding period. Four animals from each cattle types were allotted to each of the following three levels of dietary treatments: Hay + 2 kg formulated ration, Hay + 4 kg formulated ration and Hay + 6 kg formulated ration
Experimental Animals, feeding and health management
A total of 24 draught oxen (12 Fogera and 12 Adet) were used for this experiment. Experimental animals were placed in loose tie barn with concrete floor and individual pen. These experimental animals were physically examined as apparently healthy and treated against internal and external parasites using broad spectrum anthelmintics and vaccinated against bovine pasterolosis before the commencement of the trial. All experimental animals were individually fed their corresponding rations for 15 days of adaptation
Ethiopian Society of Animal Production 2014
173
followed by a 90 days experimental period (Tesfayeet al., 2007). Concentrate ration was formulated using a win feed computer program comprising of 58% sub‐graded maize grain, 40% noug cake and 2% salt. Experimental feeds were selected based on their availability in the area. Hay was offered adlib as a basic ration. Animal was also offered water ad libitum. Weight, initial price, input costs (feeds, medication, and labor) and selling price data were collected. The feed conversion efficiency of experimental animals was calculated as kg gain/kg DMI. Body conditions of experimental cows were scored from 1 to 5 monthly (Richard, 1993).
Chemical Analysis
Offered hay and concentrate samples were taken daily, bulked on a weekly basis and oven dried at 65 °C for 72 h and analyzed for DM, N (Kjeldahl‐N) according to AOAC (1990) procedures. Neutral Detergent Fiber (NDF) and Acid Detergent Fiber (ADF) were determined by the methods of Van Soest and Robertson (1985). Hemi cellulose was calculated from the difference between % NDF and % ADF.
Partial Budget Analysis
The partial budget analysis method was used based on the calculation of the total cost of the basic ration (hay) and supplemented feed levels (concentrate) and considering initial and final livestock purchasing and selling price incurred during the entire experimentation process. Partial budget analysis was employed to compute variable cost of concentrate feed ingredient /treatment, gross return per treatment, gross income from sale of animals/ treatment, net profit/treatment and marginal rate of return. Sensitivity analysis was calculated provided that the price of input increases and the price of output decreases.
Statistical Analysis
Data analyses involved 2 by 3 factorial arrangements with breed and feed level groups respectively. Analyses were conducted with the model that included feeding level (2, 4, 6 Kg) and breed (Fogera and Adet Highland Zebu) as main effects. During preliminary analysis interaction effect between breed and feed level groups was found significant except for dry matter and nutrient intake and hence included in the model. The initial body weight was also included as covariate in the model to adjust weight gain during experimental period. Data from feed intake, weight gains and income were subjected to GLM analysis of variance (ANOVA) procedure of SAS (1999). Means were separated using Duncan’s Multiple Range test (alpha=0.05). Covariates in the model were evaluated at the following values: initial weight=328.88. The statistical model used was:Yijk= µ + ai +fj+ (af)ij + b + (Inwtij ‐ Inwt) +eijk Where: Yijk= individual observation; µ = Over all mean; ai= effect of ith feeding level(i =2, 4,6 kg); fj= effect of j
th breed of the animal (Fogera and Adet Highland Zebu); afij=Interaction effect of the i
th feeding level and jth breed of the animal; b = linear regression of initial body wt (Inwt) on subsequent body weight gains and eijk = residual error.
Ethiopian Society of Animal Production 2014
174
Results and Discussion
Chemical composition and Organic Matter Digestibility of experimental ration The DM and OM content of supplemented concentrate in this study has comparatively lower than the experimental concentrate feed composed of 75% maize grain, 24% Noug cake and 1% salt and supplemented for local dual purpose cows for milk production (Adebabay et al., 2010) while, it has a bit higher CP (175 g/Kg), NDF (219 g/kg, NDF (219g/kg, and ADF (116g/kg) and HC (103g/kg).
Table 11: Chemical Composition and Digestible Organic Matter Digestibility of Experimental Feeds (g/kg DM)
Measurements Livestock grade maize grain
Noug cake Hay
Concentrate mix.
Offered Refused
DM 883 923 915 93.3 892.5 OM 988.2 912.8 912.2 914.9 870
CP 111 349 58.2 52 175 ADF 34.6 296 419 466 116 NDF 156 358 668 665 219
Lignin 29.2 113 44.5 52.9 44.6 Ash 11.8 87.2 87.8 85.1 130 Hemi‐cellulose* 121.1 62 249 199 103
DOMD 975 645 413 387 812 Hemi‐cellulose = % NDF – % ADF
DM and Nutrient Intake
Total dry mater and nutrient intake of experimental oxen are presented in Table 2. Except for total acid detergent fiber intake and total neutral detergent fiber intake, least square means were significant between treatments (P<0.01). Total TDMI per day showed significant difference between breeds and feeding levels (P<0.01).The variation in total kg DMI per day between the two breeds was largely the result of better intake of hay per day of Fogera breed than Adet highland zebu which might be due to better body size and weight of the former breed. Negaet al., 2002 in Adami Tulu Agricultural Research Center have also reported lower dry matter intake per day between Arsi (2.38 Kg) and Boran (3.37Kg) breeds fed on a ration composed of teff straw (42%), noug seed cake(25%), maize grain(32%) and Salt(1%) during restrictive phase. In contrast, higher dry matter intake was reported than the current study for Boran (5.8 Kg) and Arsi (4.58 kg) fed on a ration composed of teff (29%), wheat bran(53%), Noug cake(17%) and salt(!%) during the re‐alimentation period. Total acid detergent fiber intake and total neutral detergent fiber intake was highly significant difference between the two breeds of cattle (P<0.001). Total crude protein intake was not significantly different between both breeds (P>0.05), while, it was highly significant between feeding levels (P<0.001). The interaction between feeding level and breed had consistently showed that total dry matter and nutrient intake were not significantly different (P>0.05). The feed conversion efficiency of the experimental animals were not significantly different (P>0.05) consistently between breed, treatment
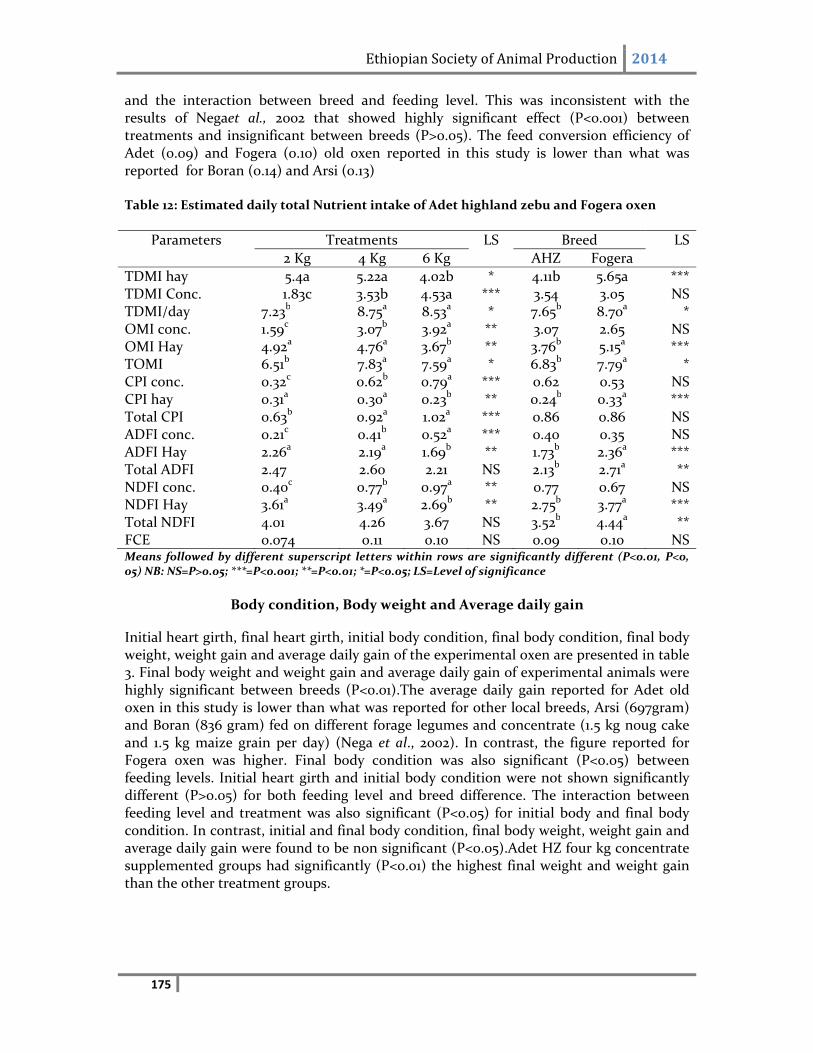
Ethiopian Society of Animal Production 2014
175
and the interaction between breed and feeding level. This was inconsistent with the results of Negaet al., 2002 that showed highly significant effect (P<0.001) between treatments and insignificant between breeds (P>0.05). The feed conversion efficiency of Adet (0.09) and Fogera (0.10) old oxen reported in this study is lower than what was reported for Boran (0.14) and Arsi (0.13)
Table 12: Estimated daily total Nutrient intake of Adet highland zebu and Fogera oxen
Parameters Treatments LS Breed LS
2 Kg 4 Kg 6 Kg AHZ Fogera
TDMI hay 5.4a 5.22a 4.02b * 4.11b 5.65a *** TDMI Conc. 1.83c 3.53b 4.53a *** 3.54 3.05 NS TDMI/day 7.23b 8.75a 8.53a * 7.65b 8.70a * OMI conc. 1.59c 3.07b 3.92a ** 3.07 2.65 NS OMI Hay 4.92a 4.76a 3.67b ** 3.76b 5.15a *** TOMI 6.51b 7.83a 7.59a * 6.83b 7.79a * CPI conc. 0.32c 0.62b 0.79a *** 0.62 0.53 NS CPI hay 0.31a 0.30a 0.23b ** 0.24b 0.33a *** Total CPI 0.63b 0.92a 1.02a *** 0.86 0.86 NS ADFI conc. 0.21c 0.41b 0.52a *** 0.40 0.35 NS ADFI Hay 2.26a 2.19a 1.69b ** 1.73b 2.36a *** Total ADFI 2.47 2.60 2.21 NS 2.13b 2.71a ** NDFI conc. 0.40c 0.77b 0.97a ** 0.77 0.67 NS NDFI Hay 3.61a 3.49a 2.69b ** 2.75b 3.77a *** Total NDFI 4.01 4.26 3.67 NS 3.52b 4.44a ** FCE 0.074 0.11 0.10 NS 0.09 0.10 NS Means followed by different superscript letters within rows are significantly different (P<0.01, P<0, 05) NB: NS=P>0.05; ***=P<0.001; **=P<0.01; *=P<0.05; LS=Level of significance
Body condition, Body weight and Average daily gain
Initial heart girth, final heart girth, initial body condition, final body condition, final body weight, weight gain and average daily gain of the experimental oxen are presented in table 3. Final body weight and weight gain and average daily gain of experimental animals were highly significant between breeds (P<0.01).The average daily gain reported for Adet old oxen in this study is lower than what was reported for other local breeds, Arsi (697gram) and Boran (836 gram) fed on different forage legumes and concentrate (1.5 kg noug cake and 1.5 kg maize grain per day) (Nega et al., 2002). In contrast, the figure reported for Fogera oxen was higher. Final body condition was also significant (P<0.05) between feeding levels. Initial heart girth and initial body condition were not shown significantly different (P>0.05) for both feeding level and breed difference. The interaction between feeding level and treatment was also significant (P<0.05) for initial body and final body condition. In contrast, initial and final body condition, final body weight, weight gain and average daily gain were found to be non significant (P<0.05).Adet HZ four kg concentrate supplemented groups had significantly (P<0.01) the highest final weight and weight gain than the other treatment groups.
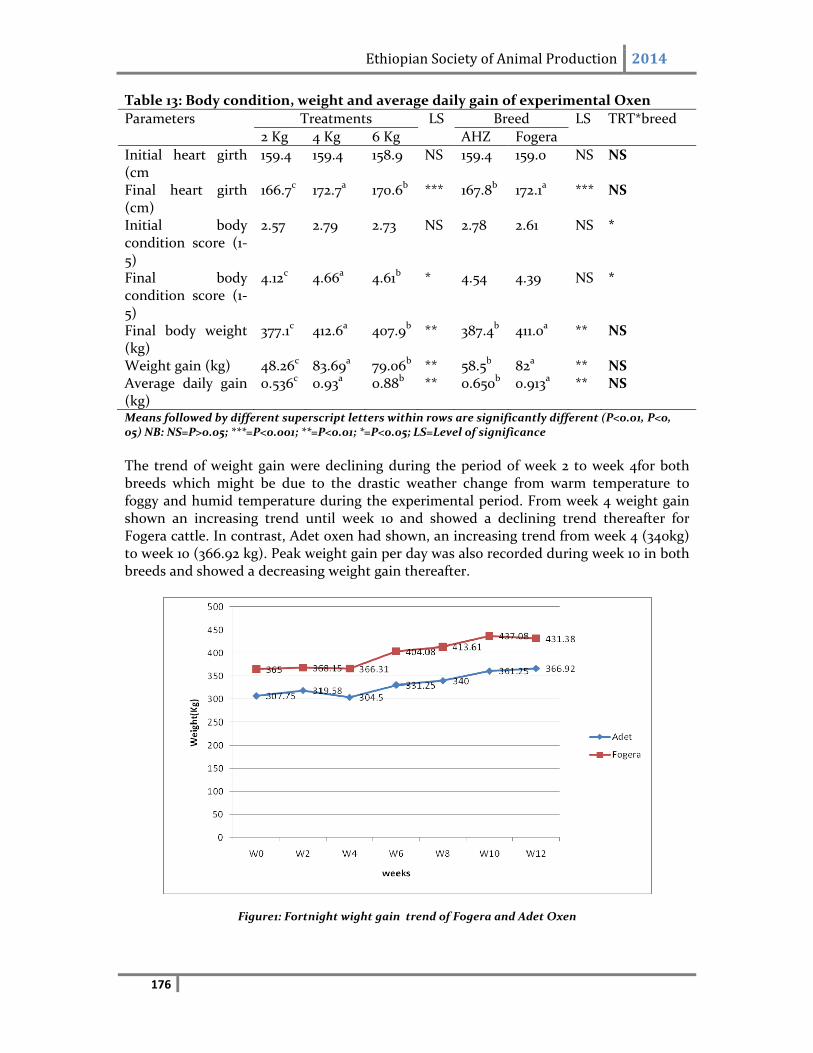
Ethiopian Society of Animal Production 2014
176
Table 13: Body condition, weight and average daily gain of experimental Oxen
Parameters Treatments LS Breed LS TRT*breed
2 Kg 4 Kg 6 Kg AHZ Fogera
Initial heart girth (cm
159.4 159.4 158.9 NS 159.4 159.0 NS NS
Final heart girth (cm)
166.7c 172.7a 170.6b *** 167.8b 172.1a *** NS
Initial body condition score (1‐5)
2.57 2.79 2.73 NS 2.78 2.61 NS *
Final body condition score (1‐5)
4.12c 4.66a 4.61b * 4.54 4.39 NS *
Final body weight (kg)
377.1c 412.6a 407.9b ** 387.4b 411.0a ** NS
Weight gain (kg) 48.26c 83.69a 79.06b ** 58.5b 82a ** NS Average daily gain (kg)
0.536c 0.93a 0.88b ** 0.650b 0.913a ** NS
Means followed by different superscript letters within rows are significantly different (P<0.01, P<0, 05) NB: NS=P>0.05; ***=P<0.001; **=P<0.01; *=P<0.05; LS=Level of significance
The trend of weight gain were declining during the period of week 2 to week 4for both breeds which might be due to the drastic weather change from warm temperature to foggy and humid temperature during the experimental period. From week 4 weight gain shown an increasing trend until week 10 and showed a declining trend thereafter for Fogera cattle. In contrast, Adet oxen had shown, an increasing trend from week 4 (340kg) to week 10 (366.92 kg). Peak weight gain per day was also recorded during week 10 in both breeds and showed a decreasing weight gain thereafter.
Figure1: Fortnight wight gain trend of Fogera and Adet Oxen
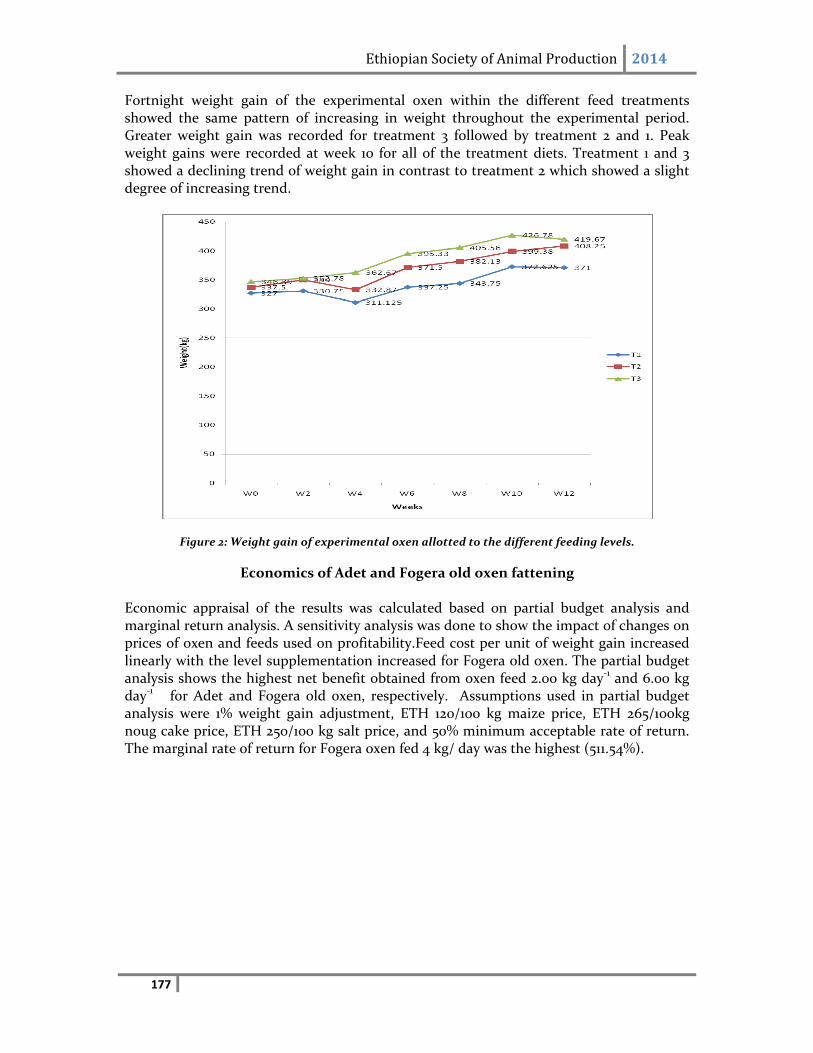
Ethiopian Society of Animal Production 2014
177
Fortnight weight gain of the experimental oxen within the different feed treatments showed the same pattern of increasing in weight throughout the experimental period. Greater weight gain was recorded for treatment 3 followed by treatment 2 and 1. Peak weight gains were recorded at week 10 for all of the treatment diets. Treatment 1 and 3 showed a declining trend of weight gain in contrast to treatment 2 which showed a slight degree of increasing trend.
Figure 2: Weight gain of experimental oxen allotted to the different feeding levels.
Economics of Adet and Fogera old oxen fattening Economic appraisal of the results was calculated based on partial budget analysis and marginal return analysis. A sensitivity analysis was done to show the impact of changes on prices of oxen and feeds used on profitability.Feed cost per unit of weight gain increased linearly with the level supplementation increased for Fogera old oxen. The partial budget analysis shows the highest net benefit obtained from oxen feed 2.00 kg day‐1 and 6.00 kg day‐1 for Adet and Fogera old oxen, respectively. Assumptions used in partial budget analysis were 1% weight gain adjustment, ETH 120/100 kg maize price, ETH 265/100kg noug cake price, ETH 250/100 kg salt price, and 50% minimum acceptable rate of return. The marginal rate of return for Fogera oxen fed 4 kg/ day was the highest (511.54%).
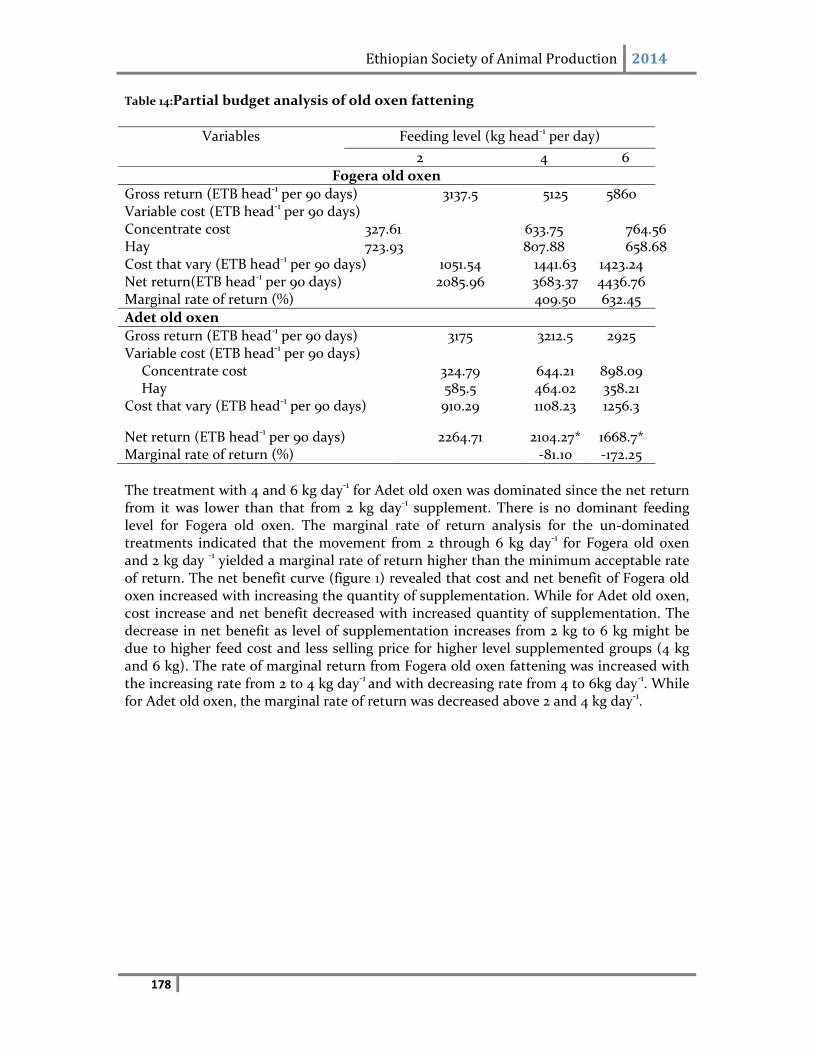
Ethiopian Society of Animal Production 2014
178
Table 14:Partial budget analysis of old oxen fattening
Variables Feeding level (kg head‐1 per day)
2 4 6
Fogera old oxen
Gross return (ETB head‐1 per 90 days) 3137.5 5125 5860 Variable cost (ETB head‐1 per 90 days) Concentrate cost 327.61 633.75 764.56 Hay 723.93 807.88 658.68 Cost that vary (ETB head‐1 per 90 days) 1051.54 1441.63 1423.24 Net return(ETB head‐1 per 90 days) 2085.96 3683.37 4436.76 Marginal rate of return (%) 409.50 632.45
Adet old oxen
Gross return (ETB head‐1 per 90 days) 3175 3212.5 2925 Variable cost (ETB head‐1 per 90 days)
Concentrate cost 324.79 644.21 898.09 Hay 585.5 464.02 358.21
Cost that vary (ETB head‐1 per 90 days) 910.29 1108.23 1256.3
Net return (ETB head‐1 per 90 days) 2264.71 2104.27* 1668.7* Marginal rate of return (%) ‐81.10 ‐172.25
The treatment with 4 and 6 kg day‐1 for Adet old oxen was dominated since the net return from it was lower than that from 2 kg day‐1 supplement. There is no dominant feeding level for Fogera old oxen. The marginal rate of return analysis for the un‐dominated treatments indicated that the movement from 2 through 6 kg day‐1 for Fogera old oxen and 2 kg day ‐1 yielded a marginal rate of return higher than the minimum acceptable rate of return. The net benefit curve (figure 1) revealed that cost and net benefit of Fogera old oxen increased with increasing the quantity of supplementation. While for Adet old oxen, cost increase and net benefit decreased with increased quantity of supplementation. The decrease in net benefit as level of supplementation increases from 2 kg to 6 kg might be due to higher feed cost and less selling price for higher level supplemented groups (4 kg and 6 kg). The rate of marginal return from Fogera old oxen fattening was increased with the increasing rate from 2 to 4 kg day‐1 and with decreasing rate from 4 to 6kg day‐1. While for Adet old oxen, the marginal rate of return was decreased above 2 and 4 kg day‐1.
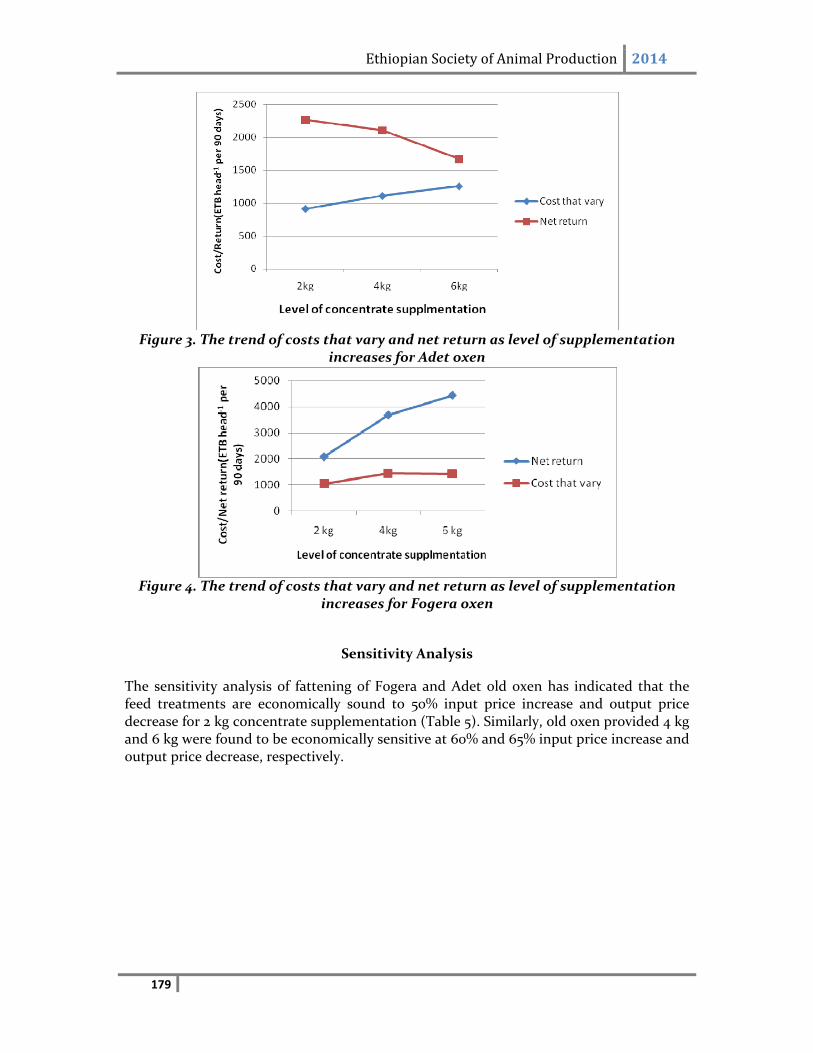
Ethiopian Society of Animal Production 2014
179
Figure 3. The trend of costs that vary and net return as level of supplementation
increases for Adet oxen
Figure 4. The trend of costs that vary and net return as level of supplementation
increases for Fogera oxen
Sensitivity Analysis
The sensitivity analysis of fattening of Fogera and Adet old oxen has indicated that the feed treatments are economically sound to 50% input price increase and output price decrease for 2 kg concentrate supplementation (Table 5). Similarly, old oxen provided 4 kg and 6 kg were found to be economically sensitive at 60% and 65% input price increase and output price decrease, respectively.
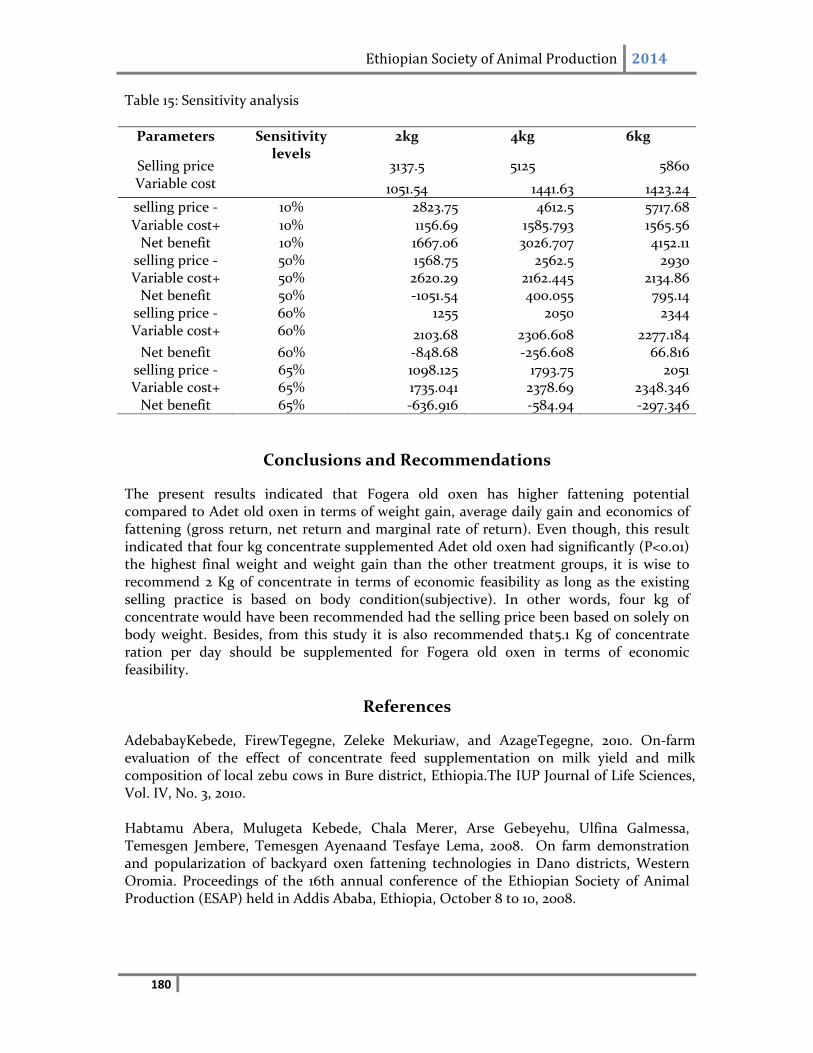
Ethiopian Society of Animal Production 2014
180
Table 15: Sensitivity analysis
Parameters Sensitivity levels
2kg 4kg 6kg
Selling price 3137.5 5125 5860 Variable cost 1051.54 1441.63 1423.24
selling price ‐ 10% 2823.75 4612.5 5717.68
Variable cost+ 10% 1156.69 1585.793 1565.56 Net benefit 10% 1667.06 3026.707 4152.11 selling price ‐ 50% 1568.75 2562.5 2930 Variable cost+ 50% 2620.29 2162.445 2134.86 Net benefit 50% ‐1051.54 400.055 795.14 selling price ‐ 60% 1255 2050 2344 Variable cost+ 60% 2103.68 2306.608 2277.184 Net benefit 60% ‐848.68 ‐256.608 66.816 selling price ‐ 65% 1098.125 1793.75 2051 Variable cost+ 65% 1735.041 2378.69 2348.346 Net benefit 65% ‐636.916 ‐584.94 ‐297.346
Conclusions and Recommendations
The present results indicated that Fogera old oxen has higher fattening potential compared to Adet old oxen in terms of weight gain, average daily gain and economics of fattening (gross return, net return and marginal rate of return). Even though, this result indicated that four kg concentrate supplemented Adet old oxen had significantly (P<0.01) the highest final weight and weight gain than the other treatment groups, it is wise to recommend 2 Kg of concentrate in terms of economic feasibility as long as the existing selling practice is based on body condition(subjective). In other words, four kg of concentrate would have been recommended had the selling price been based on solely on body weight. Besides, from this study it is also recommended that5.1 Kg of concentrate ration per day should be supplemented for Fogera old oxen in terms of economic feasibility.
References
AdebabayKebede, FirewTegegne, Zeleke Mekuriaw, and AzageTegegne, 2010. On‐farm evaluation of the effect of concentrate feed supplementation on milk yield and milk composition of local zebu cows in Bure district, Ethiopia.The IUP Journal of Life Sciences, Vol. IV, No. 3, 2010. Habtamu Abera, Mulugeta Kebede, Chala Merer, Arse Gebeyehu, Ulfina Galmessa, Temesgen Jembere, Temesgen Ayenaand Tesfaye Lema, 2008. On farm demonstration and popularization of backyard oxen fattening technologies in Dano districts, Western Oromia. Proceedings of the 16th annual conference of the Ethiopian Society of Animal Production (ESAP) held in Addis Ababa, Ethiopia, October 8 to 10, 2008.
Ethiopian Society of Animal Production 2014
181
Nega Tolla, Tadelle merkena and Asfaw Yimegnuhal, 2002. Comparison of the efficiency of compensatory growth of Borana and Arsi cattle in Ethiopia. Ethiopian Journal of animal production Vol. 2(1). 11‐23. Richard W. and Mathewman,.1993. Dairying. Technical Center for Agriculture and Rural co‐operation(CTA).Wageningen, The Netherlands. SAS 1999. Statistical Analysis System, Institute Inc., Cary, NC, USA. Tesfaye Lemma, Tesfa Geleta, Amsalu Sisay and Tekle Abebe, 2007. Effects of four different basal diets on the carcass composition of finishing Borana bulls. Journal of Cell and Animal Biology Vol. 1 (2), pp. 015‐018. Yihalem Denekew, 1994. Effect of stage of harvesting on Botanical Composition of Selected Natural Pasture for Optimum Hay production at Andassa, North Western Ethiopia. MSC.Thesis. Almaya University, Ethiopia.
Ethiopian Society of Animal Production 2014
182
Gender and Urban Dairy Production System: the Case of Debre Zeit Town, Ethiopia
Million Tadesse1, Adey Melesse1, Azage Tegegne2, and Kasahun Melesse1 1Ethiopian Institute of Agricultural Research (EIAR) 2International Livestock Research Institut2 (ILRI)
Abstract
A survey on urban dairy cattle production system was carried out to evaluate work load, share of responsibility, decision making and control over income derived from dairy production among household members. A total of thirty‐seven households were interviewed through interview schedule. Results indicated that the proportion of women dairy cattle owners was higher compared to men owners. Dairy cattle management activities were performed by employed workers (24%) and family members (76%). Among household members, female household members were responsible for all dairy cattle management activities for 64% of households, male household members for 27% and both female and male members equally for the rest 9% households. Women household members were the most decision makers on income derived from milk and milk products for 89% households, husbands for 6% and both women and men household members jointly for the rest 5% of households. Decision on income derived from sale of live animals were done by women household member for 35%, women and men household head jointly for 59% and husband for the rest 6% of households. Dairy cattle production in urban areas used as main sources of income for their family livelihood for 33% of women and 31% of men owners, additional sources of income for 57% of women and 50% of men owners and as asset accumulation for 47% of women and 50% of men owners.
Key words: Household income, Asset accumulation, Decision making
Introduction
Urban and peri‐urban dairy production has been developed in response to the fast growing demand for milk and milk products. During the past two decades, rapidly increasing urban population has created better markets and growth of demand for dairy products In Ethiopia, However, Ethiopia is not self sufficient in milk and considerable amount of foreign exchange has to be spent on the import of dairy products. Average per capita milk consumption has fallen from 30 kg (whole milk equivalent) in 1970 to about 16 kg in recent years. Population growth and urbanization are adding more stress on demand for dairy products. Delgado et al (1999) projected that prospects of meeting future demands for meat and milk and milk products requires technologies which would assist to achieve a annual increase of meat and milk products by 3.4 and 4% respectively between 1993 to 2020. Livestock related technology usuall targeted for men household members and little emphasis has been given to women. In Ethiopia rural women youth and children contribute significantly to livestock production. The role of women in activities related to livestock management is substantial even under male‐headed households; however, there is limited information on the extent of their involvement, responsibility and share of benefit derived from livestock production. This information is required to deelop
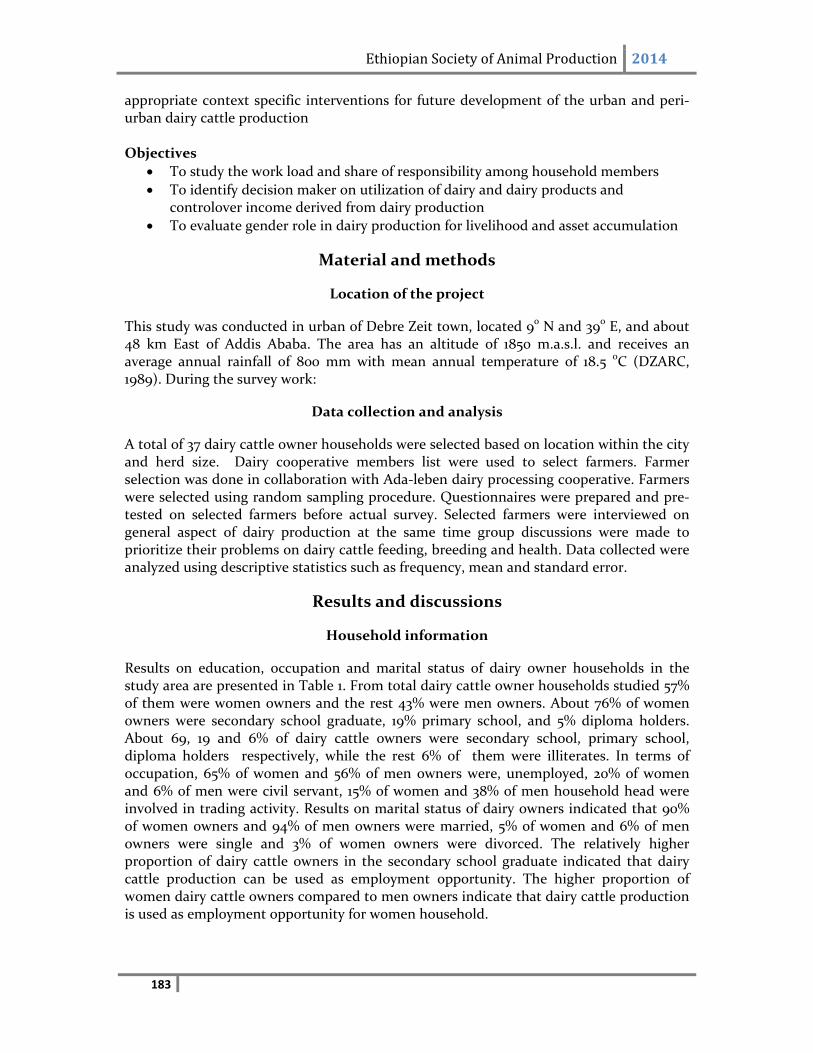
Ethiopian Society of Animal Production 2014
183
appropriate context specific interventions for future development of the urban and peri‐urban dairy cattle production
Objectives
To study the work load and share of responsibility among household members
To identify decision maker on utilization of dairy and dairy products and control0ver income derived from dairy production
To evaluate gender role in dairy production for livelihood and asset accumulation
Material and methods
Location of the project
This study was conducted in urban of Debre Zeit town, located 9o N and 39o E, and about 48 km East of Addis Ababa. The area has an altitude of 1850 m.a.s.l. and receives an average annual rainfall of 800 mm with mean annual temperature of 18.5 oC (DZARC, 1989). During the survey work:
Data collection and analysis
A total of 37 dairy cattle owner households were selected based on location within the city and herd size. Dairy cooperative members list were used to select farmers. Farmer selection was done in collaboration with Ada‐leben dairy processing cooperative. Farmers were selected using random sampling procedure. Questionnaires were prepared and pre‐tested on selected farmers before actual survey. Selected farmers were interviewed on general aspect of dairy production at the same time group discussions were made to prioritize their problems on dairy cattle feeding, breeding and health. Data collected were analyzed using descriptive statistics such as frequency, mean and standard error.
Results and discussions
Household information
Results on education, occupation and marital status of dairy owner households in the study area are presented in Table 1. From total dairy cattle owner households studied 57% of them were women owners and the rest 43% were men owners. About 76% of women owners were secondary school graduate, 19% primary school, and 5% diploma holders. About 69, 19 and 6% of dairy cattle owners were secondary school, primary school, diploma holders respectively, while the rest 6% of them were illiterates. In terms of occupation, 65% of women and 56% of men owners were, unemployed, 20% of women and 6% of men were civil servant, 15% of women and 38% of men household head were involved in trading activity. Results on marital status of dairy owners indicated that 90% of women owners and 94% of men owners were married, 5% of women and 6% of men owners were single and 3% of women owners were divorced. The relatively higher proportion of dairy cattle owners in the secondary school graduate indicated that dairy cattle production can be used as employment opportunity. The higher proportion of women dairy cattle owners compared to men owners indicate that dairy cattle production is used as employment opportunity for women household.
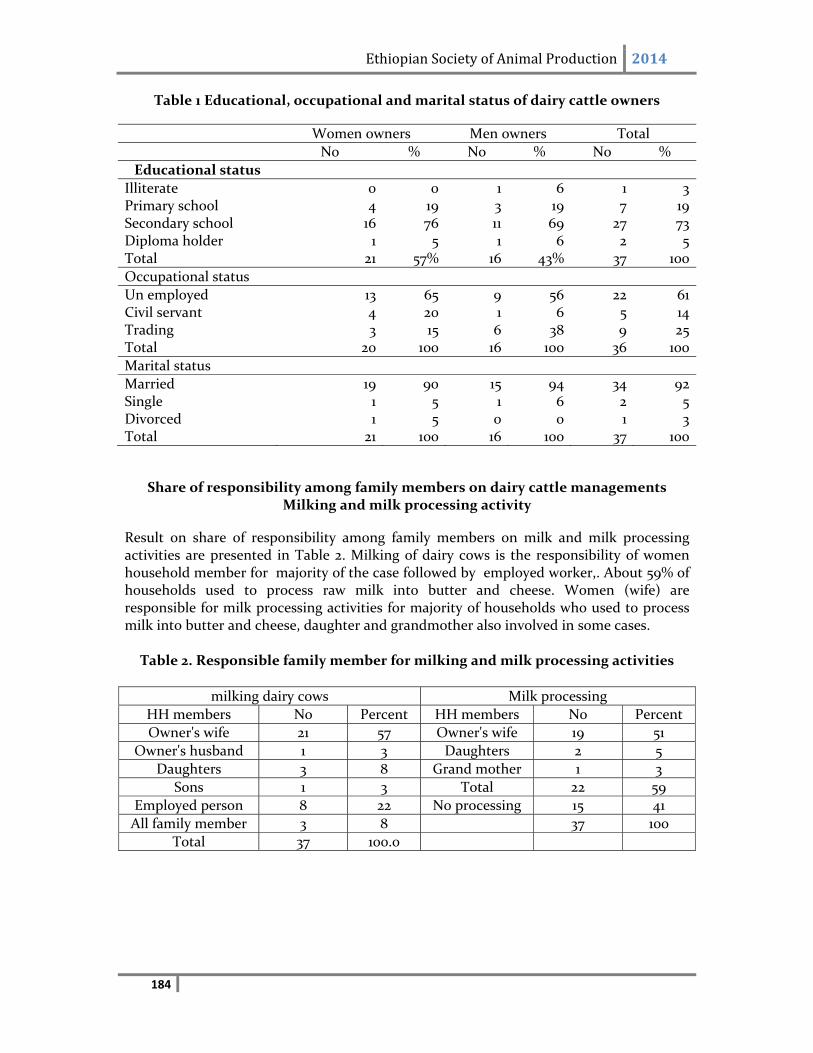
Ethiopian Society of Animal Production 2014
184
Table 1 Educational, occupational and marital status of dairy cattle owners
Women owners Men owners Total
No % No % No %
Educational status
Illiterate 0 0 1 6 1 3 Primary school 4 19 3 19 7 19 Secondary school 16 76 11 69 27 73 Diploma holder 1 5 1 6 2 5 Total 21 57% 16 43% 37 100
Occupational status
Un employed 13 65 9 56 22 61 Civil servant 4 20 1 6 5 14 Trading 3 15 6 38 9 25 Total 20 100 16 100 36 100
Marital status
Married 19 90 15 94 34 92 Single 1 5 1 6 2 5 Divorced 1 5 0 0 1 3 Total 21 100 16 100 37 100
Share of responsibility among family members on dairy cattle managements Milking and milk processing activity
Result on share of responsibility among family members on milk and milk processing activities are presented in Table 2. Milking of dairy cows is the responsibility of women household member for majority of the case followed by employed worker,. About 59% of households used to process raw milk into butter and cheese. Women (wife) are responsible for milk processing activities for majority of households who used to process milk into butter and cheese, daughter and grandmother also involved in some cases.
Table 2. Responsible family member for milking and milk processing activities
milking dairy cows Milk processing
HH members No Percent HH members No Percent
Owner's wife 21 57 Owner's wife 19 51
Owner's husband 1 3 Daughters 2 5
Daughters 3 8 Grand mother 1 3
Sons 1 3 Total 22 59
Employed person 8 22 No processing 15 41
All family member 3 8 37 100
Total 37 100.0
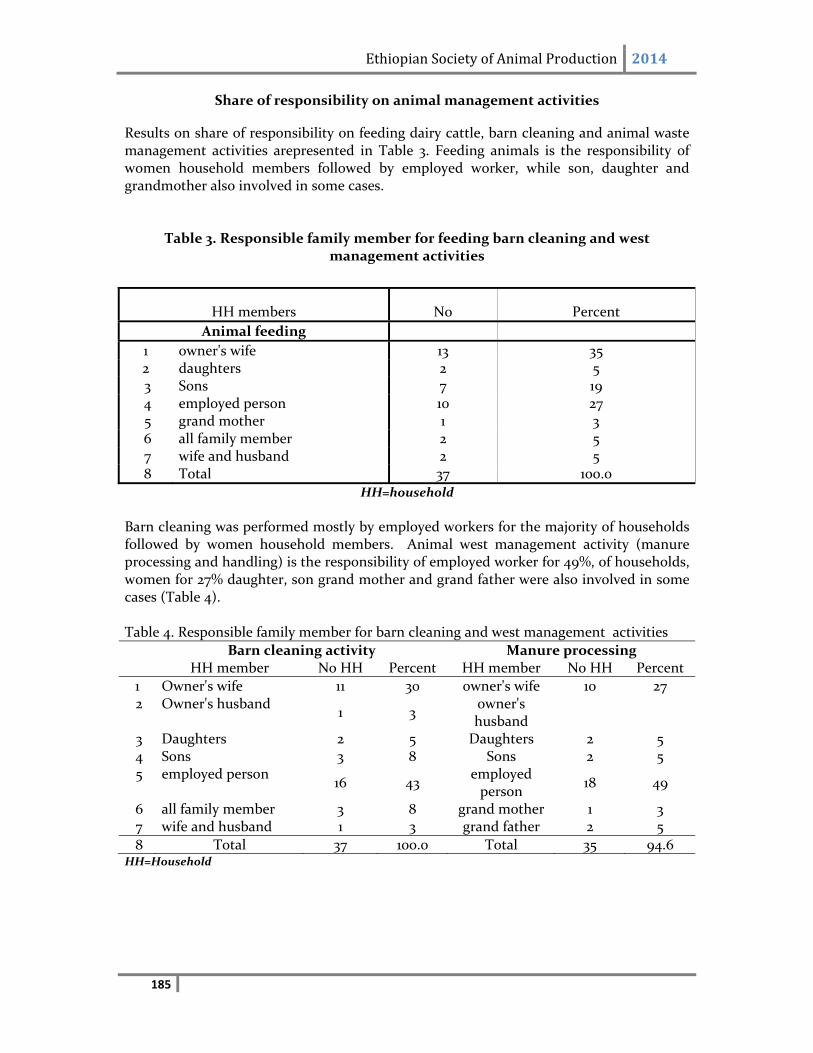
Ethiopian Society of Animal Production 2014
185
Share of responsibility on animal management activities
Results on share of responsibility on feeding dairy cattle, barn cleaning and animal waste management activities arepresented in Table 3. Feeding animals is the responsibility of women household members followed by employed worker, while son, daughter and grandmother also involved in some cases.
Table 3. Responsible family member for feeding barn cleaning and west management activities
HH members No Percent
Animal feeding
1 owner's wife 13 35 2 daughters 2 5 3 Sons 7 19 4 employed person 10 27 5 grand mother 1 3 6 all family member 2 5 7 wife and husband 2 5 8 Total 37 100.0
HH=household
Barn cleaning was performed mostly by employed workers for the majority of households followed by women household members. Animal west management activity (manure processing and handling) is the responsibility of employed worker for 49%, of households, women for 27% daughter, son grand mother and grand father were also involved in some cases (Table 4). Table 4. Responsible family member for barn cleaning and west management activities
Barn cleaning activity Manure processing HH member No HH Percent HH member No HH Percent
1 Owner's wife 11 30 owner's wife 10 27 2 Owner's husband
1 3 owner's husband
3 Daughters 2 5 Daughters 2 5 4 Sons 3 8 Sons 2 5 5 employed person
16 43 employed person
18 49
6 all family member 3 8 grand mother 1 3 7 wife and husband 1 3 grand father 2 5
8 Total 37 100.0 Total 35 94.6 HH=Household
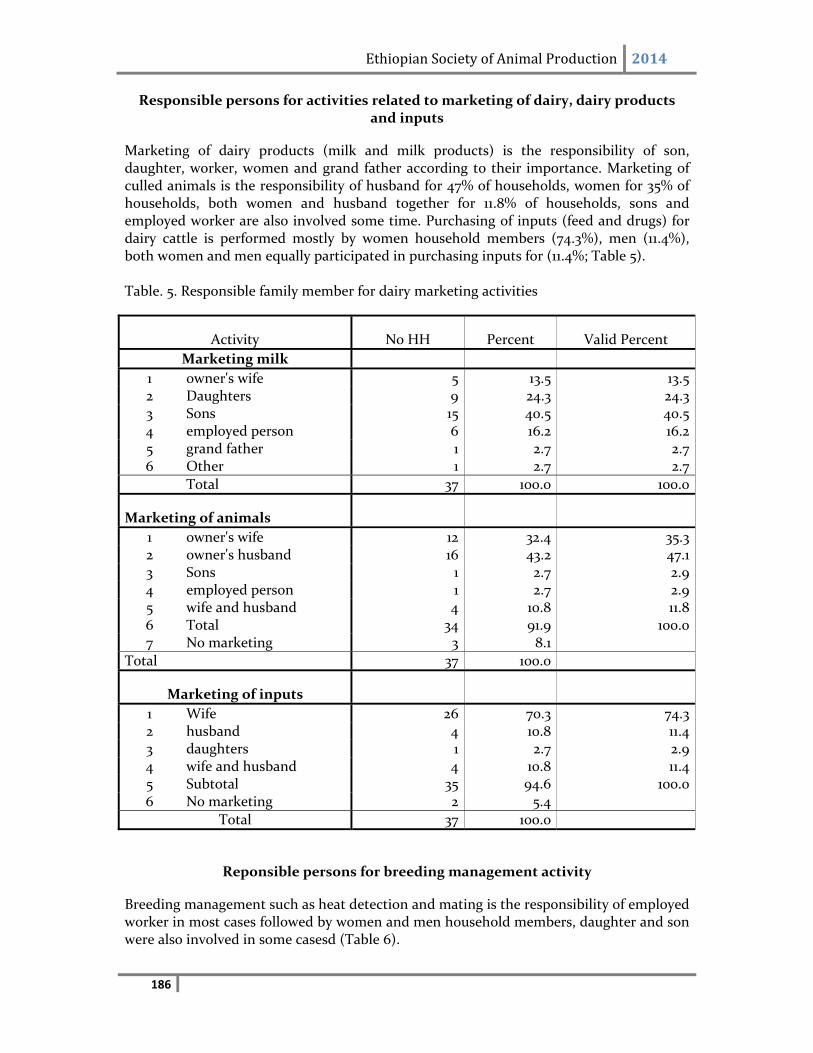
Ethiopian Society of Animal Production 2014
186
Responsible persons for activities related to marketing of dairy, dairy products and inputs
Marketing of dairy products (milk and milk products) is the responsibility of son, daughter, worker, women and grand father according to their importance. Marketing of culled animals is the responsibility of husband for 47% of households, women for 35% of households, both women and husband together for 11.8% of households, sons and employed worker are also involved some time. Purchasing of inputs (feed and drugs) for dairy cattle is performed mostly by women household members (74.3%), men (11.4%), both women and men equally participated in purchasing inputs for (11.4%; Table 5).
Table. 5. Responsible family member for dairy marketing activities
Activity No HH Percent Valid Percent
Marketing milk
1 owner's wife 5 13.5 13.5 2 Daughters 9 24.3 24.3 3 Sons 15 40.5 40.5 4 employed person 6 16.2 16.2 5 grand father 1 2.7 2.7 6 Other 1 2.7 2.7
Total 37 100.0 100.0
Marketing of animals
1 owner's wife 12 32.4 35.3 2 owner's husband 16 43.2 47.1 3 Sons 1 2.7 2.9 4 employed person 1 2.7 2.9 5 wife and husband 4 10.8 11.8 6 Total 34 91.9 100.0 7 No marketing 3 8.1
Total 37 100.0
Marketing of inputs
1 Wife 26 70.3 74.3 2 husband 4 10.8 11.4 3 daughters 1 2.7 2.9 4 wife and husband 4 10.8 11.4 5 Subtotal 35 94.6 100.0 6 No marketing 2 5.4
Total 37 100.0
Reponsible persons for breeding management activity
Breeding management such as heat detection and mating is the responsibility of employed worker in most cases followed by women and men household members, daughter and son were also involved in some casesd (Table 6).
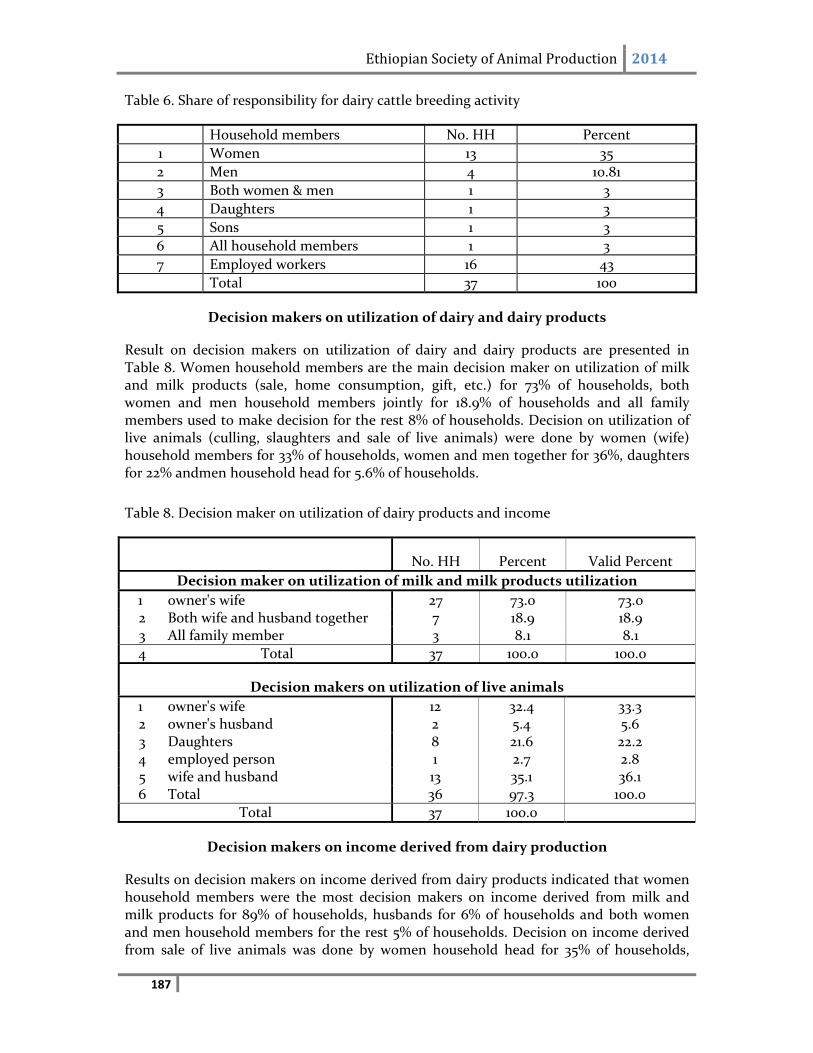
Ethiopian Society of Animal Production 2014
187
Table 6. Share of responsibility for dairy cattle breeding activity
Household members No. HH Percent
1 Women 13 35
2 Men 4 10.81
3 Both women & men 1 3
4 Daughters 1 3
5 Sons 1 3
6 All household members 1 3
7 Employed workers 16 43
Total 37 100
Decision makers on utilization of dairy and dairy products
Result on decision makers on utilization of dairy and dairy products are presented in Table 8. Women household members are the main decision maker on utilization of milk and milk products (sale, home consumption, gift, etc.) for 73% of households, both women and men household members jointly for 18.9% of households and all family members used to make decision for the rest 8% of households. Decision on utilization of live animals (culling, slaughters and sale of live animals) were done by women (wife) household members for 33% of households, women and men together for 36%, daughters for 22% andmen household head for 5.6% of households.
Table 8. Decision maker on utilization of dairy products and income
No. HH Percent Valid Percent
Decision maker on utilization of milk and milk products utilization
1 owner's wife 27 73.0 73.0 2 Both wife and husband together 7 18.9 18.9 3 All family member 3 8.1 8.1
4 Total 37 100.0 100.0
Decision makers on utilization of live animals
1 owner's wife 12 32.4 33.3 2 owner's husband 2 5.4 5.6 3 Daughters 8 21.6 22.2 4 employed person 1 2.7 2.8 5 wife and husband 13 35.1 36.1 6 Total 36 97.3 100.0
Total 37 100.0
Decision makers on income derived from dairy production
Results on decision makers on income derived from dairy products indicated that women household members were the most decision makers on income derived from milk and milk products for 89% of households, husbands for 6% of households and both women and men household members for the rest 5% of households. Decision on income derived from sale of live animals was done by women household head for 35% of households,
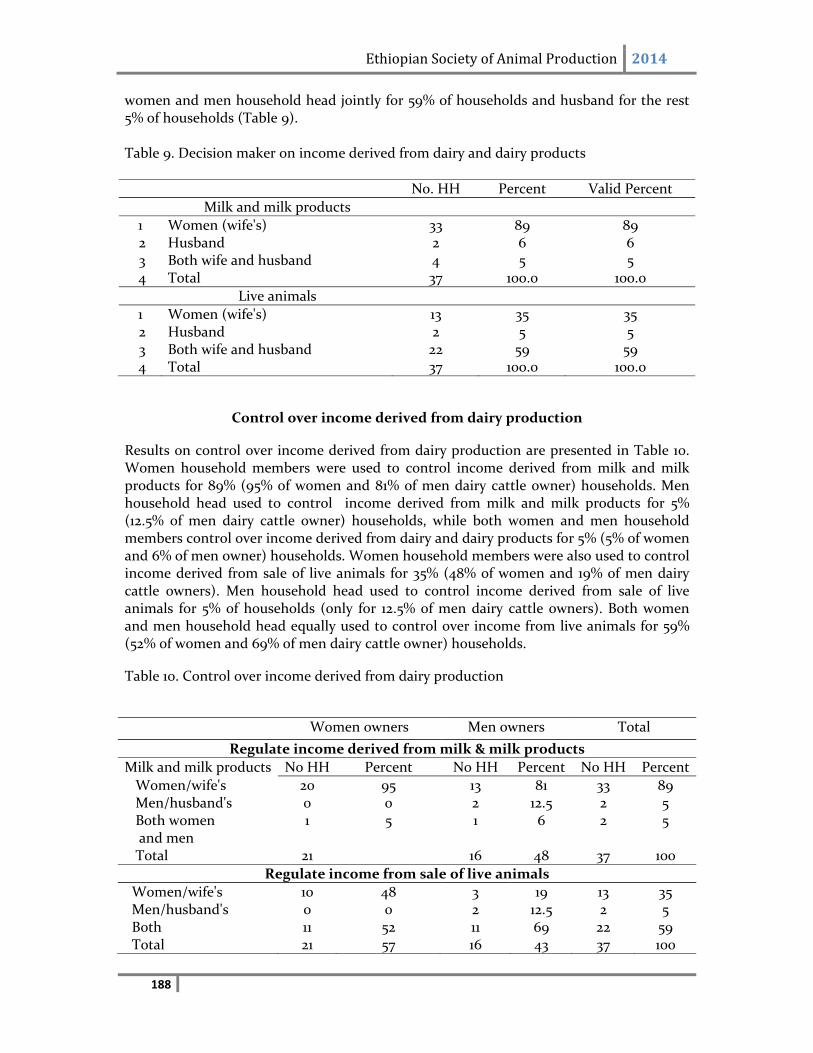
Ethiopian Society of Animal Production 2014
188
women and men household head jointly for 59% of households and husband for the rest 5% of households (Table 9).
Table 9. Decision maker on income derived from dairy and dairy products
No. HH Percent Valid Percent
Milk and milk products
1 Women (wife's) 33 89 89 2 Husband 2 6 6 3 Both wife and husband 4 5 5 4 Total 37 100.0 100.0
Live animals
1 Women (wife's) 13 35 35 2 Husband 2 5 5 3 Both wife and husband 22 59 59 4 Total 37 100.0 100.0
Control over income derived from dairy production
Results on control over income derived from dairy production are presented in Table 10. Women household members were used to control income derived from milk and milk products for 89% (95% of women and 81% of men dairy cattle owner) households. Men household head used to control income derived from milk and milk products for 5% (12.5% of men dairy cattle owner) households, while both women and men household members control over income derived from dairy and dairy products for 5% (5% of women and 6% of men owner) households. Women household members were also used to control income derived from sale of live animals for 35% (48% of women and 19% of men dairy cattle owners). Men household head used to control income derived from sale of live animals for 5% of households (only for 12.5% of men dairy cattle owners). Both women and men household head equally used to control over income from live animals for 59% (52% of women and 69% of men dairy cattle owner) households.
Table 10. Control over income derived from dairy production
Women owners Men owners Total
Regulate income derived from milk & milk products
Milk and milk products No HH Percent No HH Percent No HH Percent
Women/wife's 20 95 13 81 33 89 Men/husband's 0 0 2 12.5 2 5 Both women and men
1 5 1 6 2 5
Total 21 16 48 37 100
Regulate income from sale of live animals
Women/wife's 10 48 3 19 13 35 Men/husband's 0 0 2 12.5 2 5 Both 11 52 11 69 22 59 Total 21 57 16 43 37 100
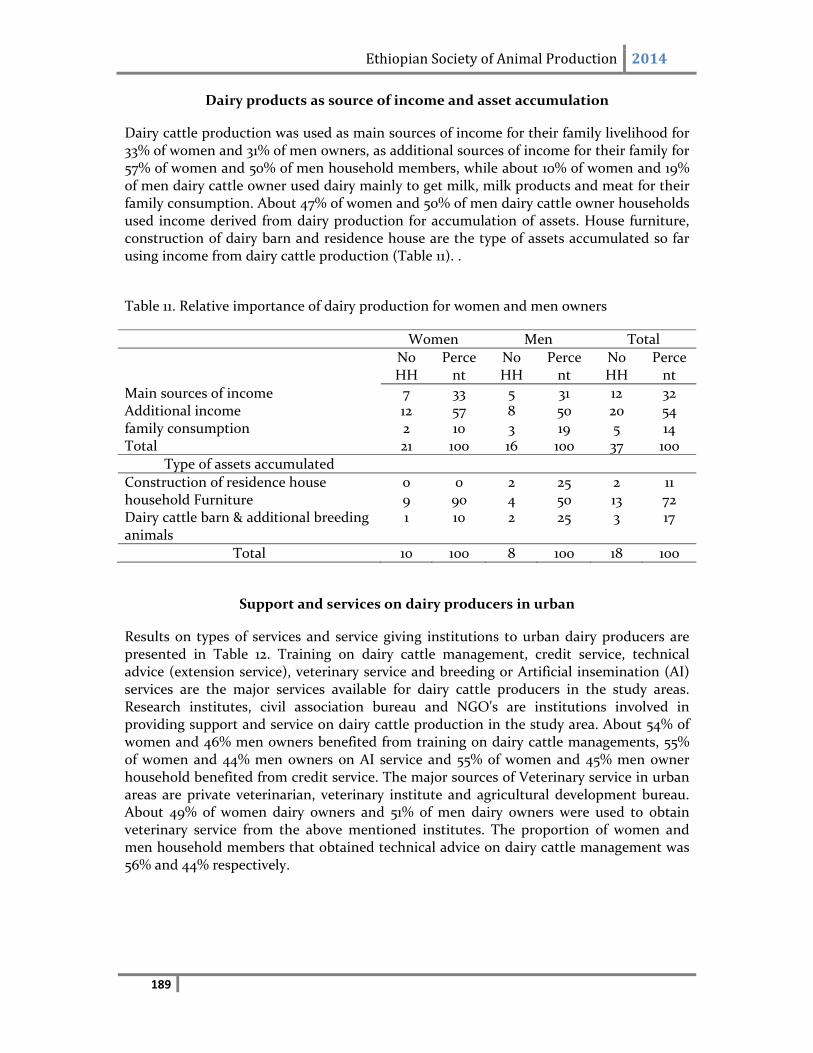
Ethiopian Society of Animal Production 2014
189
Dairy products as source of income and asset accumulation
Dairy cattle production was used as main sources of income for their family livelihood for 33% of women and 31% of men owners, as additional sources of income for their family for 57% of women and 50% of men household members, while about 10% of women and 19% of men dairy cattle owner used dairy mainly to get milk, milk products and meat for their family consumption. About 47% of women and 50% of men dairy cattle owner households used income derived from dairy production for accumulation of assets. House furniture, construction of dairy barn and residence house are the type of assets accumulated so far using income from dairy cattle production (Table 11). .
Table 11. Relative importance of dairy production for women and men owners
Women Men Total
No HH
Percent
No HH
Percent
No HH
Percent
Main sources of income 7 33 5 31 12 32 Additional income 12 57 8 50 20 54 family consumption 2 10 3 19 5 14 Total 21 100 16 100 37 100
Type of assets accumulated
Construction of residence house 0 0 2 25 2 11 household Furniture 9 90 4 50 13 72 Dairy cattle barn & additional breeding animals
1 10 2 25 3 17
Total 10 100 8 100 18 100
Support and services on dairy producers in urban
Results on types of services and service giving institutions to urban dairy producers are presented in Table 12. Training on dairy cattle management, credit service, technical advice (extension service), veterinary service and breeding or Artificial insemination (AI) services are the major services available for dairy cattle producers in the study areas. Research institutes, civil association bureau and NGO's are institutions involved in providing support and service on dairy cattle production in the study area. About 54% of women and 46% men owners benefited from training on dairy cattle managements, 55% of women and 44% men owners on AI service and 55% of women and 45% men owner household benefited from credit service. The major sources of Veterinary service in urban areas are private veterinarian, veterinary institute and agricultural development bureau. About 49% of women dairy owners and 51% of men dairy owners were used to obtain veterinary service from the above mentioned institutes. The proportion of women and men household members that obtained technical advice on dairy cattle management was 56% and 44% respectively.
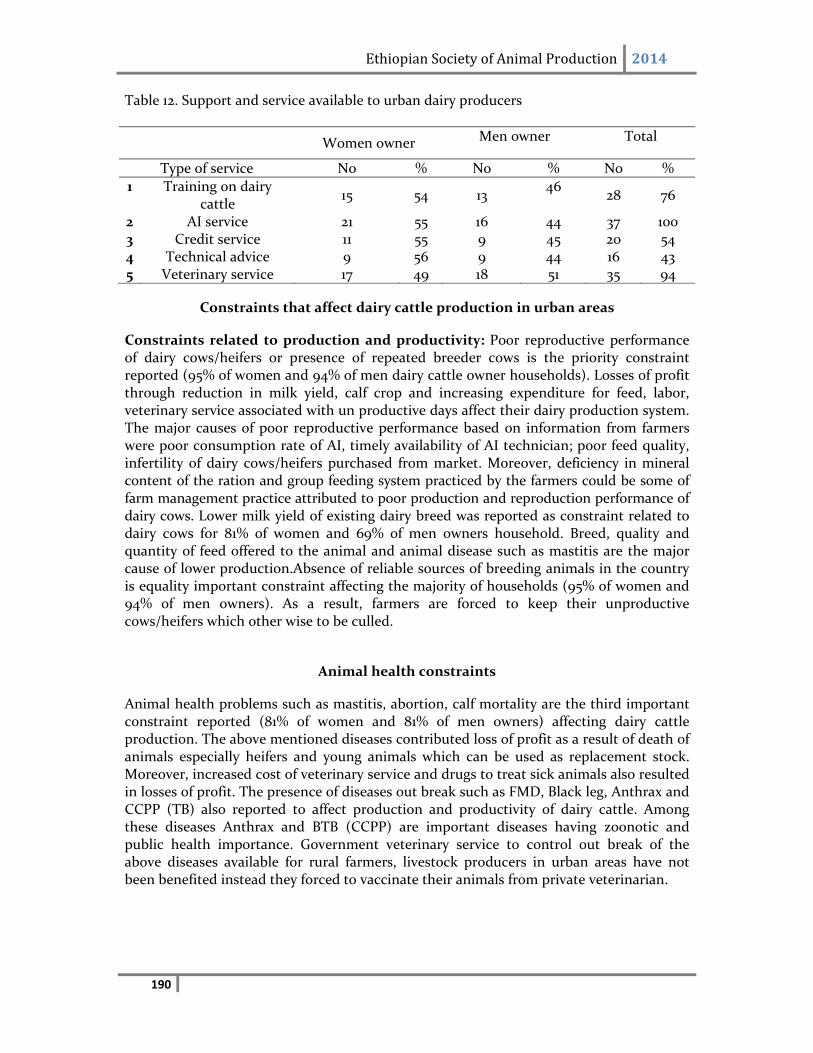
Ethiopian Society of Animal Production 2014
190
Table 12. Support and service available to urban dairy producers
Women owner Men owner Total
Type of service No % No % No %
1 Training on dairy cattle
15 54 13 46
28 76
2 AI service 21 55 16 44 37 100 3 Credit service 11 55 9 45 20 54 4 Technical advice 9 56 9 44 16 43 5 Veterinary service 17 49 18 51 35 94
Constraints that affect dairy cattle production in urban areas
Constraints related to production and productivity: Poor reproductive performance of dairy cows/heifers or presence of repeated breeder cows is the priority constraint reported (95% of women and 94% of men dairy cattle owner households). Losses of profit through reduction in milk yield, calf crop and increasing expenditure for feed, labor, veterinary service associated with un productive days affect their dairy production system. The major causes of poor reproductive performance based on information from farmers were poor consumption rate of AI, timely availability of AI technician; poor feed quality, infertility of dairy cows/heifers purchased from market. Moreover, deficiency in mineral content of the ration and group feeding system practiced by the farmers could be some of farm management practice attributed to poor production and reproduction performance of dairy cows. Lower milk yield of existing dairy breed was reported as constraint related to dairy cows for 81% of women and 69% of men owners household. Breed, quality and quantity of feed offered to the animal and animal disease such as mastitis are the major cause of lower production.Absence of reliable sources of breeding animals in the country is equality important constraint affecting the majority of households (95% of women and 94% of men owners). As a result, farmers are forced to keep their unproductive cows/heifers which other wise to be culled.
Animal health constraints
Animal health problems such as mastitis, abortion, calf mortality are the third important constraint reported (81% of women and 81% of men owners) affecting dairy cattle production. The above mentioned diseases contributed loss of profit as a result of death of animals especially heifers and young animals which can be used as replacement stock. Moreover, increased cost of veterinary service and drugs to treat sick animals also resulted in losses of profit. The presence of diseases out break such as FMD, Black leg, Anthrax and CCPP (TB) also reported to affect production and productivity of dairy cattle. Among these diseases Anthrax and BTB (CCPP) are important diseases having zoonotic and public health importance. Government veterinary service to control out break of the above diseases available for rural farmers, livestock producers in urban areas have not been benefited instead they forced to vaccinate their animals from private veterinarian.
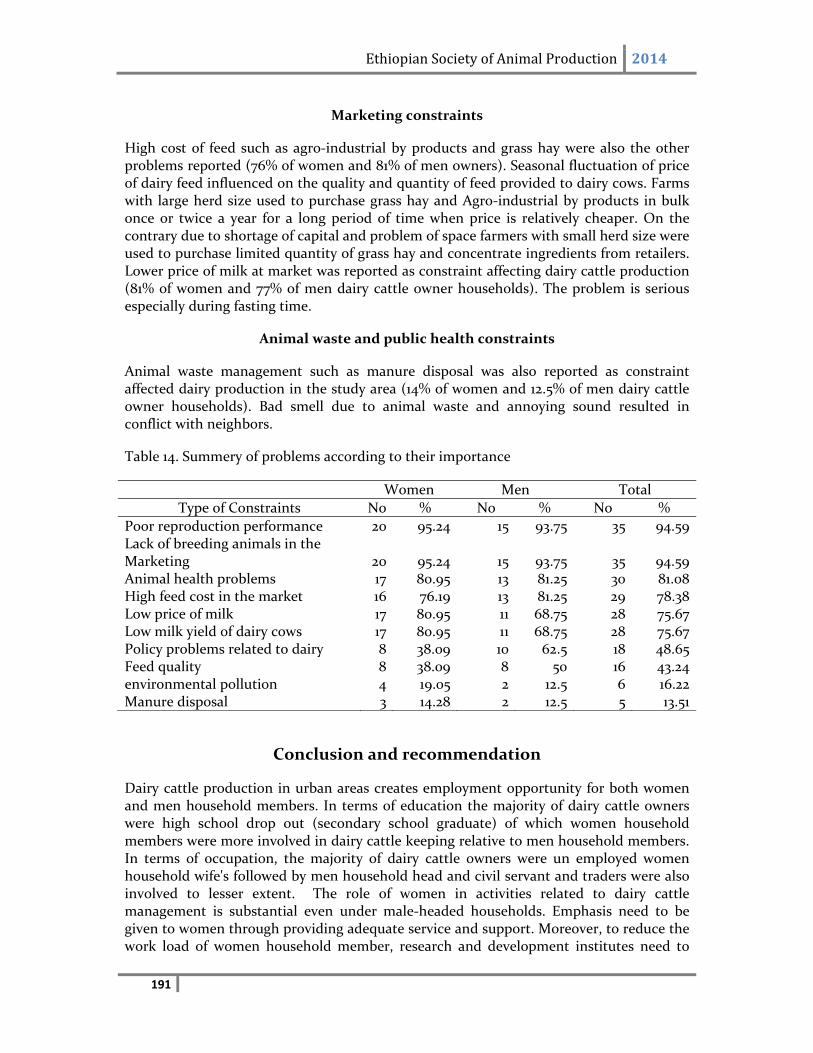
Ethiopian Society of Animal Production 2014
191
Marketing constraints
High cost of feed such as agro‐industrial by products and grass hay were also the other problems reported (76% of women and 81% of men owners). Seasonal fluctuation of price of dairy feed influenced on the quality and quantity of feed provided to dairy cows. Farms with large herd size used to purchase grass hay and Agro‐industrial by products in bulk once or twice a year for a long period of time when price is relatively cheaper. On the contrary due to shortage of capital and problem of space farmers with small herd size were used to purchase limited quantity of grass hay and concentrate ingredients from retailers. Lower price of milk at market was reported as constraint affecting dairy cattle production (81% of women and 77% of men dairy cattle owner households). The problem is serious especially during fasting time.
Animal waste and public health constraints
Animal waste management such as manure disposal was also reported as constraint affected dairy production in the study area (14% of women and 12.5% of men dairy cattle owner households). Bad smell due to animal waste and annoying sound resulted in conflict with neighbors.
Table 14. Summery of problems according to their importance
Women Men Total
Type of Constraints No % No % No %
Poor reproduction performance 20 95.24 15 93.75 35 94.59 Lack of breeding animals in the Marketing 20 95.24 15 93.75 35 94.59 Animal health problems 17 80.95 13 81.25 30 81.08 High feed cost in the market 16 76.19 13 81.25 29 78.38 Low price of milk 17 80.95 11 68.75 28 75.67 Low milk yield of dairy cows 17 80.95 11 68.75 28 75.67 Policy problems related to dairy 8 38.09 10 62.5 18 48.65 Feed quality 8 38.09 8 50 16 43.24 environmental pollution 4 19.05 2 12.5 6 16.22 Manure disposal 3 14.28 2 12.5 5 13.51
Conclusion and recommendation
Dairy cattle production in urban areas creates employment opportunity for both women and men household members. In terms of education the majority of dairy cattle owners were high school drop out (secondary school graduate) of which women household members were more involved in dairy cattle keeping relative to men household members. In terms of occupation, the majority of dairy cattle owners were un employed women household wife's followed by men household head and civil servant and traders were also involved to lesser extent. The role of women in activities related to dairy cattle management is substantial even under male‐headed households. Emphasis need to be given to women through providing adequate service and support. Moreover, to reduce the work load of women household member, research and development institutes need to
Ethiopian Society of Animal Production 2014
192
focus on development of technologies in areas of dairy product processing and marketing activities. Technology in animal waste management that reduces the negative effect of manure on public health and environment also area needs to be considered by research and development institutes. Shortage of land for dairy cattle production and animal waste management such as manure disposal affected dairy producer households in urban areas. Women were the most affected since they are responsible in activities related to animal waste management. Given the contribution of dairy cattle production to livelihood of urban producers, research and development institutes need to address issues related to animal waste management through development of suitable technologies such as biogas and compost production for better management and utilization of animal waste.
References
Debre Zeit Agricultural Research Center (DZARC), 1989. Annual report on reproductive performance of dairy cattle in urban areas. Yoseph Mekash, 1999. Impact of feed resources on productivity and reproductive performance of dairy cows in the urban and peri‐urban dairy production system in the Addis Ababa milk shed and evaluation of non‐conventional feeed resources using sheep. MSc thesis. Alemaya University of Agriculture. Nill, A, 1992. An overview of dairying in Sub‐saharan Africa in: Brokken. R.F and SeniatSeyoum (EDs). Dairy marketing in Sub‐Saharan Africa. Proceeding of a symposium held at ILCA, Addis Ababa, Ethiopia.
Ethiopian Society of Animal Production 2014
193
Urban Dairy Production system, the case of Ada’a LibenWoreda Dairy and Dairy Products Marketing Association
Million Tadesse1, Kassahun Melesse1, Adey Melesse1 andAzage Tegegne2 1Ethiopian Institute of Agricultural Research (EIAR) 2International Livestock Research Institute2 (ILRI)
Abstract
A survey on dairy production system was carried out to determine characteristics of urban dairy production system. Thirty seven households were selected From Ada’a LibenWoreda, DebreZeit town and interviewed through structured questionnaires. Results indicate that about 57% of dairy owner households were women and 43% were men owners. In terms of education 73% of households were secondary school, 20% primary school, 5% diploma holder and 3% were illiterate. Occupationally, about 61%, 14%, and 25% households were unemployed, civil servant and trader respectively. The majority of households (92%) were married, 5% single and 3% divorced. The number of animals per household varies from farms that have about one cow to those, which have up to 17 cows. The genetic composition of animals used for dairy production ranged from pure exotic to crossbred animals. Home mixed concentrate was used by 75.7% of households, 8% commercially prepared concentrate and 16% agro‐industrial by products as supplementary feed. Dairy cattle used as sources of additional income for 54%, main sources of income for 32% and as family consumption for 14% of households. House furniture, construction of dairy barn and residence house is the type of assets accumulated using income derived from dairy cattle production for 49% of households.
Key words: Urban dairy, asset accumulation, breed production system
Introduction
Ethiopia livestock is an essential component of the overall farming system serving as a source of draught power and is an integral part of the crop and livestock production system mainly in the highland region. Livestock supply farm families with meat, milk and manure and serve as source of cash income to support livelihoods (Kelay, 2002; Abebabay, 2009). However, Ethiopia is not self sufficient in milk and considerable amount of foreign exchange has to be spent on the import of dairy products. Average per capita milk consumption has fallen from 30 kg (whole milk equivalent) in 1970 to about 16 kg in recent years (Gebrewold et al., 1998). Population growth and urbanization are adding more stress on demand for dairy products. Milk and milk products consumption level in Ethiopia is a function of supply, family income, and religious obedience. In the country the high human population growth rate of 2.6% annually and the high rural to urban migrations are expected to alter food production, marketing and consumption Improvements in the dairy sector from production to consumption obviously will have great potential to provide a substantial boost to development of the sector. With changes in government policies featured by liberalization and encouragement of the private sector to participate in the development of the national economy, there exist immense opportunities to develop and improve the urban and peri‐urban dairy sector. With the increasing demand for safe, diverse and quality animal products, prices are to escalate in urban areas unless production increases proportionally. It is therefore obvious that there
Ethiopian Society of Animal Production 2014
194
is need for both horizontal and vertical expansion and intensification of dairy farming. Research and development intervention is therefore needed at this junction to optimize the urban dairy industry through organizing the different components of the dairy sector: milk production, processing, preservation and marketing in a well‐coordinated way. Therefore, the objective of present study is to evaluate characteristics of urban diary production in terms of dairy cattle breeding management, housing and feeding systems, health management, marketing of dairy products and income and assets accumulation from dairy production system
Material and methods
Study area
This study was conducted in Ada’aLibenWoreda, DebreZeit town, located 9o N and 39o E, and about 47 km East of Addis Ababa. The area has an altitude of 1850 m.a.s.l. and receives an average annual rainfall of 800 mm with mean annual temperature of 18.5 oC (DZARC, 1989).
Data collection and analysis
Thirty seven dairy cattle producer households were selected based on location within the city, and herd size. Dairy cooperative members list from Ada’aLiben Woreda Dairy and Dairy Products Marketing Association were used to select farmer and a random sampling method was employed to select households. Questionnaires were prepared and pre‐tested on selected farmers before actual survey. Selected farmers were interviewed on general aspect of dairy production at the same time group discussions were made to prioritize their problems on dairy cattle feeding, breeding and health issues. Data were analyzed using descriptive statistics such as frequency, mean and standard error and using the General Linear Model procedure (SAS, 2002).
Results and discussions
Household characteristics
Results on gender of dairy cattle keeper indicated that from total dairy cattle owner households studied 57% were women owners and the rest 43% were men owners. Results on educational status indicated that about 73% of households were secondary school, 20% primary school, 5% diploma holder, while the rest 3% were illiterate. In terms of occupation, about 61% of dairy owners are unemployed, 14% civil servant, 25% involved in trading activity. Concerning marital status the majority of dairy keepers 92% are married, 5% single and 3% divorced. The average age of dairy cattle owners was 40 years with minimum and maximum age of 26 and 51 years, respectively. From total dairy cattle owners, the majority 80% are in age class between 32 to 50 years, 17% between 33 to 50 years the remaining 3% were above 50 years old. Average family size was seven with minimum and maximum value of 1 and 17 persons per family, respectively. The relatively higher proportion of dairy cattle owners in the secondary school indicated that dairy cattle production could be used as an employment opportunity. The higher proportion of women dairy cattle owners compared to men indicated that dairy cattle production is
Ethiopian Society of Animal Production 2014
195
used as employment opportunity for women headed households. In terms of age, the higher proportion of dairy cattle owners found in age class between 33 to 50 years indicates dairy keeping in urban areas is creating an employment opportunity for productive age classes.
Dairy cattle breeds and breeding system
Results on breeds and breeding system used for dairy cattle production are presented in Table 1. The number of animals per household varies from farms that had about one cow to those which have up to 17 cows. The average number of dairy cattle per household is five.The genetic composition of animals used for dairy production ranged from pure exotic to crossbred animals. The use of local zebu breed for milk production was not reported by any of household studied. The majority of households (84%) start dairy cattle production using crossbred animals and the rest 16% of households using pure exotic (Holstein Friesian) dairy cattle breed. About 62%, 30% and 8% of households started dairy cattle production using dairy cows, heifers and female calves, respectively. Immediate need for milk yield was the major reason for those started with cows. Heifers and female calves were preferred because of poor fertility and lower milk yield associated with cows purchased from market without any documented data. The major sources of capital for dairy cattle production as reported by farmers were own capital (73), loan from relatives or friends (21.6%) donation from sons and daughters (5%). Artificial insemination is the main mating system used by all households. Natural service is used only when cows/heifers are failed to become pregnant with AI service and when semen or AI technician is not available. Similar finding was reported by Yitaye (2008) in the North Western Ethiopian highlands where the majority of dairy producers in urban and peri‐urban areas used AI service than bull service. Repeated breeding is the main problems related to breed and breeding management. Poor pregnancy rate of AI semen, availability of technician, poor heat detection by stock men, animal diseases and poor feed quality were reported as major causes of repeated breeding for 34% of households. Unavailability of AI technician, poor heat detection by stock men were reported by 31% of households, while poor pregnancy rate of AI semen and poor heat detection were reported by 23% of households.Phenotypic characteristics, breed of animal, pedigree information, health status and age of animal were the major criteria used to select good dairy cows/heifers for milk production. About 29% of households use phenotypic characteristics and breed of animal to select good dairy cows, 21% households combine information on milk production of animal and its relatives milk yield, 18% of them only information on breed of animal and 12% use phenotypic characteristics (Table 1).The use of pure exotic and crossbred animals for dairy production reported in present study attributed to better performance of these breeds for milk production. Nill (1992) also reported that intensive dairy production system in urban areas use pure exotic and crossbred animals for dairy production. Study conducted by Yoseph (1999) and Kelay (2002) also reported crossbred and pure exotic breeds are the dominant genotype used for dairy production in urban and peri‐urban areas.
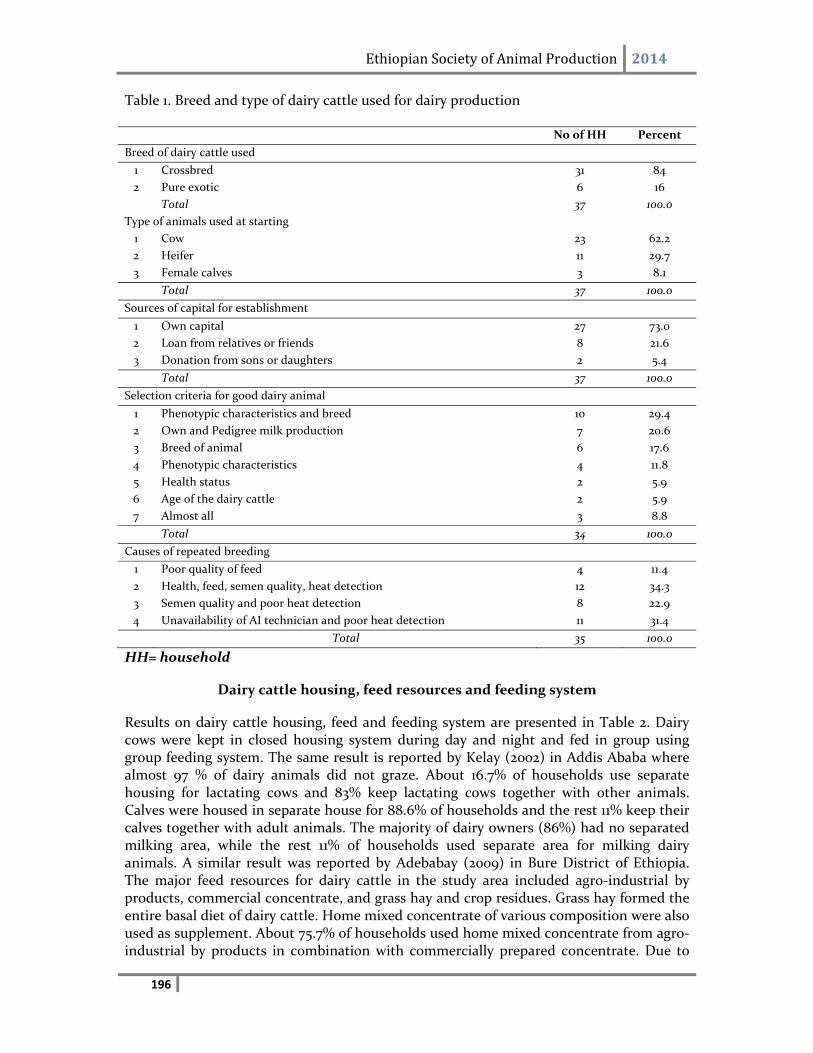
Ethiopian Society of Animal Production 2014
196
Table 1. Breed and type of dairy cattle used for dairy production
No of HH Percent
Breed of dairy cattle used
1 Crossbred 31 84
2 Pure exotic 6 16
Total 37 100.0
Type of animals used at starting
1 Cow 23 62.2
2 Heifer 11 29.7
3 Female calves 3 8.1
Total 37 100.0
Sources of capital for establishment
1 Own capital 27 73.0
2 Loan from relatives or friends 8 21.6
3 Donation from sons or daughters 2 5.4
Total 37 100.0
Selection criteria for good dairy animal
1 Phenotypic characteristics and breed 10 29.4
2 Own and Pedigree milk production 7 20.6
3 Breed of animal 6 17.6
4 Phenotypic characteristics 4 11.8
5 Health status 2 5.9
6 Age of the dairy cattle 2 5.9
7 Almost all 3 8.8
Total 34 100.0
Causes of repeated breeding
1 Poor quality of feed 4 11.4
2 Health, feed, semen quality, heat detection 12 34.3
3 Semen quality and poor heat detection 8 22.9
4 Unavailability of AI technician and poor heat detection 11 31.4
Total 35 100.0
HH= household
Dairy cattle housing, feed resources and feeding system
Results on dairy cattle housing, feed and feeding system are presented in Table 2. Dairy cows were kept in closed housing system during day and night and fed in group using group feeding system. The same result is reported by Kelay (2002) in Addis Ababa where almost 97 % of dairy animals did not graze. About 16.7% of households use separate housing for lactating cows and 83% keep lactating cows together with other animals. Calves were housed in separate house for 88.6% of households and the rest 11% keep their calves together with adult animals. The majority of dairy owners (86%) had no separated milking area, while the rest 11% of households used separate area for milking dairy animals. A similar result was reported by Adebabay (2009) in Bure District of Ethiopia. The major feed resources for dairy cattle in the study area included agro‐industrial by products, commercial concentrate, and grass hay and crop residues. Grass hay formed the entire basal diet of dairy cattle. Home mixed concentrate of various composition were also used as supplement. About 75.7% of households used home mixed concentrate from agro‐industrial by products in combination with commercially prepared concentrate. Due to
Ethiopian Society of Animal Production 2014
197
higher price, the use of commercially prepared concentrate alone is restricted to small number of farmers; only 8% of households used commercially prepared concentrate as supplementary feed. About 16% of households used agro‐industrial by products as supplementary feed. They used to prepare home mixed concentrate from such as mill and oil seed by products (Noug cake and wheat bran/middling blend). The major agro‐industrial by‐products commonly used were obtained from milling industry, oil seed extracting, sugar producing industries and breweries. Grass hay and straws are also important roughage used for dairy cattle. Almost all dairy cattle keepers used to purchase grass hay, teff and wheat straws. Non‐conventional feed resources played significant role in the study area. These include traditional brewery and alcohol residues (atela), poultry waste, vegetable wastes. Though the proportion of households using the different types of feed stuffs, the type of feed stuffs reported in the present study are in agreement with many reports (Adebabay, 2009; Kelay; 2002 and Sintayehu, 2008). Lactating cows/heifers were feed based on the basis of their milk production for 65% of households, about 16% of households fed their animals by combining milk production, body weight, age and stage of pregnancy, 11% used milk production and age of animals. Dry cows and heifers used to be fed with different type of feeds. The majority of households (84%) used to feed agro‐industrial by products as supplementary feed for dry cows and heifers, while the rest 16% do not practiced supplementary feed they used grass hay and straw to feed dry cows and heifers. About 54% of households used to feed their pregnant animals (pregnancy allowance) while the remaining 46% did not practice pregnancy allowance for pregnant cows/heifers. Lack of knowledge about pregnancy allowance (27%) and the importance of pregnancy allowance (73%) are the major reasons for not practicing supplementary feed for pregnant animals. Inadequate feeding in terms of quantity and quality seriously hampered milk production and reproductive efficiency and thereby contributes to the low productivity of dairy cattle. Moreover, seasonal fluctuation in the price of dairy feed was the major problem during the study period, and had influence on the quality and quantity of feed provided to dairy cows. Farms with large herd size used to purchase grass hay and concentrate in bulk once or twice a year when price is relatively cheaper. On the contrary medium and small dairy farms purchased limited quantity of grass hay and concentrate ingredients from retailers. Thus shortage of capital and problem of space were among the major limiting factors reported by farms with medium and small herd size that hinder them from purchasing enough amount of feed once for a year. Feed resources and feeding system obtained in this study were similar to that reported by Adebabay (2009), Kelay (2002), Sintayehu (2008) and Yoseph (1999).
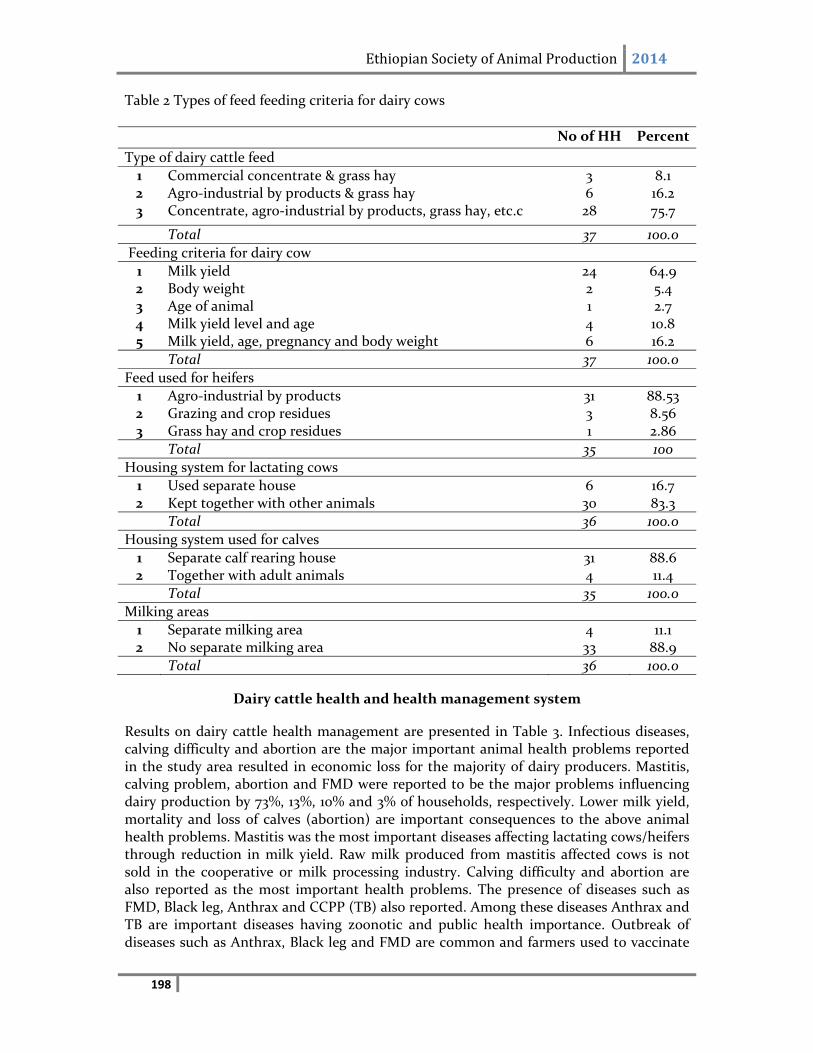
Ethiopian Society of Animal Production 2014
198
Table 2 Types of feed feeding criteria for dairy cows
No of HH Percent
Type of dairy cattle feed
1 Commercial concentrate & grass hay 3 8.1 2 Agro‐industrial by products & grass hay 6 16.2 3 Concentrate, agro‐industrial by products, grass hay, etc.c 28 75.7
Total 37 100.0
Feeding criteria for dairy cow
1 Milk yield 24 64.9 2 Body weight 2 5.4 3 Age of animal 1 2.7 4 Milk yield level and age 4 10.8 5 Milk yield, age, pregnancy and body weight 6 16.2
Total 37 100.0
Feed used for heifers
1 Agro‐industrial by products 31 88.53 2 Grazing and crop residues 3 8.56 3 Grass hay and crop residues 1 2.86
Total 35 100
Housing system for lactating cows
1 Used separate house 6 16.7 2 Kept together with other animals 30 83.3
Total 36 100.0
Housing system used for calves
1 Separate calf rearing house 31 88.6 2 Together with adult animals 4 11.4
Total 35 100.0
Milking areas
1 Separate milking area 4 11.1 2 No separate milking area 33 88.9
Total 36 100.0
Dairy cattle health and health management system
Results on dairy cattle health management are presented in Table 3. Infectious diseases, calving difficulty and abortion are the major important animal health problems reported in the study area resulted in economic loss for the majority of dairy producers. Mastitis, calving problem, abortion and FMD were reported to be the major problems influencing dairy production by 73%, 13%, 10% and 3% of households, respectively. Lower milk yield, mortality and loss of calves (abortion) are important consequences to the above animal health problems. Mastitis was the most important diseases affecting lactating cows/heifers through reduction in milk yield. Raw milk produced from mastitis affected cows is not sold in the cooperative or milk processing industry. Calving difficulty and abortion are also reported as the most important health problems. The presence of diseases such as FMD, Black leg, Anthrax and CCPP (TB) also reported. Among these diseases Anthrax and TB are important diseases having zoonotic and public health importance. Outbreak of diseases such as Anthrax, Black leg and FMD are common and farmers used to vaccinate
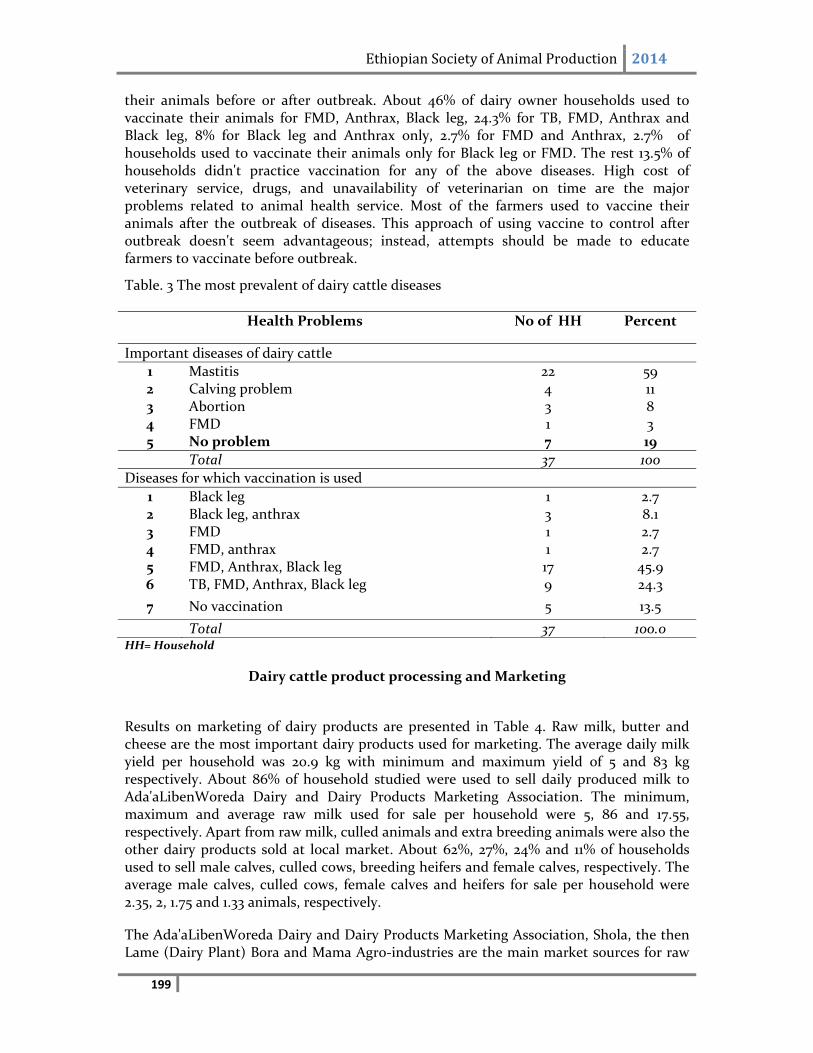
Ethiopian Society of Animal Production 2014
199
their animals before or after outbreak. About 46% of dairy owner households used to vaccinate their animals for FMD, Anthrax, Black leg, 24.3% for TB, FMD, Anthrax and Black leg, 8% for Black leg and Anthrax only, 2.7% for FMD and Anthrax, 2.7% of households used to vaccinate their animals only for Black leg or FMD. The rest 13.5% of households didn't practice vaccination for any of the above diseases. High cost of veterinary service, drugs, and unavailability of veterinarian on time are the major problems related to animal health service. Most of the farmers used to vaccine their animals after the outbreak of diseases. This approach of using vaccine to control after outbreak doesn't seem advantageous; instead, attempts should be made to educate farmers to vaccinate before outbreak.
Table. 3 The most prevalent of dairy cattle diseases
Health Problems No of HH Percent
Important diseases of dairy cattle
1 Mastitis 22 59 2 Calving problem 4 11 3 Abortion 3 8 4 FMD 1 3 5 No problem 7 19
Total 37 100
Diseases for which vaccination is used
1 Black leg 1 2.7 2 Black leg, anthrax 3 8.1 3 FMD 1 2.7 4 FMD, anthrax 1 2.7 5 FMD, Anthrax, Black leg 17 45.9 6 TB, FMD, Anthrax, Black leg 9 24.3
7 No vaccination 5 13.5
Total 37 100.0 HH= Household
Dairy cattle product processing and Marketing
Results on marketing of dairy products are presented in Table 4. Raw milk, butter and cheese are the most important dairy products used for marketing. The average daily milk yield per household was 20.9 kg with minimum and maximum yield of 5 and 83 kg respectively. About 86% of household studied were used to sell daily produced milk to Ada'aLibenWoreda Dairy and Dairy Products Marketing Association. The minimum, maximum and average raw milk used for sale per household were 5, 86 and 17.55, respectively. Apart from raw milk, culled animals and extra breeding animals were also the other dairy products sold at local market. About 62%, 27%, 24% and 11% of households used to sell male calves, culled cows, breeding heifers and female calves, respectively. The average male calves, culled cows, female calves and heifers for sale per household were 2.35, 2, 1.75 and 1.33 animals, respectively.
The Ada'aLibenWoreda Dairy and Dairy Products Marketing Association, Shola, the then Lame (Dairy Plant) Bora and Mama Agro‐industries are the main market sources for raw
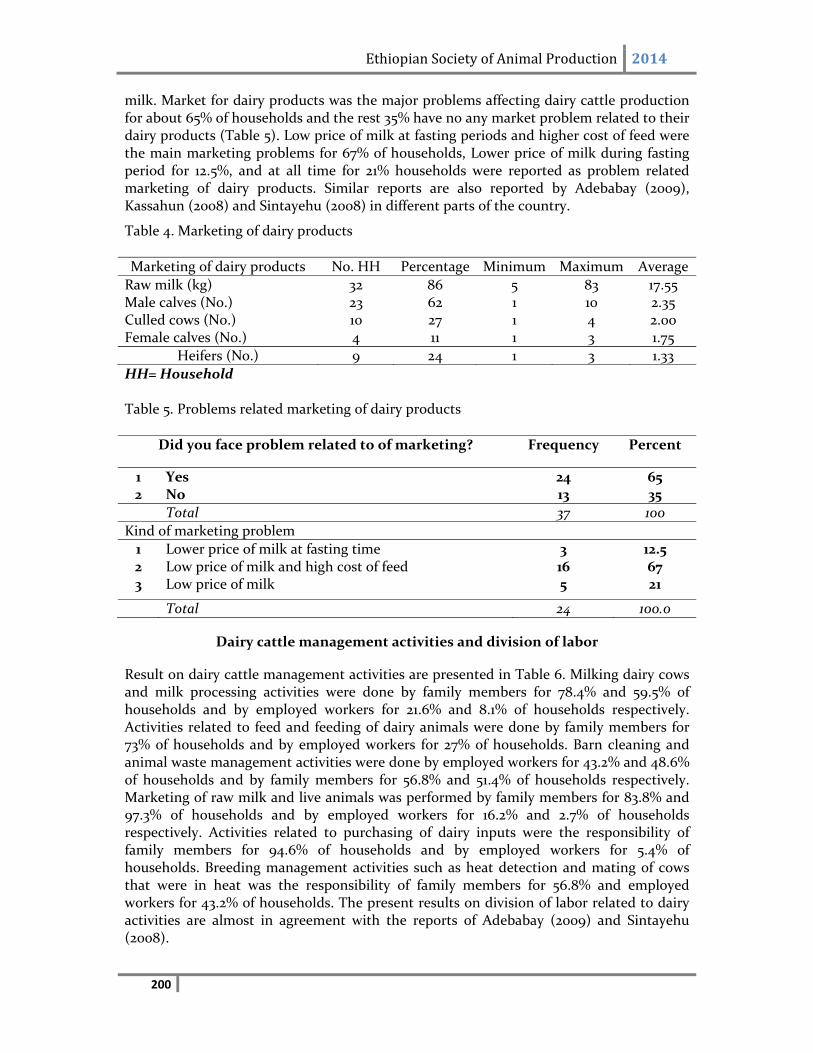
Ethiopian Society of Animal Production 2014
200
milk. Market for dairy products was the major problems affecting dairy cattle production for about 65% of households and the rest 35% have no any market problem related to their dairy products (Table 5). Low price of milk at fasting periods and higher cost of feed were the main marketing problems for 67% of households, Lower price of milk during fasting period for 12.5%, and at all time for 21% households were reported as problem related marketing of dairy products. Similar reports are also reported by Adebabay (2009), Kassahun (2008) and Sintayehu (2008) in different parts of the country.
Table 4. Marketing of dairy products
Marketing of dairy products No. HH Percentage Minimum Maximum Average
Raw milk (kg) 32 86 5 83 17.55 Male calves (No.) 23 62 1 10 2.35 Culled cows (No.) 10 27 1 4 2.00 Female calves (No.) 4 11 1 3 1.75
Heifers (No.) 9 24 1 3 1.33
HH= Household
Table 5. Problems related marketing of dairy products
Did you face problem related to of marketing? Frequency Percent
1 Yes 24 65 2 No 13 35
Total 37 100
Kind of marketing problem
1 Lower price of milk at fasting time 3 12.5 2 Low price of milk and high cost of feed 16 67 3 Low price of milk 5 21
Total 24 100.0
Dairy cattle management activities and division of labor
Result on dairy cattle management activities are presented in Table 6. Milking dairy cows and milk processing activities were done by family members for 78.4% and 59.5% of households and by employed workers for 21.6% and 8.1% of households respectively. Activities related to feed and feeding of dairy animals were done by family members for 73% of households and by employed workers for 27% of households. Barn cleaning and animal waste management activities were done by employed workers for 43.2% and 48.6% of households and by family members for 56.8% and 51.4% of households respectively. Marketing of raw milk and live animals was performed by family members for 83.8% and 97.3% of households and by employed workers for 16.2% and 2.7% of households respectively. Activities related to purchasing of dairy inputs were the responsibility of family members for 94.6% of households and by employed workers for 5.4% of households. Breeding management activities such as heat detection and mating of cows that were in heat was the responsibility of family members for 56.8% and employed workers for 43.2% of households. The present results on division of labor related to dairy activities are almost in agreement with the reports of Adebabay (2009) and Sintayehu (2008).
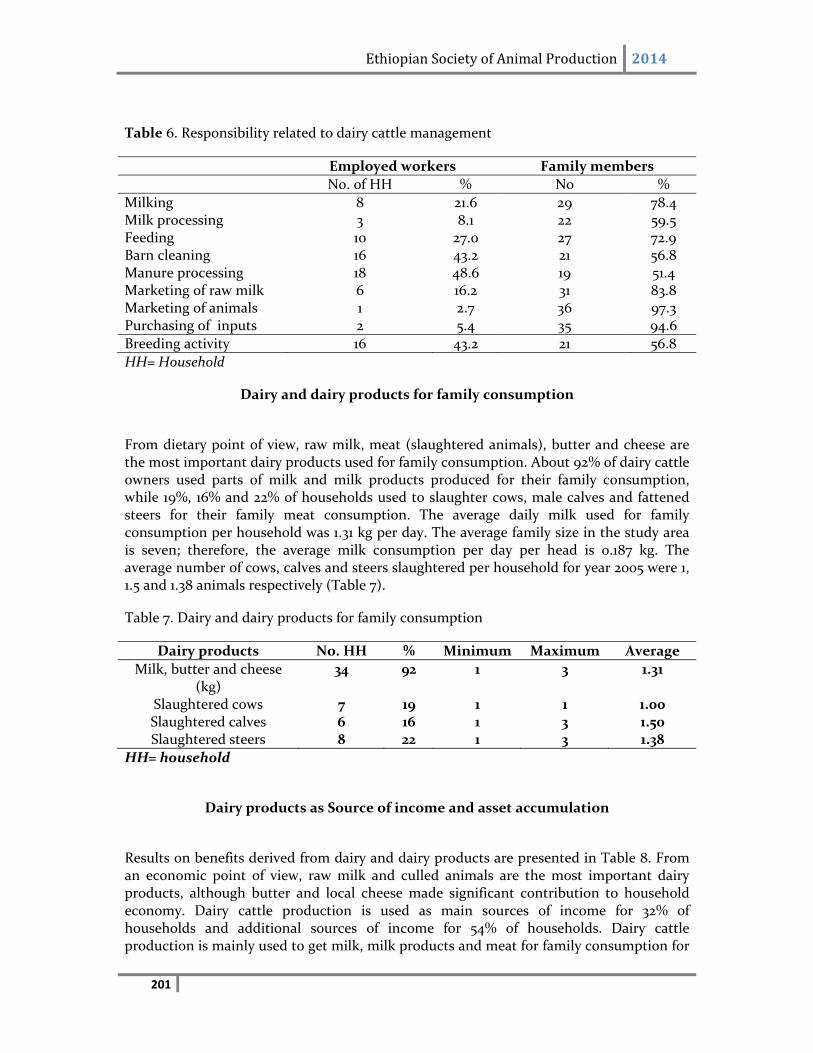
Ethiopian Society of Animal Production 2014
201
Table 6. Responsibility related to dairy cattle management
Employed workers Family members
No. of HH % No %
Milking 8 21.6 29 78.4 Milk processing 3 8.1 22 59.5 Feeding 10 27.0 27 72.9 Barn cleaning 16 43.2 21 56.8 Manure processing 18 48.6 19 51.4 Marketing of raw milk 6 16.2 31 83.8 Marketing of animals 1 2.7 36 97.3 Purchasing of inputs 2 5.4 35 94.6
Breeding activity 16 43.2 21 56.8
HH= Household
Dairy and dairy products for family consumption
From dietary point of view, raw milk, meat (slaughtered animals), butter and cheese are the most important dairy products used for family consumption. About 92% of dairy cattle owners used parts of milk and milk products produced for their family consumption, while 19%, 16% and 22% of households used to slaughter cows, male calves and fattened steers for their family meat consumption. The average daily milk used for family consumption per household was 1.31 kg per day. The average family size in the study area is seven; therefore, the average milk consumption per day per head is 0.187 kg. The average number of cows, calves and steers slaughtered per household for year 2005 were 1, 1.5 and 1.38 animals respectively (Table 7).
Table 7. Dairy and dairy products for family consumption
Dairy products No. HH % Minimum Maximum Average
Milk, butter and cheese (kg)
34 92 1 3 1.31
Slaughtered cows 7 19 1 1 1.00 Slaughtered calves 6 16 1 3 1.50 Slaughtered steers 8 22 1 3 1.38
HH= household
Dairy products as Source of income and asset accumulation
Results on benefits derived from dairy and dairy products are presented in Table 8. From an economic point of view, raw milk and culled animals are the most important dairy products, although butter and local cheese made significant contribution to household economy. Dairy cattle production is used as main sources of income for 32% of households and additional sources of income for 54% of households. Dairy cattle production is mainly used to get milk, milk products and meat for family consumption for
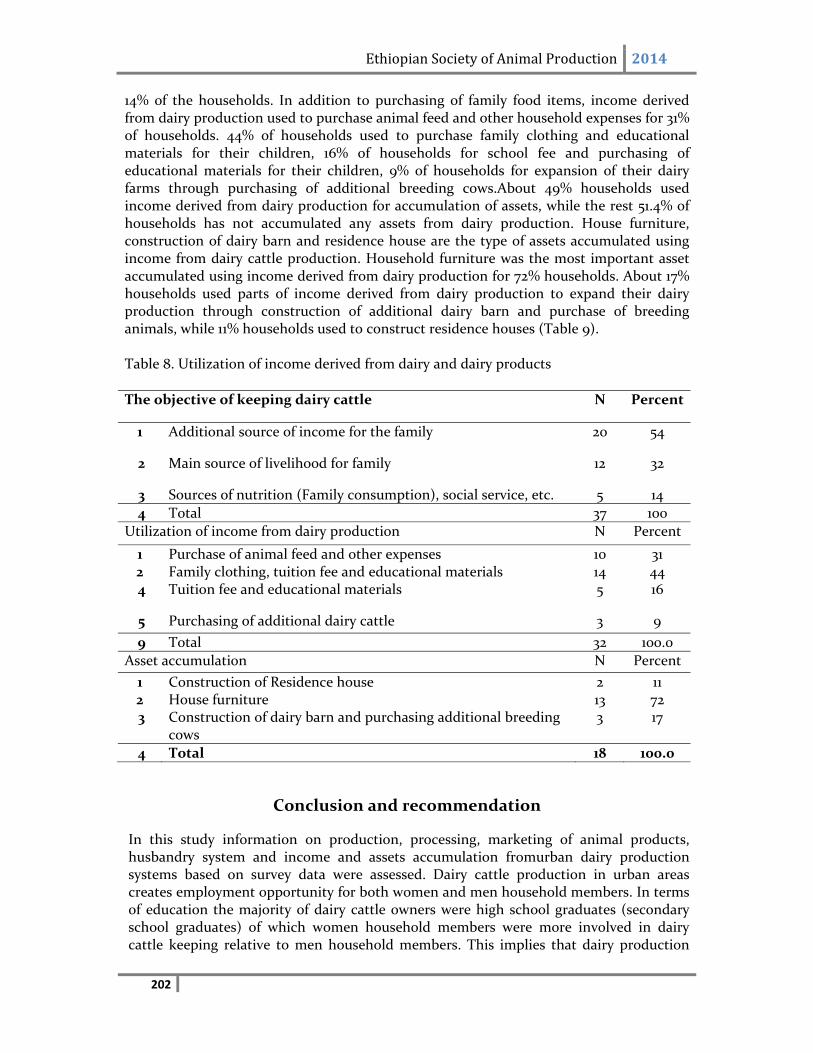
Ethiopian Society of Animal Production 2014
202
14% of the households. In addition to purchasing of family food items, income derived from dairy production used to purchase animal feed and other household expenses for 31% of households. 44% of households used to purchase family clothing and educational materials for their children, 16% of households for school fee and purchasing of educational materials for their children, 9% of households for expansion of their dairy farms through purchasing of additional breeding cows.About 49% households used income derived from dairy production for accumulation of assets, while the rest 51.4% of households has not accumulated any assets from dairy production. House furniture, construction of dairy barn and residence house are the type of assets accumulated using income from dairy cattle production. Household furniture was the most important asset accumulated using income derived from dairy production for 72% households. About 17% households used parts of income derived from dairy production to expand their dairy production through construction of additional dairy barn and purchase of breeding animals, while 11% households used to construct residence houses (Table 9).
Table 8. Utilization of income derived from dairy and dairy products
The objective of keeping dairy cattle N Percent
1 Additional source of income for the family 20 54
2 Main source of livelihood for family 12 32
3 Sources of nutrition (Family consumption), social service, etc. 5 14
4 Total 37 100
Utilization of income from dairy production N Percent
1 Purchase of animal feed and other expenses 10 31 2 Family clothing, tuition fee and educational materials 14 44 4 Tuition fee and educational materials 5 16
5 Purchasing of additional dairy cattle 3 9
9 Total 32 100.0
Asset accumulation N Percent
1 Construction of Residence house 2 11 2 House furniture 13 72 3 Construction of dairy barn and purchasing additional breeding
cows 3 17
4 Total 18 100.0
Conclusion and recommendation
In this study information on production, processing, marketing of animal products, husbandry system and income and assets accumulation fromurban dairy production systems based on survey data were assessed. Dairy cattle production in urban areas creates employment opportunity for both women and men household members. In terms of education the majority of dairy cattle owners were high school graduates (secondary school graduates) of which women household members were more involved in dairy cattle keeping relative to men household members. This implies that dairy production
Ethiopian Society of Animal Production 2014
203
could be used as source employment and source of additional income in the urban areas. Moreover, majority of dairy cattle producers were found between 33 to 50 years, indicating dairy keeping in urban areas is creating employment opportunity for productive age classes. The contribution of urban dairy production system to urban producers includes income generation and employment opportunity, assets accumulation, poverty alleviation, and improving human nutrition and health. From an economic point of view, raw milk and culled animals are the most important dairy products, although other processed milk products make significant contribution to household economy. From dietary point of view, raw milk, meat (slaughtered animals), butter and cheese are the most important dairy products used for family consumption that contribute to improve human health through provision of better nutrition. Moreover, construction of house, home furniture and dairy barn, and residence house are the type of assets accumulated using income from dairy cattle production. Poor conception rate of AI semen, unavailability of AI technician (semen) on time, poor feed quality, poor infertility of dairy cows purchased from market were major problems related to animal breeding. AI delivery system need to be improved (Number of technician and working time) based on existing cattle population and their distribution for effective and efficient services. Since infertility in dairy cows caused by different factors related to individual cow, bull (AI semen), skill of AI technician, farmers management level, detailed study on these factors need to be conducted. Problems related to price of inputs and out puts such as low price of milk especially during fasting time and high feed cost were the most important constraints related to market that influenced dairy cattle production. Strengthening the cooperative in dairy cattle feed and nutrition such as development of feed processing plant and feed quality control are issues that should be considered by the concerned body. Moreover, marketing assessment need to be practiced on availability and price of animal feed and purchasing in bulk when price is relatively cheaper is a good strategy to follow.
References
Adebabay Kebede, 2009. Characterization of Milk Production Systems, Marketing and On‐ Farm Evaluation of the Effect of Feed Supplementation on Milk Yield and Milk Composition of Cows at Bure District, Ethiopia.MSc thesis, Bahir Dar University.Bahir Dar, Ethiopia.
DZARC, 1989.Annual report on reproductive performance of dairy cattle in urban areas. Gebrewold, A., Alemayehu, M., Demeke, S., Bediye, S. and Tadesse, A. 1998.Status of dairy research in Ethiopia.In The role of village dairy co‐operatives in dairy development.Smallholder Dairy Development Project (SDDP) proceeding, Ministry of Agriculture (MOA). Addis Ababa, Ethiopia.
Kelay Belihu, 2002. Analyses of Dairy Cattle Breeding Practices in Selected Areas of Ethiopia. PhD Dissertation, Humboldt University, Berlin.
Ethiopian Society of Animal Production 2014
204
Mohamed A.M. Ahmed, Simeon Ehui, and Yemesrach Assefa. 2004. Dairy development in Ethiopia. EPTD discussion paper No. 123.International Food Policy Research Institute. Washington, DC 20006 U.S.A.
Nill, A. 1992. An overview of dairying in Sub‐saharan Africa in: Brokken. R.F and Seniat Seyoum (EDs).Dairy marketing in Sub‐Saharan Africa. Proceeding of a symposium held at ILCA, Addis Ababa, Ethiopia.
SAS, 2002. Users Guide. Version 9.0.Statistical Analysis System (SAS) Institute, Inc. Carry, NC, USA.
SintayehuYigrem, FekaduBeyene, AzageTegegne and BerhanuGebremedhin, 2008. Dairy production, processing and marketing systems of Shashemene–Dilla area, South Ethiopia. IPMS (Improving Productivity and Market Success) of Ethiopian Farmers Project Working Paper 9. ILRI (International Livestock Research Institute), Nairobi, Kenya.
Tanngka, F.K., Emerson, R.D. and Jabbar, M.A., 2002. Food Security effects of intensified dairying: evidence from the Ethiopian highlands. Socio‐economics and policy research working paper 44. ILRI (Intentional Livestock research Institute), Nairobi, Kenya.
Tesfaye Kumsa, 1995. On‐farm dairy performance of F1 crossbred cows at highland and mid altitude zones. In: Proceedings of the third National Conference of the Ethiopian Society of Animal Production. 27‐29 April 1995. Addis Ababa, Ethiopia.
Yitaye Alemayehu, 2008. Characterization and analysis of the urban and peri‐urban dairy production systems in the North western Ethiopian highlands. PhD Dissertation, University of Natural Resources and Applied Life Sciences, Vienna.
Yoseph Mekasha, 1999. Impact of feed resources on productivity and reproductive performance of dairy cows in the urban and peri‐urban dairy production system in the Addis Ababa milk shed and evaluation of non‐conventional feeed resources using sheep. MSc thesis.Alemaya University of Agriculture.

Ethiopian Society of Animal Production 2014
205
Effect of Locally Available Spices on the Microbial Quality, Consumer Acceptability and Shelf Life of Ayib: the Case of Garlic (Allium
sativum) and Ginger (Zinger officinale) Meron Regu1, Zelalem Yilma2 and Eyassu Seifu3
1 Adama Science and Technology University, P.O.Box 193, Assella, Ethiopia, Cell: +251‐0911743762; e‐mail: [email protected]
2 Country Project Mobilization Coordinator Heifer International‐ East Africa Dairy Development (EADD), Addis Ababa, Ethiopia, Cell: +251 9 11 456226; e‐ mail:
Abstract
This study was conducted to assess the effect of local preservatives (garlic and ginger) on the microbial quality, consumer acceptability (sensorial) and shelf life of “Ayib” ‐ an acid‐heat coagulated cottage type soft cheese crumbly in texture made from Arera ‐ defatted sour milk obtained as a by‐product of traditional butter‐making from “Ergo” (Ethiopian naturally fermented milk). Fresh Ayib manufactured following the traditional procedure was divided into four parts (for garlic, ginger and their mixture powder inclusion or treatments and control group with no spice addition) of one kg each. Garlic, ginger and their 1:1 ratio mixture powder were then added at 1, 3 and 5% by weight and stored for 10 days at ambient temperature. A test portion of Ayib was sampled from each treatment and the control group and evaluated every 24 hr starting from 0 hr processing for total solid, ash, fat, pH, titratable acidity and microbial properties (counts of aerobic mesophilic, coliforms and yeast and mould) using standard methods with three replication. Total solid, ash, fat and titratable acidity of samples were not affected (p>0.05) by the type as well as level of inclusion of spices used. A drop in pH value of Ayib treated with 1% garlic, (1 and 5%) ginger was observed by the first day of storage, while the pH of 5% garlic and 5% mixture treated Ayib tended to decline up to the 3rd and 4th day of storage period, respectively. The lowest mean yeast and mould counts (6.32cfu/g) and coliform counts (1.09cfu/g) were observed with 3% garlic powder treated Ayib. Based on sensory and bacteriological failure day estimation, Ayib treated with 3% garlic powder showed the lowest failure rate and could be kept up to 8 days without losing its acceptability, while the highest failure rate was observed for untreated Ayib that had a shelf life of 3.44 days. However, the difference in consumer acceptability between Ayib samples treated with 1 and 5% garlic powder and 1% mixture powder, and the control group was not marked. It can be concluded that garlic powder inclusion of 3% by weight was observed to be more effective as a natural preservative for Ayib. Sensory evaluation of Ayib showed that samples contain 5% garlic powder was considered the most acceptable one.
Key‐ words:, Ayib, microbial quality, sensory, shelf life, spices
Ethiopian Society of Animal Production 2014
206
Introduction
The composition of milk makes it an ideal medium for the growth of both spoilage as well as pathogenic microorganisms (O’Connor, 1994). Processing milk into more shelf stable products such as butter and various types of cheeses is a good means of preserving the valuable nutrients present in milk. In Ethiopia about 45% of the milk produced at national level was converted into butter, cheese and yoghurt in 2010/11(CSA, 2012). In the global market, traditionally produced cheeses are highly appreciated and are considered to be of premium value due to their flavor characteristics, which are not found in a number of industrially produced cheese varieties (Garabal, 2007). Ayib ‐ an acid‐heat coagulated cottage type soft cheese crumbly in texture made from Arera‐ defatted sour milk obtained as a by‐product of traditional butter‐making from Ergo (Ethiopian naturally fermented milk)is a traditional milk product consumed by the various ethnic groups mainly as side dish with Kitifo (minced meat) and Dorowet (chicken sauce). Ayib comprises about 79% water, 15% protein, 2% fat, 1% ash and 3% soluble milk constituents (Mogessie, 1992). Ayib can only be kept for no more than two days at ambient temperature of about 300C, while at 40C its shelf life is about seven days (O'Connor, 1993). Compared with other semi‐hard and hard cheeses, Ayib has a short shelf life mainly due to its high moisture content.
The safety of milk products with respect to food‐borne diseases is of great concern around the world. This is especially true in developing countries where production of milk and various milk products takes place under rather unsanitary and poor production conditions (Mogessie, 1990). In Ethiopia, most of the smallholder dairy producers and a substantial number of consumers do not have refrigerator and other modern preservation methods. It is, therefore, difficult to store milk and milk products for a long time. The use of natural plant preservatives is, therefore, considered as an important and practical choice. As indicated by Yanishlieva et al. (2006), in the global food industry more priority is given to natural preservatives. According to Mishra and Behal (2010), natural products such as spices can be appropriate alternatives to chemical preservatives used in various food industries minimizing their possible side effects and simultaneously improve the shelf life of food products.Different types of plants are used to improve the flavor, color and quality of milk and milk products (Fekadu, 1994; Zelalem et al., 2006; Helen, 2007; Binyam, 2008). The rhizomes of Zinger officinale (Zingibel) and Allium sativum (Netch Shinkurt) are spices commonly used as additives in Ayib‐making (Binyam, 2008; Yitaye et al., 2009). Ginger (Zinger officinale) and garlic (Allium sativum) are reported to have strong antimicrobial properties. Belewu et al. (2005), for instance, indicated that ginger extract treatment extends the shelf life of West African soft cheese for 15 days. Gundogu et al. (2009) also reported that yoghurt treated with garlic can be consumed safely for 28 days at 4±1 °C, while the control (with no spice addition) can be consumed for only 7 days. However, there is no or very limited study or report on the effect of locally available spices in general and ginger and garlic powder in particular on the microbial and sensory qualities as well as shelf life of Ayib in Ethiopia. Therefore, this work was aimed at evaluating the effect of two locally available spices (garlic and ginger) on the microbial quality, consumer acceptability and shelf life of Ayib.
Ethiopian Society of Animal Production 2014
207
Materials and Methods
Study area
The study was conducted at the Dairy Technology Laboratory of Holetta Agricultural Research Center of the Ethiopian Institute of Agricultural Research (EIAR). The study area is situated at an altitude of 2400 m.a.s.l. and receives mean annual rainfall of 1100 mm. The mean minimum and maximum temperatures of the area are 60C and 240C, respectively.
Garlic and ginger powder preparation
The outer cover of garlic (obtained from Debre Zeit Agricultural Research center) cloves were peeled off; washed with clean water; and sliced with a sharp knife. The sliced cloves were then sun dried with a final moisture content of 10% and ground by an electric kitchen grinder (Douglas et al., 2005).Fresh mature rhizomes of ginger (obtained from Jimma Agricultural Research center) were sorted, thoroughly washed, peeled and sliced (about 2 mm thickness) with a sharp knife. These sliced rhizomes were then sun dried until final moisture reached 10%. Then after, the dried gingers were ground by using electric kitchen grinder. Finally, the powder was screened through a sieve (Sukaiang et al., 2010). Both ginger and garlic powders were packed in sterile glass bottles and stored in dark and clean area (Douglas et al., 2005).
Ayib – making
The quality of milk collected from the dairy herd (local and crossbred cows) from Holeta Research Center was examined at each sampling using clot‐on‐boiling and organoleptic (flavor and color) tests. Raw milk was kept at room temperature for 48 h to sour spontaneously. The sour milk with pH of about 4.0 was churned by an electric churner to recover the butter. Then after, the defatted sour milk obtained as a by‐product of churning (butter‐making) was heated at an average temperature of 500C for 55min and cooled overnight. The whey and curd were then separated by using a sieve and the curd was retained in the sieve for about an hour for effective drainage.
Sampling and study procedure
The Ayib samples treated with ginger, garlic and their 1:1 ratio mixture powder with (1, 3 and 5%) were divided into parts and bottles, sealed with aluminum foil and stored at ambient temperature for the various physico‐chemical, microbial and sensory tests. All Ayib samples were examined every 24h starting from 0 hour (right after processing) for 10 days with three replications.
Ethiopian Society of Animal Production 2014
208
Physico‐chemical tests
Percent contents of total solid, ash and fat in the Ayib samples were analyzed following standard procedures (AOAC, 1995). Acidity of Ayib samples was determined by titrating 25ml portion of the filter that represents 2.5g of a given Ayib sample with 0.1N NaOH using phenolphthalein end point. Acidity is expressed as % lactic acid (1mL of 0.1N NaOH = 0.009 g of lactic acid) (AOAC, 1995). The pH of the Ayib samples was measured using a digital pH meter after calibrating using standard buffer solutions of pH 4 and 7 (Ratibaet al., 2006).
Microbiological Analysis
The microbiological quality tests for the Ayib samples considered include: Aerobic mesophilic bacteria count (AMBC), coliform count (CC) and yeast and mould count (YMC). Standard Plate Count Agar (SPCA) (Oxoid) was used to determine AMBC; while Violet Red Bile Agar (VRBA) (Oxoid) was used for CC; and Potato Dextrose Agar (PDA) (Oxoid) for YMC. For AMBC, dilutions were selected so that the total number of colonies on a plate was between 30‐300, while for CC dilutions were selected for plate counts of between 15‐ 150 (Richardson, 1985). Peptone water and the culture media used for each count were autoclaved for 15 min at 1210C, except Violet Red Bile Agar (VRBA), which was boiled for about 2 min until it was completely dissolved (Richardson, 1985). Media used were prepared according to the directions given by the manufacturers. Aerobic Mesophylic Bacteria Count (AMBC):after autoclaving, SPCA (Oxoid) was added into a sterile Petri dish and allowed to solidify. AMBC was made after incubating appropriate decimal dilutions of the samples in the SPCA medium at 320C for 48 h (Richardson, 1985). Coliform Count (CC): appropriate decimal dilutions were surfaceplated on VRBA (Oxoid) and counts were made after incubating the plates at 320C for 24 h (Richardson, 1985). Yeast and Mould Count (YMC). Decimal dilutions of Ayib samples were made in the same manner as for AMBC and CC described above. YMC were made after incubating plates at 250C for 5 days (Marth, 1978). Colony count was calculated by using the following formula (IDF, 1991).
Where: N = Number of cfu/g or ml of test sample; ΣC = sum of all colonies counted (between 10‐300); n1 = number of plates from the lowest dilution used for computing the count; n2 = number of plates in the next dilution factor used for computing the count; d =reciprocal of the dilution factor of used for computing the count corresponding to n1 and v= is the volume of sample applied in each plate. Shelf life determination: test portions of the control and treated Ayib samples were taken every 24 hours for the organoleptic evaluation by 5 panelists. A product is considered to be spoiled when it is discarded by at least 50% of the evaluators, and that day of discretion was considered as a failure day .The shelf life of the samples was taken to be one day less the failure day (Schmidt and Bouma, 1992).
Ethiopian Society of Animal Production 2014
209
Sensory evaluation: fifty‐eight consumers (23 men and 35 women) were selected based on: age between (18‐64 years) and habit of consuming fermented milk products. Ayib samples (20g) were placed randomly in a three digit coded white plastic plates and served in a bright well ventilated room. Distilled water was provided to the panelists to rinse their mouth after each taste. The sensory attributes of Ayib samples i.e taste, color, aroma, texture and overall acceptability were evaluated using a 5‐point Hedonic scale (5 = like very much, 4 = like moderately, 3 = neither like nor dislike, 2 = dislike moderately and 1 = dislike very much) (Lawless and Heymann, 1999).
Data analysis
The data generated from the physico‐chemical and microbial analyses were analyzed using the General Linear Model procedure of the Statistical Analysis System software (SAS, Version 9, 2002). Sensory score data were analyzed by using the analysis of variance technique (Rabita et al., 2006).The data on microbial counts were first transformed to logarithmic (log10) values before subjected to statistical analysis of variance. P<0.05 was considered as the level of significance using Duncan’s multiple ranges.Failure data were analyzed by using Weibull distribution method to model the shelf‐life data as used by Schmidt and Bouma (1992). Nominal shelf‐life was calculated from this distribution fit characteristics for each treatment. The Weibull probability distribution function is given by:
where is shape parameter, is scale parameter, . The cumulative
distribution is:
Results
Proximate composition of Ayib
Treating Ayib samples with different levels of ginger, garlic and their mixture powder had no significant (p>0.05) effect on the % total solid, ash and fat contents of the samples (Table 1).
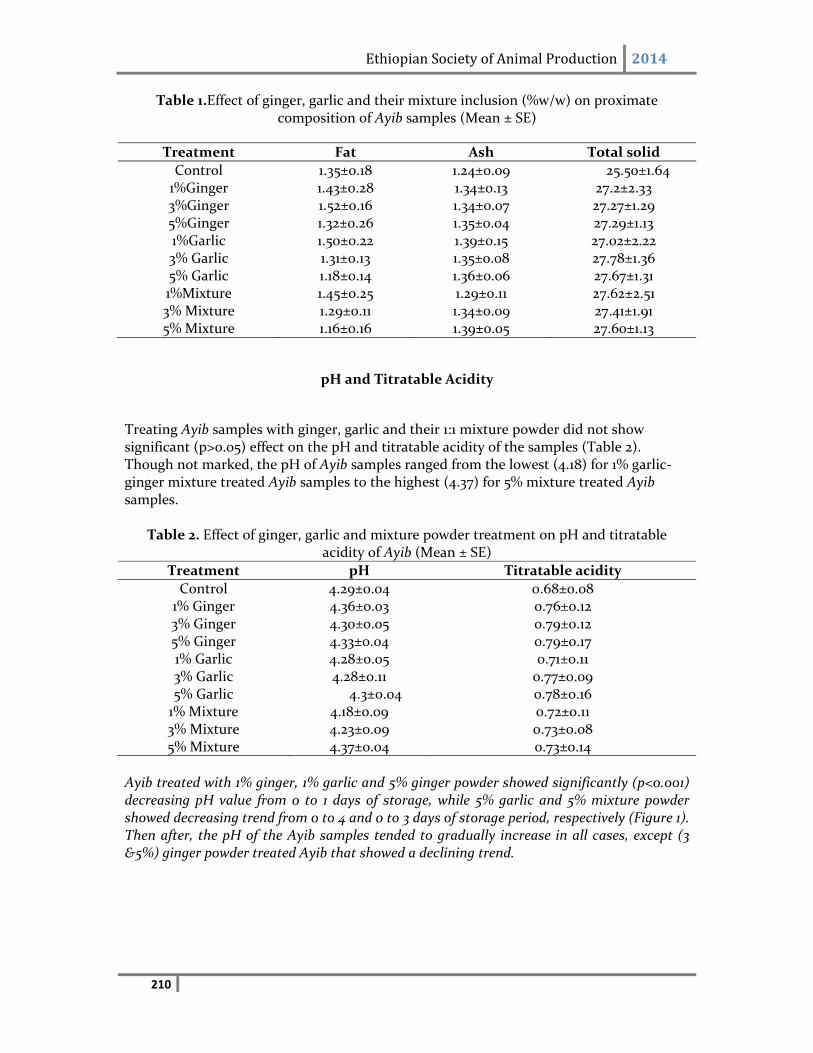
Ethiopian Society of Animal Production 2014
210
Table 1.Effect of ginger, garlic and their mixture inclusion (%w/w) on proximate composition of Ayib samples (Mean ± SE)
pH and Titratable Acidity
Treating Ayib samples with ginger, garlic and their 1:1 mixture powder did not show significant (p>0.05) effect on the pH and titratable acidity of the samples (Table 2). Though not marked, the pH of Ayib samples ranged from the lowest (4.18) for 1% garlic‐ginger mixture treated Ayib samples to the highest (4.37) for 5% mixture treated Ayib samples.
Table 2. Effect of ginger, garlic and mixture powder treatment on pH and titratable
acidity of Ayib (Mean ± SE)
Treatment pH Titratable acidity
Control 4.29±0.04 0.68±0.08 1% Ginger 4.36±0.03 0.76±0.12 3% Ginger 4.30±0.05 0.79±0.12 5% Ginger 4.33±0.04 0.79±0.17 1% Garlic 4.28±0.05 0.71±0.11 3% Garlic 4.28±0.11 0.77±0.09 5% Garlic 4.3±0.04 0.78±0.16 1% Mixture 4.18±0.09 0.72±0.11 3% Mixture 4.23±0.09 0.73±0.08 5% Mixture 4.37±0.04 0.73±0.14
Ayib treated with 1% ginger, 1% garlic and 5% ginger powder showed significantly (p<0.001) decreasing pH value from 0 to 1 days of storage, while 5% garlic and 5% mixture powder showed decreasing trend from 0 to 4 and 0 to 3 days of storage period, respectively (Figure 1). Then after, the pH of the Ayib samples tended to gradually increase in all cases, except (3 &5%) ginger powder treated Ayib that showed a declining trend.
Treatment Fat Ash Total solid
Control 1.35±0.18 1.24±0.09 25.50±1.64 1%Ginger 1.43±0.28 1.34±0.13 27.2±2.33 3%Ginger 1.52±0.16 1.34±0.07 27.27±1.29 5%Ginger 1.32±0.26 1.35±0.04 27.29±1.13 1%Garlic 1.50±0.22 1.39±0.15 27.02±2.22 3% Garlic 1.31±0.13 1.35±0.08 27.78±1.36 5% Garlic 1.18±0.14 1.36±0.06 27.67±1.31 1%Mixture 1.45±0.25 1.29±0.11 27.62±2.51 3% Mixture 1.29±0.11 1.34±0.09 27.41±1.91 5% Mixture 1.16±0.16 1.39±0.05 27.60±1.13
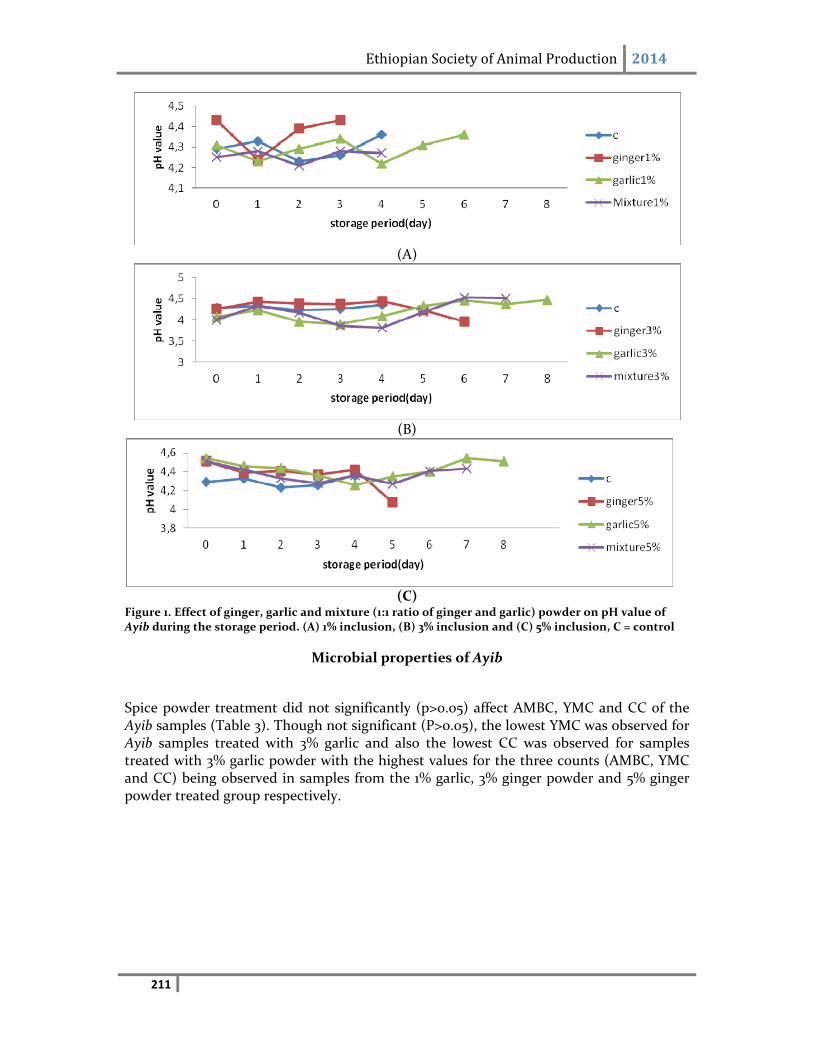
Ethiopian Society of Animal Production 2014
211
(A)
(B)
(C)
Figure 1. Effect of ginger, garlic and mixture (1:1 ratio of ginger and garlic) powder on pH value of Ayib during the storage period. (A) 1% inclusion, (B) 3% inclusion and (C) 5% inclusion, C = control
Microbial properties of Ayib
Spice powder treatment did not significantly (p>0.05) affect AMBC, YMC and CC of the Ayib samples (Table 3). Though not significant (P>0.05), the lowest YMC was observed for Ayib samples treated with 3% garlic and also the lowest CC was observed for samples treated with 3% garlic powder with the highest values for the three counts (AMBC, YMC and CC) being observed in samples from the 1% garlic, 3% ginger powder and 5% ginger powder treated group respectively.
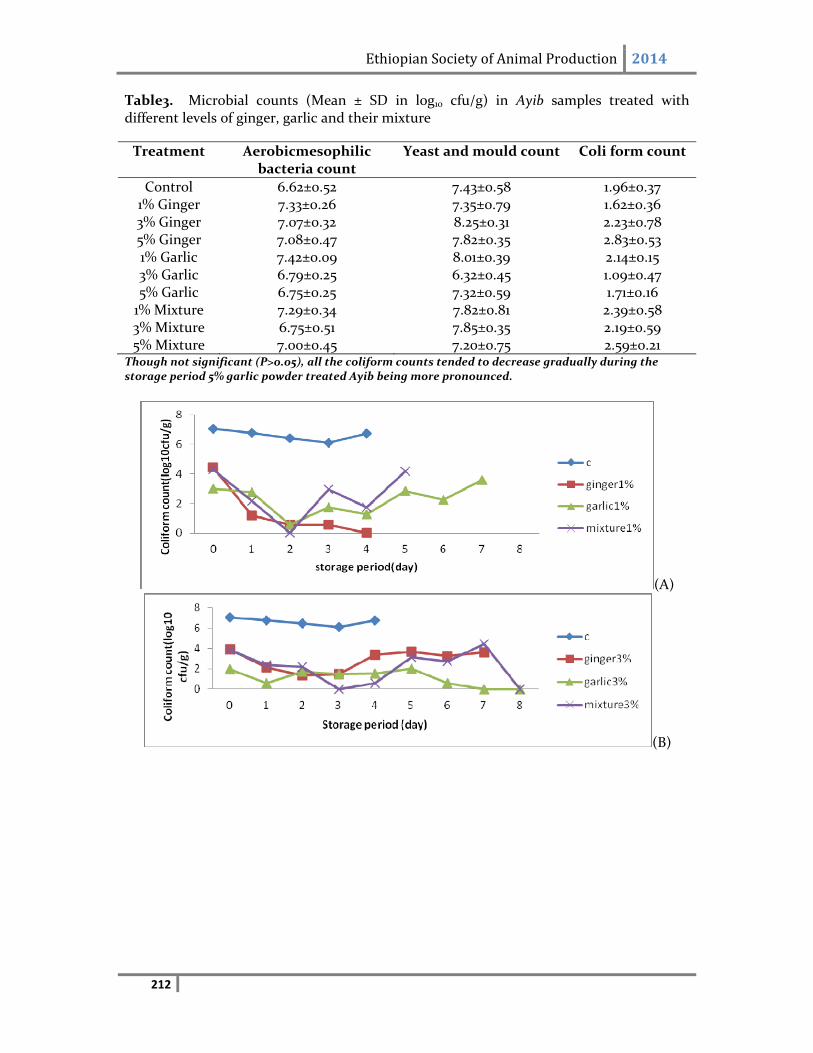
Ethiopian Society of Animal Production 2014
212
Table3. Microbial counts (Mean ± SD in log10 cfu/g) in Ayib samples treated with different levels of ginger, garlic and their mixture
Treatment Aerobicmesophilic bacteria count
Yeast and mould count Coli form count
Control 6.62±0.52 7.43±0.58 1.96±0.37 1% Ginger 7.33±0.26 7.35±0.79 1.62±0.36 3% Ginger 7.07±0.32 8.25±0.31 2.23±0.78 5% Ginger 7.08±0.47 7.82±0.35 2.83±0.53 1% Garlic 7.42±0.09 8.01±0.39 2.14±0.15 3% Garlic 6.79±0.25 6.32±0.45 1.09±0.47 5% Garlic 6.75±0.25 7.32±0.59 1.71±0.16 1% Mixture 7.29±0.34 7.82±0.81 2.39±0.58 3% Mixture 6.75±0.51 7.85±0.35 2.19±0.59 5% Mixture 7.00±0.45 7.20±0.75 2.59±0.21
Though not significant (P>0.05), all the coliform counts tended to decrease gradually during the storage period 5% garlic powder treated Ayib being more pronounced.
(A)
(B)
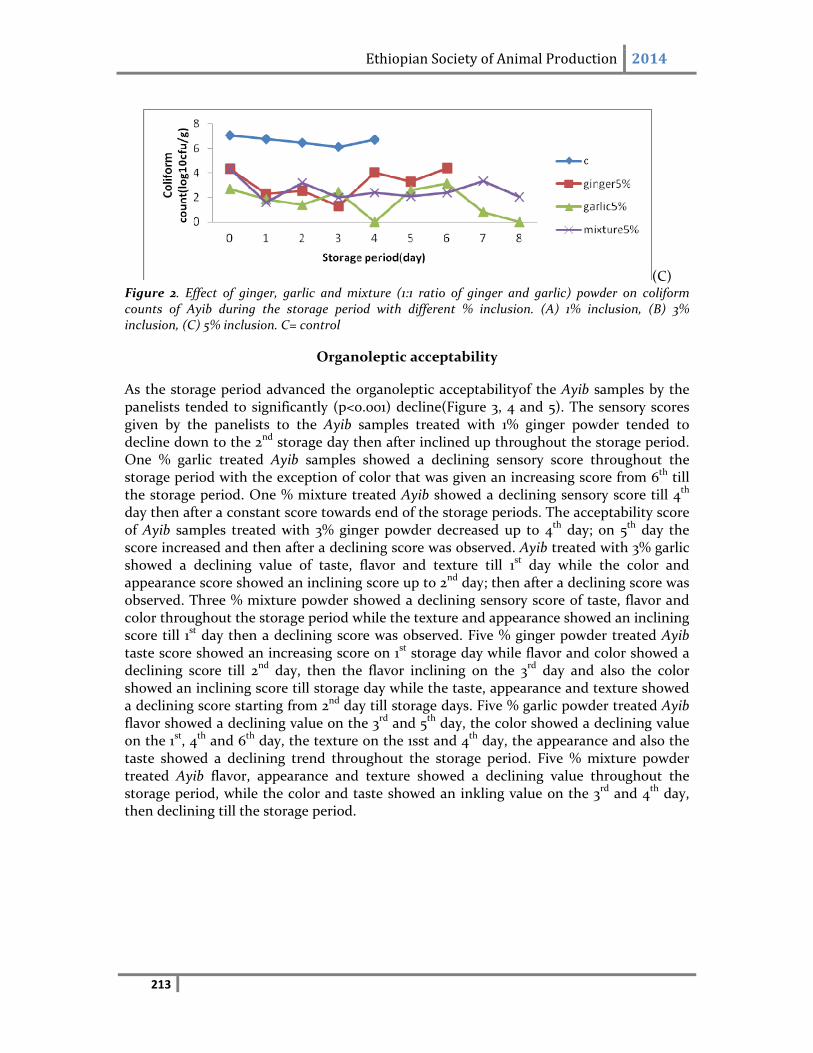
Ethiopian Society of Animal Production 2014
213
(C) Figure 2. Effect of ginger, garlic and mixture (1:1 ratio of ginger and garlic) powder on coliform counts of Ayib during the storage period with different % inclusion. (A) 1% inclusion, (B) 3% inclusion, (C) 5% inclusion. C= control
Organoleptic acceptability
As the storage period advanced the organoleptic acceptabilityof the Ayib samples by the panelists tended to significantly (p<0.001) decline(Figure 3, 4 and 5). The sensory scores given by the panelists to the Ayib samples treated with 1% ginger powder tended to decline down to the 2nd storage day then after inclined up throughout the storage period. One % garlic treated Ayib samples showed a declining sensory score throughout the storage period with the exception of color that was given an increasing score from 6th till the storage period. One % mixture treated Ayib showed a declining sensory score till 4th day then after a constant score towards end of the storage periods. The acceptability score of Ayib samples treated with 3% ginger powder decreased up to 4th day; on 5th day the score increased and then after a declining score was observed. Ayib treated with 3% garlic showed a declining value of taste, flavor and texture till 1st day while the color and appearance score showed an inclining score up to 2nd day; then after a declining score was observed. Three % mixture powder showed a declining sensory score of taste, flavor and color throughout the storage period while the texture and appearance showed an inclining score till 1st day then a declining score was observed. Five % ginger powder treated Ayib taste score showed an increasing score on 1st storage day while flavor and color showed a declining score till 2nd day, then the flavor inclining on the 3rd day and also the color showed an inclining score till storage day while the taste, appearance and texture showed a declining score starting from 2nd day till storage days. Five % garlic powder treated Ayib flavor showed a declining value on the 3rd and 5th day, the color showed a declining value on the 1st, 4th and 6th day, the texture on the 1sst and 4th day, the appearance and also the taste showed a declining trend throughout the storage period. Five % mixture powder treated Ayib flavor, appearance and texture showed a declining value throughout the storage period, while the color and taste showed an inkling value on the 3rd and 4th day, then declining till the storage period.
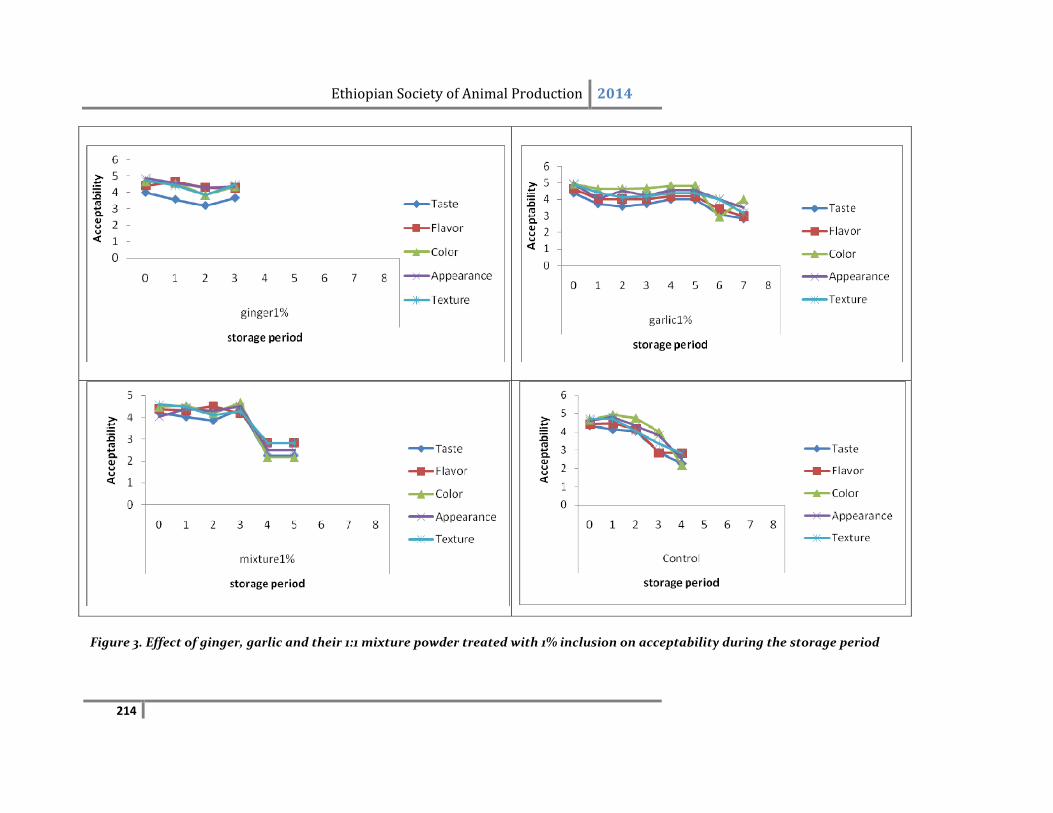
Ethiopian Society of Animal Production 2014
214
Figure 3. Effect of ginger, garlic and their 1:1 mixture powder treated with 1% inclusion on acceptability during the storage period
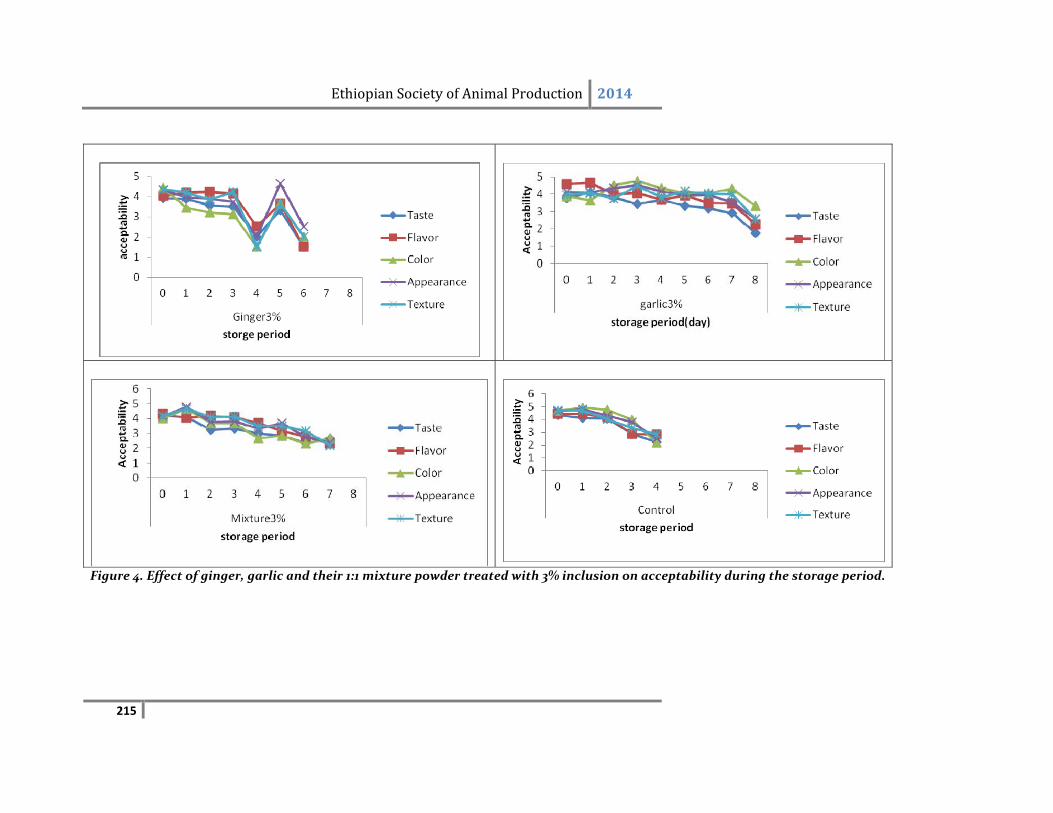
Ethiopian Society of Animal Production 2014
215
Figure 4. Effect of ginger, garlic and their 1:1 mixture powder treated with 3% inclusion on acceptability during the storage period.
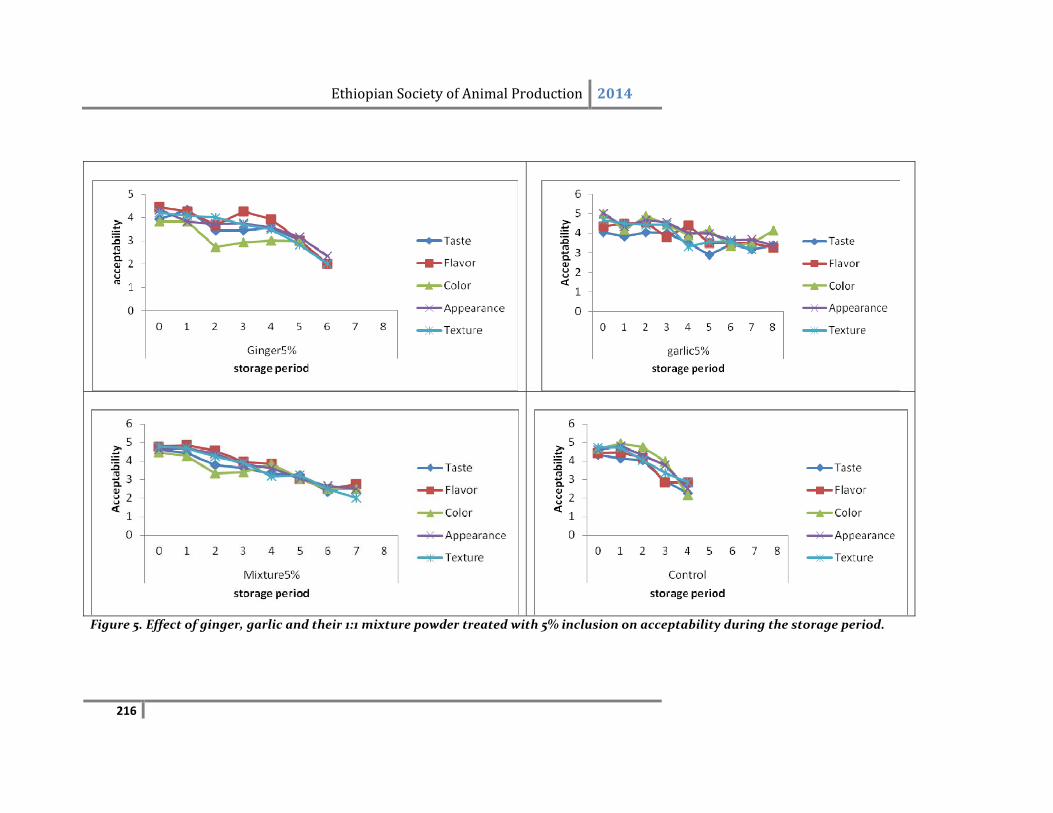
Ethiopian Society of Animal Production 2014
216
Figure 5. Effect of ginger, garlic and their 1:1 mixture powder treated with 5% inclusion on acceptability during the storage period.
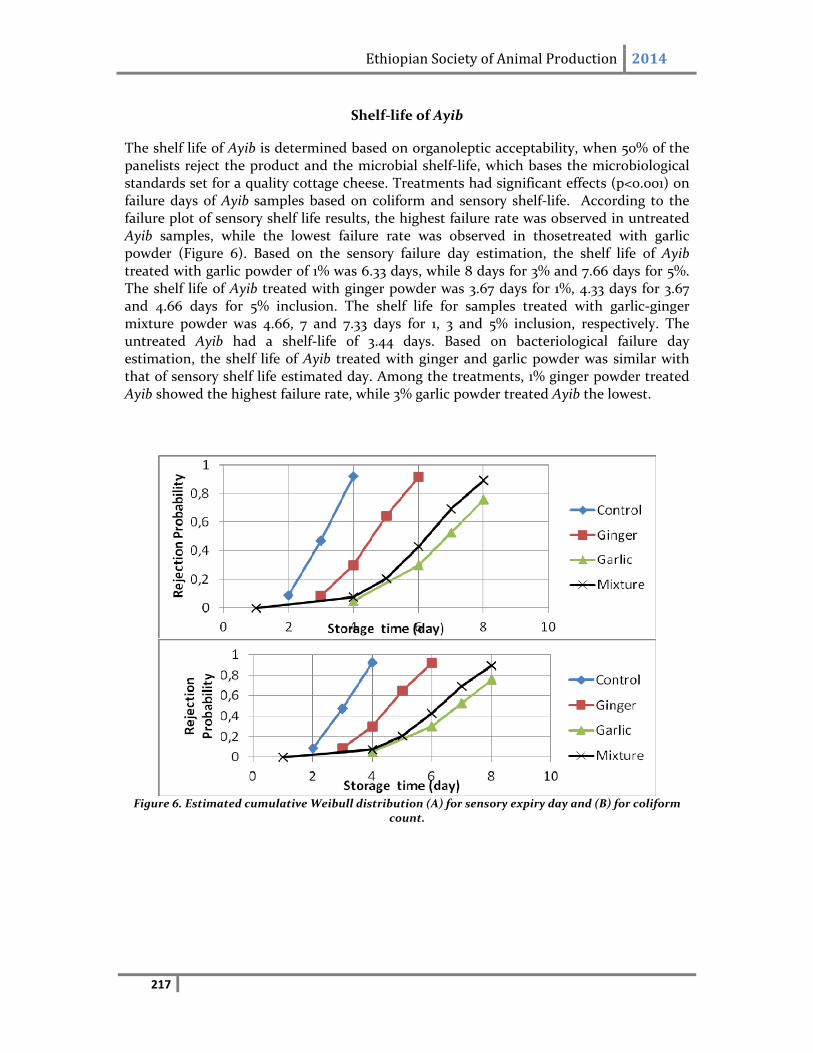
Ethiopian Society of Animal Production 2014
217
Shelf‐life of Ayib
The shelf life of Ayib is determined based on organoleptic acceptability, when 50% of the panelists reject the product and the microbial shelf‐life, which bases the microbiological standards set for a quality cottage cheese. Treatments had significant effects (p<0.001) on failure days of Ayib samples based on coliform and sensory shelf‐life. According to the failure plot of sensory shelf life results, the highest failure rate was observed in untreated Ayib samples, while the lowest failure rate was observed in thosetreated with garlic powder (Figure 6). Based on the sensory failure day estimation, the shelf life of Ayib treated with garlic powder of 1% was 6.33 days, while 8 days for 3% and 7.66 days for 5%. The shelf life of Ayib treated with ginger powder was 3.67 days for 1%, 4.33 days for 3.67 and 4.66 days for 5% inclusion. The shelf life for samples treated with garlic‐ginger mixture powder was 4.66, 7 and 7.33 days for 1, 3 and 5% inclusion, respectively. The untreated Ayib had a shelf‐life of 3.44 days. Based on bacteriological failure day estimation, the shelf life of Ayib treated with ginger and garlic powder was similar with that of sensory shelf life estimated day. Among the treatments, 1% ginger powder treated Ayib showed the highest failure rate, while 3% garlic powder treated Ayib the lowest.
Figure 6. Estimated cumulative Weibull distribution (A) for sensory expiry day and (B) for coliform
count.
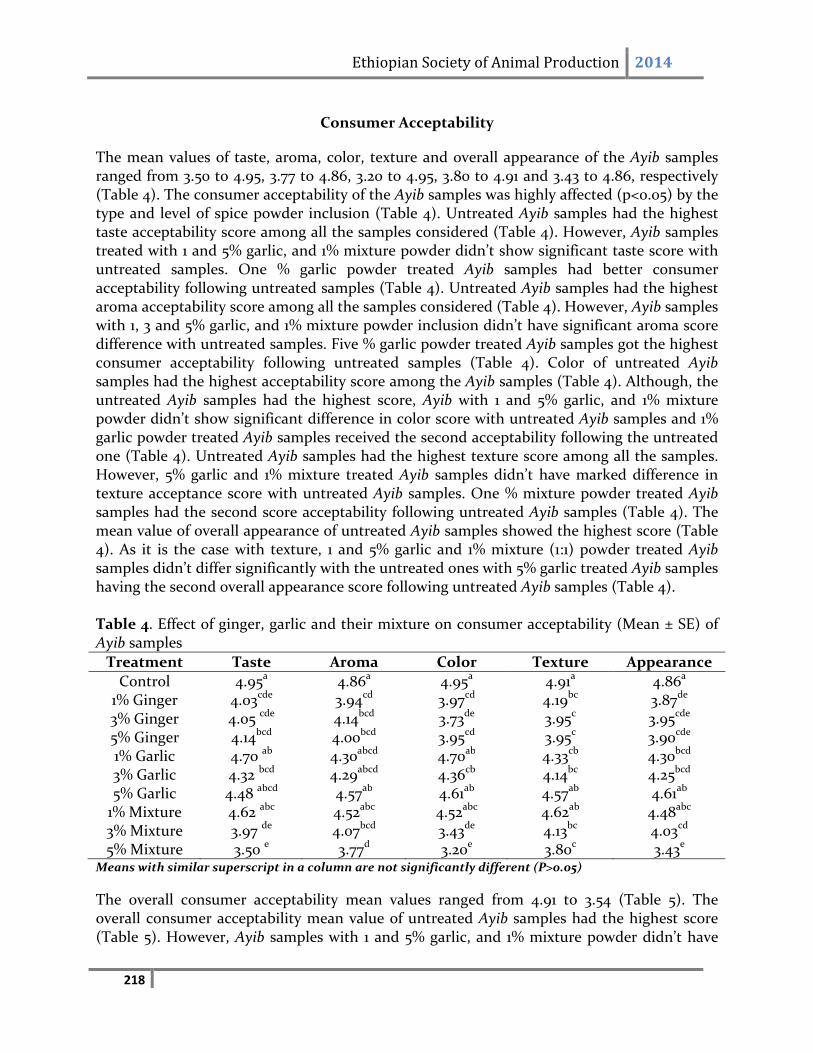
Ethiopian Society of Animal Production 2014
218
Consumer Acceptability
The mean values of taste, aroma, color, texture and overall appearance of the Ayib samples ranged from 3.50 to 4.95, 3.77 to 4.86, 3.20 to 4.95, 3.80 to 4.91 and 3.43 to 4.86, respectively (Table 4). The consumer acceptability of the Ayib samples was highly affected (p<0.05) by the type and level of spice powder inclusion (Table 4). Untreated Ayib samples had the highest taste acceptability score among all the samples considered (Table 4). However, Ayib samples treated with 1 and 5% garlic, and 1% mixture powder didn’t show significant taste score with untreated samples. One % garlic powder treated Ayib samples had better consumer acceptability following untreated samples (Table 4). Untreated Ayib samples had the highest aroma acceptability score among all the samples considered (Table 4). However, Ayib samples with 1, 3 and 5% garlic, and 1% mixture powder inclusion didn’t have significant aroma score difference with untreated samples. Five % garlic powder treated Ayib samples got the highest consumer acceptability following untreated samples (Table 4). Color of untreated Ayib samples had the highest acceptability score among the Ayib samples (Table 4). Although, the untreated Ayib samples had the highest score, Ayib with 1 and 5% garlic, and 1% mixture powder didn’t show significant difference in color score with untreated Ayib samples and 1% garlic powder treated Ayib samples received the second acceptability following the untreated one (Table 4). Untreated Ayib samples had the highest texture score among all the samples. However, 5% garlic and 1% mixture treated Ayib samples didn’t have marked difference in texture acceptance score with untreated Ayib samples. One % mixture powder treated Ayib samples had the second score acceptability following untreated Ayib samples (Table 4). The mean value of overall appearance of untreated Ayib samples showed the highest score (Table 4). As it is the case with texture, 1 and 5% garlic and 1% mixture (1:1) powder treated Ayib samples didn’t differ significantly with the untreated ones with 5% garlic treated Ayib samples having the second overall appearance score following untreated Ayib samples (Table 4). Table 4. Effect of ginger, garlic and their mixture on consumer acceptability (Mean ± SE) of Ayib samples
Treatment Taste Aroma Color Texture Appearance
Control 4.95a 4.86a 4.95a 4.91a 4.86a 1% Ginger 4.03cde 3.94cd 3.97cd 4.19bc 3.87de 3% Ginger 4.05 cde 4.14bcd 3.73de 3.95c 3.95cde 5% Ginger 4.14bcd 4.00bcd 3.95cd 3.95c 3.90cde 1% Garlic 4.70 ab 4.30abcd 4.70ab 4.33cb 4.30bcd 3% Garlic 4.32 bcd 4.29abcd 4.36cb 4.14bc 4.25bcd 5% Garlic 4.48 abcd 4.57ab 4.61ab 4.57ab 4.61ab 1% Mixture 4.62 abc 4.52abc 4.52abc 4.62ab 4.48abc 3% Mixture 3.97 de 4.07bcd 3.43de 4.13bc 4.03cd 5% Mixture 3.50 e 3.77d 3.20e 3.80c 3.43e
Means with similar superscript in a column are not significantly different (P>0.05)
The overall consumer acceptability mean values ranged from 4.91 to 3.54 (Table 5). The overall consumer acceptability mean value of untreated Ayib samples had the highest score (Table 5). However, Ayib samples with 1 and 5% garlic, and 1% mixture powder didn’t have
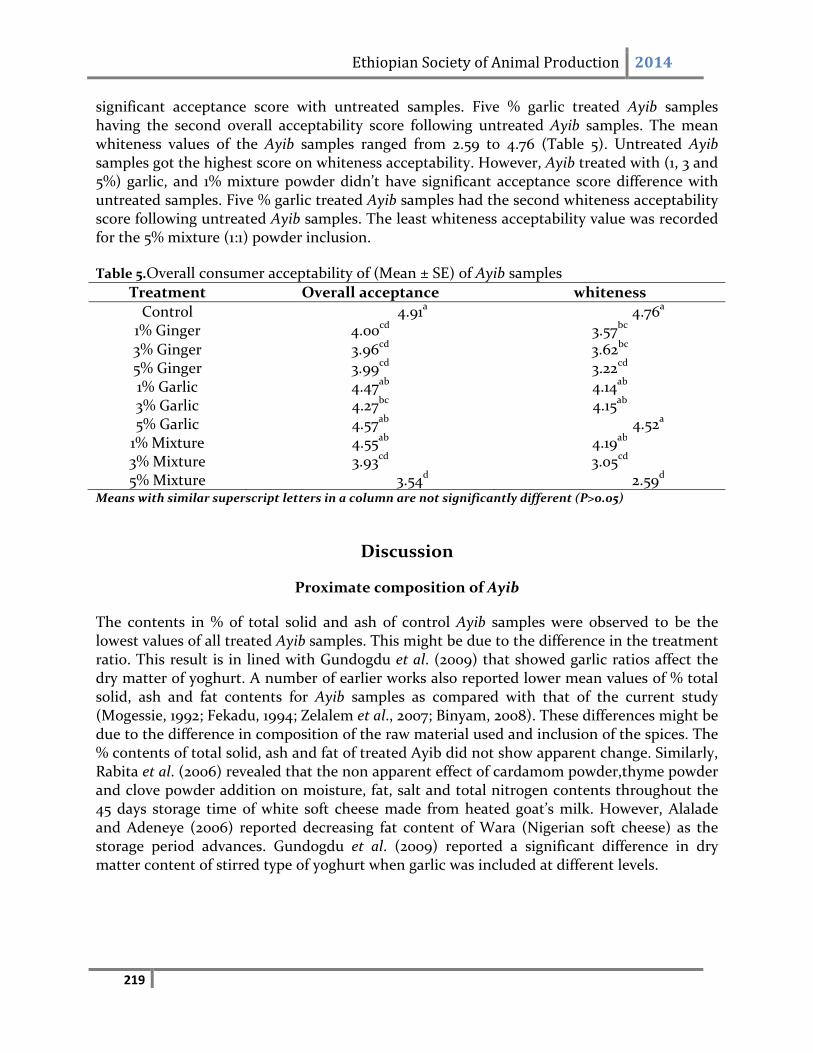
Ethiopian Society of Animal Production 2014
219
significant acceptance score with untreated samples. Five % garlic treated Ayib samples having the second overall acceptability score following untreated Ayib samples. The mean whiteness values of the Ayib samples ranged from 2.59 to 4.76 (Table 5). Untreated Ayib samples got the highest score on whiteness acceptability. However, Ayib treated with (1, 3 and 5%) garlic, and 1% mixture powder didn’t have significant acceptance score difference with untreated samples. Five % garlic treated Ayib samples had the second whiteness acceptability score following untreated Ayib samples. The least whiteness acceptability value was recorded for the 5% mixture (1:1) powder inclusion.
Table 5.Overall consumer acceptability of (Mean ± SE) of Ayib samples
Treatment Overall acceptance whiteness
Control 4.91a 4.76a 1% Ginger 4.00cd 3.57bc 3% Ginger 3.96cd 3.62bc 5% Ginger 3.99cd 3.22cd 1% Garlic 4.47ab 4.14ab 3% Garlic 4.27bc 4.15ab 5% Garlic 4.57ab 4.52a 1% Mixture 4.55ab 4.19ab 3% Mixture 3.93cd 3.05cd 5% Mixture 3.54d 2.59d
Means with similar superscript letters in a column are not significantly different (P>0.05)
Discussion
Proximate composition of Ayib
The contents in % of total solid and ash of control Ayib samples were observed to be the lowest values of all treated Ayib samples. This might be due to the difference in the treatment ratio. This result is in lined with Gundogdu et al. (2009) that showed garlic ratios affect the dry matter of yoghurt. A number of earlier works also reported lower mean values of % total solid, ash and fat contents for Ayib samples as compared with that of the current study (Mogessie, 1992; Fekadu, 1994; Zelalem et al., 2007; Binyam, 2008). These differences might be due to the difference in composition of the raw material used and inclusion of the spices. The % contents of total solid, ash and fat of treated Ayib did not show apparent change. Similarly, Rabita et al. (2006) revealed that the non apparent effect of cardamom powder,thyme powder and clove powder addition on moisture, fat, salt and total nitrogen contents throughout the 45 days storage time of white soft cheese made from heated goat’s milk. However, Alalade and Adeneye (2006) reported decreasing fat content of Wara (Nigerian soft cheese) as the storage period advances. Gundogdu et al. (2009) reported a significant difference in dry matter content of stirred type of yoghurt when garlic was included at different levels.
Ethiopian Society of Animal Production 2014
220
pH and Titratable Acidity
Ayib samples with the highest spice % inclusion showed high pH value leading to slow acid development in the samples. This result agrees with that of Rabita et al. (2006) who indicated white cheese with 0.2% cardamom showed the slowest acid development compared with that with 0.1 and 0.15% thyme powder, 0.1 and 0.2% clove powder and 0.1% cardamom powder. The decreasing trends of pH during the storage periods might be due to the activity of psychrotrophic bacteria that ferment the carbohydrate present in the spices. Metry et al. (2007) also showed that the pH of white soft cheese samples treated with cardamom, thyme and clove essential oil decreased during the pickling period (45days) in all samples. The titratable acidity of treated Ayib samples did not show marked change during the storage periods. Osman and Omer(2008), however, indicated an increasing value of Sudanese white cheese during the storage time. A similar result was also reported by Metry et al., 2007 on cardamom, thyme and clove essential oil treated white cheese during the pickling period (45 days), which deviate from this study.
Microbial properties of Ayib
The YMC and CC values of 3% garlic powder treated Ayib were lower. This might be due to the antimicrobial property of garlic. The decrease in CC during the storage period might also be due to the antimicrobial effect of garlic and acidity of Ayib. This result is also in line with that of Rabita et al. (2006) who indicated that CC of white cheese treated with cardamom, thyme and clove powder decreased from day 30 of the storage period through day 45. Metry et al. (2007) also reported that CC of white cheese treated with cardamom, thyme and clove essential oil decreased throughout the storage period.
Organoleptic Properties
The declining value of all score might be the microbial activity and acidity of Ayib. Gundogdu et al. (2009) reported a similar result where sensory properties of yoghurt samples treated with garlic decreased during the storage period.
Effects of ginger and garlic powder on shelf‐life of Ayib
Based on the sensorial and bacteriological failure day estimation garlic treated Ayib had the longest shelf life compared with the other treatments. This might be due to the antimicrobial property of garlic as stated by Javed et al. (2011) that might have hindered the microbial growth and their activity causing the unacceptable sensory and appearance properties of Ayib during the storage periods. This result is in agreement with that of Binyam (2008), who reported that the shelf life of garlic juice treated cottage cheese showed the lowest failure rate than rue and garlic‐rue mixture treated cottage cheese.
Ethiopian Society of Animal Production 2014
221
Consumer Acceptability
Five % garlic treated Ayib samples had the second overall acceptability score following untreated Ayib samples. This result is in line with that of Gundogdu et al. (2009) who revealed that yoghurt samples containing 1% garlic were more favored than samples with 0.5% in both set type and stirred type.
Conclusion
Inclusion of 3% garlic powder in Ayib can significantly decrease the coliform counts and prolong its shelf life. Further innovations are needed in Ayib processing that geared towards improving the acceptable quality of the product and also cost estimation of garlic powder treated Ayib with appropriate inclusion level should be analyzed.
Acknowledgments
The authors are grateful to the Adama Science and Technology University Research Fund for supporting this research and also EIAR especially Holeta Research Center for allowing dairy laboratory.
Reference
AOAC (Association of Official Analytical Chemistry), 1995. Official methods of analysis, 15th ed. Washington, DC, USA. Belewu, M. A., K. Y. Belewu and C. C. Nkwunonwo, 2005.Effect of biological and chemical preservatives on the shelf life of West African soft cheese. African Journal of Biotechnology, 4 (10): 1076‐1079. Binyam Kassa, 2008. Cottage cheese production in shashemene and the role of rue (ruta chalepensis) and garlic (allium sativum) on its quality and shelf life. MSc Thesis presented to the School of Graduate studies Hawasa University Ethiopia. 126p. CSA (Central Statistical Agency),2012. Agricultural sample survey. Report on crop and livestock product utilization. The Federal Democratic republic of Ethiopia, Central Statistical Agency (CSA). Private Peasant Holdings. Statistical Bulletin 570, Addis Ababa, Ethiopia. Douglas, M. and Heyes, J. and B. Smallfield, 2005. Herbs, spices and essential oils postharvest operations in developing countries. Fekadu Beyene, 1994. Farm‐made dairy products in Southern Ethiopia: Fermented milk and cottage cheese. Annual research report, Awassa College of Agriculture. Awassa, Ethiopia.
Ethiopian Society of Animal Production 2014
222
Garabal, J. I, 2007. Biodiversity and the survival of autochthonous fermented products. International microbial, 10:1‐3. Gundogdu, E., Songul, C. and Elif, D. 2009. The Effect of Garlic (Allium sativum L.) on Some Quality Properties and Shelf‐Life of Set and Stirred Yoghurt.Turkey. J. Vet. Anim. Sci., 33 (1):27‐35. Helen Nigussie, 2007. Traditional handling practice, preservation methods and evaluation of the lactoperoxidase system and container smoking on the microbial quality of cow’s and goat milk produced in Kombolcha Worda, Eastern Ethiopia MSc Thesis presented to School of Graduate Studies of Haramaya University. 42‐ 43 pp. IDF, 1991 (International Dairy Federation). Milk and milk products enumeration of microorganisms’ colony count at 300C. International IDF standard 100B: 1991: International Dairy Federation, Brussels, Belgium. Javed, M. S., M. I. Khan, M. A. Randhawa, M. W. Sajid, A. A. Khan, M. A. Nasir, 2011. Garlic (Allium Sativum L.) as an antimicrobial and antioxidant agents in beef sausages.Pak. J. Food Sci., 21(1‐4): 22‐32. Lawless, T. H. and H, Heymann, 1999. Sensory Evaluation of Food; Principles and Practice. Kluwer Academic/Plenum Publishers. New York. U.S.A. pp 827. Marth, E. H., 1978. Standard Methods for the Examination of Dairy Products.14th ed. American public health association, Washington, DC. Metry,W. A, R. B. Ahmed, O.E. Mohammed and H.M.A. Abd El‐Baky, 2007. Effect of adding cardamom, thyme and clove essential oils on some properties of white soft cheese made from goat’s milk. Alex. Journal of food science and technology, 4(1): 1‐19. Mishra, N. and K. K. Behal, 2010. Antimicrobial activity of some spices against selected microbes. International Journal of pharmacy and pharmaceutical science, 2 (3): 187‐196. Mogessie Ashenafi, 1990a. Microbial quality of Ayib, a traditional Ethiopian cottage cheese, International Journal of Food Microbiology, 10: 261‐268. Mogessie Ashenafi, 1990b. Effect of curd cooking temperature on the microbial quality of Ayib a traditional Ethiopian cottage cheese. World Journal of Microbiology and Biotechnology, 6: 159‐162. Mogessie Ashenafi, 1992. The Microbiology of Ethiopian Ayib. In: Application of Biotechnology in Traditional Fermented Foods. National Academy of Science. Washington, DC. USA. O’Connor, C. B. 1993. Traditional Cheese Making Manual. ILCA (International Livestock Centre for Africa), Addis Ababa, Ethiopia.
Ethiopian Society of Animal Production 2014
223
O’Connor, C.B. 1994.Rural dairy Technology. International Livestock Research Institute Addis Ababa, Ethiopia. Osman, A. O. E and Omer, I. A. H. 2008. Effect of storage period on weight loss, chemical composition, microbiological and sensory characteristics of Sudanese white cheese (Gibana Bayda). Pakistan Journal of nutrition, 7(1): 75‐80. Ratiba, B. A. E., Wedad, A. M. Mohamed, O. E. Abd, E. Abd El‐Aziz, H. M. 2006.Effect of cardamom, thyme and clove powder on the composition and quality of white soft cheese made from goat's milk.Assiut Journal of Agricultural Science, 37 (4): 139‐157. Richardson, G. H. 1985. Standard Methods for the Analysis of Dairy Products. 15th edition, American Public Health Association, Washington, DC., USA. Schmidt, K. and Bouma, J. 1992. Estimating shelf‐life of Cottage cheese using hazard analysis. J. Dairy Sci. 75: 2922‐2927. Sukajang, N., Jongpanyalert, B. Chantachum S. and Adulyatham, P. 2010. Effects of sodium ascorbate and drying temperature on active protease of dried ginger. Asian Journal of Food Agro‐Indusrty, 3(01): 52‐58. Yanishlieva, N.V. and Marinova E. and Pokorny, J. 2006. Natural antioxidants from herbs and spices. Eur.Journal of lipid Sci. Technol., 108: 776‐793. Yitaye Alemayehu Ayenew, Wurzinger, M. Azage Tegegne and Zollitsch, W. 2009. Handling, processing and marketing of milk in the North western Ethiopian highlands. Livestock research for Development, 21(7). Zelalem Yilma and Bernand, F. 2006. Handling and Microbial Load of Cow’s Milk and Irgo Fermented Milk Collected from Different Shops and Producers in Central Highlands of Ethiopia. Ethiopian Journal of Animal Production, 6(2): 67‐ 82. Zelalem Yilma, Loiseau G. and Bernand, F. 2007. Manufacturing efficiencies and microbial properties of butter and Ayib‐Ethiopian cottage cheese. Livestock Research for Rural Development, 19(7).
Ethiopian Society of Animal Production 2014
224
Reproduction and Breeding

Ethiopian Society of Animal Production 2014
225
Ethiopian Society of Animal Production 2014
226
Factors Affecting Reproductive Performance of Pure Jersey Cattle at Adea Berga Dairy Research Center in the Central Highlands of Ethiopia
Direba Hunde1, Gábor Mészáros2, Getnet Asefa1, Zewde Wendatir1, Rahel Nebyu1, Tadelle Dessie3
and Johan Sölkner2 1 Holeta Agricultural Research Center, P O Box 31, Holeta, Ethiopia.
2 University of Natural Resources and Life Sciences, Vienna, Austria Department of Sustainable Agricultural Systems, Gregor Mendel str. 33, A‐1180 Vienna, Austria
3 International Livestock Research Institute, P O Box 5689, Addis Ababa, Ethiopia [email protected]
Abstract
The effeciency of dairy cows are evaluated based on reproductive and productive performance. The aim of this study was to evaluate factors affects reproductive performance of pure Jersey dairy cattle. The data for this study were obtained from long‐term records of pure Jersey cows that have been kept for dairy production since 1986 in Adeaberga farms. General linear model was used to evaluate the influence of fixed factors and overall 3015 reproduction performance records from a total of 826 cows were used for this analysis. Trait studied were age at first calving, calving interval, number of services per conception and calving condition (stillbirth and abortion). The fixed effect fitted were animal group (imported and farm bred), year period (grouped based on birth, service and calving years), season (dry, light rain and main rain) and parity. The results of general linear model revealed that the influence of birth year and birth season were highly significant on age at first calving (P<0.001). Moderate difference on age at first calving and number of services required for conception were observed between imported and farm bred animals (P<0.05). Calving interval and number of services per conception were significantly influence by years and parity (P<0.001). Similarly the effect of calving season on number of services per conception was significant (P<0.001). However, calving season did not have significant influence on calving interval (P>0.05). Abortion rate was significantly influence by calving year and season (P<0.001). The overall least squares mean and standard error of reproductive performance of pure Jersey cows in the present study were 30 months for age at first calving, 497 days for caving interval and 2 for number of services per conception. 20 percent of the pregnancies were lost either by abortion or still birth. The results indicate that Jersey cows under the particular management of Adea Berga Farm showed reasonable reproductive performance.
Keywords: reproductive, age at first calving, calving interval, abortion, cattle, Jersey, Ethiopia.
Introduction
In Ethiopia, the genetic improvement of dairy cattle is mainly based on cross breeding and adoption of improved exotic breeds. Even though there is concern about adaptation problems of pure exotic dairy cattle to tropical environment (climate, feed and disease challenge), pure Friesian and Jersey dairy breeds have been utilized by large scale private and state dairy farms in Ethiopia. Improved exotic breed would potentially serve selected niches in milk supply and
Ethiopian Society of Animal Production 2014
227
have been also used as a genetic pool for the national artificial insemination center (NAIC) to recruit AI bulls for genetic improvement program of the country. Million and Tadelle (2003) reported 3183 kg milk yield in 362 days lactation length and 458 days calving interval in a herd of Holstein Friesian cows in Debre Zeyit area of Ethiopia. Similarly 39.2 month age at first calving, 1.8 services per conception, 148 days open, 445 days calving interval and 3710kg milk yield were observed on Holstein Friesian in Holeta, Stella and Dinkity located in urban and peri‐urban dairy production system of Addis Ababa milk‐shed area in Ethiopia (Tadesse et al., 2010). However there is limited information on reproductive performance of pure exotic Jersey breeds under intensive dairy management system in Ethiopia. Research reports in the tropics stated that Jersey cows are characterized by small mature body size, hardy and adaptable, low maintenance requirement, high feed conversion efficiency, high milk fat content, and good reproductive performance and has been selected for tropical research and development programs (Njubi, 1992 as cited by Musani and Mayer, 1997; Cunningham and Syrstad, 1987). Thus they could be a good alternative in the Ethiopian highland environment to use as an additional option for intensive and large scale dairy farms as well as genetic pool for genetic improvement activities. Having information on reproductive performance of pure Jersey cows on a particular farm in Ethiopia will help to suggest the future genetic improvement options for this herd as it is being managed as a bull dam station for the National AI center and also as dairy research farm. The objectives of the study were tovaluate the reproductive performance of pure Jersey cows and to evaluate factors affecting reproductive traits
Material and methods
Description of the study area
This study was conducted at Adea Berga Dairy Research Center in West Shewa Zone of Oromia regional state of Ethiopia. Adea Berga wet land is situated in the central highlands of Ethiopia at 90 16’ N latitude and 380 23’ E longitude, 70 km West of Addis Ababa and 35 km North West of Holeta. It lies at an altitude of 2500 m above sea level.
Climate
The monthly temperature and rainfall of West Shewa zone are summarized in figure 1. The Adea Berga wet land is characterized by cool sub‐tropical climate with the mean annual temperature and rainfall of 180C and 1225 mm respectively. The main rainy season is between June and September while the small rainy season occurs from March to June. The rest of the months are dry season which extend from October to February. The vegetation is mainly perennial grasses and sedges. The most common grass species in the area are Trifolium, Pennisetum and Andropogon.
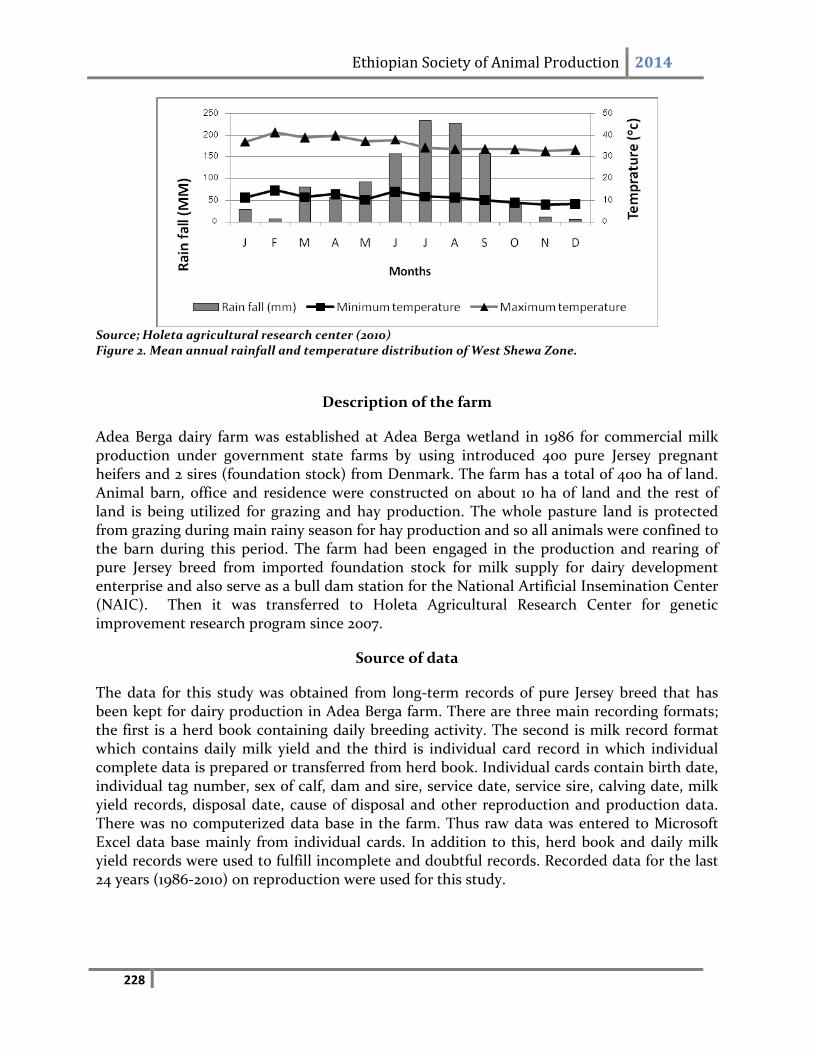
Ethiopian Society of Animal Production 2014
228
Source; Holeta agricultural research center (2010) Figure 2. Mean annual rainfall and temperature distribution of West Shewa Zone.
Description of the farm
Adea Berga dairy farm was established at Adea Berga wetland in 1986 for commercial milk production under government state farms by using introduced 400 pure Jersey pregnant heifers and 2 sires (foundation stock) from Denmark. The farm has a total of 400 ha of land. Animal barn, office and residence were constructed on about 10 ha of land and the rest of land is being utilized for grazing and hay production. The whole pasture land is protected from grazing during main rainy season for hay production and so all animals were confined to the barn during this period. The farm had been engaged in the production and rearing of pure Jersey breed from imported foundation stock for milk supply for dairy development enterprise and also serve as a bull dam station for the National Artificial Insemination Center (NAIC). Then it was transferred to Holeta Agricultural Research Center for genetic improvement research program since 2007.
Source of data
The data for this study was obtained from long‐term records of pure Jersey breed that has been kept for dairy production in Adea Berga farm. There are three main recording formats; the first is a herd book containing daily breeding activity. The second is milk record format which contains daily milk yield and the third is individual card record in which individual complete data is prepared or transferred from herd book. Individual cards contain birth date, individual tag number, sex of calf, dam and sire, service date, service sire, calving date, milk yield records, disposal date, cause of disposal and other reproduction and production data. There was no computerized data base in the farm. Thus raw data was entered to Microsoft Excel data base mainly from individual cards. In addition to this, herd book and daily milk yield records were used to fulfill incomplete and doubtful records. Recorded data for the last 24 years (1986‐2010) on reproduction were used for this study.
Ethiopian Society of Animal Production 2014
229
Herd management
Herds are managed separately depending on sex, age, pregnancy and lactation (dry or milking). Calves were allowed to suckle their dam until 5 days to obtain sufficient colostrum and then separated from their dams and offered fresh milk twice a day for about 6 months. Calves were provided with water and starting ration at 7th and 15th days of age respectively. All animals had free access to clean water. Cows and heifers were allowed to graze natural pasture for about 4 hours a day and supplemented with hay and concentrate feeds up on return to barn during dry and small rainy season. However all animals were restricted from grazing and managed indoor during main rainy season. There is regular over flood of river in the pasture land as a result of heavy rains during this period and the farm has a regular plan to harvest and stock up hay for dry and short rainy season supplementation. Calves less than 6 months, bulls and late pregnant cows and heifers were usually isolated and managed indoor. All animals were supplemented with hay and concentrate feeds constituting 60 % wheat bran (sometimes with wheat middling), 38% noug seed cake (Guizotia abyssinica) and 2% salt. The amount consumed is not exactly known, since it depends up on the amount of feed available on stock.Routine vaccination was conducted against Blackleg, Anthrax, Pasteurellosis, Foot and mouth disease and Lumpy skin disease. Animals were de‐wormed against internal parasites and treated against other infectious diseases by tentative diagnosis.
Breeding program
Pure breeding program was carried out on imported foundation stock that constitutes 400 pregnant heifers and two sires. Controlled mating program was practiced and both natural mating and artificial insemination technique were used. NAIC rarely introduce new exotic Jersey semen since this farm has been used as a bull dam station for national semen production to dispatch Jersey semen for national crossbreeding activities. Thus very few young bulls were recruited based on dam performance and physical conformation for NAIC semen collection and on station breeding activities through natural mating. The rest of the male calves were culled from the farm at an early age. Cows in heat were detected by herds men during grazing time and by guards during night time and these personnel are responsible to notify AI technicians on time. The mating date and sire identification number were recorded on herd book for every insemination and then transferred to cow’s individual card. Mating was continuous and allowed throughout the year. There were no teaser bull, heat induction or synchronization activities in the farm. Served cows and heifers were pregnancy tested by rectal palpation at about two to three months after insemination.
Data analysis
A retrospective type of study was carried out to evaluate reproductive performance of cows. Both alive and disposed cows records were pooled. Traits studied were age at first calving, calving interval, open period and number of services per conception. During data editing lactation records of eighth and above parities were pooled. Abortion and still birth records
Ethiopian Society of Animal Production 2014
230
were removed from analysis of age at first calving. General linear model (GLM) least square analysis and chi squared tests were carried out to study fixed effect (SAS version 9, 2002). The fixed effects fitted were animal group (imported and farm bred; farm bred animals were the progeny of imported animal that are raised in the farm), year period (grouped in to 5‐7 classes based on birth, service and calving years), season; grouped in to three classes, based on pattern of annual rain fall distribution (figure 1) as dry period (October, December, January and February), light rain (March, April and May) and main rain (June, July, August and September), Parity (grouped in to eight classes 1,2,3,4,5,6,7and 8+). Preliminary analysis showed that interaction effects of the fixed factors were not significant and thus not included in the model. The all pair wise comparison (PDIFF) test was used to separate least squares means. The statistical model is described as follows:
Experimental Models
1. Age at first calving (AFC) ( Birth period, birth season, animal group effect) Yijk = µ + Yi + Sj + Gk +eijk Where, Yijk is the age at first calving trait; µ is the overall mean; Yi is the fixed effect of ith year period of birth; Sj isthe fixed effect of j
th season of birth; Gk is the fixed effect of kth animal group; eijk = random residual term. 2. Calving interval and open period (Calving period, Calving season, parity effect) Yijk = µ + Yi + Sj + Pk + eijkWhere, Yijk is the calving interval trait; µ is the overall mean; Yi = the fixed effect of i
th year period of calving; Sj is the fixed effect of jth season of
calving ; Pk is the fixed effect of kth cow parity; eijk is random residual term.
3. Number of services per conception (Service period, Service season, animal groupand parity effect)Yijkl = µ + Yi + Sj +Gk + Pl +eijkl . Where, Yijkl is the number of services per conception trait; µ is the overall mean; Yi is the fixed effect of ith year period of service; Sj is the fixed effect of jth season of service; Gk is the fixed effect of kth animal group; Pl is the fixed effect of lth cow parity; eijkl is random residual term.
Results and discussions
Age at first calving (AFC)
Age at first calving is an economically important trait that determines the age when an animal begins its economic return from milk production and reproduction. The overall least squares mean and standard error of pure Jersey breed in the present study was 29.92 ± 0.17 months. The result obtained in the present study is comparable with 31 months of pure Jersey cows in humid area of Kenya (Njubi et al., 1992). It is also comparable with the report of Murdia and Tripathi (1990) who found 28 months of age at first calving on Jersey cows in India. However the value of present finding is inconsistent with the report of Makuza et al. (2000) and Banga et al. (2009) who showed higher AFC (54 months) in Zimbabwe and lower AFC (25 months) in South Africa Jersey cattle respectively. This could be due to environmental difference associated with management condition. On the other hand the
Ethiopian Society of Animal Production 2014
231
value of AFC obtained in the present study is lower than the report of several literature published on crossbred and pure Friesian in the tropics; the overall least square mean AFC of 50% crossbred in central highland of Ethiopia was 43 months (Kefena, 2004). Demeke et al. (2004) reported higher AFC (38 months) for Boran and its crosses with Friesian and Jersey breed in tropical highland of Ethiopia. Gebeyehu (1999) also reported 33 months in Chefa district of Ethiopia. Similarly Tadesse et al. (2010) found 39 months average AFC for pure Friesian in different dairy herd in Ethiopia. This could be because of the ability of Jersey breed to attain AFC at earlier age than other breeds. The least squares means and standard errors of AFC for fixed effects of birth year period, birth season and animal group are summarized in table 1. Analysis of variance revealed that AFC was significantly affected by the fixed effects of birth year periods (p< 0.01), birth season (p< 0.01) and animal group (p< 0.05). The lowest AFC was recorded on animal born between 1994 and 1996 (25.41 ± 2.38) followed by 1997 to 1999 (27.94) and 1988 to 1990 (28.91). Cows that born between 2006 and 2008 years require 8 more months to attain AFC than those between 1994 and 1996 years. This indicates that trend of AFC is increasing in recent born animal. This might be due to management fluctuation due to problems like feed shortage and health problems. The result of the present study showed that cows born during dry and main rainy season attain AFC 3 and 2.4 months earlier than those born during light rainy season respectively. These could be due to post weaning stress of main rainy season on calves born during light rainy season because of shortage of feed during rainy season as the pasture land is restricted from grazing. The significant effect of birth year and birth season obtained in this study is in agreement with the report of (Amani et al., 2007; Ahmad et al., 2007; Gebeyehu, 1999; Kefena, 2004). However the effect of birth season observed in the present study was inconsistent with the report of Sattar et al. (2004) who found no significant difference between seasons of birth in Jersey cattle in Pakistan. A significant difference was also observed between imported and farm bred animal. Imported heifers were pregnant when introduced to the country. Imported animal attain their AFC 9 months earlier than those farm bred cows. Similarly Lateef (2007) observed a significant difference between imported and farm animals in Pakistan. These could be due to the difference of environment (management condition and climate) where the animals were kept.
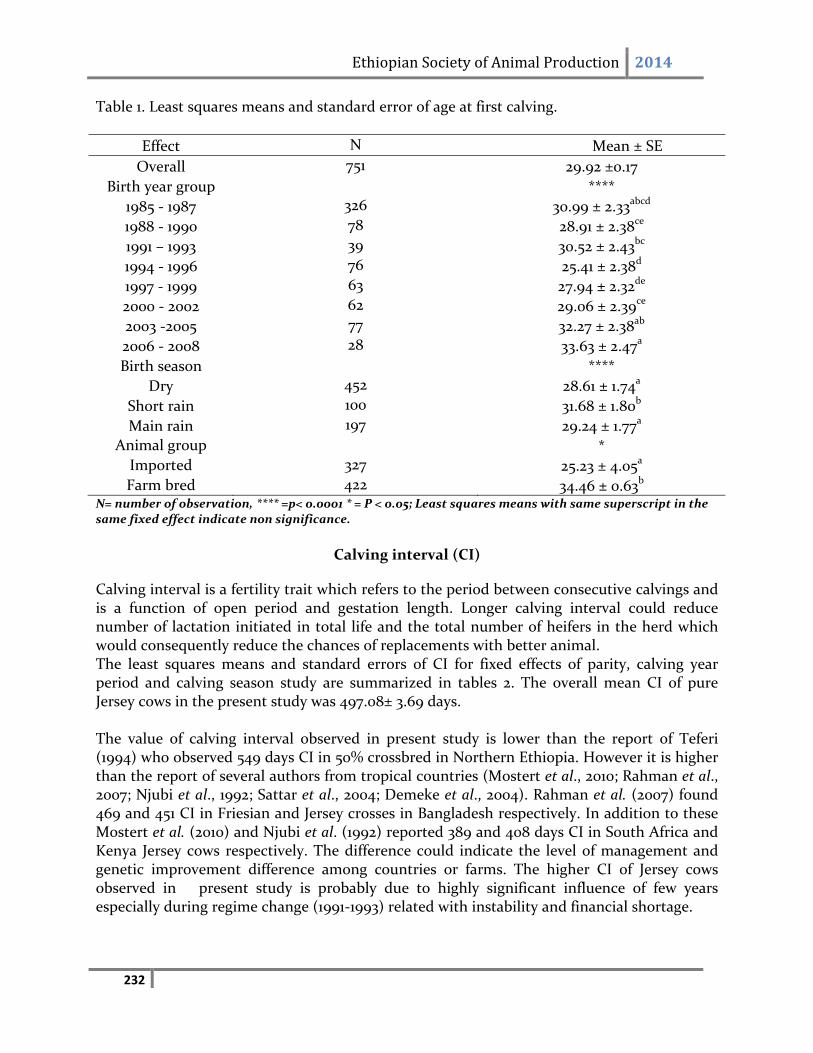
Ethiopian Society of Animal Production 2014
232
Table 1. Least squares means and standard error of age at first calving.
Effect N Mean ± SE
Overall 751 29.92 ±0.17
Birth year group ****
1985 ‐ 1987 326 30.99 ± 2.33abcd
1988 ‐ 1990 78 28.91 ± 2.38ce
1991 – 1993 39 30.52 ± 2.43bc
1994 ‐ 1996 76 25.41 ± 2.38d
1997 ‐ 1999 63 27.94 ± 2.32de
2000 ‐ 2002 62 29.06 ± 2.39ce
2003 ‐2005 77 32.27 ± 2.38ab
2006 ‐ 2008 28 33.63 ± 2.47a
Birth season ****
Dry 452 28.61 ± 1.74a
Short rain 100 31.68 ± 1.80b
Main rain 197 29.24 ± 1.77a
Animal group *
Imported 327 25.23 ± 4.05a
Farm bred 422 34.46 ± 0.63b
N= number of observation, **** =p< 0.0001 * = P < 0.05; Least squares means with same superscript in the same fixed effect indicate non significance.
Calving interval (CI)
Calving interval is a fertility trait which refers to the period between consecutive calvings and is a function of open period and gestation length. Longer calving interval could reduce number of lactation initiated in total life and the total number of heifers in the herd which would consequently reduce the chances of replacements with better animal. The least squares means and standard errors of CI for fixed effects of parity, calving year period and calving season study are summarized in tables 2. The overall mean CI of pure Jersey cows in the present study was 497.08± 3.69 days. The value of calving interval observed in present study is lower than the report of Teferi (1994) who observed 549 days CI in 50% crossbred in Northern Ethiopia. However it is higher than the report of several authors from tropical countries (Mostert et al., 2010; Rahman et al., 2007; Njubi et al., 1992; Sattar et al., 2004; Demeke et al., 2004). Rahman et al. (2007) found 469 and 451 CI in Friesian and Jersey crosses in Bangladesh respectively. In addition to these Mostert et al. (2010) and Njubi et al. (1992) reported 389 and 408 days CI in South Africa and Kenya Jersey cows respectively. The difference could indicate the level of management and genetic improvement difference among countries or farms. The higher CI of Jersey cows observed in present study is probably due to highly significant influence of few years especially during regime change (1991‐1993) related with instability and financial shortage.
Ethiopian Society of Animal Production 2014
233
The analysis of variance of present study revealed that calving interval was significantly affected by fixed effects of parity and calving year period (<0.0001). But calving season did not have significant effect. The influence of fixed effect observed in this study is in line with the findings of several researchers (Tadesse et al., 2010; Amani et al., 2007; Yosef, 2006; Sattar et al., 2004). The lowest CI interval was observed in first parity and the longest CI was observed in fifth parity. The trend of CI was a gradual increase to the 5th parity with the difference of 61 days between first parity and fifth parity. However statistically there is no significant difference from second to fifth parity (p> 0.05). The increasing trend of CI with parity observed in this study is in agreement with the report of Rege et al. (1994) who concluded that CI increase steadily to the 7th parity. But the result of this study is inconsistent with the report of Gebeyehu (2007) and Amani et al. (2007) who conclude that CI decrease as parity increases. Calving year period had a significant effect on CI (p< 0.0001). This is in line with the report of Gebeyehu (2007) and Kefena (2004) who found similar effect on crossbred cattle in central highland of Ethiopia. However there is no clear trend observed across year periods indicating inconsistent management difference between years. The lowest CI (427.66±10.74 days) was observed on cows calved in between 2000 and 2002 followed by cows calved in between 1997 and 1999 (442.75±11.31 days). The longest CI (669.60±12.41 days) was observed on cows calved in between 1991 and 1993. These could be attributed to management problems like shortage of feed and health problems during 1991 and 1993 related with instability and financial shortage due to regime change.
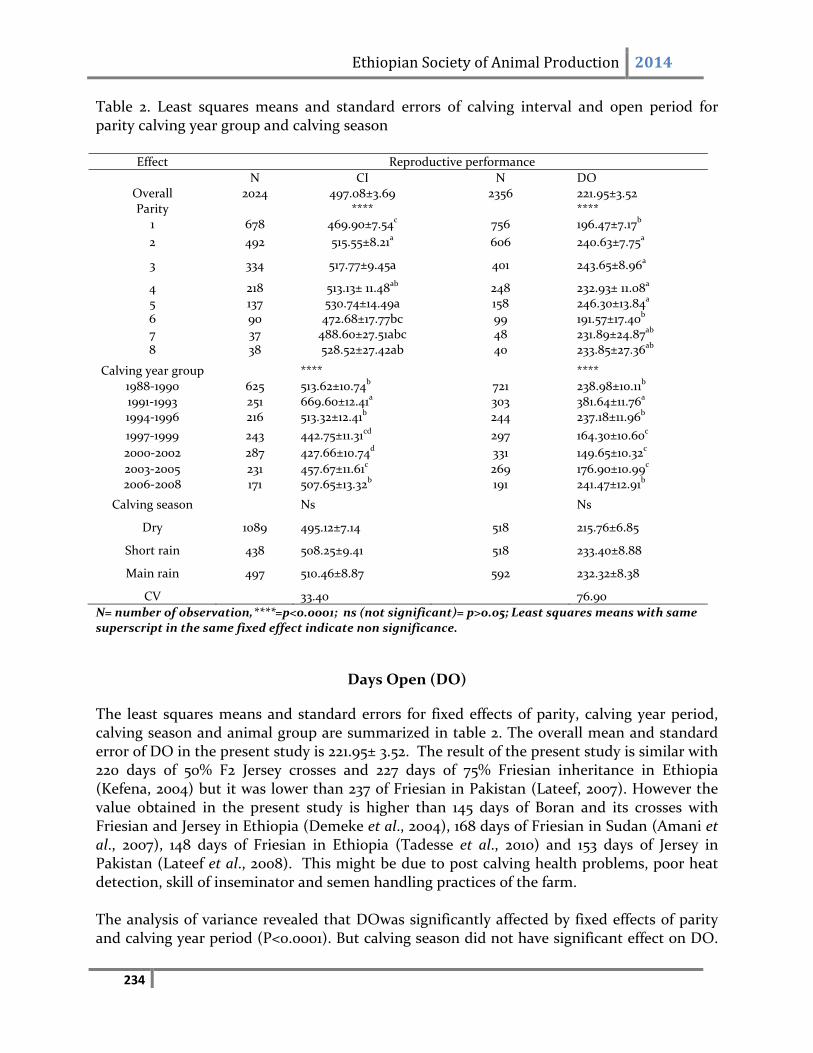
Ethiopian Society of Animal Production 2014
234
Table 2. Least squares means and standard errors of calving interval and open period for parity calving year group and calving season
Effect Reproductive performance
N CI N DO Overall 2024 497.08±3.69 2356 221.95±3.52 Parity **** ****
1 678 469.90±7.54c 756 196.47±7.17b
2 492 515.55±8.21a 606 240.63±7.75a
3 334 517.77±9.45a 401 243.65±8.96a
4 218 513.13± 11.48ab 248 232.93± 11.08a 5 137 530.74±14.49a 158 246.30±13.84a 6 90 472.68±17.77bc 99 191.57±17.40b 7 37 488.60±27.51abc 48 231.89±24.87ab 8 38 528.52±27.42ab 40 233.85±27.36ab
Calving year group **** **** 1988‐1990 625 513.62±10.74b 721 238.98±10.11b 1991‐1993 251 669.60±12.41a 303 381.64±11.76a 1994‐1996 216 513.32±12.41b 244 237.18±11.96b
1997‐1999 243 442.75±11.31cd 297 164.30±10.60c
2000‐2002 287 427.66±10.74d 331 149.65±10.32c
2003‐2005 231 457.67±11.61c 269 176.90±10.99c 2006‐2008 171 507.65±13.32b 191 241.47±12.91b
Calving season Ns Ns
Dry 1089 495.12±7.14 518 215.76±6.85
Short rain 438 508.25±9.41 518 233.40±8.88
Main rain 497 510.46±8.87 592 232.32±8.38
CV 33.40 76.90
N= number of observation,****=p<0.0001; ns (not significant)= p>0.05; Least squares means with same superscript in the same fixed effect indicate non significance.
Days Open (DO)
The least squares means and standard errors for fixed effects of parity, calving year period, calving season and animal group are summarized in table 2. The overall mean and standard error of DO in the present study is 221.95± 3.52. The result of the present study is similar with 220 days of 50% F2 Jersey crosses and 227 days of 75% Friesian inheritance in Ethiopia (Kefena, 2004) but it was lower than 237 of Friesian in Pakistan (Lateef, 2007). However the value obtained in the present study is higher than 145 days of Boran and its crosses with Friesian and Jersey in Ethiopia (Demeke et al., 2004), 168 days of Friesian in Sudan (Amani et al., 2007), 148 days of Friesian in Ethiopia (Tadesse et al., 2010) and 153 days of Jersey in Pakistan (Lateef et al., 2008). This might be due to post calving health problems, poor heat detection, skill of inseminator and semen handling practices of the farm. The analysis of variance revealed that DOwas significantly affected by fixed effects of parity and calving year period (P<0.0001). But calving season did not have significant effect on DO.
Ethiopian Society of Animal Production 2014
235
Gebeyehu et al. (2007) and Tadesse et al. (2010) reported similar findings. On the contrary Amani et al. (2007) found that year and parity did not have significant effect on DO. Hammoud et al. (2010) andLateef (2007) also noted that season of calving had significant effect on DO. Furthermore Lateef (2007) and Kefena (2004) showed that parity did not have significant effect on DO. Length of DO increased significantly as parity increased to 5th. This is in agreement with the study of Amani et al. (2007). DO was significantly increased from 196.47±7.17 days in first parity to 240.63±7.75 days in second parity and then remain constant to 5th parity. Cows in their fifth parity required 24 more days than the average for DO and 49.83 more days than first parity. However statistically there is no significant difference in DO between parity 2, 3, 4, 5, 7 and 8. On the contrary to the present study the reverse trend of DO with parity was reported by several authors (Yosef, 2006; Gebeyehu et al., 2007; Tadesse et al., 2010). The significant effect of calving period (P< 0.0001) on DO observed in the present study is consistent with the study of Gebeyehu et al.(2007), Kefena (2004), Taddesse et al. (2010) and Hammoud et al. (2010). Least square mean of DO in the present finding was significantly (P< 0.05) shorter for cows that calved during the period of 1997 to 2005 years ranging from 164.30±10.60 to 176.90±10.99 days. Mean DO were significantly (p < 0.05) rising from period of 1988‐1990 to period of 1991‐1993 and then declining until period ending 2005. However after 2005 year number of DO was radically increased to 241.47±12.91 with the difference of 64.57 days. The interruption of declining trend of DO at calving period of 1991 to 1993 was probably be due to shortage of feed and health complication as a result of financial problems during regime change. Besides this higher DO encountered during the last calving period (2006 to 2008) could attributed to change of farm management system and financial problem when the farm was transferred to research systems.
Number of services per conception (NSC)
Number of services per conception is a measure of reproductive efficiency of a cow and also reflects the efficiency of farm management. The least squares means and standard errors for fixed effects of parity, service year group, service season and animal group are summarized in table 3. The overall mean and standard error of NSC of Jersey in the present study was 2.02±0.02. The result of the present study is similar with the report of Yosef (2006) who found 2.01 NSC for Holstein breed in central highland of Ethiopia. But it is lower than the report of Lateef (2007) who found 3.30 in Friesian in Pakistan and higher than 1.80 of Friesin reported by Tadesse et al. (2010) and 1.58 of Boran and its crosses with Friesian and Jersey (Demeke et al., 2004) in Ethiopia. NSC was significantly affected by fixed effect of parity (P<0.0001), service year period (P<0.0001), service season (P<0.001) and animal group (P<0.05).The significant effect observed in the present study is in agreement with the finding of Asimwe and Kifaro (2007) and Ahmad et al. (2007). The report of some other studies like Gebeyehu et al. (2007), Hammoudet al. (2010) and Tadesse et al. (2010) are also in line with the present finding that year and parity had significant effect on NSC but contradictorily they revealed that season did not significantly influence the NSC in Friesian cows in Ethiopia and Egypt respectively.
Ethiopian Society of Animal Production 2014
236
NSC had an increasing trend as parity increases from 1st to 6th parity.This is in agreement with the report of Yosef (2006) who found an increase in NSC with parity from 1st to 4th parity, The lowest NSC was observed in the first parity (1.74 ± 0.07) and the highest NSC was recorded on 6th.parity (2.37 ±0.11). However statistically there was no significant difference between 2nd, 3rd, 4th, and 5th parity. NSC was also significantly affected by service year period. The lowest NSC was observed in animals served in between 1987 and 1989 (1.54 ± 0.11) followed by those served in between 2008 and 2010 (1.92 ± 0.12) and the maximum service required was in 1993‐1995 period (2.72 ± 0.08). An increasing trend of NSC was observed between 1988 and 1995 years with the difference of about 1.18 services. However a clear trend of NSC was not observed across years from 1996 to 2008. The effect of season of service was highly significant (P<0.0001). Similar result was showed by Asimwe and Kifaro (2007)and Ahmadet al. (2007). Animal served during dry (2.06 ± 0.05) and light rainy (2.02 ± 0.05) season had fewer services for conception than those served during main rainy season (2.23 ± 0.05). These could reflect management problems like shortage of feed during the main reason because the pasture land was protected from grazing during this season. In support to this Ahmad et al. (2007) showed that cows in fall season had maximum number of services for first conception (2.55) and cows in spring seasons had the lowest services for first conception (1.15) in Pakistan dairy cattle.The least square mean of NSC showed that imported Jersey cows require more services per conceptions (2.20 ± 0.07) than farm born cows (2.00 ± 0.05). Similar result was reported by Lateef (2007) who revealed that imported cows required more services (3.18) than farm born cows (2.51).
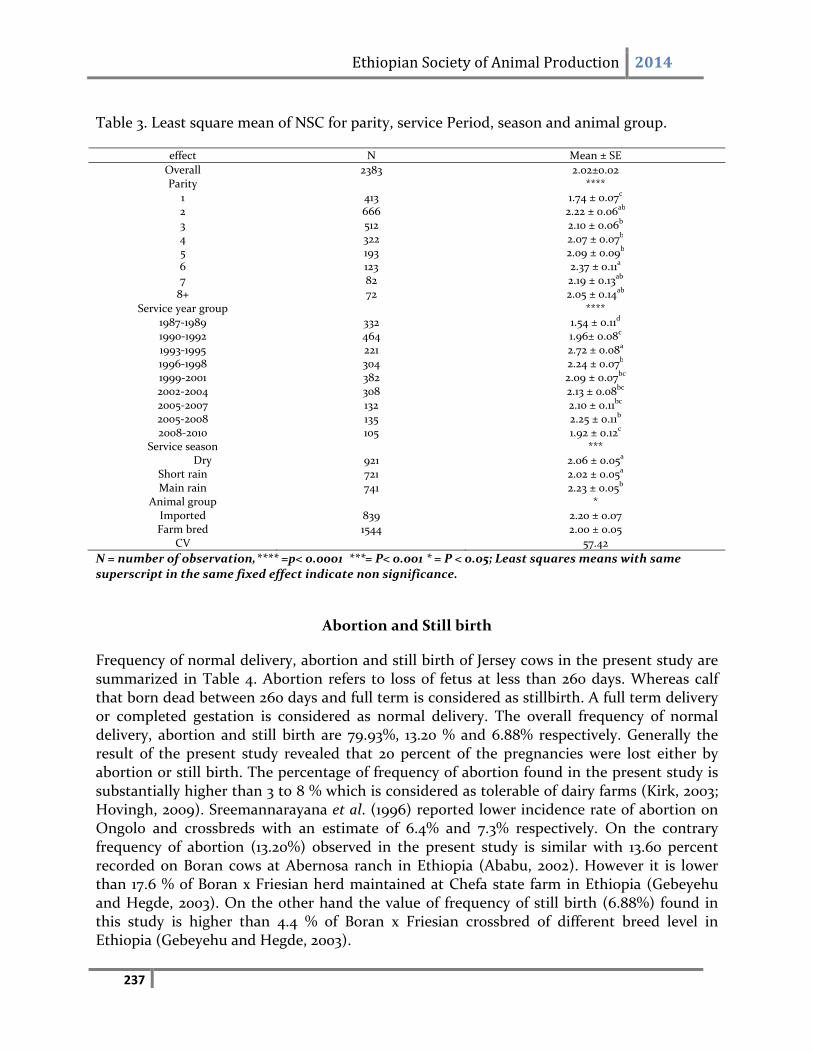
Ethiopian Society of Animal Production 2014
237
Table 3. Least square mean of NSC for parity, service Period, season and animal group.
effect N Mean ± SE
Overall 2383 2.02±0.02 Parity ****
1 413 1.74 ± 0.07c 2 666 2.22 ± 0.06ab 3 512 2.10 ± 0.06b 4 322 2.07 ± 0.07b 5 193 2.09 ± 0.09b 6 123 2.37 ± 0.11a 7 82 2.19 ± 0.13ab 8+ 72 2.05 ± 0.14ab
Service year group **** 1987‐1989 332 1.54 ± 0.11d
1990‐1992 464 1.96± 0.08c
1993‐1995 221 2.72 ± 0.08a
1996‐1998 304 2.24 ± 0.07b
1999‐2001 382 2.09 ± 0.07bc
2002‐2004 308 2.13 ± 0.08bc
2005‐2007 132 2.10 ± 0.11bc
2005‐2008 135 2.25 ± 0.11b
2008‐2010 105 1.92 ± 0.12c
Service season *** Dry 921 2.06 ± 0.05a
Short rain 721 2.02 ± 0.05a
Main rain 741 2.23 ± 0.05b
Animal group * Imported 839 2.20 ± 0.07 Farm bred 1544 2.00 ± 0.05
CV 57.42
N = number of observation,**** =p< 0.0001 ***= P< 0.001 * = P < 0.05; Least squares means with same superscript in the same fixed effect indicate non significance.
Abortion and Still birth
Frequency of normal delivery, abortion and still birth of Jersey cows in the present study are summarized in Table 4. Abortion refers to loss of fetus at less than 260 days. Whereas calf that born dead between 260 days and full term is considered as stillbirth. A full term delivery or completed gestation is considered as normal delivery. The overall frequency of normal delivery, abortion and still birth are 79.93%, 13.20 % and 6.88% respectively. Generally the result of the present study revealed that 20 percent of the pregnancies were lost either by abortion or still birth. The percentage of frequency of abortion found in the present study is substantially higher than 3 to 8 % which is considered as tolerable of dairy farms (Kirk, 2003; Hovingh, 2009). Sreemannarayana et al. (1996) reported lower incidence rate of abortion on Ongolo and crossbreds with an estimate of 6.4% and 7.3% respectively. On the contrary frequency of abortion (13.20%) observed in the present study is similar with 13.60 percent recorded on Boran cows at Abernosa ranch in Ethiopia (Ababu, 2002). However it is lower than 17.6 % of Boran x Friesian herd maintained at Chefa state farm in Ethiopia (Gebeyehu and Hegde, 2003). On the other hand the value of frequency of still birth (6.88%) found in this study is higher than 4.4 % of Boran x Friesian crossbred of different breed level in Ethiopia (Gebeyehu and Hegde, 2003).
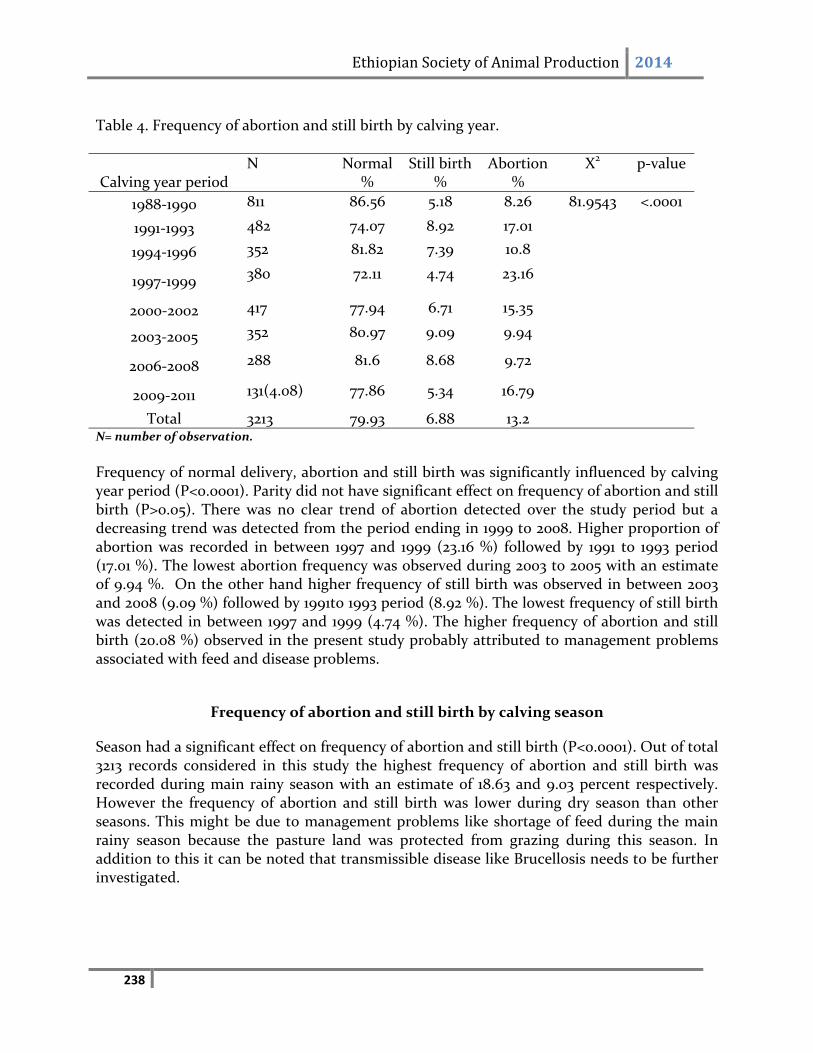
Ethiopian Society of Animal Production 2014
238
Table 4. Frequency of abortion and still birth by calving year.
Calving year period N Normal
% Still birth
% Abortion
% X2 p‐value
1988‐1990 811 86.56 5.18 8.26 81.9543 <.0001
1991‐1993 482 74.07 8.92 17.01
1994‐1996 352 81.82 7.39 10.8
1997‐1999 380 72.11 4.74 23.16
2000‐2002 417 77.94 6.71 15.35
2003‐2005 352 80.97 9.09 9.94
2006‐2008 288 81.6 8.68 9.72
2009‐2011 131(4.08) 77.86 5.34 16.79
Total 3213 79.93 6.88 13.2 N= number of observation.
Frequency of normal delivery, abortion and still birth was significantly influenced by calving year period (P<0.0001). Parity did not have significant effect on frequency of abortion and still birth (P>0.05). There was no clear trend of abortion detected over the study period but a decreasing trend was detected from the period ending in 1999 to 2008. Higher proportion of abortion was recorded in between 1997 and 1999 (23.16 %) followed by 1991 to 1993 period (17.01 %). The lowest abortion frequency was observed during 2003 to 2005 with an estimate of 9.94 %. On the other hand higher frequency of still birth was observed in between 2003 and 2008 (9.09 %) followed by 1991to 1993 period (8.92 %). The lowest frequency of still birth was detected in between 1997 and 1999 (4.74 %). The higher frequency of abortion and still birth (20.08 %) observed in the present study probably attributed to management problems associated with feed and disease problems.
Frequency of abortion and still birth by calving season
Season had a significant effect on frequency of abortion and still birth (P<0.0001). Out of total 3213 records considered in this study the highest frequency of abortion and still birth was recorded during main rainy season with an estimate of 18.63 and 9.03 percent respectively. However the frequency of abortion and still birth was lower during dry season than other seasons. This might be due to management problems like shortage of feed during the main rainy season because the pasture land was protected from grazing during this season. In addition to this it can be noted that transmissible disease like Brucellosis needs to be further investigated.
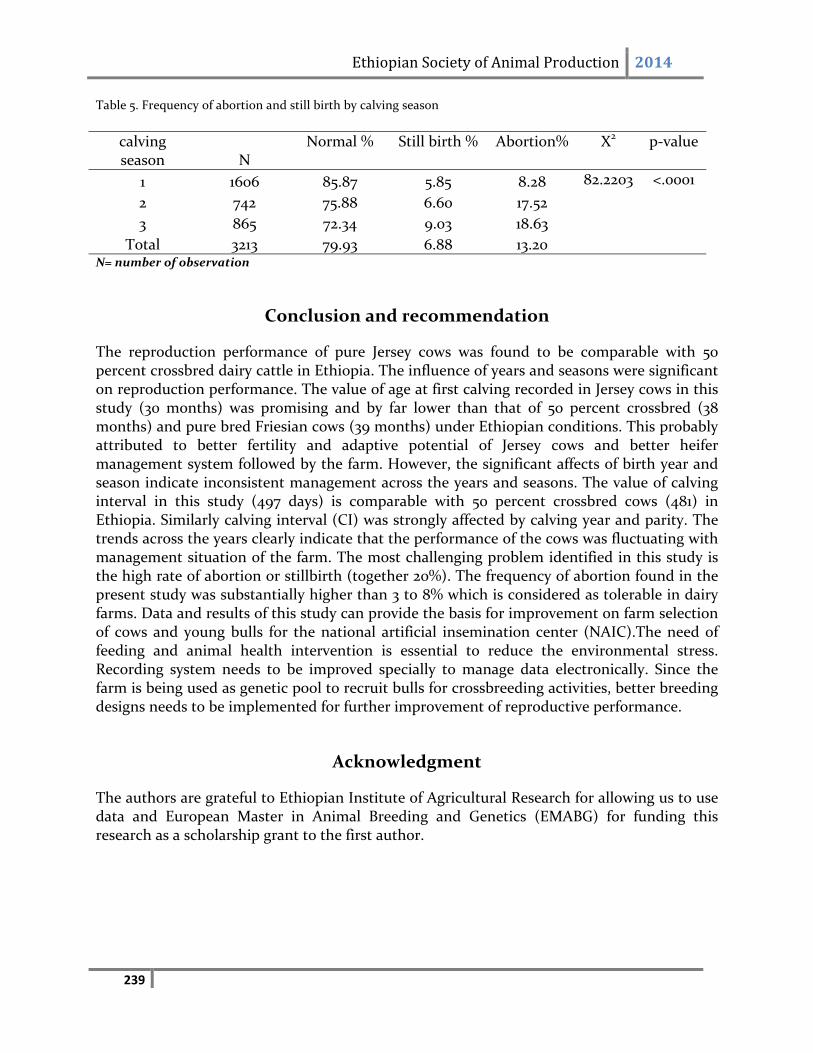
Ethiopian Society of Animal Production 2014
239
Table 5. Frequency of abortion and still birth by calving season
calving season N
Normal % Still birth % Abortion% X2 p‐value
1 1606 85.87 5.85 8.28 82.2203 <.0001
2 742 75.88 6.60 17.52
3 865 72.34 9.03 18.63
Total 3213 79.93 6.88 13.20 N= number of observation
Conclusion and recommendation
The reproduction performance of pure Jersey cows was found to be comparable with 50 percent crossbred dairy cattle in Ethiopia. The influence of years and seasons were significant on reproduction performance. The value of age at first calving recorded in Jersey cows in this study (30 months) was promising and by far lower than that of 50 percent crossbred (38 months) and pure bred Friesian cows (39 months) under Ethiopian conditions. This probably attributed to better fertility and adaptive potential of Jersey cows and better heifer management system followed by the farm. However, the significant affects of birth year and season indicate inconsistent management across the years and seasons. The value of calving interval in this study (497 days) is comparable with 50 percent crossbred cows (481) in Ethiopia. Similarly calving interval (CI) was strongly affected by calving year and parity. The trends across the years clearly indicate that the performance of the cows was fluctuating with management situation of the farm. The most challenging problem identified in this study is the high rate of abortion or stillbirth (together 20%). The frequency of abortion found in the present study was substantially higher than 3 to 8% which is considered as tolerable in dairy farms. Data and results of this study can provide the basis for improvement on farm selection of cows and young bulls for the national artificial insemination center (NAIC).The need of feeding and animal health intervention is essential to reduce the environmental stress. Recording system needs to be improved specially to manage data electronically. Since the farm is being used as genetic pool to recruit bulls for crossbreeding activities, better breeding designs needs to be implemented for further improvement of reproductive performance.
Acknowledgment
The authors are grateful to Ethiopian Institute of Agricultural Research for allowing us to use data and European Master in Animal Breeding and Genetics (EMABG) for funding this research as a scholarship grant to the first author.
Ethiopian Society of Animal Production 2014
240
References
Ababu Dekeba. 2002. Evaluation of Performance of Boran Cows in the Production of Crossbreed Dairy Heifers at Abernosa Ranch, Ethiopia. M.Sc. Thesis, Alemaya University.
Amani, Z., Abdel Gader, Mohamed Khaira. Ahmed, Lutfim, A., Musa and Kurt, J., Peters. 2007. Milk yield and reproductive performance of Friesian cows under Sudan tropical conditions. Humboldt‐Universität zu Berlin, Germany Arch. Tierz., Dummerstorf 50 (2007) 2, 155‐164. Asimwe, L. and Kifaro, G. C. 2007. Effect of breed, season, year and parity on reproductive performance of dairy cattle under smallholder production system in Bukoba district, Tanzania. Livestock Research for Rural Development 19 (10) 2007 Banga, C.B., Neser, F.W., Van der Westhuizenand Garrick, D.J. 2009. Economic values for dairy production traits under different milk payment systems in South Africa. South African Journal of Animal Science 2009, 39 (Supplement 1). Bashir Ahmad, Sirzamin Khan, Abdul Mananand Abdullah. 2007. Production and reproduction performance of Jersey cattle at cattle breeding and dairy farm hichand
charsadda NWFP .
Journal of Agricultural and Biological Science. Cunningham, E.P. and Syrstad, O. 1987. Types and breeds of tropical and temprate cattle. In: crossbreeding Bos indicus and Bos taurus for milk production in the Tropics. FOA, Rome. Paper 68. Demeke, S., Neser, F. W. C. and Schoeman S. J. 2004. Estimates of genetic parameters for Boran, Friesian, and crosses of Friesian and Jersey with the Boran cattle in the tropical highlands of Ethiopia: milk production traits and cow weight. J. Anim. Breed. 163–175 Ernest Hovingh. 2009.Abortions in Dairy Cattle ‐ I: Common Causes of Abortions. ExtensionVeterinarian, Virginia‐Maryland Regional College of Veterinary Medicine, Virginia Tech. 404‐288 Gebeyehu, G. 1999. Reproductive and Productive Performance of Friesian‐Boran Crossbred Cattle at Chaffa State Farm, Wollo, Ethiopia. M. Sc. Thesis, Alemaya University, Dire Dawa, Ethiopia Gebeyehu,G and Hegde, B.P. 2003. Abortion and calf mortality of Friesian‐Boran crossbred Cattle at Cheffa state farm, Wollo, Ethiopia.Eth. J. Anim. Prod. 3(1) 109‐117 Gebeyehu Goshu, Kelay Belihu and Abebe Berihun. 2007. Effect of parity, season and year on reproductive performance and herd life of Friesian cows at Stella private dairy farm, Ethiopia. Livestock Research for Rural Development 19 (7) 2007
Ethiopian Society of Animal Production 2014
241
Hammoud, M.H., El‐Zarkouny, S. Z., Oudah, E. Z. M. 2010. Effect of sire, age at first calving, season and year of calving and parity on reproductive performance of Friesian cows under semiarid conditions in Egypt. Archiva Zootechnica 13:1, 60‐82, 2010 61 Holetta Agriculturla Research Center (HARC). 2010. Agro‐Metrology and GIS weather data of west shewa zone for the period of 2001‐2010. Unpublished report, Holetta Research Center, Ethiopia. Kefena, E., Hegde B. P. and Tesfaye, K. 2004. Lifetime production and reproduction performances of Bos taurus x Bos indicus crossbred cows in the central highlands of Ethiopia.MSc. Thesis. Haramaya University. Ethiopia. Kefena, E., Hegde B. P. and Tesfaye, K. 2006. Lifetime production and reproduction performances of Bos taurus x Bos indicus crossbred cows in the central highlands of Ethiopia. Ethiopan Journal Animal Prod 6 (2): 37‐52. Kirk, J.H. 2003. Infectious abortions in dairy cows, http://www.vetmed.ucdavis.edu/vetext/INF‐
DA/Abortion.html Lateef ,M. 2007. Production performance of Holestien Friesian and Jersey cattle under sub tropical environment of the Punjab, Pakistan. Ph.D. thesis. Department of Livestock managment University of Agriculture, Faisalabad, Pakistan. Lateef ,M. Gondal, K. Z., Younas, M., Sarwar, M., Mustafa, M. I., and Bashir, M. K. 2008. Milk production potential of Pure bred Holestien Friesian and Jersey cows in sub tropical environment of Pakistan.University of Agriculture, Faisalabad, Pakistan Mahmudur Rahman, Rejoanoul Islam, Mohammad mubinur Rahman, Mamunul Haque and Tanuza Das. 2007. Estimation of genetic parameters for economic traits in dairy cattle of Bangladesh. Asian Journal of Animal and Veterinary Advances. Dhaka‐1207, Bangaldesh Makuza, S.M. Muchenje, V. and Chiyanike, S. 2000. Genetic evaluation of grade, appendix and pedigree cow classes in Holstein, Jersey and crossbred dairy breeds in Zimbabwe. Proceedings of the regional conference held at Malawi Institute of Management, Lilongwe, Malawi 30 ‐ October to 1 November 2000. Million Tadesse, Tadelle Dessie and Egbert Kanis. 2004. Genetic and Non‐genetic Effects on Productive and Reproductive Parameters of Arsi Cattle and Their Holstein Friesian Crosses in Ethiopia. Eth. J. Anim. Prod. 4(1) 70‐79 Mostert, B.E., Van Der Westhuizen R.R. and Theron, H.E. 2010. Calving interval genetic parameters and trends for dairy breeds in South Africa South African. Journal of Animal Science 2010, 40 (2) Animal Production Institute, Private Bag X2, Irene 0062, South Africa. Murdia, C. K., Tripathi, V.N. 1990. Factors affecting reproductive performance of Jersey cattle in India. Indian Journal of Animal production and management Vol. 6 No. 3 pp. 135‐139.
Ethiopian Society of Animal Production 2014
242
Musani, S. K. and Mayer M. 1997. Genetic and environmental trends in a large commercial jersey herd in the central rift valley, Kenya. Njubi, D., Rege, JE., Thorpe, W., Collins Lusweti, E., Nyambaka. 1992. Genetic and environmental variation in reproductive and lactational performance of Jersey cattle in the coastal lowland semi‐humid tropics.Tropical Animal Health prod.24(4):231‐41. Rege, J.E., Aboagye, S. Akah and B.K. Ahunu. 1994. Crossbreeding Jersey with Ghana shorthorn and Sokoto Gudali cattle in a tropical environment: Additive and hetrotic effects for milk production, reproduction and calf growth traits.Anim.Prod.59:21‐29. Sattar, A., Mirza, R. H. and Ahmad, I. 2004. Reproductive efficiency of Jersey cows under subtropical conditions of the Punjab. Pakistan vet. J., 24(3) 129. Sreemannarayana, Narasimha Rao A.V. and Narasimha Rao,A. 1996. Longivity and lactation effeciecy of Ongole and crossbre cows. Indian vet. J. 73. Tadesse, Million and Desse, Tadelle, 2003. Milk production performance of Zebu, Holstein Friesian and their crosses in Ethiopia. Debre Zeyit, Ethiopia. Tadesse, M., Thiengtham, J., Pinyopummin, A. and Prasanpanich, S. 2010. Productive and reproductive performance of Holstein Friesian dairy cows in Ethiopia. Livestock Research for Rural Development 22 (2) 2010 Teferi, D. 1994. Reproductive and Milk Yield Performance of Crossbred Dairy Cattle at the Co‐operative Farm in the Arsi region, Ethiopia. M.Sc. thesis, Alemaya University of Agriculture, Dire Dawa, Ethiopia. Yosef Tadesse. 2006. Genetic and non‐ genetic analysis of fertility and production traits in Holetta and Ada’a Berga dairy herd. M.Sc.Thesis. Faculty of Agriculture Department of Animal Science, School of Graduate studies. Alemaya University. Ethiopia.
Ethiopian Society of Animal Production 2014
243
Fertility of Cattle after Timed Artificial Insemination, Sex Control and Fresh Embryo Transfer
Million Tadesse Ethiopian Institute of Agricultural Research, Holetta Research Center, [email protected]
Abstract
In this current review the effect of time of artificial insemination (TAI) on pregnancy rate (PR), calf sex ratio and fresh embryo transfer (FET) after synchronization of estrus or ovulation in beef and dairy cows using studies conducted in a wide range of production systems were evaluated. Pregnancy rate to TAI were varies across experiments and lower as the second GnRH and TAI performed at early time (48 h) after Prostaglandin alpha 2 (PGF2α) injection. The inclusion of a progesterone source (controlled internal drug release device; CIDR) in TAI protocol (Cosynch) showed improvement in PR compared to Cosynch alone. Furthermore, PR was optimized by changing the time of second GnRH injection and TAI from 48 to 66‐72 h after PGF2α injection in Bos taurus breed. Results on the effect of timing of AI on calf sex ratio are inconsistent and conflicting in most of the studies. Maternal gonadotrophin and steroid hormone level, and synchronization treatment suggested to be related to sex of offspring. Response to superovulation of donor cows and PR of recipient cows were lower for Bos indicus breed compared to Bos taururs breed. Data support the use of Estradiol benzoate (EB) and GnRH along with CIDR before superovulation treatment of donor cows. Moreover, TET with fresh embryo indicated improvement in PR of recipient cows after estrus synchronization with GnRH and TET protocol.Results from this study indicated that the ovulation synchronization using GnRH and TAI or TET protocol can be utilized as strategy for improving fertility of dairy and beef cattle under tropical condition without the need for estrus detection, while the effect of TAI on calf sex ratio are inconsistent.
Key words: Cattle, pregnancy rate, timed artificial insemination, calf sex ratio, fresh embryo transfer
Introduction
Reproduction is the main limiting factor influencing production efficiency in dairy and beef cattle. Artificial insemination (AI) provides an economically viable technique to introduce desired genetics into a herd, whereas synchronization of estrus, ovulation, or both provides a more labor‐efficient way to incorporate AI and embryo transfer (ET) into management practices. Moreover, time of AI can be used to produce desired sex of offspring in cattle while, ET permits multiplication of desired animals. If these opportunities are pursued they are likely to drive the population into specialized strains of dairy and beef cattle. However, the success of AI and ET program is closely correlated with the efficiency of estrus detection, identification of correct time of insemination. Thus, one method to increase pregnancy rate (PR) is to use hormonal treatments, which synchronize estrus and ovulation, and allow for timed artificial insemination (TAI), calf sex control and TET. The purpose of this paper is to review literature pertaining to the effect of TAI on PR, calf sex ratio, and fresh ET.
Ethiopian Society of Animal Production 2014
244
Synchronization of ovulation and fixed time AI (TAI) in cattle
Estrous (heat) synchronization is a management practice that can help beef and dairy producers to improve production and reproduction efficiency and economic returns. It can help shorten the breeding and calving seasons and produce calves more uniform in age and weight (Fike et al., 1999). Estrus synchronization systems only synchronized heat, not ovulation. For example, the two shots of Lutalysesystem results in cows ovulating at various times over 5 to 7 days. In this system in order to achieve acceptable PR, producers had to check heat for 5 to 7 days and breed cows 12 hours after heat (Hall, 2002). Synchronization of ovulation is based on controlling the life‐span of the CL with PGF2α, induction of follicle development and a synchronized ovulation, or prevention of estrus using progestogen treatments (Thatcher et al., 2006).This will allow fixed‐timed AI without the need for estrus detection.
Recent ovulation synchronization research has focused on the use of gonadotrophin releasing hormone (GnRH) + Timed AI on a single day without checking heat (Yamada et al., 1999; Martinz et al., 1999; Kasimanickam et al., 2005). One protocol employing this approach is the Ovsynch regimen, consisting of GnRH treatments at day 0, followed by PGF2α treatment at day 7 and the second GnRH treatment injection and AI after 24 hours of PGF2α, injection (Pursley et al., 1998; Kasimanickam et al., 2005). If the AI is done together with second GnRH injection then the protocol is called Co‐Synch. The first GnRH treatment usually increases peripheral progesterone concentrations by inducing ovulation of a dominant follicle Martinz et al. (1999) and, thereby, synchronizes emergence of a new follicular wave leading to the synchronized development of mature dominant follicles that are induced to ovulate by a second GnRH injection given 2 to 3 d after PGF2α injection. However, the initial GnRH injection has been reported to reset follicular growth in only 64% of dairy cows Vasconcelos et al. (1999) and, 66% of beef Geary et al. (2000) and variation in follicle size when the second GnRH treatment is given has been characterized (Perry et al., 2002).
Comparison between Cosynch and Ovsynch protocol using beef cattle under similar condition indicated that giving TAI at the time of second GnRH (Cosynch protocol) resulted in lower PR compared to the Ovsynch protocol (Gear and Whittier, 1998). Similarly, Yamada et al.(1999) found higher PR for Ovsynch (59.1%) than Cosynch/control group (20.9%). However, the Cosynch protocol, in which the second GnRH injection and TAI at 48 h yielded similar PR of 52% compared with 54% for the Ovsynch protocol, in which the second GnRH injection occurs at 48 h after PGF2α, and the TAI occurs 12 to 24 h later (Geary et al., 2001). Peters and Pursley (2003) demonstrated that conception rate (CR) to TAI was greater in animals with a 48 h interval from PGF2α to GnRH than when GnRH was given at the same time as PGF2α, and that follicle size and CR increased when GnRH was given either 0, 12, 24 or 36 h after PGF2α. Furthermore, Pursley et al. (1995b; 1998) showed higher PR when cows were inseminated at 16 hours (45%) after the second GnRH injection in Ovsynch protocol, but small reduction in PR when cows were inseminated at the time of the second GnRH injection (Cosynch). The use of TAI offers advantages for inducing reproductive activity early postpartum, reducing the need for the detection of estrus, and concentrating labor efforts through the use
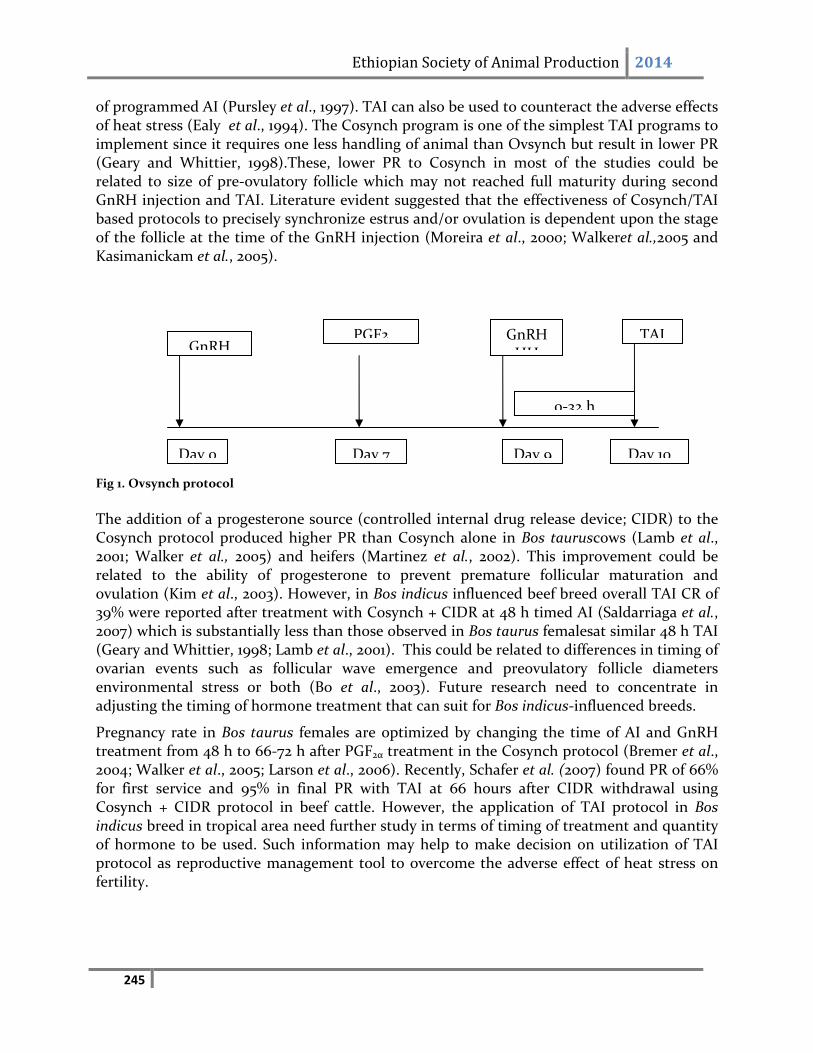
Ethiopian Society of Animal Production 2014
245
of programmed AI (Pursley et al., 1997). TAI can also be used to counteract the adverse effects of heat stress (Ealy et al., 1994). The Cosynch program is one of the simplest TAI programs to implement since it requires one less handling of animal than Ovsynch but result in lower PR (Geary and Whittier, 1998).These, lower PR to Cosynch in most of the studies could be related to size of pre‐ovulatory follicle which may not reached full maturity during second GnRH injection and TAI. Literature evident suggested that the effectiveness of Cosynch/TAI based protocols to precisely synchronize estrus and/or ovulation is dependent upon the stage of the follicle at the time of the GnRH injection (Moreira et al., 2000; Walkeret al.,2005 and Kasimanickam et al., 2005).
Fig 1. Ovsynch protocol
The addition of a progesterone source (controlled internal drug release device; CIDR) to the Cosynch protocol produced higher PR than Cosynch alone in Bos tauruscows (Lamb et al., 2001; Walker et al., 2005) and heifers (Martinez et al., 2002). This improvement could be related to the ability of progesterone to prevent premature follicular maturation and ovulation (Kim et al., 2003). However, in Bos indicus influenced beef breed overall TAI CR of 39% were reported after treatment with Cosynch + CIDR at 48 h timed AI (Saldarriaga et al., 2007) which is substantially less than those observed in Bos taurus femalesat similar 48 h TAI (Geary and Whittier, 1998; Lamb et al., 2001). This could be related to differences in timing of ovarian events such as follicular wave emergence and preovulatory follicle diameters environmental stress or both (Bo et al., 2003). Future research need to concentrate in adjusting the timing of hormone treatment that can suit for Bos indicus‐influenced breeds.
Pregnancy rate in Bos taurus females are optimized by changing the time of AI and GnRH treatment from 48 h to 66‐72 h after PGF2α treatment in the Cosynch protocol (Bremer et al., 2004; Walker et al., 2005; Larson et al., 2006). Recently, Schafer et al. (2007) found PR of 66% for first service and 95% in final PR with TAI at 66 hours after CIDR withdrawal using Cosynch + CIDR protocol in beef cattle. However, the application of TAI protocol in Bos indicus breed in tropical area need further study in terms of timing of treatment and quantity of hormone to be used. Such information may help to make decision on utilization of TAI protocol as reproductive management tool to overcome the adverse effect of heat stress on fertility.
GnRH
Day 0
PGF2
Day 7 Day 9
GnRHHH
TAI
0‐32 h
Day 10
Ethiopian Society of Animal Production 2014
246
The use of timing of insemination to alternate calf sex ratio in cattle
The ability to alter secondary sex ratio in cattle is financially attractive.In beef cattle, the increased growth rate and more efficient production of lean meat by males have financial advantages. In contrast, dairy farmers generally seek more female calves to replace their herd for increase milk production (Keane et al., 1990). Sexing technology takes advantage of the physiological differences between X and Y spermatozoa, favoring the presence of the desired kind of spermatozoa in the moment of fertilization and deviating the physiological sex ratio (Martinez et al., 2004). Numerous efforts have been directed toward developing procedures for selecting the gender of offspring. One approach has been to actually separate X ‐ from Y‐bearing spermatozoa (Amann, 1989) using flow cytometry/cell sorting method. However, the application of this new technology will depend on whether producers can economically justify the cost to process the sexed semen (Hansen, 2006). Another approach to selecting the gender of offspring is to take advantage of in vivo conditions reported to favor either X‐ or Y‐bearing spermatozoa (Johnsoet al., 1994; Wehner et al., 1997). If spermatozoa carrying a Y chromosome capacitated earlier post insemination due to great sensitivity to uterine ion concentration than those carrying an X chromosome, uterine‐oviduct environment mediated sex selection could occur (Wehner et al., 1997; Gutiérrez‐Adán et al., 1999). X sperm have a longer functional survival such that they have an advantage over Y sperm in binding to oviductal epithelial cells, remaining bound to oviductal epithelial cells over time, or both (Macfarlane et al., 2006). In many species, early insemination or mating appears to favor female offspring, whereas late mating appears to favor male offspring (Horing et al., 1996; In rate; Huck, 1993; in golden hamster). In cattle, some researchers have studied the variation of the sex ratio depending on the time of mating relative to ovulation (Martinez et al., 2004;Foote, 1977). Nevertheless, results have been very variable. Working with cattle, Martinez et al. (2004) found that the percentage of calved females (73.05%) is significantly superior for early inseminations (8–18 h), and it decreases 1.85% per hour from the onset of estrus. While, delayed insemination (greater than 30 h after estrus) produce a significant deviation of the sex ratio towards the males (72.06%). Work by Pursley et al. (1998) also showed that time of AI appeared to influence gender of calf: cows bred at 0 and 32 h appeared to have a higher percentage of female offspring. On the contrary, the earlier Foote (1977) showed no effect of the time of insemination on the sex ratio in heifers and cows. In similar way Rorie et al. (1999b) also reported that insemination of beef cattle 10 or 20 hours before expected ovulation does not alter the gender ratio of the resultant calves. Recently, AI performed at different times in the first half of the estrus period did not alter the sex ratio of offspring in dairy cows(Demural et al., 2007).Ideta et al.(2007) also reported that early insemination did not skewed female sex ratio after superovulation treatment. The disparity between the results of these studies could be due to the differences in the detection of estrus (Demural et al., 2007). The use of simpler and cost effective methods such as estrus detection aids in combination with visual observation or the use of TAI will minimize the problem of estrus detection It has been reported that the Ovatec vaginal conductivity probe measuring the electrical resistance of vaginal secretions is one means to determine proper insemination time to
Ethiopian Society of Animal Production 2014
247
significantly alter the sex ratio of the resultant offspring (Wehner et al., 1997; Leaflet, 1999). Wehner et al. (1997) reported significant difference in offspring sex ratio using Ovatec reading; early inseminated (When probe reading less than 55 on the decline scale) cow delivered heifer calves at significantly greater rate (93% female) where as, cow probed for bull calves (at probe reading greater than 60 unit on the incline scale) delivered bulls at greater rate (92% male calves) than other treatments. However, using heifers Leaflet (1999) found that a significantly lower percentage of male fetus (34.4%) when probe values were increasing than those bred during a period of decreasing probe values (69.2% male fetus) which is opposite of what was expected. Although there is a significant deviation in sex ratio in both studies, the difference between the two studies may have been due to difference in probe reading between them. The different and inconsistent results reported in literature may indicate more than one mechanism affects the sex ratio and the action of these mechanism depend on maternal gonadotrophins and steroid hormone level as suggested by (Ideta et al., 2007). In human, maternal gonadotrophins and steroid hormone levels have been suggested to casually relate to sex of zygote with high level of hormone being associated with production of female (James, 1986; Ideta et al., 2007). It is also suggested that, treatments used for synchronization of estrus or ovulation in cattle may affect the sex ratio of the resulting calves (Rorie et al., 1999b). James (1992) has suggested that in women high progesterone and gonadotrophins favor birth of females while high estrogen and testosterone favor males. The effect of maternal gonadotropin and steriod hormone level, or synchronization treatments on sex ratio in relation to timing of AI would appear to merit further investigation.
Embryo transfer in cattle
Bovine embryo transfer has been applied widely around the world. This technology increases the number of offspring obtained from donors with high genetic value and is used to disseminate desirable genetics around the world (Baruselli et al., 2006). Multiple ovulation and embryo transfer (MOET) designed to produce genetically superior offspring by superovulating selected dams and breeding these dams to superior sires by AI (Merton et al., 2003). Moreover, embryo transfer is useful in improving the genetic base of nucleus herd by permanent immigration of quality gene by purchasing genetically high quality embryo. The procedure involves synchronization of donor and recipient cows, superovulation of donor cows and ET to recipient cows (Cunningham, 1999)
Superovulation
Techniques for the superovulation of cattle involve administration of gonadotrophins at the mid‐luteal phase of the estrous cycle, followed by prostaglandin PGF2α 48 hours later to induce luteolysis, estrus and ovulation (Goulding et al., 1996). Two of the most common gonadotrophins used in cattle are pregnant mare serum gonadotrophin (PMSG) and follicle stimulating hormone (FSH), while limited use of human hCG) is also practiced. Different trials have been conducted to test the efficiency of superovulation using different
Ethiopian Society of Animal Production 2014
248
gonadotrophins. Previous study using FSH indicated that the number of embryo/ova obtained estimated to be 7‐9 with 4‐5 transferable embryos (Elsedn et al., 1978; Callensen et al., 1988). In Beef cattle the number of total ova/embryo collected and number of transferable embryo found to be 2.8 and 2.1 respectively for cows superovulated with PMSG (Gonzale et al., 1994). Moreover, comparison between FSH and PMSG (Goulding et al., 1996) indicate that the numbers of corpus luteum (CL) and embryos recovered were higher in the pFSH‐treated heifers (2.1) than the PMSG‐treated (1.5) heifers. The lower superovulation response observed in PMSG could be related to the longer half life compared to FSH. Evidence indicate that PMSG induces three to six large follicles (21.0 mm) post ovulation and prior to embryo recovery. This results in a highly estrogenic uterine environment, which may have a deleterious effect on early embryonic development (Saumande et al., 1980; Boland et al., 1978). Response to superovulation hormones could also be affected by age, breed of donor and individual animal physiological condition at the time of treatment (Baruselli et al., 2003). In Bos taurus breed, using different doses of FSH/LH the number of ova/embryo obtained vary from 5.3 to 13.2 (Willmott et al., 1990). However, in Brahman (Bos indicus) crosses the number of ova/embryo after superovulation with similar doses of FSH ranged from 4.6 to 8.5 (Tribulo et al., 1991). Research reported using FSH also showed that slightly lower number of ova/embryo (9.3) for Brahman compared to (10.2) for Holstein Frisian under similar treatment (Krininger et al., 2003). The relatively lower response for Bos indicus compared to Bos taurus in these findings likely to be due to difference in reproductive physiology, or environmental effect (heat stress) or both. Some studies suggested genetic differences in the physiology and the reproductive behavior between Bos indicus and Bos taurus cattle (Baruselli et al., 2006) can affect the efficiency of superstimulation programs. The major drawback in traditional superovulation protocol are the need for estrus detection to determine time of AI, inability to start superovulation treatments at the optimal time of follicular development and high variability in embryo production (Baruselli et al., 2003; Martinset al., 2005; Baruselli et al., 2006). Some studies suggested that the importance of initiating gonadotropin treatments at the time of follicular wave emergence (Bo et al., 1995; Son et al., 2007). Treatments designed to control follicular wave development have been based on removal of the suppressive effect of the dominant follicle, by hormonal (GnRH or estradiol and progestogen) treatment, and thereby induce synchronized emergence of a new follicular wave at a specific time after treatment (Bo et al., 1995). Administration of both EB and GnRH prior to superstimulation in CIDR‐treated Korean native cows (Bos Taurus), at any stage of the estrous cycle, resulted in a superovulatory response and embryo yield comparable to the conventional superovulation protocol (Son et al., 2007). The effect of pretreatment with GnRH and/or EB along with CIDR prior to initiation of FSH treatment appeared to be beneficial for tropical breed by avoiding the need for estrus detectionand possibly increase the efficiency of utilization of FET programs.
Ethiopian Society of Animal Production 2014
249
Fresh embryo transfer
Recipient cows play an important role in the success of FET programs. However, Variations related to embryo such as recipient breed, embryo quality, the degree of asynchrony between embryo and recipient or environment factors associated with recipient (Wright, 1981; Hasler, 2001) influence recipient PR. The effect of embryo quality on recipient PR is reported to be higher for grade 1 embryo compared to grade 2 and above (Putney et al., 1989; Hasler, 2001). Study on the effect of breed on recipient PR after FET indicated that PR were higher among dairy breed (70.5%) as compared to beef breed (65.9%) of Bos taurus origin, while a substantially lower PR (52.8%) was achieved using dairy breed as recipients (Hasler, 2001). Moreover, Spellet al. (2001) found higher PR (82.8%) using FET on Angus recipient cow. Furthermore, recent result indicates that PR were found to be from 42.‐59% per Bos tuarus X Bos indicus recipient cow (Ferreira et al., 2006) which is lower compared to these reported for Bos taurus breeds. Although information is lacking on comparative study on recipient pregnancy rate after FET between Bos taurus and Bos indicus under similar condition, the lower PR observed for Bos indicus breed could be related to short duration of estrus affecting efficiency of heat detection. Evidence on the effect of efficiency of estrus detection on PR of Bos indicus X Bos tuarus recipient under pasture condition indicated that an overall PR of 13% was observed, due largely to the low number of recipients seen in estrus (55.5%) and/or with a CL at the time of embryo transfer (28.9%; Bó et al., 2004). Alternatively, the lower PR observed after FET could also be related to the effect of heat stress on size of dominant follicle which may impairs production of estradiol required to provoke estrous behavior (Lyimo et al., 2000). Improvement in PR in heat stress dairy cattle were reported after FET on recipient cows synchronized using TET protocol (Ambrose et al., 1999). The use of ovulation synchronization with GnRH and TET protocol suggested resulting in acceptable PR without the necessity of estrus detection (Bo et al., 2004). The effectiveness or technical visibility of transfer of fresh embryo to heat stress recipient in tropical area using TET protocol need to be further study. Such information may help to improve management of recipient cows under heat stressed condition or minimize the adverse effect of heat stress on fertility.
Conclusion
Pregnancy rate to TAI protocol lower for Cosynch protocol compared to Ovsynch. Data support the benefit of inclusion of CIDR in TAI/Cosynch protocol and changing the time of second GnRH and TAI from 48 to 66‐72 h in Bos taurus breed. Future research need to concentrate on adjusting the timing of hormone treatment, and the quantity of hormone that can suit for Bos indicus‐influenced breeds. Results on control of calf sex ratio by altering time of insemination are inconsistent and conflicting in many cases. The effect of maternal gonadotropin and steriod hormone level, or synchronization treatments in calf sex ratio in relation to timing of AI would appear to merit further investigation. The relatively lower superovulation response for Bos indicus compared to Bos taurus is likely to be due to physiological difference between the two breeds, environmental (heat stress) effect or both. The ovulation synchronization with GnRH or EB before initiation of superovulation
Ethiopian Society of Animal Production 2014
250
treatment in Bostaurus breed showed comparable result compared to untreated cows. The use of GnRH and TET protocol suggested to improve PR of recipient cows after FET in heat stressed area without the necessity of estrus detection.However, the effectiveness or technical visibility of transfer of fresh embryo to heat stress zebu recipient in tropical area using ovulation synchronization with GnRH and TET protocol need to be further study.
Reference
Amann, R.P. 1989. Treatment of sperm to predetermine sex. Theriogenology. 31: 49‐60. Ambrose, J.D., M. Drost, R.L. Monson, J.J Rutledge, M.L. Leibfried‐Rutledge, M.J. Thatcher, T. Kassa, M. Binelli, P.J. Hansen, P.J. Chenoweth and W.W. Thatcher, 1999.Efficacy of Timed Embryo Transfer with Fresh and Frozen In Vitro produced Embryo to increase Pregnancy rates in Heat‐stressed Dairy cattle. J. Dairy Sci. 82: 2369‐2376 Badinga, L., W.W. Thatcher, T. Diaz, M. Drost and D. Wolfenson. 1993. Effect ofenvironmental heat stress on follicular steroidogenesis and development in lactating Holstein cows. Theriogenology. 39: 797‐810. Baruselli, P. S., M. F. de Sa´ Filho, C.M. Martins, L. F. Nasser, M.F.G. Nogueira , C. M. Barros and G.A. Bo. 2006. Superovulation and embryo transfer in Bos indicus cattle. Theriogenology. 65: 77–88. Baruselli, P.S., E.L. Reis, M.O. Marques, L.F. Nasser and G.A. Bó. 2004 .The use of hormonal treatments to improve reproductive performance of anestrous beef cattle in tropical climates. Anim. Reprod. Sci. 82–83: 479–486 Baruselli, P.S., M.O. Marques, E.L.Reis, L.F.T. Nasser, R.C.P. Silva and J.A.Menegatti. 2003. dequac¸a˜o da dose de FSH (Folltropin‐V) em protocolos de superovulac¸a˜o de vacas nelore (Bos taurus indicus) com inseminac¸a˜o artificial em tempo fixo. Acta. Sci. Vet. 31: 244–245. Bo, G.A. and R.J. Mapletoft. 2004. Control of ovarian function for fixed‐timed AI andembryo transfer without estrus detection. Proceedings of the WBC Congress, Québec, Canada. Bo, G.A., G.P. Adams, M. Caccia, M. Martinez, R.A. Pierson and R.J. Mapletoft. 1995. Ovarian follicular wave emergence after treatment with progestogen and estradiol in cattle. Anim Reprod. Sci. 39: 193–204. Boland, M.P., T.F. Crosby and I. Gordon. 1978. Morphological normality of cattle embryos following superovulation using PMSG. Theriogenology.175‐ 180. Bremer, V.R., S.M. Damiana, F.A. Ireland, D.B. Faulkner and D.J. Kesler. 2004. Optimizing the interval from PG to timed AI in the CO‐Synch + CIDR and 7‐11 Synch estrus synchronization protocols for postpartum beef cows. J. Anim. Sci. 82: 106.
Ethiopian Society of Animal Production 2014
251
Breuel, K.F., R.D. Baker, R.L. Butcher, E.C. Townsend, E.K. Inskeep, R.A. Dailey and S.P. Lemer. 1991. Effects of breed, age of donor and dosage of follicle stimulating hormone on the superovulatory response of beef cows. Theriogenology. 36: 241‐255. Bridges, G.A., L.A. Helser, D.E. Grum, M.L. Mussard, C.L. Gasser and M.L. Day. 2008. Decreasing the interval between GnRH and PGF2α from 7 to 5 days and lengthening proestrus increases timed‐AI pregnancy rates in beef cows. Theriogenology. 69: 843–851. Callesen, H., T. Greve and D. Hyttel. 1988. Preovulatory evaluation of the superovulatory response in donor cattle. Theriogenology. 30: 477‐488. Cunningham, E.P. 1999. The application of biotechnologies to enhance animal production in different farming systems. Livest. Prod. Sci.58:1–24
Demural, O., N. Mustafa, M. Abay and T. Bekyrek. 2007. The effect of artificial insemination timing on the sex ratio of offspring and fertility in dairy cows. Turk J. Vet. Anim. Sci. 31: 21‐24. Elsden, R.P., L.D. Nelson and G.E.Jr. Seidel. 1978. Superovulating cows with follicle stimulating hormone and pregnant mare's serum gonadotrophin. Theriogenology. 9: 17‐26. Ferreira, R.M., C.A. Rodrigues, H. Ayres, R.F. Mancilha, P.H. Franceschini, C.R. Esper and P.S. Baruselli. 2006. Effect of synchronizing ovulation in cattle administered a Norgestomet ear implant in association with eCG and estradiol treatments on pregnancy rateafter fixed‐time embryo transfer.Anim. Reprod. Sci. 3: 370‐375. Fike, K. E., M.E. Wehrman, B.R. Lindsey, E.G. Bergfeld, E.J. Melvin, J.A. Quintal,E. L. Zanella, F. N. Kojima and J. E. Kinder. 1999. Estrus synchronization of beef cattle with a combination of melengestrol acetate and an injection of progesterone and 17β‐estradiol. J Anim Sci1999. 77:715‐723. Foote, R.H. 1977. Sex ratios in dairy cattle under various conditionsTheriogenology. 8: 349‐356. Geary, T. W., J. C. Whittier, D. M. Hallford and M. D. MacNeil. 2001. Calf removal improves conception rates to the Ovsynch and COSynch protocols. J. Anim. Sci. 79: 1–4. Geary, T. W., E. R. Downing, J.E. Bruemmer and J.C. Whittier. 2000. Ovarian and estrous response of suckled beef cows to the select synch estrous synchronization protocol. Prof. Anim. Sci. 16: 1‐5. Geary, T.W. and J. C. Whittier. 1998. Effects of a timed insemination following synchronization of ovulation using the Ovsynch or Co‐Synch protocol in beef cows. Prof. Anim. Sci. 14: 217‐220.
Ethiopian Society of Animal Production 2014
252
Gonzalez, A. A., H. Wang, T.D. Carruthers, B. D. Murphy and R. J. Mapletoft. 1994. Superovulation in the cow with pregnant mare serum gonadotrophin: Effects of dose and anti pregnant mare serum gonadotrophin serum. Can. Vet. J. 35: 158‐162. Goulding, D., H.Williams, J. F. Roche and M. P. Boland. 1996. Factors affecting superovulation in heifers treated with PMSG. Theriogenology. 45: 765‐773. Gutiérrez‐Adán, A., G. Pérez, J. Granados, J.J. Garde, M. Pérez‐Guzmán, B. Pintado and J. De La Fuente. 1999. Relationship between sex ratio and time of insemination according to both times of ovulation and maturational state of oocyte. Zygote. 7: 37–43. Hall, J. B., W. Dee Whittier, J.Myers, M. Cline and D. Cuddy.2002. GnRH based estrus synchronization systems for beef cows.Virginia cooperative extension, pub. No. 400‐013. Hansen, G.R. 2006. Select the Sex of Your Next Calf Prior to Mating: Using Sexed Semen. http://edis.ifas.ufl.edu. Aprile 2006.
Hasler, J.F. 2001. Factors affecting frozen and fresh embryo transfer pregnancy rates in cattle. Theriogenology. 56:1401‐1415. Horing, L. and M. Mcclintock. 1996. Male sexual rest affects litter sex ratio of newborn Norway rat. Animal Behavior. 51: 991‐1005.
Huck, U.W., J. Seger and R.D. Lisk. 1993. Litter sex ratios in the golden hamster vary with time of mating and litter size and are not binomially distributed. Behav. Ecol. Sot. 26: 99‐109. Ideta, A., K.Hayama, M.Urakawa, Y.G.Jung, K.T.Lim, W.Y.Lee, H.B.Song and Y.Aoyagi. 2007. Relationship among estrous behavior, superovulatory response and grade one embryo sex ratio in superovulated Holstein heifers. J. Reprod. Dev. 53: 1015‐1021. James, W.H. 1986. Hormonal control of sex ratio. J.Theor. Biol. 118: 427‐447. James, W.H. 1992. The hypothesized hormonal control of mammalian sex ratio at birth – A second update. J. Theor Biol. 155:121‐128. Johnson, L.A., D.G. Cran and C. Polge. 1994. Recent advances in sex pre‐selection of cattle: flow cytometric sorting of x‐ and y‐chromosome bearing sperm based on DNA to produce progeny. Theriogenology. 41: 51‐56. Kasimanickam, R., J.M. Cornwell and R.L. Nebel. 2005. Fertility following fixed‐time AI or insemination at observed estrus in Ovsynch and Heatsynch programs in lactating dairy cows. Theriogenology. 63: 2550–2559. Keane, M.G. and M.J. Drennan. 1990. Comparison of growth and carcass composition of heifers in three production systems and steers and effects of implantation with anabolic agents. Irish J Agric Res. 29:1–13.
Ethiopian Society of Animal Production 2014
253
Kim, Ill‐H., G.H. Suh and D.S. Son. 2003. A progesterone‐based timed AI protocol more effectively prevents premature estrus and incomplete luteal regression than an Ovsynch protocol in lactating Holstein cows. Theriogenology. 60: 809–817
Krininger, I. C.E., J. Block, Y.M. Al‐Katanani, R.M. Rivera, C.C. Chase Jr. and P.J. Hansen. 2003. Differences between Brahman and Holstein cows in response to estrus synchronization, superovulation and resistance of embryos to heat shock. Anim. Reprod. Sci. 78:13–24 Lamb, G.C., J.S. Stevenson, D.J. Kesler, H.A. Garverick, D.R. Brown and B.E. Salfen. 2001. Inclusion of an intravaginal progesterone insert plus GnRH and prostaglandin F
2α for
ovulation control in postpartum suckled beef cows. J. Anim. Sci. 79: 2253‐2259. Larson, J.E., G.C. Lamb, J.S. Stevenson, S.K. Johnson, M.L. Day, T.W. Geary, D.J.Kesler, J.M. DeJarnette, F.N. Schrick, A. DiCostanzo and J.D. Arsenau. 2006. Synchronization of estrus in suckled beef cows for detected estrus and artificial insemination and timed artificial insemination using gonadotrophin‐releasing hormone, prostaglandin F
2α, and progesterone. J.
Anim. Sci. 84: 332‐342. Leaflet, A.S. 1999. The use of a vaginal conductivity probe to influence calf sex ratio via altered insemination time. Beef Research Report. 1999. Iowa State University. Macfarlane, M., A. Maschari and R. Pursley. 2006. Influencing sex ratio of offspring in dairy cattle. Kentucky Dairy Conference March 7. Martins, C.M., E.S.C. Castricini, E.L. Reis, J.R.S. Torres‐Ju´nior, L.U. Gimenes and M.F.Sa´ Filho. 2005. Produc¸a˜o embriona´ria de vacas holandesas a diferentes protocolos de superovulac¸a˜o com inseminac¸a˜o artificial emtempo fixo. Acta. Sci. Vet. 3: 286.
Martinez, F., M. Kaabia, F. Martinez‐Pastorb, M. Alvarez, E. Anela, J.C. Boixoc, P. de Pazb and L. Ane. 2004. Effect of the interval between estrus onset and artificial insemination on sex ratio and fertility in cattle. Theriogenology. 62: 1264–1270.
Mart´ınez, M.F., G.P.Adams, D. Bergfelt, J.P. Kastelic and R.J. Mapletoft. 1999. Effect of LH or GnRH on the dominant follicle of the first follicular wave in heifers. Anim. Reprod. Sci. 57: 23–33. Merton, J.S., A.P. de Roos, E. Mullaart, L. de Ruigh, L. Kaal, P.L. Vos and S.J. Dieleman.2003. Factors affecting oocyte quality and quantity in commercial application of embryo technologies in the cattle breeding industry. Theriogenology. 59: 651‐674.
Moreira, F., R.L. de la Sota, T. Diaz and W.W. Thatcher. 2000. Effect of day of the estrous cycle at the initiation of a timed artificial insemination protocol on reproductive responses in dairy heifers. J. Anim. Sci. 78:1568–1576.
Ethiopian Society of Animal Production 2014
254
Perry, G. A., T. W. Geary, M. C. Lucy and M. F. Smith. 2002. Effect of follicle size at time of GnRH‐induced ovulation on luteal function and fertility. J. Anim. Sci. 80: 114. Peters, M. W. and J.R. Pursley. 2003. Timing of final GnRH and the Ovsynch protocol affects ovulatory follicle size, subsequent luteal function, and fertility in dairy cows. Theriogenology. 60:1197‐1204. Pursley, J.R., W. R. Silcox and M.C. Wiltbank. 1998. Effect of time of artificial insemination on pregnancy rates, calving rates, pregnancy loss, and gender ratio after synchronization of ovulation in lactating dairy cows. J. Dairy Sci. 81: 2139–2144.
Pursley, J. R., M. R. Kosorok and M.C. Wiltbank. 1997. Reproductive management of lactating dairy cows using synchronization of ovulation. J Dairy Sci. 80:301–306. Pursley, J. R., M. O. Mee and M. C. Wiltbank. 1995. Synchronization of ovulation in dairy cows using PGF2α and GnRH. Theriogenology. 44: 915–923. Putney, D.J., M. Drost and W.W. Thatcher. 1989. Influence of summer heat stress on pregnancy rates of lactating dairy cattle following embryo transfer or artificial insemination. Theriogenology. 31:765–776. Rorie, R.W., T.D. Lester, B.R. Lindsey and R.W. McNew. 1999a. Effect of timing of artificial insemination on gender ratio in beef cattle. Theriogenology. 52: 1035‐1041. Rorie, R.W. 1999b. Effect of timing of artificial insemination on sex ratio. Theriogenology. 52: 1273‐1280.
Saldarriaga, J. P., D. A. Cooper, J. A. Cartmill, J.F. Zuluaga, R.L. Stanko and G.L.Williams. 2007. Ovarian, hormonal, and reproductive events associated with synchronization of ovulation and timed appointment breeding of Bos indicus‐influenced cattle using intravaginal progesterone, gonadotrophin‐releasing hormone, and prostaglandin F2{alpha}. J. Anim. Sci. 85:151‐162. Saumande, J. 1980. Concentrations of luteinizing hormone, oestradiol‐ 17p and progesterone in the plasma of heifers treated to induce superovulation. J. Endocrinol. 425‐437. Schafer, D. J., J. F. Bader, J. P. Meyer, J.K. Haden, M.R. Ellersieck, M.C. Lucy, M.F. Smith and D. J. Patterson. 2007. Comparison of progestin‐based protocols to synchronize estrus and ovulation before fixed‐time artificial insemination in postpartum beef cows. J. Anim. Sci. 85: 1940‐1945. Spell, A.R., W.E. Beal L.R. Corah and G. C. Lamb. 2001. Evaluating recipient and embryo factors that affect pregnancy rates of embryo transfer in beef cattle. Theriogenology. 56: 287‐297.
Ethiopian Society of Animal Production 2014
255
Son, D.S., C.Y. Choe, S.H. Choi, S.R. Cho, H.J. Kim, M.H. Han, I.S. Ryu, G.H. Suh, U.H. Kim and I.H. Kim. 2007. Effect of estradiol benzoate or GnRH treatment prior to superstimulation in CIDR‐treated, Korean native cows (Bos taurus). Anim. Reprod. Sci. 100: 14–21 Thatcher, W.W., T.R. Bilby, J.A. Bartolome, F. Silvestre, C.R. Staples and J.E.P.Santos. 2006. Strategies for improving fertility in the modern dairy cow. Theriogenology 65: 30–44. Tribulo, H., G.A. Bo, F. Jofre, J. Carcedo, A. Alonso and R.J. Mapletoft. 1991. The effect of LH concentration in a porcine pituitary extract and season on superovulatory response of Bos indicus heifers. Theriogenology. 35: 286.
Vasconcelos, J. L., R. W. Silcox, G. J. Rosa, J. R. Pursley and M. C. Wiltbank. 1999. Synchronization rate, size of the ovulatory follicle, and pregnancy rate after synchronization of ovulation beginning on different days of the estrous cycle in lactating dairy cows. Theriogenology. 52:1067‐1078. Walker, R.S., P.D. Burns, J.C. Whittier, G.E. Sides and D.D. Zalesky. 2005. Evaluation of gonadotrophin releasing hormone and insemination time using the Cosynch protocol in beef cows. Prof. Anim. Sci. 21: 190‐194. Wehner, G.R., C. Wood, A. Teague, D. Barker and H. Hubert. 1997. Efficiency of the Ovatec unit for estrus detection and calf sex control in beef cows. Animal Reprod. Sci. 46: 27‐34.
Willmott, N., J. Saunders, G.A. Bo, A. Palasz, R.A. Pierson and R.J. Mapletoft. 1990. The effect of FSH/LH ratio in pituitary extracts on superovulatory response in the cow. Theriogenology. 33: 347. Wright, J.M. 1981. Non‐surgical embryo transfer in cattle: embryo‐recipient interactions. Theriogenology. 15:43–56. Yamada, K., N. Tosihiko and M. Nagayosi. 1999. Synchronization of ovulation and fixed‐time insemination for improvement of conception rate in dairy herds with poor estrus detection efficiency. J. Reprod. Dev. 45: 51–55.
Ethiopian Society of Animal Production 2014
256
Assessment of Reproductive and Productive Performance of Dairy Cattle Breeds in Three Districts of East Shoa Zone, Central Ethiopia Kefelegn Seyoum1, Ashenafi Mengistu2, Kassahun Melesse3 and Adey Melesse3,
1Minstry of Agriculture, Kality National Artificial Insemination Center, 2Addis Ababa University, Faculty of Veterinary Medicine
3Debre Zeit Agricultural Research Center P.O.Box 32 Debre Zeit, Ethiopia
Abstract Cross sectional study was undertaken with the aim of assessing the reproductive and productive performance of dairy cows in three districts of East Shoa Zone, Oromia National Regional State. The study covered 151 dairy farms drawn from the three districts (Adama, Lume and Ada’a) and 5 PA’s each. .According to the respondents, crossbred dairy cows (<=75% exotic blood level) and artificial insemination breeding practices were predominant across all the farms studied. Significant difference (P<0.05) was observed for age at first calving and daily milk yield of cows among the three districts. However, calving interval, number of services per conception and lactation length were consistent (p>0.05) among the districts. Highly significant differences (P<0.0001) in milk yield and lactation length were observed among dairy cattle breeds. Similarly, the difference in age at first calving was significant (P<0.05). However, there was no difference (p>0.05) in the number of services per conception among the breeds considered.
Key words: District, productive, reproductive, performance, dairy cows
Introduction
In Ethiopia modern dairying started in the early 1950s when the country received the first batch of dairy cattle from the United Nations Relief and Rehabilitation Administration (UNRRA) . With the introduction of these cattle in the country, commercial liquid milk production started on large farms in and around Addis Ababa (Ketema, 2000).Dairy cattle breed improvement program in Ethiopia was also launched during the war between Ethiopia and Italy with importation of exotic dairy cattle (UNIDO, 2009). On station crossbreeding program was started by the Ethiopian Institute of Agricultural Research (the then Institute of Agricultural Research) using exotic Friesian, Jersey and Simmental as sire breeds and indigenous Horro, Boran and Barka as dam breeds with the aim of testing the productivity of crossbred dairy cows with different levels of exotic blood inheritance (Desta, 2002). Productive and reproductive traits are crucial factors determining the profitability of dairy production. For this reason that success of dairy production needs regular monitoring by assessing the productive and reproductive performance under the existing management system. Though efforts have been made for decades to improve the reproductive as well as productive performances of the dairy cattle breeds in the country, the result obtained from such efforts is not satisfactory to all dairy farms in the country equally as the gaps vary with study sites. Therefore, the aim of this study was to assess the reproductive and productive performance of dairy cattle in east Shoa zone of Oromia National regional State, Ethiopia.
Ethiopian Society of Animal Production 2014
257
Materials and Methods
Study Sites
The study was conducted in Ada’a, Lume and Adama districts of east Shoa Zone of Oromia National Regional State, Ethiopia. The districts are found within the radius of 100kms in the southeast of Addis Ababa, the capital of Ethiopia. The districts are situated within an altitude ranged from 1500 ‐ 2300 m above sea level. The mean annual rainfall is 866 mm, 860 mm and 854 mm in Ada’a, Lume and Adama, respectively. The annual minimum and maximum temperature of the study sites ranged from 7.9‐28 oC, 8‐29.2 oC and 8.5‐32 oC in Ada’a, Lume and Adama districts, respectively (IPMS, 2005).
Sampling and Data Collection
Multi‐stage sampling technique was used to select representative sample units. During the first stage, three districts were purposefully selected from east Shoa zone of Oromia National Regional State based on their potential for dairy production. Then five peasant associations (PAs) were randomly selected from each district, of which ten milk producing households randomly selected from the lists obtained from the respective district’s bureau of agriculture. A total of 151 dairy cattle holding households (50 households from each of Adama and Lume and 51 households from that of Ada’a) were included in the study. Structured questionnaire was developed to collect data on reproductive and productive performance of dairy cows and breed and breeding practices. It included age at first calving (AFC), number of service per conception (NSPC) and calving interval (CI) to assess reproductive performance of dairy cows as well as milk yield and lactation length for productive performance. The questionnaire was pretested to check its clarity and appropriateness before embarking on the actual data collection.
Data Analysis
Descriptive statistics was employed to describe qualitative data using Statistical Procedures for Social Sciences (SPSS) version 20.0 (SPSS, 2011). Quantitative data were analyzed using the General Linear Model (GLM) procedure of the Statistical Analysis System (SAS,,2002). Means with in the same category were compared using the Least Significant Difference (LSD) when F test was found to be significant. The following mathematical model was used during data analysis. Yijkl=µ+Di+Bj+e ijk. Where: Yijk= the observed value of a dependent variable; µ= overallmean; Di= the effect of district; Bj= the effect of breed and eijk = random error
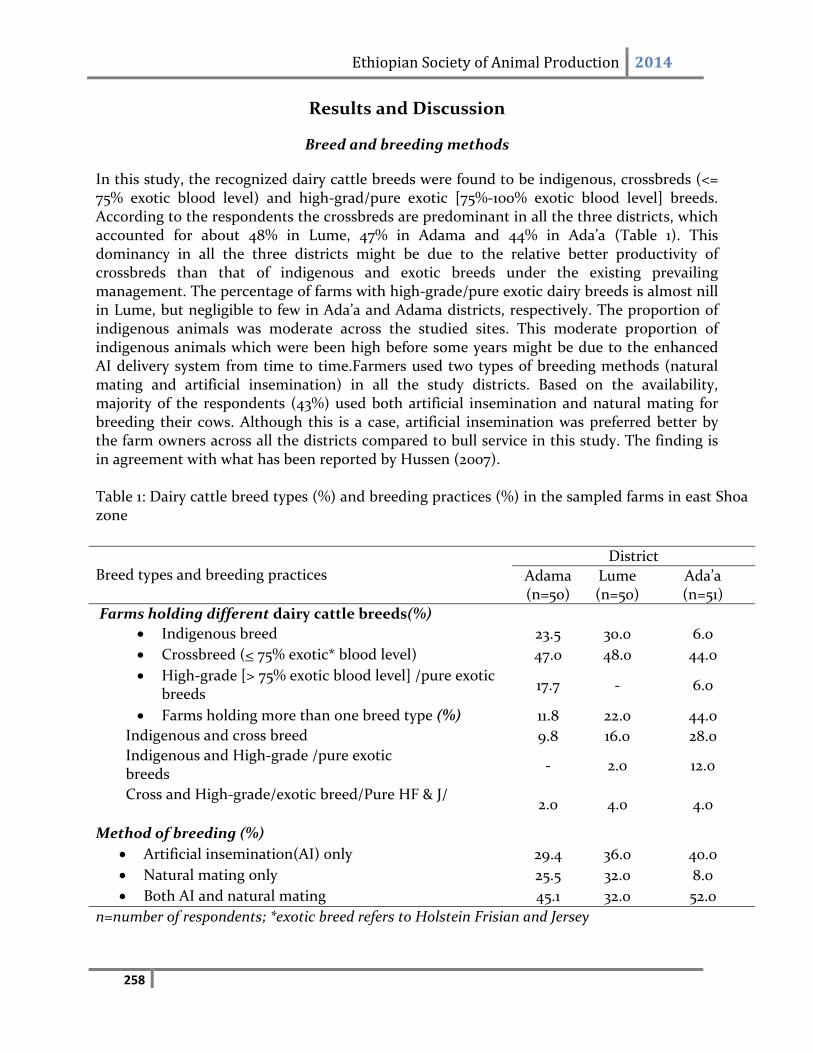
Ethiopian Society of Animal Production 2014
258
Results and Discussion
Breed and breeding methods
In this study, the recognized dairy cattle breeds were found to be indigenous, crossbreds (<= 75% exotic blood level) and high‐grad/pure exotic [75%‐100% exotic blood level] breeds. According to the respondents the crossbreds are predominant in all the three districts, which accounted for about 48% in Lume, 47% in Adama and 44% in Ada’a (Table 1). This dominancy in all the three districts might be due to the relative better productivity of crossbreds than that of indigenous and exotic breeds under the existing prevailing management. The percentage of farms with high‐grade/pure exotic dairy breeds is almost nill in Lume, but negligible to few in Ada’a and Adama districts, respectively. The proportion of indigenous animals was moderate across the studied sites. This moderate proportion of indigenous animals which were been high before some years might be due to the enhanced AI delivery system from time to time.Farmers used two types of breeding methods (natural mating and artificial insemination) in all the study districts. Based on the availability, majority of the respondents (43%) used both artificial insemination and natural mating for breeding their cows. Although this is a case, artificial insemination was preferred better by the farm owners across all the districts compared to bull service in this study. The finding is in agreement with what has been reported by Hussen (2007). Table 1: Dairy cattle breed types (%) and breeding practices (%) in the sampled farms in east Shoa zone
Breed types and breeding practices
District
Adama (n=50)
Lume (n=50)
Ada’a (n=51)
Farms holding different dairy cattle breeds(%)
Indigenous breed 23.5 30.0 6.0
Crossbreed (< 75% exotic* blood level) 47.0 48.0 44.0
High‐grade [> 75% exotic blood level] /pure exotic breeds
17.7 ‐ 6.0
Farms holding more than one breed type (%) 11.8 22.0 44.0
Indigenous and cross breed 9.8 16.0 28.0
Indigenous and High‐grade /pure exotic breeds
‐ 2.0 12.0
Cross and High‐grade/exotic breed/Pure HF & J/ 2.0 4.0 4.0
Method of breeding (%)
Artificial insemination(AI) only 29.4 36.0 40.0
Natural mating only 25.5 32.0 8.0
Both AI and natural mating 45.1 32.0 52.0
n=number of respondents; *exotic breed refers to Holstein Frisian and Jersey
Ethiopian Society of Animal Production 2014
259
Reproductive and productive performance of dairy cows
Reproductive and productive performance of dairy cows in the study area is presented in Table 2. Age at first calving, calving interval, and number of service per conception are the most economically important reproductive traits which determine the reproductive efficiency of dairy cows in dairy farming. This study demonstrated that the average age at first calving as reported by the respondants for indigenous, crossbreds and high‐grade/exotic dairy cows, regardless of their age, in Adama district was 51.8, 31.8 and 33.8months, respectively. The figure for Ada’a district was 49.1, 33.7and 35.6months, respectively, while it was 51.0, 39.5 and 38.0 months, respectively, for Lume district. Although age at first calving was consistent for indigenous (p>0.05) animals across the three districts studied, it was higher (p<0.05) for crossbred and high‐grade/pure exotic dairy breeds in Lume compared to Ada’a and Adama districts. The results of this study for age at first calving (AFC) of local/indigenous/ breeds is nearly similar to the results of McDowell (1971) which values 50 months for Horro breeds but much higher than the results of Goshu (1981) that averaged 30.3 months for Barka breeds and also slightly less than the results of Mukassa (1989) that valued 53 months for high land zebus. The results of this study in particular that of cross and exotic breed heifers of Adama and Ada’a dairy farms are also nearly similar to the result of Zewdie (2010) which valued 33.6 months. Whereas the result observed in dairy farms of Lume is slightly higher than the result described before, but nearly similar to the optimum performance of AFC under improved smallholder systems in the tropics which was described by Perera (1999) that valued 36 months. This significant variation (p<0.05) between the three districts for the results of AFC of cross breeds might be due to the difference in the level of management. Hence, heritability of AFC is generally low, indicating that this trait is highly influenced by environmental factors such as feed and health (Mukasa, 1989). The long CI for local breeds is recorded in Ada’a district 20.71 ± 7.61 months which is significantly higher than that of Adama district 18.68 ± 5.84months but not that of Lume 20.41 ± 9.55 months. The CI for crossbred cattle is significantly longer (P<0.05) in Lume district (17.38 ± 6.02 months) than that of Ada’a and Adama districts. Similar to AFC, this significant variation (p<0.05) between the districts for the results of CI of indigenous and cross breeds might be due to the difference in the level of management. Non significant difference (P>0.05) was observed in high‐grade dairy cows for CI in the three districts. In the present study CI for local breeds is lower than that of the high land zebus (Mukassa et al., 1989) that averaged 25 months, but higher than the results of Mc Dowell (1971) for Horro breeds (12.2 months), Sweenson et al., (1981) for Arisi breeds (12.9 months), and Hilemariam and Kassa (1994) for Borna breeds (15.5 months). However, for cross and exotic breeds the result is in agreement with Kiwuwa (1983) and Abdunasir (2000) which is within the range of 14.6‐18.5 months. Though the figures in AFC and CI of dairy cows in this study agree with some previous study results; it were been very difficult to the respondents to recall the exact time /figure/ while data collection of each trait which has also its own limitation for the accurate result. It is for this and other relevant importance that record keeping is advised to be maintained in each farm.
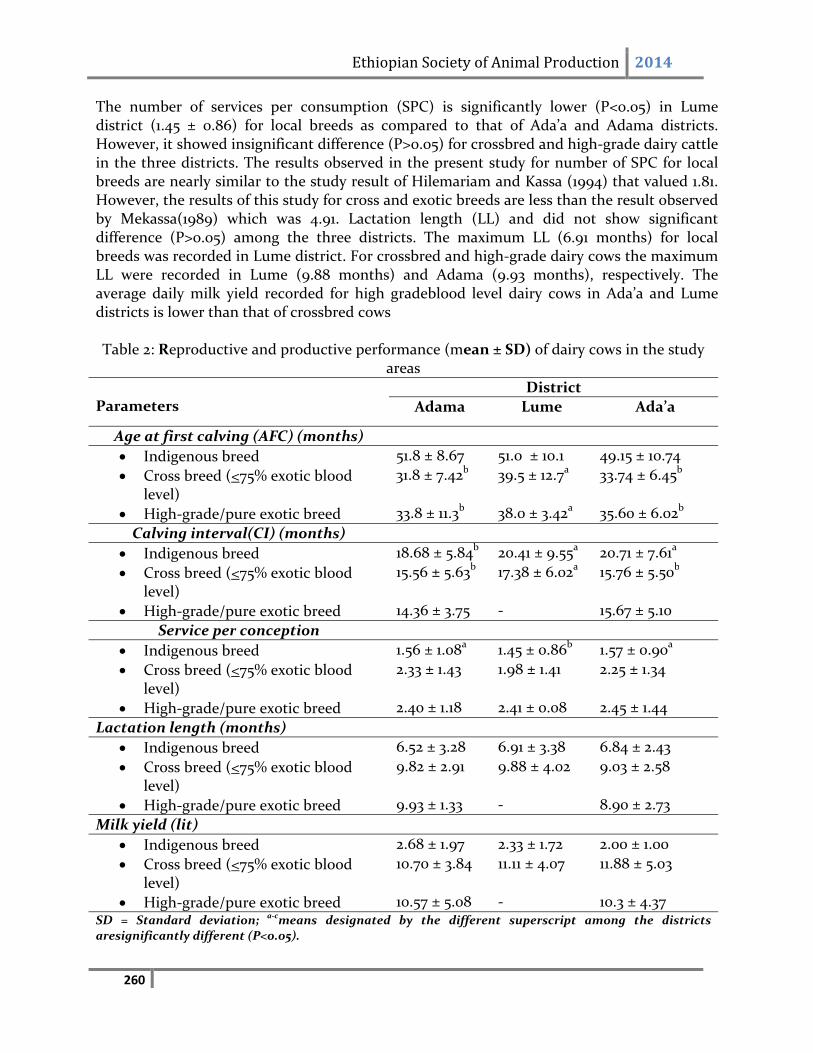
Ethiopian Society of Animal Production 2014
260
The number of services per consumption (SPC) is significantly lower (P<0.05) in Lume district (1.45 ± 0.86) for local breeds as compared to that of Ada’a and Adama districts. However, it showed insignificant difference (P>0.05) for crossbred and high‐grade dairy cattle in the three districts. The results observed in the present study for number of SPC for local breeds are nearly similar to the study result of Hilemariam and Kassa (1994) that valued 1.81. However, the results of this study for cross and exotic breeds are less than the result observed by Mekassa(1989) which was 4.91. Lactation length (LL) and did not show significant difference (P>0.05) among the three districts. The maximum LL (6.91 months) for local breeds was recorded in Lume district. For crossbred and high‐grade dairy cows the maximum LL were recorded in Lume (9.88 months) and Adama (9.93 months), respectively. The average daily milk yield recorded for high gradeblood level dairy cows in Ada’a and Lume districts is lower than that of crossbred cows Table 2: Reproductive and productive performance (mean ± SD) of dairy cows in the study
areas
Parameters
District
Adama Lume Ada’a
Age at first calving (AFC) (months)
Indigenous breed 51.8 ± 8.67 51.0 ± 10.1 49.15 ± 10.74
Cross breed (<75% exotic blood level)
31.8 ± 7.42b 39.5 ± 12.7a 33.74 ± 6.45b
High‐grade/pure exotic breed 33.8 ± 11.3b 38.0 ± 3.42a 35.60 ± 6.02b
Calving interval(CI) (months)
Indigenous breed 18.68 ± 5.84b 20.41 ± 9.55a 20.71 ± 7.61a
Cross breed (<75% exotic blood level)
15.56 ± 5.63b 17.38 ± 6.02a 15.76 ± 5.50b
High‐grade/pure exotic breed 14.36 ± 3.75 ‐ 15.67 ± 5.10
Service per conception
Indigenous breed 1.56 ± 1.08a 1.45 ± 0.86b 1.57 ± 0.90a
Cross breed (<75% exotic blood level)
2.33 ± 1.43 1.98 ± 1.41 2.25 ± 1.34
High‐grade/pure exotic breed 2.40 ± 1.18 2.41 ± 0.08 2.45 ± 1.44
Lactation length (months)
Indigenous breed 6.52 ± 3.28 6.91 ± 3.38 6.84 ± 2.43
Cross breed (<75% exotic blood level)
9.82 ± 2.91 9.88 ± 4.02 9.03 ± 2.58
High‐grade/pure exotic breed 9.93 ± 1.33 ‐ 8.90 ± 2.73
Milk yield (lit)
Indigenous breed 2.68 ± 1.97 2.33 ± 1.72 2.00 ± 1.00
Cross breed (<75% exotic blood level)
10.70 ± 3.84 11.11 ± 4.07 11.88 ± 5.03
High‐grade/pure exotic breed 10.57 ± 5.08 ‐ 10.3 ± 4.37 SD = Standard deviation; a‐cmeans designated by the different superscript among the districts aresignificantly different (P<0.05).
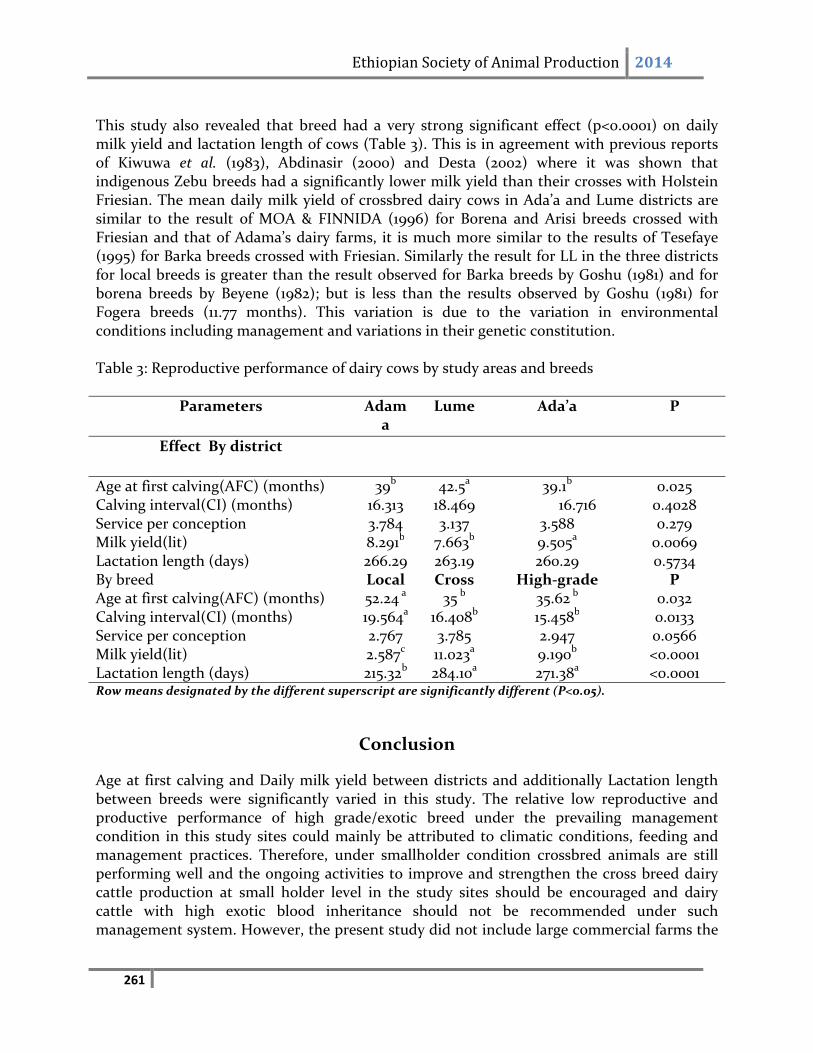
Ethiopian Society of Animal Production 2014
261
This study also revealed that breed had a very strong significant effect (p<0.0001) on daily milk yield and lactation length of cows (Table 3). This is in agreement with previous reports of Kiwuwa et al. (1983), Abdinasir (2000) and Desta (2002) where it was shown that indigenous Zebu breeds had a significantly lower milk yield than their crosses with Holstein Friesian. The mean daily milk yield of crossbred dairy cows in Ada’a and Lume districts are similar to the result of MOA & FINNIDA (1996) for Borena and Arisi breeds crossed with Friesian and that of Adama’s dairy farms, it is much more similar to the results of Tesefaye (1995) for Barka breeds crossed with Friesian. Similarly the result for LL in the three districts for local breeds is greater than the result observed for Barka breeds by Goshu (1981) and for borena breeds by Beyene (1982); but is less than the results observed by Goshu (1981) for Fogera breeds (11.77 months). This variation is due to the variation in environmental conditions including management and variations in their genetic constitution. Table 3: Reproductive performance of dairy cows by study areas and breeds
Parameters Adama
Lume Ada’a P
Effect By district
Age at first calving(AFC) (months) 39b 42.5a 39.1b 0.025 Calving interval(CI) (months) 16.313 18.469 16.716 0.4028 Service per conception 3.784 3.137 3.588 0.279 Milk yield(lit) 8.291b 7.663b 9.505a 0.0069 Lactation length (days) 266.29 263.19 260.29 0.5734 By breed Local Cross High‐grade P Age at first calving(AFC) (months) 52.24 a 35 b 35.62 b 0.032 Calving interval(CI) (months) 19.564a 16.408b 15.458b 0.0133 Service per conception 2.767 3.785 2.947 0.0566 Milk yield(lit) 2.587c 11.023a 9.190b <0.0001 Lactation length (days) 215.32b 284.10a 271.38a <0.0001 Row means designated by the different superscript are significantly different (P<0.05).
Conclusion
Age at first calving and Daily milk yield between districts and additionally Lactation length between breeds were significantly varied in this study. The relative low reproductive and productive performance of high grade/exotic breed under the prevailing management condition in this study sites could mainly be attributed to climatic conditions, feeding and management practices. Therefore, under smallholder condition crossbred animals are still performing well and the ongoing activities to improve and strengthen the cross breed dairy cattle production at small holder level in the study sites should be encouraged and dairy cattle with high exotic blood inheritance should not be recommended under such management system. However, the present study did not include large commercial farms the
Ethiopian Society of Animal Production 2014
262
performance of high‐grade and/or exotic breed should be studied with the inclusion of more variables.
Acknowledgement
The study was made possible through the financial support from Eastern Africa Agricultural Productivity Project (EAAPP). The authors would like to thank Debre Zeit Agricultural Research center staff and farmers who have made contribution to this study.
Reference
Abdinasir, I. 2000. Smallholder Dairy Production and Dairy Technology Adoption in the Mixed Farming System in Arsi highland, Ethiopia. PhD. Dissertation, Humboldt University, Berlin, Germany Ayele, S., Assegid, W., Jabbar, A., Ahmed, M. and Belachew, H. 2003. Livestock marketing in Ethiopia: A review of structure, performance and development initiatives. Socio‐economic and Policy Research Working Paper 52. ILRI (International Livestock Research Institute), Nairobi, Kenya Beyene, K. 1982. Estimation of additive and non additive genetic effects for growth, milk yield and reproduction traits of crossbred (Bos taurus X Bos indicus) cattle in the wet and dry environment in Ethiopia. PhD. Thesis, Cornell University. Ithaca, New York Desta, K. 2002. Analyses of Dairy Cattle Breeding Practices in Selected Areas of Ethiopia. PhD. Dissertation, Humboldt University of Berlin, Germany Goshu, M. 1981. Evaluation of indigenous strains for milk production. In: Summary of Animal Production Research (1968‐1980). December, 1981, Addis Ababa University, Debre Zeit Agricultural Research Center. Hailemariam, M. and Kassa M. 1994. Genetic and environmental effects on age at first calving and calving interval of naturally bred Boran (zebu) cows in Ethiopia.Animal Production, 58: 329‐334. Hussen, K. 2007. characterization of milk production system and Opportunity for market orientation: a case study of Mieso district, oromia region, Ethiopia IPMS. 2005. Ada’a – Liben woreda pilot learning site diagnosis and program design. IPMS (Improving Productivity and Market Success). A.A. Ethiopia. Ketema, H. 2000. Dairy Development in Ethiopia In: The Role of Village Dairy Co‐operatives in Dairy Development. Smallholder Dairy Development Project (SDDP) Proceeding, Ministry of Agriculture (MOA). Addis Ababa, Ethiopia
Ethiopian Society of Animal Production 2014
263
Kiwuwa, G., Trail, J., Kurtu, Y., Getachew, W., Anderson, F. and Durkin, J. 1983. Crossbred dairy cattle productivity in Arsi region, Ethiopia. Arsi Rural Development Unit and International Livestock Research Center for Africa, Addis Ababa, Ethiopia McDowell, R. 1971. Feasibility of commercial milking with cattle indigenous to the tropics. Cornell International Agricultural Development Bulletin No. 21. Cornell University, Ithaca, New York, USA. pp.22 Ministry of Agriculture (MOA) and FINNIDA. 1996. Selale peasant dairy development pilot project, Ethiopia. A report of evaluation study in blue series. Mukasa‐Mugerwa, E. 1989. A review of reproductive performance of female Bos indicus (Zebu) cattle. ILCA, Monograph No. 6. International Livestock Center for Africa, Addis Ababa, Ethiopia. p 134 Perera, O. 1999. Management of reproduction. In: small holder dairying in the tropics. ILRI (International Livestock Research Institute), Nairobi, Kenya. p 462 SAS. 2002. Users Guide. Version 9.0. Statistical Analysis System (SAS) Institute, Inc. Carry, NC. SPSS. 2011. IBM SPSS Statstics. Statistical Procedures for Social Sciences (SPSS) Version 20.0. IBM Corp. Swensson, C., Schaar, J., Brannang, E. and Meskel, L. 1981. Breeding activities of the Ethio Swedish integrated rural development project. III: Reproductive performance of Zebu and crossbred cattle. World Animal Review, 38: 31‐36. Tesfaye, K. 1995. Smallholder dairy in Ethiopia. In: Future of Livestock Industries in East and Southern Africa. Proceedings of a Workshop. 20‐23 July, 1992, Kadoma Ranch Hotel, Zimababwe United Nations Industrial Development Organization (UNIDO). 2009. Impact of the Global Economic Crisis on Least Developed Country’s Productive Capacities and Trade Prospects: Threats and Opportunities. A Case Study: the Dairy Sector in Ethiopia. Least Developed Countries Ministerial Conference, 3‐4 December 2009, Vienna International Center, Austria. Zewdie, w. 2010. Livestock production systems in relation with feed availability in the highlands and central rift valley of Ethiopia, Msc. Thesis Haramaya university, Haramaya, Ethiopia
Ethiopian Society of Animal Production 2014
264
On‐ Farm Reproductive Performance Evaluation of Farta Sheep at Estie District of Amhara National Regional State, Ethiopia
Agraw Amane1, Shigdaf Mekuriaw1 and Mengistea Taye2 1Andassa Livestock Research Center, P.O.Box 27, Bahir Dar, Ethiopia, [email protected]
2Bahir Dar University, College of Agriculture and Environmental sciences, P.O.Box 79, Bahir Dar, Ethiopia
Abstract
On‐farm reproductive performance evaluation of Farta sheep was conducted at Estie district of South Gondar Zone of Amhara National Regional State. Reproductive Performance data collected from 2010 to 2012 was used. The mean age and weight at first lambing was 471.2±12.0 days and 23.7±0.2 kg, respectively. The weight at first lambing was significantly (p<0.01) affected by parity of dam. Average lambing interval was 279.30±10.07 days and significantly affected by lambing year, lambing season, parity, postpartum ewe body weightand birth type. The average number of lambs per ewe lambing was 1.08±0.01 and significantly (p<0.01) affected by lambing year and postpartum ewe body weight. The average annual reproductive rate was1.30±0.03. Birth year, birth season and dam parity significantly (p<0.01) affected annual reproductive rate. The overall mean ewe post partum weight was 25.0±0.2kg and significantly affected bybirth year, birth season, dam parity and birth type. The on‐farm breed information on reproductive performance need to be supplemented by on‐station characterization of the breed to better understand the genetic variations and potential of the breed and design appropriate breeding strategies.
Keywords: Farta sheep, Reproductive performance, On‐farm, Estie
Introduction
Ethiopia is endowed with a large number (22.3 million; CSA 2010) and breed/type (18 populations; Tibbo, 2006) of sheep due to its extremes of variable agro climatic conditions and ecological systems that support large and very diverse animal genetic resources. The majority of sheep are distributed throughout the country, and about 70% are found in the highlands (Mengistu, 2003). Farta sheep is one of the indigenous sheep breeds reared by the rural farmers in the mixed crop–livestock farming systems of northwestern highlands of Ethiopia (Lemma 2002). They are an important source of cash income and manure, social and cultural functions, a means of insurance against drought and other diversities. Locally available sheep breeds in our country are the result of natural selection for survival under feed scarcity and disease challenges (Markos, 2006). As a result, their productivity is low compared to temperate breeds (Kassahun, 2000). So, it is very essential to improve their productivity to satisfy the animal protein demand of the large human population. Choice of breeds for improving the output from sheep should depend on the amount of information available on them. However, there is no documented information on the
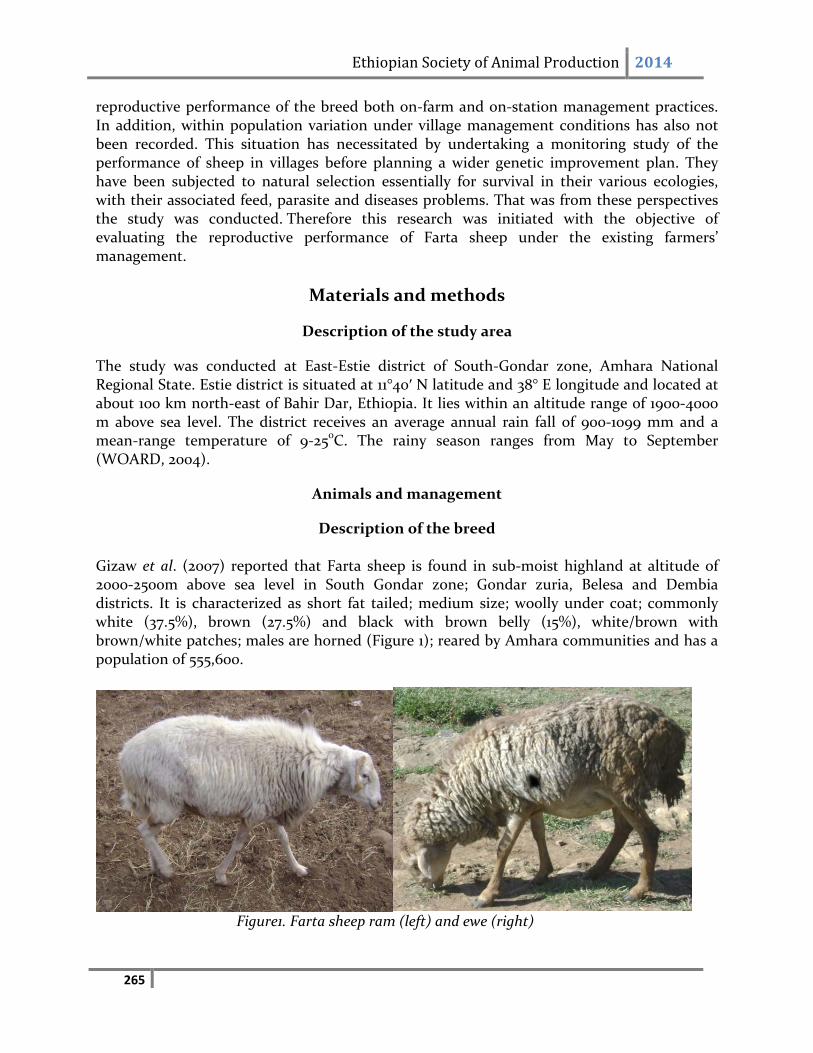
Ethiopian Society of Animal Production 2014
265
reproductive performance of the breed both on‐farm and on‐station management practices. In addition, within population variation under village management conditions has also not been recorded. This situation has necessitated by undertaking a monitoring study of the performance of sheep in villages before planning a wider genetic improvement plan. They have been subjected to natural selection essentially for survival in their various ecologies, with their associated feed, parasite and diseases problems. That was from these perspectives the study was conducted. Therefore this research was initiated with the objective of evaluating the reproductive performance of Farta sheep under the existing farmers’ management.
Materials and methods
Description of the study area
The study was conducted at East‐Estie district of South‐Gondar zone, Amhara National Regional State. Estie district is situated at 11°40′ N latitude and 38° E longitude and located at about 100 km north‐east of Bahir Dar, Ethiopia. It lies within an altitude range of 1900‐4000 m above sea level. The district receives an average annual rain fall of 900‐1099 mm and a mean‐range temperature of 9‐25oC. The rainy season ranges from May to September (WOARD, 2004).
Animals and management
Description of the breed
Gizaw et al. (2007) reported that Farta sheep is found in sub‐moist highland at altitude of 2000‐2500m above sea level in South Gondar zone; Gondar zuria, Belesa and Dembia districts. It is characterized as short fat tailed; medium size; woolly under coat; commonly white (37.5%), brown (27.5%) and black with brown belly (15%), white/brown with brown/white patches; males are horned (Figure 1); reared by Amhara communities and has a population of 555,600.
Figure1. Farta sheep ram (left) and ewe (right)
Ethiopian Society of Animal Production 2014
266
On‐ farm animal management
Farmers in the study area keep sheep in combination with other species of animals, usually with cattle and equines, depending on the availability of feed resources and the use or function of the animals. During crop harvesting times, sheep have access to grazing and crop aftermath while in dry season some farmers give supplementation for their sheep based on their physiological status. Breeding is year‐round and breeding rams run with the group flock to mate with any ewe in heat during the day. Rams are selected for mating based on their conformation (body size, colour and appearance) and sometimes based on maternal history (lamb survival, twining rate and general health).
Ram lambs born in the flock and not needed for breeding would be sold or castrated before reaching breeding age. Since the start of data collection, internal and external parasite control has been carried out. Animals have been sprayed for external parasites when tick infestation is high (as per the need). Vaccination against pastuerolosis, anthrax and black leg has been given once a year.Sick animals were treated
Data Collection
On‐farm data, collected as part of the programme on “On‐farm monitoring of Farta sheep breed at Estie district of South Gondar Zone” undertaken from 2010 to 2012, were used for the study. Animals were identified by permanent plastic ear tags applied at birth or at purchase of the animal. Reproductive data were collected by trained enumerators. The enumerators were supervised and data crosschecking was done by researchers of Andassa Livestock Research Centre on a two‐month interval. Weights were taken every month using the Salter balance (50 kg capacity with 200 g precision) for lambs until they attained 6 months of age and on a two‐ month’s interval thereafter.
Ethiopian Society of Animal Production 2014
267
Data management and analysis
All the data collected were entered and managed using Microsoft Excel computer program. Preliminary data analysis and screening of outliers were employed before conducting the main data analysis. Reproduction data were analysed using the General Linear Model procedures of SAS (2003). Tukey Kramer test was used to separate means of effects with three or more levels which were significant in the least squares analysis of variance.
For the analysis of the reproductive performance of the breed, the following models were used:‐ Model 1: For analysis of variance of age and weight at first lambing Yij = µ + Pi + Yj + Sk+ Tl + eij
Where: Yij = the observation on age and weight at first lambing; = Over all mean; Pi = Fixed effect of ewe parity (i = 1, 2, 3, 4, ≥5); Sk = Fixed effect of lamb birth season (k = dry, wet); Yj = Fixed effect of lamb birth year (j = 2010, 2011, 2012); Tl = Fixed effect of lamb birth type (l = single, multiple); eij = effect of random error Model 2: Analysis of variance of lambing interval, litter size and annual reproductive rate Yijklmn = µ + Gi + Pj + Sk + Tl + Ym + Ppn + Bo + eijklmn
Where: Yijklmn = the observation on LI, LS and ARR; = Over all means; Gi= Fixed effect of lamb sex (i = male, female); Pj = Fixed effect of ewe parity (j = 1, 2, 3, 4, ≥5); Sk = Fixed effect of lamb birth season (k = dry, wet); Tl = Fixed effect of lamb birth type (l = single, multiple); Ym = Fixed effect of lamb birth year (m = 2010, 2011, 2012); Ppn = Fixed effect of postpartum ewe body weight (n = Light, Medium, Heavy), not used for AFL and WFL, birth weight and wt at different ages, ADG and survival; Bo = Fixed effect of birth weight (o = Light, Medium, Heavy), not used for LI, LSand eijklmn = effect of random error
Results And Discussion
Age and weight at first lambing
Least square means and standard errors of age and weight at first lambing are given in Table 3. The overall mean of age at first lambing (AFL) was 471.2±12.0 days. The result obtained from the present study was slightly longer than Washera sheep in its home area (464.2±14.0 days) by Mengistie et al. (2011). This might be partly due to the better nutritional status for the ewe lamb of Washera sheep in its home area come to heat earlier than Farta sheep breed.The analysis of variance showed that none of the fixed effects considered influenced (p>0.01) age at first lambing. This is in agreement with Osuhor et al. (1997). This result, however, do not agree with results of Galina et al. (1996) who reported significant effect of season of birth and type of birth on AFL, birth weight and nutrition (Galina et al., 1996). The overall mean weight at first lambing (WFL) found in the study (23.7±0.2 kg) is greater than the value reported for Menz sheep (Demeke et al., 1995). The variation might be the difference in feed availability and quality for the ewe lambs at mating and during gestation period which in turn influence the weight of the ewe lamb at lambing.The weight of first lamber ewe lamb at first lambing has an important effect on her future reproductive
Ethiopian Society of Animal Production 2014
268
performance. For efficient reproductive performance ewe lambs should attain at least 65‐70% of their mature body weight at their first conception. Underweight pregnant first lamber ewe lamb may abort the fetus. The weight (at lambing actually) observed in the current study is almost 80% of the mature weight of the breed. The analysis of variance showed that parity of dam to which the ewe lamb was born had a significant (p<0.01) effect on the weight at first lambing. Ewes born from the first parity dams had lower weight at first lambing than others since first parity dams have lower body weight and body size than dams of the next parities. The positive correlation between body weight and age at first lambing showed considerable variation in Djallonke sheep, ewes with the lowest age and body weight lambed prematurely. Birth season, birth type and birth weight of ewe lamb did not show significant difference (p>0.01) on the weight at first lambing. Table 1. Factors affecting age and weight at first lambing
Source of variation Age at First Lambing (days) Weight at First Lambing (kg)
N LSM ± SE N LSM ± SE
Overall 103 471.2±12.0 82 23.7±0.2
Birth Season NS NS
Dry 55 472.5±14.3 45 24.0±0.6
Wet 48 469.8±18.4 37 23.4±0.7
Parity NS *
1 23 468.2±30.6 17 22.5±1.5a
2 21 470.4±25.5 16 23.5±1.0b
3 19 468.1±22.6 15 24.0±0.9b
4 14 471.5±21.6 11 23.4±0.9b
≥5 10 467.8±28.0 8 26.1±1.1b
Birth type NS NS
Single 62 470.5±13.7 51 23.2±0.5
Multiple 41 472.8±22.0 31 24.2±0.8
Birth weight1 NS NS
Light 25 468.2±24.6 19 23.7±1.0
Medium 65 467.1±12.6 53 24.8±0.5
Heavy 13 470.1±30.7 10 24.5±1.2 N = number of observations; NS: Not significant (p>0.05); *p<0.05 1Birth weight: Heavy (>3kg), Medium (2‐3kg), Light (<2kg)
Lambing interval (LI)
The overall mean and standard error of lambing interval was 279±10.07 days which is longer than the reports of Mengistie et al., 2011 for LI of Washera sheep under farmers management at its home tract area (269±6.22 days);Gumuz sheep (199±33.9 days) under farmers management (Solomon, 2007). The variation between estimates reflects the effect of different management practices, nutrition, lactation, control of reproduction management, and level of genetic makeup on possibilities for prompt re‐conception after lambing which further
Ethiopian Society of Animal Production 2014
269
influence the postpartum anoestrus and service interval. Lambing year exerted significant (p<0.01) effect on lambing interval where those ewes lambed during the year 2010 have shorter lambing interval than other following years. This finding is in line with the findings of Mengistie et al. (2011) who reported lambing year has effect on lambing interval for Washera sheep in its home area. The shorter lambing interval in the year 2010 can be explained by better feed availability and quality for the dam during postpartum anoestrus period where it shortens the postpartum anoestrus interval. Birth season had significant (p<0.01) effect on lambing interval in which ewes lambed in wet season have shorter lambing interval than ewes lambed in dry season (258± 11.2 days vs. 289± 10.0 days). The effect of season might be associated with the availability and quality of forage, where ewe lambed in wet season might have got sufficient feed and came to heat early after lambing and their lambs grew fast and weaned early at younger age. This is in agreement with previous findings (Galina et al., 1996) and could be related to availability of nutrition during parturition and lactation as affecting ewes recovery (weight gain and improvement in body condition) to come to heat early (i.e., short anoestrus interval). The interval from lambing to conception largely determines the lambing interval. Nutritional status of the ewe during the last third of gestation and early lactation also play an important role in the return to activity postpartum (Galina et al., 1996). The effect of ewe parity on lambing interval was significant (p<0.01). Ewes having first parity had the longest lambing interval than ewes with fifth parity (293±15.0vs. 253±12.6). Lambing interval decreased as parity increases from one to fifth parity. Maiden ewes had the longest lambing interval and fifth parity ewes lambed with shortest interval. The longer lambing interval for young ewes suggests that young ewes take longer time to regain or recover their body condition after lambing for the next reproduction (Ibrahim, 1998). Similar observation was reported for Washera sheep in its home area (Mengistie et al., 2011). Ewe postpartum body weight have a significant effect (p<0.01) on lambing interval where those ewes with heavy postpartum body weight have shortest lambing interval than ewes with medium and light postpartum body weight, which is associated with those ewes heavy or better body condition at parturition recover their body condition for the next reproduction or mating earlier than those ewes with medium and light weight. This result indicated that lambing interval decreased as postpartum weight increased. Galina et al., (1996) observed a negative correlation between lambing interval and postpartum ewe body weight suggesting that lambing interval tend to decrease with heavy ewes. The number of lambs that the ewe gave birth in the previous lambing had showed a significant difference (P<0.01) on lambing interval. Ewes that gave birth to singles had shorter lambing interval than multiple born ewes (269±4.2 vs. 286±5.2). It has been showed that ewes suckling twin/multiple lambs produce more milk and hence may have to mobilize their body reserves to sustain milk production for their lambs. This would lead to prolonged postpartum breeding and subsequently to long lambing interval.
Ethiopian Society of Animal Production 2014
270
Litter size
The overall mean litter size in the present study was 1.08±0.01 lambs per ewe lambing. The obtained litter size from the present study is in agreement with the literature for Menz and Horro sheep (Mukasa‐Mugerwa et al., 2002), and for Gumuz sheep (Solomon, 2007) but lower than the reports of Solomon and Gemeda (2000) for Horro sheep. The observed variation might be the difference in management practices particularly at mating and pre‐parturition time of the dam (body condition of the ewe at mating, conception, at pre‐parturition) and the difference in maternal uterine space of the dam. The analysis of variance showed that the effect of lambing year and postpartum ewe body weight had significant (p<0.01) influence on litter size whereas the difference in litter size due to lambing season and parity were not significant (p>0.01). Ewes lambed during the year 2010 were more prolific than ewes lambed in other years. There was a clear decreasing trend in litter size from year 2010 to 2012. This could be, though there is no meteorological and agronomic data to justify with, because of the deteriorating condition of the grazing land (feed availability) from year to year. Abegaz et al.(2002b) also found a significant effect of year on prolificacy. Postpartum ewe body weight was a significant source of variation (p<0.01) in litter size. Heavy ewes gave higher litter than the medium and light weight ewe groups. This might partly because of the better body condition of ewes at conception which affect the number of ova shed and fertilized. In addition, during gestation there would be less embryonic mortality with those good condition ewes. Ewes that have been flushed and gain in weight just before breeding will usually shed more ova and thus produce more lambs. Michels et al. (2000) also found out a positive and significant correlation between pre‐mating ewe weight and prolificacy. This finding is in agreement with Segura et al.(1996) who reported that ewes with weights lower than the mean of their group had fewer multiple births (p<0.01) than ewes with higher weight in Pelibuey and Blackbelly sheep.
Annual reproductive rate (ARR)
The overall mean and standard error of ARR was 1.30±0.03. The result obtained is comparable to Menz sheep (Mukasa‐Mugerwa et al., 2002). Year of birth exerted significant (p<0.01) effect on ARR inwhch ewes which had lambed in 2010 had higher ARR than those lambed the next two years. The higher ARR indicated that the better feed availability in terms ofquantity and quality at pre‐mating and during gestation period which shortens the lambing interval and increase the litter size. Season of birth exerted significant (p<0.01) effect on ARR that ewes which had lambed in dry season had lower ARR than in wet season (1.28±0.04 vs. 1.32±0.05). The effect of season might be associated with the nutritional status of the dam to have got sufficient feed and come to heat early after lambing and affect the number of ova sheds.
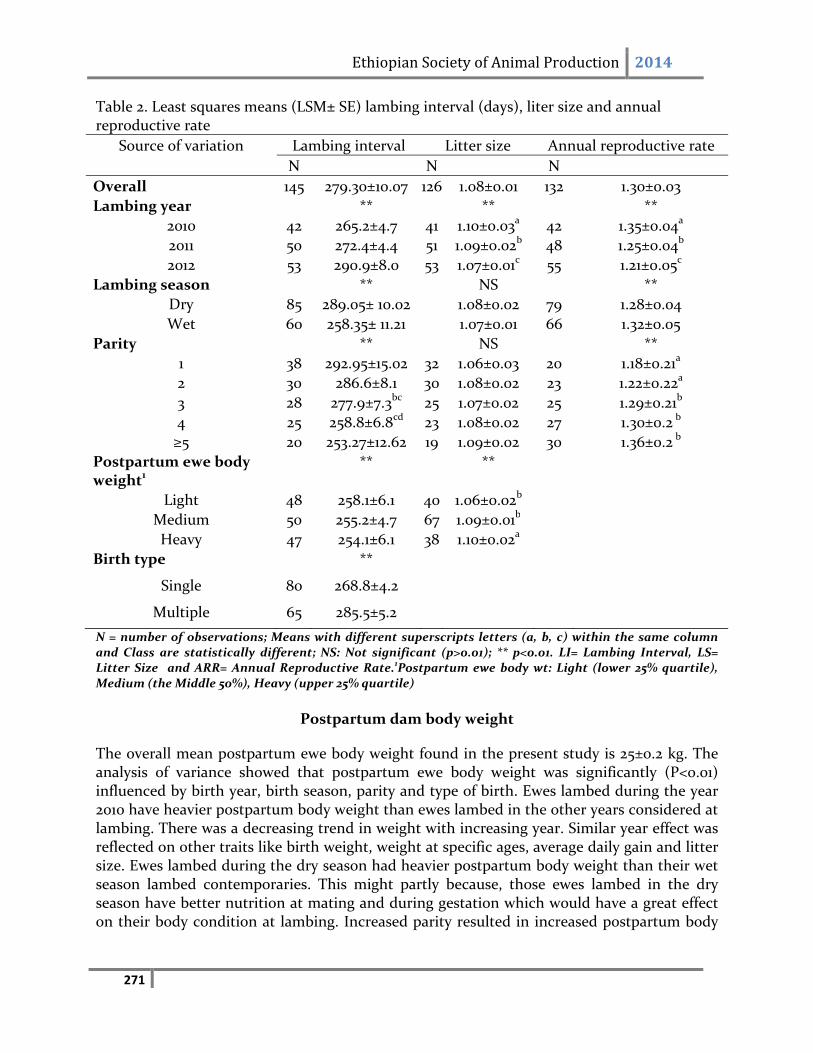
Ethiopian Society of Animal Production 2014
271
Table 2. Least squares means (LSM± SE) lambing interval (days), liter size and annual reproductive rate
Source of variation Lambing interval Litter size Annual reproductive rate
N N N
Overall 145 279.30±10.07 126 1.08±0.01 132 1.30±0.03
Lambing year ** ** **
2010 42 265.2±4.7 41 1.10±0.03a 42 1.35±0.04a
2011 50 272.4±4.4 51 1.09±0.02b 48 1.25±0.04b
2012 53 290.9±8.0 53 1.07±0.01c 55 1.21±0.05c
Lambing season ** NS **
Dry 85 289.05± 10.02 1.08±0.02 79 1.28±0.04
Wet 60 258.35± 11.21 1.07±0.01 66 1.32±0.05
Parity ** NS **
1 38 292.95±15.02 32 1.06±0.03 20 1.18±0.21a
2 30 286.6±8.1 30 1.08±0.02 23 1.22±0.22a
3 28 277.9±7.3bc 25 1.07±0.02 25 1.29±0.21b
4 25 258.8±6.8cd 23 1.08±0.02 27 1.30±0.2 b
≥5 20 253.27±12.62 19 1.09±0.02 30 1.36±0.2 b
Postpartum ewe body weight1
** **
Light 48 258.1±6.1 40 1.06±0.02b
Medium 50 255.2±4.7 67 1.09±0.01b
Heavy 47 254.1±6.1 38 1.10±0.02a
Birth type **
Single 80 268.8±4.2
Multiple 65 285.5±5.2
N = number of observations; Means with different superscripts letters (a, b, c) within the same column and Class are statistically different; NS: Not significant (p>0.01); ** p<0.01. LI= Lambing Interval, LS= Litter Size and ARR= Annual Reproductive Rate.1Postpartum ewe body wt: Light (lower 25% quartile), Medium (the Middle 50%), Heavy (upper 25% quartile)
Postpartum dam body weight
The overall mean postpartum ewe body weight found in the present study is 25±0.2 kg. The analysis of variance showed that postpartum ewe body weight was significantly (P<0.01) influenced by birth year, birth season, parity and type of birth. Ewes lambed during the year 2010 have heavier postpartum body weight than ewes lambed in the other years considered at lambing. There was a decreasing trend in weight with increasing year. Similar year effect was reflected on other traits like birth weight, weight at specific ages, average daily gain and litter size. Ewes lambed during the dry season had heavier postpartum body weight than their wet season lambed contemporaries. This might partly because, those ewes lambed in the dry season have better nutrition at mating and during gestation which would have a great effect on their body condition at lambing. Increased parity resulted in increased postpartum body
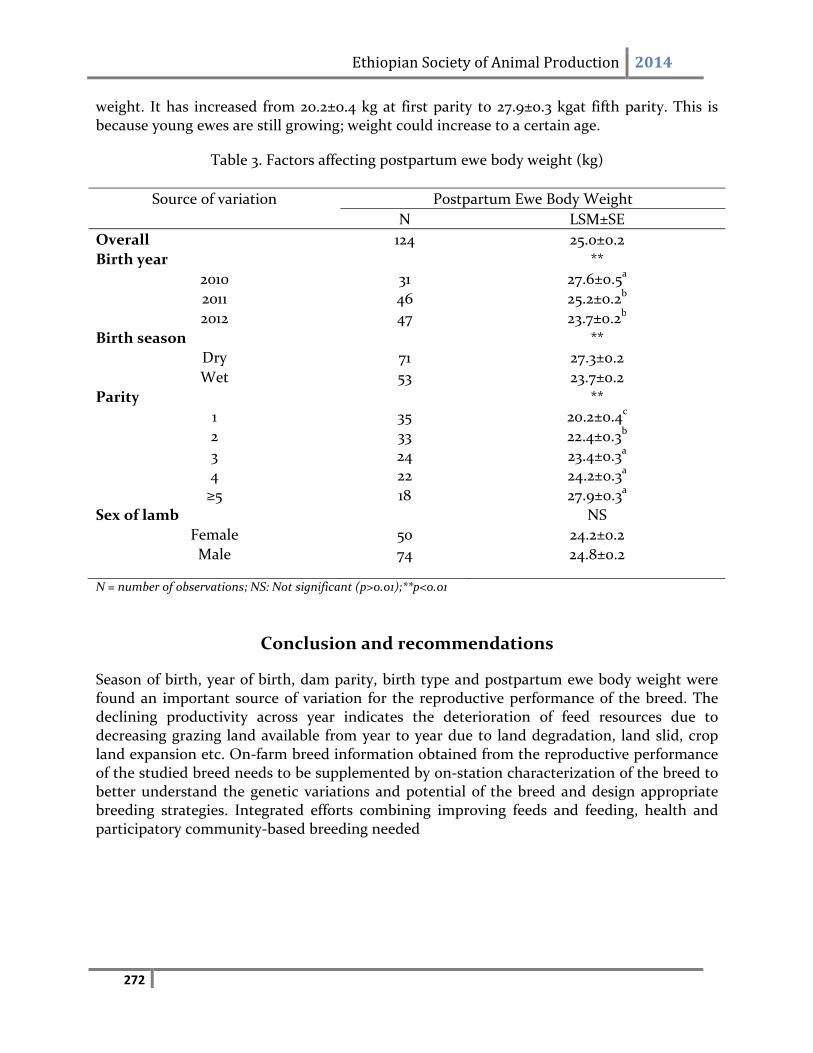
Ethiopian Society of Animal Production 2014
272
weight. It has increased from 20.2±0.4 kg at first parity to 27.9±0.3 kgat fifth parity. This is because young ewes are still growing; weight could increase to a certain age.
Table 3. Factors affecting postpartum ewe body weight (kg)
Source of variation Postpartum Ewe Body Weight
N LSM±SE
Overall 124 25.0±0.2
Birth year **
2010 31 27.6±0.5a
2011 46 25.2±0.2b
2012 47 23.7±0.2b
Birth season **
Dry 71 27.3±0.2
Wet 53 23.7±0.2
Parity **
1 35 20.2±0.4c
2 33 22.4±0.3b
3 24 23.4±0.3a
4 22 24.2±0.3a
≥5 18 27.9±0.3a
Sex of lamb NS
Female 50 24.2±0.2
Male 74 24.8±0.2
N = number of observations; NS: Not significant (p>0.01);**p<0.01
Conclusion and recommendations
Season of birth, year of birth, dam parity, birth type and postpartum ewe body weight were found an important source of variation for the reproductive performance of the breed. The declining productivity across year indicates the deterioration of feed resources due to decreasing grazing land available from year to year due to land degradation, land slid, crop land expansion etc. On‐farm breed information obtained from the reproductive performance of the studied breed needs to be supplemented by on‐station characterization of the breed to better understand the genetic variations and potential of the breed and design appropriate breeding strategies. Integrated efforts combining improving feeds and feeding, health and participatory community‐based breeding needed
Ethiopian Society of Animal Production 2014
273
Acknowledgement
The field research was fully financed by the Amhara Regional Agricultural Research Institute (ARARI) in Ethiopia. The author is greatly indebted to Mr. Eyasu Lakew for his support in data cross checking and data entry. The author is also interested to thank the enumerators at the villages for their support in data collection. We are grateful to the staff of Andassa Research Centre of ARARI, for their interest in our research and support during the field work.
References
Abegaz Solomon, Eneyew Negussie, G. Duguma and J. E. O. Rege, 2002b. Genetic parameter estimates for growth traits in Horro sheep. J. Anim. Breed. Genet. 119:35‐45. Central Statistical Agency of Ethiopia (CSA), 2010. The 2010 National Statistics‐ Agriculture. http://www.csa.gov.et/text_files/2006_national_statistics.htm (accessed on Oct., 2011) Demeke Solomon, Thwaites, S.C.J. and Lemma. S., 1995. Effects of ewe genotype andsupplementary feeding on lambing performance of Ethiopian highland sheep. Small Rumin. Res. 15:149‐153. Galina, M. A., R. Morales, E. Silva and B. Lopez, 1996. Reproductive performance of Pelibueyand Blackbelly sheep under tropical management systems in Mexico. Small Ruminant Research 22: 3l‐37 Gizaw Solomon, J. A. M. Van Arendonk, H. Komen, J. J. Windig and O. Hanotte, 2007. Population structure, genetic variation and morphological diversity in indigenous sheep of Ethiopia. International Society for Animal Genetics, Animal Genetics, 38, 621–628. Ibrahim H., 1998. Small ruminant production technique. ILRI manual 3. ILRI (International Livestock Research Institute), Nairobi, Kenya. 207 p. Lemma Sisay, 2002. Phenotypic classification and description of indigenous sheep type in theAmhara National Regional State of Ethiopia. M.Sc. Thesis. University of Natal, Pietermarizburg. 104p. Mengistie Taye, Girma Abebe, Sisay Lemma, Solomon Gizaw, Abebe Mekoya and Markos Tibbo, 2011. Reproductive Performances and Survival of Washera Sheep under Traditional Managment systems at Yilmanadensa and Quarit Districts of the Amhara National Regional State, Ethiopia. Journal of Animal Science and Veterinary Advances 10 (9): 1158‐1165. Mengistu Alemayehu, 2003. Country Pasture/Forage Resource Profiles, Ethiopia. http://www.fao.org/ag/AGP/AGPC/doc/Counprof/ Ethiopia/Ethiopia. Htm (Accessed on February 2007)
Ethiopian Society of Animal Production 2014
274
Michels, H., E. Decuypere and O. Onagbesan, 2000. Litter size, ovulation rate and prenatalsurvival in relation to ewe body weight: genetics review. Small Ruminant Research 38:199‐209. Mukasa‐Mugerwa, E., D. Anindo, S. Sovani, A. Lahlou‐Kassi, S. Tembely, J.E.O. Rege and R.L. Baker, 2002. Reproductive performance and productivity of Menz and Horro sheep lambing in the wet and dry seasons in the highlands of Ethiopia. Small Rumin. Res. 45:26‐271. Osuhor, C. U., O. A. Osinowo, B. I. Nwagu, F. O. Dennar, A. Abdullahi‐Adee, 1997. Factorsaffecting age at first lambing in Yankasa Ewes. Animal Reproduction Science 47: 205‐209. Segura, J.C., L. Sarmiento and 0. Rojas, 1996. Productivity of Pelibuey and Blackbelly ewes inMexico under extensive management . Small Ruminant Research 21:57‐62. Solomon Abegaz Guangul, 2007. In‐situ characterization of Gumuz sheep under farmers management in north‐western lowlands of Amhara region. MSc.Thesis, Haramaya University, Ethiopia. 108 p. Solomon Abegaz Kebede and Gemeda Duguma, 2000. Genetic and phenotypic parameters of growth, reproductive and survival performance of Horro sheep at Bako Agricultural Research Center. Research fellowship report, International Livestock Research Institute (ILRI), Addis Ababa, Ethiopia. Tibbo, Markos, 2006. Productivity and health of indigenous sheep breeds and crossbreds in thecentral Ethiopian highlands. Ph.D. dissertation. Department of Animal Breeding and Genetics, Faculty for Veterinary Medicine and Animal Sciences, Swedish University of Agricultural Sciences (SLU), Uppsala, Sweden. 76p. Woreda Office of Agriulture and Rural Development, 2004. East Estie, North Gondar, Ethiopia