PROCEEDINGS - tuiasi
707
PROCEEDINGS 14 th Romanian Textiles and Leather Conference 46 th International Federation of Knitting Technologists Congress Sinaia, Romania 6-8 September 2012
-
Upload
khangminh22 -
Category
Documents
-
view
1 -
download
0
Transcript of PROCEEDINGS - tuiasi
PROCEEDINGS
14th Romanian Textiles and Leather Conference
46th International Federation of Knitting Technologists Congress
Sinaia, Romania 6-8 September 2012
Organizers
“Gheorghe Asachi”Technical University of Iasi Faculty of Textiles, Leather and Industrial
Management
Co-organizers
International Federation of Knitting
Technologists Romanian Section of International Federation of
Knitting Technologists
Alumni Association of the Textile and Leather
Faculty, Iasi National Institute of Inventics, Iasi
General Association of Engineers in Romania (AGIR)
Doctoral School of the Faculty of Textiles, Leather and Industrial Management
With the support of National Authority for Scientific Research
ISSN: 2285-5378
ISSN-L: 2285-5378
NATIONAL ORGANIZING COMMITTEE 14th Romanian Textiles and Leather Conference Mariana URSACHE - coordinator Irina CRISTIAN Costică SAVA Dorin DAN Aura MIHAI Mariana ICHIM Manuela AVĂDANEI Ingrid BUCIŞCANU Carmen ANTON
46th International Federation of Knitting Technologists Congress Dorin DAN – coordinator Luminita CIOBANU Laura MACOVEI Viorica CRETU Mihai PENCIUC Ramona CIOBANU Crina BUHAI Carmen ANTON
CONFERENCE SECRETARIAT Alina DRAGOMIR Ionuţ DULGHERIU Dorin IONESI Ramona CIOBANU Corina CIOBANU
NB The responsibility for the contents and form of abstracts goes solely to authors.
3
INTERNATIONAL SCIENTIFIC COMMITTEE
14th Romanian Textiles and Leather Conference Chair: Carmen LOGHIN, „Gheorghe Asachi” Technical University of Iasi, Romania
Members:
Mario Duarte de ARAUJO University of Minho, Guimaraes Portugal Silvia AVASILCĂI „Gheorghe Asachi” Technical University of Iasi Romania Pascal BRUNIAUX ENSAIT, Roubaix France Ioan CIOARĂ „Gheorghe Asachi” Technical University of Iasi Romania Antonela CURTEZA „Gheorghe Asachi” Technical University of Iasi Romania
Krste DIMITROVSKI University of Ljubljana Slovenia
M.Cetin ERDOGAN Ege University, Izmir Turkey
Ada FERRI Politecnico di Torino Italy
Raoul FANGUEIRO University Minho, Guimaraes Portugal
Carmen GHIŢULEASA INCDTP Bucuresti Romania
Ana Marija GRANCARIC University of Zagreb Croatia
Maria GRAPINI FEPAIUS Romania Romania
Lubos HES Technical University of Liberec Czech Rep.
Vladan KONCAR ENSAIT Roubaix France
Husseyin KADOGLU Ege University, Izmir Turkey
Yordan KYOSEV University of Applied Sciences, Niederrhein Germany
Luminiţa LUPU „Gheorghe Asachi” Technical University of Iasi Romania
Stelian MAIER „Gheorghe Asachi” Technical University of Iasi Romania
Abhijit MAJUMDAR Indian Institute of Technology, Delhi India
Malgorzata MATUSIAK Textile Research Institute of Lodz Poland
Jiri MILITKY Technical University of Liberec Czech Rep.
Augustin MUREŞAN „Gheorghe Asachi” Technical University of Iasi Romania
Bulent OZIPEK Istanbul Technical University Turkey
Crişan POPESCU DWI-RWTH, Aachen Germany
Zoran STEPANOVIC University of Maribor Slovenia
Mariana URSACHE „Gheorghe Asachi” Technical University of Iasi Romania
Savvas VASSILIADIS Technological Education Institute of Piraeus Greece
Ausma VILUMSONE University of Riga Latvia
Emilia VISILEANU INCDTP Bucuresti Romania
Xianyi ZENG ENSAIT, Roubaix France
Charles Q. YANG University of Georgia USA
4
INTERNATIONAL SCIENTIFIC COMMITTEE 46th International Federation of Knitting Technologists Congress Presidents of the congress
Sen. Sc. Res. Prof. Eng. Aristide DODU, Honorary President of 46th IFKT Congress
Assoc. Prof. Dr. Mirela BLAGA, Ctext ATI President of the 46th IFKT Congress
Members:
Subhash ANAND University of Bolton UK
Mirela BLAGA “Gheorghe Asachi” Technical University of Iasi Romania
Chokri CHERIF Technical University of Dresden Germany
Alenka CUDEN University of Ljubljana Slovenia
Carmen GHITULEASA The Research-Development National Institute for Textile and Leather - INCDTP Bucuresti
Romania
Simon HARLOCK Media Innovations, Leeds UK
Abhijit MAJUMDAR Indian Institute of Technology, Delhi India
Arzu MARMARALI Ege University Turkey
Elżbieta MIELICKA Research Institute Tricotextil, Lodz Poland
Roshan SHISHOO Shishoo Consulting AB Sweden
Savvas VASSILIADIS Technological Education Institute of Piraeus Greece
Marcus WEBER University of Applied Science, Niederrhein Germany
5
Table of contents

14th Romanian Textiles and Leather Conference
Anniversary Symposium: “60 years of Textiles and Leather Higher Education in Iasi” ............................................................................................................................... 21 Plenary lectures Xuyuan TAO, Cédric COCHRANE, Ludivine MEUNIER, Fern M KELLY and Vladan KONCAR Textile Electronics, Sensors (Part 1) & Displays (Part2) ................................................................................ 22 Charles Q. YANG Flame Retardant Cotton: Progress and Currect Status .................................................................................. 36 C. POPESCU, M. SCHÜRING, QJ. ZHANG, K. HUPFER-KEMPKES, A. KAISER Comfort Index of Textiles ................................................................................................................................ 45 Lubos HES Thermal Comfort of Functional Underwear and Sport Dresses from Special Fibres and New Methods of their Testing under Real Conditions of their Wear ...................................................................................... 46
Oral and poster presentations Section 1: New Fibers and Advanced Materials Marian-Cătălin GROSU, Ioan HOSSU, Avram DORIN, Michał FRYDRYSIAK and Janusz ZIĘBA Experimental Investigation of the Magnetic Yarns .......................................................................................... 57
Section 2: Textile Science and Technology Nicoleta VORNICU, Cristina BIBIRE and Maria GEBA Research on Materials Used in Making Textiles Religious in 18-19 Centuries .............................................. 65
Taher Rajab KADDAR
Productivity Improvement of Modern Shuttleless Weaving Machines by using the Statistical Quality
Control Tools ................................................................................................................................................... 72
Monica Alina CALIN, Mirela TEODORESCU and Antonela CURTEZA Theoretical Modeling of a Carbon Nanotube as Temperature Sensor ........................................................... 77 Adriana MUSTATA, Liliana HRISTIAN and Georgeta POTOP Silk, Flax and Hemp, Sources of Native Fibrous Raw Material for Textiles and Technical Products ............. 83 Viorica CREŢU and Laura MACOVEI New Technologies for Socks Improvement .................................................................................................... 88 Laura MACOVEI and Viorica CRETU Stitch Transfer Technique Applied in Fully Fashioned Knitted Products ........................................................ 94 Marian-Cătălin GROSU, Ioan HOSSU, Gheorghe HORGA, Dorin AVRAM Procedure and Laboratory Device for Coating Yarns with Ferrimagnetic Substances ................................. 102 Monica Alina CALIN, Mirela TEODORESCU, Antonela CURTEZA Textile Industry at Nanoscale ........................................................................................................................ 107
9
Section 3: Textile Structures and Properties Ioana PETCU, Antonela CURTEZA, Pramod AGRAWAL, Ger BRINKS and Mirela TEDORESCU Study on the Development of 3D Conductive Heatable Knitted Structures .................................................. 111 Sinem GUNESOGLU, Binnaz KAPLANGİRAY and Cem GUNESOGLU An Over-All Evaluation on Thermal Comfort Characteristics of Knitted Fabrics ........................................... 118 Malgorzata MATUSIAK Application of the Artificial Neural Networks for Modeling the Thermal Properties of Woven Fabrics ......... 124 Luminița VLAD, Stan MITU and Florin VLAD Mini Bioclimatic Chamber used to Determine the Thermophysical Characteristics of the Fabrics .............. 132 Lidija GOMBOC, Renate LÜTZKENDORF, Majda SFILIGOJ SMOLE and Zoran STJEPANOVIČ Behavior of Technical Filament Yarns in Dynamic Tensile Test ................................................................... 139 Liliana HRISTIAN, Iuliana Gabriela LUPU, Demetra Lăcrămioara BORDEIANU, Georgeta POTOP
Experimental Researches Regarding the Woven Materials Made from Yarns Type Combed Wool Behaviour to Tensil Testing ........................................................................................................................... 147 Liliana HRISTIAN, Iuliana Gabriela LUPU, Demetra Lăcrămioara BORDEIANU, Georgeta POTOP
Researcehs Regarding the Creasing Behaviour of Woven Materials Made from Combed Yarns Type
Wool .............................................................................................................................................................. 153
Vasilije PETROVIĆ, Jovan STEPANOVIĆ, Ivana SKOKO, Marija STANKOVIĆ and Miodrag STAMENKOVIĆ Analysis of Deformation Characteristics of SSB Forming Sieves ................................................................ 158 Cristina PIROI, Rodica HARPA and Cezar-Doru RADU Testing Methods Employed for Assessing the Compression Capacity of Medical Stockings ...................... 166 Mariana URSACHE and Mihai PENCIUC Properties of Double Layer Knitted Fabrics With In-Lay Yarns .................................................................... 173 Savin Dorin IONESI, Raul FANGUEIRO, Luminita CIOBANU, Catalin DUMITRAS, Costea BUDULAN Evaluation of Impact Behaviour of Composite Materials Using Taguchi Method ........................................ 179 Rodica HARPA, Cristina PIROI and Cezar-Doru RADU Testing Methods Employed for Assessing the Features of Yarns Designed for Medical Stockings ............ 185 Lucica CIOARA, Ioan CIOARA, Daniela NEGRU
The Influence of the Abrasion Stress on Electrical Properties of Woven Fabrics with Metallic Fibers Content .......................................................................................................................................................... 192 Gheorge HORGA, Mihaela HORGA, Ioan HOSSU, Avram DORIN, Marian-Catalin GROSU and Florin BREABAN Research on Emissivity, Reflection and Transmission, Textile Materials, Measured by the Method of the Integrating Sphere ................................................................................................................................... 198 Ioan HOSSU, Marian-Cătălin GROSU, Gheorghe HORGA, Dorin AVRAM Thermal Conductivity of the Thick Wool Layers ............................................................................................ 205 Ioan HOSSU, Marian-Cătălin GROSU, Gheorghe HORGA, Dorin AVRAM, Florin BREABAN, Didier DEFER, Emmanuel ANTCZAK Thermal Transfer through Wool Layers ........................................................................................................ 211 Elena MOISESCU, Ecaterina PINTILIE and Constanta COMANDAR Research on the Tensile Breaking Strength of Rib Knitted Fabrics ............................................................. 218
10
Petronela AVRAM, Mirela TEODORESCU, Antonela CURTEZA, Pramod AGRAWAL and Ger BRINKS Biomimetic Approach, From Lotus Leaves to Superhydrophobic Materials ................................................. 223 Petronela AVRAM, Mirela TEODORESCU, Antonela CURTEZA, Pramod AGRAWAL and Ger BRINKS Just Like Nature – Acheaving Superhydrophobic Functional Clothing ......................................................... 228
Section 4: Functional Textiles and Clothing Cezar-Doru RADU, Mihaela HRITCU (SALARIU), Ada FERRI, Liliana FOIA and Cristina GHICIUC The Softness Sensorial Property of Anti-Allergic Textile Articles ................................................................. 233
Mihaela HRITCU (SALARIU), Cezar-Doru RADU, Aurelia GRIGORIU, Ada FERRI, Eugen ULEA and Florin LIPSA Tests and Analyses Supported By Anti-Allergic Textile Materials ................................................................ 239
Marianna GRECKA, Ausma VILUMSONE, Juris BLUMS, Zane PAVARE The Definition of Placement of Accelerometer in Cyclist’s Jacket ................................................................ 245 Ema MARIN, Marinela BARBUTA, Ioan CIOARA and Luminita CIOBANU Production of Textile Reinforced Concrete ................................................................................................... 250 Inese PARKOVA, Aleksandrs VALIŠEVSKIS, Andis UŽĀNS and Ausma VIĻUMSONE Analysis and Improvement of Nocturnal Enuresis Alarm System ................................................................ 256 Angela SCRIPCENCO, Irina CEBAN, Jana CÎRJA, Victoria IVAȘCO and Violeta PLUGARU
The Fuzzy Front End Phase of Patients’ Clothing Development ................................................................. 265
Ema MARIN, Geta TRIFAN, Ioan CIOARA and Luminita CIOBANU Mechanical Behaviour of Reinforcement Geotextiles Made of Warp Knitted Fabrics .................................. 271 Angela SCRIPCENCO The Axiomatic Design of Patients’ Clothing .................................................................................................. 278 Elena ONOFREI Study on Thermal Comfort Properties of Active Sportswear using a Thermal Manikin ................................ 283
Ana Marija GRANCARIĆ, Lea BOTTERI and Anita TARBUK Nonwoven Flame Retardant and Antibacterial Protection Composite ......................................................... 288 Ionut DULGHERIU, Cristian MATENCIUC, Luminita VLAD, Stan MITU, Manuela AVADANEI
New Concepts Regarding Mechanical Protection Equipment and Testing Them during Penetration ......... 295 Carmen LOGHIN, Pulferia NICOLAIOV, Irina IONESCU, Ionuţ DULGHERIU Thermal Characterization of Coated Fabrics ................................................................................................ 303
Jana CIRJA Study on the Requirements of Clothing for Persons with Special Needs ..................................................... 309
Corina CIOBANU, Mihai PENCIUC and Costea BUDULAN Athletic Socks ................................................................................................................................................ 314
Liliana LUTIC Concepts Regarding the Quality of the Knitted Used in Mattress Production .............................................. 320 Viorica SCOBIOALĂ-CAZAC Functionality of Special Equipment Made For Surgeons ............................................................................. 328
11
Guntis STRAZDS, Dana BELAKOVA and Inese ZIEMELE Activity of The Cross-Institutional Group of Researchers in The Project “Investigation of Latvian Renewable Raw Materials – Flax and Hemp Products for Development of Innovative Technologies and new Functional Materials” ...................................................................................................................... 334 Alexandra ENE, Emilia VISILEANU, Carmen MIHAI
Innovative Spin–Off for Medical Devices Made of Textiles Materials ........................................................... 339
Section 5: IT Applications Mihai STAN, Pyerina Carmen GHITULEASA Use of Grid Network in Designing Auxetic Textile Structures ....................................................................... 341
Section 6: Machinery Developments Daniela LIUTE Equations Applied for Programming the turn of the Roll on Tangential Windings of Constant Rate-Delivered Textiles .......................................................................................................................................... 348 Daniela LIUTE, Gabriela BUTNARU The Sequential Proportionality Coefficients of the Tension of Warp Sizing Machines ................................. 354
Section 7: Fashion Design and Product Development Mirela TEODORESCU, Monica Alina CALIN, Ioana PETCU and Antonela CURTEZA Biomimetic Innovation in Clothing Industry ................................................................................................... 360 Mirela TEODORESCU, Monica Alina CALIN, Ioana PETCU, Antonela CURTEZA, Laurence SCHACHER, Dominique ADOLPHE Structural Colours – New Inspiration for Fashion Design ............................................................................. 367 Sabina OLARU, Emilia FILIPESCU, Claudia NICULESCU, Elena FILIPESCU Research on Men Conformation with Implications in the Patterns Design for Jacket .................................. 374 Zlatina KAZLACHEVA Cad Design of Collars around Necklines in Varied Forms ............................................................................ 382 Stela BALAN, Irina TUTUNARU, Marcela IROVAN and Victoria MACOVEI Use of Non-Traditional Methods of Constructing Garments with Three-Dimensional Elements .................. 388
Marcela IROVAN, Irina TUTUNARU Stela BALAN and Rodica ODOBESCU Elaboration of Assortments of Garments for Persons with Physical Disabilities .......................................... 394
Irina TUTUNARU, Marcela IROVAN and Stela BALAN Aspects of Designing Garments for Children Affected by Metabolic Syndrome ........................................... 398
BRAHMADEEP, Sébastien THOMASSEY, SUDIPTA, Fabien SALAUN and Christine CAMPAGNE 3D Design of a Customized Garment for Specific Sportswear Applications Integrating Targeted Functionalization of Textiles .......................................................................................................................... 404 Pascal BRUNIAUX 3D Pattern-Making on Adaptive Morphotype Mannequin ............................................................................. 413 Moez HAMAD, Pascal BRUNIAUX, Sébastien THOMASSEY New Generation of 3D Adaptive Morphotype Mannequin ............................................................................ 422 Maria Mirabela CRISTEA, Antonela CURTEZA Analysis of Electrical Resistance on Metallic Thread in Embroidery ............................................................ 433
12
Ana VIRCAN, Dorin IONESI, Stan MITU and Lavinia CAPMARE Bi-Dimensional Statistical Analyse of Main Anthropometric Parameters Specific to Primary School Children ......................................................................................................................................................... 436 Emilia FILIPESCU, Sabina OLARU, Elena FILIPESCU Solutions Development for Basic Patterns Remodeling Through 3D Virtual Simulation of Body –
Garment Dimensional Fitting ........................................................................................................................ 442
Manuela AVADANEI, Ana VÎRCAN and Ionuț DULGHERIU Study Concerning the use of Anthropometrical Parameters in the Evaluation of Children Health Condition Aged from 7 To 10 Years Old ....................................................................................................... 449
Section 8: Innovations in Textile Finishing Ecaterina VASLUIANU, Vasilica POPESCU Performances Offered by the Fireproofing and Anti-Creasing Simultaneous Technology ........................... 454
Vahid AMERI DEHABADI, Hans-Jürgen BUSCHMANN and Jochen Stefan GUTMANN Effect of Polyamino Carboxylic Acids on Biostatic Properties and Dyeability of Cotto Fabrics .................... 462 Lilioara SURDU, Ioan CIOARA, Carmen GHITULEASA, Nicula GHEORGHE, Laurentiu DINCA,
Adriana SUBTIRICA, Marilena NICULESCU, Razvan RADULESCU, Cosmin MEDOR
Research Regarding the Plasma Hydrophobization of Textile Materials for Medical Articles ...................... 468
Nasser H. MOHAMED, Thomas BAHNERS, Jochen S. GUTMANN and Mathias ULBRICHT Antibacterial Properties of Plasma Pre-Treated Polyester Fabric Impregnated with Photochemically Synthesized Silver Nanoparticles ................................................................................................................. 476 Octavian POPESCU and Aurelia GRIGORIU Obtaining of Multifunctional Cellulosic Fabrics by Superficial Chemical Modification .................................. 485 Claudia UDRESCU, Franco FERRERO and Monica PERIOLATTO Ultrasound Assisted Dyeing of Cellulose Acetate ......................................................................................... 493 Angela CEREMPEI, Rodica MUREŞAN and Augustin MUREŞAN Analysis of Model Essential Oil Release Kinetics from Chitosan Matrice .................................................... 500
Ovidiu CONSTANDACHE, Angela CEREMPEI and Rodica MUREŞAN Dyeing of Polyester and Polyester Blend with Reactive Dyes ...................................................................... 506
Tatiana CONSTANDACHE, Angela CEREMPEI and Rodica MUREŞAN Special Effect Pigments ................................................................................................................................ 515
Abramiuc DANKO, Crişan POPESCU, Augustin MURESAN Improving Cotton Textile Materials Proprieties by Treating With Chitosan and Metallic Salts ..................... 522
Section 9: Advances in Leather Processing Vasilica MAIER, Stelian Sergiu MAIER, Melinda PRUNEANU, Ingrid BUCIŞCANU Assessment Protocol of Highly Hygienic Leather Types .............................................................................. 529
Vasilica MAIER, Stelian Sergiu MAIER, Melinda PRUNEANU, Ingrid BUCIŞCANU Characterization of Hystorical Leather by Thermoanalytical Techniques ..................................................... 536
Melinda PRUNEANU, Ingrid BUCIŞCANU, Stelian Sergiu MAIER, Vasilica MAIER
Conventional Tanning Vs Low Offer Chrome Tanning, Using a Melamine-Formaldehyde Resin as Pre-
Tanning Agent ............................................................................................................................................... 542
13
Tudorel BĂLĂU MÎNDRU and Iulia BĂLĂU MÎNDRU Studies on Obtaining and Use of Protein Waste ........................................................................................... 551
Section 10: Footwear Design and Technology Mihaela Ioana BARITZ and Diana COTOROS Conceptual Analysis of Ratio between the Plantar Pressure and Insole Shape during Different Types of Gait ............................................................................................................................................................. 557 Mihaela Ioana BARITZ and Diana COTOROS The Influence of Plantar Surface Shape and Height upon the Support Basis and Bipodal Stability ............. 564 Mariana PĂȘTINĂ (COSTEA), Aura MIHAI, Stan MITU Virtual and Physical Prototyping Technique for Footwear Bottom Components .......................................... 569 Bogdan SARGHIE, Aura MIHAI Comparative Study on Practical and Teoretical Estimation of the Material Consumption within Footwear Products ........................................................................................................................................ 575 Cornelia IONESCU LUCA Thermal Processes of The Moulds used in Footwear Outsoles ................................................................... 579
Cornelia IONESCU LUCA Thermic Processes in Vulcanisation Moulds used in Footwear Soles .......................................................... 585
Mariana DRIŞCU Calibrating Shoe Lasts and Experimentally Estimating the Variations in their Sizes by using Delcam
Crispin 3D– Last Maker ................................................................................................................................. 591
Marta-Catalina HARNAGEA, Aura MIHAI and Stan MITU Consumer's Criteria for Sport Shoes ............................................................................................................. 598 Florentina HARNAGEA, Marta-Catalina HARNAGEA The Influence of upper Patterns Configuration on the Specific Consumption when Cutting Leather ........... 602 Florentina HARNAGEA, Marta-Catalina HARNAGEA Tensile Strength and Elongation at Break of the Leather Substitutes used in Footwear Manufacturing ..... 608
Mariana DRIŞCU Last Modeling for Perfectly Fit Footwear using Delcam Crispin - Last Maker .............................................. 613 Carlos VAZ DE CARVALHO, Aura MIHAI, Nikolaos BILALIS, Ana Marija GRANCARIC, Eduardo COSTA, Clara SOLVES, Cláudia AZEVEDO Mismatches, Shortages and Gaps in Competencies and Skills in the Footwear Industry ........................... 619
Section 11: Ecology in Textiles and Leather Processing Ramona BOȚ-BUDEANU, Antonela CURTEZA, Augustin MURESAN Textile Ecology – Achievement of Different Color Tones using Natural Dyes on the Fabric of Linen and Hemp ...................................................................................................................................................... 628 Ingrid BUCIŞCANU, Melinda PRUNEANU, Vasilica MAIER, Stelian Sergiu MAIER Pathways to Environmental Sustainability for the Textile and Leather Industry ........................................... 633 Costică SAVA, Mariana ICHIM Recycling Cotton Waste into Fine Yarns ...................................................................................................... 639
Ramona BOȚ-BUDEANU, Antonela CURTEZA, Augustin MURESAN Eco-Friendly Dyeing – Using Natural Dyes from Nature .............................................................................. 643
14
Ecaterina VASLUIANU, Corina CIOBANU Ecotoxicological Aspects Highlighted by Easy-Care Finishing Treatments .................................................. 650
Doina TOMA, Emilia VISILEANU and Silvia POZZI Tex-Eastile-European Network for Green Textile Excellence ........................................................................ 655
Section 12: Marketing and Management Ion VERZEA, Gabriel-Petru LUCA “Production Complexification”: New Challenges of Management and Marketing in Textile Industry ........... 659
Ion VERZEA, Gabriel-Petru LUCA, Rachid CHAIB The Strategic Management of the “Production-Quality-Maintenance” Triplet .............................................. 664 Gabriel-Petru LUCA, Ion VERZEA, Irina COZMÎNCĂ Why the Romanian Textile SMES` Have to Become more than Flexible, to Become Agile ........................ 669 Gabriel-Petru LUCA, Ion VERZEA How the Romanian Textile SMES` Can Become Agile ................................................................................ 673 Pulferia NICOLAIOV, Adela FLOREA and Carmen LOGHIN Specific Innovation Approaches in Garment Manufacturing Companies ..................................................... 677 Carmen ANTON, Silviu-Mihail TIŢĂ
International Comparison of Scientific Research Performances in Textile Faculties ................................... 683
Section 13: Engineering Education Adrian BUHU, Liliana BUHU E-Learning System for Fancy Yarns Design ................................................................................................. 689 Мariana COJOCARU, Olga SUGAC On the Use of Reference Notes for Knowledge Consolidation ..................................................................... 695 Olga SUGAC, Mariana COJOCARU
Pedagogic Technologies on Organization of Student Reflexive and Valuation Activities ............................ 700
Aristide DODU, Dorin DAN The Book of the Textile Engineer .................................................................................................................. 704
Carmen Maria LOGHIN Project PRACTICA - POSDRU 90/2.1/S/60423............................................................................................ 706
15
14
th Romanian Textiles and Leather Conference – CORTEP 2012
Sinaia, 6 - 8 September 2012
TEXTILE ELECTRONICS, SENSORS (PART 1) & DISPLAYS (PART2)
Xuyuan TAO, Cédric COCHRANE, Ludivine MEUNIER, Fern M KELLY & Vladan KONCAR
University Lille Nord de France ENSAIT, GEMTEX, Roubaix, France
Abstract:The fibre form transistor has become one of the most interesting topics in the field of smart textiles. The use of PEDOT:PSS to realize a parallel wire electrochemical textile transistor has been reported. A novel geometry pattern makes the transistor easier to insert into textile fabric making the large-scale production possible. The length of transistor can be up to several centimeters. The On/Off ratio reached up to 103. The switch time is near 15s. An inverter circuit and an amplifier were fabricated by using one transistor as well in order to demonstrate the feasibility of fully textile electronic circuits. On the other side chromic materials have the ability to change their colour reversibly according to external environmental conditions. They are categorised by the stimulus that triggers the colour change. For example, thermochromic materials can be defined as those in which a colour change is induced by a change in temperature and electrochromic materials are those in which a colour change is induced when an electrical current is applied. Thermochromism is already a well-known application within the textile field, however electrochromism is not as common. In this paper, an overview of the field of electrochromic devices is provided and the successful development of a first generation flexible textile electrochromic device, achieved by ourselves, is discussed. The flexible electrochromic textile display consists of a novel 4-layer sandwich structure containing a thin spacer fabric with electrochromic compound (Prussian blue), a conductive layer and two electrodes; bottom and upper (transparent). If powered with a low voltage battery, this structure is able to generate a reversible colour change. The switching times have been measured at ~ 5 s and 4.5 V. The colour changes are monitored via CIE L*, a*, b* values.. Keywords: e-textile, electrochemical transistor, PEDOT:PSS, Textile flexible display, Conducting polymer, Prussian blue
PART 1 1 INTRODUCTION Interest in textile transistors has been growing rapidly in recent decade. According to articles published until now, fibre transistors can be divided into two families: wire thin film transistors (WTFTs) [1-3] and wire electrochemical transistors (WECTs) [4-5]. The advantage of WTFTs is the short response time (<1 µs), meanwhile the magnitude of the voltage required to control the gate is as high as several tens of volts. On the other hand, the required control voltage for WECTs is only 2~3 V. However, the large switch time, more than several tens of seconds, scales down WECTs technology to quasi-static applications. The difference between proprieties of WTFTs and WECTs result from different insulating materials between the gate and semiconductor layers. For conventional organic field-effect transistors, the insulating material is obtained from inorganic oxide (i.e.SiO2) or polymer dielectrics (~10 nF/cm2). Meanwhile for electrochemical transistors, the insulating layer is realized by the liquid or gel electrolyte (>10 µF/cm2) [6]. The excellent high capacitance of electrolytes results from the formation of electric double layers (EDLs) at interfaces, which can be exploited to induce a very large charge carrier density (>1014 cm2) in the channel of an OFET at low applied voltages [7]. In terms of the geometry pattern of wire transistors, WTFTs integrate the dielectric layer, the semiconductor layer and three electrodes (gate, source and drain) in one wire filament [1-2] (Figure 1a). As a result, the possibility and processability of integration of such transistors into textile fabric is easy to realize by simple physical contacts between different yarns. However, in order to guarantee the width-length ratio of the channel as large as possible, the deposited layer should cover the filament all around. Therefore, the filament should be continually rotated during the evaporation process. Furthermore, in order to assure the electrical performance, the thickness of different layers should be carefully controlled. Sometimes, the mask of deposition is also necessary. Hence, this complicated multiple layers deposition makes WTFTs unsuitable for the large-scale production.
22
14th Romanian Textiles and Leather Conference – CORTEP 2012
Sinaia, 6 - 8 September 2012
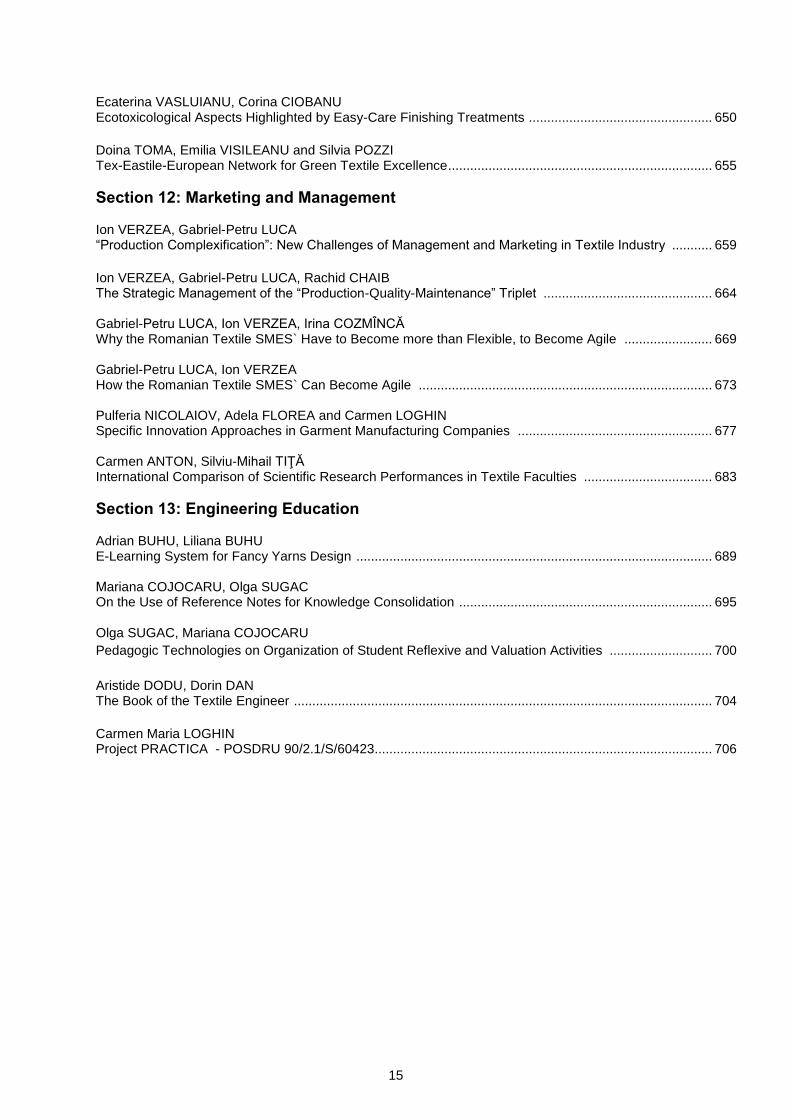
In the case of WECTs, the gate is on one yarn and other parts of transistor are on another yarn. These two separated yarns are glued to each other via an electrolyte solid which can be ion gel [7-9], poly ion liquid [10-11] or the combination of these two electrolytes [12] (Figure 1b). WECTs need neither multiple deposition nor mask, which simplifies the manufacturing process. In fact, the coating process in solution can be used to realize semiconductive or conductive layers on the yarn surface. Furthermore, because of the insensitivity of the electrolyte thickness between the channel and the gate electrode, the geometry of the transistor does not have a major impact on electrical performance. The need for precise positioning is not necessary any more. In order to make a textile electronic circuit, it is necessary to create first the fabric with the gate filament and the source-drain filament in weft and warp directions. Then, a post processing is necessary to bring the electrolyte to the cross section of these filaments and to realize finally the WECT. This post processing after the integration of the yarns into the fabric makes WECTs unsuitable for the textile application, because the electrolyte liquid may be easily absorbed into the textile fabric by the capillarity force. As a result, an inflexible spot will be left in the textile structure, which may influence its hand feel.
Figure 1: The topologies for WTFTs (a) and WECTs (b) In this article, a novel geometry pattern of WECTs has been reported. Two parallel filaments are twisted together like a thread. One of them is used for the gate electrode and the other is used for drain and source electrodes. The PEDOT:PSS is used as thin-film electrodes in the WECT. The ON and OFF states of transistor are realized by the redox reaction of the PEDOT film.
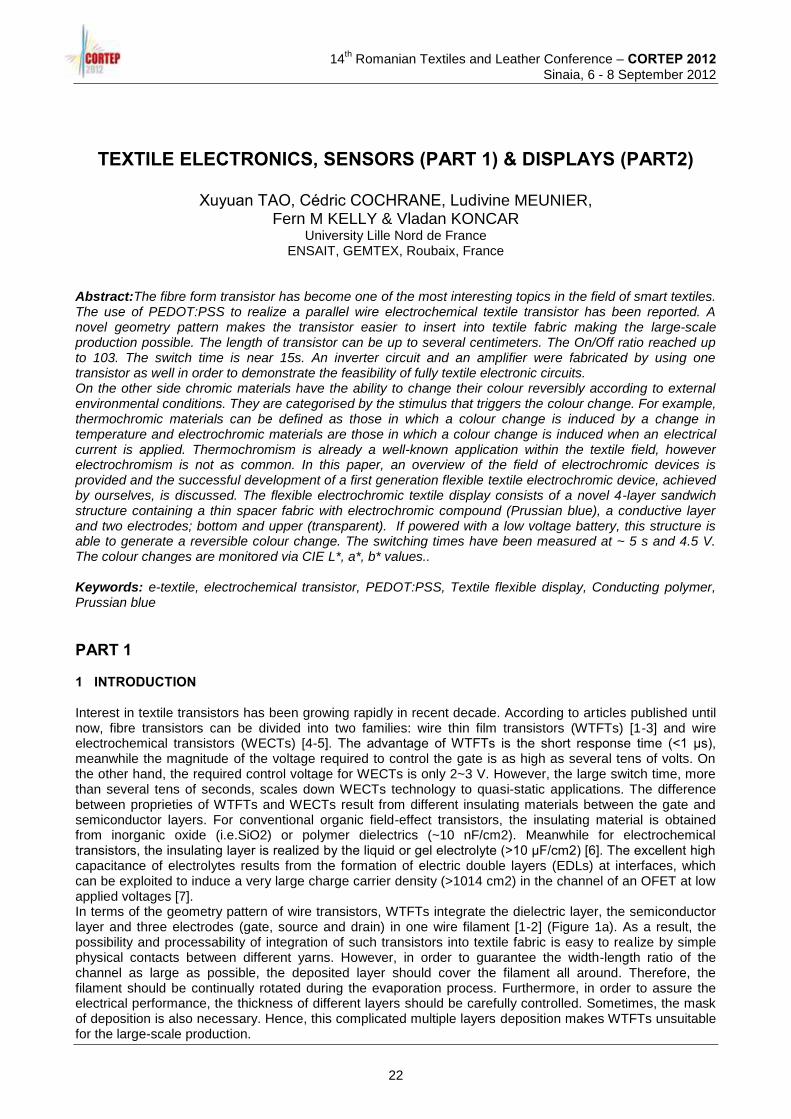
PEDOT+PSS- +M+ + e- PEDOT0 +M+PSS- (1) where M+ represents metal ions transported inside the electrolyte polymer, i.e. Ca2+, Na+ and K+. The electron e– is transported inside the PEDOT:PSS film. The redox potential is in -0.2~-0.4 V [13], which is convenient to make a low-voltage electrochemical transistor. The advantage of our novel pattern is that the transistor may be realized before the integration into the textile fabric in order to make a fully textile electronic circuit. The novel pattern WECT was inserted into a cotton fabric and the numerical and analog circuit were realized. 2 MATERIALS AND MEASUREMENTS The high-conductivity PEDOT:PSS solution (CLEVIOS™ F DDP 105) was purchased from H.C. Starck, Germany. The electrolyte solution consists of 33 wt.% poly(styrenesulfonate) (PSS) (Aldrich), 12 wt.% glycol (Sigma-Aldrich), 8 wt.% D-sorbitol (Aldrich), water and 0.1M NaClO4 (Sigma-Aldrich). The electrolyte solution was mixed up in an ultrasonic bath and can be conserved in fridge for several months. The CYCLOTENE™ 3022-35 resin (BCB35) is used as received from the Dow Chemical Company without further purifying. All electrical measurements were carried out at ambient atmosphere (20-22°C temperature and 37-40% relative on a scope (Agilent humidity). Transistor electrical measurements were realized on the Agilent 4156C Semiconductor Parameter Analyzer. Electrical circuit measurements were carried out 54622A 2-Channel) and a waveform generator (Tabor PM8571). The textural properties of conducting layers surfaces were then investigated by Scanning Electron Microscopy (ZEISS ULTRA 55). 3 EXPERIMENTAL The PEDOT:PSS coating was continually carried out by a Coatema® coating machine with a solution vat and a hot air heating system (Figure 2). This device can realize a roll-to-roll coating with controllable coating speed and heating temperature (> 100°C). One bobbin of Kevlar multifilament with PEDOT:PSS coating was
23
14
th Romanian Textiles and Leather Conference – CORTEP 2012
Sinaia, 6 - 8 September 2012
obtained using this process. The running speed of the Kevlar filament was as fast as 0.5 m/min. The Kevlar filament was heated by passing through the one meter large oven under 90°C. The coated bobbin can be kept under the ambient atmosphere for several months without changing the conductivity.
Figure 2: The scheme of the coating system
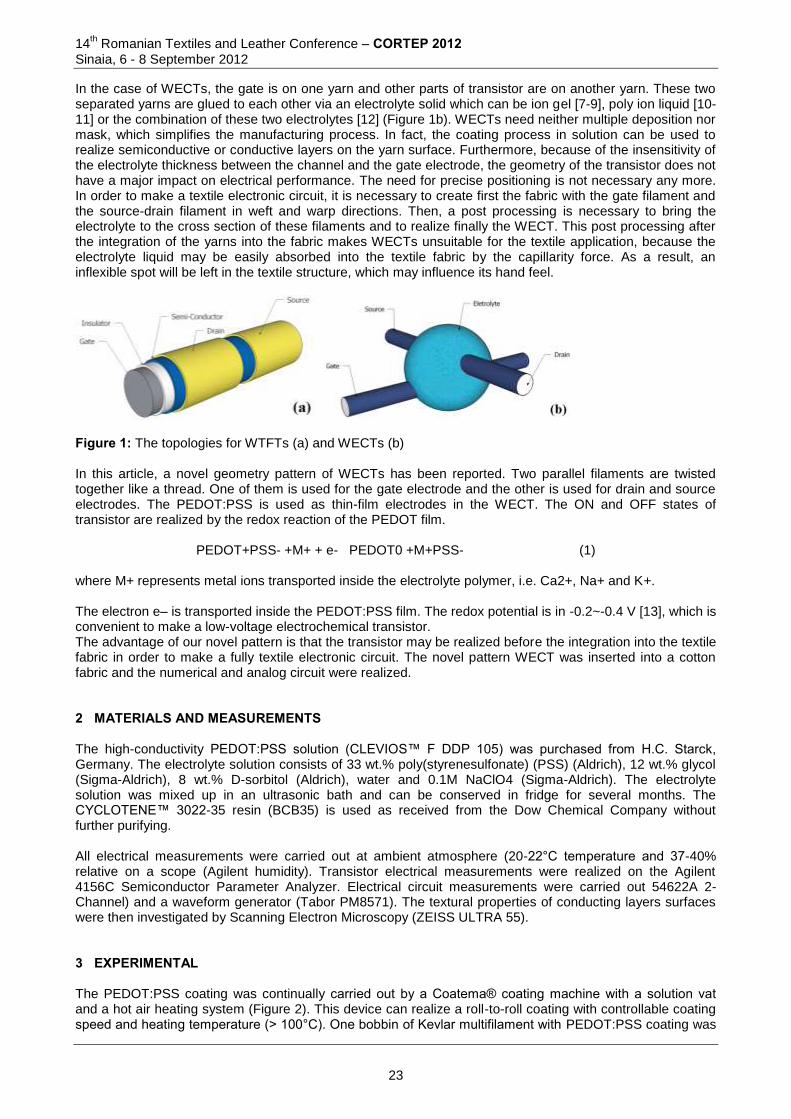
Figure 3: The scheme of WECT construction in form of a thread Two 50 cm coated filaments were cut from the bobbin for gate electrode filament and source/drain electrode filament (Figure 3a). A drop of electrolyte solution was dripped in the middle of gate electrode filament. This filament was heated in an oven at 55°C for 10 mins (Figure 3b). The length of coated electrolyte polymer was about 6 mm. After taken out of the oven, the gate electrode filament was coated with BCB35 resin by dip-coating (10 cm/min) by an automatic machine and then directly heated in a tubular oven at 250°C for 15 mins in ambient atmosphere (Figure 3c). The BCB35 coating was used as an insulator layer to avoid the electrical contact between two parallel multifilaments, when the gate electrode filament and the source/drain electrode filament were twisted together. After the resin layer was dried, the gate filament was snipped in the middle of electrolyte (Figure 3d). Finally, the gate electrode filament and the source/drain electrode filament were twisted together and the end of gate electrode filament with pre-coated electrolyte was glued again to the source/drain electrode filament by a drop of electrolyte (about 1mm long). (Figure 4)
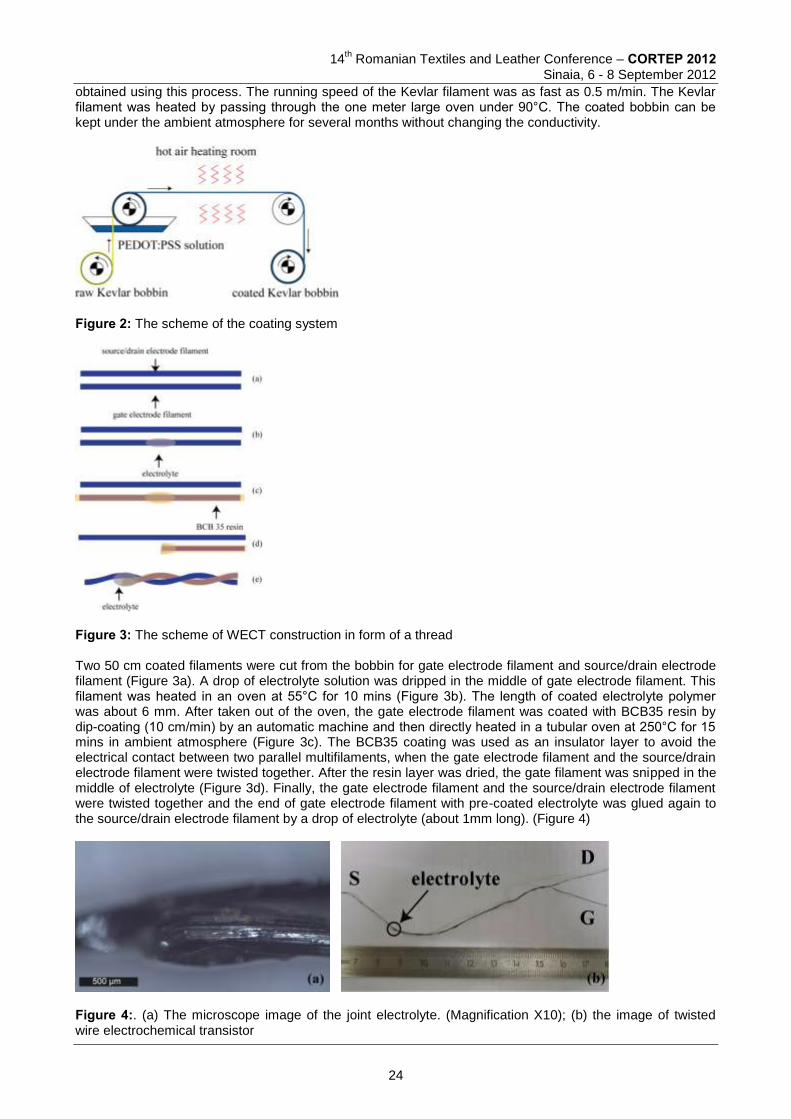
Figure 4:. (a) The microscope image of the joint electrolyte. (Magnification X10); (b) the image of twisted wire electrochemical transistor
24
14th Romanian Textiles and Leather Conference – CORTEP 2012
Sinaia, 6 - 8 September 2012
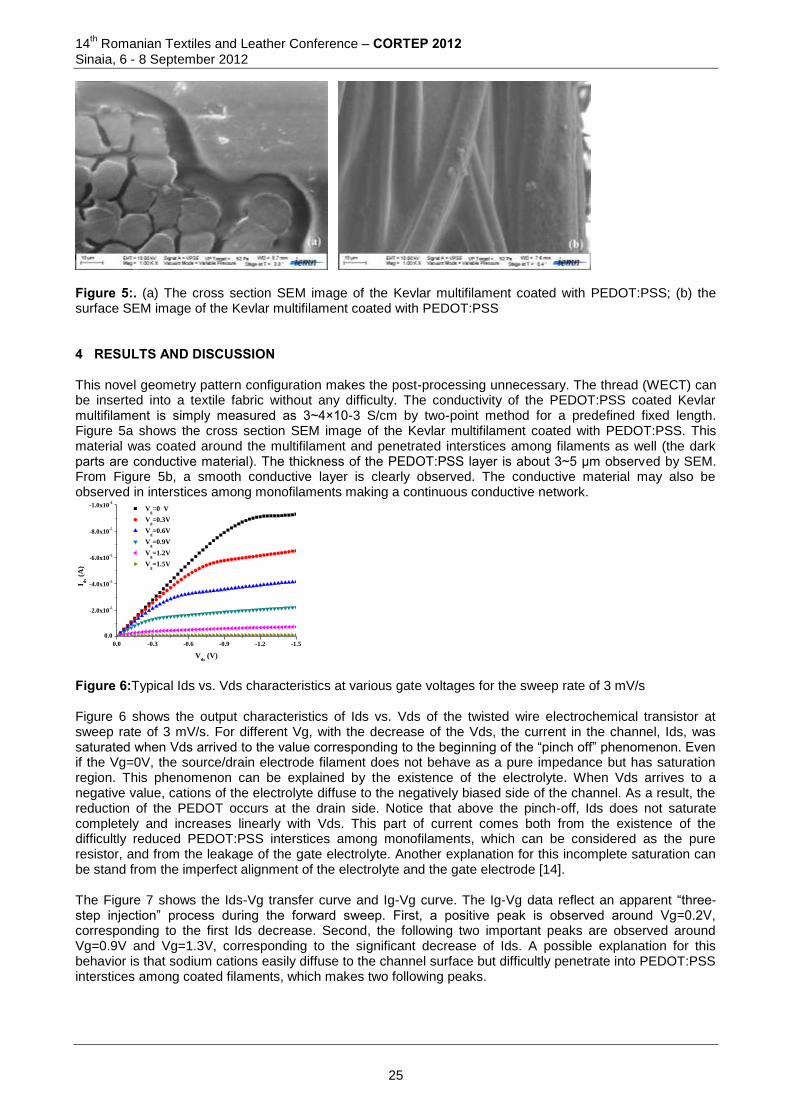
Figure 5:. (a) The cross section SEM image of the Kevlar multifilament coated with PEDOT:PSS; (b) the surface SEM image of the Kevlar multifilament coated with PEDOT:PSS 4 RESULTS AND DISCUSSION This novel geometry pattern configuration makes the post-processing unnecessary. The thread (WECT) can be inserted into a textile fabric without any difficulty. The conductivity of the PEDOT:PSS coated Kevlar multifilament is simply measured as 3~4×10⁻³ S/cm by two-point method for a predefined fixed length. Figure 5a shows the cross section SEM image of the Kevlar multifilament coated with PEDOT:PSS. This material was coated around the multifilament and penetrated interstices among filaments as well (the dark parts are conductive material). The thickness of the PEDOT:PSS layer is about 3~5 µm observed by SEM. From Figure 5b, a smooth conductive layer is clearly observed. The conductive material may also be observed in interstices among monofilaments making a continuous conductive network.
0.0 -0.3 -0.6 -0.9 -1.2 -1.5
0.0
-2.0x10⁻⁵
-4.0x10⁻⁵
-6.0x10⁻⁵
-8.0x10⁻⁵
-1.0x10⁻⁴
Vg=0 V
Vg=0.3V
Vg=0.6V
Vg=0.9V
Vg=1.2V
Vg=1.5V
I ds (
A)
Vds
(V) Figure 6:Typical Ids vs. Vds characteristics at various gate voltages for the sweep rate of 3 mV/s
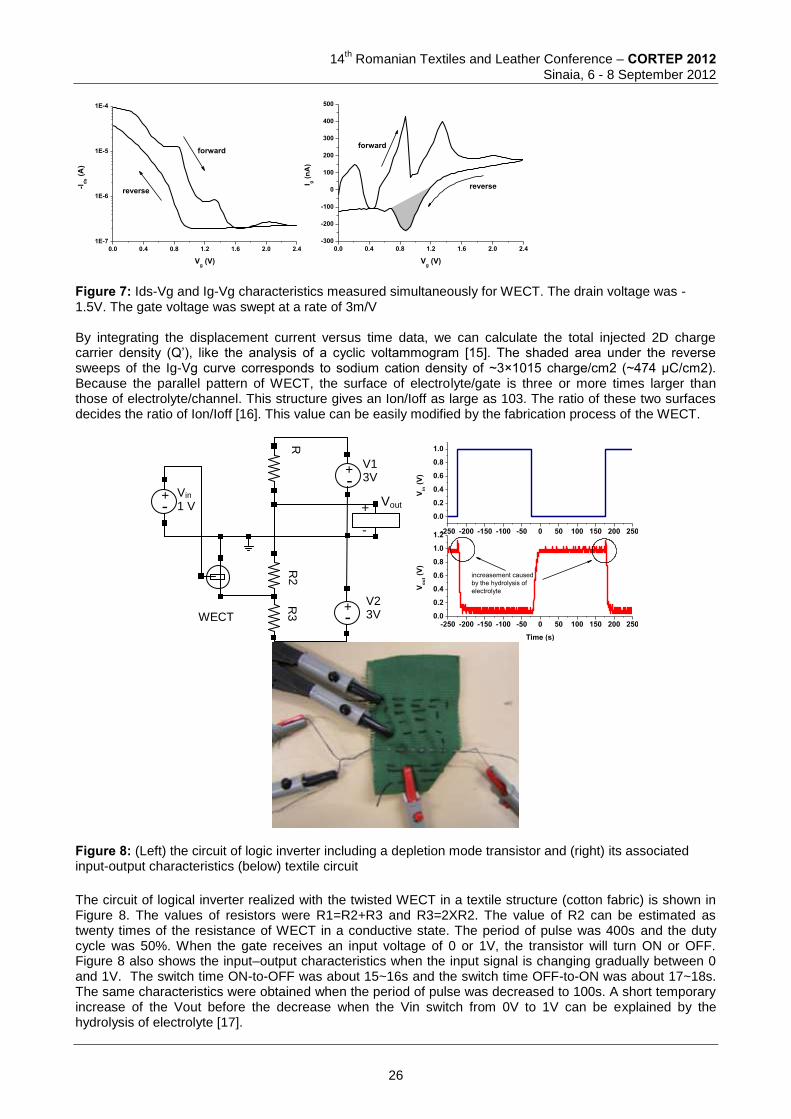
Figure 6 shows the output characteristics of Ids vs. Vds of the twisted wire electrochemical transistor at sweep rate of 3 mV/s. For different Vg, with the decrease of the Vds, the current in the channel, Ids, was saturated when Vds arrived to the value corresponding to the beginning of the “pinch off” phenomenon. Even if the Vg=0V, the source/drain electrode filament does not behave as a pure impedance but has saturation region. This phenomenon can be explained by the existence of the electrolyte. When Vds arrives to a negative value, cations of the electrolyte diffuse to the negatively biased side of the channel. As a result, the reduction of the PEDOT occurs at the drain side. Notice that above the pinch-off, Ids does not saturate completely and increases linearly with Vds. This part of current comes both from the existence of the difficultly reduced PEDOT:PSS interstices among monofilaments, which can be considered as the pure resistor, and from the leakage of the gate electrolyte. Another explanation for this incomplete saturation can be stand from the imperfect alignment of the electrolyte and the gate electrode [14]. The Figure 7 shows the Ids-Vg transfer curve and Ig-Vg curve. The Ig-Vg data reflect an apparent “three-step injection” process during the forward sweep. First, a positive peak is observed around Vg=0.2V, corresponding to the first Ids decrease. Second, the following two important peaks are observed around Vg=0.9V and Vg=1.3V, corresponding to the significant decrease of Ids. A possible explanation for this behavior is that sodium cations easily diffuse to the channel surface but difficultly penetrate into PEDOT:PSS interstices among coated filaments, which makes two following peaks.
25
14
th Romanian Textiles and Leather Conference – CORTEP 2012
Sinaia, 6 - 8 September 2012
0.0 0.4 0.8 1.2 1.6 2.0 2.41E-7
1E-6
1E-5
1E-4
-I ds (A
)
Vg (V)
forward
reverse
0.0 0.4 0.8 1.2 1.6 2.0 2.4-300
-200
-100
0
100
200
300
400
500
I g (nA
)
Vg (V)
forward
reverse
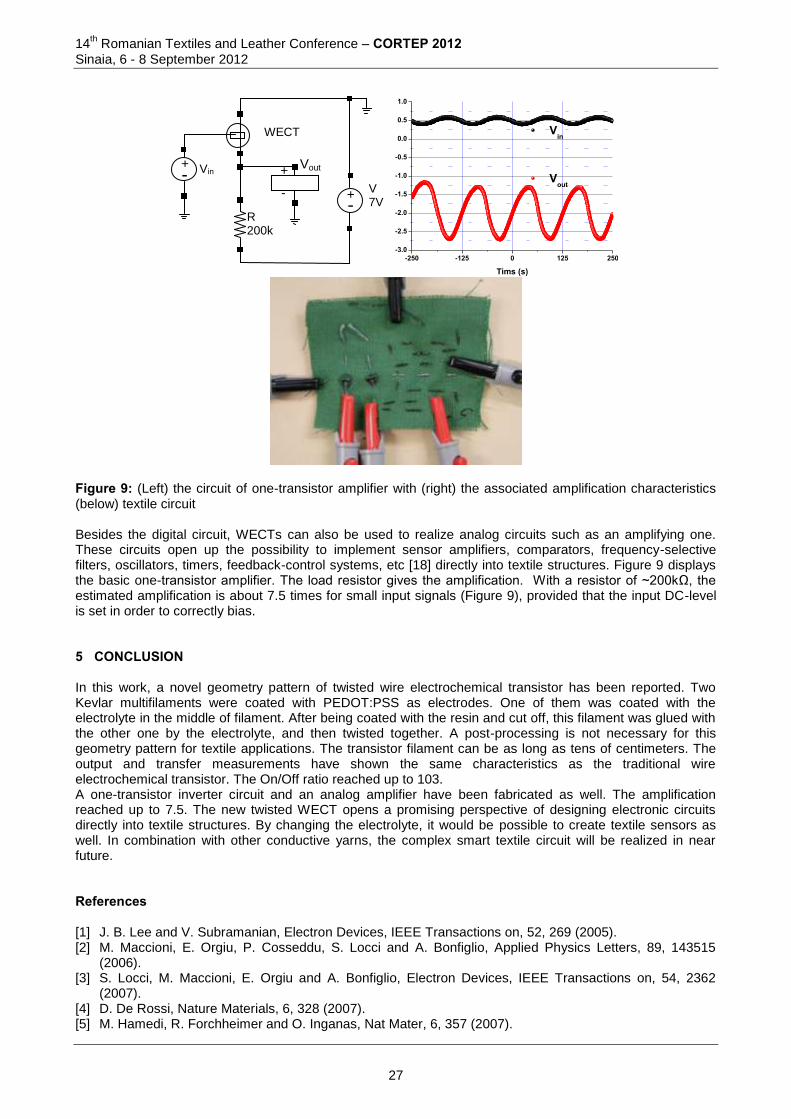
Figure 7: Ids-Vg and Ig-Vg characteristics measured simultaneously for WECT. The drain voltage was -1.5V. The gate voltage was swept at a rate of 3m/V By integrating the displacement current versus time data, we can calculate the total injected 2D charge carrier density (Q’), like the analysis of a cyclic voltammogram [15]. The shaded area under the reverse sweeps of the Ig-Vg curve corresponds to sodium cation density of ~3×10¹⁵ charge/cm2 (~474 µC/cm2). Because the parallel pattern of WECT, the surface of electrolyte/gate is three or more times larger than those of electrolyte/channel. This structure gives an Ion/Ioff as large as 103. The ratio of these two surfaces decides the ratio of Ion/Ioff [16]. This value can be easily modified by the fabrication process of the WECT.
-250 -200 -150 -100 -50 0 50 100 150 200 250
0.0
0.2
0.4
0.6
0.8
1.0
-250 -200 -150 -100 -50 0 50 100 150 200 2500.0
0.2
0.4
0.6
0.8
1.0
1.2
Vin
(V
)V
ou
t (V
)
Time (s)
increasement caused
by the hydrolysis of
electrolyte
Figure 8: (Left) the circuit of logic inverter including a depletion mode transistor and (right) its associated input-output characteristics (below) textile circuit
The circuit of logical inverter realized with the twisted WECT in a textile structure (cotton fabric) is shown in Figure 8. The values of resistors were R1=R2+R3 and R3=2XR2. The value of R2 can be estimated as twenty times of the resistance of WECT in a conductive state. The period of pulse was 400s and the duty cycle was 50%. When the gate receives an input voltage of 0 or 1V, the transistor will turn ON or OFF. Figure 8 also shows the input–output characteristics when the input signal is changing gradually between 0 and 1V. The switch time ON-to-OFF was about 15~16s and the switch time OFF-to-ON was about 17~18s. The same characteristics were obtained when the period of pulse was decreased to 100s. A short temporary increase of the Vout before the decrease when the Vin switch from 0V to 1V can be explained by the hydrolysis of electrolyte [17].
V2 3V
Vin 1 V
WECT
R3
R
2
R1
V1 3V
-
+ Vout
+ -
+ -
+ -
26
14th Romanian Textiles and Leather Conference – CORTEP 2012
Sinaia, 6 - 8 September 2012
-250 -125 0 125 250-3.0
-2.5
-2.0
-1.5
-1.0
-0.5
0.0
0.5
1.0
Vin
Vout
Tims (s)
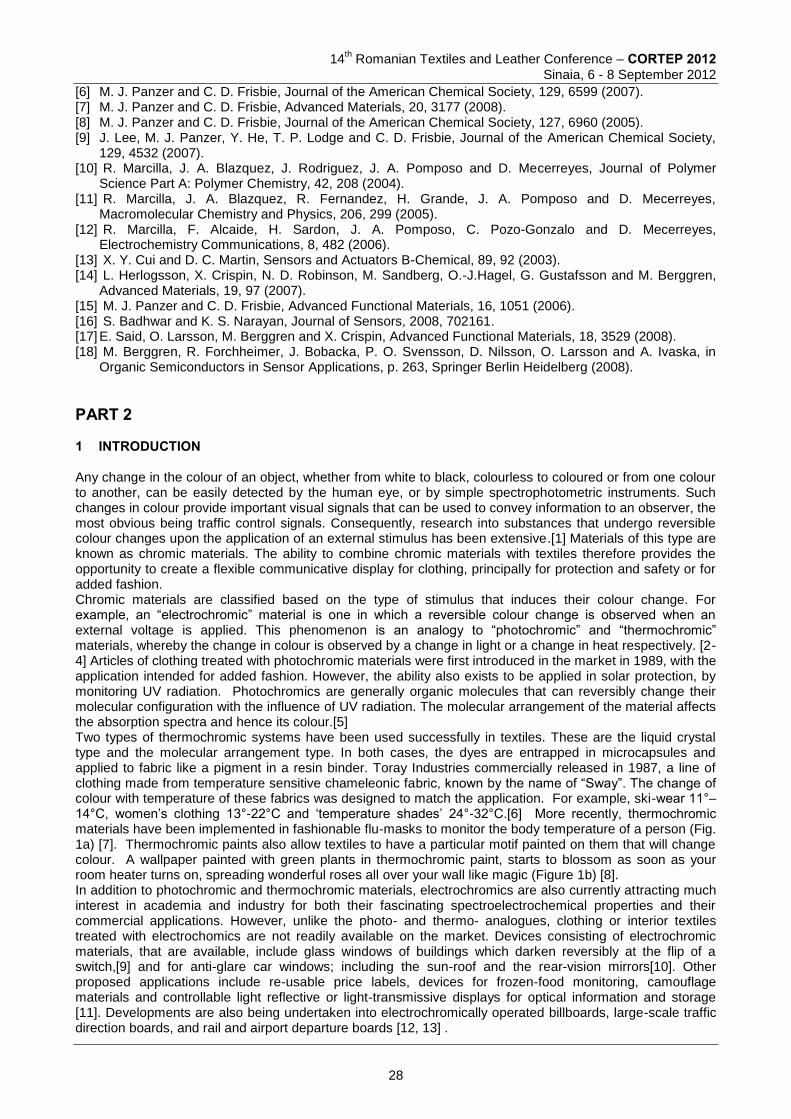
Figure 9: (Left) the circuit of one-transistor amplifier with (right) the associated amplification characteristics (below) textile circuit Besides the digital circuit, WECTs can also be used to realize analog circuits such as an amplifying one. These circuits open up the possibility to implement sensor amplifiers, comparators, frequency-selective filters, oscillators, timers, feedback-control systems, etc [18] directly into textile structures. Figure 9 displays the basic one-transistor amplifier. The load resistor gives the amplification. With a resistor of ~200kΩ, the estimated amplification is about 7.5 times for small input signals (Figure 9), provided that the input DC-level is set in order to correctly bias. 5 CONCLUSION In this work, a novel geometry pattern of twisted wire electrochemical transistor has been reported. Two Kevlar multifilaments were coated with PEDOT:PSS as electrodes. One of them was coated with the electrolyte in the middle of filament. After being coated with the resin and cut off, this filament was glued with the other one by the electrolyte, and then twisted together. A post-processing is not necessary for this geometry pattern for textile applications. The transistor filament can be as long as tens of centimeters. The output and transfer measurements have shown the same characteristics as the traditional wire electrochemical transistor. The On/Off ratio reached up to 103. A one-transistor inverter circuit and an analog amplifier have been fabricated as well. The amplification reached up to 7.5. The new twisted WECT opens a promising perspective of designing electronic circuits directly into textile structures. By changing the electrolyte, it would be possible to create textile sensors as well. In combination with other conductive yarns, the complex smart textile circuit will be realized in near future. References [1] J. B. Lee and V. Subramanian, Electron Devices, IEEE Transactions on, 52, 269 (2005). [2] M. Maccioni, E. Orgiu, P. Cosseddu, S. Locci and A. Bonfiglio, Applied Physics Letters, 89, 143515
(2006). [3] S. Locci, M. Maccioni, E. Orgiu and A. Bonfiglio, Electron Devices, IEEE Transactions on, 54, 2362
(2007). [4] D. De Rossi, Nature Materials, 6, 328 (2007). [5] M. Hamedi, R. Forchheimer and O. Inganas, Nat Mater, 6, 357 (2007).
R 200kΩ
Vin
WECT
-
+ Vout
V 7V
+ -
+ -
27
14
th Romanian Textiles and Leather Conference – CORTEP 2012
Sinaia, 6 - 8 September 2012
[6] M. J. Panzer and C. D. Frisbie, Journal of the American Chemical Society, 129, 6599 (2007). [7] M. J. Panzer and C. D. Frisbie, Advanced Materials, 20, 3177 (2008). [8] M. J. Panzer and C. D. Frisbie, Journal of the American Chemical Society, 127, 6960 (2005). [9] J. Lee, M. J. Panzer, Y. He, T. P. Lodge and C. D. Frisbie, Journal of the American Chemical Society,
129, 4532 (2007). [10] R. Marcilla, J. A. Blazquez, J. Rodriguez, J. A. Pomposo and D. Mecerreyes, Journal of Polymer
Science Part A: Polymer Chemistry, 42, 208 (2004). [11] R. Marcilla, J. A. Blazquez, R. Fernandez, H. Grande, J. A. Pomposo and D. Mecerreyes,
Macromolecular Chemistry and Physics, 206, 299 (2005). [12] R. Marcilla, F. Alcaide, H. Sardon, J. A. Pomposo, C. Pozo-Gonzalo and D. Mecerreyes,
Electrochemistry Communications, 8, 482 (2006). [13] X. Y. Cui and D. C. Martin, Sensors and Actuators B-Chemical, 89, 92 (2003). [14] L. Herlogsson, X. Crispin, N. D. Robinson, M. Sandberg, O.-J.Hagel, G. Gustafsson and M. Berggren,
Advanced Materials, 19, 97 (2007). [15] M. J. Panzer and C. D. Frisbie, Advanced Functional Materials, 16, 1051 (2006). [16] S. Badhwar and K. S. Narayan, Journal of Sensors, 2008, 702161. [17] E. Said, O. Larsson, M. Berggren and X. Crispin, Advanced Functional Materials, 18, 3529 (2008). [18] M. Berggren, R. Forchheimer, J. Bobacka, P. O. Svensson, D. Nilsson, O. Larsson and A. Ivaska, in
Organic Semiconductors in Sensor Applications, p. 263, Springer Berlin Heidelberg (2008).
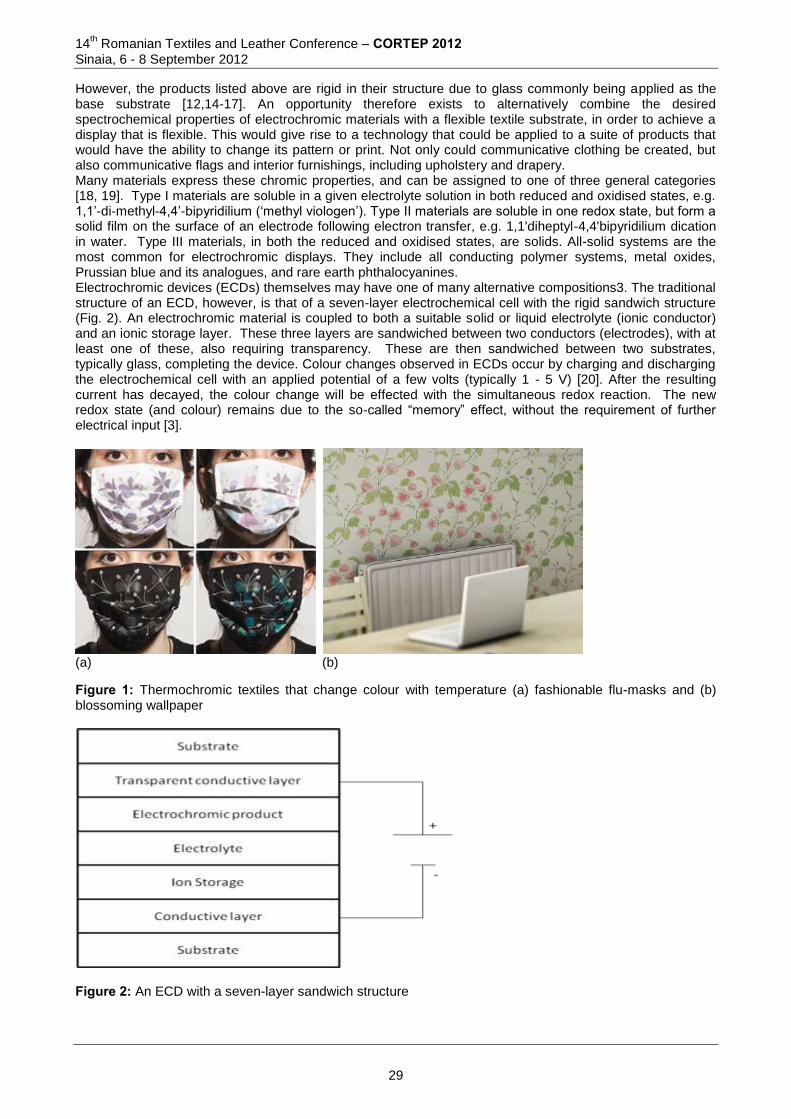
PART 2 1 INTRODUCTION Any change in the colour of an object, whether from white to black, colourless to coloured or from one colour to another, can be easily detected by the human eye, or by simple spectrophotometric instruments. Such changes in colour provide important visual signals that can be used to convey information to an observer, the most obvious being traffic control signals. Consequently, research into substances that undergo reversible colour changes upon the application of an external stimulus has been extensive.[1] Materials of this type are known as chromic materials. The ability to combine chromic materials with textiles therefore provides the opportunity to create a flexible communicative display for clothing, principally for protection and safety or for added fashion. Chromic materials are classified based on the type of stimulus that induces their colour change. For example, an “electrochromic” material is one in which a reversible colour change is observed when an external voltage is applied. This phenomenon is an analogy to “photochromic” and “thermochromic” materials, whereby the change in colour is observed by a change in light or a change in heat respectively. [2-4] Articles of clothing treated with photochromic materials were first introduced in the market in 1989, with the application intended for added fashion. However, the ability also exists to be applied in solar protection, by monitoring UV radiation. Photochromics are generally organic molecules that can reversibly change their molecular configuration with the influence of UV radiation. The molecular arrangement of the material affects the absorption spectra and hence its colour.[5] Two types of thermochromic systems have been used successfully in textiles. These are the liquid crystal type and the molecular arrangement type. In both cases, the dyes are entrapped in microcapsules and applied to fabric like a pigment in a resin binder. Toray Industries commercially released in 1987, a line of clothing made from temperature sensitive chameleonic fabric, known by the name of “Sway”. The change of colour with temperature of these fabrics was designed to match the application. For example, ski-wear 11°–14°C, women’s clothing 13°-22°C and ‘temperature shades’ 24°-32°C.[6] More recently, thermochromic materials have been implemented in fashionable flu-masks to monitor the body temperature of a person (Fig. 1a) [7]. Thermochromic paints also allow textiles to have a particular motif painted on them that will change colour. A wallpaper painted with green plants in thermochromic paint, starts to blossom as soon as your room heater turns on, spreading wonderful roses all over your wall like magic (Figure 1b) [8]. In addition to photochromic and thermochromic materials, electrochromics are also currently attracting much interest in academia and industry for both their fascinating spectroelectrochemical properties and their commercial applications. However, unlike the photo- and thermo- analogues, clothing or interior textiles treated with electrochomics are not readily available on the market. Devices consisting of electrochromic materials, that are available, include glass windows of buildings which darken reversibly at the flip of a switch,[9] and for anti-glare car windows; including the sun-roof and the rear-vision mirrors[10]. Other proposed applications include re-usable price labels, devices for frozen-food monitoring, camouflage materials and controllable light reflective or light-transmissive displays for optical information and storage [11]. Developments are also being undertaken into electrochromically operated billboards, large-scale traffic direction boards, and rail and airport departure boards [12, 13] .
28
14th Romanian Textiles and Leather Conference – CORTEP 2012
Sinaia, 6 - 8 September 2012
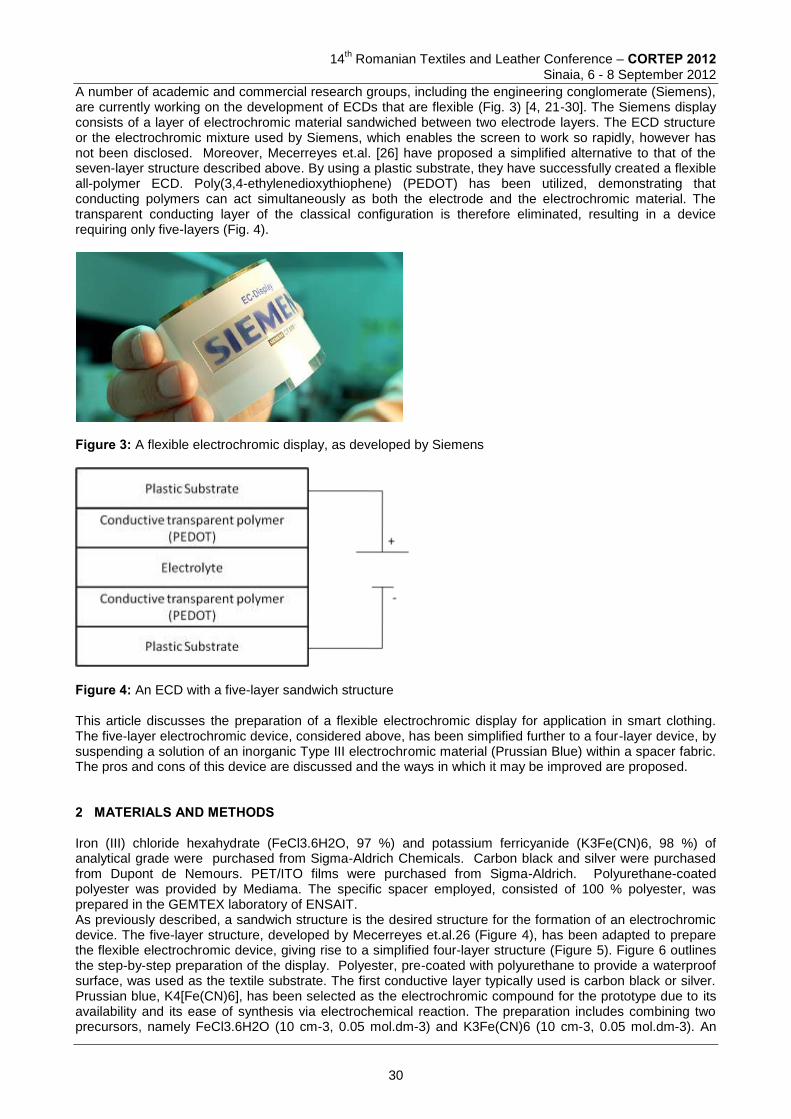
However, the products listed above are rigid in their structure due to glass commonly being applied as the base substrate [12,14-17]. An opportunity therefore exists to alternatively combine the desired spectrochemical properties of electrochromic materials with a flexible textile substrate, in order to achieve a display that is flexible. This would give rise to a technology that could be applied to a suite of products that would have the ability to change its pattern or print. Not only could communicative clothing be created, but also communicative flags and interior furnishings, including upholstery and drapery. Many materials express these chromic properties, and can be assigned to one of three general categories [18, 19]. Type I materials are soluble in a given electrolyte solution in both reduced and oxidised states, e.g. 1,1’-di-methyl-4,4’-bipyridilium (‘methyl viologen’). Type II materials are soluble in one redox state, but form a solid film on the surface of an electrode following electron transfer, e.g. 1,1'diheptyl-4,4'bipyridilium dication in water. Type III materials, in both the reduced and oxidised states, are solids. All-solid systems are the most common for electrochromic displays. They include all conducting polymer systems, metal oxides, Prussian blue and its analogues, and rare earth phthalocyanines. Electrochromic devices (ECDs) themselves may have one of many alternative compositions3. The traditional structure of an ECD, however, is that of a seven-layer electrochemical cell with the rigid sandwich structure (Fig. 2). An electrochromic material is coupled to both a suitable solid or liquid electrolyte (ionic conductor) and an ionic storage layer. These three layers are sandwiched between two conductors (electrodes), with at least one of these, also requiring transparency. These are then sandwiched between two substrates, typically glass, completing the device. Colour changes observed in ECDs occur by charging and discharging the electrochemical cell with an applied potential of a few volts (typically 1 - 5 V) [20]. After the resulting current has decayed, the colour change will be effected with the simultaneous redox reaction. The new redox state (and colour) remains due to the so-called “memory” effect, without the requirement of further electrical input [3].
(a) (b) Figure 1: Thermochromic textiles that change colour with temperature (a) fashionable flu-masks and (b) blossoming wallpaper
Figure 2: An ECD with a seven-layer sandwich structure
29
14
th Romanian Textiles and Leather Conference – CORTEP 2012
Sinaia, 6 - 8 September 2012
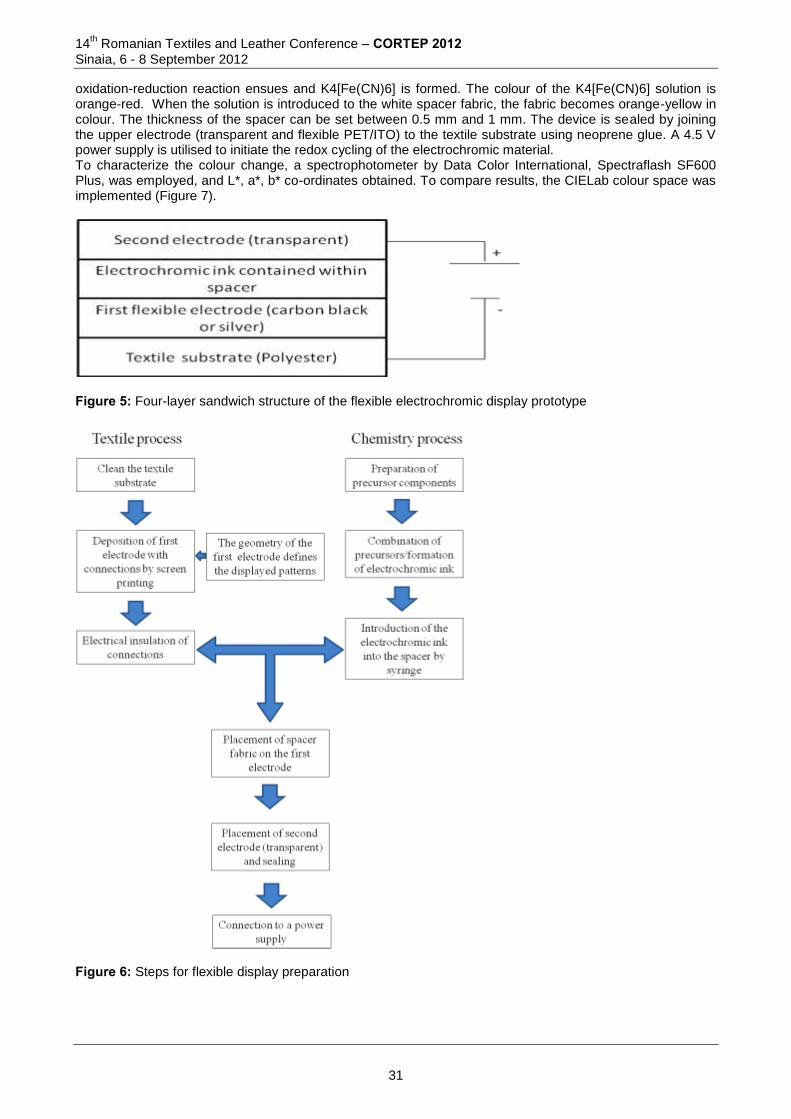
A number of academic and commercial research groups, including the engineering conglomerate (Siemens), are currently working on the development of ECDs that are flexible (Fig. 3) [4, 21-30]. The Siemens display consists of a layer of electrochromic material sandwiched between two electrode layers. The ECD structure or the electrochromic mixture used by Siemens, which enables the screen to work so rapidly, however has not been disclosed. Moreover, Mecerreyes et.al. [26] have proposed a simplified alternative to that of the seven-layer structure described above. By using a plastic substrate, they have successfully created a flexible all-polymer ECD. Poly(3,4-ethylenedioxythiophene) (PEDOT) has been utilized, demonstrating that conducting polymers can act simultaneously as both the electrode and the electrochromic material. The transparent conducting layer of the classical configuration is therefore eliminated, resulting in a device requiring only five-layers (Fig. 4).
Figure 3: A flexible electrochromic display, as developed by Siemens
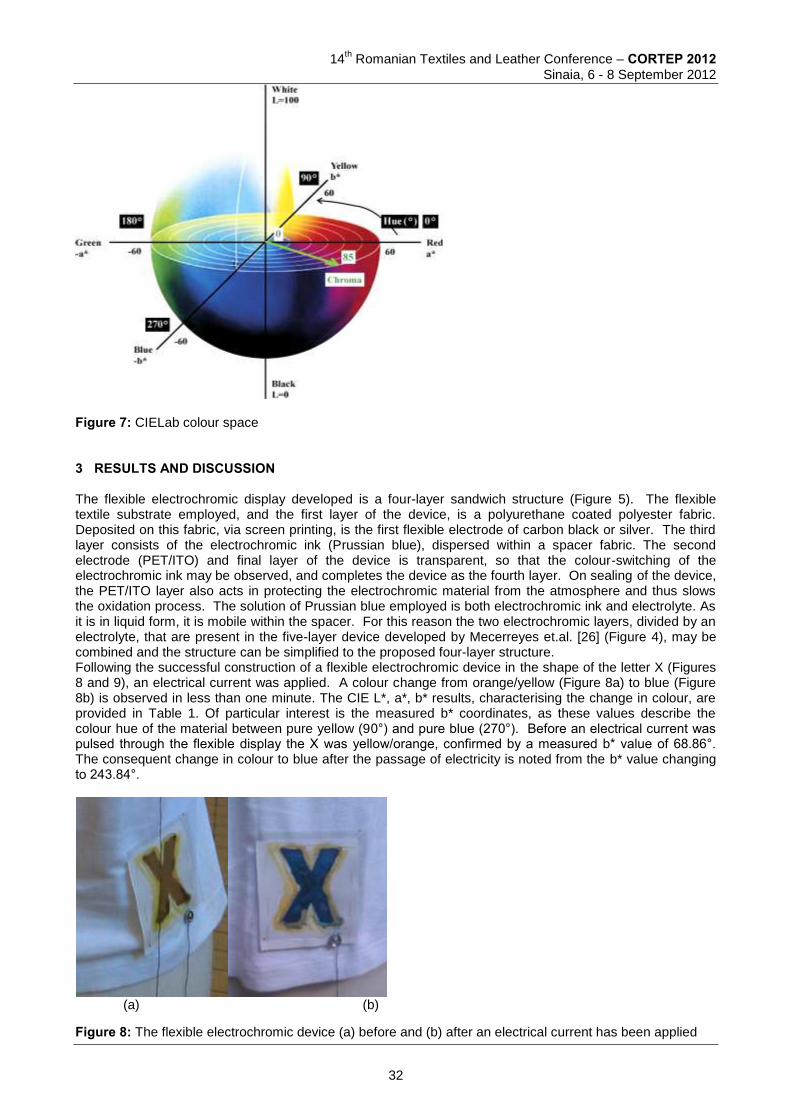
Figure 4: An ECD with a five-layer sandwich structure This article discusses the preparation of a flexible electrochromic display for application in smart clothing. The five-layer electrochromic device, considered above, has been simplified further to a four-layer device, by suspending a solution of an inorganic Type III electrochromic material (Prussian Blue) within a spacer fabric. The pros and cons of this device are discussed and the ways in which it may be improved are proposed. 2 MATERIALS AND METHODS Iron (III) chloride hexahydrate (FeCl3.6H2O, 97 %) and potassium ferricyanide (K3Fe(CN)6, 98 %) of analytical grade were purchased from Sigma-Aldrich Chemicals. Carbon black and silver were purchased from Dupont de Nemours. PET/ITO films were purchased from Sigma-Aldrich. Polyurethane-coated polyester was provided by Mediama. The specific spacer employed, consisted of 100 % polyester, was prepared in the GEMTEX laboratory of ENSAIT. As previously described, a sandwich structure is the desired structure for the formation of an electrochromic device. The five-layer structure, developed by Mecerreyes et.al.26 (Figure 4), has been adapted to prepare the flexible electrochromic device, giving rise to a simplified four-layer structure (Figure 5). Figure 6 outlines the step-by-step preparation of the display. Polyester, pre-coated with polyurethane to provide a waterproof surface, was used as the textile substrate. The first conductive layer typically used is carbon black or silver. Prussian blue, K4[Fe(CN)6], has been selected as the electrochromic compound for the prototype due to its availability and its ease of synthesis via electrochemical reaction. The preparation includes combining two precursors, namely FeCl3.6H2O (10 cm-3, 0.05 mol.dm-3) and K3Fe(CN)6 (10 cm-3, 0.05 mol.dm-3). An
30
14th Romanian Textiles and Leather Conference – CORTEP 2012
Sinaia, 6 - 8 September 2012
oxidation-reduction reaction ensues and K4[Fe(CN)6] is formed. The colour of the K4[Fe(CN)6] solution is orange-red. When the solution is introduced to the white spacer fabric, the fabric becomes orange-yellow in colour. The thickness of the spacer can be set between 0.5 mm and 1 mm. The device is sealed by joining the upper electrode (transparent and flexible PET/ITO) to the textile substrate using neoprene glue. A 4.5 V power supply is utilised to initiate the redox cycling of the electrochromic material. To characterize the colour change, a spectrophotometer by Data Color International, Spectraflash SF600 Plus, was employed, and L*, a*, b* co-ordinates obtained. To compare results, the CIELab colour space was implemented (Figure 7).
Figure 5: Four-layer sandwich structure of the flexible electrochromic display prototype
Figure 6: Steps for flexible display preparation
31
14
th Romanian Textiles and Leather Conference – CORTEP 2012
Sinaia, 6 - 8 September 2012
Figure 7: CIELab colour space 3 RESULTS AND DISCUSSION The flexible electrochromic display developed is a four-layer sandwich structure (Figure 5). The flexible textile substrate employed, and the first layer of the device, is a polyurethane coated polyester fabric. Deposited on this fabric, via screen printing, is the first flexible electrode of carbon black or silver. The third layer consists of the electrochromic ink (Prussian blue), dispersed within a spacer fabric. The second electrode (PET/ITO) and final layer of the device is transparent, so that the colour-switching of the electrochromic ink may be observed, and completes the device as the fourth layer. On sealing of the device, the PET/ITO layer also acts in protecting the electrochromic material from the atmosphere and thus slows the oxidation process. The solution of Prussian blue employed is both electrochromic ink and electrolyte. As it is in liquid form, it is mobile within the spacer. For this reason the two electrochromic layers, divided by an electrolyte, that are present in the five-layer device developed by Mecerreyes et.al. [26] (Figure 4), may be combined and the structure can be simplified to the proposed four-layer structure. Following the successful construction of a flexible electrochromic device in the shape of the letter X (Figures 8 and 9), an electrical current was applied. A colour change from orange/yellow (Figure 8a) to blue (Figure 8b) is observed in less than one minute. The CIE L*, a*, b* results, characterising the change in colour, are provided in Table 1. Of particular interest is the measured b* coordinates, as these values describe the colour hue of the material between pure yellow (90°) and pure blue (270°). Before an electrical current was pulsed through the flexible display the X was yellow/orange, confirmed by a measured b* value of 68.86°. The consequent change in colour to blue after the passage of electricity is noted from the b* value changing to 243.84°.
(a) (b)
Figure 8: The flexible electrochromic device (a) before and (b) after an electrical current has been applied
32
14th Romanian Textiles and Leather Conference – CORTEP 2012
Sinaia, 6 - 8 September 2012
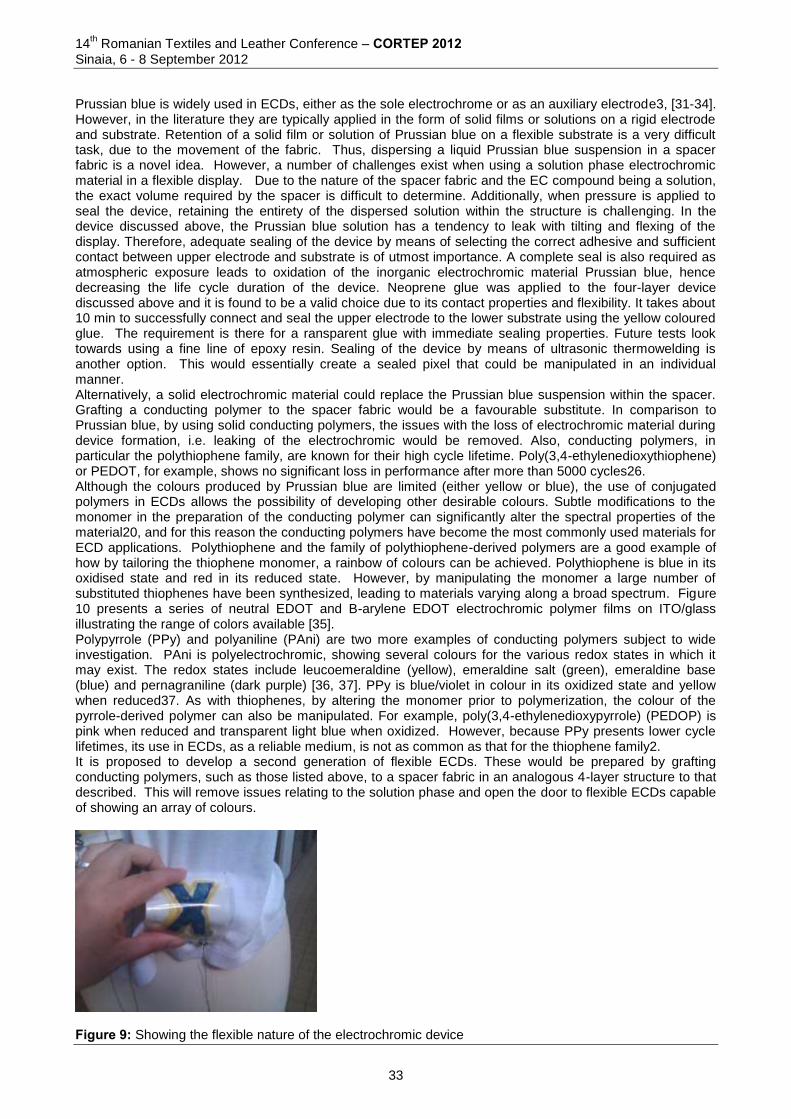
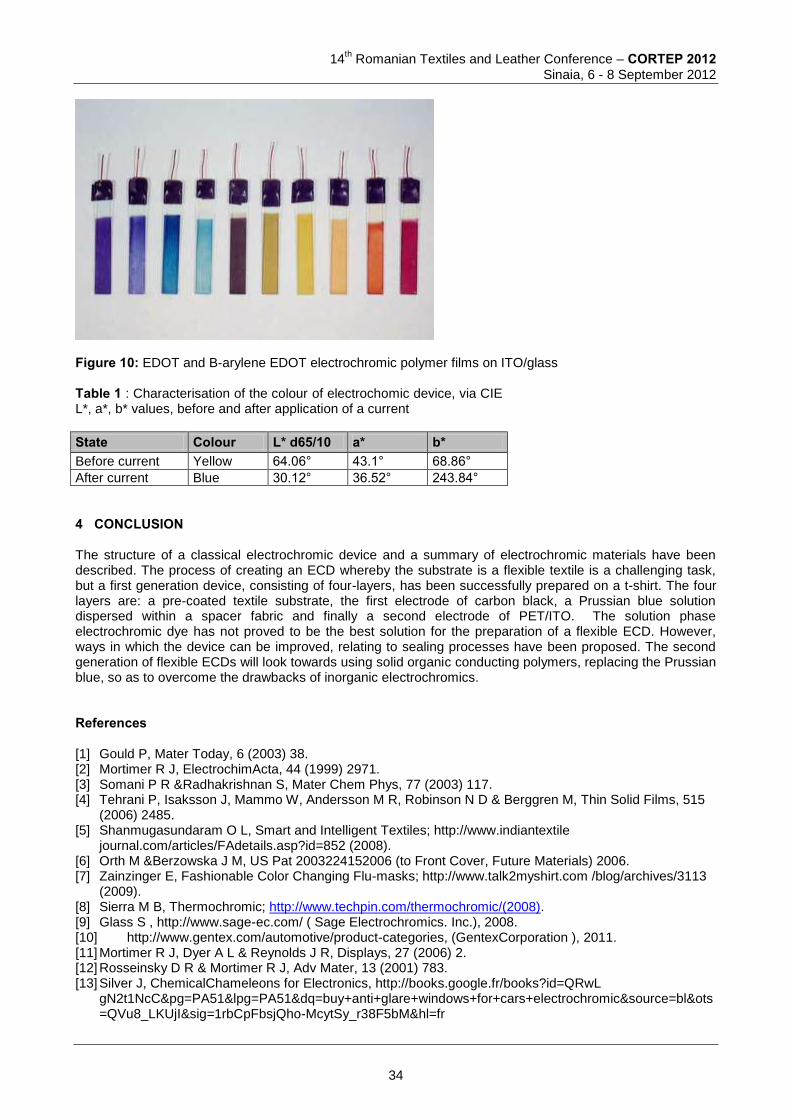
Prussian blue is widely used in ECDs, either as the sole electrochrome or as an auxiliary electrode3, [31-34]. However, in the literature they are typically applied in the form of solid films or solutions on a rigid electrode and substrate. Retention of a solid film or solution of Prussian blue on a flexible substrate is a very difficult task, due to the movement of the fabric. Thus, dispersing a liquid Prussian blue suspension in a spacer fabric is a novel idea. However, a number of challenges exist when using a solution phase electrochromic material in a flexible display. Due to the nature of the spacer fabric and the EC compound being a solution, the exact volume required by the spacer is difficult to determine. Additionally, when pressure is applied to seal the device, retaining the entirety of the dispersed solution within the structure is challenging. In the device discussed above, the Prussian blue solution has a tendency to leak with tilting and flexing of the display. Therefore, adequate sealing of the device by means of selecting the correct adhesive and sufficient contact between upper electrode and substrate is of utmost importance. A complete seal is also required as atmospheric exposure leads to oxidation of the inorganic electrochromic material Prussian blue, hence decreasing the life cycle duration of the device. Neoprene glue was applied to the four-layer device discussed above and it is found to be a valid choice due to its contact properties and flexibility. It takes about 10 min to successfully connect and seal the upper electrode to the lower substrate using the yellow coloured glue. The requirement is there for a ransparent glue with immediate sealing properties. Future tests look towards using a fine line of epoxy resin. Sealing of the device by means of ultrasonic thermowelding is another option. This would essentially create a sealed pixel that could be manipulated in an individual manner. Alternatively, a solid electrochromic material could replace the Prussian blue suspension within the spacer. Grafting a conducting polymer to the spacer fabric would be a favourable substitute. In comparison to Prussian blue, by using solid conducting polymers, the issues with the loss of electrochromic material during device formation, i.e. leaking of the electrochromic would be removed. Also, conducting polymers, in particular the polythiophene family, are known for their high cycle lifetime. Poly(3,4-ethylenedioxythiophene) or PEDOT, for example, shows no significant loss in performance after more than 5000 cycles26. Although the colours produced by Prussian blue are limited (either yellow or blue), the use of conjugated polymers in ECDs allows the possibility of developing other desirable colours. Subtle modifications to the monomer in the preparation of the conducting polymer can significantly alter the spectral properties of the material20, and for this reason the conducting polymers have become the most commonly used materials for ECD applications. Polythiophene and the family of polythiophene-derived polymers are a good example of how by tailoring the thiophene monomer, a rainbow of colours can be achieved. Polythiophene is blue in its oxidised state and red in its reduced state. However, by manipulating the monomer a large number of substituted thiophenes have been synthesized, leading to materials varying along a broad spectrum. Figure 10 presents a series of neutral EDOT and B-arylene EDOT electrochromic polymer films on ITO/glass illustrating the range of colors available [35]. Polypyrrole (PPy) and polyaniline (PAni) are two more examples of conducting polymers subject to wide investigation. PAni is polyelectrochromic, showing several colours for the various redox states in which it may exist. The redox states include leucoemeraldine (yellow), emeraldine salt (green), emeraldine base (blue) and pernagraniline (dark purple) [36, 37]. PPy is blue/violet in colour in its oxidized state and yellow when reduced37. As with thiophenes, by altering the monomer prior to polymerization, the colour of the pyrrole-derived polymer can also be manipulated. For example, poly(3,4-ethylenedioxypyrrole) (PEDOP) is pink when reduced and transparent light blue when oxidized. However, because PPy presents lower cycle lifetimes, its use in ECDs, as a reliable medium, is not as common as that for the thiophene family2. It is proposed to develop a second generation of flexible ECDs. These would be prepared by grafting conducting polymers, such as those listed above, to a spacer fabric in an analogous 4-layer structure to that described. This will remove issues relating to the solution phase and open the door to flexible ECDs capable of showing an array of colours.
Figure 9: Showing the flexible nature of the electrochromic device
33
14
th Romanian Textiles and Leather Conference – CORTEP 2012
Sinaia, 6 - 8 September 2012
Figure 10: EDOT and B-arylene EDOT electrochromic polymer films on ITO/glass Table 1 : Characterisation of the colour of electrochomic device, via CIE L*, a*, b* values, before and after application of a current
State Colour L* d65/10 a* b* Before current Yellow 64.06° 43.1° 68.86°
After current Blue 30.12° 36.52° 243.84°
4 CONCLUSION The structure of a classical electrochromic device and a summary of electrochromic materials have been described. The process of creating an ECD whereby the substrate is a flexible textile is a challenging task, but a first generation device, consisting of four-layers, has been successfully prepared on a t-shirt. The four layers are: a pre-coated textile substrate, the first electrode of carbon black, a Prussian blue solution dispersed within a spacer fabric and finally a second electrode of PET/ITO. The solution phase electrochromic dye has not proved to be the best solution for the preparation of a flexible ECD. However, ways in which the device can be improved, relating to sealing processes have been proposed. The second generation of flexible ECDs will look towards using solid organic conducting polymers, replacing the Prussian blue, so as to overcome the drawbacks of inorganic electrochromics. References [1] Gould P, Mater Today, 6 (2003) 38. [2] Mortimer R J, ElectrochimActa, 44 (1999) 2971. [3] Somani P R &Radhakrishnan S, Mater Chem Phys, 77 (2003) 117. [4] Tehrani P, Isaksson J, Mammo W, Andersson M R, Robinson N D & Berggren M, Thin Solid Films, 515
(2006) 2485. [5] Shanmugasundaram O L, Smart and Intelligent Textiles; http://www.indiantextile
journal.com/articles/FAdetails.asp?id=852 (2008). [6] Orth M &Berzowska J M, US Pat 2003224152006 (to Front Cover, Future Materials) 2006. [7] Zainzinger E, Fashionable Color Changing Flu-masks; http://www.talk2myshirt.com /blog/archives/3113
(2009). [8] Sierra M B, Thermochromic; http://www.techpin.com/thermochromic/(2008). [9] Glass S , http://www.sage-ec.com/ ( Sage Electrochromics. Inc.), 2008. [10] http://www.gentex.com/automotive/product-categories, (GentexCorporation ), 2011. [11] Mortimer R J, Dyer A L & Reynolds J R, Displays, 27 (2006) 2. [12] Rosseinsky D R & Mortimer R J, Adv Mater, 13 (2001) 783. [13] Silver J, ChemicalChameleons for Electronics, http://books.google.fr/books?id=QRwL
gN2t1NcC&pg=PA51&lpg=PA51&dq=buy+anti+glare+windows+for+cars+electrochromic&source=bl&ots=QVu8_LKUjI&sig=1rbCpFbsjQho-McytSy_r38F5bM&hl=fr
34
14th Romanian Textiles and Leather Conference – CORTEP 2012
Sinaia, 6 - 8 September 2012
&ei=WRrBTabVN4ms8gP5lqDPBQ&sa=X&oi=book_result&ct=result&resnum=3&sqi=2&ved=0CC0Q6AEwAg#v=onepage&q&f=false (1989).
[14] Is O D, Koyuncu F B, Koyuncu S &Ozdemir E, Polymer, 51 (2010) 1663. [15] Bange K &Gambke T, Adv Mater, 2 (1990) 10. [16] Gomes M A B, Gonçalves D, Pereira de Souza E C, Valla B, Aegerter M A &Bulhões L O S,
ElectrochimActa, 37 (1992) 1653. [17] Granqvist C G, Azens A, Hjelm A, Kullman L, Niklasson G A, Rönnow D, StrømmeMattsson M, Veszelei
M &Vaivars G, Sol Energy, 63 (1998) 199. [18] Monk P M S, Mortimer R J &Rosseinsky D R, Electrochromism: Fundamentals and Applications (VCH,
Weinheim), 1995. [19] Jasinski R J, J ElectrochemSoc, 124 (1977) 637. [20] Carpi F & De Rossi D, Opt Laser Technol, 38 (2006) 292. [21] Andersson P, Forchheimer R, Tehrani P & Berggren M, AdvFunct Mater, 17 (2007) 3074. [22] Azens A, Avendaño E, Backholm J, Berggren L, Gustavsson G, Karmhag R, Niklasson G A, Roos A
&Granqvist C G, Mater SciEng B, 119 (2005) 214. [23] Coleman J P, Lynch A T, Madhukar P &Wagenknecht J H, Sol Energy Mat Sol C, 56 (1999) 395. [24] Liu J & Coleman J P, Mater SciEng A, 286 (2000) 144. [25] Ma C, Taya M &Xu C, ElectrochimActa, 54 (2008) 598. [26] Mecerreyes D, Marcilla R, Ochoteco E, Grande H, Pomposo J A, Vergaz R & Sánchez Pena J M,
ElectrochimActa, 49 (2004) 3555. [27] Pagès H, Topart P &Lemordant D, ElectrochimActa, 46 (2001) 2137. [28] White C M, Gillaspie D T, Whitney E, Lee S-H, Dillon A C, Thin Solid Films, 517 (2009) 3596. [29] Knight W, Most Flexible Electronic Paper Yet Revealed; http://www.newscientist.com /article/dn4602 (
2004). [30] Tobjörk D &Österbacka R, Adv Mater, 23 (2011) 1935. [31] Chen L-C &Ho K-C, ElectrochimActa, 46 (2001) 2151. [32] Chen L-C & Ho K-C, Sensor Actuator B: Chem, 130 (2008) 418. [33] Cheng K-C, Chen F-R & Kai J-J, ElectrochimActa, 52 (2007) 3330. [34] Somani P &Radhakrishnan S, ChemPhysLett, 292 (1998) 218. [35] Sapp S A, Sotzing G A & Reynolds J R, Chem Mater, 10 (1998) 2101. [36] Dhawan S K, Ram M K, Malhotra B D & Chandra S, Synthetic Met, 75 (1995) 119. [37] Hyodo K, ElectrochimActa, 39 (1994) 265. Corresponding author:
Vladan KONCAR ENSAIT/GEMTEX F-59100 Roubaix, France, phone: +33660175261, fax: +33320248406 e-mail:[email protected]
Co-authors: Xuyuan TAO ENSAIT/GEMTEX F-59100 Roubaix, France, e-mail: [email protected] Cédric COCHRANE ENSAIT/GEMTEX F-59100 Roubaix, France, e-mail: [email protected] Ludivine MEUNIER ENSAIT/GEMTEX F-59100 Roubaix, France, e-mail: [email protected] Fern KELLY ENSAIT/GEMTEX F-59100 Roubaix, France, e-mail: [email protected]
35
14
th Romanian Textiles and Leather Conference – CORTEP 2012
Sinaia, 6 - 8 September 2012
FLAME RETARDANT COTTON: PROGRESS AND CURRECT STATUS
Charles Q. YANG Department of Textiles, Merchandising and Interior
The University of Georgia, Athens U.S.A. Abstract: The fire hazards of cotton clothing represent genuine risk to consumers. 1950-1980 was the golden age of flame retardant research. Development of flame retardants for cotton as well as for other textile fibers was the result of the recognition of the importance of such technology to human safety. Most of the major semi-durable and durable flame retardant chemicals used today were developed during that period. Examples of the successful flame retardants for cotton developed during that period and are still being used today include ammonium polyphosphates (APP), tetra(hydroxymethyl)phosphonium salts (THPX), N,N'-dimethylol dialkyl phosphonopropionamids (MDPA), and the combination of halogen-containing organic compounds and antimony oxide for back-coating. In the next twenty years (1980-2000), no novel flame retardants were developed for commercial applications whereas the existing flame retardants were continuously being improved for better performance. The efforts in flame retardants research also focused to address the environmental and toxicity issues associated with the flame retardants developed in earlier years. Since 2000, more attempts have been made to develop higher performance, lower cost and environmentally sustainable alternative flame retardants. It is apparent that the major durable flame retardants for cotton have various deficiency and could not meet all the expectation for their end uses, such as limited loss of fabric mechanical strength and abrasion resistance, retention of fabric soft hand and other aesthetic properties, formaldehyde-free, and compatibility with the traditional pad-dry-cure facility. The environmental impact of bromine-containing flame retardants, which were mostly used as back-coating on fabrics of cotton and other fibers, were assessed aggressively during this period. Polyester-cotton blends were very important fabrics for both consumer and industrial uses, but no practical flame retardant treatment has been developed despite enormous efforts made for several decades. The needs for flame retardant finishing technology for polyester-cotton blends were undoubtedly recognized. This paper overviews the historical development of flame retardants for cotton and flame retardant finishing of cotton textiles, but its emphasis is on the current status of flame retardant cotton. The challenges facing the industry lay in the following areas: (1) continuing to improve the performance and to reduce the negative environmental impact of those existing flame retardants; and (2) developing new more environmental-friendly alternative condensed phase flame retardants, finding replacement gas phase flame retardants for halogenated flame retardants for back-coating, and developing the flame retardant technology for cotton blends. Keywords: Flame retardant cotton, flame retardant finishing of cotton, cotton, cotton blends, back-coating, textile finishing. 1 INTRODUCTION Cotton was among the most widely used textile fiber in history. In spite of rapid development and growth of synthetic fibers since the 2nd world war, cotton is still the most commonly used and most important textile fiber today. Cotton is also one of the most flammable textile fibers. The fire hazards of cotton clothing represent genuine risk to consumers because of cotton's ease of ignition, vigorous burning and frequent afterglow. A study carried out in Norway, Spain and the United Kingdom for European Commission indicates
significant fire risk by clothing textiles based on results of manikin tests and household survey [1]. The study results showed that 3.2% of households reported hazardous fires incidents involving clothing in Spain. It was reported that at least 750 clothing flammability accidents occur in the UK each year, 11% of which were fatal
[2]. A more recently study in the U.S. confirmed that textiles constituted 44% of the items first ignited for 500
fatal fires happening between 1999 and 2002 [3]. The government regulations have always been the driving force for developing flame retardant finishes for
textiles. 1950-1980 was the golden age of textile flame retardant research [4]. Development of flame retardants for cotton as well as for other textile fibers was the result of the recognition of the importance of such technology to human safety. Most of the major semi-durable and durable flame retardant chemicals used today were developed during this period. Examples of the flame retardants for cotton developed during
36
14th Romanian Textiles and Leather Conference – CORTEP 2012
Sinaia, 6 - 8 September 2012
this period and still being used today include ammonium phosphate, ammonium polyphosphates (APP), tetra(hydroxymethyl)phosphnium salts (THPX), N-methylol dimethylphosphono-propionamide (MDPA), and
combination of halogen-containing organic compounds and antimony oxide for back-coating [4]. In the next twenty years (1980-2000), no novel flame retardants were developed for commercial applications whereas the existing flame retardants were continuously being improved for better performance. The efforts in flame retardant research were also focused on addressing the environment- and toxicity-related issues
associated with the flame retardants developed in earlier years [4]. Since 2000, more attempts have been made to develop higher performance, lower cost and environmentally sustainable alternative flame
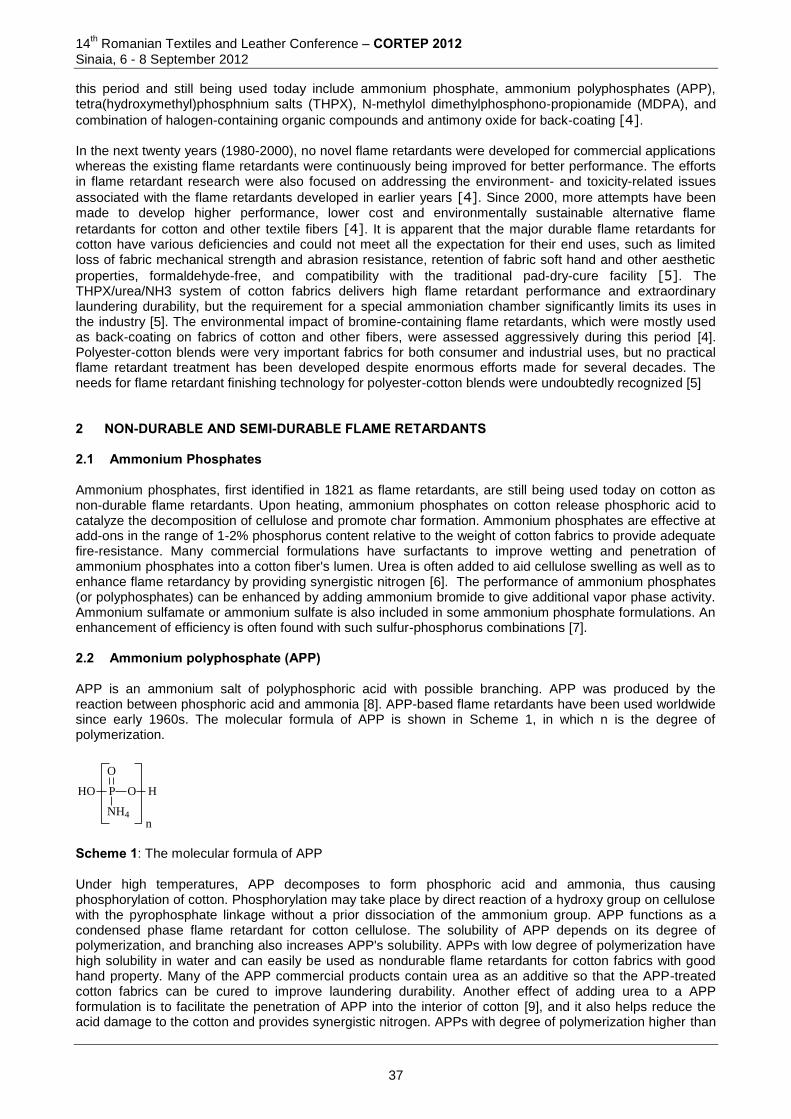
retardants for cotton and other textile fibers [4]. It is apparent that the major durable flame retardants for cotton have various deficiencies and could not meet all the expectation for their end uses, such as limited loss of fabric mechanical strength and abrasion resistance, retention of fabric soft hand and other aesthetic
properties, formaldehyde-free, and compatibility with the traditional pad-dry-cure facility [5]. The THPX/urea/NH3 system of cotton fabrics delivers high flame retardant performance and extraordinary laundering durability, but the requirement for a special ammoniation chamber significantly limits its uses in the industry [5]. The environmental impact of bromine-containing flame retardants, which were mostly used as back-coating on fabrics of cotton and other fibers, were assessed aggressively during this period [4]. Polyester-cotton blends were very important fabrics for both consumer and industrial uses, but no practical flame retardant treatment has been developed despite enormous efforts made for several decades. The needs for flame retardant finishing technology for polyester-cotton blends were undoubtedly recognized [5] 2 NON-DURABLE AND SEMI-DURABLE FLAME RETARDANTS 2.1 Ammonium Phosphates Ammonium phosphates, first identified in 1821 as flame retardants, are still being used today on cotton as non-durable flame retardants. Upon heating, ammonium phosphates on cotton release phosphoric acid to catalyze the decomposition of cellulose and promote char formation. Ammonium phosphates are effective at add-ons in the range of 1-2% phosphorus content relative to the weight of cotton fabrics to provide adequate fire-resistance. Many commercial formulations have surfactants to improve wetting and penetration of ammonium phosphates into a cotton fiber's lumen. Urea is often added to aid cellulose swelling as well as to enhance flame retardancy by providing synergistic nitrogen [6]. The performance of ammonium phosphates (or polyphosphates) can be enhanced by adding ammonium bromide to give additional vapor phase activity. Ammonium sulfamate or ammonium sulfate is also included in some ammonium phosphate formulations. An enhancement of efficiency is often found with such sulfur-phosphorus combinations [7]. 2.2 Ammonium polyphosphate (APP) APP is an ammonium salt of polyphosphoric acid with possible branching. APP was produced by the reaction between phosphoric acid and ammonia [8]. APP-based flame retardants have been used worldwide since early 1960s. The molecular formula of APP is shown in Scheme 1, in which n is the degree of polymerization.
P OHO
O
NH4
H
n Scheme 1: The molecular formula of APP Under high temperatures, APP decomposes to form phosphoric acid and ammonia, thus causing phosphorylation of cotton. Phosphorylation may take place by direct reaction of a hydroxy group on cellulose with the pyrophosphate linkage without a prior dissociation of the ammonium group. APP functions as a condensed phase flame retardant for cotton cellulose. The solubility of APP depends on its degree of polymerization, and branching also increases APP's solubility. APPs with low degree of polymerization have high solubility in water and can easily be used as nondurable flame retardants for cotton fabrics with good hand property. Many of the APP commercial products contain urea as an additive so that the APP-treated cotton fabrics can be cured to improve laundering durability. Another effect of adding urea to a APP formulation is to facilitate the penetration of APP into the interior of cotton [9], and it also helps reduce the acid damage to the cotton and provides synergistic nitrogen. APPs with degree of polymerization higher than
37
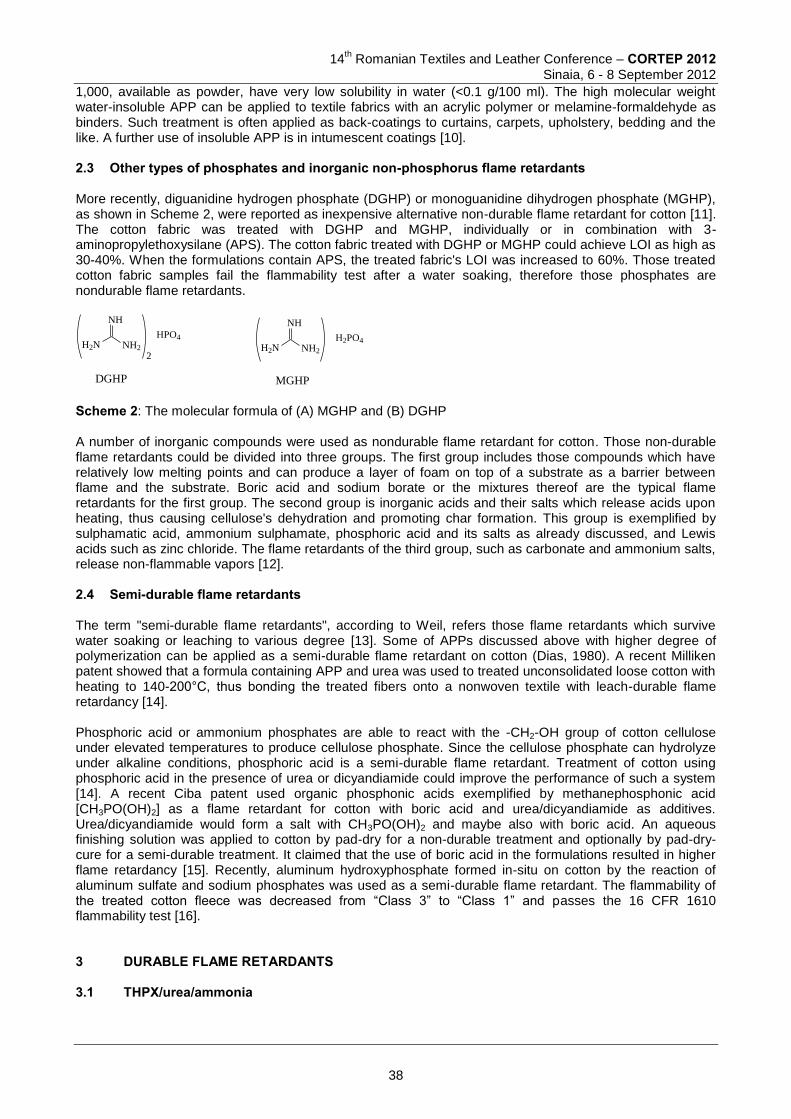
14
th Romanian Textiles and Leather Conference – CORTEP 2012
Sinaia, 6 - 8 September 2012
1,000, available as powder, have very low solubility in water (<0.1 g/100 ml). The high molecular weight water-insoluble APP can be applied to textile fabrics with an acrylic polymer or melamine-formaldehyde as binders. Such treatment is often applied as back-coatings to curtains, carpets, upholstery, bedding and the like. A further use of insoluble APP is in intumescent coatings [10]. 2.3 Other types of phosphates and inorganic non-phosphorus flame retardants More recently, diguanidine hydrogen phosphate (DGHP) or monoguanidine dihydrogen phosphate (MGHP), as shown in Scheme 2, were reported as inexpensive alternative non-durable flame retardant for cotton [11]. The cotton fabric was treated with DGHP and MGHP, individually or in combination with 3-aminopropylethoxysilane (APS). The cotton fabric treated with DGHP or MGHP could achieve LOI as high as 30-40%. When the formulations contain APS, the treated fabric's LOI was increased to 60%. Those treated cotton fabric samples fail the flammability test after a water soaking, therefore those phosphates are nondurable flame retardants.
NH
H2N NH2
2
HPO4
NH
H2N NH2
H2PO4
DGHP MGHP Scheme 2: The molecular formula of (A) MGHP and (B) DGHP A number of inorganic compounds were used as nondurable flame retardant for cotton. Those non-durable flame retardants could be divided into three groups. The first group includes those compounds which have relatively low melting points and can produce a layer of foam on top of a substrate as a barrier between flame and the substrate. Boric acid and sodium borate or the mixtures thereof are the typical flame retardants for the first group. The second group is inorganic acids and their salts which release acids upon heating, thus causing cellulose's dehydration and promoting char formation. This group is exemplified by sulphamatic acid, ammonium sulphamate, phosphoric acid and its salts as already discussed, and Lewis acids such as zinc chloride. The flame retardants of the third group, such as carbonate and ammonium salts, release non-flammable vapors [12]. 2.4 Semi-durable flame retardants The term "semi-durable flame retardants", according to Weil, refers those flame retardants which survive water soaking or leaching to various degree [13]. Some of APPs discussed above with higher degree of polymerization can be applied as a semi-durable flame retardant on cotton (Dias, 1980). A recent Milliken patent showed that a formula containing APP and urea was used to treated unconsolidated loose cotton with heating to 140-200°C, thus bonding the treated fibers onto a nonwoven textile with leach-durable flame retardancy [14]. Phosphoric acid or ammonium phosphates are able to react with the -CH2-OH group of cotton cellulose under elevated temperatures to produce cellulose phosphate. Since the cellulose phosphate can hydrolyze under alkaline conditions, phosphoric acid is a semi-durable flame retardant. Treatment of cotton using phosphoric acid in the presence of urea or dicyandiamide could improve the performance of such a system [14]. A recent Ciba patent used organic phosphonic acids exemplified by methanephosphonic acid [CH3PO(OH)2] as a flame retardant for cotton with boric acid and urea/dicyandiamide as additives. Urea/dicyandiamide would form a salt with CH3PO(OH)2 and maybe also with boric acid. An aqueous finishing solution was applied to cotton by pad-dry for a non-durable treatment and optionally by pad-dry-cure for a semi-durable treatment. It claimed that the use of boric acid in the formulations resulted in higher flame retardancy [15]. Recently, aluminum hydroxyphosphate formed in-situ on cotton by the reaction of aluminum sulfate and sodium phosphates was used as a semi-durable flame retardant. The flammability of the treated cotton fleece was decreased from “Class 3” to “Class 1” and passes the 16 CFR 1610 flammability test [16]. 3 DURABLE FLAME RETARDANTS 3.1 THPX/urea/ammonia
38
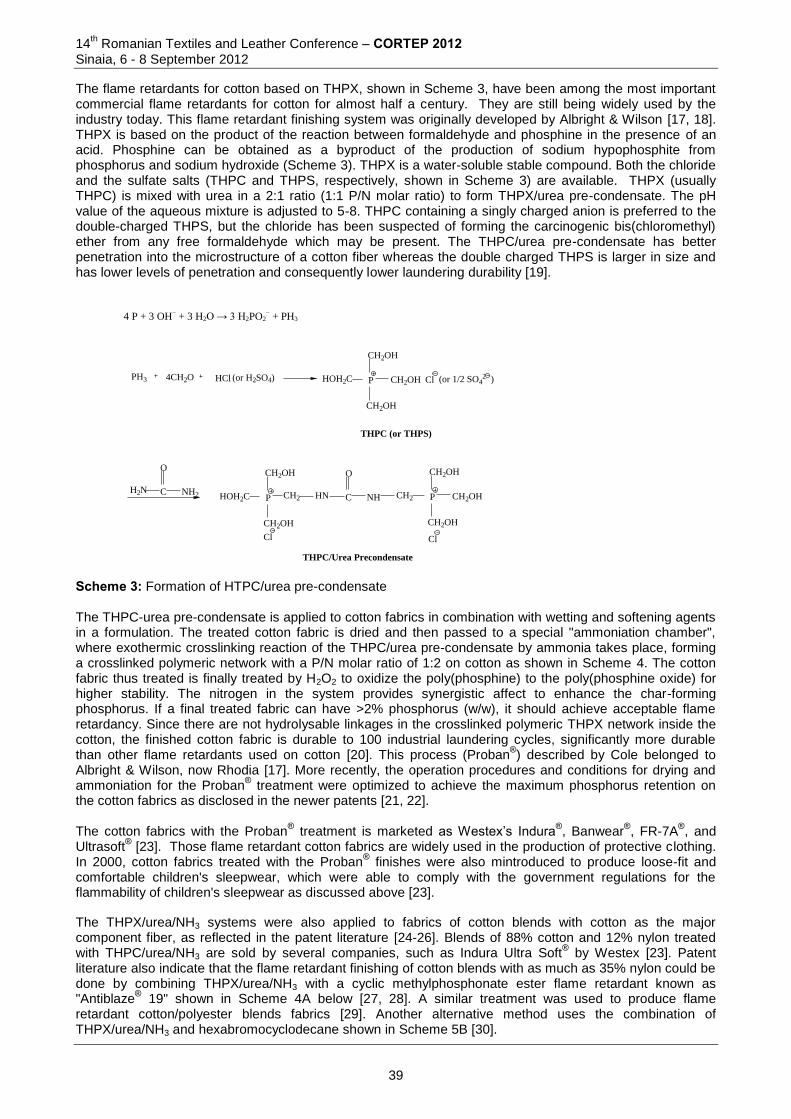
14th Romanian Textiles and Leather Conference – CORTEP 2012
Sinaia, 6 - 8 September 2012
The flame retardants for cotton based on THPX, shown in Scheme 3, have been among the most important commercial flame retardants for cotton for almost half a century. They are still being widely used by the industry today. This flame retardant finishing system was originally developed by Albright & Wilson [17, 18]. THPX is based on the product of the reaction between formaldehyde and phosphine in the presence of an acid. Phosphine can be obtained as a byproduct of the production of sodium hypophosphite from phosphorus and sodium hydroxide (Scheme 3). THPX is a water-soluble stable compound. Both the chloride and the sulfate salts (THPC and THPS, respectively, shown in Scheme 3) are available. THPX (usually THPC) is mixed with urea in a 2:1 ratio (1:1 P/N molar ratio) to form THPX/urea pre-condensate. The pH value of the aqueous mixture is adjusted to 5-8. THPC containing a singly charged anion is preferred to the double-charged THPS, but the chloride has been suspected of forming the carcinogenic bis(chloromethyl) ether from any free formaldehyde which may be present. The THPC/urea pre-condensate has better penetration into the microstructure of a cotton fiber whereas the double charged THPS is larger in size and has lower levels of penetration and consequently lower laundering durability [19].
4 P + 3 OH− + 3 H2O → 3 H2PO2− + PH3
PH3 4CH2O HCl PHOH2C
CH2OH
CH2OH
CH2OH
Cl
C NH2H2N
O
THPC (or THPS)
P CH2HOH2C
CH2OH
CH2OH
C NHHN
O
PCH2
CH2OH
CH2OH
CH2OH
ClCl
THPC/Urea Precondensate
(or H2SO4) (or 1/2 SO42 )
Scheme 3: Formation of HTPC/urea pre-condensate
The THPC-urea pre-condensate is applied to cotton fabrics in combination with wetting and softening agents in a formulation. The treated cotton fabric is dried and then passed to a special "ammoniation chamber", where exothermic crosslinking reaction of the THPC/urea pre-condensate by ammonia takes place, forming a crosslinked polymeric network with a P/N molar ratio of 1:2 on cotton as shown in Scheme 4. The cotton fabric thus treated is finally treated by H2O2 to oxidize the poly(phosphine) to the poly(phosphine oxide) for higher stability. The nitrogen in the system provides synergistic affect to enhance the char-forming phosphorus. If a final treated fabric can have >2% phosphorus (w/w), it should achieve acceptable flame retardancy. Since there are not hydrolysable linkages in the crosslinked polymeric THPX network inside the cotton, the finished cotton fabric is durable to 100 industrial laundering cycles, significantly more durable than other flame retardants used on cotton [20]. This process (Proban
®) described by Cole belonged to
Albright & Wilson, now Rhodia [17]. More recently, the operation procedures and conditions for drying and ammoniation for the Proban
® treatment were optimized to achieve the maximum phosphorus retention on
the cotton fabrics as disclosed in the newer patents [21, 22]. The cotton fabrics with the Proban
® treatment is marketed as Westex’s Indura
®, Banwear
®, FR-7A
®, and
Ultrasoft® [23]. Those flame retardant cotton fabrics are widely used in the production of protective clothing.
In 2000, cotton fabrics treated with the Proban® finishes were also mintroduced to produce loose-fit and
comfortable children's sleepwear, which were able to comply with the government regulations for the flammability of children's sleepwear as discussed above [23].
The THPX/urea/NH3 systems were also applied to fabrics of cotton blends with cotton as the major component fiber, as reflected in the patent literature [24-26]. Blends of 88% cotton and 12% nylon treated with THPC/urea/NH3 are sold by several companies, such as Indura Ultra Soft
® by Westex [23]. Patent
literature also indicate that the flame retardant finishing of cotton blends with as much as 35% nylon could be done by combining THPX/urea/NH3 with a cyclic methylphosphonate ester flame retardant known as "Antiblaze
® 19" shown in Scheme 4A below [27, 28]. A similar treatment was used to produce flame
retardant cotton/polyester blends fabrics [29]. Another alternative method uses the combination of THPX/urea/NH3 and hexabromocyclodecane shown in Scheme 5B [30].
39
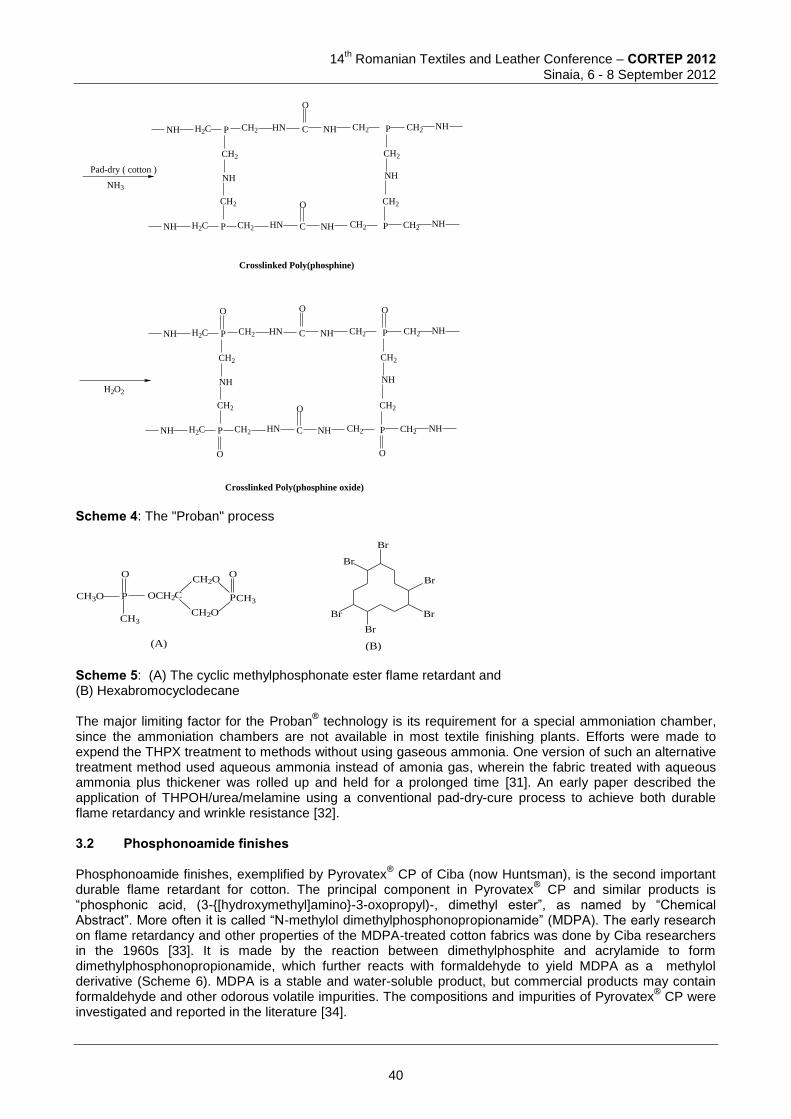
14
th Romanian Textiles and Leather Conference – CORTEP 2012
Sinaia, 6 - 8 September 2012
Crosslinked Poly(phosphine oxide)
Pad-dry ( cotton )
NH3
P CH2H2C C NHHN
O
PCH2
CH2
CH2 NHNH
CH2
NH
CH2
NH
CH2
CH2 C NHHN
O
PCH2
Crosslinked Poly(phosphine)
PH2CNH CH2 NH
H2O2
P CH2H2C C NHHN
O
PCH2
CH2
CH2 NHNH
CH2
NH
CH2
NH
CH2
CH2 C NHHN
O
PCH2PH2CNH CH2 NH
OO
OO
Scheme 4: The "Proban" process
P
O
CH3
CH3O C
CH2O
CH2O
P
O
CH3OCH2
Br
Br
Br
Br
Br
Br
(A) (B) Scheme 5: (A) The cyclic methylphosphonate ester flame retardant and (B) Hexabromocyclodecane
The major limiting factor for the Proban
® technology is its requirement for a special ammoniation chamber,
since the ammoniation chambers are not available in most textile finishing plants. Efforts were made to expend the THPX treatment to methods without using gaseous ammonia. One version of such an alternative treatment method used aqueous ammonia instead of amonia gas, wherein the fabric treated with aqueous ammonia plus thickener was rolled up and held for a prolonged time [31]. An early paper described the application of THPOH/urea/melamine using a conventional pad-dry-cure process to achieve both durable flame retardancy and wrinkle resistance [32]. 3.2 Phosphonoamide finishes Phosphonoamide finishes, exemplified by Pyrovatex
® CP of Ciba (now Huntsman), is the second important
durable flame retardant for cotton. The principal component in Pyrovatex® CP and similar products is
“phosphonic acid, (3-[hydroxymethyl]amino-3-oxopropyl)-, dimethyl ester”, as named by “Chemical Abstract”. More often it is called “N-methylol dimethylphosphonopropionamide” (MDPA). The early research on flame retardancy and other properties of the MDPA-treated cotton fabrics was done by Ciba researchers in the 1960s [33]. It is made by the reaction between dimethylphosphite and acrylamide to form dimethylphosphonopropionamide, which further reacts with formaldehyde to yield MDPA as a methylol derivative (Scheme 6). MDPA is a stable and water-soluble product, but commercial products may contain formaldehyde and other odorous volatile impurities. The compositions and impurities of Pyrovatex
® CP were
investigated and reported in the literature [34].
40
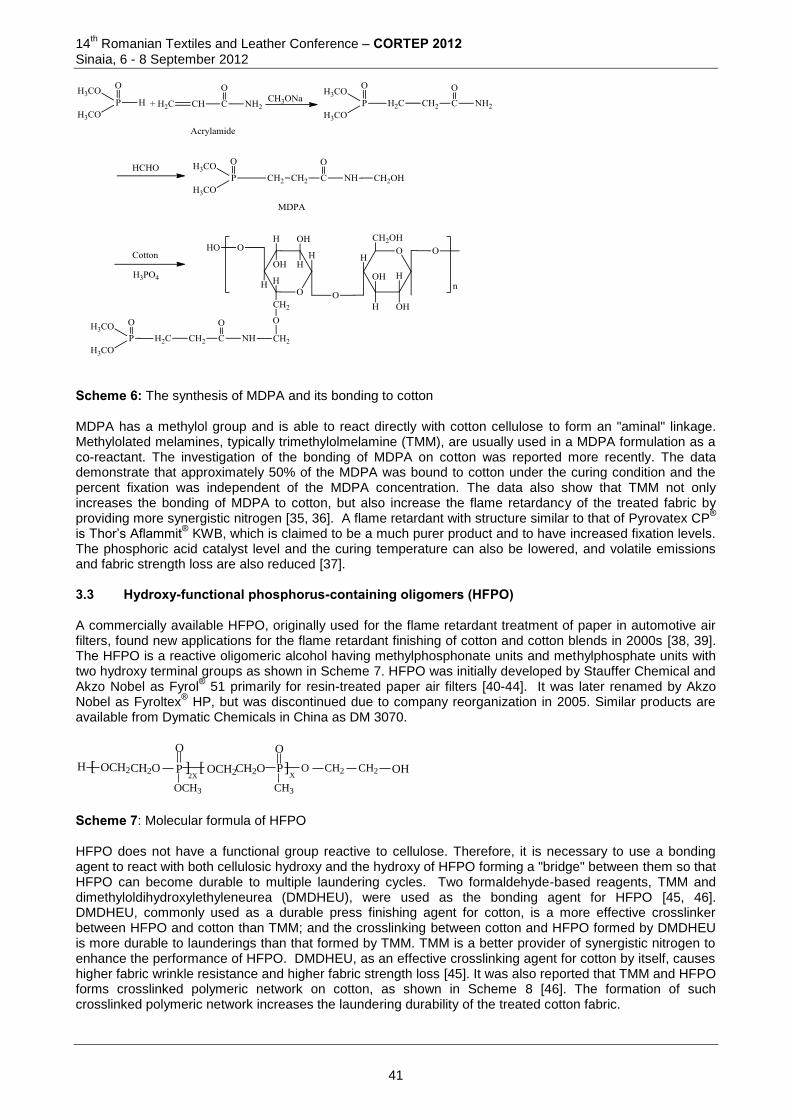
14th Romanian Textiles and Leather Conference – CORTEP 2012
Sinaia, 6 - 8 September 2012
Scheme 6: The synthesis of MDPA and its bonding to cotton MDPA has a methylol group and is able to react directly with cotton cellulose to form an "aminal" linkage. Methylolated melamines, typically trimethylolmelamine (TMM), are usually used in a MDPA formulation as a co-reactant. The investigation of the bonding of MDPA on cotton was reported more recently. The data demonstrate that approximately 50% of the MDPA was bound to cotton under the curing condition and the percent fixation was independent of the MDPA concentration. The data also show that TMM not only increases the bonding of MDPA to cotton, but also increase the flame retardancy of the treated fabric by providing more synergistic nitrogen [35, 36]. A flame retardant with structure similar to that of Pyrovatex CP
®
is Thor’s Aflammit® KWB, which is claimed to be a much purer product and to have increased fixation levels.
The phosphoric acid catalyst level and the curing temperature can also be lowered, and volatile emissions and fabric strength loss are also reduced [37]. 3.3 Hydroxy-functional phosphorus-containing oligomers (HFPO) A commercially available HFPO, originally used for the flame retardant treatment of paper in automotive air filters, found new applications for the flame retardant finishing of cotton and cotton blends in 2000s [38, 39]. The HFPO is a reactive oligomeric alcohol having methylphosphonate units and methylphosphate units with two hydroxy terminal groups as shown in Scheme 7. HFPO was initially developed by Stauffer Chemical and Akzo Nobel as Fyrol
® 51 primarily for resin-treated paper air filters [40-44]. It was later renamed by Akzo
Nobel as Fyroltex® HP, but was discontinued due to company reorganization in 2005. Similar products are
available from Dymatic Chemicals in China as DM 3070.
H [ OCH2CH2O P
O
]2X
[ CH2OOCH2 ]
O
PX
OHCH2CH2O
OCH3 CH3
Scheme 7: Molecular formula of HFPO
HFPO does not have a functional group reactive to cellulose. Therefore, it is necessary to use a bonding agent to react with both cellulosic hydroxy and the hydroxy of HFPO forming a "bridge" between them so that HFPO can become durable to multiple laundering cycles. Two formaldehyde-based reagents, TMM and dimethyloldihydroxylethyleneurea (DMDHEU), were used as the bonding agent for HFPO [45, 46]. DMDHEU, commonly used as a durable press finishing agent for cotton, is a more effective crosslinker between HFPO and cotton than TMM; and the crosslinking between cotton and HFPO formed by DMDHEU is more durable to launderings than that formed by TMM. TMM is a better provider of synergistic nitrogen to enhance the performance of HFPO. DMDHEU, as an effective crosslinking agent for cotton by itself, causes higher fabric wrinkle resistance and higher fabric strength loss [45]. It was also reported that TMM and HFPO forms crosslinked polymeric network on cotton, as shown in Scheme 8 [46]. The formation of such crosslinked polymeric network increases the laundering durability of the treated cotton fabric.
41
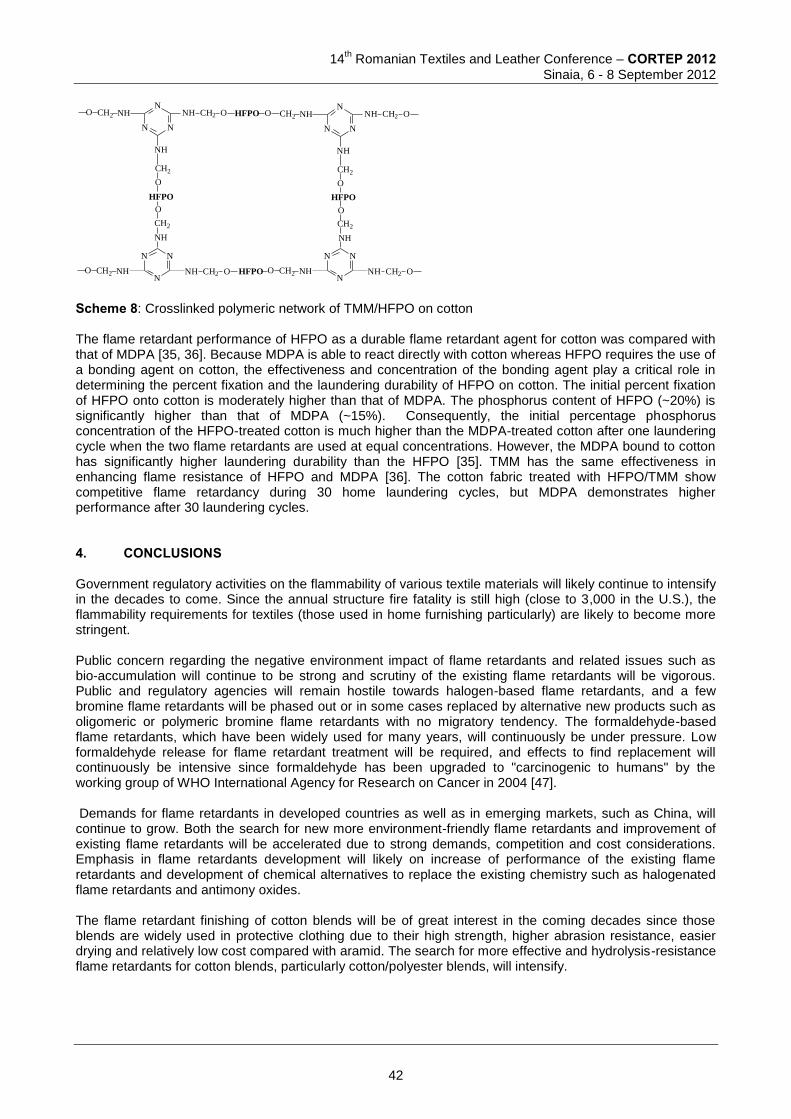
14
th Romanian Textiles and Leather Conference – CORTEP 2012
Sinaia, 6 - 8 September 2012
HFPO
HFPO
HFPOHFPO
NHNH
CH2CH2
OO
N
NN
NHCH2O
N
N
N
NH
NH CH2 ONHCH2
CH2
OO
CH2
O OCH2 NH O
N
N
N
NH
NH CH2
NH CH2 O ONH CH2O CH2 NHN
NN
Scheme 8: Crosslinked polymeric network of TMM/HFPO on cotton The flame retardant performance of HFPO as a durable flame retardant agent for cotton was compared with that of MDPA [35, 36]. Because MDPA is able to react directly with cotton whereas HFPO requires the use of a bonding agent on cotton, the effectiveness and concentration of the bonding agent play a critical role in determining the percent fixation and the laundering durability of HFPO on cotton. The initial percent fixation of HFPO onto cotton is moderately higher than that of MDPA. The phosphorus content of HFPO (~20%) is significantly higher than that of MDPA (~15%). Consequently, the initial percentage phosphorus concentration of the HFPO-treated cotton is much higher than the MDPA-treated cotton after one laundering cycle when the two flame retardants are used at equal concentrations. However, the MDPA bound to cotton has significantly higher laundering durability than the HFPO [35]. TMM has the same effectiveness in enhancing flame resistance of HFPO and MDPA [36]. The cotton fabric treated with HFPO/TMM show competitive flame retardancy during 30 home laundering cycles, but MDPA demonstrates higher performance after 30 laundering cycles. 4. CONCLUSIONS Government regulatory activities on the flammability of various textile materials will likely continue to intensify in the decades to come. Since the annual structure fire fatality is still high (close to 3,000 in the U.S.), the flammability requirements for textiles (those used in home furnishing particularly) are likely to become more stringent. Public concern regarding the negative environment impact of flame retardants and related issues such as bio-accumulation will continue to be strong and scrutiny of the existing flame retardants will be vigorous. Public and regulatory agencies will remain hostile towards halogen-based flame retardants, and a few bromine flame retardants will be phased out or in some cases replaced by alternative new products such as oligomeric or polymeric bromine flame retardants with no migratory tendency. The formaldehyde-based flame retardants, which have been widely used for many years, will continuously be under pressure. Low formaldehyde release for flame retardant treatment will be required, and effects to find replacement will continuously be intensive since formaldehyde has been upgraded to "carcinogenic to humans" by the working group of WHO International Agency for Research on Cancer in 2004 [47]. Demands for flame retardants in developed countries as well as in emerging markets, such as China, will continue to grow. Both the search for new more environment-friendly flame retardants and improvement of existing flame retardants will be accelerated due to strong demands, competition and cost considerations. Emphasis in flame retardants development will likely on increase of performance of the existing flame retardants and development of chemical alternatives to replace the existing chemistry such as halogenated flame retardants and antimony oxides. The flame retardant finishing of cotton blends will be of great interest in the coming decades since those blends are widely used in protective clothing due to their high strength, higher abrasion resistance, easier drying and relatively low cost compared with aramid. The search for more effective and hydrolysis-resistance flame retardants for cotton blends, particularly cotton/polyester blends, will intensify.
42
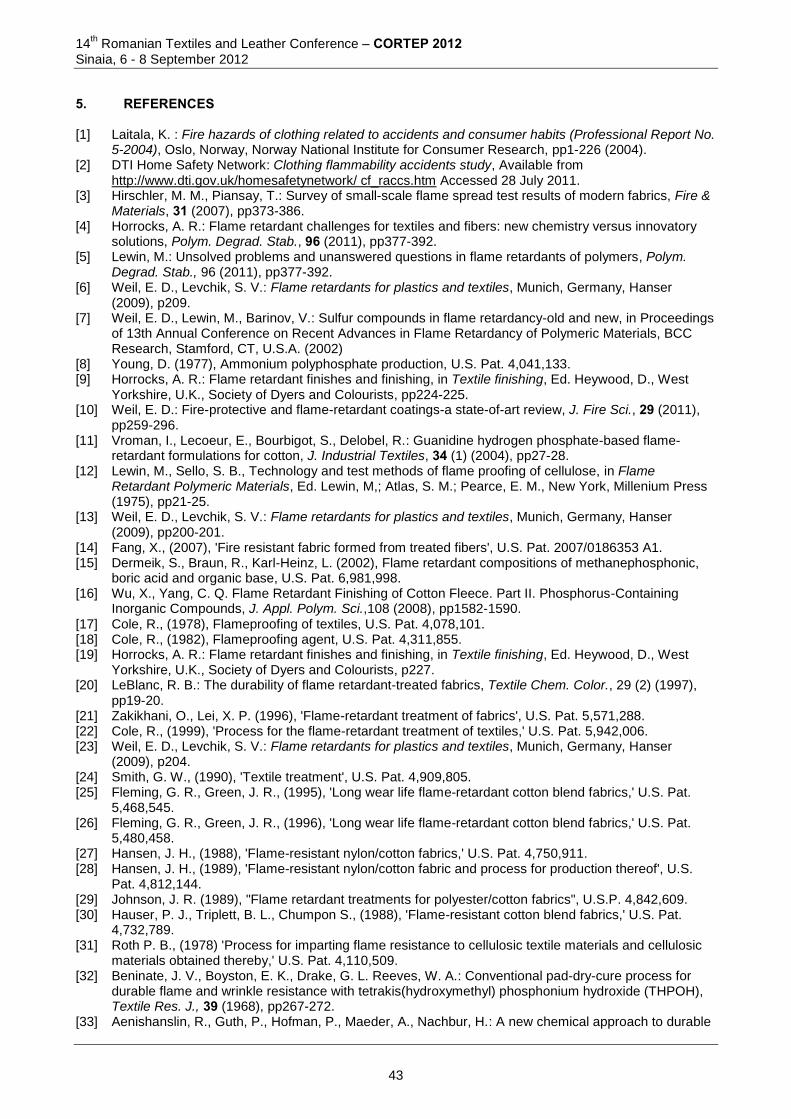
14th Romanian Textiles and Leather Conference – CORTEP 2012
Sinaia, 6 - 8 September 2012
5. REFERENCES [1] Laitala, K. : Fire hazards of clothing related to accidents and consumer habits (Professional Report No.
5-2004), Oslo, Norway, Norway National Institute for Consumer Research, pp1-226 (2004). [2] DTI Home Safety Network: Clothing flammability accidents study, Available from
http://www.dti.gov.uk/homesafetynetwork/ cf_raccs.htm Accessed 28 July 2011. [3] Hirschler, M. M., Piansay, T.: Survey of small-scale flame spread test results of modern fabrics, Fire &
Materials, 31 (2007), pp373-386. [4] Horrocks, A. R.: Flame retardant challenges for textiles and fibers: new chemistry versus innovatory
solutions, Polym. Degrad. Stab., 96 (2011), pp377-392. [5] Lewin, M.: Unsolved problems and unanswered questions in flame retardants of polymers, Polym.
Degrad. Stab., 96 (2011), pp377-392. [6] Weil, E. D., Levchik, S. V.: Flame retardants for plastics and textiles, Munich, Germany, Hanser
(2009), p209. [7] Weil, E. D., Lewin, M., Barinov, V.: Sulfur compounds in flame retardancy-old and new, in Proceedings
of 13th Annual Conference on Recent Advances in Flame Retardancy of Polymeric Materials, BCC Research, Stamford, CT, U.S.A. (2002)
[8] Young, D. (1977), Ammonium polyphosphate production, U.S. Pat. 4,041,133. [9] Horrocks, A. R.: Flame retardant finishes and finishing, in Textile finishing, Ed. Heywood, D., West
Yorkshire, U.K., Society of Dyers and Colourists, pp224-225. [10] Weil, E. D.: Fire-protective and flame-retardant coatings-a state-of-art review, J. Fire Sci., 29 (2011),
pp259-296. [11] Vroman, I., Lecoeur, E., Bourbigot, S., Delobel, R.: Guanidine hydrogen phosphate-based flame-
retardant formulations for cotton, J. Industrial Textiles, 34 (1) (2004), pp27-28. [12] Lewin, M., Sello, S. B., Technology and test methods of flame proofing of cellulose, in Flame
Retardant Polymeric Materials, Ed. Lewin, M,; Atlas, S. M.; Pearce, E. M., New York, Millenium Press (1975), pp21-25.
[13] Weil, E. D., Levchik, S. V.: Flame retardants for plastics and textiles, Munich, Germany, Hanser (2009), pp200-201.
[14] Fang, X., (2007), 'Fire resistant fabric formed from treated fibers', U.S. Pat. 2007/0186353 A1. [15] Dermeik, S., Braun, R., Karl-Heinz, L. (2002), Flame retardant compositions of methanephosphonic,
boric acid and organic base, U.S. Pat. 6,981,998. [16] Wu, X., Yang, C. Q. Flame Retardant Finishing of Cotton Fleece. Part II. Phosphorus-Containing
Inorganic Compounds, J. Appl. Polym. Sci.,108 (2008), pp1582-1590. [17] Cole, R., (1978), Flameproofing of textiles, U.S. Pat. 4,078,101. [18] Cole, R., (1982), Flameproofing agent, U.S. Pat. 4,311,855. [19] Horrocks, A. R.: Flame retardant finishes and finishing, in Textile finishing, Ed. Heywood, D., West
Yorkshire, U.K., Society of Dyers and Colourists, p227. [20] LeBlanc, R. B.: The durability of flame retardant-treated fabrics, Textile Chem. Color., 29 (2) (1997),
pp19-20. [21] Zakikhani, O., Lei, X. P. (1996), 'Flame-retardant treatment of fabrics', U.S. Pat. 5,571,288. [22] Cole, R., (1999), 'Process for the flame-retardant treatment of textiles,' U.S. Pat. 5,942,006. [23] Weil, E. D., Levchik, S. V.: Flame retardants for plastics and textiles, Munich, Germany, Hanser
(2009), p204. [24] Smith, G. W., (1990), 'Textile treatment', U.S. Pat. 4,909,805. [25] Fleming, G. R., Green, J. R., (1995), 'Long wear life flame-retardant cotton blend fabrics,' U.S. Pat.
5,468,545. [26] Fleming, G. R., Green, J. R., (1996), 'Long wear life flame-retardant cotton blend fabrics,' U.S. Pat.
5,480,458. [27] Hansen, J. H., (1988), 'Flame-resistant nylon/cotton fabrics,' U.S. Pat. 4,750,911. [28] Hansen, J. H., (1989), 'Flame-resistant nylon/cotton fabric and process for production thereof', U.S.
Pat. 4,812,144. [29] Johnson, J. R. (1989), "Flame retardant treatments for polyester/cotton fabrics", U.S.P. 4,842,609. [30] Hauser, P. J., Triplett, B. L., Chumpon S., (1988), 'Flame-resistant cotton blend fabrics,' U.S. Pat.
4,732,789. [31] Roth P. B., (1978) 'Process for imparting flame resistance to cellulosic textile materials and cellulosic
materials obtained thereby,' U.S. Pat. 4,110,509. [32] Beninate, J. V., Boyston, E. K., Drake, G. L. Reeves, W. A.: Conventional pad-dry-cure process for
durable flame and wrinkle resistance with tetrakis(hydroxymethyl) phosphonium hydroxide (THPOH), Textile Res. J., 39 (1968), pp267-272.
[33] Aenishanslin, R., Guth, P., Hofman, P., Maeder, A., Nachbur, H.: A new chemical approach to durable
43
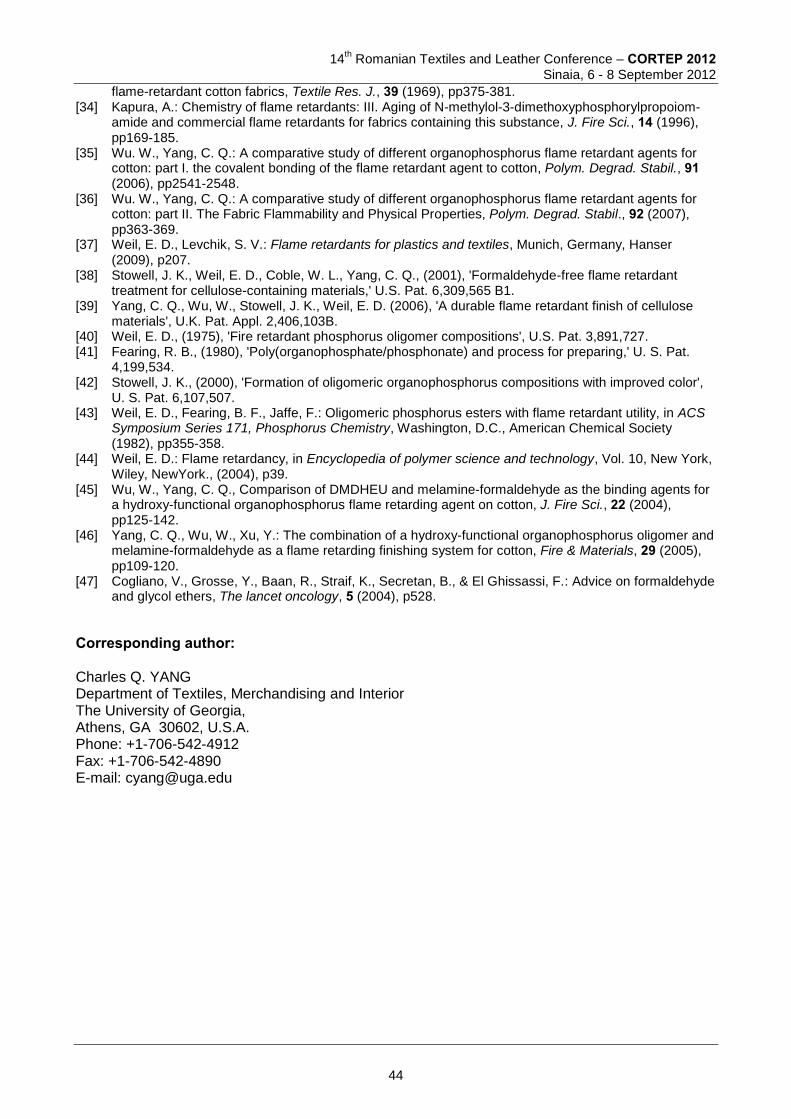
14
th Romanian Textiles and Leather Conference – CORTEP 2012
Sinaia, 6 - 8 September 2012
flame-retardant cotton fabrics, Textile Res. J., 39 (1969), pp375-381. [34] Kapura, A.: Chemistry of flame retardants: III. Aging of N-methylol-3-dimethoxyphosphorylpropoiom-
amide and commercial flame retardants for fabrics containing this substance, J. Fire Sci., 14 (1996), pp169-185.
[35] Wu. W., Yang, C. Q.: A comparative study of different organophosphorus flame retardant agents for cotton: part I. the covalent bonding of the flame retardant agent to cotton, Polym. Degrad. Stabil., 91 (2006), pp2541-2548.
[36] Wu. W., Yang, C. Q.: A comparative study of different organophosphorus flame retardant agents for cotton: part II. The Fabric Flammability and Physical Properties, Polym. Degrad. Stabil., 92 (2007), pp363-369.
[37] Weil, E. D., Levchik, S. V.: Flame retardants for plastics and textiles, Munich, Germany, Hanser (2009), p207.
[38] Stowell, J. K., Weil, E. D., Coble, W. L., Yang, C. Q., (2001), 'Formaldehyde-free flame retardant treatment for cellulose-containing materials,' U.S. Pat. 6,309,565 B1.
[39] Yang, C. Q., Wu, W., Stowell, J. K., Weil, E. D. (2006), 'A durable flame retardant finish of cellulose materials', U.K. Pat. Appl. 2,406,103B.
[40] Weil, E. D., (1975), 'Fire retardant phosphorus oligomer compositions', U.S. Pat. 3,891,727. [41] Fearing, R. B., (1980), 'Poly(organophosphate/phosphonate) and process for preparing,' U. S. Pat.
4,199,534. [42] Stowell, J. K., (2000), 'Formation of oligomeric organophosphorus compositions with improved color',
U. S. Pat. 6,107,507. [43] Weil, E. D., Fearing, B. F., Jaffe, F.: Oligomeric phosphorus esters with flame retardant utility, in ACS
Symposium Series 171, Phosphorus Chemistry, Washington, D.C., American Chemical Society (1982), pp355-358.
[44] Weil, E. D.: Flame retardancy, in Encyclopedia of polymer science and technology, Vol. 10, New York, Wiley, NewYork., (2004), p39.
[45] Wu, W., Yang, C. Q., Comparison of DMDHEU and melamine-formaldehyde as the binding agents for a hydroxy-functional organophosphorus flame retarding agent on cotton, J. Fire Sci., 22 (2004), pp125-142.
[46] Yang, C. Q., Wu, W., Xu, Y.: The combination of a hydroxy-functional organophosphorus oligomer and melamine-formaldehyde as a flame retarding finishing system for cotton, Fire & Materials, 29 (2005), pp109-120.
[47] Cogliano, V., Grosse, Y., Baan, R., Straif, K., Secretan, B., & El Ghissassi, F.: Advice on formaldehyde and glycol ethers, The lancet oncology, 5 (2004), p528.
Corresponding author: Charles Q. YANG Department of Textiles, Merchandising and Interior The University of Georgia, Athens, GA 30602, U.S.A. Phone: +1-706-542-4912 Fax: +1-706-542-4890 E-mail: [email protected]
44
14
th Romanian Textiles and Leather Conference – CORTEP 2012
Sinaia, 6 - 8 September 2012
COMFORT INDEX OF TEXTILES
C. POPESCU, M. SCHÜRING, QJ. ZHANG, K. HUPFER-KEMPKES, A. KAISER DWI an der RWTH Aachen e. V., Forckenbeckstrasse 50, D-52056, Aachen, Germany
There are many surveys and studies indicating the positive perception of wool by the public, but in spite of a huge marketing and research effort, there is a lack of studies to analyse the advantages of wool over synthetic fibres in area of apparel. We have conducted an investigation on the technical performances of three 100% wool and three 100% polyester made suits produced of fine fabrics having similar characteristics. The analysis took into consideration not only the mechanical properties, but also the moisture and heat management of the fabrics, the protection offered against environmental factors and the eco-issue. The results show that for a majority of instrumental measurable properties (quality, tailoring, performance, maintenance, protection) as well as for emotional properties such as comfort, health and ‘green’ issues, wool suits outperform PES suits. The work proposes an approach to capitalize these pluses of wool versus polyester by introducing an index for fast comparison of a product with a similar one on the market. The index is aimed to be of use not only for retails, but also for the e-commerce. Keywords: comfort, e-commerce, wool, polyester, men’s suit References (selection): 1. Kawabata S. “Development of the Objective Measurement of Fabric Handle” in Objective specification of fabric quality, mechanical properties and performance (ed Kawabata S.; Postle R.; Niwa M.) Textile Machinery Society of Japan, Osaka, Japan, 1982, p. 31. 2. DeBoos A. G., Naylor G. R. S., Slota I. J., Stanton J. “The Effect of the Diameter Characteristics of the Fibre Ends on the Skin Comfort and Handle of Knitted Wool Fabrics” in Wool Technology and Sheep Breeding, 2002, 50(2), 110-120. 3. El Mogahzy Y., Abdel-Hady F., Broughton R., Buschle-Diller G., Farag R., Mohamed A., Pasco D., Slaten B. L., Gupta B. S., Parachuru R. “Developing a Design-Oriented Fabric Comfort Model” (NTC Project: S01-AE32) in National Textile Center Research Briefs – Management Systems Competency, June 2003. Corresponding address: Name SURNAME: Crisan POPESCU Affiliation: DWI an der RWTH Aachen e.V. Country: Germany Phone: +49 241 8023326 e-mail: [email protected] ConferenceTopic: quantifying the quality of textiles
45
14th Romanian Textiles and Leather Conference – CORTEP 2012
Sinaia, 6 - 8 September 2012
THERMAL COMFORT OF FUNCTIONAL UNDERWEAR AND SPORT DRESSES FROM SPECIAL FIBRES AND NEW METHODS OF THEIR
TESTING UNDER REAL CONDITIONS OF THEIR WEAR
Lubos Hes Technical University of Liberec, Czech Republic
Abstract: Selected performance fibres presented here in short survey serve for design of functional fabrics, which exhibit enhanced thermophysiological and thermal contact properties. These improved properties should be tested by means of special measuring instruments which enable testing of functional clothing under real conditions of its use. In the second part of the paper, two new methods and instruments for testing of above mentioned properties of fabrics are presented and used for determination of thermophysiological and thermal contact properties of selected performance underwear fabrics, both in dry and wet state. From the conclusions follows, that functional underwear and sport fabrics require also new methods of testing, which respect real conditions of their practical use. Keywords: performance fibres, wet functional clothing,thermal comfort, water vapour permeability 1 INTRODUCTION Recently developed functional fibres contribute substantially to wearing comfort of not only protective and outdoor clothing, but also to daily and leasure garments. The latter textile products involve mostly the underwear or first contact layers, incl. simple sport dresses. Due to high added values of fuctional clothing, these textile products are not cheap and their price depends on their performance characteristics. However, common clothing users not always understand individual components of wearing comfort, as some of these characteristics became measurable just recently, thanks to accerelated development of new measuring methods. Moreover, sport and protective clothing is often used in wet state, and the moisture absorbed in underwear substantially changes the fabric comfort properties. The mentioned use of underwear under real conditions of their wearing made their testing even more complex, as most of the standard testing methods do not involve the testing in wet state - the testing time uses to be too long to keep the constant moisture level in the sample. That is why the number of publications dealing with comfort properties of fabrics in wet state is quite low [1].
The presentation starts with survey of comfort properties of fabrics. Then, selected performance fibres and some special fabric structures will be described, which enhance thermophysiological and thermal contact properties of fabrics, both in dry and wet state [2].
In the next chapter, common and new methods and instruments for testing of above mentioned properties of fabrics will be explained, along with the most important related ISO standard. In the experimental part, results of testing of thermophysiological and thermal contact properties of selected performance underwear fabrics, both in dry and wet state, will be presented and discussed.
From the conclusions would follow, that functional underwear and sport fabrics based on recent performance fibers may require also new methods of testing, which respect real conditions of their practical use [3]. 2 SURVEY OF COMFORT CHARACTERISTICS OF FABRICS AND GARMENTS TO BE TESTED Properties of textile fabrics and garments embrace both purely mechanical properties and heat/moisture transfer properties. Complex effect of these properties characterise comfort properties of fabrics.
Properties, which involve the effect of fabric humidity on selected mechanical parameters along with the effect of deformation properties and contact force of garments on the user’s perception during the garment wearing we call sensorial properties.
46
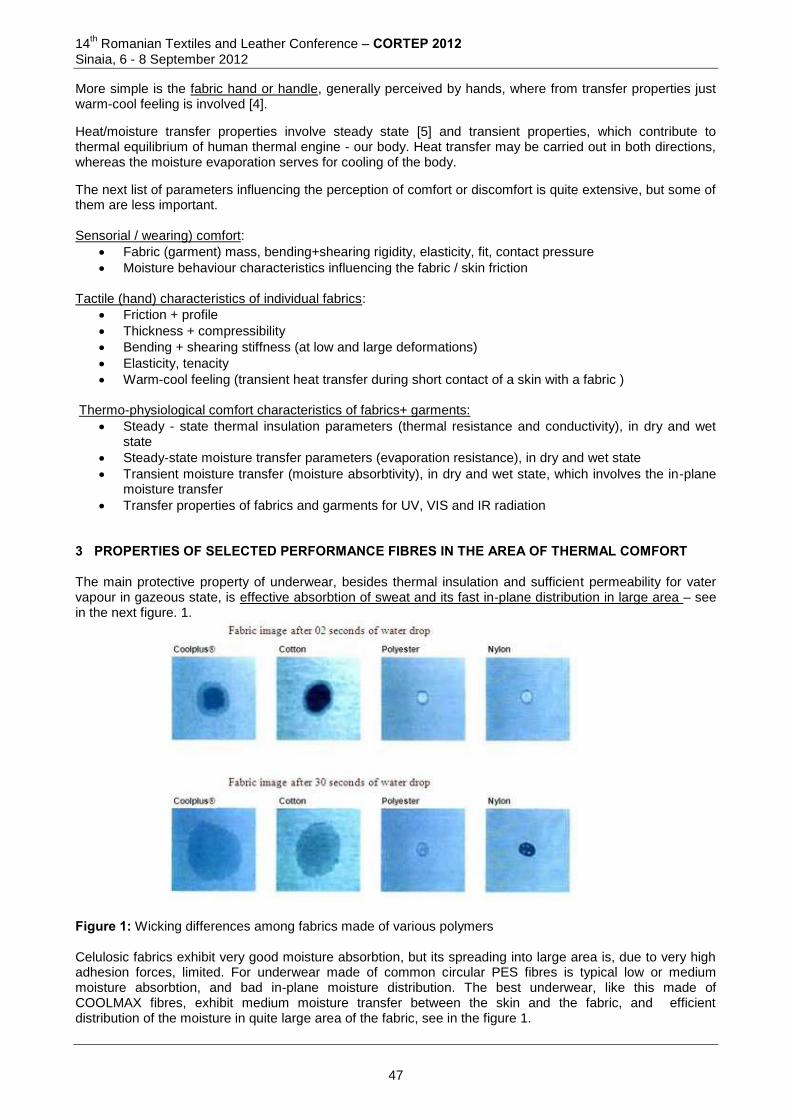
14th Romanian Textiles and Leather Conference – CORTEP 2012
Sinaia, 6 - 8 September 2012
More simple is the fabric hand or handle, generally perceived by hands, where from transfer properties just warm-cool feeling is involved [4].
Heat/moisture transfer properties involve steady state [5] and transient properties, which contribute to thermal equilibrium of human thermal engine - our body. Heat transfer may be carried out in both directions, whereas the moisture evaporation serves for cooling of the body.
The next list of parameters influencing the perception of comfort or discomfort is quite extensive, but some of them are less important. Sensorial / wearing) comfort:
Fabric (garment) mass, bending+shearing rigidity, elasticity, fit, contact pressure
Moisture behaviour characteristics influencing the fabric / skin friction Tactile (hand) characteristics of individual fabrics:
Friction + profile
Thickness + compressibility
Bending + shearing stiffness (at low and large deformations)
Elasticity, tenacity
Warm-cool feeling (transient heat transfer during short contact of a skin with a fabric ) Thermo-physiological comfort characteristics of fabrics+ garments:
Steady - state thermal insulation parameters (thermal resistance and conductivity), in dry and wet state
Steady-state moisture transfer parameters (evaporation resistance), in dry and wet state
Transient moisture transfer (moisture absorbtivity), in dry and wet state, which involves the in-plane moisture transfer
Transfer properties of fabrics and garments for UV, VIS and IR radiation 3 PROPERTIES OF SELECTED PERFORMANCE FIBRES IN THE AREA OF THERMAL COMFORT The main protective property of underwear, besides thermal insulation and sufficient permeability for vater vapour in gazeous state, is effective absorbtion of sweat and its fast in-plane distribution in large area – see in the next figure. 1.
Figure 1: Wicking differences among fabrics made of various polymers Celulosic fabrics exhibit very good moisture absorbtion, but its spreading into large area is, due to very high adhesion forces, limited. For underwear made of common circular PES fibres is typical low or medium moisture absorbtion, and bad in-plane moisture distribution. The best underwear, like this made of COOLMAX fibres, exhibit medium moisture transfer between the skin and the fabric, and efficient distribution of the moisture in quite large area of the fabric, see in the figure 1.
47

14th Romanian Textiles and Leather Conference – CORTEP 2012
Sinaia, 6 - 8 September 2012
What are the forces which cause so big differences between the in-plane conduction of fabrics made of various fibres? The answer is: the mentioned forces are the cappillary forces - see the next figure 2 (from http://www.coolplus.com.tw/).
Figure 2: From the theory follows, that the capillary pressure ΔP is proportional to the contact angle between water and the fibre, and particularly, to the inverse value of the pore diameters r and R:
ΔP = 2γ [(cos Θr)/ r - (cos ΘR)/ R] (1)
Figure 3: Channeled fiber creating micro-capillaries among yarns in fabrics for quick moisture transport Functions of the chanelled fibres:
1. To take the moisture from skin to keep the skin dry from sweating 2. To spread the moisture over lager areas onto the fabric larger spreading area increase the exposure
of wet fabric to the surrounding and the result is quick drying 3. Quick drying as the fiber does not absorb moisture into its core and the moisture remains at the fiber
surface
3.1. Examples of performance fibres with increased capillary force
Figure 4: Fibres with shallow surface grooves
48
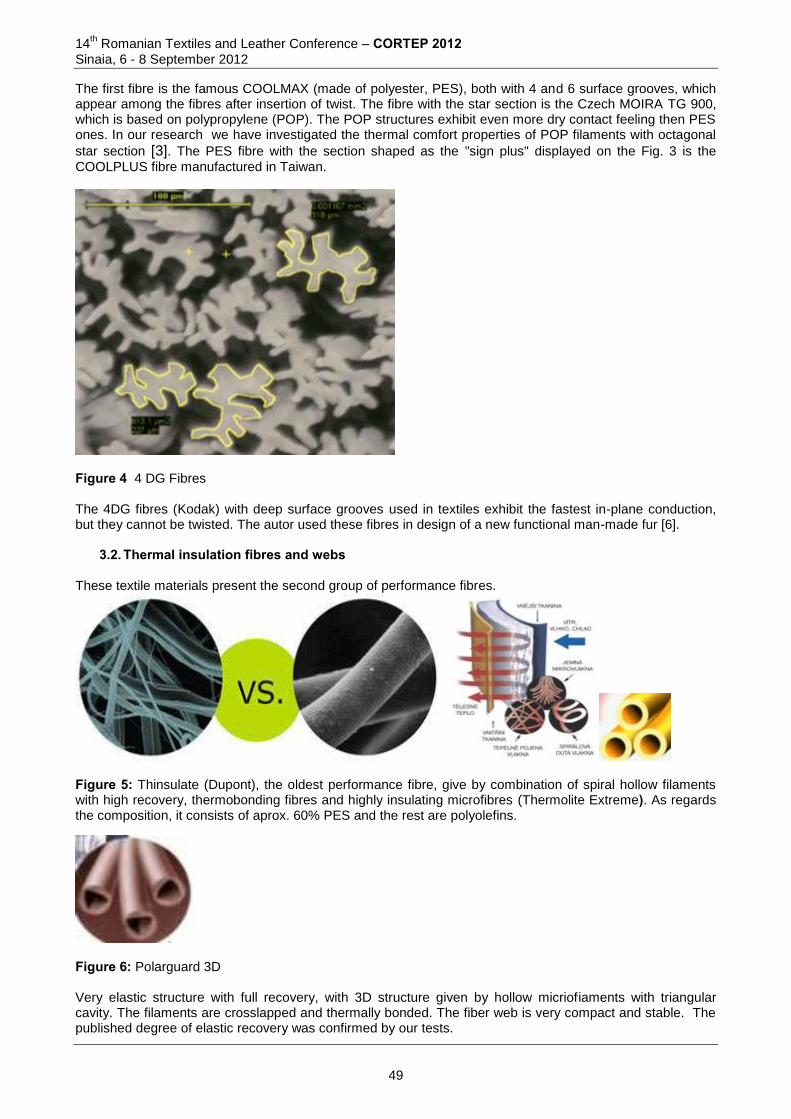
14th Romanian Textiles and Leather Conference – CORTEP 2012
Sinaia, 6 - 8 September 2012
The first fibre is the famous COOLMAX (made of polyester, PES), both with 4 and 6 surface grooves, which appear among the fibres after insertion of twist. The fibre with the star section is the Czech MOIRA TG 900, which is based on polypropylene (POP). The POP structures exhibit even more dry contact feeling then PES ones. In our research we have investigated the thermal comfort properties of POP filaments with octagonal
star section [3]. The PES fibre with the section shaped as the "sign plus" displayed on the Fig. 3 is the
COOLPLUS fibre manufactured in Taiwan.
Figure 4 4 DG Fibres
The 4DG fibres (Kodak) with deep surface grooves used in textiles exhibit the fastest in-plane conduction, but they cannot be twisted. The autor used these fibres in design of a new functional man-made fur [6].
3.2. Thermal insulation fibres and webs These textile materials present the second group of performance fibres.
Figure 5: Thinsulate (Dupont), the oldest performance fibre, give by combination of spiral hollow filaments with high recovery, thermobonding fibres and highly insulating microfibres (Thermolite Extreme). As regards the composition, it consists of aprox. 60% PES and the rest are polyolefins.
Figure 6: Polarguard 3D Very elastic structure with full recovery, with 3D structure given by hollow micriofiaments with triangular cavity. The filaments are crosslapped and thermally bonded. The fiber web is very compact and stable. The published degree of elastic recovery was confirmed by our tests.
49
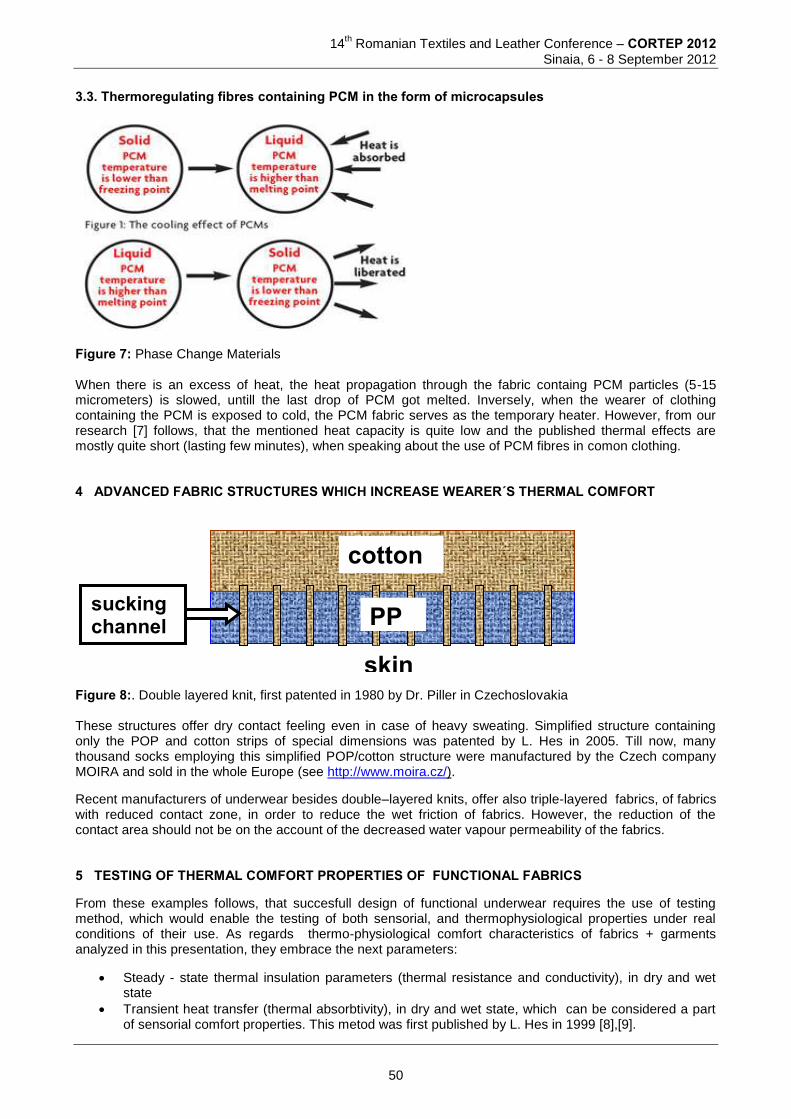
14th Romanian Textiles and Leather Conference – CORTEP 2012
Sinaia, 6 - 8 September 2012
3.3. Thermoregulating fibres containing PCM in the form of microcapsules
Figure 7: Phase Change Materials When there is an excess of heat, the heat propagation through the fabric containg PCM particles (5-15 micrometers) is slowed, untill the last drop of PCM got melted. Inversely, when the wearer of clothing containing the PCM is exposed to cold, the PCM fabric serves as the temporary heater. However, from our research [7] follows, that the mentioned heat capacity is quite low and the published thermal effects are mostly quite short (lasting few minutes), when speaking about the use of PCM fibres in comon clothing. 4 ADVANCED FABRIC STRUCTURES WHICH INCREASE WEARER´S THERMAL COMFORT
Figure 8:. Double layered knit, first patented in 1980 by Dr. Piller in Czechoslovakia These structures offer dry contact feeling even in case of heavy sweating. Simplified structure containing only the POP and cotton strips of special dimensions was patented by L. Hes in 2005. Till now, many thousand socks employing this simplified POP/cotton structure were manufactured by the Czech company MOIRA and sold in the whole Europe (see http://www.moira.cz/).
Recent manufacturers of underwear besides double–layered knits, offer also triple-layered fabrics, of fabrics with reduced contact zone, in order to reduce the wet friction of fabrics. However, the reduction of the contact area should not be on the account of the decreased water vapour permeability of the fabrics. 5 TESTING OF THERMAL COMFORT PROPERTIES OF FUNCTIONAL FABRICS From these examples follows, that succesfull design of functional underwear requires the use of testing method, which would enable the testing of both sensorial, and thermophysiological properties under real conditions of their use. As regards thermo-physiological comfort characteristics of fabrics + garments analyzed in this presentation, they embrace the next parameters:
Steady - state thermal insulation parameters (thermal resistance and conductivity), in dry and wet state
Transient heat transfer (thermal absorbtivity), in dry and wet state, which can be considered a part of sensorial comfort properties. This metod was first published by L. Hes in 1999 [8],[9].
cotton
PP sucking channel
skin
50
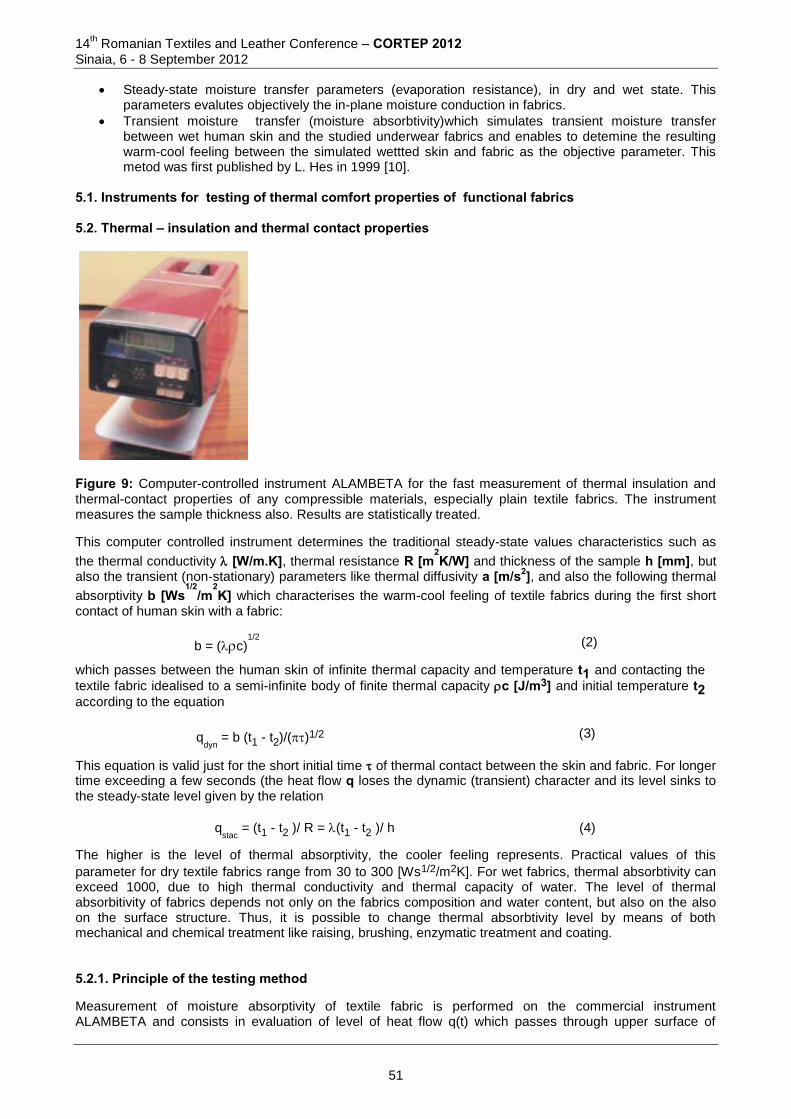
14th Romanian Textiles and Leather Conference – CORTEP 2012
Sinaia, 6 - 8 September 2012
Steady-state moisture transfer parameters (evaporation resistance), in dry and wet state. This parameters evalutes objectively the in-plane moisture conduction in fabrics.
Transient moisture transfer (moisture absorbtivity)which simulates transient moisture transfer between wet human skin and the studied underwear fabrics and enables to detemine the resulting warm-cool feeling between the simulated wettted skin and fabric as the objective parameter. This metod was first published by L. Hes in 1999 [10].
5.1. Instruments for testing of thermal comfort properties of functional fabrics 5.2. Thermal – insulation and thermal contact properties
Figure 9: Computer-controlled instrument ALAMBETA for the fast measurement of thermal insulation and thermal-contact properties of any compressible materials, especially plain textile fabrics. The instrument measures the sample thickness also. Results are statistically treated.
This computer controlled instrument determines the traditional steady-state values characteristics such as
the thermal conductivity [W/m.K], thermal resistance R [m2K/W] and thickness of the sample h [mm], but
also the transient (non-stationary) parameters like thermal diffusivity a [m/s2], and also the following thermal
absorptivity b [Ws1/2
/m2K] which characterises the warm-cool feeling of textile fabrics during the first short
contact of human skin with a fabric:
b = (c)1/2
(2)
which passes between the human skin of infinite thermal capacity and temperature t1 and contacting the
textile fabric idealised to a semi-infinite body of finite thermal capacity c [J/m3] and initial temperature t2 according to the equation
qdyn = b (t1 - t2)/()1/2 (3)
This equation is valid just for the short initial time of thermal contact between the skin and fabric. For longer time exceeding a few seconds (the heat flow q loses the dynamic (transient) character and its level sinks to the steady-state level given by the relation
qstac
= (t1 - t2 )/ R = (t1 - t2 )/ h (4)
The higher is the level of thermal absorptivity, the cooler feeling represents. Practical values of this
parameter for dry textile fabrics range from 30 to 300 [Ws1/2/m2K]. For wet fabrics, thermal absorbtivity can exceed 1000, due to high thermal conductivity and thermal capacity of water. The level of thermal absorbitivity of fabrics depends not only on the fabrics composition and water content, but also on the also on the surface structure. Thus, it is possible to change thermal absorbtivity level by means of both mechanical and chemical treatment like raising, brushing, enzymatic treatment and coating. 5.2.1. Principle of the testing method Measurement of moisture absorptivity of textile fabric is performed on the commercial instrument ALAMBETA and consists in evaluation of level of heat flow q(t) which passes through upper surface of
51
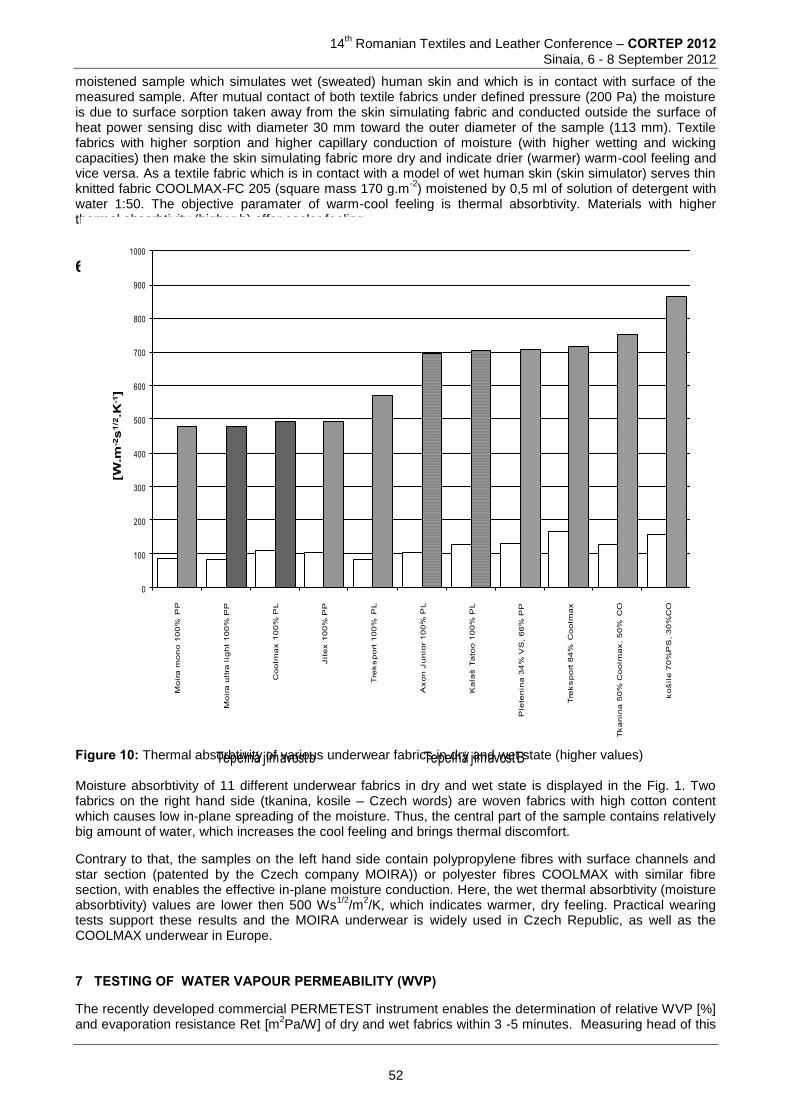
14th Romanian Textiles and Leather Conference – CORTEP 2012
Sinaia, 6 - 8 September 2012
moistened sample which simulates wet (sweated) human skin and which is in contact with surface of the measured sample. After mutual contact of both textile fabrics under defined pressure (200 Pa) the moisture is due to surface sorption taken away from the skin simulating fabric and conducted outside the surface of heat power sensing disc with diameter 30 mm toward the outer diameter of the sample (113 mm). Textile fabrics with higher sorption and higher capillary conduction of moisture (with higher wetting and wicking capacities) then make the skin simulating fabric more dry and indicate drier (warmer) warm-cool feeling and vice versa. As a textile fabric which is in contact with a model of wet human skin (skin simulator) serves thin knitted fabric COOLMAX-FC 205 (square mass 170 g.m
-2) moistened by 0,5 ml of solution of detergent with
water 1:50. The objective paramater of warm-cool feeling is thermal absorbtivity. Materials with higher thermal absorbtivity (higher b) offer cooler feeling. 6 EXAMPLE OF THE APPLICATION OF THE MOISTURE ABSORBTIVITY EVALUATION
0
100
200
300
400
500
600
700
800
900
1000
Mo
ira
mo
no
10
0%
P
P
Mo
ira
ult
ra l
igh
t 1
00
% P
P
Co
olm
ax
10
0%
PL
Jit
ex
10
0%
PP
Tre
ks
po
rt 1
00
% P
L
Ax
on
Ju
nio
r 1
00
% P
L
Ka
laš
Ta
too
10
0%
PL
Ple
ten
ina
34
% V
S,
66
% P
P
Tre
ks
po
rt 8
4%
C
oo
lma
x
Tk
an
ina
50
% C
oo
lma
x,
50
% C
O
ko
šil
e 7
0%
PS
, 3
0%
CO
[W.m
-2s1/2.K
-1]
Tepelná jímavost b Tepelná jímavost B
Figure 10: Thermal absorbtivity of various underwear fabrics in dry and wet state (higher values) Moisture absorbtivity of 11 different underwear fabrics in dry and wet state is displayed in the Fig. 1. Two fabrics on the right hand side (tkanina, kosile – Czech words) are woven fabrics with high cotton content which causes low in-plane spreading of the moisture. Thus, the central part of the sample contains relatively big amount of water, which increases the cool feeling and brings thermal discomfort.
Contrary to that, the samples on the left hand side contain polypropylene fibres with surface channels and star section (patented by the Czech company MOIRA)) or polyester fibres COOLMAX with similar fibre section, with enables the effective in-plane moisture conduction. Here, the wet thermal absorbtivity (moisture absorbtivity) values are lower then 500 Ws
1/2/m
2/K, which indicates warmer, dry feeling. Practical wearing
tests support these results and the MOIRA underwear is widely used in Czech Republic, as well as the COOLMAX underwear in Europe. 7 TESTING OF WATER VAPOUR PERMEABILITY (WVP)
The recently developed commercial PERMETEST instrument enables the determination of relative WVP [%] and evaporation resistance Ret [m
2Pa/W] of dry and wet fabrics within 3 -5 minutes. Measuring head of this
52
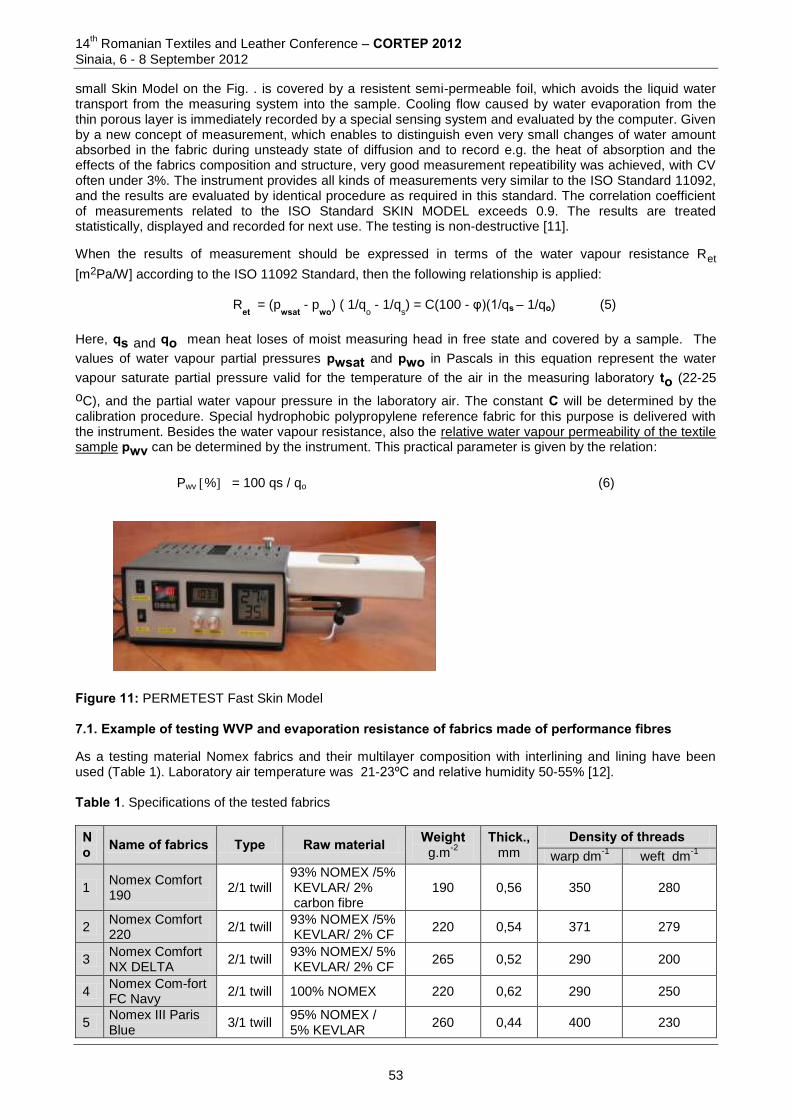
14th Romanian Textiles and Leather Conference – CORTEP 2012
Sinaia, 6 - 8 September 2012
small Skin Model on the Fig. . is covered by a resistent semi-permeable foil, which avoids the liquid water transport from the measuring system into the sample. Cooling flow caused by water evaporation from the thin porous layer is immediately recorded by a special sensing system and evaluated by the computer. Given by a new concept of measurement, which enables to distinguish even very small changes of water amount absorbed in the fabric during unsteady state of diffusion and to record e.g. the heat of absorption and the effects of the fabrics composition and structure, very good measurement repeatibility was achieved, with CV often under 3%. The instrument provides all kinds of measurements very similar to the ISO Standard 11092, and the results are evaluated by identical procedure as required in this standard. The correlation coefficient of measurements related to the ISO Standard SKIN MODEL exceeds 0.9. The results are treated statistically, displayed and recorded for next use. The testing is non-destructive [11].
When the results of measurement should be expressed in terms of the water vapour resistance Ret
[m2Pa/W] according to the ISO 11092 Standard, then the following relationship is applied:
Ret = (p
wsat - pwo) ( 1/q
o - 1/qs) = C(100 - φ)(1/qs – 1/qo) (5)
Here, qs and qo mean heat loses of moist measuring head in free state and covered by a sample. The
values of water vapour partial pressures pwsat and pwo in Pascals in this equation represent the water
vapour saturate partial pressure valid for the temperature of the air in the measuring laboratory to (22-25
oC), and the partial water vapour pressure in the laboratory air. The constant C will be determined by the calibration procedure. Special hydrophobic polypropylene reference fabric for this purpose is delivered with the instrument. Besides the water vapour resistance, also the relative water vapour permeability of the textile sample pwv can be determined by the instrument. This practical parameter is given by the relation:
Pwv % = 100 qs / qo (6)
Figure 11: PERMETEST Fast Skin Model 7.1. Example of testing WVP and evaporation resistance of fabrics made of performance fibres As a testing material Nomex fabrics and their multilayer composition with interlining and lining have been used (Table 1). Laboratory air temperature was 21-23ºC and relative humidity 50-55% [12]. Table 1. Specifications of the tested fabrics
No Name of fabrics Type Raw material Weight
g.m-2
Thick.,
mm Density of threads
warp dm-1
weft dm-1
1 Nomex Comfort 190 2/1 twill
93% NOMEX /5% KEVLAR/ 2% carbon fibre
190 0,56 350 280
2 Nomex Comfort 220
2/1 twill 93% NOMEX /5% KEVLAR/ 2% CF
220 0,54 371 279
3 Nomex Comfort NX DELTA
2/1 twill 93% NOMEX/ 5% KEVLAR/ 2% CF
265 0,52 290 200
4 Nomex Com-fort FC Navy
2/1 twill 100% NOMEX 220 0,62 290 250
5 Nomex III Paris Blue
3/1 twill 95% NOMEX / 5% KEVLAR
260 0,44 400 230
53
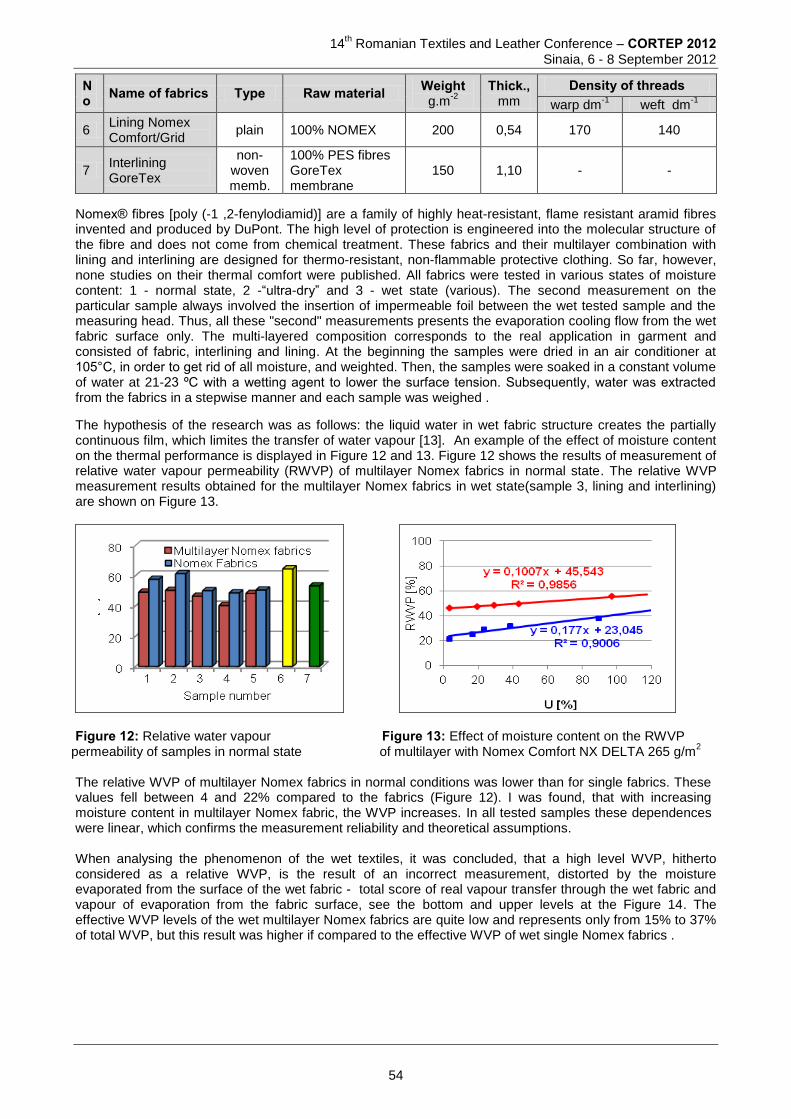
14th Romanian Textiles and Leather Conference – CORTEP 2012
Sinaia, 6 - 8 September 2012
No Name of fabrics Type Raw material Weight
g.m-2
Thick.,
mm Density of threads
warp dm-1
weft dm-1
6 Lining Nomex Comfort/Grid
plain 100% NOMEX 200 0,54 170 140
7 Interlining GoreTex
non-woven memb.
100% PES fibres GoreTex membrane
150 1,10 - -
Nomex® fibres [poly (-1 ,2-fenylodiamid)] are a family of highly heat-resistant, flame resistant aramid fibres invented and produced by DuPont. The high level of protection is engineered into the molecular structure of the fibre and does not come from chemical treatment. These fabrics and their multilayer combination with lining and interlining are designed for thermo-resistant, non-flammable protective clothing. So far, however, none studies on their thermal comfort were published. All fabrics were tested in various states of moisture content: 1 - normal state, 2 -“ultra-dry” and 3 - wet state (various). The second measurement on the particular sample always involved the insertion of impermeable foil between the wet tested sample and the measuring head. Thus, all these "second" measurements presents the evaporation cooling flow from the wet fabric surface only. The multi-layered composition corresponds to the real application in garment and consisted of fabric, interlining and lining. At the beginning the samples were dried in an air conditioner at 105°C, in order to get rid of all moisture, and weighted. Then, the samples were soaked in a constant volume of water at 21-23 ºC with a wetting agent to lower the surface tension. Subsequently, water was extracted from the fabrics in a stepwise manner and each sample was weighed .
The hypothesis of the research was as follows: the liquid water in wet fabric structure creates the partially continuous film, which limites the transfer of water vapour [13]. An example of the effect of moisture content on the thermal performance is displayed in Figure 12 and 13. Figure 12 shows the results of measurement of relative water vapour permeability (RWVP) of multilayer Nomex fabrics in normal state. The relative WVP measurement results obtained for the multilayer Nomex fabrics in wet state(sample 3, lining and interlining) are shown on Figure 13.
Figure 12: Relative water vapour Figure 13: Effect of moisture content on the RWVP
permeability of samples in normal state of multilayer with Nomex Comfort NX DELTA 265 g/m2
The relative WVP of multilayer Nomex fabrics in normal conditions was lower than for single fabrics. These values fell between 4 and 22% compared to the fabrics (Figure 12). I was found, that with increasing moisture content in multilayer Nomex fabric, the WVP increases. In all tested samples these dependences were linear, which confirms the measurement reliability and theoretical assumptions. When analysing the phenomenon of the wet textiles, it was concluded, that a high level WVP, hitherto considered as a relative WVP, is the result of an incorrect measurement, distorted by the moisture evaporated from the surface of the wet fabric - total score of real vapour transfer through the wet fabric and vapour of evaporation from the fabric surface, see the bottom and upper levels at the Figure 14. The effective WVP levels of the wet multilayer Nomex fabrics are quite low and represents only from 15% to 37% of total WVP, but this result was higher if compared to the effective WVP of wet single Nomex fabrics .
54
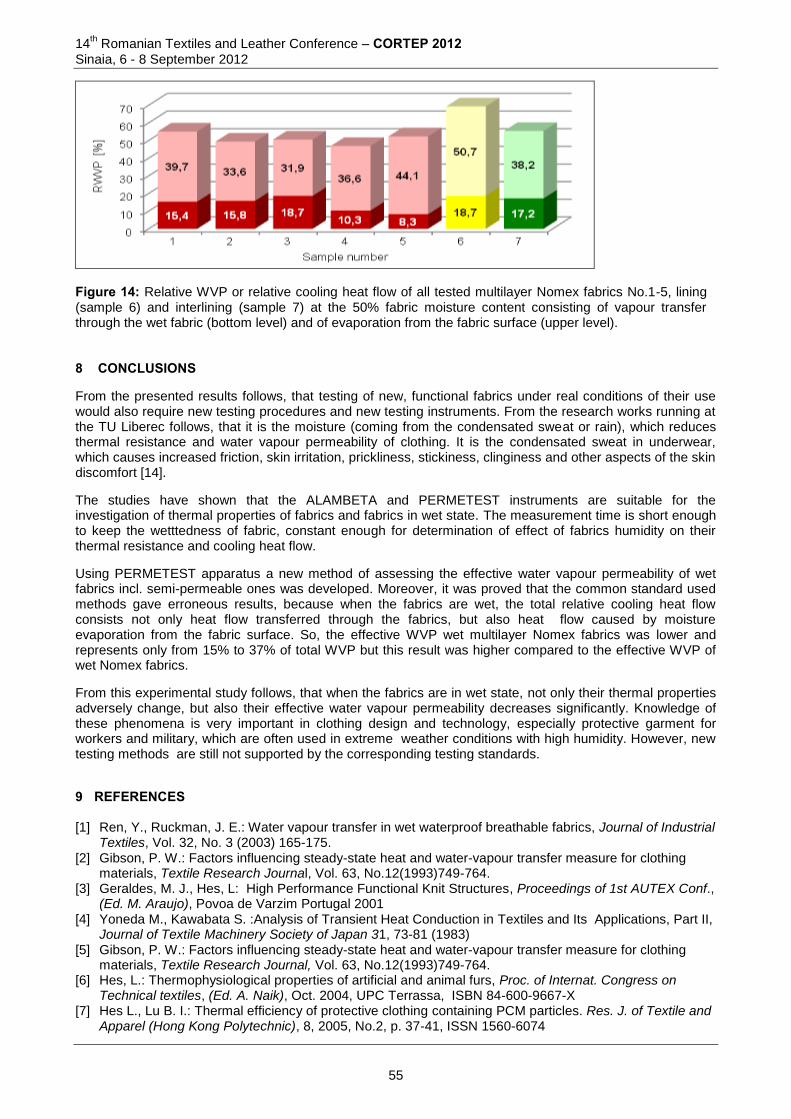
14th Romanian Textiles and Leather Conference – CORTEP 2012
Sinaia, 6 - 8 September 2012
Figure 14: Relative WVP or relative cooling heat flow of all tested multilayer Nomex fabrics No.1-5, lining (sample 6) and interlining (sample 7) at the 50% fabric moisture content consisting of vapour transfer through the wet fabric (bottom level) and of evaporation from the fabric surface (upper level). 8 CONCLUSIONS From the presented results follows, that testing of new, functional fabrics under real conditions of their use would also require new testing procedures and new testing instruments. From the research works running at the TU Liberec follows, that it is the moisture (coming from the condensated sweat or rain), which reduces thermal resistance and water vapour permeability of clothing. It is the condensated sweat in underwear, which causes increased friction, skin irritation, prickliness, stickiness, clinginess and other aspects of the skin discomfort [14].
The studies have shown that the ALAMBETA and PERMETEST instruments are suitable for the investigation of thermal properties of fabrics and fabrics in wet state. The measurement time is short enough to keep the wetttedness of fabric, constant enough for determination of effect of fabrics humidity on their thermal resistance and cooling heat flow.
Using PERMETEST apparatus a new method of assessing the effective water vapour permeability of wet fabrics incl. semi-permeable ones was developed. Moreover, it was proved that the common standard used methods gave erroneous results, because when the fabrics are wet, the total relative cooling heat flow consists not only heat flow transferred through the fabrics, but also heat flow caused by moisture evaporation from the fabric surface. So, the effective WVP wet multilayer Nomex fabrics was lower and represents only from 15% to 37% of total WVP but this result was higher compared to the effective WVP of wet Nomex fabrics.
From this experimental study follows, that when the fabrics are in wet state, not only their thermal properties adversely change, but also their effective water vapour permeability decreases significantly. Knowledge of these phenomena is very important in clothing design and technology, especially protective garment for workers and military, which are often used in extreme weather conditions with high humidity. However, new testing methods are still not supported by the corresponding testing standards. 9 REFERENCES [1] Ren, Y., Ruckman, J. E.: Water vapour transfer in wet waterproof breathable fabrics, Journal of Industrial
Textiles, Vol. 32, No. 3 (2003) 165-175. [2] Gibson, P. W.: Factors influencing steady-state heat and water-vapour transfer measure for clothing
materials, Textile Research Journal, Vol. 63, No.12(1993)749-764. [3] Geraldes, M. J., Hes, L: High Performance Functional Knit Structures, Proceedings of 1st AUTEX Conf.,
(Ed. M. Araujo), Povoa de Varzim Portugal 2001 [4] Yoneda M., Kawabata S. :Analysis of Transient Heat Conduction in Textiles and Its Applications, Part II,
Journal of Textile Machinery Society of Japan 31, 73-81 (1983) [5] Gibson, P. W.: Factors influencing steady-state heat and water-vapour transfer measure for clothing
materials, Textile Research Journal, Vol. 63, No.12(1993)749-764. [6] Hes, L.: Thermophysiological properties of artificial and animal furs, Proc. of Internat. Congress on
Technical textiles, (Ed. A. Naik), Oct. 2004, UPC Terrassa, ISBN 84-600-9667-X [7] Hes L., Lu B. I.: Thermal efficiency of protective clothing containing PCM particles. Res. J. of Textile and
Apparel (Hong Kong Polytechnic), 8, 2005, No.2, p. 37-41, ISSN 1560-6074
55
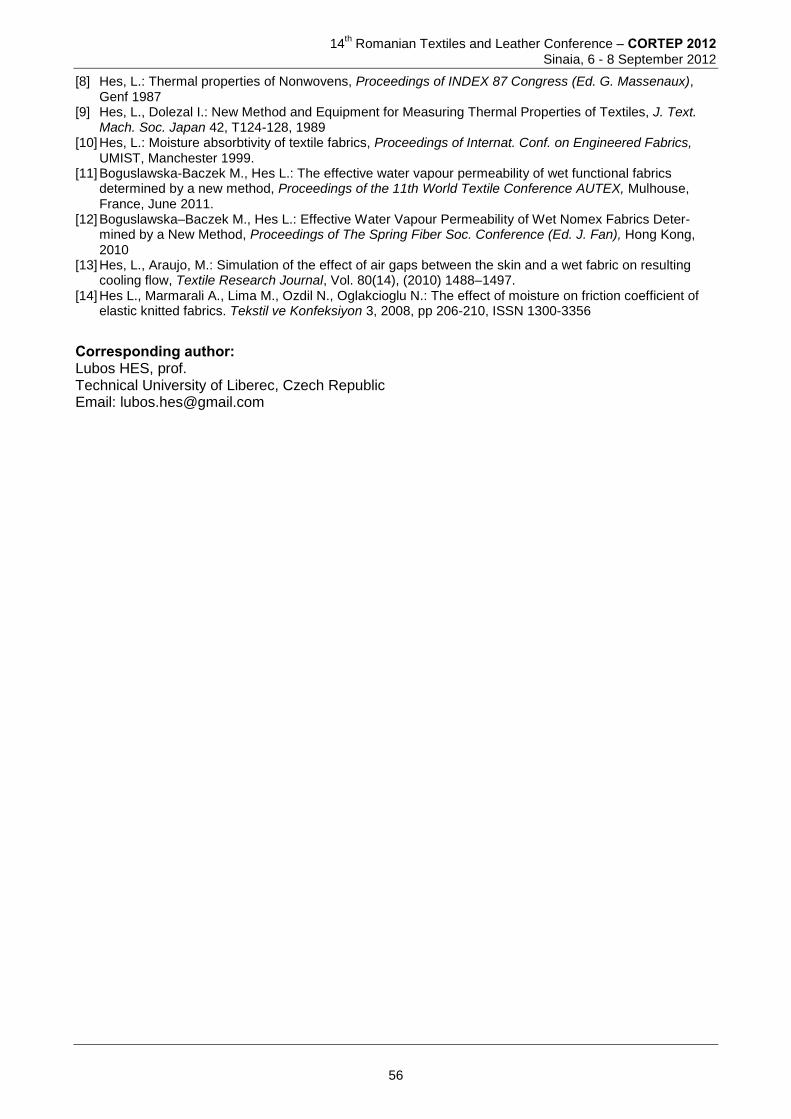
14th Romanian Textiles and Leather Conference – CORTEP 2012
Sinaia, 6 - 8 September 2012
[8] Hes, L.: Thermal properties of Nonwovens, Proceedings of INDEX 87 Congress (Ed. G. Massenaux), Genf 1987
[9] Hes, L., Dolezal I.: New Method and Equipment for Measuring Thermal Properties of Textiles, J. Text. Mach. Soc. Japan 42, T124-128, 1989
[10] Hes, L.: Moisture absorbtivity of textile fabrics, Proceedings of Internat. Conf. on Engineered Fabrics, UMIST, Manchester 1999.
[11] Boguslawska-Baczek M., Hes L.: The effective water vapour permeability of wet functional fabrics determined by a new method, Proceedings of the 11th World Textile Conference AUTEX, Mulhouse, France, June 2011.
[12] Boguslawska–Baczek M., Hes L.: Effective Water Vapour Permeability of Wet Nomex Fabrics Deter-mined by a New Method, Proceedings of The Spring Fiber Soc. Conference (Ed. J. Fan), Hong Kong, 2010
[13] Hes, L., Araujo, M.: Simulation of the effect of air gaps between the skin and a wet fabric on resulting cooling flow, Textile Research Journal, Vol. 80(14), (2010) 1488–1497.
[14] Hes L., Marmarali A., Lima M., Ozdil N., Oglakcioglu N.: The effect of moisture on friction coefficient of elastic knitted fabrics. Tekstil ve Konfeksiyon 3, 2008, pp 206-210, ISSN 1300-3356
Corresponding author: Lubos HES, prof. Technical University of Liberec, Czech Republic Email: [email protected]
56
14
th Romanian Textiles and Leather Conference – CORTEP 2012
Sinaia, 6 - 8 September 2012
EXPERIMENTAL INVESTIGATION OF THE MAGNETIC YARNS
Marian-Cătălin GROSU1, Ioan HOSSU1, Avram DORIN1 Michał FRYDRYSIAK2 & Janusz ZIĘBA2
1 “Gheorghe Asachi “ Technical University of Iaşi, Romania,
Doctoral School of the Faculty of Textile, Leather and Industrial Management 2 Technical Univesity of Łodz,Poland
Abstract: Magnetic textiles products are part of class of composite textile products used for technical, textronics, medical field, sensorial applications etc. Among the magnetic textile products, the paper regards the realization of yarns coated by ferromagnetic products obtained with a laboratory installation. The covered yarns are obtained using different recipes of mixtures using ferromagnetic or ferrimagnetic powders, binders and plasticizers. Assessment of covered yarns with magnetisable products is made with magnetic and physical characteristics such as: yarns finesses between Ttex 63 and Ttex 206 the degree of charging between 58,823 % and 86,407 %, the medium diameter of the covered yarn with the values between 305,392 μm and 335,457 μm respective determination of the curves of magnetic hysteresis and of the parameters that result from it: From analyses effectuated results that the covered yarns presents values of magnetic remanence different of 0 that can determine the capacity to magnetize themself. Keywords: Composite magnetisable yarns, composite magnetisable mixtures, ferrimagnetic powder, medium diameter, charging degree, magnetic hysteresis curve. 1 INTRODUCTION The recurrent activity in usual media also into special media are dependent by magnets and magnetic materials more than ever. Practically any electric equipment has as component a magnet, advanced object being indispensable for the degree technologically by today. The magnetic materials has various applications from electric, electronic, mechanical applications by auto industry [1] to MEM, medical and BioMEMS applications. Magnetic textiles products as a niche of special technical textile products as a table of spread for magnetic materials [2]. Among magnetic textile products, the fibers/ magnetic filaments have an unique spreading that differ from the perspective of textile raw materials and magnetic materials, technology acquisition and application possibilities in various technical fields. The fields of application are diverse enabling the obtaining of micro and nanofibers with various applications in surgery and internal medicine, obtaining paper storage, monitoring and data security labels, anti-theft elements, elements of electromagnetic absorption and antiradiant protection, in producing intelligent clothing, magnetic textile coil elements, even in cosmetics. Among the technologies for obtaining fibers / magnetic textile filaments are: the loading of the cellulose fibers lumens with magnetic particles, the "in situ" charging of the fibers and filaments by generating magnetic micrometer particles and their integration in the fiber matrix, the creation of magnetic filaments with ferrite Strontium and barium channel and not in the least the producing of magnetic filaments by extrusion from molten solution containing ferro and ferrimagnetic powders. As link components between fiber / filament and textiles surfaces, the textile fibers, after coating treatments with ferrous and ferrimagnetic materials on their surface can become magnetizable composite yarns. Likewise with magnetic fibers, the magnetizable composite yarns can be used in technical fields such as the textronics, sensory, antiradiation, medical field.
2 EXPERIMENTAL 2.1. Materials and method The magnetic materials have a first classification criterion: the property of keeping or not the magnetic properties in the absence of an external magnetic field. The presence or lack of magnetic remanence respectively geometry of the hysteresis curve differentiate the magnetic materials as hard and soft. The ferrimagnetic materials (magnetoplumbite ferrites) are a special class of hard magnetic materials. Thanks to
57
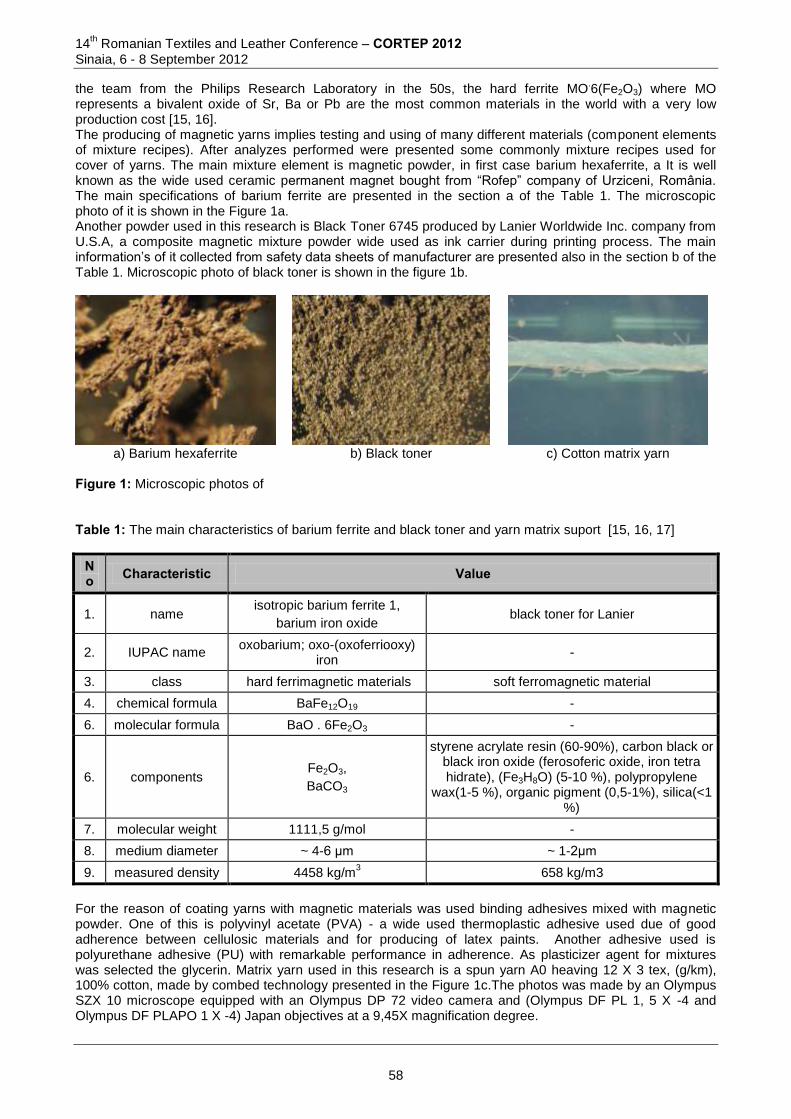
14th Romanian Textiles and Leather Conference – CORTEP 2012
Sinaia, 6 - 8 September 2012
the team from the Philips Research Laboratory in the 50s, the hard ferrite MO.6(Fe2O3) where MO
represents a bivalent oxide of Sr, Ba or Pb are the most common materials in the world with a very low production cost [15, 16]. The producing of magnetic yarns implies testing and using of many different materials (component elements of mixture recipes). After analyzes performed were presented some commonly mixture recipes used for cover of yarns. The main mixture element is magnetic powder, in first case barium hexaferrite, a It is well known as the wide used ceramic permanent magnet bought from “Rofep” company of Urziceni, România. The main specifications of barium ferrite are presented in the section a of the Table 1. The microscopic photo of it is shown in the Figure 1a. Another powder used in this research is Black Toner 6745 produced by Lanier Worldwide Inc. company from U.S.A, a composite magnetic mixture powder wide used as ink carrier during printing process. The main information’s of it collected from safety data sheets of manufacturer are presented also in the section b of the Table 1. Microscopic photo of black toner is shown in the figure 1b.
a) Barium hexaferrite b) Black toner c) Cotton matrix yarn
Figure 1: Microscopic photos of
Table 1: The main characteristics of barium ferrite and black toner and yarn matrix suport [15, 16, 17]
No Characteristic Value
1. name isotropic barium ferrite 1,
barium iron oxide black toner for Lanier
2. IUPAC name oxobarium; oxo-(oxoferriooxy)
iron -
3. class hard ferrimagnetic materials soft ferromagnetic material
4. chemical formula BaFe12O19 -
6. molecular formula BaO . 6Fe2O3 -
6. components Fe2O3,
BaCO3
styrene acrylate resin (60-90%), carbon black or black iron oxide (ferosoferic oxide, iron tetra hidrate), (Fe3H8O) (5-10 %), polypropylene
wax(1-5 %), organic pigment (0,5-1%), silica(<1 %)
7. molecular weight 1111,5 g/mol -
8. medium diameter ~ 4-6 µm ~ 1-2μm
9. measured density 4458 kg/m3 658 kg/m3
For the reason of coating yarns with magnetic materials was used binding adhesives mixed with magnetic powder. One of this is polyvinyl acetate (PVA) - a wide used thermoplastic adhesive used due of good adherence between cellulosic materials and for producing of latex paints. Another adhesive used is polyurethane adhesive (PU) with remarkable performance in adherence. As plasticizer agent for mixtures was selected the glycerin. Matrix yarn used in this research is a spun yarn A0 heaving 12 X 3 tex, (g/km), 100% cotton, made by combed technology presented in the Figure 1c.The photos was made by an Olympus SZX 10 microscope equipped with an Olympus DP 72 video camera and (Olympus DF PL 1, 5 X -4 and Olympus DF PLAPO 1 X -4) Japan objectives at a 9,45X magnification degree.
58
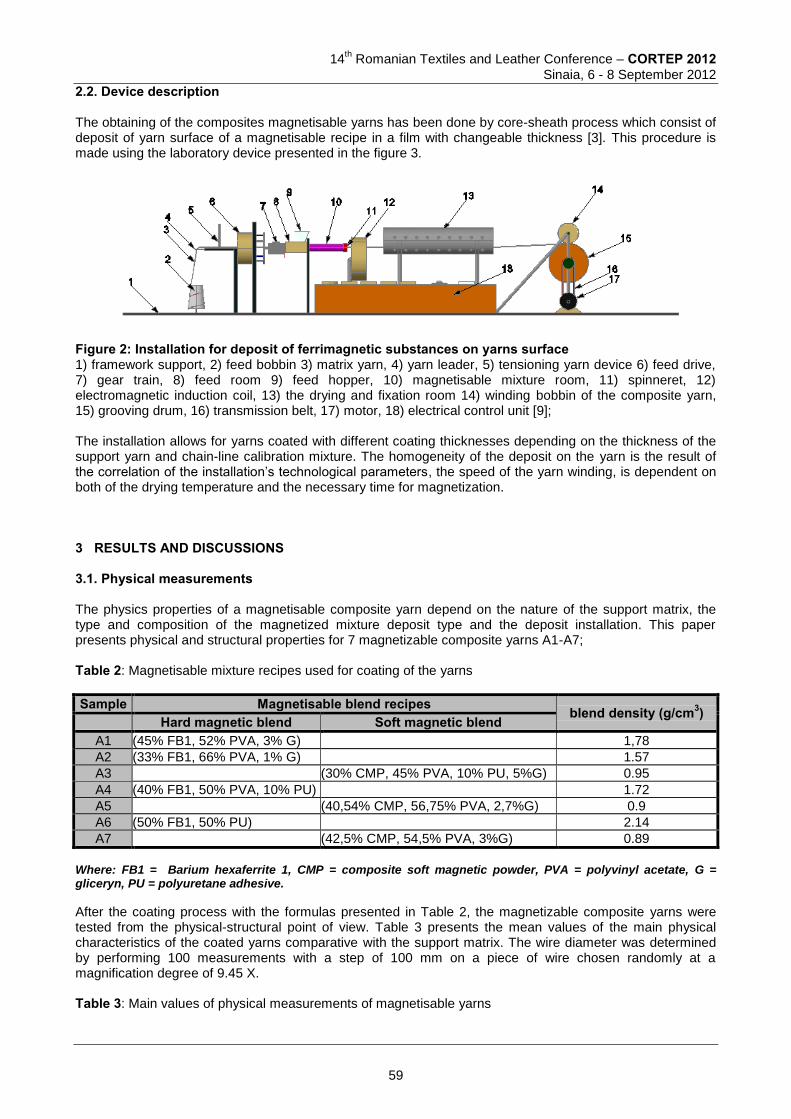
14
th Romanian Textiles and Leather Conference – CORTEP 2012
Sinaia, 6 - 8 September 2012
2.2. Device description The obtaining of the composites magnetisable yarns has been done by core-sheath process which consist of deposit of yarn surface of a magnetisable recipe in a film with changeable thickness [3]. This procedure is made using the laboratory device presented in the figure 3.
Figure 2: Installation for deposit of ferrimagnetic substances on yarns surface 1) framework support, 2) feed bobbin 3) matrix yarn, 4) yarn leader, 5) tensioning yarn device 6) feed drive, 7) gear train, 8) feed room 9) feed hopper, 10) magnetisable mixture room, 11) spinneret, 12) electromagnetic induction coil, 13) the drying and fixation room 14) winding bobbin of the composite yarn, 15) grooving drum, 16) transmission belt, 17) motor, 18) electrical control unit [9]; The installation allows for yarns coated with different coating thicknesses depending on the thickness of the support yarn and chain-line calibration mixture. The homogeneity of the deposit on the yarn is the result of the correlation of the installation’s technological parameters, the speed of the yarn winding, is dependent on both of the drying temperature and the necessary time for magnetization. 3 RESULTS AND DISCUSSIONS 3.1. Physical measurements The physics properties of a magnetisable composite yarn depend on the nature of the support matrix, the type and composition of the magnetized mixture deposit type and the deposit installation. This paper presents physical and structural properties for 7 magnetizable composite yarns A1-A7; Table 2: Magnetisable mixture recipes used for coating of the yarns
Sample Magnetisable blend recipes blend density (g/cm3) Hard magnetic blend Soft magnetic blend
A1 (45% FB1, 52% PVA, 3% G) 1,78
A2 (33% FB1, 66% PVA, 1% G) 1.57
A3 (30% CMP, 45% PVA, 10% PU, 5%G) 0.95
A4 (40% FB1, 50% PVA, 10% PU) 1.72
A5 (40,54% CMP, 56,75% PVA, 2,7%G) 0.9
A6 (50% FB1, 50% PU) 2.14
A7 (42,5% CMP, 54,5% PVA, 3%G) 0.89
Where: FB1 = Barium hexaferrite 1, CMP = composite soft magnetic powder, PVA = polyvinyl acetate, G = gliceryn, PU = polyuretane adhesive.
After the coating process with the formulas presented in Table 2, the magnetizable composite yarns were tested from the physical-structural point of view. Table 3 presents the mean values of the main physical characteristics of the coated yarns comparative with the support matrix. The wire diameter was determined by performing 100 measurements with a step of 100 mm on a piece of wire chosen randomly at a magnification degree of 9.45 X. Table 3: Main values of physical measurements of magnetisable yarns
59
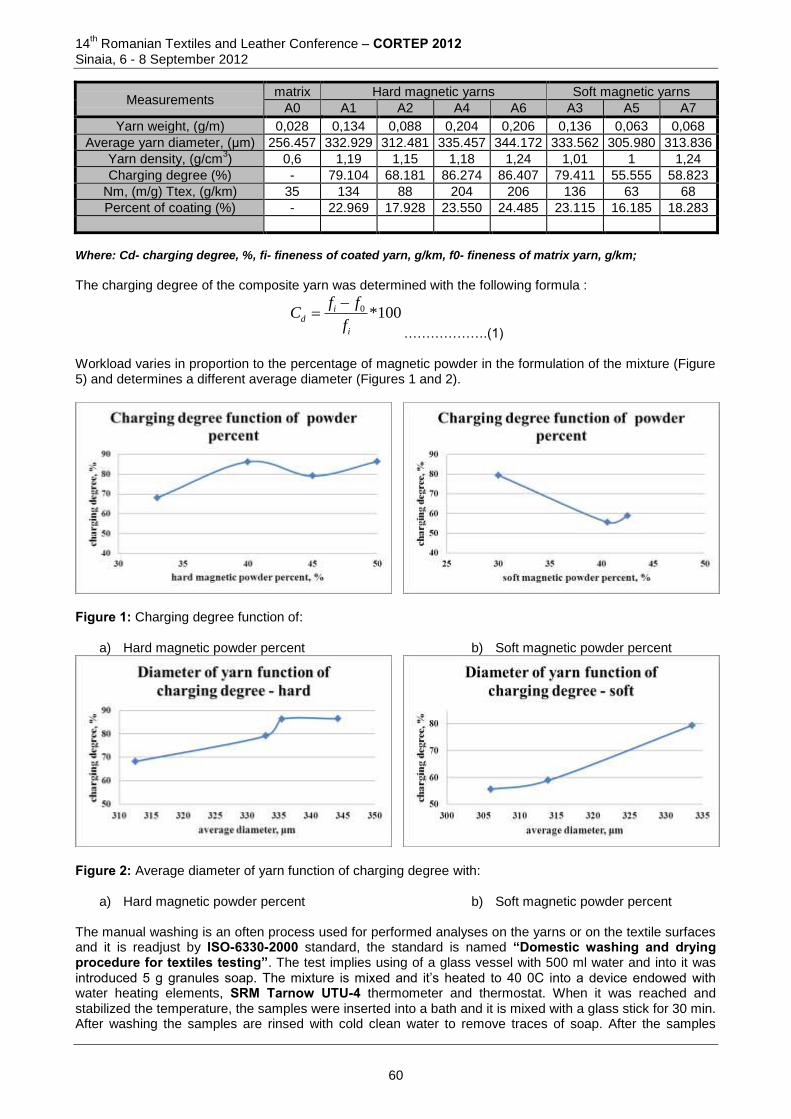
14th Romanian Textiles and Leather Conference – CORTEP 2012
Sinaia, 6 - 8 September 2012
Measurements matrix Hard magnetic yarns Soft magnetic yarns
A0 A1 A2 A4 A6 A3 A5 A7
Yarn weight, (g/m) 0,028 0,134 0,088 0,204 0,206 0,136 0,063 0,068
Average yarn diameter, (μm) 256.457 332.929 312.481 335.457 344.172 333.562 305.980 313.836
Yarn density, (g/cm3) 0,6 1,19 1,15 1,18 1,24 1,01 1 1,24
Charging degree (%) - 79.104 68.181 86.274 86.407 79.411 55.555 58.823
Nm, (m/g) Ttex, (g/km) 35 134 88 204 206 136 63 68
Percent of coating (%) - 22.969 17.928 23.550 24.485 23.115 16.185 18.283
Where: Cd- charging degree, %, fi- fineness of coated yarn, g/km, f0- fineness of matrix yarn, g/km;
The charging degree of the composite yarn was determined with the following formula :
0 *100id
i
f fC
f
……………….(1) Workload varies in proportion to the percentage of magnetic powder in the formulation of the mixture (Figure 5) and determines a different average diameter (Figures 1 and 2).
Figure 1: Charging degree function of:
a) Hard magnetic powder percent b) Soft magnetic powder percent
Figure 2: Average diameter of yarn function of charging degree with:
a) Hard magnetic powder percent b) Soft magnetic powder percent The manual washing is an often process used for performed analyses on the yarns or on the textile surfaces and it is readjust by ISO-6330-2000 standard, the standard is named “Domestic washing and drying procedure for textiles testing”. The test implies using of a glass vessel with 500 ml water and into it was introduced 5 g granules soap. The mixture is mixed and it’s heated to 40 0C into a device endowed with water heating elements, SRM Tarnow UTU-4 thermometer and thermostat. When it was reached and stabilized the temperature, the samples were inserted into a bath and it is mixed with a glass stick for 30 min. After washing the samples are rinsed with cold clean water to remove traces of soap. After the samples
60
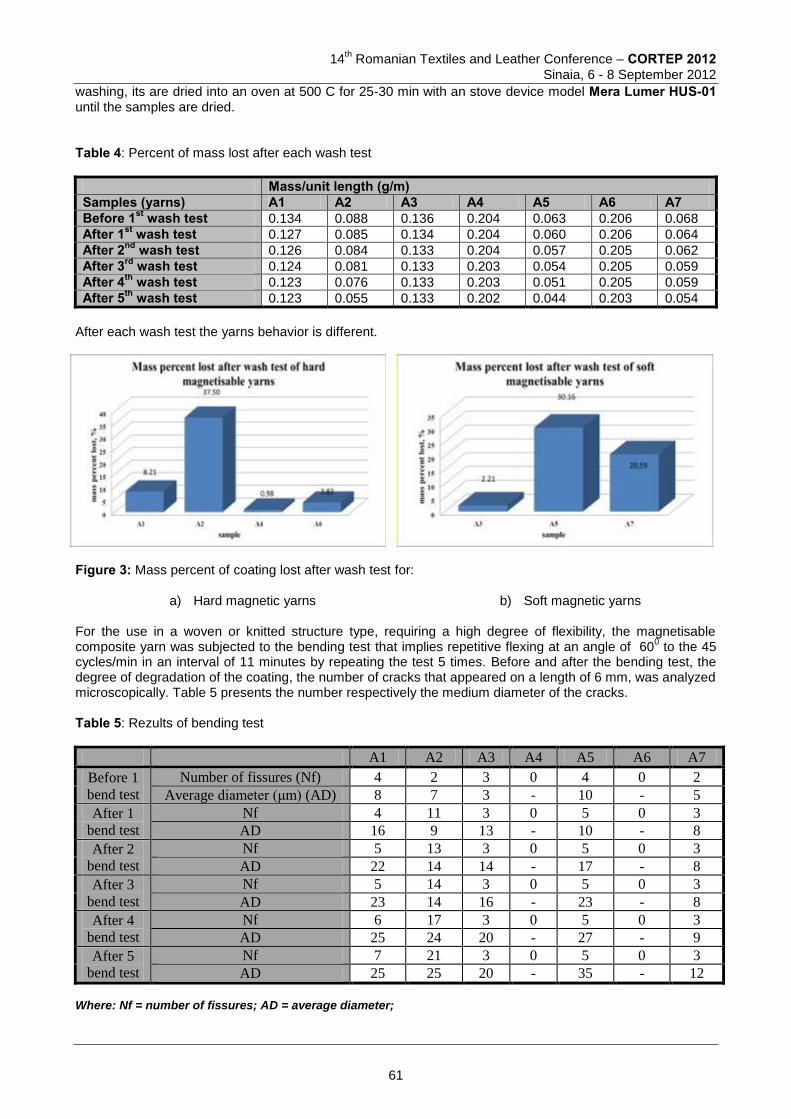
14
th Romanian Textiles and Leather Conference – CORTEP 2012
Sinaia, 6 - 8 September 2012
washing, its are dried into an oven at 500 C for 25-30 min with an stove device model Mera Lumer HUS-01 until the samples are dried. Table 4: Percent of mass lost after each wash test
Mass/unit length (g/m) Samples (yarns) A1 A2 A3 A4 A5 A6 A7 Before 1st wash test 0.134 0.088 0.136 0.204 0.063 0.206 0.068
After 1st wash test 0.127 0.085 0.134 0.204 0.060 0.206 0.064
After 2nd wash test 0.126 0.084 0.133 0.204 0.057 0.205 0.062
After 3rd wash test 0.124 0.081 0.133 0.203 0.054 0.205 0.059
After 4th wash test 0.123 0.076 0.133 0.203 0.051 0.205 0.059
After 5th wash test 0.123 0.055 0.133 0.202 0.044 0.203 0.054
After each wash test the yarns behavior is different.
Figure 3: Mass percent of coating lost after wash test for:
a) Hard magnetic yarns b) Soft magnetic yarns For the use in a woven or knitted structure type, requiring a high degree of flexibility, the magnetisable composite yarn was subjected to the bending test that implies repetitive flexing at an angle of 60
0 to the 45
cycles/min in an interval of 11 minutes by repeating the test 5 times. Before and after the bending test, the degree of degradation of the coating, the number of cracks that appeared on a length of 6 mm, was analyzed microscopically. Table 5 presents the number respectively the medium diameter of the cracks. Table 5: Rezults of bending test
A1 A2 A3 A4 A5 A6 A7
Before 1
bend test
Number of fissures (Nf) 4 2 3 0 4 0 2
Average diameter (μm) (AD) 8 7 3 - 10 - 5
After 1
bend test
Nf 4 11 3 0 5 0 3
AD 16 9 13 - 10 - 8
After 2
bend test
Nf 5 13 3 0 5 0 3
AD 22 14 14 - 17 - 8
After 3
bend test
Nf 5 14 3 0 5 0 3
AD 23 14 16 - 23 - 8
After 4
bend test
Nf 6 17 3 0 5 0 3
AD 25 24 20 - 27 - 9
After 5
bend test
Nf 7 21 3 0 5 0 3
AD 25 25 20 - 35 - 12
Where: Nf = number of fissures; AD = average diameter;
61
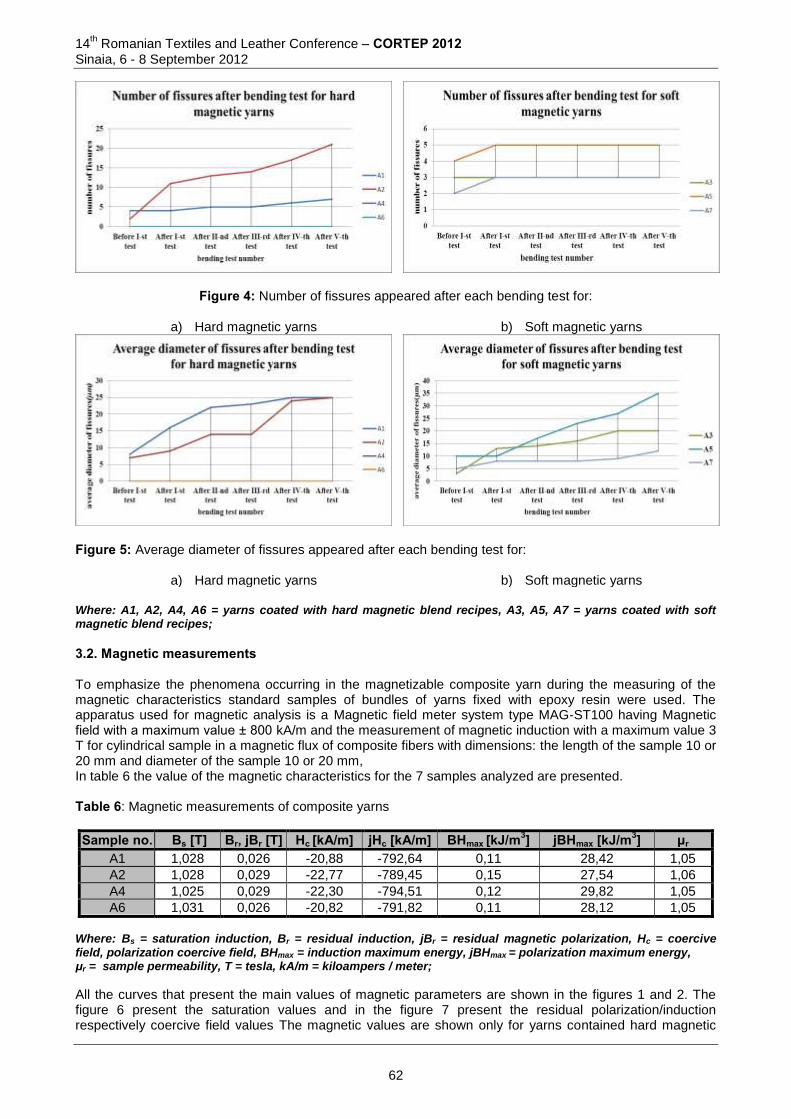
14th Romanian Textiles and Leather Conference – CORTEP 2012
Sinaia, 6 - 8 September 2012
Figure 4: Number of fissures appeared after each bending test for:
a) Hard magnetic yarns b) Soft magnetic yarns
Figure 5: Average diameter of fissures appeared after each bending test for:
a) Hard magnetic yarns b) Soft magnetic yarns Where: A1, A2, A4, A6 = yarns coated with hard magnetic blend recipes, A3, A5, A7 = yarns coated with soft magnetic blend recipes;
3.2. Magnetic measurements To emphasize the phenomena occurring in the magnetizable composite yarn during the measuring of the magnetic characteristics standard samples of bundles of yarns fixed with epoxy resin were used. The apparatus used for magnetic analysis is a Magnetic field meter system type MAG-ST100 having Magnetic field with a maximum value ± 800 kA/m and the measurement of magnetic induction with a maximum value 3 T for cylindrical sample in a magnetic flux of composite fibers with dimensions: the length of the sample 10 or 20 mm and diameter of the sample 10 or 20 mm, In table 6 the value of the magnetic characteristics for the 7 samples analyzed are presented. Table 6: Magnetic measurements of composite yarns
Sample no. Bs [T] Br, jBr [T] Hc [kA/m] jHc [kA/m] BHmax [kJ/m3] jBHmax [kJ/m3] μr A1 1,028 0,026 -20,88 -792,64 0,11 28,42 1,05
A2 1,028 0,029 -22,77 -789,45 0,15 27,54 1,06
A4 1,025 0,029 -22,30 -794,51 0,12 29,82 1,05
A6 1,031 0,026 -20,82 -791,82 0,11 28,12 1,05
Where: Bs = saturation induction, Br = residual induction, jBr = residual magnetic polarization, Hc = coercive field, polarization coercive field, BHmax = induction maximum energy, jBHmax = polarization maximum energy, μr = sample permeability, T = tesla, kA/m = kiloampers / meter;
All the curves that present the main values of magnetic parameters are shown in the figures 1 and 2. The figure 6 present the saturation values and in the figure 7 present the residual polarization/induction respectively coercive field values The magnetic values are shown only for yarns contained hard magnetic
62
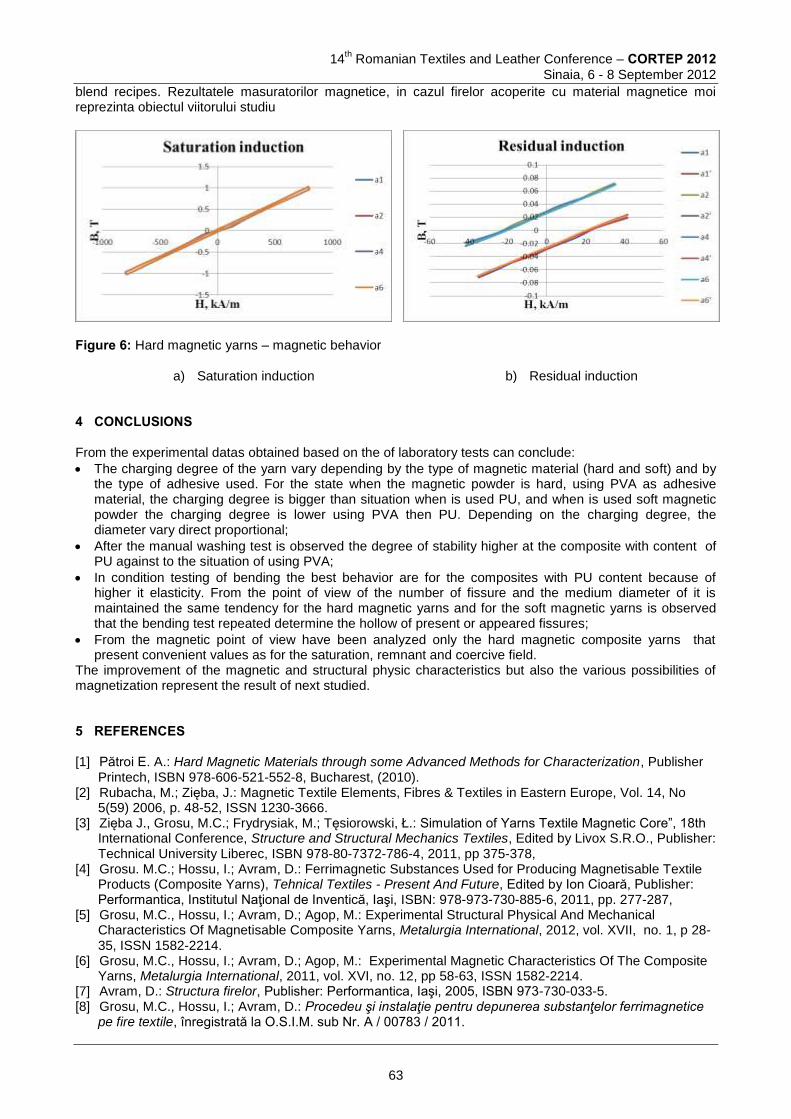
14
th Romanian Textiles and Leather Conference – CORTEP 2012
Sinaia, 6 - 8 September 2012
blend recipes. Rezultatele masuratorilor magnetice, in cazul firelor acoperite cu material magnetice moi reprezinta obiectul viitorului studiu
Figure 6: Hard magnetic yarns – magnetic behavior
a) Saturation induction b) Residual induction 4 CONCLUSIONS From the experimental datas obtained based on the of laboratory tests can conclude:
The charging degree of the yarn vary depending by the type of magnetic material (hard and soft) and by the type of adhesive used. For the state when the magnetic powder is hard, using PVA as adhesive material, the charging degree is bigger than situation when is used PU, and when is used soft magnetic powder the charging degree is lower using PVA then PU. Depending on the charging degree, the diameter vary direct proportional;
After the manual washing test is observed the degree of stability higher at the composite with content of PU against to the situation of using PVA;
In condition testing of bending the best behavior are for the composites with PU content because of higher it elasticity. From the point of view of the number of fissure and the medium diameter of it is maintained the same tendency for the hard magnetic yarns and for the soft magnetic yarns is observed that the bending test repeated determine the hollow of present or appeared fissures;
From the magnetic point of view have been analyzed only the hard magnetic composite yarns that present convenient values as for the saturation, remnant and coercive field.
The improvement of the magnetic and structural physic characteristics but also the various possibilities of magnetization represent the result of next studied. 5 REFERENCES [1] Pătroi E. A.: Hard Magnetic Materials through some Advanced Methods for Characterization, Publisher
Printech, ISBN 978-606-521-552-8, Bucharest, (2010). [2] Rubacha, M.; Zięba, J.: Magnetic Textile Elements, Fibres & Textiles in Eastern Europe, Vol. 14, No
5(59) 2006, p. 48-52, ISSN 1230-3666. [3] Zięba J., Grosu, M.C.; Frydrysiak, M.; Tęsiorowski, Ł.: Simulation of Yarns Textile Magnetic Core”, 18th
International Conference, Structure and Structural Mechanics Textiles, Edited by Livox S.R.O., Publisher: Technical University Liberec, ISBN 978-80-7372-786-4, 2011, pp 375-378,
[4] Grosu. M.C.; Hossu, I.; Avram, D.: Ferrimagnetic Substances Used for Producing Magnetisable Textile Products (Composite Yarns), Tehnical Textiles - Present And Future, Edited by Ion Cioară, Publisher: Performantica, Institutul Naţional de Inventică, Iaşi, ISBN: 978-973-730-885-6, 2011, pp. 277-287,
[5] Grosu, M.C., Hossu, I.; Avram, D.; Agop, M.: Experimental Structural Physical And Mechanical Characteristics Of Magnetisable Composite Yarns, Metalurgia International, 2012, vol. XVII, no. 1, p 28-35, ISSN 1582-2214.
[6] Grosu, M.C., Hossu, I.; Avram, D.; Agop, M.: Experimental Magnetic Characteristics Of The Composite Yarns, Metalurgia International, 2011, vol. XVI, no. 12, pp 58-63, ISSN 1582-2214.
[7] Avram, D.: Structura firelor, Publisher: Performantica, Iaşi, 2005, ISBN 973-730-033-5. [8] Grosu, M.C., Hossu, I.; Avram, D.: Procedeu şi instalaţie pentru depunerea substanţelor ferrimagnetice
pe fire textile, înregistrată la O.S.I.M. sub Nr. A / 00783 / 2011.
63
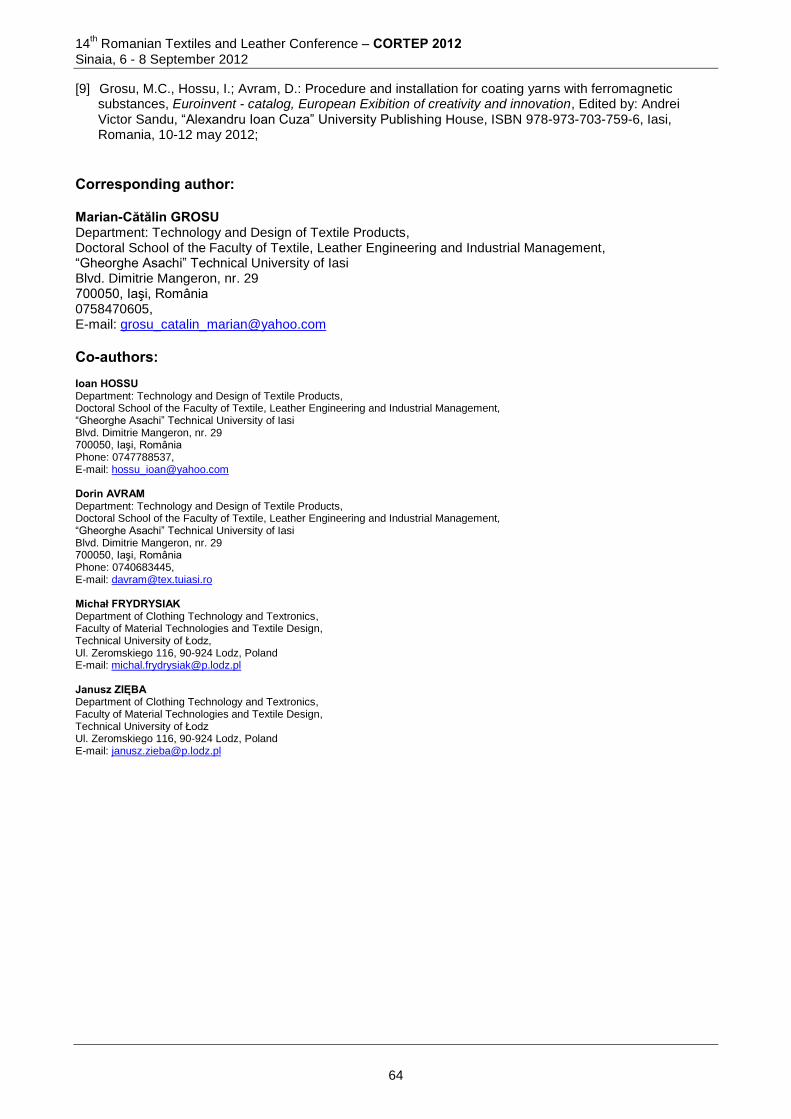
14th Romanian Textiles and Leather Conference – CORTEP 2012
Sinaia, 6 - 8 September 2012
[9] Grosu, M.C., Hossu, I.; Avram, D.: Procedure and installation for coating yarns with ferromagnetic substances, Euroinvent - catalog, European Exibition of creativity and innovation, Edited by: Andrei Victor Sandu, “Alexandru Ioan Cuza” University Publishing House, ISBN 978-973-703-759-6, Iasi, Romania, 10-12 may 2012;
Corresponding author: Marian-Cătălin GROSU Department: Technology and Design of Textile Products, Doctoral School of the Faculty of Textile, Leather Engineering and Industrial Management, “Gheorghe Asachi” Technical University of Iasi Blvd. Dimitrie Mangeron, nr. 29 700050, Iaşi, România 0758470605, E-mail: [email protected]
Co-authors: Ioan HOSSU Department: Technology and Design of Textile Products, Doctoral School of the Faculty of Textile, Leather Engineering and Industrial Management, “Gheorghe Asachi” Technical University of Iasi Blvd. Dimitrie Mangeron, nr. 29 700050, Iaşi, România Phone: 0747788537, E-mail: [email protected] Dorin AVRAM Department: Technology and Design of Textile Products, Doctoral School of the Faculty of Textile, Leather Engineering and Industrial Management, “Gheorghe Asachi” Technical University of Iasi Blvd. Dimitrie Mangeron, nr. 29 700050, Iaşi, România Phone: 0740683445, E-mail: [email protected] Michał FRYDRYSIAK Department of Clothing Technology and Textronics, Faculty of Material Technologies and Textile Design, Technical University of Łodz, Ul. Zeromskiego 116, 90-924 Lodz, Poland E-mail: [email protected] Janusz ZIĘBA Department of Clothing Technology and Textronics, Faculty of Material Technologies and Textile Design, Technical University of Łodz Ul. Zeromskiego 116, 90-924 Lodz, Poland E-mail: [email protected]
64
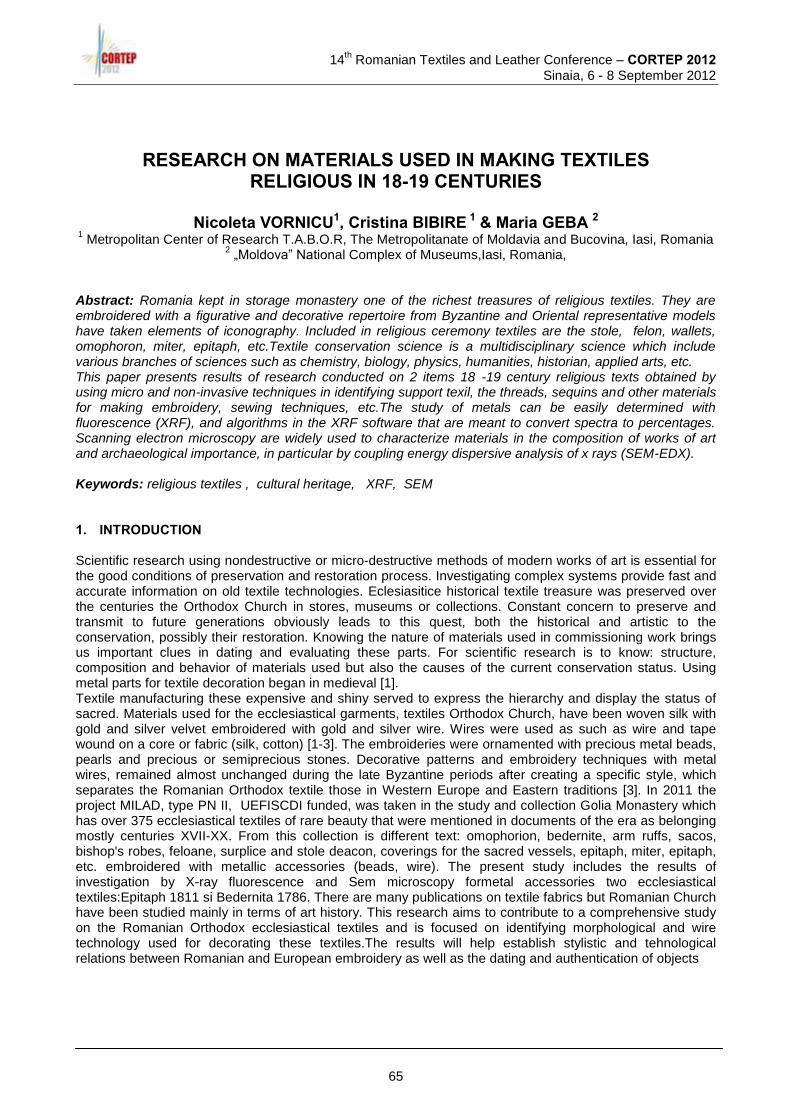
14
th Romanian Textiles and Leather Conference – CORTEP 2012
Sinaia, 6 - 8 September 2012
RESEARCH ON MATERIALS USED IN MAKING TEXTILES RELIGIOUS IN 18-19 CENTURIES
Nicoleta VORNICU1, Cristina BIBIRE 1 & Maria GEBA 2
1 Metropolitan Center of Research T.A.B.O.R, The Metropolitanate of Moldavia and Bucovina, Iasi, Romania
2 „Moldova” National Complex of Museums,Iasi, Romania,
Abstract: Romania kept in storage monastery one of the richest treasures of religious textiles. They are embroidered with a figurative and decorative repertoire from Byzantine and Oriental representative models have taken elements of iconography. Included in religious ceremony textiles are the stole, felon, wallets, omophoron, miter, epitaph, etc.Textile conservation science is a multidisciplinary science which include various branches of sciences such as chemistry, biology, physics, humanities, historian, applied arts, etc. This paper presents results of research conducted on 2 items 18 -19 century religious texts obtained by using micro and non-invasive techniques in identifying support texil, the threads, sequins and other materials for making embroidery, sewing techniques, etc.The study of metals can be easily determined with fluorescence (XRF), and algorithms in the XRF software that are meant to convert spectra to percentages. Scanning electron microscopy are widely used to characterize materials in the composition of works of art and archaeological importance, in particular by coupling energy dispersive analysis of x rays (SEM-EDX). Keywords: religious textiles , cultural heritage, XRF, SEM 1. INTRODUCTION Scientific research using nondestructive or micro-destructive methods of modern works of art is essential for the good conditions of preservation and restoration process. Investigating complex systems provide fast and accurate information on old textile technologies. Eclesiasitice historical textile treasure was preserved over the centuries the Orthodox Church in stores, museums or collections. Constant concern to preserve and transmit to future generations obviously leads to this quest, both the historical and artistic to the conservation, possibly their restoration. Knowing the nature of materials used in commissioning work brings us important clues in dating and evaluating these parts. For scientific research is to know: structure, composition and behavior of materials used but also the causes of the current conservation status. Using metal parts for textile decoration began in medieval [1]. Textile manufacturing these expensive and shiny served to express the hierarchy and display the status of sacred. Materials used for the ecclesiastical garments, textiles Orthodox Church, have been woven silk with gold and silver velvet embroidered with gold and silver wire. Wires were used as such as wire and tape wound on a core or fabric (silk, cotton) [1-3]. The embroideries were ornamented with precious metal beads, pearls and precious or semiprecious stones. Decorative patterns and embroidery techniques with metal wires, remained almost unchanged during the late Byzantine periods after creating a specific style, which separates the Romanian Orthodox textile those in Western Europe and Eastern traditions [3]. In 2011 the project MILAD, type PN II, UEFISCDI funded, was taken in the study and collection Golia Monastery which has over 375 ecclesiastical textiles of rare beauty that were mentioned in documents of the era as belonging mostly centuries XVII-XX. From this collection is different text: omophorion, bedernite, arm ruffs, sacos, bishop's robes, feloane, surplice and stole deacon, coverings for the sacred vessels, epitaph, miter, epitaph, etc. embroidered with metallic accessories (beads, wire). The present study includes the results of investigation by X-ray fluorescence and Sem microscopy formetal accessories two ecclesiastical textiles:Epitaph 1811 si Bedernita 1786. There are many publications on textile fabrics but Romanian Church have been studied mainly in terms of art history. This research aims to contribute to a comprehensive study on the Romanian Orthodox ecclesiastical textiles and is focused on identifying morphological and wire technology used for decorating these textiles.The results will help establish stylistic and tehnological relations between Romanian and European embroidery as well as the dating and authentication of objects
65
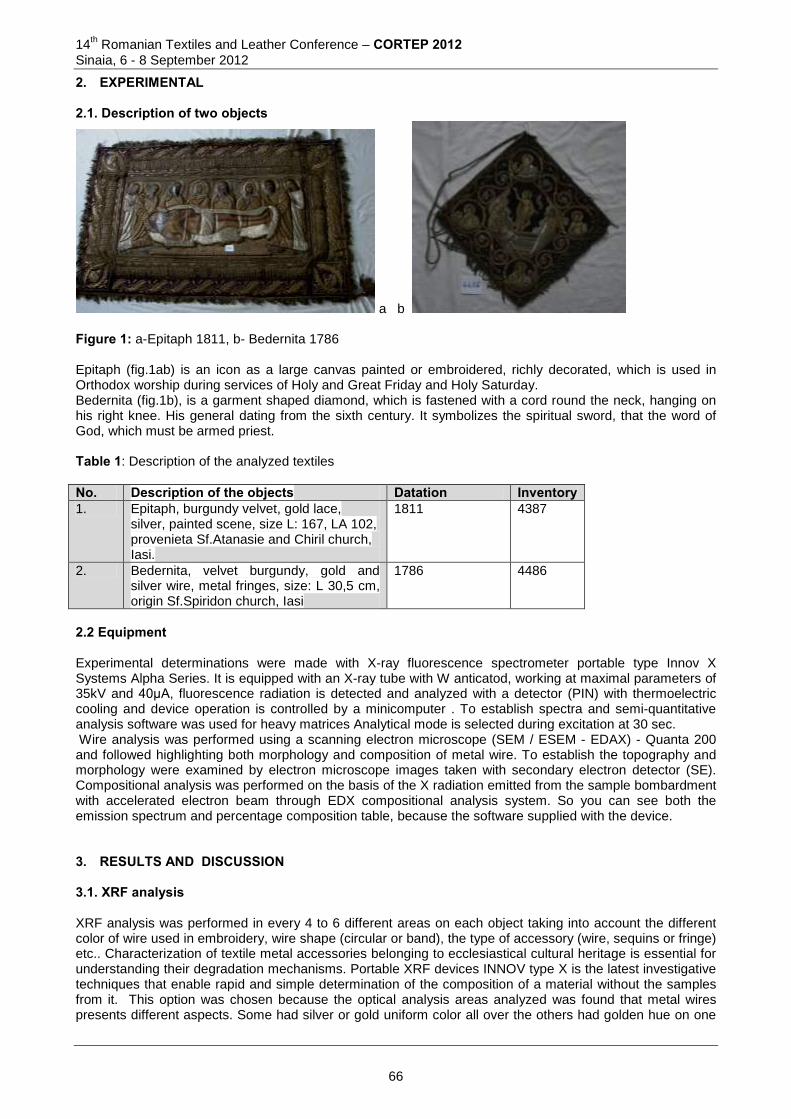
14th Romanian Textiles and Leather Conference – CORTEP 2012
Sinaia, 6 - 8 September 2012
2. EXPERIMENTAL 2.1. Description of two objects
a b Figure 1: a-Epitaph 1811, b- Bedernita 1786 Epitaph (fig.1ab) is an icon as a large canvas painted or embroidered, richly decorated, which is used in Orthodox worship during services of Holy and Great Friday and Holy Saturday. Bedernita (fig.1b), is a garment shaped diamond, which is fastened with a cord round the neck, hanging on his right knee. His general dating from the sixth century. It symbolizes the spiritual sword, that the word of God, which must be armed priest. Table 1: Description of the analyzed textiles
No. Description of the objects Datation Inventory 1. Epitaph, burgundy velvet, gold lace,
silver, painted scene, size L: 167, LA 102, provenieta Sf.Atanasie and Chiril church, Iasi.
1811 4387
2. Bedernita, velvet burgundy, gold and silver wire, metal fringes, size: L 30,5 cm, origin Sf.Spiridon church, Iasi
1786 4486
2.2 Equipment Experimental determinations were made with X-ray fluorescence spectrometer portable type Innov X Systems Alpha Series. It is equipped with an X-ray tube with W anticatod, working at maximal parameters of 35kV and 40μA, fluorescence radiation is detected and analyzed with a detector (PIN) with thermoelectric cooling and device operation is controlled by a minicomputer . To establish spectra and semi-quantitative analysis software was used for heavy matrices Analytical mode is selected during excitation at 30 sec. Wire analysis was performed using a scanning electron microscope (SEM / ESEM - EDAX) - Quanta 200 and followed highlighting both morphology and composition of metal wire. To establish the topography and morphology were examined by electron microscope images taken with secondary electron detector (SE). Compositional analysis was performed on the basis of the X radiation emitted from the sample bombardment with accelerated electron beam through EDX compositional analysis system. So you can see both the emission spectrum and percentage composition table, because the software supplied with the device. 3. RESULTS AND DISCUSSION 3.1. XRF analysis XRF analysis was performed in every 4 to 6 different areas on each object taking into account the different color of wire used in embroidery, wire shape (circular or band), the type of accessory (wire, sequins or fringe) etc.. Characterization of textile metal accessories belonging to ecclesiastical cultural heritage is essential for understanding their degradation mechanisms. Portable XRF devices INNOV type X is the latest investigative techniques that enable rapid and simple determination of the composition of a material without the samples from it. This option was chosen because the optical analysis areas analyzed was found that metal wires presents different aspects. Some had silver or gold uniform color all over the others had golden hue on one
66
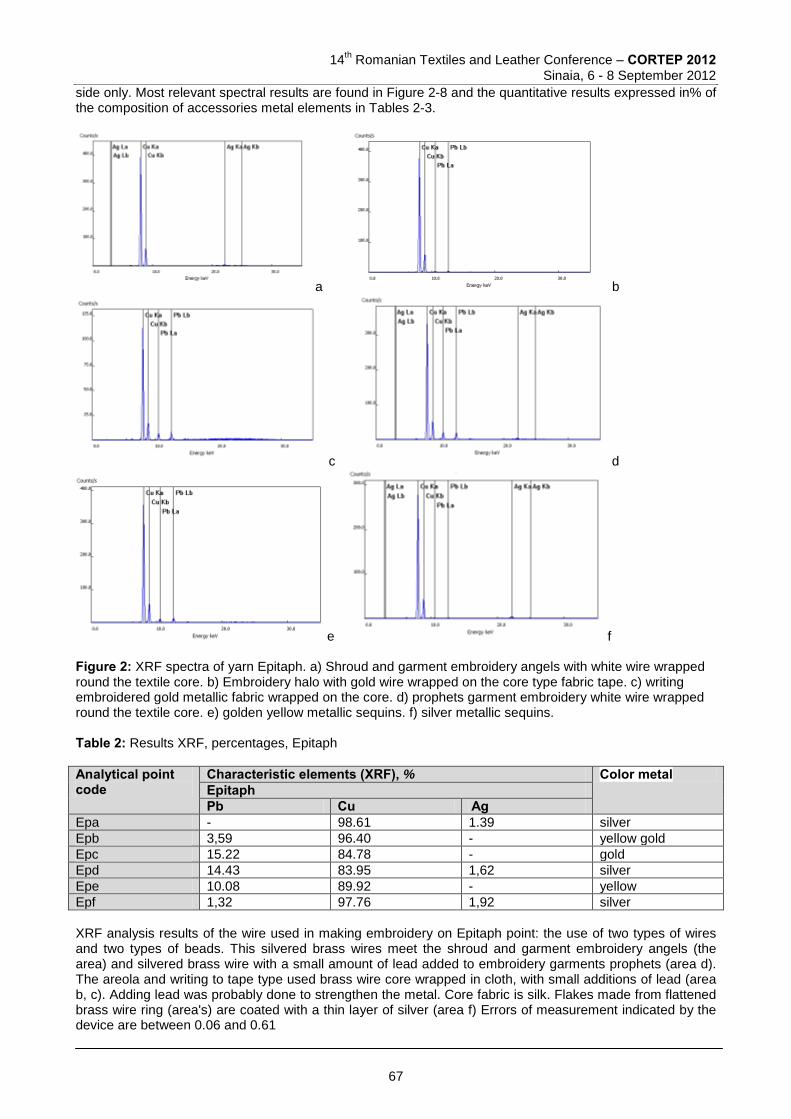
14
th Romanian Textiles and Leather Conference – CORTEP 2012
Sinaia, 6 - 8 September 2012
side only. Most relevant spectral results are found in Figure 2-8 and the quantitative results expressed in% of the composition of accessories metal elements in Tables 2-3.
a b
c d
e f Figure 2: XRF spectra of yarn Epitaph. a) Shroud and garment embroidery angels with white wire wrapped round the textile core. b) Embroidery halo with gold wire wrapped on the core type fabric tape. c) writing embroidered gold metallic fabric wrapped on the core. d) prophets garment embroidery white wire wrapped round the textile core. e) golden yellow metallic sequins. f) silver metallic sequins. Table 2: Results XRF, percentages, Epitaph
Analytical point code
Characteristic elements (XRF), % Color metal Epitaph Pb Cu Ag
Epa - 98.61 1.39 silver
Epb 3,59 96.40 - yellow gold
Epc 15.22 84.78 - gold
Epd 14.43 83.95 1,62 silver
Epe 10.08 89.92 - yellow
Epf 1,32 97.76 1,92 silver
XRF analysis results of the wire used in making embroidery on Epitaph point: the use of two types of wires and two types of beads. This silvered brass wires meet the shroud and garment embroidery angels (the area) and silvered brass wire with a small amount of lead added to embroidery garments prophets (area d). The areola and writing to tape type used brass wire core wrapped in cloth, with small additions of lead (area b, c). Adding lead was probably done to strengthen the metal. Core fabric is silk. Flakes made from flattened brass wire ring (area's) are coated with a thin layer of silver (area f) Errors of measurement indicated by the device are between 0.06 and 0.61
67
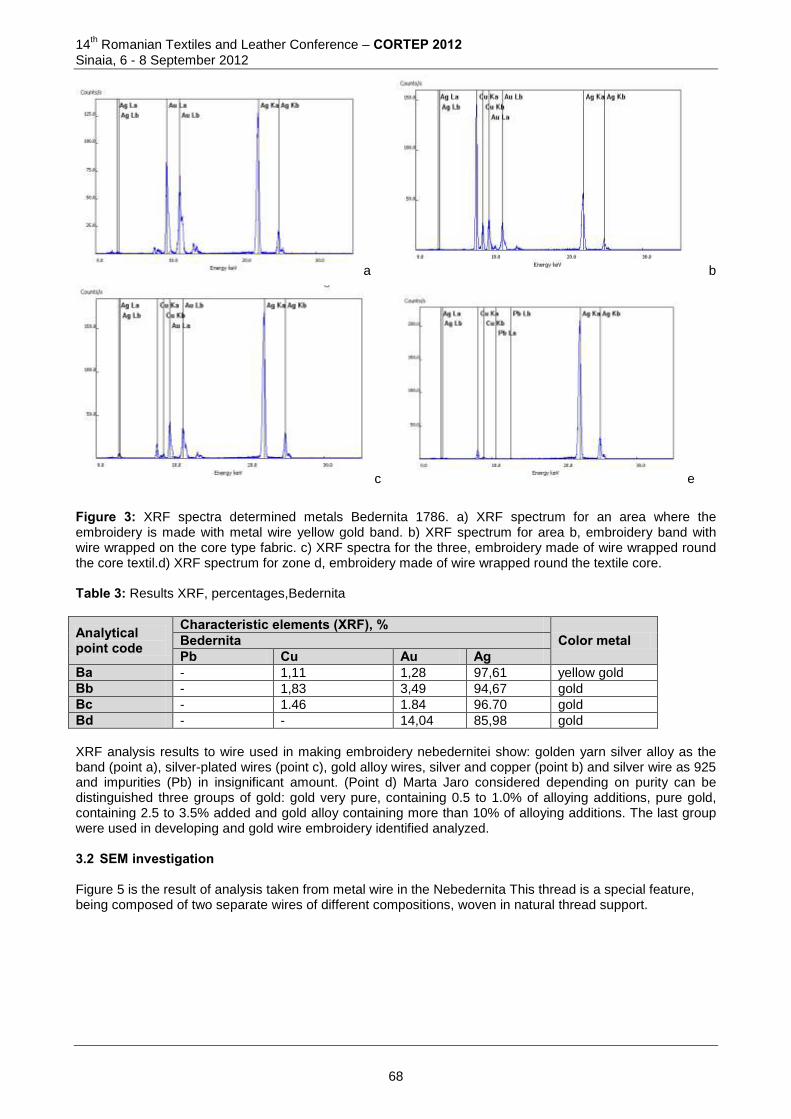
14th Romanian Textiles and Leather Conference – CORTEP 2012
Sinaia, 6 - 8 September 2012
a b
c e
Figure 3: XRF spectra determined metals Bedernita 1786. a) XRF spectrum for an area where the embroidery is made with metal wire yellow gold band. b) XRF spectrum for area b, embroidery band with wire wrapped on the core type fabric. c) XRF spectra for the three, embroidery made of wire wrapped round the core textil.d) XRF spectrum for zone d, embroidery made of wire wrapped round the textile core. Table 3: Results XRF, percentages,Bedernita
Analytical point code
Characteristic elements (XRF), % Color metal Bedernita
Pb Cu Au Ag Ba - 1,11 1,28 97,61 yellow gold
Bb - 1,83 3,49 94,67 gold
Bc - 1.46 1.84 96.70 gold
Bd - - 14,04 85,98 gold
XRF analysis results to wire used in making embroidery nebedernitei show: golden yarn silver alloy as the band (point a), silver-plated wires (point c), gold alloy wires, silver and copper (point b) and silver wire as 925 and impurities (Pb) in insignificant amount. (Point d) Marta Jaro considered depending on purity can be distinguished three groups of gold: gold very pure, containing 0.5 to 1.0% of alloying additions, pure gold, containing 2.5 to 3.5% added and gold alloy containing more than 10% of alloying additions. The last group were used in developing and gold wire embroidery identified analyzed. 3.2 SEM investigation Figure 5 is the result of analysis taken from metal wire in the Nebedernita This thread is a special feature, being composed of two separate wires of different compositions, woven in natural thread support.
68
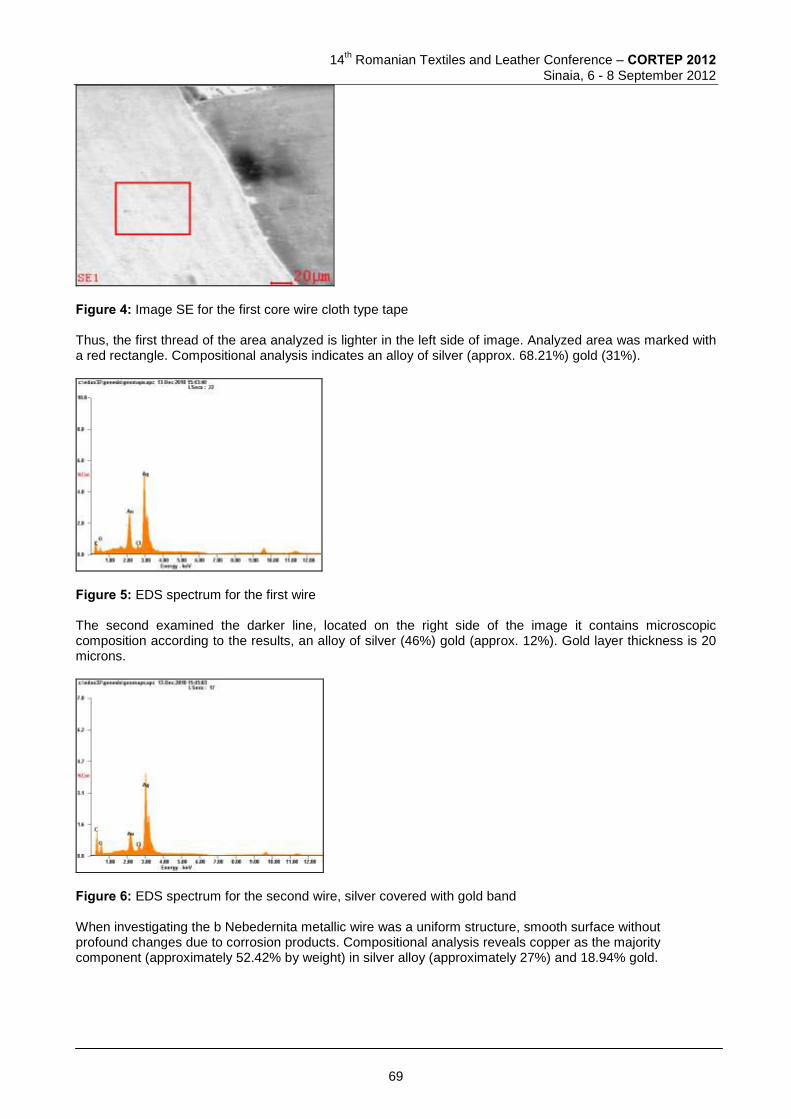
14
th Romanian Textiles and Leather Conference – CORTEP 2012
Sinaia, 6 - 8 September 2012
Figure 4: Image SE for the first core wire cloth type tape Thus, the first thread of the area analyzed is lighter in the left side of image. Analyzed area was marked with a red rectangle. Compositional analysis indicates an alloy of silver (approx. 68.21%) gold (31%).
Figure 5: EDS spectrum for the first wire The second examined the darker line, located on the right side of the image it contains microscopic composition according to the results, an alloy of silver (46%) gold (approx. 12%). Gold layer thickness is 20 microns.
Figure 6: EDS spectrum for the second wire, silver covered with gold band When investigating the b Nebedernita metallic wire was a uniform structure, smooth surface without profound changes due to corrosion products. Compositional analysis reveals copper as the majority component (approximately 52.42% by weight) in silver alloy (approximately 27%) and 18.94% gold.
69
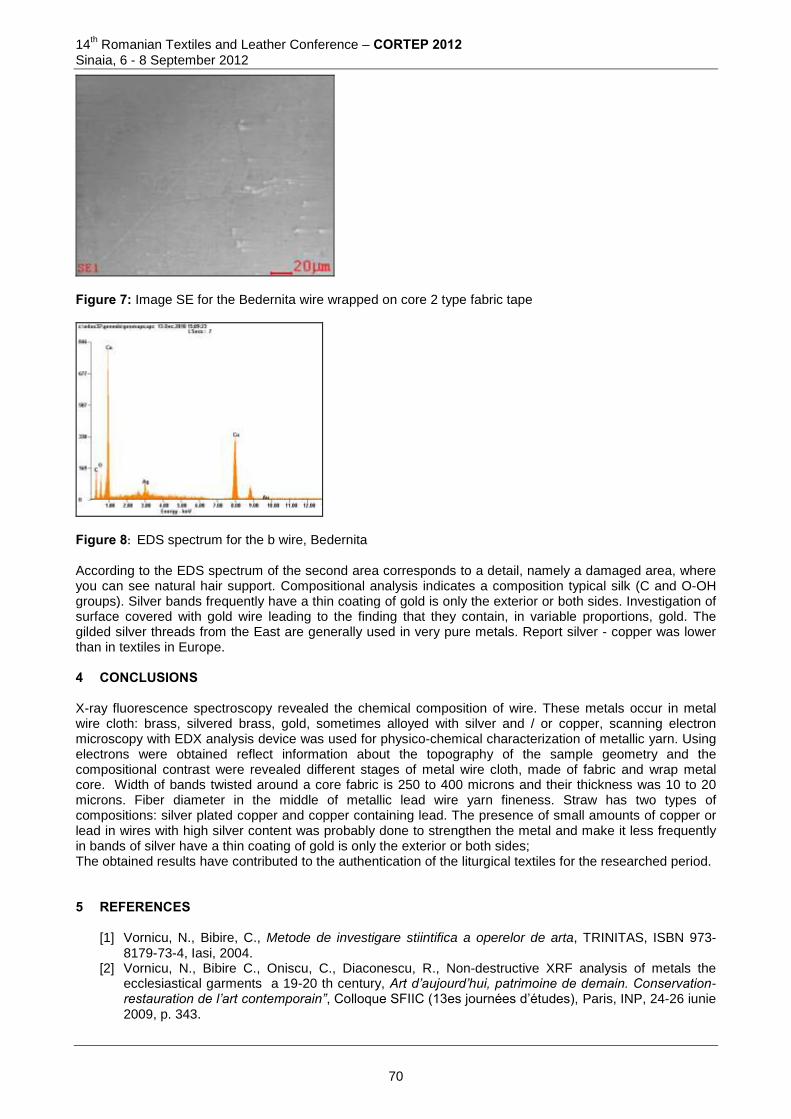
14th Romanian Textiles and Leather Conference – CORTEP 2012
Sinaia, 6 - 8 September 2012
Figure 7: Image SE for the Bedernita wire wrapped on core 2 type fabric tape
Figure 8: EDS spectrum for the b wire, Bedernita According to the EDS spectrum of the second area corresponds to a detail, namely a damaged area, where you can see natural hair support. Compositional analysis indicates a composition typical silk (C and O-OH groups). Silver bands frequently have a thin coating of gold is only the exterior or both sides. Investigation of surface covered with gold wire leading to the finding that they contain, in variable proportions, gold. The gilded silver threads from the East are generally used in very pure metals. Report silver - copper was lower than in textiles in Europe. 4 CONCLUSIONS X-ray fluorescence spectroscopy revealed the chemical composition of wire. These metals occur in metal wire cloth: brass, silvered brass, gold, sometimes alloyed with silver and / or copper, scanning electron microscopy with EDX analysis device was used for physico-chemical characterization of metallic yarn. Using electrons were obtained reflect information about the topography of the sample geometry and the compositional contrast were revealed different stages of metal wire cloth, made of fabric and wrap metal core. Width of bands twisted around a core fabric is 250 to 400 microns and their thickness was 10 to 20 microns. Fiber diameter in the middle of metallic lead wire yarn fineness. Straw has two types of compositions: silver plated copper and copper containing lead. The presence of small amounts of copper or lead in wires with high silver content was probably done to strengthen the metal and make it less frequently in bands of silver have a thin coating of gold is only the exterior or both sides; The obtained results have contributed to the authentication of the liturgical textiles for the researched period. 5 REFERENCES
[1] Vornicu, N., Bibire, C., Metode de investigare stiintifica a operelor de arta, TRINITAS, ISBN 973-8179-73-4, Iasi, 2004.
[2] Vornicu, N., Bibire C., Oniscu, C., Diaconescu, R., Non-destructive XRF analysis of metals the ecclesiastical garments a 19-20 th century, Art d’aujourd’hui, patrimoine de demain. Conservation-restauration de l’art contemporain”, Colloque SFIIC (13es journées d’études), Paris, INP, 24-26 iunie 2009, p. 343.
70
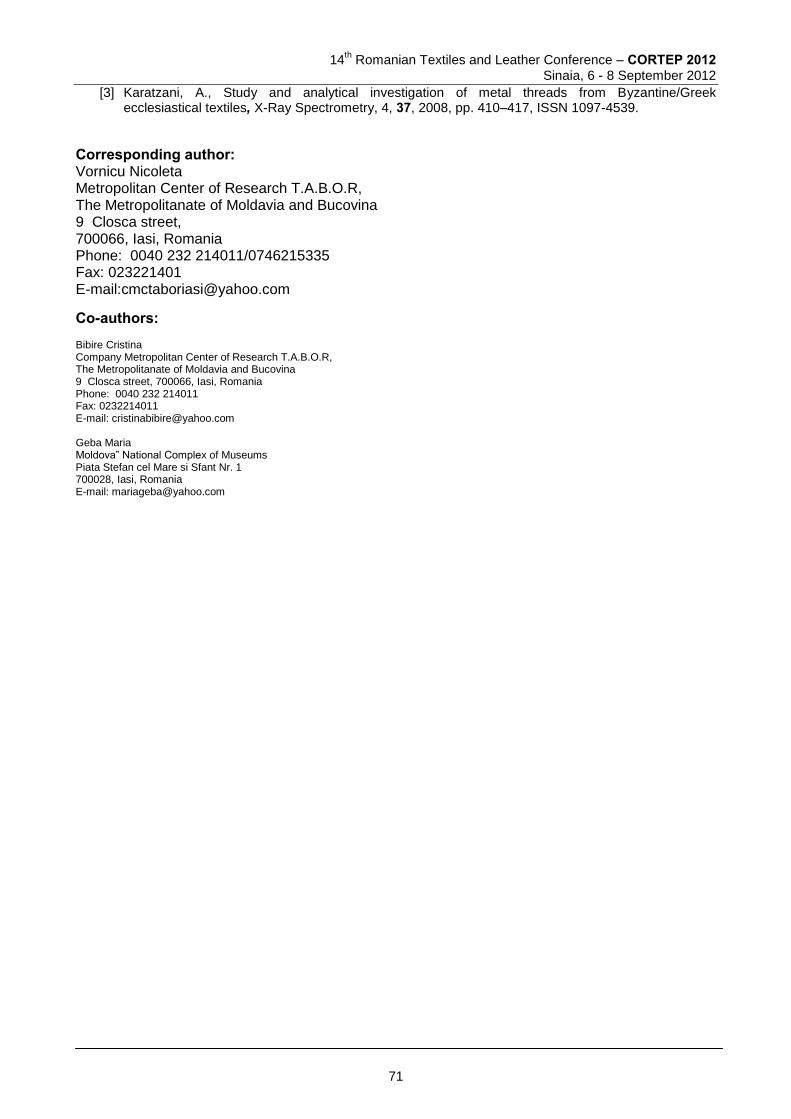
14
th Romanian Textiles and Leather Conference – CORTEP 2012
Sinaia, 6 - 8 September 2012
[3] Karatzani, A., Study and analytical investigation of metal threads from Byzantine/Greek ecclesiastical textiles, X-Ray Spectrometry, 4, 37, 2008, pp. 410–417, ISSN 1097-4539.
Corresponding author: Vornicu Nicoleta Metropolitan Center of Research T.A.B.O.R, The Metropolitanate of Moldavia and Bucovina 9 Closca street, 700066, Iasi, Romania Phone: 0040 232 214011/0746215335 Fax: 023221401 E-mail:[email protected]
Co-authors: Bibire Cristina Company Metropolitan Center of Research T.A.B.O.R, The Metropolitanate of Moldavia and Bucovina 9 Closca street, 700066, Iasi, Romania Phone: 0040 232 214011 Fax: 0232214011 E-mail: [email protected] Geba Maria Moldova” National Complex of Museums Piata Stefan cel Mare si Sfant Nr. 1 700028, Iasi, Romania E-mail: [email protected]
71
14
th Romanian Textiles and Leather Conference – CORTEP 2012
Sinaia, 6 - 8 September 2012
PRODUCTIVITY IMPROVEMENT OF MODERN SHUTTLELESS WEAVING MACHINES BY USING THE STATISTICAL QUALITY CONTROL TOOLS
Taher Rajab KADDAR
Faculty of Chemical and Petroleum Engineering - AL-Baath University – Homs - Syria
Abstract: Textile industry is one of the pillars of the Syrian economy, due to the availability of raw material. In Syria exists twenty six general textile companies, 7 weaving companies are producing woven fabrics , equipped with modern shuttleless weaving machines, and hundreds of small and medium-sized companies. It is necessary to improve productivity and quality continuously to reduce the cost of products. In this research we have identified the causes of low productivity of Shuttleless weaving Machines for general weaving companies by using the quality tools, and we ordered the reasons according to their importance and frequency, and we developed a methodology to treatment them. The methodology was harmonized to be applicable in the similar companies. Keywords: Improvement, weaving Machines, Quality Tools
1. INTRODUCTION
Textile industry it's one of the basic components in Syrian economy and it's known since ancient, but currently suffers of low productivity compared with the available production capacities, which weakens their competitiveness in the global markets. In Syrian Arab Republic exists twenty-six big general textile companies , include 7 weaving companies produce all kinds of woven fabrics , belong to General Organization for Textile Industries GOTI , and other hundreds of small and medium-sized companies, are producing woven fabrics, equipped with modern shuttleless weaving machines. Therefore it is necessary to improve continuously the productivity and quality to reduce the cost of products. All Syrian weaving companies contain Modern shuttleless weaving machines .The general weaving companies are: Company of Commerce and Industry United (Damascus) , United Arab Company for industry (Damascus) - General Company for Spinning and Weaving (Damascus) - General Company for Spinning and Weaving and Dyeing (Homs) , Syrian Company for Spinning and Weaving (Aleppo) , Alshhbaa Company for spinning and weaving (Aleppo) - Latakia Weaving Company. The production capacity of general weaving companies, is about 120 million linear meter annually , this quantity are produced by Shuttleless weaving Machines, such as: Sulzer , projectile and rapier weaving machines, Saurer , Picanol, , Textima . All companies produce similar products, which enable all companies to take advantage of the search results.[1,2] The various shuttleless weaving machines can be classified into various groups :
1- Projectile weaving machines
2- Rapier weaving machines
3- Fluid Jet weaving machines
4- Multiphase weaving machines The most common shuttleless weaving machines are: Air jet Weaving Machines, Rapier weaving Machines, Projectile weaving Machines [1,2] . They differ one to other of maximum weft insertion rate (m/min) , work width (cm) , number of weft colors . In Syria exists thousands of modern weaving machines of every group. For this reason, we have planned to execute this research. In this research we have identified the causes of low productivity of modern shuttleless weaving machines, to improve productivity using the quality tools, for one of the weaving companies in major public sector, and we have ordered the reasons according to their importance and frequency, and we have developed a methodology to resolve them, through the conducted study. The methodology it’s applicable to similar companies.
72
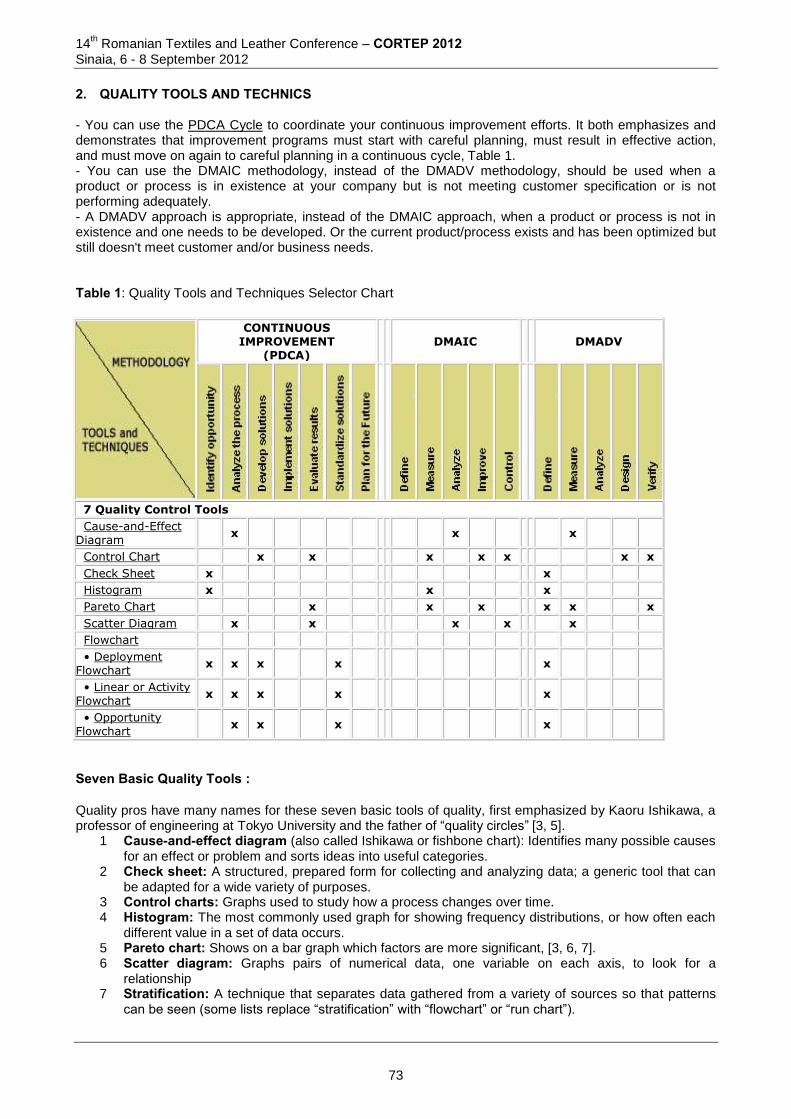
14th Romanian Textiles and Leather Conference – CORTEP 2012
Sinaia, 6 - 8 September 2012
2. QUALITY TOOLS AND TECHNICS - You can use the PDCA Cycle to coordinate your continuous improvement efforts. It both emphasizes and demonstrates that improvement programs must start with careful planning, must result in effective action, and must move on again to careful planning in a continuous cycle, Table 1. - You can use the DMAIC methodology, instead of the DMADV methodology, should be used when a product or process is in existence at your company but is not meeting customer specification or is not performing adequately. - A DMADV approach is appropriate, instead of the DMAIC approach, when a product or process is not in existence and one needs to be developed. Or the current product/process exists and has been optimized but still doesn't meet customer and/or business needs. Table 1: Quality Tools and Techniques Selector Chart
CONTINUOUS IMPROVEMENT
(PDCA) DMAIC DMADV
7 Quality Control Tools
Cause-and-Effect Diagram
x x x
Control Chart x x x x x x x
Check Sheet x x
Histogram x x x
Pareto Chart x x x x x x
Scatter Diagram x x x x x
Flowchart
• Deployment Flowchart
x x x x x
• Linear or Activity Flowchart
x x x x x
• Opportunity Flowchart
x x x x
Seven Basic Quality Tools : Quality pros have many names for these seven basic tools of quality, first emphasized by Kaoru Ishikawa, a professor of engineering at Tokyo University and the father of “quality circles” [3, 5].
1 Cause-and-effect diagram (also called Ishikawa or fishbone chart): Identifies many possible causes for an effect or problem and sorts ideas into useful categories.
2 Check sheet: A structured, prepared form for collecting and analyzing data; a generic tool that can be adapted for a wide variety of purposes.
3 Control charts: Graphs used to study how a process changes over time. 4 Histogram: The most commonly used graph for showing frequency distributions, or how often each
different value in a set of data occurs. 5 Pareto chart: Shows on a bar graph which factors are more significant, [3, 6, 7]. 6 Scatter diagram: Graphs pairs of numerical data, one variable on each axis, to look for a
relationship 7 Stratification: A technique that separates data gathered from a variety of sources so that patterns
can be seen (some lists replace “stratification” with “flowchart” or “run chart”).
73
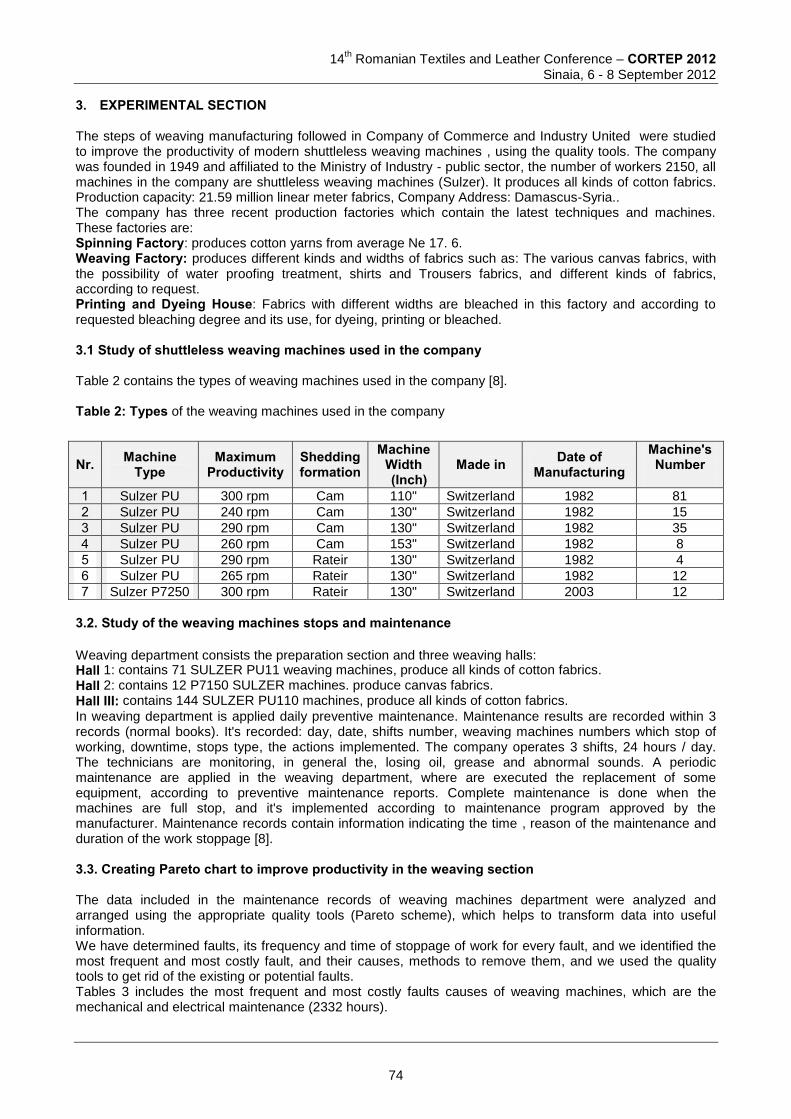
14
th Romanian Textiles and Leather Conference – CORTEP 2012
Sinaia, 6 - 8 September 2012
3. EXPERIMENTAL SECTION The steps of weaving manufacturing followed in Company of Commerce and Industry United were studied to improve the productivity of modern shuttleless weaving machines , using the quality tools. The company was founded in 1949 and affiliated to the Ministry of Industry - public sector, the number of workers 2150, all machines in the company are shuttleless weaving machines (Sulzer). It produces all kinds of cotton fabrics. Production capacity: 21.59 million linear meter fabrics, Company Address: Damascus-Syria.. The company has three recent production factories which contain the latest techniques and machines. These factories are: Spinning Factory: produces cotton yarns from average Ne 17. 6. Weaving Factory: produces different kinds and widths of fabrics such as: The various canvas fabrics, with the possibility of water proofing treatment, shirts and Trousers fabrics, and different kinds of fabrics, according to request. Printing and Dyeing House: Fabrics with different widths are bleached in this factory and according to requested bleaching degree and its use, for dyeing, printing or bleached. 3.1 Study of shuttleless weaving machines used in the company Table 2 contains the types of weaving machines used in the company [8]. Table 2: Types of the weaving machines used in the company
Machine's Number
Date of
Manufacturing Made in Machine
Width (Inch)
Shedding formation
Maximum Productivity
Machine Type Nr.
81 1982 Switzerland 110" Cam 300 rpm Sulzer PU 1
15 1982 Switzerland 130" Cam 240 rpm Sulzer PU 2
35 1982 Switzerland 130" Cam 290 rpm Sulzer PU 3
8 1982 Switzerland 153" Cam 260 rpm Sulzer PU 4
4 1982 Switzerland 130" Rateir 290 rpm Sulzer PU 5
12 1982 Switzerland 130" Rateir 265 rpm Sulzer PU 6
12 2003 Switzerland 130" Rateir 300 rpm Sulzer P7250 7
3.2. Study of the weaving machines stops and maintenance Weaving department consists the preparation section and three weaving halls: Hall 1: contains 71 SULZER PU11 weaving machines, produce all kinds of cotton fabrics.
Hall 2: contains 12 P7150 SULZER machines. produce canvas fabrics.
Hall III: contains 144 SULZER PU110 machines, produce all kinds of cotton fabrics.
In weaving department is applied daily preventive maintenance. Maintenance results are recorded within 3 records (normal books). It's recorded: day, date, shifts number, weaving machines numbers which stop of working, downtime, stops type, the actions implemented. The company operates 3 shifts, 24 hours / day. The technicians are monitoring, in general the, losing oil, grease and abnormal sounds. A periodic maintenance are applied in the weaving department, where are executed the replacement of some equipment, according to preventive maintenance reports. Complete maintenance is done when the machines are full stop, and it's implemented according to maintenance program approved by the manufacturer. Maintenance records contain information indicating the time , reason of the maintenance and duration of the work stoppage [8]. 3.3. Creating Pareto chart to improve productivity in the weaving section The data included in the maintenance records of weaving machines department were analyzed and arranged using the appropriate quality tools (Pareto scheme), which helps to transform data into useful information. We have determined faults, its frequency and time of stoppage of work for every fault, and we identified the most frequent and most costly fault, and their causes, methods to remove them, and we used the quality tools to get rid of the existing or potential faults. Tables 3 includes the most frequent and most costly faults causes of weaving machines, which are the mechanical and electrical maintenance (2332 hours).
74
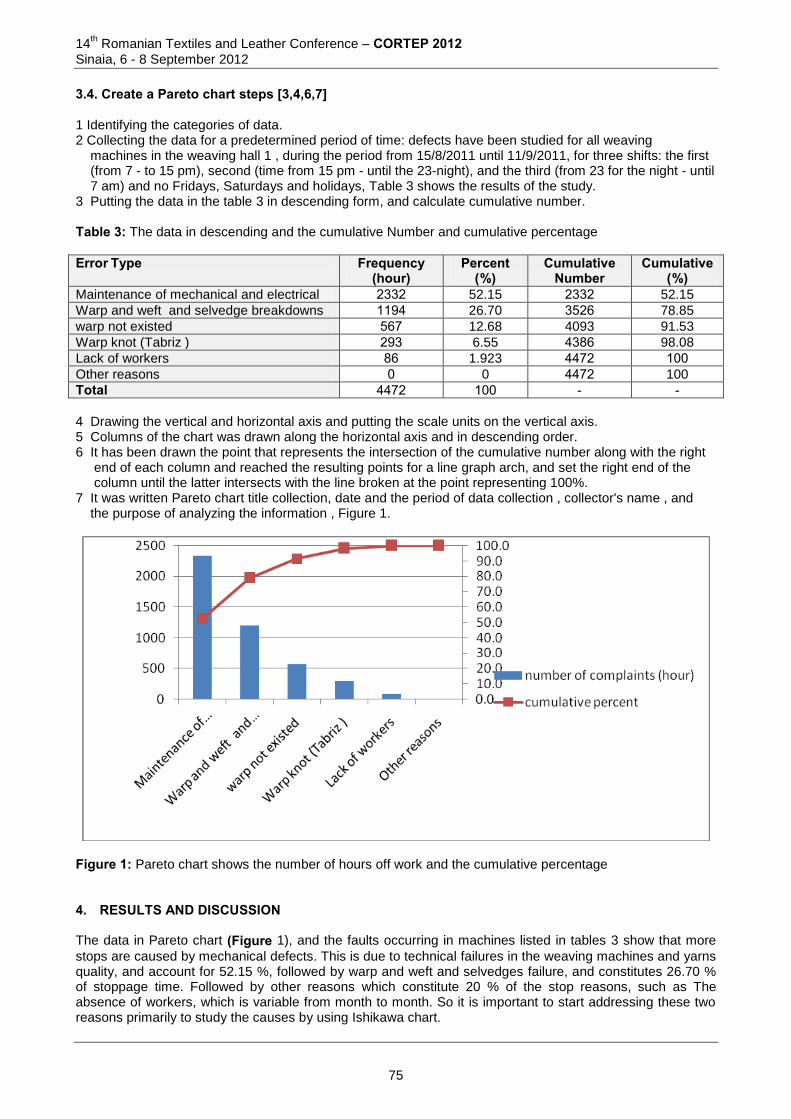
14th Romanian Textiles and Leather Conference – CORTEP 2012
Sinaia, 6 - 8 September 2012
3.4. Create a Pareto chart steps [3,4,6,7] 1 Identifying the categories of data. 2 Collecting the data for a predetermined period of time: defects have been studied for all weaving machines in the weaving hall 1 , during the period from 15/8/2011 until 11/9/2011, for three shifts: the first (from 7 - to 15 pm), second (time from 15 pm - until the 23-night), and the third (from 23 for the night - until 7 am) and no Fridays, Saturdays and holidays, Table 3 shows the results of the study. 3 Putting the data in the table 3 in descending form, and calculate cumulative number. Table 3: The data in descending and the cumulative Number and cumulative percentage
Error Type Frequency (hour)
Percent (%)
Cumulative Number
Cumulative (%)
Maintenance of mechanical and electrical 2332 52.15 2332 52.15
Warp and weft and selvedge breakdowns 1114 26.70 3526 78.85
warp not existed 567 12.68 4093 91.53
Warp knot (Tabriz ) 213 6.55 4336 98.08
Lack of workers 36 1.923 4472 111
Other reasons 1 0 4472 100
Total 4472 111 - -
4 Drawing the vertical and horizontal axis and putting the scale units on the vertical axis. 5 Columns of the chart was drawn along the horizontal axis and in descending order. 6 It has been drawn the point that represents the intersection of the cumulative number along with the right end of each column and reached the resulting points for a line graph arch, and set the right end of the column until the latter intersects with the line broken at the point representing 100%. 7 It was written Pareto chart title collection, date and the period of data collection , collector's name , and the purpose of analyzing the information , Figure 1.
Figure 1: Pareto chart shows the number of hours off work and the cumulative percentage 4. RESULTS AND DISCUSSION The data in Pareto chart (Figure 1), and the faults occurring in machines listed in tables 3 show that more
stops are caused by mechanical defects. This is due to technical failures in the weaving machines and yarns quality, and account for 52.15 %, followed by warp and weft and selvedges failure, and constitutes 26.70 % of stoppage time. Followed by other reasons which constitute 20 % of the stop reasons, such as The absence of workers, which is variable from month to month. So it is important to start addressing these two reasons primarily to study the causes by using Ishikawa chart.
75
14
th Romanian Textiles and Leather Conference – CORTEP 2012
Sinaia, 6 - 8 September 2012
5. CONCLUSIONS 1 It have been identified failures that lead to low productivity of the weaving machines. and, the reasons to occur using the quality tools. 2 It have been identified ways to address the failures that lead to low productivity of weaving machines using the quality tools . 3 The technical situation of the machines used is an important cause of malfunctions mentioned, so we suggest intensification of maintenance periods and seek to replace the machines and the development and modernization of the company. 4 A scientific methodology has been developed to study, analyze , diagnose problems and finding solutions to them. The search results can be generalized to similar weaving companies. 5 The used maintenance system in the company is the emergency and planned maintenance system. Many Failures are resulting due to the existence of big number of weaving machines in the company ( 227 machines), and despite the existence of faults records , the advantage of this records is low , because they aren't subjected to careful analysis, and can be used more in the case of the use of quality tools proposed in this research . 6. REFERENCES [1] Adanur, Sabit , Hand book of weaving, 1
st edition, Technomic Publishing Co., Alabama,U.S.A- Auburn
University ,Textile Eng. Dept., 2001. [2] Kaddar, Taher,Weaving Technology book (2), AL-Baath University Publishing , Syria , 2008. [3] Kaddar,Taher, The Entrance to total Quality and ISO 9000 ,Dar Alhasad ,Damascus, Syria, 1998. [4] Michele McDonough ,Creating Pareto Charts With Microsoft Excel 2007/2010 ,Updated Sep 20, 2011,
Available on www.brighthub.com/office/.../8708.aspx [5] Nancy R. Tague’s. The Quality Toolbox, Second Edition, ASQ Quality Press, 2004, page 15. [6] Pareto Diagram, Institute for Healthcare Improvement. Boston, Massachusetts, USA [online], updated
17.03.2012 [cited dd.mm. 2004]. Available on www: <http:// www.magmutual.com. [7] Sample Pareto Diagram:Types of Errors Discovered During Surgical Setup, (Institute for
Healthcare Improvement Boston , Massachusetts, USA, 2004 ) [8] Sulzer Textile, P7150, PU 110, Adjustment Manual, Operating Instructions, Switzerland.
Corresponding author: Dr. Eng. Taher Rajab Kaddar Department of Textile and Spinning Engineering Faculty of Chemical and Petroleum Engineering AL-Baath University 0096331, Homs Syria Phone: +963115350098 Mobile phone: +963933517314 Fax: +963312126716 E-mail: [email protected]
76
14
th Romanian Textiles and Leather Conference – CORTEP 2012
Sinaia, 6 - 8 September 2012
THEORETICAL MODELING OF A CARBON NANOTUBE AS TEMPERATURE SENSOR
Monica Alina CALIN, Mirela TEODORESCU & Antonela CURTEZA
„Gheorghe Asachi” Technical University of Iasi, Romania Doctoral School of the Faculty of Textile, Leather and Industrial Management
Abstract: The theoretical modeling of the thermal conductivity of a single wall carbon nanotube is (SWNT) is studied. In the first part of the study, we focus on the effective thermic conductivity coefficient for the nanocomposites. Using the Fourier law, we simulate the theoretical behavior of a single walled carbon nanotube by studying the unidimensional thermic flux through the nanotube and the heat area transfer ratio. It was shown that the effective thermic conductivity coefficient of the nanocomposite increases with the volume fraction of the nanostructure. The second part of the study is focused on the influence of the geometry of the phasic structural “elements” to the effective thermic conductivity coefficient. In the third part of the paper, we study the temperature dependencies of the effective thermic conduction coefficient. Using the Wiedemann-Franz Equation, it was shown that the considered single walled carbon nanotube can work as a temperature sensor. Keywords: thermal conductivity, carbon nanotube, nanocomposites, sensors. 1 INTRODUCTION Sensors have a significant impact in everyday life. Due to this fact, there is a continuous and strong demand for producing highly sensitive, responsive sensors, at low costs. The high level of sensor request on the market, leads to the developing of new sensing materials and technologies, in an on-going process. Carbon nanotubes present a large variety of unique multifunctional properties such as optical transparency, charge dissipation, electrical shielding strength enhancement, that make them great candidates for a range of unique applications. Sensors are devices that can detect or measure physical and chemical quantities such as temperature, pressure, sound and concentration. The main requests of a good sensor are high sensitivity, fast response, low cost, high volume production, high reliability. The sensors have a wide range of possible applications, in many fields ranging from biomedical to automotive industry. Nanotechnology takes the sensors to a new level, by being able to create miniaturized sensors. [7] The discovery of carbon nanotubes aroused the interest of scientist to develop CNT-based sensors for many applications. Below, a theoretical modelling of a carbon nanotube as temperature sensor is studied. 2 EFFECTIVE THERMIC CONDUCTIVITY COEFFICIENT FOR NANOCOMPOSITES If we consider that the heat transfer in nanocomposites (matrix and nanostructure) is a consequence of the Fourier’s law [1]:
TkTj )(
(1)
where )(Tj
is the heat flux density, T is the temperature gradient and that it is realized on different “trajectories”
through both matrix and nanostructure. If both the equation (1) and the way that the thermic transfer through the nanocomposites is made are accepted, then the unidimensional termic flux will satisfy the following equation:
77

14th Romanian Textiles and Leather Conference – CORTEP 2012
Sinaia, 6 - 8 September 2012
Q = + =-
N
NN
M
MMdx
dTAk
dx
dTAk
(2)
where Q is the total heat flux through the nanocomposite, QM is the heat flux through the matrix, QN is the heat flux through the nanostructure, kM is the thermic conductivity coefficient of the matrix, kN is the thermic conductivity coefficient of the nanostructure, AM is the thermic transfer axis within the matrix, AN is the thermic transfer area in the nanostructure, is the unidimensional thermic gradient in the matrix, is the unidimensional thermic gradient in the nanostructure. Supposing that the both the matrix and the nanostructure are in thermic equilibrium in any “location”, we can write:
dx
dT
dx
dT
dx
dT
NM (3)
The equation (2) becomes:
Q = -kMAM
MM
NN
Ak
Ak
dx
dT1 (4)
For calculating the heat area transfer ratio, let ε be the structural elements volume fraction of the nanostructure and (1-ε) the structural elements volume fraction of the matrix. Then, the number of studied elements for the two constituents of the nanocomposite can be calculated as follows:
nM =
Mv
1 (5)
nN =
Nv
(6)
where vM is the volume of the structural “element” within the matrix and vN is the volume of the structural “element” within the nanostructure. The areas of the surfaces corresponding to the phases of the matrix and nanostructure have the following equations:
(7)
(8)
where aM is the area of the structural “element” within the matrix and aN is the area of the structural “element” within the nanostructure. If we consider that the heat area transfer ratio is equal to the phase surface area ratio
M
N
M
N
S
S
A
A (9)
or, more explicitly,
M
N
N
M
M
N
M
N
a
a
v
v
S
S
A
A
1 (10)
then, according to the thermic properties of the phases and the geometrical characteristics and the volume fractions of the studied “elements” according to the specific phases, the total heat flux (4) becomes:
Q = -kMAM
M
N
N
M
M
N
a
a
v
v
k
k
dx
dT
11
(11)
78
14
th Romanian Textiles and Leather Conference – CORTEP 2012
Sinaia, 6 - 8 September 2012
If kef is the effective thermal conductivity coefficient so that the total thermic flux has the following equation:
Q = - (12)
By identifying the (11) and (12) equations we obtain:
M
N
N
M
M
N
Mefa
a
v
v
k
kkk
11
(13)
For <<1 the equation (13) will become:
M
N
N
M
M
NMef
a
a
v
v
k
kkk 1
(14)
This result indicates the fact that the effective thermic conductivity coefficient of the nanocomposite increases with the volume fraction of the nanostructure. 3 THE INFLUENCE OF THE GEOMETRY OF THE PHASIC STRUCTURAL “ELEMENTS” TO THE
EFFECTIVE THERMIC CONDUCTIVITY COEFFICIENT We will study the way that the geometrical characteristics of the phasic structural “elements” influence the effective conductivity (14). We will consider the following situations: a) the phasic structural “elements” are spheres of rM and rN radius. Then:
vM= 3
3
4Mr
aM = 24 Mr
vN = 3
3
4Nr
aN = 24 Nr (15a-d)
which, through (13), induces the dependence:
kef =
N
M
M
NM
r
r
k
kk
11 (16)
For the particular situation when the equation (16) can be written as follows:
kef =
11
M
NM
k
kk (17)
specifying that the effective conductivity does not depend on the geometric characteristics of the phasic structural “elements”. b) the structural “element” of the nanostructure is the cylindrical tube in Figure 1:
79

14th Romanian Textiles and Leather Conference – CORTEP 2012
Sinaia, 6 - 8 September 2012
Figure 1: Geometric characteristics of the nanotube: average exterior radius RN, average interior radius rN and the average generatrix lN.
Then we will have:
= II
NN aa
)( 22
NNN rRa
NNN
II
N lrRa )(2
NNNNN
NNN
N
N
lrRrR
lrR
a
v
)(2)(
)(22
22
(18a-e)
which, through (13) induces the dependence:
NNNNN
NNN
M
M
M
NMef
lrRrR
lrR
a
v
k
kkk
)(2)(
)(
11
22
22
(19)
where:
Na is the bidimensional axis of the structural “element” of the nanostructure and is the longitudinal axis of the same “element”. In the equation (19) we can distinguish the thermic conduction along the carbon nanotube; in this situation, the effective thermal conductivity coefficient will be:
NNM
M
M
II
NM
II
efrRa
v
k
kkk
2
11
(20)
and the thermic conduction perpendicular to the carbon nanotube; in this situation the effective thermal conductivity coefficient becomes:
NM
M
M
NMef
la
v
k
kkk
1
11
(21)
where is the longitudinal thermic conduction coefficient of the nanostructure and
efk is the transversal thermic conduction coefficient of the nanostructure.
80
14
th Romanian Textiles and Leather Conference – CORTEP 2012
Sinaia, 6 - 8 September 2012
4 TEMPERATURE DEPENDENCIES OF THE EFFECTIVE THERMIC CONDUCTION COEFFICIENT Usually, the thermic transfer coefficients of the phases of the nanocomposite depend on the absolute temperature:
(22 a, b)
Then, the equation (13) becomes:
N
N
M
MNMef
v
a
a
vTkTkTk
1)()()( (23)
Particularly, for a nanocomposite having as structural “element” a carbon nanotube, the equation (15) becomes either:
NNM
MII
NM
II
efrRa
vTkTkTk
2
1)()()(
(24)
defining the temperature dependency of the longitudinal effective thermic conductivity coefficient, or:
NM
MNMef
la
vTkTkTk
1
1)()()(
(25)
defining the temperature dependency of the transversal effective thermic conductivity coefficient. Knowing the temperature dependencies (22 a,b) and the geometry of the structural “elements” of the nanocomposite, the following equation can be determined:
(26)
At this point, if the variation of the effective thermal conductivity coefficient is measured, one can determine the right temperature variation. This means that the considered carbon nanotube can work as a temperature sensor. More than that, the effective conductivity variations allow the measuring of the temperature variations, considering the connection between the thermal conductivity coefficient and the electric conductivity coefficient (Wiedemann-Franz Equation) [3-6]:
(27)
More precisely, we will have:
(28)
5 ACKNOWLEDGEMENT This paper was realised with the support of EURODOC “Doctoral Scholarships for research performance at European level” project, ID 59410, financed by the European Social Found and Romanian Government. 6 REFERENCES [1] Thomas, J.A.; Iutzi, R. M. and McGaughey, A.J.H., Thermal conductivity and phonon transport in empty and water-
filled carbon nanotubes, Physical review B 81, 045413, USA, 2010. [2] Chang, C.W. et. Al, Breakdown of Fourier’s Law in Nanotube Thermal Conductors, Physical Review Letters, PRL
101, 075903, USA, 2008. [3] Yang, D.J. et al, Thermal conductivity of multiwalled carbon nanotubes, Physical review B 66, 165440, (USA
2002). [4] Pradhan, N. R., Thermal conductivity of nanowires, nanowires and polymer – nanotube composites, Worcester
Polytechnic Institute Department of Physics, 2010. [5] Pop, E. et al, Electrical and thermal transport in metallic single – walled carbon nanotubes on insulating substrates,
Journal of applied physics 101, 093710, USA, 2007
81
14th Romanian Textiles and Leather Conference – CORTEP 2012
Sinaia, 6 - 8 September 2012
[6] Hone, J., Carbon Nanotubes: Thermal Properties, Dekker Encyclopedia of Nanoscience and Nanotechnology, 2004.
[7] Sinha, N.; Ma,J. and Yeow J.T.W., Carbon nanotube-based sensors, Journal of Nanoscience and Nanotechnology, Vol. 6, 573-590, American Scientific Publishers, Printed in the United States of America, 2006
Corresponding author: Monica Alina Calin Faculty of Textiles & Leather Engineering and Industrial Management/ Doctoral School of "Gheorghe Asachi" Technical University of Iasi Bvd. D. Mangeron No.67 700050, Iași, Romania E-mail: [email protected]
Co-authors: Mirela TEODORESCU Faculty of Textiles & Leather Engineering and Industrial Management/
Doctoral School of "Gheorghe Asachi" Technical University of Iasi
Bvd. D. Mangeron No.67 700050, Iași, Romania E-mail: [email protected] Antonela CURTEZA Faculty of Textiles & Leather Engineering and Industrial Management/ "Gheorghe Asachi" Technical University of Iasi Bvd. D. Mangeron No.67 700050, Iași, Romania E-mail: [email protected]
82
14
th Romanian Textiles and Leather Conference – CORTEP 2012
Sinaia, 6 - 8 September 2012
SILK, FLAX AND HEMP, SOURCES OF NATIVE FIBROUS RAW MATERIAL FOR TEXTILES AND TECHNICAL PRODUCTS
Adriana MUSTATA, Liliana HRISTIAN & Georgeta POTOP
“Gheorghe Asachi” Technical University of Iasi, Romania Abstract: Slik, flax and hemp offer the possibility of obtaining ecological products with new functional properties for the textile industrie, modern composite, construction materials, supplies, cosmetics, medical textiles etc. High air permeability, hygroscopicity, mechanical properties are some characteristics of silk, flax and hemp fibres allowing their use in the field of modern technical materials. In the present paper principal properties of the fibers and yarns from silk, flax and hemp are analyzed. Keywords: silk, flax, hemp, yarn, technical materials 1 INTRODUCTION Natural silk with high mechanical properties, produced by the spiders, lepidoptera, is bio-compatible, with particularly polymer structures, an excellent material for use in medicine, for photonics, optoelectronics and high-technology [1]. Due to its good permeability and light absorbing ability, silk is regarded as the "Queen of Fibers". Silk has the function of anti-ultraviolet radiation, has excellent qualities of acoustic absorption, dust absorption and strongly heat-resistant [2,3]. The increasing of the silkworm was one of the occupations with long tradition in Romania. Since the XIV century this activity was signaled in almost all areas of our country. Production of the silkworm cocoons was 4000 tons in 1986 and in 1989 was over 12 800 tons. From silk, in Romania at Lugoj were obtained filament yarns and spun yarns in a wide range: Nm 12, Nm 60, 100, 140, 200 and twisted yarns with the doubling 2 or 3, [4, 5]. The hemp and flax, of which we extract fibres with the same name, are plants having one of the best capacities of industrialization, of all the technical plants. Everything is exploited, stems and seeds, nothing is thrown, obtaining fibres, threads, fabrics, cords, ropes, cables, hawsers, lines, cosmetics, products for the
motor vehicles’ industry or other technical fields. Before 1989, Romania was among European countries with
the largest areas planted with flax and hemp, and the third country in the world among the manufacturers of
hemp [4-6]. In the last time, the researcher’s efforts from the flax and hemp industry are directed to obtain
materials that have environmental protection through to the end of their life cycle. Flax and hemp fibers, ecological, non-toxic and biodegradable materials, which absorb easily the humidity, [7] and burn without leaving residues are exploited in fibers for fabrics or knitting with the destination of technical clothing or items, multi-warped products such as: shoemaking thread, band, braids, ropes, diverse uses in the motor vehicles construction industry, geotextiles and agrotextiles. In the motor vehicle industry, the hemp fibers, ecological products are used as replacement of the glass fibers from some components. The great automobile companies are interested in achieving some sub-assemblies from hemp fibers, as resistant as the classical ones, [8]. The aim of this paper is the analysis of the principal properties of the fibers and yarns from silk, flax and hemp as justification of their modern fields of use. 2 EXPERIMENTAL
The yarns investigated were filament yarns from silk (grege, dyed yarns, bleached yarns), spun yarns from
flax and hemp. The water absorption in these types of yarns modifies their mechanical properties and it is important to know the transfer mode of these characteristics. For the serial testing in wet stage, the yarns were stressed after 10 minutes moisten and their drying between two sheets of absorbent paper. Measuring of the breaking strength yarns was made according to ISO 2062 on TINIUS OLSEN H5 K-T yarn tester (England) by automatic registering of the load–displacement
83
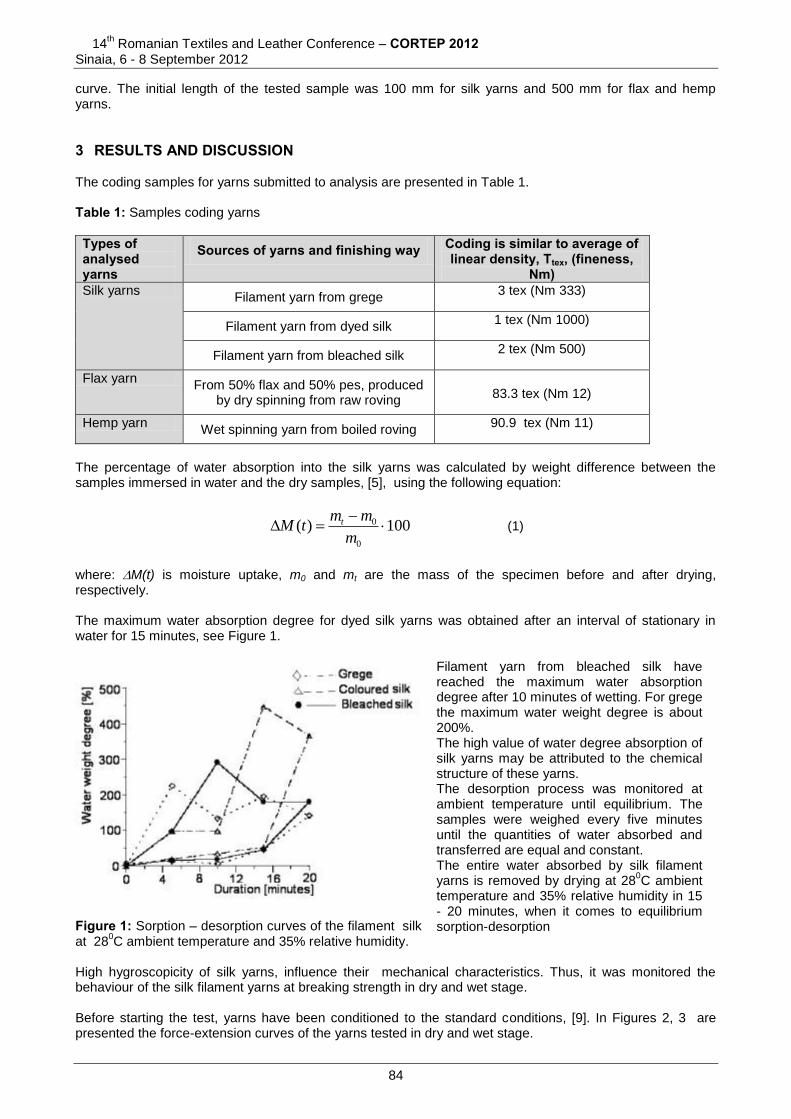
14th Romanian Textiles and Leather Conference – CORTEP 2012
Sinaia, 6 - 8 September 2012
curve. The initial length of the tested sample was 100 mm for silk yarns and 500 mm for flax and hemp yarns.
3 RESULTS AND DISCUSSION The coding samples for yarns submitted to analysis are presented in Table 1. Table 1: Samples coding yarns
Types of analysed yarns
Sources of yarns and finishing way Coding is similar to average of linear density, Ttex, (fineness,
Nm) Silk yarns
Filament yarn from grege 3 tex (Nm 333)
Filament yarn from dyed silk 1 tex (Nm 1000)
Filament yarn from bleached silk 2 tex (Nm 500)
Flax yarn From 50% flax and 50% pes, produced
by dry spinning from raw roving
83.3 tex (Nm 12)
Hemp yarn Wet spinning yarn from boiled roving
90.9 tex (Nm 11)
The percentage of water absorption into the silk yarns was calculated by weight difference between the samples immersed in water and the dry samples, [5], using the following equation:
100)(0
0
m
mmtM t (1)
where: M(t) is moisture uptake, m0 and mt are the mass of the specimen before and after drying, respectively. The maximum water absorption degree for dyed silk yarns was obtained after an interval of stationary in water for 15 minutes, see Figure 1.
Filament yarn from bleached silk have reached the maximum water absorption degree after 10 minutes of wetting. For grege the maximum water weight degree is about 200%. The high value of water degree absorption of silk yarns may be attributed to the chemical structure of these yarns. The desorption process was monitored at ambient temperature until equilibrium. The samples were weighed every five minutes until the quantities of water absorbed and transferred are equal and constant. The entire water absorbed by silk filament yarns is removed by drying at 28
0C ambient
temperature and 35% relative humidity in 15 - 20 minutes, when it comes to equilibrium sorption-desorption
Figure 1: Sorption – desorption curves of the filament silk at 28
0C ambient temperature and 35% relative humidity.
High hygroscopicity of silk yarns, influence their mechanical characteristics. Thus, it was monitored the behaviour of the silk filament yarns at breaking strength in dry and wet stage. Before starting the test, yarns have been conditioned to the standard conditions, [9]. In Figures 2, 3 are presented the force-extension curves of the yarns tested in dry and wet stage.
84

14
th Romanian Textiles and Leather Conference – CORTEP 2012
Sinaia, 6 - 8 September 2012
.
For the filament yarn 3 tex extracted from grege the decrease of the tensile breaking strength in wet stage is about 12% in comparison with the resistance obtained in dry stage (Figure 2). Tenacity of this type of yarn, in wet stage, is reduced by 44%, while the linear density increase over 45%.
Figure 2: Force-extension curves of the silk filament yarn 3 tex, from grege tested in dry stage, curves: 1-5 and in wet stage after 10 minutes of stationary in water, curves 6-10.
The strength yarn of the dyed silk decreases with about 5% in wet stage and tenacity of their specific resistance is reduced with about 36% in wet stage. In the same time the linear density of the filament yarn increases from 1 tex to 1.6 tex.
Figure 3: Force-extension curves of the silk filament yarn 1 tex, extracted from colored weave tested in dry stage, curves: 1-5 and in wet stage after 10 minutes of stationary in water, curves 6-10.
High hygroscopicity of flax and hemp fibres and yarns is known, [7]. Flax and hemp yarns have different behaviour in wet stage comparatively with the silk yarns, because of their basic component – cellulose. Hemp yarn 90.9 tex (Nm 11), produced by wet spinning from boiled roving, in wet stage presents 98% an increase of the average tenacity, in comparison with the value obtained in dry stage, see Figure 4.
Figure 4: Force-extension curves of the hemp yarn 90.9 tex (Nm 11), produced by wet spinning from boiled roving, tested in dry stage, curves: 1-5 and in wet stage after 10 minutes wetting, curves: 6-11.
85
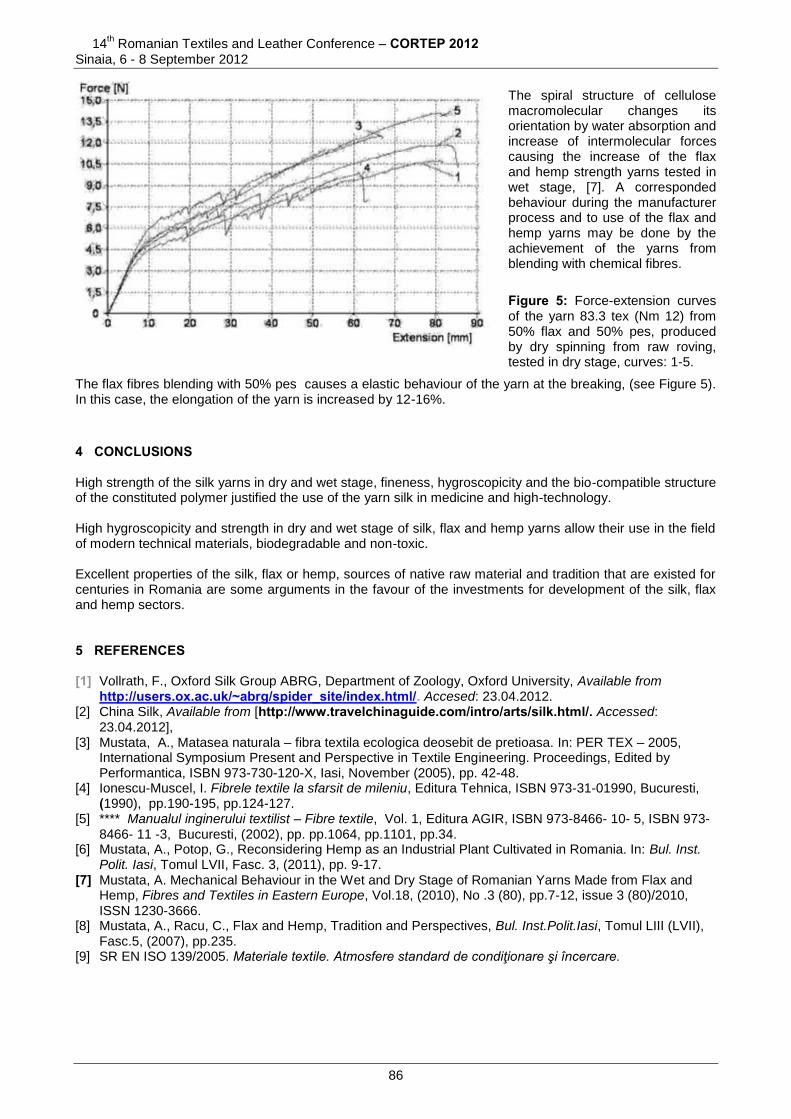
14th Romanian Textiles and Leather Conference – CORTEP 2012
Sinaia, 6 - 8 September 2012
The spiral structure of cellulose macromolecular changes its orientation by water absorption and increase of intermolecular forces causing the increase of the flax and hemp strength yarns tested in wet stage, [7]. A corresponded behaviour during the manufacturer process and to use of the flax and hemp yarns may be done by the achievement of the yarns from blending with chemical fibres. Figure 5: Force-extension curves of the yarn 83.3 tex (Nm 12) from 50% flax and 50% pes, produced by dry spinning from raw roving, tested in dry stage, curves: 1-5.
The flax fibres blending with 50% pes causes a elastic behaviour of the yarn at the breaking, (see Figure 5). In this case, the elongation of the yarn is increased by 12-16%.
4 CONCLUSIONS High strength of the silk yarns in dry and wet stage, fineness, hygroscopicity and the bio-compatible structure of the constituted polymer justified the use of the yarn silk in medicine and high-technology. High hygroscopicity and strength in dry and wet stage of silk, flax and hemp yarns allow their use in the field of modern technical materials, biodegradable and non-toxic. Excellent properties of the silk, flax or hemp, sources of native raw material and tradition that are existed for centuries in Romania are some arguments in the favour of the investments for development of the silk, flax and hemp sectors. 5 REFERENCES [1] Vollrath, F., Oxford Silk Group ABRG, Department of Zoology, Oxford University, Available from
http://users.ox.ac.uk/~abrg/spider_site/index.html/. Accesed: 23.04.2012. [2] China Silk, Available from [http://www.travelchinaguide.com/intro/arts/silk.html/. Accessed:
23.04.2012], [3] Mustata, A., Matasea naturala – fibra textila ecologica deosebit de pretioasa. In: PER TEX – 2005,
International Symposium Present and Perspective in Textile Engineering. Proceedings, Edited by Performantica, ISBN 973-730-120-X, Iasi, November (2005), pp. 42-48.
[4] Ionescu-Muscel, I. Fibrele textile la sfarsit de mileniu, Editura Tehnica, ISBN 973-31-01990, Bucuresti, (1990), pp.190-195, pp.124-127.
[5] **** Manualul inginerului textilist – Fibre textile, Vol. 1, Editura AGIR, ISBN 973-8466- 10- 5, ISBN 973-8466- 11 -3, Bucuresti, (2002), pp. pp.1064, pp.1101, pp.34.
[6] Mustata, A., Potop, G., Reconsidering Hemp as an Industrial Plant Cultivated in Romania. In: Bul. Inst. Polit. Iasi, Tomul LVII, Fasc. 3, (2011), pp. 9-17.
[7] Mustata, A. Mechanical Behaviour in the Wet and Dry Stage of Romanian Yarns Made from Flax and Hemp, Fibres and Textiles in Eastern Europe, Vol.18, (2010), No .3 (80), pp.7-12, issue 3 (80)/2010, ISSN 1230-3666.
[8] Mustata, A., Racu, C., Flax and Hemp, Tradition and Perspectives, Bul. Inst.Polit.Iasi, Tomul LIII (LVII), Fasc.5, (2007), pp.235.
[9] SR EN ISO 139/2005. Materiale textile. Atmosfere standard de condiţionare şi încercare.
86
14
th Romanian Textiles and Leather Conference – CORTEP 2012
Sinaia, 6 - 8 September 2012
Corresponding author: Adriana Mustata, prof.dr.eng Faculty of Textiles&Leather Engineering and Industrial Management "Gheorghe Asachi" Technical University of Iasi 29, Blvd. Dimitrie Mangeron 700050, Iasi Romania E-mail: [email protected]
Co-authors: Liliana Hristian, asist.dr.eng Faculty of Textiles&Leather Engineering and Industrial Management "Gheorghe Asachi" Technical University of Iasi 29, Blvd. Dimitrie Mangeron 700050, Iasi Romania E-mail: [email protected] Georgeta Potop, asist.dr.eng. Faculty of Textiles&Leather Engineering and Industrial Management "Gheorghe Asachi" Technical University of Iasi 29, Blvd. Dimitrie Mangeron 700050, Iasi Romania E-mail: [email protected]
87
14
th Romanian Textiles and Leather Conference – CORTEP 2012
Sinaia, 6 - 8 September 2012
NEW TECHNOLOGIES FOR SOCKS IMPROVEMENT
Viorica CRETU & Laura MACOVEI ”Gheorghe Asachi
” Technical University of Iasi, Romania
Abstract: Wearing proper socks, during any sport activity or just when you are walking, is critical because every action creates different stress points and other possible problems on the human foot. The paper presents some of the improved and new constructions, developed by the socks manufacturers, to reduce the incidence of blisters, to ensure a good impact and shearing protection, in different impact areas or vulnerable spots of the feet, to get a total comfort for the feet, an appropriate cushioning and an exceptionally fit of the socks. Keywords: sock, cushioning fabrics, fit systems, new structures. 1 INTRODUCTION Change and adaptation are among the major themes in sock segment of today’s legwear sector because, be it doing any sport activity, or just spending a few hours walking, socks play a crucial role in foot comfort. The develop of activity-specific socks, using improved and new constructions, are parts of new technologies developed by the legwear manufacturers as an answer to the lifestyle needs of consumers. 2 SOCKS WITH IMPROVED AND NEW CONSTRUCTIONS For outdoor enthusiasts, and especially for athletes, wearing proper socks is critical because during these activities the human foot are subject of different stress. To reduce the incidence of blisters, to ensure protection, in different impact areas or vulnerable spots, and to avoid other foot problems, the socks must ensure, by them construction and knitting structures, a total comfort for the feet, an appropriate cushioning, an exceptionally fit and a good impact and shearing protection. 2.1 Cushion socks During walking and running, that most of us do on man-made surfaces (asphalt and hard floors), our feet must be protected from those surfaces. Inside the shoe or boot, in all moving activities, our foot is subject to pressure and impact forces [1], [2]:
- pressure - the direct force applied to the surface of the feet, when we place our weight on them, is, only when standing still, about ½ of our body weight placed on each foot;
- impact - the sudden force between the foot and the surface, result in absorbing, by each foot, approximately 1 – ½ times our body weight - when we walk, and approximately 3 to 4 times our body weight – when we run.
Our feet are natural protected from these forces by the foot pads. But, the hard surfaces damage faster these pads, and more, the damage is compounded by poorly designed and poorly fitted socks and shoes. On the same time, as people age, they suffer loss of the foot pads on the bottom of their feet. To protect the foot pads from shearing forces, and to replace the function of natural pads, where fat pad degradation has already occurred, THORLO engineered socks with cushion fabrics [3] in the specific feet’s areas, as heel, forefoot and toe (Figure1). So, instead of the tissues on the feet moving in opposite directions, the terry padding moves under the feet, transferring the movement from the tissues of the foot to the terry padding itself. The cushion fabric is a Thorlos anatomically designed patented terry padding, placed inside of the sock (Figure 2), with a specific density correlated to:
- the demands of different athletic activities; - the climate conditions the activity is conducted in; - the shoes that the athlete wears.
88

14th Romanian Textiles and Leather Conference – CORTEP 2012
Sinaia, 6 - 8 September 2012
Figure 1: Foot’s areas to place the cushion fabric Figure 2: Cushion fabric – terry structure inside the sock DRYMAX, an other sport socks producer, designed protective padding socks with different density levels [4]: Low Density (LD), Medium Density (MD) and High Density (HD) (Figure 3), a Medium Density sock (Figure 4), having 43.200 terry loops in a square inch.
Figure 3: DRYMAX - levels of terry loops density Figure 4: Aspect of a Medium Density sock The nature of the cushion fabric is very important too, because the padding socks are used inside the shoes. So, if the cushion fabric is natural (cotton, wool, silk) it becomes harmful to the feet because they absorb moisture and become saturated. To avoid this problem, DRYMAX realized a cushion terry fabric based on a Dual Layer System, including two layers (Figure 5):
Figure 5: DRYMAX - Dual Layer System for cushion fabric
89
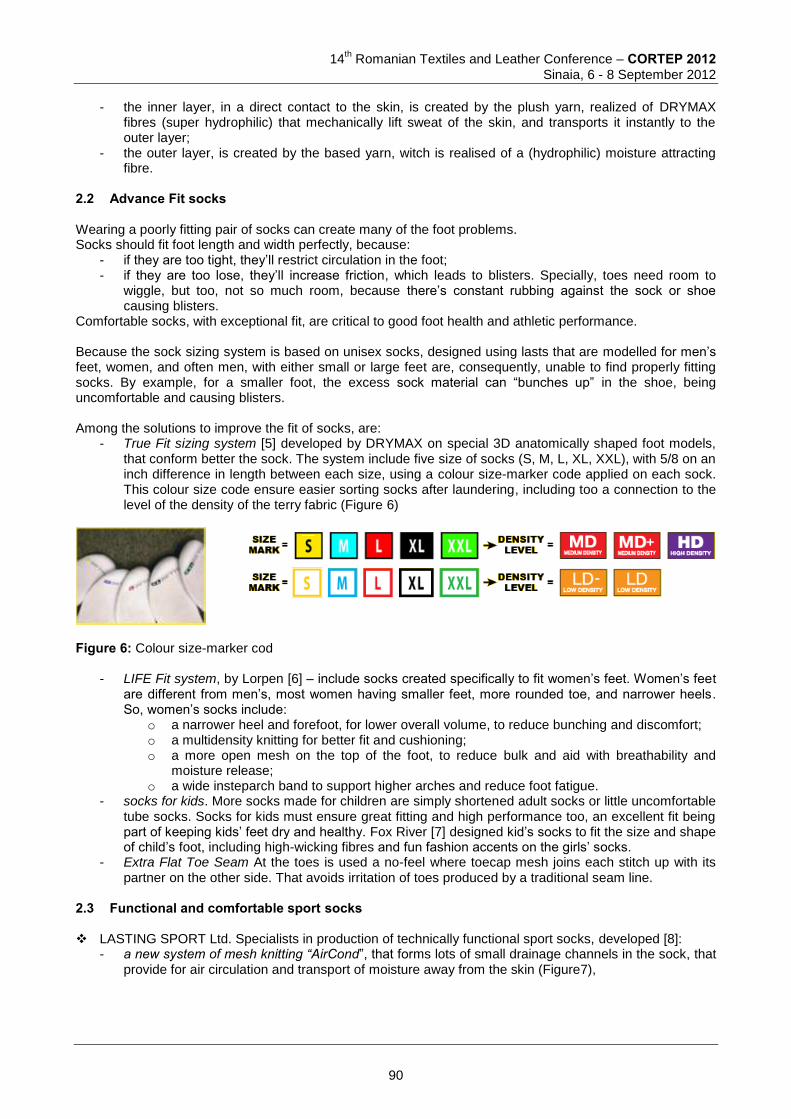
14
th Romanian Textiles and Leather Conference – CORTEP 2012
Sinaia, 6 - 8 September 2012
- the inner layer, in a direct contact to the skin, is created by the plush yarn, realized of DRYMAX
fibres (super hydrophilic) that mechanically lift sweat of the skin, and transports it instantly to the outer layer;
- the outer layer, is created by the based yarn, witch is realised of a (hydrophilic) moisture attracting fibre.
2.2 Advance Fit socks Wearing a poorly fitting pair of socks can create many of the foot problems. Socks should fit foot length and width perfectly, because:
- if they are too tight, they’ll restrict circulation in the foot; - if they are too lose, they’ll increase friction, which leads to blisters. Specially, toes need room to
wiggle, but too, not so much room, because there’s constant rubbing against the sock or shoe causing blisters.
Comfortable socks, with exceptional fit, are critical to good foot health and athletic performance. Because the sock sizing system is based on unisex socks, designed using lasts that are modelled for men’s feet, women, and often men, with either small or large feet are, consequently, unable to find properly fitting socks. By example, for a smaller foot, the excess sock material can “bunches up” in the shoe, being uncomfortable and causing blisters. Among the solutions to improve the fit of socks, are:
- True Fit sizing system [5] developed by DRYMAX on special 3D anatomically shaped foot models, that conform better the sock. The system include five size of socks (S, M, L, XL, XXL), with 5/8 on an inch difference in length between each size, using a colour size-marker code applied on each sock. This colour size code ensure easier sorting socks after laundering, including too a connection to the level of the density of the terry fabric (Figure 6)
Figure 6: Colour size-marker cod
- LIFE Fit system, by Lorpen [6] – include socks created specifically to fit women’s feet. Women’s feet are different from men’s, most women having smaller feet, more rounded toe, and narrower heels. So, women’s socks include:
o a narrower heel and forefoot, for lower overall volume, to reduce bunching and discomfort; o a multidensity knitting for better fit and cushioning; o a more open mesh on the top of the foot, to reduce bulk and aid with breathability and
moisture release; o a wide insteparch band to support higher arches and reduce foot fatigue.
- socks for kids. More socks made for children are simply shortened adult socks or little uncomfortable tube socks. Socks for kids must ensure great fitting and high performance too, an excellent fit being part of keeping kids’ feet dry and healthy. Fox River [7] designed kid’s socks to fit the size and shape of child’s foot, including high-wicking fibres and fun fashion accents on the girls’ socks.
- Extra Flat Toe Seam At the toes is used a no-feel where toecap mesh joins each stitch up with its partner on the other side. That avoids irritation of toes produced by a traditional seam line.
2.3 Functional and comfortable sport socks LASTING SPORT Ltd. Specialists in production of technically functional sport socks, developed [8]:
- a new system of mesh knitting “AirCond”, that forms lots of small drainage channels in the sock, that provide for air circulation and transport of moisture away from the skin (Figure7),
90
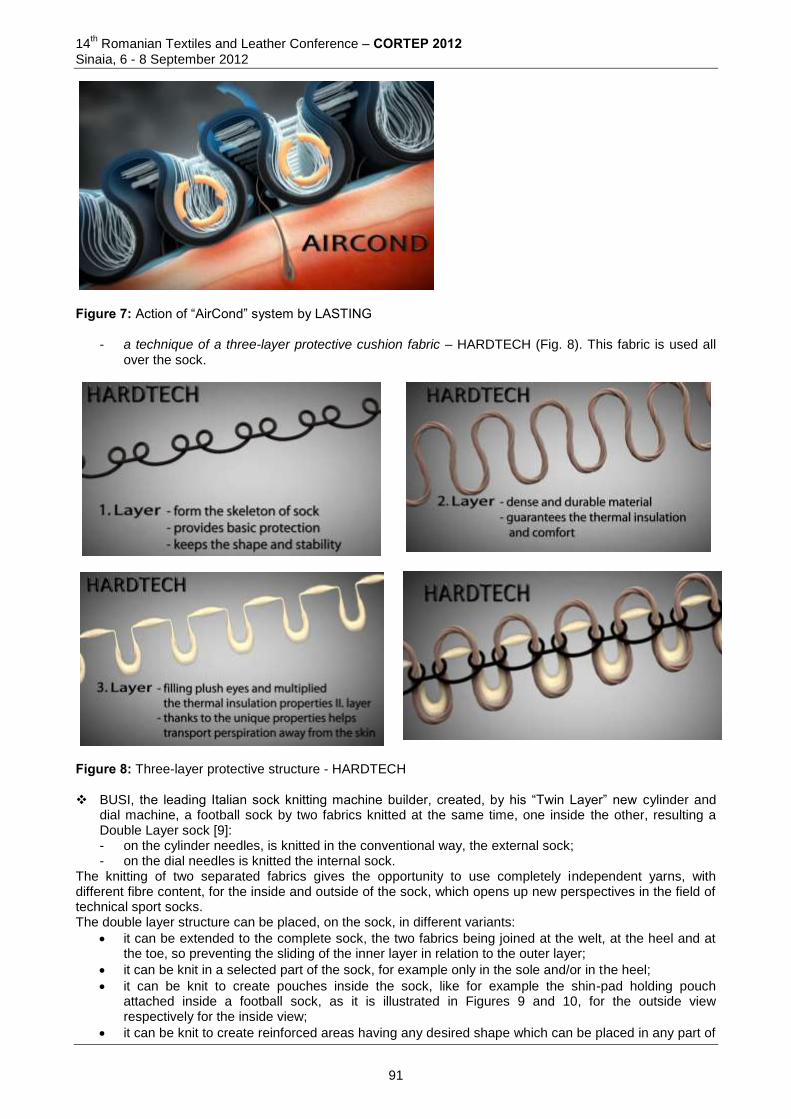
14th Romanian Textiles and Leather Conference – CORTEP 2012
Sinaia, 6 - 8 September 2012
Figure 7: Action of “AirCond” system by LASTING
- a technique of a three-layer protective cushion fabric – HARDTECH (Fig. 8). This fabric is used all over the sock.
Figure 8: Three-layer protective structure - HARDTECH BUSI, the leading Italian sock knitting machine builder, created, by his “Twin Layer” new cylinder and
dial machine, a football sock by two fabrics knitted at the same time, one inside the other, resulting a Double Layer sock [9]: - on the cylinder needles, is knitted in the conventional way, the external sock; - on the dial needles is knitted the internal sock.
The knitting of two separated fabrics gives the opportunity to use completely independent yarns, with different fibre content, for the inside and outside of the sock, which opens up new perspectives in the field of technical sport socks. The double layer structure can be placed, on the sock, in different variants:
it can be extended to the complete sock, the two fabrics being joined at the welt, at the heel and at the toe, so preventing the sliding of the inner layer in relation to the outer layer;
it can be knit in a selected part of the sock, for example only in the sole and/or in the heel;
it can be knit to create pouches inside the sock, like for example the shin-pad holding pouch attached inside a football sock, as it is illustrated in Figures 9 and 10, for the outside view respectively for the inside view;
it can be knit to create reinforced areas having any desired shape which can be placed in any part of
91
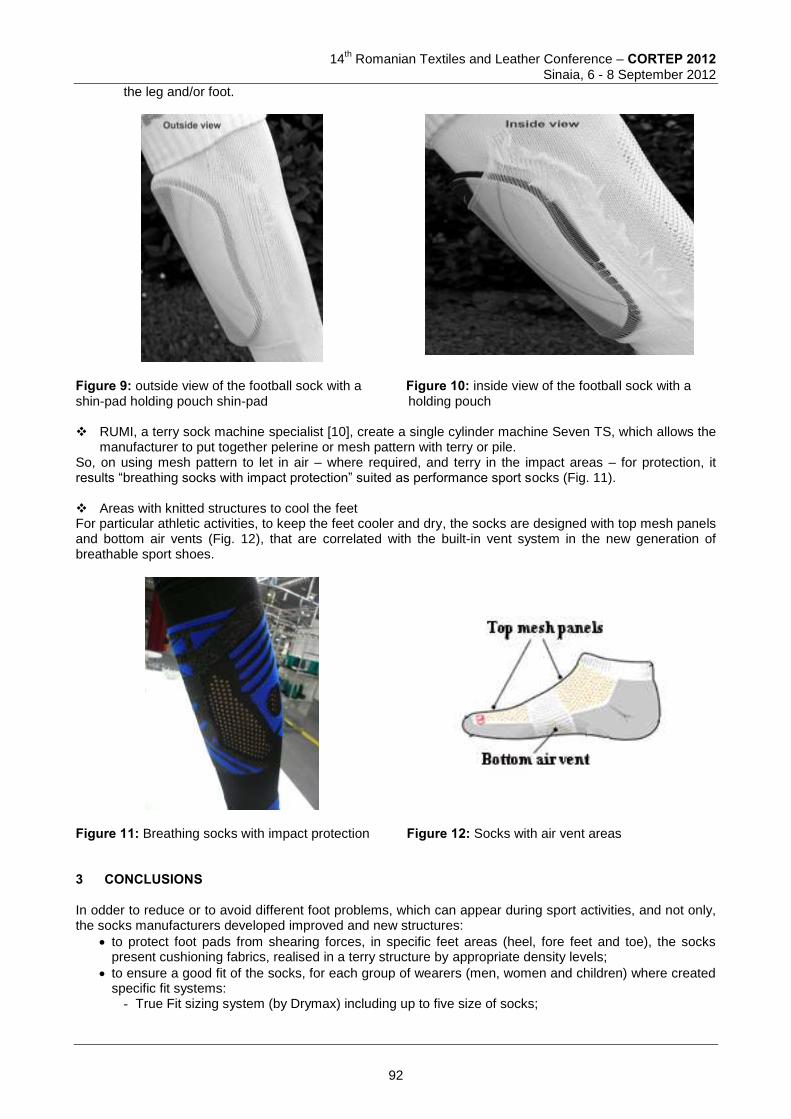
14
th Romanian Textiles and Leather Conference – CORTEP 2012
Sinaia, 6 - 8 September 2012
the leg and/or foot.
Figure 9: outside view of the football sock with a Figure 10: inside view of the football sock with a shin-pad holding pouch shin-pad holding pouch
RUMI, a terry sock machine specialist [10], create a single cylinder machine Seven TS, which allows the
manufacturer to put together pelerine or mesh pattern with terry or pile. So, on using mesh pattern to let in air – where required, and terry in the impact areas – for protection, it results “breathing socks with impact protection” suited as performance sport socks (Fig. 11). Areas with knitted structures to cool the feet For particular athletic activities, to keep the feet cooler and dry, the socks are designed with top mesh panels and bottom air vents (Fig. 12), that are correlated with the built-in vent system in the new generation of breathable sport shoes.
Figure 11: Breathing socks with impact protection Figure 12: Socks with air vent areas 3 CONCLUSIONS In odder to reduce or to avoid different foot problems, which can appear during sport activities, and not only, the socks manufacturers developed improved and new structures:
to protect foot pads from shearing forces, in specific feet areas (heel, fore feet and toe), the socks present cushioning fabrics, realised in a terry structure by appropriate density levels;
to ensure a good fit of the socks, for each group of wearers (men, women and children) where created specific fit systems:
- True Fit sizing system (by Drymax) including up to five size of socks;
92
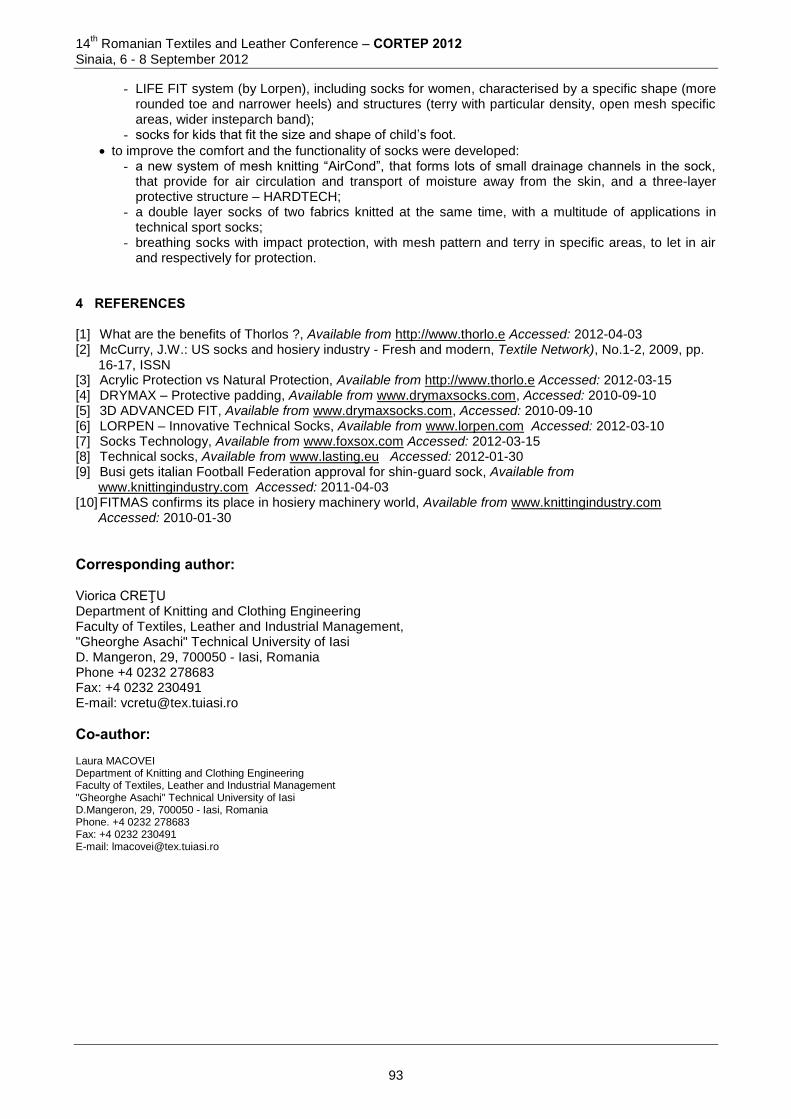
14th Romanian Textiles and Leather Conference – CORTEP 2012
Sinaia, 6 - 8 September 2012
- LIFE FIT system (by Lorpen), including socks for women, characterised by a specific shape (more rounded toe and narrower heels) and structures (terry with particular density, open mesh specific areas, wider insteparch band);
- socks for kids that fit the size and shape of child’s foot.
to improve the comfort and the functionality of socks were developed: - a new system of mesh knitting “AirCond”, that forms lots of small drainage channels in the sock,
that provide for air circulation and transport of moisture away from the skin, and a three-layer protective structure – HARDTECH;
- a double layer socks of two fabrics knitted at the same time, with a multitude of applications in technical sport socks;
- breathing socks with impact protection, with mesh pattern and terry in specific areas, to let in air and respectively for protection.
4 REFERENCES [1] What are the benefits of Thorlos ?, Available from http://www.thorlo.e Accessed: 2012-04-03 [2] McCurry, J.W.: US socks and hosiery industry - Fresh and modern, Textile Network), No.1-2, 2009, pp.
16-17, ISSN [3] Acrylic Protection vs Natural Protection, Available from http://www.thorlo.e Accessed: 2012-03-15 [4] DRYMAX – Protective padding, Available from www.drymaxsocks.com, Accessed: 2010-09-10 [5] 3D ADVANCED FIT, Available from www.drymaxsocks.com, Accessed: 2010-09-10 [6] LORPEN – Innovative Technical Socks, Available from www.lorpen.com Accessed: 2012-03-10 [7] Socks Technology, Available from www.foxsox.com Accessed: 2012-03-15 [8] Technical socks, Available from www.lasting.eu Accessed: 2012-01-30 [9] Busi gets italian Football Federation approval for shin-guard sock, Available from
www.knittingindustry.com Accessed: 2011-04-03 [10] FITMAS confirms its place in hosiery machinery world, Available from www.knittingindustry.com
Accessed: 2010-01-30
Corresponding author: Viorica CREŢU Department of Knitting and Clothing Engineering Faculty of Textiles, Leather and Industrial Management, "Gheorghe Asachi" Technical University of Iasi D. Mangeron, 29, 700050 - Iasi, Romania Phone +4 0232 278683 Fax: +4 0232 230491 E-mail: [email protected]
Co-author: Laura MACOVEI Department of Knitting and Clothing Engineering Faculty of Textiles, Leather and Industrial Management "Gheorghe Asachi" Technical University of Iasi D.Mangeron, 29, 700050 - Iasi, Romania Phone. +4 0232 278683 Fax: +4 0232 230491 E-mail: [email protected]
93
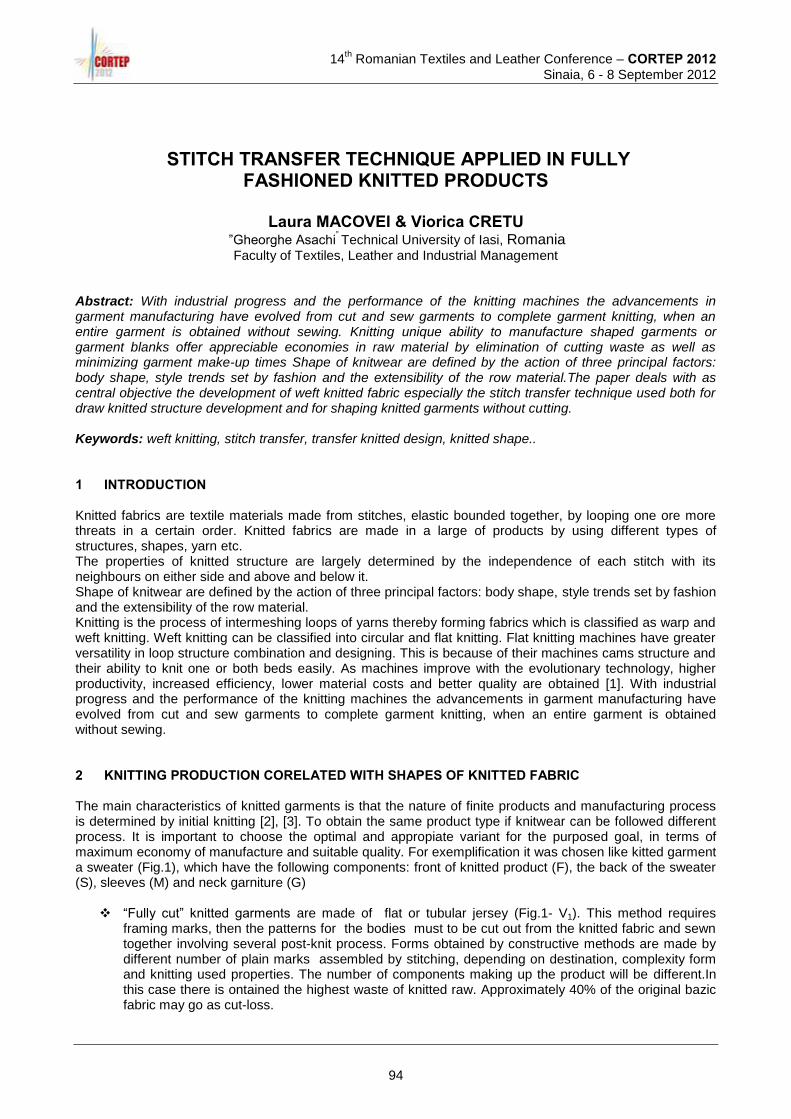
14
th Romanian Textiles and Leather Conference – CORTEP 2012
Sinaia, 6 - 8 September 2012
STITCH TRANSFER TECHNIQUE APPLIED IN FULLY FASHIONED KNITTED PRODUCTS
Laura MACOVEI & Viorica CRETU
”Gheorghe Asachi
” Technical University of Iasi, Romania
Faculty of Textiles, Leather and Industrial Management Abstract: With industrial progress and the performance of the knitting machines the advancements in garment manufacturing have evolved from cut and sew garments to complete garment knitting, when an entire garment is obtained without sewing. Knitting unique ability to manufacture shaped garments or garment blanks offer appreciable economies in raw material by elimination of cutting waste as well as minimizing garment make-up times Shape of knitwear are defined by the action of three principal factors: body shape, style trends set by fashion and the extensibility of the row material.The paper deals with as central objective the development of weft knitted fabric especially the stitch transfer technique used both for draw knitted structure development and for shaping knitted garments without cutting. Keywords: weft knitting, stitch transfer, transfer knitted design, knitted shape.. 1 INTRODUCTION Knitted fabrics are textile materials made from stitches, elastic bounded together, by looping one ore more threats in a certain order. Knitted fabrics are made in a large of products by using different types of structures, shapes, yarn etc. The properties of knitted structure are largely determined by the independence of each stitch with its neighbours on either side and above and below it. Shape of knitwear are defined by the action of three principal factors: body shape, style trends set by fashion and the extensibility of the row material. Knitting is the process of intermeshing loops of yarns thereby forming fabrics which is classified as warp and weft knitting. Weft knitting can be classified into circular and flat knitting. Flat knitting machines have greater versatility in loop structure combination and designing. This is because of their machines cams structure and their ability to knit one or both beds easily. As machines improve with the evolutionary technology, higher productivity, increased efficiency, lower material costs and better quality are obtained [1]. With industrial progress and the performance of the knitting machines the advancements in garment manufacturing have evolved from cut and sew garments to complete garment knitting, when an entire garment is obtained without sewing. 2 KNITTING PRODUCTION CORELATED WITH SHAPES OF KNITTED FABRIC The main characteristics of knitted garments is that the nature of finite products and manufacturing process is determined by initial knitting [2], [3]. To obtain the same product type if knitwear can be followed different process. It is important to choose the optimal and appropiate variant for the purposed goal, in terms of maximum economy of manufacture and suitable quality. For exemplification it was chosen like kitted garment a sweater (Fig.1), which have the following components: front of knitted product (F), the back of the sweater (S), sleeves (M) and neck garniture (G)
“Fully cut” knitted garments are made of flat or tubular jersey (Fig.1- V1). This method requires framing marks, then the patterns for the bodies must to be cut out from the knitted fabric and sewn together involving several post-knit process. Forms obtained by constructive methods are made by different number of plain marks assembled by stitching, depending on destination, complexity form and knitting used properties. The number of components making up the product will be different.In this case there is ontained the highest waste of knitted raw. Approximately 40% of the original bazic fabric may go as cut-loss.
94
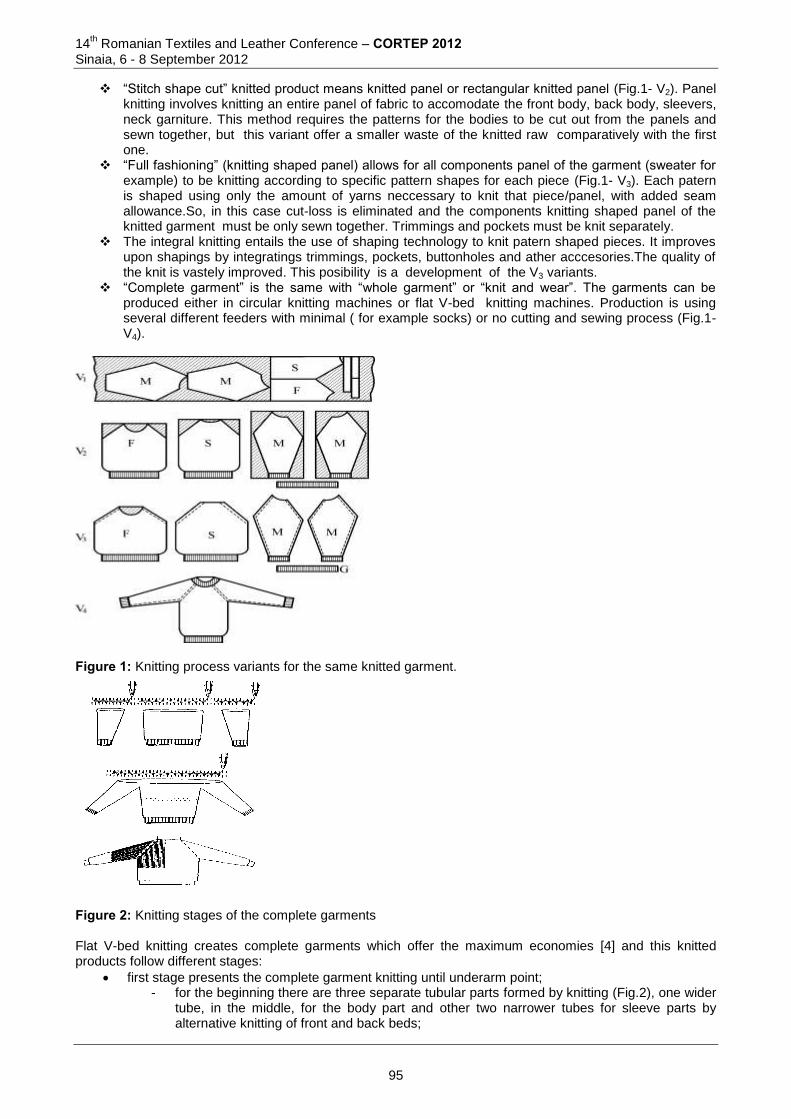
14th Romanian Textiles and Leather Conference – CORTEP 2012
Sinaia, 6 - 8 September 2012
“Stitch shape cut” knitted product means knitted panel or rectangular knitted panel (Fig.1- V2). Panel knitting involves knitting an entire panel of fabric to accomodate the front body, back body, sleevers, neck garniture. This method requires the patterns for the bodies to be cut out from the panels and sewn together, but this variant offer a smaller waste of the knitted raw comparatively with the first one.
“Full fashioning” (knitting shaped panel) allows for all components panel of the garment (sweater for example) to be knitting according to specific pattern shapes for each piece (Fig.1- V3). Each patern is shaped using only the amount of yarns neccessary to knit that piece/panel, with added seam allowance.So, in this case cut-loss is eliminated and the components knitting shaped panel of the knitted garment must be only sewn together. Trimmings and pockets must be knit separately.
The integral knitting entails the use of shaping technology to knit patern shaped pieces. It improves upon shapings by integratings trimmings, pockets, buttonholes and ather acccesories.The quality of the knit is vastely improved. This posibility is a development of the V3 variants.
“Complete garment” is the same with “whole garment” or “knit and wear”. The garments can be produced either in circular knitting machines or flat V-bed knitting machines. Production is using several different feeders with minimal ( for example socks) or no cutting and sewing process (Fig.1- V4).
Figure 1: Knitting process variants for the same knitted garment.
Figure 2: Knitting stages of the complete garments Flat V-bed knitting creates complete garments which offer the maximum economies [4] and this knitted products follow different stages:
first stage presents the complete garment knitting until underarm point; - for the beginning there are three separate tubular parts formed by knitting (Fig.2), one wider
tube, in the middle, for the body part and other two narrower tubes for sleeve parts by alternative knitting of front and back beds;
95
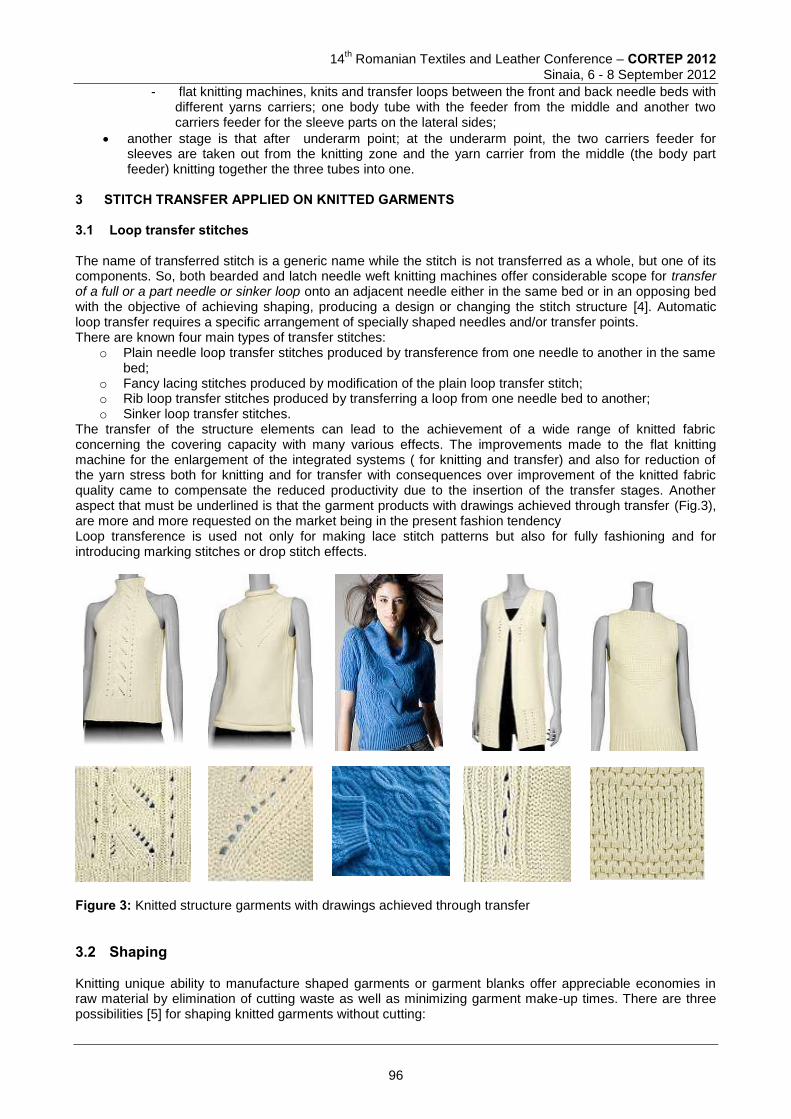
14
th Romanian Textiles and Leather Conference – CORTEP 2012
Sinaia, 6 - 8 September 2012
- flat knitting machines, knits and transfer loops between the front and back needle beds with different yarns carriers; one body tube with the feeder from the middle and another two carriers feeder for the sleeve parts on the lateral sides;
another stage is that after underarm point; at the underarm point, the two carriers feeder for sleeves are taken out from the knitting zone and the yarn carrier from the middle (the body part feeder) knitting together the three tubes into one.
3 STITCH TRANSFER APPLIED ON KNITTED GARMENTS 3.1 Loop transfer stitches The name of transferred stitch is a generic name while the stitch is not transferred as a whole, but one of its components. So, both bearded and latch needle weft knitting machines offer considerable scope for transfer of a full or a part needle or sinker loop onto an adjacent needle either in the same bed or in an opposing bed with the objective of achieving shaping, producing a design or changing the stitch structure [4]. Automatic loop transfer requires a specific arrangement of specially shaped needles and/or transfer points. There are known four main types of transfer stitches:
o Plain needle loop transfer stitches produced by transference from one needle to another in the same bed;
o Fancy lacing stitches produced by modification of the plain loop transfer stitch; o Rib loop transfer stitches produced by transferring a loop from one needle bed to another; o Sinker loop transfer stitches.
The transfer of the structure elements can lead to the achievement of a wide range of knitted fabric concerning the covering capacity with many various effects. The improvements made to the flat knitting machine for the enlargement of the integrated systems ( for knitting and transfer) and also for reduction of the yarn stress both for knitting and for transfer with consequences over improvement of the knitted fabric quality came to compensate the reduced productivity due to the insertion of the transfer stages. Another aspect that must be underlined is that the garment products with drawings achieved through transfer (Fig.3), are more and more requested on the market being in the present fashion tendency Loop transference is used not only for making lace stitch patterns but also for fully fashioning and for introducing marking stitches or drop stitch effects.
Figure 3: Knitted structure garments with drawings achieved through transfer
3.2 Shaping Knitting unique ability to manufacture shaped garments or garment blanks offer appreciable economies in raw material by elimination of cutting waste as well as minimizing garment make-up times. There are three possibilities [5] for shaping knitted garments without cutting:
96
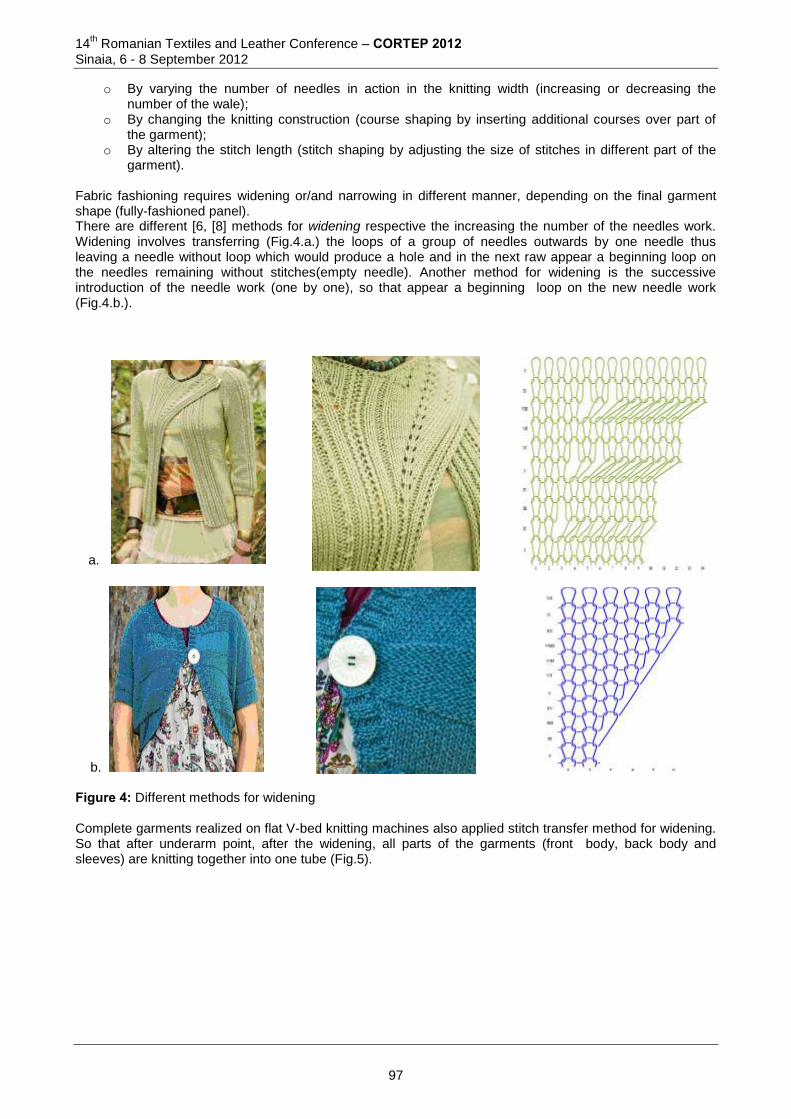
14th Romanian Textiles and Leather Conference – CORTEP 2012
Sinaia, 6 - 8 September 2012
o By varying the number of needles in action in the knitting width (increasing or decreasing the number of the wale);
o By changing the knitting construction (course shaping by inserting additional courses over part of the garment);
o By altering the stitch length (stitch shaping by adjusting the size of stitches in different part of the garment).
Fabric fashioning requires widening or/and narrowing in different manner, depending on the final garment shape (fully-fashioned panel). There are different [6, [8] methods for widening respective the increasing the number of the needles work. Widening involves transferring (Fig.4.a.) the loops of a group of needles outwards by one needle thus leaving a needle without loop which would produce a hole and in the next raw appear a beginning loop on the needles remaining without stitches(empty needle). Another method for widening is the successive introduction of the needle work (one by one), so that appear a beginning loop on the new needle work (Fig.4.b.).
a.
b.
Figure 4: Different methods for widening
Complete garments realized on flat V-bed knitting machines also applied stitch transfer method for widening. So that after underarm point, after the widening, all parts of the garments (front body, back body and sleeves) are knitting together into one tube (Fig.5).
97
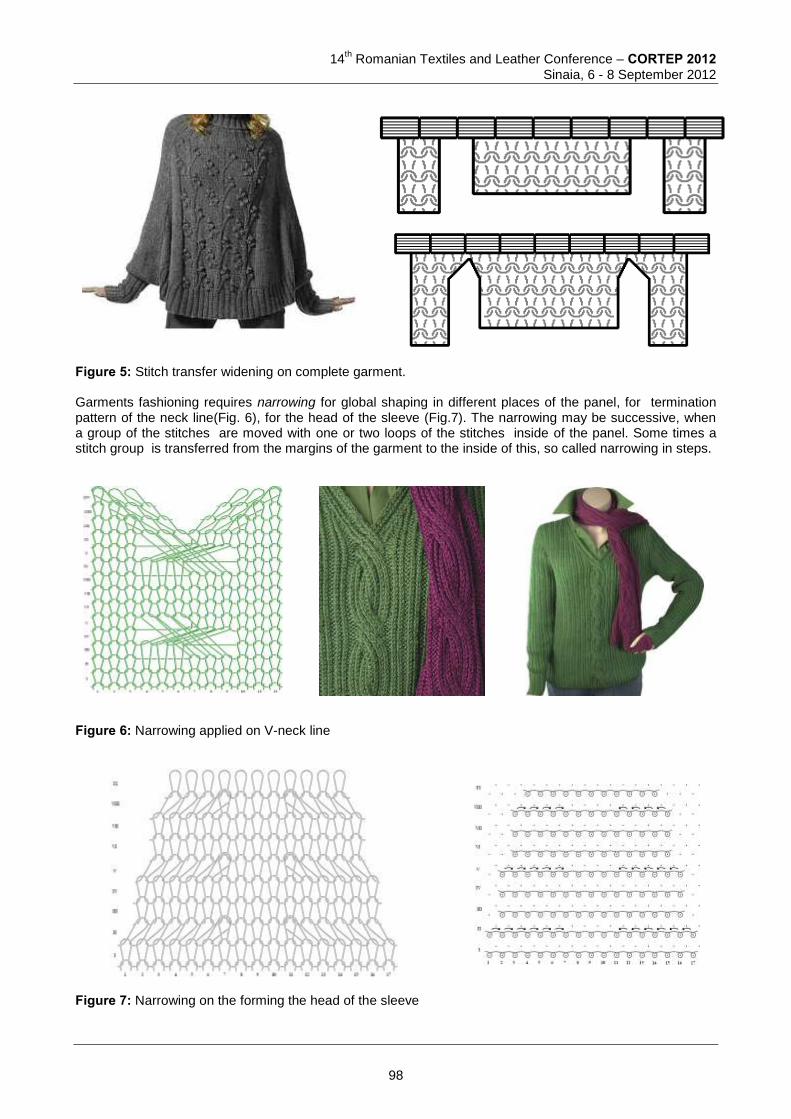
14
th Romanian Textiles and Leather Conference – CORTEP 2012
Sinaia, 6 - 8 September 2012
Figure 5: Stitch transfer widening on complete garment. Garments fashioning requires narrowing for global shaping in different places of the panel, for termination pattern of the neck line(Fig. 6), for the head of the sleeve (Fig.7). The narrowing may be successive, when a group of the stitches are moved with one or two loops of the stitches inside of the panel. Some times a stitch group is transferred from the margins of the garment to the inside of this, so called narrowing in steps.
Figure 6: Narrowing applied on V-neck line
Figure 7: Narrowing on the forming the head of the sleeve
98
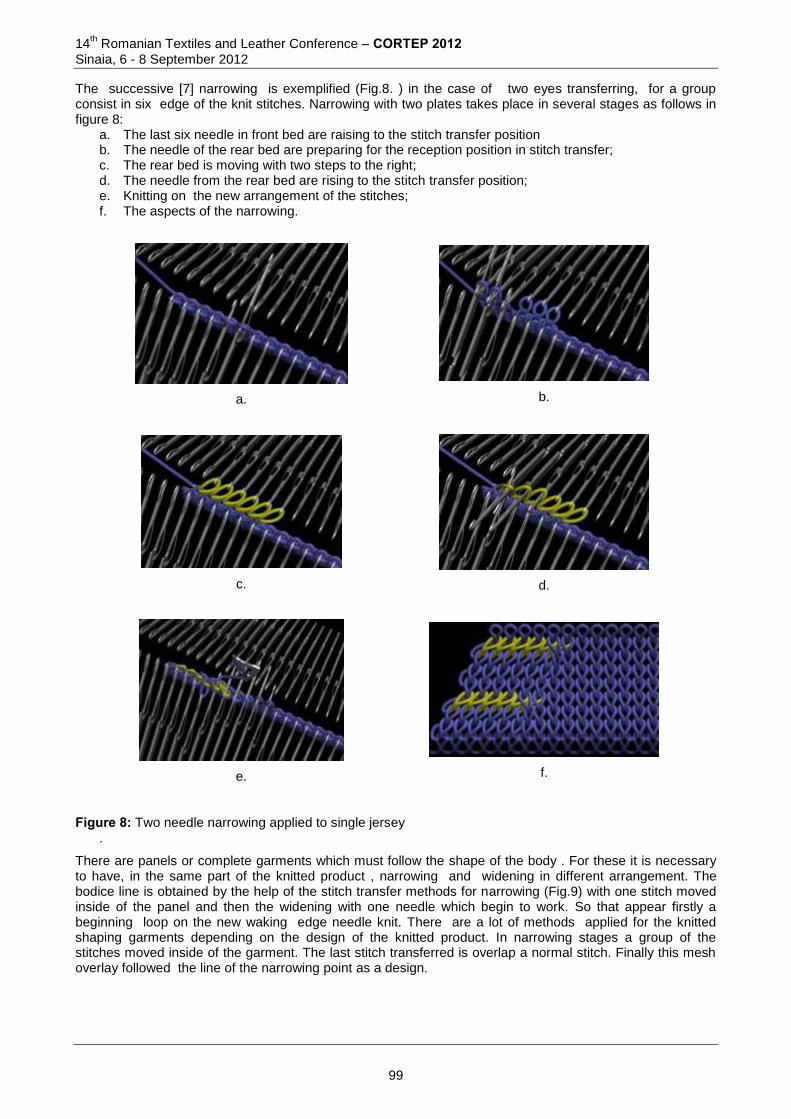
14th Romanian Textiles and Leather Conference – CORTEP 2012
Sinaia, 6 - 8 September 2012
The successive [7] narrowing is exemplified (Fig.8. ) in the case of two eyes transferring, for a group consist in six edge of the knit stitches. Narrowing with two plates takes place in several stages as follows in figure 8:
a. The last six needle in front bed are raising to the stitch transfer position b. The needle of the rear bed are preparing for the reception position in stitch transfer; c. The rear bed is moving with two steps to the right; d. The needle from the rear bed are rising to the stitch transfer position; e. Knitting on the new arrangement of the stitches; f. The aspects of the narrowing.
a.
b.
c.
d.
e.
f.
Figure 8: Two needle narrowing applied to single jersey
.
There are panels or complete garments which must follow the shape of the body . For these it is necessary to have, in the same part of the knitted product , narrowing and widening in different arrangement. The bodice line is obtained by the help of the stitch transfer methods for narrowing (Fig.9) with one stitch moved inside of the panel and then the widening with one needle which begin to work. So that appear firstly a beginning loop on the new waking edge needle knit. There are a lot of methods applied for the knitted shaping garments depending on the design of the knitted product. In narrowing stages a group of the stitches moved inside of the garment. The last stitch transferred is overlap a normal stitch. Finally this mesh overlay followed the line of the narrowing point as a design.
99
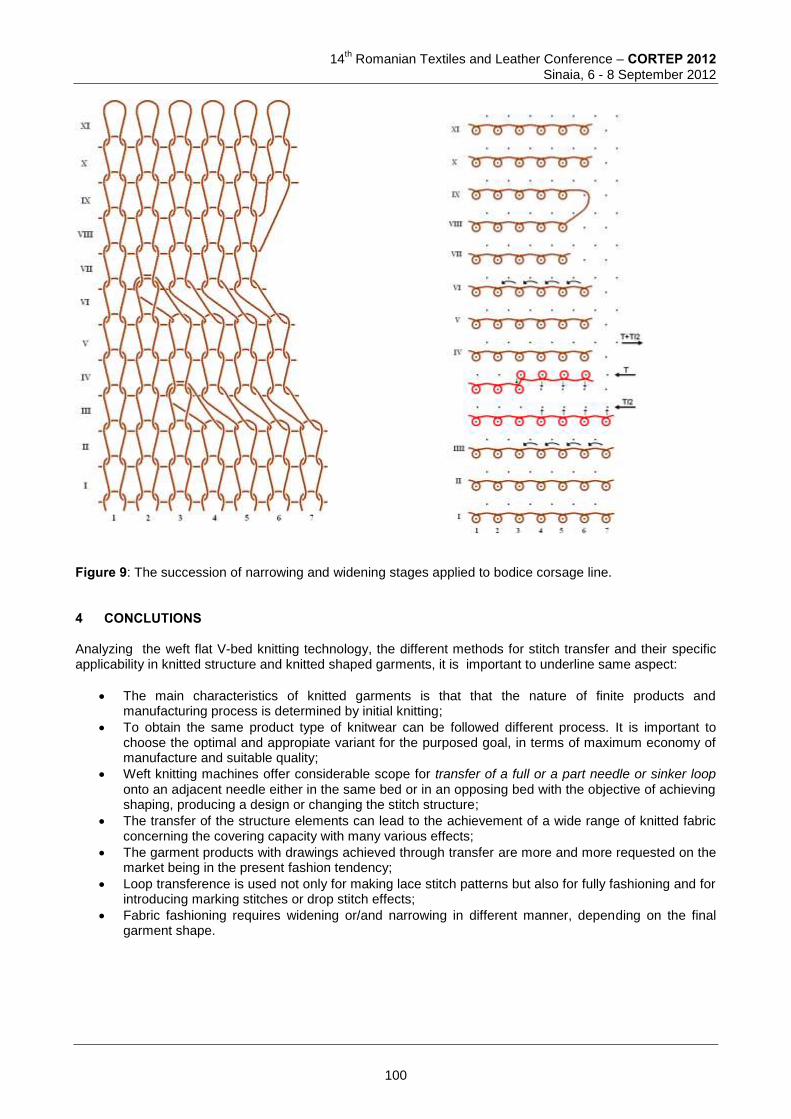
14
th Romanian Textiles and Leather Conference – CORTEP 2012
Sinaia, 6 - 8 September 2012
Figure 9: The succession of narrowing and widening stages applied to bodice corsage line. 4 CONCLUTIONS Analyzing the weft flat V-bed knitting technology, the different methods for stitch transfer and their specific applicability in knitted structure and knitted shaped garments, it is important to underline same aspect:
The main characteristics of knitted garments is that that the nature of finite products and manufacturing process is determined by initial knitting;
To obtain the same product type of knitwear can be followed different process. It is important to choose the optimal and appropiate variant for the purposed goal, in terms of maximum economy of manufacture and suitable quality;
Weft knitting machines offer considerable scope for transfer of a full or a part needle or sinker loop onto an adjacent needle either in the same bed or in an opposing bed with the objective of achieving shaping, producing a design or changing the stitch structure;
The transfer of the structure elements can lead to the achievement of a wide range of knitted fabric concerning the covering capacity with many various effects;
The garment products with drawings achieved through transfer are more and more requested on the market being in the present fashion tendency;
Loop transference is used not only for making lace stitch patterns but also for fully fashioning and for introducing marking stitches or drop stitch effects;
Fabric fashioning requires widening or/and narrowing in different manner, depending on the final garment shape.
100
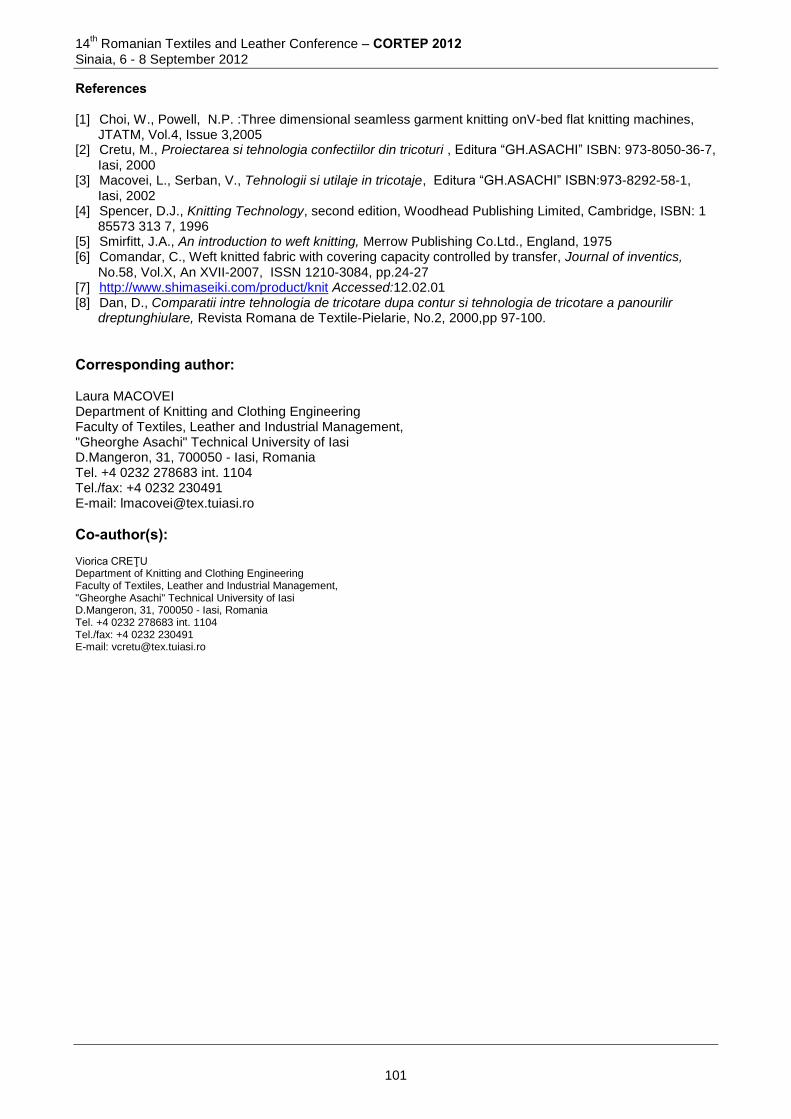
14th Romanian Textiles and Leather Conference – CORTEP 2012
Sinaia, 6 - 8 September 2012
References [1] Choi, W., Powell, N.P. :Three dimensional seamless garment knitting onV-bed flat knitting machines,
JTATM, Vol.4, Issue 3,2005 [2] Cretu, M., Proiectarea si tehnologia confectiilor din tricoturi , Editura “GH.ASACHI” ISBN: 973-8050-36-7,
Iasi, 2000 [3] Macovei, L., Serban, V., Tehnologii si utilaje in tricotaje, Editura “GH.ASACHI” ISBN:973-8292-58-1,
Iasi, 2002 [4] Spencer, D.J., Knitting Technology, second edition, Woodhead Publishing Limited, Cambridge, ISBN: 1
85573 313 7, 1996 [5] Smirfitt, J.A., An introduction to weft knitting, Merrow Publishing Co.Ltd., England, 1975 [6] Comandar, C., Weft knitted fabric with covering capacity controlled by transfer, Journal of inventics,
No.58, Vol.X, An XVII-2007, ISSN 1210-3084, pp.24-27 [7] http://www.shimaseiki.com/product/knit Accessed:12.02.01 [8] Dan, D., Comparatii intre tehnologia de tricotare dupa contur si tehnologia de tricotare a panourilir
dreptunghiulare, Revista Romana de Textile-Pielarie, No.2, 2000,pp 97-100.
Corresponding author: Laura MACOVEI Department of Knitting and Clothing Engineering Faculty of Textiles, Leather and Industrial Management, "Gheorghe Asachi" Technical University of Iasi D.Mangeron, 31, 700050 - Iasi, Romania Tel. +4 0232 278683 int. 1104 Tel./fax: +4 0232 230491 E-mail: [email protected]
Co-author(s): Viorica CREŢU Department of Knitting and Clothing Engineering Faculty of Textiles, Leather and Industrial Management, "Gheorghe Asachi" Technical University of Iasi D.Mangeron, 31, 700050 - Iasi, Romania Tel. +4 0232 278683 int. 1104 Tel./fax: +4 0232 230491 E-mail: [email protected]
101
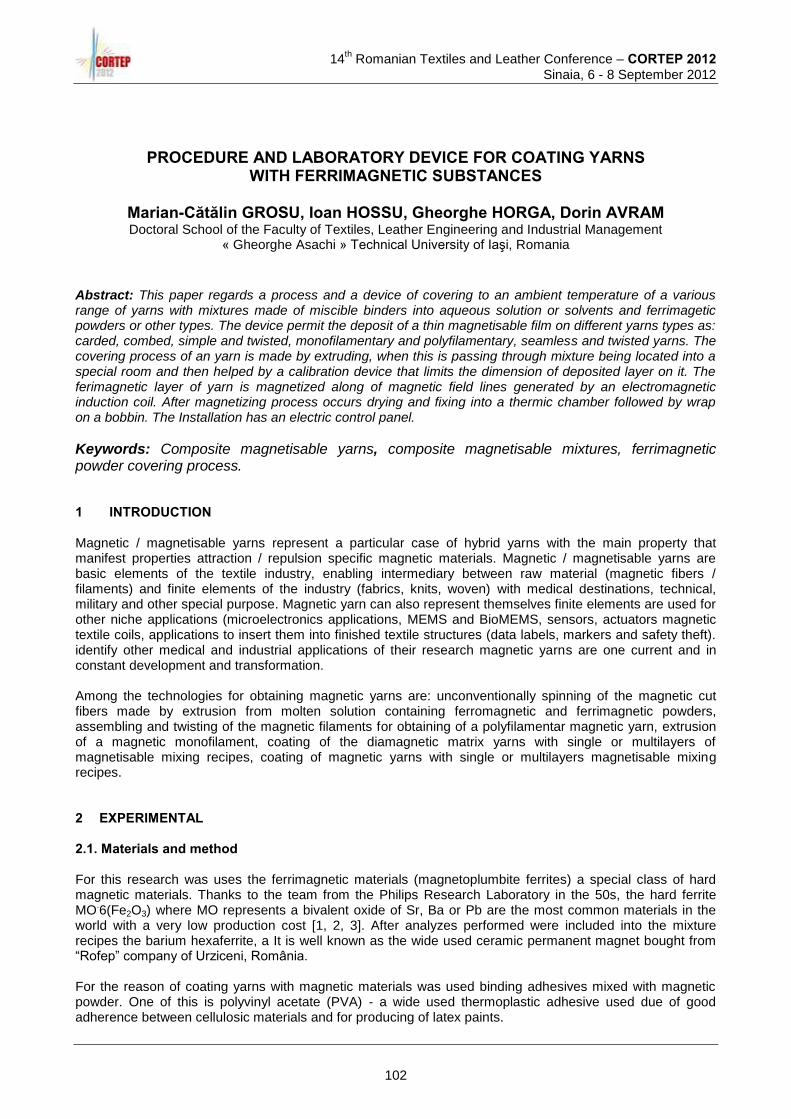
14
th Romanian Textiles and Leather Conference – CORTEP 2012
Sinaia, 6 - 8 September 2012
PROCEDURE AND LABORATORY DEVICE FOR COATING YARNS WITH FERRIMAGNETIC SUBSTANCES
Marian-Cătălin GROSU, Ioan HOSSU, Gheorghe HORGA, Dorin AVRAM Doctoral School of the Faculty of Textiles, Leather Engineering and Industrial Management
« Gheorghe Asachi » Technical University of Iaşi, Romania
Abstract: This paper regards a process and a device of covering to an ambient temperature of a various range of yarns with mixtures made of miscible binders into aqueous solution or solvents and ferrimagetic powders or other types. The device permit the deposit of a thin magnetisable film on different yarns types as: carded, combed, simple and twisted, monofilamentary and polyfilamentary, seamless and twisted yarns. The covering process of an yarn is made by extruding, when this is passing through mixture being located into a special room and then helped by a calibration device that limits the dimension of deposited layer on it. The ferimagnetic layer of yarn is magnetized along of magnetic field lines generated by an electromagnetic induction coil. After magnetizing process occurs drying and fixing into a thermic chamber followed by wrap on a bobbin. The Installation has an electric control panel.
Keywords: Composite magnetisable yarns, composite magnetisable mixtures, ferrimagnetic powder covering process. 1 INTRODUCTION Magnetic / magnetisable yarns represent a particular case of hybrid yarns with the main property that manifest properties attraction / repulsion specific magnetic materials. Magnetic / magnetisable yarns are basic elements of the textile industry, enabling intermediary between raw material (magnetic fibers / filaments) and finite elements of the industry (fabrics, knits, woven) with medical destinations, technical, military and other special purpose. Magnetic yarn can also represent themselves finite elements are used for other niche applications (microelectronics applications, MEMS and BioMEMS, sensors, actuators magnetic textile coils, applications to insert them into finished textile structures (data labels, markers and safety theft). identify other medical and industrial applications of their research magnetic yarns are one current and in constant development and transformation. Among the technologies for obtaining magnetic yarns are: unconventionally spinning of the magnetic cut fibers made by extrusion from molten solution containing ferromagnetic and ferrimagnetic powders, assembling and twisting of the magnetic filaments for obtaining of a polyfilamentar magnetic yarn, extrusion of a magnetic monofilament, coating of the diamagnetic matrix yarns with single or multilayers of magnetisable mixing recipes, coating of magnetic yarns with single or multilayers magnetisable mixing recipes. 2 EXPERIMENTAL 2.1. Materials and method For this research was uses the ferrimagnetic materials (magnetoplumbite ferrites) a special class of hard magnetic materials. Thanks to the team from the Philips Research Laboratory in the 50s, the hard ferrite MO
.6(Fe2O3) where MO represents a bivalent oxide of Sr, Ba or Pb are the most common materials in the
world with a very low production cost [1, 2, 3]. After analyzes performed were included into the mixture recipes the barium hexaferrite, a It is well known as the wide used ceramic permanent magnet bought from “Rofep” company of Urziceni, România. For the reason of coating yarns with magnetic materials was used binding adhesives mixed with magnetic powder. One of this is polyvinyl acetate (PVA) - a wide used thermoplastic adhesive used due of good adherence between cellulosic materials and for producing of latex paints.
102
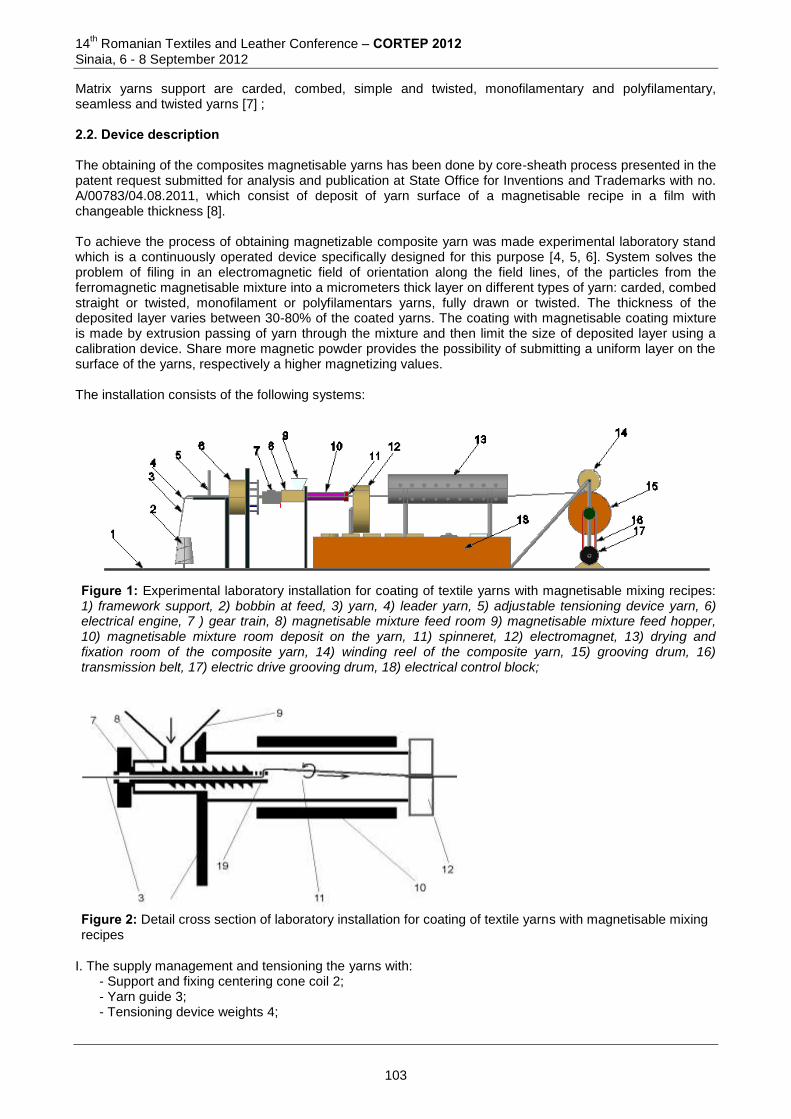
14th Romanian Textiles and Leather Conference – CORTEP 2012
Sinaia, 6 - 8 September 2012
Matrix yarns support are carded, combed, simple and twisted, monofilamentary and polyfilamentary, seamless and twisted yarns [7] ; 2.2. Device description The obtaining of the composites magnetisable yarns has been done by core-sheath process presented in the patent request submitted for analysis and publication at State Office for Inventions and Trademarks with no. A/00783/04.08.2011, which consist of deposit of yarn surface of a magnetisable recipe in a film with changeable thickness [8]. To achieve the process of obtaining magnetizable composite yarn was made experimental laboratory stand which is a continuously operated device specifically designed for this purpose [4, 5, 6]. System solves the problem of filing in an electromagnetic field of orientation along the field lines, of the particles from the ferromagnetic magnetisable mixture into a micrometers thick layer on different types of yarn: carded, combed straight or twisted, monofilament or polyfilamentars yarns, fully drawn or twisted. The thickness of the deposited layer varies between 30-80% of the coated yarns. The coating with magnetisable coating mixture is made by extrusion passing of yarn through the mixture and then limit the size of deposited layer using a calibration device. Share more magnetic powder provides the possibility of submitting a uniform layer on the surface of the yarns, respectively a higher magnetizing values. The installation consists of the following systems:
Figure 1: Experimental laboratory installation for coating of textile yarns with magnetisable mixing recipes: 1) framework support, 2) bobbin at feed, 3) yarn, 4) leader yarn, 5) adjustable tensioning device yarn, 6) electrical engine, 7 ) gear train, 8) magnetisable mixture feed room 9) magnetisable mixture feed hopper, 10) magnetisable mixture room deposit on the yarn, 11) spinneret, 12) electromagnet, 13) drying and fixation room of the composite yarn, 14) winding reel of the composite yarn, 15) grooving drum, 16) transmission belt, 17) electric drive grooving drum, 18) electrical control block;
Figure 2: Detail cross section of laboratory installation for coating of textile yarns with magnetisable mixing recipes
I. The supply management and tensioning the yarns with: - Support and fixing centering cone coil 2; - Yarn guide 3; - Tensioning device weights 4;
103

14
th Romanian Textiles and Leather Conference – CORTEP 2012
Sinaia, 6 - 8 September 2012
II. The supply, transport and storage of the mixture magnetized deposit composed of: - Gravity hopper feeding system 9; - Conveyor worm 19 gear driven by an electric motor 6 with power to acquire and deposit the mixture
magnetized yarn; - Magnetizing mixture supply chamber 8 inside which the mixture conveyor worm 19 is found;
III. The deposit and yarn calibration of magnetisable substances consists of the following:
- Magnetisable mixture settling chamber 19 located in a magnetic field created by an electromagnetic coil 12 traveled to align along the field lines of particles from depositing the ferromagnetic mixture on yarn;
- Calibration device of layer deposited on the yarn 11; IV. Drying and fixing system deposited layers on yarns consists of:
- Linear halogen lamp placed eccentrically in a reflective aluminum tube 13; - The yarn guidance system located at a distance of 1 cm from the heat source, the drying process,
vapors are released to the outside of the tube through the holes provided for this purpose; V. The winding system comprises of: - Assembly consists of a grooving drum 15 shaft driving the drying system driven by a variable speed electric motor 17; - Cylindrical coil 14 of magnetic yarn that is driven by friction with grooved drum; VI. Electric drive system 18 contains the following systems:
- General switch that powers the system with 220 V (AC); - Electrical transformer that supplies 24 V (DC) coil inside which creates an electromagnetic field; - Switch to engine power; - Switch lamp; - Variable voltage - Switch coil;
3 RESULTS AND DISCUSSIONS The presentation of the installation components is done below, in terms of their functionality. The matrix yarn 3 supplied by the coil 2, with reference to Figure 1, is passed through yarn leader 4 and get the tensioning device 5 which may be adjustable. Out of 5 yarn tensioning device 3 reaches the supply room of the magnetisable mixture 8 by channels axis gear 7, and the conveyor worm 19.
The worm conveyor 19 is driven in rotation by the electric motor 6 by means of the gear 7 which is fixed to the camp in the left wall of the room supply mixtures 8 and receives rotational motion from the electric motor gear transmission 6.
The supply room of the magnetisable mixture 8, supply mix magnetized previously done is done by gravity hooper 9. Yarn deposition chamber 3 reaches the magnetisable mixture worm transport channel 11 and out of channel 19 can be either axial direction of the channel or radial direction thereof, to give a yarn rotating around its own axis, with rotating conveyor worm 19. Radial output wire of the conveyor worm 19 is used to increase deposit uniformity magnetized mixture yarn.
Worm conveyor 19 has triple function:
- The acquisition and management of magnetisable mixture fed through the chute chamber 9 by submitting the magnetisable mixture 10 chamber;
- Management of yarn 3 out of 5 tensioning device to the mixing chamber deposit 10;
- To achieve a rotation of three textile yarn around its own axis;
Into the deposition chamber 10, mixing power is pushed by the conveyor worm 19 to the calibration device 11. Submission mixture on the yarn 3 in adjustable magnetic field generated by an electromagnet 12 is achieved by rotation (Vr) of the fiber mixture Magnetisable and is calibrated to output speed (Vt) of the calibration device 11.
Magnetisable mixture deposited on the yarn 3 is fixed by solvent evaporation, the latter through the drying chamber 13, the temperature of which is ensured by an adjustable linear halogen lamp. After drying, the wire 3 is wound onto the winding cylinder 14 driven by friction with grooved drum 15 which is driven by belt 16 by the electric motor 17. Components of the system presented are operated by electrical control unit 18.
104
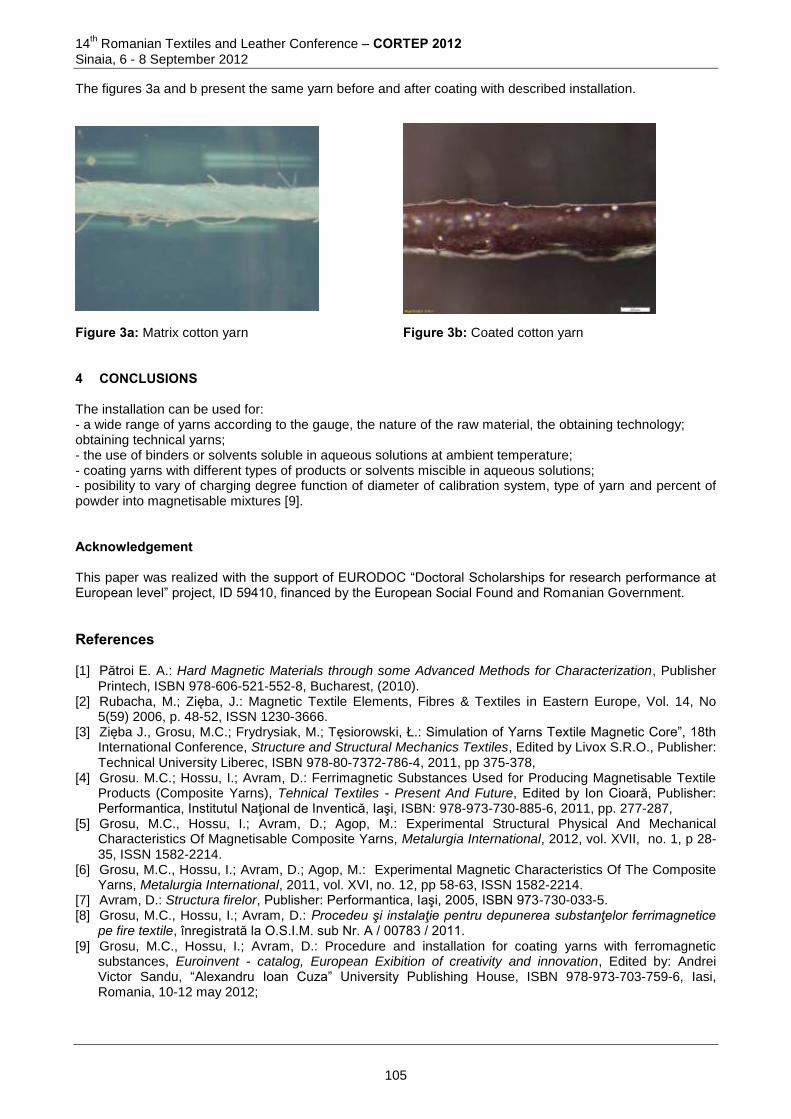
14th Romanian Textiles and Leather Conference – CORTEP 2012
Sinaia, 6 - 8 September 2012
The figures 3a and b present the same yarn before and after coating with described installation.
Figure 3a: Matrix cotton yarn Figure 3b: Coated cotton yarn 4 CONCLUSIONS The installation can be used for: - a wide range of yarns according to the gauge, the nature of the raw material, the obtaining technology; obtaining technical yarns; - the use of binders or solvents soluble in aqueous solutions at ambient temperature; - coating yarns with different types of products or solvents miscible in aqueous solutions; - posibility to vary of charging degree function of diameter of calibration system, type of yarn and percent of powder into magnetisable mixtures [9]. Acknowledgement This paper was realized with the support of EURODOC “Doctoral Scholarships for research performance at European level” project, ID 59410, financed by the European Social Found and Romanian Government. References [1] Pătroi E. A.: Hard Magnetic Materials through some Advanced Methods for Characterization, Publisher
Printech, ISBN 978-606-521-552-8, Bucharest, (2010). [2] Rubacha, M.; Zięba, J.: Magnetic Textile Elements, Fibres & Textiles in Eastern Europe, Vol. 14, No
5(59) 2006, p. 48-52, ISSN 1230-3666. [3] Zięba J., Grosu, M.C.; Frydrysiak, M.; Tęsiorowski, Ł.: Simulation of Yarns Textile Magnetic Core”, 18th
International Conference, Structure and Structural Mechanics Textiles, Edited by Livox S.R.O., Publisher: Technical University Liberec, ISBN 978-80-7372-786-4, 2011, pp 375-378,
[4] Grosu. M.C.; Hossu, I.; Avram, D.: Ferrimagnetic Substances Used for Producing Magnetisable Textile Products (Composite Yarns), Tehnical Textiles - Present And Future, Edited by Ion Cioară, Publisher: Performantica, Institutul Naţional de Inventică, Iaşi, ISBN: 978-973-730-885-6, 2011, pp. 277-287,
[5] Grosu, M.C., Hossu, I.; Avram, D.; Agop, M.: Experimental Structural Physical And Mechanical Characteristics Of Magnetisable Composite Yarns, Metalurgia International, 2012, vol. XVII, no. 1, p 28-35, ISSN 1582-2214.
[6] Grosu, M.C., Hossu, I.; Avram, D.; Agop, M.: Experimental Magnetic Characteristics Of The Composite Yarns, Metalurgia International, 2011, vol. XVI, no. 12, pp 58-63, ISSN 1582-2214.
[7] Avram, D.: Structura firelor, Publisher: Performantica, Iaşi, 2005, ISBN 973-730-033-5. [8] Grosu, M.C., Hossu, I.; Avram, D.: Procedeu şi instalaţie pentru depunerea substanţelor ferrimagnetice
pe fire textile, înregistrată la O.S.I.M. sub Nr. A / 00783 / 2011. [9] Grosu, M.C., Hossu, I.; Avram, D.: Procedure and installation for coating yarns with ferromagnetic
substances, Euroinvent - catalog, European Exibition of creativity and innovation, Edited by: Andrei Victor Sandu, “Alexandru Ioan Cuza” University Publishing House, ISBN 978-973-703-759-6, Iasi, Romania, 10-12 may 2012;
105
14
th Romanian Textiles and Leather Conference – CORTEP 2012
Sinaia, 6 - 8 September 2012
Corresponding author:
Marian-Cătălin GROSU Doctoral School of the Faculty of Textile, Leather Engineering and Industrial Management, “Gheorghe Asachi” Technical University of Iasi, Romania Blvd. Dimitrie Mangeron, nr. 29 700050, Iaşi, România 0758470605, [email protected]
Co-author(s): Ioan HOSSU Doctoral School of the Faculty of Textile, Leather Engineering and Industrial Management, “Gheorghe Asachi” Technical University of Iasi, Romania Blvd. Dimitrie Mangeron, nr. 29 700050, Iaşi, România 0747788537, [email protected] Gheorghe HORGA Doctoral School of the Faculty of Textile, Leather Engineering and Industrial Management, “Gheorghe Asachi” Technical University of Iasi, Romania Blvd. Dimitrie Mangeron, nr. 29 700050, Iaşi, România 0740216548, [email protected] Dorin AVRAM Department: Technology and Design of Textile Products, Faculty of Textile, Leather Engineering and Industrial Management, “Gheorghe Asachi” Technical University of Iasi, Romania Blvd. Dimitrie Mangeron, nr. 29 700050, Iaşi, România 0740683445, [email protected]
106

14
th Romanian Textiles and Leather Conference – CORTEP 2012
Sinaia, 6 - 8 September 2012
TEXTILE INDUSTRY AT NANOSCALE
Monica Alina CALIN, Mirela TEODORESCU & Antonela CURTEZA „Gheorghe Asachi” Technical University of Iasi, Romania,
Doctoral School of the Faculty of Textile, Leather and Industrial Management Abstract: Nanotechnology is the study of manipulating matter on atomic and molecular scale. Usually, it deals with the developing of different materials, devices or any other structures while working with dimensions sized from 1 to 100 nanometers. The fields of interests for nanotechnology are widely spread, the main idea being based upon molecular self-assembly and developing new revolutionary materials by trying to control the matter on atomic scale. So far, nanotechnology has been applied in various fields such as: aerospace, automotive, construction, medicine, molecular biology, electronics, biomaterials, organic chemistry, physics, textiles, etc. In the textile field, nanotechnology enables the manipulation of fibers at the level of atoms and molecules to alter their properties and qualities. Textiles are changing thanks to nanotechnology. Textiles with integrated electronics, healthcare systems, protective clothing, textiles with self-cleaning abilities, textiles that behave like sensors are some examples of what nanotechnologies can do. As well as developing textiles to withstand extreme environments, scientists have looked to naturally existing viral nanoparticles that live in some of the harshest environments on earth, for new building blocks for nanotechnology. Such an example are the carbon nanotubes (CNTs) which can significantly improve the mechanical properties of the textile materials, giving them better strength and flexibility and making them behave as sensors for temperature, pressure, humidity, etc. Keywords: nanotechnology, carbon nanotubes, advanced textiles, sensors. 1 INTRODUCTION Nanotechnology refers to the study of particles at nano scale (1m=10
-9nm) in order to be able to develop
different types of materials, devices, or other structures. Nanotechnology is a new science which was extended on many domains during the past 10 years. So far, nanotechnology has been applied in various fields such as: aerospace, automotive, construction, medicine, molecular biology, electronics, biomaterials, organic chemistry, physics, textiles etc. The efforts of nanotechnology are focused on exploiting the atoms, molecules and particles at nano scale, in a precise and controlled manner, in order to obtain products with a fundamentally different structure and new properties. In the textile field, nanotechnology enables the manipulation of fibers at the level of atoms or molecules in order to alter their properties and qualities. The beginnings of nanotechnology consist in the “atomic assembly” which was first mentioned by the physicist Richard Freyman. The concept of “Nanotechnology” was firstly used by the Japanese scientist Norio Taniguchi in the paper called “On the Basic Concept of Nanotechnology”. [5] 2 INFORMATION Nanotechnology can be applied to textiles, increasing the number of possible applications for fibers and the value of the final product. Textiles based on nanofibers have better properties such as: higher absorption capacity, higher filtering efficiency and a better structural variation. Having these advantages, the nanofibers technology has a huge commercial opportunity in the filters and carbon nanofibers markets. Using nanotechnology in order to help the textile industry to enter new areas of the applications based on nanofibers, will increase the level of the traditional technology and will integrate the nanotechnology in nanotextiles. The new techniques will also improve the nonwovens and will provide key options of the materials for the medical, semiconducting or high-tech textiles.[1,2] In the table below are present some of the applications of nanotechnology in the textile field.
107
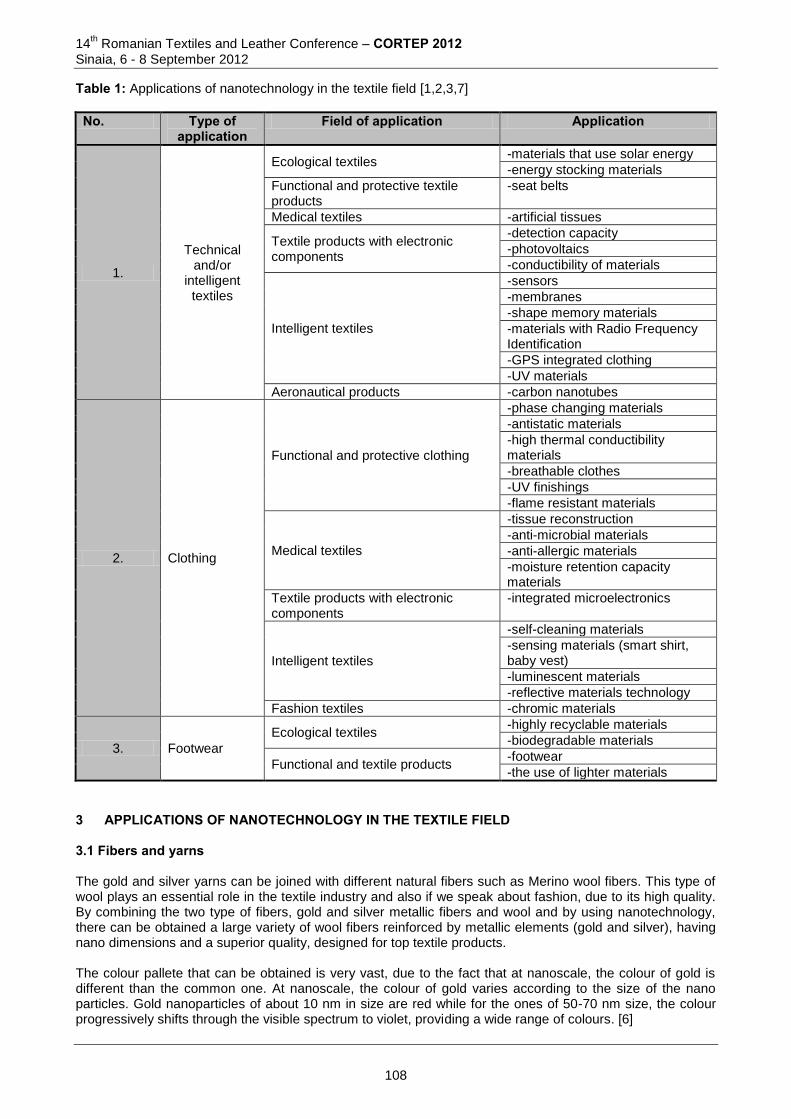
14th Romanian Textiles and Leather Conference – CORTEP 2012
Sinaia, 6 - 8 September 2012
Table 1: Applications of nanotechnology in the textile field [1,2,3,7]
No. Type of application
Field of application Application
1.
Technical and/or
intelligent textiles
Ecological textiles -materials that use solar energy
-energy stocking materials
Functional and protective textile products
-seat belts
Medical textiles -artificial tissues
Textile products with electronic components
-detection capacity
-photovoltaics
-conductibility of materials
Intelligent textiles
-sensors
-membranes
-shape memory materials
-materials with Radio Frequency Identification
-GPS integrated clothing
-UV materials
Aeronautical products -carbon nanotubes
2. Clothing
Functional and protective clothing
-phase changing materials
-antistatic materials
-high thermal conductibility materials
-breathable clothes
-UV finishings
-flame resistant materials
Medical textiles
-tissue reconstruction
-anti-microbial materials
-anti-allergic materials
-moisture retention capacity materials
Textile products with electronic components
-integrated microelectronics
Intelligent textiles
-self-cleaning materials
-sensing materials (smart shirt, baby vest)
-luminescent materials
-reflective materials technology
Fashion textiles -chromic materials
3. Footwear
Ecological textiles -highly recyclable materials
-biodegradable materials
Functional and textile products -footwear
-the use of lighter materials
3 APPLICATIONS OF NANOTECHNOLOGY IN THE TEXTILE FIELD 3.1 Fibers and yarns The gold and silver yarns can be joined with different natural fibers such as Merino wool fibers. This type of wool plays an essential role in the textile industry and also if we speak about fashion, due to its high quality. By combining the two type of fibers, gold and silver metallic fibers and wool and by using nanotechnology, there can be obtained a large variety of wool fibers reinforced by metallic elements (gold and silver), having nano dimensions and a superior quality, designed for top textile products. The colour pallete that can be obtained is very vast, due to the fact that at nanoscale, the colour of gold is different than the common one. At nanoscale, the colour of gold varies according to the size of the nano particles. Gold nanoparticles of about 10 nm in size are red while for the ones of 50-70 nm size, the colour progressively shifts through the visible spectrum to violet, providing a wide range of colours. [6]
108
14
th Romanian Textiles and Leather Conference – CORTEP 2012
Sinaia, 6 - 8 September 2012
The nano sized gold rods are usually green or blue, the colour depending on the ratio between the extreme dimensions of the nanoparticles. Silver has similar effect when studied at nanoscale. Also, they have efficient antimicrobial properties. As applications in the fashion field, it is possible to use the gold and silver nanoparticles as dyes in order to increase the quality of Merino wool and other types of wool for obtaining textile fabrics or carpets. 3.2 Chromic materials A type of intelligent materials are the ones that change colour according to the outside environmental conditions. They are also known as “Chameleon materials”. The concept of “chromic materials” refers to materials that release or change colour in the presence of external stimuli. The chromic materials can be classified according to the stimuli that influence them:
Photochromic materials: the external stimulus is light
Thermochromic materials: the external stimulus is heat
Electrochromic materials: the external stimulus is electricity
Piezo chromic materials: the external stimulus is pressure
Solvate chromic materials: the external stimuli are gas or liquids 3.3 Photovoltaic materials The photovoltaic effect was discovered in 1893 by Becquerel. Photovoltaic materials can generate electric current by light excitation. In the textile field, the main application of photovoltaics is the power supply of the integrated electronic devices. The power supply can be done directly from the solar cells to the electronic devices, or can use solar energy to charge batteries that will then power the closest electronic device (mp3 players, cell phone). 3.4. Membranes The membranes are usually made by polymers and can contain one or more layers, according to the aiming properties. Then, the membranes are deposited in textiles in order to add more properties to them. The polymers used can be: biopolymers, synthetic polymers etc. One of the main application of membranes is for sportswear, for impermeable clothing and with a high degree breathability. It was proved that by using a simple membrane system, fabrics with a high water exchange can be obtained with a good elimination of sweat at the garment interface and the creation of an external barrier with extreme water repellence. The best provider of textile membranes is Gore; they manufacture wafer-thin microporous membrane which contains over 9 million pores per square inch. [7] 3.5. Conductive materials There are two types of conductive materials: metals and polymers. They can both be used for conductivity, thermal or electric, due to the fact that the processes are similar and result from electronic agitation/conduction. The application of conductive materials are: heated clothes for extreme winter conditions, heated diving suits that resist to very low temperatures, power supply for electronic devices in garments 3.6. Shape memory materials There are shape memory materials stable at two or more temperature states in which they can assume different shapes when their transformation temperature has been reached. There are also electro active polymers which can change shape as response to electrical stimuli. For clothing, the phase changing temperatures of these materials must be close to the body temperature. There have been made polyurethane films that can be incorporated between adjacent layers of clothing. When the temperature of the outer layer decreases to a specific point, the polyurethane film responds. A very important aspect is the fact that the deformation must be capable of reversal if the outer layer of clothing becomes warmer.[7]
109
14th Romanian Textiles and Leather Conference – CORTEP 2012
Sinaia, 6 - 8 September 2012
4 CONCLUSIONS The unique properties of nano materials gained the attention of scientist also for the textile field, due to the huge potential to realiza new fibers or create new ones with improved properties. Most of the applications of the nanotechnology can be extended in order to obtain new results in the textiles fabrication processes. Future interdisciplinary collaborations will lead to a notable progress in the fabrication of nanomaterials. Some of the main aspects expected in the near future are the improvement of the resistance of medical fibers and materials, electronic textiles, fibers with increased antibacterial properties, environmentally friendly textile products etc. 5 ACKNOWLEDGEMENT This paper was realised with the support of EURODOC “Doctoral Scholarships for research performance at European level” project, ID 59410, financed by the European Social Found and Romanian Government. 6 REFERENCES [1] Aravin, P. P., Nano Textile; [2] Ramsden, J. Nanotechnology, 2009, ISBN 978-87-7681-418-2, 126 p. [3] Popov, V.N., Carbon nanotubes: properties and application, Materials Science and Engineering,
Elsevier, 2004, 102 p. [4] Kartikeyan. M.R., Kavitha. T. K. - Smart and Intelligent textiles [5] Kaviyarasu.R – Application of Nano Technology [6] Merino wool shines bright with gold nano particles, Available from
http://www.fibre2fashion.com/news/wool-news/newsdetails.aspx?news_id=58498 Accessed: 2012-06-11 [7] New Cloth Market, State of the art in smart textiles and interactive fabrics, 2009 Corresponding author: Monica Alina Calin Faculty of Textiles & Leather Engineering and Industrial Management Doctoral School of "Gheorghe Asachi" Technical University of Iasi Bvd. D. Mangeron No.67 700050, Iași, Romania E-mail: [email protected]
Co-authors: Mirela TEODORESCU Faculty of Textiles & Leather Engineering and Industrial Management
Doctoral School of "Gheorghe Asachi" Technical University of Iasi
Bvd. D. Mangeron No.67 700050, Iași, Romania E-mail: [email protected] Antonela CURTEZA Faculty of Textiles & Leather Engineering and Industrial Management/ "Gheorghe Asachi" Technical University of Iasi Bvd. D. Mangeron No.67 700050, Iași, Romania E-mail: [email protected]
110
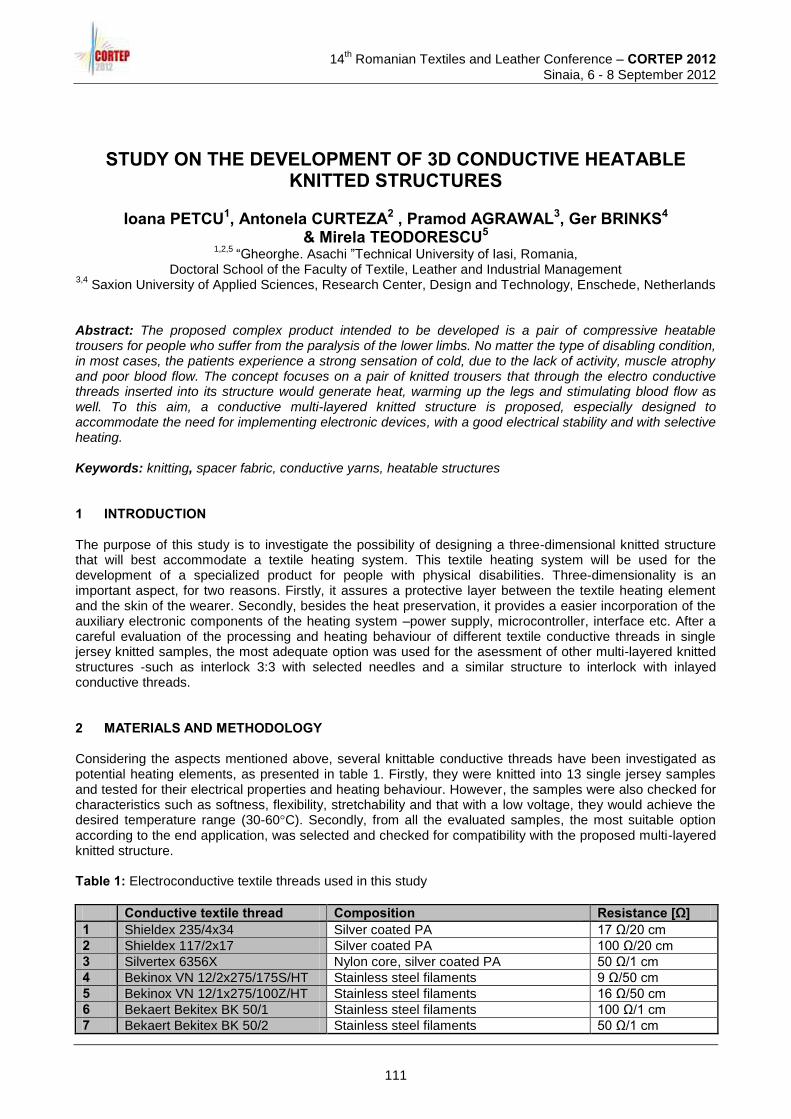
14
th Romanian Textiles and Leather Conference – CORTEP 2012
Sinaia, 6 - 8 September 2012
STUDY ON THE DEVELOPMENT OF 3D CONDUCTIVE HEATABLE KNITTED STRUCTURES
Ioana PETCU1, Antonela CURTEZA2 , Pramod AGRAWAL3, Ger BRINKS4
& Mirela TEODORESCU5 1,2,5
“Gheorghe. Asachi ”Technical University of Iasi, Romania, Doctoral School of the Faculty of Textile, Leather and Industrial Management
3,4 Saxion University of Applied Sciences, Research Center, Design and Technology, Enschede, Netherlands
Abstract: The proposed complex product intended to be developed is a pair of compressive heatable trousers for people who suffer from the paralysis of the lower limbs. No matter the type of disabling condition, in most cases, the patients experience a strong sensation of cold, due to the lack of activity, muscle atrophy and poor blood flow. The concept focuses on a pair of knitted trousers that through the electro conductive threads inserted into its structure would generate heat, warming up the legs and stimulating blood flow as well. To this aim, a conductive multi-layered knitted structure is proposed, especially designed to accommodate the need for implementing electronic devices, with a good electrical stability and with selective heating. Keywords: knitting, spacer fabric, conductive yarns, heatable structures 1 INTRODUCTION The purpose of this study is to investigate the possibility of designing a three-dimensional knitted structure that will best accommodate a textile heating system. This textile heating system will be used for the development of a specialized product for people with physical disabilities. Three-dimensionality is an important aspect, for two reasons. Firstly, it assures a protective layer between the textile heating element and the skin of the wearer. Secondly, besides the heat preservation, it provides a easier incorporation of the auxiliary electronic components of the heating system –power supply, microcontroller, interface etc. After a careful evaluation of the processing and heating behaviour of different textile conductive threads in single jersey knitted samples, the most adequate option was used for the asessment of other multi-layered knitted structures -such as interlock 3:3 with selected needles and a similar structure to interlock with inlayed conductive threads. 2 MATERIALS AND METHODOLOGY Considering the aspects mentioned above, several knittable conductive threads have been investigated as potential heating elements, as presented in table 1. Firstly, they were knitted into 13 single jersey samples and tested for their electrical properties and heating behaviour. However, the samples were also checked for characteristics such as softness, flexibility, stretchability and that with a low voltage, they would achieve the desired temperature range (30-60°C). Secondly, from all the evaluated samples, the most suitable option according to the end application, was selected and checked for compatibility with the proposed multi-layered knitted structure. Table 1: Electroconductive textile threads used in this study
Conductive textile thread Composition Resistance [Ω] 1 Shieldex 235/4x34 Silver coated PA 17 Ω/20 cm
2 Shieldex 117/2x17 Silver coated PA 100 Ω/20 cm
3 Silvertex 6356X Nylon core, silver coated PA 50 Ω/1 cm
4 Bekinox VN 12/2x275/175S/HT Stainless steel filaments 9 Ω/50 cm
5 Bekinox VN 12/1x275/100Z/HT Stainless steel filaments 16 Ω/50 cm
6 Bekaert Bekitex BK 50/1 Stainless steel filaments 100 Ω/1 cm
7 Bekaert Bekitex BK 50/2 Stainless steel filaments 50 Ω/1 cm
111
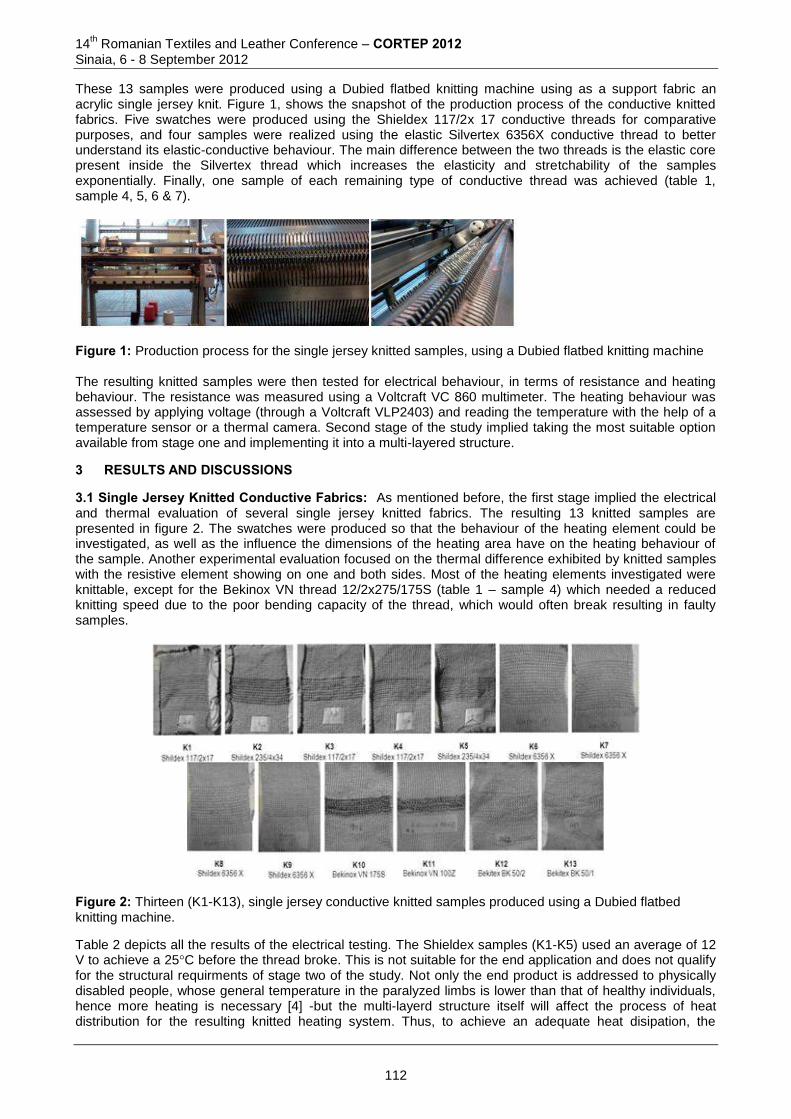
14th Romanian Textiles and Leather Conference – CORTEP 2012
Sinaia, 6 - 8 September 2012
These 13 samples were produced using a Dubied flatbed knitting machine using as a support fabric an acrylic single jersey knit. Figure 1, shows the snapshot of the production process of the conductive knitted fabrics. Five swatches were produced using the Shieldex 117/2x 17 conductive threads for comparative purposes, and four samples were realized using the elastic Silvertex 6356X conductive thread to better understand its elastic-conductive behaviour. The main difference between the two threads is the elastic core present inside the Silvertex thread which increases the elasticity and stretchability of the samples exponentially. Finally, one sample of each remaining type of conductive thread was achieved (table 1, sample 4, 5, 6 & 7).
Figure 1: Production process for the single jersey knitted samples, using a Dubied flatbed knitting machine The resulting knitted samples were then tested for electrical behaviour, in terms of resistance and heating behaviour. The resistance was measured using a Voltcraft VC 860 multimeter. The heating behaviour was assessed by applying voltage (through a Voltcraft VLP2403) and reading the temperature with the help of a temperature sensor or a thermal camera. Second stage of the study implied taking the most suitable option available from stage one and implementing it into a multi-layered structure.
3 RESULTS AND DISCUSSIONS
3.1 Single Jersey Knitted Conductive Fabrics: As mentioned before, the first stage implied the electrical and thermal evaluation of several single jersey knitted fabrics. The resulting 13 knitted samples are presented in figure 2. The swatches were produced so that the behaviour of the heating element could be investigated, as well as the influence the dimensions of the heating area have on the heating behaviour of the sample. Another experimental evaluation focused on the thermal difference exhibited by knitted samples with the resistive element showing on one and both sides. Most of the heating elements investigated were knittable, except for the Bekinox VN thread 12/2x275/175S (table 1 – sample 4) which needed a reduced knitting speed due to the poor bending capacity of the thread, which would often break resulting in faulty samples.
Figure 2: Thirteen (K1-K13), single jersey conductive knitted samples produced using a Dubied flatbed knitting machine.
Table 2 depicts all the results of the electrical testing. The Shieldex samples (K1-K5) used an average of 12 V to achieve a 25°C before the thread broke. This is not suitable for the end application and does not qualify for the structural requirments of stage two of the study. Not only the end product is addressed to physically disabled people, whose general temperature in the paralyzed limbs is lower than that of healthy individuals, hence more heating is necessary [4] -but the multi-layerd structure itself will affect the process of heat distribution for the resulting knitted heating system. Thus, to achieve an adequate heat disipation, the
112
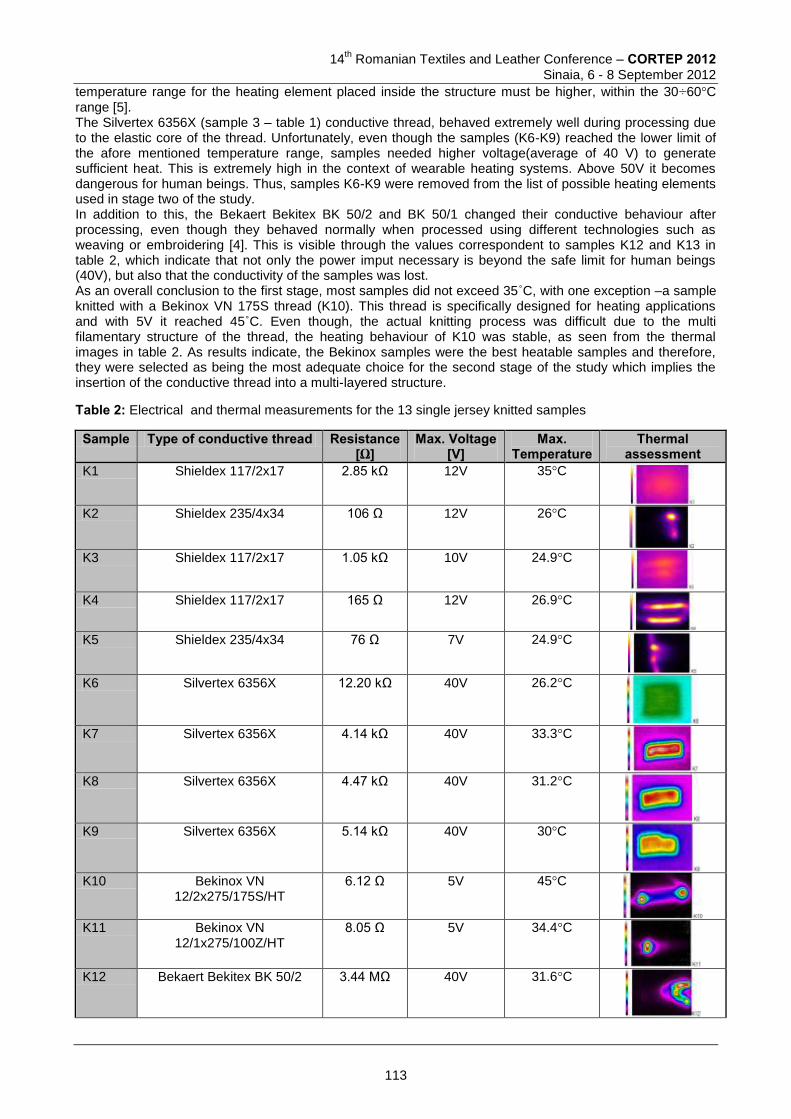
14
th Romanian Textiles and Leather Conference – CORTEP 2012
Sinaia, 6 - 8 September 2012
temperature range for the heating element placed inside the structure must be higher, within the 30÷60°C range [5]. The Silvertex 6356X (sample 3 – table 1) conductive thread, behaved extremely well during processing due to the elastic core of the thread. Unfortunately, even though the samples (K6-K9) reached the lower limit of the afore mentioned temperature range, samples needed higher voltage(average of 40 V) to generate sufficient heat. This is extremely high in the context of wearable heating systems. Above 50V it becomes dangerous for human beings. Thus, samples K6-K9 were removed from the list of possible heating elements used in stage two of the study. In addition to this, the Bekaert Bekitex BK 50/2 and BK 50/1 changed their conductive behaviour after processing, even though they behaved normally when processed using different technologies such as weaving or embroidering [4]. This is visible through the values correspondent to samples K12 and K13 in table 2, which indicate that not only the power imput necessary is beyond the safe limit for human beings (40V), but also that the conductivity of the samples was lost. As an overall conclusion to the first stage, most samples did not exceed 35˚C, with one exception –a sample knitted with a Bekinox VN 175S thread (K10). This thread is specifically designed for heating applications and with 5V it reached 45˚C. Even though, the actual knitting process was difficult due to the multi filamentary structure of the thread, the heating behaviour of K10 was stable, as seen from the thermal images in table 2. As results indicate, the Bekinox samples were the best heatable samples and therefore, they were selected as being the most adequate choice for the second stage of the study which implies the insertion of the conductive thread into a multi-layered structure.
Table 2: Electrical and thermal measurements for the 13 single jersey knitted samples
Sample Type of conductive thread Resistance [Ω]
Max. Voltage [V]
Max. Temperature
Thermal assessment
K1 Shieldex 117/2x17 2.85 kΩ 12V 35°C
K2 Shieldex 235/4x34 106 Ω 12V 26°C
K3 Shieldex 117/2x17 1.05 kΩ 10V 24.9°C
K4 Shieldex 117/2x17 165 Ω 12V 26.9°C
K5 Shieldex 235/4x34 76 Ω 7V 24.9°C
K6 Silvertex 6356X 12.20 kΩ 40V 26.2°C
K7 Silvertex 6356X 4.14 kΩ 40V 33.3°C
K8 Silvertex 6356X 4.47 kΩ 40V 31.2°C
K9 Silvertex 6356X 5.14 kΩ 40V 30°C
K10 Bekinox VN
12/2x275/175S/HT 6.12 Ω 5V 45°C
K11 Bekinox VN
12/1x275/100Z/HT 8.05 Ω 5V 34.4°C
K12 Bekaert Bekitex BK 50/2 3.44 MΩ 40V 31.6°C
113
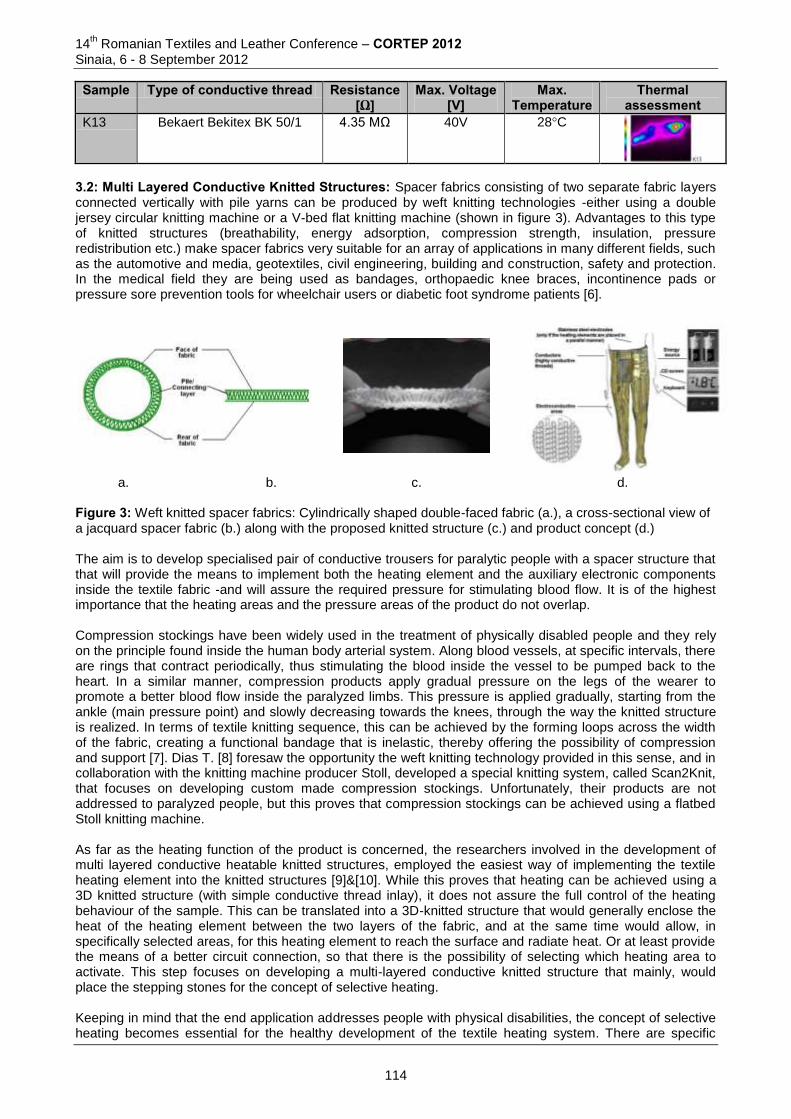
14th Romanian Textiles and Leather Conference – CORTEP 2012
Sinaia, 6 - 8 September 2012
Sample Type of conductive thread Resistance [Ω]
Max. Voltage [V]
Max. Temperature
Thermal assessment
K13 Bekaert Bekitex BK 50/1 4.35 MΩ 40V 28°C
3.2: Multi Layered Conductive Knitted Structures: Spacer fabrics consisting of two separate fabric layers connected vertically with pile yarns can be produced by weft knitting technologies -either using a double jersey circular knitting machine or a V-bed flat knitting machine (shown in figure 3). Advantages to this type of knitted structures (breathability, energy adsorption, compression strength, insulation, pressure redistribution etc.) make spacer fabrics very suitable for an array of applications in many different fields, such as the automotive and media, geotextiles, civil engineering, building and construction, safety and protection. In the medical field they are being used as bandages, orthopaedic knee braces, incontinence pads or pressure sore prevention tools for wheelchair users or diabetic foot syndrome patients [6].
a. b. c. d.
Figure 3: Weft knitted spacer fabrics: Cylindrically shaped double-faced fabric (a.), a cross-sectional view of a jacquard spacer fabric (b.) along with the proposed knitted structure (c.) and product concept (d.) The aim is to develop specialised pair of conductive trousers for paralytic people with a spacer structure that that will provide the means to implement both the heating element and the auxiliary electronic components inside the textile fabric -and will assure the required pressure for stimulating blood flow. It is of the highest importance that the heating areas and the pressure areas of the product do not overlap. Compression stockings have been widely used in the treatment of physically disabled people and they rely on the principle found inside the human body arterial system. Along blood vessels, at specific intervals, there are rings that contract periodically, thus stimulating the blood inside the vessel to be pumped back to the heart. In a similar manner, compression products apply gradual pressure on the legs of the wearer to promote a better blood flow inside the paralyzed limbs. This pressure is applied gradually, starting from the ankle (main pressure point) and slowly decreasing towards the knees, through the way the knitted structure is realized. In terms of textile knitting sequence, this can be achieved by the forming loops across the width of the fabric, creating a functional bandage that is inelastic, thereby offering the possibility of compression and support [7]. Dias T. [8] foresaw the opportunity the weft knitting technology provided in this sense, and in collaboration with the knitting machine producer Stoll, developed a special knitting system, called Scan2Knit, that focuses on developing custom made compression stockings. Unfortunately, their products are not addressed to paralyzed people, but this proves that compression stockings can be achieved using a flatbed Stoll knitting machine. As far as the heating function of the product is concerned, the researchers involved in the development of multi layered conductive heatable knitted structures, employed the easiest way of implementing the textile heating element into the knitted structures [9]&[10]. While this proves that heating can be achieved using a 3D knitted structure (with simple conductive thread inlay), it does not assure the full control of the heating behaviour of the sample. This can be translated into a 3D-knitted structure that would generally enclose the heat of the heating element between the two layers of the fabric, and at the same time would allow, in specifically selected areas, for this heating element to reach the surface and radiate heat. Or at least provide the means of a better circuit connection, so that there is the possibility of selecting which heating area to activate. This step focuses on developing a multi-layered conductive knitted structure that mainly, would place the stepping stones for the concept of selective heating. Keeping in mind that the end application addresses people with physical disabilities, the concept of selective heating becomes essential for the healthy development of the textile heating system. There are specific
114
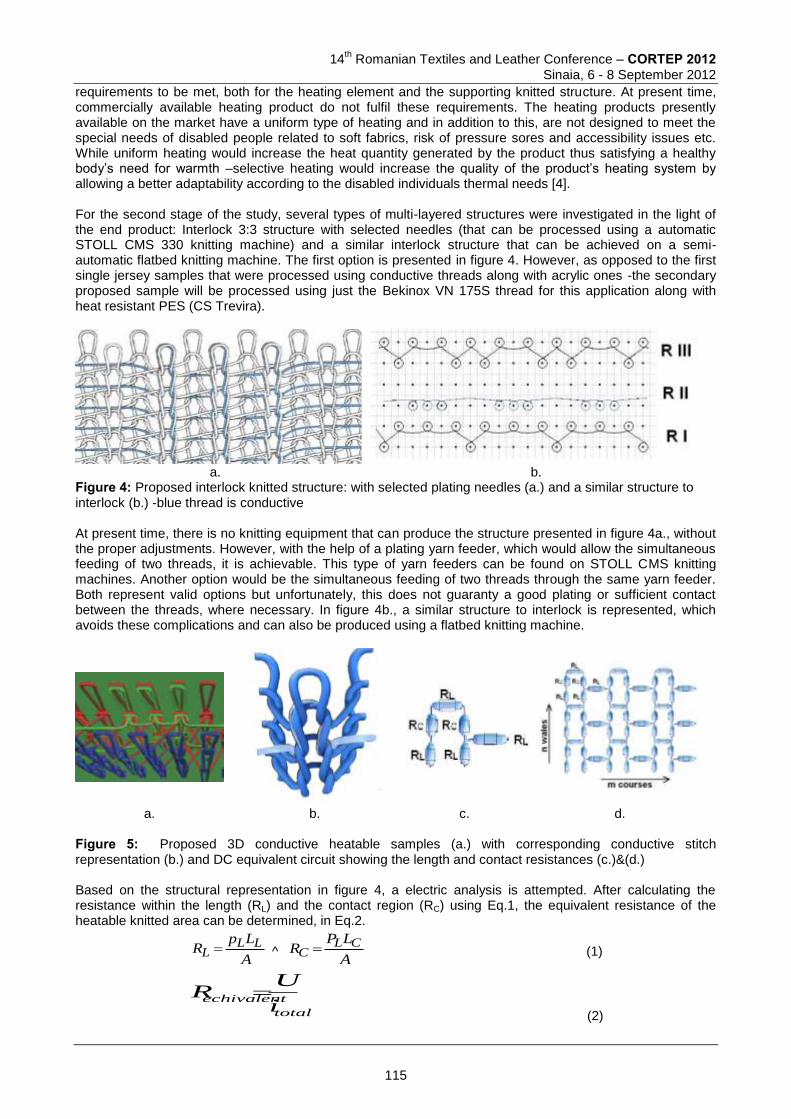
14
th Romanian Textiles and Leather Conference – CORTEP 2012
Sinaia, 6 - 8 September 2012
requirements to be met, both for the heating element and the supporting knitted structure. At present time, commercially available heating product do not fulfil these requirements. The heating products presently available on the market have a uniform type of heating and in addition to this, are not designed to meet the special needs of disabled people related to soft fabrics, risk of pressure sores and accessibility issues etc. While uniform heating would increase the heat quantity generated by the product thus satisfying a healthy body’s need for warmth –selective heating would increase the quality of the product’s heating system by allowing a better adaptability according to the disabled individuals thermal needs [4]. For the second stage of the study, several types of multi-layered structures were investigated in the light of the end product: Interlock 3:3 structure with selected needles (that can be processed using a automatic STOLL CMS 330 knitting machine) and a similar interlock structure that can be achieved on a semi-automatic flatbed knitting machine. The first option is presented in figure 4. However, as opposed to the first single jersey samples that were processed using conductive threads along with acrylic ones -the secondary proposed sample will be processed using just the Bekinox VN 175S thread for this application along with heat resistant PES (CS Trevira).
a. b. Figure 4: Proposed interlock knitted structure: with selected plating needles (a.) and a similar structure to interlock (b.) -blue thread is conductive At present time, there is no knitting equipment that can produce the structure presented in figure 4a., without the proper adjustments. However, with the help of a plating yarn feeder, which would allow the simultaneous feeding of two threads, it is achievable. This type of yarn feeders can be found on STOLL CMS knitting machines. Another option would be the simultaneous feeding of two threads through the same yarn feeder. Both represent valid options but unfortunately, this does not guaranty a good plating or sufficient contact between the threads, where necessary. In figure 4b., a similar structure to interlock is represented, which avoids these complications and can also be produced using a flatbed knitting machine.
a. b. c. d. Figure 5: Proposed 3D conductive heatable samples (a.) with corresponding conductive stitch representation (b.) and DC equivalent circuit showing the length and contact resistances (c.)&(d.) Based on the structural representation in figure 4, a electric analysis is attempted. After calculating the resistance within the length (RL) and the contact region (RC) using Eq.1, the equivalent resistance of the heatable knitted area can be determined, in Eq.2.
A
LpR LL
L ^ A
LPR CL
C (1)
total
echivalenti
UR
(2)
115
14th Romanian Textiles and Leather Conference – CORTEP 2012
Sinaia, 6 - 8 September 2012
where PL is the correspondent resistivity and A the cross-sectional area of the conductive yarn. LL and LC are the length of the yarn in that particular segment of the stitch or contacting zone. To determine the current and temperature distribution, Planck's law of radiation is used, where Kc is the radiation constant of the conductive fiber and Ta represents the ambient temperature.
4
1
4)( ac
LL T
K
PT (3)
4
1
4)( ac
CC T
K
PT (4)
With the corresponding power distribution inside the stitch areas, shown in Eq. 5 and 6; where IL and IC are the current distributions inside the stitch segments and contacting areas. The resistances RL and RC are shown in Eq. 1.
2LLL xIRP (5)
2CCC xIRP (6)
4 CONCLUSIONS The knitting technology allows the best integration of the resistive/conductive elements into the textile structure. Thirteen single jersey samples were investigated in this study for their electrical properties and heating behaviour, in view of developing 3D knitting structures. The purpose of the analysis was to investigate the possibility of using three dimensional knitted structures in the development of a textile heating system especially designed to accommodate the special needs of physically disabled people. The heating products presently available on the market have a uniform type of heating and in addition to this, are not designed to meet the special needs of disabled people related to soft fabrics, risk of pressure sores and accessibility issues etc. -and in the light of these aspects, the concept of selective heating was proposed as the workframe for the 3D heatable spacer structure. 5 REFERENCES [1] Petcu I.; Curteza A.; Teodorescu M.& Kalaoglu F.: “The psycho-esthetical effects of colors on people
with physical disabilities” AUTEX Book of Proceedings (2011) Vol. 2, pp.1009-1013, ISBN 978-2-7466-2858-8
[2] Petcu I.: "Research studies on the development of textile products for physically disabled people" EUROINVENT Catalogue (2012), pp. 182-183, ISBN 978-973-702-851-8
[3] Petcu I.; Curteza A.:"Heatable compressive textile product for physically disabled people" INVENTICA Proceedings Book (2012), pp. 350-355, ISSN 1844-7880
[4] Petcu I.; Curteza A.; Agrawal P.; Brinks G.& Teodorescu M.: "Thermal profile of paralytic legs in the development of highly functional clothing for the physically disabled" ITC&DC (6th International Textile, clothing &design conference– Magic World of Textiles) 7-10.10.2012, Dubrovnik, Croatia -paper accepted for publishing
[5] Frydrysiak M. & Ziegler S.: "The research of electrical leads to textronics application" AUTEX Proceedings Book (2012), Vol.2, ISBN 978-953-7105-47-1, pp. 1453-1458
[6] Davies A., Williams, J.: "The use of spacer fabrics for adsorbent medical applications" Journal of Fiber Engineering and Informatics 1 (2009) No.4, pp.321
[7] Anand S.:"Spacers -At the technical frontier" Knitting International 110 (1305) pp. 38-41 [8] Dias, T.:"Novel technology for design and engineering pressure systems for the treatment of venous
ulcers", Second International Conference on Advanced Fibre/Textile Materials 2002, Ueda, Japan, November 2002
[9] Steinig-Nowakowski, C.:"PlatinHeat- vielseiting adaptive textile Heizeelemente", TITV Konference -Multifunktionsintegration durch Textile Mikrosystemtechnik, 2012, Zeulenroda, Germany, February 2012
[10] Meinel, H. et al: "Automobiles Interieur der Zukunft- smart textiles fur frisches Design und neue Funktionen" TITV Konference -Multifunktionsintegration durch Textile Mikrosystemtechnik, 2012, Zeulenroda, Germany, February 2012
116
14
th Romanian Textiles and Leather Conference – CORTEP 2012
Sinaia, 6 - 8 September 2012
6 ACKNOWLEDGEMENT This study has been realised with the support of EUROGOD “Doctoral scholarships for research performance at European Level” project, financed by the European Social Fund and Romanian Government, with the help of Saxion University,Research Centre Design and Technology, Enschede, The Netherlands.
Corresponding author: Eng. Ioana PETCU, PhD student Doctoral School of the Faculty of Textile, Leather and Industrial Management, “Georghe Asachi” Technical University Dimitrie Mangeron Bvl. No.76 700050, Iasi, Romania Phone: +040741268261 E-mail: [email protected]; [email protected]
Co-author(s): Prof. Antonela CURTEZA, PhD Doctoral School of the Faculty of Textile-Leather and Industrial Management/ “Gheorghe Asachi” Technical University Dimitrie Mangeron Bvl. No.76 700050, Iasi, Romania Phone: +040745537286 ; E-mail: [email protected] Eng. Mirela TEODORESCU, PhD student Doctoral School of the Faculty of Textile-Leather and Industrial Management / “Gheorghe Asachi” Technical University Dimitrie Mangeron Bvl. No.76 700050, Iasi, Romania Phone: +040742692369; E-mail: [email protected] Dr. Pramod AGRAWAL, Associate Prof. Saxion University of Applied Science, Research Centre, Design and Technology M.H.Tromplaan 28 7513 AB, Enschede, Netherlands Phone: +(31) (0)6 49311325; E-mail: [email protected] Prof. Ger BRINKS, Ir. Saxion University of Applied Science, Research Centre, Design and Technology M.H.Tromplaan 28, 7513 AB, Enschede, Netherlands E-mail: [email protected]
117
14th Romanian Textiles and Leather Conference – CORTEP 2012
Sinaia, 6 - 8 September 2012
AN OVER-ALL EVALUATION ON THERMAL COMFORT CHARACTERISTICS OF KNITTED FABRICS
Sinem GUNESOGLU1, Binnaz KAPLANGİRAY2 & Cem GUNESOGLU1
1 Textile Engineering Department, Gaziantep University, Gaziantep, Turkey
2 Textile Engineering Department, Uludag University, Bursa, Turkey
Abstract: This study investigates the thermal comfort characteristics of cotton, polypropylene, polyester and novel polyester (Coolplus) rib knitted fabrics. For this purpose, three fabric constructions of all fibre types were produced and thermal conductivity, thermal resistance and thermal absorptivity measurements of the samples were conducted. The results were evaluated by the ANOVA results to determine the contribution of the variables which are fibre type and fabric construction. Keywords: Thermal comfort, thermal conductivity, thermal resistance, thermal absorptivity. 1 INTRODUCTION Thermal comfort is a fundamentally important element of outdoor garments and fabric thermal properties have been a great interest and importance for textile researchers, since they are the major characteristics that determine the thermal comfort. Thus, it is possible to find literature focused on thermal properties of textile fabrics and clothing [1 – 5] and in the various papers [6 – 9], heat transfer is considered to be one of the concepts to characterize the thermal comfort along with the mass transfer. Heat transfer from human body to the fabric that is at a lower temperature than the skin surface is caused by mechanical contact of textile fabric with human skin [10 – 12] and thermal properties of fabrics determine the characteristics of heat transfer. The typical time dependence of this heat flow is given in Fig.1. It is known
that human skin, which is 0,5 mm thick and whose neutron ends, located in the middle, take 0,1-0,3 second to reach the maximum heat flow qmax (W/m
2) as the heat begins to flow through the contact subject.
Having reached this peak value, the heat flow decreases and then stabilizes within 3-15 second to steady
state heat flow q(0,) (W/m2) [13].
Traditionally, most of the measurements in fabric thermal properties were conducted in this steady-state, analyzing easily measured properties, such as thermal conductivity and resistance.
Thermal conductivity (W/mK) is derived from the steady state heat flow q(0,) (W/m2) taking place at the
end of the transient phase (Fig. 1) and is given by the equation (1) below:
q(0,) = )( 21 tth
(1)
where h (mm) is the thickness; and (t1 – t2) (K), is the temperature gradient between human skin and fabric. Thermal resistance R (m
2K/W) of a clothing system is then calculated by the equation (2) below :
R =
h (2)
It is commonly accepted that the thermal resistance of textile materials is not determined solely by the thermal conductivity of fiber, but depends largely on fabric thickness as it is seen in the equation (2).
However, the steady-state measurements do not reflect the real wearing situation alone since human body interacts with clothing dynamically and there are also dynamic or transient state thermal contact properties besides steady state thermal properties which are a function of transient state of heat flow. The dynamic thermal contact of a textile fabric with human skin causes feeling of warmth or coolness due to the heat flow from human body and the more the heat flows and the quicker it reaches the peak value, the cooler feeling
118
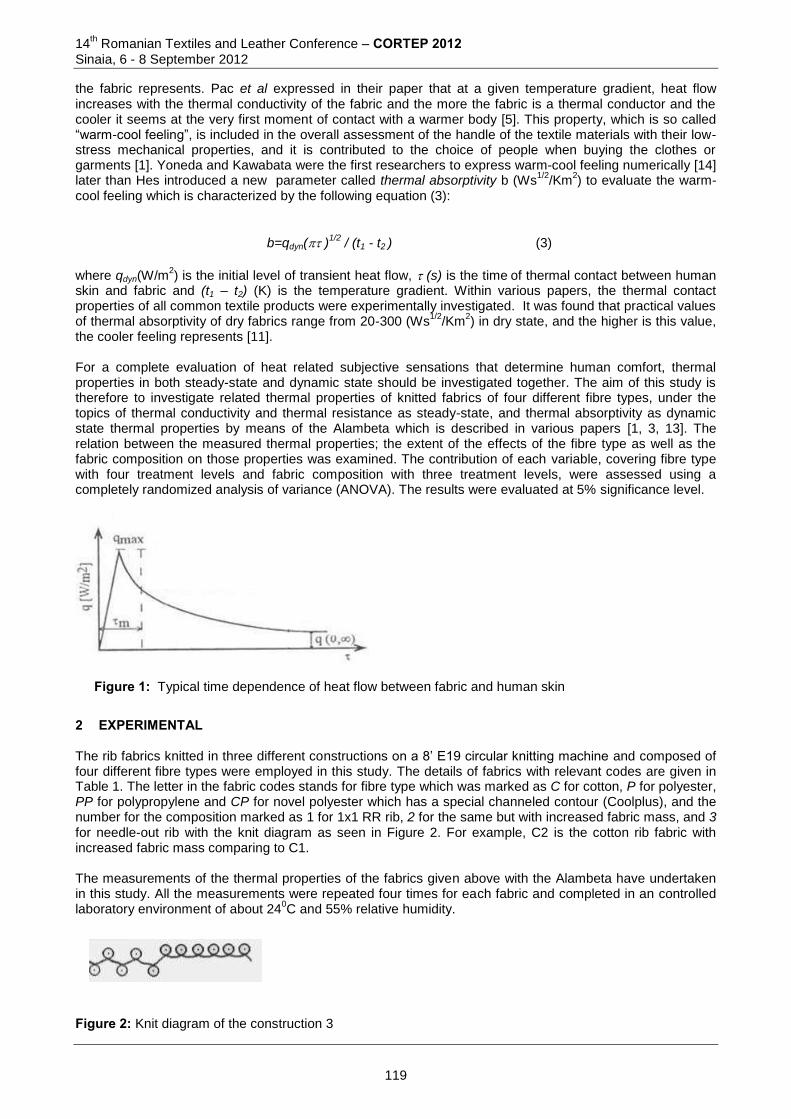
14th Romanian Textiles and Leather Conference – CORTEP 2012
Sinaia, 6 - 8 September 2012
the fabric represents. Pac et al expressed in their paper that at a given temperature gradient, heat flow increases with the thermal conductivity of the fabric and the more the fabric is a thermal conductor and the cooler it seems at the very first moment of contact with a warmer body [5]. This property, which is so called “warm-cool feeling”, is included in the overall assessment of the handle of the textile materials with their low-stress mechanical properties, and it is contributed to the choice of people when buying the clothes or garments [1]. Yoneda and Kawabata were the first researchers to express warm-cool feeling numerically [14] later than Hes introduced a new parameter called thermal absorptivity b (Ws
1/2/Km
2) to evaluate the warm-
cool feeling which is characterized by the following equation (3):
b=qdyn( )1/2
/ (t1 - t2 ) (3)
where qdyn(W/m2) is the initial level of transient heat flow, (s) is the time of thermal contact between human
skin and fabric and (t1 – t2) (K) is the temperature gradient. Within various papers, the thermal contact properties of all common textile products were experimentally investigated. It was found that practical values of thermal absorptivity of dry fabrics range from 20-300 (Ws
1/2/Km
2) in dry state, and the higher is this value,
the cooler feeling represents [11]. For a complete evaluation of heat related subjective sensations that determine human comfort, thermal properties in both steady-state and dynamic state should be investigated together. The aim of this study is therefore to investigate related thermal properties of knitted fabrics of four different fibre types, under the topics of thermal conductivity and thermal resistance as steady-state, and thermal absorptivity as dynamic state thermal properties by means of the Alambeta which is described in various papers [1, 3, 13]. The relation between the measured thermal properties; the extent of the effects of the fibre type as well as the fabric composition on those properties was examined. The contribution of each variable, covering fibre type with four treatment levels and fabric composition with three treatment levels, were assessed using a completely randomized analysis of variance (ANOVA). The results were evaluated at 5% significance level.
Figure 1: Typical time dependence of heat flow between fabric and human skin
2 EXPERIMENTAL The rib fabrics knitted in three different constructions on a 8’ E19 circular knitting machine and composed of four different fibre types were employed in this study. The details of fabrics with relevant codes are given in Table 1. The letter in the fabric codes stands for fibre type which was marked as C for cotton, P for polyester, PP for polypropylene and CP for novel polyester which has a special channeled contour (Coolplus), and the number for the composition marked as 1 for 1x1 RR rib, 2 for the same but with increased fabric mass, and 3 for needle-out rib with the knit diagram as seen in Figure 2. For example, C2 is the cotton rib fabric with increased fabric mass comparing to C1. The measurements of the thermal properties of the fabrics given above with the Alambeta have undertaken in this study. All the measurements were repeated four times for each fabric and completed in an controlled laboratory environment of about 24
0C and 55% relative humidity.
Figure 2: Knit diagram of the construction 3
119
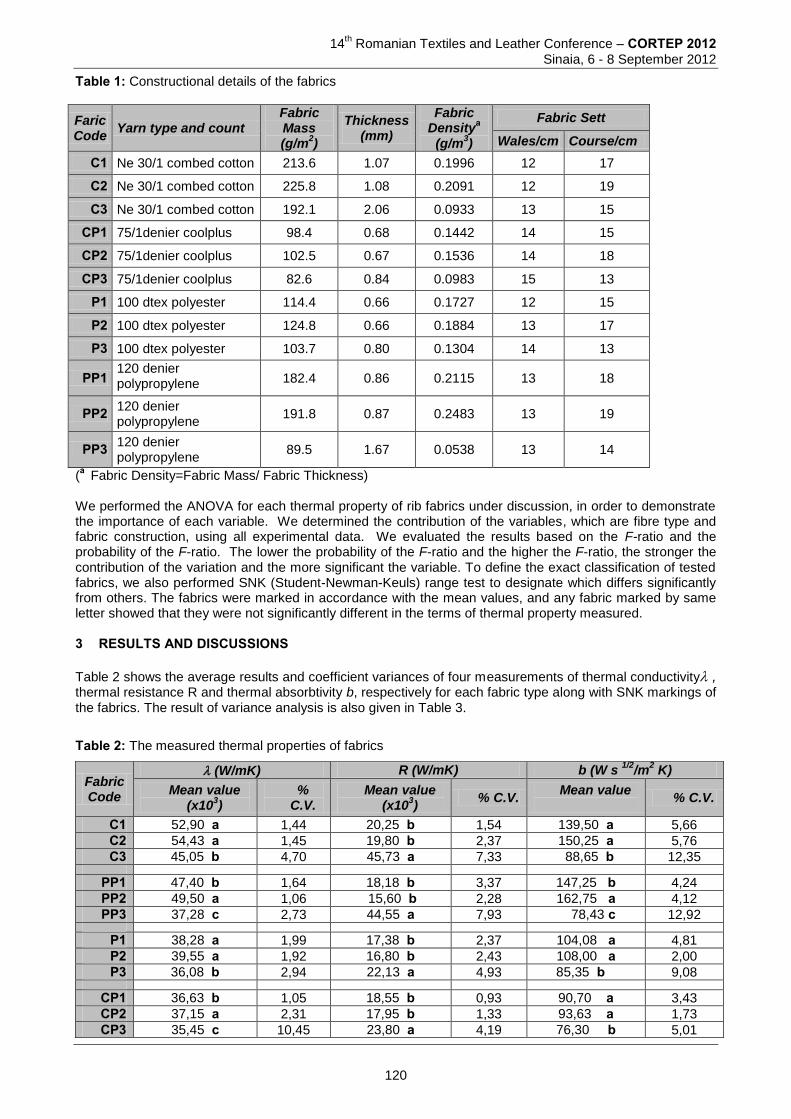
14th Romanian Textiles and Leather Conference – CORTEP 2012
Sinaia, 6 - 8 September 2012
Table 1: Constructional details of the fabrics
Faric Code
Yarn type and count Fabric Mass (g/m
2)
Thickness (mm)
Fabric Density
a
(g/m3)
Fabric Sett
Wales/cm Course/cm
C1 Ne 30/1 combed cotton 213.6 1.07 0.1996 12 17
C2 Ne 30/1 combed cotton 225.8 1.08 0.2091 12 19
C3 Ne 30/1 combed cotton 192.1 2.06 0.0933 13 15
CP1 75/1denier coolplus 98.4 0.68 0.1442 14 15
CP2 75/1denier coolplus 102.5 0.67 0.1536 14 18
CP3 75/1denier coolplus 82.6 0.84 0.0983 15 13
P1 100 dtex polyester 114.4 0.66 0.1727 12 15
P2 100 dtex polyester 124.8 0.66 0.1884 13 17
P3 100 dtex polyester 103.7 0.80 0.1304 14 13
PP1 120 denier polypropylene
182.4 0.86 0.2115 13 18
PP2 120 denier polypropylene
191.8 0.87 0.2483 13 19
PP3 120 denier polypropylene
89.5 1.67 0.0538 13 14
(a Fabric Density=Fabric Mass/ Fabric Thickness)
We performed the ANOVA for each thermal property of rib fabrics under discussion, in order to demonstrate the importance of each variable. We determined the contribution of the variables, which are fibre type and fabric construction, using all experimental data. We evaluated the results based on the F-ratio and the probability of the F-ratio. The lower the probability of the F-ratio and the higher the F-ratio, the stronger the contribution of the variation and the more significant the variable. To define the exact classification of tested fabrics, we also performed SNK (Student-Newman-Keuls) range test to designate which differs significantly from others. The fabrics were marked in accordance with the mean values, and any fabric marked by same letter showed that they were not significantly different in the terms of thermal property measured. 3 RESULTS AND DISCUSSIONS
Table 2 shows the average results and coefficient variances of four measurements of thermal conductivity , thermal resistance R and thermal absorbtivity b, respectively for each fabric type along with SNK markings of the fabrics. The result of variance analysis is also given in Table 3. Table 2: The measured thermal properties of fabrics
Fabric Code
(W/mK) R (W/mK) b (W s 1/2
/m2 K)
Mean value (x10
3)
% C.V.
Mean value (x10
3)
% C.V. Mean value
% C.V.
C1 52,90 a 1,44 20,25 b 1,54 139,50 a 5,66
C2 54,43 a 1,45 19,80 b 2,37 150,25 a 5,76
C3 45,05 b 4,70 45,73 a 7,33 88,65 b 12,35
PP1 47,40 b 1,64 18,18 b 3,37 147,25 b 4,24
PP2 49,50 a 1,06 15,60 b 2,28 162,75 a 4,12
PP3 37,28 c 2,73 44,55 a 7,93 78,43 c 12,92
P1 38,28 a 1,99 17,38 b 2,37 104,08 a 4,81
P2 39,55 a 1,92 16,80 b 2,43 108,00 a 2,00
P3 36,08 b 2,94 22,13 a 4,93 85,35 b 9,08
CP1 36,63 b 1,05 18,55 b 0,93 90,70 a 3,43
CP2 37,15 a 2,31 17,95 b 1,33 93,63 a 1,73
CP3 35,45 c 10,45 23,80 a 4,19 76,30 b 5,01
120
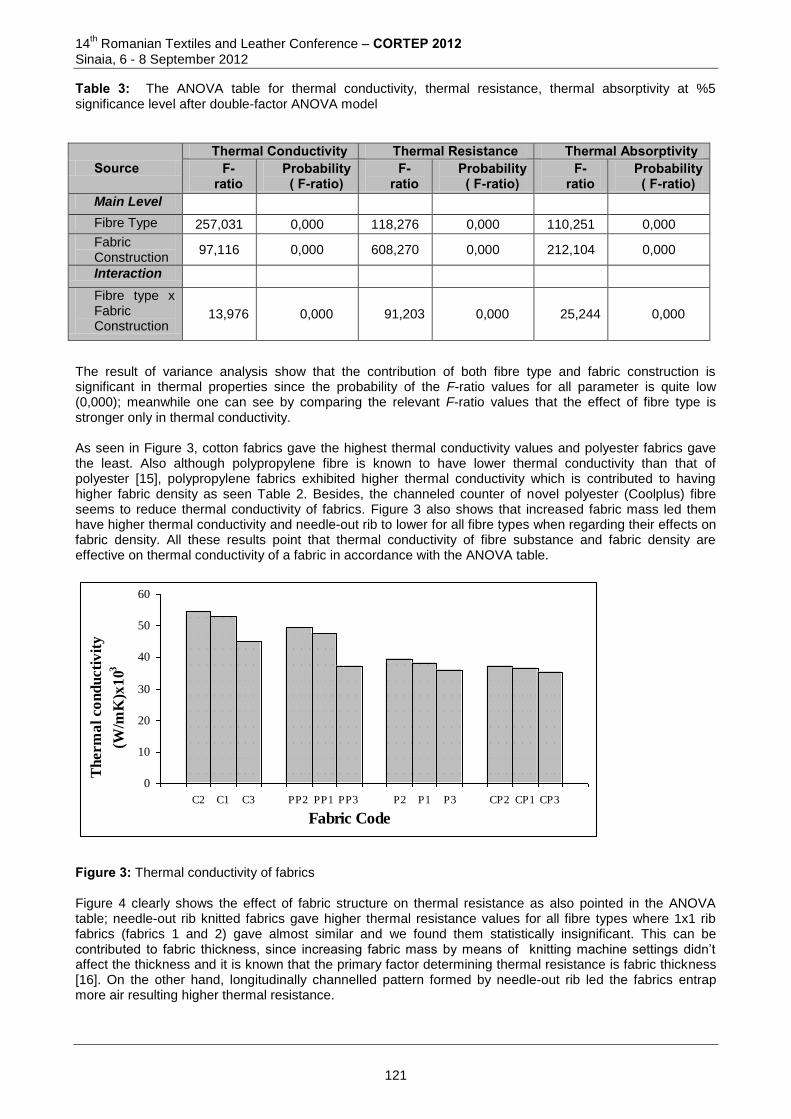
14th Romanian Textiles and Leather Conference – CORTEP 2012
Sinaia, 6 - 8 September 2012
Table 3: The ANOVA table for thermal conductivity, thermal resistance, thermal absorptivity at %5 significance level after double-factor ANOVA model
Source Thermal Conductivity Thermal Resistance Thermal Absorptivity
F-ratio
Probability ( F-ratio)
F-ratio
Probability ( F-ratio)
F-ratio
Probability ( F-ratio)
Main Level
Fibre Type 257,031 0,000 118,276 0,000 110,251 0,000
Fabric Construction
97,116 0,000 608,270 0,000 212,104 0,000
Interaction
Fibre type x Fabric Construction
13,976 0,000 91,203 0,000 25,244 0,000
The result of variance analysis show that the contribution of both fibre type and fabric construction is significant in thermal properties since the probability of the F-ratio values for all parameter is quite low (0,000); meanwhile one can see by comparing the relevant F-ratio values that the effect of fibre type is stronger only in thermal conductivity. As seen in Figure 3, cotton fabrics gave the highest thermal conductivity values and polyester fabrics gave the least. Also although polypropylene fibre is known to have lower thermal conductivity than that of polyester [15], polypropylene fabrics exhibited higher thermal conductivity which is contributed to having higher fabric density as seen Table 2. Besides, the channeled counter of novel polyester (Coolplus) fibre seems to reduce thermal conductivity of fabrics. Figure 3 also shows that increased fabric mass led them have higher thermal conductivity and needle-out rib to lower for all fibre types when regarding their effects on fabric density. All these results point that thermal conductivity of fibre substance and fabric density are effective on thermal conductivity of a fabric in accordance with the ANOVA table.
0
10
20
30
40
50
60
C2 C1 C3 PP2 PP1 PP3 P2 P1 P3 CP2 CP1 CP3
Fabric Code
Th
erm
al
co
nd
ucti
vit
y
(W/m
K)x
103
Figure 3: Thermal conductivity of fabrics Figure 4 clearly shows the effect of fabric structure on thermal resistance as also pointed in the ANOVA table; needle-out rib knitted fabrics gave higher thermal resistance values for all fibre types where 1x1 rib fabrics (fabrics 1 and 2) gave almost similar and we found them statistically insignificant. This can be contributed to fabric thickness, since increasing fabric mass by means of knitting machine settings didn’t affect the thickness and it is known that the primary factor determining thermal resistance is fabric thickness [16]. On the other hand, longitudinally channelled pattern formed by needle-out rib led the fabrics entrap more air resulting higher thermal resistance.
121

14th Romanian Textiles and Leather Conference – CORTEP 2012
Sinaia, 6 - 8 September 2012
0
5
10
15
20
25
30
35
40
45
50
C3 C1 C2 PP3 PP1 PP2 P3 P1 P2 CP3 CP1 CP2
Fabric Code
Th
erm
al re
sist
an
ce
(m2K
/W)x
103
Figure 4: Thermal resistance of fabrics
When evaluating thermal absorptivity, it should be noted firstly from Figure 5 that increased fabric mass caused higher thermal absorbitivity (cooler feeling when touched). This is especially significant in polypropylene fabrics. As the fabric mass is increased by the machinery settings, it causes shorter stitch length; as it is reported by Pac et al. [5] that the longer the stitch length the less the fabric absorbs energy and the warmer feeling the fabric represents. Secondly, fabrics 3 gave the least thermal absorbtivity values for all fibre types. Longitudinally channeled pattern decreased the contact area between fabric and skin; lowered heat loss and thermal absorptivity and resulted warmer feeling. Finally, it may be concluded that polyester fabrics gave the warmer feeling at similar construction when comparing to cotton and polypropylene.
0
20
40
60
80
100
120
140
160
180
C2 C1 C3 PP2 PP1 PP3 P2 P1 P3 CP2 CP1 CP3
Fabric Code
Th
erm
al
ab
sorp
tiv
ity
(Ws1
/2/m
2K
)
Figure 5: Thermal absorptivity of fabrics 4 CONCLUSIONS In this paper, we investigated thermal properties of rib knitted fabrics of four fibre types in three fabric constructions, in both steady-state (thermal absorptivity) and dynamic state (thermal conductivity and resistance) together. We found the contribution of both fibre type and fabric construction is significant in thermal properties; the effect of fibre type is stronger only in thermal conductivity so it is concluded that heat-related comfort sensations largely depend on fabric construction. Increased fabric mass caused higher thermal conductivity and absorptivity values; meanwhile the measured thermal properties and SNK markings showed that the effect of fabric construction on thermal absorptivity and thermal conductivity was similar for all fibre types except Coolplus; bearing a strong relation between those two thermal properties. When comparing % changes in the mean values of thermal properties of each fabric construction, we found that change in fabric construction affected thermal properties in both state heavily for polypropylene; thus it
122
14th Romanian Textiles and Leather Conference – CORTEP 2012
Sinaia, 6 - 8 September 2012
may be concluded that thermal comfort sensation of polypropylene knitted fabrics is comparatively dependent on fabric construction, on the other hand it was the least for Coolplus. 5 REFERENCES [1] Hes, L.: An Experimental Analysis on Thermal Insulation and Thermal Contact Properties of Animal Furs
with Biomimetic Objectives, Proceedings of The Fall Annual Fiber Society Conference, Fiber Society, October 2002, Natick, USA
[2] Hes, L. et al.: Effect of Mutual Bonding of Textile Layers on Thermal Insulation and Thermal Contact Properties of Fabric Assemblies, Textile Research Journal, Vol. 66, (1996), No. 4, pp. 245 – 250
[3] Gunesoglu S. et al: Thermal Contact Properties of 2-Yarn Fleece Knitted Fabrics, Fibres & Textiles in Eastern Europe, Vol.13, (2005), No.2(50), pp.46 – 50
[4] Gunesoglu, S. An Investigation on Comfort Properties of Sportwear Clothings, Uludag University, PhD Thesis, Turkey, (2005), 181p
[5] Pac, M.J. et al.: Warm-Cool Feeling Relative to Tribological Properties of Fabrics, Textile Research Journal, Vol. 71, (2001), No. 9, pp. 806 – 812
[6] Ruckman, J.E.; Murray, R.: Engineering of Clothing Systems for Improved Thermophysiological Comfort, International Journal of Clothing Science and Technology, Vol. 11, (1999), No. 1 pp. 37 – 52
[7] Grabowska, K.E.: Personal Protection by Textiles in the Focus of Stabilisation Thermal Conditions, Proceedings of AUTEX Conference, pp. 72 – 75, The University of Minho, June 2001, Minho ,Portugal
[8] Geraldes, M.J. et al: High Performance Functional Knit Structures, Proceedings of AUTEX Conference, pp. 227 – 235, The University of Minho, June 2001, Minho, Portugal
[9] Gunesoglu, S.;, Meric, B.: Heat and Mass Transfer Properties of 2- Yarn Fleece Knitting Fabrics, Indian Journal of Fibre & Textile Research, Vol.31, (2006), September, pp. 415 – 421
[10] Hes, L.: Recent Developments in the field of User Friendly Testing of Mechanical and Comfort Properties of Textile Fabrics and Garments, Proceedings of World Textile Congress of the Textile Institute, Textile Institute, March 2002, Cairo, Egypt
[11] Hes, L.: Imperfections of Common Nonwoven’s Thermal Resistance Test Methods, Proceedings of INTC, INTC, September, 2000, Dallas, USA
[12] Hes, L. et al.: The Effect of Underwear on Thermal Contact Feeling Caused by Dressing up and Wearing of Garments. Proceedings of AUTEX Conference, pp. 236 – 245, The University of Minho, June 2001, Minho, Portugal
[13] Hes, L.: Optimisation of Shirt Fabrics Composition from the Point of View of Their Appearance and Thermal comfort, International Journal of Clothing Science and Technology, Vol. 11, (1999), No. 2/3, p. 105 – 115
[14] Yoneda, M.; Kawabata, S.: A Theoretical Consideration on the Objective Measurement of Warm/Cool Feeling, The Textile Machinery Society of Japan, 1982, pp. 393 – 406
[15] Warner, S.B.: Fiber Science, Prentice Hall, ISBN 0024245410, NJ, USA., pp. 231 – 233, (1995) [16] Ukponmwan, J. O.:,The Thermal Insulation Properties of Fabrics, The Textile Institute International,
ISBN-10: 1870812654 / ISBN-13: 9781870812658, Manchester, UK, 51p (1993) Corresponding author: Sinem GUNESOGLU Textile Engineering Department, Engineering Faculty, Gaziantep University 27340, Gaziantep, Turkey Phone: +90 342 3172715 Fax: +90 342 3172706 E-mail: [email protected]
Co-authors: Binnaz KAPLANGİRAY Textile Engineering Department, Engineering & Architecture Faculty, Uludag University Cem GUNESOGLU Textile Engineering Department, Engineering Faculty, Gaziantep University 27340, Gaziantep, Turkey Phone: +90 342 3172716 Fax: +90 342 3172706 E-mail: [email protected]
123
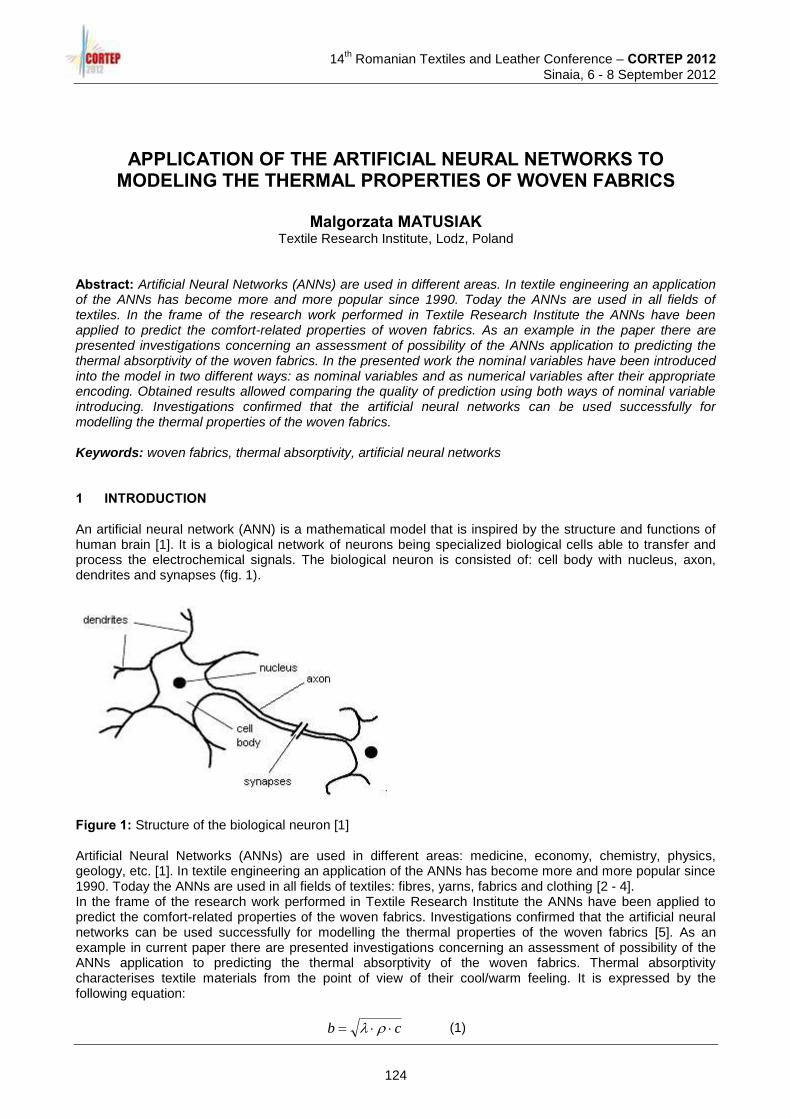
14
th Romanian Textiles and Leather Conference – CORTEP 2012
Sinaia, 6 - 8 September 2012
APPLICATION OF THE ARTIFICIAL NEURAL NETWORKS TO MODELING THE THERMAL PROPERTIES OF WOVEN FABRICS
Malgorzata MATUSIAK
Textile Research Institute, Lodz, Poland Abstract: Artificial Neural Networks (ANNs) are used in different areas. In textile engineering an application of the ANNs has become more and more popular since 1990. Today the ANNs are used in all fields of textiles. In the frame of the research work performed in Textile Research Institute the ANNs have been applied to predict the comfort-related properties of woven fabrics. As an example in the paper there are presented investigations concerning an assessment of possibility of the ANNs application to predicting the thermal absorptivity of the woven fabrics. In the presented work the nominal variables have been introduced into the model in two different ways: as nominal variables and as numerical variables after their appropriate encoding. Obtained results allowed comparing the quality of prediction using both ways of nominal variable introducing. Investigations confirmed that the artificial neural networks can be used successfully for modelling the thermal properties of the woven fabrics. Keywords: woven fabrics, thermal absorptivity, artificial neural networks 1 INTRODUCTION An artificial neural network (ANN) is a mathematical model that is inspired by the structure and functions of human brain [1]. It is a biological network of neurons being specialized biological cells able to transfer and process the electrochemical signals. The biological neuron is consisted of: cell body with nucleus, axon, dendrites and synapses (fig. 1).
Figure 1: Structure of the biological neuron [1]
Artificial Neural Networks (ANNs) are used in different areas: medicine, economy, chemistry, physics, geology, etc. [1]. In textile engineering an application of the ANNs has become more and more popular since 1990. Today the ANNs are used in all fields of textiles: fibres, yarns, fabrics and clothing [2 - 4]. In the frame of the research work performed in Textile Research Institute the ANNs have been applied to predict the comfort-related properties of the woven fabrics. Investigations confirmed that the artificial neural networks can be used successfully for modelling the thermal properties of the woven fabrics [5]. As an example in current paper there are presented investigations concerning an assessment of possibility of the ANNs application to predicting the thermal absorptivity of the woven fabrics. Thermal absorptivity characterises textile materials from the point of view of their cool/warm feeling. It is expressed by the following equation:
cb (1)
124
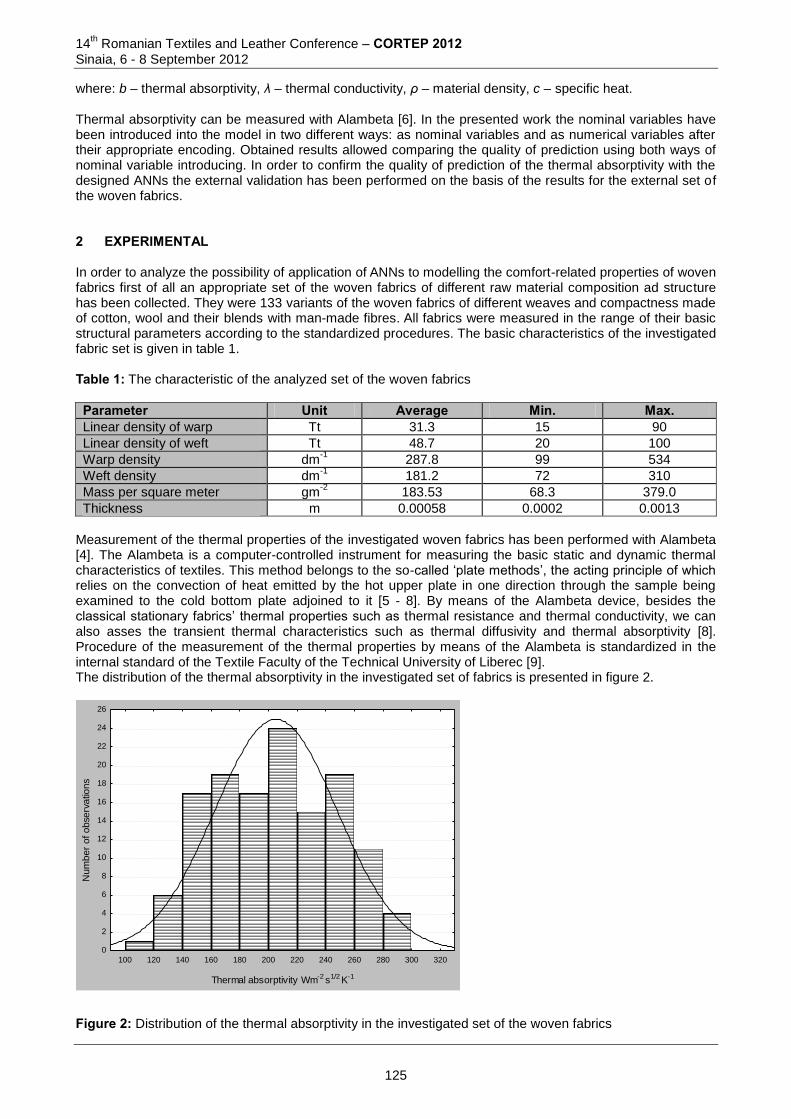
14th Romanian Textiles and Leather Conference – CORTEP 2012
Sinaia, 6 - 8 September 2012
where: b – thermal absorptivity, λ – thermal conductivity, ρ – material density, c – specific heat. Thermal absorptivity can be measured with Alambeta [6]. In the presented work the nominal variables have been introduced into the model in two different ways: as nominal variables and as numerical variables after their appropriate encoding. Obtained results allowed comparing the quality of prediction using both ways of nominal variable introducing. In order to confirm the quality of prediction of the thermal absorptivity with the designed ANNs the external validation has been performed on the basis of the results for the external set of the woven fabrics. 2 EXPERIMENTAL In order to analyze the possibility of application of ANNs to modelling the comfort-related properties of woven fabrics first of all an appropriate set of the woven fabrics of different raw material composition ad structure has been collected. They were 133 variants of the woven fabrics of different weaves and compactness made of cotton, wool and their blends with man-made fibres. All fabrics were measured in the range of their basic structural parameters according to the standardized procedures. The basic characteristics of the investigated fabric set is given in table 1. Table 1: The characteristic of the analyzed set of the woven fabrics
Parameter Unit Average Min. Max. Linear density of warp Tt 31.3 15 90
Linear density of weft Tt 48.7 20 100
Warp density dm-1
287.8 99 534
Weft density dm-1
181.2 72 310
Mass per square meter gm-2
183.53 68.3 379.0
Thickness m 0.00058 0.0002 0.0013 Measurement of the thermal properties of the investigated woven fabrics has been performed with Alambeta [4]. The Alambeta is a computer-controlled instrument for measuring the basic static and dynamic thermal characteristics of textiles. This method belongs to the so-called ‘plate methods’, the acting principle of which relies on the convection of heat emitted by the hot upper plate in one direction through the sample being examined to the cold bottom plate adjoined to it [5 - 8]. By means of the Alambeta device, besides the classical stationary fabrics’ thermal properties such as thermal resistance and thermal conductivity, we can also asses the transient thermal characteristics such as thermal diffusivity and thermal absorptivity [8]. Procedure of the measurement of the thermal properties by means of the Alambeta is standardized in the internal standard of the Textile Faculty of the Technical University of Liberec [9]. The distribution of the thermal absorptivity in the investigated set of fabrics is presented in figure 2.
100 120 140 160 180 200 220 240 260 280 300 320
Thermal absorptivity Wm-2 s1/2 K-1
0
2
4
6
8
10
12
14
16
18
20
22
24
26
Nu
mb
er
of o
bse
rva
tions
Figure 2: Distribution of the thermal absorptivity in the investigated set of the woven fabrics
125
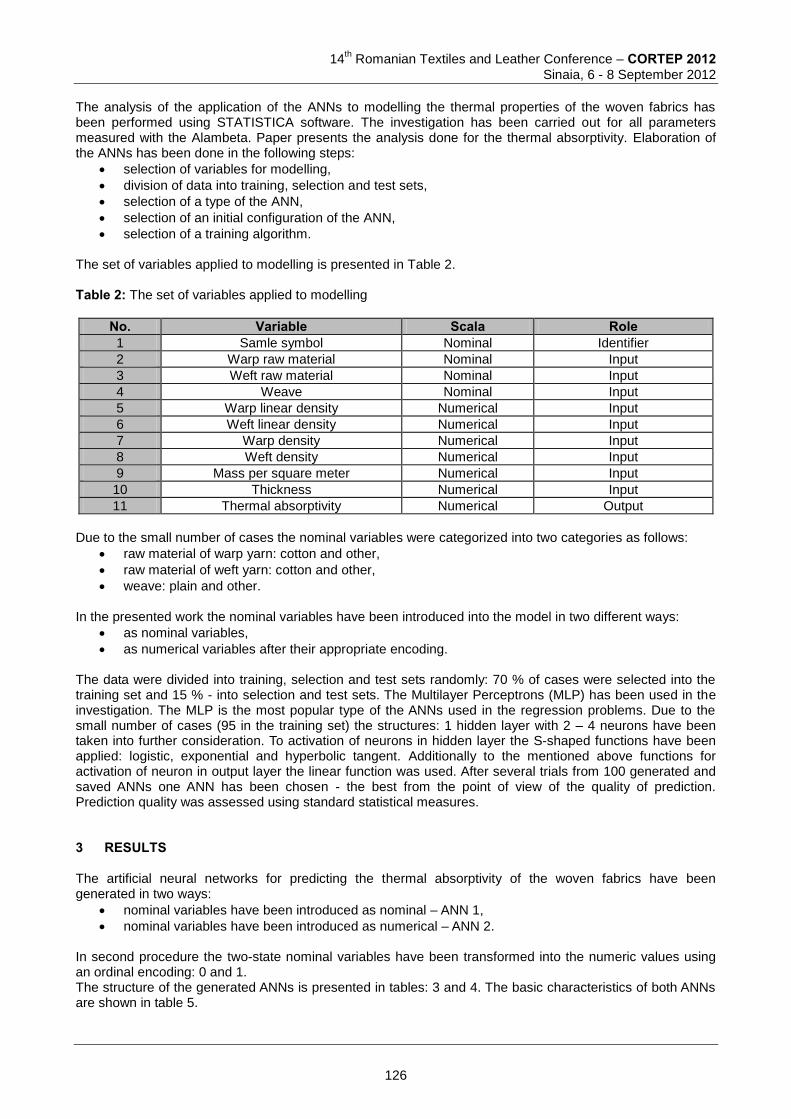
14
th Romanian Textiles and Leather Conference – CORTEP 2012
Sinaia, 6 - 8 September 2012
The analysis of the application of the ANNs to modelling the thermal properties of the woven fabrics has been performed using STATISTICA software. The investigation has been carried out for all parameters measured with the Alambeta. Paper presents the analysis done for the thermal absorptivity. Elaboration of the ANNs has been done in the following steps:
selection of variables for modelling,
division of data into training, selection and test sets,
selection of a type of the ANN,
selection of an initial configuration of the ANN,
selection of a training algorithm. The set of variables applied to modelling is presented in Table 2. Table 2: The set of variables applied to modelling
No. Variable Scala Role 1 Samle symbol Nominal Identifier
2 Warp raw material Nominal Input
3 Weft raw material Nominal Input
4 Weave Nominal Input
5 Warp linear density Numerical Input
6 Weft linear density Numerical Input
7 Warp density Numerical Input
8 Weft density Numerical Input
9 Mass per square meter Numerical Input
10 Thickness Numerical Input
11 Thermal absorptivity Numerical Output
Due to the small number of cases the nominal variables were categorized into two categories as follows:
raw material of warp yarn: cotton and other,
raw material of weft yarn: cotton and other,
weave: plain and other.
In the presented work the nominal variables have been introduced into the model in two different ways:
as nominal variables,
as numerical variables after their appropriate encoding. The data were divided into training, selection and test sets randomly: 70 % of cases were selected into the training set and 15 % - into selection and test sets. The Multilayer Perceptrons (MLP) has been used in the investigation. The MLP is the most popular type of the ANNs used in the regression problems. Due to the small number of cases (95 in the training set) the structures: 1 hidden layer with 2 – 4 neurons have been taken into further consideration. To activation of neurons in hidden layer the S-shaped functions have been applied: logistic, exponential and hyperbolic tangent. Additionally to the mentioned above functions for activation of neuron in output layer the linear function was used. After several trials from 100 generated and saved ANNs one ANN has been chosen - the best from the point of view of the quality of prediction. Prediction quality was assessed using standard statistical measures. 3 RESULTS The artificial neural networks for predicting the thermal absorptivity of the woven fabrics have been generated in two ways:
nominal variables have been introduced as nominal – ANN 1,
nominal variables have been introduced as numerical – ANN 2. In second procedure the two-state nominal variables have been transformed into the numeric values using an ordinal encoding: 0 and 1. The structure of the generated ANNs is presented in tables: 3 and 4. The basic characteristics of both ANNs are shown in table 5.
126
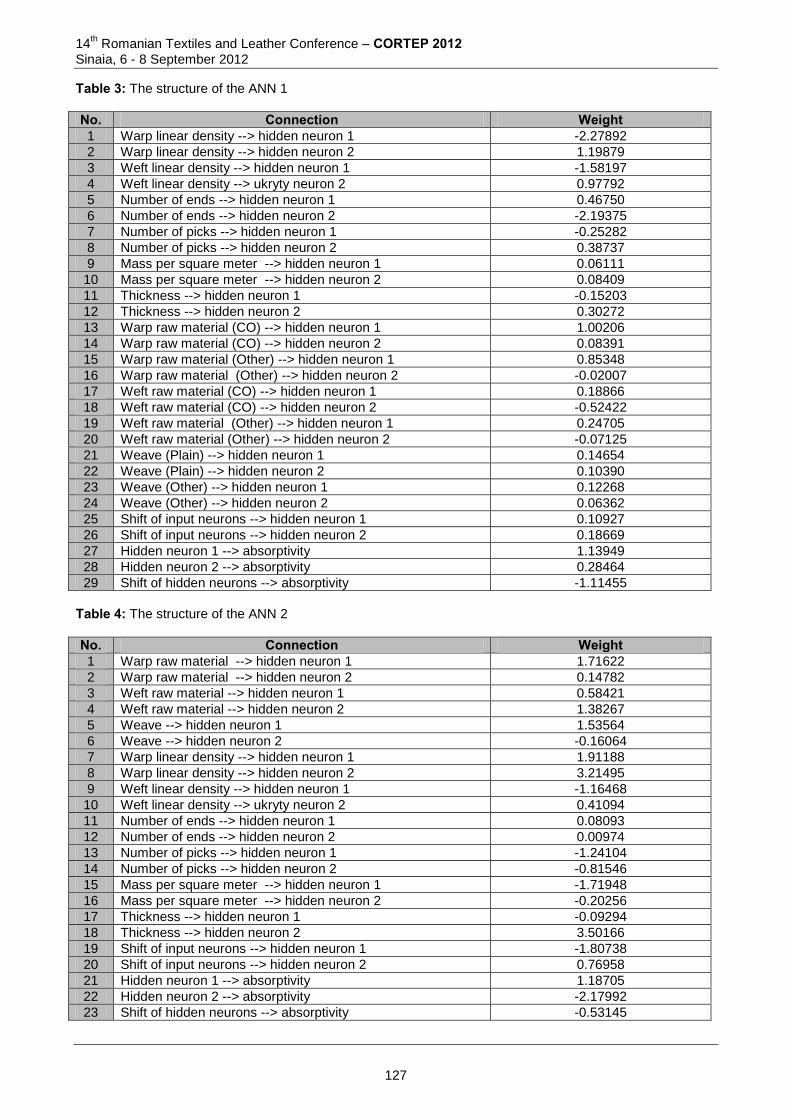
14th Romanian Textiles and Leather Conference – CORTEP 2012
Sinaia, 6 - 8 September 2012
Table 3: The structure of the ANN 1
No. Connection Weight 1 Warp linear density --> hidden neuron 1 -2.27892
2 Warp linear density --> hidden neuron 2 1.19879
3 Weft linear density --> hidden neuron 1 -1.58197
4 Weft linear density --> ukryty neuron 2 0.97792
5 Number of ends --> hidden neuron 1 0.46750
6 Number of ends --> hidden neuron 2 -2.19375
7 Number of picks --> hidden neuron 1 -0.25282
8 Number of picks --> hidden neuron 2 0.38737
9 Mass per square meter --> hidden neuron 1 0.06111
10 Mass per square meter --> hidden neuron 2 0.08409
11 Thickness --> hidden neuron 1 -0.15203
12 Thickness --> hidden neuron 2 0.30272
13 Warp raw material (CO) --> hidden neuron 1 1.00206
14 Warp raw material (CO) --> hidden neuron 2 0.08391
15 Warp raw material (Other) --> hidden neuron 1 0.85348
16 Warp raw material (Other) --> hidden neuron 2 -0.02007
17 Weft raw material (CO) --> hidden neuron 1 0.18866
18 Weft raw material (CO) --> hidden neuron 2 -0.52422
19 Weft raw material (Other) --> hidden neuron 1 0.24705
20 Weft raw material (Other) --> hidden neuron 2 -0.07125
21 Weave (Plain) --> hidden neuron 1 0.14654
22 Weave (Plain) --> hidden neuron 2 0.10390
23 Weave (Other) --> hidden neuron 1 0.12268
24 Weave (Other) --> hidden neuron 2 0.06362
25 Shift of input neurons --> hidden neuron 1 0.10927
26 Shift of input neurons --> hidden neuron 2 0.18669
27 Hidden neuron 1 --> absorptivity 1.13949
28 Hidden neuron 2 --> absorptivity 0.28464
29 Shift of hidden neurons --> absorptivity -1.11455
Table 4: The structure of the ANN 2
No. Connection Weight 1 Warp raw material --> hidden neuron 1 1.71622
2 Warp raw material --> hidden neuron 2 0.14782
3 Weft raw material --> hidden neuron 1 0.58421
4 Weft raw material --> hidden neuron 2 1.38267
5 Weave --> hidden neuron 1 1.53564
6 Weave --> hidden neuron 2 -0.16064
7 Warp linear density --> hidden neuron 1 1.91188
8 Warp linear density --> hidden neuron 2 3.21495
9 Weft linear density --> hidden neuron 1 -1.16468
10 Weft linear density --> ukryty neuron 2 0.41094
11 Number of ends --> hidden neuron 1 0.08093
12 Number of ends --> hidden neuron 2 0.00974
13 Number of picks --> hidden neuron 1 -1.24104
14 Number of picks --> hidden neuron 2 -0.81546
15 Mass per square meter --> hidden neuron 1 -1.71948
16 Mass per square meter --> hidden neuron 2 -0.20256
17 Thickness --> hidden neuron 1 -0.09294
18 Thickness --> hidden neuron 2 3.50166
19 Shift of input neurons --> hidden neuron 1 -1.80738
20 Shift of input neurons --> hidden neuron 2 0.76958
21 Hidden neuron 1 --> absorptivity 1.18705
22 Hidden neuron 2 --> absorptivity -2.17992
23 Shift of hidden neurons --> absorptivity -0.53145
127
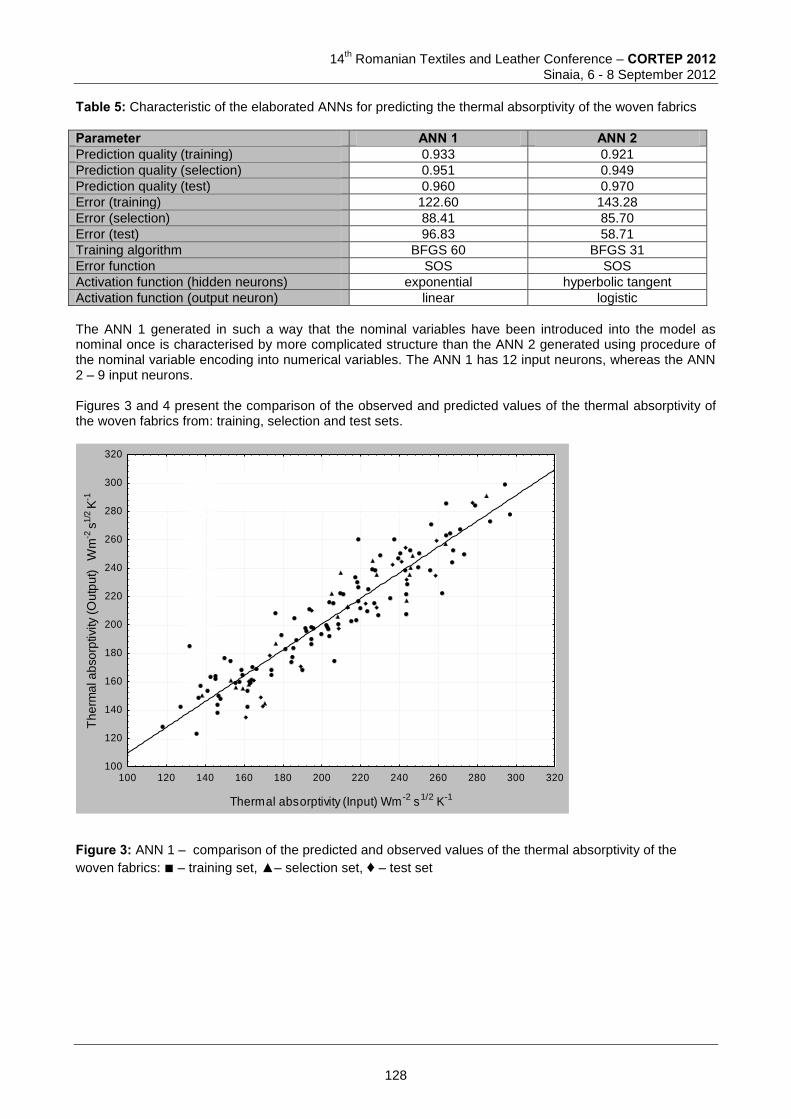
14
th Romanian Textiles and Leather Conference – CORTEP 2012
Sinaia, 6 - 8 September 2012
Table 5: Characteristic of the elaborated ANNs for predicting the thermal absorptivity of the woven fabrics
Parameter ANN 1 ANN 2 Prediction quality (training) 0.933 0.921
Prediction quality (selection) 0.951 0.949
Prediction quality (test) 0.960 0.970
Error (training) 122.60 143.28
Error (selection) 88.41 85.70
Error (test) 96.83 58.71
Training algorithm BFGS 60 BFGS 31
Error function SOS SOS
Activation function (hidden neurons) exponential hyperbolic tangent
Activation function (output neuron) linear logistic
The ANN 1 generated in such a way that the nominal variables have been introduced into the model as nominal once is characterised by more complicated structure than the ANN 2 generated using procedure of the nominal variable encoding into numerical variables. The ANN 1 has 12 input neurons, whereas the ANN 2 – 9 input neurons. Figures 3 and 4 present the comparison of the observed and predicted values of the thermal absorptivity of the woven fabrics from: training, selection and test sets.
100 120 140 160 180 200 220 240 260 280 300 320
Thermal absorptivity (Input) Wm-2
s1/2
K-1
100
120
140
160
180
200
220
240
260
280
300
320
Th
erm
al a
bso
rptivity (
Outp
ut)
W
m-2
s1
/2 K
-1
Figure 3: ANN 1 – comparison of the predicted and observed values of the thermal absorptivity of the
woven fabrics: – training set, – selection set, ♦ – test set
128
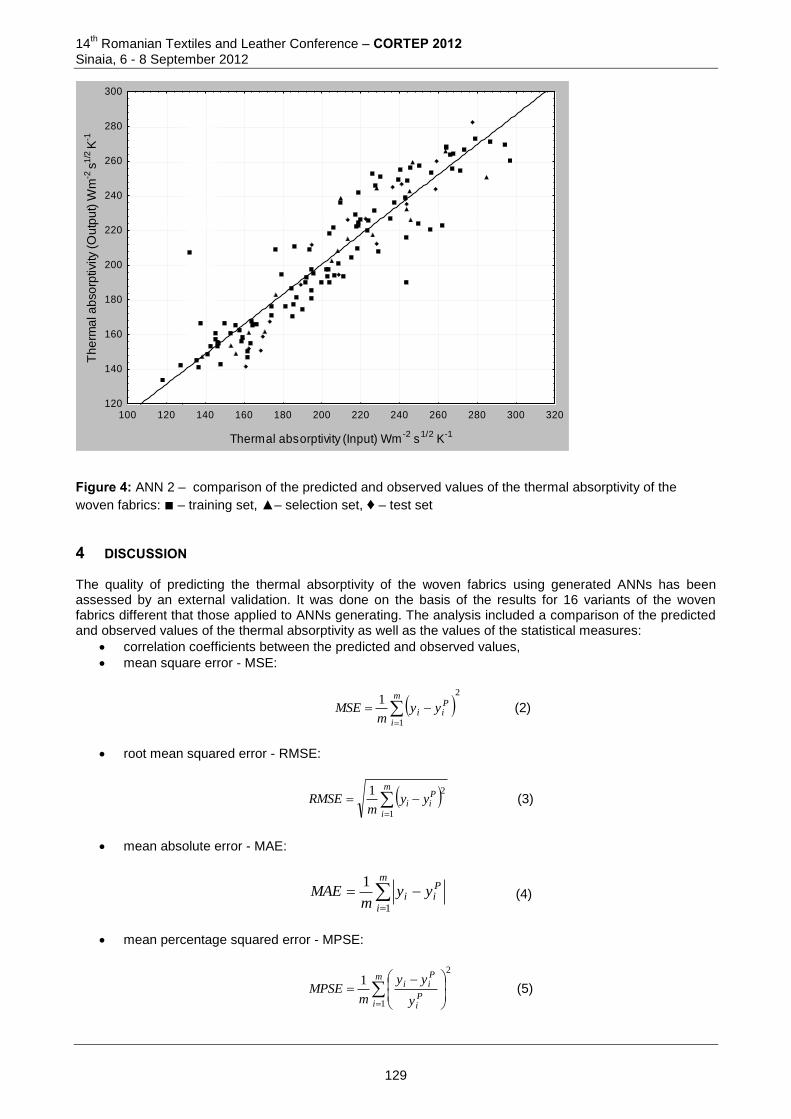
14th Romanian Textiles and Leather Conference – CORTEP 2012
Sinaia, 6 - 8 September 2012
100 120 140 160 180 200 220 240 260 280 300 320
Thermal absorptivity (Input) Wm-2
s1/2
K-1
120
140
160
180
200
220
240
260
280
300T
he
rma
l a
bso
rptivity (
Outp
ut)
Wm
-2 s
1/2
K-1
Figure 4: ANN 2 – comparison of the predicted and observed values of the thermal absorptivity of the
woven fabrics: – training set, – selection set, ♦ – test set
4 DISCUSSION The quality of predicting the thermal absorptivity of the woven fabrics using generated ANNs has been assessed by an external validation. It was done on the basis of the results for 16 variants of the woven fabrics different that those applied to ANNs generating. The analysis included a comparison of the predicted and observed values of the thermal absorptivity as well as the values of the statistical measures:
correlation coefficients between the predicted and observed values,
mean square error - MSE:
2
1
1
m
i
Pii yy
mMSE (2)
root mean squared error - RMSE:
m
i
Pii yy
mRMSE
1
21 (3)
mean absolute error - MAE:
m
i
Pii yy
mMAE
1
1 (4)
mean percentage squared error - MPSE:
2
1
1
m
iPi
Pii
y
yy
mMPSE (5)
129
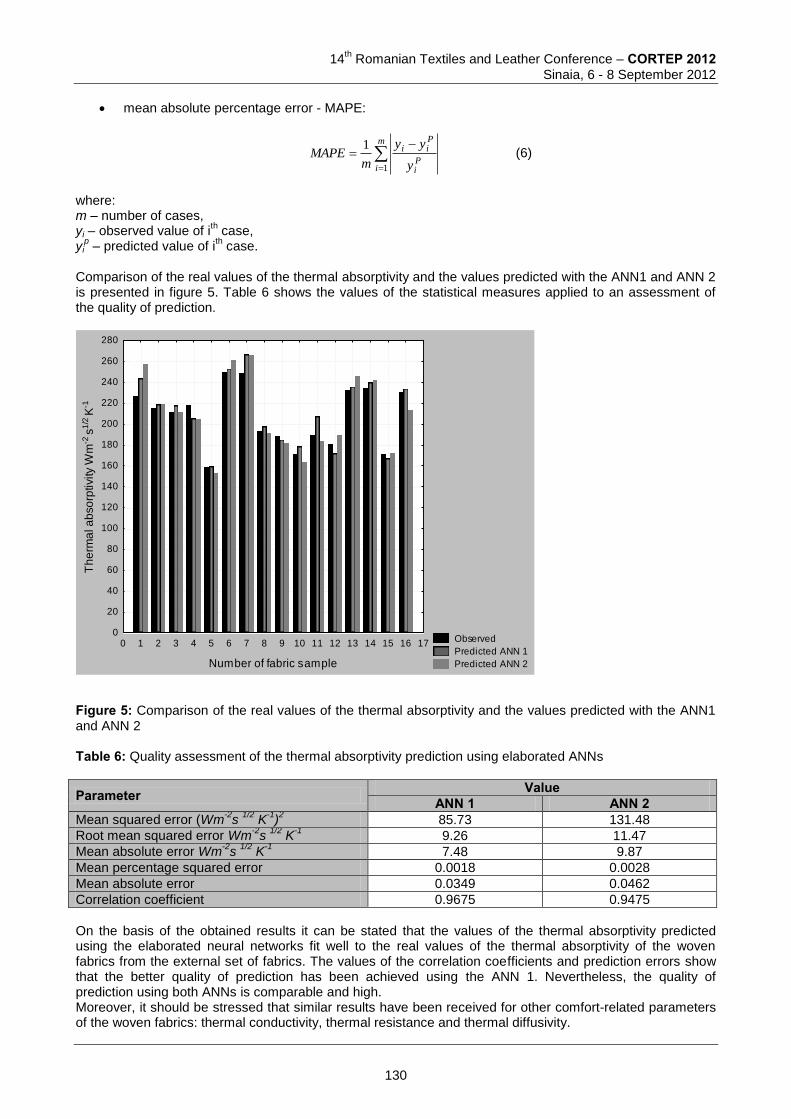
14
th Romanian Textiles and Leather Conference – CORTEP 2012
Sinaia, 6 - 8 September 2012
mean absolute percentage error - MAPE:
m
iPi
Pii
y
yy
mMAPE
1
1 (6)
where: m – number of cases, yi – observed value of i
th case,
yip – predicted value of i
th case.
Comparison of the real values of the thermal absorptivity and the values predicted with the ANN1 and ANN 2 is presented in figure 5. Table 6 shows the values of the statistical measures applied to an assessment of the quality of prediction.
Observed
Predicted ANN 1
Predicted ANN 2
0 1 2 3 4 5 6 7 8 9 10 11 12 13 14 15 16 17
Number of fabric sample
0
20
40
60
80
100
120
140
160
180
200
220
240
260
280
Th
erm
al a
bso
rptivity W
m-2
s1
/2 K
-1
Figure 5: Comparison of the real values of the thermal absorptivity and the values predicted with the ANN1 and ANN 2 Table 6: Quality assessment of the thermal absorptivity prediction using elaborated ANNs
Parameter Value ANN 1 ANN 2
Mean squared error (Wm-2
s 1/2
K-1
)2
85.73 131.48
Root mean squared error Wm-2
s 1/2
K-1
9.26 11.47
Mean absolute error Wm-2
s 1/2
K-1
7.48 9.87
Mean percentage squared error 0.0018 0.0028
Mean absolute error 0.0349 0.0462
Correlation coefficient 0.9675 0.9475
On the basis of the obtained results it can be stated that the values of the thermal absorptivity predicted using the elaborated neural networks fit well to the real values of the thermal absorptivity of the woven fabrics from the external set of fabrics. The values of the correlation coefficients and prediction errors show that the better quality of prediction has been achieved using the ANN 1. Nevertheless, the quality of prediction using both ANNs is comparable and high. Moreover, it should be stressed that similar results have been received for other comfort-related parameters of the woven fabrics: thermal conductivity, thermal resistance and thermal diffusivity.
130
14th Romanian Textiles and Leather Conference – CORTEP 2012
Sinaia, 6 - 8 September 2012
5 CONCLUSIONS Presented investigations confirmed that the artificial neural networks can be applied successfully to predicting the thermal absorptivity of the woven fabrics. Obtained results allowed comparing the quality of prediction using both ways of the nominal variable introducing into the model: as nominal and as numerical ones. While introducing the nominal variables as nominal - without numerical encoding - the number of input neurons in the elaborated ANN is higher than in the case of the ANN generated with introducing the nominal variables as numerical ones. The ANN 1 generated in such a way that the nominal variables have been introduced into the model as nominal ones are characterised by better quality of prediction in comparison to the ANN 2 generated using procedure with numerical encoding of the nominal variables. Nevertheless, we should remember that the compared ANNs have been chosen from a big number of the ANNs generated using both procedures. It is probable that making another choice we could find ANNs of better quality of prediction. It is also possible to repeat several times the procedure of generating the ANNs in order to find the best ANN. Every time the cases for training, selection and test sets are chosen randomly. Due to this fact every time we can expect different results. While generating the ANNs for the modelling the thermal properties of the woven fabrics one of the most important problems is an appropriate preparation of set of the input data from the point of view of the appropriate number of observations, representativeness of cases, proper categorisation of the nominal variables and even distribution of the nominal variables in categories. The choice of the best ANN from among big number generated ANNs should be based on the assessment of the prediction quality using standard statistical measures and external validation. 6 REFERENCES [1] Tadeusiewicz R., Introduction into the ANNs Application Practice (In Polish), Available from
http://www.statsoft.pl/czytelnia/neuron/wprowdoprak.html, Accessed: 2012.06.19. [2] Vassilidas S., et al., Artificial Neural Networks and Their Applications in the Engineering of Fabrics, In
Woven Fabric Engineering, Edited by P. Dobnik-Dubrowski, India (2010), Available from: www.Sciyo.com, pp. 111 – 134.
[3] Jackowska-Strumiłło L., et al. Neural Model of the Spinning Process for Predicting Selected Properties of Flax/Cotton Yarn Blends, Fibres & Textiles in Eastern Europe Vol. 12, No. 4 (48), (2004) pp. 17 – 21.
[4] Bhattacharjee D., Kothari V.K., A Neural Network System for Prediction of Thermal Resistance of Textile Fabrics, Textile Research Journal 77(1), (2007) pp. 4 – 12.
[5] Matusiak M., Thermal Insulation of Woven Fabrics for Clothing, Monograph, Works of Textile Research Institute, Special edition, Textile Research Institute, Lodz, Poland (2011).
[6] Hes L., Sluka P., Uvod do komfortu textilii, Technical University of Liberec, Liberec, Czech Republic, (2005).
[7] Matusiak M., Investigation of the Thermal Insulation Properties of Multilayer Textiles, Fibres & Textiles in Eastern Europe, 14, 5(59), (2006) pp. 98 – 112.
[8] Hes L., et al., Neue Methode und Einrichtung zur objektiven Bewertung der Thermokontakten Eigenschaften textiler Flaschengebilde, Melliand Textilberichte, 9/1990 (1990), pp. 679 – 681.
[9] Internal Standard No. 23-204-02/01 Measurement of the Thermal Properties by Alambeta Device, Technical University of Liberec (2001).
Acknowledgment Investigations presented in the paper were carried out in the frame of the project Nr N N507 280436 funded by the Polish Ministry of Science and Higher Education in years 2009-2011.
orresponding author: Małgorzata MATUSIAK Scientific Department of Textile Composites Technology Textile Research Institute 5/15 Brzezinska str. 92-103 Lodz, Poland Phone: 4842 6163172, Fax: 48426792638, E-mail: [email protected]
131
14
th Romanian Textiles and Leather Conference – CORTEP 2012
Sinaia, 6 - 8 September 2012
BIOCLIMATE MICRO CHAMBER USED TO ESTABLISH THE THERMO PHYSICAL CHARACTERISTICS OF MATERIALS
Luminiţa VLAD1, Stan MITU1 & Florin VLAD2 1 “Gheorghe Asachi” Techical University of Iasi, Romania
2Analiz Test SRL of Iasi,Romania
Abstract: The problem of ensuring the wearer’s comfort by properly establishing the thermo physical characteristics of fabrics within the clothing structures plays an important part in the current concern of the researchers and manufacturers in the textile area. This paper proposes a bioclimatic micro chamber, equipped with all the facilities that are specific to the climatic chambers used for testing the comfort parameters, using models constructed to mimic all the functions of the human body. In the bioclimatic micro chamber there are also created conditions of microclimate changes: specific limits for temperature, speed of air movement and relative humidity. These parameters are particularly involved in changing thermal resistance limits for clothing structures designed this way that have waterproof basic materials, proved by different methods. The use of this device considerably shortens the investigation time because the information on the comfort parameters is obtained simultaneously with the information on the climatic and the human body parameters Keywords: comfort, bioclimatic micro-chamber, thermal resistance, waterproof materials. Keywords: comfort, bioclimatic micro chamber, thermal resistance, waterproof materials
1 INTRODUCTION At this stage the concept of comfort is one of the most discussed topics in the field of textile fabrics, with an impact on the quality of fabrics and clothing, and with consequences on the wearer’s performances [2]. Research conducted so far have led to the conclusion that the man - clothing - environment “system" is an unique one, determining the comfort conditions with implications on the clothing’s use value [5]. Although in this system clothing is considered a passive component, by protecting the body from the influence of the weather and from environmental nuisances that may arise at work, we would like to emphasize that clothing is not just a passive cover of the skin, thus it interacts with it, modifying its thermoregulatory function [6]. Wearing comfort will be determined by the choice of fabric properties, according to their use requirements, to the structure of the whole clothing ensemble, but also to the spatial disposition of the structures in the ensemble through a proper projection of clothing [1]. These conditions require knowing how to objectively determine, as accurately as possible, the main features of the health-genetic indicators ensemble: the thermal insulation capacity, the retention capacity, the moisture absorption and transport capacity, as well as the body’s ventilation capacity. The experimental methods of evaluation are various, nowadays there are known: the tests during wearing, which involve the use of human subjects or mannequins, and laboratory tests, operated on fabrics. Tests during wearing on human subjects have been rarely conducted in recent years because they require a lot of time and they are expensive, but they still remain more conclusive than laboratory tests. Using real mannequins ("Charlie" and "Taro") by placing them into the large dimensions bioclimatic chamber, or using virtual mannequins has allowed a direct determination of the insulating properties of fabrics, products and clothing structures, related to the simultaneous transfer of heat and moisture from the body, through the clothing and towards the outside environment [1, 4]. Recent research in the field of laboratory equipment are materialized in building the small dimensions bioclimatic chambers that can simulate skin, also known as "skin model". Currently, various bioclimatic chambers made in research institutes based on the "skin model" are known. Thus, the model made at the Hohenstein Institute, in Germany, enables the assessment of thermal-physiological comfort based on the measurement of physical parameters for a single fabric or for a fabric system, under stationary conditions. Based on the Kawabata laboratory methods, another “skin model” was made at the "North Carolina State University", which provides data on the exchange of heat, moisture and air, the evaluation of moisture and heat transfer and the absorption mechanisms. In China, at the "Tianjin Institute of Textile Science & Technology" there has been made a new model of bioclimatic chamber that allows the measuring of thermal resistance and water vapor passage resistance in the case of fabrics, the results of the measurements being processed by a computer
132
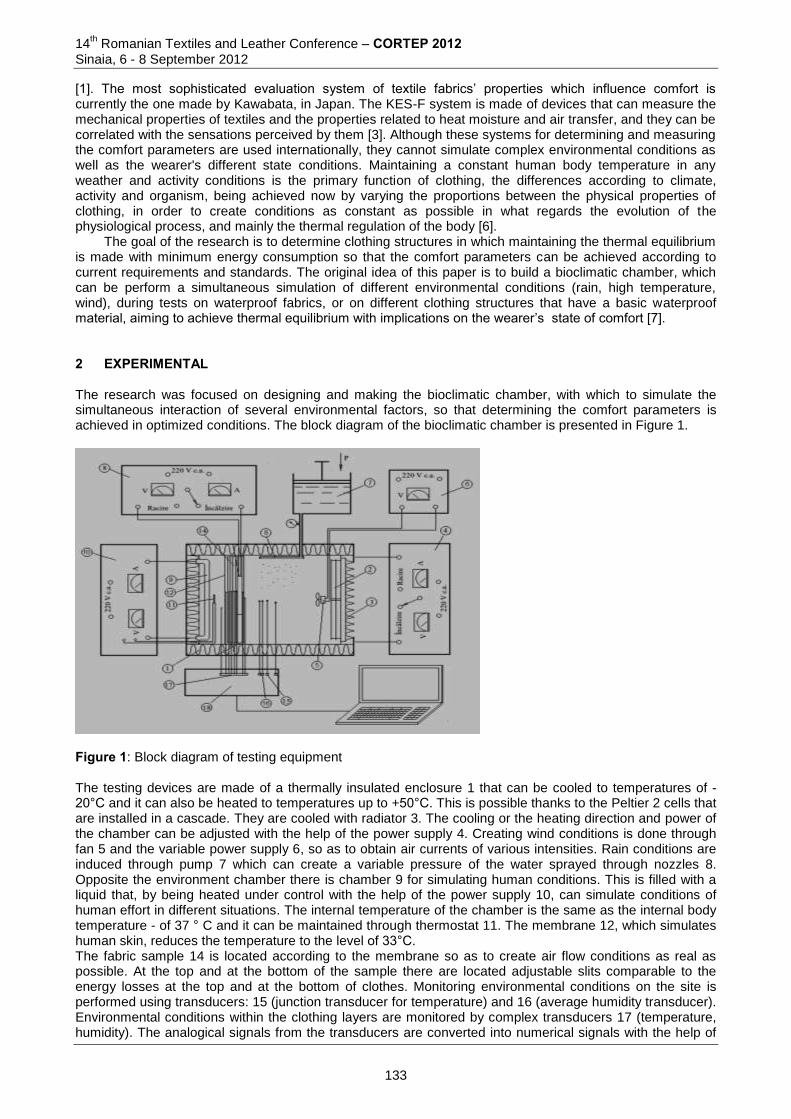
14th Romanian Textiles and Leather Conference – CORTEP 2012
Sinaia, 6 - 8 September 2012
[1]. The most sophisticated evaluation system of textile fabrics’ properties which influence comfort is currently the one made by Kawabata, in Japan. The KES-F system is made of devices that can measure the mechanical properties of textiles and the properties related to heat moisture and air transfer, and they can be correlated with the sensations perceived by them [3]. Although these systems for determining and measuring the comfort parameters are used internationally, they cannot simulate complex environmental conditions as well as the wearer's different state conditions. Maintaining a constant human body temperature in any weather and activity conditions is the primary function of clothing, the differences according to climate, activity and organism, being achieved now by varying the proportions between the physical properties of clothing, in order to create conditions as constant as possible in what regards the evolution of the physiological process, and mainly the thermal regulation of the body [6].
The goal of the research is to determine clothing structures in which maintaining the thermal equilibrium is made with minimum energy consumption so that the comfort parameters can be achieved according to current requirements and standards. The original idea of this paper is to build a bioclimatic chamber, which can be perform a simultaneous simulation of different environmental conditions (rain, high temperature, wind), during tests on waterproof fabrics, or on different clothing structures that have a basic waterproof material, aiming to achieve thermal equilibrium with implications on the wearer’s state of comfort [7]. 2 EXPERIMENTAL The research was focused on designing and making the bioclimatic chamber, with which to simulate the simultaneous interaction of several environmental factors, so that determining the comfort parameters is achieved in optimized conditions. The block diagram of the bioclimatic chamber is presented in Figure 1.
Figure 1: Block diagram of testing equipment The testing devices are made of a thermally insulated enclosure 1 that can be cooled to temperatures of - 20°C and it can also be heated to temperatures up to +50°C. This is possible thanks to the Peltier 2 cells that are installed in a cascade. They are cooled with radiator 3. The cooling or the heating direction and power of the chamber can be adjusted with the help of the power supply 4. Creating wind conditions is done through fan 5 and the variable power supply 6, so as to obtain air currents of various intensities. Rain conditions are induced through pump 7 which can create a variable pressure of the water sprayed through nozzles 8. Opposite the environment chamber there is chamber 9 for simulating human conditions. This is filled with a liquid that, by being heated under control with the help of the power supply 10, can simulate conditions of human effort in different situations. The internal temperature of the chamber is the same as the internal body temperature - of 37 ° C and it can be maintained through thermostat 11. The membrane 12, which simulates human skin, reduces the temperature to the level of 33°C. The fabric sample 14 is located according to the membrane so as to create air flow conditions as real as possible. At the top and at the bottom of the sample there are located adjustable slits comparable to the energy losses at the top and at the bottom of clothes. Monitoring environmental conditions on the site is performed using transducers: 15 (junction transducer for temperature) and 16 (average humidity transducer). Environmental conditions within the clothing layers are monitored by complex transducers 17 (temperature, humidity). The analogical signals from the transducers are converted into numerical signals with the help of
133
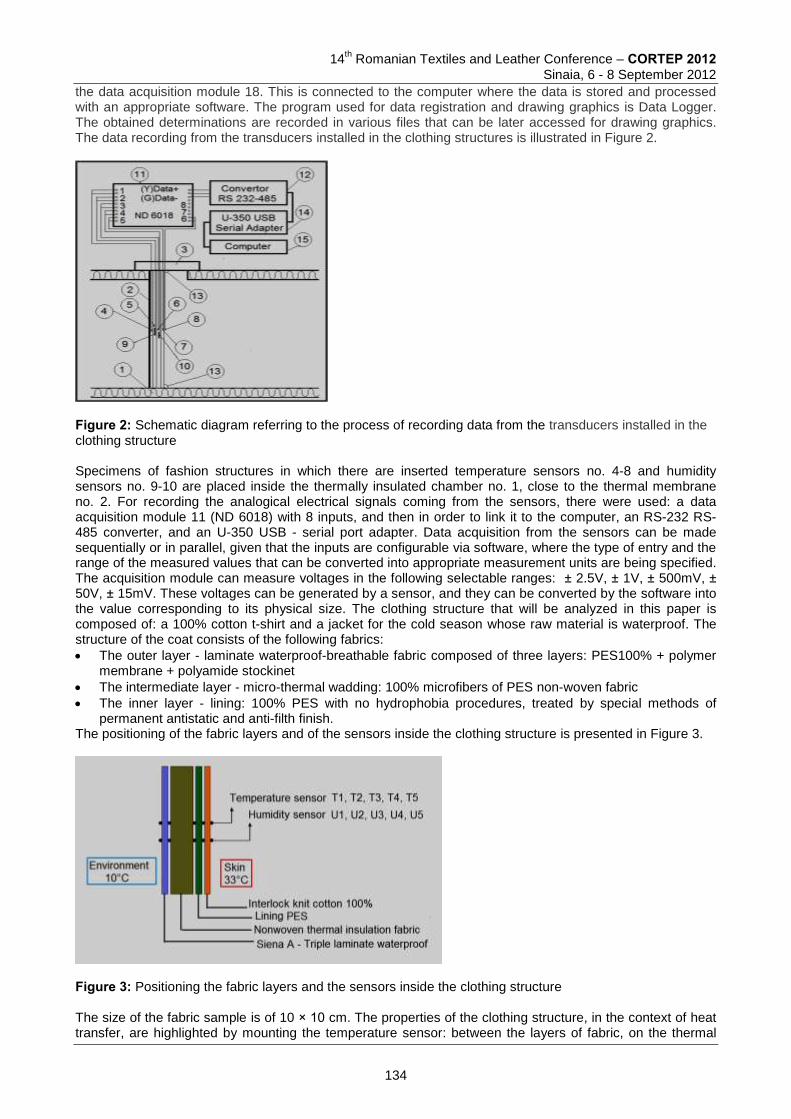
14
th Romanian Textiles and Leather Conference – CORTEP 2012
Sinaia, 6 - 8 September 2012
the data acquisition module 18. This is connected to the computer where the data is stored and processed with an appropriate software. The program used for data registration and drawing graphics is Data Logger. The obtained determinations are recorded in various files that can be later accessed for drawing graphics. The data recording from the transducers installed in the clothing structures is illustrated in Figure 2.
Figure 2: Schematic diagram referring to the process of recording data from the transducers installed in the clothing structure Specimens of fashion structures in which there are inserted temperature sensors no. 4-8 and humidity sensors no. 9-10 are placed inside the thermally insulated chamber no. 1, close to the thermal membrane no. 2. For recording the analogical electrical signals coming from the sensors, there were used: a data acquisition module 11 (ND 6018) with 8 inputs, and then in order to link it to the computer, an RS-232 RS-485 converter, and an U-350 USB - serial port adapter. Data acquisition from the sensors can be made sequentially or in parallel, given that the inputs are configurable via software, where the type of entry and the range of the measured values that can be converted into appropriate measurement units are being specified. The acquisition module can measure voltages in the following selectable ranges: ± 2.5V, ± 1V, ± 500mV, ± 50V, ± 15mV. These voltages can be generated by a sensor, and they can be converted by the software into the value corresponding to its physical size. The clothing structure that will be analyzed in this paper is composed of: a 100% cotton t-shirt and a jacket for the cold season whose raw material is waterproof. The structure of the coat consists of the following fabrics:
The outer layer - laminate waterproof-breathable fabric composed of three layers: PES100% + polymer membrane + polyamide stockinet
The intermediate layer - micro-thermal wadding: 100% microfibers of PES non-woven fabric
The inner layer - lining: 100% PES with no hydrophobia procedures, treated by special methods of permanent antistatic and anti-filth finish.
The positioning of the fabric layers and of the sensors inside the clothing structure is presented in Figure 3.
Figure 3: Positioning the fabric layers and the sensors inside the clothing structure The size of the fabric sample is of 10 × 10 cm. The properties of the clothing structure, in the context of heat transfer, are highlighted by mounting the temperature sensor: between the layers of fabric, on the thermal
134
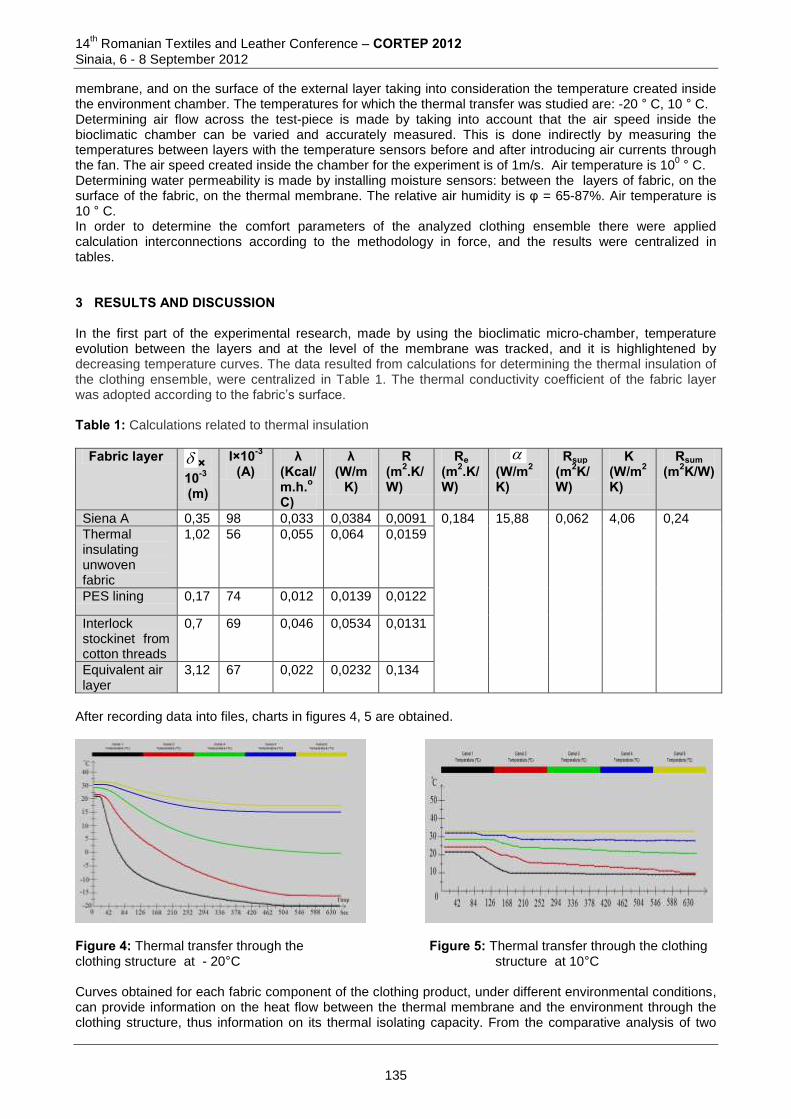
14th Romanian Textiles and Leather Conference – CORTEP 2012
Sinaia, 6 - 8 September 2012
membrane, and on the surface of the external layer taking into consideration the temperature created inside the environment chamber. The temperatures for which the thermal transfer was studied are: -20 ° C, 10 ° C. Determining air flow across the test-piece is made by taking into account that the air speed inside the bioclimatic chamber can be varied and accurately measured. This is done indirectly by measuring the temperatures between layers with the temperature sensors before and after introducing air currents through the fan. The air speed created inside the chamber for the experiment is of 1m/s. Air temperature is 10
0 ° C.
Determining water permeability is made by installing moisture sensors: between the layers of fabric, on the surface of the fabric, on the thermal membrane. The relative air humidity is φ = 65-87%. Air temperature is 10 ° C. In order to determine the comfort parameters of the analyzed clothing ensemble there were applied calculation interconnections according to the methodology in force, and the results were centralized in tables. 3 RESULTS AND DISCUSSION In the first part of the experimental research, made by using the bioclimatic micro-chamber, temperature evolution between the layers and at the level of the membrane was tracked, and it is highlightened by decreasing temperature curves. The data resulted from calculations for determining the thermal insulation of the clothing ensemble, were centralized in Table 1. The thermal conductivity coefficient of the fabric layer was adopted according to the fabric’s surface. Table 1: Calculations related to thermal insulation
Fabric layer ×10-3
(m)
I×10-3
(A) λ
(Kcal/m.h.oC)
λ (W/m
K)
R (m2.K/W)
Re (m2.K/ W)
(W/m2
K)
Rsup (m2K/W)
K (W/m2
K)
Rsum (m2K/W)
Siena A 0,35 98 0,033 0,0384 0,0091 0,184 15,88 0,062 4,06 0,24
Thermal insulating unwoven fabric
1,02 56 0,055 0,064 0,0159
PES lining 0,17 74 0,012 0,0139 0,0122
Interlock stockinet from cotton threads
0,7 69 0,046 0,0534 0,0131
Equivalent air layer
3,12 67 0,022 0,0232 0,134
After recording data into files, charts in figures 4, 5 are obtained.
Figure 4: Thermal transfer through the Figure 5: Thermal transfer through the clothing clothing structure at - 20°C structure at 10°C Curves obtained for each fabric component of the clothing product, under different environmental conditions, can provide information on the heat flow between the thermal membrane and the environment through the clothing structure, thus information on its thermal isolating capacity. From the comparative analysis of two
135
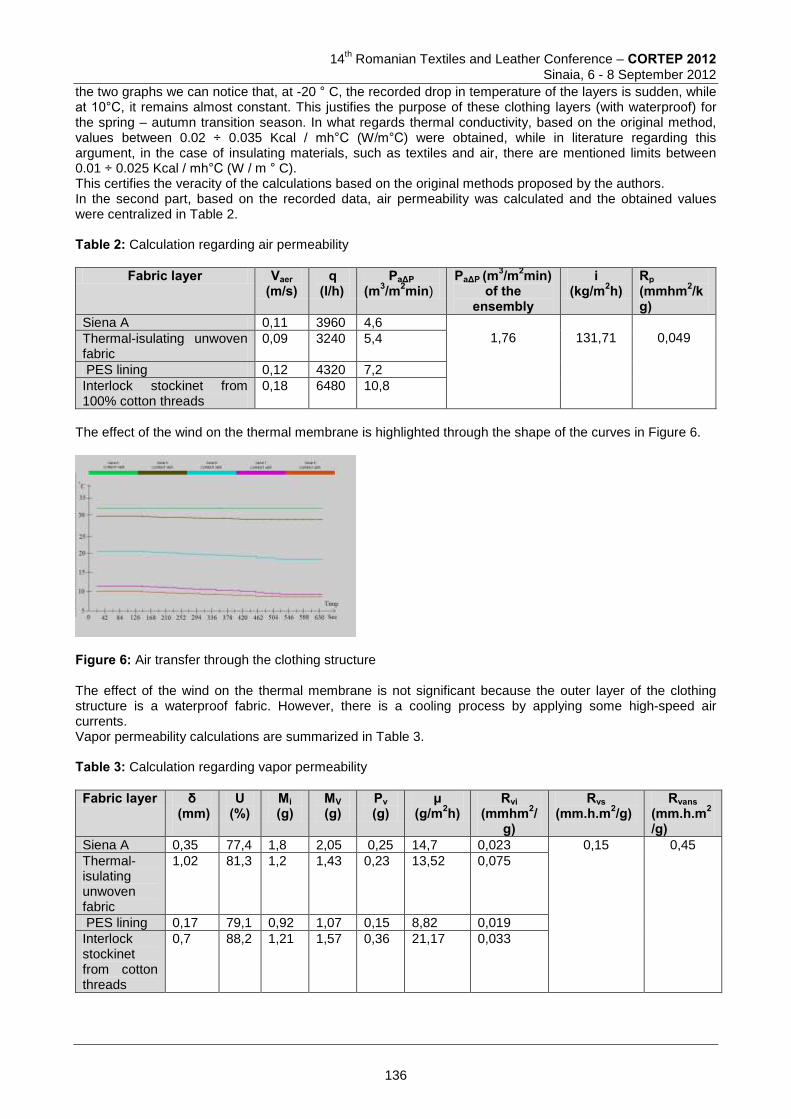
14
th Romanian Textiles and Leather Conference – CORTEP 2012
Sinaia, 6 - 8 September 2012
the two graphs we can notice that, at -20 ° C, the recorded drop in temperature of the layers is sudden, while at 10°C, it remains almost constant. This justifies the purpose of these clothing layers (with waterproof) for the spring – autumn transition season. In what regards thermal conductivity, based on the original method, values between 0.02 ÷ 0.035 Kcal / mh°C (W/m°C) were obtained, while in literature regarding this argument, in the case of insulating materials, such as textiles and air, there are mentioned limits between 0.01 ÷ 0.025 Kcal / mh°C (W / m ° C). This certifies the veracity of the calculations based on the original methods proposed by the authors. In the second part, based on the recorded data, air permeability was calculated and the obtained values were centralized in Table 2. Table 2: Calculation regarding air permeability
Fabric layer Vaer (m/s)
q (l/h)
PaΔP (m3/m2min)
PaΔP (m3/m2min) of the
ensembly
i (kg/m2h)
Rp (mmhm2/kg)
Siena A 0,11 3960 4,6 1,76
131,71
0,049 Thermal-isulating unwoven
fabric 0,09 3240 5,4
PES lining 0,12 4320 7,2
Interlock stockinet from 100% cotton threads
0,18 6480 10,8
The effect of the wind on the thermal membrane is highlighted through the shape of the curves in Figure 6.
Figure 6: Air transfer through the clothing structure The effect of the wind on the thermal membrane is not significant because the outer layer of the clothing structure is a waterproof fabric. However, there is a cooling process by applying some high-speed air currents. Vapor permeability calculations are summarized in Table 3. Table 3: Calculation regarding vapor permeability
Fabric layer δ (mm)
U (%)
Mi (g)
MV (g)
Pv (g)
µ (g/m2h)
Rvi (mmhm2/
g)
Rvs (mm.h.m2/g)
Rvans (mm.h.m2
/g) Siena A 0,35 77,4 1,8 2,05 0,25 14,7 0,023 0,15 0,45
Thermal-isulating unwoven fabric
1,02 81,3 1,2 1,43 0,23 13,52 0,075
PES lining 0,17 79,1 0,92 1,07 0,15 8,82 0,019
Interlock stockinet from cotton threads
0,7 88,2 1,21 1,57 0,36 21,17 0,033
136
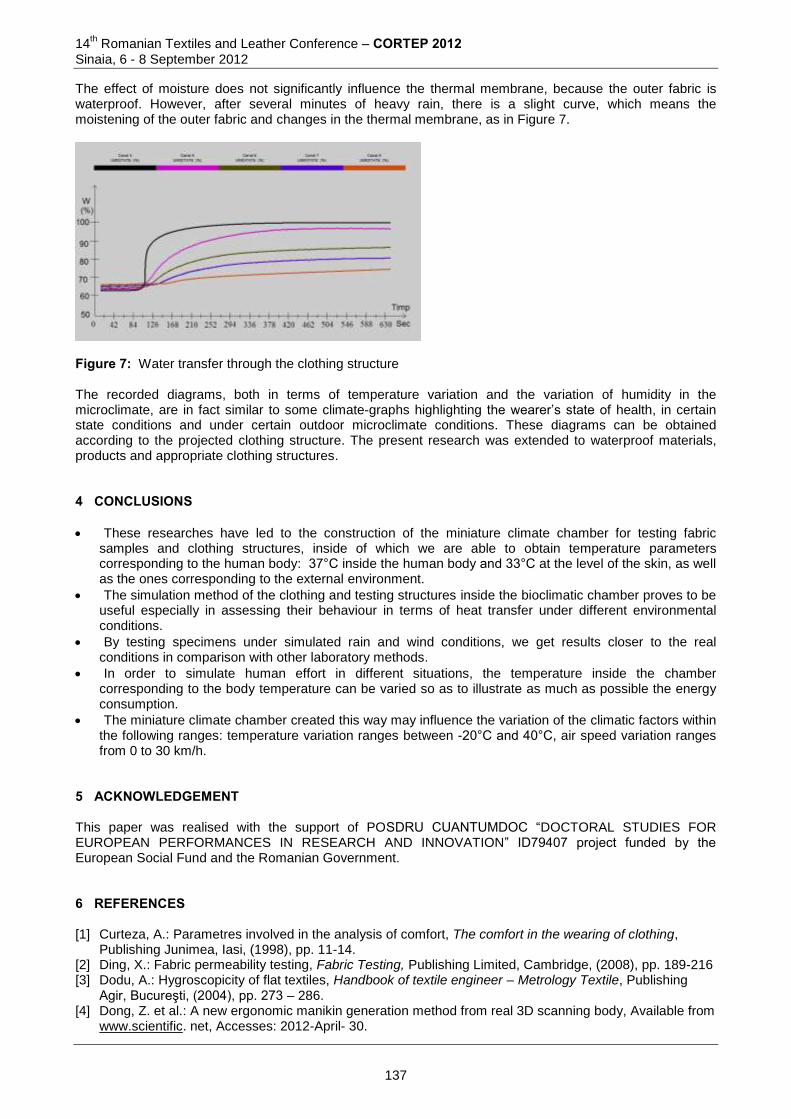
14th Romanian Textiles and Leather Conference – CORTEP 2012
Sinaia, 6 - 8 September 2012
The effect of moisture does not significantly influence the thermal membrane, because the outer fabric is waterproof. However, after several minutes of heavy rain, there is a slight curve, which means the moistening of the outer fabric and changes in the thermal membrane, as in Figure 7.
Figure 7: Water transfer through the clothing structure
The recorded diagrams, both in terms of temperature variation and the variation of humidity in the microclimate, are in fact similar to some climate-graphs highlighting the wearer’s state of health, in certain state conditions and under certain outdoor microclimate conditions. These diagrams can be obtained according to the projected clothing structure. The present research was extended to waterproof materials, products and appropriate clothing structures. 4 CONCLUSIONS
These researches have led to the construction of the miniature climate chamber for testing fabric samples and clothing structures, inside of which we are able to obtain temperature parameters corresponding to the human body: 37°C inside the human body and 33°C at the level of the skin, as well as the ones corresponding to the external environment.
The simulation method of the clothing and testing structures inside the bioclimatic chamber proves to be useful especially in assessing their behaviour in terms of heat transfer under different environmental conditions.
By testing specimens under simulated rain and wind conditions, we get results closer to the real conditions in comparison with other laboratory methods.
In order to simulate human effort in different situations, the temperature inside the chamber corresponding to the body temperature can be varied so as to illustrate as much as possible the energy consumption.
The miniature climate chamber created this way may influence the variation of the climatic factors within the following ranges: temperature variation ranges between -20°C and 40°C, air speed variation ranges from 0 to 30 km/h.
5 ACKNOWLEDGEMENT This paper was realised with the support of POSDRU CUANTUMDOC “DOCTORAL STUDIES FOR EUROPEAN PERFORMANCES IN RESEARCH AND INNOVATION” ID79407 project funded by the European Social Fund and the Romanian Government. 6 REFERENCES [1] Curteza, A.: Parametres involved in the analysis of comfort, The comfort in the wearing of clothing,
Publishing Junimea, Iasi, (1998), pp. 11-14. [2] Ding, X.: Fabric permeability testing, Fabric Testing, Publishing Limited, Cambridge, (2008), pp. 189-216 [3] Dodu, A.: Hygroscopicity of flat textiles, Handbook of textile engineer – Metrology Textile, Publishing
Agir, Bucureşti, (2004), pp. 273 – 286. [4] Dong, Z. et al.: A new ergonomic manikin generation method from real 3D scanning body, Available from
www.scientific. net, Accesses: 2012-April- 30.
137
14
th Romanian Textiles and Leather Conference – CORTEP 2012
Sinaia, 6 - 8 September 2012
[5] Mitu, S.: Generalities on the definition of the comfort, Comfort and function of clothing products, Publishing Gh. Asachi, Iaşi, (2000), pp. 6 – 15.
[6] Mitu, S. & Hâncu, S,: Heat and mass transfer through clothing, Textile Industry, Vol. LVIII, No. 3, (2007), pp. 133 – 145.
[7] Vlad, L: România, patent, no. 201200002 as “Bioclimate micro chamber”.
Corresponding author: Luminiţa VLAD Department of Industrial Engineering Faculty of Textile, Leather and Industrial Management Techical University “Gheorghe Asachi” of Iasi Blvd. Dimitrie Mangeron, nr. 29 70050, Iasi-Romania E-mail: [email protected]
Co-authors: Stan MITU Department of Industrial Engineering Faculty of Textile-Leather and Industrial Management Techical University “Gheorghe Asachi” Blvd. Dimitrie Mangeron, nr. 29 70050, Iasi-Romania E-mail: [email protected] Florin VLAD Company: Analiz Test SRL Blv. Carol I, nr.5 700506, Iasi-Romania E-mail: [email protected]
138
14
th Romanian Textiles and Leather Conference – CORTEP 2012
Sinaia, 6 - 8 September 2012
BEHAVIOR OF TECHNICAL FILAMENT YARNS IN DYNAMIC TENSILE TEST
Lidija GOMBOC1, Renate Lützkendorf1, Majda SFILIGOJ SMOLE2 &
Zoran STJEPANOVIČ2 1TITK - Thüringisches Institut für Textil- und Kunststoff-Forschung e.V., Rudolstadt, Germany
2University of Maribor, Faculty of Mechanical Engineering, Maribor, Slovenia
Abstract: Technical textiles are fundamentally different from the traditional textile yarns and textiles. Special yarns and textile materials, produced using these fibres, are usually exposed to high dynamic load conditions during processing and use. The interpretation of the material behaviour under dynamic load conditions is still characterized by parameters, determined under standard tensile tests using achievable testing speeds and strain rates. Due to their viscoelastic properties, the behaviour of polymeric yarns depends on the loading speed. Suitable standard test method is still missing for the determination of mechanical properties under high strain rate. Only the high-speed tests provide the valid experimental data to describe the material behaviour under high load conditions. The study has shown that the test speed influences the behaviour of technical filament yarns in dynamic tensile tests. Experimental results showed major influence of the test speed on elongation of investigated yarns while tensile strength was not significantly affected. Keywords: Tensile test, high speed tensile test, servo-hydraulic tensile testing machine, strain rate, elongation rate 1 INTRODUCTION AND MOTIVATIONS FOR THE STUDY Special yarns, resp. yarns for technical applications are usually exposed to high dynamic loading during processing and in final use. Therefore, they fundamentally differ from traditional textile yarns regarding their requirements- and performance-profile [1, 2]. Interpretation of the material behaviour under dynamic load conditions is still characterized by parameters, which are determined under standard tensile test with present testing speed and strain rates. Due to their viscoelastic properties the behaviour of polymeric yarns depends on the loading speed [3]. A suitable standard test method was missing for the determination of mechanical properties under high strain rate – especially the stress-strain properties of filament yarns with or without twist. Introduction of high-speed tests provide the valid experimental data to describe the material behaviour under high load conditions [4]. Suitable standards for the execution of high-speed tensile test for textiles are still to be developed. Results of tensile tests on high performance PA 6.6., PA 4.6 and PET yarns are presented in this paper [5]. In the study, the yarns were first tested at low strain rates ranging from 0,0017 s-1 to 1,2 s-1 (quasi-static tensile test) using a conventional tensile testing machine [6]. Next, a servo-hydraulic tensile testing machine was used. The clamps and the testing technology have been slightly modified, which allowed execution of tensile tests at higher strain rates ranging from 1 s-1 to 500 s-1 (dynamic tensile test). To implement the corresponding strain rates both the gauge length and testing speed were varied on both tensile testing machines. Basis for the discussion was the stress-strain behaviour of investigated yarns. The experimental data were analyzed and discussed in terms of influential parameters (clamps, type of testing machine, gauge length). 2 THEORETICAL PART – STANDARD VS. DYNAMIC TENSILE TEST Some technical textiles are made of high-performance fibres, the fibres with specific functional characteristics. They differ from the common textile fibres primarily regarding the exceptional mechanical properties, especially for high strength, resp. module. [1, 2, 7]. Textiles are exposed to dynamic loads, not only during the use, but also already during the production, because of modern high-speed production machinery. In the further manufacture of textiles (woven and knitted fabric) the yarns are subjected to the high dynamic and cyclic loads [4, 8, 9]. Especially the most of the technical textiles used in the automotive
139
14th Romanian Textiles and Leather Conference – CORTEP 2012
Sinaia, 6 - 8 September 2012
industry are exposed to high tensile loads. Tensile properties of textile materials are usually explained only with the data obtained under standard test conditions, with low deformation rates. The suitable, standardised test method for explaining the tensile behaviour at high-speed loading is still missing. Only data obtained at high loading rates enable a realistic assessment of the behaviour of textile materials exposed to high-speed dynamic loading. As a result of the tensile testing in addition to the tensile strength and elongation we mostly use the force-elongation curve, which graphically illustrates the relationship between the tensile strength and elongation. Force-elongation diagram allows calculation of the deformation work [2, 10], as well as checking of the tensile test [2, 11], since the shape of the curve shows the occurrence of possible errors during the test. Although the dynamic tensile testing of textile materials becomes more and more important, the testing process has not been standardized yet. Various measuring devices are in use that were designed for testing the mechanical properties of metals and plastics. Since the measurement principles test courses vary, the results obtained cannot be directly compared. Therefore, the most of existing testing devices convey only the breaking force and breaking elongation [4]. Few of these devices are suitable for testing textile fibres or yarns without significant adjustment. The following devices/principles are used today for performing the dynamic testing of textile materials:
a device that operates on the principle of free fall a device that operates on the principle of rotation Split-Hopkinson-Tensile-bar, which operates using the principle of compressed air Uster Tensojet measuring device, high-speed tensile device which operates on the principle of servo-hydraulics.
In the course of this research, the yarns were first tested at low strain rates ranging from 0,0017 s-1 to 1,2 s-1 using a conventional tensile testing machine, after which a servo-hydraulic tensile testing machine was used [5, 6]. The clamps and the testing technology have been slightly modified, which allowed execution of tensile tests at higher strain rates ranging from 1 s-1 to 500 s-1. This conforms to the definition of the dynamic tensile test. Both measuring devices have an automated system for data acquisition. Measuring device is connected to a PC through the corresponding control unit. Both devices allow numerical and graphical observation of the dependence between the load force and deformation. All tests were carried out in a climatic chamber, under standard testing conditions: temperature 20°C ± 2°C and relative humidity 65% ± 5% - according to DIN EN 139 [12]. First, we performed tensile test for clamp length of 500 mm and a constant testing speed of 500 mm/min. After that we varied the clamping lengths of the specimen and the testing speed. Clamping length and testing speed was varied at conventional as well as high-speed testing. With this model, we covered the range of expansion testing rates between 0.0017 and 1,2 s
-1 for the low speed testing and between 1 and
500 s-1
for high-speed testing [5]. Due to variation in the clamping length and test speed in dynamic tensile testing procedure, it is necessary to
introduce two additional quantities: the extension rate and elongation speed ( ), which provide detailed time-
dependent deformation [44]. The rate of expansion is defined as the ratio between the speed and clamping length (1/s or s
-1), while the extension rate is defined as the extension (in %) per time unit (%/s or %s
-1) [4,
13, 14]. 3 EXPERIMENTAL PART 3.1 Materials and methods High performance technical filament yarns: PA 6.6., PA 4.6 and PET yarns were tested using the conventional and high-speed testing devices. The first one, Zwick Z010 is a relatively simple tensile test whereby thread is pulled at a constant rate of speed until it breaks. Dynamic tensile tests were performed using the servo-hydraulic tensile testing machine Zwick HTM 2008 [5, 6]. Usually, the following measurements (yarn parameters) are obtained: breaking force (maximum force), breaking tenacity, elongation, initial modulus and breaking toughness (energy). These parameters describe the yarn characteristics and are crucial for predicting the yarn behaviour in upcoming manufacturing processes, such us weaving and knitting.
140
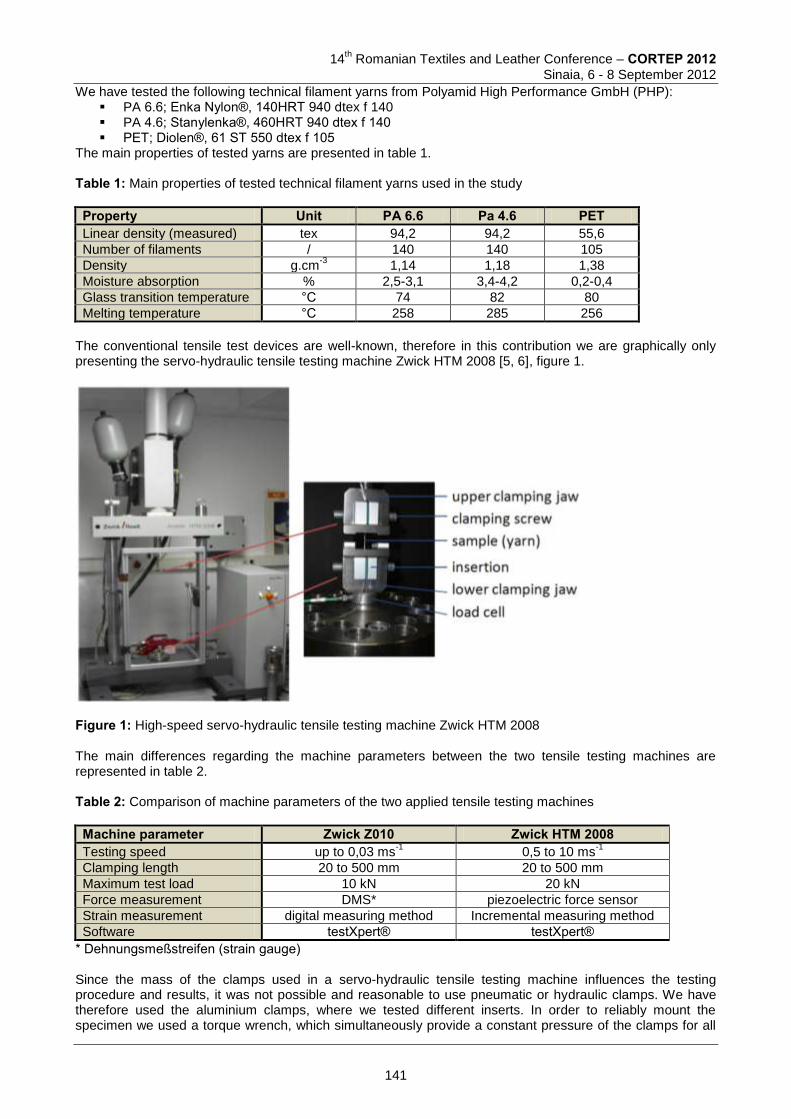
14
th Romanian Textiles and Leather Conference – CORTEP 2012
Sinaia, 6 - 8 September 2012
We have tested the following technical filament yarns from Polyamid High Performance GmbH (PHP): PA 6.6; Enka Nylon®, 140HRT 940 dtex f 140 PA 4.6; Stanylenka®, 460HRT 940 dtex f 140 PET; Diolen®, 61 ST 550 dtex f 105
The main properties of tested yarns are presented in table 1. Table 1: Main properties of tested technical filament yarns used in the study
Property Unit PA 6.6 Pa 4.6 PET Linear density (measured) tex 94,2 94,2 55,6
Number of filaments / 140 140 105
Density g.cm-3
1,14 1,18 1,38
Moisture absorption % 2,5-3,1 3,4-4,2 0,2-0,4
Glass transition temperature °C 74 82 80
Melting temperature °C 258 285 256
The conventional tensile test devices are well-known, therefore in this contribution we are graphically only presenting the servo-hydraulic tensile testing machine Zwick HTM 2008 [5, 6], figure 1.
Figure 1: High-speed servo-hydraulic tensile testing machine Zwick HTM 2008 The main differences regarding the machine parameters between the two tensile testing machines are represented in table 2. Table 2: Comparison of machine parameters of the two applied tensile testing machines Machine parameter Zwick Z010 Zwick HTM 2008 Testing speed up to 0,03 ms
-1 0,5 to 10 ms
-1
Clamping length 20 to 500 mm 20 to 500 mm
Maximum test load 10 kN 20 kN
Force measurement DMS* piezoelectric force sensor
Strain measurement digital measuring method Incremental measuring method
Software testXpert® testXpert®
* Dehnungsmeßstreifen (strain gauge) Since the mass of the clamps used in a servo-hydraulic tensile testing machine influences the testing procedure and results, it was not possible and reasonable to use pneumatic or hydraulic clamps. We have therefore used the aluminium clamps, where we tested different inserts. In order to reliably mount the specimen we used a torque wrench, which simultaneously provide a constant pressure of the clamps for all
141
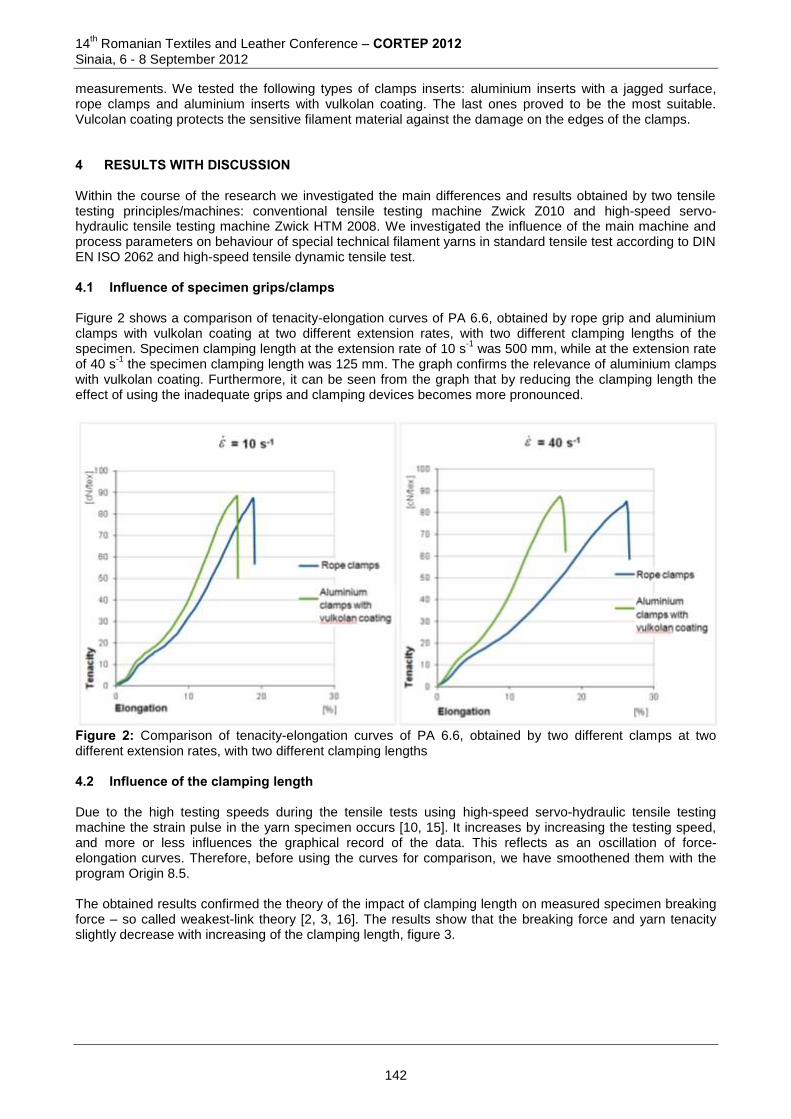
14th Romanian Textiles and Leather Conference – CORTEP 2012
Sinaia, 6 - 8 September 2012
measurements. We tested the following types of clamps inserts: aluminium inserts with a jagged surface, rope clamps and aluminium inserts with vulkolan coating. The last ones proved to be the most suitable. Vulcolan coating protects the sensitive filament material against the damage on the edges of the clamps. 4 RESULTS WITH DISCUSSION Within the course of the research we investigated the main differences and results obtained by two tensile testing principles/machines: conventional tensile testing machine Zwick Z010 and high-speed servo-hydraulic tensile testing machine Zwick HTM 2008. We investigated the influence of the main machine and process parameters on behaviour of special technical filament yarns in standard tensile test according to DIN EN ISO 2062 and high-speed tensile dynamic tensile test. 4.1 Influence of specimen grips/clamps Figure 2 shows a comparison of tenacity-elongation curves of PA 6.6, obtained by rope grip and aluminium clamps with vulkolan coating at two different extension rates, with two different clamping lengths of the specimen. Specimen clamping length at the extension rate of 10 s
-1 was 500 mm, while at the extension rate
of 40 s-1
the specimen clamping length was 125 mm. The graph confirms the relevance of aluminium clamps with vulkolan coating. Furthermore, it can be seen from the graph that by reducing the clamping length the effect of using the inadequate grips and clamping devices becomes more pronounced.
Figure 2: Comparison of tenacity-elongation curves of PA 6.6, obtained by two different clamps at two different extension rates, with two different clamping lengths 4.2 Influence of the clamping length Due to the high testing speeds during the tensile tests using high-speed servo-hydraulic tensile testing machine the strain pulse in the yarn specimen occurs [10, 15]. It increases by increasing the testing speed, and more or less influences the graphical record of the data. This reflects as an oscillation of force-elongation curves. Therefore, before using the curves for comparison, we have smoothened them with the program Origin 8.5. The obtained results confirmed the theory of the impact of clamping length on measured specimen breaking force – so called weakest-link theory [2, 3, 16]. The results show that the breaking force and yarn tenacity slightly decrease with increasing of the clamping length, figure 3.
142
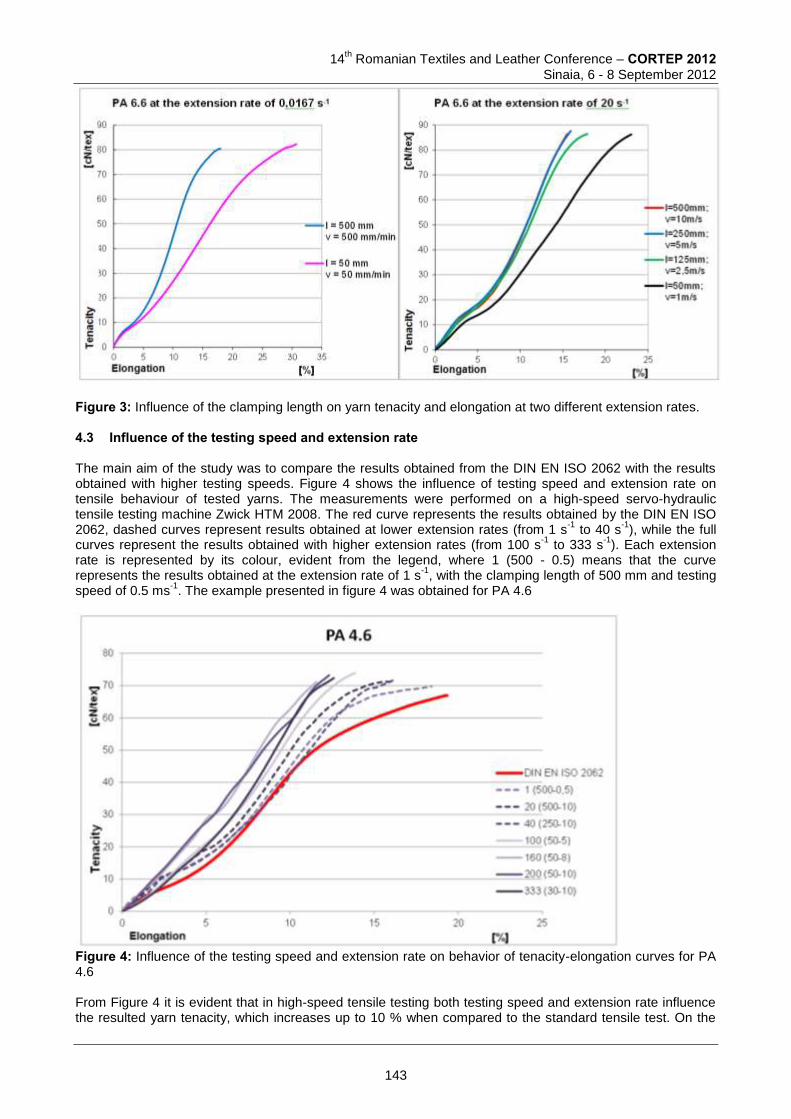
14
th Romanian Textiles and Leather Conference – CORTEP 2012
Sinaia, 6 - 8 September 2012
Figure 3: Influence of the clamping length on yarn tenacity and elongation at two different extension rates. 4.3 Influence of the testing speed and extension rate The main aim of the study was to compare the results obtained from the DIN EN ISO 2062 with the results obtained with higher testing speeds. Figure 4 shows the influence of testing speed and extension rate on tensile behaviour of tested yarns. The measurements were performed on a high-speed servo-hydraulic tensile testing machine Zwick HTM 2008. The red curve represents the results obtained by the DIN EN ISO 2062, dashed curves represent results obtained at lower extension rates (from 1 s
-1 to 40 s
-1), while the full
curves represent the results obtained with higher extension rates (from 100 s-1
to 333 s-1
). Each extension rate is represented by its colour, evident from the legend, where 1 (500 - 0.5) means that the curve represents the results obtained at the extension rate of 1 s
-1, with the clamping length of 500 mm and testing
speed of 0.5 ms-1
. The example presented in figure 4 was obtained for PA 4.6
Figure 4: Influence of the testing speed and extension rate on behavior of tenacity-elongation curves for PA 4.6 From Figure 4 it is evident that in high-speed tensile testing both testing speed and extension rate influence the resulted yarn tenacity, which increases up to 10 % when compared to the standard tensile test. On the
143
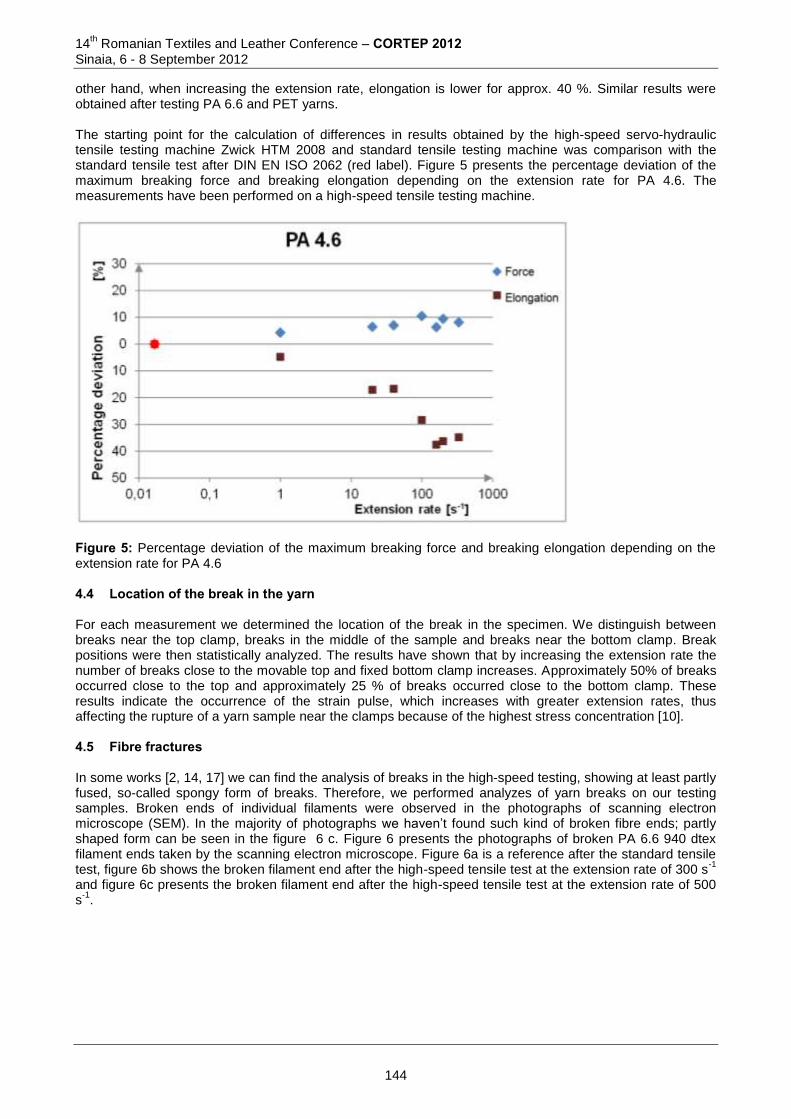
14th Romanian Textiles and Leather Conference – CORTEP 2012
Sinaia, 6 - 8 September 2012
other hand, when increasing the extension rate, elongation is lower for approx. 40 %. Similar results were obtained after testing PA 6.6 and PET yarns. The starting point for the calculation of differences in results obtained by the high-speed servo-hydraulic tensile testing machine Zwick HTM 2008 and standard tensile testing machine was comparison with the standard tensile test after DIN EN ISO 2062 (red label). Figure 5 presents the percentage deviation of the maximum breaking force and breaking elongation depending on the extension rate for PA 4.6. The measurements have been performed on a high-speed tensile testing machine.
Figure 5: Percentage deviation of the maximum breaking force and breaking elongation depending on the extension rate for PA 4.6 4.4 Location of the break in the yarn For each measurement we determined the location of the break in the specimen. We distinguish between breaks near the top clamp, breaks in the middle of the sample and breaks near the bottom clamp. Break positions were then statistically analyzed. The results have shown that by increasing the extension rate the number of breaks close to the movable top and fixed bottom clamp increases. Approximately 50% of breaks occurred close to the top and approximately 25 % of breaks occurred close to the bottom clamp. These results indicate the occurrence of the strain pulse, which increases with greater extension rates, thus affecting the rupture of a yarn sample near the clamps because of the highest stress concentration [10]. 4.5 Fibre fractures In some works [2, 14, 17] we can find the analysis of breaks in the high-speed testing, showing at least partly fused, so-called spongy form of breaks. Therefore, we performed analyzes of yarn breaks on our testing samples. Broken ends of individual filaments were observed in the photographs of scanning electron microscope (SEM). In the majority of photographs we haven’t found such kind of broken fibre ends; partly shaped form can be seen in the figure 6 c. Figure 6 presents the photographs of broken PA 6.6 940 dtex filament ends taken by the scanning electron microscope. Figure 6a is a reference after the standard tensile test, figure 6b shows the broken filament end after the high-speed tensile test at the extension rate of 300 s
-1
and figure 6c presents the broken filament end after the high-speed tensile test at the extension rate of 500 s
-1.
144
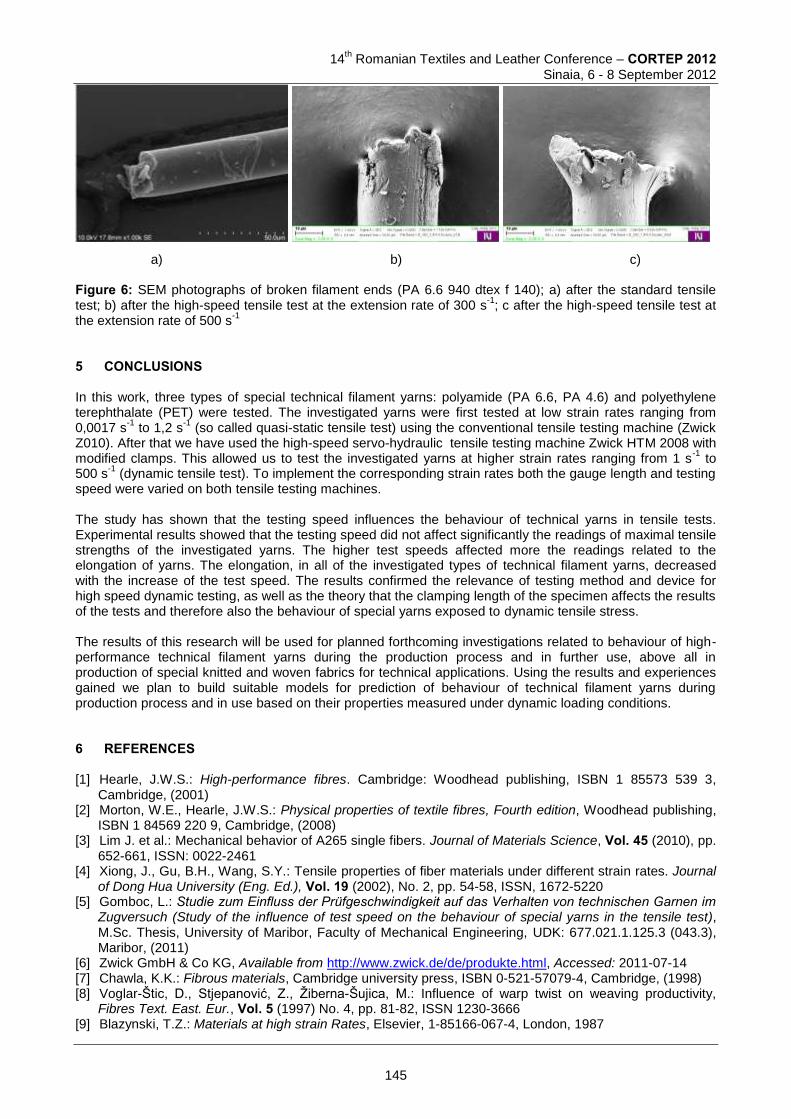
14
th Romanian Textiles and Leather Conference – CORTEP 2012
Sinaia, 6 - 8 September 2012
a) b) c) Figure 6: SEM photographs of broken filament ends (PA 6.6 940 dtex f 140); a) after the standard tensile test; b) after the high-speed tensile test at the extension rate of 300 s
-1; c after the high-speed tensile test at
the extension rate of 500 s-1
5 CONCLUSIONS In this work, three types of special technical filament yarns: polyamide (PA 6.6, PA 4.6) and polyethylene terephthalate (PET) were tested. The investigated yarns were first tested at low strain rates ranging from 0,0017 s
-1 to 1,2 s
-1 (so called quasi-static tensile test) using the conventional tensile testing machine (Zwick
Z010). After that we have used the high-speed servo-hydraulic tensile testing machine Zwick HTM 2008 with modified clamps. This allowed us to test the investigated yarns at higher strain rates ranging from 1 s
-1 to
500 s-1
(dynamic tensile test). To implement the corresponding strain rates both the gauge length and testing speed were varied on both tensile testing machines. The study has shown that the testing speed influences the behaviour of technical yarns in tensile tests. Experimental results showed that the testing speed did not affect significantly the readings of maximal tensile strengths of the investigated yarns. The higher test speeds affected more the readings related to the elongation of yarns. The elongation, in all of the investigated types of technical filament yarns, decreased with the increase of the test speed. The results confirmed the relevance of testing method and device for high speed dynamic testing, as well as the theory that the clamping length of the specimen affects the results of the tests and therefore also the behaviour of special yarns exposed to dynamic tensile stress. The results of this research will be used for planned forthcoming investigations related to behaviour of high-performance technical filament yarns during the production process and in further use, above all in production of special knitted and woven fabrics for technical applications. Using the results and experiences gained we plan to build suitable models for prediction of behaviour of technical filament yarns during production process and in use based on their properties measured under dynamic loading conditions. 6 REFERENCES [1] Hearle, J.W.S.: High-performance fibres. Cambridge: Woodhead publishing, ISBN 1 85573 539 3,
Cambridge, (2001) [2] Morton, W.E., Hearle, J.W.S.: Physical properties of textile fibres, Fourth edition, Woodhead publishing,
ISBN 1 84569 220 9, Cambridge, (2008) [3] Lim J. et al.: Mechanical behavior of A265 single fibers. Journal of Materials Science, Vol. 45 (2010), pp.
652-661, ISSN: 0022-2461 [4] Xiong, J., Gu, B.H., Wang, S.Y.: Tensile properties of fiber materials under different strain rates. Journal
of Dong Hua University (Eng. Ed.), Vol. 19 (2002), No. 2, pp. 54-58, ISSN, 1672-5220 [5] Gomboc, L.: Studie zum Einfluss der Prüfgeschwindigkeit auf das Verhalten von technischen Garnen im
Zugversuch (Study of the influence of test speed on the behaviour of special yarns in the tensile test), M.Sc. Thesis, University of Maribor, Faculty of Mechanical Engineering, UDK: 677.021.1.125.3 (043.3), Maribor, (2011)
[6] Zwick GmbH & Co KG, Available from http://www.zwick.de/de/produkte.html, Accessed: 2011-07-14 [7] Chawla, K.K.: Fibrous materials, Cambridge university press, ISBN 0-521-57079-4, Cambridge, (1998) [8] Voglar-Štic, D., Stjepanović, Z., Žiberna-Šujica, M.: Influence of warp twist on weaving productivity,
Fibres Text. East. Eur., Vol. 5 (1997) No. 4, pp. 81-82, ISSN 1230-3666 [9] Blazynski, T.Z.: Materials at high strain Rates, Elsevier, 1-85166-067-4, London, 1987
145

14th Romanian Textiles and Leather Conference – CORTEP 2012
Sinaia, 6 - 8 September 2012
[10] Reumann, R.D.: Prüfverfahren in der Textil- und Bekleidungstechnik, Springer-Verlag Berlin Heideberg, ISBN 3 54066 147 6, Berlin, (2000)
[11] Pospischil, H.O.: Prüfmethoden für die Labors der Textilindustrie: 3. überarb. und erw. Auflage, fv VEB Fachbuchverlag Leipzig, Leipzig, (1975)
[12] DIN EN 139, Textilien - Normalklimate für die Probenvorbereitung und Prüfung DIN (ISO 139:2005), Deutsches Institut für Normung e. V., Berlin, (2005)
[13] Meyers, M.A.: Dynamic behavior of materials. Wiley-IEEE, (1994) [14] Bahners, T.: Untersuchung des visko-elastischen Verhaltens technischer Garne bei
Kurzzeitbeanspruchungen mit hoher Dehnungsgeschwindigkeit, Schlussbericht. Krefeld, (2011) [15] Maurer, G.: Schnellzugversuche an Kunststoffen. Zwick/Roell, 14. Fachmesse für Prüftechnik, (2005) [16] Jianwen, L.: Untersuchung von Verbundwerkstoffen mit Basalt- und PBO-Fasern-Verstärkung,
Dissertation, Fakultät Maschinenwesen der Technischen Universität Dresden, Dresden, (2008) [17] Hearle, J.W.S., Lomas, B., Cook, W.D.: Atlas of fibre fracture and damage to textiles, Woodhead & The
Textile Institute, ISBN 1 85573 539 3, Cambridge, (1998)
Corresponding author:
Zoran STJEPANOVIČ Department of Textile Materials and Design Faculty of Mechanical Engineering University of Maribor Smetanova 17 2000 Maribor, Slovenia phone: +386 2 2207945, fax : +386 2 2207990, e-mail: [email protected]
Co-author(s): Lidija GOMBOC Abteilung Textil- und Werkstoff-Forschung TITK - Thüringisches Institut für Textil- und Kunststoff-Forschung e.V. Breitscheidstraße 97 07407 Rudolstadt, Germany phone: +49 (0) 3672 379 311, fax: +49 (0) 3672 379 379, e-mail: [email protected]
Renate LÜTZKENDORF
Abteilung Textil- und Werkstoff-Forschung TITK - Thüringisches Institut für Textil- und Kunststoff-Forschung e.V. Breitscheidstraße 97 07407 Rudolstadt, Germany phone: +49 (0) 3672 379 300, fax: +49 (0) 3672 379 379, e-mail: [email protected] Majda Sfiligoj SMOLE Department of Textile Materials and Design Faculty of Mechanical Engineering University of Maribor Smetanova 17 2000 Maribor, Slovenia phone: +386 2 2207883, e-mail: [email protected]
146
14
th Romanian Textiles and Leather Conference – CORTEP 2012
Sinaia, 6 - 8 September 2012
EXPERIMENTAL RESEARCHES REGARDING THE TENSILE BEHAVIOR OF WOVEN MATERIALS MADE FROM YARNS TYPE COMBED WOOL
Liliana HRISTIAN, Iuliana Gabriela LUPU
Demetra Lăcrămioara BORDEIANU & Georgeta POTOP “Gheorghe Asachi” Technical University of Iasi, Romania
Abstract:The paper analyses the tensile behaviour of woven fabrics made from 45%Wool + 55PES used for garments. Analysis of fabric behaviour during wearing has shown that these are submitted to simple and repeated uniaxial or biaxial tensile strains. The level of these strains is often within the elastic limit, rarely going over yielding. Therefore the designer must be able to evaluate the mechanical behaviour of such fabrics in order to control the fabric behaviour in the garment. This evaluation is carried out based on the tensile testing, using certain indexes specific to the stress-strain curve. The paper considers an experimental matrix based on woven fabrics of different yarn counts, different or equal yarn count for warp and weft systems and different structures. The fabrics were tested using a testing machine and the results were then compared in order to determine the fabrics’ tensile behaviour and
the factors of influence that affect it.From the point of view of tensile testing, the woven materials having twill weave are preferable because this type of structure is characterised by higher durability and better yarn stability in the fabric. In practice, the woven material must exhibit an optimum behaviour to repeated strains, flexions and abrasions during wearing process. The analysis of fabrics tensile properties studied by investigation of stress-strain diagrams reveals that the main factors influencing the tensile strength are:yarns fineness, technological density of those two systems of yarns and the weaving type. Keywords: breaking deformation specific work, stress-strain curve, factors of influence, elasticity modulus.
1 INTRODUCTION The fabric tensile properties depend on the tensile properties of the two yarn systems and the fabric structural parameters (yarn fineness, technological density of the two yarn systems and weaving type). One of the main objectives in designing a fabric is the tensile behaviour. By means of the tensile behaviour one can analyze the fabric behaviour during wearing process, as it shows that these are subjected to simple or repeated uniaxial or biaxial tensile strains. The level of these strains can be close to the ultimate tensile strength or they can have small, insignificant values; that is why the designer must anticipate the behaviour to such strains. This can be appreciated by determining the indices inferred from the stress-strain diagram, relevant for the peculiarities of the strain process as follows [1,2,3]: - − Proportionality, elasticity, yielding and breaking limits;
− Elasticity modulus for warp and weft yarns, calculated with:
texweftp
p
twarpTP
FE
200, [N/tex] (1)
texweftp
p
tweftTP
FE
200, [N/tex] (2)
where: pF and p − the force and elongation corresponding to the proportionality limit;
warpP and weftP − the fabric warp and weft density;
texT − yarn’s linear density.
− Work of rupture
147
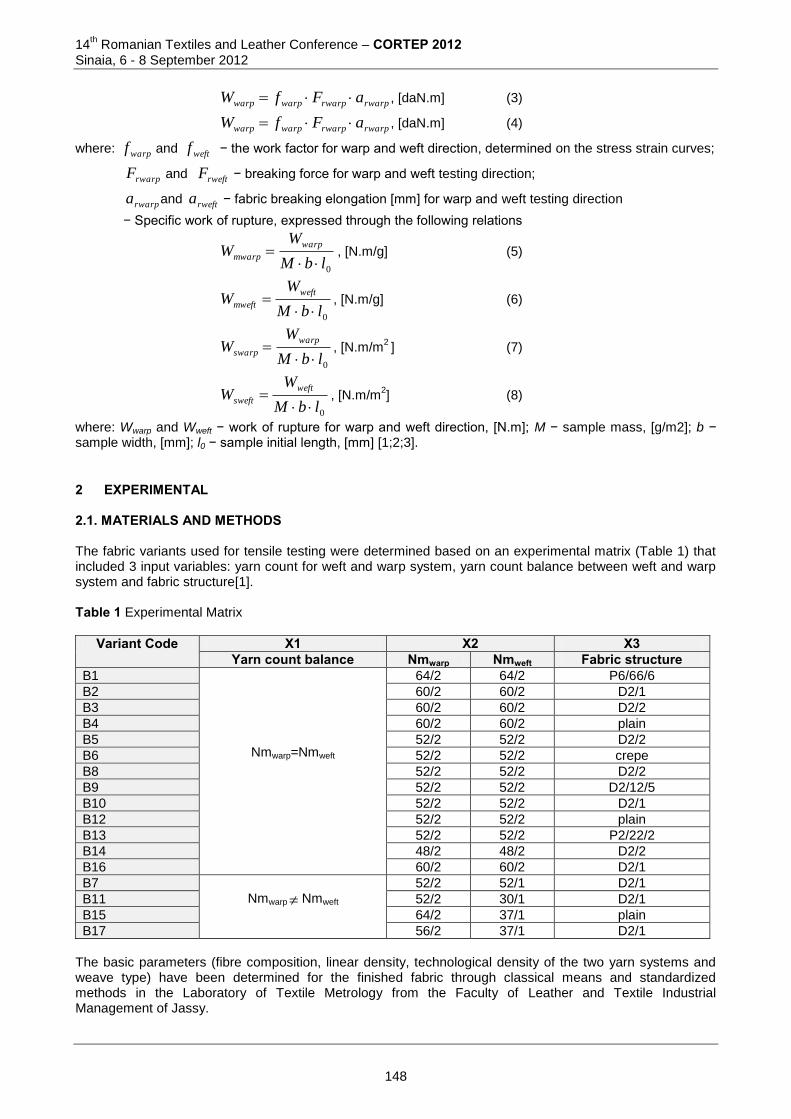
14th Romanian Textiles and Leather Conference – CORTEP 2012
Sinaia, 6 - 8 September 2012
rwarprwarpwarpwarp aFfW , [daN.m] (3)
rwarprwarpwarpwarp aFfW , [daN.m] (4)
where: warpf and weftf − the work factor for warp and weft direction, determined on the stress strain curves;
rwarpF and rweftF − breaking force for warp and weft testing direction;
rwarpa and rwefta − fabric breaking elongation [mm] for warp and weft testing direction
− Specific work of rupture, expressed through the following relations
0lbM
WW
warp
mwarp
, [N.m/g] (5)
0lbM
WW
weft
mweft
, [N.m/g] (6)
0lbM
WW
warp
swarp
, [N.m/m2 ] (7)
0lbM
WW
weft
sweft
, [N.m/m2] (8)
where: Wwarp and Wweft − work of rupture for warp and weft direction, [N.m]; M − sample mass, [g/m2]; b − sample width, [mm]; l0 − sample initial length, [mm] [1;2;3].
2 EXPERIMENTAL 2.1. MATERIALS AND METHODS The fabric variants used for tensile testing were determined based on an experimental matrix (Table 1) that included 3 input variables: yarn count for weft and warp system, yarn count balance between weft and warp system and fabric structure[1]. Table 1 Experimental Matrix
Variant Code X1 X2 X3 Yarn count balance Nmwarp Nmweft Fabric structure
B1
Nmwarp=Nmweft
64/2 64/2 P6/66/6
B2 60/2 60/2 D2/1
B3 60/2 60/2 D2/2
B4 60/2 60/2 plain
B5 52/2 52/2 D2/2
B6 52/2 52/2 crepe
B8 52/2 52/2 D2/2
B9 52/2 52/2 D2/12/5
B10 52/2 52/2 D2/1
B12 52/2 52/2 plain
B13 52/2 52/2 P2/22/2
B14 48/2 48/2 D2/2
B16 60/2 60/2 D2/1
B7 Nmwarp Nmweft
52/2 52/1 D2/1
B11 52/2 30/1 D2/1
B15 64/2 37/1 plain
B17 56/2 37/1 D2/1
The basic parameters (fibre composition, linear density, technological density of the two yarn systems and weave type) have been determined for the finished fabric through classical means and standardized methods in the Laboratory of Textile Metrology from the Faculty of Leather and Textile Industrial Management of Jassy.
148
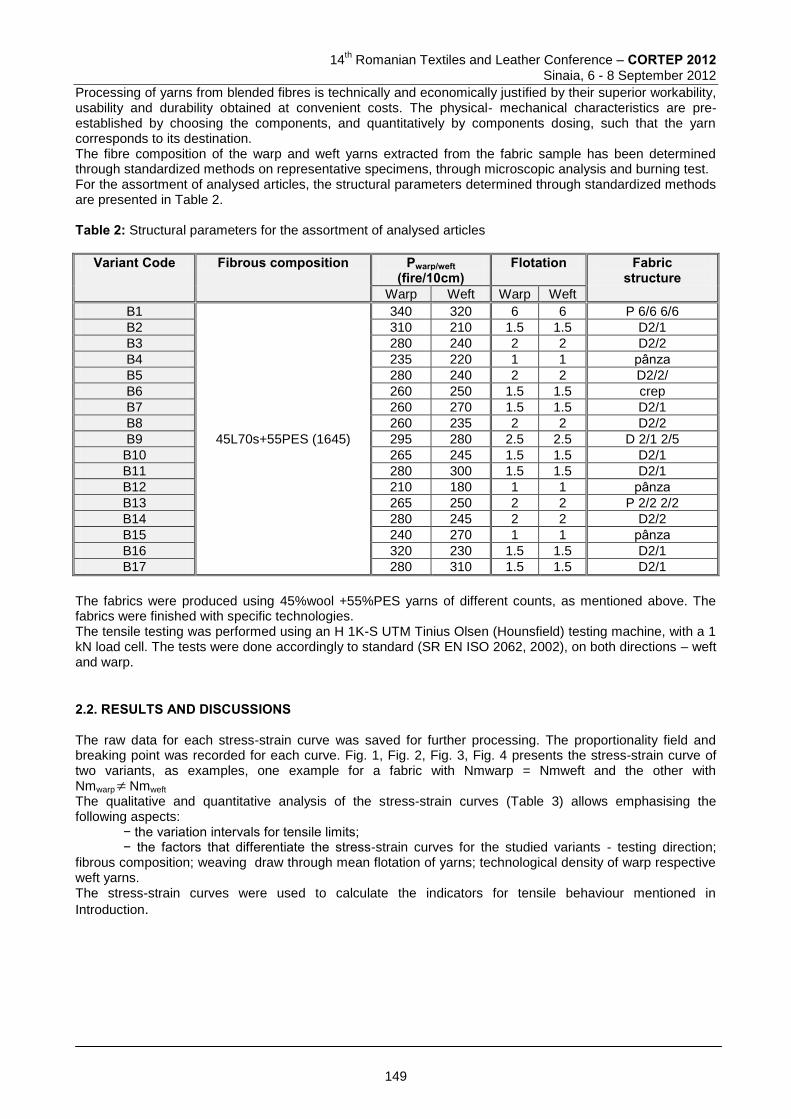
14
th Romanian Textiles and Leather Conference – CORTEP 2012
Sinaia, 6 - 8 September 2012
Processing of yarns from blended fibres is technically and economically justified by their superior workability, usability and durability obtained at convenient costs. The physical- mechanical characteristics are pre-established by choosing the components, and quantitatively by components dosing, such that the yarn corresponds to its destination. The fibre composition of the warp and weft yarns extracted from the fabric sample has been determined through standardized methods on representative specimens, through microscopic analysis and burning test. For the assortment of analysed articles, the structural parameters determined through standardized methods are presented in Table 2. Table 2: Structural parameters for the assortment of analysed articles
Variant Code Fibrous composition Pwarp/weft (fire/10cm)
Flotation Fabric structure
Warp Weft Warp Weft
B1
45L70s+55PES (1645)
340 320 6 6 P 6/6 6/6
B2 310 210 1.5 1.5 D2/1
B3 280 240 2 2 D2/2
B4 235 220 1 1 pânza
B5 280 240 2 2 D2/2/
B6 260 250 1.5 1.5 crep
B7 260 270 1.5 1.5 D2/1
B8 260 235 2 2 D2/2
B9 295 280 2.5 2.5 D 2/1 2/5
B10 265 245 1.5 1.5 D2/1
B11 280 300 1.5 1.5 D2/1
B12 210 180 1 1 pânza
B13 265 250 2 2 P 2/2 2/2
B14 280 245 2 2 D2/2
B15 240 270 1 1 pânza
B16 320 230 1.5 1.5 D2/1
B17 280 310 1.5 1.5 D2/1
The fabrics were produced using 45%wool +55%PES yarns of different counts, as mentioned above. The fabrics were finished with specific technologies. The tensile testing was performed using an H 1K-S UTM Tinius Olsen (Hounsfield) testing machine, with a 1 kN load cell. The tests were done accordingly to standard (SR EN ISO 2062, 2002), on both directions – weft and warp.
2.2. RESULTS AND DISCUSSIONS The raw data for each stress-strain curve was saved for further processing. The proportionality field and breaking point was recorded for each curve. Fig. 1, Fig. 2, Fig. 3, Fig. 4 presents the stress-strain curve of two variants, as examples, one example for a fabric with Nmwarp = Nmweft and the other with Nmwarp Nmweft
The qualitative and quantitative analysis of the stress-strain curves (Table 3) allows emphasising the following aspects:
− the variation intervals for tensile limits; − the factors that differentiate the stress-strain curves for the studied variants - testing direction;
fibrous composition; weaving draw through mean flotation of yarns; technological density of warp respective weft yarns. The stress-strain curves were used to calculate the indicators for tensile behaviour mentioned in
Introduction.
149
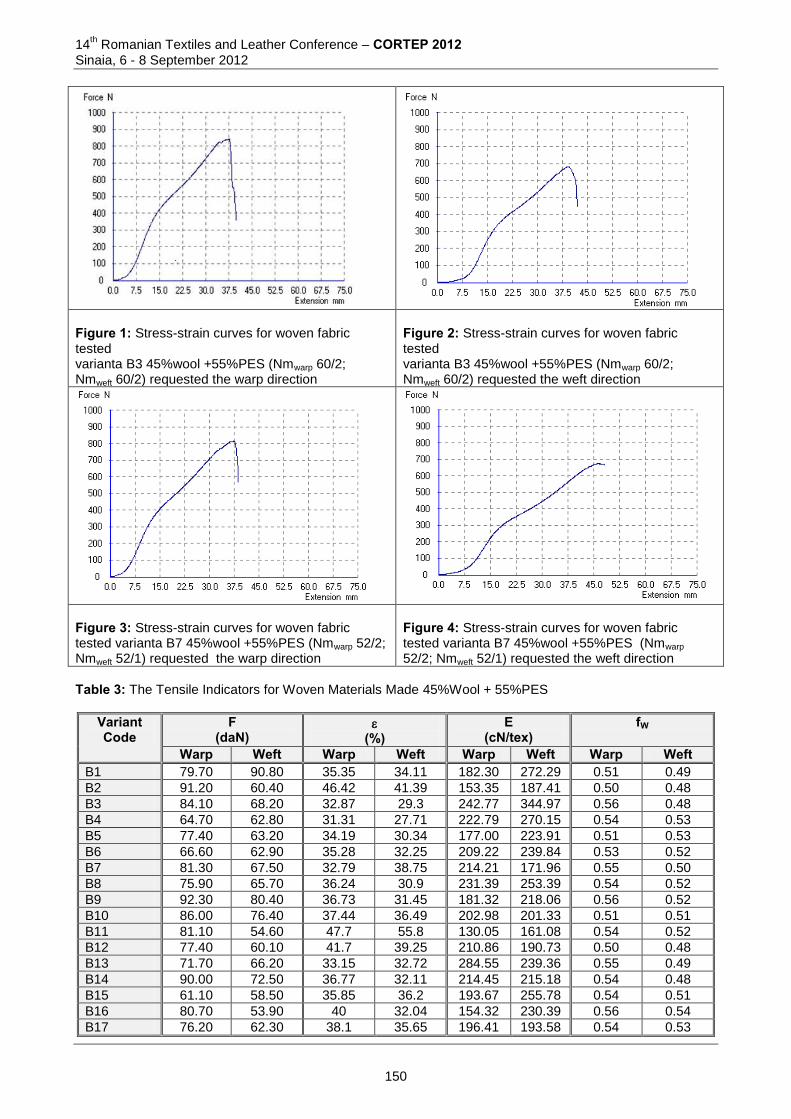
14th Romanian Textiles and Leather Conference – CORTEP 2012
Sinaia, 6 - 8 September 2012
Figure 1: Stress-strain curves for woven fabric tested varianta B3 45%wool +55%PES (Nmwarp 60/2; Nmweft 60/2) requested the warp direction
Figure 2: Stress-strain curves for woven fabric tested varianta B3 45%wool +55%PES (Nmwarp 60/2; Nmweft 60/2) requested the weft direction
Figure 3: Stress-strain curves for woven fabric tested varianta B7 45%wool +55%PES (Nmwarp 52/2; Nmweft 52/1) requested the warp direction
Figure 4: Stress-strain curves for woven fabric tested varianta B7 45%wool +55%PES (Nmwarp 52/2; Nmweft 52/1) requested the weft direction
Table 3: The Tensile Indicators for Woven Materials Made 45%Wool + 55%PES
Variant Code
F (daN)
(%)
E (cN/tex)
fW
Warp Weft Warp Weft Warp Weft Warp Weft B1 79.70 90.80 35.35 34.11 182.30 272.29 0.51 0.49
B2 91.20 60.40 46.42 41.39 153.35 187.41 0.50 0.48
B3 84.10 68.20 32.87 29.3 242.77 344.97 0.56 0.48
B4 64.70 62.80 31.31 27.71 222.79 270.15 0.54 0.53
B5 77.40 63.20 34.19 30.34 177.00 223.91 0.51 0.53
B6 66.60 62.90 35.28 32.25 209.22 239.84 0.53 0.52
B7 81.30 67.50 32.79 38.75 214.21 171.96 0.55 0.50
B8 75.90 65.70 36.24 30.9 231.39 253.39 0.54 0.52
B9 92.30 80.40 36.73 31.45 181.32 218.06 0.56 0.52
B10 86.00 76.40 37.44 36.49 202.98 201.33 0.51 0.51
B11 81.10 54.60 47.7 55.8 130.05 161.08 0.54 0.52
B12 77.40 60.10 41.7 39.25 210.86 190.73 0.50 0.48
B13 71.70 66.20 33.15 32.72 284.55 239.36 0.55 0.49
B14 90.00 72.50 36.77 32.11 214.45 215.18 0.54 0.48
B15 61.10 58.50 35.85 36.2 193.67 255.78 0.54 0.51
B16 80.70 53.90 40 32.04 154.32 230.39 0.56 0.54
B17 76.20 62.30 38.1 35.65 196.41 193.58 0.54 0.53
150
14
th Romanian Textiles and Leather Conference – CORTEP 2012
Sinaia, 6 - 8 September 2012
(Table 3 continued)
Variant Code W (daN.m)
Wm (daN.m/g)
Ws (daN.m/m2)
Warp Weft Warp Weft Warp Weft B1 1.42 1.53 1.26 1.35 284.80 306.56
B2 2.12 1.20 2.16 1.22 424.96 240.69
B3 1.55 0.95 1.35 0.83 309.86 189.88
B4 1.10 0.92 1.36 1.13 219.98 183.15
B5 1.34 1.02 1.27 0.97 268.55 204.19
B6 1.25 1.05 1.30 1.10 249.06 210.97
B7 1.46 1.30 1.45 1.29 292.61 260.91
B8 1.49 1.06 1.39 0.99 297.37 212.86
B9 1.90 1.31 1.56 1.08 379.70 262.97
B10 1.65 1.43 1.62 1.40 330.95 285.27
B11 2.09 1.58 1.80 1.37 417.79 316.85
B12 1.61 1.13 1.92 1.35 321.53 225.30
B13 1.30 1.05 1.25 1.01 261.00 210.75
B14 1.78 1.12 1.52 0.95 356.11 223.24
B15 1.18 1.08 1.54 1.41 236.57 216.01
B16 1.81 0.93 1.80 0.93 361.54 186.51
B17 1.57 1.17 1.63 1.22 313.37 234.62
The following useful observations can be drawn based on the analysis of the values in Table 2 and on their graphical representation:
for woven fabrics with Nmwarp = Nmweft − the maximum breaking strength for warp direction has been recorded for variant B9,
characteristics: Fwarp = 92,30 daN, Nmwarp 52/2; Nmweft 52/2, Pwarp = 295 yarns/10cm; Pweft = 280 yarns/10cm;
warp yarns twist T = 648 twists/m respective twist of weft yarns T = 637 twists/m and compound diagonal
bonding 51
22D . Variant B1 has the maximum breaking strength for weft direction, Fweft = 90,80 daN,
Nmwarp 64/2; Nmweft 64/2, Pwarp = 340 yarns/10cm; Pweft = 320 yarns/10cm; warp yarns twist T = 747 twists/m
respective twist of weft yarns T = 735 twists/m and panama weave 66
66P .
− the minimum breaking strength for warp direction has been recorded for variant B4, Fwarp = 64,70 daN, Nmwarp 60/2; Nmweft 60/2, Pwarp = 235 yarns/10cm; Pweft = 220 yarns/10cm; warp yarns twist T = 712 twists/m; weft yarns twist T = 701 twists/m, plain weave. Variant B16 has the minimum breaking strength for weft direction, Fweft = 53,90 daN, Nmwrap 60/2; Nmweft 60/2, Pwarp = 320 yarns/10cm; Pweft = 230 yarns/10cm;
warp yarns twist T = 723 twist/m; weft yarns twist T = 712 twists/m; diagonal bonding /1
2D .
for fabric variants with Nmwarp Nmweft − the maximum breaking strength for both testing directions has been recorded for variant B7, Fwarp
= 81,30 daN, Fweft = 67,50 daN Nmwarp 52/2; Nmweft 52/1, Pwarp = 260 yarns/10cm; Pweft = 270 yarns/10cm;
warp yarns twist T = 648 twists/m and weft yarns twist T=520 twists/m; having diagonal bonding /1
2D .
− the minimum breaking strength for warp direction has been recorded for variant B15, Fwarp = 61,10 daN, Nmwarp 64/2; Nmweft 37/1, Pwarp = 240 yarns/10cm; Pweft = 270 yarns/10cm; warp yarns twist T = 764 twists/m; weft yarns twist T = 596 twists/m; plain bonding. The minimum breaking strength value for weft direction has been determined for variant B11, Fweft = 54,60 daN, Nmwarp 52/2; Nmweft 30/1, Pwarp =280 yarns/10cm; Pweft = 300 yarns/10cm; warp yarns twist T = 648 twists/m; weft yarns twist T = 637 twists/m;
twill weave /1
2D .
The plain weave is characterized by the smallest values of the ultimate strength, in the direction of both the warp and the weft yarns, which is justified by the fact that the evolution of the two yarn systems provides a good positional stability of yarns, these having a bigger crimp frequency.
151
14th Romanian Textiles and Leather Conference – CORTEP 2012
Sinaia, 6 - 8 September 2012
3 CONCLUSIONS
Based on the analysis of the tensile behaviour determined for the fabric variants, the following general conclusions can be drawn: 1. The influence factors on tensile strength of woven materials are: yarns fineness, technological density of warp respective weft yarn systems and bonding type. The maximum values have been recorded for fabric variants having compound diagonal bonding, fundamental diagonal bonding and panama bonding due to their bigger yarn flotation (a value of 1.5; 2 or 6). Meanwhile, the minimum values have been observed for variants having plain bonding for which the flotation value is 1. 2. Elasticity modulus is bigger on warp direction owing to the smaller influence of the twist degree. The increasing of the twist degree lead to the increasing of the twist angle and decreasing of the yarn elasticity. 3. Depending on shape of the stress-strain curve, the mechanical work factor can have one from the following values:
− fw = 0.5 – ideal case; − fw < 0.5 case in which both yarn systems manifest a reduced deformation strength; − fw > 0.5 case in which both yarn systems manifest an increased deformation strength.
From the experimental data results that the mechanical work factor has values over 0.5 for almost all fabric variants. 4. From the point of view of tensile testing, the woven materials having diagonal bonding are preferable because this type of structure is characterised by higher durability and better yarn stability in the fabric. In practice, the woven material must exhibit an optimum behaviour to repeated strains, flexions and abrasions during wearing process. 5. One can establish a fabric hierarchy in term of their behaviour to tensile strength based on the evaluation of the specific mechanical energy consumed to break the specimen. The value of the quality index is influenced by: - the nature of the utilized raw material; - adopted technological process and parameters of processing; - the parameters of geometrical structure at which the product is accomplished; - technology and technological finishing parameters applied to the product. 6. The woven fabrics accomplished from yarns type combed wool (blend of 45% W+ 55%PES) are characterized by specific structural parameters and specific aspect, as well as by their physical-mechanical properties which satisfy the requirements of a certain area of utilization (external clothing products). The percentage of chemical fibres blended with wool fibres influences both the development of the technological process and the physical-mechanical characteristics of the fabrics. A factor that must be especially taken into account is the shrinkage, which diminishes as the polyester fibres are introduces.
4 REFERENCES [1] HRISTIAN, L. Substantion and Elaboration of a New Testing Methodology of Woven Materials Surface
Characteristics with Classical Testing Methods. Doctoral Thesis, “Gheorghe Asachi” Technical University, Jassy, 2008.
[2] NECULAIASA, M., HRISTIAN L., HARPA R., Metrology Textiles. Applications, Edited by VIE, Jassy, 2002.
[3] HRISTIAN, L. A Study regarding the tensile behaviour of woollen woven fabrics, BULLETIN OF THE POLYTECHNIC INSTITUTE OF IASI, Published by "Gheorghe Asachi" Technical University of Tome LVII (LXI), the fascia. 2, 2011 Section TEXTILE LEATHER
[4] Standards SR EN ISO 13934-1:2002-Textiles-Tensile properties of fabrics−Determination of maximum force and elongation at maximum force using the strip method.
Corresponding author Liliana HRISTIAN Department/Laboratory: Engineering and design of textiles Faculty of Textile, Leather and Industrial Management “Gheorghe Asachi” Technical University of Iasi Blvd. Dimitrie Mangeron, nr. 29 700050, Iasi, Romania E-mail: [email protected]
152
14
th Romanian Textiles and Leather Conference – CORTEP 2012
Sinaia, 6 - 8 September 2012
RESEARCEHS REGARDING THE CREASING BEHAVIOUR OF WOVEN MATERIALS MADE FROM COMBED YARNS TYPE WOOL
Liliana HRISTIAN, Iuliana Gabriela LUPU,
Demetra Lăcrămioara BORDEIANU & Georgeta POTOP “Gheorghe Asachi” Technical University of Iasi, Romania
Abstract: In this paper we have analyzed the behaviour to creasing of some fabrics made of wool type combed yarns used to manufacture clothing products. Creasing is the result of irreversible changes created through the reciprocal sliding of structural fibre components when exposed to a bending strain. Based on experimental measurements, we have differentiated the factors that influence the ability to recover from creasing / bending the assortment of fabrics. The creasing of woven materials is a complex process of deformation under the action of mechanical stretching, bending and compression strains. The strain level (strain speed, time, alternation of application direction, compression or stretching level) through creasing determines the total deformation, which in turn determines the ratio between the elastic components of recovery and the remnant deformation value. The experimental trials have been performed on a series of woven materials made of wool, PES and Dorlastan yarns having different fineness and in different blends. Factors like fibrous composition, properties of constituent fibres, woven materials’ structure parameters, mechanical properties of warp and weft yarns and finishing treatments that influenced the recovery capacity from crease/folding were investigated experimentally through several tests which revealed their importance in the process. Based on the data presented above, one can observe that under the standard condition, the recovery angle is higher along the weft yarns direction, which could be due to the following reasons: warp yarns fatigue during the weaving process; difference in the densities of the two yarn systems; different response of the two yarn systems during the finishing process.
Keywords: creasing, structural parameters, coefficient from creasing, recovery angle after folding. 1 INTRODUCTION The creasing of woven materials made of wool type combed yarns used for ready-made clothes is an undesired deformation effect with temporary or permanent character, which is caused by a composed strain of bending and compression during utilization, processing or maintenance. It is manifested by the appearance of wrinkles, folds or stripes on the surface of woven materials, thus diminishing their qualitative appearance, as well as their practical value. Therefore, the woven materials used for garments manufacturing are classified in the following categories:
- reduced creasing, wool type articles; - average creasing, articles made of synthetic yarns; - pronounced creasing, articles made of cellulose yarns that can be improved through superior finishing.
Creasing is the result of irreversible changes created through the reciprocal sliding of structural fibre components when exposed to a bending strain. Creasing is specific to oriented structures with high crystallinity (cellulose fibres). Sliding appears due to the hydrogen bond breaking which can, however, be easily reformed in other positions conferring a permanent character to creasing [1]. Factors like fibrous composition, properties of constituent fibres, structural woven parameters, mechanical properties of warp and weft yarns and finishing treatments that influenced the recovery capacity from creasing/folding were investigated such that to assess their importance. In order to reveal the influence of weave on the surface characteristics of woven materials, we have expressed it through the mean flotation Fwarp for warp yarns and mean flotation Fweft for weft yarns. The intersection between a warp yarn and a weft yarn is called weave point, thus the weave contains all weave points having a warp or weft effect along a longitudinal or transversal direction [2]. One or more bonding points having the same effect and forming one weave segment can exist in longitudinal or transversal direction. The weave segments with the same effect are called flotation (F). There can be warp flotation (Fwarp) when the warp yarn passes over the weft yarn, and weft flotation (Fweft) when the weft yarns
153
14
th Romanian Textiles and Leather Conference – CORTEP 2012
Sinaia, 6 - 8 September 2012
passes over the warp yarn. The flotation size, similar to the weave segment, have the minimum value F=1. The following relations exist between the ration (R), number of passes (t) and mean flotation (F):
warp
weftwarp
t
RF ; (1)
weft
warp
weftt
RF (2)
2 EXPERIMENTAL 2.1. MATERIALS AND METHODS The experimental trials have been performed on a series of woven materials made of 44%Wool+54%PES+2%Dorlastan; 44%Wool+53%PES+3%Dorlastan, 44%Wool+52%PES+4%Dorlastan, 43%Wool+52%PES+5%Dorlastan. The fabric variants used for trials to crimp were determined based on an experimental matrix (Table 1) which included 4 input variables: fibrous composition, warp/weft yarn fineness, technological density of the two yarn systems and the weave type. Table 1 Experimental Matrix
Variant Code
X1 X2 X3 X4 Fibrous composition Yarn count
balance Nmwarp Nmweft Fabric structure
C2 44L70s+53PES+3D (1645) Nmwarp=Nmweft
60/2 60/2 plain
C3 44L70s+54PES+2D (1645) 52/2 52/2 D2/2
C7 44L74s+53PES+3D (1645) 60/2 60/2 D2/1
C9 44L74s+52PES+4D (1645) 37/1 37/1 D2/1
C1 43L70s+52PES+5D (1645) Nmwarp Nmweft
56/2 37/1 D2/1
C4 44L70s+54PES+2D (1645) 52/2 52/1 D2/1
C5 44L74s+53PES+3D (1645) 56/2 37/1 D2/1
C6 44L74s+53PES+3D (1645) 56/2 37/1 D2/1
The measurements are done on woven samples having standard dimensions. These are folded at 180
o and
pressed along the direction of one of the constituent fibre systems by applying over a defined time interval folding forces which are dependent on the unit surface mass. After the removal of the folding forces, the sample is left to relax freely. The recovery angle is measured at the end of a determined time interval [3]. The following indicators are used for estimating the capacity of textile materials to maintain their initial shape and dimensions during the wearing time:
the recovery angle after folding ( )- the angle between the sample sides folded according to the
SR ISO 3932, after the removal of the folding force; recovery coefficient (%) calculated according to relation (3):
100180
1
o
(3)
where the recovery coefficient can be determined:
-at t1=1 minute after stress relieving when either 1 (%) or the instantaneous recovery coefficient is
determined; -at t2=10 minutes after stress relieving when either 2 (%) or the slow recovery coefficient is
determined. The latter is defined by relation (4):
100180
122 o
(4)
The total coefficient of recovery after folding is calculated according to relation (5):
21 (5)
154
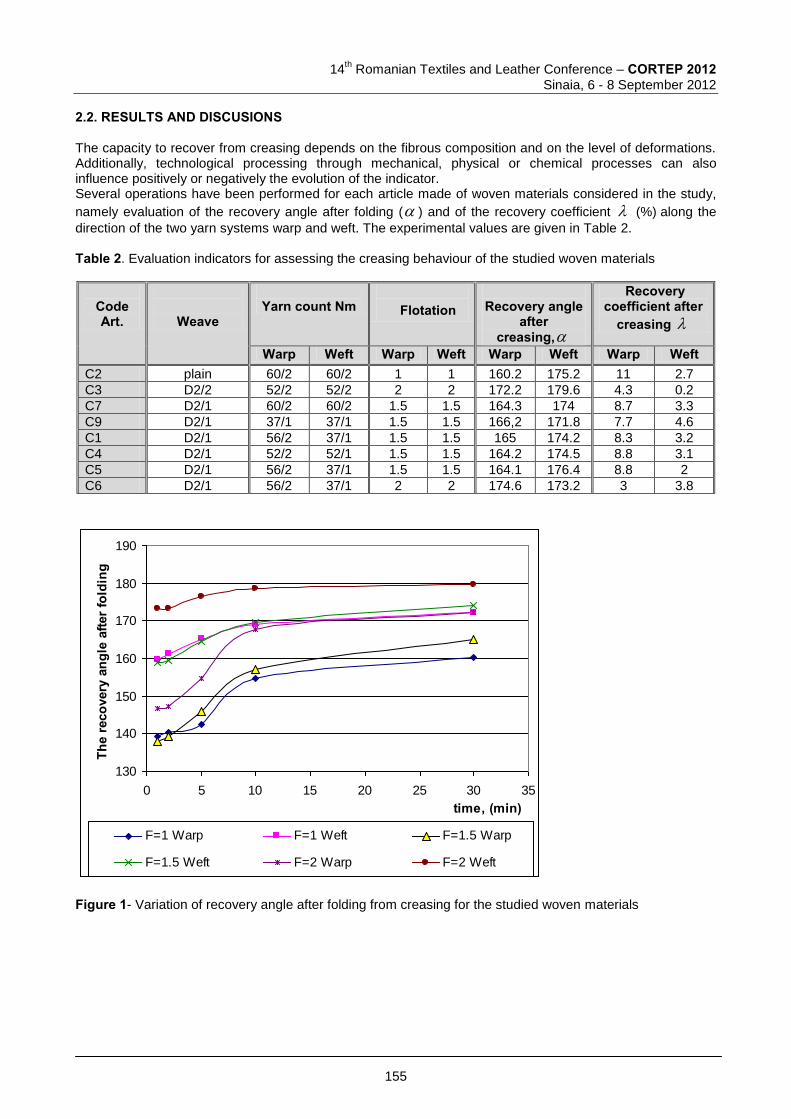
14
th Romanian Textiles and Leather Conference – CORTEP 2012
Sinaia, 6 - 8 September 2012
2.2. RESULTS AND DISCUSIONS The capacity to recover from creasing depends on the fibrous composition and on the level of deformations. Additionally, technological processing through mechanical, physical or chemical processes can also influence positively or negatively the evolution of the indicator. Several operations have been performed for each article made of woven materials considered in the study,
namely evaluation of the recovery angle after folding ( ) and of the recovery coefficient (%) along the
direction of the two yarn systems warp and weft. The experimental values are given in Table 2. Table 2. Evaluation indicators for assessing the creasing behaviour of the studied woven materials
Code Art.
Weave
Yarn count Nm
Flotation
Recovery angle
after creasing,
Recovery coefficient after
creasing
Warp Weft Warp Weft Warp Weft Warp Weft C2 plain 60/2 60/2 1 1 160.2 175.2 11 2.7
C3 D2/2 52/2 52/2 2 2 172.2 179.6 4.3 0.2
C7 D2/1 60/2 60/2 1.5 1.5 164.3 174 8.7 3.3
C9 D2/1 37/1 37/1 1.5 1.5 166,2 171.8 7.7 4.6
C1 D2/1 56/2 37/1 1.5 1.5 165 174.2 8.3 3.2
C4 D2/1 52/2 52/1 1.5 1.5 164.2 174.5 8.8 3.1
C5 D2/1 56/2 37/1 1.5 1.5 164.1 176.4 8.8 2
C6 D2/1 56/2 37/1 2 2 174.6 173.2 3 3.8
130
140
150
160
170
180
190
0 5 10 15 20 25 30 35
time, (min)
The
reco
very
ang
le a
fter f
oldi
ng
F=1 Warp F=1 Weft F=1.5 Warp
F=1.5 Weft F=2 Warp F=2 Weft
Figure 1- Variation of recovery angle after folding from creasing for the studied woven materials
155
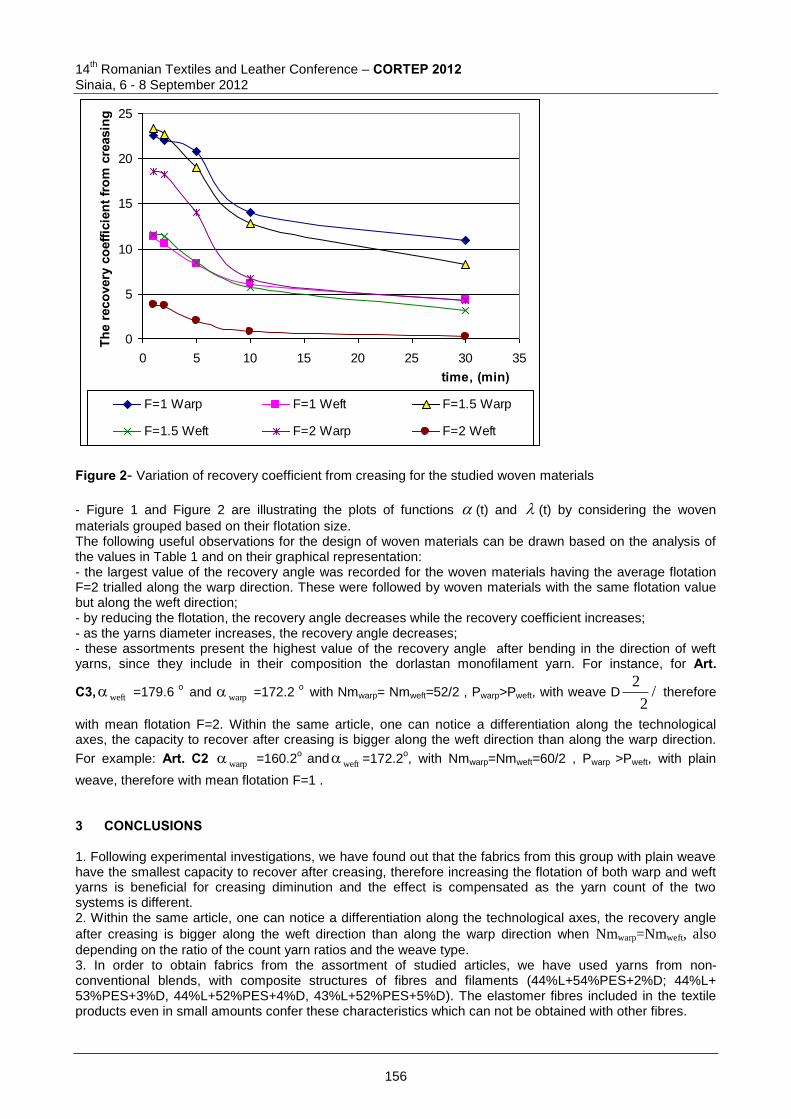
14
th Romanian Textiles and Leather Conference – CORTEP 2012
Sinaia, 6 - 8 September 2012
0
5
10
15
20
25
0 5 10 15 20 25 30 35
time, (min)
The
reco
very
coe
ffici
ent f
rom
cre
asin
g
F=1 Warp F=1 Weft F=1.5 Warp
F=1.5 Weft F=2 Warp F=2 Weft
Figure 2- Variation of recovery coefficient from creasing for the studied woven materials
- Figure 1 and Figure 2 are illustrating the plots of functions (t) and (t) by considering the woven
materials grouped based on their flotation size. The following useful observations for the design of woven materials can be drawn based on the analysis of the values in Table 1 and on their graphical representation: - the largest value of the recovery angle was recorded for the woven materials having the average flotation F=2 trialled along the warp direction. These were followed by woven materials with the same flotation value but along the weft direction; - by reducing the flotation, the recovery angle decreases while the recovery coefficient increases; - as the yarns diameter increases, the recovery angle decreases; - these assortments present the highest value of the recovery angle after bending in the direction of weft yarns, since they include in their composition the dorlastan monofilament yarn. For instance, for Art.
C3, weft =179.6 o
and
warp =172.2
o with Nmwarp= Nmweft=52/2 , Pwarp>Pweft, with weave D /
2
2 therefore
with mean flotation F=2. Within the same article, one can notice a differentiation along the technological axes, the capacity to recover after creasing is bigger along the weft direction than along the warp direction.
For example: Art. C2 warp =160.2
o and weft =172.2
o, with Nmwarp=Nmweft=60/2 , Pwarp >Pweft, with plain
weave, therefore with mean flotation F=1 . 3 CONCLUSIONS 1. Following experimental investigations, we have found out that the fabrics from this group with plain weave have the smallest capacity to recover after creasing, therefore increasing the flotation of both warp and weft yarns is beneficial for creasing diminution and the effect is compensated as the yarn count of the two systems is different. 2. Within the same article, one can notice a differentiation along the technological axes, the recovery angle
after creasing is bigger along the weft direction than along the warp direction when Nmwarp=Nmweft, also depending on the ratio of the count yarn ratios and the weave type. 3. In order to obtain fabrics from the assortment of studied articles, we have used yarns from non-conventional blends, with composite structures of fibres and filaments (44%L+54%PES+2%D; 44%L+ 53%PES+3%D, 44%L+52%PES+4%D, 43%L+52%PES+5%D). The elastomer fibres included in the textile products even in small amounts confer these characteristics which can not be obtained with other fibres.
156
14
th Romanian Textiles and Leather Conference – CORTEP 2012
Sinaia, 6 - 8 September 2012
4. One can notice a diminution of the recovery angle from crease as the participation quota in the blend is modified, since the creasing behaviour is determined by the deformability of the component fibres with respect to the creasing process. When the product is executed from fibre blends, the behaviour is determined by both fibres properties and their participation quota in the blend. 5. The yarns from this group destined for weft have the biggest relative elongation due to the dorlastan filaments from yarn composition, determining the diminution of the recovery angle from crease. By increasing the participation quota of dorlastan by 1%, one can notice an increase of deformability, expressed in the relative elongation at break; for example, the yarn Nm37/1 (44%L+53%PES+4%D) has a relative elongation
=27,54 %, and the yarn Nm37/1 (43%L+52%PES+5%D) has a relative elongation =31.54 %.
6. By simultaneously reducing the two parameters: yarn count and flotation length, one can get a more diminished tensile condition in the fibres of the two yarn systems, which gets reflected in the values of the recovery angle from creasing. 4 REFERENCES [1] HRISTIAN, L. Substantiation and Elaboration of a New Testing Methodology of Woven Materials Surface Characteristics with Classical Testing Methods. Doctor Degree Thesis, “Gheorghe Asachi” Technical University, Iasi, 2008. [2] CIOARA L., Structura Tesăturilor. Edited Cermi, Iasi,1998. [3] NECULAIASA M., HRISTIAN L., HARPA R., Metrology Textiles. Applications, Edited by, Iasi, 2002.
Corresponding author Liliana HRISTIAN Department/Laboratory: Engineering and design of textiles Faculty of Textile, Leather and Industrial Management “Gheorghe Asachi” Technical University Blvd. Dimitrie Mangeron, nr. 29 700050, Iasi, Romania e-mail: [email protected]
157
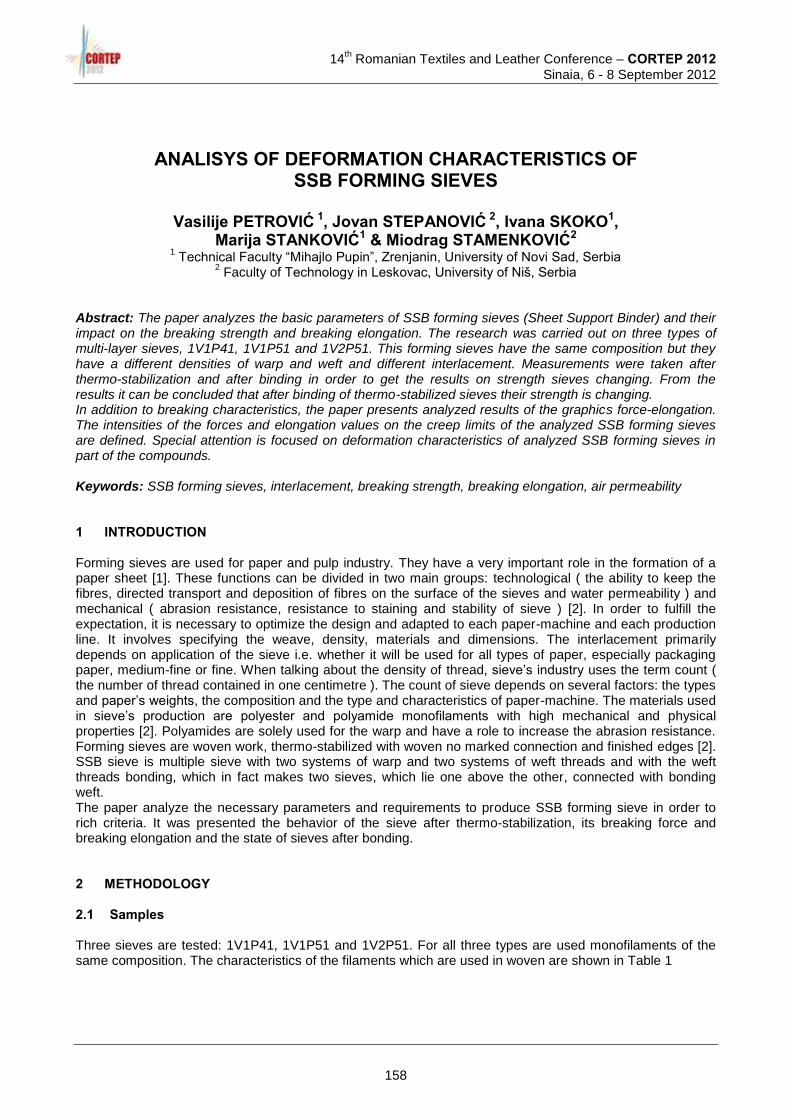
14
th Romanian Textiles and Leather Conference – CORTEP 2012
Sinaia, 6 - 8 September 2012
ANALISYS OF DEFORMATION CHARACTERISTICS OF SSB FORMING SIEVES
Vasilije PETROVIĆ 1, Jovan STEPANOVIĆ 2, Ivana SKOKO1,
Marija STANKOVIĆ1 & Miodrag STAMENKOVIĆ2 1 Technical Faculty “Mihajlo Pupin”, Zrenjanin, University of Novi Sad, Serbia
2 Faculty of Technology in Leskovac, University of Niš, Serbia
Abstract: The paper analyzes the basic parameters of SSB forming sieves (Sheet Support Binder) and their impact on the breaking strength and breaking elongation. The research was carried out on three types of multi-layer sieves, 1V1P41, 1V1P51 and 1V2P51. This forming sieves have the same composition but they have a different densities of warp and weft and different interlacement. Measurements were taken after thermo-stabilization and after binding in order to get the results on strength sieves changing. From the results it can be concluded that after binding of thermo-stabilized sieves their strength is changing. In addition to breaking characteristics, the paper presents analyzed results of the graphics force-elongation. The intensities of the forces and elongation values on the creep limits of the analyzed SSB forming sieves are defined. Special attention is focused on deformation characteristics of analyzed SSB forming sieves in part of the compounds. Keywords: SSB forming sieves, interlacement, breaking strength, breaking elongation, air permeability 1 INTRODUCTION Forming sieves are used for paper and pulp industry. They have a very important role in the formation of a paper sheet [1]. These functions can be divided in two main groups: technological ( the ability to keep the fibres, directed transport and deposition of fibres on the surface of the sieves and water permeability ) and mechanical ( abrasion resistance, resistance to staining and stability of sieve ) [2]. In order to fulfill the expectation, it is necessary to optimize the design and adapted to each paper-machine and each production line. It involves specifying the weave, density, materials and dimensions. The interlacement primarily depends on application of the sieve i.e. whether it will be used for all types of paper, especially packaging paper, medium-fine or fine. When talking about the density of thread, sieve’s industry uses the term count ( the number of thread contained in one centimetre ). The count of sieve depends on several factors: the types and paper’s weights, the composition and the type and characteristics of paper-machine. The materials used in sieve’s production are polyester and polyamide monofilaments with high mechanical and physical properties [2]. Polyamides are solely used for the warp and have a role to increase the abrasion resistance. Forming sieves are woven work, thermo-stabilized with woven no marked connection and finished edges [2]. SSB sieve is multiple sieve with two systems of warp and two systems of weft threads and with the weft threads bonding, which in fact makes two sieves, which lie one above the other, connected with bonding weft. The paper analyze the necessary parameters and requirements to produce SSB forming sieve in order to rich criteria. It was presented the behavior of the sieve after thermo-stabilization, its breaking force and breaking elongation and the state of sieves after bonding. 2 METHODOLOGY 2.1 Samples Three sieves are tested: 1V1P41, 1V1P51 and 1V2P51. For all three types are used monofilaments of the same composition. The characteristics of the filaments which are used in woven are shown in Table 1
158
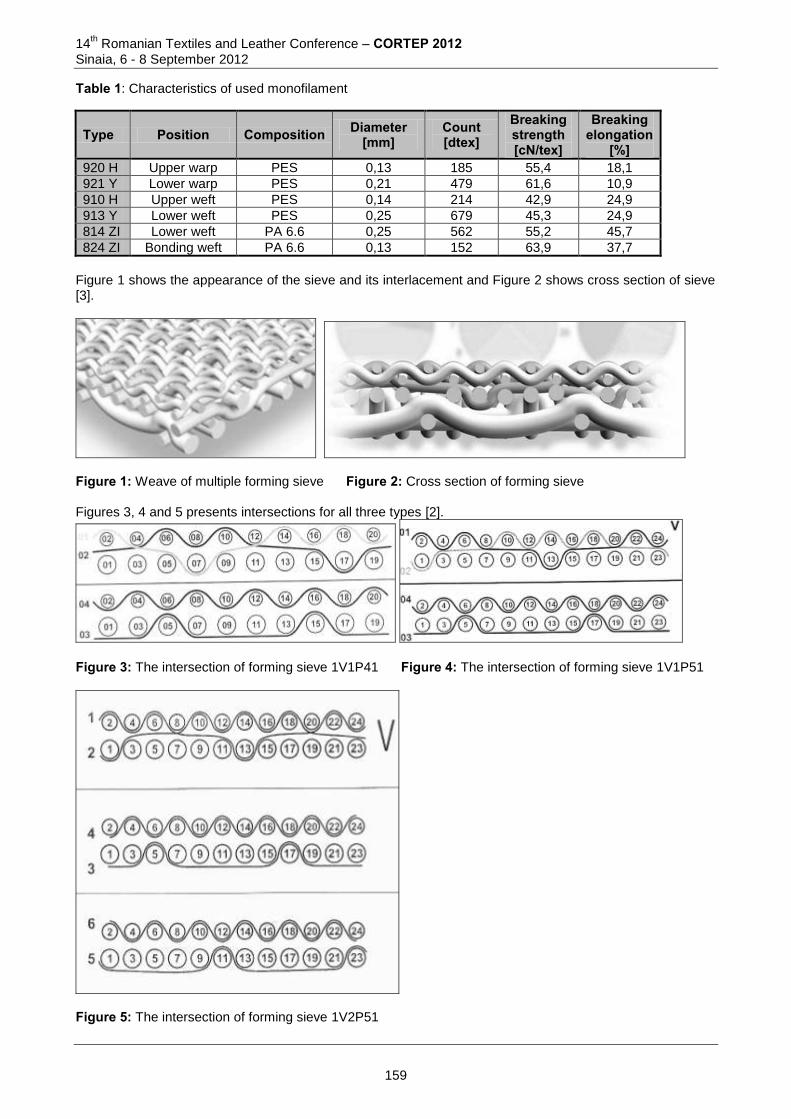
14th Romanian Textiles and Leather Conference – CORTEP 2012
Sinaia, 6 - 8 September 2012
Table 1: Characteristics of used monofilament
Type Position Composition Diameter [mm]
Count [dtex]
Breaking strength [cN/tex]
Breaking elongation
[%] 920 H Upper warp PES 0,13 185 55,4 18,1
921 Y Lower warp PES 0,21 479 61,6 10,9
910 H Upper weft PES 0,14 214 42,9 24,9
913 Y Lower weft PES 0,25 679 45,3 24,9
814 ZI Lower weft PA 6.6 0,25 562 55,2 45,7
824 ZI Bonding weft PA 6.6 0,13 152 63,9 37,7
Figure 1 shows the appearance of the sieve and its interlacement and Figure 2 shows cross section of sieve [3].
Figure 1: Weave of multiple forming sieve Figure 2: Cross section of forming sieve Figures 3, 4 and 5 presents intersections for all three types [2].
Figure 3: The intersection of forming sieve 1V1P41 Figure 4: The intersection of forming sieve 1V1P51
Figure 5: The intersection of forming sieve 1V2P51
159
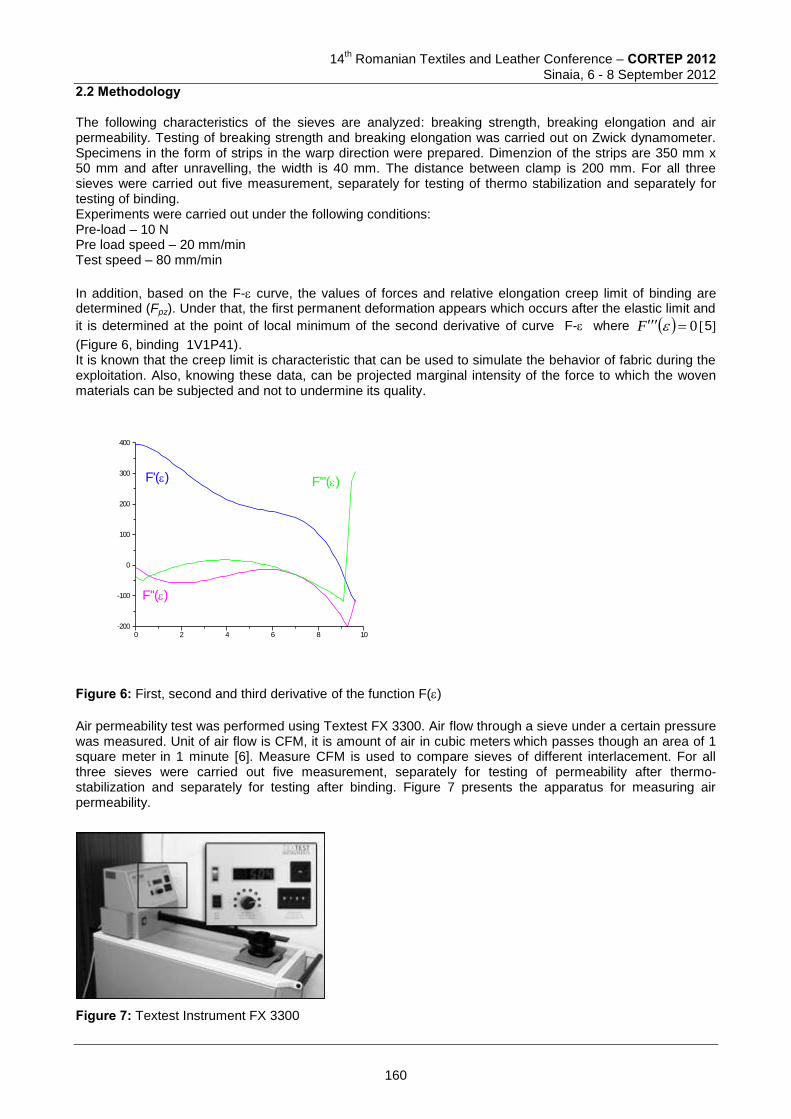
14
th Romanian Textiles and Leather Conference – CORTEP 2012
Sinaia, 6 - 8 September 2012
2.2 Methodology The following characteristics of the sieves are analyzed: breaking strength, breaking elongation and air permeability. Testing of breaking strength and breaking elongation was carried out on Zwick dynamometer. Specimens in the form of strips in the warp direction were prepared. Dimenzion of the strips are 350 mm x 50 mm and after unravelling, the width is 40 mm. The distance between clamp is 200 mm. For all three sieves were carried out five measurement, separately for testing of thermo stabilization and separately for testing of binding. Experiments were carried out under the following conditions: Pre-load – 10 N Pre load speed – 20 mm/min Test speed – 80 mm/min
In addition, based on the F- curve, the values of forces and relative elongation creep limit of binding are determined (Fpz). Under that, the first permanent deformation appears which occurs after the elastic limit and
it is determined at the point of local minimum of the second derivative of curve F- where 0 F 5
(Figure 6, binding 1V1P41). It is known that the creep limit is characteristic that can be used to simulate the behavior of fabric during the exploitation. Also, knowing these data, can be projected marginal intensity of the force to which the woven materials can be subjected and not to undermine its quality.
0 2 4 6 8 10-200
-100
0
100
200
300
400
F'''()
F''()
F'()
Figure 6: First, second and third derivative of the function F()
Air permeability test was performed using Textest FX 3300. Air flow through a sieve under a certain pressure was measured. Unit of air flow is CFM, it is amount of air in cubic meters
which passes though an area of 1
square meter in 1 minute [6]. Measure CFM is used to compare sieves of different interlacement. For all
three sieves were carried out five measurement, separately for testing of permeability after thermo- stabilization and separately for testing after binding. Figure 7 presents the apparatus for measuring air permeability.
Figure 7: Textest Instrument FX 3300
160
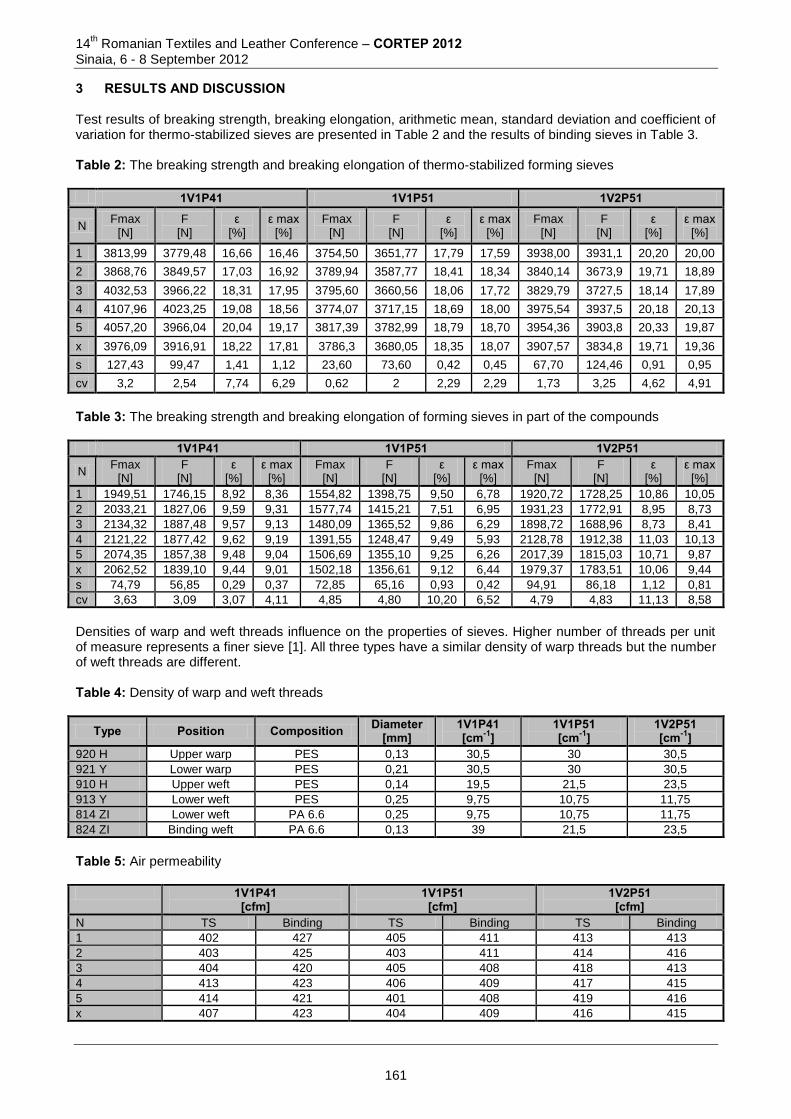
14th Romanian Textiles and Leather Conference – CORTEP 2012
Sinaia, 6 - 8 September 2012
3 RESULTS AND DISCUSSION Test results of breaking strength, breaking elongation, arithmetic mean, standard deviation and coefficient of variation for thermo-stabilized sieves are presented in Table 2 and the results of binding sieves in Table 3. Table 2: The breaking strength and breaking elongation of thermo-stabilized forming sieves
1V1P41 1V1P51 1V2P51
N Fmax
[N] F
[N] ε
[%] ε max
[%] Fmax
[N] F
[N] ε
[%] ε max
[%] Fmax
[N] F
[N] ε
[%] ε max
[%]
1 3813,99 3779,48 16,66 16,46 3754,50 3651,77 17,79 17,59 3938,00 3931,1 20,20 20,00
2 3868,76 3849,57 17,03 16,92 3789,94 3587,77 18,41 18,34 3840,14 3673,9 19,71 18,89
3 4032,53 3966,22 18,31 17,95 3795,60 3660,56 18,06 17,72 3829,79 3727,5 18,14 17,89
4 4107,96 4023,25 19,08 18,56 3774,07 3717,15 18,69 18,00 3975,54 3937,5 20,18 20,13
5 4057,20 3966,04 20,04 19,17 3817,39 3782,99 18,79 18,70 3954,36 3903,8 20,33 19,87
x 3976,09 3916,91 18,22 17,81 3786,3 3680,05 18,35 18,07 3907,57 3834,8 19,71 19,36
s 127,43 99,47 1,41 1,12 23,60 73,60 0,42 0,45 67,70 124,46 0,91 0,95
cv 3,2 2,54 7,74 6,29 0,62 2 2,29 2,29 1,73 3,25 4,62 4,91
Table 3: The breaking strength and breaking elongation of forming sieves in part of the compounds
1V1P41 1V1P51 1V2P51
N Fmax
[N] F
[N] ε
[%] ε max
[%] Fmax
[N] F
[N] ε
[%] ε max
[%] Fmax
[N] F
[N] ε
[%] ε max
[%]
1 1949,51 1746,15 8,92 8,36 1554,82 1398,75 9,50 6,78 1920,72 1728,25 10,86 10,05
2 2033,21 1827,06 9,59 9,31 1577,74 1415,21 7,51 6,95 1931,23 1772,91 8,95 8,73
3 2134,32 1887,48 9,57 9,13 1480,09 1365,52 9,86 6,29 1898,72 1688,96 8,73 8,41
4 2121,22 1877,42 9,62 9,19 1391,55 1248,47 9,49 5,93 2128,78 1912,38 11,03 10,13
5 2074,35 1857,38 9,48 9,04 1506,69 1355,10 9,25 6,26 2017,39 1815,03 10,71 9,87
x 2062,52 1839,10 9,44 9,01 1502,18 1356,61 9,12 6,44 1979,37 1783,51 10,06 9,44
s 74,79 56,85 0,29 0,37 72,85 65,16 0,93 0,42 94,91 86,18 1,12 0,81
cv 3,63 3,09 3,07 4,11 4,85 4,80 10,20 6,52 4,79 4,83 11,13 8,58
Densities of warp and weft threads influence on the properties of sieves. Higher number of threads per unit of measure represents a finer sieve [1]. All three types have a similar density of warp threads but the number of weft threads are different. Table 4: Density of warp and weft threads
Type Position Composition Diameter [mm]
1V1P41 [cm-1]
1V1P51 [cm-1]
1V2P51 [cm-1]
920 H Upper warp PES 0,13 30,5 30 30,5
921 Y Lower warp PES 0,21 30,5 30 30,5
910 H Upper weft PES 0,14 19,5 21,5 23,5
913 Y Lower weft PES 0,25 9,75 10,75 11,75
814 ZI Lower weft PA 6.6 0,25 9,75 10,75 11,75
824 ZI Binding weft PA 6.6 0,13 39 21,5 23,5
Table 5: Air permeability
1V1P41 [cfm]
1V1P51 [cfm]
1V2P51 [cfm]
N TS Binding TS Binding TS Binding
1 402 427 405 411 413 413
2 403 425 403 411 414 416
3 404 420 405 408 418 413
4 413 423 406 409 417 415
5 414 421 401 408 419 416
x 407 423 404 409 416 415
161
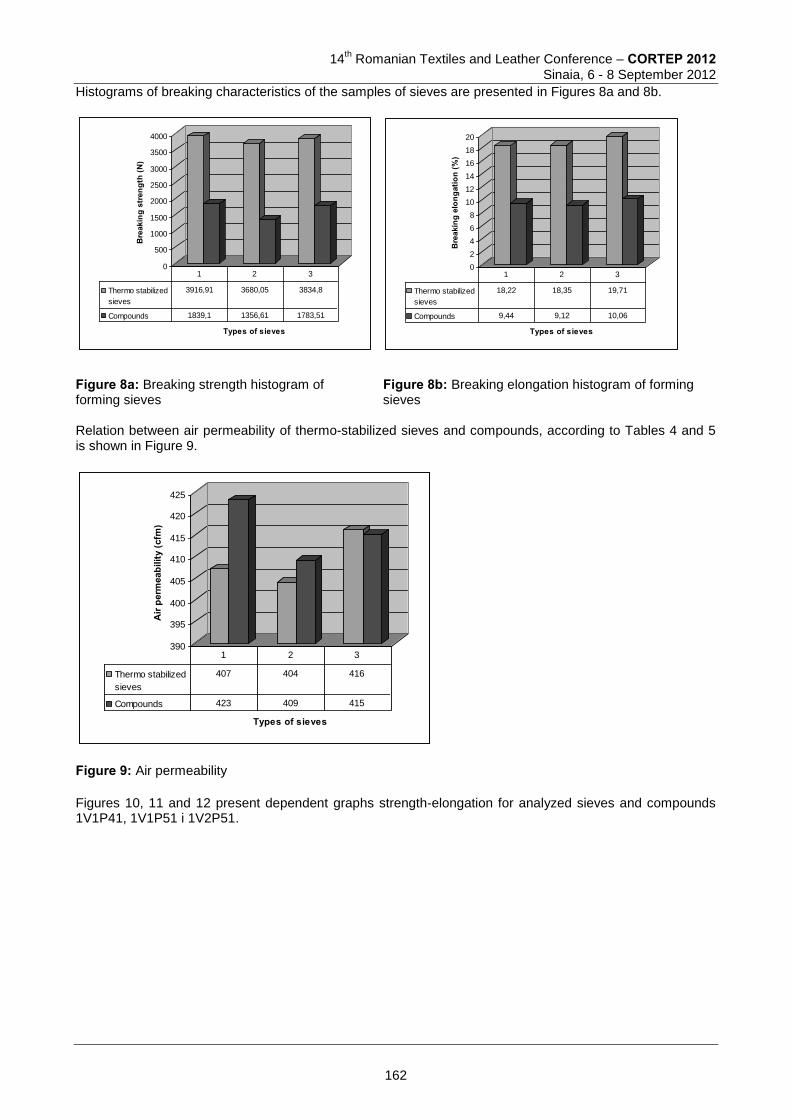
14
th Romanian Textiles and Leather Conference – CORTEP 2012
Sinaia, 6 - 8 September 2012
Histograms of breaking characteristics of the samples of sieves are presented in Figures 8a and 8b.
0
500
1000
1500
2000
2500
3000
3500
4000B
reak
ing
stre
ngth
(N)
Types of sieves
Thermo stabilized
sieves
3916,91 3680,05 3834,8
Compounds 1839,1 1356,61 1783,51
1 2 3
0
2
4
6
8
10
12
14
16
18
20
Bre
akin
g el
onga
tion
(%)
Types of sieves
Thermo stabilized
sieves
18,22 18,35 19,71
Compounds 9,44 9,12 10,06
1 2 3
Figure 8a: Breaking strength histogram of Figure 8b: Breaking elongation histogram of forming forming sieves sieves Relation between air permeability of thermo-stabilized sieves and compounds, according to Tables 4 and 5 is shown in Figure 9.
390
395
400
405
410
415
420
425
Air
perm
eabi
lity
(cfm
)
Types of sieves
Thermo stabilized
sieves
407 404 416
Compounds 423 409 415
1 2 3
Figure 9: Air permeability
Figures 10, 11 and 12 present dependent graphs strength-elongation for analyzed sieves and compounds 1V1P41, 1V1P51 i 1V2P51.
162
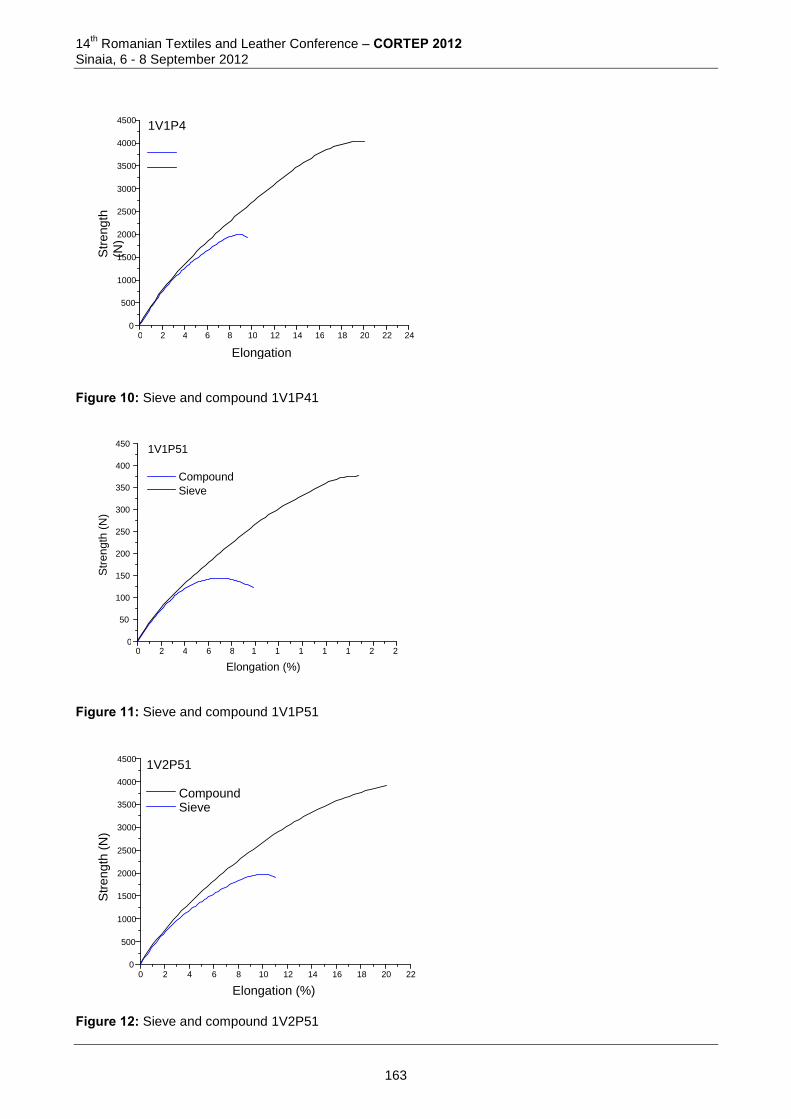
14th Romanian Textiles and Leather Conference – CORTEP 2012
Sinaia, 6 - 8 September 2012
Figure 10: Sieve and compound 1V1P41
Figure 11: Sieve and compound 1V1P51
Figure 12: Sieve and compound 1V2P51
0 2 4 6 8 10 12 14 16 18 20 22 0
500
1000
1500
2000
2500
3000
3500
4000
4500 1V2P51
Compound Sieve
Str
ength
(N
)
Elongation (%)
0 2 4 6 8 10 12 14 16 18 20 22 24 0
500
1000
1500
2000
2500
3000
3500
4000
4500 1V1P41
Compound Sieve
Str
ength
(N)
Elongation (%)
0 2 4 6 8 10
12
14
16
18
20
22
0
500
1000
1500
2000
2500
3000
3500
4000
4500 1V1P51
Compound
Sieve
Str
en
gth
(N
)
Elongation (%)
163
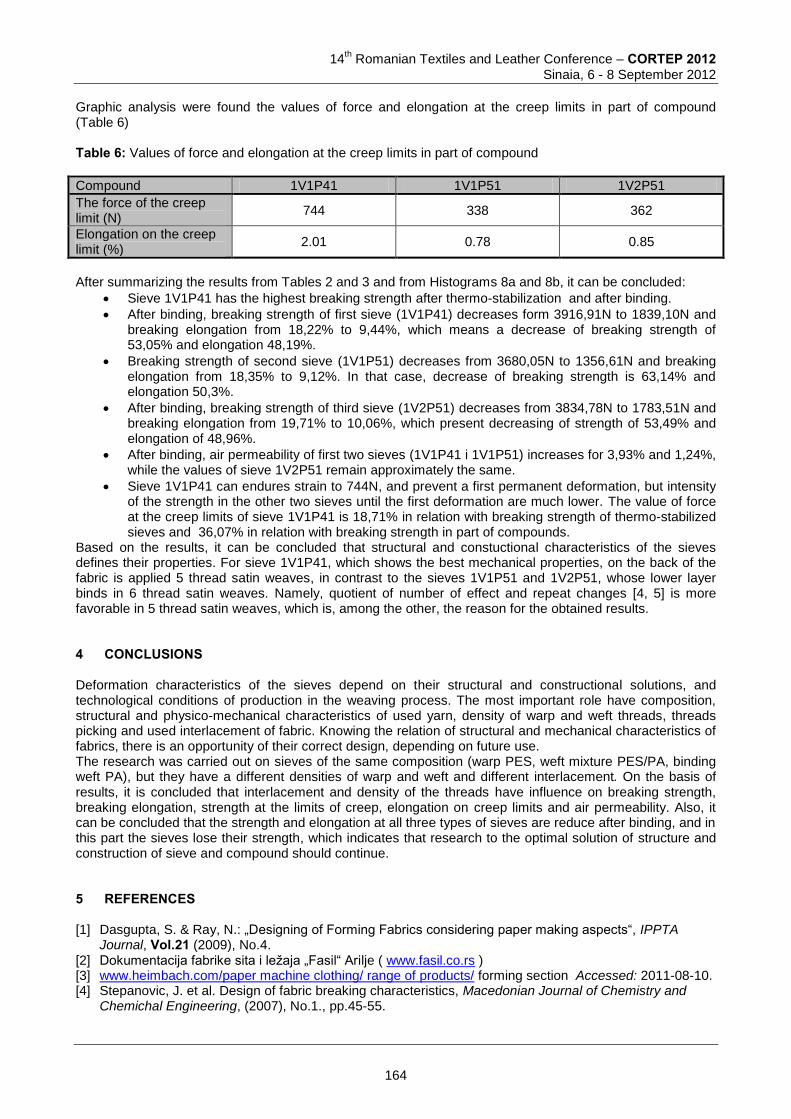
14
th Romanian Textiles and Leather Conference – CORTEP 2012
Sinaia, 6 - 8 September 2012
Graphic analysis were found the values of force and elongation at the creep limits in part of compound (Table 6) Table 6: Values of force and elongation at the creep limits in part of compound Compound 1V1P41 1V1P51 1V2P51
The force of the creep limit (N)
744 338 362
Elongation on the creep limit (%)
2.01 0.78 0.85
After summarizing the results from Tables 2 and 3 and from Histograms 8a and 8b, it can be concluded:
Sieve 1V1P41 has the highest breaking strength after thermo-stabilization and after binding.
After binding, breaking strength of first sieve (1V1P41) decreases form 3916,91N to 1839,10N and breaking elongation from 18,22% to 9,44%, which means a decrease of breaking strength of 53,05% and elongation 48,19%.
Breaking strength of second sieve (1V1P51) decreases from 3680,05N to 1356,61N and breaking elongation from 18,35% to 9,12%. In that case, decrease of breaking strength is 63,14% and elongation 50,3%.
After binding, breaking strength of third sieve (1V2P51) decreases from 3834,78N to 1783,51N and breaking elongation from 19,71% to 10,06%, which present decreasing of strength of 53,49% and elongation of 48,96%.
After binding, air permeability of first two sieves (1V1P41 i 1V1P51) increases for 3,93% and 1,24%, while the values of sieve 1V2P51 remain approximately the same.
Sieve 1V1P41 can endures strain to 744N, and prevent a first permanent deformation, but intensity of the strength in the other two sieves until the first deformation are much lower. The value of force at the creep limits of sieve 1V1P41 is 18,71% in relation with breaking strength of thermo-stabilized sieves and 36,07% in relation with breaking strength in part of compounds.
Based on the results, it can be concluded that structural and constuctional characteristics of the sieves defines their properties. For sieve 1V1P41, which shows the best mechanical properties, on the back of the fabric is applied 5 thread satin weaves, in contrast to the sieves 1V1P51 and 1V2P51, whose lower layer binds in 6 thread satin weaves. Namely, quotient of number of effect and repeat changes [4, 5] is more favorable in 5 thread satin weaves, which is, among the other, the reason for the obtained results. 4 CONCLUSIONS Deformation characteristics of the sieves depend on their structural and constructional solutions, and technological conditions of production in the weaving process. The most important role have composition, structural and physico-mechanical characteristics of used yarn, density of warp and weft threads, threads picking and used interlacement of fabric. Knowing the relation of structural and mechanical characteristics of fabrics, there is an opportunity of their correct design, depending on future use. The research was carried out on sieves of the same composition (warp PES, weft mixture PES/PA, binding weft PA), but they have a different densities of warp and weft and different interlacement. On the basis of results, it is concluded that interlacement and density of the threads have influence on breaking strength, breaking elongation, strength at the limits of creep, elongation on creep limits and air permeability. Also, it can be concluded that the strength and elongation at all three types of sieves are reduce after binding, and in this part the sieves lose their strength, which indicates that research to the optimal solution of structure and construction of sieve and compound should continue. 5 REFERENCES [1] Dasgupta, S. & Ray, N.: „Designing of Forming Fabrics considering paper making aspects“, IPPTA
Journal, Vol.21 (2009), No.4. [2] Dokumentacija fabrike sita i ležaja „Fasil“ Arilje ( www.fasil.co.rs ) [3] www.heimbach.com/paper machine clothing/ range of products/ forming section Accessed: 2011-08-10. [4] Stepanovic, J. et al. Design of fabric breaking characteristics, Macedonian Journal of Chemistry and
Chemichal Engineering, (2007), No.1., pp.45-55.
164
14th Romanian Textiles and Leather Conference – CORTEP 2012
Sinaia, 6 - 8 September 2012
[5] Stepanovic, J. et al. Influence of relative density on deformation characteristics of fabrics in plain weave, Indian Journal of Fibre & Textile Research, (2009), No.1., pp. 76-81.
[6] http://weavexx.com/weavexx Accessed: 2011-12-15.
Corresponding author: Vasilije PETROVIC Department of Clothing technology/ Technical Faculty “Mihajlo Pupin” Zrenjanin, University of Novi Sad Djure Djakovica bb 23000, Zrenjanin, Serbia Phone: +381 23 550515; Fax: +381 23 550520; E-mail: [email protected]
Co-authors: Jovan STEPANOVIĆ Department of Textile Technology, Faculty of Technology of Leskovac, University of Niš Bulevar Oslobodjenja 124 16000, Leskovac, Serbia Phone: +381 16 24720; Fax: +381 16 242859; E-mail: [email protected] Ivana SKOKO Department of Clothing technology/ Technical Faculty “Mihajlo Pupin” Zrenjanin, University of Novi Sad Djure Djakovica bb 23000, Zrenjanin, Serbia Phone: +381 23 550515; Fax: +381 23 550520; E-mail: [email protected] Marija STANKOVIC Department of Clothing technology/ Technical Faculty “Mihajlo Pupin” Zrenjanin, University of Novi Sad Djure Djakovica bb 23000, Zrenjanin, Serbia Phone: +381 23 550515; Fax: +381 23 550520; E-mail: [email protected] Miodrag STAMENKOVIC Department of Textile Technology, Faculty of Technology of Leskovac, University of Niš Bulevar Oslobodjenja 124 16000, Leskovac, Serbia Phone: +381 16 247203; Fax: +381 16 242859; E-mail: [email protected]
165
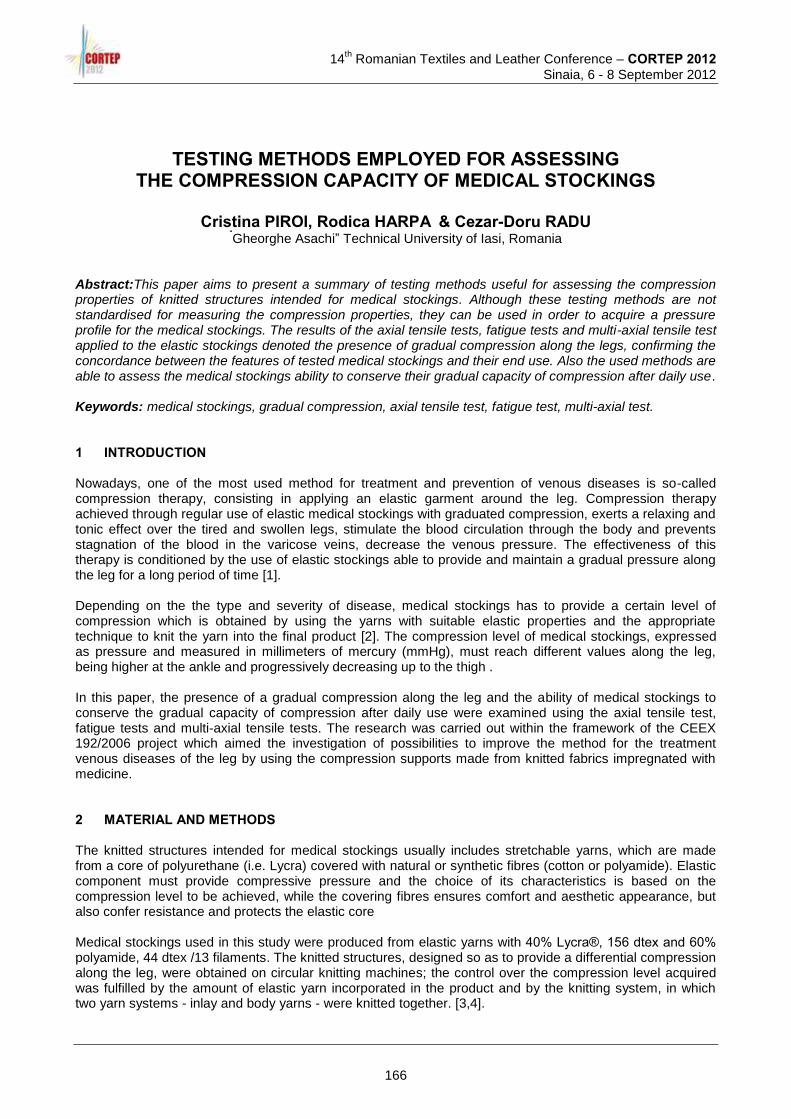
14
th Romanian Textiles and Leather Conference – CORTEP 2012
Sinaia, 6 - 8 September 2012
TESTING METHODS EMPLOYED FOR ASSESSING THE COMPRESSION CAPACITY OF MEDICAL STOCKINGS
Cristina PIROI, Rodica HARPA & Cezar-Doru RADU
“Gheorghe Asachi” Technical University of Iasi, Romania
Abstract:This paper aims to present a summary of testing methods useful for assessing the compression properties of knitted structures intended for medical stockings. Although these testing methods are not standardised for measuring the compression properties, they can be used in order to acquire a pressure profile for the medical stockings. The results of the axial tensile tests, fatigue tests and multi-axial tensile test applied to the elastic stockings denoted the presence of gradual compression along the legs, confirming the concordance between the features of tested medical stockings and their end use. Also the used methods are able to assess the medical stockings ability to conserve their gradual capacity of compression after daily use. Keywords: medical stockings, gradual compression, axial tensile test, fatigue test, multi-axial test. 1 INTRODUCTION Nowadays, one of the most used method for treatment and prevention of venous diseases is so-called compression therapy, consisting in applying an elastic garment around the leg. Compression therapy achieved through regular use of elastic medical stockings with graduated compression, exerts a relaxing and tonic effect over the tired and swollen legs, stimulate the blood circulation through the body and prevents stagnation of the blood in the varicose veins, decrease the venous pressure. The effectiveness of this therapy is conditioned by the use of elastic stockings able to provide and maintain a gradual pressure along the leg for a long period of time [1]. Depending on the the type and severity of disease, medical stockings has to provide a certain level of compression which is obtained by using the yarns with suitable elastic properties and the appropriate technique to knit the yarn into the final product [2]. The compression level of medical stockings, expressed as pressure and measured in millimeters of mercury (mmHg), must reach different values along the leg, being higher at the ankle and progressively decreasing up to the thigh . In this paper, the presence of a gradual compression along the leg and the ability of medical stockings to conserve the gradual capacity of compression after daily use were examined using the axial tensile test, fatigue tests and multi-axial tensile tests. The research was carried out within the framework of the CEEX 192/2006 project which aimed the investigation of possibilities to improve the method for the treatment venous diseases of the leg by using the compression supports made from knitted fabrics impregnated with medicine. 2 MATERIAL AND METHODS The knitted structures intended for medical stockings usually includes stretchable yarns, which are made from a core of polyurethane (i.e. Lycra) covered with natural or synthetic fibres (cotton or polyamide). Elastic component must provide compressive pressure and the choice of its characteristics is based on the compression level to be achieved, while the covering fibres ensures comfort and aesthetic appearance, but also confer resistance and protects the elastic core Medical stockings used in this study were produced from elastic yarns with 40% Lycra®, 156 dtex and 60% polyamide, 44 dtex /13 filaments. The knitted structures, designed so as to provide a differential compression along the leg, were obtained on circular knitting machines; the control over the compression level acquired was fulfilled by the amount of elastic yarn incorporated in the product and by the knitting system, in which two yarn systems - inlay and body yarns - were knitted together. [3,4].
166
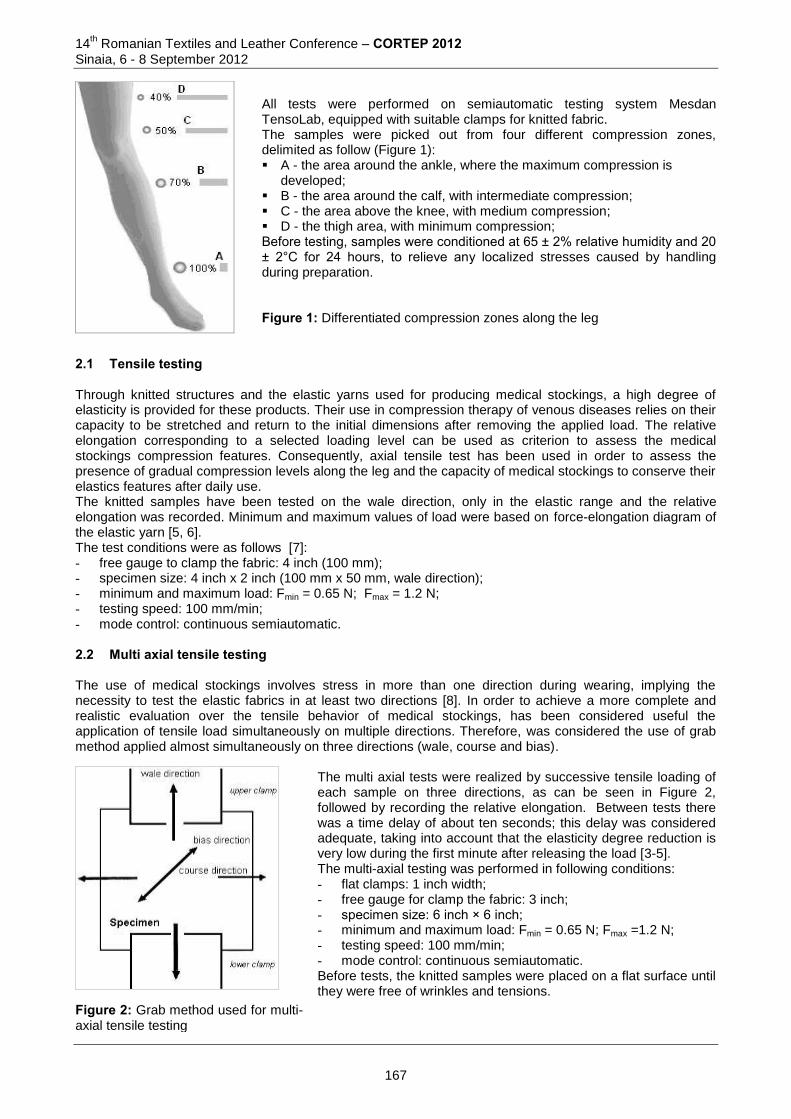
14th Romanian Textiles and Leather Conference – CORTEP 2012
Sinaia, 6 - 8 September 2012
All tests were performed on semiautomatic testing system Mesdan TensoLab, equipped with suitable clamps for knitted fabric. The samples were picked out from four different compression zones, delimited as follow (Figure 1): A - the area around the ankle, where the maximum compression is
developed; B - the area around the calf, with intermediate compression; C - the area above the knee, with medium compression; D - the thigh area, with minimum compression; Before testing, samples were conditioned at 65 ± 2% relative humidity and 20 ± 2°C for 24 hours, to relieve any localized stresses caused by handling during preparation. Figure 1: Differentiated compression zones along the leg
2.1 Tensile testing Through knitted structures and the elastic yarns used for producing medical stockings, a high degree of elasticity is provided for these products. Their use in compression therapy of venous diseases relies on their capacity to be stretched and return to the initial dimensions after removing the applied load. The relative elongation corresponding to a selected loading level can be used as criterion to assess the medical stockings compression features. Consequently, axial tensile test has been used in order to assess the presence of gradual compression levels along the leg and the capacity of medical stockings to conserve their elastics features after daily use. The knitted samples have been tested on the wale direction, only in the elastic range and the relative elongation was recorded. Minimum and maximum values of load were based on force-elongation diagram of the elastic yarn [5, 6]. The test conditions were as follows [7]: - free gauge to clamp the fabric: 4 inch (100 mm); - specimen size: 4 inch x 2 inch (100 mm x 50 mm, wale direction); - minimum and maximum load: Fmin = 0.65 N; Fmax = 1.2 N; - testing speed: 100 mm/min; - mode control: continuous semiautomatic. 2.2 Multi axial tensile testing The use of medical stockings involves stress in more than one direction during wearing, implying the necessity to test the elastic fabrics in at least two directions [8]. In order to achieve a more complete and realistic evaluation over the tensile behavior of medical stockings, has been considered useful the application of tensile load simultaneously on multiple directions. Therefore, was considered the use of grab method applied almost simultaneously on three directions (wale, course and bias).
Figure 2: Grab method used for multi-axial tensile testing
The multi axial tests were realized by successive tensile loading of each sample on three directions, as can be seen in Figure 2, followed by recording the relative elongation. Between tests there was a time delay of about ten seconds; this delay was considered adequate, taking into account that the elasticity degree reduction is very low during the first minute after releasing the load [3-5]. The multi-axial testing was performed in following conditions: - flat clamps: 1 inch width; - free gauge for clamp the fabric: 3 inch; - specimen size: 6 inch × 6 inch; - minimum and maximum load: Fmin = 0.65 N; Fmax =1.2 N; - testing speed: 100 mm/min; - mode control: continuous semiautomatic. Before tests, the knitted samples were placed on a flat surface until they were free of wrinkles and tensions.
167
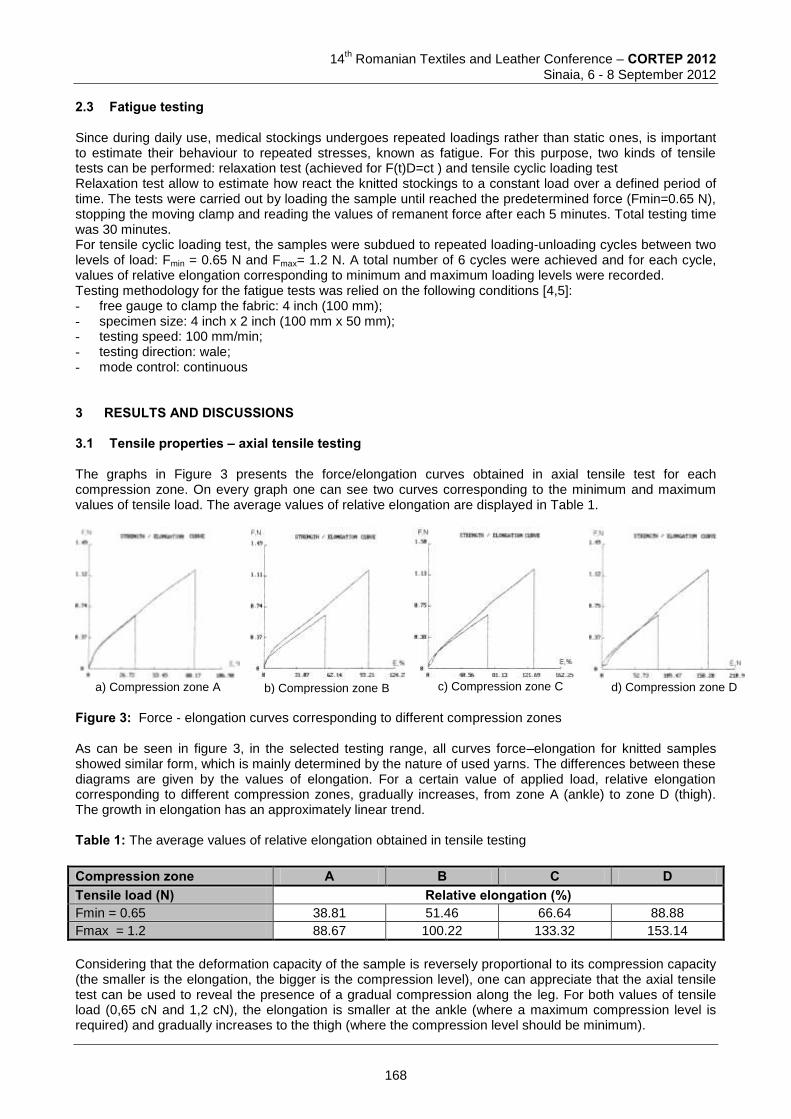
14
th Romanian Textiles and Leather Conference – CORTEP 2012
Sinaia, 6 - 8 September 2012
2.3 Fatigue testing Since during daily use, medical stockings undergoes repeated loadings rather than static ones, is important to estimate their behaviour to repeated stresses, known as fatigue. For this purpose, two kinds of tensile tests can be performed: relaxation test (achieved for F(t)D=ct ) and tensile cyclic loading test Relaxation test allow to estimate how react the knitted stockings to a constant load over a defined period of time. The tests were carried out by loading the sample until reached the predetermined force (Fmin=0.65 N), stopping the moving clamp and reading the values of remanent force after each 5 minutes. Total testing time was 30 minutes. For tensile cyclic loading test, the samples were subdued to repeated loading-unloading cycles between two levels of load: Fmin = 0.65 N and Fmax= 1.2 N. A total number of 6 cycles were achieved and for each cycle, values of relative elongation corresponding to minimum and maximum loading levels were recorded. Testing methodology for the fatigue tests was relied on the following conditions [4,5]: - free gauge to clamp the fabric: 4 inch (100 mm); - specimen size: 4 inch x 2 inch (100 mm x 50 mm); - testing speed: 100 mm/min; - testing direction: wale; - mode control: continuous 3 RESULTS AND DISCUSSIONS 3.1 Tensile properties – axial tensile testing The graphs in Figure 3 presents the force/elongation curves obtained in axial tensile test for each compression zone. On every graph one can see two curves corresponding to the minimum and maximum values of tensile load. The average values of relative elongation are displayed in Table 1.
a) Compression zone A b) Compression zone B c) Compression zone C d) Compression zone D
Figure 3: Force - elongation curves corresponding to different compression zones As can be seen in figure 3, in the selected testing range, all curves force–elongation for knitted samples showed similar form, which is mainly determined by the nature of used yarns. The differences between these diagrams are given by the values of elongation. For a certain value of applied load, relative elongation corresponding to different compression zones, gradually increases, from zone A (ankle) to zone D (thigh). The growth in elongation has an approximately linear trend. Table 1: The average values of relative elongation obtained in tensile testing
Compression zone A B C D
Tensile load (N) Relative elongation (%) Fmin = 0.65 38.81 51.46 66.64 88.88
Fmax = 1.2 88.67 100.22 133.32 153.14
Considering that the deformation capacity of the sample is reversely proportional to its compression capacity (the smaller is the elongation, the bigger is the compression level), one can appreciate that the axial tensile test can be used to reveal the presence of a gradual compression along the leg. For both values of tensile load (0,65 cN and 1,2 cN), the elongation is smaller at the ankle (where a maximum compression level is required) and gradually increases to the thigh (where the compression level should be minimum).
168
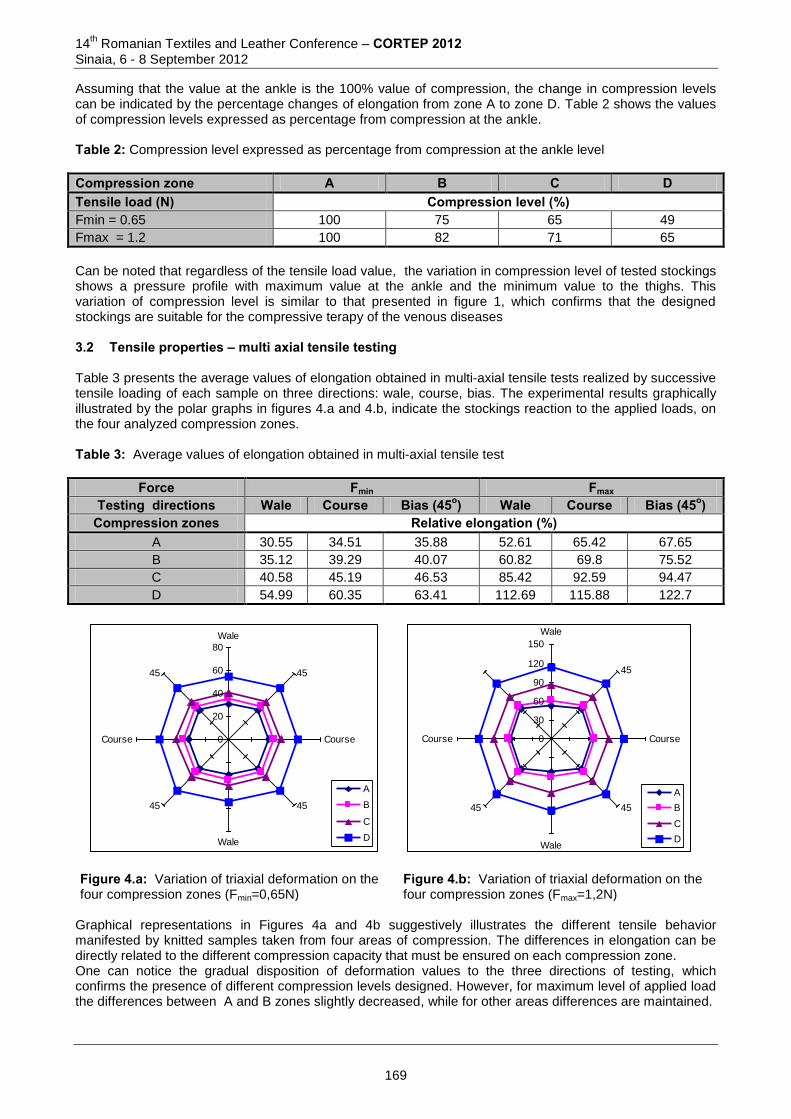
14th Romanian Textiles and Leather Conference – CORTEP 2012
Sinaia, 6 - 8 September 2012
Assuming that the value at the ankle is the 100% value of compression, the change in compression levels can be indicated by the percentage changes of elongation from zone A to zone D. Table 2 shows the values of compression levels expressed as percentage from compression at the ankle. Table 2: Compression level expressed as percentage from compression at the ankle level
Compression zone A B C D
Tensile load (N) Compression level (%) Fmin = 0.65 100 75 65 49
Fmax = 1.2 100 82 71 65
Can be noted that regardless of the tensile load value, the variation in compression level of tested stockings shows a pressure profile with maximum value at the ankle and the minimum value to the thighs. This variation of compression level is similar to that presented in figure 1, which confirms that the designed stockings are suitable for the compressive terapy of the venous diseases 3.2 Tensile properties – multi axial tensile testing Table 3 presents the average values of elongation obtained in multi-axial tensile tests realized by successive tensile loading of each sample on three directions: wale, course, bias. The experimental results graphically illustrated by the polar graphs in figures 4.a and 4.b, indicate the stockings reaction to the applied loads, on the four analyzed compression zones. Table 3: Average values of elongation obtained in multi-axial tensile test
Force Fmin Fmax Testing directions Wale Course Bias (45o) Wale Course Bias (45o)
Compression zones Relative elongation (%) A 30.55 34.51 35.88 52.61 65.42 67.65
B 35.12 39.29 40.07 60.82 69.8 75.52
C 40.58 45.19 46.53 85.42 92.59 94.47
D 54.99 60.35 63.41 112.69 115.88 122.7
0
20
40
60
80
Wale
45
Course
45
Wale
45
Course
45
A
B
C
D
0
30
60
90
120
150
Wale
45
Course
45
Wale
45
Course
A
B
C
D
Figure 4.a: Variation of triaxial deformation on the four compression zones (Fmin=0,65N)
Figure 4.b: Variation of triaxial deformation on the four compression zones (Fmax=1,2N)
Graphical representations in Figures 4a and 4b suggestively illustrates the different tensile behavior manifested by knitted samples taken from four areas of compression. The differences in elongation can be directly related to the different compression capacity that must be ensured on each compression zone. One can notice the gradual disposition of deformation values to the three directions of testing, which confirms the presence of different compression levels designed. However, for maximum level of applied load the differences between A and B zones slightly decreased, while for other areas differences are maintained.
169
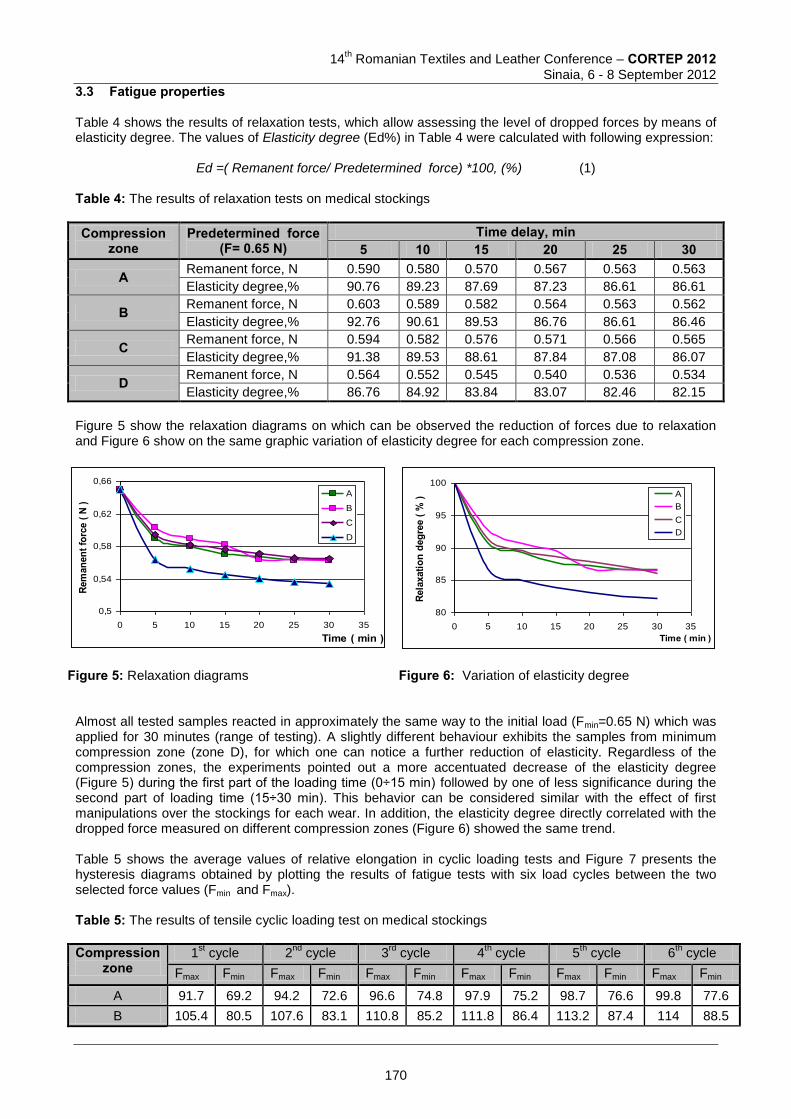
14
th Romanian Textiles and Leather Conference – CORTEP 2012
Sinaia, 6 - 8 September 2012
3.3 Fatigue properties Table 4 shows the results of relaxation tests, which allow assessing the level of dropped forces by means of elasticity degree. The values of Elasticity degree (Ed%) in Table 4 were calculated with following expression:
Ed =( Remanent force/ Predetermined force) *100, (%) (1) Table 4: The results of relaxation tests on medical stockings
Compression zone
Predetermined force (F= 0.65 N)
Time delay, min 5 10 15 20 25 30
A Remanent force, N 0.590 0.580 0.570 0.567 0.563 0.563
Elasticity degree,% 90.76 89.23 87.69 87.23 86.61 86.61
B Remanent force, N 0.603 0.589 0.582 0.564 0.563 0.562
Elasticity degree,% 92.76 90.61 89.53 86.76 86.61 86.46
C Remanent force, N 0.594 0.582 0.576 0.571 0.566 0.565
Elasticity degree,% 91.38 89.53 88.61 87.84 87.08 86.07
D Remanent force, N 0.564 0.552 0.545 0.540 0.536 0.534
Elasticity degree,% 86.76 84.92 83.84 83.07 82.46 82.15
Figure 5 show the relaxation diagrams on which can be observed the reduction of forces due to relaxation and Figure 6 show on the same graphic variation of elasticity degree for each compression zone.
0,5
0,54
0,58
0,62
0,66
0 5 10 15 20 25 30 35
Time ( min )
Rem
anen
t for
ce (
N )
A
B
C
D
80
85
90
95
100
0 5 10 15 20 25 30 35
Time ( min )
Rela
xatio
n de
gree
( %
) A
B
C
D
Figure 5: Relaxation diagrams
Figure 6: Variation of elasticity degree
Almost all tested samples reacted in approximately the same way to the initial load (Fmin=0.65 N) which was applied for 30 minutes (range of testing). A slightly different behaviour exhibits the samples from minimum compression zone (zone D), for which one can notice a further reduction of elasticity. Regardless of the compression zones, the experiments pointed out a more accentuated decrease of the elasticity degree (Figure 5) during the first part of the loading time (0÷15 min) followed by one of less significance during the second part of loading time (15÷30 min). This behavior can be considered similar with the effect of first manipulations over the stockings for each wear. In addition, the elasticity degree directly correlated with the dropped force measured on different compression zones (Figure 6) showed the same trend. Table 5 shows the average values of relative elongation in cyclic loading tests and Figure 7 presents the hysteresis diagrams obtained by plotting the results of fatigue tests with six load cycles between the two selected force values (Fmin and Fmax). Table 5: The results of tensile cyclic loading test on medical stockings
Compression zone
1st cycle 2
nd cycle 3
rd cycle 4
th cycle 5
th cycle 6
th cycle
Fmax Fmin Fmax Fmin Fmax Fmin Fmax Fmin Fmax Fmin Fmax Fmin
A 91.7 69.2 94.2 72.6 96.6 74.8 97.9 75.2 98.7 76.6 99.8 77.6
B 105.4 80.5 107.6 83.1 110.8 85.2 111.8 86.4 113.2 87.4 114 88.5
170
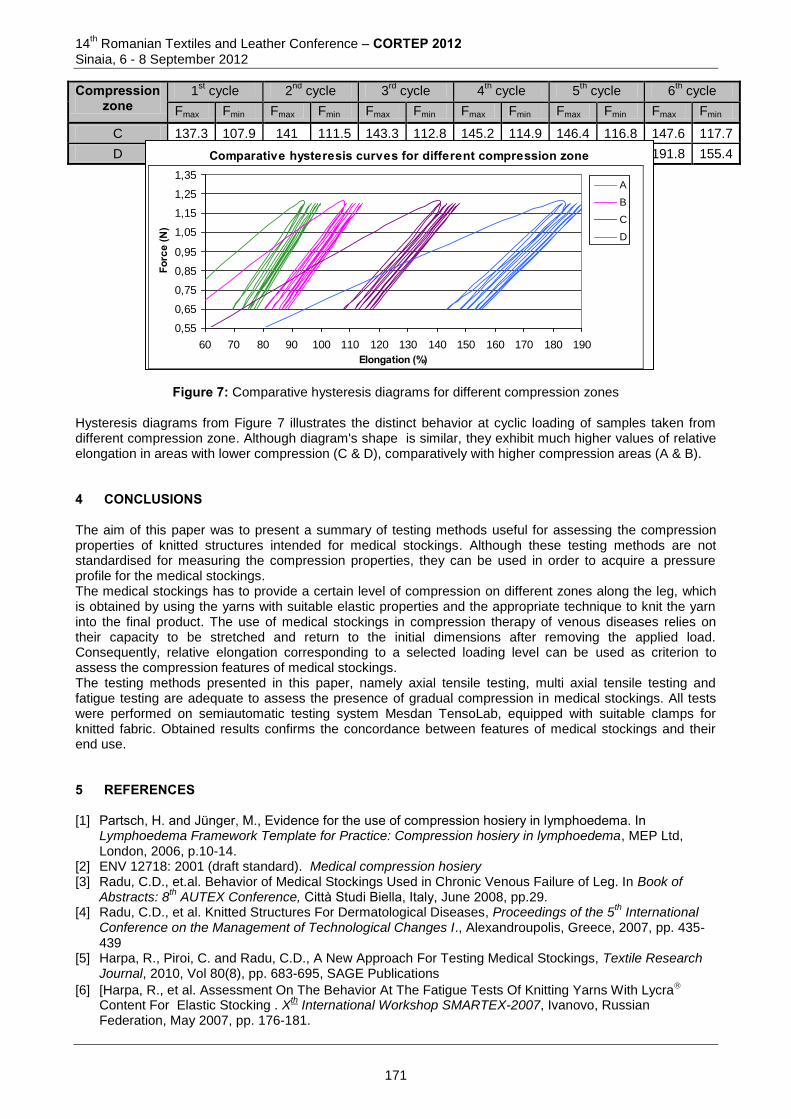
14th Romanian Textiles and Leather Conference – CORTEP 2012
Sinaia, 6 - 8 September 2012
Compression zone
1st cycle 2
nd cycle 3
rd cycle 4
th cycle 5
th cycle 6
th cycle
Fmax Fmin Fmax Fmin Fmax Fmin Fmax Fmin Fmax Fmin Fmax Fmin
C 137.3 107.9 141 111.5 143.3 112.8 145.2 114.9 146.4 116.8 147.6 117.7
D 178.5 143.2 183 148 186 150.2 188.3 152.8 190.3 154.6 191.8 155.4 Comparative hysteresis curves for different compression zone
0,55
0,65
0,75
0,85
0,95
1,05
1,15
1,25
1,35
60 70 80 90 100 110 120 130 140 150 160 170 180 190
Elongation (%)
Forc
e (N
)
A
B
C
D
Figure 7: Comparative hysteresis diagrams for different compression zones Hysteresis diagrams from Figure 7 illustrates the distinct behavior at cyclic loading of samples taken from different compression zone. Although diagram's shape is similar, they exhibit much higher values of relative elongation in areas with lower compression (C & D), comparatively with higher compression areas (A & B). 4 CONCLUSIONS The aim of this paper was to present a summary of testing methods useful for assessing the compression properties of knitted structures intended for medical stockings. Although these testing methods are not standardised for measuring the compression properties, they can be used in order to acquire a pressure profile for the medical stockings. The medical stockings has to provide a certain level of compression on different zones along the leg, which is obtained by using the yarns with suitable elastic properties and the appropriate technique to knit the yarn into the final product. The use of medical stockings in compression therapy of venous diseases relies on their capacity to be stretched and return to the initial dimensions after removing the applied load. Consequently, relative elongation corresponding to a selected loading level can be used as criterion to assess the compression features of medical stockings. The testing methods presented in this paper, namely axial tensile testing, multi axial tensile testing and fatigue testing are adequate to assess the presence of gradual compression in medical stockings. All tests were performed on semiautomatic testing system Mesdan TensoLab, equipped with suitable clamps for knitted fabric. Obtained results confirms the concordance between features of medical stockings and their end use. 5 REFERENCES [1] Partsch, H. and Jünger, M., Evidence for the use of compression hosiery in lymphoedema. In
Lymphoedema Framework Template for Practice: Compression hosiery in lymphoedema, MEP Ltd, London, 2006, p.10-14.
[2] ENV 12718: 2001 (draft standard). Medical compression hosiery [3] Radu, C.D., et.al. Behavior of Medical Stockings Used in Chronic Venous Failure of Leg. In Book of
Abstracts: 8th AUTEX Conference, Città Studi Biella, Italy, June 2008, pp.29.
[4] Radu, C.D., et al. Knitted Structures For Dermatological Diseases, Proceedings of the 5th International
Conference on the Management of Technological Changes I., Alexandroupolis, Greece, 2007, pp. 435-439
[5] Harpa, R., Piroi, C. and Radu, C.D., A New Approach For Testing Medical Stockings, Textile Research Journal, 2010, Vol 80(8), pp. 683-695, SAGE Publications
[6] [Harpa, R., et al. Assessment On The Behavior At The Fatigue Tests Of Knitting Yarns With Lycra Content For Elastic Stocking . X
th International Workshop SMARTEX-2007, Ivanovo, Russian
Federation, May 2007, pp. 176-181.
171
14
th Romanian Textiles and Leather Conference – CORTEP 2012
Sinaia, 6 - 8 September 2012
[7] ISO 5081:1999 (Draft standard). Textiles –Woven fabrics –Strip Method. [8] Bassett. R.J., Postle. R. and Pan. N., Experimental Methods for Measuring Fabric Mechanical
Properties: A Review and Analysis, Textile Research Journal, 69 (11), 1999, p.866-875
Corresponding author: Cristina PIROI Department of Engineering & Design of Textile Products Faculty of Textiles Leather Engineering and Industrial Management, “Gheorghe Asachi “Technical University of Iasi Romania Phone: +40 232 278683 (1143), E-mail: [email protected] Co-authors: Rodica HARPA Faculty of Textiles Leather Engineering and Industrial Management, Gheorghe Asachi Technical University of Iasi Romania Phone: +40 232 278683 (1148), E-mail: [email protected] Cezar-Doru RADU Faculty of Textiles Leather Engineering and Industrial Management, Gheorghe Asachi Technical University of Iasi Romania Phone: +40 232 278683 (1226), E-mail: [email protected]
172
14
th Romanian Textiles and Leather Conference – CORTEP 2012
Sinaia, 6 - 8 September 2012
PROPERTIES OF DOUBLE LAYER KNITTED FABRICS WITH IN-LAY YARNS
Mariana URSACHE & Mihai PENCIUC
“Gheorghe Asachi” Technical University of Iaşi, Romania Abstract: The double layer knitted fabrics with in-lay yarns, also known as spacer fabrics, represent a type of knitted fabrics that can be used for producing a wide range of products with certain properties that can be obtained due to their structure and raw material used. In this research several variances of double layer knitted fabrics with in-lay yarns were produced on a flat knitting machine using cotton yarns. The knitting method for the production of the experimented fabrics is known as a “tuck stitch” technique that refers to the binding method between the face and rear layers. The study is focused on the effect of several input variables on fabric weight, thickness and stitch density. The input variables are: number of yarns used for the connection between face and back layers, the needle bed gating (rib or interlock gating), the repeating unit for in-lay yarn feeding and the stitch cam adjustment in case of the connection yarns. The results, presented in values, graphs and equations indicate that fabric weight and thickness are affected by the selected input variables and they can be predicted in certain knitting conditions. Keywords: Knitting, flat knitted fabrics, spacer fabrics, physical properties. 1 INTRODUCTION The diversification and potential of the knitted fabrics is continuously growing and the knitting technology and machinery developments can offer a multitude of solutions for satisfying the required performances of the knitted products as functional or conventional textiles. The double layer knitted fabrics with in-lay yarns, as spacer knitted fabrics, have the properties that can meet the needed requirements of the final products. The most used textile technology for the production of the spacer fabrics is the knitting technology on weft or warp knitting machines with double needle bed. The double layer knitted fabrics with in-lay yarns are composed of two separate fabric planes which are joined together by interconnection (or spacer) yarns that can be identical or different from the properties used for the face and rear layers. This 3D construction provide these type of fabrics with certain properties that cannot be given by the conventional structures. Due to their properties, given by the structure and raw materials, the double layer knitted fabrics with in-lay yarns find their use in many application areas such as medical textiles, automotive textiles, geotextiles, protective textiles, sportswear, home textiles, composites etc. [1, 2, 3].
Many researchers have studied this type of fabrics and the obtained results have revealed their properties, or new applications. Ozturk et all (2010) have studied the influence of fabric structure on sound absorption behavior of spacer knitted structures and demonstrated that they have greater sound absorbency than conventional plain knitted fabrics [4]. Abounaim and Cherif (2012) have developed innovative lightweight three-dimensional spacer fabrics [5] and Abounaim et al (2009) also have investigated their potential for composite materials [6]. Investigations have been made on the influence of knitting structure and raw materials on the dynamics of water absorption in double-layered weft knitted fabrics [7] or on various comfort properties [8 – 11]. At the basis of this research stays the increased demand of weft spacer fabrics and the production possibilities given by the knitting machines. When using knitted spacer fabrics for conventional apparel, among the properties that should be considered are the physical and comfort properties that include: elasticity, bending, thickness, air and vapour permeability, insulation, temperature regulation etc. The present paper presents the results of the investigations on the effect of structure, stitch cam adjustments and number of in-lay yarns used for the interconnection between the outer layers, on certain physical and structural characteristics of different double layer knitted fabrics with in-lay yarns.
173
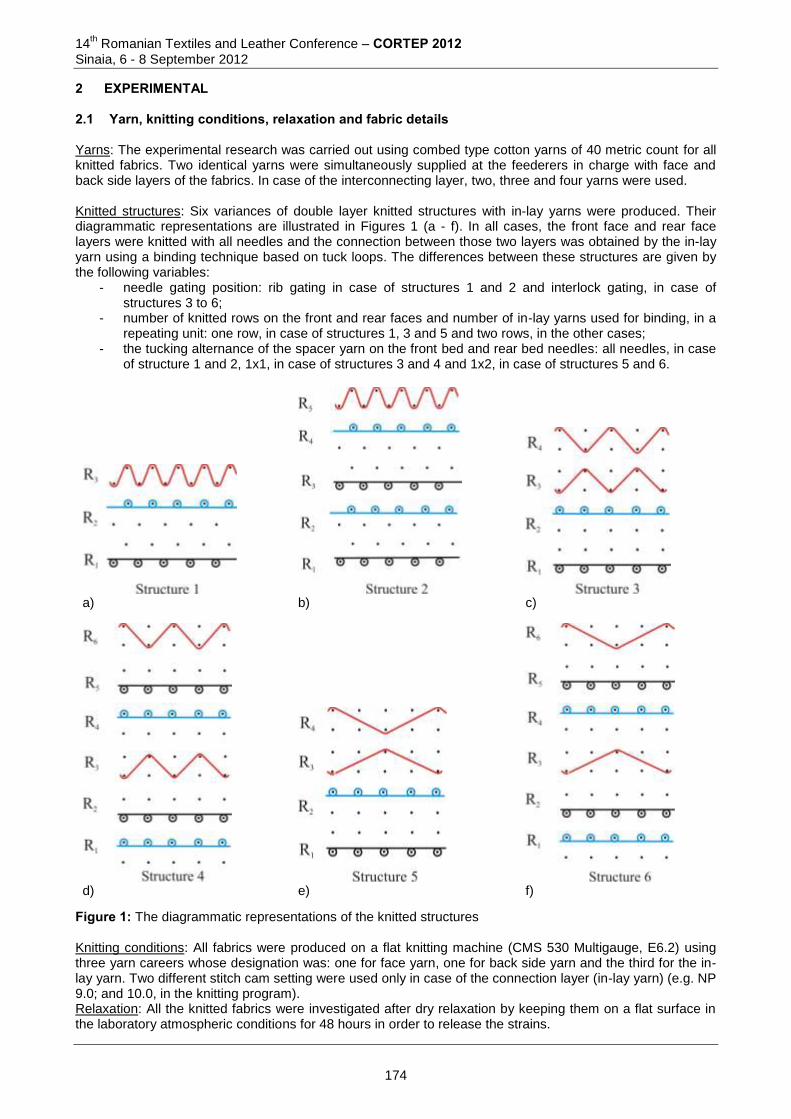
14th Romanian Textiles and Leather Conference – CORTEP 2012
Sinaia, 6 - 8 September 2012
2 EXPERIMENTAL 2.1 Yarn, knitting conditions, relaxation and fabric details Yarns: The experimental research was carried out using combed type cotton yarns of 40 metric count for all knitted fabrics. Two identical yarns were simultaneously supplied at the feederers in charge with face and back side layers of the fabrics. In case of the interconnecting layer, two, three and four yarns were used. Knitted structures: Six variances of double layer knitted structures with in-lay yarns were produced. Their diagrammatic representations are illustrated in Figures 1 (a - f). In all cases, the front face and rear face layers were knitted with all needles and the connection between those two layers was obtained by the in-lay yarn using a binding technique based on tuck loops. The differences between these structures are given by the following variables:
- needle gating position: rib gating in case of structures 1 and 2 and interlock gating, in case of structures 3 to 6;
- number of knitted rows on the front and rear faces and number of in-lay yarns used for binding, in a repeating unit: one row, in case of structures 1, 3 and 5 and two rows, in the other cases;
- the tucking alternance of the spacer yarn on the front bed and rear bed needles: all needles, in case of structure 1 and 2, 1x1, in case of structures 3 and 4 and 1x2, in case of structures 5 and 6.
a) b) c)
d) e) f)
Figure 1: The diagrammatic representations of the knitted structures Knitting conditions: All fabrics were produced on a flat knitting machine (CMS 530 Multigauge, E6.2) using three yarn careers whose designation was: one for face yarn, one for back side yarn and the third for the in-lay yarn. Two different stitch cam setting were used only in case of the connection layer (in-lay yarn) (e.g. NP 9.0; and 10.0, in the knitting program). Relaxation: All the knitted fabrics were investigated after dry relaxation by keeping them on a flat surface in the laboratory atmospheric conditions for 48 hours in order to release the strains.
174
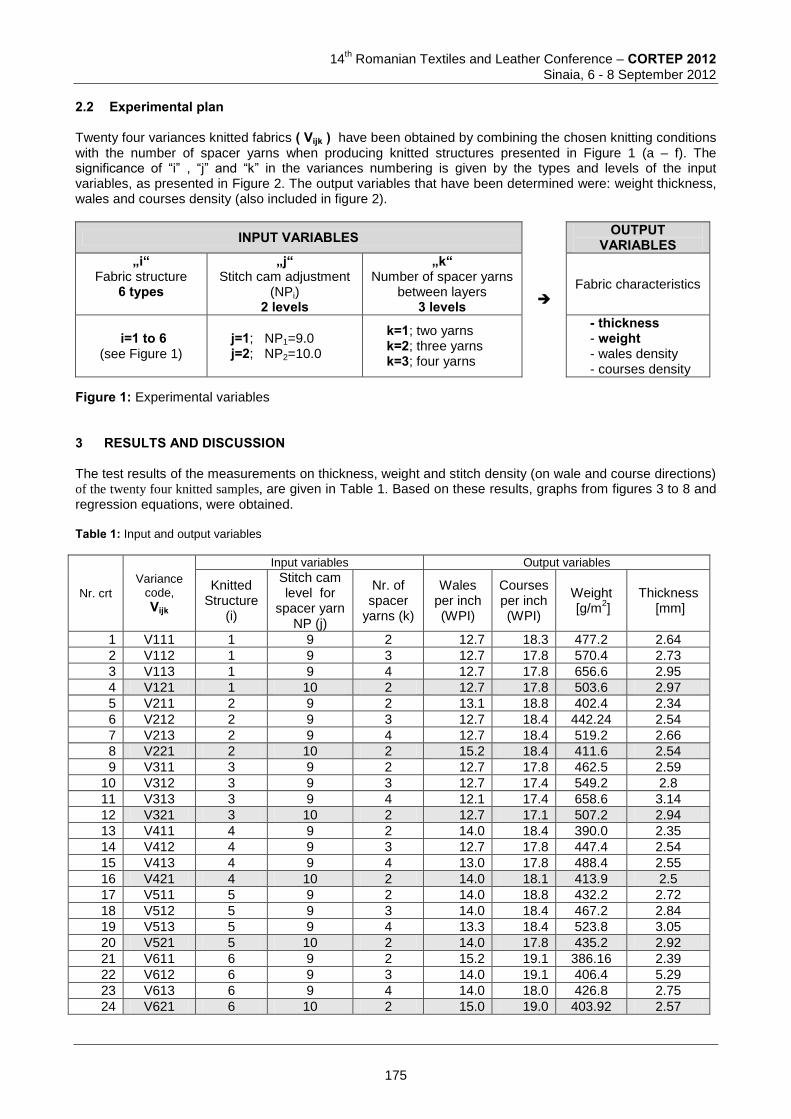
14
th Romanian Textiles and Leather Conference – CORTEP 2012
Sinaia, 6 - 8 September 2012
2.2 Experimental plan Twenty four variances knitted fabrics ( Vijk ) have been obtained by combining the chosen knitting conditions with the number of spacer yarns when producing knitted structures presented in Figure 1 (a – f). The significance of “i” , “j” and “k” in the variances numbering is given by the types and levels of the input variables, as presented in Figure 2. The output variables that have been determined were: weight thickness, wales and courses density (also included in figure 2).
INPUT VARIABLES
OUTPUT VARIABLES
„i“ Fabric structure
6 types
„j“ Stitch cam adjustment
(NPi) 2 levels
„k“ Number of spacer yarns
between layers 3 levels
Fabric characteristics
i=1 to 6 (see Figure 1)
j=1; NP1=9.0 j=2; NP2=10.0
k=1; two yarns k=2; three yarns k=3; four yarns
- thickness - weight - wales density - courses density
Figure 1: Experimental variables
3 RESULTS AND DISCUSSION The test results of the measurements on thickness, weight and stitch density (on wale and course directions) of the twenty four knitted samples, are given in Table 1. Based on these results, graphs from figures 3 to 8 and regression equations, were obtained. Table 1: Input and output variables
Nr. crt
Variance code,
Vijk
Input variables Output variables
Knitted Structure
(i)
Stitch cam level for
spacer yarn NP (j)
Nr. of spacer
yarns (k)
Wales per inch (WPI)
Courses per inch (WPI)
Weight [g/m
2]
Thickness [mm]
1 V111 1 9 2 12.7 18.3 477.2 2.64
2 V112 1 9 3 12.7 17.8 570.4 2.73
3 V113 1 9 4 12.7 17.8 656.6 2.95
4 V121 1 10 2 12.7 17.8 503.6 2.97
5 V211 2 9 2 13.1 18.8 402.4 2.34
6 V212 2 9 3 12.7 18.4 442.24 2.54
7 V213 2 9 4 12.7 18.4 519.2 2.66
8 V221 2 10 2 15.2 18.4 411.6 2.54
9 V311 3 9 2 12.7 17.8 462.5 2.59
10 V312 3 9 3 12.7 17.4 549.2 2.8
11 V313 3 9 4 12.1 17.4 658.6 3.14
12 V321 3 10 2 12.7 17.1 507.2 2.94
13 V411 4 9 2 14.0 18.4 390.0 2.35
14 V412 4 9 3 12.7 17.8 447.4 2.54
15 V413 4 9 4 13.0 17.8 488.4 2.55
16 V421 4 10 2 14.0 18.1 413.9 2.5
17 V511 5 9 2 14.0 18.8 432.2 2.72
18 V512 5 9 3 14.0 18.4 467.2 2.84
19 V513 5 9 4 13.3 18.4 523.8 3.05
20 V521 5 10 2 14.0 17.8 435.2 2.92
21 V611 6 9 2 15.2 19.1 386.16 2.39
22 V612 6 9 3 14.0 19.1 406.4 5.29
23 V613 6 9 4 14.0 18.0 426.8 2.75
24 V621 6 10 2 15.0 19.0 403.92 2.57
175
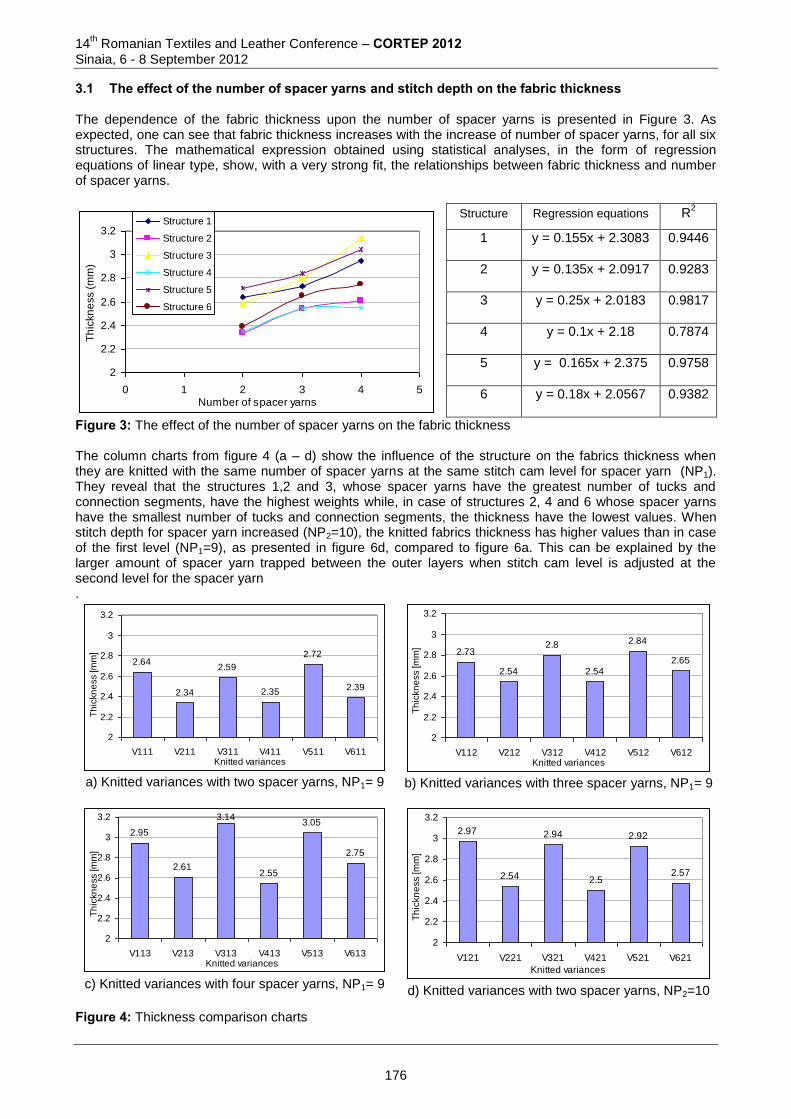
14th Romanian Textiles and Leather Conference – CORTEP 2012
Sinaia, 6 - 8 September 2012
3.1 The effect of the number of spacer yarns and stitch depth on the fabric thickness The dependence of the fabric thickness upon the number of spacer yarns is presented in Figure 3. As expected, one can see that fabric thickness increases with the increase of number of spacer yarns, for all six structures. The mathematical expression obtained using statistical analyses, in the form of regression equations of linear type, show, with a very strong fit, the relationships between fabric thickness and number of spacer yarns.
2
2.2
2.4
2.6
2.8
3
3.2
0 1 2 3 4 5Number of spacer yarns
Th
ickn
ess (
mm
)
Structure 1
Structure 2
Structure 3
Structure 4
Structure 5
Structure 6
Structure Regression equations R2
1 y = 0.155x + 2.3083 0.9446
2 y = 0.135x + 2.0917 0.9283
3 y = 0.25x + 2.0183 0.9817
4 y = 0.1x + 2.18 0.7874
5 y = 0.165x + 2.375 0.9758
6 y = 0.18x + 2.0567 0.9382
Figure 3: The effect of the number of spacer yarns on the fabric thickness The column charts from figure 4 (a – d) show the influence of the structure on the fabrics thickness when they are knitted with the same number of spacer yarns at the same stitch cam level for spacer yarn (NP1). They reveal that the structures 1,2 and 3, whose spacer yarns have the greatest number of tucks and connection segments, have the highest weights while, in case of structures 2, 4 and 6 whose spacer yarns have the smallest number of tucks and connection segments, the thickness have the lowest values. When stitch depth for spacer yarn increased (NP2=10), the knitted fabrics thickness has higher values than in case of the first level (NP1=9), as presented in figure 6d, compared to figure 6a. This can be explained by the larger amount of spacer yarn trapped between the outer layers when stitch cam level is adjusted at the second level for the spacer yarn .
2.64
2.34
2.59
2.35
2.72
2.39
2
2.2
2.4
2.6
2.8
3
3.2
V111 V211 V311 V411 V511 V611Knitted variances
Th
ickn
ess [m
m]
a) Knitted variances with two spacer yarns, NP1= 9
2.73
2.54
2.8
2.54
2.84
2.65
2
2.2
2.4
2.6
2.8
3
3.2
V112 V212 V312 V412 V512 V612Knitted variances
Th
ickn
ess [m
m]
b) Knitted variances with three spacer yarns, NP1= 9
2.95
2.61
3.14
2.55
3.05
2.75
2
2.2
2.4
2.6
2.8
3
3.2
V113 V213 V313 V413 V513 V613Knitted variances
Th
ickn
ess [m
m]
c) Knitted variances with four spacer yarns, NP1= 9
2.97
2.54
2.94
2.5
2.92
2.57
2
2.2
2.4
2.6
2.8
3
3.2
V121 V221 V321 V421 V521 V621
Knitted variances
Th
ickn
ess [m
m]
d) Knitted variances with two spacer yarns, NP2=10
Figure 4: Thickness comparison charts
176
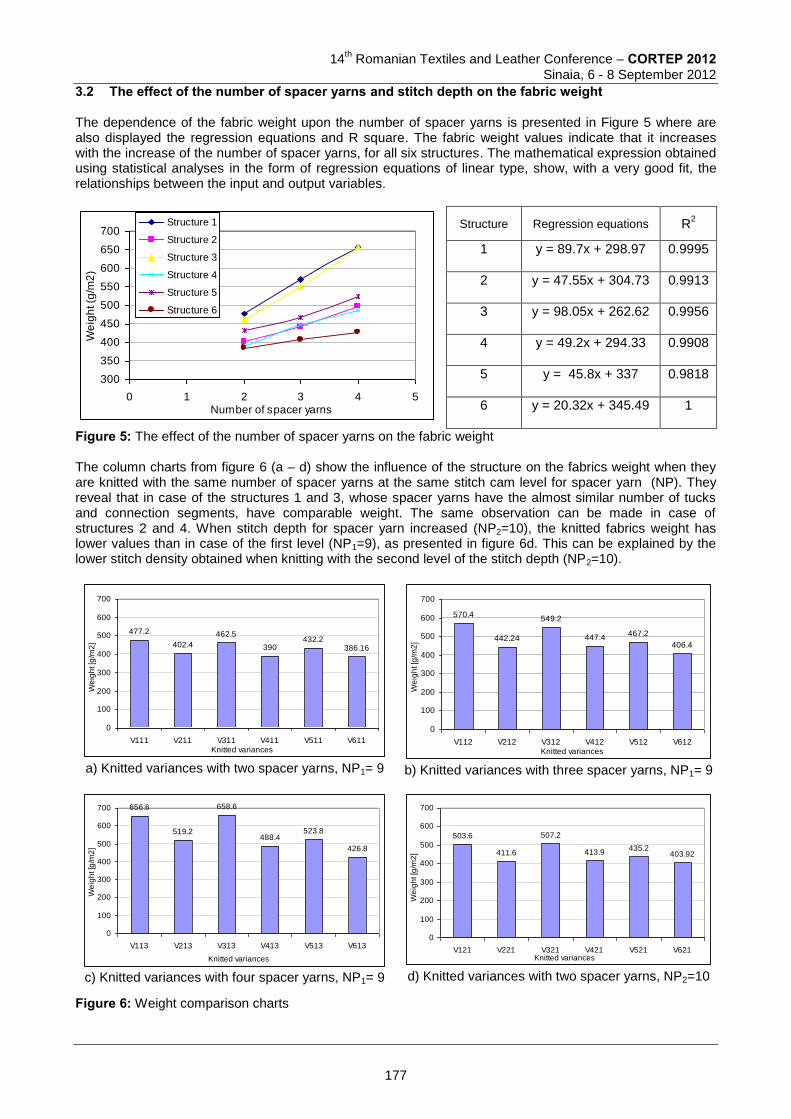
14
th Romanian Textiles and Leather Conference – CORTEP 2012
Sinaia, 6 - 8 September 2012
3.2 The effect of the number of spacer yarns and stitch depth on the fabric weight The dependence of the fabric weight upon the number of spacer yarns is presented in Figure 5 where are also displayed the regression equations and R square. The fabric weight values indicate that it increases with the increase of the number of spacer yarns, for all six structures. The mathematical expression obtained using statistical analyses in the form of regression equations of linear type, show, with a very good fit, the relationships between the input and output variables.
300
350
400
450
500
550
600
650
700
0 1 2 3 4 5Number of spacer yarns
We
igh
t (g
/m2
)
Structure 1
Structure 2
Structure 3
Structure 4
Structure 5
Structure 6
Structure Regression equations R2
1 y = 89.7x + 298.97 0.9995
2 y = 47.55x + 304.73 0.9913
3 y = 98.05x + 262.62 0.9956
4 y = 49.2x + 294.33 0.9908
5 y = 45.8x + 337 0.9818
6 y = 20.32x + 345.49 1
Figure 5: The effect of the number of spacer yarns on the fabric weight The column charts from figure 6 (a – d) show the influence of the structure on the fabrics weight when they are knitted with the same number of spacer yarns at the same stitch cam level for spacer yarn (NP). They reveal that in case of the structures 1 and 3, whose spacer yarns have the almost similar number of tucks and connection segments, have comparable weight. The same observation can be made in case of structures 2 and 4. When stitch depth for spacer yarn increased (NP2=10), the knitted fabrics weight has lower values than in case of the first level (NP1=9), as presented in figure 6d. This can be explained by the lower stitch density obtained when knitting with the second level of the stitch depth (NP2=10).
477.2
402.4
462.5
390432.2
386.16
0
100
200
300
400
500
600
700
V111 V211 V311 V411 V511 V611Knitted variances
We
igh
t [g
/m2
]
a) Knitted variances with two spacer yarns, NP1= 9
570.4
442.24
549.2
447.4467.2
406.4
0
100
200
300
400
500
600
700
V112 V212 V312 V412 V512 V612Knitted variances
We
igh
t [g
/m2
]
b) Knitted variances with three spacer yarns, NP1= 9
656.6
519.2
658.6
488.4523.8
426.8
0
100
200
300
400
500
600
700
V113 V213 V313 V413 V513 V613
Knitted variances
We
igh
t [g
/m2
]
c) Knitted variances with four spacer yarns, NP1= 9
503.6
411.6
507.2
413.9435.2
403.92
0
100
200
300
400
500
600
700
V121 V221 V321 V421 V521 V621Knitted variances
We
igh
t [g
/m2
]
d) Knitted variances with two spacer yarns, NP2=10
Figure 6: Weight comparison charts
177
14th Romanian Textiles and Leather Conference – CORTEP 2012
Sinaia, 6 - 8 September 2012
3.3 The effect of the structure, number of spacer yarns and stitch depth on the stitch density From the values of stitch density on wale and course direction, included in Table 1, one can observe the followings: - when the number of yarns increase, both stitch density on wale and course direction show a very slight
decrease; - the variation of the stitch depth for the spacer yarn from the first level (NP2) to the second level (NP2=10)
does not cause significant changes in stitch density. 4 CONCLUSIONS The characteristics of the double layer knitted fabrics with in-lay yarns produced with different stitch cam adjusting and number of in-lay yarns on were studied. The raw material and yarn properties were kept the same for all the fabrics in order to determine the influence of the modification of the knit structure, number of in-lay yarns and on the selected fabric characteristics. The results, presented in values, graphs and equations indicate that fabric weight and thickness are affected by the selected input variables and they can be predicted in certain knitting conditions. References [1] Ray, SC., Fundamentals and advances in knitting technology, 1
st edition, New Delhi, India, Woodhead
Publishing India Pvt Ltd., 2012, p 284 [2] Bruer, S.,M., Smith, G., Three-Dimensionally Knit Spacer Fabrics: A review of Production Technique and
Applications, Journal of Textile and Apparel, Technology and management, Vol.4, Issue 4, 2005, pp 1-31 [3] Palash, P., Debiprasad G., Warp knitting structures for technical use, Journal of the TEXTILE
Association, May-June 2011, pp. 9-22 [4] Kucukali Ozturk M.et al, A study on the influence of fabric structure on sound absorption behavior of
spacer knitted structures, Proceedings of 7th International Conference - TEXSCI 2010, September 6-8, Liberec, Czech Republic (2010)
[5] Abounaim, MD., Cherif, C., Flat-knitted innovative three-dimensional spacer fabrics: a competitive solution for lightweight, Textile Research Journal 2012, 82(3) pp 288–298
[6] Abounaim, Md. Hoffmann, G. Diestel, O. Cherif,C., 3D Spacer Fabric as Sandwich Structure by Flat Knitting for Composite using Hybrid Yarn, AUTEX 2009 World Textile Conference, pp. 675 - 681
[7] Bivainytė, Mikučionienė, D., Investigation on the Dynamic Water Absorption of Double-Layered Weft Knitted Fabrics, FIBRES & TEXTILES in Eastern Europe 2011, Vol. 19, No. 6 (89) pp. 64-70.
[8] Ertekin, G., Marmarali, A., Heat, air and water vapor transfer properties of circular knitted spacer fabrics, Tekstil ve Konfeksiyon Nr. 4, 2011, pp.369-373
[9] Supuren,G., et al, Moisture management and thermal absorptivity properties of double-face knitted fabrics, Textile Research Journal 2011, 81, pp 1320-1330
[10] Mallikarjunan, K. et al, Comfort and Thermo Physiological Characteristics of Mulltylayered Fabrics for Medical Textiles, Journal of Textile and Apparel, Technology and management, Vol.7, Issue 1, 2011, pp 1-15
[11] Salopek, I., Skenderi, Z., Srdjak M., The role of fabric parameters in the achievement of Thermophysiological comfort, Proceedings of 44 Congress IFKT, 2008, Saint-Petersburg, 23-27 September 2008, p. 1-7
Corresponding author: Mariana URSACHE Department of Knitting and Clothing Engineering Faculty of Textiles, Leather and Industrial Engineering “Gheorghe Asachi” Technical University of Iasi Prof.dr. D.Mangeron Blv., 29, 700050, Iaşi, Romania phone: +4 0232 278680 / 1113 fax: +4 0232 230491 e-mail: [email protected]
Co-author: Mihai PENCIUC Department of Knitting and Clothing Engineering Faculty of Textiles, Leather and Industrial Engineering University: “Gheorghe Asachi” Technical University of Iasi Prof.dr. D.Mangeron Blv., 29, 700050, Iaşi, Romania phone: +4 0232 278680 / 1129 fax: +4 0232 230491 e-mail: [email protected]
178
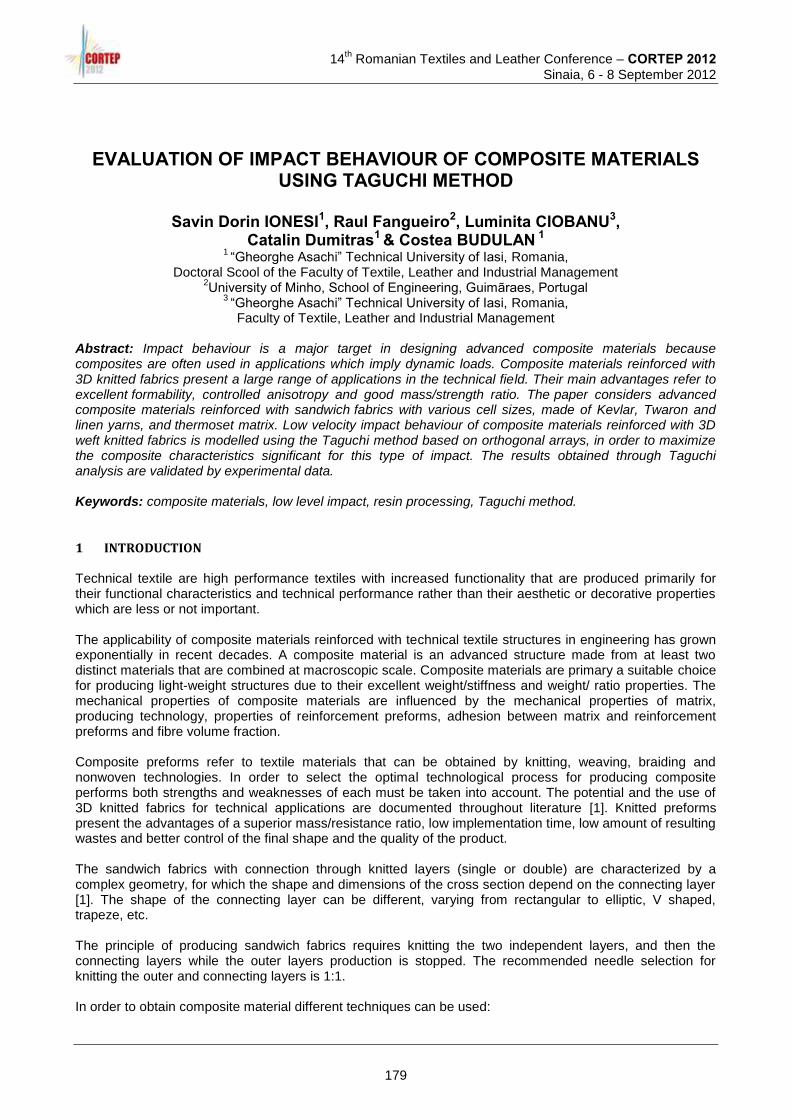
14
th Romanian Textiles and Leather Conference – CORTEP 2012
Sinaia, 6 - 8 September 2012
EVALUATION OF IMPACT BEHAVIOUR OF COMPOSITE MATERIALS USING TAGUCHI METHOD
Savin Dorin IONESI1, Raul Fangueiro2, Luminita CIOBANU3,
Catalin Dumitras1 & Costea BUDULAN 1 1 “Gheorghe Asachi” Technical University of Iasi, Romania,
Doctoral Scool of the Faculty of Textile, Leather and Industrial Management 2University of Minho, School of Engineering, Guimãraes, Portugal
3 “Gheorghe Asachi” Technical University of Iasi, Romania, Faculty of Textile, Leather and Industrial Management
Abstract: Impact behaviour is a major target in designing advanced composite materials because composites are often used in applications which imply dynamic loads. Composite materials reinforced with 3D knitted fabrics present a large range of applications in the technical field. Their main advantages refer to excellent formability, controlled anisotropy and good mass/strength ratio. The paper considers advanced composite materials reinforced with sandwich fabrics with various cell sizes, made of Kevlar, Twaron and linen yarns, and thermoset matrix. Low velocity impact behaviour of composite materials reinforced with 3D weft knitted fabrics is modelled using the Taguchi method based on orthogonal arrays, in order to maximize the composite characteristics significant for this type of impact. The results obtained through Taguchi analysis are validated by experimental data. Keywords: composite materials, low level impact, resin processing, Taguchi method.
1 INTRODUCTION Technical textile are high performance textiles with increased functionality that are produced primarily for their functional characteristics and technical performance rather than their aesthetic or decorative properties which are less or not important. The applicability of composite materials reinforced with technical textile structures in engineering has grown exponentially in recent decades. A composite material is an advanced structure made from at least two distinct materials that are combined at macroscopic scale. Composite materials are primary a suitable choice for producing light-weight structures due to their excellent weight/stiffness and weight/ ratio properties. The mechanical properties of composite materials are influenced by the mechanical properties of matrix, producing technology, properties of reinforcement preforms, adhesion between matrix and reinforcement preforms and fibre volume fraction. Composite preforms refer to textile materials that can be obtained by knitting, weaving, braiding and nonwoven technologies. In order to select the optimal technological process for producing composite performs both strengths and weaknesses of each must be taken into account. The potential and the use of 3D knitted fabrics for technical applications are documented throughout literature [1]. Knitted preforms present the advantages of a superior mass/resistance ratio, low implementation time, low amount of resulting wastes and better control of the final shape and the quality of the product. The sandwich fabrics with connection through knitted layers (single or double) are characterized by a complex geometry, for which the shape and dimensions of the cross section depend on the connecting layer [1]. The shape of the connecting layer can be different, varying from rectangular to elliptic, V shaped, trapeze, etc. The principle of producing sandwich fabrics requires knitting the two independent layers, and then the connecting layers while the outer layers production is stopped. The recommended needle selection for knitting the outer and connecting layers is 1:1. In order to obtain composite material different techniques can be used:
179
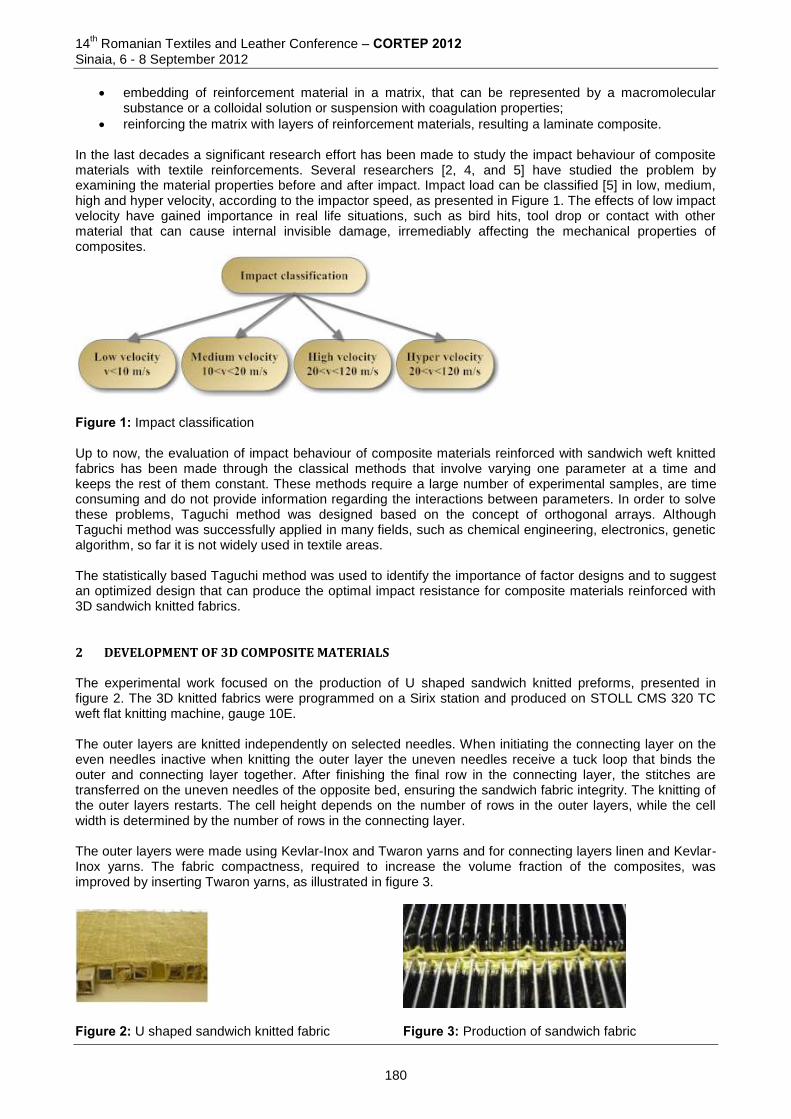
14th Romanian Textiles and Leather Conference – CORTEP 2012
Sinaia, 6 - 8 September 2012
embedding of reinforcement material in a matrix, that can be represented by a macromolecular substance or a colloidal solution or suspension with coagulation properties;
reinforcing the matrix with layers of reinforcement materials, resulting a laminate composite. In the last decades a significant research effort has been made to study the impact behaviour of composite materials with textile reinforcements. Several researchers [2, 4, and 5] have studied the problem by examining the material properties before and after impact. Impact load can be classified [5] in low, medium, high and hyper velocity, according to the impactor speed, as presented in Figure 1. The effects of low impact velocity have gained importance in real life situations, such as bird hits, tool drop or contact with other material that can cause internal invisible damage, irremediably affecting the mechanical properties of composites.
Figure 1: Impact classification Up to now, the evaluation of impact behaviour of composite materials reinforced with sandwich weft knitted fabrics has been made through the classical methods that involve varying one parameter at a time and keeps the rest of them constant. These methods require a large number of experimental samples, are time consuming and do not provide information regarding the interactions between parameters. In order to solve these problems, Taguchi method was designed based on the concept of orthogonal arrays. Although Taguchi method was successfully applied in many fields, such as chemical engineering, electronics, genetic algorithm, so far it is not widely used in textile areas. The statistically based Taguchi method was used to identify the importance of factor designs and to suggest an optimized design that can produce the optimal impact resistance for composite materials reinforced with 3D sandwich knitted fabrics.
2 DEVELOPMENT OF 3D COMPOSITE MATERIALS The experimental work focused on the production of U shaped sandwich knitted preforms, presented in figure 2. The 3D knitted fabrics were programmed on a Sirix station and produced on STOLL CMS 320 TC weft flat knitting machine, gauge 10E. The outer layers are knitted independently on selected needles. When initiating the connecting layer on the even needles inactive when knitting the outer layer the uneven needles receive a tuck loop that binds the outer and connecting layer together. After finishing the final row in the connecting layer, the stitches are transferred on the uneven needles of the opposite bed, ensuring the sandwich fabric integrity. The knitting of the outer layers restarts. The cell height depends on the number of rows in the outer layers, while the cell width is determined by the number of rows in the connecting layer. The outer layers were made using Kevlar-Inox and Twaron yarns and for connecting layers linen and Kevlar-Inox yarns. The fabric compactness, required to increase the volume fraction of the composites, was improved by inserting Twaron yarns, as illustrated in figure 3.
Figure 2: U shaped sandwich knitted fabric
Figure 3: Production of sandwich fabric
180
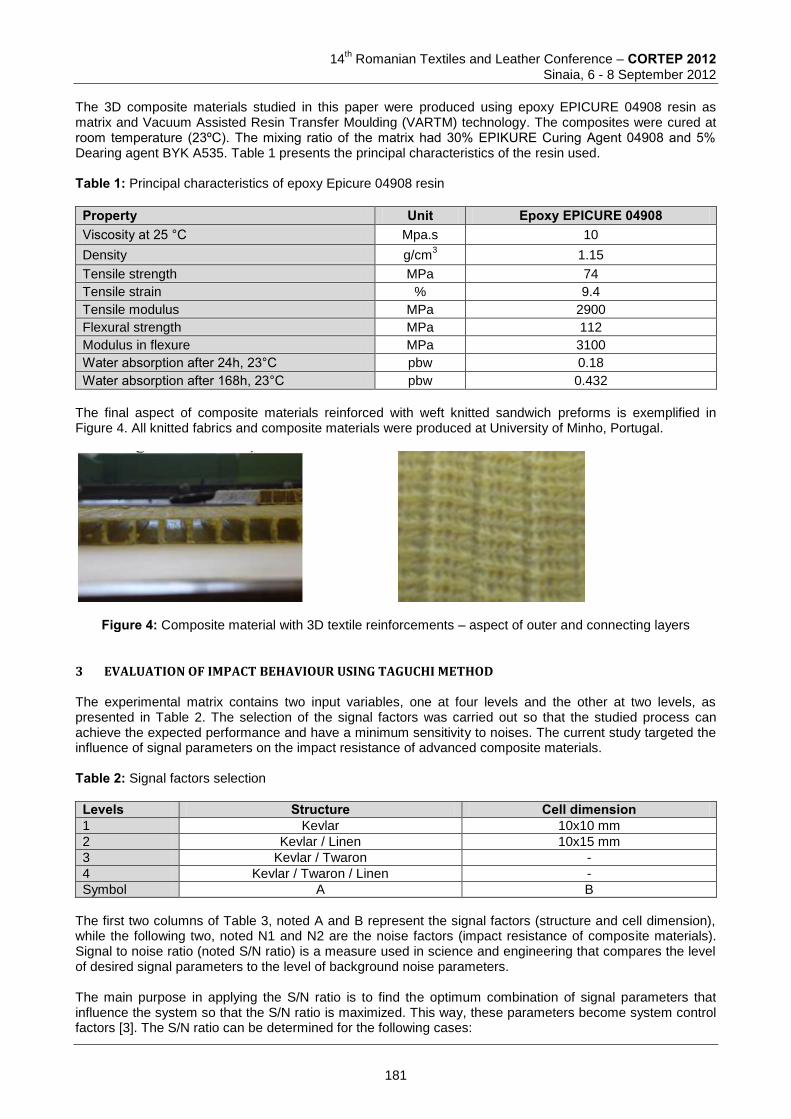
14
th Romanian Textiles and Leather Conference – CORTEP 2012
Sinaia, 6 - 8 September 2012
The 3D composite materials studied in this paper were produced using epoxy EPICURE 04908 resin as matrix and Vacuum Assisted Resin Transfer Moulding (VARTM) technology. The composites were cured at room temperature (23ºC). The mixing ratio of the matrix had 30% EPIKURE Curing Agent 04908 and 5% Dearing agent BYK A535. Table 1 presents the principal characteristics of the resin used. Table 1: Principal characteristics of epoxy Epicure 04908 resin
Property Unit Epoxy EPICURE 04908 Viscosity at 25 °C Mpa.s 10
Density g/cm3 1.15
Tensile strength MPa 74
Tensile strain % 9.4
Tensile modulus MPa 2900
Flexural strength MPa 112
Modulus in flexure MPa 3100
Water absorption after 24h, 23°C pbw 0.18
Water absorption after 168h, 23°C pbw 0.432
The final aspect of composite materials reinforced with weft knitted sandwich preforms is exemplified in Figure 4. All knitted fabrics and composite materials were produced at University of Minho, Portugal.
Figure 4: Composite material with 3D textile reinforcements – aspect of outer and connecting layers 3 EVALUATION OF IMPACT BEHAVIOUR USING TAGUCHI METHOD The experimental matrix contains two input variables, one at four levels and the other at two levels, as presented in Table 2. The selection of the signal factors was carried out so that the studied process can achieve the expected performance and have a minimum sensitivity to noises. The current study targeted the influence of signal parameters on the impact resistance of advanced composite materials. Table 2: Signal factors selection
Levels Structure Cell dimension 1 Kevlar 10x10 mm
2 Kevlar / Linen 10x15 mm
3 Kevlar / Twaron -
4 Kevlar / Twaron / Linen -
Symbol A B
The first two columns of Table 3, noted A and B represent the signal factors (structure and cell dimension), while the following two, noted N1 and N2 are the noise factors (impact resistance of composite materials). Signal to noise ratio (noted S/N ratio) is a measure used in science and engineering that compares the level of desired signal parameters to the level of background noise parameters. The main purpose in applying the S/N ratio is to find the optimum combination of signal parameters that influence the system so that the S/N ratio is maximized. This way, these parameters become system control factors [3]. The S/N ratio can be determined for the following cases:
181
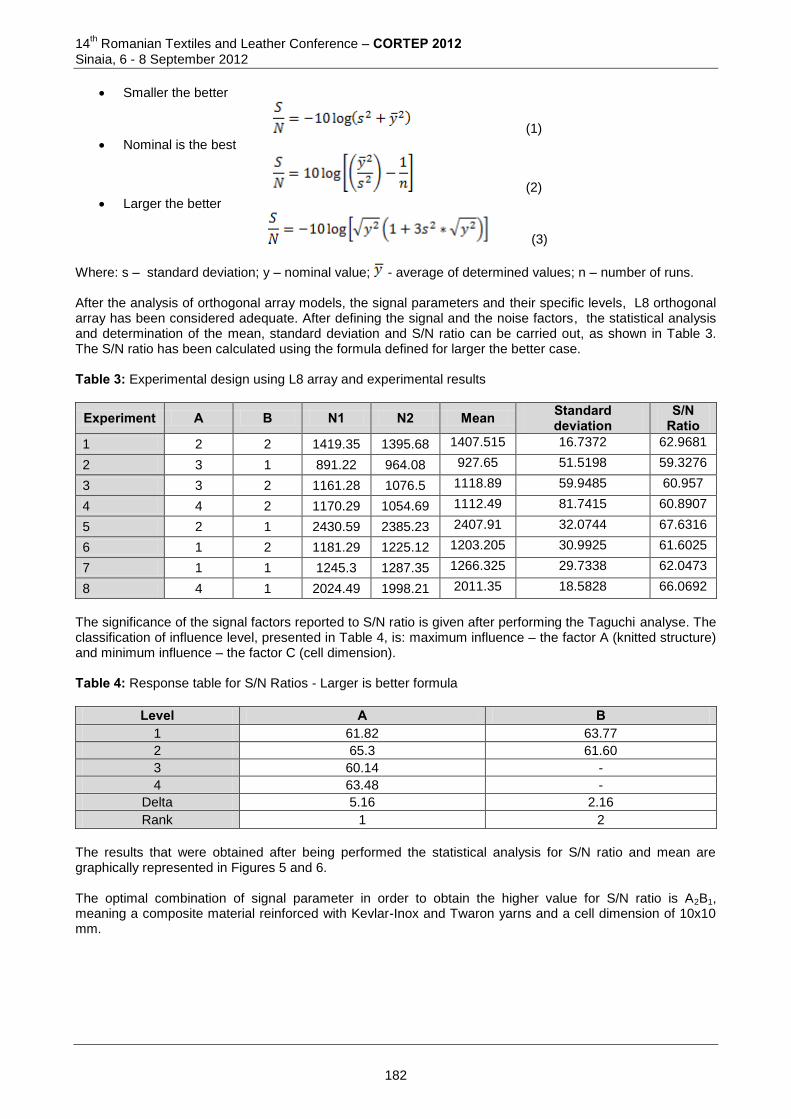
14th Romanian Textiles and Leather Conference – CORTEP 2012
Sinaia, 6 - 8 September 2012
Smaller the better
(1)
Nominal is the best
(2)
Larger the better
(3)
Where: s – standard deviation; y – nominal value; - average of determined values; n – number of runs. After the analysis of orthogonal array models, the signal parameters and their specific levels, L8 orthogonal array has been considered adequate. After defining the signal and the noise factors, the statistical analysis and determination of the mean, standard deviation and S/N ratio can be carried out, as shown in Table 3. The S/N ratio has been calculated using the formula defined for larger the better case. Table 3: Experimental design using L8 array and experimental results
Experiment A B N1 N2 Mean Standard deviation
S/N Ratio
1 2 2 1419.35 1395.68 1407.515 16.7372 62.9681
2 3 1 891.22 964.08 927.65 51.5198 59.3276
3 3 2 1161.28 1076.5 1118.89 59.9485 60.957
4 4 2 1170.29 1054.69 1112.49 81.7415 60.8907
5 2 1 2430.59 2385.23 2407.91 32.0744 67.6316
6 1 2 1181.29 1225.12 1203.205 30.9925 61.6025
7 1 1 1245.3 1287.35 1266.325 29.7338 62.0473
8 4 1 2024.49 1998.21 2011.35 18.5828 66.0692
The significance of the signal factors reported to S/N ratio is given after performing the Taguchi analyse. The classification of influence level, presented in Table 4, is: maximum influence – the factor A (knitted structure) and minimum influence – the factor C (cell dimension). Table 4: Response table for S/N Ratios - Larger is better formula
Level A B 1 61.82 63.77
2 65.3 61.60
3 60.14 -
4 63.48 -
Delta 5.16 2.16
Rank 1 2
The results that were obtained after being performed the statistical analysis for S/N ratio and mean are graphically represented in Figures 5 and 6. The optimal combination of signal parameter in order to obtain the higher value for S/N ratio is A2B1, meaning a composite material reinforced with Kevlar-Inox and Twaron yarns and a cell dimension of 10x10 mm.
182
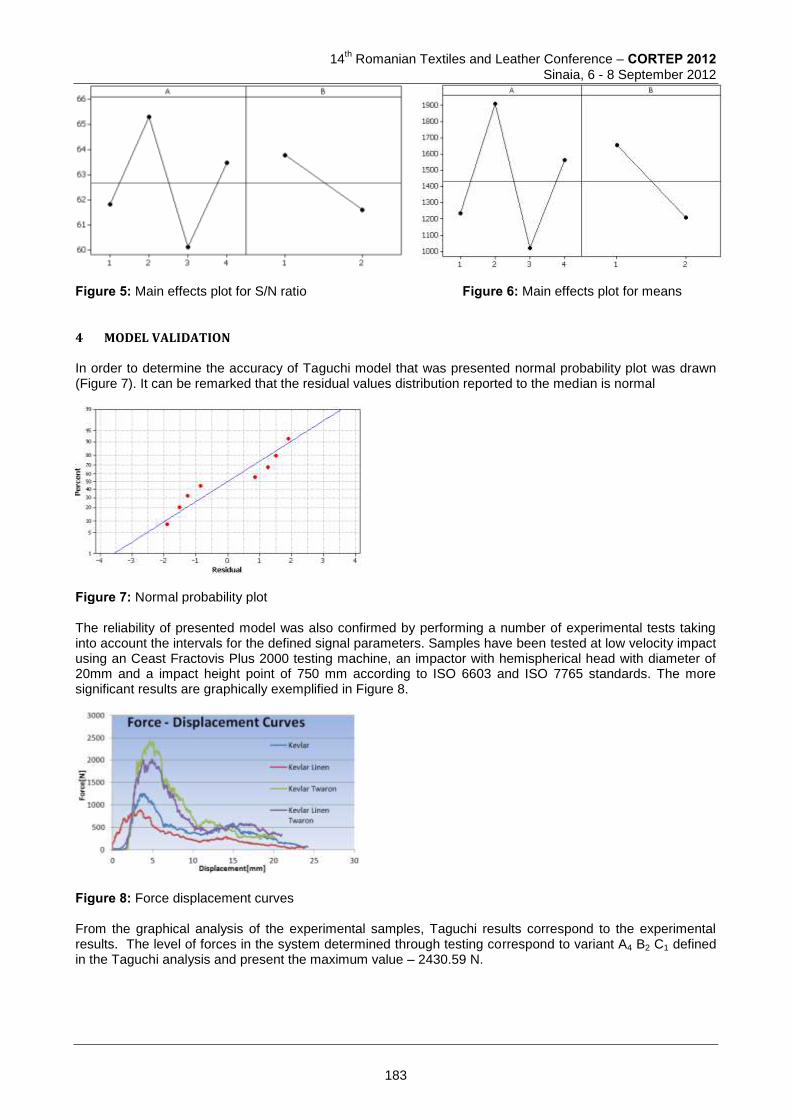
14
th Romanian Textiles and Leather Conference – CORTEP 2012
Sinaia, 6 - 8 September 2012
Figure 5: Main effects plot for S/N ratio
Figure 6: Main effects plot for means
4 MODEL VALIDATION In order to determine the accuracy of Taguchi model that was presented normal probability plot was drawn (Figure 7). It can be remarked that the residual values distribution reported to the median is normal
Figure 7: Normal probability plot The reliability of presented model was also confirmed by performing a number of experimental tests taking into account the intervals for the defined signal parameters. Samples have been tested at low velocity impact using an Ceast Fractovis Plus 2000 testing machine, an impactor with hemispherical head with diameter of 20mm and a impact height point of 750 mm according to ISO 6603 and ISO 7765 standards. The more significant results are graphically exemplified in Figure 8.
Figure 8: Force displacement curves From the graphical analysis of the experimental samples, Taguchi results correspond to the experimental results. The level of forces in the system determined through testing correspond to variant A4 B2 C1 defined in the Taguchi analysis and present the maximum value – 2430.59 N.
183
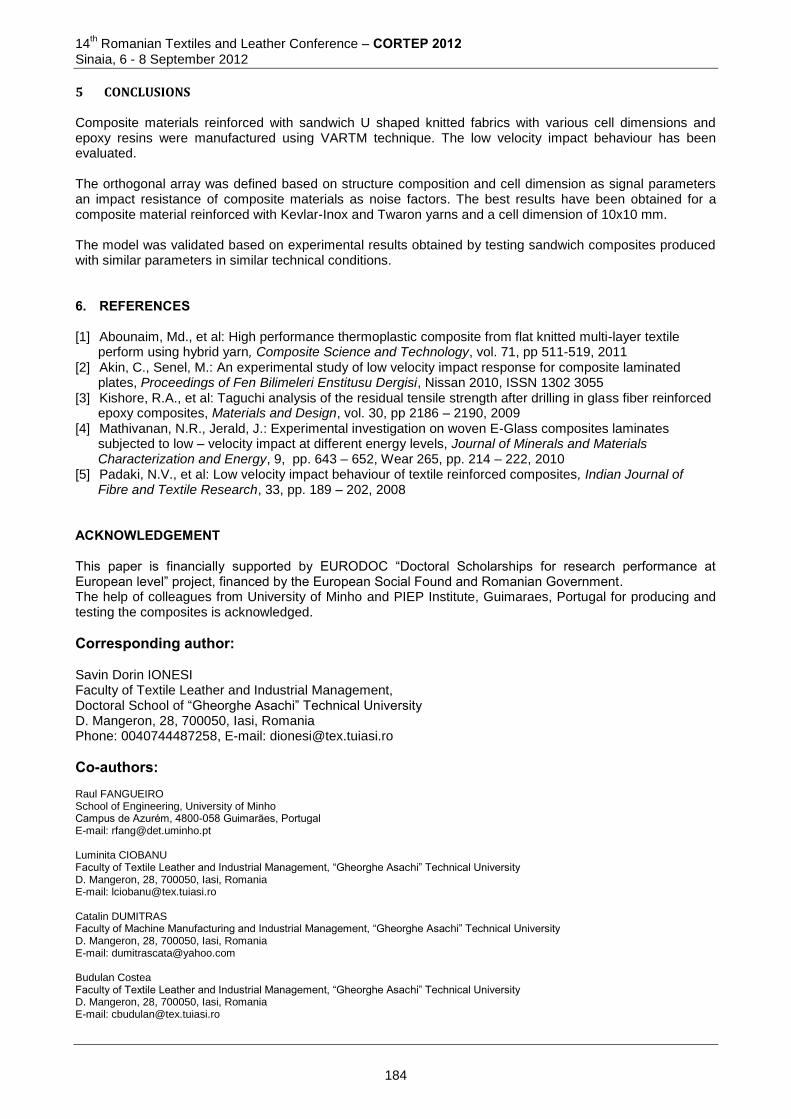
14th Romanian Textiles and Leather Conference – CORTEP 2012
Sinaia, 6 - 8 September 2012
5 CONCLUSIONS Composite materials reinforced with sandwich U shaped knitted fabrics with various cell dimensions and epoxy resins were manufactured using VARTM technique. The low velocity impact behaviour has been evaluated. The orthogonal array was defined based on structure composition and cell dimension as signal parameters an impact resistance of composite materials as noise factors. The best results have been obtained for a composite material reinforced with Kevlar-Inox and Twaron yarns and a cell dimension of 10x10 mm. The model was validated based on experimental results obtained by testing sandwich composites produced with similar parameters in similar technical conditions. 6. REFERENCES [1] Abounaim, Md., et al: High performance thermoplastic composite from flat knitted multi-layer textile
perform using hybrid yarn, Composite Science and Technology, vol. 71, pp 511-519, 2011 [2] Akin, C., Senel, M.: An experimental study of low velocity impact response for composite laminated
plates, Proceedings of Fen Bilimeleri Enstitusu Dergisi, Nissan 2010, ISSN 1302 3055 [3] Kishore, R.A., et al: Taguchi analysis of the residual tensile strength after drilling in glass fiber reinforced
epoxy composites, Materials and Design, vol. 30, pp 2186 – 2190, 2009 [4] Mathivanan, N.R., Jerald, J.: Experimental investigation on woven E-Glass composites laminates
subjected to low – velocity impact at different energy levels, Journal of Minerals and Materials Characterization and Energy, 9, pp. 643 – 652, Wear 265, pp. 214 – 222, 2010
[5] Padaki, N.V., et al: Low velocity impact behaviour of textile reinforced composites, Indian Journal of Fibre and Textile Research, 33, pp. 189 – 202, 2008
ACKNOWLEDGEMENT This paper is financially supported by EURODOC “Doctoral Scholarships for research performance at European level” project, financed by the European Social Found and Romanian Government. The help of colleagues from University of Minho and PIEP Institute, Guimaraes, Portugal for producing and testing the composites is acknowledged.
Corresponding author: Savin Dorin IONESI Faculty of Textile Leather and Industrial Management, Doctoral School of “Gheorghe Asachi” Technical University D. Mangeron, 28, 700050, Iasi, Romania Phone: 0040744487258, E-mail: [email protected]
Co-authors: Raul FANGUEIRO School of Engineering, University of Minho Campus de Azurém, 4800-058 Guimarães, Portugal E-mail: [email protected] Luminita CIOBANU Faculty of Textile Leather and Industrial Management, “Gheorghe Asachi” Technical University D. Mangeron, 28, 700050, Iasi, Romania E-mail: [email protected] Catalin DUMITRAS Faculty of Machine Manufacturing and Industrial Management, “Gheorghe Asachi” Technical University D. Mangeron, 28, 700050, Iasi, Romania E-mail: [email protected] Budulan Costea Faculty of Textile Leather and Industrial Management, “Gheorghe Asachi” Technical University D. Mangeron, 28, 700050, Iasi, Romania E-mail: [email protected]
184
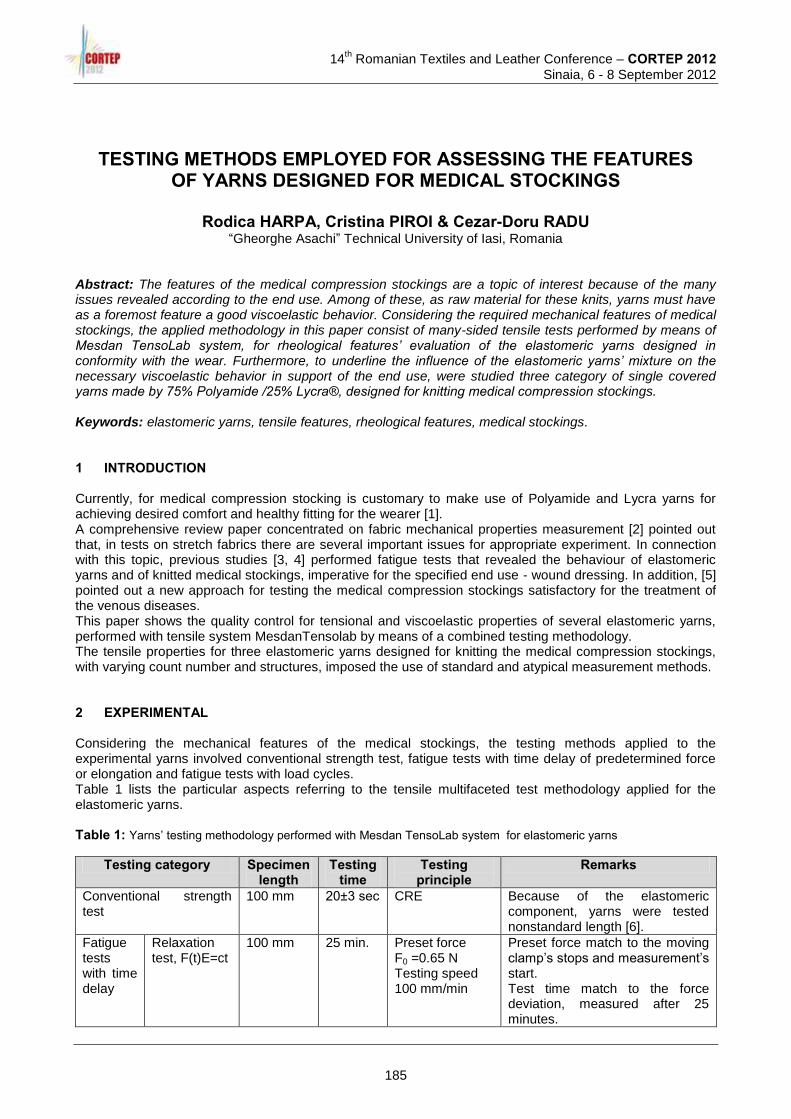
14
th Romanian Textiles and Leather Conference – CORTEP 2012
Sinaia, 6 - 8 September 2012
TESTING METHODS EMPLOYED FOR ASSESSING THE FEATURES OF YARNS DESIGNED FOR MEDICAL STOCKINGS
Rodica HARPA, Cristina PIROI & Cezar-Doru RADU
“Gheorghe Asachi” Technical University of Iasi, Romania Abstract: The features of the medical compression stockings are a topic of interest because of the many issues revealed according to the end use. Among of these, as raw material for these knits, yarns must have as a foremost feature a good viscoelastic behavior. Considering the required mechanical features of medical stockings, the applied methodology in this paper consist of many-sided tensile tests performed by means of Mesdan TensoLab system, for rheological features’ evaluation of the elastomeric yarns designed in conformity with the wear. Furthermore, to underline the influence of the elastomeric yarns’ mixture on the necessary viscoelastic behavior in support of the end use, were studied three category of single covered yarns made by 75% Polyamide /25% Lycra®, designed for knitting medical compression stockings. Keywords: elastomeric yarns, tensile features, rheological features, medical stockings. 1 INTRODUCTION Currently, for medical compression stocking is customary to make use of Polyamide and Lycra yarns for achieving desired comfort and healthy fitting for the wearer [1]. A comprehensive review paper concentrated on fabric mechanical properties measurement [2] pointed out that, in tests on stretch fabrics there are several important issues for appropriate experiment. In connection with this topic, previous studies [3, 4] performed fatigue tests that revealed the behaviour of elastomeric yarns and of knitted medical stockings, imperative for the specified end use - wound dressing. In addition, [5] pointed out a new approach for testing the medical compression stockings satisfactory for the treatment of the venous diseases. This paper shows the quality control for tensional and viscoelastic properties of several elastomeric yarns, performed with tensile system MesdanTensolab by means of a combined testing methodology. The tensile properties for three elastomeric yarns designed for knitting the medical compression stockings, with varying count number and structures, imposed the use of standard and atypical measurement methods. 2 EXPERIMENTAL Considering the mechanical features of the medical stockings, the testing methods applied to the experimental yarns involved conventional strength test, fatigue tests with time delay of predetermined force or elongation and fatigue tests with load cycles. Table 1 lists the particular aspects referring to the tensile multifaceted test methodology applied for the elastomeric yarns. Table 1: Yarns’ testing methodology performed with Mesdan TensoLab system for elastomeric yarns
Testing category Specimen length
Testing time
Testing principle
Remarks
Conventional strength test
100 mm 20±3 sec CRE Because of the elastomeric component, yarns were tested nonstandard length [6].
Fatigue tests with time delay
Relaxation test, F(t)E=ct
100 mm 25 min. Preset force F0 =0.65 N Testing speed 100 mm/min
Preset force match to the moving clamp’s stops and measurement’s start. Test time match to the force deviation, measured after 25 minutes.
185
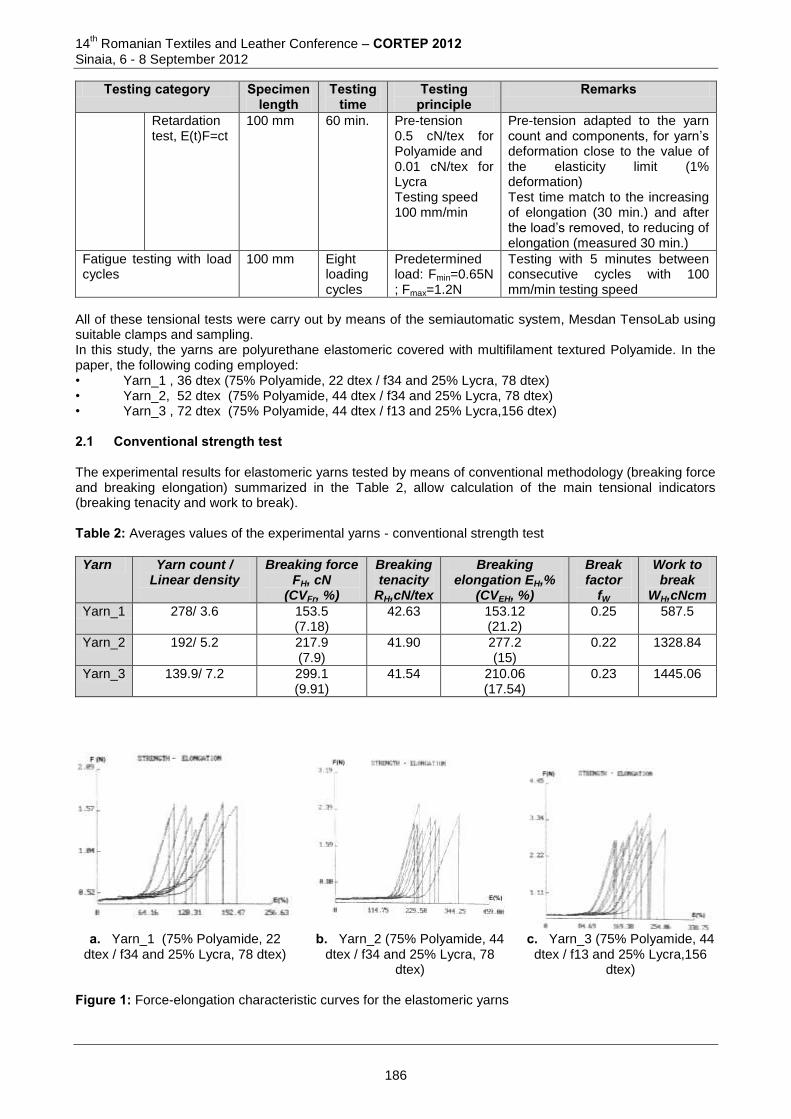
14th Romanian Textiles and Leather Conference – CORTEP 2012
Sinaia, 6 - 8 September 2012
Testing category Specimen length
Testing time
Testing principle
Remarks
Retardation test, E(t)F=ct
100 mm 60 min. Pre-tension 0.5 cN/tex for Polyamide and 0.01 cN/tex for Lycra Testing speed 100 mm/min
Pre-tension adapted to the yarn count and components, for yarn’s deformation close to the value of the elasticity limit (1% deformation) Test time match to the increasing of elongation (30 min.) and after the load’s removed, to reducing of elongation (measured 30 min.)
Fatigue testing with load cycles
100 mm Eight loading cycles
Predetermined load: Fmin=0.65N ; Fmax=1.2N
Testing with 5 minutes between consecutive cycles with 100 mm/min testing speed
All of these tensional tests were carry out by means of the semiautomatic system, Mesdan TensoLab using suitable clamps and sampling. In this study, the yarns are polyurethane elastomeric covered with multifilament textured Polyamide. In the paper, the following coding employed: • Yarn_1 , 36 dtex (75% Polyamide, 22 dtex / f34 and 25% Lycra, 78 dtex) • Yarn_2, 52 dtex (75% Polyamide, 44 dtex / f34 and 25% Lycra, 78 dtex) • Yarn_3 , 72 dtex (75% Polyamide, 44 dtex / f13 and 25% Lycra,156 dtex) 2.1 Conventional strength test The experimental results for elastomeric yarns tested by means of conventional methodology (breaking force and breaking elongation) summarized in the Table 2, allow calculation of the main tensional indicators (breaking tenacity and work to break). Table 2: Averages values of the experimental yarns - conventional strength test Yarn Yarn count /
Linear density
Breaking force FH, cN
(CVFr, %)
Breaking tenacity
RH,cN/tex
Breaking elongation EH,%
(CVEH, %)
Break factor
fW
Work to break
WH,cNcm
Yarn_1 278/ 3.6 153.5 (7.18)
42.63 153.12 (21.2)
0.25 587.5
Yarn_2 192/ 5.2 217.9 (7.9)
41.90 277.2 (15)
0.22 1328.84
Yarn_3 139.9/ 7.2 299.1 (9.91)
41.54 210.06 (17.54)
0.23 1445.06
a. Yarn_1 (75% Polyamide, 22 dtex / f34 and 25% Lycra, 78 dtex)
b. Yarn_2 (75% Polyamide, 44 dtex / f34 and 25% Lycra, 78
dtex)
c. Yarn_3 (75% Polyamide, 44 dtex / f13 and 25% Lycra,156
dtex) Figure 1: Force-elongation characteristic curves for the elastomeric yarns
186
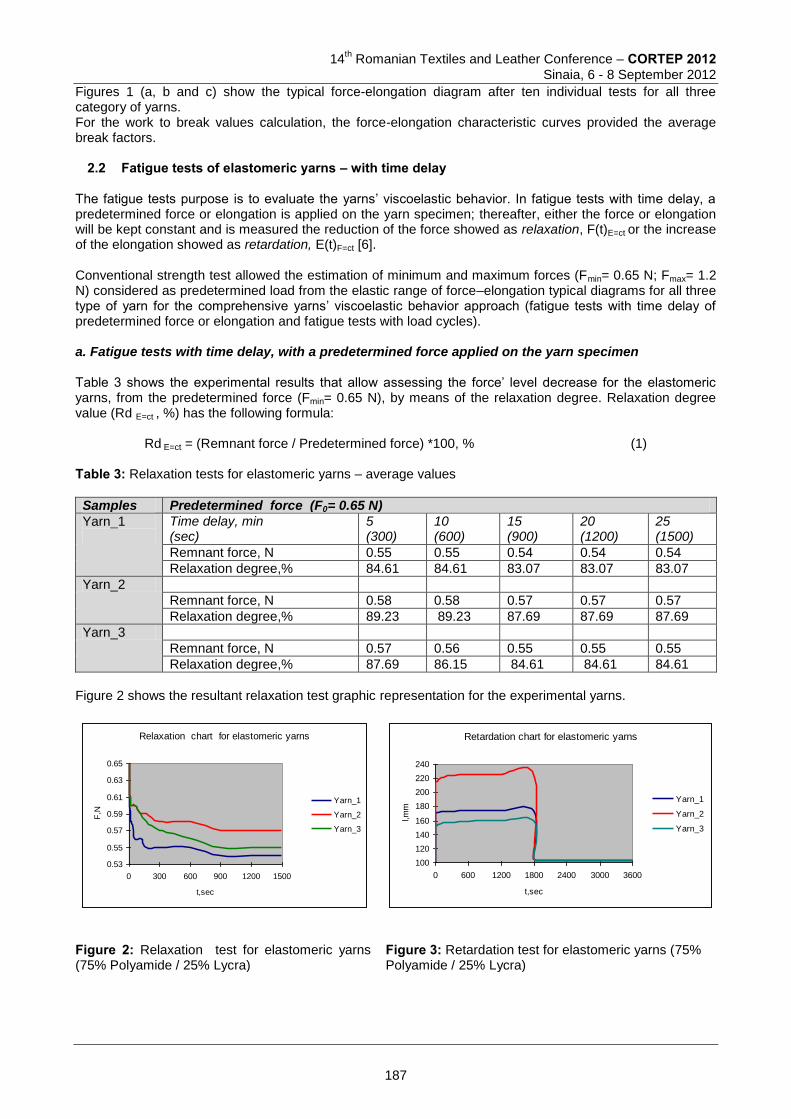
14
th Romanian Textiles and Leather Conference – CORTEP 2012
Sinaia, 6 - 8 September 2012
Figures 1 (a, b and c) show the typical force-elongation diagram after ten individual tests for all three category of yarns. For the work to break values calculation, the force-elongation characteristic curves provided the average break factors.
2.2 Fatigue tests of elastomeric yarns – with time delay The fatigue tests purpose is to evaluate the yarns’ viscoelastic behavior. In fatigue tests with time delay, a predetermined force or elongation is applied on the yarn specimen; thereafter, either the force or elongation will be kept constant and is measured the reduction of the force showed as relaxation, F(t)E=ct or the increase of the elongation showed as retardation, E(t)F=ct [6]. Conventional strength test allowed the estimation of minimum and maximum forces (Fmin= 0.65 N; Fmax= 1.2 N) considered as predetermined load from the elastic range of force–elongation typical diagrams for all three type of yarn for the comprehensive yarns’ viscoelastic behavior approach (fatigue tests with time delay of predetermined force or elongation and fatigue tests with load cycles). a. Fatigue tests with time delay, with a predetermined force applied on the yarn specimen
Table 3 shows the experimental results that allow assessing the force’ level decrease for the elastomeric yarns, from the predetermined force (Fmin= 0.65 N), by means of the relaxation degree. Relaxation degree value (Rd E=ct , %) has the following formula:
Rd E=ct = (Remnant force / Predetermined force) *100, % (1) Table 3: Relaxation tests for elastomeric yarns – average values
Samples Predetermined force (F0= 0.65 N)
Yarn_1
Time delay, min (sec)
5 (300)
10 (600)
15 (900)
20 (1200)
25 (1500)
Remnant force, N 0.55 0.55 0.54 0.54 0.54
Relaxation degree,% 84.61 84.61 83.07 83.07 83.07
Yarn_2
Remnant force, N 0.58 0.58 0.57 0.57 0.57
Relaxation degree,% 89.23 89.23 87.69 87.69 87.69
Yarn_3
Remnant force, N 0.57 0.56 0.55 0.55 0.55
Relaxation degree,% 87.69 86.15 84.61 84.61 84.61
Figure 2 shows the resultant relaxation test graphic representation for the experimental yarns.
Figure 2: Relaxation test for elastomeric yarns (75% Polyamide / 25% Lycra)
Figure 3: Retardation test for elastomeric yarns (75% Polyamide / 25% Lycra)
Relaxation chart for elastomeric yarns
0.53
0.55
0.57
0.59
0.61
0.63
0.65
0 300 600 900 1200 1500
t,sec
F,N
Yarn_1
Yarn_2
Yarn_3
Retardation chart for elastomeric yarns
100
120
140
160
180
200
220
240
0 600 1200 1800 2400 3000 3600
t,sec
l,mm
Yarn_1
Yarn_2
Yarn_3
187

14th Romanian Textiles and Leather Conference – CORTEP 2012
Sinaia, 6 - 8 September 2012
b. Fatigue tests with time delay, with a predetermined elongation applied on the yarn specimen Table 4 shows the experimental results that allow assessing the elongation’ level increase of the elastomeric yarns for a constant load over a defined period; after the load removing, the reducing of elongation measured for 30 minutes. Test length (lo, mm) is the point with lower elongation value when reaching the pretension and the maximum length (l1, mm) is the point with upper elongation value (after 30 minutes); the changed length (l2, mm) is measured after 60 minutes. The rank of elongation’ increase, for elastomeric yarns was calculated with the retardation degree. Retardation degree value (Rd F=ct , %) has the following formula:
Rd F=ct = ,%10001
21
ll
ll (2)
Table 4: Retardation tests for elastomeric yarns - average values
Yarns Test length, lo (mm)
Maximum length, l1(mm)
Changed length, l2(mm)
Total elongation, Et,%
Remnant elongation E2,%
Retardation degree, %
Yarn_1 100 170 103 70 3 95.71
Yarn_2 100 213 102 113 2 98.23
Yarn_3 100 159 102 59 2 96.6
Figure 3 shows the resultant retardation test graphic representation for the experimental yarns.
2.3 Fatigue testing of elastomeric yarns - with load cycles The defined forces, minimum and maximum (Fmin= 0.65 N; Fmax= 1.2 N) considered as predetermined load from the elastic range of force–elongation diagram for all three type of yarns, were applied on the elastomeric yarns samples within eighth loading cycles. The first loading cycle starting from the predetermined lower force (Fmin = 0.65 N) to the predetermined higher force (F max=1.2 N); after that, the higher force was reduced, until the lowest force was reached again. Table 5 shows the average values of elongation obtained after fatigue tests with eighth loading cycles (cc) accomplished on the elastomeric yarns by means of Mesdan TensoLab. Table 5: Fatigue behaviour of elastomeric yarns for eighth loading cycles
Samples
Elongation for eighth loading cycles
Fmin Fmax Fmin Fmax Fmin Fmax Fmin Fmax
Yarn_1
1 cc 2 cc 3 cc 4 cc
73.4 96.7 83.1 96.81 83.7 96.9 84.5 97.03
5 cc 6 cc 7 cc 8cc
85.6 97.23 85.9 97.5 86.1 97.59 86.2 97.6
Yarn_2
1 cc 2 cc 3 cc 4 cc
177.6 229.5 191 230.5 193.5 230.8 198.1 231.4
5 cc 6 cc 7 cc 8cc
198.7 232 199 232.4 199.5 233.7 199.8 235.1
Yarn_3
1 cc 2 cc 3 cc 4 cc
154.1 217.6 161 217.7 168.1 217.8 169.2 217.9
5 cc 6 cc 7 cc 8cc
171 218 173.5 218.3 174 218.5 176.5 218.7
188
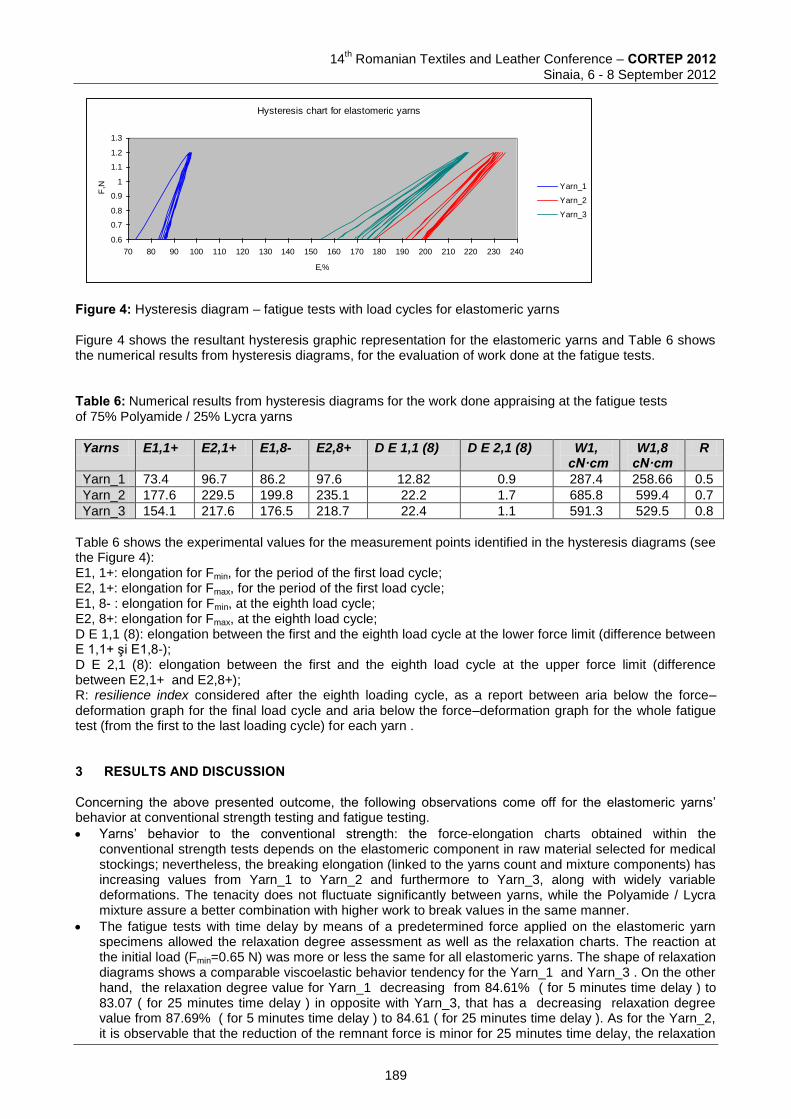
14
th Romanian Textiles and Leather Conference – CORTEP 2012
Sinaia, 6 - 8 September 2012
Figure 4: Hysteresis diagram – fatigue tests with load cycles for elastomeric yarns Figure 4 shows the resultant hysteresis graphic representation for the elastomeric yarns and Table 6 shows the numerical results from hysteresis diagrams, for the evaluation of work done at the fatigue tests. Table 6: Numerical results from hysteresis diagrams for the work done appraising at the fatigue tests of 75% Polyamide / 25% Lycra yarns
Yarns E1,1+ E2,1+ E1,8- E2,8+ D E 1,1 (8) D E 2,1 (8) W1, cN·cm
W1,8 cN·cm
R
Yarn_1 73.4 96.7 86.2 97.6 12.82 0.9 287.4 258.66 0.5
Yarn_2 177.6 229.5 199.8 235.1 22.2 1.7 685.8 599.4 0.7
Yarn_3 154.1 217.6 176.5 218.7 22.4 1.1 591.3 529.5 0.8
Table 6 shows the experimental values for the measurement points identified in the hysteresis diagrams (see the Figure 4): E1, 1+: elongation for Fmin, for the period of the first load cycle; E2, 1+: elongation for Fmax, for the period of the first load cycle; E1, 8- : elongation for Fmin, at the eighth load cycle; E2, 8+: elongation for Fmax, at the eighth load cycle; D E 1,1 (8): elongation between the first and the eighth load cycle at the lower force limit (difference between E 1,1+ şi E1,8-); D E 2,1 (8): elongation between the first and the eighth load cycle at the upper force limit (difference between E2,1+ and E2,8+); R: resilience index considered after the eighth loading cycle, as a report between aria below the force–deformation graph for the final load cycle and aria below the force–deformation graph for the whole fatigue test (from the first to the last loading cycle) for each yarn . 3 RESULTS AND DISCUSSION Concerning the above presented outcome, the following observations come off for the elastomeric yarns’ behavior at conventional strength testing and fatigue testing.
Yarns’ behavior to the conventional strength: the force-elongation charts obtained within the conventional strength tests depends on the elastomeric component in raw material selected for medical stockings; nevertheless, the breaking elongation (linked to the yarns count and mixture components) has increasing values from Yarn_1 to Yarn_2 and furthermore to Yarn_3, along with widely variable deformations. The tenacity does not fluctuate significantly between yarns, while the Polyamide / Lycra mixture assure a better combination with higher work to break values in the same manner.
The fatigue tests with time delay by means of a predetermined force applied on the elastomeric yarn specimens allowed the relaxation degree assessment as well as the relaxation charts. The reaction at the initial load (Fmin=0.65 N) was more or less the same for all elastomeric yarns. The shape of relaxation diagrams shows a comparable viscoelastic behavior tendency for the Yarn_1 and Yarn_3 . On the other hand, the relaxation degree value for Yarn_1 decreasing from 84.61% ( for 5 minutes time delay ) to 83.07 ( for 25 minutes time delay ) in opposite with Yarn_3, that has a decreasing relaxation degree value from 87.69% ( for 5 minutes time delay ) to 84.61 ( for 25 minutes time delay ). As for the Yarn_2, it is observable that the reduction of the remnant force is minor for 25 minutes time delay, the relaxation
Hysteresis chart for elastomeric yarns
0.6
0.7
0.8
0.9
1
1.1
1.2
1.3
70 80 90 100 110 120 130 140 150 160 170 180 190 200 210 220 230 240
E,%
F,N Yarn_1
Yarn_2
Yarn_3
189
14th Romanian Textiles and Leather Conference – CORTEP 2012
Sinaia, 6 - 8 September 2012
degree value changing from 89.23% (for 5 minutes time delay) to 87.69 (for 25 minutes time delay); that make known a better behavior for the purpose of these yarns - knitted fabrics for medical compression stockings.
The fatigue tests with time delay by means of a predetermined elongation applied on the elastomeric yarn specimens allowed the retardation degree assessment and the retardation charts, too. The shape of the retardation diagrams shows similar behavior for all yarns; the retardation degree value for Yarn_1 is 95.71% (after 60 minutes time delay) and 96.6 % for Yarn_3. The Yarn_2 get to 98.23 % retardation, confirming a better behavior for the final purpose of these yarns intended for medical compression stockings.
The fatigue tests with load cycles reveal that, after eighth cycles between two-selected force values (from the elastic range of force–elongation typical diagrams), the Yarn_2 and Yarn_3 would preserve to a great extent the designed gradual compression in medical stockings instead of Yarn_1. The hysteresis diagrams achieved as results of these tests allowed the resilience index calculation that can provide the reaction and suitability of the designed elastomeric yarns to subsequent fatigue tests, associated with the real wear.
4 CONCLUSIONS In the quality control of the elastomeric yarns, atypical tensile testing methodology is necessary because of the Lycra’s effect in yarns‘ mixture both, on the behavior to conventional strength test and on the viscoelastic behavior; the last one is essential for the destination as yarns designed for medical compression stocking. In this paper, the experimental yarns are three polyurethane elastomeric covered with multifilament textured Polyamide (75% Polyamide / 25% Lycra) that are different as a count number and mixture’s structure, too. In regular dress in and wear, the medical compression stockings have to keep the designed compression for about eighth month’s successive wearing-washing cycles; therefore, adequate rheological features should characterize the elastomeric yarns designed for knitting these products. Considering the mechanical features of the medical stockings, the testing methods applied to the experimental yarns involved the conventional strength test, the fatigue tests with time delay of predetermined force or elongation and the fatigue tests with load cycles, all together performed by means of Mesdan TensoLab system. Considering the overall testing results’ viewpoint, the 52 dtex elastomeric yarn with codification Yarn_2 (75% Polyamide, 44 dtex / f34 and 25% Lycra, 78 dtex) reveals the better features adequate to destination, succeed by the Yarn_3, 72 dtex (75% Polyamide, 44 dtex / f13 and 25% Lycra,156 dtex). In this paper, all fatigue tests provided the elastomeric yarns’ suitability in preserving the needed compression after wearing-washing cycles applied on the stockings. ACKNOWLEDGEMENTS This research was supported by the CEEX 192/2006 DERMACTIVTEX project.(Romania). 5 REFERENCES [1] Doherty, D.C., Morgan, P.A. and Moffatt, C.J., Role of hosiery in lower limb lymphoedema.
Lymphoedema Framework. Template for Practice: Compression hosiery in lymphoedema. London: MEP Ltd.10-14 (2006), Available from www.woundsinternational.com
[2] Bassett, R.J., Postle, R. and Pan, N., Experimental Methods for Measuring Fabric Mechanical Properties: A Review and Analysis. Textile Res. J. 69 (11):866-875 (1999), ISSN: 0040-5175
[3] Harpa. R., Radu .C.D., Cristian. I. and Piroi.C., Assessment On The Behaviour At The Fatigue Tests Of Knitting Yarns With Lycra® Content for Elastic Stocking, Proceedings of X
th International Workshop
SMARTEX Ivanovo, p.176-181, Russia, (2007), ISBN 978-5-88954-228-5 [4] Radu. C.D., Tulbure. A., Agafitei. G., Popescu. V., Piroi. C. and Harpa. R., Knitted Structures For
Dermatological Diseases. Proceedings of the 5th International Conference on the Management of
Technological Changes, Alexandropoulos, Vol. I. Greece, 435-439, (2007), ISBN :978-960-8932-1-2 [5] Harpa, R., Piroi, C. and Radu, C.D., A New Approach For Testing Medical Stockings, Textile Research
Journal , 80(8), p. 683-695, (2010), ISSN: 0040-5175 [6] Uster Technologies, USTER ®Laboratory Systems. Application Handbook, (2002), Available from
www.uster.com (CD)
190
14
th Romanian Textiles and Leather Conference – CORTEP 2012
Sinaia, 6 - 8 September 2012
Corresponding author: Rodica HARPA Department of Engineering & Design of Textile Products, Faculty of Textiles & Leather Engineering and Industrial Management, ”Gheorghe Asachi” Technical University of Iasi 700050 - Iaşi, România Phone: +40 232 278683 (1148) Fax:+(40) 232 23049 E-mail: [email protected]
Co-author(s): Cristina PIROI Department of Engineering & Design of Textile Products, Faculty of Textiles & Leather Engineering and Industrial Management, ”Gheorghe Asachi” Technical University of Iasi 700050 - Iaşi, România Phone: +40 232 278683 (1143), Fax:+(40) 232 23049, E-mail: [email protected] Cezar Doru RADU
Department of Chemical Engineering of Textile Products, Faculty of Textiles & Leather Engineering and Industrial Management, ”Gheorghe Asachi” Technical University of Iasi 700050 - Iaşi, România Phone: +40 232 278683 (1226), Fax:+(40) 232 23049, E-mail: [email protected]
191
14
th Romanian Textiles and Leather Conference – CORTEP 2012
Sinaia, 6 - 8 September 2012
THE INFLUENCE OF THE ABRASION STRESS ON ELECTRICAL
PROPERTIES OF WOVEN FABRICS WITH METALLIC FIBERS CONTENT
Lucica CIOARA, Ioan CIOARA & Daniela NEGRU1 Gheorghe Asachi Technical University of Iasi,
Faculty of Textile and Leather Engineering and Industrial Management, Iaşi, Romania
Abstract: One of the technical solutions for achievement of textile fabrics with electrical properties is through insertion of metallic yarns or yarns with metallic fibers in the woven structure. Such woven fabrics can be used for anti-static protective equipments and for electromagnetic shielding. During usage of these equipments one of the most frequent stresses is the abrasion. The fibrous composition and the electrical properties of the woven fabrics are affected. This paper presents a study regarding the influence of the abrasion stress on electrical properties of woven fabrics with metallic fibers content, respectively on the electrical surface resistivity. The experimental program conceived for research includes two variants woven fabrics. For all the variants of woven fabrics, the yarns containing stainless steel fibers were inserted in the structure as weft yarns. The woven fabrics have the compound structure, weft backed weave. The fiber composition and the weave woven fabric influences the abrasion behavior. Loss of metal fibers by abrasion cause change of the electrical resistance of the fabric.
Keywords: woven fabric, metallic fiber, abrasion, resistivity.
1 INTRODUCTION
In the last decade, conductive textile fabrics have been considered for electromagnetic shielding and
anti-electrostatic purposes in various applications for electrical and electronic industries and the defense, due to their properties such are the elasticity, electrostatic discharge and EMI protection [1]. Many conductive fibers are used in the textile fabrics to confer to the textile fabrics resistivity for electromagnetic shielding applications and for electrostatic discharge purposes. The required resistivity of an anti-electrostatic material is in the range from 10
9 – 10
13Ω/cm
2 [2].
From the surface resistivity point of view, the woven fabrics can be classified as follows [2, EN 1149]: - conductive materials, with resistivity lower than 10
5 Ω;
- antistatic materials, with resistivity between 105 – 10
12 Ω;
- insulating materials, with resistivity higher than 1012
Ω; - materials with electromagnetic shielding properties, with resistivity lower than 10
3 Ω.
Textile fabrics can be improved using different materials so the final product obtained, besides intrinsic properties conferred by the textile fabric itself to gain other specific properties that make them proper to use in many applications. Textile fabrics having incorporated metallic fibers or yarns have electrical properties which make them suitable for applications in fields of antistatic garments and products or EMI shielding, in function of the metallic fiber content. In case of the stainless steel fibers, those fibers confer electrical conductivity . Conductive textiles can be obtained through several methods, such as insertion of metallic fibers/yarns in the woven/knitted structure, coating with conductive coatings, etc. The aim is to obtain conductive fabrics and to keep the textile characteristics, according to the method used, like friction resistance, elasticity, durability, the drape. The most advantageous solution for manufacturing of antistatic woven fabrics is that of use of conductive yarns even distributed into fabric structure because in comparison with the other methods the antistatic effect is stable and also do not depend on the air humidity. The reason of this statement is that the stainless steel fibers have not only good conductive properties, but also good washing resistance. The antistatic properties,
192
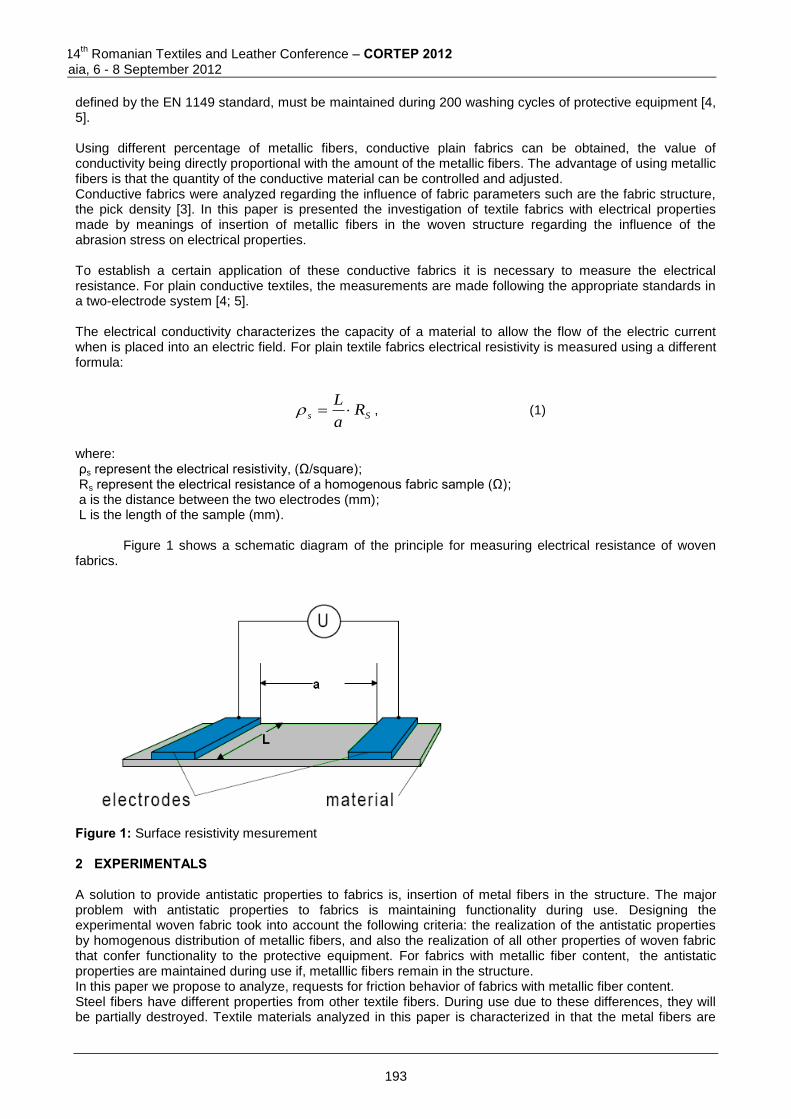
14th Romanian Textiles and Leather Conference – CORTEP 2012
Sinaia, 6 - 8 September 2012
defined by the EN 1149 standard, must be maintained during 200 washing cycles of protective equipment [4, 5]. Using different percentage of metallic fibers, conductive plain fabrics can be obtained, the value of conductivity being directly proportional with the amount of the metallic fibers. The advantage of using metallic fibers is that the quantity of the conductive material can be controlled and adjusted. Conductive fabrics were analyzed regarding the influence of fabric parameters such are the fabric structure, the pick density [3]. In this paper is presented the investigation of textile fabrics with electrical properties made by meanings of insertion of metallic fibers in the woven structure regarding the influence of the abrasion stress on electrical properties. To establish a certain application of these conductive fabrics it is necessary to measure the electrical resistance. For plain conductive textiles, the measurements are made following the appropriate standards in a two-electrode system [4; 5]. The electrical conductivity characterizes the capacity of a material to allow the flow of the electric current when is placed into an electric field. For plain textile fabrics electrical resistivity is measured using a different formula:
Ss Ra
L , (1)
where: ρs represent the electrical resistivity, (Ω/square); Rs represent the electrical resistance of a homogenous fabric sample (Ω); a is the distance between the two electrodes (mm); L is the length of the sample (mm).
Figure 1 shows a schematic diagram of the principle for measuring electrical resistance of woven fabrics.
Figure 1: Surface resistivity mesurement
2 EXPERIMENTALS A solution to provide antistatic properties to fabrics is, insertion of metal fibers in the structure. The major problem with antistatic properties to fabrics is maintaining functionality during use. Designing the experimental woven fabric took into account the following criteria: the realization of the antistatic properties by homogenous distribution of metallic fibers, and also the realization of all other properties of woven fabric that confer functionality to the protective equipment. For fabrics with metallic fiber content, the antistatic properties are maintained during use if, metalllic fibers remain in the structure. In this paper we propose to analyze, requests for friction behavior of fabrics with metallic fiber content. Steel fibers have different properties from other textile fibers. During use due to these differences, they will be partially destroyed. Textile materials analyzed in this paper is characterized in that the metal fibers are
193
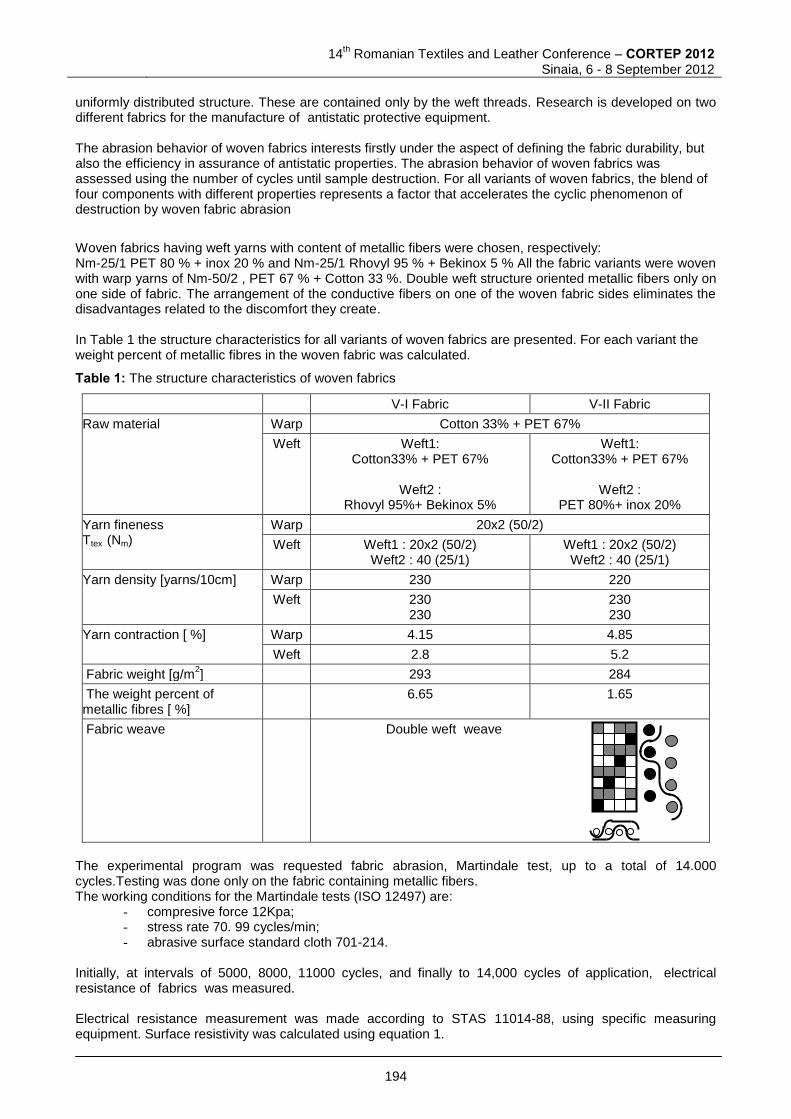
14th Romanian Textiles and Leather Conference – CORTEP 2012
Sinaia, 6 - 8 September 2012
uniformly distributed structure. These are contained only by the weft threads. Research is developed on two different fabrics for the manufacture of antistatic protective equipment. The abrasion behavior of woven fabrics interests firstly under the aspect of defining the fabric durability, but also the efficiency in assurance of antistatic properties. The abrasion behavior of woven fabrics was assessed using the number of cycles until sample destruction. For all variants of woven fabrics, the blend of four components with different properties represents a factor that accelerates the cyclic phenomenon of destruction by woven fabric abrasion
Woven fabrics having weft yarns with content of metallic fibers were chosen, respectively: Nm-25/1 PET 80 % + inox 20 % and Nm-25/1 Rhovyl 95 % + Bekinox 5 % All the fabric variants were woven with warp yarns of Nm-50/2 , PET 67 % + Cotton 33 %. Double weft structure oriented metallic fibers only on one side of fabric. The arrangement of the conductive fibers on one of the woven fabric sides eliminates the disadvantages related to the discomfort they create. In Table 1 the structure characteristics for all variants of woven fabrics are presented. For each variant the weight percent of metallic fibres in the woven fabric was calculated.
Table 1: The structure characteristics of woven fabrics
V-I Fabric V-II Fabric
Raw material Warp Cotton 33% + PET 67%
Weft Weft1: Cotton33% + PET 67%
Weft2 :
Rhovyl 95%+ Bekinox 5%
Weft1: Cotton33% + PET 67%
Weft2 :
PET 80%+ inox 20%
Yarn fineness Ttex (Nm)
Warp 20x2 (50/2)
Weft Weft1 : 20x2 (50/2) Weft2 : 40 (25/1)
Weft1 : 20x2 (50/2) Weft2 : 40 (25/1)
Yarn density [yarns/10cm] Warp 230 220
Weft 230 230
230 230
Yarn contraction [ %] Warp 4.15 4.85
Weft 2.8 5.2
Fabric weight [g/m2] 293 284
The weight percent of metallic fibres [ %]
6.65 1.65
Fabric weave Double weft weave
The experimental program was requested fabric abrasion, Martindale test, up to a total of 14.000 cycles.Testing was done only on the fabric containing metallic fibers. The working conditions for the Martindale tests (ISO 12497) are:
- compresive force 12Kpa; - stress rate 70. 99 cycles/min; - abrasive surface standard cloth 701-214.
Initially, at intervals of 5000, 8000, 11000 cycles, and finally to 14,000 cycles of application, electrical resistance of fabrics was measured. Electrical resistance measurement was made according to STAS 11014-88, using specific measuring equipment. Surface resistivity was calculated using equation 1.
194
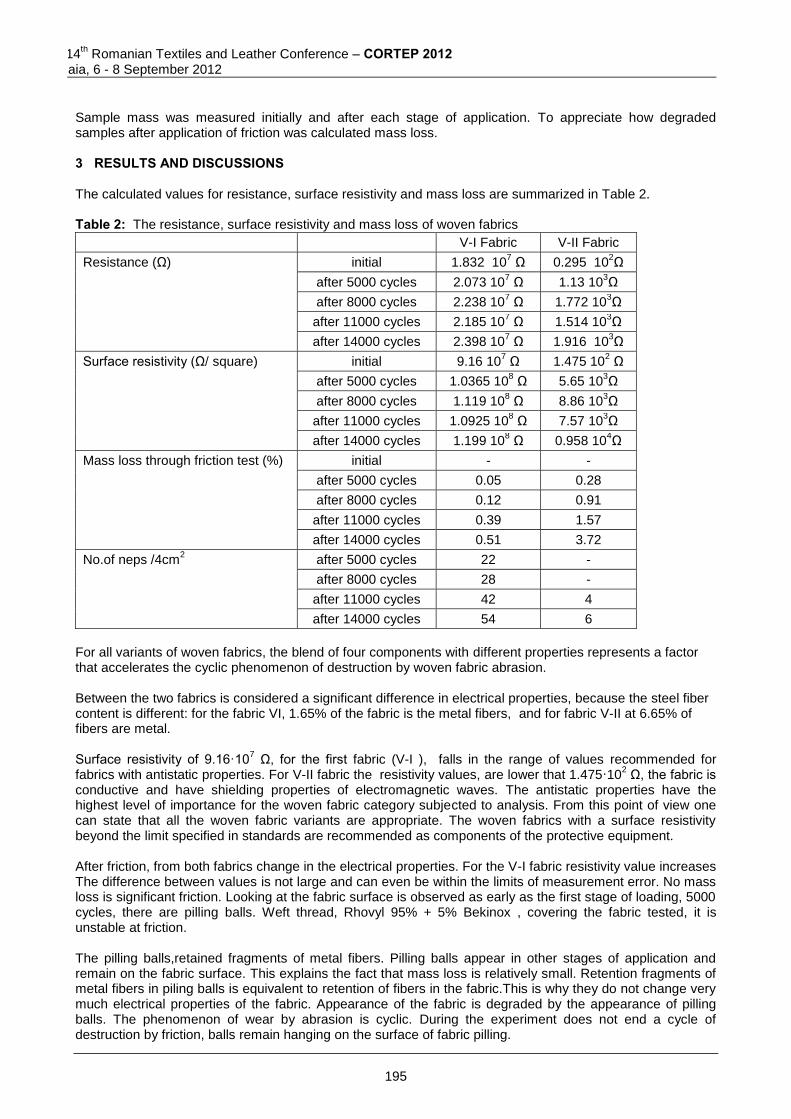
14th Romanian Textiles and Leather Conference – CORTEP 2012
Sinaia, 6 - 8 September 2012
Sample mass was measured initially and after each stage of application. To appreciate how degraded samples after application of friction was calculated mass loss.
3 RESULTS AND DISCUSSIONS
The calculated values for resistance, surface resistivity and mass loss are summarized in Table 2. Table 2: The resistance, surface resistivity and mass loss of woven fabrics
V-I Fabric V-II Fabric
Resistance (Ω) initial 1.832 107 Ω 0.295 10
2Ω
after 5000 cycles 2.073 107 Ω 1.13 10
3Ω
after 8000 cycles 2.238 107 Ω 1.772 10
3Ω
after 11000 cycles 2.185 107 Ω 1.514 10
3Ω
after 14000 cycles 2.398 107 Ω 1.916 10
3Ω
Surface resistivity (Ω/ square) initial 9.16 107 Ω 1.475 10
2 Ω
after 5000 cycles 1.0365 108 Ω 5.65 10
3Ω
after 8000 cycles 1.119 108 Ω 8.86 10
3Ω
after 11000 cycles 1.0925 108 Ω 7.57 10
3Ω
after 14000 cycles 1.199 108 Ω 0.958 10
4Ω
Mass loss through friction test (%)
initial - -
after 5000 cycles 0.05 0.28
after 8000 cycles 0.12 0.91
after 11000 cycles 0.39 1.57
after 14000 cycles 0.51 3.72
No.of neps /4cm2
after 5000 cycles 22 -
after 8000 cycles 28 -
after 11000 cycles 42 4
after 14000 cycles 54 6
For all variants of woven fabrics, the blend of four components with different properties represents a factor that accelerates the cyclic phenomenon of destruction by woven fabric abrasion. Between the two fabrics is considered a significant difference in electrical properties, because the steel fiber content is different: for the fabric VI, 1.65% of the fabric is the metal fibers, and for fabric V-II at 6.65% of fibers are metal. Surface resistivity of 9.16·10
7 Ω, for the first fabric (V-I ), falls in the range of values recommended for
fabrics with antistatic properties. For V-II fabric the resistivity values, are lower that 1.475·102 Ω, the fabric is
conductive and have shielding properties of electromagnetic waves. The antistatic properties have the highest level of importance for the woven fabric category subjected to analysis. From this point of view one can state that all the woven fabric variants are appropriate. The woven fabrics with a surface resistivity beyond the limit specified in standards are recommended as components of the protective equipment. After friction, from both fabrics change in the electrical properties. For the V-I fabric resistivity value increases The difference between values is not large and can even be within the limits of measurement error. No mass loss is significant friction. Looking at the fabric surface is observed as early as the first stage of loading, 5000 cycles, there are pilling balls. Weft thread, Rhovyl 95% + 5% Bekinox , covering the fabric tested, it is unstable at friction. The pilling balls,retained fragments of metal fibers. Pilling balls appear in other stages of application and remain on the fabric surface. This explains the fact that mass loss is relatively small. Retention fragments of metal fibers in piling balls is equivalent to retention of fibers in the fabric.This is why they do not change very much electrical properties of the fabric. Appearance of the fabric is degraded by the appearance of pilling balls. The phenomenon of wear by abrasion is cyclic. During the experiment does not end a cycle of destruction by friction, balls remain hanging on the surface of fabric pilling.
195
14th Romanian Textiles and Leather Conference – CORTEP 2012
Sinaia, 6 - 8 September 2012
At confectioner equipment should be considered that, the fabric has two parts and metal fiber is focused on only one of them. Manufacturing protective equipment must be designed with the metal fiber is not exposed to intense friction applications. From friction, fabric V-II supports higher mass changes and the surface resistivity. Mass loss is small in the first two stages of application. Fabric pilling is not. At the end of the testing program the mass loss is 3.72%. During the application does not appear the pilling in fabric. Weft thread, PET 80% + 20% steel, which appears on the tested fabric, more resistant to abrasion. Observed on the fabric surface fragments of metal fibers drawn from fabric. These fragments are not retained in the structure and pass the loss of mass. When the friction program is end, the fabric is lighter, due to loss of metal fibers. Metallic fiber loss increases the resistivity of the fabric. Resistivity value increases from 1.475·10
2 Ω, to 0.958·10
4 Ω value.
We can note that the mass loss of a significant amount is made up of fragments of metal fibers. Fabric remains in the category of fabrics with antistatic properties and electromagnetic wave shielding. It is recommended when using fabric on the fabric part with metal fibers not exert abrasion. Friction may change its electrical properties. 4 CONCLUSIONS
- The abrasion behavior of woven fabrics interests firstly under the aspect of defining the fabric
durability, but also the efficiency in assurance of antistatic properties. The abrasion behavior of woven fabrics was assessed using the mass loss and the number of pilling balls.
- The friction wear of the analyzed woven fabrics containing metallic fiber results in modifications
of the percentage of metallic fiber and implicitely in modification of the surface resistivity. - For all variants of tested woven fabrics, the antistatic propreties remain at the level adequate for
accomplishing in their exploatation functional they were designed for.
- Double weft weave , used to achieve fabric provides durability in use. The arrangement of the conductive fibers on one of the woven fabric sides eliminates the disadvantages related to the discomfort they create. Fabric abrasion exposure during use, can be controlled such that, the metallic fiber content is not modified. This will not change the electrical properties.
- Fabric V-II, which has the structure for the second weft, yarns PET 80% + 20% steel, after abrasion, it keeps the look, but lose more weight. Mass loss is loss of electrical properties.
- Fabric VI, which has in the structure for the second weft, yarns Rhovyl 95% + 5% Bekinox,
losing less metallic fibers. Fabric appearance is affected by the occurrence of pilling balls.
References [1] Safárová, V., Grégr, J., Electrical conductivity measurement of fibers and yarn. 7th International
Conference - TEXSCI 2010, September 6-8, Liberec, Czech Republic. [2] Chen, H.C., et al. Comparison of electromagnetic shielding effectiveness properties of diverse
conductive textiles via various measurement techniques. Journal of Materials Processing Technology. 2007, 192-193, s. 549-554.
[3] Neelakandan, V, Madhusoothanan, M., Electrical Resistivity Studies on Polyaniline Coated Polyester Fabrics, Journal of Engineered Fibers and Fabrics, Volume 5, Issue 3 - 2010
[4] Kacprzyk, R., Measurements of the Volume and Surface Resistance of Textile Materials. Fibres & Textiles in Eastern Europe 2011, Vol. 19, No. 1 (84) pp. 47-49.
[5] STAS 11014-88, MATERIALE TEXTILE-Determinarea rezistivitatii, 1988 [6] Bonnot, G. (1996). L’electicite statique eliminee, TUT, No..4, p.55-57, ISSN 1161-9317 [7] Fuchs, H.& Haase, J. (1998). Overview of new protective clothing types against termal and electrical risk,
Technical textiles, nov., p.211-213, ISSN 0964-5993 [8] Pinar, A.& Michalak, L.(2007). Influence of structural Parameters of wale - knitted fabrics on their
electrostatic properties, Fibres& textiles in Esteam Europe, No.5, dec., p.69-74, eISSN 1230 – 3666
196
14th Romanian Textiles and Leather Conference – CORTEP 2012
Sinaia, 6 - 8 September 2012
[9] Tack, L. (2007). Des solutions de securite pour les vetements de protection, TUT, nr.65, nov., p. 32-37, ISSN 1161-9317
[10] Cioară L.,, Cioară I., Toma D., Relaţia structură proprietăţi pentru ţesături antistatice, Industria Textilă, ISSN 1222-5347, nr.2, pp.81-85, (2010)
[11] Cioara L., Cioara I., Onofrei E., Toma D.The caracteristics of woven fabrics for multi-functional protective clothing, Proceedings International Scientific Conference UNITECH-07 GABROVO - Bulgaria, ISSN 1313-230X, volume 2, pag.86-89, 23-24 november 2007
Corresponding author: Lucica CIOARA Associate professor, Faculty of Textile and Leather Engineering and Industrial Management « Gheorghe Asachi » Technical University of Iasi , [email protected]
Co-authors: Ioan CIOARA, Professor, Faculty of Textile and Leather Engineering and Industrial Management « Gheorghe Asachi » Technical University of Iasi , [email protected] Daniela NEGRU, Assistant professor, Faculty of Textile and Leather Engineering and Industrial Management « Gheorghe Asachi » Technical University of Iasi , [email protected]
197
14
th Romanian Textiles and Leather Conference – CORTEP 2012
Sinaia, 6 - 8 September 2012
RESEARCH ON EMISSIVITY, REFLECTION AND TRANSMISSION OF TEXTILE MATERIALS, MEASURED BY THE METHOD OF THE
INTEGRATING SPHERE
Gheorge HORGA1, Mihaela HORGA1, Ioan HOSSU1 Avram DORIN1, Marian-Catalin GROSU1 and Florin BREABAN2
1 « Gheorghe Asachi » Technical University of Iaşi, Faculty of Textiles,
Leather Engineering and Industrial Management 2
Univ Lille Nord de France, F-59000 Lille, France, UArtois, LGCgE, IUTB-CRITTM2A /S2T-EHVL F-62400 Béthune, France,
Abstract: This paper presents a study on behavior point of view of emissivity, reflection and transmission in the invisible infrared radiation on untested textile materials accomplished through various processes: layers by using fiber thermal-adhesive, layers made by the method Struto and fibers recovered using in the form of bulk. Measurements have been performed with high precision equipment, specific emissivity measurements using the method integrating sphere in the spectral domain: 7,6 μm ÷ 12,4 μm at ambient environment temperature 21
0C, using an integrating sphere, a generator of ultraviolet radiation, power supply, pc and a standard with
known emissivity. Following research on optical properties of textile samples resulting emissivity values between 0,873 and 0,951 which varies depending on the way to build layers, respectively a surface states.
Keywords: textiles nonwoven, spectral emissivity, integrating sphere method, infrared radiation., 1 INTRODUCTION This paper presents a study of the behaviors being performed reusable textiles used in pipe insulation thermal insulation covers that carry hot water with temperatures up to 90
0C.
Textile materials accomplished through various processes: layers by using fiber thermal-adhesive, layers made by the method Struto and fibers recovered using in the form of bulk. The main parameter of thermal insulation of pipes is the coefficient of thermal conductivity of the material, λ, besides this parameter need studied on behavior point of view of emissivity, reflection and transmission in the invisible infrared radiation. The total amount of radiative energy emitted from a surface into all directions above it is termed emissive power; we distinguish between spectral (at a given wavelength l, per unit wavelength) and total (encompassing all wavelengths) emissive power. The magnitude of emissive power depends on wavelength l, temperature T, and a surface property, called emissivity e, which relates the ability of a surface to emit radiative energy to that of an ideal surface, which emits the maximum possible energy (at a given wavelength and temperature). Such an ideal surface is known as a “blackbody” or “black surface,” since it absorbs all incoming radiation; i.e., it reflects no radiation and is, therefore, invisible (“black”) to the human eye. The spectral distribution of the emissive power of a black surface is given by Planck’s law [1][2]. Four fundamental radiative properties are defined [3]:
Reflectivity, radiation incoming total
radiation incoming ofpart reflected
Absorptivity, radiation incoming total
radiation incoming ofpart absorbed
198
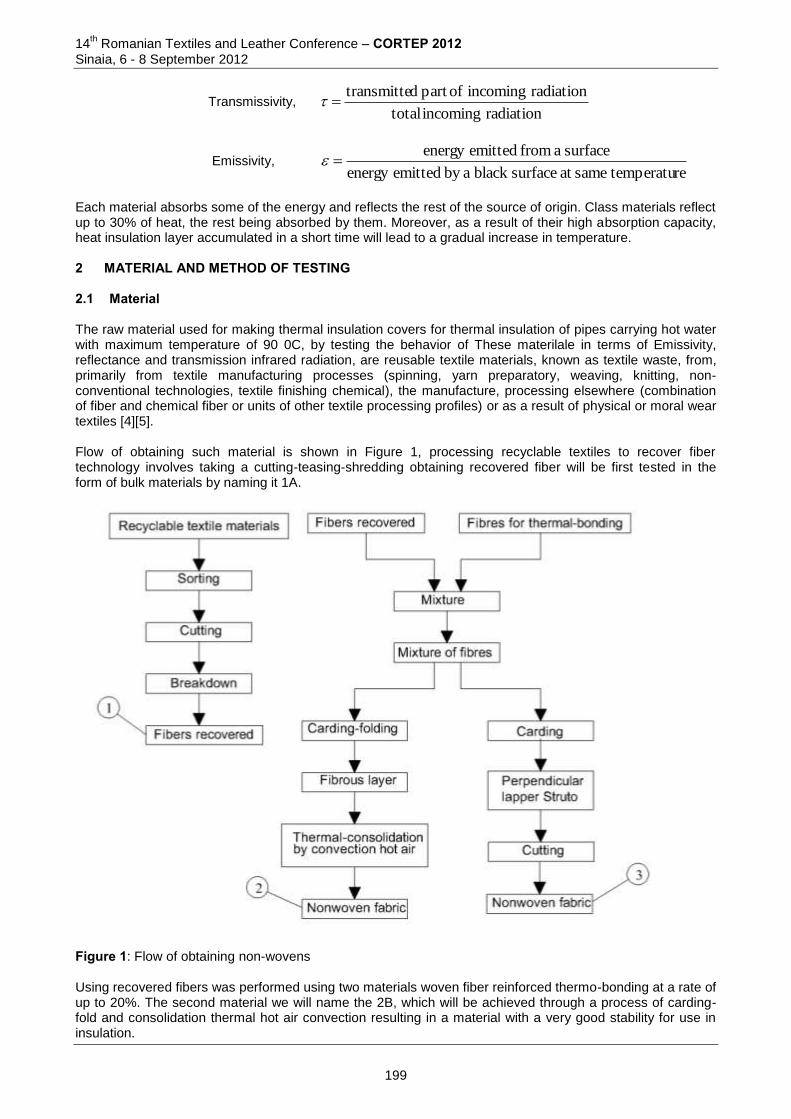
14th Romanian Textiles and Leather Conference – CORTEP 2012
Sinaia, 6 - 8 September 2012
Transmissivity, radiation incoming total
radiation incoming ofpart dtransmitte
Emissivity, re temperatusameat surfaceblack aby emittedenergy
surface a from emittedenergy
Each material absorbs some of the energy and reflects the rest of the source of origin. Class materials reflect up to 30% of heat, the rest being absorbed by them. Moreover, as a result of their high absorption capacity, heat insulation layer accumulated in a short time will lead to a gradual increase in temperature.
2 MATERIAL AND METHOD OF TESTING 2.1 Material The raw material used for making thermal insulation covers for thermal insulation of pipes carrying hot water with maximum temperature of 90 0C, by testing the behavior of These materilale in terms of Emissivity, reflectance and transmission infrared radiation, are reusable textile materials, known as textile waste, from, primarily from textile manufacturing processes (spinning, yarn preparatory, weaving, knitting, non-conventional technologies, textile finishing chemical), the manufacture, processing elsewhere (combination of fiber and chemical fiber or units of other textile processing profiles) or as a result of physical or moral wear textiles [4][5]. Flow of obtaining such material is shown in Figure 1, processing recyclable textiles to recover fiber technology involves taking a cutting-teasing-shredding obtaining recovered fiber will be first tested in the form of bulk materials by naming it 1A. Figure 1: Flow of obtaining non-wovens Using recovered fibers was performed using two materials woven fiber reinforced thermo-bonding at a rate of up to 20%. The second material we will name the 2B, which will be achieved through a process of carding-fold and consolidation thermal hot air convection resulting in a material with a very good stability for use in insulation.
199
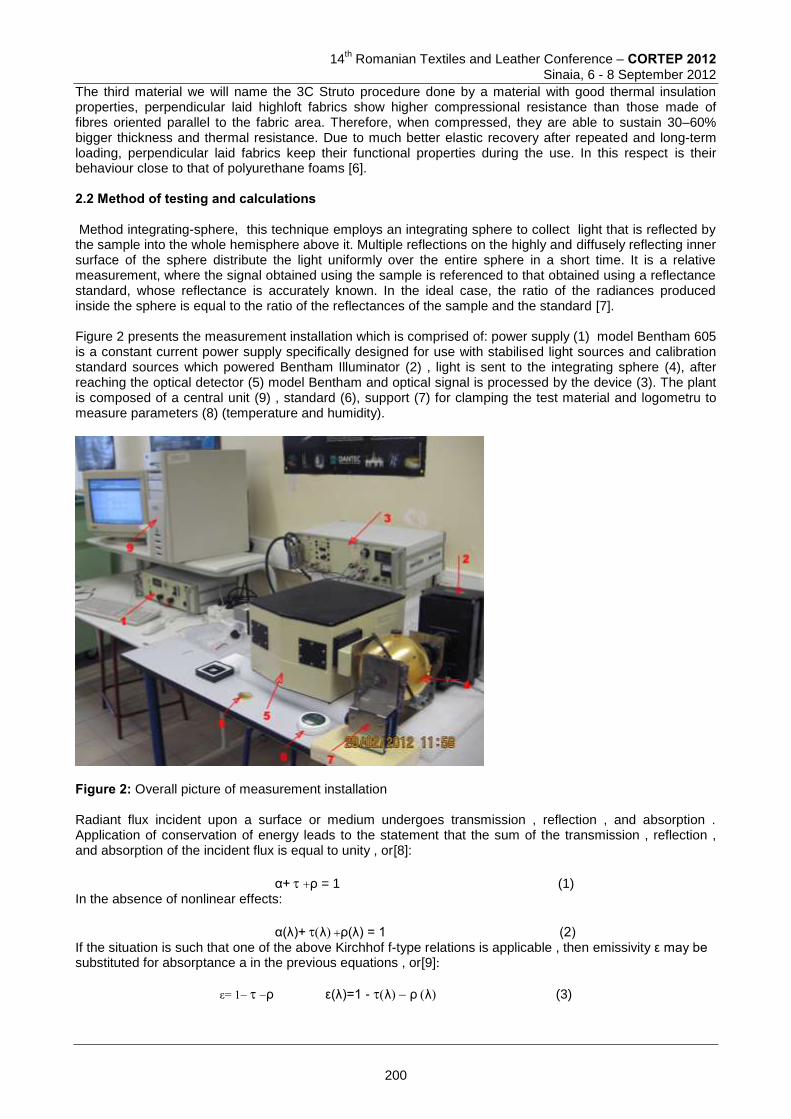
14
th Romanian Textiles and Leather Conference – CORTEP 2012
Sinaia, 6 - 8 September 2012
The third material we will name the 3C Struto procedure done by a material with good thermal insulation properties, perpendicular laid highloft fabrics show higher compressional resistance than those made of fibres oriented parallel to the fabric area. Therefore, when compressed, they are able to sustain 30–60% bigger thickness and thermal resistance. Due to much better elastic recovery after repeated and long-term loading, perpendicular laid fabrics keep their functional properties during the use. In this respect is their behaviour close to that of polyurethane foams [6].
2.2 Method of testing and calculations Method integrating-sphere, this technique employs an integrating sphere to collect light that is reflected by the sample into the whole hemisphere above it. Multiple reflections on the highly and diffusely reflecting inner surface of the sphere distribute the light uniformly over the entire sphere in a short time. It is a relative measurement, where the signal obtained using the sample is referenced to that obtained using a reflectance standard, whose reflectance is accurately known. In the ideal case, the ratio of the radiances produced inside the sphere is equal to the ratio of the reflectances of the sample and the standard [7]. Figure 2 presents the measurement installation which is comprised of: power supply (1) model Bentham 605 is a constant current power supply specifically designed for use with stabilised light sources and calibration standard sources which powered Bentham Illuminator (2) , light is sent to the integrating sphere (4), after reaching the optical detector (5) model Bentham and optical signal is processed by the device (3). The plant is composed of a central unit (9) , standard (6), support (7) for clamping the test material and logometru to measure parameters (8) (temperature and humidity).
Figure 2: Overall picture of measurement installation Radiant flux incident upon a surface or medium undergoes transmission , reflection , and absorption . Application of conservation of energy leads to the statement that the sum of the transmission , reflection , and absorption of the incident flux is equal to unity , or[8]:
α+ρ = 1 (1) In the absence of nonlinear effects:
α(λ)+λρ(λ) = 1 (2) If the situation is such that one of the above Kirchhof f-type relations is applicable , then emissivity ε may be substituted for absorptance a in the previous equations , or[9]:
ε= 1ρ ε(λ)=1 - λρλ(3)
200
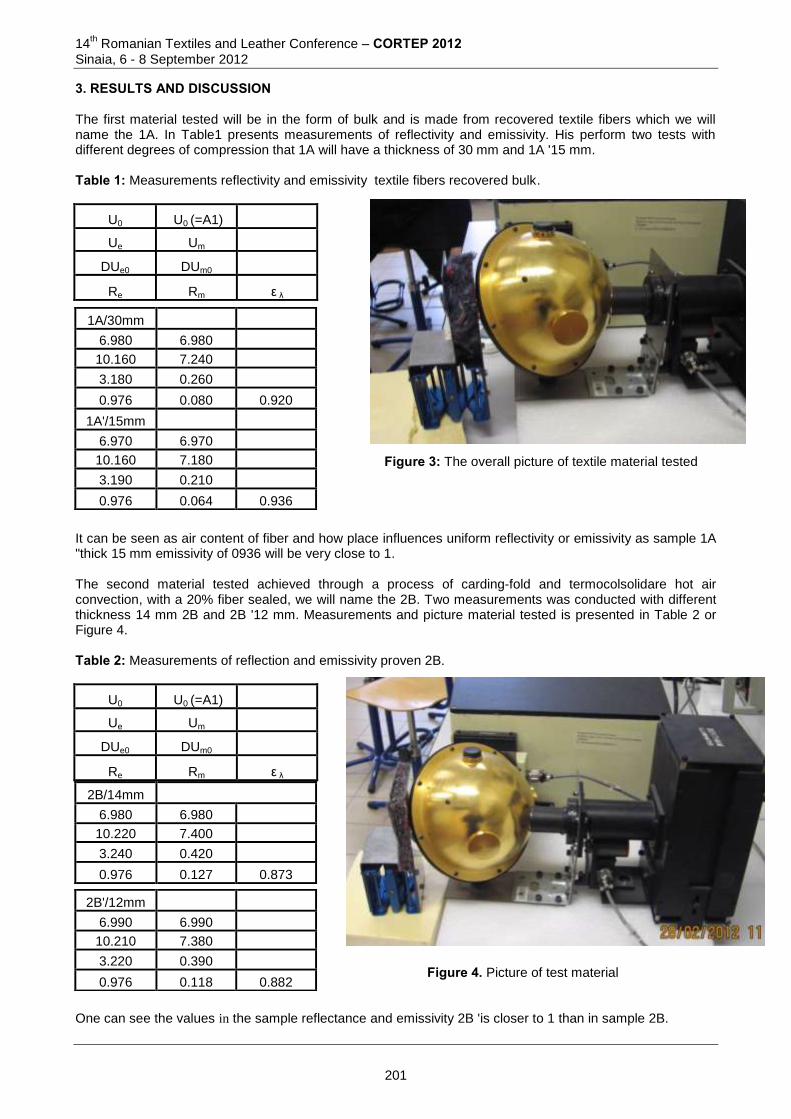
14th Romanian Textiles and Leather Conference – CORTEP 2012
Sinaia, 6 - 8 September 2012
3. RESULTS AND DISCUSSION The first material tested will be in the form of bulk and is made from recovered textile fibers which we will name the 1A. In Table1 presents measurements of reflectivity and emissivity. His perform two tests with different degrees of compression that 1A will have a thickness of 30 mm and 1A '15 mm. Table 1: Measurements reflectivity and emissivity textile fibers recovered bulk.
U0 U0 (=A1)
Ue Um
DUe0 DUm0
Re Rm ε λ
Figure 3: The overall picture of textile material tested
It can be seen as air content of fiber and how place influences uniform reflectivity or emissivity as sample 1A "thick 15 mm emissivity of 0936 will be very close to 1. The second material tested achieved through a process of carding-fold and termocolsolidare hot air convection, with a 20% fiber sealed, we will name the 2B. Two measurements was conducted with different thickness 14 mm 2B and 2B '12 mm. Measurements and picture material tested is presented in Table 2 or Figure 4. Table 2: Measurements of reflection and emissivity proven 2B.
U0 U0 (=A1)
Ue Um
DUe0 DUm0
Re Rm ε λ
Figure 4. Picture of test material
One can see the values in the sample reflectance and emissivity 2B 'is closer to 1 than in sample 2B.
1A/30mm
6.980 6.980
10.160 7.240
3.180 0.260
0.976 0.080 0.920
1A'/15mm
6.970 6.970
10.160 7.180
3.190 0.210
0.976 0.064 0.936
2B/14mm
6.980 6.980
10.220 7.400
3.240 0.420
0.976 0.127 0.873
2B'/12mm
6.990 6.990
10.210 7.380
3.220 0.390
0.976 0.118 0.882
201
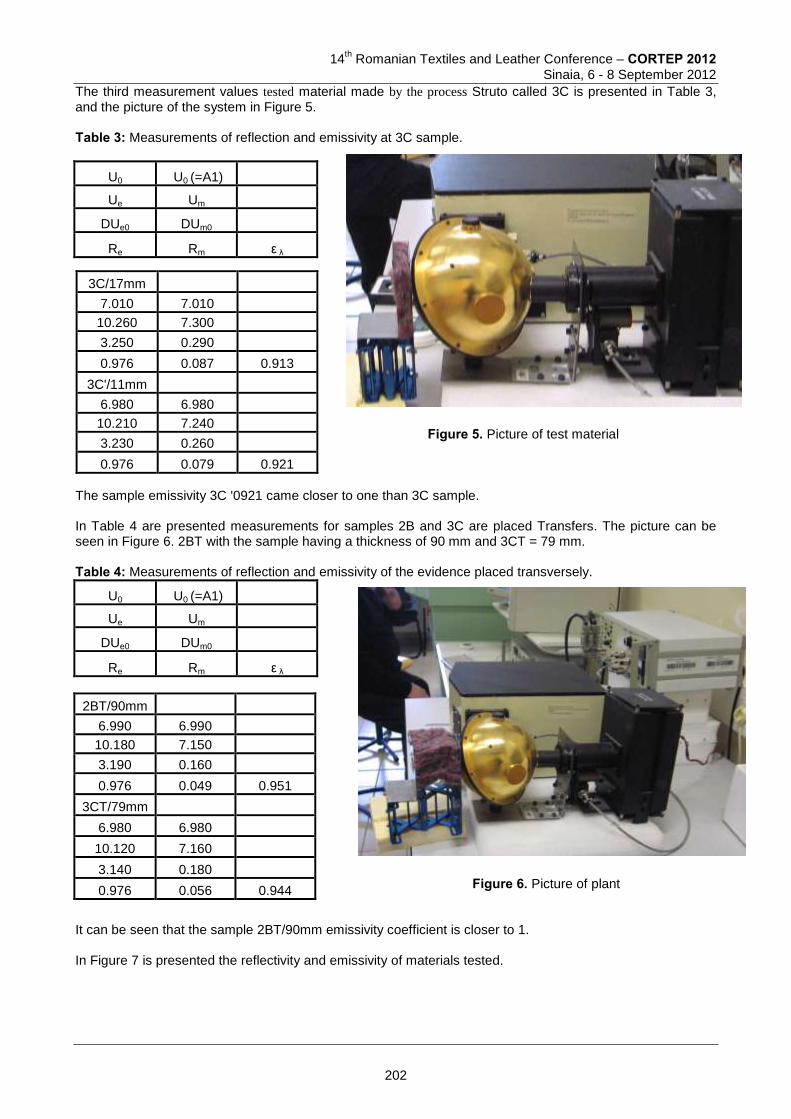
14
th Romanian Textiles and Leather Conference – CORTEP 2012
Sinaia, 6 - 8 September 2012
The third measurement values tested material made by the process Struto called 3C is presented in Table 3, and the picture of the system in Figure 5. Table 3: Measurements of reflection and emissivity at 3C sample.
U0 U0 (=A1)
Ue Um
DUe0 DUm0
Re Rm ε λ
Figure 5. Picture of test material
The sample emissivity 3C '0921 came closer to one than 3C sample. In Table 4 are presented measurements for samples 2B and 3C are placed Transfers. The picture can be seen in Figure 6. 2BT with the sample having a thickness of 90 mm and 3CT = 79 mm. Table 4: Measurements of reflection and emissivity of the evidence placed transversely.
U0 U0 (=A1)
Ue Um
DUe0 DUm0
Re Rm ε λ
Figure 6. Picture of plant
It can be seen that the sample 2BT/90mm emissivity coefficient is closer to 1. In Figure 7 is presented the reflectivity and emissivity of materials tested.
3C/17mm
7.010 7.010
10.260 7.300
3.250 0.290
0.976 0.087 0.913
3C'/11mm
6.980 6.980
10.210 7.240
3.230 0.260
0.976 0.079 0.921
2BT/90mm
6.990 6.990
10.180 7.150
3.190 0.160
0.976 0.049 0.951
3CT/79mm
6.980 6.980
10.120 7.160
3.140 0.180
0.976 0.056 0.944
202
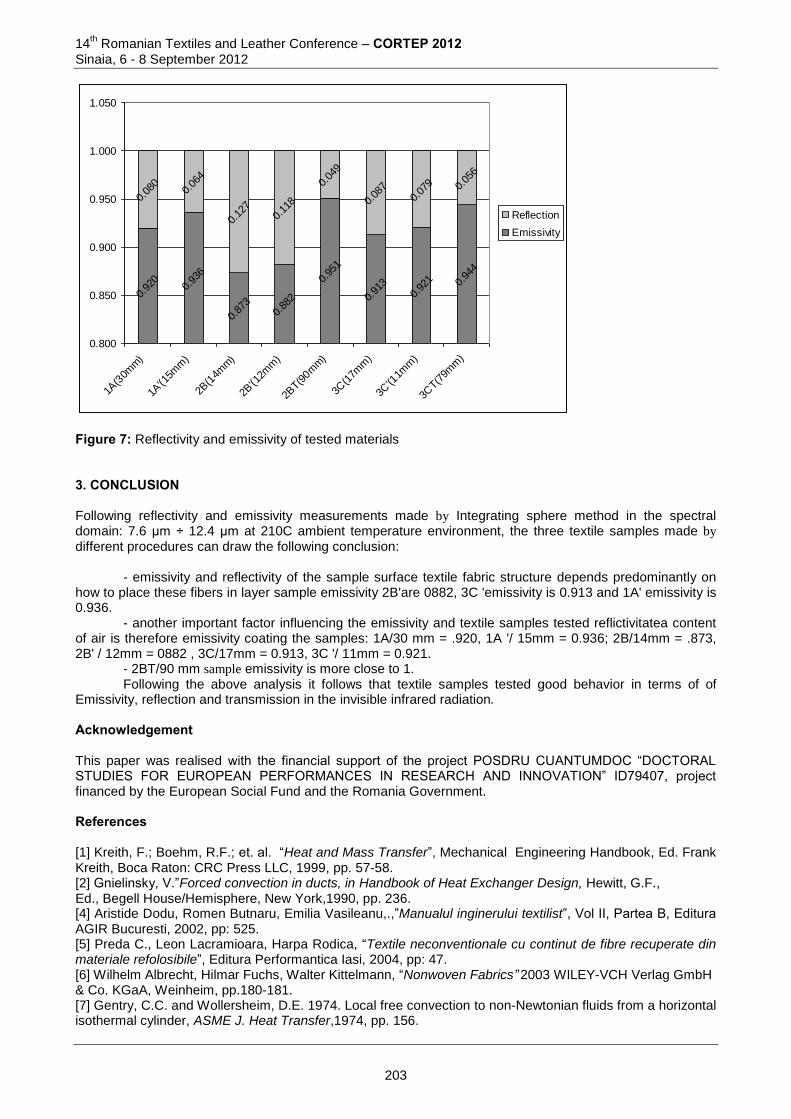
14th Romanian Textiles and Leather Conference – CORTEP 2012
Sinaia, 6 - 8 September 2012
0.92
00.
936
0.87
30.
882
0.95
1
0.91
30.
921 0.
944
0.08
00.
064
0.12
70.
118
0.04
9
0.08
70.
079 0.
056
0.800
0.850
0.900
0.950
1.000
1.050
1A(3
0mm)
1A'(1
5mm
)
2B(1
4mm)
2B'(1
2mm
)
2BT(9
0mm)
3C(1
7mm
)
3C'(1
1mm
)
3CT(7
9mm
)
Reflection
Emissivity
Figure 7: Reflectivity and emissivity of tested materials 3. CONCLUSION Following reflectivity and emissivity measurements made by Integrating sphere method in the spectral domain: 7.6 μm ÷ 12.4 μm at 210C ambient temperature environment, the three textile samples made by different procedures can draw the following conclusion:
- emissivity and reflectivity of the sample surface textile fabric structure depends predominantly on how to place these fibers in layer sample emissivity 2B'are 0882, 3C 'emissivity is 0.913 and 1A' emissivity is 0.936.
- another important factor influencing the emissivity and textile samples tested reflictivitatea content of air is therefore emissivity coating the samples: 1A/30 mm = .920, 1A '/ 15mm = 0.936; 2B/14mm = .873, 2B' / 12mm = 0882 , 3C/17mm = 0.913, 3C '/ 11mm = 0.921.
- 2BT/90 mm sample emissivity is more close to 1. Following the above analysis it follows that textile samples tested good behavior in terms of of
Emissivity, reflection and transmission in the invisible infrared radiation. Acknowledgement This paper was realised with the financial support of the project POSDRU CUANTUMDOC “DOCTORAL STUDIES FOR EUROPEAN PERFORMANCES IN RESEARCH AND INNOVATION” ID79407, project financed by the European Social Fund and the Romania Government. References [1] Kreith, F.; Boehm, R.F.; et. al. “Heat and Mass Transfer”, Mechanical Engineering Handbook, Ed. Frank Kreith, Boca Raton: CRC Press LLC, 1999, pp. 57-58. [2] Gnielinsky, V.”Forced convection in ducts, in Handbook of Heat Exchanger Design, Hewitt, G.F., Ed., Begell House/Hemisphere, New York,1990, pp. 236. [4] Aristide Dodu, Romen Butnaru, Emilia Vasileanu,.,”Manualul inginerului textilist”, Vol II, Partea B, Editura AGIR Bucuresti, 2002, pp: 525. [5] Preda C., Leon Lacramioara, Harpa Rodica, “Textile neconventionale cu continut de fibre recuperate din materiale refolosibile”, Editura Performantica Iasi, 2004, pp: 47. [6] Wilhelm Albrecht, Hilmar Fuchs, Walter Kittelmann, “Nonwoven Fabrics” 2003 WILEY-VCH Verlag GmbH & Co. KGaA, Weinheim, pp.180-181. [7] Gentry, C.C. and Wollersheim, D.E. 1974. Local free convection to non-Newtonian fluids from a horizontal isothermal cylinder, ASME J. Heat Transfer,1974, pp. 156.
203
14
th Romanian Textiles and Leather Conference – CORTEP 2012
Sinaia, 6 - 8 September 2012
[8] Achim Seifter, Konstantinos Boboridis, Andrew W. Obst, “Comparison of emissivity meausurements using an integrating sphere reflectometer and a laser polarimeter on surfaces with various degrees of roughness “, XVII IMEKO World Congress Metrology in the 3rd Millennium June 22−27, 2003, Dubrovnik, Croatia [9] James M . Palmer, “Optical Radiation Measurements”, Optical Sciences Center Uniyersity of Arizona Tucson , Arizona, 1995, pp.25.8
Corresponding address: Name SURNAME: Gheorghe Horga Department/Laboratory: Technology and Textile Products Design Faculty: Faculty of Textiles, Leather Engineering and Industrial Management University/Company: « Gheorghe Asachi » Technical University of Iaşi Address of Institution/Company Postal code, city: Iasi State: Romania phone: 0740216548 fax: e-mail: [email protected] Corresponding author: Name SURNAME: Gheorghe Horga Department/Laboratory: Technology and Textile Products Design Faculty: Faculty of Textiles, Leather Engineering and Industrial Management University/Company: « Gheorghe Asachi » Technical University of Iaşi Address of Institution/Company Postal code, city: Iasi State: Romania phone: 0740216548 fax: e-mail: [email protected] Co-author(s): Name SURNAME: Mihaela HORGA Department/Laboratory: Technology and Textile Products Design Faculty: Faculty of Textiles, Leather Engineering and Industrial Management University/Company: « Gheorghe Asachi » Technical University of Iaşi Address of Institution/Company Postal code, city: Iasi State: Romania phone: 0740216548 fax: e-mail: [email protected] Name SURNAME: Dorin AVRAM Department/Laboratory: Technology and Textile Products Design Faculty: Faculty of Textiles, Leather Engineering and Industrial Management University/Company: « Gheorghe Asachi » Technical University of Iaşi Address of Institution/Company Postal code, city: Iasi State: Romania phone: - e-mail: [email protected] Name SURNAME: Ioan HOSSU Department/Laboratory: Technology and Textile Products Design Faculty: Faculty of Textiles, Leather Engineering and Industrial Management University/Company: « Gheorghe Asachi » Technical University of Iaşi Address of Institution/Company Postal code, city: Iasi State: Romania phone: - e-mail: [email protected]
204
14
th Romanian Textiles and Leather Conference – CORTEP 2012
Sinaia, 6 - 8 September 2012
THERMAL CONDUCTIVITY OF THE THICK WOOL LAYERS
Ioan HOSSU, Marian-Cătălin GROSU, Gheorghe HORGA & Dorin AVRAM “Gheorghe Asachi” Technical University of Iaşi, Romania
Abstract: Thick fibers of sheep wool (diameter over 32 μm), processed in insulating mattresses, is the natural and ecological building and environmental protection at the same time. In all countries, simple materials and combinations of increasingly diverse structures appear embedded in buildings to improve their thermal performance, achieved by inclusion of recovered vegetable substances such as wood, nut shells, straw, etc., insulation of natural materials: cellulose, flax, hemp, wool, etc., wall structures made increasingly more efficient and have become a permanent specialized markets. Of all, only, sheep's wool is 100% natural and specially designed for thermal protection. Became affordable, by replacing massive synthetic fibers, wool in general and the thick fiber (fiber diameter in excess of 32 micrometers) in particular, may become available as "clothing" for houses. The paper presents results of measurements of thermal conductivity of the wool textile thick layers, made with artisanal laboratory installation. Measurements are made on samples with densities between 16.51 kg/m
3 and 37 kg/m
3 layers with thickness between 54 and 121 mm, at temperatures from 20
0C to 60
0C,
confirming thermal insulating properties of wool from sheep Keywords: Thick wool layer, Thermal conductivity, coefficient of thermal transfer, sheep wool insulation. 1 INTRODUCTION In all countries, simple materials and combinations of more and more diversified appear embedded in buildings structures to improve their thermal performance, achieved by the inclusion of recovered vegetable substances, such as wood, nut shells, straw, etc., insulation of natural materials: cellulose, flax, hemp, wool, etc., mural structures made increasingly more efficient and have become a permanent specialized markets. Among all the these materials only, sheep wool is 100% natural and specially designed for thermal protection. Became affordable due to massive replacement of synthetic fibers, wool generally and wool thick fiber (higher fiber diameter value of 32 micrometers) in particular may become accessible as "clothing" for houses. Thick sheep wool fibers (diameter over 32 m), processed for insulation mattresses, natural and organic solution is for the protection of buildings and the environment simultaneously. The paper presents the results of measurements of thermal conductivity of wool textile layers thick, made with artisanal laboratory installation. Measurements are made on samples with densities between 13 kg/m3 and 37 kg/m3 having a thickness layers between 54 and 121 mm, at temperatures from 20 0C to 60 0C, confirm good thermal insulation properties of wool from sheep. 2 EXPERIMENTAL
2.1 Materials and equipment
The experiments were performed on samples taken from different treating and technologic processing phases, being selected after following criteria [6]:
- Age of samples; - Manufacturing degree; - Fiber position into the layer;
All the samples obtained and their technological processes degree are made are presented into the Table 1;
205
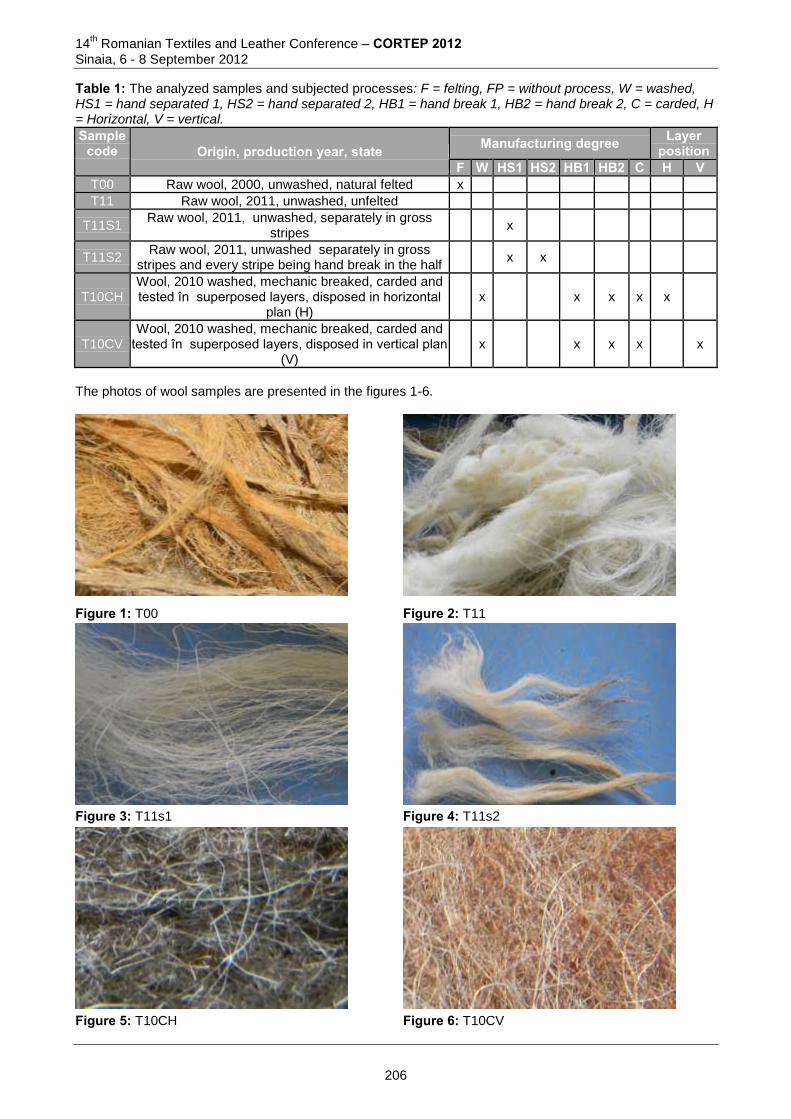
14th Romanian Textiles and Leather Conference – CORTEP 2012
Sinaia, 6 - 8 September 2012
Table 1: The analyzed samples and subjected processes: F = felting, FP = without process, W = washed, HS1 = hand separated 1, HS2 = hand separated 2, HB1 = hand break 1, HB2 = hand break 2, C = carded, H = Horizontal, V = vertical.
Sample code Origin, production year, state Manufacturing degree Layer
position F W HS1 HS2 HB1 HB2 C H V
T00 Raw wool, 2000, unwashed, natural felted x
T11 Raw wool, 2011, unwashed, unfelted
T11S1 Raw wool, 2011, unwashed, separately in gross
stripes x
T11S2 Raw wool, 2011, unwashed separately in gross
stripes and every stripe being hand break in the half x x
T10CH Wool, 2010 washed, mechanic breaked, carded and tested în superposed layers, disposed in horizontal
plan (H) x x x x x
T10CV Wool, 2010 washed, mechanic breaked, carded and
tested în superposed layers, disposed in vertical plan (V)
x x x x x
The photos of wool samples are presented in the figures 1-6.
Figure 1: T00 Figure 2: T11
Figure 3: T11s1 Figure 4: T11s2
Figure 5: T10CH Figure 6: T10CV
206
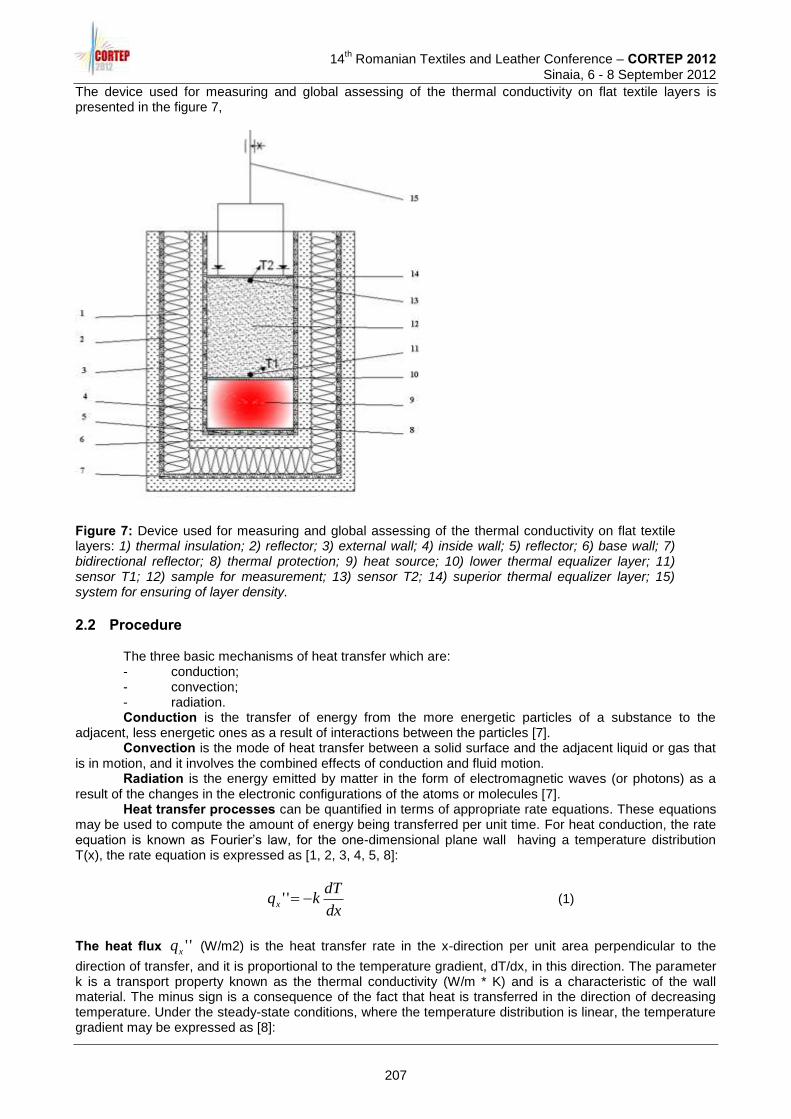
14
th Romanian Textiles and Leather Conference – CORTEP 2012
Sinaia, 6 - 8 September 2012
The device used for measuring and global assessing of the thermal conductivity on flat textile layers is presented in the figure 7,
Figure 7: Device used for measuring and global assessing of the thermal conductivity on flat textile layers: 1) thermal insulation; 2) reflector; 3) external wall; 4) inside wall; 5) reflector; 6) base wall; 7) bidirectional reflector; 8) thermal protection; 9) heat source; 10) lower thermal equalizer layer; 11) sensor T1; 12) sample for measurement; 13) sensor T2; 14) superior thermal equalizer layer; 15) system for ensuring of layer density. 2.2 Procedure
The three basic mechanisms of heat transfer which are: - conduction; - convection; - radiation. Conduction is the transfer of energy from the more energetic particles of a substance to the
adjacent, less energetic ones as a result of interactions between the particles [7]. Convection is the mode of heat transfer between a solid surface and the adjacent liquid or gas that
is in motion, and it involves the combined effects of conduction and fluid motion. Radiation is the energy emitted by matter in the form of electromagnetic waves (or photons) as a
result of the changes in the electronic configurations of the atoms or molecules [7]. Heat transfer processes can be quantified in terms of appropriate rate equations. These equations
may be used to compute the amount of energy being transferred per unit time. For heat conduction, the rate equation is known as Fourier’s law, for the one-dimensional plane wall having a temperature distribution T(x), the rate equation is expressed as [1, 2, 3, 4, 5, 8]:
dx
dTkqx '' (1)
The heat flux ''xq (W/m2) is the heat transfer rate in the x-direction per unit area perpendicular to the
direction of transfer, and it is proportional to the temperature gradient, dT/dx, in this direction. The parameter k is a transport property known as the thermal conductivity (W/m * K) and is a characteristic of the wall material. The minus sign is a consequence of the fact that heat is transferred in the direction of decreasing temperature. Under the steady-state conditions, where the temperature distribution is linear, the temperature gradient may be expressed as [8]:
207
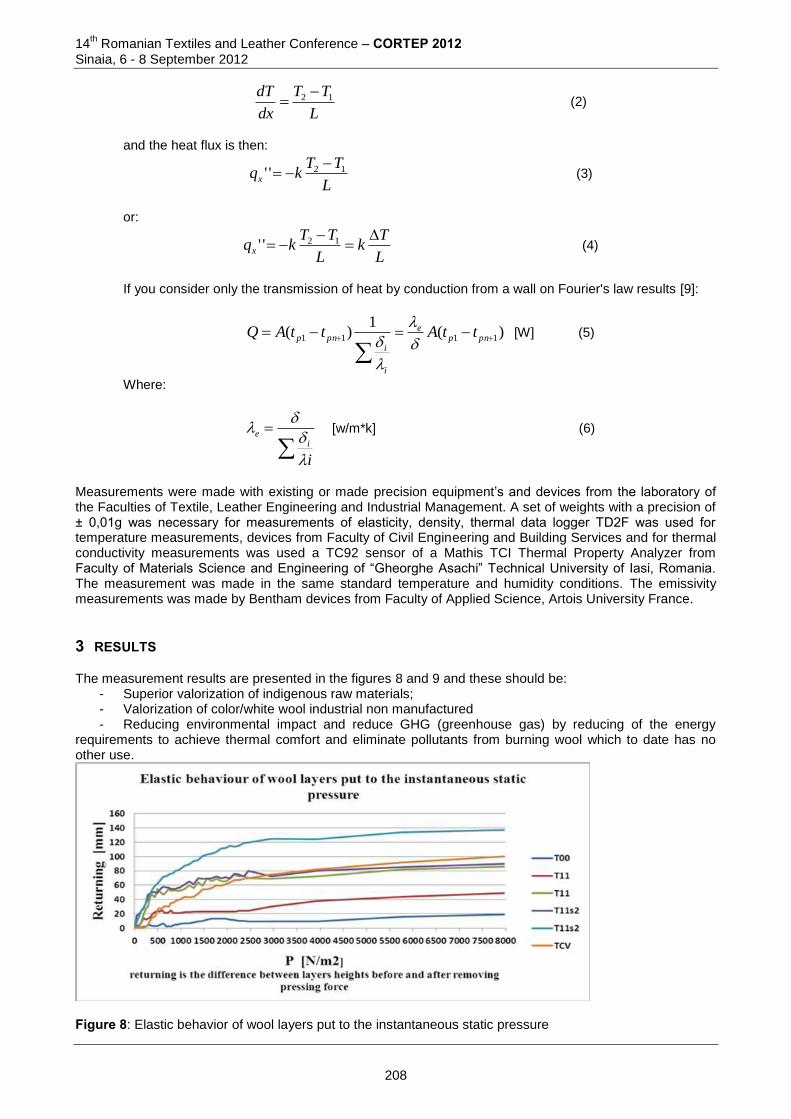
14th Romanian Textiles and Leather Conference – CORTEP 2012
Sinaia, 6 - 8 September 2012
L
TT
dx
dT 12 (2)
and the heat flux is then:
L
TTkqx
12''
(3)
or:
L
Tk
L
TTkqx
12'' (4)
If you consider only the transmission of heat by conduction from a wall on Fourier's law results [9]:
)(1
)( 1111
pnp
e
i
ipnp ttAttAQ
[W] (5)
Where:
i
ie
[w/m*k] (6)
Measurements were made with existing or made precision equipment’s and devices from the laboratory of the Faculties of Textile, Leather Engineering and Industrial Management. A set of weights with a precision of ± 0,01g was necessary for measurements of elasticity, density, thermal data logger TD2F was used for temperature measurements, devices from Faculty of Civil Engineering and Building Services and for thermal conductivity measurements was used a TC92 sensor of a Mathis TCI Thermal Property Analyzer from Faculty of Materials Science and Engineering of “Gheorghe Asachi” Technical University of Iasi, Romania. The measurement was made in the same standard temperature and humidity conditions. The emissivity measurements was made by Bentham devices from Faculty of Applied Science, Artois University France.
3 RESULTS
The measurement results are presented in the figures 8 and 9 and these should be: - Superior valorization of indigenous raw materials; - Valorization of color/white wool industrial non manufactured - Reducing environmental impact and reduce GHG (greenhouse gas) by reducing of the energy
requirements to achieve thermal comfort and eliminate pollutants from burning wool which to date has no other use.
Figure 8: Elastic behavior of wool layers put to the instantaneous static pressure
208
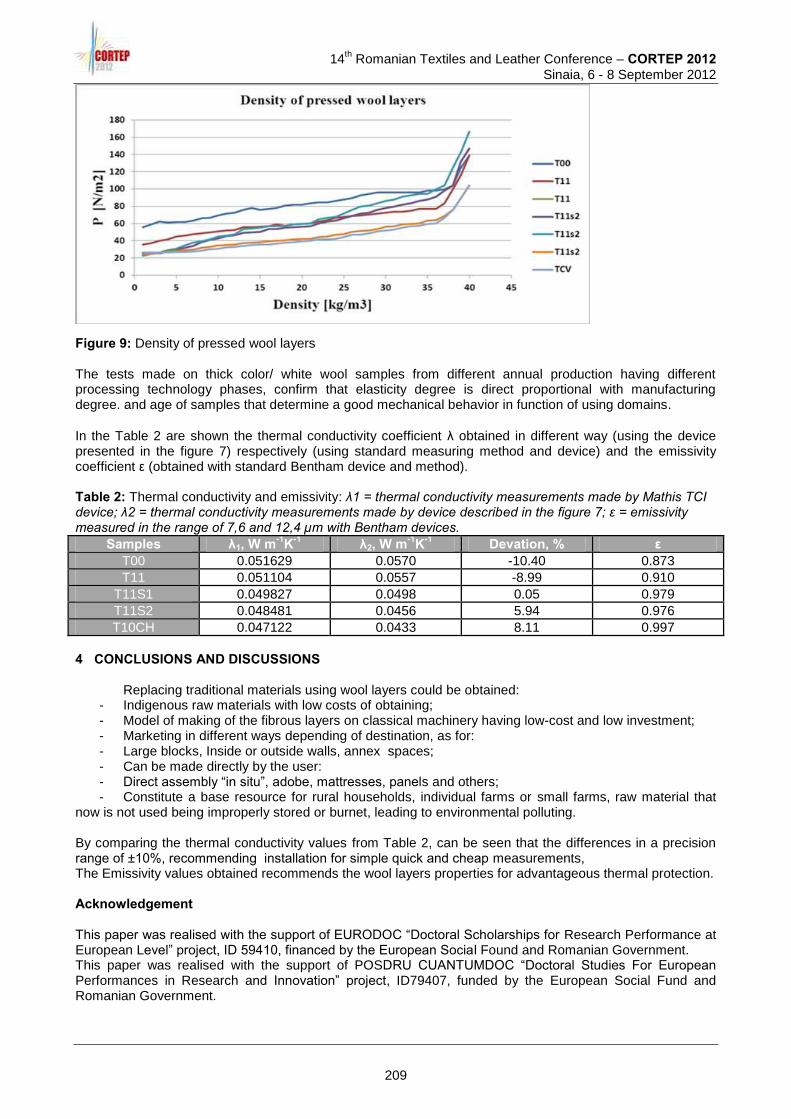
14
th Romanian Textiles and Leather Conference – CORTEP 2012
Sinaia, 6 - 8 September 2012
Figure 9: Density of pressed wool layers The tests made on thick color/ white wool samples from different annual production having different processing technology phases, confirm that elasticity degree is direct proportional with manufacturing degree. and age of samples that determine a good mechanical behavior in function of using domains.
In the Table 2 are shown the thermal conductivity coefficient λ obtained in different way (using the device presented in the figure 7) respectively (using standard measuring method and device) and the emissivity coefficient ε (obtained with standard Bentham device and method). Table 2: Thermal conductivity and emissivity: λ1 = thermal conductivity measurements made by Mathis TCI device; λ2 = thermal conductivity measurements made by device described in the figure 7; ε = emissivity measured in the range of 7,6 and 12,4 µm with Bentham devices.
Samples λ1, W m-1K-1 λ2, W m-1K-1 Devation, % ε T00 0.051629 0.0570 -10.40 0.873
T11 0.051104 0.0557 -8.99 0.910
T11S1 0.049827 0.0498 0.05 0.979
T11S2 0.048481 0.0456 5.94 0.976
T10CH 0.047122 0.0433 8.11 0.997
4 CONCLUSIONS AND DISCUSSIONS
Replacing traditional materials using wool layers could be obtained: - Indigenous raw materials with low costs of obtaining; - Model of making of the fibrous layers on classical machinery having low-cost and low investment; - Marketing in different ways depending of destination, as for: - Large blocks, Inside or outside walls, annex spaces; - Can be made directly by the user: - Direct assembly “in situ”, adobe, mattresses, panels and others; - Constitute a base resource for rural households, individual farms or small farms, raw material that
now is not used being improperly stored or burnet, leading to environmental polluting. By comparing the thermal conductivity values from Table 2, can be seen that the differences in a precision range of ±10%, recommending installation for simple quick and cheap measurements, The Emissivity values obtained recommends the wool layers properties for advantageous thermal protection.
Acknowledgement This paper was realised with the support of EURODOC “Doctoral Scholarships for Research Performance at European Level” project, ID 59410, financed by the European Social Found and Romanian Government. This paper was realised with the support of POSDRU CUANTUMDOC “Doctoral Studies For European Performances in Research and Innovation” project, ID79407, funded by the European Social Fund and Romanian Government.
209
14th Romanian Textiles and Leather Conference – CORTEP 2012
Sinaia, 6 - 8 September 2012
References [1] Kreith F, Boehm R F. et. al, Heat and Mass Transfer, Mechanical Engineering Handbook, Publisher:
Frank Kreith, Boca Raton, CRC Pres LLC, 1999. [2] Marchio D, Reboux P, Introduction aux transferts termiques, Ecole des mines de Paris, Publisher: Mines
PARIS ParisTech ISBN: 9782911762932, 2008. [3] Kaviany M, Heat Transfer Physics, Publishing : Canbridge University Press, ISBN 13 978-0-511-43694-
9, 2008. [4] Stefănescu D, Leca A, Transfer de căldură şi masă ; Teorie şi aplicaţii, Publishing Didactică şi
Pedagogică Bucureşti, 1893. [5] Bejan A, Kraus A, Heat Transfer Handbook, Publishing: John Wiley and Sons, ISBN 0-471-39015-1,
2003. [6] Hossu I., Grosu M.C. Horga G., Pruteanu M., Avram D., Breabăn F., Vizureanu P.,
Obtaining Procedures and Measuring Devices for the Thermo-physical Parameters of the Wool Fibers Layers, The XVI-th International Exhibition of Research, Innovation and Technological Transfer "Inventica 2012” 13-15 Iunie , Iaşi, România.
[7] Çengel Y. A., Heat Transfer a Practical Arrpoach, Complet Solution Manual to Acompany, July 2002, pp. 20;
[8] Bergman T.L, Incropera F. P., Lavine A. S., Dewitt D. P., “Introduction to Heat Transfer”, 2002 by John Wiley & Sons, Inc., Chapter 1, pp. 4-5;
[9] STAS 5912/89 Metoda placii incalzitoare cu un singur corp de proba cu aparatul TERMOCOND01;
Corresponding author: Hossu IOAN Department: The Engineering and Design of Textile Products Faculty of Textile, Leather Engineering and Industrial Management The “Gheorghe Asachi” Technical University of Iaşi Address: Blvd. Dimitrie Mangeron, nr. 29, 700050, Iaşi, România +40747788537; +40 232 278683 (1180) , [email protected], [email protected]
Co-authors: Marian-Cătălin GROSU Department: Technology and Design of Textile Products, Faculty of Textile, Leather Engineering and Industrial Management, “Gheorghe Asachi” Technical University of Iasi, Romania Blvd. Dimitrie Mangeron, nr. 29 700050, Iaşi, România
0758470605, [email protected]
Gheorghe HORGA Department: Technology and Design of Textile Products, Faculty of Textile, Leather Engineering and Industrial Management, “Gheorghe Asachi” Technical University of Iasi, Romania Blvd. Dimitrie Mangeron, nr. 29, 700050, Iaşi, România
0740216548, [email protected]
Dorin AVRAM Department: Technology and Design of Textile Products, Faculty of Textile, Leather Engineering and Industrial Management, “Gheorghe Asachi” Technical University of Iasi, Romania Blvd. Dimitrie Mangeron, nr. 29, 700050, Iaşi, România
0740683445, [email protected]
210
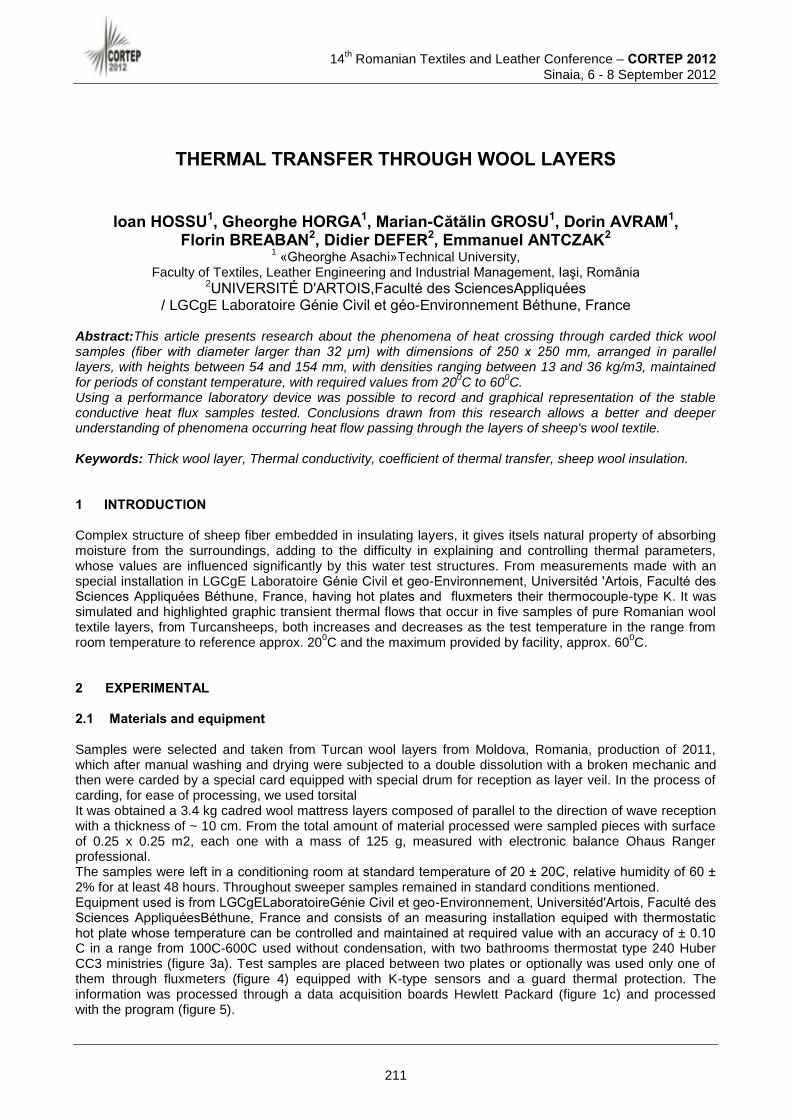
14
th Romanian Textiles and Leather Conference – CORTEP 2012
Sinaia, 6 - 8 September 2012
THERMAL TRANSFER THROUGH WOOL LAYERS
Ioan HOSSU1, Gheorghe HORGA1, Marian-Cătălin GROSU1, Dorin AVRAM1, Florin BREABAN2, Didier DEFER2, Emmanuel ANTCZAK2
1 «Gheorghe Asachi»Technical University,
Faculty of Textiles, Leather Engineering and Industrial Management, Iaşi, România 2UNIVERSITÉ D'ARTOIS,Faculté des SciencesAppliquées
/ LGCgE Laboratoire Génie Civil et géo-Environnement Béthune, France Abstract:This article presents research about the phenomena of heat crossing through carded thick wool samples (fiber with diameter larger than 32 μm) with dimensions of 250 x 250 mm, arranged in parallel layers, with heights between 54 and 154 mm, with densities ranging between 13 and 36 kg/m3, maintained for periods of constant temperature, with required values from 20
0C to 60
0C.
Using a performance laboratory device was possible to record and graphical representation of the stable conductive heat flux samples tested. Conclusions drawn from this research allows a better and deeper understanding of phenomena occurring heat flow passing through the layers of sheep's wool textile. Keywords: Thick wool layer, Thermal conductivity, coefficient of thermal transfer, sheep wool insulation. 1 INTRODUCTION Complex structure of sheep fiber embedded in insulating layers, it gives itsels natural property of absorbing moisture from the surroundings, adding to the difficulty in explaining and controlling thermal parameters, whose values are influenced significantly by this water test structures. From measurements made with an special installation in LGCgE Laboratoire Génie Civil et geo-Environnement, Universitéd 'Artois, Faculté des Sciences Appliquées Béthune, France, having hot plates and fluxmeters their thermocouple-type K. It was simulated and highlighted graphic transient thermal flows that occur in five samples of pure Romanian wool textile layers, from Turcansheeps, both increases and decreases as the test temperature in the range from room temperature to reference approx. 20
0C and the maximum provided by facility, approx. 60
0C.
2 EXPERIMENTAL 2.1 Materials and equipment
Samples were selected and taken from Turcan wool layers from Moldova, Romania, production of 2011, which after manual washing and drying were subjected to a double dissolution with a broken mechanic and then were carded by a special card equipped with special drum for reception as layer veil. In the process of carding, for ease of processing, we used torsital It was obtained a 3.4 kg cadred wool mattress layers composed of parallel to the direction of wave reception with a thickness of ~ 10 cm. From the total amount of material processed were sampled pieces with surface of 0.25 x 0.25 m2, each one with a mass of 125 g, measured with electronic balance Ohaus Ranger professional. The samples were left in a conditioning room at standard temperature of 20 ± 20C, relative humidity of 60 ± 2% for at least 48 hours. Throughout sweeper samples remained in standard conditions mentioned. Equipment used is from LGCgELaboratoireGénie Civil et geo-Environnement, Universitéd'Artois, Faculté des Sciences AppliquéesBéthune, France and consists of an measuring installation equiped with thermostatic hot plate whose temperature can be controlled and maintained at required value with an accuracy of ± 0.10 C in a range from 100C-600C used without condensation, with two bathrooms thermostat type 240 Huber CC3 ministries (figure 3a). Test samples are placed between two plates or optionally was used only one of them through fluxmeters (figure 4) equipped with K-type sensors and a guard thermal protection. The information was processed through a data acquisition boards Hewlett Packard (figure 1c) and processed with the program (figure 5).
211
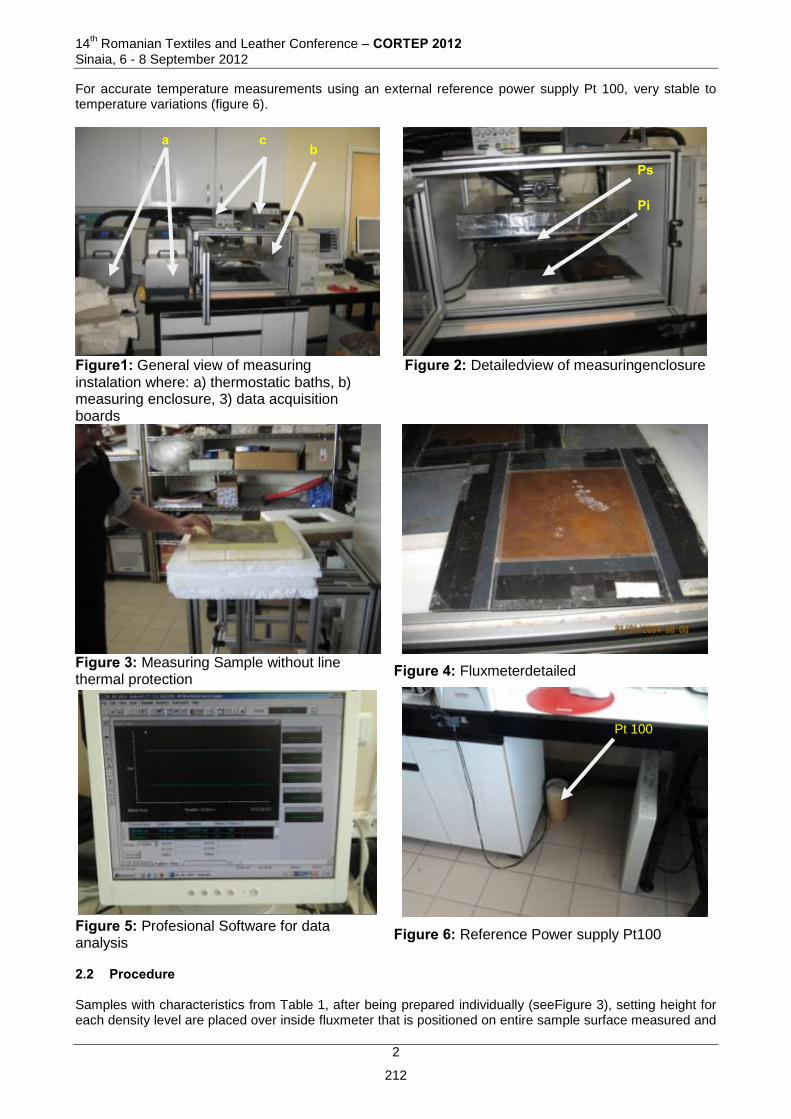
14th Romanian Textiles and Leather Conference – CORTEP 2012
Sinaia, 6 - 8 September 2012
2
For accurate temperature measurements using an external reference power supply Pt 100, very stable to temperature variations (figure 6).
Figure1: General view of measuring instalation where: a) thermostatic baths, b) measuring enclosure, 3) data acquisition boards
Figure 2: Detailedview of measuringenclosure
Figure 3: Measuring Sample without line thermal protection
Figure 4: Fluxmeterdetailed
Figure 5: Profesional Software for data analysis
Figure 6: Reference Power supply Pt100
2.2 Procedure Samples with characteristics from Table 1, after being prepared individually (seeFigure 3), setting height for each density level are placed over inside fluxmeter that is positioned on entire sample surface measured and
a b
c
Ps
Pi
Pt 100
212

14
th Romanian Textiles and Leather Conference – CORTEP 2012
Sinaia, 6 - 8 September 2012
centered inner plate hot surface of inside plate. The upper fluxmeter measures the heat transfer throughmeasure element on the outer surface being positioned above the hole properly (figure 3). Simulation of the presen tresearch was done by changing the plates temperature of the base board in the upward and downward to the laboratory ambient temperature. 3 RESULTS
All the samples has the constant mass of 125 g, homogeneous distributed on an area of 0,0625 m2, having
the densities (see Table 1):
13 kg/m3 associated to a layer heights of 154 mm,
16,5 kg/m3 associated to a layer heights of 121 mm,
25 kg/m3 associated to a layer heights of 80 mm,
33,5 kg/m3 associated to a layer heights of 60 mm şi
37 kg/m3 associated to a layer heights of 54 mm.
The tests were made at temperatures between 22.10C - 63
0C, compared to ambient temperature.
Measurement results represents the influence that have the density the temperature difference and the
humidity on heat flow transition through five Turcan wool samples, coded according to Table 1, processed as
carded fiber layer with densities of 13kg/m3, 16.5kg/m
3, 25kg/m
3, 37kg/m
3; and 25 kg/m
3, subjected to
heating and cooling said into the testing device, testing starts at ambient temperature or at the specified
explicitly
Table 1:Samples and encoded parametrs
Encoding and the anlasyzed samples characterstics for themal transfer through thick turcan wool layers
Crt. no. Sample code
Encoded parameters ρ h Tinf Tsup Observations Kg/m3 mm 0C 0C
1 S1 TF 13-154-51.7 13.0 154 20 51.7 T0 = Ta = Tinf
2 S2 TF 16.5-121-60 16.5 121 20 60.0 T0 = 50 0C
3 S3 TF 25-80-51.7 25.0 80 20 51.7 T0 = 57 0C
4 S4 TF 37-54-51.7 37.0 54 20 51.7 T0 = Ta = Tinf
5 S5 TF 25-80-51.7 25.0 80 20 51.7 T0 = Ta = Tinf
For the sample S1 TF 13-154-51.7, de 13 kg/m2the lower plate was used only, heated from ambient
temperature T0 = Ta = Tinf , up to temperature about Tmax = 51.7 0C, pursuing the:
- Evolution in time of cold surface temperature Ta = Tinf , reference temperature;
- The maximum flux absorbed by the sample in time to reach the maximum temperature Tmax =
51.7 0C and flux evolution through cold surface, aferent during testing time;
- Flux through cold surface în during experiment time;
- Evolution and trend sheat flows through the hot and coldsurfaces
Figure 7: Measurement S1 T 13-154-51.7 a) complete b) zoom
213
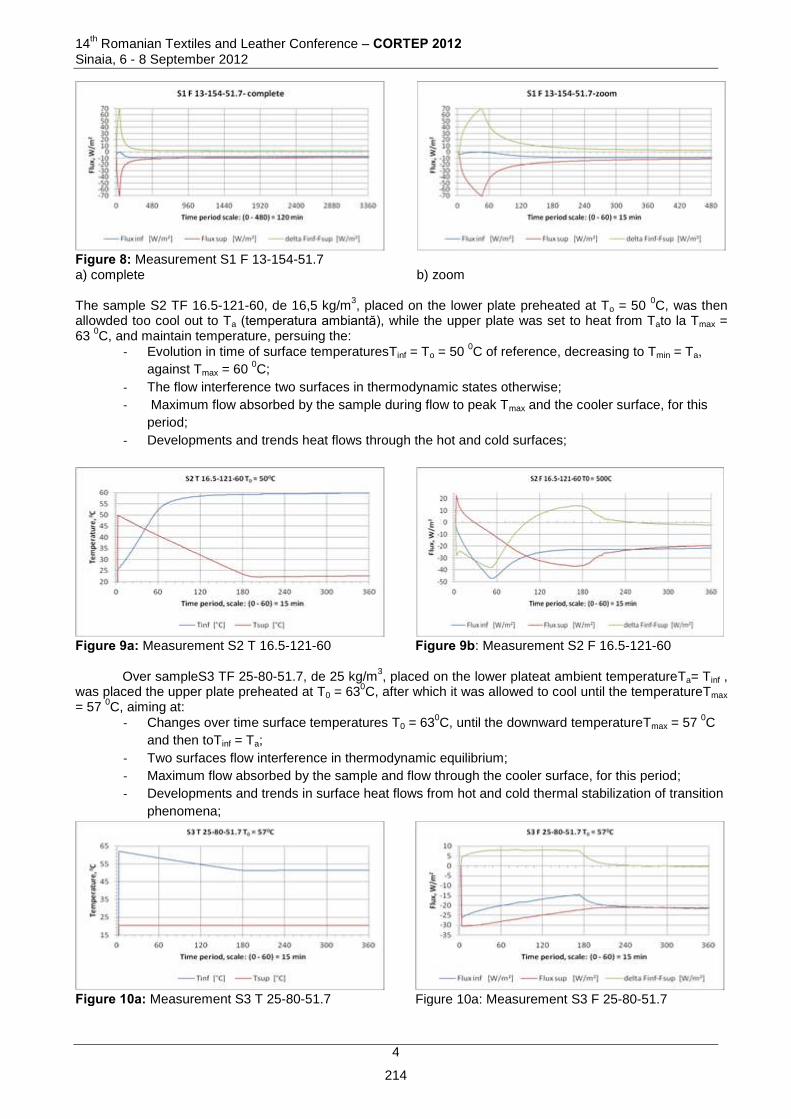
14th Romanian Textiles and Leather Conference – CORTEP 2012
Sinaia, 6 - 8 September 2012
4
Figure 8: Measurement S1 F 13-154-51.7 a) complete b) zoom The sample S2 TF 16.5-121-60, de 16,5 kg/m
3, placed on the lower plate preheated at To = 50
0C, was then
allowded too cool out to Ta (temperatura ambiantă), while the upper plate was set to heat from Tato la Tmax = 63
0C, and maintain temperature, persuing the:
- Evolution in time of surface temperaturesTinf = To = 50 0C of reference, decreasing to Tmin = Ta,
against Tmax = 60 0C;
- The flow interference two surfaces in thermodynamic states otherwise;
- Maximum flow absorbed by the sample during flow to peak Tmax and the cooler surface, for this
period;
- Developments and trends heat flows through the hot and cold surfaces;
Figure 9a: Measurement S2 T 16.5-121-60 Figure 9b: Measurement S2 F 16.5-121-60 Over sampleS3 TF 25-80-51.7, de 25 kg/m
3, placed on the lower plateat ambient temperatureTa= Tinf ,
was placed the upper plate preheated at T0 = 630C, after which it was allowed to cool until the temperatureTmax
= 57 0C, aiming at:
- Changes over time surface temperatures T0 = 630C, until the downward temperatureTmax = 57
0C
and then toTinf = Ta;
- Two surfaces flow interference in thermodynamic equilibrium;
- Maximum flow absorbed by the sample and flow through the cooler surface, for this period;
- Developments and trends in surface heat flows from hot and cold thermal stabilization of transition
phenomena;
Figure 10a: Measurement S3 T 25-80-51.7 Figure 10a: Measurement S3 F 25-80-51.7
214
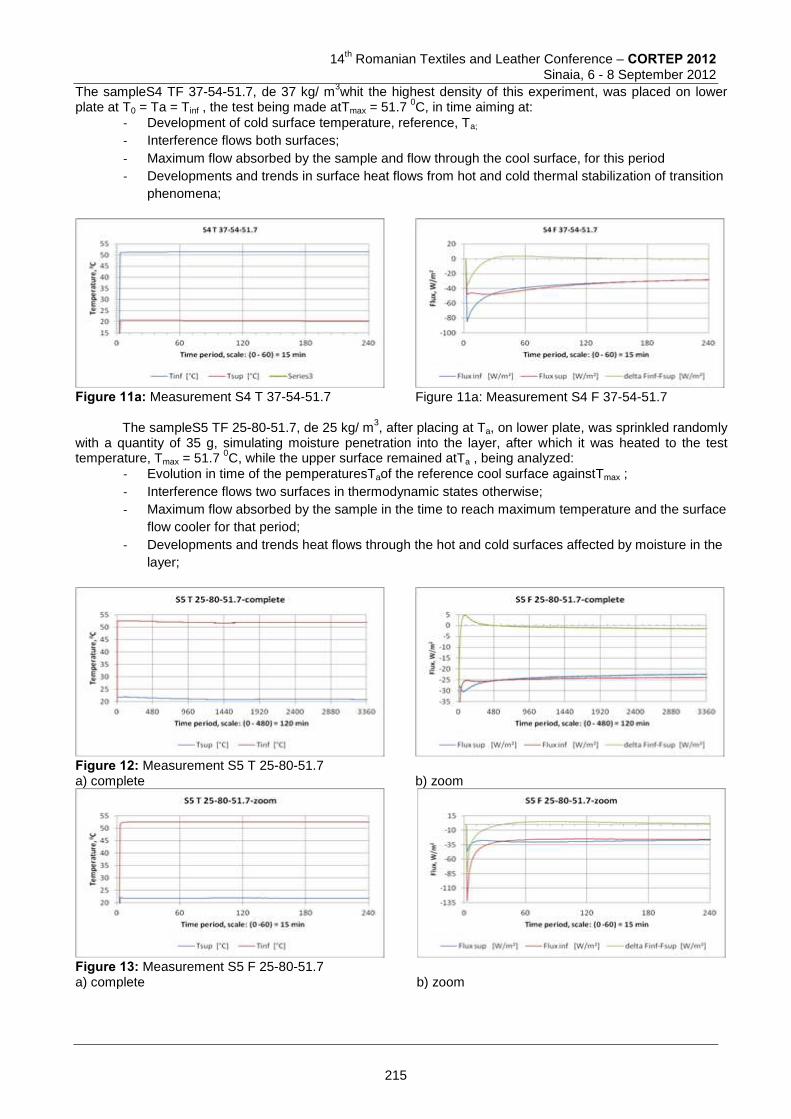
14
th Romanian Textiles and Leather Conference – CORTEP 2012
Sinaia, 6 - 8 September 2012
The sampleS4 TF 37-54-51.7, de 37 kg/ m3whit the highest density of this experiment, was placed on lower
plate at T0 = Ta = Tinf , the test being made atTmax = 51.7 0C, in time aiming at:
- Development of cold surface temperature, reference, Ta;
- Interference flows both surfaces;
- Maximum flow absorbed by the sample and flow through the cool surface, for this period
- Developments and trends in surface heat flows from hot and cold thermal stabilization of transition
phenomena;
Figure 11a: Measurement S4 T 37-54-51.7 Figure 11a: Measurement S4 F 37-54-51.7 The sampleS5 TF 25-80-51.7, de 25 kg/ m
3, after placing at Ta, on lower plate, was sprinkled randomly
with a quantity of 35 g, simulating moisture penetration into the layer, after which it was heated to the test temperature, Tmax = 51.7
0C, while the upper surface remained atTa , being analyzed:
- Evolution in time of the pemperaturesTaof the reference cool surface againstTmax ;
- Interference flows two surfaces in thermodynamic states otherwise;
- Maximum flow absorbed by the sample in the time to reach maximum temperature and the surface
flow cooler for that period;
- Developments and trends heat flows through the hot and cold surfaces affected by moisture in the
layer;
Figure 12: Measurement S5 T 25-80-51.7 a) complete b) zoom
Figure 13: Measurement S5 F 25-80-51.7 a) complete b) zoom
215
14th Romanian Textiles and Leather Conference – CORTEP 2012
Sinaia, 6 - 8 September 2012
6
4 CONCLUSIONS AND DISCUSSIONS
Conductive heat transfer through insulating layers of wool, even briefly presented by the few examples, proves to be particularly complex becausethe heat flow tends to quickly traverse the environment or between the two plates or between hot plate and environment, to which a thermal inertia vigorously opposes that is able to quench the flooding energy and alleviate the warming in depth. The flow harmony of the two heat flows blends into a share transfer and receivingheat, finally reaching for the last sample flooded, for the heat transferred to be to the heat source, an absolutely fabulous phenomenon that will be the subject to a continuation of this paper which will include the results mathematically quantified of these experiences. Thermal protection in absolute terms, doesn’t exist! Whatever the mode of protection of buildings or any thermally protected enclosures, transfer tends toward absolute minimum value when the system tends to zero degrees absolute, 0K. Approaches for isolating heat transfer through any of the forms of heat transfer: conduction, convection, radiation and mass transfer, translate into increased opportunities for extension of time of heat transfer and providing for a pre-established time required to achieve comfort conditions. In this way, the turcan Romanian wool tested, meets abundantly and still many, perhaps unexpected "surprises" to reveal. Acknowledgements This paper was realised with the support of EURODOC “Doctoral Scholarships for Research Performance at European Level” project, ID 59410, financed by the European Social Found and Romanian Government. This paper was realised with the support of POSDRU CUANTUMDOC “Doctoral Studies For European Performances in Research and Innovation” project, ID79407, funded by the European Social Fund and Romanian Government. References
[1] Antczak E, Indentification par impédance thermique: Application a la caractérisation des géométraux Thèse de doctorat a la Faculté des Sciences Appliquées, Béthune, Université d’Artois, 1996. [2] Antczak E, Chauchois A, Defer D, Duthoit B, Characterization of the thermal effusivity saturated soil by the inverse method in the freqvency domain Laboratoire D’Artois Mécanique et Habitat, Faculté des Sciences Appliquées, Béthune, France, Applied Thermal Engineering, vol. 23, pp. 1525-1536, 2003. [3] Antczak E, Defer D, Elaoami M, Duthoit B, Mesures fluxmétriques appliquees a l’étude des caractéristiques thermophysiques d’un mortier en cours de prise XXII
ème rencontres universitaires de
Génie Civil, Marne la Vallée, France, 2004. [4] http://www.captec.fr/ [5] Lienhard H J IV, Lienhard H J V, A Heat Transfer Textbook, Third Edition, Publishing: Phlulogiston Press Cambridge, Massachusetts, 01, 2003. [MTP] Marc T. P., "Conceperea şi realizarea unor structuri rutiere cu performanţe ridicate", Teza de doctorat, Universitatea "Politehnică" din Timişoara, 19.12.2011. [6] HOSSU I, GROSU M. C, HORGA G., AVRAM D, „Non spinnable Turcan wool, as basis of rawmaterials for insulation of the civile constructions”, Tehnical Textiles - PresentandFutureSimposyum, Book of Papers, Editor: Ioan Cioară, Editura Performantica, ISBN: 978-973-730-885-6 October, 2011, Iaşi, România, pag 177-186;
Corresponding author: Hossu IOAN Department: The Engineering and Design of Textile Products Faculty of Textile, Leather Engineering and Industrial Management The “Gheorghe Asachi” TechnicalUniversity of Iaşi Address: Blvd. DimitrieMangeron, nr. 29, 700050, Iaşi, România +40747788537; +40 232 278683 (1180) , [email protected], [email protected]
Co-authors: Marian-Cătălin GROSU Department: Technology and Design of Textile Products, Faculty of Textile, Leather Engineering and Industrial Management, “Gheorghe Asachi” TechnicalUniversity of Iasi, Romania
216
14
th Romanian Textiles and Leather Conference – CORTEP 2012
Sinaia, 6 - 8 September 2012
Blvd. Dimitrie Mangeron, nr. 29 700050, Iaşi, România
0758470605, [email protected] Gheorghe HORGA Department: Technology and Design of Textile Products, Faculty of Textile, Leather Engineering and Industrial Management, “Gheorghe Asachi” TechnicalUniversity of Iasi, Romania Blvd. Dimitrie Mangeron, nr. 29, 700050, Iaşi, România
0740216548, [email protected]
Dorin AVRAM Department: Technology and Design of Textile Products, Faculty of Textile, Leather Engineering and Industrial Management, “Gheorghe Asachi” TechnicalUniversity of Iasi, Romania Blvd. Dimitrie Mangeron, nr. 29, 700050, Iaşi, România
0740683445, [email protected] Florin BREABAN University Lille Nord de France, F-59000 Lille, France, UArtois, LGCgE, IUTB-CRITTM2A /S2T-EHVL F-62400 Béthune, Tél : 03 21 63 23 00; 06 78 00 34 58; Fax : 03 21 68 49 57
[email protected], Didier DEFER University Lille Nord de France, F-59000 Lille, France, UArtois, LGCgE, IUTB-CRITTM2A /S2T-EHVL F-62408 Béthune, Courriel Tél. 03 21 63 71 55
[email protected] Emmanuel ANTCZAK University Lille Nord de France, F-59000 Lille, France, UArtois, LGCgE, IUTB-CRITTM2A /S2T-EHVL F-62400 Béthune, Courriel Tél. 03 21 63 71 52
217
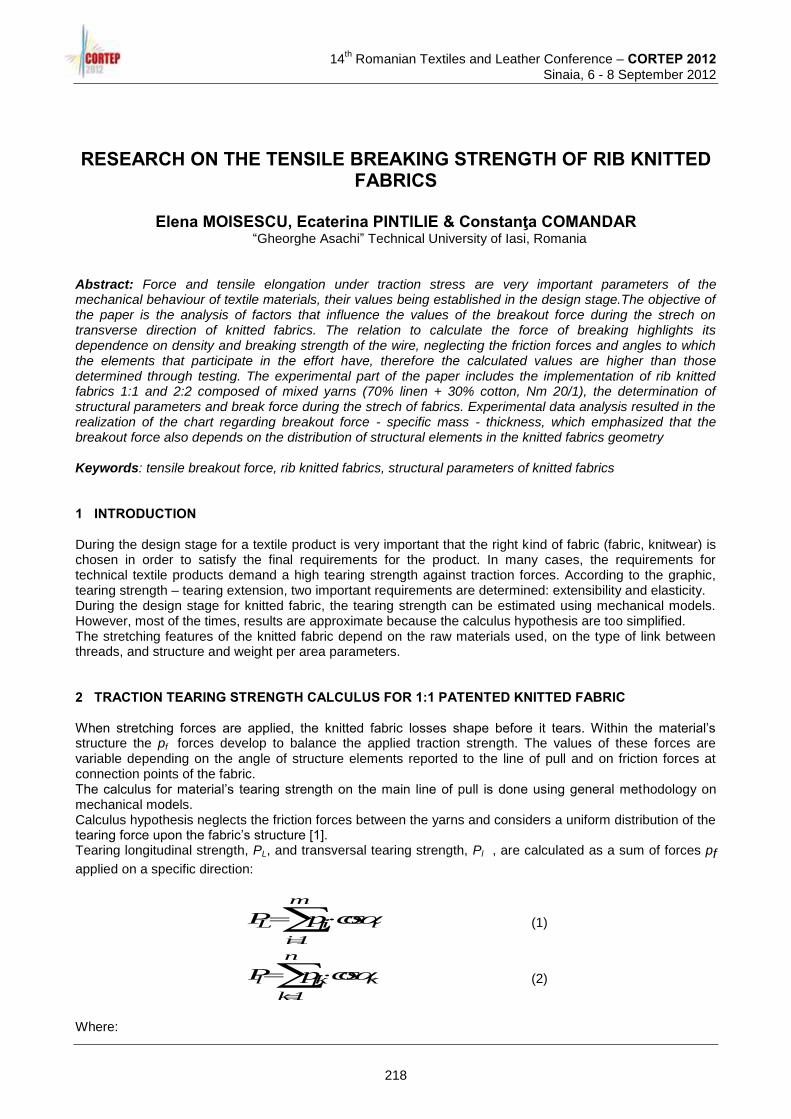
14
th Romanian Textiles and Leather Conference – CORTEP 2012
Sinaia, 6 - 8 September 2012
RESEARCH ON THE TENSILE BREAKING STRENGTH OF RIB KNITTED FABRICS
Elena MOISESCU, Ecaterina PINTILIE & Constanţa COMANDAR
“Gheorghe Asachi” Technical University of Iasi, Romania Abstract: Force and tensile elongation under traction stress are very important parameters of the mechanical behaviour of textile materials, their values being established in the design stage.The objective of the paper is the analysis of factors that influence the values of the breakout force during the strech on transverse direction of knitted fabrics. The relation to calculate the force of breaking highlights its dependence on density and breaking strength of the wire, neglecting the friction forces and angles to which the elements that participate in the effort have, therefore the calculated values are higher than those determined through testing. The experimental part of the paper includes the implementation of rib knitted fabrics 1:1 and 2:2 composed of mixed yarns (70% linen + 30% cotton, Nm 20/1), the determination of structural parameters and break force during the strech of fabrics. Experimental data analysis resulted in the realization of the chart regarding breakout force - specific mass - thickness, which emphasized that the breakout force also depends on the distribution of structural elements in the knitted fabrics geometry Keywords: tensile breakout force, rib knitted fabrics, structural parameters of knitted fabrics 1 INTRODUCTION During the design stage for a textile product is very important that the right kind of fabric (fabric, knitwear) is chosen in order to satisfy the final requirements for the product. In many cases, the requirements for technical textile products demand a high tearing strength against traction forces. According to the graphic, tearing strength – tearing extension, two important requirements are determined: extensibility and elasticity. During the design stage for knitted fabric, the tearing strength can be estimated using mechanical models. However, most of the times, results are approximate because the calculus hypothesis are too simplified. The stretching features of the knitted fabric depend on the raw materials used, on the type of link between threads, and structure and weight per area parameters. 2 TRACTION TEARING STRENGTH CALCULUS FOR 1:1 PATENTED KNITTED FABRIC When stretching forces are applied, the knitted fabric losses shape before it tears. Within the material’s structure the pf forces develop to balance the applied traction strength. The values of these forces are variable depending on the angle of structure elements reported to the line of pull and on friction forces at connection points of the fabric. The calculus for material’s tearing strength on the main line of pull is done using general methodology on mechanical models. Calculus hypothesis neglects the friction forces between the yarns and considers a uniform distribution of the tearing force upon the fabric’s structure [1]. Tearing longitudinal strength, PL, and transversal tearing strength, Pl , are calculated as a sum of forces pf
applied on a specific direction:
P pL fi i
i
m
cos1
(1)
P pl fk k
k
n
cos1
(2)
Where:
218
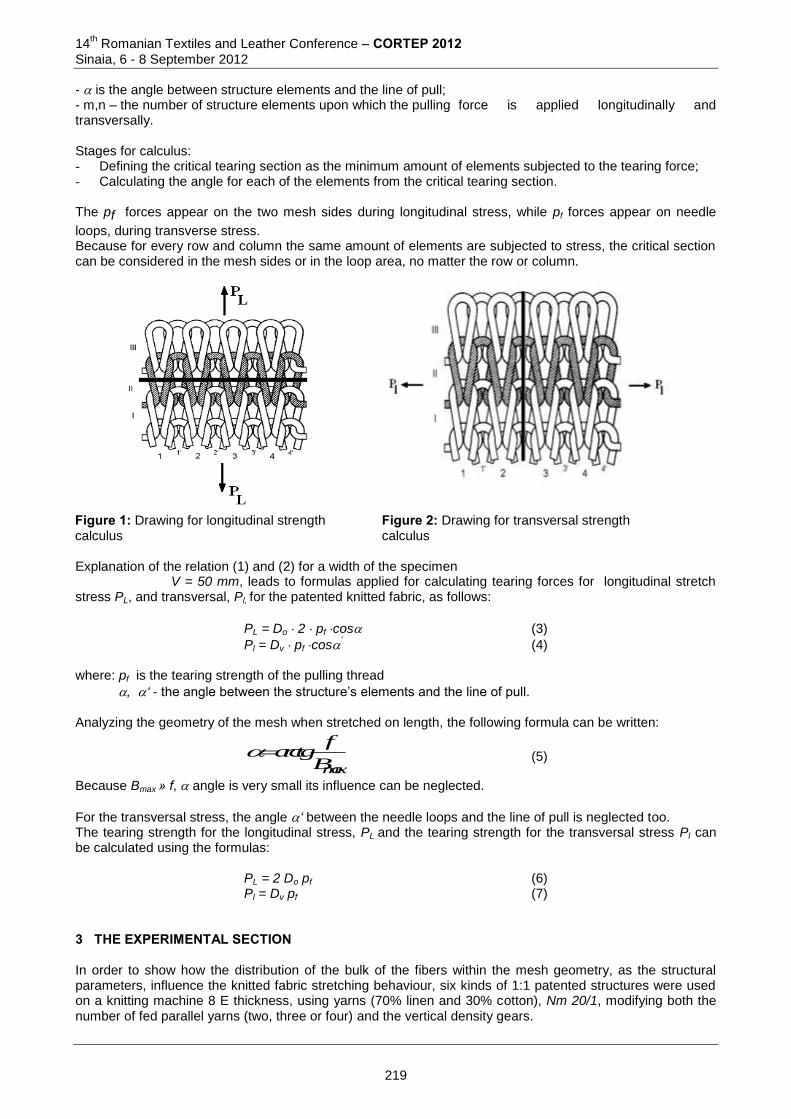
14th Romanian Textiles and Leather Conference – CORTEP 2012
Sinaia, 6 - 8 September 2012
- is the angle between structure elements and the line of pull; - m,n – the number of structure elements upon which the pulling force is applied longitudinally and transversally. Stages for calculus: - Defining the critical tearing section as the minimum amount of elements subjected to the tearing force; - Calculating the angle for each of the elements from the critical tearing section. The pf forces appear on the two mesh sides during longitudinal stress, while pf forces appear on needle
loops, during transverse stress. Because for every row and column the same amount of elements are subjected to stress, the critical section can be considered in the mesh sides or in the loop area, no matter the row or column.
Figure 1: Drawing for longitudinal strength calculus
Figure 2: Drawing for transversal strength calculus
Explanation of the relation (1) and (2) for a width of the specimen V = 50 mm, leads to formulas applied for calculating tearing forces for longitudinal stretch stress PL, and transversal, Pl, for the patented knitted fabric, as follows:
PL = Do 2 pf cos (3)
Pl = Dv pf cos‘ (4)
where: pf is the tearing strength of the pulling thread
, ‘ - the angle between the structure’s elements and the line of pull. Analyzing the geometry of the mesh when stretched on length, the following formula can be written:
arctgf
Bmax (5)
Because Bmax » f, angle is very small its influence can be neglected.
For the transversal stress, the angle ‘ between the needle loops and the line of pull is neglected too. The tearing strength for the longitudinal stress, PL and the tearing strength for the transversal stress Pl can be calculated using the formulas:
PL = 2 Do pf (6) Pl = Dv pf (7)
3 THE EXPERIMENTAL SECTION In order to show how the distribution of the bulk of the fibers within the mesh geometry, as the structural parameters, influence the knitted fabric stretching behaviour, six kinds of 1:1 patented structures were used on a knitting machine 8 E thickness, using yarns (70% linen and 30% cotton), Nm 20/1, modifying both the number of fed parallel yarns (two, three or four) and the vertical density gears.
219
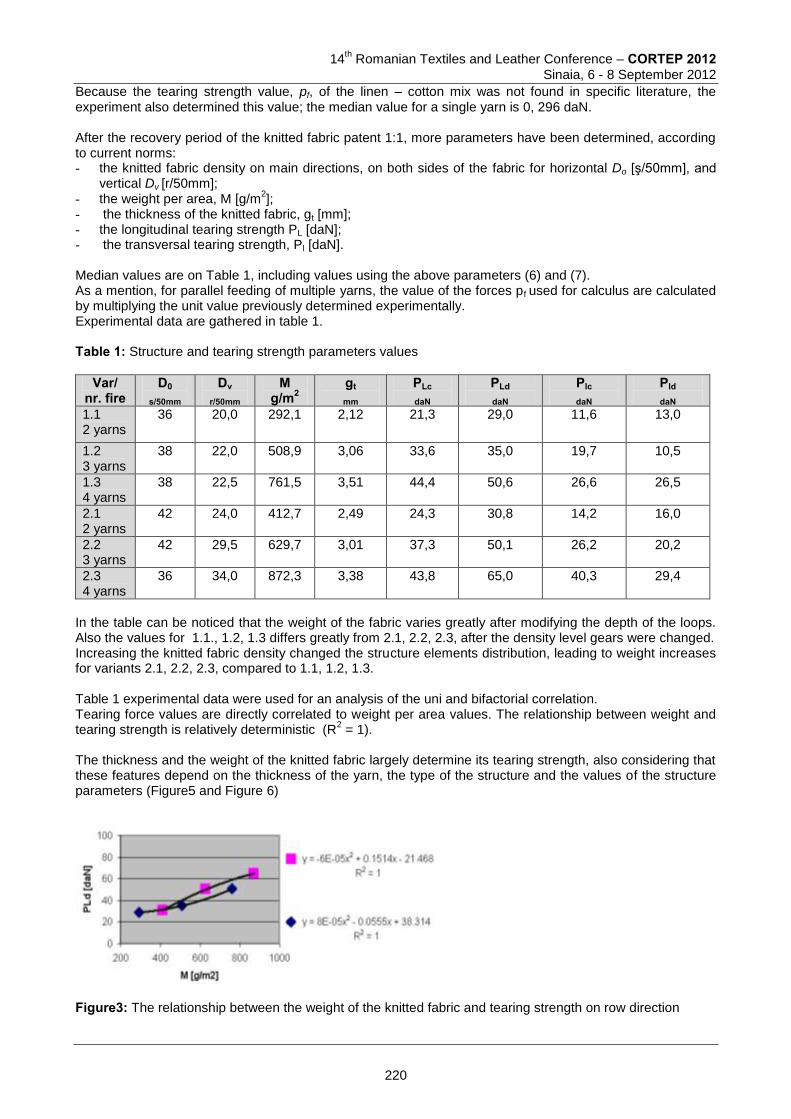
14
th Romanian Textiles and Leather Conference – CORTEP 2012
Sinaia, 6 - 8 September 2012
Because the tearing strength value, pf, of the linen – cotton mix was not found in specific literature, the experiment also determined this value; the median value for a single yarn is 0, 296 daN. After the recovery period of the knitted fabric patent 1:1, more parameters have been determined, according to current norms: - the knitted fabric density on main directions, on both sides of the fabric for horizontal Do [ş/50mm], and
vertical Dv [r/50mm]; - the weight per area, M [g/m
2];
- the thickness of the knitted fabric, gt [mm]; - the longitudinal tearing strength PL [daN]; - the transversal tearing strength, Pl [daN]. Median values are on Table 1, including values using the above parameters (6) and (7). As a mention, for parallel feeding of multiple yarns, the value of the forces pf used for calculus are calculated by multiplying the unit value previously determined experimentally. Experimental data are gathered in table 1. Table 1: Structure and tearing strength parameters values
Var/ nr. fire
D0
s/50mm
Dv
r/50mm
M g/m2
gt
mm
PLc
daN
PLd
daN
Plc
daN
Pld
daN 1.1 2 yarns
36 20,0 292,1 2,12 21,3 29,0 11,6 13,0
1.2 3 yarns
38 22,0 508,9 3,06 33,6 35,0 19,7 10,5
1.3 4 yarns
38 22,5 761,5 3,51 44,4 50,6 26,6 26,5
2.1 2 yarns
42 24,0 412,7 2,49 24,3 30,8 14,2 16,0
2.2 3 yarns
42 29,5 629,7 3,01 37,3 50,1 26,2 20,2
2.3 4 yarns
36 34,0 872,3 3,38 43,8 65,0 40,3 29,4
In the table can be noticed that the weight of the fabric varies greatly after modifying the depth of the loops. Also the values for 1.1., 1.2, 1.3 differs greatly from 2.1, 2.2, 2.3, after the density level gears were changed. Increasing the knitted fabric density changed the structure elements distribution, leading to weight increases for variants 2.1, 2.2, 2.3, compared to 1.1, 1.2, 1.3. Table 1 experimental data were used for an analysis of the uni and bifactorial correlation. Tearing force values are directly correlated to weight per area values. The relationship between weight and tearing strength is relatively deterministic (R
2 = 1).
The thickness and the weight of the knitted fabric largely determine its tearing strength, also considering that these features depend on the thickness of the yarn, the type of the structure and the values of the structure parameters (Figure5 and Figure 6)
Figure3: The relationship between the weight of the knitted fabric and tearing strength on row direction
220
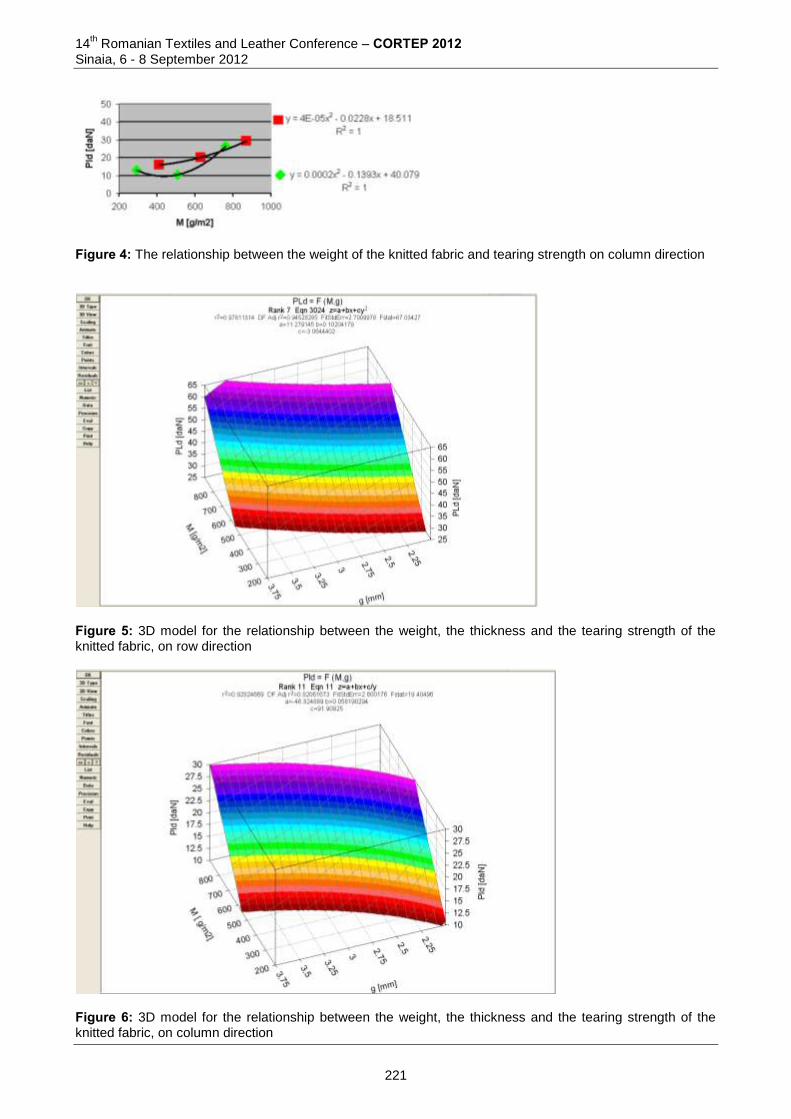
14th Romanian Textiles and Leather Conference – CORTEP 2012
Sinaia, 6 - 8 September 2012
Figure 4: The relationship between the weight of the knitted fabric and tearing strength on column direction
Figure 5: 3D model for the relationship between the weight, the thickness and the tearing strength of the knitted fabric, on row direction
Figure 6: 3D model for the relationship between the weight, the thickness and the tearing strength of the knitted fabric, on column direction
221
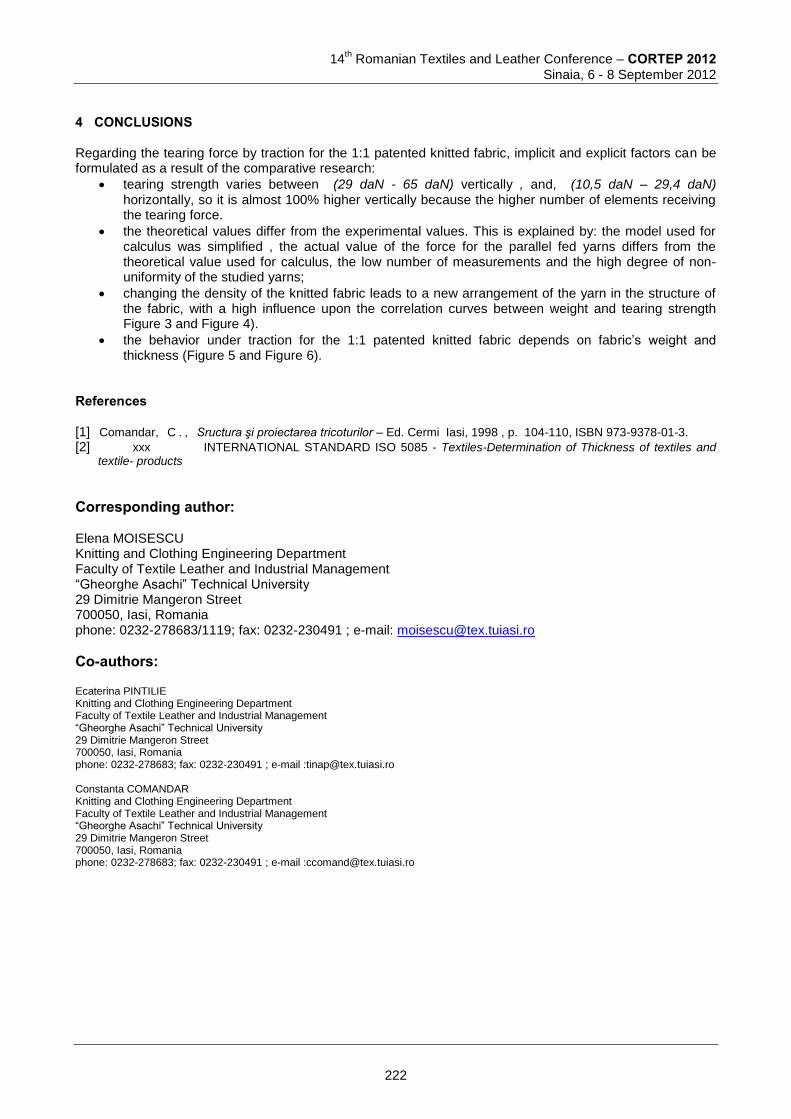
14
th Romanian Textiles and Leather Conference – CORTEP 2012
Sinaia, 6 - 8 September 2012
4 CONCLUSIONS Regarding the tearing force by traction for the 1:1 patented knitted fabric, implicit and explicit factors can be formulated as a result of the comparative research:
tearing strength varies between (29 daN - 65 daN) vertically , and, (10,5 daN – 29,4 daN) horizontally, so it is almost 100% higher vertically because the higher number of elements receiving the tearing force.
the theoretical values differ from the experimental values. This is explained by: the model used for calculus was simplified , the actual value of the force for the parallel fed yarns differs from the theoretical value used for calculus, the low number of measurements and the high degree of non-uniformity of the studied yarns;
changing the density of the knitted fabric leads to a new arrangement of the yarn in the structure of the fabric, with a high influence upon the correlation curves between weight and tearing strength Figure 3 and Figure 4).
the behavior under traction for the 1:1 patented knitted fabric depends on fabric’s weight and thickness (Figure 5 and Figure 6).
References [1] Comandar, C . , Sructura şi proiectarea tricoturilor – Ed. Cermi Iasi, 1998 , p. 104-110, ISBN 973-9378-01-3. [2] xxx INTERNATIONAL STANDARD ISO 5085 - Textiles-Determination of Thickness of textiles and
textile- products
Corresponding author: Elena MOISESCU Knitting and Clothing Engineering Department Faculty of Textile Leather and Industrial Management “Gheorghe Asachi” Technical University 29 Dimitrie Mangeron Street 700050, Iasi, Romania phone: 0232-278683/1119; fax: 0232-230491 ; e-mail: [email protected]
Co-authors: Ecaterina PINTILIE Knitting and Clothing Engineering Department Faculty of Textile Leather and Industrial Management “Gheorghe Asachi” Technical University 29 Dimitrie Mangeron Street 700050, Iasi, Romania phone: 0232-278683; fax: 0232-230491 ; e-mail :[email protected] Constanta COMANDAR Knitting and Clothing Engineering Department Faculty of Textile Leather and Industrial Management “Gheorghe Asachi” Technical University 29 Dimitrie Mangeron Street 700050, Iasi, Romania phone: 0232-278683; fax: 0232-230491 ; e-mail :[email protected]
222
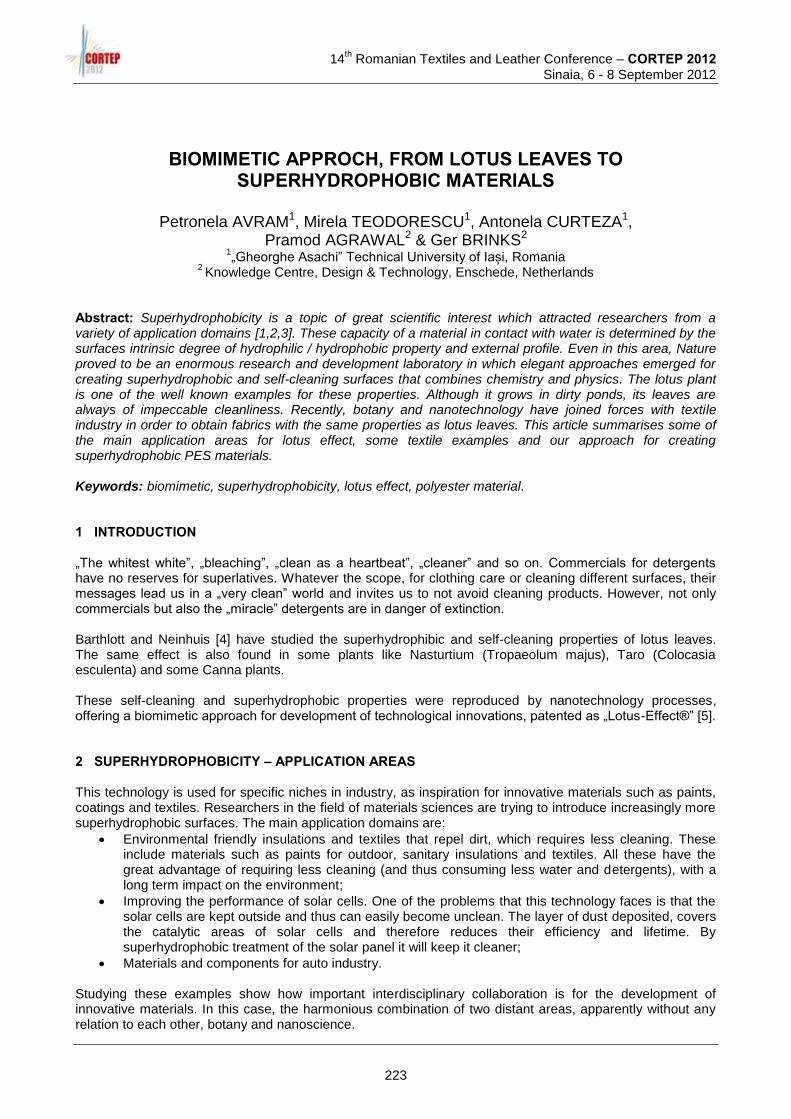
14
th Romanian Textiles and Leather Conference – CORTEP 2012
Sinaia, 6 - 8 September 2012
BIOMIMETIC APPROCH, FROM LOTUS LEAVES TO SUPERHYDROPHOBIC MATERIALS
Petronela AVRAM1, Mirela TEODORESCU1, Antonela CURTEZA1,
Pramod AGRAWAL2 & Ger BRINKS2 1„Gheorghe Asachi” Technical University of Iași, Romania
2 Knowledge Centre, Design & Technology, Enschede, Netherlands
Abstract: Superhydrophobicity is a topic of great scientific interest which attracted researchers from a variety of application domains [1,2,3]. These capacity of a material in contact with water is determined by the surfaces intrinsic degree of hydrophilic / hydrophobic property and external profile. Even in this area, Nature proved to be an enormous research and development laboratory in which elegant approaches emerged for creating superhydrophobic and self-cleaning surfaces that combines chemistry and physics. The lotus plant is one of the well known examples for these properties. Although it grows in dirty ponds, its leaves are always of impeccable cleanliness. Recently, botany and nanotechnology have joined forces with textile industry in order to obtain fabrics with the same properties as lotus leaves. This article summarises some of the main application areas for lotus effect, some textile examples and our approach for creating superhydrophobic PES materials. Keywords: biomimetic, superhydrophobicity, lotus effect, polyester material. 1 INTRODUCTION „The whitest white”, „bleaching”, „clean as a heartbeat”, „cleaner” and so on. Commercials for detergents have no reserves for superlatives. Whatever the scope, for clothing care or cleaning different surfaces, their messages lead us in a „very clean” world and invites us to not avoid cleaning products. However, not only commercials but also the „miracle” detergents are in danger of extinction. Barthlott and Neinhuis [4] have studied the superhydrophibic and self-cleaning properties of lotus leaves. The same effect is also found in some plants like Nasturtium (Tropaeolum majus), Taro (Colocasia esculenta) and some Canna plants. These self-cleaning and superhydrophobic properties were reproduced by nanotechnology processes, offering a biomimetic approach for development of technological innovations, patented as „Lotus-Effect®” [5]. 2 SUPERHYDROPHOBICITY – APPLICATION AREAS This technology is used for specific niches in industry, as inspiration for innovative materials such as paints, coatings and textiles. Researchers in the field of materials sciences are trying to introduce increasingly more superhydrophobic surfaces. The main application domains are:
Environmental friendly insulations and textiles that repel dirt, which requires less cleaning. These include materials such as paints for outdoor, sanitary insulations and textiles. All these have the great advantage of requiring less cleaning (and thus consuming less water and detergents), with a long term impact on the environment;
Improving the performance of solar cells. One of the problems that this technology faces is that the solar cells are kept outside and thus can easily become unclean. The layer of dust deposited, covers the catalytic areas of solar cells and therefore reduces their efficiency and lifetime. By superhydrophobic treatment of the solar panel it will keep it cleaner;
Materials and components for auto industry. Studying these examples show how important interdisciplinary collaboration is for the development of innovative materials. In this case, the harmonious combination of two distant areas, apparently without any relation to each other, botany and nanoscience.
223
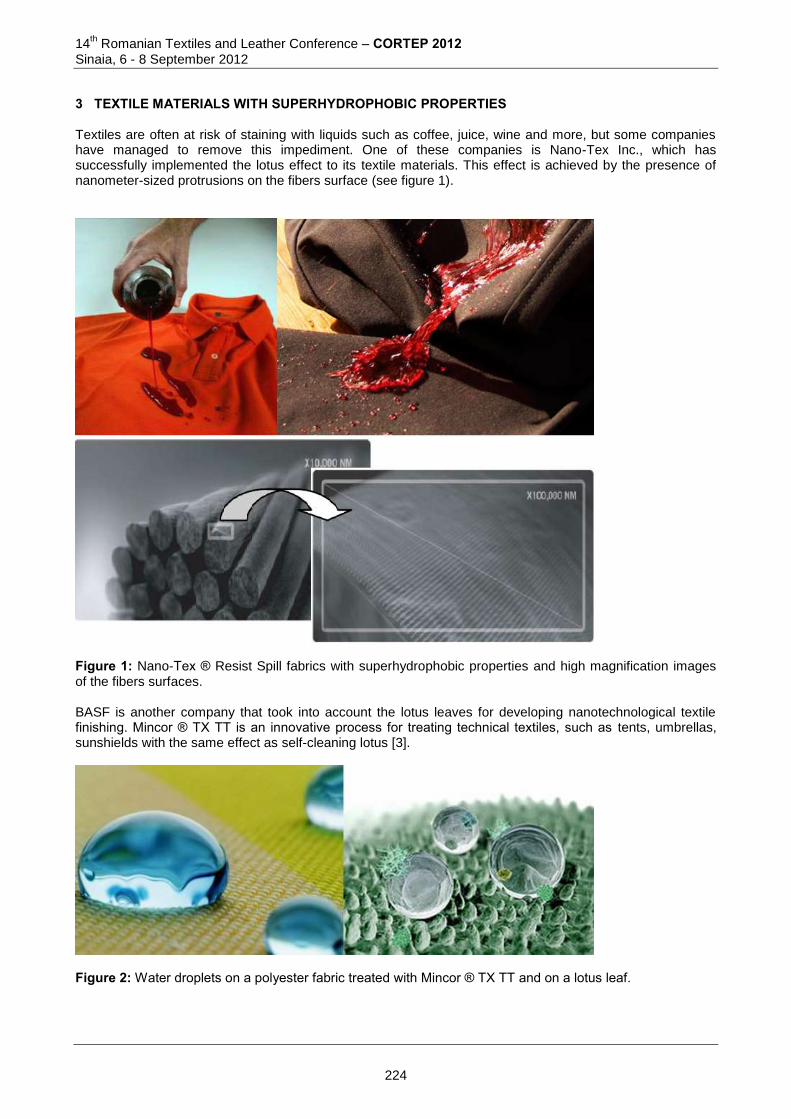
14th Romanian Textiles and Leather Conference – CORTEP 2012
Sinaia, 6 - 8 September 2012
3 TEXTILE MATERIALS WITH SUPERHYDROPHOBIC PROPERTIES Textiles are often at risk of staining with liquids such as coffee, juice, wine and more, but some companies have managed to remove this impediment. One of these companies is Nano-Tex Inc., which has successfully implemented the lotus effect to its textile materials. This effect is achieved by the presence of nanometer-sized protrusions on the fibers surface (see figure 1).
Figure 1: Nano-Tex ® Resist Spill fabrics with superhydrophobic properties and high magnification images of the fibers surfaces. BASF is another company that took into account the lotus leaves for developing nanotechnological textile finishing. Mincor ® TX TT is an innovative process for treating technical textiles, such as tents, umbrellas, sunshields with the same effect as self-cleaning lotus [3].
Figure 2: Water droplets on a polyester fabric treated with Mincor ® TX TT and on a lotus leaf.
224
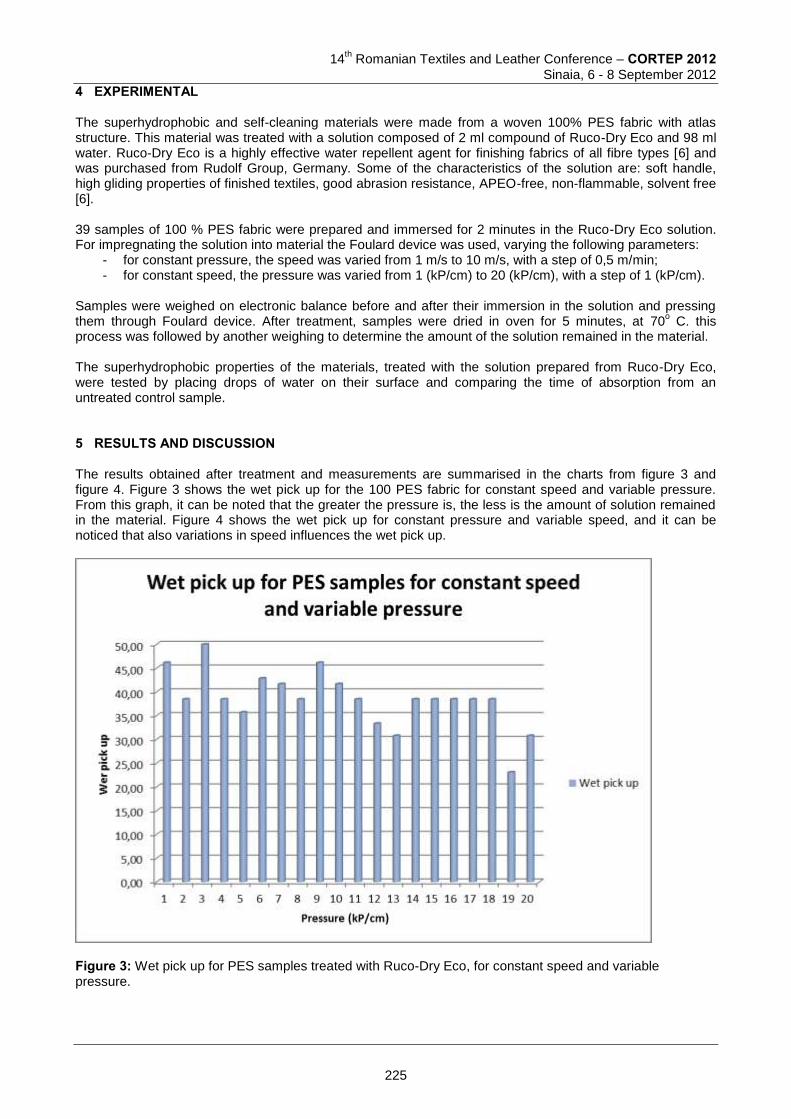
14
th Romanian Textiles and Leather Conference – CORTEP 2012
Sinaia, 6 - 8 September 2012
4 EXPERIMENTAL The superhydrophobic and self-cleaning materials were made from a woven 100% PES fabric with atlas structure. This material was treated with a solution composed of 2 ml compound of Ruco-Dry Eco and 98 ml water. Ruco-Dry Eco is a highly effective water repellent agent for finishing fabrics of all fibre types [6] and was purchased from Rudolf Group, Germany. Some of the characteristics of the solution are: soft handle, high gliding properties of finished textiles, good abrasion resistance, APEO-free, non-flammable, solvent free [6]. 39 samples of 100 % PES fabric were prepared and immersed for 2 minutes in the Ruco-Dry Eco solution. For impregnating the solution into material the Foulard device was used, varying the following parameters:
- for constant pressure, the speed was varied from 1 m/s to 10 m/s, with a step of 0,5 m/min; - for constant speed, the pressure was varied from 1 (kP/cm) to 20 (kP/cm), with a step of 1 (kP/cm).
Samples were weighed on electronic balance before and after their immersion in the solution and pressing them through Foulard device. After treatment, samples were dried in oven for 5 minutes, at 70
o C. this
process was followed by another weighing to determine the amount of the solution remained in the material. The superhydrophobic properties of the materials, treated with the solution prepared from Ruco-Dry Eco, were tested by placing drops of water on their surface and comparing the time of absorption from an untreated control sample. 5 RESULTS AND DISCUSSION The results obtained after treatment and measurements are summarised in the charts from figure 3 and figure 4. Figure 3 shows the wet pick up for the 100 PES fabric for constant speed and variable pressure. From this graph, it can be noted that the greater the pressure is, the less is the amount of solution remained in the material. Figure 4 shows the wet pick up for constant pressure and variable speed, and it can be noticed that also variations in speed influences the wet pick up.
Figure 3: Wet pick up for PES samples treated with Ruco-Dry Eco, for constant speed and variable pressure.
225
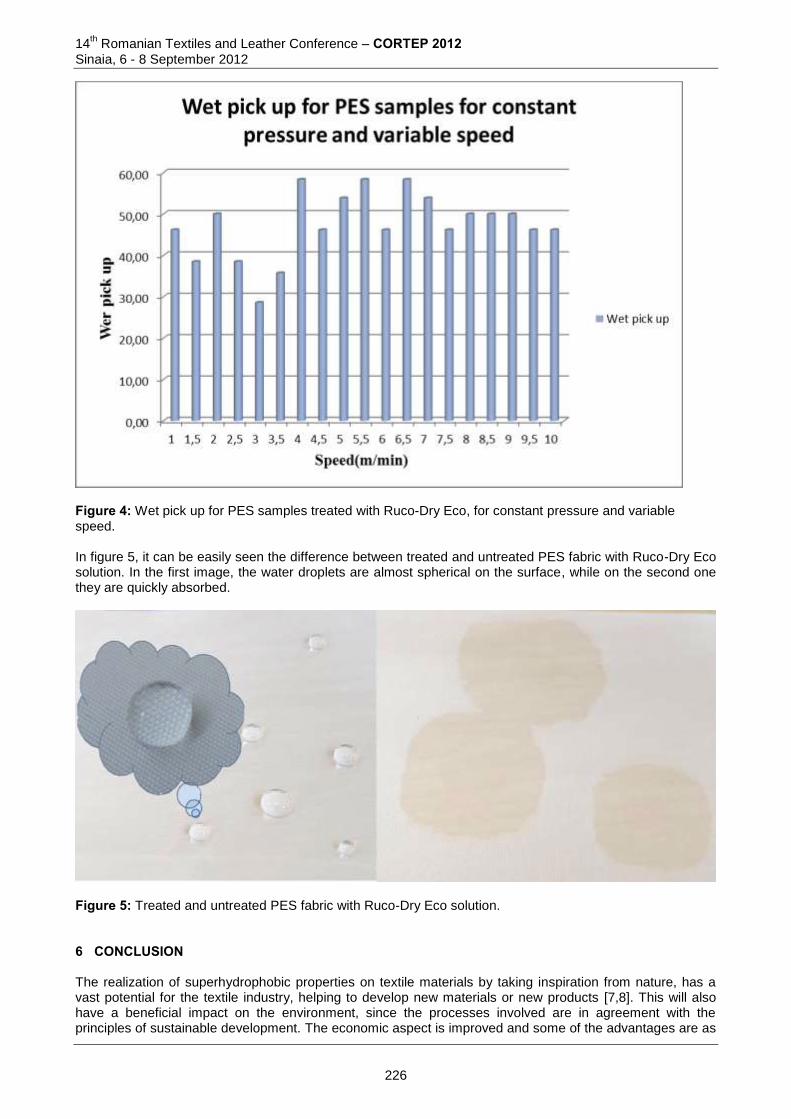
14th Romanian Textiles and Leather Conference – CORTEP 2012
Sinaia, 6 - 8 September 2012
Figure 4: Wet pick up for PES samples treated with Ruco-Dry Eco, for constant pressure and variable speed. In figure 5, it can be easily seen the difference between treated and untreated PES fabric with Ruco-Dry Eco solution. In the first image, the water droplets are almost spherical on the surface, while on the second one they are quickly absorbed.
Figure 5: Treated and untreated PES fabric with Ruco-Dry Eco solution. 6 CONCLUSION The realization of superhydrophobic properties on textile materials by taking inspiration from nature, has a vast potential for the textile industry, helping to develop new materials or new products [7,8]. This will also have a beneficial impact on the environment, since the processes involved are in agreement with the principles of sustainable development. The economic aspect is improved and some of the advantages are as
226
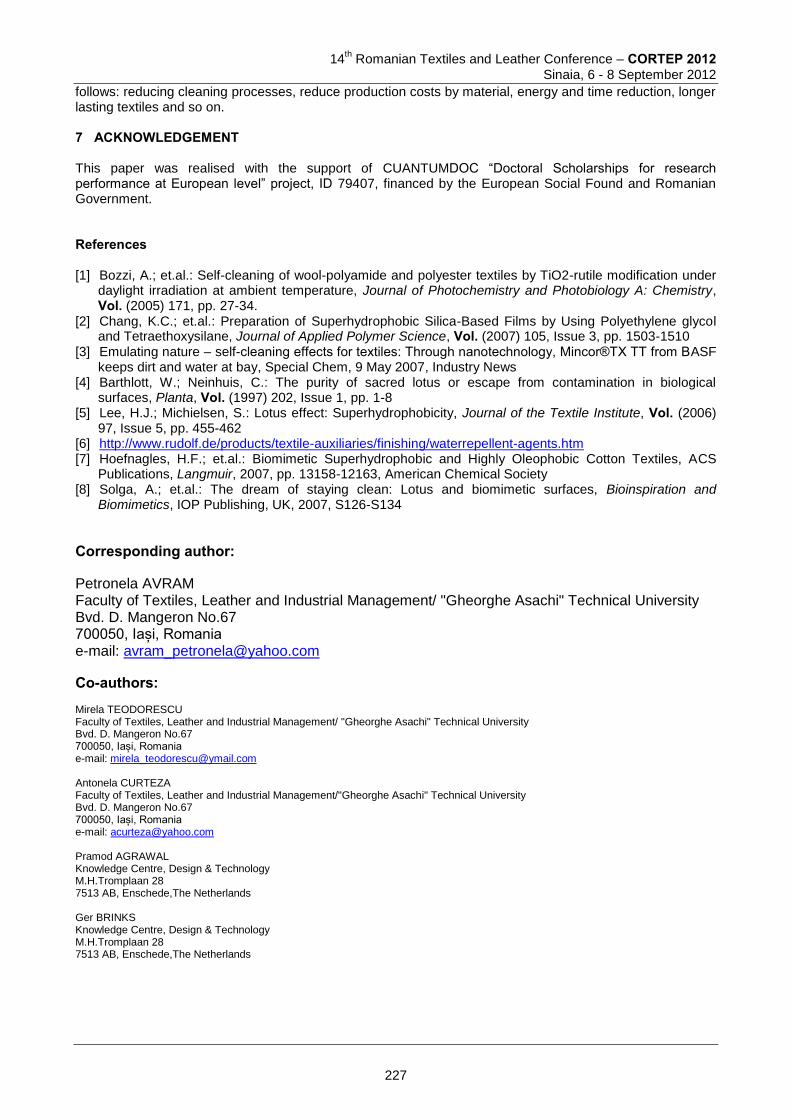
14
th Romanian Textiles and Leather Conference – CORTEP 2012
Sinaia, 6 - 8 September 2012
follows: reducing cleaning processes, reduce production costs by material, energy and time reduction, longer lasting textiles and so on. 7 ACKNOWLEDGEMENT This paper was realised with the support of CUANTUMDOC “Doctoral Scholarships for research performance at European level” project, ID 79407, financed by the European Social Found and Romanian Government. References [1] Bozzi, A.; et.al.: Self-cleaning of wool-polyamide and polyester textiles by TiO2-rutile modification under
daylight irradiation at ambient temperature, Journal of Photochemistry and Photobiology A: Chemistry, Vol. (2005) 171, pp. 27-34.
[2] Chang, K.C.; et.al.: Preparation of Superhydrophobic Silica-Based Films by Using Polyethylene glycol and Tetraethoxysilane, Journal of Applied Polymer Science, Vol. (2007) 105, Issue 3, pp. 1503-1510
[3] Emulating nature – self-cleaning effects for textiles: Through nanotechnology, Mincor®TX TT from BASF keeps dirt and water at bay, Special Chem, 9 May 2007, Industry News
[4] Barthlott, W.; Neinhuis, C.: The purity of sacred lotus or escape from contamination in biological surfaces, Planta, Vol. (1997) 202, Issue 1, pp. 1-8
[5] Lee, H.J.; Michielsen, S.: Lotus effect: Superhydrophobicity, Journal of the Textile Institute, Vol. (2006) 97, Issue 5, pp. 455-462
[6] http://www.rudolf.de/products/textile-auxiliaries/finishing/waterrepellent-agents.htm [7] Hoefnagles, H.F.; et.al.: Biomimetic Superhydrophobic and Highly Oleophobic Cotton Textiles, ACS
Publications, Langmuir, 2007, pp. 13158-12163, American Chemical Society [8] Solga, A.; et.al.: The dream of staying clean: Lotus and biomimetic surfaces, Bioinspiration and
Biomimetics, IOP Publishing, UK, 2007, S126-S134
Corresponding author:
Petronela AVRAM Faculty of Textiles, Leather and Industrial Management/ "Gheorghe Asachi" Technical University Bvd. D. Mangeron No.67 700050, Iași, Romania e-mail: [email protected]
Co-authors: Mirela TEODORESCU Faculty of Textiles, Leather and Industrial Management/ "Gheorghe Asachi" Technical University Bvd. D. Mangeron No.67 700050, Iași, Romania e-mail: [email protected] Antonela CURTEZA Faculty of Textiles, Leather and Industrial Management/"Gheorghe Asachi" Technical University Bvd. D. Mangeron No.67 700050, Iași, Romania e-mail: [email protected] Pramod AGRAWAL Knowledge Centre, Design & Technology M.H.Tromplaan 28 7513 AB, Enschede,The Netherlands Ger BRINKS Knowledge Centre, Design & Technology M.H.Tromplaan 28 7513 AB, Enschede,The Netherlands
227
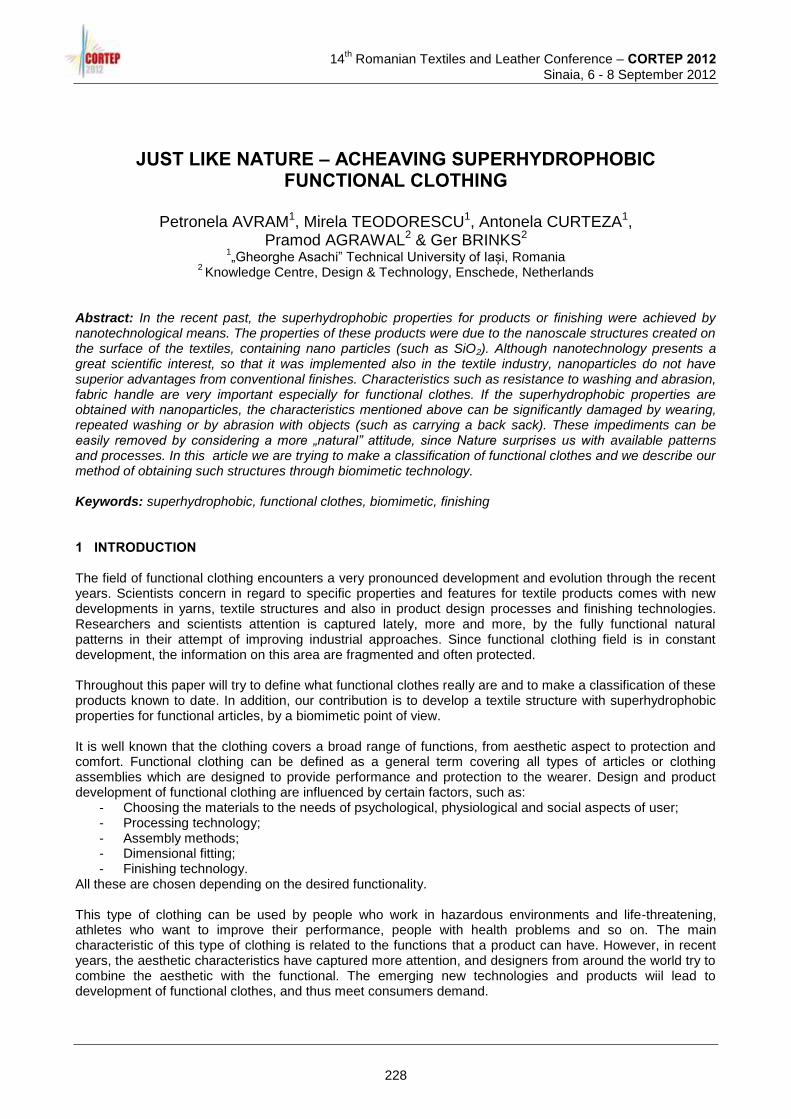
14
th Romanian Textiles and Leather Conference – CORTEP 2012
Sinaia, 6 - 8 September 2012
JUST LIKE NATURE – ACHEAVING SUPERHYDROPHOBIC FUNCTIONAL CLOTHING
Petronela AVRAM1, Mirela TEODORESCU1, Antonela CURTEZA1,
Pramod AGRAWAL2 & Ger BRINKS2 1„Gheorghe Asachi” Technical University of Iași, Romania
2 Knowledge Centre, Design & Technology, Enschede, Netherlands
Abstract: In the recent past, the superhydrophobic properties for products or finishing were achieved by nanotechnological means. The properties of these products were due to the nanoscale structures created on the surface of the textiles, containing nano particles (such as SiO2). Although nanotechnology presents a great scientific interest, so that it was implemented also in the textile industry, nanoparticles do not have superior advantages from conventional finishes. Characteristics such as resistance to washing and abrasion, fabric handle are very important especially for functional clothes. If the superhydrophobic properties are obtained with nanoparticles, the characteristics mentioned above can be significantly damaged by wearing, repeated washing or by abrasion with objects (such as carrying a back sack). These impediments can be easily removed by considering a more „natural” attitude, since Nature surprises us with available patterns and processes. In this article we are trying to make a classification of functional clothes and we describe our method of obtaining such structures through biomimetic technology. Keywords: superhydrophobic, functional clothes, biomimetic, finishing 1 INTRODUCTION The field of functional clothing encounters a very pronounced development and evolution through the recent years. Scientists concern in regard to specific properties and features for textile products comes with new developments in yarns, textile structures and also in product design processes and finishing technologies. Researchers and scientists attention is captured lately, more and more, by the fully functional natural patterns in their attempt of improving industrial approaches. Since functional clothing field is in constant development, the information on this area are fragmented and often protected. Throughout this paper will try to define what functional clothes really are and to make a classification of these products known to date. In addition, our contribution is to develop a textile structure with superhydrophobic properties for functional articles, by a biomimetic point of view. It is well known that the clothing covers a broad range of functions, from aesthetic aspect to protection and comfort. Functional clothing can be defined as a general term covering all types of articles or clothing assemblies which are designed to provide performance and protection to the wearer. Design and product development of functional clothing are influenced by certain factors, such as:
- Choosing the materials to the needs of psychological, physiological and social aspects of user; - Processing technology; - Assembly methods; - Dimensional fitting; - Finishing technology.
All these are chosen depending on the desired functionality. This type of clothing can be used by people who work in hazardous environments and life-threatening, athletes who want to improve their performance, people with health problems and so on. The main characteristic of this type of clothing is related to the functions that a product can have. However, in recent years, the aesthetic characteristics have captured more attention, and designers from around the world try to combine the aesthetic with the functional. The emerging new technologies and products wiil lead to development of functional clothes, and thus meet consumers demand.
228
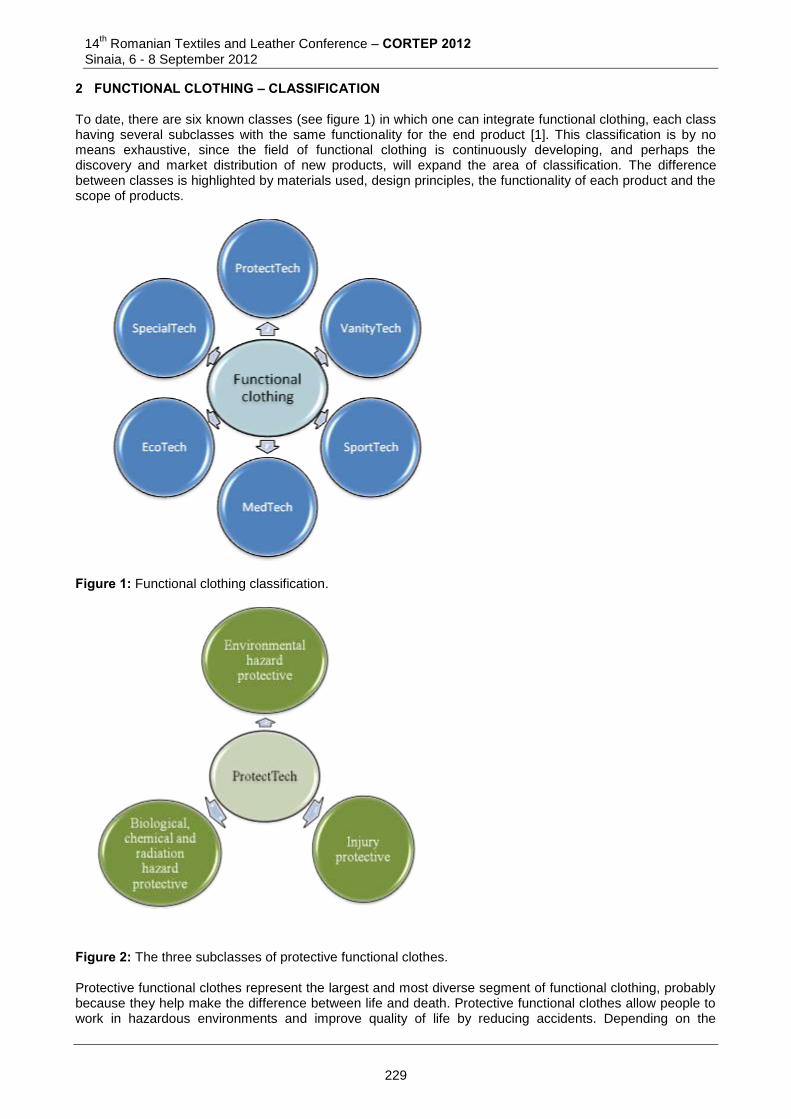
14th Romanian Textiles and Leather Conference – CORTEP 2012
Sinaia, 6 - 8 September 2012
2 FUNCTIONAL CLOTHING – CLASSIFICATION To date, there are six known classes (see figure 1) in which one can integrate functional clothing, each class having several subclasses with the same functionality for the end product [1]. This classification is by no means exhaustive, since the field of functional clothing is continuously developing, and perhaps the discovery and market distribution of new products, will expand the area of classification. The difference between classes is highlighted by materials used, design principles, the functionality of each product and the scope of products.
Figure 1: Functional clothing classification.
Figure 2: The three subclasses of protective functional clothes. Protective functional clothes represent the largest and most diverse segment of functional clothing, probably because they help make the difference between life and death. Protective functional clothes allow people to work in hazardous environments and improve quality of life by reducing accidents. Depending on the
229
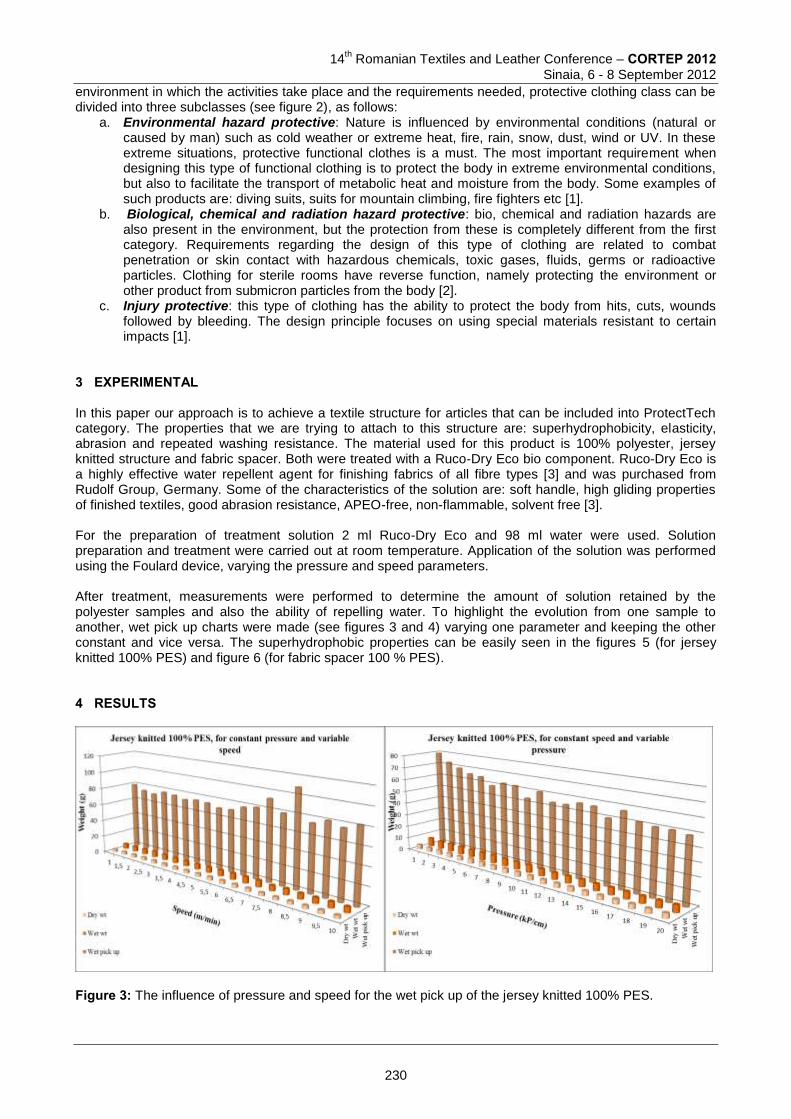
14
th Romanian Textiles and Leather Conference – CORTEP 2012
Sinaia, 6 - 8 September 2012
environment in which the activities take place and the requirements needed, protective clothing class can be divided into three subclasses (see figure 2), as follows:
a. Environmental hazard protective: Nature is influenced by environmental conditions (natural or caused by man) such as cold weather or extreme heat, fire, rain, snow, dust, wind or UV. In these extreme situations, protective functional clothes is a must. The most important requirement when designing this type of functional clothing is to protect the body in extreme environmental conditions, but also to facilitate the transport of metabolic heat and moisture from the body. Some examples of such products are: diving suits, suits for mountain climbing, fire fighters etc [1].
b. Biological, chemical and radiation hazard protective: bio, chemical and radiation hazards are also present in the environment, but the protection from these is completely different from the first category. Requirements regarding the design of this type of clothing are related to combat penetration or skin contact with hazardous chemicals, toxic gases, fluids, germs or radioactive particles. Clothing for sterile rooms have reverse function, namely protecting the environment or other product from submicron particles from the body [2].
c. Injury protective: this type of clothing has the ability to protect the body from hits, cuts, wounds followed by bleeding. The design principle focuses on using special materials resistant to certain impacts [1].
3 EXPERIMENTAL In this paper our approach is to achieve a textile structure for articles that can be included into ProtectTech category. The properties that we are trying to attach to this structure are: superhydrophobicity, elasticity, abrasion and repeated washing resistance. The material used for this product is 100% polyester, jersey knitted structure and fabric spacer. Both were treated with a Ruco-Dry Eco bio component. Ruco-Dry Eco is a highly effective water repellent agent for finishing fabrics of all fibre types [3] and was purchased from Rudolf Group, Germany. Some of the characteristics of the solution are: soft handle, high gliding properties of finished textiles, good abrasion resistance, APEO-free, non-flammable, solvent free [3]. For the preparation of treatment solution 2 ml Ruco-Dry Eco and 98 ml water were used. Solution preparation and treatment were carried out at room temperature. Application of the solution was performed using the Foulard device, varying the pressure and speed parameters. After treatment, measurements were performed to determine the amount of solution retained by the polyester samples and also the ability of repelling water. To highlight the evolution from one sample to another, wet pick up charts were made (see figures 3 and 4) varying one parameter and keeping the other constant and vice versa. The superhydrophobic properties can be easily seen in the figures 5 (for jersey knitted 100% PES) and figure 6 (for fabric spacer 100 % PES). 4 RESULTS
Figure 3: The influence of pressure and speed for the wet pick up of the jersey knitted 100% PES.
230
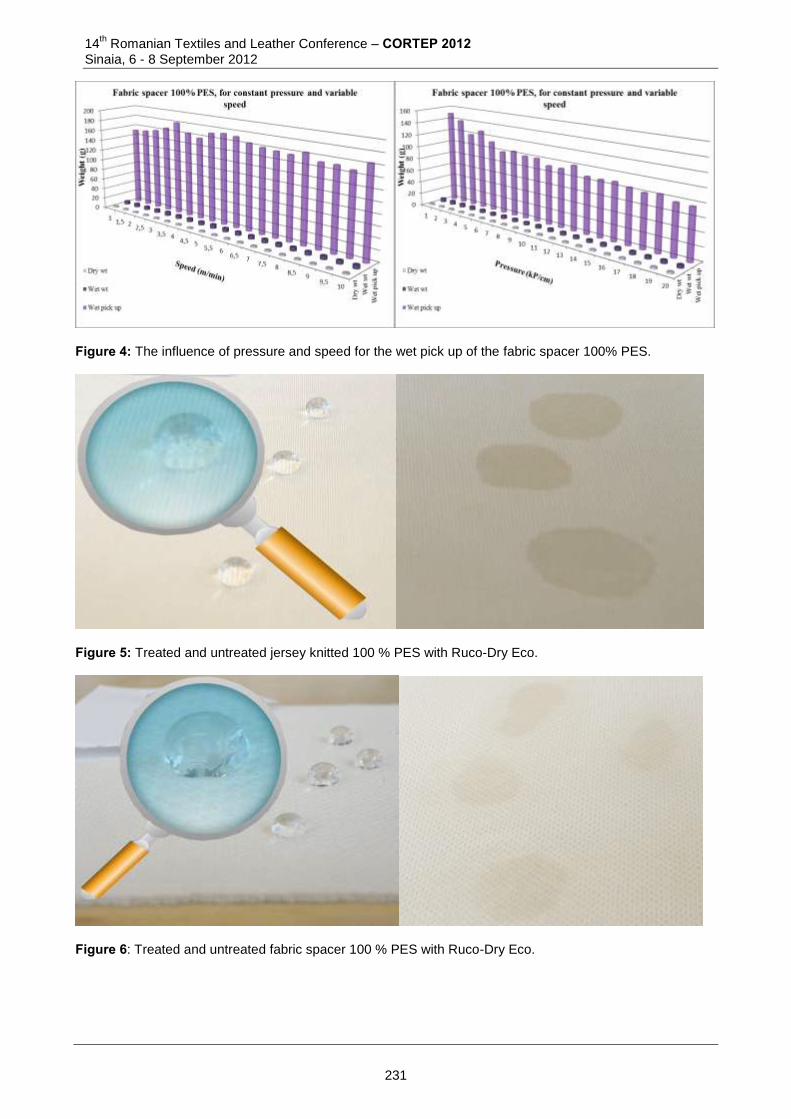
14th Romanian Textiles and Leather Conference – CORTEP 2012
Sinaia, 6 - 8 September 2012
Figure 4: The influence of pressure and speed for the wet pick up of the fabric spacer 100% PES.
Figure 5: Treated and untreated jersey knitted 100 % PES with Ruco-Dry Eco.
Figure 6: Treated and untreated fabric spacer 100 % PES with Ruco-Dry Eco.
231
14
th Romanian Textiles and Leather Conference – CORTEP 2012
Sinaia, 6 - 8 September 2012
5 CONCLUSION Taking into consideration the models found in nature, has proven to be one successful approach for achieving superior properties for textiles and clothes. In our case, textile finishing with Ruco-Dry Eco considered the natural pattern of lotus leaves the source of drawing inspiration. Thanks to the new emerging field of biomimetics, we can now say that if it is good enough for nature, it is good enough for us and the success stories of implementing it into the textile sector surprise us every day. 6 ACKNOWLEDGEMENT This paper was realised with the support of CUANTUMDOC “Doctoral Scholarships for research performance at European level” project, ID 79407, financed by the European Social Found and Romanian Government. References [1] Gupta, D.: Functional clothing – Definition and classification, Indian Journal of Fibre & Textile Research,
Vol. (2011) 36, pp. 321-326. [2] Smith, W.C.: An Overview of Protective Clothing – Markets, Materials, Needs (Industrial Textile
Associates), 1999. http://www.intexa.com/. [3] http://www.rudolf.de/products/textile-auxiliaries/finishing/waterrepellent-agents.htm
Corresponding author: Petronela AVRAM Faculty of Textiles, Leather and Industrial Management /"Gheorghe Asachi" Technical University Bvd. D. Mangeron No.67 700050, Iași, Romania e-mail: [email protected]
Co-authors: Mirela TEODORESCU Faculty of Textiles, Leather and Industrial Management/ "Gheorghe Asachi" Technical University Bvd. D. Mangeron No.67 700050, Iași, Romania e-mail: [email protected] Antonela CURTEZA Faculty of Textiles, Leather and Industrial Management/ "Gheorghe Asachi" Technical University Bvd. D. Mangeron No.67 700050, Iași, Romania e-mail: [email protected] Pramod AGRAWAL Knowledge Centre, Design & Technology M.H.Tromplaan 28 7513 AB, Enschede,The Netherlands Ger BRINKS Knowledge Centre, Design & Technology M.H.Tromplaan 28 7513 AB, Enschede,The Netherlands
232

14
th Romanian Textiles and Leather Conference – CORTEP 2012
Sinaia, 6 - 8 September 2012
THE SOFTNESS SENSORIAL PROPERTY OF ANTI-ALLERGIC TEXTILE FABRICS
Cezar-Doru RADU1, Mihaela HRITCU (SALARIU)1, Ada FERRI2,
Lili FOIA3 & Cristina GHICIUC3 1 “Gheorghe Asachi” Technical University of Iasi, Romania
2 Politecnico di Torino, Corso Duca, Torino, Italy
3 “Grigore T. Popa” University of Medicine and Pharmacy, asi, Romania
Abstract: Within this study, as textile support was used an interlock knitting from 100% cotton processed for: impurities removing, sterilization and corresponding chemical reactivity and respectively treated with natural anti-allergic active principles: Viola tricoloris Herba (VTH), menthol (M) and propolis (P) released as controlled mode by means of a cyclodextrin which determines an inclusion compound. The anti-allergic textile material is intended to patients with cutaneous affections: contact dermatitis and atopic dermatitis, of allergical nature. The softness of anti-allergic textile materials represents a sensorial characteristic with a great importance, especially in these disorders. Beside on specific medication, the handle is the second characteristic as importance in case of an efficient therapy. The paper presents the handle evaluation of biomaterials achieved by means of tactile assessments for textile samples (witness and treated with active principles) on a panel of normal subjects and with a developed tactile sense. The study has been performed in premises of Textile-Leather Faculty monitoring a group of 50 peoples respectively a group of 26 peoples with good tactile assessments from another centers. Based on data obtained have been appreciated the handle characteristics function on treatment variants with active principles; for some treatment variants it was concluded that active principles applied on anti-allergic textile support can manifests an softening effect. Keywords: handle, tactile assessments, anti-allergic textile materials, cutaneous diseases. 1 INTRODUCTION The quality of a garment is evaluated by color, shape made, handle and price. The handle is sensorial appreciated by consumer using touching the textile surface with skin fingers. Study objective assessment of handle starts from its sensing mechanism, namely the existence of two elements: the textile surface and observer. The handle is likely sensory perception, or by measuring the difference of touch may be made by measurement of physical quantities. World textile sought and still seeks an objective measurement of garment handle. Fabric roughness and some properties coming from fibre to fabric including fiber diameter, fiber tensile properties are essential factors in determining roughness. Fabric roughness is associated with a number of objectively measured physical properties, such as prickle, shear stiffness, friction, bending stiffness, thickness, areal density and the level of smoothness [1]. Fabric handle has been defined as “subjective assessment of a textile obtained from the sense of touch”. It is concerned with the subjective judgement of roughness, smoothness, harshness, pliability, thickness [1]. A physical quantity able to describe uniquely and objectively the size of handle is still missing. Appreciation is subjective feel of a sample compared with existing memory and feeling a previous assessment by attributes such as: smooth, silky, soft, hard, etc. The handle is an assessment on an individual preference based on experience when it touches including one item that has two characteristics: the subjectivity of human experience and objectivity specific physical and mechanical properties of surfaces. Tactile sense has got as information means the hand of observer; in practice, the skin determines difference between energy transmitted to fabric surface and the answer received from surface; the energy flux is taken by brain and changed into tactile information. The information gained is different from visual ability where light energy comes from a source and then is received by the eye and processed by the brain. This paper aims to assess subjective of softness characteristic determined and expressed by a number of observers on samples of a knitted fabric with anti-allergic properties. In the case of allergic skin diseases, therapeutic effectiveness is due to medication and skin sensorial comfort on a sensitized skin against blouse or pajama pants [2].The work presented is part of a study of
233
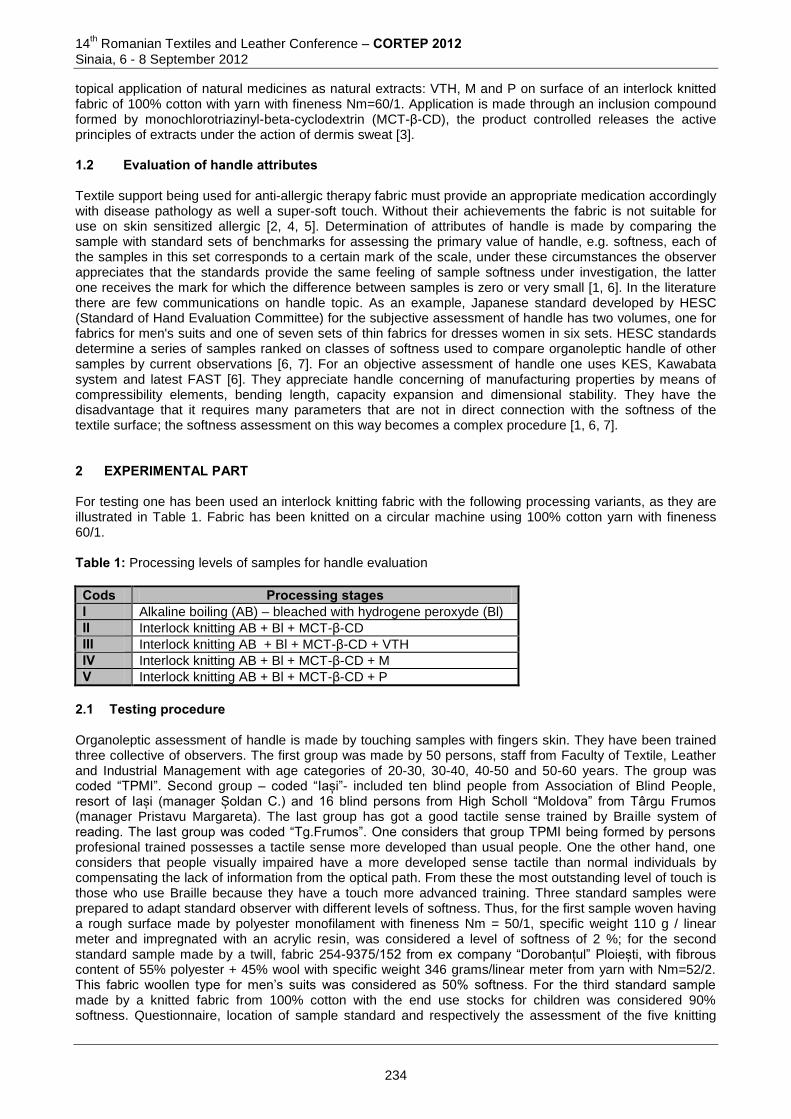
14th Romanian Textiles and Leather Conference – CORTEP 2012
Sinaia, 6 - 8 September 2012
topical application of natural medicines as natural extracts: VTH, M and P on surface of an interlock knitted fabric of 100% cotton with yarn with fineness Nm=60/1. Application is made through an inclusion compound formed by monochlorotriazinyl-beta-cyclodextrin (MCT-β-CD), the product controlled releases the active principles of extracts under the action of dermis sweat [3]. 1.2 Evaluation of handle attributes Textile support being used for anti-allergic therapy fabric must provide an appropriate medication accordingly with disease pathology as well a super-soft touch. Without their achievements the fabric is not suitable for use on skin sensitized allergic [2, 4, 5]. Determination of attributes of handle is made by comparing the sample with standard sets of benchmarks for assessing the primary value of handle, e.g. softness, each of the samples in this set corresponds to a certain mark of the scale, under these circumstances the observer appreciates that the standards provide the same feeling of sample softness under investigation, the latter one receives the mark for which the difference between samples is zero or very small [1, 6]. In the literature there are few communications on handle topic. As an example, Japanese standard developed by HESC (Standard of Hand Evaluation Committee) for the subjective assessment of handle has two volumes, one for fabrics for men's suits and one of seven sets of thin fabrics for dresses women in six sets. HESC standards determine a series of samples ranked on classes of softness used to compare organoleptic handle of other samples by current observations [6, 7]. For an objective assessment of handle one uses KES, Kawabata system and latest FAST [6]. They appreciate handle concerning of manufacturing properties by means of compressibility elements, bending length, capacity expansion and dimensional stability. They have the disadvantage that it requires many parameters that are not in direct connection with the softness of the textile surface; the softness assessment on this way becomes a complex procedure [1, 6, 7]. 2 EXPERIMENTAL PART For testing one has been used an interlock knitting fabric with the following processing variants, as they are illustrated in Table 1. Fabric has been knitted on a circular machine using 100% cotton yarn with fineness 60/1. Table 1: Processing levels of samples for handle evaluation
Cods Processing stages I Alkaline boiling (AB) – bleached with hydrogene peroxyde (Bl)
II Interlock knitting AB + Bl + MCT-β-CD
III Interlock knitting AB + Bl + MCT-β-CD + VTH
IV Interlock knitting AB + Bl + MCT-β-CD + M V Interlock knitting AB + Bl + MCT-β-CD + P
2.1 Testing procedure Organoleptic assessment of handle is made by touching samples with fingers skin. They have been trained three collective of observers. The first group was made by 50 persons, staff from Faculty of Textile, Leather and Industrial Management with age categories of 20-30, 30-40, 40-50 and 50-60 years. The group was coded “TPMI”. Second group – coded “Iași”- included ten blind people from Association of Blind People, resort of Iași (manager Șoldan C.) and 16 blind persons from High Scholl “Moldova” from Târgu Frumos (manager Pristavu Margareta). The last group has got a good tactile sense trained by Braille system of reading. The last group was coded “Tg.Frumos”. One considers that group TPMI being formed by persons profesional trained possesses a tactile sense more developed than usual people. One the other hand, one considers that people visually impaired have a more developed sense tactile than normal individuals by compensating the lack of information from the optical path. From these the most outstanding level of touch is those who use Braille because they have a touch more advanced training. Three standard samples were prepared to adapt standard observer with different levels of softness. Thus, for the first sample woven having a rough surface made by polyester monofilament with fineness Nm = 50/1, specific weight 110 g / linear meter and impregnated with an acrylic resin, was considered a level of softness of 2 %; for the second standard sample made by a twill, fabric 254-9375/152 from ex company “Dorobanțul” Ploiești, with fibrous content of 55% polyester + 45% wool with specific weight 346 grams/linear meter from yarn with Nm=52/2. This fabric woollen type for men’s suits was considered as 50% softness. For the third standard sample made by a knitted fabric from 100% cotton with the end use stocks for children was considered 90% softness. Questionnaire, location of sample standard and respectively the assessment of the five knitting
234
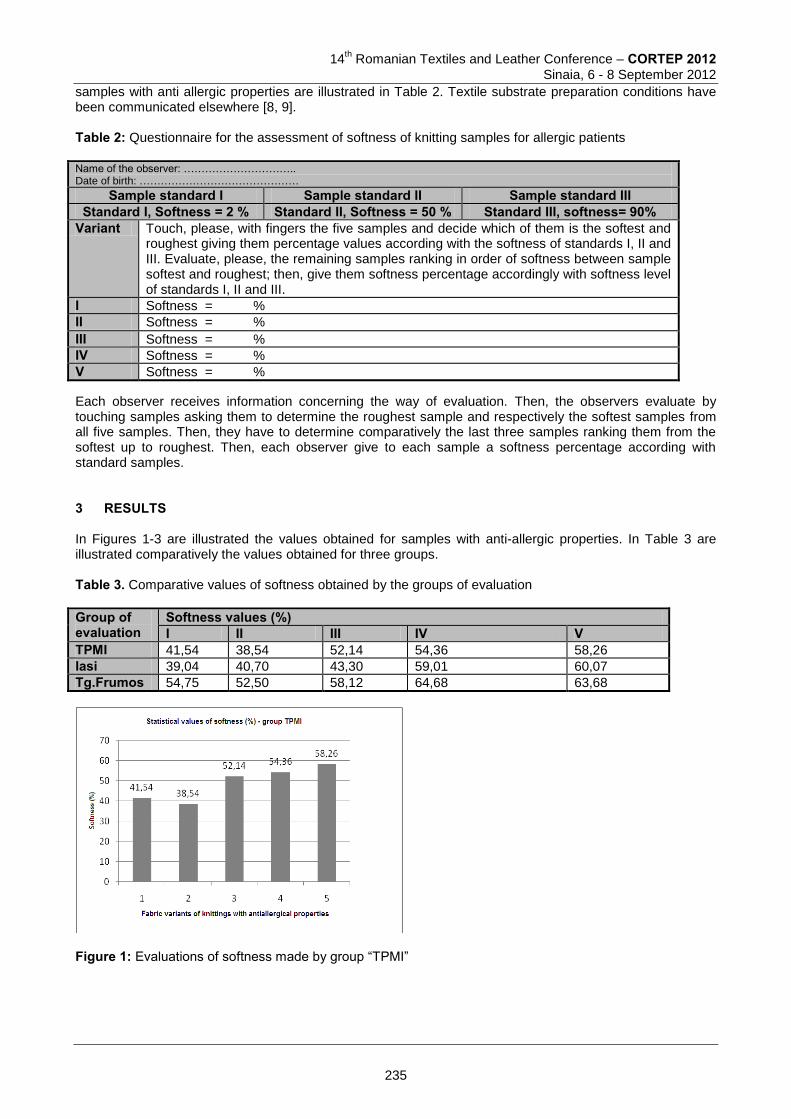
14
th Romanian Textiles and Leather Conference – CORTEP 2012
Sinaia, 6 - 8 September 2012
samples with anti allergic properties are illustrated in Table 2. Textile substrate preparation conditions have been communicated elsewhere [8, 9].
Table 2: Questionnaire for the assessment of softness of knitting samples for allergic patients Name of the observer: ………………………….. Date of birth: ………………………………………
Sample standard I Sample standard II Sample standard III Standard I, Softness = 2 % Standard II, Softness = 50 % Standard III, softness= 90%
Variant Touch, please, with fingers the five samples and decide which of them is the softest and roughest giving them percentage values according with the softness of standards I, II and III. Evaluate, please, the remaining samples ranking in order of softness between sample softest and roughest; then, give them softness percentage accordingly with softness level of standards I, II and III.
I Softness = %
II Softness = %
III Softness = %
IV Softness = %
V Softness = % Each observer receives information concerning the way of evaluation. Then, the observers evaluate by touching samples asking them to determine the roughest sample and respectively the softest samples from all five samples. Then, they have to determine comparatively the last three samples ranking them from the softest up to roughest. Then, each observer give to each sample a softness percentage according with standard samples. 3 RESULTS In Figures 1-3 are illustrated the values obtained for samples with anti-allergic properties. In Table 3 are illustrated comparatively the values obtained for three groups. Table 3. Comparative values of softness obtained by the groups of evaluation Group of evaluation
Softness values (%) I II III IV V
TPMI 41,54 38,54 52,14 54,36 58,26
Iasi 39,04 40,70 43,30 59,01 60,07
Tg.Frumos 54,75 52,50 58,12 64,68 63,68
Figure 1: Evaluations of softness made by group “TPMI”
235
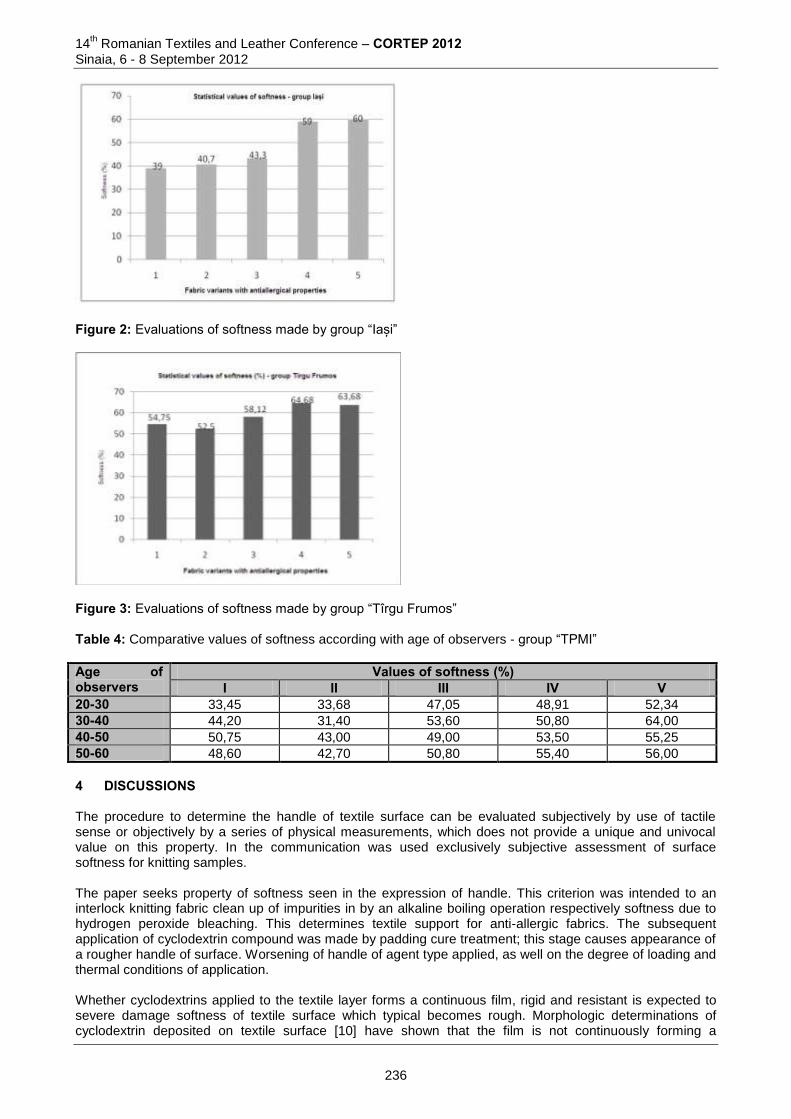
14th Romanian Textiles and Leather Conference – CORTEP 2012
Sinaia, 6 - 8 September 2012
Figure 2: Evaluations of softness made by group “Iași”
Figure 3: Evaluations of softness made by group “Tîrgu Frumos” Table 4: Comparative values of softness according with age of observers - group “TPMI” Age of observers
Values of softness (%) I II III IV V
20-30 33,45 33,68 47,05 48,91 52,34
30-40 44,20 31,40 53,60 50,80 64,00
40-50 50,75 43,00 49,00 53,50 55,25
50-60 48,60 42,70 50,80 55,40 56,00
4 DISCUSSIONS The procedure to determine the handle of textile surface can be evaluated subjectively by use of tactile sense or objectively by a series of physical measurements, which does not provide a unique and univocal value on this property. In the communication was used exclusively subjective assessment of surface softness for knitting samples. The paper seeks property of softness seen in the expression of handle. This criterion was intended to an interlock knitting fabric clean up of impurities in by an alkaline boiling operation respectively softness due to hydrogen peroxide bleaching. This determines textile support for anti-allergic fabrics. The subsequent application of cyclodextrin compound was made by padding cure treatment; this stage causes appearance of a rougher handle of surface. Worsening of handle of agent type applied, as well on the degree of loading and thermal conditions of application. Whether cyclodextrins applied to the textile layer forms a continuous film, rigid and resistant is expected to severe damage softness of textile surface which typical becomes rough. Morphologic determinations of cyclodextrin deposited on textile surface [10] have shown that the film is not continuously forming a
236

14
th Romanian Textiles and Leather Conference – CORTEP 2012
Sinaia, 6 - 8 September 2012
deposition of associated particles in the most accessible regions of textile structure. From this point of view, handle got no reason to be rough. If cyclodextrins fixing conditions requires a high heat conditions are created severe damage on handle. In this case, fixation was performed at 160 °C for 10 minutes. Duration of 10 minutes and the heat of 160 °C are considered severe conditions that result in advanced dehydration of support which is in connection with a much rougher handle. To accomplish the study formed three groups of observers “TPMI” group consists of teachers, students and staff who through their profession have connection with textiles. The group of 50 people, analyzed as well by age category offers by the number of persons used a good statistical safety. In agreement with the results one obtained that after alkaline boiling and hydrogen peroxide bleaching the cotton knitting acquires a 41.54% average softness. In stage II of grafting with MCT-β-CD the knitting surface becomes worse, so the softness is the average value 38.54%, so a decrease of almost 3%. The formation of inclusion compounds with VTH, M and P the softness obtained in these cases annihilates the impact of the cyclodextrin compound on the surface and has a softening effect so that softness for inclusion compound with VTH, variant III increased from 38.54 to 52.14% (a increase of 13.6%), respectively 54.36% for M (an increase of 15.82%) and up to 58.26% for P (an increase of 19.72%). Starting from a recommendation of prof. Muresan next softness evaluation was made by blind people. It started from the fact that the absence of visual stimuli perceived is compensated by increasing other sensory-cognitive senses. The group of blind people from Iasi having available only ten persons formed a heterogeneous group because of from all group of ten, two were 70 years. Considering the state the human skin thickens with age one obtained the same comparative classification of treatment variants, but at a lower accuracy. Starting from the results analyzed so far one has been observed that blind people who know Braille, so those who practice almost daily sense of touching determined with better accuracy results compared with the first group of blind people. Group “Tîrgu.Frumos” polarized two-level people of age 14-30 and 30-40 years. The evaluations were allowed to obtain softness values with better accuracy. This group consists of 16 persons. In agreement with the results after alkaline boiling and hydrogen peroxide bleaching of cotton knitting one acquires a 54.75% average softness. In stage II surface grafted with MCT-β-CD becomes rougher; thus the softness is the average value 52.50%, so a decrease of 2.25%. The formation of inclusion compounds with VTH, M and P softness obtained annihilates the impact of cyclodextrin on the surface and they have a softening effect, so softness for inclusion compound with VTH, variant III increased from 52.50 to 58.12% (an increase of 5.62%), respectively up to 64.68% for M (an increase of 12.18%) and up to 63.68% for P (an increase of 11.18%). In the case of group “Tîrgu-Frumos” the best softening effect is determined by M which overpasses only with 1% inclusion compound with P; in the case of group “TPMI”, softening effect of P overpass M with 3,9%. In these conditions, roughening of textile surface has been received, as shown in Figures 2 and 3 as well in Tables 3 and 4, as a decrease in softness from 2 to 9%, except for the group “Iasi”. Handle samples is improved in a lesser extent after the formation of inclusion compound with VTH, version III, in a proportion increased for inclusion compound with M, variant IV, and respectively with P, variant V. It is an important item of an anti-allergic textile fabric worn by a patient on a particularly sensitive skin. Analyzing birthday of evaluators one concluded that age that gives the best accuracy assessment handle of a textile item is 30-40 years for the following reasons: - assessors have sufficient life experience - the effect of neurological erosion and respectively thickening of the skin are not decisive changed - the age group uses the widest range of expression values from 44 - 64% The results obtained are not mutually exclusive but reinforce the state that rougher knitting handle is due to cyclodextrin. Presence of active principles (VTH, M and P) compensates the effect of cyclodextrin on surface and they obviously determine a softening effect. In strictly terms of clinician the appearance of softness required as a criterion for a quality garment worn directly on the skin surface of highly sensitized allergic disease is already performed. 5 CONCLUSIONS 1. Stages of alkaline boiling and bleaching with hydrogen peroxide performed in the absence of a softener
determine an appropriate softness of knitting samples.
237
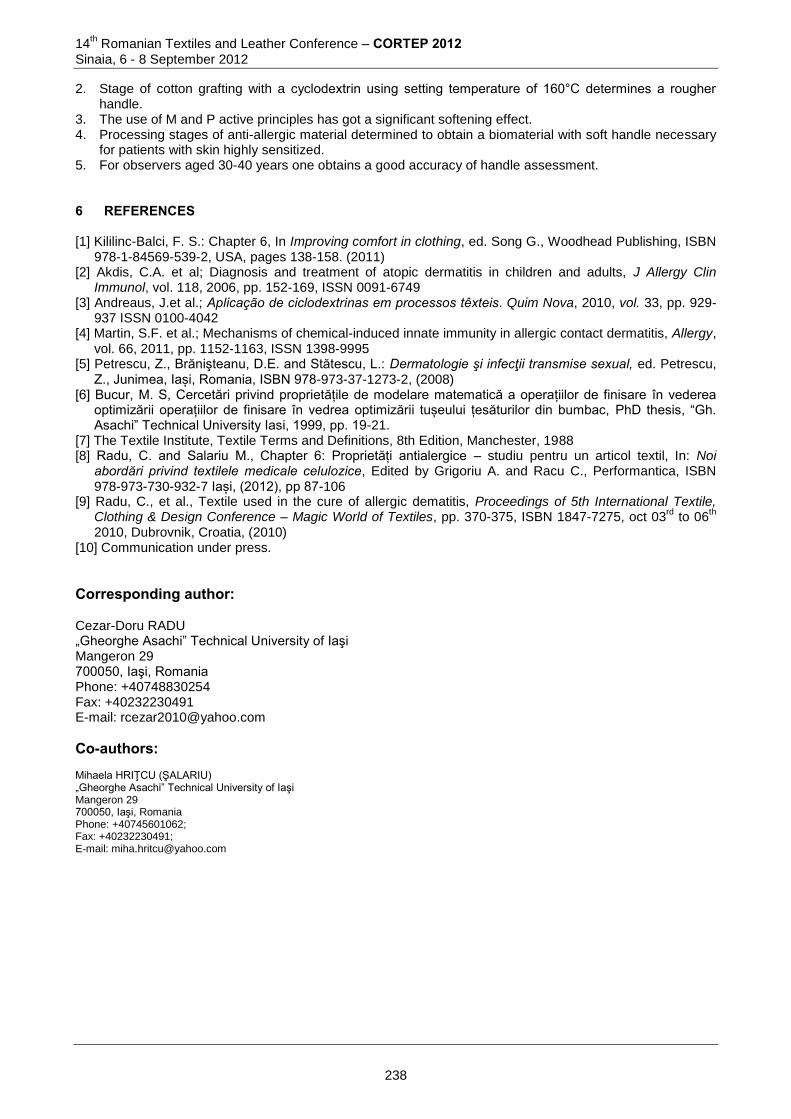
14th Romanian Textiles and Leather Conference – CORTEP 2012
Sinaia, 6 - 8 September 2012
2. Stage of cotton grafting with a cyclodextrin using setting temperature of 160°C determines a rougher handle.
3. The use of M and P active principles has got a significant softening effect. 4. Processing stages of anti-allergic material determined to obtain a biomaterial with soft handle necessary
for patients with skin highly sensitized. 5. For observers aged 30-40 years one obtains a good accuracy of handle assessment.
6 REFERENCES [1] Kililinc-Balci, F. S.: Chapter 6, In Improving comfort in clothing, ed. Song G., Woodhead Publishing, ISBN
978-1-84569-539-2, USA, pages 138-158. (2011) [2] Akdis, C.A. et al; Diagnosis and treatment of atopic dermatitis in children and adults, J Allergy Clin
Immunol, vol. 118, 2006, pp. 152-169, ISSN 0091-6749 [3] Andreaus, J.et al.; Aplicação de ciclodextrinas em processos têxteis. Quim Nova, 2010, vol. 33, pp. 929-
937 ISSN 0100-4042 [4] Martin, S.F. et al.; Mechanisms of chemical-induced innate immunity in allergic contact dermatitis, Allergy,
vol. 66, 2011, pp. 1152-1163, ISSN 1398-9995 [5] Petrescu, Z., Brănişteanu, D.E. and Stătescu, L.: Dermatologie şi infecţii transmise sexual, ed. Petrescu,
Z., Junimea, Iași, Romania, ISBN 978-973-37-1273-2, (2008) [6] Bucur, M. S, Cercetări privind proprietățile de modelare matematică a operațiilor de finisare în vederea
optimizării operațiilor de finisare în vedrea optimizării tușeului țesăturilor din bumbac, PhD thesis, “Gh. Asachi” Technical University Iasi, 1999, pp. 19-21.
[7] The Textile Institute, Textile Terms and Definitions, 8th Edition, Manchester, 1988 [8] Radu, C. and Salariu M., Chapter 6: Proprietăți antialergice – studiu pentru un articol textil, In: Noi
abordări privind textilele medicale celulozice, Edited by Grigoriu A. and Racu C., Performantica, ISBN 978-973-730-932-7 Iași, (2012), pp 87-106
[9] Radu, C., et al., Textile used in the cure of allergic dematitis, Proceedings of 5th International Textile, Clothing & Design Conference – Magic World of Textiles, pp. 370-375, ISBN 1847-7275, oct 03
rd to 06
th
2010, Dubrovnik, Croatia, (2010) [10] Communication under press. Corresponding author: Cezar-Doru RADU „Gheorghe Asachi” Technical University of Iaşi Mangeron 29 700050, Iaşi, Romania Phone: +40748830254 Fax: +40232230491 E-mail: [email protected]
Co-authors: Mihaela HRIŢCU (ŞALARIU) „Gheorghe Asachi” Technical University of Iaşi Mangeron 29 700050, Iaşi, Romania Phone: +40745601062; Fax: +40232230491; E-mail: [email protected]
238
14
th Romanian Textiles and Leather Conference – CORTEP 2012
Sinaia, 6 - 8 September 2012
TESTS AND ANALYSES SUPPORTED BY ANTI-ALLERGIC TEXTILE MATERIALS
Mihaela HRITCU (SALARIU)1, Cezar-Doru RADU1, Aurelia GRIGORIU1,
Ada FERRI2, Eugen ULEA3 & Florin LIPSA3 1“Gheorghe Asachi”Technical University of Iasi, Romania
Doctoral School of the Faculty of Textile, Leather and Industrial Management 2Politecnico di Torino, Corso Duca, Torino, Italy
3“Ion Ionescu de la Brad” University of Agricultural Sciences and Veterinary Medicine Iasi, Romania
Abstract: One highlights different tests and analyses related on interlock knitting by 100% cotton intended for cutaneous allergic diseases (contact dermatitis and atopic dermatitis). The textile support has followed special preparation stages and treatments to include anti-allergic natural active principles: Viola tricoloris Herba, menthol and propolis by means of monochlorotriazinyl-beta-cyclodextrin able to form a controlled release system. The paper provides an overview of the different factors which interfered along the whole research: conditions of processing, specific characteristics in connection with real behaviour in a biological system. In the paper one carries out additional aspects on different factors which could involve in an allergic medium, washing fastness and kinetics of Viola tricoloris Herba release from inclusion compound under action of artificial sweat according to international standard. One focused on analyses supported by untreated and treated anti-allergic textile: washing fastness, kinetics release of active principle from inclusion compound grafted on textile fabric under action of artificial sweat, evaluation of colour difference and behaviour of textile fibers in allergic conditions caused by different mycetes of fungi Keywords: anti-allergic textile materials, monochlorotriazinyl-beta-cyclodextrin, biological conditions, active principle release. 1 INTRODUCTION Due to the major discomfort caused by cutaneous diseases within this research have been attempted to design a special textile material with anti-allergic properties intended for patients with atopic dermatitis (AD) and contact dermatitis (CD). By using of an anti-allergic textile material at direct contact with the sensitive skin can be achieve a friendly microclimate to the support textile-skin-environmental interface leading to improving the condition of patient health. The paper describes an overview of the recent research which may lead to new approaches in designing of these special textile materials. The textile support has been supported treatments to include anti-allergic natural active principles (propolis, mentol and Viola tricoloris Herba) by means of a reactive product called monocholorotrizinyl-beta-cyclodextrin able to form a controlled release system up to sensitive dermis level. One focused on different tests and analyses supported by untreated and treated anti-allergic textile: washing fastness, kinetics release of active principle from inclusion compound grafted on textile fabric under action of artificial sweat, evaluation of colour difference, additional aspects on different factors which could involve an allergic medium. 2 EXPERIMENTAL PART 2.1 Materials and methods In the case of textile materials intended for patients with allergic skin diseases, essential are the choosing the type of textile support. Then, due to the multiple advantages (high comfort indices, capacity of draping) in the experimental study have been used a knitting fabric with an interlock structure made by 100% cotton (Egyptian origin) from yarns with fineness of Nm = 60/1.
239
14th Romanian Textiles and Leather Conference – CORTEP 2012
Sinaia, 6 - 8 September 2012
To improve the biocompatibility of support textile with the epidermis were applied an stage of alkaline treatment and bleaching with hydrogen peroxide. After performing of these phases, the textile fabric has become hydrophilic, soft, aseptic and biocompatible with a good reactivity for further chemical modifications. These performances are confirmed by experimental studies communicated in other works [1, 2].
After preparation stages for the support fabric have been followed a grafted phase with cyclodextrin product MCT-β-CD. The product, due to the its special cavity is able to form inclusion compounds with the active principles. Once included in the cyclodextrin cavity the active principles can be released in a controlled manner, under the action of dermal stimuli (sweat, temperature, humidity and friction). The aim of our research is that in the treatment of allergic cutaneous diseases to use a curative anti-allergic support textile with topic application by using of natural products. These imply avoiding of side effects and other disadvantages related to oral administration (the most important is the drug digest by liver). Bearing in mind to these considerations, a non-aggressive approach is to use natural products based on herbs: menthol and Viola tricoloris Herba and propolis - a bee product, all with well-known anti-allergic and antimicrobial action [3-5]. Traditional Chinese medicine encourages the use of numerous alternative therapeutic options that can be taken by topical, oral or injectable forms. A possible therapeutic way is the use of various herbs that are combined in different formulations [6]. A high number of herbs from Chinese flora (Herba menthae, Flos lonicerae, Paeonia lactiflora and others) which were used in the treatment of allergic skin diseases, based on experimental studies [7, 8] in clinical trials has been demonstrated a significant efficiency in amelioration of diseases by suppress inflammatory mediators release. By means of in vivo tests which were effectuated on animals, for the active principles have been obtained the therapeutic concentrations which were applied on textile support grafted with MCT-β-CD. The active principles have been applied on the grafted textile surface by a spraying technique followed by a heat treatment at 50 °C (in Venticell drying chamber) for 4 hours. For experimental studies the each fabric sample (untreated ant treated with active priciples) has been codified (V.I, V.II, V.III, V.IV, V.V, V.VI) according to scheme which is illustrated in Figure 1.
Figure 1: Knitted fabrics codification 2.2 Colour difference After the grafting stage and treatment stage with active principles the knitted samples, especially those grafted with MCT-β-CD and treated with propolis and Viola tricoloris Herba, have been suffered colour modifications comparatively with untreated sample. Thus, to highlight the colour changes of untreated and treated samples have been evaluated the colour differences. The colour differences were performed with a Spectroflash 500
® Datacolor (Switzerland) spectrophotometer
in CIELAB scale by means of Micromatch 200 software. As light source was used D65/10 illuminant. Based on the remissions in the range of 380 – 700 nm wavelength have been obtained the colourful components: ΔL* (the lightness difference between reproducing and standard sample), Δa* (the difference for red/green variation between reproducing and standard sample), Δb* (the difference for yellow/blue variation between reproducing and standard sample), ΔE (total colour difference). One noticed that standard sample represents the untreated sample fabric (sample coded with V.I) and the reproducing samples were considerate the grafted fabric sample (coded with V.II) and treated samples (V.III÷V.VI). The total colour difference can be calculated with following relationship:
ΔE = [(ΔL*)2 + (Δa*)
2 + (Δb*)
2]1/2
(1)
240
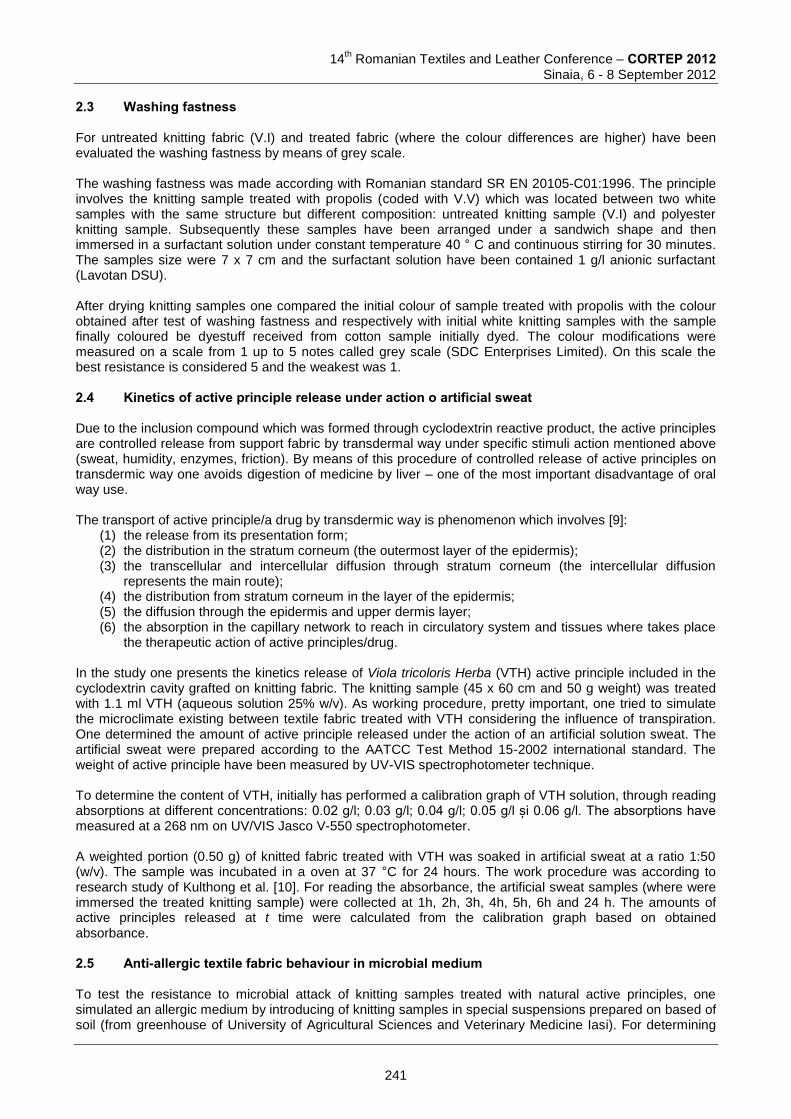
14
th Romanian Textiles and Leather Conference – CORTEP 2012
Sinaia, 6 - 8 September 2012
2.3 Washing fastness For untreated knitting fabric (V.I) and treated fabric (where the colour differences are higher) have been evaluated the washing fastness by means of grey scale. The washing fastness was made according with Romanian standard SR EN 20105-C01:1996. The principle involves the knitting sample treated with propolis (coded with V.V) which was located between two white samples with the same structure but different composition: untreated knitting sample (V.I) and polyester knitting sample. Subsequently these samples have been arranged under a sandwich shape and then immersed in a surfactant solution under constant temperature 40 ° C and continuous stirring for 30 minutes. The samples size were 7 x 7 cm and the surfactant solution have been contained 1 g/l anionic surfactant (Lavotan DSU). After drying knitting samples one compared the initial colour of sample treated with propolis with the colour obtained after test of washing fastness and respectively with initial white knitting samples with the sample finally coloured be dyestuff received from cotton sample initially dyed. The colour modifications were measured on a scale from 1 up to 5 notes called grey scale (SDC Enterprises Limited). On this scale the best resistance is considered 5 and the weakest was 1. 2.4 Kinetics of active principle release under action o artificial sweat Due to the inclusion compound which was formed through cyclodextrin reactive product, the active principles are controlled release from support fabric by transdermal way under specific stimuli action mentioned above (sweat, humidity, enzymes, friction). By means of this procedure of controlled release of active principles on transdermic way one avoids digestion of medicine by liver – one of the most important disadvantage of oral way use. The transport of active principle/a drug by transdermic way is phenomenon which involves [9]:
(1) the release from its presentation form; (2) the distribution in the stratum corneum (the outermost layer of the epidermis); (3) the transcellular and intercellular diffusion through stratum corneum (the intercellular diffusion
represents the main route); (4) the distribution from stratum corneum in the layer of the epidermis; (5) the diffusion through the epidermis and upper dermis layer; (6) the absorption in the capillary network to reach in circulatory system and tissues where takes place
the therapeutic action of active principles/drug. In the study one presents the kinetics release of Viola tricoloris Herba (VTH) active principle included in the cyclodextrin cavity grafted on knitting fabric. The knitting sample (45 x 60 cm and 50 g weight) was treated with 1.1 ml VTH (aqueous solution 25% w/v). As working procedure, pretty important, one tried to simulate the microclimate existing between textile fabric treated with VTH considering the influence of transpiration. One determined the amount of active principle released under the action of an artificial solution sweat. The artificial sweat were prepared according to the AATCC Test Method 15-2002 international standard. The weight of active principle have been measured by UV-VIS spectrophotometer technique. To determine the content of VTH, initially has performed a calibration graph of VTH solution, through reading absorptions at different concentrations: 0.02 g/l; 0.03 g/l; 0.04 g/l; 0.05 g/l și 0.06 g/l. The absorptions have measured at a 268 nm on UV/VIS Jasco V-550 spectrophotometer. A weighted portion (0.50 g) of knitted fabric treated with VTH was soaked in artificial sweat at a ratio 1:50 (w/v). The sample was incubated in a oven at 37 °C for 24 hours. The work procedure was according to research study of Kulthong et al. [10]. For reading the absorbance, the artificial sweat samples (where were immersed the treated knitting sample) were collected at 1h, 2h, 3h, 4h, 5h, 6h and 24 h. The amounts of active principles released at t time were calculated from the calibration graph based on obtained absorbance. 2.5 Anti-allergic textile fabric behaviour in microbial medium To test the resistance to microbial attack of knitting samples treated with natural active principles, one simulated an allergic medium by introducing of knitting samples in special suspensions prepared on based of soil (from greenhouse of University of Agricultural Sciences and Veterinary Medicine Iasi). For determining
241
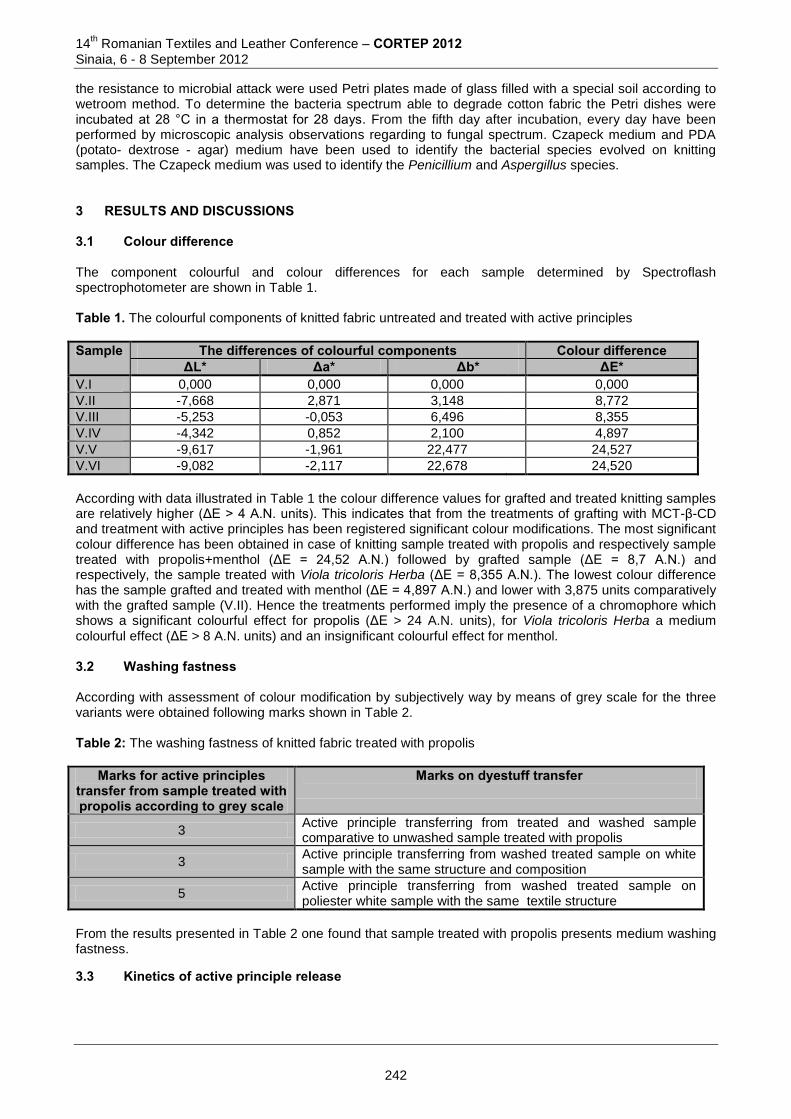
14th Romanian Textiles and Leather Conference – CORTEP 2012
Sinaia, 6 - 8 September 2012
the resistance to microbial attack were used Petri plates made of glass filled with a special soil according to wetroom method. To determine the bacteria spectrum able to degrade cotton fabric the Petri dishes were incubated at 28 °C in a thermostat for 28 days. From the fifth day after incubation, every day have been performed by microscopic analysis observations regarding to fungal spectrum. Czapeck medium and PDA (potato- dextrose - agar) medium have been used to identify the bacterial species evolved on knitting samples. The Czapeck medium was used to identify the Penicillium and Aspergillus species. 3 RESULTS AND DISCUSSIONS 3.1 Colour difference The component colourful and colour differences for each sample determined by Spectroflash spectrophotometer are shown in Table 1. Table 1. The colourful components of knitted fabric untreated and treated with active principles
Sample The differences of colourful components Colour difference
ΔL* Δa* Δb* ΔE* V.I 0,000 0,000 0,000 0,000
V.II -7,668 2,871 3,148 8,772 V.III -5,253 -0,053 6,496 8,355 V.IV -4,342 0,852 2,100 4,897 V.V -9,617 -1,961 22,477 24,527 V.VI -9,082 -2,117 22,678 24,520
According with data illustrated in Table 1 the colour difference values for grafted and treated knitting samples are relatively higher (ΔE > 4 A.N. units). This indicates that from the treatments of grafting with MCT-β-CD and treatment with active principles has been registered significant colour modifications. The most significant colour difference has been obtained in case of knitting sample treated with propolis and respectively sample treated with propolis+menthol (ΔE = 24,52 A.N.) followed by grafted sample (ΔE = 8,7 A.N.) and respectively, the sample treated with Viola tricoloris Herba (ΔE = 8,355 A.N.). The lowest colour difference has the sample grafted and treated with menthol (ΔE = 4,897 A.N.) and lower with 3,875 units comparatively with the grafted sample (V.II). Hence the treatments performed imply the presence of a chromophore which shows a significant colourful effect for propolis (ΔE > 24 A.N. units), for Viola tricoloris Herba a medium colourful effect (ΔE > 8 A.N. units) and an insignificant colourful effect for menthol. 3.2 Washing fastness According with assessment of colour modification by subjectively way by means of grey scale for the three variants were obtained following marks shown in Table 2. Table 2: The washing fastness of knitted fabric treated with propolis
Marks for active principles transfer from sample treated with propolis according to grey scale
Marks on dyestuff transfer
3 Active principle transferring from treated and washed sample comparative to unwashed sample treated with propolis
3 Active principle transferring from washed treated sample on white sample with the same structure and composition
5 Active principle transferring from washed treated sample on poliester white sample with the same textile structure
From the results presented in Table 2 one found that sample treated with propolis presents medium washing fastness. 3.3 Kinetics of active principle release
242
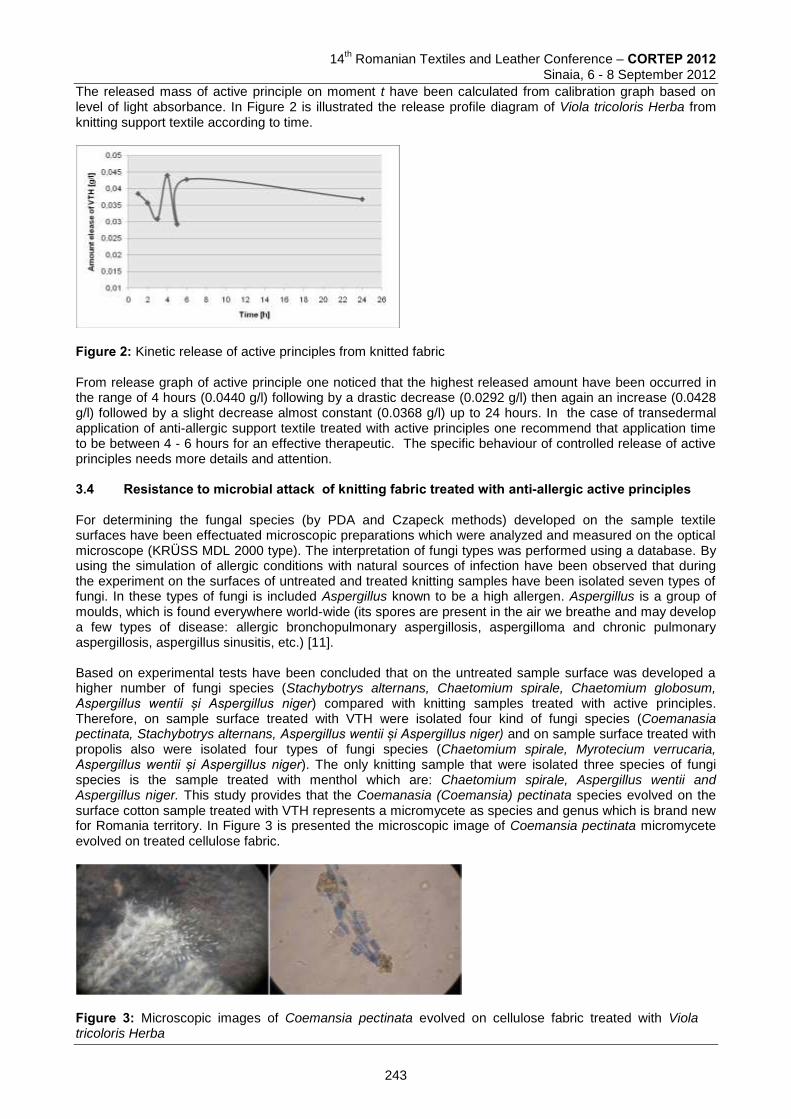
14
th Romanian Textiles and Leather Conference – CORTEP 2012
Sinaia, 6 - 8 September 2012
The released mass of active principle on moment t have been calculated from calibration graph based on level of light absorbance. In Figure 2 is illustrated the release profile diagram of Viola tricoloris Herba from knitting support textile according to time.
Figure 2: Kinetic release of active principles from knitted fabric From release graph of active principle one noticed that the highest released amount have been occurred in the range of 4 hours (0.0440 g/l) following by a drastic decrease (0.0292 g/l) then again an increase (0.0428 g/l) followed by a slight decrease almost constant (0.0368 g/l) up to 24 hours. In the case of transedermal application of anti-allergic support textile treated with active principles one recommend that application time to be between 4 - 6 hours for an effective therapeutic. The specific behaviour of controlled release of active principles needs more details and attention. 3.4 Resistance to microbial attack of knitting fabric treated with anti-allergic active principles For determining the fungal species (by PDA and Czapeck methods) developed on the sample textile surfaces have been effectuated microscopic preparations which were analyzed and measured on the optical microscope (KRÜSS MDL 2000 type). The interpretation of fungi types was performed using a database. By using the simulation of allergic conditions with natural sources of infection have been observed that during the experiment on the surfaces of untreated and treated knitting samples have been isolated seven types of fungi. In these types of fungi is included Aspergillus known to be a high allergen. Aspergillus is a group of moulds, which is found everywhere world-wide (its spores are present in the air we breathe and may develop a few types of disease: allergic bronchopulmonary aspergillosis, aspergilloma and chronic pulmonary aspergillosis, aspergillus sinusitis, etc.) [11]. Based on experimental tests have been concluded that on the untreated sample surface was developed a higher number of fungi species (Stachybotrys alternans, Chaetomium spirale, Chaetomium globosum, Aspergillus wentii și Aspergillus niger) compared with knitting samples treated with active principles. Therefore, on sample surface treated with VTH were isolated four kind of fungi species (Coemanasia pectinata, Stachybotrys alternans, Aspergillus wentii și Aspergillus niger) and on sample surface treated with propolis also were isolated four types of fungi species (Chaetomium spirale, Myrotecium verrucaria, Aspergillus wentii și Aspergillus niger). The only knitting sample that were isolated three species of fungi species is the sample treated with menthol which are: Chaetomium spirale, Aspergillus wentii and Aspergillus niger. This study provides that the Coemanasia (Coemansia) pectinata species evolved on the surface cotton sample treated with VTH represents a micromycete as species and genus which is brand new for Romania territory. In Figure 3 is presented the microscopic image of Coemansia pectinata micromycete evolved on treated cellulose fabric.
Figure 3: Microscopic images of Coemansia pectinata evolved on cellulose fabric treated with Viola tricoloris Herba
243
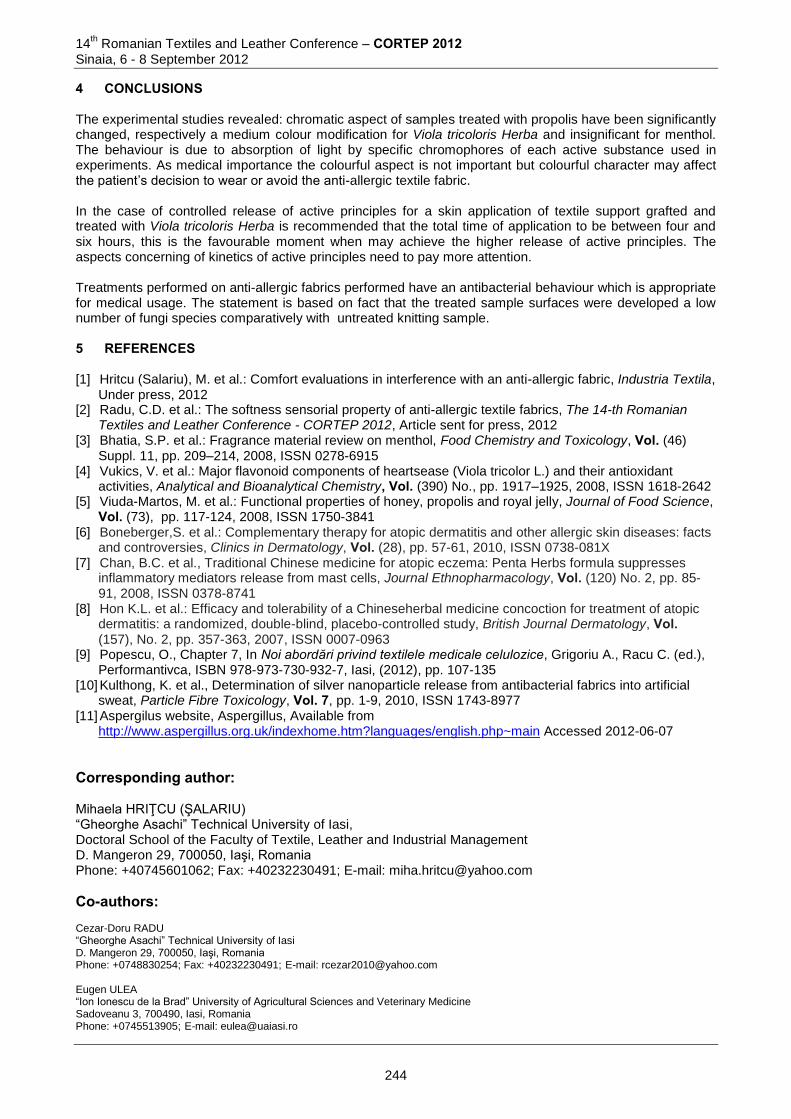
14th Romanian Textiles and Leather Conference – CORTEP 2012
Sinaia, 6 - 8 September 2012
4 CONCLUSIONS The experimental studies revealed: chromatic aspect of samples treated with propolis have been significantly changed, respectively a medium colour modification for Viola tricoloris Herba and insignificant for menthol. The behaviour is due to absorption of light by specific chromophores of each active substance used in experiments. As medical importance the colourful aspect is not important but colourful character may affect the patient’s decision to wear or avoid the anti-allergic textile fabric. In the case of controlled release of active principles for a skin application of textile support grafted and treated with Viola tricoloris Herba is recommended that the total time of application to be between four and six hours, this is the favourable moment when may achieve the higher release of active principles. The aspects concerning of kinetics of active principles need to pay more attention. Treatments performed on anti-allergic fabrics performed have an antibacterial behaviour which is appropriate for medical usage. The statement is based on fact that the treated sample surfaces were developed a low number of fungi species comparatively with untreated knitting sample. 5 REFERENCES [1] Hritcu (Salariu), M. et al.: Comfort evaluations in interference with an anti-allergic fabric, Industria Textila,
Under press, 2012 [2] Radu, C.D. et al.: The softness sensorial property of anti-allergic textile fabrics, The 14-th Romanian
Textiles and Leather Conference - CORTEP 2012, Article sent for press, 2012 [3] Bhatia, S.P. et al.: Fragrance material review on menthol, Food Chemistry and Toxicology, Vol. (46)
Suppl. 11, pp. 209–214, 2008, ISSN 0278-6915 [4] Vukics, V. et al.: Major flavonoid components of heartsease (Viola tricolor L.) and their antioxidant
activities, Analytical and Bioanalytical Chemistry, Vol. (390) No., pp. 1917–1925, 2008, ISSN 1618-2642 [5] Viuda-Martos, M. et al.: Functional properties of honey, propolis and royal jelly, Journal of Food Science,
Vol. (73), pp. 117-124, 2008, ISSN 1750-3841 [6] Boneberger,S. et al.: Complementary therapy for atopic dermatitis and other allergic skin diseases: facts
and controversies, Clinics in Dermatology, Vol. (28), pp. 57-61, 2010, ISSN 0738-081X [7] Chan, B.C. et al., Traditional Chinese medicine for atopic eczema: Penta Herbs formula suppresses
inflammatory mediators release from mast cells, Journal Ethnopharmacology, Vol. (120) No. 2, pp. 85-91, 2008, ISSN 0378-8741
[8] Hon K.L. et al.: Efficacy and tolerability of a Chineseherbal medicine concoction for treatment of atopic dermatitis: a randomized, double-blind, placebo-controlled study, British Journal Dermatology, Vol. (157), No. 2, pp. 357-363, 2007, ISSN 0007-0963
[9] Popescu, O., Chapter 7, In Noi abordări privind textilele medicale celulozice, Grigoriu A., Racu C. (ed.), Performantivca, ISBN 978-973-730-932-7, Iasi, (2012), pp. 107-135
[10] Kulthong, K. et al., Determination of silver nanoparticle release from antibacterial fabrics into artificial sweat, Particle Fibre Toxicology, Vol. 7, pp. 1-9, 2010, ISSN 1743-8977
[11] Aspergilus website, Aspergillus, Available from http://www.aspergillus.org.uk/indexhome.htm?languages/english.php~main Accessed 2012-06-07
Corresponding author: Mihaela HRIŢCU (ŞALARIU) “Gheorghe Asachi” Technical University of Iasi, Doctoral School of the Faculty of Textile, Leather and Industrial Management D. Mangeron 29, 700050, Iaşi, Romania Phone: +40745601062; Fax: +40232230491; E-mail: [email protected]
Co-authors: Cezar-Doru RADU “Gheorghe Asachi” Technical University of Iasi D. Mangeron 29, 700050, Iaşi, Romania Phone: +0748830254; Fax: +40232230491; E-mail: [email protected] Eugen ULEA “Ion Ionescu de la Brad” University of Agricultural Sciences and Veterinary Medicine Sadoveanu 3, 700490, Iasi, Romania Phone: +0745513905; E-mail: [email protected]
244
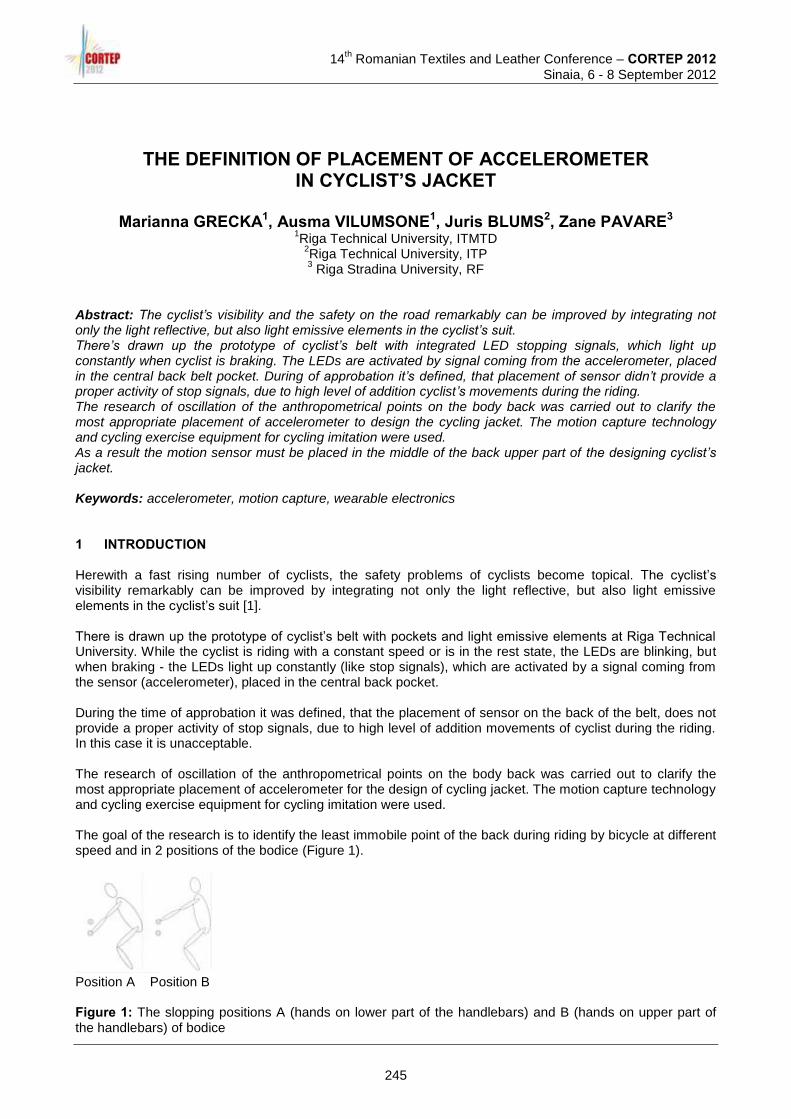
14
th Romanian Textiles and Leather Conference – CORTEP 2012
Sinaia, 6 - 8 September 2012
THE DEFINITION OF PLACEMENT OF ACCELEROMETER IN CYCLIST’S JACKET
Marianna GRECKA1, Ausma VILUMSONE1, Juris BLUMS2, Zane PAVARE3
1Riga Technical University, ITMTD
2Riga Technical University, ITP 3 Riga Stradina University, RF
Abstract: The cyclist’s visibility and the safety on the road remarkably can be improved by integrating not only the light reflective, but also light emissive elements in the cyclist’s suit. There’s drawn up the prototype of cyclist’s belt with integrated LED stopping signals, which light up constantly when cyclist is braking. The LEDs are activated by signal coming from the accelerometer, placed in the central back belt pocket. During of approbation it’s defined, that placement of sensor didn’t provide a proper activity of stop signals, due to high level of addition cyclist’s movements during the riding. The research of oscillation of the anthropometrical points on the body back was carried out to clarify the most appropriate placement of accelerometer to design the cycling jacket. The motion capture technology and cycling exercise equipment for cycling imitation were used. As a result the motion sensor must be placed in the middle of the back upper part of the designing cyclist’s jacket. Keywords: accelerometer, motion capture, wearable electronics 1 INTRODUCTION Herewith a fast rising number of cyclists, the safety problems of cyclists become topical. The cyclist’s visibility remarkably can be improved by integrating not only the light reflective, but also light emissive elements in the cyclist’s suit [1]. There is drawn up the prototype of cyclist’s belt with pockets and light emissive elements at Riga Technical University. While the cyclist is riding with a constant speed or is in the rest state, the LEDs are blinking, but when braking - the LEDs light up constantly (like stop signals), which are activated by a signal coming from the sensor (accelerometer), placed in the central back pocket. During the time of approbation it was defined, that the placement of sensor on the back of the belt, does not provide a proper activity of stop signals, due to high level of addition movements of cyclist during the riding. In this case it is unacceptable. The research of oscillation of the anthropometrical points on the body back was carried out to clarify the most appropriate placement of accelerometer for the design of cycling jacket. The motion capture technology and cycling exercise equipment for cycling imitation were used. The goal of the research is to identify the least immobile point of the back during riding by bicycle at different speed and in 2 positions of the bodice (Figure 1).
Position A Position B Figure 1: The slopping positions A (hands on lower part of the handlebars) and B (hands on upper part of the handlebars) of bodice
245
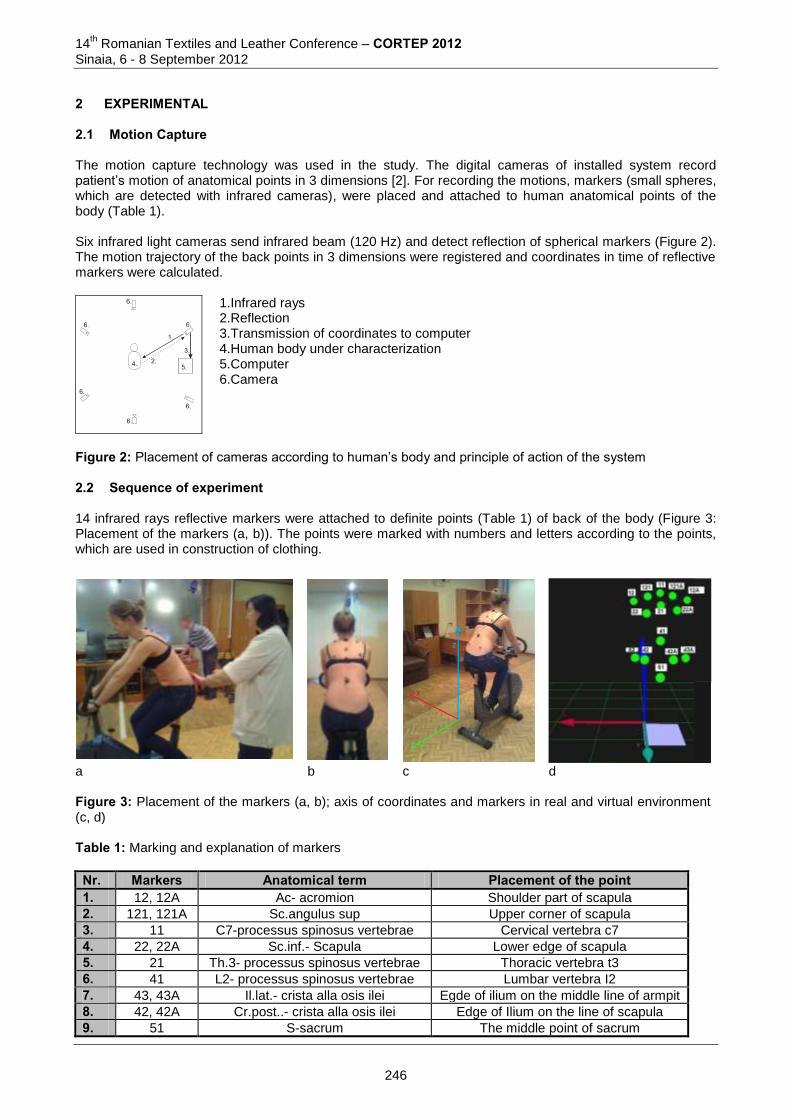
14th Romanian Textiles and Leather Conference – CORTEP 2012
Sinaia, 6 - 8 September 2012
2 EXPERIMENTAL 2.1 Motion Capture The motion capture technology was used in the study. The digital cameras of installed system record patient’s motion of anatomical points in 3 dimensions [2]. For recording the motions, markers (small spheres, which are detected with infrared cameras), were placed and attached to human anatomical points of the body (Table 1). Six infrared light cameras send infrared beam (120 Hz) and detect reflection of spherical markers (Figure 2). The motion trajectory of the back points in 3 dimensions were registered and coordinates in time of reflective markers were calculated.
1.Infrared rays 2.Reflection 3.Transmission of coordinates to computer 4.Human body under characterization 5.Computer 6.Camera
Figure 2: Placement of cameras according to human’s body and principle of action of the system 2.2 Sequence of experiment 14 infrared rays reflective markers were attached to definite points (Table 1) of back of the body (Figure 3: Placement of the markers (a, b)). The points were marked with numbers and letters according to the points, which are used in construction of clothing.
Table 1: Marking and explanation of markers
Nr. Markers Anatomical term Placement of the point 1. 12, 12A Ac- acromion Shoulder part of scapula
2. 121, 121A Sc.angulus sup Upper corner of scapula
3. 11 C7-processus spinosus vertebrae Cervical vertebra c7
4. 22, 22A Sc.inf.- Scapula Lower edge of scapula
5. 21 Th.3- processus spinosus vertebrae Thoracic vertebra t3
6. 41 L2- processus spinosus vertebrae Lumbar vertebra I2
7. 43, 43A Il.lat.- crista alla osis ilei Egde of ilium on the middle line of armpit
8. 42, 42A Cr.post..- crista alla osis ilei Edge of Ilium on the line of scapula
9. 51 S-sacrum The middle point of sacrum
a b c d Figure 3: Placement of the markers (a, b); axis of coordinates and markers in real and virtual environment (c, d)
246

14
th Romanian Textiles and Leather Conference – CORTEP 2012
Sinaia, 6 - 8 September 2012
Cycling equipment was prepared for experiment: the height of the saddle and handlebars had been regulated according to the parameters of human body, the load had been adjusted and test ‘rides’ had been made. Eight experimental ‘rides’ were made at different speeds and in two slopping positions of the body. Each ‘ride’ lasted 10 seconds. Conditions of the experiment with cycling equipment see in Table 2. Table 2: Conditions of the experiment with cycling equipment
Nr. Position Speed, km/h Time, s 1. A 15 10
2. A 20 10
3. A 25 10
4. A increasing from 15 to 30 10
5. B 15 10
6. B 20 10
7. B 25 10
8. B increasing from 15 to 30 10
Using special software and cameras, each coordinates in time of the markers were automatically registered and calculated, and visualized on monitor of computer. 2.3 Processing of the data During the time of experiment it was observed, that markers (42, 43, 42A, 43), placed on the lower part of the back, had greater amplitude of motion than other markers. Therefore these points were excluded from the further calculations. Total amplitude of acceleration of each marker was clarified, when minimal and maximal values of total acceleration were identified. The component of acceleration (1) of motion point in the definite direction is the derivation of component of speed, or the second derivation of according coordinate [3]:
(1) where ax - x component of the acceleration;
ay - y component of the acceleration; az - z component of the acceleration; t – time (s); vx - x component of the velocity; vy - y component of the velocity; vz - z component of the velocity.
Absolute value of acceleration is:
(2) where atotal – module of total acceleration. Table 3: The example of the calculation of total acceleration of marker 12 (increasing speed from 15 to 30 km/h)
Nr. x vx ax y vy ay z vz az v akop 1. 20,79 0,31 -0,26 352,32 -0,03 -0,001 1397,75 0,09 0,01 0,32 0,26
… … … … … … … … … … … …
2400. 5,27 -0,52 0,21 340,21 -0,25 0,04 1399,49 0,14 0,04 0,59 0,22
min -0,90 -1,58 -1,41 0,002
max 0,92 1,58 1,24 2,14
min-max 1,82 3,16 2,65 2,14
247
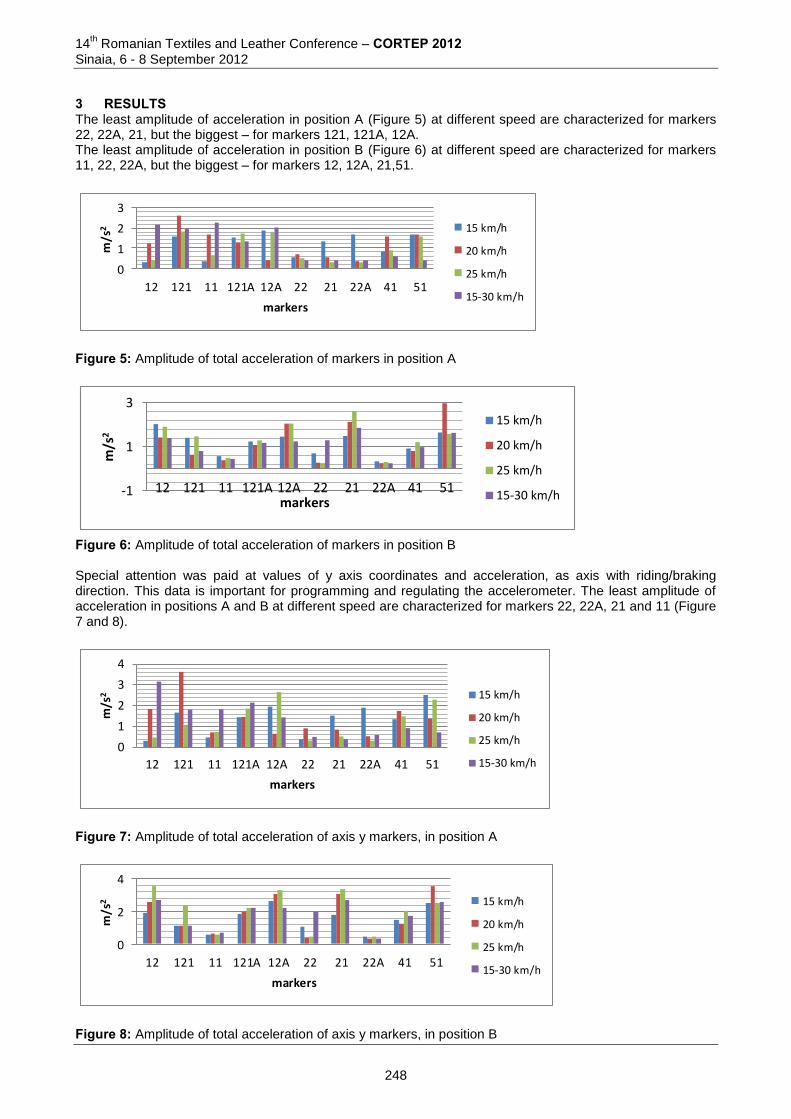
14th Romanian Textiles and Leather Conference – CORTEP 2012
Sinaia, 6 - 8 September 2012
3 RESULTS The least amplitude of acceleration in position A (Figure 5) at different speed are characterized for markers 22, 22A, 21, but the biggest – for markers 121, 121A, 12A. The least amplitude of acceleration in position B (Figure 6) at different speed are characterized for markers 11, 22, 22A, but the biggest – for markers 12, 12A, 21,51.
0
1
2
3
12 121 11 121A 12A 22 21 22A 41 51
m/s
2
markers
15 km/h
20 km/h
25 km/h
15-30 km/h
Figure 5: Amplitude of total acceleration of markers in position A
-1
1
3
12 121 11 121A 12A 22 21 22A 41 51
m/s
2
markers
15 km/h
20 km/h
25 km/h
15-30 km/h
Figure 6: Amplitude of total acceleration of markers in position B Special attention was paid at values of y axis coordinates and acceleration, as axis with riding/braking direction. This data is important for programming and regulating the accelerometer. The least amplitude of acceleration in positions A and B at different speed are characterized for markers 22, 22A, 21 and 11 (Figure 7 and 8).
0
1
2
3
4
12 121 11 121A 12A 22 21 22A 41 51
m/s
2
markers
15 km/h
20 km/h
25 km/h
15-30 km/h
Figure 7: Amplitude of total acceleration of axis y markers, in position A
0
2
4
12 121 11 121A 12A 22 21 22A 41 51
m/s
2
markers
15 km/h
20 km/h
25 km/h
15-30 km/h
Figure 8: Amplitude of total acceleration of axis y markers, in position B
248
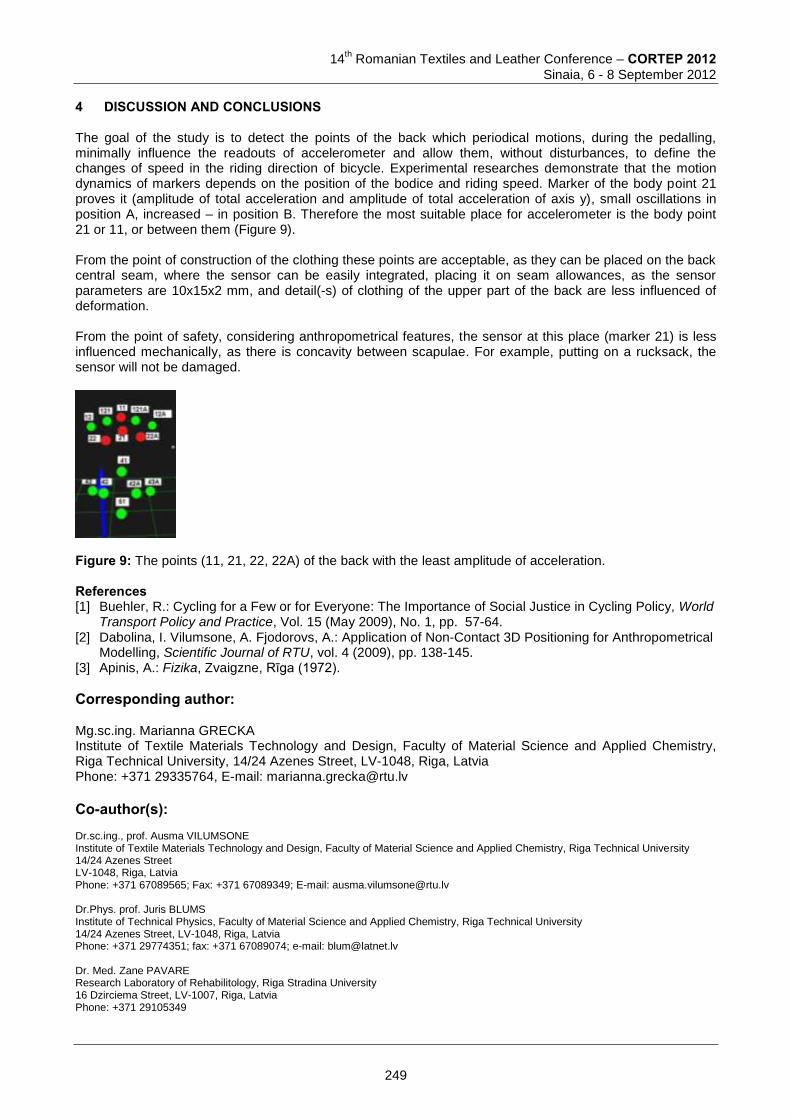
14
th Romanian Textiles and Leather Conference – CORTEP 2012
Sinaia, 6 - 8 September 2012
4 DISCUSSION AND CONCLUSIONS The goal of the study is to detect the points of the back which periodical motions, during the pedalling, minimally influence the readouts of accelerometer and allow them, without disturbances, to define the changes of speed in the riding direction of bicycle. Experimental researches demonstrate that the motion dynamics of markers depends on the position of the bodice and riding speed. Marker of the body point 21 proves it (amplitude of total acceleration and amplitude of total acceleration of axis y), small oscillations in position A, increased – in position B. Therefore the most suitable place for accelerometer is the body point 21 or 11, or between them (Figure 9). From the point of construction of the clothing these points are acceptable, as they can be placed on the back central seam, where the sensor can be easily integrated, placing it on seam allowances, as the sensor parameters are 10x15x2 mm, and detail(-s) of clothing of the upper part of the back are less influenced of deformation. From the point of safety, considering anthropometrical features, the sensor at this place (marker 21) is less influenced mechanically, as there is concavity between scapulae. For example, putting on a rucksack, the sensor will not be damaged.
Figure 9: The points (11, 21, 22, 22A) of the back with the least amplitude of acceleration. References [1] Buehler, R.: Cycling for a Few or for Everyone: The Importance of Social Justice in Cycling Policy, World
Transport Policy and Practice, Vol. 15 (May 2009), No. 1, pp. 57-64. [2] Dabolina, I. Vilumsone, A. Fjodorovs, A.: Application of Non-Contact 3D Positioning for Anthropometrical
Modelling, Scientific Journal of RTU, vol. 4 (2009), pp. 138-145. [3] Apinis, A.: Fizika, Zvaigzne, Rīga (1972).
Corresponding author: Mg.sc.ing. Marianna GRECKA Institute of Textile Materials Technology and Design, Faculty of Material Science and Applied Chemistry, Riga Technical University, 14/24 Azenes Street, LV-1048, Riga, Latvia Phone: +371 29335764, E-mail: [email protected]
Co-author(s): Dr.sc.ing., prof. Ausma VILUMSONE Institute of Textile Materials Technology and Design, Faculty of Material Science and Applied Chemistry, Riga Technical University 14/24 Azenes Street LV-1048, Riga, Latvia Phone: +371 67089565; Fax: +371 67089349; E-mail: [email protected] Dr.Phys. prof. Juris BLUMS Institute of Technical Physics, Faculty of Material Science and Applied Chemistry, Riga Technical University 14/24 Azenes Street, LV-1048, Riga, Latvia Phone: +371 29774351; fax: +371 67089074; e-mail: [email protected] Dr. Med. Zane PAVARE Research Laboratory of Rehabilitology, Riga Stradina University 16 Dzirciema Street, LV-1007, Riga, Latvia Phone: +371 29105349
249
14th Romanian Textiles and Leather Conference – CORTEP 2012
Sinaia, 6 - 8 September 2012
PRODUCTION OF TEXTILE REINFORCED CONCRETE
Ema MARIN1, Marinela BARBUTA2, Ioan CIOARA1 & Luminita CIOBANU1 1"Gheorghe Asachi" Technical University of Iasi, Faculty of Textile, Leather and Industrial Management
2"Gheorghe Asachi" Technical University of Iasi, Faculty of Civil Engineering and Building Services
Abstract: Textile materials are used in the field of building for different applications, ranging from thermal isolation to building roofs. In the last 20 years, the reinforcement of concrete with textiles is well documented in the existing literature, showing the potential of these products and the increasing interest shown by researchers and producers. The paper intends to study the mechanical behaviour of fibre reinforced concrete (also known as polymer concrete). It discusses the production of such composites, considering the type of fibres and the fibres length, as well as the mixture of polymer concrete. The specific method of production is presented. An experimental matrix is proposed. The variants of reinforced concrete were tested to determine their specific characteristics: compressive strength, flexural strength and split tensile strength. The experimental results are presented and discussed comparatively, in order to emphasise the influence of the two factors considered - type of reinforcement and fibre length. Keywords: polymer concrete, technical fibres, compressive strength, flexural strength, split tensile strength
1. INTRODUCTION Composite materials represent an important domain of application for textile materials, with the advantage of controlling the product behaviour starting with its design. Composites are materials made of distinct materials with specific characteristics that brought together act in a manner different from their own. Such products have known a strong development in the last decades its applications becoming wider and significantly important. Apart from industrial and aeronautical applications, a domain with good potential is the reinforcement of building elements - walls, beams, etc. Currently there are two types of composites - fibre reinforced concrete (FRC) and textile reinforced concrete (TRC). In the first case, the reinforcement is made of fibres/yarns, while in the second the reinforcement is made of textile fabrics (woven, non-woven, braided or knitted). The reinforcement of concrete elements in buildings is used for the following reasons:
repairing a structure destroyed due to design errors;
catastrophic disasters, caused by strong winds, explosions, floods, earthquakes;
an increase in the building's strength due to a change in destination;
degradation of foundation land;
reinforcement corrosion caused by high chemical aggressiveness. The advantages of using textile materials as reinforcement for concrete refer to:
production of materials with different properties in comparison with traditional materials;
a cut-down in the consumption of expensive or rare raw materials;
a cut-down in production costs;
the decrease of production time;
lower weight than traditional materials;
increased life duration due to excellent mechanical and chemical properties;
increased viability and safety during use;
low maintenance costs;
increased possibilities of obtaining complex shapes.
250
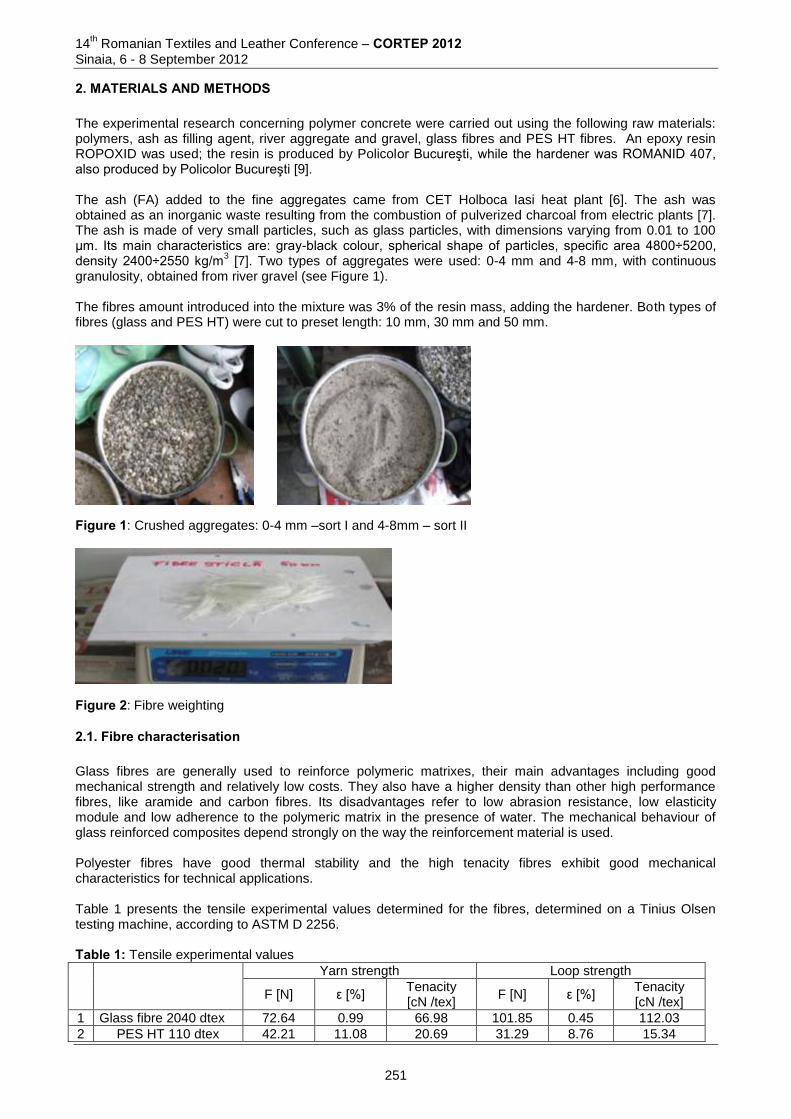
14th Romanian Textiles and Leather Conference – CORTEP 2012
Sinaia, 6 - 8 September 2012
2. MATERIALS AND METHODS The experimental research concerning polymer concrete were carried out using the following raw materials: polymers, ash as filling agent, river aggregate and gravel, glass fibres and PES HT fibres. An epoxy resin ROPOXID was used; the resin is produced by Policolor Bucureşti, while the hardener was ROMANID 407, also produced by Policolor Bucureşti [9]. The ash (FA) added to the fine aggregates came from CET Holboca Iasi heat plant [6]. The ash was obtained as an inorganic waste resulting from the combustion of pulverized charcoal from electric plants [7]. The ash is made of very small particles, such as glass particles, with dimensions varying from 0.01 to 100 µm. Its main characteristics are: gray-black colour, spherical shape of particles, specific area 4800÷5200, density 2400÷2550 kg/m
3 [7]. Two types of aggregates were used: 0-4 mm and 4-8 mm, with continuous
granulosity, obtained from river gravel (see Figure 1). The fibres amount introduced into the mixture was 3% of the resin mass, adding the hardener. Both types of fibres (glass and PES HT) were cut to preset length: 10 mm, 30 mm and 50 mm.
Figure 1: Crushed aggregates: 0-4 mm –sort I and 4-8mm – sort II
Figure 2: Fibre weighting
2.1. Fibre characterisation Glass fibres are generally used to reinforce polymeric matrixes, their main advantages including good mechanical strength and relatively low costs. They also have a higher density than other high performance fibres, like aramide and carbon fibres. Its disadvantages refer to low abrasion resistance, low elasticity module and low adherence to the polymeric matrix in the presence of water. The mechanical behaviour of glass reinforced composites depend strongly on the way the reinforcement material is used. Polyester fibres have good thermal stability and the high tenacity fibres exhibit good mechanical characteristics for technical applications. Table 1 presents the tensile experimental values determined for the fibres, determined on a Tinius Olsen testing machine, according to ASTM D 2256.
Table 1: Tensile experimental values
Yarn strength Loop strength
F [N] ε [%] Tenacity [cN /tex]
F [N] ε [%] Tenacity [cN /tex]
1 Glass fibre 2040 dtex 72.64 0.99 66.98 101.85 0.45 112.03
2 PES HT 110 dtex 42.21 11.08 20.69 31.29 8.76 15.34
251
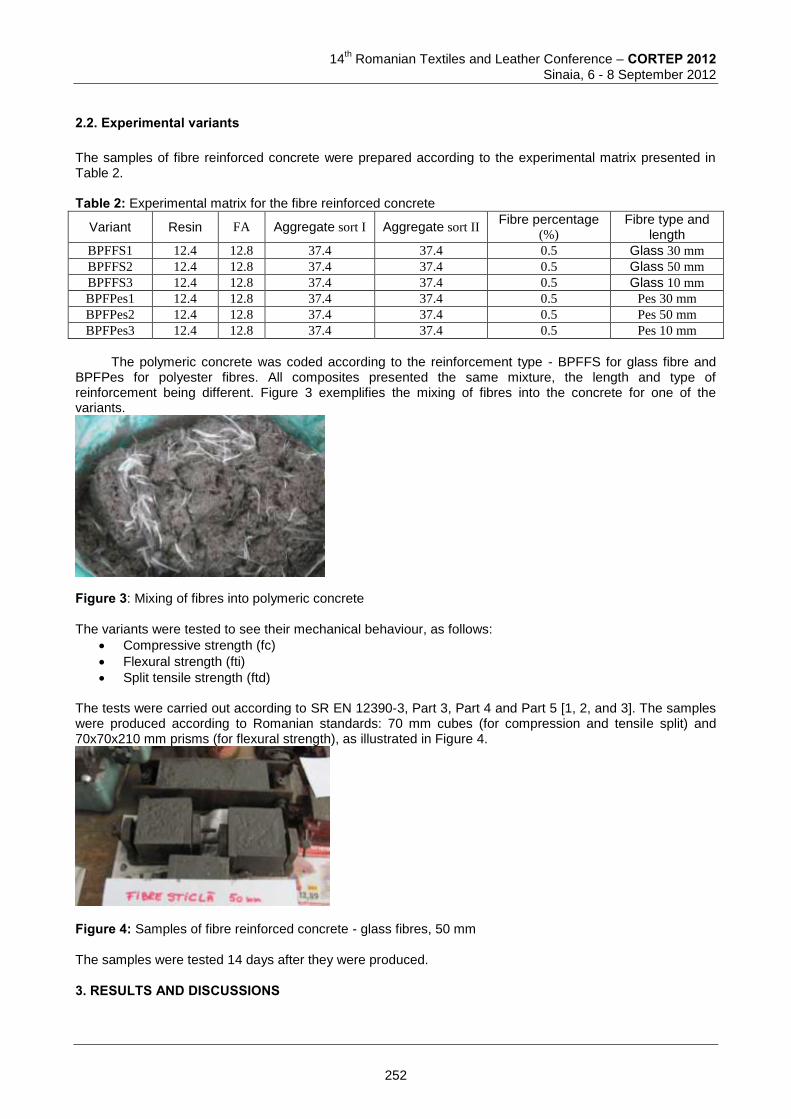
14
th Romanian Textiles and Leather Conference – CORTEP 2012
Sinaia, 6 - 8 September 2012
2.2. Experimental variants The samples of fibre reinforced concrete were prepared according to the experimental matrix presented in Table 2.
Table 2: Experimental matrix for the fibre reinforced concrete
Variant Resin FA Aggregate sort I Aggregate sort II Fibre percentage
(%) Fibre type and
length
BPFFS1 12.4 12.8 37.4 37.4 0.5 Glass 30 mm
BPFFS2 12.4 12.8 37.4 37.4 0.5 Glass 50 mm
BPFFS3 12.4 12.8 37.4 37.4 0.5 Glass 10 mm
BPFPes1 12.4 12.8 37.4 37.4 0.5 Pes 30 mm
BPFPes2 12.4 12.8 37.4 37.4 0.5 Pes 50 mm
BPFPes3 12.4 12.8 37.4 37.4 0.5 Pes 10 mm
The polymeric concrete was coded according to the reinforcement type - BPFFS for glass fibre and
BPFPes for polyester fibres. All composites presented the same mixture, the length and type of reinforcement being different. Figure 3 exemplifies the mixing of fibres into the concrete for one of the variants.
Figure 3: Mixing of fibres into polymeric concrete The variants were tested to see their mechanical behaviour, as follows:
Compressive strength (fc)
Flexural strength (fti)
Split tensile strength (ftd) The tests were carried out according to SR EN 12390-3, Part 3, Part 4 and Part 5 [1, 2, and 3]. The samples were produced according to Romanian standards: 70 mm cubes (for compression and tensile split) and 70x70x210 mm prisms (for flexural strength), as illustrated in Figure 4.
Figure 4: Samples of fibre reinforced concrete - glass fibres, 50 mm The samples were tested 14 days after they were produced.
3. RESULTS AND DISCUSSIONS
252
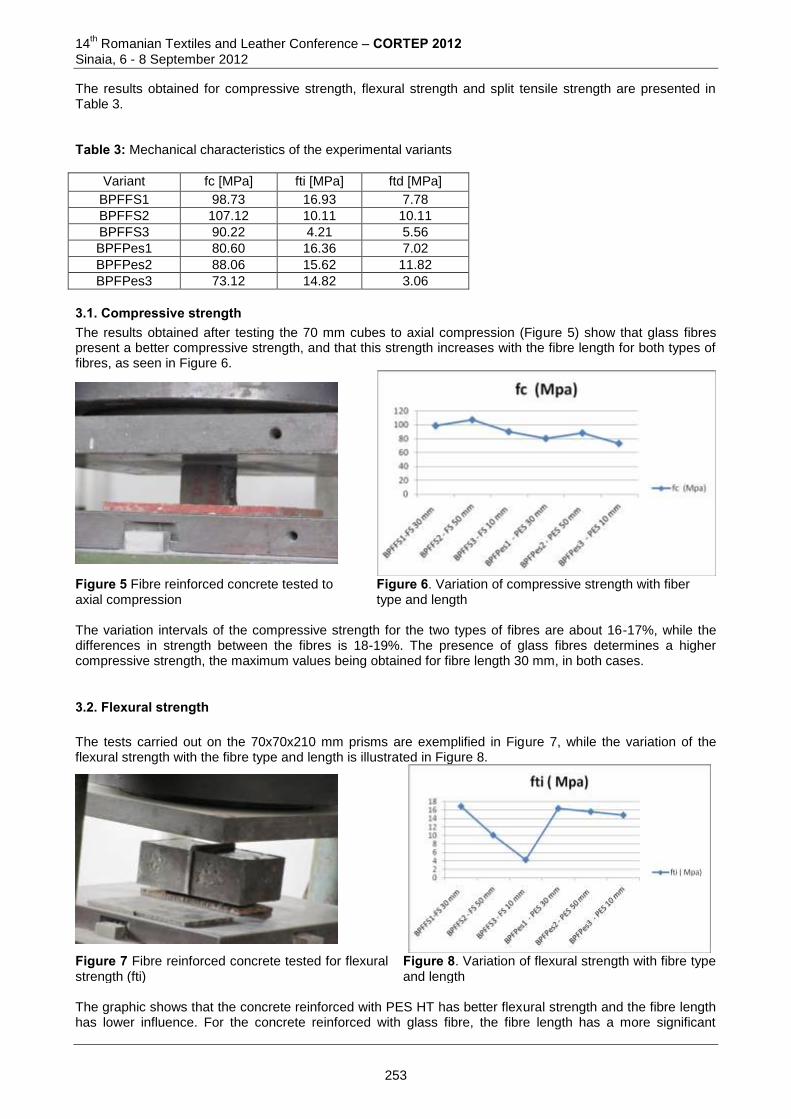
14th Romanian Textiles and Leather Conference – CORTEP 2012
Sinaia, 6 - 8 September 2012
The results obtained for compressive strength, flexural strength and split tensile strength are presented in Table 3.
Table 3: Mechanical characteristics of the experimental variants
Variant fc [MPa]
fti [MPa]
ftd [MPa]
BPFFS1 98.73 16.93 7.78
BPFFS2 107.12 10.11 10.11
BPFFS3 90.22 4.21 5.56
BPFPes1 80.60 16.36 7.02
BPFPes2 88.06 15.62 11.82
BPFPes3 73.12 14.82 3.06
3.1. Compressive strength The results obtained after testing the 70 mm cubes to axial compression (Figure 5) show that glass fibres present a better compressive strength, and that this strength increases with the fibre length for both types of fibres, as seen in Figure 6.
Figure 5 Fibre reinforced concrete tested to axial compression
Figure 6. Variation of compressive strength with fiber type and length
The variation intervals of the compressive strength for the two types of fibres are about 16-17%, while the differences in strength between the fibres is 18-19%. The presence of glass fibres determines a higher compressive strength, the maximum values being obtained for fibre length 30 mm, in both cases.
3.2. Flexural strength The tests carried out on the 70x70x210 mm prisms are exemplified in Figure 7, while the variation of the flexural strength with the fibre type and length is illustrated in Figure 8.
Figure 7 Fibre reinforced concrete tested for flexural strength (fti)
Figure 8. Variation of flexural strength with fibre type and length
The graphic shows that the concrete reinforced with PES HT has better flexural strength and the fibre length has lower influence. For the concrete reinforced with glass fibre, the fibre length has a more significant
253
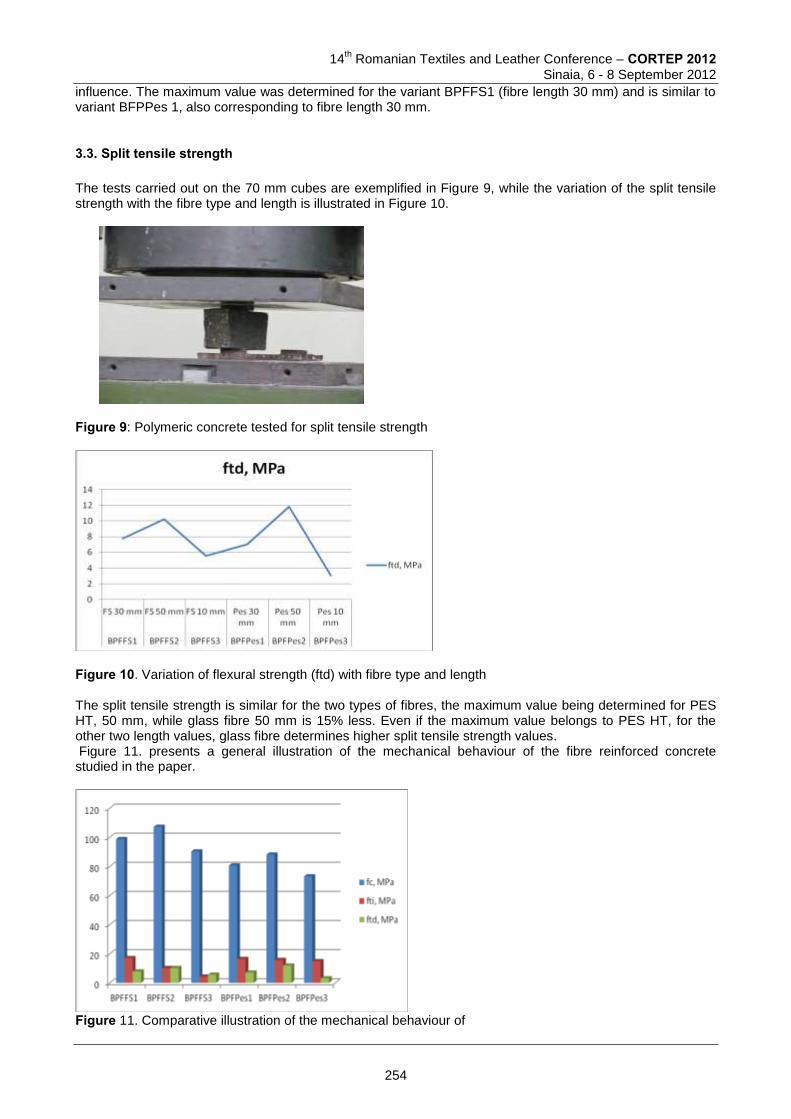
14
th Romanian Textiles and Leather Conference – CORTEP 2012
Sinaia, 6 - 8 September 2012
influence. The maximum value was determined for the variant BPFFS1 (fibre length 30 mm) and is similar to variant BFPPes 1, also corresponding to fibre length 30 mm.
3.3. Split tensile strength
The tests carried out on the 70 mm cubes are exemplified in Figure 9, while the variation of the split tensile strength with the fibre type and length is illustrated in Figure 10.
Figure 9: Polymeric concrete tested for split tensile strength
Figure 10. Variation of flexural strength (ftd) with fibre type and length The split tensile strength is similar for the two types of fibres, the maximum value being determined for PES HT, 50 mm, while glass fibre 50 mm is 15% less. Even if the maximum value belongs to PES HT, for the other two length values, glass fibre determines higher split tensile strength values. Figure 11. presents a general illustration of the mechanical behaviour of the fibre reinforced concrete studied in the paper.
Figure 11. Comparative illustration of the mechanical behaviour of
254
14th Romanian Textiles and Leather Conference – CORTEP 2012
Sinaia, 6 - 8 September 2012
4. CONCLUSIONS The paper presents a study concerning the mechanical behaviour of fibre reinforced concrete. Two types of fibres, each with three fibre length were used to produce concrete samples that were tested to determine compressive strength, flexural strength and split tensile strength. The experimental results show that both variables (fibre type and fibre length) have a significant influence on the specific mechanical properties of the reinforced concrete. Glass fibre reinforcement improves compressive behaviour, while PES HT fibres are best used for flexural strength. A fibre length of 30 mm proved to have the best results. Further work will develop the production of fibre reinforced concrete, by investigating other possible raw materials and the amount added to concrete. References
[1] SR EN 12390-3:2005 – Testing hardened concrete. Part 3: Compressive strength of test specimens. [2] SR EN 12390-5:2005 - Testing hardened concrete. Part 5: Flexural strength of test specimens [3] SR EN 12390-4:2005 - Testing hardened concrete. Part 4: Split tensile strength of test specimens [4] Reis JML. Effect of Textile Waste on the Mechanical Properties of Polymer Concrete. Mater Res 2009;
12(1): 63-67. [5] Reis JML, Ferreira AJM. Assessment of fracture properties of epoxy polymer concrete reinforced with
short carbon and glass fibers. Constr Build Mater 2004; 18: 523-528. [6] Barbuta M, Diaconescu RM, Harja M. Using Neural Networks for Prediction of Properties of Polymer
Concrete with Fly Ash. J Mater Civil Eng 2012; 24(5): 523-528, doi:10.1061/(ASCE)MT.1943-5533.0000413
[7] Barbuta M, Harja M, Baran I. Comparison of Mechanical Properties for Polymer Concrete with Different Types of Filler, J Mater Civ Eng 2010; 22(7): 696-701.
[8] Barbuta, M., and Lepădatu, D. Mechanical characteristics investigation of polymer concrete using mixture design of experiments and response surface method. Journal of Applied Science, . 2008, 8(12): 2242–2249.
[9] Barbuta, M., Taranu, N., and Harja, M. Wastes used in obtaining polymer composite, Environmental Engineering and Management Journal, 2009, 8(5): 1145-1150.
[10] Barbuta, M., Harja, M., and Babor, D. Concrete polymer with fly ash. Morphologic analysis based on scanning electron microscopic observations, Romanian Journal of Materials, 2010, 40(1): 3-14.
Corresponding author: Ema Marin Faculty of Textile, Leather and Industrial Management, Str. D. Mangeron, 29, Iasi, 700050, Romania, e-mail address: [email protected] Co-authors: Marinela Barbuta Faculty of Civil Engineering and Building Services, Str. D. Mangeron, corp R, Iasi, 700050, Romania, e-mail address: [email protected] Ioan Cioara Faculty of Textile, Leather and Industrial Management, Str. D. Mangeron, 29, Iasi, 700050, Romania, e-mail address: [email protected] Luminita Ciobanu Faculty of Textile, Leather and Industrial Management, Str. D. Mangeron, 29, Iasi, 700050, Romania, e-mail address: [email protected]
255
14
th Romanian Textiles and Leather Conference – CORTEP 2012
Sinaia, 6 - 8 September 2012
ANALYSIS AND IMPROVEMENT OF NOCTURNAL ENURESIS ALARM SYSTEM
Inese PARKOVA1, Aleksandrs VALIŠEVSKIS1, Andis UŽĀNS2 & Ausma VIĻUMSONE1
1 Riga Technical University, Institute of Textile Material Technologies and Design
2 Riga Stradins University, Faculty of Medicine
Abstract: Bedwetting (Nocturnal Enuresis) is a common problem throughout the world, it has a very high prevalence in the preschool population and the prevalence slowly falls during childhood. Several therapies exist to solve this problem, one of them is enuresis alarm, which is a primary and an effective nocturnal enuresis treatment method for children. In the paper different alarm systems were summarized: pad-and-bell alarms, wearable wired alarms and wearable wireless alarms, analyzing its advantages and drawbacks Operation and construction as well as attachment technology and placement in the garment of alarm units and sensors have been explored. This study describes issues related to enuresis alarm systems from the comfort and safety point of view, as well as recommendations for improvement of sensor and alarm unit design. Keywords: nocturnal enuresis, alarm system, comfort, conductive threads 1 INTRODUCTION Bedwetting or nocturnal enuresis is a common problem. Statistical data show that a significant number of children and youth suffer from nocturnal enuresis. Different approaches towards the treatment of enuresis are being studied – alarm systems are compared to non-treatment and to drug therapies, as well as to combined therapies, analysing their efficiency and decrease in wetting frequency [1]. The aim of this research is to summarize available nocturnal enuresis alarm systems, to analyse advantages and drawbacks: to compare modules of the systems from the point of view of comfort and efficiency, by analysing their design, materials and usage convenience. As a result, options for improving the existing alarm systems are proposed, which ensure a more comfortable use of the product. 2 ENURESIS – DEFINITION OF THE PROBLEM Nocturnal enuresis or bed-wetting is intermittent incontinence during sleep of children after age of 5 years [2]. This problem affects about 15%- 20% five year old children and have tendency to decrease by age: it affects 5-10% of seven year olds and about 2% eighteen year olds [3]. Nocturnal enuresis is condition which is related with psychosocial consequences and may precipitate wide range of behavioural and developmental problems and decreased quality of life. Psychosocial problems have been reported to 40 % of affected children. Emotional and behavioural problems [4], social difference and restricted peer relationships are observed. 2.1 Causes of Enuresis Nocturnal enuresis can be caused by many factors, it is affected by genetic, physiological and psychological causes. Most often this issue is transmitted genetically – the risk of nocturnal enuresis is 15% if neither parent was affected, 40% if one parent was affected and 70-75% if both had the condition [5]. In paper [6] it is mentioned that the conventional paradigm for bed-wetting presumes three factors: disorder of sleep arousal, nocturnal polyuria and a reduced nocturnal bladder capacity. Upper airway obstruction is another cause of nocturnal enuresis. Behavioural factors predisposing enuresis are excessive fluid intake and inappropriate toilet training. Heterogeneity of enuresis is still topic of research. 2.2 Treatment Methods There are several approaches towards the reduction of bed-wetting, for example, reducing the fluid intake during the second half of the day and no liquid intake before going to bed, going to the toilet before going to
256
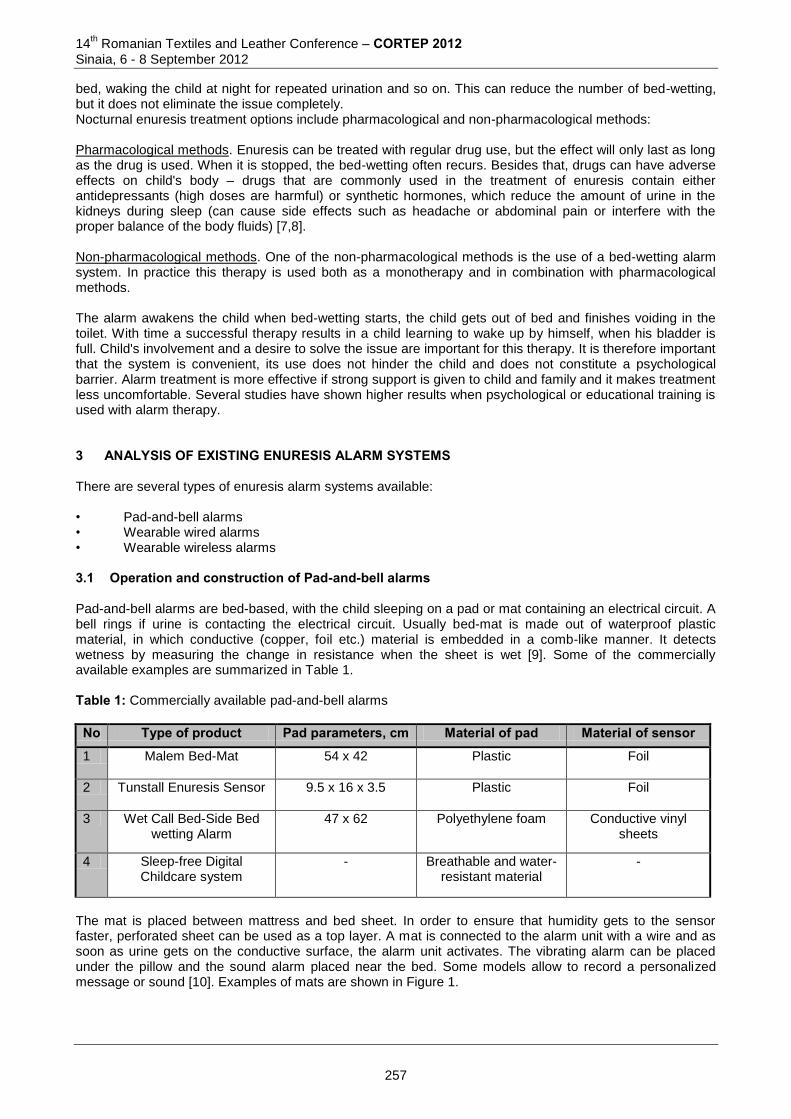
14th Romanian Textiles and Leather Conference – CORTEP 2012
Sinaia, 6 - 8 September 2012
bed, waking the child at night for repeated urination and so on. This can reduce the number of bed-wetting, but it does not eliminate the issue completely. Nocturnal enuresis treatment options include pharmacological and non-pharmacological methods: Pharmacological methods. Enuresis can be treated with regular drug use, but the effect will only last as long as the drug is used. When it is stopped, the bed-wetting often recurs. Besides that, drugs can have adverse effects on child's body – drugs that are commonly used in the treatment of enuresis contain either antidepressants (high doses are harmful) or synthetic hormones, which reduce the amount of urine in the kidneys during sleep (can cause side effects such as headache or abdominal pain or interfere with the proper balance of the body fluids) [7,8]. Non-pharmacological methods. One of the non-pharmacological methods is the use of a bed-wetting alarm system. In practice this therapy is used both as a monotherapy and in combination with pharmacological methods. The alarm awakens the child when bed-wetting starts, the child gets out of bed and finishes voiding in the toilet. With time a successful therapy results in a child learning to wake up by himself, when his bladder is full. Child's involvement and a desire to solve the issue are important for this therapy. It is therefore important that the system is convenient, its use does not hinder the child and does not constitute a psychological barrier. Alarm treatment is more effective if strong support is given to child and family and it makes treatment less uncomfortable. Several studies have shown higher results when psychological or educational training is used with alarm therapy. 3 ANALYSIS OF EXISTING ENURESIS ALARM SYSTEMS There are several types of enuresis alarm systems available: • Pad-and-bell alarms • Wearable wired alarms • Wearable wireless alarms 3.1 Operation and construction of Pad-and-bell alarms Pad-and-bell alarms are bed-based, with the child sleeping on a pad or mat containing an electrical circuit. A bell rings if urine is contacting the electrical circuit. Usually bed-mat is made out of waterproof plastic material, in which conductive (copper, foil etc.) material is embedded in a comb-like manner. It detects wetness by measuring the change in resistance when the sheet is wet [9]. Some of the commercially available examples are summarized in Table 1. Table 1: Commercially available pad-and-bell alarms
No Type of product Pad parameters, cm Material of pad Material of sensor
1 Malem Bed-Mat
54 x 42 Plastic Foil
2 Tunstall Enuresis Sensor
9.5 x 16 x 3.5 Plastic Foil
3 Wet Call Bed-Side Bed wetting Alarm
47 x 62 Polyethylene foam Conductive vinyl sheets
4 Sleep-free Digital Childcare system
- Breathable and water-resistant material
-
The mat is placed between mattress and bed sheet. In order to ensure that humidity gets to the sensor faster, perforated sheet can be used as a top layer. A mat is connected to the alarm unit with a wire and as soon as urine gets on the conductive surface, the alarm unit activates. The vibrating alarm can be placed under the pillow and the sound alarm placed near the bed. Some models allow to record a personalized message or sound [10]. Examples of mats are shown in Figure 1.
257
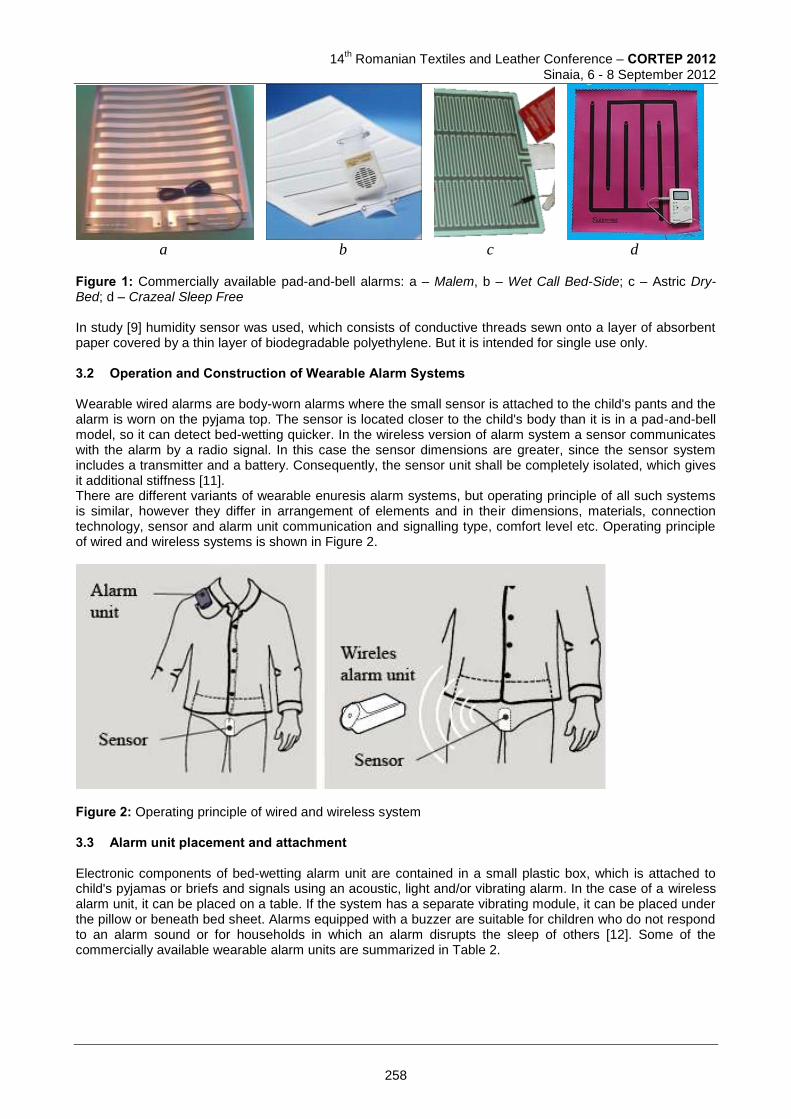
14
th Romanian Textiles and Leather Conference – CORTEP 2012
Sinaia, 6 - 8 September 2012
a b c d
Figure 1: Commercially available pad-and-bell alarms: a – Malem, b – Wet Call Bed-Side; c – Astric Dry-Bed; d – Crazeal Sleep Free In study [9] humidity sensor was used, which consists of conductive threads sewn onto a layer of absorbent paper covered by a thin layer of biodegradable polyethylene. But it is intended for single use only. 3.2 Operation and Construction of Wearable Alarm Systems Wearable wired alarms are body-worn alarms where the small sensor is attached to the child's pants and the alarm is worn on the pyjama top. The sensor is located closer to the child's body than it is in a pad-and-bell model, so it can detect bed-wetting quicker. In the wireless version of alarm system a sensor communicates with the alarm by a radio signal. In this case the sensor dimensions are greater, since the sensor system includes a transmitter and a battery. Consequently, the sensor unit shall be completely isolated, which gives it additional stiffness [11]. There are different variants of wearable enuresis alarm systems, but operating principle of all such systems is similar, however they differ in arrangement of elements and in their dimensions, materials, connection technology, sensor and alarm unit communication and signalling type, comfort level etc. Operating principle of wired and wireless systems is shown in Figure 2.
Figure 2: Operating principle of wired and wireless system 3.3 Alarm unit placement and attachment Electronic components of bed-wetting alarm unit are contained in a small plastic box, which is attached to child's pyjamas or briefs and signals using an acoustic, light and/or vibrating alarm. In the case of a wireless alarm unit, it can be placed on a table. If the system has a separate vibrating module, it can be placed under the pillow or beneath bed sheet. Alarms equipped with a buzzer are suitable for children who do not respond to an alarm sound or for households in which an alarm disrupts the sleep of others [12]. Some of the commercially available wearable alarm units are summarized in Table 2.
258
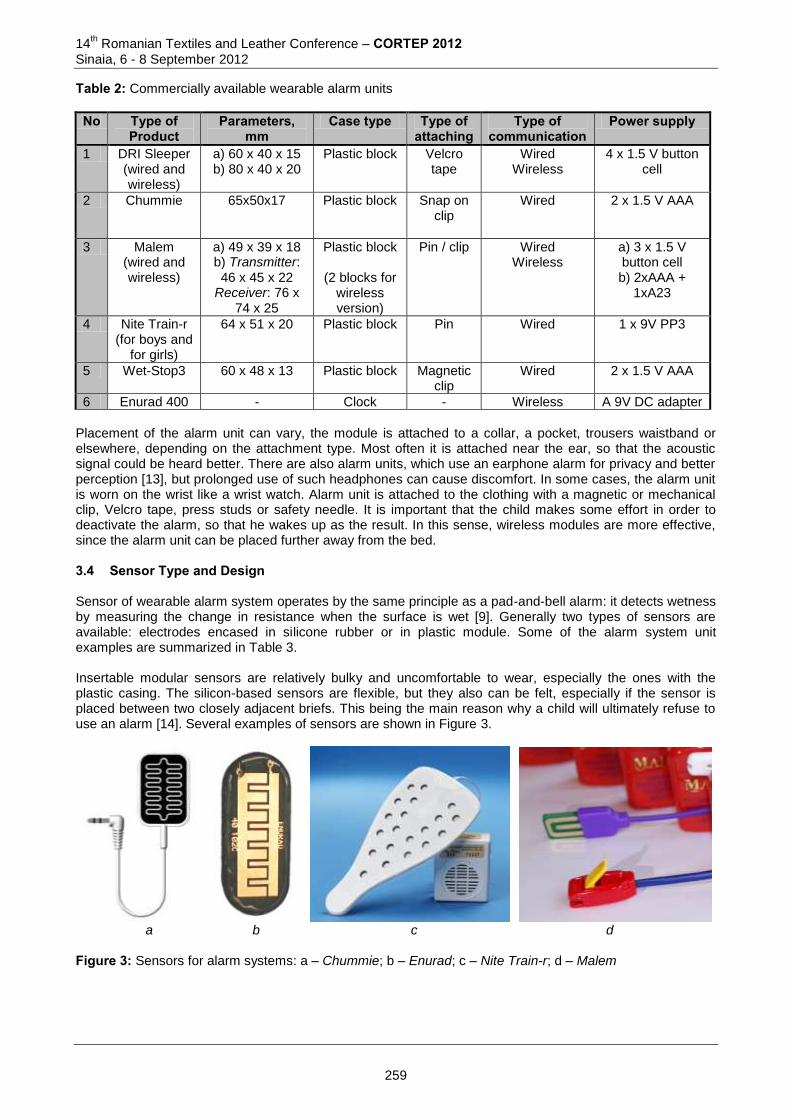
14th Romanian Textiles and Leather Conference – CORTEP 2012
Sinaia, 6 - 8 September 2012
Table 2: Commercially available wearable alarm units
No Type of Product
Parameters, mm
Case type Type of attaching
Type of communication
Power supply
1 DRI Sleeper (wired and wireless)
a) 60 x 40 x 15 b) 80 x 40 x 20
Plastic block
Velcro tape
Wired Wireless
4 x 1.5 V button cell
2 Chummie 65x50x17 Plastic block Snap on clip
Wired
2 x 1.5 V AAA
3 Malem (wired and wireless)
a) 49 x 39 x 18 b) Transmitter: 46 x 45 x 22
Receiver: 76 x 74 x 25
Plastic block
(2 blocks for wireless version)
Pin / clip
Wired Wireless
a) 3 x 1.5 V button cell b) 2xAAA +
1xA23
4 Nite Train-r (for boys and
for girls)
64 x 51 x 20
Plastic block
Pin
Wired
1 x 9V PP3
5 Wet-Stop3 60 x 48 x 13 Plastic block Magnetic clip
Wired
2 x 1.5 V AAA
6 Enurad 400 - Clock - Wireless A 9V DC adapter
Placement of the alarm unit can vary, the module is attached to a collar, a pocket, trousers waistband or elsewhere, depending on the attachment type. Most often it is attached near the ear, so that the acoustic signal could be heard better. There are also alarm units, which use an earphone alarm for privacy and better perception [13], but prolonged use of such headphones can cause discomfort. In some cases, the alarm unit is worn on the wrist like a wrist watch. Alarm unit is attached to the clothing with a magnetic or mechanical clip, Velcro tape, press studs or safety needle. It is important that the child makes some effort in order to deactivate the alarm, so that he wakes up as the result. In this sense, wireless modules are more effective, since the alarm unit can be placed further away from the bed. 3.4 Sensor Type and Design Sensor of wearable alarm system operates by the same principle as a pad-and-bell alarm: it detects wetness by measuring the change in resistance when the surface is wet [9]. Generally two types of sensors are available: electrodes encased in silicone rubber or in plastic module. Some of the alarm system unit examples are summarized in Table 3. Insertable modular sensors are relatively bulky and uncomfortable to wear, especially the ones with the plastic casing. The silicon-based sensors are flexible, but they also can be felt, especially if the sensor is placed between two closely adjacent briefs. This being the main reason why a child will ultimately refuse to use an alarm [14]. Several examples of sensors are shown in Figure 3.
a b c d
Figure 3: Sensors for alarm systems: a – Chummie; b – Enurad; c – Nite Train-r; d – Malem
259
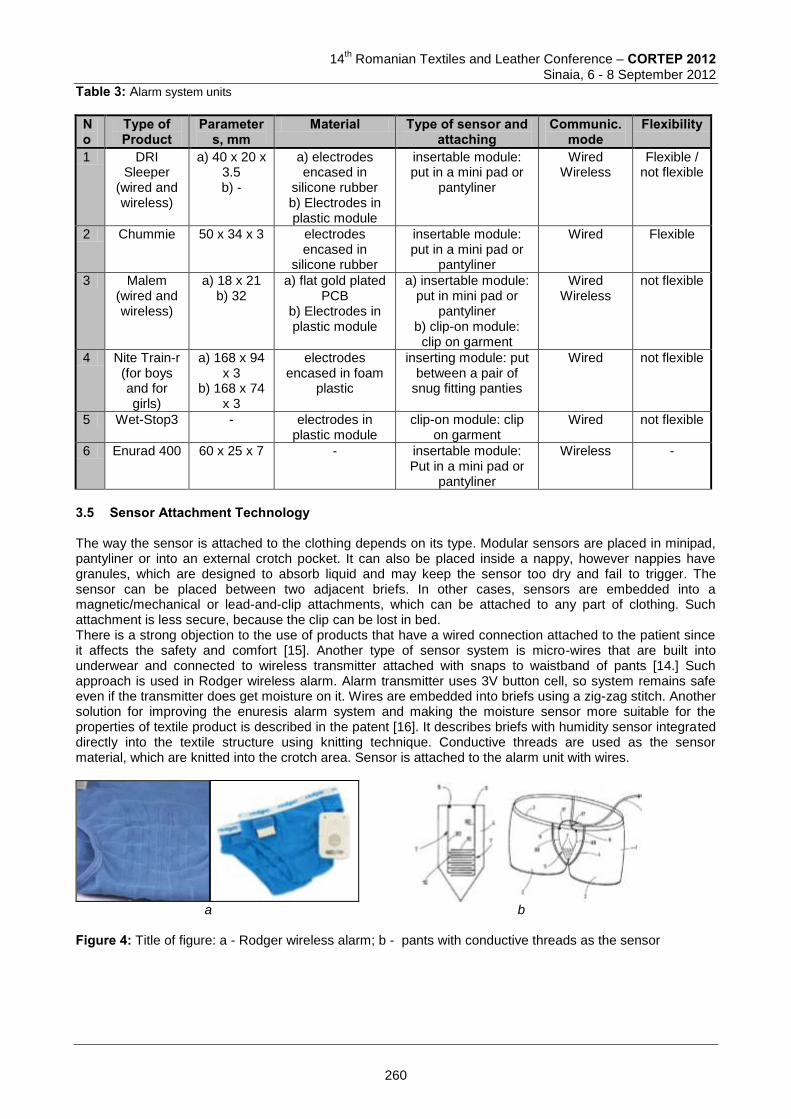
14
th Romanian Textiles and Leather Conference – CORTEP 2012
Sinaia, 6 - 8 September 2012
Table 3: Alarm system units
No
Type of Product
Parameters, mm
Material Type of sensor and attaching
Communic. mode
Flexibility
1 DRI Sleeper
(wired and wireless)
a) 40 x 20 x 3.5 b) -
a) electrodes encased in
silicone rubber b) Electrodes in plastic module
insertable module: put in a mini pad or
pantyliner
Wired Wireless
Flexible / not flexible
2 Chummie 50 x 34 x 3 electrodes encased in
silicone rubber
insertable module: put in a mini pad or
pantyliner
Wired
Flexible
3 Malem (wired and wireless)
a) 18 x 21 b) 32
a) flat gold plated PCB
b) Electrodes in plastic module
a) insertable module: put in mini pad or
pantyliner b) clip-on module: clip on garment
Wired Wireless
not flexible
4 Nite Train-r (for boys and for girls)
a) 168 x 94 x 3
b) 168 x 74 x 3
electrodes encased in foam
plastic
inserting module: put between a pair of
snug fitting panties
Wired
not flexible
5 Wet-Stop3 - electrodes in plastic module
clip-on module: clip on garment
Wired
not flexible
6 Enurad 400 60 x 25 x 7 - insertable module: Put in a mini pad or
pantyliner
Wireless -
3.5 Sensor Attachment Technology The way the sensor is attached to the clothing depends on its type. Modular sensors are placed in minipad, pantyliner or into an external crotch pocket. It can also be placed inside a nappy, however nappies have granules, which are designed to absorb liquid and may keep the sensor too dry and fail to trigger. The sensor can be placed between two adjacent briefs. In other cases, sensors are embedded into a magnetic/mechanical or lead-and-clip attachments, which can be attached to any part of clothing. Such attachment is less secure, because the clip can be lost in bed. There is a strong objection to the use of products that have a wired connection attached to the patient since it affects the safety and comfort [15]. Another type of sensor system is micro-wires that are built into underwear and connected to wireless transmitter attached with snaps to waistband of pants [14.] Such approach is used in Rodger wireless alarm. Alarm transmitter uses 3V button cell, so system remains safe even if the transmitter does get moisture on it. Wires are embedded into briefs using a zig-zag stitch. Another solution for improving the enuresis alarm system and making the moisture sensor more suitable for the properties of textile product is described in the patent [16]. It describes briefs with humidity sensor integrated directly into the textile structure using knitting technique. Conductive threads are used as the sensor material, which are knitted into the crotch area. Sensor is attached to the alarm unit with wires.
a b
Figure 4: Title of figure: a - Rodger wireless alarm; b - pants with conductive threads as the sensor
260

14th Romanian Textiles and Leather Conference – CORTEP 2012
Sinaia, 6 - 8 September 2012
4 REQUIREMENTS FOR COMFORTABLE ENURESIS ALARM SYSTEM Child's skin is very sensitive and underwear comfort is especially important. This section describes issues related to enuresis alarm systems from the comfort and safety point of view, as well as recommendations for improvement of sensor and alarm unit design. 4.1 Options for Enuresis Alarm Sensor Factors affecting the comfort of underwear are evaluated from the following aspects:
Sensorial (softness, stiffness, smoothness, roughness, prickliness, dampness, clinginess of the fabrics);
Hygienic (hygroscopicity of underwear fabrics, heat transmission, moisture management)
Motion (fitting, freedom of movements);
Aesthetic (design, quality) [17]. During the optimization of enuresis alarm systems, it is necessary to take into account these factors when choosing product materials, design technology and system layout. Below is a description of enuresis alarm system issues from the comfort and safety aspects: Sensorial. Wires are mostly stiff and inflexible, so that they reduce comfort of the product. Wires in pyjamas can psychologically affect the child, creating a reluctance or a complex towards the product, which may decrease the effectiveness of treatment, because in this case child's willingness to participate in therapy is very important. Hygienic. Increased perspiration during sleep can lead to false alarms. Moisture management of the intimate apparel is important as it helps to remove excessive wetness. Modified fibres have been applied to sportswear and underwear for perspiration absorbency [17]. Thus, sweat evaporates more quickly and accumulate less on the surface of clothing, which can reduce the likelihood of false bed-wetting alarms. After studying regulations in the area of children's sleepwear safety, it was found that no special restrictions on textile materials, which affect the hygienic properties, are defined. Several regulations were largely based on fire properties of apparel and textiles [18]. Burning characteristics of fibres show that cotton and linen fabrics are least resistant to fire, on the other hand PE, PA, silk and modacrylic fabrics are more secure [19]. Motion. If the elements attached to sleepwear are rigid and inflexible, they reduce the sleeping comfort, especially during movements. The movement also affects the reliable operation of the system – if sleep is restless, insertable or clippable sensor can detach or slip away, connecting wire may break, alarm unit can disconnect. Aesthetic. Visually the system must be as neutral as possible in order to avoid psychological discomfort or complexes. Safety. Paper [20] indicates that during the design of a secure children's clothing it is recommended to avoid using long cords that could pose a serious risk of accidents if they get stuck in nearby objects. In the existing enuresis alarm systems cables that connect trousers and pyjamas are located near child's neck, and can pose certain security risks if they get entangled during a troubled sleep [14]. On the other hand, wireless sensors have greater size (because of additional batteries and electronics), which reduces the comfort properties. Perhaps a wireless solution requires to construct a distributed system. Alarm devices that are attached with a safety needle are dangerous as well, because if they detach accidentally, they may result in a serious injury. 4.2 Options for Enuresis Alarm Sensor It is important to choose an appropriate size of the sensor – if the sensor is too small, then it may not detect the urination, but if it is too large, it may cause discomfort when it is worn [21]. The sensor must be placed in the area, which is mostly exposed to contact with the first drops of urine. Consequently, a solution that ensures greater comfort and detection efficiency is a direct sensor integration into briefs crotch area and using conductive material, which is incorporated into the fabric structure. It is possible to integrate conductive contacts or circuits into textile structure, using various non-traditional techniques, such as: printing or laminating of conductive materials, interweaving, knitting, sewing or embroidery with conductive threads. As a result it is possible to obtain a flexible sensor with characteristics of a textile product, which covers the entire area subject to wetting. When one uses conductive materials suitable for textiles (yarn or coatings), it is necessary to think about their properties – they have to be thin and durable enough and should have good electrical conductivity, as well as they should be resistant to various environmental factors (moisture, friction, bending, tension, etc.).
261
14
th Romanian Textiles and Leather Conference – CORTEP 2012
Sinaia, 6 - 8 September 2012
We propose to design sensors with embroidery technique using conductive threads. As was mentioned before, conductive threads are a preferable material for enuresis alarm sensors, since they blend with the textile structure of underwear and bedding sheet, inducing less stress on the treated person. As was found in a previous study [22], conductive threads behave differently in seams, so before their use in textile circuits it is important to determine the properties of threads. Resistance of conductive seams can be influenced of different variables: type of thread, length of stitch, number of package layers, integration method. Resistance of some samples was affected by tension, for that reason its behaviour is influenced by sewing process, which defines strain of thread in fabric. In order to assess suitability of such threads for the application envisioned, it is necessary to develop a suitable sensor configuration and to test the longevity and stability of the materials used. 4.3 Options for Enuresis Alarm Unit Enuresis alarm systems are placed inside plastic cases – some are bigger and others are smaller, although all are rigid and non-flexible. With the development of smart textiles field, now there are various solutions for flexible electronic circuits, which can be applied to the alarm unit in order to improve the system. Possible ways to improve enuresis alarm system include: development of a flexible or soft alarm module, replacing wires with textile conductive threads, integrating connectors and conductive traces into the textile material. Although certain parts of the system will inevitably remain hard – e.g. a speaker, control electronics etc., it is still possible to add a degree of freedom by placing these elements on a flexible PCB or a circuit printed with conductive ink on a flexible substrate. Further this module can be encapsulated into an elastomer to provide protection without compromising flexibility. Additional protective measures should be applied in this case so that the electronic components do not get damaged by excessive bending. On the other hand, such system is more suitable both for attaching to the garment and to the bed or lining in close proximity to the sleeping person, as it increases comfort and reduces risk of injuries. 5 CONCLUSIONS When enuresis alarm system is used in a medical therapy, child's involvement is important, so it is essential that the system is convenient and does not cause the child a psychological discomfort. Existing enuresis alarm systems use wires that connect trousers with pyjamas, which can cause a child aversion to therapy. Besides that, cables are located near child's neck and can pose certain security risks if they get entangled during a troubled sleep. In order to improve the system comfort properties, modular humidity sensor should be replaced with a textile sensor, which is embroidered with conductive threads on fabric. Conductive threads are a preferable material for enuresis alarm sensors, since they blend with the textile structure of underwear and bedding sheet, inducing less stress on the treated person. In order to assess suitability of such threads for the application envisioned, it is necessary to develop a suitable sensor configuration and to test the longevity and stability of the materials used. 6 SUMMARY Bed-wetting or nocturnal enuresis is a common issue, statistical data show that a significant number of children and youth suffer from nocturnal enuresis. There are different approaches towards the treatment of enuresis – both pharmacological methods and non-pharmacological methods. Enuresis alarm system is one of the most effective non-pharmacological treatment methods. The alarm awakens the child when bed-wetting starts, the child gets out of bed and finishes voiding in the toilet. With time a successful therapy results in a child learning to wake up by himself, when his bladder is full. Different enuresis alarm system types have been discussed in the article: pad-and-bell alarms, wearable wired alarms and wearable wireless alarms. Operation and design of all alarm types have been analysed, describing alarm unit placement and fastening techniques, sensor types and construction. The existing systems were evaluated, highlighting drawbacks and providing requirements for comfortable enuresis alarm system. Acknowledgement This work has been supported by the European Social Fund within the projects “Support for the implementation of doctoral studies at Riga Technical University” and “Establishment of interdisciplinary
262
14th Romanian Textiles and Leather Conference – CORTEP 2012
Sinaia, 6 - 8 September 2012
research groups for new functional properties of smart textiles development and integrating in innovative products” (ESF Nr 2009/0198/1DP/1.1.1.2.0./09/APIA/VIAA/148). 7 REFERENCES [1] Clinical Guideline Centre: Nocturnal enuresis - The management of bed-wetting in children and young
people. London: National Clinical Guideline Centre. 2010. Available from www.nice.org.uk accessed: 2012.04.04.
[2] Neveus T, Eggart P, Evans J et al: Evaluation of and Treatment for Monosymptomatic Enuresis: A Standardization Document From the International Children’s Continence Society, Available from http://i-c-c-s.org/pdfs/standardisation-documents/Monosympt-Enuresis.pdf, accessed 2012-04-06 accessed: 2012.03.04.
[3] Neveus T. : Nocturnal enuresis: theoretic background and practical guidelines, Pediatr. Nefrol, Vol. (26),pp. 1207-1214,ISSN 1432-198X
[4] Sempik J., Ward H., Darker J: Emotional and behavioural difficulties of children and young people at entry into care, Clin Child Psych Psychiatry. Vol 13, No. 2, pp: 221-33, ISSN 1461-7021
[5] Dr Huw T.: Nocturnal Enuresis in Children, Available from http://www.patient.co.uk/doctor/Nocturnal-Enuresis-in-Children.htm Accessed: 2012-05-24
[6] Lane Wm.; Robson M.: Name of Paper, Available from http://www.sld.cu/galerias/pdf/sitios/urologia/enuresis.pdf Accessed: 2012-05-24
[7] Dr Page A. PhD.: The Bedwetting Report, Available from http://www.dri-sleeper.com/thereport.htm Accessed: 2012-05-24
[8] Bedwetting (Nocturnal Enuresis), Available from http://www.patient.co.uk/health/Bedwetting.htm Accessed: 2012-05-18
[9] Hemani A, Huang J., Jayaprakash G. plus et.al: Disposable Mattress Cover That Detects When the Sheets Are Wet. ECE 4884/4007 Senior Design Project, 2007.
[10] Bed-Mat Sensor, Available from http://www.malem.co.uk/bedmat-sensor-p-22.html Accessed: 2012-05-02
[11] Dr Page A. PhD.: The sensor is the key, Available from http://www.dri-sleeper.com/bedwetting-alarm-sensor.htm Accessed: 2012-05-04
[12] Thiedke C.: Nocturnal Enuresis. American family physicians. Vol. 67 (2003), number 7, pp. 1499-1506. [13] Enuresis moisture alarms, Available from http://wetbuster.com/alarms.htm Accessed: 2012-05-12 [14] UK Bedwetting Alarm Supplier, Available from http://bedwettingalarm.co.uk/aboutrodger.html Accessed:
2012-05-08 [15] Biswas J., Wai A.A.P., Foo V.S.F. plus et.al: Design of a Smart Continence Management System Based
on Initial User Requirement Assessment. Smart homes and health telematics, Vol 5120 (2008), pp. 62-72, ISBN 978-3-540-69916-3.
[16] Jahn M., Wilhaus M., Von Riedheim plus et.al: Knit good with moisture sensor. Patent pub. No.: US 2011/0132040 A1.
[17] Yu W.: Achieving comfort in intimate apparel, In Improving comfort in clothing , Woodhead Publishing, ISBN:978-1-84569-539-2, Cambridge (2011), pp. 427-448
[18] Australian Competition & Consumer Commission: Children’s nightwear and paper patterns for children’s nightwear. Available from http://www.accc.gov.au/content/index.phtml/itemId/323661 Accessed: 2012-05-08
[19] Jan S.: Facts About Fabric flammability. North Central Regional Extension Publication 174. 2003. [20] Quality characterisation of apparel. Edited by Subrata Das - Oxford: Woodhead Publishing, ISBN 81
908001 3 Cambridge (2009) [21] Page A.E.: Device and apparatus for detecting moisture. Patent. Pub.No.: US 2008/0246620 A1. [22] Parkova I., Vališevskis A., Viļumsone A. et.al.: Improvements of smart garment electronic contact
system. Proceedings of CIMTEC 2012. Montecatini Terme, June 2012. Available from http://www.scientific.net
Corresponding author: Inese PARKOVA Riga Technical University, Institute of Textile Material Technologies and Design Azenes str. 14/24, LV 1048, Riga, Latvia Phone: +371 26140868; E-mail: [email protected]
263
14
th Romanian Textiles and Leather Conference – CORTEP 2012
Sinaia, 6 - 8 September 2012
Co-author(s): Aleksandrs VALIŠEVSKIS Riga Technical University, Institute of Textile Material Technologies and Design Azenes str. 14/24, LV 1048, Riga, Latvia Phone: +371 29775840 e-mail: [email protected] Andis UŽĀNS Doctoral department / Faculty of Medicine / Riga Stradins University Dzirciema iela 16, Riga, LV 1007, Latvia Phone: +371 29558821 E-mail: [email protected] Ausma VIĻUMSONE Riga Technical University, Institute of Textile Material Technologies and Design Azenes str. 14/24, LV 1048, Riga, Latvia Phone: +371 67089565; E-mail: [email protected]
264
14
th Romanian Textiles and Leather Conference – CORTEP 2012
Sinaia, 6 - 8 September 2012
THE FUZZY FRONT END PHASE OF PATIENTS’ CLOTHING DEVELOPMENT
Angela SCRIPCENCO, Irina CEBAN, Jana CÎRJA,
Victoria IVAȘCO & Violeta PLUGARU Technical University of Moldova
Abstract: To ensure a comfortable life activity of people with various diseases clothing should take into account the peculiarities of the course and treatment of disease and should be a different type of clothes than the usually used. Research aim is to increase the level of satisfaction of the sick people in hospitalization with special clothing appropriate to its condition of exploitation. In such way it is necessary to establish the submitted requirements to clothing products. Determination the conditions of exploitation for ensure the vital functions of sick persons and identification the submitted requirements to clothing was effected by sociological questionnaire which have survey all component parts of the exploitation process, as are sick persons, medical staff and relatives who are caring for the sick. The results of the questionnaire were processed by statistical analysis and determined the level of consensus of participants. Keywords: People with disabilities, comfort requirements, textiles, questionnaires, function and classification of hospital garments. 1 INTRODUCTION One of the indicators of social development is its attitude toward vulnerable people - children, old age people, sick and disabled. The problem of ensuring patient comfort is an interdisciplinary, which has deep aspect in terms of patient care by medical personnel and influence of environment. Welfare of the patient is assured of normal environmental conditions, inpatient medical care and clothing. Clothing as the object of ensuring comfort can be appreciated in terms of commodity, because it provides the normal physiological processes of the human body. Currently textile products for patients are developed as bedding textile materials using special processing, for example, antibacterial, or materials with high sorption properties. At the same time there are varieties of clothing products for people with limited movement, which is different from usual clothing by constructive functional structure adapted to the lifestyle of these people.
It should be noted that foreign researchers are actively being developed as new materials that promote the healing and functional hospital clothes, which facilitates the holding of medical procedures and manipulation in the treatment of patients [2]. In Moldova, the researches of design hospital garments almost non-existent, as the budgets of medical establishments are limited and difficult to provide decent medical assistance and medical workers' salaries.
At the same time develop the clothing products adequate to patients depending on the type and severity of disease presents a scientific problem to develop ergonomic products that will be possible to ensure the patient’s life quality, care and comfort to serve these people. 2 EXPERIMENTAL Initial process of pre-development of innovative products is defined as those activities that take place before the development of formal, well-structured new products. In fact, the initial pre-development "fuzzy front end" is the initial phase of generating ideas and developing new product concept [5]. Fuzzy front end in generally consists of three tasks: strategic planning, concept generation and, particularly, pre-technical evaluation of product design. Vague, indistinct fuzzy initial process comes from the uncertainty in technology, customer requirements, markets, resources, capabilities and limitations of the company. In this context it is important to identify customer requirements in accordance with conditions of exploitation. Study on identification requirements submitted clothing products was performed by a sociological survey (Figure 1) [3, 4]. Research aim is to Increase the level of satisfaction of the sick people in hospitalization with
265
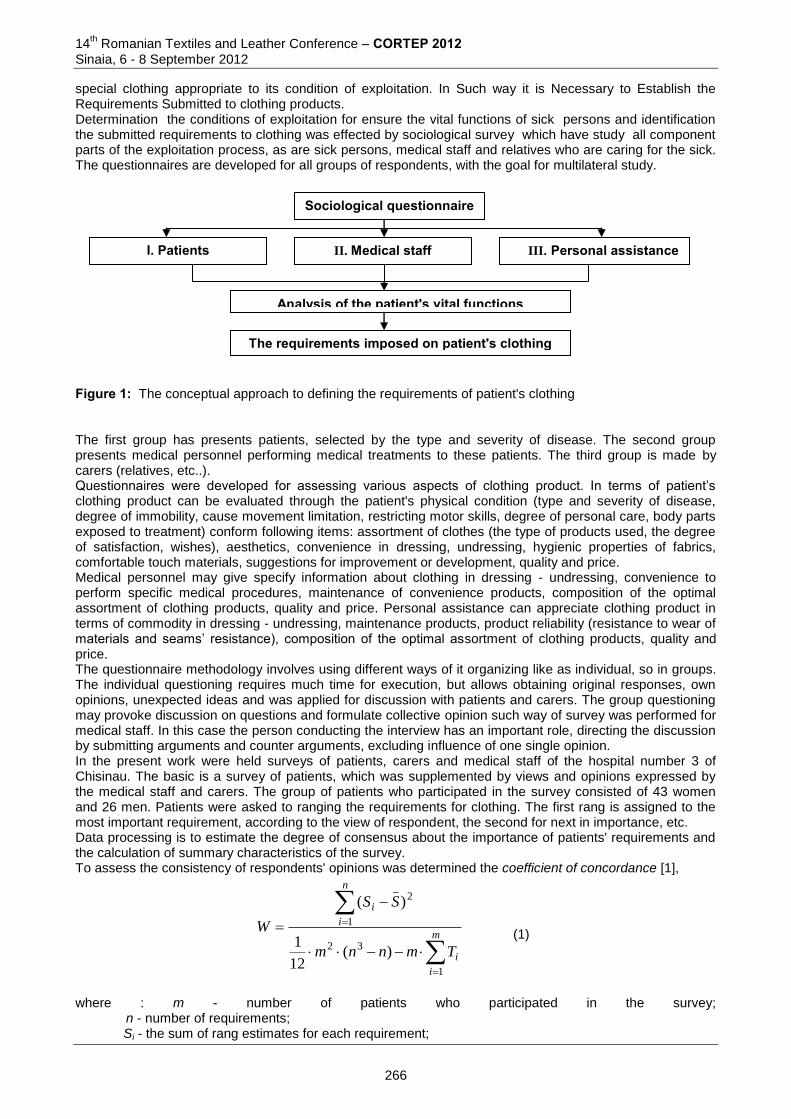
14th Romanian Textiles and Leather Conference – CORTEP 2012
Sinaia, 6 - 8 September 2012
special clothing appropriate to its condition of exploitation. In Such way it is Necessary to Establish the Requirements Submitted to clothing products. Determination the conditions of exploitation for ensure the vital functions of sick persons and identification the submitted requirements to clothing was effected by sociological survey which have study all component parts of the exploitation process, as are sick persons, medical staff and relatives who are caring for the sick. The questionnaires are developed for all groups of respondents, with the goal for multilateral study.
Figure 1: The conceptual approach to defining the requirements of patient's clothing The first group has presents patients, selected by the type and severity of disease. The second group presents medical personnel performing medical treatments to these patients. The third group is made by carers (relatives, etc..). Questionnaires were developed for assessing various aspects of clothing product. In terms of patient’s clothing product can be evaluated through the patient's physical condition (type and severity of disease, degree of immobility, cause movement limitation, restricting motor skills, degree of personal care, body parts exposed to treatment) conform following items: assortment of clothes (the type of products used, the degree of satisfaction, wishes), aesthetics, convenience in dressing, undressing, hygienic properties of fabrics, comfortable touch materials, suggestions for improvement or development, quality and price. Medical personnel may give specify information about clothing in dressing - undressing, convenience to perform specific medical procedures, maintenance of convenience products, composition of the optimal assortment of clothing products, quality and price. Personal assistance can appreciate clothing product in terms of commodity in dressing - undressing, maintenance products, product reliability (resistance to wear of materials and seams’ resistance), composition of the optimal assortment of clothing products, quality and price. The questionnaire methodology involves using different ways of it organizing like as individual, so in groups. The individual questioning requires much time for execution, but allows obtaining original responses, own opinions, unexpected ideas and was applied for discussion with patients and carers. The group questioning may provoke discussion on questions and formulate collective opinion such way of survey was performed for medical staff. In this case the person conducting the interview has an important role, directing the discussion by submitting arguments and counter arguments, excluding influence of one single opinion. In the present work were held surveys of patients, carers and medical staff of the hospital number 3 of Chisinau. The basic is a survey of patients, which was supplemented by views and opinions expressed by the medical staff and carers. The group of patients who participated in the survey consisted of 43 women and 26 men. Patients were asked to ranging the requirements for clothing. The first rang is assigned to the most important requirement, according to the view of respondent, the second for next in importance, etc. Data processing is to estimate the degree of consensus about the importance of patients' requirements and the calculation of summary characteristics of the survey. To assess the consistency of respondents' opinions was determined the coefficient of concordance [1],
m
i
i
n
i
i
Tmnnm
SS
W
1
32
1
2_
)(12
1
)(
(1)
where : m - number of patients who participated in the survey; n - number of requirements; Si - the sum of rang estimates for each requirement;
Sociological questionnaire
I. Patients
II. Medical staff
III. Personal assistance
Analysis of the patient's vital functions
The requirements imposed on patient's clothing
266
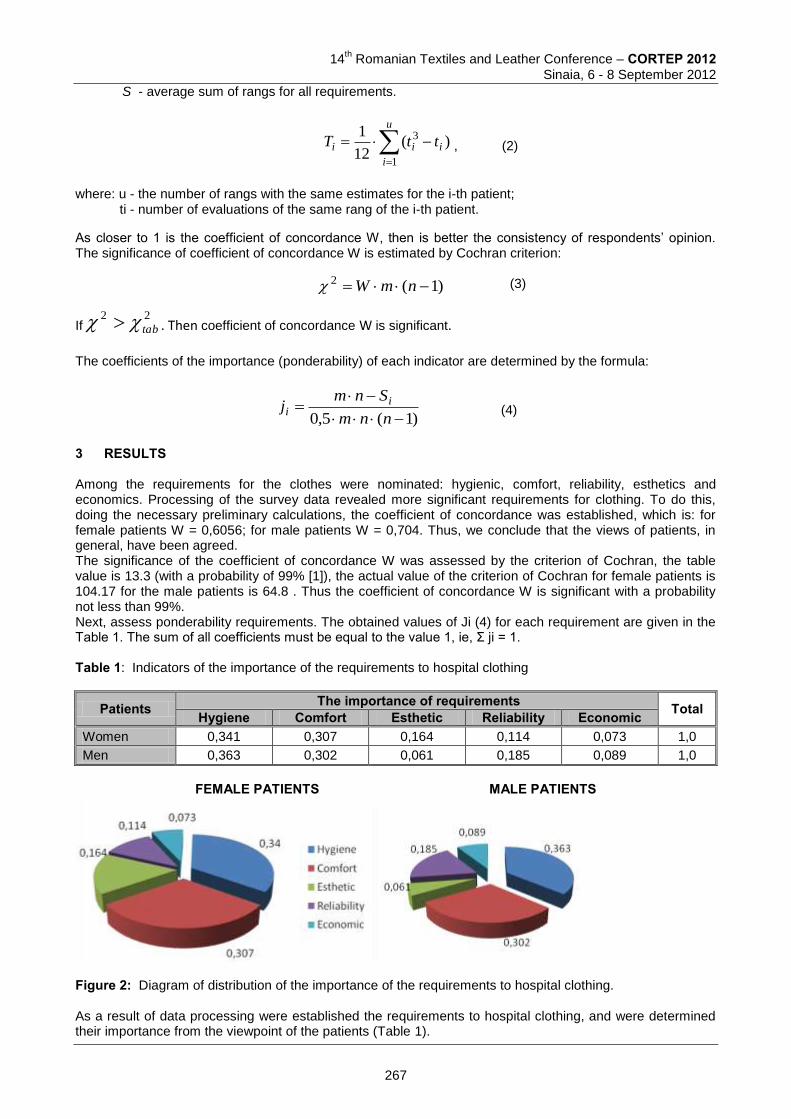
14
th Romanian Textiles and Leather Conference – CORTEP 2012
Sinaia, 6 - 8 September 2012
S - average sum of rangs for all requirements.
)(12
1
1
3
u
i
iii ttT , (2)
where: u - the number of rangs with the same estimates for the i-th patient; ti - number of evaluations of the same rang of the i-th patient.
As closer to 1 is the coefficient of concordance W, then is better the consistency of respondents’ opinion. The significance of coefficient of concordance W is estimated by Cochran criterion:
(3)
If22
tab . Then coefficient of concordance W is significant.
The coefficients of the importance (ponderability) of each indicator are determined by the formula:
)1(5,0
nnm
Snmj ii (4)
3 RESULTS Among the requirements for the clothes were nominated: hygienic, comfort, reliability, esthetics and economics. Processing of the survey data revealed more significant requirements for clothing. To do this, doing the necessary preliminary calculations, the coefficient of concordance was established, which is: for female patients W = 0,6056; for male patients W = 0,704. Thus, we conclude that the views of patients, in general, have been agreed. The significance of the coefficient of concordance W was assessed by the criterion of Cochran, the table value is 13.3 (with a probability of 99% [1]), the actual value of the criterion of Cochran for female patients is 104.17 for the male patients is 64.8 . Thus the coefficient of concordance W is significant with a probability not less than 99%. Next, assess ponderability requirements. The obtained values of Ji (4) for each requirement are given in the Table 1. The sum of all coefficients must be equal to the value 1, ie, Σ ji = 1. Table 1: Indicators of the importance of the requirements to hospital clothing
Patients The importance of requirements Total Hygiene Comfort Esthetic Reliability Economic Women 0,341 0,307 0,164 0,114 0,073 1,0
Men 0,363 0,302 0,061 0,185 0,089 1,0
FEMALE PATIENTS MALE PATIENTS
Figure 2: Diagram of distribution of the importance of the requirements to hospital clothing. As a result of data processing were established the requirements to hospital clothing, and were determined their importance from the viewpoint of the patients (Table 1).
)1(2 nmW
267

14th Romanian Textiles and Leather Conference – CORTEP 2012
Sinaia, 6 - 8 September 2012
4 DISCUSSION When ranking the requirements for hospital clothes, the most significant were determined as hygienic and comfort of clothing that meets the ergonomic requirements for hospital garments. The high ergonomic qualities provide comfort to the patient and medical staff for carry out various medical procedures. The least significant indicator is the cost of clothing. Among the requirements of esthetics and reliability the men' and women ' opinions are differed: women consider the appearance of clothing is more important, men prefer more reliable. Analysis of exploitation conditions of hospital cloths allowed developing a framework of requirements for hospital clothes, which is presented in Table 2. Table 2: Requirements for patient's clothing
Requirements Purpose Means to achieve the aim
Protective Protecting patients from exposure to biological agents
using of materials with antiseptic, antibacterial properties; minimal division of forms; reducing the number of stitches
Ergonomic: -hygienic
Providing comfort apparel climate and temperature
using materials with the following properties: thermal conductivity; air permeability; hygroscopicity; moisture conductivity
-anthropometric Conformity of the product with the size, shape, body proportions of the figure, the ease of dressing, undressing
selection of an optimal design solution (form, cut, silhouette, optimal gain on the encirclement freedom, the length of the product, the length of the sleeves);
weight of the product (up to 10% of body weight); an optional structural elements (slots, zipper, pockets); the presence of additional components (hood, gloves,
blankets for damaged limbs)
-psycho-physio-logical
Excluding the negative impact of clothing on the patient's body
the use of thin, light and soft materials; design and location of stitches and zippers; use of the textile structure with minimum area of
supporting surface; use of materials with the effect of massage
Exploitation Wear resistance durability; ease of care and washing; resistance to high temperatures for disinfection; stability of the linear dimensions; color stability to repeated washing and disinfection
Esthetical The relevance and universality, hide physical defects
comfortable color solution; compliance with fashion trends; visual accent of the healthy body zone
Economics Reasonable price, the minimum cost to keep appearance of a product
the cost of material; material capacity; standardization and unification; price of the product; costs of exploitation of the product
Having determined the basic groups of the requirements for clothing for patients, it is possible to develop a framework for quality of materials used for this type of clothing. Nomenclature of quality indices makes it possible to assess compliance with the requirements of selected materials. And also take into account the requirements for materials at the stage of material selection in designing new products.
Thus, to the requirements for materials for hospital clothing has been developed nomenclature of quality indicators (figure 3).
Analysis of exploitation conditions patient's clothing allowed to develop a classification of hospital garments used by patients in a medical institution, depending on the severity of the disease. Thus, we consider three groups of patients with complete, partial and minimal immobility, which is a consequence of illness, injury or
268
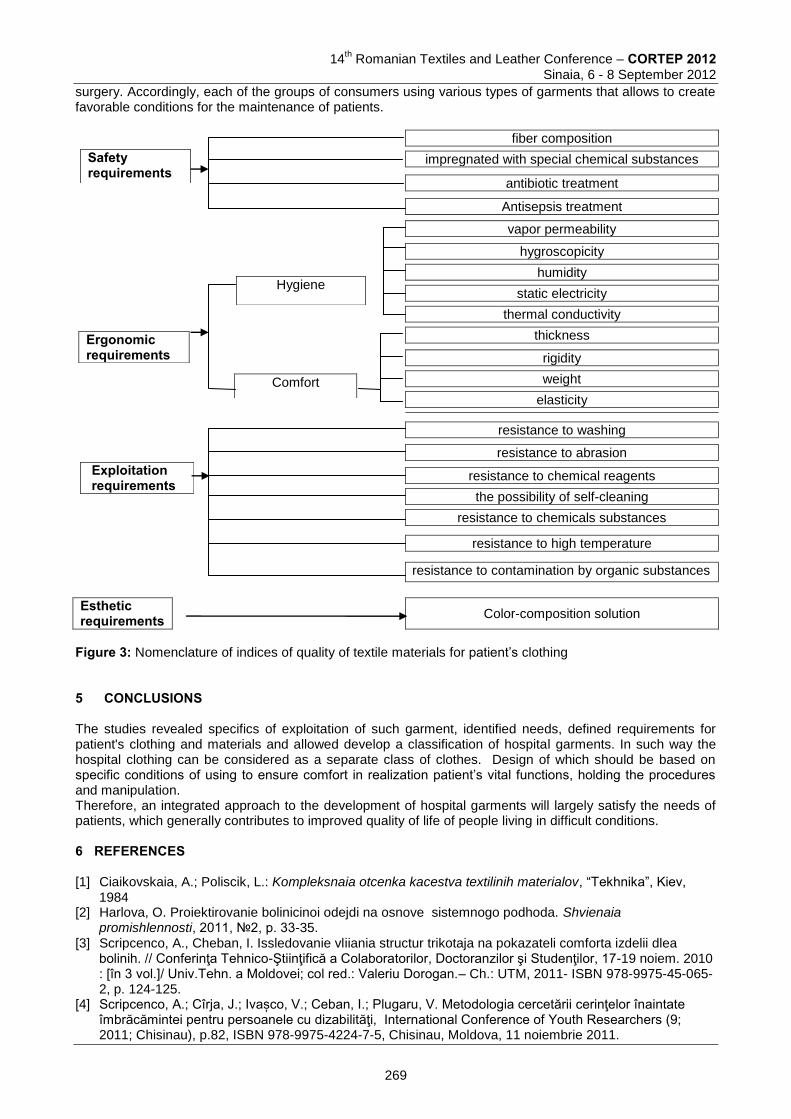
14
th Romanian Textiles and Leather Conference – CORTEP 2012
Sinaia, 6 - 8 September 2012
surgery. Accordingly, each of the groups of consumers using various types of garments that allows to create favorable conditions for the maintenance of patients.
Safety requirements
Ergonomic requirements
Hygiene
Comfort
fiber composition
impregnated with special chemical substances
antibiotic treatment
Antisepsis treatment
vapor permeability
hygroscopicity
humidity
static electricity
thermal conductivity
thickness
rigidity
weight
elasticity
Exploitation requirements
resistance to washing
resistance to abrasion
resistance to chemical reagents
the possibility of self-cleaning
resistance to chemicals substances
resistance to high temperature
resistance to contamination by organic substances
Esthetic requirements
Color-composition solution
Figure 3: Nomenclature of indices of quality of textile materials for patient’s clothing 5 CONCLUSIONS The studies revealed specifics of exploitation of such garment, identified needs, defined requirements for patient's clothing and materials and allowed develop a classification of hospital garments. In such way the hospital clothing can be considered as a separate class of clothes. Design of which should be based on specific conditions of using to ensure comfort in realization patient’s vital functions, holding the procedures and manipulation. Therefore, an integrated approach to the development of hospital garments will largely satisfy the needs of patients, which generally contributes to improved quality of life of people living in difficult conditions. 6 REFERENCES [1] Ciaikovskaia, A.; Poliscik, L.: Kompleksnaia otcenka kacestva textilinih materialov, “Tekhnika”, Kiev,
1984 [2] Harlova, O. Proiektirovanie bolinicinoi odejdi na osnove sistemnogo podhoda. Shvienaia
promishlennosti, 2011, 2, p. 33-35. [3] Scripcenco, A., Cheban, I. Issledovanie vliiania structur trikotaja na pokazateli comforta izdelii dlea
bolinih. // Соnferinţa Tehnico-Ştiinţifică a Colaboratorilor, Doctoranzilor şi Studenţilor, 17-19 noiem. 2010 : [în 3 vol.]/ Univ.Tehn. a Moldovei; col red.: Valeriu Dorogan.– Ch.: UTM, 2011- ISBN 978-9975-45-065-2, p. 124-125.
[4] Scripcenco, A.; Cîrja, J.; Ivașco, V.; Ceban, I.; Plugaru, V. Metodologia cercetării cerinţelor înaintate îmbrăcămintei pentru persoanele cu dizabilităţi, International Conference of Youth Researchers (9; 2011; Chisinau), p.82, ISBN 978-9975-4224-7-5, Chisinau, Moldova, 11 noiembrie 2011.
269
14th Romanian Textiles and Leather Conference – CORTEP 2012
Sinaia, 6 - 8 September 2012
[5] http://ro.wikipedia.org/wiki/Procesul_initial_de_pre-dezvoltare_a_produselor
Corresponding author: Angela SCRIPCENCO,PhD Department of Clothes and Knitwear Technology, Head of Departament Faculty of Textile Industry, Technical University of Moldova Bd. Stefan cel Mare, 168 MD 2004, Chișinău, R.Moldova Phone:373-022-32-95-75; E-mail [email protected]
Co-authors: Irina CEBAN, Master engineer Department of Clothes and Knitwear Technology, Assistant prof. Faculty of Textile Industry , Technical University of Moldova Bd. Stefan cel Mare, 168 MD 2004, Chișinău, R.Moldova Phone: 373-022-32-95-75; E-mail: [email protected] Jana CÎRJA, PhD Department of Clothes and Knitwear Technology, Assistant prof. Faculty Textile Industry, Technical University of Moldova Bd. Stefan cel Mare, 168 MD 2004, Chișinău, R.Moldova Phone: 373-022-32-95-75; E-mail: [email protected] Victoria IVAȘCO, Master engineer Department of Clothes and Knitwear Technology, Assistant prof. Faculty Textile Industry, Technical University of Moldova Bd. Stefan cel Mare, 168 MD 2004, Chișinău, R.Moldova Phone: 373-022-32-95-75; E-mail: [email protected] Violeta PLUGARU, Master engineer Department of Clothes and Knitwear Technology, Engineer Faculty Textile Industry, Technical University of Moldova Bd. Stefan cel Mare, 168 MD 2004, Chișinău, R.Moldova Phone: 373-022-32-95-75; E-mail: [email protected]
270
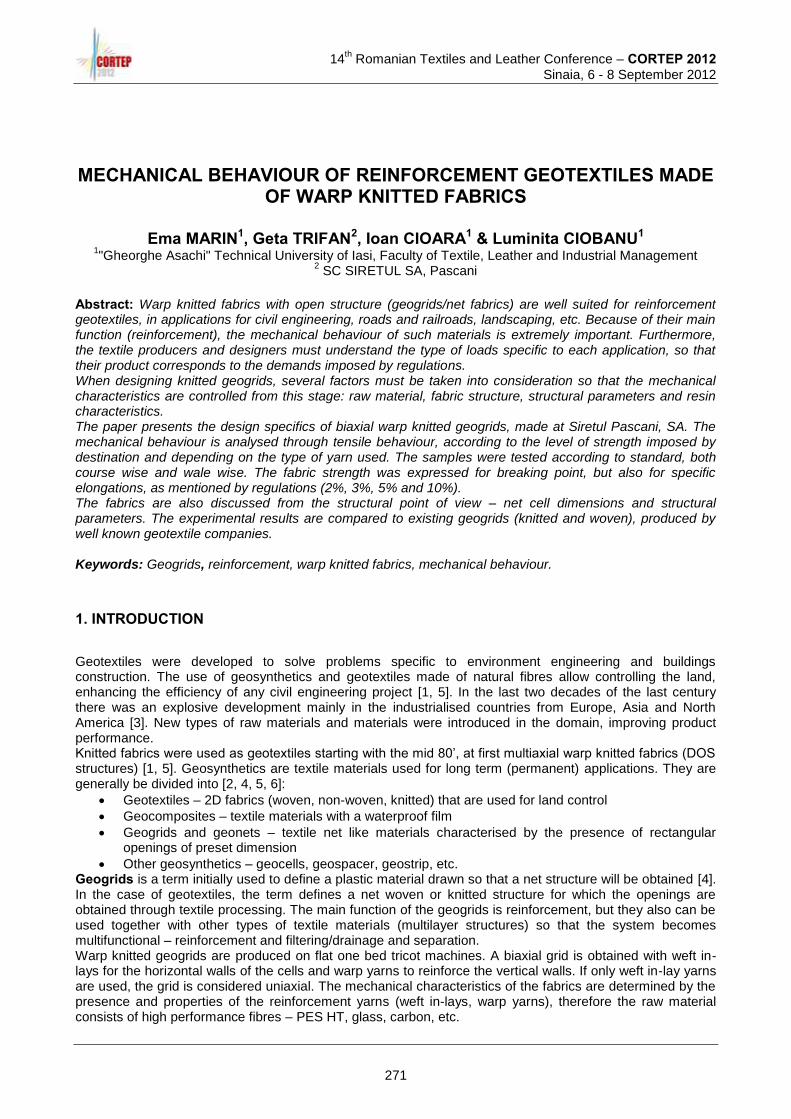
14
th Romanian Textiles and Leather Conference – CORTEP 2012
Sinaia, 6 - 8 September 2012
MECHANICAL BEHAVIOUR OF REINFORCEMENT GEOTEXTILES MADE OF WARP KNITTED FABRICS
Ema MARIN1, Geta TRIFAN2, Ioan CIOARA1 & Luminita CIOBANU1
1"Gheorghe Asachi" Technical University of Iasi, Faculty of Textile, Leather and Industrial Management
2 SC SIRETUL SA, Pascani
Abstract: Warp knitted fabrics with open structure (geogrids/net fabrics) are well suited for reinforcement geotextiles, in applications for civil engineering, roads and railroads, landscaping, etc. Because of their main function (reinforcement), the mechanical behaviour of such materials is extremely important. Furthermore, the textile producers and designers must understand the type of loads specific to each application, so that their product corresponds to the demands imposed by regulations. When designing knitted geogrids, several factors must be taken into consideration so that the mechanical characteristics are controlled from this stage: raw material, fabric structure, structural parameters and resin characteristics. The paper presents the design specifics of biaxial warp knitted geogrids, made at Siretul Pascani, SA. The mechanical behaviour is analysed through tensile behaviour, according to the level of strength imposed by destination and depending on the type of yarn used. The samples were tested according to standard, both course wise and wale wise. The fabric strength was expressed for breaking point, but also for specific elongations, as mentioned by regulations (2%, 3%, 5% and 10%). The fabrics are also discussed from the structural point of view – net cell dimensions and structural parameters. The experimental results are compared to existing geogrids (knitted and woven), produced by well known geotextile companies. Keywords: Geogrids, reinforcement, warp knitted fabrics, mechanical behaviour.
1. INTRODUCTION
Geotextiles were developed to solve problems specific to environment engineering and buildings construction. The use of geosynthetics and geotextiles made of natural fibres allow controlling the land, enhancing the efficiency of any civil engineering project [1, 5]. In the last two decades of the last century there was an explosive development mainly in the industrialised countries from Europe, Asia and North America [3]. New types of raw materials and materials were introduced in the domain, improving product performance. Knitted fabrics were used as geotextiles starting with the mid 80’, at first multiaxial warp knitted fabrics (DOS structures) [1, 5]. Geosynthetics are textile materials used for long term (permanent) applications. They are generally be divided into [2, 4, 5, 6]:
Geotextiles – 2D fabrics (woven, non-woven, knitted) that are used for land control
Geocomposites – textile materials with a waterproof film
Geogrids and geonets – textile net like materials characterised by the presence of rectangular openings of preset dimension
Other geosynthetics – geocells, geospacer, geostrip, etc. Geogrids is a term initially used to define a plastic material drawn so that a net structure will be obtained [4]. In the case of geotextiles, the term defines a net woven or knitted structure for which the openings are obtained through textile processing. The main function of the geogrids is reinforcement, but they also can be used together with other types of textile materials (multilayer structures) so that the system becomes multifunctional – reinforcement and filtering/drainage and separation. Warp knitted geogrids are produced on flat one bed tricot machines. A biaxial grid is obtained with weft in-lays for the horizontal walls of the cells and warp yarns to reinforce the vertical walls. If only weft in-lay yarns are used, the grid is considered uniaxial. The mechanical characteristics of the fabrics are determined by the presence and properties of the reinforcement yarns (weft in-lays, warp yarns), therefore the raw material consists of high performance fibres – PES HT, glass, carbon, etc.
271
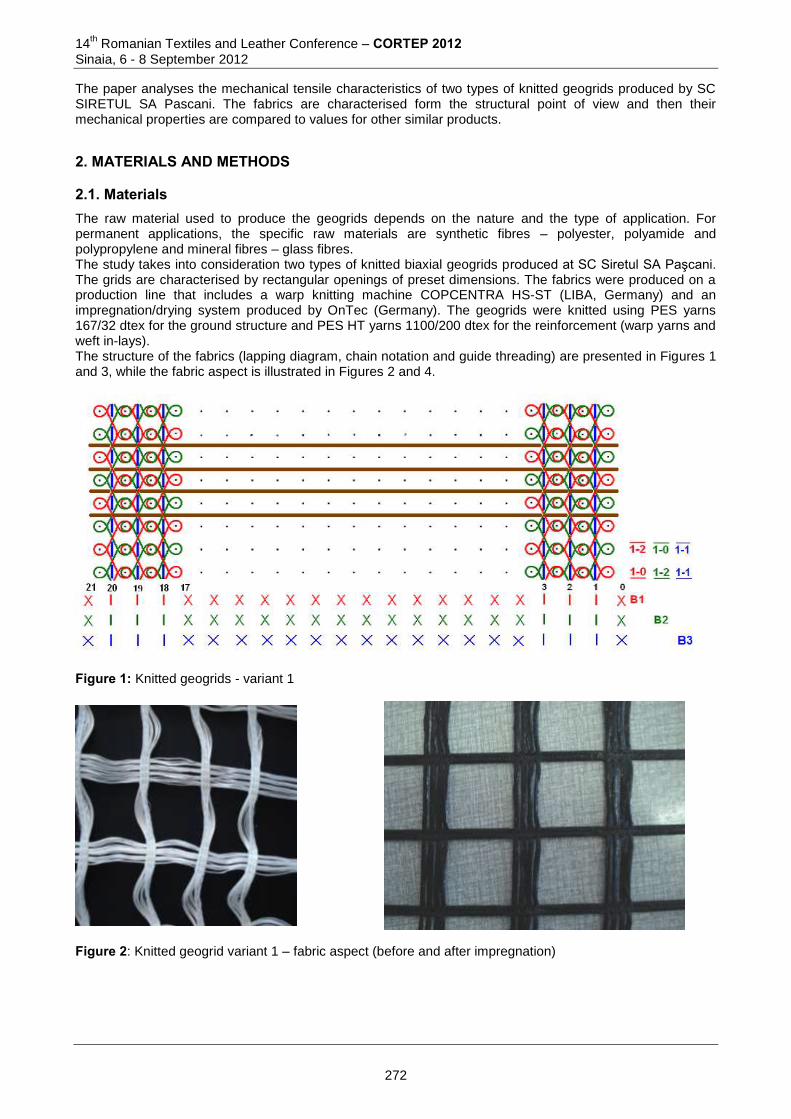
14th Romanian Textiles and Leather Conference – CORTEP 2012
Sinaia, 6 - 8 September 2012
The paper analyses the mechanical tensile characteristics of two types of knitted geogrids produced by SC SIRETUL SA Pascani. The fabrics are characterised form the structural point of view and then their mechanical properties are compared to values for other similar products.
2. MATERIALS AND METHODS
2.1. Materials The raw material used to produce the geogrids depends on the nature and the type of application. For permanent applications, the specific raw materials are synthetic fibres – polyester, polyamide and polypropylene and mineral fibres – glass fibres. The study takes into consideration two types of knitted biaxial geogrids produced at SC Siretul SA Paşcani. The grids are characterised by rectangular openings of preset dimensions. The fabrics were produced on a production line that includes a warp knitting machine COPCENTRA HS-ST (LIBA, Germany) and an impregnation/drying system produced by OnTec (Germany). The geogrids were knitted using PES yarns 167/32 dtex for the ground structure and PES HT yarns 1100/200 dtex for the reinforcement (warp yarns and weft in-lays). The structure of the fabrics (lapping diagram, chain notation and guide threading) are presented in Figures 1 and 3, while the fabric aspect is illustrated in Figures 2 and 4.
Figure 1: Knitted geogrids - variant 1
Figure 2: Knitted geogrid variant 1 – fabric aspect (before and after impregnation)
272
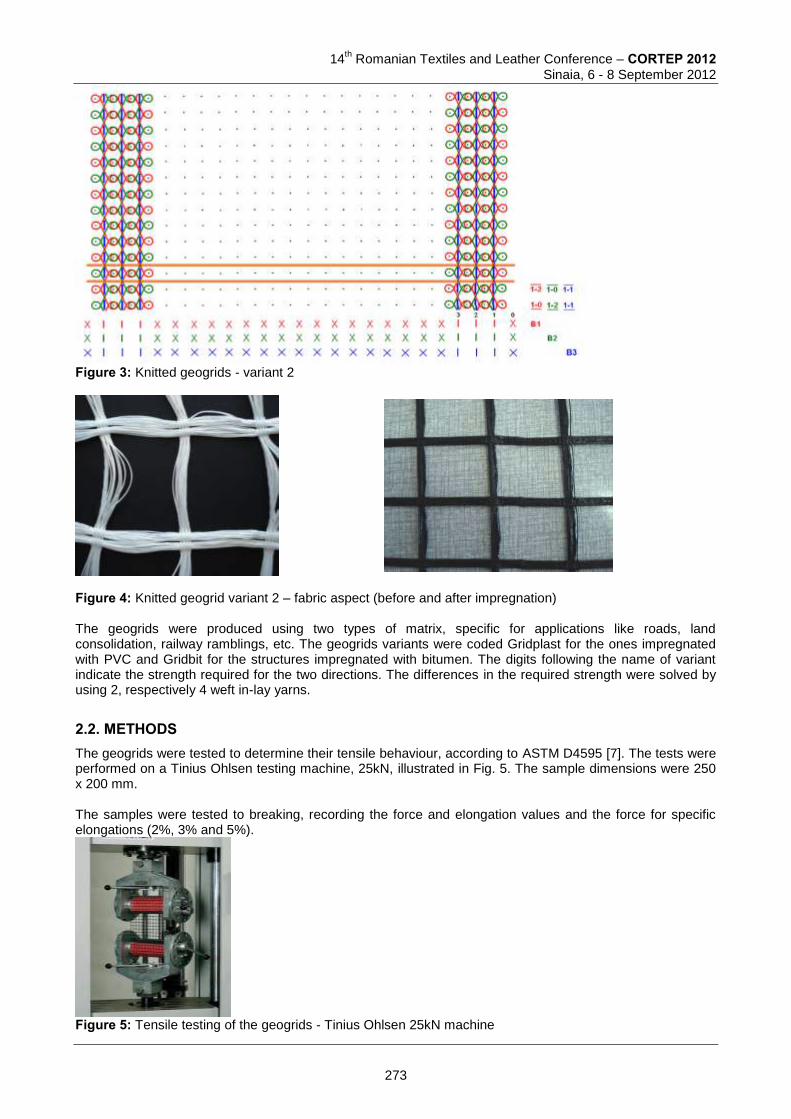
14
th Romanian Textiles and Leather Conference – CORTEP 2012
Sinaia, 6 - 8 September 2012
Figure 3: Knitted geogrids - variant 2
Figure 4: Knitted geogrid variant 2 – fabric aspect (before and after impregnation) The geogrids were produced using two types of matrix, specific for applications like roads, land consolidation, railway ramblings, etc. The geogrids variants were coded Gridplast for the ones impregnated with PVC and Gridbit for the structures impregnated with bitumen. The digits following the name of variant indicate the strength required for the two directions. The differences in the required strength were solved by using 2, respectively 4 weft in-lay yarns.
2.2. METHODS The geogrids were tested to determine their tensile behaviour, according to ASTM D4595 [7]. The tests were performed on a Tinius Ohlsen testing machine, 25kN, illustrated in Fig. 5. The sample dimensions were 250 x 200 mm. The samples were tested to breaking, recording the force and elongation values and the force for specific elongations (2%, 3% and 5%).
Figure 5: Tensile testing of the geogrids - Tinius Ohlsen 25kN machine
273
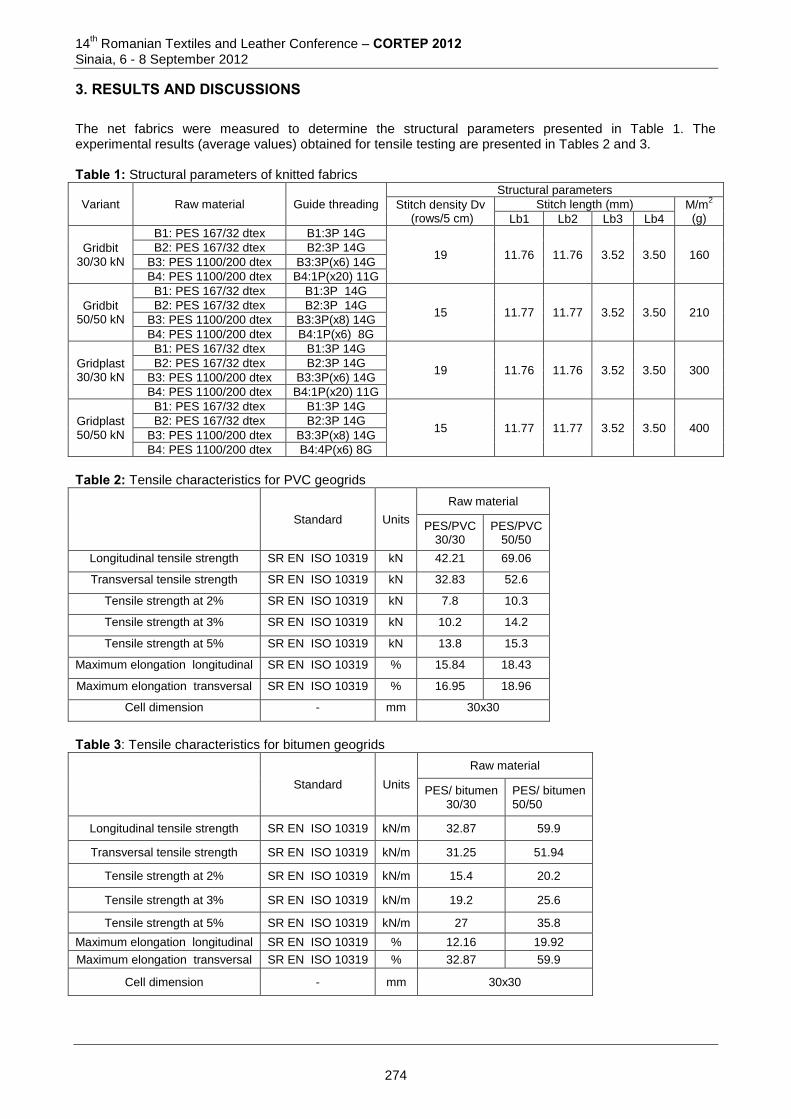
14th Romanian Textiles and Leather Conference – CORTEP 2012
Sinaia, 6 - 8 September 2012
3. RESULTS AND DISCUSSIONS The net fabrics were measured to determine the structural parameters presented in Table 1. The experimental results (average values) obtained for tensile testing are presented in Tables 2 and 3. Table 1: Structural parameters of knitted fabrics
Variant Raw material Guide threading
Structural parameters
Stitch density Dv (rows/5 cm)
Stitch length (mm) M/m2
(g) Lb1 Lb2 Lb3 Lb4
Gridbit 30/30 kN
B1: PES 167/32 dtex B1:3P 14G
19 11.76 11.76 3.52 3.50 160 B2: PES 167/32 dtex B2:3P 14G
B3: PES 1100/200 dtex B3:3P(x6) 14G
B4: PES 1100/200 dtex B4:1P(x20) 11G
Gridbit 50/50 kN
B1: PES 167/32 dtex B1:3P 14G
15 11.77 11.77 3.52 3.50 210 B2: PES 167/32 dtex B2:3P 14G
B3: PES 1100/200 dtex B3:3P(x8) 14G
B4: PES 1100/200 dtex B4:1P(x6) 8G
Gridplast 30/30 kN
B1: PES 167/32 dtex B1:3P 14G
19 11.76 11.76 3.52 3.50 300 B2: PES 167/32 dtex B2:3P 14G
B3: PES 1100/200 dtex B3:3P(x6) 14G
B4: PES 1100/200 dtex B4:1P(x20) 11G
Gridplast 50/50 kN
B1: PES 167/32 dtex B1:3P 14G
15 11.77 11.77 3.52 3.50 400 B2: PES 167/32 dtex B2:3P 14G
B3: PES 1100/200 dtex B3:3P(x8) 14G
B4: PES 1100/200 dtex B4:4P(x6) 8G
Table 2: Tensile characteristics for PVC geogrids
Standard Units
Raw material
PES/PVC 30/30
PES/PVC 50/50
Longitudinal tensile strength SR EN ISO 10319 kN 42.21 69.06
Transversal tensile strength SR EN ISO 10319 kN 32.83 52.6
Tensile strength at 2% SR EN ISO 10319 kN 7.8 10.3
Tensile strength at 3% SR EN ISO 10319 kN 10.2 14.2
Tensile strength at 5% SR EN ISO 10319 kN 13.8 15.3
Maximum elongation longitudinal SR EN ISO 10319 % 15.84 18.43
Maximum elongation transversal SR EN ISO 10319 % 16.95 18.96
Cell dimension - mm 30x30
Table 3: Tensile characteristics for bitumen geogrids
Standard Units
Raw material
PES/ bitumen 30/30
PES/ bitumen 50/50
Longitudinal tensile strength SR EN ISO 10319 kN/m 32.87 59.9
Transversal tensile strength SR EN ISO 10319 kN/m 31.25 51.94
Tensile strength at 2% SR EN ISO 10319 kN/m 15.4 20.2
Tensile strength at 3% SR EN ISO 10319 kN/m 19.2 25.6
Tensile strength at 5% SR EN ISO 10319 kN/m 27 35.8
Maximum elongation longitudinal SR EN ISO 10319 % 12.16 19.92
Maximum elongation transversal SR EN ISO 10319 % 32.87 59.9
Cell dimension - mm 30x30
274
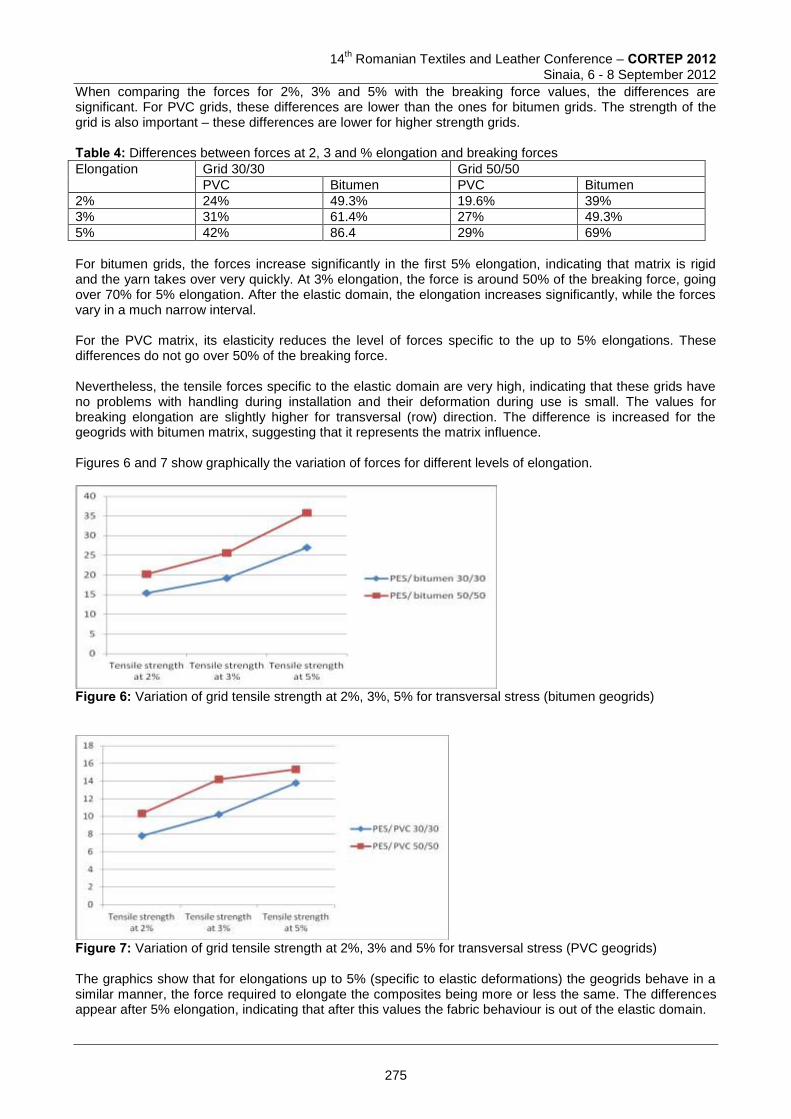
14
th Romanian Textiles and Leather Conference – CORTEP 2012
Sinaia, 6 - 8 September 2012
When comparing the forces for 2%, 3% and 5% with the breaking force values, the differences are significant. For PVC grids, these differences are lower than the ones for bitumen grids. The strength of the grid is also important – these differences are lower for higher strength grids. Table 4: Differences between forces at 2, 3 and % elongation and breaking forces
Elongation Grid 30/30 Grid 50/50
PVC Bitumen PVC Bitumen
2% 24% 49.3% 19.6% 39%
3% 31% 61.4% 27% 49.3%
5% 42% 86.4 29% 69%
For bitumen grids, the forces increase significantly in the first 5% elongation, indicating that matrix is rigid and the yarn takes over very quickly. At 3% elongation, the force is around 50% of the breaking force, going over 70% for 5% elongation. After the elastic domain, the elongation increases significantly, while the forces vary in a much narrow interval. For the PVC matrix, its elasticity reduces the level of forces specific to the up to 5% elongations. These differences do not go over 50% of the breaking force. Nevertheless, the tensile forces specific to the elastic domain are very high, indicating that these grids have no problems with handling during installation and their deformation during use is small. The values for breaking elongation are slightly higher for transversal (row) direction. The difference is increased for the geogrids with bitumen matrix, suggesting that it represents the matrix influence. Figures 6 and 7 show graphically the variation of forces for different levels of elongation.
Figure 6: Variation of grid tensile strength at 2%, 3%, 5% for transversal stress (bitumen geogrids)
Figure 7: Variation of grid tensile strength at 2%, 3% and 5% for transversal stress (PVC geogrids) The graphics show that for elongations up to 5% (specific to elastic deformations) the geogrids behave in a similar manner, the force required to elongate the composites being more or less the same. The differences appear after 5% elongation, indicating that after this values the fabric behaviour is out of the elastic domain.
275
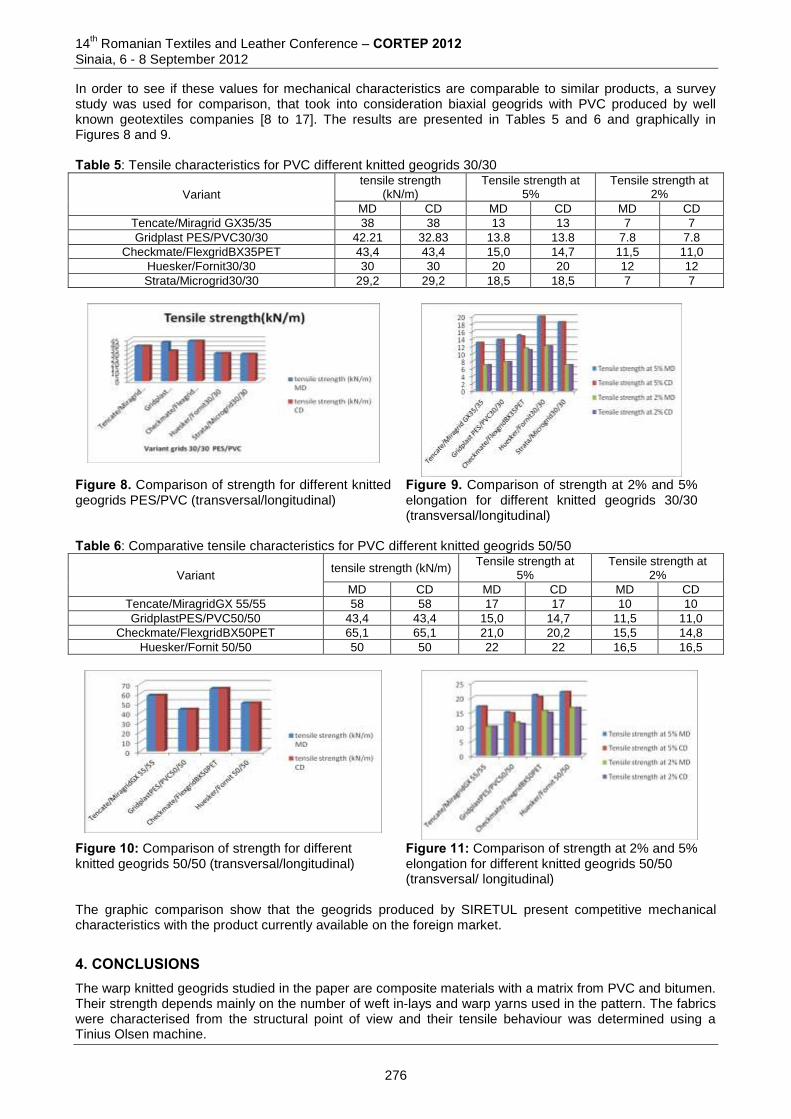
14th Romanian Textiles and Leather Conference – CORTEP 2012
Sinaia, 6 - 8 September 2012
In order to see if these values for mechanical characteristics are comparable to similar products, a survey study was used for comparison, that took into consideration biaxial geogrids with PVC produced by well known geotextiles companies [8 to 17]. The results are presented in Tables 5 and 6 and graphically in Figures 8 and 9. Table 5: Tensile characteristics for PVC different knitted geogrids 30/30
Variant
tensile strength (kN/m)
Tensile strength at 5%
Tensile strength at 2%
MD CD MD CD MD CD
Tencate/Miragrid GX35/35 38 38 13 13 7 7
Gridplast PES/PVC30/30 42.21 32.83 13.8 13.8 7.8 7.8
Checkmate/FlexgridBX35PET 43,4 43,4 15,0 14,7 11,5 11,0
Huesker/Fornit30/30 30 30 20 20 12 12
Strata/Microgrid30/30 29,2 29,2 18,5 18,5 7 7
Figure 8. Comparison of strength for different knitted geogrids PES/PVC (transversal/longitudinal)
Figure 9. Comparison of strength at 2% and 5% elongation for different knitted geogrids 30/30 (transversal/longitudinal)
Table 6: Comparative tensile characteristics for PVC different knitted geogrids 50/50
Variant tensile strength (kN/m)
Tensile strength at 5%
Tensile strength at 2%
MD CD MD CD MD CD
Tencate/MiragridGX 55/55 58 58 17 17 10 10
GridplastPES/PVC50/50 43,4 43,4 15,0 14,7 11,5 11,0
Checkmate/FlexgridBX50PET 65,1 65,1 21,0 20,2 15,5 14,8
Huesker/Fornit 50/50 50 50 22 22 16,5 16,5
Figure 10: Comparison of strength for different knitted geogrids 50/50 (transversal/longitudinal)
Figure 11: Comparison of strength at 2% and 5% elongation for different knitted geogrids 50/50 (transversal/ longitudinal)
The graphic comparison show that the geogrids produced by SIRETUL present competitive mechanical characteristics with the product currently available on the foreign market.
4. CONCLUSIONS The warp knitted geogrids studied in the paper are composite materials with a matrix from PVC and bitumen. Their strength depends mainly on the number of weft in-lays and warp yarns used in the pattern. The fabrics were characterised from the structural point of view and their tensile behaviour was determined using a Tinius Olsen machine.
276
14
th Romanian Textiles and Leather Conference – CORTEP 2012
Sinaia, 6 - 8 September 2012
The results show that the variation of forces is similar for the two types of composites for elongations up to 5% elongation, suggesting that they have similar behaviour in the elastic domain. The forces increase significantly up to 5% elongation, the type of matrix having a strong influence. For the bitumen grids, the force level at 5% elongation is 86%, respectively 69% of the breaking force. The grids with higher strength (50/50) present lower levels for the forces in the elastic domain. The influence of the matrix is also emphasised when analysing the differences in elongation at breaking – these differences are a bit higher for the bitumen grids (up to 3%). A comparison with similar products on the international market show that the grids produced by Siretul Pascani present excellent tensile characteristics. References [1] Adanur, S., Geotextiles, in Wellington Sears Handbook of Industrial Textiles, editor Adanur, S., Johnston
Industries Group, 1995, ISBN 1-56676 340-1, 297-325 [2] Batali, L., Geocompozite bentonitice, Ed. Conspress, 1999 [3] Byrne, C., Technical Textiles market – an overview, in Handbook of Technical Textiles, editors Horrocks,
A.R., Annand, S.C., Woodhead Publishing Ltd., Cambridge, UK, 2000, ISBN 1 85573 385 4, 1-23 [4] Kellner, L., Gazdaru, A., Feodorov, V. Geosinteticele in constructii, vol I, editura Semne 94 SRL,
Bucuresti, ISBN 973-96829-0-1 [5] Rankilor, P.,R., Textiles in Civil Engineering, Part 1- geotextiles, in Handbook of Technical Textiles,
editors Horrocks, A. R., Anand, S.C., Woodhead Publ. Ltd. Cambridge, England, 2000, ISBN 1 85573 3854, 358-372
[6] Rawas, B.C. - Proceedings of International Workshop on Geotextiles, November, 1999 [7] ASTM. _1994_Standard test method for tensile properties of geotextiles by the wide-width strip method.”
ASTM standard D 4595-94 [8] www.autogrid.hu (accessed at 28.05.2012) [9] www.huesker.com/uk/index.html (accessed at 22.04.2012) [10] www.b2bconsulting.ro (accessed at 22.04.2012) [11] www.cofra.com/typar.html (accessed at 20.04.2012) [12] www.huesker.com/uk/index.html (accessed at .2012) [13] www.iridexcons.ro (accessed at 15.03.2012) [14] www.minet.ro (accessed at 15.03.2012) [15] www.montorg.ro (accessed at 12.05.2012) [16] www.profilux.ro (accessed at 12.05.2012) [17] www.sciencedirect.com/science (accessed at 25.042012)
Corresponding author: Ema Marin, “Gheorghe Asachi” Technical University of Iaşi Faculty of Textile, Leather and Industrial Management, Str. D. Mangeron, 29, 700050, Iasi, Romania, e-mail address: [email protected] Co-authors: Geta Trifan, SC. SIRETUL SA, Str. Gradinitei, Pascani, Romania e-mail address: [email protected] Ioan Cioara, “Gheorghe Asachi” Technical University of Iaşi Faculty of Textile, Leather and Industrial Management, Str. D. Mangeron, 29, 700050, Iasi, Romania, e-mail address: [email protected] Luminita Ciobanu, “Gheorghe Asachi” Technical University of Iaşi Faculty of Textile, Leather and Industrial Management, Str. D. Mangeron, 29, 700050, Iasi, Romania, e-mail address: [email protected]
277
14
th Romanian Textiles and Leather Conference – CORTEP 2012
Sinaia, 6 - 8 September 2012
THE AXIOMATIC DESIGN OF PATIENTS’ CLOTHING
Angela SCRIPCENCO Technical University of Moldova
Abstract: To ensure a comfortable life activity of people with various diseases clothing should take into account the peculiarities of the course and treatment of disease and should be a different type of clothes than the usually used. Clothing as an object of study can be viewed in the aggregate of morphological characteristics: the silhouette, the sleeves cut, the type of clasps, technology of processing the neck hole, the presence of constructive decorative elements, color palette design, type of material. Morphological analysis suggests a multilevel study of object signs of and variants of their execution, adequate for the specific conditions of using cloths. The combination of morphological variants will provide a variety of product models, which, if further development can be considered as a model in the product line offers the group of hospital clothing in accordance with the requirements and peculiarities of its exploitation. Keywords: special clothing, people with disabilities, comfort requirements, axiomatic design, classification of hospital garments, morphological analysis. 1. INTRODUCTION The most important wealth of the country - is the health of its population. An essential means to provide the necessary conditions for the treatment of patients could serve to ensure them with comfortable clothing. This group of consumers needs social adaptation, which contributes to including in use the specially designed range of clothing. In this context, relevant is to create ergonomic, functional and esthetic hospital clothing for physical and mental rehabilitation of patients. The aim of this work is to develop an information base for the design of the range of hospital clothes. The basic concept is that the hospital clothes should be comfortable for patients, and its simple design solution should provide a quick access to carry out medical procedures. Researchers have observed that the moral condition of the patient depends largely on the success of treatment. The system approach to the design of hospital garments based on the classification of garments. Classification of hospital garments takes into account the sex and age, seasonality, destination, the division into types and subtypes of clothing. Axiomatic design is a methodology for system design using matrix methods for systems analysis and transformation of customer needs into functional requirements, design parameters and process variables [1]. 2. EXPERIMENTAL On the basis of the exploitation conditions of hospital cloths defined its basic functions, which are different from casual wear. In this case, along with standard functions directed to ensure comfort microclimate under the apparel space, protection from adverse environmental conditions, and hospitals from mechanical damage have been revealed special functions. Identify the special functions of hospital clothing, and their formalization will allow for the development of targeted products in narrowing the search field and the cutoff previously unacceptable solutions. An important function is the provision of hospital clothing comfort to sick and medical personnel during various medical procedures, while providing psychological comfort of the patient is an equivalent function. Under the psychological comfort we mean creating the conditions for excluding any patient discomfort due to his physical state. The study on the fuzzy front end [5] phase during the survey, conducted among patients at the clinic and medical staff, identified the basic procedures, techniques and its topography executing, then it was grouped according to the relevant parts of the body surface [4]. Based on the allocation of specific groups of diseases, should be developed the corresponding them design of hospital clothing, providing quick access to the patient's body without causing discomfort. The concept of
278
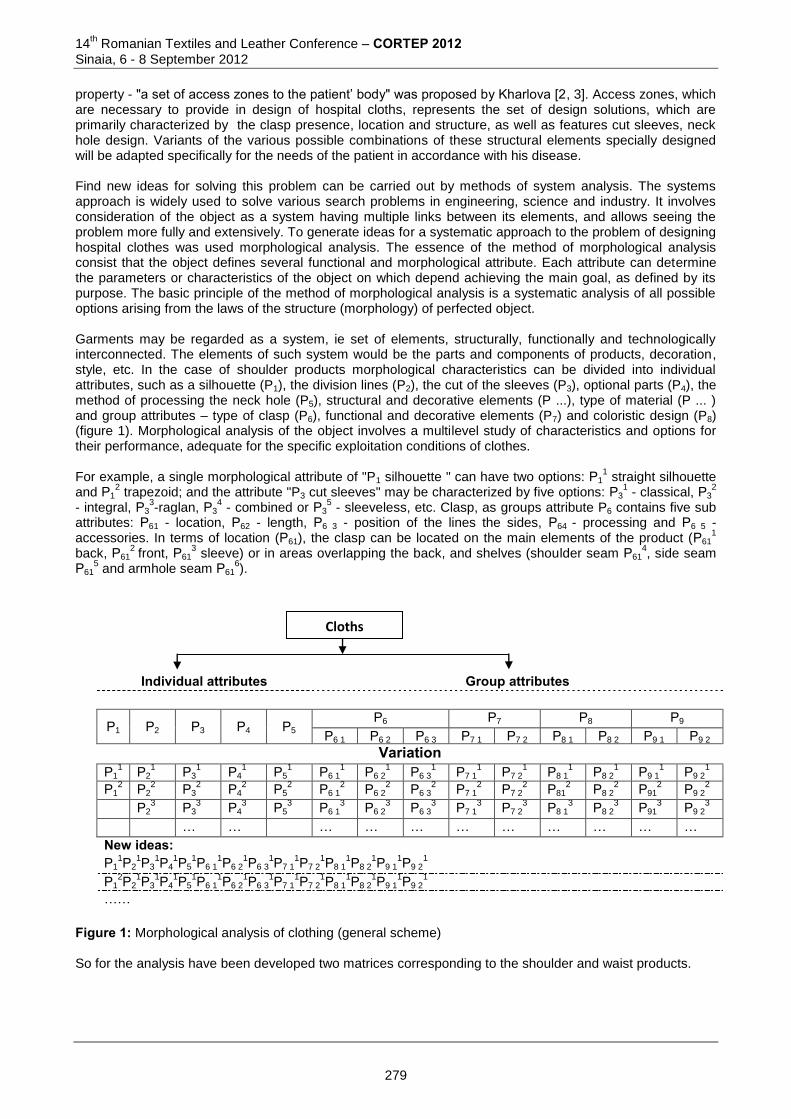
14th Romanian Textiles and Leather Conference – CORTEP 2012
Sinaia, 6 - 8 September 2012
property - "a set of access zones to the patient’ body" was proposed by Kharlova [2, 3]. Access zones, which are necessary to provide in design of hospital cloths, represents the set of design solutions, which are primarily characterized by the clasp presence, location and structure, as well as features cut sleeves, neck hole design. Variants of the various possible combinations of these structural elements specially designed will be adapted specifically for the needs of the patient in accordance with his disease. Find new ideas for solving this problem can be carried out by methods of system analysis. The systems approach is widely used to solve various search problems in engineering, science and industry. It involves consideration of the object as a system having multiple links between its elements, and allows seeing the problem more fully and extensively. To generate ideas for a systematic approach to the problem of designing hospital clothes was used morphological analysis. The essence of the method of morphological analysis consist that the object defines several functional and morphological attribute. Each attribute can determine the parameters or characteristics of the object on which depend achieving the main goal, as defined by its purpose. The basic principle of the method of morphological analysis is a systematic analysis of all possible options arising from the laws of the structure (morphology) of perfected object. Garments may be regarded as a system, ie set of elements, structurally, functionally and technologically interconnected. The elements of such system would be the parts and components of products, decoration, style, etc. In the case of shoulder products morphological characteristics can be divided into individual attributes, such as a silhouette (P1), the division lines (P2), the cut of the sleeves (P3), optional parts (P4), the method of processing the neck hole (P5), structural and decorative elements (P ...), type of material (P ... ) and group attributes – type of clasp (P6), functional and decorative elements (P7) and coloristic design (P8) (figure 1). Morphological analysis of the object involves a multilevel study of characteristics and options for their performance, adequate for the specific exploitation conditions of clothes. For example, a single morphological attribute of "P1 silhouette " can have two options: Р1
1 straight silhouette
and Р12 trapezoid; and the attribute "P3 cut sleeves" may be characterized by five options: Р3
1 - classical, Р3
2
- integral, Р33-raglan, Р3
4 - combined or Р3
5 - sleeveless, etc. Clasp, as groups attribute P6 contains five sub
attributes: Р61 - location, Р62 - length, Р6 3 - position of the lines the sides, Р64 - processing and Р6 5 - accessories. In terms of location (Р61), the clasp can be located on the main elements of the product (Р61
1
back, Р612
front, Р613 sleeve) or in areas overlapping the back, and shelves (shoulder seam Р61
4, side seam
Р615 and armhole seam Р61
6).
Figure 1: Morphological analysis of clothing (general scheme) So for the analysis have been developed two matrices corresponding to the shoulder and waist products.
Individual attributes Group attributes
Р1 Р2 Р3 Р4 Р5 Р6 Р7 Р8 Р9
Р6 1 Р6 2 Р6 3 Р7 1 Р7 2 Р8 1 Р8 2 Р9 1 Р9 2
Variation Р1
1 Р2
1 Р3
1 Р4
1 Р5
1 Р6 1
1 Р6 2
1 Р6 3
1 Р7 1
1 Р7 2
1 Р8 1
1 Р8 2
1 Р9 1
1 Р9 2
1
Р12 Р2
2 Р3
2 Р4
2 Р5
2 Р6 1
2 Р6 2
2 Р6 3
2 Р7 1
2 Р7 2
2 Р81
2 Р8 2
2 Р91
2 Р9 2
2
Р23
Р33
Р43
Р53
Р6 13
Р6 23
Р6 33
Р7 13
Р7 23
Р8 13
Р8 23
Р913
Р9 23
… … … … … … … … … … …
New ideas: Р1
1Р2
1Р3
1Р4
1Р5
1Р6 1
1Р6 2
1Р6 3
1Р7 1
1Р7 2
1Р8 1
1Р8 2
1Р9 1
1Р9 2
1
Р12Р2
1Р3
1Р4
1Р5
1Р6 1
1Р6 2
1Р6 3
1Р7 1
1Р7 2
1Р8 1
1Р8 2
1Р9 1
1Р9 2
1
……
Cloths
279
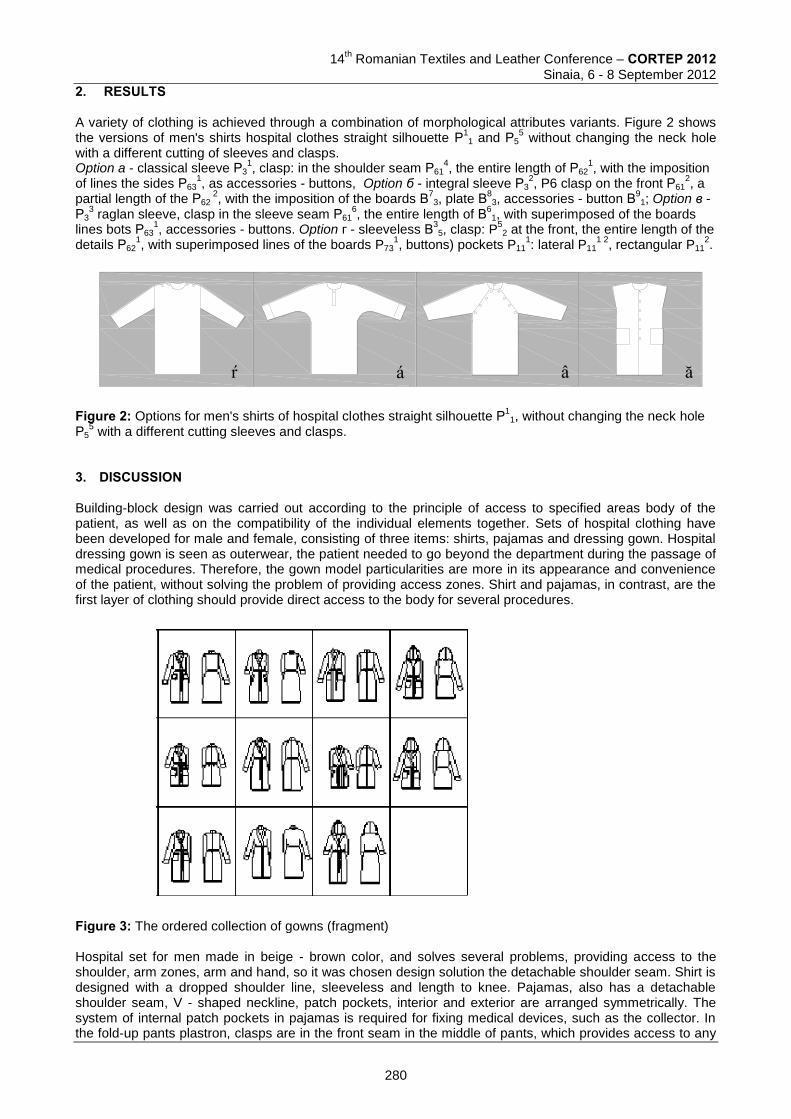
14
th Romanian Textiles and Leather Conference – CORTEP 2012
Sinaia, 6 - 8 September 2012
2. RESULTS A variety of clothing is achieved through a combination of morphological attributes variants. Figure 2 shows the versions of men's shirts hospital clothes straight silhouette Р
11 and Р5
5 without changing the neck hole
with a different cutting of sleeves and clasps. Option a - classical sleeve Р3
1, clasp: in the shoulder seam Р61
4, the entire length of Р62
1, with the imposition
of lines the sides Р631, as accessories - buttons, Option б - integral sleeve Р3
2, P6 clasp on the front Р61
2, a
partial length of the Р62 2, with the imposition of the boards В
73, plate В
83, accessories - button В
91; Option в -
Р33 raglan sleeve, clasp in the sleeve seam Р61
6, the entire length of В
61, with superimposed of the boards
lines bots Р631, accessories - buttons. Option г - sleeveless В
35, clasp: P
52 at the front, the entire length of the
details Р621, with superimposed lines of the boards P73
1, buttons) pockets P11
1: lateral P11
1 2, rectangular P11
2.
ŕ á â ă
Figure 2: Options for men's shirts of hospital clothes straight silhouette Р
11, without changing the neck hole
Р55 with a different cutting sleeves and clasps.
3. DISCUSSION Building-block design was carried out according to the principle of access to specified areas body of the patient, as well as on the compatibility of the individual elements together. Sets of hospital clothing have been developed for male and female, consisting of three items: shirts, pajamas and dressing gown. Hospital dressing gown is seen as outerwear, the patient needed to go beyond the department during the passage of medical procedures. Therefore, the gown model particularities are more in its appearance and convenience of the patient, without solving the problem of providing access zones. Shirt and pajamas, in contrast, are the first layer of clothing should provide direct access to the body for several procedures.
Figure 3: The ordered collection of gowns (fragment) Hospital set for men made in beige - brown color, and solves several problems, providing access to the shoulder, arm zones, arm and hand, so it was chosen design solution the detachable shoulder seam. Shirt is designed with a dropped shoulder line, sleeveless and length to knee. Pajamas, also has a detachable shoulder seam, V - shaped neckline, patch pockets, interior and exterior are arranged symmetrically. The system of internal patch pockets in pajamas is required for fixing medical devices, such as the collector. In the fold-up pants plastron, clasps are in the front seam in the middle of pants, which provides access to any
280
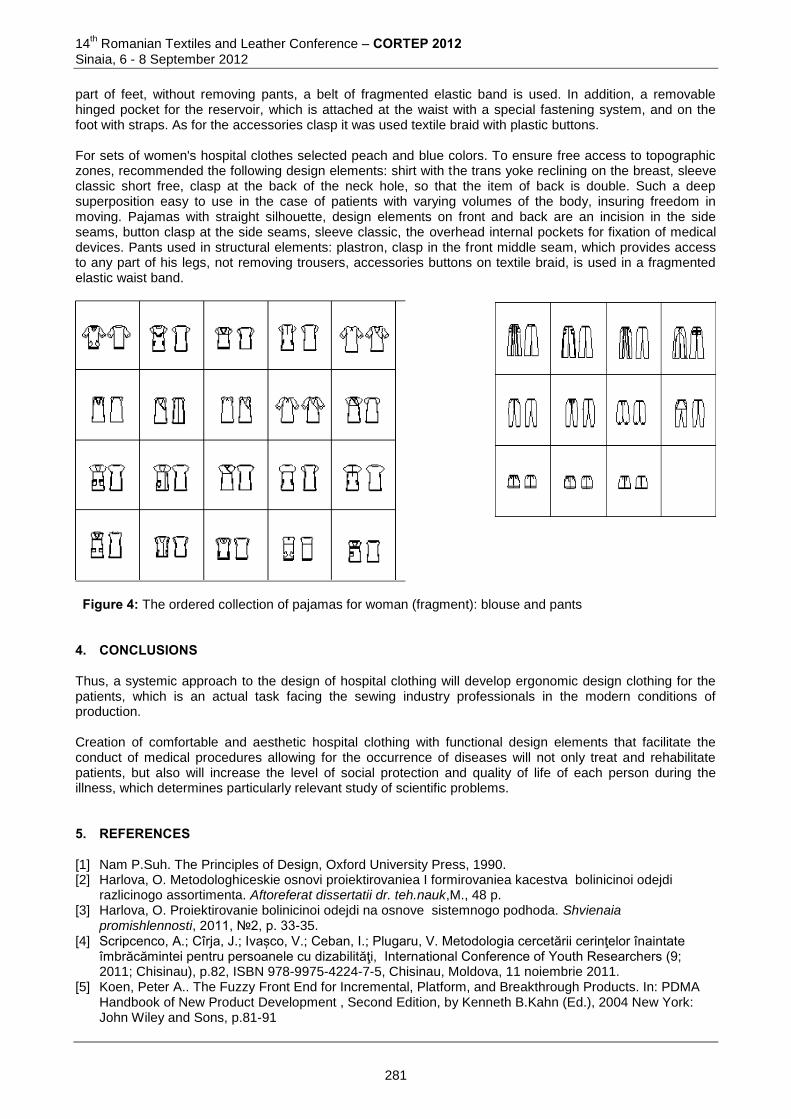
14th Romanian Textiles and Leather Conference – CORTEP 2012
Sinaia, 6 - 8 September 2012
part of feet, without removing pants, a belt of fragmented elastic band is used. In addition, a removable hinged pocket for the reservoir, which is attached at the waist with a special fastening system, and on the foot with straps. As for the accessories clasp it was used textile braid with plastic buttons. For sets of women's hospital clothes selected peach and blue colors. To ensure free access to topographic zones, recommended the following design elements: shirt with the trans yoke reclining on the breast, sleeve classic short free, clasp at the back of the neck hole, so that the item of back is double. Such a deep superposition easy to use in the case of patients with varying volumes of the body, insuring freedom in moving. Pajamas with straight silhouette, design elements on front and back are an incision in the side seams, button clasp at the side seams, sleeve classic, the overhead internal pockets for fixation of medical devices. Pants used in structural elements: plastron, clasp in the front middle seam, which provides access to any part of his legs, not removing trousers, accessories buttons on textile braid, is used in a fragmented elastic waist band.
Figure 4: The ordered collection of pajamas for woman (fragment): blouse and pants
4. CONCLUSIONS Thus, a systemic approach to the design of hospital clothing will develop ergonomic design clothing for the patients, which is an actual task facing the sewing industry professionals in the modern conditions of production. Creation of comfortable and aesthetic hospital clothing with functional design elements that facilitate the conduct of medical procedures allowing for the occurrence of diseases will not only treat and rehabilitate patients, but also will increase the level of social protection and quality of life of each person during the illness, which determines particularly relevant study of scientific problems. 5. REFERENCES [1] Nam P.Suh. The Principles of Design, Oxford University Press, 1990. [2] Harlova, O. Metodologhiceskie osnovi proiektirovaniea I formirovaniea kacestva bolinicinoi odejdi
razlicinogo assortimenta. Aftoreferat dissertatii dr. teh.nauk,M., 48 p. [3] Harlova, O. Proiektirovanie bolinicinoi odejdi na osnove sistemnogo podhoda. Shvienaia
promishlennosti, 2011, 2, p. 33-35. [4] Scripcenco, A.; Cîrja, J.; Ivașco, V.; Ceban, I.; Plugaru, V. Metodologia cercetării cerinţelor înaintate
îmbrăcămintei pentru persoanele cu dizabilităţi, International Conference of Youth Researchers (9; 2011; Chisinau), p.82, ISBN 978-9975-4224-7-5, Chisinau, Moldova, 11 noiembrie 2011.
[5] Koen, Peter A.. The Fuzzy Front End for Incremental, Platform, and Breakthrough Products. In: PDMA Handbook of New Product Development , Second Edition, by Kenneth B.Kahn (Ed.), 2004 New York: John Wiley and Sons, p.81-91
281
14
th Romanian Textiles and Leather Conference – CORTEP 2012
Sinaia, 6 - 8 September 2012
Corresponding address: Angela SCRIPCENCO,PhD Department of Clothes and Knitwear Technology, Head of Departament Faculty of Textile INDUSTRY, Technical University of Moldova Bd. Stefan cel Mare, 168 MD 2004, Chișinău, R.Moldova Phone:373-022-32-95-75; E-mail [email protected]
282
14
th Romanian Textiles and Leather Conference – CORTEP 2012
Sinaia, 6 - 8 September 2012
STUDY ON THERMAL COMFORT PROPERTIES OF ACTIVE SPORTSWEAR USING A THERMAL MANIKIN
Elena ONOFREI
“Gheorghe Asachi” Technical University of Iasi, Romania Abstract: The thermal comfort properties of textiles have gained the attention of researchers in the recent years, especially with the development of functional textiles. In this context, thermal manikins are increasingly used for development of clothing systems with improved thermal properties. The aim of this paper is to study the thermal comfort behaviour of active sportswear using the thermal manikin. T-
shirts for outdoor activities, made of Outlast yarn, was tested according to ISO 15831. Four samples were tested and thermal insulation values were obtained using both parallel and serial methods. There were differences of 8 - 9% between thermal insulation values obtained by the two calculation methods, the serial calculation giving higher values then the parallel model. Keywords: thermal comfort, thermal manikin, sportswear. 1 INTRODUCTION Laboratory tests to determine the thermal resistance of textiles date back to the 1930´s. During the 1930's, the guarded-ring flat plates and 3-dimensional heated cylinders were commonly used to measure thermal resistance of single or multiple textile layers. The development of the clo unit in 1941 by Gagge, Burton, and Bazett was an important advancement in clothing science as it provided for a standard measure of the thermal insulation of clothing [1, 2]. Nowadays, one of the ways of assessing the comfort characteristics of clothing and other textiles (eg sleeping bags, bedding) is by using the thermo-regulatory manikin. Thermal manikins can be grouped into three generations. The first generation were statics and non-perspiring manikins. Initially they were built one-segment and later multi-segments (with several, independently controlled segments over the body surface). The second generation of thermal manikins were movable (walkable), but non-perspiring ones. Manikins are constructed with joints that allowed the manikin to be seated or perform “walking” or “cycling” movements. The third generation manikins, so-called sweating thermal manikins, can simulate true perspiration and body motion. They simulate heat and moisture production in a similar way to the human body and measure the influence of clothing in different environmental and sweating conditions. However, they are relatively rare, and their design and test method vary considerable from lab to lab [1-3]. Thermal manikins are mostly used for research purpose, but an increasing interest in the use of manikins enlarged areas of applications. Thermal manikins are widely used for the analysis of the thermal interface between the human body and its environment. Particular applications are found in the determination of thermal properties of clothing and development of clothing systems with improved thermal properties (i.e. functional clothing system). The repeatability of a thermal insulation measurement within one single laboratory for a sample is normally in the range 2–4 %, whereas the reproducibility between laboratories is in the range 5–10%. These variations are reasonably small [4]. Increasing worldwide interest and participation in active sports and outdoor leisure have resulted in strong growth in the consumption of textile materials in sport clothing and sport equipment. Belonging to the technical textile industry, Sporttech is a small field, but due to the high performance fibres used, Sporttech was one of the largest segment in value terms [5]. Due to an increased interest in health, new requirementes are demanded for sport-specific clothing. Active wear is expected to provide a thermal equilibrium between the heat produced by the body while performing a sport and the heat released into the environment.The development of these products requires the analysis and the optimization of many textile properties. In particular, the thermophysiological behavior related to the sportswear plays a crucial role, having a direct impact on the athletes performance. In this study were determined the thermal properties of active t-shirt using the thermal manikin.
283
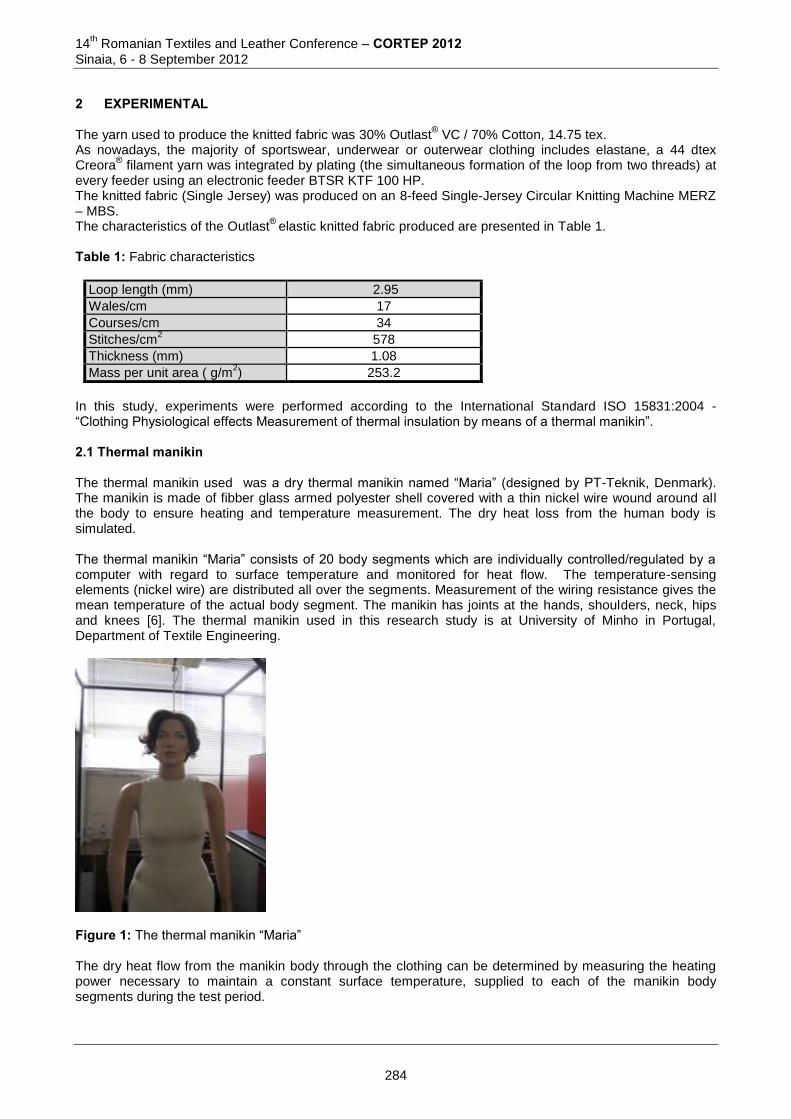
14th Romanian Textiles and Leather Conference – CORTEP 2012
Sinaia, 6 - 8 September 2012
2 EXPERIMENTAL The yarn used to produce the knitted fabric was 30% Outlast
® VC / 70% Cotton, 14.75 tex.
As nowadays, the majority of sportswear, underwear or outerwear clothing includes elastane, a 44 dtex Creora
® filament yarn was integrated by plating (the simultaneous formation of the loop from two threads) at
every feeder using an electronic feeder BTSR KTF 100 HP. The knitted fabric (Single Jersey) was produced on an 8-feed Single-Jersey Circular Knitting Machine MERZ – MBS. The characteristics of the Outlast
® elastic knitted fabric produced are presented in Table 1.
Table 1: Fabric characteristics
Loop length (mm) 2.95
Wales/cm 17
Courses/cm 34
Stitches/cm2
578
Thickness (mm) 1.08
Mass per unit area ( g/m2) 253.2
In this study, experiments were performed according to the International Standard ISO 15831:2004 - “Clothing Physiological effects Measurement of thermal insulation by means of a thermal manikin”. 2.1 Thermal manikin The thermal manikin used was a dry thermal manikin named “Maria” (designed by PT-Teknik, Denmark). The manikin is made of fibber glass armed polyester shell covered with a thin nickel wire wound around all the body to ensure heating and temperature measurement. The dry heat loss from the human body is simulated. The thermal manikin “Maria” consists of 20 body segments which are individually controlled/regulated by a computer with regard to surface temperature and monitored for heat flow. The temperature-sensing elements (nickel wire) are distributed all over the segments. Measurement of the wiring resistance gives the mean temperature of the actual body segment. The manikin has joints at the hands, shoulders, neck, hips and knees [6]. The thermal manikin used in this research study is at University of Minho in Portugal, Department of Textile Engineering.
Figure 1: The thermal manikin “Maria” The dry heat flow from the manikin body through the clothing can be determined by measuring the heating power necessary to maintain a constant surface temperature, supplied to each of the manikin body segments during the test period.
284
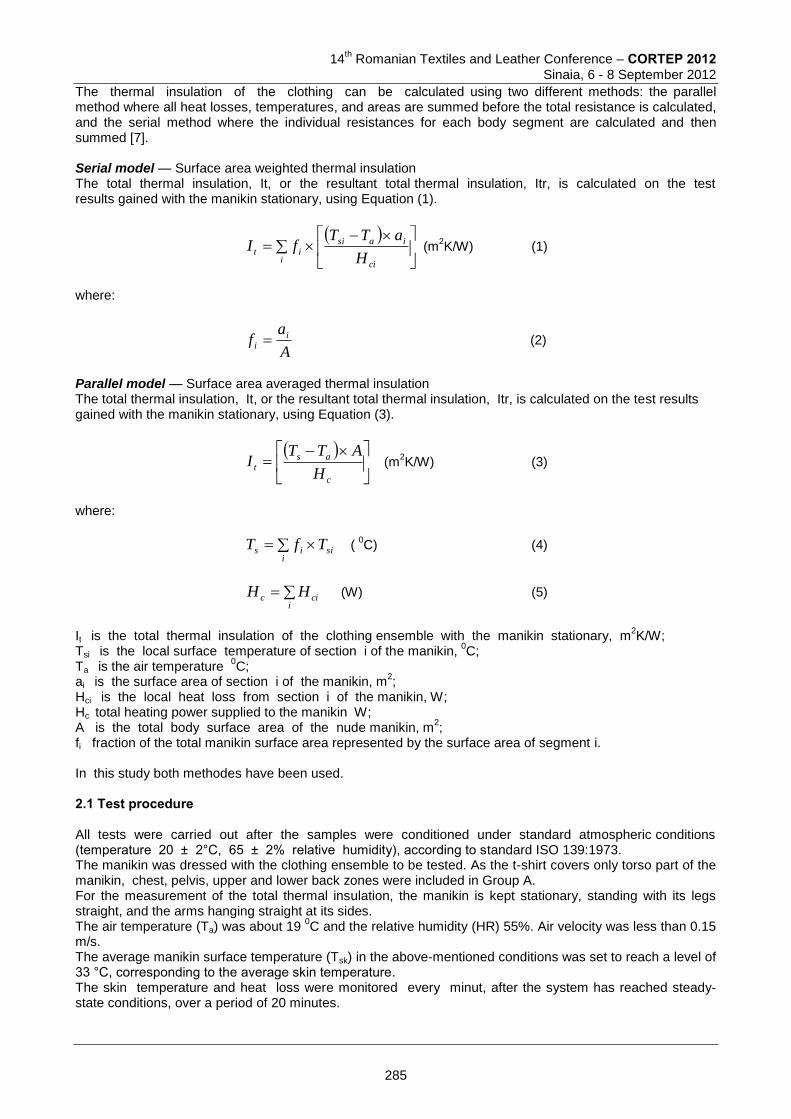
14
th Romanian Textiles and Leather Conference – CORTEP 2012
Sinaia, 6 - 8 September 2012
The thermal insulation of the clothing can be calculated using two different methods: the parallel method where all heat losses, temperatures, and areas are summed before the total resistance is calculated, and the serial method where the individual resistances for each body segment are calculated and then summed [7]. Serial model — Surface area weighted thermal insulation The total thermal insulation, It, or the resultant total thermal insulation, Itr, is calculated on the test results gained with the manikin stationary, using Equation (1).
ci
iasi
iit
H
aTTfI (m
2K/W) (1)
where:
A
af i
i (2)
Parallel model — Surface area averaged thermal insulation The total thermal insulation, It, or the resultant total thermal insulation, Itr, is calculated on the test results gained with the manikin stationary, using Equation (3).
c
as
tH
ATTI (m
2K/W) (3)
where:
sii
is TfT ( 0C) (4)
i
cic HH (W) (5)
It is the total thermal insulation of the clothing ensemble with the manikin stationary, m
2K/W;
Tsi is the local surface temperature of section i of the manikin, 0C;
Ta is the air temperature 0C;
ai is the surface area of section i of the manikin, m2;
Hci is the local heat loss from section i of the manikin, W; Hc total heating power supplied to the manikin W; A is the total body surface area of the nude manikin, m
2;
fi fraction of the total manikin surface area represented by the surface area of segment i. In this study both methodes have been used. 2.1 Test procedure All tests were carried out after the samples were conditioned under standard atmospheric conditions (temperature 20 ± 2°C, 65 ± 2% relative humidity), according to standard ISO 139:1973. The manikin was dressed with the clothing ensemble to be tested. As the t-shirt covers only torso part of the manikin, chest, pelvis, upper and lower back zones were included in Group A. For the measurement of the total thermal insulation, the manikin is kept stationary, standing with its legs straight, and the arms hanging straight at its sides. The air temperature (Ta) was about 19
0C and the relative humidity (HR) 55%. Air velocity was less than 0.15
m/s. The average manikin surface temperature (Tsk) in the above-mentioned conditions was set to reach a level of 33 °C, corresponding to the average skin temperature. The skin temperature and heat loss were monitored every minut, after the system has reached steady-state conditions, over a period of 20 minutes.
285
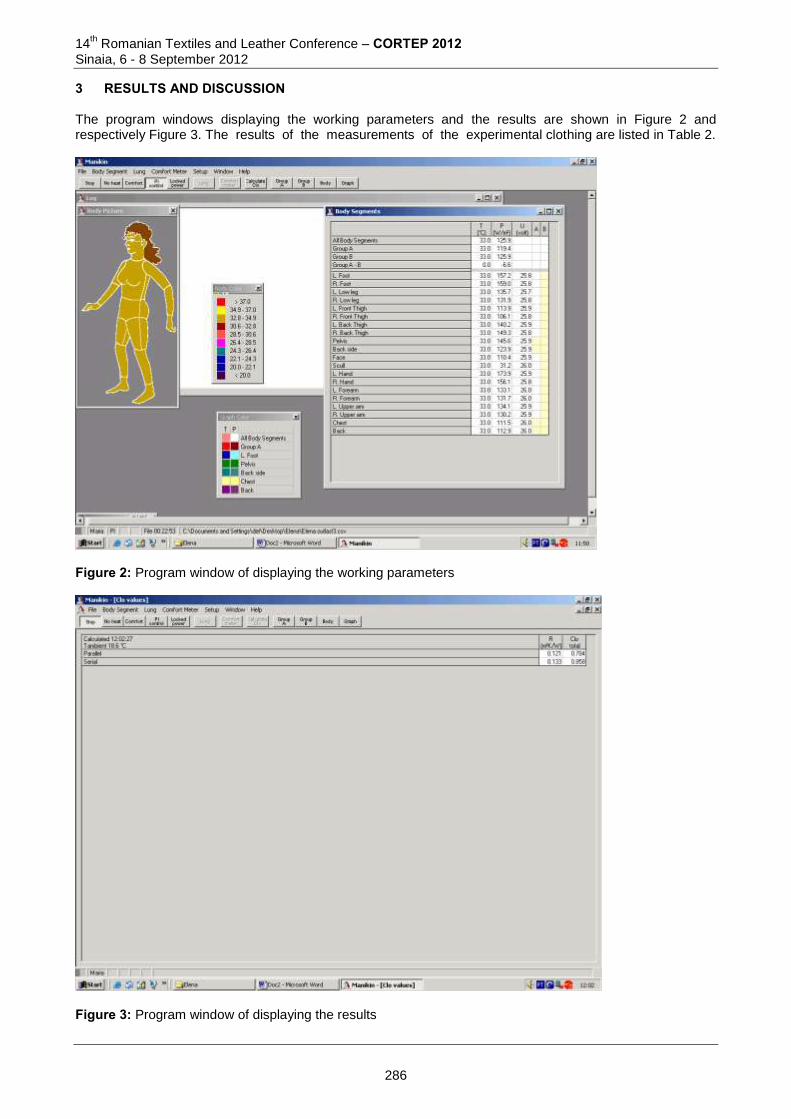
14th Romanian Textiles and Leather Conference – CORTEP 2012
Sinaia, 6 - 8 September 2012
3 RESULTS AND DISCUSSION The program windows displaying the working parameters and the results are shown in Figure 2 and respectively Figure 3. The results of the measurements of the experimental clothing are listed in Table 2.
Figure 2: Program window of displaying the working parameters
Figure 3: Program window of displaying the results
286
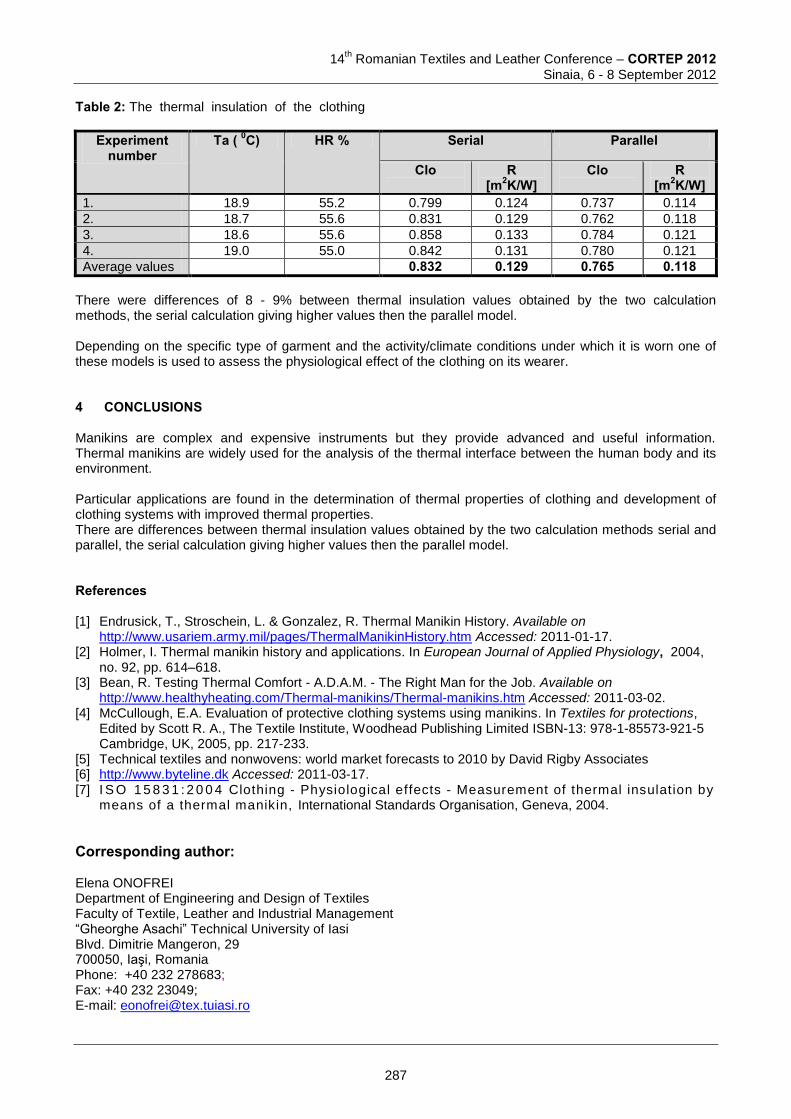
14
th Romanian Textiles and Leather Conference – CORTEP 2012
Sinaia, 6 - 8 September 2012
Table 2: The thermal insulation of the clothing
Experiment number
Ta ( 0C) HR % Serial Parallel
Clo
R [m2K/W]
Clo
R [m2K/W]
1. 18.9 55.2 0.799 0.124 0.737 0.114
2. 18.7 55.6 0.831 0.129 0.762 0.118
3. 18.6 55.6 0.858 0.133 0.784 0.121
4. 19.0 55.0 0.842 0.131 0.780 0.121
Average values 0.832 0.129 0.765 0.118 There were differences of 8 - 9% between thermal insulation values obtained by the two calculation methods, the serial calculation giving higher values then the parallel model. Depending on the specific type of garment and the activity/climate conditions under which it is worn one of these models is used to assess the physiological effect of the clothing on its wearer. 4 CONCLUSIONS Manikins are complex and expensive instruments but they provide advanced and useful information. Thermal manikins are widely used for the analysis of the thermal interface between the human body and its environment. Particular applications are found in the determination of thermal properties of clothing and development of clothing systems with improved thermal properties. There are differences between thermal insulation values obtained by the two calculation methods serial and parallel, the serial calculation giving higher values then the parallel model. References [1] Endrusick, T., Stroschein, L. & Gonzalez, R. Thermal Manikin History. Available on
http://www.usariem.army.mil/pages/ThermalManikinHistory.htm Accessed: 2011-01-17. [2] Holmer, I. Thermal manikin history and applications. In European Journal of Applied Physiology, 2004,
no. 92, pp. 614–618. [3] Bean, R. Testing Thermal Comfort - A.D.A.M. - The Right Man for the Job. Available on
http://www.healthyheating.com/Thermal-manikins/Thermal-manikins.htm Accessed: 2011-03-02. [4] McCullough, E.A. Evaluation of protective clothing systems using manikins. In Textiles for protections,
Edited by Scott R. A., The Textile Institute, Woodhead Publishing Limited ISBN-13: 978-1-85573-921-5 Cambridge, UK, 2005, pp. 217-233.
[5] Technical textiles and nonwovens: world market forecasts to 2010 by David Rigby Associates [6] http://www.byteline.dk Accessed: 2011-03-17. [7] I S O 1 5 8 3 1 : 2 0 0 4 Clothing - Physiological effects - Measurement of thermal insulation by
means of a thermal manikin, International Standards Organisation, Geneva, 2004.
Corresponding author: Elena ONOFREI Department of Engineering and Design of Textiles Faculty of Textile, Leather and Industrial Management “Gheorghe Asachi” Technical University of Iasi Blvd. Dimitrie Mangeron, 29 700050, Iaşi, Romania Phone: +40 232 278683; Fax: +40 232 23049; E-mail: [email protected]
287
14
th Romanian Textiles and Leather Conference – CORTEP 2012
Sinaia, 6 - 8 September 2012
NONWOVEN FLAME RETARDANT AND ANTIBACTERIAL PROTECTION COMPOSITE
Ana Marija GRANCARIĆ, Lea BOTTERI & Anita TARBUK
University of Zagreb, Croatia Abstract: This paper used lightweight, skin-friendly three layered fabric composite of non-woven activated carbon (ACN) fabric is sandwiched between two skin friendly cellulose (FR Rayon) layers. This composite made of non-woven has been developed by Chemical Engineers at The Institute of Environmental and Human Health at Texas Tech University to fight against chemical and biological agents. In previous our paper this composite has shown the perfect protect against fire based on the positive influence of carbon layer with high flame protection, on composite material. , the carbon layer (ACN) does not burn at room condition at all. For its burning it is necessary to have at least 47 % of oxygen which indicates its very high LOI value. The present paper discusses about selecting antimicrobial treatments which provides the optimum protection against Gram positive and Gram negative bacteria for composite materials. Antimicrobial protection against Staphylococcus aureus and Klebsiella pneumoniae organisms is determined according to EN ISO 20645:2004. Flame retardancy of composite and its layers was determined trought its burning behavior. Two standard methods, ISO 6940:2004 Textile fabrics – Burning behavior – Determination of ease of ignition of vertically oriented specimens and ISO 4589:1996 – Plastics – Determination of burning behavior by oxygen index using Limiting Oxygen Index (LOI) Chamber by Dynisco, were applied respectively.
Keywords: nonwoven composite, flame retardancy, antimicrobial agents, zeolite, azalide, Octenisept 1 INTRODUCTION Textiles are carriers and real reservoirs of micro-organisms such as bacteria, viruses and fungi. It was
proved that textiles are really active and are responsible for a lot of infections in communities. The goals of
this paper is to reach the highest antimicrobial protection by using different compounds and commercial agents, from simple cationic tenside to antibiotic for human medicine. We used three layered fabric material with the nonwoven activated carbon (ACN) fabric layer sandwiched between two skin friendly non-woven Rayon nonwoven layers was manufactured at Texas Tech University using the H1 technology needle loom Fehrer
®AG [1-3]. This material was treated with cationic surfactant Hexadecyl-trimethyl amonium chloride
(HDTMAC), atiseptic Octenidine dihydrochloride (Octenisept®)[4], microlide cmpound azalide (as active
component of Azithromycin) and zeolite to give to composite material antimicrobial properties. Antiseptic is a substance which kills or prevents the growth of bacteria and viruses (micro-organisms) on the outer surfaces of the body. Antiseptics are distinguished from antibiotics, which act inside the same body, only against bacteria, and disinfectants, which operate on inanimate objects such as medical devices [5]. The first compound used on textiles for an antibiotic treatment was azalide. Azalides are subclass of macrolide antibiotics and Azithromycin is the first macrolide antibiotic. So, it is possible to imagine some applications in textile such as clothing in hospital, protection masks, woven for laundry, and also socks, knitted for summer clothing, underwear etc [6,7]. Its spectrum of activity is wider than others and includes Gram positive and Gram negative organisms. The next used component are nanoparticles of natural zeolite clinoptilolite, the mineral substances applied on new textiles for protection and therapy applications such as medical, protective and sports applications. They are hydrated natural or synthetic micro-porous crystals with defined structures based on AlO4 and SiO4 tetrahedal linked through the common oxygen atoms [8]. They can be used as adsorbent, ion exchangers, catalysts and detergent builders in industry, agriculture, veterinary, medicine, health care or environmental protection. Activated natural zeolite clinoptilolite are produced by a tribomechanical processing. Flame retardancy of composite and its layers was determined trough its burning behavior [9,10]
288
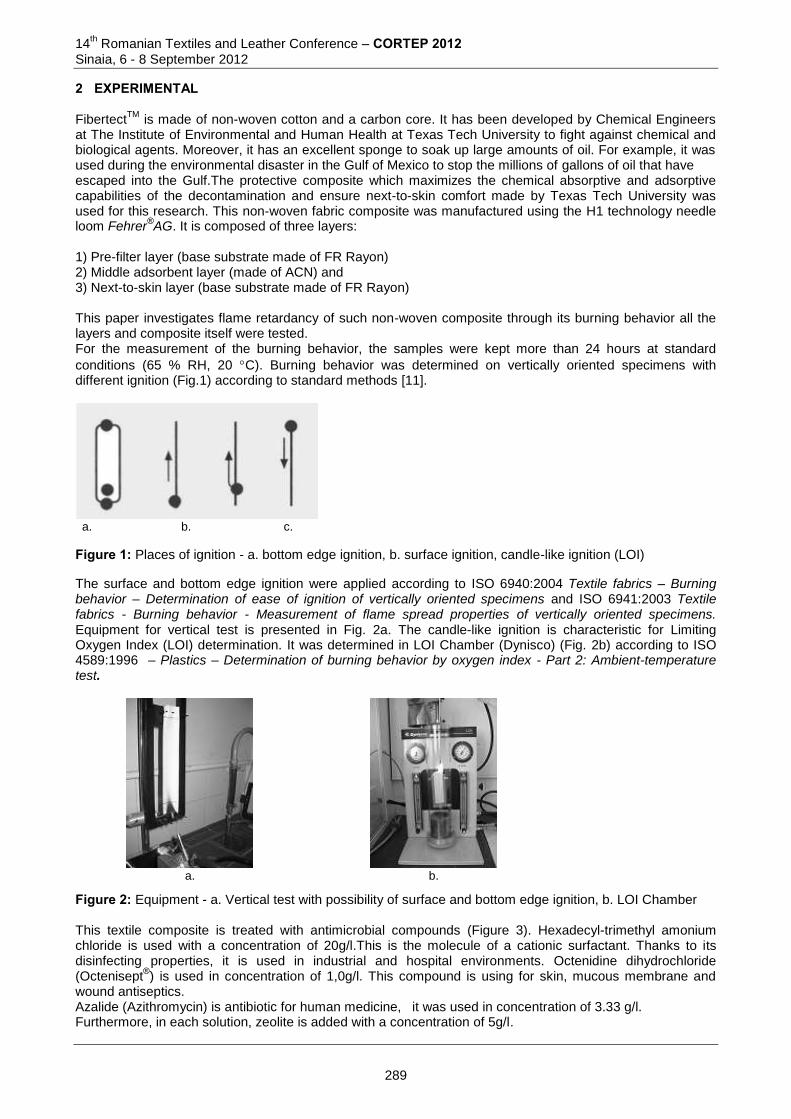
14th Romanian Textiles and Leather Conference – CORTEP 2012
Sinaia, 6 - 8 September 2012
2 EXPERIMENTAL Fibertect
TM is made of non-woven cotton and a carbon core. It has been developed by Chemical Engineers
at The Institute of Environmental and Human Health at Texas Tech University to fight against chemical and biological agents. Moreover, it has an excellent sponge to soak up large amounts of oil. For example, it was used during the environmental disaster in the Gulf of Mexico to stop the millions of gallons of oil that have escaped into the Gulf.The protective composite which maximizes the chemical absorptive and adsorptive capabilities of the decontamination and ensure next-to-skin comfort made by Texas Tech University was used for this research. This non-woven fabric composite was manufactured using the H1 technology needle loom Fehrer
®AG. It is composed of three layers:
1) Pre-filter layer (base substrate made of FR Rayon) 2) Middle adsorbent layer (made of ACN) and 3) Next-to-skin layer (base substrate made of FR Rayon) This paper investigates flame retardancy of such non-woven composite through its burning behavior all the layers and composite itself were tested. For the measurement of the burning behavior, the samples were kept more than 24 hours at standard
conditions (65 % RH, 20 C). Burning behavior was determined on vertically oriented specimens with different ignition (Fig.1) according to standard methods [11].
a. b. c.
Figure 1: Places of ignition - a. bottom edge ignition, b. surface ignition, candle-like ignition (LOI)
The surface and bottom edge ignition were applied according to ISO 6940:2004 Textile fabrics – Burning behavior – Determination of ease of ignition of vertically oriented specimens and ISO 6941:2003 Textile fabrics - Burning behavior - Measurement of flame spread properties of vertically oriented specimens.
Equipment for vertical test is presented in Fig. 2a. The candle-like ignition is characteristic for Limiting Oxygen Index (LOI) determination. It was determined in LOI Chamber (Dynisco) (Fig. 2b) according to ISO 4589:1996 – Plastics – Determination of burning behavior by oxygen index - Part 2: Ambient-temperature test.
a. b.
Figure 2: Equipment - a. Vertical test with possibility of surface and bottom edge ignition, b. LOI Chamber This textile composite is treated with antimicrobial compounds (Figure 3). Hexadecyl-trimethyl amonium chloride is used with a concentration of 20g/l.This is the molecule of a cationic surfactant. Thanks to its disinfecting properties, it is used in industrial and hospital environments. Octenidine dihydrochloride (Octenisept
®) is used in concentration of 1,0g/l. This compound is using for skin, mucous membrane and
wound antiseptics. Azalide (Azithromycin) is antibiotic for human medicine, it was used in concentration of 3.33 g/l. Furthermore, in each solution, zeolite is added with a concentration of 5g/l.
289
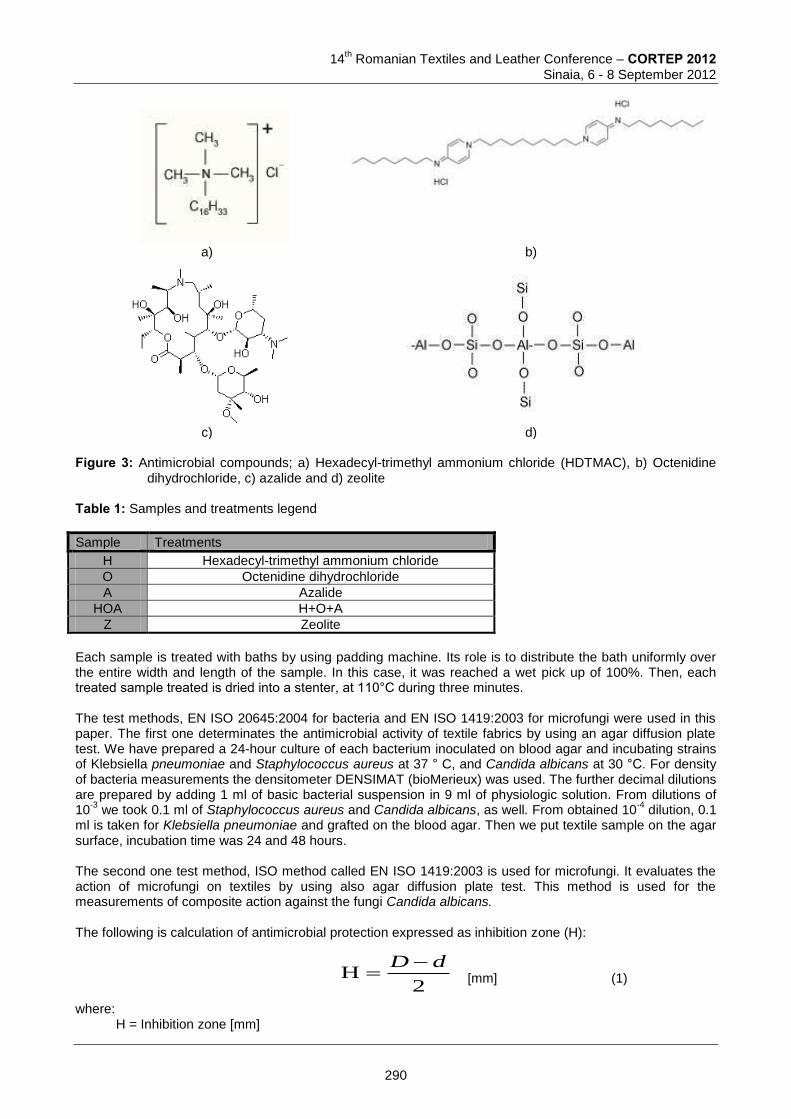
14
th Romanian Textiles and Leather Conference – CORTEP 2012
Sinaia, 6 - 8 September 2012
a) b)
c) d) Figure 3: Antimicrobial compounds; a) Hexadecyl-trimethyl ammonium chloride (HDTMAC), b) Octenidine
dihydrochloride, c) azalide and d) zeolite Table 1: Samples and treatments legend
Sample Treatments
H Hexadecyl-trimethyl ammonium chloride
O Octenidine dihydrochloride
A Azalide
HOA H+O+A
Z Zeolite
Each sample is treated with baths by using padding machine. Its role is to distribute the bath uniformly over the entire width and length of the sample. In this case, it was reached a wet pick up of 100%. Then, each treated sample treated is dried into a stenter, at 110°C during three minutes. The test methods, EN ISO 20645:2004 for bacteria and EN ISO 1419:2003 for microfungi were used in this paper. The first one determinates the antimicrobial activity of textile fabrics by using an agar diffusion plate test. We have prepared a 24-hour culture of each bacterium inoculated on blood agar and incubating strains of Klebsiella pneumoniae and Staphylococcus aureus at 37 ° C, and Candida albicans at 30 °C. For density of bacteria measurements the densitometer DENSIMAT (bioMerieux) was used. The further decimal dilutions are prepared by adding 1 ml of basic bacterial suspension in 9 ml of physiologic solution. From dilutions of 10
-3 we took 0.1 ml of Staphylococcus aureus and Candida albicans, as well. From obtained 10
-4 dilution, 0.1
ml is taken for Klebsiella pneumoniae and grafted on the blood agar. Then we put textile sample on the agar surface, incubation time was 24 and 48 hours. The second one test method, ISO method called EN ISO 1419:2003 is used for microfungi. It evaluates the action of microfungi on textiles by using also agar diffusion plate test. This method is used for the measurements of composite action against the fungi Candida albicans. The following is calculation of antimicrobial protection expressed as inhibition zone (H): [mm] (1) where: H = Inhibition zone [mm]
2H
dD
290
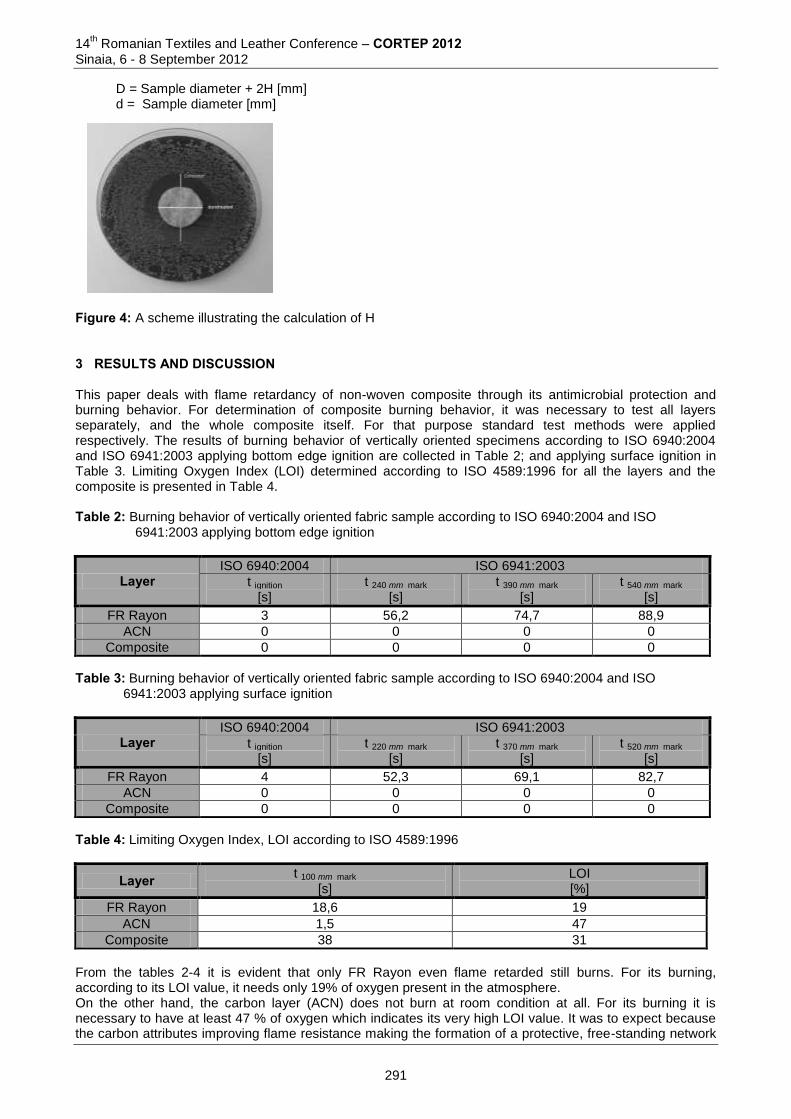
14th Romanian Textiles and Leather Conference – CORTEP 2012
Sinaia, 6 - 8 September 2012
D = Sample diameter + 2H [mm] d = Sample diameter [mm]
Figure 4: A scheme illustrating the calculation of H 3 RESULTS AND DISCUSSION This paper deals with flame retardancy of non-woven composite through its antimicrobial protection and burning behavior. For determination of composite burning behavior, it was necessary to test all layers separately, and the whole composite itself. For that purpose standard test methods were applied respectively. The results of burning behavior of vertically oriented specimens according to ISO 6940:2004 and ISO 6941:2003 applying bottom edge ignition are collected in Table 2; and applying surface ignition in Table 3. Limiting Oxygen Index (LOI) determined according to ISO 4589:1996 for all the layers and the composite is presented in Table 4. Table 2: Burning behavior of vertically oriented fabric sample according to ISO 6940:2004 and ISO
6941:2003 applying bottom edge ignition
Layer ISO 6940:2004 ISO 6941:2003
t ignition [s]
t 240 mm mark [s]
t 390 mm mark [s]
t 540 mm mark [s]
FR Rayon 3 56,2 74,7 88,9
ACN 0 0 0 0
Composite 0 0 0 0
Table 3: Burning behavior of vertically oriented fabric sample according to ISO 6940:2004 and ISO
6941:2003 applying surface ignition
Layer ISO 6940:2004 ISO 6941:2003
t ignition [s]
t 220 mm mark [s]
t 370 mm mark [s]
t 520 mm mark [s]
FR Rayon 4 52,3 69,1 82,7
ACN 0 0 0 0
Composite 0 0 0 0
Table 4: Limiting Oxygen Index, LOI according to ISO 4589:1996
Layer t 100 mm mark [s]
LOI [%]
FR Rayon 18,6 19
ACN 1,5 47
Composite 38 31
From the tables 2-4 it is evident that only FR Rayon even flame retarded still burns. For its burning, according to its LOI value, it needs only 19% of oxygen present in the atmosphere. On the other hand, the carbon layer (ACN) does not burn at room condition at all. For its burning it is necessary to have at least 47 % of oxygen which indicates its very high LOI value. It was to expect because the carbon attributes improving flame resistance making the formation of a protective, free-standing network
291
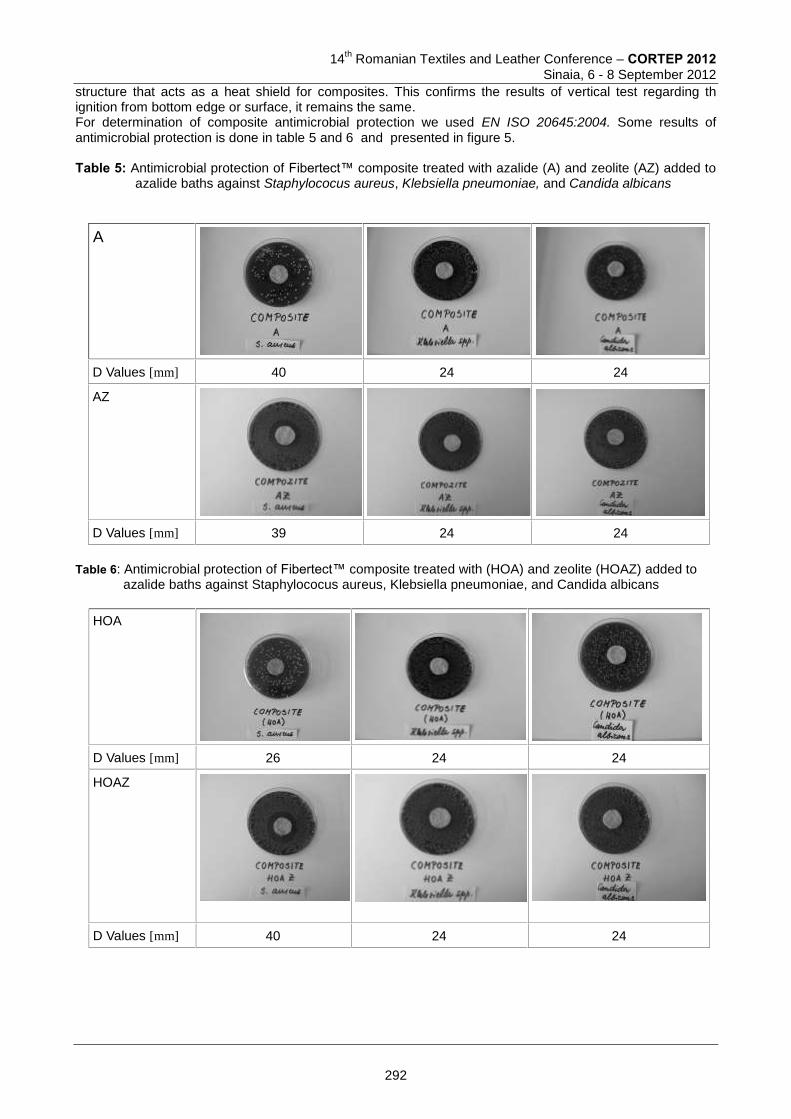
14
th Romanian Textiles and Leather Conference – CORTEP 2012
Sinaia, 6 - 8 September 2012
structure that acts as a heat shield for composites. This confirms the results of vertical test regarding th ignition from bottom edge or surface, it remains the same. For determination of composite antimicrobial protection we used EN ISO 20645:2004. Some results of antimicrobial protection is done in table 5 and 6 and presented in figure 5. Table 5: Antimicrobial protection of Fibertect™ composite treated with azalide (A) and zeolite (AZ) added to
azalide baths against Staphylococus aureus, Klebsiella pneumoniae, and Candida albicans
A
D Values [mm] 40 24 24
AZ
D Values [mm] 39 24 24
Table 6: Antimicrobial protection of Fibertect™ composite treated with (HOA) and zeolite (HOAZ) added to
azalide baths against Staphylococus aureus, Klebsiella pneumoniae, and Candida albicans
HOA
D Values [mm] 26 24 24
HOAZ
D Values [mm] 40 24 24
292
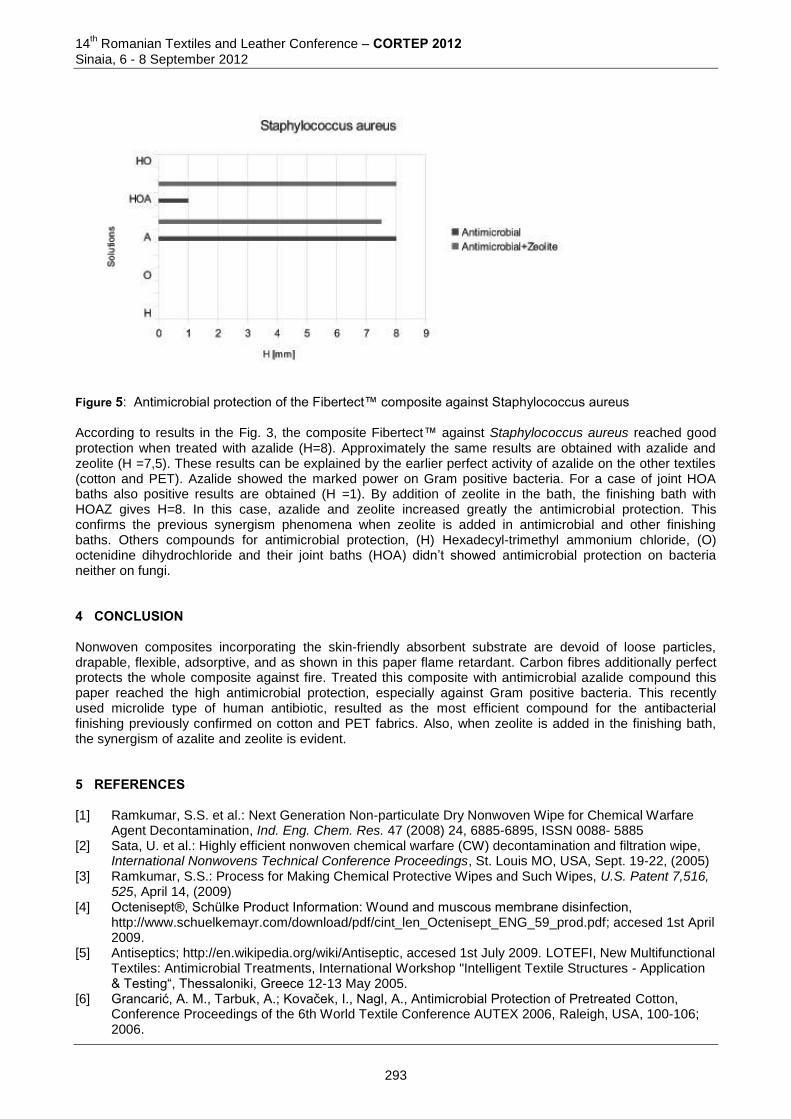
14th Romanian Textiles and Leather Conference – CORTEP 2012
Sinaia, 6 - 8 September 2012
Figure 5: Antimicrobial protection of the Fibertect™ composite against Staphylococcus aureus According to results in the Fig. 3, the composite Fibertect™ against Staphylococcus aureus reached good protection when treated with azalide (H=8). Approximately the same results are obtained with azalide and zeolite (H =7,5). These results can be explained by the earlier perfect activity of azalide on the other textiles (cotton and PET). Azalide showed the marked power on Gram positive bacteria. For a case of joint HOA baths also positive results are obtained (H =1). By addition of zeolite in the bath, the finishing bath with HOAZ gives H=8. In this case, azalide and zeolite increased greatly the antimicrobial protection. This confirms the previous synergism phenomena when zeolite is added in antimicrobial and other finishing baths. Others compounds for antimicrobial protection, (H) Hexadecyl-trimethyl ammonium chloride, (O) octenidine dihydrochloride and their joint baths (HOA) didn’t showed antimicrobial protection on bacteria neither on fungi. 4 CONCLUSION Nonwoven composites incorporating the skin-friendly absorbent substrate are devoid of loose particles, drapable, flexible, adsorptive, and as shown in this paper flame retardant. Carbon fibres additionally perfect protects the whole composite against fire. Treated this composite with antimicrobial azalide compound this paper reached the high antimicrobial protection, especially against Gram positive bacteria. This recently used microlide type of human antibiotic, resulted as the most efficient compound for the antibacterial finishing previously confirmed on cotton and PET fabrics. Also, when zeolite is added in the finishing bath, the synergism of azalite and zeolite is evident. 5 REFERENCES [1] Ramkumar, S.S. et al.: Next Generation Non-particulate Dry Nonwoven Wipe for Chemical Warfare
Agent Decontamination, Ind. Eng. Chem. Res. 47 (2008) 24, 6885-6895, ISSN 0088- 5885 [2] Sata, U. et al.: Highly efficient nonwoven chemical warfare (CW) decontamination and filtration wipe,
International Nonwovens Technical Conference Proceedings, St. Louis MO, USA, Sept. 19-22, (2005) [3] Ramkumar, S.S.: Process for Making Chemical Protective Wipes and Such Wipes, U.S. Patent 7,516,
525, April 14, (2009) [4] Octenisept®, Schülke Product Information: Wound and muscous membrane disinfection,
http://www.schuelkemayr.com/download/pdf/cint_len_Octenisept_ENG_59_prod.pdf; accesed 1st April 2009.
[5] Antiseptics; http://en.wikipedia.org/wiki/Antiseptic, accesed 1st July 2009. LOTEFI, New Multifunctional Textiles: Antimicrobial Treatments, International Workshop "Intelligent Textile Structures - Application & Testing“, Thessaloniki, Greece 12-13 May 2005.
[6] Grancarić, A. M., Tarbuk, A.; Kovaček, I., Nagl, A., Antimicrobial Protection of Pretreated Cotton, Conference Proceedings of the 6th World Textile Conference AUTEX 2006, Raleigh, USA, 100-106; 2006.
293
14
th Romanian Textiles and Leather Conference – CORTEP 2012
Sinaia, 6 - 8 September 2012
[7] Grancarić, A. M.; Tarbuk, A.; Kovaček, I., Nanoparticles of Activated Natural Zeolite on Textiles for Protection and Therapy; Chemical Industry & Chemical Engineering Quarterly 15; 201-208, (2009), ISSN 1451-9372
[8] Grancarić, A. M., Marković, L.; Tarbuk, A., Active Multifunctional Cotton Treated with Zeolite Nanoparticles, Tekstil 56, 543-553, (2007) ISSN 0492-5882
[9] Klimaviciute, V., Grancaric, A., Tarbuk, A. Flame Retardancy of Narrow PP/PET Textiles for Military Use, Proceedings of 9th AUTEX Conference, Engineering - Development and Modernization of Production, Egipat, Kairo; University of Bihac, Faculty of Technical Engineering, 2009, CD-ROM, 1-6
[10] Grancarić, A. M., Tarbuk, A.; Klimaviciute, V.; Fiamengo, I. Flame Retardant Narrow Cotton – Decomposition of Cotton Cellulose, Proceedings of AUTEX2010 10th World Textile Conference, Vilnus, Kaunas University of Technology, 2010. CD ROM, Finishing, Dyeing (1)-Finishing, Dyeing (6)
[11] Grancarić, Anamarija; Tarbuk, Anita; Ramkumar, S. Seshadri. Flame Retardancy of Nonwoven Composite Proceedings of 4
th Scientific-Professional Symposium Textile Science and Economy,
Ujević, Darko ; Penava, Željko (Ed.), 127-130, ISBN: 978-953-7105-39-6, Zagreb, Faculty of Textile Technology University of Zagreb, Zagreb, Croatia (2011)
Corresponding author: Ana Marija GRANCARIC University of Zagreb Faculty of Textile Technology, Department of Textile Chemistry and Ecology, Prilaz baruna Filipovića 30 HR-10000 Zagreb, Croatia Phone: +3851 4877 360 Fax: +3851 4877 355 E-mail: [email protected]
Co-author(s): Lea BOTTERI University of Zagreb Faculty of Textile Technology, Department of Textile Chemistry and Ecology, Prilaz baruna Filipovića 28a HR-10000 Zagreb, Croatia Phone: +3851 4877 358 Fax: +3851 4877 355 E-mail: [email protected] Anita TARBUK University of Zagreb Faculty of Textile Technology, Department of Textile Chemistry and Ecology, Prilaz baruna Filipovića 28a HR-10000 Zagreb, Croatia Phone: +3851 4877 358; Fax: +3851 4877 355; E-mail: [email protected]
294
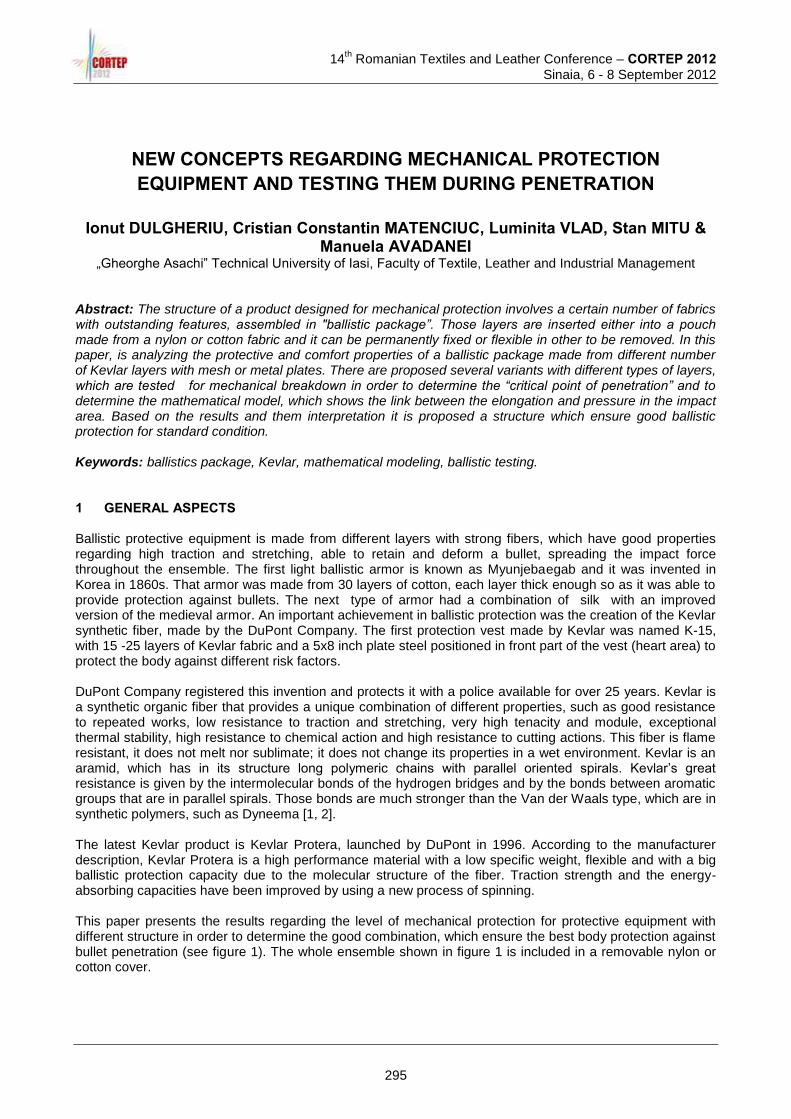
14
th Romanian Textiles and Leather Conference – CORTEP 2012
Sinaia, 6 - 8 September 2012
NEW CONCEPTS REGARDING MECHANICAL PROTECTION EQUIPMENT AND TESTING THEM DURING PENETRATION
Ionut DULGHERIU, Cristian Constantin MATENCIUC, Luminita VLAD, Stan MITU &
Manuela AVADANEI „Gheorghe Asachi” Technical University of Iasi, Faculty of Textile, Leather and Industrial Management
Abstract: The structure of a product designed for mechanical protection involves a certain number of fabrics with outstanding features, assembled in "ballistic package”. Those layers are inserted either into a pouch made from a nylon or cotton fabric and it can be permanently fixed or flexible in other to be removed. In this paper, is analyzing the protective and comfort properties of a ballistic package made from different number of Kevlar layers with mesh or metal plates. There are proposed several variants with different types of layers, which are tested for mechanical breakdown in order to determine the “critical point of penetration” and to determine the mathematical model, which shows the link between the elongation and pressure in the impact area. Based on the results and them interpretation it is proposed a structure which ensure good ballistic protection for standard condition. Keywords: ballistics package, Kevlar, mathematical modeling, ballistic testing. 1 GENERAL ASPECTS Ballistic protective equipment is made from different layers with strong fibers, which have good properties regarding high traction and stretching, able to retain and deform a bullet, spreading the impact force throughout the ensemble. The first light ballistic armor is known as Myunjebaegab and it was invented in Korea in 1860s. That armor was made from 30 layers of cotton, each layer thick enough so as it was able to provide protection against bullets. The next type of armor had a combination of silk with an improved version of the medieval armor. An important achievement in ballistic protection was the creation of the Kevlar synthetic fiber, made by the DuPont Company. The first protection vest made by Kevlar was named K-15, with 15 -25 layers of Kevlar fabric and a 5x8 inch plate steel positioned in front part of the vest (heart area) to protect the body against different risk factors. DuPont Company registered this invention and protects it with a police available for over 25 years. Kevlar is a synthetic organic fiber that provides a unique combination of different properties, such as good resistance to repeated works, low resistance to traction and stretching, very high tenacity and module, exceptional thermal stability, high resistance to chemical action and high resistance to cutting actions. This fiber is flame resistant, it does not melt nor sublimate; it does not change its properties in a wet environment. Kevlar is an aramid, which has in its structure long polymeric chains with parallel oriented spirals. Kevlar’s great resistance is given by the intermolecular bonds of the hydrogen bridges and by the bonds between aromatic groups that are in parallel spirals. Those bonds are much stronger than the Van der Waals type, which are in synthetic polymers, such as Dyneema [1, 2]. The latest Kevlar product is Kevlar Protera, launched by DuPont in 1996. According to the manufacturer description, Kevlar Protera is a high performance material with a low specific weight, flexible and with a big ballistic protection capacity due to the molecular structure of the fiber. Traction strength and the energy-absorbing capacities have been improved by using a new process of spinning. This paper presents the results regarding the level of mechanical protection for protective equipment with different structure in order to determine the good combination, which ensure the best body protection against bullet penetration (see figure 1). The whole ensemble shown in figure 1 is included in a removable nylon or cotton cover.
295
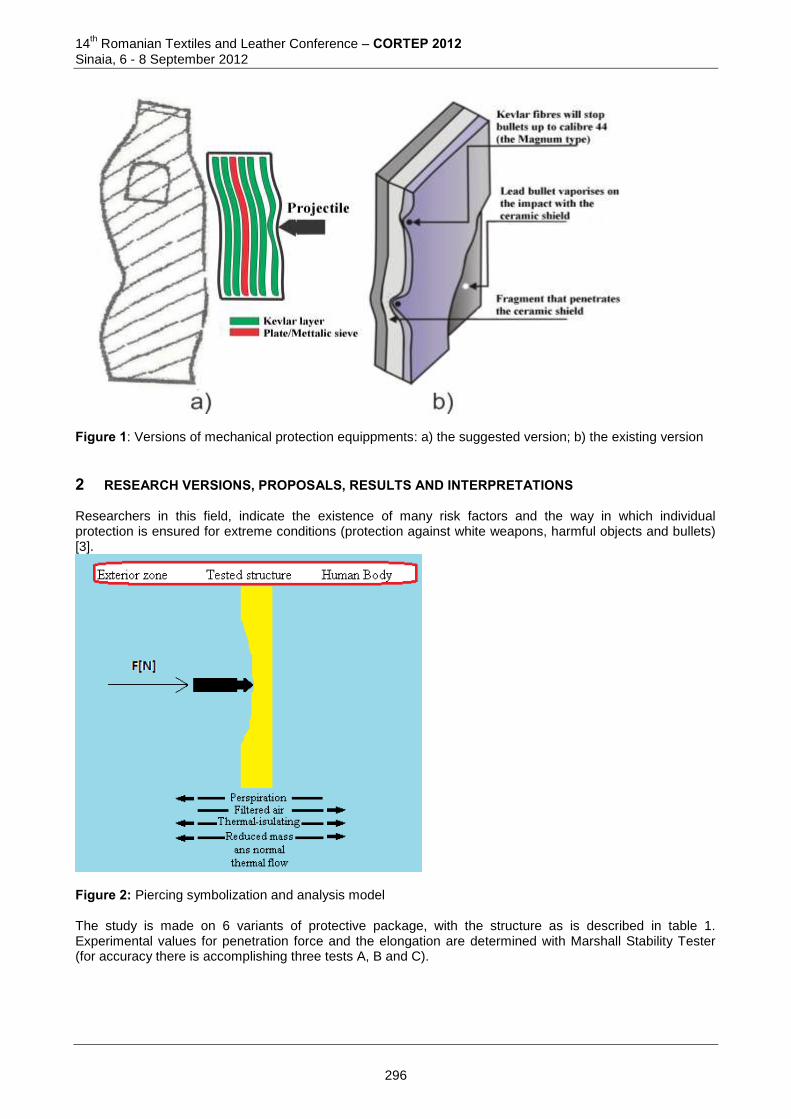
14th Romanian Textiles and Leather Conference – CORTEP 2012
Sinaia, 6 - 8 September 2012
Figure 1: Versions of mechanical protection equippments: a) the suggested version; b) the existing version
2 RESEARCH VERSIONS, PROPOSALS, RESULTS AND INTERPRETATIONS Researchers in this field, indicate the existence of many risk factors and the way in which individual protection is ensured for extreme conditions (protection against white weapons, harmful objects and bullets) [3].
Figure 2: Piercing symbolization and analysis model The study is made on 6 variants of protective package, with the structure as is described in table 1. Experimental values for penetration force and the elongation are determined with Marshall Stability Tester (for accuracy there is accomplishing three tests A, B and C).
296
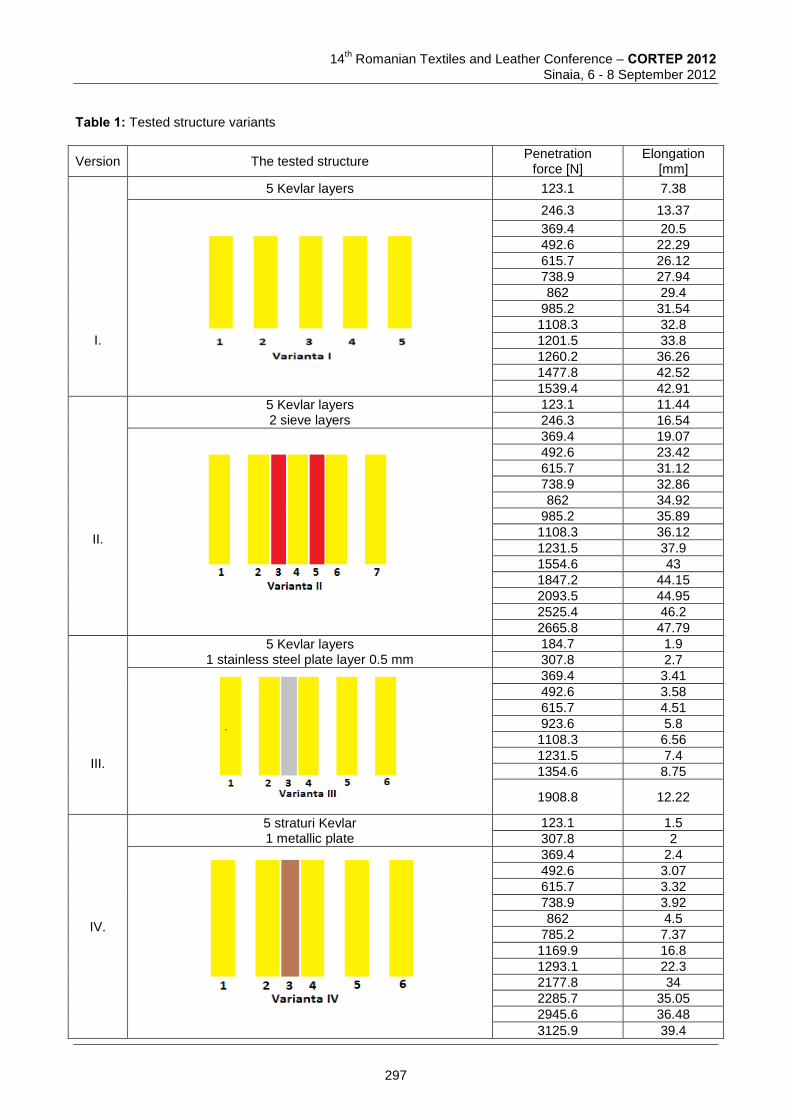
14
th Romanian Textiles and Leather Conference – CORTEP 2012
Sinaia, 6 - 8 September 2012
Table 1: Tested structure variants
Version The tested structure Penetration
force [N] Elongation
[mm]
I.
5 Kevlar layers 123.1 7.38
246.3 13.37
369.4 20.5
492.6 22.29
615.7 26.12
738.9 27.94
862 29.4
985.2 31.54
1108.3 32.8
1201.5 33.8
1260.2 36.26
1477.8 42.52
1539.4 42.91
II.
5 Kevlar layers 2 sieve layers
123.1 11.44
246.3 16.54
369.4 19.07
492.6 23.42
615.7 31.12
738.9 32.86
862 34.92
985.2 35.89
1108.3 36.12
1231.5 37.9
1554.6 43
1847.2 44.15
2093.5 44.95
2525.4 46.2
2665.8 47.79
III.
5 Kevlar layers 1 stainless steel plate layer 0.5 mm
184.7 1.9
307.8 2.7
369.4 3.41
492.6 3.58
615.7 4.51
923.6 5.8
1108.3 6.56
1231.5 7.4
1354.6 8.75
1908.8 12.22
IV.
5 straturi Kevlar 1 metallic plate
123.1 1.5
307.8 2
369.4 2.4
492.6 3.07
615.7 3.32
738.9 3.92
862 4.5
785.2 7.37
1169.9 16.8
1293.1 22.3
2177.8 34
2285.7 35.05
2945.6 36.48
3125.9 39.4
297
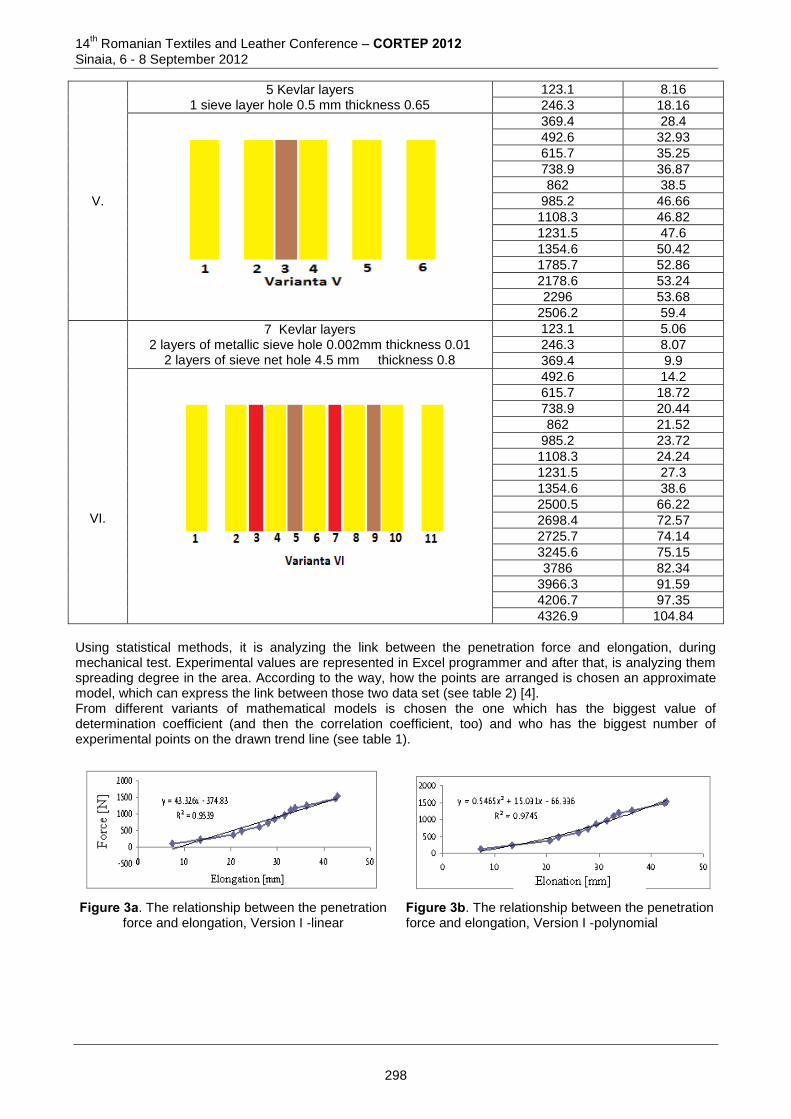
14th Romanian Textiles and Leather Conference – CORTEP 2012
Sinaia, 6 - 8 September 2012
V.
5 Kevlar layers 1 sieve layer hole 0.5 mm thickness 0.65
123.1 8.16
246.3 18.16
369.4 28.4
492.6 32.93
615.7 35.25
738.9 36.87
862 38.5
985.2 46.66
1108.3 46.82
1231.5 47.6
1354.6 50.42
1785.7 52.86
2178.6 53.24
2296 53.68
2506.2 59.4
VI.
7 Kevlar layers 2 layers of metallic sieve hole 0.002mm thickness 0.01
2 layers of sieve net hole 4.5 mm thickness 0.8
123.1 5.06
246.3 8.07
369.4 9.9
492.6 14.2
615.7 18.72
738.9 20.44
862 21.52
985.2 23.72
1108.3 24.24
1231.5 27.3
1354.6 38.6
2500.5 66.22
2698.4 72.57
2725.7 74.14
3245.6 75.15
3786 82.34
3966.3 91.59
4206.7 97.35
4326.9 104.84
Using statistical methods, it is analyzing the link between the penetration force and elongation, during mechanical test. Experimental values are represented in Excel programmer and after that, is analyzing them spreading degree in the area. According to the way, how the points are arranged is chosen an approximate model, which can express the link between those two data set (see table 2) [4]. From different variants of mathematical models is chosen the one which has the biggest value of determination coefficient (and then the correlation coefficient, too) and who has the biggest number of experimental points on the drawn trend line (see table 1).
Figure 3a. The relationship between the penetration force and elongation, Version I -linear
Figure 3b. The relationship between the penetration force and elongation, Version I -polynomial
298

14
th Romanian Textiles and Leather Conference – CORTEP 2012
Sinaia, 6 - 8 September 2012
Figure 4a. The relationship between the penetration force and elongation, Version II -linear
Figure 4b. The relationship between the penetration force and elongation, Version II -polynomial
Figure 5a. The relationship between the penetration force and elongation, Version III -linear
Figure 5b The relationship between the penetration force and elongation, Version III -polynomial
Figure 6a. The relationship between the penetration force and elongation, Version IV -linear
Figure 6b. The relationship between the penetration force and elongation, Version IV -polynomial
Figure 7a. The relationship between the penetration force and elongation, Version V -linear
Figure 7b. The relationship between the penetration force and elongation, Version V -polynomial
Figure 8a. The relationship between the penetration force and elongation, Version VI -linear
Figure 8b. The relationship between the penetration force and elongation, Version VI -polynomial
299
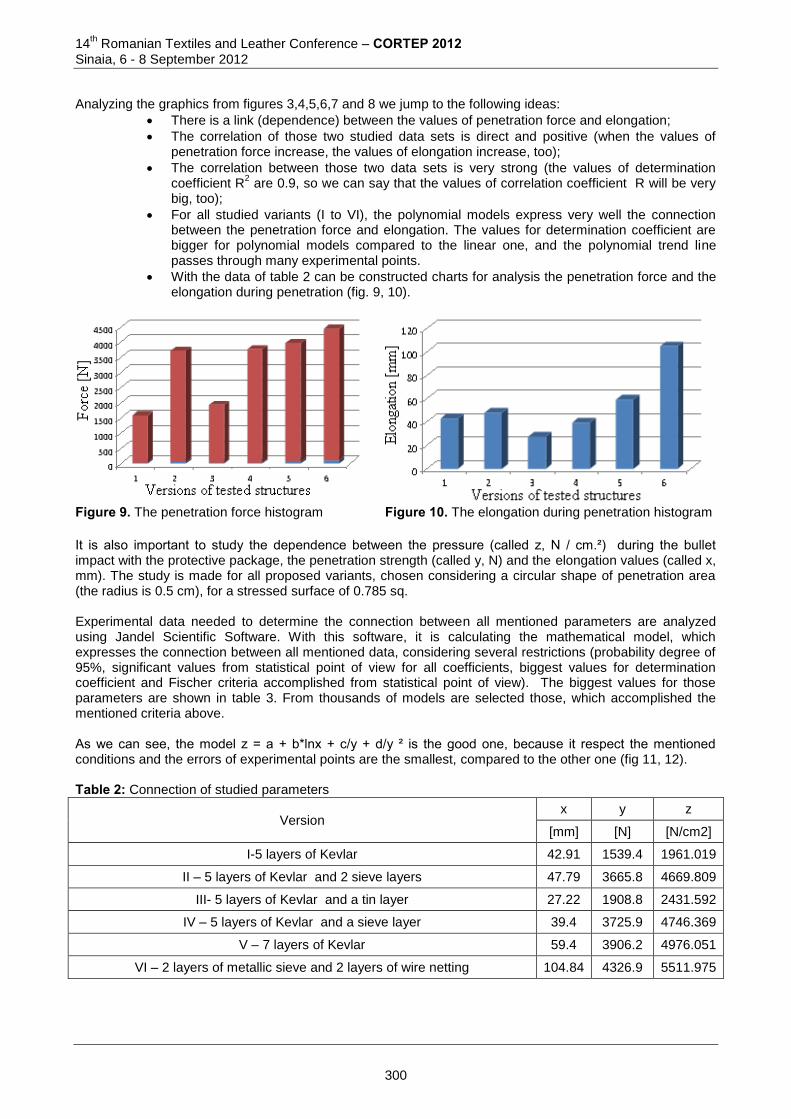
14th Romanian Textiles and Leather Conference – CORTEP 2012
Sinaia, 6 - 8 September 2012
Analyzing the graphics from figures 3,4,5,6,7 and 8 we jump to the following ideas:
There is a link (dependence) between the values of penetration force and elongation;
The correlation of those two studied data sets is direct and positive (when the values of penetration force increase, the values of elongation increase, too);
The correlation between those two data sets is very strong (the values of determination coefficient R
2 are 0.9, so we can say that the values of correlation coefficient R will be very
big, too);
For all studied variants (I to VI), the polynomial models express very well the connection between the penetration force and elongation. The values for determination coefficient are bigger for polynomial models compared to the linear one, and the polynomial trend line passes through many experimental points.
With the data of table 2 can be constructed charts for analysis the penetration force and the elongation during penetration (fig. 9, 10).
Figure 9. The penetration force histogram Figure 10. The elongation during penetration histogram
It is also important to study the dependence between the pressure (called z, N / cm.²) during the bullet impact with the protective package, the penetration strength (called y, N) and the elongation values (called x, mm). The study is made for all proposed variants, chosen considering a circular shape of penetration area (the radius is 0.5 cm), for a stressed surface of 0.785 sq. Experimental data needed to determine the connection between all mentioned parameters are analyzed using Jandel Scientific Software. With this software, it is calculating the mathematical model, which expresses the connection between all mentioned data, considering several restrictions (probability degree of 95%, significant values from statistical point of view for all coefficients, biggest values for determination coefficient and Fischer criteria accomplished from statistical point of view). The biggest values for those parameters are shown in table 3. From thousands of models are selected those, which accomplished the mentioned criteria above. As we can see, the model z = a + b*lnx + c/y + d/y ² is the good one, because it respect the mentioned conditions and the errors of experimental points are the smallest, compared to the other one (fig 11, 12). Table 2: Connection of studied parameters
Version x y z
[mm] [N] [N/cm2]
I-5 layers of Kevlar 42.91 1539.4 1961.019
II – 5 layers of Kevlar and 2 sieve layers 47.79 3665.8 4669.809
III- 5 layers of Kevlar and a tin layer 27.22 1908.8 2431.592
IV – 5 layers of Kevlar and a sieve layer 39.4 3725.9 4746.369
V – 7 layers of Kevlar 59.4 3906.2 4976.051
VI – 2 layers of metallic sieve and 2 layers of wire netting 104.84 4326.9 5511.975
300
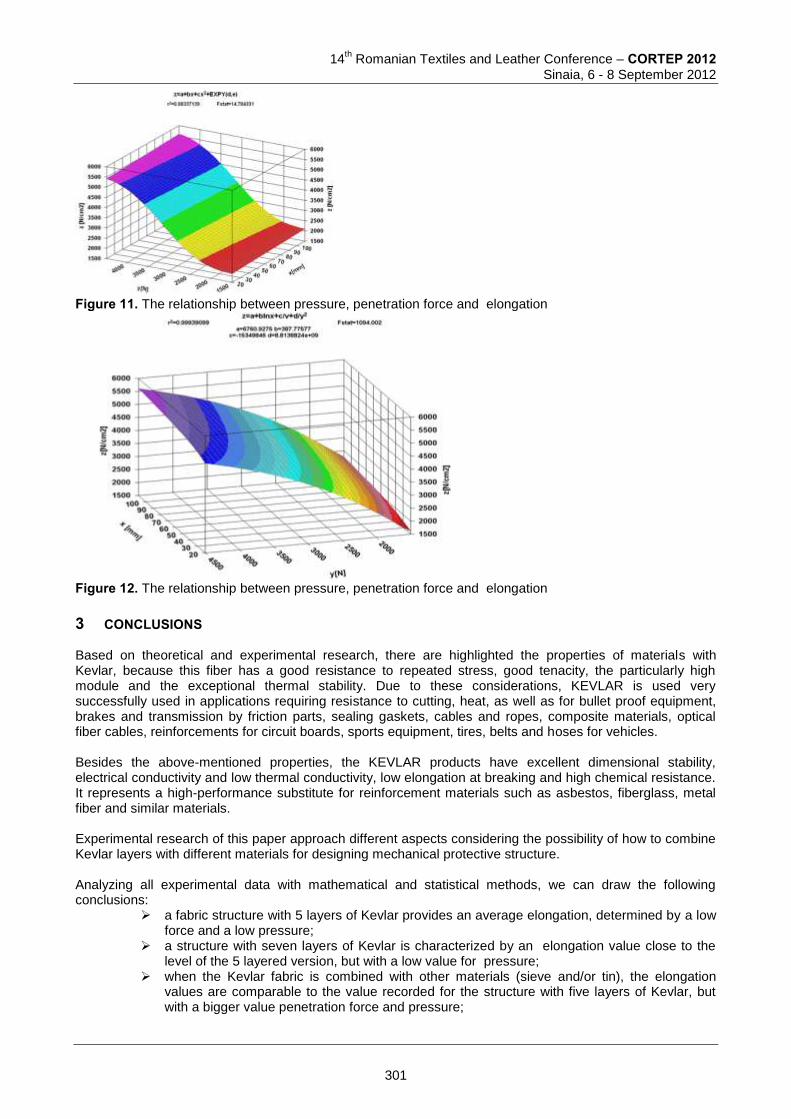
14
th Romanian Textiles and Leather Conference – CORTEP 2012
Sinaia, 6 - 8 September 2012
Figure 11. The relationship between pressure, penetration force and elongation
Figure 12. The relationship between pressure, penetration force and elongation
3 CONCLUSIONS Based on theoretical and experimental research, there are highlighted the properties of materials with Kevlar, because this fiber has a good resistance to repeated stress, good tenacity, the particularly high module and the exceptional thermal stability. Due to these considerations, KEVLAR is used very successfully used in applications requiring resistance to cutting, heat, as well as for bullet proof equipment, brakes and transmission by friction parts, sealing gaskets, cables and ropes, composite materials, optical fiber cables, reinforcements for circuit boards, sports equipment, tires, belts and hoses for vehicles. Besides the above-mentioned properties, the KEVLAR products have excellent dimensional stability, electrical conductivity and low thermal conductivity, low elongation at breaking and high chemical resistance. It represents a high-performance substitute for reinforcement materials such as asbestos, fiberglass, metal fiber and similar materials. Experimental research of this paper approach different aspects considering the possibility of how to combine Kevlar layers with different materials for designing mechanical protective structure. Analyzing all experimental data with mathematical and statistical methods, we can draw the following conclusions:
a fabric structure with 5 layers of Kevlar provides an average elongation, determined by a low force and a low pressure;
a structure with seven layers of Kevlar is characterized by an elongation value close to the level of the 5 layered version, but with a low value for pressure;
when the Kevlar fabric is combined with other materials (sieve and/or tin), the elongation values are comparable to the value recorded for the structure with five layers of Kevlar, but with a bigger value penetration force and pressure;
301
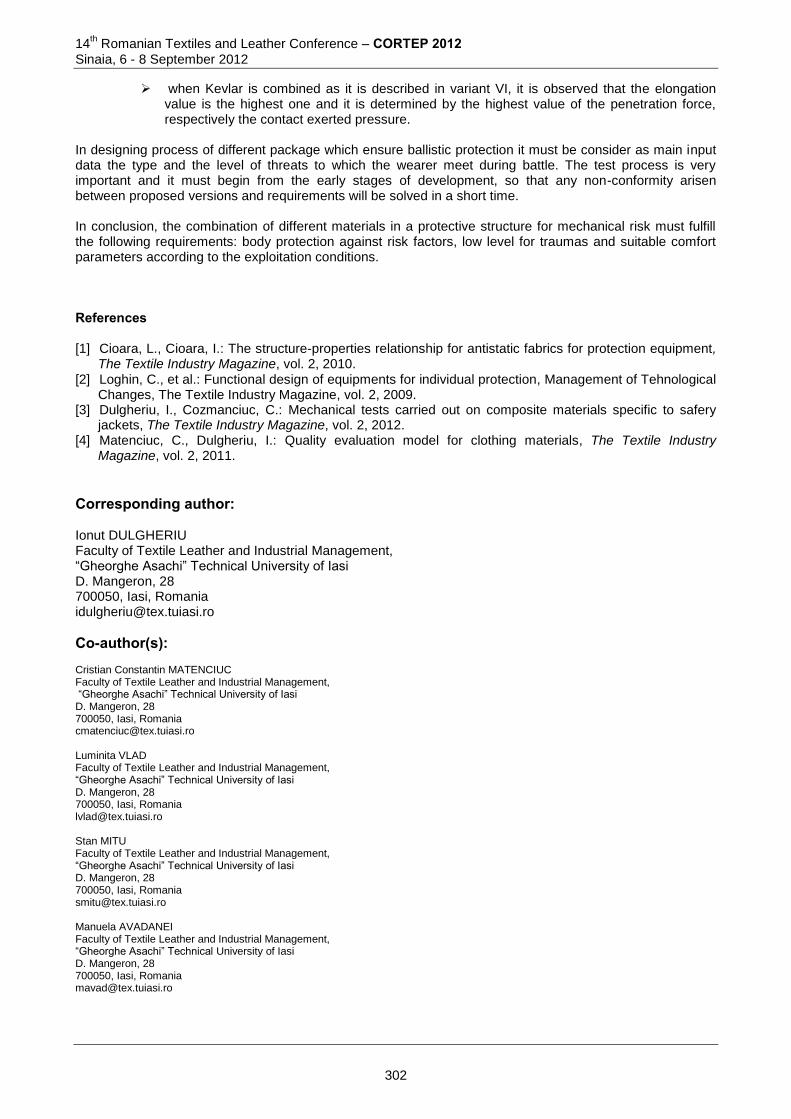
14th Romanian Textiles and Leather Conference – CORTEP 2012
Sinaia, 6 - 8 September 2012
when Kevlar is combined as it is described in variant VI, it is observed that the elongation value is the highest one and it is determined by the highest value of the penetration force, respectively the contact exerted pressure.
In designing process of different package which ensure ballistic protection it must be consider as main input data the type and the level of threats to which the wearer meet during battle. The test process is very important and it must begin from the early stages of development, so that any non-conformity arisen between proposed versions and requirements will be solved in a short time. In conclusion, the combination of different materials in a protective structure for mechanical risk must fulfill the following requirements: body protection against risk factors, low level for traumas and suitable comfort parameters according to the exploitation conditions. References [1] Cioara, L., Cioara, I.: The structure-properties relationship for antistatic fabrics for protection equipment,
The Textile Industry Magazine, vol. 2, 2010. [2] Loghin, C., et al.: Functional design of equipments for individual protection, Management of Tehnological
Changes, The Textile Industry Magazine, vol. 2, 2009. [3] Dulgheriu, I., Cozmanciuc, C.: Mechanical tests carried out on composite materials specific to safery
jackets, The Textile Industry Magazine, vol. 2, 2012. [4] Matenciuc, C., Dulgheriu, I.: Quality evaluation model for clothing materials, The Textile Industry
Magazine, vol. 2, 2011.
Corresponding author: Ionut DULGHERIU Faculty of Textile Leather and Industrial Management, “Gheorghe Asachi” Technical University of Iasi D. Mangeron, 28 700050, Iasi, Romania [email protected]
Co-author(s): Cristian Constantin MATENCIUC Faculty of Textile Leather and Industrial Management, “Gheorghe Asachi” Technical University of Iasi D. Mangeron, 28 700050, Iasi, Romania [email protected] Luminita VLAD Faculty of Textile Leather and Industrial Management, “Gheorghe Asachi” Technical University of Iasi D. Mangeron, 28 700050, Iasi, Romania [email protected] Stan MITU Faculty of Textile Leather and Industrial Management, “Gheorghe Asachi” Technical University of Iasi D. Mangeron, 28 700050, Iasi, Romania [email protected] Manuela AVADANEI Faculty of Textile Leather and Industrial Management, “Gheorghe Asachi” Technical University of Iasi D. Mangeron, 28 700050, Iasi, Romania [email protected]
302
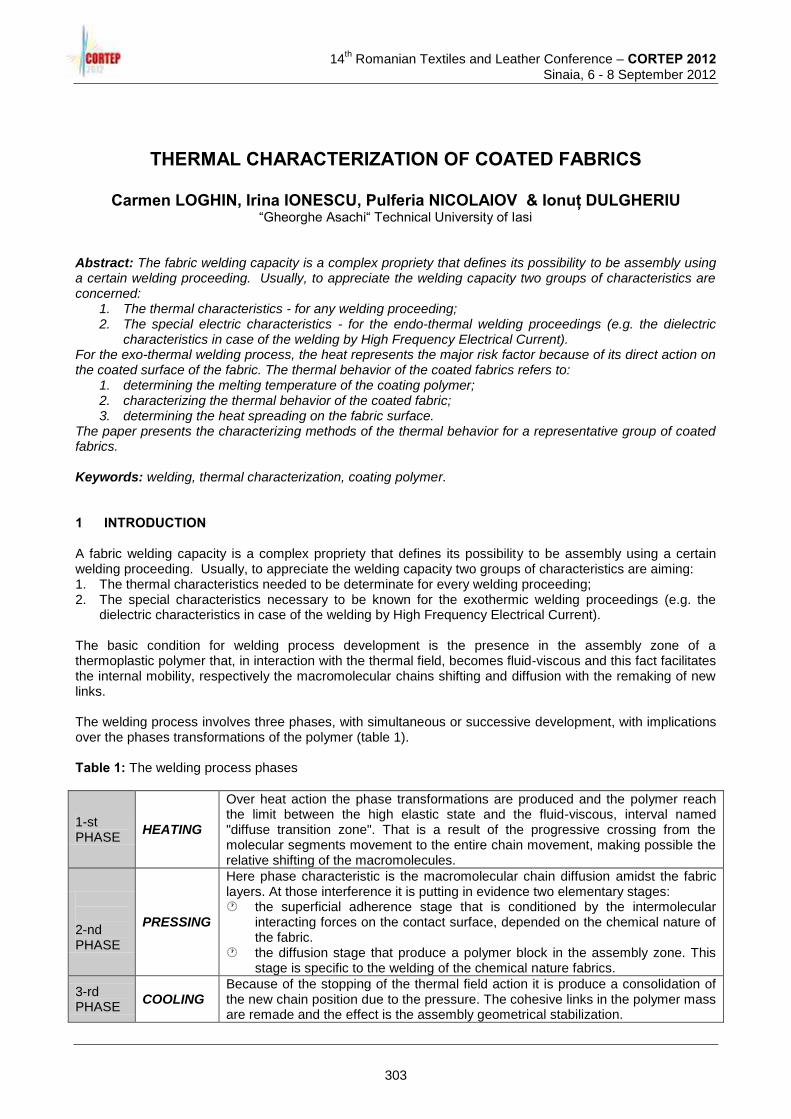
14
th Romanian Textiles and Leather Conference – CORTEP 2012
Sinaia, 6 - 8 September 2012
THERMAL CHARACTERIZATION OF COATED FABRICS
Carmen LOGHIN, Irina IONESCU, Pulferia NICOLAIOV & Ionuț DULGHERIU “Gheorghe Asachi“ Technical University of Iasi
Abstract: The fabric welding capacity is a complex propriety that defines its possibility to be assembly using a certain welding proceeding. Usually, to appreciate the welding capacity two groups of characteristics are concerned:
1. The thermal characteristics - for any welding proceeding; 2. The special electric characteristics - for the endo-thermal welding proceedings (e.g. the dielectric
characteristics in case of the welding by High Frequency Electrical Current). For the exo-thermal welding process, the heat represents the major risk factor because of its direct action on the coated surface of the fabric. The thermal behavior of the coated fabrics refers to:
1. determining the melting temperature of the coating polymer; 2. characterizing the thermal behavior of the coated fabric; 3. determining the heat spreading on the fabric surface.
The paper presents the characterizing methods of the thermal behavior for a representative group of coated fabrics. Keywords: welding, thermal characterization, coating polymer. 1 INTRODUCTION A fabric welding capacity is a complex propriety that defines its possibility to be assembly using a certain welding proceeding. Usually, to appreciate the welding capacity two groups of characteristics are aiming: 1. The thermal characteristics needed to be determinate for every welding proceeding; 2. The special characteristics necessary to be known for the exothermic welding proceedings (e.g. the
dielectric characteristics in case of the welding by High Frequency Electrical Current). The basic condition for welding process development is the presence in the assembly zone of a thermoplastic polymer that, in interaction with the thermal field, becomes fluid-viscous and this fact facilitates the internal mobility, respectively the macromolecular chains shifting and diffusion with the remaking of new links. The welding process involves three phases, with simultaneous or successive development, with implications over the phases transformations of the polymer (table 1). Table 1: The welding process phases
1-st PHASE
HEATING
Over heat action the phase transformations are produced and the polymer reach the limit between the high elastic state and the fluid-viscous, interval named "diffuse transition zone". That is a result of the progressive crossing from the molecular segments movement to the entire chain movement, making possible the relative shifting of the macromolecules.
2-nd PHASE
PRESSING
Here phase characteristic is the macromolecular chain diffusion amidst the fabric layers. At those interference it is putting in evidence two elementary stages: the superficial adherence stage that is conditioned by the intermolecular
interacting forces on the contact surface, depended on the chemical nature of the fabric.
the diffusion stage that produce a polymer block in the assembly zone. This stage is specific to the welding of the chemical nature fabrics.
3-rd PHASE
COOLING Because of the stopping of the thermal field action it is produce a consolidation of the new chain position due to the pressure. The cohesive links in the polymer mass are remade and the effect is the assembly geometrical stabilization.
303

14th Romanian Textiles and Leather Conference – CORTEP 2012
Sinaia, 6 - 8 September 2012
2 MATERIALS AND METHODS The specific character of the phenomena governing the welding process is a decisive argument to investigate the thermal behavior of the coated fabrics. In the exo-thermal process, the temperature is the principal risk factor because of the heat intensity action to the fabric. The thermal behavior of the composite fabrics refers to: determining the melting temperature of the coating polymer; characterizing the thermal behavior of the coated fabric; determining the heat spreading on the fabric surface. The paper presents the characterization of the thermal behavior for a representative group of coated fabrics presented in table 2. Table 2: Characteristics of coated fabrics
Cod Commercial category Fabric
composition
Coating polymer
Chemical nature
Coating method Orientation
F1 Gore-tex tape - PUR + Hot melt Laminated -
F2 Cissarel 100%PA PUR Indirect
stratification Exterior
F3 - 100%PES PUR Impregnation Exterior
F4 - - PCV Single layer -
F5 Tyvek PRO-TECH "F" 100%PE PE Laminated Exterior
To characterizing the thermal behavior of the mentioned coated fabrics and to put in evidence the melting intervals it is used the thermogravimetric analyze in un-isothermal conditions. The MOM derivatographic type PAULIK-PAULIK-ERDEY has been used. There are applied the following analyze methods:
the thermogravimetry (TG);
the derivative thermogravimetry (DTG);
the differential thermal analyze (DTA). DTA is a dynamic technique that permits to record the temperature difference between the sample and the reference substance depending on time or temperature. The same substances are placed in the same enclosure and in programmed heating conditions. TG permits the mass measurement of a heating or cooling sample depending on time or temperature. The complex processes are took place in successive serial stages. DTG is the technique with that it is possible to deduce the differential of a thermo gravimetrical curve depending on time or temperature, giving information about the kinetics of the thermal decomposition processes. The thermograms (presented as superimposed curves, figure 1 and 2) were been recorded in the same conditions to avoid the dates modifications and to permits their comparing:
sample mass - 50 mg;
heating speed - 12 oC/min;
DTG, DTA sensibility - 1/10;
the maximal temperature - 900 oC;
reference substance - Al2O3;
normal environment.
304
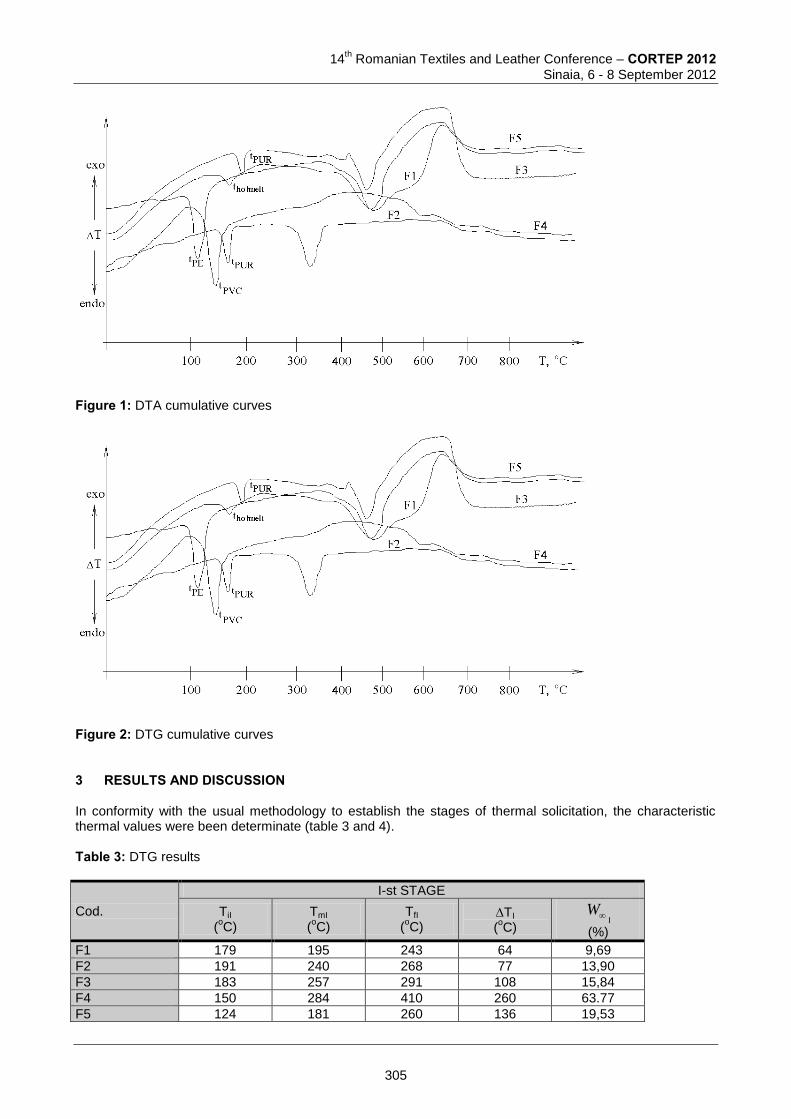
14
th Romanian Textiles and Leather Conference – CORTEP 2012
Sinaia, 6 - 8 September 2012
Figure 1: DTA cumulative curves
Figure 2: DTG cumulative curves 3 RESULTS AND DISCUSSION In conformity with the usual methodology to establish the stages of thermal solicitation, the characteristic thermal values were been determinate (table 3 and 4). Table 3: DTG results
Cod.
I-st STAGE
TiI (oC)
TmI (oC)
TfI (oC)
TI (oC)
WI
(%)
F1 179 195 243 64 9,69
F2 191 240 268 77 13,90
F3 183 257 291 108 15,84
F4 150 284 410 260 63.77
F5 124 181 260 136 19,53
305
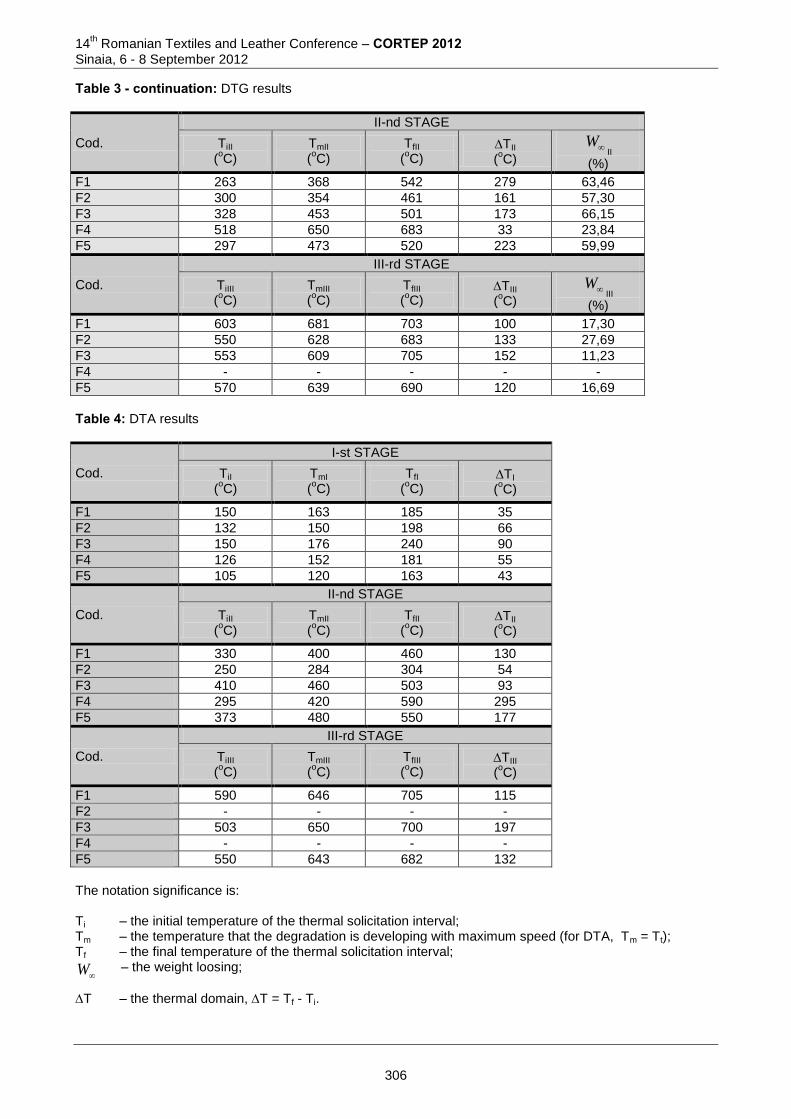
14th Romanian Textiles and Leather Conference – CORTEP 2012
Sinaia, 6 - 8 September 2012
Table 3 - continuation: DTG results
Cod.
II-nd STAGE
TiII (oC)
TmII (oC)
TfII (oC)
TII (oC)
WII
(%)
F1 263 368 542 279 63,46
F2 300 354 461 161 57,30
F3 328 453 501 173 66,15
F4 518 650 683 33 23,84
F5 297 473 520 223 59,99
Cod.
III-rd STAGE
TiIII (oC)
TmIII (oC)
TfIII (oC)
TIII (oC)
WIII
(%)
F1 603 681 703 100 17,30
F2 550 628 683 133 27,69
F3 553 609 705 152 11,23
F4 - - - - -
F5 570 639 690 120 16,69
Table 4: DTA results
Cod.
I-st STAGE
TiI (oC)
TmI (oC)
TfI (oC)
TI (oC)
F1 150 163 185 35
F2 132 150 198 66
F3 150 176 240 90
F4 126 152 181 55
F5 105 120 163 43
Cod.
II-nd STAGE
TiII (oC)
TmII (oC)
TfII (oC)
TII (oC)
F1 330 400 460 130
F2 250 284 304 54
F3 410 460 503 93
F4 295 420 590 295
F5 373 480 550 177
Cod.
III-rd STAGE
TiIII (oC)
TmIII (oC)
TfIII (oC)
TIII (oC)
F1 590 646 705 115
F2 - - - -
F3 503 650 700 197
F4 - - - -
F5 550 643 682 132
The notation significance is: Ti – the initial temperature of the thermal solicitation interval; Tm – the temperature that the degradation is developing with maximum speed (for DTA, Tm = Tt); Tf – the final temperature of the thermal solicitation interval;
– the weight loosing;
T – the thermal domain, T = Tf - Ti.
W
306
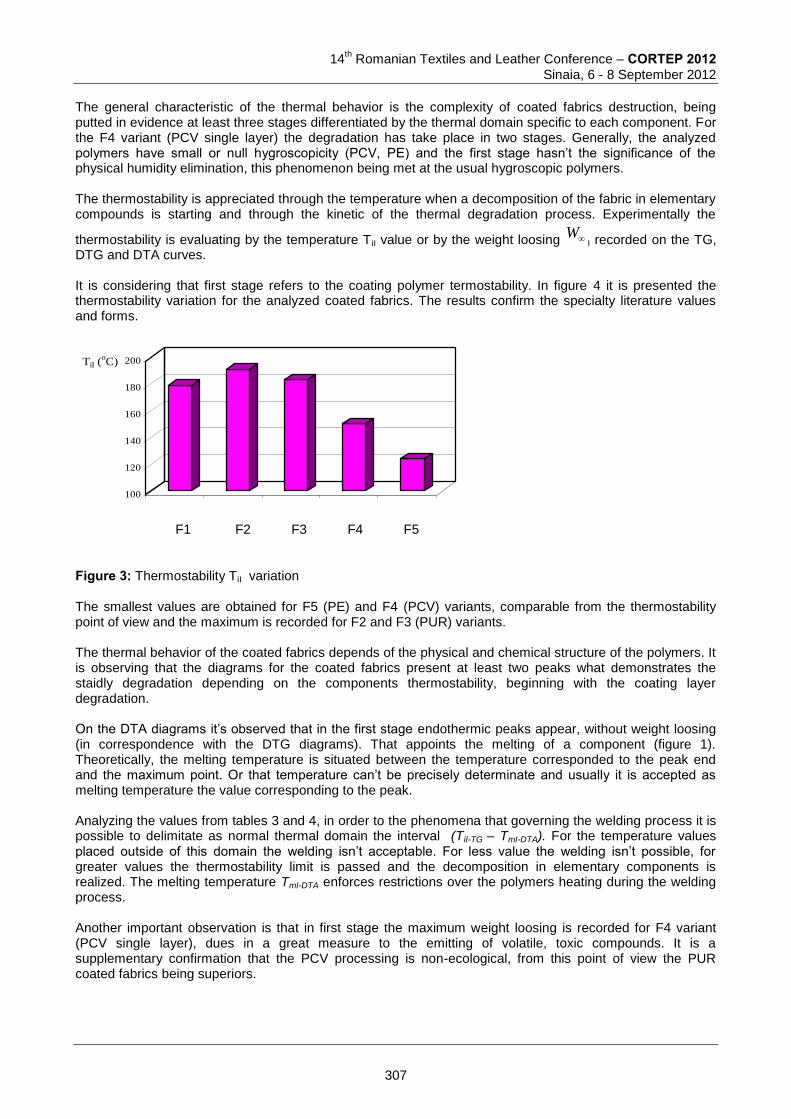
14
th Romanian Textiles and Leather Conference – CORTEP 2012
Sinaia, 6 - 8 September 2012
The general characteristic of the thermal behavior is the complexity of coated fabrics destruction, being putted in evidence at least three stages differentiated by the thermal domain specific to each component. For the F4 variant (PCV single layer) the degradation has take place in two stages. Generally, the analyzed polymers have small or null hygroscopicity (PCV, PE) and the first stage hasn’t the significance of the physical humidity elimination, this phenomenon being met at the usual hygroscopic polymers. The thermostability is appreciated through the temperature when a decomposition of the fabric in elementary compounds is starting and through the kinetic of the thermal degradation process. Experimentally the
thermostability is evaluating by the temperature TiI value or by the weight loosing WI recorded on the TG,
DTG and DTA curves. It is considering that first stage refers to the coating polymer termostability. In figure 4 it is presented the thermostability variation for the analyzed coated fabrics. The results confirm the specialty literature values and forms.
100
120
140
160
180
200TiI (oC)
Figure 3: Thermostability TiI variation The smallest values are obtained for F5 (PE) and F4 (PCV) variants, comparable from the thermostability point of view and the maximum is recorded for F2 and F3 (PUR) variants. The thermal behavior of the coated fabrics depends of the physical and chemical structure of the polymers. It is observing that the diagrams for the coated fabrics present at least two peaks what demonstrates the staidly degradation depending on the components thermostability, beginning with the coating layer degradation. On the DTA diagrams it’s observed that in the first stage endothermic peaks appear, without weight loosing (in correspondence with the DTG diagrams). That appoints the melting of a component (figure 1). Theoretically, the melting temperature is situated between the temperature corresponded to the peak end and the maximum point. Or that temperature can’t be precisely determinate and usually it is accepted as melting temperature the value corresponding to the peak. Analyzing the values from tables 3 and 4, in order to the phenomena that governing the welding process it is possible to delimitate as normal thermal domain the interval (TiI-TG – TmI-DTA). For the temperature values placed outside of this domain the welding isn’t acceptable. For less value the welding isn’t possible, for greater values the thermostability limit is passed and the decomposition in elementary components is realized. The melting temperature TmI-DTA enforces restrictions over the polymers heating during the welding process. Another important observation is that in first stage the maximum weight loosing is recorded for F4 variant (PCV single layer), dues in a great measure to the emitting of volatile, toxic compounds. It is a supplementary confirmation that the PCV processing is non-ecological, from this point of view the PUR coated fabrics being superiors.
F1 F2 F3 F4 F5
307
14th Romanian Textiles and Leather Conference – CORTEP 2012
Sinaia, 6 - 8 September 2012
4 CONCLUSIONS
1. The thermal characteristics’ knowing is a premise of the welding technological parameters establish. 2. The thermal behavior study is the only that permits to establish the useful thermal domain. 3. For the temperature values placed outside of this domain the welding isn’t acceptable. For less value the welding isn’t possible, for greater values the thermo-stability limit is passed and the decomposition in elementary components is realized. The melting temperature TmI-DTA enforces restrictions over the polymers heating during the welding process.
References [1] Finol, C.A., Robinson, K.: Thermal modelling of modern engines: a review of empirical correlations to
estimate the in-cylinder heat transfer coefficient, Heat Transfer, Macmillan Publishing Company, New York, 2006.
[2] Wang, F.S.: Mathematical modelling and computer simulation of insulation systems in below grade applications, Proceedings of the ASHRAE/DOE Thermal Performance of Exterior Envelopes of Buildings Conference, 1979.
[3] Mcmasters IV, R.L., Wichman, I.S.: Compound Material Thermal Parameters for a Layered Material Resembling an Automobile Firewall, Heat Transfer Engineering , 23:44–56, 2002
[4] Loghin, C.: PhD Thesis, “Gheorghe Asachi” Technical University, Iasi, Romania, 1999 [5] Nicolaiov, P.: PhD Thesis, “Gheorghe Asachi” Technical University, Iasi, Romania, 1998
Corresponding author: Carmen LOGHIN Department of Knitting and Clothing Engineering, Faculty of Textiles, Leather & Industrial Management, “Gheorghe Asachi” Technical University of Iasi Prof.dr.doc.Dimitrie Mangeron, 29 70050, Iasi, Romania phone: 0040 745 659 126 fax: 0040 232 230 491 e-mail: [email protected]
Co-author(s): Irina IONESCU Department of Knitting and Clothing Engineering, Faculty of Textiles, Leather & Industrial Management, “Gheorghe Asachi” Technical University of Iasi Prof.dr.doc.Dimitrie Mangeron, 29 70050, Iasi, Romania fax: 0040 232 230 491 e-mail: [email protected] Pulferia NICOLAIOV Department of Knitting and Clothing Engineering, Faculty of Textiles, Leather & Industrial Management, “Gheorghe Asachi” Technical University of Iasi Prof.dr.doc.Dimitrie Mangeron, 29 70050, Iasi, Romania fax: 0040 232 230 491 e-mail: [email protected] Ionuț DULGHERIU Department of Knitting and Clothing Engineering, Faculty of Textiles, Leather & Industrial Management, “Gheorghe Asachi” Technical University of Iasi Prof.dr.doc.Dimitrie Mangeron, 29 70050, Iasi, Romania fax: 0040 232 230 491 e-mail: [email protected]
308
14
th Romanian Textiles and Leather Conference – CORTEP 2012
Sinaia, 6 - 8 September 2012
STUDIU PRIVIND CERINTELE IMPUSE PRODUSELOR DE ÎMBRĂCĂMINTE DESTINATE PERSOANELOR CU NEVOI SPECIALE
Jana CÎRJĂ
Technical University of Moldova, Chișinău Abstract: Present researches concerning people with special needs are based on the concept of equal opportunities; therefore, the elements of clothing product must contribute to the improvement of life quality and increasing the independence for this category of people. In this paper, the research is focused on correlation of requirements formulated by people with special needs generated by the degree of restraint (minimum immobility, partial or complete) with the comfort properties of clothing products. The study identified the main requirements imposed for knitted clothing, in order to ensure a high level of comfort. The results have been achieved after interviewing a total of 80 people with special needs aged between 20 and 60 years. The study shows that persons with disabilities require specific clothing products and, in general, this category of users have big difficulties to purchase products in accordance with the requirements determined by their medical conditions. Keywords: disabilities, people with special needs, comfort, clothing. 1 INTRODUCERE
Produsul de îmbrăcăminte are funcții multiple, reprezentînd în mod cert, categoria de produse de cea mai mare necesitate în viața oamenilor. Dintr-n anumit punct de vedere, produsul de îmbrăcăminte are funcția de asigurare și apărare a corpului în condiții de mediu, muncă și casnic, iar din alt punct de vedere atestă apartenența socială a purtătorului și definește particularitățile personalității acestuia în raport cu societatea. Scopul acestei lucrări este de a prezenta nivelul actual de asigurare a persoanelor cu nevoi speciale cu produse vestimentare și identificarea cerințelor impuse de către acești purtători. Pe plan mondial există companii specializate, care produc produse de îmbrăcăminte „specială” pentru persoane cu dizabilități fizice, ceea ce nu putem spune despre Republica Moldova, cu toate că persoanele cu dizabilități reprezintă 4,31% din populația țării. Conform datelor statistice ale Comisiei Europene persoanele cu dizabilități reprezintă peste 15% din populația UE, 2,97% din populația României, 16,4 % din populația Federației Ruse și 4,31% din populația Republicii Moldova. În Satele Unite ale Americii, datele arată că 20,6% din populaţie, adică aproximativ 54 de milioane de americani suferă de una sau mai multe forme de dizabilităţi. Aceste date servesc drept puncte de pornire în studiul și rezolvarea problemelor ce țin de asigurarea acestei categorii de persoane cu produse de imbrăcăminte adecvate. Dizabilitatea poate sa apară din trei mari cauze: dizabilitate congenitală, dizabilitate dezvoltată și dizabilitate dobîndită. Dizabilitatea, indiferent de tip (fizic sau mental) reprezintă o formă de “stigmatizare socială“ iar cei care suferă se confruntă atât cu boala propriu-zisă cat și cu disconfortul funcțional și estetic al produselor de imbrăcaminte. Produsele adaptate persoanelor cu nevoi speciale vor contribui la asigurarea stării de confort fizic și psihic, atît de importante pentru oricare categorie de purtători. Prezentul studiu, privindid identificarea cerințelor impuse produselor de îmbrăcăminte din tricot destinate persoanelor cu nevoi speciale, pornește și are ca primă etapă definirea noțiunii de persoană cu nevoi speciale, cauzele apariției acestor nevoi precum și problemele ce determină cerințele pentru produsele de îmbracaminte destinate aceastei grupe de persoane.
309
14th Romanian Textiles and Leather Conference – CORTEP 2012
Sinaia, 6 - 8 September 2012
2 ASPECTE GENERALE PRIVIND PERSOANELE CU NEVOI SPECIALE Conform literaturii de specialitate, prin „persoane cu nevoi speciale” sunt numite persoanele cu dizabilități sau persoanele cu handicap. Termenul de nevoi speciale este o noţiune vagă, ambiguă, confuză, fiind introdus în literatură pentru a înlocui expresiile traumatizante de genul: anormal, deficient, inadaptat, sau pentru a îngloba, într-un termen mai general, toate dificultăţile întâmpinate de o persoană cu consecinţe directe pe plan social. Dizabilitatea, ca și concept, este greu de definit și de măsurat, datorită diversității manifestărilor clinice. Din acest motiv, claritatea conceptuală este un element fundamental pentru dezvoltarea unei baze teoretice de lucru în cercetarea temei propuse, respectiv proiectarea adecvată a îmbrăcămintei. De-a lungul timpului, pentru definirea noțiunii de dizabilitate au fost utilizaţi diferiţi termeni consideraţi sinonimi: deficienţă, incapacitate, handicap. Intre ei însă există diferenţe iar literatura de specialitate definește fiecare termen astfel: Deficienţa se referă la situaţia intrinsecă ce se defineşte în termeni medicali ca lipsă de integritate anatomică și funcțională a unui organ. Incapacitatea se referă la aspectul funcţional (lipsa de capacitate, funcționalitate limitată a activității fizice și/sau psihice a individului). Handicapul vizează în special aspectul social (dificultăţi de adaptare socială, individul avînd capacitate redusă de răspuns la cerințele mediului fizic și social). În literatura de specialitate actuală se folosesc termeni ca: persoane cu nevoi speciale, persoane cu cerințe educative speciale, persoane cu dizabilități etc., termeni considerați mai puțin traumatizanți, mai puțin stigmatizanți pentru persoanele in cauză. În urma studiului, în categoria persoanelor cu nevoi speciale s-au inclus:
persoane cu handicap
fizic,
psihic; persoane cu imobilizare
minimă,
parțială,
totală; persoane spitalizate
cu imobilizare,
cu mobilizare minimă,
fără imobilizare. 3 PARTEA EXPERIMENTALĂ Analizînd situația actuală cu privire la persoanele cu nevoi speciale din Republica Moldova, studiul s-a desfășurat în trei etape. Fiecare etapă s-a desfășurat după același principiu de cercetare, diferențierea realizîndu-se prin grupa sau categoria de personae cu nevoi speciale. În cadrul primei etape s-au luat în studiu persoanele din categoria celor spitalizate, cu diferite grade de imobilizare, aparute în urma unui traumatism, boli sau intervenție chirurgicală. Metoda de cercetare a fost metoda interviului, iar drept puncte de pornire au fost: analiza cauzelor apariției imobilizării, problemele care apar datorită imobilizării, problemele cu care se confruntă această categorie de persoane în ceea ce priveşte funcționalitatea îmbrăcămintei. În cadrul studiului au participat 80 de persoane spitalizate, de sex feminin și masculin, care au fost intervievați în baza unui chestionar. În studiu au fost incluse persoane cu vîrste cuprinse între 20 și 60 ani dintre care 60,32% au fost femei și 40,68 % bărbați (figura 1). Gradul de imobilizare în cazul persoanelor luate în studiu a fost definit drept un factor foarte important de influență asupra stării de confort, a capacității de muncă al persoanelor cu mișcari limitate, cît și asupra identificării cerințelor impuse materialelor textile din care urmează a se confecționa produsele.
310
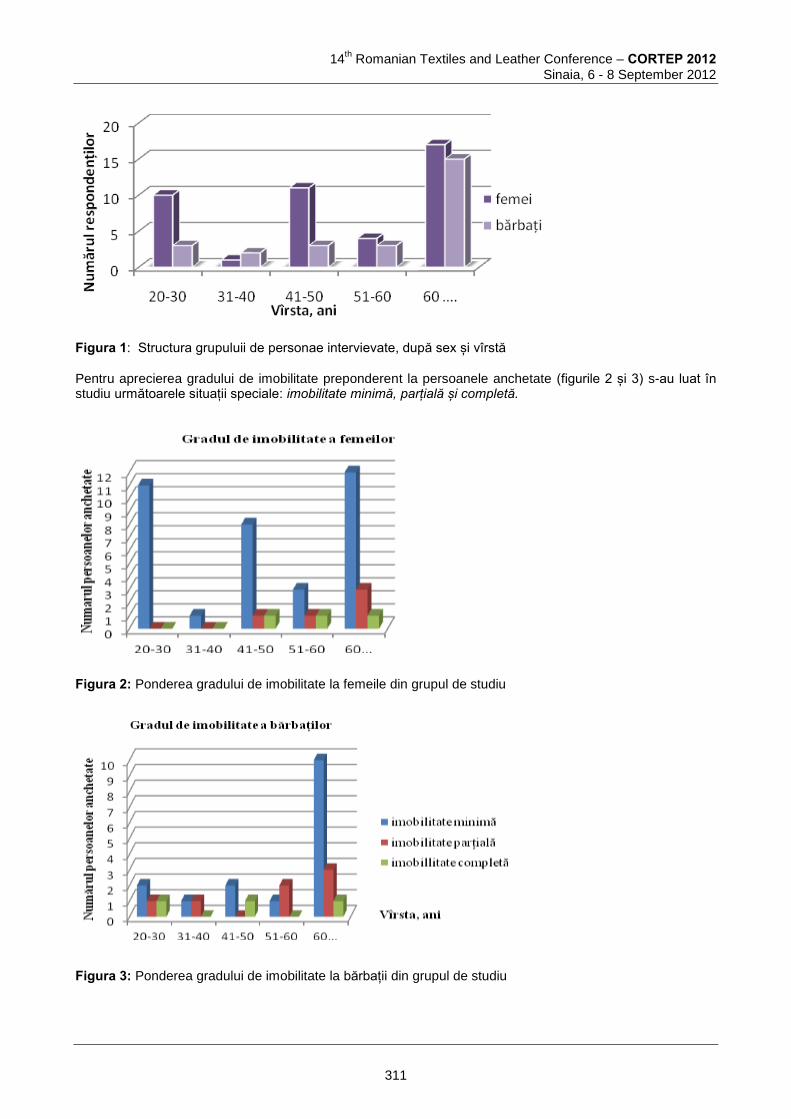
14
th Romanian Textiles and Leather Conference – CORTEP 2012
Sinaia, 6 - 8 September 2012
Figura 1: Structura grupuluii de personae intervievate, după sex și vîrstă Pentru aprecierea gradului de imobilitate preponderent la persoanele anchetate (figurile 2 și 3) s-au luat în studiu următoarele situații speciale: imobilitate minimă, parțială și completă.
Figura 2: Ponderea gradului de imobilitate la femeile din grupul de studiu
Figura 3: Ponderea gradului de imobilitate la bărbații din grupul de studiu
311
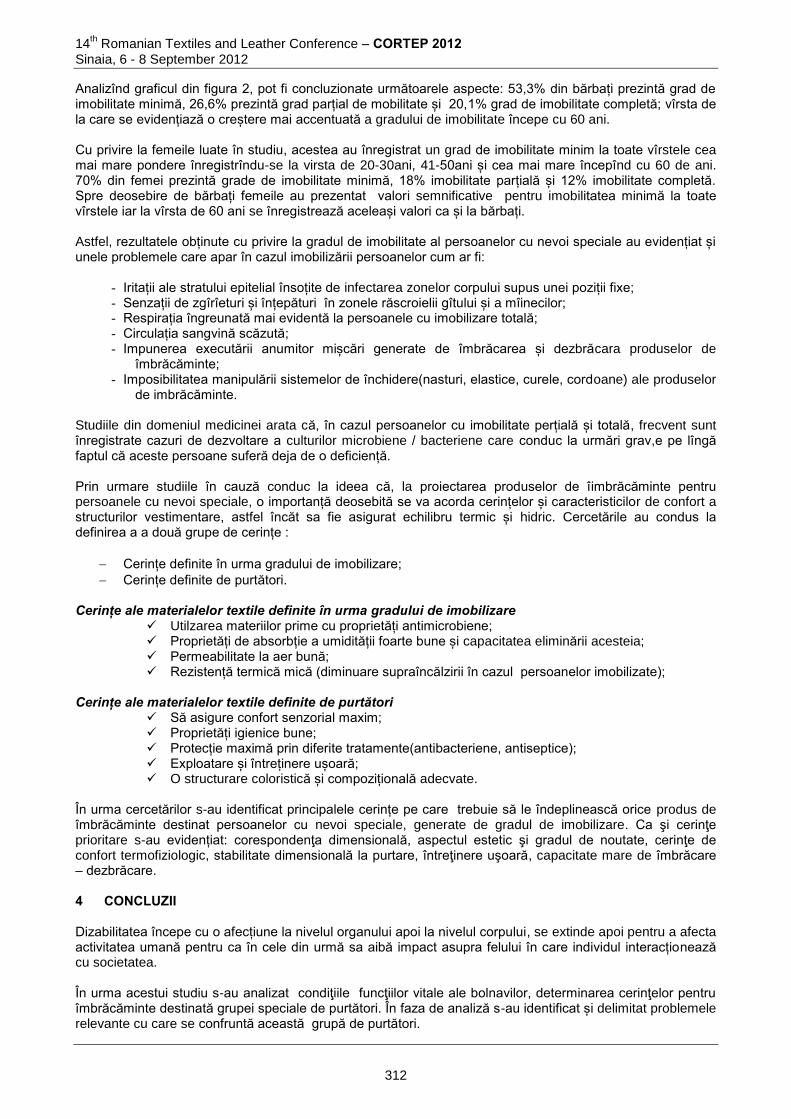
14th Romanian Textiles and Leather Conference – CORTEP 2012
Sinaia, 6 - 8 September 2012
Analizînd graficul din figura 2, pot fi concluzionate următoarele aspecte: 53,3% din bărbați prezintă grad de imobilitate minimă, 26,6% prezintă grad parțial de mobilitate și 20,1% grad de imobilitate completă; vîrsta de la care se evidențiază o creștere mai accentuată a gradului de imobilitate începe cu 60 ani. Cu privire la femeile luate în studiu, acestea au înregistrat un grad de imobilitate minim la toate vîrstele cea mai mare pondere înregistrîndu-se la virsta de 20-30ani, 41-50ani și cea mai mare începînd cu 60 de ani. 70% din femei prezintă grade de imobilitate minimă, 18% imobilitate parțială și 12% imobilitate completă. Spre deosebire de bărbați femeile au prezentat valori semnificative pentru imobilitatea minimă la toate vîrstele iar la vîrsta de 60 ani se înregistrează aceleași valori ca și la bărbați. Astfel, rezultatele obținute cu privire la gradul de imobilitate al persoanelor cu nevoi speciale au evidențiat și unele problemele care apar în cazul imobilizării persoanelor cum ar fi:
- Iritații ale stratului epitelial însoțite de infectarea zonelor corpului supus unei poziții fixe; - Senzații de zgîrîeturi și înțepături în zonele răscroielii gîtului și a mîinecilor; - Respirația îngreunată mai evidentă la persoanele cu imobilizare totală; - Circulația sangvină scăzută; - Impunerea executării anumitor mișcări generate de îmbrăcarea și dezbrăcara produselor de
îmbrăcăminte; - Imposibilitatea manipulării sistemelor de închidere(nasturi, elastice, curele, cordoane) ale produselor
de imbrăcăminte.
Studiile din domeniul medicinei arata că, în cazul persoanelor cu imobilitate perțială și totală, frecvent sunt înregistrate cazuri de dezvoltare a culturilor microbiene / bacteriene care conduc la urmări grav,e pe lîngă faptul că aceste persoane suferă deja de o deficiență. Prin urmare studiile în cauză conduc la ideea că, la proiectarea produselor de îimbrăcăminte pentru persoanele cu nevoi speciale, o importanță deosebită se va acorda cerințelor și caracteristicilor de confort a structurilor vestimentare, astfel încăt sa fie asigurat echilibru termic și hidric. Cercetările au condus la definirea a a două grupe de cerințe :
Cerințe definite în urma gradului de imobilizare;
Cerințe definite de purtători. Cerințe ale materialelor textile definite în urma gradului de imobilizare
Utilzarea materiilor prime cu proprietăți antimicrobiene; Proprietăți de absorbție a umidității foarte bune și capacitatea eliminării acesteia; Permeabilitate la aer bună; Rezistență termică mică (diminuare supraîncălzirii în cazul persoanelor imobilizate);
Cerințe ale materialelor textile definite de purtători
Să asigure confort senzorial maxim; Proprietăți igienice bune; Protecție maximă prin diferite tratamente(antibacteriene, antiseptice); Exploatare și întreținere ușoară; O structurare coloristică și compozițională adecvate.
În urma cercetărilor s-au identificat principalele cerințe pe care trebuie să le îndeplinească orice produs de îmbrăcăminte destinat persoanelor cu nevoi speciale, generate de gradul de imobilizare. Ca şi cerinţe prioritare s-au evidențiat: corespondenţa dimensională, aspectul estetic şi gradul de noutate, cerinţe de confort termofiziologic, stabilitate dimensională la purtare, întreţinere uşoară, capacitate mare de îmbrăcare – dezbrăcare. 4 CONCLUZII Dizabilitatea începe cu o afecțiune la nivelul organului apoi la nivelul corpului, se extinde apoi pentru a afecta activitatea umană pentru ca în cele din urmă sa aibă impact asupra felului în care individul interacționează cu societatea. În urma acestui studiu s-au analizat condiţiile funcţiilor vitale ale bolnavilor, determinarea cerinţelor pentru îmbrăcăminte destinată grupei speciale de purtători. În faza de analiză s-au identificat și delimitat problemele relevante cu care se confruntă această grupă de purtători.
312
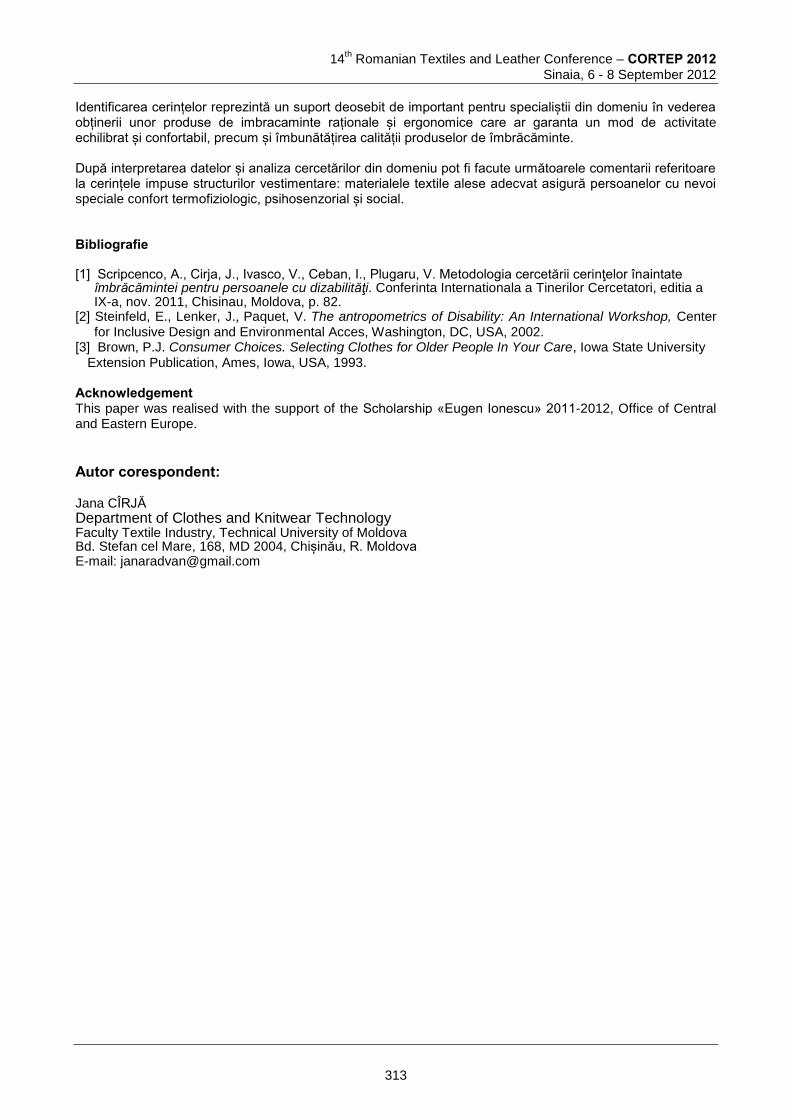
14
th Romanian Textiles and Leather Conference – CORTEP 2012
Sinaia, 6 - 8 September 2012
Identificarea cerințelor reprezintă un suport deosebit de important pentru specialiștii din domeniu în vederea obținerii unor produse de imbracaminte raționale și ergonomice care ar garanta un mod de activitate echilibrat și confortabil, precum și îmbunătățirea calității produselor de îmbrăcăminte. După interpretarea datelor și analiza cercetărilor din domeniu pot fi facute următoarele comentarii referitoare la cerințele impuse structurilor vestimentare: materialele textile alese adecvat asigură persoanelor cu nevoi speciale confort termofiziologic, psihosenzorial și social. Bibliografie [1] Scripcenco, A., Cirja, J., Ivasco, V., Ceban, I., Plugaru, V. Metodologia cercetării cerinţelor înaintate
îmbrăcămintei pentru persoanele cu dizabilităţi. Conferinta Internationala a Tinerilor Cercetatori, editia a IX-a, nov. 2011, Chisinau, Moldova, p. 82.
[2] Steinfeld, E., Lenker, J., Paquet, V. The antropometrics of Disability: An International Workshop, Center for Inclusive Design and Environmental Acces, Washington, DC, USA, 2002.
[3] Brown, P.J. Consumer Choices. Selecting Clothes for Older People In Your Care, Iowa State University Extension Publication, Ames, Iowa, USA, 1993.
Acknowledgement This paper was realised with the support of the Scholarship «Eugen Ionescu» 2011-2012, Office of Central and Eastern Europe.
Autor corespondent: Jana CÎRJĂ Department of Clothes and Knitwear Technology Faculty Textile Industry, Technical University of Moldova Bd. Stefan cel Mare, 168, MD 2004, Chișinău, R. Moldova E-mail: [email protected]
313
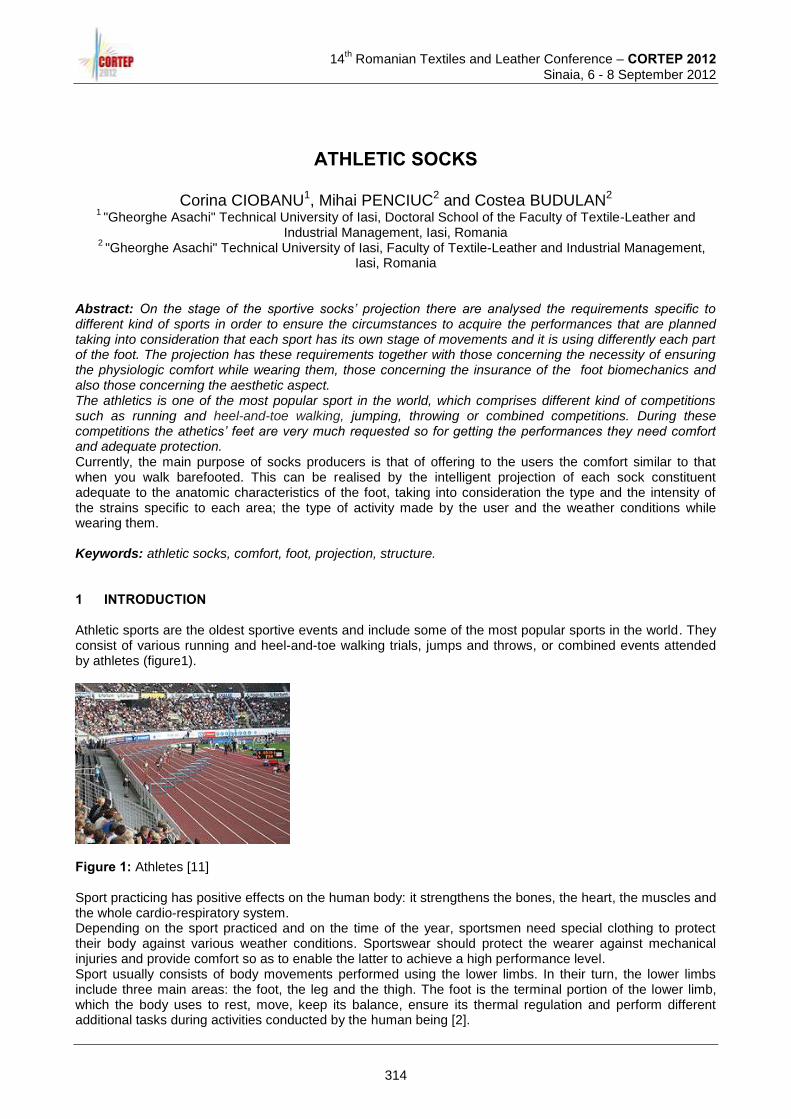
14
th Romanian Textiles and Leather Conference – CORTEP 2012
Sinaia, 6 - 8 September 2012
ATHLETIC SOCKS
Corina CIOBANU1, Mihai PENCIUC2 and Costea BUDULAN2
1 "Gheorghe Asachi" Technical University of Iasi, Doctoral School of the Faculty of Textile-Leather and
Industrial Management, Iasi, Romania 2 "Gheorghe Asachi" Technical University of Iasi, Faculty of Textile-Leather and Industrial Management,
Iasi, Romania Abstract: On the stage of the sportive socks’ projection there are analysed the requirements specific to different kind of sports in order to ensure the circumstances to acquire the performances that are planned taking into consideration that each sport has its own stage of movements and it is using differently each part of the foot. The projection has these requirements together with those concerning the necessity of ensuring the physiologic comfort while wearing them, those concerning the insurance of the foot biomechanics and also those concerning the aesthetic aspect. The athletics is one of the most popular sport in the world, which comprises different kind of competitions such as running and heel-and-toe walking, jumping, throwing or combined competitions. During these competitions the athetics’ feet are very much requested so for getting the performances they need comfort and adequate protection. Currently, the main purpose of socks producers is that of offering to the users the comfort similar to that when you walk barefooted. This can be realised by the intelligent projection of each sock constituent adequate to the anatomic characteristics of the foot, taking into consideration the type and the intensity of the strains specific to each area; the type of activity made by the user and the weather conditions while wearing them. Keywords: athletic socks, comfort, foot, projection, structure. 1 INTRODUCTION Athletic sports are the oldest sportive events and include some of the most popular sports in the world. They consist of various running and heel-and-toe walking trials, jumps and throws, or combined events attended by athletes (figure1).
Figure 1: Athletes [11] Sport practicing has positive effects on the human body: it strengthens the bones, the heart, the muscles and the whole cardio-respiratory system. Depending on the sport practiced and on the time of the year, sportsmen need special clothing to protect their body against various weather conditions. Sportswear should protect the wearer against mechanical injuries and provide comfort so as to enable the latter to achieve a high performance level. Sport usually consists of body movements performed using the lower limbs. In their turn, the lower limbs include three main areas: the foot, the leg and the thigh. The foot is the terminal portion of the lower limb, which the body uses to rest, move, keep its balance, ensure its thermal regulation and perform different additional tasks during activities conducted by the human being [2].
314
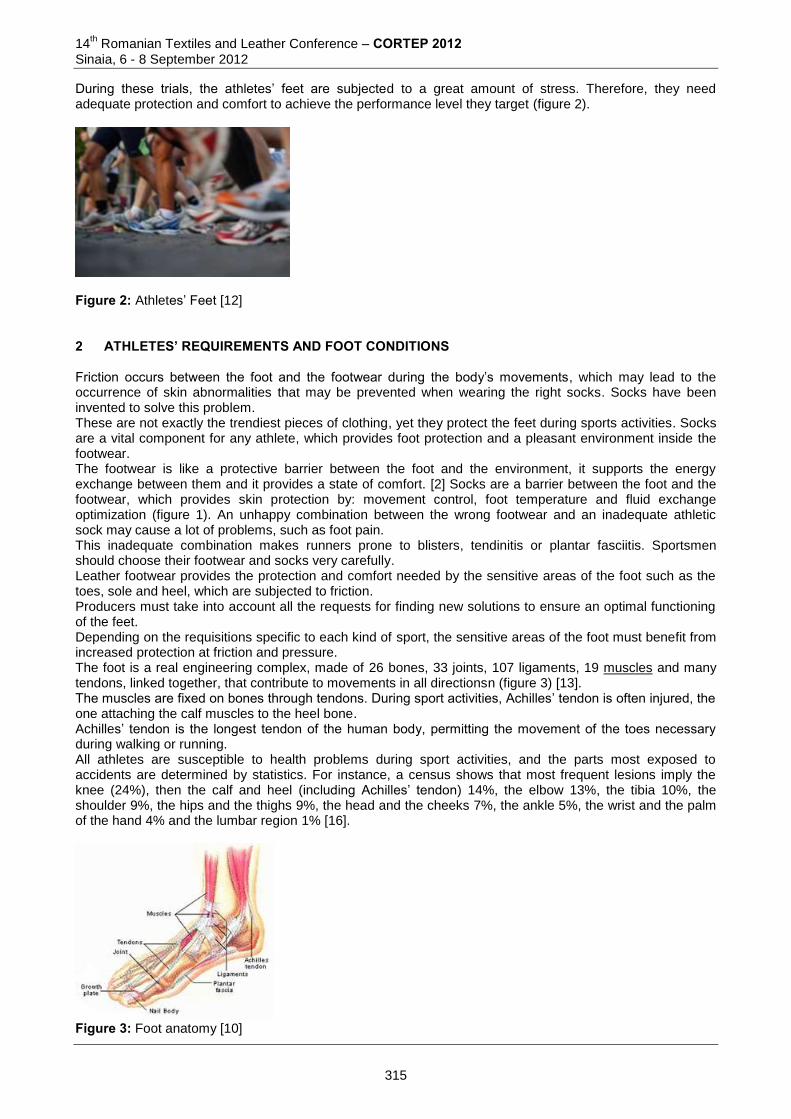
14th Romanian Textiles and Leather Conference – CORTEP 2012
Sinaia, 6 - 8 September 2012
During these trials, the athletes’ feet are subjected to a great amount of stress. Therefore, they need adequate protection and comfort to achieve the performance level they target (figure 2).
Figure 2: Athletes’ Feet [12] 2 ATHLETES’ REQUIREMENTS AND FOOT CONDITIONS Friction occurs between the foot and the footwear during the body’s movements, which may lead to the occurrence of skin abnormalities that may be prevented when wearing the right socks. Socks have been invented to solve this problem. These are not exactly the trendiest pieces of clothing, yet they protect the feet during sports activities. Socks are a vital component for any athlete, which provides foot protection and a pleasant environment inside the footwear. The footwear is like a protective barrier between the foot and the environment, it supports the energy exchange between them and it provides a state of comfort. [2] Socks are a barrier between the foot and the footwear, which provides skin protection by: movement control, foot temperature and fluid exchange optimization (figure 1). An unhappy combination between the wrong footwear and an inadequate athletic sock may cause a lot of problems, such as foot pain. This inadequate combination makes runners prone to blisters, tendinitis or plantar fasciitis. Sportsmen should choose their footwear and socks very carefully. Leather footwear provides the protection and comfort needed by the sensitive areas of the foot such as the toes, sole and heel, which are subjected to friction. Producers must take into account all the requests for finding new solutions to ensure an optimal functioning of the feet. Depending on the requisitions specific to each kind of sport, the sensitive areas of the foot must benefit from increased protection at friction and pressure. The foot is a real engineering complex, made of 26 bones, 33 joints, 107 ligaments, 19 muscles and many tendons, linked together, that contribute to movements in all directionsn (figure 3) [13]. The muscles are fixed on bones through tendons. During sport activities, Achilles’ tendon is often injured, the one attaching the calf muscles to the heel bone. Achilles’ tendon is the longest tendon of the human body, permitting the movement of the toes necessary during walking or running. All athletes are susceptible to health problems during sport activities, and the parts most exposed to accidents are determined by statistics. For instance, a census shows that most frequent lesions imply the knee (24%), then the calf and heel (including Achilles’ tendon) 14%, the elbow 13%, the tibia 10%, the shoulder 9%, the hips and the thighs 9%, the head and the cheeks 7%, the ankle 5%, the wrist and the palm of the hand 4% and the lumbar region 1% [16].
Figure 3: Foot anatomy [10]
315
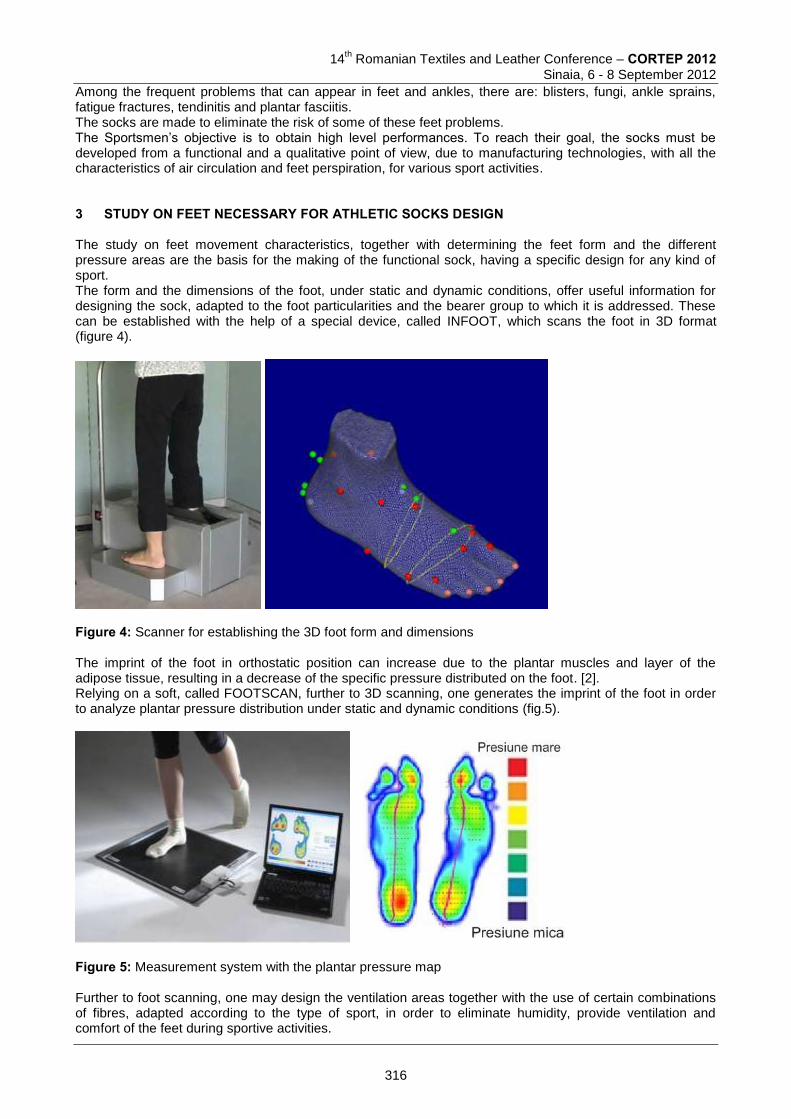
14
th Romanian Textiles and Leather Conference – CORTEP 2012
Sinaia, 6 - 8 September 2012
Among the frequent problems that can appear in feet and ankles, there are: blisters, fungi, ankle sprains, fatigue fractures, tendinitis and plantar fasciitis. The socks are made to eliminate the risk of some of these feet problems. The Sportsmen’s objective is to obtain high level performances. To reach their goal, the socks must be developed from a functional and a qualitative point of view, due to manufacturing technologies, with all the characteristics of air circulation and feet perspiration, for various sport activities. 3 STUDY ON FEET NECESSARY FOR ATHLETIC SOCKS DESIGN The study on feet movement characteristics, together with determining the feet form and the different pressure areas are the basis for the making of the functional sock, having a specific design for any kind of sport. The form and the dimensions of the foot, under static and dynamic conditions, offer useful information for designing the sock, adapted to the foot particularities and the bearer group to which it is addressed. These can be established with the help of a special device, called INFOOT, which scans the foot in 3D format (figure 4).
Figure 4: Scanner for establishing the 3D foot form and dimensions The imprint of the foot in orthostatic position can increase due to the plantar muscles and layer of the adipose tissue, resulting in a decrease of the specific pressure distributed on the foot. [2]. Relying on a soft, called FOOTSCAN, further to 3D scanning, one generates the imprint of the foot in order to analyze plantar pressure distribution under static and dynamic conditions (fig.5).
Figure 5: Measurement system with the plantar pressure map Further to foot scanning, one may design the ventilation areas together with the use of certain combinations of fibres, adapted according to the type of sport, in order to eliminate humidity, provide ventilation and comfort of the feet during sportive activities.
316
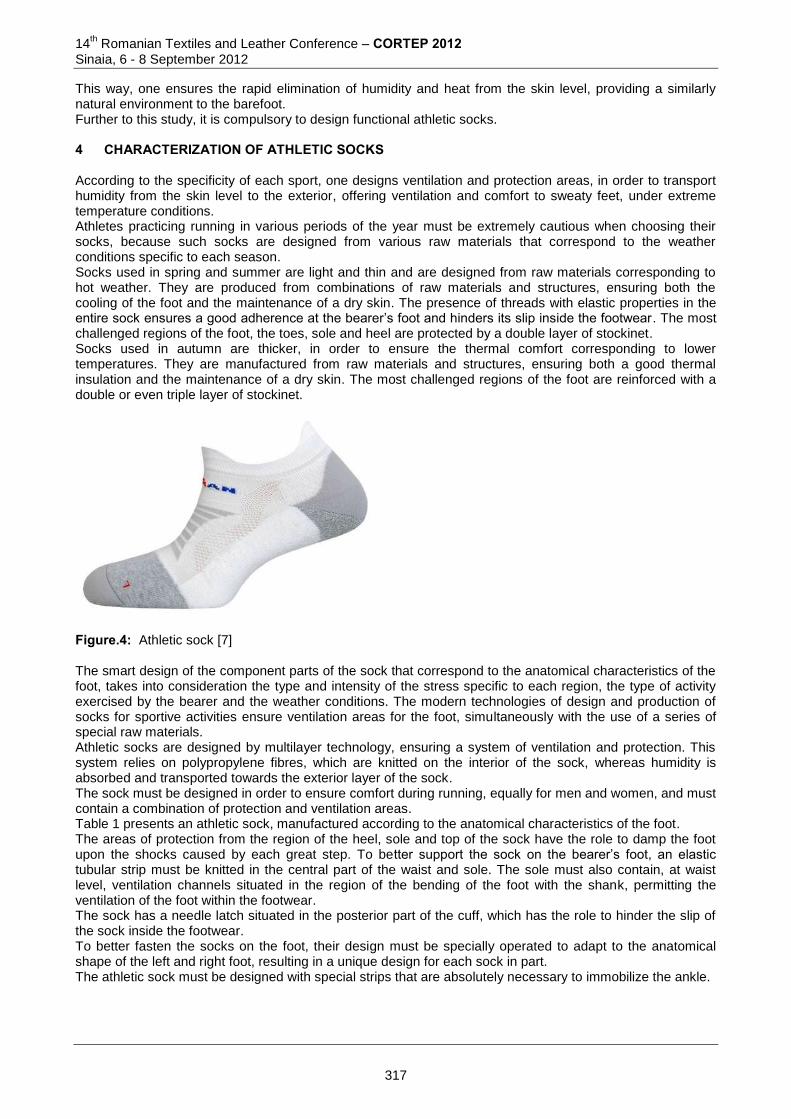
14th Romanian Textiles and Leather Conference – CORTEP 2012
Sinaia, 6 - 8 September 2012
This way, one ensures the rapid elimination of humidity and heat from the skin level, providing a similarly natural environment to the barefoot. Further to this study, it is compulsory to design functional athletic socks. 4 CHARACTERIZATION OF ATHLETIC SOCKS According to the specificity of each sport, one designs ventilation and protection areas, in order to transport humidity from the skin level to the exterior, offering ventilation and comfort to sweaty feet, under extreme temperature conditions. Athletes practicing running in various periods of the year must be extremely cautious when choosing their socks, because such socks are designed from various raw materials that correspond to the weather conditions specific to each season. Socks used in spring and summer are light and thin and are designed from raw materials corresponding to hot weather. They are produced from combinations of raw materials and structures, ensuring both the cooling of the foot and the maintenance of a dry skin. The presence of threads with elastic properties in the entire sock ensures a good adherence at the bearer’s foot and hinders its slip inside the footwear. The most challenged regions of the foot, the toes, sole and heel are protected by a double layer of stockinet. Socks used in autumn are thicker, in order to ensure the thermal comfort corresponding to lower temperatures. They are manufactured from raw materials and structures, ensuring both a good thermal insulation and the maintenance of a dry skin. The most challenged regions of the foot are reinforced with a double or even triple layer of stockinet.
Figure.4: Athletic sock [7] The smart design of the component parts of the sock that correspond to the anatomical characteristics of the foot, takes into consideration the type and intensity of the stress specific to each region, the type of activity exercised by the bearer and the weather conditions. The modern technologies of design and production of socks for sportive activities ensure ventilation areas for the foot, simultaneously with the use of a series of special raw materials. Athletic socks are designed by multilayer technology, ensuring a system of ventilation and protection. This system relies on polypropylene fibres, which are knitted on the interior of the sock, whereas humidity is absorbed and transported towards the exterior layer of the sock. The sock must be designed in order to ensure comfort during running, equally for men and women, and must contain a combination of protection and ventilation areas. Table 1 presents an athletic sock, manufactured according to the anatomical characteristics of the foot. The areas of protection from the region of the heel, sole and top of the sock have the role to damp the foot upon the shocks caused by each great step. To better support the sock on the bearer’s foot, an elastic tubular strip must be knitted in the central part of the waist and sole. The sole must also contain, at waist level, ventilation channels situated in the region of the bending of the foot with the shank, permitting the ventilation of the foot within the footwear. The sock has a needle latch situated in the posterior part of the cuff, which has the role to hinder the slip of the sock inside the footwear. To better fasten the socks on the foot, their design must be specially operated to adapt to the anatomical shape of the left and right foot, resulting in a unique design for each sock in part. The athletic sock must be designed with special strips that are absolutely necessary to immobilize the ankle.
317
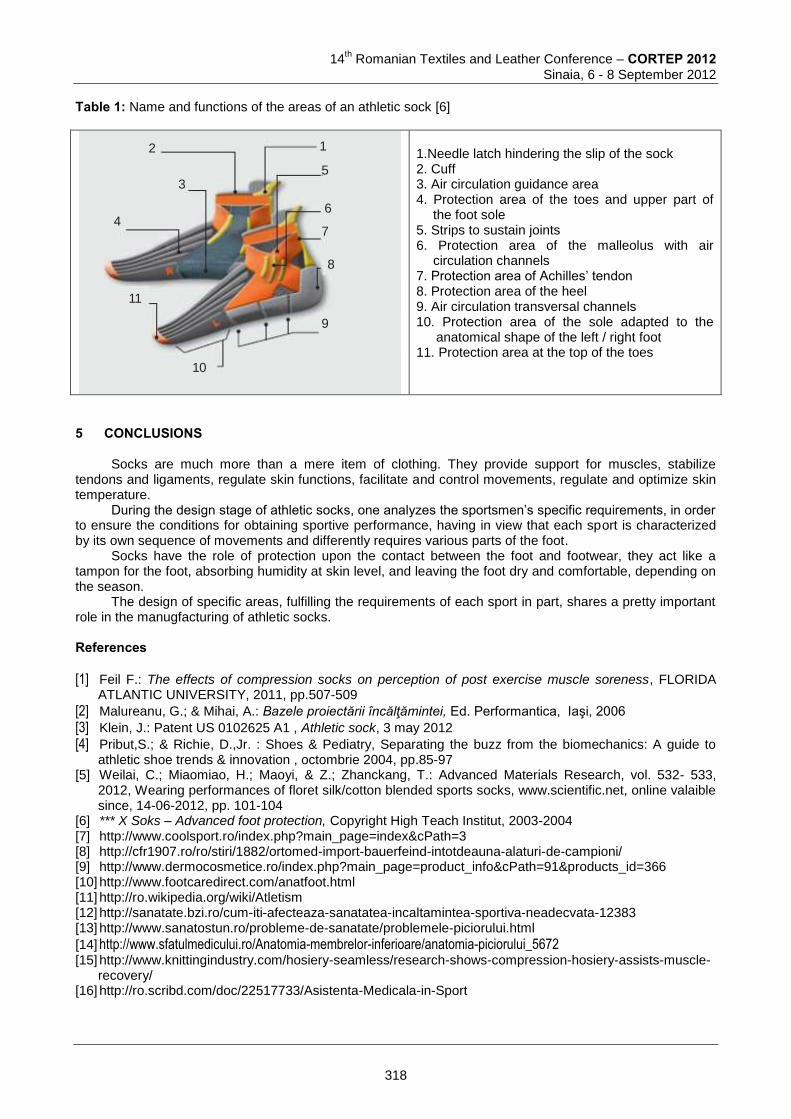
14
th Romanian Textiles and Leather Conference – CORTEP 2012
Sinaia, 6 - 8 September 2012
Table 1: Name and functions of the areas of an athletic sock [6]
2
3
4
1
6
7
8
5
9
10
11
1.Needle latch hindering the slip of the sock 2. Cuff 3. Air circulation guidance area 4. Protection area of the toes and upper part of
the foot sole 5. Strips to sustain joints 6. Protection area of the malleolus with air
circulation channels 7. Protection area of Achilles’ tendon 8. Protection area of the heel 9. Air circulation transversal channels 10. Protection area of the sole adapted to the
anatomical shape of the left / right foot 11. Protection area at the top of the toes
5 CONCLUSIONS
Socks are much more than a mere item of clothing. They provide support for muscles, stabilize tendons and ligaments, regulate skin functions, facilitate and control movements, regulate and optimize skin temperature.
During the design stage of athletic socks, one analyzes the sportsmen’s specific requirements, in order to ensure the conditions for obtaining sportive performance, having in view that each sport is characterized by its own sequence of movements and differently requires various parts of the foot.
Socks have the role of protection upon the contact between the foot and footwear, they act like a tampon for the foot, absorbing humidity at skin level, and leaving the foot dry and comfortable, depending on the season.
The design of specific areas, fulfilling the requirements of each sport in part, shares a pretty important role in the manugfacturing of athletic socks. References
[1] Feil F.: The effects of compression socks on perception of post exercise muscle soreness, FLORIDA ATLANTIC UNIVERSITY, 2011, pp.507-509
[2] Malureanu, G.; & Mihai, A.: Bazele proiectării încălţămintei, Ed. Performantica, Iaşi, 2006 [3] Klein, J.: Patent US 0102625 A1 , Athletic sock, 3 may 2012 [4] Pribut,S.; & Richie, D.,Jr. : Shoes & Pediatry, Separating the buzz from the biomechanics: A guide to
athletic shoe trends & innovation , octombrie 2004, pp.85-97 [5] Weilai, C.; Miaomiao, H.; Maoyi, & Z.; Zhanckang, T.: Advanced Materials Research, vol. 532- 533,
2012, Wearing performances of floret silk/cotton blended sports socks, www.scientific.net, online valaible since, 14-06-2012, pp. 101-104
[6] *** X Soks – Advanced foot protection, Copyright High Teach Institut, 2003-2004 [7] http://www.coolsport.ro/index.php?main_page=index&cPath=3 [8] http://cfr1907.ro/ro/stiri/1882/ortomed-import-bauerfeind-intotdeauna-alaturi-de-campioni/ [9] http://www.dermocosmetice.ro/index.php?main_page=product_info&cPath=91&products_id=366 [10] http://www.footcaredirect.com/anatfoot.html [11] http://ro.wikipedia.org/wiki/Atletism [12] http://sanatate.bzi.ro/cum-iti-afecteaza-sanatatea-incaltamintea-sportiva-neadecvata-12383 [13] http://www.sanatostun.ro/probleme-de-sanatate/problemele-piciorului.html
[14] http://www.sfatulmedicului.ro/Anatomia-membrelor-inferioare/anatomia-piciorului_5672 [15] http://www.knittingindustry.com/hosiery-seamless/research-shows-compression-hosiery-assists-muscle-
recovery/ [16] http://ro.scribd.com/doc/22517733/Asistenta-Medicala-in-Sport
318
14th Romanian Textiles and Leather Conference – CORTEP 2012
Sinaia, 6 - 8 September 2012
Acknowledgement This paper was realised with the support of POSDRU CUANTUMDOC “DOCTORAL STUDIES FOR EUROPEAN PERFORMANCES IN RESEARCH AND INOVATION” ID79407 project funded by the European Social Found and Romanian Government.
Corresponding author: Corina CIOBANU Doctoral School of the Faculty of Textiles, Leather and Industrial Management, "Gheorghe Asachi"Technical University of Iasi 53 D. Mangeron Blvd., 700050 Iasi, Romania phone: +40745975427 e-mail: [email protected]
Co-author(s): Mihai PENCIUC Faculty of Textiles, Leather and Industrial Management, "Gheorghe Asachi"Technical University of Iasi 53 D. Mangeron Blvd., 700050 Iasi, Romania phone: 0744695905 e-mail: [email protected] Costea BUDULAN Faculty of Textiles Leather and Industrial Management, "Gheorghe Asachi"Technical University of Iasi 53 D. Mangeron Blvd., 700050 Iasi, Romania phone: 0745589051 e-mail: [email protected]
319
14
th Romanian Textiles and Leather Conference – CORTEP 2012
Sinaia, 6 - 8 September 2012
CONCEPTS REGARDING THE QUALITY OF THE KNITTED USED IN MATTRESS PRODUCTION
Liliana LUTIC
“Gheorghe Asachi” Technical University of Iasi, Romania Abstract: Quality assurance by satisfying the demands of the beneficiaries is the prime objective of any commercial society. The demands of the beneficiary are at the root of the creative and design process, finalized by elaborating the product and process documentation. When designing a product it is necessary to take into account the real demands of the user, while establishing the final presentation will take into consideration the perceived requirements. Seeing as the customer demands regard both the presentation and the commercial product value, its functionality (wear behavior), as well as under duty response, the quality of a product can be perceived differently by competent customers and unadvised ones. The goal of this paper consists in presenting an offer model for knitted products intended for mattress manufacturing, released by the producer, so that the beneficiaries can take a fully informed decision. Keywords: quality, requirements, knitted, mattress 1 INTRODUCTION Quality assurance by satisfying the demands of the beneficiaries is the prime objective of any commercial society. The relationship producer - beneficiary can manifest: between the production factory and the commercial one, between the production factory and user, or inside the production company. In the first case, the satisfaction of the beneficiary (commercial firm) depends on the way the quality requirements were met, given the conditions of respecting the delivery terms and the pre-established costs. If at least one of these conditions is not met, the premise of rejecting the product batch exists or other unwanted situations (payment refusal, calling-off future contracts). When the beneficiary coincides with the customer, the quality will be appreciated considering the product behavior during use and maintenance. In case of noticing some deficiencies, a great importance relies in the promptitude of resolving the reclamations addressed to the production firm. When the relationship between producer and beneficiary manifests itself inside the firm, each step of the production process is equally both producer and beneficiary. In this case, the dissatisfaction of the persons implicated in the fabrication process will be due to disturbances occurring in the design, execution, transport, storage or expedition stages. The demands of the beneficiary are at the root of the creative and design process, finalized by elaborating the product and process documentation. When designing a product it is necessary to take into account the real demands of the user, while establishing the final presentation will take into consideration the perceived requirements. 2 CONCEPTS REGARDING THE QUALITY OF THE KNITTED USED IN MATTRESS PRODUCTION 2.1 Requirements imposed by the beneficiary (quality requirements) Beneficiary requirements target both the presentation and the commercial value of the product, its functionality (behavior during usage), as well as its behavior under the action of the solicitation it is subjected to (availability). Demands regarding the presentation value derive from the fact that any product in order to enter the sphere of interest of a potential customer must transmit an esthetic message through style, model, chromatic combinations, novelty elements, etc. These demands determine the degree of product amenity and implicitly its success on the market. Demands targeting the commercial value apply to the presentation approach of the product for sales, as well as the information given by it (fibrous composition, dimensions, brand, maintenance etc.).
320
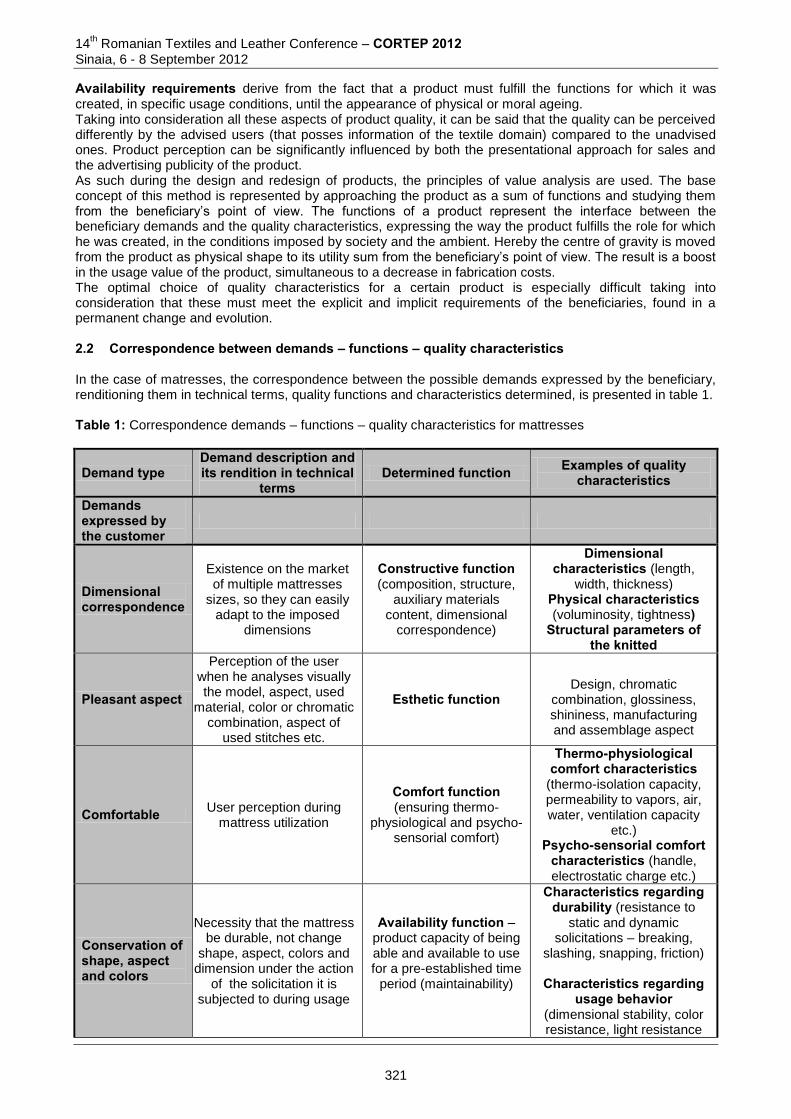
14th Romanian Textiles and Leather Conference – CORTEP 2012
Sinaia, 6 - 8 September 2012
Availability requirements derive from the fact that a product must fulfill the functions for which it was created, in specific usage conditions, until the appearance of physical or moral ageing. Taking into consideration all these aspects of product quality, it can be said that the quality can be perceived differently by the advised users (that posses information of the textile domain) compared to the unadvised ones. Product perception can be significantly influenced by both the presentational approach for sales and the advertising publicity of the product. As such during the design and redesign of products, the principles of value analysis are used. The base concept of this method is represented by approaching the product as a sum of functions and studying them from the beneficiary’s point of view. The functions of a product represent the interface between the beneficiary demands and the quality characteristics, expressing the way the product fulfills the role for which he was created, in the conditions imposed by society and the ambient. Hereby the centre of gravity is moved from the product as physical shape to its utility sum from the beneficiary’s point of view. The result is a boost in the usage value of the product, simultaneous to a decrease in fabrication costs. The optimal choice of quality characteristics for a certain product is especially difficult taking into consideration that these must meet the explicit and implicit requirements of the beneficiaries, found in a permanent change and evolution. 2.2 Correspondence between demands – functions – quality characteristics In the case of matresses, the correspondence between the possible demands expressed by the beneficiary, renditioning them in technical terms, quality functions and characteristics determined, is presented in table 1. Table 1: Correspondence demands – functions – quality characteristics for mattresses
Demand type Demand description and its rendition in technical
terms Determined function Examples of quality
characteristics
Demands expressed by the customer
Dimensional correspondence
Existence on the market of multiple mattresses
sizes, so they can easily adapt to the imposed
dimensions
Constructive function (composition, structure,
auxiliary materials content, dimensional
correspondence)
Dimensional characteristics (length,
width, thickness) Physical characteristics (voluminosity, tightness)
Structural parameters of the knitted
Pleasant aspect
Perception of the user when he analyses visually the model, aspect, used
material, color or chromatic combination, aspect of
used stitches etc.
Esthetic function
Design, chromatic
combination, glossiness, shininess, manufacturing and assemblage aspect
Comfortable User perception during mattress utilization
Comfort function (ensuring thermo-
physiological and psycho-sensorial comfort)
Thermo-physiological comfort characteristics
(thermo-isolation capacity, permeability to vapors, air, water, ventilation capacity
etc.) Psycho-sensorial comfort
characteristics (handle, electrostatic charge etc.)
Conservation of shape, aspect and colors
Necessity that the mattress be durable, not change
shape, aspect, colors and dimension under the action
of the solicitation it is subjected to during usage
Availability function – product capacity of being able and available to use for a pre-established time
period (maintainability)
Characteristics regarding durability (resistance to
static and dynamic solicitations – breaking,
slashing, snapping, friction)
Characteristics regarding usage behavior
(dimensional stability, color resistance, light resistance
321
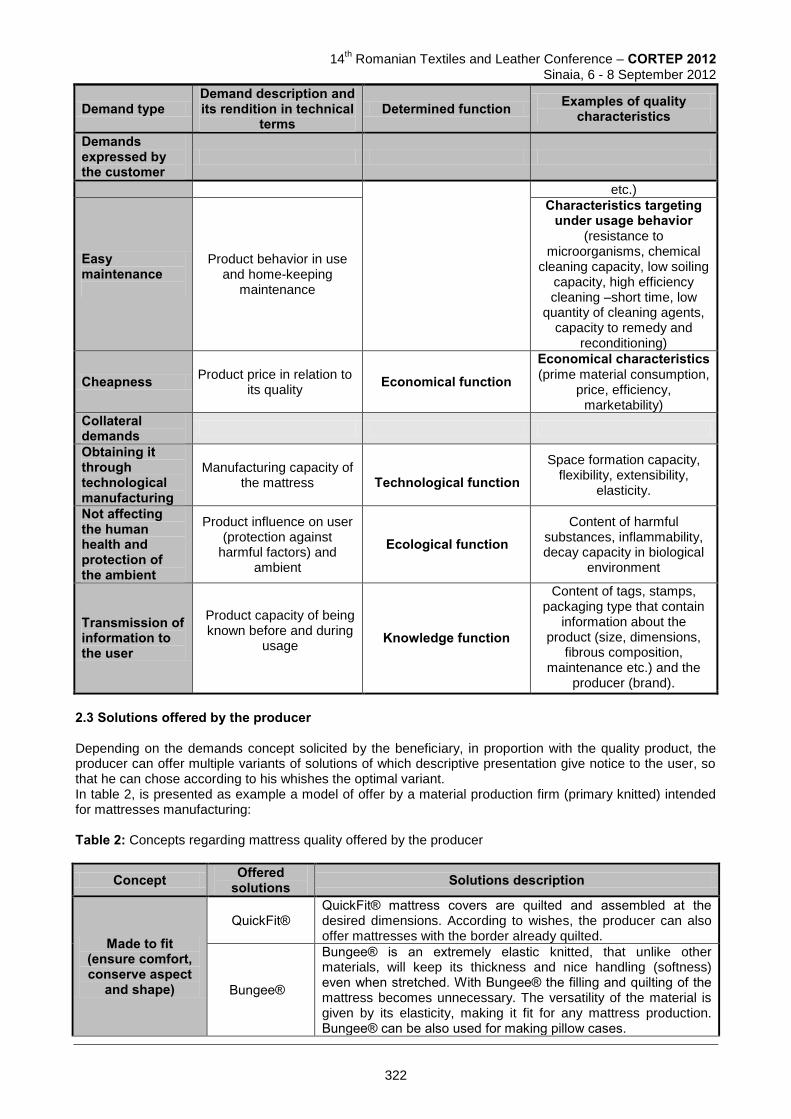
14
th Romanian Textiles and Leather Conference – CORTEP 2012
Sinaia, 6 - 8 September 2012
Demand type Demand description and its rendition in technical
terms Determined function Examples of quality
characteristics
Demands expressed by the customer
etc.)
Easy maintenance
Product behavior in use and home-keeping
maintenance
Characteristics targeting under usage behavior
(resistance to microorganisms, chemical
cleaning capacity, low soiling capacity, high efficiency cleaning –short time, low
quantity of cleaning agents, capacity to remedy and
reconditioning)
Cheapness Product price in relation to its quality
Economical function Economical characteristics (prime material consumption,
price, efficiency, marketability)
Collateral demands
Obtaining it through technological manufacturing
Manufacturing capacity of the mattress
Technological function
Space formation capacity, flexibility, extensibility,
elasticity.
Not affecting the human health and protection of the ambient
Product influence on user (protection against
harmful factors) and ambient
Ecological function Content of harmful
substances, inflammability, decay capacity in biological
environment
Transmission of information to the user
Product capacity of being known before and during
usage
Knowledge function
Content of tags, stamps, packaging type that contain
information about the product (size, dimensions,
fibrous composition, maintenance etc.) and the
producer (brand).
2.3 Solutions offered by the producer Depending on the demands concept solicited by the beneficiary, in proportion with the quality product, the producer can offer multiple variants of solutions of which descriptive presentation give notice to the user, so that he can chose according to his whishes the optimal variant. In table 2, is presented as example a model of offer by a material production firm (primary knitted) intended for mattresses manufacturing: Table 2: Concepts regarding mattress quality offered by the producer
Concept Offered solutions Solutions description
Made to fit (ensure comfort, conserve aspect
and shape)
QuickFit® QuickFit® mattress covers are quilted and assembled at the desired dimensions. According to wishes, the producer can also offer mattresses with the border already quilted.
Bungee®
Bungee® is an extremely elastic knitted, that unlike other materials, will keep its thickness and nice handling (softness) even when stretched. With Bungee® the filling and quilting of the mattress becomes unnecessary. The versatility of the material is given by its elasticity, making it fit for any mattress production. Bungee® can be also used for making pillow cases.
322
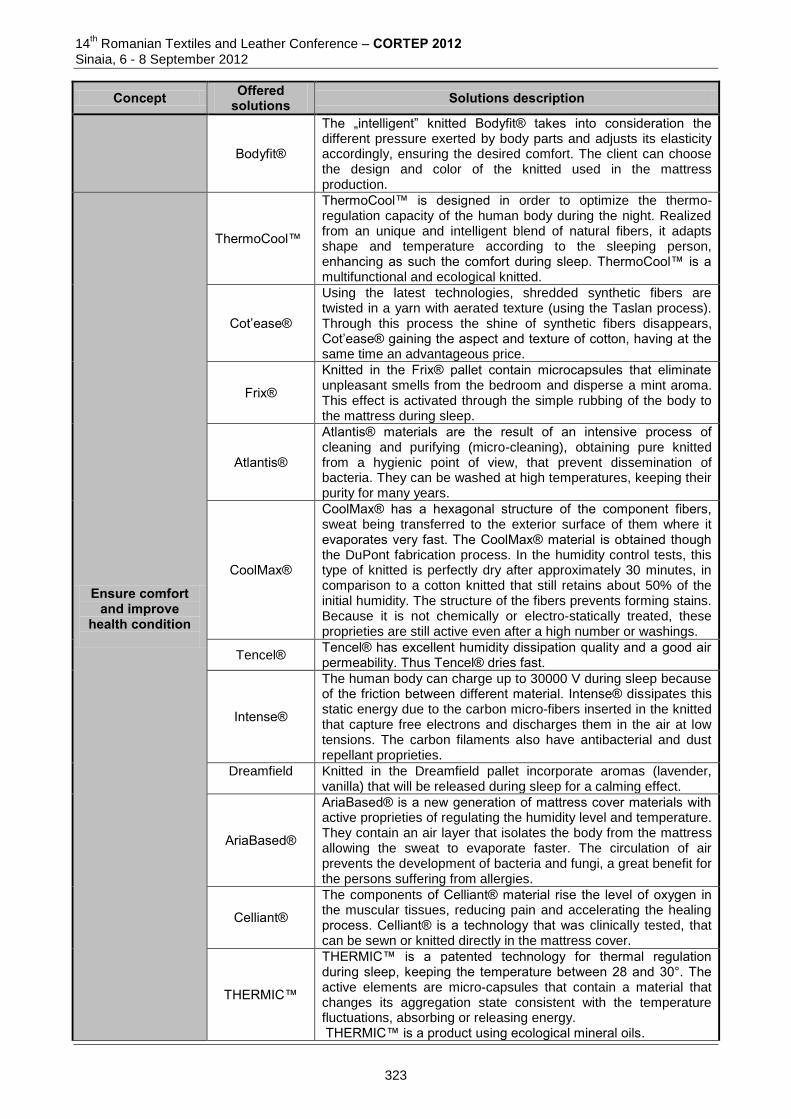
14th Romanian Textiles and Leather Conference – CORTEP 2012
Sinaia, 6 - 8 September 2012
Concept Offered solutions Solutions description
Bodyfit®
The „intelligent” knitted Bodyfit® takes into consideration the different pressure exerted by body parts and adjusts its elasticity accordingly, ensuring the desired comfort. The client can choose the design and color of the knitted used in the mattress production.
Ensure comfort and improve
health condition
ThermoCool™
ThermoCool™ is designed in order to optimize the thermo-regulation capacity of the human body during the night. Realized from an unique and intelligent blend of natural fibers, it adapts shape and temperature according to the sleeping person, enhancing as such the comfort during sleep. ThermoCool™ is a multifunctional and ecological knitted.
Cot’ease®
Using the latest technologies, shredded synthetic fibers are twisted in a yarn with aerated texture (using the Taslan process). Through this process the shine of synthetic fibers disappears, Cot’ease® gaining the aspect and texture of cotton, having at the same time an advantageous price.
Frix®
Knitted in the Frix® pallet contain microcapsules that eliminate unpleasant smells from the bedroom and disperse a mint aroma. This effect is activated through the simple rubbing of the body to the mattress during sleep.
Atlantis®
Atlantis® materials are the result of an intensive process of cleaning and purifying (micro-cleaning), obtaining pure knitted from a hygienic point of view, that prevent dissemination of bacteria. They can be washed at high temperatures, keeping their purity for many years.
CoolMax®
CoolMax® has a hexagonal structure of the component fibers, sweat being transferred to the exterior surface of them where it evaporates very fast. The CoolMax® material is obtained though the DuPont fabrication process. In the humidity control tests, this type of knitted is perfectly dry after approximately 30 minutes, in comparison to a cotton knitted that still retains about 50% of the initial humidity. The structure of the fibers prevents forming stains. Because it is not chemically or electro-statically treated, these proprieties are still active even after a high number or washings.
Tencel® Tencel® has excellent humidity dissipation quality and a good air permeability. Thus Tencel® dries fast.
Intense®
The human body can charge up to 30000 V during sleep because of the friction between different material. Intense® dissipates this static energy due to the carbon micro-fibers inserted in the knitted that capture free electrons and discharges them in the air at low tensions. The carbon filaments also have antibacterial and dust repellant proprieties.
Dreamfield
Knitted in the Dreamfield pallet incorporate aromas (lavender, vanilla) that will be released during sleep for a calming effect.
AriaBased®
AriaBased® is a new generation of mattress cover materials with active proprieties of regulating the humidity level and temperature. They contain an air layer that isolates the body from the mattress allowing the sweat to evaporate faster. The circulation of air prevents the development of bacteria and fungi, a great benefit for the persons suffering from allergies.
Celliant®
The components of Celliant® material rise the level of oxygen in the muscular tissues, reducing pain and accelerating the healing process. Celliant® is a technology that was clinically tested, that can be sewn or knitted directly in the mattress cover.
THERMIC™
THERMIC™ is a patented technology for thermal regulation during sleep, keeping the temperature between 28 and 30°. The active elements are micro-capsules that contain a material that changes its aggregation state consistent with the temperature fluctuations, absorbing or releasing energy. THERMIC™ is a product using ecological mineral oils.
323
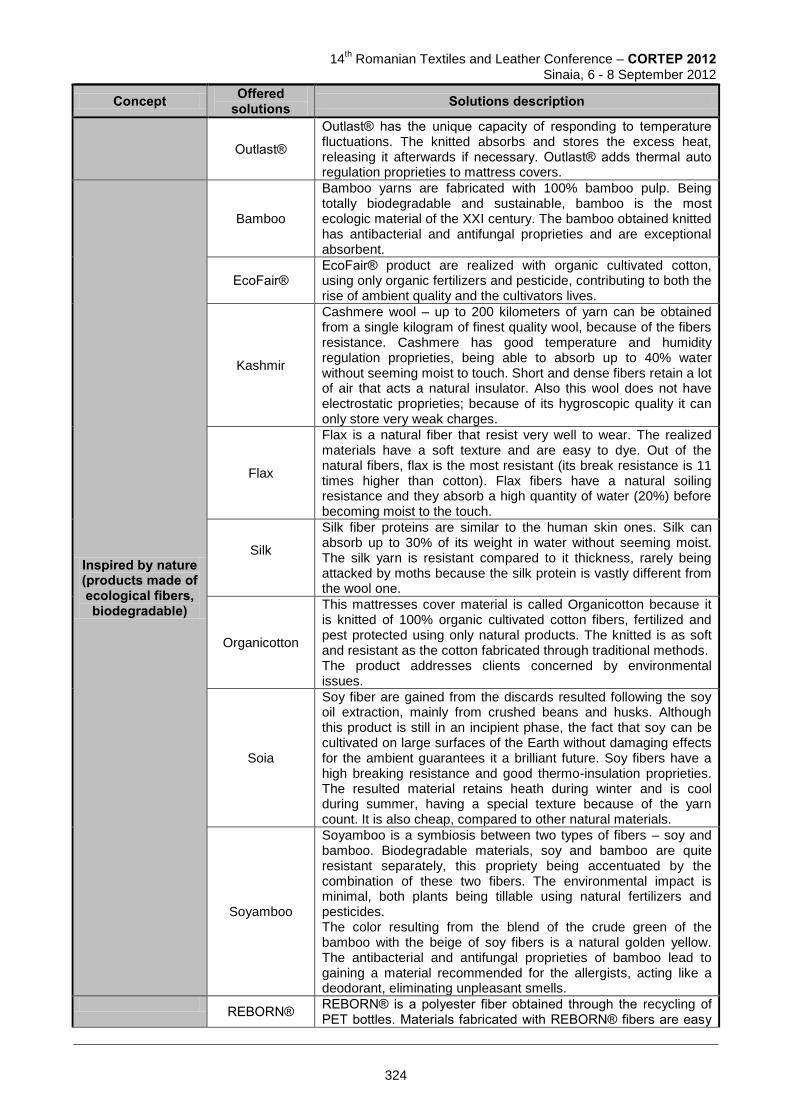
14
th Romanian Textiles and Leather Conference – CORTEP 2012
Sinaia, 6 - 8 September 2012
Concept Offered solutions Solutions description
Outlast®
Outlast® has the unique capacity of responding to temperature fluctuations. The knitted absorbs and stores the excess heat, releasing it afterwards if necessary. Outlast® adds thermal auto regulation proprieties to mattress covers.
Inspired by nature (products made of ecological fibers, biodegradable)
Bamboo
Bamboo yarns are fabricated with 100% bamboo pulp. Being totally biodegradable and sustainable, bamboo is the most ecologic material of the XXI century. The bamboo obtained knitted has antibacterial and antifungal proprieties and are exceptional absorbent.
EcoFair® EcoFair® product are realized with organic cultivated cotton, using only organic fertilizers and pesticide, contributing to both the rise of ambient quality and the cultivators lives.
Kashmir
Cashmere wool – up to 200 kilometers of yarn can be obtained from a single kilogram of finest quality wool, because of the fibers resistance. Cashmere has good temperature and humidity regulation proprieties, being able to absorb up to 40% water without seeming moist to touch. Short and dense fibers retain a lot of air that acts a natural insulator. Also this wool does not have electrostatic proprieties; because of its hygroscopic quality it can only store very weak charges.
Flax
Flax is a natural fiber that resist very well to wear. The realized materials have a soft texture and are easy to dye. Out of the natural fibers, flax is the most resistant (its break resistance is 11 times higher than cotton). Flax fibers have a natural soiling resistance and they absorb a high quantity of water (20%) before becoming moist to the touch.
Silk
Silk fiber proteins are similar to the human skin ones. Silk can absorb up to 30% of its weight in water without seeming moist. The silk yarn is resistant compared to it thickness, rarely being attacked by moths because the silk protein is vastly different from the wool one.
Organicotton
This mattresses cover material is called Organicotton because it is knitted of 100% organic cultivated cotton fibers, fertilized and pest protected using only natural products. The knitted is as soft and resistant as the cotton fabricated through traditional methods. The product addresses clients concerned by environmental issues.
Soia
Soy fiber are gained from the discards resulted following the soy oil extraction, mainly from crushed beans and husks. Although this product is still in an incipient phase, the fact that soy can be cultivated on large surfaces of the Earth without damaging effects for the ambient guarantees it a brilliant future. Soy fibers have a high breaking resistance and good thermo-insulation proprieties. The resulted material retains heath during winter and is cool during summer, having a special texture because of the yarn count. It is also cheap, compared to other natural materials.
Soyamboo
Soyamboo is a symbiosis between two types of fibers – soy and bamboo. Biodegradable materials, soy and bamboo are quite resistant separately, this propriety being accentuated by the combination of these two fibers. The environmental impact is minimal, both plants being tillable using natural fertilizers and pesticides. The color resulting from the blend of the crude green of the bamboo with the beige of soy fibers is a natural golden yellow. The antibacterial and antifungal proprieties of bamboo lead to gaining a material recommended for the allergists, acting like a deodorant, eliminating unpleasant smells.
REBORN®
REBORN® is a polyester fiber obtained through the recycling of PET bottles. Materials fabricated with REBORN® fibers are easy
324
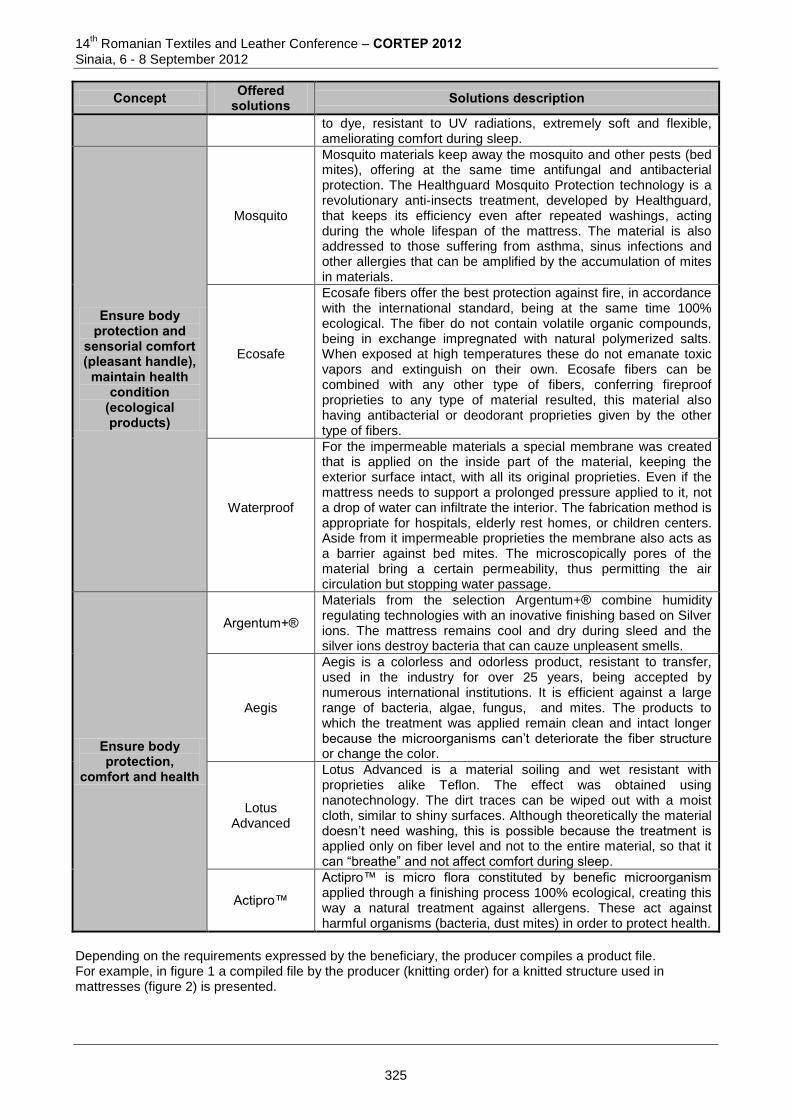
14th Romanian Textiles and Leather Conference – CORTEP 2012
Sinaia, 6 - 8 September 2012
Concept Offered solutions Solutions description
to dye, resistant to UV radiations, extremely soft and flexible, ameliorating comfort during sleep.
Ensure body protection and
sensorial comfort (pleasant handle),
maintain health condition
(ecological products)
Mosquito
Mosquito materials keep away the mosquito and other pests (bed mites), offering at the same time antifungal and antibacterial protection. The Healthguard Mosquito Protection technology is a revolutionary anti-insects treatment, developed by Healthguard, that keeps its efficiency even after repeated washings, acting during the whole lifespan of the mattress. The material is also addressed to those suffering from asthma, sinus infections and other allergies that can be amplified by the accumulation of mites in materials.
Ecosafe
Ecosafe fibers offer the best protection against fire, in accordance with the international standard, being at the same time 100% ecological. The fiber do not contain volatile organic compounds, being in exchange impregnated with natural polymerized salts. When exposed at high temperatures these do not emanate toxic vapors and extinguish on their own. Ecosafe fibers can be combined with any other type of fibers, conferring fireproof proprieties to any type of material resulted, this material also having antibacterial or deodorant proprieties given by the other type of fibers.
Waterproof
For the impermeable materials a special membrane was created that is applied on the inside part of the material, keeping the exterior surface intact, with all its original proprieties. Even if the mattress needs to support a prolonged pressure applied to it, not a drop of water can infiltrate the interior. The fabrication method is appropriate for hospitals, elderly rest homes, or children centers. Aside from it impermeable proprieties the membrane also acts as a barrier against bed mites. The microscopically pores of the material bring a certain permeability, thus permitting the air circulation but stopping water passage.
Ensure body protection,
comfort and health
Argentum+®
Materials from the selection Argentum+® combine humidity regulating technologies with an inovative finishing based on Silver ions. The mattress remains cool and dry during sleed and the silver ions destroy bacteria that can cauze unpleasent smells.
Aegis
Aegis is a colorless and odorless product, resistant to transfer, used in the industry for over 25 years, being accepted by numerous international institutions. It is efficient against a large range of bacteria, algae, fungus, and mites. The products to which the treatment was applied remain clean and intact longer because the microorganisms can’t deteriorate the fiber structure or change the color.
Lotus Advanced
Lotus Advanced is a material soiling and wet resistant with proprieties alike Teflon. The effect was obtained using nanotechnology. The dirt traces can be wiped out with a moist cloth, similar to shiny surfaces. Although theoretically the material doesn’t need washing, this is possible because the treatment is applied only on fiber level and not to the entire material, so that it can “breathe” and not affect comfort during sleep.
Actipro™
Actipro™ is micro flora constituted by benefic microorganism applied through a finishing process 100% ecological, creating this way a natural treatment against allergens. These act against harmful organisms (bacteria, dust mites) in order to protect health.
Depending on the requirements expressed by the beneficiary, the producer compiles a product file. For example, in figure 1 a compiled file by the producer (knitting order) for a knitted structure used in mattresses (figure 2) is presented.
325
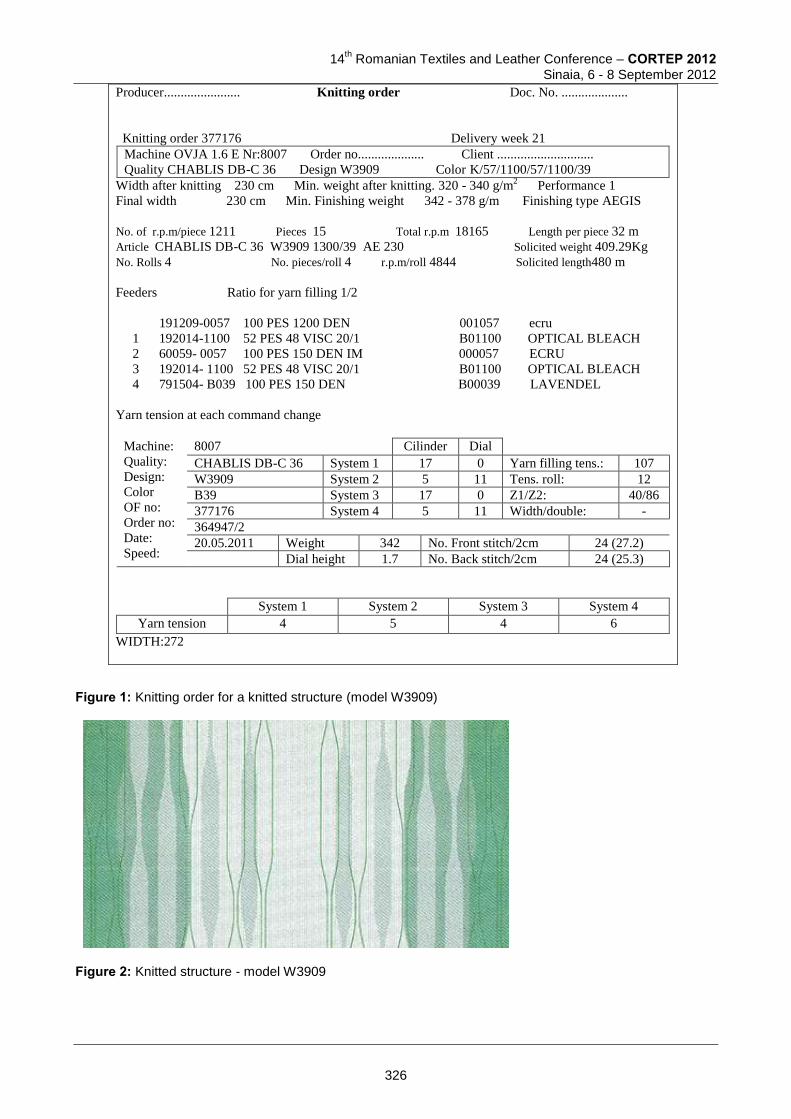
14
th Romanian Textiles and Leather Conference – CORTEP 2012
Sinaia, 6 - 8 September 2012
Producer....................... Knitting order Doc. No. ....................
Knitting order 377176 Delivery week 21
Machine OVJA 1.6 E Nr:8007 Order no.................... Client .............................
Quality CHABLIS DB-C 36 Design W3909 Color K/57/1100/57/1100/39
Width after knitting 230 cm Min. weight after knitting. 320 - 340 g/m2 Performance 1
Final width 230 cm Min. Finishing weight 342 - 378 g/m Finishing type AEGIS
No. of r.p.m/piece 1211 Pieces 15 Total r.p.m 18165 Length per piece 32 m
Article CHABLIS DB-C 36 W3909 1300/39 AE 230 Solicited weight 409.29Kg
No. Rolls 4 No. pieces/roll 4 r.p.m/roll 4844 Solicited length480 m
Feeders Ratio for yarn filling 1/2
191209-0057 100 PES 1200 DEN 001057 ecru
1 192014-1100 52 PES 48 VISC 20/1 B01100 OPTICAL BLEACH
2 60059- 0057 100 PES 150 DEN IM 000057 ECRU
3 192014- 1100 52 PES 48 VISC 20/1 B01100 OPTICAL BLEACH
4 791504- B039 100 PES 150 DEN B00039 LAVENDEL
Yarn tension at each command change
Machine:
Quality:
Design:
Color
OF no:
Order no:
Date:
Speed:
8007 Cilinder Dial
CHABLIS DB-C 36 System 1 17 0 Yarn filling tens.: 107
W3909 System 2 5 11 Tens. roll: 12
B39 System 3 17 0 Z1/Z2: 40/86
377176 System 4 5 11 Width/double: -
364947/2
20.05.2011 Weight 342 No. Front stitch/2cm 24 (27.2)
Dial height 1.7 No. Back stitch/2cm 24 (25.3)
System 1 System 2 System 3 System 4
Yarn tension 4 5 4 6
WIDTH:272
Figure 1: Knitting order for a knitted structure (model W3909)
Figure 2: Knitted structure - model W3909
326
14th Romanian Textiles and Leather Conference – CORTEP 2012
Sinaia, 6 - 8 September 2012
3 CONCLUSIONS Quality insurance by satisfying the demands of the beneficiaries is the prime objective of any commercial society. These demands target both the presentation and the commercial value of the product, its functionality, as well as its behavior under the action of the solicitation it is subjected to. The activity of creation, design and improvement of product quality, always begin with the analysis of their functions and are finalized by the compilation of the technical documentation for product and process. This fact implies the translation of the requirements expressed through the voice of the beneficiary in technical notions specific for the production. This paper presents an offer model of knitted products intended for mattress manufacturing, released by the producer, taking into consideration the beneficiaries requirements. Depending on the requirements concept solicited in relation to product quality, the producers offer multiple solution versions of which descriptive presentations give notice to the users so that they can make decisions in full knowledge and adopt according to their wishes the optimal variant. 4 REFERENCES [1] http://www.online-home.ro [2] http://www.desleeclama.com [3] http://www.ramedepat.ro/saltele [4] http://www.ikea.com/ro/ro/catalog/categories/departments/bedroom/10609/ [5] http://www.deslee-interior.com/functions/content. [6] http://www.dormeo.ro/ [7] http://www.ramedepat.ro/saltele?gclid=COTXorXPhrACFUVc3wod5TFKmQ [8] Pandelea, A. Proiectarea unei colectii de tricoturi utilizate la realizarea saltelelor, proiect de diploma. Iasi,
2012. Corresponding author: Liliana LUTIC Knitting and Clothing Engineering Department Faculty of Textile Leather and Industrial Management “Gheorghe Asachi” Technical University of Iasi 29 Dimitrie Mangeron Street 700050, Iasi, Romania Phone: 0232-278683/1107 Fax: 0232-230491 E-mail: [email protected]
327
14
th Romanian Textiles and Leather Conference – CORTEP 2012
Sinaia, 6 - 8 September 2012
FUNCTIONALITY OF SPECIAL EQUIPMENT MADE FOR SURGEONS
Viorica SCOBIOALĂ-CAZAC Technical University of Moldova, Chisinau, Rep.of Moldova
Abstract: This article presents results of study on functional analysis equipment for surgeons to identify special requirements imposed by carriers, to identify topographical areas liable to various applications, analysis the character of applications affecting special equipment. Keywords: functional analysis, equipment for surgeons, special equipment. 1 INTRODUCTION Functionality of equipment that doctors use directly affects the quality of services offered by them. Compliance functionality requirements, especially in the surgeons work involving applications of different nature more complex than the work of other medical specialties, would help ensure favorable microclimate, safety and protection of their health. Controversial discussions about the need for special equipment assigned to certain stereotypes with reference to the cut, design and technological solution, color raises again the problem of special equipment for surgeons. 2 SCOPE OF THE SURGEONS Scope of the surgeons concerns surgery representing the medical specialty that treats diseases or injuries by operative manual and instrumental interventions. Sized surgery has specializations shown in Figure 1, each of which is characterized by risk factors, conditions and specific manipulations required to be considered in the aesthetics and technological design of special clothing equipment. Functionality of surgical activity involves special equipment among other elements and specialized skills required is determined by goals scored by:
development and application of surgical techniques of choice;
identify optimal solutions for the diagnosis and surgical treatment;
development of specific instrumentation capable of reproducing closely surgical gestures used in laparoscopic surgery;
identify effective ways of surgery handling;
standardization of surgical techniques operative time;
comparative analysis of different surgical techniques;
remote evaluation of results;
remote survival assess;
evaluation of immune response;
strengthening joint work of specialists in various medical and scientific specializations;
selection of surgical methods to reduce hospitalization time for patients;
deepening of the most innovative aspects of surgery;
facilitate exchange of information, views and experience among surgeons throughout the world;
development of transplant experience;
promoting effective surgical technologies;
development of mixed surgical centers;
implementation of computer technologies in surgical technology.
328
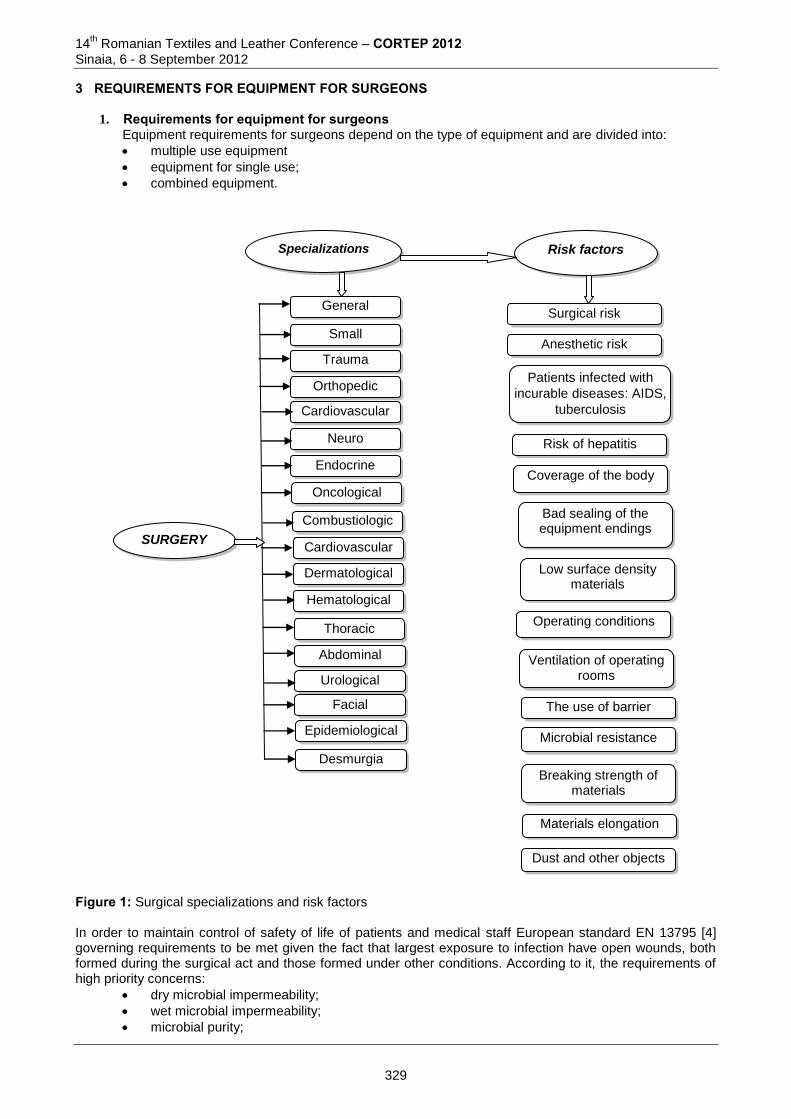
14th Romanian Textiles and Leather Conference – CORTEP 2012
Sinaia, 6 - 8 September 2012
3 REQUIREMENTS FOR EQUIPMENT FOR SURGEONS
1. Requirements for equipment for surgeons Equipment requirements for surgeons depend on the type of equipment and are divided into:
multiple use equipment
equipment for single use;
combined equipment.
Figure 1: Surgical specializations and risk factors In order to maintain control of safety of life of patients and medical staff European standard EN 13795 [4] governing requirements to be met given the fact that largest exposure to infection have open wounds, both formed during the surgical act and those formed under other conditions. According to it, the requirements of high priority concerns:
dry microbial impermeability;
wet microbial impermeability;
microbial purity;
Abdominal
SURGERY
General
Small
Trauma
Specializations Risk factors
Orthopedic
Neuro
Oncological
Cardiovascular
Endocrine
Combustiologic
Hematological
Thoracic
Urological
Facial
Epidemiological
Desmurgia
Surgical risk
Anesthetic risk
Patients infected with
incurable diseases: AIDS,
tuberculosis
Risk of hepatitis
Coverage of the body
Bad sealing of the equipment endings
Low surface density materials
Operating conditions
Cardiovascular
Dermatological
Ventilation of operating rooms
The use of barrier
Microbial resistance
Materials elongation
Breaking strength of materials
Dust and other objects
329

14
th Romanian Textiles and Leather Conference – CORTEP 2012
Sinaia, 6 - 8 September 2012
impermeability to liquids;
impermeability to dust and fibers from all sources [1-3]. Although these requirements are priority safety standards as outlined in the standard there are many
other requirements that are just as important as those mentioned but not covered in this standard. These can be exemplified as follows:
physiological comfort;
sensory comfort;
thermo comfort;
the operating environment conditions: temperature, humidity;
the material properties: mass, impermeability to liquids, surface density, air permeability, drapery, rigidity, heat resistance, conductivity, electrostatic charge;
structural characteristics of the products: cut, size, contour lines of decorations;
aesthetic characteristics: shape, color;
technological characteristics of products: type of joints used, strengthening elements, etc.. Thus the design of special equipment for surgeons will be analyzed thoroughly addressed
specialization, risk factors, assessment during static and dynamic surgical activity, topographical areas subject to various applications, character of applications, etc. 4 CONSTRUCTIVE-FUNCTIONAL APPROACH TO SOLVING SPECIAL EQUIPMENT Constructive-functional approach solving special equipment for surgeons in this study is systematic and aims to obtain special equipment that would consider factors to influence priority in providing their multifunctionality (Figure 2):
surgical field;
risk factors;
environmental conditions;
operating conditions;
ergonomic features of surgeons;
properties of the materials dedicated for equipment manufacture;
topography areas subject to applications;
applications character;
variations of applications character. 5 ANALYSIS FUNCTIONS OF THE EQUIPMENT FOR SURGEONS Meeting requirements submitted to special equipment needs to identify their functions (table 1). Table 1: Functions of special equipment destined surgeons
Group of functions Usual Aesthetic-informational
Protective Funcțional Ergonomic Reliability
Economic
Aesthetic Informational
Microbial protection
Ensure carrying out surgery
Anthropometric compliance: in static
dynamic.
Stabile shape
Minimal cost
Compliance with the image and aesthetic requirements of the medical institution
Information about product
Protection of action of infectious diseases agents
Product compliance with predestination surgical field
Psychophysiological compliance:
the perception;
tactile;
convenience of using small elements and parts system,
Strength of materials
Aesthetic concept compliance with the surgeons activity
Information about carriers preferences
330
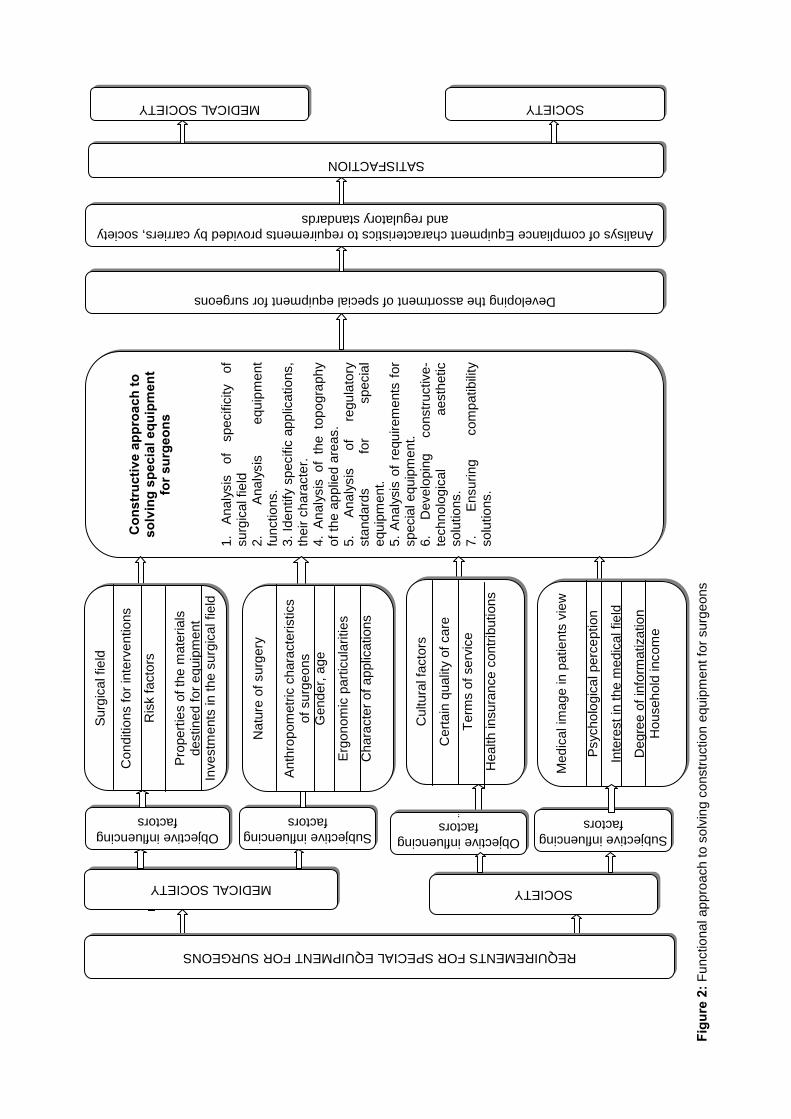
Figu
re 2
: Fu
nctio
na
l ap
pro
ach
to s
olv
ing
constr
uction
equ
ipm
ent
for
surg
eons
MEDICAL SOCIETY SOCIETY
Subjective influencing
factors
Objective influencing
factors
Objective influencing
factors
i
Subjective influencing
factors
C
onst
ruct
ive
appr
oach
to
solv
ing
spec
ial e
quip
men
t fo
r sur
geon
s
1.
Ana
lysis
of
specific
ity
of
surg
ical fie
ld
2.
Ana
lysis
equ
ipm
ent
functions.
3.
Ide
ntify
specific
app
lications,
their c
hara
cte
r.
4.
An
aly
sis
of
the to
po
gra
ph
y
of
the a
pplie
d a
reas.
5.
Ana
lysis
of
regu
lato
ry
sta
ndard
s
for
specia
l equ
ipm
ent.
5.
Ana
lysis
of
requ
irem
ents
for
specia
l eq
uip
ment.
6.
Develo
pin
g
constr
uctive
-te
chno
log
ical
aesth
etic
solu
tions.
7.
Ensuri
ng
com
patibili
ty
solu
tions.
Developing the assortment of special equipment for surgeons
Analisys of compliance Equipment characteristics to requirements provided by carriers, society
and regulatory standards
SATISFACTION
MEDICAL SOCIETY
SOCIETY
REQUIREMENTS FOR SPECIAL EQUIPMENT FOR SURGEONS
Surg
ical fie
ld
Cond
itio
ns f
or
inte
rve
ntions
Ris
k facto
rs
P
ropert
ies o
f th
e m
ate
rials
destin
ed f
or
eq
uip
ment
Investm
ents
in the s
urg
ica
l field
Natu
re o
f surg
ery
Anth
ropom
etr
ic c
hara
cte
ristics
of
surg
eons
Gender,
age
Erg
on
om
ic p
art
icula
rities
Chara
cte
r of
ap
plic
ations
Cultura
l fa
cto
rs
Cert
ain
qualit
y o
f care
Term
s o
f serv
ice
Health insura
nce
contr
ibutions
Med
ical im
age
in p
atie
nts
vie
w
Psycho
logic
al perc
eption
Inte
rest
in t
he m
edic
al fie
ld
Degre
e o
f in
form
atization
H
ouseh
old
incom
e
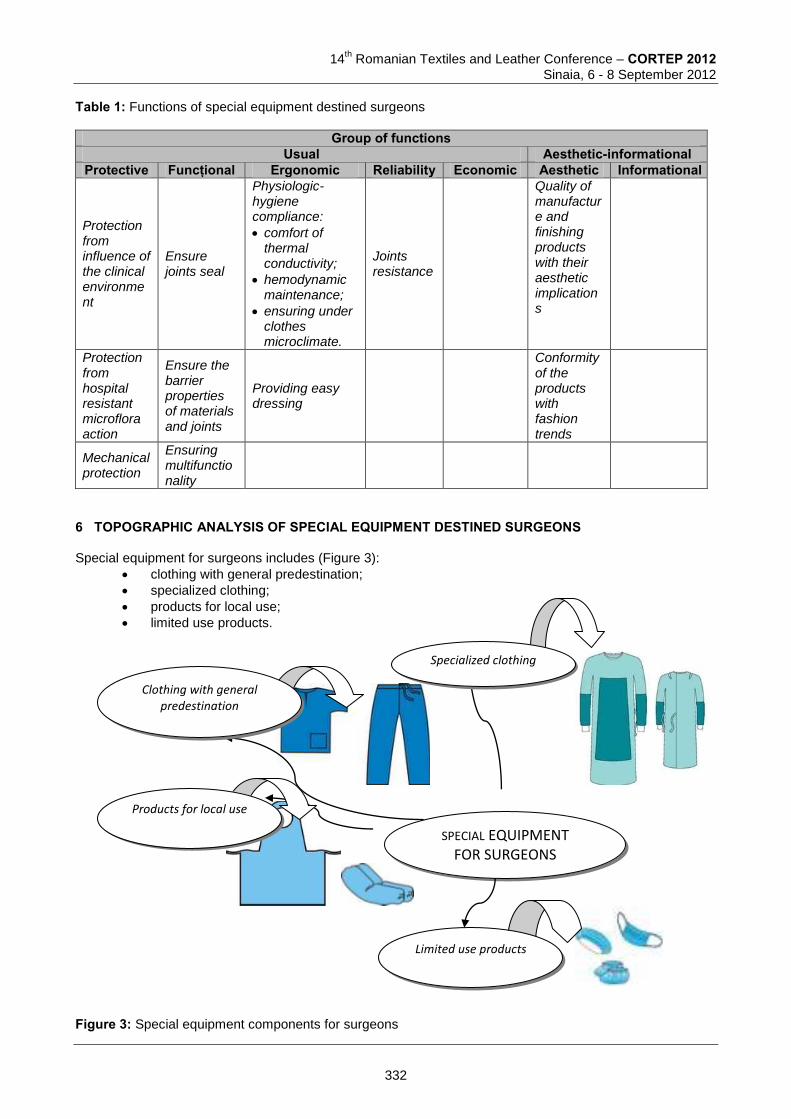
14
th Romanian Textiles and Leather Conference – CORTEP 2012
Sinaia, 6 - 8 September 2012
Table 1: Functions of special equipment destined surgeons
Group of functions Usual Aesthetic-informational
Protective Funcțional Ergonomic Reliability Economic Aesthetic Informational
Protection from influence of the clinical environment
Ensure joints seal
Physiologic-hygiene compliance:
comfort of thermal conductivity;
hemodynamic maintenance;
ensuring under clothes microclimate.
Joints resistance
Quality of manufacture and finishing products with their aesthetic implications
Protection from hospital resistant microflora action
Ensure the barrier properties of materials and joints
Providing easy dressing
Conformity of the products with fashion trends
Mechanical protection
Ensuring multifunctionality
6 TOPOGRAPHIC ANALYSIS OF SPECIAL EQUIPMENT DESTINED SURGEONS Special equipment for surgeons includes (Figure 3):
clothing with general predestination;
specialized clothing;
products for local use;
limited use products.
Figure 3: Special equipment components for surgeons
SPECIAL EQUIPMENT FOR SURGEONS
Specialized clothing
Limited use products
Clothing with general predestination
Products for local use
332
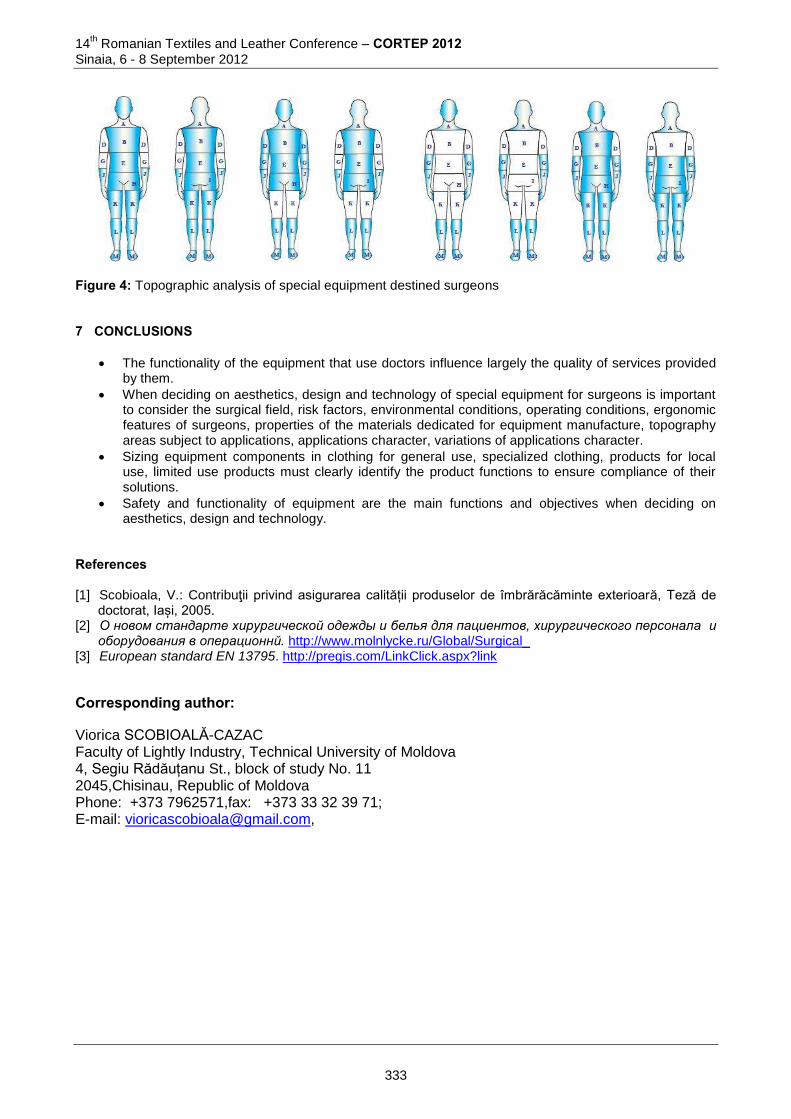
14th Romanian Textiles and Leather Conference – CORTEP 2012
Sinaia, 6 - 8 September 2012
Figure 4: Topographic analysis of special equipment destined surgeons 7 CONCLUSIONS
The functionality of the equipment that use doctors influence largely the quality of services provided by them.
When deciding on aesthetics, design and technology of special equipment for surgeons is important to consider the surgical field, risk factors, environmental conditions, operating conditions, ergonomic features of surgeons, properties of the materials dedicated for equipment manufacture, topography areas subject to applications, applications character, variations of applications character.
Sizing equipment components in clothing for general use, specialized clothing, products for local use, limited use products must clearly identify the product functions to ensure compliance of their solutions.
Safety and functionality of equipment are the main functions and objectives when deciding on aesthetics, design and technology.
References [1] Scobioala, V.: Contribuţii privind asigurarea calității produselor de îmbrărăcăminte exterioară, Teză de
doctorat, Iași, 2005. [2] О новом стандарте хирургической одежды и белья для пациентов, хирургического персонала и
оборудования в операционнй. http://www.molnlycke.ru/Global/Surgical_ [3] European standard EN 13795. http://pregis.com/LinkClick.aspx?link
Corresponding author:
Viorica SCOBIOALĂ-CAZAC Faculty of Lightly Industry, Technical University of Moldova
4, Segiu Rădăuțanu St., block of study No. 11 2045,Chisinau, Republic of Moldova Phone: +373 7962571,fax: +373 33 32 39 71; E-mail: [email protected],
333
14
th Romanian Textiles and Leather Conference – CORTEP 2012
Sinaia, 6 - 8 September 2012
ACTIVITY OF THE CROSS-INSTITUTIONAL GROUP OF RESEARCHERS IN THE PROJECT “INVESTIGATION OF LATVIAN RENEWABLE RAW MATERIALS – FLAX AND HEMP PRODUCTS FOR DEVELOPMENT OF INNOVATIVE TECHNOLOGIES AND NEW FUNCTIONAL MATERIALS”
Guntis STRAZDS1, Dana BELAKOVA 2& Inese ZIEMELE 2
1 Association of Textile and Clothing Industry, Riga, Latvia 2 Riga Technical University / Azenes 14/24, Riga, Latvia
Abstract: A research project is being carried out in Riga Technical University, Institute of Textile Materials Technology and Design, which main goal is to create new and innovative materials with high added value by processing renewable resources grown in Latvia (hemp and flax), to favour the development of the national economy and expand the exposure of materials friendly to the humans and nature. The estimated results of the project: 1. The evaluation of the sorts of hemp and flax appropriate for the local conditions, the research of the latest cultivation technology agro-technical parameters; 2. Research of the characteristics of flax and hemp fibre; 3. Modification of flax and hemp fibre and their products to ensure the necessary characteristics of the end product; 4. Research of fibre felt or non-woven material furniture, interior and building inner decoration material usage possibilities. Several working groups from different institutions located in different regions of Latvia are involved in the implementation of the project – Riga Technical University (Textile Material Technology and Design Institute; Polymer material technology department); Agricultural Science Centre of Latgale; The University of Latvia (Institute of Biology, Institute of Solid State Physics), as well as the Genetic Resource Centre of the Latvian State Forestry Research Institute, which requests for a specific project work organization. The goal of the article is to reflect the experience in organizing, managing and implementing such projects, showing the cooperation model between institutions from different industries. Keywords: Latvian renewable resources, hemp and flax. 1 LATVIAN TEXTILE INDUSTRY In times of the global crisis the lack of guarantees to the tune of several ten million Lats the textile industry suffered significantly – several companies went bankrupt, others fired their workers. At present the Latvian economy recovers slowly but certainly and the textile industry is not endangered anymore. Already in the second half of 2009 the production volumes in the industry started rising gradually. Positive tendencies continued to show during 2010 and 2011, when the light industry experienced a rapid rise of the production volumes. During the eleven months of 2011 the production volumes exceeded the results of the previous year by 22,3%. The production volumes also exceeded the results of the manufacturing industry by 10,4%, namely, in the manufacturing industry the production volumes in the first 11 months rose by 11,9% in 2011 compared to the year before [1]. The textile industry is traditional and one of the most important sectors in Latvia, providing a significant investment in the economy of Latvia. The export of textile products and clothing adds up to 6% of the overall product and service export volumes in the country [2]. At present 711 companies of the textile industry in Latvia employ 13000 employees who produce goods in the value of Ls 350 mill. during a year. About 90% of it is export. In financial terms clothing has the largest specific weight in the export (Ls 70,9 mill.), textile (Ls 46,6 mill.), leather and fur products (Ls 7,7 mill.), shoes (Ls 4,7 mill.) and headdress (Ls 0,4 mill.) [2]. Figure 1 demonstrates the turnover changes of individual manufacturing industry sectors in 2011 in per cent compared to 2010. Obviously the production of textile products and clothing does not exceed for instance the volumes of car production, nevertheless it holds a stable position in the shared turnover changes. The changes in the turnover of clothing production have to be mentioned especially because, compared to 2010, the turnover of finished clothing has increased by 24,8%. Similarly the textile product turnover is also
334
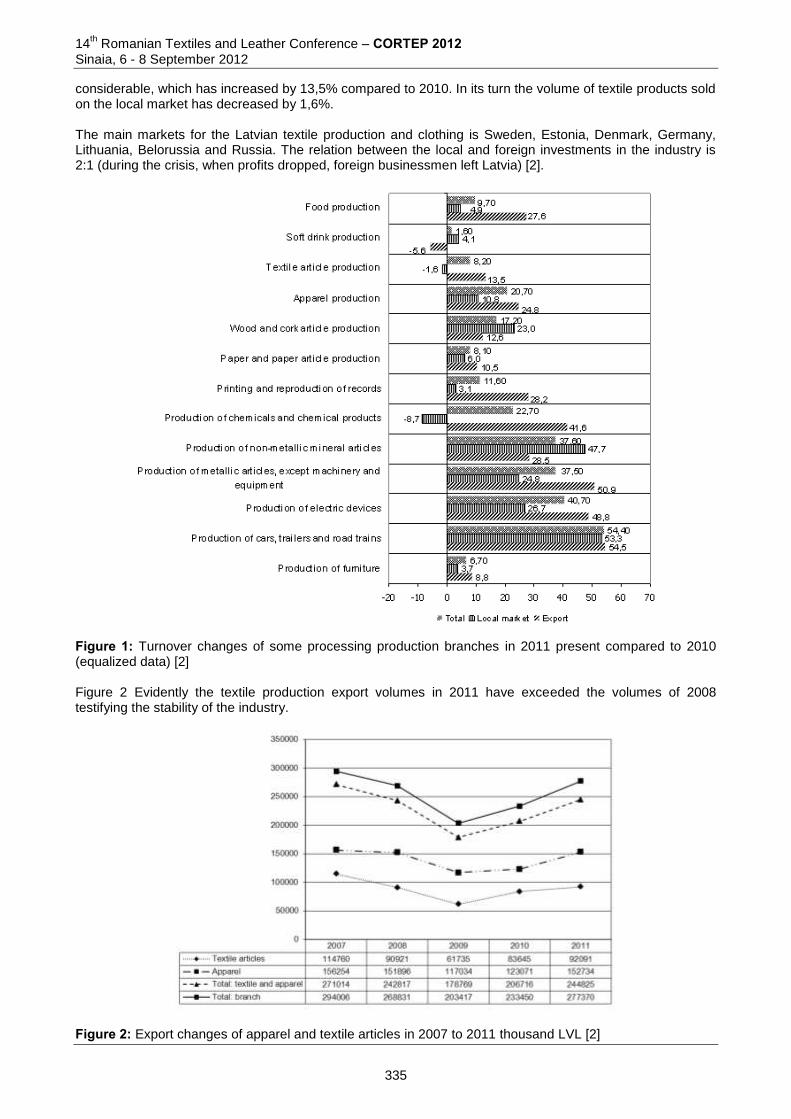
14th Romanian Textiles and Leather Conference – CORTEP 2012
Sinaia, 6 - 8 September 2012
considerable, which has increased by 13,5% compared to 2010. In its turn the volume of textile products sold on the local market has decreased by 1,6%. The main markets for the Latvian textile production and clothing is Sweden, Estonia, Denmark, Germany, Lithuania, Belorussia and Russia. The relation between the local and foreign investments in the industry is 2:1 (during the crisis, when profits dropped, foreign businessmen left Latvia) [2].
Figure 1: Turnover changes of some processing production branches in 2011 present compared to 2010 (equalized data) [2] Figure 2 Evidently the textile production export volumes in 2011 have exceeded the volumes of 2008 testifying the stability of the industry.
Figure 2: Export changes of apparel and textile articles in 2007 to 2011 thousand LVL [2]
335
14
th Romanian Textiles and Leather Conference – CORTEP 2012
Sinaia, 6 - 8 September 2012
2 CROSS-INSTITUTIONAL RESEARCH The textile industry and the production of goods from natural materials is an integral part of the Latvian national economy, which exists since the 19
th century. To maintain the stability of the industry and the
competitiveness in the country it is important to carry out scientific research to create new and improved natural plant fibre textile products and material characteristics. The regulation of the Cabinet of Ministers No.594 on the prior scientific directions foresee a sustainable usage of local resources by developing new products and technologies. Form March 1, 2010 Riga Technical University has started a complex cooperation project of fundamental and applied sciences financed by the Latvian Council of Science called “Investigation of Latvian Renewable Raw Materials – Flax and Hemp Products for Development Of Innovative Technologies and New Functional Materials”. Its main goal is to create new and innovative materials with high added value by processing renewable resources grown in Latvia (hemp and flax), to favour the development of the national economy and expand the exposure of materials friendly to the humans and nature. The duration of the project is 4 years. Several scientific institutions have joined together to achieve one goal – Riga Technical University (RTU) Textile Material Technology and Design Institute (TTDI), the RTU Polymer Material Institute, the Institute of Solid State Physics of the University of Latvia (UL), The UL Institute of Biology, Agriculture Science Centre of Latgale, the Genetic Resource Centre of the Latvian State Forest Research Institute. The research themes of the scientific institution group embrace a full cycle of flax and hemp cultivation and zero waste processing, which complies with one of the conceptual priorities of the textile industries development – the development of the natural fibre (flax and hemp) sector by increasing the production of technical fabric and non-woven material production (for car interiors, isolation materials, non-woven materials for household purposes), recycling of sheave into building materials, fuel and fertilizers, usage of linseed oil in pharmacology and production of paint and lacquer. 3 COOPERATION MODEL The Genetic Resource Centre of the Latvian State Forest Research Institute "Silava" carries out the genetic analysis of flax and successfully excretes DNA from hemp leaves, approbates and selects retrotransporon (iPBS) markers for use for flax weft culture analysis. The Institute of Biology, University of Latvia in cooperation with the Agriculture Science Centre of Latgale and the Genetic Resource Centre of the State Forestry Institute “Silava” carry out a research on the possibilities of using biotechnological methods on fibre plants. The Institute of Biology carries out research on a quicker selection of new flax sorts and identifies optimal conditions for the acquisition of flax DH plants-reproducers from Latvian flax hybrids. Experiments are carried out within the framework of the projects on flax somatic callus cultures, to determine the cause for somatic changes and affecting factors. The Agriculture Science Centre of Latgale has established fibre and oil flax, hemp field experiments. Within the framework of the project phenological observations are carried out during the vegetation period, determining the growth phases of the plants, the steadiness of lodgings, the length and density of the plants. The chlorophyll concentration during the vegetation period is determined for all sorts and types of hemp. The fibre flax sorts created in Latvia are evaluated by qualitative and quantitative criteria. The genetic resources of flax are researched in cooperation with the Genetic Resource Centre of the State Forestry Institute. The flax is selected and new growing technologies are being developed. In its turn the long fibre, the oil flax seed oil quantity and quality is determined in cooperation with the RTU TTDI and Polymer Material Institute. The Institute of Textile Materials Technologies and Design, Riga Technical University carry out research on flax and hemp fibre characteristics and determines the optimal production parameters of yarn, cord, cloth and textiles. The TTDI in cooperation with the RTU Polymer Material Institute carries out research on the physical and chemical technologies of hemp functionalization and the physical parameters of fibres, threads, cloths and felt before functionalization. Hemp and flax fibre tests have been carried out to determine which sorts are better suited for cultivation in Latvian climatic conditions, as well as what quality fibres can be acquired in Latvia.
336
14th Romanian Textiles and Leather Conference – CORTEP 2012
Sinaia, 6 - 8 September 2012
In cooperation with Latvian businessman and the Institute of Wood Chemistry, furniture, interior and interior isolation of buildings and construction material production technologies are developed on the basis of flax and hemp sources grown in Latvia. Similarly, in cooperation with businessmen, research on heat/sound insulation material patterns and technological research, analysis of mechanical and other exploitation characteristics and evaluation for door leaf production using hemp fibre are being carried out. A door pattern has been developed. In cooperation with the Solid State Physics Institute research is carried out on the improvement of hemp fibre thermo-mechanical characteristics. In its turn in cooperation with the Agriculture Science Centre of Latgale, where the fibre of different sorts has been acquired, research is carried out on the evaluation of fibre quality characteristics. The Institute of Polymer Materials, Riga Technical University, in cooperation with the RTU TTDI group, carries out research on the improvements of the methodology to determine the physically-mechanical characteristics and light persistence of modified pulp phloem fibre threads (flax, hemp). Hemp raw fibre modifications are examined, the enzyme and alkali treatment effect on the physically-mechanical characteristics of the fibre is being compared. Research on flax and hemp thread alkali treatment in different conditions and its influence on the physically-mechanical characteristics for further usage in composite materials has been started. The Polymer material group studies the colouring of flax cloth with direct dye for usage in restoration as well as the usage of natural fibre in wood (plywood) and biologically degradable chorded composites within the framework of the project. The institute of Solid State Physics of the University of Latvia carries out research on the technological process in vacuum (RF&DC magnetron sputtering) and the adjustment of the argon ion cannon to the functionalization of fibre materials with metallic coating (dispersion modes of argon plasma for the metals Al, Cu and Ni have been determined) and develops equipment for coating of threads. The construction of the thermo mechanical characteristic (strength-tension) determination device on the basis of the Mecmesin model “MultiTest 1-i” with the software EMPEROR has been finished and the research on the thermo-mechanical characteristics of fibre materials, including hemp threads, has been started. 4 CONCLUSIONS Since ancient times flax and hemp have been one of the most important crops in Latvia. It was the first currency of Latvia. In the Free State period in Latvia flax was grown in an area wider than 70 thousand hectares and harvested more than 20 thousand tonnes on flax fibre certifying that Latvia has experience and potential. A full cycle production is important for Latvia, starting with the work of the farmer, pre-processing, after-treatment and distribution. Scientific research is an integral part of the process, therefore the governmental support and the possibility to carry out research is very important. The development of new processing technologies of fibre grown in Latvia will favour the development and export of several sectors of the national economy. In accordance with the opinion of representatives of the Association of Textile and Clothing Industry it has been prognosticated that in 2012 the export of the light industry in Latvia will exceed 300 million Lats, but the number of employees will decrease by 2 – 3 thousand workers. Basing on the forecasts of the associations’ representatives, the production volumes of the textile industry will increase by 3% - 5% a year during the next five years, but the sewing production volumes after 2012 will decrease by 2% - 3% a year. The development of the textile product production sector will be ensured by several measures including the usage of sustainable raw materials like flax, hemp, nettle, reed and wood in the textile industry as well as the usage of flax and hemp cloth and non-woven materials in production, including the production of agrarian textiles and non-woven materials for household purposes [1]. 5 REFERENCES [1] State Education Developement Agency; Employers’ Confederation of Latvia; Free Trade Union
Confederation of Latvia; National Centre for Education and State Agency of Education Quality. Project of European Social Fund. Activity „Development of a sectoral qualifications system and improvement of the efficiency and quality of vocational education and training” agreement number 2010/0274/1DP/1.2.1.1.1/10/IPIA/VIAA/001.; http://www.lbas.lv/upload/stuff/201205/tekstils_2012.
[2] Association of Textile and Clothing Industry, Annual report
337
14
th Romanian Textiles and Leather Conference – CORTEP 2012
Sinaia, 6 - 8 September 2012
Corresponding author: Dana BELAKOVA Institute of Textile Materials and Technology Faculty of Materials Science and Applied chemistry Riga Technical University Azenes 14/24 LV-1048, Riga Latvia Phone: +371 67089173; E-mail: [email protected]
Co-authors: Guntis STRAZDS Association of Textile and Clothing Industry Elizabetes 2 - 420, Riga, LV - 1010, Latvia E-mail: [email protected] Inese ZIEMELE Institute of Textile Materials and Technology Faculty of Materials Science and Applied chemistry Riga Technical University Azenes 14/24 LV-1048, Riga Latvia Phone: +371 67089173; E-mail: [email protected]
338
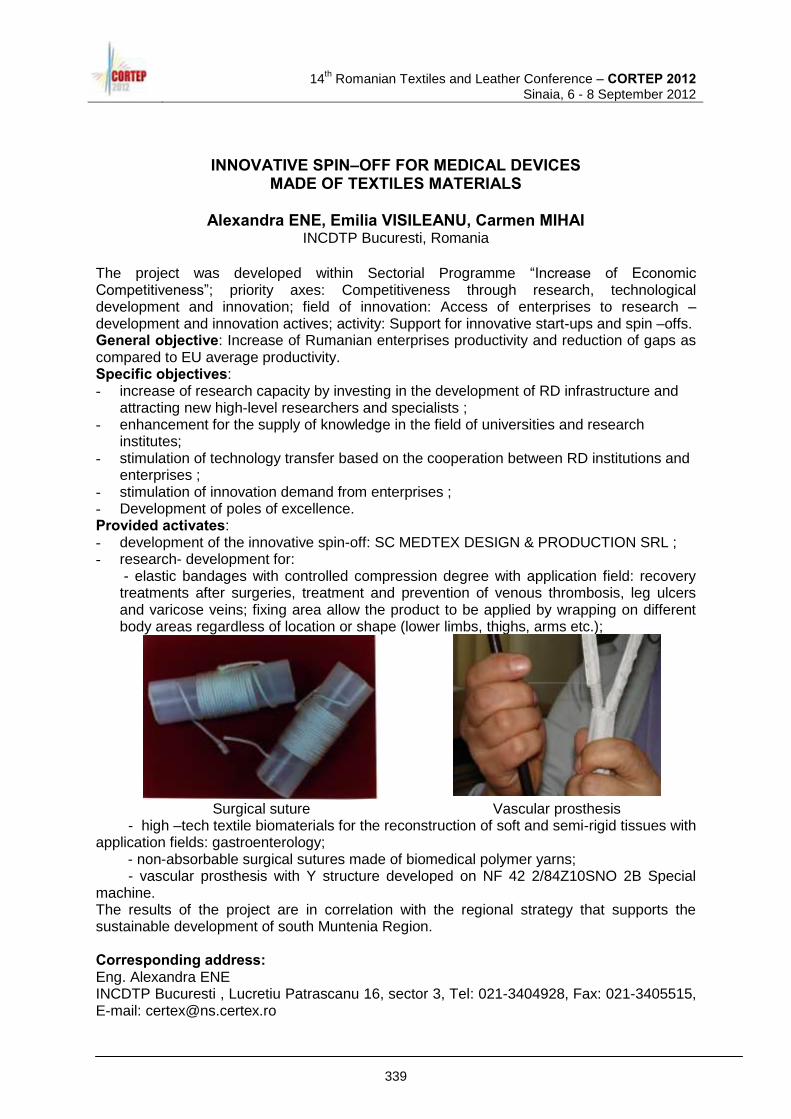
14th Romanian Textiles and Leather Conference – CORTEP 2012
Sinaia, 6 - 8 September 2012
INNOVATIVE SPIN–OFF FOR MEDICAL DEVICES MADE OF TEXTILES MATERIALS
Alexandra ENE, Emilia VISILEANU, Carmen MIHAI
INCDTP Bucuresti, Romania
The project was developed within Sectorial Programme “Increase of Economic Competitiveness”; priority axes: Competitiveness through research, technological development and innovation; field of innovation: Access of enterprises to research –development and innovation actives; activity: Support for innovative start-ups and spin –offs. General objective: Increase of Rumanian enterprises productivity and reduction of gaps as compared to EU average productivity. Specific objectives: - increase of research capacity by investing in the development of RD infrastructure and
attracting new high-level researchers and specialists ; - enhancement for the supply of knowledge in the field of universities and research
institutes; - stimulation of technology transfer based on the cooperation between RD institutions and
enterprises ; - stimulation of innovation demand from enterprises ; - Development of poles of excellence. Provided activates: - development of the innovative spin-off: SC MEDTEX DESIGN & PRODUCTION SRL ; - research- development for:
- elastic bandages with controlled compression degree with application field: recovery treatments after surgeries, treatment and prevention of venous thrombosis, leg ulcers and varicose veins; fixing area allow the product to be applied by wrapping on different body areas regardless of location or shape (lower limbs, thighs, arms etc.);
Surgical suture Vascular prosthesis - high –tech textile biomaterials for the reconstruction of soft and semi-rigid tissues with application fields: gastroenterology;
- non-absorbable surgical sutures made of biomedical polymer yarns; - vascular prosthesis with Y structure developed on NF 42 2/84Z10SNO 2B Special machine. The results of the project are in correlation with the regional strategy that supports the sustainable development of south Muntenia Region. Corresponding address: Eng. Alexandra ENE INCDTP Bucuresti , Lucretiu Patrascanu 16, sector 3, Tel: 021-3404928, Fax: 021-3405515, E-mail: [email protected]
339
14th Romanian Textiles and Leather Conference – CORTEP 2012
Sinaia, 6 - 8 September 2012
340
14
th Romanian Textiles and Leather Conference – CORTEP 2012
Sinaia, 6 - 8 September 2012
USE OF GRID NETWORK IN DESIGNING AUXETIC TEXTILE STRUCTURES
Mihai STAN & Pyerina Carmen GHITULEASA
The National Research&Development Institute for Textiles and Leather, Bucharest, Romania Abstract: A material is called auxetic if it is characterized by negative Poisson’s ratio, which basically means that a sample subjected to longitudinal traction "swells" and thins to contraction. The paper is structured in three parts. The first part presents the characteristics of auxetic type elastic media, with reference to textile structures. The second part presents a virtual prototype in which an auxetic yarn is mechanically obtained. The third part presents the numerical results obtained using an original mathematical model with GRID networks. The mathematical model is based on the notion of fabric "atom", meaning that the connection points are assimilated with some material points of a certain mass, and fabric "atoms" interact through elastic forces acting in warp and weft yarns. The large number of model equations makes numerical modeling possible only by using the GRID network. The numerical values obtained are compared with numerical results obtained using COMSOL MULTIPHYSICS product in which a textile sample is assimilated with an elastic membrane. Keywords: auxetic, GRID network, designing textile structures 1 INTRODUCTION The virtual prototype is to be understood as a chain of complex simulations enabling the transit to the practical manufacturing of the real prototype of a certain product. Its efficiency lies with the fact that it enables the carrying out of simulations close to the behavior real conditions of the future product in the specific conditions of its use. The computer technological results and the use of the improved algorithms enable nowadays the approach of complex problems (field interactions, etc) which trigger the underlying of certain processes and phenomena that arose in the core of the problem submitted to analysis. Furthermore, the last years enabled the obtaining of certain theoretical outcome and not only related to materials. It would be enough to mention to this end the latest research in the field of meta-materials. (materials which are characterized by negative values for the magnetic permeability and the electric permeability, respectively) or/and of the auxetic materials (materials characterized by negative Poisson coefficient, actually we talk about materials which expand their volume when found under the action of axis longitudinal tractions). The work shows a series of aspects specific to the textile structures having auxetic properties, so that in the end a mathematical pattern is developed and used in designing the auxetic textile structures. 2 SHORT DESCRIPTION OF THE ELASTIC AUXETIC STRUCTURES [1-5] Considering a continuous elastic medium, an elastic auxetic structure is characterized by a negative Poisson ratio. It is known that within the limits of classical elasticity theory, Poisson ratio can not be negative, so that all models constructed so far take as possible values positive values for Poisson ratio. Theoretical speculation (in the 40’s) on the possibility of the existence of materials characterized by negative values of Poisson ratio, became real when the first auxetic structures were accomplished (negative values of Poisson ratio) [1-3].….…… Poisson ratio is defined as the ratio:
(1)
341
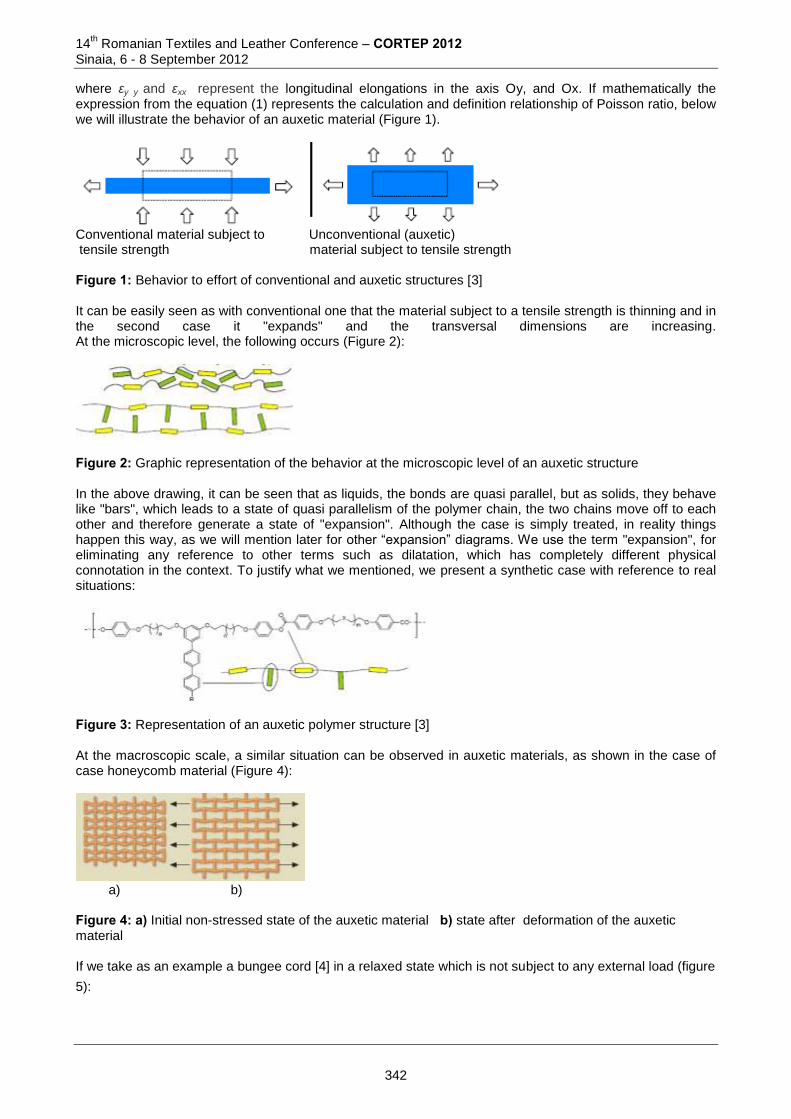
14th Romanian Textiles and Leather Conference – CORTEP 2012
Sinaia, 6 - 8 September 2012
where εy y and εxx represent the longitudinal elongations in the axis Oy, and Ox. If mathematically the expression from the equation (1) represents the calculation and definition relationship of Poisson ratio, below we will illustrate the behavior of an auxetic material (Figure 1).
Conventional material subject to Unconventional (auxetic) tensile strength material subject to tensile strength Figure 1: Behavior to effort of conventional and auxetic structures [3] It can be easily seen as with conventional one that the material subject to a tensile strength is thinning and in the second case it "expands" and the transversal dimensions are increasing. At the microscopic level, the following occurs (Figure 2):
Figure 2: Graphic representation of the behavior at the microscopic level of an auxetic structure In the above drawing, it can be seen that as liquids, the bonds are quasi parallel, but as solids, they behave like "bars", which leads to a state of quasi parallelism of the polymer chain, the two chains move off to each other and therefore generate a state of "expansion". Although the case is simply treated, in reality things happen this way, as we will mention later for other “expansion” diagrams. We use the term "expansion", for eliminating any reference to other terms such as dilatation, which has completely different physical connotation in the context. To justify what we mentioned, we present a synthetic case with reference to real situations:
Figure 3: Representation of an auxetic polymer structure [3] At the macroscopic scale, a similar situation can be observed in auxetic materials, as shown in the case of case honeycomb material (Figure 4):
a) b)
Figure 4: a) Initial non-stressed state of the auxetic material b) state after deformation of the auxetic material If we take as an example a bungee cord [4] in a relaxed state which is not subject to any external load (figure
5):...............................................................
342
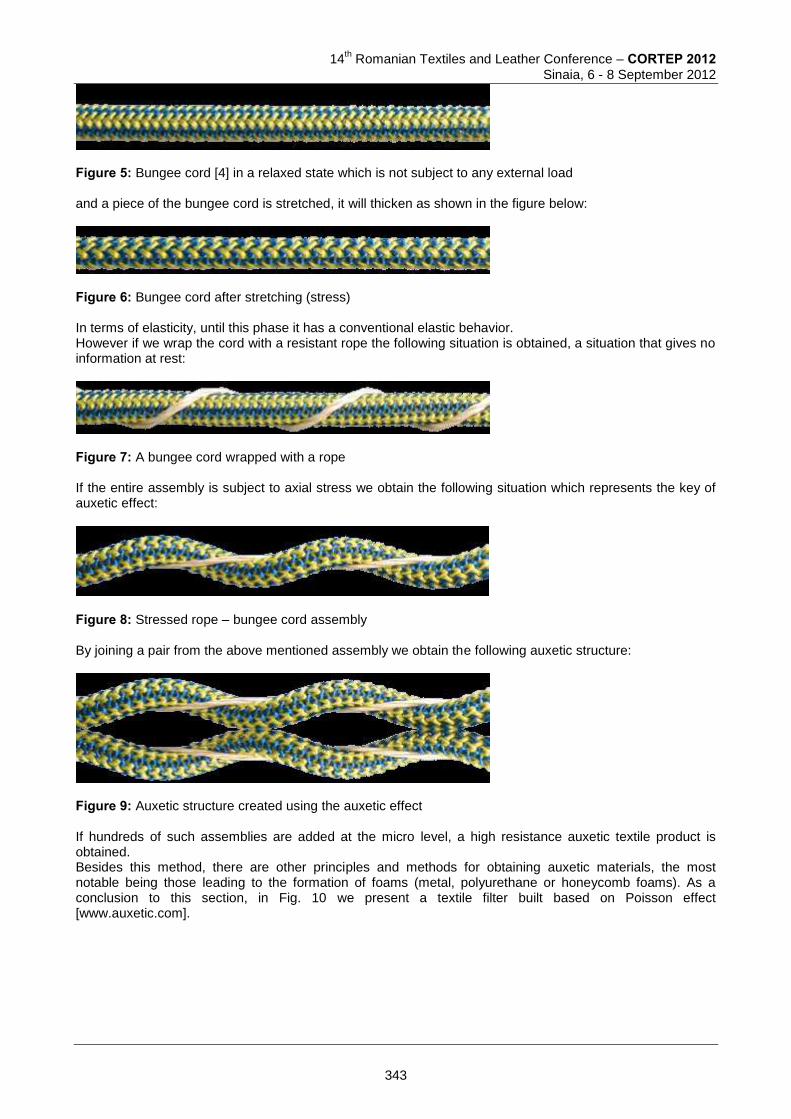
14
th Romanian Textiles and Leather Conference – CORTEP 2012
Sinaia, 6 - 8 September 2012
Figure 5: Bungee cord [4] in a relaxed state which is not subject to any external load and a piece of the bungee cord is stretched, it will thicken as shown in the figure below:
Figure 6: Bungee cord after stretching (stress) In terms of elasticity, until this phase it has a conventional elastic behavior. However if we wrap the cord with a resistant rope the following situation is obtained, a situation that gives no information at rest:
Figure 7: A bungee cord wrapped with a rope If the entire assembly is subject to axial stress we obtain the following situation which represents the key of auxetic effect:
Figure 8: Stressed rope – bungee cord assembly
By joining a pair from the above mentioned assembly we obtain the following auxetic structure:
Figure 9: Auxetic structure created using the auxetic effect If hundreds of such assemblies are added at the micro level, a high resistance auxetic textile product is obtained. Besides this method, there are other principles and methods for obtaining auxetic materials, the most notable being those leading to the formation of foams (metal, polyurethane or honeycomb foams). As a conclusion to this section, in Fig. 10 we present a textile filter built based on Poisson effect [www.auxetic.com].
343
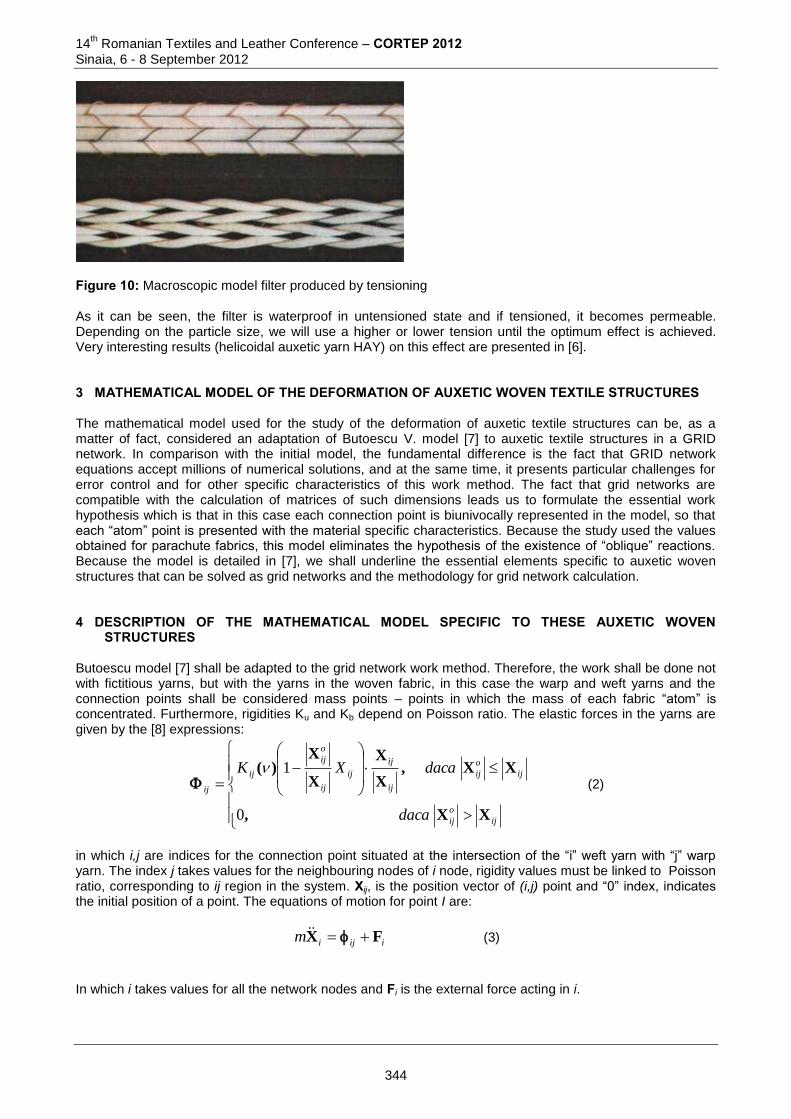
14th Romanian Textiles and Leather Conference – CORTEP 2012
Sinaia, 6 - 8 September 2012
Figure 10: Macroscopic model filter produced by tensioning
As it can be seen, the filter is waterproof in untensioned state and if tensioned, it becomes permeable. Depending on the particle size, we will use a higher or lower tension until the optimum effect is achieved. Very interesting results (helicoidal auxetic yarn HAY) on this effect are presented in [6]. 3 MATHEMATICAL MODEL OF THE DEFORMATION OF AUXETIC WOVEN TEXTILE STRUCTURES The mathematical model used for the study of the deformation of auxetic textile structures can be, as a matter of fact, considered an adaptation of Butoescu V. model [7] to auxetic textile structures in a GRID network. In comparison with the initial model, the fundamental difference is the fact that GRID network equations accept millions of numerical solutions, and at the same time, it presents particular challenges for error control and for other specific characteristics of this work method. The fact that grid networks are compatible with the calculation of matrices of such dimensions leads us to formulate the essential work hypothesis which is that in this case each connection point is biunivocally represented in the model, so that each “atom” point is presented with the material specific characteristics. Because the study used the values obtained for parachute fabrics, this model eliminates the hypothesis of the existence of “oblique” reactions. Because the model is detailed in [7], we shall underline the essential elements specific to auxetic woven structures that can be solved as grid networks and the methodology for grid network calculation. 4 DESCRIPTION OF THE MATHEMATICAL MODEL SPECIFIC TO THESE AUXETIC WOVEN
STRUCTURES Butoescu model [7] shall be adapted to the grid network work method. Therefore, the work shall be done not with fictitious yarns, but with the yarns in the woven fabric, in this case the warp and weft yarns and the connection points shall be considered mass points – points in which the mass of each fabric “atom” is concentrated. Furthermore, rigidities Ku and Kb depend on Poisson ratio. The elastic forces in the yarns are given by the [8] expressions:
ij
o
ij
ij
o
ij
ij
ij
ij
ij
o
ij
ij
ij
daca
dacaXK
XX,
XX,X
X
X
X)(
0
1 (2)
in which i,j are indices for the connection point situated at the intersection of the “i” weft yarn with “j” warp yarn. The index j takes values for the neighbouring nodes of i node, rigidity values must be linked to Poisson ratio, corresponding to ij region in the system. Xij, is the position vector of (i,j) point and “0” index, indicates the initial position of a point. The equations of motion for point I are:
iijim FX (3)
In which i takes values for all the network nodes and Fi is the external force acting in i.
344
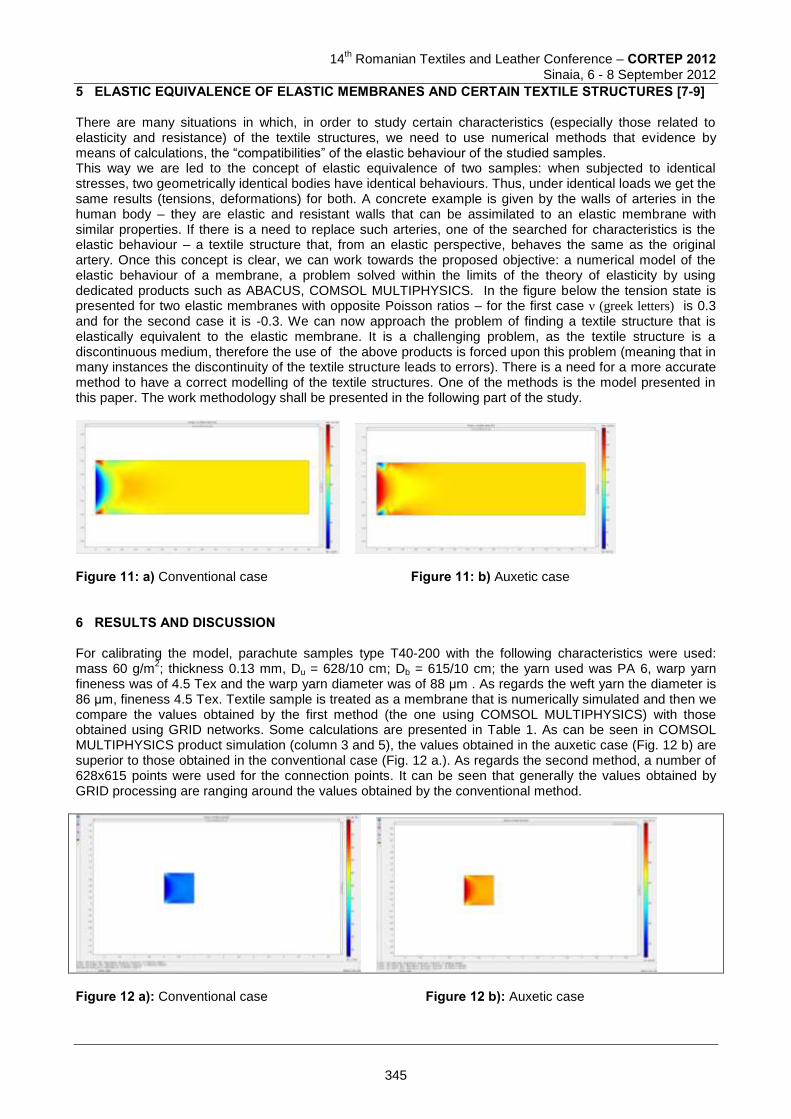
14
th Romanian Textiles and Leather Conference – CORTEP 2012
Sinaia, 6 - 8 September 2012
5 ELASTIC EQUIVALENCE OF ELASTIC MEMBRANES AND CERTAIN TEXTILE STRUCTURES [7-9] There are many situations in which, in order to study certain characteristics (especially those related to elasticity and resistance) of the textile structures, we need to use numerical methods that evidence by means of calculations, the “compatibilities” of the elastic behaviour of the studied samples. This way we are led to the concept of elastic equivalence of two samples: when subjected to identical stresses, two geometrically identical bodies have identical behaviours. Thus, under identical loads we get the same results (tensions, deformations) for both. A concrete example is given by the walls of arteries in the human body – they are elastic and resistant walls that can be assimilated to an elastic membrane with similar properties. If there is a need to replace such arteries, one of the searched for characteristics is the elastic behaviour – a textile structure that, from an elastic perspective, behaves the same as the original artery. Once this concept is clear, we can work towards the proposed objective: a numerical model of the elastic behaviour of a membrane, a problem solved within the limits of the theory of elasticity by using dedicated products such as ABACUS, COMSOL MULTIPHYSICS. In the figure below the tension state is presented for two elastic membranes with opposite Poisson ratios – for the first case ν (greek letters) is 0.3 and for the second case it is -0.3. We can now approach the problem of finding a textile structure that is elastically equivalent to the elastic membrane. It is a challenging problem, as the textile structure is a discontinuous medium, therefore the use of the above products is forced upon this problem (meaning that in many instances the discontinuity of the textile structure leads to errors). There is a need for a more accurate method to have a correct modelling of the textile structures. One of the methods is the model presented in this paper. The work methodology shall be presented in the following part of the study.
Figure 11: a) Conventional case Figure 11: b) Auxetic case 6 RESULTS AND DISCUSSION For calibrating the model, parachute samples type T40-200 with the following characteristics were used: mass 60 g/m
2; thickness 0.13 mm, Du = 628/10 cm; Db = 615/10 cm; the yarn used was PA 6, warp yarn
fineness was of 4.5 Tex and the warp yarn diameter was of 88 μm . As regards the weft yarn the diameter is 86 μm, fineness 4.5 Tex. Textile sample is treated as a membrane that is numerically simulated and then we compare the values obtained by the first method (the one using COMSOL MULTIPHYSICS) with those obtained using GRID networks. Some calculations are presented in Table 1. As can be seen in COMSOL MULTIPHYSICS product simulation (column 3 and 5), the values obtained in the auxetic case (Fig. 12 b) are superior to those obtained in the conventional case (Fig. 12 a.). As regards the second method, a number of 628x615 points were used for the connection points. It can be seen that generally the values obtained by GRID processing are ranging around the values obtained by the conventional method.
Figure 12 a): Conventional case Figure 12 b): Auxetic case
345
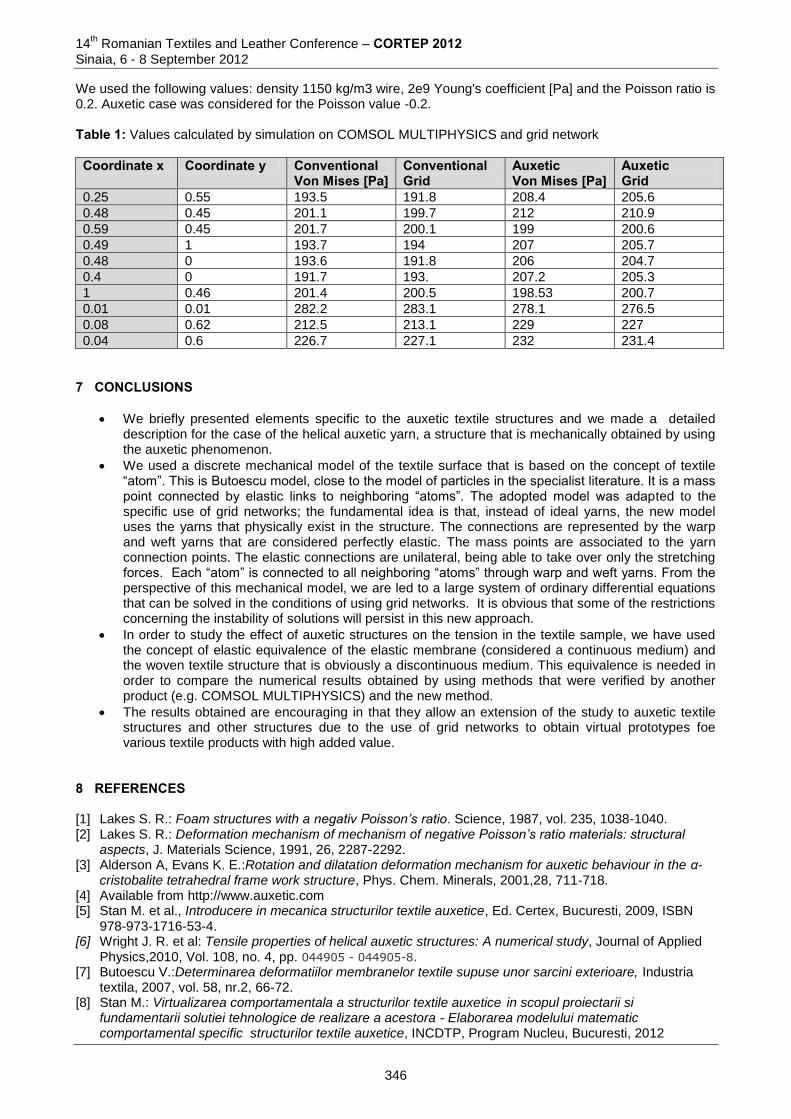
14th Romanian Textiles and Leather Conference – CORTEP 2012
Sinaia, 6 - 8 September 2012
We used the following values: density 1150 kg/m3 wire, 2e9 Young's coefficient [Pa] and the Poisson ratio is 0.2. Auxetic case was considered for the Poisson value -0.2. Table 1: Values calculated by simulation on COMSOL MULTIPHYSICS and grid network Coordinate x Coordinate y Conventional
Von Mises [Pa] Conventional Grid
Auxetic Von Mises [Pa]
Auxetic Grid
0.25 0.55 193.5 191.8 208.4 205.6
0.48 0.45 201.1 199.7 212 210.9
0.59 0.45 201.7 200.1 199 200.6
0.49 1 193.7 194 207 205.7
0.48 0 193.6 191.8 206 204.7
0.4 0 191.7 193. 207.2 205.3
1 0.46 201.4 200.5 198.53 200.7
0.01 0.01 282.2 283.1 278.1 276.5
0.08 0.62 212.5 213.1 229 227
0.04 0.6 226.7 227.1 232 231.4
7 CONCLUSIONS
We briefly presented elements specific to the auxetic textile structures and we made a detailed description for the case of the helical auxetic yarn, a structure that is mechanically obtained by using the auxetic phenomenon.
We used a discrete mechanical model of the textile surface that is based on the concept of textile “atom”. This is Butoescu model, close to the model of particles in the specialist literature. It is a mass point connected by elastic links to neighboring “atoms”. The adopted model was adapted to the specific use of grid networks; the fundamental idea is that, instead of ideal yarns, the new model uses the yarns that physically exist in the structure. The connections are represented by the warp and weft yarns that are considered perfectly elastic. The mass points are associated to the yarn connection points. The elastic connections are unilateral, being able to take over only the stretching forces. Each “atom” is connected to all neighboring “atoms” through warp and weft yarns. From the perspective of this mechanical model, we are led to a large system of ordinary differential equations that can be solved in the conditions of using grid networks. It is obvious that some of the restrictions concerning the instability of solutions will persist in this new approach.
In order to study the effect of auxetic structures on the tension in the textile sample, we have used the concept of elastic equivalence of the elastic membrane (considered a continuous medium) and the woven textile structure that is obviously a discontinuous medium. This equivalence is needed in order to compare the numerical results obtained by using methods that were verified by another product (e.g. COMSOL MULTIPHYSICS) and the new method.
The results obtained are encouraging in that they allow an extension of the study to auxetic textile structures and other structures due to the use of grid networks to obtain virtual prototypes foe various textile products with high added value.
8 REFERENCES [1] Lakes S. R.: Foam structures with a negativ Poisson’s ratio. Science, 1987, vol. 235, 1038-1040. [2] Lakes S. R.: Deformation mechanism of mechanism of negative Poisson’s ratio materials: structural
aspects, J. Materials Science, 1991, 26, 2287-2292. [3] Alderson A, Evans K. E.:Rotation and dilatation deformation mechanism for auxetic behaviour in the α-
cristobalite tetrahedral frame work structure, Phys. Chem. Minerals, 2001,28, 711-718. [4] Available from http://www.auxetic.com [5] Stan M. et al., Introducere in mecanica structurilor textile auxetice, Ed. Certex, Bucuresti, 2009, ISBN
978-973-1716-53-4. [6] Wright J. R. et al: Tensile properties of helical auxetic structures: A numerical study, Journal of Applied
Physics,2010, Vol. 108, no. 4, pp. 044905 - 044905-8. [7] Butoescu V.:Determinarea deformatiilor membranelor textile supuse unor sarcini exterioare, Industria
textila, 2007, vol. 58, nr.2, 66-72. [8] Stan M.: Virtualizarea comportamentala a structurilor textile auxetice in scopul proiectarii si
fundamentarii solutiei tehnologice de realizare a acestora - Elaborarea modelului matematic comportamental specific structurilor textile auxetice, INCDTP, Program Nucleu, Bucuresti, 2012
346
14
th Romanian Textiles and Leather Conference – CORTEP 2012
Sinaia, 6 - 8 September 2012
[9] Stan M., Cercetari privind caracterizarea curgerii biofluidului in si prin structuri tridimensionale de tip dispozitive medicale invazive obtinute prin tehnologii de prelucrare mecano-textila. Modele virtuale cu aplicatii speciale. INCDTP, Program Nucleu, Bucuresti, 2011.
[10] Stan M., The use of GRID networks for designing high added value textiles (Poster), Aachen-Dresden International Textile Conference, Aachen, nov. 24-25, 2011.
Corresponding author: Mihai STAN Textile systems for aeronautics research departament The National Research & Development Institute for Textiles and Leather 16 L. Patrascanu street, 030508, Bucharest, Romania Phone: (004)021-340.49.28, Fax: (004)021-340.55.15, E-mail: [email protected] Co-author Pyerina Carmen GHITULEASA General Director The National Research&Development Institute for Textiles and Leather 16 L. Patrascanu street, 030508, Bucharest, Romania Phone: (004)021-340.49.28, Fax: (004)021-340.55.15, E-mail: [email protected]
347
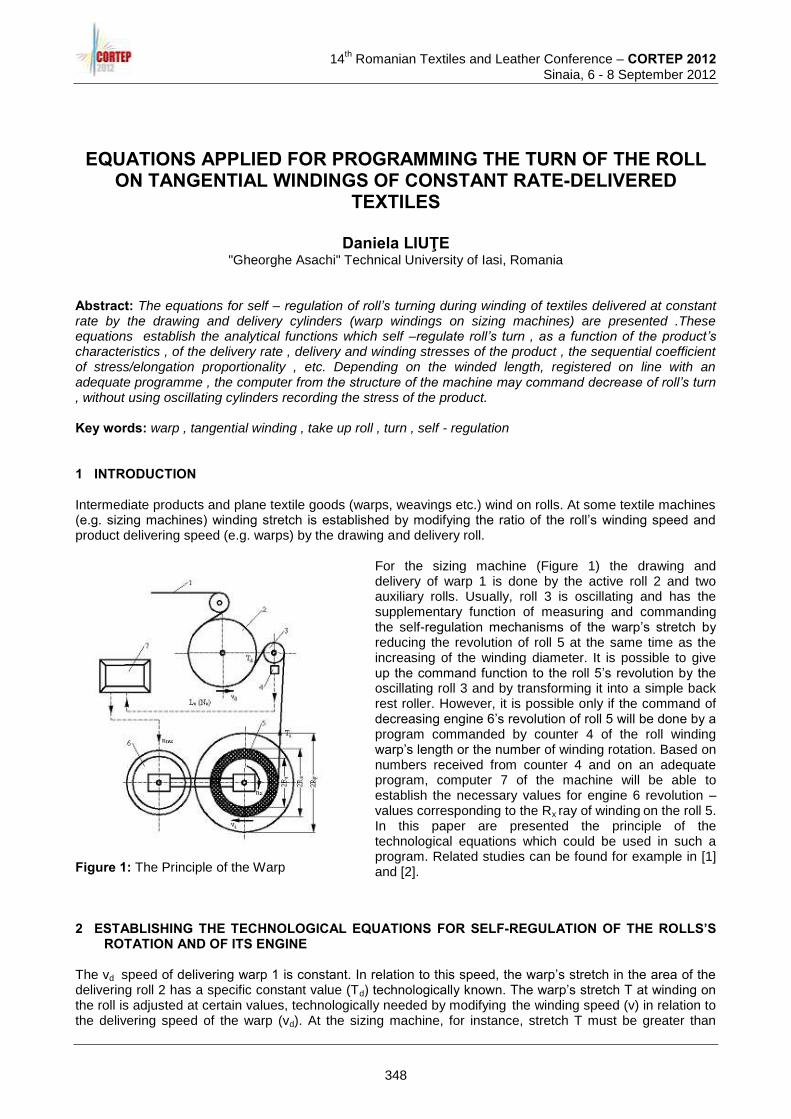
14
th Romanian Textiles and Leather Conference – CORTEP 2012
Sinaia, 6 - 8 September 2012
EQUATIONS APPLIED FOR PROGRAMMING THE TURN OF THE ROLL ON TANGENTIAL WINDINGS OF CONSTANT RATE-DELIVERED
TEXTILES
Daniela LIUŢE "Gheorghe Asachi" Technical University of Iasi, Romania
Abstract: The equations for self – regulation of roll’s turning during winding of textiles delivered at constant rate by the drawing and delivery cylinders (warp windings on sizing machines) are presented .These equations establish the analytical functions which self –regulate roll’s turn , as a function of the product’s characteristics , of the delivery rate , delivery and winding stresses of the product , the sequential coefficient of stress/elongation proportionality , etc. Depending on the winded length, registered on line with an adequate programme , the computer from the structure of the machine may command decrease of roll’s turn , without using oscillating cylinders recording the stress of the product. Key words: warp , tangential winding , take up roll , turn , self - regulation 1 INTRODUCTION Intermediate products and plane textile goods (warps, weavings etc.) wind on rolls. At some textile machines (e.g. sizing machines) winding stretch is established by modifying the ratio of the roll’s winding speed and product delivering speed (e.g. warps) by the drawing and delivery roll.
Figure 1: The Principle of the Warp
For the sizing machine (Figure 1) the drawing and delivery of warp 1 is done by the active roll 2 and two auxiliary rolls. Usually, roll 3 is oscillating and has the supplementary function of measuring and commanding the self-regulation mechanisms of the warp’s stretch by reducing the revolution of roll 5 at the same time as the increasing of the winding diameter. It is possible to give up the command function to the roll 5’s revolution by the oscillating roll 3 and by transforming it into a simple back rest roller. However, it is possible only if the command of decreasing engine 6’s revolution of roll 5 will be done by a program commanded by counter 4 of the roll winding warp’s length or the number of winding rotation. Based on numbers received from counter 4 and on an adequate program, computer 7 of the machine will be able to establish the necessary values for engine 6 revolution – values corresponding to the Rx ray of winding on the roll 5. In this paper are presented the principle of the technological equations which could be used in such a program. Related studies can be found for example in [1] and [2].
2 ESTABLISHING THE TECHNOLOGICAL EQUATIONS FOR SELF-REGULATION OF THE ROLLS’S
ROTATION AND OF ITS ENGINE The vd speed of delivering warp 1 is constant. In relation to this speed, the warp’s stretch in the area of the delivering roll 2 has a specific constant value (Td) technologically known. The warp’s stretch T at winding on the roll is adjusted at certain values, technologically needed by modifying the winding speed (v) in relation to the delivering speed of the warp (vd). At the sizing machine, for instance, stretch T must be greater than
348

14th Romanian Textiles and Leather Conference – CORTEP 2012
Sinaia, 6 - 8 September 2012
stretch Td achievable by v > vd. The difference of the speed’s v – vd generates stretch T which is technologically necessary at winding. The increase of the yarn’s stretch from value Td to value T generates a certain sequential stretching of the yarn (ε di) between the delivery rolls and the winding roll. For intervals close to the stretch’s variation and for its relatively small values, the proportionality equation between the stretch and the sequential stretching is :
dipsdi KTT or dispi KT (1)
Where:
Ksp – is the sequential coefficient of proportionality between the sequential increasing of the yarn’s stretch and the sequential stretching suffered by it in cN/% .
Ti and Td – the yarn’s stretch at the winding point on the roll, respectively the yarn’s stretch at the delivery point of the drawing rolls.
Δ Ti – the increase of the yarn’s stretch at the delivery winding area ε di – the percentage of the lengthening of the yarn in the delivery winding area.
Kinematically, the lengthening of the εdi is determined by the following equation:
100d
ddi
v
vv (2)
Therefore
100d
d
spdiv
vvKTT
(3)
Hence the speed v of the roll winding, which appears to be technologically necessary, is given by
ps
did
K
TTvv
1001 (4)
The roll winding speed is kinematically achieved and is determined by the following equation:
v = 2 π Rx nx (5)
where: Rx – is the winding ray which increases constantly;
nx – the roll turn which has to constantly decrease in order to maintain the constant speed v, respectively the stretch T. By equivalating the technologically necessary speed with the kinematically achievable speed we obtain the following equation
xx
sp
did nR
K
TTv 2
1001
(6)
The roll turn has to decrease at the same time as the winding ray increases as follows:
sp
di
x
dx
K
TT
R
vn
1001
2 (7)
The yarn’s tensions (T) and (Td) are technologically known and the sequential coefficient of proportionality tension/lengthening Kps, in cN/% can be experimentally determined. The command of the decrease of the roll’s turn (nx) can be determined by means of the measurement of the ray (Rx), by means of monitoring the winded length of the roll (Lx), or by means of monitoring the winding
349

14
th Romanian Textiles and Leather Conference – CORTEP 2012
Sinaia, 6 - 8 September 2012
turns (Nx). Depending on the number of the winding turns, ray Rx is determined using one of the following equations:
Rx = Rxo + Nx,for textiles having measurable (8)
Rx =Rxo + 510
ut PT Nx, for warps, (9)
Where: Rx – stands for the winding ray at one point in time (in cm);
Rx0 – the initial ray of the roll (the support-tube) (in cm);
the thickness of a lap winded on a take up roll (in cm); Nx – the number of winding turns from the beginning of making the roll up to the attainment of ray Rx
(if these can be monitored); Tt – the fineness of the winded yarn (in tex); Pu – the warp setting (in yarns/cm); ρ – the winding density (in g/cm
3).
The expression of ray Rx depending on length Lx winded on the take up roll is given by the following equations (e.g. [3]):
xxx LRR
2
0 , for textiles with measurable (10)
xut
xx LPT
RR5
2
010
, for warps (11)
where Lx is the length of the textile product winded on the roll (in cm). The equations necessary for establishing the turn of the roll and written to be used by a computer program for the turn self-regulation are:
sp
di
xx
dx
K
TT
NR
vn
1001
2 0 (12)
sp
di
xut
x
dx
K
TT
NPT
R
vn
1001
102
50
(13)
sp
di
xx
dx
K
TT
LR
vn
1001
2 2
0
(14)
sp
di
xut
x
dx
K
TT
LPT
R
vn
1001
102
5
2
0
(15)
In all situations, the turn of the roll’s engine (nmx) can be determined by equation (16).
nmx = nx (16) where ism stands for the mechanical speed ratio between the spindle of the roll and the shaft of the engine.
350
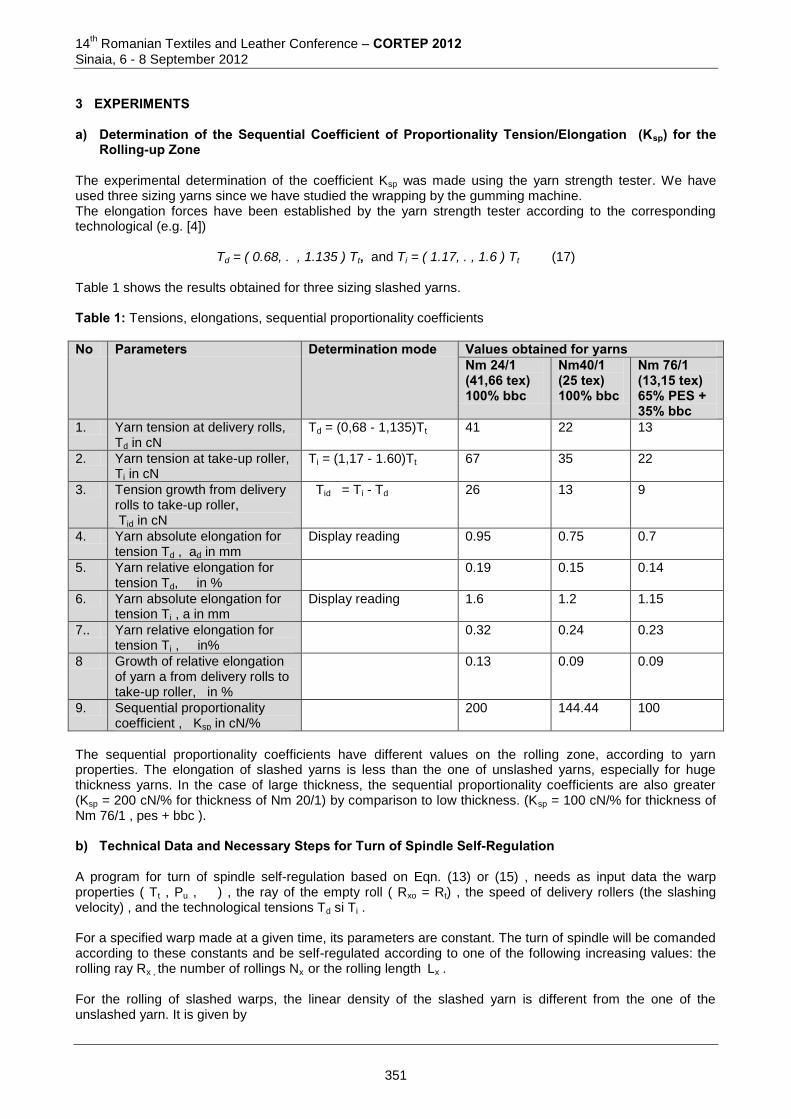
14th Romanian Textiles and Leather Conference – CORTEP 2012
Sinaia, 6 - 8 September 2012
3 EXPERIMENTS a) Determination of the Sequential Coefficient of Proportionality Tension/Elongation (Ksp) for the
Rolling-up Zone The experimental determination of the coefficient Ksp was made using the yarn strength tester. We have used three sizing yarns since we have studied the wrapping by the gumming machine. The elongation forces have been established by the yarn strength tester according to the corresponding technological (e.g. [4])
Td = ( 0.68, . , 1.135 ) Tt, and Ti = ( 1.17, . , 1.6 ) Tt (17) Table 1 shows the results obtained for three sizing slashed yarns. Table 1: Tensions, elongations, sequential proportionality coefficients
No Parameters Determination mode Values obtained for yarns Nm 24/1 (41,66 tex) 100% bbc
Nm40/1 (25 tex) 100% bbc
Nm 76/1 (13,15 tex) 65% PES + 35% bbc
1. Yarn tension at delivery rolls, Td in cN
Td = (0,68 - 1,135)Tt 41 22 13
2. Yarn tension at take-up roller, Ti in cN
Ti = (1,17 - 1.60)Tt 67 35 22
3. Tension growth from delivery rolls to take-up roller, Tid in cN
Tid = Ti - Td 26 13 9
4. Yarn absolute elongation for tension Td , ad in mm
Display reading 0.95 0.75 0.7
5. Yarn relative elongation for tension Td, in %
0.19 0.15 0.14
6. Yarn absolute elongation for tension Ti , a in mm
Display reading 1.6 1.2 1.15
7.. Yarn relative elongation for tension Ti , in%
0.32 0.24 0.23
8 Growth of relative elongation of yarn a from delivery rolls to take-up roller, in %
0.13 0.09 0.09
9. Sequential proportionality coefficient , Ksp in cN/%
200 144.44 100
The sequential proportionality coefficients have different values on the rolling zone, according to yarn properties. The elongation of slashed yarns is less than the one of unslashed yarns, especially for huge thickness yarns. In the case of large thickness, the sequential proportionality coefficients are also greater (Ksp = 200 cN/% for thickness of Nm 20/1) by comparison to low thickness. (Ksp = 100 cN/% for thickness of Nm 76/1 , pes + bbc ). b) Technical Data and Necessary Steps for Turn of Spindle Self-Regulation A program for turn of spindle self-regulation based on Eqn. (13) or (15) , needs as input data the warp properties ( Tt , Pu , ) , the ray of the empty roll ( Rxo = Rt) , the speed of delivery rollers (the slashing velocity) , and the technological tensions Td si Ti . For a specified warp made at a given time, its parameters are constant. The turn of spindle will be comanded according to these constants and be self-regulated according to one of the following increasing values: the rolling ray Rx , the number of rollings Nx or the rolling length Lx . For the rolling of slashed warps, the linear density of the slashed yarn is different from the one of the unslashed yarn. It is given by
351
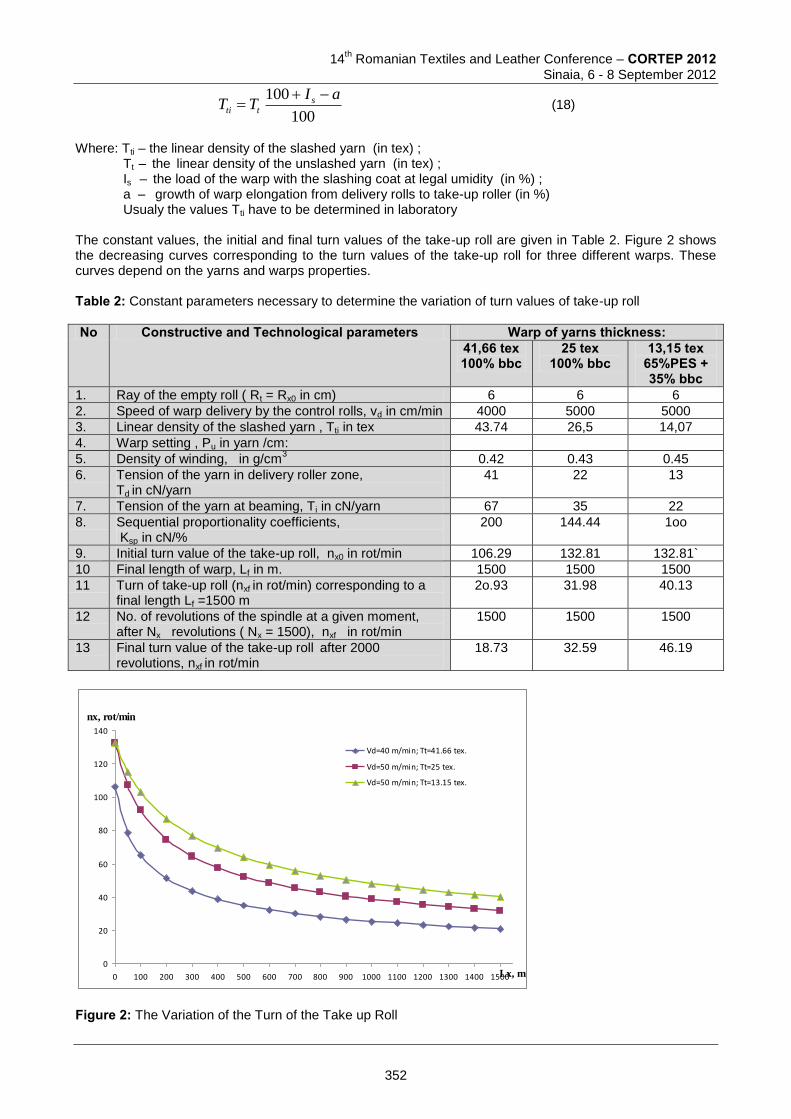
14
th Romanian Textiles and Leather Conference – CORTEP 2012
Sinaia, 6 - 8 September 2012
100
100 aITT s
tti
(18)
Where: Tti – the linear density of the slashed yarn (in tex) ;
Tt – the linear density of the unslashed yarn (in tex) ; Is – the load of the warp with the slashing coat at legal umidity (in %) ; a – growth of warp elongation from delivery rolls to take-up roller (in %) Usualy the values Tti have to be determined in laboratory
The constant values, the initial and final turn values of the take-up roll are given in Table 2. Figure 2 shows the decreasing curves corresponding to the turn values of the take-up roll for three different warps. These curves depend on the yarns and warps properties. Table 2: Constant parameters necessary to determine the variation of turn values of take-up roll
No Constructive and Technological parameters Warp of yarns thickness: 41,66 tex 100% bbc
25 tex 100% bbc
13,15 tex 65%PES + 35% bbc
1. Ray of the empty roll ( Rt = Rx0 in cm) 6 6 6
2. Speed of warp delivery by the control rolls, vd in cm/min 4000 5000 5000
3. Linear density of the slashed yarn , Tti in tex 43.74 26,5 14,07
4. Warp setting , Pu in yarn /cm:
5. Density of winding, in g/cm3
0.42 0.43 0.45
6. Tension of the yarn in delivery roller zone, Td in cN/yarn
41 22 13
7. Tension of the yarn at beaming, Ti in cN/yarn 67 35 22
8. Sequential proportionality coefficients, Ksp in cN/%
200 144.44 1oo
9. Initial turn value of the take-up roll, nx0 in rot/min 106.29 132.81 132.81`
10 Final length of warp, Lf in m. 1500 1500 1500
11 Turn of take-up roll (nxf in rot/min) corresponding to a final length Lf =1500 m
2o.93 31.98 40.13
12 No. of revolutions of the spindle at a given moment, after Nx revolutions ( Nx = 1500), nxf in rot/min
1500 1500 1500
13 Final turn value of the take-up roll after 2000 revolutions, nxf in rot/min
18.73 32.59 46.19
0
20
40
60
80
100
120
140
0 100 200 300 400 500 600 700 800 900 1000 1100 1200 1300 1400 1500Lx, m
nx, rot/min
Vd=40 m/min; Tt=41.66 tex.
Vd=50 m/min; Tt=25 tex.
Vd=50 m/min; Tt=13.15 tex.
Figure 2: The Variation of the Turn of the Take up Roll
352
14th Romanian Textiles and Leather Conference – CORTEP 2012
Sinaia, 6 - 8 September 2012
To write a computer program for the turn of spindle self-regulation by use of the technological equations presented above we have to follow the steps: 1. Find out the sequential proportionality coefficient (Ksp) ; One can use a dynamometer TINIUS OLSEN
H5K – T or an experiment stand ; 2. Find out the technological tension of the winding on yarn (Ti) and the tension (Td) from the previous zone
( take-up rolls) ; 3. Find out the linear density of the slashed yarn (Tti), if we refer to a slashed warp ; 4. Know the warp setting (Pu) and the density of winding as function of yarns tension and the take-up press 5. To write for the machine processor a program to compute the turn value (nx) of the roll, using Eqn. (15)
or a similar one; 6. To input to the machine processor all constant values (kinetics, tehnological) corresponding to a given
warp (see for instance Table 2; 7. On-line registration on the machine counter device of Lx , the length winded on the roll, and sending of
Lx value to the memory of the machine processor ; 8. On-line computing, by the machine processor, of nx , the turn value for the roll, and of nmx , the turn
value for the roll engine, as function of Lx above and the decrease of these values according to the equations involved in this paper.
4 CONCLUSIONS 1. Yarn dynamometers, such as *TINIUS OLSEN tip H5K-T* can obtain sequential proportionality
coefficients for tension/elongation ; 2. 2. Knowing the sequential proportionality coefficients allows us to find out new technological equations
for the self-regulation of the rotation of take-up rolls, according to the equations established above ; 3. The technological principles described by the new computing equations allows the self-regulation of the
rotation of take-up rolls by use of a computer program started by the machine counter device of the rolled warp. Therefore commands received from the tensioning roller can be dropped ;
4. Giving up self-regulation commands received from the tensioning roller allows one to transform it in a simple thread guide roller and therefore to simplify the mechanism used.
5 REFERENCES [1] Liute, Daniela; Racu, Cristina : Technological calculation relations for computer control of the revolutions
of driving motors of the band warping drum, Buletinul Institutului Politehnic Iasi, Tomul LV(LIX), Fasc.2, (2009), p. 10
[2] Liute, Daniela; Buhu, A: Relations for programming of beams revolutions at warp wrapping with constant variations of yarn tension, Industria Textila, Vol. 63 (2012), No.1, pp. 8-13
[3] Liute, Daniela; Liute, Dumitru : Bazele prelucrarii firelor textile, Editura Performatica, Iasi, 2010 [4] * * * Manualul inginerului textilist vol.I, sectiunea IV.4, Editura AGIR, Bucuresti, 2002 Corresponding author: Daniela LIUTE, Lecturer, PhD Faculty of Textile, Leather and Industrial Management, “Gheorghe Asachi” Technical University of Iasi D. Mangeron Blvd., no. 29 700050, Iasi, Romania Phone: 02322278680 E-mail: [email protected]
353
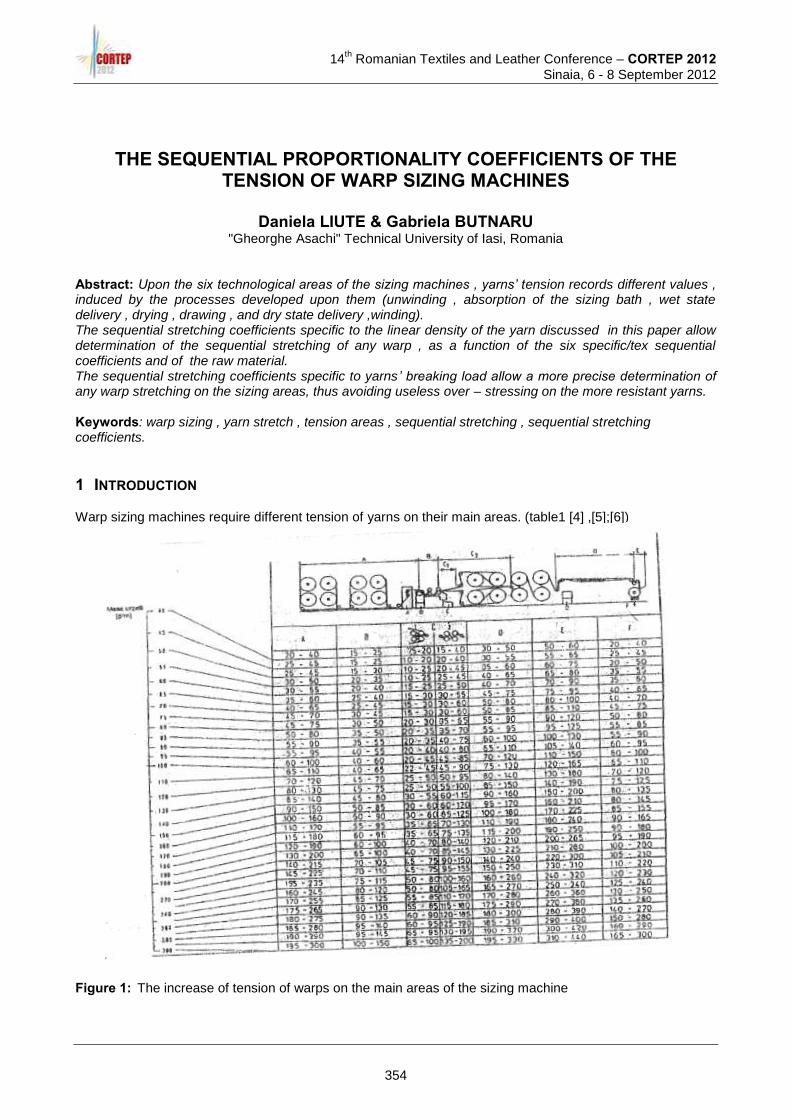
14
th Romanian Textiles and Leather Conference – CORTEP 2012
Sinaia, 6 - 8 September 2012
THE SEQUENTIAL PROPORTIONALITY COEFFICIENTS OF THE TENSION OF WARP SIZING MACHINES
Daniela LIUTE & Gabriela BUTNARU
"Gheorghe Asachi" Technical University of Iasi, Romania Abstract: Upon the six technological areas of the sizing machines , yarns’ tension records different values , induced by the processes developed upon them (unwinding , absorption of the sizing bath , wet state delivery , drying , drawing , and dry state delivery ,winding). The sequential stretching coefficients specific to the linear density of the yarn discussed in this paper allow determination of the sequential stretching of any warp , as a function of the six specific/tex sequential coefficients and of the raw material. The sequential stretching coefficients specific to yarns’ breaking load allow a more precise determination of any warp stretching on the sizing areas, thus avoiding useless over – stressing on the more resistant yarns. Keywords: warp sizing , yarn stretch , tension areas , sequential stretching , sequential stretching coefficients.
1 INTRODUCTION Warp sizing machines require different tension of yarns on their main areas. (table1 [4] ,[5];[6])
Figure 1: The increase of tension of warps on the main areas of the sizing machine
354
14th Romanian Textiles and Leather Conference – CORTEP 2012
Sinaia, 6 - 8 September 2012
2 THE SEQUENTIAL PROPORTIONALITY COEFFICIENTS OF THE TENSION SPECIFIC OF THE YARN COUNT
For each area, different technological tensions are recommended depending on the mass of the warp (Mu, in g/m, table 1[5; 6]). Regarding the mass Mu, the great diversity of warps leads to the recommended yarn tension having approximately 200 different numerical values for the the sequential tension (which is specific of the sizing areas). Each numerical value is meant for each different mixture of yarns. The recommended tensions are introduced in tables showing the daN per warp. The recommended sequential tensions required for the sizing process can simplified by means of sequential proportionality coefficients of the tension specific of the linear density of the yarn. The mass of the warp is expressed in tex (in g/km warp):
Ttu = Mu 1000 (1) where: Ttu – stands for the linear density of the warp expressed in tex warp; Mu – the mass of the warp expressed in g/m. By knowing the sequential tensions recommended for the different numerical values of the mass Mu (expressed in g/m) of all the areas of the warp, the sequential proportionality coefficient of the tension specific of the length density Kst (expressed in cN/tex) can be determined as follows:
tu
u
stT
TK (2)
where: Kst – stands for the sequential proportionality coefficient of the tension specific of the linear density expressed in cN/tex; Tu – the warp tension (expressed in cN/warp) technologically recommended according to the mass of the warp (approx. 200 numerical values for the 6 areas of the sizing machine, for each type of yarn [4, 5, 6]) The sequential proportionality coefficient specific of the linear density (which is thus determined) is valid for the entire warp (tex-warp) as well as for each of the yarn making up the warp (tex-yarn). All of the yarns of the warp have the same tension, which results in the same specific sequential proportionality coefficient of tension for each tex (Kst, expressed in cN/tex). In order to determine the sequential proportionality coefficients of the tension of linear density, the tensions technologically recommended for the entire warp (Tu) and the mass of the warp (expressed in tex) are required. The already determined numerical values of the sequential proportionality coefficients of tension specific per tex for each sizing area no longer depend on the mass of the warp, resulting into almost constant numerical values for all the warps with the numerical value of the mass ranging from 40 to 300 g/m. There will no longer be approx. 33 different recommendations/proposals for the warp tension specific of each particular area since only one recommendation/proposal (in the form of a sequential proportionality coefficient of tension –Kst expressed in cN/tex) is enough. The recommended numerical values of the specific sequential proportionality coefficients of tension per tex for the main areas of the sizing machine determined on the basis of the recommended tensions and in accordance with the warp mass are introduced in table 2 in which area F is also introduced. Area F is the area of the rotary machine which is characterized by a type of pressure recommended also by means of the specific coefficient per tex. The expression of the recommended numerical values (for the required tension of the yarns/yarns) achieved by means of the specific sequential proportionality coefficients per tex makes possible the use of only 7 recommended limits (for this coefficient –table 2) for each sizing area instead of approx. 230 recommended limits for the tension required for the entire warp. The tension required for the entire warp and for each particular area of the warp is determined by means of the following equation:
Tu = Kst Fu T (3) where : Fu – stands for the number of yarns/yarns within/making up the sized warp; Tt – the linear density of the yarn, in tex
355
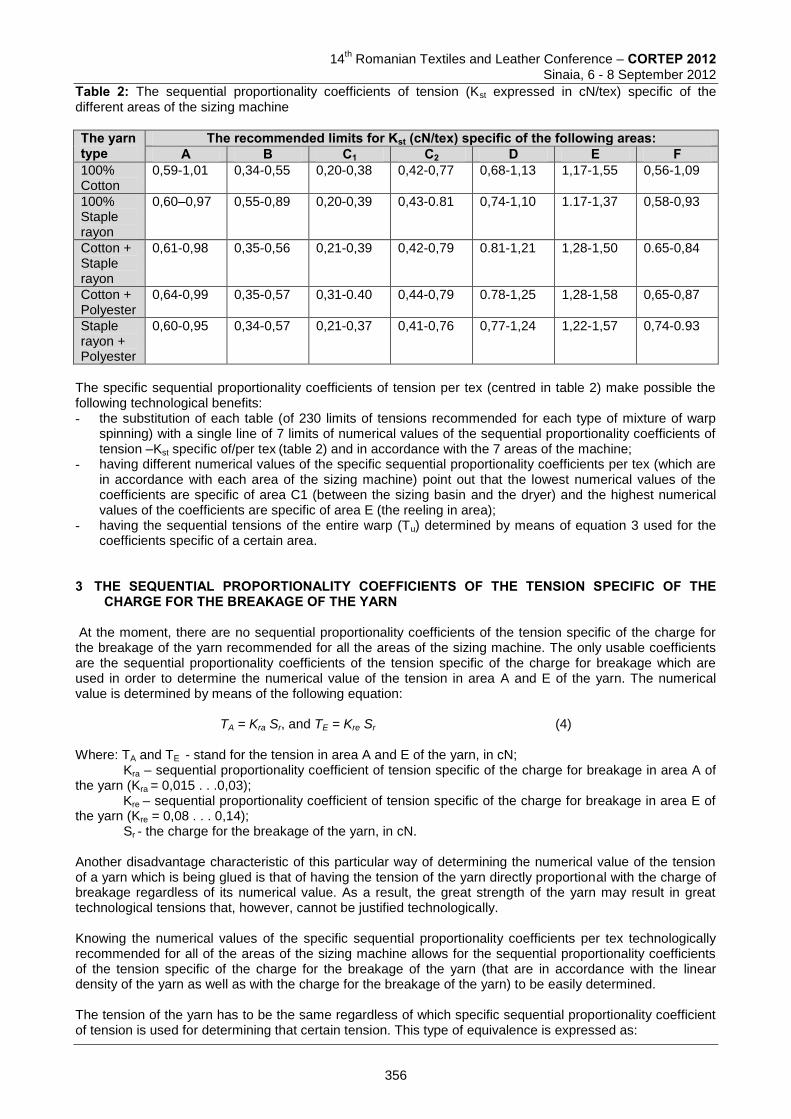
14
th Romanian Textiles and Leather Conference – CORTEP 2012
Sinaia, 6 - 8 September 2012
Table 2: The sequential proportionality coefficients of tension (Kst expressed in cN/tex) specific of the different areas of the sizing machine The yarn type
The recommended limits for Kst (cN/tex) specific of the following areas: A B C1 C2 D E F
100% Cotton
0,59-1,01 0,34-0,55 0,20-0,38 0,42-0,77 0,68-1,13 1,17-1,55 0,56-1,09
100% Staple rayon
0,60–0,97 0,55-0,89 0,20-0,39 0,43-0.81 0,74-1,10 1.17-1,37 0,58-0,93
Cotton + Staple rayon
0,61-0,98 0,35-0,56 0,21-0,39 0,42-0,79 0.81-1,21 1,28-1,50 0.65-0,84
Cotton + Polyester
0,64-0,99 0,35-0,57 0,31-0.40 0,44-0,79 0.78-1,25 1,28-1,58 0,65-0,87
Staple rayon + Polyester
0,60-0,95 0,34-0,57 0,21-0,37 0,41-0,76 0,77-1,24 1,22-1,57 0,74-0.93
The specific sequential proportionality coefficients of tension per tex (centred in table 2) make possible the following technological benefits: - the substitution of each table (of 230 limits of tensions recommended for each type of mixture of warp
spinning) with a single line of 7 limits of numerical values of the sequential proportionality coefficients of tension –Kst specific of/per tex (table 2) and in accordance with the 7 areas of the machine;
- having different numerical values of the specific sequential proportionality coefficients per tex (which are in accordance with each area of the sizing machine) point out that the lowest numerical values of the coefficients are specific of area C1 (between the sizing basin and the dryer) and the highest numerical values of the coefficients are specific of area E (the reeling in area);
- having the sequential tensions of the entire warp (Tu) determined by means of equation 3 used for the coefficients specific of a certain area.
3 THE SEQUENTIAL PROPORTIONALITY COEFFICIENTS OF THE TENSION SPECIFIC OF THE
CHARGE FOR THE BREAKAGE OF THE YARN At the moment, there are no sequential proportionality coefficients of the tension specific of the charge for the breakage of the yarn recommended for all the areas of the sizing machine. The only usable coefficients are the sequential proportionality coefficients of the tension specific of the charge for breakage which are used in order to determine the numerical value of the tension in area A and E of the yarn. The numerical value is determined by means of the following equation:
TA = Kra Sr, and TE = Kre Sr (4) Where: TA and TE - stand for the tension in area A and E of the yarn, in cN; Kra – sequential proportionality coefficient of tension specific of the charge for breakage in area A of the yarn (Kra = 0,015 . . .0,03);
Kre – sequential proportionality coefficient of tension specific of the charge for breakage in area E of the yarn (Kre = 0,08 . . . 0,14); Sr - the charge for the breakage of the yarn, in cN. Another disadvantage characteristic of this particular way of determining the numerical value of the tension of a yarn which is being glued is that of having the tension of the yarn directly proportional with the charge of breakage regardless of its numerical value. As a result, the great strength of the yarn may result in great technological tensions that, however, cannot be justified technologically. Knowing the numerical values of the specific sequential proportionality coefficients per tex technologically recommended for all of the areas of the sizing machine allows for the sequential proportionality coefficients of the tension specific of the charge for the breakage of the yarn (that are in accordance with the linear density of the yarn as well as with the charge for the breakage of the yarn) to be easily determined. The tension of the yarn has to be the same regardless of which specific sequential proportionality coefficient of tension is used for determining that certain tension. This type of equivalence is expressed as:
356
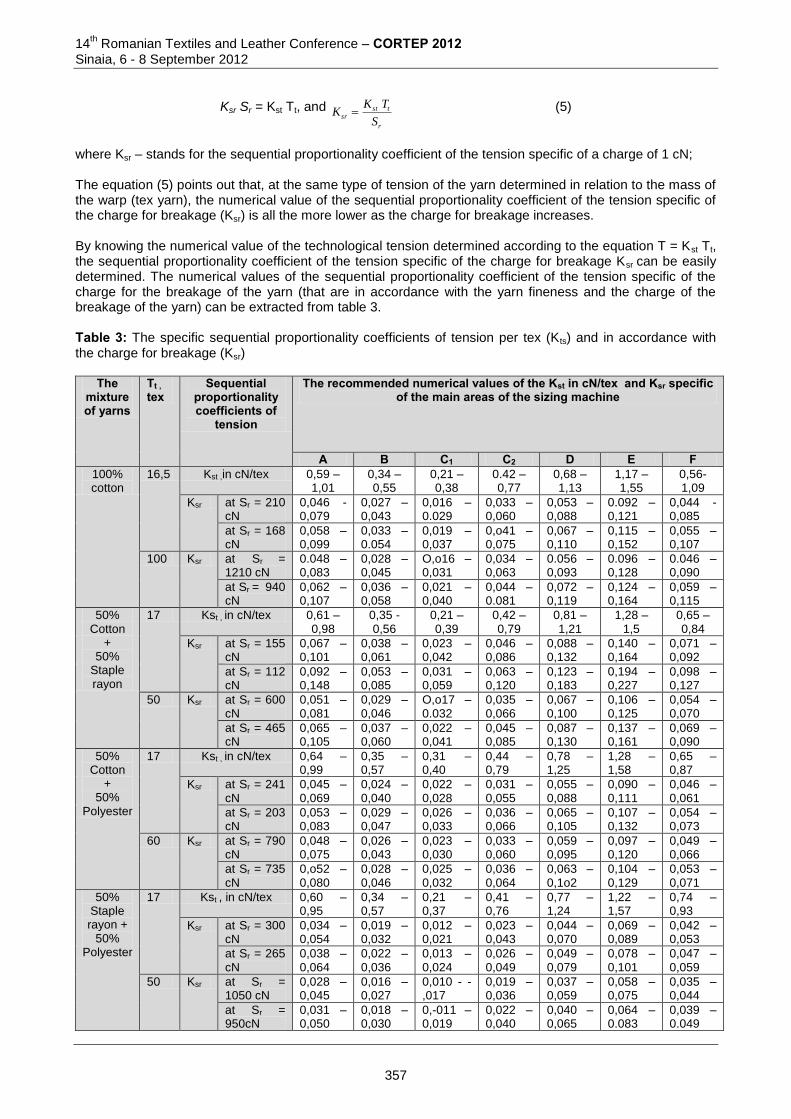
14th Romanian Textiles and Leather Conference – CORTEP 2012
Sinaia, 6 - 8 September 2012
Ksr Sr = Kst Tt, and
r
tstsr
S
TKK (5)
where Ksr – stands for the sequential proportionality coefficient of the tension specific of a charge of 1 cN; The equation (5) points out that, at the same type of tension of the yarn determined in relation to the mass of the warp (tex yarn), the numerical value of the sequential proportionality coefficient of the tension specific of the charge for breakage (Ksr) is all the more lower as the charge for breakage increases. By knowing the numerical value of the technological tension determined according to the equation T = Kst Tt, the sequential proportionality coefficient of the tension specific of the charge for breakage Ksr can be easily determined. The numerical values of the sequential proportionality coefficient of the tension specific of the charge for the breakage of the yarn (that are in accordance with the yarn fineness and the charge of the breakage of the yarn) can be extracted from table 3. Table 3: The specific sequential proportionality coefficients of tension per tex (Kts) and in accordance with the charge for breakage (Ksr)
The mixture of yarns
Tt , tex
Sequential proportionality coefficients of
tension
The recommended numerical values of the Kst in cN/tex and Ksr specific of the main areas of the sizing machine
A B C1 C2 D E F 100% cotton
16,5 Kst ,in cN/tex 0,59 – 1,01
0,34 – 0,55
0,21 – 0,38
0.42 – 0,77
0,68 – 1,13
1,17 – 1,55
0,56-1,09
Ksr at Sr = 210 cN
0,046 - 0,079
0,027 – 0,043
0,016 – 0.029
0,033 – 0,060
0,053 – 0,088
0.092 – 0,121
0,044 - 0,085
at Sr = 168 cN
0,058 – 0,099
0,033 – 0.054
0,019 – 0,037
0,o41 – 0,075
0,067 – 0,110
0,115 – 0,152
0,055 – 0,107
100 Ksr at Sr =
1210 cN 0.048 – 0,083
0,028 – 0,045
O,o16 – 0,031
0,034 – 0,063
0.056 – 0,093
0.096 – 0,128
0.046 – 0,090
at Sr = 940 cN
0,062 – 0,107
0,036 – 0,058
0,021 – 0,040
0,044 – 0.081
0,072 – 0,119
0,124 – 0,164
0,059 – 0,115
50% Cotton
+ 50%
Staple rayon
17 Kst , in cN/tex 0,61 – 0,98
0,35 -0,56
0,21 – 0,39
0,42 – 0,79
0,81 – 1,21
1,28 – 1,5
0,65 – 0,84
Ksr at Sr = 155 cN
0,067 – 0,101
0,038 – 0,061
0,023 – 0,042
0,046 – 0,086
0,088 – 0,132
0,140 – 0,164
0,071 – 0,092
at Sr = 112 cN
0,092 – 0,148
0,053 – 0,085
0,031 – 0,059
0,063 – 0,120
0,123 – 0,183
0,194 – 0,227
0,098 – 0,127
50 Ksr at Sr = 600 cN
0,051 – 0,081
0,029 – 0,046
O,o17 – 0.032
0,035 – 0,066
0,067 – 0,100
0,106 – 0,125
0,054 – 0,070
at Sr = 465 cN
0,065 – 0,105
0,037 – 0,060
0,022 – 0,041
0,045 – 0,085
0,087 – 0,130
0,137 – 0,161
0,069 – 0,090
50% Cotton
+ 50%
Polyester
17 Kst , in cN/tex 0,64 – 0,99
0,35 – 0,57
0,31 – 0,40
0,44 – 0,79
0,78 – 1,25
1,28 – 1,58
0,65 – 0,87
Ksr at Sr = 241 cN
0,045 – 0,069
0,024 – 0,040
0,022 – 0,028
0,031 – 0,055
0,055 – 0,088
0,090 – 0,111
0,046 – 0,061
at Sr = 203 cN
0,053 – 0,083
0,029 – 0,047
0,026 – 0,033
0,036 – 0,066
0,065 – 0,105
0,107 – 0,132
0,054 – 0,073
60 Ksr at Sr = 790 cN
0,048 – 0,075
0,026 – 0,043
0,023 – 0,030
0,033 – 0,060
0,059 – 0,095
0,097 – 0,120
0,049 – 0,066
at Sr = 735 cN
0,o52 – 0,080
0,028 – 0,046
0,025 – 0,032
0,036 – 0,064
0,063 – 0,1o2
0,104 – 0,129
0,053 – 0,071
50% Staple rayon +
50% Polyester
17 Kst , in cN/tex 0,60 – 0,95
0,34 – 0,57
0,21 – 0,37
0,41 – 0,76
0,77 – 1,24
1,22 – 1,57
0,74 – 0,93
Ksr at Sr = 300 cN
0,034 – 0,054
0,019 – 0,032
0,012 – 0,021
0,023 – 0,043
0,044 – 0,070
0,069 – 0,089
0,042 – 0,053
at Sr = 265 cN
0,038 – 0,064
0,022 – 0,036
0,013 – 0,024
0,026 – 0,049
0,049 – 0,079
0,078 – 0,101
0,047 – 0,059
50 Ksr at Sr = 1050 cN
0,028 – 0,045
0,016 – 0,027
0,010 - -,017
0,019 – 0,036
0,037 – 0,059
0,058 – 0,075
0,035 – 0,044
at Sr = 950cN
0,031 – 0,050
0,018 – 0,030
0,-011 – 0,019
0,022 – 0,040
0,040 – 0,065
0,064 – 0.083
0,039 – 0.049
357
14
th Romanian Textiles and Leather Conference – CORTEP 2012
Sinaia, 6 - 8 September 2012
The numerical values offered within table 3 point out the following: a) For the same fineness of the yarn, the numerical value of the sequential proportionality coefficient of the
tension specific of the charge for the breakage of the yarn decreases as the numerical value of the charge for the breakage of the yarn decreases.
Numerical examples: - in area A, at yarn 50 tex (50% cotton + 50% Staple rayon), the Ksr coefficient decreases from the
numerical values of Ksr = 0,065 – 0,105, for Sr = 465 cN, to the numerical values of Ksr = 0,051 – 0,081 for Sr = 600 cN;
- in area E, at yarn 17 tex, the Ksr coefficient decreases from the numerical values of 0.078- 0,101, for Sr =265 cN, to 0 069 – 0,089 for Sr = 300 cN.
b) The decrease in variation limits of the Ksr coefficients along with the increase in the charge for the breakage of the yarn is all the more emphatic if the limits to the charge of breakage ( Sr ) are taken into consideration regardless of the yarn fineness.
Numerical examples: - In area A, at the yarns of 50% cotton + 50% staple rayon, the numerical value of the sequential
proportionality coefficient of tension decreases from the limits of Ksr = 0,092 – 0,148 (corresponding to the numerical value of Sr = 112 cN) to the limits of Ksr = 0,051 – 0,081 (corresponding to the numerical value of Sr = 600 cN);
- In area E, at yarns of 50% staple rayon + 50% polyester, the sequential proportionality coefficient of tension decreases from the limits of Ksr = 0,078 – 0,101 (corresponding to the numerical value of Sr = 265 cN) to the limits of Ksr = 0,058 – 0,075 (corresponding to the numerical value of Sr = 1050 cN). The general rule of the decrease of the numerical value of the Ksr coefficients along with the increase of the numerical value of the charge for the breakage of the yarn remains valid for all the areas of the sizing machine. The overcharge of the yarns with high breakage charges is thus avoided. The yarns with lower breakage charges require the use of sequential proportionality coefficients of tension that are specific of the greater breakage charge on all of the areas of the sizing machine in order to make possible the technological working conditions (the parallelizing of yarns, the adequate separation of the yarns in the division plane etc) 4 CONCLUSIONS
1. The expression of the warp mass in tex or in ktex has made possible the use of the specific sequential proportionality coefficient per tex in the attempt to determine the numerical value of the tension of the warp on all the areas of the sizing machine.
2. The use of the specific sequential proportionality coefficient of tension per tex makes possible the substitution of each table (of 230 limits of tensions recommended for each type of mixture of warp spinning) with a single line of 7 limits of numerical values of the sequential proportionality coefficients of tension that are in accordance with the 7 areas of the machine.
3. The numerical value of the tension specific of the entire warp can be determined –whenever required –for each of the areas of the sizing machine by taking into consideration the number of yarns in the warp as well as the linear density of the yarn in tex.
4. In the case of using the sequential proportionality coefficient of the tension specific of the charge for the breakage of the yarn, these can be determined by means of the specific sequential proportionality coefficients of tension per tex and can be introduced in tables organized according to the main areas of the sizing machine. (table 3).
5. The new technique of determining the sequential proportionality coefficients of the tension specific of the charge for the breakage of the yarn makes possible the avoidance of the unnecessary overcharge (of the yarns) with great strength as a result of the simultaneous decrease in the numerical values of these coefficients and increase in the numerical value of the charge of the breakage of the yarn.
5 REFERENCES [1] Daniela Liute, Dumitru Liute, Bazele prelucrarii firelor textile, Editura Performantica , Iasi,2010. [2] Dumitru Liute, Ioan Iacob, Adrian Buhu, Daniela Liuțe, Procese si masini de prelucrat fire –proiectare
tehnologica- Editura B IT, Iasi,1997 [3] Stegmaier Th., Trauter. J., System zur Regelung des Beschlichtungsgrades und zur p Protocollierung
relevanter Dateu beim Schlichteu, Melliand Textilberichte,1990,nr.3,p.166 [4] * * * Sucker – Muller, Mașini și tehnologie de încleiere
358
14th Romanian Textiles and Leather Conference – CORTEP 2012
Sinaia, 6 - 8 September 2012
[5] * * * Manualul inginerului textilist, sectunea IV.4 Editura AGIR,Bucuresti,2002 [6] * * * Benninger-Zell, Masini si tehnologie de încleire
Corresponding author: Daniela LIUTE, Lecturer, PhD Faculty of Textile, Leather and Industrial Management, “Gheorghe Asachi” Technical University of iasi D. Mangeron Blvd., no. 29 700050, Iasi, Romania Phone: 02322278680, E-mail: [email protected]
Co- author: Gabriela BUTNARU Faculty of Textiles, Leather and Industrial Management “Gheorghe Asachi” Technical University of Iasi D.Mangeron Blv, 53, 700050, Iaşi, Romania
359
14
th Romanian Textiles and Leather Conference – CORTEP 2012
Sinaia, 6 - 8 September 2012
BIOMIMETIC INNOVATION IN CLOTHING INDUSTRY
Mirela TEODORESCU, Monica Alina CĂLIN, Ioana PETCU & Antonela CURTEZA ”Gheorghe Asachi”
Technical University of Iasi, Romania
Doctoral School of the Faculty of Textile, Leather Engineering and Industrial Management Abstract: Biomimetic innovation in the clothing sector is undoubtedly in its infancy, since there are just a few examples commercially available. So far, there have been no publications devoted to the investigation regarding the possibilities that could provide biological paradigms to clothing industry in terms of functionality. In this paper, the goal is to begin such an exploration by associating key issues that clothing sector deals with, and suggestions emerging from the biomimetics principles. The overview of the apparel industry, including the design process and product requirements will be followed by a brief explanation of biomimetic principles of design and development methods. Finally, opportunities will be explored, key issues and future trends of biomimetic innovation in the clothing industry. Keywords: biomimetic, innovation, design, clothing. 1 INTRODUCTION Biomimetics, or direct inspiration from living things, is one of the most promising ways to exploit the vast database consisting of fully functional models, existing in nature. As we will see, biomimetics should be addressed in a conceptual way, so that biological models can generate methods to design prototypes, rather than a faithful imitation of studied examples. The complex structures of biological materials are characterised by a perfect balance between design and functionality. Increasing knowledge of the biological structures, associated with advances in micro- and nano- scale technologies have allowed the transfer of biological mechanisms in the industry. Since the nineteenth century, revolutionary changes have occurred in many areas of science and technology, with a profound impact on human beings. Chips, computers and the Internet were invented, the completion of the human genome and many other discoveries have transformed the world. Although the textile sector has a history of several thousand years, the last century brought significant developments. Rapid growing of scientific understanding has led to improvement in using processing technologies of natural fibres and obtaining techniques of synthetic fibres. We have learned a lot from nature. Viscose, nylon, polyester and other chemical fibres have been invented in searching for a natural replica. But as technology has progressed, the synthetic fibres and the fabrics obtained from these surpass the natural one in many aspects. In this fascinating era that we live in, we can feel the great impact of technology on traditional textiles and clothing industry. In tradition, many areas of science and engineering were separated. Recently, there is a considerable movement of convergence between these fields, and the results are amazing. Biomimetic technology for materials and structures is one of them. What are the biomimetic materials and structures? Nature provides numerous examples of structures that worth to be imitated. Nature has a vast laboratory of life development that dates back billions of years, while human beings has just begun to develop biomimetic materials and structures. 2 BIOMIMETIC APPLICATIONS IN TEXTILE INDUSTRY The concept of biologically inspired innovation is not entirely new for textile and clothing industry. Biology has always represented a rich source of visual and aesthetic inspiration for textile design. Motifs such as animals, flowers and insects are widely used in the design process, by different techniques (weaving, printing, embroidery etc.).
360
14th Romanian Textiles and Leather Conference – CORTEP 2012
Sinaia, 6 - 8 September 2012
Over thousands of years, the natural environment has provided the essential raw materials for making clothing. In cold environments, humans transferred the protective functions of natural leather and fur into clothing, creating very good insulation capacity for both cold air and for water [1]. Plants and animals were the only source of fibres (cotton, linen, silk, wool, etc.) used for making fabrics until the first half of the twentieth century with the advent of artificial fibres. But all these are not under the biomimetic umbrella, which aims to imitate the design, properties and mechanisms of natural materials instead of taking them directly from nature. In terms of imitating natural materials properties there were two key occasions, which led to great successes in the history of textile technology. Properties of silk fibres have been the subject for human obsession for centuries. Efforts to synthesize a material that mimics resistance, smoothness and luster of silk dates back around 3000 BC in China. However, until the early twentieth century, when the first artificial fibre was produced (rayon imitate silk luster, but not silk resistance [2]), these efforts were not successful. Several decades later, nylon production caused an unprecedented revolution in the textile industry, because it provided a successful alternative than silk (nylon is smooth and incredibly durable). The second wave took place in 1970, when clothes made of synthetic fibres began to decline in popularity and demand for clothes made of natural materials has increased. Innovations inspired by biological mechanisms rarely found application in the clothing sector. In fact, the first biomimetic project in this field was the invention of Velcro in 1950. Today, the product has many applications in industry, with a strong presence in the clothing sector. Last decade, however, showed a gradual migration of biomimetic technologies in clothing, mainly through functional and performance textiles. These developments have introduced new features to products, such as improved performance offered by the FastSkin swimming suits from Speedo, and alternative methods for incorporating additional functions to textile systems. FastSkin swimming suits have tiny scales on the surface just like the morphology of shark skin. Sharks can swim remarkable fast for their size and shape, because it is believed that the skin texture reduce friction with the water, thereby increasing speed. Speedo claims that the FastSkin product can provide this functionality to a swimmer. Although there is no scientific evidence that demonstrates this functionality, the product have become widely accepted by athletes worldwide. Another example of biomimetics in textile technology application is Lotus effect. It adds stain resistant properties to textiles, which are more environmentally friendly than conventional finishing [3,4]. The lotus effect has been inspired by the properties of water-repellent and self-cleaning lotus leaf. Its functionality proved to be due to a layer of epicuticular wax crystals covering the leaf surface [5]. Initially, this technology has been adopted by the paint industry to produce a self-cleaning paint for buildings. Recently, it was found that could be used in textile industry too, for water-, stains- and dirt-resistant clothing, without affecting the appearance or fabric touches. Although there are conventional finishes which achieve the same effect (eg. coating with teflon), they use toxic chemicals, while methods used to create Lotus effect (eg. plasma treatment) has low energy consumption, thus providing an ecological alternative [3,4]. 2.1 Overview on textile industry The relationship between clothing industry and biomimetics requires prior outline for each area and then to identify the links between the two. This section will focus on the clothing industry and provide a brief overview of the processes involved in garment production stage from product design to product sale. Also, the functionality requirements of clothing from the perspective of product performance are also described and will include casual wear and protective clothing. This section highlights key events and concepts necessary for the purpose of this paper, it is by no means exhaustive. Clothing sector produces a wide range of products, which may vary from textile for aviation and space to Fast Fashion products, that are designed to have a short life cycle. There have been developed several specific models to illustrate the production stages. In figure 1 it is showed a simplified model, emphasizing basic procedures through which the product travels from the design concept to the consumer. Because the field is so vast, the map illustrated in figure 1 deliberately omitted the fabrication of components, fabrics, packaging, transportation and distribution of products. Emphasis is placed on the sequence of events that occur as a result of fashion design decisions, assuming that the fabrics, the components, etc., are chosen by the design team based on the information such as composition, performance and history of the product.
361
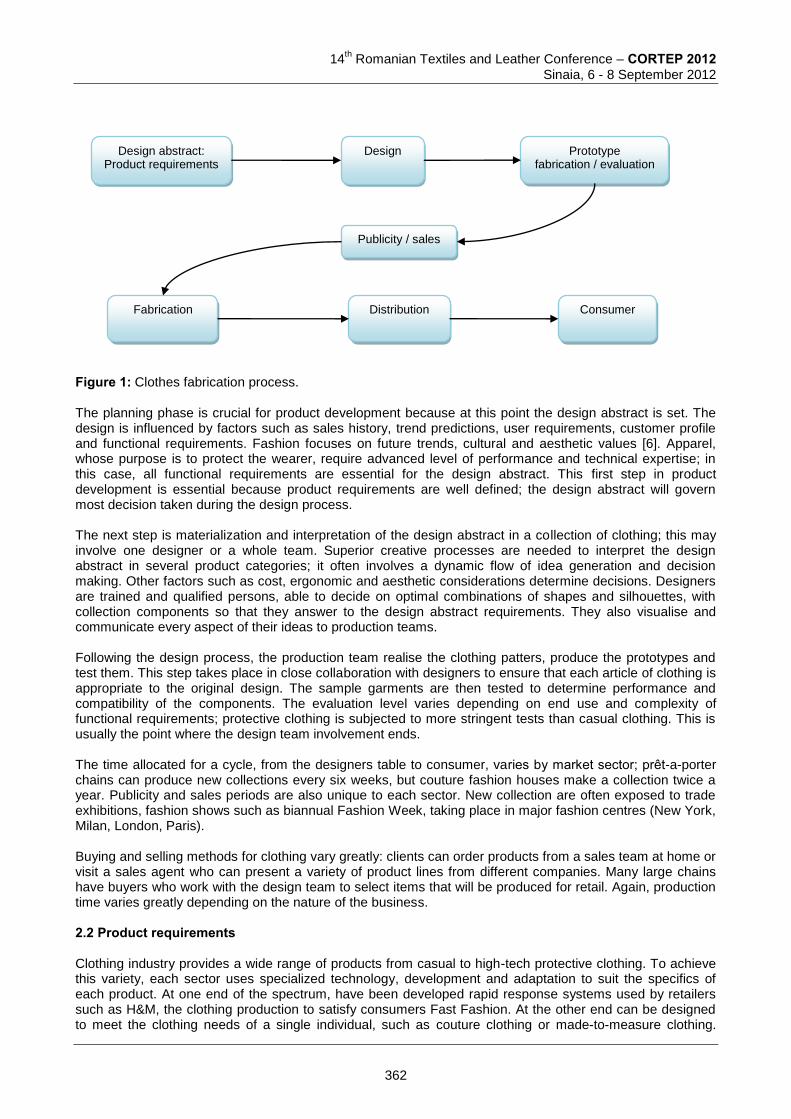
14
th Romanian Textiles and Leather Conference – CORTEP 2012
Sinaia, 6 - 8 September 2012
Figure 1: Clothes fabrication process. The planning phase is crucial for product development because at this point the design abstract is set. The design is influenced by factors such as sales history, trend predictions, user requirements, customer profile and functional requirements. Fashion focuses on future trends, cultural and aesthetic values [6]. Apparel, whose purpose is to protect the wearer, require advanced level of performance and technical expertise; in this case, all functional requirements are essential for the design abstract. This first step in product development is essential because product requirements are well defined; the design abstract will govern most decision taken during the design process. The next step is materialization and interpretation of the design abstract in a collection of clothing; this may involve one designer or a whole team. Superior creative processes are needed to interpret the design abstract in several product categories; it often involves a dynamic flow of idea generation and decision making. Other factors such as cost, ergonomic and aesthetic considerations determine decisions. Designers are trained and qualified persons, able to decide on optimal combinations of shapes and silhouettes, with collection components so that they answer to the design abstract requirements. They also visualise and communicate every aspect of their ideas to production teams. Following the design process, the production team realise the clothing patters, produce the prototypes and test them. This step takes place in close collaboration with designers to ensure that each article of clothing is appropriate to the original design. The sample garments are then tested to determine performance and compatibility of the components. The evaluation level varies depending on end use and complexity of functional requirements; protective clothing is subjected to more stringent tests than casual clothing. This is usually the point where the design team involvement ends. The time allocated for a cycle, from the designers table to consumer, varies by market sector; prêt-a-porter chains can produce new collections every six weeks, but couture fashion houses make a collection twice a year. Publicity and sales periods are also unique to each sector. New collection are often exposed to trade exhibitions, fashion shows such as biannual Fashion Week, taking place in major fashion centres (New York, Milan, London, Paris). Buying and selling methods for clothing vary greatly: clients can order products from a sales team at home or visit a sales agent who can present a variety of product lines from different companies. Many large chains have buyers who work with the design team to select items that will be produced for retail. Again, production time varies greatly depending on the nature of the business. 2.2 Product requirements Clothing industry provides a wide range of products from casual to high-tech protective clothing. To achieve this variety, each sector uses specialized technology, development and adaptation to suit the specifics of each product. At one end of the spectrum, have been developed rapid response systems used by retailers such as H&M, the clothing production to satisfy consumers Fast Fashion. At the other end can be designed to meet the clothing needs of a single individual, such as couture clothing or made-to-measure clothing.
Design abstract: Product requirements
Prototype fabrication / evaluation
Distribution Fabrication
Publicity / sales
Consumer
Design
362
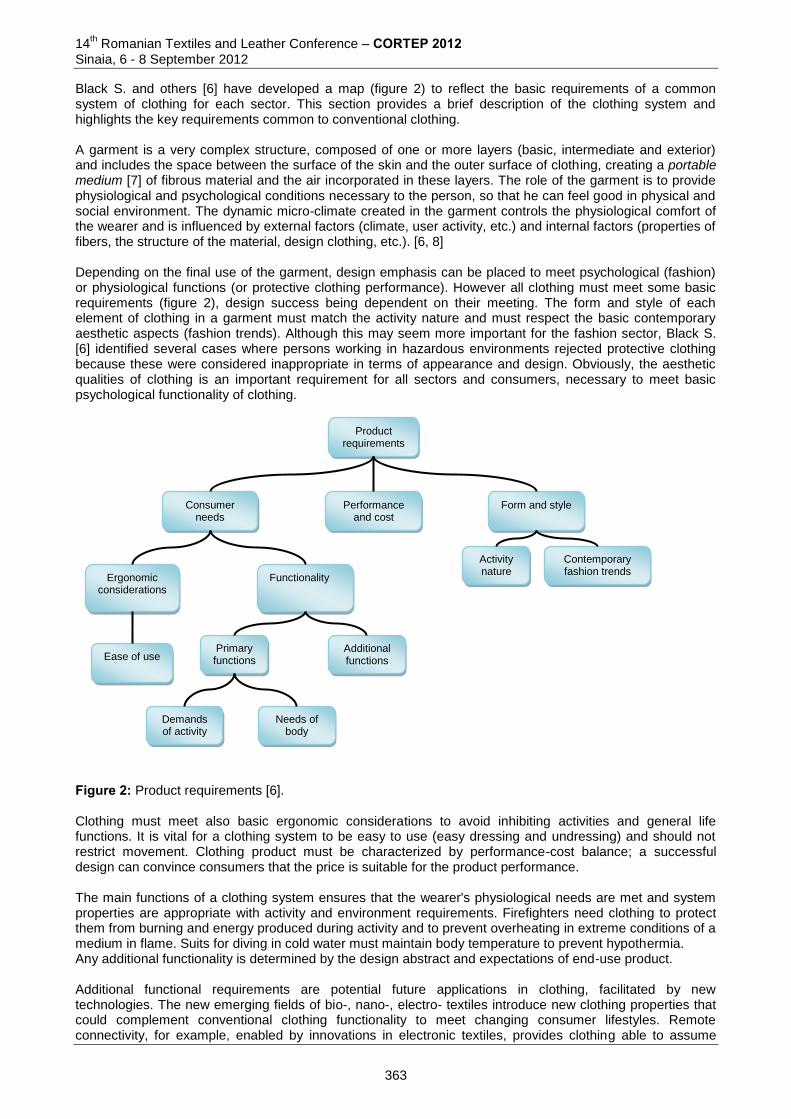
14th Romanian Textiles and Leather Conference – CORTEP 2012
Sinaia, 6 - 8 September 2012
Black S. and others [6] have developed a map (figure 2) to reflect the basic requirements of a common system of clothing for each sector. This section provides a brief description of the clothing system and highlights the key requirements common to conventional clothing. A garment is a very complex structure, composed of one or more layers (basic, intermediate and exterior) and includes the space between the surface of the skin and the outer surface of clothing, creating a portable medium [7] of fibrous material and the air incorporated in these layers. The role of the garment is to provide physiological and psychological conditions necessary to the person, so that he can feel good in physical and social environment. The dynamic micro-climate created in the garment controls the physiological comfort of the wearer and is influenced by external factors (climate, user activity, etc.) and internal factors (properties of fibers, the structure of the material, design clothing, etc.). [6, 8] Depending on the final use of the garment, design emphasis can be placed to meet psychological (fashion) or physiological functions (or protective clothing performance). However all clothing must meet some basic requirements (figure 2), design success being dependent on their meeting. The form and style of each element of clothing in a garment must match the activity nature and must respect the basic contemporary aesthetic aspects (fashion trends). Although this may seem more important for the fashion sector, Black S. [6] identified several cases where persons working in hazardous environments rejected protective clothing because these were considered inappropriate in terms of appearance and design. Obviously, the aesthetic qualities of clothing is an important requirement for all sectors and consumers, necessary to meet basic psychological functionality of clothing.
Figure 2: Product requirements [6]. Clothing must meet also basic ergonomic considerations to avoid inhibiting activities and general life functions. It is vital for a clothing system to be easy to use (easy dressing and undressing) and should not restrict movement. Clothing product must be characterized by performance-cost balance; a successful design can convince consumers that the price is suitable for the product performance. The main functions of a clothing system ensures that the wearer's physiological needs are met and system properties are appropriate with activity and environment requirements. Firefighters need clothing to protect them from burning and energy produced during activity and to prevent overheating in extreme conditions of a medium in flame. Suits for diving in cold water must maintain body temperature to prevent hypothermia. Any additional functionality is determined by the design abstract and expectations of end-use product. Additional functional requirements are potential future applications in clothing, facilitated by new technologies. The new emerging fields of bio-, nano-, electro- textiles introduce new clothing properties that could complement conventional clothing functionality to meet changing consumer lifestyles. Remote connectivity, for example, enabled by innovations in electronic textiles, provides clothing able to assume
Functionality
Contemporary fashion trends
Ergonomic
considerations
Performance and cost
Primary functions
Consumer needs
Form and style
Ease of use
Activity nature
Demands of activity
Needs of body
Product requirements
Additional functions
363

14
th Romanian Textiles and Leather Conference – CORTEP 2012
Sinaia, 6 - 8 September 2012
additional roles currently performed by devices such as mobile phones, PDAs and satellite tracking devices. This sector of the clothing industry is very new and the first innovations that began to appear on the market were mainly developed by sports and performance sectors. In the context of protective clothing for outdoor activities, the most important factor in determining the functional profile of the system is determined by external conditions that affect the user's physiology, namely, temperature, moisture concentration in the atmosphere, weather (rain, snow, sun, wind). Protection functions associated with psychological threats and other potential hazards such as germs, chemicals, physical impact, etc., are not excluded for cold weather clothing. From a user perspective, conservation and protection of physiological comfort has major importance and is based on the flexibility of clothing microclimate to allow changes in the system and protection against external factors (wind, rain, snow). Protective clothing for cold weather must keep enough heat in the system to ensure wearer comfort, while managing water and cold air transfer from the external environment and humidity produced by the individual. The design and selection of clothing materials which compose the system are key factors in managing microclimate conditions. Permeability to heat, moisture and air of the clothing system can be controlled to some extent through materials properties. 3 GENERAL PRESENTATION OF BIOMIMETIC DESIGN AND DEVELOPMENT The relationship between clothing design and biology can be highlighted by two points of view: one is described in the previous sections (overview on textile industry and product requirements) and the other try to establish the key principles of biomimetic design and how these can be put into new technologies. 3.1 Key principles of biomimetic design Since life exists on this earth, living creatures have been forced to survive and adapt in various environments. In their struggle to survive, plants and animals developed mechanisms and structures so that they can optimally use the natural resources. In this regard, the natural world seems a giant research & development laboratory in which current species tell success stories. Initially, the link between biology and engineering was established by the principle similarity of energy/resources in nature and cost in engineering world. Utilising optimally the minimum of resources was seen as a great opportunity for designing intelligent yet inexpensive materials and structures [9]. Biomimetic researchers believe that nature is an unlimited source of inspiration for intelligent and sustainable design described by three principles:
a) fabrication with low energy consumption; b) the functionality is engineered through design; c) the structures are multifunctional and/or adaptive.
The fabrication methods used for production of man-made materials and structures implies energy consumption, emissions of toxic chemicals, temperatures and high pressures conditions. In textile sector, production of artificial fibres is just one of the many examples in which large amounts of energy are required and large quantities of waste follow. Nature, instead, produces materials with low consumption of energy, at temperatures and pressures similar to those necessary for life. Also, there is no need for toxic chemicals, usually water being appropriate for developing natural structures. The functionality of materials produced in nature is engineered through design and ordering of basic components [9, 10]. The desired properties of an artificial material, such as: rigidity, resistance, elasticity etc., determine the methods by which it is obtained. As a result of this demanding, there can be found over 300 artificial polymers, since for every new required property, a new material was produced. Nature does not work like that, it uses only two polymers (protein and polysaccharide), but their structural variations provide much more properties then their artificial replicas [11]. One good example of natural polymer that can offer a wide range of mechanical properties is insect cuticle, composed of chitin and protein, which can be flexible or rigid, transparent or opaque, according to the differences of the polymer chain [12]. 3.2 Future trends of biomimetic innovation in the clothing industry
364
14th Romanian Textiles and Leather Conference – CORTEP 2012
Sinaia, 6 - 8 September 2012
As materials science has advanced, there have been a progress in textile technology too, which has caused a drastic changing in functional aspect of clothing, reducing the boundaries between the product and the wearer. First adopted by the military and space industries, new functional and smart technologies entered gradually into other clothing fields. Now, clothing can change its shape to stimuli such as temperature or electricity, through shape memory materials embedded into textiles. Drug delivery can also be enhanced through textile and patient’s vital functions can be monitor by introducing washable electronic circuits into clothing. Despite this, future trends in clothing are somewhat blurry. This lack of perspective can be seen even in movie and television industry. Although, many times, this area has almost unlimited budgets for high-quality film making, they reflect the same lack of imagination. Science fiction characters are dressed in funny metallic cloaks, the actors in the combat movies from the future are just like comic replicas of medieval knights, equipped with shiny clothing with buttons with uncertain functions. Interweaving of biomimetic innovation and clothing industry can fill this arid space, shaping the future clothes. 4 CONCLUSION Biomimetics, or direct inspiration from living things, is one of the most promising ways to exploit the vast database consisting of fully functional models, existing in nature. As we have seen, biomimetics should be addressed in a conceptual way, so that biological models can generate methods to design prototypes, rather than a faithful imitation of studied examples. In summary, nature can offer lot of information and inspiration for the way we produce our clothes. The complex structures of biological materials are characterised by a perfect balance between design and functionality. Increasing knowledge of the biological structures, associated with advances in micro- and nano- scale technologies have allowed the transfer of biological mechanisms in the industry. In the recent years, many new multifunctional materials, inspired by those found in nature, have been reported. In the context of clothing industry, biomimetics can lead to an improvement of the ecological footprint of the field. ACKNOWLEDGEMENT This paper was realised with the support of EURODOC “Doctoral Scholarships for research performance at European level” project, ID 59410, financed by the European Social Found and Romanian Government.
5 REFERENCES [1] Ammitzboll, T. et al: Clothing, British Museum Publications, London, (1991) [2] Cook, G. : Handbook of textile fibres, Woodhead Publishing, Cambridge, (2003) [3] Slater, K. : Comfort properties of textiles, Textile Progress, Vol. (1977) 9, pp. 1-91 [4] Slater, K. : Environmental impact of textiles: Production, processes and protection, Woodhead
Publishing Series in Textiles No. 27, ISBN 1 85573 541 5, (2003) [5] Neinhuis, C. & Barthlott, W.: Characterization and Distribution of Water-repellent, Self-cleaning Plant
Surfaces, Annals of Botany, Vol. (1997) 79, pp. 667-677 [6] Black, S. et al: Textiles for protection, Woodhead Publishing Series in Textiles No. 44, ISBN 1 85573 921
6, (2005) [7] Watkins, S.M.: Clothing: The Portable Environment, Iowa State Pr; 2 Sub edition, ISBN-10: 0813803187,
(1995) [8] Kapsali, V. & Dunamore, P.: „Biomimetic principles in clothing technology” in Biologically inspired
textiles, Woodhead Publishing Series in Textiles No. 77, ISBN 1 84569 247 0, (2008) [9] Vincent, J.F.V.: Smart by nature in Beukers, A & Hinte, E.V.: Lightness the inevitable renaissance of
minimum energy structures, 010 Publishers, Rotterdam, (1998), pp.42-47 [10] Benyus, J.M.: Biomimicry: Innovation Inspired by Nature, William Morrow Paperbacks, ISBN-10:
0060533226, (2002) [11] Vincent, J.F.V. et al: Biomimetics-its practice and theory, Journal of the Royal Society. Interface, Vol. 3
(2006) 9, pp. 471-482 [12] Vincent, J.F.V.: Structural Biomaterials, Princeton University Press, ISBN: 9780691025131 (1990)
365
14
th Romanian Textiles and Leather Conference – CORTEP 2012
Sinaia, 6 - 8 September 2012
Corresponding author: Mirela TEODORESCU Faculty of Textile, Leather Engineering and Industrial Management/ "Gheorghe Asachi" Technical University Bvd. D. Mangeron No.67 700050, Iași, Romania E-mail: [email protected]
Co-authors: Monica Alina CĂLIN Faculty of Textil, Leather Engineering and Industrial Management/ "Gheorghe Asachi" Technical University Bvd. D. Mangeron No.67 700050, Iași, Romania E-mail: [email protected] Ioana PETCU Faculty of Textile, Leather Engineering and Industrial Management/ "Gheorghe Asachi" Technical University Bvd. D. Mangeron No.67 700050, Iași, Romania E-mail: [email protected] Antonela CURTEZA Faculty of Textile, Leather Engineering and Industrial Management/ "Gheorghe Asachi" Technical University Bvd. D. Mangeron No.67 700050, Iași, Romania E-mail: [email protected]
366

14
th Romanian Textiles and Leather Conference – CORTEP 2012
Sinaia, 6 - 8 September 2012
STRUCTURAL COLOURS – NEW INSPIRATION FOR FASHION DESIGN –
Mirela TEODORESCU1, Monica Alina CALIN1 , Ioana PETCU1, Antonela CURTEZA1,
Laurence SCHACHER2, Dominique ADOLPHE2 1„Gheorghe Asachi” Technical University of Iasi, Romania,
Doctoral School of the Faculty of Textile, Leather Engineering and Industrial Management 2 ENSISA, Université de Haute-Alsace Mulhouse-Colmar, Mulhouse, France
Abstract: Structural colour has attracted increasingly more attention, after the development of innovative applications in various fields where surface appearance is important, among which we may mention the paint industry, automobiles, cosmetics and, of course, textiles. The thoroughgoing studies and researches revealed that these structural colours are due to complex micro architectures, highly ordered, which are quite difficult to reproduce even with the latest nanotechnology. This study was initiated in an effort to seek an interpretation of these phenomena of colour, so abundant in nature, and to develop theoretical and practical models leading to biomimetic textiles. Keywords: structural colours, iridescence, biomimetic, textile. 1 INTRODUCTION Colour effects occur generally in nature as psychophysical sensation determined by the eye response to light radiations reflected from the surfaces of surrounding objects. However, sometimes colours have a purely physical origin (light diffraction and interference) caused by the surface structure of objects. Depending on their origin, colours can be simply classified in pigmentary colours and structural colours. The latter being one of the problems of great scientific interest that researchers have faced in recent years. Most of these structural colours are based on simple optical phenomena: thin film interference, multilayer reflectors, diffraction gratings, photonic crystals, light scattering. However, naturally occurring colours encounter a great variety of models and to achieve visual perception, are used simultaneously high reflectivity in a specific wavelength range and generates diffuse light in a wide angular range. Although, initially, these features seem to be contradictory in optical terms, this is nevertheless possible by optimal combination of regular with irregular structures. The scientific definition of structural colour has not yet been established, and its features are often highlighted in contrast to pigmentary colours [1]. When a surface is illuminated, the colour sensation perceived is determined by all of the reflected wavelength and processed in the cortex, while other wavelengths of light are eliminated. As figure 1 illustrates, the elimination can occur in two ways. The first way consists in light absorption in the material, which is the usual case of the materials that incorporates pigments, dyes or metals. The colour is determined by the exchange of energy between light and electrons. The second is that specific structure of the surface causes reflection, scattering or deviations of the wavelength of light so that they do not reach the eyes. The colour is determined by purely physical phenomena of light interacting with the material structure, and light energy remains the same. One well-known object that produces structural colour is a glass prism, which bends and separates light rays into the colours of visible spectrum. The phenomena caused by interaction of light with surface structures are, generally, referred to by two expressions – structural colour and iridescence – but, although they are often used interchangeably, it is necessary to differentiate them based on the optical processes listed above. The term „iridescence” need to be used in a narrower sense than „structural colour” because it describes the changes of surfaces colour by the angle of incident light and the position of the observer. Also known as „the
367
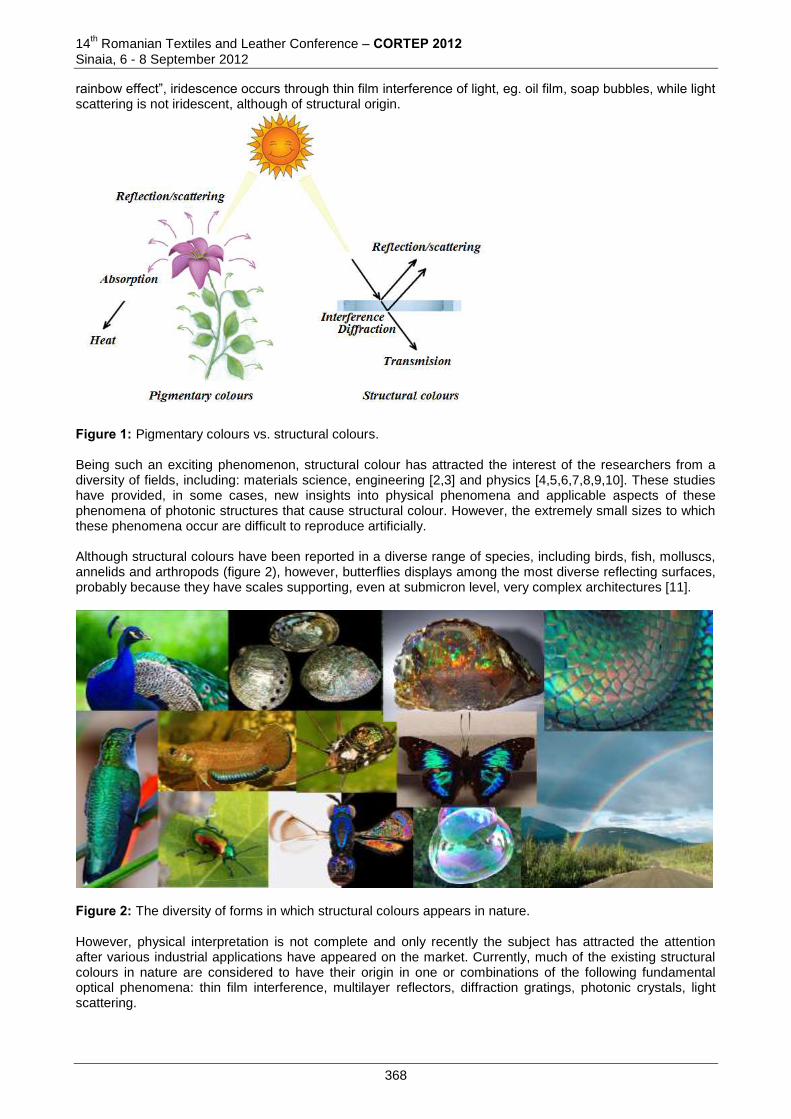
14th Romanian Textiles and Leather Conference – CORTEP 2012
Sinaia, 6 - 8 September 2012
rainbow effect”, iridescence occurs through thin film interference of light, eg. oil film, soap bubbles, while light scattering is not iridescent, although of structural origin.
Figure 1: Pigmentary colours vs. structural colours. Being such an exciting phenomenon, structural colour has attracted the interest of the researchers from a diversity of fields, including: materials science, engineering [2,3] and physics [4,5,6,7,8,9,10]. These studies have provided, in some cases, new insights into physical phenomena and applicable aspects of these phenomena of photonic structures that cause structural colour. However, the extremely small sizes to which these phenomena occur are difficult to reproduce artificially. Although structural colours have been reported in a diverse range of species, including birds, fish, molluscs, annelids and arthropods (figure 2), however, butterflies displays among the most diverse reflecting surfaces, probably because they have scales supporting, even at submicron level, very complex architectures [11].
Figure 2: The diversity of forms in which structural colours appears in nature. However, physical interpretation is not complete and only recently the subject has attracted the attention after various industrial applications have appeared on the market. Currently, much of the existing structural colours in nature are considered to have their origin in one or combinations of the following fundamental optical phenomena: thin film interference, multilayer reflectors, diffraction gratings, photonic crystals, light scattering.
368
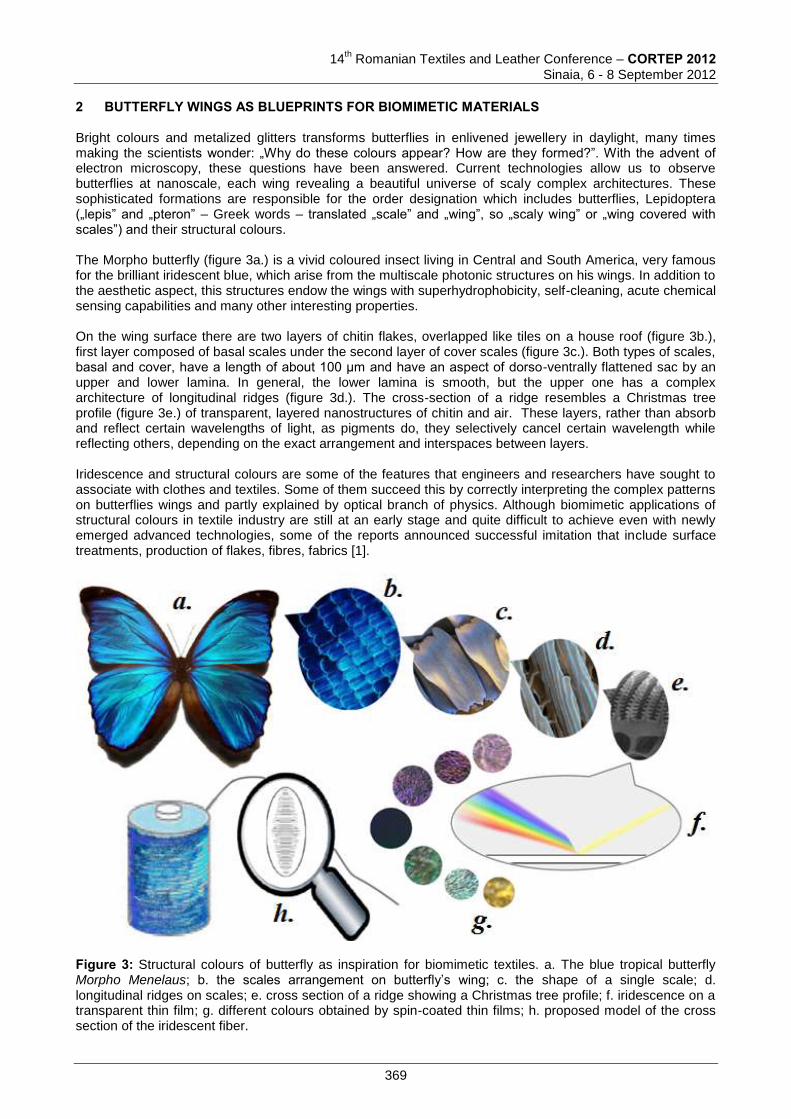
14
th Romanian Textiles and Leather Conference – CORTEP 2012
Sinaia, 6 - 8 September 2012
2 BUTTERFLY WINGS AS BLUEPRINTS FOR BIOMIMETIC MATERIALS Bright colours and metalized glitters transforms butterflies in enlivened jewellery in daylight, many times making the scientists wonder: „Why do these colours appear? How are they formed?”. With the advent of electron microscopy, these questions have been answered. Current technologies allow us to observe butterflies at nanoscale, each wing revealing a beautiful universe of scaly complex architectures. These sophisticated formations are responsible for the order designation which includes butterflies, Lepidoptera („lepis” and „pteron” – Greek words – translated „scale” and „wing”, so „scaly wing” or „wing covered with scales”) and their structural colours. The Morpho butterfly (figure 3a.) is a vivid coloured insect living in Central and South America, very famous for the brilliant iridescent blue, which arise from the multiscale photonic structures on his wings. In addition to the aesthetic aspect, this structures endow the wings with superhydrophobicity, self-cleaning, acute chemical sensing capabilities and many other interesting properties. On the wing surface there are two layers of chitin flakes, overlapped like tiles on a house roof (figure 3b.), first layer composed of basal scales under the second layer of cover scales (figure 3c.). Both types of scales, basal and cover, have a length of about 100 μm and have an aspect of dorso-ventrally flattened sac by an upper and lower lamina. In general, the lower lamina is smooth, but the upper one has a complex architecture of longitudinal ridges (figure 3d.). The cross-section of a ridge resembles a Christmas tree profile (figure 3e.) of transparent, layered nanostructures of chitin and air. These layers, rather than absorb and reflect certain wavelengths of light, as pigments do, they selectively cancel certain wavelength while reflecting others, depending on the exact arrangement and interspaces between layers. Iridescence and structural colours are some of the features that engineers and researchers have sought to associate with clothes and textiles. Some of them succeed this by correctly interpreting the complex patterns on butterflies wings and partly explained by optical branch of physics. Although biomimetic applications of structural colours in textile industry are still at an early stage and quite difficult to achieve even with newly emerged advanced technologies, some of the reports announced successful imitation that include surface treatments, production of flakes, fibres, fabrics [1].
Figure 3: Structural colours of butterfly as inspiration for biomimetic textiles. a. The blue tropical butterfly Morpho Menelaus; b. the scales arrangement on butterfly’s wing; c. the shape of a single scale; d. longitudinal ridges on scales; e. cross section of a ridge showing a Christmas tree profile; f. iridescence on a transparent thin film; g. different colours obtained by spin-coated thin films; h. proposed model of the cross section of the iridescent fiber.
369
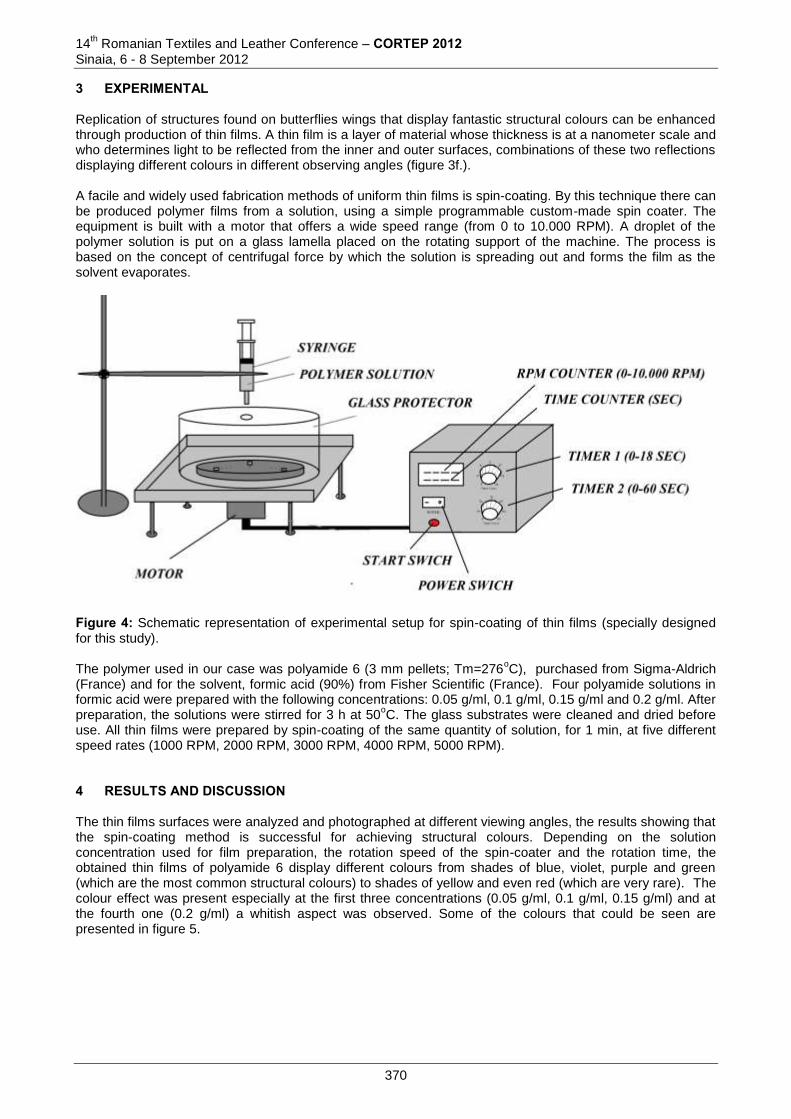
14th Romanian Textiles and Leather Conference – CORTEP 2012
Sinaia, 6 - 8 September 2012
3 EXPERIMENTAL Replication of structures found on butterflies wings that display fantastic structural colours can be enhanced through production of thin films. A thin film is a layer of material whose thickness is at a nanometer scale and who determines light to be reflected from the inner and outer surfaces, combinations of these two reflections displaying different colours in different observing angles (figure 3f.). A facile and widely used fabrication methods of uniform thin films is spin-coating. By this technique there can be produced polymer films from a solution, using a simple programmable custom-made spin coater. The equipment is built with a motor that offers a wide speed range (from 0 to 10.000 RPM). A droplet of the polymer solution is put on a glass lamella placed on the rotating support of the machine. The process is based on the concept of centrifugal force by which the solution is spreading out and forms the film as the solvent evaporates.
Figure 4: Schematic representation of experimental setup for spin-coating of thin films (specially designed for this study). The polymer used in our case was polyamide 6 (3 mm pellets; Tm=276
oC), purchased from Sigma-Aldrich
(France) and for the solvent, formic acid (90%) from Fisher Scientific (France). Four polyamide solutions in formic acid were prepared with the following concentrations: 0.05 g/ml, 0.1 g/ml, 0.15 g/ml and 0.2 g/ml. After preparation, the solutions were stirred for 3 h at 50
oC. The glass substrates were cleaned and dried before
use. All thin films were prepared by spin-coating of the same quantity of solution, for 1 min, at five different speed rates (1000 RPM, 2000 RPM, 3000 RPM, 4000 RPM, 5000 RPM). 4 RESULTS AND DISCUSSION The thin films surfaces were analyzed and photographed at different viewing angles, the results showing that the spin-coating method is successful for achieving structural colours. Depending on the solution concentration used for film preparation, the rotation speed of the spin-coater and the rotation time, the obtained thin films of polyamide 6 display different colours from shades of blue, violet, purple and green (which are the most common structural colours) to shades of yellow and even red (which are very rare). The colour effect was present especially at the first three concentrations (0.05 g/ml, 0.1 g/ml, 0.15 g/ml) and at the fourth one (0.2 g/ml) a whitish aspect was observed. Some of the colours that could be seen are presented in figure 5.
370

14
th Romanian Textiles and Leather Conference – CORTEP 2012
Sinaia, 6 - 8 September 2012
Figure 5: Structurally coloured thin films obtained by spin-coating of polyamide 6. Since visual analysis is a rather subjective method in terms of colours, further investigations were needed. In this regard, the reflectance data of thin films were taken using a portable spectrophotometer – Datacolor Check II. These data were interpreted using reflectance spectrum graphs. The comparative study of these graphs showed that, as predicted, the reflectance peaks vary significantly between films obtained from the same solution concentration but at different rotation speeds and, also, for different solution concentration and the same rotation speed. This is illustrated in figure 6, for the films obtained from the solution concentration of 0,05 g/ml polyamide 6 in formic acid, and for rotation speeds of the spin-coater of 1000 RPM (figure 6a), 2000 RPM (figure 6b), 3000 RPM (figure 6c), 4000 RPM (figure 6d), 5000 RPM (figure 6e). Figure 7 shows different reflection spectra of films obtained from different solution concentration (0.05 g/ml - figure 7a, 0.1 g/ml - figure 7b, 0.15 g/ml - figure 7c and 0.2 g/ml - figure 7d) but at the same rotation speed (3000 RPM). It can also be noticed that the colours are more intense in films obtained from lower solution concentration and at higher rotation speed.
Figure 6: Reflectance data for thin films of polyamide 6 obtained with the solution concentration of 0,05 g/ml and for different rotation speeds of the spin-coater: a. 1000 RPM, b. 2000 RPM, c. 3000 RPM, d. 4000 RPM, e. 5000 RPM.
371
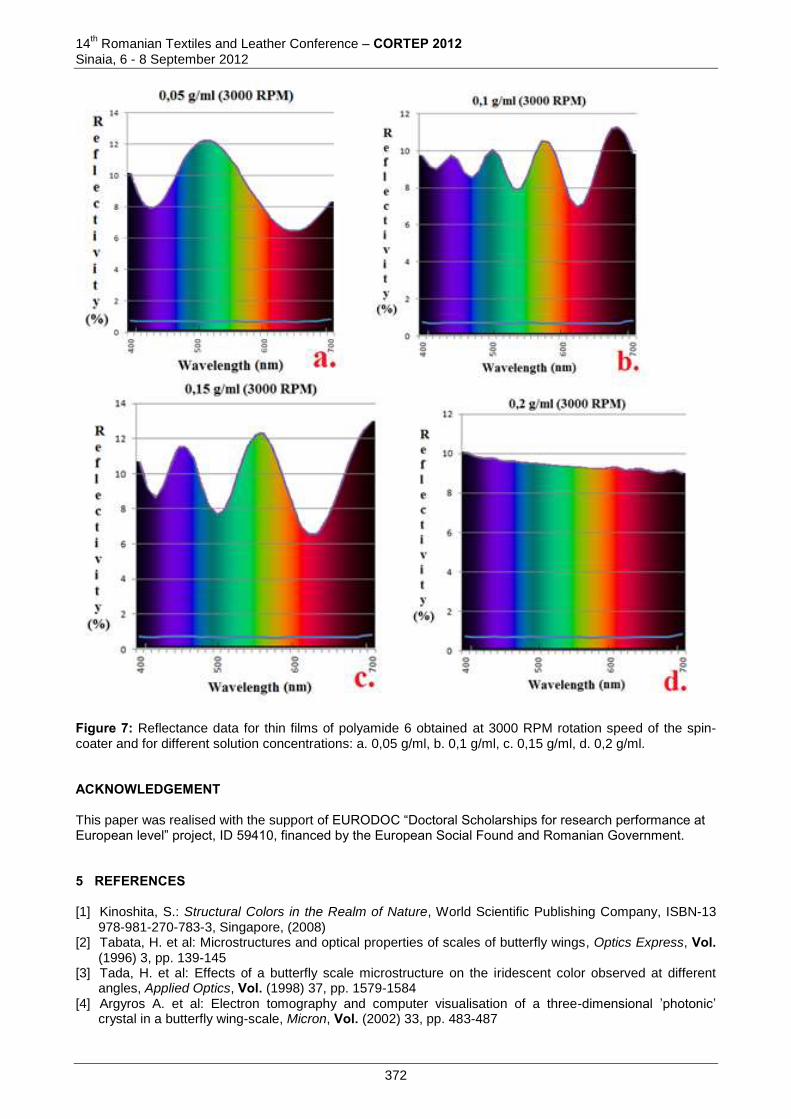
14th Romanian Textiles and Leather Conference – CORTEP 2012
Sinaia, 6 - 8 September 2012
Figure 7: Reflectance data for thin films of polyamide 6 obtained at 3000 RPM rotation speed of the spin-coater and for different solution concentrations: a. 0,05 g/ml, b. 0,1 g/ml, c. 0,15 g/ml, d. 0,2 g/ml. ACKNOWLEDGEMENT This paper was realised with the support of EURODOC “Doctoral Scholarships for research performance at European level” project, ID 59410, financed by the European Social Found and Romanian Government. 5 REFERENCES [1] Kinoshita, S.: Structural Colors in the Realm of Nature, World Scientific Publishing Company, ISBN-13
978-981-270-783-3, Singapore, (2008) [2] Tabata, H. et al: Microstructures and optical properties of scales of butterfly wings, Optics Express, Vol.
(1996) 3, pp. 139-145 [3] Tada, H. et al: Effects of a butterfly scale microstructure on the iridescent color observed at different
angles, Applied Optics, Vol. (1998) 37, pp. 1579-1584 [4] Argyros A. et al: Electron tomography and computer visualisation of a three-dimensional ’photonic’
crystal in a butterfly wing-scale, Micron, Vol. (2002) 33, pp. 483-487
372

14
th Romanian Textiles and Leather Conference – CORTEP 2012
Sinaia, 6 - 8 September 2012
[5] Vukusic P. et al: Structurally assisted blackness in butterfly scales, Proceedings of the Royal Society, B
Biological Sciences, Vol. (2004) 271, pp. 237-239
[6] Kinoshita, S.; Yoshioka, S.: Structural Colors in Nature: The Role of Regularity and Irregularity in the Structure, ChemPhysChem, Vol. (2005) 6, pp. 1442-1459
[7] Berthier S. et al: Morphological structure and optical properties of the wings of Morphidae, Journal of Insect Science, Vol. (2006) 13, pp. 145-157
[8] Prum, R. O. et al: Anatomically diverse butterfly scales all produce structural colours by coherent scattering, The Journal of Experimental Biology, Vol. (2006) 209, pp. 748-765
[9] Wickham, S. et al: Exaggeration and suppression of iridescence: the evolution of two-dimensional butterfly structural colours, Journal of Royal Society Interface, Vol. (2006) 3, pp. 99-109
[10] Yoshioka, S.; Kinoshita, S.: Single-scale spectroscopy of structurally colored butterflies: measurements of quantified reflectance and transmittance, Journal of the Optical Society of America A: Optics, Image Science, and Vision, Vol. (2006) 23, pp. 134-141
[11] Ingram, A. L.; Parker, A. R.: A review of the diversity and evolution of photonic structures in butterflies, incorporating the work of John Huxley (The Natural History Museum, London from 1961 to 1990), Philosophical Transactions of the Royal Society (Biological Sciences), Vol. (2008) 363, pp. 2465-2480
Corresponding author: Mirela TEODORESCU Doctoral School of the Faculty of Textile, Leather and Industrial Management "Gheorghe Asachi" Technical University of Iasi Bvd. D. Mangeron No.67 700050, Iași, Romania E-mail: [email protected]
Co-authors: Monica Alina CĂLIN Doctoral School of the Faculty of Textile, Leather Engineering and Industrial Management "Gheorghe Asachi" Technical University of Iasi Bvd. D. Mangeron No.67 700050, Iași, Romania E-mail: [email protected] Ioana PETCU Doctoral School of the Faculty of Textile, Leather Engineering and Industrial Management "Gheorghe Asachi" Technical University of Iasi Bvd. D. Mangeron No.67 700050, Iași, Romania E-mail: [email protected] Antonela CURTEZA Doctoral School of the Faculty of Textile, Leather Engineering and Industrial Management "Gheorghe Asachi" Technical University of Iasi Bvd. D. Mangeron No.67 700050, Iași, Romania E-mail: [email protected] Laurence SCHACHER Ecole Nationale Supérieure d’Ingénieurs Sud Alsace-ENSISA, Université de Haute-Alsace Mulhouse-Colmar 12 rue des frères Lumière 68093 Mulhouse, France Dominique ADOLPHE Ecole Nationale Supérieure d’Ingénieurs Sud Alsace-ENSISA, Université de Haute-Alsace Mulhouse-Colmar 12 rue des frères Lumière 68093 Mulhouse, France
373
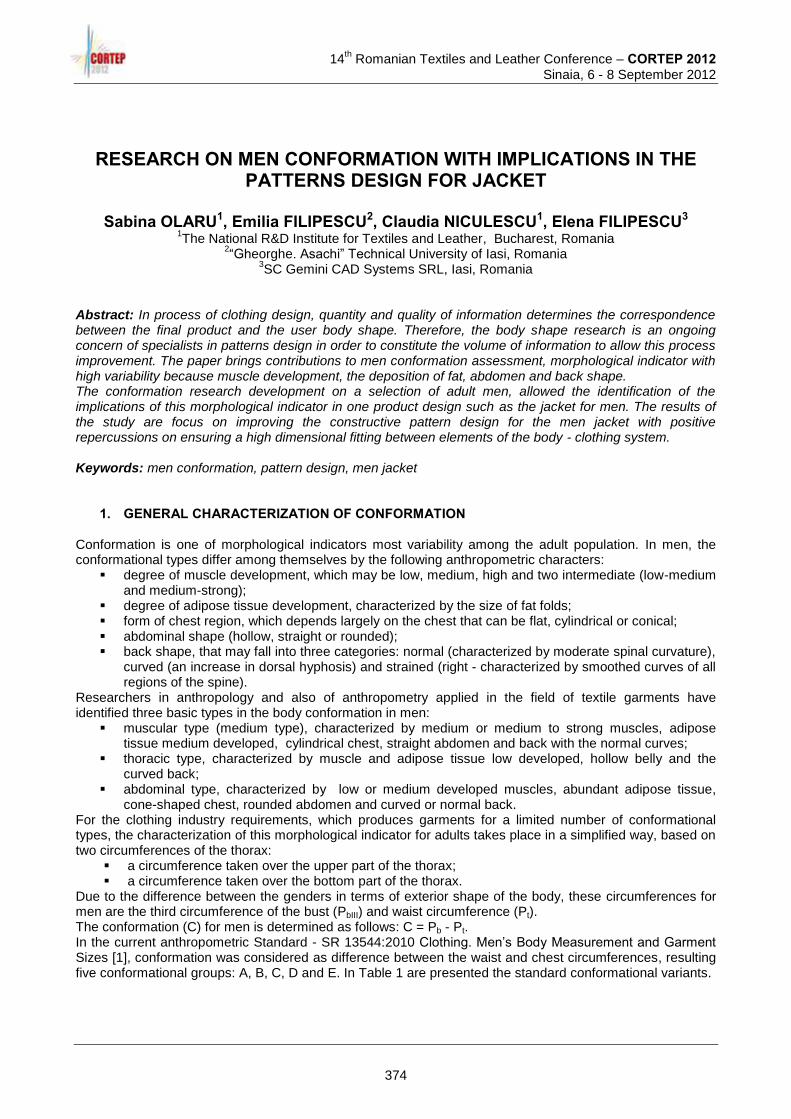
14
th Romanian Textiles and Leather Conference – CORTEP 2012
Sinaia, 6 - 8 September 2012
RESEARCH ON MEN CONFORMATION WITH IMPLICATIONS IN THE PATTERNS DESIGN FOR JACKET
Sabina OLARU1, Emilia FILIPESCU2, Claudia NICULESCU1, Elena FILIPESCU3
1The National R&D Institute for Textiles and Leather, Bucharest, Romania
2“Gheorghe. Asachi” Technical University of Iasi, Romania
3SC Gemini CAD Systems SRL, Iasi, Romania
Abstract: In process of clothing design, quantity and quality of information determines the correspondence between the final product and the user body shape. Therefore, the body shape research is an ongoing concern of specialists in patterns design in order to constitute the volume of information to allow this process improvement. The paper brings contributions to men conformation assessment, morphological indicator with high variability because muscle development, the deposition of fat, abdomen and back shape. The conformation research development on a selection of adult men, allowed the identification of the implications of this morphological indicator in one product design such as the jacket for men. The results of the study are focus on improving the constructive pattern design for the men jacket with positive repercussions on ensuring a high dimensional fitting between elements of the body - clothing system. Keywords: men conformation, pattern design, men jacket
1. GENERAL CHARACTERIZATION OF CONFORMATION Conformation is one of morphological indicators most variability among the adult population. In men, the conformational types differ among themselves by the following anthropometric characters:
degree of muscle development, which may be low, medium, high and two intermediate (low-medium and medium-strong);
degree of adipose tissue development, characterized by the size of fat folds; form of chest region, which depends largely on the chest that can be flat, cylindrical or conical; abdominal shape (hollow, straight or rounded); back shape, that may fall into three categories: normal (characterized by moderate spinal curvature),
curved (an increase in dorsal hyphosis) and strained (right - characterized by smoothed curves of all regions of the spine).
Researchers in anthropology and also of anthropometry applied in the field of textile garments have identified three basic types in the body conformation in men:
muscular type (medium type), characterized by medium or medium to strong muscles, adipose tissue medium developed, cylindrical chest, straight abdomen and back with the normal curves;
thoracic type, characterized by muscle and adipose tissue low developed, hollow belly and the curved back;
abdominal type, characterized by low or medium developed muscles, abundant adipose tissue, cone-shaped chest, rounded abdomen and curved or normal back.
For the clothing industry requirements, which produces garments for a limited number of conformational types, the characterization of this morphological indicator for adults takes place in a simplified way, based on two circumferences of the thorax:
a circumference taken over the upper part of the thorax; a circumference taken over the bottom part of the thorax.
Due to the difference between the genders in terms of exterior shape of the body, these circumferences for men are the third circumference of the bust (PbIII) and waist circumference (Pt). The conformation (C) for men is determined as follows: C = Pb - Pt. In the current anthropometric Standard - SR 13544:2010 Clothing. Men’s Body Measurement and Garment Sizes [1], conformation was considered as difference between the waist and chest circumferences, resulting five conformational groups: A, B, C, D and E. In Table 1 are presented the standard conformational variants.
374
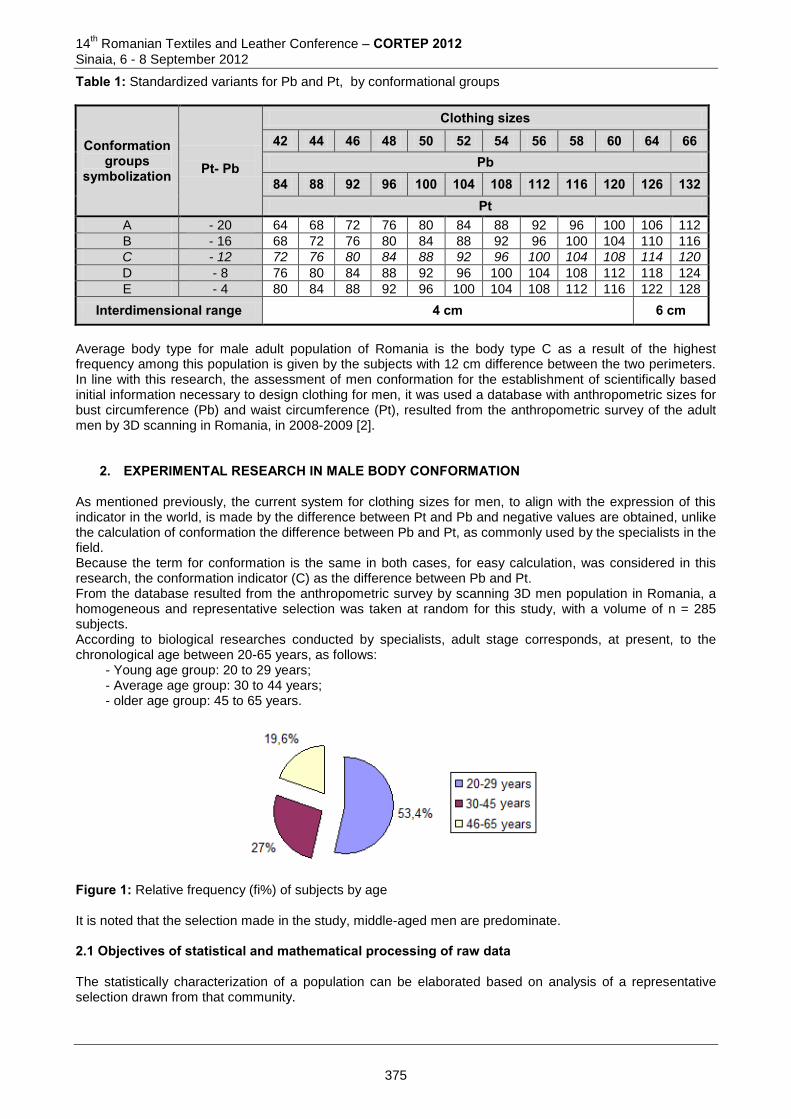
14th Romanian Textiles and Leather Conference – CORTEP 2012
Sinaia, 6 - 8 September 2012
Table 1: Standardized variants for Pb and Pt, by conformational groups
Conformation groups
symbolization
Pt- Pb
Clothing sizes 42 44 46 48 50 52 54 56 58 60 64 66
Pb 84 88 92 96 100 104 108 112 116 120 126 132
Pt A - 20 64 68 72 76 80 84 88 92 96 100 106 112
B - 16 68 72 76 80 84 88 92 96 100 104 110 116
C - 12 72 76 80 84 88 92 96 100 104 108 114 120
D - 8 76 80 84 88 92 96 100 104 108 112 118 124
E - 4 80 84 88 92 96 100 104 108 112 116 122 128
Interdimensional range 4 cm 6 cm
Average body type for male adult population of Romania is the body type C as a result of the highest frequency among this population is given by the subjects with 12 cm difference between the two perimeters. In line with this research, the assessment of men conformation for the establishment of scientifically based initial information necessary to design clothing for men, it was used a database with anthropometric sizes for bust circumference (Pb) and waist circumference (Pt), resulted from the anthropometric survey of the adult men by 3D scanning in Romania, in 2008-2009 [2].
2. EXPERIMENTAL RESEARCH IN MALE BODY CONFORMATION As mentioned previously, the current system for clothing sizes for men, to align with the expression of this indicator in the world, is made by the difference between Pt and Pb and negative values are obtained, unlike the calculation of conformation the difference between Pb and Pt, as commonly used by the specialists in the field. Because the term for conformation is the same in both cases, for easy calculation, was considered in this research, the conformation indicator (C) as the difference between Pb and Pt. From the database resulted from the anthropometric survey by scanning 3D men population in Romania, a homogeneous and representative selection was taken at random for this study, with a volume of n = 285 subjects. According to biological researches conducted by specialists, adult stage corresponds, at present, to the chronological age between 20-65 years, as follows:
- Young age group: 20 to 29 years; - Average age group: 30 to 44 years; - older age group: 45 to 65 years.
Figure 1: Relative frequency (fi%) of subjects by age It is noted that the selection made in the study, middle-aged men are predominate. 2.1 Objectives of statistical and mathematical processing of raw data The statistically characterization of a population can be elaborated based on analysis of a representative selection drawn from that community.
375
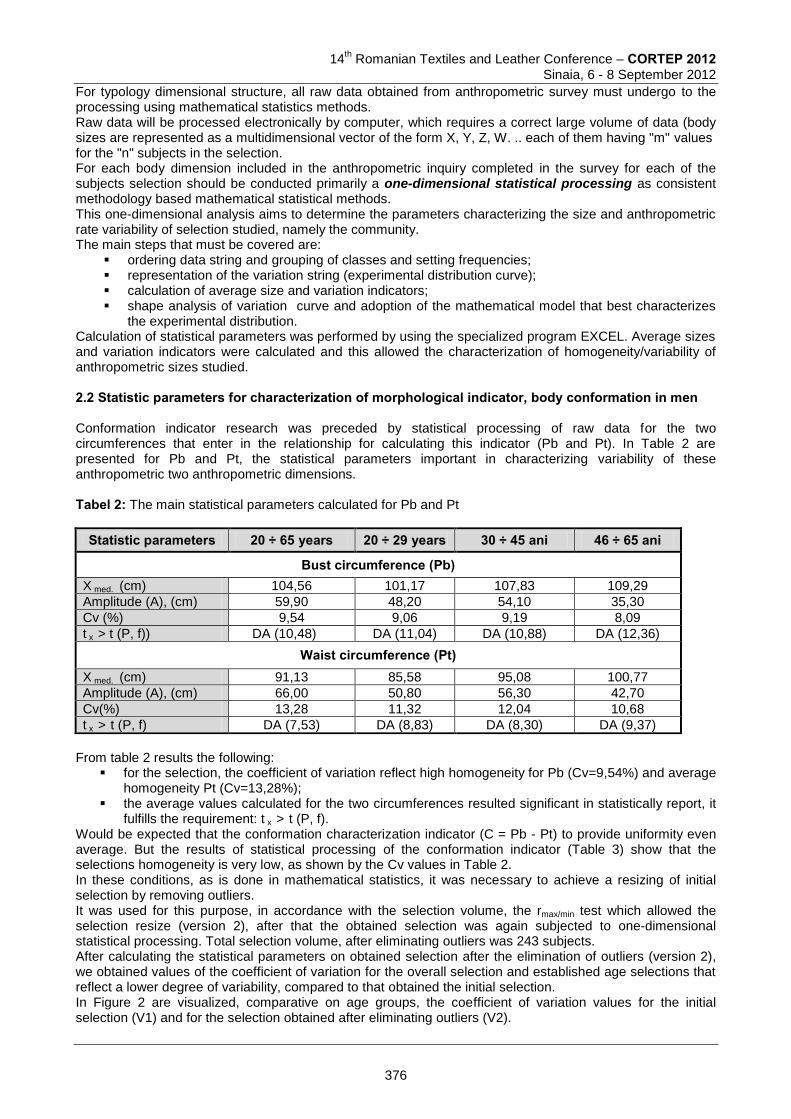
14
th Romanian Textiles and Leather Conference – CORTEP 2012
Sinaia, 6 - 8 September 2012
For typology dimensional structure, all raw data obtained from anthropometric survey must undergo to the processing using mathematical statistics methods. Raw data will be processed electronically by computer, which requires a correct large volume of data (body sizes are represented as a multidimensional vector of the form X, Y, Z, W. .. each of them having "m" values for the "n" subjects in the selection. For each body dimension included in the anthropometric inquiry completed in the survey for each of the subjects selection should be conducted primarily a one-dimensional statistical processing as consistent methodology based mathematical statistical methods. This one-dimensional analysis aims to determine the parameters characterizing the size and anthropometric rate variability of selection studied, namely the community. The main steps that must be covered are:
ordering data string and grouping of classes and setting frequencies; representation of the variation string (experimental distribution curve); calculation of average size and variation indicators; shape analysis of variation curve and adoption of the mathematical model that best characterizes
the experimental distribution. Calculation of statistical parameters was performed by using the specialized program EXCEL. Average sizes and variation indicators were calculated and this allowed the characterization of homogeneity/variability of anthropometric sizes studied. 2.2 Statistic parameters for characterization of morphological indicator, body conformation in men Conformation indicator research was preceded by statistical processing of raw data for the two circumferences that enter in the relationship for calculating this indicator (Pb and Pt). In Table 2 are presented for Pb and Pt, the statistical parameters important in characterizing variability of these anthropometric two anthropometric dimensions. Tabel 2: The main statistical parameters calculated for Pb and Pt
Statistic parameters 20 ÷ 65 years 20 ÷ 29 years 30 ÷ 45 ani 46 ÷ 65 ani
Bust circumference (Pb) X med. (cm) 104,56 101,17 107,83 109,29
Amplitude (A), (cm) 59,90 48,20 54,10 35,30
Cv (%) 9,54 9,06 9,19 8,09
t x > t (P, f)) DA (10,48) DA (11,04) DA (10,88) DA (12,36)
Waist circumference (Pt) X med. (cm) 91,13 85,58 95,08 100,77
Amplitude (A), (cm) 66,00 50,80 56,30 42,70
Cv(%) 13,28 11,32 12,04 10,68
t x > t (P, f) DA (7,53) DA (8,83) DA (8,30) DA (9,37)
From table 2 results the following:
for the selection, the coefficient of variation reflect high homogeneity for Pb (Cv=9,54%) and average homogeneity Pt (Cv=13,28%);
the average values calculated for the two circumferences resulted significant in statistically report, it fulfills the requirement: t x > t (P, f).
Would be expected that the conformation characterization indicator (C = Pb - Pt) to provide uniformity even average. But the results of statistical processing of the conformation indicator (Table 3) show that the selections homogeneity is very low, as shown by the Cv values in Table 2. In these conditions, as is done in mathematical statistics, it was necessary to achieve a resizing of initial selection by removing outliers. It was used for this purpose, in accordance with the selection volume, the rmax/min test which allowed the selection resize (version 2), after that the obtained selection was again subjected to one-dimensional statistical processing. Total selection volume, after eliminating outliers was 243 subjects. After calculating the statistical parameters on obtained selection after the elimination of outliers (version 2), we obtained values of the coefficient of variation for the overall selection and established age selections that reflect a lower degree of variability, compared to that obtained the initial selection. In Figure 2 are visualized, comparative on age groups, the coefficient of variation values for the initial selection (V1) and for the selection obtained after eliminating outliers (V2).
376
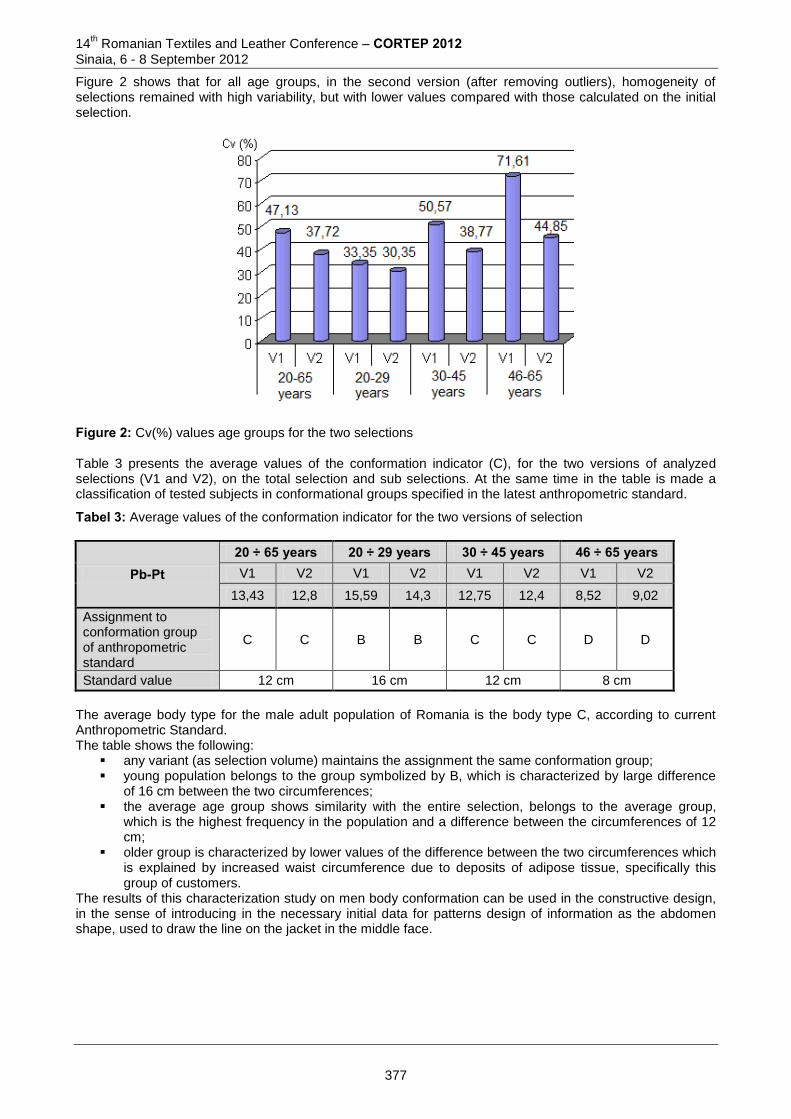
14th Romanian Textiles and Leather Conference – CORTEP 2012
Sinaia, 6 - 8 September 2012
Figure 2 shows that for all age groups, in the second version (after removing outliers), homogeneity of selections remained with high variability, but with lower values compared with those calculated on the initial selection.
Figure 2: Cv(%) values age groups for the two selections Table 3 presents the average values of the conformation indicator (C), for the two versions of analyzed selections (V1 and V2), on the total selection and sub selections. At the same time in the table is made a classification of tested subjects in conformational groups specified in the latest anthropometric standard.
Tabel 3: Average values of the conformation indicator for the two versions of selection
Pb-Pt 20 ÷ 65 years 20 ÷ 29 years 30 ÷ 45 years 46 ÷ 65 years V1 V2 V1 V2 V1 V2 V1 V2
13,43 12,8 15,59 14,3 12,75 12,4 8,52 9,02
Assignment to conformation group of anthropometric standard
C C B B C C D D
Standard value 12 cm 16 cm 12 cm 8 cm
The average body type for the male adult population of Romania is the body type C, according to current Anthropometric Standard. The table shows the following:
any variant (as selection volume) maintains the assignment the same conformation group; young population belongs to the group symbolized by B, which is characterized by large difference
of 16 cm between the two circumferences; the average age group shows similarity with the entire selection, belongs to the average group,
which is the highest frequency in the population and a difference between the circumferences of 12 cm;
older group is characterized by lower values of the difference between the two circumferences which is explained by increased waist circumference due to deposits of adipose tissue, specifically this group of customers.
The results of this characterization study on men body conformation can be used in the constructive design, in the sense of introducing in the necessary initial data for patterns design of information as the abdomen shape, used to draw the line on the jacket in the middle face.
377
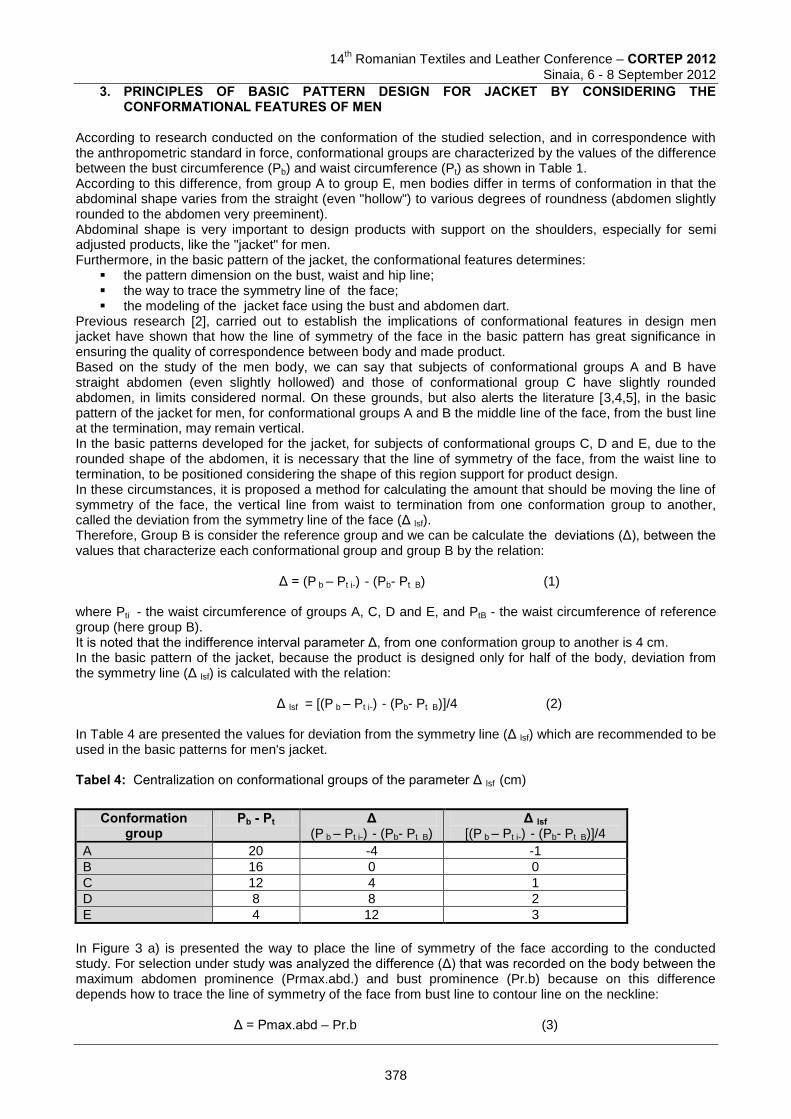
14
th Romanian Textiles and Leather Conference – CORTEP 2012
Sinaia, 6 - 8 September 2012
3. PRINCIPLES OF BASIC PATTERN DESIGN FOR JACKET BY CONSIDERING THE CONFORMATIONAL FEATURES OF MEN
According to research conducted on the conformation of the studied selection, and in correspondence with the anthropometric standard in force, conformational groups are characterized by the values of the difference between the bust circumference (Pb) and waist circumference (Pt) as shown in Table 1. According to this difference, from group A to group E, men bodies differ in terms of conformation in that the abdominal shape varies from the straight (even "hollow") to various degrees of roundness (abdomen slightly rounded to the abdomen very preeminent). Abdominal shape is very important to design products with support on the shoulders, especially for semi adjusted products, like the "jacket" for men. Furthermore, in the basic pattern of the jacket, the conformational features determines:
the pattern dimension on the bust, waist and hip line; the way to trace the symmetry line of the face; the modeling of the jacket face using the bust and abdomen dart.
Previous research [2], carried out to establish the implications of conformational features in design men jacket have shown that how the line of symmetry of the face in the basic pattern has great significance in ensuring the quality of correspondence between body and made product. Based on the study of the men body, we can say that subjects of conformational groups A and B have straight abdomen (even slightly hollowed) and those of conformational group C have slightly rounded abdomen, in limits considered normal. On these grounds, but also alerts the literature [3,4,5], in the basic pattern of the jacket for men, for conformational groups A and B the middle line of the face, from the bust line at the termination, may remain vertical. In the basic patterns developed for the jacket, for subjects of conformational groups C, D and E, due to the rounded shape of the abdomen, it is necessary that the line of symmetry of the face, from the waist line to termination, to be positioned considering the shape of this region support for product design. In these circumstances, it is proposed a method for calculating the amount that should be moving the line of symmetry of the face, the vertical line from waist to termination from one conformation group to another, called the deviation from the symmetry line of the face (Δ lsf). Therefore, Group B is consider the reference group and we can be calculate the deviations (Δ), between the values that characterize each conformational group and group B by the relation:
Δ = (P b – Pt i-) - (Pb- Pt B) (1) where Pti - the waist circumference of groups A, C, D and E, and PtB - the waist circumference of reference group (here group B). It is noted that the indifference interval parameter Δ, from one conformation group to another is 4 cm. In the basic pattern of the jacket, because the product is designed only for half of the body, deviation from the symmetry line (Δ lsf) is calculated with the relation:
Δ lsf = [(P b – Pt i-) - (Pb- Pt B)]/4 (2) In Table 4 are presented the values for deviation from the symmetry line (Δ lsf) which are recommended to be used in the basic patterns for men's jacket.
Tabel 4: Centralization on conformational groups of the parameter Δ lsf (cm)
In Figure 3 a) is presented the way to place the line of symmetry of the face according to the conducted study. For selection under study was analyzed the difference (Δ) that was recorded on the body between the maximum abdomen prominence (Prmax.abd.) and bust prominence (Pr.b) because on this difference depends how to trace the line of symmetry of the face from bust line to contour line on the neckline:
Δ = Pmax.abd – Pr.b (3)
Conformation group
Pb - Pt Δ (P b – Pt i-) - (Pb- Pt B)
Δ lsf [(P b – Pt i-) - (Pb- Pt B)]/4
A 20 -4 -1
B 16 0 0
C 12 4 1
D 8 8 2
E 4 12 3
378
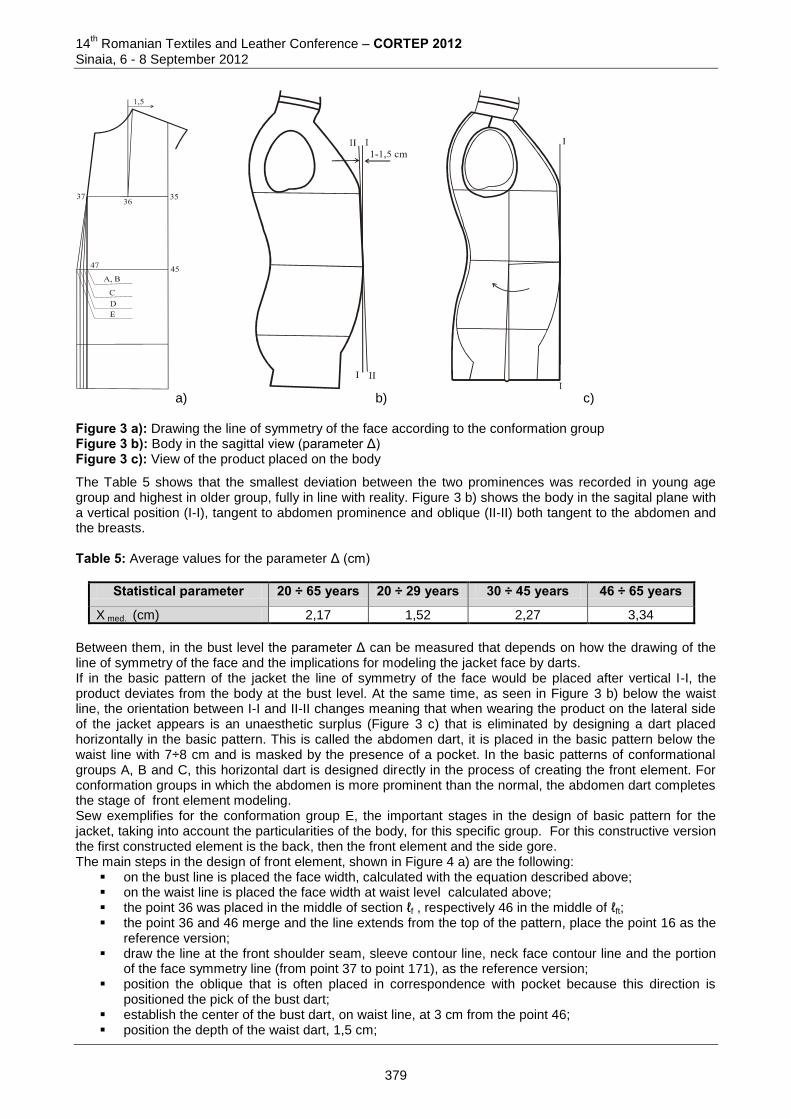
14th Romanian Textiles and Leather Conference – CORTEP 2012
Sinaia, 6 - 8 September 2012
a) b) c) Figure 3 a): Drawing the line of symmetry of the face according to the conformation group Figure 3 b): Body in the sagittal view (parameter Δ) Figure 3 c): View of the product placed on the body
The Table 5 shows that the smallest deviation between the two prominences was recorded in young age group and highest in older group, fully in line with reality. Figure 3 b) shows the body in the sagital plane with a vertical position (I-I), tangent to abdomen prominence and oblique (II-II) both tangent to the abdomen and the breasts. Table 5: Average values for the parameter Δ (cm)
Statistical parameter 20 ÷ 65 years 20 ÷ 29 years 30 ÷ 45 years 46 ÷ 65 years
X med. (cm) 2,17 1,52 2,27 3,34
Between them, in the bust level the parameter Δ can be measured that depends on how the drawing of the line of symmetry of the face and the implications for modeling the jacket face by darts. If in the basic pattern of the jacket the line of symmetry of the face would be placed after vertical I-I, the product deviates from the body at the bust level. At the same time, as seen in Figure 3 b) below the waist line, the orientation between I-I and II-II changes meaning that when wearing the product on the lateral side of the jacket appears is an unaesthetic surplus (Figure 3 c) that is eliminated by designing a dart placed horizontally in the basic pattern. This is called the abdomen dart, it is placed in the basic pattern below the waist line with 7÷8 cm and is masked by the presence of a pocket. In the basic patterns of conformational groups A, B and C, this horizontal dart is designed directly in the process of creating the front element. For conformation groups in which the abdomen is more prominent than the normal, the abdomen dart completes the stage of front element modeling. Sew exemplifies for the conformation group E, the important stages in the design of basic pattern for the jacket, taking into account the particularities of the body, for this specific group. For this constructive version the first constructed element is the back, then the front element and the side gore. The main steps in the design of front element, shown in Figure 4 a) are the following:
on the bust line is placed the face width, calculated with the equation described above; on the waist line is placed the face width at waist level calculated above; the point 36 was placed in the middle of section ℓf , respectively 46 in the middle of ℓft; the point 36 and 46 merge and the line extends from the top of the pattern, place the point 16 as the
reference version; draw the line at the front shoulder seam, sleeve contour line, neck face contour line and the portion
of the face symmetry line (from point 37 to point 171), as the reference version; position the oblique that is often placed in correspondence with pocket because this direction is
positioned the pick of the bust dart; establish the center of the bust dart, on waist line, at 3 cm from the point 46; position the depth of the waist dart, 1,5 cm;
379
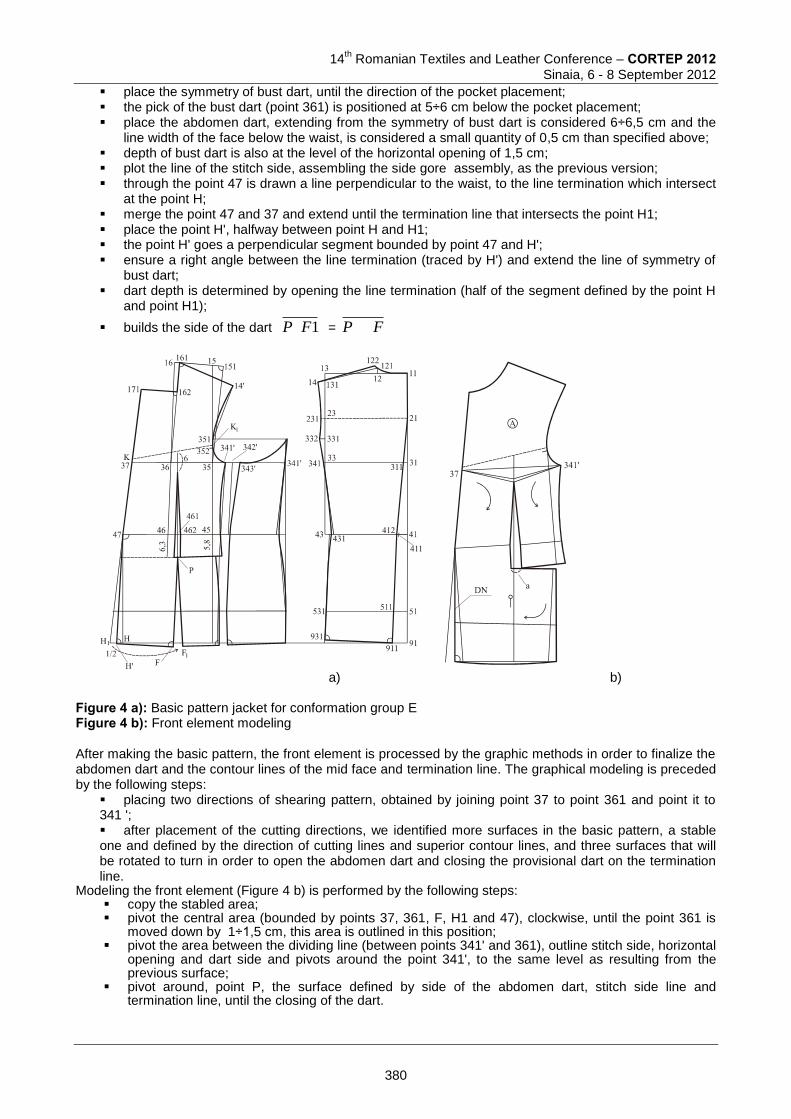
14
th Romanian Textiles and Leather Conference – CORTEP 2012
Sinaia, 6 - 8 September 2012
place the symmetry of bust dart, until the direction of the pocket placement; the pick of the bust dart (point 361) is positioned at 5÷6 cm below the pocket placement; place the abdomen dart, extending from the symmetry of bust dart is considered 6÷6,5 cm and the
line width of the face below the waist, is considered a small quantity of 0,5 cm than specified above; depth of bust dart is also at the level of the horizontal opening of 1,5 cm; plot the line of the stitch side, assembling the side gore assembly, as the previous version; through the point 47 is drawn a line perpendicular to the waist, to the line termination which intersect
at the point H; merge the point 47 and 37 and extend until the termination line that intersects the point H1; place the point H', halfway between point H and H1; the point H' goes a perpendicular segment bounded by point 47 and H'; ensure a right angle between the line termination (traced by H') and extend the line of symmetry of
bust dart; dart depth is determined by opening the line termination (half of the segment defined by the point H
and point H1);
builds the side of the dart 1FP = FP
a) b)
Figure 4 a): Basic pattern jacket for conformation group E Figure 4 b): Front element modeling After making the basic pattern, the front element is processed by the graphic methods in order to finalize the abdomen dart and the contour lines of the mid face and termination line. The graphical modeling is preceded by the following steps:
placing two directions of shearing pattern, obtained by joining point 37 to point 361 and point it to 341 '; after placement of the cutting directions, we identified more surfaces in the basic pattern, a stable one and defined by the direction of cutting lines and superior contour lines, and three surfaces that will be rotated to turn in order to open the abdomen dart and closing the provisional dart on the termination line.
Modeling the front element (Figure 4 b) is performed by the following steps: copy the stabled area; pivot the central area (bounded by points 37, 361, F, H1 and 47), clockwise, until the point 361 is
moved down by 1÷1,5 cm, this area is outlined in this position; pivot the area between the dividing line (between points 341' and 361), outline stitch side, horizontal
opening and dart side and pivots around the point 341', to the same level as resulting from the previous surface;
pivot around, point P, the surface defined by side of the abdomen dart, stitch side line and termination line, until the closing of the dart.
380
14th Romanian Textiles and Leather Conference – CORTEP 2012
Sinaia, 6 - 8 September 2012
CONCLUSIONS Research of the conformation for the selection under study showed that this morphological indicator has a high variability among all age groups analyzed. Framing studied selections in conformational groups specified in the current dimensional typology shows the following:
young people belong to the group symbolized by B, which is characterized by large difference of 16 cm between the two circumferences;
the average age group shows similarity with the entire selection, belongs to the average group, which is the highest frequency in the population and a difference between the circumferences of 12 cm;
older group is characterized by lower values of the difference between the two circumferences (Pb-Pt = 8 cm) which is explained by increased waist perimeter due to deposits of fat, specifically this group of customers.
The results of experimental research conducted on men conformations allowed the adaptation of design solutions for the jacket basic pattern, on conformation. For the conformation group E, it was exemplified the basic pattern sizing, drawing the line of symmetry of the face and shape of the element to obtain depth of bust and abdomen dart in correspondence with the prominent abdomen form. Modeling the front element of the jacket proposed in the paper has as the end result a good dimensional correlation between the body shape and garment. REFERENCES [1] Standard - SR 13544:2010 Clothing. Men’s Body Measurement and Garment Sizes [2] Niculescu C., Salistean A., Olaru S, Filipescu E, Avadanei M, Danila E, 3D Body Scanner
Anthropometric Investigation of the Romanian Population and Anthropometric Data Assessment, Proceedings of International scientific conference : Innovative solution for sustainable development of textiles industry, Oradea, 28 – 29 Mai, 2010, Edited by the University of Oradea, CD-Rom Vol.1, ISSN 2068-1070-5590, p108-114
[3] Filipescu E. & Avadanei M, Structura si proiectarea confectiilor textile, Ed. Performantica, Iasi, 2007, p 67-75
[4] Atelier no. 4/2006 [5] Atelier no.1/2008
Corresponding address: Dr. eng. Sabina OLARU Research Department of Design and Anthropometry The National R&D Institute for Textiles and Leather
16, Lucretiu Patrascanu street 030508, Bucharest, Romania Phone: 0213404928, Fax: 0213405515, E-mail: [email protected]
Co-authors: Prof. Dr. Eng. Emilia FILIPESCU Faculty of Textile, Leather and Industrial Management, “Gheorghe Asachi” Technical University of Iasi 53, Dumitru Mangeron Street 700050, Iasi, Romania E-mail: [email protected] Eng. Claudia NICULESCU Research Department of Design and Anthropometry The National R&D Institute for Textiles and Leather 16, Lucretiu Patrascanu street 030508, Bucharest , Romania Phone: 0213404928, Fax: 0213405515, E-mail: [email protected] Dr. Eng. Filipescu Elena SC Gemini CAD Systems SRL 2A, Tudor Vianu street Iasi, Romania, E-mail: [email protected]
381
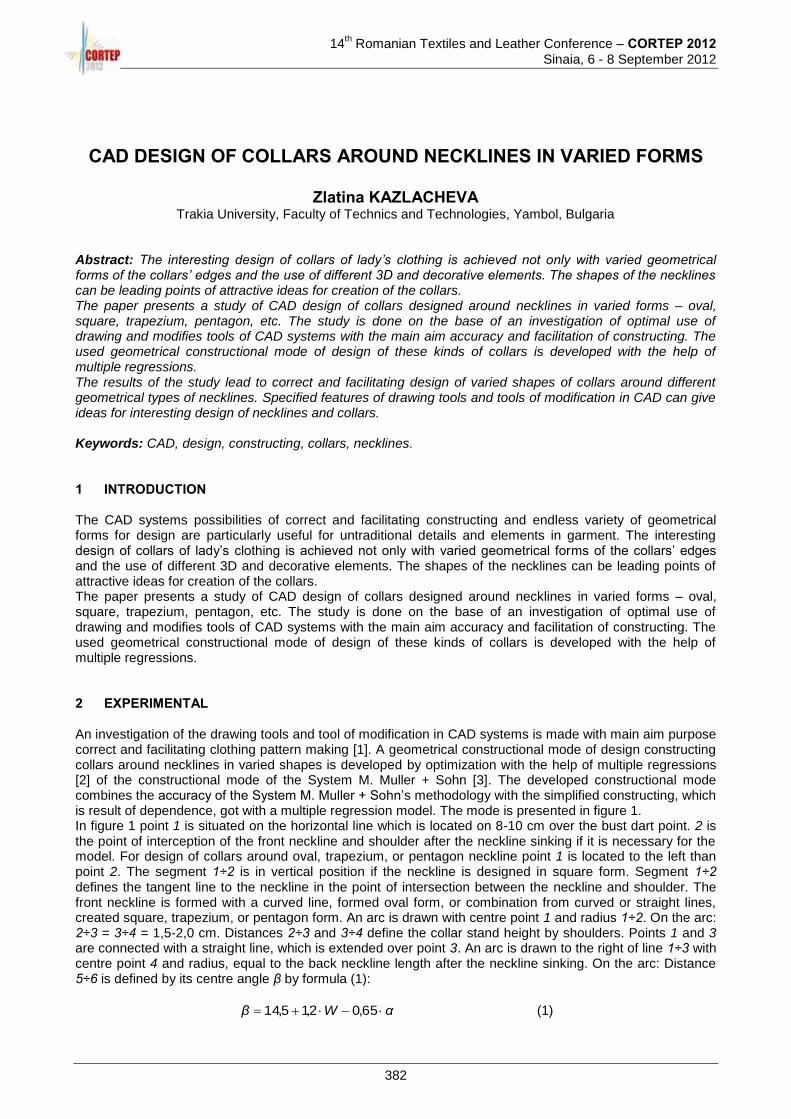
14th Romanian Textiles and Leather Conference – CORTEP 2012
Sinaia, 6 - 8 September 2012
CAD DESIGN OF COLLARS AROUND NECKLINES IN VARIED FORMS
Zlatina KAZLACHEVA Trakia University, Faculty of Technics and Technologies, Yambol, Bulgaria
Abstract: The interesting design of collars of lady’s clothing is achieved not only with varied geometrical forms of the collars’ edges and the use of different 3D and decorative elements. The shapes of the necklines can be leading points of attractive ideas for creation of the collars. The paper presents a study of CAD design of collars designed around necklines in varied forms – oval, square, trapezium, pentagon, etc. The study is done on the base of an investigation of optimal use of drawing and modifies tools of CAD systems with the main aim accuracy and facilitation of constructing. The used geometrical constructional mode of design of these kinds of collars is developed with the help of multiple regressions. The results of the study lead to correct and facilitating design of varied shapes of collars around different geometrical types of necklines. Specified features of drawing tools and tools of modification in CAD can give ideas for interesting design of necklines and collars. Keywords: CAD, design, constructing, collars, necklines. 1 INTRODUCTION The CAD systems possibilities of correct and facilitating constructing and endless variety of geometrical forms for design are particularly useful for untraditional details and elements in garment. The interesting design of collars of lady’s clothing is achieved not only with varied geometrical forms of the collars’ edges and the use of different 3D and decorative elements. The shapes of the necklines can be leading points of attractive ideas for creation of the collars. The paper presents a study of CAD design of collars designed around necklines in varied forms – oval, square, trapezium, pentagon, etc. The study is done on the base of an investigation of optimal use of drawing and modifies tools of CAD systems with the main aim accuracy and facilitation of constructing. The used geometrical constructional mode of design of these kinds of collars is developed with the help of multiple regressions. 2 EXPERIMENTAL An investigation of the drawing tools and tool of modification in CAD systems is made with main aim purpose correct and facilitating clothing pattern making [1]. A geometrical constructional mode of design constructing collars around necklines in varied shapes is developed by optimization with the help of multiple regressions [2] of the constructional mode of the System M. Muller + Sohn [3]. The developed constructional mode combines the accuracy of the System M. Muller + Sohn’s methodology with the simplified constructing, which is result of dependence, got with a multiple regression model. The mode is presented in figure 1. In figure 1 point 1 is situated on the horizontal line which is located on 8-10 cm over the bust dart point. 2 is the point of interception of the front neckline and shoulder after the neckline sinking if it is necessary for the model. For design of collars around oval, trapezium, or pentagon neckline point 1 is located to the left than point 2. The segment 1÷2 is in vertical position if the neckline is designed in square form. Segment 1÷2 defines the tangent line to the neckline in the point of intersection between the neckline and shoulder. The front neckline is formed with a curved line, formed oval form, or combination from curved or straight lines, created square, trapezium, or pentagon form. An arc is drawn with centre point 1 and radius 1÷2. On the arc: 2÷3 = 3÷4 = 1,5-2,0 cm. Distances 2÷3 and 3÷4 define the collar stand height by shoulders. Points 1 and 3 are connected with a straight line, which is extended over point 3. An arc is drawn to the right of line 1÷3 with centre point 4 and radius, equal to the back neckline length after the neckline sinking. On the arc: Distance 5÷6 is defined by its centre angle β by formula (1):
αβ 65,02,15,14 W (1)
382

14th Romanian Textiles and Leather Conference – CORTEP 2012
Sinaia, 6 - 8 September 2012
In formula (1) β, ° is the central angle of the collar slope arc 5÷6, W, cm – the collar width by the shoulders, α, ° – the roll line angle (the angle between segment 1÷3 and vertical line). Distance 6÷7 = 2÷3 + 1,0 determines the collar stand height by the back middle. Points 1 and 4 are connected with a line, which is the same as the line of the neckline – 1÷2. The line 1÷4 defines the collar connecting line to the front neckline. Points 1 and 4 are connected with a line, which is the same as the line of the neckline – 1÷2. The line 1÷4 defines the collar connecting line to the front neckline. Points 4 and 7 are connected with a curved line and curve 4÷7 defines the collar connected line to the back neckline. A line, which is perpendicular to 4÷7 is drawn. On the new line: 7÷8 = 6÷7. Distance 7÷8 defines the collar stand height by the back middle. Distance 8÷9 determines the collar width by the back middle. On the front shoulder distance 2÷10 define the collar width by the shoulders. The collar edge is drawn with a curved line between points 1 and 9 through point 10. The collar edge line shape depends from the model and fashion trends.
Figure 1: Constructional mode of design of collars around necklines in varied forms. Design of a collar around a trapezium neckline
Figure 2: Design of a collar around an oval neckline
Figure 1 presents an collar deign around a trapezium neckline, but the geometrical constructional mode is suitable for every design of collar around neckline in different shape, when the tangent to the neckline in the shoulder point is sloped to the shoulder or is in vertical position. For example figure 2 presents a collar around an oval neckline. 3 RESULTS CAD design of collars around necklines in varied forms, presented in figures 3 and 4, combines the priorities of the geometrical constructional mode [2], presented in figure 1 and investigation of optimal use of drawing and modify tools of CAD systems [1]. In results CAD systems make pattern making more accurate and facilitated. In figure 3 the polyline a forms the front neckline. In this example the front neckline is in pentagon shape and is formed with the CAD drawing tools: two straight lines (segments) with roundness between them. If a neckline is formed in shape of trapezium two lines – straight ones (segments) or splines (b-splines or
383
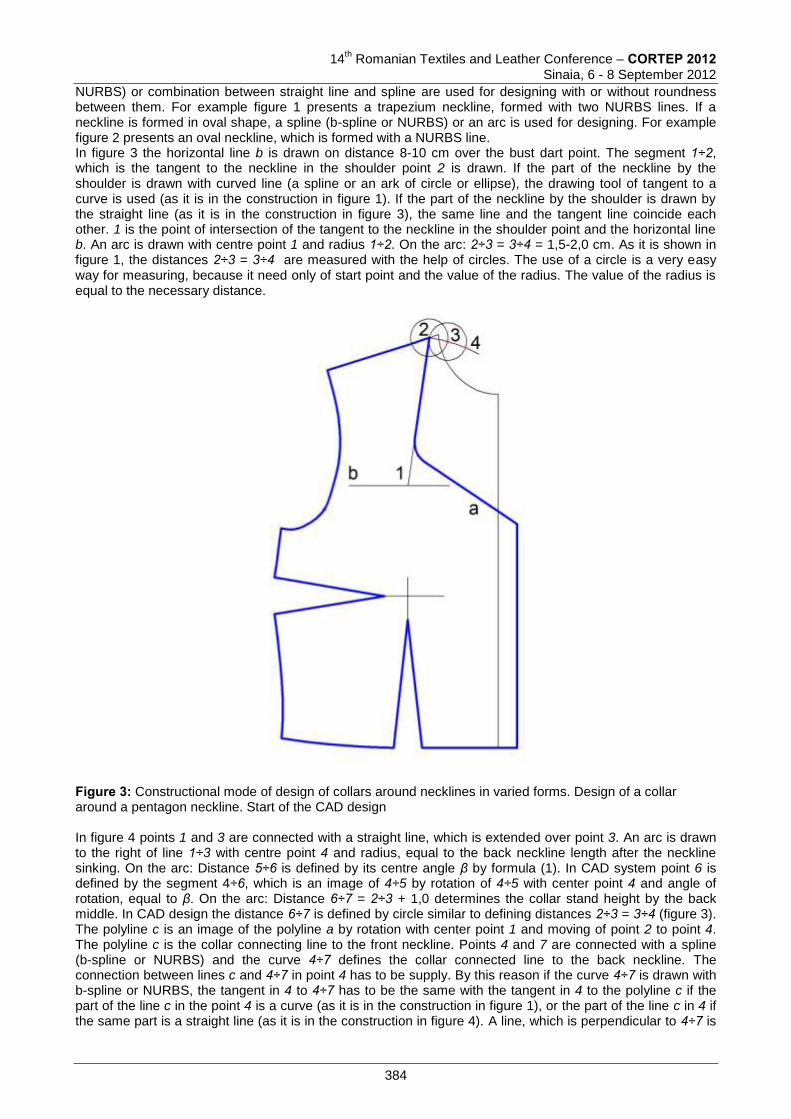
14
th Romanian Textiles and Leather Conference – CORTEP 2012
Sinaia, 6 - 8 September 2012
NURBS) or combination between straight line and spline are used for designing with or without roundness between them. For example figure 1 presents a trapezium neckline, formed with two NURBS lines. If a neckline is formed in oval shape, a spline (b-spline or NURBS) or an arc is used for designing. For example figure 2 presents an oval neckline, which is formed with a NURBS line. In figure 3 the horizontal line b is drawn on distance 8-10 cm over the bust dart point. The segment 1÷2, which is the tangent to the neckline in the shoulder point 2 is drawn. If the part of the neckline by the shoulder is drawn with curved line (a spline or an ark of circle or ellipse), the drawing tool of tangent to a curve is used (as it is in the construction in figure 1). If the part of the neckline by the shoulder is drawn by the straight line (as it is in the construction in figure 3), the same line and the tangent line coincide each other. 1 is the point of intersection of the tangent to the neckline in the shoulder point and the horizontal line b. An arc is drawn with centre point 1 and radius 1÷2. On the arc: 2÷3 = 3÷4 = 1,5-2,0 cm. As it is shown in figure 1, the distances 2÷3 = 3÷4 are measured with the help of circles. The use of a circle is a very easy way for measuring, because it need only of start point and the value of the radius. The value of the radius is equal to the necessary distance.
Figure 3: Constructional mode of design of collars around necklines in varied forms. Design of a collar around a pentagon neckline. Start of the CAD design In figure 4 points 1 and 3 are connected with a straight line, which is extended over point 3. An arc is drawn to the right of line 1÷3 with centre point 4 and radius, equal to the back neckline length after the neckline sinking. On the arc: Distance 5÷6 is defined by its centre angle β by formula (1). In CAD system point 6 is defined by the segment 4÷6, which is an image of 4÷5 by rotation of 4÷5 with center point 4 and angle of rotation, equal to β. On the arc: Distance 6÷7 = 2÷3 + 1,0 determines the collar stand height by the back middle. In CAD design the distance 6÷7 is defined by circle similar to defining distances 2÷3 = 3÷4 (figure 3). The polyline c is an image of the polyline a by rotation with center point 1 and moving of point 2 to point 4. The polyline c is the collar connecting line to the front neckline. Points 4 and 7 are connected with a spline (b-spline or NURBS) and the curve 4÷7 defines the collar connected line to the back neckline. The connection between lines c and 4÷7 in point 4 has to be supply. By this reason if the curve 4÷7 is drawn with b-spline or NURBS, the tangent in 4 to 4÷7 has to be the same with the tangent in 4 to the polyline c if the part of the line c in the point 4 is a curve (as it is in the construction in figure 1), or the part of the line c in 4 if the same part is a straight line (as it is in the construction in figure 4). A line, which is perpendicular to 4÷7 is
384

14th Romanian Textiles and Leather Conference – CORTEP 2012
Sinaia, 6 - 8 September 2012
drawn. If the CAD system doesn’t offer a possibility of drawing of a perpendicular line to a curve, the tangent to the curve 4÷7 in the point 7 has to be drawn. In figure 4 this tangent is line d. Then the perpendicular line to d has to be drawn. On the perpendicular line: 7÷8 = 6÷7. Distance 7÷8 defines the collar stand height by the back middle. Distance 8÷9 determines the collar width by the back middle. In CAD design the distances 7÷8 and 8÷9 are defined by circles similar to defining distances 2÷3 = 3÷4 (figure 3). The line e is drawn perpendicular to the middle collar line 7÷8÷9. On the front shoulder distance 2÷10 define the collar width by the shoulders. This distance is defined by a circle too. A polyline f, which defines the collar edge, is drawn between point 9 and polyline c through point 10. The tangent to f in point 9 has to be line e. The collar edge line shape depends from the model and fashion trends and polyline f can be drawn in CAD with the use of varied drawing tools: splines (b-splines or NURBS), Beziers, arcs, straight lines, roundness, etc. In the figure 4 the collar edge is drawn with a NURBS curve.
Figure 4: Constructional mode of design of collars around necklines in varied forms. CAD design. Design of a collar around a pentagon neckline 4 APPLICATION Figure 5 presents a model of a lady’s jacket with a collar around a square neckline. The CAD design of the collar is shown in figure 6. The square neckline is drawn with a horizontal straight line and a NURBS curve in vertical direction. A collar edge is drawn with a NURBS curve and two straight lines with an acute angle. Figure 7 presents a model of a lady’s jacket with a collar around a pentagon neckline. The CAD design of the collar is shown in figure 8. The pentagon neckline is drawn with two straight lines with an obtuse almost a
385
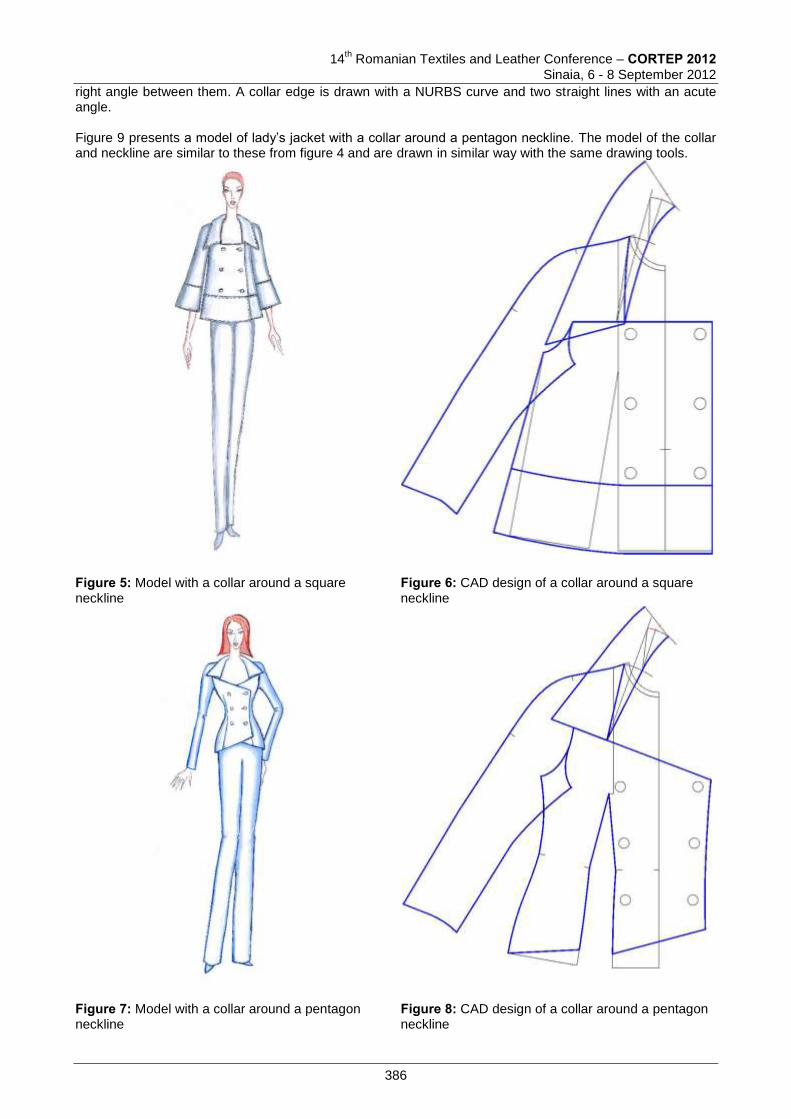
14
th Romanian Textiles and Leather Conference – CORTEP 2012
Sinaia, 6 - 8 September 2012
right angle between them. A collar edge is drawn with a NURBS curve and two straight lines with an acute angle. Figure 9 presents a model of lady’s jacket with a collar around a pentagon neckline. The model of the collar and neckline are similar to these from figure 4 and are drawn in similar way with the same drawing tools.
Figure 5: Model with a collar around a square neckline
Figure 6: CAD design of a collar around a square neckline
Figure 7: Model with a collar around a pentagon neckline
Figure 8: CAD design of a collar around a pentagon neckline
386
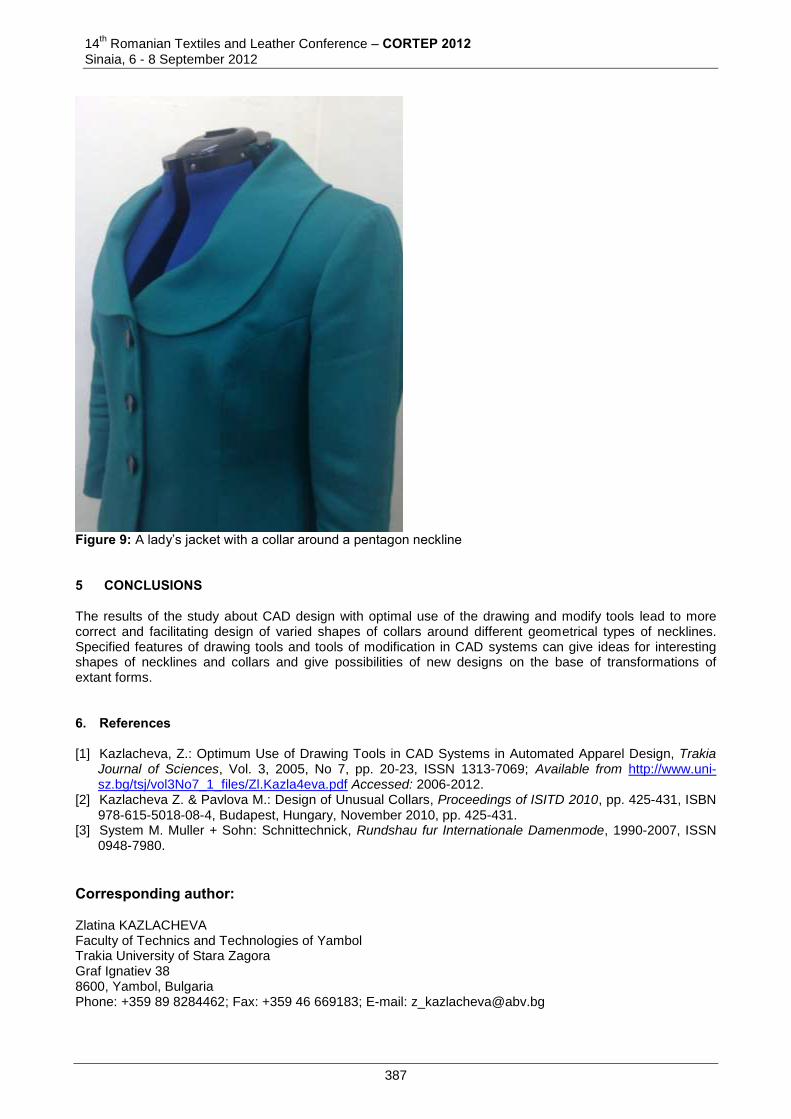
14th Romanian Textiles and Leather Conference – CORTEP 2012
Sinaia, 6 - 8 September 2012
Figure 9: A lady’s jacket with a collar around a pentagon neckline 5 CONCLUSIONS The results of the study about CAD design with optimal use of the drawing and modify tools lead to more correct and facilitating design of varied shapes of collars around different geometrical types of necklines. Specified features of drawing tools and tools of modification in CAD systems can give ideas for interesting shapes of necklines and collars and give possibilities of new designs on the base of transformations of extant forms. 6. References [1] Kazlacheva, Z.: Optimum Use of Drawing Tools in CAD Systems in Automated Apparel Design, Trakia
Journal of Sciences, Vol. 3, 2005, No 7, pp. 20-23, ISSN 1313-7069; Available from http://www.uni-sz.bg/tsj/vol3No7_1_files/Zl.Kazla4eva.pdf Accessed: 2006-2012.
[2] Kazlacheva Z. & Pavlova M.: Design of Unusual Collars, Proceedings of ISITD 2010, pp. 425-431, ISBN 978-615-5018-08-4, Budapest, Hungary, November 2010, pp. 425-431.
[3] System M. Muller + Sohn: Schnittechnick, Rundshau fur Internationale Damenmode, 1990-2007, ISSN 0948-7980.
Corresponding author: Zlatina KAZLACHEVA Faculty of Technics and Technologies of Yambol Trakia University of Stara Zagora Graf Ignatiev 38 8600, Yambol, Bulgaria Phone: +359 89 8284462; Fax: +359 46 669183; E-mail: [email protected]
387
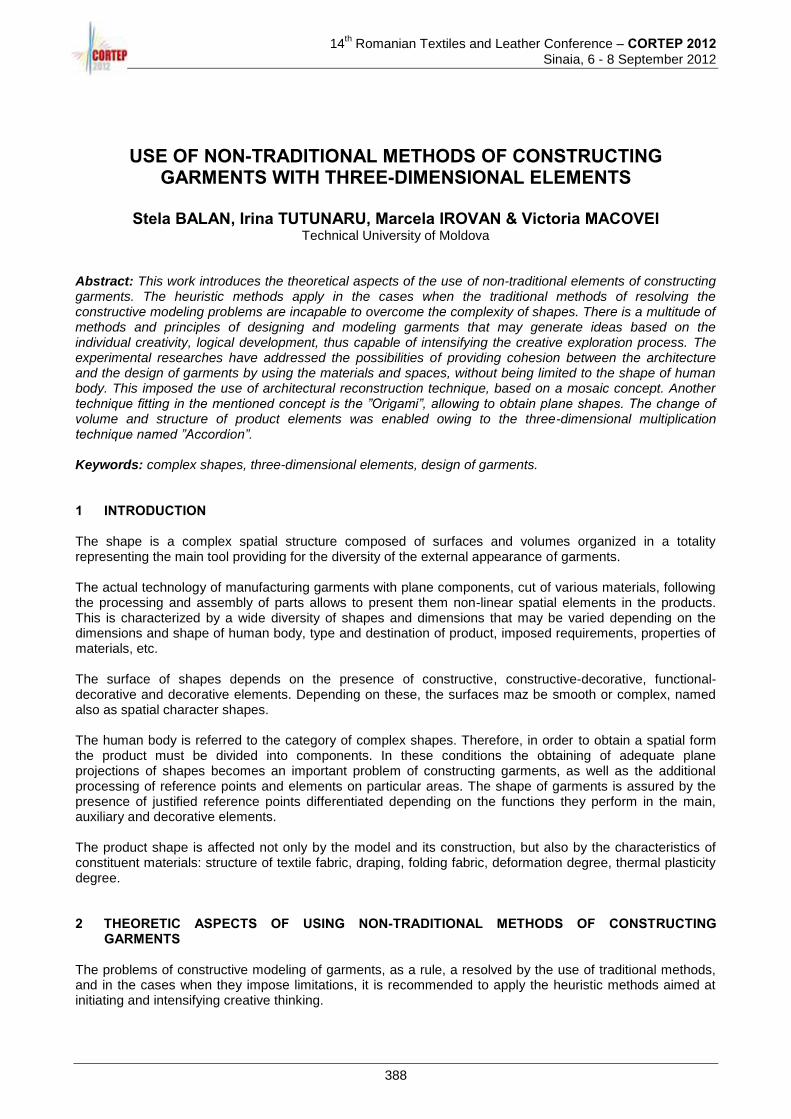
14th Romanian Textiles and Leather Conference – CORTEP 2012
Sinaia, 6 - 8 September 2012
USE OF NON-TRADITIONAL METHODS OF CONSTRUCTING GARMENTS WITH THREE-DIMENSIONAL ELEMENTS
Stela BALAN, Irina TUTUNARU, Marcela IROVAN & Victoria MACOVEI
Technical University of Moldova Abstract: This work introduces the theoretical aspects of the use of non-traditional elements of constructing garments. The heuristic methods apply in the cases when the traditional methods of resolving the constructive modeling problems are incapable to overcome the complexity of shapes. There is a multitude of methods and principles of designing and modeling garments that may generate ideas based on the individual creativity, logical development, thus capable of intensifying the creative exploration process. The experimental researches have addressed the possibilities of providing cohesion between the architecture and the design of garments by using the materials and spaces, without being limited to the shape of human body. This imposed the use of architectural reconstruction technique, based on a mosaic concept. Another technique fitting in the mentioned concept is the ”Origami”, allowing to obtain plane shapes. The change of volume and structure of product elements was enabled owing to the three-dimensional multiplication technique named ”Accordion”. Keywords: complex shapes, three-dimensional elements, design of garments. 1 INTRODUCTION The shape is a complex spatial structure composed of surfaces and volumes organized in a totality representing the main tool providing for the diversity of the external appearance of garments. The actual technology of manufacturing garments with plane components, cut of various materials, following the processing and assembly of parts allows to present them non-linear spatial elements in the products. This is characterized by a wide diversity of shapes and dimensions that may be varied depending on the dimensions and shape of human body, type and destination of product, imposed requirements, properties of materials, etc. The surface of shapes depends on the presence of constructive, constructive-decorative, functional-decorative and decorative elements. Depending on these, the surfaces maz be smooth or complex, named also as spatial character shapes. The human body is referred to the category of complex shapes. Therefore, in order to obtain a spatial form the product must be divided into components. In these conditions the obtaining of adequate plane projections of shapes becomes an important problem of constructing garments, as well as the additional processing of reference points and elements on particular areas. The shape of garments is assured by the presence of justified reference points differentiated depending on the functions they perform in the main, auxiliary and decorative elements. The product shape is affected not only by the model and its construction, but also by the characteristics of constituent materials: structure of textile fabric, draping, folding fabric, deformation degree, thermal plasticity degree. 2 THEORETIC ASPECTS OF USING NON-TRADITIONAL METHODS OF CONSTRUCTING
GARMENTS The problems of constructive modeling of garments, as a rule, a resolved by the use of traditional methods, and in the cases when they impose limitations, it is recommended to apply the heuristic methods aimed at initiating and intensifying creative thinking.
388

14th Romanian Textiles and Leather Conference – CORTEP 2012
Sinaia, 6 - 8 September 2012
The creative process is an extremely complex phenomenon offering unrepeatable results owed to the overcoming of psychological inertia. The heuristic methods represent a set of algorithm-based procedures used in the creative practice on a large scale and providing for unexpected and original results. The non-traditional methods of constructing garments are divided into creative and digital methods (scheme 1). Scheme 1: Classification of non-traditional methods of constructing garments The creative methods are divided into five groups:
I. Methods of re-approaching design problems: I.1 Formulation of analogical problems; I.2 Reformulation of problems; I.3 Formulation of additional questions; I.4 Deficiency series; I.5 Free expression of functions.
II. Design methods: II.1 Combinatory method; II.2 Deconstruction methods; II.3 Modular method.
III. Methods providing for new paradoxical solutions: III.1 Inversion; III.2 Empathy; III.3 “Brainstorming”; III.4 “Brain besiege”; III.5 “Meeting of pirates”; III.6 Delphi; III.7 Caricatures.
IV. Analytical methods: IV.1 The seven searching times: Who? What? Where? With what? Why? How? When?; IV.2 Construction of matrices and networks; IV.3 Generation of ideas by diagrams
V. Methods based on professional games: V.1 Scripting – writing scenarios; V.2 Simulation games. These methods are successfully used in the avant-garde fashion. The generate elements that were initially referred to grotesque and absurd ones but later accepted as rational. The creation process may not be deprived of inspiration sources, such as natural phenomena, social events, objects of reality in the surrounding environment, etc. The designer is always in the search for new shapes, modalities of conjugating volumes and various combinations of constructive elements. Therefore, the fashion comprises a continuous series of experiments initiated by the most prestigious creators of images who are known to the wide public allover the world and after some time they become banal. The fashion operates as a three-stroke engine: invention, spreading, preemption.
Non-traditional methods of constructing garments
Creative Digital
389
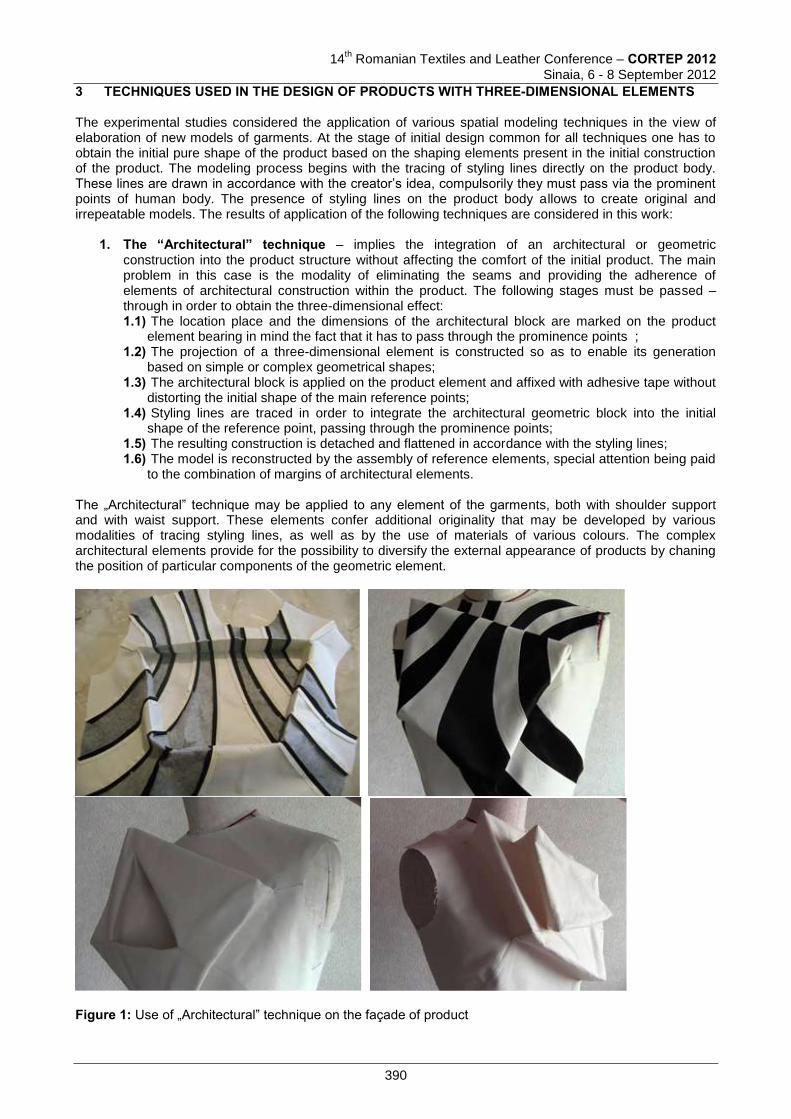
14
th Romanian Textiles and Leather Conference – CORTEP 2012
Sinaia, 6 - 8 September 2012
3 TECHNIQUES USED IN THE DESIGN OF PRODUCTS WITH THREE-DIMENSIONAL ELEMENTS The experimental studies considered the application of various spatial modeling techniques in the view of elaboration of new models of garments. At the stage of initial design common for all techniques one has to obtain the initial pure shape of the product based on the shaping elements present in the initial construction of the product. The modeling process begins with the tracing of styling lines directly on the product body. These lines are drawn in accordance with the creator’s idea, compulsorily they must pass via the prominent points of human body. The presence of styling lines on the product body allows to create original and irrepeatable models. The results of application of the following techniques are considered in this work:
1. The “Architectural” technique – implies the integration of an architectural or geometric construction into the product structure without affecting the comfort of the initial product. The main problem in this case is the modality of eliminating the seams and providing the adherence of elements of architectural construction within the product. The following stages must be passed –through in order to obtain the three-dimensional effect: 1.1) The location place and the dimensions of the architectural block are marked on the product
element bearing in mind the fact that it has to pass through the prominence points ; 1.2) The projection of a three-dimensional element is constructed so as to enable its generation
based on simple or complex geometrical shapes; 1.3) The architectural block is applied on the product element and affixed with adhesive tape without
distorting the initial shape of the main reference points; 1.4) Styling lines are traced in order to integrate the architectural geometric block into the initial
shape of the reference point, passing through the prominence points; 1.5) The resulting construction is detached and flattened in accordance with the styling lines; 1.6) The model is reconstructed by the assembly of reference elements, special attention being paid
to the combination of margins of architectural elements.
The „Architectural” technique may be applied to any element of the garments, both with shoulder support and with waist support. These elements confer additional originality that may be developed by various modalities of tracing styling lines, as well as by the use of materials of various colours. The complex architectural elements provide for the possibility to diversify the external appearance of products by chaning the position of particular components of the geometric element.
Figure 1: Use of „Architectural” technique on the façade of product
390
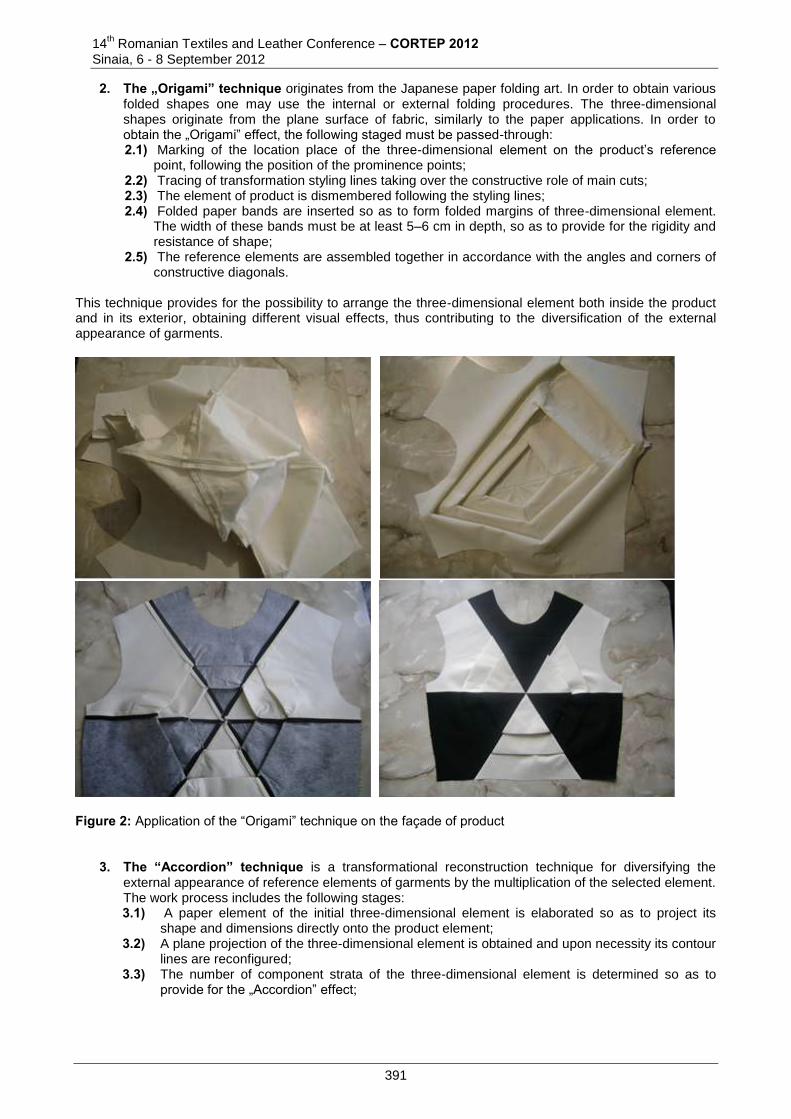
14th Romanian Textiles and Leather Conference – CORTEP 2012
Sinaia, 6 - 8 September 2012
2. The „Origami” technique originates from the Japanese paper folding art. In order to obtain various folded shapes one may use the internal or external folding procedures. The three-dimensional shapes originate from the plane surface of fabric, similarly to the paper applications. In order to obtain the „Origami” effect, the following staged must be passed-through: 2.1) Marking of the location place of the three-dimensional element on the product’s reference
point, following the position of the prominence points; 2.2) Tracing of transformation styling lines taking over the constructive role of main cuts; 2.3) The element of product is dismembered following the styling lines; 2.4) Folded paper bands are inserted so as to form folded margins of three-dimensional element.
The width of these bands must be at least 5–6 cm in depth, so as to provide for the rigidity and resistance of shape;
2.5) The reference elements are assembled together in accordance with the angles and corners of constructive diagonals.
This technique provides for the possibility to arrange the three-dimensional element both inside the product and in its exterior, obtaining different visual effects, thus contributing to the diversification of the external appearance of garments.
Figure 2: Application of the “Origami” technique on the façade of product
3. The “Accordion” technique is a transformational reconstruction technique for diversifying the external appearance of reference elements of garments by the multiplication of the selected element. The work process includes the following stages: 3.1) A paper element of the initial three-dimensional element is elaborated so as to project its
shape and dimensions directly onto the product element; 3.2) A plane projection of the three-dimensional element is obtained and upon necessity its contour
lines are reconfigured; 3.3) The number of component strata of the three-dimensional element is determined so as to
provide for the „Accordion” effect;
391
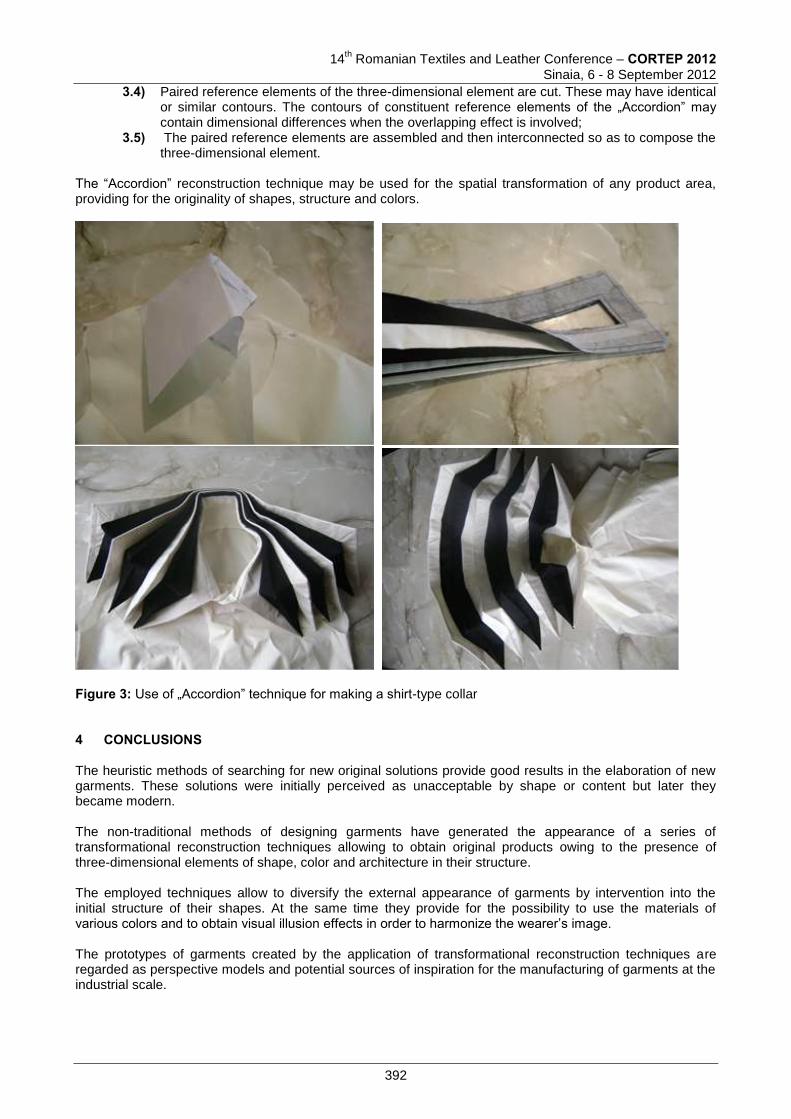
14
th Romanian Textiles and Leather Conference – CORTEP 2012
Sinaia, 6 - 8 September 2012
3.4) Paired reference elements of the three-dimensional element are cut. These may have identical or similar contours. The contours of constituent reference elements of the „Accordion” may contain dimensional differences when the overlapping effect is involved;
3.5) The paired reference elements are assembled and then interconnected so as to compose the three-dimensional element.
The “Accordion” reconstruction technique may be used for the spatial transformation of any product area, providing for the originality of shapes, structure and colors.
Figure 3: Use of „Accordion” technique for making a shirt-type collar 4 CONCLUSIONS The heuristic methods of searching for new original solutions provide good results in the elaboration of new garments. These solutions were initially perceived as unacceptable by shape or content but later they became modern. The non-traditional methods of designing garments have generated the appearance of a series of transformational reconstruction techniques allowing to obtain original products owing to the presence of three-dimensional elements of shape, color and architecture in their structure. The employed techniques allow to diversify the external appearance of garments by intervention into the initial structure of their shapes. At the same time they provide for the possibility to use the materials of various colors and to obtain visual illusion effects in order to harmonize the wearer’s image. The prototypes of garments created by the application of transformational reconstruction techniques are regarded as perspective models and potential sources of inspiration for the manufacturing of garments at the industrial scale.
392
14th Romanian Textiles and Leather Conference – CORTEP 2012
Sinaia, 6 - 8 September 2012
5 REFERENCES [1] Мартынова, А. И., Андреева, Е. Г. Конструктивное моделирование одежды. Москва: Московский
государственный университет дизайна и технологии, (2006) [2] Янчевская, Е. А., Тимашева, З. Н. Конструирование и особенности изготовления женских
платьев сложных форм. 2-е изд., доп. - Москва: Легпромытиздат, (1991) [3] Sato, Shingo. Transformational Reconstruction, Available from: http://www.trpattern.com/, Accessed:
2012-07-24. [4] Transformational Reconstruction by Shingo Sato, updated on the spring of 2011, Available from:
http://www.youtube.com/watch?v=Yq9zunlyQ5U, Accessed: 2012-07-24. [5] TR Cutting School in Milan 2012, Available from: http://trpattern2.xoom.it/virgiliowizard/home, Accessed:
2012-07-24. [6] Trpattern Workshop For Fashion Design, Available from:
http://wn.com/TRpattern_workshop_for_Fashion_design, Accessed: 2012-07-24.
Corresponding author: Stela BALAN Head of Department of Modelling of Textiles and Knitwear Confections, Faculty of Light Industry, Technical University of Moldova Blvd. Stefan cel Mare, 168 MD-2001, Chisinau, Republic of Moldova Phone: +373 22 32 95 75; Fax: +373 22 32 39 71; E-mail: [email protected]
Co-authors: Irina TUTUNARU Department of Modelling of Textiles and Knitwear Confections, Faculty of Light Industry, Technical University of Moldova blvd. Stefan cel Mare, 168 MD-2001, Chisinau, Republic of Moldova Phone: +373 22 32 95 75; Fax: +373 22 32 39 71; E-mail: [email protected] Marcela IROVAN Department of Modelling of Textiles and Knitwear Confections, Faculty of Light Industry, Technical University of Moldova blvd. Stefan cel Mare, 168 MD-2001, Chisinau, Republic of Moldova Phone: +373 22 32 95 75; Fax: +373 22 32 39 71; E-mail: [email protected] Victoria MACOVEI Department of Modelling of Textiles and Knitwear Confections, Faculty of Light Industry, Technical University of Moldova blvd. Stefan cel Mare, 168 MD-2001, Chisinau, Republic of Moldova Phone: +373 22 32 95 75; Fax: +373 22 32 39 71; E-mail: [email protected]
393
14
th Romanian Textiles and Leather Conference – CORTEP 2012
Sinaia, 6 - 8 September 2012
ELABORATION OF ASSORTMENTS OF GARMENTS FOR PERSONS WITH PHYSICAL DISABILITIES
Marcela IROVAN, Irina TUTUNARU, Stela BALAN & Rodica ODOBESCO
Technical University of Moldova Abstract: The elaboration and development of assortment of garments for persons with physical disabilities remains to be one of the actual concerns of specialists in textile. At the same time these problems are interconnected with the social protection policies and human society, as dressing is an important factor in the process of rehabilitation and social reintegration of persons with physical disabilities. This work addresses the problem of designing garments with high ergonomic characteristics and functional elements adapted to the specific requirements of the users with locomotion deficiencies. The theoretical investigations were aimed at the identification of the causes of locomotion disabilities and analysis of specific requirements to the garments, as well as at the determination of technological design correlated with the functional capacities and needs of the persons with locomotion deficiencies. The experimental results of the studies were implemented in a series of models of usual dresses with high ergonomics and functionality for the persons with physical disabilities of locomotion apparatus. Keywords: elaboration of assortments, garments for persons with physical disabilities 1 INTRODUCTION The multitude of diseases immobilizing the people and making them dependent on the wheelchair determines their lifestyle to a significant extent. The wheelchair limits the amplitude and the number of accessible movements and reduces the functional possibilities of organism. These aspects determine the structure of the system of requirements imposed to the products and the specific approach to the composition, construction and technology of manufacturing. The social reintegration and potential development of persons with locomotion system diseases is associated with a series of social and psychological problems. For a successful adaptation process the disabled persons first of all need psychological comfort that is to a considerable extent determined by the corresponding external appearance. In this context the use of inappropriate garments limits the self-service capacity and determines the psychological discomfort. 2 THEORETIC STUDIES Following the conducted theoretic studies it is proposed to divide the garments for the persons affected by physical disability in usual items as a specific subclass, defined as ergonomic clothing that may be used for various purposes, with subsequent division by destination: special destination, product types, seasons, sex of wearer, dimension and type of product, etc. The ergonomic products may be considered as elements integrated into the system „disabled person - clothing- environment” that must be adapted to the wearer’s vital processes with special needs, so as to comply with the characteristic movements and positions. So, we have defined the ergonomic clothing for the disabled persons, designed in accordance with their functional capacities and needs, with various technical accessories, aid systems and special parts. Based on the results of problem analysis, the persons with locomotion system disabilities may be divided into three classes depending on the degree of affection of vertebral column:
First class – includes the persons with partial or total immobility of upper extremities and head, determined by the affections of the cervical zone of vertebral column.
394
14th Romanian Textiles and Leather Conference – CORTEP 2012
Sinaia, 6 - 8 September 2012
The second class includes persons with partial immobility of body and normal functioning of upper extremities and upper part of the body, determined by the affections of sacral zone of vertebral column.
The third class includes persons with partial or total immobility of lower extremities and normal functioning of upper members and body, enabling the person to use the wheelchair. The theoretical researches were centered on the needs of the disabled persons of class three. Taking the definition of ergonomic clothing as a subclass of usual wear, it has the same system of requirements to the users, being distinguished by the specific attainment methods. One may identify the following groups of requirements imposed to the garments intended for the people with locomotion system disability: 1) Ergonomic requirements determining the commodity of wearing, freedom of movements and static
correspondence; 2) Hygienic-physiological requirements imposing the conditions of comfort in the under-product strata; 3) Exploitation requirements imposing reliability and high resistance to wear; 4) Aesthetic requirements imposing a modern external appearance, attenuation of specific anthropo-
morphological particularities and outlining of the strong aspects of the wearer’s image; 5) Economic requirements – these impose pricing limits for procurement and low maintenance costs. The tools providing for the observation of requirements imposed onto the products for the physically disabled persons include:
Ergonomic requirements that may be assured by the justified volume of products, original constructive solutions, presence of cuts and tucks, closing systems and pockets, use of transformable elements.
Physiological-hygienic requirements that may be assured by the use of main and auxiliary materials with adequate hygienic properties, by increase legerity margins, by the use of ventilation systems for the under-product strata.
The exploitation requirements may be assured by adequate physical-mechanical characteristics of materials, by the use of applied constructive elements extending the life period of products and by the technological processing methods.
The aesthetic requirements may be assured by the chosen chromatic gamma, by the use of modern elements, correct proportioning of products and location of compositional center on the unaffected parts of the body.
The economic requirements may be assured by the use of relatively cheap materials with good body shape maintenance properties, resistant to frequent washing, chemical laundry and sweat action, as well as by a rational construction and progressive processing methods. 3 EXPERIMENTAL STUDIES In order to determine the requirements imposed to the ergonomic clothing a study has been implemented in order to examine the preferences of persons with locomotion system disabilities. The study covered 17 persons aged 18 to 56. All respondents have mentioned that they are not indifferent to the trends of fashion, but convenience in wearing is the most important criterion in choosing garments, easy dressing and undressing being the top priorities. The main wardrobe of the persons with locomotion system disability is composed of suits and separate products: jacket with trousers 88%, training suits 53%, jeans and shirts 41%, classic suits 12%, tricots76%, pullovers 59%, blouses 18%. No skirts and dresses have been reported to exist in the wardrobes of the interviewed persons. As for the materials, tricot is preferred by 67% of respondents as they consider it to be more comfortable and better positioned on the body. Color is the primary characteristic of any combination of products chosen depending on the fashion trends, season of the year and group of wearers. The data collected during the study denotes that the most popular are the dark and moderate nuances – 33%, the light nuances being less popular – 21% and imprints even less popular – 13%. Based on the results of analyses of the mentioned study it became possible to identify compositional-constructive solutions preferred by the wearers included into the target group. Generally, they prefer the straight, semi-adjusted or adjusted silhouette, shirt-type sleeve cuts, raglan or kimono of soft shapes, the closing system is preferred on the frontal reference element or in the lateral seam, in the form of textile band or buttons with buttonholes, zippers. The wearers prefer to have numerous ergonomically located pockets in
395
14
th Romanian Textiles and Leather Conference – CORTEP 2012
Sinaia, 6 - 8 September 2012
order to facilitate wearing without causing lesions. Flattened collars (32%) and hoods (18%) are preferred, as they do not cause incommodity to the wearers who have to make frequent movements with their superior extremities. The new models of ergonomic garments for the persons affected by locomotion system disabilities must provide for the possibility of self-service owing to the adequate constructive solutions used for the closing systems and functional-constructive elements, as well as to provide for an aesthetic look in the static and dynamic positions specific for moving in the wheelchair. The results of the study and the analysis of deficiencies identified in the products worn by the respondents allowed to identify the particularities of constructive and technological design of the main types of products worn by the wearers:
There are high requirements to the correspondence of waist width at the shoulder level, as they determine the liberty of movements necessary for moving the wheelchair;
The frontal side of the product with shoulder support is designed with smaller length compared to the back side, in order to prevent folds;
The lateral seams of products with shoulder support are designed shorter in order to prevent touching the wheels, thus providing to the free and safe movement;
For a better comfort ventilation elements are provided;
The wearers prefer the products of pelerine type covering the body down to the level of chair in front and at the back, with a textile band down to the termination, in order to fix the product volume;
The trousers are designed with a back side by 3-8 cm higher than the front side, so that in the sitting position the waist line is horizontal and the lumbar region is covered;
Well-ironed and soft seams are preferred in order to prevent callosities and lesions from appearance. 100% polyester line is recommended for seam trimming, no. 120-160;
The closing system for the waist-support products is generally longer than usual, so as to facilitate easy dressing in sitting or lying position, sometimes the closing system is provided in both lateral seams;
The betel at the back level, of 1/2 or 1/3 of length shall be trimmed with an elastic band, so that the trousers come in direct contact with the back at that level;
The length of trousers shall be increased compared to the standard one by 6 – 8 cm;
On the front side of trousers, at the knee level, tucks or folds shall be provided so as to prevent prominences in sitting position. In continuation one may consider the sketches of a series of models of ergonomic clothing elaborated for the preferred types of products. In order to comply with the wearers’ requirements and to harmonize the anthropo-morphological particularities and the specifics of static position it was proposed to use the following constructive –functional elements:
1) For the products with support on shoulders – the product silhouette is semi-adjusted with convergent terminations; the product length above the shoulder line must be increased at back; the sleeves shall be of classical applied type, with a length of ¾, with convergent terminations, provided with freedom folds and elements for adjusting the width at terminations; the face and back of the product has an ergonomic freedom fold; the collars are of classical type for the closing system up to the neck base. 2) For the products with support on waist – trousers – the silhouette is straight; the shape at the support level is provided by a corselet; the closing system is extended and doubled, located in the lateral area; in the knee area on the front the tucks provide for the product shape; at the waist line level there is a possibility to adjust the product width by laces or by an elastic element.
The models of products shown on the figure 1 have been designed and manufactured in an individual system, the position and the dimensions of constructive-functional elements being cleared out experimentally. In order to elaborate models of ergonomic products the authors have selected assorted fabric with high hygienic and exploitation properties: wool with lavs, cotton with artificial and/or synthetic fibers providing for a good external aesthetic appearance, integrity of product and stability of shape for its entire life period. The ergonomic products for persons with physical locomotion system disabilities have been highly appreciated both for their anthropometric correspondence in statics and dynamics and for the aesthetic look of proposed solutions.
396
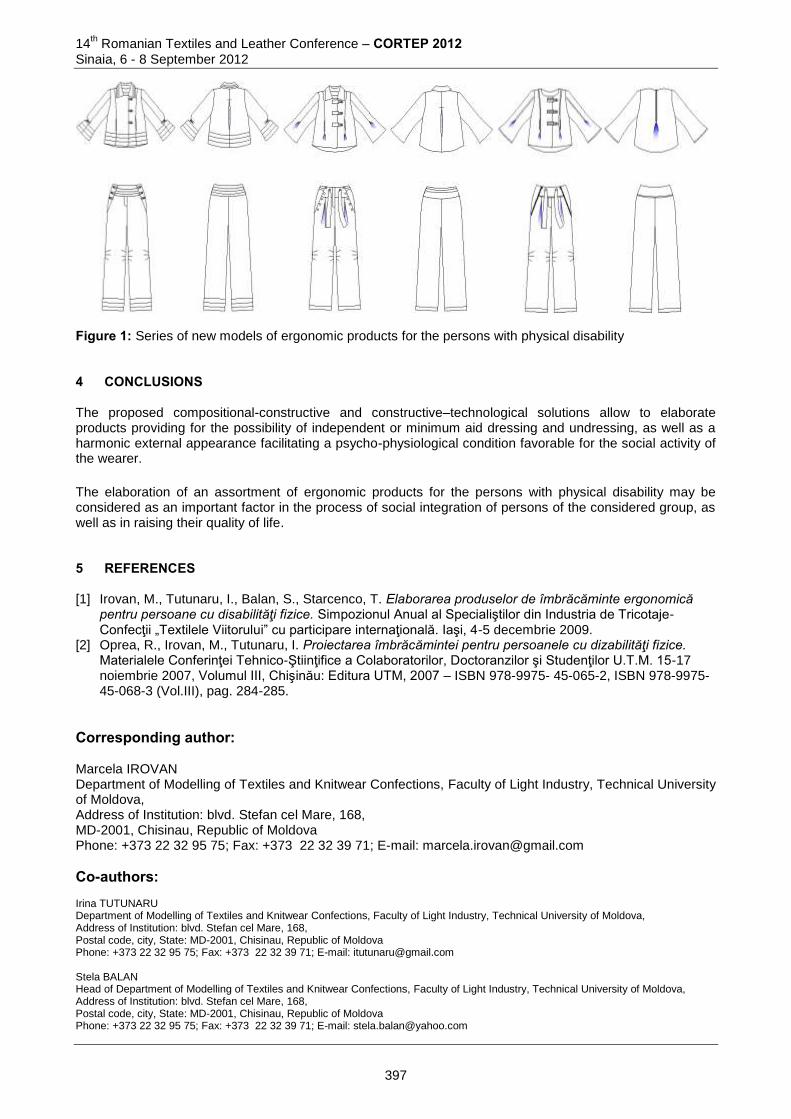
14th Romanian Textiles and Leather Conference – CORTEP 2012
Sinaia, 6 - 8 September 2012
Figure 1: Series of new models of ergonomic products for the persons with physical disability 4 CONCLUSIONS The proposed compositional-constructive and constructive–technological solutions allow to elaborate products providing for the possibility of independent or minimum aid dressing and undressing, as well as a harmonic external appearance facilitating a psycho-physiological condition favorable for the social activity of the wearer.
The elaboration of an assortment of ergonomic products for the persons with physical disability may be considered as an important factor in the process of social integration of persons of the considered group, as well as in raising their quality of life. 5 REFERENCES [1] Irovan, M., Tutunaru, I., Balan, S., Starcenco, T. Elaborarea produselor de îmbrăcăminte ergonomică
pentru persoane cu disabilităţi fizice. Simpozionul Anual al Specialiştilor din Industria de Tricotaje-Confecţii „Textilele Viitorului” cu participare internaţională. Iaşi, 4-5 decembrie 2009.
[2] Oprea, R., Irovan, M., Tutunaru, I. Proiectarea îmbrăcămintei pentru persoanele cu dizabilităţi fizice. Materialele Conferinţei Tehnico-Ştiinţifice a Colaboratorilor, Doctoranzilor şi Studenţilor U.T.M. 15-17 noiembrie 2007, Volumul III, Chişinău: Editura UTM, 2007 – ISBN 978-9975- 45-065-2, ISBN 978-9975-45-068-3 (Vol.III), pag. 284-285.
Corresponding author: Marcela IROVAN Department of Modelling of Textiles and Knitwear Confections, Faculty of Light Industry, Technical University of Moldova, Address of Institution: blvd. Stefan cel Mare, 168, MD-2001, Chisinau, Republic of Moldova Phone: +373 22 32 95 75; Fax: +373 22 32 39 71; E-mail: [email protected]
Co-authors: Irina TUTUNARU Department of Modelling of Textiles and Knitwear Confections, Faculty of Light Industry, Technical University of Moldova, Address of Institution: blvd. Stefan cel Mare, 168, Postal code, city, State: MD-2001, Chisinau, Republic of Moldova Phone: +373 22 32 95 75; Fax: +373 22 32 39 71; E-mail: [email protected] Stela BALAN Head of Department of Modelling of Textiles and Knitwear Confections, Faculty of Light Industry, Technical University of Moldova, Address of Institution: blvd. Stefan cel Mare, 168, Postal code, city, State: MD-2001, Chisinau, Republic of Moldova Phone: +373 22 32 95 75; Fax: +373 22 32 39 71; E-mail: [email protected]
397
14
th Romanian Textiles and Leather Conference – CORTEP 2012
Sinaia, 6 - 8 September 2012
ASPECTS OF DESIGNING GARMENTS FOR CHILDREN AFFECTED BY METABOLIC SYNDROME
Irina TUTUNARU, Marcela IROVAN & Stela BALAN
Technical University of Moldova Abstract: The work presents the results of the investigation of problem of designing garments for the children affected by the metabolic syndrome. The initial stage of investigation included the study of anthropomorphological and anthropometric particularities of children affected by metabolic syndrome. The investigation was aimed towards the structuring of a rational assortment of garments for the children with metabolic syndrome, determination of specific functions and requirements, as well as identification of recommended compositional-constructive and functional-constructive solutions. The assortment of products that may be offered to these children is limited. Also was identified the problem of providing these children with adequately dimensioned products. As a rule, the children are offered products of bigger sizes, products of other age groups in order to provide the necessary degree of freedom. The garments adequate to the body dimensions and shapes of the affected children provide for the possibility of physical activity, normal development and healthy lifestyle. Keywords: metabolic syndrome, garments for children, design techniques. 1 INTRODUCTION In the recent decades the scientists and doctors are becoming more and more preoccupied by various metabolic diseases and disorders associated with obesity, collectively referred to as metabolic syndrome. Numerous researches of the metabolic syndrome at children and adolescents are being conducted. The increasing incidence of obesity at children and the growing number of metabolic disorders on the background of obesity made the research of metabolic syndrome at this age category very actual. At the same time the elaboration of a wardrobe for various activities and age groups of children affected by metabolic syndrome constitutes an actual problem for the industry specialists. The design of products for children, including garments and footwear, must be based on the principle of uppermost comfort of wearing, maintenance of health and correct physical development. The solution of this design problem is impossible, unless the anatomic-morphological, psychological, growth and development particularities are accounted-for. The assortment and the compositional and constructive-technological solutions of new models of garments for children are determined in accordance with the age particularities of children’s organism that is in constant growth and development. 2 SELECTION AND ANALYSIS OF INITIAL DATA FOR THE DESIGN In the scientific and practical works aimed at the solution of problems associated with raising the quality level and the competitiveness of industry-made products more and more attention is being paid to the ergonomic studies of the "man– object- environment" system. The incomplete morphological and functional development of all systems and organs of adolescents, the process of continuous growth imply a lower resistance of organism to the unfavorable impact of the surrounding environment, including of the inadequately dimensioned clothing. The garments are in permanent direct contact with the child’s body, therefore they must possess properties and shapes compliant with the anatomic-physiological and psychological particularities of the child’s organism that are manifested during the wearing or during specific activities (playing, studying, etc.). The manufacturing of garments at the industrial scale is done for common type bodies, while the individualized manufacturing requires specific data on the particularities of the wearers’ external shapes.
398
14th Romanian Textiles and Leather Conference – CORTEP 2012
Sinaia, 6 - 8 September 2012
Numerous morphological characteristics are used for specifying the external shape of the human body, such as the posture, conformance, proportions of body. Therefore, all the classification schemes of bodies may be divided into two big classes: anthropometric and morphological, determining the shape of body and its component elements. In the process of designing garments the most valuable are the anthropo-morphological classification schemes that reflect both the dimensions and the shapes of human body. The particularities of external human body shape are determined by the posture to a significant extent. The classification of postures of children’s and adolescents’ bodies has been proposed by the Polish researcher N. Voleanschii, providing for the three complexes each consisting of three target groups depending on the vertebral column bend – cyphotic, balanced and lordotic. The body conformance is determined by the combination of indicators characterizing the body dimensions, the development degree of skeleton, muscles, subcutaneous adipose tissues, shape of back, extremities and abdomen. Numerous specialists consider that the most successful body conformance classification scheme is the one elaborated by Stefco-Ostrovschii that distinguishes the pure, intermediate and undetermined conformance types. The pure types are divided into asthenic, thoracic, muscular and digestive ones. According to the criteria proposed by the International Diabetes Federation in 2007, the metabolic syndrome is diagnosed at children and its main criterion is the central obesity at the perimeter of waist. The waist circumference is also one of the major dimensional indicators determining the product characteristics in the respective area. Additionally, it is used not only in the process of designing garments for children, but also in the determination of the body conformance group. The main dimensional characteristics defining the body type according to the contemporary dimensional typology for the children are: body height, circumference of bust and circumference of waist. By comparing the common type dimensional characteristics with the ones specific to sick children, it has been established that the obese children have higher waist circumference values:
• for the girls of the first conformance group in the interval of 63, 66, 69 cm compared to 51, 54, 57 and 60 cm proposed by the anthropometric standards and for the second group - 69, 72, 75 cm compared to the 57, 60, 63 si 66 cm;
• for the boys of the first conformance group in the interval of 66, 69, 72 and 75 cm compared to the
51, 54, 57, 60 and 63 cm proposed by the anthropometric standards and for the second group -72, 75, 78, 81 and 84 cm compared to 57, 60, 63, 66 and 69 cm.
This fact imposes the search of compositional-constructive solutions capable of providing for the anthropometric correspondence of garments in the area affected by the mentioned syndrome. These requirements provide objective information on the properties of primary importance at certain stages of design. In the process of designing the contemporary industrial products they have to comply with all the necessary requirements and must implement all the functions, bearing in mind the material and time costs of manufacturing that in their turn depend on the consumption, design, manufacturing and selling conditions. Good knowledge of the group of wearers, of their activity conditions, needs and interests, as well as of the functions of garments allows to determine the main requirements to the garments at the user level, the characteristics of materials and construction of products. In the normal conditions of exploitation of usual clothing the most important indicator is the temperature, as namely the temperature affects the basal metabolism that maintains the thermal equilibrium. The children’s bodies are characterized by the body area and mass of blood circulating throuth the relatively large epithelial tissues, as well as by the higher intensity of metabolic processes, by the imperfect thermal regulation mechanism and higher thermolytic effect that easily induce hypo- and hyperthermic conditions. The organism of the child affected by the metabolic syndrome is predisposed to overheating. This fact imposes the choice of adequate garments that must be of light fabric, freely cut, with transformable constructive elements. These may provide for a better natural ventilation with simultaneous removal of metabolic products. The ergonomic requirements include the totality of criteria imposed to the correspondence properties with the anatomic-physiological and psychological requirements of children, as well as to the convenience and safety of wearing by optimization of physical and psychic load. The ergonomic requirements characterize the
399
14
th Romanian Textiles and Leather Conference – CORTEP 2012
Sinaia, 6 - 8 September 2012
degree of accommodation of the product with the child and are based on the ergonomic properties of the „man– product– environment” system. The hygienic requirements determine the inoffensive conditions of human activity and are regulated by the sanitary-hygienic norms. This group of requirements is of top priority for the children’s garments, as the protection reactions of the children are not so strong compared to the adults. In order to provide compliance with the psycho-physiological requirements, the products are not to impose any unpleasant sensations in perception. The perception of material at touch depends on its action over the skin. The new and silky materials are perceived as convenient ones, as they do not exert a potential risk of damage to the epithelial tissue. The hard seams, materials and sub-assemblies, thick fabric with asperities are more likely to generate negative emotions. The blood circulation disorders at children affected by metabolic syndrome often result in the appearance of exanthemas on skin. In order to avoid exanthemas, the clothing must not provoke discomfort by friction, displacement on the body surface or pressure. The clothing chosen in accordance with the sizes and shapes of children’s bodies provide for reasonable freedom of physical activity, normal development and healthy lifestyle. The personality formation requirements are associated with the educational functions of clothing. This group contains requirements to the formation of skills and abilities, aesthetic taste and psycho-physiological development. Therefore, there must be a high level of agreement between the product and wearer, his/her age group and psychomotor development. The products intended for children must comply with the requirements of continuous psychomotor development based on the specific dimensional and model particularities. The models of garments for children also must comply with the aesthetic requirements that are met by assuring correspondence between the suit as a system, physiognomy and age group of the child, as well as between the elements making-up the suit, the colors and used materials. The commercially available products manufactured based on the dimensional standards for the common type bodies, when purchased for the children affected by metabolic syndrome are either too narrow and affect the blood circulation or do not correspond to the age group. As a rule, the products of bigger dimensions are proposed, or the products for the next age groups, so as to provide for the necessary degree of freedom. The anthropometric correspondence is the basis of the design stage. Therefore, a justified choice of design method and solutions of comfort is necessary. It means that the main problem of design is reduced to a totality of interdependent processes affecting the changes in the object of design. The design stage itself begins with the selection of dimensional adequacy assurance methods for the subsequent period of wearing. For this purpose one may use the dynamic or morphological transformation tools and methods. The combined variant may also be used – in some sectors the growth dynamics is compensated by additions, in other cases – by application of morphological transformations. 3 PRINCIPLES OF DESIGNING GARMENTS FOR THE CHILDREN AFFECTED BY METABOLIC
SYNDROME The object of experimental study was the dress with semi-adjusted silhouette for girls aged 6,5...11,5 years. The basic structures for this type of product have been elaborated by the CAER garment design method. The dimensional characteristics of children’s bodies approved by the state standard GOST 17916-86 applied in the Republic of Moldova. This normative act provides for 5 conformance groups for the common body types of girls with a height of 134 cm and bust perimeter of 68 cm. The basic structures of the dress are obtained for the first, third and fifth conformance groups. In order to identify the deviations occurring in the designed basic structures the author used the comparative analysis of resulting contours by their juxtaposition. The waist line in transversal direction and the symmetry lines of frontal and back reference elements in longitudinal dimension have been chosen as juxtaposition lines. The waist line has been chosen due to the fact that is the main level line clear in configuration, having a strictly determined position, providing for a close contour on the body, being at the same time
400

14th Romanian Textiles and Leather Conference – CORTEP 2012
Sinaia, 6 - 8 September 2012
interconnected with any point of human body, preserving its functions in the process of determining the position of constructive and template points. The front and rear reference elements have been juxtaposed in separate in accordance with the symmetry lines in order to identify the directions and legalities of modifying the dependent parameters based exclusively on the conformance indicator, starting from the practically equal value of parameters identifying the shape and the dimensions of the product central area. In the result of juxtaposition it was determined that the front and back reference elements have substantial differences at the level of back width and face width, as well as in the degree of inclination of shoulder lines, depth of bust cut, as well as in the value of frontal and posterior equilibrium of constructions. For a more detailed analysis the values of constructive parameters of obtained structures have been examined. In total 23 constructive parameters were considered. The obtained values have confirmed the differences identified by juxtaposition and enable us to affirm the following:
1) The width of back element first increases sharply by 0,7 cm and then at slower rates, showing a difference of only 0,2 cm.
2) The width of sleeve cut increases uniformly by 0,5 cm from one structure to another. 3) The width of product façade decreases at relatively uniform rates by 0,2 cm and 0,4 cm from one
structure to another. 4) The width of bust line element differs substantially, denoting an increase by 2,0 cm and 0,3 cm for
the structure elaborated for the maximum conformance group. 5) The parameters of neck cut do not differ substantially, the differences being of 0,1 cm, that being
at the sensitivity limit. 6) The bust element has demonstrated an unexpected evolution, its depth has registered a decrease
in the direction of structure for the bigger conformance group, having reached the „0” value here. 7) The shoulder line inclination on the back element reduces from 18 down to 15 and then down to
13 degrees. 8) The inclination angle of the anterior shoulder line is characterized by non-uniform variability. 9) The length of sleeve cut and sleeve head increases uniformly. 10) The sleeve width at the depth level increases uniformly by 0,4 and 0,5 cm. 11) The anterior-posterior equilibrium of the structure is characterized by a non-directional variability,
first coming down from 0 to -1,3 cm, then increasing to 1,5 cm. The results mentioned above allow us to formulate a series of recommendations for the optimization of construction of garments and to adapt their dimensions to the differences imposed by the conformance group parameters. Hence, the most rational should be the models in which:
1) Elements providing for the adjustment of back width by at least 2 cm are provided; 2) Sleeves with a high degree of adjustment at the depth level are avoided; 3) The frontal element at the level of width measurement may be left unmodified; 4) At the bust line level one has to provide elements for the adjustment of its width by around 2 cm; 5) Given that the neck cut parameters do not vary substantially, the differences being of only 0,1 cm
– at the sensitivity level, one may affirm that namely the lateral areas of the product need to be modified;
6) Reduction of the depth of bust element in the structures elaborated for the small school age group allows us to recommend the models in which the product shape in the pectoral area is made of free-shape elements;
7) The decreasing shoulder line inclination angle may be compensated by the models with volume fixation elements at the waist line or at the shoulder line;
8) The values with different significance of anterior-posterior balance attest the differences associated, most probably, with the body posture. Therefore, one shall opt for the solutions in which the superior support area provides the possibility to modify the parameters owing to the extensibility of used fabric or by the use of additions adequate for the trunk length.
401
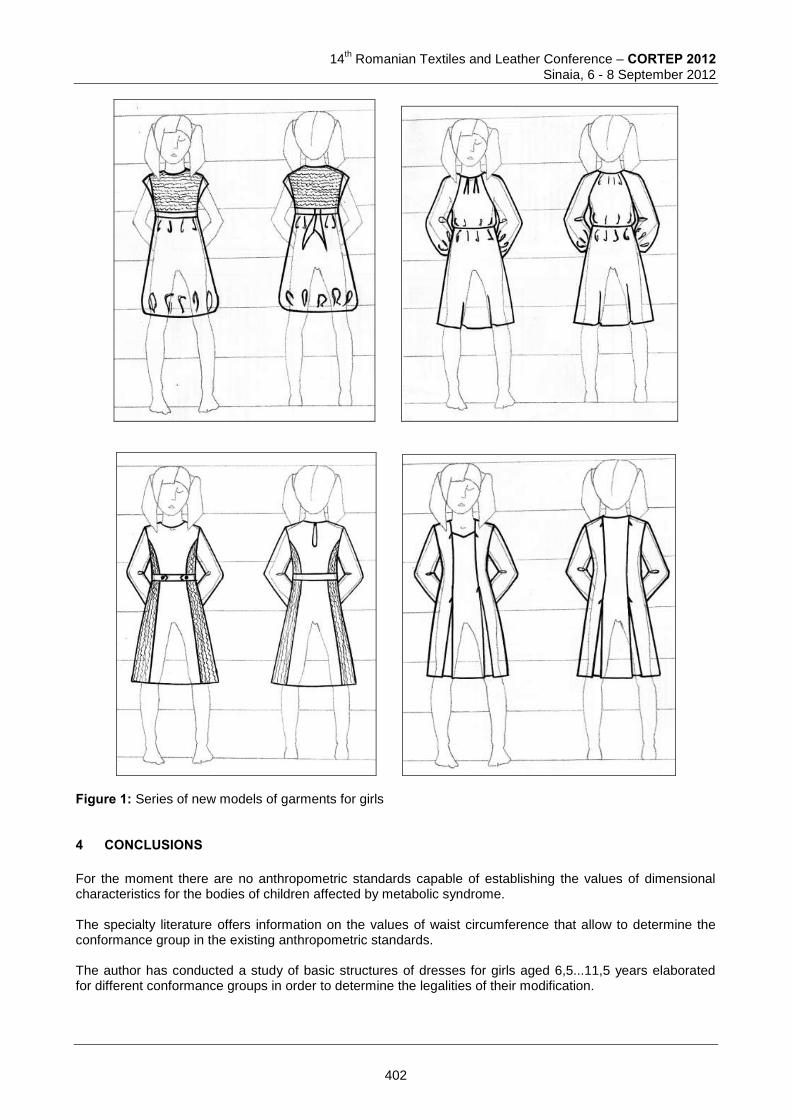
14
th Romanian Textiles and Leather Conference – CORTEP 2012
Sinaia, 6 - 8 September 2012
Figure 1: Series of new models of garments for girls 4 CONCLUSIONS For the moment there are no anthropometric standards capable of establishing the values of dimensional characteristics for the bodies of children affected by metabolic syndrome. The specialty literature offers information on the values of waist circumference that allow to determine the conformance group in the existing anthropometric standards. The author has conducted a study of basic structures of dresses for girls aged 6,5...11,5 years elaborated for different conformance groups in order to determine the legalities of their modification.
402

14th Romanian Textiles and Leather Conference – CORTEP 2012
Sinaia, 6 - 8 September 2012
The identified legalities of modification allow to design new models of garments with flexible structure assured by the use of materials with diverse extensibility characteristics, as well as by the use of transformable compositional-constructive elements. The identified compositional-constructive solutions allow to elaborate products for serial production, highly suitable for the children affected by metabolic syndrome. 5 REFERENCES [1] Иващенко, И.Н., Махрова, И.A. Проектирование одежды для детей с метаболическим синдромом.
Швейная промышленность. 3, 2011, стр. 34-35. [2] Мациевская, И.А. Разработка эргономического проектирования школьной одежды.
Автореферат на соиск. уч. степ. к.т.н., Москва. (2007) [3] Ушанова, Л.В. Разработка принципов художественного проектирования форменной одежды.
Москва. (2002)
Corresponding author: Irina TUTUNARU Department of Modelling of Textiles and Knitwear Confections, Faculty of Light Industry, Technical University of Moldova blvd. Stefan cel Mare, 168 MD-2001, Chisinau, Republic of Moldova Phone: +373 22 32 95 75; Fax: +373 22 32 39 71; E-mail: [email protected]
Co-authors: Marcela IROVAN Department of Modelling of Textiles and Knitwear Confections, Faculty of Light Industry, Technical University of Moldova blvd. Stefan cel Mare, 168 MD-2001, Chisinau, Republic of Moldova Phone: +373 22 32 95 75; Fax: +373 22 32 39 71; E-mail: [email protected] Stela BALAN Head of Department of Modelling of Textiles and Knitwear Confections, Faculty of Light Industry, Technical University of Moldova blvd. Stefan cel Mare, 168 MD-2001, Chisinau, Republic of Moldova Phone: +373 22 32 95 75; Fax: +373 22 32 39 71; E-mail: [email protected]
403
14
th Romanian Textiles and Leather Conference – CORTEP 2012
Sinaia, 6 - 8 September 2012
3D DESIGN OF A CUSTOMIZED GARMENT FOR SPECIFIC SPORTSWEAR APPLICATIONS INTEGRATING TARGETED
FUNCTIONALIZATION OF TEXTILES
BRAHMADEEP, Sébastien THOMASSEY, SUDIPTA, Fabien SALAUN & Christine CAMPAGNE
GEMTEX – ENSAIT, Roubaix & University of Lille/ France Abstract: This paper aims to describe the methodology for customizing garments for specific sportswear applications by integrating targeted functionalization of textiles. The functionality concerns mechanical interaction with the skin related to movement and physiologic interaction in terms of moisture and heat management on skin contact. The concept is based on new materials functionalized with eco-friendly plant-derived ‘lignans’, which demonstrated scalable effects on skin moisture, vitality, flora and fungal outbreaks. Within micro-encapsulated systems with known kinetics, controlled release and triggered emission, lignans help adjust comfort to changing conditions of climate and motion. For intelligent integration, interaction areas with the skin during the practice of the concerned sports are carefully identified for greater effectiveness. CAD enables a quick customized product design according to the user, application, comfort and desired functionalities. The obtained patterns include the required information for the production process (measurements of the user and fitted cut, areas to functionalize). This process guarantees maximum efficiency of functionalization with minimum waste, while keeping intact the garment’s features. The result: a fully customizable garment integrating high added-value textiles which could be produced quickly with controlled costs. Keywords: micro-encapsulation, lignans, textile functionalization, 3D design, sportswear applications. 1 INTRODUCTION Mass customization almost always uses flexible computer-aided manufacturing systems to produce custom output. Those systems combine the low unit costs of mass production processes with the flexibility of individual customization. It is the new frontier in business competition for both manufacturing and service industries. At its core is a tremendous increase in variety and customization without a corresponding increase in costs. At its limit, it is the mass production of individually customized goods and services. At its best, it provides strategic advantage and economic value. Mass customization is the method of "effectively postponing the task of differentiating a product for a specific customer until the latest possible point in the supply network ". Conducted experiments to test the impacts of mass customization when postponed to the stage of retail, online shopping. It found that users perceive greater usefulness and enjoyment with a mass customization interface vs. a more typical shopping interface, particularly in a task of moderate complexity. [1] [2] This paper describes the methodology to achieve customized garments for specific sportswear applications integrating targeted functionalization of textiles. The functionality concerns mechanical interaction with the skin related to movement and physiologic interaction in terms of moisture and heat management on skin contact. The solutions should be effective, low cost and not decreasing performances on look and feel, hence fully compatible with optimal acceptance. The product and process concept is based on new materials functionalized with eco-friendly plant derived substances called lignans [3]. Lignans had demonstrated scalable effects on moisture on the skin, skin vitality, skin flora and fungal outbreaks. Lignans should be included in micro-encapsulated systems with known kinetics, controlled release and triggered emission in order to adjust comfort to changing conditions of climate and motion [4][7]. Functionalized textiles should be intelligently integrated into the garments. Indeed, interaction areas with the skin should be carefully identified to increase the effectiveness of the expected properties: the functionalized areas should be placed in the right place and the garment should allow interaction with the skin during the practice of the considered sport. For this, computer aided design (body scanner, 3D CAD software) enables a quick and customized design of the product according to the user, the application, the comfort and the desired functionalities. Thus, the
404
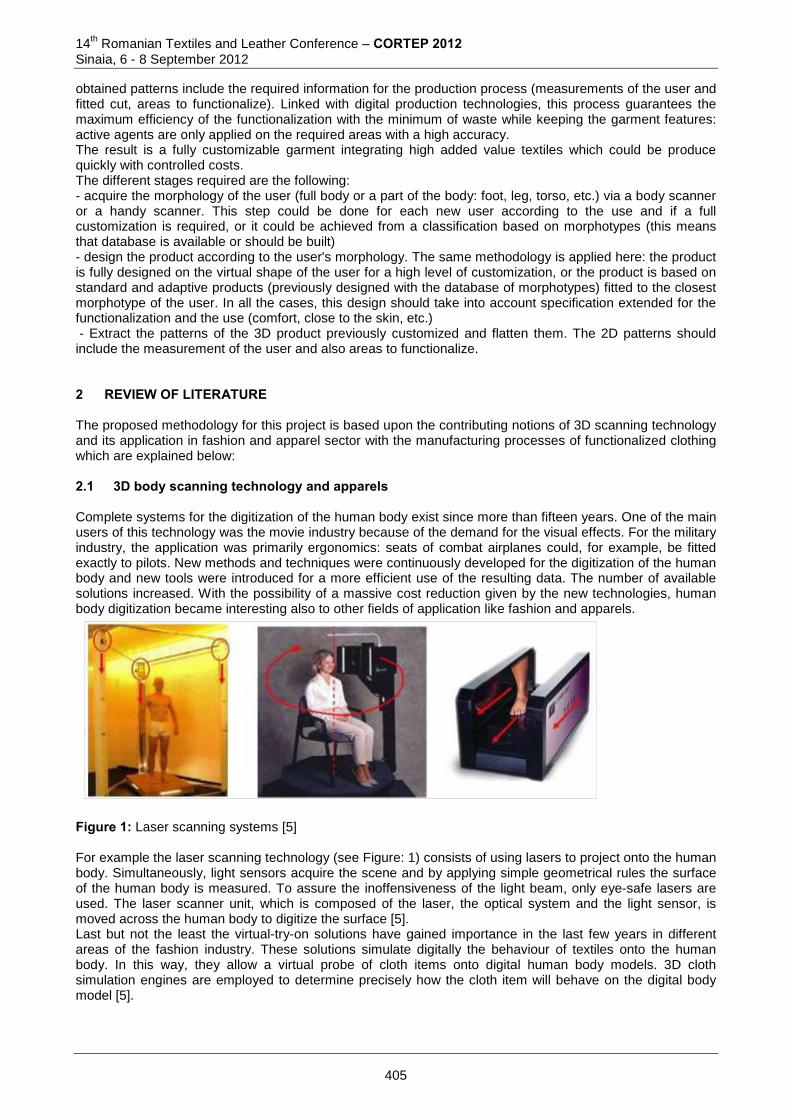
14th Romanian Textiles and Leather Conference – CORTEP 2012
Sinaia, 6 - 8 September 2012
obtained patterns include the required information for the production process (measurements of the user and fitted cut, areas to functionalize). Linked with digital production technologies, this process guarantees the maximum efficiency of the functionalization with the minimum of waste while keeping the garment features: active agents are only applied on the required areas with a high accuracy. The result is a fully customizable garment integrating high added value textiles which could be produce quickly with controlled costs. The different stages required are the following: - acquire the morphology of the user (full body or a part of the body: foot, leg, torso, etc.) via a body scanner or a handy scanner. This step could be done for each new user according to the use and if a full customization is required, or it could be achieved from a classification based on morphotypes (this means that database is available or should be built) - design the product according to the user's morphology. The same methodology is applied here: the product is fully designed on the virtual shape of the user for a high level of customization, or the product is based on standard and adaptive products (previously designed with the database of morphotypes) fitted to the closest morphotype of the user. In all the cases, this design should take into account specification extended for the functionalization and the use (comfort, close to the skin, etc.) - Extract the patterns of the 3D product previously customized and flatten them. The 2D patterns should include the measurement of the user and also areas to functionalize. 2 REVIEW OF LITERATURE
The proposed methodology for this project is based upon the contributing notions of 3D scanning technology and its application in fashion and apparel sector with the manufacturing processes of functionalized clothing which are explained below: 2.1 3D body scanning technology and apparels Complete systems for the digitization of the human body exist since more than fifteen years. One of the main users of this technology was the movie industry because of the demand for the visual effects. For the military industry, the application was primarily ergonomics: seats of combat airplanes could, for example, be fitted exactly to pilots. New methods and techniques were continuously developed for the digitization of the human body and new tools were introduced for a more efficient use of the resulting data. The number of available solutions increased. With the possibility of a massive cost reduction given by the new technologies, human body digitization became interesting also to other fields of application like fashion and apparels.
Figure 1: Laser scanning systems [5] For example the laser scanning technology (see Figure: 1) consists of using lasers to project onto the human body. Simultaneously, light sensors acquire the scene and by applying simple geometrical rules the surface of the human body is measured. To assure the inoffensiveness of the light beam, only eye-safe lasers are used. The laser scanner unit, which is composed of the laser, the optical system and the light sensor, is moved across the human body to digitize the surface [5]. Last but not the least the virtual-try-on solutions have gained importance in the last few years in different areas of the fashion industry. These solutions simulate digitally the behaviour of textiles onto the human body. In this way, they allow a virtual probe of cloth items onto digital human body models. 3D cloth simulation engines are employed to determine precisely how the cloth item will behave on the digital body model [5].
405
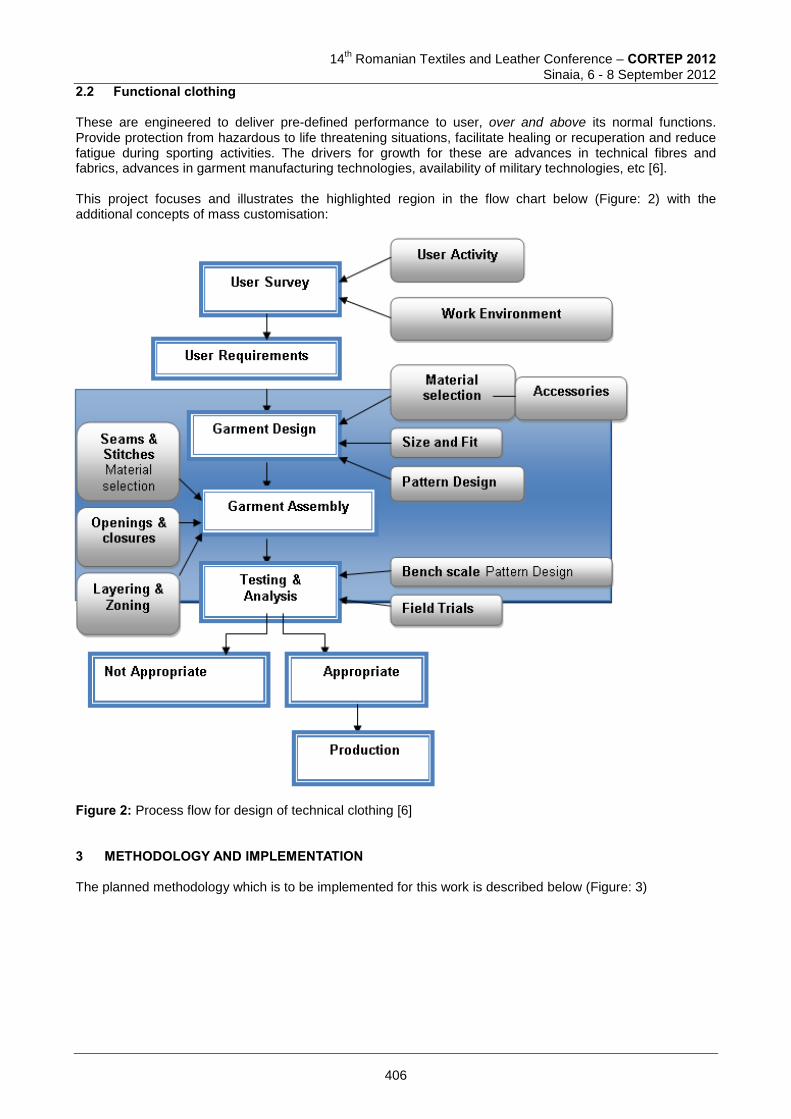
14
th Romanian Textiles and Leather Conference – CORTEP 2012
Sinaia, 6 - 8 September 2012
2.2 Functional clothing These are engineered to deliver pre-defined performance to user, over and above its normal functions. Provide protection from hazardous to life threatening situations, facilitate healing or recuperation and reduce fatigue during sporting activities. The drivers for growth for these are advances in technical fibres and fabrics, advances in garment manufacturing technologies, availability of military technologies, etc [6]. This project focuses and illustrates the highlighted region in the flow chart below (Figure: 2) with the additional concepts of mass customisation:
Figure 2: Process flow for design of technical clothing [6] 3 METHODOLOGY AND IMPLEMENTATION The planned methodology which is to be implemented for this work is described below (Figure: 3)
406

14th Romanian Textiles and Leather Conference – CORTEP 2012
Sinaia, 6 - 8 September 2012
Figure 3: Flow chart of the planned methodology 3.1 Listing out the end user requirements An evaluation of the user's requirements in terms of required functionalities and ergonomics was performed through a direct contact with the end users. For this work, we selected the biker’s jacket development which will lead to design studies and be carried out in order to suggest concepts, evaluating shape, dimension, positioning and functionality of the garment. The functionalities targeted for this garment are the anti-bacterial, anti-sweating and anti-oxidant properties of the active substances called lignans [2]. 3.2 Obtaining the morphology via 3D scanner and design of 3D patterns (stand-up position) The 3D morphology of the user in stand-up position is obtained by scanning our model with a 3D scanner. The scan obtained is rectified for errors (such as holes and other defects) in order to be fully compatible with 3D CAD software (see Figure: 4).
407
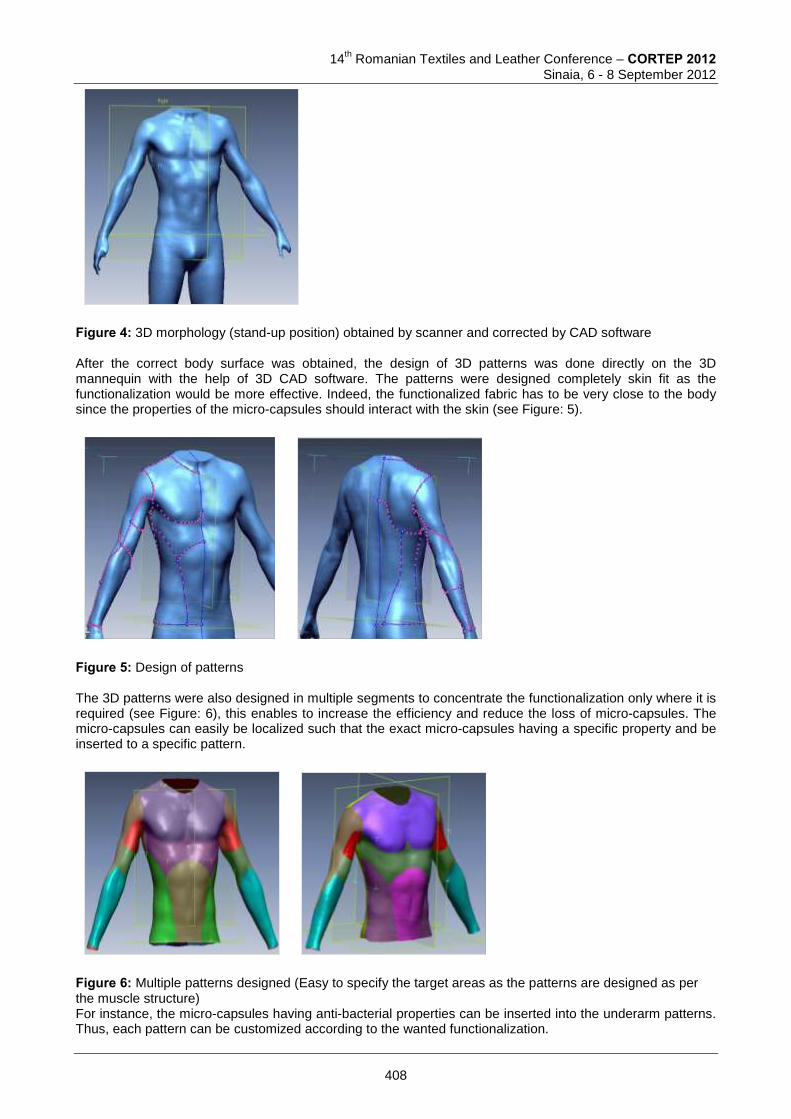
14
th Romanian Textiles and Leather Conference – CORTEP 2012
Sinaia, 6 - 8 September 2012
Figure 4: 3D morphology (stand-up position) obtained by scanner and corrected by CAD software After the correct body surface was obtained, the design of 3D patterns was done directly on the 3D mannequin with the help of 3D CAD software. The patterns were designed completely skin fit as the functionalization would be more effective. Indeed, the functionalized fabric has to be very close to the body since the properties of the micro-capsules should interact with the skin (see Figure: 5).
Figure 5: Design of patterns The 3D patterns were also designed in multiple segments to concentrate the functionalization only where it is required (see Figure: 6), this enables to increase the efficiency and reduce the loss of micro-capsules. The micro-capsules can easily be localized such that the exact micro-capsules having a specific property and be inserted to a specific pattern.
Figure 6: Multiple patterns designed (Easy to specify the target areas as the patterns are designed as per the muscle structure) For instance, the micro-capsules having anti-bacterial properties can be inserted into the underarm patterns. Thus, each pattern can be customized according to the wanted functionalization.
408
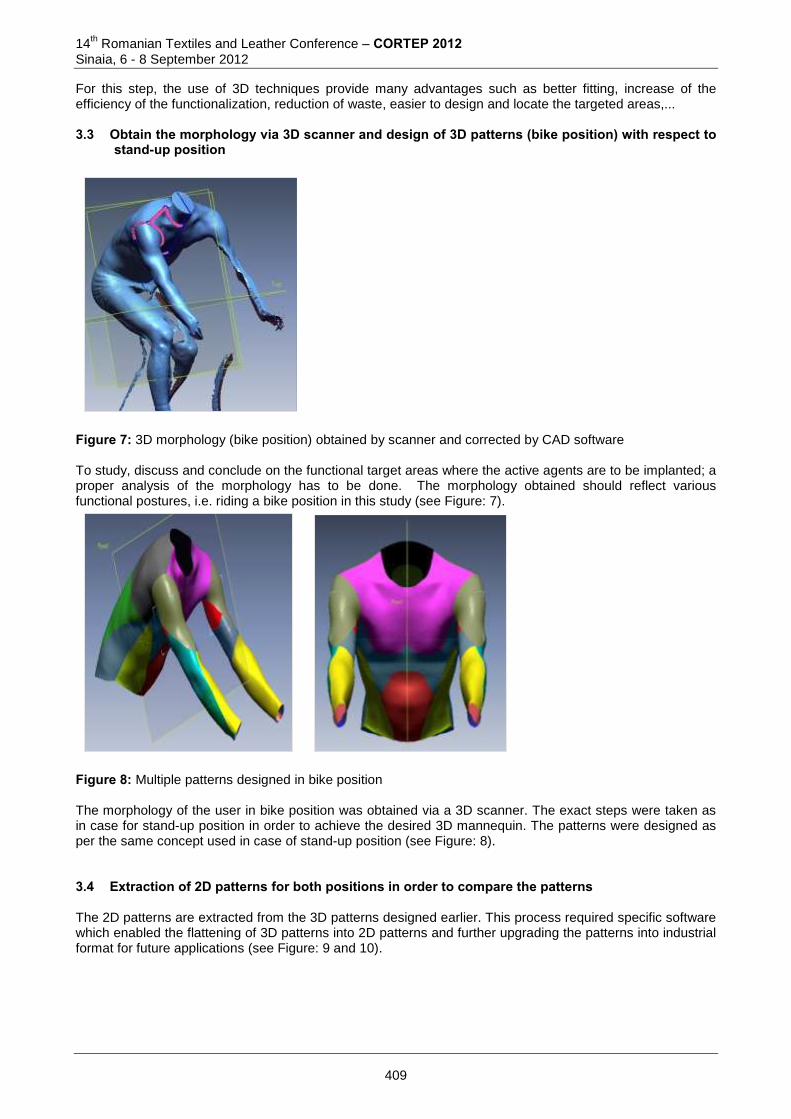
14th Romanian Textiles and Leather Conference – CORTEP 2012
Sinaia, 6 - 8 September 2012
For this step, the use of 3D techniques provide many advantages such as better fitting, increase of the efficiency of the functionalization, reduction of waste, easier to design and locate the targeted areas,... 3.3 Obtain the morphology via 3D scanner and design of 3D patterns (bike position) with respect to
stand-up position
Figure 7: 3D morphology (bike position) obtained by scanner and corrected by CAD software To study, discuss and conclude on the functional target areas where the active agents are to be implanted; a proper analysis of the morphology has to be done. The morphology obtained should reflect various functional postures, i.e. riding a bike position in this study (see Figure: 7).
Figure 8: Multiple patterns designed in bike position The morphology of the user in bike position was obtained via a 3D scanner. The exact steps were taken as in case for stand-up position in order to achieve the desired 3D mannequin. The patterns were designed as per the same concept used in case of stand-up position (see Figure: 8). 3.4 Extraction of 2D patterns for both positions in order to compare the patterns The 2D patterns are extracted from the 3D patterns designed earlier. This process required specific software which enabled the flattening of 3D patterns into 2D patterns and further upgrading the patterns into industrial format for future applications (see Figure: 9 and 10).
409
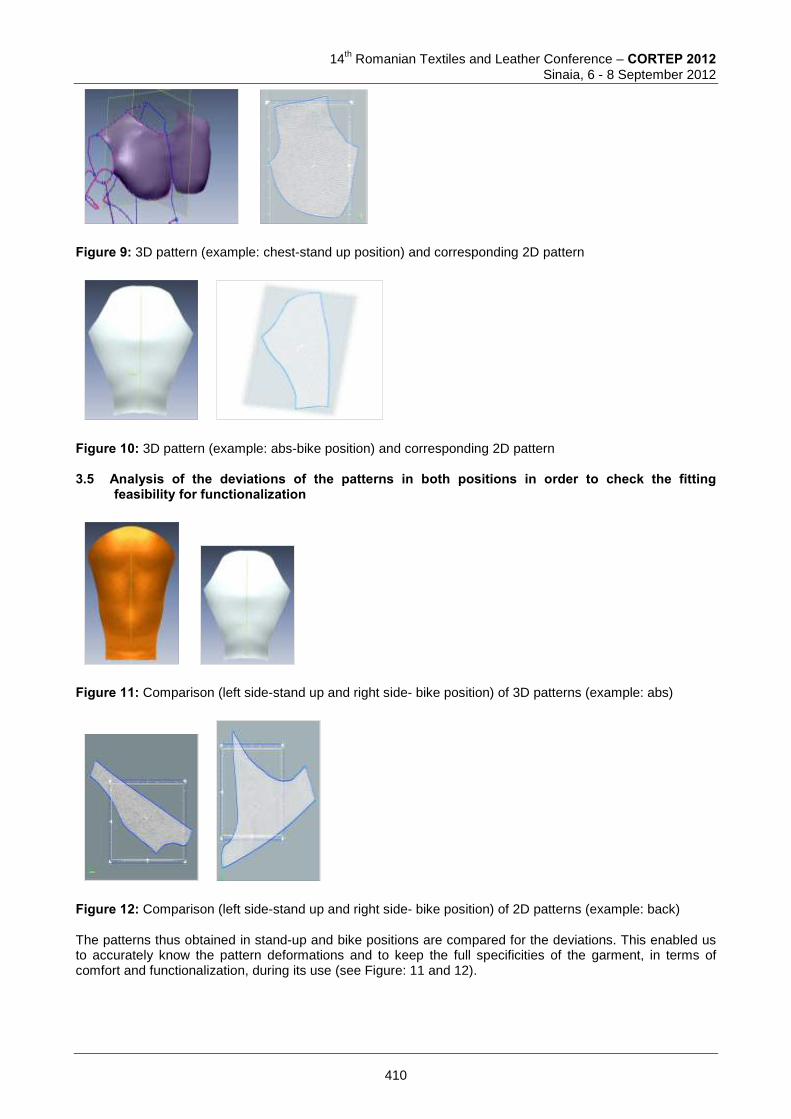
14
th Romanian Textiles and Leather Conference – CORTEP 2012
Sinaia, 6 - 8 September 2012
Figure 9: 3D pattern (example: chest-stand up position) and corresponding 2D pattern
Figure 10: 3D pattern (example: abs-bike position) and corresponding 2D pattern 3.5 Analysis of the deviations of the patterns in both positions in order to check the fitting
feasibility for functionalization
Figure 11: Comparison (left side-stand up and right side- bike position) of 3D patterns (example: abs)
Figure 12: Comparison (left side-stand up and right side- bike position) of 2D patterns (example: back) The patterns thus obtained in stand-up and bike positions are compared for the deviations. This enabled us to accurately know the pattern deformations and to keep the full specificities of the garment, in terms of comfort and functionalization, during its use (see Figure: 11 and 12).
410
14th Romanian Textiles and Leather Conference – CORTEP 2012
Sinaia, 6 - 8 September 2012
4 DISCUSSION This methodology provides many interests for the design of functionalized garments:
The patterns obtained via this method (3D scanning of human morphology) were highly customizable.
The design of patterns obtained can be modified at any stage as per the requirements of the end user.
The design of multiple patterns obtained enables to localize the exact areas to functionalize as per the respective properties of the active agents (micro-capsules) while keeping the others properties of the garment.
The patterns were obtained in both drawing and industrial format which enables the easy editing and virtual stitch/fit testing respectively. These patterns are ready to be manufactured.
However, some limitations can occur such as:
Since the design of patterns with respect to the localization of micro-capsules is very accurate, the functional properties of the active agents (micro-capsules) have to be clearly identified and known. Indeed, the exact properties of lignans, used in this project, were still under experimentation.
Downstream of this design, the production technologies, especially for the application of micro-capsules, should be able to accurate enough to fully exploit the benefits of the methodology.
The mannequin scanned should be very representative of the users. This requires a perfect knowledge of the target population via for instance a measurement campaign which is always expensive and time consuming.
Scopes:
The patterns are to be marked with the areas to functionalize as per the respective properties of the active agents (micro-capsules).
The process of finding the deviations of patterns in different positions may be done again with new techniques in order to get more accurate data on the exact functional areas on patterns where the active agents may be introduced.
The final patterns obtained may be tested for fit and feasibility related issues virtually on computers or a proto-sample may be developed.
5 CONCLUSION This work was designed for very specific purpose i.e. for demonstration of design, development and manufacturing of functional end products for underwear and sportswear sector. Since, there is a growing demand for individualism in the developed market sectors on the globe. This methodology can be implemented to enhance the concept of advanced mass customisation. It can act as a feasible tool in the design and manufacturing of functional clothing ranging from sophisticated military apparels to kids wear. The same techniques can also be implemented to other sectors where the demand for customisation is moving-up. (For example: shoes, seats and berths, ergonomic furniture, etc.) This will lead to better customer satisfaction, increase individualisation and will generate profit in the process. 6 REFERENCES [1] Chase, Richard B., Jacobs, Robert.F., Aquilano, Nicholas J.: (Operations Management for Competitive
Advantage) 11th ed., New York: McGraw-Hill/Irwin). (2006), pp. 419 [2] Kamis, Koufaris and Stern: MIS Quarterly , Vol.32 (2008), pp. 159-177 [3] Christofidou; Solomidou, M.: Flaxseed lignan complex and its use thereof, US Patent 2011/0300247 A1,
December 8 (2011) [4] Topcu.G.; Demirkiran.O.: Lignan from taxus species, (Topics in Heterocyclic Chemistry, Springer-Verlag,
Berlin-Heidelberg), (2007), pp.103-144 [5] D'Apuzzo.N., Nicola D'Apuzzo, Hometrica Consulting, Culmannstrasse 59, 8006 Zurich, Switzerland [6] Gupta.D, Indian Institute of Technology, New Delhi, INDIA (Indian Journal of Fibre & Textile Research),
Vol.36, December (2011), pp. 321-326
411
14
th Romanian Textiles and Leather Conference – CORTEP 2012
Sinaia, 6 - 8 September 2012
[7] Chatterjee, S., Salaun, F., Campagne, C., Vaupre, S., Beirão, A.: Preparation of microcapsules with multi-layers structure stabilized by chitosan and sodium dodecyl sulfate, (Carbohydrate Polymers), In Press, Accepted Manuscript, Available online 19 June 2012.
Corresponding author: Sébastien THOMASSEY ENSAIT / GEMTEX 2 allée Louise et Victor Champier 59100, Roubaix, France Phone: +32 (0)3 20 25 64 64 E-mail: [email protected]
Co-authors: BRAHMADEEP 2 allée Louise et Victor Champier 59100, Roubaix, France Phone: +32 (0)3 20 25 64 64
E-mail: [email protected] SUDIPTA 2 allée Louise et Victor Champier 59100, Roubaix, France Phone: +32 (0)3 20 25 64 64
E-mail: [email protected] Fabien SALAUN 2 allée Louise et Victor Champier 59100, Roubaix, France Phone: +32 (0)3 20 25 64 64
E-mail: [email protected] Christine CAMPAGNE 2 allée Louise et Victor Champier 59100, Roubaix, France Phone: +32 (0)3 20 25 64 64
E-mail: [email protected]
412
14
th Romanian Textiles and Leather Conference – CORTEP 2012
Sinaia, 6 - 8 September 2012
3D PATTERN-MAKING ON ADAPTIVE MORPHOTYPE MANNEQUIN
Pascal BRUNIAUX GEMTEX - ENSAIT / Roubaix & University of Lille – North, France
Abstract:The goal of our study is to improve performances of the clothing design process by implementing rigorous methods of analysis integrated in 3D CAD tools. The first section of this paper briefly presents a method for designing a human body from the morphological data of the morphotypes and the anthropometric data of the measurement campaign. The second part shows the feasibility of creating a tailored garment directly on 3D shape of the body. This method of garment design takes into account directly in 3D the ease values for increasing the fit of the garment. The third part proposes a method for parameterization of the traditional 2D pattern-making techniques. The idea is to automatically customize the garment according to the measures of the consumer. The last part presents the tries-on the parametric mannequin of the 2D and 3D pattern-making. They draw attention to the various errors that can be made in the process of pattern-making using traditional 2D techniques. Keywords: garment modelling, 3D virtual garment prototyping, draping technique, adaptive mannequin, morphotype. 1 INTRODUCTION: The apparel industry is increasingly forced to change its clothing design process if it wishes to remain competitive with globalization and avoid copies of the new models. This assessment leads to the reduction of pattern-making time in order to increase the number of collections per year. Some companies prefer to use this creativity gain to reduce the cost of manpower or increase the quality of their products. Work [1] highlighted the importance of introducing three representation models to perform the simulation of the clothing design process: human body model, clothing model and environment model. The aim of our study is to provide an answer to this problem by analysing the different steps of development.
The first weakness of the creative process is the validation of each garment to the new collection. For this, various manual tries-on are needed to verify their fallen, their fitting, well-going... Many research teams have focused their work in this area which is located downstream of the process. The most significant industrial progresses were to simulate this step of virtual try-on 3D mannequin [2][3][4]. A European project has shown the economic benefit of reducing the tedious step of real try-on the new models [Leapfrog]. For this, it recommends replacing the various real tries-on, numbering five in general, by four virtual tries-on and one real one. But these studies did not take sufficient account of the quality of input data of the process.
The second weakness lies at level of these input data. For example, the morphologies of the proposed numerical mannequins must be representative of the consumer. Nowadays, the average consumer is defined by a morphotype belonging to one class of the target population [campaign]. Similarly, the basic models of clothing need to be updated because they no longer meet the morphology of the average consumer. These data-input errors can explain the increase in returns on unsold which have been temporarily slowed by in-house try-on live model with standard measurements. But in this case, this live model shall not evolve morphologically and is not necessarily representative of the population.
Another weakness point is also in the methods of work at the establishment of new basic models of clothing. They should not be founded solely on the pattern-making methods validated some years ago. New morphologies require changes in the size and position of the darts, constant data defining the slope of shoulders or the position of some anthropometric points.
To overcome these weaknesses, several years of research have allowed establishing a new tailored clothing design process on 3D morphotype mannequin. This article describes chronologically the process. The first chapter summarizes the design process of a parametric mannequin fitted to the morphology of morphotypes. The second shows the feasibility of creating a tailored garment directly on the 3D mannequin by following
413
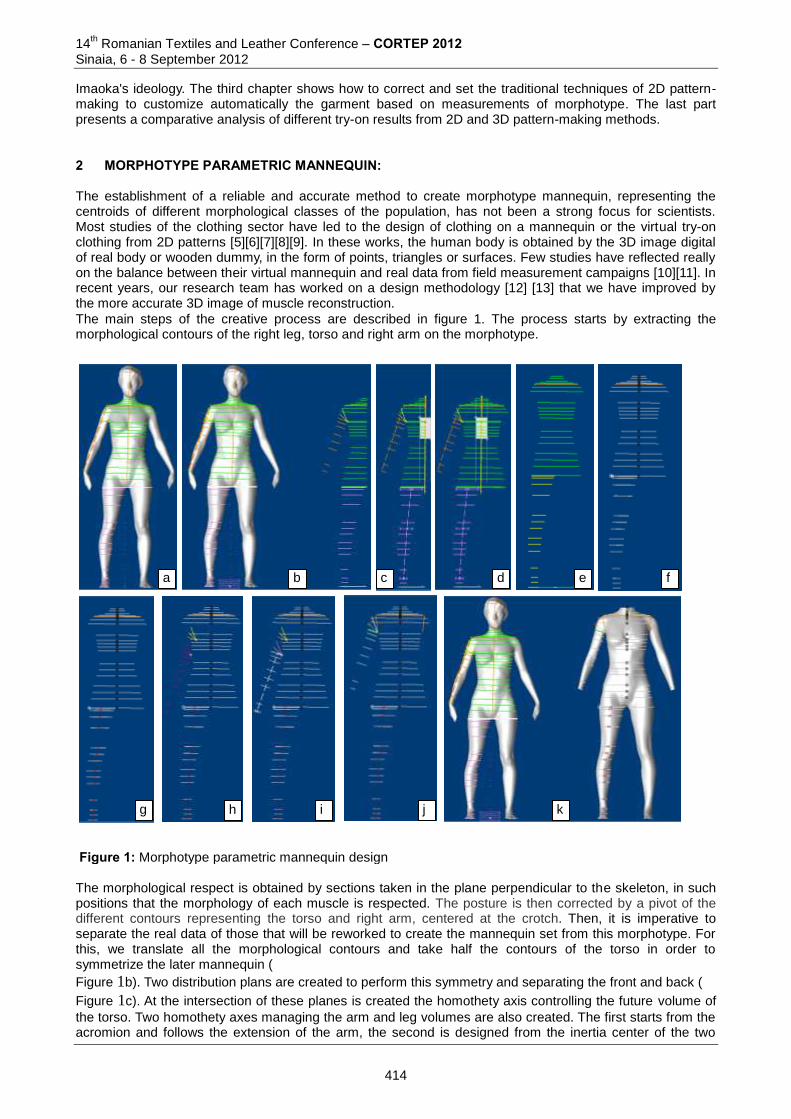
14th Romanian Textiles and Leather Conference – CORTEP 2012
Sinaia, 6 - 8 September 2012
Imaoka's ideology. The third chapter shows how to correct and set the traditional techniques of 2D pattern-making to customize automatically the garment based on measurements of morphotype. The last part presents a comparative analysis of different try-on results from 2D and 3D pattern-making methods.
2 MORPHOTYPE PARAMETRIC MANNEQUIN: The establishment of a reliable and accurate method to create morphotype mannequin, representing the centroids of different morphological classes of the population, has not been a strong focus for scientists. Most studies of the clothing sector have led to the design of clothing on a mannequin or the virtual try-on clothing from 2D patterns [5][6][7][8][9]. In these works, the human body is obtained by the 3D image digital of real body or wooden dummy, in the form of points, triangles or surfaces. Few studies have reflected really on the balance between their virtual mannequin and real data from field measurement campaigns [10][11]. In recent years, our research team has worked on a design methodology [12] [13] that we have improved by the more accurate 3D image of muscle reconstruction.
The main steps of the creative process are described in figure 1. The process starts by extracting the morphological contours of the right leg, torso and right arm on the morphotype.
The morphological respect is obtained by sections taken in the plane perpendicular to the skeleton, in such positions that the morphology of each muscle is respected. The posture is then corrected by a pivot of the different contours representing the torso and right arm, centered at the crotch. Then, it is imperative to separate the real data of those that will be reworked to create the mannequin set from this morphotype. For this, we translate all the morphological contours and take half the contours of the torso in order to symmetrize the later mannequin (
Figure 1b). Two distribution plans are created to perform this symmetry and separating the front and back (
Figure 1c). At the intersection of these planes is created the homothety axis controlling the future volume of
the torso. Two homothety axes managing the arm and leg volumes are also created. The first starts from the acromion and follows the extension of the arm, the second is designed from the inertia center of the two
a b c d f
g ha
i j k
e
Figure 1: Morphotype parametric mannequin design
414
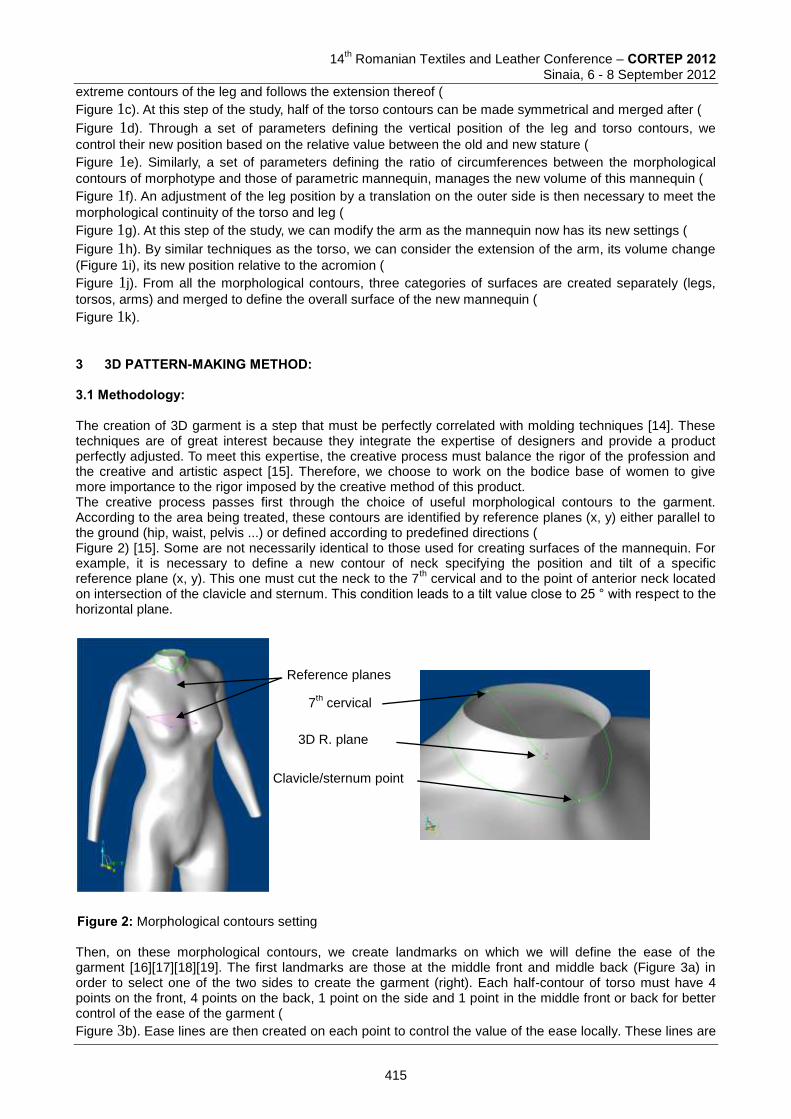
14
th Romanian Textiles and Leather Conference – CORTEP 2012
Sinaia, 6 - 8 September 2012
extreme contours of the leg and follows the extension thereof (
Figure 1c). At this step of the study, half of the torso contours can be made symmetrical and merged after (
Figure 1d). Through a set of parameters defining the vertical position of the leg and torso contours, we
control their new position based on the relative value between the old and new stature (
Figure 1e). Similarly, a set of parameters defining the ratio of circumferences between the morphological
contours of morphotype and those of parametric mannequin, manages the new volume of this mannequin (
Figure 1f). An adjustment of the leg position by a translation on the outer side is then necessary to meet the
morphological continuity of the torso and leg (
Figure 1g). At this step of the study, we can modify the arm as the mannequin now has its new settings (
Figure 1h). By similar techniques as the torso, we can consider the extension of the arm, its volume change
(Figure 1i), its new position relative to the acromion (
Figure 1j). From all the morphological contours, three categories of surfaces are created separately (legs,
torsos, arms) and merged to define the overall surface of the new mannequin (
Figure 1k).
3 3D PATTERN-MAKING METHOD: 3.1 Methodology: The creation of 3D garment is a step that must be perfectly correlated with molding techniques [14]. These techniques are of great interest because they integrate the expertise of designers and provide a product perfectly adjusted. To meet this expertise, the creative process must balance the rigor of the profession and the creative and artistic aspect [15]. Therefore, we choose to work on the bodice base of women to give more importance to the rigor imposed by the creative method of this product. The creative process passes first through the choice of useful morphological contours to the garment. According to the area being treated, these contours are identified by reference planes (x, y) either parallel to the ground (hip, waist, pelvis ...) or defined according to predefined directions ( Figure 2) [15]. Some are not necessarily identical to those used for creating surfaces of the mannequin. For example, it is necessary to define a new contour of neck specifying the position and tilt of a specific reference plane (x, y). This one must cut the neck to the 7
th cervical and to the point of anterior neck located
on intersection of the clavicle and sternum. This condition leads to a tilt value close to 25 ° with respect to the horizontal plane.
Then, on these morphological contours, we create landmarks on which we will define the ease of the garment [16][17][18][19]. The first landmarks are those at the middle front and middle back (Figure 3a) in order to select one of the two sides to create the garment (right). Each half-contour of torso must have 4 points on the front, 4 points on the back, 1 point on the side and 1 point in the middle front or back for better control of the ease of the garment (
Figure 3b). Ease lines are then created on each point to control the value of the ease locally. These lines are
Reference planes
3D R. plane
7th cervical
Clavicle/sternum point
Figure 2: Morphological contours setting
415
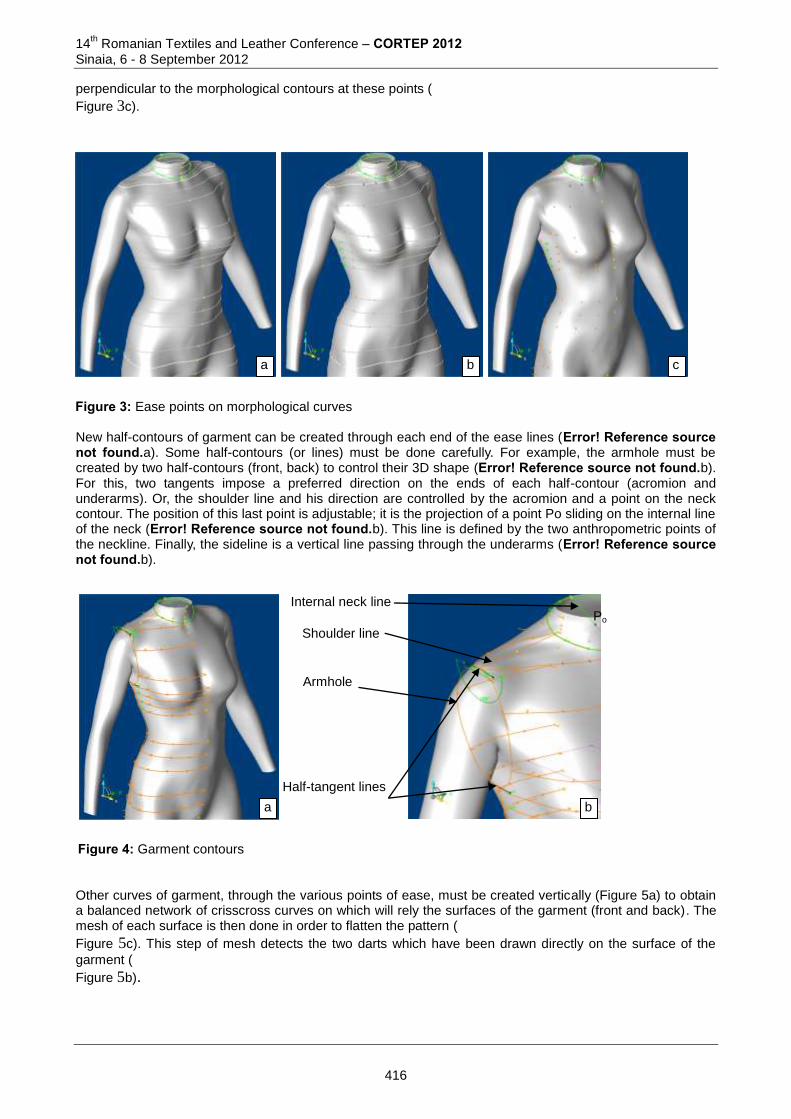
14th Romanian Textiles and Leather Conference – CORTEP 2012
Sinaia, 6 - 8 September 2012
perpendicular to the morphological contours at these points (
Figure 3c).
New half-contours of garment can be created through each end of the ease lines (Error! Reference source not found.a). Some half-contours (or lines) must be done carefully. For example, the armhole must be created by two half-contours (front, back) to control their 3D shape (Error! Reference source not found.b). For this, two tangents impose a preferred direction on the ends of each half-contour (acromion and underarms). Or, the shoulder line and his direction are controlled by the acromion and a point on the neck contour. The position of this last point is adjustable; it is the projection of a point Po sliding on the internal line of the neck (Error! Reference source not found.b). This line is defined by the two anthropometric points of the neckline. Finally, the sideline is a vertical line passing through the underarms (Error! Reference source not found.b).
Other curves of garment, through the various points of ease, must be created vertically (Figure 5a) to obtain a balanced network of crisscross curves on which will rely the surfaces of the garment (front and back). The mesh of each surface is then done in order to flatten the pattern (
Figure 5c). This step of mesh detects the two darts which have been drawn directly on the surface of the
garment (
Figure 5b).
a b c
Figure 3: Ease points on morphological curves
Figure 4: Garment contours
Armhole
Shoulder line
Half-tangent lines
Internal neck line Po
a b
416
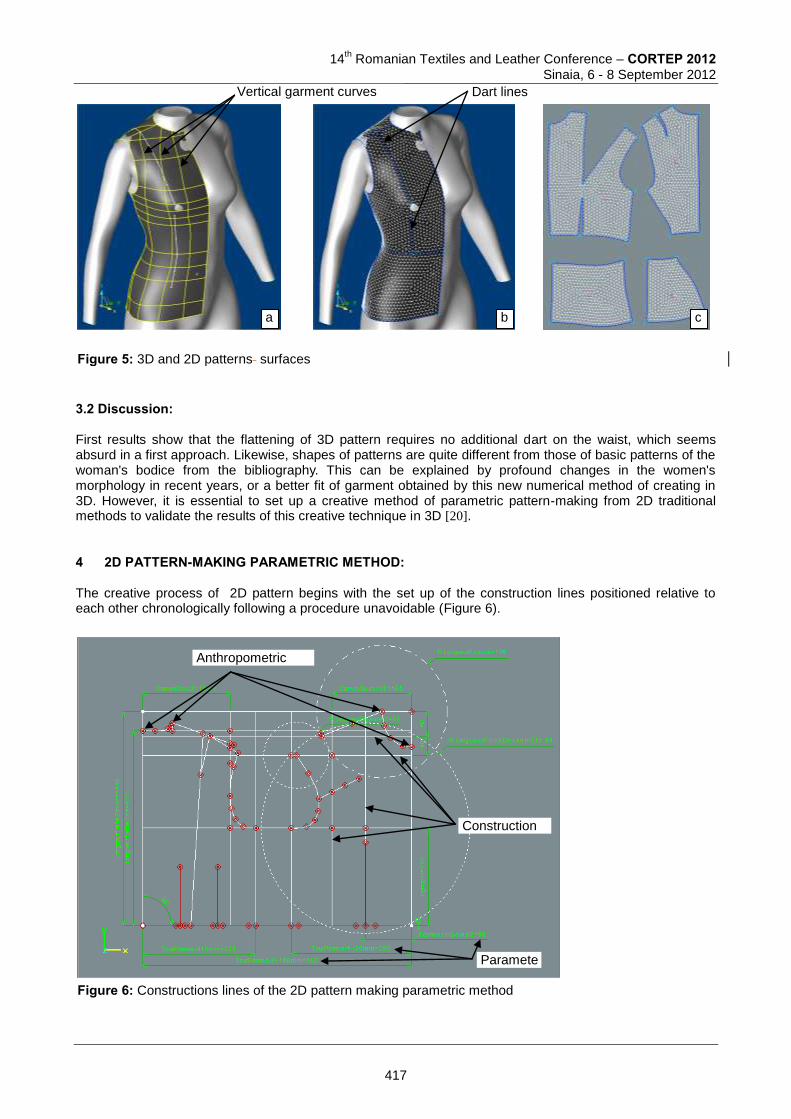
14
th Romanian Textiles and Leather Conference – CORTEP 2012
Sinaia, 6 - 8 September 2012
3.2 Discussion: First results show that the flattening of 3D pattern requires no additional dart on the waist, which seems absurd in a first approach. Likewise, shapes of patterns are quite different from those of basic patterns of the woman's bodice from the bibliography. This can be explained by profound changes in the women's morphology in recent years, or a better fit of garment obtained by this new numerical method of creating in 3D. However, it is essential to set up a creative method of parametric pattern-making from 2D traditional methods to validate the results of this creative technique in 3D [20].
4 2D PATTERN-MAKING PARAMETRIC METHOD: The creative process of 2D pattern begins with the set up of the construction lines positioned relative to each other chronologically following a procedure unavoidable (Figure 6).
a b c
Vertical garment curves Dart lines
Figure 5: 3D and 2D patterns surfaces
Parameters
Construction lines
Anthropometric points
Figure 6: Constructions lines of the 2D pattern making parametric method
417
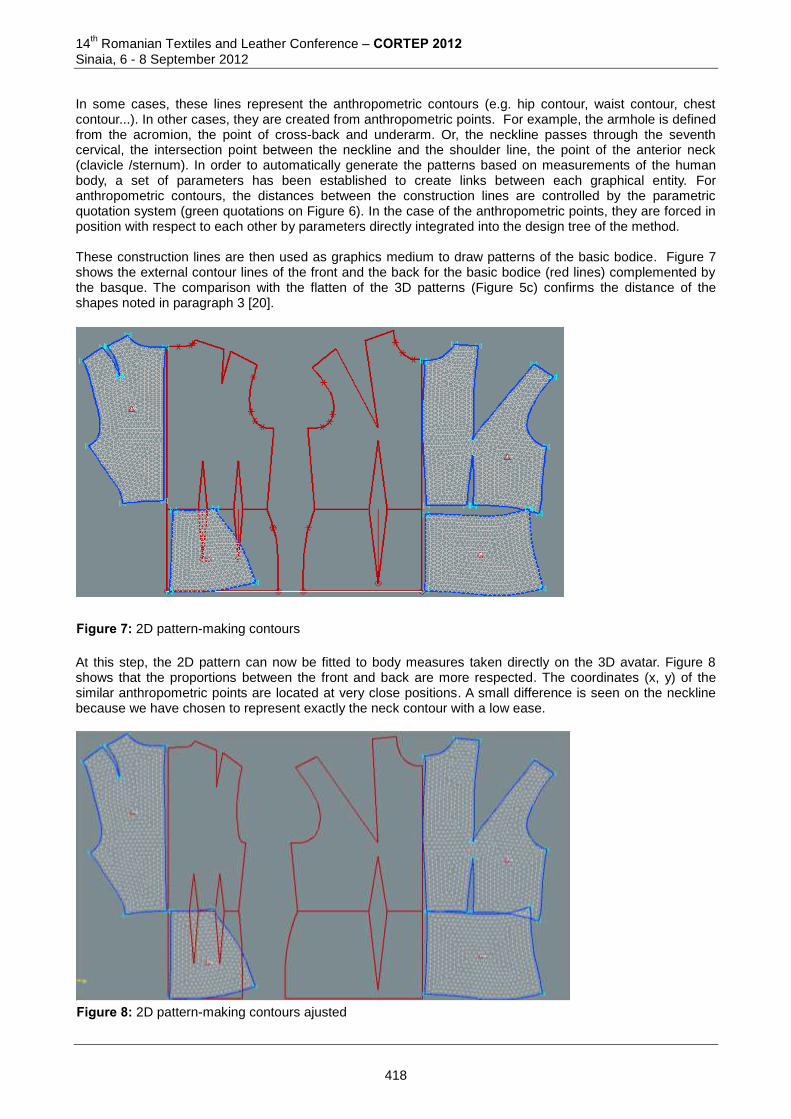
14th Romanian Textiles and Leather Conference – CORTEP 2012
Sinaia, 6 - 8 September 2012
In some cases, these lines represent the anthropometric contours (e.g. hip contour, waist contour, chest contour...). In other cases, they are created from anthropometric points. For example, the armhole is defined from the acromion, the point of cross-back and underarm. Or, the neckline passes through the seventh cervical, the intersection point between the neckline and the shoulder line, the point of the anterior neck (clavicle /sternum). In order to automatically generate the patterns based on measurements of the human body, a set of parameters has been established to create links between each graphical entity. For anthropometric contours, the distances between the construction lines are controlled by the parametric quotation system (green quotations on Figure 6). In the case of the anthropometric points, they are forced in position with respect to each other by parameters directly integrated into the design tree of the method. These construction lines are then used as graphics medium to draw patterns of the basic bodice. Figure 7 shows the external contour lines of the front and the back for the basic bodice (red lines) complemented by the basque. The comparison with the flatten of the 3D patterns (Figure 5c) confirms the distance of the shapes noted in paragraph 3 [20].
At this step, the 2D pattern can now be fitted to body measures taken directly on the 3D avatar. Figure 8 shows that the proportions between the front and back are more respected. The coordinates (x, y) of the similar anthropometric points are located at very close positions. A small difference is seen on the neckline because we have chosen to represent exactly the neck contour with a low ease.
Figure 7: 2D pattern-making contours
Figure 8: 2D pattern-making contours ajusted
418
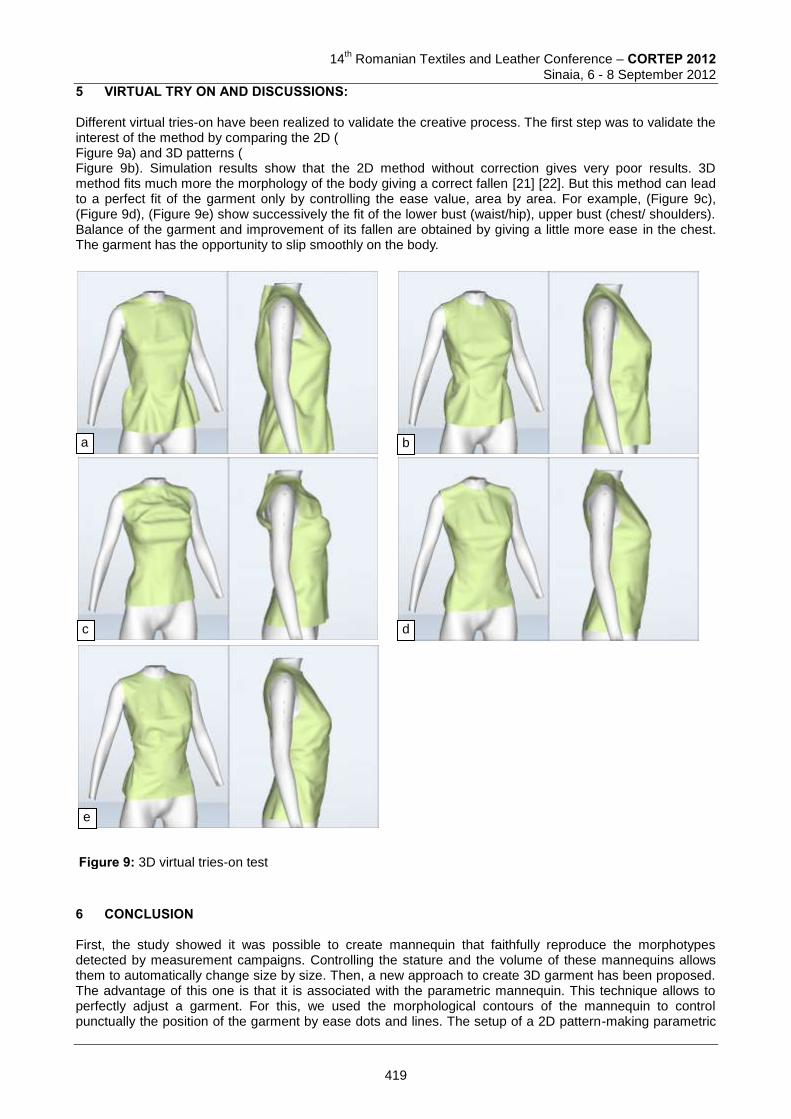
14
th Romanian Textiles and Leather Conference – CORTEP 2012
Sinaia, 6 - 8 September 2012
5 VIRTUAL TRY ON AND DISCUSSIONS: Different virtual tries-on have been realized to validate the creative process. The first step was to validate the interest of the method by comparing the 2D ( Figure 9a) and 3D patterns ( Figure 9b). Simulation results show that the 2D method without correction gives very poor results. 3D method fits much more the morphology of the body giving a correct fallen [21] [22]. But this method can lead to a perfect fit of the garment only by controlling the ease value, area by area. For example, (Figure 9c), (Figure 9d), (Figure 9e) show successively the fit of the lower bust (waist/hip), upper bust (chest/ shoulders). Balance of the garment and improvement of its fallen are obtained by giving a little more ease in the chest. The garment has the opportunity to slip smoothly on the body.
6 CONCLUSION First, the study showed it was possible to create mannequin that faithfully reproduce the morphotypes detected by measurement campaigns. Controlling the stature and the volume of these mannequins allows them to automatically change size by size. Then, a new approach to create 3D garment has been proposed. The advantage of this one is that it is associated with the parametric mannequin. This technique allows to perfectly adjust a garment. For this, we used the morphological contours of the mannequin to control punctually the position of the garment by ease dots and lines. The setup of a 2D pattern-making parametric
Figure 9: 3D virtual tries-on test
a b
c d
e
419
14th Romanian Textiles and Leather Conference – CORTEP 2012
Sinaia, 6 - 8 September 2012
method, using the traditional pattern-making methods, allowed to customize the garment. The data have been compared with those of the creative method of 3D garment to validate this new method. Finally, different virtual tries-on have been realized to show the quality of the 3D method results and the flexibility of use relative to the 2D method. Future works will be focused on the automated grading of garment through the parametric mannequin. 7. References : [1] Imaoka, H.: Three models for garment simulation, International Journal of Clothing Science and
Technology, Vol. 8, No. 3, pp. 10-21, 1996. [2] Provot, X.: Animation réaliste de vêtement, Thèse de Doctorat, Université René, Descartes - Paris V,
1997. [3] Yang, Y.: Cloth Modelling and Animation using viscoelastic surface, Thèse de PhD, Ecole
polytechnique Fédérale de Lausanne, 1994.
[4] Volino, P.: Mechanical simulation of deformable surfaces for animation of synthetic garments, Thèse de PhD, Université de Genève, 1998.
1) [5] Chiricota, Y.; Cochaux, O. & Provost, A.: Geometrical modelling of garments, International Journal of 2) Clothing Science and Technology, Vol. 13, No. 1, pp.38-52, 2001.
[6] Wang, C.L.; Wang, Y. & Yuen, M.M.F.: Feature based 3D garment design through 2D sketches, Computer Aided Design, Vol. 35, pp. 659-672, 2002.
[7] Magnenat-Thalmann, N.; Soe, H. & Cordier, F.: Automatic Modeling of Animatable Virtual Humans – A survey, (3DIM’03) IEEE Proccedings of he Fourth International Conference on 3D Digital Imaging and Modeling, pp. 2-10, Geneva, Switzerland, October, 2003.
[8] Turquin, E.; Cani, M-P. & Hughes, J.F.: Sketching garments for virtual characters, EUROGRAPHICS Workshop on Sketch-Based Interfaces and Modeling, pp. 175-182, August, 2004.
[9] Seo, T. & Magnenat-Thalmann, N.: An example-based approach to human body manipulation, Graphical Models, Vol. 66, pp. 1-23, 2004.
[10] Thomassey, S. & Bruniaux, P.: Identification of typical morphotypes in a sample of population, Intelligent Textiles and Mass Customisation International Conference, Casablanca, Morocco, November, 2009.
[11] Gupta, S.; Bruniaux, P. & Koncar, V.: Adaptive model of the human body. A new tool for fashion designers, 8
th International Foundation of Fashion Technology Institutes Conference (IFFTI): Fashion in
the Digital A, Raleigh, USA, 2006. [12] Cichocka, A. & Bruniaux, P.: Adaptive model of the human body. Methodology of design of the
morphotype mannequin, ISC’2006, 4th annual International Industrial Simulation Conference, Palermo,
Italy, June, 2006. [13] Cichocka, A.; Bruniaux, P. & Koncar, V.: Modelling of a virtual morphotype mannequin for garment
design, 13th Romanian Textiles and Leather Conference Iasi, Romania, October, 2007.
[14] Zangrillo, F.L.: Fashion design for the plus-size, Fairchild publications, New York, U.S.A., 1990. [16] Chen, Y. & al.: Estimation of ease allowance of a garment using fuzzy logic, 6
th International
FLINS2004,Conference on Applied Computational Intelligence, Blankenberghe, Belgium, September, 2004.
[17] Chen, Y. & al.: A new method of ease allowance generation for personalization of garment design. International Journal of Clothing Science and Technology, Vol. 20, No 3, pp. 161-173, 2008.
[18] Wang, Z. & al.: Study on the relation between garment style and ease distribution, Journal of Donghua University, Vol. 21, No. 6, pp. 1-37, 2004.
[19] Wang, Z. & al.: Modelling of cross-sectional shape for women’s jacket design, SEN’I GAKKAISHI, Vol. 63, No. 4, pp. 86-87, 2007.
[15] Cichocka, A.; Bruniaux, P. & Koncar, V.: Modelling of Virtual Garment Design in 3D, Research Journal of Textile and Apparel, Vol. 11, No. 4, pp. 55-63, 2007.
[20] Cichocka, A. & Bruniaux, P.: Comparison of traditional 2D and virtual patterns design in 3D, Journal of Advanced Computational Intelligence & Intelligent Informatics, Vol. 13, No. 5, pp. 542-549, 2009.
[21] Cichocka, A. & Bruniaux, P.: Influence of the human body deformation on garment mass customization process, ITMC 2009, Ecole Supérieure des Industries du Textile et de l'Habillement (ESITH), Casablanca, Morocco, November, 2009.
[22] Karakas, S.; Akabag, N.; Cichocka, A. & Bruniaux, P.: Deformation analysis of the human body using pattern garment reverse engineering, AUTEX 2009, World Textile Conference, Izmir, Turkey, May, 2009.
420

14
th Romanian Textiles and Leather Conference – CORTEP 2012
Sinaia, 6 - 8 September 2012
Corresponding author: Pascal BRUNIAUX GEMTEX 2, Allée Louise et Victor Champier BP 30329 59056, Roubaix Cedex 1, FRANCE Phone: +33 (0)3 20 25 64 85 ; fax : +33 (0)3 20 24 84 06 E-mail: [email protected]
421
14
th Romanian Textiles and Leather Conference – CORTEP 2012
Sinaia, 6 - 8 September 2012
NEW GENERATION OF 3D ADAPTIVE MORPHOTYPE MANNEQUIN
Moez HAMAD, Pascal BRUNIAUX & Sébastien THOMASSEY GEMTEX – ENSAIT, Roubaix & University of Lille ,France
Abstract: The aim of this paper is to present design methodology of 3D adaptive virtual mannequins. This mythology integrates anthropometric data which represents human morphology of a targeted population [3]. The solution should be effective, low cost and realistic. Our methodology is based on real morphological data extracted from a measurement campaign to define the morphotype. This morphotype is then parameterized with anthropometric rules to make the mannequin adaptive according to the related population [1,2]. A reverse engineering and geometric modeling techniques are applied to generate a model of the subject from scanned data. Thereby, sections curves are extracted. This process guarantees the maximum efficiency of the functionalization. The parameterized mannequin morphotype is based on a model surface representation defined from section curves. The conception of the mannequin morphotype requires first : to choose and locate these curves, then to define settings and links between measurement campaign data and these curves. In conclusion, the whole model is managed by different types of parameters directly related to surface curves. These parameters are supposed to be able to manage size and morphology of the 3D model. Keywords: 3D adaptive mannequin, morphotype, measurement campaign, body scanner, 3D CAD system. 1 INTRODUCTION The new dynamics of global trade such as globalization, mass customization, rapid change in fashion trends, new media, the morphological evolution of populations, requires crucial changes in traditional methods of design, With a complex and fluctuating environment, apparel industry is facing a new reality. So company competitiveness depends on its ability to optimize resources management, according to these new issues. This optimization could be achieved by the use of virtual reality technologies enabling 3D visualization. However, this new dynamic requires strong changes in traditional fashion methods of design and represents an additional challenge for global apparel industry. The first step to reach this digital era of fashion design is to develop adaptive morphotypes mannequins. Besides the size of the population has changed, as indicated by the new measurement campaigns performed using the scanner for scanning thousands of people in the U.S.A, UK, France and many other places. The silhouette of women today is much changed from the rectangular shape to the inverted triangle. Furthermore, the human body today is closer to the scale of 7.5 heads. That’s why clothes ready-to-wear is fine for very small parts of the population. This record shows that development of adaptive model morphotype or custom models is a challenge for further industrial world needed the ready to wear and mass customization. In this paper, an approach for the parametric design of human models is developed. For this, a measurement database with 3D descriptions of a representative sample of the targeted population has to be collected. These measurements are gathered from 3D scanners. The work presented in this paper is an extension of constructing human models for building a 3D digital mannequin database using reverse engineering. Human models are fundamentals to develop the design automation technology of customized clothes. Features extracted from the human model are the major contribution of databases used in the fashion industry. One of main advantage provided by our design methodology is the possibility of encoding the relationship between clothes and human bodies. Therefore for any human bodies shape, clothes are automatically regenerated by maintaining the same method. In reverse engineering, the geometric model of an object is built from a cloud of points. This method is commonly used to model a sculpted object. For instance, Milroy et al. [4] address the fitting problem with an approximate global order one continuity between the B-spline surfaces. With the same technique, Ko et al. [5] propose a method to model a human face from a set of points. In literature, human body modeling methodologies can be classified into creative and reconstructive approaches. Anatomically-based modelers [6,7] can simulate underlying muscles, bones, and generalized tissue. They fall into the creative category of human modeling approaches. The interactive design is allowed
422
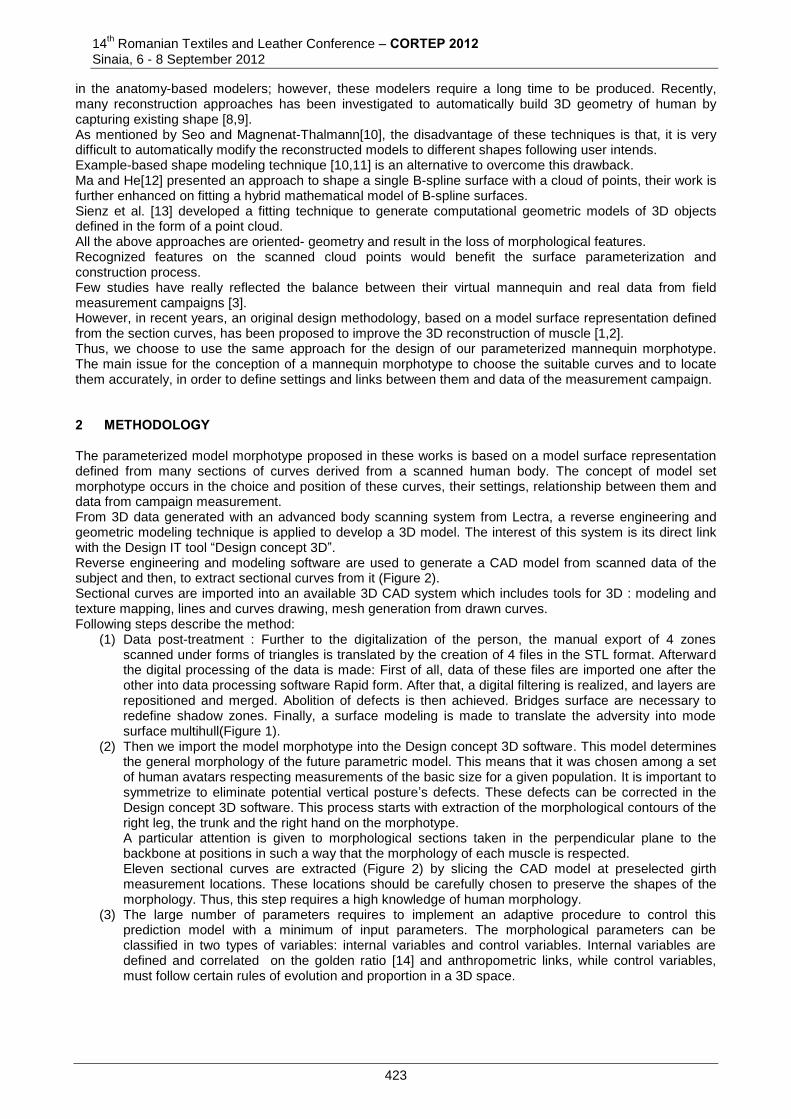
14th Romanian Textiles and Leather Conference – CORTEP 2012
Sinaia, 6 - 8 September 2012
in the anatomy-based modelers; however, these modelers require a long time to be produced. Recently, many reconstruction approaches has been investigated to automatically build 3D geometry of human by capturing existing shape [8,9]. As mentioned by Seo and Magnenat-Thalmann[10], the disadvantage of these techniques is that, it is very difficult to automatically modify the reconstructed models to different shapes following user intends. Example-based shape modeling technique [10,11] is an alternative to overcome this drawback. Ma and He[12] presented an approach to shape a single B-spline surface with a cloud of points, their work is further enhanced on fitting a hybrid mathematical model of B-spline surfaces. Sienz et al. [13] developed a fitting technique to generate computational geometric models of 3D objects defined in the form of a point cloud. All the above approaches are oriented- geometry and result in the loss of morphological features. Recognized features on the scanned cloud points would benefit the surface parameterization and construction process. Few studies have really reflected the balance between their virtual mannequin and real data from field measurement campaigns [3]. However, in recent years, an original design methodology, based on a model surface representation defined from the section curves, has been proposed to improve the 3D reconstruction of muscle [1,2]. Thus, we choose to use the same approach for the design of our parameterized mannequin morphotype. The main issue for the conception of a mannequin morphotype to choose the suitable curves and to locate them accurately, in order to define settings and links between them and data of the measurement campaign. 2 METHODOLOGY The parameterized model morphotype proposed in these works is based on a model surface representation defined from many sections of curves derived from a scanned human body. The concept of model set morphotype occurs in the choice and position of these curves, their settings, relationship between them and data from campaign measurement. From 3D data generated with an advanced body scanning system from Lectra, a reverse engineering and geometric modeling technique is applied to develop a 3D model. The interest of this system is its direct link with the Design IT tool “Design concept 3D”. Reverse engineering and modeling software are used to generate a CAD model from scanned data of the subject and then, to extract sectional curves from it (Figure 2). Sectional curves are imported into an available 3D CAD system which includes tools for 3D : modeling and texture mapping, lines and curves drawing, mesh generation from drawn curves. Following steps describe the method:
(1) Data post-treatment : Further to the digitalization of the person, the manual export of 4 zones scanned under forms of triangles is translated by the creation of 4 files in the STL format. Afterward the digital processing of the data is made: First of all, data of these files are imported one after the other into data processing software Rapid form. After that, a digital filtering is realized, and layers are repositioned and merged. Abolition of defects is then achieved. Bridges surface are necessary to redefine shadow zones. Finally, a surface modeling is made to translate the adversity into mode surface multihull(Figure 1).
(2) Then we import the model morphotype into the Design concept 3D software. This model determines the general morphology of the future parametric model. This means that it was chosen among a set of human avatars respecting measurements of the basic size for a given population. It is important to symmetrize to eliminate potential vertical posture’s defects. These defects can be corrected in the Design concept 3D software. This process starts with extraction of the morphological contours of the right leg, the trunk and the right hand on the morphotype. A particular attention is given to morphological sections taken in the perpendicular plane to the backbone at positions in such a way that the morphology of each muscle is respected. Eleven sectional curves are extracted (Figure 2) by slicing the CAD model at preselected girth measurement locations. These locations should be carefully chosen to preserve the shapes of the morphology. Thus, this step requires a high knowledge of human morphology.
(3) The large number of parameters requires to implement an adaptive procedure to control this prediction model with a minimum of input parameters. The morphological parameters can be classified in two types of variables: internal variables and control variables. Internal variables are defined and correlated on the golden ratio [14] and anthropometric links, while control variables, must follow certain rules of evolution and proportion in a 3D space.
423
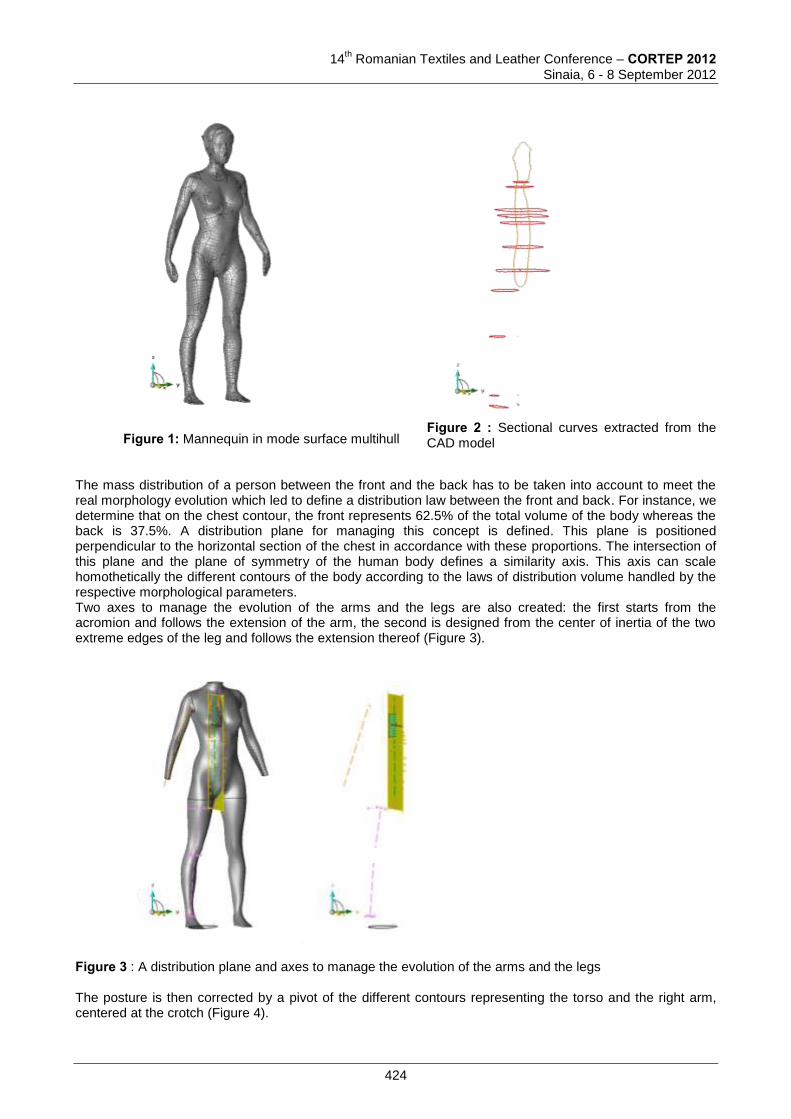
14
th Romanian Textiles and Leather Conference – CORTEP 2012
Sinaia, 6 - 8 September 2012
Figure 1: Mannequin in mode surface multihull
Figure 2 : Sectional curves extracted from the CAD model
The mass distribution of a person between the front and the back has to be taken into account to meet the real morphology evolution which led to define a distribution law between the front and back. For instance, we determine that on the chest contour, the front represents 62.5% of the total volume of the body whereas the back is 37.5%. A distribution plane for managing this concept is defined. This plane is positioned perpendicular to the horizontal section of the chest in accordance with these proportions. The intersection of this plane and the plane of symmetry of the human body defines a similarity axis. This axis can scale homothetically the different contours of the body according to the laws of distribution volume handled by the respective morphological parameters. Two axes to manage the evolution of the arms and the legs are also created: the first starts from the acromion and follows the extension of the arm, the second is designed from the center of inertia of the two extreme edges of the leg and follows the extension thereof (Figure 3).
Figure 3 : A distribution plane and axes to manage the evolution of the arms and the legs
The posture is then corrected by a pivot of the different contours representing the torso and the right arm, centered at the crotch (Figure 4).
424
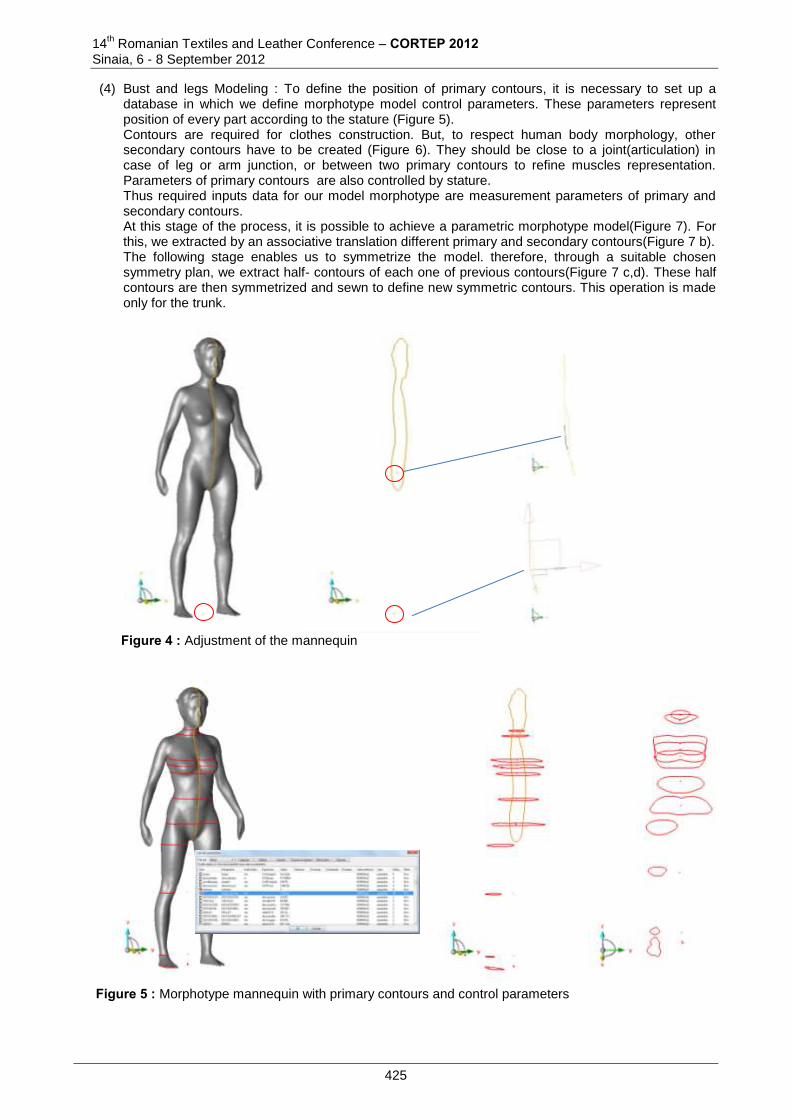
14th Romanian Textiles and Leather Conference – CORTEP 2012
Sinaia, 6 - 8 September 2012
(4) Bust and legs Modeling : To define the position of primary contours, it is necessary to set up a database in which we define morphotype model control parameters. These parameters represent position of every part according to the stature (Figure 5). Contours are required for clothes construction. But, to respect human body morphology, other secondary contours have to be created (Figure 6). They should be close to a joint(articulation) in case of leg or arm junction, or between two primary contours to refine muscles representation. Parameters of primary contours are also controlled by stature. Thus required inputs data for our model morphotype are measurement parameters of primary and secondary contours. At this stage of the process, it is possible to achieve a parametric morphotype model(Figure 7). For this, we extracted by an associative translation different primary and secondary contours(Figure 7 b). The following stage enables us to symmetrize the model. therefore, through a suitable chosen symmetry plan, we extract half- contours of each one of previous contours(Figure 7 c,d). These half contours are then symmetrized and sewn to define new symmetric contours. This operation is made only for the trunk.
Figure 5 : Morphotype mannequin with primary contours and control parameters
Figure 4 : Adjustment of the mannequin
425
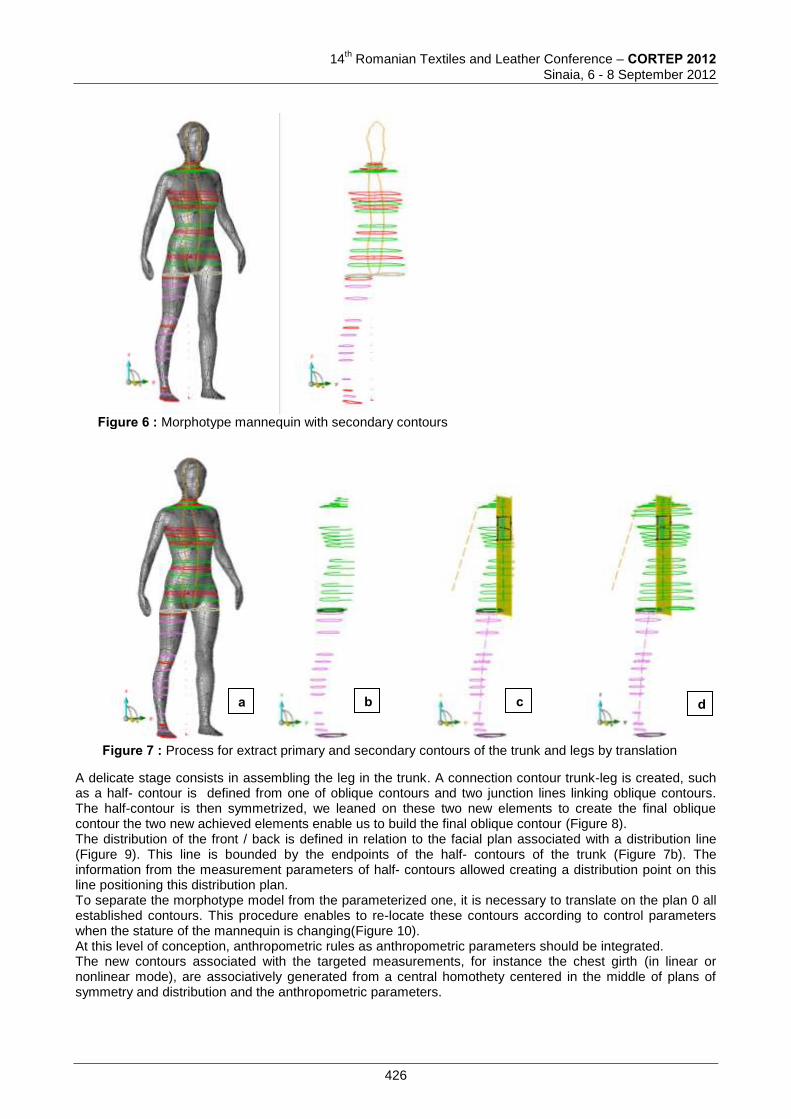
14
th Romanian Textiles and Leather Conference – CORTEP 2012
Sinaia, 6 - 8 September 2012
A delicate stage consists in assembling the leg in the trunk. A connection contour trunk-leg is created, such as a half- contour is defined from one of oblique contours and two junction lines linking oblique contours. The half-contour is then symmetrized, we leaned on these two new elements to create the final oblique contour the two new achieved elements enable us to build the final oblique contour (Figure 8). The distribution of the front / back is defined in relation to the facial plan associated with a distribution line (Figure 9). This line is bounded by the endpoints of the half- contours of the trunk (Figure 7b). The information from the measurement parameters of half- contours allowed creating a distribution point on this line positioning this distribution plan. To separate the morphotype model from the parameterized one, it is necessary to translate on the plan 0 all established contours. This procedure enables to re-locate these contours according to control parameters when the stature of the mannequin is changing(Figure 10). At this level of conception, anthropometric rules as anthropometric parameters should be integrated. The new contours associated with the targeted measurements, for instance the chest girth (in linear or nonlinear mode), are associatively generated from a central homothety centered in the middle of plans of symmetry and distribution and the anthropometric parameters.
Figure 6 : Morphotype mannequin with secondary contours
Figure 7 : Process for extract primary and secondary contours of the trunk and legs by translation
a b c d
426
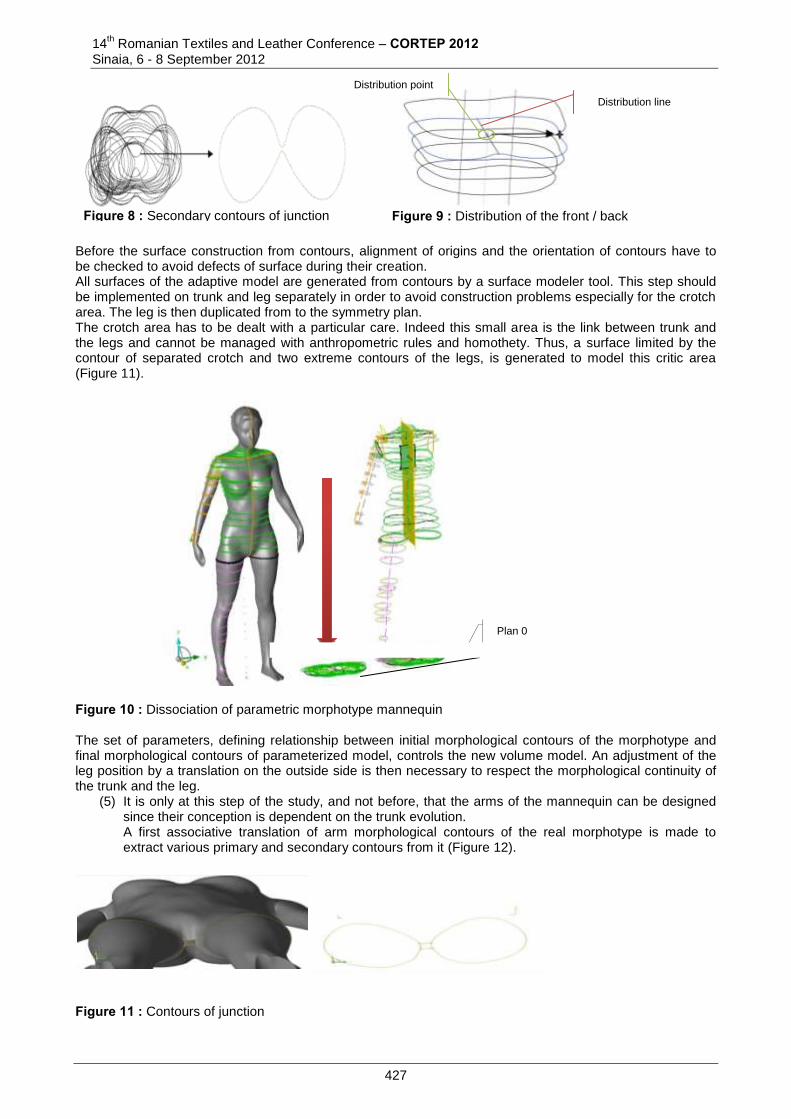
14th Romanian Textiles and Leather Conference – CORTEP 2012
Sinaia, 6 - 8 September 2012
Figure 9 : Distribution of the front / back
Before the surface construction from contours, alignment of origins and the orientation of contours have to be checked to avoid defects of surface during their creation. All surfaces of the adaptive model are generated from contours by a surface modeler tool. This step should be implemented on trunk and leg separately in order to avoid construction problems especially for the crotch area. The leg is then duplicated from to the symmetry plan. The crotch area has to be dealt with a particular care. Indeed this small area is the link between trunk and the legs and cannot be managed with anthropometric rules and homothety. Thus, a surface limited by the contour of separated crotch and two extreme contours of the legs, is generated to model this critic area (Figure 11).
Figure 10 : Dissociation of parametric morphotype mannequin The set of parameters, defining relationship between initial morphological contours of the morphotype and final morphological contours of parameterized model, controls the new volume model. An adjustment of the leg position by a translation on the outside side is then necessary to respect the morphological continuity of the trunk and the leg.
(5) It is only at this step of the study, and not before, that the arms of the mannequin can be designed since their conception is dependent on the trunk evolution. A first associative translation of arm morphological contours of the real morphotype is made to extract various primary and secondary contours from it (Figure 12).
Figure 11 : Contours of junction
Plan 0
Figure 8 : Secondary contours of junction
Distribution line
Distribution point
427
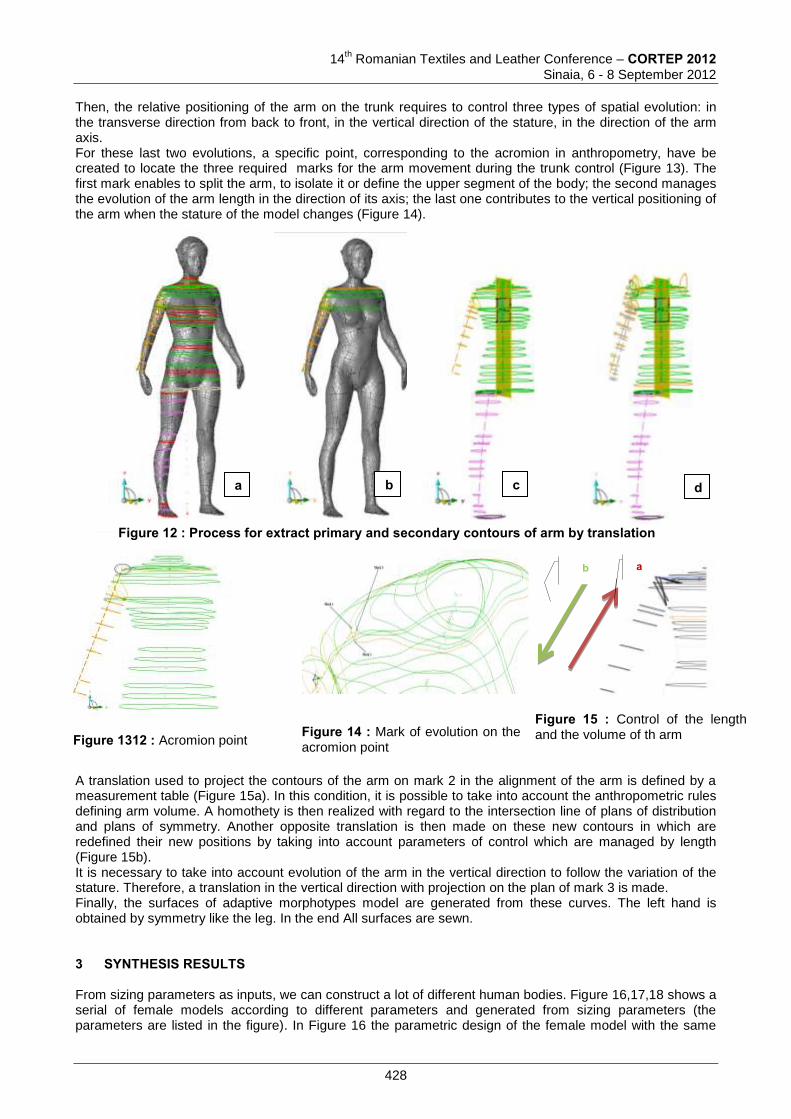
14
th Romanian Textiles and Leather Conference – CORTEP 2012
Sinaia, 6 - 8 September 2012
Then, the relative positioning of the arm on the trunk requires to control three types of spatial evolution: in the transverse direction from back to front, in the vertical direction of the stature, in the direction of the arm axis. For these last two evolutions, a specific point, corresponding to the acromion in anthropometry, have be created to locate the three required marks for the arm movement during the trunk control (Figure 13). The first mark enables to split the arm, to isolate it or define the upper segment of the body; the second manages the evolution of the arm length in the direction of its axis; the last one contributes to the vertical positioning of the arm when the stature of the model changes (Figure 14).
Figure 1312 : Acromion point
Figure 14 : Mark of evolution on the acromion point
Figure 15 : Control of the length and the volume of th arm
A translation used to project the contours of the arm on mark 2 in the alignment of the arm is defined by a measurement table (Figure 15a). In this condition, it is possible to take into account the anthropometric rules defining arm volume. A homothety is then realized with regard to the intersection line of plans of distribution and plans of symmetry. Another opposite translation is then made on these new contours in which are redefined their new positions by taking into account parameters of control which are managed by length (Figure 15b). It is necessary to take into account evolution of the arm in the vertical direction to follow the variation of the stature. Therefore, a translation in the vertical direction with projection on the plan of mark 3 is made. Finally, the surfaces of adaptive morphotypes model are generated from these curves. The left hand is obtained by symmetry like the leg. In the end All surfaces are sewn. 3 SYNTHESIS RESULTS From sizing parameters as inputs, we can construct a lot of different human bodies. Figure 16,17,18 shows a serial of female models according to different parameters and generated from sizing parameters (the parameters are listed in the figure). In Figure 16 the parametric design of the female model with the same
a b
a b c d
Figure 12 : Process for extract primary and secondary contours of arm by translation
428
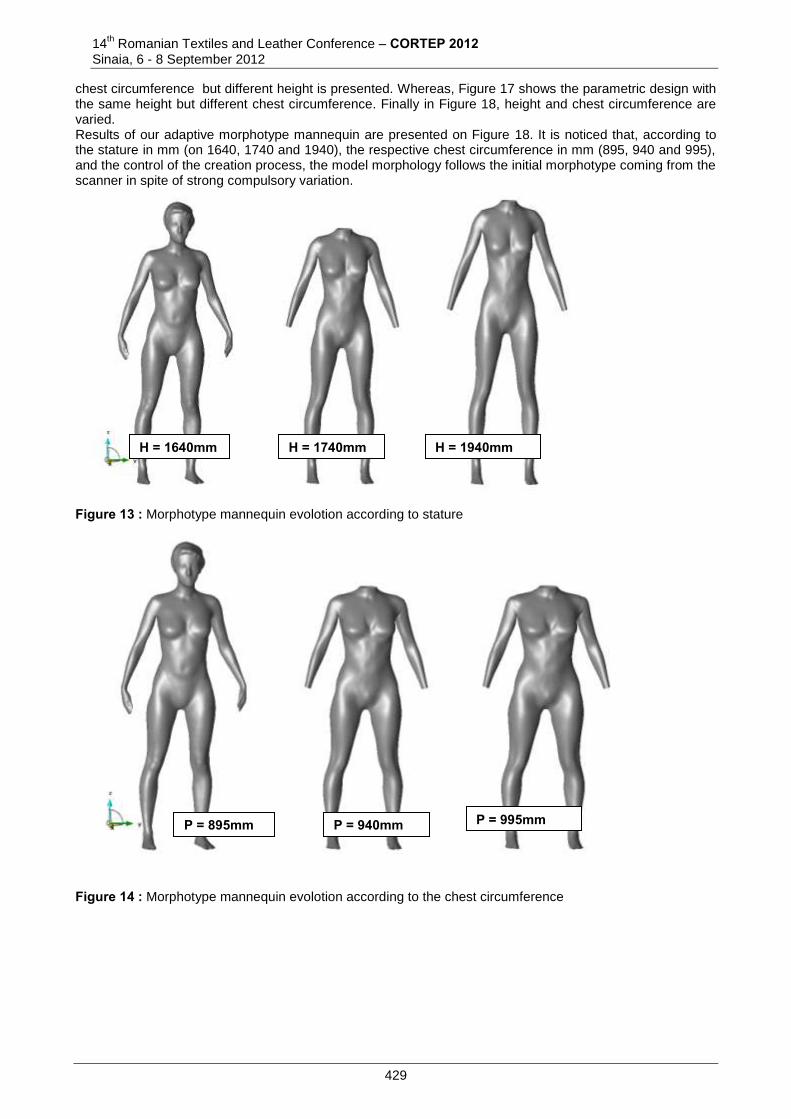
14th Romanian Textiles and Leather Conference – CORTEP 2012
Sinaia, 6 - 8 September 2012
chest circumference but different height is presented. Whereas, Figure 17 shows the parametric design with the same height but different chest circumference. Finally in Figure 18, height and chest circumference are varied. Results of our adaptive morphotype mannequin are presented on Figure 18. It is noticed that, according to the stature in mm (on 1640, 1740 and 1940), the respective chest circumference in mm (895, 940 and 995), and the control of the creation process, the model morphology follows the initial morphotype coming from the scanner in spite of strong compulsory variation.
Figure 13 : Morphotype mannequin evolotion according to stature
Figure 14 : Morphotype mannequin evolotion according to the chest circumference
H = 1640mm H = 1740mm
H = 1940mm
P = 895mm
P = 940mm
P = 995mm
429
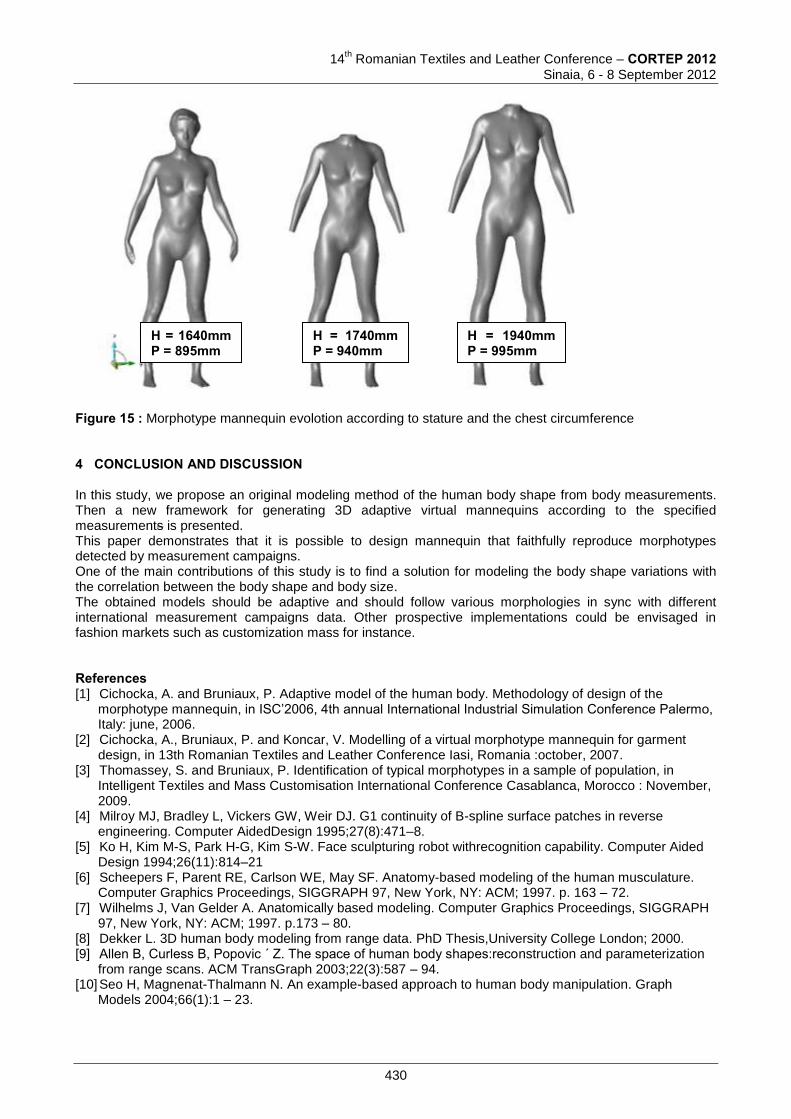
14
th Romanian Textiles and Leather Conference – CORTEP 2012
Sinaia, 6 - 8 September 2012
Figure 15 : Morphotype mannequin evolotion according to stature and the chest circumference 4 CONCLUSION AND DISCUSSION In this study, we propose an original modeling method of the human body shape from body measurements. Then a new framework for generating 3D adaptive virtual mannequins according to the specified measurements is presented. This paper demonstrates that it is possible to design mannequin that faithfully reproduce morphotypes detected by measurement campaigns. One of the main contributions of this study is to find a solution for modeling the body shape variations with the correlation between the body shape and body size. The obtained models should be adaptive and should follow various morphologies in sync with different international measurement campaigns data. Other prospective implementations could be envisaged in fashion markets such as customization mass for instance. References [1] Cichocka, A. and Bruniaux, P. Adaptive model of the human body. Methodology of design of the
morphotype mannequin, in ISC’2006, 4th annual International Industrial Simulation Conference Palermo, Italy: june, 2006.
[2] Cichocka, A., Bruniaux, P. and Koncar, V. Modelling of a virtual morphotype mannequin for garment design, in 13th Romanian Textiles and Leather Conference Iasi, Romania :october, 2007.
[3] Thomassey, S. and Bruniaux, P. Identification of typical morphotypes in a sample of population, in Intelligent Textiles and Mass Customisation International Conference Casablanca, Morocco : November, 2009.
[4] Milroy MJ, Bradley L, Vickers GW, Weir DJ. G1 continuity of B-spline surface patches in reverse engineering. Computer AidedDesign 1995;27(8):471–8.
[5] Ko H, Kim M-S, Park H-G, Kim S-W. Face sculpturing robot withrecognition capability. Computer Aided Design 1994;26(11):814–21
[6] Scheepers F, Parent RE, Carlson WE, May SF. Anatomy-based modeling of the human musculature. Computer Graphics Proceedings, SIGGRAPH 97, New York, NY: ACM; 1997. p. 163 – 72.
[7] Wilhelms J, Van Gelder A. Anatomically based modeling. Computer Graphics Proceedings, SIGGRAPH 97, New York, NY: ACM; 1997. p.173 – 80.
[8] Dekker L. 3D human body modeling from range data. PhD Thesis,University College London; 2000. [9] Allen B, Curless B, Popovic ´ Z. The space of human body shapes:reconstruction and parameterization
from range scans. ACM TransGraph 2003;22(3):587 – 94. [10] Seo H, Magnenat-Thalmann N. An example-based approach to human body manipulation. Graph
Models 2004;66(1):1 – 23.
H = 1640mm P = 895mm
H = 1740mm P = 940mm
H = 1940mm P = 995mm
430
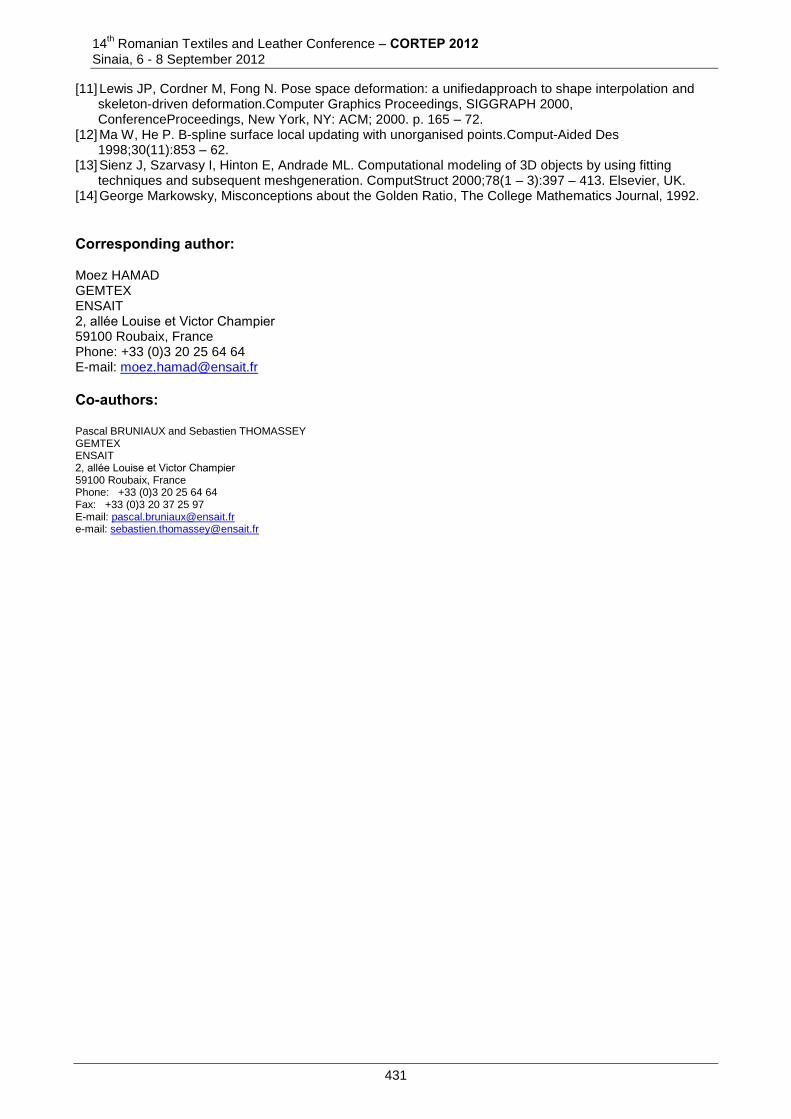
14th Romanian Textiles and Leather Conference – CORTEP 2012
Sinaia, 6 - 8 September 2012
[11] Lewis JP, Cordner M, Fong N. Pose space deformation: a unifiedapproach to shape interpolation and skeleton-driven deformation.Computer Graphics Proceedings, SIGGRAPH 2000, ConferenceProceedings, New York, NY: ACM; 2000. p. 165 – 72.
[12] Ma W, He P. B-spline surface local updating with unorganised points.Comput-Aided Des 1998;30(11):853 – 62.
[13] Sienz J, Szarvasy I, Hinton E, Andrade ML. Computational modeling of 3D objects by using fitting techniques and subsequent meshgeneration. ComputStruct 2000;78(1 – 3):397 – 413. Elsevier, UK.
[14] George Markowsky, Misconceptions about the Golden Ratio, The College Mathematics Journal, 1992. Corresponding author: Moez HAMAD GEMTEX ENSAIT 2, allée Louise et Victor Champier 59100 Roubaix, France Phone: +33 (0)3 20 25 64 64 E-mail: [email protected]
Co-authors: Pascal BRUNIAUX and Sebastien THOMASSEY GEMTEX ENSAIT 2, allée Louise et Victor Champier 59100 Roubaix, France Phone: +33 (0)3 20 25 64 64 Fax: +33 (0)3 20 37 25 97 E-mail: [email protected] e-mail: [email protected]
431
14
th Romanian Textiles and Leather Conference – CORTEP 2012
Sinaia, 6 - 8 September 2012
ANALYSIS OF ELECTRICAL RESISTANCE ON METALLIC THREAD IN EMBROIDERY
Maria Mirabela CRISTEA & Antonela CURTEZA “Gheorghe Asachi“ Technical University of Iasi, Romania
Doctoral School of the Faculty of Textile, Leather and Industrial Management Abstract: This paper presents a analysis of electric properties at the metallic thread in embroidery. This analysis entails the determination of the electrical resistance on the metallic thread in free status, to determine the factors that actuate these parameters, but also optimal settings of embroidery machine when using this thread. We did the embroidery with metallic thread in zigzag form, with different value of density. We calculated electrical resistance property for each sample and we remarked that this parameter it's been modified based on dimension and density of the stitch. The results show that the electrical resistance at metallic thread advances once you increase the length of the thread, used in embroidery because of its fixing elements by fabric, the bobbin thread and fabric. This phenomenon has been observed because the electric resistance is directly proportional to length of the conductor (in this case, the metallic thread).
Keywords: metallic thread, electric resistance, e-broidery, electronic circuit 1. INTRODUCTION Using metallic thread in embroidery is a very old topic because this type of stitching it was use on the decorative purpose. Because of technological changes during of the 90s, however, the scientists have given a new definition to embroidery: “Embroidery is the only textile technology in which threads can be arranged in (almost) any direction”. [1] In last few years, the science has adopted this technique to create smart textiles for various applications in different fields. We are also conducting research in one of the electronic textile field whose applications are found in technical textiles. The objective of this study is to determine the electrical resistance of the metallic thread used in embroidery, by zigzag stitch, with certain characteristics. This parameter is the most important on developing an electronic circuit. 2. EXPERIMENTAL Electrical resistance on the metallic thread is the most important parameter when we developing the electrical circuit on the embroidery [2]. 2.1 Materials We used the denim fabric for testing; some of its properties are given below. Table 1: Fabric properties
Colour Face (Dark blue) Reverse (Greenish Blue)
Weave Design 3/1 Twill
Number of Ends/cm 49 fils/cm
Yarn count of ends 33.64 tex
Number of Picks/cn 25 duites/cm
Yarn count of picks 65.42 tex
Width of fabric 156 cm
432
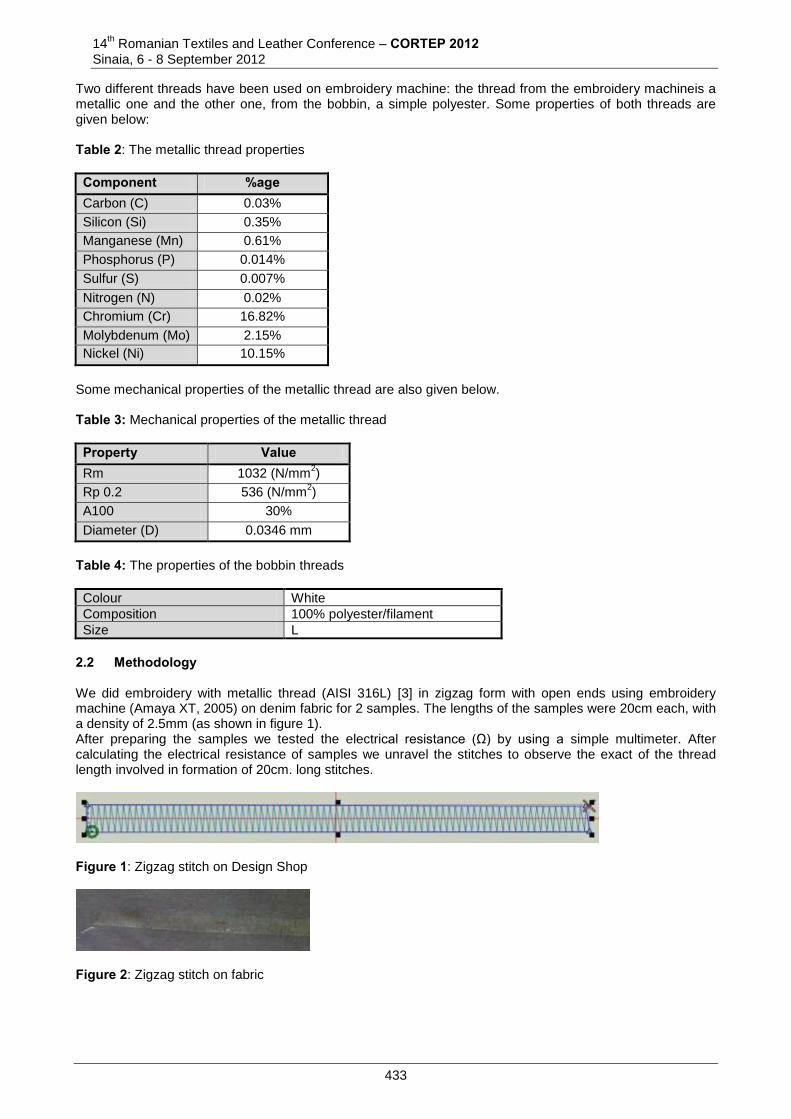
14th Romanian Textiles and Leather Conference – CORTEP 2012
Sinaia, 6 - 8 September 2012
Two different threads have been used on embroidery machine: the thread from the embroidery machineis a metallic one and the other one, from the bobbin, a simple polyester. Some properties of both threads are given below: Table 2: The metallic thread properties
Component %age Carbon (C) 0.03%
Silicon (Si) 0.35%
Manganese (Mn) 0.61%
Phosphorus (P) 0.014%
Sulfur (S) 0.007%
Nitrogen (N) 0.02%
Chromium (Cr) 16.82%
Molybdenum (Mo) 2.15%
Nickel (Ni) 10.15%
Some mechanical properties of the metallic thread are also given below. Table 3: Mechanical properties of the metallic thread
Property Value Rm 1032 (N/mm
2)
Rp 0.2 536 (N/mm2)
A100 30%
Diameter (D) 0.0346 mm
Table 4: The properties of the bobbin threads Colour White
Composition 100% polyester/filament
Size L
2.2 Methodology We did embroidery with metallic thread (AISI 316L) [3] in zigzag form with open ends using embroidery machine (Amaya XT, 2005) on denim fabric for 2 samples. The lengths of the samples were 20cm each, with a density of 2.5mm (as shown in figure 1). After preparing the samples we tested the electrical resistance (Ω) by using a simple multimeter. After calculating the electrical resistance of samples we unravel the stitches to observe the exact of the thread length involved in formation of 20cm. long stitches.
Figure 1: Zigzag stitch on Design Shop
Figure 2: Zigzag stitch on fabric
433
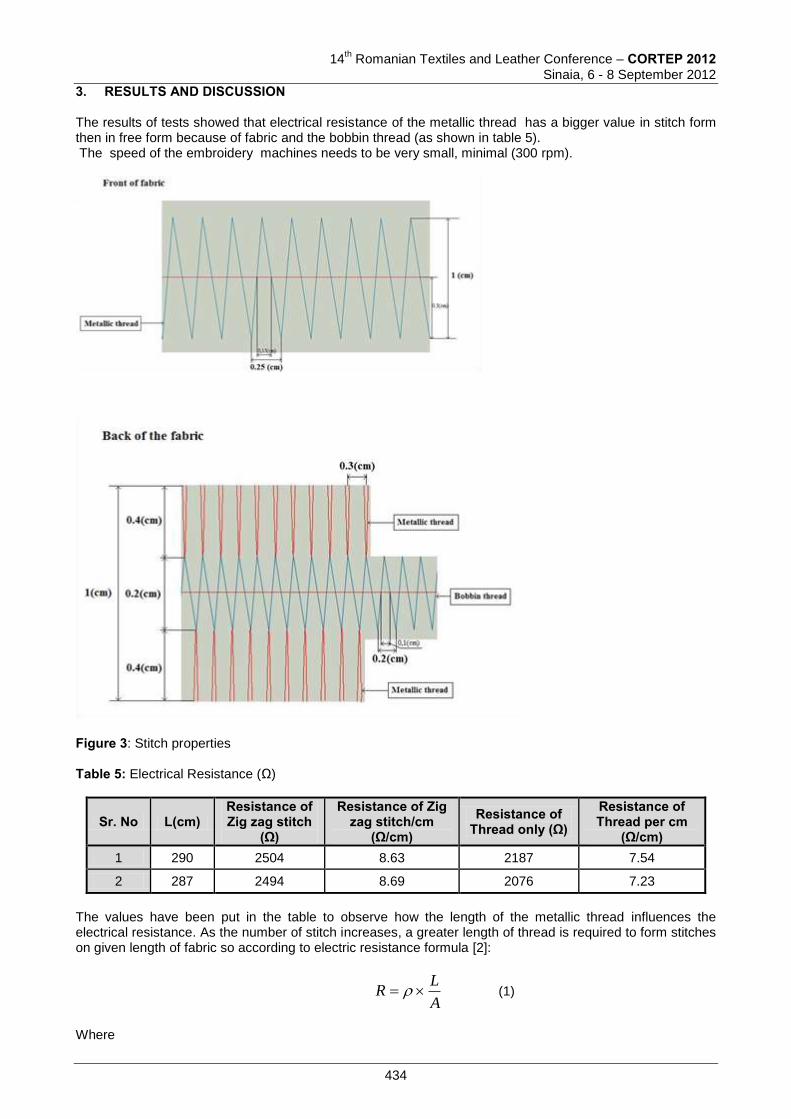
14
th Romanian Textiles and Leather Conference – CORTEP 2012
Sinaia, 6 - 8 September 2012
3. RESULTS AND DISCUSSION The results of tests showed that electrical resistance of the metallic thread has a bigger value in stitch form then in free form because of fabric and the bobbin thread (as shown in table 5). The speed of the embroidery machines needs to be very small, minimal (300 rpm).
Figure 3: Stitch properties Table 5: Electrical Resistance (Ω)
Sr. No L(cm) Resistance of Zig zag stitch
(Ω)
Resistance of Zig zag stitch/cm
(Ω/cm) Resistance of
Thread only (Ω) Resistance of Thread per cm
(Ω/cm) 1 290 2504 8.63 2187 7.54
2 287 2494 8.69 2076 7.23
The values have been put in the table to observe how the length of the metallic thread influences the electrical resistance. As the number of stitch increases, a greater length of thread is required to form stitches on given length of fabric so according to electric resistance formula [2]:
A
LR (1)
Where
434
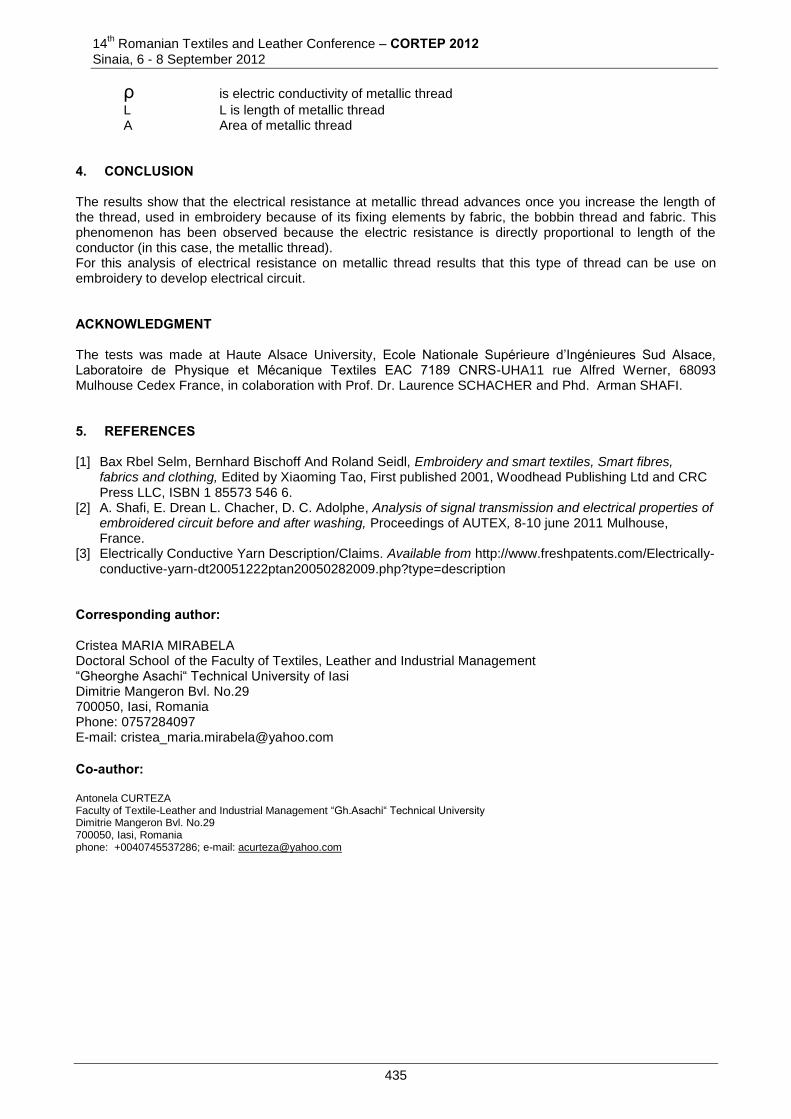
14th Romanian Textiles and Leather Conference – CORTEP 2012
Sinaia, 6 - 8 September 2012
ρ is electric conductivity of metallic thread
L L is length of metallic thread A Area of metallic thread 4. CONCLUSION The results show that the electrical resistance at metallic thread advances once you increase the length of the thread, used in embroidery because of its fixing elements by fabric, the bobbin thread and fabric. This phenomenon has been observed because the electric resistance is directly proportional to length of the conductor (in this case, the metallic thread). For this analysis of electrical resistance on metallic thread results that this type of thread can be use on embroidery to develop electrical circuit. ACKNOWLEDGMENT The tests was made at Haute Alsace University, Ecole Nationale Supérieure d’Ingénieures Sud Alsace, Laboratoire de Physique et Mécanique Textiles EAC 7189 CNRS-UHA11 rue Alfred Werner, 68093 Mulhouse Cedex France, in colaboration with Prof. Dr. Laurence SCHACHER and Phd. Arman SHAFI. 5. REFERENCES [1] Bax Rbel Selm, Bernhard Bischoff And Roland Seidl, Embroidery and smart textiles, Smart fibres,
fabrics and clothing, Edited by Xiaoming Tao, First published 2001, Woodhead Publishing Ltd and CRC Press LLC, ISBN 1 85573 546 6.
[2] A. Shafi, E. Drean L. Chacher, D. C. Adolphe, Analysis of signal transmission and electrical properties of embroidered circuit before and after washing, Proceedings of AUTEX, 8-10 june 2011 Mulhouse, France.
[3] Electrically Conductive Yarn Description/Claims. Available from http://www.freshpatents.com/Electrically-conductive-yarn-dt20051222ptan20050282009.php?type=description
Corresponding author: Cristea MARIA MIRABELA Doctoral School
of the Faculty of Textiles, Leather and Industrial Management
“Gheorghe Asachi“ Technical University of Iasi Dimitrie Mangeron Bvl. No.29 700050, Iasi, Romania Phone: 0757284097 E-mail: [email protected]
Co-author: Antonela CURTEZA Faculty of Textile-Leather and Industrial Management “Gh.Asachi“ Technical University Dimitrie Mangeron Bvl. No.29 700050, Iasi, Romania phone: +0040745537286; e-mail: [email protected]
435
14
th Romanian Textiles and Leather Conference – CORTEP 2012
Sinaia, 6 - 8 September 2012
BI-DIMENSIONAL STATISTICAL ANALYSE OF MAIN ANTHROPOMETRIC PARAMETERS SPECIFIC TO PRIMARY SCHOOL
CHILDRENS
Ana VIRCAN, Dorin IONESI, Stan MITU & Lavinia CAPMARE ”Gheorghe Asachi” Technical University of Iasi, Romania,
Doctoral School of the Faculty of Textile, Leather and Industrial Management Abstract: Physical and psychical growth and development on children is influenced by genetic factors, social, geographical, nutritional, educational and civilization ones, therefore being a dynamic process and uneven in time. The present paper analyses the growth and development of children aged 7-10, in order to obtain the necessary information for designing patterns according to the studied age group dimensions. The aim of the paper is characterizing the age group 7-10 based on the analysis of the main body dimensions’ variations. The experimental data necessary for the study were obtained by applying direct measurement method on a target group of 393 children (194 girls and 199 boys), being analyzed bivariately for identifying the specific morphological types of this group and the appearance frequency. Keywords: anthropometry, growth, morphological types, finding frequency.
1 INTRODUCTION Serial manufacturing of products must be oriented towards the satisfaction of consumers. In this conditions clothing manufacturing for children must be based on the identification of main morphological types found among the population and their frequency of appearance. The growth and development of the child body is a dynamic process, uneven in time, having successive and coherent stages that impose specific traits for each childhood period. This process is characterized by a set of psycho-physical characteristics with a certain stability that allows traits identification among the same age subjects or within a close interval of age, therefore it is correct and useful to analyze this process on different periods of growth and development. Researchers have demonstrated the existence of a secular growth of the body dimensions particular values, making necessary the updating of data bases used in industrial manufacturing of children clothing, having as aim the personal comfort. The updating is made based on some anthropometrical investigations on a target group of children, for a specific age group [1]. The aim of the paper is to identify and characterize the morphological types specific for the age group 7-10 years, using the data obtained from an anthropometrical investigation on a target group of 193 girls and 199 boys, from the Oltenia region. The necessary data were obtained through direct measurement method, according to STAS 5279-87 and SR ISO 3635/98. 2 RESULTS OBTAINED AND INTERPRETATION By analyzing the variation of anthropometric sizes that characterize human body was demonstrated that these show similarities with the Gauss Laplace distribution law [2]. 2.1. The necessary data for bivariate statistical processing Based on the statistical results obtained from the previous researches, for the same corresponding dimensions of the two selections (girls and boys aged 7-10), the paper presents the applications of the bivariate statistics analysis. In the study were considered the main anthropometric parameters longitudinally oriented ( Ic – body height) and transversally oriented (Pb- bust perimeter common to both selections, Ps- hip perimeter for girls
436
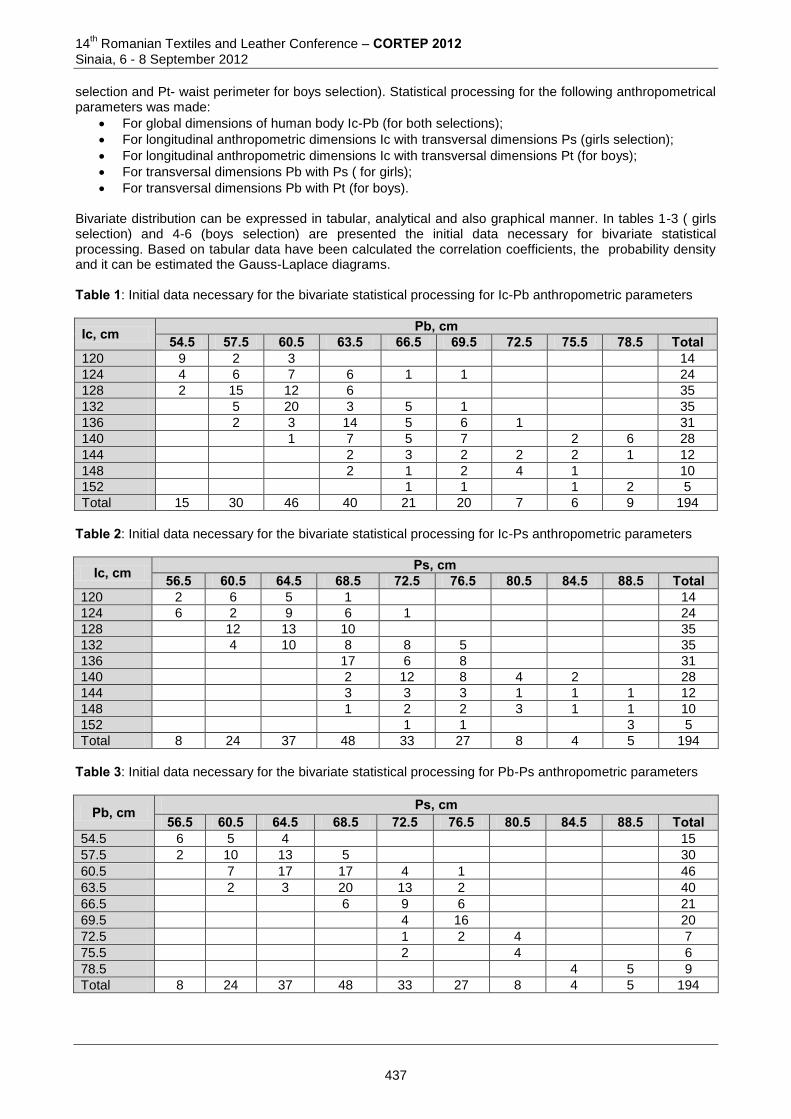
14th Romanian Textiles and Leather Conference – CORTEP 2012
Sinaia, 6 - 8 September 2012
selection and Pt- waist perimeter for boys selection). Statistical processing for the following anthropometrical parameters was made:
For global dimensions of human body Ic-Pb (for both selections);
For longitudinal anthropometric dimensions Ic with transversal dimensions Ps (girls selection);
For longitudinal anthropometric dimensions Ic with transversal dimensions Pt (for boys);
For transversal dimensions Pb with Ps ( for girls);
For transversal dimensions Pb with Pt (for boys). Bivariate distribution can be expressed in tabular, analytical and also graphical manner. In tables 1-3 ( girls selection) and 4-6 (boys selection) are presented the initial data necessary for bivariate statistical processing. Based on tabular data have been calculated the correlation coefficients, the probability density and it can be estimated the Gauss-Laplace diagrams. Table 1: Initial data necessary for the bivariate statistical processing for Ic-Pb anthropometric parameters
Ic, cm Pb, cm 54.5 57.5 60.5 63.5 66.5 69.5 72.5 75.5 78.5 Total
120 9 2 3 14
124 4 6 7 6 1 1 24
128 2 15 12 6 35
132 5 20 3 5 1 35
136 2 3 14 5 6 1 31
140 1 7 5 7 2 6 28
144 2 3 2 2 2 1 12
148 2 1 2 4 1 10
152 1 1 1 2 5
Total 15 30 46 40 21 20 7 6 9 194
Table 2: Initial data necessary for the bivariate statistical processing for Ic-Ps anthropometric parameters
Ic, cm Ps, cm 56.5 60.5 64.5 68.5 72.5 76.5 80.5 84.5 88.5 Total
120 2 6 5 1 14
124 6 2 9 6 1 24
128 12 13 10 35
132 4 10 8 8 5 35
136 17 6 8 31
140 2 12 8 4 2 28
144 3 3 3 1 1 1 12
148 1 2 2 3 1 1 10
152 1 1 3 5
Total 8 24 37 48 33 27 8 4 5 194
Table 3: Initial data necessary for the bivariate statistical processing for Pb-Ps anthropometric parameters
Pb, cm Ps, cm 56.5 60.5 64.5 68.5 72.5 76.5 80.5 84.5 88.5 Total
54.5 6 5 4 15
57.5 2 10 13 5 30
60.5 7 17 17 4 1 46
63.5 2 3 20 13 2 40
66.5 6 9 6 21
69.5 4 16 20
72.5 1 2 4 7
75.5 2 4 6
78.5 4 5 9
Total 8 24 37 48 33 27 8 4 5 194
437
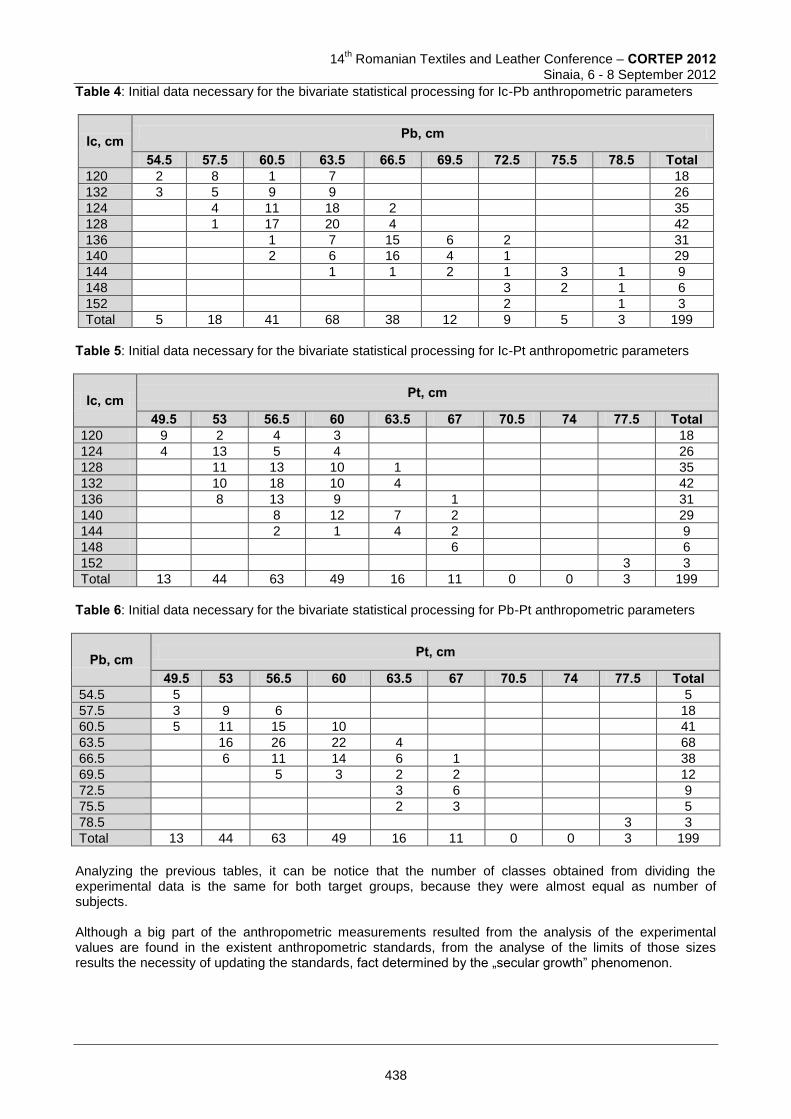
14
th Romanian Textiles and Leather Conference – CORTEP 2012
Sinaia, 6 - 8 September 2012
Table 4: Initial data necessary for the bivariate statistical processing for Ic-Pb anthropometric parameters
Ic, cm Pb, cm
54.5 57.5 60.5 63.5 66.5 69.5 72.5 75.5 78.5 Total 120 2 8 1 7 18
132 3 5 9 9 26
124 4 11 18 2 35
128 1 17 20 4 42
136 1 7 15 6 2 31
140 2 6 16 4 1 29
144 1 1 2 1 3 1 9
148 3 2 1 6
152 2 1 3
Total 5 18 41 68 38 12 9 5 3 199
Table 5: Initial data necessary for the bivariate statistical processing for Ic-Pt anthropometric parameters
Ic, cm Pt, cm
49.5 53 56.5 60 63.5 67 70.5 74 77.5 Total 120 9 2 4 3 18
124 4 13 5 4 26
128 11 13 10 1 35
132 10 18 10 4 42
136 8 13 9 1 31
140 8 12 7 2 29
144 2 1 4 2 9
148 6 6
152 3 3
Total 13 44 63 49 16 11 0 0 3 199
Table 6: Initial data necessary for the bivariate statistical processing for Pb-Pt anthropometric parameters
Pb, cm Pt, cm
49.5 53 56.5 60 63.5 67 70.5 74 77.5 Total 54.5 5 5
57.5 3 9 6 18
60.5 5 11 15 10 41
63.5 16 26 22 4 68
66.5 6 11 14 6 1 38
69.5 5 3 2 2 12
72.5 3 6 9
75.5 2 3 5
78.5 3 3
Total 13 44 63 49 16 11 0 0 3 199
Analyzing the previous tables, it can be notice that the number of classes obtained from dividing the experimental data is the same for both target groups, because they were almost equal as number of subjects. Although a big part of the anthropometric measurements resulted from the analysis of the experimental values are found in the existent anthropometric standards, from the analyse of the limits of those sizes results the necessity of updating the standards, fact determined by the „secular growth” phenomenon.
438

14th Romanian Textiles and Leather Conference – CORTEP 2012
Sinaia, 6 - 8 September 2012
2.2 The used process and the research results The primary data from tables 1-6 represent the necessary elements for verifying the probability density, this being made by applying the bivariate distribution law [2,3,4,5]:
22
22
)1(2
1
212
1),(
y
i
y
i
x
i
x
i
s
yy
s
yy
s
xxr
s
xx
r
yx
erss
yxF
(1)
yxi
yi
ssn
yxxxr
(2) where : F(x,y) - the function represents the number of subjects from a certain size; xi, yi - individual values of the parameters marked on the columns, respectively in tables 1-3;
x , y - arithmetic average weighted of the two variables; σx, σy – standard deviations of the two variables; r – correlation coefficient between the two variables for general collectivity; ni - represents the total for the individual values. To calculate the theoretical number of subjects F(x,y) by applying the relation (1) it is necessary to determine the correlation coefficient for the pairs of anthropometric parameters studied based on the relation (2). The values of those parameters can be analyzed in parallel with the values shown in tables 1-6. The most strong correlation is observed between the dimensions with the same body orientation on both selections (tables 7 and 8). Table 7: Correlation coefficients for the pairs of anthropometric parameters for girls selection
Pairs of anthropometric parameters
Calculating correlation coefficients
Values of correlation coefficients
Ic - Pb 508.10957
190.7429
0,678
Ic – Ps 420.12477
833.8933
0,716
Pb- Ps 768.8491
624.7608
0,896
Table 8: Correlation coefficients for the pairs of anthropometric parameters for boys selection
Pairs of anthropometric parameters
Calculating correlation coefficients
Values of correlation coefficients
Ic - Pb 054.7774
164.5224
0.672
Ic - Pt 322.9201
044.4481
0.487
Pb - Pt 412.6174
715.5618
0.910
The result obtained after calculate the F(x,y) function are used to determine the theoretical number of subjects, in order to verify the normal distribution values calculated for the Gauss-Laplace considered parameters.
439
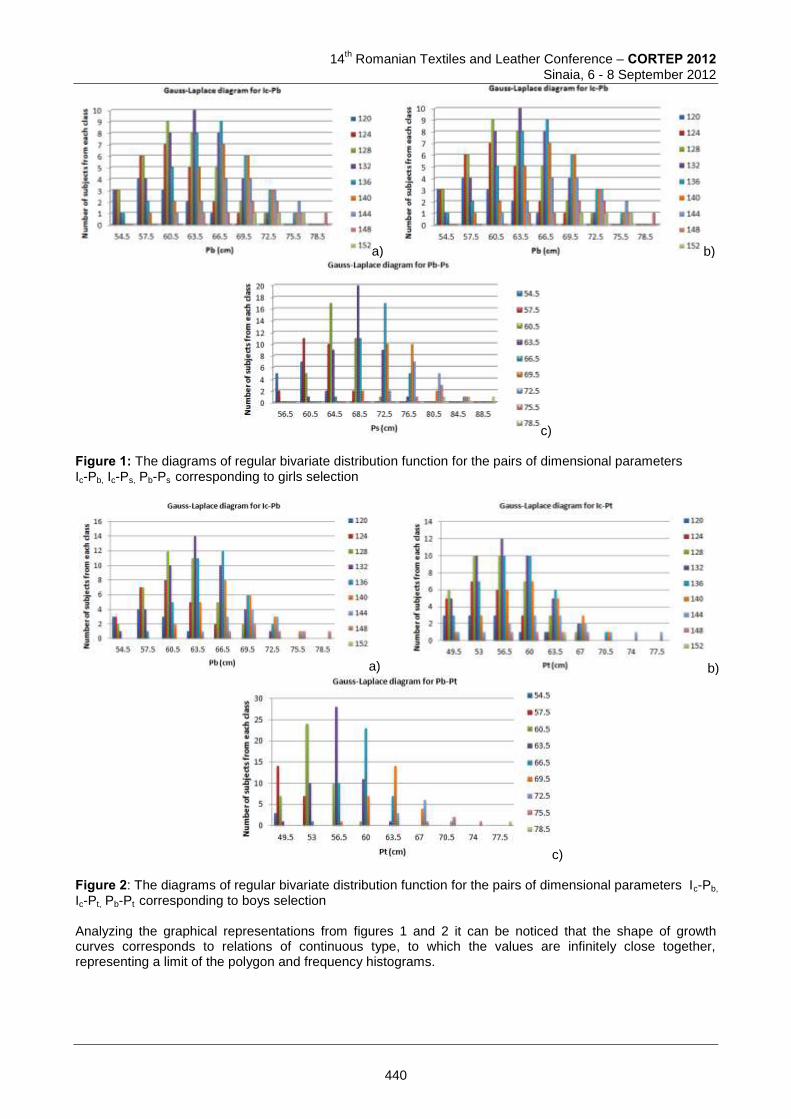
14
th Romanian Textiles and Leather Conference – CORTEP 2012
Sinaia, 6 - 8 September 2012
a) b)
c) Figure 1: The diagrams of regular bivariate distribution function for the pairs of dimensional parameters Ic-Pb, Ic-Ps, Pb-Ps corresponding to girls selection
a) b)
c) Figure 2: The diagrams of regular bivariate distribution function for the pairs of dimensional parameters Ic-Pb, Ic-Pt, Pb-Pt corresponding to boys selection Analyzing the graphical representations from figures 1 and 2 it can be noticed that the shape of growth curves corresponds to relations of continuous type, to which the values are infinitely close together, representing a limit of the polygon and frequency histograms.
440
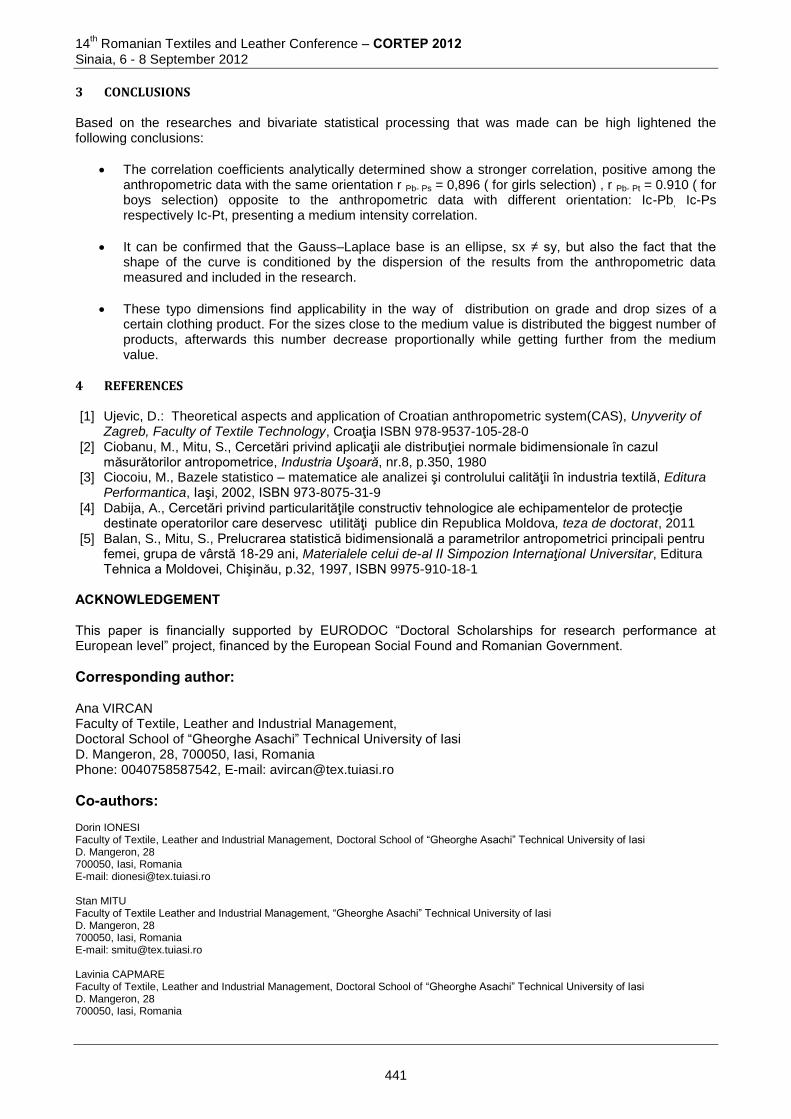
14th Romanian Textiles and Leather Conference – CORTEP 2012
Sinaia, 6 - 8 September 2012
3 CONCLUSIONS Based on the researches and bivariate statistical processing that was made can be high lightened the following conclusions:
The correlation coefficients analytically determined show a stronger correlation, positive among the anthropometric data with the same orientation r Pb- Ps = 0,896 ( for girls selection) , r Pb- Pt = 0.910 ( for boys selection) opposite to the anthropometric data with different orientation: Ic-Pb, Ic-Ps
respectively Ic-Pt, presenting a medium intensity correlation.
It can be confirmed that the Gauss–Laplace base is an ellipse, sx ≠ sy, but also the fact that the shape of the curve is conditioned by the dispersion of the results from the anthropometric data measured and included in the research.
These typo dimensions find applicability in the way of distribution on grade and drop sizes of a certain clothing product. For the sizes close to the medium value is distributed the biggest number of products, afterwards this number decrease proportionally while getting further from the medium value.
4 REFERENCES [1] Ujevic, D.: Theoretical aspects and application of Croatian anthropometric system(CAS), Unyverity of
Zagreb, Faculty of Textile Technology, Croaţia ISBN 978-9537-105-28-0 [2] Ciobanu, M., Mitu, S., Cercetări privind aplicaţii ale distribuţiei normale bidimensionale în cazul
măsurătorilor antropometrice, Industria Uşoară, nr.8, p.350, 1980 [3] Ciocoiu, M., Bazele statistico – matematice ale analizei şi controlului calităţii în industria textilă, Editura
Performantica, Iaşi, 2002, ISBN 973-8075-31-9 [4] Dabija, A., Cercetări privind particularităţile constructiv tehnologice ale echipamentelor de protecţie
destinate operatorilor care deservesc utilităţi publice din Republica Moldova, teza de doctorat, 2011 [5] Balan, S., Mitu, S., Prelucrarea statistică bidimensională a parametrilor antropometrici principali pentru
femei, grupa de vârstă 18-29 ani, Materialele celui de-al II Simpozion Internaţional Universitar, Editura Tehnica a Moldovei, Chişinău, p.32, 1997, ISBN 9975-910-18-1
ACKNOWLEDGEMENT This paper is financially supported by EURODOC “Doctoral Scholarships for research performance at European level” project, financed by the European Social Found and Romanian Government.
Corresponding author: Ana VIRCAN Faculty of Textile, Leather and Industrial Management, Doctoral School of “Gheorghe Asachi” Technical University of Iasi D. Mangeron, 28, 700050, Iasi, Romania Phone: 0040758587542, E-mail: [email protected]
Co-authors: Dorin IONESI Faculty of Textile, Leather and Industrial Management, Doctoral School of “Gheorghe Asachi” Technical University of Iasi D. Mangeron, 28 700050, Iasi, Romania E-mail: [email protected] Stan MITU Faculty of Textile Leather and Industrial Management, “Gheorghe Asachi” Technical University of Iasi D. Mangeron, 28 700050, Iasi, Romania E-mail: [email protected] Lavinia CAPMARE Faculty of Textile, Leather and Industrial Management, Doctoral School of “Gheorghe Asachi” Technical University of Iasi D. Mangeron, 28 700050, Iasi, Romania
441
14th Romanian Textiles and Leather Conference – CORTEP 2012
Sinaia, 6 - 8 September 2012
SOLUTIONS DEVELOPMENT FOR BASIC PATTERNS REMODELING THROUGH 3D VIRTUAL SIMULATION OF
BODY – GARMENT DIMENSIONAL FITTING
Emilia FILIPESCU1, Sabina OLARU2 & Elena FILIPESCU3 1 “Gheorghe Asachi” Technical University of Iasi, Romania
2 The National R&D Institute for Textiles and Leather, Bucharest- Romania
3 SC Gemini CAD Systems SRL, Iasi, Romania
Abstract: The 2D geometric method for basic patterns design, through classic technology or using specialized CAD systems require a practical verification stage of the developed patterns quality. Research developed in this paper are in line with this context, research that focused on: selecting a certain body from the database obtained through 3D scanning, which represents the
conformational type F; designing the basic pattern for body type F (168-92-108) using the system Gemini CAD; analysis and inventory of the dimensional deviations; simulation of correspondence between the user body and the patterns - virtual fitting; develop and implement solutions to adapt basic patterns - reshaping the basic patterns; simulation of the remodeled patterns. Researches developed in the paper provide concrete information on an innovative approach of clothing design process, with favorable repercussions in assuring a high dimensional correspondence between the garment and the concrete form of the potential user body. Keywords: virtual simulation, pattern design, body type 1 INTRODUCTION The classic clothing design technology, in the manually system or by using CAD systems, finalizing the design of basic and model patterns requires material execution of the prototype, most of times to repeat this step until completion and optimization of basic and model patterns. This is a laborious task and is made of high consumption of time and material costs, due to practical execution of the prototype. This work technique is used in the industrial system of clothing manufacturing, when designing patterns is based on design algorithms using standardized values of type bodies. These problems can be eliminated by integration of CAD technology in production systems with positive effects on labor productivity, reduce manufacturing/delivery time, expansion of clothing production after specific dimensions of users, but the industrial system. The qualitative leap in the field of industrial design, but after the body sizes of customers, so-called "individualized clothing" is made possible due to the CAD systems performances, integration of both modules: MTM design and simulation in the virtual space of the correspondence between body and product designed in 2D. 3D virtual simulation of the correspondence between designed product and the human body is an innovative technique that offers many advantages among which a essential role is the rapid renewal of models, reduction of costs relating to implementation of practical prototypes, ensuring a high correlation with body shape of the users. In this context, the paper presents the results of theoretical and applied research, which aimed:
Morphological analysis of some subjects, research on their body classification based on the main dimensions, according to a standard body type;
Inventory of the indicators dimensional deviations of tested subjects from the body type values, which the tested subjects fits according to their main dimensions;
Development of design algorithm for dress basic pattern, with standardized values of body type; Virtual simulation of correspondence between the selected body and the garment made for the body
type, with specific assessment of the deviations that resulted; Development and implementation of solutions to adapt the initial basic patterns to the concrete form
the subject tested, remodeling basic patterns; Completion of initial patterns with re-simulation of the remodeled patterns.
442
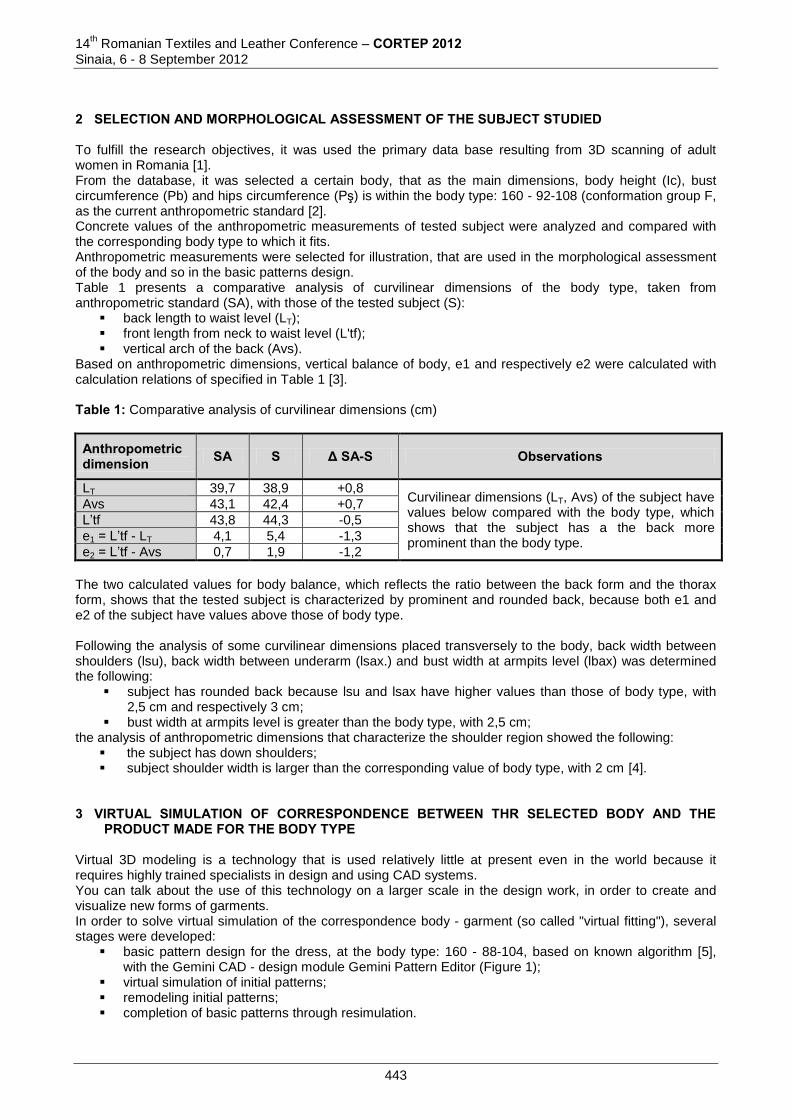
14th Romanian Textiles and Leather Conference – CORTEP 2012
Sinaia, 6 - 8 September 2012
2 SELECTION AND MORPHOLOGICAL ASSESSMENT OF THE SUBJECT STUDIED To fulfill the research objectives, it was used the primary data base resulting from 3D scanning of adult women in Romania [1]. From the database, it was selected a certain body, that as the main dimensions, body height (Ic), bust circumference (Pb) and hips circumference (Pş) is within the body type: 160 - 92-108 (conformation group F, as the current anthropometric standard [2]. Concrete values of the anthropometric measurements of tested subject were analyzed and compared with the corresponding body type to which it fits. Anthropometric measurements were selected for illustration, that are used in the morphological assessment of the body and so in the basic patterns design. Table 1 presents a comparative analysis of curvilinear dimensions of the body type, taken from anthropometric standard (SA), with those of the tested subject (S):
back length to waist level (LT); front length from neck to waist level (L'tf); vertical arch of the back (Avs).
Based on anthropometric dimensions, vertical balance of body, e1 and respectively e2 were calculated with calculation relations of specified in Table 1 [3]. Table 1: Comparative analysis of curvilinear dimensions (cm)
Anthropometric dimension SA S Δ SA-S Observations
LT 39,7 38,9 +0,8 Curvilinear dimensions (LT, Avs) of the subject have values below compared with the body type, which shows that the subject has a the back more prominent than the body type.
Avs 43,1 42,4 +0,7
L’tf 43,8 44,3 -0,5
e1 = L’tf - LT 4,1 5,4 -1,3
e2 = L’tf - Avs 0,7 1,9 -1,2
The two calculated values for body balance, which reflects the ratio between the back form and the thorax form, shows that the tested subject is characterized by prominent and rounded back, because both e1 and e2 of the subject have values above those of body type. Following the analysis of some curvilinear dimensions placed transversely to the body, back width between shoulders (lsu), back width between underarm (lsax.) and bust width at armpits level (lbax) was determined the following:
subject has rounded back because lsu and lsax have higher values than those of body type, with 2,5 cm and respectively 3 cm;
bust width at armpits level is greater than the body type, with 2,5 cm; the analysis of anthropometric dimensions that characterize the shoulder region showed the following:
the subject has down shoulders; subject shoulder width is larger than the corresponding value of body type, with 2 cm [4].
3 VIRTUAL SIMULATION OF CORRESPONDENCE BETWEEN THR SELECTED BODY AND THE
PRODUCT MADE FOR THE BODY TYPE Virtual 3D modeling is a technology that is used relatively little at present even in the world because it requires highly trained specialists in design and using CAD systems. You can talk about the use of this technology on a larger scale in the design work, in order to create and visualize new forms of garments. In order to solve virtual simulation of the correspondence body - garment (so called "virtual fitting"), several stages were developed:
basic pattern design for the dress, at the body type: 160 - 88-104, based on known algorithm [5], with the Gemini CAD - design module Gemini Pattern Editor (Figure 1);
virtual simulation of initial patterns; remodeling initial patterns; completion of basic patterns through resimulation.
443
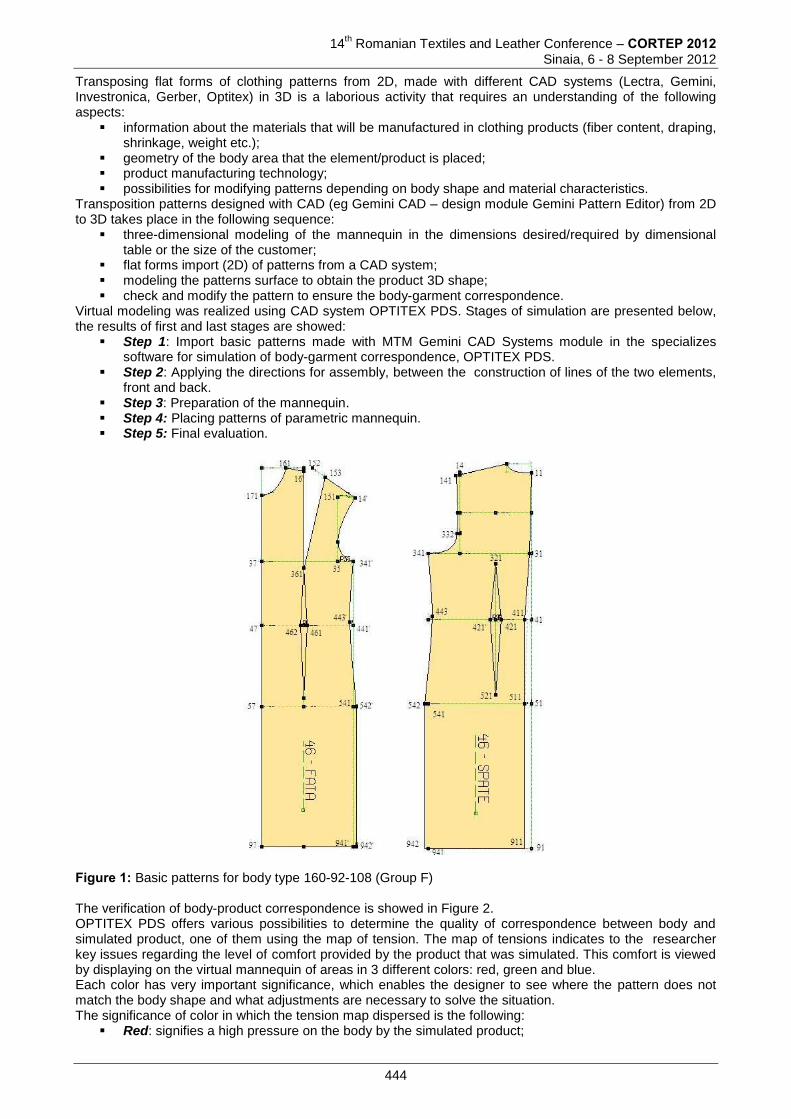
14th Romanian Textiles and Leather Conference – CORTEP 2012
Sinaia, 6 - 8 September 2012
Transposing flat forms of clothing patterns from 2D, made with different CAD systems (Lectra, Gemini, Investronica, Gerber, Optitex) in 3D is a laborious activity that requires an understanding of the following aspects:
information about the materials that will be manufactured in clothing products (fiber content, draping, shrinkage, weight etc.);
geometry of the body area that the element/product is placed; product manufacturing technology; possibilities for modifying patterns depending on body shape and material characteristics.
Transposition patterns designed with CAD (eg Gemini CAD – design module Gemini Pattern Editor) from 2D to 3D takes place in the following sequence:
three-dimensional modeling of the mannequin in the dimensions desired/required by dimensional table or the size of the customer;
flat forms import (2D) of patterns from a CAD system; modeling the patterns surface to obtain the product 3D shape; check and modify the pattern to ensure the body-garment correspondence.
Virtual modeling was realized using CAD system OPTITEX PDS. Stages of simulation are presented below, the results of first and last stages are showed:
Step 1: Import basic patterns made with MTM Gemini CAD Systems module in the specializes software for simulation of body-garment correspondence, OPTITEX PDS.
Step 2: Applying the directions for assembly, between the construction of lines of the two elements, front and back.
Step 3: Preparation of the mannequin. Step 4: Placing patterns of parametric mannequin. Step 5: Final evaluation.
Figure 1: Basic patterns for body type 160-92-108 (Group F) The verification of body-product correspondence is showed in Figure 2. OPTITEX PDS offers various possibilities to determine the quality of correspondence between body and simulated product, one of them using the map of tension. The map of tensions indicates to the researcher key issues regarding the level of comfort provided by the product that was simulated. This comfort is viewed by displaying on the virtual mannequin of areas in 3 different colors: red, green and blue. Each color has very important significance, which enables the designer to see where the pattern does not match the body shape and what adjustments are necessary to solve the situation. The significance of color in which the tension map dispersed is the following:
Red: signifies a high pressure on the body by the simulated product;
444
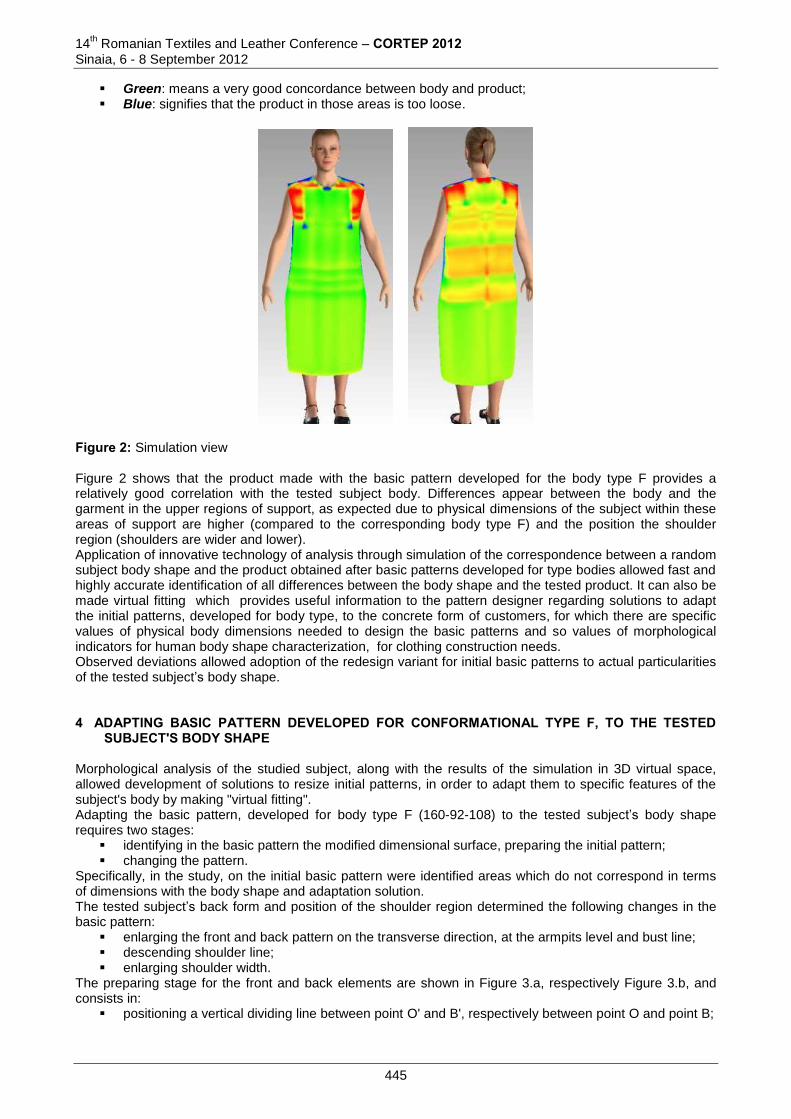
14th Romanian Textiles and Leather Conference – CORTEP 2012
Sinaia, 6 - 8 September 2012
Green: means a very good concordance between body and product; Blue: signifies that the product in those areas is too loose.
Figure 2: Simulation view Figure 2 shows that the product made with the basic pattern developed for the body type F provides a relatively good correlation with the tested subject body. Differences appear between the body and the garment in the upper regions of support, as expected due to physical dimensions of the subject within these areas of support are higher (compared to the corresponding body type F) and the position the shoulder region (shoulders are wider and lower). Application of innovative technology of analysis through simulation of the correspondence between a random subject body shape and the product obtained after basic patterns developed for type bodies allowed fast and highly accurate identification of all differences between the body shape and the tested product. It can also be made virtual fitting which provides useful information to the pattern designer regarding solutions to adapt the initial patterns, developed for body type, to the concrete form of customers, for which there are specific values of physical body dimensions needed to design the basic patterns and so values of morphological indicators for human body shape characterization, for clothing construction needs. Observed deviations allowed adoption of the redesign variant for initial basic patterns to actual particularities of the tested subject’s body shape. 4 ADAPTING BASIC PATTERN DEVELOPED FOR CONFORMATIONAL TYPE F, TO THE TESTED
SUBJECT'S BODY SHAPE Morphological analysis of the studied subject, along with the results of the simulation in 3D virtual space, allowed development of solutions to resize initial patterns, in order to adapt them to specific features of the subject's body by making "virtual fitting". Adapting the basic pattern, developed for body type F (160-92-108) to the tested subject’s body shape requires two stages:
identifying in the basic pattern the modified dimensional surface, preparing the initial pattern; changing the pattern.
Specifically, in the study, on the initial basic pattern were identified areas which do not correspond in terms of dimensions with the body shape and adaptation solution. The tested subject’s back form and position of the shoulder region determined the following changes in the basic pattern:
enlarging the front and back pattern on the transverse direction, at the armpits level and bust line; descending shoulder line; enlarging shoulder width.
The preparing stage for the front and back elements are shown in Figure 3.a, respectively Figure 3.b, and consists in:
positioning a vertical dividing line between point O' and B', respectively between point O and point B;
445
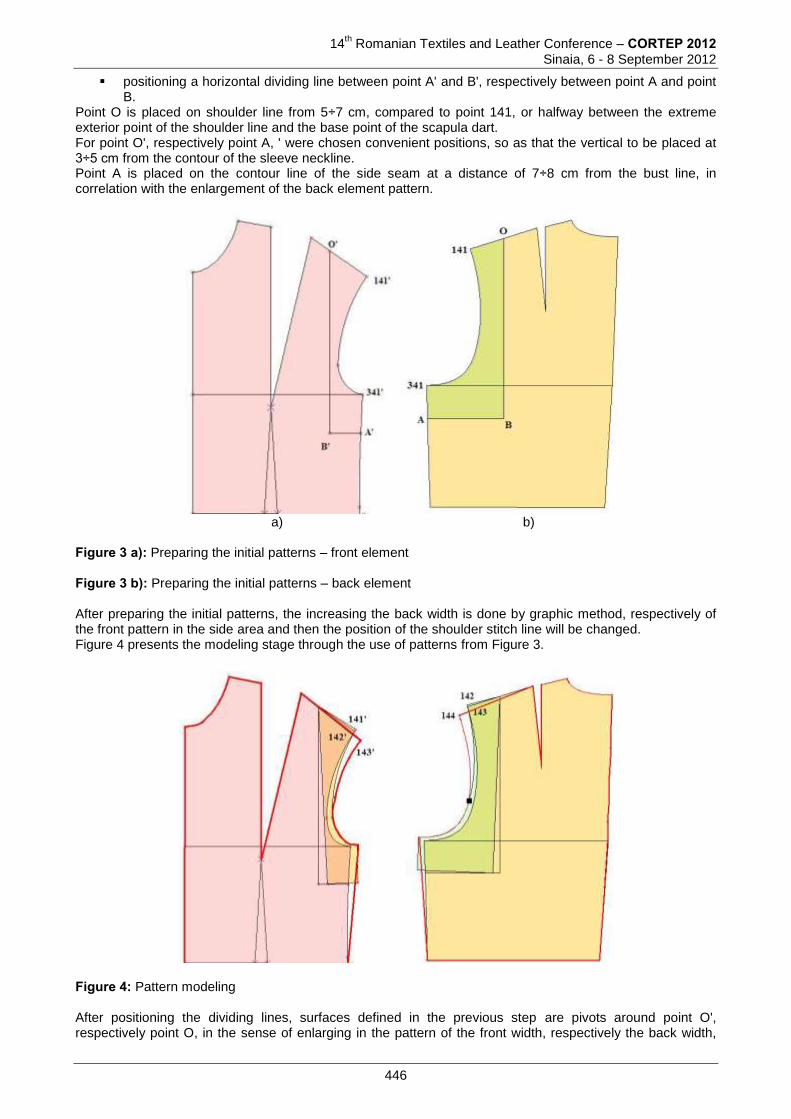
14th Romanian Textiles and Leather Conference – CORTEP 2012
Sinaia, 6 - 8 September 2012
positioning a horizontal dividing line between point A' and B', respectively between point A and point B.
Point O is placed on shoulder line from 5÷7 cm, compared to point 141, or halfway between the extreme exterior point of the shoulder line and the base point of the scapula dart. For point O', respectively point A, ' were chosen convenient positions, so as that the vertical to be placed at 3÷5 cm from the contour of the sleeve neckline. Point A is placed on the contour line of the side seam at a distance of 7÷8 cm from the bust line, in correlation with the enlargement of the back element pattern.
a) b) Figure 3 a): Preparing the initial patterns – front element Figure 3 b): Preparing the initial patterns – back element After preparing the initial patterns, the increasing the back width is done by graphic method, respectively of the front pattern in the side area and then the position of the shoulder stitch line will be changed. Figure 4 presents the modeling stage through the use of patterns from Figure 3.
Figure 4: Pattern modeling After positioning the dividing lines, surfaces defined in the previous step are pivots around point O', respectively point O, in the sense of enlarging in the pattern of the front width, respectively the back width,
446
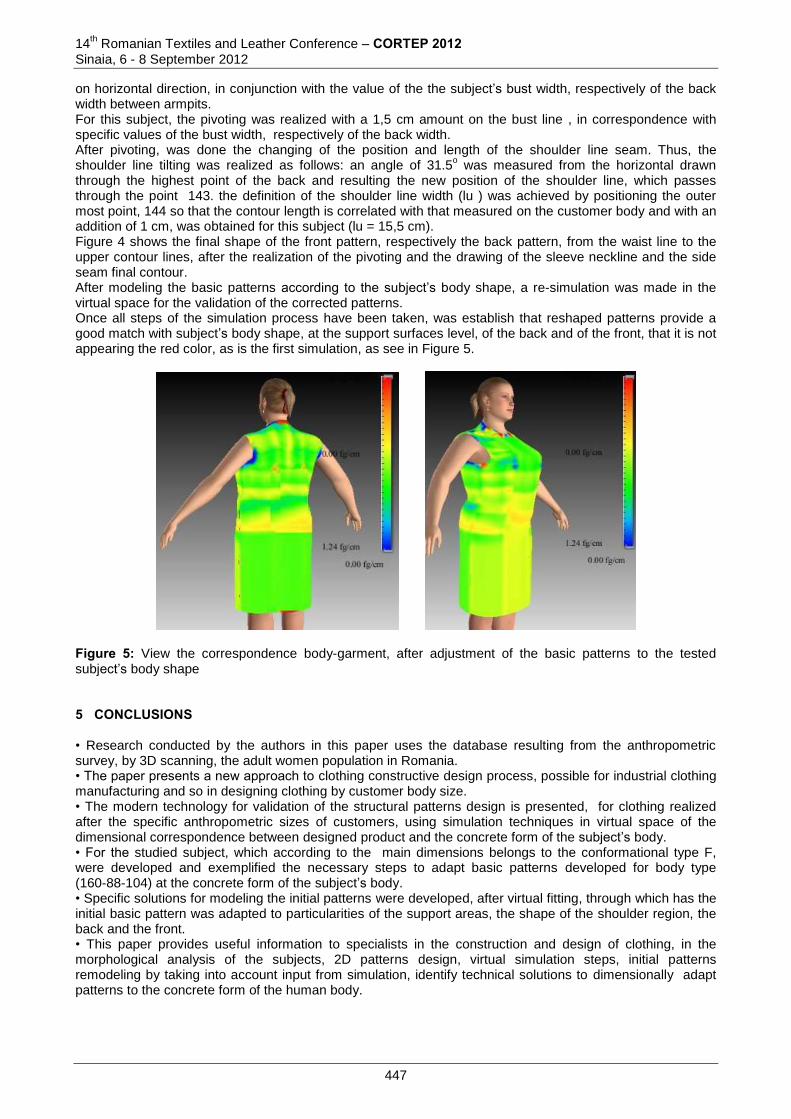
14th Romanian Textiles and Leather Conference – CORTEP 2012
Sinaia, 6 - 8 September 2012
on horizontal direction, in conjunction with the value of the the subject’s bust width, respectively of the back width between armpits. For this subject, the pivoting was realized with a 1,5 cm amount on the bust line , in correspondence with specific values of the bust width, respectively of the back width. After pivoting, was done the changing of the position and length of the shoulder line seam. Thus, the shoulder line tilting was realized as follows: an angle of 31.5
o was measured from the horizontal drawn
through the highest point of the back and resulting the new position of the shoulder line, which passes through the point 143. the definition of the shoulder line width (lu ) was achieved by positioning the outer most point, 144 so that the contour length is correlated with that measured on the customer body and with an addition of 1 cm, was obtained for this subject (lu = 15,5 cm). Figure 4 shows the final shape of the front pattern, respectively the back pattern, from the waist line to the upper contour lines, after the realization of the pivoting and the drawing of the sleeve neckline and the side seam final contour. After modeling the basic patterns according to the subject’s body shape, a re-simulation was made in the virtual space for the validation of the corrected patterns. Once all steps of the simulation process have been taken, was establish that reshaped patterns provide a good match with subject’s body shape, at the support surfaces level, of the back and of the front, that it is not appearing the red color, as is the first simulation, as see in Figure 5.
Figure 5: View the correspondence body-garment, after adjustment of the basic patterns to the tested subject’s body shape 5 CONCLUSIONS • Research conducted by the authors in this paper uses the database resulting from the anthropometric survey, by 3D scanning, the adult women population in Romania. • The paper presents a new approach to clothing constructive design process, possible for industrial clothing manufacturing and so in designing clothing by customer body size. • The modern technology for validation of the structural patterns design is presented, for clothing realized after the specific anthropometric sizes of customers, using simulation techniques in virtual space of the dimensional correspondence between designed product and the concrete form of the subject’s body. • For the studied subject, which according to the main dimensions belongs to the conformational type F, were developed and exemplified the necessary steps to adapt basic patterns developed for body type (160-88-104) at the concrete form of the subject’s body. • Specific solutions for modeling the initial patterns were developed, after virtual fitting, through which has the initial basic pattern was adapted to particularities of the support areas, the shape of the shoulder region, the back and the front. • This paper provides useful information to specialists in the construction and design of clothing, in the morphological analysis of the subjects, 2D patterns design, virtual simulation steps, initial patterns remodeling by taking into account input from simulation, identify technical solutions to dimensionally adapt patterns to the concrete form of the human body.
447
14th Romanian Textiles and Leather Conference – CORTEP 2012
Sinaia, 6 - 8 September 2012
6 REFERENCES [1] Niculescu C., Salistean A., Olaru S, Filipescu E, Avadanei M, Danila E, 3D Body Scanner
Anthropometric Investigation of the Romanian Population and Anthropometric Data Assessment, Proceedings of International scientific conference : Innovative solution for sustainable development of textiles industry, Oradea, 28 – 29 Mai, 2010, Edited by the University of Oradea, CD-Rom Vol.1, ISSN 2068-1070-5590, p108-114
[2] Standard - SR 13545:2010 Clothing. Women’s Body Measurement and Garment Sizes [3] Filipescu E., Contribuţii la proiectarea 2D a îmbrăcămintei individualizate şi modelarea în spaţiul virtual
3D, Editura POLITEHNIUM, Iaşi, 2011 [4] Filipescu Emilia, Avădanei Manuela, Filipescu Elena & Niculescu Claudia, General aspect concerning
humanbody proportion characterization, Faculty of Textile Engineering Technical University of Liberec and Czech Section of Textile Institute Manchester, STRUTEX, 2009
[5] Filipescu E., Avădanei M., Structura şi proiectarea confecţiilor textile. Indrumar de laborator, Ed. Performantica, Iasi, 2007
Corresponding address: Emilia FILIPESCU, Prof. Dr.PhD. Faculty of Textile, Leather and Industrial Management, “Gheorghe Asachi” Technical University of Iasi 53, Dumitru Mangeron Blvd. 700050, Iasi, Romania Phone: +40 232 278683 Fax: +40 232 230491 E-mail: [email protected]
Co-author(s): Sabina OLARU, Eng. Dr. Research Department of Design and Anthropometry The National R&D Institute for Textiles and Leather 16, Lucretiu Patrascanu street 030508, Bucharest , Romania Phone: 0213404928, Fax: 0213405515, E-mail: [email protected]
Elena FILIPESCU, Eng. Dr. SC Gemini CAD Systems SRL 2A, Tudor Vianu Str Iasi, Romania, E-mail: [email protected]
448
14
th Romanian Textiles and Leather Conference – CORTEP 2012
Sinaia, 6 - 8 September 2012
STUDY CONCERNING THE USE OF ANTHROPOMETRICAL PARAMETERS IN THE EVALUATION OF CHILDREN HEALTH
CONDITION AGED FROM 7 TO 10 YEARS OLD
Manuela AVADANEI, Ana VÎRCAN & Ionuț DULGHERIU “Gheorghe Asachi” Technical University of Iasi, Romania
Abstract: In nowadays, anthropometrical research for children is applied to characterize the growing and developing process and to analyses the health condition, too. Social level, life style, education, geographic area, nutrition, genetically heritage and habits have an important influence on children, both on growing process, psychomotor and sensorial development. The purpose of this paper is to analyze the children health from weight point of view, aged from 7 to 10 years old from Oltenia region, considering body mass index after age and gender criteria and waist to height ratio [2,3].
Keywords: child, age, body mass, waist to height. 1 INTRODUCTION It is a well-known thing that the health and body condition of an adult are determined by the childhood behavior, type of physical activities, which are developed, nutrition and social condition. Since we are busy population/ parents with a lot of stress and responsibilities, many families “abandoned” the care of how the children are eating, what are they doing during a day or several days. The World Health Organization (WHO) in 2000 recognized that childhood obesity, overweight or underweight is developing from early ages and it becomes an important problem for the future adult population "Childhood obesity is rapidly emerging as a global epidemic” (WHO 2000). Generally, obesity is defined as a visible excess of body fat. When the fat tissue is well developed, there is a big probability of appearance of some illnesses. Fat mass increases in terms of absolute values with age, but different on gender. Scientists from medical field (Reilly et al. 1995; Pietrobelli et al. 1998) developed indirect methods to analyze body composition and evaluate the total fat mass (e.g. underwater weighing, dual energy x-ray absorptiometry). Those methods require special equipment, with high-qualified personnel, but are not proper to use frequently to analyze public health or children investigation. A simple and easy method used to make an initial characterization of child health is based on the analyses of body dimensions values or different indexes calculated with them. Weight for height (WHtR) and BMI-for-age, calculated considering age and gender criteria (WHO, 2006) are indexes frequently used to analyze if the child is underweight, normal, overweight or obese [2,3]. In our country, as over the world, geographical conditions, social stage, culture and education, nutrition, genetically heritage etc. are several factors which have a major influence in child body shape, health and in its growing rhythm. The purpose of this paper is to characterize the weight developing degree of children aged from 7 to 10 years, from Oltenia region. The study is made on a sample of 192 boy’s subjects and 202 girl’s subjects [1]. 2 EXPERIMENTAL PART An important index defined and used by the scientists from medical field to asses a disease risk for obesity, cardiovascular problems etc. is waist to height index. This index is calculating with the following formula: [4, 6].
WHtR=Pt/Ic (1) Where: Pt- the waist perimeter (cm) Ic- the body height (cm).
449
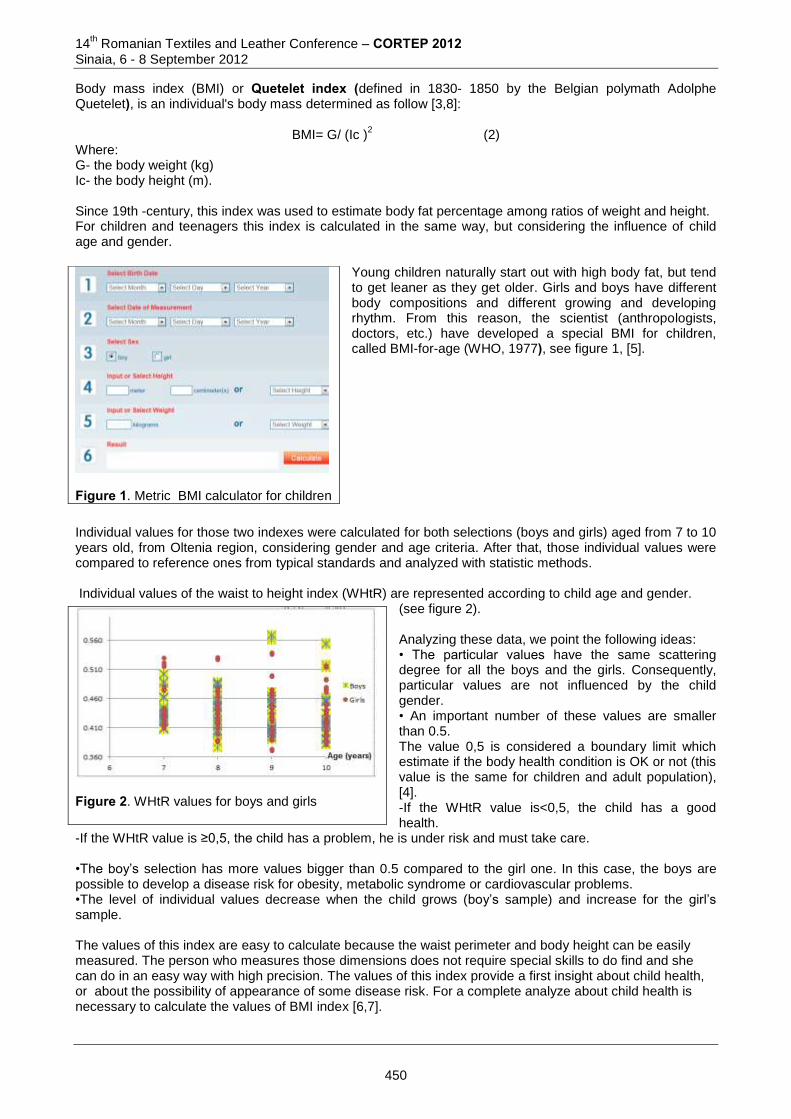
14th Romanian Textiles and Leather Conference – CORTEP 2012
Sinaia, 6 - 8 September 2012
Body mass index (BMI) or Quetelet index (defined in 1830- 1850 by the Belgian polymath Adolphe Quetelet), is an individual's body mass determined as follow [3,8]:
BMI= G/ (Ic )2 (2)
Where: G- the body weight (kg) Ic- the body height (m). Since 19th -century, this index was used to estimate body fat percentage among ratios of weight and height. For children and teenagers this index is calculated in the same way, but considering the influence of child age and gender.
Young children naturally start out with high body fat, but tend to get leaner as they get older. Girls and boys have different body compositions and different growing and developing rhythm. From this reason, the scientist (anthropologists, doctors, etc.) have developed a special BMI for children, called BMI-for-age (WHO, 1977), see figure 1, [5].
Individual values for those two indexes were calculated for both selections (boys and girls) aged from 7 to 10 years old, from Oltenia region, considering gender and age criteria. After that, those individual values were compared to reference ones from typical standards and analyzed with statistic methods. Individual values of the waist to height index (WHtR) are represented according to child age and gender.
(see figure 2). Analyzing these data, we point the following ideas: • The particular values have the same scattering degree for all the boys and the girls. Consequently, particular values are not influenced by the child gender. • An important number of these values are smaller than 0.5. The value 0,5 is considered a boundary limit which estimate if the body health condition is OK or not (this value is the same for children and adult population), [4]. -If the WHtR value is<0,5, the child has a good health.
-If the WHtR value is ≥0,5, the child has a problem, he is under risk and must take care. •The boy’s selection has more values bigger than 0.5 compared to the girl one. In this case, the boys are possible to develop a disease risk for obesity, metabolic syndrome or cardiovascular problems. •The level of individual values decrease when the child grows (boy’s sample) and increase for the girl’s sample. The values of this index are easy to calculate because the waist perimeter and body height can be easily measured. The person who measures those dimensions does not require special skills to do find and she can do in an easy way with high precision. The values of this index provide a first insight about child health, or about the possibility of appearance of some disease risk. For a complete analyze about child health is necessary to calculate the values of BMI index [6,7].
Figure 1. Metric BMI calculator for children
Figure 2. WHtR values for boys and girls
450
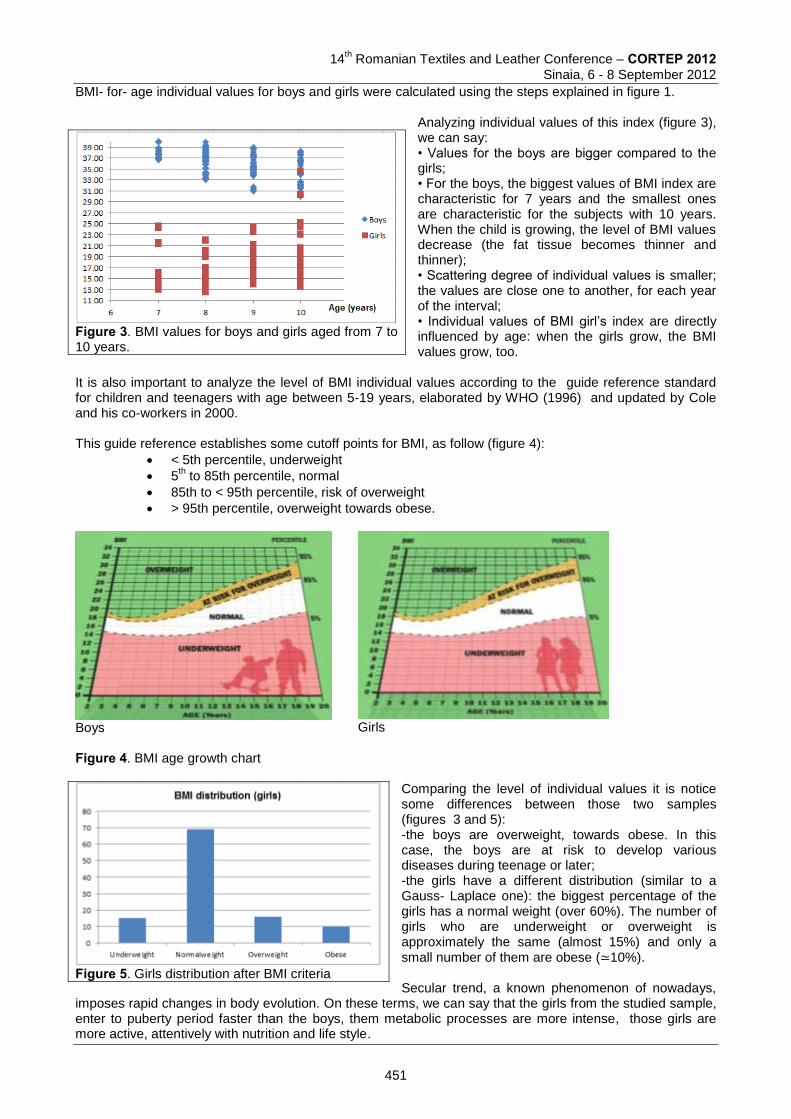
14
th Romanian Textiles and Leather Conference – CORTEP 2012
Sinaia, 6 - 8 September 2012
BMI- for- age individual values for boys and girls were calculated using the steps explained in figure 1.
Analyzing individual values of this index (figure 3), we can say: • Values for the boys are bigger compared to the girls; • For the boys, the biggest values of BMI index are characteristic for 7 years and the smallest ones are characteristic for the subjects with 10 years. When the child is growing, the level of BMI values decrease (the fat tissue becomes thinner and thinner); • Scattering degree of individual values is smaller; the values are close one to another, for each year of the interval; • Individual values of BMI girl’s index are directly influenced by age: when the girls grow, the BMI values grow, too.
It is also important to analyze the level of BMI individual values according to the guide reference standard for children and teenagers with age between 5-19 years, elaborated by WHO (1996) and updated by Cole and his co-workers in 2000. This guide reference establishes some cutoff points for BMI, as follow (figure 4):
< 5th percentile, underweight
5th to 85th percentile, normal
85th to < 95th percentile, risk of overweight
> 95th percentile, overweight towards obese.
Boys
Girls
Figure 4. BMI age growth chart
Comparing the level of individual values it is notice some differences between those two samples (figures 3 and 5): -the boys are overweight, towards obese. In this case, the boys are at risk to develop various diseases during teenage or later; -the girls have a different distribution (similar to a Gauss- Laplace one): the biggest percentage of the girls has a normal weight (over 60%). The number of girls who are underweight or overweight is approximately the same (almost 15%) and only a small number of them are obese (≃10%). Secular trend, a known phenomenon of nowadays,
imposes rapid changes in body evolution. On these terms, we can say that the girls from the studied sample, enter to puberty period faster than the boys, them metabolic processes are more intense, those girls are more active, attentively with nutrition and life style.
Figure 3. BMI values for boys and girls aged from 7 to 10 years.
Figure 5. Girls distribution after BMI criteria
451
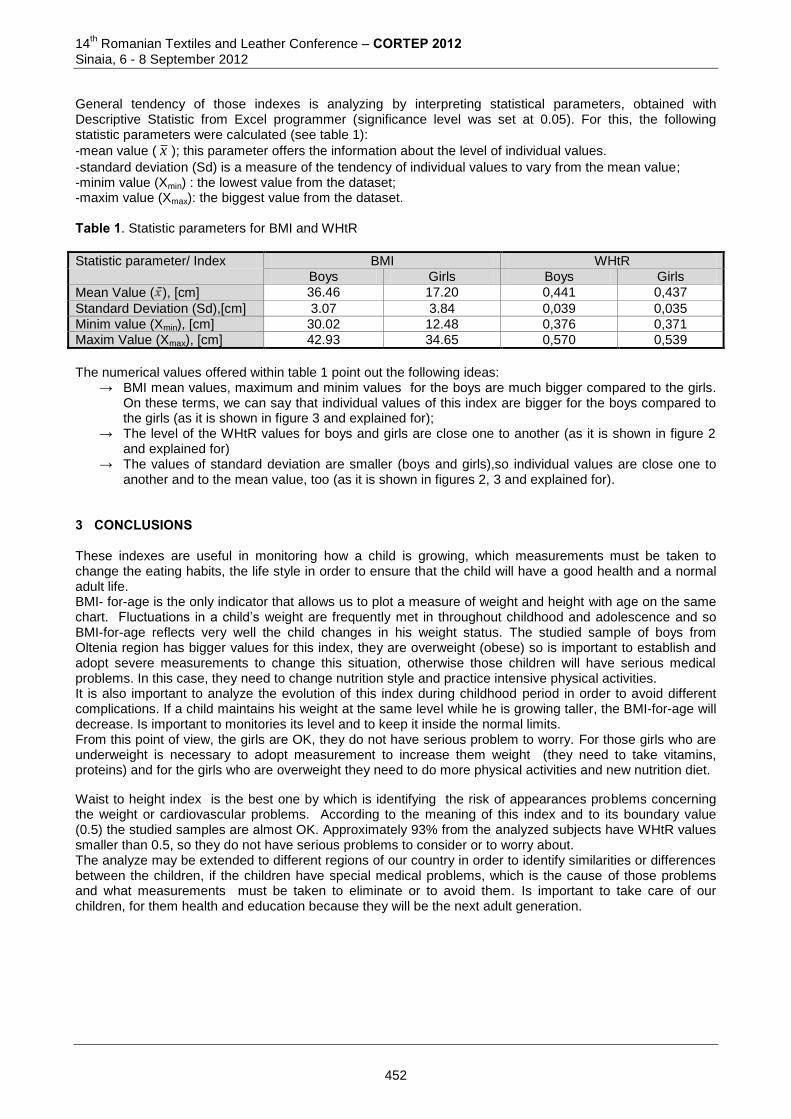
14th Romanian Textiles and Leather Conference – CORTEP 2012
Sinaia, 6 - 8 September 2012
General tendency of those indexes is analyzing by interpreting statistical parameters, obtained with Descriptive Statistic from Excel programmer (significance level was set at 0.05). For this, the following statistic parameters were calculated (see table 1): -mean value ( x ); this parameter offers the information about the level of individual values.
-standard deviation (Sd) is a measure of the tendency of individual values to vary from the mean value; -minim value (Xmin) : the lowest value from the dataset;
-maxim value (Xmax): the biggest value from the dataset. Table 1. Statistic parameters for BMI and WHtR
Statistic parameter/ Index BMI WHtR
Boys Girls Boys Girls
Mean Value ( ), [cm] 36.46 17.20 0,441 0,437
Standard Deviation (Sd),[cm] 3.07 3.84 0,039 0,035
Minim value (Xmin), [cm] 30.02 12.48 0,376 0,371
Maxim Value (Xmax), [cm] 42.93 34.65 0,570 0,539
The numerical values offered within table 1 point out the following ideas:
→ BMI mean values, maximum and minim values for the boys are much bigger compared to the girls. On these terms, we can say that individual values of this index are bigger for the boys compared to the girls (as it is shown in figure 3 and explained for);
→ The level of the WHtR values for boys and girls are close one to another (as it is shown in figure 2 and explained for)
→ The values of standard deviation are smaller (boys and girls),so individual values are close one to another and to the mean value, too (as it is shown in figures 2, 3 and explained for).
3 CONCLUSIONS These indexes are useful in monitoring how a child is growing, which measurements must be taken to change the eating habits, the life style in order to ensure that the child will have a good health and a normal adult life. BMI- for-age is the only indicator that allows us to plot a measure of weight and height with age on the same chart. Fluctuations in a child’s weight are frequently met in throughout childhood and adolescence and so BMI-for-age reflects very well the child changes in his weight status. The studied sample of boys from Oltenia region has bigger values for this index, they are overweight (obese) so is important to establish and adopt severe measurements to change this situation, otherwise those children will have serious medical problems. In this case, they need to change nutrition style and practice intensive physical activities. It is also important to analyze the evolution of this index during childhood period in order to avoid different complications. If a child maintains his weight at the same level while he is growing taller, the BMI-for-age will decrease. Is important to monitories its level and to keep it inside the normal limits. From this point of view, the girls are OK, they do not have serious problem to worry. For those girls who are underweight is necessary to adopt measurement to increase them weight (they need to take vitamins, proteins) and for the girls who are overweight they need to do more physical activities and new nutrition diet.
Waist to height index is the best one by which is identifying the risk of appearances problems concerning the weight or cardiovascular problems. According to the meaning of this index and to its boundary value (0.5) the studied samples are almost OK. Approximately 93% from the analyzed subjects have WHtR values smaller than 0.5, so they do not have serious problems to consider or to worry about. The analyze may be extended to different regions of our country in order to identify similarities or differences between the children, if the children have special medical problems, which is the cause of those problems and what measurements must be taken to eliminate or to avoid them. Is important to take care of our children, for them health and education because they will be the next adult generation.
452
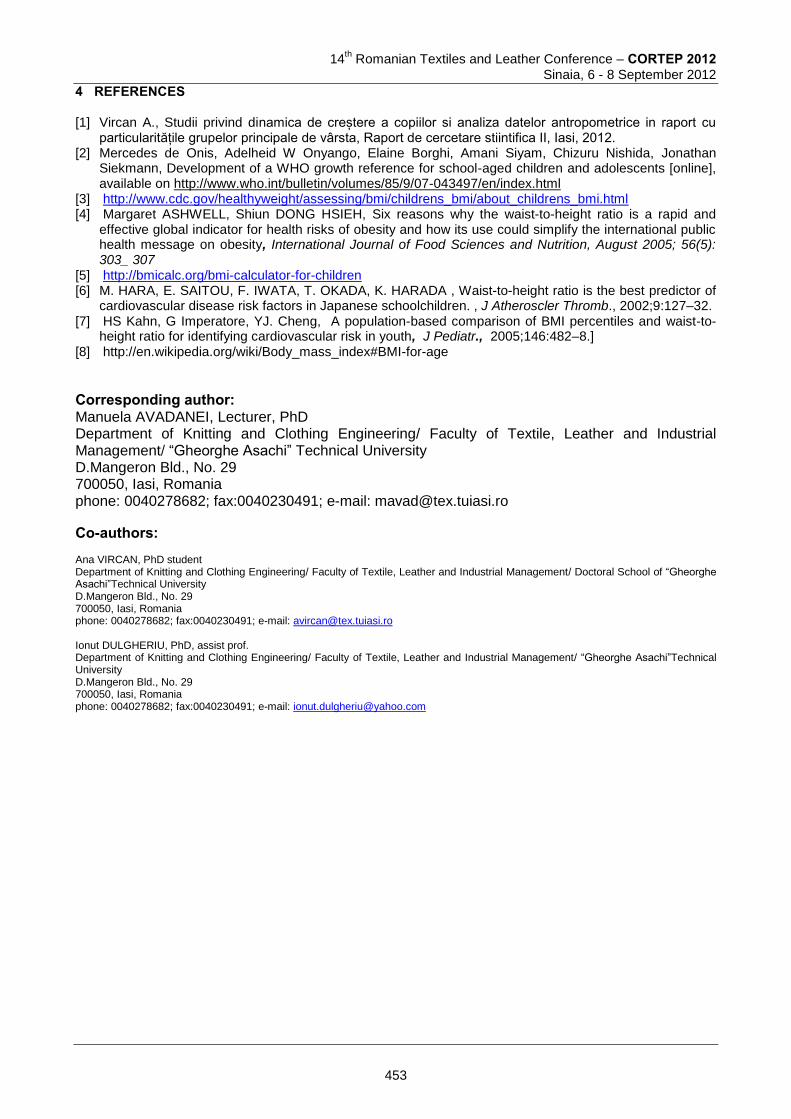
14
th Romanian Textiles and Leather Conference – CORTEP 2012
Sinaia, 6 - 8 September 2012
4 REFERENCES [1] Vircan A., Studii privind dinamica de creștere a copiilor si analiza datelor antropometrice in raport cu
particularitățile grupelor principale de vârsta, Raport de cercetare stiintifica II, Iasi, 2012. [2] Mercedes de Onis, Adelheid W Onyango, Elaine Borghi, Amani Siyam, Chizuru Nishida, Jonathan
Siekmann, Development of a WHO growth reference for school-aged children and adolescents [online], available on http://www.who.int/bulletin/volumes/85/9/07-043497/en/index.html
[3] http://www.cdc.gov/healthyweight/assessing/bmi/childrens_bmi/about_childrens_bmi.html [4] Margaret ASHWELL, Shiun DONG HSIEH, Six reasons why the waist-to-height ratio is a rapid and
effective global indicator for health risks of obesity and how its use could simplify the international public health message on obesity, International Journal of Food Sciences and Nutrition, August 2005; 56(5): 303_/307
[5] http://bmicalc.org/bmi-calculator-for-children [6] M. HARA, E. SAITOU, F. IWATA, T. OKADA, K. HARADA , Waist-to-height ratio is the best predictor of
cardiovascular disease risk factors in Japanese schoolchildren. , J Atheroscler Thromb., 2002;9:127–32. [7] HS Kahn, G Imperatore, YJ. Cheng, A population-based comparison of BMI percentiles and waist-to-
height ratio for identifying cardiovascular risk in youth, J Pediatr., 2005;146:482–8.] [8] http://en.wikipedia.org/wiki/Body_mass_index#BMI-for-age
Corresponding author: Manuela AVADANEI, Lecturer, PhD Department of Knitting and Clothing Engineering/ Faculty of Textile, Leather and Industrial Management/ “Gheorghe Asachi” Technical University D.Mangeron Bld., No. 29 700050, Iasi, Romania phone: 0040278682; fax:0040230491; e-mail: [email protected]
Co-authors: Ana VIRCAN, PhD student Department of Knitting and Clothing Engineering/ Faculty of Textile, Leather and Industrial Management/ Doctoral School of “Gheorghe Asachi”Technical University D.Mangeron Bld., No. 29 700050, Iasi, Romania phone: 0040278682; fax:0040230491; e-mail: [email protected] Ionut DULGHERIU, PhD, assist prof. Department of Knitting and Clothing Engineering/ Faculty of Textile, Leather and Industrial Management/ “Gheorghe Asachi”Technical University D.Mangeron Bld., No. 29 700050, Iasi, Romania phone: 0040278682; fax:0040230491; e-mail: [email protected]
453
14
th Romanian Textiles and Leather Conference – CORTEP 2012
Sinaia, 6 - 8 September 2012
PERFORMANCES OFFERED BY THE FIREPROOFING AND ANTI-CREASING SIMULTANEOUS TECHNOLOGY
Ecaterina VASLUIANU & Vasilica POPESCU ”Gheorghe Asachi”
Technical University of Iasi, Romania
Faculty of Textiles, Leather and Industrial Management Abstract: In this paper we aim to show the combined multiple effects of cellulose materials, by obtaining a product based on the chemical reaction of a fire retardant agent (Aflammit KWB) and a natural polymer-chitosan, with H3PO4 present as catalyst, trough several treatment procedures. The newly syntesized compound was applied to the fabric by pad-dry-cure technology. We analysed the effects of chitosan concentration (20-80g/l chitosan) on the performance of the new product as an agent with multiple caracteristics: fireproofing and anti-creasing. The obtained effects were highlighted by qualitative method (FT-IR) and quantitative methods (degree of takeover (G.P.=100%), the crease recovery angles, the mass after combustion, the aftertime flame and the durability during repeated washing cycles. Keywords: Aflammit KWB, anti-creasing, chitosan, cotton, fireproofing. 1 INTRODUCTION Present tendencies in textile are aiming to leave behind traditional methods in order to discover new ways to increase complexity in practical area as well as using advanced materials especially polymers [1]. A representative example is textile flame-retardancy [2],[3],[4]. Due to the fact that cotton fabric presents a soft touch, it is easy-washable and comfortable to wear, the cotton is used to manufacture a lot of clothes, uniforms, protective clothing and so on [5],[6]. When a burner flame is applied to cellulosic materials treated with flame-retardant substances they must not spread the fire and stop burning when the source is turned off [7],[8],[9]. In this paper, Aflammit KWB was used as a flame-retardancy agent together with chitosan, they were used on textile materials using pad-dry-cure technology. Over the years many multiple simultaneous effects on ennoblement of fabrics were demonstrated, for exemple anti-creasing, soil release and dirt proof [10],[11]. This paper presents the reaction mechanism that leads to simultaneous technologies of textile material: flame-retardancy and anti-creasing proved by afterflame time, the flame spread time, the weight loss after burning, the crease recovery angles, weight loss as well as washing durability. 2 EXPERIMENTAL 2.1 Materials Aflammit KWB was provided from IASITEX SA/Romania with characteristics presented in table 1, oxygenated water (ACS reagent, 29.0-32.0 wt. % H2O2 basis), phosphoric acid (reagent grade, crystalline, ≥98%), sodium hydrosulfite (reducing agent, technical grade, 85%) sodium silicate, Chitosan highly viscous provided from Sigma Aldrich with characteristics presented in table 1, glacial acetic acid 100%, sodium hydroxide (p.a), sodium carbonate (p.a), sodium chlorate (40g/mol at 20
0C) from Merck company, Bactosol
PHC from Clariant company, non-ionic surfactant (Romopal O) from ROMTENSID SA Timișoara, România. The cotton fabric 100% was provided from IASITEX SA company/ Iași, România. 2.2 Scouring The cotton fabric was prepared in two stages: desizing and scouring. The first one was realized with 3g/l Bactosol PHC, 1g/l NaCl, Hm=1:30, at 100
0C temperature, for 30 minutes followed by hot washing. The
scouring was realized with 30 g/l NaOH, 15 g/l Na2CO3, 3 g/l surfactant, 9 g/l silicate sodium, 15 g/l reducing agent, at 100
0C temperature, for 30 minutes followed by hot washing, warm washing then cold washing and
drying at room temperature.
454
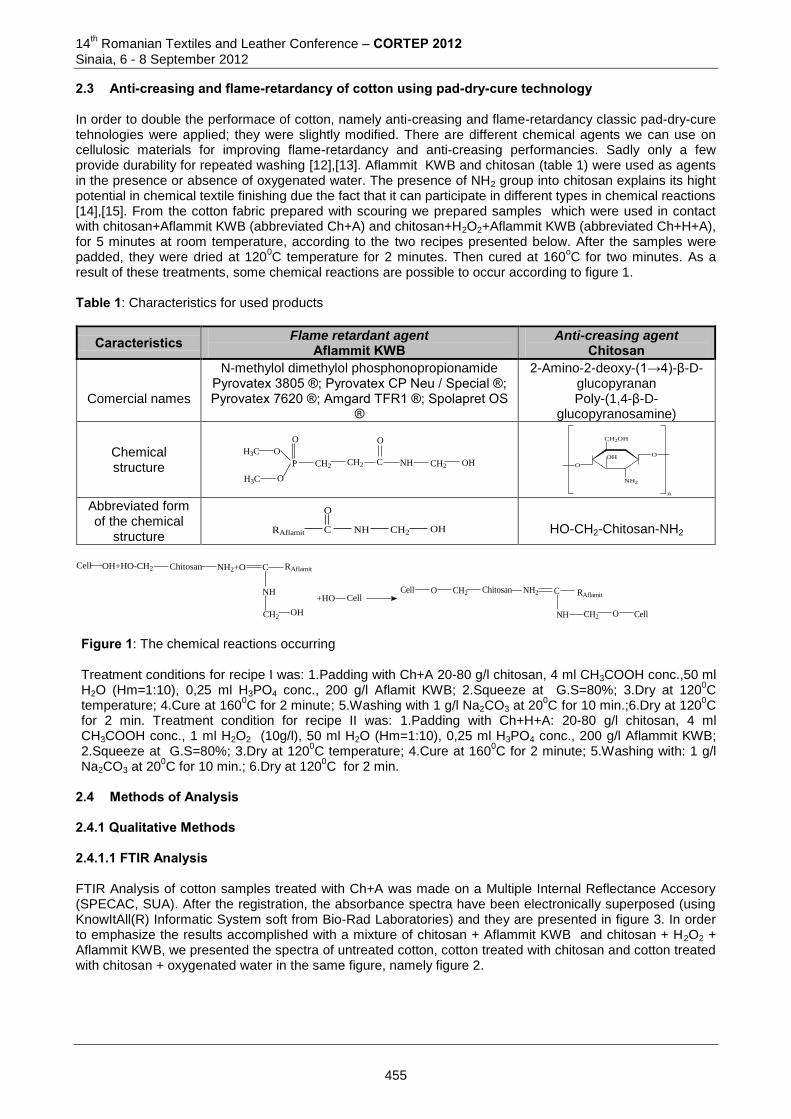
14th Romanian Textiles and Leather Conference – CORTEP 2012
Sinaia, 6 - 8 September 2012
2.3 Anti-creasing and flame-retardancy of cotton using pad-dry-cure technology In order to double the performace of cotton, namely anti-creasing and flame-retardancy classic pad-dry-cure tehnologies were applied; they were slightly modified. There are different chemical agents we can use on cellulosic materials for improving flame-retardancy and anti-creasing performancies. Sadly only a few provide durability for repeated washing [12],[13]. Aflammit KWB and chitosan (table 1) were used as agents in the presence or absence of oxygenated water. The presence of NH2 group into chitosan explains its hight potential in chemical textile finishing due the fact that it can participate in different types in chemical reactions [14],[15]. From the cotton fabric prepared with scouring we prepared samples which were used in contact with chitosan+Aflammit KWB (abbreviated Ch+A) and chitosan+H2O2+Aflammit KWB (abbreviated Ch+H+A), for 5 minutes at room temperature, according to the two recipes presented below. After the samples were padded, they were dried at 120
0C temperature for 2 minutes. Then cured at 160
oC for two minutes. As a
result of these treatments, some chemical reactions are possible to occur according to figure 1. Table 1: Characteristics for used products
Caracteristics Flame retardant agent Aflammit KWB
Anti-creasing agent Chitosan
Comercial names
N-methylol dimethylol phosphonopropionamide Pyrovatex 3805 ®; Pyrovatex CP Neu / Special ®; Pyrovatex 7620 ®; Amgard TFR1 ®; Spolapret OS
®
2-Amino-2-deoxy-(1→4)-β-D-glucopyranan Poly-(1,4-β-D-
glucopyranosamine)
Chemical structure P
O
O
H3C
H3C
CH2 CH2 NH CH2 OH
O
C
O
O
CH2OH
O
NH2
OH
n Abbreviated form of the chemical
structure C NH CH2 OH
O
RAflamit
HO-CH2-Chitosan-NH2
Cell OH+HO-CH2 Chitosan NH2+O C RAflamit
NH
CH2OH
+HO CellCell O CH2 Chitosan NH2 C
CH2 O Cell
RAflamit
NH Figure 1: The chemical reactions occurring
Treatment conditions for recipe I was: 1.Padding with Ch+A 20-80 g/l chitosan, 4 ml CH3COOH conc.,50 ml H2O (Hm=1:10), 0,25 ml H3PO4 conc., 200 g/l Aflamit KWB; 2.Squeeze at G.S=80%; 3.Dry at 120
0C
temperature; 4.Cure at 1600C for 2 minute; 5.Washing with 1 g/l Na2CO3 at 20
0C for 10 min.;6.Dry at 120
0C
for 2 min. Treatment condition for recipe II was: 1.Padding with Ch+H+A: 20-80 g/l chitosan, 4 ml CH3COOH conc., 1 ml H2O2 (10g/l), 50 ml H2O (Hm=1:10), 0,25 ml H3PO4 conc., 200 g/l Aflammit KWB; 2.Squeeze at G.S=80%; 3.Dry at 120
0C temperature; 4.Cure at 160
0C for 2 minute; 5.Washing with: 1 g/l
Na2CO3 at 200C for 10 min.; 6.Dry at 120
0C for 2 min.
2.4 Methods of Analysis 2.4.1 Qualitative Methods 2.4.1.1 FTIR Analysis FTIR Analysis of cotton samples treated with Ch+A was made on a Multiple Internal Reflectance Accesory (SPECAC, SUA). After the registration, the absorbance spectra have been electronically superposed (using KnowItAll(R) Informatic System soft from Bio-Rad Laboratories) and they are presented in figure 3. In order to emphasize the results accomplished with a mixture of chitosan + Aflammit KWB and chitosan + H2O2 + Aflammit KWB, we presented the spectra of untreated cotton, cotton treated with chitosan and cotton treated with chitosan + oxygenated water in the same figure, namely figure 2.
455
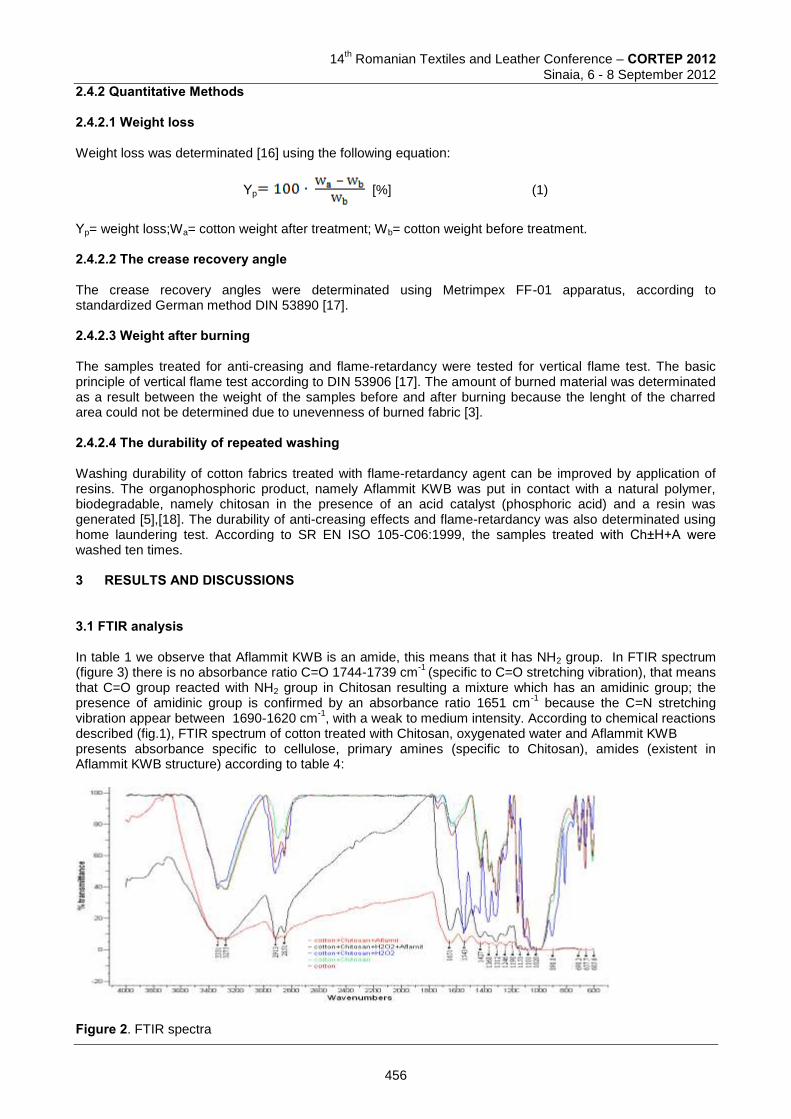
14
th Romanian Textiles and Leather Conference – CORTEP 2012
Sinaia, 6 - 8 September 2012
2.4.2 Quantitative Methods 2.4.2.1 Weight loss Weight loss was determinated [16] using the following equation:
Υp [%] (1)
Υp= weight loss;Wa= cotton weight after treatment; Wb= cotton weight before treatment. 2.4.2.2 The crease recovery angle The crease recovery angles were determinated using Metrimpex FF-01 apparatus, according to standardized German method DIN 53890 [17]. 2.4.2.3 Weight after burning The samples treated for anti-creasing and flame-retardancy were tested for vertical flame test. The basic principle of vertical flame test according to DIN 53906 [17]. The amount of burned material was determinated as a result between the weight of the samples before and after burning because the lenght of the charred area could not be determined due to unevenness of burned fabric [3]. 2.4.2.4 The durability of repeated washing Washing durability of cotton fabrics treated with flame-retardancy agent can be improved by application of resins. The organophosphoric product, namely Aflammit KWB was put in contact with a natural polymer, biodegradable, namely chitosan in the presence of an acid catalyst (phosphoric acid) and a resin was generated [5],[18]. The durability of anti-creasing effects and flame-retardancy was also determinated using home laundering test. According to SR EN ISO 105-C06:1999, the samples treated with Ch±H+A were washed ten times. 3 RESULTS AND DISCUSSIONS 3.1 FTIR analysis In table 1 we observe that Aflammit KWB is an amide, this means that it has NH2 group. In FTIR spectrum (figure 3) there is no absorbance ratio C=O 1744-1739 cm
-1 (specific to C=O stretching vibration), that means
that C=O group reacted with NH2 group in Chitosan resulting a mixture which has an amidinic group; the presence of amidinic group is confirmed by an absorbance ratio 1651 cm
-1 because the C=N stretching
vibration appear between 1690-1620 cm-1
, with a weak to medium intensity. According to chemical reactions described (fig.1), FTIR spectrum of cotton treated with Chitosan, oxygenated water and Aflammit KWB presents absorbance specific to cellulose, primary amines (specific to Chitosan), amides (existent in Aflammit KWB structure) according to table 4:
Figure 2. FTIR spectra
456
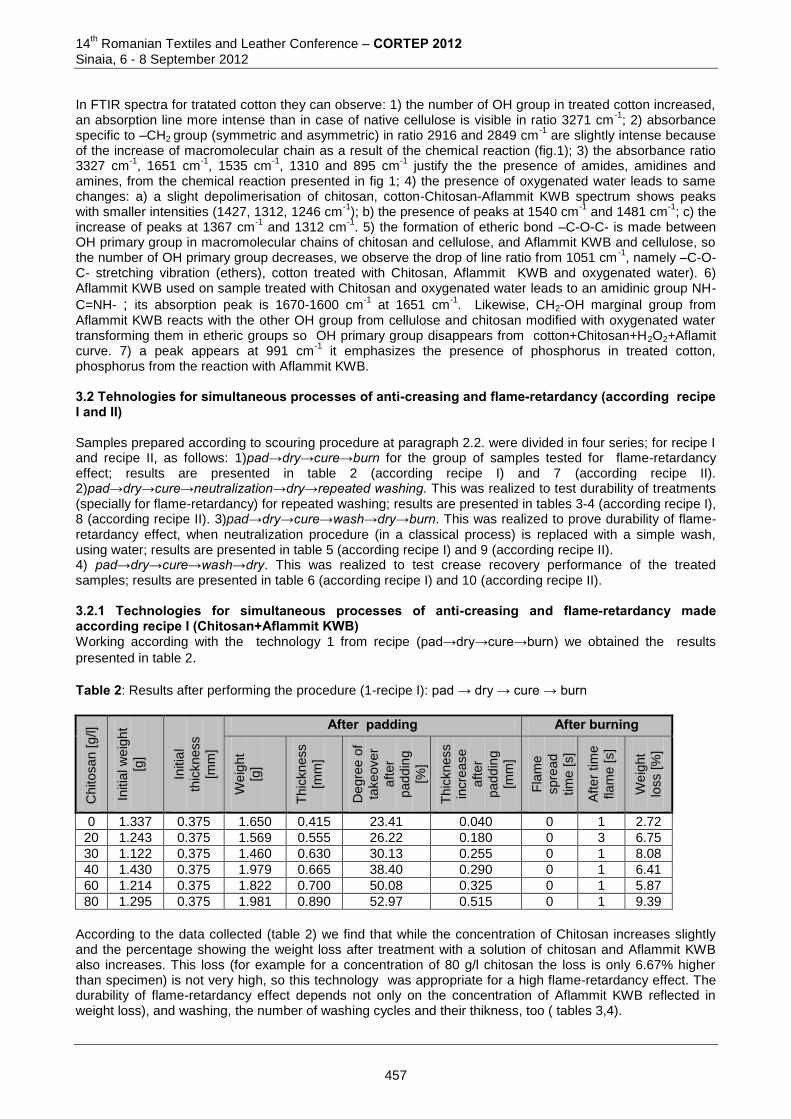
14th Romanian Textiles and Leather Conference – CORTEP 2012
Sinaia, 6 - 8 September 2012
In FTIR spectra for tratated cotton they can observe: 1) the number of OH group in treated cotton increased, an absorption line more intense than in case of native cellulose is visible in ratio 3271 cm
-1; 2) absorbance
specific to –CH2 group (symmetric and asymmetric) in ratio 2916 and 2849 cm-1
are slightly intense because of the increase of macromolecular chain as a result of the chemical reaction (fig.1); 3) the absorbance ratio 3327 cm
-1, 1651 cm
-1, 1535 cm
-1, 1310 and 895 cm
-1 justify the the presence of amides, amidines and
amines, from the chemical reaction presented in fig 1; 4) the presence of oxygenated water leads to same changes: a) a slight depolimerisation of chitosan, cotton-Chitosan-Aflammit KWB spectrum shows peaks with smaller intensities (1427, 1312, 1246 cm
-1); b) the presence of peaks at 1540 cm
-1 and 1481 cm
-1; c) the
increase of peaks at 1367 cm-1
and 1312 cm-1
. 5) the formation of etheric bond –C-O-C- is made between OH primary group in macromolecular chains of chitosan and cellulose, and Aflammit KWB and cellulose, so the number of OH primary group decreases, we observe the drop of line ratio from 1051 cm
-1, namely –C-O-
C- stretching vibration (ethers), cotton treated with Chitosan, Aflammit KWB and oxygenated water). 6) Aflammit KWB used on sample treated with Chitosan and oxygenated water leads to an amidinic group NH-
C=NH- ; its absorption peak is 1670-1600 cm-1
at 1651 cm-1
. Likewise, CH2-OH marginal group from Aflammit KWB reacts with the other OH group from cellulose and chitosan modified with oxygenated water transforming them in etheric groups so OH primary group disappears from cotton+Chitosan+H2O2+Aflamit curve. 7) a peak appears at 991 cm
-1 it emphasizes the presence of phosphorus in treated cotton,
phosphorus from the reaction with Aflammit KWB. 3.2 Tehnologies for simultaneous processes of anti-creasing and flame-retardancy (according recipe I and II) Samples prepared according to scouring procedure at paragraph 2.2. were divided in four series; for recipe I and recipe II, as follows: 1)pad→dry→cure→burn for the group of samples tested for flame-retardancy effect; results are presented in table 2 (according recipe I) and 7 (according recipe II). 2)pad→dry→cure→neutralization→dry→repeated washing. This was realized to test durability of treatments (specially for flame-retardancy) for repeated washing; results are presented in tables 3-4 (according recipe I), 8 (according recipe II). 3)pad→dry→cure→wash→dry→burn. This was realized to prove durability of flame-retardancy effect, when neutralization procedure (in a classical process) is replaced with a simple wash, using water; results are presented in table 5 (according recipe I) and 9 (according recipe II). 4) pad→dry→cure→wash→dry. This was realized to test crease recovery performance of the treated samples; results are presented in table 6 (according recipe I) and 10 (according recipe II). 3.2.1 Technologies for simultaneous processes of anti-creasing and flame-retardancy made according recipe I (Chitosan+Aflammit KWB) Working according with the technology 1 from recipe (pad→dry→cure→burn) we obtained the results
presented in table 2. Table 2: Results after performing the procedure (1-recipe I): pad → dry → cure → burn
Chitosan [
g/l]
Initia
l w
eig
ht
[g]
Initia
l
thic
kness
[mm
]
After padding After burning
We
ight
[g]
Thic
kness
[mm
]
Degre
e o
f
takeover
after
padd
ing
[%]
Thic
kness
incre
ase
after
padd
ing
[mm
]
Fla
me
spre
ad
tim
e [s]
After
tim
e
flam
e [s]
We
ight
loss [%
]
0 1.337 0.375 1.650 0.415 23.41 0.040 0 1 2.72
20 1.243 0.375 1.569 0.555 26.22 0.180 0 3 6.75
30 1.122 0.375 1.460 0.630 30.13 0.255 0 1 8.08
40 1.430 0.375 1.979 0.665 38.40 0.290 0 1 6.41
60 1.214 0.375 1.822 0.700 50.08 0.325 0 1 5.87
80 1.295 0.375 1.981 0.890 52.97 0.515 0 1 9.39
According to the data collected (table 2) we find that while the concentration of Chitosan increases slightly and the percentage showing the weight loss after treatment with a solution of chitosan and Aflammit KWB also increases. This loss (for example for a concentration of 80 g/l chitosan the loss is only 6.67% higher than specimen) is not very high, so this technology was appropriate for a high flame-retardancy effect. The durability of flame-retardancy effect depends not only on the concentration of Aflammit KWB reflected in weight loss), and washing, the number of washing cycles and their thikness, too ( tables 3,4).
457
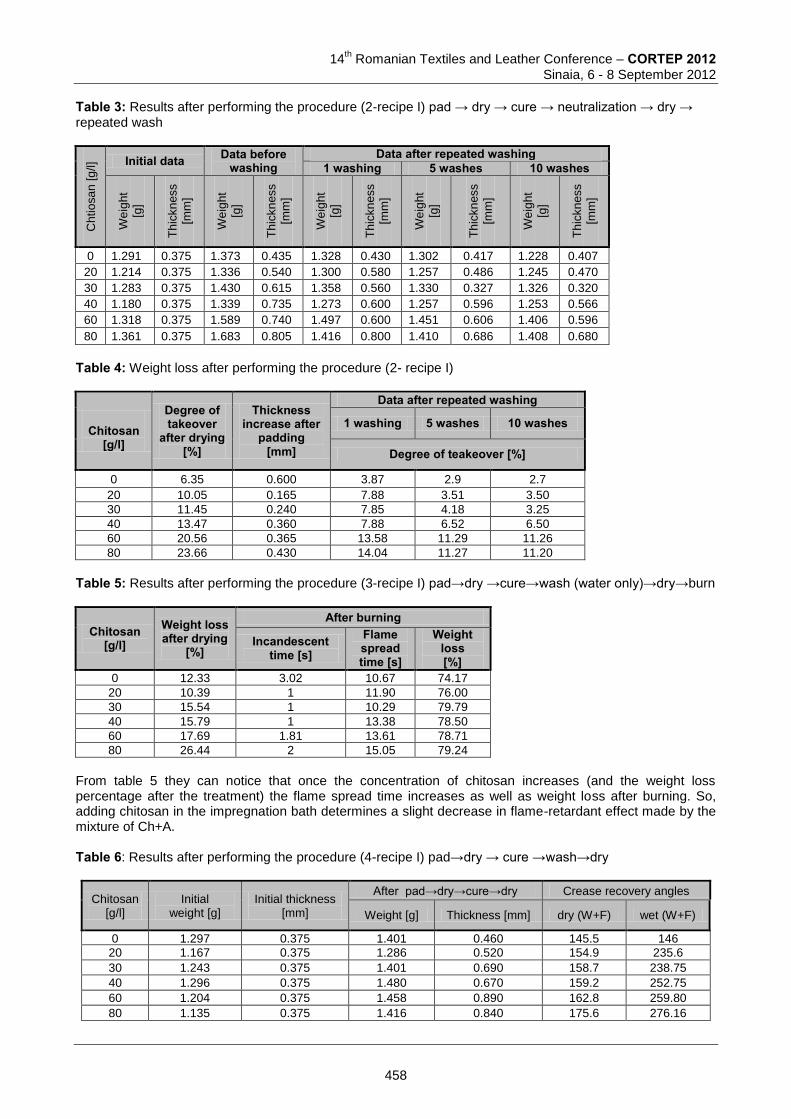
14
th Romanian Textiles and Leather Conference – CORTEP 2012
Sinaia, 6 - 8 September 2012
Table 3: Results after performing the procedure (2-recipe I) pad → dry → cure → neutralization → dry → repeated wash
Ch
tio
sa
n [g
/l] Initial data Data before
washing Data after repeated washing
1 washing 5 washes 10 washes
We
ight
[g]
Th
ickn
ess
[mm
]
We
ight
[g]
Th
ickn
ess
[mm
]
We
ight
[g]
Th
ickn
ess
[mm
]
We
ight
[g]
Th
ickn
ess
[mm
]
We
ight
[g]
Th
ickn
ess
[mm
]
0 1.291 0.375 1.373 0.435 1.328 0.430 1.302 0.417 1.228 0.407
20 1.214 0.375 1.336 0.540 1.300 0.580 1.257 0.486 1.245 0.470
30 1.283 0.375 1.430 0.615 1.358 0.560 1.330 0.327 1.326 0.320
40 1.180 0.375 1.339 0.735 1.273 0.600 1.257 0.596 1.253 0.566
60 1.318 0.375 1.589 0.740 1.497 0.600 1.451 0.606 1.406 0.596
80 1.361 0.375 1.683 0.805 1.416 0.800 1.410 0.686 1.408 0.680
Table 4: Weight loss after performing the procedure (2- recipe I)
Chitosan
[g/l]
Degree of takeover
after drying [%]
Thickness increase after
padding [mm]
Data after repeated washing
1 washing 5 washes 10 washes
Degree of teakeover [%]
0 6.35 0.600 3.87 2.9 2.7
20 10.05 0.165 7.88 3.51 3.50
30 11.45 0.240 7.85 4.18 3.25
40 13.47 0.360 7.88 6.52 6.50
60 20.56 0.365 13.58 11.29 11.26
80 23.66 0.430 14.04 11.27 11.20
Table 5: Results after performing the procedure (3-recipe I) pad→dry →cure→wash (water only)→dry→burn
Chitosan [g/l]
Weight loss after drying
[%]
After burning
Incandescent time [s]
Flame spread time [s]
Weight loss [%]
0 12.33 3.02 10.67 74.17
20 10.39 1 11.90 76.00
30 15.54 1 10.29 79.79
40 15.79 1 13.38 78.50
60 17.69 1.81 13.61 78.71
80 26.44 2 15.05 79.24
From table 5 they can notice that once the concentration of chitosan increases (and the weight loss percentage after the treatment) the flame spread time increases as well as weight loss after burning. So, adding chitosan in the impregnation bath determines a slight decrease in flame-retardant effect made by the mixture of Ch+A. Table 6: Results after performing the procedure (4-recipe I) pad→dry → cure →wash→dry
Chitosan [g/l]
Initial weight [g]
Initial thickness [mm]
After pad→dry→cure→dry Crease recovery angles
Weight [g] Thickness [mm] dry (W+F) wet (W+F)
0 1.297 0.375 1.401 0.460 145.5 146
20 1.167 0.375 1.286 0.520 154.9 235.6
30 1.243 0.375 1.401 0.690 158.7 238.75
40 1.296 0.375 1.480 0.670 159.2 252.75
60 1.204 0.375 1.458 0.890 162.8 259.80
80 1.135 0.375 1.416 0.840 175.6 276.16
458
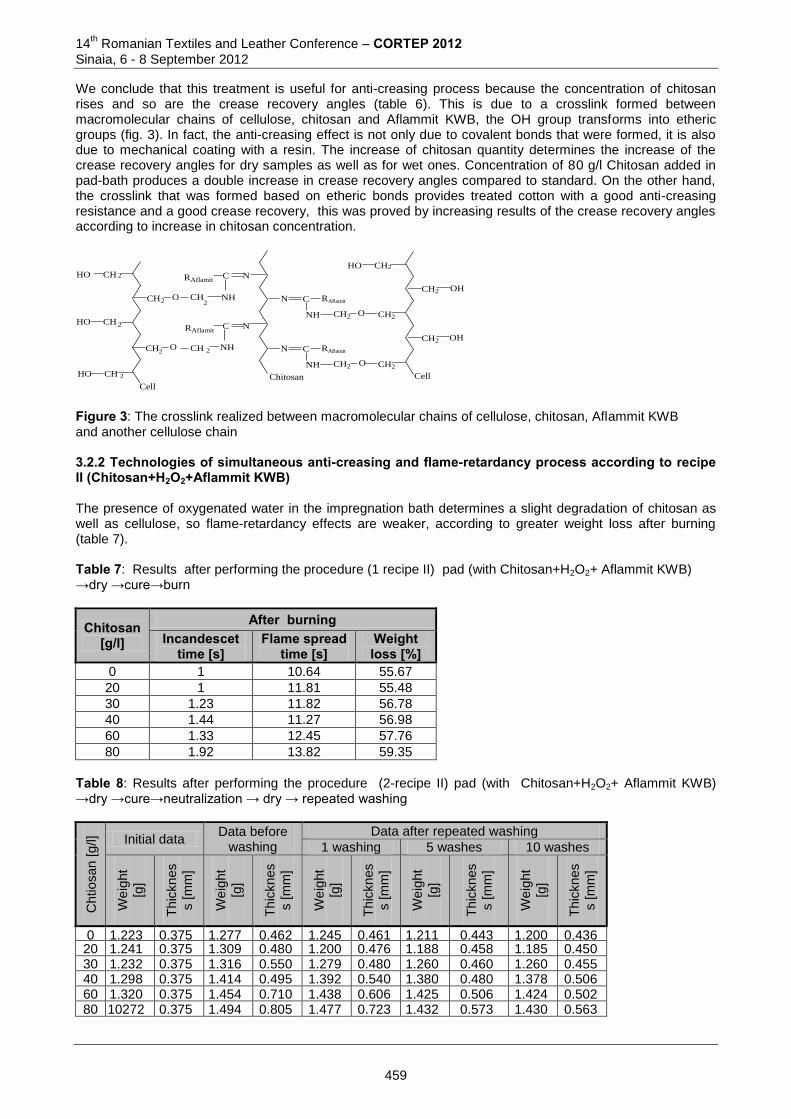
14th Romanian Textiles and Leather Conference – CORTEP 2012
Sinaia, 6 - 8 September 2012
We conclude that this treatment is useful for anti-creasing process because the concentration of chitosan rises and so are the crease recovery angles (table 6). This is due to a crosslink formed between macromolecular chains of cellulose, chitosan and Aflammit KWB, the OH group transforms into etheric groups (fig. 3). In fact, the anti-creasing effect is not only due to covalent bonds that were formed, it is also due to mechanical coating with a resin. The increase of chitosan quantity determines the increase of the crease recovery angles for dry samples as well as for wet ones. Concentration of 80 g/l Chitosan added in pad-bath produces a double increase in crease recovery angles compared to standard. On the other hand, the crosslink that was formed based on etheric bonds provides treated cotton with a good anti-creasing resistance and a good crease recovery, this was proved by increasing results of the crease recovery angles according to increase in chitosan concentration.
HO CH 2
HO CH 2
HO CH 2
OCH2
OCH2
Cell
CH N
NC
NH
NC
CH 2 NH
Chitosan
C RAflamit
NH CH2 O CH2
N C RAflamit
NH CH2 O CH2
HO CH2
CH2
CH2
OH
OH
Cell
RAflamit
RAflamit
2
Figure 3: The crosslink realized between macromolecular chains of cellulose, chitosan, Aflammit KWB and another cellulose chain 3.2.2 Technologies of simultaneous anti-creasing and flame-retardancy process according to recipe II (Chitosan+H2O2+Aflammit KWB) The presence of oxygenated water in the impregnation bath determines a slight degradation of chitosan as well as cellulose, so flame-retardancy effects are weaker, according to greater weight loss after burning (table 7). Table 7: Results after performing the procedure (1 recipe II) pad (with Chitosan+H2O2+ Aflammit KWB) →dry →cure→burn
Chitosan [g/l]
After burning Incandescet
time [s] Flame spread
time [s] Weight loss [%]
0 1 10.64 55.67
20 1 11.81 55.48
30 1.23 11.82 56.78
40 1.44 11.27 56.98
60 1.33 12.45 57.76
80 1.92 13.82 59.35
Table 8: Results after performing the procedure (2-recipe II) pad (with Chitosan+H2O2+ Aflammit KWB) →dry →cure→neutralization → dry → repeated washing
Chtiosan
[g/l] Initial data
Data before washing
Data after repeated washing
1 washing 5 washes 10 washes
We
ight
[g]
Thic
knes
s [m
m]
We
ight
[g]
Thic
knes
s [m
m]
We
ight
[g]
Thic
knes
s [m
m]
We
ight
[g]
Thic
knes
s [m
m]
We
ight
[g]
Thic
knes
s [m
m]
0 1.223 0.375 1.277 0.462 1.245 0.461 1.211 0.443 1.200 0.436 20 1.241 0.375 1.309 0.480 1.200 0.476 1.188 0.458 1.185 0.450 30 1.232 0.375 1.316 0.550 1.279 0.480 1.260 0.460 1.260 0.455 40 1.298 0.375 1.414 0.495 1.392 0.540 1.380 0.480 1.378 0.506 60 1.320 0.375 1.454 0.710 1.438 0.606 1.425 0.506 1.424 0.502 80 10272 0.375 1.494 0.805 1.477 0.723 1.432 0.573 1.430 0.563
459
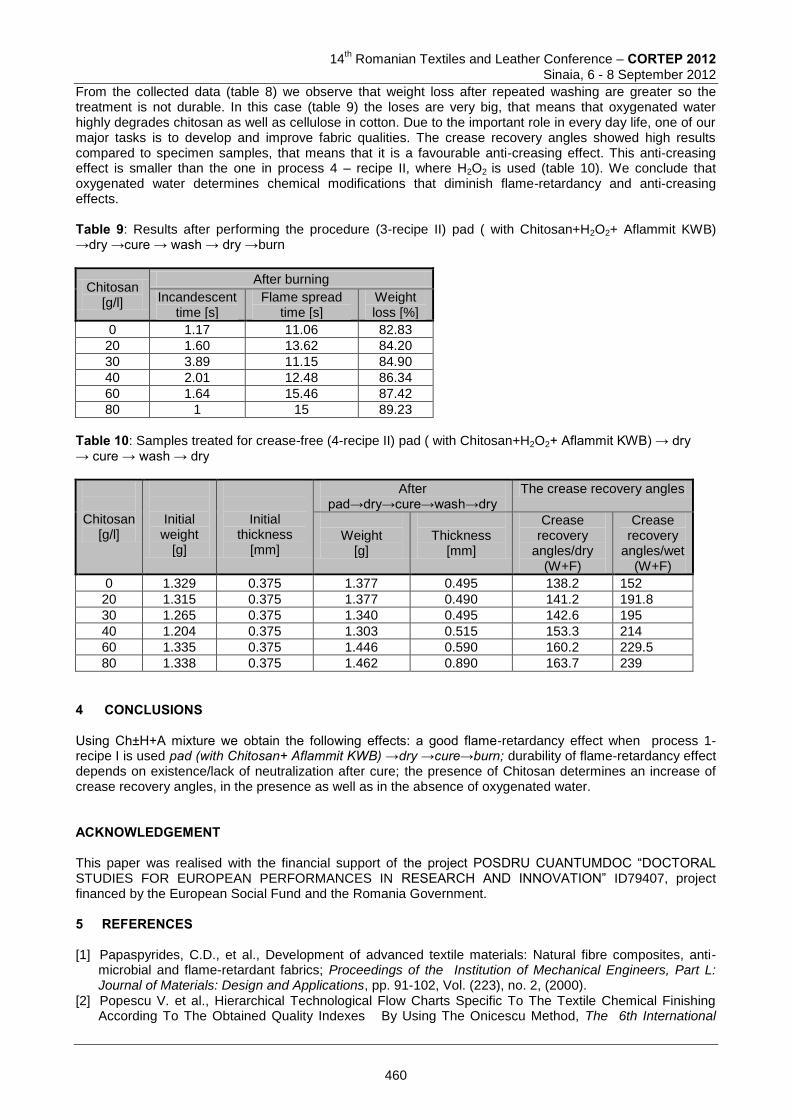
14
th Romanian Textiles and Leather Conference – CORTEP 2012
Sinaia, 6 - 8 September 2012
From the collected data (table 8) we observe that weight loss after repeated washing are greater so the treatment is not durable. In this case (table 9) the loses are very big, that means that oxygenated water highly degrades chitosan as well as cellulose in cotton. Due to the important role in every day life, one of our major tasks is to develop and improve fabric qualities. The crease recovery angles showed high results compared to specimen samples, that means that it is a favourable anti-creasing effect. This anti-creasing effect is smaller than the one in process 4 – recipe II, where H2O2 is used (table 10). We conclude that oxygenated water determines chemical modifications that diminish flame-retardancy and anti-creasing effects. Table 9: Results after performing the procedure (3-recipe II) pad ( with Chitosan+H2O2+ Aflammit KWB) →dry →cure → wash → dry →burn
Chitosan [g/l]
After burning
Incandescent time [s]
Flame spread time [s]
Weight loss [%]
0 1.17 11.06 82.83
20 1.60 13.62 84.20
30 3.89 11.15 84.90
40 2.01 12.48 86.34
60 1.64 15.46 87.42
80 1 15 89.23
Table 10: Samples treated for crease-free (4-recipe II) pad ( with Chitosan+H2O2+ Aflammit KWB) → dry → cure → wash → dry
Chitosan [g/l]
Initial weight
[g]
Initial thickness
[mm]
After pad→dry→cure→wash→dry
The crease recovery angles
Weight
[g]
Thickness
[mm]
Crease recovery
angles/dry (W+F)
Crease recovery
angles/wet (W+F)
0 1.329 0.375 1.377 0.495 138.2 152
20 1.315 0.375 1.377 0.490 141.2 191.8
30 1.265 0.375 1.340 0.495 142.6 195
40 1.204 0.375 1.303 0.515 153.3 214
60 1.335 0.375 1.446 0.590 160.2 229.5
80 1.338 0.375 1.462 0.890 163.7 239
4 CONCLUSIONS Using Ch±H+A mixture we obtain the following effects: a good flame-retardancy effect when process 1-recipe I is used pad (with Chitosan+ Aflammit KWB) →dry →cure→burn; durability of flame-retardancy effect depends on existence/lack of neutralization after cure; the presence of Chitosan determines an increase of crease recovery angles, in the presence as well as in the absence of oxygenated water. ACKNOWLEDGEMENT This paper was realised with the financial support of the project POSDRU CUANTUMDOC “DOCTORAL STUDIES FOR EUROPEAN PERFORMANCES IN RESEARCH AND INNOVATION” ID79407, project financed by the European Social Fund and the Romania Government. 5 REFERENCES [1] Papaspyrides, C.D., et al., Development of advanced textile materials: Natural fibre composites, anti-
microbial and flame-retardant fabrics; Proceedings of the Institution of Mechanical Engineers, Part L: Journal of Materials: Design and Applications, pp. 91-102, Vol. (223), no. 2, (2000).
[2] Popescu V. et al., Hierarchical Technological Flow Charts Specific To The Textile Chemical Finishing According To The Obtained Quality Indexes By Using The Onicescu Method, The 6th International
460
14th Romanian Textiles and Leather Conference – CORTEP 2012
Sinaia, 6 - 8 September 2012
Conference On The Management Of Technological Changes, pp. 769-772, Vol. 2, Alexandroupolis, Greece, (2009).
[3] Popescu V. et al., Determination of the Factors Influencing the Flame Retardant Efficiency of the Protection - Dyed Cellulose Materials Using the Analysis of Variances, Materiale Plastice , Vol.(46), No. 1 , pp. 95-100, 2009.
[4] Drago, K. et. al, Formaldehide free Biding System for Flame Retardant Finishing of Cotton Fabrics, Fibres &Textiles in Eastern Europe, Vol. (20), pp. 94-98, ISSN 1230-3666.
[5] Popescu V. et al., Objective hierarchization of some technologies for cotton fireproofing, The 7th
International Industrial Simulation Conference ISC’2009, pp. 352-355, Loughborough, United Kingdom, (2009).
[6] Popescu V., Iliescu, E., Study for achieve the hierarchy of the technological lines In chemical textiles finishing domain, International symposium “Scientific Research a bridge for European integration”, pp. 52-57, Arad, (2004).
[7] Iliescu E., Gh., Nagy, Popescu V., Superior finishing of the textile materials, Ed. TehnoPress, ISBN 973-702-041-3, Iasi, (2004).
[8] Popescu V., Technology for preparation, bleaching and aperture of materials textile, Vol I Celluosic materials, pp. 52-54, Editure Tehnopress, Iasi, (2007).
[9] Popescu V. et al., Statistical Analysis of the Results of Some technologies for cotton fireproofing, The 7th
International Industrial Simulation Conference ISC’2009, pp. 347-351, Loughborough, United Kingdom, (2009).
[10] Popescu V., Iliescu E., The flame proofing treatment of the 100%cotton fabrics, International Symposium “Scientific Research- a bridge for European Integration”, pp. 95-100, Arad, (2004).
[11] Popescu V. et al., Soil-release treatment of the cotton fabric (100%), Romanian Textile and Leather Journal, Iasi, Vol. no.1, pp.61-76, (2005).
[12] Popescu V. et al., Behaviour of cotton at the action of flame proof reagents, International Symposium “Present and perspective in textile engineering” , pp.524-536, Iasi, Romania, (2005).
[13] Iliescu, E., Mureșan, R., Mureșan, A., Quality control of training processes and superior finishing of textiles, pp.103-105, Ed. Dosoftei, ISBN 973-9135-49-3, Iași, (1997).
[14] Popescu V., Radu,C. D.,The efficiency of flame retardant treatment on a Pes 100% Knit, Buletinul IPI, Tomul LIII(LVII), pp. 509- 516, Fasc. 5. vol II, (2007).
[15] Honarkar, H., Barikani, M.: Applications of biopolymers I: chitosan, Monatsh Chem, Vol. 140, pp.1403–1420, (2009).
[16] Mureșan, A.: Equipment and processes for textile finishing, pp.253-254, Ed. Performantica, Iasi, (2009). [17] Iliescu, E., Mureșan, R., Mureșan, A., Quality control of training processes and superior finishing of
textiles, Ed. Dosoftei, ISBN 973-9135-46-3, Iași, (1997) [18] El-Tahlawy, K.: Chitosan phosphate: A new way for production of eco-friendly flame-retardant cotton
textiles, Journal of the Textile Institute, Vol. (99), pp. 185 – 191, ISSN 0040-5000.
Corresponding author:
Ecaterina VASLUIANU Department of Textile Chemical Engineering Faculty of Textiles, Leather & Industrial Management/ “Gheorghe Asachi” Technical University 53 D. Mangeron Blvd. 700050, Iasi Romania Phone: +40741316666; E-mail: [email protected]
Co-author: Vasilica POPESCU Department of Textile Chemical Engineering Faculty of Textiles, Leather & Industrial Management/ “Gheorghe Asachi’ Technical University 53 D. Mangeron Blvd. 700050, Iasi Romania E-mail: [email protected]
461
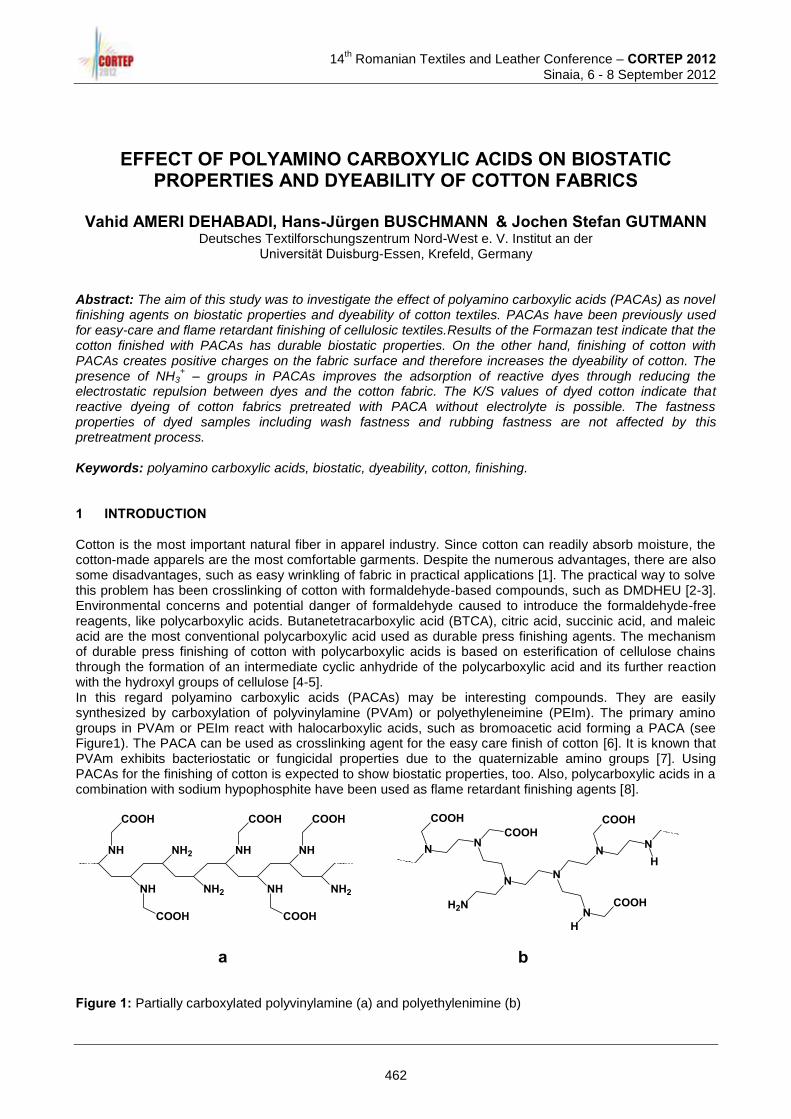
14
th Romanian Textiles and Leather Conference – CORTEP 2012
Sinaia, 6 - 8 September 2012
EFFECT OF POLYAMINO CARBOXYLIC ACIDS ON BIOSTATIC PROPERTIES AND DYEABILITY OF COTTON FABRICS
Vahid AMERI DEHABADI, Hans-Jürgen BUSCHMANN & Jochen Stefan GUTMANN
Deutsches Textilforschungszentrum Nord-West e. V. Institut an der Universität Duisburg-Essen, Krefeld, Germany
Abstract: The aim of this study was to investigate the effect of polyamino carboxylic acids (PACAs) as novel finishing agents on biostatic properties and dyeability of cotton textiles. PACAs have been previously used for easy-care and flame retardant finishing of cellulosic textiles.Results of the Formazan test indicate that the cotton finished with PACAs has durable biostatic properties. On the other hand, finishing of cotton with PACAs creates positive charges on the fabric surface and therefore increases the dyeability of cotton. The presence of NH3
+ – groups in PACAs improves the adsorption of reactive dyes through reducing the
electrostatic repulsion between dyes and the cotton fabric. The K/S values of dyed cotton indicate that reactive dyeing of cotton fabrics pretreated with PACA without electrolyte is possible. The fastness properties of dyed samples including wash fastness and rubbing fastness are not affected by this pretreatment process. Keywords: polyamino carboxylic acids, biostatic, dyeability, cotton, finishing. 1 INTRODUCTION Cotton is the most important natural fiber in apparel industry. Since cotton can readily absorb moisture, the cotton-made apparels are the most comfortable garments. Despite the numerous advantages, there are also some disadvantages, such as easy wrinkling of fabric in practical applications [1]. The practical way to solve this problem has been crosslinking of cotton with formaldehyde-based compounds, such as DMDHEU [2-3]. Environmental concerns and potential danger of formaldehyde caused to introduce the formaldehyde-free reagents, like polycarboxylic acids. Butanetetracarboxylic acid (BTCA), citric acid, succinic acid, and maleic acid are the most conventional polycarboxylic acid used as durable press finishing agents. The mechanism of durable press finishing of cotton with polycarboxylic acids is based on esterification of cellulose chains through the formation of an intermediate cyclic anhydride of the polycarboxylic acid and its further reaction with the hydroxyl groups of cellulose [4-5]. In this regard polyamino carboxylic acids (PACAs) may be interesting compounds. They are easily synthesized by carboxylation of polyvinylamine (PVAm) or polyethyleneimine (PEIm). The primary amino groups in PVAm or PEIm react with halocarboxylic acids, such as bromoacetic acid forming a PACA (see Figure1). The PACA can be used as crosslinking agent for the easy care finish of cotton [6]. It is known that PVAm exhibits bacteriostatic or fungicidal properties due to the quaternizable amino groups [7]. Using PACAs for the finishing of cotton is expected to show biostatic properties, too. Also, polycarboxylic acids in a combination with sodium hypophosphite have been used as flame retardant finishing agents [8]. Figure 1: Partially carboxylated polyvinylamine (a) and polyethylenimine (b)
NH
NH
NH2
NH2
NH
NH
COOH
NH
NH2
COOH
COOH
COOH
COOHH2N
N N
N NNN
COOHCOOH
COOH
NH
COOH
H
a b
462
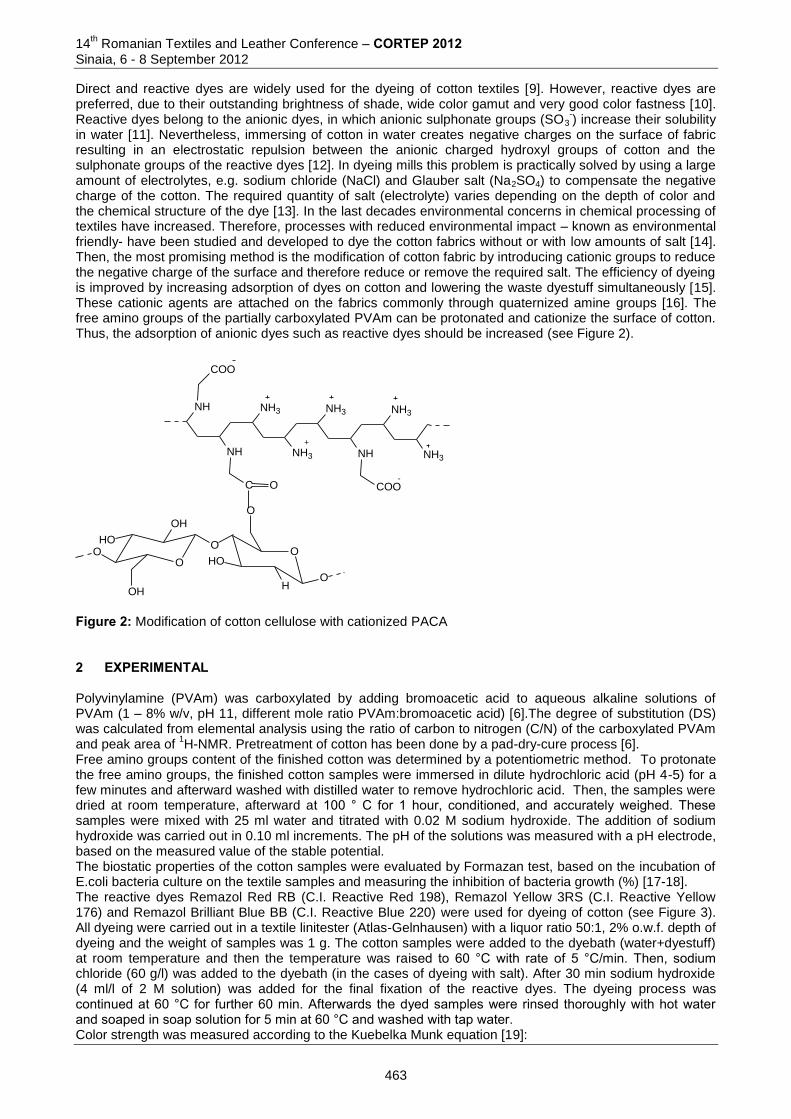
14th Romanian Textiles and Leather Conference – CORTEP 2012
Sinaia, 6 - 8 September 2012
Direct and reactive dyes are widely used for the dyeing of cotton textiles [9]. However, reactive dyes are preferred, due to their outstanding brightness of shade, wide color gamut and very good color fastness [10]. Reactive dyes belong to the anionic dyes, in which anionic sulphonate groups (SO3
-) increase their solubility
in water [11]. Nevertheless, immersing of cotton in water creates negative charges on the surface of fabric resulting in an electrostatic repulsion between the anionic charged hydroxyl groups of cotton and the sulphonate groups of the reactive dyes [12]. In dyeing mills this problem is practically solved by using a large amount of electrolytes, e.g. sodium chloride (NaCl) and Glauber salt (Na2SO4) to compensate the negative charge of the cotton. The required quantity of salt (electrolyte) varies depending on the depth of color and the chemical structure of the dye [13]. In the last decades environmental concerns in chemical processing of textiles have increased. Therefore, processes with reduced environmental impact – known as environmental friendly- have been studied and developed to dye the cotton fabrics without or with low amounts of salt [14]. Then, the most promising method is the modification of cotton fabric by introducing cationic groups to reduce the negative charge of the surface and therefore reduce or remove the required salt. The efficiency of dyeing is improved by increasing adsorption of dyes on cotton and lowering the waste dyestuff simultaneously [15]. These cationic agents are attached on the fabrics commonly through quaternized amine groups [16]. The free amino groups of the partially carboxylated PVAm can be protonated and cationize the surface of cotton. Thus, the adsorption of anionic dyes such as reactive dyes should be increased (see Figure 2).
NH
NH
NH3
NH3
NH3
NH
NH3
NH3
COO
COOC O-
+
O
OH
HOO
OH
OO
O
H
HO
O
Figure 2: Modification of cotton cellulose with cationized PACA 2 EXPERIMENTAL Polyvinylamine (PVAm) was carboxylated by adding bromoacetic acid to aqueous alkaline solutions of PVAm (1 – 8% w/v, pH 11, different mole ratio PVAm:bromoacetic acid) [6].The degree of substitution (DS) was calculated from elemental analysis using the ratio of carbon to nitrogen (C/N) of the carboxylated PVAm and peak area of
1H-NMR. Pretreatment of cotton has been done by a pad-dry-cure process [6].
Free amino groups content of the finished cotton was determined by a potentiometric method. To protonate the free amino groups, the finished cotton samples were immersed in dilute hydrochloric acid (pH 4-5) for a few minutes and afterward washed with distilled water to remove hydrochloric acid. Then, the samples were dried at room temperature, afterward at 100 ° C for 1 hour, conditioned, and accurately weighed. These samples were mixed with 25 ml water and titrated with 0.02 M sodium hydroxide. The addition of sodium hydroxide was carried out in 0.10 ml increments. The pH of the solutions was measured with a pH electrode, based on the measured value of the stable potential. The biostatic properties of the cotton samples were evaluated by Formazan test, based on the incubation of E.coli bacteria culture on the textile samples and measuring the inhibition of bacteria growth (%) [17-18]. The reactive dyes Remazol Red RB (C.I. Reactive Red 198), Remazol Yellow 3RS (C.I. Reactive Yellow 176) and Remazol Brilliant Blue BB (C.I. Reactive Blue 220) were used for dyeing of cotton (see Figure 3). All dyeing were carried out in a textile linitester (Atlas-Gelnhausen) with a liquor ratio 50:1, 2% o.w.f. depth of dyeing and the weight of samples was 1 g. The cotton samples were added to the dyebath (water+dyestuff) at room temperature and then the temperature was raised to 60 °C with rate of 5 °C/min. Then, sodium chloride (60 g/l) was added to the dyebath (in the cases of dyeing with salt). After 30 min sodium hydroxide (4 ml/l of 2 M solution) was added for the final fixation of the reactive dyes. The dyeing process was continued at 60 °C for further 60 min. Afterwards the dyed samples were rinsed thoroughly with hot water and soaped in soap solution for 5 min at 60 °C and washed with tap water. Color strength was measured according to the Kuebelka Munk equation [19]:
463
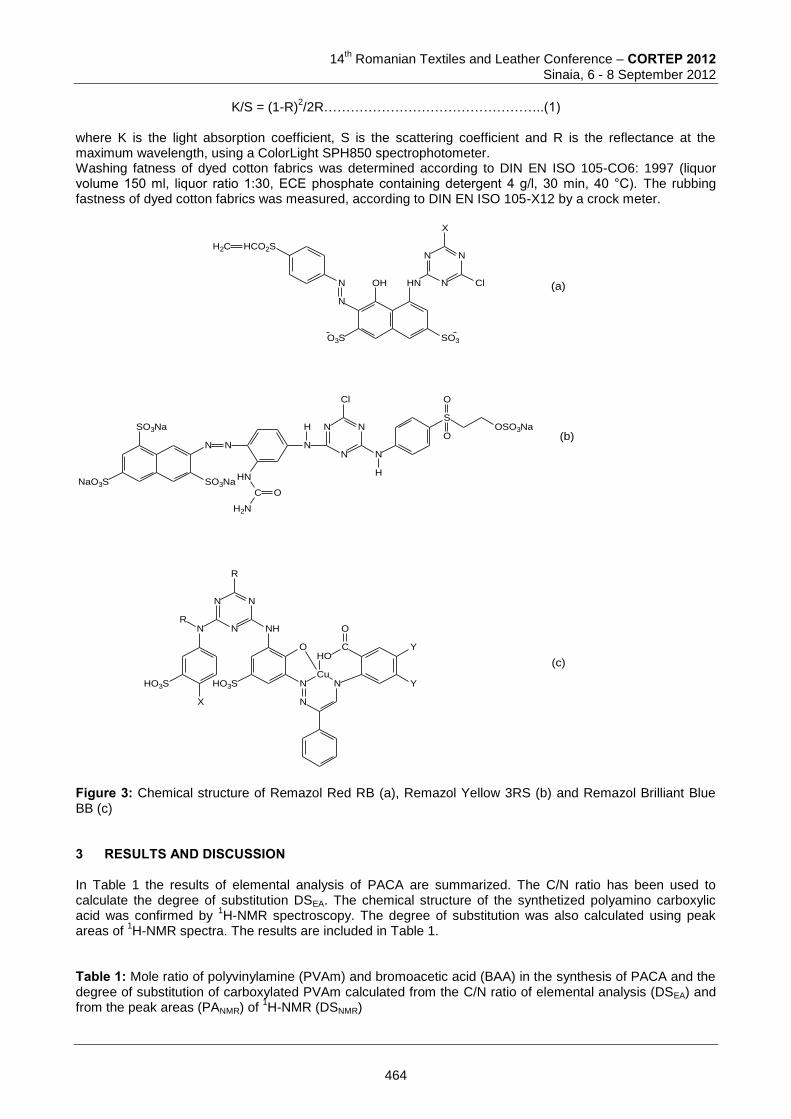
14
th Romanian Textiles and Leather Conference – CORTEP 2012
Sinaia, 6 - 8 September 2012
K/S = (1-R)
2/2R…………………………………………..(1)
where K is the light absorption coefficient, S is the scattering coefficient and R is the reflectance at the maximum wavelength, using a ColorLight SPH850 spectrophotometer. Washing fatness of dyed cotton fabrics was determined according to DIN EN ISO 105-CO6: 1997 (liquor volume 150 ml, liquor ratio 1:30, ECE phosphate containing detergent 4 g/l, 30 min, 40 °C). The rubbing fastness of dyed cotton fabrics was measured, according to DIN EN ISO 105-X12 by a crock meter.
HCO2S
N
N
O3S
HNOH
SO3
N
NN
X
Cl
H2C
NaO3S
N
SO3Na
SO3Na
N
HN
C
H2N
O
N
H
N
NN
N
SOSO3Na
Cl
H
O
O
NN
HO3S
X
NN
R
R
NH
NCu
HOO
HO3S
N
N
C
O
Y
Y
(a)
(b)
(c)
Figure 3: Chemical structure of Remazol Red RB (a), Remazol Yellow 3RS (b) and Remazol Brilliant Blue BB (c) 3 RESULTS AND DISCUSSION In Table 1 the results of elemental analysis of PACA are summarized. The C/N ratio has been used to calculate the degree of substitution DSEA. The chemical structure of the synthetized polyamino carboxylic acid was confirmed by
1H-NMR spectroscopy. The degree of substitution was also calculated using peak
areas of 1H-NMR spectra. The results are included in Table 1.
Table 1: Mole ratio of polyvinylamine (PVAm) and bromoacetic acid (BAA) in the synthesis of PACA and the degree of substitution of carboxylated PVAm calculated from the C/N ratio of elemental analysis (DSEA) and from the peak areas (PANMR) of
1H-NMR (DSNMR)
464
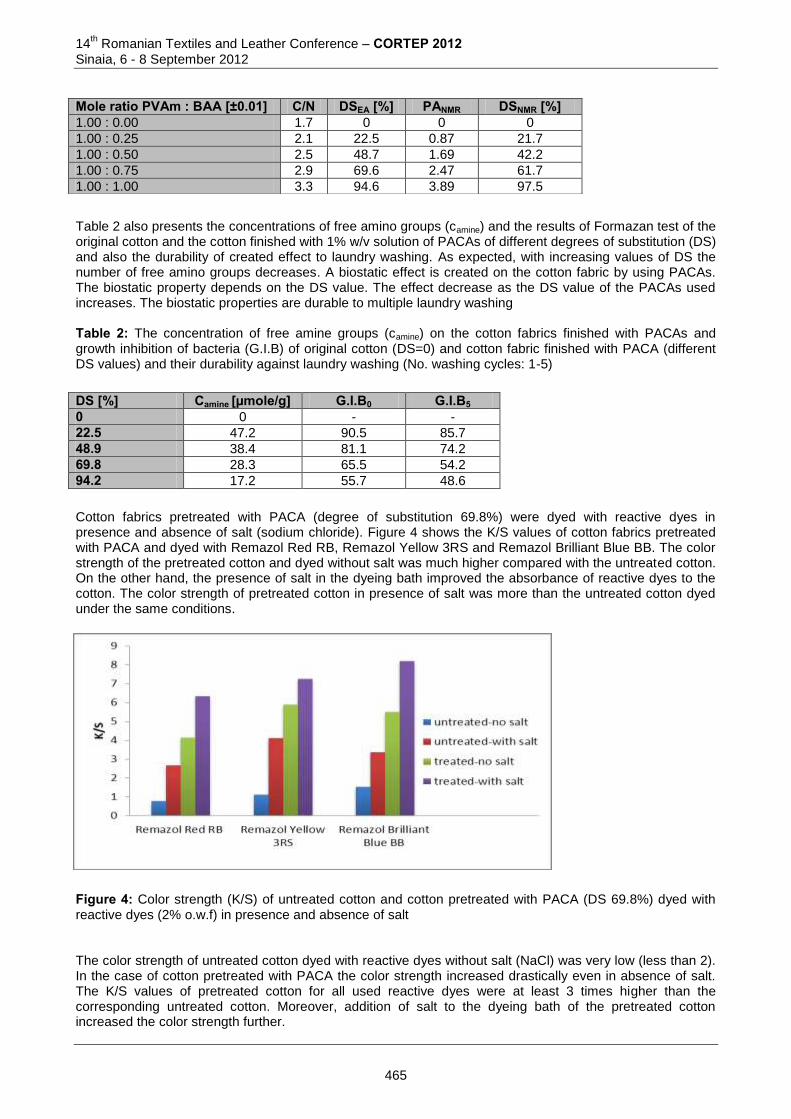
14th Romanian Textiles and Leather Conference – CORTEP 2012
Sinaia, 6 - 8 September 2012
Table 2 also presents the concentrations of free amino groups (camine) and the results of Formazan test of the original cotton and the cotton finished with 1% w/v solution of PACAs of different degrees of substitution (DS) and also the durability of created effect to laundry washing. As expected, with increasing values of DS the number of free amino groups decreases. A biostatic effect is created on the cotton fabric by using PACAs. The biostatic property depends on the DS value. The effect decrease as the DS value of the PACAs used increases. The biostatic properties are durable to multiple laundry washing Table 2: The concentration of free amine groups (camine) on the cotton fabrics finished with PACAs and growth inhibition of bacteria (G.I.B) of original cotton (DS=0) and cotton fabric finished with PACA (different DS values) and their durability against laundry washing (No. washing cycles: 1-5)
Cotton fabrics pretreated with PACA (degree of substitution 69.8%) were dyed with reactive dyes in presence and absence of salt (sodium chloride). Figure 4 shows the K/S values of cotton fabrics pretreated with PACA and dyed with Remazol Red RB, Remazol Yellow 3RS and Remazol Brilliant Blue BB. The color strength of the pretreated cotton and dyed without salt was much higher compared with the untreated cotton. On the other hand, the presence of salt in the dyeing bath improved the absorbance of reactive dyes to the cotton. The color strength of pretreated cotton in presence of salt was more than the untreated cotton dyed under the same conditions. Figure 4: Color strength (K/S) of untreated cotton and cotton pretreated with PACA (DS 69.8%) dyed with reactive dyes (2% o.w.f) in presence and absence of salt The color strength of untreated cotton dyed with reactive dyes without salt (NaCl) was very low (less than 2). In the case of cotton pretreated with PACA the color strength increased drastically even in absence of salt. The K/S values of pretreated cotton for all used reactive dyes were at least 3 times higher than the corresponding untreated cotton. Moreover, addition of salt to the dyeing bath of the pretreated cotton increased the color strength further.
Mole ratio PVAm : BAA [±0.01] C/N DSEA [%] PANMR DSNMR [%] 1.00 : 0.00 1.7 0 0 0
1.00 : 0.25 2.1 22.5 0.87 21.7
1.00 : 0.50 2.5 48.7 1.69 42.2
1.00 : 0.75 2.9 69.6 2.47 61.7
1.00 : 1.00 3.3 94.6 3.89 97.5
DS [%] Camine [µmole/g] G.I.B0 G.I.B5 0 0 - -
22.5 47.2 90.5 85.7
48.9 38.4 81.1 74.2
69.8 28.3 65.5 54.2
94.2 17.2 55.7 48.6
465
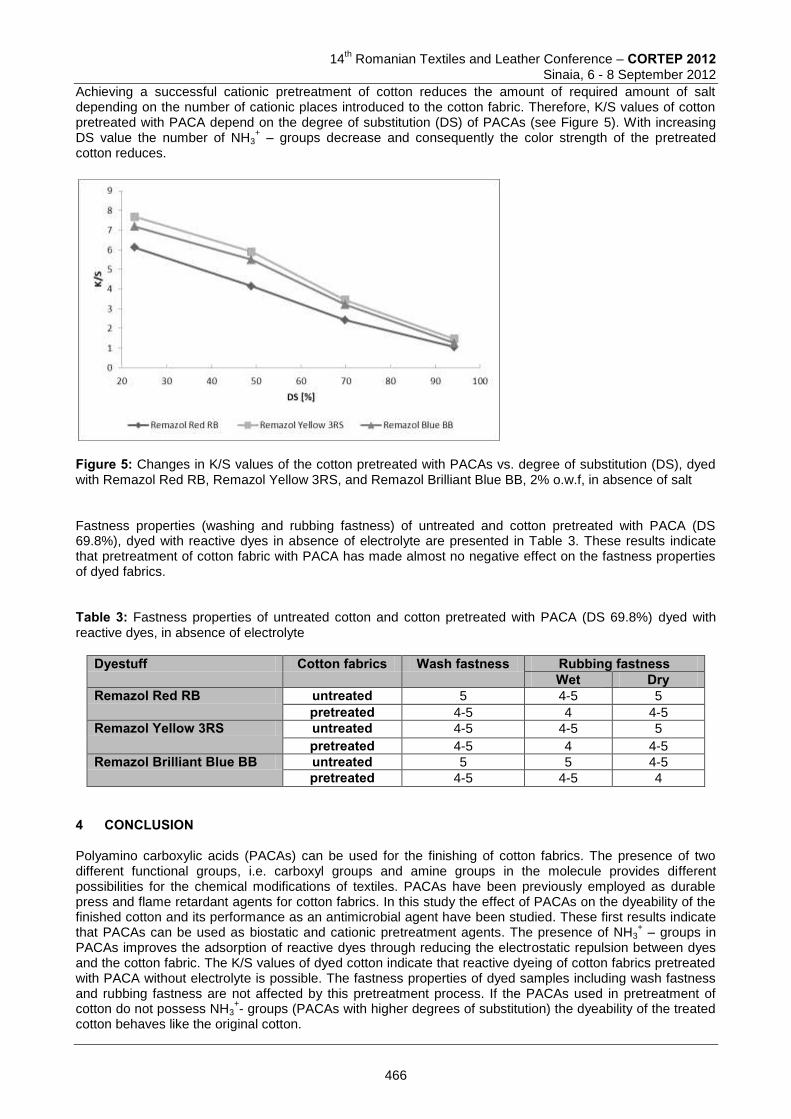
14
th Romanian Textiles and Leather Conference – CORTEP 2012
Sinaia, 6 - 8 September 2012
Achieving a successful cationic pretreatment of cotton reduces the amount of required amount of salt depending on the number of cationic places introduced to the cotton fabric. Therefore, K/S values of cotton pretreated with PACA depend on the degree of substitution (DS) of PACAs (see Figure 5). With increasing DS value the number of NH3
+ – groups decrease and consequently the color strength of the pretreated
cotton reduces.
Figure 5: Changes in K/S values of the cotton pretreated with PACAs vs. degree of substitution (DS), dyed with Remazol Red RB, Remazol Yellow 3RS, and Remazol Brilliant Blue BB, 2% o.w.f, in absence of salt Fastness properties (washing and rubbing fastness) of untreated and cotton pretreated with PACA (DS 69.8%), dyed with reactive dyes in absence of electrolyte are presented in Table 3. These results indicate that pretreatment of cotton fabric with PACA has made almost no negative effect on the fastness properties of dyed fabrics. Table 3: Fastness properties of untreated cotton and cotton pretreated with PACA (DS 69.8%) dyed with reactive dyes, in absence of electrolyte
Dyestuff Cotton fabrics Wash fastness Rubbing fastness Wet Dry
Remazol Red RB untreated 5 4-5 5
pretreated 4-5 4 4-5
Remazol Yellow 3RS untreated 4-5 4-5 5
pretreated 4-5 4 4-5
Remazol Brilliant Blue BB untreated 5 5 4-5
pretreated 4-5 4-5 4
4 CONCLUSION Polyamino carboxylic acids (PACAs) can be used for the finishing of cotton fabrics. The presence of two different functional groups, i.e. carboxyl groups and amine groups in the molecule provides different possibilities for the chemical modifications of textiles. PACAs have been previously employed as durable press and flame retardant agents for cotton fabrics. In this study the effect of PACAs on the dyeability of the finished cotton and its performance as an antimicrobial agent have been studied. These first results indicate that PACAs can be used as biostatic and cationic pretreatment agents. The presence of NH3
+ – groups in
PACAs improves the adsorption of reactive dyes through reducing the electrostatic repulsion between dyes and the cotton fabric. The K/S values of dyed cotton indicate that reactive dyeing of cotton fabrics pretreated with PACA without electrolyte is possible. The fastness properties of dyed samples including wash fastness and rubbing fastness are not affected by this pretreatment process. If the PACAs used in pretreatment of cotton do not possess NH3
+- groups (PACAs with higher degrees of substitution) the dyeability of the treated
cotton behaves like the original cotton.
466
14th Romanian Textiles and Leather Conference – CORTEP 2012
Sinaia, 6 - 8 September 2012
5 REFERENCES [1] Schindler, W. D.& Hauser, P. J.: Chemical Finishing of Textiles, Woodhead, ISBN 1 85573 905 4,
Cambridge, (2004). [2] Geubtner, M.: Fortschritte bei der Hochveredlung von Viskose-und Modalfaserartikeln, Melliand
Textilberichte, Vol. 71 (1990), pp. 214-218. [3] Sharpe, G.& Mallinson, P.: Easy care finishing of celluolsics, In Textile Finishing, Society of Dyers and
Colourists, ISBN 0 901956 81 3, Cambridge, (2003), pp. 337-350. [4] Yang, C.: FTIR spectroscopy study of ester crosslinking of cotton cellulose catalyzed by sodium
hypophosphite, Textile Research Journal, Vol. 71 (2001),No. 3, pp. 201-206. [5] Lewis, D.& Voncina, B.: Durable press finishing of cotton with polycarboxylic acids. II. Ester crosslinking
of cotton with dithiosuccinic acid derivative of S-triazine, Journal of Applied Polymer Science, Vol. 66 (1997), pp. 171-177.
[6] Ameri Dehabadi, V. et al.: Durable press finishing of cotton fabrics with polyamino carboxylic acids, Carbohydrate Polymers, Vol. 89 (2012), pp. 558-563.
[7] Thölmann, D. et al.: SAM-Polymers-ein polymerbiozides Additiv (Polymers with antimicrobial properties), European Coatings Journal, (2003), pp. 105-107.
[8] Wu, X. et al.: Flame retardant finishing of cotton fleece: part VII. Polycarboxylic acids with different numbers of functional groups, Cellulose, Vol. 17 (2010), pp. 859-870.
[9] Ibrahim, NA. et al.: Multifunctional anionic cotton dyeing, Journal of Applied Polymer Science, Vol. 115 (2010), pp. 3249-3255.
[10] Lewis, DM. & Vo, LLT.: Dyeing cotton with reactive dyes under neutral conditions. Coloration Technology, Vol. 123 (2007), pp. 306-311.
[11] Lim, SH & Hudson, SM.: Application of fiber-reactive chitosan reactive derivative to cotton fabric as a zero-salt dyeing auxiliary, Coloration. Technology, Vol. 120 (2004) pp. 108-113.
[12] Jang, J. et al..: Investigation of the improved dyeability of cationized cotton via photografting with UV active cationic monomers, Coloration Technology. Vol. 117 (2001) pp. 139-146.
[13] Srikulkit, K & Santifuengkul, P. : Salt-free dyeing of cotton cellulose with a model cationic reactive dye, Journal of Society of Dyers and Colorists, Vol. 116 (2000) pp. 398-402.
[14] Guan, Y. et al.: Application of polycarboxylic acid sodium salt in the dyeing of cotton fabric with reactive dyes, Journal of Applied Polymer Science, Vol. 105 (2007), pp. 726-732.
[15] Tutak, M. & Özdemir, MO.: Reactive dyeing of cationized cotton: Effects on the dyeing yield and the fastness properties, Journal of Applied Polymer Science, Vol. 119 (2011), pp. 500-504.
[16] Zhang, F. et al.: Synthesis of an amino-terminated hyperbranched polymer and its application in reactive dyeing on cotton as salt-free dyeing auxiliary, Coloration Technology, Vol. 123 (2007), pp. 351-357.
[17] Altman, F.: Trazolium salts and formazans, Progress in Histochemistry and Cytochemistry, Vol. 9 (1976), pp. 1-56.
[18] Oppermann, W. et al.: Schnelltest zur Beurteilung antimikrobieller Textilien, Textilveredlung, Vol. 37 (2003), pp. 16-21.
[19] Garland, C. : Colour Technology. In Textile Chemistry. Research Triangle Park: American Association of Textile Chemists and Colorists, pp. 107, (1993).
Corresponding author: Vahid AMERI DEHABADI Deutsches Textilforschungszentrum Nord-West e. V. Institut an der Universität Duisburg-Essen Adlerstr. 1, 47798 Krefeld, Germany Phone: +(49) (2151) 843 157 ; Fax : +(49) (2151) 843 143 ; Email : [email protected]
Co-authors: Hans-Jürgen BUSCHMANN, Ph.D. Deutsches Textilforschungszentrum Nord-West e. V. Institut an der Universität Duisburg-Essen Adlerstr. 1, 47798 Krefeld, Germany Phone: +(49) (2151) 843 210 ; Fax: +(49) (2151) 843 143 ; E-mail: [email protected] Prof. Jochen S. GUTMANNI, Ph. D. Deutsches Textilforschungszentrum Nord-West e. V. Institut an der Universität Duisburg-Essen Adlerstr. 1, 47798 Krefeld, Germany Phone: +(49) (2151) 843 190 ; Fax: +(49) (2151) 843 143; Email : [email protected]
467
14
th Romanian Textiles and Leather Conference – CORTEP 2012
Sinaia, 6 - 8 September 2012
RESEARCH REGARDING THE PLASMA HYDROPHOBIZATION OF TEXTILE MATERIALS FOR MEDICAL ARTICLES
Lilioara SURDU1, Ioan CIOARA2, Carmen GHITULEASA1, Nicula GHEORGHE1,
Laurentiu DINCA1, Adriana SUBTIRICA1, Marilena NICULESCU1, Razvan RADULESCU1& Cosmin MEDOR3
1 The National R&D Institute for Textiles and Leather Bucharest
2 “Gheorghe Asachi” Technical University of Iasi,
3 University of Medicine and Farmacy "Carol Davila" Bucharest
Abstract: The protection robes used by the medical staff within the surgery operating units should meet a number of requirements, such as: decreased absorption ability for fluids and decreased capability of water retention.Chemical treatment of the fabrics used as medical work equipment was successful in obtaining the desired properties, but there are environmental concerns related to the disposal of chemicals after treatment.[1] Taking into account the advantages of the plasma treatment technology, an enormous interest was gained in the last years, tending to replace chemical applications in finishing and pre-treatment of textiles products.This paper outlines the results of comparative research regarding the hydrophobic properties of several textiles with special destination – medical articles – using comparatively two processes: classical chemical treatment for hydrophobization and plasma hydrophobization. Surface treatment efficiency was assessed through laboratory tests (vapor permeability and air permeability) and their appearance by electronic microscopy. The hydrophobic properties of the produced materials have been evaluated by establishing the quantity of absorbed water, absorption time and contact angle. Hydrophobic treatment of cotton fabrics with plasma gas such as hexafloropropane (C3H2F6) leads to a smooth surface with increased contact angle of water. The best results for hydrophobization with plasma treatment was observed on cotton materials. The research highlighted that the plasma technology represents a new alternative for better modification of medical surfaces and textiles. Keywords: plasma, textile materials, surface morphology, functionality 1. INTRODUCTION Plasma is a (partly) ionized gas, which contains free charge carriers (electrons and ions), active radicals and excited molecules. So-called non-thermal plasmas are particularly interesting, because they operate at relatively low temperatures and do not inflict thermal damage to nearby objects. In the past two decades non-thermal plasmas have made a revolutionary appearance in solid state processing technology.[9] Surface preparation and modification has gained in the last decennia an enormous interest and discovered new applications. It is a complete other approach to modify only the surface properties without changing the bulk properties. This delivers new materials with new possibilities, which opens perspectives to resolve production or design problems or even develop complete new applications. Production problems are mainly caused by the substitution of the base material to new materials for example polymers, which have not the correct surface behavior for further processing.[3] Design requires of course another way of thinking because one has to take distance from the conventional mechanical and chemical modification of surfaces. [4] The low pressure plasma technology is such an alternative where on a dry, environmental friendly and cost-efficient way the surface is modified on microscopic level. [5] The plasma technology will be described together with the different application groups. Meaning is to give a good overview of the possibilities of plasma nowadays and to open new thoughts for the future.[3] The plasma treatment was realized to INCDTP by CD400 Roll-to-roll, Low pressure plasma equipment. Hydrophobic treatment of textile materials for medical articles was realized with hexafloropropane (C3H2F6). The advantage of this plasma compared with atmospheric-plasma equipment is that it is a well controlled and reproducible technique. Surface treatment process for hydrophobic treatment Surface preparation and modification has gained in the last years an enormous interest and discovered new applications. It is a complete other approach to modify only the surface.
468
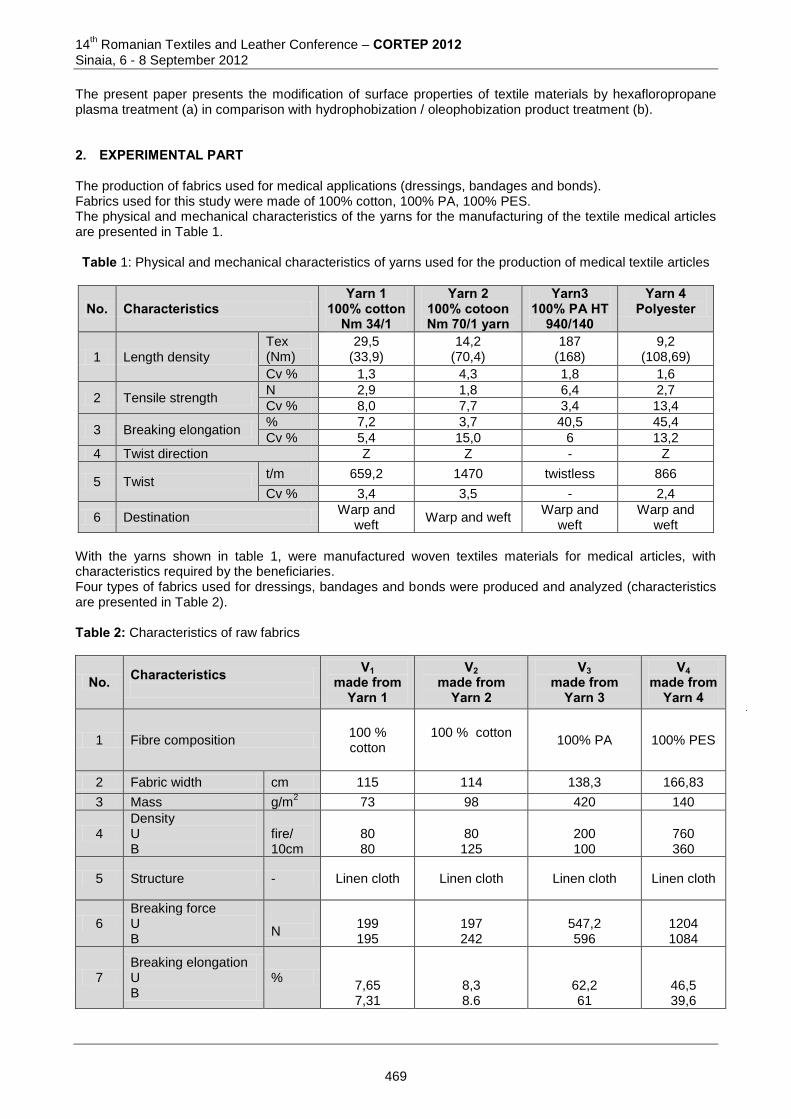
14th Romanian Textiles and Leather Conference – CORTEP 2012
Sinaia, 6 - 8 September 2012
The present paper presents the modification of surface properties of textile materials by hexafloropropane plasma treatment (a) in comparison with hydrophobization / oleophobization product treatment (b). 2. EXPERIMENTAL PART The production of fabrics used for medical applications (dressings, bandages and bonds). Fabrics used for this study were made of 100% cotton, 100% PA, 100% PES. The physical and mechanical characteristics of the yarns for the manufacturing of the textile medical articles are presented in Table 1. Table 1: Physical and mechanical characteristics of yarns used for the production of medical textile articles
No. Characteristics Yarn 1
100% cotton Nm 34/1
Yarn 2 100% cotoon Nm 70/1 yarn
Yarn3 100% PA HT
940/140
Yarn 4 Polyester
1 Length density
Tex (Nm)
29,5 (33,9)
14,2 (70,4)
187 (168)
9,2 (108,69)
Cv % 1,3 4,3 1,8 1,6
2 Tensile strength N 2,9 1,8 6,4 2,7
Cv % 8,0 7,7 3,4 13,4
3 Breaking elongation % 7,2 3,7 40,5 45,4
Cv % 5,4 15,0 6 13,2
4 Twist direction Z Z - Z
5 Twist t/m 659,2 1470 twistless 866
Cv % 3,4 3,5 - 2,4
6 Destination Warp and
weft Warp and weft
Warp and weft
Warp and weft
With the yarns shown in table 1, were manufactured woven textiles materials for medical articles, with characteristics required by the beneficiaries. Four types of fabrics used for dressings, bandages and bonds were produced and analyzed (characteristics are presented in Table 2). Table 2: Characteristics of raw fabrics
No. Characteristics
V1 made from
Yarn 1
V2 made from
Yarn 2
V3 made from
Yarn 3
V4 made from
Yarn 4
1 Fibre composition
100 % cotton
100 % cotton
100% PA 100% PES
2 Fabric width cm 115 114 138,3 166,83
3 Mass g/m2
73 98 420 140
4 Density U B
fire/ 10cm
80 80
80 125
200 100
760 360
5 Structure - Linen cloth Linen cloth Linen cloth Linen cloth
6 Breaking force U B
N
199 195
197 242
547,2 596
1204 1084
7 Breaking elongation U B
%
7,65 7,31
8,3 8.6
62,2 61
46,5 39,6
469
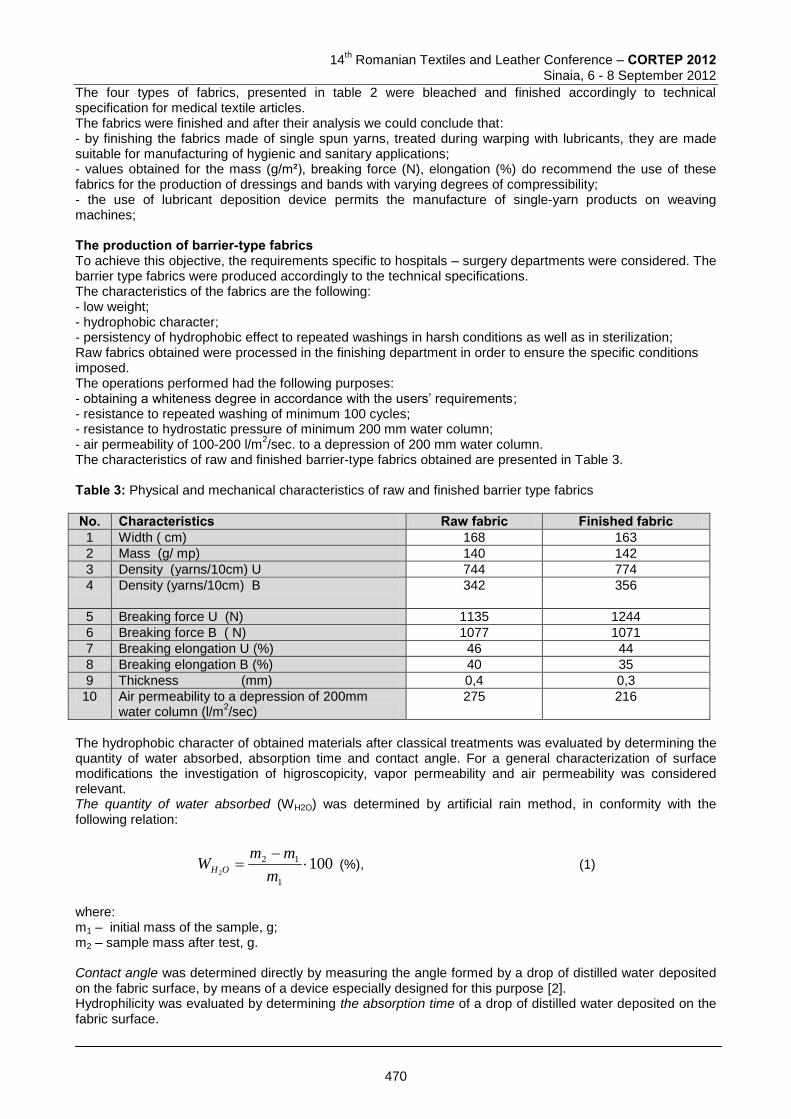
14
th Romanian Textiles and Leather Conference – CORTEP 2012
Sinaia, 6 - 8 September 2012
The four types of fabrics, presented in table 2 were bleached and finished accordingly to technical specification for medical textile articles. The fabrics were finished and after their analysis we could conclude that: - by finishing the fabrics made of single spun yarns, treated during warping with lubricants, they are made suitable for manufacturing of hygienic and sanitary applications; - values obtained for the mass (g/m²), breaking force (N), elongation (%) do recommend the use of these fabrics for the production of dressings and bands with varying degrees of compressibility; - the use of lubricant deposition device permits the manufacture of single-yarn products on weaving machines; The production of barrier-type fabrics To achieve this objective, the requirements specific to hospitals – surgery departments were considered. The barrier type fabrics were produced accordingly to the technical specifications. The characteristics of the fabrics are the following: - low weight; - hydrophobic character; - persistency of hydrophobic effect to repeated washings in harsh conditions as well as in sterilization; Raw fabrics obtained were processed in the finishing department in order to ensure the specific conditions imposed. The operations performed had the following purposes: - obtaining a whiteness degree in accordance with the users’ requirements; - resistance to repeated washing of minimum 100 cycles; - resistance to hydrostatic pressure of minimum 200 mm water column; - air permeability of 100-200 l/m
2/sec. to a depression of 200 mm water column.
The characteristics of raw and finished barrier-type fabrics obtained are presented in Table 3. Table 3: Physical and mechanical characteristics of raw and finished barrier type fabrics
No. Characteristics Raw fabric Finished fabric 1 Width ( cm) 168 163
2 Mass (g/ mp) 140 142
3 Density (yarns/10cm) U 744 774
4 Density (yarns/10cm) B
342 356
5 Breaking force U (N) 1135 1244
6 Breaking force B ( N) 1077 1071
7 Breaking elongation U (%) 46 44
8 Breaking elongation B (%) 40 35
9 Thickness (mm) 0,4 0,3
10 Air permeability to a depression of 200mm water column (l/m
2/sec)
275 216
The hydrophobic character of obtained materials after classical treatments was evaluated by determining the quantity of water absorbed, absorption time and contact angle. For a general characterization of surface modifications the investigation of higroscopicity, vapor permeability and air permeability was considered relevant. The quantity of water absorbed (WH2O) was determined by artificial rain method, in conformity with the following relation:
1001
12
2
m
mmW OH (%), (1)
where: m1 – initial mass of the sample, g; m2 – sample mass after test, g. Contact angle was determined directly by measuring the angle formed by a drop of distilled water deposited on the fabric surface, by means of a device especially designed for this purpose [2]. Hydrophilicity was evaluated by determining the absorption time of a drop of distilled water deposited on the fabric surface.
470
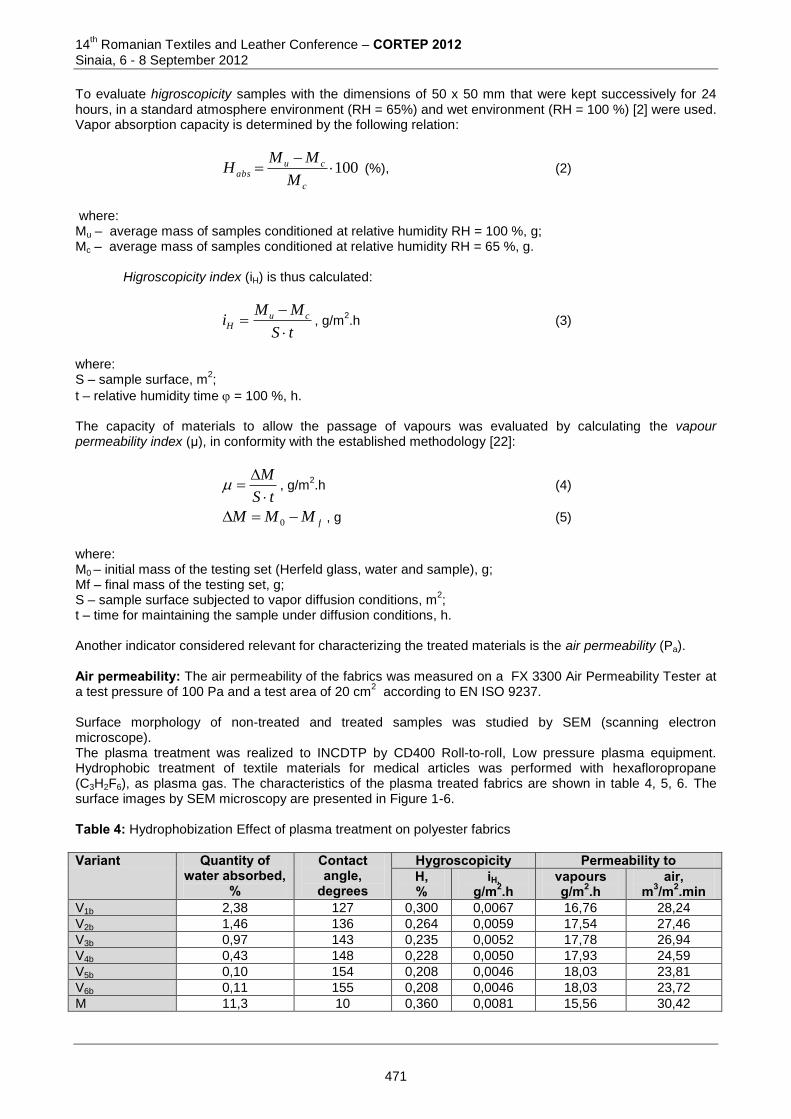
14th Romanian Textiles and Leather Conference – CORTEP 2012
Sinaia, 6 - 8 September 2012
To evaluate higroscopicity samples with the dimensions of 50 x 50 mm that were kept successively for 24 hours, in a standard atmosphere environment (RH = 65%) and wet environment (RH = 100 %) [2] were used. Vapor absorption capacity is determined by the following relation:
100
c
cuabs
M
MMH (%), (2)
where: Mu – average mass of samples conditioned at relative humidity RH = 100 %, g; Mc – average mass of samples conditioned at relative humidity RH = 65 %, g. Higroscopicity index (iH) is thus calculated:
tS
MMi cuH
, g/m
2.h (3)
where: S – sample surface, m
2;
t – relative humidity time = 100 %, h. The capacity of materials to allow the passage of vapours was evaluated by calculating the vapour permeability index (μ), in conformity with the established methodology [22]:
tS
M
, g/m
2.h (4)
fMMM 0 , g (5)
where: M0 – initial mass of the testing set (Herfeld glass, water and sample), g; Mf – final mass of the testing set, g; S – sample surface subjected to vapor diffusion conditions, m
2;
t – time for maintaining the sample under diffusion conditions, h. Another indicator considered relevant for characterizing the treated materials is the air permeability (Pa). Air permeability: The air permeability of the fabrics was measured on a FX 3300 Air Permeability Tester at a test pressure of 100 Pa and a test area of 20 cm
2 according to EN ISO 9237.
Surface morphology of non-treated and treated samples was studied by SEM (scanning electron microscope). The plasma treatment was realized to INCDTP by CD400 Roll-to-roll, Low pressure plasma equipment. Hydrophobic treatment of textile materials for medical articles was performed with hexafloropropane (C3H2F6), as plasma gas. The characteristics of the plasma treated fabrics are shown in table 4, 5, 6. The surface images by SEM microscopy are presented in Figure 1-6. Table 4: Hydrophobization Effect of plasma treatment on polyester fabrics
Variant Quantity of water absorbed,
%
Contact angle,
degrees
Hygroscopicity Permeability to H, %
iH, g/m2.h
vapours g/m2.h
air, m3/m2.min
V1b 2,38 127 0,300 0,0067 16,76 28,24
V2b 1,46 136 0,264 0,0059 17,54 27,46
V3b 0,97 143 0,235 0,0052 17,78 26,94
V4b 0,43 148 0,228 0,0050 17,93 24,59
V5b 0,10 154 0,208 0,0046 18,03 23,81
V6b 0,11 155 0,208 0,0046 18,03 23,72
M 11,3 10 0,360 0,0081 15,56 30,42
471
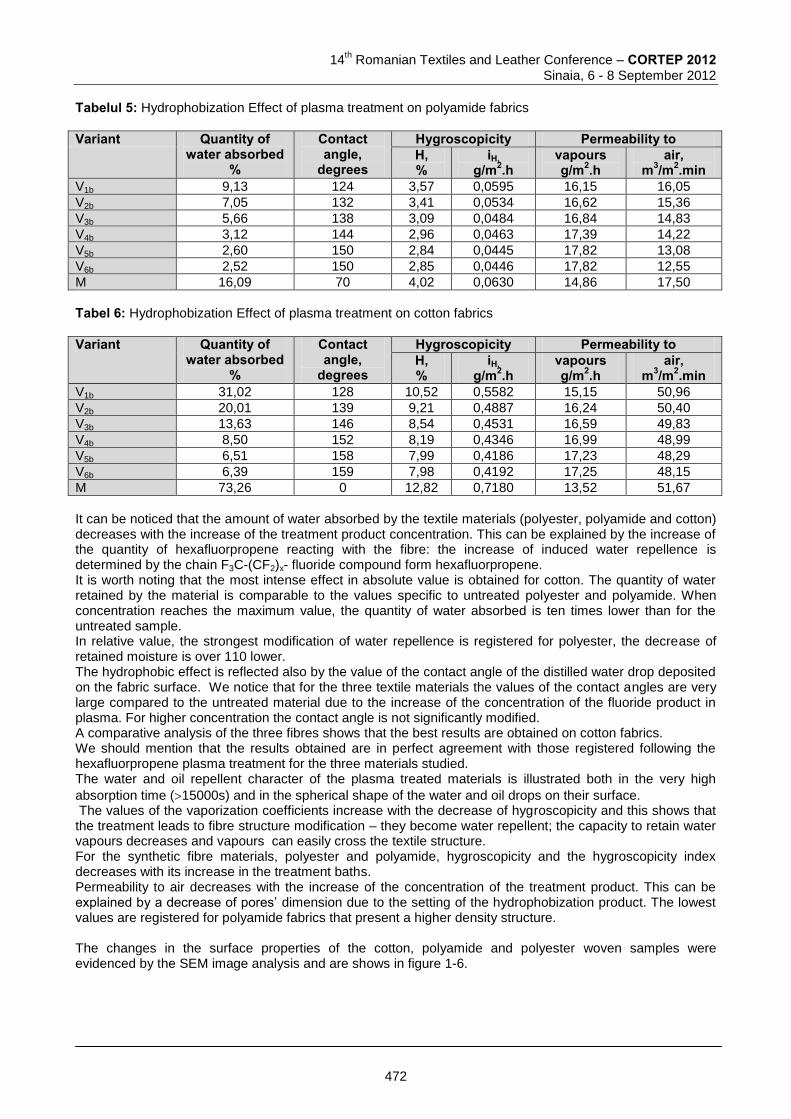
14
th Romanian Textiles and Leather Conference – CORTEP 2012
Sinaia, 6 - 8 September 2012
Tabelul 5: Hydrophobization Effect of plasma treatment on polyamide fabrics
Variant Quantity of water absorbed
%
Contact angle,
degrees
Hygroscopicity Permeability to H, %
iH, g/m2.h
vapours g/m2.h
air, m3/m2.min
V1b 9,13 124 3,57 0,0595 16,15 16,05
V2b 7,05 132 3,41 0,0534 16,62 15,36
V3b 5,66 138 3,09 0,0484 16,84 14,83
V4b 3,12 144 2,96 0,0463 17,39 14,22
V5b 2,60 150 2,84 0,0445 17,82 13,08
V6b 2,52 150 2,85 0,0446 17,82 12,55
M 16,09 70 4,02 0,0630 14,86 17,50
Tabel 6: Hydrophobization Effect of plasma treatment on cotton fabrics
Variant Quantity of water absorbed
%
Contact angle,
degrees
Hygroscopicity Permeability to H, %
iH, g/m2.h
vapours g/m2.h
air, m3/m2.min
V1b 31,02 128 10,52 0,5582 15,15 50,96
V2b 20,01 139 9,21 0,4887 16,24 50,40
V3b 13,63 146 8,54 0,4531 16,59 49,83
V4b 8,50 152 8,19 0,4346 16,99 48,99
V5b 6,51 158 7,99 0,4186 17,23 48,29
V6b 6,39 159 7,98 0,4192 17,25 48,15
M 73,26 0 12,82 0,7180 13,52 51,67
It can be noticed that the amount of water absorbed by the textile materials (polyester, polyamide and cotton) decreases with the increase of the treatment product concentration. This can be explained by the increase of the quantity of hexafluorpropene reacting with the fibre: the increase of induced water repellence is determined by the chain F3C-(CF2)x- fluoride compound form hexafluorpropene. It is worth noting that the most intense effect in absolute value is obtained for cotton. The quantity of water retained by the material is comparable to the values specific to untreated polyester and polyamide. When concentration reaches the maximum value, the quantity of water absorbed is ten times lower than for the untreated sample. In relative value, the strongest modification of water repellence is registered for polyester, the decrease of retained moisture is over 110 lower. The hydrophobic effect is reflected also by the value of the contact angle of the distilled water drop deposited on the fabric surface. We notice that for the three textile materials the values of the contact angles are very large compared to the untreated material due to the increase of the concentration of the fluoride product in plasma. For higher concentration the contact angle is not significantly modified. A comparative analysis of the three fibres shows that the best results are obtained on cotton fabrics. We should mention that the results obtained are in perfect agreement with those registered following the hexafluorpropene plasma treatment for the three materials studied. The water and oil repellent character of the plasma treated materials is illustrated both in the very high
absorption time (15000s) and in the spherical shape of the water and oil drops on their surface. The values of the vaporization coefficients increase with the decrease of hygroscopicity and this shows that the treatment leads to fibre structure modification – they become water repellent; the capacity to retain water vapours decreases and vapours can easily cross the textile structure. For the synthetic fibre materials, polyester and polyamide, hygroscopicity and the hygroscopicity index decreases with its increase in the treatment baths. Permeability to air decreases with the increase of the concentration of the treatment product. This can be explained by a decrease of pores’ dimension due to the setting of the hydrophobization product. The lowest values are registered for polyamide fabrics that present a higher density structure. The changes in the surface properties of the cotton, polyamide and polyester woven samples were evidenced by the SEM image analysis and are shows in figure 1-6.
472
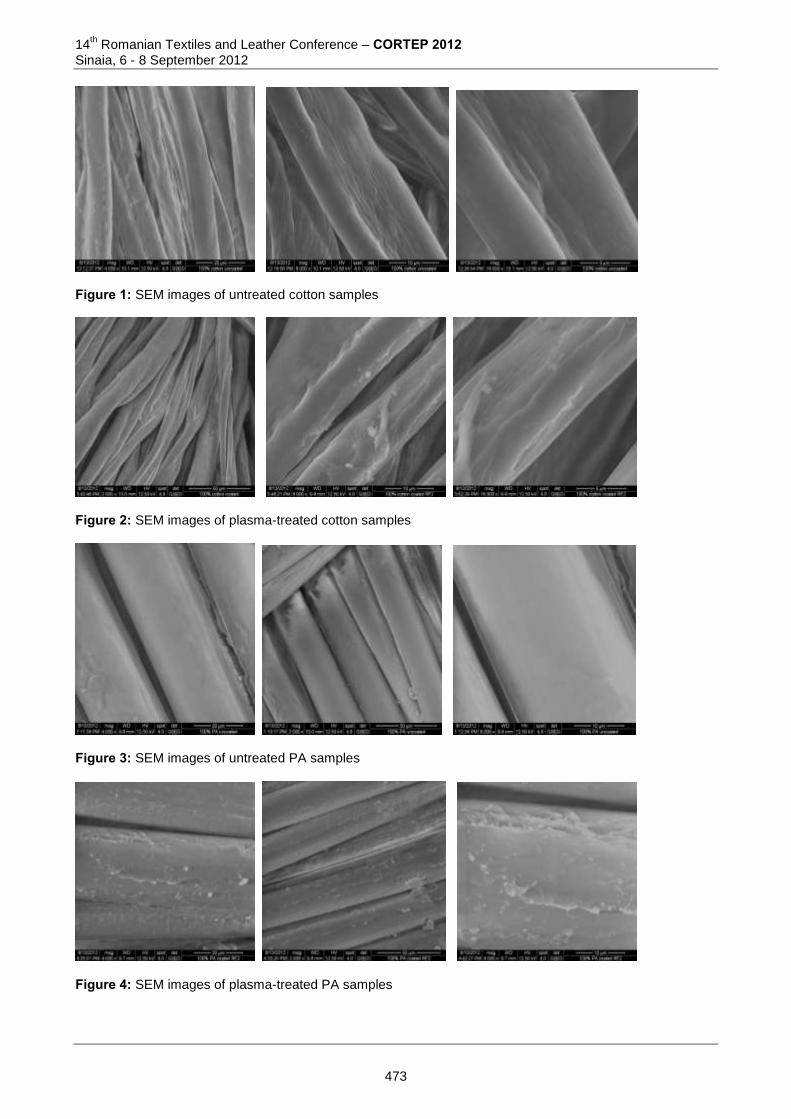
14th Romanian Textiles and Leather Conference – CORTEP 2012
Sinaia, 6 - 8 September 2012
Figure 1: SEM images of untreated cotton samples
Figure 2: SEM images of plasma-treated cotton samples
Figure 3: SEM images of untreated PA samples
Figure 4: SEM images of plasma-treated PA samples
473
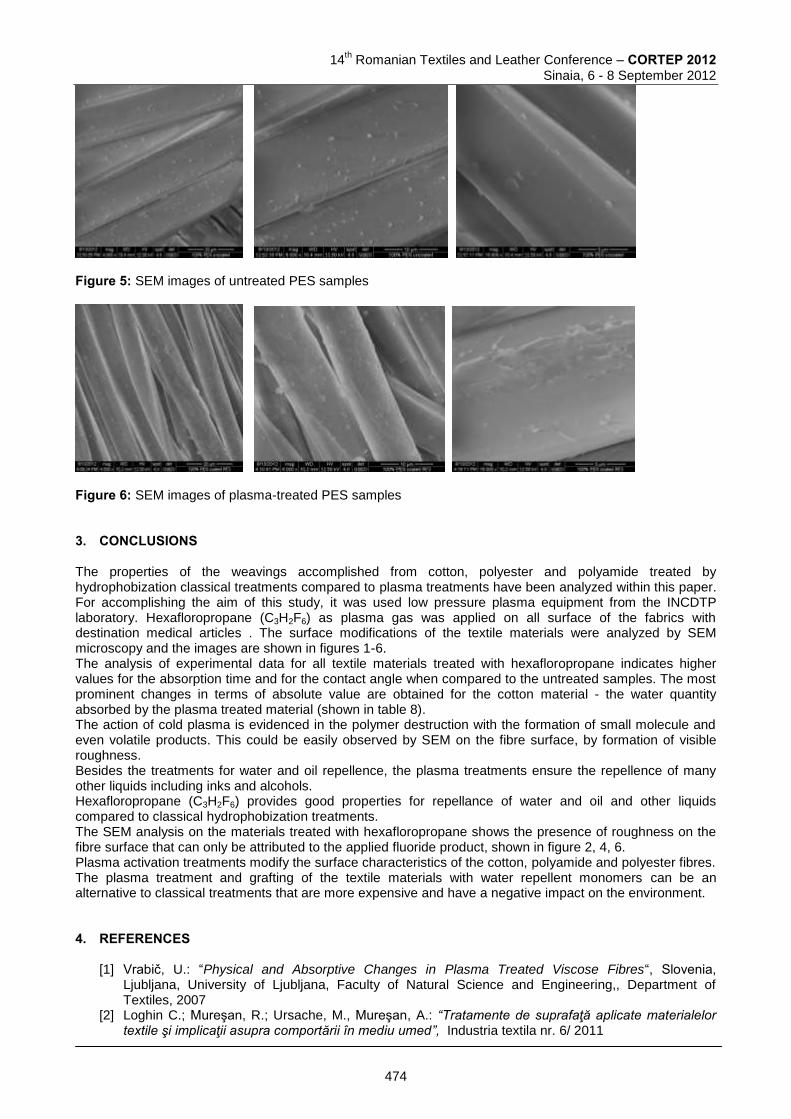
14
th Romanian Textiles and Leather Conference – CORTEP 2012
Sinaia, 6 - 8 September 2012
Figure 5: SEM images of untreated PES samples
Figure 6: SEM images of plasma-treated PES samples 3. CONCLUSIONS The properties of the weavings accomplished from cotton, polyester and polyamide treated by hydrophobization classical treatments compared to plasma treatments have been analyzed within this paper. For accomplishing the aim of this study, it was used low pressure plasma equipment from the INCDTP laboratory. Hexafloropropane (C3H2F6) as plasma gas was applied on all surface of the fabrics with destination medical articles . The surface modifications of the textile materials were analyzed by SEM microscopy and the images are shown in figures 1-6. The analysis of experimental data for all textile materials treated with hexafloropropane indicates higher values for the absorption time and for the contact angle when compared to the untreated samples. The most prominent changes in terms of absolute value are obtained for the cotton material - the water quantity absorbed by the plasma treated material (shown in table 8). The action of cold plasma is evidenced in the polymer destruction with the formation of small molecule and even volatile products. This could be easily observed by SEM on the fibre surface, by formation of visible roughness. Besides the treatments for water and oil repellence, the plasma treatments ensure the repellence of many other liquids including inks and alcohols. Hexafloropropane (C3H2F6) provides good properties for repellance of water and oil and other liquids compared to classical hydrophobization treatments. The SEM analysis on the materials treated with hexafloropropane shows the presence of roughness on the fibre surface that can only be attributed to the applied fluoride product, shown in figure 2, 4, 6. Plasma activation treatments modify the surface characteristics of the cotton, polyamide and polyester fibres. The plasma treatment and grafting of the textile materials with water repellent monomers can be an alternative to classical treatments that are more expensive and have a negative impact on the environment. 4. REFERENCES
[1] Vrabič, U.: “Physical and Absorptive Changes in Plasma Treated Viscose Fibres“, Slovenia, Ljubljana, University of Ljubljana, Faculty of Natural Science and Engineering,, Department of Textiles, 2007
[2] Loghin C.; Mureşan, R.; Ursache, M., Mureşan, A.: “Tratamente de suprafaţă aplicate materialelor textile şi implicaţii asupra comportării în mediu umed”, Industria textila nr. 6/ 2011
474
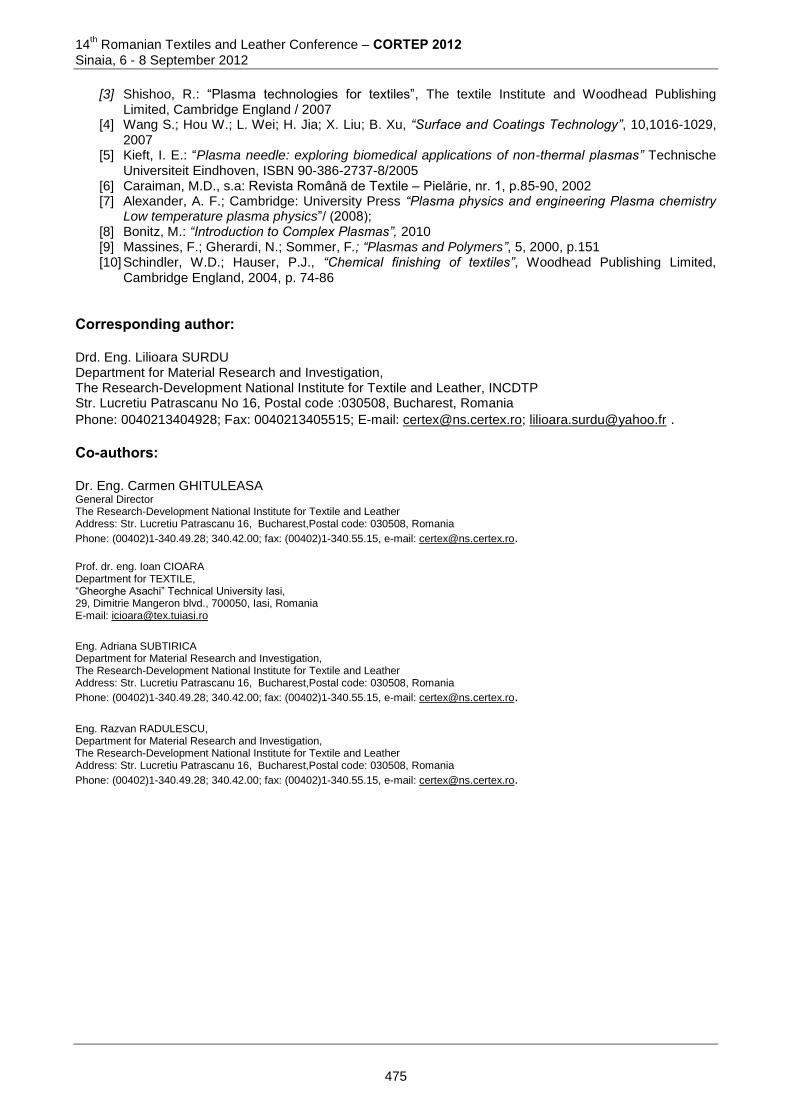
14th Romanian Textiles and Leather Conference – CORTEP 2012
Sinaia, 6 - 8 September 2012
[3] Shishoo, R.: “Plasma technologies for textiles”, The textile Institute and Woodhead Publishing Limited, Cambridge England / 2007
[4] Wang S.; Hou W.; L. Wei; H. Jia; X. Liu; B. Xu, “Surface and Coatings Technology”, 10,1016-1029, 2007
[5] Kieft, I. E.: “Plasma needle: exploring biomedical applications of non-thermal plasmas” Technische Universiteit Eindhoven, ISBN 90-386-2737-8/2005
[6] Caraiman, M.D., s.a: Revista Română de Textile – Pielărie, nr. 1, p.85-90, 2002 [7] Alexander, A. F.; Cambridge: University Press “Plasma physics and engineering Plasma chemistry
Low temperature plasma physics”/ (2008); [8] Bonitz, M.: “Introduction to Complex Plasmas”, 2010 [9] Massines, F.; Gherardi, N.; Sommer, F.; “Plasmas and Polymers”, 5, 2000, p.151 [10] Schindler, W.D.; Hauser, P.J., “Chemical finishing of textiles”, Woodhead Publishing Limited,
Cambridge England, 2004, p. 74-86 Corresponding author: Drd. Eng. Lilioara SURDU Department for Material Research and Investigation, The Research-Development National Institute for Textile and Leather, INCDTP Str. Lucretiu Patrascanu No 16, Postal code :030508, Bucharest, Romania
Phone: 0040213404928; Fax: 0040213405515; E-mail: [email protected]; [email protected] . Co-authors:
Dr. Eng. Carmen GHITULEASA
General Director The Research-Development National Institute for Textile and Leather Address: Str. Lucretiu Patrascanu 16, Bucharest,Postal code: 030508, Romania
Phone: (00402)1-340.49.28; 340.42.00; fax: (00402)1-340.55.15, e-mail: [email protected]. Prof. dr. eng. Ioan CIOARA Department for TEXTILE, “Gheorghe Asachi” Technical University Iasi, 29, Dimitrie Mangeron blvd., 700050, Iasi, Romania E-mail: [email protected]
Eng. Adriana SUBTIRICA Department for Material Research and Investigation, The Research-Development National Institute for Textile and Leather Address: Str. Lucretiu Patrascanu 16, Bucharest,Postal code: 030508, Romania
Phone: (00402)1-340.49.28; 340.42.00; fax: (00402)1-340.55.15, e-mail: [email protected].
Eng. Razvan RADULESCU, Department for Material Research and Investigation, The Research-Development National Institute for Textile and Leather Address: Str. Lucretiu Patrascanu 16, Bucharest,Postal code: 030508, Romania
Phone: (00402)1-340.49.28; 340.42.00; fax: (00402)1-340.55.15, e-mail: [email protected].
475

14
th Romanian Textiles and Leather Conference – CORTEP 2012
Sinaia, 6 - 8 September 2012
ANTIBACTERIAL PROPERTIES OF PLASMA PRE-TREATED POLYESTER FABRIC IMPREGNATED WITH PHOTOCHEMICALLY
SYNTHESIZED SILVER NANOPARTICLES
Nasser H. Mohamed1, Thomas Bahners1, Jochen S. Gutmann1,2 & Mathias Ulbricht1,3 1Deutsches Textilforschungszentrum Nord-West, Krefeld, Germany
2Lehrstuhl für Physikalische Chemie, Universität Duisburg-Essen, Germany
3Lehrstuhl für Technische Chemie II, Universität Duisburg-Essen, Germany
Abstract: Silver nanoparticle colloids were prepared by UV irradiation of a silver nitrate solution. Poly(methacrylic acid) (PMAA) served as stabilizing agent. Transmission electron microscopy (TEM), dynamic light scattering (DLS), and UV-VIS spectroscopy were used to prove the occurrence of nanoparticles. Fabrics made from polyester (PET) were finished with the colloid using a dyeing machine. In order to enhance wettability, the fabrics were plasma-treated in air. Energy dispersive X-ray spectroscopy (EDX) confirmed presence of elemental silver on the surface of PET fibers, and silver nanoparticles were well dispersed on the surface as shown by scanning electron microscopy (SEM). The amount of silver particles adsorbed on the polyester samples was quantitatively determined by inductively coupled plasma optical emission spectrometry (ICP-OES) before and after laundering. The antibacterial activity of the modified fabrics was measured by quantitative and qualitative methods. After the deposition of silver nanoparticles, the fabrics showed high antimicrobial and bactericidal activity with regard to E. Coli and M. Luteus. The samples, which had been pre-treated by plasma exhibit antibacterial efficacy of the impregnated fabrics was maintained also after laundering. Keywords: Silver nanoparticles, polyester, plasma and antibacterial properties. 1. INTRODUCTION
In recent years nanoparticles of silver have been found to exhibit interesting antibacterial activities due to the large surface to volume ratio. Many methods have been reported for the preparation of silver nanoparticles such as chemical reduction, electrochemical synthesis, photochemistry, or by exposure to UV or γ-radiation. Addition of water-soluble polymers may control particle growth and stabilize intermediates. One of the most frequently applied additives is the sodium salt of poly(methacrylic acid) (PMAA). Using PMAA offers numerous advantages due to its physical and chemical properties. Furthermore, it does not show any toxic chemical effect. Moreover, it fulfils the ever increasing demand for safe, eco-friendly and low-cost processing of materials [1-4]. The application of silver NPs in the antibacterial finishing of textiles is favorable due to their stability and high surface-to-volume ratio. Therefore, considerable amount of silver atoms on the surface of the NPs is exposed toward the surrounding medium, providing a significant bactericidal efficiency [5]. In this work silver nanoparticles were prepared by a simple and inexpensive single step synthesis based on UV activation of a solution of silver nitrate and poly (methacrylic acid). The silver nanoparticles were applied to a PET fabric by finishing the fabric with the resulting colloid of silver nanoparticles. The effect of a plasma pre-treatment on wettability and on particle adhesion on the surface, as suggested by [7], was studied. The treatment was effected by atmospheric air plasma, which can be applied in the production line without the need for vacuum. The achieved bactericidal effect on both Gram-positive bacterium Micrococcus luteus and Gram-negative bacterium Escherichia coli was examined. Additionally, the laundering durability of the bactericidal effects was studied. 2. EXPERIMENTAL Materials Silver nitrate (99.9% - Carl Roth GmbH) and Poly(methacrylic acid) sodium salt (PMAA; 40% solution in water; Aldrich) were used without further purification. A plain weave PET fabric served as standard sample. Preparation of silver nanoparticles [5]
476
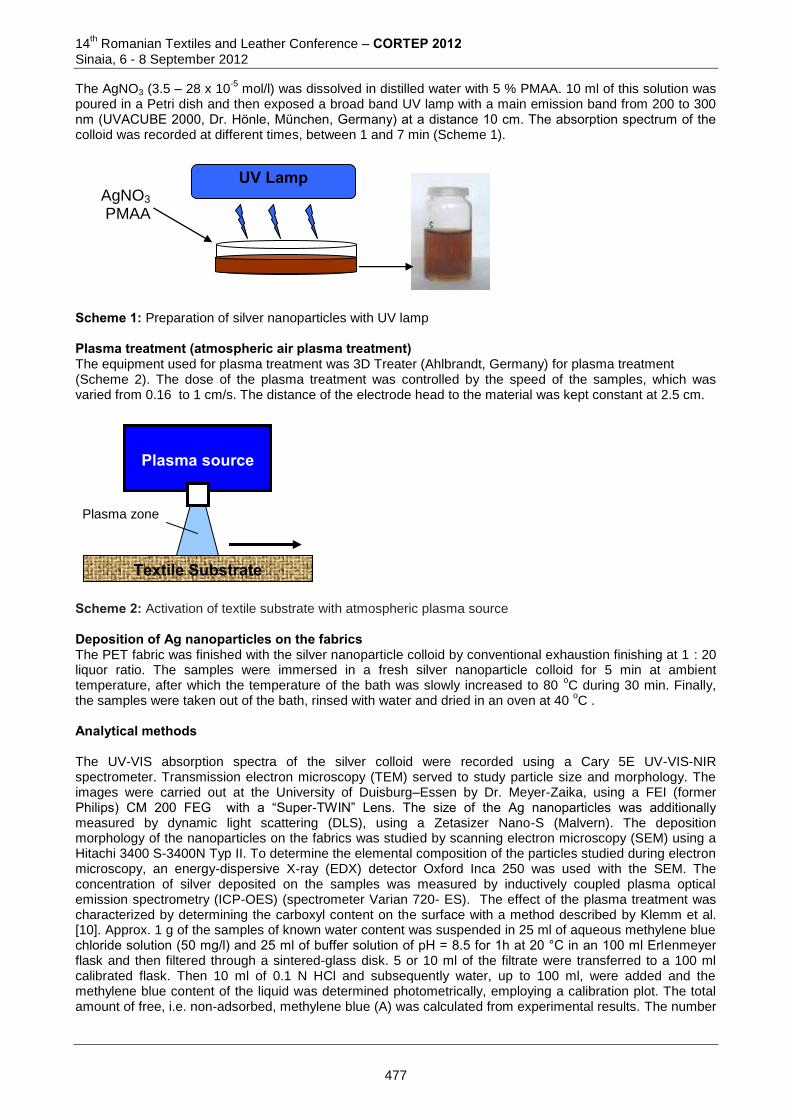
14th Romanian Textiles and Leather Conference – CORTEP 2012
Sinaia, 6 - 8 September 2012
UV Lamp AgNO3 PMAA
Plasma source
Textile Substrate
Plasma zone
The AgNO3 (3.5 – 28 x 10-5
mol/l) was dissolved in distilled water with 5 % PMAA. 10 ml of this solution was poured in a Petri dish and then exposed a broad band UV lamp with a main emission band from 200 to 300 nm (UVACUBE 2000, Dr. Hönle, München, Germany) at a distance 10 cm. The absorption spectrum of the colloid was recorded at different times, between 1 and 7 min (Scheme 1).
Scheme 1: Preparation of silver nanoparticles with UV lamp Plasma treatment (atmospheric air plasma treatment) The equipment used for plasma treatment was 3D Treater (Ahlbrandt, Germany) for plasma treatment (Scheme 2). The dose of the plasma treatment was controlled by the speed of the samples, which was varied from 0.16 to 1 cm/s. The distance of the electrode head to the material was kept constant at 2.5 cm.
Scheme 2: Activation of textile substrate with atmospheric plasma source Deposition of Ag nanoparticles on the fabrics The PET fabric was finished with the silver nanoparticle colloid by conventional exhaustion finishing at 1 : 20 liquor ratio. The samples were immersed in a fresh silver nanoparticle colloid for 5 min at ambient temperature, after which the temperature of the bath was slowly increased to 80
oC during 30 min. Finally,
the samples were taken out of the bath, rinsed with water and dried in an oven at 40 oC .
Analytical methods The UV-VIS absorption spectra of the silver colloid were recorded using a Cary 5E UV-VIS-NIR spectrometer. Transmission electron microscopy (TEM) served to study particle size and morphology. The images were carried out at the University of Duisburg–Essen by Dr. Meyer-Zaika, using a FEI (former Philips) CM 200 FEG with a “Super-TWIN” Lens. The size of the Ag nanoparticles was additionally measured by dynamic light scattering (DLS), using a Zetasizer Nano-S (Malvern). The deposition morphology of the nanoparticles on the fabrics was studied by scanning electron microscopy (SEM) using a Hitachi 3400 S-3400N Typ II. To determine the elemental composition of the particles studied during electron microscopy, an energy-dispersive X-ray (EDX) detector Oxford Inca 250 was used with the SEM. The concentration of silver deposited on the samples was measured by inductively coupled plasma optical emission spectrometry (ICP-OES) (spectrometer Varian 720- ES). The effect of the plasma treatment was characterized by determining the carboxyl content on the surface with a method described by Klemm et al. [10]. Approx. 1 g of the samples of known water content was suspended in 25 ml of aqueous methylene blue chloride solution (50 mg/l) and 25 ml of buffer solution of pH = 8.5 for 1h at 20 °C in an 100 ml Erlenmeyer flask and then filtered through a sintered-glass disk. 5 or 10 ml of the filtrate were transferred to a 100 ml calibrated flask. Then 10 ml of 0.1 N HCl and subsequently water, up to 100 ml, were added and the methylene blue content of the liquid was determined photometrically, employing a calibration plot. The total amount of free, i.e. non-adsorbed, methylene blue (A) was calculated from experimental results. The number
477
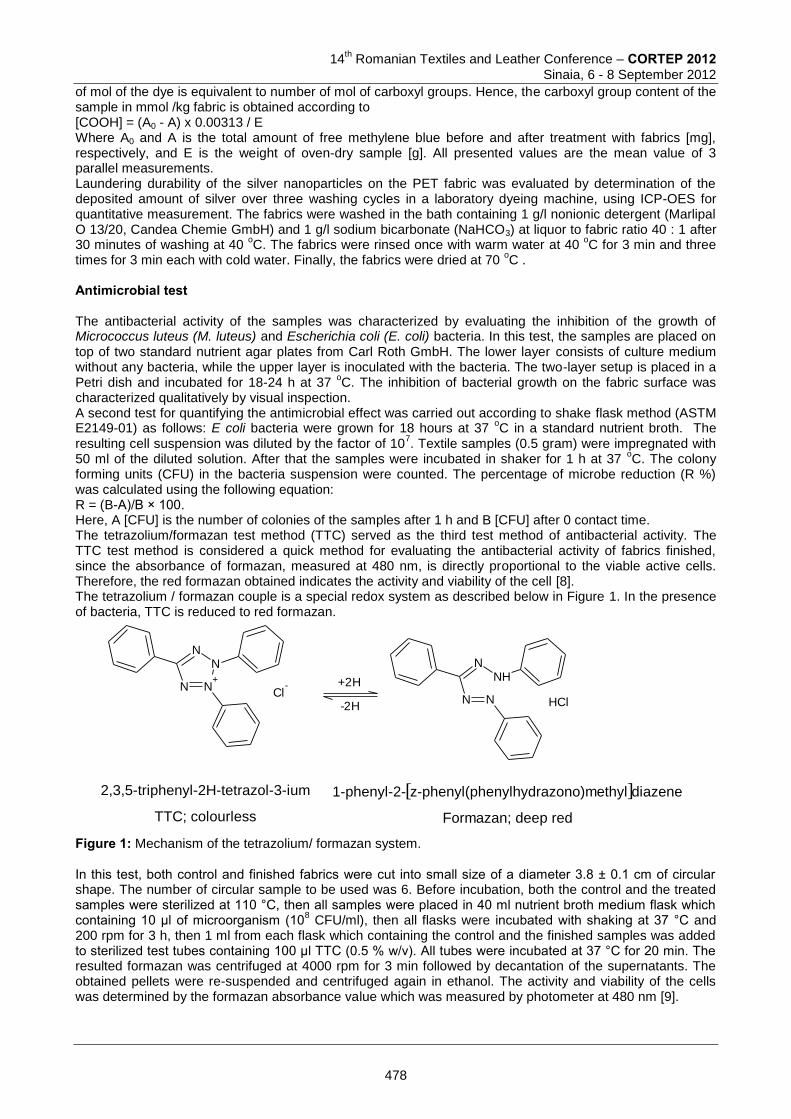
14
th Romanian Textiles and Leather Conference – CORTEP 2012
Sinaia, 6 - 8 September 2012
of mol of the dye is equivalent to number of mol of carboxyl groups. Hence, the carboxyl group content of the sample in mmol /kg fabric is obtained according to [COOH] = (A0 - A) x 0.00313 / E Where A0 and A is the total amount of free methylene blue before and after treatment with fabrics [mg], respectively, and E is the weight of oven-dry sample [g]. All presented values are the mean value of 3 parallel measurements. Laundering durability of the silver nanoparticles on the PET fabric was evaluated by determination of the deposited amount of silver over three washing cycles in a laboratory dyeing machine, using ICP-OES for quantitative measurement. The fabrics were washed in the bath containing 1 g/l nonionic detergent (Marlipal O 13/20, Candea Chemie GmbH) and 1 g/l sodium bicarbonate (NaHCO3) at liquor to fabric ratio 40 : 1 after 30 minutes of washing at 40
oC. The fabrics were rinsed once with warm water at 40
oC for 3 min and three
times for 3 min each with cold water. Finally, the fabrics were dried at 70 oC .
Antimicrobial test The antibacterial activity of the samples was characterized by evaluating the inhibition of the growth of Micrococcus luteus (M. luteus) and Escherichia coli (E. coli) bacteria. In this test, the samples are placed on top of two standard nutrient agar plates from Carl Roth GmbH. The lower layer consists of culture medium without any bacteria, while the upper layer is inoculated with the bacteria. The two-layer setup is placed in a Petri dish and incubated for 18-24 h at 37
oC. The inhibition of bacterial growth on the fabric surface was
characterized qualitatively by visual inspection. A second test for quantifying the antimicrobial effect was carried out according to shake flask method (ASTM E2149-01) as follows: E coli bacteria were grown for 18 hours at 37
oC in a standard nutrient broth. The
resulting cell suspension was diluted by the factor of 107. Textile samples (0.5 gram) were impregnated with
50 ml of the diluted solution. After that the samples were incubated in shaker for 1 h at 37 oC. The colony
forming units (CFU) in the bacteria suspension were counted. The percentage of microbe reduction (R %) was calculated using the following equation: R = (B-A)/B × 100. Here, A [CFU] is the number of colonies of the samples after 1 h and B [CFU] after 0 contact time. The tetrazolium/formazan test method (TTC) served as the third test method of antibacterial activity. The TTC test method is considered a quick method for evaluating the antibacterial activity of fabrics finished, since the absorbance of formazan, measured at 480 nm, is directly proportional to the viable active cells. Therefore, the red formazan obtained indicates the activity and viability of the cell [8]. The tetrazolium / formazan couple is a special redox system as described below in Figure 1. In the presence of bacteria, TTC is reduced to red formazan.
N
N
N
N+
Cl- +2H
-2H
N
N
NH
N ClH
2,3,5-triphenyl-2H-tetrazol-3-ium
TTC; colourless
1-phenyl-2- z-phenyl(phenylhydrazono)methyl diazene
Formazan; deep red
[ ]
Figure 1: Mechanism of the tetrazolium/ formazan system.
In this test, both control and finished fabrics were cut into small size of a diameter 3.8 ± 0.1 cm of circular shape. The number of circular sample to be used was 6. Before incubation, both the control and the treated samples were sterilized at 110 °C, then all samples were placed in 40 ml nutrient broth medium flask which containing 10 μl of microorganism (10
8 CFU/ml), then all flasks were incubated with shaking at 37 °C and
200 rpm for 3 h, then 1 ml from each flask which containing the control and the finished samples was added to sterilized test tubes containing 100 μl TTC (0.5 % w/v). All tubes were incubated at 37 °C for 20 min. The resulted formazan was centrifuged at 4000 rpm for 3 min followed by decantation of the supernatants. The obtained pellets were re-suspended and centrifuged again in ethanol. The activity and viability of the cells was determined by the formazan absorbance value which was measured by photometer at 480 nm [9].
478

14th Romanian Textiles and Leather Conference – CORTEP 2012
Sinaia, 6 - 8 September 2012
3. RESULTS AND DISCUSSION The mechanism for the formation of Ag nanoparticles under UV irradiation in aqueous solutions of PMAA is based on the reduction of Ag
+ by reactive species from the photochemical reaction of PMAA. Initially, the
solution of AgNO3 and PMAA was colorless, but, following UV irradiation with increasing time, obvious color changes from colorless to light yellow, then to brown, and finally to dark brown were observed. As is seen in Figure 2, before the irradiation, the solution showed no absorption in the wavelength range from 350 to 800 nm. After 1 minute of UV irradiation, a weak absorption band centered at 500 nm appeared. When further extending the irradiation time from 1.5 to 5 min, the intensity of this absorption band increased significantly. At the same time, a peak at ca. 430 nm was also observed upon the irradiation. The increase in the absorbance of the absorption peak indicated the gradual growth of Ag nanoparticles upon prolonged UV irradiation. The peak in the spectrum at 450-500 nm is assumed to be due to interactions of PMAA with Ag
+
ions and Ag nanoparticles as sketched in Figure 3.
Figure 2: Absorption spectra of silver nanoparticle colloids produced from a AgNO3 solution with a concentration of silver of [Ag
+] = 7x10
-5 mol/l by UV irradiation under variation of exposure time.
Figure 3: A possible mechanism for the interaction between Ag
+, Ag nanoparticles and PMAA
Figure 4: SEM of Ag nanoparticles stabilized by PMAA (a), TEM images of silver nanoparticles (b and c), and silver particles size distribution obtained by count (d)
0
0.1
0.2
0.3
0.4
0.5
0.6
0.7
0.8
0.9
1
250 300 350 400 450 500 550 600 650 700 750 800
nm
Abs.
0 min.
0.5 min.
1 min.
1.5 min.
2 min.
3 min.
5 min.
7min.
silver particles size distribution
-10
0
10
20
30
40
50
352520171513107531
silver particles size
parti
cle
coun
t %
(a)
(b)
(c)
(d)
-OOC-
-COO-
-COO-
-COO-
-COO-
-COO-
-COO-
-COO-
-COO-
-COO-
-COO-
-COO-
-COO-
-COO-
-COO-
-CO
O-
-CO
O-
-CO
O -
-OOC-
-OOC-
-OOC-
-OOC-
-O
OC
-
-OOC-
- OO
C-
-OOC-
Ag+
Ag+
Ag+
Ag+
Ag+
Ag+
Ag+
Ag+
Ag+
Ag+
Ag+
Ag+
Ag+
Ag+
Ag+
-OOC-
-OOC-
-CO
O-
-OOC-
-COO-
-COO-
-COO-
-COO-
-COO-
-COO-
-COO-
-COO-
-COO-
-COO-
-COO-
-COO-
-COO-
-COO-
-CO
O-
-CO
O-
-CO
O -
-OOC-
-OOC-
-OOC-
-OOC-
-O
OC
-
-OOC-
- OO
C-
-OOC-Ag+
Ag+
Ag+
Ag+
Ag+
Ag+
-OOC-
-OOC-
-CO
O-
UV-Irradiation
Ag+
Ag+
Ag+
Ag+
479

14
th Romanian Textiles and Leather Conference – CORTEP 2012
Sinaia, 6 - 8 September 2012
3 2 1
Figure 4 shows typical SEM and TEM images of Ag nanoparticles with PMAA obtained after 5 min UV irradiation. A size distribution of the Ag nanoparticles was obtained by analysis of the TEM image and showed diameters ranging from 3 nm to 35 nm. More than 70% of the Ag NPs have a size smaller than 15 nm and no particles larger than about 35 nm were observed in the TEM image shown in at Figure 4. This is in good agreement with the nanoparticles size distribution (number distribution) obtained by DSL (Figure 5).
Figure 5: The size distribution of silver nanoparticles by number obtained from DSL
Figure 6: SEM images of Ag nanoparticles on the surface (a), spots of high silver content indicated by EDX mapping (b), and EDX spectrum (c) The PET fabric was finished with the silver nanoparticle colloid by conventional exhaustion finishing. The deposition of silver nanoparticles from the colloid on the fiber surface was then analyzed by scanning electron microscopy. The SEM images of fibers from the untreated PET fabric and from a fabric loaded with 15 mg/kg silver on the fabric (Figure 6) revealed unevenly distributed silver nanoparticles on the fiber surface. Energy-dispersive X–ray spectroscopy (EDX) was employed to establish the chemical identity of the observed particles. It can be clearly seen from EDX mapping (Figure 6b) and the integral EDX spectrum (Figure 6c). In order to study the effect of a plasma pre-treatment on wettability and on particle adhesion on the surface, a number of samples were treated by atmospheric air plasma. The intensity of the plasma treatment (“dose”) is determined by electrodes-to-sample distance and treatment time, which was controlled by the speed of the moving samples. The experiments showed that the dose was critical. Thermal damage to the fibers was found, if the dose was too high, as is exemplarily shown in the SEM images in Figure 7.
(a)
(b)
(c)
480
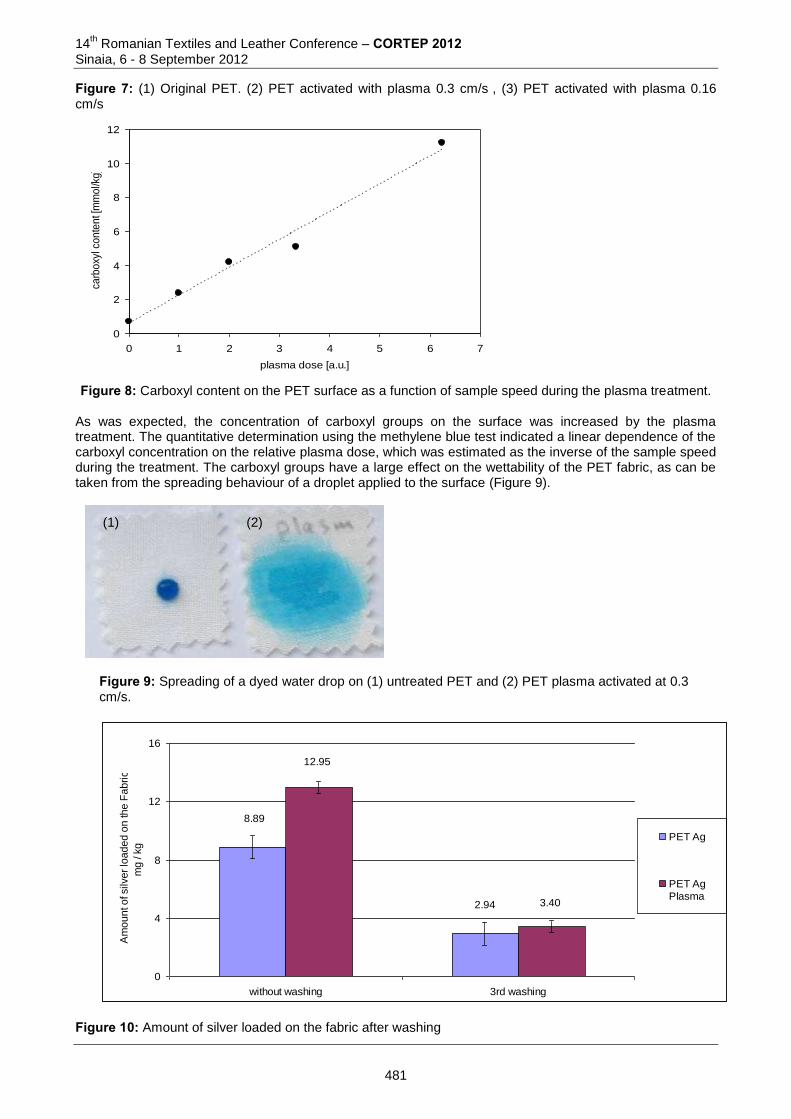
14th Romanian Textiles and Leather Conference – CORTEP 2012
Sinaia, 6 - 8 September 2012
(1) (2)
Figure 7: (1) Original PET. (2) PET activated with plasma 0.3 cm/s , (3) PET activated with plasma 0.16
cm/s
0
2
4
6
8
10
12
0 1 2 3 4 5 6 7
plasma dose [a.u.]
carb
oxy
l co
nte
nt [
mm
ol/k
g]
Figure 8: Carboxyl content on the PET surface as a function of sample speed during the plasma treatment.
As was expected, the concentration of carboxyl groups on the surface was increased by the plasma treatment. The quantitative determination using the methylene blue test indicated a linear dependence of the carboxyl concentration on the relative plasma dose, which was estimated as the inverse of the sample speed during the treatment. The carboxyl groups have a large effect on the wettability of the PET fabric, as can be taken from the spreading behaviour of a droplet applied to the surface (Figure 9).
Figure 9: Spreading of a dyed water drop on (1) untreated PET and (2) PET plasma activated at 0.3 cm/s.
8.89
2.94
12.95
3.40
0
4
8
12
16
without washing 3rd washing
Am
ou
nt o
f silve
r lo
ad
ed
on
th
e F
ab
ric
mg
/ k
g
PET Ag
PET Ag
Plasma
Figure 10: Amount of silver loaded on the fabric after washing
481
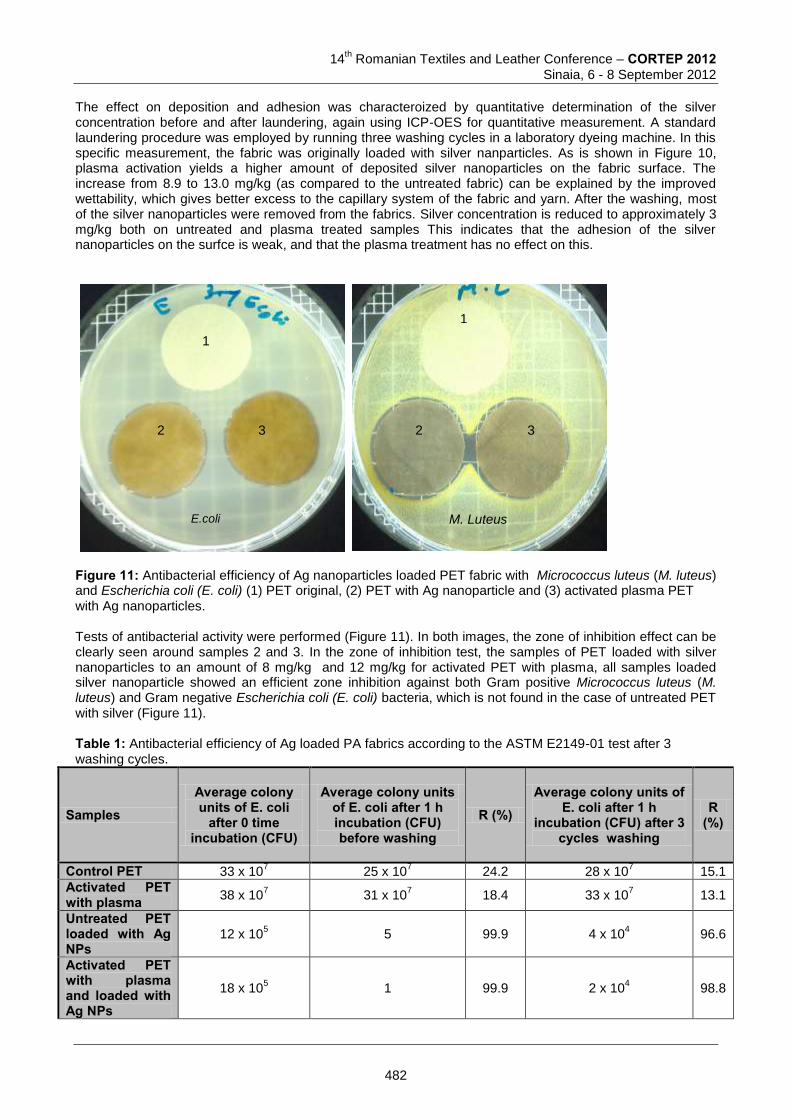
14
th Romanian Textiles and Leather Conference – CORTEP 2012
Sinaia, 6 - 8 September 2012
E.coli
1
2 3
1
M. Luteus
3 2
The effect on deposition and adhesion was characteroized by quantitative determination of the silver concentration before and after laundering, again using ICP-OES for quantitative measurement. A standard laundering procedure was employed by running three washing cycles in a laboratory dyeing machine. In this specific measurement, the fabric was originally loaded with silver nanparticles. As is shown in Figure 10, plasma activation yields a higher amount of deposited silver nanoparticles on the fabric surface. The increase from 8.9 to 13.0 mg/kg (as compared to the untreated fabric) can be explained by the improved wettability, which gives better excess to the capillary system of the fabric and yarn. After the washing, most of the silver nanoparticles were removed from the fabrics. Silver concentration is reduced to approximately 3 mg/kg both on untreated and plasma treated samples This indicates that the adhesion of the silver nanoparticles on the surfce is weak, and that the plasma treatment has no effect on this.
Figure 11: Antibacterial efficiency of Ag nanoparticles loaded PET fabric with Micrococcus luteus (M. luteus) and Escherichia coli (E. coli) (1) PET original, (2) PET with Ag nanoparticle and (3) activated plasma PET with Ag nanoparticles. Tests of antibacterial activity were performed (Figure 11). In both images, the zone of inhibition effect can be clearly seen around samples 2 and 3. In the zone of inhibition test, the samples of PET loaded with silver nanoparticles to an amount of 8 mg/kg and 12 mg/kg for activated PET with plasma, all samples loaded silver nanoparticle showed an efficient zone inhibition against both Gram positive Micrococcus luteus (M. luteus) and Gram negative Escherichia coli (E. coli) bacteria, which is not found in the case of untreated PET with silver (Figure 11). Table 1: Antibacterial efficiency of Ag loaded PA fabrics according to the ASTM E2149-01 test after 3 washing cycles.
Samples Average colony units of E. coli
after 0 time incubation (CFU)
Average colony units of E. coli after 1 h incubation (CFU) before washing
R (%) Average colony units of
E. coli after 1 h incubation (CFU) after 3
cycles washing
R (%)
Control PET 33 x 107 25 x 10
7 24.2 28 x 10
7 15.1
Activated PET with plasma 38 x 10
7 31 x 10
7 18.4 33 x 10
7 13.1
Untreated PET loaded with Ag NPs
12 x 105 5 99.9 4 x 10
4 96.6
Activated PET with plasma and loaded with Ag NPs
18 x 105 1 99.9 2 x 10
4 98.8
482
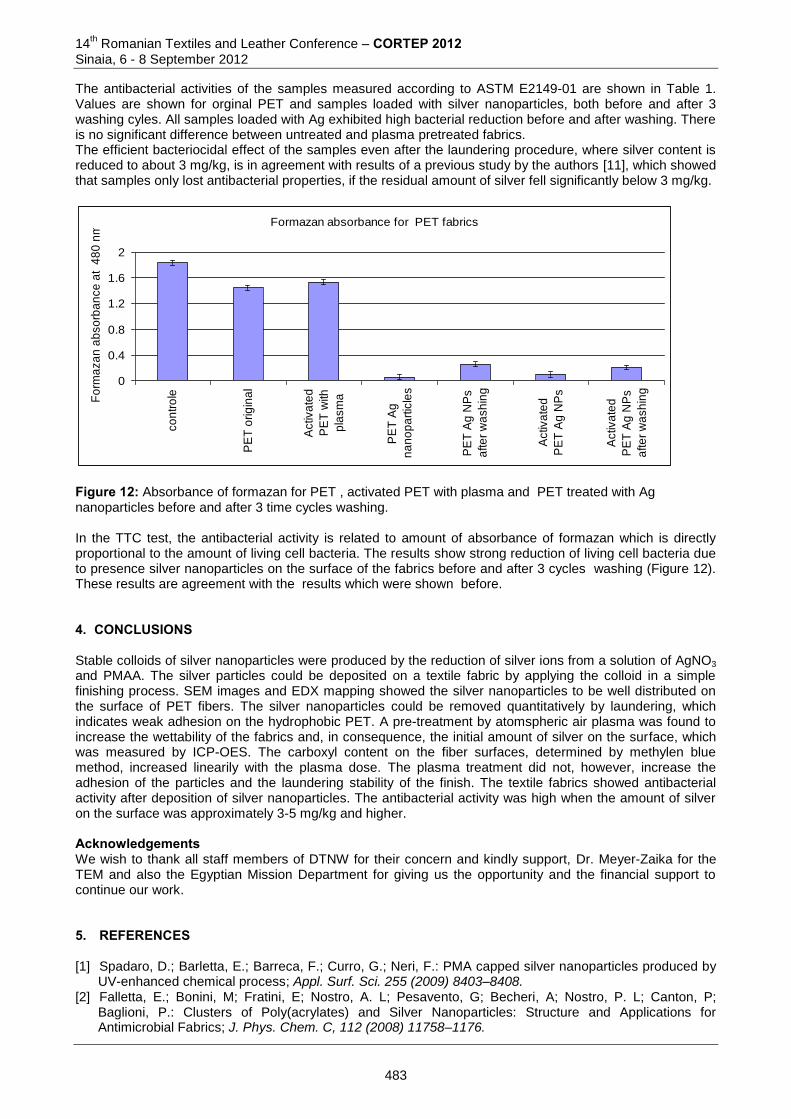
14th Romanian Textiles and Leather Conference – CORTEP 2012
Sinaia, 6 - 8 September 2012
The antibacterial activities of the samples measured according to ASTM E2149-01 are shown in Table 1. Values are shown for orginal PET and samples loaded with silver nanoparticles, both before and after 3 washing cyles. All samples loaded with Ag exhibited high bacterial reduction before and after washing. There is no significant difference between untreated and plasma pretreated fabrics. The efficient bacteriocidal effect of the samples even after the laundering procedure, where silver content is reduced to about 3 mg/kg, is in agreement with results of a previous study by the authors [11], which showed that samples only lost antibacterial properties, if the residual amount of silver fell significantly below 3 mg/kg.
Formazan absorbance for PET fabrics
0
0.4
0.8
1.2
1.6
2
co
ntr
ole
PE
T o
rig
ina
l
Activ
ate
d
PE
T w
ith
pla
sm
a
PE
T A
g
na
no
pa
rtic
les
PE
T A
g N
Ps
afte
r w
ash
ing
Activ
ate
d
PE
T A
g N
Ps
Activ
ate
d
PE
T A
g N
Ps
afte
r w
ash
ing
Fo
rma
za
n a
bso
rba
nce
at 4
80
nm
Figure 12: Absorbance of formazan for PET , activated PET with plasma and PET treated with Ag nanoparticles before and after 3 time cycles washing. In the TTC test, the antibacterial activity is related to amount of absorbance of formazan which is directly proportional to the amount of living cell bacteria. The results show strong reduction of living cell bacteria due to presence silver nanoparticles on the surface of the fabrics before and after 3 cycles washing (Figure 12). These results are agreement with the results which were shown before. 4. CONCLUSIONS Stable colloids of silver nanoparticles were produced by the reduction of silver ions from a solution of AgNO3 and PMAA. The silver particles could be deposited on a textile fabric by applying the colloid in a simple finishing process. SEM images and EDX mapping showed the silver nanoparticles to be well distributed on the surface of PET fibers. The silver nanoparticles could be removed quantitatively by laundering, which indicates weak adhesion on the hydrophobic PET. A pre-treatment by atomspheric air plasma was found to increase the wettability of the fabrics and, in consequence, the initial amount of silver on the surface, which was measured by ICP-OES. The carboxyl content on the fiber surfaces, determined by methylen blue method, increased linearily with the plasma dose. The plasma treatment did not, however, increase the adhesion of the particles and the laundering stability of the finish. The textile fabrics showed antibacterial activity after deposition of silver nanoparticles. The antibacterial activity was high when the amount of silver on the surface was approximately 3-5 mg/kg and higher. Acknowledgements We wish to thank all staff members of DTNW for their concern and kindly support, Dr. Meyer-Zaika for the TEM and also the Egyptian Mission Department for giving us the opportunity and the financial support to continue our work. 5. REFERENCES [1] Spadaro, D.; Barletta, E.; Barreca, F.; Curro, G.; Neri, F.: PMA capped silver nanoparticles produced by
UV-enhanced chemical process; Appl. Surf. Sci. 255 (2009) 8403–8408. [2] Falletta, E.; Bonini, M; Fratini, E; Nostro, A. L; Pesavento, G; Becheri, A; Nostro, P. L; Canton, P;
Baglioni, P.: Clusters of Poly(acrylates) and Silver Nanoparticles: Structure and Applications for Antimicrobial Fabrics; J. Phys. Chem. C, 112 (2008) 11758–1176.
483
14
th Romanian Textiles and Leather Conference – CORTEP 2012
Sinaia, 6 - 8 September 2012
[3] Henglein, A.: Colloidal Silver Nanoparticles: Photochemical Preparation and Interaction with O2, CCl4, and Some Metal Ions; Chem. Mater. 10 (1998) 444-450.
[4] Zhang, J. G; Xu, S. Q; Kumacheva, E.: Photogeneration of Fluorescent Silver Nanoclusters in Polymer Microgels; Adv. Mater., 17, 2336, (2005).
[5] Mohamed, N. H.; Bahners, T.; Gutmann, J. S.; Ulbricht, M.: Synthesis of Silver Nanoparticles by Photochemical Reduction using Poly(methacrylic acid) and their Application as Antimicrobial agent; 2. Junges Chemie Symposium Ruhr, Essen, Germany, September 22
(2011).
[6] leroux, L.; Perwuelz, A.; Campagne, C.; Bhary, N.: Atmospheric Air-plasma Treatment of Polyester Textile Structures, J. Adhes. Sci. Technol. 20 (2006) 939-957.
[7] Maja, R.; Vesna, I.; Vesna, V.; Suzana, D.; Petar, J.; Zoran, S.; Jovan, M. N. Antibacterial effect of silver nanoparticles deposited on corona-treated polyester and polyamide fabrics, Polym. Adv. Technol. 19 (2008) 1816–1821.
[8] Fouda, M.; Knittel, D.; Zimehl, R.; Hipler, C.; Schollmeyer, E. Adv. Chitin Sci. 8, (2005), 418. [9] Seidler, E. The tetrazolium-formazan system: design and histochemistry, Gustav Fischer Verlag, New
York, 1991. [10] Klemm, D.; Philipp, B.; Heinze, T.; Heinze, U.; Wgaenknecht, W. Comprehensive Cellulose Chemistry
Volume I, Fundamentals and Analytical Methods. Wiley-VCH: Weinheim, 1998. [11] Mohamed, N. H.; Bahners, T.; Gutmann, J. S.; Ulbricht, M.: Antibacterial properties of Poly(ethylene
terephthalate) impregnated with photochemically synthesized silver anoparticles, 5th Aachen –Dresden
International Textile Conference, Aachen, November 24- 25 (2011)
Corresponding address: Nasser H. Mohamed Deutsches Textilforschungszentrum Nord-West e.V. Adlerstr 1, 47798 ,Krefeld, Germany Phone: +49/2151/843/156; Fax:+49/2151/843/143 E-mail: [email protected]
Co-authors: Dr. Thomas Bahners Deutsches Textilforschungszentrum Nord-West e.V. Adlerstr. 1, 47798 ,Krefeld, Germany Phone: +49/2151/843/156 ; Fax:+49/2151/843/143; E-mail: [email protected] Prof. Dr. Jochen Gutmann DeutschesTextilforschungszentrum Nord-Weste.V. Adlerstrasse1, D-47798, Krefeld Phone: +49/2151/843/0; fax: +49/2151/843/143 E-mail: [email protected] E-mail: [email protected]
Prof. Dr. Mathias Ulbricht Universität Duisburg-Essen Lehrstuhl für Technische Chemie II Universitätsstraße 7, 45141 Essen Phone: +49/201/183/3151; Fax: +49/201/183/3147 Email: [email protected]
484
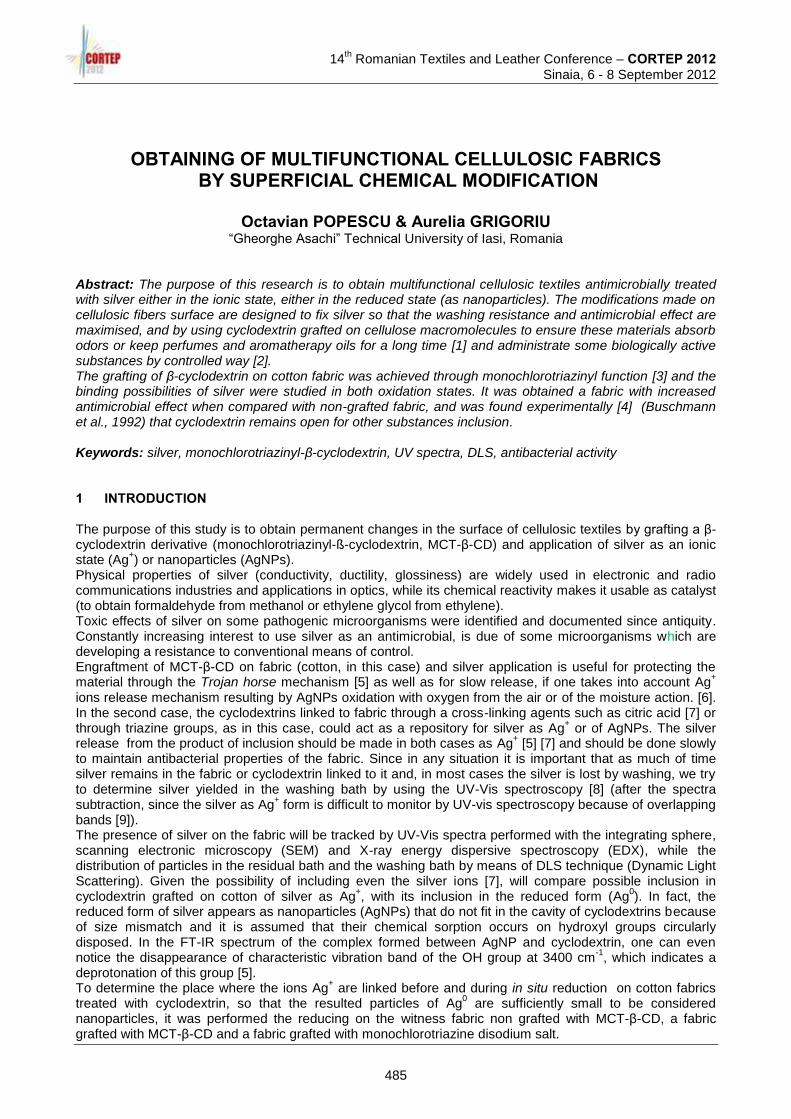
14
th Romanian Textiles and Leather Conference – CORTEP 2012
Sinaia, 6 - 8 September 2012
OBTAINING OF MULTIFUNCTIONAL CELLULOSIC FABRICS BY SUPERFICIAL CHEMICAL MODIFICATION
Octavian POPESCU & Aurelia GRIGORIU
“Gheorghe Asachi” Technical University of Iasi, Romania Abstract: The purpose of this research is to obtain multifunctional cellulosic textiles antimicrobially treated with silver either in the ionic state, either in the reduced state (as nanoparticles). The modifications made on cellulosic fibers surface are designed to fix silver so that the washing resistance and antimicrobial effect are maximised, and by using cyclodextrin grafted on cellulose macromolecules to ensure these materials absorb odors or keep perfumes and aromatherapy oils for a long time [1] and administrate some biologically active substances by controlled way [2]. The grafting of β-cyclodextrin on cotton fabric was achieved through monochlorotriazinyl function [3] and the binding possibilities of silver were studied in both oxidation states. It was obtained a fabric with increased antimicrobial effect when compared with non-grafted fabric, and was found experimentally [4] (Buschmann et al., 1992) that cyclodextrin remains open for other substances inclusion. Keywords: silver, monochlorotriazinyl-β-cyclodextrin, UV spectra, DLS, antibacterial activity 1 INTRODUCTION The purpose of this study is to obtain permanent changes in the surface of cellulosic textiles by grafting a β-cyclodextrin derivative (monochlorotriazinyl-ß-cyclodextrin, MCT-β-CD) and application of silver as an ionic state (Ag
+) or nanoparticles (AgNPs).
Physical properties of silver (conductivity, ductility, glossiness) are widely used in electronic and radio communications industries and applications in optics, while its chemical reactivity makes it usable as catalyst (to obtain formaldehyde from methanol or ethylene glycol from ethylene). Toxic effects of silver on some pathogenic microorganisms were identified and documented since antiquity. Constantly increasing interest to use silver as an antimicrobial, is due of some microorganisms which are developing a resistance to conventional means of control. Engraftment of MCT-β-CD on fabric (cotton, in this case) and silver application is useful for protecting the material through the Trojan horse mechanism [5] as well as for slow release, if one takes into account Ag
+
ions release mechanism resulting by AgNPs oxidation with oxygen from the air or of the moisture action. [6]. In the second case, the cyclodextrins linked to fabric through a cross-linking agents such as citric acid [7] or through triazine groups, as in this case, could act as a repository for silver as Ag
+ or of AgNPs. The silver
release from the product of inclusion should be made in both cases as Ag+ [5] [7] and should be done slowly
to maintain antibacterial properties of the fabric. Since in any situation it is important that as much of time silver remains in the fabric or cyclodextrin linked to it and, in most cases the silver is lost by washing, we try to determine silver yielded in the washing bath by using the UV-Vis spectroscopy [8] (after the spectra subtraction, since the silver as Ag
+ form is difficult to monitor by UV-vis spectroscopy because of overlapping
bands [9]). The presence of silver on the fabric will be tracked by UV-Vis spectra performed with the integrating sphere, scanning electronic microscopy (SEM) and X-ray energy dispersive spectroscopy (EDX), while the distribution of particles in the residual bath and the washing bath by means of DLS technique (Dynamic Light Scattering). Given the possibility of including even the silver ions [7], will compare possible inclusion in cyclodextrin grafted on cotton of silver as Ag
+, with its inclusion in the reduced form (Ag
0). In fact, the
reduced form of silver appears as nanoparticles (AgNPs) that do not fit in the cavity of cyclodextrins because of size mismatch and it is assumed that their chemical sorption occurs on hydroxyl groups circularly disposed. In the FT-IR spectrum of the complex formed between AgNP and cyclodextrin, one can even notice the disappearance of characteristic vibration band of the OH group at 3400 cm
-1, which indicates a
deprotonation of this group [5]. To determine the place where the ions Ag
+ are linked before and during in situ reduction on cotton fabrics
treated with cyclodextrin, so that the resulted particles of Ag0 are sufficiently small to be considered
nanoparticles, it was performed the reducing on the witness fabric non grafted with MCT-β-CD, a fabric grafted with MCT-β-CD and a fabric grafted with monochlorotriazine disodium salt.
485
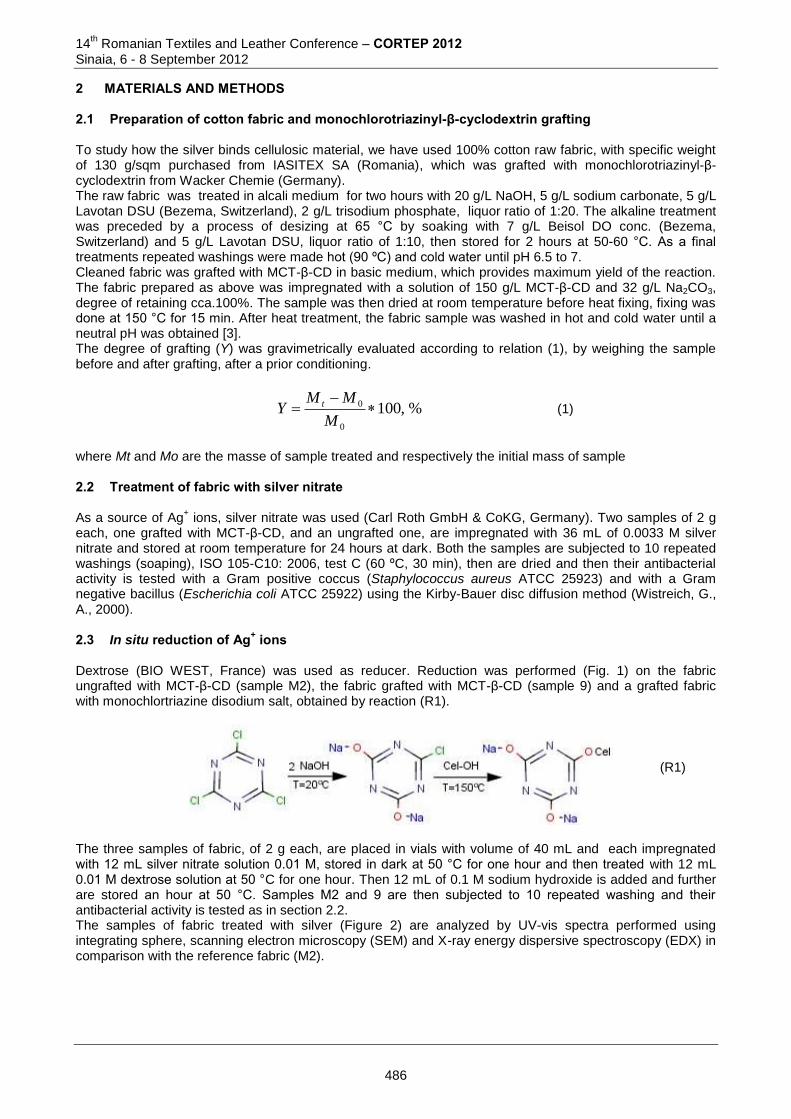
14th Romanian Textiles and Leather Conference – CORTEP 2012
Sinaia, 6 - 8 September 2012
2 MATERIALS AND METHODS 2.1 Preparation of cotton fabric and monochlorotriazinyl-β-cyclodextrin grafting To study how the silver binds cellulosic material, we have used 100% cotton raw fabric, with specific weight of 130 g/sqm purchased from IASITEX SA (Romania), which was grafted with monochlorotriazinyl-β-cyclodextrin from Wacker Chemie (Germany). The raw fabric was treated in alcali medium for two hours with 20 g/L NaOH, 5 g/L sodium carbonate, 5 g/L Lavotan DSU (Bezema, Switzerland), 2 g/L trisodium phosphate, liquor ratio of 1:20. The alkaline treatment was preceded by a process of desizing at 65 °C by soaking with 7 g/L Beisol DO conc. (Bezema, Switzerland) and 5 g/L Lavotan DSU, liquor ratio of 1:10, then stored for 2 hours at 50-60 °C. As a final treatments repeated washings were made hot (90 ºC) and cold water until pH 6.5 to 7. Cleaned fabric was grafted with MCT-β-CD in basic medium, which provides maximum yield of the reaction. The fabric prepared as above was impregnated with a solution of 150 g/L MCT-β-CD and 32 g/L Na2CO3, degree of retaining cca.100%. The sample was then dried at room temperature before heat fixing, fixing was done at 150 °C for 15 min. After heat treatment, the fabric sample was washed in hot and cold water until a neutral pH was obtained [3]. The degree of grafting (Y) was gravimetrically evaluated according to relation (1), by weighing the sample before and after grafting, after a prior conditioning.
%,1000
0
M
MMY t
(1)
where Mt and Mo are the masse of sample treated and respectively the initial mass of sample 2.2 Treatment of fabric with silver nitrate As a source of Ag
+ ions, silver nitrate was used (Carl Roth GmbH & CoKG, Germany). Two samples of 2 g
each, one grafted with MCT-β-CD, and an ungrafted one, are impregnated with 36 mL of 0.0033 M silver nitrate and stored at room temperature for 24 hours at dark. Both the samples are subjected to 10 repeated washings (soaping), ISO 105-C10: 2006, test C (60 ºC, 30 min), then are dried and then their antibacterial activity is tested with a Gram positive coccus (Staphylococcus aureus ATCC 25923) and with a Gram negative bacillus (Escherichia coli ATCC 25922) using the Kirby-Bauer disc diffusion method (Wistreich, G., A., 2000). 2.3 In situ reduction of Ag+ ions Dextrose (BIO WEST, France) was used as reducer. Reduction was performed (Fig. 1) on the fabric ungrafted with MCT-β-CD (sample M2), the fabric grafted with MCT-β-CD (sample 9) and a grafted fabric with monochlortriazine disodium salt, obtained by reaction (R1).
The three samples of fabric, of 2 g each, are placed in vials with volume of 40 mL and each impregnated with 12 mL silver nitrate solution 0.01 M, stored in dark at 50 °C for one hour and then treated with 12 mL 0.01 M dextrose solution at 50 °C for one hour. Then 12 mL of 0.1 M sodium hydroxide is added and further are stored an hour at 50 °C. Samples M2 and 9 are then subjected to 10 repeated washing and their antibacterial activity is tested as in section 2.2. The samples of fabric treated with silver (Figure 2) are analyzed by UV-vis spectra performed using integrating sphere, scanning electron microscopy (SEM) and X-ray energy dispersive spectroscopy (EDX) in comparison with the reference fabric (M2).
(R1)
486
14
th Romanian Textiles and Leather Conference – CORTEP 2012
Sinaia, 6 - 8 September 2012
Figure 1: Appearance of fabrics and reducing silver bath for the ungrafted fabric with MCT-β-CD (Sample M2), fabric grafted with MCT-β-CD (Sample 9), fabric grafted with triazine (Sample T) and fabric treated with triazine after 24 hours at 50 °C (Sample T24)
Sample M2 Sample 9
Sample T Sample T24 Figure 2: Appearance of fabrics treated with silver in reduced form: fabric ungrafted with MCT-β-CD (sample M2), fabric grafted with MCT-β-CD (sample 9), fabric grafted with triazine (sample T) and fabric treated with triazine after 24 hours at 50 °C (sample T24) 2.4 Analytical Methods UV-Vis spectra were recorded in the 200-800 nm range using a spectrophotometer Cary 5E UV-Vis-NIR (Varian) equipped with integrating sphere. The baseline was performed using the fabric normally used for these tests, untreated. The measurements of the particle size of Ag
0 were made using apparatus Zetasizer Nano S produced by
Malvern Instruments which is able to perform submicron measurements using a process called DLS (Dynamic Light Scattering). This method uses Brownian motion, anyway present at temperatures above 0 °K, and that correlates with particle size. This is achieved by illuminating the particles with laser light followed
487
14th Romanian Textiles and Leather Conference – CORTEP 2012
Sinaia, 6 - 8 September 2012
by analyzing the scattered light intensity fluctuations. Brownian motion is the movement of particles due to random collisions with molecules of the liquid that surrounds the particle. An important feature of Brownian motion for DLS technique is that small particles move faster and larger particles move more slowly. The relationship between particle size and velocity due to Brownian motion is given by the Stokes-Einstein equation. Zetasizer Nano S apparatus measures the scattered light intensity fluctuations and uses them in calculating the particle size in the sample. If large particles are measured, then, because they are moving slowly, slowly varies the intensity of scattered light. If the measured particles are small, fast-moving, scattered light intensity will fluctuate quickly. Measurements were made by standard operating procedure (SOP). This is a measurement model which predefines all settings and ensures that the determinations made on the same type of tests are performed under the same conditions. The samples of residual bath from reduction of silver and washings were diluted with distilled water in the ratio 1:100 in order to reduce turbidity. Scanning electron microscopy (SEM) was used to examine the cellulosic fiber surface treated with silver being able to obtain information on dimensions and form of deposits formed. Images were made with Hitachi S3400N microscope with tungsten filament. Fabric samples were sprayed with gold before examination on the device Emitech K500X. Elemental analysis was performed using Energy dispersive X-ray spectroscopy (EDX) by means of an Oxford X-Max Silicon Drift Detector (Oxford X-Max SDD) and INCA software (Oxford). 2.5 Testing of antimicrobial activity The fabric samples treated with Ag
0 and Ag
+ ions respectively, both ungrafted and grafted with MCT-β-CD,
were tested with Staphylococcus aureus and Escherichia coli by Kirby-Bauer disc diffusion method. The bacterial cultures of 18 hours were obtained from the bacterial inoculums, which was standardized, yielding 108 CFU / mL. The culture medium used (LB) was inoculated with that inoculum, after which on the surface of the medium were applied 0.8 cm diameter discs from tissue samples. Appreciation of antibacterial activity was achieved after 24 hours of incubation at 37
0C, by measuring the inhibition zones around discs of
textiles. 3 RESULTS AND DISCUSSIONS In Figures 1 and 2, one can see obvious differences in color between fabric that does not contain nitrogen compounds (M2) and those containing nitrogen as triazines (samples 9, T, and T24). In the sample M2, which is a common fabric, alkaline cleaned and treated like other samples with silver ions reduced in situ, we obtained large silver particles which gives dark colour. Assuming that the particles of silver in the residual bath have approximately the same size as those on the fabric, can be seen from the result of analysis made by DLS (Figure 3) that the average particle size is cca.300 nm for ungrafted fabric and below 10 nm for fabric grafted MCT-β-CD, as well as fabric grafted with disodium salt of monochlorotriazine, both by normal reducing when in fact, silver ions have remained largely unreduced (Sample T) and after 24 hours (Sample T24), when fabric has reached almost the same colour as the sample 9. The fact that silver ions remained unreduced in the case of T sample after the normal time of reduction (see Figure 4) can be explained by their binding to nitrogen atoms of the triazine grafted on cellulose. By extending the reaction time has still managed the reducing process but amount of Ag
0 particles
has not reached the level achieved in the sample 9 (see absorbances in Figure 4). Spectrum of ungrafted fabric (M2) from Figure 4, has a very flat aspect and this would mean the formation of large silver particles, as confirmed by DLS analysis and sample color. Instead, the spectrum of fabric grafted with MCT-β-CD confirms the small size of particles determined by DLS analysis, showing a high and narrow peak at 439 nm, characteristic wavelength of about 10 nm size of silver nanoparticles. Biological tests showed antibacterial activity of silver in both oxidation states (Ag
+ şi Ag
0), silver existing on
the fabric grafted with MCT-β-CD, both against Gram positive Staphylococcus aureus and Gram negative bacillus Escherichia coli (Figure 6). In the case of silver in reduced state, activity against coccus is slightly higher than for bacillus and in the case of silver ion, situation is as reverse (Figure 7). Diffusion test method shows a more pronounced activity of silver ion, compared with the reduced silver. This can be explained by different cell wall structure of the two species, providing a hydrophilic character in the case of Gram negative bacteria (Escherichia coli) and a hydrophobic character in the case of Gram positive bacteria (Staphylococcus aureus). Hydrophilic character allows silver ions to interfere easier in the case of Escherichia coli than Staphylococcus aureus and conversely. Since the diffusion method can distort the results due to lower diffusion of silver in reduced state (as particles) at future studies will apply another method to test antimicrobial activity (eg. Tetrazolium method).
488
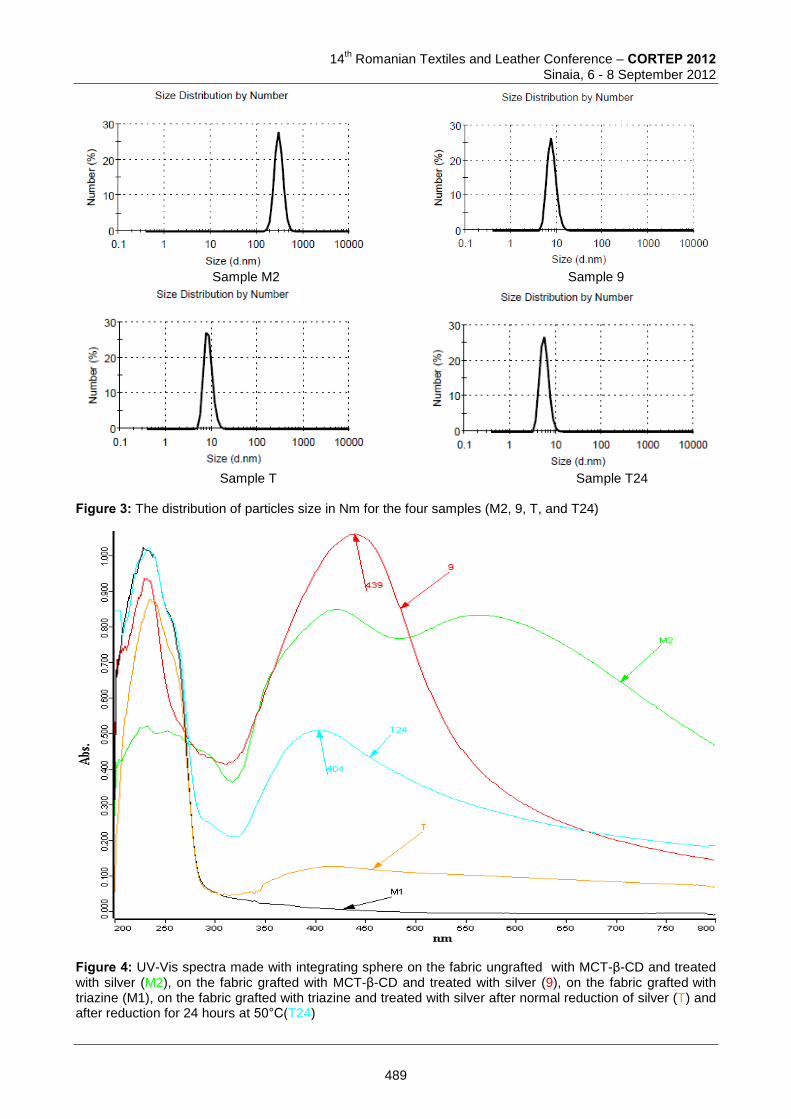
14
th Romanian Textiles and Leather Conference – CORTEP 2012
Sinaia, 6 - 8 September 2012
Sample M2 Sample 9
Sample T Sample T24 Figure 3: The distribution of particles size in Nm for the four samples (M2, 9, T, and T24)
Figure 4: UV-Vis spectra made with integrating sphere on the fabric ungrafted with MCT-β-CD and treated with silver (M2), on the fabric grafted with MCT-β-CD and treated with silver (9), on the fabric grafted with triazine (M1), on the fabric grafted with triazine and treated with silver after normal reduction of silver (T) and after reduction for 24 hours at 50°C(T24)
489
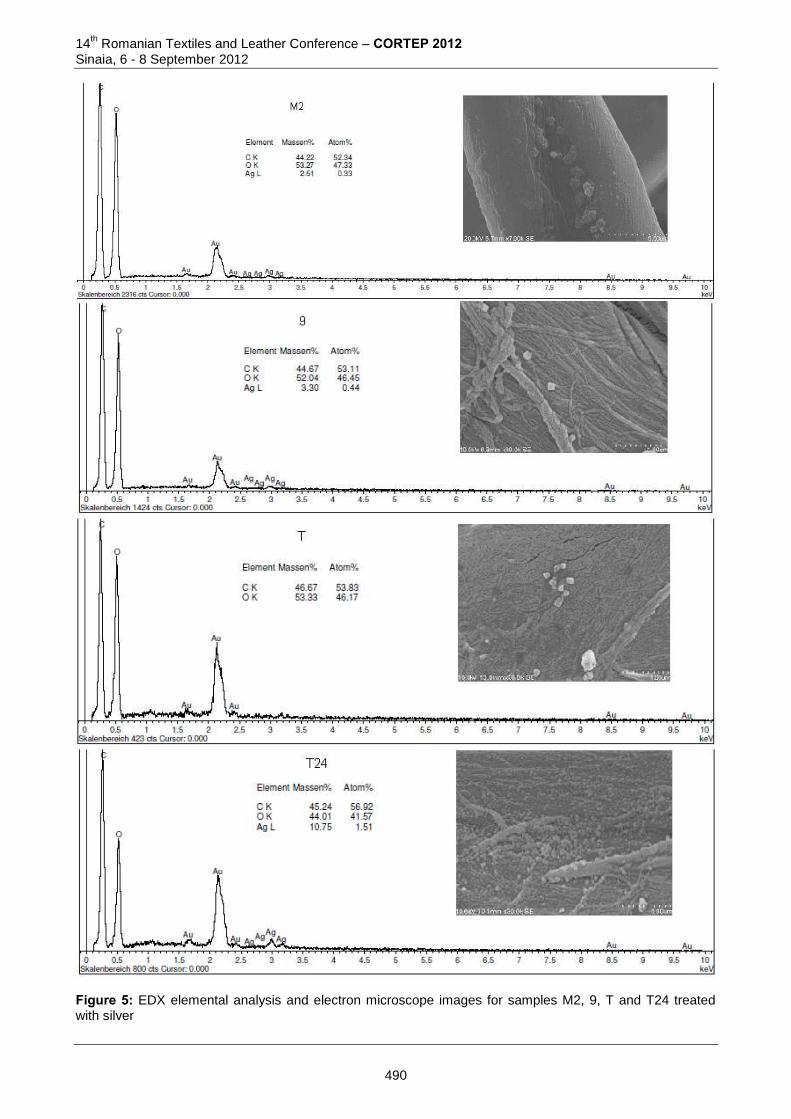
14th Romanian Textiles and Leather Conference – CORTEP 2012
Sinaia, 6 - 8 September 2012
Figure 5: EDX elemental analysis and electron microscope images for samples M2, 9, T and T24 treated with silver
490
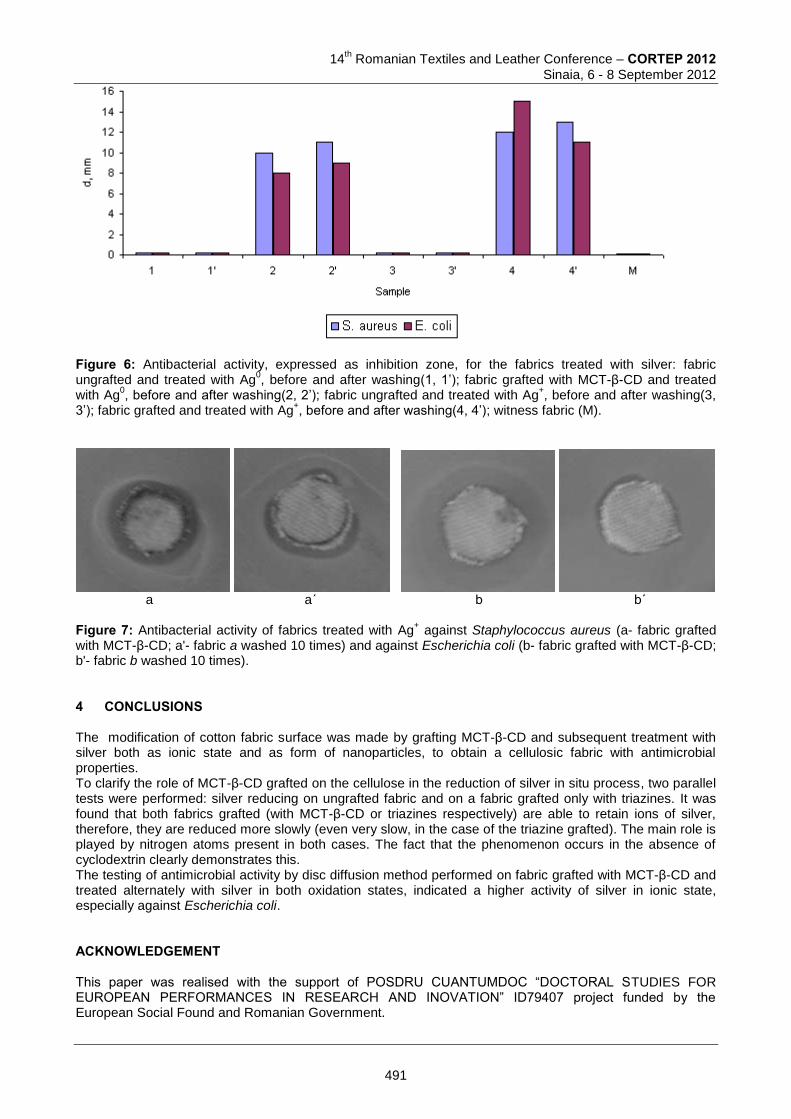
14
th Romanian Textiles and Leather Conference – CORTEP 2012
Sinaia, 6 - 8 September 2012
Figure 6: Antibacterial activity, expressed as inhibition zone, for the fabrics treated with silver: fabric ungrafted and treated with Ag
0, before and after washing(1, 1’); fabric grafted with MCT-β-CD and treated
with Ag0, before and after washing(2, 2’); fabric ungrafted and treated with Ag
+, before and after washing(3,
3’); fabric grafted and treated with Ag+, before and after washing(4, 4’); witness fabric (M).
a a´ b b´ Figure 7: Antibacterial activity of fabrics treated with Ag
+ against Staphylococcus aureus (a- fabric grafted
with MCT-β-CD; a'- fabric a washed 10 times) and against Escherichia coli (b- fabric grafted with MCT-β-CD; b'- fabric b washed 10 times). 4 CONCLUSIONS The modification of cotton fabric surface was made by grafting MCT-β-CD and subsequent treatment with silver both as ionic state and as form of nanoparticles, to obtain a cellulosic fabric with antimicrobial properties. To clarify the role of MCT-β-CD grafted on the cellulose in the reduction of silver in situ process, two parallel tests were performed: silver reducing on ungrafted fabric and on a fabric grafted only with triazines. It was found that both fabrics grafted (with MCT-β-CD or triazines respectively) are able to retain ions of silver, therefore, they are reduced more slowly (even very slow, in the case of the triazine grafted). The main role is played by nitrogen atoms present in both cases. The fact that the phenomenon occurs in the absence of cyclodextrin clearly demonstrates this. The testing of antimicrobial activity by disc diffusion method performed on fabric grafted with MCT-β-CD and treated alternately with silver in both oxidation states, indicated a higher activity of silver in ionic state, especially against Escherichia coli.
ACKNOWLEDGEMENT This paper was realised with the support of POSDRU CUANTUMDOC “DOCTORAL STUDIES FOR EUROPEAN PERFORMANCES IN RESEARCH AND INOVATION” ID79407 project funded by the European Social Found and Romanian Government.
491
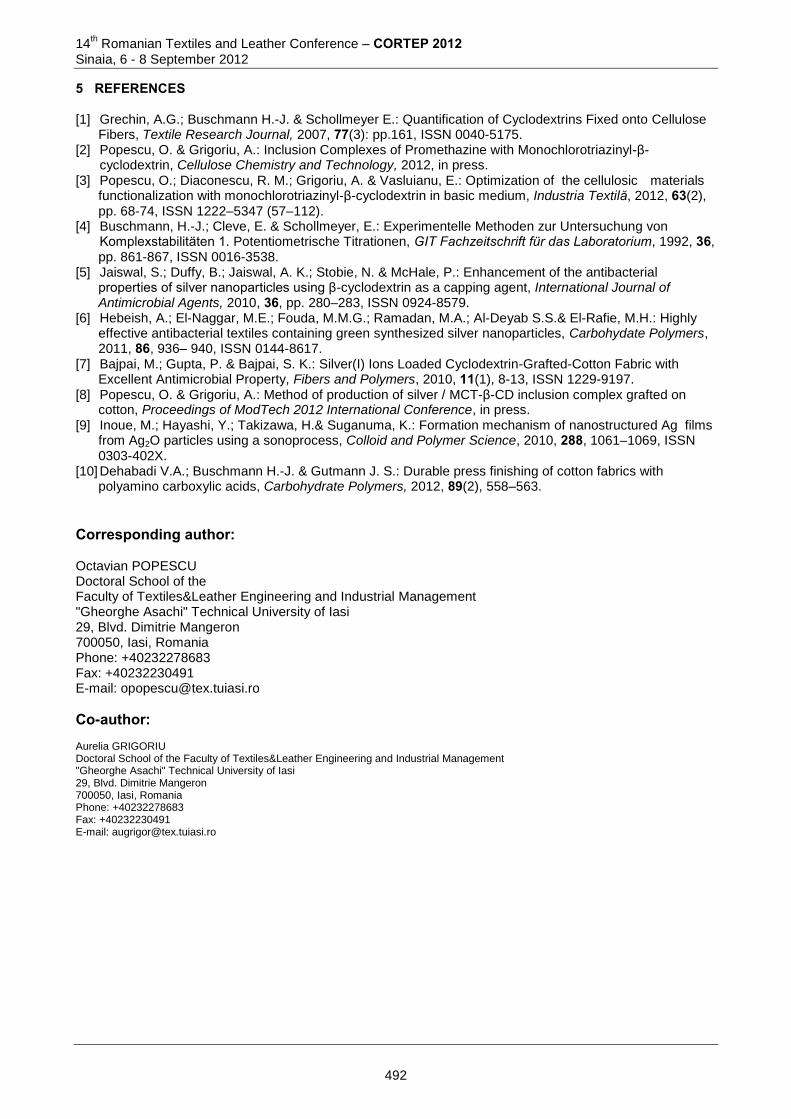
14th Romanian Textiles and Leather Conference – CORTEP 2012
Sinaia, 6 - 8 September 2012
5 REFERENCES [1] Grechin, A.G.; Buschmann H.-J. & Schollmeyer E.: Quantification of Cyclodextrins Fixed onto Cellulose
Fibers, Textile Research Journal, 2007, 77(3): pp.161, ISSN 0040-5175. [2] Popescu, O. & Grigoriu, A.: Inclusion Complexes of Promethazine with Monochlorotriazinyl-β-
cyclodextrin, Cellulose Chemistry and Technology, 2012, in press. [3] Popescu, O.; Diaconescu, R. M.; Grigoriu, A. & Vasluianu, E.: Optimization of the cellulosic materials
functionalization with monochlorotriazinyl-β-cyclodextrin in basic medium, Industria Textilă, 2012, 63(2), pp. 68-74, ISSN 1222–5347 (57–112).
[4] Buschmann, H.-J.; Cleve, E. & Schollmeyer, E.: Experimentelle Methoden zur Untersuchung von Komplexstabilitäten 1. Potentiometrische Titrationen, GIT Fachzeitschrift für das Laboratorium, 1992, 36, pp. 861-867, ISSN 0016-3538.
[5] Jaiswal, S.; Duffy, B.; Jaiswal, A. K.; Stobie, N. & McHale, P.: Enhancement of the antibacterial properties of silver nanoparticles using β-cyclodextrin as a capping agent, International Journal of Antimicrobial Agents, 2010, 36, pp. 280–283, ISSN 0924-8579.
[6] Hebeish, A.; El-Naggar, M.E.; Fouda, M.M.G.; Ramadan, M.A.; Al-Deyab S.S.& El-Rafie, M.H.: Highly effective antibacterial textiles containing green synthesized silver nanoparticles, Carbohydate Polymers, 2011, 86, 936– 940, ISSN 0144-8617.
[7] Bajpai, M.; Gupta, P. & Bajpai, S. K.: Silver(I) Ions Loaded Cyclodextrin-Grafted-Cotton Fabric with Excellent Antimicrobial Property, Fibers and Polymers, 2010, 11(1), 8-13, ISSN 1229-9197.
[8] Popescu, O. & Grigoriu, A.: Method of production of silver / MCT-β-CD inclusion complex grafted on cotton, Proceedings of ModTech 2012 International Conference, in press.
[9] Inoue, M.; Hayashi, Y.; Takizawa, H.& Suganuma, K.: Formation mechanism of nanostructured Ag films from Ag2O particles using a sonoprocess, Colloid and Polymer Science, 2010, 288, 1061–1069, ISSN 0303-402X.
[10] Dehabadi V.A.; Buschmann H.-J. & Gutmann J. S.: Durable press finishing of cotton fabrics with polyamino carboxylic acids, Carbohydrate Polymers, 2012, 89(2), 558–563.
Corresponding author: Octavian POPESCU Doctoral School of the Faculty of Textiles&Leather Engineering and Industrial Management "Gheorghe Asachi" Technical University of Iasi 29, Blvd. Dimitrie Mangeron 700050, Iasi, Romania Phone: +40232278683 Fax: +40232230491 E-mail: [email protected]
Co-author: Aurelia GRIGORIU Doctoral School of the Faculty of Textiles&Leather Engineering and Industrial Management "Gheorghe Asachi" Technical University of Iasi 29, Blvd. Dimitrie Mangeron 700050, Iasi, Romania Phone: +40232278683 Fax: +40232230491 E-mail: [email protected]
492
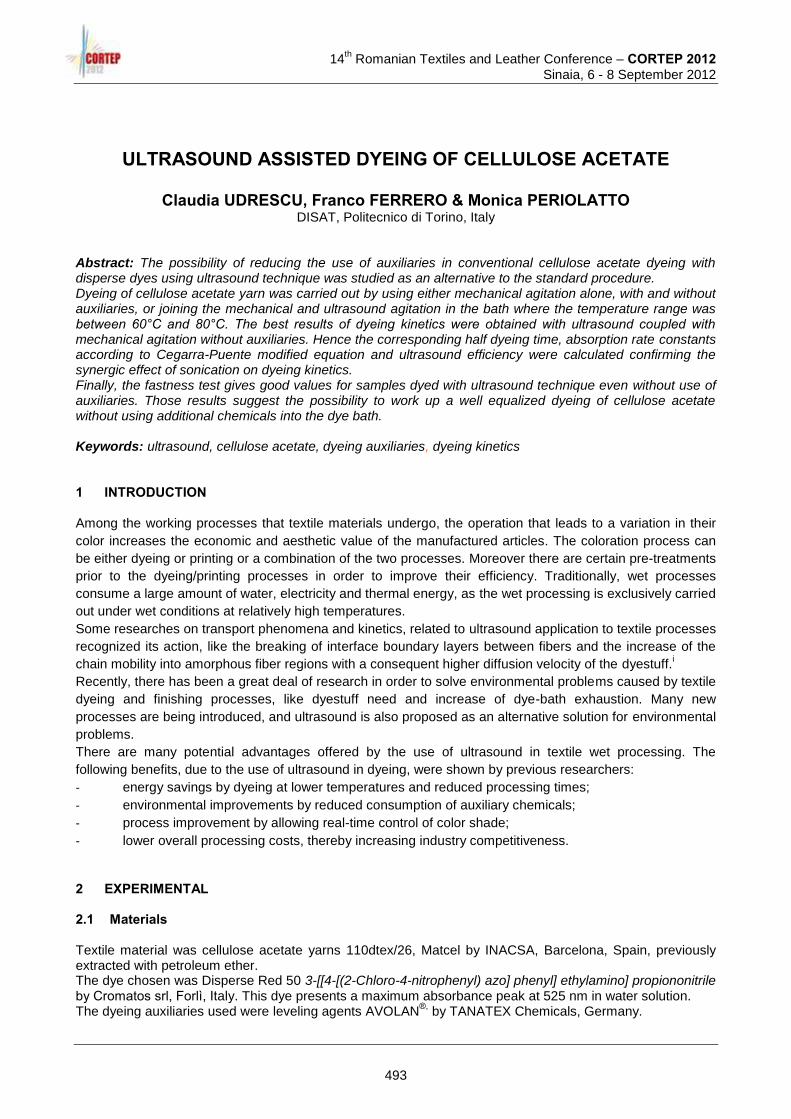
14
th Romanian Textiles and Leather Conference – CORTEP 2012
Sinaia, 6 - 8 September 2012
ULTRASOUND ASSISTED DYEING OF CELLULOSE ACETATE
Claudia UDRESCU, Franco FERRERO & Monica PERIOLATTO
DISAT, Politecnico di Torino, Italy Abstract: The possibility of reducing the use of auxiliaries in conventional cellulose acetate dyeing with disperse dyes using ultrasound technique was studied as an alternative to the standard procedure. Dyeing of cellulose acetate yarn was carried out by using either mechanical agitation alone, with and without auxiliaries, or joining the mechanical and ultrasound agitation in the bath where the temperature range was between 60°C and 80°C. The best results of dyeing kinetics were obtained with ultrasound coupled with mechanical agitation without auxiliaries. Hence the corresponding half dyeing time, absorption rate constants according to Cegarra-Puente modified equation and ultrasound efficiency were calculated confirming the synergic effect of sonication on dyeing kinetics. Finally, the fastness test gives good values for samples dyed with ultrasound technique even without use of auxiliaries. Those results suggest the possibility to work up a well equalized dyeing of cellulose acetate without using additional chemicals into the dye bath. Keywords: ultrasound, cellulose acetate, dyeing auxiliaries, dyeing kinetics 1 INTRODUCTION Among the working processes that textile materials undergo, the operation that leads to a variation in their
color increases the economic and aesthetic value of the manufactured articles. The coloration process can
be either dyeing or printing or a combination of the two processes. Moreover there are certain pre-treatments
prior to the dyeing/printing processes in order to improve their efficiency. Traditionally, wet processes
consume a large amount of water, electricity and thermal energy, as the wet processing is exclusively carried
out under wet conditions at relatively high temperatures.
Some researches on transport phenomena and kinetics, related to ultrasound application to textile processes
recognized its action, like the breaking of interface boundary layers between fibers and the increase of the
chain mobility into amorphous fiber regions with a consequent higher diffusion velocity of the dyestuff.i
Recently, there has been a great deal of research in order to solve environmental problems caused by textile
dyeing and finishing processes, like dyestuff need and increase of dye-bath exhaustion. Many new
processes are being introduced, and ultrasound is also proposed as an alternative solution for environmental
problems.
There are many potential advantages offered by the use of ultrasound in textile wet processing. The
following benefits, due to the use of ultrasound in dyeing, were shown by previous researchers:
- energy savings by dyeing at lower temperatures and reduced processing times;
- environmental improvements by reduced consumption of auxiliary chemicals;
- process improvement by allowing real-time control of color shade;
- lower overall processing costs, thereby increasing industry competitiveness.
2 EXPERIMENTAL 2.1 Materials Textile material was cellulose acetate yarns 110dtex/26, Matcel by INACSA, Barcelona, Spain, previously extracted with petroleum ether. The dye chosen was Disperse Red 50 3-[[4-[(2-Chloro-4-nitrophenyl) azo] phenyl] ethylamino] propiononitrile by Cromatos srl, Forlì, Italy. This dye presents a maximum absorbance peak at 525 nm in water solution. The dyeing auxiliaries used were leveling agents AVOLAN
®, by TANATEX Chemicals, Germany.
493

14th Romanian Textiles and Leather Conference – CORTEP 2012
Sinaia, 6 - 8 September 2012
2.2 Dyeing process The first aim of this laboratory study was the determination of isothermal exhaustion curves of the dyebath, with mechanical agitation alone or coupling ultrasound with it, at different temperatures of the process: 60°C, 70°C and 80°C. In the case of mechanical agitation the experiments were performed without and with auxiliaries. An Elmasonic S60H (Elma GmbH&Co, Singen, Germany) ultrasonic and thermo-controlled bath was used. It can generate ultrasound at 37 kHz with effective ultrasound power of 150 W and heating power of 400W. The dyeing procedure was performed on 2.00 g cellulose acetate yarns immersed in a beaker containing dyebath. The beaker was immersed in the water bath of the ultrasonic equipment. Mechanical agitation was provided by a laboratory stirrer, dipped in the beaker at about 100 rpm. The material to liquor ratio was 1:50 by using 1% o.w.f. of dye. In order to monitor dye exhaustion the dyeing experiment was maintained for 110 min., by analyzing the bath samples every 10 min. The measurements were performed with an UV-VIS spectrophotometer UNICAM UV2 (ATI Unicam, Cambridge, UK). Finally, the dyed samples were squeezed, thoroughly rinsed with cold water and dried at ambient temperature. 2.3 Ultrasound effect evaluation After careful analysis of the literature in this field, it was considered appropriate to process the data obtained from the above curves, in order to determine coefficients of absorption for each isotherm and apparent activation energy. From the obtained values of bath exhaustion kinetic parameters, it was possible to calculate the absorption coefficient (K) from the isotherms of dyeing considered (at 60, 70 and 80°C) through the equation of Cegarra-Puente, subsequently modified in such a way that takes into account the effect of the decrease in the concentration of the dye in the dyebath:
KataE
Et lnln1lnln2
2
(1)
Where: Et is the dye concentration in the fiber at time t, E∞ is the dye concentration at the equilibrium, a is the slope of the straight line obtained by plotting the first member of the equation (1) in function
of ln t, K is the absorption rate constant, t is the dyeing time.
Arrhenius equation was used for apparent activation energy calculation:
RT
E
T eKK
0 (2)
where: KT is the absorption rate constant at the absolute temperature T, K0 is frequency factor, R is the ideal gas constant (R = 8.314 kJ/mol), T is the absolute temperature.
Finally, ultrasonic efficiency (ΔK%) to accelerate the dyeing rate was calculated by introducing the following equation:
100)(
%
ST
STUS
K
KKK (3)
where: KUS and KST are the rate constants of dyeing with ultrasonic and stirring alone process, respectively. In order to evaluate the dyeing for each samples were done tests of fastness to domestic washing
(UNI-EN ISO 105-C01) and test of resistance to rubbing (UNI-EN ISO 105-X12).
494
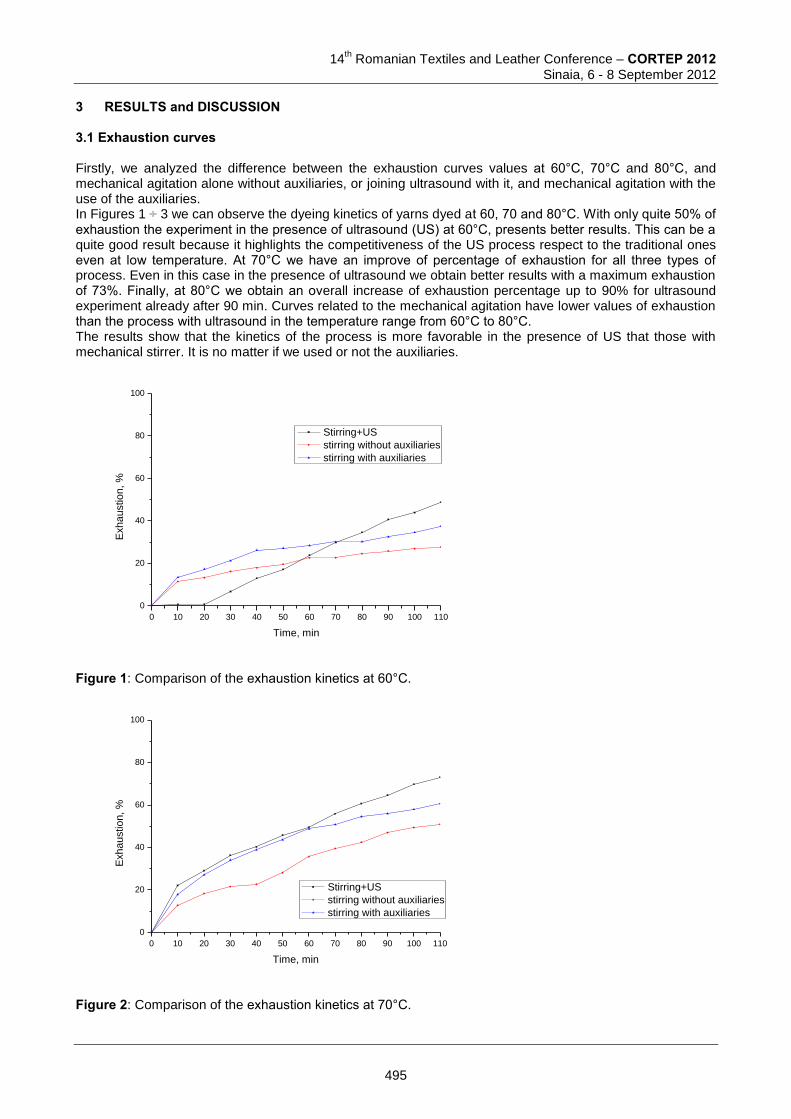
14
th Romanian Textiles and Leather Conference – CORTEP 2012
Sinaia, 6 - 8 September 2012
3 RESULTS and DISCUSSION 3.1 Exhaustion curves Firstly, we analyzed the difference between the exhaustion curves values at 60°C, 70°C and 80°C, and mechanical agitation alone without auxiliaries, or joining ultrasound with it, and mechanical agitation with the use of the auxiliaries. In Figures 1 ÷ 3 we can observe the dyeing kinetics of yarns dyed at 60, 70 and 80°C. With only quite 50% of exhaustion the experiment in the presence of ultrasound (US) at 60°C, presents better results. This can be a quite good result because it highlights the competitiveness of the US process respect to the traditional ones even at low temperature. At 70°C we have an improve of percentage of exhaustion for all three types of process. Even in this case in the presence of ultrasound we obtain better results with a maximum exhaustion of 73%. Finally, at 80°C we obtain an overall increase of exhaustion percentage up to 90% for ultrasound experiment already after 90 min. Curves related to the mechanical agitation have lower values of exhaustion than the process with ultrasound in the temperature range from 60°C to 80°C. The results show that the kinetics of the process is more favorable in the presence of US that those with mechanical stirrer. It is no matter if we used or not the auxiliaries.
0 10 20 30 40 50 60 70 80 90 100 110
0
20
40
60
80
100
Exha
ustio
n, %
Time, min
Stirring+US
stirring without auxiliaries
stirring with auxiliaries
Figure 1: Comparison of the exhaustion kinetics at 60°C.
0 10 20 30 40 50 60 70 80 90 100 110
0
20
40
60
80
100
Exha
ustio
n, %
Time, min
Stirring+US
stirring without auxiliaries
stirring with auxiliaries
Figure 2: Comparison of the exhaustion kinetics at 70°C.
495
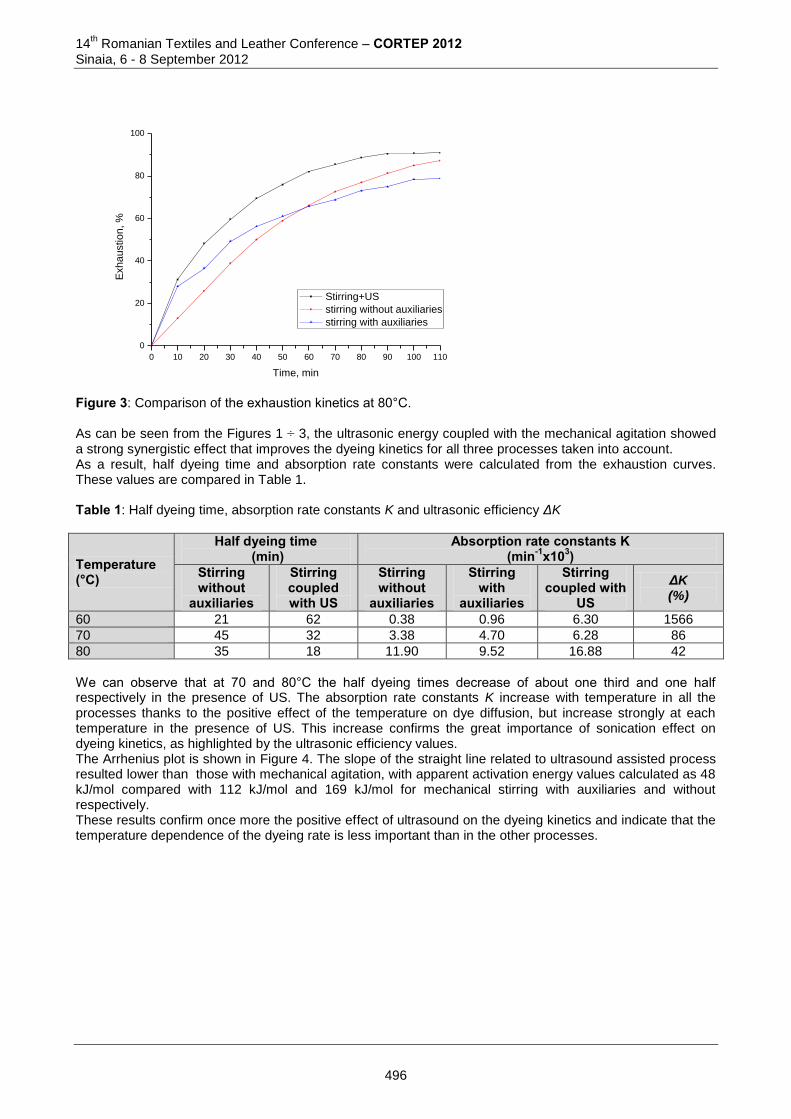
14th Romanian Textiles and Leather Conference – CORTEP 2012
Sinaia, 6 - 8 September 2012
0 10 20 30 40 50 60 70 80 90 100 110
0
20
40
60
80
100
Exha
ustio
n, %
Time, min
Stirring+US
stirring without auxiliaries
stirring with auxiliaries
Figure 3: Comparison of the exhaustion kinetics at 80°C. As can be seen from the Figures 1 ÷ 3, the ultrasonic energy coupled with the mechanical agitation showed a strong synergistic effect that improves the dyeing kinetics for all three processes taken into account. As a result, half dyeing time and absorption rate constants were calculated from the exhaustion curves. These values are compared in Table 1. Table 1: Half dyeing time, absorption rate constants K and ultrasonic efficiency ΔK
Temperature (°C)
Half dyeing time (min)
Absorption rate constants K (min-1x10³)
Stirring without
auxiliaries
Stirring coupled with US
Stirring without
auxiliaries
Stirring with
auxiliaries
Stirring coupled with
US ΔK (%)
60 21 62 0.38 0.96 6.30 1566
70 45 32 3.38 4.70 6.28 86
80 35 18 11.90 9.52 16.88 42
We can observe that at 70 and 80°C the half dyeing times decrease of about one third and one half respectively in the presence of US. The absorption rate constants K increase with temperature in all the processes thanks to the positive effect of the temperature on dye diffusion, but increase strongly at each temperature in the presence of US. This increase confirms the great importance of sonication effect on dyeing kinetics, as highlighted by the ultrasonic efficiency values. The Arrhenius plot is shown in Figure 4. The slope of the straight line related to ultrasound assisted process resulted lower than those with mechanical agitation, with apparent activation energy values calculated as 48 kJ/mol compared with 112 kJ/mol and 169 kJ/mol for mechanical stirring with auxiliaries and without respectively. These results confirm once more the positive effect of ultrasound on the dyeing kinetics and indicate that the temperature dependence of the dyeing rate is less important than in the other processes.
496
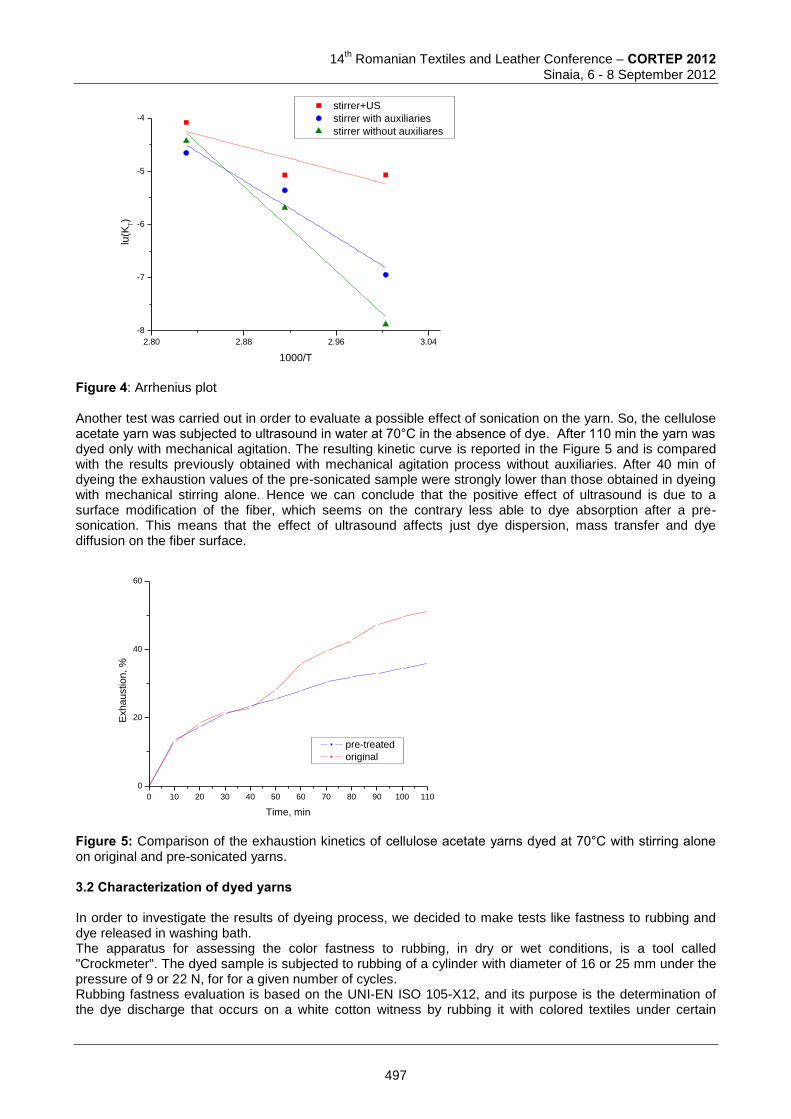
14
th Romanian Textiles and Leather Conference – CORTEP 2012
Sinaia, 6 - 8 September 2012
2.80 2.88 2.96 3.04
-8
-7
-6
-5
-4lu
(KT)
1000/T
stirrer+US
stirrer with auxiliaries
stirrer without auxiliares
Figure 4: Arrhenius plot Another test was carried out in order to evaluate a possible effect of sonication on the yarn. So, the cellulose acetate yarn was subjected to ultrasound in water at 70°C in the absence of dye. After 110 min the yarn was dyed only with mechanical agitation. The resulting kinetic curve is reported in the Figure 5 and is compared with the results previously obtained with mechanical agitation process without auxiliaries. After 40 min of dyeing the exhaustion values of the pre-sonicated sample were strongly lower than those obtained in dyeing with mechanical stirring alone. Hence we can conclude that the positive effect of ultrasound is due to a surface modification of the fiber, which seems on the contrary less able to dye absorption after a pre-sonication. This means that the effect of ultrasound affects just dye dispersion, mass transfer and dye diffusion on the fiber surface.
0 10 20 30 40 50 60 70 80 90 100 110
0
20
40
60
Exh
au
stio
n, %
Time, min
pre-treated
original
Figure 5: Comparison of the exhaustion kinetics of cellulose acetate yarns dyed at 70°C with stirring alone on original and pre-sonicated yarns. 3.2 Characterization of dyed yarns In order to investigate the results of dyeing process, we decided to make tests like fastness to rubbing and dye released in washing bath. The apparatus for assessing the color fastness to rubbing, in dry or wet conditions, is a tool called "Crockmeter". The dyed sample is subjected to rubbing of a cylinder with diameter of 16 or 25 mm under the pressure of 9 or 22 N, for for a given number of cycles. Rubbing fastness evaluation is based on the UNI-EN ISO 105-X12, and its purpose is the determination of the dye discharge that occurs on a white cotton witness by rubbing it with colored textiles under certain
497
14th Romanian Textiles and Leather Conference – CORTEP 2012
Sinaia, 6 - 8 September 2012
conditions of pressure and speed. The assessment is made observing the color differences with reference to the gray scale, as reported in Table 2. However the results of the washing tests to domestic laundering, carried out according to UNI-EN ISO 105-C01, were assessed by the spectrophotometric determinations of the dye released in the washing bath and the results are compared also in Table 2. Table 2: Results of rubbing fastness and dye released in the washing bath
Dyeing process Temperature Staining on cotton (degree)
Dye released in the washing bath (mg/L)
Stirring alone 60°C 4 0.078
Stirring with auxiliaries 60°C 3 0.072
Stirring with ultrasound 60°C 4 0.086
Stirring alone 70°C 4 0.069
Stirring with auxiliaries 70°C 4 0.059
Stirring with ultrasound 70°C 4 0.068
Stirring alone 80°C 5 0.081
Stirring with auxiliaries 80°C 5 0.076
Stirring with ultrasound 80°C 5 0.065
It can be noted that the results of the rubbing tests are as much satisfactory as the temperature increases ad there are not significant differences among the dyeing processes. Even the washing fastness is satisfactory because the dye released in the washing bath is relatively low. Therefore we can deduce that in any case the dye is mostly fixed and not simply adsorbed on the fiber surface. 4 CONCLUSIONS The positive effect of sonication on the dyeing efficiency of cellulose acetate yarn dyed with disperse dye was confirmed by the evaluation of kinetic parameters and satisfactory fastness values. Overall, the ultrasound process can improve the dye dispersion, mass transfer and diffusion, but does not affect the structure of the fiber. Moreover the ultrasound coupled with mechanical stirring yields better results than mechanical stirring in the presence of auxiliaries and at 80°C the best exhaustion value of 90% was reached already after 90 min. Therefore the results suggest the ultrasound-assisted dyeing as an ecofriendly alternative to traditional processes due to reduction of energy consumption and organic load of wastewaters. Acknowledgements The authors would like to acknowledge Dr. Alice Lorenzetti for her valuable support in the experimental investigation. 5 REFERENCES [1] Smith B., et al, Ultrasound – A novel dyeing accelerant. Amer. Dyestuff Rep., 1988, no 77 (10), pp 15-
20. [2] Carr W. W, et al, “Fundamental Investigation of Ultrasonic Effects in Textile Wet Processing”, National
Textile Center Annual Report, 1996, pp 143 – 151. [3] Saligram A.N., et al. Dyeing of polyester fibres using ultrasound. J. Soc. Dyers Colour, 1993, no. 109, pp
236-266. [4] Carriòn Fité F.J., Dyeing polyester at low temperatures: kinetics of dyeing with disperse dyes. Text. Res.
J, 1995, no. 65, pp 362-368. [5] Lee K.W., et al. Characteristic of ultrasonic dyeing on poly(ethylene terephthalate). Text. Res. J., 2003,
no. 73, pp 751-755. [6] Ferrero F., Periolatto M., Ultrasound for low temperature dyeing of wool with acid dye. Ultrasonic
Sonochemistry, 2012, no. 19, pp 601-606.
498
14
th Romanian Textiles and Leather Conference – CORTEP 2012
Sinaia, 6 - 8 September 2012
Corresponding author: Claudia Iuliana UDRESCU Department of Applied Science and Technology Politecnico di Torino Corso Duca degli Abruzzi, 24 10129, Torino, Italy Phone:+39 011 0904694 Fax: +39 011 0904624 E-mail: [email protected] Co-authors: Franco FERRERO Department of Applied Science and Technology Politecnico di Torino Corso Duca degli Abruzzi, 24 10129, Torino, Italy Phone: +39 011 0904653 Fax: +39 011 0904624 E-mail: [email protected] Monica PERIOLATTO Department of Applied Science and Technology Politecnico di Torino Corso Duca degli Abruzzi, 24 10129, Torino, Italy Phone: +39 011 0904630 Fax.: +39 011 0904624 E-mail: [email protected]
499
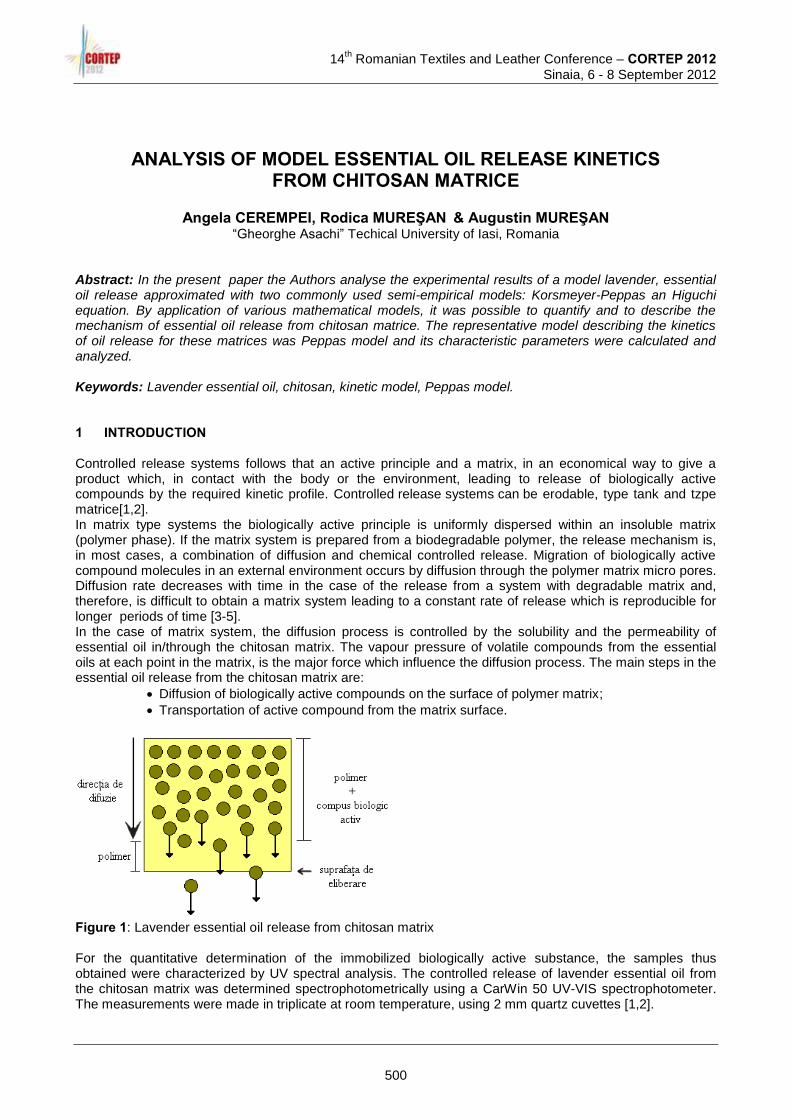
14
th Romanian Textiles and Leather Conference – CORTEP 2012
Sinaia, 6 - 8 September 2012
ANALYSIS OF MODEL ESSENTIAL OIL RELEASE KINETICS FROM CHITOSAN MATRICE
Angela CEREMPEI, Rodica MUREŞAN & Augustin MUREŞAN
“Gheorghe Asachi” Techical University of Iasi, Romania Abstract: In the present paper the Authors analyse the experimental results of a model lavender, essential oil release approximated with two commonly used semi-empirical models: Korsmeyer-Peppas an Higuchi equation. By application of various mathematical models, it was possible to quantify and to describe the mechanism of essential oil release from chitosan matrice. The representative model describing the kinetics of oil release for these matrices was Peppas model and its characteristic parameters were calculated and analyzed. Keywords: Lavender essential oil, chitosan, kinetic model, Peppas model. 1 INTRODUCTION Controlled release systems follows that an active principle and a matrix, in an economical way to give a product which, in contact with the body or the environment, leading to release of biologically active compounds by the required kinetic profile. Controlled release systems can be erodable, type tank and tzpe matrice[1,2]. In matrix type systems the biologically active principle is uniformly dispersed within an insoluble matrix (polymer phase). If the matrix system is prepared from a biodegradable polymer, the release mechanism is, in most cases, a combination of diffusion and chemical controlled release. Migration of biologically active compound molecules in an external environment occurs by diffusion through the polymer matrix micro pores. Diffusion rate decreases with time in the case of the release from a system with degradable matrix and, therefore, is difficult to obtain a matrix system leading to a constant rate of release which is reproducible for longer periods of time [3-5]. In the case of matrix system, the diffusion process is controlled by the solubility and the permeability of essential oil in/through the chitosan matrix. The vapour pressure of volatile compounds from the essential oils at each point in the matrix, is the major force which influence the diffusion process. The main steps in the essential oil release from the chitosan matrix are:
Diffusion of biologically active compounds on the surface of polymer matrix;
Transportation of active compound from the matrix surface.
Figure 1: Lavender essential oil release from chitosan matrix
For the quantitative determination of the immobilized biologically active substance, the samples thus obtained were characterized by UV spectral analysis. The controlled release of lavender essential oil from the chitosan matrix was determined spectrophotometrically using a CarWin 50 UV-VIS spectrophotometer. The measurements were made in triplicate at room temperature, using 2 mm quartz cuvettes [1,2].
500
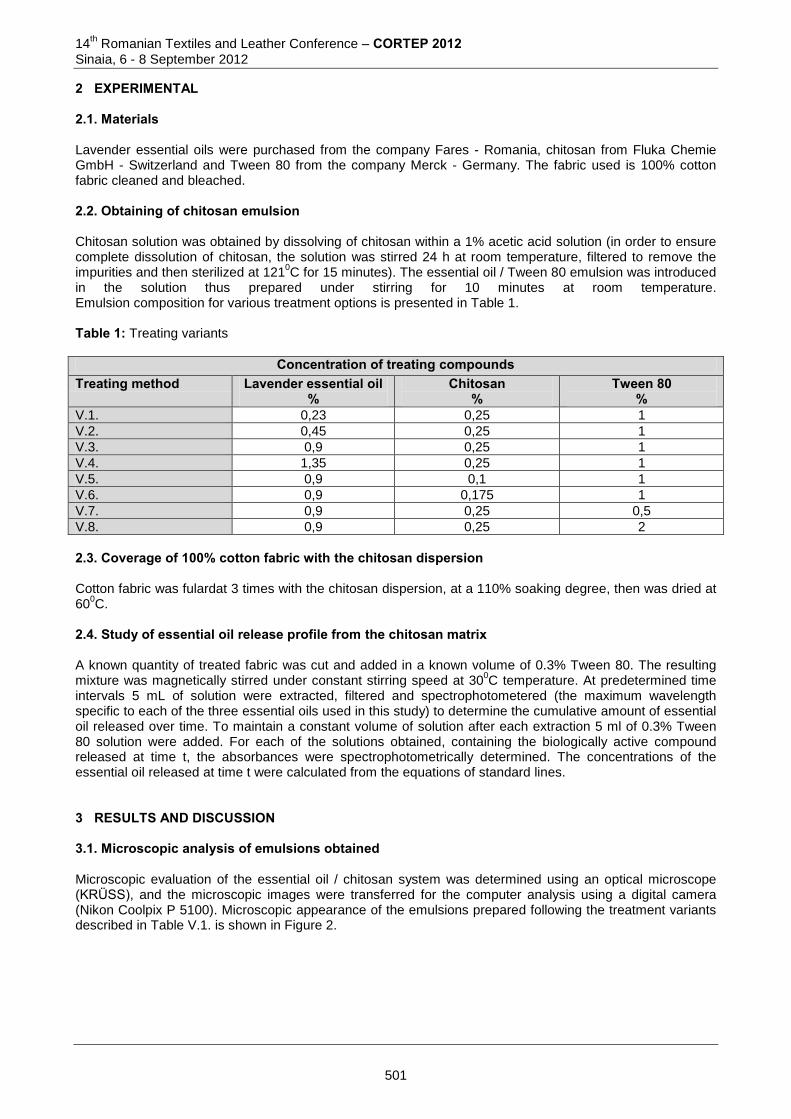
14th Romanian Textiles and Leather Conference – CORTEP 2012
Sinaia, 6 - 8 September 2012
2 EXPERIMENTAL 2.1. Materials Lavender essential oils were purchased from the company Fares - Romania, chitosan from Fluka Chemie GmbH - Switzerland and Tween 80 from the company Merck - Germany. The fabric used is 100% cotton fabric cleaned and bleached. 2.2. Obtaining of chitosan emulsion Chitosan solution was obtained by dissolving of chitosan within a 1% acetic acid solution (in order to ensure complete dissolution of chitosan, the solution was stirred 24 h at room temperature, filtered to remove the impurities and then sterilized at 121
0C for 15 minutes). The essential oil / Tween 80 emulsion was introduced
in the solution thus prepared under stirring for 10 minutes at room temperature. Emulsion composition for various treatment options is presented in Table 1. Table 1: Treating variants
Concentration of treating compounds Treating method Lavender essential oil
% Chitosan
% Tween 80
% V.1. 0,23 0,25 1
V.2. 0,45 0,25 1
V.3. 0,9 0,25 1
V.4. 1,35 0,25 1
V.5. 0,9 0,1 1
V.6. 0,9 0,175 1
V.7. 0,9 0,25 0,5
V.8. 0,9 0,25 2
2.3. Coverage of 100% cotton fabric with the chitosan dispersion Cotton fabric was fulardat 3 times with the chitosan dispersion, at a 110% soaking degree, then was dried at 60
0C.
2.4. Study of essential oil release profile from the chitosan matrix A known quantity of treated fabric was cut and added in a known volume of 0.3% Tween 80. The resulting mixture was magnetically stirred under constant stirring speed at 30
0C temperature. At predetermined time
intervals 5 mL of solution were extracted, filtered and spectrophotometered (the maximum wavelength specific to each of the three essential oils used in this study) to determine the cumulative amount of essential oil released over time. To maintain a constant volume of solution after each extraction 5 ml of 0.3% Tween 80 solution were added. For each of the solutions obtained, containing the biologically active compound released at time t, the absorbances were spectrophotometrically determined. The concentrations of the essential oil released at time t were calculated from the equations of standard lines. 3 RESULTS AND DISCUSSION 3.1. Microscopic analysis of emulsions obtained Microscopic evaluation of the essential oil / chitosan system was determined using an optical microscope (KRÜSS), and the microscopic images were transferred for the computer analysis using a digital camera (Nikon Coolpix P 5100). Microscopic appearance of the emulsions prepared following the treatment variants described in Table V.1. is shown in Figure 2.
501
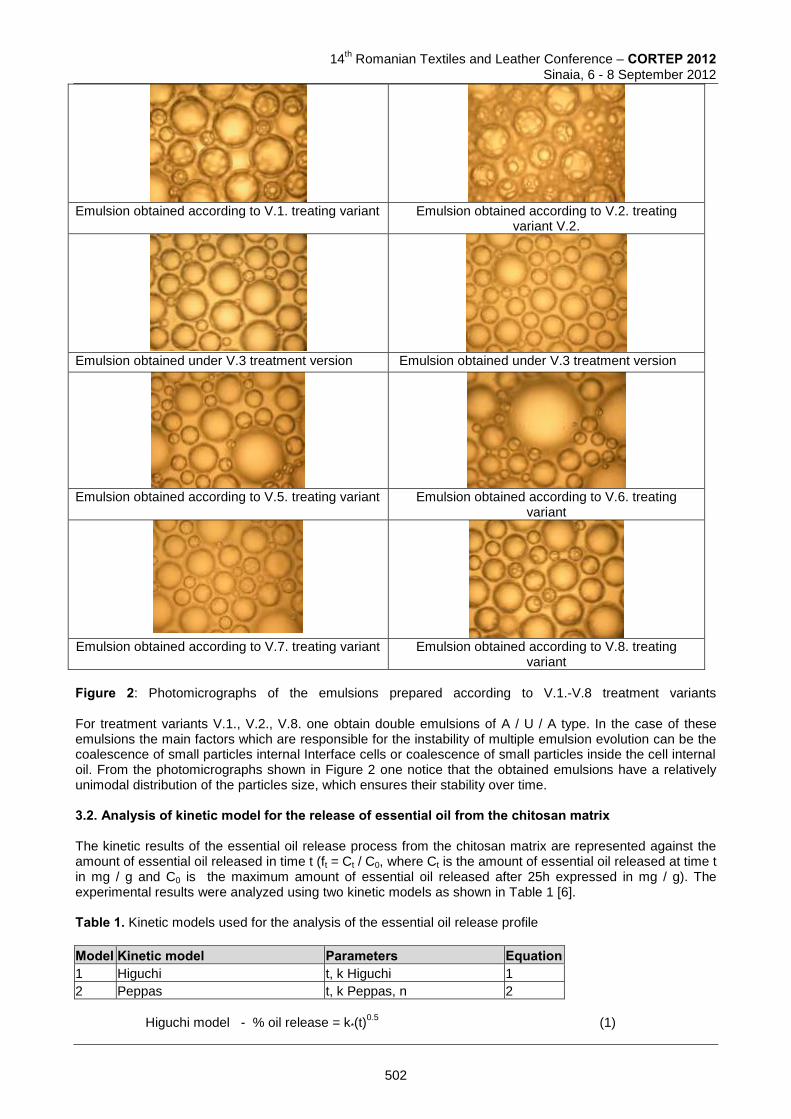
14
th Romanian Textiles and Leather Conference – CORTEP 2012
Sinaia, 6 - 8 September 2012
Emulsion obtained according to V.1. treating variant Emulsion obtained according to V.2. treating
variant V.2.
Emulsion obtained under V.3 treatment version Emulsion obtained under V.3 treatment version
Emulsion obtained according to V.5. treating variant Emulsion obtained according to V.6. treating
variant
Emulsion obtained according to V.7. treating variant Emulsion obtained according to V.8. treating
variant
Figure 2: Photomicrographs of the emulsions prepared according to V.1.-V.8 treatment variants For treatment variants V.1., V.2., V.8. one obtain double emulsions of A / U / A type. In the case of these emulsions the main factors which are responsible for the instability of multiple emulsion evolution can be the coalescence of small particles internal Interface cells or coalescence of small particles inside the cell internal oil. From the photomicrographs shown in Figure 2 one notice that the obtained emulsions have a relatively unimodal distribution of the particles size, which ensures their stability over time. 3.2. Analysis of kinetic model for the release of essential oil from the chitosan matrix The kinetic results of the essential oil release process from the chitosan matrix are represented against the amount of essential oil released in time t (ft = Ct / C0, where Ct is the amount of essential oil released at time t in mg / g and C0 is the maximum amount of essential oil released after 25h expressed in mg / g). The experimental results were analyzed using two kinetic models as shown in Table 1 [6]. Table 1. Kinetic models used for the analysis of the essential oil release profile
Model Kinetic model Parameters Equation 1 Higuchi t, k Higuchi 1
2 Peppas t, k Peppas, n 2
Higuchi model - % oil release = k*(t)
0.5 (1)
502
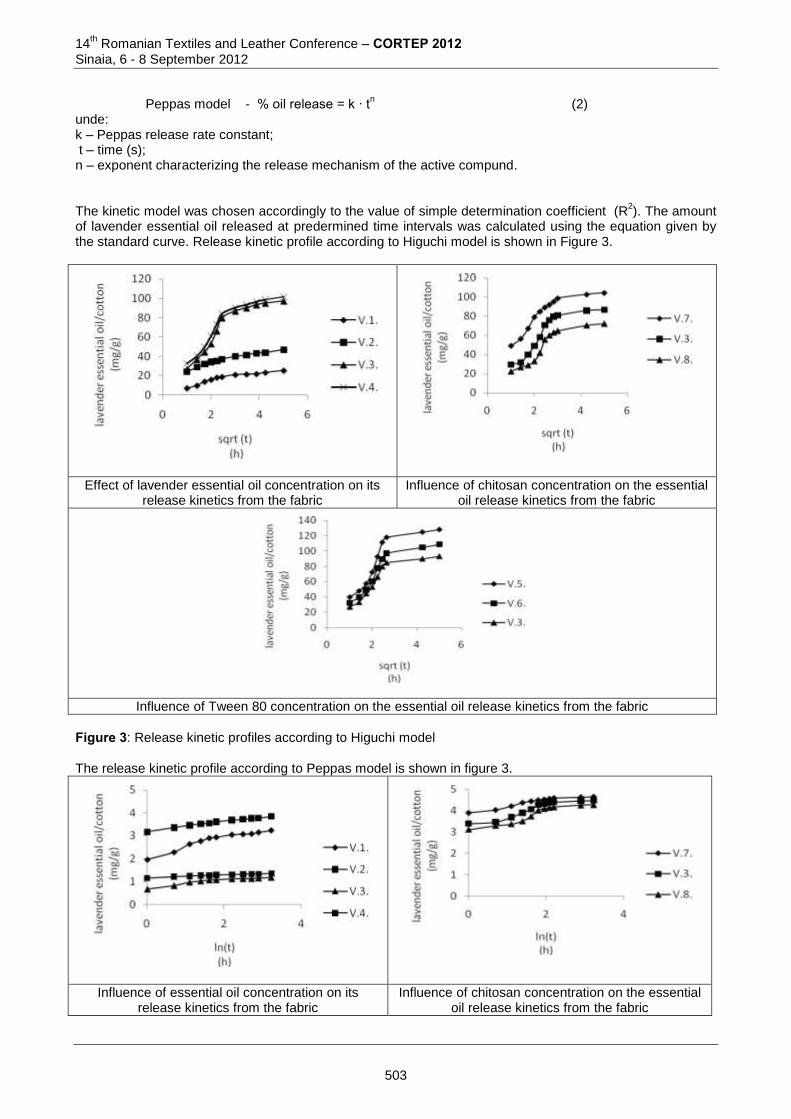
14th Romanian Textiles and Leather Conference – CORTEP 2012
Sinaia, 6 - 8 September 2012
Peppas model - % oil release = k ∙ t
n (2)
unde:
k – Peppas release rate constant; t – time (s); n – exponent characterizing the release mechanism of the active compund. The kinetic model was chosen accordingly to the value of simple determination coefficient (R
2). The amount
of lavender essential oil released at predermined time intervals was calculated using the equation given by the standard curve. Release kinetic profile according to Higuchi model is shown in Figure 3.
Effect of lavender essential oil concentration on its release kinetics from the fabric
Influence of chitosan concentration on the essential oil release kinetics from the fabric
Influence of Tween 80 concentration on the essential oil release kinetics from the fabric
Figure 3: Release kinetic profiles according to Higuchi model The release kinetic profile according to Peppas model is shown in figure 3.
Influence of essential oil concentration on its release kinetics from the fabric
Influence of chitosan concentration on the essential oil release kinetics from the fabric
503
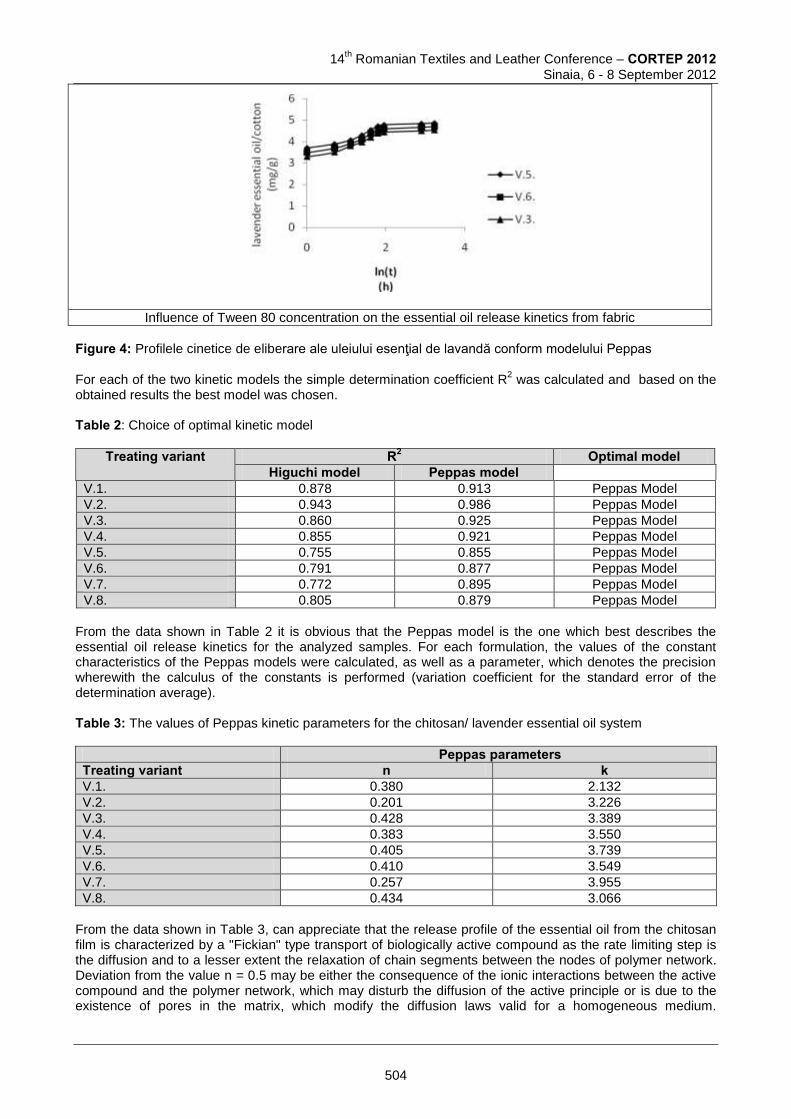
14
th Romanian Textiles and Leather Conference – CORTEP 2012
Sinaia, 6 - 8 September 2012
Influence of Tween 80 concentration on the essential oil release kinetics from fabric
Figure 4: Profilele cinetice de eliberare ale uleiului esenţial de lavandă conform modelului Peppas For each of the two kinetic models the simple determination coefficient R
2 was calculated and based on the
obtained results the best model was chosen. Table 2: Choice of optimal kinetic model
Treating variant R2 Optimal model Higuchi model Peppas model
V.1. 0.878 0.913 Peppas Model
V.2. 0.943 0.986 Peppas Model
V.3. 0.860 0.925 Peppas Model
V.4. 0.855 0.921 Peppas Model
V.5. 0.755 0.855 Peppas Model
V.6. 0.791 0.877 Peppas Model
V.7. 0.772 0.895 Peppas Model
V.8. 0.805 0.879 Peppas Model
From the data shown in Table 2 it is obvious that the Peppas model is the one which best describes the essential oil release kinetics for the analyzed samples. For each formulation, the values of the constant characteristics of the Peppas models were calculated, as well as a parameter, which denotes the precision wherewith the calculus of the constants is performed (variation coefficient for the standard error of the determination average). Table 3: The values of Peppas kinetic parameters for the chitosan/ lavender essential oil system
Peppas parameters Treating variant n k V.1. 0.380 2.132
V.2. 0.201 3.226
V.3. 0.428 3.389
V.4. 0.383 3.550
V.5. 0.405 3.739
V.6. 0.410 3.549
V.7. 0.257 3.955
V.8. 0.434 3.066
From the data shown in Table 3, can appreciate that the release profile of the essential oil from the chitosan film is characterized by a "Fickian" type transport of biologically active compound as the rate limiting step is the diffusion and to a lesser extent the relaxation of chain segments between the nodes of polymer network. Deviation from the value n = 0.5 may be either the consequence of the ionic interactions between the active compound and the polymer network, which may disturb the diffusion of the active principle or is due to the existence of pores in the matrix, which modify the diffusion laws valid for a homogeneous medium.
504
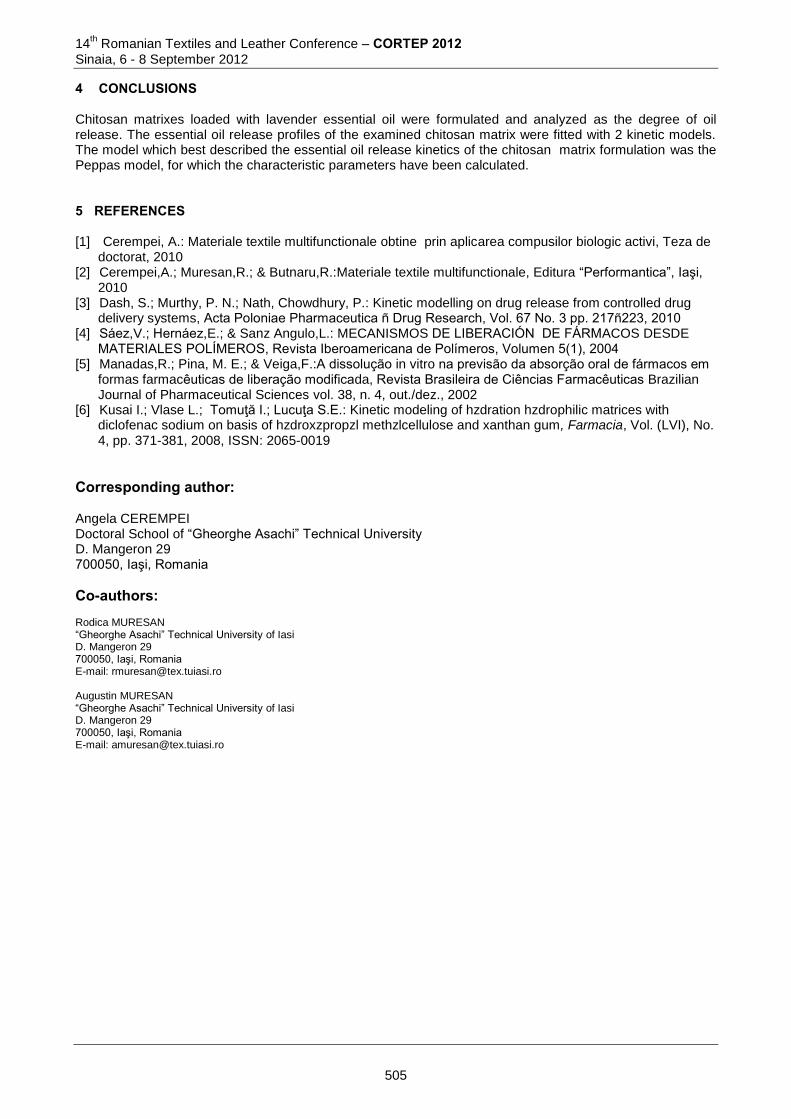
14th Romanian Textiles and Leather Conference – CORTEP 2012
Sinaia, 6 - 8 September 2012
4 CONCLUSIONS Chitosan matrixes loaded with lavender essential oil were formulated and analyzed as the degree of oil release. The essential oil release profiles of the examined chitosan matrix were fitted with 2 kinetic models. The model which best described the essential oil release kinetics of the chitosan matrix formulation was the Peppas model, for which the characteristic parameters have been calculated. 5 REFERENCES [1] Cerempei, A.: Materiale textile multifunctionale obtine prin aplicarea compusilor biologic activi, Teza de
doctorat, 2010 [2] Cerempei,A.; Muresan,R.; & Butnaru,R.:Materiale textile multifunctionale, Editura “Performantica”, Iaşi,
2010 [3] Dash, S.; Murthy, P. N.; Nath, Chowdhury, P.: Kinetic modelling on drug release from controlled drug
delivery systems, Acta Poloniae Pharmaceutica ñ Drug Research, Vol. 67 No. 3 pp. 217ñ223, 2010 [4] Sáez,V.; Hernáez,E.; & Sanz Angulo,L.: MECANISMOS DE LIBERACIÓN DE FÁRMACOS DESDE
MATERIALES POLÍMEROS, Revista Iberoamericana de Polímeros, Volumen 5(1), 2004 [5] Manadas,R.; Pina, M. E.; & Veiga,F.:A dissolução in vitro na previsão da absorção oral de fármacos em
formas farmacêuticas de liberação modificada, Revista Brasileira de Ciências Farmacêuticas Brazilian Journal of Pharmaceutical Sciences vol. 38, n. 4, out./dez., 2002
[6] Kusai I.; Vlase L.; Tomuţă I.; Lucuţa S.E.: Kinetic modeling of hzdration hzdrophilic matrices with diclofenac sodium on basis of hzdroxzpropzl methzlcellulose and xanthan gum, Farmacia, Vol. (LVI), No. 4, pp. 371-381, 2008, ISSN: 2065-0019
Corresponding author: Angela CEREMPEI Doctoral School of “Gheorghe Asachi” Technical University D. Mangeron 29 700050, Iaşi, Romania
Co-authors: Rodica MURESAN “Gheorghe Asachi” Technical University of Iasi D. Mangeron 29 700050, Iaşi, Romania E-mail: [email protected] Augustin MURESAN “Gheorghe Asachi” Technical University of Iasi D. Mangeron 29 700050, Iaşi, Romania E-mail: [email protected]
505
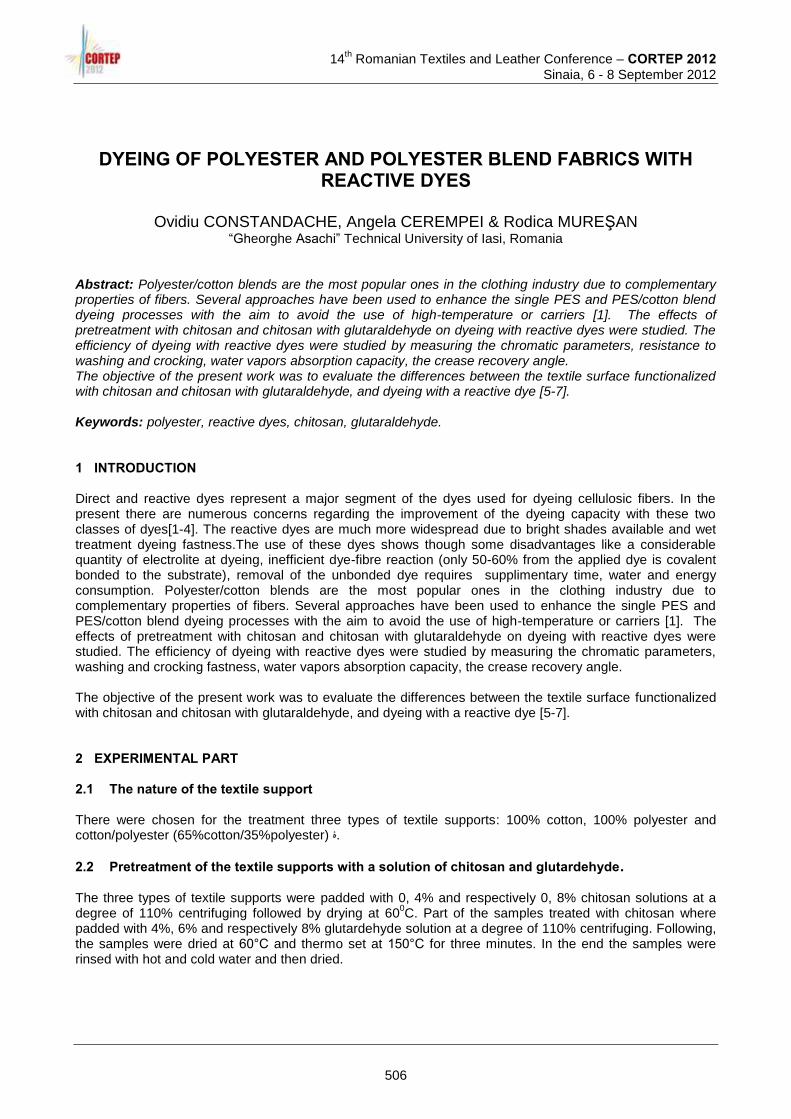
14
th Romanian Textiles and Leather Conference – CORTEP 2012
Sinaia, 6 - 8 September 2012
DYEING OF POLYESTER AND POLYESTER BLEND FABRICS WITH REACTIVE DYES
Ovidiu CONSTANDACHE, Angela CEREMPEI & Rodica MUREŞAN
“Gheorghe Asachi” Technical University of Iasi, Romania Abstract: Polyester/cotton blends are the most popular ones in the clothing industry due to complementary properties of fibers. Several approaches have been used to enhance the single PES and PES/cotton blend dyeing processes with the aim to avoid the use of high-temperature or carriers [1]. The effects of pretreatment with chitosan and chitosan with glutaraldehyde on dyeing with reactive dyes were studied. The efficiency of dyeing with reactive dyes were studied by measuring the chromatic parameters, resistance to washing and crocking, water vapors absorption capacity, the crease recovery angle. The objective of the present work was to evaluate the differences between the textile surface functionalized with chitosan and chitosan with glutaraldehyde, and dyeing with a reactive dye [5-7]. Keywords: polyester, reactive dyes, chitosan, glutaraldehyde. 1 INTRODUCTION Direct and reactive dyes represent a major segment of the dyes used for dyeing cellulosic fibers. In the present there are numerous concerns regarding the improvement of the dyeing capacity with these two classes of dyes[1-4]. The reactive dyes are much more widespread due to bright shades available and wet treatment dyeing fastness.The use of these dyes shows though some disadvantages like a considerable quantity of electrolite at dyeing, inefficient dye-fibre reaction (only 50-60% from the applied dye is covalent bonded to the substrate), removal of the unbonded dye requires supplimentary time, water and energy consumption. Polyester/cotton blends are the most popular ones in the clothing industry due to complementary properties of fibers. Several approaches have been used to enhance the single PES and PES/cotton blend dyeing processes with the aim to avoid the use of high-temperature or carriers [1]. The effects of pretreatment with chitosan and chitosan with glutaraldehyde on dyeing with reactive dyes were studied. The efficiency of dyeing with reactive dyes were studied by measuring the chromatic parameters, washing and crocking fastness, water vapors absorption capacity, the crease recovery angle. The objective of the present work was to evaluate the differences between the textile surface functionalized with chitosan and chitosan with glutaraldehyde, and dyeing with a reactive dye [5-7]. 2 EXPERIMENTAL PART 2.1 The nature of the textile support There were chosen for the treatment three types of textile supports: 100% cotton, 100% polyester and cotton/polyester (65%cotton/35%polyester) ۀ.
2.2 Pretreatment of the textile supports with a solution of chitosan and glutardehyde. The three types of textile supports were padded with 0, 4% and respectively 0, 8% chitosan solutions at a degree of 110% centrifuging followed by drying at 60
0C. Part of the samples treated with chitosan where
padded with 4%, 6% and respectively 8% glutardehyde solution at a degree of 110% centrifuging. Following, the samples were dried at 60°C and thermo set at 150°C for three minutes. In the end the samples were rinsed with hot and cold water and then dried.
506
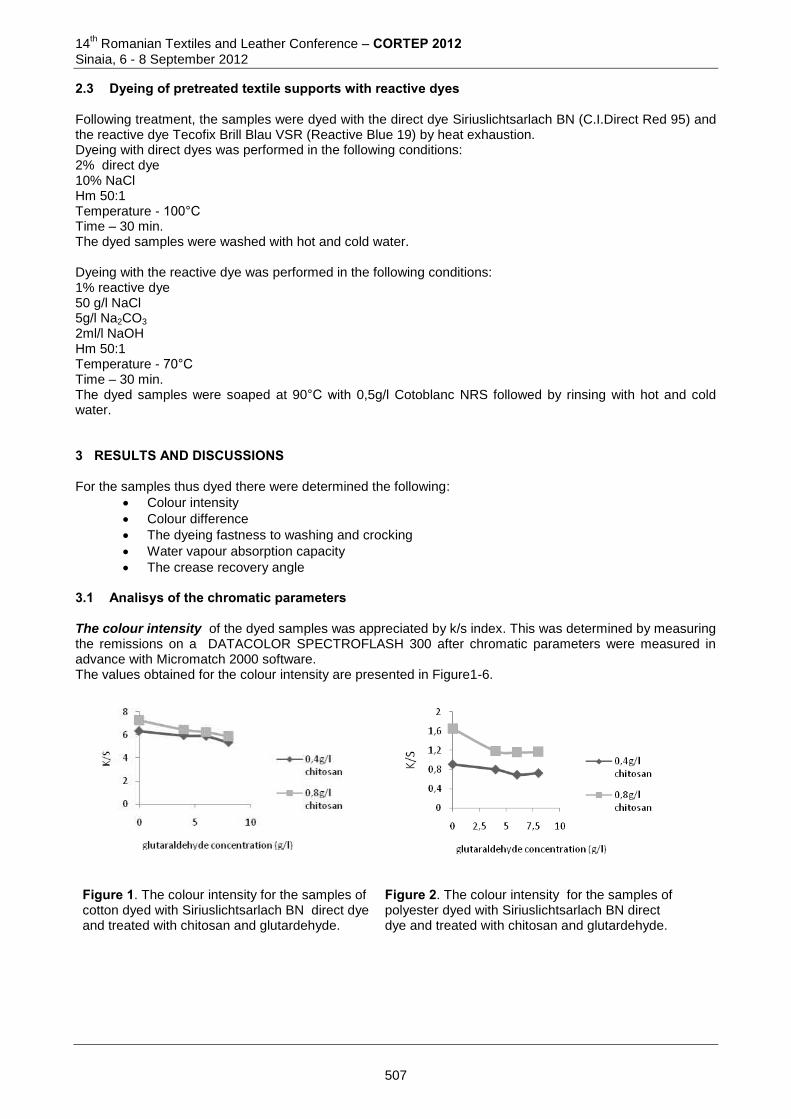
14th Romanian Textiles and Leather Conference – CORTEP 2012
Sinaia, 6 - 8 September 2012
2.3 Dyeing of pretreated textile supports with reactive dyes Following treatment, the samples were dyed with the direct dye Siriuslichtsarlach BN (C.I.Direct Red 95) and the reactive dye Tecofix Brill Blau VSR (Reactive Blue 19) by heat exhaustion. Dyeing with direct dyes was performed in the following conditions: 2% direct dye 10% NaCl Hm 50:1 Temperature - 100°C Time – 30 min. The dyed samples were washed with hot and cold water. Dyeing with the reactive dye was performed in the following conditions: 1% reactive dye 50 g/l NaCl 5g/l Na2CO3 2ml/l NaOH Hm 50:1 Temperature - 70°C Time – 30 min. The dyed samples were soaped at 90°C with 0,5g/l Cotoblanc NRS followed by rinsing with hot and cold water. 3 RESULTS AND DISCUSSIONS For the samples thus dyed there were determined the following:
Colour intensity
Colour difference
The dyeing fastness to washing and crocking
Water vapour absorption capacity
The crease recovery angle 3.1 Analisys of the chromatic parameters The colour intensity of the dyed samples was appreciated by k/s index. This was determined by measuring the remissions on a DATACOLOR SPECTROFLASH 300 after chromatic parameters were measured in advance with Micromatch 2000 software. The values obtained for the colour intensity are presented in Figure1-6.
Figure 1. The colour intensity for the samples of cotton dyed with Siriuslichtsarlach BN direct dye and treated with chitosan and glutardehyde.
Figure 2. The colour intensity for the samples of polyester dyed with Siriuslichtsarlach BN direct dye and treated with chitosan and glutardehyde.
507
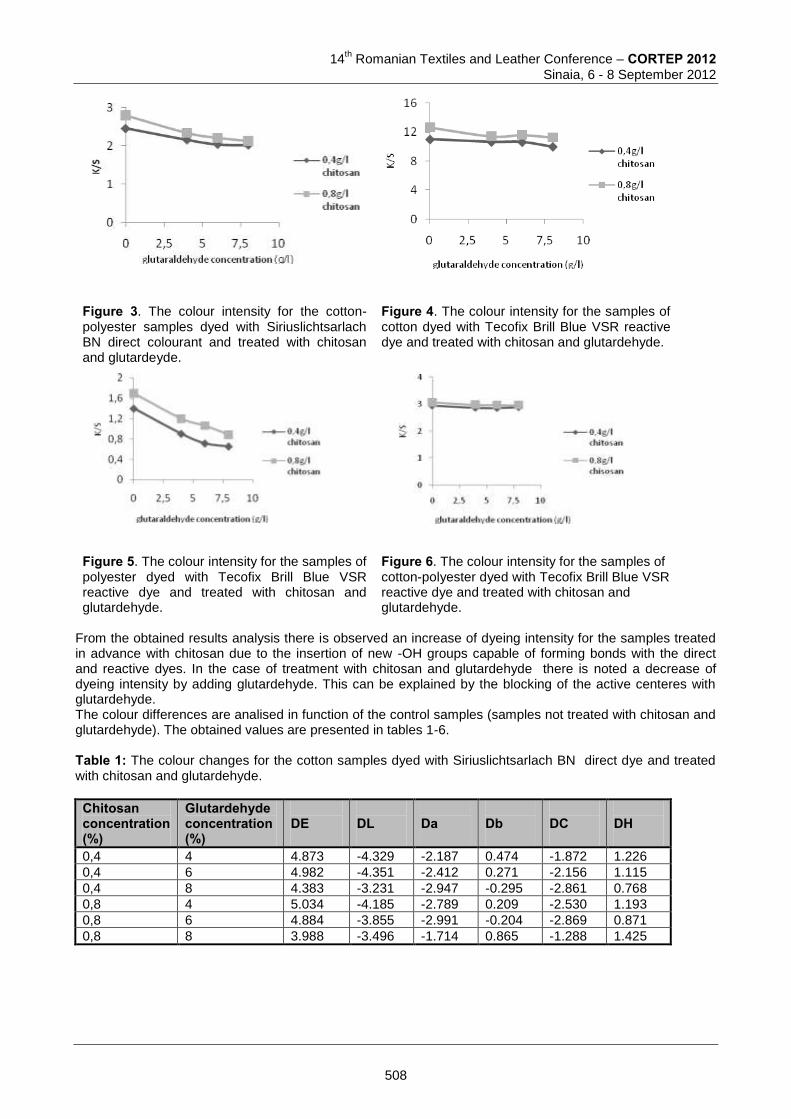
14
th Romanian Textiles and Leather Conference – CORTEP 2012
Sinaia, 6 - 8 September 2012
Figure 3. The colour intensity for the cotton- polyester samples dyed with Siriuslichtsarlach BN direct colourant and treated with chitosan and glutardeyde.
Figure 4. The colour intensity for the samples of cotton dyed with Tecofix Brill Blue VSR reactive dye and treated with chitosan and glutardehyde.
Figure 5. The colour intensity for the samples of polyester dyed with Tecofix Brill Blue VSR reactive dye and treated with chitosan and glutardehyde.
Figure 6. The colour intensity for the samples of cotton-polyester dyed with Tecofix Brill Blue VSR reactive dye and treated with chitosan and glutardehyde.
From the obtained results analysis there is observed an increase of dyeing intensity for the samples treated in advance with chitosan due to the insertion of new -OH groups capable of forming bonds with the direct and reactive dyes. In the case of treatment with chitosan and glutardehyde there is noted a decrease of dyeing intensity by adding glutardehyde. This can be explained by the blocking of the active centeres with glutardehyde. The colour differences are analised in function of the control samples (samples not treated with chitosan and glutardehyde). The obtained values are presented in tables 1-6. Table 1: The colour changes for the cotton samples dyed with Siriuslichtsarlach BN direct dye and treated with chitosan and glutardehyde.
Chitosan concentration (%)
Glutardehyde concentration (%)
DE
DL
Da
Db
DC
DH
0,4 4 4.873 -4.329 -2.187 0.474 -1.872 1.226
0,4 6 4.982 -4.351 -2.412 0.271 -2.156 1.115
0,4 8 4.383 -3.231 -2.947 -0.295 -2.861 0.768
0,8 4 5.034 -4.185 -2.789 0.209 -2.530 1.193
0,8 6 4.884 -3.855 -2.991 -0.204 -2.869 0.871
0,8 8 3.988 -3.496 -1.714 0.865 -1.288 1.425
508
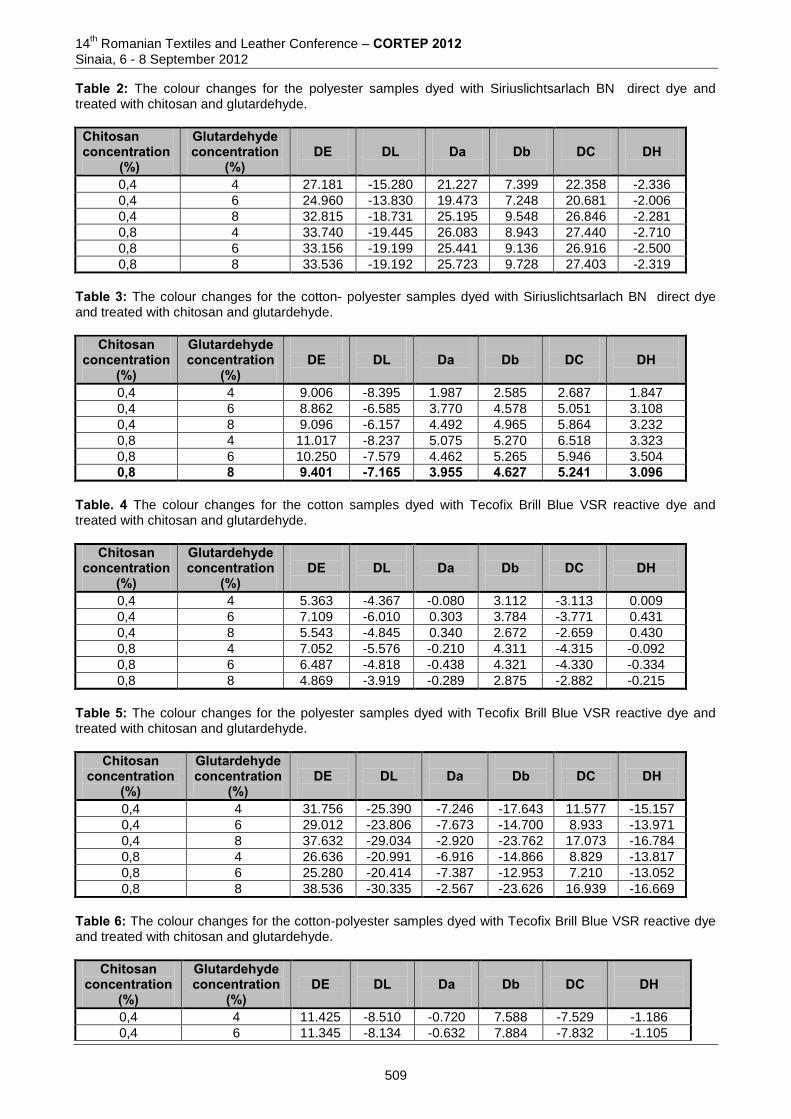
14th Romanian Textiles and Leather Conference – CORTEP 2012
Sinaia, 6 - 8 September 2012
Table 2: The colour changes for the polyester samples dyed with Siriuslichtsarlach BN direct dye and treated with chitosan and glutardehyde.
Chitosan concentration
(%)
Glutardehyde concentration
(%)
DE
DL
Da
Db
DC
DH
0,4 4 27.181 -15.280 21.227 7.399 22.358 -2.336
0,4 6 24.960 -13.830 19.473 7.248 20.681 -2.006
0,4 8 32.815 -18.731 25.195 9.548 26.846 -2.281
0,8 4 33.740 -19.445 26.083 8.943 27.440 -2.710
0,8 6 33.156 -19.199 25.441 9.136 26.916 -2.500
0,8 8 33.536 -19.192 25.723 9.728 27.403 -2.319
Table 3: The colour changes for the cotton- polyester samples dyed with Siriuslichtsarlach BN direct dye and treated with chitosan and glutardehyde.
Chitosan concentration
(%)
Glutardehyde concentration
(%)
DE
DL
Da
Db
DC
DH
0,4 4 9.006 -8.395 1.987 2.585 2.687 1.847
0,4 6 8.862 -6.585 3.770 4.578 5.051 3.108
0,4 8 9.096 -6.157 4.492 4.965 5.864 3.232
0,8 4 11.017 -8.237 5.075 5.270 6.518 3.323
0,8 6 10.250 -7.579 4.462 5.265 5.946 3.504
0,8 8 9.401 -7.165 3.955 4.627 5.241 3.096 Table. 4 The colour changes for the cotton samples dyed with Tecofix Brill Blue VSR reactive dye and treated with chitosan and glutardehyde.
Chitosan concentration
(%)
Glutardehyde concentration
(%)
DE
DL
Da
Db
DC
DH
0,4 4 5.363 -4.367 -0.080 3.112 -3.113 0.009
0,4 6 7.109 -6.010 0.303 3.784 -3.771 0.431
0,4 8 5.543 -4.845 0.340 2.672 -2.659 0.430
0,8 4 7.052 -5.576 -0.210 4.311 -4.315 -0.092
0,8 6 6.487 -4.818 -0.438 4.321 -4.330 -0.334
0,8 8 4.869 -3.919 -0.289 2.875 -2.882 -0.215
Table 5: The colour changes for the polyester samples dyed with Tecofix Brill Blue VSR reactive dye and treated with chitosan and glutardehyde.
Chitosan concentration
(%)
Glutardehyde concentration
(%)
DE
DL
Da
Db
DC
DH
0,4 4 31.756 -25.390 -7.246 -17.643 11.577 -15.157
0,4 6 29.012 -23.806 -7.673 -14.700 8.933 -13.971
0,4 8 37.632 -29.034 -2.920 -23.762 17.073 -16.784
0,8 4 26.636 -20.991 -6.916 -14.866 8.829 -13.817
0,8 6 25.280 -20.414 -7.387 -12.953 7.210 -13.052
0,8 8 38.536 -30.335 -2.567 -23.626 16.939 -16.669
Table 6: The colour changes for the cotton-polyester samples dyed with Tecofix Brill Blue VSR reactive dye and treated with chitosan and glutardehyde.
Chitosan concentration
(%)
Glutardehyde concentration
(%)
DE
DL
Da
Db
DC
DH
0,4 4 11.425 -8.510 -0.720 7.588 -7.529 -1.186
0,4 6 11.345 -8.134 -0.632 7.884 -7.832 -1.105
509
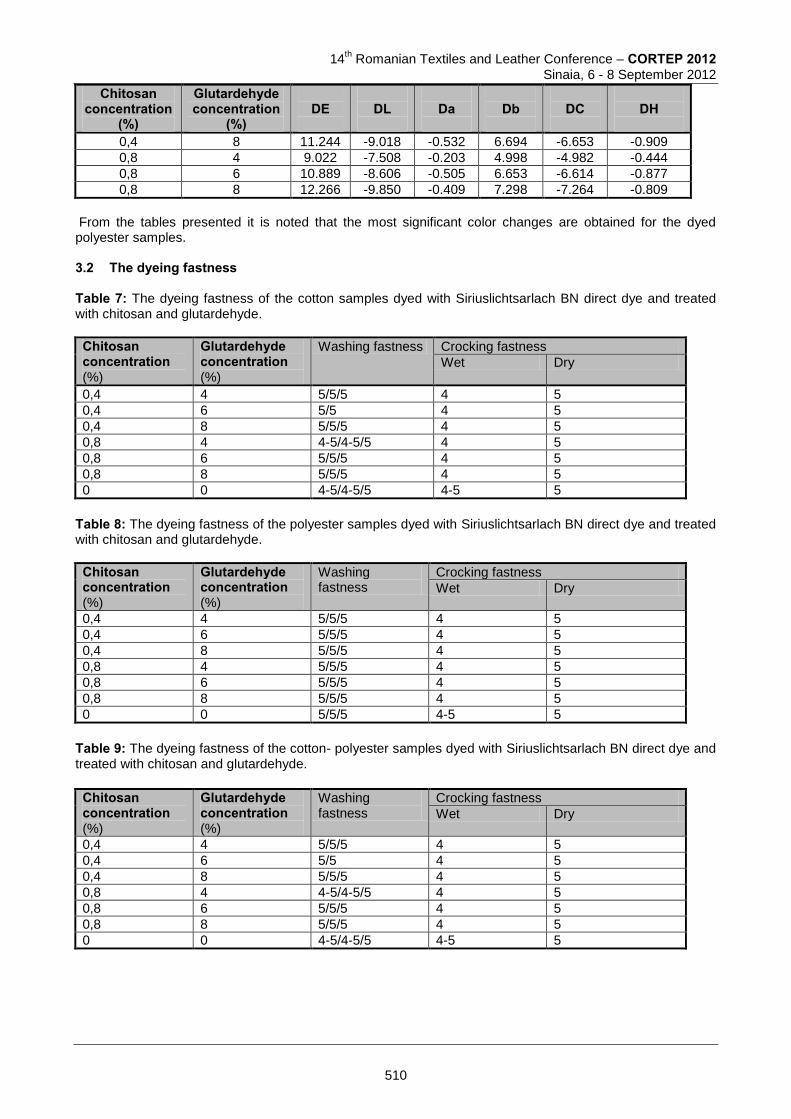
14
th Romanian Textiles and Leather Conference – CORTEP 2012
Sinaia, 6 - 8 September 2012
Chitosan concentration
(%)
Glutardehyde concentration
(%)
DE
DL
Da
Db
DC
DH
0,4 8 11.244 -9.018 -0.532 6.694 -6.653 -0.909
0,8 4 9.022 -7.508 -0.203 4.998 -4.982 -0.444
0,8 6 10.889 -8.606 -0.505 6.653 -6.614 -0.877
0,8 8 12.266 -9.850 -0.409 7.298 -7.264 -0.809
From the tables presented it is noted that the most significant color changes are obtained for the dyed polyester samples. 3.2 The dyeing fastness Table 7: The dyeing fastness of the cotton samples dyed with Siriuslichtsarlach BN direct dye and treated with chitosan and glutardehyde. Chitosan concentration (%)
Glutardehyde concentration (%)
Washing fastness Crocking fastness
Wet Dry
0,4 4 5/5/5 4 5
0,4 6 5/5 4 5
0,4 8 5/5/5 4 5
0,8 4 4-5/4-5/5 4 5
0,8 6 5/5/5 4 5
0,8 8 5/5/5 4 5
0 0 4-5/4-5/5 4-5 5
Table 8: The dyeing fastness of the polyester samples dyed with Siriuslichtsarlach BN direct dye and treated with chitosan and glutardehyde.
Chitosan concentration (%)
Glutardehyde concentration (%)
Washing fastness
Crocking fastness
Wet Dry
0,4 4 5/5/5 4 5
0,4 6 5/5/5 4 5
0,4 8 5/5/5 4 5
0,8 4 5/5/5 4 5
0,8 6 5/5/5 4 5
0,8 8 5/5/5 4 5
0 0 5/5/5 4-5 5
Table 9: The dyeing fastness of the cotton- polyester samples dyed with Siriuslichtsarlach BN direct dye and treated with chitosan and glutardehyde.
Chitosan concentration (%)
Glutardehyde concentration (%)
Washing fastness
Crocking fastness
Wet Dry
0,4 4 5/5/5 4 5
0,4 6 5/5 4 5
0,4 8 5/5/5 4 5
0,8 4 4-5/4-5/5 4 5
0,8 6 5/5/5 4 5
0,8 8 5/5/5 4 5
0 0 4-5/4-5/5 4-5 5
510
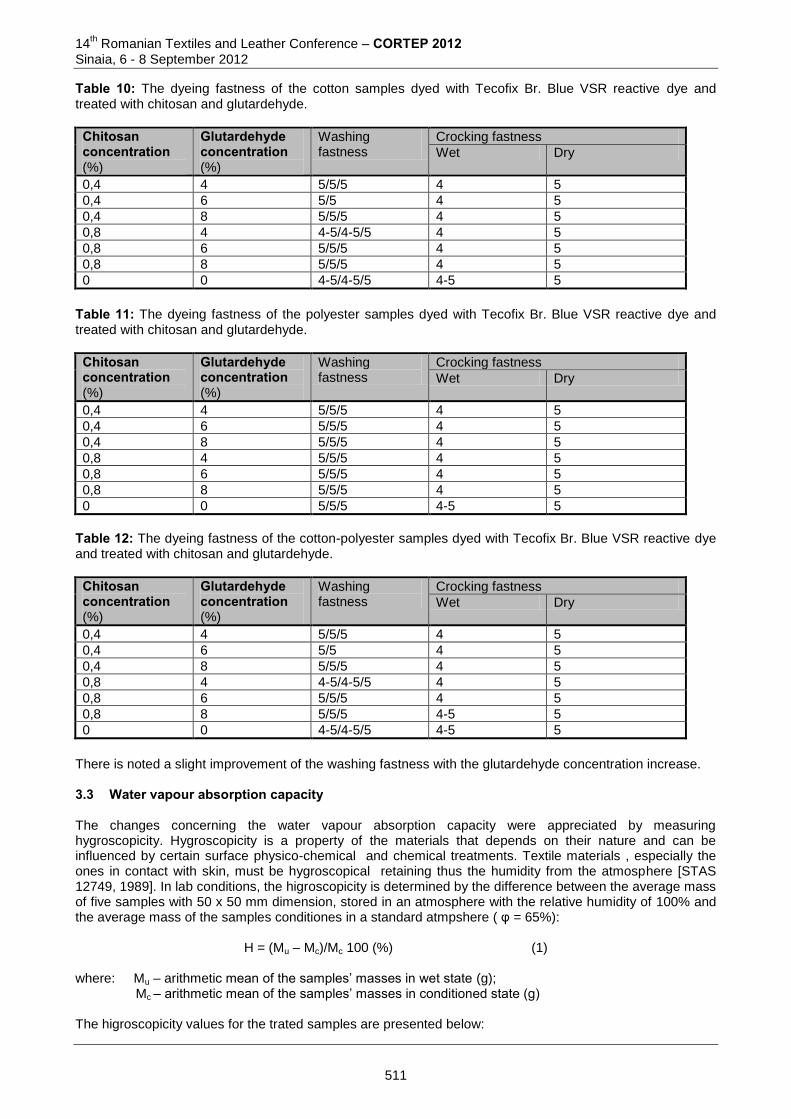
14th Romanian Textiles and Leather Conference – CORTEP 2012
Sinaia, 6 - 8 September 2012
Table 10: The dyeing fastness of the cotton samples dyed with Tecofix Br. Blue VSR reactive dye and treated with chitosan and glutardehyde.
Chitosan concentration (%)
Glutardehyde concentration (%)
Washing fastness
Crocking fastness
Wet Dry
0,4 4 5/5/5 4 5
0,4 6 5/5 4 5
0,4 8 5/5/5 4 5
0,8 4 4-5/4-5/5 4 5
0,8 6 5/5/5 4 5
0,8 8 5/5/5 4 5
0 0 4-5/4-5/5 4-5 5
Table 11: The dyeing fastness of the polyester samples dyed with Tecofix Br. Blue VSR reactive dye and treated with chitosan and glutardehyde.
Chitosan concentration (%)
Glutardehyde concentration (%)
Washing fastness
Crocking fastness
Wet Dry
0,4 4 5/5/5 4 5
0,4 6 5/5/5 4 5
0,4 8 5/5/5 4 5
0,8 4 5/5/5 4 5
0,8 6 5/5/5 4 5
0,8 8 5/5/5 4 5
0 0 5/5/5 4-5 5
Table 12: The dyeing fastness of the cotton-polyester samples dyed with Tecofix Br. Blue VSR reactive dye and treated with chitosan and glutardehyde.
Chitosan concentration (%)
Glutardehyde concentration (%)
Washing fastness
Crocking fastness
Wet Dry
0,4 4 5/5/5 4 5
0,4 6 5/5 4 5
0,4 8 5/5/5 4 5
0,8 4 4-5/4-5/5 4 5
0,8 6 5/5/5 4 5
0,8 8 5/5/5 4-5 5
0 0 4-5/4-5/5 4-5 5
There is noted a slight improvement of the washing fastness with the glutardehyde concentration increase. 3.3 Water vapour absorption capacity The changes concerning the water vapour absorption capacity were appreciated by measuring hygroscopicity. Hygroscopicity is a property of the materials that depends on their nature and can be influenced by certain surface physico-chemical and chemical treatments. Textile materials , especially the ones in contact with skin, must be hygroscopical retaining thus the humidity from the atmosphere [STAS 12749, 1989]. In lab conditions, the higroscopicity is determined by the difference between the average mass of five samples with 50 x 50 mm dimension, stored in an atmosphere with the relative humidity of 100% and the average mass of the samples conditiones in a standard atmpshere ( φ = 65%):
H = (Mu – Mc)/Mc 100 (%) (1)
where: Mu – arithmetic mean of the samples’ masses in wet state (g); Mc – arithmetic mean of the samples’ masses in conditioned state (g)
The higroscopicity values for the trated samples are presented below:
511
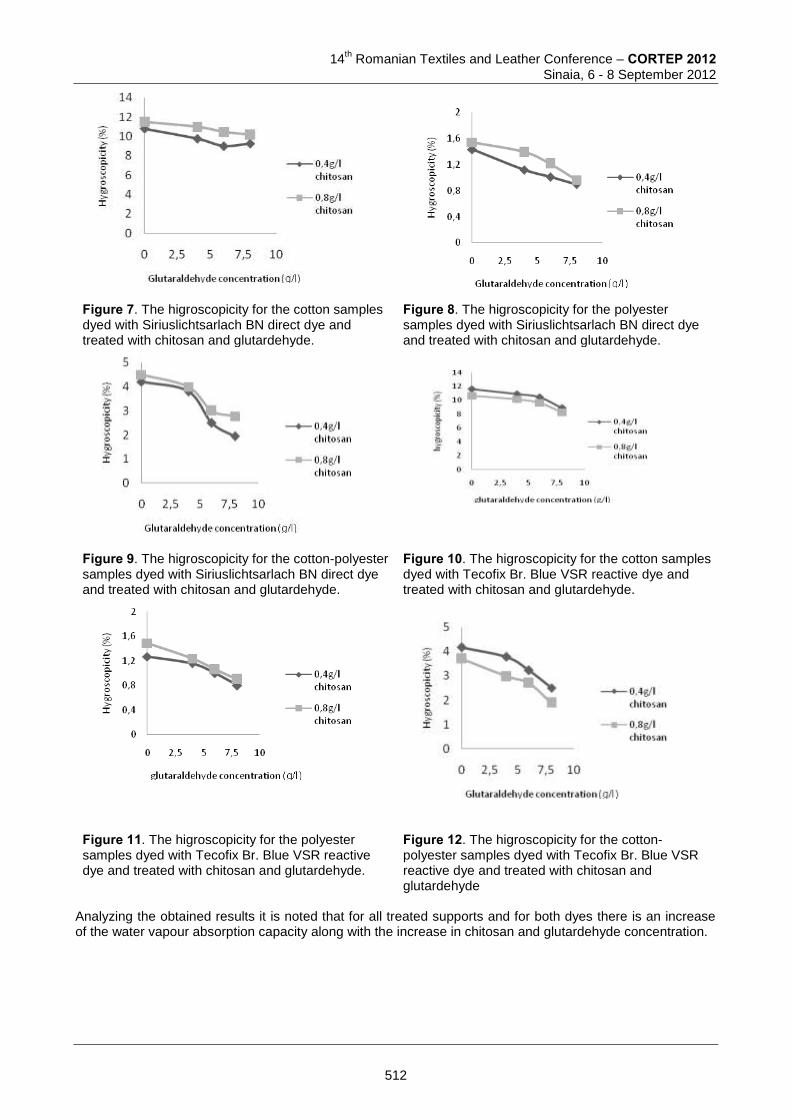
14
th Romanian Textiles and Leather Conference – CORTEP 2012
Sinaia, 6 - 8 September 2012
Figure 7. The higroscopicity for the cotton samples dyed with Siriuslichtsarlach BN direct dye and treated with chitosan and glutardehyde.
Figure 8. The higroscopicity for the polyester samples dyed with Siriuslichtsarlach BN direct dye and treated with chitosan and glutardehyde.
Figure 9. The higroscopicity for the cotton-polyester samples dyed with Siriuslichtsarlach BN direct dye and treated with chitosan and glutardehyde.
Figure 10. The higroscopicity for the cotton samples dyed with Tecofix Br. Blue VSR reactive dye and treated with chitosan and glutardehyde.
Figure 11. The higroscopicity for the polyester samples dyed with Tecofix Br. Blue VSR reactive dye and treated with chitosan and glutardehyde.
Figure 12. The higroscopicity for the cotton-polyester samples dyed with Tecofix Br. Blue VSR reactive dye and treated with chitosan and glutardehyde
Analyzing the obtained results it is noted that for all treated supports and for both dyes there is an increase of the water vapour absorption capacity along with the increase in chitosan and glutardehyde concentration.
512
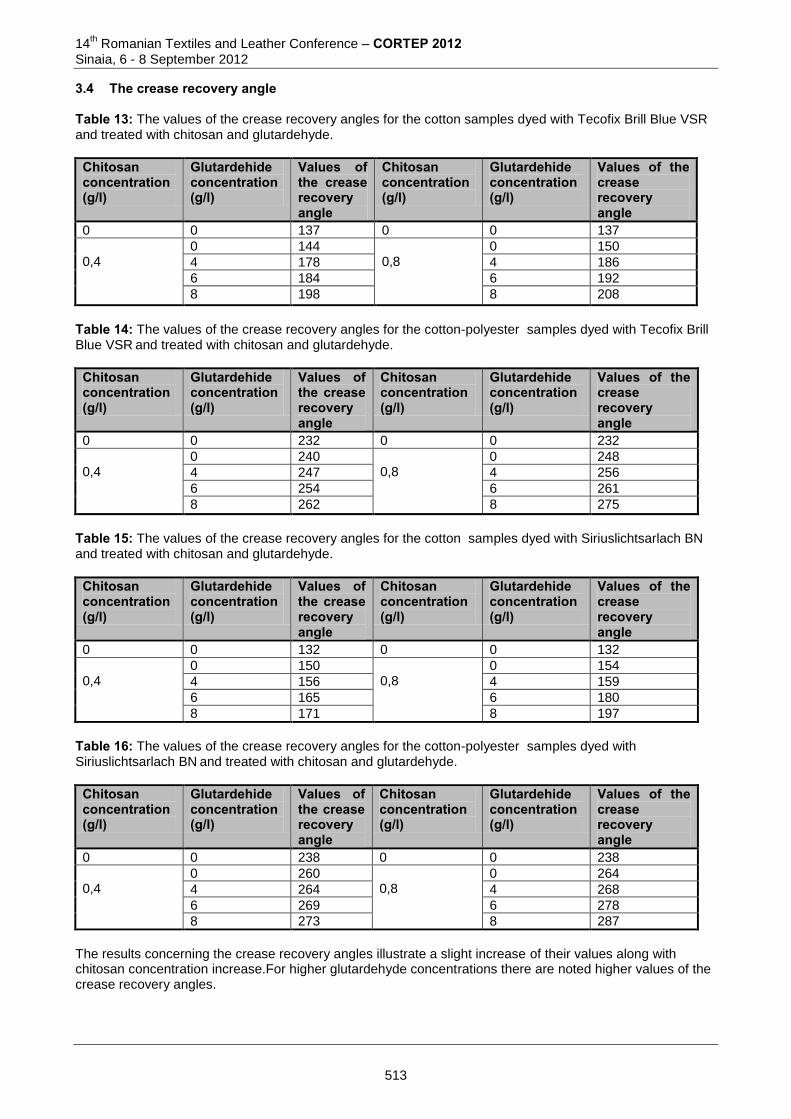
14th Romanian Textiles and Leather Conference – CORTEP 2012
Sinaia, 6 - 8 September 2012
3.4 The crease recovery angle Table 13: The values of the crease recovery angles for the cotton samples dyed with Tecofix Brill Blue VSR
and treated with chitosan and glutardehyde.
Chitosan concentration (g/l)
Glutardehide concentration (g/l)
Values of the crease recovery angle
Chitosan concentration (g/l)
Glutardehide concentration (g/l)
Values of the crease recovery angle
0 0 137 0 0 137
0,4
0 144 0,8
0 150
4 178 4 186
6 184 6 192
8 198 8 208
Table 14: The values of the crease recovery angles for the cotton-polyester samples dyed with Tecofix Brill Blue VSR
and treated with chitosan and glutardehyde.
Chitosan concentration (g/l)
Glutardehide concentration (g/l)
Values of the crease recovery angle
Chitosan concentration (g/l)
Glutardehide concentration (g/l)
Values of the crease recovery angle
0 0 232 0 0 232
0,4
0 240 0,8
0 248
4 247 4 256
6 254 6 261
8 262 8 275
Table 15: The values of the crease recovery angles for the cotton samples dyed with Siriuslichtsarlach BN
and treated with chitosan and glutardehyde.
Chitosan concentration (g/l)
Glutardehide concentration (g/l)
Values of the crease recovery angle
Chitosan concentration (g/l)
Glutardehide concentration (g/l)
Values of the crease recovery angle
0 0 132 0 0 132
0,4
0 150 0,8
0 154
4 156 4 159
6 165 6 180
8 171 8 197
Table 16: The values of the crease recovery angles for the cotton-polyester samples dyed with Siriuslichtsarlach BN
and treated with chitosan and glutardehyde.
Chitosan concentration (g/l)
Glutardehide concentration (g/l)
Values of the crease recovery angle
Chitosan concentration (g/l)
Glutardehide concentration (g/l)
Values of the crease recovery angle
0 0 238 0 0 238
0,4
0 260 0,8
0 264
4 264 4 268
6 269 6 278
8 273 8 287
The results concerning the crease recovery angles illustrate a slight increase of their values along with chitosan concentration increase.For higher glutardehyde concentrations there are noted higher values of the crease recovery angles.
513
14
th Romanian Textiles and Leather Conference – CORTEP 2012
Sinaia, 6 - 8 September 2012
4 REFERENCES [1] Ristic, N., Jovancic, P, Canal, C., Jocic, D.: One-bath One-dye Class Dyeing of PES/Cotton Blends
after Corona and Chitosan Treatment, Fibers and Polymers, Vol.10, No.4, pp. 466-475, 2009 [2] Vakhitova, N. A. and Safonov, V. V.: Effect of Chitosan on the Efficiency of Dyeing Textiles with Active
Dyes, Chemidtrz and materials science, Vol. 35, No. 1, pp.27-28, 2003 [3] Öktem, T.: Surface treatment of cotton fabrics with chitosan, Color Technologi, Vol. 119, pag. 241, 2003 [4] Walawska, A., Filipowska, B., Rybicki, E.: Dyeing Polyester and Cotton-Polyester Fabrics by Chitosan
Treatament, Fibres and Textiles in Eastern Europe, Vol.11, No.2, pp.71-74, 2003 [5] Silva, C. M., Carneiro, F., O’neill, A., Fonseca, l.: Cutinase—A New Tool for Biomodification of Synthetic
Fibers, You have full text access to this content, Journal of Polymer Science Part A: Polymer Chemistry, Vol. 43, Issue 11, 2005
[6] Lehocky, M., Mracek, A.: Improvement of dye adsorption on synthetic polyester fibers by low temperature plasma pretreatment, Czechoslovak Journal of Physics, Vol. 56, pp. 1277-1282, 2006
[7] Colleoni, C., Massafra, M. R., Migani, V., Rosace, G., Dendrimer Finishing Influence on CO/PES Blended Fabrics Color Assessment, Journal of Applied Polymer Science, Vol. 120, Issue 4,pp. 2122-2129
Corresponding address: Ovidiu CONSTANDACHE, PhD student, Department of Chemical Engineering in Textile and Leather Faculty of Textile,Leather and Industrial Management/ “Gheorghe. Asachi”;Technical University D. Mangeron Street, No. 29 700050, Iasi, Romania phone: 0722684523; mobile: 074552806; e-mail: [email protected]
Co-authors: Angela CEREMPEI Department of Chemical Engineering in Textile and Leather Faculty of Textile,Leather and Industrial Management/ “Gheorghe. Asachi”;Technical University D. Mangeron Street, No. 29 700050, Iasi, Romania phone: 0722684523 Rodica MURESAN Department of Chemical Engineering in Textile and Leather Faculty of Textile,Leather and Industrial Management/ “Gheorghe. Asachi”;Technical University D. Mangeron Street, No. 29 700050, Iasi, Romania e-mail:[email protected]
514
14
th Romanian Textiles and Leather Conference – CORTEP 2012
Sinaia, 6 - 8 September 2012
SPECIAL EFFECT PIGMENTS
Tatiana CONSTANDACHE, Angela CEREMPEI & Rodica MUREŞAN “Gheorghe Asachi” Techical University of Iaşi, Romania
Abstract: Effect coatings show a revival. Special aesthetic paint effects, some of which were already known in medieval times, are nowadays being introduced again, although now via modern technical means [1]. Together with the need for more environmentally safe paint systems the consumer also requests highly esthetic coatings, especially concerning colour and effect [2]. This paper comprises descriptive information about special effect pigments, which are themselves environmentally safe and are used for high esthetic requirements, work in solvent free paint systems. Keywords: Effect pigment, thermochromic pigments, fluorescent pigments, pearlescent pigments 1 INTRODUCTION The first effect coatings are found in England at the court of Henry III (13th century) on wooden panels replacing tapestry normally used on walls. Soon they were also applied on furniture and other objects, by craftsmen as well as artists. A great variety of colours and aesthetic effects is found, including imitations of expensive materials. The application techniques were complex and time-consuming, as we can tell from surviving descriptions and recipes. Rationalisation of paint production and application in the 20th century led to the almost complete disappearance of effect coatings, but in the last few years a renewed interest can be observed. An obvious example is the use of metallic finishes on cars, but even in architectural paints today's consumer is asking for fashionable aesthetic effects. This trend will continue and become more important in the near future. Research in the field of effect coatings is focused on the chemical and physical mechanisms producing the special effects, on relevant up-to-date application technology, and on colour design. New binders, pigmentsand additives, and new physical modifications, are being investigated to produce a variety of effect paints. The application methods should fit in with modern practice and equipment. Specialists in colour design are needed to create the colour combinations and effects, which must be in tune with the character of the object to be painted. An essential aspect of effect coatings is a proper relationship between coating and object. The coating should support and improve the identity of the object, and enhance its beauty [1]. Driven by trends in fashion, automotive and other consumer markets, pigments that generate special effects have a growing economic significance and can be found in various industrial products and end-user applications. In decorative uses, special effect pigments provide three major advantages: they can create the illusion of optical depth, which is for example be observed when applying pearlescent pigments in car paints; they can generate subtle to startling angle-dependent eye-catching color effects, which can for example be used in car paints or decorative printing; the have the ability to imitate the effect of natural pearls in buttons, plastic bottles, and many other decorative objects [3-4]. 2 CLASSIFICATION AND USE SPECIAL PIGMENTS 2.1 Pigments pearl The surface of the pearl pigments is covered with TiO 2 , Fe 2 O 3 TiO 2, Fe 2 O 3 or other oxides. This class does not contain coloring pigments and pearl effect is given by a long cycle of reflection and refractions. Color pearl pigments are resistant to environmental conditions (light, weather conditions), high temperature (up to 800-900 o C). Pigment and oxide film on its surface has a very good resistance to chemical compounds which allows them to keep their properties under the influence of acids and bases. Pearl gloss pigment particle size depends on:
a 5-25 μm - g laugh laughing opacity ICAT silky appearance;
515

14th Romanian Textiles and Leather Conference – CORTEP 2012
Sinaia, 6 - 8 September 2012
a 10-60 μm - average opacity g rad - pearly
a 10-100 µm - g rad low-pearly haze a 40-200 μm - G rad opacity very low-aspect Crystal
They meet several series pearl pigment:
Series White silver is composed of a mineral product you covered TiO 2 . The final color depends on pigment particle size of mineral product and the coating. For this series of pigments are used two types of coatings: Road and Anata. Size of pigments is between 5 and 700 microns.
Series intermediate product is formed from a mineral coated TiO 2. The color of this series of pigments is given by the thickness of the coating (layer of TiO 2). Usually painted surface with this series of pigments present colors: yellow, red, purple, blue, and green.
Series "golden light" pigments in this series are composed of mineral products coated with TiO 2 and Fe 2 O 3. golden hue of different intensity is given by the thickness of TiO 2 and Fe 2 O 3.
Series "Мetalizată" consists of my products in all aims coated Fe 2 O 3 and has shades of tan, red-brown hue of red wine, etc. The shade depends on coating thickness. This series makes the surface pigments that are applied metallic luster and appearance.
Pigments series "Brilliant" This series of transparent pigment is made from fibers of high conductivity, which are covered with a special layer of oxides.
Pearl pigments are used in paints, inks and plastics. As you increase coating thickness, color Pearl pigment range to white yellow , silver, red, blue and green. Different colors can be achievements thread by adding a second layer oxide iron (gold and beige) or oxide chromium (green), and a range of colors metal (bronze and copper), is done by replacing titan titanium with oxide iron. No color is these pigments to be special, but their appearance Pearl, which can be "ajusted" by adjust the size of their chips. Flakes ( small pigment approximately 5 microns) given a aspect Satin with opacity good [7-9]. Flakes with larger (about 25 25 microns) give a effect shiny with covering power. Combine to achieve the desired brightness and opacity pearl pigments mix of different sizes. As well they present attractive, pearl pigments also have protective role by reflecting the sun's harmful rays. Because size and form pigment particles are so important to achieve the particular attention is given to incorporate pigments in plastics. Thrust too large can crushed pigment flakes thereby reducing gloss effect [10-12]. 2.2 Pigments thermal indicators Pigments thermal indicators a specific color temperature changes permanent or reversible. Are usually salts of mercury, chromium, copper, antimony, iron at that temperature lost water of crystallization or switch to their composition and go into another product of a different hue.
516
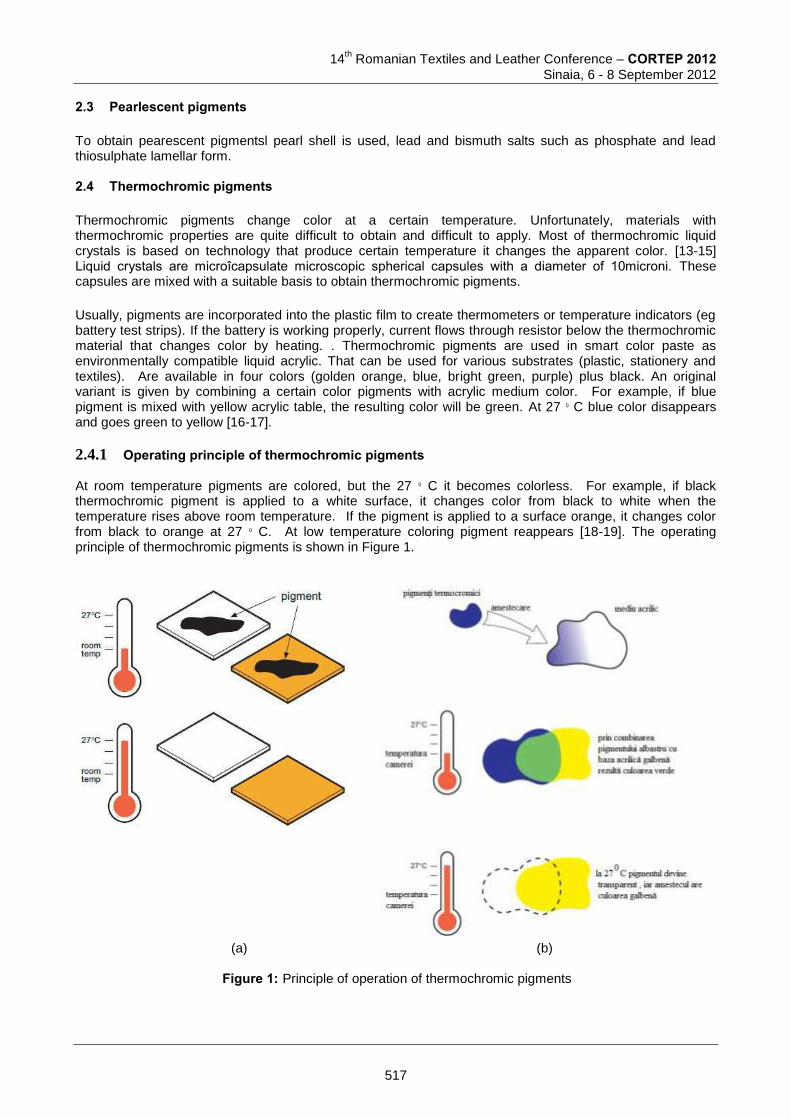
14
th Romanian Textiles and Leather Conference – CORTEP 2012
Sinaia, 6 - 8 September 2012
2.3 Pearlescent pigments To obtain pearescent pigmentsl pearl shell is used, lead and bismuth salts such as phosphate and lead thiosulphate lamellar form. 2.4 Thermochromic pigments Thermochromic pigments change color at a certain temperature. Unfortunately, materials with thermochromic properties are quite difficult to obtain and difficult to apply. Most of thermochromic liquid crystals is based on technology that produce certain temperature it changes the apparent color. [13-15] Liquid crystals are microîcapsulate microscopic spherical capsules with a diameter of 10microni. These capsules are mixed with a suitable basis to obtain thermochromic pigments. Usually, pigments are incorporated into the plastic film to create thermometers or temperature indicators (eg battery test strips). If the battery is working properly, current flows through resistor below the thermochromic material that changes color by heating. . Thermochromic pigments are used in smart color paste as environmentally compatible liquid acrylic. That can be used for various substrates (plastic, stationery and textiles). Are available in four colors (golden orange, blue, bright green, purple) plus black. An original variant is given by combining a certain color pigments with acrylic medium color. For example, if blue pigment is mixed with yellow acrylic table, the resulting color will be green. At 27 0 C blue color disappears and goes green to yellow [16-17]. 2.4.1 Operating principle of thermochromic pigments At room temperature pigments are colored, but the 27 0 C it becomes colorless. For example, if black thermochromic pigment is applied to a white surface, it changes color from black to white when the temperature rises above room temperature. If the pigment is applied to a surface orange, it changes color from black to orange at 27 0 C. At low temperature coloring pigment reappears [18-19]. The operating principle of thermochromic pigments is shown in Figure 1.
(a) (b)
Figure 1: Principle of operation of thermochromic pigments
517
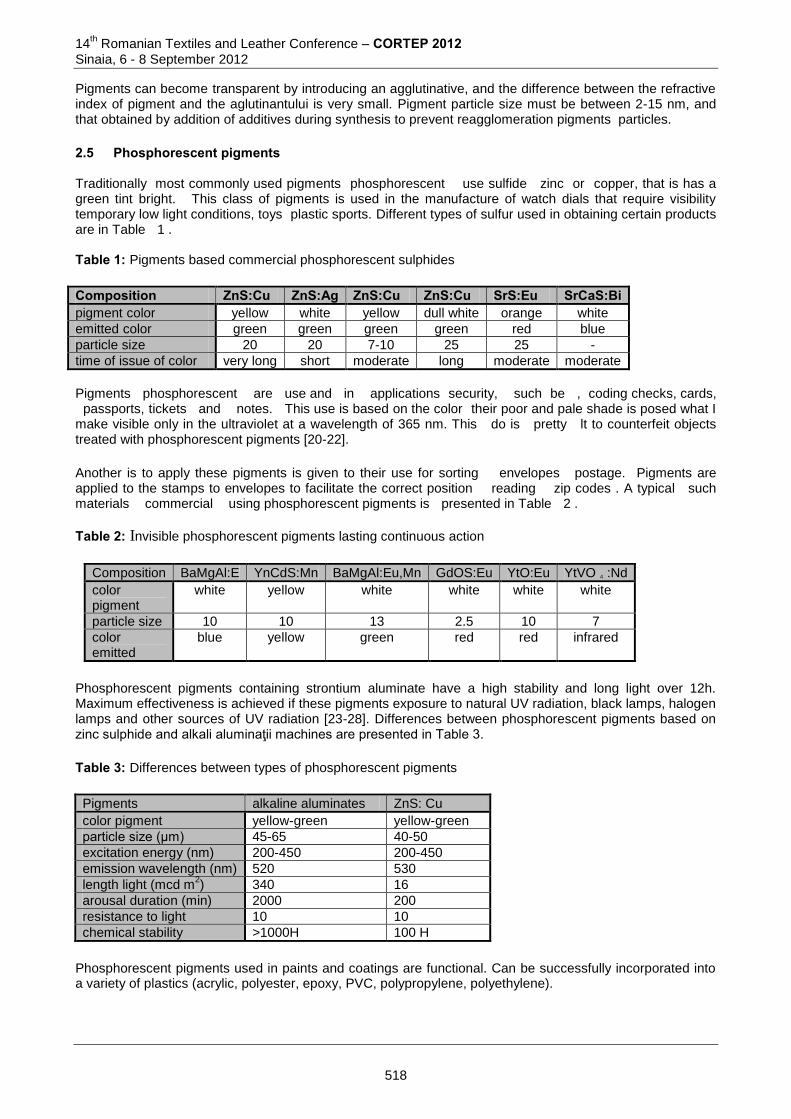
14th Romanian Textiles and Leather Conference – CORTEP 2012
Sinaia, 6 - 8 September 2012
Pigments can become transparent by introducing an agglutinative, and the difference between the refractive index of pigment and the aglutinantului is very small. Pigment particle size must be between 2-15 nm, and that obtained by addition of additives during synthesis to prevent reagglomeration pigments particles. 2.5 Phosphorescent pigments
Traditionally most commonly used pigments phosphorescent use sulfide zinc or copper, that is has a green tint bright. This class of pigments is used in the manufacture of watch dials that require visibility temporary low light conditions, toys plastic sports. Different types of sulfur used in obtaining certain products are in Table 1 . Table 1: Pigments based commercial phosphorescent sulphides
Composition ZnS:Cu ZnS:Ag ZnS:Cu ZnS:Cu SrS:Eu SrCaS:Bi pigment color yellow white yellow dull white orange white emitted color green green green green red blue particle size 20 20 7-10 25 25 - time of issue of color very long short moderate long moderate moderate
Pigments phosphorescent are use and in applications security, such be , coding checks, cards, passports, tickets and notes. This use is based on the color their poor and pale shade is posed what I make visible only in the ultraviolet at a wavelength of 365 nm. This do is pretty lt to counterfeit objects treated with phosphorescent pigments [20-22]. Another is to apply these pigments is given to their use for sorting envelopes postage. Pigments are applied to the stamps to envelopes to facilitate the correct position reading zip codes . A typical such materials commercial using phosphorescent pigments is presented in Table 2 . Table 2: Invisible phosphorescent pigments lasting continuous action
Composition BaMgAl:E YnCdS:Mn BaMgAl:Eu,Mn GdOS:Eu YtO:Eu YtVO 4 :Nd color pigment
white yellow white white white white
particle size 10 10 13 2.5 10 7 color emitted
blue yellow green red red infrared
Phosphorescent pigments containing strontium aluminate have a high stability and long light over 12h. Maximum effectiveness is achieved if these pigments exposure to natural UV radiation, black lamps, halogen lamps and other sources of UV radiation [23-28]. Differences between phosphorescent pigments based on zinc sulphide and alkali aluminaţii machines are presented in Table 3. Table 3: Differences between types of phosphorescent pigments
Pigments alkaline aluminates ZnS: Cu color pigment yellow-green yellow-green particle size (μm) 45-65 40-50 excitation energy (nm) 200-450 200-450 emission wavelength (nm) 520 530 length light (mcd m
2) 340 16
arousal duration (min) 2000 200 resistance to light 10 10 chemical stability >1000H 100 H
Phosphorescent pigments used in paints and coatings are functional. Can be successfully incorporated into a variety of plastics (acrylic, polyester, epoxy, PVC, polypropylene, polyethylene).
518
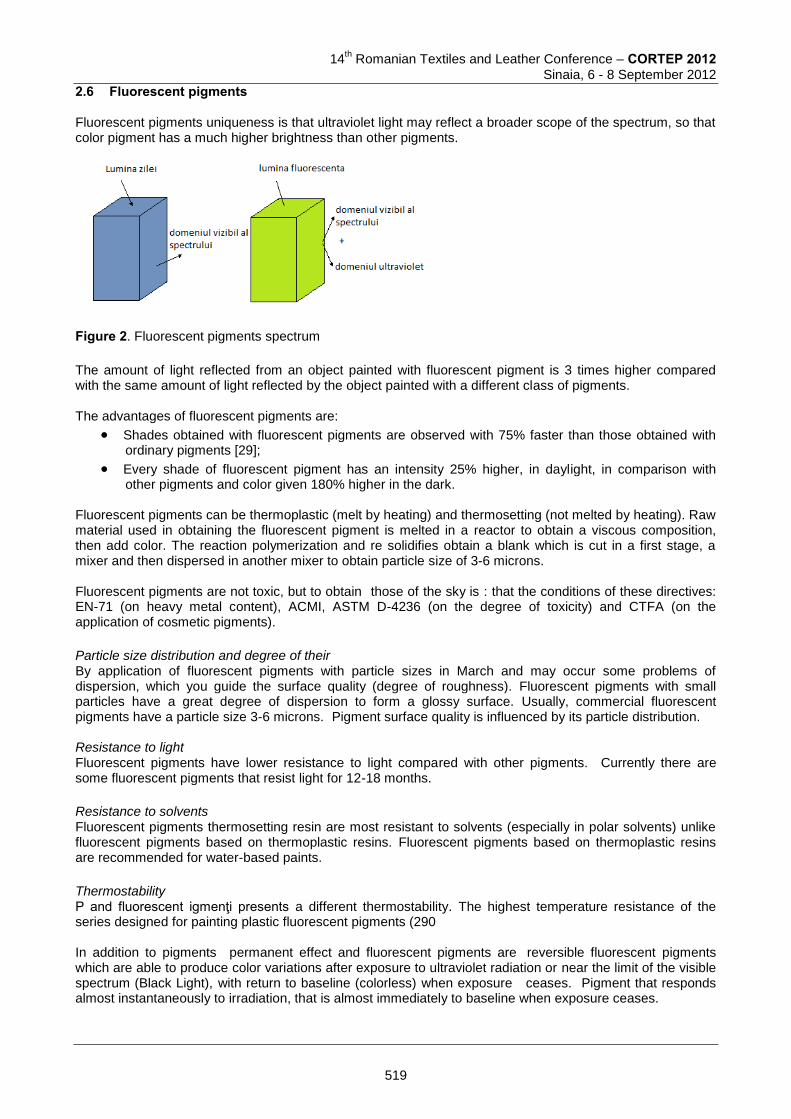
14
th Romanian Textiles and Leather Conference – CORTEP 2012
Sinaia, 6 - 8 September 2012
2.6 Fluorescent pigments Fluorescent pigments uniqueness is that ultraviolet light may reflect a broader scope of the spectrum, so that color pigment has a much higher brightness than other pigments.
Figure 2. Fluorescent pigments spectrum
The amount of light reflected from an object painted with fluorescent pigment is 3 times higher compared with the same amount of light reflected by the object painted with a different class of pigments. The advantages of fluorescent pigments are:
Shades obtained with fluorescent pigments are observed with 75% faster than those obtained with ordinary pigments [29];
Every shade of fluorescent pigment has an intensity 25% higher, in daylight, in comparison with other pigments and color given 180% higher in the dark.
Fluorescent pigments can be thermoplastic (melt by heating) and thermosetting (not melted by heating). Raw material used in obtaining the fluorescent pigment is melted in a reactor to obtain a viscous composition, then add color. The reaction polymerization and re solidifies obtain a blank which is cut in a first stage, a mixer and then dispersed in another mixer to obtain particle size of 3-6 microns. Fluorescent pigments are not toxic, but to obtain those of the sky is : that the conditions of these directives: EN-71 (on heavy metal content), ACMI, ASTM D-4236 (on the degree of toxicity) and CTFA (on the application of cosmetic pigments). Particle size distribution and degree of their By application of fluorescent pigments with particle sizes in March and may occur some problems of dispersion, which you guide the surface quality (degree of roughness). Fluorescent pigments with small particles have a great degree of dispersion to form a glossy surface. Usually, commercial fluorescent pigments have a particle size 3-6 microns. Pigment surface quality is influenced by its particle distribution. Resistance to light Fluorescent pigments have lower resistance to light compared with other pigments. Currently there are some fluorescent pigments that resist light for 12-18 months. Resistance to solvents Fluorescent pigments thermosetting resin are most resistant to solvents (especially in polar solvents) unlike fluorescent pigments based on thermoplastic resins. Fluorescent pigments based on thermoplastic resins are recommended for water-based paints. Thermostability P and fluorescent igmenţi presents a different thermostability. The highest temperature resistance of the series designed for painting plastic fluorescent pigments (290 In addition to pigments permanent effect and fluorescent pigments are reversible fluorescent pigments which are able to produce color variations after exposure to ultraviolet radiation or near the limit of the visible spectrum (Black Light), with return to baseline (colorless) when exposure ceases. Pigment that responds almost instantaneously to irradiation, that is almost immediately to baseline when exposure ceases.
519
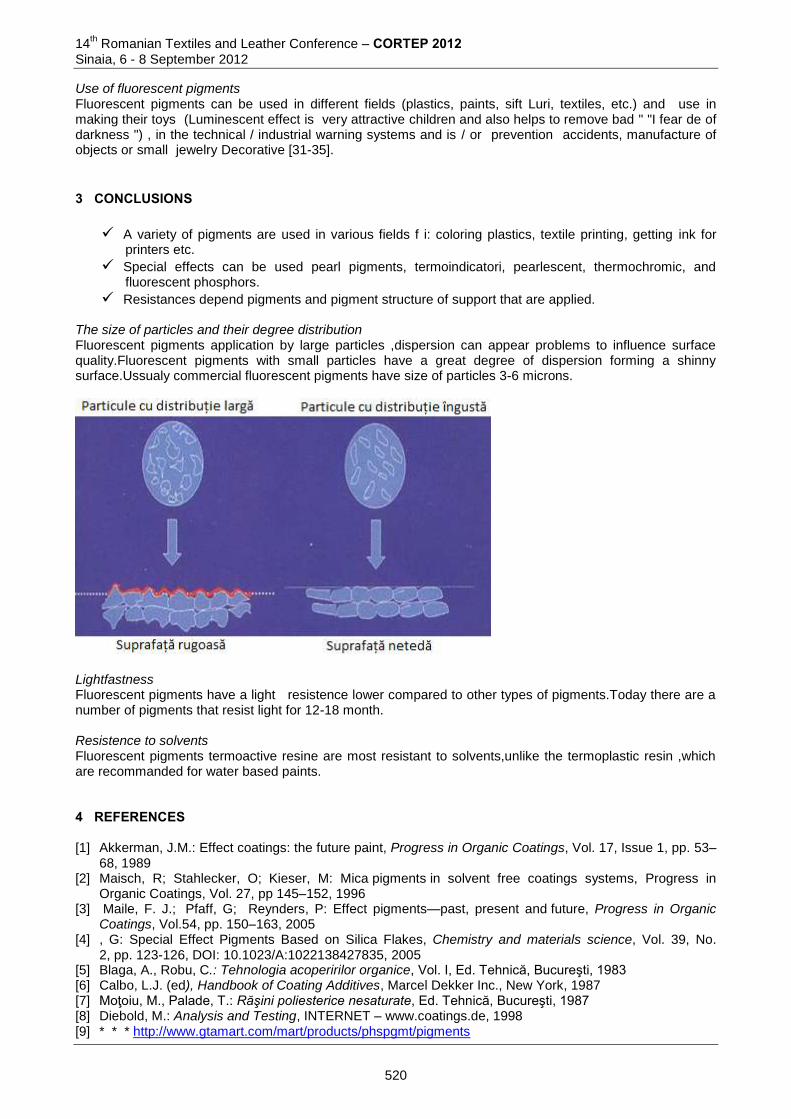
14th Romanian Textiles and Leather Conference – CORTEP 2012
Sinaia, 6 - 8 September 2012
Use of fluorescent pigments Fluorescent pigments can be used in different fields (plastics, paints, sift Luri, textiles, etc.) and use in making their toys (Luminescent effect is very attractive children and also helps to remove bad " "I fear de of darkness ") , in the technical / industrial warning systems and is / or prevention accidents, manufacture of objects or small jewelry Decorative [31-35].
3 CONCLUSIONS
A variety of pigments are used in various fields f i: coloring plastics, textile printing, getting ink for printers etc.
Special effects can be used pearl pigments, termoindicatori, pearlescent, thermochromic, and fluorescent phosphors.
Resistances depend pigments and pigment structure of support that are applied. The size of particles and their degree distribution Fluorescent pigments application by large particles ,dispersion can appear problems to influence surface quality.Fluorescent pigments with small particles have a great degree of dispersion forming a shinny surface.Ussualy commercial fluorescent pigments have size of particles 3-6 microns.
Lightfastness Fluorescent pigments have a light resistence lower compared to other types of pigments.Today there are a number of pigments that resist light for 12-18 month. Resistence to solvents Fluorescent pigments termoactive resine are most resistant to solvents,unlike the termoplastic resin ,which are recommanded for water based paints. 4 REFERENCES [1] Akkerman, J.M.: Effect coatings: the future paint, Progress in Organic Coatings, Vol. 17, Issue 1, pp. 53–
68, 1989 [2] Maisch, R; Stahlecker, O; Kieser, M: Mica pigments in solvent free coatings systems, Progress in
Organic Coatings, Vol. 27, pp 145–152, 1996 [3] Maile, F. J.; Pfaff, G; Reynders, P: Effect pigments—past, present and future, Progress in Organic
Coatings, Vol.54, pp. 150–163, 2005 [4] , G: Special Effect Pigments Based on Silica Flakes, Chemistry and materials science, Vol. 39, No.
2, pp. 123-126, DOI: 10.1023/A:1022138427835, 2005 [5] Blaga, A., Robu, C.: Tehnologia acoperirilor organice, Vol. I, Ed. Tehnică, Bucureşti, 1983 [6] Calbo, L.J. (ed), Handbook of Coating Additives, Marcel Dekker Inc., New York, 1987 [7] Moţoiu, M., Palade, T.: Răşini poliesterice nesaturate, Ed. Tehnică, Bucureşti, 1987 [8] Diebold, M.: Analysis and Testing, INTERNET – www.coatings.de, 1998 [9] * * * http://www.gtamart.com/mart/products/phspgmt/pigments
520
14
th Romanian Textiles and Leather Conference – CORTEP 2012
Sinaia, 6 - 8 September 2012
[10] Urquhart & Associates, http://www.u1000.com [11] Campbell, A.K.: Principles and Applications in Biology and Medicine, VCH, Weinheim, 1988. [12] Martindill, M.G.: Conference Papers, ChemiChromics USA ’99, New Orleans, January 1999, Spring
Innovations, UK. [13] http://www.sili.ru/cathegory.php?section=section_151 [14] Product Guide, glowbug, Division of Capricorn Chemicals, UK [15] Martindill, M.G.: PPCJ, September 1999, pp. 30–31 [16] Befumo, P and Becidyan, N: Am. Ink Maker, January 1999, pp. 31–36 [17] Contag, C.H. and Contag, P.R.: Chem Ind., 6 September 1999, pp. 664–666 [18] Tilley, R.J.D.:Colour and the Optical Properties of Materials, Wiley, Chichester, 2000, pp. 276 [19] Martin, R., Chem. Ind., 1 March 1999, 173–177; P. Blood, Chem. Br., July 1999, pp. 38–40 [20] Kelly, S.M.: Flat Panel Displays. Advanced Organic Materials, Royal Society of Chemistry, Cambridge,
2000. [21] Kelly, S.M.: Flat Panel Displays. Advanced Organic Materials, Royal Society of Chemistry, Cambridge,
2000, pp. 157 [22] McKnight, M. E.; Vorburger, T. V.; Marx, E; Nadal, M. E.; Barnes, P. Y. and Galler, M. A.:
Measurements and predictions of light scattering from clear coatings, Appl. Opt. 40, pp. 2159–2168, 2001
[23] Germer, T. A.: Polarized light scattering by microroughness and small defects in dielectric layers, J. Opt. Soc. Am. A 18, pp. 1279–1288, 2001
[24] Germer, T. A.: Measurement of roughness of two interfaces of a dielectric film by scattering ellipsometry, Phys. Rev. Lett. 85, pp. 349–352, 2000
[25] Sparrow, J. R.; Nakanishi, K.; Parish, C. A. Invest. Ophthalmol. Vis. Sci. 2000, pp. 41 [26] http://www.polymery.ru/letter.php?n_id=4838 [27] http://www.polikonta.com/articles/fluriki.html [28] Fernández, J. E.: Materials for Aesthetic, Energy-Efficient, and Self-Diagnostic Buildings, Science, 315,
pp. 1807-1810, 2007 [29] Christie, R. M.; Mackay, J. L.: Colaration Technology, Metal salt azo pigments, Vol. 124, pp. 133-144,
2008 [30] http://www.polikonta.com/articles/masterbatches.html
Corresponding address: Tatiana CONSTANDACHE Department of Chemical Engineering in Textile and Leather Faculty of Textile, Leather and Industrial Management/ “Gheorghe Asachi Technical University B-dul D. Mangeron No.53-55 700050, Iasi, Romania e-mail: [email protected] Co-authors: Angela CEREMPEI Department of Chemical Engineering in Textile and Leather Faculty of Textile, Leather and Industrial Management/ “Gheorghe Asachi Technical University B-dul D. Mangeron No.53-55 700050, Iasi, Romania phone: 0722684523
Rodica MURESAN Department of Chemical Engineering in Textile and Leather Faculty of Textile, Leather and Industrial Management/ “Gheorghe Asachi Technical University B-dul D. Mangeron No.53-55 700050, Iasi, Romania e-mail:[email protected]
521

14
th Romanian Textiles and Leather Conference – CORTEP 2012
Sinaia, 6 - 8 September 2012
IMPROVING COTTON TEXTILE MATERIALS PROPRIETIES BY TREATING WITH CHITOSAN AND METALLIC SALTS
Abramiuc DANKO1,Crisan POPESCU2 & Augustin MURESAN1
1“Gheorghe Asachi” Techical University of Iasi, Romania
2 DWI at RWTH Aachen University, Germany
Abstract: The paper investigates the possibility to enhance the dyeing capacity of cotton fabrics at dyeing with reactive dyes. Several variants have been considered and the results indicate that the treatment with chitosan and copper sulphate shows the most potential. The final results suggests that together with the enhancement of the dyeing capacity there were also obtained antibacterial and crease recovery effects. Keywords: cotton, reactive dyes, chitosan, CuSO4, chromatic parameters, antimicrobial effect, crease recovery. 1 INTRODUCTION Cellulosic fibres are widely used for apparel industry and the most demanded class of dyes required for colouring them is those of reactive dyes. As a consequence numerous studies are concerned with the improvement of the dyeing performances achievable with this class of dyes. Reactive dyes are largely used because of their bright shades and high fastness to wet treatments. There are, however, many drawbacks which need addressed for improving further the dyeing process. Among them there are problems rise by the large amount of electrolytes required for dyeing, and by the, sometime, low yield of the reaction of dye with fibre, which leads to the loss of unfixed dye from the fabric in effluents and produces a waste of resources [1-18]. Micro-organisms are often found on natural polymer fibres like cellulose because due to their natural retention of water, oxygen and other nutrient sources (salts, amino acids, carboxylic acids from sweat, skin fat and dead cells) they provide the medium for cells growing. The consequences of contamination of textile materials with microorganisms are: the bad odour (from essential metabolic processes of bacteria), the colour fading, the mould spots and the loss of functional proprieties. The degradation action of fungi and bacteria for cellulosic fabrics is a major inconvenient for using these fibres in products like: camping articles, canvas, filters, textiles for fishing industry, furniture fabrics, textiles for decoration, etc. Chitosan has been found as a promising natural alternative to overcome the problems of micro-organism growing. It is not yet well documented how chitosan attacks the bacteria cell, but there are presumptions that positive charged primary amino groups interact with negative charged residues found on the surface of the microbe. This interaction changes the surface of the organism cell by blocking air permeability and leads to the cell’s death. The antimicrobial effects together with the non-toxicity, biodegradation, and biocompatibility grant chitosan to be used in agriculture, medicine, pharmacy, and textile industry. The use of chitosan has been studied for improving both the dyeing capacity and the antimicrobial activity against microorganism and fungi found on textile materials. Some heavy metal salts are also known for having antimicrobial properties against a large spectrum of gram positive and gram negative bacteria, as well as against some fungi (mould and yeast) [19-24]. The aim of this paper is to look after a treatment combining chitosan and heavy metal salts for improving the dyeing capacity, increasing the crease recovery and providing bacteriostatic properties to cellulosic based textile materials.
522
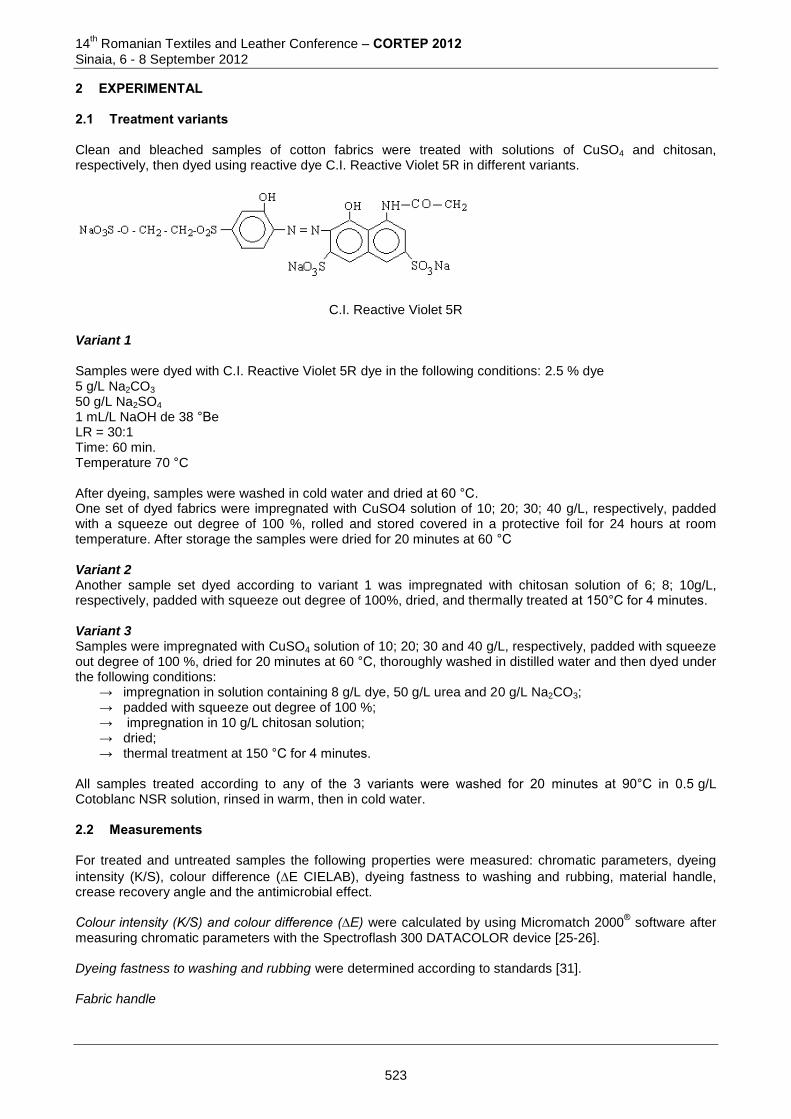
14th Romanian Textiles and Leather Conference – CORTEP 2012
Sinaia, 6 - 8 September 2012
2 EXPERIMENTAL 2.1 Treatment variants Clean and bleached samples of cotton fabrics were treated with solutions of CuSO4 and chitosan, respectively, then dyed using reactive dye C.I. Reactive Violet 5R in different variants.
C.I. Reactive Violet 5R Variant 1 Samples were dyed with C.I. Reactive Violet 5R dye in the following conditions: 2.5 % dye 5 g/L Na2CO3
50 g/L Na2SO4
1 mL/L NaOH de 38 °Be LR = 30:1 Time: 60 min. Temperature 70 °C After dyeing, samples were washed in cold water and dried at 60 °C. One set of dyed fabrics were impregnated with CuSO4 solution of 10; 20; 30; 40 g/L, respectively, padded with a squeeze out degree of 100 %, rolled and stored covered in a protective foil for 24 hours at room temperature. After storage the samples were dried for 20 minutes at 60 °C Variant 2 Another sample set dyed according to variant 1 was impregnated with chitosan solution of 6; 8; 10g/L, respectively, padded with squeeze out degree of 100%, dried, and thermally treated at 150°C for 4 minutes. Variant 3 Samples were impregnated with CuSO4 solution of 10; 20; 30 and 40 g/L, respectively, padded with squeeze out degree of 100 %, dried for 20 minutes at 60 °C, thoroughly washed in distilled water and then dyed under the following conditions:
→ impregnation in solution containing 8 g/L dye, 50 g/L urea and 20 g/L Na2CO3; → padded with squeeze out degree of 100 %; → impregnation in 10 g/L chitosan solution; → dried; → thermal treatment at 150 °C for 4 minutes.
All samples treated according to any of the 3 variants were washed for 20 minutes at 90°C in 0.5 g/L Cotoblanc NSR solution, rinsed in warm, then in cold water. 2.2 Measurements For treated and untreated samples the following properties were measured: chromatic parameters, dyeing
intensity (K/S), colour difference (E CIELAB), dyeing fastness to washing and rubbing, material handle, crease recovery angle and the antimicrobial effect. Colour intensity (K/S) and colour difference (∆E) were calculated by using Micromatch 2000
® software after
measuring chromatic parameters with the Spectroflash 300 DATACOLOR device [25-26]. Dyeing fastness to washing and rubbing were determined according to standards [31]. Fabric handle
523
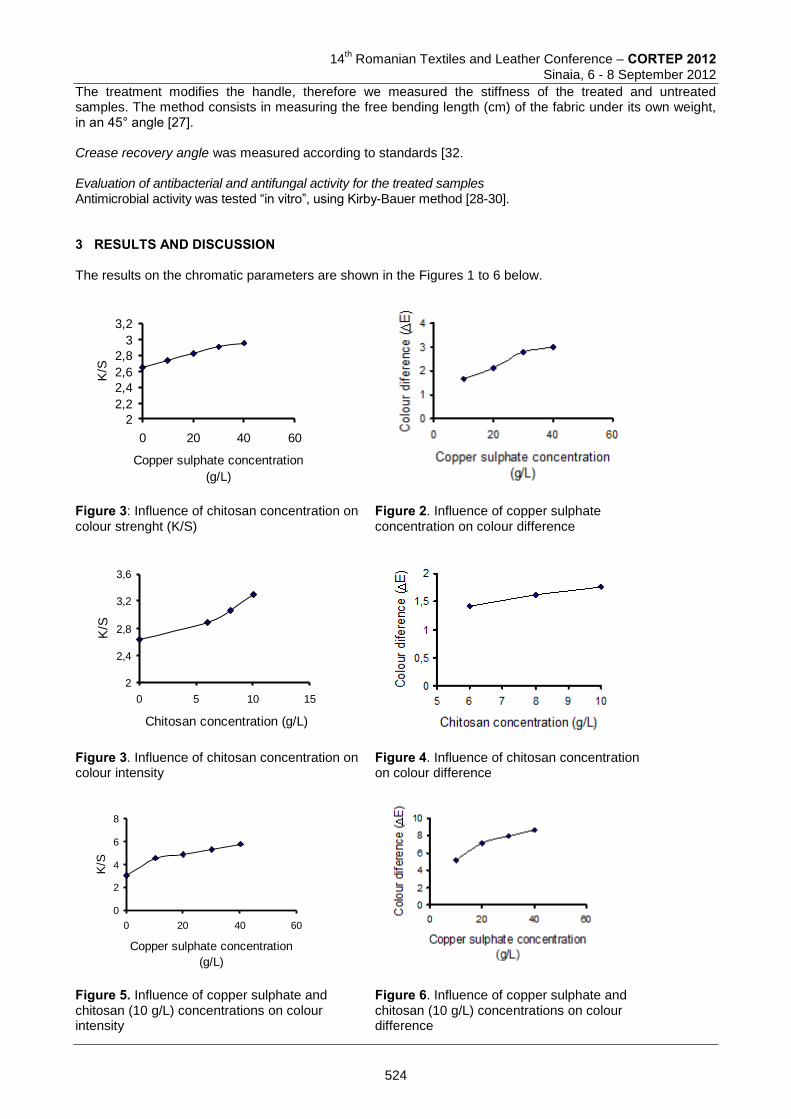
14
th Romanian Textiles and Leather Conference – CORTEP 2012
Sinaia, 6 - 8 September 2012
The treatment modifies the handle, therefore we measured the stiffness of the treated and untreated samples. The method consists in measuring the free bending length (cm) of the fabric under its own weight, in an 45° angle [27]. Crease recovery angle was measured according to standards [32. Evaluation of antibacterial and antifungal activity for the treated samples Antimicrobial activity was tested “in vitro”, using Kirby-Bauer method [28-30]. 3 RESULTS AND DISCUSSION The results on the chromatic parameters are shown in the Figures 1 to 6 below.
2
2,2
2,4
2,6
2,8
3
3,2
0 20 40 60
Copper sulphate concentration
(g/L)
K/S
Figure 3: Influence of chitosan concentration on colour strenght (K/S)
Figure 2. Influence of copper sulphate concentration on colour difference
2
2,4
2,8
3,2
3,6
0 5 10 15
Chitosan concentration (g/L)
K/S
Figure 3. Influence of chitosan concentration on colour intensity
Figure 4. Influence of chitosan concentration on colour difference
0
2
4
6
8
0 20 40 60
Copper sulphate concentration
(g/L)
K/S
Figure 5. Influence of copper sulphate and chitosan (10 g/L) concentrations on colour intensity
Figure 6. Influence of copper sulphate and chitosan (10 g/L) concentrations on colour difference
524
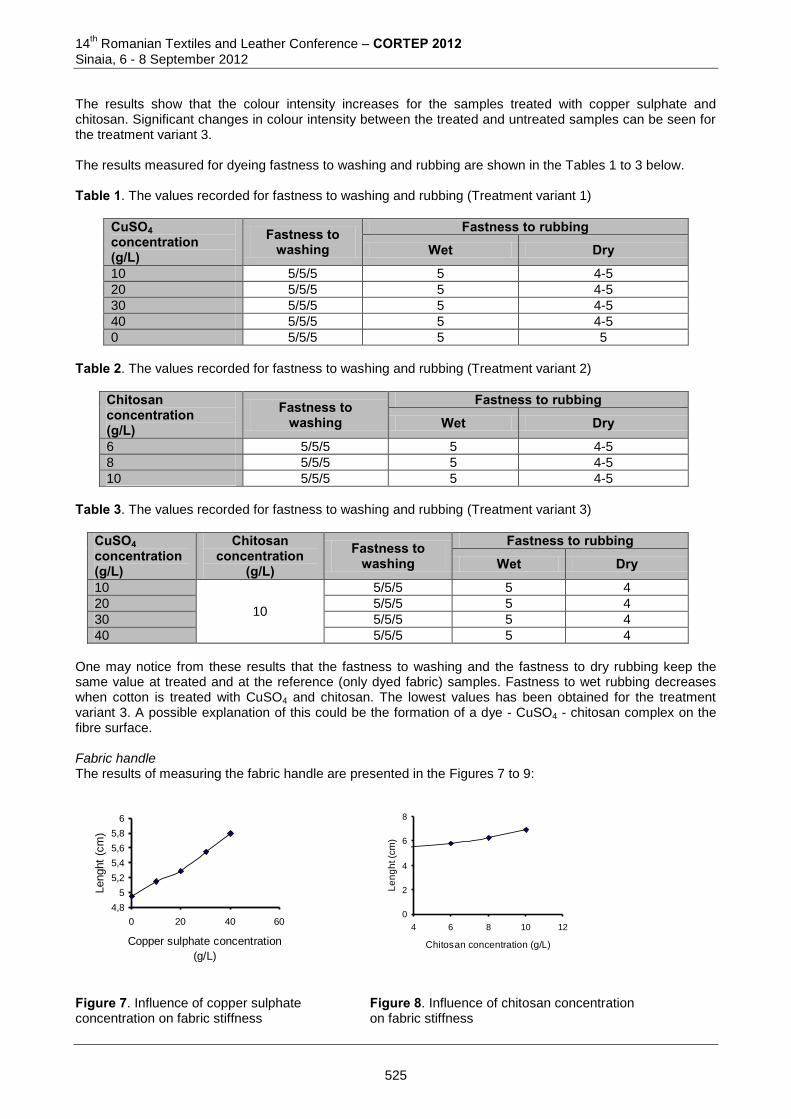
14th Romanian Textiles and Leather Conference – CORTEP 2012
Sinaia, 6 - 8 September 2012
The results show that the colour intensity increases for the samples treated with copper sulphate and chitosan. Significant changes in colour intensity between the treated and untreated samples can be seen for the treatment variant 3. The results measured for dyeing fastness to washing and rubbing are shown in the Tables 1 to 3 below. Table 1. The values recorded for fastness to washing and rubbing (Treatment variant 1)
CuSO4 concentration (g/L)
Fastness to washing
Fastness to rubbing
Wet Dry
10 5/5/5 5 4-5
20 5/5/5 5 4-5
30 5/5/5 5 4-5
40 5/5/5 5 4-5
0 5/5/5 5 5
Table 2. The values recorded for fastness to washing and rubbing (Treatment variant 2)
Chitosan concentration (g/L)
Fastness to washing
Fastness to rubbing
Wet Dry
6 5/5/5 5 4-5
8 5/5/5 5 4-5
10 5/5/5 5 4-5
Table 3. The values recorded for fastness to washing and rubbing (Treatment variant 3)
CuSO4 concentration (g/L)
Chitosan concentration
(g/L) Fastness to
washing Fastness to rubbing
Wet Dry
10
10
5/5/5 5 4
20 5/5/5 5 4
30 5/5/5 5 4
40 5/5/5 5 4
One may notice from these results that the fastness to washing and the fastness to dry rubbing keep the same value at treated and at the reference (only dyed fabric) samples. Fastness to wet rubbing decreases when cotton is treated with CuSO4 and chitosan. The lowest values has been obtained for the treatment variant 3. A possible explanation of this could be the formation of a dye - CuSO4 - chitosan complex on the fibre surface. Fabric handle The results of measuring the fabric handle are presented in the Figures 7 to 9:
4,8
5
5,2
5,4
5,6
5,8
6
0 20 40 60
Copper sulphate concentration
(g/L)
Lenght
(cm
)
0
2
4
6
8
4 6 8 10 12
Chitosan concentration (g/L)
Le
ng
ht (c
m)
Figure 7. Influence of copper sulphate concentration on fabric stiffness
Figure 8. Influence of chitosan concentration on fabric stiffness
525
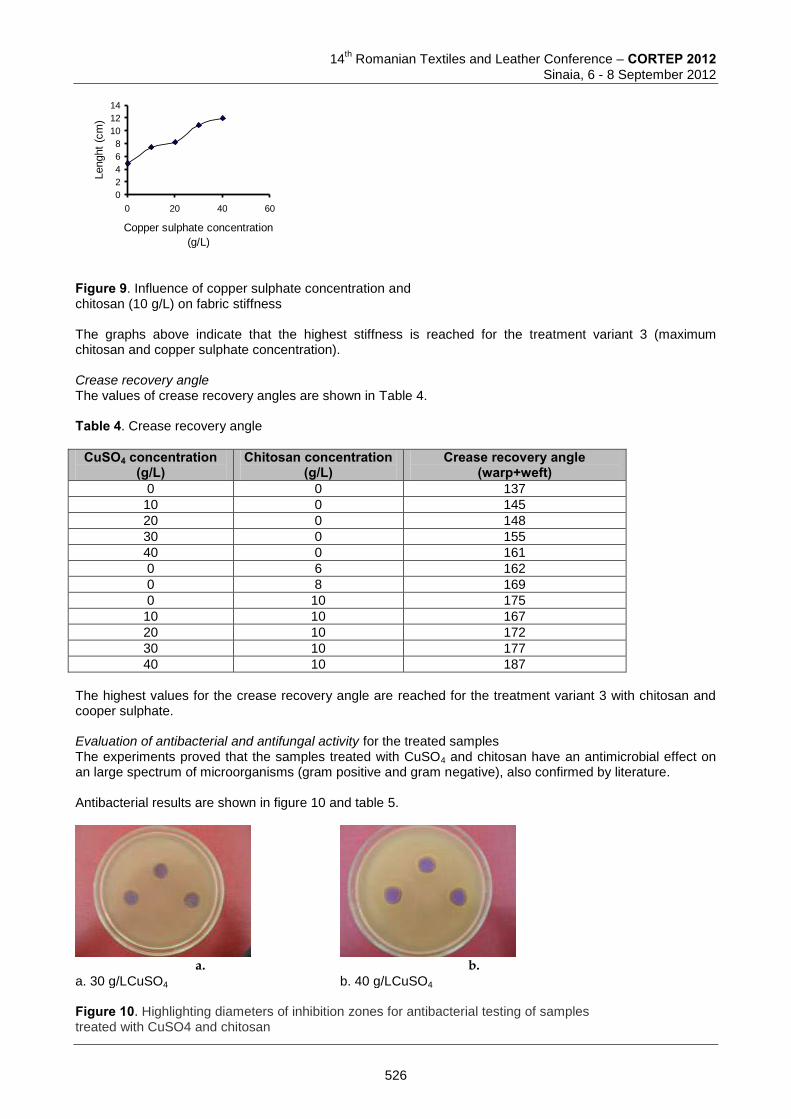
14
th Romanian Textiles and Leather Conference – CORTEP 2012
Sinaia, 6 - 8 September 2012
0
2
4
6
8
10
12
14
0 20 40 60
Copper sulphate concentration
(g/L)
Lenght
(cm
)
Figure 9. Influence of copper sulphate concentration and chitosan (10 g/L) on fabric stiffness The graphs above indicate that the highest stiffness is reached for the treatment variant 3 (maximum chitosan and copper sulphate concentration). Crease recovery angle The values of crease recovery angles are shown in Table 4. Table 4. Crease recovery angle
CuSO4 concentration (g/L)
Chitosan concentration (g/L)
Crease recovery angle (warp+weft)
0 0 137
10 0 145
20 0 148
30 0 155
40 0 161
0 6 162
0 8 169
0 10 175
10 10 167
20 10 172
30 10 177
40 10 187
The highest values for the crease recovery angle are reached for the treatment variant 3 with chitosan and cooper sulphate. Evaluation of antibacterial and antifungal activity for the treated samples The experiments proved that the samples treated with CuSO4 and chitosan have an antimicrobial effect on an large spectrum of microorganisms (gram positive and gram negative), also confirmed by literature. Antibacterial results are shown in figure 10 and table 5.
a.
b.
a. 30 g/LCuSO4 b. 40 g/LCuSO4 Figure 10. Highlighting diameters of inhibition zones for antibacterial testing of samples treated with CuSO4 and chitosan
526
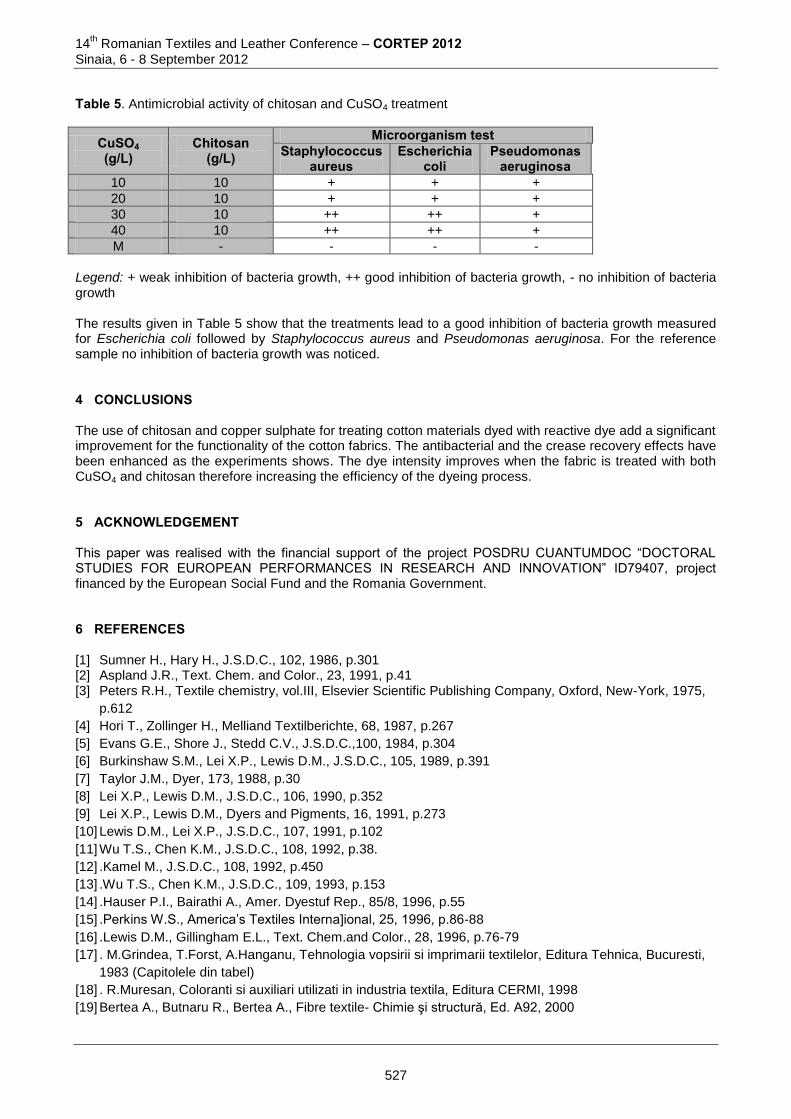
14th Romanian Textiles and Leather Conference – CORTEP 2012
Sinaia, 6 - 8 September 2012
Table 5. Antimicrobial activity of chitosan and CuSO4 treatment
CuSO4 (g/L)
Chitosan (g/L)
Microorganism test Staphylococcus
aureus Escherichia
coli Pseudomonas
aeruginosa 10 10 + + +
20 10 + + +
30 10 ++ ++ +
40 10 ++ ++ +
M - - - -
Legend: + weak inhibition of bacteria growth, ++ good inhibition of bacteria growth, - no inhibition of bacteria growth The results given in Table 5 show that the treatments lead to a good inhibition of bacteria growth measured for Escherichia coli followed by Staphylococcus aureus and Pseudomonas aeruginosa. For the reference sample no inhibition of bacteria growth was noticed. 4 CONCLUSIONS The use of chitosan and copper sulphate for treating cotton materials dyed with reactive dye add a significant improvement for the functionality of the cotton fabrics. The antibacterial and the crease recovery effects have been enhanced as the experiments shows. The dye intensity improves when the fabric is treated with both CuSO4 and chitosan therefore increasing the efficiency of the dyeing process. 5 ACKNOWLEDGEMENT This paper was realised with the financial support of the project POSDRU CUANTUMDOC “DOCTORAL STUDIES FOR EUROPEAN PERFORMANCES IN RESEARCH AND INNOVATION” ID79407, project financed by the European Social Fund and the Romania Government. 6 REFERENCES [1] Sumner H., Hary H., J.S.D.C., 102, 1986, p.301 [2] Aspland J.R., Text. Chem. and Color., 23, 1991, p.41 [3] Peters R.H., Textile chemistry, vol.III, Elsevier Scientific Publishing Company, Oxford, New-York, 1975,
p.612
[4] Hori T., Zollinger H., Melliand Textilberichte, 68, 1987, p.267
[5] Evans G.E., Shore J., Stedd C.V., J.S.D.C.,100, 1984, p.304
[6] Burkinshaw S.M., Lei X.P., Lewis D.M., J.S.D.C., 105, 1989, p.391
[7] Taylor J.M., Dyer, 173, 1988, p.30
[8] Lei X.P., Lewis D.M., J.S.D.C., 106, 1990, p.352
[9] Lei X.P., Lewis D.M., Dyers and Pigments, 16, 1991, p.273
[10] Lewis D.M., Lei X.P., J.S.D.C., 107, 1991, p.102
[11] Wu T.S., Chen K.M., J.S.D.C., 108, 1992, p.38.
[12] .Kamel M., J.S.D.C., 108, 1992, p.450
[13] .Wu T.S., Chen K.M., J.S.D.C., 109, 1993, p.153
[14] .Hauser P.I., Bairathi A., Amer. Dyestuf Rep., 85/8, 1996, p.55
[15] .Perkins W.S., America’s Textiles Interna]ional, 25, 1996, p.86-88
[16] .Lewis D.M., Gillingham E.L., Text. Chem.and Color., 28, 1996, p.76-79
[17] . M.Grindea, T.Forst, A.Hanganu, Tehnologia vopsirii si imprimarii textilelor, Editura Tehnica, Bucuresti,
1983 (Capitolele din tabel)
[18] . R.Muresan, Coloranti si auxiliari utilizati in industria textila, Editura CERMI, 1998
[19] Bertea A., Butnaru R., Bertea A., Fibre textile- Chimie şi structură, Ed. A92, 2000
527
14
th Romanian Textiles and Leather Conference – CORTEP 2012
Sinaia, 6 - 8 September 2012
[20] . D. T. W. Chun, G.R. Gamble, Using the Reactive Dye Method to Covalently Attach Antibacterial
Compounds to Cotton, The Journal of Cotton Science, vol.11, 2007, 154–158
[21] . Zitao Zhang, Liang Chen, Jinmin Ji, Antibacterial Properties of Cotton Fabrics Treated with Chitosan,
Textile Research Journal December 2003 vol. 73 , nr. 12, p. 1103-1106
[22] Ali Elshaefei, H.T. El-Zanfaly, Application of Antimicrobials in the Developmet of Textiles, Asian Journal
of Applied Sciences, 2011, pg. 1-11
[23] Bhuvana Giri, Raghunathan Subramaniam, STUDIES ON FRICTIONAL BEHAVIOUR OF
CHITOSANCOATED FABRICS, AUTEX Research Journal, Vol. 6, Nr. 4, 2006 , p.216-222
[24] Mary Grace, M., Navin Chand, Sunil Kumar Bajpai, Alginate-Cotton Cellulose (CACC) Fibers with
Excellent Antibacterial Properties, Journal of Engineered Fibers and Fabric Vol. 4,Nr 3, 2009, p.24-35
[25] . S. Anita, T. Ramachandran, R. rajendran, M. Mahalakshmi, A study of the antimicrobial property of
encapsulated copper oxide nanoparticles on cotton fabric, Textile Research Journal , vol. 81 nr. 10,
2011, p. 1081-1088
[26] Puşcaş E.L., Teoria şi măsurarea culorii, Rotaprint, Iaşi, 1983, p.14
[27] .Puşcaş E.L., Radu D.C., Introducere în cunoaşterea şi măsurarea culorii, Ed. Dosoftei, Iaşi, 1997
[28] . Bucur M., Metode obiective de apreciere a tuşeului, Industria textilă,32, nr.1, 2001, p.39
[29] .Lau L., Fan J., Siu T., Text.Res.Journ., 72, 931, 2002
[30] .Mukhopadhyay A., Kothari V.K., Indian Journ.of Fibre and Textile Res., 27, 393, 2002
[31] .Stamenova M., Becheva R., Tsanov T., Tekstil i Oblekla, 10, 11, 2002
[32] * * * SR ISO 105 – A02:1995
[33] . * * * SR EN 22313/1997
Corresponding author:
Abramiuc DANKO, PhD Student Department of Textile Chemical Engineering Faculty of Textiles, Leather & Industrial Management/ “Gheorghe Asachi” Technical University 53 D. Mangeron Blvd. 700050, Iasi Romania
Phone:+40723241349; e-mail: [email protected] Co-authors: Crisan POPESCU DWI at RWTH Aachen University, Germany e-mail:[email protected] Augustin MURESAN Department of Chemical Engineering in Textile and Leather Faculty of Textile, Leather and Industrial Management/ “Gheorghe Asachi Technical University B-dul D. Mangeron No.53-55 700050, Iasi, Romania e-mail:[email protected]
528
14
th Romanian Textiles and Leather Conference – CORTEP 2012
Sinaia, 6 - 8 September 2012
ASSESSMENT PROTOCOL OF HIGHLY HYGIENIC LEATHER TYPES
Vasilica MAIER, Stelian Sergiu MAIER, Melinda PRUNEANU & Ingrid BUCIŞCANU
"Gheorghe Asachi” Technical University of Iasi, Romania Abstract: This paper proposes and defends an original protocol for the assessment of the behaviour of highly hygienic leather during natural and accelerated artificial ageing. The proposed protocol is based on the standards and methods associated to some leather-related determinations, though inappropriate for the qualitative evaluation of the highly hygienic leathers. The most important parameters for the assessment of highly hygienic leather mainly concern its ability to inhibit the development of microorganism colonies, especially of the fungi types, both on leather surface and in cross-section. The proposed protocol consists of a minimum set of standardized determinations, identically performed for all the hygienic tested leather types. The number and nature of determinations were established on the basis of the complex characterization of both naturally and artificially aged leather samples. Keywords: hygienic leather, assessment protocol, minimum set of assessment criteria 1 INTRODUCTION The testing methodology of highly hygienic leather has not been standardized yet, neither in Romania nor at international level. This paper aims to propose and support an original protocol for the assessment of the behavior of this kind of leather during natural and artificial ageing. This protocol is based on standards and methodologies associated to some leather-related determinations ([1] – [6]) which are not nevertheless appropriate for the qualitative assessment of the hygienic leather. The most important parameters that account for the assessment of the hygienic leather are mainly related to its ability to preserve the capacity to inhibit the growth of microorganism colonies, especially of the fungi types, both on leather surface and in cross-section. When upper leather is rendered hygienic by fatliquoring with fungicide-containing fatliquoring compositions, the main characteristics of the highly hygienic leather that meets the requirements for higher comfort footwear, are as follows: (i) stability of the intrinsic charcteristics defining the “highly hygienic” leather type, and (ii) durability of the “highly hygienic leather” characteristics, both in wearing and in simple storage ageing conditions. The proposed protocol consists of performing a common minimum set of standardized tests and analyses for all leather samples, in the following lifetime stages of the manufactured leather: (i) soon after the leather manufacturing process, when leather fully achieves the characteristics of the hygienic leather type, (ii) after natural ageing under controlled climate storage conditions, at constant temperature and relative humidity (RH), and (iii) after accelerated artificial ageing in controlled atmosphere, when leather is subjected to recurring, sharp changes of air temperature and relative humidity values. The minimum set of necessary tests will be selected pursuant to a complex characterization of the aged leather samples, both in natural ageing and in accelerated artificial ageing conditions.
2 EXPERIMENTAL 2.1 Materials and methods 2.1.1 Natural ageing of the hygienic leather samples The proposed ageing methodology consists of keeping the leather samples in controlled climates in three subsequent stages differing by the storage time and relative humidity values, as it follows: - (i) close climate chamber for 50 days, at RH 86 % and temperature of 22 ± 1 °C; - (ii) close climate chamber for 50 days at RH 68 % and temperature of 22 ± 1 °C;
529
14th Romanian Textiles and Leather Conference – CORTEP 2012
Sinaia, 6 - 8 September 2012
- (iii) close climate chamber for 50 days at RH 51 % and temperature of 22 ± 1 °C. Such conditions simulate seasonal climate variations to which the hygienic leather articles are subjected during actual wearing conditions. The required values of the relative humidity were obtained in glass desiccators filled with saturated solutions of: - potassium chloride (KCl), for RH 86 %; - ammonium nitrate (NH4NO3), for RH 68 %; - calcium nitrate (Ca(NO3)2 4 H2O), for RH 51 %. After the 150-day conditioning treatment, leather samples were prepared in accordance with the testing methods prescriptions, for each of the tests the leather samples were subjected to. 2.1.2 Accelerated artificial ageing of the hygienic leather samples Accelerated artificial ageing consists of significant and sharp changes of the air parameters in order to simulate, in a shorter time, the effects of longer contact with the human body during wearing. In this respect, before each conditioning cycle, leather samples were immersed in an artificial perspiration solution. A complete cycle of accelerated artificial ageing of hygienic leather samples consists of the following stages: - (i) steeping the leather samples into the artificial perspiration solution for 1 min; - (ii) keeping the leather samples in a constant climate chamber for 4 days, at RH 86 % and temperature
of 80 ± 2 °C; - (iii) keeping the leather samples in a constant climate chamber for 2 days, at RH 35 % and temperature
of 120 ± 2 °C; - (iv) keeping the leather samples in a constant climate chamber for 2 days, at RH 86 % and temperature
of 22 ± 1 °C. An extended 32-day testing cycle was performed, by repeating the accelerated artificial ageing cycle for four times. The composition of the artificial perspiration solution was: 20 g/L NaCl, 17.5 g/L NH4Cl, 5 ml/L glacial acetic acid, 15 ml/L lactic acid, 10 g/L Na2SO4, 8 ml/L etilic alcohol. The pH of the final solution was corrected to 4,7 with 0,1 M NaOH solution. 3 RESULTS AND DISCUSSION The criteria and parameters taken in account for the certification of hygienic leather with higher wearing comfort are given in Table 1. The experimental values of the tested parameters are within the commonly acceped ranges for chrome leather retanned with vegetable tannins. An objective comparison between the performances of the tested leather in the three testing conditions (recently processed leather, processed leather after a 150-day natural ageing, and processed leather after accelerated ageing), as they are reflected by the experimental values of the parameters given in Table 1, can be performed by statistical normalization of the value series of each index or parameter. Each value series of each index or parameter from Table 1 was processed according to the formula:
MEASURED
MEASURED MEASUREDNORMALIZED
Ind
Ind - IndInd =
σ (1)
where: IndNORMALIZED represents the normalized value of a given index/parameter; IndMEASURED represents the
actual value of a given index; MEASUREDInd is the mean value of experimental values of a given index, and
MEASUREDInd represemts the standard deviation of the mean.
Thus, the variation range of each index or parameter is confined to a dimensionless domain, which corresponds to a gaussian distribution with null mean and standard deviation of 1. As a consequence, abstract comparisons between different parameters become possible, in all of the three life stages of leather samples.
530
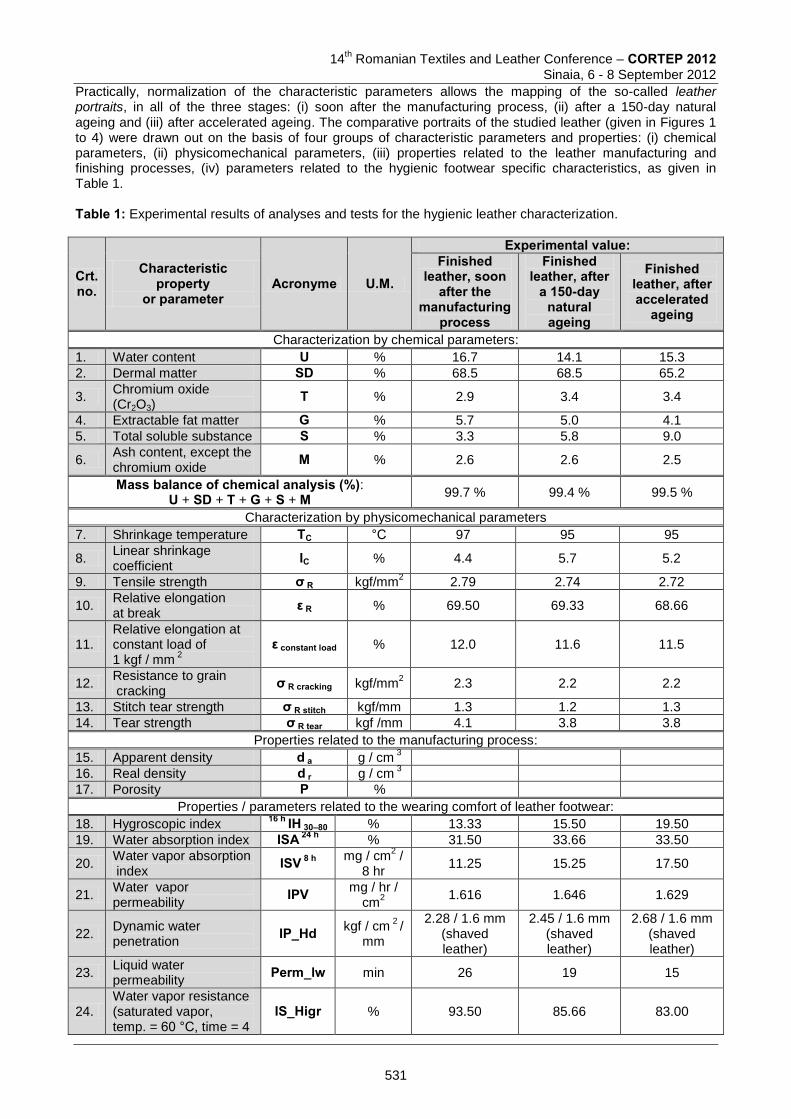
14
th Romanian Textiles and Leather Conference – CORTEP 2012
Sinaia, 6 - 8 September 2012
Practically, normalization of the characteristic parameters allows the mapping of the so-called leather portraits, in all of the three stages: (i) soon after the manufacturing process, (ii) after a 150-day natural ageing and (iii) after accelerated ageing. The comparative portraits of the studied leather (given in Figures 1 to 4) were drawn out on the basis of four groups of characteristic parameters and properties: (i) chemical parameters, (ii) physicomechanical parameters, (iii) properties related to the leather manufacturing and finishing processes, (iv) parameters related to the hygienic footwear specific characteristics, as given in Table 1. Table 1: Experimental results of analyses and tests for the hygienic leather characterization.
Crt. no.
Characteristic property
or parameter Acronyme U.M.
Experimental value: Finished
leather, soon after the
manufacturing process
Finished leather, after
a 150-day natural ageing
Finished leather, after accelerated
ageing
Characterization by chemical parameters:
1. Water content U % 16.7 14.1 15.3
2. Dermal matter SD % 68.5 68.5 65.2
3. Chromium oxide (Cr2O3)
T % 2.9 3.4 3.4
4. Extractable fat matter G % 5.7 5.0 4.1
5. Total soluble substance S % 3.3 5.8 9.0
6. Ash content, except the chromium oxide
M % 2.6 2.6 2.5
Mass balance of chemical analysis (%): U + SD + T + G + S + M
99.7 % 99.4 % 99.5 %
Characterization by physicomechanical parameters
7. Shrinkage temperature TC °C 97 95 95
8. Linear shrinkage coefficient
IC % 4.4 5.7 5.2
9. Tensile strength σ R kgf/mm2 2.79 2.74 2.72
10. Relative elongation at break
ε R % 69.50 69.33 68.66
11. Relative elongation at constant load of 1 kgf / mm
2
ε constant load % 12.0 11.6 11.5
12. Resistance to grain cracking
σ R cracking kgf/mm2 2.3 2.2 2.2
13. Stitch tear strength σ R stitch kgf/mm 1.3 1.2 1.3
14. Tear strength σ R tear kgf /mm 4.1 3.8 3.8
Properties related to the manufacturing process:
15. Apparent density d a g / cm 3
16. Real density d r g / cm 3
17. Porosity P %
Properties / parameters related to the wearing comfort of leather footwear:
18. Hygroscopic index 16 h IH 30–80 % 13.33 15.50 19.50
19. Water absorption index ISA 24 h % 31.50 33.66 33.50
20. Water vapor absorption index
ISV 8 h mg / cm2 /
8 hr 11.25 15.25 17.50
21. Water vapor permeability
IPV mg / hr / cm
2 1.616 1.646 1.629
22. Dynamic water penetration
IP_Hd kgf / cm 2
/ mm
2.28 / 1.6 mm (shaved leather)
2.45 / 1.6 mm (shaved leather)
2.68 / 1.6 mm (shaved leather)
23. Liquid water permeability
Perm_lw min 26 19 15
24. Water vapor resistance (saturated vapor, temp. = 60 °C, time = 4
IS_Higr % 93.50 85.66 83.00
531
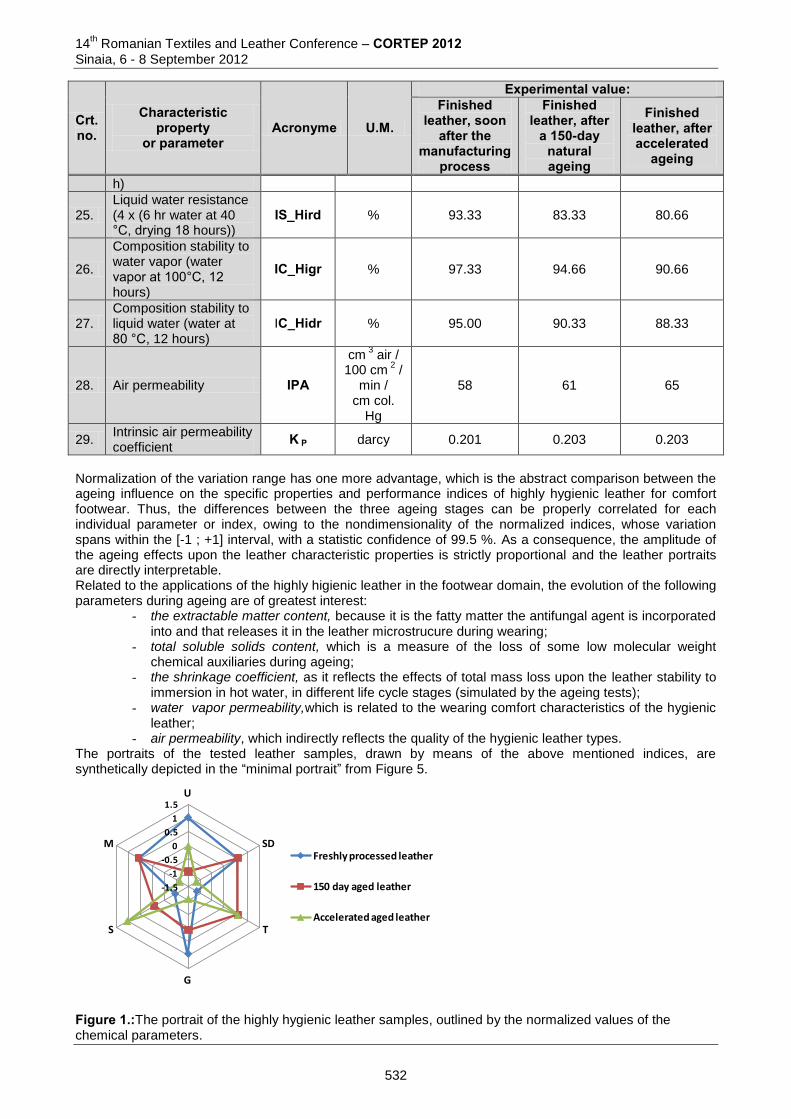
14th Romanian Textiles and Leather Conference – CORTEP 2012
Sinaia, 6 - 8 September 2012
Crt. no.
Characteristic property
or parameter Acronyme U.M.
Experimental value: Finished
leather, soon after the
manufacturing process
Finished leather, after
a 150-day natural ageing
Finished leather, after accelerated
ageing
h)
25. Liquid water resistance (4 x (6 hr water at 40 °C, drying 18 hours))
IS_Hird % 93.33 83.33 80.66
26.
Composition stability to water vapor (water vapor at 100°C, 12 hours)
IC_Higr % 97.33 94.66 90.66
27. Composition stability to liquid water (water at 80 °C, 12 hours)
IC_Hidr % 95.00 90.33 88.33
28. Air permeability IPA
cm 3 air /
100 cm 2 /
min / cm col.
Hg
58 61 65
29. Intrinsic air permeability coefficient
K P darcy 0.201 0.203 0.203
Normalization of the variation range has one more advantage, which is the abstract comparison between the ageing influence on the specific properties and performance indices of highly hygienic leather for comfort footwear. Thus, the differences between the three ageing stages can be properly correlated for each individual parameter or index, owing to the nondimensionality of the normalized indices, whose variation spans within the [-1 ; +1] interval, with a statistic confidence of 99.5 %. As a consequence, the amplitude of the ageing effects upon the leather characteristic properties is strictly proportional and the leather portraits are directly interpretable. Related to the applications of the highly higienic leather in the footwear domain, the evolution of the following parameters during ageing are of greatest interest:
- the extractable matter content, because it is the fatty matter the antifungal agent is incorporated into and that releases it in the leather microstrucure during wearing;
- total soluble solids content, which is a measure of the loss of some low molecular weight chemical auxiliaries during ageing;
- the shrinkage coefficient, as it reflects the effects of total mass loss upon the leather stability to immersion in hot water, in different life cycle stages (simulated by the ageing tests);
- water vapor permeability,which is related to the wearing comfort characteristics of the hygienic leather;
- air permeability, which indirectly reflects the quality of the hygienic leather types. The portraits of the tested leather samples, drawn by means of the above mentioned indices, are synthetically depicted in the “minimal portrait” from Figure 5.
-1.5
-1
-0.5
0
0.5
1
1.5U
SD
T
G
S
MFreshly processed leather
150 day aged leather
Accelerated aged leather
Figure 1.:The portrait of the highly hygienic leather samples, outlined by the normalized values of the chemical parameters.
532
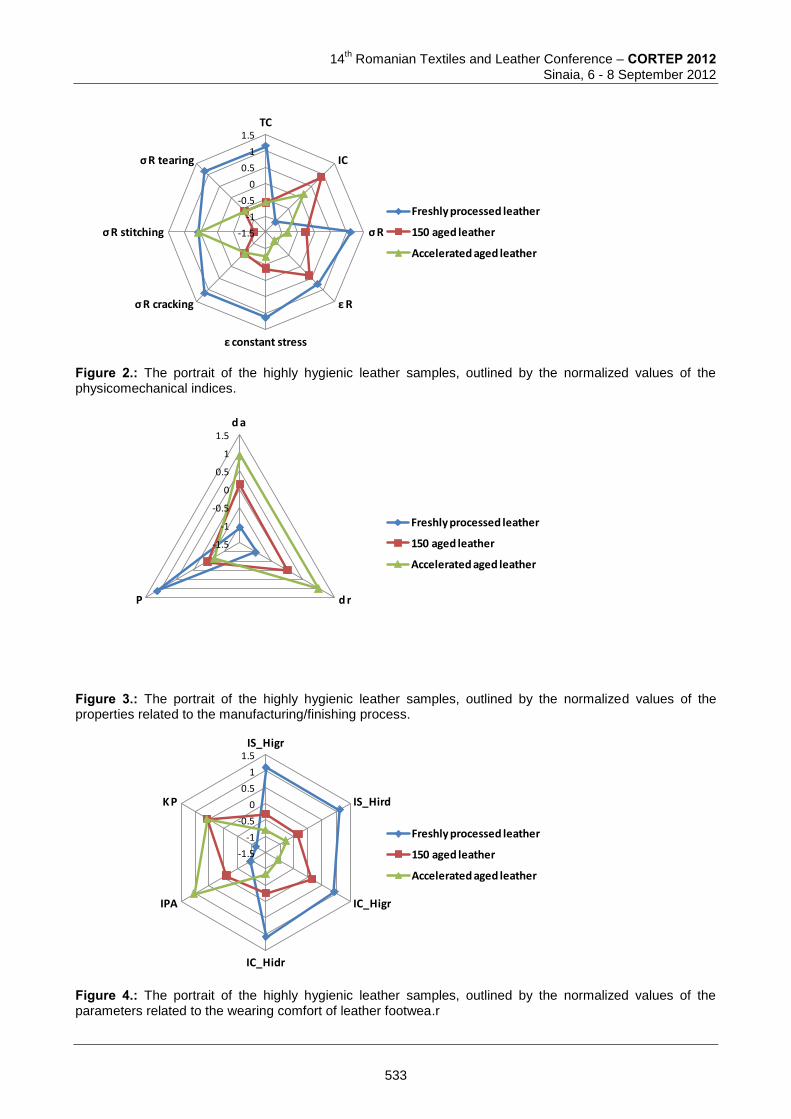
14
th Romanian Textiles and Leather Conference – CORTEP 2012
Sinaia, 6 - 8 September 2012
-1.5
-1
-0.5
0
0.5
1
1.5TC
IC
σ R
ε R
ε constant stress
σ R cracking
σ R stitching
σ R tearing
Freshly processed leather
150 aged leather
Accelerated aged leather
Figure 2.: The portrait of the highly hygienic leather samples, outlined by the normalized values of the physicomechanical indices.
-1.5
-1
-0.5
0
0.5
1
1.5d a
d r P
Freshly processed leather
150 aged leather
Accelerated aged leather
Figure 3.: The portrait of the highly hygienic leather samples, outlined by the normalized values of the properties related to the manufacturing/finishing process.
-1.5
-1
-0.5
0
0.5
1
1.5IS_Higr
IS_Hird
IC_Higr
IC_Hidr
IPA
K P
Freshly processed leather
150 aged leather
Accelerated aged leather
Figure 4.: The portrait of the highly hygienic leather samples, outlined by the normalized values of the parameters related to the wearing comfort of leather footwea.r
533
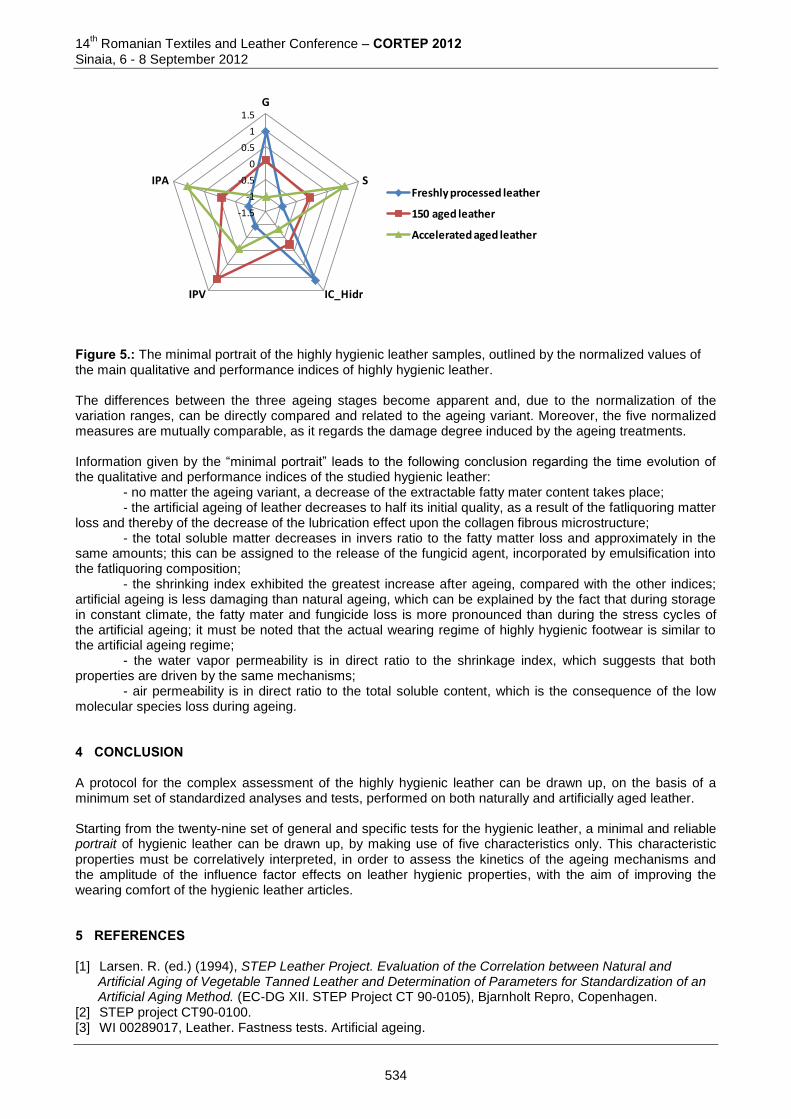
14th Romanian Textiles and Leather Conference – CORTEP 2012
Sinaia, 6 - 8 September 2012
-1.5
-1
-0.5
0
0.5
1
1.5G
S
IC_HidrIPV
IPAFreshly processed leather
150 aged leather
Accelerated aged leather
Figure 5.: The minimal portrait of the highly hygienic leather samples, outlined by the normalized values of the main qualitative and performance indices of highly hygienic leather. The differences between the three ageing stages become apparent and, due to the normalization of the variation ranges, can be directly compared and related to the ageing variant. Moreover, the five normalized measures are mutually comparable, as it regards the damage degree induced by the ageing treatments. Information given by the “minimal portrait” leads to the following conclusion regarding the time evolution of the qualitative and performance indices of the studied hygienic leather: - no matter the ageing variant, a decrease of the extractable fatty mater content takes place; - the artificial ageing of leather decreases to half its initial quality, as a result of the fatliquoring matter loss and thereby of the decrease of the lubrication effect upon the collagen fibrous microstructure; - the total soluble matter decreases in invers ratio to the fatty matter loss and approximately in the same amounts; this can be assigned to the release of the fungicid agent, incorporated by emulsification into the fatliquoring composition; - the shrinking index exhibited the greatest increase after ageing, compared with the other indices; artificial ageing is less damaging than natural ageing, which can be explained by the fact that during storage in constant climate, the fatty mater and fungicide loss is more pronounced than during the stress cycles of the artificial ageing; it must be noted that the actual wearing regime of highly hygienic footwear is similar to the artificial ageing regime; - the water vapor permeability is in direct ratio to the shrinkage index, which suggests that both properties are driven by the same mechanisms; - air permeability is in direct ratio to the total soluble content, which is the consequence of the low molecular species loss during ageing. 4 CONCLUSION A protocol for the complex assessment of the highly hygienic leather can be drawn up, on the basis of a minimum set of standardized analyses and tests, performed on both naturally and artificially aged leather. Starting from the twenty-nine set of general and specific tests for the hygienic leather, a minimal and reliable portrait of hygienic leather can be drawn up, by making use of five characteristics only. This characteristic properties must be correlatively interpreted, in order to assess the kinetics of the ageing mechanisms and the amplitude of the influence factor effects on leather hygienic properties, with the aim of improving the wearing comfort of the hygienic leather articles. 5 REFERENCES [1] Larsen. R. (ed.) (1994), STEP Leather Project. Evaluation of the Correlation between Natural and
Artificial Aging of Vegetable Tanned Leather and Determination of Parameters for Standardization of an Artificial Aging Method. (EC-DG XII. STEP Project CT 90-0105), Bjarnholt Repro, Copenhagen.
[2] STEP project CT90-0100. [3] WI 00289017, Leather. Fastness tests. Artificial ageing.
534
14
th Romanian Textiles and Leather Conference – CORTEP 2012
Sinaia, 6 - 8 September 2012
[4] CEN EN 12749 1999-09-00 Footwear, Ageing Conditioning. [5] ISO/FDIS 17228:2004, Leather. Tests for colour fastness. Change in colour with accelerated ageing. [6] SR EN ISO 17228:2006, Finished leather. Tests for colour fastness. Color change by ageing agents.
Corresponding author: Stelian Sergiu MAIER Department of Leather and Leather Substitutes Technology Faculty of Textile., Leather and Industrial Management./ “Gheorghe Asachi’ Technical University of Iasi Bd. D. Mangeron 53, 700050. Iasi, Romania Phone: 0740 024729; Fax: 0232 279850; E-mail: [email protected]
Co-author(s): Vasilica MAIER Department of Leather and Leather Substitutes Technology Faculty of Textile., Leather and Industrial Management./ “Gheorghe Asachi’ Technical University Bd. D. Mangeron 53. 700050. Iasi, Romania Phone: 0740 024729; Fax: 0232 279850; E-mail: [email protected] Melinda PRUNEANU Department of Leather and Leather Substitutes Technology Faculty of Textile., Leather and Industrial Management./ “Gheorghe Asachi’ Technical University Bd. D. Mangeron 53. 700050. Iasi, Romania Phone: 0740 024729; Fax: 0232 279850; E-mail: [email protected]
Ingrid Ioana BUCIŞCANU Department of Leather and Leather Substitutes Technology Faculty of Textile., Leather and Industrial Management./ “Gheorghe Asachi’ Technical University Bd. D. Mangeron 53. 700050. Iasi, Romania Phone: 0740 024729; Fax: 0232 279850; E-mail: [email protected]
535
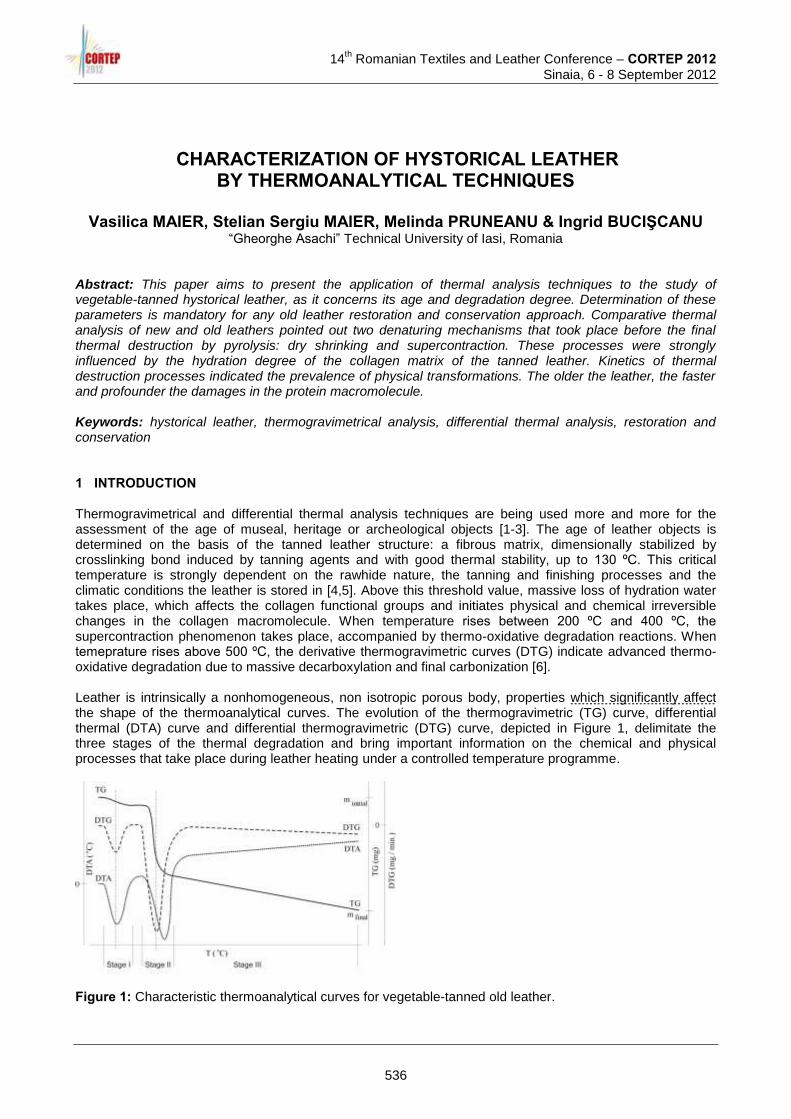
14
th Romanian Textiles and Leather Conference – CORTEP 2012
Sinaia, 6 - 8 September 2012
CHARACTERIZATION OF HYSTORICAL LEATHER BY THERMOANALYTICAL TECHNIQUES
Vasilica MAIER, Stelian Sergiu MAIER, Melinda PRUNEANU & Ingrid BUCIŞCANU
“Gheorghe Asachi” Technical University of Iasi, Romania Abstract: This paper aims to present the application of thermal analysis techniques to the study of vegetable-tanned hystorical leather, as it concerns its age and degradation degree. Determination of these parameters is mandatory for any old leather restoration and conservation approach. Comparative thermal analysis of new and old leathers pointed out two denaturing mechanisms that took place before the final thermal destruction by pyrolysis: dry shrinking and supercontraction. These processes were strongly influenced by the hydration degree of the collagen matrix of the tanned leather. Kinetics of thermal destruction processes indicated the prevalence of physical transformations. The older the leather, the faster and profounder the damages in the protein macromolecule. Keywords: hystorical leather, thermogravimetrical analysis, differential thermal analysis, restoration and conservation
1 INTRODUCTION Thermogravimetrical and differential thermal analysis techniques are being used more and more for the assessment of the age of museal, heritage or archeological objects [1-3]. The age of leather objects is determined on the basis of the tanned leather structure: a fibrous matrix, dimensionally stabilized by crosslinking bond induced by tanning agents and with good thermal stability, up to 130 ºC. This critical temperature is strongly dependent on the rawhide nature, the tanning and finishing processes and the climatic conditions the leather is stored in [4,5]. Above this threshold value, massive loss of hydration water takes place, which affects the collagen functional groups and initiates physical and chemical irreversible changes in the collagen macromolecule. When temperature rises between 200 ºC and 400 ºC, the supercontraction phenomenon takes place, accompanied by thermo-oxidative degradation reactions. When temeprature rises above 500 ºC, the derivative thermogravimetric curves (DTG) indicate advanced thermo-oxidative degradation due to massive decarboxylation and final carbonization [6]. Leather is intrinsically a nonhomogeneous, non isotropic porous body, properties which significantly affect the shape of the thermoanalytical curves. The evolution of the thermogravimetric (TG) curve, differential thermal (DTA) curve and differential thermogravimetric (DTG) curve, depicted in Figure 1, delimitate the three stages of the thermal degradation and bring important information on the chemical and physical processes that take place during leather heating under a controlled temperature programme.
Figure 1: Characteristic thermoanalytical curves for vegetable-tanned old leather.
536
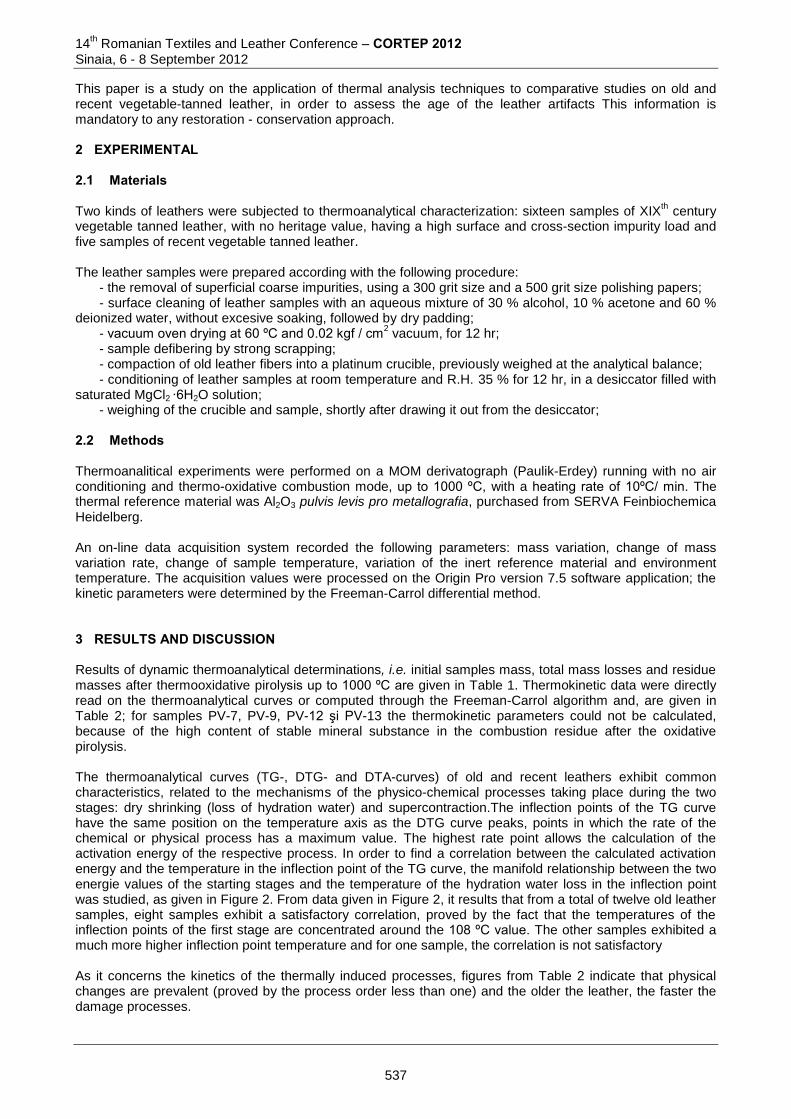
14th Romanian Textiles and Leather Conference – CORTEP 2012
Sinaia, 6 - 8 September 2012
This paper is a study on the application of thermal analysis techniques to comparative studies on old and recent vegetable-tanned leather, in order to assess the age of the leather artifacts This information is mandatory to any restoration - conservation approach. 2 EXPERIMENTAL 2.1 Materials Two kinds of leathers were subjected to thermoanalytical characterization: sixteen samples of XIX
th century
vegetable tanned leather, with no heritage value, having a high surface and cross-section impurity load and five samples of recent vegetable tanned leather. The leather samples were prepared according with the following procedure:
- the removal of superficial coarse impurities, using a 300 grit size and a 500 grit size polishing papers; - surface cleaning of leather samples with an aqueous mixture of 30 % alcohol, 10 % acetone and 60 %
deionized water, without excesive soaking, followed by dry padding; - vacuum oven drying at 60 ºC and 0.02 kgf / cm
2 vacuum, for 12 hr;
- sample defibering by strong scrapping; - compaction of old leather fibers into a platinum crucible, previously weighed at the analytical balance; - conditioning of leather samples at room temperature and R.H. 35 % for 12 hr, in a desiccator filled with
saturated MgCl2 ∙6H2O solution; - weighing of the crucible and sample, shortly after drawing it out from the desiccator;
2.2 Methods Thermoanalitical experiments were performed on a MOM derivatograph (Paulik-Erdey) running with no air conditioning and thermo-oxidative combustion mode, up to 1000 ºC, with a heating rate of 10ºC/ min. The thermal reference material was Al2O3 pulvis levis pro metallografia, purchased from SERVA Feinbiochemica Heidelberg. An on-line data acquisition system recorded the following parameters: mass variation, change of mass variation rate, change of sample temperature, variation of the inert reference material and environment temperature. The acquisition values were processed on the Origin Pro version 7.5 software application; the kinetic parameters were determined by the Freeman-Carrol differential method. 3 RESULTS AND DISCUSSION Results of dynamic thermoanalytical determinations, i.e. initial samples mass, total mass losses and residue masses after thermooxidative pirolysis up to 1000 ºC are given in Table 1. Thermokinetic data were directly read on the thermoanalytical curves or computed through the Freeman-Carrol algorithm and, are given in Table 2; for samples PV-7, PV-9, PV-12 şi PV-13 the thermokinetic parameters could not be calculated, because of the high content of stable mineral substance in the combustion residue after the oxidative pirolysis. The thermoanalytical curves (TG-, DTG- and DTA-curves) of old and recent leathers exhibit common characteristics, related to the mechanisms of the physico-chemical processes taking place during the two stages: dry shrinking (loss of hydration water) and supercontraction.The inflection points of the TG curve have the same position on the temperature axis as the DTG curve peaks, points in which the rate of the chemical or physical process has a maximum value. The highest rate point allows the calculation of the activation energy of the respective process. In order to find a correlation between the calculated activation energy and the temperature in the inflection point of the TG curve, the manifold relationship between the two energie values of the starting stages and the temperature of the hydration water loss in the inflection point was studied, as given in Figure 2. From data given in Figure 2, it results that from a total of twelve old leather samples, eight samples exhibit a satisfactory correlation, proved by the fact that the temperatures of the inflection points of the first stage are concentrated around the 108 ºC value. The other samples exhibited a much more higher inflection point temperature and for one sample, the correlation is not satisfactory As it concerns the kinetics of the thermally induced processes, figures from Table 2 indicate that physical changes are prevalent (proved by the process order less than one) and the older the leather, the faster the damage processes.
537

14
th Romanian Textiles and Leather Conference – CORTEP 2012
Sinaia, 6 - 8 September 2012
An old leather dating technique, based on the identification of the temperature at which the hydration loss rate is highest, requires that leathers with similar characteristics are grouped together. The similarity degree of both old leather and recent leather samples is presented in the similarity dendogram from Figure 3. It can be seen that samples PV-5, PV-15, PV-11, PV-6 and PV-16 move away from the other samples, probably to to a higher metal oxides content (the above-mentioned samples come from leathers that stayed in prolonged contact with metal objects). Table 1: Results of gravimetric determinations for old leather (PV) and recent leather (PR) samples subjected to thermal analysis.
Sample code
Sample nature/provenience
Initial mass [g]
Residue mass
[g]
Total mass loss [g]
Total mass loss [%]
PV-1 Shelfback of religious book 0,1962 0,0016 0,1946 99,18
PV-2 Cordoba leather 0,1878 0,0037 0,1841 98,03
PV-3 Outer covering leather for trunks 0,3108 0,0064 0,3044 97,94
PV-4 Military harness leather belt 0,2915 0,0065 0,2850 97,77
PV-5 Romanian sword sheath leather 0,4180 0,0153 0,4027 96,34
PV-6 Bookbinding leather from a laic book 0,3471 0,0136 0,3335 96,08
PV-7 Armchair leather upholstery 0,0796 0,0042 0,0754 94,72
PV-8 Romanian sword hilt leather 0,2551 0,0138 0,2413 94,59
PV-9 Oriental yataghan leather sheath 0,1151 0,0063 0,1088 94,53
PV-10 Bookbinding leather from a religious book 0,2739 0,0181 0,258 93,39
PV-11 Military belt leather 0,4080 0,0297 0,3783 92,72
PV-12 Bible bookbinding leather, dated 1896 0,2959 0,0149 0,2810 90,96
PV-13 Morocco leather, dated 1841 0,3349 0,0344 0,3005 89,73
PV-14 Leather for cigarette-case lining 0,2647 0,0289 0,2358 89,08
PV-15 Russian sword hilt leather, dated 1837 0,3715 0,0562 0,3153 84,87
PV-16 Parade harness leather belt 0,4122 0,0780 0,3342 81,08
PR-1 Chestnut-tanned leather 0,2268 0,0020 0,2248 99,12
PR-2 Oak-tanned leather 0,2428 0,0023 0,2405 99,05
PR-3 Valex-tanned leather 0,3227 0,0034 0,3193 98,95
PR-4 Quebracho-tanned leather 0,2346 0,0038 0,2308 98,38
PR-5 Wattle-tanned leather 0,3316 0,0069 0,3247 97,92
Figure 2: Correlation between the activation energies of stage I and stage II processes, as a function of the inflection point of stage I. As a result of the analysis and statistical comparison of the thermonalytical data for old and recent leathers, the statistical synopsis of the temperature distribution at the beginning and at the end of the dry shrinking
538
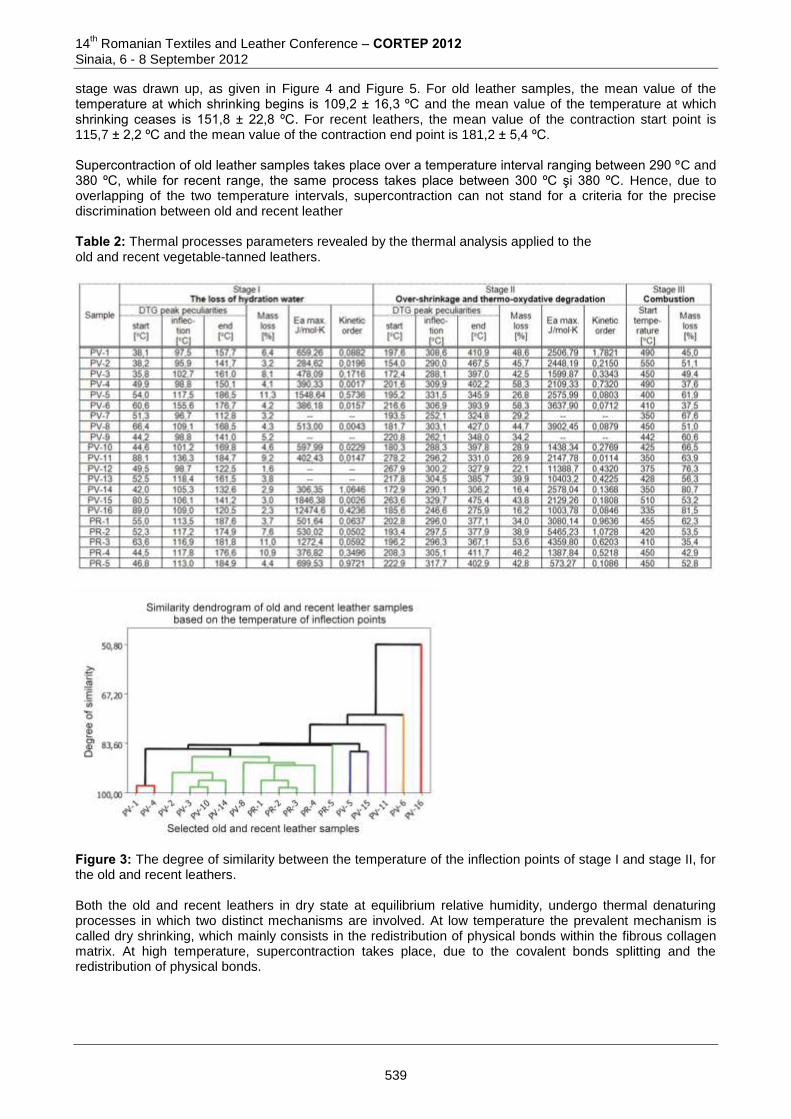
14th Romanian Textiles and Leather Conference – CORTEP 2012
Sinaia, 6 - 8 September 2012
stage was drawn up, as given in Figure 4 and Figure 5. For old leather samples, the mean value of the temperature at which shrinking begins is 109,2 ± 16,3 ºC and the mean value of the temperature at which shrinking ceases is 151,8 ± 22,8 ºC. For recent leathers, the mean value of the contraction start point is 115,7 ± 2,2 ºC and the mean value of the contraction end point is 181,2 ± 5,4 ºC. Supercontraction of old leather samples takes place over a temperature interval ranging between 290 ºC and 380 ºC, while for recent range, the same process takes place between 300 ºC şi 380 ºC. Hence, due to overlapping of the two temperature intervals, supercontraction can not stand for a criteria for the precise discrimination between old and recent leather Table 2: Thermal processes parameters revealed by the thermal analysis applied to the old and recent vegetable-tanned leathers.
Figure 3: The degree of similarity between the temperature of the inflection points of stage I and stage II, for the old and recent leathers. Both the old and recent leathers in dry state at equilibrium relative humidity, undergo thermal denaturing processes in which two distinct mechanisms are involved. At low temperature the prevalent mechanism is called dry shrinking, which mainly consists in the redistribution of physical bonds within the fibrous collagen matrix. At high temperature, supercontraction takes place, due to the covalent bonds splitting and the redistribution of physical bonds.
539
14
th Romanian Textiles and Leather Conference – CORTEP 2012
Sinaia, 6 - 8 September 2012
160150140130120110100
Median
Mean
120115110105100
1st Q uartile 98.73
Median 104.00
3rd Q uartile 115.40
Maximum 155.60
100.56 117.89
98.78 111.09
12.02 25.17
A -Squared 1.39
P-V alue < 0.005
Mean 109.22
StDev 16.27
V ariance 264.57
Skewness 1.95920
Kurtosis 3.82304
N 16
Minimum 95.90
A nderson-Darling Normality Test
95% C onfidence Interv al for Mean
95% C onfidence Interv al for Median
95% C onfidence Interv al for StDev
95% Confidence Intervals
Contraction start point - Old leathers
180160140120
Median
Mean
170165160155150145140
1st Q uartile 134.70
Median 153.90
3rd Q uartile 169.48
Maximum 186.50
139.66 163.94
139.01 168.81
16.83 35.26
A -Squared 0.21
P-V alue 0.838
Mean 151.80
StDev 22.78
V ariance 518.98
Skewness -0.132001
Kurtosis -0.975583
N 16
Minimum 112.80
A nderson-Darling Normality Test
95% C onfidence Interv al for Mean
95% C onfidence Interv al for Median
95% C onfidence Interv al for StDev
95% Confidence Intervals
Contraction end point - Old leathers
Figure 4: Statistical distribution of the dry shrinking range parameters for old leather samples.
118117116115114113
Median
Mean
119118117116115114113
1st Q uartile 113.25
Median 116.90
3rd Q uartile 117.50
Maximum 117.80
112.89 118.47
113.00 117.80
1.35 6.46
A -Squared 0.48
P-V alue 0.119
Mean 115.68
StDev 2.25
V ariance 5.06
Skewness -0.54055
Kurtosis -3.01798
N 5
Minimum 113.00
A nderson-Darling Normality Test
95% C onfidence Interv al for Mean
95% C onfidence Interv al for Median
95% C onfidence Interv al for StDev
95% Confidence Intervals
Contraction start point - Recent leathers
187.5185.0182.5180.0177.5175.0
Median
Mean
187.5185.0182.5180.0177.5175.0
1st Q uartile 175.75
Median 181.80
3rd Q uartile 186.25
Maximum 187.60
174.48 187.84
174.90 187.60
3.22 15.46
A -Squared 0.22
P-V alue 0.663
Mean 181.16
StDev 5.38
V ariance 28.96
Skewness -0.05471
Kurtosis -2.21247
N 5
Minimum 174.90
A nderson-Darling Normality Test
95% C onfidence Interv al for Mean
95% C onfidence Interv al for Median
95% C onfidence Interv al for StDev
95% Confidence Intervals
Contraction end point - Recent leathers
Figure 5: Statistical distribution of the dry shrinking range parameters for recent leather samples.
4 CONCLUSIONS Thermogravimetric and thermal diferential analysis curves allow the establishment, on the temperature scale, of two main process that contribute to the thermal denaturing of leather: dry shrinking and supercontraction. The first stage of leather thermal denaturing i.e. the dry shrinking, for which the predominant mechansim is the redistribution of the physical bonds is decisive for old leather dating. Statistical and comparative processing of experimental thermoanalytical data show that dry shrinking of old leather ranges between 110 and 150 °C, while recent leather exhibit a broader temperature range, between 115 and180 °C. An old leather dating technique can be established on the basis of the maximum hydration water loss temperature, determined by thermoanalytical techniques. 5 REFERENCES [1] Della Gatta G., Badea E., Ceccarelli R., Usacheva T., Mašić A. Assessment of damage in old parchment
by DSC and SEM, J. Therm. Anal. Cal. 82, 2005, 637-649. [2] Deselnicu V., Maier S., Ioniuc A, Geba M., Albu L., Melniciuc N., Deselnicu D.C., Contribution to
development of special leather to be used in the restoration of historical objects, Bulletinul Institutului Politehnic Iaşi, Tomul LIII(LVII), Fasc.5, 2007, 271-276.
[3] Rabek J. F. Experimental Methods in Polymer Chemistry. Physical Principles and Applications., Wiley & sons, New York, 1980.
[4] Asandei N., Chiriţă A., Bulacovschi J., Industria Uşoară 22 (4), 1975, 151-157.
540
14th Romanian Textiles and Leather Conference – CORTEP 2012
Sinaia, 6 - 8 September 2012
[5] Vasile C., Călugăru E. M., Stoleriu A., Şabliovschi M., Mihai E., Polymer thermal behavior, Editura Academiei, Bucureşti, 1980.
[6] Higman E. B., Schmeltz I., Schlotzhauer W. S., Products from the thermal degradation of some naturally occurring materials, J. Agric. Food Chem., 1970, 18 (4), 636–639.
Corresponding author: Stelian Sergiu MAIER Department of Leather and Leather Substitutes Technology Faculty of Textile, Leather and Industrial Management “Gheorghe Asachi” Technical University of Iasi Bd. D. Mangeron 53 700050. Iasi, Romania Phone: 0740 024729; Fax: 0232 279850; E-mail: [email protected]
Co-author(s): Vasilica MAIER Department of Leather and Leather Substitutes Technology Faculty of Textile., Leather and Industrial Management./ “Gheorghe Asachi” Technical University of Iasi Bd. D. Mangeron 53. 700050. Iasi, Romania Phone: 0740 024729; Fax: 0232 279850; E-mail: [email protected] Melinda PRUNEANU Department of Leather and Leather Substitutes Technology Faculty of Textile., Leather and Industrial Management./ “Gheorghe Asachi” Technical University Bd. D. Mangeron 53. 700050. Iasi, Romania Phone: 0740 024729 Fax: 0232 279850 E-mail: [email protected]
Ingrid Ioana BUCIŞCANU Department of Leather and Leather Substitutes Technology Faculty of Textile., Leather and Industrial Management./ “Gheorghe Asachi” Technical University Bd. D. Mangeron 53. 700050. Iasi, Romania Phone: 0740 024729 Fax: 0232 279850 E-mail: [email protected]
541
14
th Romanian Textiles and Leather Conference – CORTEP 2012
Sinaia, 6 - 8 September 2012
CONVENTIONAL TANNING VS LOW-OFFER CHROME TANNING, USING A MELAMINE-FORMALDEHYDE RESIN AS PRE-TANNING AGENT
Melinda Pruneanu, Ingrid Bucişcanu, Stelian Sergiu Maier & Vasilica Maier
“Gheorghe Asachi” Technical University of Iasi,Romania Abstract: This paper presents a non-conventional tanning technology, which uses a benzenesulfonate melamine-formaldehyde resin (BSMF) as pre-tanning agent. BSMF tanning alone can produce white leather, which generates crome-free leather wastes. A BSMF pre-tanning step can be applied prior to a tanning step with lower chrome offer compared with the conventional chrome tanning technology. Thus, low chrome-content leathers can be obtained, having the organoleptic properties and physico-mechanical behavior similar to those obtained through conventional processing. The ATR-FTIR spectra and SEM images indicate a cross-linking degree significantly higher than that achieved by the conventional tanning agents. A BSMF pre-tanning, followed by a chrome tanning with an offer of 1 % Cr2O3 and mimosa extract retanning results in leather having the compositional and structural chracteristics required by the upper leather type standards. Keywords: pre-tanning agents, tanned leather, wet-white leather, basic chromium salt 1 INTRODUCTION During recent years, there has been an increasing interest in the replacement of chrome as tanning agent, due to increasing restrictions regarding the environment pollution with chrome-containing wastewater, sludge and solid wastes coming from tanneries. Efforts to find alternative solutions have been focused on complete replacement of chrome with other tanning agents (basic salts of metals such as Al, Zr, Ti, vegetable tannins, reactive organic compounds), partial chrome replacement, use of wet-white tanning, alternate technologies with low-offer or high chrome exhaustion [1-9]. Sulfonated melamine-formaldehyde resins are usually used as retanning agents, but little investigation has been done on their use as pre-tanning agents [10, 11, 17-19]. Chemically modified or condensed triazine, known as sulfonated melamine-formaldehyde resins (SMF) showed satisfactory pre-tanning or even tanning effects [12-16], but have at the same time several shortcomings, such as low storage stability, high hydrophilicity imparted to leather, high prices. These are the main resons why the SMFs have not gained large industrial applicability as syntans. Studies on the use of benzenesulfonated melamine-formaldehyde (BSMF) resin as pre-tanning agent showed that its tanning effect is based on its uniform diffusion in the leather cross-section, and on its ability to envelope the collagen fibers and to fill the interfibrillar voids within the collagen fibrous matrix [20-22]. This paper proposes and assesses a novel tanning technology of cattle hides, which consists of a pre-tanning step with the benzenesulfonated melamine-formaldehyde resin, a low chrome offer tanning stage and a final vegetable retanning, in order to obtain low chrome-content finished leather that meet the quality requirements for upper leather. 2 EXPERIMENTAL The efficacy of the BSMF resin as pre-tanning agent was tested within a novel technological process for the obtaining of upper leather from light and medium weight cattle hides.The framework technological process, which uses the BSMF product as pre-tanning agents in conjuction with a low-offer chrome tanning stage is given in Table 1 2.1. Materials - indigenous cattle hide, conventionally processed in the beamhouse to obtain 100% delimed and bated
pelt;
542
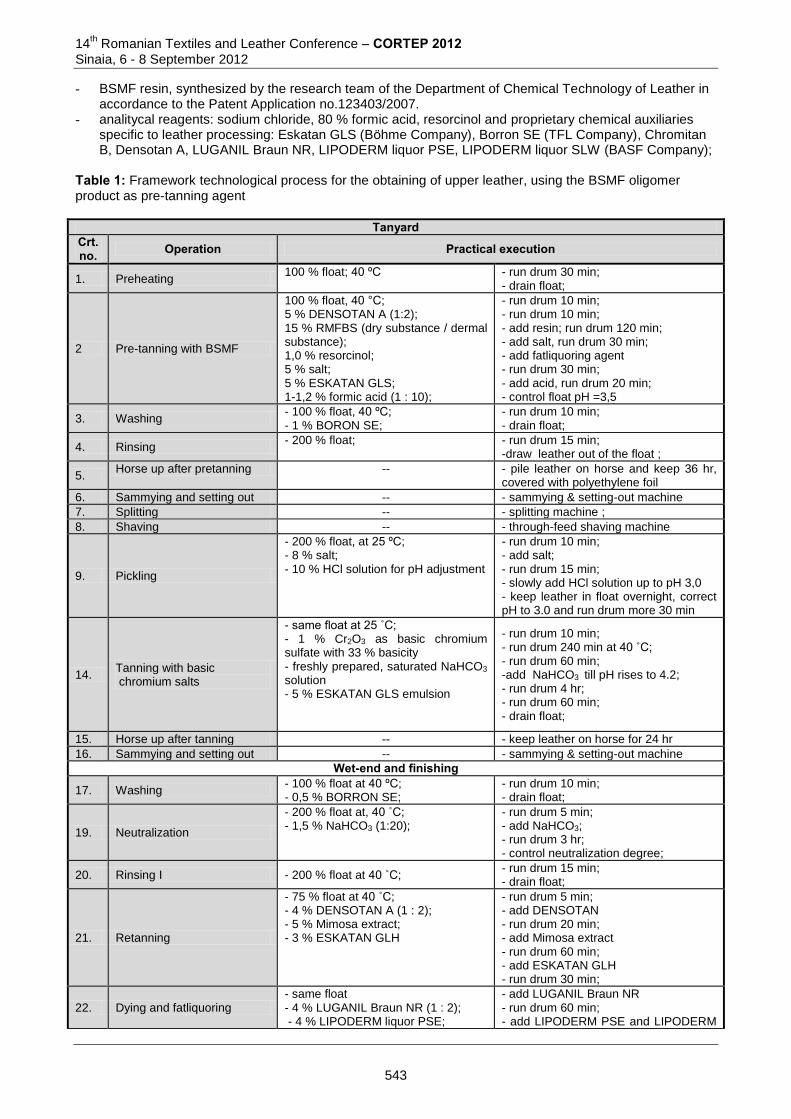
14th Romanian Textiles and Leather Conference – CORTEP 2012
Sinaia, 6 - 8 September 2012
- BSMF resin, synthesized by the research team of the Department of Chemical Technology of Leather in accordance to the Patent Application no.123403/2007.
- analitycal reagents: sodium chloride, 80 % formic acid, resorcinol and proprietary chemical auxiliaries specific to leather processing: Eskatan GLS (Böhme Company), Borron SE (TFL Company), Chromitan B, Densotan A, LUGANIL Braun NR, LIPODERM liquor PSE, LIPODERM liquor SLW (BASF Company);
Table 1: Framework technological process for the obtaining of upper leather, using the BSMF oligomer product as pre-tanning agent
Tanyard Crt. no. Operation Practical execution
1. Preheating 100 % float; 40 ºC
- run drum 30 min; - drain float;
2 Pre-tanning with BSMF
100 % float, 40 °C; 5 % DENSOTAN A (1:2); 15 % RMFBS (dry substance / dermal substance); 1,0 % resorcinol; 5 % salt; 5 % ESKATAN GLS; 1-1,2 % formic acid (1 : 10);
- run drum 10 min; - run drum 10 min; - add resin; run drum 120 min; - add salt, run drum 30 min; - add fatliquoring agent - run drum 30 min; - add acid, run drum 20 min; - control float pH =3,5
3. Washing - 100 % float, 40 ºC; - 1 % BORON SE;
- run drum 10 min; - drain float;
4. Rinsing - 200 % float; - run drum 15 min;
-draw leather out of the float ;
5. Horse up after pretanning -- - pile leather on horse and keep 36 hr,
covered with polyethylene foil
6. Sammying and setting out -- - sammying & setting-out machine
7. Splitting -- - splitting machine ;
8. Shaving -- - through-feed shaving machine
9. Pickling
- 200 % float, at 25 ºC; - 8 % salt; - 10 % HCl solution for pH adjustment
- run drum 10 min; - add salt; - run drum 15 min; - slowly add HCl solution up to pH 3,0 - keep leather in float overnight, correct pH to 3.0 and run drum more 30 min
14. Tanning with basic chromium salts
- same float at 25 ˚C; - 1 % Cr2O3 as basic chromium sulfate with 33 % basicity - freshly prepared, saturated NaHCO3 solution - 5 % ESKATAN GLS emulsion
- run drum 10 min; - run drum 240 min at 40 ˚C; - run drum 60 min; -add NaHCO3 till pH rises to 4.2; - run drum 4 hr; - run drum 60 min; - drain float;
15. Horse up after tanning -- - keep leather on horse for 24 hr
16. Sammying and setting out -- - sammying & setting-out machine
Wet-end and finishing
17. Washing - 100 % float at 40 ºC; - 0,5 % BORRON SE;
- run drum 10 min; - drain float;
19. Neutralization
- 200 % float at, 40 ˚C; - 1,5 % NaHCO3 (1:20);
- run drum 5 min; - add NaHCO3; - run drum 3 hr; - control neutralization degree;
20. Rinsing I - 200 % float at 40 ˚C; - run drum 15 min; - drain float;
21. Retanning
- 75 % float at 40 ˚C; - 4 % DENSOTAN A (1 : 2); - 5 % Mimosa extract; - 3 % ESKATAN GLH
- run drum 5 min; - add DENSOTAN - run drum 20 min; - add Mimosa extract - run drum 60 min; - add ESKATAN GLH - run drum 30 min;
22. Dying and fatliquoring - same float - 4 % LUGANIL Braun NR (1 : 2); - 4 % LIPODERM liquor PSE;
- add LUGANIL Braun NR - run drum 60 min; - add LIPODERM PSE and LIPODERM
543
14
th Romanian Textiles and Leather Conference – CORTEP 2012
Sinaia, 6 - 8 September 2012
Tanyard Crt. no. Operation Practical execution
- 2 % LIPODERM liquor SLW; - 1 % formic acid solution 10 %
SLW - run drum 20 min; -add formic acid - run drum 30 min; - drain float;
23. Rinsing II - 200 % float at 40 ˚C; - run drum 5 min; - drain float;
24. Horse up after wet finishing -- - keep leather on horse, 12÷18 hr;
25. Sammying and setting out -- - sammying & setting-out machine;
26. Air-drying in freely hanging state
-- - overhead dryer
27. Staking -- - hydraulic staking machine;
28. Toogle drying -- - drying tunnel;
29. Reconditioning -- - spraying;
30. Milling -- - milling drum;
31. Staking II -- - staking machine;
32. Horse up - keep leather on horse 5-6 hr ;
33. Buffing on the flesh side -- - buffing machine;
34. Dedusting -- - dedusting machine;
35. Chemical grain redress
- aqueous solution containing: 1 g / L ammonia; 0,5 g / L BORRON SE; 6 g / L tehnical alcohol;
- spraying on the grain side
36. Air –drying in freely hanging state
-- - overhead dryer
37. Mechanical grain redress (ironing)
-- - through feed ironing machine
Leather thus processed was subjected to physicochemical and physicomechanical characterization Leather thus processed can undertake any subsequent dry finishing process
2.2. Methods - Physical and chemical analysis of pretanned leather samples, performed in accordance with SR EN ISO
2418:2003, SR EN ISO 2419:2006 and SR EN ISO 4044:2002; - FTIR-ATR Spectroscopy of treated leathers recorded on a Digilab/Excalibur FTS 2000 spectrometer on
a Zn crystal in the 700-4000 cm-1
range, in a total number of 24 scans and resolution of 4 cm-1
; - SEM Electron Microscopy: collagen fiber morphology of the leather samples was investigated by
scanning electron microscopy, SEM using a Vega 2 Tescan microscope; 3 RESULTS AND DISCUSSION 3.1. Physicomechanical and chemical characterization of the tested leather types The numerical values of the physicomechanical and chemical characteristics of the leather samples processed according with the framework technology are presented in Table 1. From the analysis of data given in table 2, it is obvious that the pretanning stage has a positive effect on the physicomechanical properties and allows the execution of the mechanical operations such as splitting and shaving in the tanyard. Subsequent chrome tanning and vegetable retanning provides leather with charcteristics that are similar to conventionally tanned leather, mainly as it regards the hidrothermal stability. The only noticeable discrepancy is related to the extractible matter content, which is much lower than that imposed by standards. Susequent fatliquoring with carefully chosen fatliquoring products can make up for this shortcoming. 3.2. FTIR-ATR Spectroscopy The A, B, C spectra (Figure 1) are typical for the collagen polypeptide structure; the absorbtion bands at 1641 cm
-1 are characteristic for the deformation vibrations of the CO bond in the carbonyl group (amide I),
while the absorption bands at 1544 cm-1
are characteristic for the C-NH bond in the carbonyl group (amide II). Absorbtion bands of COO
- group at 1409 cm
-1 and methyl groups (-CH3) at 1485 cm
-1 are also noticed.
Absorbtion bands in the 1090 -1020 cm-1
range (1066 cm-1
) correspond to C-N bonds of primary amino
544
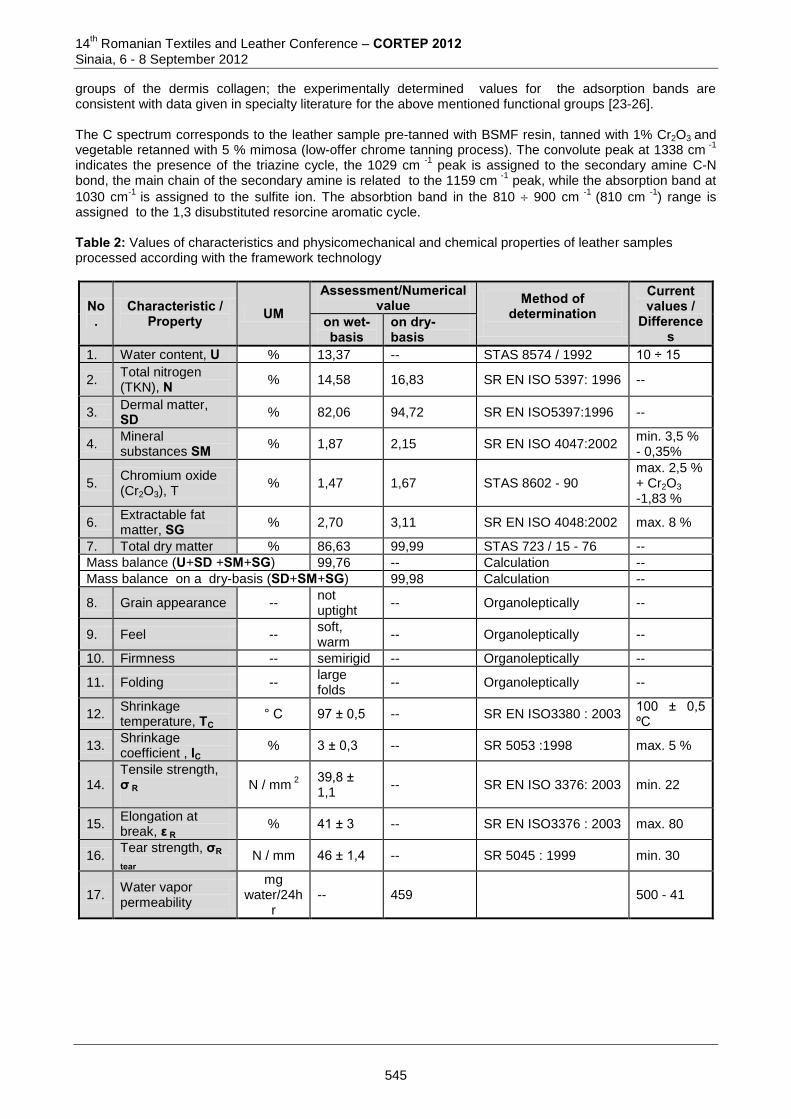
14th Romanian Textiles and Leather Conference – CORTEP 2012
Sinaia, 6 - 8 September 2012
groups of the dermis collagen; the experimentally determined values for the adsorption bands are consistent with data given in specialty literature for the above mentioned functional groups [23-26]. The C spectrum corresponds to the leather sample pre-tanned with BSMF resin, tanned with 1% Cr2O3 and vegetable retanned with 5 % mimosa (low-offer chrome tanning process). The convolute peak at 1338 cm
-1
indicates the presence of the triazine cycle, the 1029 cm -1
peak is assigned to the secondary amine C-N bond, the main chain of the secondary amine is related to the 1159 cm
-1 peak, while the absorption band at
1030 cm-1
is assigned to the sulfite ion. The absorbtion band in the 810 900 cm -1
(810 cm -1
) range is assigned to the 1,3 disubstituted resorcine aromatic cycle. Table 2: Values of characteristics and physicomechanical and chemical properties of leather samples processed according with the framework technology
No.
Characteristic / Property UM
Assessment/Numerical value Method of
determination
Current values /
Differences
on wet-basis
on dry-basis
1. Water content, U % 13,37 -- STAS 8574 / 1992 10 ÷ 15
2. Total nitrogen (TKN), N
% 14,58 16,83 SR EN ISO 5397: 1996 --
3. Dermal matter, SD
% 82,06 94,72 SR EN ISO5397:1996 --
4. Mineral substances SM
% 1,87 2,15 SR EN ISO 4047:2002 min. 3,5 % - 0,35%
5. Chromium oxide (Cr2O3), T
% 1,47 1,67 STAS 8602 - 90 max. 2,5 % + Cr2O3 -1,83 %
6. Extractable fat matter, SG
% 2,70 3,11 SR EN ISO 4048:2002 max. 8 %
7. Total dry matter % 86,63 99,99 STAS 723 / 15 - 76 --
Mass balance (U+SD +SM+SG) 99,76 -- Calculation --
Mass balance on a dry-basis (SD+SM+SG) 99,98 Calculation --
8. Grain appearance -- not uptight
-- Organoleptically --
9. Feel -- soft, warm
-- Organoleptically --
10. Firmness -- semirigid -- Organoleptically --
11. Folding -- large folds
-- Organoleptically --
12. Shrinkage temperature, TC
° C 97 ± 0,5 -- SR EN ISO3380 : 2003 100 ± 0,5 ºC
13. Shrinkage coefficient , IC
% 3 ± 0,3 -- SR 5053 :1998 max. 5 %
14. Tensile strength, σ R
N / mm 2
39,8 ± 1,1
-- SR EN ISO 3376: 2003 min. 22
15. Elongation at break, ε R
% 41 ± 3 -- SR EN ISO3376 : 2003 max. 80
16. Tear strength, σR
tear N / mm 46 ± 1,4 -- SR 5045 : 1999 min. 30
17. Water vapor permeability
mg water/24h
r -- 459 500 - 41
545
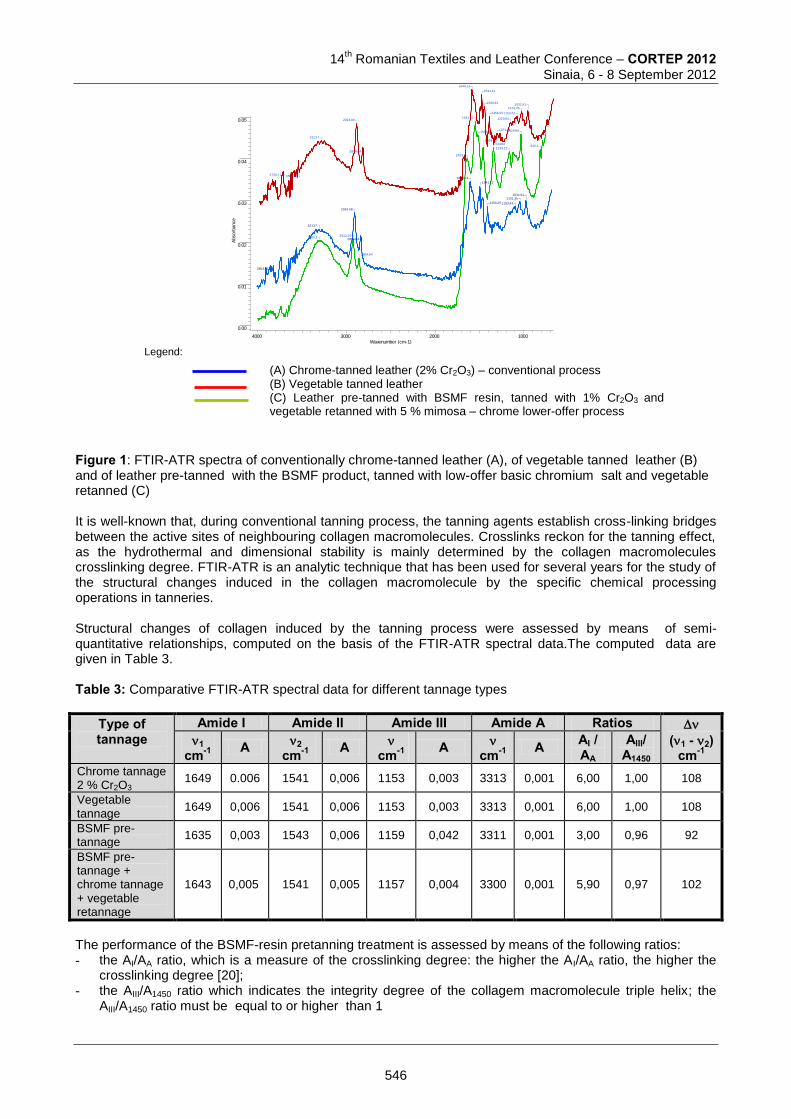
14
th Romanian Textiles and Leather Conference – CORTEP 2012
Sinaia, 6 - 8 September 2012
4000 3000 2000 1000Wavenumber (cm-1)
0.00
0.01
0.02
0.03
0.04
0.05
Absorb
ance
810.1
1029.99
1159.22
1338.61456.25
1508.33
1541.12
1633.7
2854.64
2922.153300.2
1031.911101.35
1153.43
1220.94
1373.31
1456.25
1508.33
1541.12
1649.13
2854.64
2924.08
3313.7
3556.733736.11
1031.911101.35
1153.431456.25
1541.12
1649.13
2854.64
2924.08
3313.7
3853.77
Figure 1: FTIR-ATR spectra of conventionally chrome-tanned leather (A), of vegetable tanned leather (B) and of leather pre-tanned with the BSMF product, tanned with low-offer basic chromium salt and vegetable retanned (C) It is well-known that, during conventional tanning process, the tanning agents establish cross-linking bridges between the active sites of neighbouring collagen macromolecules. Crosslinks reckon for the tanning effect, as the hydrothermal and dimensional stability is mainly determined by the collagen macromolecules crosslinking degree. FTIR-ATR is an analytic technique that has been used for several years for the study of the structural changes induced in the collagen macromolecule by the specific chemical processing operations in tanneries. Structural changes of collagen induced by the tanning process were assessed by means of semi-quantitative relationships, computed on the basis of the FTIR-ATR spectral data.The computed data are given in Table 3. Table 3: Comparative FTIR-ATR spectral data for different tannage types
Type of tannage
Amide I Amide II Amide III Amide A Ratios (1 - 2)
cm-1 1
cm-1 A 2 cm-1 A
cm-1 A cm-1 A AI /
AA AIII/
A1450 Chrome tannage 2 % Cr2O3
1649 0.006 1541 0,006 1153 0,003 3313 0,001 6,00 1,00 108
Vegetable tannage
1649 0,006 1541 0,006 1153 0,003 3313 0,001 6,00 1,00 108
BSMF pre-tannage
1635 0,003 1543 0,006 1159 0,042 3311 0,001 3,00 0,96 92
BSMF pre-tannage + chrome tannage + vegetable retannage
1643 0,005 1541 0,005 1157 0,004 3300 0,001 5,90 0,97 102
The performance of the BSMF-resin pretanning treatment is assessed by means of the following ratios: - the AI/AA ratio, which is a measure of the crosslinking degree: the higher the AI/AA ratio, the higher the
crosslinking degree [20]; - the AIII/A1450 ratio which indicates the integrity degree of the collagem macromolecule triple helix; the
AIII/A1450 ratio must be equal to or higher than 1
Legend:
(A) Chrome-tanned leather (2% Cr2O3) – conventional process (B) Vegetable tanned leather (C) Leather pre-tanned with BSMF resin, tanned with 1% Cr2O3 and vegetable retanned with 5 % mimosa – chrome lower-offer process
546
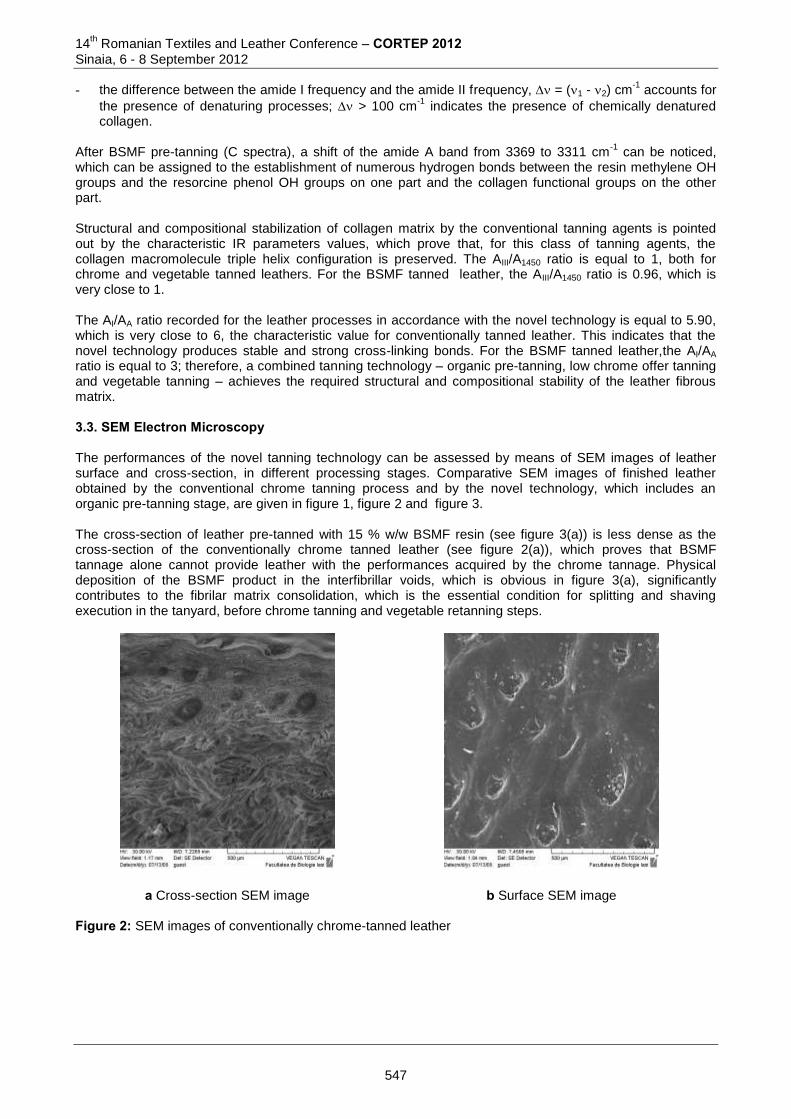
14th Romanian Textiles and Leather Conference – CORTEP 2012
Sinaia, 6 - 8 September 2012
- the difference between the amide I frequency and the amide II frequency, = (1 - 2) cm-1
accounts for
the presence of denaturing processes; > 100 cm-1
indicates the presence of chemically denatured collagen.
After BSMF pre-tanning (C spectra), a shift of the amide A band from 3369 to 3311 cm
-1 can be noticed,
which can be assigned to the establishment of numerous hydrogen bonds between the resin methylene OH groups and the resorcine phenol OH groups on one part and the collagen functional groups on the other part. Structural and compositional stabilization of collagen matrix by the conventional tanning agents is pointed out by the characteristic IR parameters values, which prove that, for this class of tanning agents, the collagen macromolecule triple helix configuration is preserved. The AIII/A1450 ratio is equal to 1, both for chrome and vegetable tanned leathers. For the BSMF tanned leather, the AIII/A1450 ratio is 0.96, which is very close to 1. The AI/AA ratio recorded for the leather processes in accordance with the novel technology is equal to 5.90, which is very close to 6, the characteristic value for conventionally tanned leather. This indicates that the novel technology produces stable and strong cross-linking bonds. For the BSMF tanned leather,the AI/AA ratio is equal to 3; therefore, a combined tanning technology – organic pre-tanning, low chrome offer tanning and vegetable tanning – achieves the required structural and compositional stability of the leather fibrous matrix. 3.3. SEM Electron Microscopy The performances of the novel tanning technology can be assessed by means of SEM images of leather surface and cross-section, in different processing stages. Comparative SEM images of finished leather obtained by the conventional chrome tanning process and by the novel technology, which includes an organic pre-tanning stage, are given in figure 1, figure 2 and figure 3. The cross-section of leather pre-tanned with 15 % w/w BSMF resin (see figure 3(a)) is less dense as the cross-section of the conventionally chrome tanned leather (see figure 2(a)), which proves that BSMF tannage alone cannot provide leather with the performances acquired by the chrome tannage. Physical deposition of the BSMF product in the interfibrillar voids, which is obvious in figure 3(a), significantly contributes to the fibrilar matrix consolidation, which is the essential condition for splitting and shaving execution in the tanyard, before chrome tanning and vegetable retanning steps.
a Cross-section SEM image
b Surface SEM image
Figure 2: SEM images of conventionally chrome-tanned leather
547
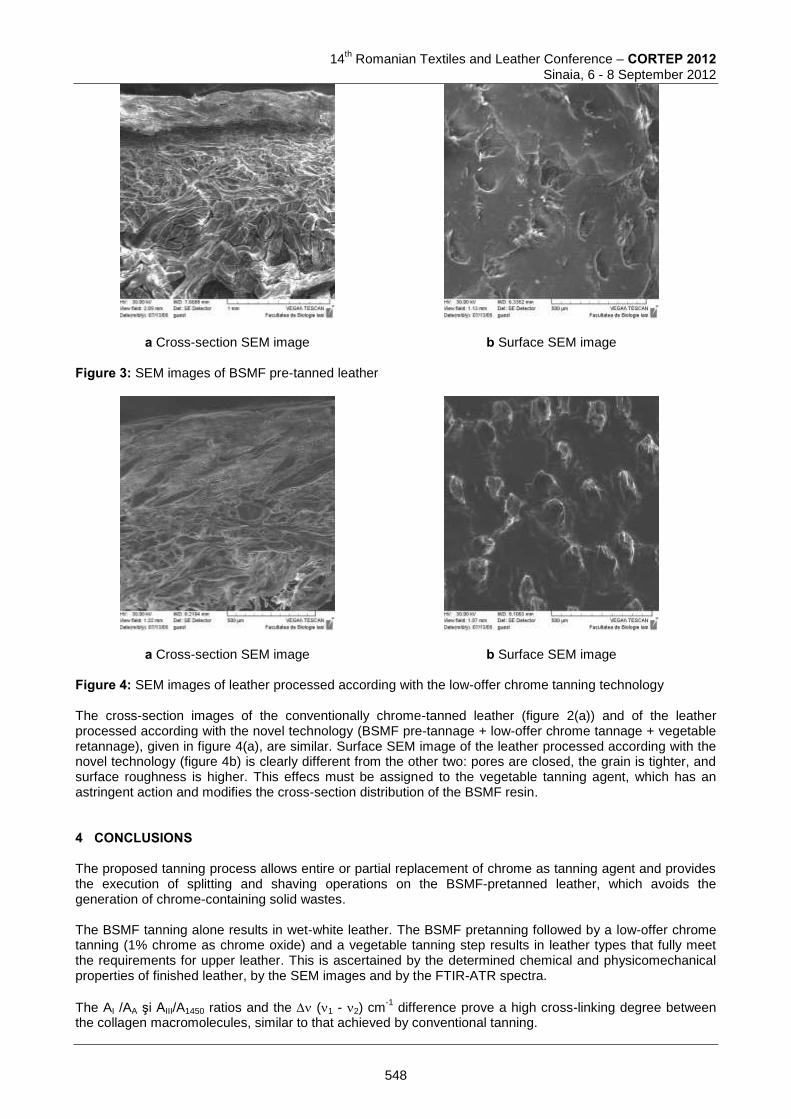
14
th Romanian Textiles and Leather Conference – CORTEP 2012
Sinaia, 6 - 8 September 2012
a Cross-section SEM image
b Surface SEM image
Figure 3: SEM images of BSMF pre-tanned leather
a Cross-section SEM image
b Surface SEM image
Figure 4: SEM images of leather processed according with the low-offer chrome tanning technology The cross-section images of the conventionally chrome-tanned leather (figure 2(a)) and of the leather processed according with the novel technology (BSMF pre-tannage + low-offer chrome tannage + vegetable retannage), given in figure 4(a), are similar. Surface SEM image of the leather processed according with the novel technology (figure 4b) is clearly different from the other two: pores are closed, the grain is tighter, and surface roughness is higher. This effecs must be assigned to the vegetable tanning agent, which has an astringent action and modifies the cross-section distribution of the BSMF resin. 4 CONCLUSIONS The proposed tanning process allows entire or partial replacement of chrome as tanning agent and provides the execution of splitting and shaving operations on the BSMF-pretanned leather, which avoids the generation of chrome-containing solid wastes. The BSMF tanning alone results in wet-white leather. The BSMF pretanning followed by a low-offer chrome tanning (1% chrome as chrome oxide) and a vegetable tanning step results in leather types that fully meet the requirements for upper leather. This is ascertained by the determined chemical and physicomechanical properties of finished leather, by the SEM images and by the FTIR-ATR spectra.
The AI /AA şi AIII/A1450 ratios and the (1 - 2) cm-1
difference prove a high cross-linking degree between the collagen macromolecules, similar to that achieved by conventional tanning.
548

14th Romanian Textiles and Leather Conference – CORTEP 2012
Sinaia, 6 - 8 September 2012
A tanning process that includes a BSMF resin pre-tanning and a low-offer chrome tanning provides leather with structural and compositional stability that meet the requirement for finished leather types. 5 REFERENCES [1] Hajoun F., Bi Shi, Youjie He, et.al, XXIII JULTCS Congress Proceedings, 1995, 175 - 182. [2] Puntener A. G. , J.A.L.C.A., 91, 1996, 278- 296. [3] Ciambeli P., Naviglio B., Bianchi L., et.al, C.P.M.C., vol. LXXIII (3), 1997, 135-143.
[4] El A Mma A., J.A.L.C.A., 93, 1998, 1- 16.
[5] El A Mma A., J.A.L.C.A., 94, 2000, 19 – 24. [6] Ramana Reddy G.V., Saravanan P., Srinivasan K.S.V. ,et.al, J.A.L.C.A., 95, 2000, 333– 340. [7] S.S. Maier, N. Badea, F. Vitan, V. Maier, ˝Peliculogeni pentru finisarea pieilor", Editura Bolta Rece, 1996, Iaşi. [8] Heidemann E., Fundamentals of Leather Manufacturier, Eduard Roether Krieger Publishing Co., Darmstadt, 1993, 627. [9] Badea N., Vitan F., Maier S.S., Chimia şi ingineria tăbăcirii în crom a pieilor, Editura Cronica, 1991. [10] Covington A. D., Ma Song, New High Stability, Synthetic Organic Tannage, IULTCS Congress Proceedings, London, 1997, 565 – 570. [11] Covington A.D., Theory and Mechanism of tanning- present thinking and future implications for industry, J.S.L.T.C., vol 85 (1), 2001, 24-34. [12] Dawson W. O., Brevet US Pat. No. 2316741 ,1943. [13] D’Alelio G. F., Brevet US Pat. No. 3068190 , 1962. [14] Förster, F., Keller K., Becker H., Lotz W. , Brevet US Pat. No. 4822372, 1989. [15] El-Sayed N.H., El-Shahath Nashy H.A., Synthesis and application of urea paraformaldehyde polymer as a tanning agent, J.S.L.T.C., vol. 86 (6), 2002, 240-247. [16] El-Shahat N.H. Nashy, Influence of a Synthesizad Condensed Polymer as a Pre and Retanning Agent on the Properties of Buffalo Leather, J.S.L.T.C. vol. 87(2), 2003, 189-197. [17] George B., Pizzi A., Simon C., et al, Leather light stability/ tannins antioxidant characteristics for leather made with vegetable tannins/ MUF resins, J.A.L.C.A., vol. 99(1), 2004, 1-11. [18] Venkataboopathy K., Prabhu R., Suman Meenakshi, et. al., Preparation and charactrisation of synthetic tannins based on phenol- dimethylurea resin, J.S.L.T.C., vol. 85(5), 2001, 175- 177. [19] D` Aquino A., D` Elia G., Naviglio B., et.al, Synthetic organic tannage based on melamine resin and THPS: Development for high-quality bovine upper leather, J.S.L.T.C., vol. 87(5), 2003, 189-197. [20] Albu, M.G., Ghica, M.V., Giurginca, M., et.al, Spectral characteristics and antioxidant properties of tannic acid immobilized in drug delivery systems, Rev. Chim. (Bucuresti), 60, 2009, 666-672. [21] Albu, M.G., Ghica, M.V., Giurginca, M., et.al., Antioxidant properties of immobilized tannic acid on collagen hydrogels and matrices, ECOMAT 2008 – International Conference on Ecological Materials and Technologies, Bucuresti, 25-26 septembrie 2008. [22] Sionkowska, A., Wisniewski, M., Skopinska, et.al, The photochemical stability of collagen-chitosan blends, J. Photochem. Photobiol. A: Chem., 162, 2004, 545-554. [23] S. Jaisankar, S. Gupta, Z. Lakshminarayana, et.al, Water based Anionic Sulfonated Melamine Formaldehyde Condensate oligomer as Retanning agent for Leather Processing, J.A.L.C.A., 105 (9), 2010, 289-296. Corresponding author: Melinda PRUNEANU Department of Leather and Leather Substitutes Technology Faculty of Textile., Leather and Industrial Management “Gheorghe Asachi’ Technical University Bd. D. Mangeron 53. 700050. Iasi, Romania Phone: 0740 024729; Fax: 0232 279850; E-mail: [email protected]
Co-authors: Ingrid Ioana BUCIŞCANU Department of Leather and Leather Substitutes Technology Faculty of Textile., Leather and Industrial Management “Gheorghe Asachi’ Technical University of Iasi
549
14
th Romanian Textiles and Leather Conference – CORTEP 2012
Sinaia, 6 - 8 September 2012
Bd. D. Mangeron 53. 700050. Iasi, Romania Phone: 0740 024729; Fax: 0232 279850; E-mail: [email protected] Stelian Sergiu MAIER Department of Leather and Leather Substitutes Technology Faculty of Textile., Leather and Industrial Management “Gheorghe Asachi’ Technical University of Iasi Bd. D. Mangeron 53. 700050. Iasi, Romania Phone: 0740 024729; Fax: 0232 279850; E-mail: [email protected] Vasilica MAIER Department of Leather and Leather Substitutes Technology Faculty of Textile., Leather and Industrial Management “Gheorghe Asachi’ Technical University of Iasi Bd. D. Mangeron 53. 700050. Iasi, Romania Phone: 0740 024729; Fax: 0232 279850; E-mail: [email protected]
550
14
th Romanian Textiles and Leather Conference – CORTEP 2012
Sinaia, 6 - 8 September 2012
STUDIES ON OBTAINING AND USE OF PROTEIN WASTE
Tudorel BĂLĂU MÎNDRU & Iulia BĂLĂU MÎNDRU “Gheorghe Asachi" Technical University of Iaşi, Romania
Abstract: Protein waste from wool, feathers, hair, skin were processed by alkaline hydrolysis resulting series of hydrolysed protein and fibrous waste that can be used as fillers for phono and termoabsorbante boards and for obtaining of nanofibres mixtures by centrifugal spinning effect. FTIR analysis, SEM, heat transfer coefficient values and physico-chemical and mechanical characterisation highlights the transformations of structural and morphological features. Kewords: protein waste, spinning the centrifugal effect, fibrous wastes, heat transfer coefficient, nanofibres mixtures.
1 INTRODUCTION Generally, the organic waste produced from protein materials such as: skin hides, wool, feather, hair can be processed by different physical or physical chemical methods for obtaining of products which can have various utilizations: nutrients for agriculture [1], cosmetics (salves and creams based on keratine) [2], geotextiles, thermal and phonic insulating construction materials [3], nanofibrous materials with various applications for coatings, batteries, sensors, tissue engineering, medical textiles [4,5], etc. There are also studies for using protein residues of wool, feather and hair in mixtures for obtaining fibercement plates [6,7]. The main advantages of natural fiber composites [8] are: low specific weight resulting in a higher specific strength and stiffness than glass fiber, are a renewable source, the production requires little energy, and CO2
is used while oxygen is given back to the environment; it can be produced with low investment at low cost which makes the material an interesting product for low wage countries, they have good thermal and acoustic insulating properties. Until recently, electrospinning was proved to be an attractive method of making fibrous materials obtained by applying a high voltage (10-30kV) and low intensity current on a solution containing a polar solvent which is passed through a metallic nozzle (with a pump spinning). The method has the disadvantage of unstable jet of solution, high consumption of electricity plus a reduced rate due to a low electrospinning speed and need a special protection due to high voltage power supply [9-13]. A new way to obtain nanofibres, generically named spinning by centrifugal or rotational effect, allows to work at much higher speeds, therefore a sensible increase of efficiency, plus the advantage of low power consumption (no more working on high voltage but at a voltage of 220-230V) and the opportunity to work with a wide range of solvents and polymer melts [12]. The effect of centrifugal spinning process to obtain nanofibres is the use of solutions or melts of natural or synthetic polymers which supplies a spinning head fitted with nozzles spinning. That head is positioned on the axis of a spinning centrifuge speed work between 2500 to 20,000 rev / min [9-11]. Taking into account the multiple possibilities of using this waste, in the paper is presented an obtainig method of proteic powders for subsequent use as fillers for panels for termoconductivity and phonoacoustic improuvment, and new obtaining method of new nanofibrous mixtures by centrifugal spinning.
551
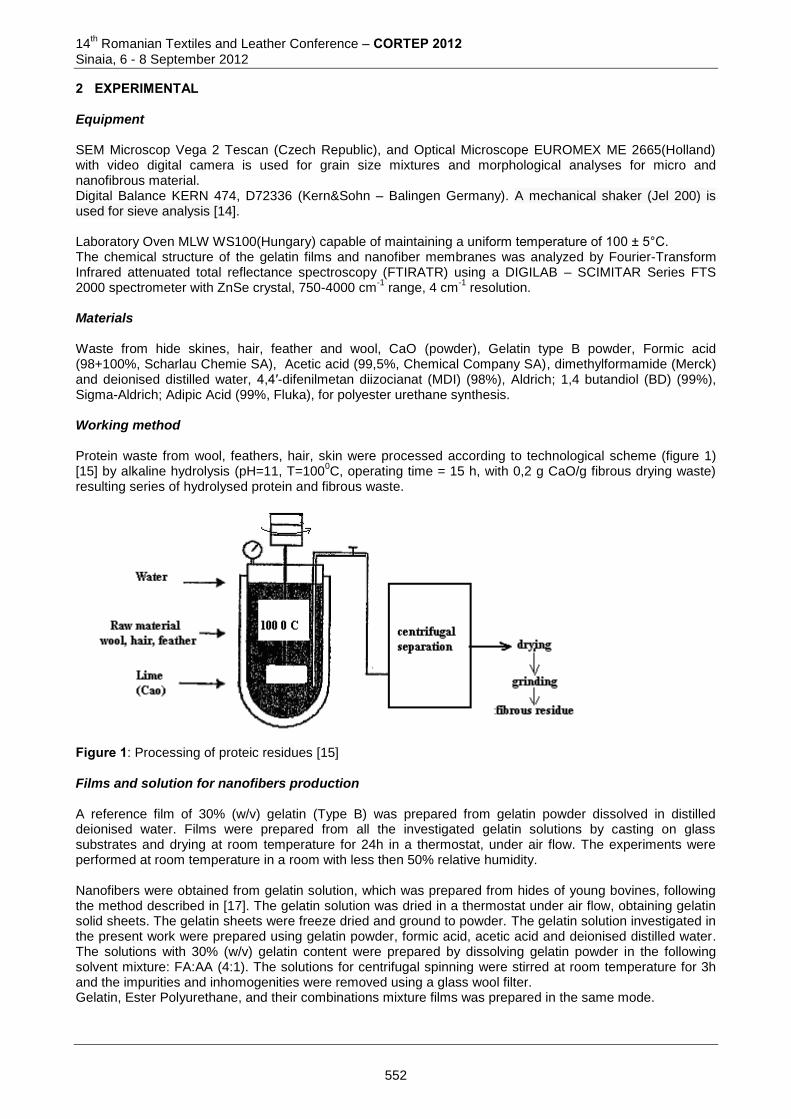
14th Romanian Textiles and Leather Conference – CORTEP 2012
Sinaia, 6 - 8 September 2012
2 EXPERIMENTAL Equipment SEM Microscop Vega 2 Tescan (Czech Republic), and Optical Microscope EUROMEX ME 2665(Holland) with video digital camera is used for grain size mixtures and morphological analyses for micro and nanofibrous material. Digital Balance KERN 474, D72336 (Kern&Sohn – Balingen Germany). A mechanical shaker (Jel 200) is used for sieve analysis [14]. Laboratory Oven MLW WS100(Hungary) capable of maintaining a uniform temperature of 100 ± 5°C. The chemical structure of the gelatin films and nanofiber membranes was analyzed by Fourier-Transform Infrared attenuated total reflectance spectroscopy (FTIRATR) using a DIGILAB – SCIMITAR Series FTS 2000 spectrometer with ZnSe crystal, 750-4000 cm
-1 range, 4 cm
-1 resolution.
Materials Waste from hide skines, hair, feather and wool, CaO (powder), Gelatin type B powder, Formic acid (98+100%, Scharlau Chemie SA), Acetic acid (99,5%, Chemical Company SA), dimethylformamide (Merck) and deionised distilled water, 4,4′-difenilmetan diizocianat (MDI) (98%), Aldrich; 1,4 butandiol (BD) (99%), Sigma-Aldrich; Adipic Acid (99%, Fluka), for polyester urethane synthesis. Working method Protein waste from wool, feathers, hair, skin were processed according to technological scheme (figure 1) [15] by alkaline hydrolysis (pH=11, T=100
0C, operating time = 15 h, with 0,2 g CaO/g fibrous drying waste)
resulting series of hydrolysed protein and fibrous waste.
Figure 1: Processing of proteic residues [15] Films and solution for nanofibers production A reference film of 30% (w/v) gelatin (Type B) was prepared from gelatin powder dissolved in distilled deionised water. Films were prepared from all the investigated gelatin solutions by casting on glass substrates and drying at room temperature for 24h in a thermostat, under air flow. The experiments were performed at room temperature in a room with less then 50% relative humidity. Nanofibers were obtained from gelatin solution, which was prepared from hides of young bovines, following the method described in [17]. The gelatin solution was dried in a thermostat under air flow, obtaining gelatin solid sheets. The gelatin sheets were freeze dried and ground to powder. The gelatin solution investigated in the present work were prepared using gelatin powder, formic acid, acetic acid and deionised distilled water. The solutions with 30% (w/v) gelatin content were prepared by dissolving gelatin powder in the following solvent mixture: FA:AA (4:1). The solutions for centrifugal spinning were stirred at room temperature for 3h and the impurities and inhomogenities were removed using a glass wool filter. Gelatin, Ester Polyurethane, and their combinations mixture films was prepared in the same mode.
552
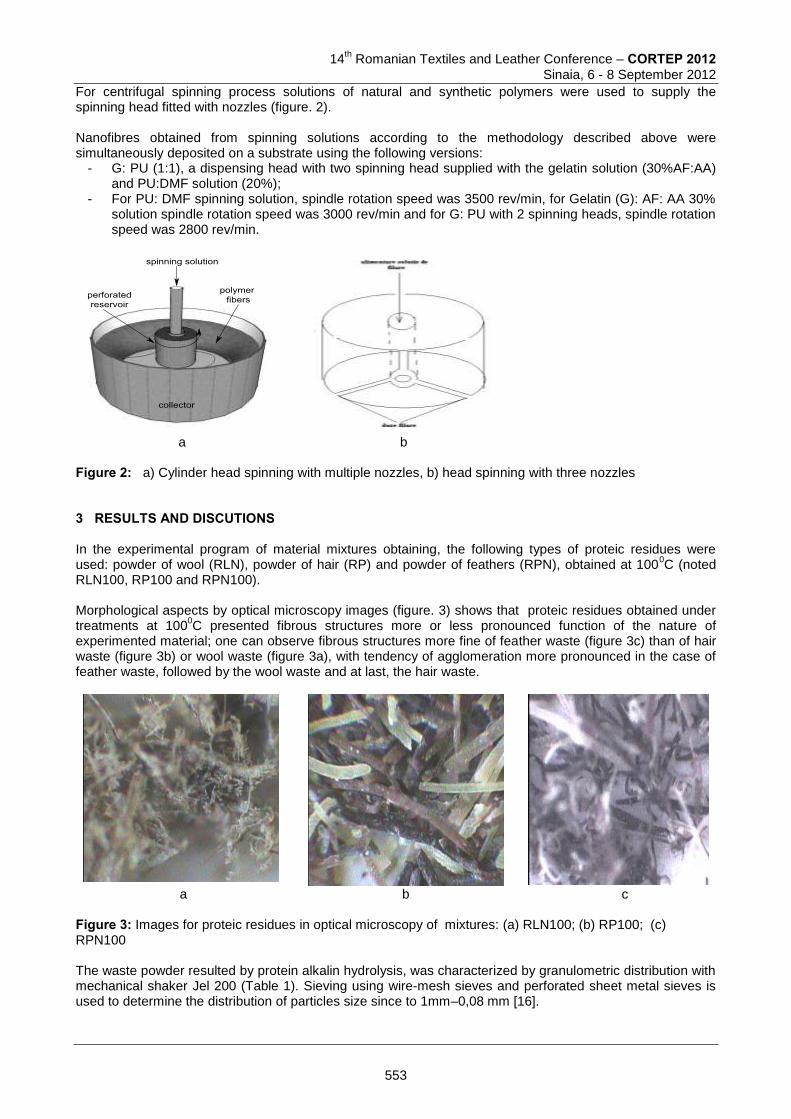
14
th Romanian Textiles and Leather Conference – CORTEP 2012
Sinaia, 6 - 8 September 2012
For centrifugal spinning process solutions of natural and synthetic polymers were used to supply the spinning head fitted with nozzles (figure. 2). Nanofibres obtained from spinning solutions according to the methodology described above were simultaneously deposited on a substrate using the following versions:
- G: PU (1:1), a dispensing head with two spinning head supplied with the gelatin solution (30%AF:AA) and PU:DMF solution (20%);
- For PU: DMF spinning solution, spindle rotation speed was 3500 rev/min, for Gelatin (G): AF: AA 30% solution spindle rotation speed was 3000 rev/min and for G: PU with 2 spinning heads, spindle rotation speed was 2800 rev/min.
a b Figure 2: a) Cylinder head spinning with multiple nozzles, b) head spinning with three nozzles 3 RESULTS AND DISCUTIONS In the experimental program of material mixtures obtaining, the following types of proteic residues were used: powder of wool (RLN), powder of hair (RP) and powder of feathers (RPN), obtained at 100
0C (noted
RLN100, RP100 and RPN100). Morphological aspects by optical microscopy images (figure. 3) shows that proteic residues obtained under treatments at 100
0C presented fibrous structures more or less pronounced function of the nature of
experimented material; one can observe fibrous structures more fine of feather waste (figure 3c) than of hair waste (figure 3b) or wool waste (figure 3a), with tendency of agglomeration more pronounced in the case of feather waste, followed by the wool waste and at last, the hair waste.
a b c
Figure 3: Images for proteic residues in optical microscopy of mixtures: (a) RLN100; (b) RP100; (c) RPN100 The waste powder resulted by protein alkalin hydrolysis, was characterized by granulometric distribution with mechanical shaker Jel 200 (Table 1). Sieving using wire-mesh sieves and perforated sheet metal sieves is used to determine the distribution of particles size since to 1mm–0,08 mm [16].
553
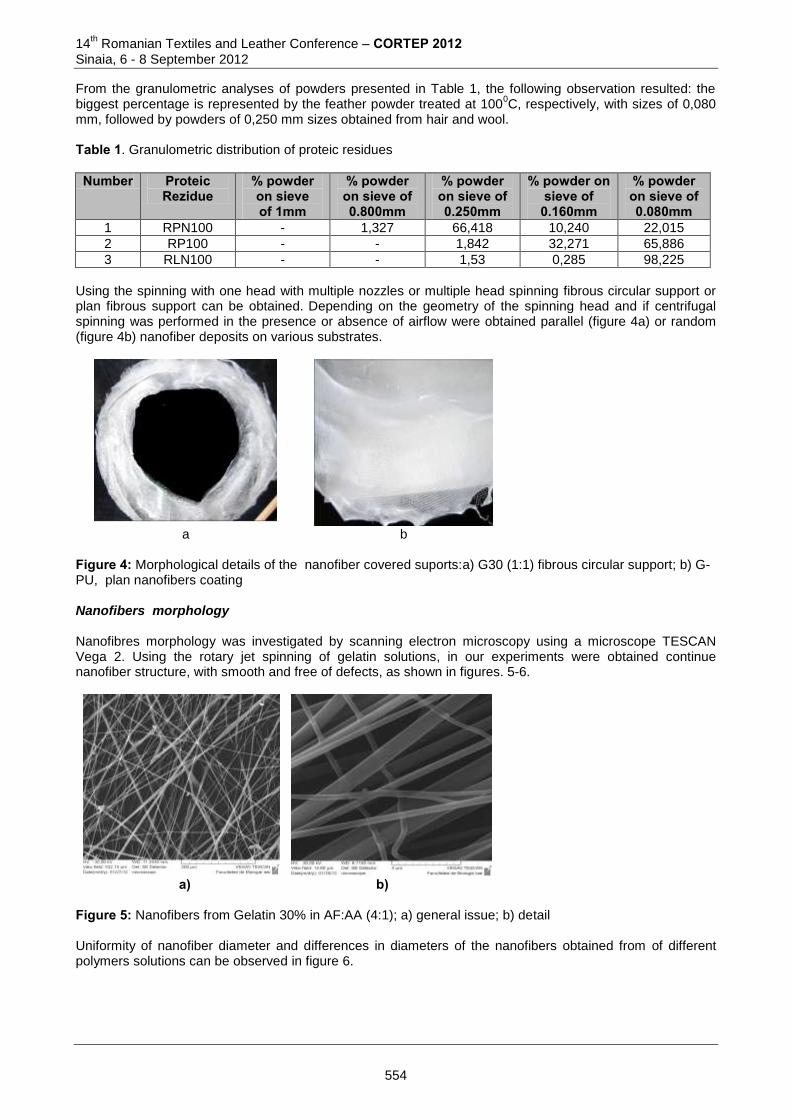
14th Romanian Textiles and Leather Conference – CORTEP 2012
Sinaia, 6 - 8 September 2012
From the granulometric analyses of powders presented in Table 1, the following observation resulted: the biggest percentage is represented by the feather powder treated at 100
0C, respectively, with sizes of 0,080
mm, followed by powders of 0,250 mm sizes obtained from hair and wool. Table 1. Granulometric distribution of proteic residues
Number Proteic Rezidue
% powder on sieve of 1mm
% powder on sieve of 0.800mm
% powder on sieve of 0.250mm
% powder on sieve of 0.160mm
% powder on sieve of 0.080mm
1 RPN100 - 1,327 66,418 10,240 22,015
2 RP100 - - 1,842 32,271 65,886
3 RLN100 - - 1,53 0,285 98,225
Using the spinning with one head with multiple nozzles or multiple head spinning fibrous circular support or plan fibrous support can be obtained. Depending on the geometry of the spinning head and if centrifugal spinning was performed in the presence or absence of airflow were obtained parallel (figure 4a) or random (figure 4b) nanofiber deposits on various substrates.
a b
Figure 4: Morphological details of the nanofiber covered suports:a) G30 (1:1) fibrous circular support; b) G-PU, plan nanofibers coating Nanofibers morphology Nanofibres morphology was investigated by scanning electron microscopy using a microscope TESCAN Vega 2. Using the rotary jet spinning of gelatin solutions, in our experiments were obtained continue nanofiber structure, with smooth and free of defects, as shown in figures. 5-6.
a) b)
Figure 5: Nanofibers from Gelatin 30% in AF:AA (4:1); a) general issue; b) detail Uniformity of nanofiber diameter and differences in diameters of the nanofibers obtained from of different polymers solutions can be observed in figure 6.
554
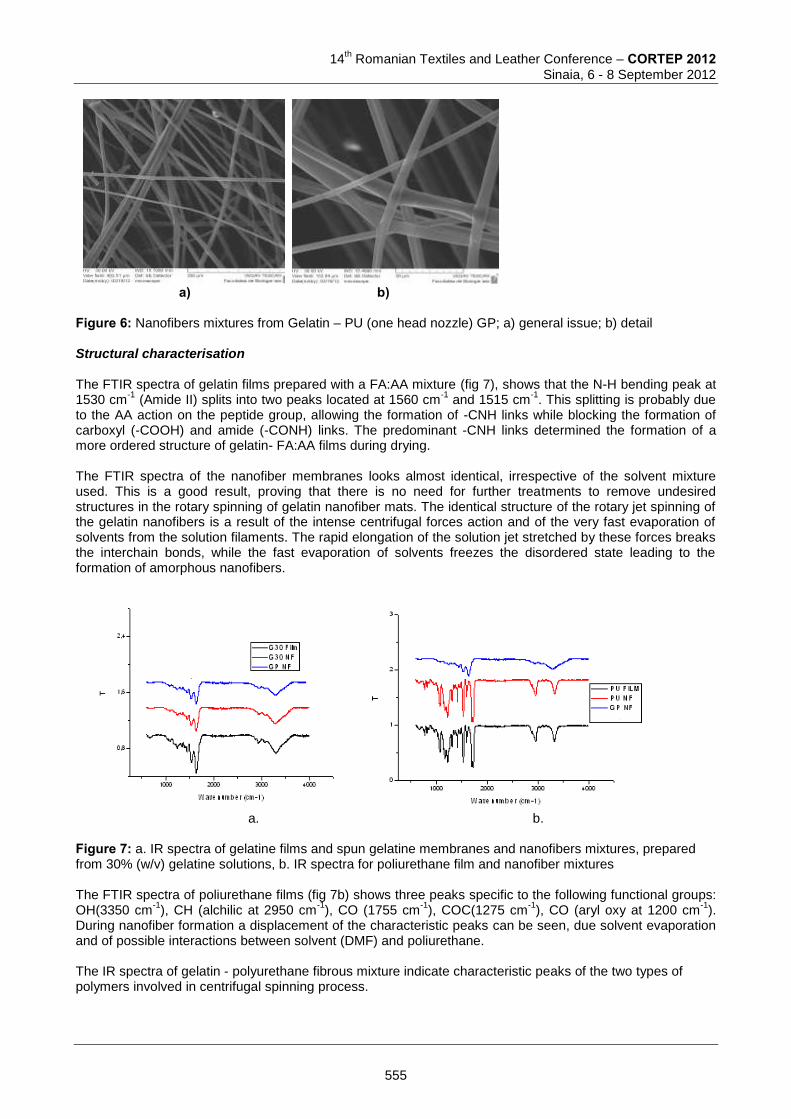
14
th Romanian Textiles and Leather Conference – CORTEP 2012
Sinaia, 6 - 8 September 2012
a) b)
Figure 6: Nanofibers mixtures from Gelatin – PU (one head nozzle) GP; a) general issue; b) detail Structural characterisation The FTIR spectra of gelatin films prepared with a FA:AA mixture (fig 7), shows that the N-H bending peak at 1530 cm
-1 (Amide II) splits into two peaks located at 1560 cm
-1 and 1515 cm
-1. This splitting is probably due
to the AA action on the peptide group, allowing the formation of -CNH links while blocking the formation of carboxyl (-COOH) and amide (-CONH) links. The predominant -CNH links determined the formation of a more ordered structure of gelatin- FA:AA films during drying. The FTIR spectra of the nanofiber membranes looks almost identical, irrespective of the solvent mixture used. This is a good result, proving that there is no need for further treatments to remove undesired structures in the rotary spinning of gelatin nanofiber mats. The identical structure of the rotary jet spinning of the gelatin nanofibers is a result of the intense centrifugal forces action and of the very fast evaporation of solvents from the solution filaments. The rapid elongation of the solution jet stretched by these forces breaks the interchain bonds, while the fast evaporation of solvents freezes the disordered state leading to the formation of amorphous nanofibers.
a. b.
Figure 7: a. IR spectra of gelatine films and spun gelatine membranes and nanofibers mixtures, prepared from 30% (w/v) gelatine solutions, b. IR spectra for poliurethane film and nanofiber mixtures The FTIR spectra of poliurethane films (fig 7b) shows three peaks specific to the following functional groups: OH(3350 cm
-1), CH (alchilic at 2950 cm
-1), CO (1755 cm
-1), COC(1275 cm
-1), CO (aryl oxy at 1200 cm
-1).
During nanofiber formation a displacement of the characteristic peaks can be seen, due solvent evaporation and of possible interactions between solvent (DMF) and poliurethane. The IR spectra of gelatin - polyurethane fibrous mixture indicate characteristic peaks of the two types of polymers involved in centrifugal spinning process.
555
14th Romanian Textiles and Leather Conference – CORTEP 2012
Sinaia, 6 - 8 September 2012
4 CONCLUSIONS Laboratory experiments conducted to obtain protein waste by alkaline hydrolysis, and nanofiber supports by centrifugal spinning process highlight the following:
1. The alkaline hydrolysis of protein waste (from wool, feathers, hair, skin) allows to obtain by-products
which can have various utilizations as thermal and phonic insulating construction materials (waste from wool, feathers, hair), or as nanofibrous materials (gelatin from hide skin).
2. Further studies are necesary for establishing the thermal and phonic insulating properties of the obtained boards.
3. Spinning by centrifugal or rotational effect, can be an alternative method for nanofiber obtaining, allowing to work at much higher speeds, and low power consumption (voltage of 220-230V).
4. Depending on the spinning head geometry and spinning parameters the resulting nanofibers are parallel or random submitted on the collector surface and present an uniform appearance in terms of diameter.
5. The use of fibrous mixtures from different polymer solution for centrifugal spinning allows to obtain new fibrous materials for various applications (filters, coatings, batteries, sensors, tissue engineering, medical textiles).
References [1] Schoenian,S. “A beginner’s Guide to Raising Sheep” <http://www.sheep101.info/201/nutrientmgt.html>
(Mar. 13. 2012). [2] Rouse, J.G., and Van Dyke, M. E., “A Review of Keratin-Based Biomaterials for Biomedical
Applications”. Materials, 3, 999-1014, 2010. [3] Asdrubali, F. (2006). Survey on the acoustical properties of new sustainable materials for noise control,
Euronoise, Tampere, Finland, 1-10. [4] Anthony L. Andrady, Science and Technology of Polymer Nanofibers, Copyright 2008 by John Wiley &
Sons, Inc, [5] Jamil A. Matthews, Gary E. Wnek, David G. Simpson, and Gary L. Bowlin, Electrospinning of Collagen
Nanofibers, Biomacromolecules 2002, 3, 232-238 [6] Harwell, A, (June 2010) Green Public Procurement, “Thermal Insulation Technical Background Report”,
Report for the European Commission – DG Environment, June 2010. [7] Gruder, S., “Building Green Guide” Sustainable Product Choices, Solid & Hazardous Waste Education
Center, 2005. [8] Tudu, P., ”Processing and characterization of natural fiber reinforced polymer composites”, thesis
department of Mecanical Engineering, National Institute of Technology Rourkela – 769008, 2009 [9] Mellado, P., McIlwee, H.A., , Badrossamay, M.R., and all, A simple model for nanofiber formation by
rotary jet-spinning, Applied Physics Letters, 2010, 99 [10] Desch, A.,, and all, Nanofiber Spinning - Installations by Dienes Apparatebau, with the technology of
Reiter OFT recognized with the Techtextil 2009 innovation award. [11] ****, Centrifugal solution spun nanofiber process, International publication Number, WO 2009/079253 A2 [12] Ramakrishna S., Fujihara K., Wee-Eong T.Teik-Cheng L. & Zuwei Ma-An Introduction to Electrospinning
and Nanofibers, Copyright © 2005 by World Scientific Publishing Co. Pte. Ltd. [13] Ashok Kumar-Nanofibers, Published by Intech Olajnica 19/2, 32000 Vukovar, Croatia, 2010 [14] ***, ISO 565:1990 [15] ***, US Patent 2010/0202936 A1 [16] ***, ISO 3219/1993 [17] C. G. B. Cole, J. J. Roberts, The SA Journal of Food Science and Nutrition 8, 139 (1996). Corresponding author:
Co-author:
Tudorel BĂLĂU MÎNDRU Chemical Engineering în Textile-Leather Department Faculty of Textile, Leather and Industrial Management “Gheorghe Asachi” Technical University of Iasi B-dul D. Mangeron 73, 700050, Iasi, Romania Phone: 0232279850, Fax: 023227985 E-mail: [email protected]
Iulia BĂLĂU MÎNDRU Chemical Engineering în Textile-Leather Department Faculty of Textile, Leather and Industrial Management “Gheorghe Asachi” Technical University of Iasi B-dul D. Mangeron 73 700050, Iasi, Romania Phone: 0232278683; Fax: 0232230491; E-mail: [email protected]
556
14
th Romanian Textiles and Leather Conference – CORTEP 2012
Sinaia, 6 - 8 September 2012
CONCEPTUAL ANALYSIS OF RATIO BETWEEN THE PLANTAR PRESSURE AND INSOLE SHAPE DURING DIFFERENT TYPES OF GAIT
Mihaela Ioana BARITZ & Diana COTOROS
University “Transilvania” Brasov, Romania Abstract: Some aspects related to the structuring of a new measuring and assessment of plantar pressure with respect to the feet shape and dimensions are presented in this paper. In the first part of the paper, we analyzed the bone structure anatomic aspect of a sample and performed anthropometric measurements in order to establish the shape and modelling limits of the plantar surface. In the paper second part we presented the compatibility solutions between the plantar pressure measurements and insoles shapes from the software library. In the final part of the paper we presented the results of this methodology applied upon a subjects’ sample out of which we selected two different cases – hollow foot and flat foot and the proposed concept establishes a direct correlation between the plantar pressure level/dispersion and the insoles’ shape. Keywords: plantar pressure, Footscan plate, gait, insole. 1 INTRODUCTION The construction of the human body, by its complex structure, allows a range of its components motions and also the displacement of the entire body especially based upon the locomotion system. The locomotion system should be regarded both as an assembly and as a structure in order to be able to understand its way of action at components level and at intrinsic and extrinsic connections level. By the human locomotion process we understand not only a displacement of the human body with respect to a previous support point on the ground but may also be considered as a displacement of one of its segments about a reference point or system. [2] Thus, the definition of the locomotion process is absolutely subjected to the motion laws or biological displacement application. The locomotion system consists of an assembly of bones, muscles, blood vessels and nerve endings that allow the complex functions of maintaining bipedal posture, constant displacement or at different speeds and not last of support for the entire body. In this respect the analysis of the plantar pressure, of the distribution and nominal values determined by different postures represents an interdisciplinary research area, approached by various strategies or methodologies. Generally the main determinations upon the locomotion system behaviour try to highlight the deviations from the normal state and sometimes too few analysis structures of the causes and connections to the other functions of the human body are developed. [3,4] A range of factors determines at the inferior level of the locomotion system the occurrence of the flat foot anomaly. These factors, grouped in excessive weight, postural abnormalities, weakening of support tissues or excessive body strain may lead to the weakening of ligaments and muscles that support the plantar arcade on the length of the locomotion system, and finally to its “collapse”. The excessive strain upon the foot arcade, the gait, the bipedal position or performing exercises on a hard surface may weaken or “flat: during time the metatarsal arcade on the anterior side of the foot. This will lead to the increase of the pressure exerted upon the nerves and blood vessels, creating pain and irritation. The opposite version of this plantar arch, namely the anomaly called “hollow foot” is manifested by some groups of human subjects. Generally most people have a certain arch in their plantar surface, leaving a free space between the foot and the ground. Some persons may have a higher plantar arch or much lower than normal. For example, due to this higher plantar arch, during gait or rest, a pretty high weight is pressed upon the smaller surface of the sole at the ground contact (just some part of the heel and toes). The hollow foot shape may induce a set of symptoms like pain and postural instability. This shape may be developed at any age and can be manifested in one foot or in both. [1] A lot of researchers were preoccupied by the study of these shapes of the plantar surface, determining from medical point of view the causes of these complex and diverse forms of this part of the locomotion system and at the same time correction, improving and even avoiding solutions and versions were searched for. All these researches represent at this moment a dedicated or personalized information and solutions database, that may be diversified and the used to develop an analysis structure.
557
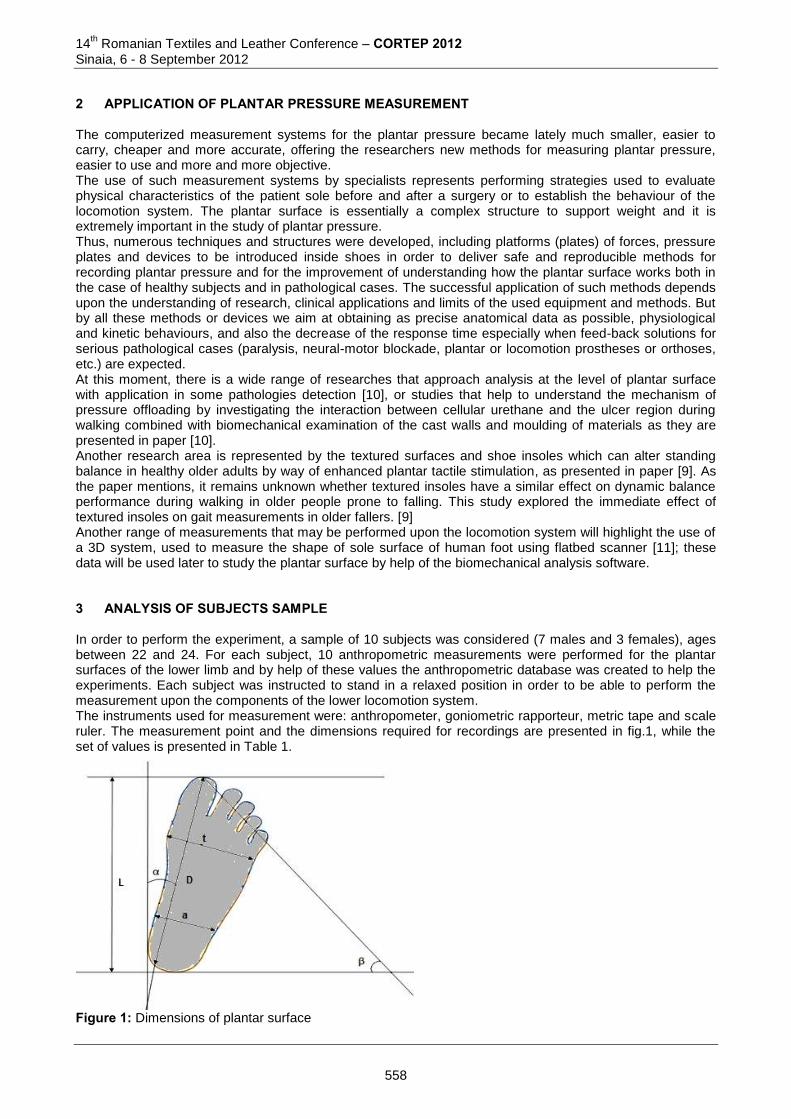
14th Romanian Textiles and Leather Conference – CORTEP 2012
Sinaia, 6 - 8 September 2012
2 APPLICATION OF PLANTAR PRESSURE MEASUREMENT The computerized measurement systems for the plantar pressure became lately much smaller, easier to carry, cheaper and more accurate, offering the researchers new methods for measuring plantar pressure, easier to use and more and more objective. The use of such measurement systems by specialists represents performing strategies used to evaluate physical characteristics of the patient sole before and after a surgery or to establish the behaviour of the locomotion system. The plantar surface is essentially a complex structure to support weight and it is extremely important in the study of plantar pressure. Thus, numerous techniques and structures were developed, including platforms (plates) of forces, pressure plates and devices to be introduced inside shoes in order to deliver safe and reproducible methods for recording plantar pressure and for the improvement of understanding how the plantar surface works both in the case of healthy subjects and in pathological cases. The successful application of such methods depends upon the understanding of research, clinical applications and limits of the used equipment and methods. But by all these methods or devices we aim at obtaining as precise anatomical data as possible, physiological and kinetic behaviours, and also the decrease of the response time especially when feed-back solutions for serious pathological cases (paralysis, neural-motor blockade, plantar or locomotion prostheses or orthoses, etc.) are expected. At this moment, there is a wide range of researches that approach analysis at the level of plantar surface with application in some pathologies detection [10], or studies that help to understand the mechanism of pressure offloading by investigating the interaction between cellular urethane and the ulcer region during walking combined with biomechanical examination of the cast walls and moulding of materials as they are presented in paper [10]. Another research area is represented by the textured surfaces and shoe insoles which can alter standing balance in healthy older adults by way of enhanced plantar tactile stimulation, as presented in paper [9]. As the paper mentions, it remains unknown whether textured insoles have a similar effect on dynamic balance performance during walking in older people prone to falling. This study explored the immediate effect of textured insoles on gait measurements in older fallers. [9] Another range of measurements that may be performed upon the locomotion system will highlight the use of a 3D system, used to measure the shape of sole surface of human foot using flatbed scanner [11]; these data will be used later to study the plantar surface by help of the biomechanical analysis software. 3 ANALYSIS OF SUBJECTS SAMPLE In order to perform the experiment, a sample of 10 subjects was considered (7 males and 3 females), ages between 22 and 24. For each subject, 10 anthropometric measurements were performed for the plantar surfaces of the lower limb and by help of these values the anthropometric database was created to help the experiments. Each subject was instructed to stand in a relaxed position in order to be able to perform the measurement upon the components of the lower locomotion system. The instruments used for measurement were: anthropometer, goniometric rapporteur, metric tape and scale ruler. The measurement point and the dimensions required for recordings are presented in fig.1, while the set of values is presented in Table 1.
Figure 1: Dimensions of plantar surface
558
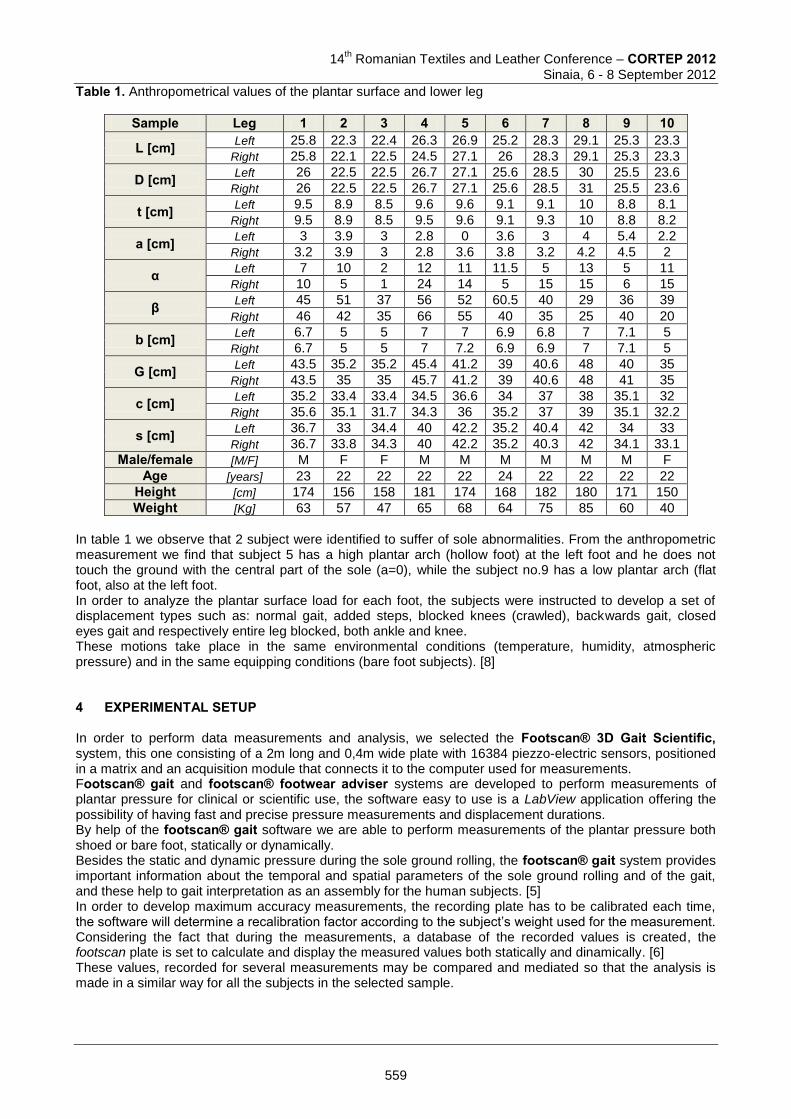
14
th Romanian Textiles and Leather Conference – CORTEP 2012
Sinaia, 6 - 8 September 2012
Table 1. Anthropometrical values of the plantar surface and lower leg
In table 1 we observe that 2 subject were identified to suffer of sole abnormalities. From the anthropometric measurement we find that subject 5 has a high plantar arch (hollow foot) at the left foot and he does not touch the ground with the central part of the sole (a=0), while the subject no.9 has a low plantar arch (flat foot, also at the left foot. In order to analyze the plantar surface load for each foot, the subjects were instructed to develop a set of displacement types such as: normal gait, added steps, blocked knees (crawled), backwards gait, closed eyes gait and respectively entire leg blocked, both ankle and knee. These motions take place in the same environmental conditions (temperature, humidity, atmospheric pressure) and in the same equipping conditions (bare foot subjects). [8] 4 EXPERIMENTAL SETUP In order to perform data measurements and analysis, we selected the Footscan® 3D Gait Scientific, system, this one consisting of a 2m long and 0,4m wide plate with 16384 piezzo-electric sensors, positioned in a matrix and an acquisition module that connects it to the computer used for measurements. Footscan® gait and footscan® footwear adviser systems are developed to perform measurements of plantar pressure for clinical or scientific use, the software easy to use is a LabView application offering the possibility of having fast and precise pressure measurements and displacement durations. By help of the footscan® gait software we are able to perform measurements of the plantar pressure both shoed or bare foot, statically or dynamically. Besides the static and dynamic pressure during the sole ground rolling, the footscan® gait system provides important information about the temporal and spatial parameters of the sole ground rolling and of the gait, and these help to gait interpretation as an assembly for the human subjects. [5] In order to develop maximum accuracy measurements, the recording plate has to be calibrated each time, the software will determine a recalibration factor according to the subject’s weight used for the measurement. Considering the fact that during the measurements, a database of the recorded values is created, the footscan plate is set to calculate and display the measured values both statically and dinamically. [6] These values, recorded for several measurements may be compared and mediated so that the analysis is made in a similar way for all the subjects in the selected sample.
Sample Leg 1 2 3 4 5 6 7 8 9 10
L [cm] Left 25.8 22.3 22.4 26.3 26.9 25.2 28.3 29.1 25.3 23.3
Right 25.8 22.1 22.5 24.5 27.1 26 28.3 29.1 25.3 23.3
D [cm] Left 26 22.5 22.5 26.7 27.1 25.6 28.5 30 25.5 23.6
Right 26 22.5 22.5 26.7 27.1 25.6 28.5 31 25.5 23.6
t [cm] Left 9.5 8.9 8.5 9.6 9.6 9.1 9.1 10 8.8 8.1
Right 9.5 8.9 8.5 9.5 9.6 9.1 9.3 10 8.8 8.2
a [cm] Left 3 3.9 3 2.8 0 3.6 3 4 5.4 2.2
Right 3.2 3.9 3 2.8 3.6 3.8 3.2 4.2 4.5 2
α Left 7 10 2 12 11 11.5 5 13 5 11
Right 10 5 1 24 14 5 15 15 6 15
β Left 45 51 37 56 52 60.5 40 29 36 39
Right 46 42 35 66 55 40 35 25 40 20
b [cm] Left 6.7 5 5 7 7 6.9 6.8 7 7.1 5
Right 6.7 5 5 7 7.2 6.9 6.9 7 7.1 5
G [cm] Left 43.5 35.2 35.2 45.4 41.2 39 40.6 48 40 35
Right 43.5 35 35 45.7 41.2 39 40.6 48 41 35
c [cm] Left 35.2 33.4 33.4 34.5 36.6 34 37 38 35.1 32
Right 35.6 35.1 31.7 34.3 36 35.2 37 39 35.1 32.2
s [cm] Left 36.7 33 34.4 40 42.2 35.2 40.4 42 34 33
Right 36.7 33.8 34.3 40 42.2 35.2 40.3 42 34.1 33.1
Male/female [M/F] M F F M M M M M M F
Age [years] 23 22 22 22 22 24 22 22 22 22
Height [cm] 174 156 158 181 174 168 182 180 171 150
Weight [Kg] 63 57 47 65 68 64 75 85 60 40
559
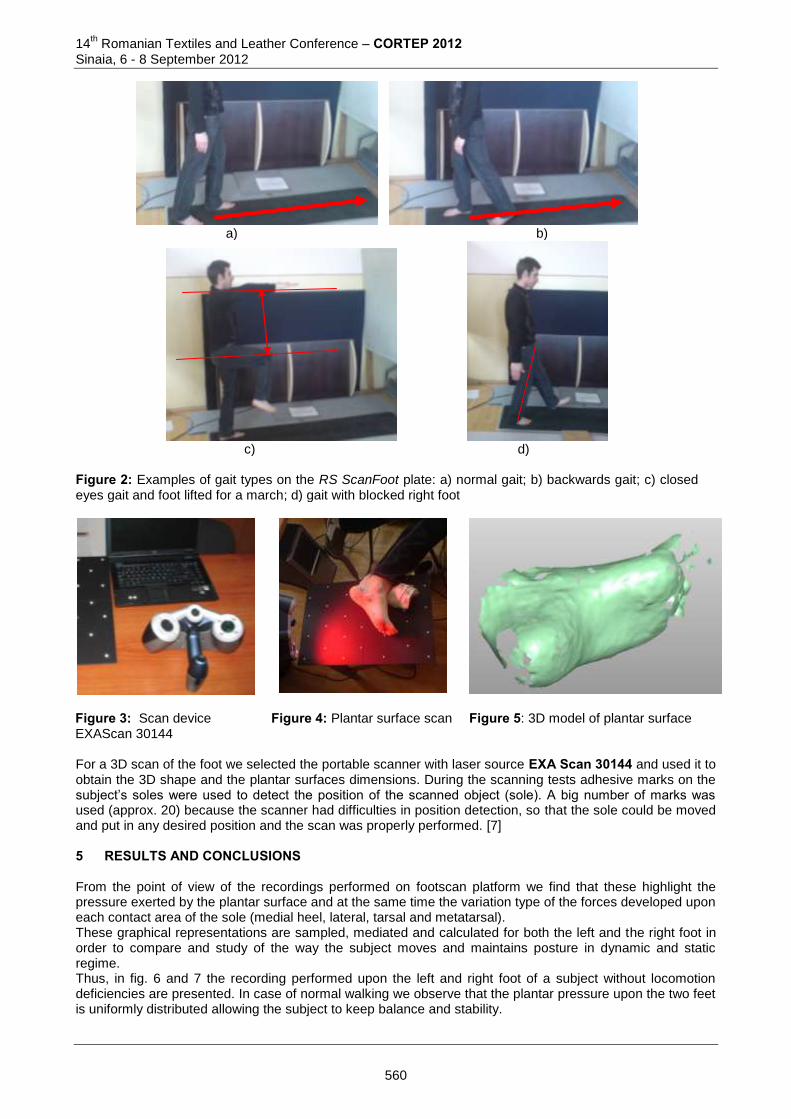
14th Romanian Textiles and Leather Conference – CORTEP 2012
Sinaia, 6 - 8 September 2012
a) b)
c) d)
Figure 2: Examples of gait types on the RS ScanFoot plate: a) normal gait; b) backwards gait; c) closed eyes gait and foot lifted for a march; d) gait with blocked right foot
Figure 3: Scan device EXAScan 30144
Figure 4: Plantar surface scan
Figure 5: 3D model of plantar surface
For a 3D scan of the foot we selected the portable scanner with laser source EXA Scan 30144 and used it to obtain the 3D shape and the plantar surfaces dimensions. During the scanning tests adhesive marks on the subject’s soles were used to detect the position of the scanned object (sole). A big number of marks was used (approx. 20) because the scanner had difficulties in position detection, so that the sole could be moved and put in any desired position and the scan was properly performed. [7] 5 RESULTS AND CONCLUSIONS From the point of view of the recordings performed on footscan platform we find that these highlight the pressure exerted by the plantar surface and at the same time the variation type of the forces developed upon each contact area of the sole (medial heel, lateral, tarsal and metatarsal). These graphical representations are sampled, mediated and calculated for both the left and the right foot in order to compare and study of the way the subject moves and maintains posture in dynamic and static regime. Thus, in fig. 6 and 7 the recording performed upon the left and right foot of a subject without locomotion deficiencies are presented. In case of normal walking we observe that the plantar pressure upon the two feet is uniformly distributed allowing the subject to keep balance and stability.
560
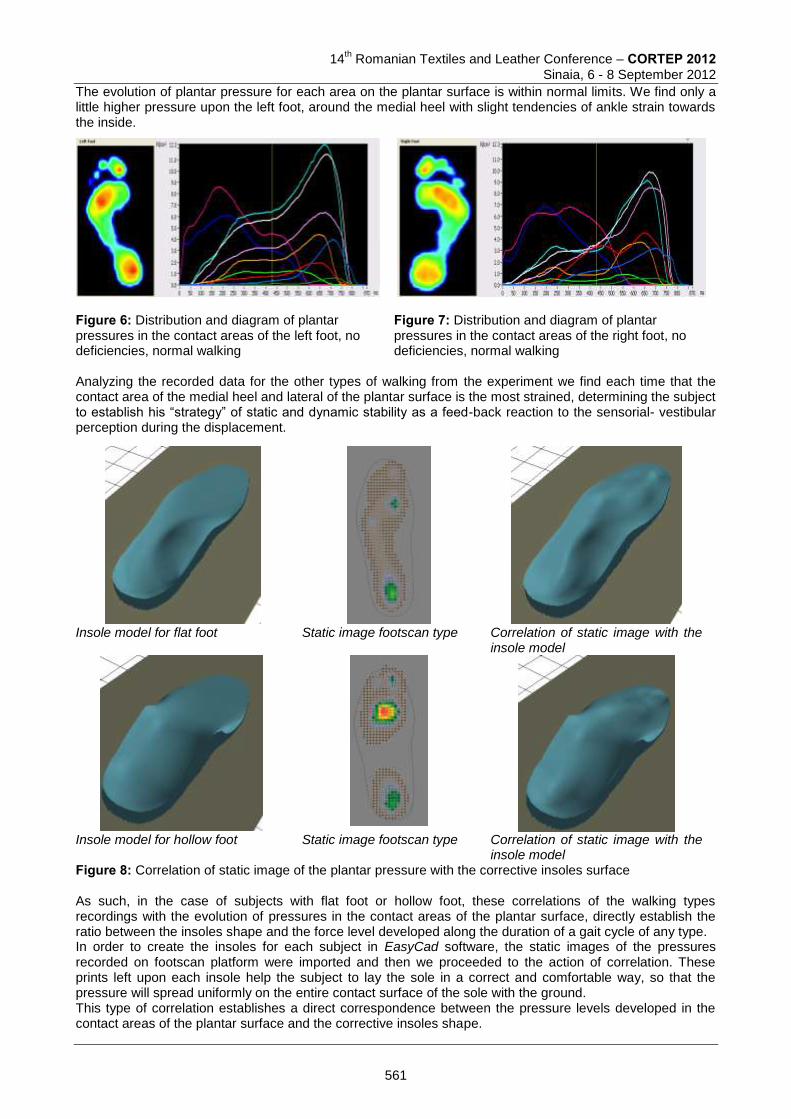
14
th Romanian Textiles and Leather Conference – CORTEP 2012
Sinaia, 6 - 8 September 2012
The evolution of plantar pressure for each area on the plantar surface is within normal limits. We find only a little higher pressure upon the left foot, around the medial heel with slight tendencies of ankle strain towards the inside.
Analyzing the recorded data for the other types of walking from the experiment we find each time that the contact area of the medial heel and lateral of the plantar surface is the most strained, determining the subject to establish his “strategy” of static and dynamic stability as a feed-back reaction to the sensorial- vestibular perception during the displacement.
As such, in the case of subjects with flat foot or hollow foot, these correlations of the walking types recordings with the evolution of pressures in the contact areas of the plantar surface, directly establish the ratio between the insoles shape and the force level developed along the duration of a gait cycle of any type. In order to create the insoles for each subject in EasyCad software, the static images of the pressures recorded on footscan platform were imported and then we proceeded to the action of correlation. These prints left upon each insole help the subject to lay the sole in a correct and comfortable way, so that the pressure will spread uniformly on the entire contact surface of the sole with the ground. This type of correlation establishes a direct correspondence between the pressure levels developed in the contact areas of the plantar surface and the corrective insoles shape.
Figure 6: Distribution and diagram of plantar pressures in the contact areas of the left foot, no deficiencies, normal walking
Figure 7: Distribution and diagram of plantar pressures in the contact areas of the right foot, no deficiencies, normal walking
Insole model for flat foot Static image footscan type Correlation of static image with the
insole model
Insole model for hollow foot Static image footscan type Correlation of static image with the
insole model Figure 8: Correlation of static image of the plantar pressure with the corrective insoles surface
561
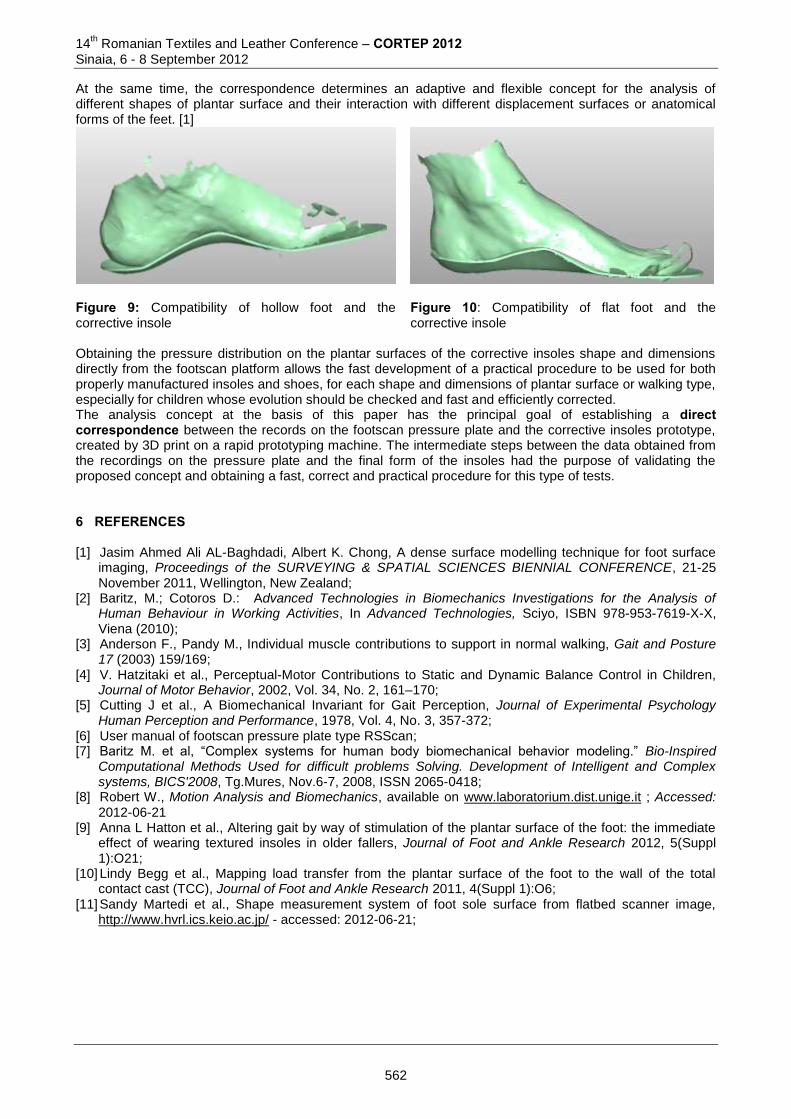
14th Romanian Textiles and Leather Conference – CORTEP 2012
Sinaia, 6 - 8 September 2012
At the same time, the correspondence determines an adaptive and flexible concept for the analysis of different shapes of plantar surface and their interaction with different displacement surfaces or anatomical forms of the feet. [1]
Figure 9: Compatibility of hollow foot and the corrective insole
Figure 10: Compatibility of flat foot and the corrective insole
Obtaining the pressure distribution on the plantar surfaces of the corrective insoles shape and dimensions directly from the footscan platform allows the fast development of a practical procedure to be used for both properly manufactured insoles and shoes, for each shape and dimensions of plantar surface or walking type, especially for children whose evolution should be checked and fast and efficiently corrected. The analysis concept at the basis of this paper has the principal goal of establishing a direct correspondence between the records on the footscan pressure plate and the corrective insoles prototype, created by 3D print on a rapid prototyping machine. The intermediate steps between the data obtained from the recordings on the pressure plate and the final form of the insoles had the purpose of validating the proposed concept and obtaining a fast, correct and practical procedure for this type of tests. 6 REFERENCES [1] Jasim Ahmed Ali AL-Baghdadi, Albert K. Chong, A dense surface modelling technique for foot surface
imaging, Proceedings of the SURVEYING & SPATIAL SCIENCES BIENNIAL CONFERENCE, 21-25 November 2011, Wellington, New Zealand;
[2] Baritz, M.; Cotoros D.: Advanced Technologies in Biomechanics Investigations for the Analysis of Human Behaviour in Working Activities, In Advanced Technologies, Sciyo, ISBN 978-953-7619-X-X, Viena (2010);
[3] Anderson F., Pandy M., Individual muscle contributions to support in normal walking, Gait and Posture 17 (2003) 159/169;
[4] V. Hatzitaki et al., Perceptual-Motor Contributions to Static and Dynamic Balance Control in Children, Journal of Motor Behavior, 2002, Vol. 34, No. 2, 161–170;
[5] Cutting J et al., A Biomechanical Invariant for Gait Perception, Journal of Experimental Psychology Human Perception and Performance, 1978, Vol. 4, No. 3, 357-372;
[6] User manual of footscan pressure plate type RSScan; [7] Baritz M. et al, “Complex systems for human body biomechanical behavior modeling.” Bio-Inspired
Computational Methods Used for difficult problems Solving. Development of Intelligent and Complex systems, BICS'2008, Tg.Mures, Nov.6-7, 2008, ISSN 2065-0418;
[8] Robert W., Motion Analysis and Biomechanics, available on www.laboratorium.dist.unige.it ; Accessed: 2012-06-21
[9] Anna L Hatton et al., Altering gait by way of stimulation of the plantar surface of the foot: the immediate effect of wearing textured insoles in older fallers, Journal of Foot and Ankle Research 2012, 5(Suppl 1):O21;
[10] Lindy Begg et al., Mapping load transfer from the plantar surface of the foot to the wall of the total contact cast (TCC), Journal of Foot and Ankle Research 2011, 4(Suppl 1):O6;
[11] Sandy Martedi et al., Shape measurement system of foot sole surface from flatbed scanner image, http://www.hvrl.ics.keio.ac.jp/ - accessed: 2012-06-21;
562
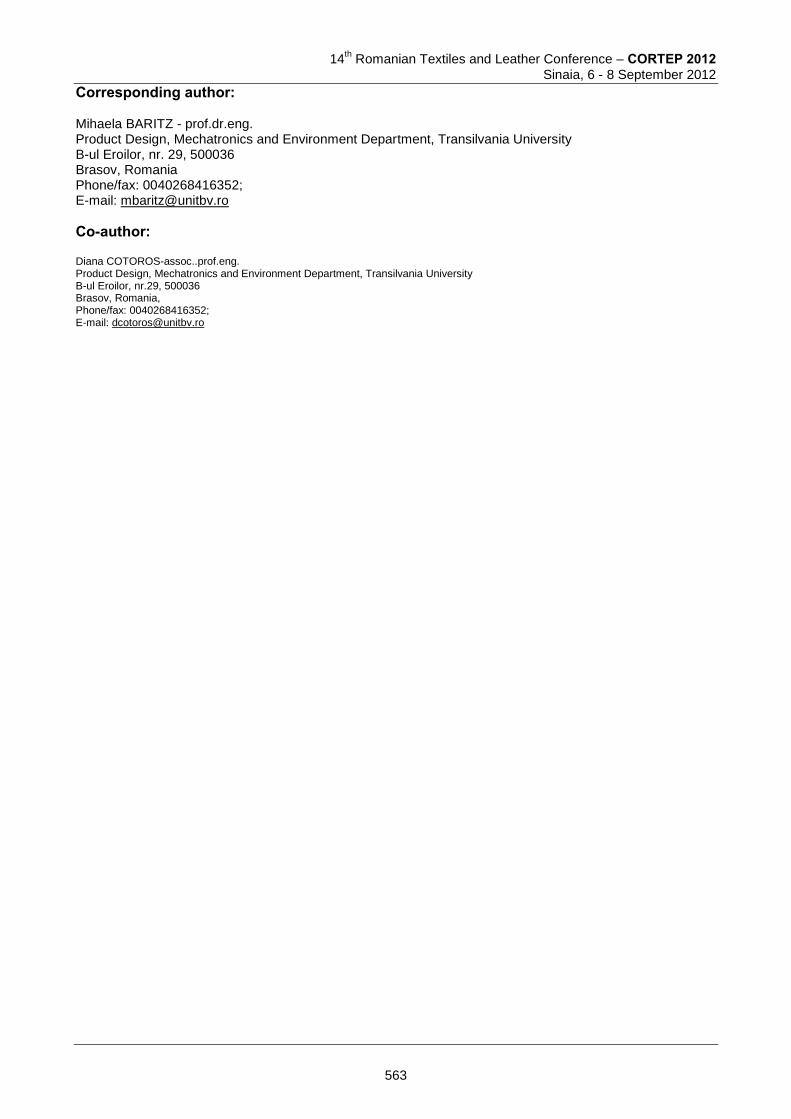
14
th Romanian Textiles and Leather Conference – CORTEP 2012
Sinaia, 6 - 8 September 2012
Corresponding author: Mihaela BARITZ - prof.dr.eng. Product Design, Mechatronics and Environment Department, Transilvania University B-ul Eroilor, nr. 29, 500036 Brasov, Romania Phone/fax: 0040268416352; E-mail: [email protected]
Co-author: Diana COTOROS-assoc..prof.eng. Product Design, Mechatronics and Environment Department, Transilvania University B-ul Eroilor, nr.29, 500036 Brasov, Romania, Phone/fax: 0040268416352; E-mail: [email protected]
563
14
th Romanian Textiles and Leather Conference – CORTEP 2012
Sinaia, 6 - 8 September 2012
THE INFLUENCE OF PLANTAR SURFACE SHAPE AND HEIGHT UPON THE SUPPORT BASIS AND BIPODAL STABILITY
Mihaela Ioana BARITZ & Diana COTOROS
University “Transilvania” Brasov, Romania Abstract: Some aspects concerning the analysis of the shoes’ influence with various shapes and heel heights upon the support basis and bipodal stability are presented in this paper. In the first part of the paper we present some general aspects of posture and stability and for experimental analyze we selected a group of female subjects, aged 20-24, using shoes with different heels shapes and heights, with no anatomic, pathologic or structural abnormalities. Thus, the analysis took into account only the subjects’ behaviour concerning the size and shape of the support basis (small, large and normal basis) highlighting the stability areas variations in the same recording conditions (open eyes, arms along the body, bipodal position) and also the forces developed by the locomotion system with respect to the support basis. This modulated analysis allowed a correlation setting between the heels shape and height in relation to the stability area. In the final part we presented the results and conclusions of this study. Keywords: stability, plantar surface, posture, heeled shoes. 1 INTRODUCTION ”The biomechanical studies upon the structure of human body are an important source of information at this moment, meant for knowing and understanding the human factor behaviour in different configurations of internal or external environments that may affect their stability and space-time orientation.” [8] The bipodal stability of the human body is assured by some elements of this structure and is influenced by a range of external and internal factors acting upon it. Generally, in the studies dedicated to the biomechanical analysis upon the human organism we consider a certain range of factors keeping the other factors (internal, anthropometric and biologic) within normal limits, without significant changes with respect to the organism evolution along the experiments. The stability, balance, locomotion or other types of motilities processes of the human body are assured by the locomotion system that is supported by the plantar surfaces of both feet. The system elasticity is assured by the joints, muscles and tendons, while the rigidity by the bone structure, the control of the entire system being coordinated by the vestibular, visual sensorial systems by means of the central nervous system (CNS). This entire assembly works in normal regime as long as no internal, external or combined factors (subjects’ sample, equipment, devices or instruments etc.) intervene upon it. According to some theoretical studies, posture represents: ”a term to describe the orientation of any body segment relative to the gravitational vector and balance: a term to describe the dynamics of body posture to prevent falling” [9] In the same respect the other terms describing the human body behaviour in these situations are defined. Thus: ”center of mass (COM) is the point where all the mass of a body is concentrated, or the point about which a body would balance without a tendency to rotate. All the linear forces acting on the body is balanced (sum of forces acting on human body is equal with 0) and all the rotary forces acting on the body is balanced (sum of moments acting on human body is equal with 0).” [9] In order to analyze the standing subjects behaviour, on a support with no other bumps, recent studies show that the accurate location of COM”depends on: individual's anatomical structure, habitual standing posture, current position, external support. Location in human body of the COM generally accepted that it is located at~57% of standing height in males and ~ 55% of standing height in females, also varies with body build, posture, age, and gender (infant > child > adult - in % of body height from the floor). Also, location of COM remains fixed as long as the body does NOT change the shape and dimensions”. [9] Another important parameter for defining the stability state is determined by the center of pressure (COP) defined as the point where the resultant of all ground reaction forces act and also as the center of gravity (COG) defined as the vertical projection of the center of mass to the ground. From the point of view of stability and balance of the human body structure we have to consider the determination of the stability with respect to the ground position and respectively to the type of motion the structure is involved in.
564
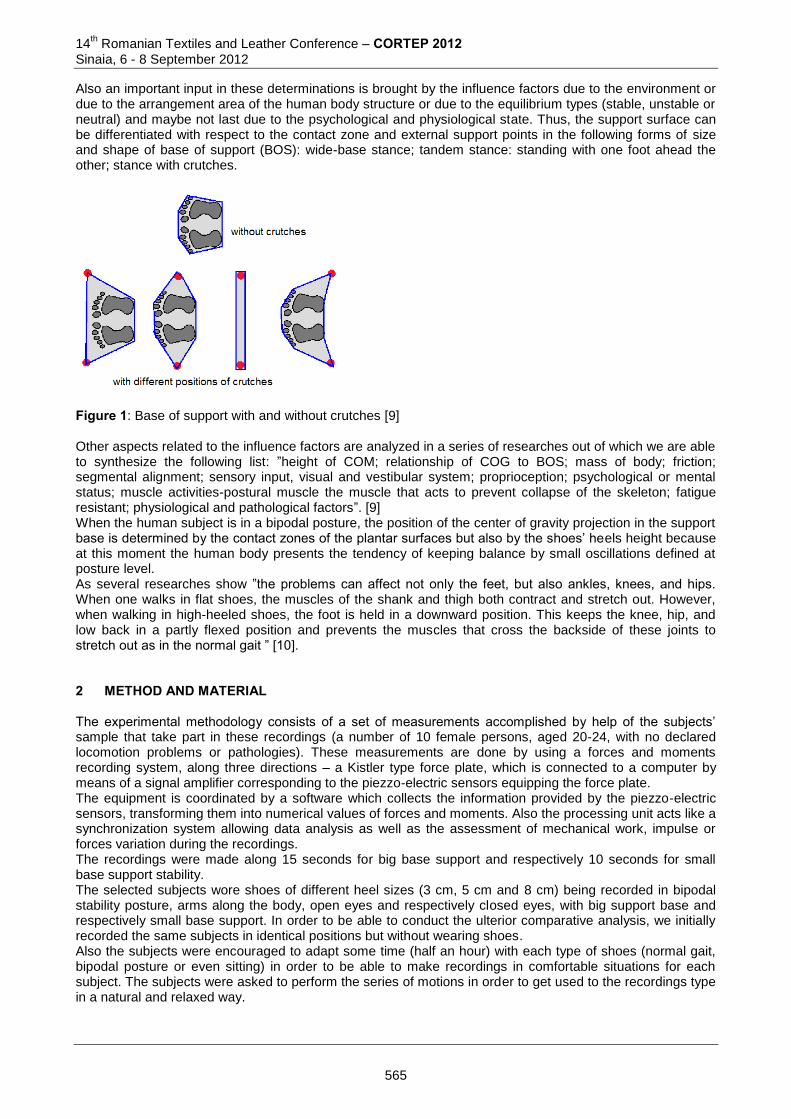
14th Romanian Textiles and Leather Conference – CORTEP 2012
Sinaia, 6 - 8 September 2012
Also an important input in these determinations is brought by the influence factors due to the environment or due to the arrangement area of the human body structure or due to the equilibrium types (stable, unstable or neutral) and maybe not last due to the psychological and physiological state. Thus, the support surface can be differentiated with respect to the contact zone and external support points in the following forms of size and shape of base of support (BOS): wide-base stance; tandem stance: standing with one foot ahead the other; stance with crutches.
Figure 1: Base of support with and without crutches [9] Other aspects related to the influence factors are analyzed in a series of researches out of which we are able to synthesize the following list: ”height of COM; relationship of COG to BOS; mass of body; friction; segmental alignment; sensory input, visual and vestibular system; proprioception; psychological or mental status; muscle activities-postural muscle the muscle that acts to prevent collapse of the skeleton; fatigue resistant; physiological and pathological factors”. [9] When the human subject is in a bipodal posture, the position of the center of gravity projection in the support base is determined by the contact zones of the plantar surfaces but also by the shoes’ heels height because at this moment the human body presents the tendency of keeping balance by small oscillations defined at posture level. As several researches show ”the problems can affect not only the feet, but also ankles, knees, and hips. When one walks in flat shoes, the muscles of the shank and thigh both contract and stretch out. However, when walking in high-heeled shoes, the foot is held in a downward position. This keeps the knee, hip, and low back in a partly flexed position and prevents the muscles that cross the backside of these joints to stretch out as in the normal gait ” [10]. 2 METHOD AND MATERIAL The experimental methodology consists of a set of measurements accomplished by help of the subjects’ sample that take part in these recordings (a number of 10 female persons, aged 20-24, with no declared locomotion problems or pathologies). These measurements are done by using a forces and moments recording system, along three directions – a Kistler type force plate, which is connected to a computer by means of a signal amplifier corresponding to the piezzo-electric sensors equipping the force plate. The equipment is coordinated by a software which collects the information provided by the piezzo-electric sensors, transforming them into numerical values of forces and moments. Also the processing unit acts like a synchronization system allowing data analysis as well as the assessment of mechanical work, impulse or forces variation during the recordings. The recordings were made along 15 seconds for big base support and respectively 10 seconds for small base support stability. The selected subjects wore shoes of different heel sizes (3 cm, 5 cm and 8 cm) being recorded in bipodal stability posture, arms along the body, open eyes and respectively closed eyes, with big support base and respectively small base support. In order to be able to conduct the ulterior comparative analysis, we initially recorded the same subjects in identical positions but without wearing shoes. Also the subjects were encouraged to adapt some time (half an hour) with each type of shoes (normal gait, bipodal posture or even sitting) in order to be able to make recordings in comfortable situations for each subject. The subjects were asked to perform the series of motions in order to get used to the recordings type in a natural and relaxed way.
565
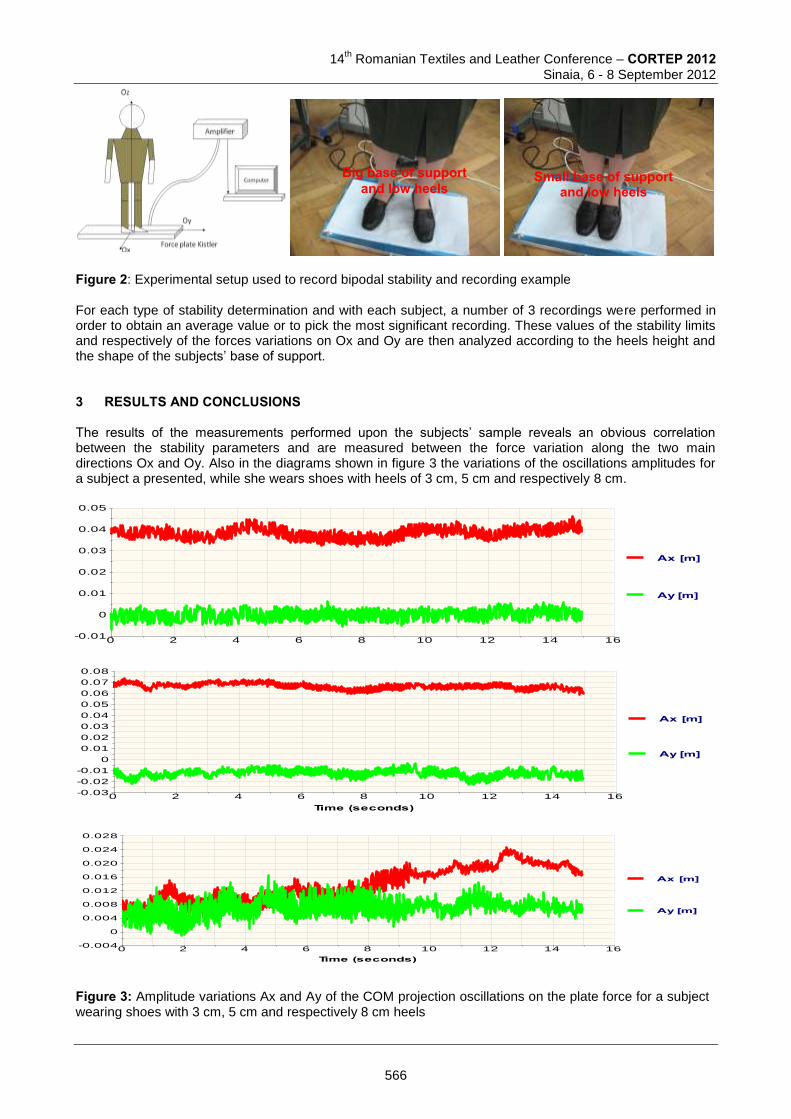
14
th Romanian Textiles and Leather Conference – CORTEP 2012
Sinaia, 6 - 8 September 2012
Figure 2: Experimental setup used to record bipodal stability and recording example For each type of stability determination and with each subject, a number of 3 recordings were performed in order to obtain an average value or to pick the most significant recording. These values of the stability limits and respectively of the forces variations on Ox and Oy are then analyzed according to the heels height and the shape of the subjects’ base of support. 3 RESULTS AND CONCLUSIONS The results of the measurements performed upon the subjects’ sample reveals an obvious correlation between the stability parameters and are measured between the force variation along the two main directions Ox and Oy. Also in the diagrams shown in figure 3 the variations of the oscillations amplitudes for a subject a presented, while she wears shoes with heels of 3 cm, 5 cm and respectively 8 cm.
Time (seconds)
0 2 4 6 8 10 12 14 16-0.01
0
0.01
0.02
0.03
0.04
0.05
Ax [m]
Ay [m]
Time (seconds)
0 2 4 6 8 10 12 14 16-0.03
-0.02
-0.01
0
0.01
0.02
0.03
0.04
0.05
0.06
0.07
0.08
Ax [m]
Ay [m]
Time (seconds)
0 2 4 6 8 10 12 14 16-0.004
0
0.004
0.008
0.012
0.016
0.020
0.024
0.028
Ax [m]
Ay [m]
Figure 3: Amplitude variations Ax and Ay of the COM projection oscillations on the plate force for a subject wearing shoes with 3 cm, 5 cm and respectively 8 cm heels
Big base of support and low heels
Small base of support and low heels
566
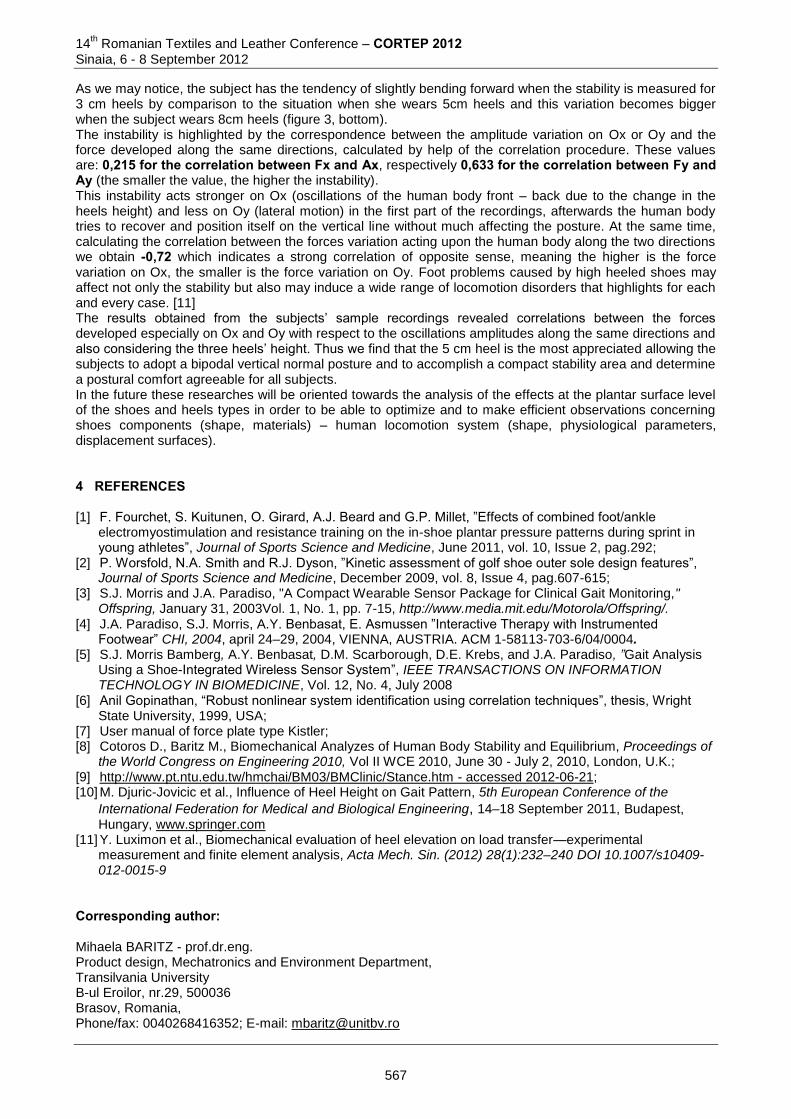
14th Romanian Textiles and Leather Conference – CORTEP 2012
Sinaia, 6 - 8 September 2012
As we may notice, the subject has the tendency of slightly bending forward when the stability is measured for 3 cm heels by comparison to the situation when she wears 5cm heels and this variation becomes bigger when the subject wears 8cm heels (figure 3, bottom). The instability is highlighted by the correspondence between the amplitude variation on Ox or Oy and the force developed along the same directions, calculated by help of the correlation procedure. These values are: 0,215 for the correlation between Fx and Ax, respectively 0,633 for the correlation between Fy and Ay (the smaller the value, the higher the instability). This instability acts stronger on Ox (oscillations of the human body front – back due to the change in the heels height) and less on Oy (lateral motion) in the first part of the recordings, afterwards the human body tries to recover and position itself on the vertical line without much affecting the posture. At the same time, calculating the correlation between the forces variation acting upon the human body along the two directions we obtain -0,72 which indicates a strong correlation of opposite sense, meaning the higher is the force variation on Ox, the smaller is the force variation on Oy. Foot problems caused by high heeled shoes may affect not only the stability but also may induce a wide range of locomotion disorders that highlights for each and every case. [11] The results obtained from the subjects’ sample recordings revealed correlations between the forces developed especially on Ox and Oy with respect to the oscillations amplitudes along the same directions and also considering the three heels’ height. Thus we find that the 5 cm heel is the most appreciated allowing the subjects to adopt a bipodal vertical normal posture and to accomplish a compact stability area and determine a postural comfort agreeable for all subjects. In the future these researches will be oriented towards the analysis of the effects at the plantar surface level of the shoes and heels types in order to be able to optimize and to make efficient observations concerning shoes components (shape, materials) – human locomotion system (shape, physiological parameters, displacement surfaces). 4 REFERENCES [1] F. Fourchet, S. Kuitunen, O. Girard, A.J. Beard and G.P. Millet, ”Effects of combined foot/ankle
electromyostimulation and resistance training on the in-shoe plantar pressure patterns during sprint in young athletes”, Journal of Sports Science and Medicine, June 2011, vol. 10, Issue 2, pag.292;
[2] P. Worsfold, N.A. Smith and R.J. Dyson, ”Kinetic assessment of golf shoe outer sole design features”, Journal of Sports Science and Medicine, December 2009, vol. 8, Issue 4, pag.607-615;
[3] S.J. Morris and J.A. Paradiso, "A Compact Wearable Sensor Package for Clinical Gait Monitoring," Offspring, January 31, 2003Vol. 1, No. 1, pp. 7-15, http://www.media.mit.edu/Motorola/Offspring/.
[4] J.A. Paradiso, S.J. Morris, A.Y. Benbasat, E. Asmussen ”Interactive Therapy with Instrumented Footwear” CHI, 2004, april 24–29, 2004, VIENNA, AUSTRIA. ACM 1-58113-703-6/04/0004.
[5] S.J. Morris Bamberg, A.Y. Benbasat, D.M. Scarborough, D.E. Krebs, and J.A. Paradiso, ”Gait Analysis Using a Shoe-Integrated Wireless Sensor System”, IEEE TRANSACTIONS ON INFORMATION TECHNOLOGY IN BIOMEDICINE, Vol. 12, No. 4, July 2008
[6] Anil Gopinathan, “Robust nonlinear system identification using correlation techniques”, thesis, Wright State University, 1999, USA;
[7] User manual of force plate type Kistler; [8] Cotoros D., Baritz M., Biomechanical Analyzes of Human Body Stability and Equilibrium, Proceedings of
the World Congress on Engineering 2010, Vol II WCE 2010, June 30 - July 2, 2010, London, U.K.; [9] http://www.pt.ntu.edu.tw/hmchai/BM03/BMClinic/Stance.htm - accessed 2012-06-21; [10] M. Djuric-Jovicic et al., Influence of Heel Height on Gait Pattern, 5th European Conference of the
International Federation for Medical and Biological Engineering, 14–18 September 2011, Budapest, Hungary, www.springer.com
[11] Y. Luximon et al., Biomechanical evaluation of heel elevation on load transfer—experimental measurement and finite element analysis, Acta Mech. Sin. (2012) 28(1):232–240 DOI 10.1007/s10409-012-0015-9
Corresponding author: Mihaela BARITZ - prof.dr.eng. Product design, Mechatronics and Environment Department, Transilvania University B-ul Eroilor, nr.29, 500036 Brasov, Romania, Phone/fax: 0040268416352; E-mail: [email protected]
567

14
th Romanian Textiles and Leather Conference – CORTEP 2012
Sinaia, 6 - 8 September 2012
Co-author: Diana COTOROS assoc. prof. eng. Product design, Mechatronics and Environment Department, Transilvania University B-ul Eroilor, nr.29, 500036 Brasov, Romania, Phone/fax: 0040268416352; E-mail: [email protected]
568
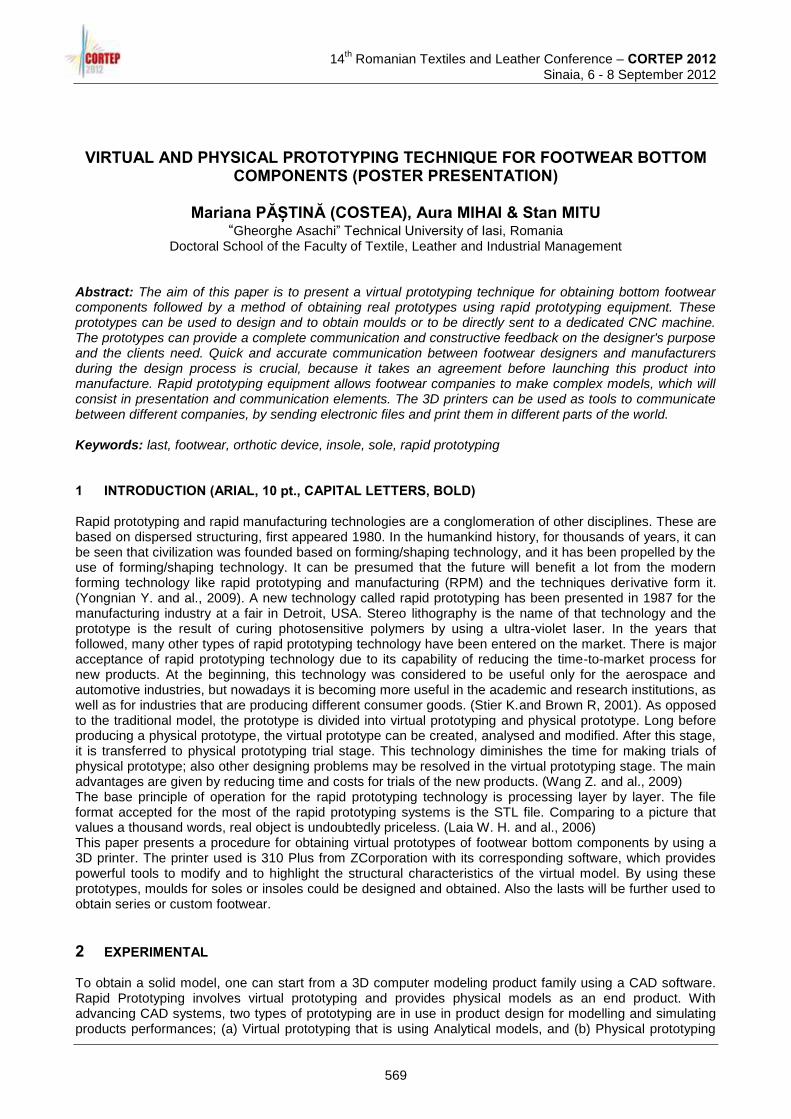
14
th Romanian Textiles and Leather Conference – CORTEP 2012
Sinaia, 6 - 8 September 2012
VIRTUAL AND PHYSICAL PROTOTYPING TECHNIQUE FOR FOOTWEAR BOTTOM COMPONENTS (POSTER PRESENTATION)
Mariana PĂȘTINĂ (COSTEA), Aura MIHAI & Stan MITU
“Gheorghe Asachi” Technical University of Iasi, Romania Doctoral School of the Faculty of Textile, Leather and Industrial Management
Abstract: The aim of this paper is to present a virtual prototyping technique for obtaining bottom footwear components followed by a method of obtaining real prototypes using rapid prototyping equipment. These prototypes can be used to design and to obtain moulds or to be directly sent to a dedicated CNC machine. The prototypes can provide a complete communication and constructive feedback on the designer's purpose and the clients need. Quick and accurate communication between footwear designers and manufacturers during the design process is crucial, because it takes an agreement before launching this product into manufacture. Rapid prototyping equipment allows footwear companies to make complex models, which will consist in presentation and communication elements. The 3D printers can be used as tools to communicate between different companies, by sending electronic files and print them in different parts of the world. Keywords: last, footwear, orthotic device, insole, sole, rapid prototyping 1 INTRODUCTION (ARIAL, 10 pt., CAPITAL LETTERS, BOLD) Rapid prototyping and rapid manufacturing technologies are a conglomeration of other disciplines. These are based on dispersed structuring, first appeared 1980. In the humankind history, for thousands of years, it can be seen that civilization was founded based on forming/shaping technology, and it has been propelled by the use of forming/shaping technology. It can be presumed that the future will benefit a lot from the modern forming technology like rapid prototyping and manufacturing (RPM) and the techniques derivative form it. (Yongnian Y. and al., 2009). A new technology called rapid prototyping has been presented in 1987 for the manufacturing industry at a fair in Detroit, USA. Stereo lithography is the name of that technology and the prototype is the result of curing photosensitive polymers by using a ultra-violet laser. In the years that followed, many other types of rapid prototyping technology have been entered on the market. There is major acceptance of rapid prototyping technology due to its capability of reducing the time-to-market process for new products. At the beginning, this technology was considered to be useful only for the aerospace and automotive industries, but nowadays it is becoming more useful in the academic and research institutions, as well as for industries that are producing different consumer goods. (Stier K.and Brown R, 2001). As opposed to the traditional model, the prototype is divided into virtual prototyping and physical prototype. Long before producing a physical prototype, the virtual prototype can be created, analysed and modified. After this stage, it is transferred to physical prototyping trial stage. This technology diminishes the time for making trials of physical prototype; also other designing problems may be resolved in the virtual prototyping stage. The main advantages are given by reducing time and costs for trials of the new products. (Wang Z. and al., 2009) The base principle of operation for the rapid prototyping technology is processing layer by layer. The file format accepted for the most of the rapid prototyping systems is the STL file. Comparing to a picture that values a thousand words, real object is undoubtedly priceless. (Laia W. H. and al., 2006) This paper presents a procedure for obtaining virtual prototypes of footwear bottom components by using a 3D printer. The printer used is 310 Plus from ZCorporation with its corresponding software, which provides powerful tools to modify and to highlight the structural characteristics of the virtual model. By using these prototypes, moulds for soles or insoles could be designed and obtained. Also the lasts will be further used to obtain series or custom footwear.
2 EXPERIMENTAL To obtain a solid model, one can start from a 3D computer modeling product family using a CAD software. Rapid Prototyping involves virtual prototyping and provides physical models as an end product. With advancing CAD systems, two types of prototyping are in use in product design for modelling and simulating products performances; (a) Virtual prototyping that is using Analytical models, and (b) Physical prototyping
569
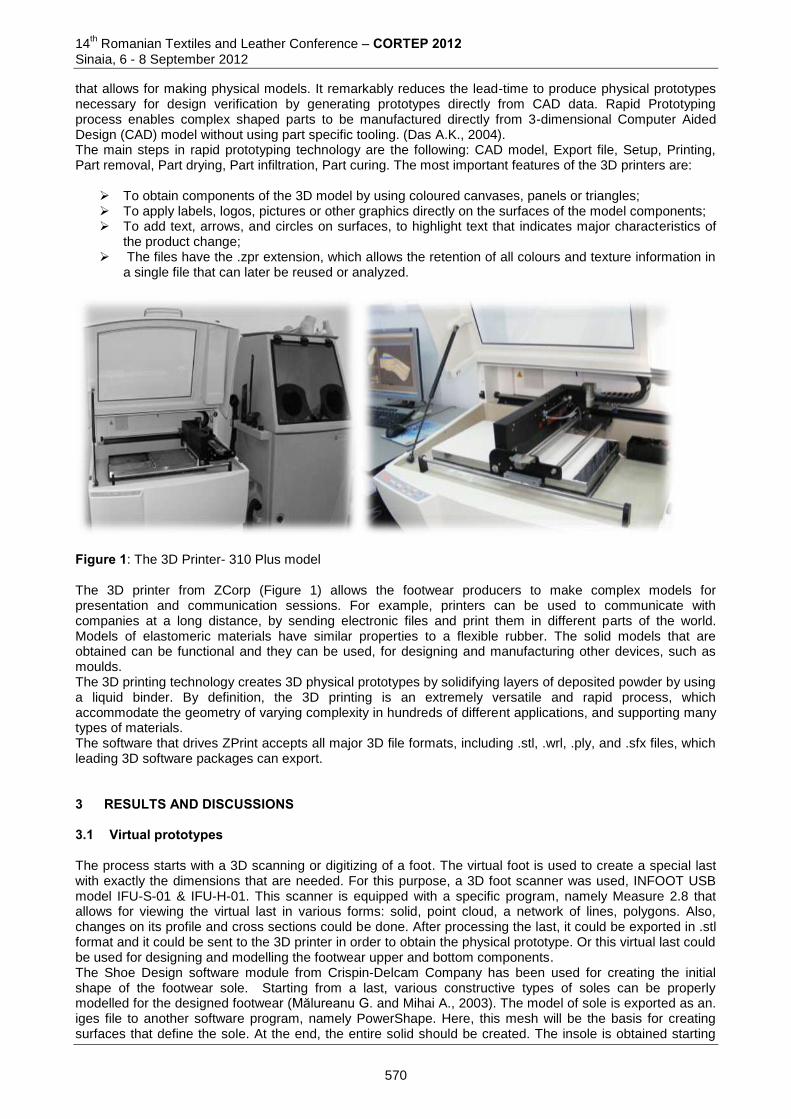
14th Romanian Textiles and Leather Conference – CORTEP 2012
Sinaia, 6 - 8 September 2012
that allows for making physical models. It remarkably reduces the lead-time to produce physical prototypes necessary for design verification by generating prototypes directly from CAD data. Rapid Prototyping process enables complex shaped parts to be manufactured directly from 3-dimensional Computer Aided Design (CAD) model without using part specific tooling. (Das A.K., 2004). The main steps in rapid prototyping technology are the following: CAD model, Export file, Setup, Printing, Part removal, Part drying, Part infiltration, Part curing. The most important features of the 3D printers are:
To obtain components of the 3D model by using coloured canvases, panels or triangles; To apply labels, logos, pictures or other graphics directly on the surfaces of the model components; To add text, arrows, and circles on surfaces, to highlight text that indicates major characteristics of
the product change; The files have the .zpr extension, which allows the retention of all colours and texture information in
a single file that can later be reused or analyzed.
Figure 1: The 3D Printer- 310 Plus model The 3D printer from ZCorp (Figure 1) allows the footwear producers to make complex models for presentation and communication sessions. For example, printers can be used to communicate with companies at a long distance, by sending electronic files and print them in different parts of the world. Models of elastomeric materials have similar properties to a flexible rubber. The solid models that are obtained can be functional and they can be used, for designing and manufacturing other devices, such as moulds. The 3D printing technology creates 3D physical prototypes by solidifying layers of deposited powder by using a liquid binder. By definition, the 3D printing is an extremely versatile and rapid process, which accommodate the geometry of varying complexity in hundreds of different applications, and supporting many types of materials. The software that drives ZPrint accepts all major 3D file formats, including .stl, .wrl, .ply, and .sfx files, which leading 3D software packages can export. 3 RESULTS AND DISCUSSIONS 3.1 Virtual prototypes The process starts with a 3D scanning or digitizing of a foot. The virtual foot is used to create a special last with exactly the dimensions that are needed. For this purpose, a 3D foot scanner was used, INFOOT USB model IFU-S-01 & IFU-H-01. This scanner is equipped with a specific program, namely Measure 2.8 that allows for viewing the virtual last in various forms: solid, point cloud, a network of lines, polygons. Also, changes on its profile and cross sections could be done. After processing the last, it could be exported in .stl format and it could be sent to the 3D printer in order to obtain the physical prototype. Or this virtual last could be used for designing and modelling the footwear upper and bottom components. The Shoe Design software module from Crispin-Delcam Company has been used for creating the initial shape of the footwear sole. Starting from a last, various constructive types of soles can be properly modelled for the designed footwear (Mălureanu G. and Mihai A., 2003). The model of sole is exported as an. iges file to another software program, namely PowerShape. Here, this mesh will be the basis for creating surfaces that define the sole. At the end, the entire solid should be created. The insole is obtained starting
570
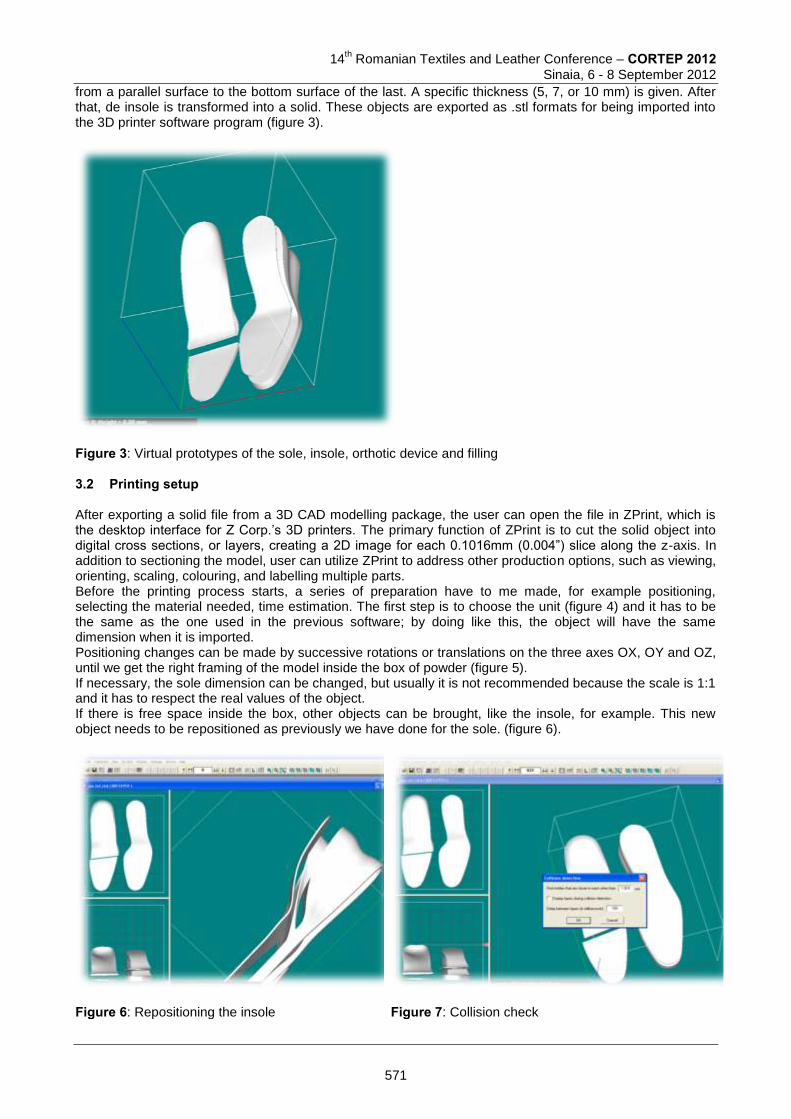
14
th Romanian Textiles and Leather Conference – CORTEP 2012
Sinaia, 6 - 8 September 2012
from a parallel surface to the bottom surface of the last. A specific thickness (5, 7, or 10 mm) is given. After that, de insole is transformed into a solid. These objects are exported as .stl formats for being imported into the 3D printer software program (figure 3).
Figure 3: Virtual prototypes of the sole, insole, orthotic device and filling 3.2 Printing setup After exporting a solid file from a 3D CAD modelling package, the user can open the file in ZPrint, which is the desktop interface for Z Corp.’s 3D printers. The primary function of ZPrint is to cut the solid object into digital cross sections, or layers, creating a 2D image for each 0.1016mm (0.004”) slice along the z-axis. In addition to sectioning the model, user can utilize ZPrint to address other production options, such as viewing, orienting, scaling, colouring, and labelling multiple parts. Before the printing process starts, a series of preparation have to me made, for example positioning, selecting the material needed, time estimation. The first step is to choose the unit (figure 4) and it has to be the same as the one used in the previous software; by doing like this, the object will have the same dimension when it is imported. Positioning changes can be made by successive rotations or translations on the three axes OX, OY and OZ, until we get the right framing of the model inside the box of powder (figure 5). If necessary, the sole dimension can be changed, but usually it is not recommended because the scale is 1:1 and it has to respect the real values of the object. If there is free space inside the box, other objects can be brought, like the insole, for example. This new object needs to be repositioned as previously we have done for the sole. (figure 6).
Figure 6: Repositioning the insole
Figure 7: Collision check
571
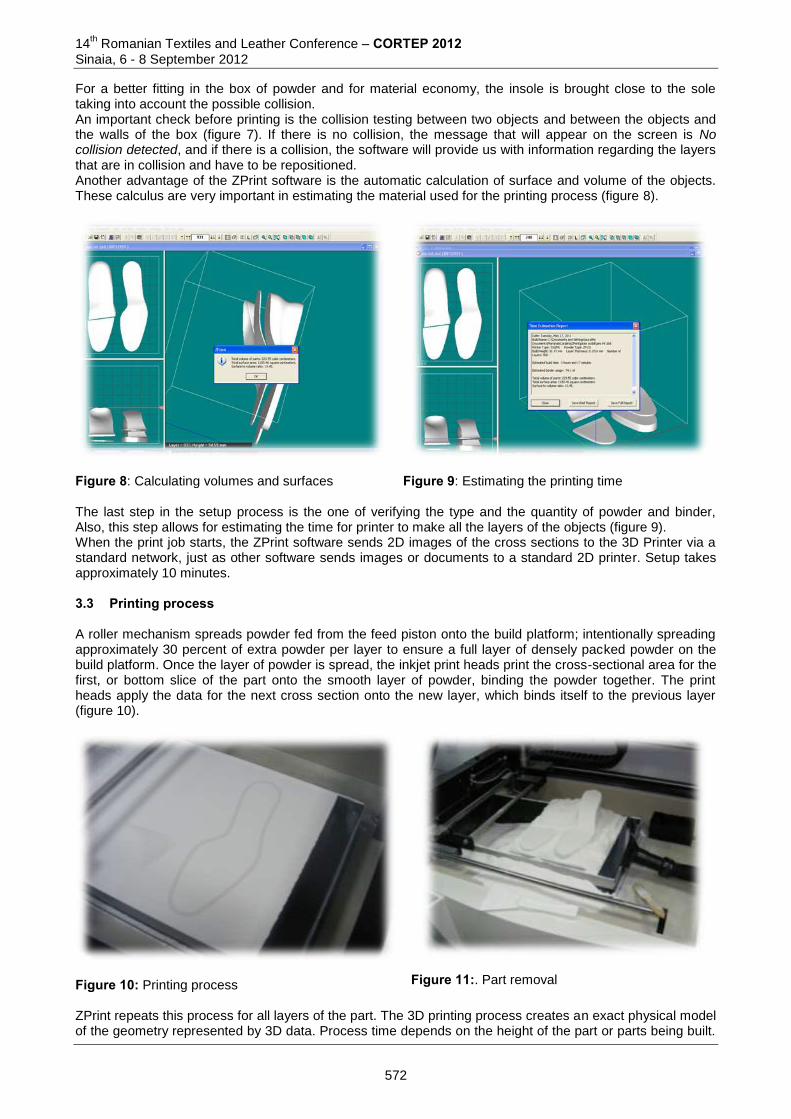
14th Romanian Textiles and Leather Conference – CORTEP 2012
Sinaia, 6 - 8 September 2012
For a better fitting in the box of powder and for material economy, the insole is brought close to the sole taking into account the possible collision. An important check before printing is the collision testing between two objects and between the objects and the walls of the box (figure 7). If there is no collision, the message that will appear on the screen is No collision detected, and if there is a collision, the software will provide us with information regarding the layers that are in collision and have to be repositioned. Another advantage of the ZPrint software is the automatic calculation of surface and volume of the objects. These calculus are very important in estimating the material used for the printing process (figure 8).
Figure 8: Calculating volumes and surfaces
Figure 9: Estimating the printing time The last step in the setup process is the one of verifying the type and the quantity of powder and binder, Also, this step allows for estimating the time for printer to make all the layers of the objects (figure 9). When the print job starts, the ZPrint software sends 2D images of the cross sections to the 3D Printer via a standard network, just as other software sends images or documents to a standard 2D printer. Setup takes approximately 10 minutes. 3.3 Printing process A roller mechanism spreads powder fed from the feed piston onto the build platform; intentionally spreading approximately 30 percent of extra powder per layer to ensure a full layer of densely packed powder on the build platform. Once the layer of powder is spread, the inkjet print heads print the cross-sectional area for the first, or bottom slice of the part onto the smooth layer of powder, binding the powder together. The print heads apply the data for the next cross section onto the new layer, which binds itself to the previous layer (figure 10).
Figure 10: Printing process
Figure 11:. Part removal
ZPrint repeats this process for all layers of the part. The 3D printing process creates an exact physical model of the geometry represented by 3D data. Process time depends on the height of the part or parts being built.
572
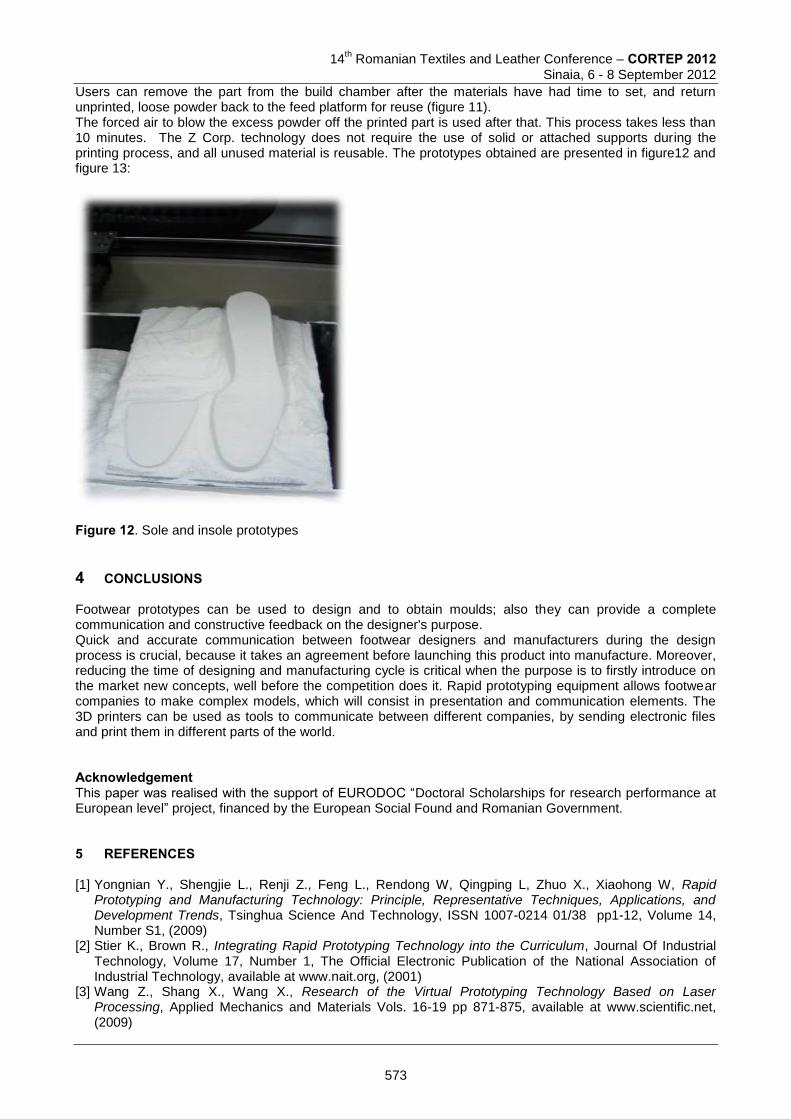
14
th Romanian Textiles and Leather Conference – CORTEP 2012
Sinaia, 6 - 8 September 2012
Users can remove the part from the build chamber after the materials have had time to set, and return unprinted, loose powder back to the feed platform for reuse (figure 11). The forced air to blow the excess powder off the printed part is used after that. This process takes less than 10 minutes. The Z Corp. technology does not require the use of solid or attached supports during the printing process, and all unused material is reusable. The prototypes obtained are presented in figure12 and figure 13:
Figure 12. Sole and insole prototypes
4 CONCLUSIONS Footwear prototypes can be used to design and to obtain moulds; also they can provide a complete communication and constructive feedback on the designer's purpose. Quick and accurate communication between footwear designers and manufacturers during the design process is crucial, because it takes an agreement before launching this product into manufacture. Moreover, reducing the time of designing and manufacturing cycle is critical when the purpose is to firstly introduce on the market new concepts, well before the competition does it. Rapid prototyping equipment allows footwear companies to make complex models, which will consist in presentation and communication elements. The 3D printers can be used as tools to communicate between different companies, by sending electronic files and print them in different parts of the world. Acknowledgement This paper was realised with the support of EURODOC “Doctoral Scholarships for research performance at European level” project, financed by the European Social Found and Romanian Government. 5 REFERENCES [1] Yongnian Y., Shengjie L., Renji Z., Feng L., Rendong W, Qingping L, Zhuo X., Xiaohong W, Rapid
Prototyping and Manufacturing Technology: Principle, Representative Techniques, Applications, and Development Trends, Tsinghua Science And Technology, ISSN 1007-0214 01/38 pp1-12, Volume 14, Number S1, (2009)
[2] Stier K., Brown R., Integrating Rapid Prototyping Technology into the Curriculum, Journal Of Industrial Technology, Volume 17, Number 1, The Official Electronic Publication of the National Association of Industrial Technology, available at www.nait.org, (2001)
[3] Wang Z., Shang X., Wang X., Research of the Virtual Prototyping Technology Based on Laser Processing, Applied Mechanics and Materials Vols. 16-19 pp 871-875, available at www.scientific.net, (2009)
573
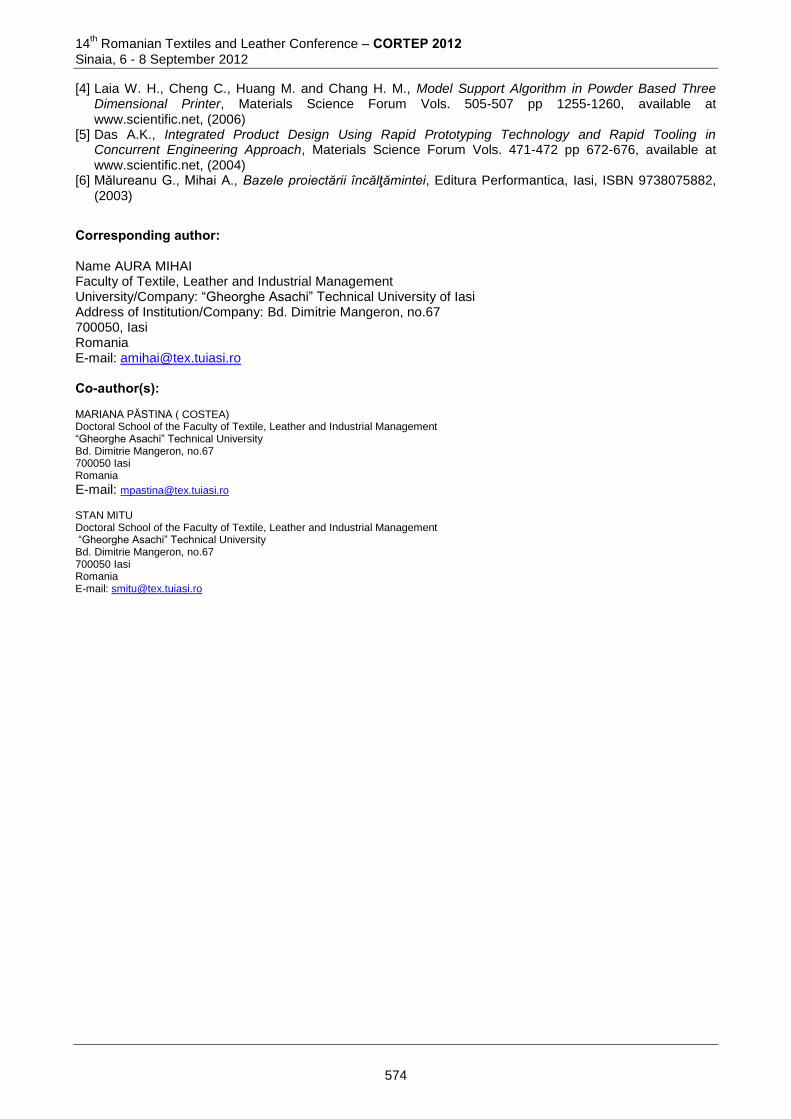
14th Romanian Textiles and Leather Conference – CORTEP 2012
Sinaia, 6 - 8 September 2012
[4] Laia W. H., Cheng C., Huang M. and Chang H. M., Model Support Algorithm in Powder Based Three Dimensional Printer, Materials Science Forum Vols. 505-507 pp 1255-1260, available at www.scientific.net, (2006)
[5] Das A.K., Integrated Product Design Using Rapid Prototyping Technology and Rapid Tooling in Concurrent Engineering Approach, Materials Science Forum Vols. 471-472 pp 672-676, available at www.scientific.net, (2004)
[6] Mălureanu G., Mihai A., Bazele proiectării încălţămintei, Editura Performantica, Iasi, ISBN 9738075882, (2003)
Corresponding author: Name AURA MIHAI Faculty of Textile, Leather and Industrial Management University/Company: “Gheorghe Asachi” Technical University of Iasi Address of Institution/Company: Bd. Dimitrie Mangeron, no.67 700050, Iasi Romania E-mail: [email protected] Co-author(s): MARIANA PĂSTINA ( COSTEA) Doctoral School of the Faculty of Textile, Leather and Industrial Management “Gheorghe Asachi” Technical University Bd. Dimitrie Mangeron, no.67 700050 Iasi Romania
E-mail: [email protected]
STAN MITU Doctoral School of the Faculty of Textile, Leather and Industrial Management “Gheorghe Asachi” Technical University Bd. Dimitrie Mangeron, no.67 700050 Iasi Romania E-mail: [email protected]
574
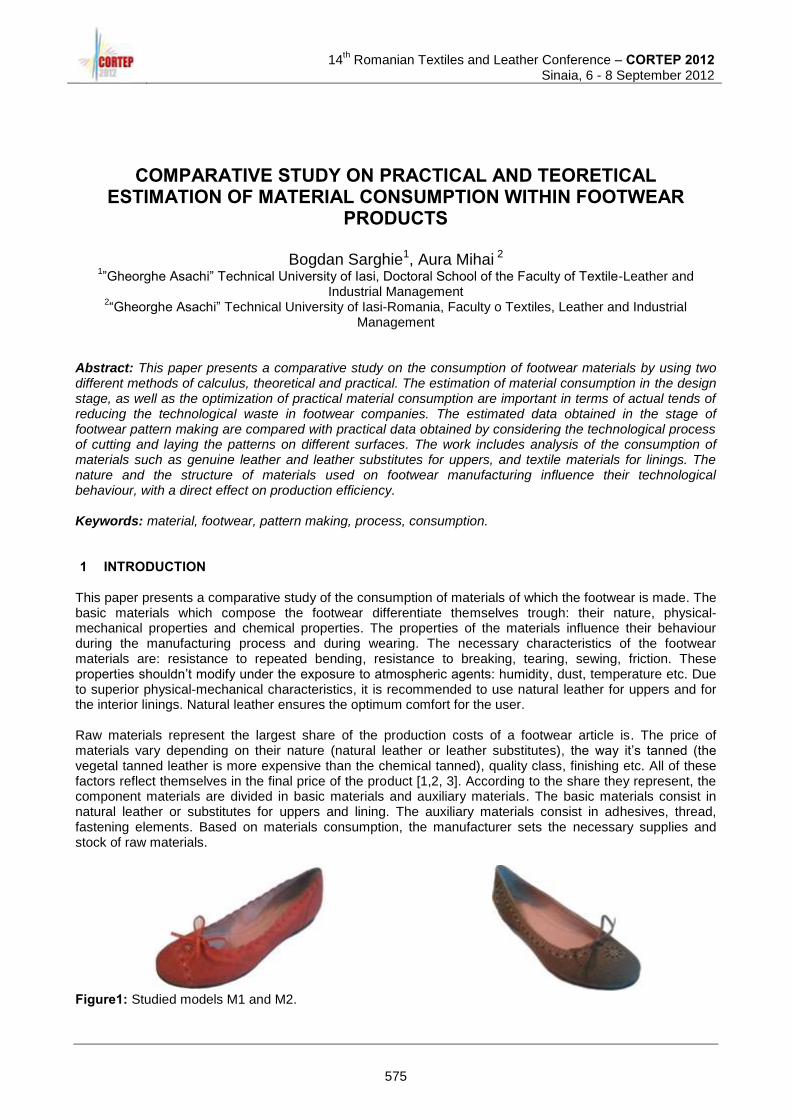
14
th Romanian Textiles and Leather Conference – CORTEP 2012
Sinaia, 6 - 8 September 2012
COMPARATIVE STUDY ON PRACTICAL AND TEORETICAL ESTIMATION OF MATERIAL CONSUMPTION WITHIN FOOTWEAR
PRODUCTS
Bogdan Sarghie1, Aura Mihai 2 1”Gheorghe Asachi” Technical University of Iasi, Doctoral School of the Faculty of Textile-Leather and
Industrial Management 2“Gheorghe Asachi” Technical University of Iasi-Romania, Faculty o Textiles, Leather and Industrial
Management Abstract: This paper presents a comparative study on the consumption of footwear materials by using two different methods of calculus, theoretical and practical. The estimation of material consumption in the design stage, as well as the optimization of practical material consumption are important in terms of actual tends of reducing the technological waste in footwear companies. The estimated data obtained in the stage of footwear pattern making are compared with practical data obtained by considering the technological process of cutting and laying the patterns on different surfaces. The work includes analysis of the consumption of materials such as genuine leather and leather substitutes for uppers, and textile materials for linings. The nature and the structure of materials used on footwear manufacturing influence their technological behaviour, with a direct effect on production efficiency. Keywords: material, footwear, pattern making, process, consumption. 1 INTRODUCTION
This paper presents a comparative study of the consumption of materials of which the footwear is made. The basic materials which compose the footwear differentiate themselves trough: their nature, physical-mechanical properties and chemical properties. The properties of the materials influence their behaviour during the manufacturing process and during wearing. The necessary characteristics of the footwear materials are: resistance to repeated bending, resistance to breaking, tearing, sewing, friction. These properties shouldn’t modify under the exposure to atmospheric agents: humidity, dust, temperature etc. Due to superior physical-mechanical characteristics, it is recommended to use natural leather for uppers and for the interior linings. Natural leather ensures the optimum comfort for the user. Raw materials represent the largest share of the production costs of a footwear article is. The price of materials vary depending on their nature (natural leather or leather substitutes), the way it’s tanned (the vegetal tanned leather is more expensive than the chemical tanned), quality class, finishing etc. All of these factors reflect themselves in the final price of the product [1,2, 3]. According to the share they represent, the component materials are divided in basic materials and auxiliary materials. The basic materials consist in natural leather or substitutes for uppers and lining. The auxiliary materials consist in adhesives, thread, fastening elements. Based on materials consumption, the manufacturer sets the necessary supplies and stock of raw materials.
Figure1: Studied models M1 and M2.
575

14
th Romanian Textiles and Leather Conference – CORTEP 2012
Sinaia, 6 - 8 September 2012
2 MATERIALS AND METHODS For the estimation of materials usage we have selected two models of women’s low-cut shoes (M1, M2). Outer part of footwear uppers is made of bovine leather, calf skin, natural finishing, middle part of the uppers is made of reinforcement lining and inner part of uppers is made from pig leather basan. The materials for which the theoretical and practical consumption have been determined divide themselves into two categories: basic materials and auxiliary materials. The basic materials that compose the footwear consist in natural leather for uppers and lining and intermediary materials with a reinforcement role, fabric. The auxiliary materials used in the manufacturing of footwear consist in adhesives and sewing thread, with the role of joining the component patterns. 2.1 The Calculus of base material consumption For the calculus of the theoretical consumption standard (Nc) for leather it is necessary to determine the net surface of each pattern (A) and of the set of patterns (As), in dm
2, and of the perimeter of each pattern (P)
and of the set of patterns (Ps), in dm. The theoretical placement factor (Fa) is expressed in percents (%). Because particular configuration and size differences of the footwear patterns, during pattern cutting, different types of material wastes result. Index of material utilisation (U) is determine by the amount of material wastes [4,5].
pD
tmD
nD100U (%) (1)
/pair)2(dmU
100s
A
cN cI
(2)
2.2 The Calculus of leather substitute materials consumption For the two footwear models fabric (with the role of strengthening the upper patterns) and micro porous material (for the insole) have been used as leather substitutes. The leather substitutes are delivered as lengths of linen (rolls). These materials have uniform properties: dimension, thickness, aspect and the lack of quality defects. In order to determine the consumption of leather substitute materials it is necessary to determine the number of patterns that can be cut on the length and width of the material. The basic rule for the leather substitute pattern cutting is that the direction of maximum stress of the pattern must correspond to the direction of minimum deformation of the material. The parameters for the calculus of the consumption of leather substitute materials are the number of patterns set on the length (nL), the number of patterns set on the width (nB), the length and the width of the material (L and B), marginal refuse at the beginning of the cutting pattern (ΔL1 and ΔB1), equal on both directions (5 mm), the length and width of the pattern (l and b), interpenetration or detachment of the pattern on the two directions (ΔL and ΔB) and the marginal refuse on the two directions (ΔL2 and ΔB2). The theoretical consumption standard for each pattern of leather substitute is calculated with the formula [4,5]:
/pair)2(dmn
Ln
Bn
optimL
maxB
cN s
(3)
Where: Bmax – the maximum width of the material; Loptim – the optimum length of the material; nB and nL – the number of patterns set on the length and width of the material; ns – the number of patterns from the set. 2.3 The calculus of the theoretical consumption of sewing thread. For the calculus of the theoretical consumption of sewing thread it is necessary to know the type of sewing, the thickness of the interwoven patterns and of the length of the sewing. The formula [4,5] needed to determine the length of thread of a simple sewing with two threads is:
Lη)iδn2(2l (4)
Where: l – the length of thread for a centimetre of sewing (cm); L – the length of the sewing (cm); n – thickness of the sewing (paces/cm); δi- the thickness of the interwoven materials, cm; a – amplitude f the zigzag sewing = 0,3 cm; η – coefficient dependent on the elasticity of the thread and that of the material.
576
14
th Romanian Textiles and Leather Conference – CORTEP 2012
Sinaia, 6 - 8 September 2012
2.4 The calculus of the theoretical consumption of adhesive. The factors that influence adhesive consumption are: the type of adhesive, its concentration, the nature of the solvent, volatility and density, the thickness of the pellicle, the size of the surface upon which the adhesive is applied. The standard for adhesive consumption is represented by the mass of dried substance added to the mass of the solvent [4,5].
s
nsolv
Msu
Mc
N (4)
Where: Msu – dried substance mass (g); Msolv – mass of the solvent (g); ns – number of smears per pair. The calculus id done for each pattern, than it is added, knowing the number of similar patterns in the pair. 2.5 The calculus of practical consumption of materials The experimental calculus of basic materials and auxiliary materials consumption has been realized in a practical manner, inside a footwear producing unit. The values for materials consumption have been obtained by calculating the quantity of materials used for manufacturing the two models of footwear during the manufacturing process. Knowing the area of the component patterns of the footwear and of the initial quantity of natural leather materials for the uppers and lining and that of the quantity of leather substitute materials for fabric and micro-porous and the production volume (number of pairs) the necessary of materials needed to realize production has been obtained. By analyzing the initial quantity of materials and the quantity of used materials we were able to calculate the consumption of materials for the manufactured models. 3. Results and discussions The basic materials for which the consumption standard has been calculated consist of natural leather (calf) for uppers and pig leather for the lining. The auxiliary materials for which the consumption standard has been calculated consist of yarn made of PES (SINTROM type yarn), with a fineness in metric number of 65/3 corresponding and natural rubber-type adhesive for the temporary joining of the patterns and polychloroprene-type adhesive for the final joining of the upper part of the footwear and the sole. The results of the theoretical and experimental calculations for the two footwear models M1 and M2 are presented in Table 1. Table 1: Theoretical and practical consumption estimation results.
Type of material Measurement
unit
M1 M2
Theoretical consumption
Practical consumption
Theoretical consumption
Practical consumption
Leather for uppers dm2 13.98 15.21 16.63 16.91
Leather for linings dm2
10.61 11.58 10.51 11.03
Reinforcement lining
dm2 10.65 11.3 10.65 11.26
Fabric for the intermediary insole
dm2 3.75 4.10 3.64 3.92
Micro-porous for the intermediary
insole dm
2 3.41 3.82 3.41 3.82
Sewing thread m 11.09 16.75 9.55 18.10
Natural rubber adhesive
g 23.21 29.5 21.47 26.35
Polychloroprene adhesive
g 34.62 46.51 36.58 49.11
The practical resulted consumption of materials is higher than the theoretical one. For all the types of material: natural leather for the outer subgroup of footwear uppers, natural leather for the lining, reinforcement fabric for the middle subgroup, micro-porous material for the insoles, yarn and adhesive, an increase of the consumption has been noticed during the manufacturing process. During the manufacturing of the footwear models, we have noticed that the materials don’t respect the quality requirements, as there are great variations of their characteristics of the natural leather. The number and nature of the defects and the variation in the dimensions of the leather have contributed to the increase of the consumption of materials. In the case of the footwear manufacturing unit in which the two footwear models have been
577
14
th Romanian Textiles and Leather Conference – CORTEP 2012
Sinaia, 6 - 8 September 2012
manufactures the technological means had a high degree of usage, in the case of some equipment. The average age of the employees is high, between 45-55 years, influencing the manufacturing operations, resulting in a larger number of not concordant pairs. The cutting machines used are of different technological types, with different quality of the cutting and the execution time for each machine. In the case of the section for assembly trough sewing of the patterns, the sewing machines had different degrees of usage, there were cases of machines breaking down, the quality of the manufacturing operations was different for each worker. The experience of the workers, the quality of the execution of the operations, the usage of the sewing machines have influenced the direction of yarn consumption used for the joining of the patterns. In the department where the superior ensemble was joined (upper part of the footwear) with the inferior ensemble (sole) the adhesive consumption is influenced by the skill of each worker, the appliance of the adhesive being made by hand, the quantity of adhesive applied to the materials varying from pair to pair. 5. Conclusions The theoretical calculations used to determine the consumption of materials use only the characteristics of the materials, their nature, dimensions and composition. The consumption of materials obtained in practice are higher than the consumption obtained experimentally, regardless of the nature or type of material. The quantity of materials and the variation of their characteristics differ in great degrees, especially in the case of natural leather for the upper of the footwear and for lining. The level of the technical means of the footwear producing unit and the degree of usage of the machines influence the quality of manufacturing during cutting, sewing and adhesive sole joining, with direct influence on the consumption of materials. The experience of the employees, their age and skill have directly influenced the quality of the final footwear product and, implicit, the quantity of materials used. References [1] Ionescu, C., Volocariu V.: Materii prime pentu confectii din piele si inlocuitori, Ed. Universitătii din
Oradea, ISBN 973-613-758-9, Oradea, 2005 [2] Volocariu, R.: Procese de fabricatie in industria confectiilor din piele si inlocuitori, Ed. “Gh. Asachi”, Iasi,
1999 [3] Mălureanu, G., Cociu V.: Bazele tehnologiei produselor din piele si inlocuitori, Ed. Rotaprint, Iasi, 1991; [4] Volocariu R., Marcus L.: Indrumar pentru lucrari practice la disciplina Procese de Fabricatie în Industria
Confecţiilor din Piele, Partea I, Ed. PIM, ISBN 978-973-716-606-7, Iasi, 2007 [5] Volocariu R., Marcus L., Ionescu C.: Indrumar pentru lucrari practice la disciplina Procese de Fabricatie
în Industria Confectiilor din Piele, Partea II, Ed. PIM, ISBN 978-973-716-755-2, Iasi, 2007 ACKNOWLEDGEMENT This paper was realised with the support of POSDRU CUANTUMDOC “DOCTORAL STUDIES FOR EUROPEAN PERFORMANCES IN RESEARCH AND INNOVATION” ID79407 project funded by the European Social Fund and Romanian Government.
Corresponding author: Bogdan SARGHIE Department of Footwear Design and Technology Faculty o Textiles, Leather and Industrial Management Technical University “Gheorghe Asachi” of Iasi-Romania Blvd. Dimitrie Mangeron, nr. 29, 700050, Iaşi, România Phone/fax: +4 0232 230491, e-mail: [email protected]
Co-author: Aura MIHAI Department of Footwear Design and Technology Faculty o Textiles, Leather and Industrial Management Technical University “Gheorghe Asachi” of Iasi-Romania Blvd. Dimitrie Mangeron, nr. 29, 700050, Iaşi, România Phone/fax: +4 0232 230491, e-mail: [email protected]
578
14
th Romanian Textiles and Leather Conference – CORTEP 2012
Sinaia, 6 - 8 September 2012
THERMAL PROCESSES OF THE MOULDS USED IN FOOTWEAR OUTSOLES
Cornelia IONESCU LUCA
“Gheorghe Asachi” Technical University of Iasi, Romania Abstract: In the case of thermoplastic plastic masses, the mould cavity is feuded by injection. The fluid plastic mass takes the shape of the cavity and than, in a technological time, the obtained product cools until a temperature which makes possible its unloading without any deformation. The cooling of the polymer is made by thermo convection transference from the mould to the environment or by conduction from the mould to the cooled areas of the equipment. The paper presents some contributions for thermical calculation on the injection and cooling processes of the plastic masses in moulds in footwear outsoles manufacturing. It presents some aspects about the dynamics of plastic masses cooling process in moulds after the injection, some calculation formulas and some researching results. Keywords: footwear, footwear outsoles, mould, thermal calculation 1 INTRODUCTION In the case of thermoplastic plastic masses, the mould cavity is feuded by injection. The fluid plastic mass takes the shape of the cavity and than, in a technological time, the obtained product cools until a temperature which makes possible its unloading without any deformation. The cooling of the polymer is made by thermo convection transference from the mould to the environment or by conduction from the mould to the cooled areas of the equipment. Considering the diagram of the footwear outsoles injection, the proper injection time of the polymer melting into the mould cavity is a small one. It ends when the mould is sealed (when the cavity feeding canal closes the connection with the cavity by cooling and solidification of the polymer. Taking into account the time of one cycle for one pair of outsoles obtaining, it has two components: the time necessary for the mould and equipment feeding and the time for the cooling of the polymer. In the outsoles injection equipment case, the feeding stages take place out of the polymer injection, solidification and cooling proper time. So, the main consumer time stage of the manufacturing process is the polymer cooling stage. The paper presents some aspects about the dynamic of the polymer melting cooling process into the moulds, some experimental results and the conclusions about the polymer blends cooling into the moulds. 2 THERMAL PROCESSES OF THE MOULDS USED IN FOOTWEAR OUTSOLES 2.1. Dynamics of the cooling process The footwear outsoles made by the injection of the polymer blends, often use polymerized vinyl chloride and thermoplastic rubber having special formulas. For these blends the feeding mould temperature is about 40-50
0C, the polymer melting having about 180-220
0C.
The outsoles injection equipments have two or more working posts. The two working posts equipments have two moulds, left-right, and one for the polymer injection, cooling and solidification process and another one, for the unloading of the obtaining products. The equipments having more working posts are carousel type and they have working posts multiple of 6, 12, 16, 20, even until 40, depending on the productivity of the equipment. The time necessary for one pair of outsoles [3],[4] obtaining, τc, is calculated using relation (1).The time of the process, τp, has two components: the time necessary for the polymer injection into the mould cavity and the time necessary for the polymer blend cooling and solidification until a temperature which allows the unloading of the product without any deformation. The feeding time is out of the proper thermo chemic process time:
579

14th Romanian Textiles and Leather Conference – CORTEP 2012
Sinaia, 6 - 8 September 2012
dpc , (seconds) (1)
where: τc-time for one cycle of one outsole obtaining, (seconds); τp- time for the polymer blend thermo chemical injection, cooling and solidification process, (seconds); τd –time for the mould feeding, (seconds). For a continuous manufacturing process, the removing of the waiting times is made respecting the conditions pointed in relation (2):
dc n ,( seconds ) (2)
where: n- number moulds. An optimum productivity equipment realizes about 200 outsoles pairs/ mould/8hours. The time for one cycle of one outsoles pair manufacturing is about 2,5 minutes (150 seconds). The injection time is about (10-15) seconds. So, for the two working posts equipment, the condition pointed in relation (2) may be realized in controlled cooling conditions of the mould using an refrigerating installation of the equipment [3],[4]. In the equipment carousel type case, having a big moulds number, more than 6-40, the cooling time amplifies in the same time with the increasing of the working posts number. This aspect allows an environment cooling of the mould, in the same time with the carousel rotation or permissive conditions for the cooling, more permissive than in two working posts equipments case. The cooling of the polymer into the mould until 70-80
0C, (in this field, the handle deformation is hardly
probable) takes place into the mould. In this case, the heat quantity transfer by a mass unit may be calculated using relation (3):
tmcQ , (kcal/Kg) (3)
where: Q- heat given by 1 Kg of polymer melting, [Kcal/Kg]; m- mass, [Kg]; c- specific heat, [kcal/Kg
0C]; Δt-
temperature difference between the injection temperature, ti = (180-2000C), and the medium unloading
temperature of the product, (70-800C).
Considering that the polymer cooling takes place from the mould wall in contact with the cool area, the temperature into the middle of the product made into the mould cavity is about equal to the injection temperature. In this case, it is possible to admit a medium temperature of the product, tm, which may be considered equal to the arithmetic media of the two temperatures, relation (4):
2
pi
m
ttt
, (seconds) (4)
where: ti- injection temperature, [0C]; tp- peripheral temperature of the product, [
0C].
The polymer warm lost must be taken by the mould and given to the environment, through the walls. Considering an polymer layer, having a δ thickness and an infinitesimal layer having a dx infinitesimal thickness, placed at x distance from the edge of the wall, which transfer warm to the environment, as pointed in Fig.1, the heat transference from this layer to the environment is pointed in relation (5).
SdxqdvqdmqdQc , (Kcal) (5)
where: dQc- transference warm, [Kcal]; ρ- polymer density, [Kg/m
3]; m- polymer mass, [Kg]; v- polymer
volume, [m3]; S- area of the volume unit having dx thickness, [m
2];q- warm transference by a mass unit,
[Kcal/Kg].
Figure 1: Cooling dynamics of one polymer layer having δ thickness
580
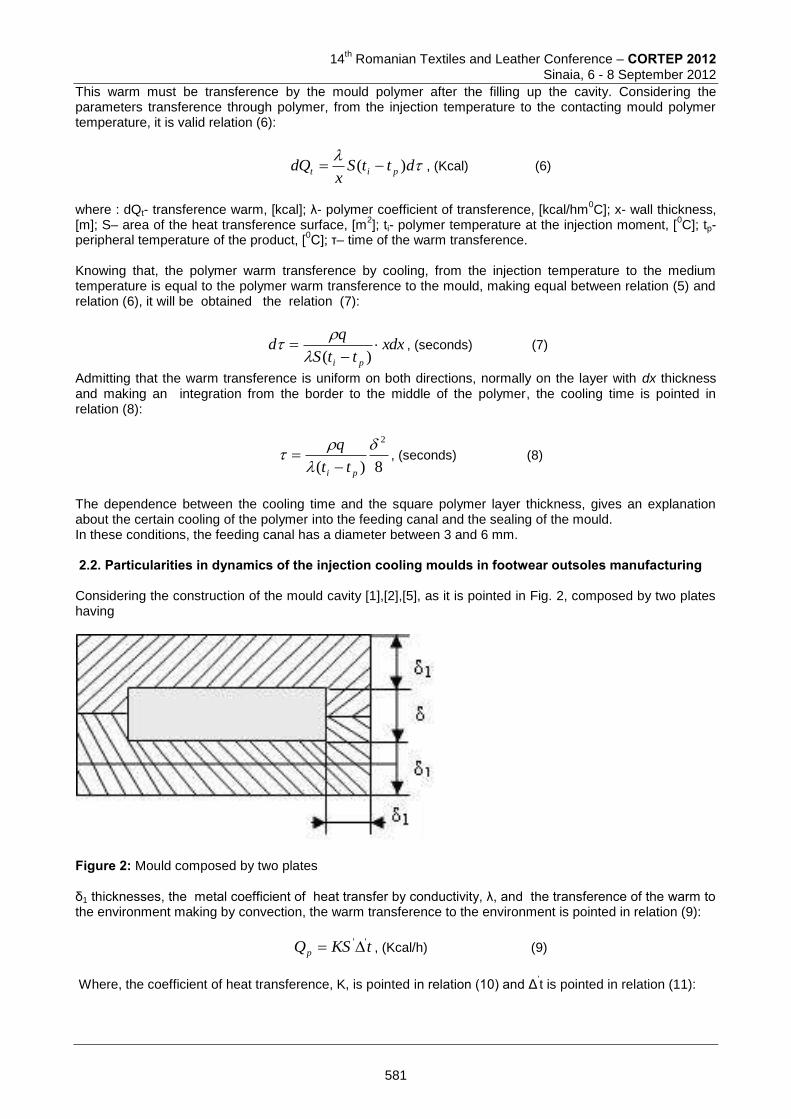
14
th Romanian Textiles and Leather Conference – CORTEP 2012
Sinaia, 6 - 8 September 2012
This warm must be transference by the mould polymer after the filling up the cavity. Considering the parameters transference through polymer, from the injection temperature to the contacting mould polymer temperature, it is valid relation (6):
dttSx
dQ pit )( , (Kcal) (6)
where : dQt- transference warm, [kcal]; λ- polymer coefficient of transference, [kcal/hm
0C]; x- wall thickness,
[m]; S– area of the heat transference surface, [m2]; ti- polymer temperature at the injection moment, [
0C]; tp-
peripheral temperature of the product, [0C]; τ– time of the warm transference.
Knowing that, the polymer warm transference by cooling, from the injection temperature to the medium temperature is equal to the polymer warm transference to the mould, making equal between relation (5) and relation (6), it will be obtained the relation (7):
xdxttS
qd
pi
)(
, (seconds) (7)
Admitting that the warm transference is uniform on both directions, normally on the layer with dx thickness and making an integration from the border to the middle of the polymer, the cooling time is pointed in relation (8):
8)(
2
pi tt
q
, (seconds) (8)
The dependence between the cooling time and the square polymer layer thickness, gives an explanation about the certain cooling of the polymer into the feeding canal and the sealing of the mould. In these conditions, the feeding canal has a diameter between 3 and 6 mm. 2.2. Particularities in dynamics of the injection cooling moulds in footwear outsoles manufacturing Considering the construction of the mould cavity [1],[2],[5], as it is pointed in Fig. 2, composed by two plates having
Figure 2: Mould composed by two plates δ1 thicknesses, the metal coefficient of heat transfer by conductivity, λ, and the transference of the warm to the environment making by convection, the warm transference to the environment is pointed in relation (9):
tKSQp
'' , (Kcal/h) (9)
Where, the coefficient of heat transference, K, is pointed in relation (10) and Δ
’t is pointed in relation (11):
581
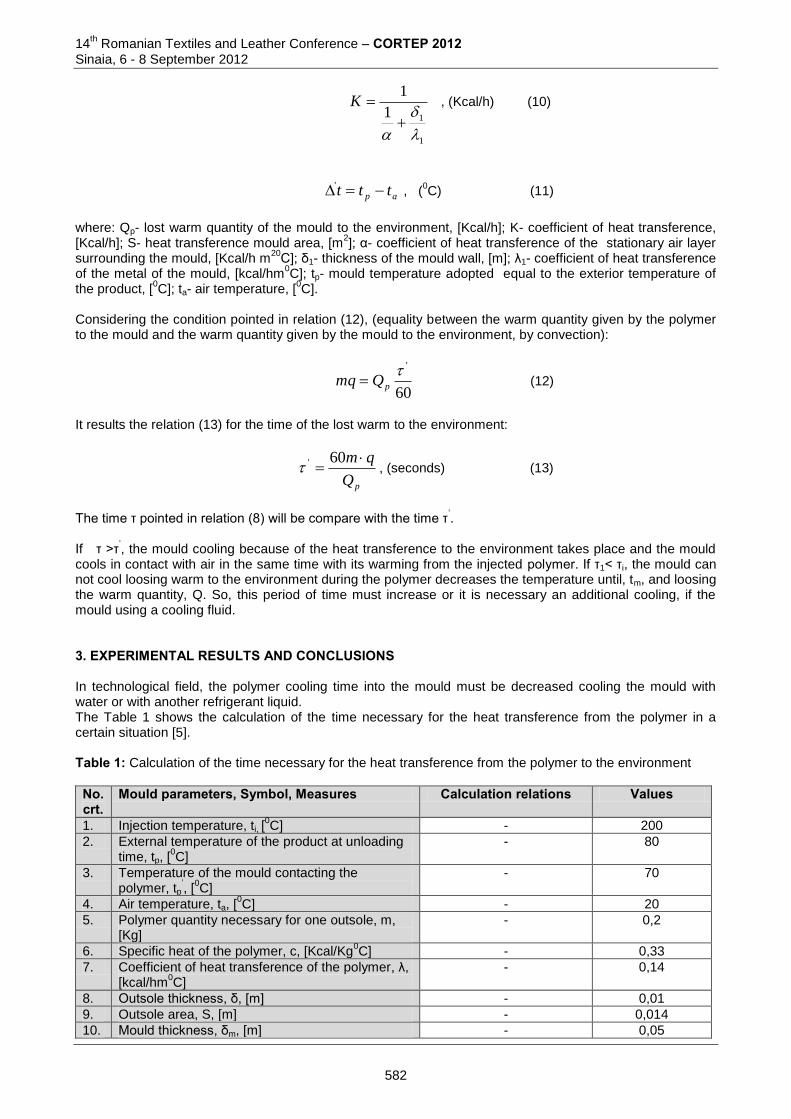
14th Romanian Textiles and Leather Conference – CORTEP 2012
Sinaia, 6 - 8 September 2012
1
11
1
K , (Kcal/h) (10)
ap ttt ' , (
0C) (11)
where: Qp- lost warm quantity of the mould to the environment, [Kcal/h]; K- coefficient of heat transference, [Kcal/h]; S- heat transference mould area, [m
2]; α- coefficient of heat transference of the stationary air layer
surrounding the mould, [Kcal/h m20
C]; δ1- thickness of the mould wall, [m]; λ1- coefficient of heat transference of the metal of the mould, [kcal/hm
0C]; tp- mould temperature adopted equal to the exterior temperature of
the product, [0C]; ta- air temperature, [
0C].
Considering the condition pointed in relation (12), (equality between the warm quantity given by the polymer to the mould and the warm quantity given by the mould to the environment, by convection):
60
'pQmq (12)
It results the relation (13) for the time of the lost warm to the environment:
pQ
qm
60' , (seconds) (13)
The time τ pointed in relation (8) will be compare with the time τ
’.
If τ >τ
’, the mould cooling because of the heat transference to the environment takes place and the mould
cools in contact with air in the same time with its warming from the injected polymer. If τ1< τi, the mould can not cool loosing warm to the environment during the polymer decreases the temperature until, tm, and loosing the warm quantity, Q. So, this period of time must increase or it is necessary an additional cooling, if the mould using a cooling fluid. 3. EXPERIMENTAL RESULTS AND CONCLUSIONS In technological field, the polymer cooling time into the mould must be decreased cooling the mould with water or with another refrigerant liquid. The Table 1 shows the calculation of the time necessary for the heat transference from the polymer in a certain situation [5]. Table 1: Calculation of the time necessary for the heat transference from the polymer to the environment
No. crt.
Mould parameters, Symbol, Measures Calculation relations Values
1. Injection temperature, ti, [0C] - 200
2. External temperature of the product at unloading time, tp, [
0C]
- 80
3. Temperature of the mould contacting the polymer, tp
’, [
0C]
- 70
4. Air temperature, ta, [0C] - 20
5. Polymer quantity necessary for one outsole, m, [Kg]
- 0,2
6. Specific heat of the polymer, c, [Kcal/Kg0C] - 0,33
7. Coefficient of heat transference of the polymer, λ, [kcal/hm
0C]
- 0,14
8. Outsole thickness, δ, [m] - 0,01
9. Outsole area, S, [m] - 0,014
10. Mould thickness, δm, [m] - 0,05
582
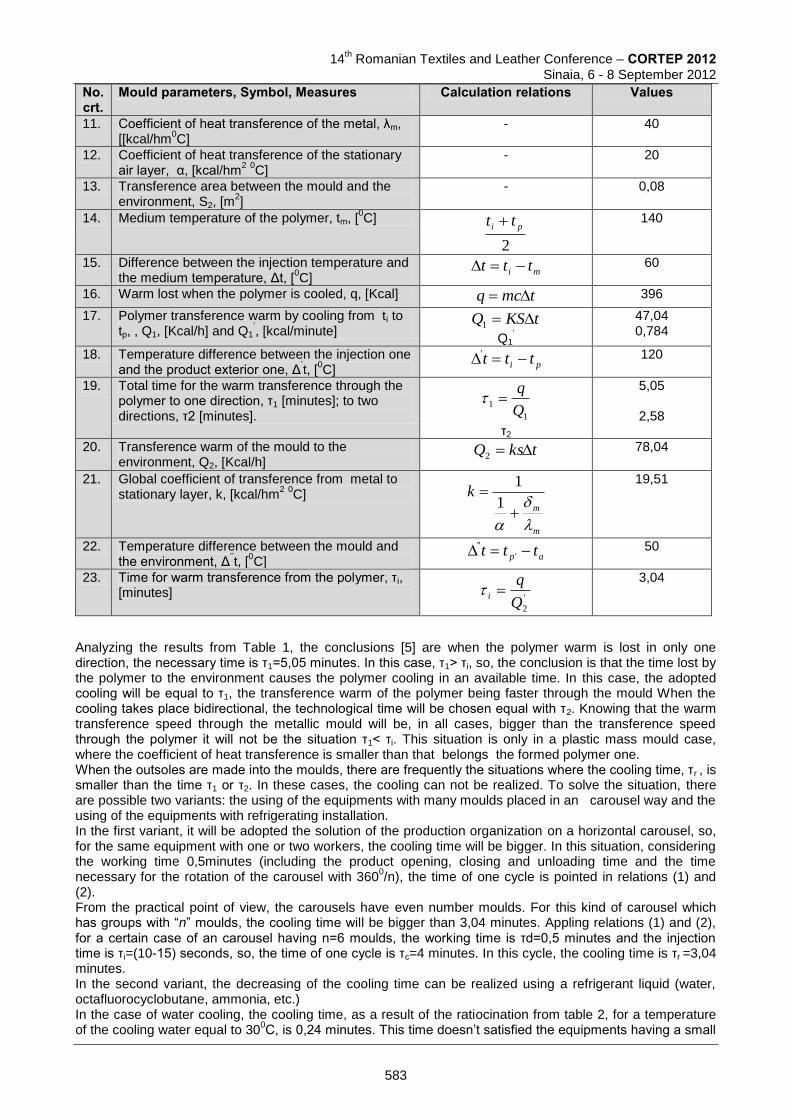
14
th Romanian Textiles and Leather Conference – CORTEP 2012
Sinaia, 6 - 8 September 2012
No. crt.
Mould parameters, Symbol, Measures Calculation relations Values
11. Coefficient of heat transference of the metal, λm, [[kcal/hm
0C]
- 40
12. Coefficient of heat transference of the stationary air layer, α, [kcal/hm
2 0C]
- 20
13. Transference area between the mould and the environment, S2, [m
2]
- 0,08
14. Medium temperature of the polymer, tm, [0C]
2
pi tt
140
15. Difference between the injection temperature and the medium temperature, Δt, [
0C]
mi ttt 60
16. Warm lost when the polymer is cooled, q, [Kcal] tmcq 396
17. Polymer transference warm by cooling from ti to tp, , Q1, [Kcal/h] and Q1
’, [kcal/minute]
tKSQ 1
Q1’
47,04 0,784
18. Temperature difference between the injection one and the product exterior one, Δ
’t, [
0C]
pi ttt ' 120
19. Total time for the warm transference through the polymer to one direction, τ1 [minutes]; to two directions, τ2 [minutes]. 1
1Q
q
τ2
5,05
2,58
20. Transference warm of the mould to the environment, Q2, [Kcal/h]
tksQ 2 78,04
21. Global coefficient of transference from metal to stationary layer, k, [kcal/hm
2 0C]
m
m
k
1
1
19,51
22. Temperature difference between the mould and the environment, Δ
’’t, [
0C]
ap ttt '
'' 50
23. Time for warm transference from the polymer, τi, [minutes] '
2Q
qi
3,04
Analyzing the results from Table 1, the conclusions [5] are when the polymer warm is lost in only one direction, the necessary time is τ1=5,05 minutes. In this case, τ1> τi, so, the conclusion is that the time lost by the polymer to the environment causes the polymer cooling in an available time. In this case, the adopted cooling will be equal to τ1, the transference warm of the polymer being faster through the mould When the cooling takes place bidirectional, the technological time will be chosen equal with τ2. Knowing that the warm transference speed through the metallic mould will be, in all cases, bigger than the transference speed through the polymer it will not be the situation τ1< τi. This situation is only in a plastic mass mould case, where the coefficient of heat transference is smaller than that belongs the formed polymer one. When the outsoles are made into the moulds, there are frequently the situations where the cooling time, τr , is smaller than the time τ1 or τ2. In these cases, the cooling can not be realized. To solve the situation, there are possible two variants: the using of the equipments with many moulds placed in an carousel way and the using of the equipments with refrigerating installation. In the first variant, it will be adopted the solution of the production organization on a horizontal carousel, so, for the same equipment with one or two workers, the cooling time will be bigger. In this situation, considering the working time 0,5minutes (including the product opening, closing and unloading time and the time necessary for the rotation of the carousel with 360
0/n), the time of one cycle is pointed in relations (1) and
(2). From the practical point of view, the carousels have even number moulds. For this kind of carousel which has groups with “n” moulds, the cooling time will be bigger than 3,04 minutes. Appling relations (1) and (2), for a certain case of an carousel having n=6 moulds, the working time is τd=0,5 minutes and the injection time is τi=(10-15) seconds, so, the time of one cycle is τc=4 minutes. In this cycle, the cooling time is τr =3,04 minutes. In the second variant, the decreasing of the cooling time can be realized using a refrigerant liquid (water, octafluorocyclobutane, ammonia, etc.) In the case of water cooling, the cooling time, as a result of the ratiocination from table 2, for a temperature of the cooling water equal to 30
0C, is 0,24 minutes. This time doesn’t satisfied the equipments having a small
583
14th Romanian Textiles and Leather Conference – CORTEP 2012
Sinaia, 6 - 8 September 2012
number-2,4,6, of working posts. For these equipments, the cooling of the moulds is made using refrigerating installations based on octafluorocyclobutane, ammonia, etc. 3 REFERENCES [1] Chirilã, E.;Ionescu Luca, C.: Theoretical aspects for mathematical modeling of the optimum number of
the nests that a cast must have, Buletinul I.P.Iaşi, Tomul LIV(LVIII), Fasc. 1-3, Secţia Construcţii de maşini, pp.125-129, 2008, ISSN 1011-2855, Iasi, Romania
[2] Chirilã, E.; Ionescu Luca, C.: Solutions on the different models of cavities for soles obtaining, Annals of the University of Oradea, fascicle of Textiles-Leatherwork, volume IX, 2008, p.236-240, ISSN 1582-5590, Romania
[3] Ionescu Luca, C.: Matriţe şi procese de formare în matriţe din industria de încãlţãminte, Editura Cronica Iaşi, 1995, ISBN 973-9206-09-3, Romania
[4] Ionescu Luca C.; Mocanu R., Proiectarea matriţelor pentru încãlţãminte, Elemente de proiectare geometricã a tãlpilor matriţate, Editura Pim Iaşi, 2010, ISBN 978-606-13-0100-3
[5] Project no. 134124-LLP 2007-RO-LMP, Project no. 2007-3111/001-001 LE3-MULPRO, Available from: . http://www.virtual-shoedesign.com/May 2012
Corresponding author: Cornelia IONESCU LUCA “Gheorghe Asachi” Technical University of Iasi Faculty of Textile, Leather and Industrial Management
Bd. Dimitrie Mangeron, no. 29 700050, Iasi, Romania Phone: +40232278683 (2273) E-mail: [email protected]
584
14
th Romanian Textiles and Leather Conference – CORTEP 2012
Sinaia, 6 - 8 September 2012
THERMIC PROCESSES IN VULCANISATION MOULDS USED IN FOOTWEAR SOLES
Cornelia IONESCU LUCA
“Gheorghe Asachi” Technical University of Iasi, Romania Abstract: The rubber footwear soles, depending on manufacturing system, may be obtained through vulcanization processes of the rubber blend straight on the vamps, or as semi finished soles which will be assembled on the vamps using gluing or sewing processes. During the vulcanization process of the rubber blend into the moulds for the footwear soles manufacturing, a high quantity of heating is necessary because the temperature of the rubber blend must increase till 120ºC (so, the process of flowing and the filling up of the cavities of the moulds takes place). In the beginning, up to this temperature, it will be used a certain latent heat for melting sulfur (up to the heat necessary for a continuous increasing of the temperature), for decomposition of the agent which produce pore spaces, etc. It follows a new heating period during the temperature will increase till 150-165
0C. During the process of the
vulcanized products manufacturing, the mould often changes the temperature of the cavity. The paper presents some contributions in thermo calculation of the vulcanization process of the rubber blend in manufacturing. The calculation depending on the optimum adopted vulcanization technological regime using the vulcanization equipments in an efficient way. Keywords: footwear, footwear outsoles, mould, thermal calculation 1 INTRODUCTION The rubber footwear soles, depending on manufacturing system, may be obtained through vulcanization processes of the rubber blend straight on the vamps, or as semi finished soles which will be assembled on the vamps using gluing or sewing processes. The vulcanization equipments are various and complex depending on the soles manufacturing process, straight on vamps, or as semi finished soles, on the working posts number placed on the unselected of the aggregate, on the number of colors of the future soles, etc. During the vulcanization process of the rubber blend into the moulds for the footwear soles manufacturing, a high quantity of heating is necessary because the temperature of the rubber blend must increase till 120ºC (so, the process of flowing and the filling up of the cavities of the moulds takes place). In the beginning, up to this temperature, it will be used a certain latent heat for melting sulfur (up to the heat necessary for a continuous increasing of the temperature), for decomposition of the agent which produce pore spaces, etc. It follows a new heating period during the temperature will increase till 150-165
0C. Now, the thermo chemic
vulcanization process is an exothermic one. Depending on the formulas of the rubber and on the vulcanization time, chemical processes are complex being an actual problem of researches in the field. The paper presents some results of the authors, studding the thermo chemical processes of vulcanization of the rubber blends into the moulds in footwear manufacturing. There will be presented some aspects about thermo balance of the mould heating and the dynamics of the heating process of the rubber blend. 2 THERMIC PROCESSES IN VULCANISATION MOULDS USED IN FOOTWEAR SOLES 2.1. The heating thermo balance The thermo calculation of the mould heating depending on the direction of the heat flow. The cavity may be heated only through mould dies and upper die or may be heated through metallic shoe-last. The thermo calculation is for a continuous regime respectively, for a working shift. In this case, the warm necessary for sole heating and vulcanization includes the heat lusted in environment. The heating looses may take place in many ways: by heat conductivity of areas with contacts with mould seat, by convection in environment, on the mould areas contacting with environment, by radiation in environment, by convection on cavities surfaces during the mould is open.
585
14th Romanian Textiles and Leather Conference – CORTEP 2012
Sinaia, 6 - 8 September 2012
The calculations are based [4], [6] on the classic formulas. a. The warm calculation for the rubber blend heating is based on formula (1) and it is the necessary heating for the blend temperature increasing from the feeding temperature to the vulcanization temperature:
)( ava ttcvtmcQ , [kcal/cycle] (1)
where: Qa- warm for blend heating, [kcal/cycle]; m- rubber mass, [Kg]; v- mould cavity volume, [dm
3]; ρ-
rubber blend density, [Kg/dm3]; c- specific heat, [kcal/Kg
0C]; tv – vulcanization temperature, [
0C]; ta- feeding
blend temperature, [ 0C].
Knowing that “n” cycles will be realized in one hour, the necessary warm for rubber blend heating one hour, (Qah) is:
aah nQQ (2)
b. The warm lost by conductivity is sent from the mould to the seat and its calculation is identical with the calculation of the warm which is sent from a warm wall to a cold one, relation (3):
)( emc ttStkSQ
, (Kcal/h) (3)
where: Qc- warm sent by conduction, [Kcal/h]; K- coefficient of heat transfer, [Kcal/m
2h
0C]; λ- coefficient of
thermo conductivity for the mould material, [Kcal/hm0C]; δ- wall thickness, [m]; tm-mould temperature on
heating elements level, [ 0C]; te- mould temperature on the seat area, [
0C].
c. The warm lost by convection is given by the warm mould to the environment in two different stages: in all cycle time, by the mould areas contacting the environment and in all time, when the mould is open by cavity area. The warm lost by convection is pointed in relations (4) and (5):
)( amcv ttStKSQ ,(Kcal/h) (4)
where: Qcv-warm lost by convection, [Kcal/h]; K- coefficient of heat transfer by convection from the mould to environment, [Kcal/h m
2 0C]; S- mould area contacting the environment, [m
2]; tm- mould temperature, [ºC], ta-
environment temperature, [0C].
60)(
60
'''
nttS
ntKSQ mccv , (Kcal/h) (5)
where: '
cvQ - warm lost by convection while the mould is open, [Kcal/h]; S’- mould cavity area, [m
2]; tc- cavity
temperature, [ 0C]; n- cycles numbers per hour; τ– time when the mould is opened, [minutes/cycle]. The
warm lost by convection while the mould is open is a part from total cycle time. This lost may be includes in heating system efficiency, knowing that the time while the mold is open, is short. d. The warm lost by radiation is on the free mould area and is pointed in relation (6):
44
100100
rcr
TTCFSQ ,(Kcal/h) (6)
where: Qr- warm lost by radiation, [Kcal/h]; C- coefficient of emission of the mould material, [Kcal/hm
2 (
0K)
4];
F-coefficient of parallelism; S-mould free area [m2]; Tc- mould warm wall temperature, [
0K]; Tr- environment
temperature, [ 0K].
e. Partial warms totalizing The warm quantity which a heating system must give is pointed in relation (7) which totalizing the warm necessary for the heating of the rubber blends into the mould cavity and the warm lost during one cycle.
rcvcat QQQQQ (7)
In this balance, the latent heat necessary for physical and chemical processes into the mass of rubber blend
was not considered (because, in the beginning, the process has an endothermic character and than the
586
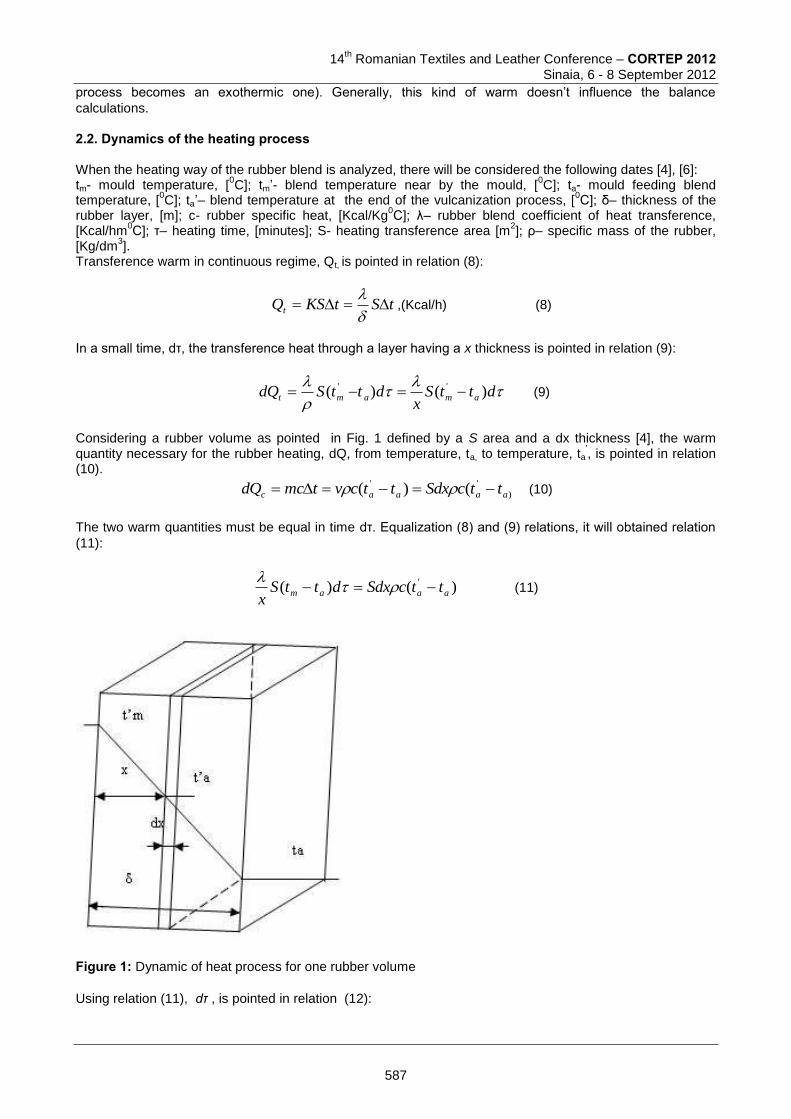
14
th Romanian Textiles and Leather Conference – CORTEP 2012
Sinaia, 6 - 8 September 2012
process becomes an exothermic one). Generally, this kind of warm doesn’t influence the balance
calculations. 2.2. Dynamics of the heating process When the heating way of the rubber blend is analyzed, there will be considered the following dates [4], [6]: tm- mould temperature, [
0C]; tm’- blend temperature near by the mould, [
0C]; ta- mould feeding blend
temperature, [0C]; ta’– blend temperature at the end of the vulcanization process, [
0C]; δ– thickness of the
rubber layer, [m]; c- rubber specific heat, [Kcal/Kg0C]; λ– rubber blend coefficient of heat transference,
[Kcal/hm0C]; τ– heating time, [minutes]; S- heating transference area [m
2]; ρ– specific mass of the rubber,
[Kg/dm3].
Transference warm in continuous regime, Qt, is pointed in relation (8):
tStKSQt
,(Kcal/h) (8)
In a small time, dτ, the transference heat through a layer having a x thickness is pointed in relation (9):
dttS
xdttSdQ amamt )()( '' (9)
Considering a rubber volume as pointed in Fig. 1 defined by a S area and a dx thickness [4], the warm quantity necessary for the rubber heating, dQ, from temperature, ta, to temperature, ta
’, is pointed in relation
(10).
)
'' ()( aaaac ttcSdxttcvtmcdQ (10)
The two warm quantities must be equal in time dτ. Equalization (8) and (9) relations, it will obtained relation
(11):
)()( '
aaam ttcSdxdttSx
(11)
Figure 1: Dynamic of heat process for one rubber volume
Using relation (11), dτ , is pointed in relation (12):
587
14th Romanian Textiles and Leather Conference – CORTEP 2012
Sinaia, 6 - 8 September 2012
xdxtt
ttcd
mm
aa
)(
)('
'
(12)
The rubber layer heating in entire thickness δ,(from 0 to δ), is pointed in relation (13):
2)(
(
)(
)( 2)
'
0
'
'
am
aa
am
ma
tt
ttcxdx
tt
ttc
(13)
So, it is obviously that, the time necessary reaching temperature, ta′, depends on δ
2. This time is as big as
the rubber layer thickness is bigger.
3 SPECIFIC PARTICULARITIES IN VULCANIZATION PROCESS OF FOOTWEAR SOLES The manufacturing process of footwear soles is a complex problem, depending on the different thicknesses [1], [2], [5] of the rubber blend from heel in comparison with the rest of the sole. In a certain case of a footwear sole with a sole thickness equal with 0,01m, a heel thickness equal with 0,03 m and values for the following parameters: ρ - 1,5·10
3 Kg/dm
3; c - 0,33 kcal/Kg
0C; λ- 0,14 Kcal/Kg
0C; δ- 0,01
m; tm- 1750C; ta- 80
0C; ta
’- 160
0C; (ta
’-ta) = 160-80=80
0C; (tm-ta) = 175-80 = 95
0C, using relation (13), the time
is, τ = 9 minutes. Following the algorithm for the vulcanization process [1],[2],[3] of one sole having a thickness equal with 10 mm and a thickness of heel equal with 30 mm, for the time of heating and vulcanization of rubber blend is equal with 9 minutes. This time is not technological accepted. So, the heating process in the footwear soles vulcanization must be reconsidered. During the soles vulcanization, the thermo flux is leaded on normal directions to the mould cavity. In these conditions the distance of the flux is different from the distance from the mould till the middle of the heel in the heel area. On the designed sole in horizontal and vertical plane, the distances are a little bit smaller. It was observed that for an interior point, its heating is the sum of minimum two directions of thermo flux normal leaded to the product. So, the heating time is less than the theoretical one. The time may be different depending on the blend formula [5]. Depending on the type and percentage of the vulcanization promoters, it is possible to obtain blends with a rapid vulcanization or a slow one. For the decreasing of the vulcanization time it is necessary to use different rubber blend in heel area and in the rest of the sole [7], [8]. In the heel area it will use a blend with a lower vulcanization temperature and in the rest of the sole, a rubber blend with a higher one. Another way in decreasing time, used especially in footwear manufactured on shoe-last and vulcanized in vulcanization with warm air equipments, is the using of a pre vulcanization process of the rubber blend used for heel area. I this way, during the real sole is vulcanized, the sole in heel area is vulcanized, too, until a complete vulcanization of the heel. The pointed technological solutions don’t change the vulcanization regime and they allow only to differentiate the two areas of the sole from the vulcanization chemical point of view [7],[8],[9]. For solving this problem it will be reconsidered the heating processes in connection with the reaction warm. Around the temperature of 120
0C,
the process is endothermic, the heating being absorbed for the sulphur melting and for the porosity agents decomposing. So, for a certain period of time the heating speed will be decrease. This effect is not a very intense one because, normally, the sulphur percentage is about 2% and the sulphur fusion warm is 10cal/g. For 1 cm
3 having 1,5 g, with a 0,03 g sulphur quantity, the warm consumption is about 0,3 cal. In the same
time with the vulcanization process beginning, the freedom of the reaction warm generates an important thermo effect because when the sulphur is stabilized as rubber sulphur, the free warm is approximate 412 cal for 1g of rubber. The percentage of rubber sulphur is small for 2% sulphur. So, it will be considered the warm produces depending on the stabilized sulphur quantity. The warm produces in blend mass will accelerate the heating process, but not enough for allowing an acceptable technology. But, there is another problem, too: for a heating time τ1, the temperature of the rubber layer contacted the mould wall, tm
’, is a little bit different from the mould temperature.
588
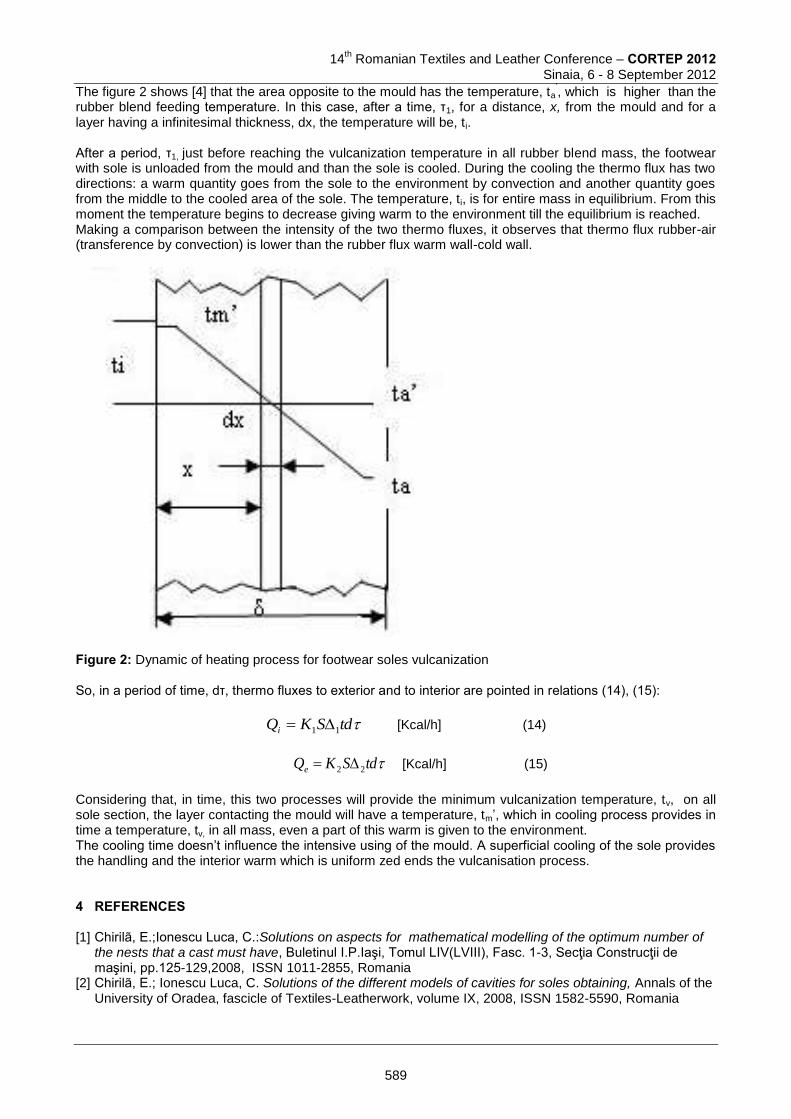
14
th Romanian Textiles and Leather Conference – CORTEP 2012
Sinaia, 6 - 8 September 2012
The figure 2 shows [4] that the area opposite to the mould has the temperature, ta’, which is higher than the
rubber blend feeding temperature. In this case, after a time, τ1, for a distance, x, from the mould and for a layer having a infinitesimal thickness, dx, the temperature will be, ti. After a period, τ1, just before reaching the vulcanization temperature in all rubber blend mass, the footwear with sole is unloaded from the mould and than the sole is cooled. During the cooling the thermo flux has two directions: a warm quantity goes from the sole to the environment by convection and another quantity goes from the middle to the cooled area of the sole. The temperature, ti, is for entire mass in equilibrium. From this moment the temperature begins to decrease giving warm to the environment till the equilibrium is reached. Making a comparison between the intensity of the two thermo fluxes, it observes that thermo flux rubber-air (transference by convection) is lower than the rubber flux warm wall-cold wall.
Figure 2: Dynamic of heating process for footwear soles vulcanization So, in a period of time, dτ, thermo fluxes to exterior and to interior are pointed in relations (14), (15):
tdSKQi 11 [Kcal/h] (14)
tdSKQe 22 [Kcal/h] (15)
Considering that, in time, this two processes will provide the minimum vulcanization temperature, tv, on all sole section, the layer contacting the mould will have a temperature, tm’, which in cooling process provides in time a temperature, tv, in all mass, even a part of this warm is given to the environment. The cooling time doesn’t influence the intensive using of the mould. A superficial cooling of the sole provides the handling and the interior warm which is uniform zed ends the vulcanisation process. 4 REFERENCES [1] Chirilã, E.;Ionescu Luca, C.:Solutions on aspects for mathematical modelling of the optimum number of
the nests that a cast must have, Buletinul I.P.Iaşi, Tomul LIV(LVIII), Fasc. 1-3, Secţia Construcţii de maşini, pp.125-129,2008, ISSN 1011-2855, Romania
[2] Chirilã, E.; Ionescu Luca, C. Solutions of the different models of cavities for soles obtaining, Annals of the University of Oradea, fascicle of Textiles-Leatherwork, volume IX, 2008, ISSN 1582-5590, Romania
589
14th Romanian Textiles and Leather Conference – CORTEP 2012
Sinaia, 6 - 8 September 2012
[3] Chirilã, E.; Ionescu Luca, C.: Theoretical aspects for mathematical modeling of the optimum number of the nests that a cast must have, Buletinul I.P.Iaşi, Tomul LIV(LVIII), Fasc. 1-3, Secţia Construcţii de maşini, pp.125-129, ISSN 1011-2855, Iasi, Romania
[4] Cociu, V.; Volocariu, R.S & Ionescu Luca C., Matriţe dispozitive de formare, Rotaprint, Universitatea Tehnicã “Gheorghe Asachi” Iaşi, 1994,Romania.
[5] Dragomir, A.;Ionescu Luca, C. Emplacement possibilities of the cavities and some positioning possibilities of the injection channels in the moulds used footwear manufacturing, volum “X International Conference on the Theory of Machines and Mechanism, Proceedings, sept. 2-4, 2008, Tehnical University of Liberec, pp. 189-193, ISBN 978-80-7372-370-5, Czech Republic.
[6] Ionescu Luca, C. Matriţe şi procese de formare în matriţe din industria de încãlţãminte, Editura Cronica Iaşi, Romania, ISBN 973-9206-09-3
[7] Ionescu Luca, C.: Contributions for establishing the right number of nests that a cast must have, Annals of the Oradea University, Fascicle of Manage Contributions for Establishingment and Technological Engeneering, Vol. VII (XVII), pp. 863-866, 2008, ISSN 1583-0691, Romania.
[8] Ionescu Luca, C.; Dragomir A. (2008), The method of designing assisted oncomputer of the footwear’s soles, vol. II, International Scientific Conference UNITECH 08 Gabrovo,21-22 November 2008pp.378-382, ISSN 1313-230X, Bulgaria.
[9] Ionescu Luca, C.; Automatic systems of cast manipulation for the machinesand injection aggregates built-up for the footwear industry, Annals of the Oradea University, Fascicle of Management and Technological Engeneering, Vol. VII (XVII),p. 867-872, 2008, ISSN 1583-0691, Romania
Corresponding author: Cornelia IONESCU LUCA “Gheorghe Asachi” Technical University of Iasi Faculty of Textiles Leather and Industrial Management
Bd. Dimitrie Mangeron, no. 29 700050, Iasi, Romania Phone: +40232278683 (2273) E-mail: [email protected]
590
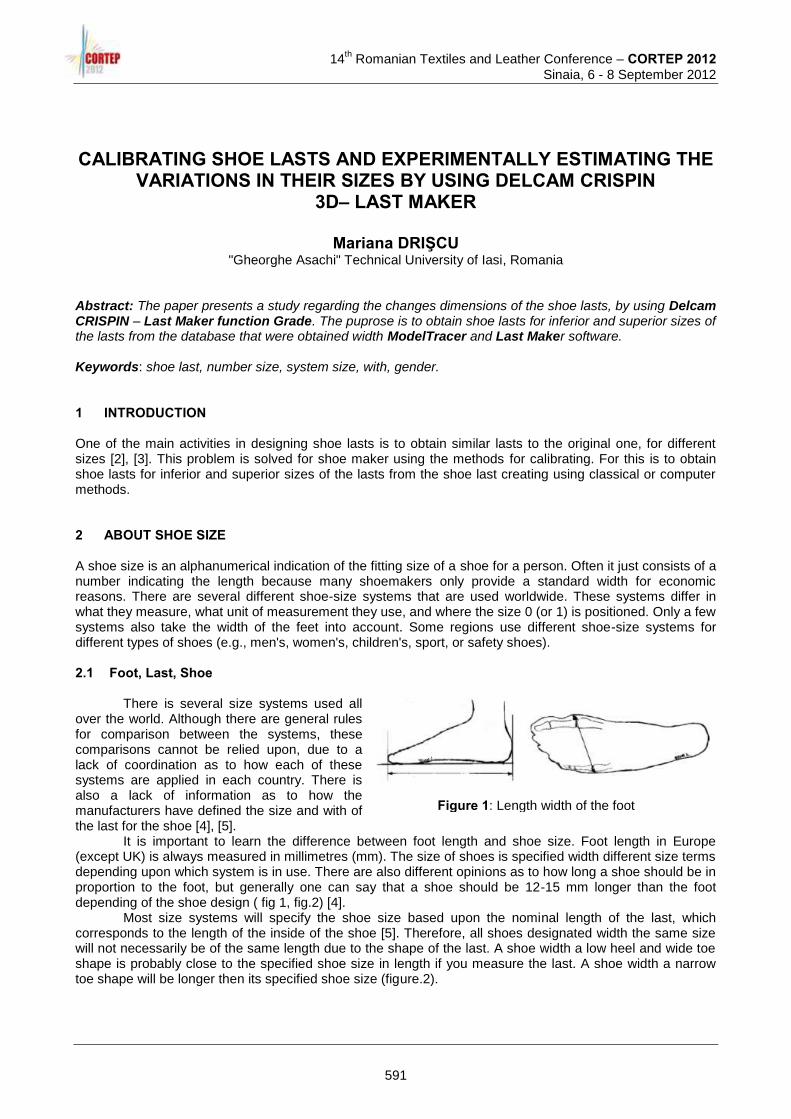
14
th Romanian Textiles and Leather Conference – CORTEP 2012
Sinaia, 6 - 8 September 2012
CALIBRATING SHOE LASTS AND EXPERIMENTALLY ESTIMATING THE VARIATIONS IN THEIR SIZES BY USING DELCAM CRISPIN
3D– LAST MAKER
Mariana DRIŞCU "Gheorghe Asachi" Technical University of Iasi, Romania
Abstract: The paper presents a study regarding the changes dimensions of the shoe lasts, by using Delcam CRISPIN – Last Maker function Grade. The puprose is to obtain shoe lasts for inferior and superior sizes of the lasts from the database that were obtained width ModelTracer and Last Maker software. Keywords: shoe last, number size, system size, with, gender.
1 INTRODUCTION One of the main activities in designing shoe lasts is to obtain similar lasts to the original one, for different sizes [2], [3]. This problem is solved for shoe maker using the methods for calibrating. For this is to obtain shoe lasts for inferior and superior sizes of the lasts from the shoe last creating using classical or computer methods. 2 ABOUT SHOE SIZE A shoe size is an alphanumerical indication of the fitting size of a shoe for a person. Often it just consists of a number indicating the length because many shoemakers only provide a standard width for economic reasons. There are several different shoe-size systems that are used worldwide. These systems differ in what they measure, what unit of measurement they use, and where the size 0 (or 1) is positioned. Only a few systems also take the width of the feet into account. Some regions use different shoe-size systems for different types of shoes (e.g., men's, women's, children's, sport, or safety shoes). 2.1 Foot, Last, Shoe
There is several size systems used all over the world. Although there are general rules for comparison between the systems, these comparisons cannot be relied upon, due to a lack of coordination as to how each of these systems are applied in each country. There is also a lack of information as to how the manufacturers have defined the size and with of the last for the shoe [4], [5].
It is important to learn the difference between foot length and shoe size. Foot length in Europe (except UK) is always measured in millimetres (mm). The size of shoes is specified width different size terms depending upon which system is in use. There are also different opinions as to how long a shoe should be in proportion to the foot, but generally one can say that a shoe should be 12-15 mm longer than the foot depending of the shoe design ( fig 1, fig.2) [4].
Most size systems will specify the shoe size based upon the nominal length of the last, which corresponds to the length of the inside of the shoe [5]. Therefore, all shoes designated width the same size will not necessarily be of the same length due to the shape of the last. A shoe width a low heel and wide toe shape is probably close to the specified shoe size in length if you measure the last. A shoe width a narrow toe shape will be longer then its specified shoe size (figure.2).
Figure 1: Length width of the foot
591
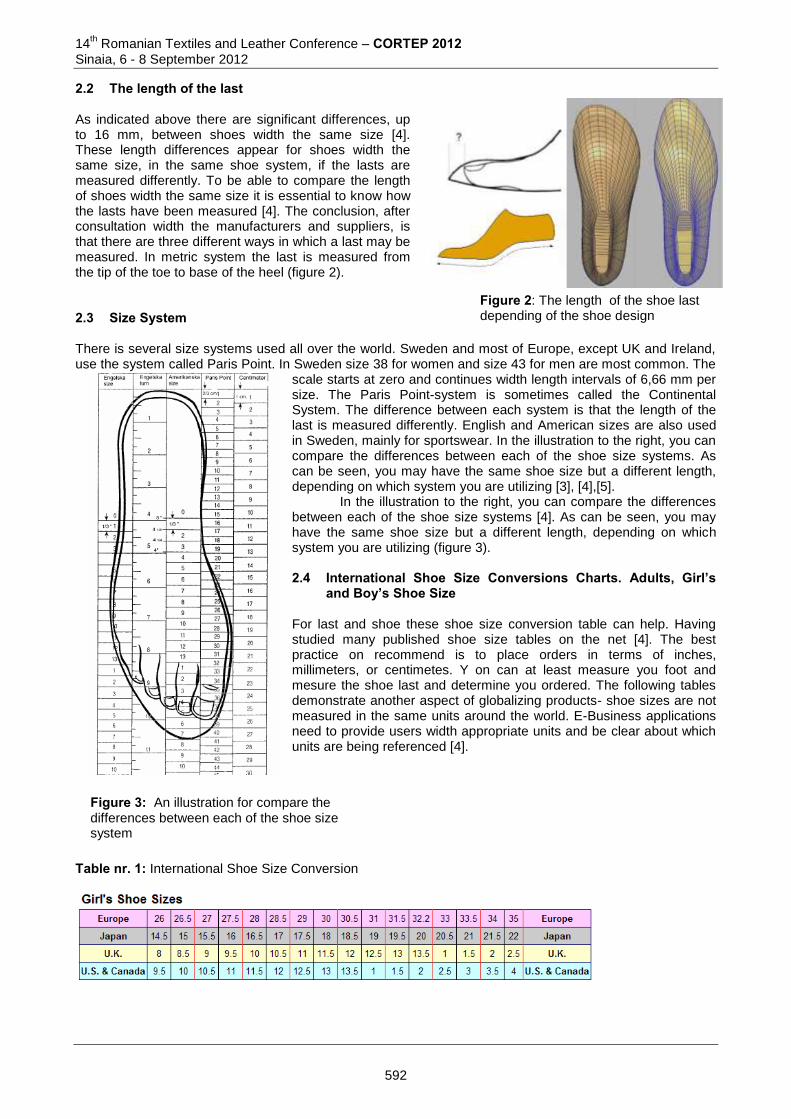
14th Romanian Textiles and Leather Conference – CORTEP 2012
Sinaia, 6 - 8 September 2012
2.2 The length of the last As indicated above there are significant differences, up to 16 mm, between shoes width the same size [4]. These length differences appear for shoes width the same size, in the same shoe system, if the lasts are measured differently. To be able to compare the length of shoes width the same size it is essential to know how the lasts have been measured [4]. The conclusion, after consultation width the manufacturers and suppliers, is that there are three different ways in which a last may be measured. In metric system the last is measured from the tip of the toe to base of the heel (figure 2). 2.3 Size System There is several size systems used all over the world. Sweden and most of Europe, except UK and Ireland, use the system called Paris Point. In Sweden size 38 for women and size 43 for men are most common. The
scale starts at zero and continues width length intervals of 6,66 mm per size. The Paris Point-system is sometimes called the Continental System. The difference between each system is that the length of the last is measured differently. English and American sizes are also used in Sweden, mainly for sportswear. In the illustration to the right, you can compare the differences between each of the shoe size systems. As can be seen, you may have the same shoe size but a different length, depending on which system you are utilizing [3], [4],[5].
In the illustration to the right, you can compare the differences between each of the shoe size systems [4]. As can be seen, you may have the same shoe size but a different length, depending on which system you are utilizing (figure 3). 2.4 International Shoe Size Conversions Charts. Adults, Girl’s
and Boy’s Shoe Size For last and shoe these shoe size conversion table can help. Having studied many published shoe size tables on the net [4]. The best practice on recommend is to place orders in terms of inches, millimeters, or centimetes. Y on can at least measure you foot and mesure the shoe last and determine you ordered. The following tables demonstrate another aspect of globalizing products- shoe sizes are not measured in the same units around the world. E-Business applications need to provide users width appropriate units and be clear about which units are being referenced [4].
Table nr. 1: International Shoe Size Conversion
Figure 2: The length of the shoe last depending of the shoe design
Figure 3: An illustration for compare the differences between each of the shoe size system
592
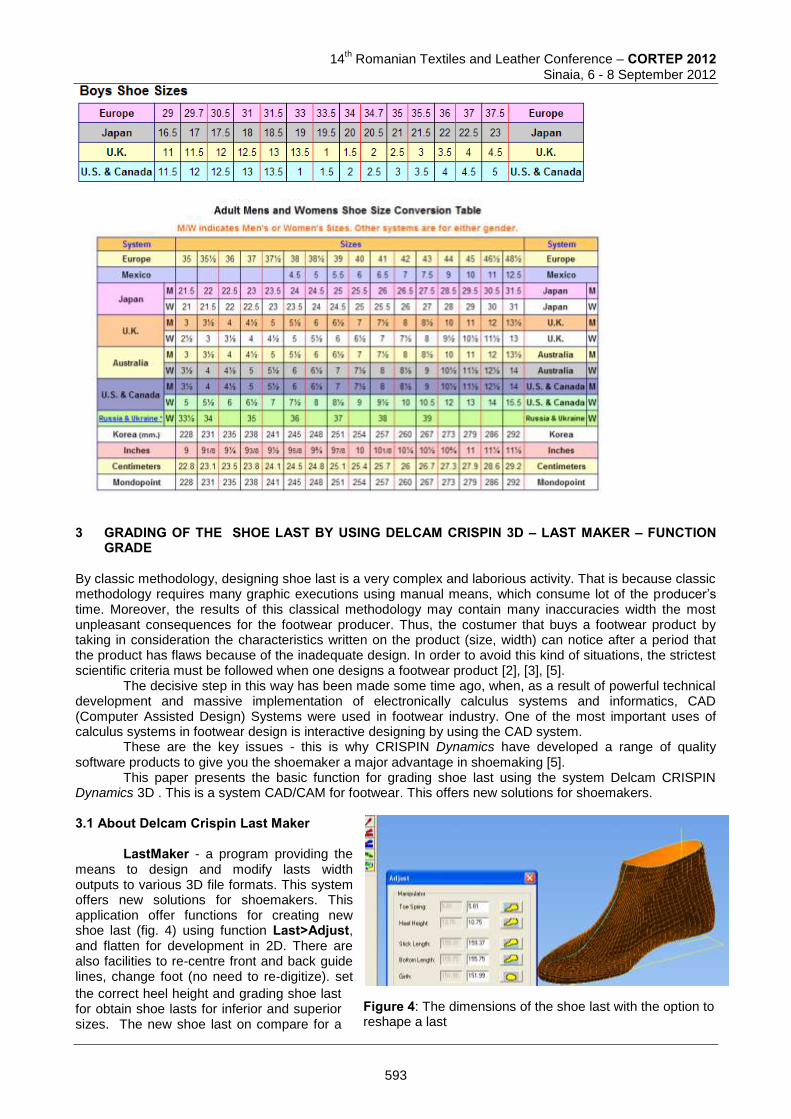
14
th Romanian Textiles and Leather Conference – CORTEP 2012
Sinaia, 6 - 8 September 2012
3 GRADING OF THE SHOE LAST BY USING DELCAM CRISPIN 3D – LAST MAKER – FUNCTION
GRADE By classic methodology, designing shoe last is a very complex and laborious activity. That is because classic methodology requires many graphic executions using manual means, which consume lot of the producer’s time. Moreover, the results of this classical methodology may contain many inaccuracies width the most unpleasant consequences for the footwear producer. Thus, the costumer that buys a footwear product by taking in consideration the characteristics written on the product (size, width) can notice after a period that the product has flaws because of the inadequate design. In order to avoid this kind of situations, the strictest scientific criteria must be followed when one designs a footwear product [2], [3], [5].
The decisive step in this way has been made some time ago, when, as a result of powerful technical development and massive implementation of electronically calculus systems and informatics, CAD (Computer Assisted Design) Systems were used in footwear industry. One of the most important uses of calculus systems in footwear design is interactive designing by using the CAD system.
These are the key issues - this is why CRISPIN Dynamics have developed a range of quality software products to give you the shoemaker a major advantage in shoemaking [5].
This paper presents the basic function for grading shoe last using the system Delcam CRISPIN Dynamics 3D . This is a system CAD/CAM for footwear. This offers new solutions for shoemakers. 3.1 About Delcam Crispin Last Maker
LastMaker - a program providing the means to design and modify lasts width outputs to various 3D file formats. This system offers new solutions for shoemakers. This application offer functions for creating new shoe last (fig. 4) using function Last>Adjust, and flatten for development in 2D. There are also facilities to re-centre front and back guide lines, change foot (no need to re-digitize). set
the correct heel height and grading shoe last for obtain shoe lasts for inferior and superior sizes. The new shoe last on compare for a
Figure 4: The dimensions of the shoe last with the option to reshape a last
593
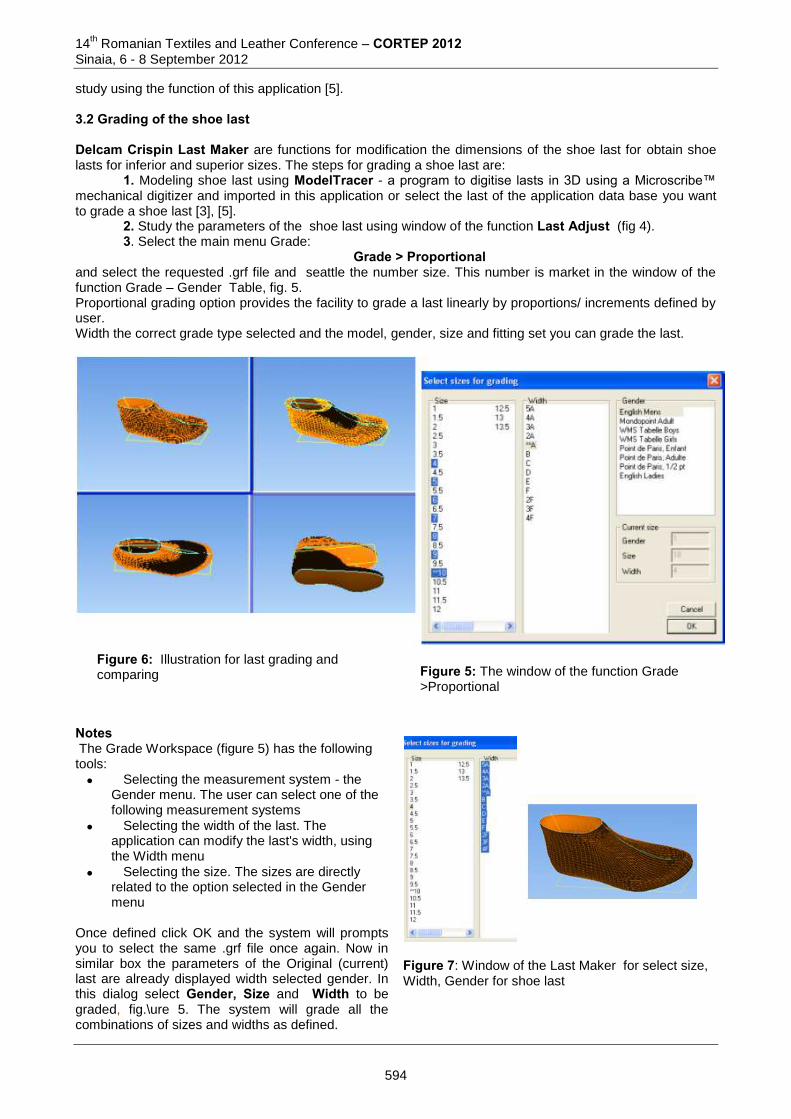
14th Romanian Textiles and Leather Conference – CORTEP 2012
Sinaia, 6 - 8 September 2012
study using the function of this application [5]. 3.2 Grading of the shoe last Delcam Crispin Last Maker are functions for modification the dimensions of the shoe last for obtain shoe lasts for inferior and superior sizes. The steps for grading a shoe last are:
1. Modeling shoe last using ModelTracer - a program to digitise lasts in 3D using a Microscribe™ mechanical digitizer and imported in this application or select the last of the application data base you want to grade a shoe last [3], [5].
2. Study the parameters of the shoe last using window of the function Last Adjust (fig 4). 3. Select the main menu Grade:
Grade > Proportional and select the requested .grf file and seattle the number size. This number is market in the window of the function Grade – Gender Table, fig. 5. Proportional grading option provides the facility to grade a last linearly by proportions/ increments defined by user. Width the correct grade type selected and the model, gender, size and fitting set you can grade the last.
Notes The Grade Workspace (figure 5) has the following tools:
Selecting the measurement system - the Gender menu. The user can select one of the following measurement systems
Selecting the width of the last. The application can modify the last's width, using the Width menu
Selecting the size. The sizes are directly related to the option selected in the Gender menu
Once defined click OK and the system will prompts you to select the same .grf file once again. Now in similar box the parameters of the Original (current) last are already displayed width selected gender. In this dialog select Gender, Size and Width to be graded, fig.\ure 5. The system will grade all the combinations of sizes and widths as defined.
Figure 7: Window of the Last Maker for select size, Width, Gender for shoe last
Figure 5: The window of the function Grade >Proportional
Figure 6: Illustration for last grading and comparing
594

14
th Romanian Textiles and Leather Conference – CORTEP 2012
Sinaia, 6 - 8 September 2012
All the graded lasts will be graded and place into separate files so they can be easily saved separately, (fig. 10, fig. 11). . For better control of the graded files use the Window > Cascade function or using function Compare (figure 6) 4 STUDIES FOR GRADING THE SHOE LAST We execute a studies using function Grade for a women last. The steps for this studies are:
1. We are modelling a shoe last for women using the methode of Model Tracer for digitise lasts in 3D with a Microscribe™ mechanical digitizer. 2. We imported in application Last Maker for study of the shoe last: views, geometrical parameters. 3. we execute the function: Last>Adjust to bring the parameters of this shoe last using for grading (figure 4). 4. We execute a studie for values of the parameters stick length – par1, bottom length- par2, girth-par3 for determination the number size. 5. We execute the function Grade> Proportional. In the window of this function we market: number size, width size, size system (figure 5, figure 7).
Figure 8: The window for select size for grading
5 RESULTS The paper present the analysis of the variation of the basic geometrical parameters of the lasts during the grading process, as applied in Last maker. To this respect, we use a women's shoe last and graded the last using two different methods.
The size of the last was varied, while the width of the last of kept unchaged
The width of the last was varied, while the size was left unchanged 5.1 The variation of the seize of the last while keeping the width unchanged The study involved the following steps:
A women's shoe last was selected, fig. 4.
The measurements of the last were set using the Last Adjust tool in the menu, fig. 4.
The last was modeled for size 4, width A in the English Ladies measurement system, fig.7.
The last was scaled for sizes 4 to 10, while keeping the width unchanged, fig.8.
Each file containing the new last was studied, fig. 10.
The measurements was recorded in the database, fig.9 and table 2. The measurements were recorded in a database and turned into graphics by using Excel ( see table nr 2, the graphics of figure 9). By looking at the values in the data table ( see table nr. 2) , as well as the graphics themselves (see figure 9), one can see that the length of the last has varied, while the width remained stable.
595
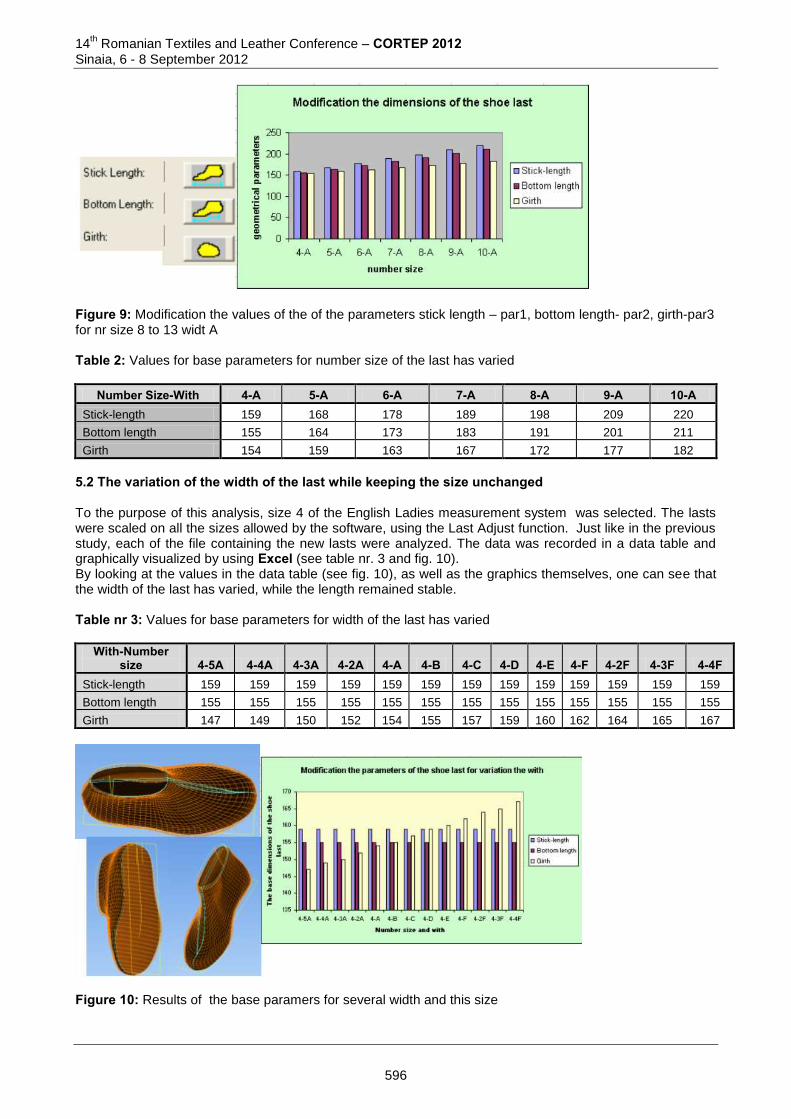
14th Romanian Textiles and Leather Conference – CORTEP 2012
Sinaia, 6 - 8 September 2012
Figure 9: Modification the values of the of the parameters stick length – par1, bottom length- par2, girth-par3 for nr size 8 to 13 widt A Table 2: Values for base parameters for number size of the last has varied
Number Size-With 4-A 5-A 6-A 7-A 8-A 9-A 10-A Stick-length 159 168 178 189 198 209 220
Bottom length 155 164 173 183 191 201 211
Girth 154 159 163 167 172 177 182
5.2 The variation of the width of the last while keeping the size unchanged To the purpose of this analysis, size 4 of the English Ladies measurement system was selected. The lasts were scaled on all the sizes allowed by the software, using the Last Adjust function. Just like in the previous study, each of the file containing the new lasts were analyzed. The data was recorded in a data table and graphically visualized by using Excel (see table nr. 3 and fig. 10). By looking at the values in the data table (see fig. 10), as well as the graphics themselves, one can see that the width of the last has varied, while the length remained stable. Table nr 3: Values for base parameters for width of the last has varied
With-Number size 4-5A 4-4A 4-3A 4-2A 4-A 4-B 4-C 4-D 4-E 4-F 4-2F 4-3F 4-4F
Stick-length 159 159 159 159 159 159 159 159 159 159 159 159 159
Bottom length 155 155 155 155 155 155 155 155 155 155 155 155 155
Girth 147 149 150 152 154 155 157 159 160 162 164 165 167
Figure 10: Results of the base paramers for several width and this size
596

14
th Romanian Textiles and Leather Conference – CORTEP 2012
Sinaia, 6 - 8 September 2012
6 CONCLUSIONS The last is a central to shoe industry. Shoe design experts would always admit that a good last is a more important factor in the choice of a product in comparison to the price, because it assures a higher comfort. In this respect, computer aided modeling of the last can help increase the performance of the footwear producer. Last Maker gives the user the option to design the last according to the requirements and the standards of the clients. Automatic scaling can efficiently be used to produce lasts for all the sizes that are to be produced. The study represents a guarantee of the work precision and usefulness of the software for shoe producers. 7 REFERENCES [1] Costea M., Drişcu M (2011), Crispin Dynamics 3D –New solution for shoemakers creating and
modification of the shoe last, Leather and Footwear Journal 11 (2011), pg 109-120, ISSN 1583-4433 [2] Drişcu M. (2010), Reconstruction and flattening of the surface shoe last, Proceedings of The 14
th
Internaţional Conference, Iaşi&Chişinãu ModTech2010, May, 2010, Romania, ISSN:2006-391 [3] Mihai Aura, Costea M ş.a. Customized footwear insers for high arched foot – one case study,
Proceedings of the 3nd International Conference on Advanced Materials and Systems 2010- ICAMS 2010 Bucuresti
[4] ***http://www.google.ro/search?q=shoe+size&hl=ro&prmd=imvns&tbm=isch&tbo=u&source=univ&sa=X&ei=KlpTT4DwNaik4ATx7rGzDQ&sqi=2&ved=0CEkQsAQ&biw=1024&bih=515
[5] *** DELCAM Crispin CAD Suite 3D
Corresponding author: Mariana DRISCU “Gheorghe Asachi” Technical University of Iasi Faculty of Textile, Leather and Industrial Management
Bd. Dimitrie Mangeron, no. 29 700050, Iasi, Romania
597
14
th Romanian Textiles and Leather Conference – CORTEP 2012
Sinaia, 6 - 8 September 2012
CONSUMER'S CRITERIA FOR SPORT SHOES
Marta HARNAGEA1, Aura MIHAI2 & Stan MITU1 1 “Gheorghe Asachi” Technical University of Iasi, Romania
Doctoral School of the Faculty of Textile, Leather and Industrial Management 2 “Gheorghe Asachi” Technical University of Iasi, Romania Faculty of Textile, Leather and Industrial Management
Abstract: The popularity of sport shoes has its origins in the growing interest for the different physical activities. The sport shoes market has known an ascending evolution in close connection to the development and changes in sport practices. Indeed when practising a sport activity, the shoes must be adapted to the specific features of the sport in question. Therefore sport shoes must: 1) respond to the natural shape of the foot; 2) protect the foot against repeated microtraumas; 3) facilitate technical gestures. The shape and the interior dimensions of the shoes must assure a maximal degree of freedom for the active muscles, as local high pressures may disturb the peripheral circulation and may affect the nervous terminations, generating with time different foot diseases. The present paper reviews the criteria that determine the choice of sport shoes. Keywords: sport, shoes, criteria, consumer 1 INTRODUCTION Nowadays the frequency of sports activity has progressed because we are more and more concerned with physical activity behaviors that have beneficial effects on the health and wellness. Sport footwear has developed significantly in the last decades and the sport footwear industry is now able to face each demand of sport activity. The majority of consumers choose the branded products and they trust the brand name and its quality. Health improvement is perceived to be the main benefit of practicing a sport activity. However sports-related injuries represent a barrier to continued participation. Moreover sport injury development lacks in an approach of understanding the functional connection between the injuries and the related movement. Frequent injuries due to practicing a sport activity may be caused by several risk factors: high repetitive loading on the foot, anatomical predispositions, excessive subtalar joint pronation, running surfaces, shoes and training habits [1]. The healthiness of the feet is strictly dependent on the functionality of the footwear. Sport shoes industry intends to respond to the necessities of each category of sport and shoe designs have changed over the years to optimize performance. The three most important functional design factors for sport shoes are: injury prevention, performance and comfort [2]. Appropriately designed shoes can reduce injury risk, acting as a reducing factor for the effects of repeated impacts and excessive pronation. Cushioning and shock attenuation properties of the soles (like air cells in the heel area, variable density material, rounded contours/shapes) redistribute stresses and reduce high plantar pressures, attenuating the shock waves transmitted to the skeleton. Human performance in sports is achieved if shoes are designed for the specific sports and exercices and for the relevant surface qualities [3]. Poor design is often associated with a lack of biomechanical functions of the shoes such as impact attenuation and rearfoot control.
598
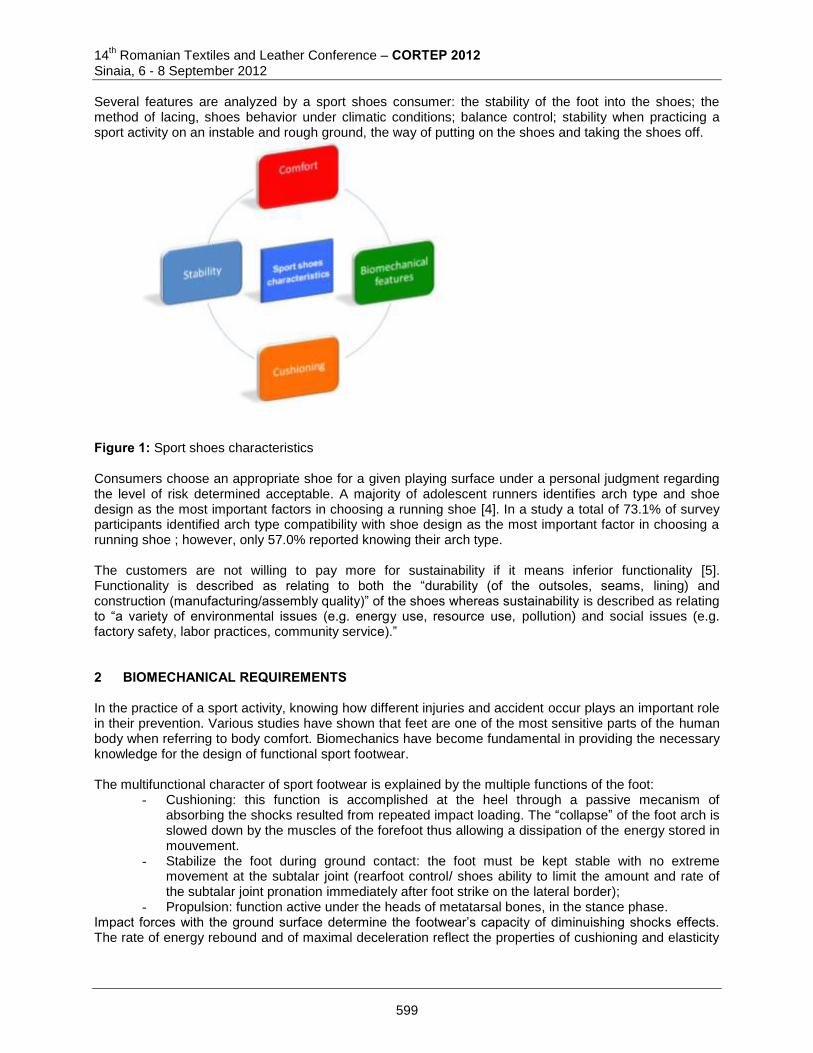
14th Romanian Textiles and Leather Conference – CORTEP 2012
Sinaia, 6 - 8 September 2012
Several features are analyzed by a sport shoes consumer: the stability of the foot into the shoes; the method of lacing, shoes behavior under climatic conditions; balance control; stability when practicing a sport activity on an instable and rough ground, the way of putting on the shoes and taking the shoes off.
Figure 1: Sport shoes characteristics Consumers choose an appropriate shoe for a given playing surface under a personal judgment regarding the level of risk determined acceptable. A majority of adolescent runners identifies arch type and shoe design as the most important factors in choosing a running shoe [4]. In a study a total of 73.1% of survey participants identified arch type compatibility with shoe design as the most important factor in choosing a running shoe ; however, only 57.0% reported knowing their arch type. The customers are not willing to pay more for sustainability if it means inferior functionality [5]. Functionality is described as relating to both the “durability (of the outsoles, seams, lining) and construction (manufacturing/assembly quality)” of the shoes whereas sustainability is described as relating to “a variety of environmental issues (e.g. energy use, resource use, pollution) and social issues (e.g. factory safety, labor practices, community service).” 2 BIOMECHANICAL REQUIREMENTS In the practice of a sport activity, knowing how different injuries and accident occur plays an important role in their prevention. Various studies have shown that feet are one of the most sensitive parts of the human body when referring to body comfort. Biomechanics have become fundamental in providing the necessary knowledge for the design of functional sport footwear. The multifunctional character of sport footwear is explained by the multiple functions of the foot:
- Cushioning: this function is accomplished at the heel through a passive mecanism of absorbing the shocks resulted from repeated impact loading. The “collapse” of the foot arch is slowed down by the muscles of the forefoot thus allowing a dissipation of the energy stored in mouvement.
- Stabilize the foot during ground contact: the foot must be kept stable with no extreme movement at the subtalar joint (rearfoot control/ shoes ability to limit the amount and rate of the subtalar joint pronation immediately after foot strike on the lateral border);
- Propulsion: function active under the heads of metatarsal bones, in the stance phase. Impact forces with the ground surface determine the footwear’s capacity of diminuishing shocks effects. The rate of energy rebound and of maximal deceleration reflect the properties of cushioning and elasticity
599
14
th Romanian Textiles and Leather Conference – CORTEP 2012
Sinaia, 6 - 8 September 2012
of the sole. A small degree of cushioning is related to a diminuished absorption energy. Human body has its own natural systems of cushioning: the plant of the foot, joint’s cartilages . The cushioning materials performances are not yet confirmed by scientic research. Under the biomechanical point of view the main aspects to be considered are the following: the adaptation of the footwear to the form and dimensions of the foot; adaptation of the footwear to the physiological movements of the foot; capacity of reducing the loads and the rearfoot motion. Plantar pression distribution is a determinant component in preventing and tracking injury development, having a big impact on comfort sensations. From a technical point of view footwear comfort may be defined as combination of several factors: adaptability, internal climate, humidity level, plantar pression distribution and the ground impact forces [6]. The most common injuries are ankle sprains, tendinitis, bone fractures, contusions, soft-tissue injuries. For analyzing in detail the injury mechanisms, finite element method is often used so as to improve the knowledge of the biomechanical behavior of the hind foot and ankle, being a helpful tool for sport footwear design. 3 PARTICULARITIES OF SPORT SHOES Sport shoes have special construction features imposed by their destination. The vamp is generally design from one piece of material minimizing the number of seams and therefore irritation to the foot. Technical pieces are developed more and more for offering stability to the rearfoot. The counter pattern protects the the hindfoot, limiting the ankle dorsiflexion; it must not exceed the subtalar joint in order not to produce friction at malleols [7]. The tongue pattern is ussualy reinforced so as to protect the superior area of the foot from the compression induced by the lacing system. Frequently the posterior side of the shoe is provided with a pattern that must prevent from friction or irritations on the Achile’s tendon. The linings must make proof of water vapour absorption and air permeability. The sole must have a geometry that assures good properties of ground adherence between the footwear and the ground surface, anti-slips features being an important component in the prevention of fall-related injuries. Many sports such as football, soccer, baseball, softball, impose spikes on the surface of the outer sole as for the interaction with different types of surfaces including grass, dirt, artificial turf, synthetic fields, or clay based track surfaces. Shoe sole design is based on many factors such as foot shape/size, comfort and materials. Soles are generally made of materials with cushioning properties such as: foamed ethylene vinyl acetate (EVA), thermoplastic polyurethane (TPU), rubber, air, gel, etc. The sole thickness and its material highly influence perceived comfort. In particular, softer materials and thicker soles contribute to increasing the degree of comfort. The anti slip performances are a critical feature of the specifications sheet of a sport shoe. The high local pressures or friction can be avoided through an anatomically shaped insoles that prevent foot sliding in the shoe. Insoles with moisture control properties keep feet dry by pulling moisture away. 4 CONCLUSIONS In the latest years, shoe manufacturers have oriented their research in several directions such as : materials and footwears' weight ; claiming health benefits by integrating foot physiology ; footwear design adapted to foot movements specific to each category of sport. As function of the various sport disciplines, the demands of the consumers are addressed by specialized footwear constructions. The healthiest sport shoes are the one that interfere in a small amount with our natural body movements. When submitted to effort, feet may swell and so the shoes must not compress. Sport shoes must bring the
600
14th Romanian Textiles and Leather Conference – CORTEP 2012
Sinaia, 6 - 8 September 2012
following benefits: to sustain the natural gait and permit the full anatomical range of motions; to absorb shocks; to strengthen the pelvian muscle; to ameliorate the posture and the breathing. Moreover sport shoes are expected to help loosing weight, tonify muscles and to improve blood circulation to feet. Sport shoes must be used for their intended and designed purpose in order to decrease the risk of injuries. The consumer's choice is based on a brand preference, purchasing power, social status, country of origin, preference in design and colour, and most importantly fit. Sport shoes consumers take also into consideration criteria like: stability, grip, lightness, flexibility, breathing properties, playing ground's type, durability. This paper requires further study as consumers' criteria is of great importance to sport footwear manufactures. REFERENCES [1] Shorten, M.R., Running shoe design: protection and performance, 2000, pp 159-169 in Marathon
Medicine (Ed. D. Tunstall Pedoe) London, Royal Society of Medicine, Available from http://www.biomechanica.com/docs/publications/docs/Shorten%20-%20Running%20Shoe.pdf
[2] Reinschmidt C, Nigg BM., Current issues in the design of running and court shoes, Sportverletz Sportschaden. 2000 Sep;14(3):71-81.
[3] Bartlett R. Footwear: biomechanics and injury aspects; effects of sports equipment and technique. In: Sports Biomechanics reducing injury and improving performance. New York: E&FN SPON Publishers an Impring of Routledge; 1999. p. 77–86.
[4] Enke Ryan C. et al., Running Shoe Selection Criteria Among Adolescent Cross-Country Runners, the American Academy of Physical Medicine and Rehabilitation, Vol. 1, 816-819, September 2009
[5] Luchs Michael G. et al., Trading-off sustainability: choice and willingness-to-pay given a trade-off between sustainability and functional performance
[6] Silva, R.M. et al.., Evaluation of shock absorption properties of rubber materials regarding footwear applications, Polymer Testing 28 (2009) 642–647
[7] Daum,B., La chaussure du randonneur, Médecine et chirurgie du pied, Volume 25, Number 1 (2009), 21-26, DOI: 10.1007/s10243-009-0181-z
[8] Goldcher A., Nataf E., Podologie du sport De A à Z toutes les pathologies, tous les sports (Médicine du sport), Elsevier Masson, 2002
[9] Franciosa P. et al., Improving comfort of shoe sole through experiments based on CAD-FEM modeling, Medical Engineering & Physics, 2012
Corresponding author: Marta-Catalina HARNAGEA “Gheorghe Asachi” Technical University of Iasi Faculty of Textile, Leather and Industrial Management B-dul D. Mangeron, No. 53-55, 700050, Iasi, Romania Phone: +40 232 278683/ 1267, E-mail: [email protected]
Co-authors: Aura MIHAI “Gheorghe Asachi” Technical University of Iasi Faculty of Textile, Leather and Industrial Management B-dul D. Mangeron, No. 53-55 700050, Iasi, Romania Phone: +40 232 278683 / 1267, E-mail: [email protected] Stan MITU “Gheorghe Asachi” Technical University of Iasi Faculty of Textile, Leather and Industrial Management B-dul D. Mangeron, No. 53-55 700050, Iasi, Romania Phone: +40 232 278683, E-mail: [email protected]
601
14
th Romanian Textiles and Leather Conference – CORTEP 2012
Sinaia, 6 - 8 September 2012
THE INFLUENCE OF UPPER PATTERNS CONFIGURATION ON THE SPECIFIC CONSUMPTION WHEN CUTTING LEATHER
Florentina HARNAGEA & Marta-Catalina HARNAGEA
“Gheorghe Asachi” Technical University of Iasi, Romania Abstract: Footwear design is a process implying aesthetical and functional criteria. From an economical point of view it is important to optimize the pattern’s configuration so as to improve the material utilization. Material that is wasted at cutting influences significantly the consumption norm as small gaps cannot usually be used afterwards. Generally a nesting system that allows the maximum utilization of the material surface (the optimal nesting of the pieces so that both good quality parts and the lowest waste amount) is chosen. The aim of this study, therefore, was to show the influence of the shoe uppers configuration on the nesting factor and implicitly on the specific consumption norms at cutting leather. Keywords: footwear, uppers, waste, nesting factor, specific consumptions 1 INTRODUCTION The reduction of materials is becoming an important issue because footwear industry is facing declining profit margins. In a footwear factory, the material-cutting room includes an important operation in which pattern pieces of different sizes and styles of a shoe are laid out on leather of arbitrary width and length in order to achieve the highest utilization of material [1]. The particularities of a shoe model are given by the patterns that may differ so as for shape and surface. In the design process patterns are conceived in such a way that they respond to the esthetical and functional criteria that are required in the specification sheet of the product [2]. The optimization of the pattern’s configuration is necessary from an economical point of view because the layout of pattern pieces always contains areas of unusable fabric due to the irregular shapes. The nesting of dissimilar shapes implies managing several types of wastes [3]. Thus, when designing the footwear component parts, a nesting system that allows the maximum utilization of the material surface (the optimal nesting of the pieces so that both good quality parts and the lowest waste amount could be obtained) will be chosen. In order to obtain an efficient layout of shoe patterns several design techniques may be used so as to optimize the material utilization [4]. The part’s contour and the chosen nesting have a significant influence not only upon the nesting factor but as well upon the normal wastes (the amount of the wastes issued from the curved configuration of the similar parts, Dn). In this paper there is presented the result of the research concerning the effect of the footwear uppers configuration on the nesting factor and implicitly on the specific consumptions at cutting on a leather. The performance of the proposed methodology is validated by the results that demonstrate an effective means by which to increase the material utilization. 2 METHOD The amount of the wastes issued from the curved configuration of the similar parts (Dn) is determined considering the theoretical nesting models. After establishing the methods of nesting for each single pattern there is obtained the nesting factor as a proportion between the area of the patterns included in parallelogram and the area of the parallelogram that includes similar patterns. The nesting factor of each pattern was calculated using the following relation:
100A
AnF
p
rsa
, [%] (1) where:
Ar - patterns’ surface area, in dm2;
ns - number of similar patterns included in parallelogram Ap – parallelogram’s area, in dm
2
602
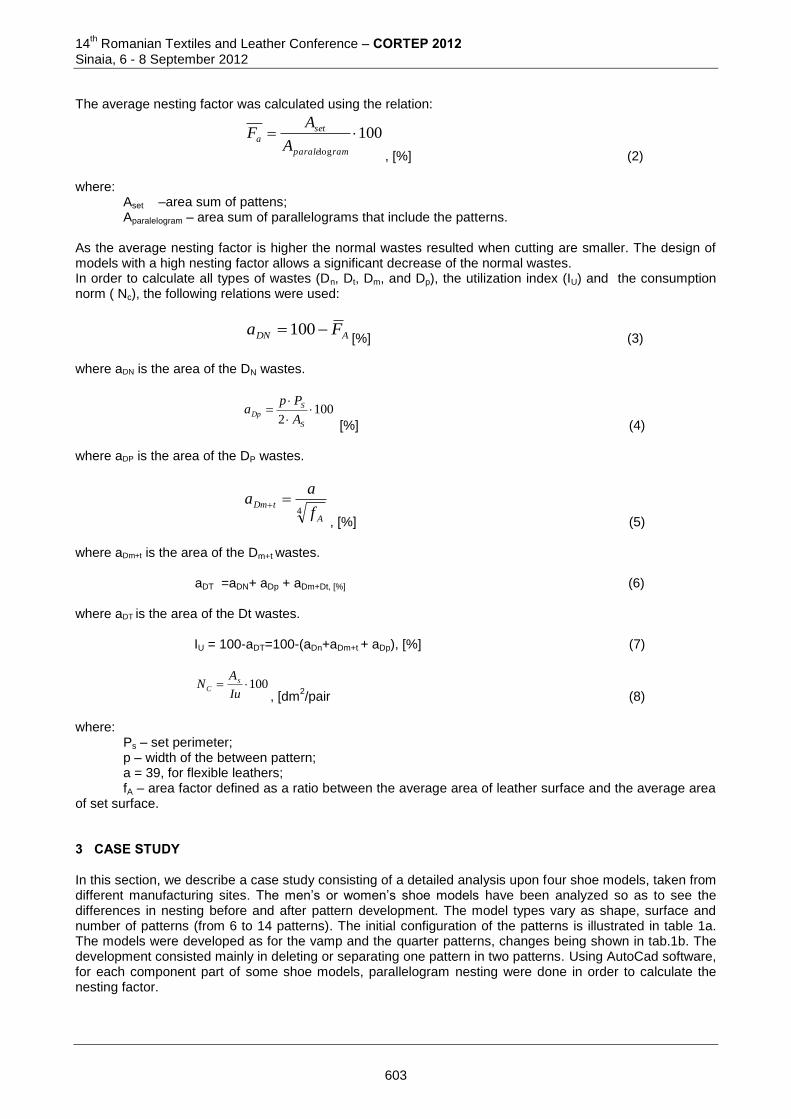
14th Romanian Textiles and Leather Conference – CORTEP 2012
Sinaia, 6 - 8 September 2012
The average nesting factor was calculated using the relation:
100log
ramparale
set
aA
AF
, [%] (2) where:
Aset –area sum of pattens; Aparalelogram – area sum of parallelograms that include the patterns.
As the average nesting factor is higher the normal wastes resulted when cutting are smaller. The design of models with a high nesting factor allows a significant decrease of the normal wastes. In order to calculate all types of wastes (Dn, Dt, Dm, and Dp), the utilization index (IU) and the consumption norm ( Nc), the following relations were used:
ADN Fa 100[%] (3)
where aDN is the area of the DN wastes.
1002
S
S
DpA
Ppa
[%] (4) where aDP is the area of the DP wastes.
4A
tDmf
aa
, [%] (5) where aDm+t is the area of the Dm+t wastes.
aDT =aDN+ aDp + aDm+Dt, [%] (6)
where aDT is the area of the Dt wastes.
IU = 100-aDT=100-(aDn+aDm+t + aDp), [%] (7)
100Iu
AN s
C
, [dm2/pair (8)
where:
Ps – set perimeter; p – width of the between pattern; a = 39, for flexible leathers; fA – area factor defined as a ratio between the average area of leather surface and the average area
of set surface. 3 CASE STUDY In this section, we describe a case study consisting of a detailed analysis upon four shoe models, taken from different manufacturing sites. The men’s or women’s shoe models have been analyzed so as to see the differences in nesting before and after pattern development. The model types vary as shape, surface and number of patterns (from 6 to 14 patterns). The initial configuration of the patterns is illustrated in table 1a. The models were developed as for the vamp and the quarter patterns, changes being shown in tab.1b. The development consisted mainly in deleting or separating one pattern in two patterns. Using AutoCad software, for each component part of some shoe models, parallelogram nesting were done in order to calculate the nesting factor.
603
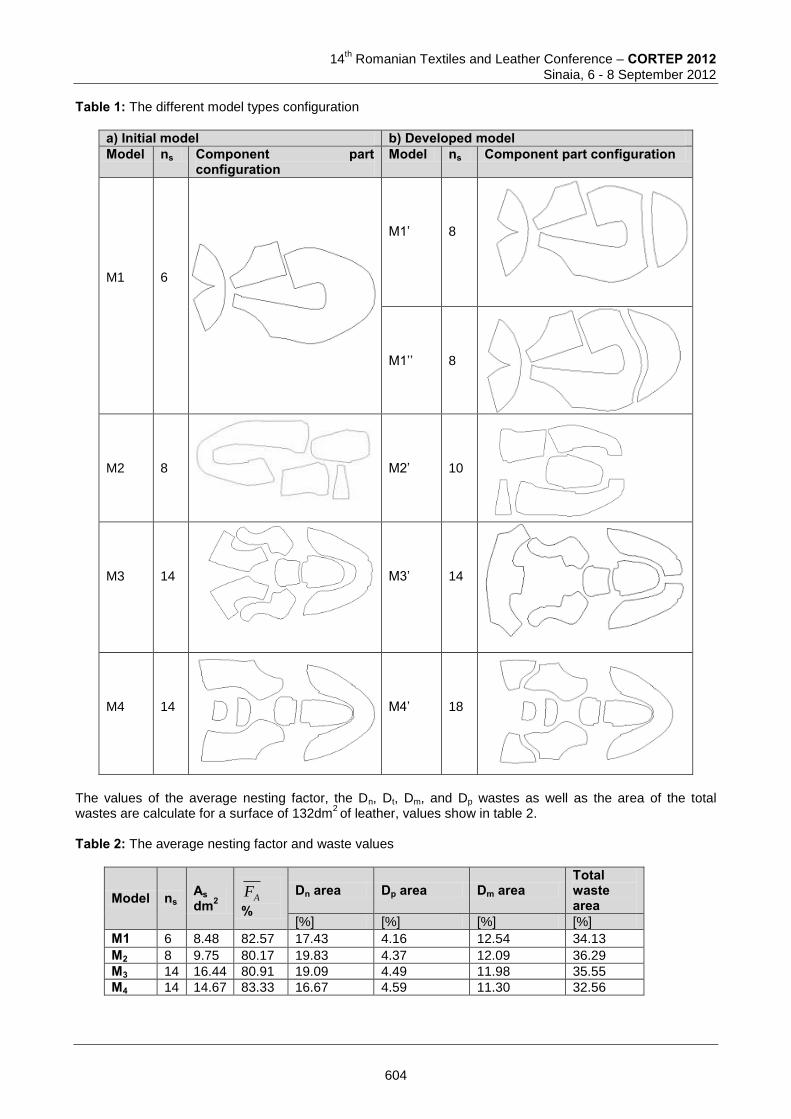
14
th Romanian Textiles and Leather Conference – CORTEP 2012
Sinaia, 6 - 8 September 2012
Table 1: The different model types configuration
a) Initial model b) Developed model Model ns Component part
configuration Model ns Component part configuration
M1
6
M1’
8
M1’’
8
M2
8
M2’
10
M3
14
M3’
14
M4
14
M4’
18
The values of the average nesting factor, the Dn, Dt, Dm, and Dp wastes as well as the area of the total wastes are calculate for a surface of 132dm
2 of leather, values show in table 2.
Table 2: The average nesting factor and waste values
Model ns As dm2 AF
% Dn area Dp area Dm area
Total waste area
[%] [%] [%] [%]
M1 6 8.48 82.57 17.43 4.16 12.54 34.13
M2 8 9.75 80.17 19.83 4.37 12.09 36.29
M3 14 16.44 80.91 19.09 4.49 11.98 35.55
M4 14 14.67 83.33 16.67 4.59 11.30 32.56
604
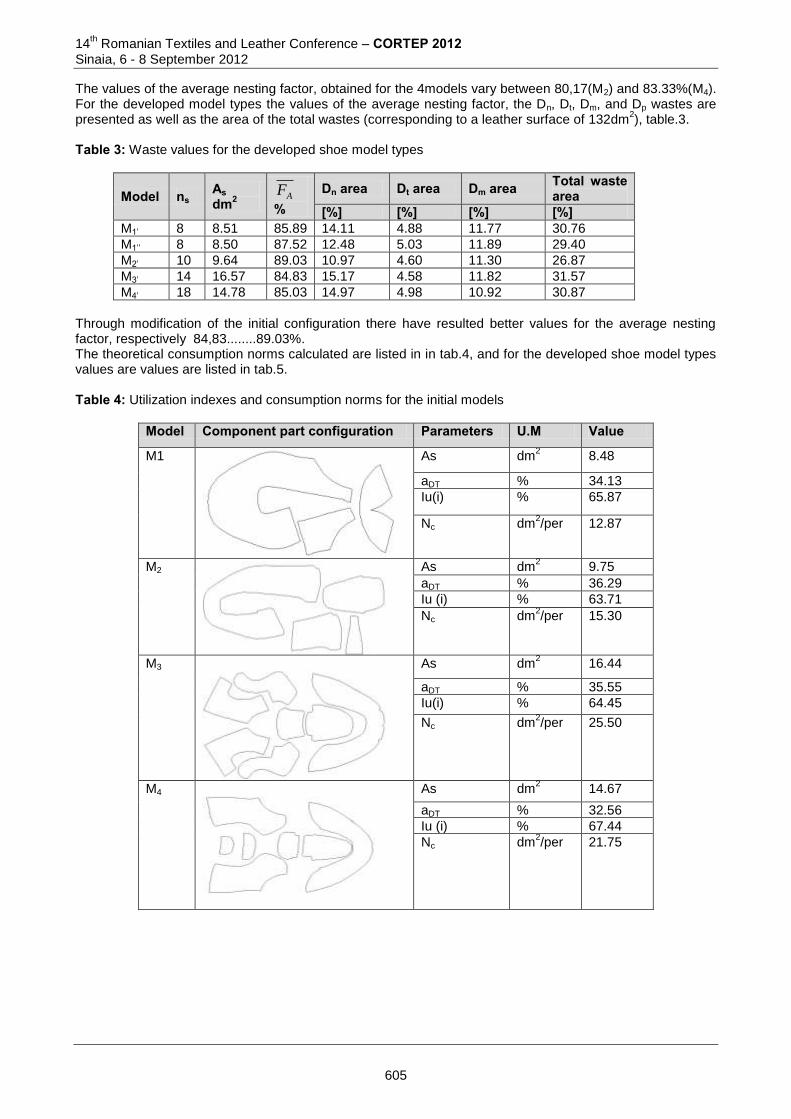
14th Romanian Textiles and Leather Conference – CORTEP 2012
Sinaia, 6 - 8 September 2012
The values of the average nesting factor, obtained for the 4models vary between 80,17(M2) and 83.33%(M4). For the developed model types the values of the average nesting factor, the Dn, Dt, Dm, and Dp wastes are presented as well as the area of the total wastes (corresponding to a leather surface of 132dm
2), table.3.
Table 3: Waste values for the developed shoe model types
Model ns As dm2 AF
% Dn area Dt area Dm area Total waste
area [%] [%] [%] [%]
M1’ 8 8.51 85.89 14.11 4.88 11.77 30.76
M1’’ 8 8.50 87.52 12.48 5.03 11.89 29.40
M2’ 10 9.64 89.03 10.97 4.60 11.30 26.87
M3’ 14 16.57 84.83 15.17 4.58 11.82 31.57
M4’ 18 14.78 85.03 14.97 4.98 10.92 30.87
Through modification of the initial configuration there have resulted better values for the average nesting factor, respectively 84,83........89.03%. The theoretical consumption norms calculated are listed in in tab.4, and for the developed shoe model types values are values are listed in tab.5. Table 4: Utilization indexes and consumption norms for the initial models
Model Component part configuration Parameters U.M Value
M1
As dm2 8.48
aDT % 34.13
Iu(i) % 65.87
Nc dm2/per 12.87
M2
As dm2 9.75
aDT % 36.29
Iu (i) % 63.71
Nc dm2/per 15.30
M3
As dm2 16.44
aDT % 35.55
Iu(i) % 64.45
Nc dm2/per 25.50
M4
As dm2 14.67
aDT % 32.56
Iu (i) % 67.44
Nc dm2/per 21.75
605

14
th Romanian Textiles and Leather Conference – CORTEP 2012
Sinaia, 6 - 8 September 2012
Table 5: Utilization indexes for the developed shoe model types
Model Component partconfiguration
Parameter M.U Value
M1’
As dm2 8.51
aDT % 30.76
Iu (i) % 69.24
Nc(i) dm2/per 12.29
M1’’
As dm2 8.50
aDT % 29.40
Iu (i) % 70.6
Nc(i) dm2/per 12.04
M2’
As dm2 9.64
aDT % 26.87
Iu(i) % 73.13
Nc(i) dm2/per 13.18
M3’
As dm2 16.57
aDT % 31.57
Iu (i) % 68.43
Nc(i) dm2/per 24.21
M4’
As dm2 14.78
aDT % 30.87
Iu(i) % 69.13
Nc(i) dm2/per 21.38
The developed shoe model types (Vm) show differences in comparison to the initial shoe model types(Vi) as for the utilization index and the consumption norm.
0 10 20 30 40 50 60 70 80
M1
M2
M3
M4
Iu, % Vi Vm
0
5
10
15
20
25
Nc, dm2/ pair
M1 M2 M3 M4
Vi Vm
Figure 1: Variation of the utilization index Figure 2:Variation of the consumption norm
606
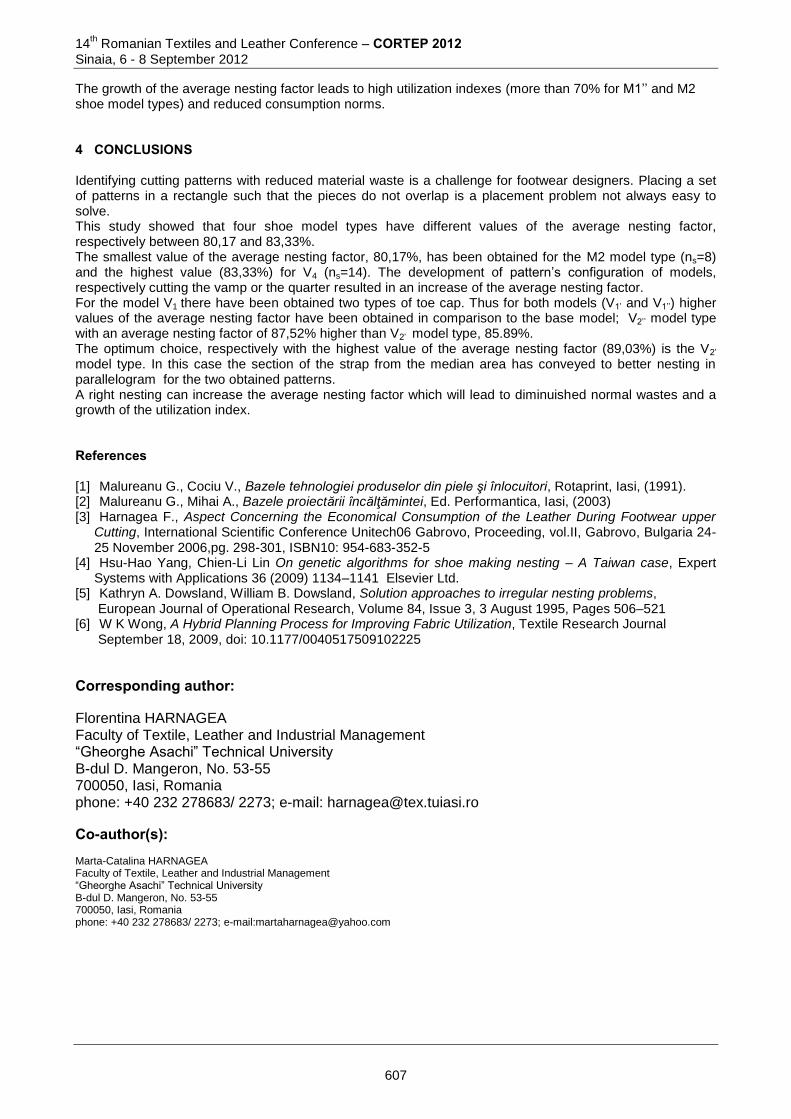
14th Romanian Textiles and Leather Conference – CORTEP 2012
Sinaia, 6 - 8 September 2012
The growth of the average nesting factor leads to high utilization indexes (more than 70% for M1’’ and M2 shoe model types) and reduced consumption norms. 4 CONCLUSIONS Identifying cutting patterns with reduced material waste is a challenge for footwear designers. Placing a set of patterns in a rectangle such that the pieces do not overlap is a placement problem not always easy to solve. This study showed that four shoe model types have different values of the average nesting factor, respectively between 80,17 and 83,33%. The smallest value of the average nesting factor, 80,17%, has been obtained for the M2 model type (ns=8) and the highest value (83,33%) for V4 (ns=14). The development of pattern’s configuration of models, respectively cutting the vamp or the quarter resulted in an increase of the average nesting factor. For the model V1 there have been obtained two types of toe cap. Thus for both models (V1’ and V1’’) higher values of the average nesting factor have been obtained in comparison to the base model; V2’’ model type with an average nesting factor of 87,52% higher than V2’ model type, 85.89%. The optimum choice, respectively with the highest value of the average nesting factor (89,03%) is the V2’ model type. In this case the section of the strap from the median area has conveyed to better nesting in parallelogram for the two obtained patterns. A right nesting can increase the average nesting factor which will lead to diminuished normal wastes and a growth of the utilization index. References [1] Malureanu G., Cociu V., Bazele tehnologiei produselor din piele şi înlocuitori, Rotaprint, Iasi, (1991). [2] Malureanu G., Mihai A., Bazele proiectării încălţămintei, Ed. Performantica, Iasi, (2003) [3] Harnagea F., Aspect Concerning the Economical Consumption of the Leather During Footwear upper
Cutting, International Scientific Conference Unitech06 Gabrovo, Proceeding, vol.II, Gabrovo, Bulgaria 24-25 November 2006,pg. 298-301, ISBN10: 954-683-352-5
[4] Hsu-Hao Yang, Chien-Li Lin On genetic algorithms for shoe making nesting – A Taiwan case, Expert Systems with Applications 36 (2009) 1134–1141 Elsevier Ltd.
[5] Kathryn A. Dowsland, William B. Dowsland, Solution approaches to irregular nesting problems, European Journal of Operational Research, Volume 84, Issue 3, 3 August 1995, Pages 506–521
[6] W K Wong, A Hybrid Planning Process for Improving Fabric Utilization, Textile Research Journal September 18, 2009, doi: 10.1177/0040517509102225
Corresponding author:
Florentina HARNAGEA Faculty of Textile, Leather and Industrial Management “Gheorghe Asachi” Technical University B-dul D. Mangeron, No. 53-55 700050, Iasi, Romania phone: +40 232 278683/ 2273; e-mail: [email protected]
Co-author(s): Marta-Catalina HARNAGEA Faculty of Textile, Leather and Industrial Management “Gheorghe Asachi” Technical University B-dul D. Mangeron, No. 53-55 700050, Iasi, Romania phone: +40 232 278683/ 2273; e-mail:[email protected]
607
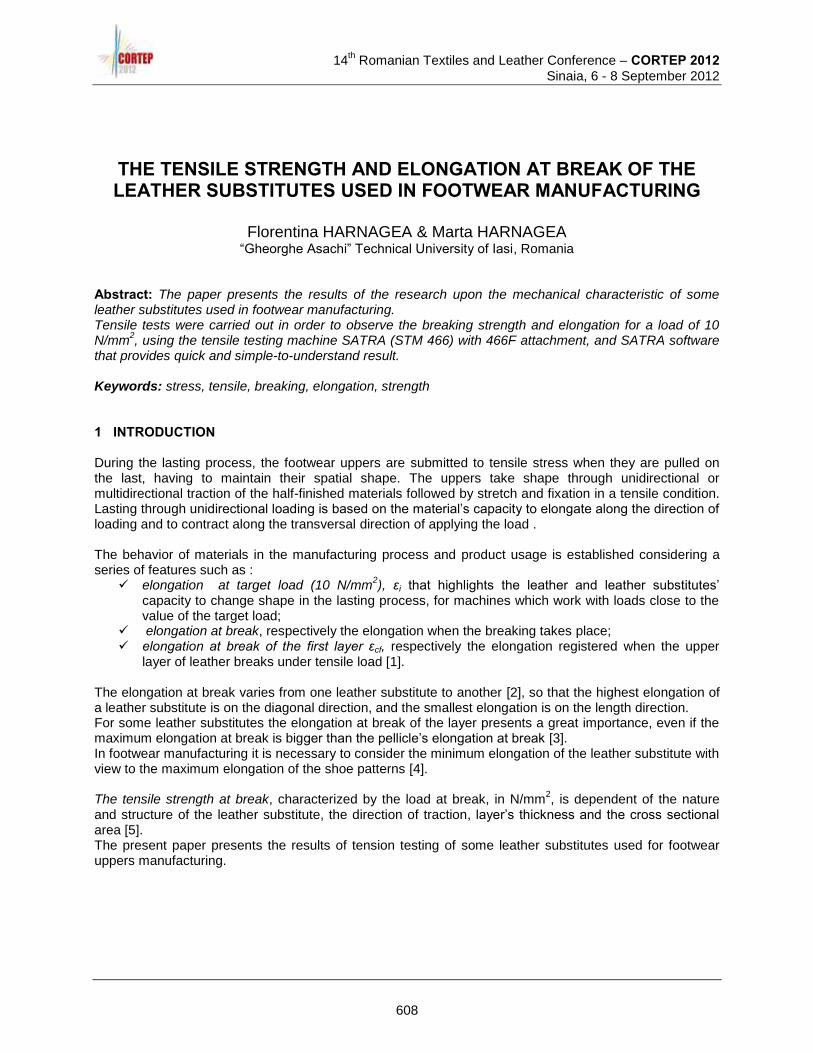
14
th Romanian Textiles and Leather Conference – CORTEP 2012
Sinaia, 6 - 8 September 2012
THE TENSILE STRENGTH AND ELONGATION AT BREAK OF THE LEATHER SUBSTITUTES USED IN FOOTWEAR MANUFACTURING
Florentina HARNAGEA & Marta HARNAGEA
“Gheorghe Asachi” Technical University of Iasi, Romania Abstract: The paper presents the results of the research upon the mechanical characteristic of some leather substitutes used in footwear manufacturing. Tensile tests were carried out in order to observe the breaking strength and elongation for a load of 10 N/mm
2, using the tensile testing machine SATRA (STM 466) with 466F attachment, and SATRA software
that provides quick and simple-to-understand result. Keywords: stress, tensile, breaking, elongation, strength 1 INTRODUCTION During the lasting process, the footwear uppers are submitted to tensile stress when they are pulled on the last, having to maintain their spatial shape. The uppers take shape through unidirectional or multidirectional traction of the half-finished materials followed by stretch and fixation in a tensile condition. Lasting through unidirectional loading is based on the material’s capacity to elongate along the direction of loading and to contract along the transversal direction of applying the load . The behavior of materials in the manufacturing process and product usage is established considering a series of features such as :
elongation at target load (10 N/mm2), εi that highlights the leather and leather substitutes’
capacity to change shape in the lasting process, for machines which work with loads close to the value of the target load;
elongation at break, respectively the elongation when the breaking takes place; elongation at break of the first layer εcf, respectively the elongation registered when the upper
layer of leather breaks under tensile load [1]. The elongation at break varies from one leather substitute to another [2], so that the highest elongation of a leather substitute is on the diagonal direction, and the smallest elongation is on the length direction. For some leather substitutes the elongation at break of the layer presents a great importance, even if the maximum elongation at break is bigger than the pellicle’s elongation at break [3]. In footwear manufacturing it is necessary to consider the minimum elongation of the leather substitute with view to the maximum elongation of the shoe patterns [4]. The tensile strength at break, characterized by the load at break, in N/mm
2, is dependent of the nature
and structure of the leather substitute, the direction of traction, layer’s thickness and the cross sectional area [5]. The present paper presents the results of tension testing of some leather substitutes used for footwear uppers manufacturing.
608
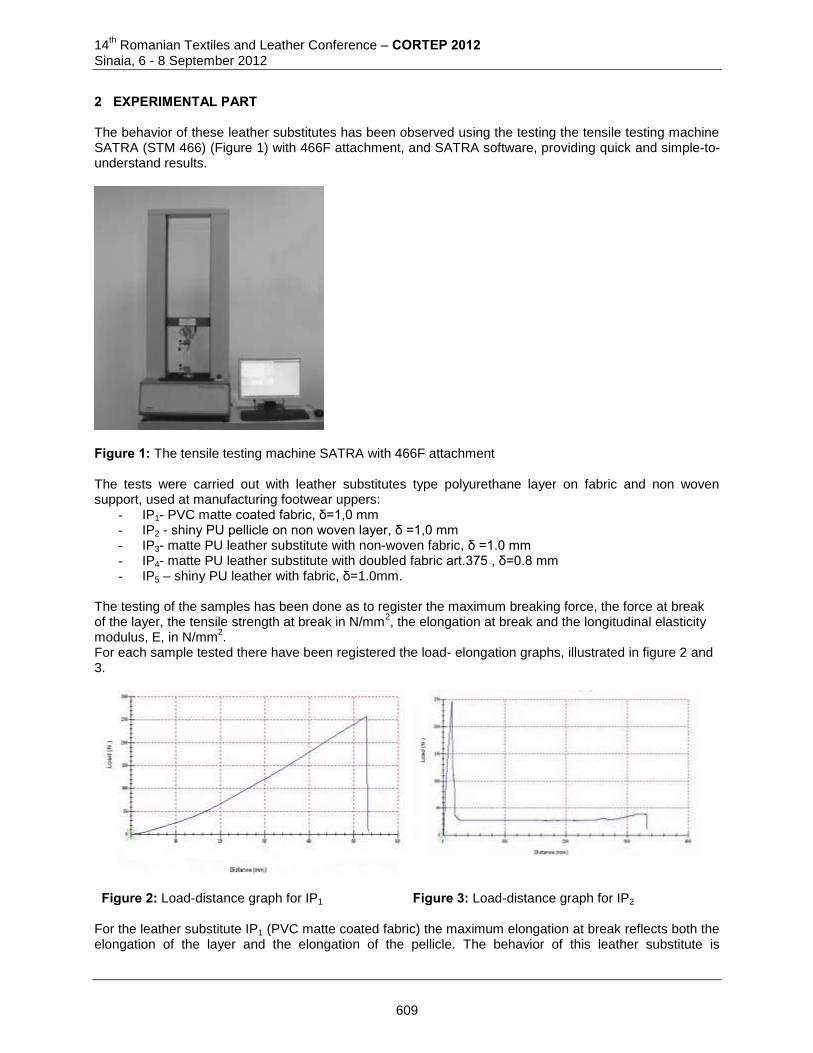
14th Romanian Textiles and Leather Conference – CORTEP 2012
Sinaia, 6 - 8 September 2012
2 EXPERIMENTAL PART The behavior of these leather substitutes has been observed using the testing the tensile testing machine SATRA (STM 466) (Figure 1) with 466F attachment, and SATRA software, providing quick and simple-to-understand results.
Figure 1: The tensile testing machine SATRA with 466F attachment The tests were carried out with leather substitutes type polyurethane layer on fabric and non woven support, used at manufacturing footwear uppers:
- IP1- PVC matte coated fabric, δ=1,0 mm - IP2 - shiny PU pellicle on non woven layer, δ =1,0 mm - IP3- matte PU leather substitute with non-woven fabric, δ =1.0 mm - IP4- matte PU leather substitute with doubled fabric art.375 , δ=0.8 mm - IP5 – shiny PU leather with fabric, δ=1.0mm.
The testing of the samples has been done as to register the maximum breaking force, the force at break of the layer, the tensile strength at break in N/mm
2, the elongation at break and the longitudinal elasticity
modulus, E, in N/mm2.
For each sample tested there have been registered the load- elongation graphs, illustrated in figure 2 and 3.
Figure 2: Load-distance graph for IP1
Figure 3: Load-distance graph for IP2
For the leather substitute IP1 (PVC matte coated fabric) the maximum elongation at break reflects both the elongation of the layer and the elongation of the pellicle. The behavior of this leather substitute is
609
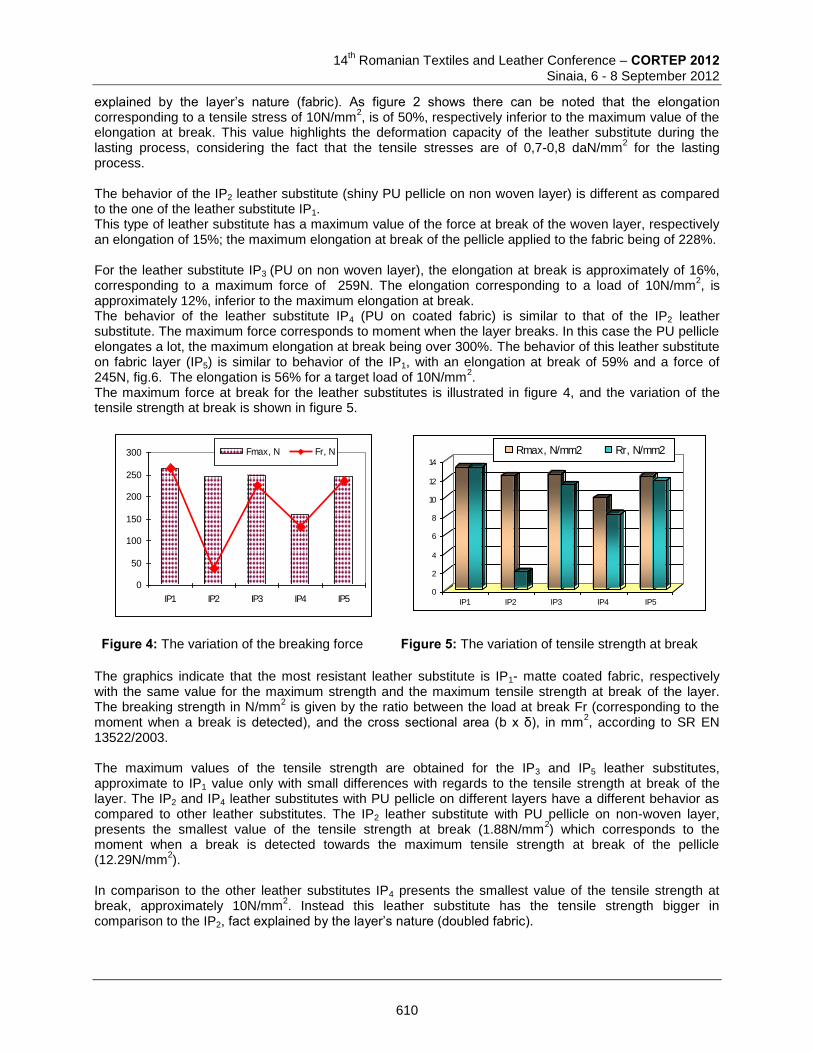
14
th Romanian Textiles and Leather Conference – CORTEP 2012
Sinaia, 6 - 8 September 2012
explained by the layer’s nature (fabric). As figure 2 shows there can be noted that the elongat ion corresponding to a tensile stress of 10N/mm
2, is of 50%, respectively inferior to the maximum value of the
elongation at break. This value highlights the deformation capacity of the leather substitute during the lasting process, considering the fact that the tensile stresses are of 0,7-0,8 daN/mm
2 for the lasting
process. The behavior of the IP2 leather substitute (shiny PU pellicle on non woven layer) is different as compared to the one of the leather substitute IP1. This type of leather substitute has a maximum value of the force at break of the woven layer, respectively an elongation of 15%; the maximum elongation at break of the pellicle applied to the fabric being of 228%. For the leather substitute IP3 (PU on non woven layer), the elongation at break is approximately of 16%, corresponding to a maximum force of 259N. The elongation corresponding to a load of 10N/mm
2, is
approximately 12%, inferior to the maximum elongation at break. The behavior of the leather substitute IP4 (PU on coated fabric) is similar to that of the IP2 leather substitute. The maximum force corresponds to moment when the layer breaks. In this case the PU pellicle elongates a lot, the maximum elongation at break being over 300%. The behavior of this leather substitute on fabric layer (IP5) is similar to behavior of the IP1, with an elongation at break of 59% and a force of 245N, fig.6. The elongation is 56% for a target load of 10N/mm
2.
The maximum force at break for the leather substitutes is illustrated in figure 4, and the variation of the tensile strength at break is shown in figure 5.
0
50
100
150
200
250
300
IP1 IP2 IP3 IP4 IP5
Fmax, N Fr, N
0
2
4
6
8
10
12
14
IP1 IP2 IP3 IP4 IP5
Rmax, N/mm2 Rr, N/mm2
Figure 4: The variation of the breaking force
Figure 5: The variation of tensile strength at break
The graphics indicate that the most resistant leather substitute is IP1- matte coated fabric, respectively with the same value for the maximum strength and the maximum tensile strength at break of the layer. The breaking strength in N/mm
2 is given by the ratio between the load at break Fr (corresponding to the
moment when a break is detected), and the cross sectional area (b x δ), in mm2, according to SR EN
13522/2003. The maximum values of the tensile strength are obtained for the IP3 and IP5 leather substitutes, approximate to IP1 value only with small differences with regards to the tensile strength at break of the layer. The IP2 and IP4 leather substitutes with PU pellicle on different layers have a different behavior as compared to other leather substitutes. The IP2 leather substitute with PU pellicle on non-woven layer, presents the smallest value of the tensile strength at break (1.88N/mm
2) which corresponds to the
moment when a break is detected towards the maximum tensile strength at break of the pellicle (12.29N/mm
2).
In comparison to the other leather substitutes IP4 presents the smallest value of the tensile strength at break, approximately 10N/mm
2. Instead this leather substitute has the tensile strength bigger in
comparison to the IP2, fact explained by the layer’s nature (doubled fabric).
610
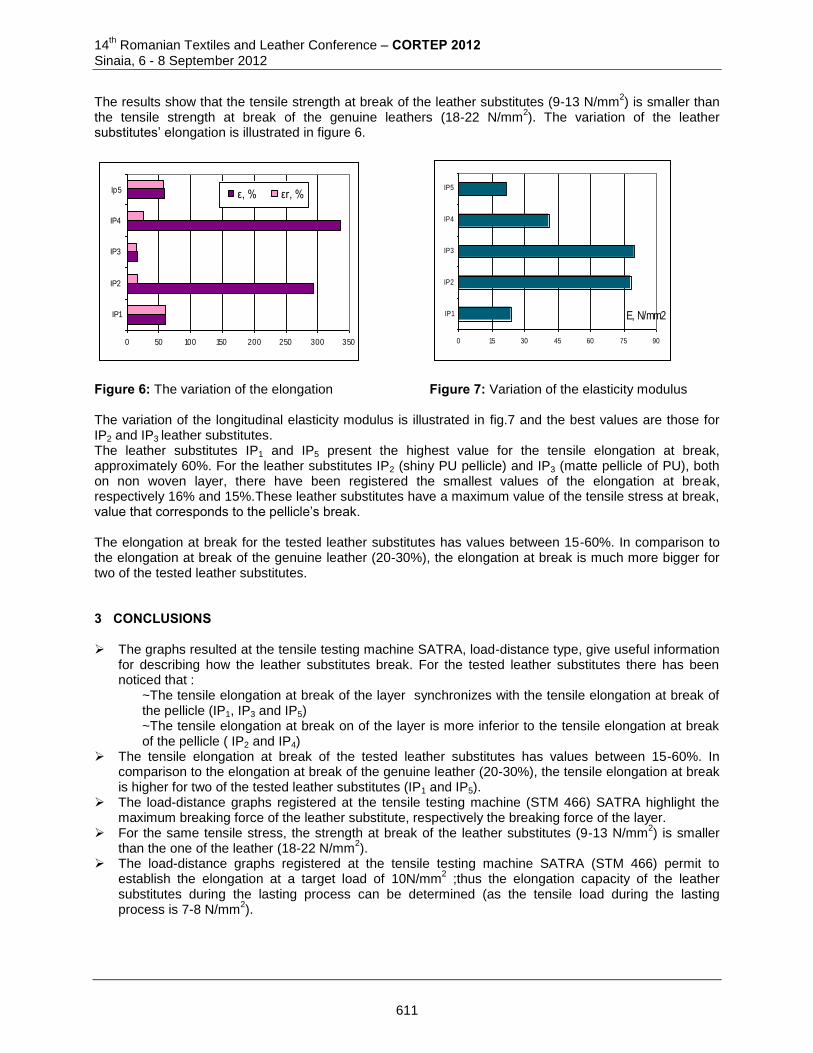
14th Romanian Textiles and Leather Conference – CORTEP 2012
Sinaia, 6 - 8 September 2012
The results show that the tensile strength at break of the leather substitutes (9-13 N/mm2) is smaller than
the tensile strength at break of the genuine leathers (18-22 N/mm2). The variation of the leather
substitutes’ elongation is illustrated in figure 6.
0 50 100 150 200 250 300 350
IP1
IP2
IP3
IP4
Ip5 ε, % εr, %
E, N/mm2
0 15 30 45 60 75 90
IP1
IP2
IP3
IP4
IP5
Figure 6: The variation of the elongation Figure 7: Variation of the elasticity modulus The variation of the longitudinal elasticity modulus is illustrated in fig.7 and the best values are those for IP2 and IP3 leather substitutes. The leather substitutes IP1 and IP5 present the highest value for the tensile elongation at break, approximately 60%. For the leather substitutes IP2 (shiny PU pellicle) and IP3 (matte pellicle of PU), both on non woven layer, there have been registered the smallest values of the elongation at break, respectively 16% and 15%.These leather substitutes have a maximum value of the tensile stress at break, value that corresponds to the pellicle’s break. The elongation at break for the tested leather substitutes has values between 15-60%. In comparison to the elongation at break of the genuine leather (20-30%), the elongation at break is much more bigger for two of the tested leather substitutes. 3 CONCLUSIONS The graphs resulted at the tensile testing machine SATRA, load-distance type, give useful information
for describing how the leather substitutes break. For the tested leather substitutes there has been noticed that :
~The tensile elongation at break of the layer synchronizes with the tensile elongation at break of the pellicle (IP1, IP3 and IP5) ~The tensile elongation at break on of the layer is more inferior to the tensile elongation at break of the pellicle ( IP2 and IP4)
The tensile elongation at break of the tested leather substitutes has values between 15-60%. In comparison to the elongation at break of the genuine leather (20-30%), the tensile elongation at break is higher for two of the tested leather substitutes (IP1 and IP5).
The load-distance graphs registered at the tensile testing machine (STM 466) SATRA highlight the maximum breaking force of the leather substitute, respectively the breaking force of the layer.
For the same tensile stress, the strength at break of the leather substitutes (9-13 N/mm2) is smaller
than the one of the leather (18-22 N/mm2).
The load-distance graphs registered at the tensile testing machine SATRA (STM 466) permit to establish the elongation at a target load of 10N/mm
2 ;thus the elongation capacity of the leather
substitutes during the lasting process can be determined (as the tensile load during the lasting process is 7-8 N/mm
2).
611

14
th Romanian Textiles and Leather Conference – CORTEP 2012
Sinaia, 6 - 8 September 2012
References: [1] Harnagea F., Secan C., Study regarding the leather substitutes behavior at tensile stress, Annals of
the Oradea University, Fascicle of Management and Technological Engineering,vol VII (XVII, ISSN 1583-0691, 2008, p.1462
[2] Jankauskaitė V.&al, Stress distribution in polymeric film laminated leather under biaxial loading, Proceedings of the Estonian Academy of Sciences,Engineering, Volume 12 No. 2,2006,p.111-124,
[3] Lin J. et al, Modelling of the performance of leather in a uni-axial shoe-last simulator, Journal of strain analysis, Vol 27 No 4, ImechE, 1992
[4] Thanikaivelan, P. & al., Gauge length effect on the tensile properties of leather, Journal of Applied Polymer Science, Volume 101, Issue 2, 2006, pages 1202–1209
[5] Vitan F., Badea N.& Pache A., Reologia pielii si a inlocuitorilor de piele, Ed.Cronica ISBN 973-95279-8-1, 1991, pages 125-134
Corresponding author:
Florentina HARNAGEA Faculty of Textile, Leather and Industrial Management “Gheorghe Asachi” Technical University B-dul D. Mangeron, No. 53-55 700050, Iasi, Romania phone: +40 232 278683/ 2273; e-mail: [email protected]
Co-author(s): Marta-Catalina HARNAGEA Faculty of Textile, Leather and Industrial Management “Gheorghe Asachi” Technical University B-dul D. Mangeron, No. 53-55 700050, Iasi, Romania phone: +40 232 278683/ 2273; e-mail:[email protected]
612
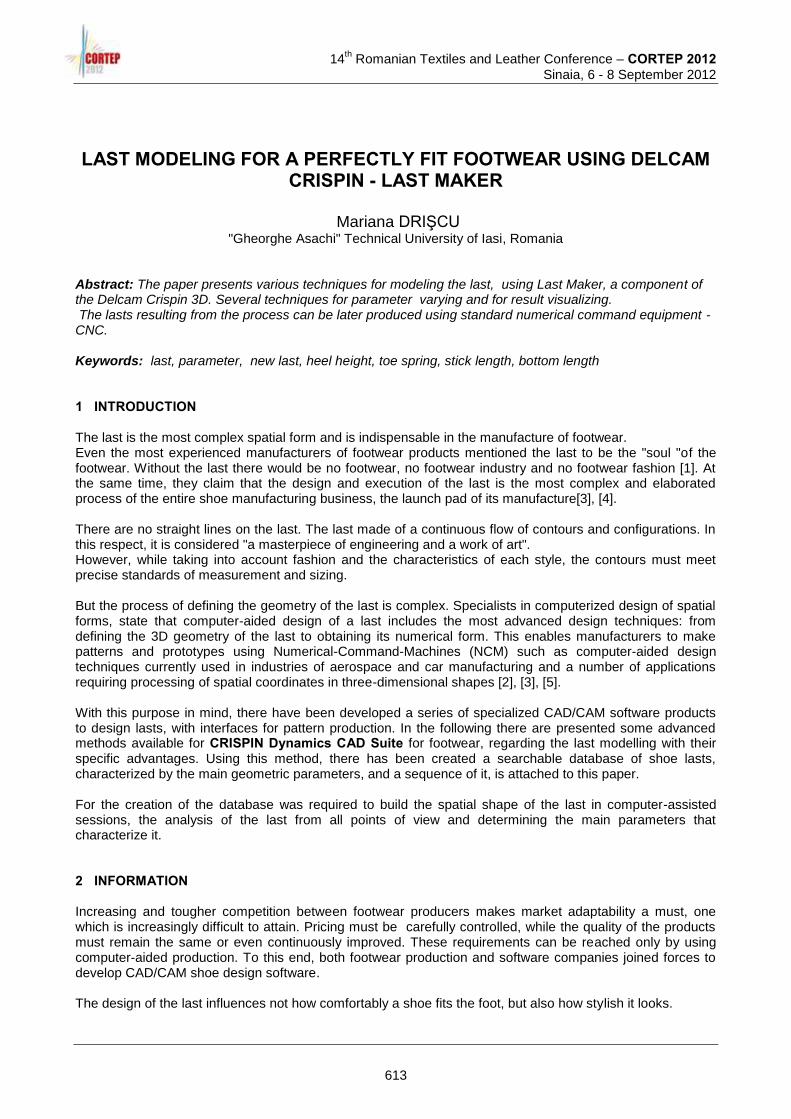
14
th Romanian Textiles and Leather Conference – CORTEP 2012
Sinaia, 6 - 8 September 2012
LAST MODELING FOR A PERFECTLY FIT FOOTWEAR USING DELCAM CRISPIN - LAST MAKER
Mariana DRIŞCU
"Gheorghe Asachi" Technical University of Iasi, Romania Abstract: The paper presents various techniques for modeling the last, using Last Maker, a component of the Delcam Crispin 3D. Several techniques for parameter varying and for result visualizing. The lasts resulting from the process can be later produced using standard numerical command equipment - CNC. Keywords: last, parameter, new last, heel height, toe spring, stick length, bottom length 1 INTRODUCTION The last is the most complex spatial form and is indispensable in the manufacture of footwear. Even the most experienced manufacturers of footwear products mentioned the last to be the "soul "of the footwear. Without the last there would be no footwear, no footwear industry and no footwear fashion [1]. At the same time, they claim that the design and execution of the last is the most complex and elaborated process of the entire shoe manufacturing business, the launch pad of its manufacture[3], [4]. There are no straight lines on the last. The last made of a continuous flow of contours and configurations. In this respect, it is considered "a masterpiece of engineering and a work of art". However, while taking into account fashion and the characteristics of each style, the contours must meet precise standards of measurement and sizing. But the process of defining the geometry of the last is complex. Specialists in computerized design of spatial forms, state that computer-aided design of a last includes the most advanced design techniques: from defining the 3D geometry of the last to obtaining its numerical form. This enables manufacturers to make patterns and prototypes using Numerical-Command-Machines (NCM) such as computer-aided design techniques currently used in industries of aerospace and car manufacturing and a number of applications requiring processing of spatial coordinates in three-dimensional shapes [2], [3], [5]. With this purpose in mind, there have been developed a series of specialized CAD/CAM software products to design lasts, with interfaces for pattern production. In the following there are presented some advanced methods available for CRISPIN Dynamics CAD Suite for footwear, regarding the last modelling with their specific advantages. Using this method, there has been created a searchable database of shoe lasts, characterized by the main geometric parameters, and a sequence of it, is attached to this paper. For the creation of the database was required to build the spatial shape of the last in computer-assisted sessions, the analysis of the last from all points of view and determining the main parameters that characterize it. 2 INFORMATION Increasing and tougher competition between footwear producers makes market adaptability a must, one which is increasingly difficult to attain. Pricing must be carefully controlled, while the quality of the products must remain the same or even continuously improved. These requirements can be reached only by using computer-aided production. To this end, both footwear production and software companies joined forces to develop CAD/CAM shoe design software. The design of the last influences not how comfortably a shoe fits the foot, but also how stylish it looks.
613
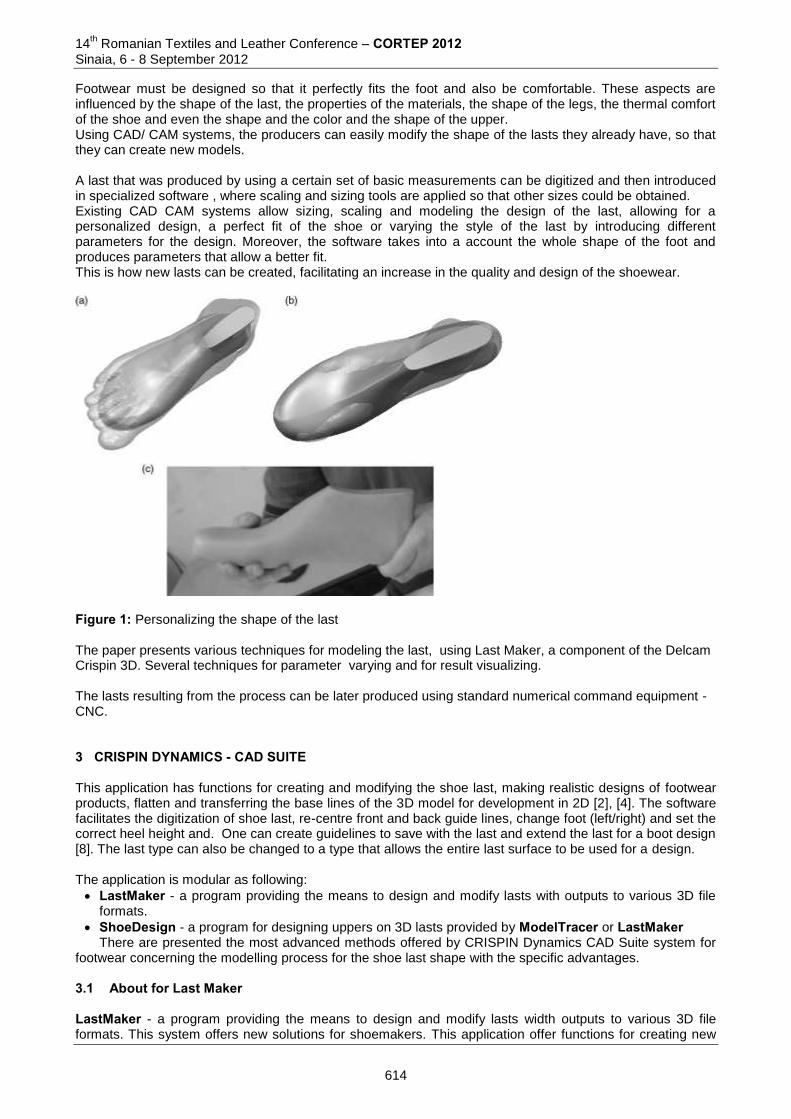
14th Romanian Textiles and Leather Conference – CORTEP 2012
Sinaia, 6 - 8 September 2012
Footwear must be designed so that it perfectly fits the foot and also be comfortable. These aspects are influenced by the shape of the last, the properties of the materials, the shape of the legs, the thermal comfort of the shoe and even the shape and the color and the shape of the upper. Using CAD/ CAM systems, the producers can easily modify the shape of the lasts they already have, so that they can create new models. A last that was produced by using a certain set of basic measurements can be digitized and then introduced in specialized software , where scaling and sizing tools are applied so that other sizes could be obtained. Existing CAD CAM systems allow sizing, scaling and modeling the design of the last, allowing for a personalized design, a perfect fit of the shoe or varying the style of the last by introducing different parameters for the design. Moreover, the software takes into a account the whole shape of the foot and produces parameters that allow a better fit. This is how new lasts can be created, facilitating an increase in the quality and design of the shoewear.
Figure 1: Personalizing the shape of the last The paper presents various techniques for modeling the last, using Last Maker, a component of the Delcam Crispin 3D. Several techniques for parameter varying and for result visualizing. The lasts resulting from the process can be later produced using standard numerical command equipment - CNC. 3 CRISPIN DYNAMICS - CAD SUITE This application has functions for creating and modifying the shoe last, making realistic designs of footwear products, flatten and transferring the base lines of the 3D model for development in 2D [2], [4]. The software facilitates the digitization of shoe last, re-centre front and back guide lines, change foot (left/right) and set the correct heel height and. One can create guidelines to save with the last and extend the last for a boot design [8]. The last type can also be changed to a type that allows the entire last surface to be used for a design. The application is modular as following:
LastMaker - a program providing the means to design and modify lasts with outputs to various 3D file formats.
ShoeDesign - a program for designing uppers on 3D lasts provided by ModelTracer or LastMaker There are presented the most advanced methods offered by CRISPIN Dynamics CAD Suite system for
footwear concerning the modelling process for the shoe last shape with the specific advantages. 3.1 About for Last Maker LastMaker - a program providing the means to design and modify lasts width outputs to various 3D file formats. This system offers new solutions for shoemakers. This application offer functions for creating new
614

14
th Romanian Textiles and Leather Conference – CORTEP 2012
Sinaia, 6 - 8 September 2012
shoe last (fig. 4) using function Last>Adjust, and flatten for development in 2D. There are also facilities to re-centre front and back guide lines, change foot (no need to re-digitize). set the correct heel height and grading shoe last for obtain shoe lasts for inferior and superior sizes. The new shoe last on compare for a study using the function of this application [4], [5]. 3.2 SHOE LAST analysis LastMaker - a program providing the means to design and modify lasts width outputs to various 3D file formats. This system offers new solutions for shoemakers. This application offer functions for creating new shoe last (figure 4) using function Last>Adjust, and flatten for development in 2D. There are also facilities to re-centre front and back guide lines, change foot (no need to re-digitize). set the correct the base dimensions of the shoe last: Toe Spring Heel Height Stick Length Bottom Length Girth Figure 2: The menu of the function Last>Adjust and the functions
Figure 3: The base geometric parameter of the function Adjust The new shoe last on compare for a study using the function of this application [5]. 3.2.1 The function for modification Toe Spring Function for modification Toe Spring:
Menu>Edit>Last>Adjust>Toe Spring 3.2.2 The function for modification Heel Height Function for modification Heel Height: Menu>Edit>Last>Adjust>Heel Height 3.2.3 The function for modification Stick Length
615
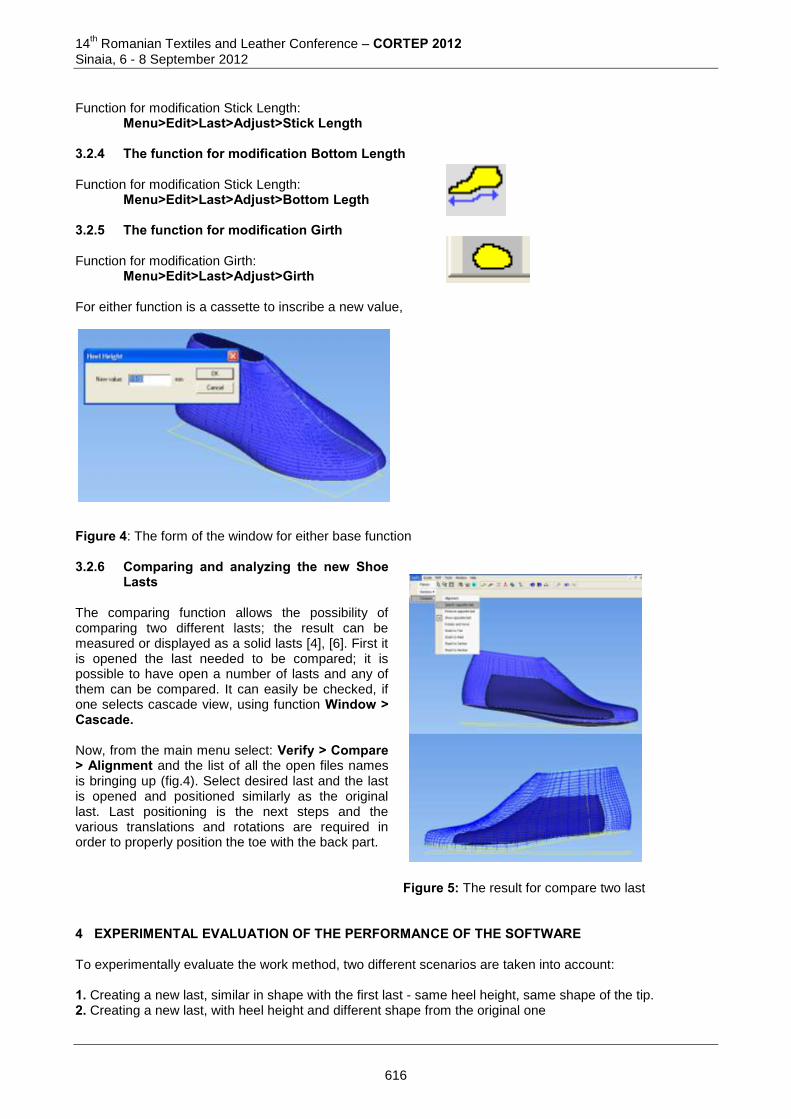
14th Romanian Textiles and Leather Conference – CORTEP 2012
Sinaia, 6 - 8 September 2012
Function for modification Stick Length:
Menu>Edit>Last>Adjust>Stick Length 3.2.4 The function for modification Bottom Length Function for modification Stick Length:
Menu>Edit>Last>Adjust>Bottom Legth 3.2.5 The function for modification Girth Function for modification Girth:
Menu>Edit>Last>Adjust>Girth For either function is a cassette to inscribe a new value,
Figure 4: The form of the window for either base function 3.2.6 Comparing and analyzing the new Shoe
Lasts The comparing function allows the possibility of comparing two different lasts; the result can be measured or displayed as a solid lasts [4], [6]. First it is opened the last needed to be compared; it is possible to have open a number of lasts and any of them can be compared. It can easily be checked, if one selects cascade view, using function Window > Cascade. Now, from the main menu select: Verify > Compare > Alignment and the list of all the open files names is bringing up (fig.4). Select desired last and the last is opened and positioned similarly as the original last. Last positioning is the next steps and the various translations and rotations are required in order to properly position the toe with the back part.
Figure 5: The result for compare two last
4 EXPERIMENTAL EVALUATION OF THE PERFORMANCE OF THE SOFTWARE To experimentally evaluate the work method, two different scenarios are taken into account: 1. Creating a new last, similar in shape with the first last - same heel height, same shape of the tip. 2. Creating a new last, with heel height and different shape from the original one
616
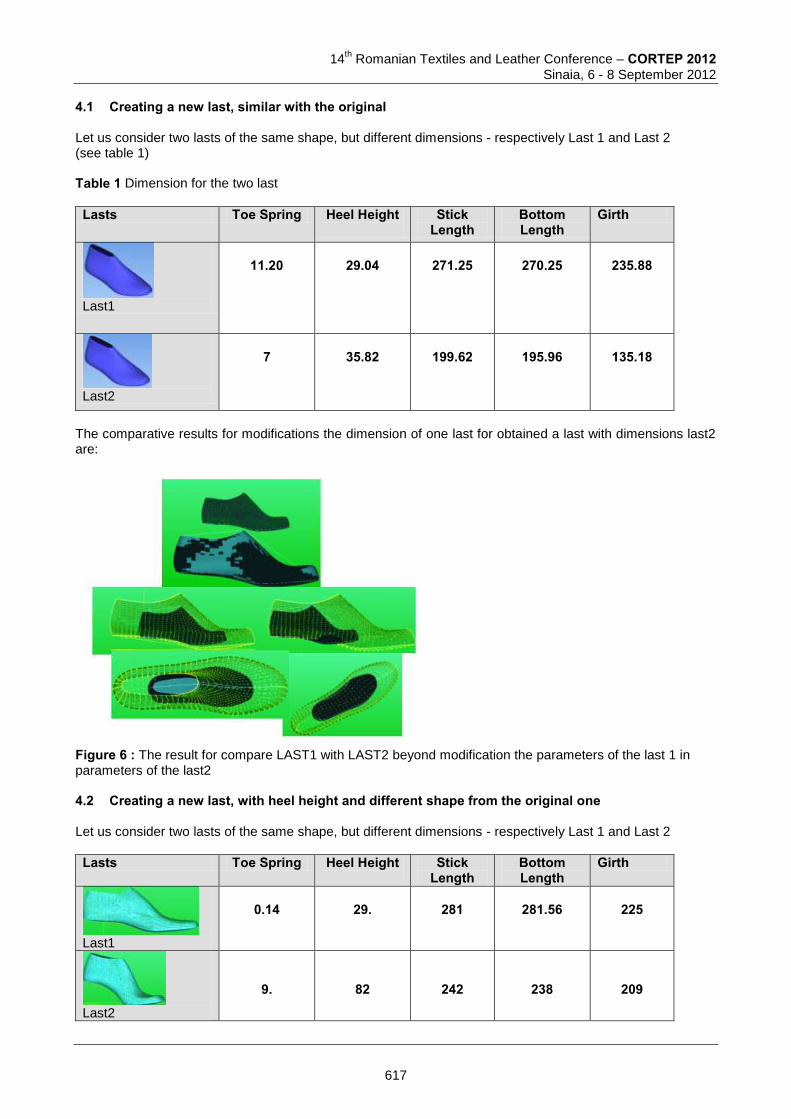
14
th Romanian Textiles and Leather Conference – CORTEP 2012
Sinaia, 6 - 8 September 2012
4.1 Creating a new last, similar with the original Let us consider two lasts of the same shape, but different dimensions - respectively Last 1 and Last 2 (see table 1) Table 1 Dimension for the two last
Lasts Toe Spring Heel Height
Stick Length
Bottom Length
Girth
Last1
11.20
29.04
271.25
270.25
235.88
Last2
7
35.82
199.62
195.96
135.18
The comparative results for modifications the dimension of one last for obtained a last with dimensions last2 are:
Figure 6 : The result for compare LAST1 with LAST2 beyond modification the parameters of the last 1 in parameters of the last2 4.2 Creating a new last, with heel height and different shape from the original one Let us consider two lasts of the same shape, but different dimensions - respectively Last 1 and Last 2
Lasts Toe Spring Heel Height
Stick Length
Bottom Length
Girth
Last1
0.14
29.
281
281.56
225
Last2
9.
82
242
238
209
617
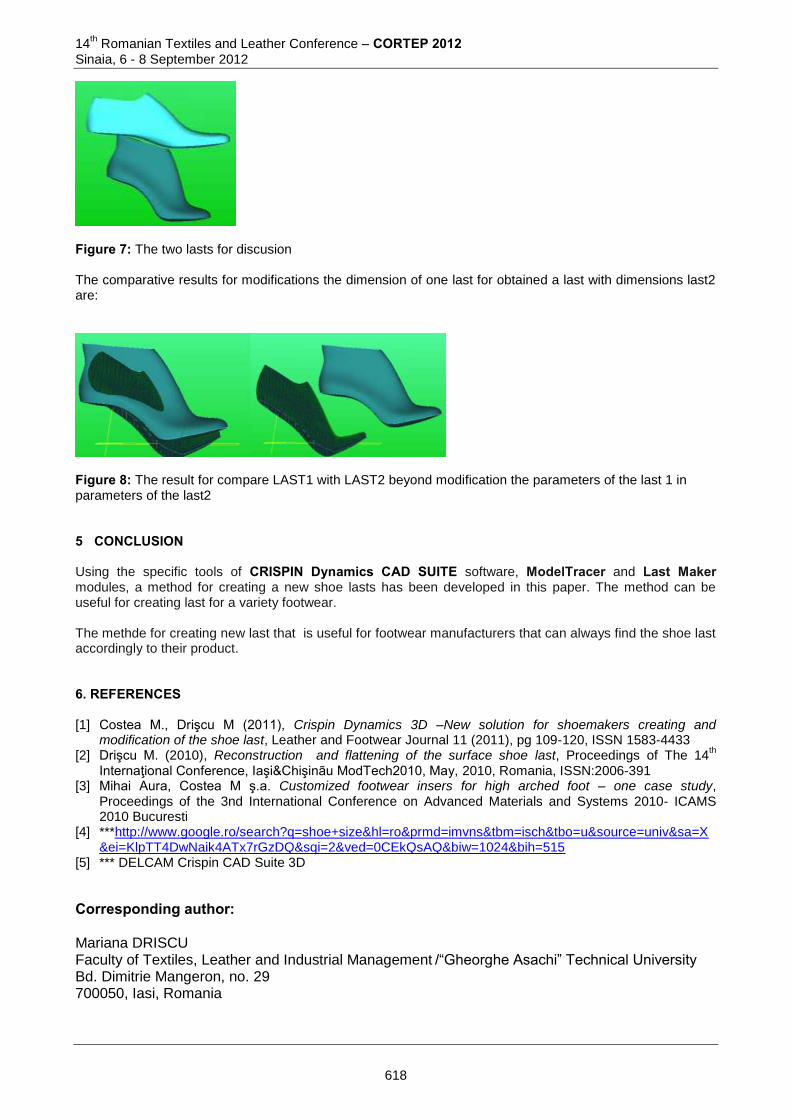
14th Romanian Textiles and Leather Conference – CORTEP 2012
Sinaia, 6 - 8 September 2012
Figure 7: The two lasts for discusion The comparative results for modifications the dimension of one last for obtained a last with dimensions last2 are:
Figure 8: The result for compare LAST1 with LAST2 beyond modification the parameters of the last 1 in parameters of the last2 5 CONCLUSION Using the specific tools of CRISPIN Dynamics CAD SUITE software, ModelTracer and Last Maker modules, a method for creating a new shoe lasts has been developed in this paper. The method can be useful for creating last for a variety footwear. The methde for creating new last that is useful for footwear manufacturers that can always find the shoe last accordingly to their product. 6. REFERENCES [1] Costea M., Drişcu M (2011), Crispin Dynamics 3D –New solution for shoemakers creating and
modification of the shoe last, Leather and Footwear Journal 11 (2011), pg 109-120, ISSN 1583-4433 [2] Drişcu M. (2010), Reconstruction and flattening of the surface shoe last, Proceedings of The 14
th
Internaţional Conference, Iaşi&Chişinãu ModTech2010, May, 2010, Romania, ISSN:2006-391 [3] Mihai Aura, Costea M ş.a. Customized footwear insers for high arched foot – one case study,
Proceedings of the 3nd International Conference on Advanced Materials and Systems 2010- ICAMS 2010 Bucuresti
[4] ***http://www.google.ro/search?q=shoe+size&hl=ro&prmd=imvns&tbm=isch&tbo=u&source=univ&sa=X&ei=KlpTT4DwNaik4ATx7rGzDQ&sqi=2&ved=0CEkQsAQ&biw=1024&bih=515
[5] *** DELCAM Crispin CAD Suite 3D
Corresponding author: Mariana DRISCU Faculty of Textiles, Leather and Industrial Management /“Gheorghe Asachi” Technical University Bd. Dimitrie Mangeron, no. 29 700050, Iasi, Romania
618
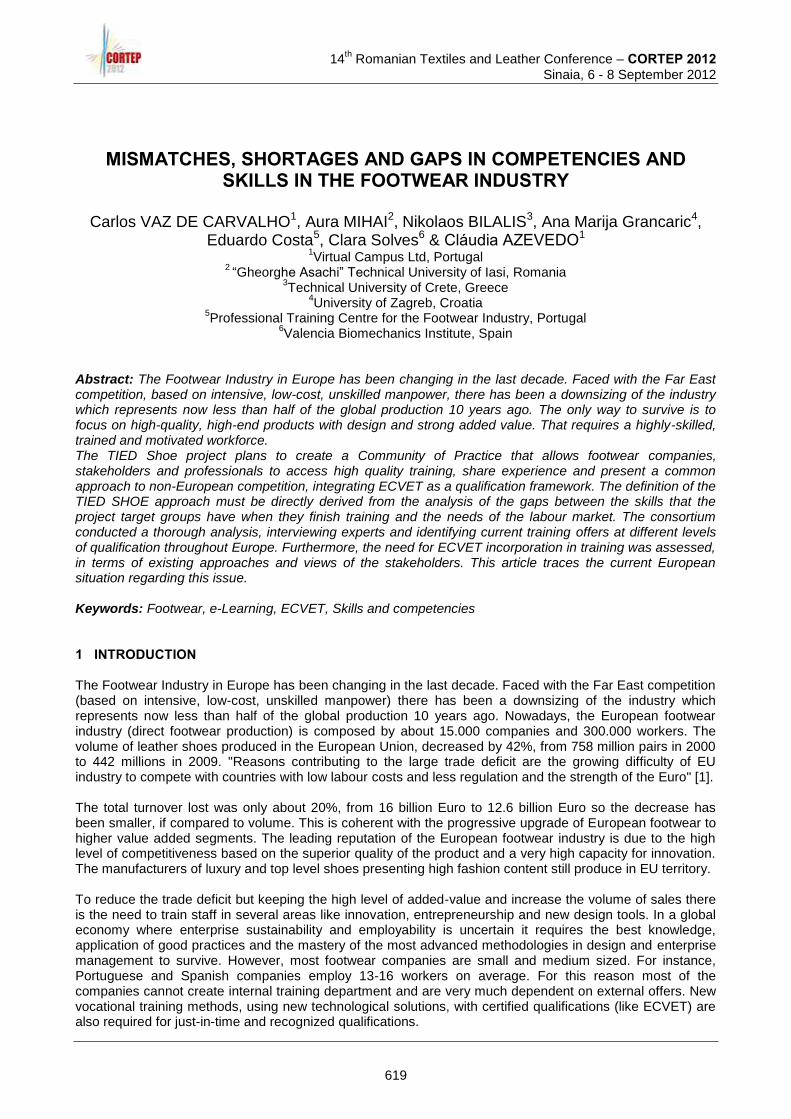
14
th Romanian Textiles and Leather Conference – CORTEP 2012
Sinaia, 6 - 8 September 2012
MISMATCHES, SHORTAGES AND GAPS IN COMPETENCIES AND SKILLS IN THE FOOTWEAR INDUSTRY
Carlos VAZ DE CARVALHO1, Aura MIHAI2, Nikolaos BILALIS3, Ana Marija Grancaric4,
Eduardo Costa5, Clara Solves6 & Cláudia AZEVEDO1
1Virtual Campus Ltd, Portugal
2 “Gheorghe Asachi” Technical University of Iasi, Romania
3Technical University of Crete, Greece
4University of Zagreb, Croatia
5Professional Training Centre for the Footwear Industry, Portugal
6Valencia Biomechanics Institute, Spain
Abstract: The Footwear Industry in Europe has been changing in the last decade. Faced with the Far East competition, based on intensive, low-cost, unskilled manpower, there has been a downsizing of the industry which represents now less than half of the global production 10 years ago. The only way to survive is to focus on high-quality, high-end products with design and strong added value. That requires a highly-skilled, trained and motivated workforce. The TIED Shoe project plans to create a Community of Practice that allows footwear companies, stakeholders and professionals to access high quality training, share experience and present a common approach to non-European competition, integrating ECVET as a qualification framework. The definition of the TIED SHOE approach must be directly derived from the analysis of the gaps between the skills that the project target groups have when they finish training and the needs of the labour market. The consortium conducted a thorough analysis, interviewing experts and identifying current training offers at different levels of qualification throughout Europe. Furthermore, the need for ECVET incorporation in training was assessed, in terms of existing approaches and views of the stakeholders. This article traces the current European situation regarding this issue. Keywords: Footwear, e-Learning, ECVET, Skills and competencies 1 INTRODUCTION The Footwear Industry in Europe has been changing in the last decade. Faced with the Far East competition (based on intensive, low-cost, unskilled manpower) there has been a downsizing of the industry which represents now less than half of the global production 10 years ago. Nowadays, the European footwear industry (direct footwear production) is composed by about 15.000 companies and 300.000 workers. The volume of leather shoes produced in the European Union, decreased by 42%, from 758 million pairs in 2000 to 442 millions in 2009. "Reasons contributing to the large trade deficit are the growing difficulty of EU industry to compete with countries with low labour costs and less regulation and the strength of the Euro" [1]. The total turnover lost was only about 20%, from 16 billion Euro to 12.6 billion Euro so the decrease has been smaller, if compared to volume. This is coherent with the progressive upgrade of European footwear to higher value added segments. The leading reputation of the European footwear industry is due to the high level of competitiveness based on the superior quality of the product and a very high capacity for innovation. The manufacturers of luxury and top level shoes presenting high fashion content still produce in EU territory. To reduce the trade deficit but keeping the high level of added-value and increase the volume of sales there is the need to train staff in several areas like innovation, entrepreneurship and new design tools. In a global economy where enterprise sustainability and employability is uncertain it requires the best knowledge, application of good practices and the mastery of the most advanced methodologies in design and enterprise management to survive. However, most footwear companies are small and medium sized. For instance, Portuguese and Spanish companies employ 13-16 workers on average. For this reason most of the companies cannot create internal training department and are very much dependent on external offers. New vocational training methods, using new technological solutions, with certified qualifications (like ECVET) are also required for just-in-time and recognized qualifications.
619
14th Romanian Textiles and Leather Conference – CORTEP 2012
Sinaia, 6 - 8 September 2012
The precursor VTC-Shoe project [2], that run from 2007 till 2009, created a Virtual Training Centre to: 1) Setup a functional training centre, with high quality training materials, to train and share best practice in footwear design; 2) Improve and upgrade competences and skills of the VET colleges and training schools; 3) Extend the common educational qualifications of footwear professionals in particular in the design area and the accreditation of the skills and knowledge of those professionals. This tool was tested and applied with success in several countries like Romania, Turkey and Greece. The curriculum and the content include theoretical knowledge and practical skills and are divided in four parts: Foot; Footwear; Measurements and Tools; Design and Pattern Making. Trainees also have the opportunity to use this educational software to solve specific problems, for example to design a new footwear product as development of classic constructive types. Now, the TIED Shoe project plans to: 1) extend the concept of the Virtual Training Centre (functional training centre, with high quality materials, in a virtual space accessible from everywhere) into a Community of Practice that allows footwear companies, stakeholders and professionals to share experience and present a common approach to non-European competition. With this approach it will be possible to adjust the current situation of development in the footwear industry in these countries, making it more innovative, more advanced and more profitable; 2) incorporate new modules (Innovation, Internationalization, Entrepreneurship and New Design Tools) to the VTC-shoe that address the need for Innovation and Internationalization; in particular, Internationalization will deal with new emerging large consumption markets, like Brazil, China, India or Russia where demand for high quality shoes is not being answered by the local production of low costs shoes. With these new modules it will be possible to extend the VTC concept to other staff; the contents will be available in Portuguese, Spanish, Croat, Romanian, Greek and English to allow their use throughout Europe; 3) propose a common framework for conformity of online learning modules within the ECVET framework, contributing this way to the enlarged recognition of qualifications in the footwear industry and to the accreditation of the skills and knowledge of professionals; 4) transfer existing innovation into other countries where the footwear industry is strong or is developing, namely Portugal, Spain and Croatia; The overall and specific objectives of the project have been set up under the rationale for increasing the Footwear sector competitively by orientating the needs for training in shoe design to innovative content development, providing lifelong learning and continuing education opportunities. ICT-related skills in the shoe design area are also vital for the competitiveness of the footwear sector and for increase job opportunities and employment. The TIED Shoe is clearly addressing the need to promote the acquisition of key competencies in VET but is also developing activities to promote the use and conformity to ECVET for transparency and recognition of learning outcomes and qualifications. The project addresses the footwear industry but the methodology and tools can be replicated in other industrial sectors. 2 EXPERIMENTAL Like stated before the TIED Shoe project is based on the results of the VTC-Shoe project. The project targeted shoe design trainers and trainees engaged in public (colleges, vocational schools, etc.) and private training centres. To some extent, the project also targeted other manufacturing sectors dealing with footwear like tanning and finishing of leather, manufacture of luggage and handbags. The developed materials were used to create a new, efficient, and innovative training tool at basic and intermediate levels and to design a competency-curriculum. The pedagogical methodology of VTC-Shoe focused on learning by doing. Trainees also had the opportunity to use this educational software to solve specific problems, for example to design a new footwear product as a development of classic constructive types. In terms of quality and innovation in vocational training, VTC-Shoe contributed to improve the qualifications and competences of the trainees in this field and this has only been possible due to the well designed and well programmed curriculum proposed. In addition, considering that education is a dynamic process, it was made possible throughout the project development, given its dynamic and open characteristics, to improve the quality of vocational and technical education, and this is one of the reasons why it is now possible to transfer and adapt innovation under the new TIED Shoe project.
620
14
th Romanian Textiles and Leather Conference – CORTEP 2012
Sinaia, 6 - 8 September 2012
The VTC-Shoe has promoted innovation in e-learning content, through the educational programme and new teaching methods developed and implemented into a virtually designed and served training centre which is accessible over internet. The project has promoted and reinforced the contribution of vocational training to the process of innovation through the virtual training centre and its application set up a new and good example for virtual learning in national vocational training systems. The concrete and complete definition of the implementation effort of TIED SHOE must be directly derived from the analysis of the gaps between the skills that the project target groups have when they finish training and the needs of the labour market. When the proposal was prepared the consortium conducted a draft analysis of this gap, based on the skills and competencies required by the industries and the ones that were provided by training offers in the involved countries and Europe in general. In this stage of the projects a more thorough analysis was done, interviewing experts and identifying current training offers at different levels of qualification. Furthermore, the need for ECVET incorporation in training was assessed, in terms of existing approaches and views of the stakeholders. 3 RESULTS AND DISCUSSION The overall objective of this study was to fully understand the reality of the Footwear industry in each of the participating countries and in Europe. This stage of the research was realized through desk and field research. The national teams in each partner country performed the current situation analysis in their countries and in the neighbouring regions also through discussions with relevant individuals and authorities. The national teams prepared a report describing the status in their own country and results of the analysis, training needs and new qualification needs. The local reports were the basis for the development of a comparative report for all the countries of the partnership. 3.1 Skills and Competencies Gaps Experts agree that there are effectively gaps and shortages. These can occur because when trainees leave school, they are still unprepared to fully assume a professional position. Therefore there is the need for a traineeship period. “People come here much unprepared. The training they had is not always enough. They can draw, but they can’t develop a collection.” [PT4] “Regarding gaps in knowledge when accessing job, one main issue is to create designs optimized for manufacturing, designs that can be efficiently transformed into manufactured products. Another issue is the lack of knowledge in the footwear design under an anatomical and biomechanics scope, to know the ergonomic and anthropometric recommendations to design footwear.” [ES1] On the other side, there are students that finish the courses with a good technical preparation and the gap occurs because sometimes the companies do not have the capacity needed for taking advantage of this knowledge. Companies are not prepared with the necessary means to develop their work towards a greater level of profitability and with open attitude regarding innovation and change. “Depending on the specific field there are always positive and negative aspects. In a group of trainees each individual has its own capacities which are not always properly observed and exploited. It would be positive to discover new methods that would help trainees to eliminate fears and difficulties.” [PT5] In Croatia, in order to surpass eventual gaps large companies chose to do in-house training. “As mainly high-tech Croatian footwear companies they try to continuously organize in-house or other education systems for their employees, just to survive any gap between the competencies of the target groups and the competences required by their jobs. For this reason two year ago they sent around 20 employees to study the Higher School programme offered by TTF.” [HR1] On the contrary, according to Greek experts, no companies in the footwear sector have private facilities for training. They get their employees from the existing training schemes, namely ELKEDE, and they don’t invest in-house training. 3.2 Level of Education of Designers and Top Level Staff One key aspect relates to the education/training level that the project’s target group should have to perform adequately their tasks. Most experts think that all top-level professionals (and not only) should have a good academic background, including a higher education degree. In Portugal, this means that experts view the level 4 of professional qualification (equivalent to a complete secondary education) as the minimum.
621
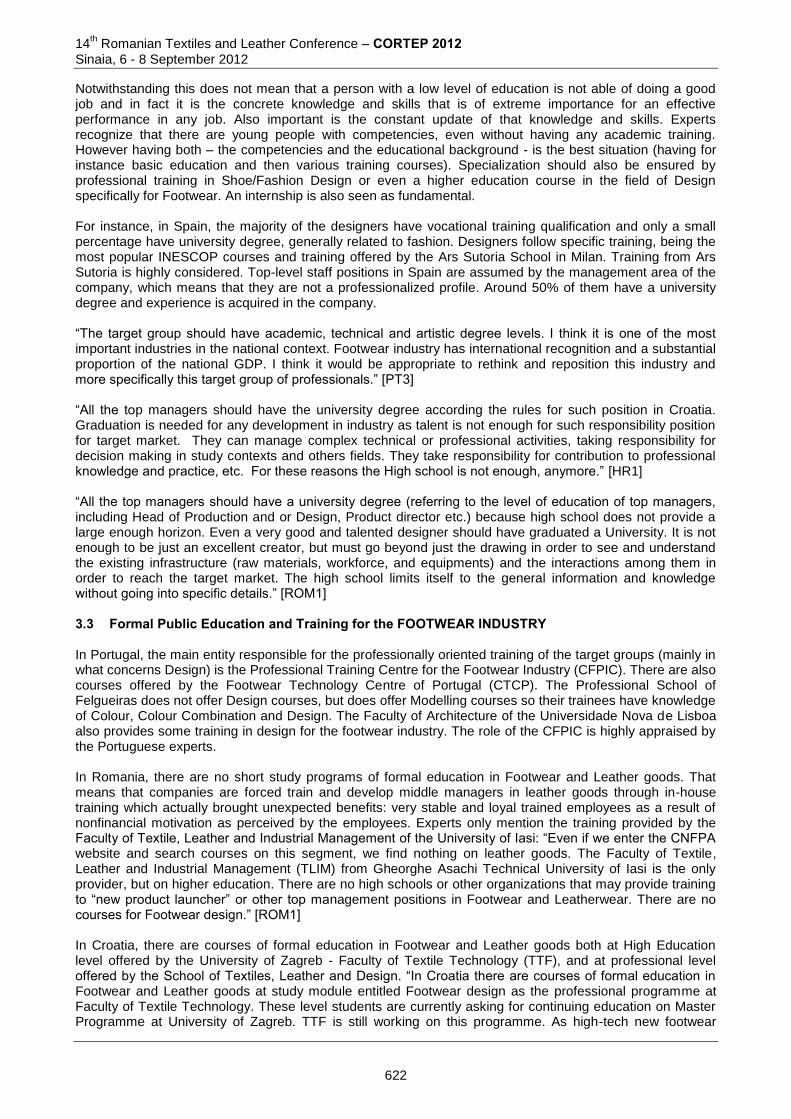
14th Romanian Textiles and Leather Conference – CORTEP 2012
Sinaia, 6 - 8 September 2012
Notwithstanding this does not mean that a person with a low level of education is not able of doing a good job and in fact it is the concrete knowledge and skills that is of extreme importance for an effective performance in any job. Also important is the constant update of that knowledge and skills. Experts recognize that there are young people with competencies, even without having any academic training. However having both – the competencies and the educational background - is the best situation (having for instance basic education and then various training courses). Specialization should also be ensured by professional training in Shoe/Fashion Design or even a higher education course in the field of Design specifically for Footwear. An internship is also seen as fundamental. For instance, in Spain, the majority of the designers have vocational training qualification and only a small percentage have university degree, generally related to fashion. Designers follow specific training, being the most popular INESCOP courses and training offered by the Ars Sutoria School in Milan. Training from Ars Sutoria is highly considered. Top-level staff positions in Spain are assumed by the management area of the company, which means that they are not a professionalized profile. Around 50% of them have a university degree and experience is acquired in the company. “The target group should have academic, technical and artistic degree levels. I think it is one of the most important industries in the national context. Footwear industry has international recognition and a substantial proportion of the national GDP. I think it would be appropriate to rethink and reposition this industry and more specifically this target group of professionals.” [PT3] “All the top managers should have the university degree according the rules for such position in Croatia. Graduation is needed for any development in industry as talent is not enough for such responsibility position for target market. They can manage complex technical or professional activities, taking responsibility for decision making in study contexts and others fields. They take responsibility for contribution to professional knowledge and practice, etc. For these reasons the High school is not enough, anymore.” [HR1] “All the top managers should have a university degree (referring to the level of education of top managers, including Head of Production and or Design, Product director etc.) because high school does not provide a large enough horizon. Even a very good and talented designer should have graduated a University. It is not enough to be just an excellent creator, but must go beyond just the drawing in order to see and understand the existing infrastructure (raw materials, workforce, and equipments) and the interactions among them in order to reach the target market. The high school limits itself to the general information and knowledge without going into specific details.” [ROM1] 3.3 Formal Public Education and Training for the FOOTWEAR INDUSTRY In Portugal, the main entity responsible for the professionally oriented training of the target groups (mainly in what concerns Design) is the Professional Training Centre for the Footwear Industry (CFPIC). There are also courses offered by the Footwear Technology Centre of Portugal (CTCP). The Professional School of Felgueiras does not offer Design courses, but does offer Modelling courses so their trainees have knowledge of Colour, Colour Combination and Design. The Faculty of Architecture of the Universidade Nova de Lisboa also provides some training in design for the footwear industry. The role of the CFPIC is highly appraised by the Portuguese experts. In Romania, there are no short study programs of formal education in Footwear and Leather goods. That means that companies are forced train and develop middle managers in leather goods through in-house training which actually brought unexpected benefits: very stable and loyal trained employees as a result of nonfinancial motivation as perceived by the employees. Experts only mention the training provided by the Faculty of Textile, Leather and Industrial Management of the University of Iasi: “Even if we enter the CNFPA website and search courses on this segment, we find nothing on leather goods. The Faculty of Textile, Leather and Industrial Management (TLIM) from Gheorghe Asachi Technical University of Iasi is the only provider, but on higher education. There are no high schools or other organizations that may provide training to “new product launcher” or other top management positions in Footwear and Leatherwear. There are no courses for Footwear design.” [ROM1] In Croatia, there are courses of formal education in Footwear and Leather goods both at High Education level offered by the University of Zagreb - Faculty of Textile Technology (TTF), and at professional level offered by the School of Textiles, Leather and Design. “In Croatia there are courses of formal education in Footwear and Leather goods at study module entitled Footwear design as the professional programme at Faculty of Textile Technology. These level students are currently asking for continuing education on Master Programme at University of Zagreb. TTF is still working on this programme. As high-tech new footwear
622
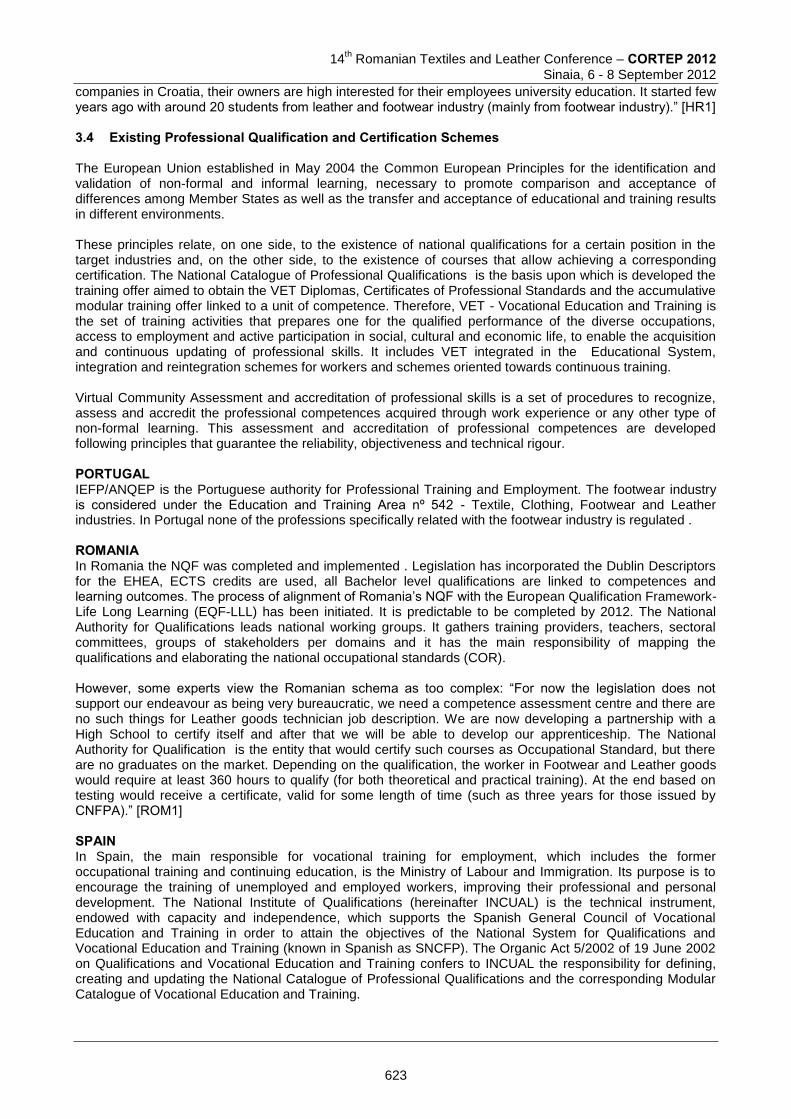
14
th Romanian Textiles and Leather Conference – CORTEP 2012
Sinaia, 6 - 8 September 2012
companies in Croatia, their owners are high interested for their employees university education. It started few years ago with around 20 students from leather and footwear industry (mainly from footwear industry).” [HR1] 3.4 Existing Professional Qualification and Certification Schemes The European Union established in May 2004 the Common European Principles for the identification and validation of non-formal and informal learning, necessary to promote comparison and acceptance of differences among Member States as well as the transfer and acceptance of educational and training results in different environments. These principles relate, on one side, to the existence of national qualifications for a certain position in the target industries and, on the other side, to the existence of courses that allow achieving a corresponding certification. The National Catalogue of Professional Qualifications is the basis upon which is developed the training offer aimed to obtain the VET Diplomas, Certificates of Professional Standards and the accumulative modular training offer linked to a unit of competence. Therefore, VET - Vocational Education and Training is the set of training activities that prepares one for the qualified performance of the diverse occupations, access to employment and active participation in social, cultural and economic life, to enable the acquisition and continuous updating of professional skills. It includes VET integrated in the Educational System, integration and reintegration schemes for workers and schemes oriented towards continuous training. Virtual Community Assessment and accreditation of professional skills is a set of procedures to recognize, assess and accredit the professional competences acquired through work experience or any other type of non-formal learning. This assessment and accreditation of professional competences are developed following principles that guarantee the reliability, objectiveness and technical rigour. PORTUGAL IEFP/ANQEP is the Portuguese authority for Professional Training and Employment. The footwear industry is considered under the Education and Training Area nº 542 - Textile, Clothing, Footwear and Leather industries. In Portugal none of the professions specifically related with the footwear industry is regulated . ROMANIA In Romania the NQF was completed and implemented . Legislation has incorporated the Dublin Descriptors for the EHEA, ECTS credits are used, all Bachelor level qualifications are linked to competences and learning outcomes. The process of alignment of Romania’s NQF with the European Qualification Framework-Life Long Learning (EQF-LLL) has been initiated. It is predictable to be completed by 2012. The National Authority for Qualifications leads national working groups. It gathers training providers, teachers, sectoral committees, groups of stakeholders per domains and it has the main responsibility of mapping the qualifications and elaborating the national occupational standards (COR). However, some experts view the Romanian schema as too complex: “For now the legislation does not support our endeavour as being very bureaucratic, we need a competence assessment centre and there are no such things for Leather goods technician job description. We are now developing a partnership with a High School to certify itself and after that we will be able to develop our apprenticeship. The National Authority for Qualification is the entity that would certify such courses as Occupational Standard, but there are no graduates on the market. Depending on the qualification, the worker in Footwear and Leather goods would require at least 360 hours to qualify (for both theoretical and practical training). At the end based on testing would receive a certificate, valid for some length of time (such as three years for those issued by CNFPA).” [ROM1] SPAIN In Spain, the main responsible for vocational training for employment, which includes the former occupational training and continuing education, is the Ministry of Labour and Immigration. Its purpose is to encourage the training of unemployed and employed workers, improving their professional and personal development. The National Institute of Qualifications (hereinafter INCUAL) is the technical instrument, endowed with capacity and independence, which supports the Spanish General Council of Vocational Education and Training in order to attain the objectives of the National System for Qualifications and Vocational Education and Training (known in Spanish as SNCFP). The Organic Act 5/2002 of 19 June 2002 on Qualifications and Vocational Education and Training confers to INCUAL the responsibility for defining, creating and updating the National Catalogue of Professional Qualifications and the corresponding Modular Catalogue of Vocational Education and Training.
623
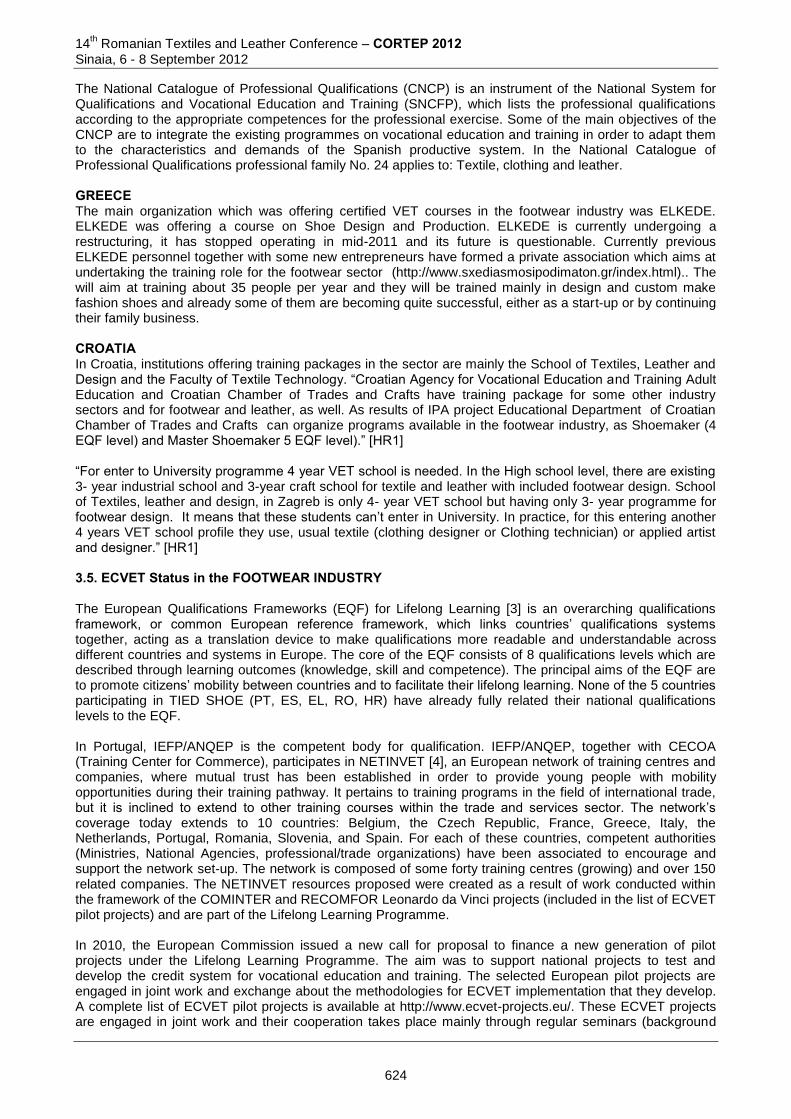
14th Romanian Textiles and Leather Conference – CORTEP 2012
Sinaia, 6 - 8 September 2012
The National Catalogue of Professional Qualifications (CNCP) is an instrument of the National System for Qualifications and Vocational Education and Training (SNCFP), which lists the professional qualifications according to the appropriate competences for the professional exercise. Some of the main objectives of the CNCP are to integrate the existing programmes on vocational education and training in order to adapt them to the characteristics and demands of the Spanish productive system. In the National Catalogue of Professional Qualifications professional family No. 24 applies to: Textile, clothing and leather. GREECE The main organization which was offering certified VET courses in the footwear industry was ELKEDE. ELKEDE was offering a course on Shoe Design and Production. ELKEDE is currently undergoing a restructuring, it has stopped operating in mid-2011 and its future is questionable. Currently previous ELKEDE personnel together with some new entrepreneurs have formed a private association which aims at undertaking the training role for the footwear sector (http://www.sxediasmosipodimaton.gr/index.html).. The will aim at training about 35 people per year and they will be trained mainly in design and custom make fashion shoes and already some of them are becoming quite successful, either as a start-up or by continuing their family business. CROATIA In Croatia, institutions offering training packages in the sector are mainly the School of Textiles, Leather and Design and the Faculty of Textile Technology. “Croatian Agency for Vocational Education and Training Adult Education and Croatian Chamber of Trades and Crafts have training package for some other industry sectors and for footwear and leather, as well. As results of IPA project Educational Department of Croatian Chamber of Trades and Crafts can organize programs available in the footwear industry, as Shoemaker (4 EQF level) and Master Shoemaker 5 EQF level).” [HR1] “For enter to University programme 4 year VET school is needed. In the High school level, there are existing 3- year industrial school and 3-year craft school for textile and leather with included footwear design. School of Textiles, leather and design, in Zagreb is only 4- year VET school but having only 3- year programme for footwear design. It means that these students can’t enter in University. In practice, for this entering another 4 years VET school profile they use, usual textile (clothing designer or Clothing technician) or applied artist and designer.” [HR1] 3.5. ECVET Status in the FOOTWEAR INDUSTRY The European Qualifications Frameworks (EQF) for Lifelong Learning [3] is an overarching qualifications framework, or common European reference framework, which links countries’ qualifications systems together, acting as a translation device to make qualifications more readable and understandable across different countries and systems in Europe. The core of the EQF consists of 8 qualifications levels which are described through learning outcomes (knowledge, skill and competence). The principal aims of the EQF are to promote citizens’ mobility between countries and to facilitate their lifelong learning. None of the 5 countries participating in TIED SHOE (PT, ES, EL, RO, HR) have already fully related their national qualifications levels to the EQF. In Portugal, IEFP/ANQEP is the competent body for qualification. IEFP/ANQEP, together with CECOA (Training Center for Commerce), participates in NETINVET [4], an European network of training centres and companies, where mutual trust has been established in order to provide young people with mobility opportunities during their training pathway. It pertains to training programs in the field of international trade, but it is inclined to extend to other training courses within the trade and services sector. The network’s coverage today extends to 10 countries: Belgium, the Czech Republic, France, Greece, Italy, the Netherlands, Portugal, Romania, Slovenia, and Spain. For each of these countries, competent authorities (Ministries, National Agencies, professional/trade organizations) have been associated to encourage and support the network set-up. The network is composed of some forty training centres (growing) and over 150 related companies. The NETINVET resources proposed were created as a result of work conducted within the framework of the COMINTER and RECOMFOR Leonardo da Vinci projects (included in the list of ECVET pilot projects) and are part of the Lifelong Learning Programme. In 2010, the European Commission issued a new call for proposal to finance a new generation of pilot projects under the Lifelong Learning Programme. The aim was to support national projects to test and develop the credit system for vocational education and training. The selected European pilot projects are engaged in joint work and exchange about the methodologies for ECVET implementation that they develop. A complete list of ECVET pilot projects is available at http://www.ecvet-projects.eu/. These ECVET projects are engaged in joint work and their cooperation takes place mainly through regular seminars (background
624
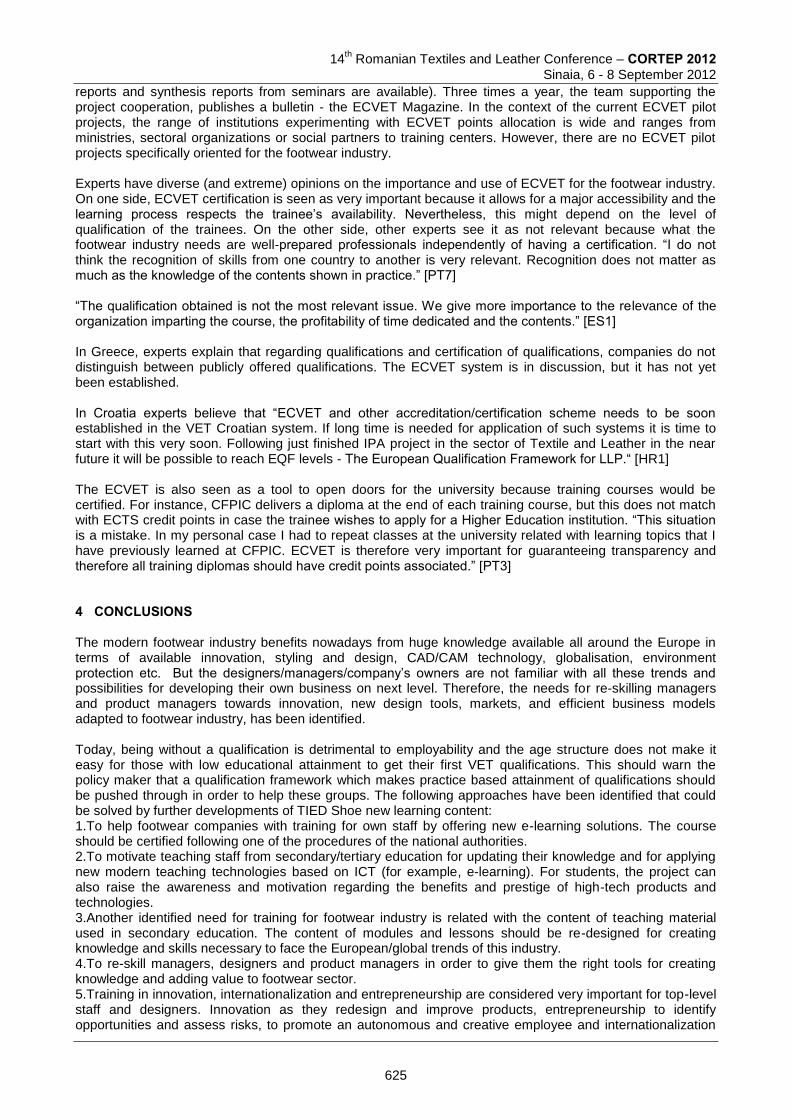
14
th Romanian Textiles and Leather Conference – CORTEP 2012
Sinaia, 6 - 8 September 2012
reports and synthesis reports from seminars are available). Three times a year, the team supporting the project cooperation, publishes a bulletin - the ECVET Magazine. In the context of the current ECVET pilot projects, the range of institutions experimenting with ECVET points allocation is wide and ranges from ministries, sectoral organizations or social partners to training centers. However, there are no ECVET pilot projects specifically oriented for the footwear industry. Experts have diverse (and extreme) opinions on the importance and use of ECVET for the footwear industry. On one side, ECVET certification is seen as very important because it allows for a major accessibility and the learning process respects the trainee’s availability. Nevertheless, this might depend on the level of qualification of the trainees. On the other side, other experts see it as not relevant because what the footwear industry needs are well-prepared professionals independently of having a certification. “I do not think the recognition of skills from one country to another is very relevant. Recognition does not matter as much as the knowledge of the contents shown in practice.” [PT7] “The qualification obtained is not the most relevant issue. We give more importance to the relevance of the organization imparting the course, the profitability of time dedicated and the contents.” [ES1] In Greece, experts explain that regarding qualifications and certification of qualifications, companies do not distinguish between publicly offered qualifications. The ECVET system is in discussion, but it has not yet been established. In Croatia experts believe that “ECVET and other accreditation/certification scheme needs to be soon established in the VET Croatian system. If long time is needed for application of such systems it is time to start with this very soon. Following just finished IPA project in the sector of Textile and Leather in the near future it will be possible to reach EQF levels - The European Qualification Framework for LLP.“ [HR1] The ECVET is also seen as a tool to open doors for the university because training courses would be certified. For instance, CFPIC delivers a diploma at the end of each training course, but this does not match with ECTS credit points in case the trainee wishes to apply for a Higher Education institution. “This situation is a mistake. In my personal case I had to repeat classes at the university related with learning topics that I have previously learned at CFPIC. ECVET is therefore very important for guaranteeing transparency and therefore all training diplomas should have credit points associated.” [PT3] 4 CONCLUSIONS The modern footwear industry benefits nowadays from huge knowledge available all around the Europe in terms of available innovation, styling and design, CAD/CAM technology, globalisation, environment protection etc. But the designers/managers/company’s owners are not familiar with all these trends and possibilities for developing their own business on next level. Therefore, the needs for re-skilling managers and product managers towards innovation, new design tools, markets, and efficient business models adapted to footwear industry, has been identified. Today, being without a qualification is detrimental to employability and the age structure does not make it easy for those with low educational attainment to get their first VET qualifications. This should warn the policy maker that a qualification framework which makes practice based attainment of qualifications should be pushed through in order to help these groups. The following approaches have been identified that could be solved by further developments of TIED Shoe new learning content: 1.To help footwear companies with training for own staff by offering new e-learning solutions. The course should be certified following one of the procedures of the national authorities. 2.To motivate teaching staff from secondary/tertiary education for updating their knowledge and for applying new modern teaching technologies based on ICT (for example, e-learning). For students, the project can also raise the awareness and motivation regarding the benefits and prestige of high-tech products and technologies. 3.Another identified need for training for footwear industry is related with the content of teaching material used in secondary education. The content of modules and lessons should be re-designed for creating knowledge and skills necessary to face the European/global trends of this industry. 4.To re-skill managers, designers and product managers in order to give them the right tools for creating knowledge and adding value to footwear sector. 5.Training in innovation, internationalization and entrepreneurship are considered very important for top-level staff and designers. Innovation as they redesign and improve products, entrepreneurship to identify opportunities and assess risks, to promote an autonomous and creative employee and internationalization
625
14th Romanian Textiles and Leather Conference – CORTEP 2012
Sinaia, 6 - 8 September 2012
due to being forced to export on highly competitive markets, proved by existing contracts with large foreign companies. Experts clearly see that the project courses will be very useful to complement existing skills and knowledge. Responsible for production would mostly benefit from the Innovation and Design modules. The top management (CEO, CFO) would benefit from Entrepreneurship and Internationalization modules to enhance knowledge of the economic side of the business. 6.Experts suggested new modules like in depth know-how on Product Grading, Development of Collections based on Colour and Materials, Fashion and Technology, Adapting to Global Market, from Innovative Ideas to Marketable Products, Branding in the Footwear Industry. 7.On-line training is adequate for designers and for professionals from the commercial areas when they do not belong also to the company management areas. Even if company managers are reluctant to use on-line training, particularly in case of traditional organizations, they might be convinced to use it instead of seminars or workshops in business schools. 8.The use of ECVET and other accreditation/certification schemes for this industry should be beneficial for the TIED Shoe project. Experts expressed that opinion that they would like a certificate in order to ensure that qualified and highly professional lecturers and trainers deliver these courses. 5 ACKNOWLEDGMENT
This work has been supported by the European Commission through a project grant from the Lifelong Learning Programme, Leonardo Transfer of Innovation action, under the name Training in Innovation, Entrepreneurship and Design for the Footwear Industry, reference 2011-1-PT1-LEO05-08590. 6 REFERENCES [1] European Union, External Dimension of the Footwear Sector, Available from:
http://ec.europa.eu/enterprise/sectors/footwear/external-dimension/index_en.htm, Accessed on 2011-01-03
[2] http://vtc.shoe-design.ro/index.php?lang=en [3] http://ec.europa.eu/eqf [4] http://www.netinvet.eu/
Corresponding author: Aura MIHAI Faculty of Textile, Leather and Industrial Management/ “Gheorghe Asachi Technical University B-dul D. Mangeron No.53-55 700050, Iasi, Romania phone: +40232 278683/1267: e-mail: [email protected]
Co-authors: Carlos VAZ DE CARVALHO Virtual Campus Lda Av. Fernão Magalhães, 716 1º 4350-151, Porto, PORTUGAL phone: +351229734385; fax: +351229734385; e-mail:[email protected] Nikolaos BILALIS Department of Production Engineering and Management/ Technical University of Crete University Campus, Coynoypidiana 73100, Chania, GREECE phone:+30 2821037247; fax:+30 2821037554; e-mail: [email protected] Ana Marija GRANCARIC Fcaulty of Textile, University of Zagreb Trg maršala Tita 14 HR-10002 ZAGREB, CROATIA phone: (+385 1) 4564 111; fax: (+ 385 1) 4830 602; e-mail: [email protected] Eduardo COSTA Center for Professional Training of the Footwear Industry Rua Visconde, 990 3700-265 São João da Madeira phone:+351 256 815 060/1/2; fax:+351 256 815 069 ;e-mail:[email protected]
626

14
th Romanian Textiles and Leather Conference – CORTEP 2012
Sinaia, 6 - 8 September 2012
Clara SOLVES Valencia Biomechanics Institute Universitat Politècnica de València. Edificio 9C. , Camino de Vera s/n. 46022 (Valencia) España phone: +34 96 387 91 60; fax: +34 96 387 91 69; e-mail: [email protected] Cláudia AZEVEDO Virtual Campus Lda, Av. Fernão Magalhães, 716 1º 4350-151, Porto, PORTUGAL phone: +351229734385; fax: +351229734385 ; e-mail:[email protected]
627
14
th Romanian Textiles and Leather Conference – CORTEP 2012
Sinaia, 6 - 8 September 2012
TEXTILE ECOLOGY – ACHIEVEMENT OF DIFFERENT COLOR TONES USING NATURAL DYES ON THE FABRIC OF LINEN AND HEMP
Ramona BOȚ-BUDEANU, Antonela CURTEZA & Augustin MURESAN
“Gheorghe Asachi“ Technical University of Iasi, Romania, Doctoral School of the Faculty of Textile, Leather and Industrial Management
Abstract: The focus of this paper is to shed light on the benefits of organic textiles through a comparison between ecological textiles and classic textiles and to make a presentation of the benefits brought by fabrics dyed with natural dyes both on the environment and human. The advantage of natural dyes is eco-friendly, they do not create any environmental problems at the stage of production or use and maintains ecological balance. For a long time is prevalent the idea that hemp, linen, cotton, wool, silk textiles are among the healthiest textiles. Substances used in conventional synthetic materials are classified by U.S. Environmental Protection Agency as potentially carcinogenic substances [1]. Last but not least, the textile industry brings many environmental drawbacks, the most damage is done by the fabric dyeing process, unlike organic fabric dyeing process which uses fertilizers, pesticides and animal dyes, respecting standards and periodic testing the soil. Keywords: ecology, environmentally friendly materials, hemp, linen, natural dyes.
1 Introduction Textile, garment and fashion industry have a huge impact on the environment.Research on consumers, shows that there is an unprecedented wave of concerns regarding the production of clothes and how they affect the environment. Dyeing of textiles with synthetic dyestuffs is characterized by high negative impacts on the environment, dyers as well as the endusers. Most synthetic dyes are petro-based products. The environmental damage caused by use of synthetic dyes in large quantities has become visibly discernible over the last two decades. The international markets particularly the European Union, the origin of synthetic dyes, has strongly supported banning of use of certain synthetic dyes that have adverse effect on the environment and on people [2]. The main advantages of synthetic dyes were ease of processing, better fastness properties and attractive economics of operation for the dyer and weaver. On account of these advantages, the synthetic dyes gained wide acceptance and the use of natural dyes on commercial scales was discontinued. Therefore, interest in natural dyes has increased considerably on account of their high compatibility with environment, relatively low toxicity and allergic effects, as well as availability of various natural coloring sources such as from plants, insects, minerals and fungi [3]. Ecological attribute takes into account environmental compliance throughout the whole product manufacturing cycle, an ecological textile product may be described as follows: exclusive natural origin, no pesticides, chemical fertilizers and treatments, natural fibers and textiles treatment. Not only hemp, flax, cotton, wool, silk can be obtained within the guidelines of ecological culture. Being free of petrochemical substances, clothes made of these materials have a much lower risk of producing allergies, especially for sensitive skin. Natural compounds have been found to have UV-protective properties and when applied to textiles they would protect human skin from hazardous solar ultraviolet radiation. It seems that the cleavage of hydrogen bonds in the molecules of the natural dyes contributes to their capacity to absorb UV-radiation [4]. According to Singh et al., the concentration of dye increased the bactericidal properties of dyed textile [5]. Over time, the use of natural dyes found recognition as an art form. Absence of: • consistent availability of natural dyes in an easily transportable and storable form in adequate quantities and quality • economically attractive raw material supply and package of practices • strong marketing and distribution network
628

14th Romanian Textiles and Leather Conference – CORTEP 2012
Sinaia, 6 - 8 September 2012
• reliable source of supply., have been some of the constraints that have continued to prevail in the industry for a long time. The use of non alergic and eco-friendly natural dyes on textile has become a matter of significant importance due to the increased environmental awareness in order to avoid some hazardous synthetic dyes. 2 MATERIALS Green garments made from natural organic materials are one of the best ways to save the environment and are only bringing benefits to the human body and are especially recommended to people with dermatological affections and people with sensitive skin. Hemp and linen fabrics have many qualities and are more desirable in today's textile industry. * strong, durable, comfortable and of high performance beeing useful in any season. * exceptionally comfortable and healthy, hypoallergenic and non-irritating to skin. * excellent insulation and thermal conductance. * very resistant against damage caused by moths, bacteria, salt water, sunlight, abrasion and chemicals, while also being biodegradable, unlike synthetic fibers. * protection against UV radiation. * have a rich and supple texture, durability and amazing resistance. * an excellent environmentally friendly alternative to cotton growing and synthetic fibers that destroy the environment. * better biodegradability and higher compatibility with the environment. 3 METHODOLOGY It has been used four types of fabrics 100% hemp and linen: Roberta White, Silvana R., Twill, Any, that were dyed with the essence of red beet, onion leaves and black tea.
- Red Beet: it has been cut into small pieces (3 kg) and put to boil in dyeing bath in 2 liters of water at a temperature of 150 degrees Celsius, resulting 1 liter of dye.
- Onion leaves: 600 grams of dried onion leaves were put on to boil for 1 hour in 4 liters of water at
100 degrees Celsius, thus obtaining 2 liters of dye solution.
- Black tea: it has been put to boil 500 grams of black tea in about 2.5 liters of water at a temperature of 130 degrees Celsius for 50 minutes, resulting 1 liter of dye.
Dyeing additions (pH adjustment) were: acetic acid, sodium bicarbonate and borsch. Borsch was used both for it’s acid pH, as well as because in its composition there are a number of organic substances mordants (natural tannins) that will influence the final color. After dyeing, fabrics were washed at 30 ° C, rinsed and dried. 4 RESULTS AND DISCUSSION Each extract solution was divided into four equal parts, which were used in dyeing, as follows: A.- without adds; B.- with the addition of borsch; C.- with the addition of acetic acid; D.- with the adition of sodium bicarbonate, in each case we used the ratio of 20 ml adds at 100 ml of extract solution. Dyeing results with natural dyes: The colors presented were obtained on samples from fabric Roberta White, Silvana R, Twill, Any.
629
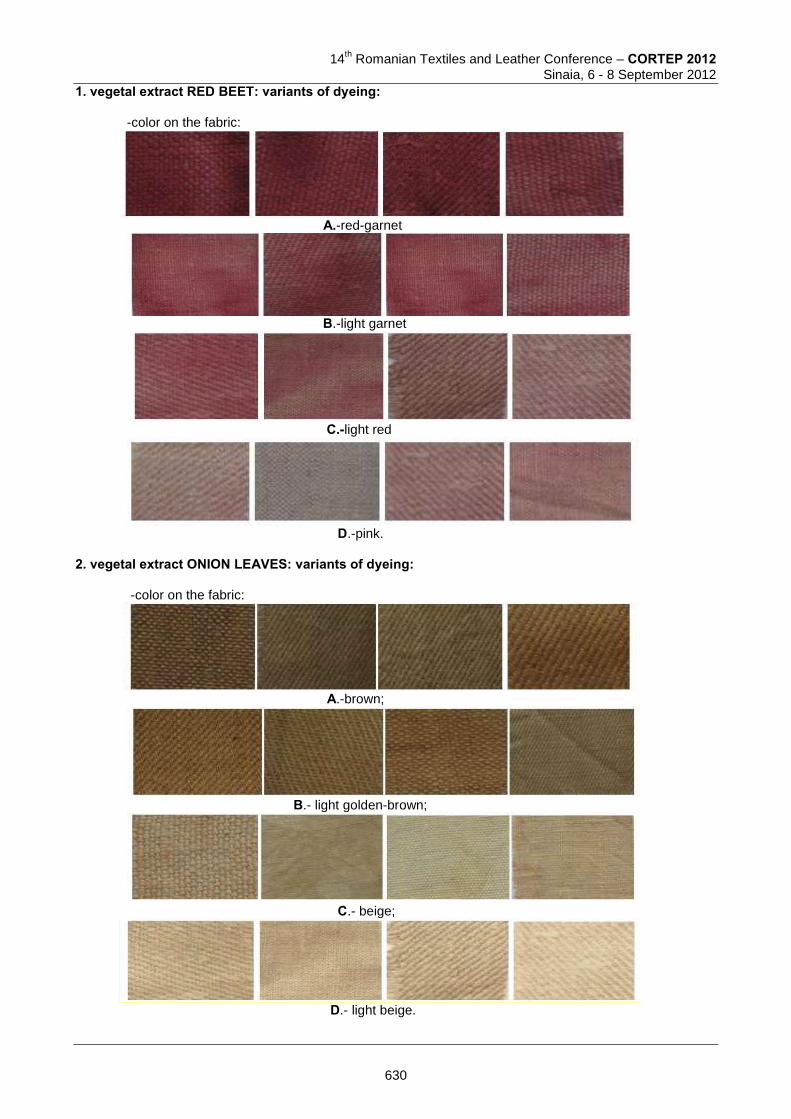
14
th Romanian Textiles and Leather Conference – CORTEP 2012
Sinaia, 6 - 8 September 2012
1. vegetal extract RED BEET: variants of dyeing:
-color on the fabric:
A.-red-garnet
B.-light garnet
C.-light red
D.-pink. 2. vegetal extract ONION LEAVES: variants of dyeing: -color on the fabric:
A.-brown;
B.- light golden-brown;
C.- beige;
D.- light beige.
630
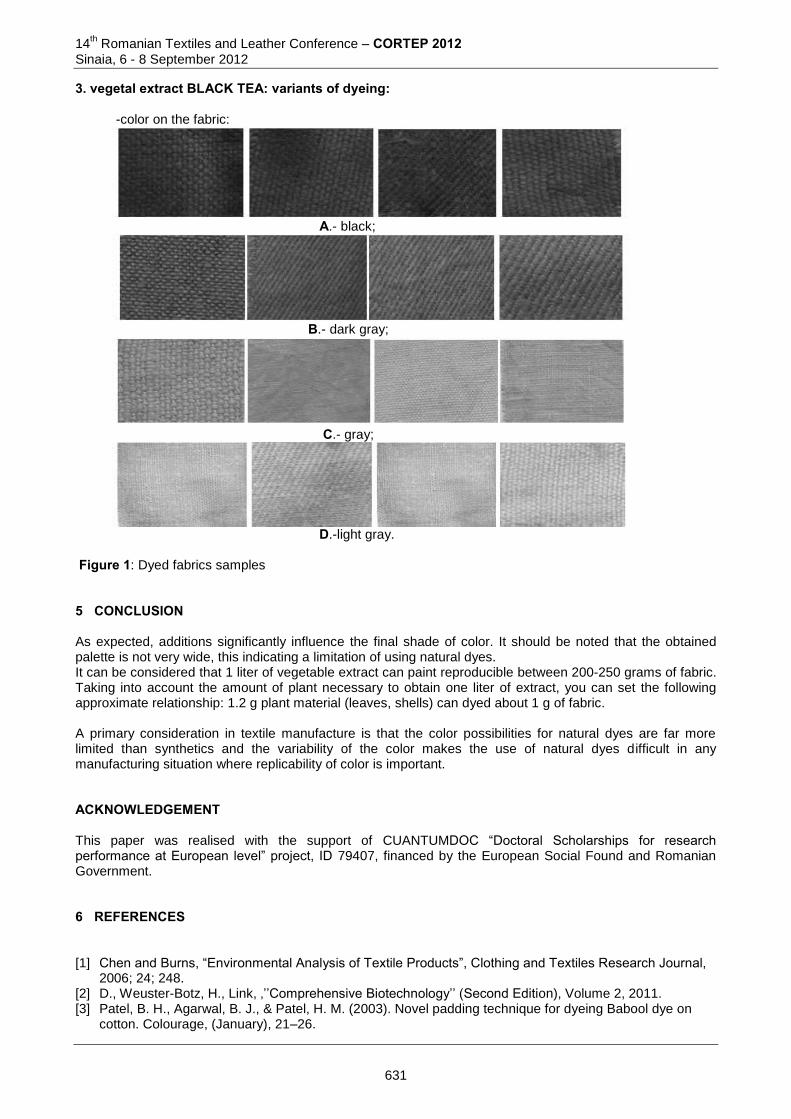
14th Romanian Textiles and Leather Conference – CORTEP 2012
Sinaia, 6 - 8 September 2012
3. vegetal extract BLACK TEA: variants of dyeing: -color on the fabric:
A.- black;
B.- dark gray;
C.- gray;
D.-light gray. Figure 1: Dyed fabrics samples 5 CONCLUSION As expected, additions significantly influence the final shade of color. It should be noted that the obtained palette is not very wide, this indicating a limitation of using natural dyes. It can be considered that 1 liter of vegetable extract can paint reproducible between 200-250 grams of fabric. Taking into account the amount of plant necessary to obtain one liter of extract, you can set the following approximate relationship: 1.2 g plant material (leaves, shells) can dyed about 1 g of fabric. A primary consideration in textile manufacture is that the color possibilities for natural dyes are far more limited than synthetics and the variability of the color makes the use of natural dyes difficult in any manufacturing situation where replicability of color is important. ACKNOWLEDGEMENT This paper was realised with the support of CUANTUMDOC “Doctoral Scholarships for research performance at European level” project, ID 79407, financed by the European Social Found and Romanian Government. 6 REFERENCES [1] Chen and Burns, “Environmental Analysis of Textile Products”, Clothing and Textiles Research Journal,
2006; 24; 248. [2] D., Weuster-Botz, H., Link, ‚’’Comprehensive Biotechnology’’ (Second Edition), Volume 2, 2011. [3] Patel, B. H., Agarwal, B. J., & Patel, H. M. (2003). Novel padding technique for dyeing Babool dye on
cotton. Colourage, (January), 21–26.
631
14
th Romanian Textiles and Leather Conference – CORTEP 2012
Sinaia, 6 - 8 September 2012
[4] Feng, X. X., Zhang, L. L., Chen, J. Y. and Zhang, J. C. New insights into solar UV protective properties of natural dye. J. Clean. Prod. 2007;15:366–72.
[5] Singh, R., Jain, A., Panwar, S., Gupta, D. and Khare, S. K. Antimicrobial activity ofsome natural dyes. Dyes Pigm. 2005;66:99–102.)
Corresponding author: Ramona BOȚ- BUDEANU Doctoral School
of the Faculty of Textiles, Leather and Industrial Management,
“Gheorghe Asachi“ Technical University of Iasi Dimitrie Mangeron Bvl. No.29 700050, Iasi, Romania Phone: +0040740331278; E-mail: [email protected]
Co-authors: Antonela CURTEZA Faculty of Textile-Leather and Industrial Management “Gh.Asachi“ Technical University Dimitrie Mangeron Bvl. No.29 700050, Iasi, Romania Phone: +0040745537286; E-mail: [email protected] Augustin MURESAN Faculty of Textile-Leather and Industrial Management “Gh.Asachi“ Technical University of Iasi Dimitrie Mangeron Bvl. No.29 700050, Iasi, Romania Phone: +0040232278683; E-mail: [email protected]
632
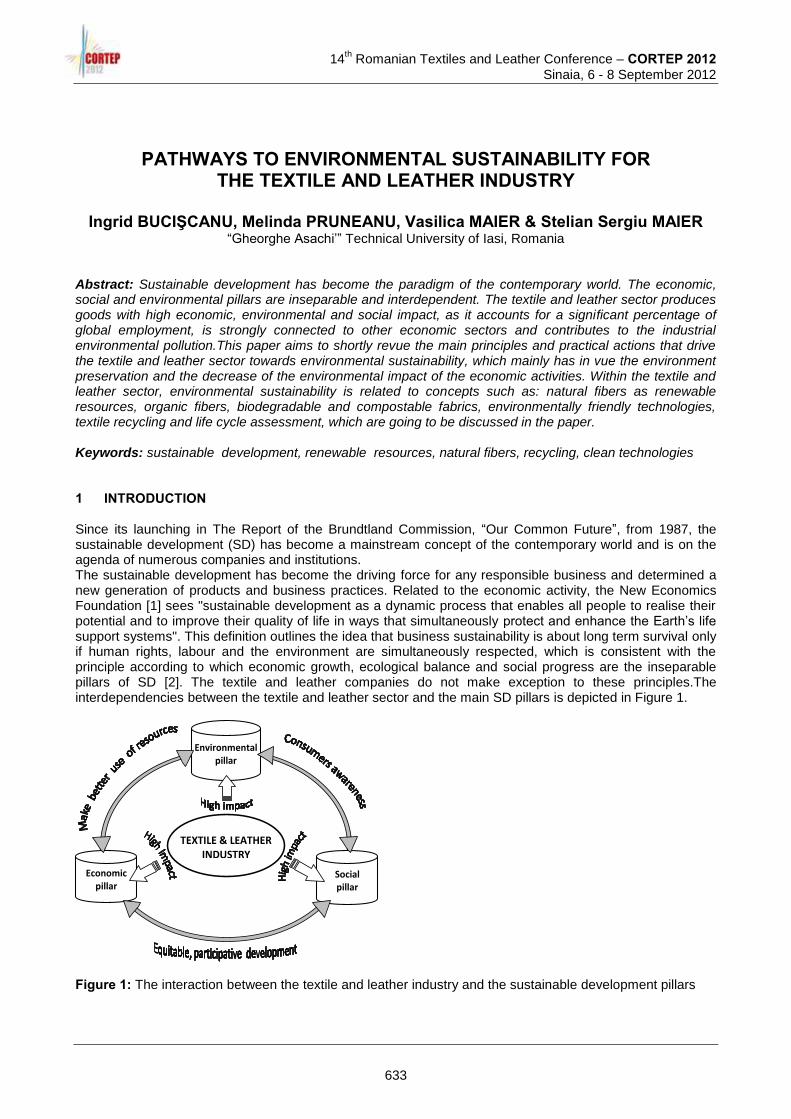
14
th Romanian Textiles and Leather Conference – CORTEP 2012
Sinaia, 6 - 8 September 2012
PATHWAYS TO ENVIRONMENTAL SUSTAINABILITY FOR THE TEXTILE AND LEATHER INDUSTRY
Ingrid BUCIŞCANU, Melinda PRUNEANU, Vasilica MAIER & Stelian Sergiu MAIER
“Gheorghe Asachi’” Technical University of Iasi, Romania Abstract: Sustainable development has become the paradigm of the contemporary world. The economic, social and environmental pillars are inseparable and interdependent. The textile and leather sector produces goods with high economic, environmental and social impact, as it accounts for a significant percentage of global employment, is strongly connected to other economic sectors and contributes to the industrial environmental pollution.This paper aims to shortly revue the main principles and practical actions that drive the textile and leather sector towards environmental sustainability, which mainly has in vue the environment preservation and the decrease of the environmental impact of the economic activities. Within the textile and leather sector, environmental sustainability is related to concepts such as: natural fibers as renewable resources, organic fibers, biodegradable and compostable fabrics, environmentally friendly technologies, textile recycling and life cycle assessment, which are going to be discussed in the paper. Keywords: sustainable development, renewable resources, natural fibers, recycling, clean technologies 1 INTRODUCTION Since its launching in The Report of the Brundtland Commission, “Our Common Future”, from 1987, the sustainable development (SD) has become a mainstream concept of the contemporary world and is on the agenda of numerous companies and institutions. The sustainable development has become the driving force for any responsible business and determined a new generation of products and business practices. Related to the economic activity, the New Economics Foundation [1] sees "sustainable development as a dynamic process that enables all people to realise their potential and to improve their quality of life in ways that simultaneously protect and enhance the Earth’s life support systems". This definition outlines the idea that business sustainability is about long term survival only if human rights, labour and the environment are simultaneously respected, which is consistent with the principle according to which economic growth, ecological balance and social progress are the inseparable pillars of SD [2]. The textile and leather companies do not make exception to these principles.The interdependencies between the textile and leather sector and the main SD pillars is depicted in Figure 1.
Environmental pillar
Economic pillar
Social pillar
TEXTILE & LEATHER INDUSTRY
Figure 1: The interaction between the textile and leather industry and the sustainable development pillars
633
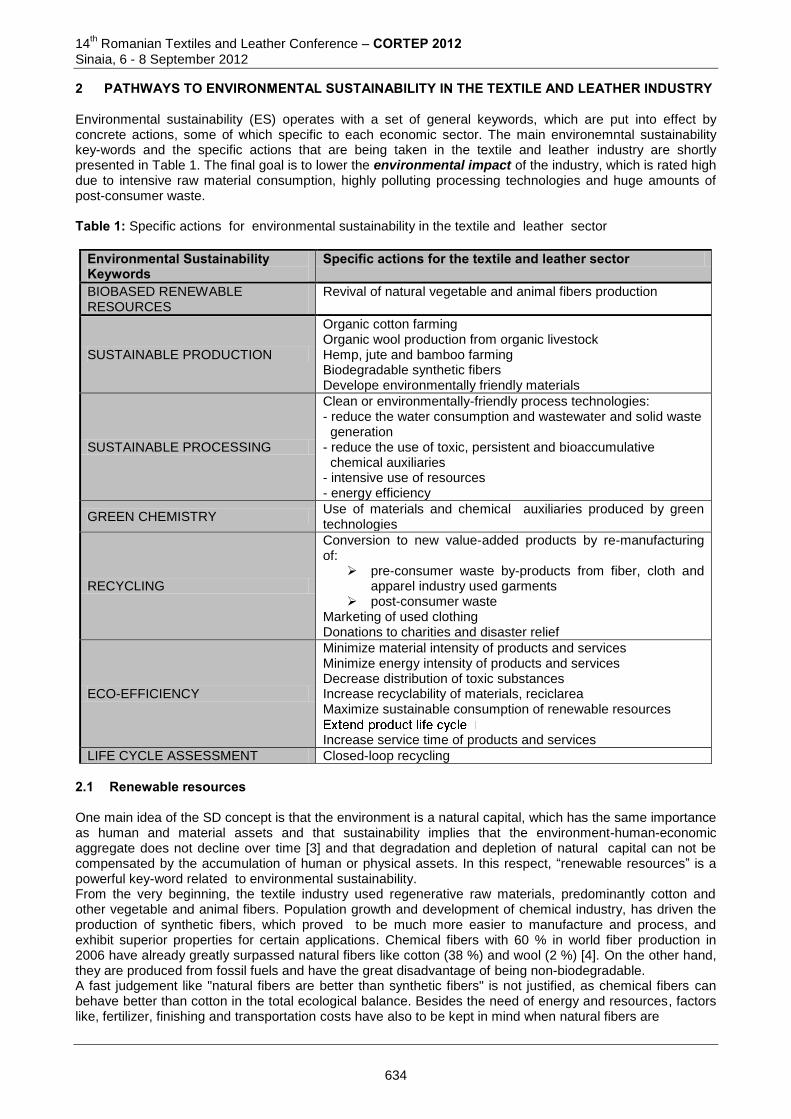
14th Romanian Textiles and Leather Conference – CORTEP 2012
Sinaia, 6 - 8 September 2012
2 PATHWAYS TO ENVIRONMENTAL SUSTAINABILITY IN THE TEXTILE AND LEATHER INDUSTRY Environmental sustainability (ES) operates with a set of general keywords, which are put into effect by concrete actions, some of which specific to each economic sector. The main environemntal sustainability key-words and the specific actions that are being taken in the textile and leather industry are shortly presented in Table 1. The final goal is to lower the environmental impact of the industry, which is rated high due to intensive raw material consumption, highly polluting processing technologies and huge amounts of post-consumer waste. Table 1: Specific actions for environmental sustainability in the textile and leather sector
Environmental Sustainability Keywords
Specific actions for the textile and leather sector
BIOBASED RENEWABLE RESOURCES
Revival of natural vegetable and animal fibers production
SUSTAINABLE PRODUCTION
Organic cotton farming Organic wool production from organic livestock Hemp, jute and bamboo farming Biodegradable synthetic fibers Develope environmentally friendly materials
SUSTAINABLE PROCESSING
Clean or environmentally-friendly process technologies: - reduce the water consumption and wastewater and solid waste generation - reduce the use of toxic, persistent and bioaccumulative chemical auxiliaries - intensive use of resources - energy efficiency
GREEN CHEMISTRY Use of materials and chemical auxiliaries produced by green technologies
RECYCLING
Conversion to new value-added products by re-manufacturing of:
pre-consumer waste by-products from fiber, cloth and apparel industry used garments
post-consumer waste Marketing of used clothing Donations to charities and disaster relief
ECO-EFFICIENCY
Minimize material intensity of products and services Minimize energy intensity of products and services Decrease distribution of toxic substances Increase recyclability of materials, reciclarea Maximize sustainable consumption of renewable resources
Increase service time of products and services
LIFE CYCLE ASSESSMENT Closed-loop recycling
2.1 Renewable resources One main idea of the SD concept is that the environment is a natural capital, which has the same importance as human and material assets and that sustainability implies that the environment-human-economic aggregate does not decline over time [3] and that degradation and depletion of natural capital can not be compensated by the accumulation of human or physical assets. In this respect, “renewable resources” is a powerful key-word related to environmental sustainability. From the very beginning, the textile industry used regenerative raw materials, predominantly cotton and other vegetable and animal fibers. Population growth and development of chemical industry, has driven the production of synthetic fibers, which proved to be much more easier to manufacture and process, and exhibit superior properties for certain applications. Chemical fibers with 60 % in world fiber production in 2006 have already greatly surpassed natural fibers like cotton (38 %) and wool (2 %) [4]. On the other hand, they are produced from fossil fuels and have the great disadvantage of being non-biodegradable. A fast judgement like "natural fibers are better than synthetic fibers" is not justified, as chemical fibers can behave better than cotton in the total ecological balance. Besides the need of energy and resources, factors like, fertilizer, finishing and transportation costs have also to be kept in mind when natural fibers are
634
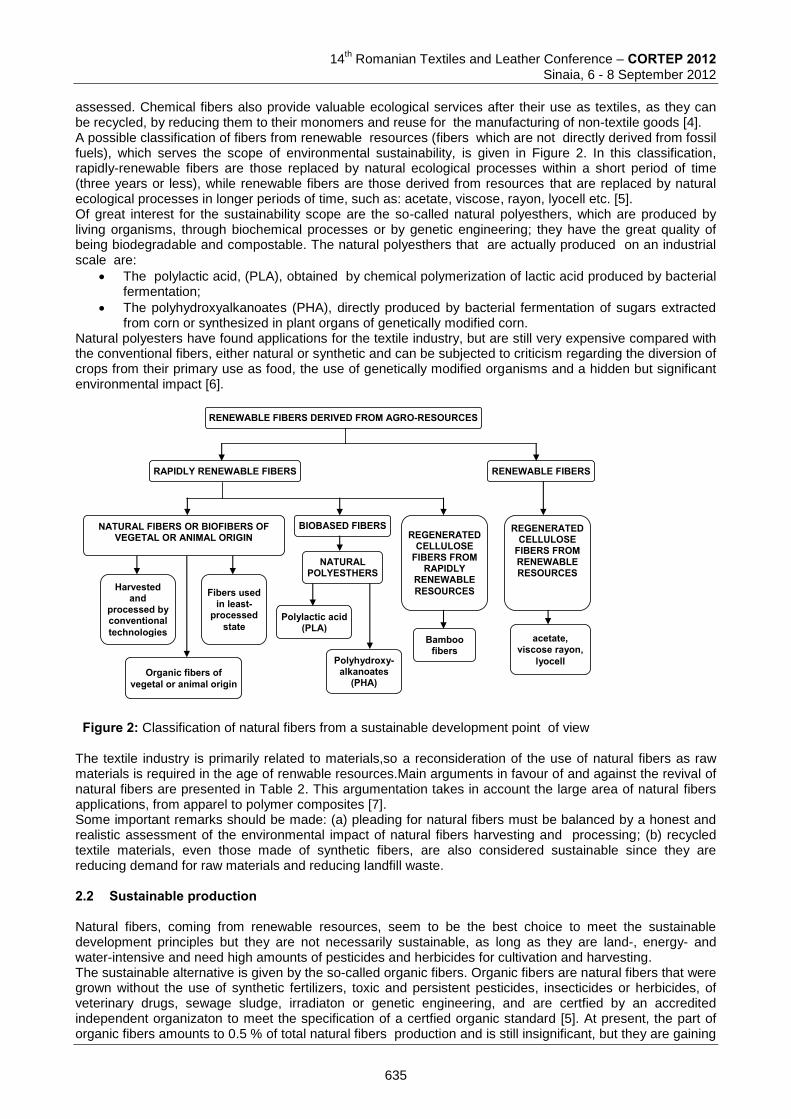
14
th Romanian Textiles and Leather Conference – CORTEP 2012
Sinaia, 6 - 8 September 2012
assessed. Chemical fibers also provide valuable ecological services after their use as textiles, as they can be recycled, by reducing them to their monomers and reuse for the manufacturing of non-textile goods [4]. A possible classification of fibers from renewable resources (fibers which are not directly derived from fossil fuels), which serves the scope of environmental sustainability, is given in Figure 2. In this classification, rapidly-renewable fibers are those replaced by natural ecological processes within a short period of time (three years or less), while renewable fibers are those derived from resources that are replaced by natural ecological processes in longer periods of time, such as: acetate, viscose, rayon, lyocell etc. [5]. Of great interest for the sustainability scope are the so-called natural polyesthers, which are produced by living organisms, through biochemical processes or by genetic engineering; they have the great quality of being biodegradable and compostable. The natural polyesthers that are actually produced on an industrial scale are:
The polylactic acid, (PLA), obtained by chemical polymerization of lactic acid produced by bacterial fermentation;
The polyhydroxyalkanoates (PHA), directly produced by bacterial fermentation of sugars extracted from corn or synthesized in plant organs of genetically modified corn.
Natural polyesters have found applications for the textile industry, but are still very expensive compared with the conventional fibers, either natural or synthetic and can be subjected to criticism regarding the diversion of crops from their primary use as food, the use of genetically modified organisms and a hidden but significant environmental impact [6].
RENEWABLE FIBERS DERIVED FROM AGRO-RESOURCES
RAPIDLY RENEWABLE FIBERS RENEWABLE FIBERS
NATURAL FIBERS OR BIOFIBERS OF VEGETAL OR ANIMAL ORIGIN
BIOBASED FIBERS REGENERATED
CELLULOSE FIBERS FROM
RAPIDLY RENEWABLE RESOURCES
NATURAL POLYESTHERS
Polylactic acid (PLA)
Polyhydroxy- alkanoates
(PHA)
Harvested and
processed by conventional technologies
Fibers used in least-
processed state
Organic fibers of vegetal or animal origin
REGENERATED CELLULOSE
FIBERS FROM RENEWABLE RESOURCES
Bamboo fibers
acetate, viscose rayon,
lyocell
Figure 2: Classification of natural fibers from a sustainable development point of view
The textile industry is primarily related to materials,so a reconsideration of the use of natural fibers as raw materials is required in the age of renwable resources.Main arguments in favour of and against the revival of natural fibers are presented in Table 2. This argumentation takes in account the large area of natural fibers applications, from apparel to polymer composites [7]. Some important remarks should be made: (a) pleading for natural fibers must be balanced by a honest and realistic assessment of the environmental impact of natural fibers harvesting and processing; (b) recycled textile materials, even those made of synthetic fibers, are also considered sustainable since they are reducing demand for raw materials and reducing landfill waste. 2.2 Sustainable production Natural fibers, coming from renewable resources, seem to be the best choice to meet the sustainable development principles but they are not necessarily sustainable, as long as they are land-, energy- and water-intensive and need high amounts of pesticides and herbicides for cultivation and harvesting. The sustainable alternative is given by the so-called organic fibers. Organic fibers are natural fibers that were grown without the use of synthetic fertilizers, toxic and persistent pesticides, insecticides or herbicides, of veterinary drugs, sewage sludge, irradiaton or genetic engineering, and are certfied by an accredited independent organizaton to meet the specification of a certfied organic standard [5]. At present, the part of organic fibers amounts to 0.5 % of total natural fibers production and is still insignificant, but they are gaining
635
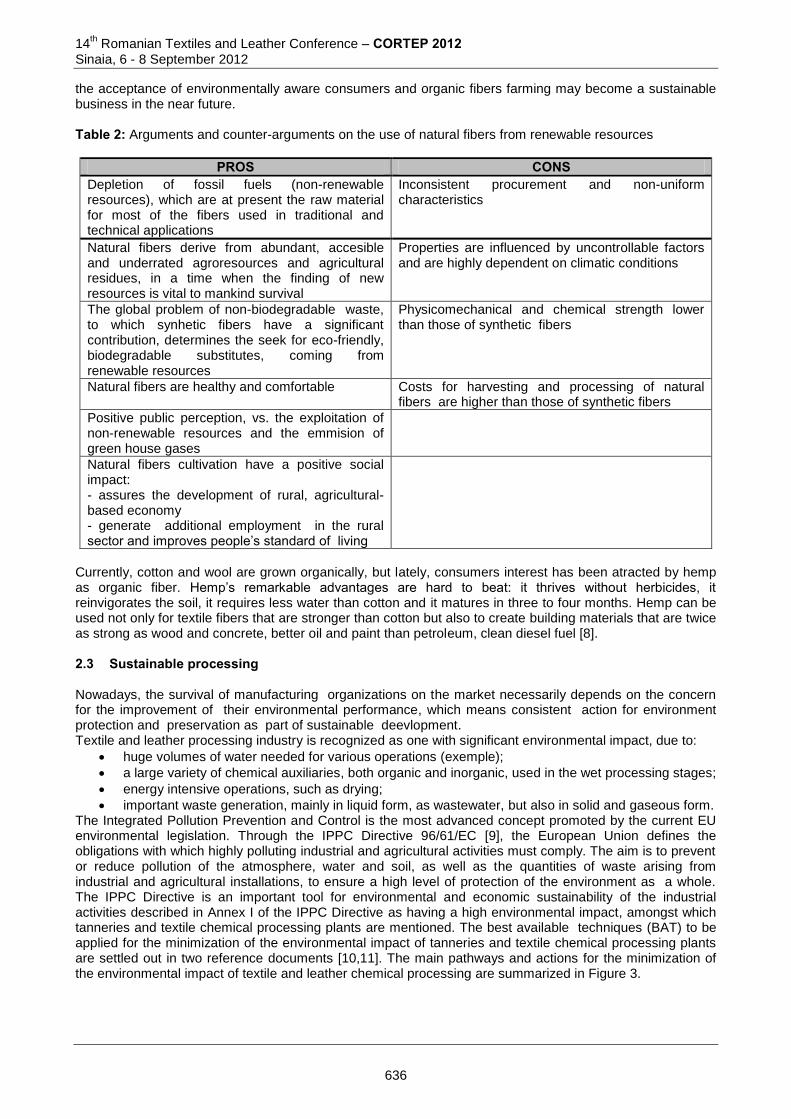
14th Romanian Textiles and Leather Conference – CORTEP 2012
Sinaia, 6 - 8 September 2012
the acceptance of environmentally aware consumers and organic fibers farming may become a sustainable business in the near future. Table 2: Arguments and counter-arguments on the use of natural fibers from renewable resources
PROS CONS Depletion of fossil fuels (non-renewable resources), which are at present the raw material for most of the fibers used in traditional and technical applications
Inconsistent procurement and non-uniform characteristics
Natural fibers derive from abundant, accesible and underrated agroresources and agricultural residues, in a time when the finding of new resources is vital to mankind survival
Properties are influenced by uncontrollable factors and are highly dependent on climatic conditions
The global problem of non-biodegradable waste, to which synhetic fibers have a significant contribution, determines the seek for eco-friendly, biodegradable substitutes, coming from renewable resources
Physicomechanical and chemical strength lower than those of synthetic fibers
Natural fibers are healthy and comfortable Costs for harvesting and processing of natural fibers are higher than those of synthetic fibers
Positive public perception, vs. the exploitation of non-renewable resources and the emmision of green house gases
Natural fibers cultivation have a positive social impact: - assures the development of rural, agricultural-based economy - generate additional employment in the rural sector and improves people’s standard of living
Currently, cotton and wool are grown organically, but lately, consumers interest has been atracted by hemp as organic fiber. Hemp’s remarkable advantages are hard to beat: it thrives without herbicides, it reinvigorates the soil, it requires less water than cotton and it matures in three to four months. Hemp can be used not only for textile fibers that are stronger than cotton but also to create building materials that are twice as strong as wood and concrete, better oil and paint than petroleum, clean diesel fuel [8]. 2.3 Sustainable processing Nowadays, the survival of manufacturing organizations on the market necessarily depends on the concern for the improvement of their environmental performance, which means consistent action for environment protection and preservation as part of sustainable deevlopment. Textile and leather processing industry is recognized as one with significant environmental impact, due to:
huge volumes of water needed for various operations (exemple);
a large variety of chemical auxiliaries, both organic and inorganic, used in the wet processing stages;
energy intensive operations, such as drying;
important waste generation, mainly in liquid form, as wastewater, but also in solid and gaseous form. The Integrated Pollution Prevention and Control is the most advanced concept promoted by the current EU environmental legislation. Through the IPPC Directive 96/61/EC [9], the European Union defines the obligations with which highly polluting industrial and agricultural activities must comply. The aim is to prevent or reduce pollution of the atmosphere, water and soil, as well as the quantities of waste arising from industrial and agricultural installations, to ensure a high level of protection of the environment as a whole. The IPPC Directive is an important tool for environmental and economic sustainability of the industrial activities described in Annex I of the IPPC Directive as having a high environmental impact, amongst which tanneries and textile chemical processing plants are mentioned. The best available techniques (BAT) to be applied for the minimization of the environmental impact of tanneries and textile chemical processing plants are settled out in two reference documents [10,11]. The main pathways and actions for the minimization of the environmental impact of textile and leather chemical processing are summarized in Figure 3.
636
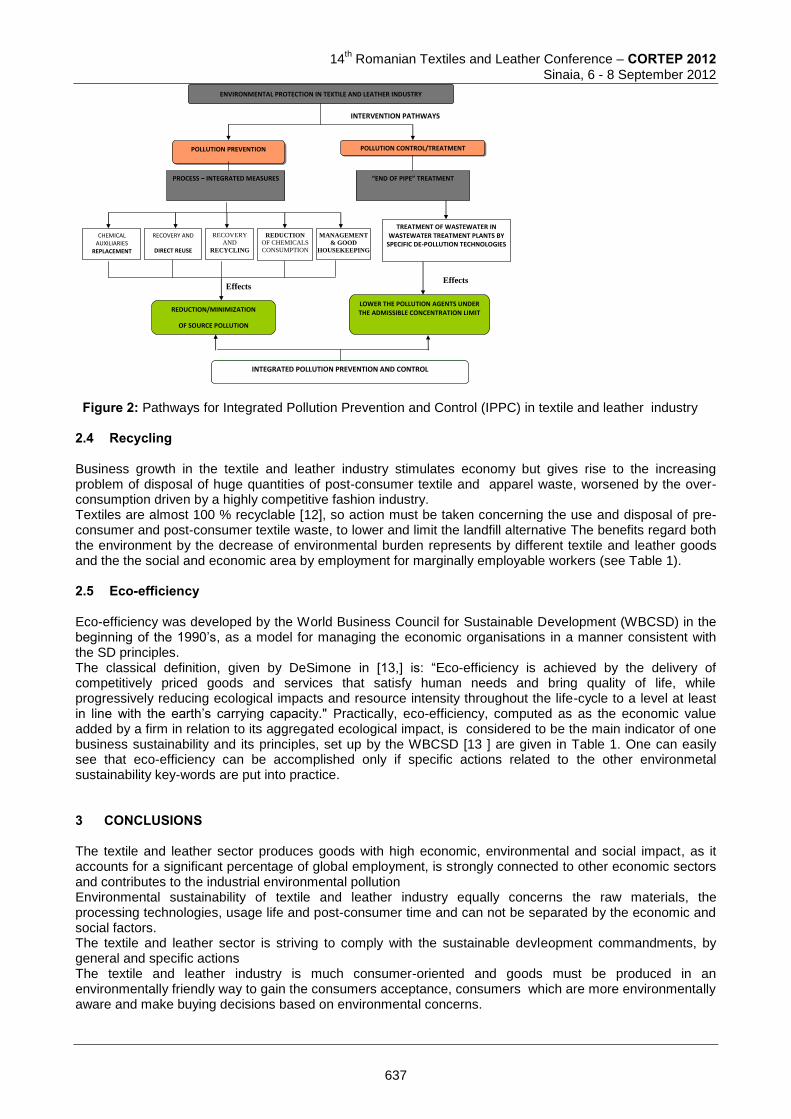
14
th Romanian Textiles and Leather Conference – CORTEP 2012
Sinaia, 6 - 8 September 2012
Effects Effects
INTERVENTION PATHWAYS
ENVIRONMENTAL PROTECTION IN TEXTILE AND LEATHER INDUSTRY
POLLUTION PREVENTION POLLUTION CONTROL/TREATMENT
PROCESS – INTEGRATED MEASURES
REDUCTION/MINIMIZATION
OF SOURCE POLLUTION
“END OF PIPE” TREATMENT
TREATMENT OF WASTEWATER IN WASTEWATER TREATMENT PLANTS BY
SPECIFIC DE-POLLUTION TECHNOLOGIES
LOWER THE POLLUTION AGENTS UNDER THE ADMISSIBLE CONCENTRATION LIMIT
INTEGRATED POLLUTION PREVENTION AND CONTROL
CHEMICAL AUXILIARIES
REPLACEMENT
REDUCTION
OF CHEMICALS
CONSUMPTION
RECOVERY AND
DIRECT REUSE
RECOVERY
AND
RECYCLING
MANAGEMENT
& GOOD
HOUSEKEEPING
Figure 2: Pathways for Integrated Pollution Prevention and Control (IPPC) in textile and leather industry
2.4 Recycling Business growth in the textile and leather industry stimulates economy but gives rise to the increasing problem of disposal of huge quantities of post-consumer textile and apparel waste, worsened by the over-consumption driven by a highly competitive fashion industry. Textiles are almost 100 % recyclable [12], so action must be taken concerning the use and disposal of pre-consumer and post-consumer textile waste, to lower and limit the landfill alternative The benefits regard both the environment by the decrease of environmental burden represents by different textile and leather goods and the the social and economic area by employment for marginally employable workers (see Table 1). 2.5 Eco-efficiency Eco-efficiency was developed by the World Business Council for Sustainable Development (WBCSD) in the beginning of the 1990’s, as a model for managing the economic organisations in a manner consistent with the SD principles. The classical definition, given by DeSimone in [13,] is: “Eco-efficiency is achieved by the delivery of competitively priced goods and services that satisfy human needs and bring quality of life, while progressively reducing ecological impacts and resource intensity throughout the life-cycle to a level at least in line with the earth’s carrying capacity." Practically, eco-efficiency, computed as as the economic value added by a firm in relation to its aggregated ecological impact, is considered to be the main indicator of one business sustainability and its principles, set up by the WBCSD [13 ] are given in Table 1. One can easily see that eco-efficiency can be accomplished only if specific actions related to the other environmetal sustainability key-words are put into practice. 3 CONCLUSIONS The textile and leather sector produces goods with high economic, environmental and social impact, as it accounts for a significant percentage of global employment, is strongly connected to other economic sectors and contributes to the industrial environmental pollution Environmental sustainability of textile and leather industry equally concerns the raw materials, the processing technologies, usage life and post-consumer time and can not be separated by the economic and social factors. The textile and leather sector is striving to comply with the sustainable devleopment commandments, by general and specific actions The textile and leather industry is much consumer-oriented and goods must be produced in an environmentally friendly way to gain the consumers acceptance, consumers which are more environmentally aware and make buying decisions based on environmental concerns.
637
14th Romanian Textiles and Leather Conference – CORTEP 2012
Sinaia, 6 - 8 September 2012
References [1] Doane, D., MacGillivray, A.: Economic Sustainability – The business of staying in business, Available
from http://projectsigma.co.uk/RnDStreams/RD_economic_sustain.pdf Accessed: 2012-07-25 [2] Lehni, M. et al.: Eco-Efficiency: creating more value with less impact, World Business Council for
Sustainable Development, ISBN 2940240175, Geneva, (2000) [3] Pearce D., Barbier E.B.: Blueprint for a sustainable economy, Earthscan Publications Ltd, ISBN 1-85383
515-3, London, (2000) [4] Petry F.: Environmental protection and sustainability in the textile industry, Melliand Textilberichte 7-
8/2008, Available from http://www.drpetry.de/pdf/Environmental.pdf Accessed: 2012-06-11 [5] NSF International: Fiber Sourcing Category, Available from http://ebookbrowse.com/05-02-08-fiber-
sourcing-category-doc-d177604397 Accessed: 2011-09-08 [6] Gerngross T.U., Slater S.C.: How Green Are Green Plastics?, Scientific American Magazine, August ,8,
(2000), pp 37-41, Available from www.sciam.com/2000/0800issue/0800gerngross.html Accessed: 2010-11-15
[7] Thomas, S. et al.: Natural Fibres: Structure, Properties and Applications, in Bio- and Nano- Polymer Composites, Springer Verlag, ISBN 978-3-642-17369-1, (2011), pp. 3-42
[8] Kalivas G.: Value of Teaching Sustainability in the Textile Industry, Available from http://www3.fitnyc.edu/sustainabilityatfit/papers_of_interest/gkalivas1.pdf, Accessed: 2012-06-11
[9] Council Directive 96/61/EC, Available from http://eur-lex.europa.eu/LexUriServ/ LexUriServ.do?uri=DD:15:03:31996L0061:RO:PDF, Accessed: 2012-07-28
[10] European Commision: IPPC Reference Document on Best Available Techniques for the Textiles Industry, July 2003, Available from http://eippcb.jrc.es/reference/BREF/txt_bref_0703.pdf, Accessed: 2012-06-01
[11] European IPPC Bureau, Reference Document on Best Available Techniques for the Tanning of Hides and Skins, May 2001, Available from: www.elaw.org/assets/pdf/tan%5Fbref%5F0501.pdf, Accessed: 2012-06-01
[12] Hawley, J.M.: Understanding and improving textile recycling: a systems prespective, In Sustainable textiles. Lyfe cycle and environmental impact, Woodhead Publishing Limited, ISBN 978-1-84569-453-1, Cambridge, (2009), pp. 179-198
[13] DeSimone, L. D., Popoff, F. with the WBCSD.: Eco-efficiency: The Business Link to Sustainable Development, MIT Press, ISBN 0262041626, Cambridge, (1997)
Corresponding author: Ingrid BUCIŞCANU Department of Leather and Leather Substitutes Technology Faculty of Textile, Leather and Industrial Management, “Gheorghe Asachi” Technical University of Iasi 53 D. Mangeron Blvd 700050, Iasi, Romania Phone: 0745 5515743; Fax: 0232 279850; E-mail: [email protected]
Co-authors: Melinda PRUNEANU Department of Leather and Leather Substitutes Technology Faculty of Textile, Leather and Industrial Management, “Gheorghe Asachi” Technical University of Iasi 53 D. Mangeron Blvd 700050, Iasi, Romania Phone: 0744 365704; Fax: 0232 279850; E-mail: [email protected] Vasilica MAIER Department of Leather and Leather Substitutes Technology Faculty of Textile, Leather and Industrial Management, “Gheorghe Asachi” Technical University of Iasi 53 D. Mangeron Blvd 700050, Iasi, Romania Phone: 0740 024729; Fax: 0232 279850; E-mail: [email protected] Stelian Sergiu SURNAME Department of Leather and Leather Substitutes Technology Faculty of Textile, Leather and Industrial Management, “Gheorghe Asachi” Technical University of Iasi 53 D. Mangeron Blvd 700050, Iasi, Romania Phone: 0740 024729; Fax: 0232 279850; E-mail: [email protected]
638
14
th Romanian Textiles and Leather Conference – CORTEP 2012
Sinaia, 6 - 8 September 2012
RECYCLING COTTON WASTE INTO FINE YARNS
Costică SAVA, Mariana ICHIM “Gheorghe Asachi” Technical University of Iasi, Romania
Abstract: Awareness of the need to recycle textile waste has been increased in the last few years because of increasing costs of raw material and the environmental and economic aspects associated with waste disposal. In this research, blends of virgin cotton and reclaimed cotton fibers were processed into rotor yarns (Nm 34 and Nm 40). Yarn twist and waste percent were varied at three levels and their influence on tensile behavior of yarns has been evaluated. Keywords: recycled cotton, waste ratio, twist coefficient, rotor yarn 1. INTRODUCTION Waste generation is unavoidable in any manufacturing process. Waste disposal in landfills or waste incineration are very costly and do not constitute viable solutions because affect the environment and human health by air, water or land pollution. The best solution is to prevent the generation of such waste, to minimize the quantity of waste by applying the best technologies and to reuse the waste into another useful application. Waste should be treated as a resource of raw material. Recycling, the reuse of waste reduces both the demand for raw material and the quantity of waste requiring final disposal. The increasing costs, and sometimes deficiency of raw materials led companies to focus on improving raw material exploitation. Waste could be used either within the same manufacturing process that generated it or could be sold to other industries. Textile waste can be classified in two categories: pre-consumer or post-consumer waste. Pre-consumer or post-industrial waste is that generated in the manufacturing process of textile products and consists of:
Fiber, by-products and yarn waste;
Defective woven, knitted or non-woven fabric pieces;
Trimmings and cuttings from the apparel manufacturing industry;
Non-conforming products;
Unsold stock from brands, wholesalers and retailers. Post-consumer waste are the textile products discarded after their service life because they are worn out, damaged, outgrown, or gone out of fashion. The clothing or household textiles of reasonable to good quality can be recovered and subsequently recycled by another user as second-hand products. Therefore, a part of the post-consumer waste is given to charities but most of it is thrown away with the domestic garbage. The clothes and other textiles end up in municipal landfills or incineration plants. Studies concerning the reuse of recycled cotton fibers in spinning have been published previously [1, 2, 3, 4], but the second raw material consisted of waste from the ginning, opening and cleaning, or carding process. It is known that, on average, 50 % of this category of wastes consists of good fibers. Our research aimed at recycling cotton fibers obtained by cutting and shredding of clippings generated from the garment manufacturing. A characteristic of this fibrous material is that it contents a very high percent of short fibers that leads to processing difficulties and low quality of yarn. Because the mean fiber length lies close to half an inch, blends with carrier fibers were used. 2. MATERIALS AND METHODS The clippings collected after the cutting and sewing process were sorted by nature and color and were processed on a tearing line that consisted of Margasa guillotine cutter, pneumatic mixing chamber and TN-1000 Margasa rag tearing machine with 6 drums having increasing pin densities. The fibrous material was compressed into bales on a Kavurlar baling press. Because the application of the yarns is fabrics for gauze bandages, only white cotton scraps were selected.
639
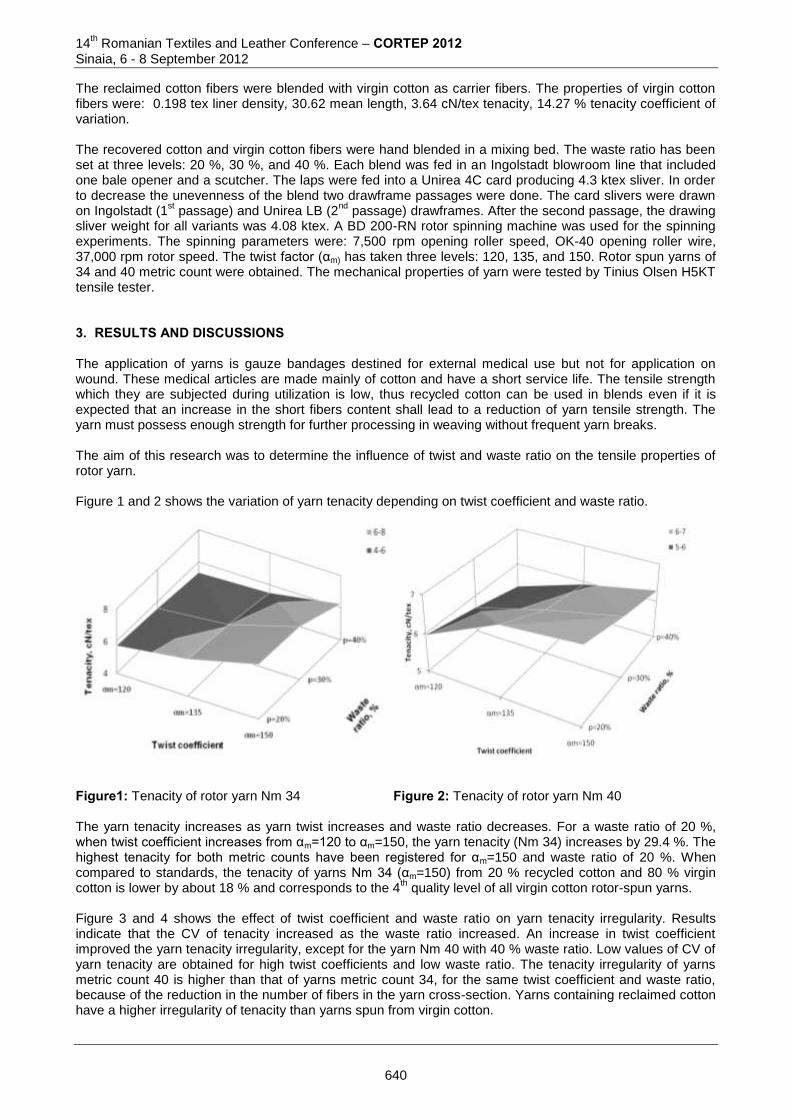
14th Romanian Textiles and Leather Conference – CORTEP 2012
Sinaia, 6 - 8 September 2012
The reclaimed cotton fibers were blended with virgin cotton as carrier fibers. The properties of virgin cotton fibers were: 0.198 tex liner density, 30.62 mean length, 3.64 cN/tex tenacity, 14.27 % tenacity coefficient of variation. The recovered cotton and virgin cotton fibers were hand blended in a mixing bed. The waste ratio has been set at three levels: 20 %, 30 %, and 40 %. Each blend was fed in an Ingolstadt blowroom line that included one bale opener and a scutcher. The laps were fed into a Unirea 4C card producing 4.3 ktex sliver. In order to decrease the unevenness of the blend two drawframe passages were done. The card slivers were drawn on Ingolstadt (1
st passage) and Unirea LB (2
nd passage) drawframes. After the second passage, the drawing
sliver weight for all variants was 4.08 ktex. A BD 200-RN rotor spinning machine was used for the spinning experiments. The spinning parameters were: 7,500 rpm opening roller speed, OK-40 opening roller wire, 37,000 rpm rotor speed. The twist factor (αm) has taken three levels: 120, 135, and 150. Rotor spun yarns of 34 and 40 metric count were obtained. The mechanical properties of yarn were tested by Tinius Olsen H5KT tensile tester. 3. RESULTS AND DISCUSSIONS The application of yarns is gauze bandages destined for external medical use but not for application on wound. These medical articles are made mainly of cotton and have a short service life. The tensile strength which they are subjected during utilization is low, thus recycled cotton can be used in blends even if it is expected that an increase in the short fibers content shall lead to a reduction of yarn tensile strength. The yarn must possess enough strength for further processing in weaving without frequent yarn breaks. The aim of this research was to determine the influence of twist and waste ratio on the tensile properties of rotor yarn. Figure 1 and 2 shows the variation of yarn tenacity depending on twist coefficient and waste ratio.
Figure1: Tenacity of rotor yarn Nm 34
Figure 2: Tenacity of rotor yarn Nm 40
The yarn tenacity increases as yarn twist increases and waste ratio decreases. For a waste ratio of 20 %, when twist coefficient increases from αm=120 to αm=150, the yarn tenacity (Nm 34) increases by 29.4 %. The highest tenacity for both metric counts have been registered for αm=150 and waste ratio of 20 %. When compared to standards, the tenacity of yarns Nm 34 (αm=150) from 20 % recycled cotton and 80 % virgin cotton is lower by about 18 % and corresponds to the 4
th quality level of all virgin cotton rotor-spun yarns.
Figure 3 and 4 shows the effect of twist coefficient and waste ratio on yarn tenacity irregularity. Results indicate that the CV of tenacity increased as the waste ratio increased. An increase in twist coefficient improved the yarn tenacity irregularity, except for the yarn Nm 40 with 40 % waste ratio. Low values of CV of yarn tenacity are obtained for high twist coefficients and low waste ratio. The tenacity irregularity of yarns metric count 40 is higher than that of yarns metric count 34, for the same twist coefficient and waste ratio, because of the reduction in the number of fibers in the yarn cross-section. Yarns containing reclaimed cotton have a higher irregularity of tenacity than yarns spun from virgin cotton.
640
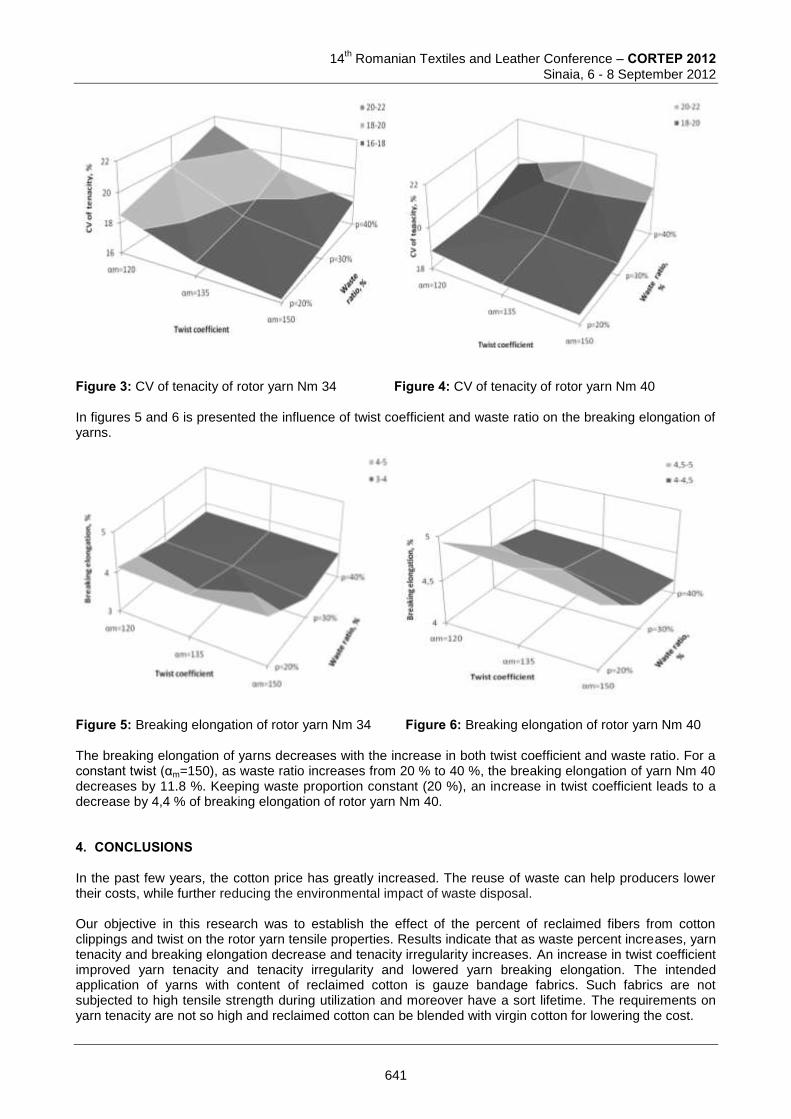
14
th Romanian Textiles and Leather Conference – CORTEP 2012
Sinaia, 6 - 8 September 2012
Figure 3: CV of tenacity of rotor yarn Nm 34
Figure 4: CV of tenacity of rotor yarn Nm 40
In figures 5 and 6 is presented the influence of twist coefficient and waste ratio on the breaking elongation of yarns.
Figure 5: Breaking elongation of rotor yarn Nm 34
Figure 6: Breaking elongation of rotor yarn Nm 40
The breaking elongation of yarns decreases with the increase in both twist coefficient and waste ratio. For a constant twist (αm=150), as waste ratio increases from 20 % to 40 %, the breaking elongation of yarn Nm 40 decreases by 11.8 %. Keeping waste proportion constant (20 %), an increase in twist coefficient leads to a decrease by 4,4 % of breaking elongation of rotor yarn Nm 40. 4. CONCLUSIONS In the past few years, the cotton price has greatly increased. The reuse of waste can help producers lower their costs, while further reducing the environmental impact of waste disposal. Our objective in this research was to establish the effect of the percent of reclaimed fibers from cotton clippings and twist on the rotor yarn tensile properties. Results indicate that as waste percent increases, yarn tenacity and breaking elongation decrease and tenacity irregularity increases. An increase in twist coefficient improved yarn tenacity and tenacity irregularity and lowered yarn breaking elongation. The intended application of yarns with content of reclaimed cotton is gauze bandage fabrics. Such fabrics are not subjected to high tensile strength during utilization and moreover have a sort lifetime. The requirements on yarn tenacity are not so high and reclaimed cotton can be blended with virgin cotton for lowering the cost.
641
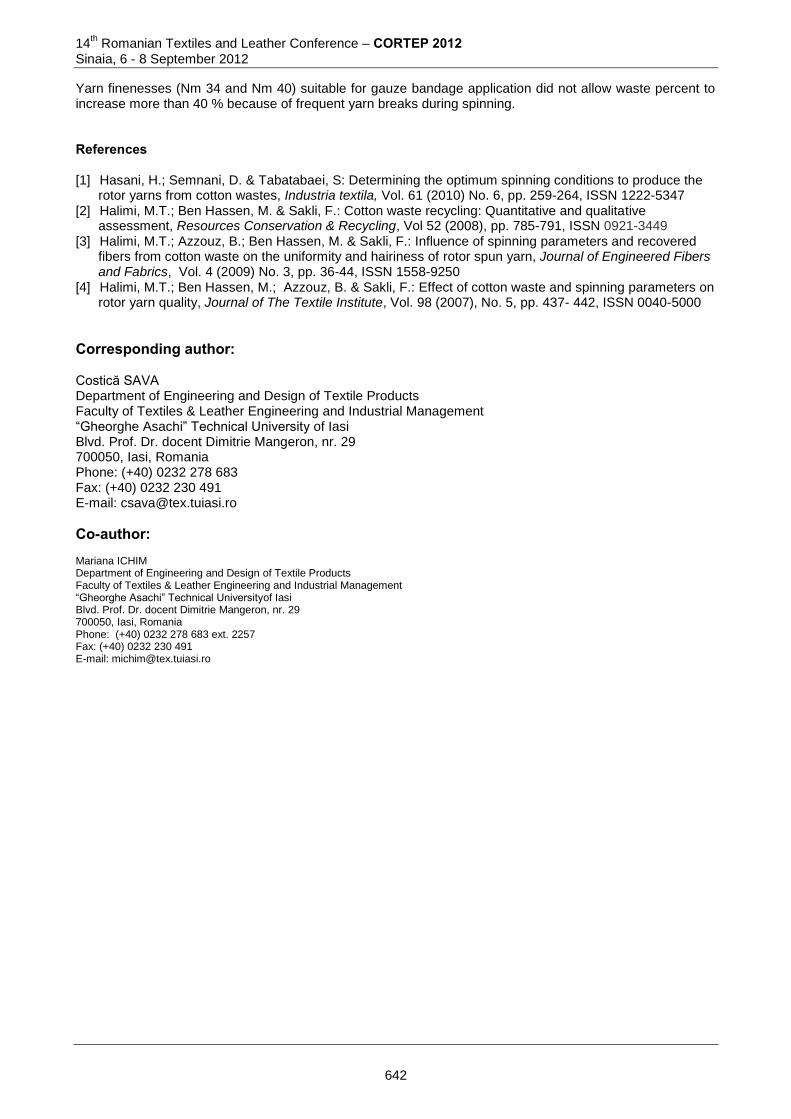
14th Romanian Textiles and Leather Conference – CORTEP 2012
Sinaia, 6 - 8 September 2012
Yarn finenesses (Nm 34 and Nm 40) suitable for gauze bandage application did not allow waste percent to increase more than 40 % because of frequent yarn breaks during spinning. References [1] Hasani, H.; Semnani, D. & Tabatabaei, S: Determining the optimum spinning conditions to produce the
rotor yarns from cotton wastes, Industria textila, Vol. 61 (2010) No. 6, pp. 259-264, ISSN 1222-5347 [2] Halimi, M.T.; Ben Hassen, M. & Sakli, F.: Cotton waste recycling: Quantitative and qualitative
assessment, Resources Conservation & Recycling, Vol 52 (2008), pp. 785-791, ISSN 0921-3449 [3] Halimi, M.T.; Azzouz, B.; Ben Hassen, M. & Sakli, F.: Influence of spinning parameters and recovered
fibers from cotton waste on the uniformity and hairiness of rotor spun yarn, Journal of Engineered Fibers and Fabrics, Vol. 4 (2009) No. 3, pp. 36-44, ISSN 1558-9250
[4] Halimi, M.T.; Ben Hassen, M.; Azzouz, B. & Sakli, F.: Effect of cotton waste and spinning parameters on rotor yarn quality, Journal of The Textile Institute, Vol. 98 (2007), No. 5, pp. 437- 442, ISSN 0040-5000
Corresponding author: Costică SAVA Department of Engineering and Design of Textile Products Faculty of Textiles & Leather Engineering and Industrial Management “Gheorghe Asachi” Technical University of Iasi Blvd. Prof. Dr. docent Dimitrie Mangeron, nr. 29 700050, Iasi, Romania Phone: (+40) 0232 278 683 Fax: (+40) 0232 230 491 E-mail: [email protected]
Co-author: Mariana ICHIM Department of Engineering and Design of Textile Products Faculty of Textiles & Leather Engineering and Industrial Management “Gheorghe Asachi” Technical Universityof Iasi Blvd. Prof. Dr. docent Dimitrie Mangeron, nr. 29 700050, Iasi, Romania Phone: (+40) 0232 278 683 ext. 2257 Fax: (+40) 0232 230 491 E-mail: [email protected]
642
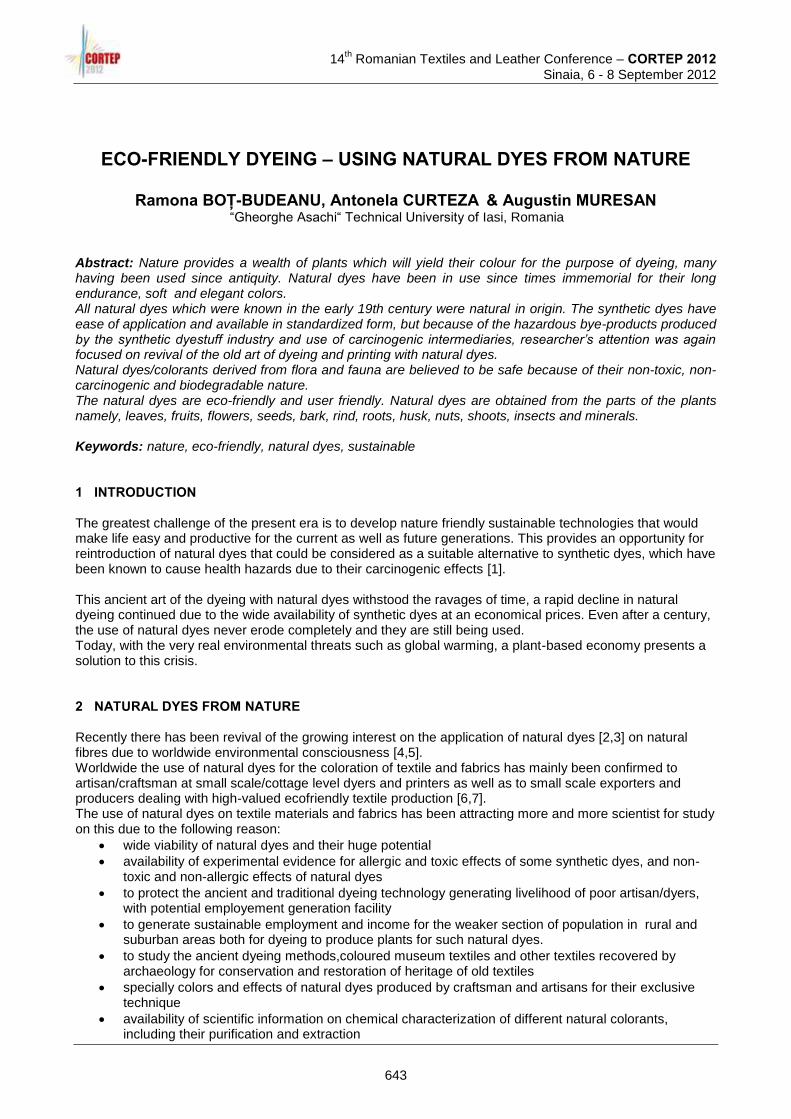
14
th Romanian Textiles and Leather Conference – CORTEP 2012
Sinaia, 6 - 8 September 2012
ECO-FRIENDLY DYEING – USING NATURAL DYES FROM NATURE
Ramona BOȚ-BUDEANU, Antonela CURTEZA & Augustin MURESAN “Gheorghe Asachi“ Technical University of Iasi, Romania
Abstract: Nature provides a wealth of plants which will yield their colour for the purpose of dyeing, many having been used since antiquity. Natural dyes have been in use since times immemorial for their long endurance, soft and elegant colors. All natural dyes which were known in the early 19th century were natural in origin. The synthetic dyes have ease of application and available in standardized form, but because of the hazardous bye-products produced by the synthetic dyestuff industry and use of carcinogenic intermediaries, researcher’s attention was again focused on revival of the old art of dyeing and printing with natural dyes. Natural dyes/colorants derived from flora and fauna are believed to be safe because of their non-toxic, non-carcinogenic and biodegradable nature. The natural dyes are eco-friendly and user friendly. Natural dyes are obtained from the parts of the plants namely, leaves, fruits, flowers, seeds, bark, rind, roots, husk, nuts, shoots, insects and minerals. Keywords: nature, eco-friendly, natural dyes, sustainable 1 INTRODUCTION The greatest challenge of the present era is to develop nature friendly sustainable technologies that would make life easy and productive for the current as well as future generations. This provides an opportunity for reintroduction of natural dyes that could be considered as a suitable alternative to synthetic dyes, which have been known to cause health hazards due to their carcinogenic effects [1]. This ancient art of the dyeing with natural dyes withstood the ravages of time, a rapid decline in natural dyeing continued due to the wide availability of synthetic dyes at an economical prices. Even after a century, the use of natural dyes never erode completely and they are still being used. Today, with the very real environmental threats such as global warming, a plant-based economy presents a solution to this crisis. 2 NATURAL DYES FROM NATURE Recently there has been revival of the growing interest on the application of natural dyes [2,3] on natural fibres due to worldwide environmental consciousness [4,5]. Worldwide the use of natural dyes for the coloration of textile and fabrics has mainly been confirmed to artisan/craftsman at small scale/cottage level dyers and printers as well as to small scale exporters and producers dealing with high-valued ecofriendly textile production [6,7]. The use of natural dyes on textile materials and fabrics has been attracting more and more scientist for study on this due to the following reason:
wide viability of natural dyes and their huge potential
availability of experimental evidence for allergic and toxic effects of some synthetic dyes, and non-toxic and non-allergic effects of natural dyes
to protect the ancient and traditional dyeing technology generating livelihood of poor artisan/dyers, with potential employement generation facility
to generate sustainable employment and income for the weaker section of population in rural and suburban areas both for dyeing to produce plants for such natural dyes.
to study the ancient dyeing methods,coloured museum textiles and other textiles recovered by archaeology for conservation and restoration of heritage of old textiles
specially colors and effects of natural dyes produced by craftsman and artisans for their exclusive technique
availability of scientific information on chemical characterization of different natural colorants, including their purification and extraction
643
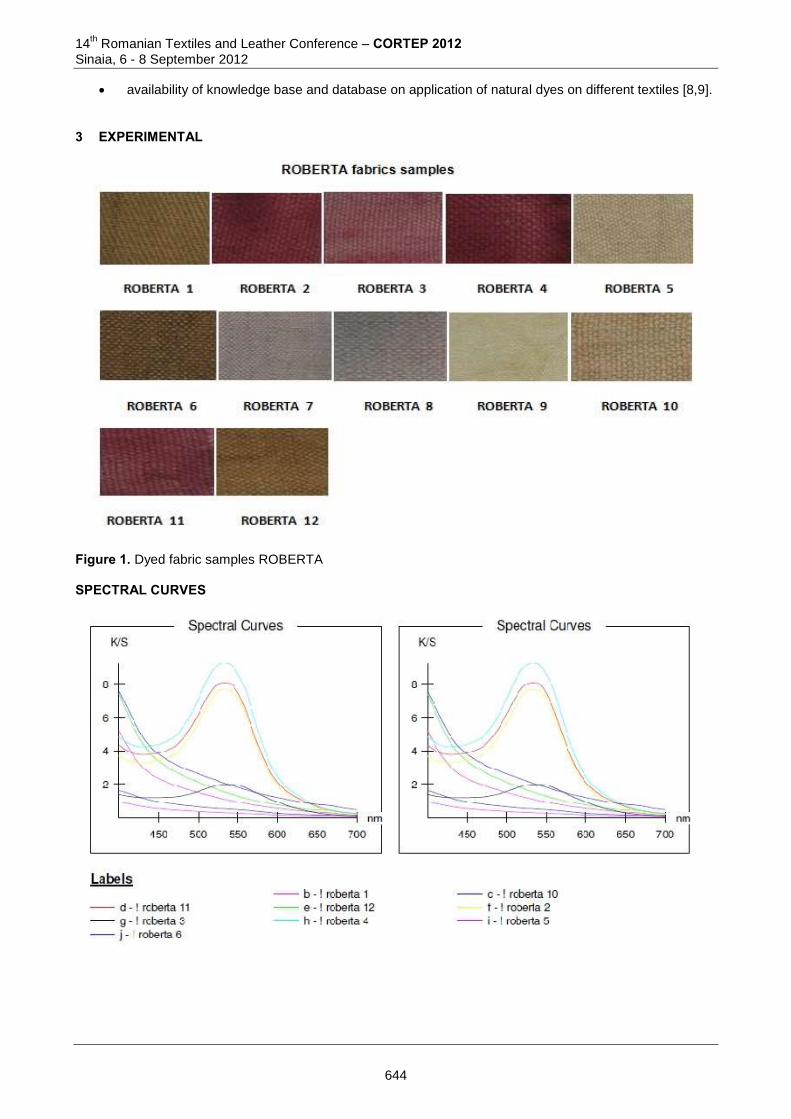
14th Romanian Textiles and Leather Conference – CORTEP 2012
Sinaia, 6 - 8 September 2012
availability of knowledge base and database on application of natural dyes on different textiles [8,9].
3 EXPERIMENTAL
Figure 1. Dyed fabric samples ROBERTA SPECTRAL CURVES
644
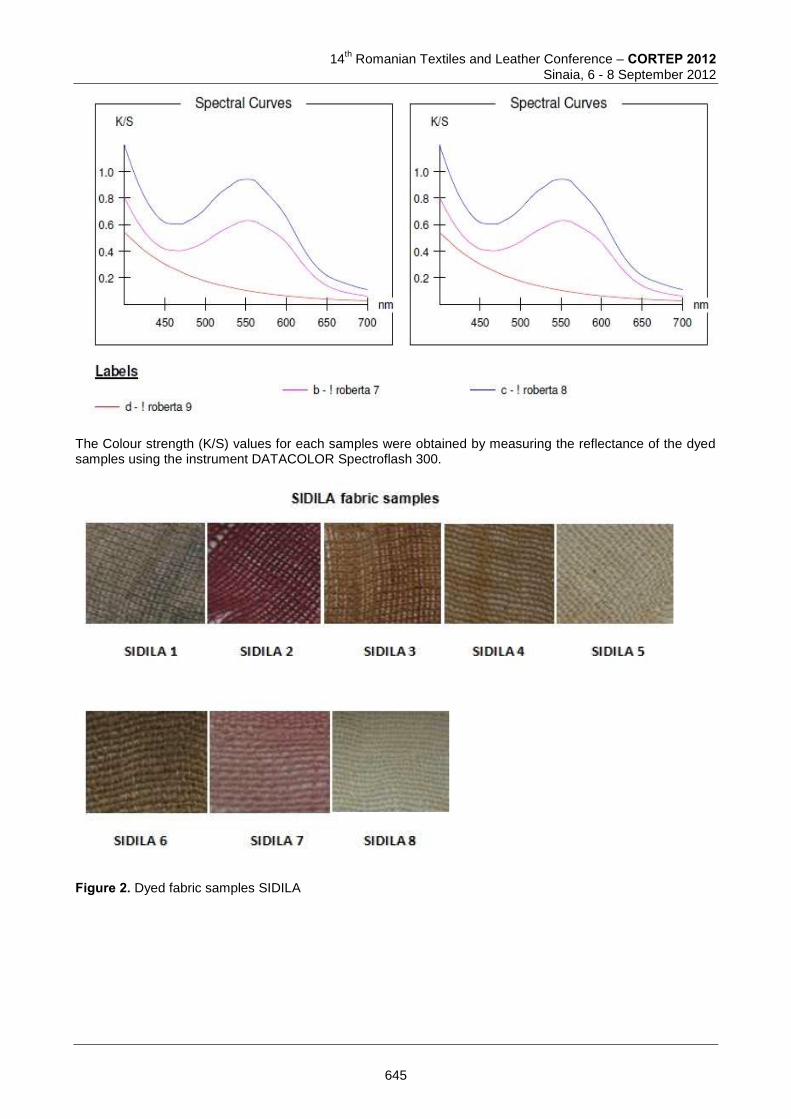
14
th Romanian Textiles and Leather Conference – CORTEP 2012
Sinaia, 6 - 8 September 2012
The Colour strength (K/S) values for each samples were obtained by measuring the reflectance of the dyed samples using the instrument DATACOLOR Spectroflash 300.
Figure 2. Dyed fabric samples SIDILA
645
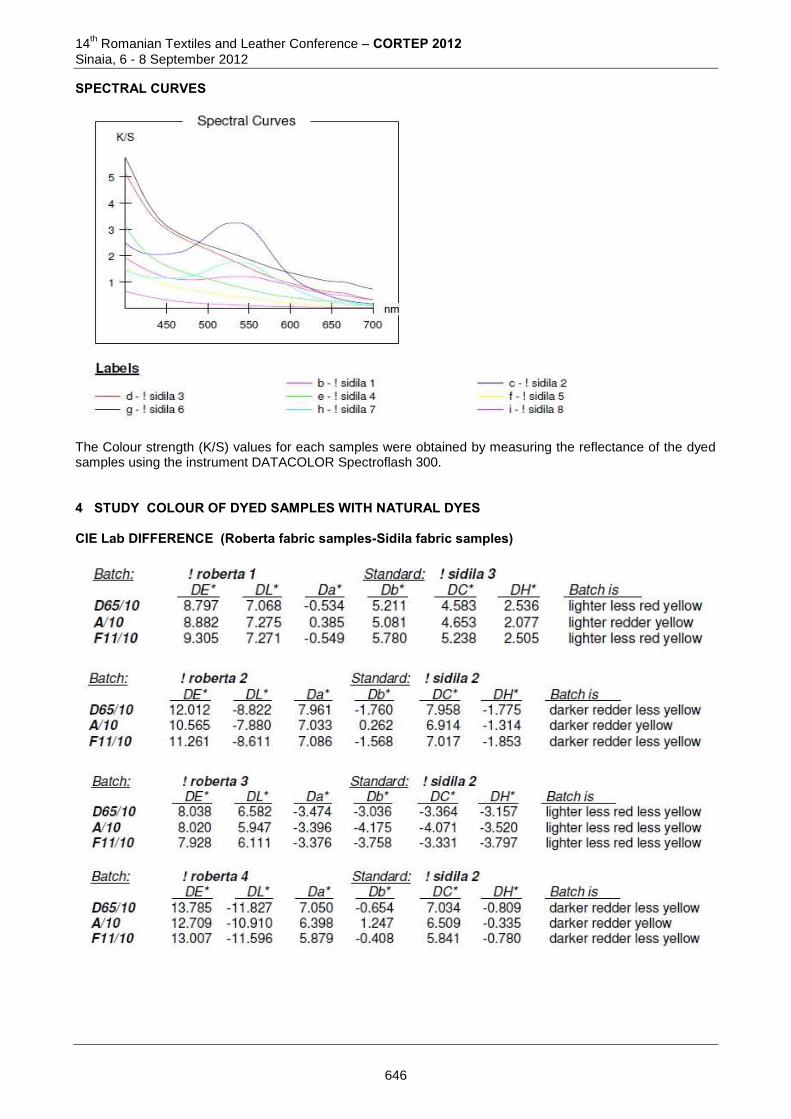
14th Romanian Textiles and Leather Conference – CORTEP 2012
Sinaia, 6 - 8 September 2012
SPECTRAL CURVES
The Colour strength (K/S) values for each samples were obtained by measuring the reflectance of the dyed samples using the instrument DATACOLOR Spectroflash 300. 4 STUDY COLOUR OF DYED SAMPLES WITH NATURAL DYES CIE Lab DIFFERENCE (Roberta fabric samples-Sidila fabric samples)
646
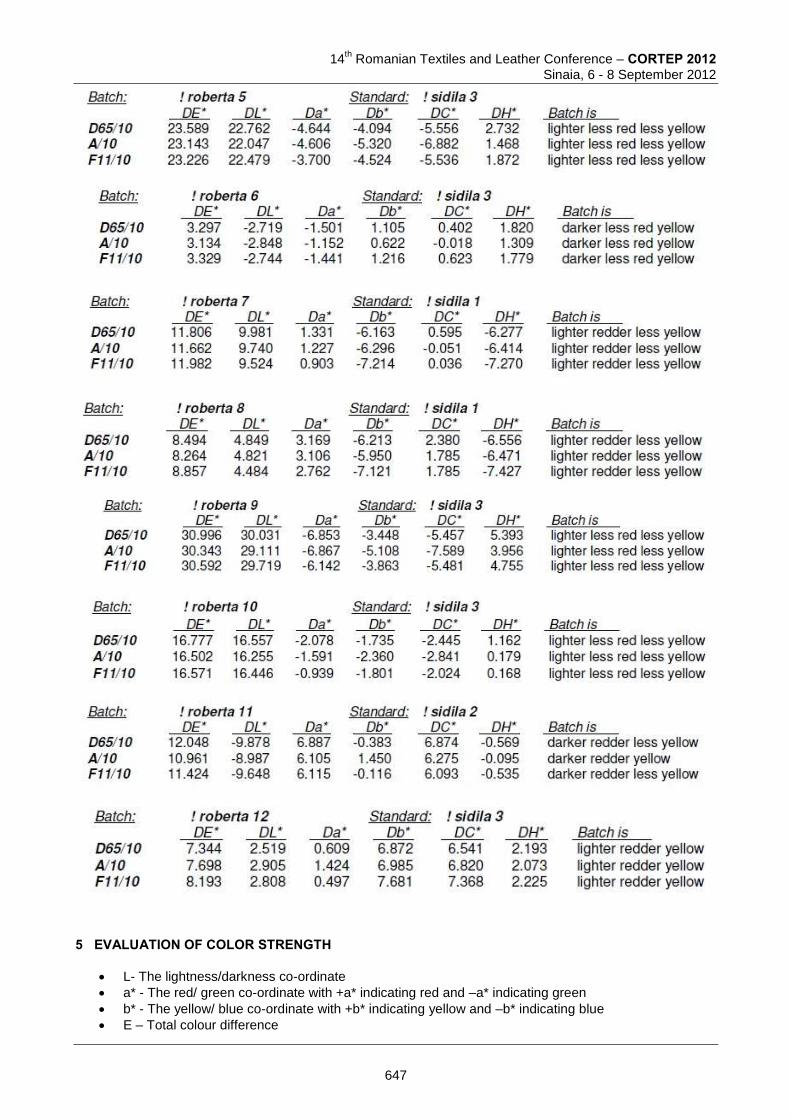
14
th Romanian Textiles and Leather Conference – CORTEP 2012
Sinaia, 6 - 8 September 2012
5 EVALUATION OF COLOR STRENGTH
L- The lightness/darkness co-ordinate
a* - The red/ green co-ordinate with +a* indicating red and –a* indicating green
b* - The yellow/ blue co-ordinate with +b* indicating yellow and –b* indicating blue
E – Total colour difference
647
14th Romanian Textiles and Leather Conference – CORTEP 2012
Sinaia, 6 - 8 September 2012
6 CONCLUSION The colour strength of hemp fabrics samples dyed with natural dyes ( Roberta and Sidila) was evaluated using DATACOLOR Spectroflash 300.
the reflectance spectrum of the dyed samples.
coloration tone as compared spectrophotometrically by defining C*, L*, H*,a*,b* and DE* ab values.
the colourimetric parameters L*,a*,b*,C*,H* were measured for depth of the colour. Total colour difference: _E value The total colour difference was calculated by using the following formula:
E = _a2 + _L2 + _ b2 (1) Where:
E – represents the total colour difference;
a* – co-ordinate defining the red/green axis (+a* = red ; –a* = green)
b*– co-ordinate defining the yellow/blue axis (+b* = yellow ; –b* = blue)
L – Lightness/darkness between the sample and standard
+L – indicates the sample is lighter than standard
-L – indicates the sample is darker than standard. The art of dyeing with natural dyes has gained momentum, not only for safety of health and environment, but also for their beauty and novelty. 7 ACKNOWLEDGEMENT This paper was realised with the support of CUANTUMDOC “Doctoral Scholarships for research performance at European level” project, ID 79407, financed by the European Social Found and Romanian Government. REFERENCES [1] Sewekow, U., 1988. Natural dyes e an alternative to synthetic dyes. Melliand Textilber ,69 (4), 145-148 [2] Kamat S.Y & Alat D.V, Indian Textile Journal, (3),1990 [3] Glover B., Textile Chem. Colours, 27, (4), 1995 [4] Smith R&Wagner S.,Arn. Dyest Rep., 80, (9),1991 [5] Dalby G.,J. Soc Dyers Colours, 109, (1), 1993, (8) [6] Chavan, R.B., Colourage, 42(4), 27, 1995 [7] Glover B.& Pierce J.H., J.Soc.Dyers Color, 109(1),1993 [8] Samanta A.K, Singhee D.& Sethia M., Proceedings, Convention of Natural Dyes, edited by Deepy Gupta
and M.L. Gubeajani (2001,20) [9] Gotman V.D., Dorugade V.A., Chitins, Shirodkar K.J & Palor M., Proceedings, Convention of Natural
Dyes, edited by Deeph Gupta and M.L Gubajani, 2001(32).
Corresponding author: Ramona BOȚ- BUDEANU Faculty of Textile, Leather and Industrial Management/ Doctoral School of “Gheorghe Asachi“ Technical University Dimitrie Mangeron Bvl. No.29 700050, Iasi, Romania phone: +0040740331278; e-mail: [email protected]
648

14
th Romanian Textiles and Leather Conference – CORTEP 2012
Sinaia, 6 - 8 September 2012
Co-authors: Antonela CURTEZA Faculty of Textile, Leather and Industrial Management/“Gheorghe Asachi“ Technical University Dimitrie Mangeron Bvl. No.29 700050, Iasi, Romania phone: +0040745537286; e-mail: [email protected] Augustin MURESAN Faculty of Textile, Leather and Industrial Management/ “Gheorghe Asachi“ Technical University Dimitrie Mangeron Bvl. No.29 700050, Iasi, Romania phone: +0040232278683; e-mail: [email protected]
649
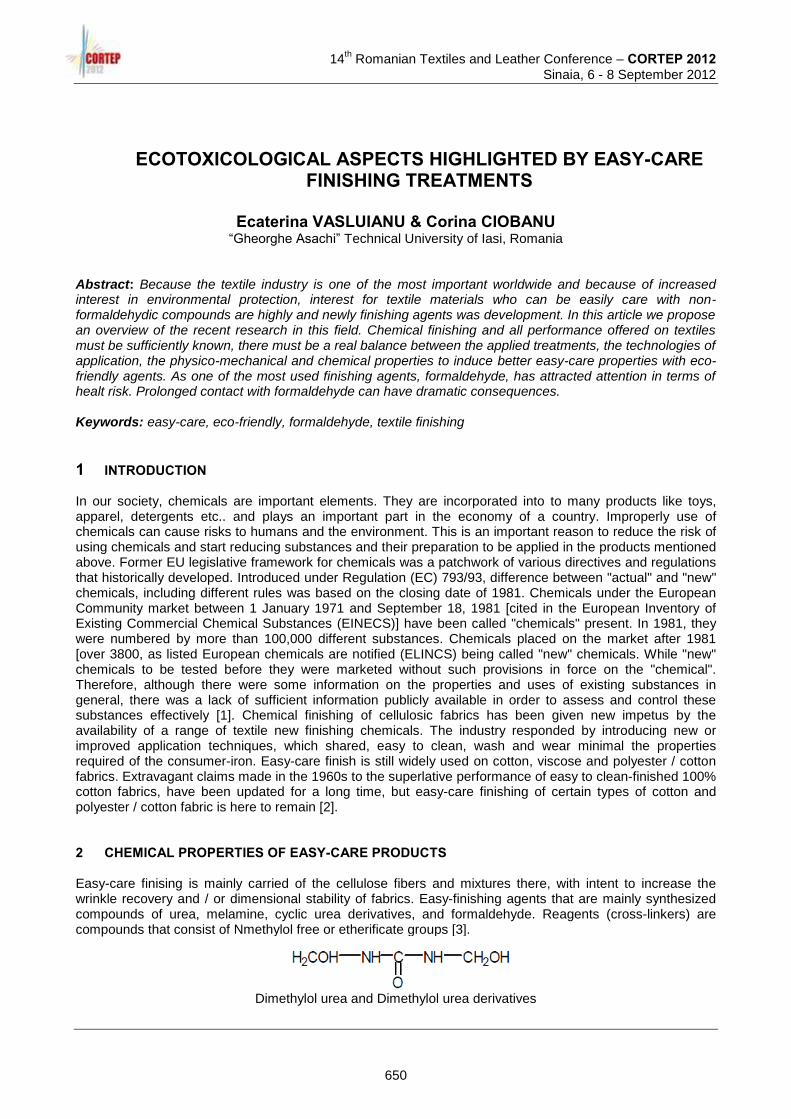
14
th Romanian Textiles and Leather Conference – CORTEP 2012
Sinaia, 6 - 8 September 2012
ECOTOXICOLOGICAL ASPECTS HIGHLIGHTED BY EASY-CARE FINISHING TREATMENTS
Ecaterina VASLUIANU & Corina CIOBANU
“Gheorghe Asachi” Technical University of Iasi, Romania Abstract: Because the textile industry is one of the most important worldwide and because of increased interest in environmental protection, interest for textile materials who can be easily care with non-formaldehydic compounds are highly and newly finishing agents was development. In this article we propose an overview of the recent research in this field. Chemical finishing and all performance offered on textiles must be sufficiently known, there must be a real balance between the applied treatments, the technologies of application, the physico-mechanical and chemical properties to induce better easy-care properties with eco-friendly agents. As one of the most used finishing agents, formaldehyde, has attracted attention in terms of healt risk. Prolonged contact with formaldehyde can have dramatic consequences. Keywords: easy-care, eco-friendly, formaldehyde, textile finishing
1 INTRODUCTION In our society, chemicals are important elements. They are incorporated into to many products like toys, apparel, detergents etc.. and plays an important part in the economy of a country. Improperly use of chemicals can cause risks to humans and the environment. This is an important reason to reduce the risk of using chemicals and start reducing substances and their preparation to be applied in the products mentioned above. Former EU legislative framework for chemicals was a patchwork of various directives and regulations that historically developed. Introduced under Regulation (EC) 793/93, difference between "actual" and "new" chemicals, including different rules was based on the closing date of 1981. Chemicals under the European Community market between 1 January 1971 and September 18, 1981 [cited in the European Inventory of Existing Commercial Chemical Substances (EINECS)] have been called "chemicals" present. In 1981, they were numbered by more than 100,000 different substances. Chemicals placed on the market after 1981 [over 3800, as listed European chemicals are notified (ELINCS) being called "new" chemicals. While "new" chemicals to be tested before they were marketed without such provisions in force on the "chemical". Therefore, although there were some information on the properties and uses of existing substances in general, there was a lack of sufficient information publicly available in order to assess and control these substances effectively [1]. Chemical finishing of cellulosic fabrics has been given new impetus by the availability of a range of textile new finishing chemicals. The industry responded by introducing new or improved application techniques, which shared, easy to clean, wash and wear minimal the properties required of the consumer-iron. Easy-care finish is still widely used on cotton, viscose and polyester / cotton fabrics. Extravagant claims made in the 1960s to the superlative performance of easy to clean-finished 100% cotton fabrics, have been updated for a long time, but easy-care finishing of certain types of cotton and polyester / cotton fabric is here to remain [2]. 2 CHEMICAL PROPERTIES OF EASY-CARE PRODUCTS Easy-care finising is mainly carried of the cellulose fibers and mixtures there, with intent to increase the wrinkle recovery and / or dimensional stability of fabrics. Easy-finishing agents that are mainly synthesized compounds of urea, melamine, cyclic urea derivatives, and formaldehyde. Reagents (cross-linkers) are compounds that consist of Nmethylol free or etherificate groups [3].
Dimethylol urea and Dimethylol urea derivatives
650
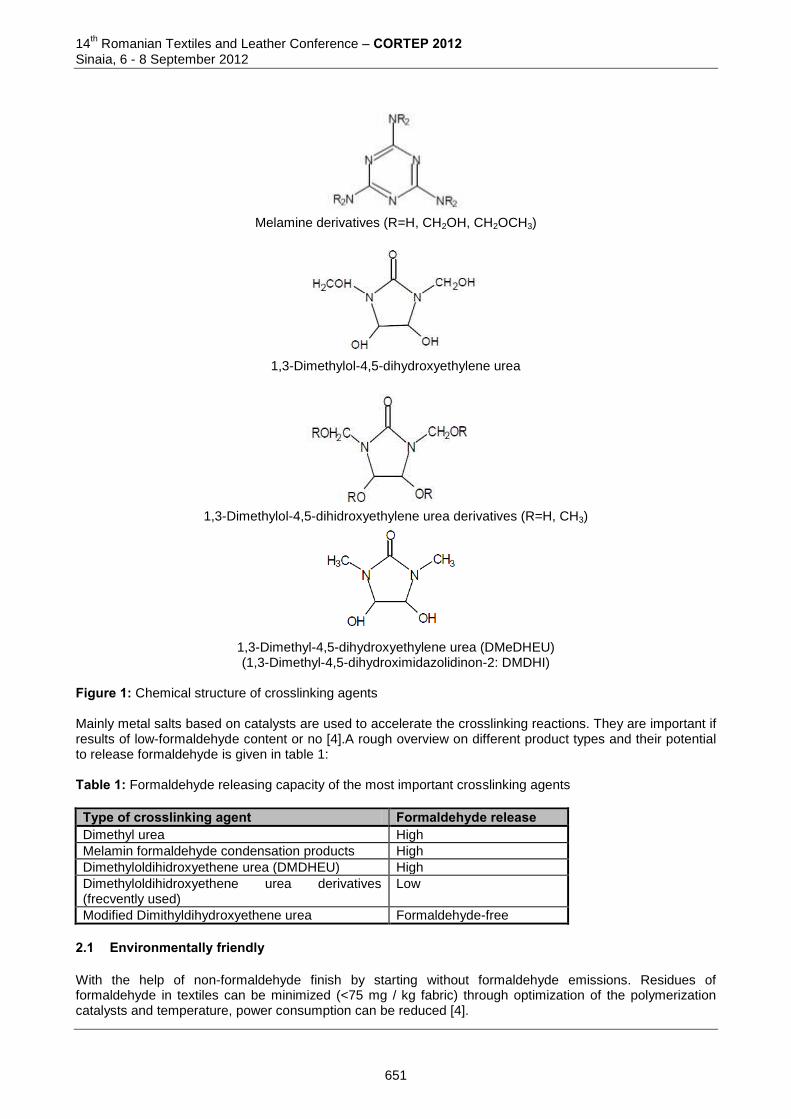
14th Romanian Textiles and Leather Conference – CORTEP 2012
Sinaia, 6 - 8 September 2012
Melamine derivatives (R=H, CH2OH, CH2OCH3)
1,3-Dimethylol-4,5-dihydroxyethylene urea
1,3-Dimethylol-4,5-dihidroxyethylene urea derivatives (R=H, CH3)
1,3-Dimethyl-4,5-dihydroxyethylene urea (DMeDHEU) (1,3-Dimethyl-4,5-dihydroximidazolidinon-2: DMDHI)
Figure 1: Chemical structure of crosslinking agents Mainly metal salts based on catalysts are used to accelerate the crosslinking reactions. They are important if results of low-formaldehyde content or no [4].A rough overview on different product types and their potential to release formaldehyde is given in table 1: Table 1: Formaldehyde releasing capacity of the most important crosslinking agents
Type of crosslinking agent Formaldehyde release Dimethyl urea High
Melamin formaldehyde condensation products High
Dimethyloldihidroxyethene urea (DMDHEU) High
Dimethyloldihidroxyethene urea derivatives (frecvently used)
Low
Modified Dimithyldihydroxyethene urea Formaldehyde-free
2.1 Environmentally friendly With the help of non-formaldehyde finish by starting without formaldehyde emissions. Residues of formaldehyde in textiles can be minimized (<75 mg / kg fabric) through optimization of the polymerization catalysts and temperature, power consumption can be reduced [4].
651
14
th Romanian Textiles and Leather Conference – CORTEP 2012
Sinaia, 6 - 8 September 2012
2.2 Application of on textile material Easy-care-products that can be applied on fabric similar to the conventional products. During and the the quantity of catalysts, time and the temperature should be tailored. The amount necessary for the formaldehyde free products is about two times greater [5].
2.3 Cross-media effects Crosslinking agents above mentioned are difficult to biodegradables.. Nevertheless only low values are taken into consideration for the waste water. Non-optimized processes use of formaldehyde may be betrayed by heavy smell the formaldehyde content. Throughout worldwide are companies that provides different easy-care-which with no formaldehyde finishing. Typical examples of finishing recipes is easy-to: Finishing low formaldehude on cotton (cloth): 40-60 g / l crosslinking agent, 12 to 20 g / l catalyst, liquor pick-up: 70%, drying and condensation (150 ° C, 3 min). Typically recipe for free formaldehyde finishing of cotton: 80-120 g / l crosslinking agent (integrated catalyst), Liquor pick-up: 80%, acidifying with acetic acid, drying and condensation (130 ° C, 1 min). Curing compounds are often applied in combination with wetting agents, softeners, products that increase extraction power. Prices for products without formaldehyde are significantly higher than the for low-formaldehyde products. Regulations on off-gas formaldehyde in compliance with various codes of conduct on consumer health (eco-labels) are the main motivation for use without formaldehyde or formaldehyde-low products [2]. Easy-care-care finishes is usually applied materials of cellulose or cellulose blend. The main explanatory words are easy-care-Care, durable press, at least which, easy-care to iron, no-iron, wash and wear, crease resistant, permanent press, shrink proof, wrinkle resistant, wrinkle free. The main effects of an easy-care-care finishes are to reduce the swelling and the shrinkage, improve recovery angle of wet or dry (CRA), smooth after drying. CRA (crease recovery angle) is the amount of crease recovery angle of on warp and weft directions. These values are between 150 ° to about 300 °. An inevitable effect of crosslinking cellulose finishes specifically at reducing elasticity and flexibility of cellulose fibers. Inevitably, this causes a decrease in tensile and abrasion resistance [6].
2.4 Easy-care finishing aplications The conventional pad-dry-cure method is the process most widely used to impart easy-care properties to cellulosic fabrics. It is relatively simple and yields fabric with the properties outlined in the table 2. It is a characteristic feature of the classical pad-dry-cure method that an improvement in dry crease recovery is accompanied by a corresponding deterioration in physical properties. In fact a direct relationship exists between increase in dry crease recovery angle and loss in strength or abrasion resistance. Many modifications have been proposed to the basic method to obtain an optimum balance between improved easy-care performance and loss in strength. Some of these variants found commercial application, at least for a time [7]. Table 2: Advantages and disadvantages of the pad-dry-cure process for easy-care finishing of cellulosis fibres
Advantages Disadvantages High dry crease recovery Reduction in tear strength
Moderately good wet crease recovery Loss in abrasion resistance
Good dimensional stability Change of shade of dyed fabricas
Good retention of shape Release of formaldehyde
Excellent easy-care properties Danger of fishy odours
Table 3: Advanteges and disadvantages of the pre-cure and post-cure processes for easy-care finishing of cellulosis fibres
Application Method Advantages Disadvantages Pre-cure High process productivity Poor crease retention
Post-cure Excellent crease retention Curing equipment needed by garment manufacturer
652
14th Romanian Textiles and Leather Conference – CORTEP 2012
Sinaia, 6 - 8 September 2012
2.5 Chemistry of easy-care finishes The main features of DMDHEU based products are: small low reactivity, durability to washing, low low retention of chlor , very low formaldehyde release, is the most widely used product in durable press finishing. DMeDHEU not contain formaldehyde. It is synthesized from N, N-dimethyl urea and glyoxal. DMeDHEU can be modified by reaction with alcohols such as methanol, diethylene glycol. DMDHEU products are less reactive due to hydroxyl groups. Strong catalysts are required for successful crosslinking. DMeDHEU cost about twice as much as DMDHEU products. In order to obtain comparable effects, easy-care and durable press to DMDHEU, almost twice the amount of DMeDHEU necessary. However, A1: 1 mixture of DMDHEU and DMeDHEU is popular because of its low levels of formaldehyde, with slightly lower physical properties at an acceptable cost. The main features of DMeDHEU products: formaldehyde-free, very low reactivity, very low chlorine retention, limited durability to laundering, yellowing effect when air is not changed, the development of unpleasant odors, depending on the formulation of catalysts for finishing press easy to maintain and durable, the reaction of DMDHEU with cellulose requires an acid catalyst to yield acceptable textile processing under appropriate conditions, the most common catalysts are Lewis acids such as magnesium chloride and zinc nitrate, which generates acidic conditions during the healing process, thereby, liqueurs and neutral finish good bath stability. Sulfuric and hydrochloric acids and ammonium salts serve as excellent catalysts, but also degrades unwanted fibers. Often, citric acid is combined with Lewis acid to provide additional impetus for condensation reactions especially short shock. In acidic conditions, products DMDHEU react by oxygen protonation [8].
3 CONCLUSIONS Improvement of functional characteristics of textiles is an significant strong point for textile industry. Frequently involves the use of a chemical compound generation of undesired side effects. Thus, it aims towards chemical elimination of formaldehyde in textile finishing. Even if some properties of the textile materials will be minimized, we will have the certainty of a clean environment. Therefore need to develop such materials is constantly increasing. Over time, in textile field and action started green technologies for remove toxic compounds action. To improve the caracteristics of use and easy-care maintenance of textile is required higher finishing technologies for fabrics who containing cellulose in view of environmental protection. Ecofriendly easy-care finishing involves a number of advantages such as crease recovery, anti-static finishing, stability and limited hydrolysis resistance changes. Given the increased interest in this type of fabric, the development of textile products with new properties is possible with polymers with modified structures, by incorporating functional monomers by polymerization, grafting, changes in in processes of ancillary products and environmental performance. Hereby, is induced such a range of functional effects highly valued by consumers and their extravagant claims. In conclusion, chemical finishing of textiles has an answer by introducing newly substances due to chemical alternatives. Acknowledgement This work was acomplished with the financial support of the project POSDRU CUANTUMDOC “DOCTORAL STUDIES FOR EUROPEAN PERFORMANCES IN RESEARCH AND INNOVATION” ID79407, project financed by the European Social Fund and the Romania Gouvernment. 4 REFERENCES [1] Maatman, L.: Safe use of chemicals in the supply chian Surname, Master of Science thesis,
Netherlands, (2010). [2] Gaurav, D.;: The Rising Demand For Easy-Care Clothing, Available from http://ezinearticles.com/?The-
Rising-Demand-For-Easy-Care-Clothing&id=544346 Accessed:, 2012-05-21. [3] Schronberger, H. & Schafer, T.: Best avaible techniques in textile industry, ISSN 0722-186X, Berlin,
(2003), pp. 275-278. [4] Formaldehyde, Commonwealth of Australia, ISBN 0975847090, Sydney, (2006) [5] Gaurav, D.: The Rising Demand For Easy-Care Clothing, Available from http://ezinearticles.com/?The-
Rising-Demand-For-Easy-Care-Clothing&id=544346, Accessed: 2012-05-21. [6] Easy care and durable press finishes of cellulosic, Avaible from http://textilelibrary.blogspot.fr, Accesed
2012-05-21.
653
14
th Romanian Textiles and Leather Conference – CORTEP 2012
Sinaia, 6 - 8 September 2012
[7] Vaddi, S., Balakrishnaiah, B.: Wrinkle-recovery treatment to khadi & handloom fabrics, Avaible from http://www.indiantextilejournal.com/articles/FAdetails.asp?id=144, Accesed 2012.05.21.
[8] Gulrajani, M.L., Gupta, D.: Emerging techniques for functional finishing of textiles, Indian Journal of Fibre & Textile Research, Vol. No. 36., (2011) pp. 388-397, ISSN 0971-0426.
Corresponding author: Ecaterina VASLUIANU Department of Textile Chemical Engineering Faculty of Textiles, Leather & Industrial Management “Gheorghe Asachi” Technical University of Iasi 53 D. Mangeron Blvd. 700050, Iasi Romania Phone: +741316666 E-mail: [email protected]
Co-author(s): Corina CIOBANU Doctoral School of the Faculty of Textiles, Leather & Industrial Management “Gheorghe Asachi” Technical University of Iasi 53 D. Mangeron Blvd. 700050, Iasi, Romania E-mail: [email protected]
654
14
th Romanian Textiles and Leather Conference – CORTEP 2012
Sinaia, 6 - 8 September 2012
TEX-EASTILE-EUROPEAN NETWORK FOR GREEN TEXTILE EXCELLENCE
Doina TOMA1, Emilia VISILEANU 1 & Silvia POZZI 2
1 National R&D Institute for Textiles and Leather, Bucharest, Romania
2 Euroimpresa Legnano S.c.r.l, Legnano, Italy
Abstract: The aim of this paper is to present the research project “Tex-EASTile : sustainable innovation for textile in South East Europe ” funded by the European Union under Transnational Cooperation Programme South East Europe.The mission of the project Tex-EASTile is to create a new synergy between the public and private sector in order to disseminate knowledge, to promote the application of eco-design tools and to spread product sustainability principles in manufacturing productions and consumptions, encouraging the Public Administrations to purchase them. The purpose of Tex-EASTile is to establish a community of excellence to improve the offer of “green” textile in the market, supporting, in particular, the innovation of production and distribution processes in order to reduce their environmental impact. Keywords: sustainable innovation, green marketing tools, green public procurement, sustainable networking 1 INTRODUCTION Tex-EASTile is a project on sustainable innovation in the textile sector involving partners across South East Europe. The project has been co- funded by the European Union under South East Europe Transnational Cooperation Programme whose aim is to improve territorial, economic and social integration through the development of international partnerships on issues of strategic importance. The need of Tex-EASTile arises from the imperative to increase the competitiveness of the textile sector in the project area. As new markets are becoming increasingly strong in manufacturing textile products, the markets in the EU region have to take up the challenge in order to keep up with worldwide competitors, especially in a moment in which low-wages are no longer the solution to improve competitiveness. In this context, the strategy around the overall quality and value of the textile product emerged, leading manufacturers and stakeholders to understand that the winning strategy to become world leader revolves around improving the quality and the value of what they produce. At the same time, ECODESIGN emerged as a potential high value-added to the manufacturing products of the textile sector, which could represent a winning strategy for the UE competitors in the field. Indeed, growing importance is given to ECODESIGN by political institutions at all levels and by consumers, too, while GPP (Green Public Procurement) is emerging as a new practice among Public Administrations. The main aim of the project is twofold as it addresses both the private sector (SME) and the public systems (Public Administrations ). The project aims to improve the knowledge and the development of methods and tools targeted to the eco-friendly manufacturing of the textile sector within the SME and at the same time it aims at fostering the adoption of public procurement procedures complying with environmental sustainable practices. Tex-EASTile also aims to create a "Community of excellence" by promoting and consolidating knowledge exchange and developing sustainable cooperation, by the means of common methodology and shared instruments. 2 METHODOLOGY To achieve the project objectives a threefold strategy was adopted:
A) Harmonization of the operators competences and knowledge with regard to green marketing tools, so to individuate homogenous methods of application;
B) Testing of the tools in SMEs, so to increase the enterprises awareness on green approach and to promote new targeted project initiatives ;
655
14th Romanian Textiles and Leather Conference – CORTEP 2012
Sinaia, 6 - 8 September 2012
C) Enhancement of eco-sustainability principles in Public Administration internal management, so to encourage Public Administration in assuming the role of potential buyer and supporter of more favorable market conditions for the diffusion of environmentally friendly products.
All the above mentioned actions will result in the creation of a “Community of Excellence” with the participation of innovation research centers and technological institutes, SMEs, Public Administrations, universities, Chambers of Commerce, development agencies and other stakeholders. Starting from a shared and homogeneous knowledge on the theme, the Community will contribute to improve SMEs competitiveness , based on the fact that the easiest is for the eco-label to be recognized and understood, the strongest is the warranty message it communicates in terms of product high value and quality company processes The project actions are organized into three different categories : 1) Research Activities: definition of the work strategy starting from the standardization and strengthening of the partners knowledge on textile manufacturing industry and market trends, as well as Green Public Procurement in force legislation. 2) Applied Actions: definition and testing of an “Eco-Design” Handbook for SMEs taking into account eco-sustainable tools, methodologies and techniques for the Textile Industry such as: product certification, product traceability, Environmental Management System (first environmental analysis, set up of the system procedures, start up of the certification process), Corporate Social Responsibility. The Handbook contents will be diffused among SMEs and Public Administrations. 3) Network of Excellence: creation and maintenance of on line Forum and Focus Group for information exchange and diffusion on the sector technological development and normative regulation. The outputs and results capitalisation will reinforce networking between the project partners and stakeholders. 3 RESULTS AND DISCUSSION One of the aims of Tex -EASTile was to share and build knowledge among different countries. We did it through shared methodologies, working together to refine our purposes and developing joint tools, suitable for uneven backgrounds. After evening out and sharing information about the textile sector in each country, the challenge was how to shift from theory to operational work, how to move to that innovation we wanted to promote. For SMEs we tried to provide simple, clear useful information and tools. We submitted over 50 questionnaires and performed over 20 audits. The aim was to make enterpreneurs easier to understand their needs and opportunities. As regards PAs we realized we knew very little about Public Administration purchasing behavior, before talking about GPP. Laws can be in force, but GPP experience is so poor, we felt we need to better understand how does PAs approach the public purchasing, then to investigate the “green” part of it, to finally come to textiles, possibly green textiles. Due to the lack of knowledge in the area of GPP, our public tender authorities make no attempt to announce “green” requirements, as competitive (low) price is still a priority. Therefore the improvement of knowledge and education are very important. As a result of the above mentioneted problem and the lack of the customers’ knowledge about the advantages of “green” products, such products do not have an appropriate market; therefore, this should be created in the first place, as companies will not manufacture such products without sufficient demand. It is not necessary to define a “transnational tool”, as all countries involved in this project are familiar with the requirement systems that apply to products (i.e. EU ecolabel, Oeko-Tex® Standard 100) or the manufacturing process as a whole (i.e. EMAS, ISO 14001, Oeko-Tex® Standard 1000). It is a serious problem that obtaining the distinctive marks for the products and the manufacturing process requires considerable funds, because of the test and license fees on the one part and because of any necessary investments on the other part. However, SMEs are struggling to survive because of the decreased purchasing power, and there are very few projects supporting such investments. Education, as clearly shown by the “tool” created in this project, should be started with children so that a natural demand is created for green products for the future.
656
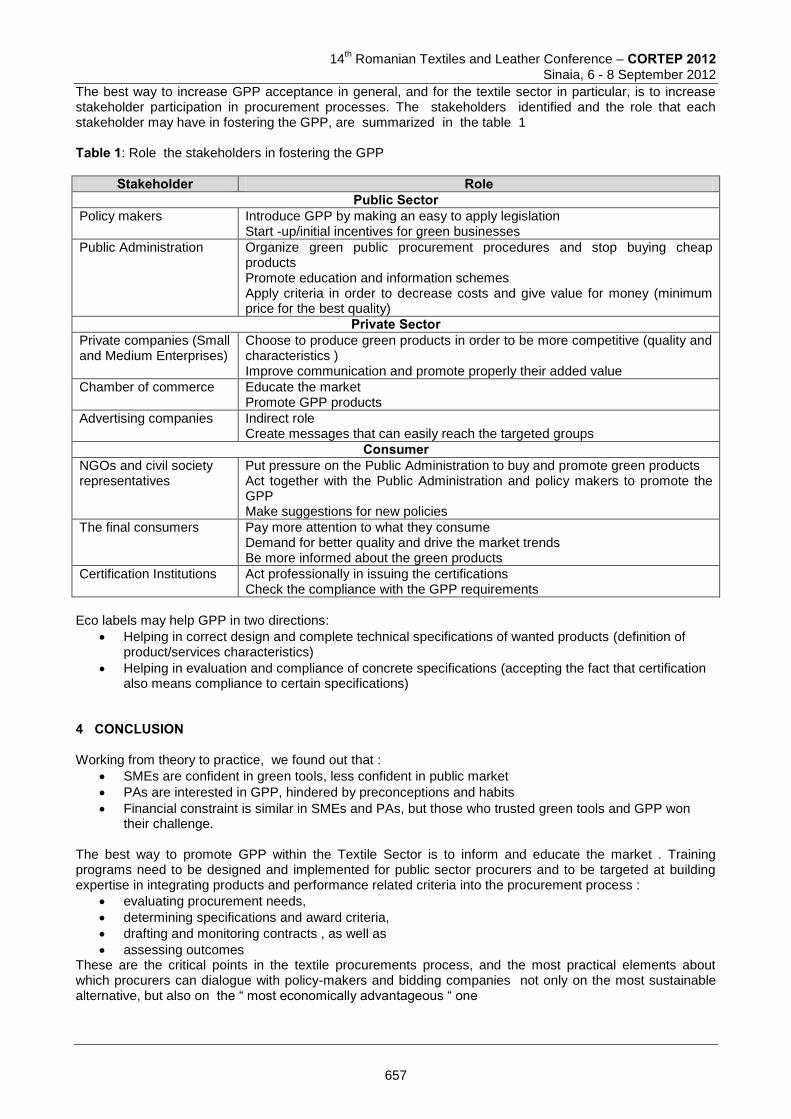
14
th Romanian Textiles and Leather Conference – CORTEP 2012
Sinaia, 6 - 8 September 2012
The best way to increase GPP acceptance in general, and for the textile sector in particular, is to increase stakeholder participation in procurement processes. The stakeholders identified and the role that each stakeholder may have in fostering the GPP, are summarized in the table 1 Table 1: Role the stakeholders in fostering the GPP
Stakeholder Role Public Sector
Policy makers Introduce GPP by making an easy to apply legislation Start -up/initial incentives for green businesses
Public Administration
Organize green public procurement procedures and stop buying cheap products Promote education and information schemes Apply criteria in order to decrease costs and give value for money (minimum price for the best quality)
Private Sector Private companies (Small and Medium Enterprises)
Choose to produce green products in order to be more competitive (quality and characteristics ) Improve communication and promote properly their added value
Chamber of commerce Educate the market Promote GPP products
Advertising companies Indirect role Create messages that can easily reach the targeted groups
Consumer NGOs and civil society representatives
Put pressure on the Public Administration to buy and promote green products Act together with the Public Administration and policy makers to promote the GPP Make suggestions for new policies
The final consumers Pay more attention to what they consume Demand for better quality and drive the market trends Be more informed about the green products
Certification Institutions Act professionally in issuing the certifications Check the compliance with the GPP requirements
Eco labels may help GPP in two directions:
Helping in correct design and complete technical specifications of wanted products (definition of product/services characteristics)
Helping in evaluation and compliance of concrete specifications (accepting the fact that certification also means compliance to certain specifications)
4 CONCLUSION Working from theory to practice, we found out that :
SMEs are confident in green tools, less confident in public market
PAs are interested in GPP, hindered by preconceptions and habits
Financial constraint is similar in SMEs and PAs, but those who trusted green tools and GPP won their challenge.
The best way to promote GPP within the Textile Sector is to inform and educate the market . Training programs need to be designed and implemented for public sector procurers and to be targeted at building expertise in integrating products and performance related criteria into the procurement process :
evaluating procurement needs,
determining specifications and award criteria,
drafting and monitoring contracts , as well as
assessing outcomes These are the critical points in the textile procurements process, and the most practical elements about which procurers can dialogue with policy-makers and bidding companies not only on the most sustainable alternative, but also on the “ most economically advantageous “ one
657
14th Romanian Textiles and Leather Conference – CORTEP 2012
Sinaia, 6 - 8 September 2012
One of the project aim was to create a COMMUNITY OF EXCELLENCE made by the relevant stakeholders of this market. But, these two players are still too far one each other, talking different languages, still having a lot to discover and to practice in green market. Tex- EASTile did a lot to bring near SMEs and PAs, but to change their way more effort is needed. Working together for 3 years, we constitute the first kernel of the Community of Excellence, improving our competences for the profit of our stakeholders. We believe a broader Community of Excellence will arise under the push of the European legislation and the requirements of a wise market, where the balance between price and quality will be recognized as the standard not the exception. 5 ACKNOWLEDGEMENTS The research leading to these results has received funding from the South East Europe Transnational Cooperation Programme , project code SEE/A/ 069 /1.1/X Project partners are: Euroimpresa (coordinator), Centro Tessile Cotoniero e Abbigliamento ( CentroCOT), Centro per lo Sviluppo Tecnologico, Energia e Competitività delle PMI della Regione Lombardia (CESTEC) , University of Chemical Technology and Metallurgy Sofia (ATDLTD) , Bulgarian Chamber of Commerce and Industry ( BCCI Sofia) , , The National Research-Development Institute for Textile and Leather ( INCDTP ) , Chamber of Commerce and Industry of Bucharest ( BCCI Bucharest), Clothing Textile and Fibre Technological Development SA ( CLOTEFI) , Hellenic Fashion Industry Association ( SEPPE) , Pannon Business Network Association ( PBNA) Pedagogical Service and Research Centre, University of West ( PSRC) , Sarajevo Economic Regional Development Agency ( SERDA)
Corresponding author : Doina TOMA Material Engineering and Textiles Process Research Department National R&D Institute for Textiles and Leather 16, Lucretiu Patrascanu, 030508, Bucharest, Romania Phone: 004021340492; Fax: 00403405515; E-mail: [email protected] Co-authors Emilia VISILEANU Material Engineering and Textiles Process Research Department National R&D Institute for Textiles and Leather 16, Lucretiu Patrascanu, 030508, Bucharest, Romania Phone: 0040213404928; Fax: 00403405515; E-mail: [email protected] Silvia POZZI Project Manager European Funded Programs Euroimpresa Legnano S.c.r.l 46, Via Pisacane, 20025 Legnano (MI), Italy Phone: 0331487210; Fax: 0331487200; E-mail: [email protected]
658
14th Romanian Textiles and Leather Conference – CORTEP 2012
Sinaia, 6 - 8 September 2012
“PRODUCTION COMPLEXIFICATION”: NEW CHALLENGES OF MANAGEMENT AND MARKETING IN TEXTILE INDUSTRY
Ion VERZEA & Gabriel-Petru LUCA
”Gheorghe Asachi” Technical University of Iasi, Romania Abstract: The present paperwork intends to be an overall analyze of the socio-economical context in which the companies have to operate today. The mentioned analyze is developed around of a genuine concept that was suggested by the authors of this paper: “Production Complexification”. That new concept starts from the premise that, at the moment, a textile firm has difficulties to decide What, How, When, and How Much have to produce! We consider that the external environment of the textile companies is increasing adverse, with more and more constraints, all these being defined by turbulent elements, which are specific to the modern and sophisticated consumer behavior. In our research we will display the main elements of textile firms’ response, elements centered on the supporting factors for an increased industrial flexibility, for “client orientated” activity, and for adapting organizational structures to the changing environment. Keywords: Production Complexification, Consumer behavior, Industrial flexibility, Marketing, Organizational management 1. THE EXTERNAL ENVIRONMENTAL CHARACTERISTICS OF TEXTILE ENTERPRISES
Romanian textile industry cannot ignore the profound changes in the world economy, currently facing an acute world crisis, which led to an unprecedented restraint of products demand. Therefore, we see around us sometimes desperate efforts of companies to produce and to survive in a hostile economic climate, which focuses more on marketing than on the direct creation of value. We believe that, in terms of textile firms in Romania, the current difficulties results from the markets world trend [1]. We find that the current Romanian businesses have competitors coming from all continents of the world. For example, on the same domestic or foreign market, a Romanian textile product can compete by other similar from India, Bangladesh or China, manufactured with a reduced cost, or can compete by other from a European country, with high image characteristics and high technical-functional features. This determinate the difficulty of finding a stable niche market where companies could define their competitive advantages [2]. In this markets world trend, the clients behavior is in a continuous evolution. Customers buy when they need or like to buy and everything depends on the prompt supply of the required product. As a natural consequence of such a context, the business’ success depends on the direct contact preservation with the company’ clients, as well as, on the building of a good, strong relationship with both, the clients, and the providers of raw materials and/or different manufacturing utilities [3]. In this way, are born the required premises both for a quick identification of the client’s needs, and for a quick feed-back concerning the features, the quantity and, the quality of the delivered products. In addition, by applying a rigorous selection procedure of its business partners, it is quite natural that the company benefits of an equal respect and treatment on behalf of its raw materials and manufacturing utilities providers. In such conditions, the success key in the textile business field lays in the right relationships setting with the firm’s clients, which means that the products fully meet the client’ expectations. The premises for a good cooperation between company and its clients start from the very contradictions displayed in Figure no. 1.
659
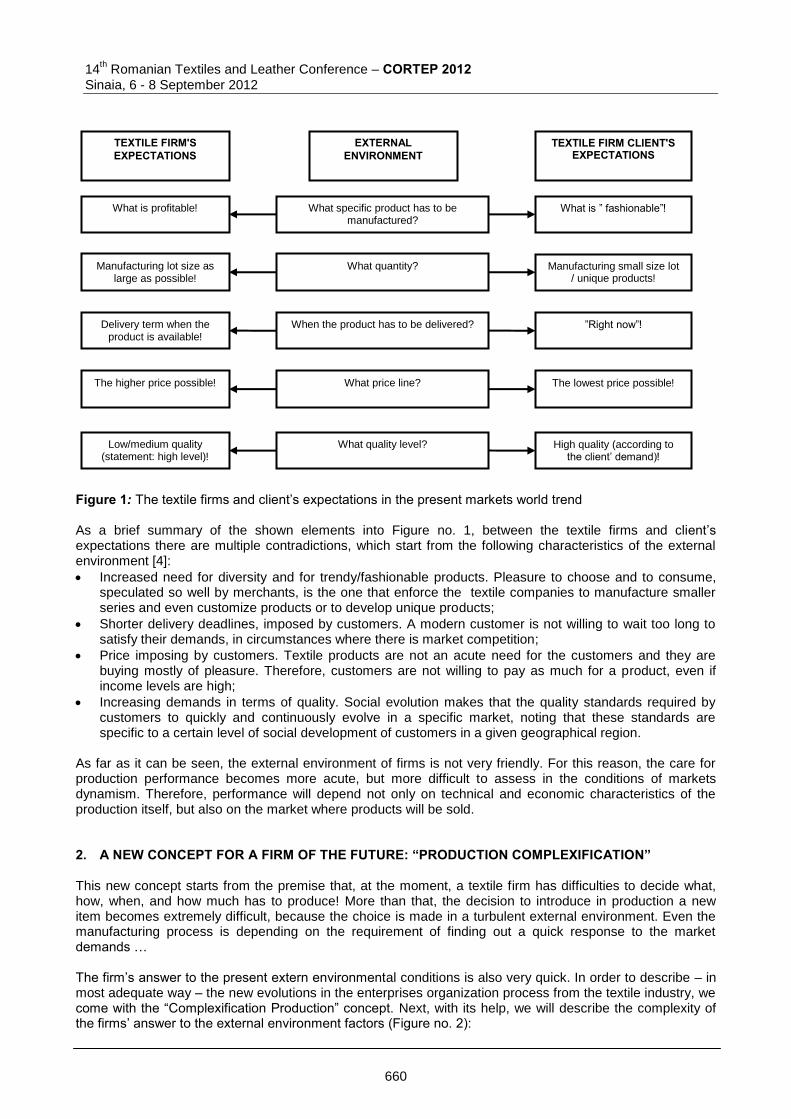
14
th Romanian Textiles and Leather Conference – CORTEP 2012
Sinaia, 6 - 8 September 2012
Figure 1: The textile firms and client’s expectations in the present markets world trend As a brief summary of the shown elements into Figure no. 1, between the textile firms and client’s expectations there are multiple contradictions, which start from the following characteristics of the external environment [4]:
Increased need for diversity and for trendy/fashionable products. Pleasure to choose and to consume, speculated so well by merchants, is the one that enforce the textile companies to manufacture smaller series and even customize products or to develop unique products;
Shorter delivery deadlines, imposed by customers. A modern customer is not willing to wait too long to satisfy their demands, in circumstances where there is market competition;
Price imposing by customers. Textile products are not an acute need for the customers and they are buying mostly of pleasure. Therefore, customers are not willing to pay as much for a product, even if income levels are high;
Increasing demands in terms of quality. Social evolution makes that the quality standards required by customers to quickly and continuously evolve in a specific market, noting that these standards are specific to a certain level of social development of customers in a given geographical region.
As far as it can be seen, the external environment of firms is not very friendly. For this reason, the care for production performance becomes more acute, but more difficult to assess in the conditions of markets dynamism. Therefore, performance will depend not only on technical and economic characteristics of the production itself, but also on the market where products will be sold. 2. A NEW CONCEPT FOR A FIRM OF THE FUTURE: “PRODUCTION COMPLEXIFICATION” This new concept starts from the premise that, at the moment, a textile firm has difficulties to decide what, how, when, and how much has to produce! More than that, the decision to introduce in production a new item becomes extremely difficult, because the choice is made in a turbulent external environment. Even the manufacturing process is depending on the requirement of finding out a quick response to the market demands … The firm’s answer to the present extern environmental conditions is also very quick. In order to describe – in most adequate way – the new evolutions in the enterprises organization process from the textile industry, we come with the “Complexification Production” concept. Next, with its help, we will describe the complexity of the firms’ answer to the external environment factors (Figure no. 2):
TEXTILE FIRM'S EXPECTATIONS
TEXTILE FIRM CLIENT'S EXPECTATIONS
What specific product has to be manufactured?
What is profitable! What is ” fashionable”!
What quantity?
Manufacturing lot size as
large as possible! Manufacturing small size lot
/ unique products!
When the product has to be delivered?
Delivery term when the
product is available! ”Right now”!
What price line?
The higher price possible! The lowest price possible!
What quality level?
Low/medium quality
(statement: high level)! High quality (according to
the client’ demand)!
EXTERNAL ENVIRONMENT
660
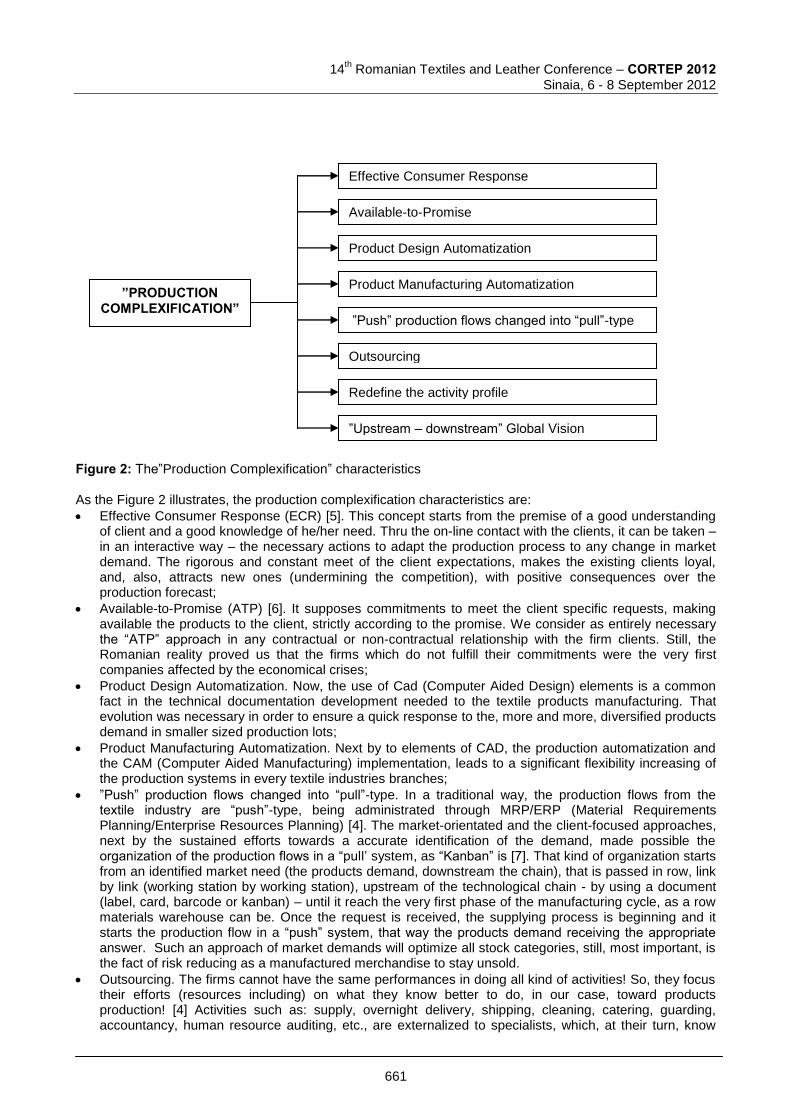
14
th Romanian Textiles and Leather Conference – CORTEP 2012
Sinaia, 6 - 8 September 2012
Figure 2: The”Production Complexification” characteristics As the Figure 2 illustrates, the production complexification characteristics are:
Effective Consumer Response (ECR) [5]. This concept starts from the premise of a good understanding of client and a good knowledge of he/her need. Thru the on-line contact with the clients, it can be taken – in an interactive way – the necessary actions to adapt the production process to any change in market demand. The rigorous and constant meet of the client expectations, makes the existing clients loyal, and, also, attracts new ones (undermining the competition), with positive consequences over the production forecast;
Available-to-Promise (ATP) [6]. It supposes commitments to meet the client specific requests, making available the products to the client, strictly according to the promise. We consider as entirely necessary the “ATP” approach in any contractual or non-contractual relationship with the firm clients. Still, the Romanian reality proved us that the firms which do not fulfill their commitments were the very first companies affected by the economical crises;
Product Design Automatization. Now, the use of Cad (Computer Aided Design) elements is a common fact in the technical documentation development needed to the textile products manufacturing. That evolution was necessary in order to ensure a quick response to the, more and more, diversified products demand in smaller sized production lots;
Product Manufacturing Automatization. Next by to elements of CAD, the production automatization and the CAM (Computer Aided Manufacturing) implementation, leads to a significant flexibility increasing of the production systems in every textile industries branches;
”Push” production flows changed into “pull”-type. In a traditional way, the production flows from the textile industry are “push”-type, being administrated through MRP/ERP (Material Requirements Planning/Enterprise Resources Planning) [4]. The market-orientated and the client-focused approaches, next by the sustained efforts towards a accurate identification of the demand, made possible the organization of the production flows in a “pull’ system, as “Kanban” is [7]. That kind of organization starts from an identified market need (the products demand, downstream the chain), that is passed in row, link by link (working station by working station), upstream of the technological chain - by using a document (label, card, barcode or kanban) – until it reach the very first phase of the manufacturing cycle, as a row materials warehouse can be. Once the request is received, the supplying process is beginning and it starts the production flow in a “push” system, that way the products demand receiving the appropriate answer. Such an approach of market demands will optimize all stock categories, still, most important, is the fact of risk reducing as a manufactured merchandise to stay unsold.
Outsourcing. The firms cannot have the same performances in doing all kind of activities! So, they focus their efforts (resources including) on what they know better to do, in our case, toward products production! [4] Activities such as: supply, overnight delivery, shipping, cleaning, catering, guarding, accountancy, human resource auditing, etc., are externalized to specialists, which, at their turn, know
”PRODUCTION COMPLEXIFICATION”
Effective Consumer Response
Available-to-Promise
Product Design Automatization
Product Manufacturing Automatization
”Push” production flows changed into “pull”-type
Outsourcing
Redefine the activity profile
”Upstream – downstream” Global Vision
661
14
th Romanian Textiles and Leather Conference – CORTEP 2012
Sinaia, 6 - 8 September 2012
very well how to perform in that field of activity. The outsourcing brings, usually, important savings to the companies budget, savings that can be assigned to the augmentation of the performances in manufacturing activity;
Redefine the activity profile. If we take as an example a company involved in the ready-made clothing industry, we will notice that the firm cannot be equally efficient in every each phase of the production flow (cutting, making, pressing), or in each needed supporting activities (technical documentation development, logistics, maintenance, quality assurance). Consequently, the firms analyze their own performance and focus the efforts and the available resources on what they know to do better (and, very important, better than the competition)! So, we can notice there are firms which redefine the activity profile of their own, focus on the technical documentation design only, or on the product quality control only, on the embroidering or on the pressing only, and, recently, there are firms focused more on cutting operations, then on confectioning ones.
“Upstream-downstream” Global Vision. The textile industry was developed around the classical and highly complex approach of the upstream inputs production flow (the source of row materials) towards the downstream outputs (B2C businesses). Each link of the technological chain - represented by different firms specialized in specific components of textile industry (such as spinning, weaving, knitting, confectioning and trading) – is influenced by the well run of the upstream-link, and, at its turn, influences the next link from downstream. A disturbance pop-up anywhere upstream or downstream of the chain will manifest itself in the same way. What really interferes in the malfunction spreading logics is the “Forrester Effect” (or the so-named “bullwhip effect”) [8], which show that the disturbance is gradually amplifying in respect with its spreading level towards the other links of the chain (like a bullwhip). It is reached the situation in which even the initial disturbing entity is disturbed again, this time much more, by the entities that already have suffered by its malfunction. Consequently, a textile firm, no matter where it is placed on the upstream-downstream chain – has to have the vision of the whole technological chain, so to be able to face, efficiently, the disturbances which can come from one way or another.
To all these elements of textile production complexification, we add the continuously reducing of the manufacturing cycles, some firms achieves the performance to get in 2-3 working days small size production lots or, even, unique products. 3. CONCLUSIONS The present paperwork shows an authors’ point of view on the textile firms’ strategic management, their daily activity being developed under the stress of a large diversity of demands and constraints, which are provided by the existing turbulences from the international markets, as well as by different aspects of the consumer behavior. In order to define this phenomenon, we have proposed a brand-new concept of “production complexification”. For an accurate description of it, the authors have used a systemic approach of different elements of the firms’ answer to the many disturbances provided by the external environment. That systemic approach that has lead to the concept definition, allows firms to find out an optimal answer to next questions: ”What, How, When, and How Much have to produce”! 4. REFERENCES: [1] Verzea, I., G.P. Luca, G.P., Manea, R. Chaib, R. The Textile Industry Production Systems Performance
Assessment in the Global Market Changes Context. Part I: Theoretical Argumentation, Proceedings of the 7
th International Conference on Management of Technological Changes, Vol. I, September 3
rd-5
th,
Alexandroupolis, Greece, 2009, pp. 757-759. [2] Verzea, I., Luca, G.P., Manea, L.R., Benidir, M. The Textile Industry Production Systems Performance
Assessment in the Global Market Changes Context. Part II. Practical research, Proceedings of the 7th
International Conference on Management of Technological Changes, Vol. I, September 3rd
-5th,
Alexandroupolis, Greece, 2009, pp. 753-756. [3] Devillard, O., Rey, D. Culture d’entreprise: un actif stratégique. Efficacité et performance collective, Ed.
Dunod, Paris, 2008 [4] Verzea, I., Gabriel, M., The Golden Triangle of the Total Productive Management , Ed. Performantica, Iasi,
2003 [5] POPA, V., ECR (Efficient Consumer Response), Ed. Economica, Bucureşti. [6] PIMOR, Y., Logistique – technique et mise en œuvre, Ed. DUNOD, Paris, 2001. [7] SHINGO, S., Maîtrise de la production et méthode KANBAN: le cas Toyota, Ed. Les Editions
d'Organisation, Paris,1992.
662
14
th Romanian Textiles and Leather Conference – CORTEP 2012
Sinaia, 6 - 8 September 2012
[8] [FORN09] FORNAS, B., L’effet «coup de fouet», une théorie économique qui explique le marasme horloger, Business Montres & Joaillerie, La Lettre Internationale Des Marchés Horlogers, 28 janvier 2009.
Corresponding author: Ion VERZEA ”Gheorghe Asachi” Technical University of Iasi Faculty of Industrial Management, Textile and Leather Engineering Department of Engineering and Management Bdul D. Mangeron, no. 53 700050 – Iasi; Romania E-mail: [email protected]
Co-author: Gabriel-Petru LUCA ”Gheorghe Asachi” Technical University of Iasi Faculty of Industrial Management, Textile and Leather Engineering Department of Engineering and Management Bdul D. Mangeron, no. 53 700050 – Iasi;Romania E-mail: [email protected]
663
14
th Romanian Textiles and Leather Conference – CORTEP 2012
Sinaia, 6 - 8 September 2012
THE STRATEGIC MANAGEMENT OF THE “PRODUCTION-QUALITY-MAINTENANCE” TRIPLET
Ion VERZEA1, Gabriel-Petru LUCA 1& Rachid CHAIB 2
1 “Gheorghe Asachi” Technical University of Iasi, Romania
2 Mentouri University of Constantine, Algeria
Abstract: In a classical approach, the management of a production system has to allow, on the one hand, a proper assignment of resources (people, time, money, information) to different kind of activities, and, on the other hand, an accurate planning of production flows. According to the organizational logics, the “engine” of firm` performances increasing will be represented by the production function, which, at its turn, is supported by the “Quality” and “Maintenance” functions. This paperwork - a direct result of the practical experience gained through time by our team in the technical-economic analysis process of the production systems - has as main objective to show a genuine approach of production system management, throughout the setting of some overall strategies applied to the “Production-Quality-Maintenance” triplet. These strategies will define the fields of action and responsibility for each area of above-mentioned triplet, as well as the common responsibilities and the interrelationships among them. Keywords: Production Management, Quality Management, Maintenance Management, Production-Quality-Maintenance Triplet, Strategic Management 1. THE PRODUCTION – QUALITY – MAINTENANCE MANAGEMENT: A REAL FACT! If we should try to find out the answer to the question “Who is the key-player of the industrial business’ success?” the answer will certainly depend on the respondent:
the firm’ manager will argue that he/she is the responsible for the smooth run of manufacturing, including the objectives achievement and the overall right run of the enterprise;
the quality assurance’ manager will take the credits on his/her account as a “guardian” of the warrant that all the demands will be met accordingly to the product’ technical specifications [1];
the maintenance’ manager will consider, on good reasons, that without perfectly operational equipments, and kept in a functional state, in every moment, any production and/or quality purpose becomes, from the beginning, an impossible task to achieve.
In such a case it seems that all of them are right… So, what really is happening? If the production system functioning would be ideal, the answer would be easy to find out: to organize the production system in distinct entities for each mentioned function (production, quality, maintenance), considered by us as being the “PQM Triplet”, because that will allow:
A proper assignment of all resources (people, time, money,…) to different kind of activities;
A right personnel specialization (as production, quality, maintenance operator) accordingly to each specific work task, developing the supportive framework for “highest performance to every work station”;
An accurate planning of production flows accordingly to the products’ manufacturing logics;
A realistic hierarchy of all decisional factors, in which the “engine” will be represented by the production function.
This should be the description of flawlessly logics for the production organizing process, in which the “Production”, “Quality” and “Maintenance” functions ensure a good run of the manufacturing activities. But the reality shows that in a production system we cannot find any ideal element, because, in an enough long while:
No firm did succeed to achieve the goal of “zero defects”;
The equipments do not have any ideal component inside (they go out of order and wear down);
664
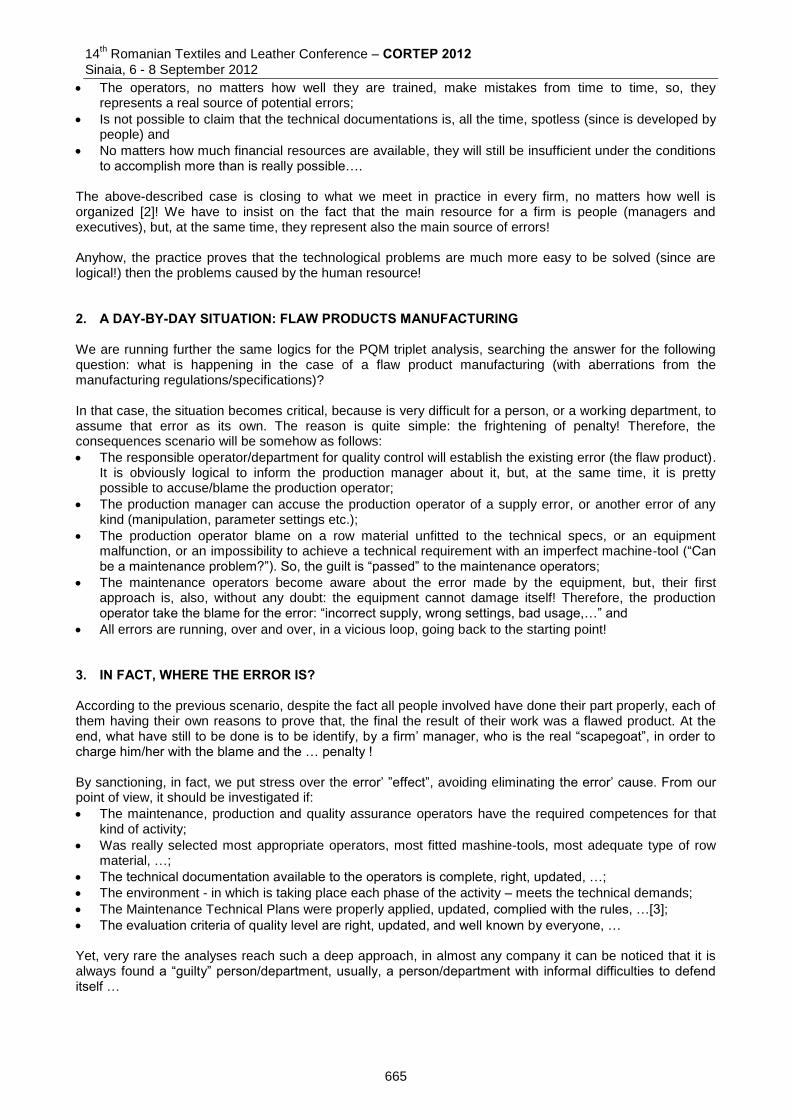
14th Romanian Textiles and Leather Conference – CORTEP 2012
Sinaia, 6 - 8 September 2012
The operators, no matters how well they are trained, make mistakes from time to time, so, they represents a real source of potential errors;
Is not possible to claim that the technical documentations is, all the time, spotless (since is developed by people) and
No matters how much financial resources are available, they will still be insufficient under the conditions to accomplish more than is really possible….
The above-described case is closing to what we meet in practice in every firm, no matters how well is organized [2]! We have to insist on the fact that the main resource for a firm is people (managers and executives), but, at the same time, they represent also the main source of errors! Anyhow, the practice proves that the technological problems are much more easy to be solved (since are logical!) then the problems caused by the human resource! 2. A DAY-BY-DAY SITUATION: FLAW PRODUCTS MANUFACTURING We are running further the same logics for the PQM triplet analysis, searching the answer for the following question: what is happening in the case of a flaw product manufacturing (with aberrations from the manufacturing regulations/specifications)? In that case, the situation becomes critical, because is very difficult for a person, or a working department, to assume that error as its own. The reason is quite simple: the frightening of penalty! Therefore, the consequences scenario will be somehow as follows:
The responsible operator/department for quality control will establish the existing error (the flaw product). It is obviously logical to inform the production manager about it, but, at the same time, it is pretty possible to accuse/blame the production operator;
The production manager can accuse the production operator of a supply error, or another error of any kind (manipulation, parameter settings etc.);
The production operator blame on a row material unfitted to the technical specs, or an equipment malfunction, or an impossibility to achieve a technical requirement with an imperfect machine-tool (“Can be a maintenance problem?”). So, the guilt is “passed” to the maintenance operators;
The maintenance operators become aware about the error made by the equipment, but, their first approach is, also, without any doubt: the equipment cannot damage itself! Therefore, the production operator take the blame for the error: “incorrect supply, wrong settings, bad usage,…” and
All errors are running, over and over, in a vicious loop, going back to the starting point! 3. IN FACT, WHERE THE ERROR IS? According to the previous scenario, despite the fact all people involved have done their part properly, each of them having their own reasons to prove that, the final the result of their work was a flawed product. At the end, what have still to be done is to be identify, by a firm’ manager, who is the real “scapegoat”, in order to charge him/her with the blame and the … penalty ! By sanctioning, in fact, we put stress over the error’ ”effect”, avoiding eliminating the error’ cause. From our point of view, it should be investigated if:
The maintenance, production and quality assurance operators have the required competences for that kind of activity;
Was really selected most appropriate operators, most fitted mashine-tools, most adequate type of row material, …;
The technical documentation available to the operators is complete, right, updated, …;
The environment - in which is taking place each phase of the activity – meets the technical demands;
The Maintenance Technical Plans were properly applied, updated, complied with the rules, …[3];
The evaluation criteria of quality level are right, updated, and well known by everyone, … Yet, very rare the analyses reach such a deep approach, in almost any company it can be noticed that it is always found a “guilty” person/department, usually, a person/department with informal difficulties to defend itself …
665
14
th Romanian Textiles and Leather Conference – CORTEP 2012
Sinaia, 6 - 8 September 2012
4. WHAT THE CONSEQUENCES ARE FOR SUCH A SITUATION? Because their complexity, the consequences are pretty difficult to be described, yet, based on numerous cases met in the managerial practice, we can synthesizes the following:
We can notice an “escape” attempt from responsibility at the operator’s level, trend which becomes more obvious when the penalty regulation is harsher;
In order to avoid the sanctions, the operators ask – for any further action – for the approval from the direct supervisor;
The managers from the lower hierarchical levels ask, at their turn, for confirmations/approvals from their superiors in any case they have something to do;
The responsibilities are “passed”, every time possible, to the upper hierarchical levels. The managers find themselves, generally, in the situation to allocate a lot of time to the operational aspects of their activity, and less to the forecast activity, planning and strategic management;
The production processes become more and more birocratical, any action being accompanied by a specific document. Many times, for a manager, it can be reached a daily status in which the formal aspects of an activity become more important than the outcome itself.
Added to above-mentioned, we can notice another consequences category related to the errors made in the production-quality-maintenance activities, this time to the human resources level:
The existence into firm of an “informal” organizational structure (in parallel to the “formal” one). People make alliances not according to the functional criteria, but on the basis of personal interest, personal bonds (relatives bonds), subjective common objectives (totally different from the corporative objectives they are pay for …), etc.;
Thus, it is reach an organizational status equivalent to a “clan”-type structure (production operator’s clan, quality assurance operator’s clan, logistics operator’s clan, etc
The communication process among all these clans is strongly affected, becoming limited only to the basic formalism of the informational links of production activity;
A clan starts to become “dominant” by comparison to the other clans, on the criteria related to the individuals’ personality. The members of such a clan will never be find guilty for an error;
Another clan will be “dominated”, being always found responsible for the inherent errors of the production activity.
We would like that “state of fact” to stay just a story about the way how “once upon of time …” a production system was organized! Unfortunately, that still is a now-a-days story … 5. A NEW STRATEGY: THE INTEGRATION OF P-Q-M FUNCTIONS Still, in the situations previously displayed, where the truth is? From our point of view, somewhere between … just because the next reasons:
From a theoretical point of view, if we shell succeed to bring into firm the best operators for the PQM functions, the firm should become a “leader” in the product’ production [4];
Yet, from the practical point of view, we never ever succeed to do that, the success of the production system will depend on the smooth cooperation among the members of those tree functions
At this point, the existing “synergy” intervenes among the members inside of each workgroup, as well as, among the different workgroups;
Managers are responsible for cohesion’s building-up and preservation among both the teams’ members and different workgroups.
Consequently, we appreciate that, for an enterprise modern management, all these three functions (Production-Quality-Maintenance) cannot be organized as apart operating entities! More than that, it is necessary to integrate all these in one system that will ensure, at the same time, autonomy and cooperation. The suggested pattern is as follows (Figure 1):
666
14th Romanian Textiles and Leather Conference – CORTEP 2012
Sinaia, 6 - 8 September 2012
Figure 1: The Integration of “Production-Quality-Maintenance” Functions The integration pattern of P-Q-M functions, displayed in the Figure no. 1, is based on the precise delimitation of following cooperation/autonomy zones:
Individual autonomy zones, assigned to PQM specific functions accomplishment;
Individual cooperation zones for each function in relationship with the other remaining functions of the triplet (P/C, M/Q, P/M);
A common responsibility zone for all three functions, named, by us, as (PQM Integration Zone).
In this peculiar working manner, it can be properly defined both the own individual responsibilities and the common responsibilities for each function separately. More, we are thinking to the need for some common strategies, targeting the accomplishment of the mutual objectives of the production system … The integration pattern we have established comes to meet another current problem of the production management: what basic qualification the managers of these three functions should have? Our findings, from the Romanian socio-economical environment, show that the educational system does not provide – in a “pure” state of training - any kind of qualification such as “production manager”, “quality assurance manager”, or “maintenance manager”. The “engineer” attribute does cover, throughout the required competences, only partially these three functions, and the “master” specializations are able to solve, also partially, one or other necessary competences. Thus, it becomes obvious the need to define a new management function in the modern companies: the “P-Q-M Manager” specially prepared to take in his/her charge the common responsibility of all three functions. Finally, but not necessarily the last issue is the need for new study programs specially developed to train these managers … 6. CONCLUSIONS Our present research starts from the existing case’ criticism in the organizing – as distinct entities – of the “Production”, “Quality” and “Maintenance” functions, a real fact encountered in most industrial enterprises. In order to eliminate the identified drawbacks – related especially to the recognized manufacturing errors – it was recommended an integrated approach of above-mentioned functions, by defining the “”PQM Triplet. From the strategic point of view, it was suggested an integration pattern which allow defining the limits between the individual autonomy and the common responsibility for each PQM function. 7. REFERENCES: [1] Verzea, I. The 5S of Manufacturing and Quality Management: A New Challenge for Textile Enterprises
?, Textile Industry, No.3/2008, p. 125-130 [2] Verzea, I, Luca, G.P., Manea, L.R., Lazarescu, R.P., The TPM In Romania – Future Approaches,
Proceedings of the 4th International Conference on the Management of Technical Change, Chania, Greece, 2005, p. 137-142
[3] Verzea, I.; Gabriel, M., Luca, G. P., The Safety Breakeven Point - Strategic Tool of Maintenance Management, Proceedings of the 3th International Conference on the Management of Technical Change, Chania, Greece, 2003, p. 273-278
[4] Gallaire, J.M., Les outils de la performance industrielle, Ed. Eyrolles, Paris, 2008
PRODUCTION
QUALITY
MAINTENANCE
Autonomy Zone Q
Cooperation Zone P/Q
Cooperation Zone M/Q
Autonomy Zone P
Cooperation Zone P/M
Autonomy Zone M
P - Q – M Integration Zone
667
14
th Romanian Textiles and Leather Conference – CORTEP 2012
Sinaia, 6 - 8 September 2012
Corresponding author: Ion VERZEA ”Gheorghe Asachi” Technical University of Iasi Faculty of Industrial Management, Textile and Leather Engineering/ Department of Engineering and Management Bdul D. Mangeron, no. 53 700050 – Iasi; Romania E-mail: [email protected]
Co-author: Gabriel-Petru LUCA ”Gheorghe Asachi” Technical University of Iasi Faculty of Industrial Management, Textile and Leather Engineering/ Department of Engineering and Management Bdul D. Mangeron, no. 53 700050 – Iasi;Romania E-mail: [email protected] Rachid CHAIB Department of Mechanical Engineering, Faculty of Engineering, Mentouri University of Constantine Address of Institution: B.P. 325 Route Ain El Bey 25017, Constantine, Algeria E-mail: [email protected]
668
14th Romanian Textiles and Leather Conference – CORTEP 2012
Sinaia, 6 - 8 September 2012
WHY THE ROMANIAN TEXTILE SMEs` HAVE TO BECOME MORE THAN FLEXIBLE, TO BECOME AGILE
Gabriel-Petru LUCA , Ion VERZEA & Irina COZMÎNCĂ
“Gheorghe Asachi” Technical University of Iasi, Romania Abstract: In the framework of a global economy crisis, the statistics seem to prove that flexibility is no longer enough in order to avoid troubles. The Romanian Textile SMEs are found themselves in a deeper … trouble. Most of them have not their own recognized international brand; therefore they have not their own international market, being strongly dependent on the other foreign producers. The present paperwork shows the reasons for the Romanian Textile SMEs to change direction of their approach and start the efforts to become agile. Also, the authors will underline the tools needed to be used – such as the ERP (Enterprise Resources Planning) and GT (Group Technology) - and, as well as, the ways and concepts (customization and e-commerce) to put them to work, in order to ensure the present survival and, mostly, the further development of economical activities. Keywords: Agility, Global Economy Crisis, Customization, E-Commerce, ERP, GT. 1. SOME PRESENT EUROPEAN ECONOMICAL FEATURES Many years – almost the past 5 decades - the global economy increased continuously, excepting several short and almost local “hiccups”. The economic landscape was well set, the firms and the entrepreneurs were walking on “solid ground”. But the year 2008 has arrived. Most market players start, slowly, one by one, to realize that something is wrong. Their activities, based on - so successfully until now - flexibility approach, seems to work no so well as before. The “happy times” are over. The year 2008 brings a real nightmare for everyone involved in business: a baby crisis. What is new? Unfortunately the crisis itself: the baby is growing old rapidly and it does not look like the crisis of the 20’s. It is totally different. It is, obviously, something else. Why it is obvious? Because not only the market players are confused, but also the governments are, they really do not know how to deal with this specific crisis. Different governments mean different approaches. But who knows when these policies will show their benefits? If are any! None is able now to predict even how long will last this crisis. They say about 2-3 years, but also 10 years. And, how it will evolve? Another riddle! On the other hand, there are a group of several European countries (PIIGS – Portugal, Ireland, Italy, Greece, and Spain) which raise a serious question mark about the future of Europe Union as a whole. When the powerful countries in Europe are still in recession or, such as Germany – the European “locomotive”, benefits of a small rate of economical increasing, how – and for how long – can they help the countries less powerful? If they are debating on macroeconomic policies, the actors, especially the small ones, at microeconomic level are left alone. They are running out of time, of clients, and, finally, of financial resources as well. The SME’s cannot afford to wait for a macroeconomic solution. They have to help themselves somehow [6]. 2. A POSSIBLE SHAPE OF THE NEXT FUTURE BUSINESS ENVIRONMENT Added to the general European recession, a very stressful situation is now provided by the Greece political end economical evolution, which can withdraw from the euro currency zone, and, more, from the European Union. The costs of such a scenario are quite difficult to estimate, but, sure, they are big. Therefore, taken into account also the features mentioned at §1, the future becomes cloudy and, most important, pretty enough unpredictable:
Economic growth – even a small one – uncertain for most countries; Firms’ expansion - on new emerging markets – very limited; Macroeconomic indicators – discouraging for new and large investments; National currencies, euro included - of the main economic powers - relatively fluctuant; Banking system – unreliable and unaffordable for many, firms and individuals;
669
14th Romanian Textiles and Leather Conference – CORTEP 2012
Sinaia, 6 - 8 September 2012
Population purchasing power – a constant decrease as well, or, in the best scenario, stationary; If the European economical context is so business adverse, how can it be for the Romanian textile SMEs? 3. THE NOW-A-DAYS ROMANIAN TEXTILE SMES STATUS The NIS (National Institute of Statistics) shows that about 90-95% of Romanian textile enterprises are running in “loan” system. This means that the local producers involved in the textile field of activity are strongly dependent on foreign producers which have their own international markets. There are many reasons for such an undesired status, reasons which can be split into 2 main categories issues: macro and microeconomic. Macroeconomic issues (in fact, real threats): High level of taxes (fiscal legislation) especially on labor and VAT; A much too fluctuant fiscal legislation which makes futile any business plan; Time consuming for taxes payment; High level of burocracy and corruption; Increased degrees of fiscal evasion and underground economy (illegal competition); Austerity policies (reduced wages and pensions) which lead to a continuously shrinking local market; Microeconomic issues (weaknesses): Very limited financial resources (undercapitalization); Small capabilities for investments (in high technology, in design and, especially, in marketing); Relative small production capacity (for medium sized and large markets); Lack of notoriety and reliability (that means no brand) Also, the NIS underlines that over 70% of Romanian exports are realized towards EU countries. So, added to local problems are European economic problems. Yet, same feature above-mentioned can be used as leverage for a good change. As EU member, Romania benefit of no custom taxes (duty free) and, at the same time, it has fully access to large European markets (such as Great Britain, France, Germany, even Switzerland – despite the fact it a non-EU country) with much greater absorption capacity than the Romanian market. 4. FLEXIBLE OR AGILE: A POSSIBLE INSPIRED CHOICE In the almost last five decades, a trend, initially, has become general rule of successfully development of firms, despite their activity - goods or services production and delivery: the flexible approach. Many reasons have required to enterprises, small or large, to run under the flexibility “umbrella”, one of these reasons being related to the market demand: a more and more increasing diversity of product portfolio. That meant the “sunset” for the mass production, and, by consequence, the disappearance of included huge benefits for the producers: a quick and pretty comfortable recover of their investment at low production costs. Step by step, the global merchandise transactions volumes were shifted to medium, small and, even, very small production features, not more than 20 percents of global transactions of goods being nowadays specific to a large and a mass production. For almost any firm to become “flexible” is the equivalent of becoming successfully, the activities based on old and traditional product “recipes” being excepted, obviously. By ensuring the flexibility of their manufacturing processes or overall activity, the firms were able to find a convenient balance between two contradictory objectives: the largest variety of their outputs at the lowest possible production costs [6]. In short, flexibility is the system (firm, machine, activity) capability to adapt itself efficiently – from a technical, technological, and/or organizational point of view - in a short time and with low costs, to new production tasks, in order to meet the new market demands. If the “flexibility” it seems do not work anymore or – at least – as well as before, what else can be put instead? Some do believe that is time for “agility” philosophy and practical approach of the firms’ activities. So do us [6]. A vital objective of our days – and, perhaps, of days will come - is to adapt the production and the market approach in order to survive in an unpredictable ever-changing and turbulent economical environment in a global crisis. A real solution is rising as a global solution for market players: “agility”. At its turn, briefly, agility does the same thing as flexibility, but at a greater scale, and, this is the main difference, with an increased forecast capability concerning the future evolution of the relevant market indicators. In other words, the agility is the system capability to be highly flexible under the constraints of a turbulent market. So, in fact, the
670
14
th Romanian Textiles and Leather Conference – CORTEP 2012
Sinaia, 6 - 8 September 2012
difference between flexibility and agility lays not so much in the operating manner of these two concepts or approaches, but in the operating levels due to nature of the environment (market). Practically, flexibility operates well on a predictable market, and the agility makes an organization able to face the challenge of a turbulent market. A turbulent market is described by a highly level of dynamism and a low level of predictability, both levels concerning the environmental composition key-factors. The agile enterprise is more than an opportunistic business and/or an innovative one. It has to prove a proactive leadership able to make the firm adaptable enough to transform itself proficiency into whatever the environmental business require. The essence of agile concept can be reduced at staying in business on an ever-changing marketplace [6]. To manage change and to compete in a rapidly changing business world are emerging under the concept of the agile enterprise. Agile organizations can be almost any size or type, but what distinguishes them from the traditional business is the ability to anticipate the change and to react quickly [3, 4]. The Small and Medium Size Enterprises may have many liabilities (under-capitalization, limited manufacturing capacity, lack of different resources to overcome unpredicted crisis and so on), but they have an obvious important advantage: a highly level of mobility. That means that the small companies, by their own nature, are quite agile. Why not take advantage of this specific feature for SME`s and start a not very expensive process of augmentation? How the firms can become agile? By putting together to work several operating tools, many of them being already well-known. 5. HOW THE ROMANIAN TEXTILE SMES CAN PUT THE AGILITY’S TOOLS AT WORK According to the analysis done at §3, it is obvious that, excepting a sustained lobby at the macroeconomic level, the SMEs can quickly do something good only at microeconomic level. Since being agile means being a master of present and, especially, future change, through the proficient capabilities of high self-adaptation and quick response to the changing market demands, a customer-focused company has a set of tools to implement in its own activity. These tools, specific to every enterprise function, are displayed below:
For Corporate Management – a proactive leadership with excellent viability and CIM (Computer Integrated Manufacturing) approach, based on agile information system and a quick making-decision system as well;
For Human Resource – training programs in agile methods and techniques; For Manufacturing Process – a JIT (Just In Time), CAGT (Computer Aided Group Technology), or,
better, ERP (Enterprise Resource Planning)– approach, and, where is possible, highly adaptable (agile) production systems (such as agile fixtures, machines, cells, assembly lines);
For Product Design - a CAD (Computer Aided Design) approach focused on client perception of value; For Marketing – a developed feed-before Informational System of gathering data, by using new and
relevant aggregate indicators for the market composition key-factors; For Financial-Accountancy – low fixed operational costs approach [1, 2, 5].
How much of each tool is needed at any time is a relative question - relative to the dynamics of the competitive operating environment. What is really important, all the time, is to have an agile information system. That means to be able to collect environmental data rapidly and to set the trend of the future complete change [6]. Of course, for micro-enterprises (no more of 9 employees) and small firms (until 25 employees) most of the above mentioned tools are much too expensive or, even, impossible to apply. So, for such a firms, more available and with a quick visible effect are several general valid approaches, which if they will be take into account will help many Romanian SMEs to ensure their economical survival and, later, step-by-step, to become less dependent to the “loan” system. Now-a-days, a set of marketing concepts proved themselves, worldwide, as success-keys for a business. This set includes next two important concepts: handmade manufactured production and customized products. For the low-tech Romanian textile SMEs those two concepts are – by nature – already operational. Adding to that the consistent impact of the concepts of e-marketing, e-commerce and e-business, we have a picture of an alternative kind of business for any interested firm, alternative that can operate in parallel with the main-stream of activity. What is required more is the need, implicit the firm’s concern, to create an on-line real brand. This way, for the beginning, the Romanian textile SMEs have direct access to a large market, they can control perfectly the sales volume (according to their own existing production capacity), and, very important, will act under a personal brand. In time, after the firms will learn and succeed to consolidate their brand, and, consequently, will accumulate enough capital, they can start to use the on-line brand for a physical presence and distribution on the international markets.
671
14th Romanian Textiles and Leather Conference – CORTEP 2012
Sinaia, 6 - 8 September 2012
6. CONCLUSIONS Due to the present very harsh economical context, national and international as well, and, at the same time, due to the future predictable strong constraints, the Romanian Textile SMEs have to try to take advantage from “Agility” concept approach. Being, on the one hand – by nature - agile, and, on the other hand, mostly low-tech, the SMEs has the opportunity to operate under a brand of their own on a large market, the EU one, by putting to work the concepts of handmade manufactured production and customized products, and by using a very modern tool: the virtual shop. In other words, all they have to do is to use the present weaknesses as future strong points. Also, creating now an on-line brand it will be possible to use it as a stepping-stone for a future well-recognized brand for a physical presence and distribution on the international markets. Thus, the Romanian textile SMEs will be able to give up to the development-restricted “loan” system and to become independent producers, operating on their own international markets. But, for the moment, they have a strong chance to survive and to overcome the crisis. 7. REFERENCES: [1] Desouza, K. (2006), Agile Information System. Conceptualization, Construction, and Management,
Butterworth Heinemann, USA. [2] Dove, R. (1999), Agile System Principles. Design Principles for Higly Adaptable Business System with
Tangible Manufacturing Examples, Maynard’s Industrial Handbook, McGrawHill, USA. [3] Dove, R. (2001), Response Ability. The Language, Structure and Culture of the Agile Enterprise, John
Wiley & Sons, USA. [4] Goranson, H.T., (1999), The Agile Virtual Enterprise: Cases, Metrics, Tools, Greenwood Publishing
Group, USA. [5] Gratham, C., Ware, J., Williamson, C., (2007), Corporate Agility: A Revolutionary New Model for
Competing in a Flat World, AMACOM, USA. [6] Luca G.P., Verzea I., Manea L.R., “Agility”: A Global Buzz World or a Global Working Concept for a
Global Economy Crisis?, MCT 2009, Vol. I, September 3rd
-5th, Alexandroupolis, Greece, 2009, pp. 245 -
250 Corresponding author: Gabriel-Petru LUCA The”Gheorghe Asachi” Technical University of Iasi Faculty of Industrial Management, Textile and Leather Engineering/ Department of Engineering and Management Bdul D. Mangeron, no. 53 700050, Iasi, Romania E-mail: [email protected] Co-authors: Ion VERZEA The”Gheorghe Asachi” Technical University of Iasi Faculty of Industrial Management, Textile and Leather Engineering/ Department of Engineering and Management Bdul D. Mangeron, no. 53 700050, Iasi, Romania E-mail: [email protected] Irina COZMÎNCĂ The”Gheorghe Asachi” Technical University of Iasi Faculty of Machine Manufacturing and Industrial Management/ Department of Machine Tools Bdul D. Mangeron, no. 39 700050, Iasi;Romani E-mail: [email protected]
672
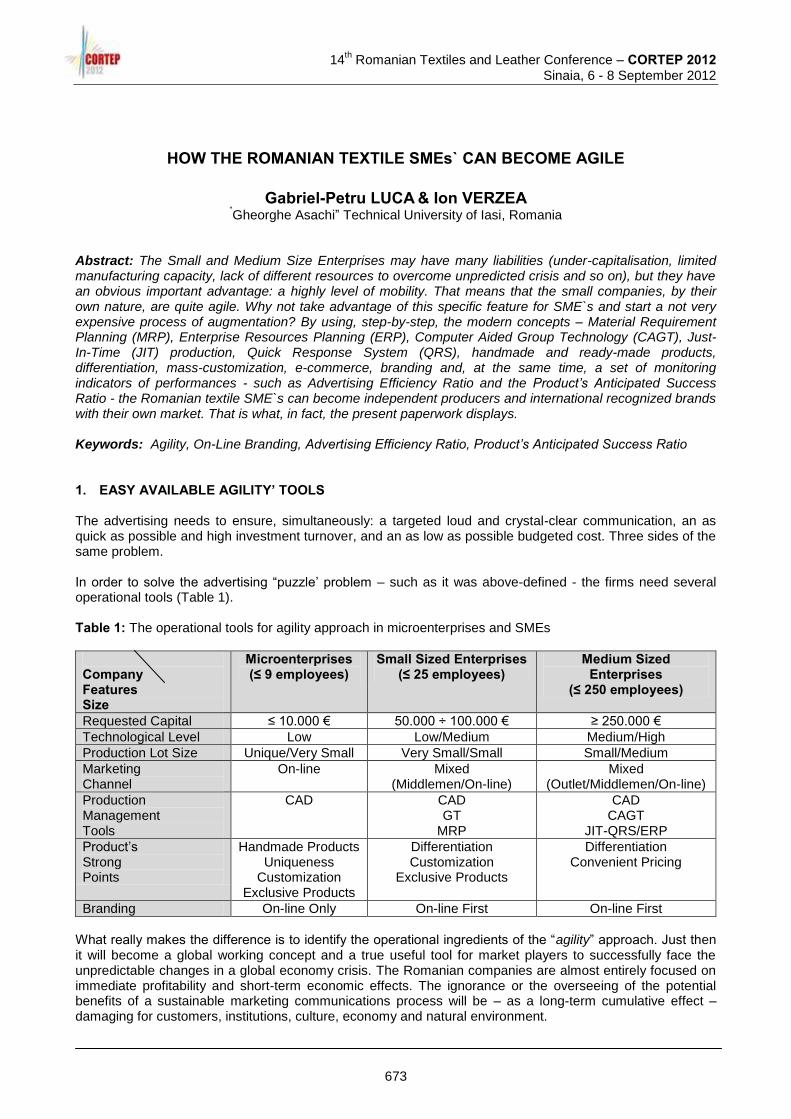
14
th Romanian Textiles and Leather Conference – CORTEP 2012
Sinaia, 6 - 8 September 2012
HOW THE ROMANIAN TEXTILE SMEs` CAN BECOME AGILE
Gabriel-Petru LUCA & Ion VERZEA “Gheorghe Asachi” Technical University of Iasi, Romania
Abstract: The Small and Medium Size Enterprises may have many liabilities (under-capitalisation, limited manufacturing capacity, lack of different resources to overcome unpredicted crisis and so on), but they have an obvious important advantage: a highly level of mobility. That means that the small companies, by their own nature, are quite agile. Why not take advantage of this specific feature for SME`s and start a not very expensive process of augmentation? By using, step-by-step, the modern concepts – Material Requirement Planning (MRP), Enterprise Resources Planning (ERP), Computer Aided Group Technology (CAGT), Just-In-Time (JIT) production, Quick Response System (QRS), handmade and ready-made products, differentiation, mass-customization, e-commerce, branding and, at the same time, a set of monitoring indicators of performances - such as Advertising Efficiency Ratio and the Product’s Anticipated Success Ratio - the Romanian textile SME`s can become independent producers and international recognized brands with their own market. That is what, in fact, the present paperwork displays. Keywords: Agility, On-Line Branding, Advertising Efficiency Ratio, Product’s Anticipated Success Ratio 1. EASY AVAILABLE AGILITY’ TOOLS The advertising needs to ensure, simultaneously: a targeted loud and crystal-clear communication, an as quick as possible and high investment turnover, and an as low as possible budgeted cost. Three sides of the same problem. In order to solve the advertising “puzzle’ problem – such as it was above-defined - the firms need several operational tools (Table 1). Table 1: The operational tools for agility approach in microenterprises and SMEs
Company Features Size
Microenterprises (≤ 9 employees)
Small Sized Enterprises (≤ 25 employees)
Medium Sized Enterprises
(≤ 250 employees)
Requested Capital ≤ 10.000 € 50.000 ÷ 100.000 € ≥ 250.000 €
Technological Level Low Low/Medium Medium/High
Production Lot Size Unique/Very Small Very Small/Small Small/Medium
Marketing Channel
On-line Mixed (Middlemen/On-line)
Mixed (Outlet/Middlemen/On-line)
Production Management Tools
CAD CAD GT
MRP
CAD CAGT
JIT-QRS/ERP
Product’s Strong Points
Handmade Products Uniqueness
Customization Exclusive Products
Differentiation Customization
Exclusive Products
Differentiation Convenient Pricing
Branding On-line Only On-line First On-line First
What really makes the difference is to identify the operational ingredients of the “agility” approach. Just then it will become a global working concept and a true useful tool for market players to successfully face the unpredictable changes in a global economy crisis. The Romanian companies are almost entirely focused on immediate profitability and short-term economic effects. The ignorance or the overseeing of the potential benefits of a sustainable marketing communications process will be – as a long-term cumulative effect – damaging for customers, institutions, culture, economy and natural environment.
673
14th Romanian Textiles and Leather Conference – CORTEP 2012
Sinaia, 6 - 8 September 2012
Directly related to a sustainable marketing communication there are some basics rules to be kept in view by the companies which try to become greener and/or to promote ecological products [1]:
To present with accuracy the positive environmental features of the product; To avoid the – directly or indirectly - delusion of the consumer regarding the real eco-
performances of the product; To demonstrate the truth of their claims concerning the ecological characteristics of the product; To emphasize the consumer’s contribution to the environment preservation by using the product.
Concerning the agility concept, this is the system capability to be highly flexible under the constraints of a turbulent market. So, in fact, the difference between flexibility and agility lays not so much in the operating manner of these two concepts or approaches, but in the operating levels due to nature of the environment (market). Practically, flexibility operates well on a predictable market, and the agility makes an organization able to face the challenge of a turbulent market. A turbulent market is described by a highly level of dynamism and a low level of predictability, both levels concerning the environmental composition key-factors. The agile enterprise is more then an opportunistic business and/or an innovative one. It has to prove a proactive leadership able to make the firm adaptable enough to transform itself proficiency into whatever the environmental business require. The essence of agile concept can be reduced at staying in business on an ever-changing marketplace. To manage change and to compete in a rapidly changing business world are emerging under the concept of the agile enterprise. Agile organizations can be almost any size or type, but what distinguishes them from the traditional business is the ability to anticipate the change and to react quickly. Businesses from an industry in trouble are not prepared at all to face the future climax of the crisis, predicted to happen in 2013. About a 25-30% textile industry decline in 2009, according to a forecast made by FEPAIUS (Romanian Employers’ Federation from Textile Industry), and the decline in 2010-2011 recorded an average of another 15% says National Institute of Statistics. How the firms can become agile? By putting together to work several operating tools mentioned in Table 1, and, for medium sized ones, by monitoring the tools' evolution through a set of indicators such as Total Flexibility Degree and Distribution Efficiency Ratio, next by two new aggregate indicators: the Advertising Efficiency Ratio and the Product’s Anticipated Success Ratio.
2. AGILITY’ INDICATORS FOR MEDIUM SIZED ENTERPRISE’S PERFORMANCES Next, will be detailed two new aggregate indicators useful in agility’ monitoring: the Advertising Efficiency Ratio and the Product’s Anticipated Success Ratio.
Advertising Efficiency Ratio (GAER ):
C
VC = G
R
vtprAER
100
1 (1)
where:
tprC - is the time factor for the advertising design process ( 1);
tprC = 1 (if the advertising campaign’s design process does not overcome the assigned time limit);
tprC 1 (if the advertising campaign’s design process overcomes the assigned time limit. The higher is the
overtime margin, the smaller is the time factor value).
vV - is the expected sales value that can be direct assigned to the advertising campaign (lei);
C R- is the expected total cost (design and operating processes) of the advertising campaign (lei).
The higher is the GAER value, the higher is efficiency of the advertising campaign. The ratio will display that
with how many currency units (lei) the sales value has increased to one currency unit invested in the advertising campaign [4].
Product’s Anticipated Success Ratio ( GASP ):
674
14
th Romanian Textiles and Leather Conference – CORTEP 2012
Sinaia, 6 - 8 September 2012
t
pi
= G
t
tt
ASP %
.
1001
(2)
where:
it - the estimated importance probability for the main leading trend factor on a specific marketplace ( 1);
pt - the firm’s factor weight relative to the main competitor on a Lickert scale (0 ÷ t);
t - the total number of identified factors which are defining for a trend.
The higher is the GASP value, the greater are the chances of the product to be a successful release on the
marketplace. The GASP ratio will show what the anticipated total probability of a product’s success on a
marketplace is ( 100%).
As ratio range, there are 4 levels of the GASP :
0 % 0.25% → Low success level
0.26% 0.50% → Medium success level
0.51% 0.75% → High success level
0.76% 100% → Very high success level [5] By monitoring the evolution of these two aggregate indicators, next to the Total Flexibility Degree and Distribution Efficiency Ratio, the medium sized enterprises are able to know their agility level and, more important, the required corrections to be done in order to preserve or to improve their agility capability. 3. THE STEPPING-STONE: THE ON-LINE BRANDING Nowadays to have a firm website is a common fact, but also is a true steppingstone in creating your own brand, especially for the textile Romanian companies, which are so depending to the lohn production system. In order to become less depending to the foreign producers and traders, in others words, to have their own markets, building an on-line brand becomes a compulsory step. For microenterprises and small size companies is something more: the only way to survive and, later, to grow. And for Romanian textile SMEs the EU market is practically … infinite. To create a virtual shop is not at all complicated or expensive, being easy affordable even for the Romanian firms, which are strongly undercapitalized. To choose a brand name a logo, a domain name, and a search engine, seems to be an easy task, but is a tricky one, because, according to a well known saying, “the first impression last”. [2] Here, the textile Romanian firms have to take advantage of their existing strong point: handmade manufacturing. Also, next by other brand facets, is really important to keep in mind that “a brand speaks to our self-image”. [3] Therefore, in order to optimize the site, the key-words are important, and next by “handmade”, the Romanian companies can also successfully use “unique”, “different”, “special”, “customization”, even, why not, “Dracula Land”, and so on. A final issue is the language. After the segmentation and targeting, the chosen foreign markets from different countries will set the language the firms have to use on their website. For the reason to become more attractive, the website must to be built in least several language, English, German, French, and if possible, Italian and Spanish. Of course, ideal is to use the language of each market-country which was targeted. In time, if the firm’ website is managed in a smart way the on-line brand will allows to start a traditional distribution channel, keeping operational the virtual shops. 4. CONCLUSIONS Nowadays, the grate gurus in marketing and business management (Phillip Kotler, Al Ries) identifying several key factors to achieve success: promptness, differentiation, customization, handmade manufacturing, environmental friendly approach, e-commerce/e-business, marketing alliances and brand building. Some of these successfully features are easy available, even by nature, to the textile Romanian enterprises, which are, especially the SMEs, so low-tech, so undercapitalized, so …no-name. So, by taking advantage of handmade approach and on-line commerce and advertising, the local companies will be able to create their own brands and markets.
675
14th Romanian Textiles and Leather Conference – CORTEP 2012
Sinaia, 6 - 8 September 2012
Also, in the production management, no expensive but highly efficient concepts are now affordable even for small sizes enterprises; Computer Aided Design (CAD), Material Requirement Planning (MRP), Group Technology (GT). The new aggregate indicators - such as the Advertising Efficiency Ratio and the Product’s Anticipated Success Ratio - were successfully tested in several simulations by using real database. The first indicator allows the firms to be sure that an advertising campaign will be a good investment, and not just another expense, meaning, in fact, a loss. Do not forget that, throughout the marketing communications process, any firm is trying “to sell” its own image. Therefore, a convincing image of customer orientated company will became a vital and strategic competitive advantage in the not so far future. The second indicator increases the company’s chances to succeed in their attempt to place new products on a turbulent market, despite the actual statistics which prove empirically that almost 80% new products fail at their first release. Since the “happy times” are over, and the global economy crisis become more and more deeper, the business more and more turbulent, and the changes more and more unpredictable, the organizations have a chance to survive only if they will try to adapt themselves, becoming really agile. Otherwise the “Agility” will be just another “global buzzword” in a “see” of bankruptcies. 5. REFERENCES: [1] Desouza, K. (2006), Agile Information System. Conceptualization, Construction, and Management,
Butterworth Heinemann, USA. [2] Cocoran, Ian, The Art of Digital Branding, Allworth Press, ISBN-13:978-1-58115-488-7,USA, 2007 [3] Kapferer, J.N., The New Strategic Brand Management, Fourth Edition, Kogan Page, Ltd.,, ISBN 978 0
7494 5085 4, USA, 2008 [4] Luca, G.P., Verzea, I., The Advertising Efficiency Ratio: A Marketing Aggregate Indicator Modeling For A
Noisy And Turbulent Market, Environmental Engineering And Management Journal, Volume: 8 Issue: 5 , 2009, Pages: 1221-1223
[5] Verzea, I; Luca, G.P; Cozminca, I., The Product's Anticipated Success Ratio On The Turbulent Markets: A Genuine Tool For The Agile Enterprises, Environmental Engineering And Management Journal, Volume: 8 Issue: 5, 2009, Pages: 1231-1233
Corresponding author: Gabriel-Petru LUCA ”Gheorghe Asachi” Technical University Faculty of Industrial Management, Textile and Leather Engineering/ Department of Engineering and Management Bdul D. Mangeron, no. 53 700050; Iasi; Romania E-mail: [email protected]
Co-author: Ion VERZEA ”Gheorghe Asachi” Technical University Faculty of Industrial Management, Textile and Leather Engineering/ Department of Engineering and Management Bdul D. Mangeron, no. 53 700050, Iasi; Romania E-mail: [email protected]
676
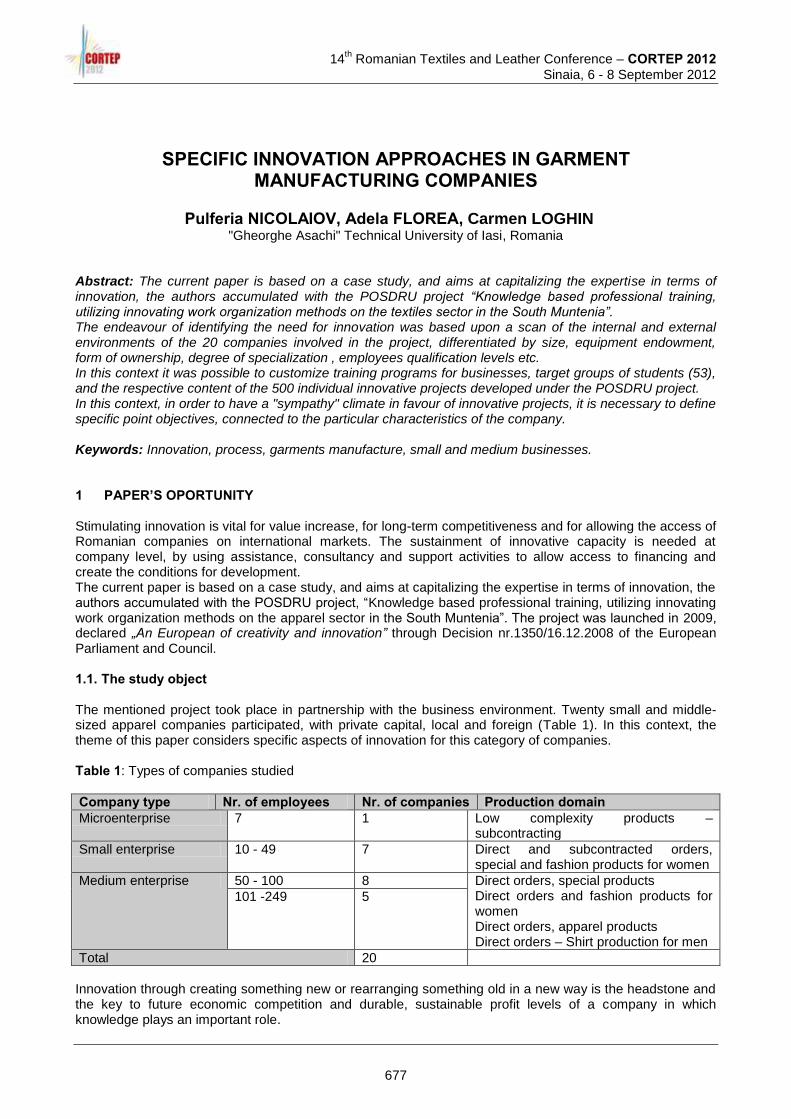
14
th Romanian Textiles and Leather Conference – CORTEP 2012
Sinaia, 6 - 8 September 2012
SPECIFIC INNOVATION APPROACHES IN GARMENT MANUFACTURING COMPANIES
Pulferia NICOLAIOV, Adela FLOREA, Carmen LOGHIN
"Gheorghe Asachi" Technical University of Iasi, Romania Abstract: The current paper is based on a case study, and aims at capitalizing the expertise in terms of innovation, the authors accumulated with the POSDRU project “Knowledge based professional training, utilizing innovating work organization methods on the textiles sector in the South Muntenia”. The endeavour of identifying the need for innovation was based upon a scan of the internal and external environments of the 20 companies involved in the project, differentiated by size, equipment endowment, form of ownership, degree of specialization , employees qualification levels etc. In this context it was possible to customize training programs for businesses, target groups of students (53), and the respective content of the 500 individual innovative projects developed under the POSDRU project. In this context, in order to have a "sympathy" climate in favour of innovative projects, it is necessary to define specific point objectives, connected to the particular characteristics of the company. Keywords: Innovation, process, garments manufacture, small and medium businesses. 1 PAPER’S OPORTUNITY Stimulating innovation is vital for value increase, for long-term competitiveness and for allowing the access of Romanian companies on international markets. The sustainment of innovative capacity is needed at company level, by using assistance, consultancy and support activities to allow access to financing and create the conditions for development. The current paper is based on a case study, and aims at capitalizing the expertise in terms of innovation, the authors accumulated with the POSDRU project, “Knowledge based professional training, utilizing innovating work organization methods on the apparel sector in the South Muntenia”. The project was launched in 2009, declared „An European of creativity and innovation” through Decision nr.1350/16.12.2008 of the European Parliament and Council. 1.1. The study object The mentioned project took place in partnership with the business environment. Twenty small and middle-sized apparel companies participated, with private capital, local and foreign (Table 1). In this context, the theme of this paper considers specific aspects of innovation for this category of companies. Table 1: Types of companies studied
Company type Nr. of employees Nr. of companies Production domain Microenterprise 7 1 Low complexity products –
subcontracting
Small enterprise 10 - 49 7 Direct and subcontracted orders, special and fashion products for women
Medium enterprise 50 - 100 8 Direct orders, special products Direct orders and fashion products for women Direct orders, apparel products Direct orders – Shirt production for men
101 -249 5
Total 20
Innovation through creating something new or rearranging something old in a new way is the headstone and the key to future economic competition and durable, sustainable profit levels of a company in which knowledge plays an important role.
677
14th Romanian Textiles and Leather Conference – CORTEP 2012
Sinaia, 6 - 8 September 2012
Scientific, technical, technological, organizational and managerial innovation represents the keys to survival and success in the new economy based on knowledge. The culture of innovation, based on change and knowledge, is based on thinking flexibility, creativity, and professional competence. The economy of the project includes training programs and punctual process innovation projects, at a work system level in small and middle-sized companies from the apparel sector. This paper’s objective is the identification of specific aspects regarding innovation from the perspective of implementation at company levels in the production sector of apparel. The purpose of the paper is defining the necessary condition for developing a stimulating and sustaining environment for the innovation and identification of specific implementation instruments in these companies, an essential factor for increasing their competition potential. 1.2. Creative innovation in small and middle-sized apparel companies In the industrial environment, regardless of the profile, constant innovation will place the company one step ahead of its competitors. The competitive advantages of textile apparel sector are found by concentrating attention on quality and design, innovation and technology and products with high added value. Innovation, as a successful exploitation of new ideas, by including new technology, organizational methods and their practical implementation is the headstone and the key of competition in the future economy and the durable and sustainable profit level of a company, in which knowledge plays an important role. A relationship exists between the dimension of the companies and their innovation capacity. If the large companies can afford developing large research projects – radical innovation, small and middle sized companies have the advantage of flexibility, being able to develop efficient, continuous programs for incremental innovation. Between the relevant arguments that sustain the opportunity of the theme developed in this paper, we notice:
The significant weight of small and middle sized companies in the structure of the apparel sector in the country,
Small companies bring flexibility, teamwork and creativity,
Small and middle-sized companies have the benefit of a better adaptation capacity for surviving and developing on the market,
At the level of apparel technological lines, 40% of the productivity increase is due to using automated equipment and 60% due to innovation in the process of implementation [1].
The position of the apparel producer on the last bearing of finite products in textile industry requires a direct contact with the final client, individual consumer and fashion market, which is continuously reinventing itself. Competition pressure and the continuous change of demands and client expectations forces enterprises to permanently look for innovative creative solutions which can guarantee them a good market position. Creativity and innovation, as solutions for development and efficiency, condition one another. The two activities require the same conditions to develop in an enterprise. Creativity always implies bringing a new element to the equation and it’s the starting point of innovation. 2 STUDY METHODOLOGY The study is based on applied research, regarding innovation in apparel industry. The basis for documenting it includes analysis and interpretation of how the activities of the project take place, regarding innovation from a small and middle-sized company perspective.
The steps for the work methodology include:
Making sure priorities regarding the innovation activity for the studied company level are obvious,
Identifying different innovative approaches, related to the company specific,
Explaining and arguing the chosen innovation solutions,
Comparative evaluation of the perception at different company levels,
Symmetrical presentation of the instruments and resources for innovation in small/medium-sized apparel companies.
Considering the results of the analysis as well as the availability of the studies companies, the paper limits itself at approaching the aspects of technological process innovation. Process innovation refers to internal aspects of the enterprise and has the sole purpose of improving the internal performances of the company. In a time marked by global recession, innovation depends on the management style and the means to value and plan internal resources, changes in fabrication processes, perfecting the existent methods, valuing the gained experience, teaching the employees to value and exploit opportunities (Figure 1).
678
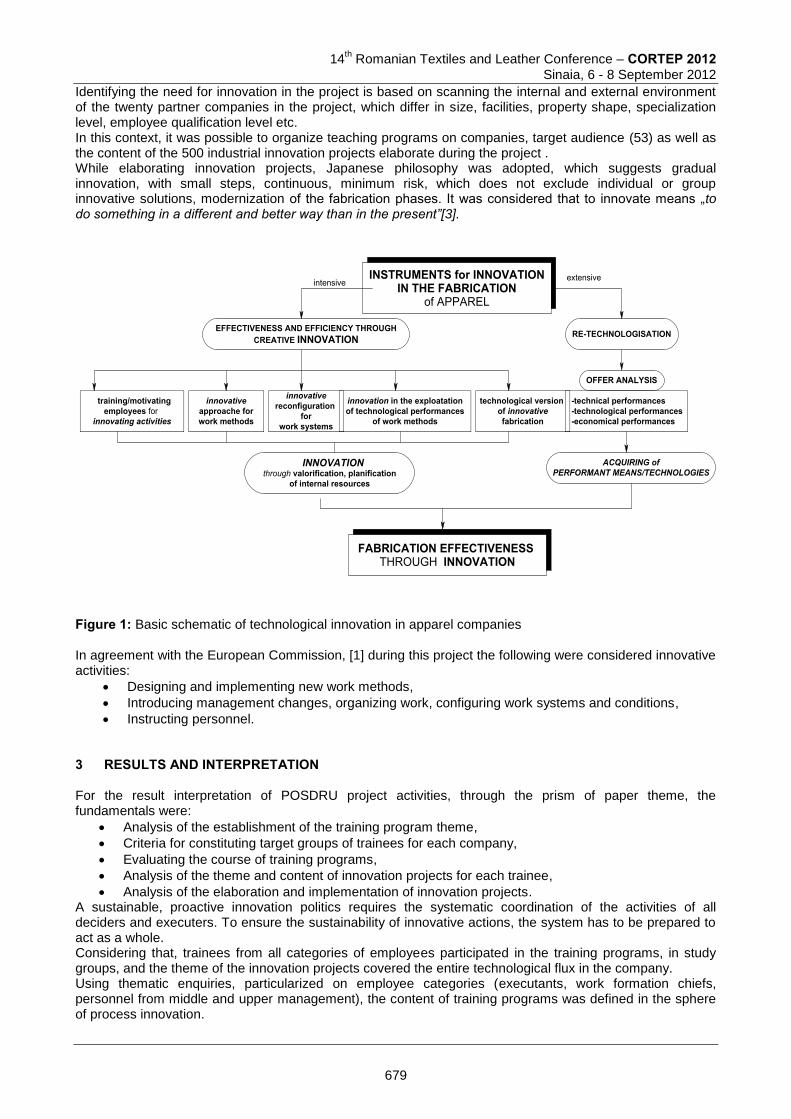
14
th Romanian Textiles and Leather Conference – CORTEP 2012
Sinaia, 6 - 8 September 2012
Identifying the need for innovation in the project is based on scanning the internal and external environment of the twenty partner companies in the project, which differ in size, facilities, property shape, specialization level, employee qualification level etc. In this context, it was possible to organize teaching programs on companies, target audience (53) as well as the content of the 500 industrial innovation projects elaborate during the project . While elaborating innovation projects, Japanese philosophy was adopted, which suggests gradual innovation, with small steps, continuous, minimum risk, which does not exclude individual or group innovative solutions, modernization of the fabrication phases. It was considered that to innovate means „to do something in a different and better way than in the present”[3].
Figure 1: Basic schematic of technological innovation in apparel companies In agreement with the European Commission, [1] during this project the following were considered innovative activities:
Designing and implementing new work methods,
Introducing management changes, organizing work, configuring work systems and conditions,
Instructing personnel. 3 RESULTS AND INTERPRETATION For the result interpretation of POSDRU project activities, through the prism of paper theme, the fundamentals were:
Analysis of the establishment of the training program theme,
Criteria for constituting target groups of trainees for each company,
Evaluating the course of training programs,
Analysis of the theme and content of innovation projects for each trainee,
Analysis of the elaboration and implementation of innovation projects. A sustainable, proactive innovation politics requires the systematic coordination of the activities of all deciders and executers. To ensure the sustainability of innovative actions, the system has to be prepared to act as a whole. Considering that, trainees from all categories of employees participated in the training programs, in study groups, and the theme of the innovation projects covered the entire technological flux in the company. Using thematic enquiries, particularized on employee categories (executants, work formation chiefs, personnel from middle and upper management), the content of training programs was defined in the sphere of process innovation.
679
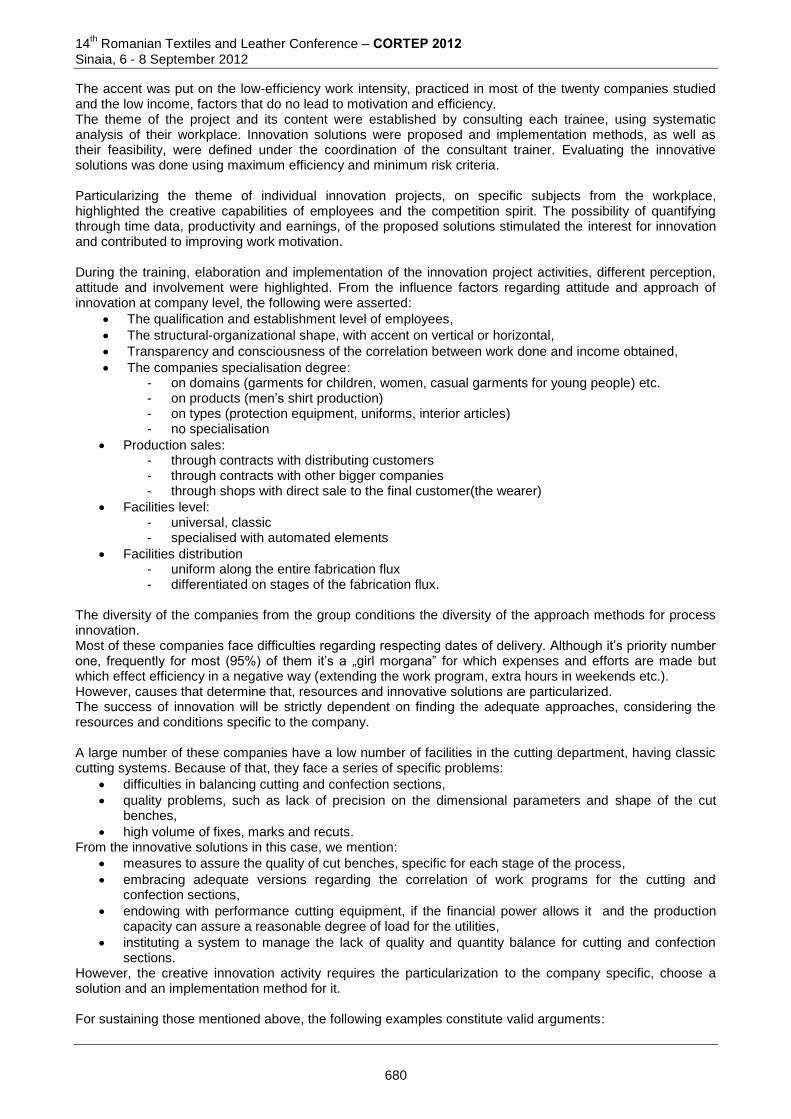
14th Romanian Textiles and Leather Conference – CORTEP 2012
Sinaia, 6 - 8 September 2012
The accent was put on the low-efficiency work intensity, practiced in most of the twenty companies studied and the low income, factors that do no lead to motivation and efficiency. The theme of the project and its content were established by consulting each trainee, using systematic analysis of their workplace. Innovation solutions were proposed and implementation methods, as well as their feasibility, were defined under the coordination of the consultant trainer. Evaluating the innovative solutions was done using maximum efficiency and minimum risk criteria. Particularizing the theme of individual innovation projects, on specific subjects from the workplace, highlighted the creative capabilities of employees and the competition spirit. The possibility of quantifying through time data, productivity and earnings, of the proposed solutions stimulated the interest for innovation and contributed to improving work motivation. During the training, elaboration and implementation of the innovation project activities, different perception, attitude and involvement were highlighted. From the influence factors regarding attitude and approach of innovation at company level, the following were asserted:
The qualification and establishment level of employees,
The structural-organizational shape, with accent on vertical or horizontal,
Transparency and consciousness of the correlation between work done and income obtained,
The companies specialisation degree: - on domains (garments for children, women, casual garments for young people) etc. - on products (men’s shirt production) - on types (protection equipment, uniforms, interior articles) - no specialisation
Production sales: - through contracts with distributing customers - through contracts with other bigger companies - through shops with direct sale to the final customer(the wearer)
Facilities level: - universal, classic - specialised with automated elements
Facilities distribution - uniform along the entire fabrication flux - differentiated on stages of the fabrication flux.
The diversity of the companies from the group conditions the diversity of the approach methods for process innovation. Most of these companies face difficulties regarding respecting dates of delivery. Although it’s priority number one, frequently for most (95%) of them it’s a „girl morgana” for which expenses and efforts are made but which effect efficiency in a negative way (extending the work program, extra hours in weekends etc.). However, causes that determine that, resources and innovative solutions are particularized. The success of innovation will be strictly dependent on finding the adequate approaches, considering the resources and conditions specific to the company. A large number of these companies have a low number of facilities in the cutting department, having classic cutting systems. Because of that, they face a series of specific problems:
difficulties in balancing cutting and confection sections,
quality problems, such as lack of precision on the dimensional parameters and shape of the cut benches,
high volume of fixes, marks and recuts. From the innovative solutions in this case, we mention:
measures to assure the quality of cut benches, specific for each stage of the process,
embracing adequate versions regarding the correlation of work programs for the cutting and confection sections,
endowing with performance cutting equipment, if the financial power allows it and the production capacity can assure a reasonable degree of load for the utilities,
instituting a system to manage the lack of quality and quantity balance for cutting and confection sections.
However, the creative innovation activity requires the particularization to the company specific, choose a solution and an implementation method for it. For sustaining those mentioned above, the following examples constitute valid arguments:
680
14
th Romanian Textiles and Leather Conference – CORTEP 2012
Sinaia, 6 - 8 September 2012
1). For example, in microenterprises and small companies, which work on subcontracts, with a fluctuating lowly qualified personnel, minimum technical facilities and an empirical normalization of work, it’s obvious that the activity develops with an accent on work intensity with high efforts for quality assurance. In this context, the preoccupations for innovation are erratic, punctual, at the particular initiative of some of the workers who look for empirical solutions to simplify their work. In most of the cases, these solutions are not efficient and only relate with a specific routine of the worker. On this basis, establishing quality and respecting delivery dates are essential problems with which these firms confront. Obviously, in this case, the priority for innovation has to aim at the simplification and unification of work methods, method training and realistic normalization of work. 2). Firms based on the structure of old workmanship cooperation (25%) having pluri-qualified work force, capable of obtaining quality, usually target contracting and subcontracting of complex fashion products, with a large amount of manual labour. The universal facilities, without technological equipment, old, routined work force, minimum technological design, medium conservative management, non-transparent salaries are factors that diminish the efficiency of these companies. First priority for these companies would be increasing efficiency by simplifying technology, facilitating machines with gadgets and organizing a training program for medium management, to teach them technological and workplace design, work normalization and production scheduling. A favourable resource of the innovative attitude with considerable implications on efficiency is the flattened work organizational structure, cooperative spirit, with similarities to the „teamwork” concept. Thus, a transparent salary system on such a structure is an efficient instrument for stimulating innovation. 3). Companies specialized on the product (men shirt), facilitated with specialized automated equipment in the confection section, with a technological flux structured on group, with classic equipment in the cutting section, with qualified work force, have a low economic efficiency and confront with difficulties in respecting delivery dates. Causes for the difficulties mentioned above are:
low quality of the cuts, which influences: - increase in recuts, fixes, marks, additional technological phases - degree of equipment usage in the confection section
scarce work methods, determine an increase in operation time, due to: - scarce configuration of the work place - absence of a unitary work method - absence of method trainers
absence of a realistic normalization of work generates - difficulties in balancing technological lines - deficiency regarding the perception of correlation between work done and earned income
Priority for innovation in this company would be training in the domain of normalization and work methods for the middle management and balancing the facilities in the cutting, confection and finishing departments. Group structure of the technological lines is a favourable factor for implementing an innovative system for „teamwork” 4). For companies specialized in products for interior design, where large scale details are used, the priority for innovation programs would be the adequate reconfiguration of work places, which would allow a decrease in the volume of work object handling and effort, resulting in positive effects for the execution time. For the stimulation and efficiency of innovation for small and middle-sized companies, transforming the enterprise based on workforce to an enterprise based on knowledge and creativity and using the advantages of advanced technology becomes necessary. For measuring, analysing and evaluation innovation in small and middle-sized companies, with availability for incremental innovation, the most relevant indicators are considered to be the effect and impact on the company efficiency. 4 CONCLUSIONS The final purpose of innovation is to ensure competitive, economical increase and long term development, as well as work satisfaction. To sustain the viability of the process innovation concept and the constant need for innovation, people with expertise in the domain and stimulant factors for involving them in innovative activities are required. No company can develop without creating conditions to use the handiest resource, which is insufficiently use, the human mind. The capacity companies have to be innovative depends in a large way on their employees, their competences and knowledge. Training programs with adequate theme and solving individual innovation projects result in:
681
14th Romanian Textiles and Leather Conference – CORTEP 2012
Sinaia, 6 - 8 September 2012
knowledge increase,
obtaining the ability to innovate in the production practice,
generates operational efficiency and flexibility. The experience of the POSDRU project demonstrated that an innovation project can succeed if the new knowledge is assimilated in the specific company conditions. Each innovation has to be considered a project itself and has to be treated as an investment. The success of innovation activities relies on the necessity of prediction and conscious assumption of calculable risks, of changes and their placement in a value vector for change and development strategies. Avoiding patterned approaches is imposed, because they block creativity and they can generate difficulties in the practical transposal of the designed solutions, in the perception of benefits and reticence to implementing innovation projects. Efficient, creative work generates satisfaction, not mechanical work. In this context, for installing a „sympathy” climate favourable to innovative project, it is necessary to:
define specific punctual objectives, related to the characteristics of the company,
use a sustainable, proactive innovation politics,
evaluate the impact of the results,
popularise the success cases. 5 REFERENCES [1] Nicolaiov, P.; Florea, A.; Loghin, C.; Metode inovative de organizare a operatiilor de lucru in sectorul
confectii textile Metode inovative de organizare a operatiilor de lucru in sectorul confectii textile, ISBN -978-973-1716-61-9, editura CERTEX, Bucharest, 2010
[2] Thomas, A.; Stewart , A.; Lectii din lunga cursă a companiei TOYOTA, interviu cu Katsuaki Watanabe, Revista BIZ, nr.155, martie 2008, pg.39 – ISSN 1454-8380 46
[3] COVRIG, M.; GHEOGHE,C.; Inovare şi transfer tehnologic, www.amotion.pub.ro/oferta_educationala
Corresponding author: Pulferia NICOLAIOV "Gheorghe Asachi" Technical University of Iasi Faculty of Textiles, Leather and Industrial Management, 29 D. Mangeron Blvd. 700050, IASI, Romania Phone/ Fax: 004.0232.230.491 E-mail: [email protected]
Co-author(s): Adela FLOREA
"Gheorghe Asachi" Technical University of Iasi Faculty of Textiles-Leather and Industrial Management 29 D. Mangeron Blvd. 700050, IASI, Romania Phone/ Fax: 004.0232.230.491 E-mail: [email protected] Carmen LOGHIN
"Gheorghe Asachi" Technical University of Iasi Faculty of Textiles-Leather and Industrial Management 29 D. Mangeron Blvd. 700050, IASI, Romania Phone/ Fax: 004.0232.230.491 E-mail: [email protected]
682
14th Romanian Textiles and Leather Conference – CORTEP 2012
, 5tfr6 - 8 September 2012, Sinaia, Romania
INTERNATIONAL COMPARISON OF SCIENTIFIC RESEARCH PERFORMANCES IN TEXTILE FACULTIES
Carmen ANTON 1, Silviu-Mihail TIŢĂ 2
1 National Inventics Institute, Iasi, Romania
2 Al.I.Cuza University Iaşi, Faculty of Business Administration, Romania
Abstract: The scientific performance of Faculties of Textile and Leather Engineering were compared by some indicators: number of article, h-index and number of citation for the article publish in two databases Scopus and Web Of Science from 2005 - 2012. The aim of this study is to elaborate a comparative analysis between the performance in scientific textiles and leather research for 12 internationally recognized Universities in: Turkey (Ege University, Istanbul Technical University), France (ENSAIT - Ecole Nationale Supérieure des Arts et Industries Textiles, ENSISA - Ecole Nationale Supérieure des Ingénieurs Sud Alsace), England (Heriot Watt University), Lithuania (Kaunas University of Technology), Ukraine (Kiev National University of Technologies and Design), Italy (Politecnico di Torino), Albania (Polytechnic University of Tirana), Poland (Technical University of Lodz), Romania (Technical University of Iasi) and Czech Republic (Technical University of Liberec ) more or less differentiated according to the fields covered by the offer of programs and scientific studies. Keywords: measuring performances, indicators, evaluation, research, h-index; 1. INTRODUCTION Bibliometrics has become a standard tool of science policy and research management in the last decades. In particular, academic institutions increasingly rely on citation analysis for making hiring, promotion, tenure, and funding decisions (Weingart 2005). The need for accountability in Higher Education (HE) has led governments, research authorities and University administrators to assess research performance (Panaretos and Malesios 2009). The performance concept in a technical domain is probably one of the main affinities which this has with the science management. The concept of performance management was persuasively seeded in the postindustrial world in the late 1980s and blossomed in the 1990s. It incorporates key features of past efforts to reform the management of social service systems and programs.(Blalock,1999). The scientific research activity is - within a competitive and global economic environment- the main source of knok-how as both of technology and management. The technology innovation and the ability to offer products earlier, with higher quality, and at a lower price than the competitors, have become somewhat of a cliché. However, this is more important today than ever before. (Karlsson, Trygg and Elftrom, 2004). Performance’ measurement of scientific research activities in any domain has an important role because: - it demonstrates their results and quality to stakeholders; - it identifies their current strengths and weaknesses for the purposes of planning, monitoring progress and finding better ways to improve service quality (Tanner, Ninh, Johanson and Denison, 2010). - We strongly consider that presenting the achieved results in this domain is beneficial for the future actions which are going to be carried on by researchers with the purpose of arising the scientific relevance of the teams they belong to and beside that in the present conditions when, more and more, the performance in this branch is an important access way to the financial resources.
683
14th Romanian Textiles and Leather Conference – CORTEP 2012
6 - 8 September 2012, Sinaia, Romania
The comparison with other researchers the observation of the achieved results of other faculties and of the subdomains in which they perform, have also the role of creating and developing researching networks or researching and technological transfer centres. Beside that, there can be added significant questions for this domain as it follows: which might be the direction to where a particular area of Europe is going and how can we take part at the future scientific revolution? The aims of this article are the ones presented above and it is definetly not intended to realise a classification or a ranking of the analysed faculties or universities. 2. THE RESEARCH METHODOLOGY The research frames to realise a comparative analysis at the same level of results of scientific research activity within 12 faculties of textile in various countries of Europe : Turkey (Ege University- Faculty of Engineering - Textile Engineering Department, Istanbul Technical University- School of Textile Technologies and Design), France (ENSAIT - Ecole Nationale Supérieure des Arts et Industries Textiles, ENSISA - Ecole Nationale Supérieure des Ingénieurs Sud Alsace), England (Heriot Watt University- School of Textiles and Design), Lithuania (Kaunas University of Technology- Fac. of Design and Technologies - Department of Textile Technology), Ukraine (Kiev National University of Technologies and Design), Italy (Politecnico di Torino- Department of Materials Science and Technical Engineering), Albania (Polytechnic University of Tirana- Textile and Fashion Department), Poland (Technical University of Lodz- Textile Faculty), Romania (Technical University of Iasi- Faculty of Textiles and Leather Engineering) and Czech Republic (Technical University of Liberec Textile Faculty - Department of Textile ). Data has been collected from two main sources: Institute of Scientific Information (ISI Philadelphia USA) – Web of Science and Scopus Data Base. From the methodological point of view, the two data bases are the main collections of scientific articles at the world’s level which have as indexed a high number of reviews from all domains of activity. The results were observed between 2005 and 2012 when according to statistic dates the competition for publishing articles in well-known reviews or conferences further indexed was rising significantly. The framed analyse is of bibliometric type and the main indicators of evaluation are the relevant ones at the international level: number of ISI articles, number of ISI indexed scientific articles, number of citations and of h-index. The research’s limitations have depended on the information access to the analysed data base because between the two sources there is a major difference of coding manner. For searching, it was used the Web of Science and Scopus searching systems and the chosen criterion was the name of that particular faculty or university. The differences concerning the manner in which the names of universities and faculties are codified, are significant because Web of Science uses particular abbreviations while, from this point of view, Scopus facilitates the searching by using the complete name of that institution, but also of its substructures. Considering this, in some cases for Web of Science the search is more difficult and there might be possible to get different results. Another limitation depends also on the way of searching specific to The Web of Science and it is due to the fact that these abbreviations in the case of some faculties are very difficult to be identified and that is why it was preferable for researchers to use the domain of scientific research, in our case the „textile materials”. Therefore, it is possible as researchers not to be only within that faculty, but they can be from other member faculties of a particular university, the reason being that Web of Science displays a specific criterion and other two closer. 3. RESEARCH RESULTS Between 2005 – 2012 according to SCOPUS data base the scientific performance of analysed faculties of textile sums up a number of 1221 of publications of which a number of 1000 are scientific articles, this representing a percentage of 81,9%,173 (14,16) are conference proceeding, 1,9% representing book review and 2,04 are other scientific results such as: press articles, editorials, etc.
684
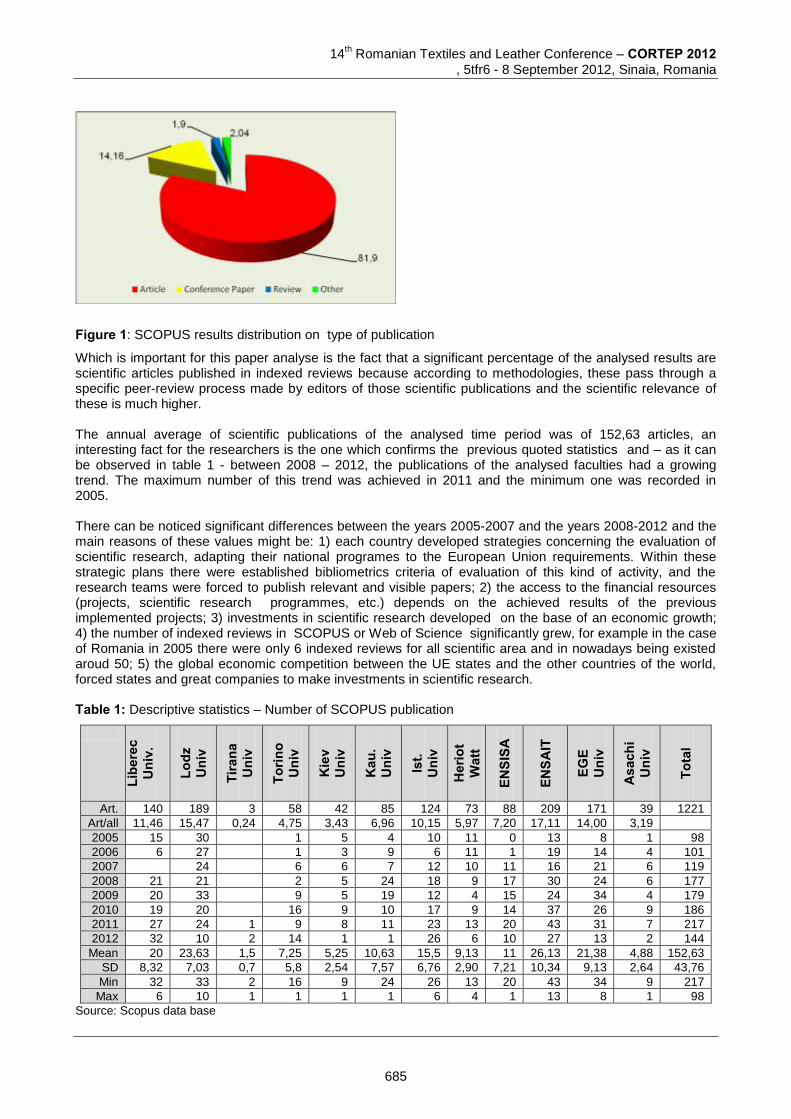
14th Romanian Textiles and Leather Conference – CORTEP 2012
, 5tfr6 - 8 September 2012, Sinaia, Romania
Figure 1: SCOPUS results distribution on type of publication
Which is important for this paper analyse is the fact that a significant percentage of the analysed results are scientific articles published in indexed reviews because according to methodologies, these pass through a specific peer-review process made by editors of those scientific publications and the scientific relevance of these is much higher. The annual average of scientific publications of the analysed time period was of 152,63 articles, an interesting fact for the researchers is the one which confirms the previous quoted statistics and – as it can be observed in table 1 - between 2008 – 2012, the publications of the analysed faculties had a growing trend. The maximum number of this trend was achieved in 2011 and the minimum one was recorded in 2005. There can be noticed significant differences between the years 2005-2007 and the years 2008-2012 and the main reasons of these values might be: 1) each country developed strategies concerning the evaluation of scientific research, adapting their national programes to the European Union requirements. Within these strategic plans there were established bibliometrics criteria of evaluation of this kind of activity, and the research teams were forced to publish relevant and visible papers; 2) the access to the financial resources (projects, scientific research programmes, etc.) depends on the achieved results of the previous implemented projects; 3) investments in scientific research developed on the base of an economic growth; 4) the number of indexed reviews in SCOPUS or Web of Science significantly grew, for example in the case of Romania in 2005 there were only 6 indexed reviews for all scientific area and in nowadays being existed aroud 50; 5) the global economic competition between the UE states and the other countries of the world, forced states and great companies to make investments in scientific research. Table 1: Descriptive statistics – Number of SCOPUS publication
Libe
rec
Uni
v.
Lo
dz
Uni
v
Tira
na
Uni
v
Torin
o U
niv
Kie
v U
niv
Kau
. U
niv
Ist.
Uni
v
Her
iot
Wat
t
ENSI
SA
ENSA
IT
EGE
Uni
v
Asa
chi
Uni
v
Tota
l
Art. 140 189 3 58 42 85 124 73 88 209 171 39 1221
Art/all 11,46 15,47 0,24 4,75 3,43 6,96 10,15 5,97 7,20 17,11 14,00 3,19
2005 15 30 1 5 4 10 11 0 13 8 1 98
2006 6 27 1 3 9 6 11 1 19 14 4 101
2007 24 6 6 7 12 10 11 16 21 6 119
2008 21 21 2 5 24 18 9 17 30 24 6 177
2009 20 33 9 5 19 12 4 15 24 34 4 179
2010 19 20 16 9 10 17 9 14 37 26 9 186
2011 27 24 1 9 8 11 23 13 20 43 31 7 217
2012 32 10 2 14 1 1 26 6 10 27 13 2 144
Mean 20 23,63 1,5 7,25 5,25 10,63 15,5 9,13 11 26,13 21,38 4,88 152,63
SD 8,32 7,03 0,7 5,8 2,54 7,57 6,76 2,90 7,21 10,34 9,13 2,64 43,76
Min 32 33 2 16 9 24 26 13 20 43 34 9 217
Max 6 10 1 1 1 1 6 4 1 13 8 1 98
Source: Scopus data base
685
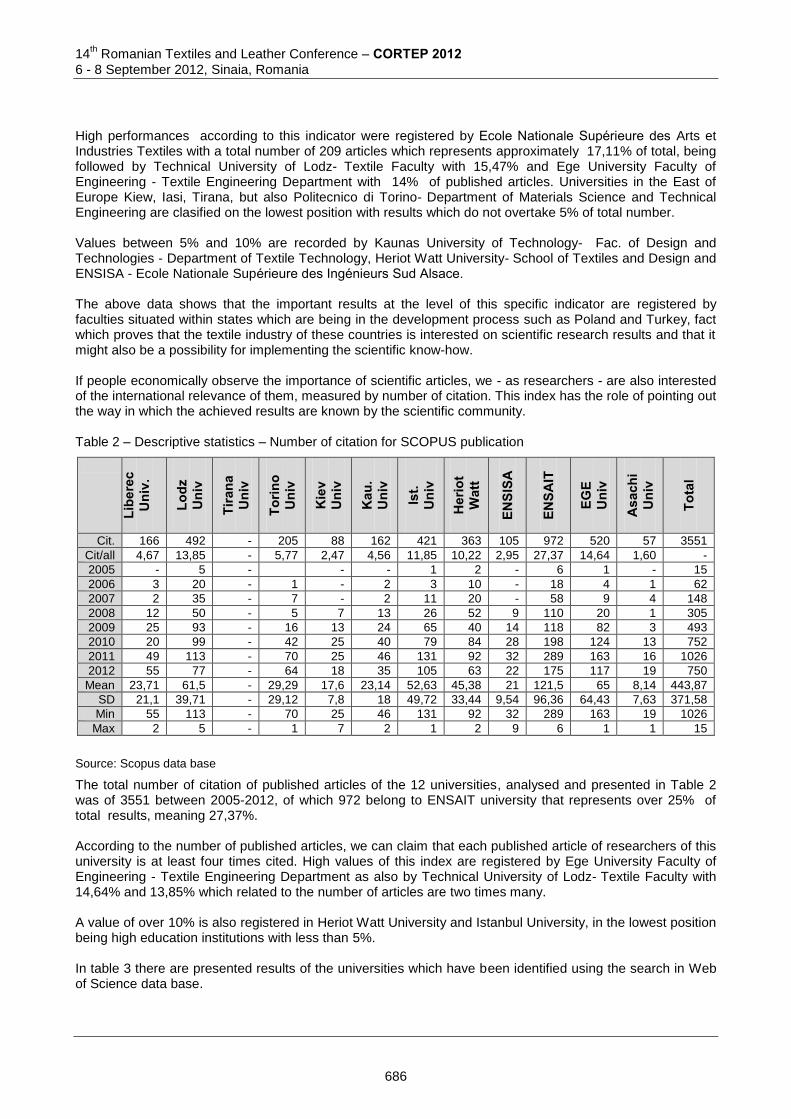
14th Romanian Textiles and Leather Conference – CORTEP 2012
6 - 8 September 2012, Sinaia, Romania
High performances according to this indicator were registered by Ecole Nationale Supérieure des Arts et Industries Textiles with a total number of 209 articles which represents approximately 17,11% of total, being followed by Technical University of Lodz- Textile Faculty with 15,47% and Ege University Faculty of Engineering - Textile Engineering Department with 14% of published articles. Universities in the East of Europe Kiew, Iasi, Tirana, but also Politecnico di Torino- Department of Materials Science and Technical Engineering are clasified on the lowest position with results which do not overtake 5% of total number. Values between 5% and 10% are recorded by Kaunas University of Technology- Fac. of Design and Technologies - Department of Textile Technology, Heriot Watt University- School of Textiles and Design and ENSISA - Ecole Nationale Supérieure des Ingénieurs Sud Alsace.
The above data shows that the important results at the level of this specific indicator are registered by faculties situated within states which are being in the development process such as Poland and Turkey, fact which proves that the textile industry of these countries is interested on scientific research results and that it might also be a possibility for implementing the scientific know-how. If people economically observe the importance of scientific articles, we - as researchers - are also interested of the international relevance of them, measured by number of citation. This index has the role of pointing out the way in which the achieved results are known by the scientific community.
Table 2 – Descriptive statistics – Number of citation for SCOPUS publication
Libe
rec
Uni
v.
Lo
dz
Uni
v
Tira
na
Uni
v
Torin
o U
niv
Kie
v U
niv
Kau
. U
niv
Ist.
Uni
v
Her
iot
Wat
t
ENSI
SA
ENSA
IT
EGE
Uni
v
Asa
chi
Uni
v
Tota
l
Cit. 166 492 - 205 88 162 421 363 105 972 520 57 3551
Cit/all 4,67 13,85 - 5,77 2,47 4,56 11,85 10,22 2,95 27,37 14,64 1,60 -
2005 - 5 - - - 1 2 - 6 1 - 15
2006 3 20 - 1 - 2 3 10 - 18 4 1 62
2007 2 35 - 7 - 2 11 20 - 58 9 4 148
2008 12 50 - 5 7 13 26 52 9 110 20 1 305
2009 25 93 - 16 13 24 65 40 14 118 82 3 493
2010 20 99 - 42 25 40 79 84 28 198 124 13 752
2011 49 113 - 70 25 46 131 92 32 289 163 16 1026
2012 55 77 - 64 18 35 105 63 22 175 117 19 750
Mean 23,71 61,5 - 29,29 17,6 23,14 52,63 45,38 21 121,5 65 8,14 443,87
SD 21,1 39,71 - 29,12 7,8 18 49,72 33,44 9,54 96,36 64,43 7,63 371,58
Min 55 113 - 70 25 46 131 92 32 289 163 19 1026
Max 2 5 - 1 7 2 1 2 9 6 1 1 15
Source: Scopus data base
The total number of citation of published articles of the 12 universities, analysed and presented in Table 2 was of 3551 between 2005-2012, of which 972 belong to ENSAIT university that represents over 25% of total results, meaning 27,37%. According to the number of published articles, we can claim that each published article of researchers of this university is at least four times cited. High values of this index are registered by Ege University Faculty of Engineering - Textile Engineering Department as also by Technical University of Lodz- Textile Faculty with 14,64% and 13,85% which related to the number of articles are two times many. A value of over 10% is also registered in Heriot Watt University and Istanbul University, in the lowest position being high education institutions with less than 5%. In table 3 there are presented results of the universities which have been identified using the search in Web of Science data base.
686
14th Romanian Textiles and Leather Conference – CORTEP 2012
, 5tfr6 - 8 September 2012, Sinaia, Romania
According to this source, the analysed textile faculties have published 969 scientific papers, in this case existing a methodological limitation caused by the fact that for Technical University of Lodz- Textile Faculty and Politecnico di Torino- Department of Materials Science and Technical Engineering, we could not identify the number of their publications, thus we preferred to eliminate the two entities from this calculation, instead of using wrong information which are not according to the exact result. Between 2005-2012, in comparison with SCOPUS data base, in the case of Web of Science it is proved that the annual number of articles increases until 2008, followed by an insignificant decrease, reaching the maximum value of 198 publications in 2011. The minimum value is recorded in 2012 because of index paper manner or because the research is elaborated at the end of July 2012. More than that, we can observe a decrease of publications’ number which may represent a worriment for the Web of Science data base, even if the pressure for indexed reviews is very high.
Table 3: – Descriptive statistics – Number of publication in Web of Science
Libe
rec
Uni
v.
Lo
dz
Uni
v
Tira
na
Uni
v
Torin
o U
niv
Kie
v U
niv
Kau
. U
niv
Ist.
Uni
v
Her
iot
Wat
t
ENSI
SA
ENSA
IT
EGE
Uni
v
Asa
chi
Uni
v
Tota
l
Art 66 2 50 60 236 63 68 177 237 10 969
Art/all 6,81 0,20 5,16 6,19 24,35 6,5 7,01 18,26 24,45 1,03
2005 3 6 3 24 10 - 15 11 - 72
2006 2 9 3 25 9 1 20 21 - 90
2007 11 8 5 27 9 13 8 26 1 108
2008 12 10 10 33 7 14 27 37 4 154
2009 8 4 13 35 6 8 20 40 - 134
2010 12 5 11 26 5 14 31 43 - 147
2011 11 1 5 11 53 11 14 41 47 4 198
2012 7 1 3 4 13 6 4 15 12 1 66
Mean 8,25 6,25 7,5 29,5 7,875 9,71 22,13 29,63 2,5 121,13
SD 3,99 2,49 4,14 11,56 2,17 5,44 10,48 14,08 1,73 45,39
Min 12 1 10 13 53 11 14 41 47 4 198
Max 2 1 3 3 13 5 1 8 11 1 66
Source: Scopus and Web of Science data base
The economic evolution of Turkey is relieved by the number of Web of Science publications, technical universities registered here, have published approximately 50% of total number. Ege University Faculty of Engineering - Textile Engineering Department and Istanbul Technical University- School of Textile Technologies and Design have published 237 respectively 236 articles, which represents 24,45% respectively 24,35%. Comparing with SCOPUS data base, researchers of ENSAIT have published 177 articles which represents 18,26%. The rest of faculties have values between 5 and 10%, excepting Technical University of Iasi- Faculty of Textiles and Leather Engineering which in this source has only 10 indexed articles and Polytechnic University of Tirana- Textile and Fashion Department with only 2 indeed articles.
Figure 2: Web of Science results distribution by type of publication
687
14th Romanian Textiles and Leather Conference – CORTEP 2012
6 - 8 September 2012, Sinaia, Romania
Statistics between 2005-2012 on the type of publication is similar to the SCOPUS data base, according to Figure 2: 86,8% of papers are articles, 9,8% are conference proceeding indexed in Web of Science , the rest of 3,4% are book reviews or editorials of various newspapers.
Another relevant indicator for researchers is h-index (A scientist has index h if h of his/her Np papers
have at least h citations each, and the other (Np − h) papers have no more than h citations each). A
high value of this index, means that many of the published papers are in the same time cited.In table 4 there are shown the results of faculties at this index and we can observe that ENSAIT - Ecole Nationale Supérieure des Arts et Industries Textiles has an h-index of 16 respectively 14 for the period between 2005-2012. Researchers from Istanbul Technical University and EGE University have a higher h-index than 10. Table 4: H-index results
SCOPUS WoS SCOPUS WoS
Liberec 7 6 Istambul 10 15
Lodz 10
Heriot Watt 9 9
Tirana
ENSISA 5 4
Torino 7
ENSAIT 16 14
Kiev 5 4 EGE 11 10
Kaunas 6 5 ASACHI 4 2
Analysing the results of some technical faculties, we believe that these cannot have high h-index values because their purpose is implementing researching results.
4. CONCLUSIONS
The scientific performances of textile faculties within analysed technical universities are significant in comparison with another scientific area. Being a technical domain, various countries using public resources or private companies which finances these kind of researches are interested in applying them for creating added economic value. For this, a good example is Turkey which - as it is observed – finances intensively the activity of scientific research in the textile material domain.
References
1. Weingart, P.: Impact of bibliometrics upon the science system: Inadvertent consequences?
Scientometrics,Vol 62, No 1, 2005, 117–131 2. Panaretos, J.; Malesios, C.: Assessing scientific research performance and impact with single indices,
Scientometrics, Vol. 81, No. 3, 2009, pp 635-670 3. Blalock, A.B.: Evaluation Research and the Performance Management Movement From Estrangement to
Useful Integration?, Evaluation, Vol 5, No 2, 1999, pp 117-149; 4. Karlsson,M.; Trygg, L.; Elfstrom, B.O.; Measuring R&D productivity: complementing the picture by
focusing on research activities, Technovation, Vol 24, 2004, pp. 179-186. 5. Tanner, K.; Ninh, K.T; Johanson, G.; Denison,T: Systematic performance measurement for university
libraries in Vietnam, Library Management, Vol. 31 Iss: 8/9, pp.702 – 716; 6. Hirsch,J.E.; An index to quantify an individual's scientific research output Available from:
http://en.wikipedia.org/wiki/Hirsch_number; Corresponding author:
Co-author(s):
Carmen ANTON
National Inventics Institute of Iasi Tudor Vladimirescu Street No 24 Iasi, Romania Phone: +40745100325, Email: [email protected]
Silviu TIŢĂ Management, Marketing and Business Administration Department Faculty of Business Administration, University Al.I.Cuza Iasi Carol I, No 11 700506 Iasi, Romania Phone +40745369847, Email [email protected]
688
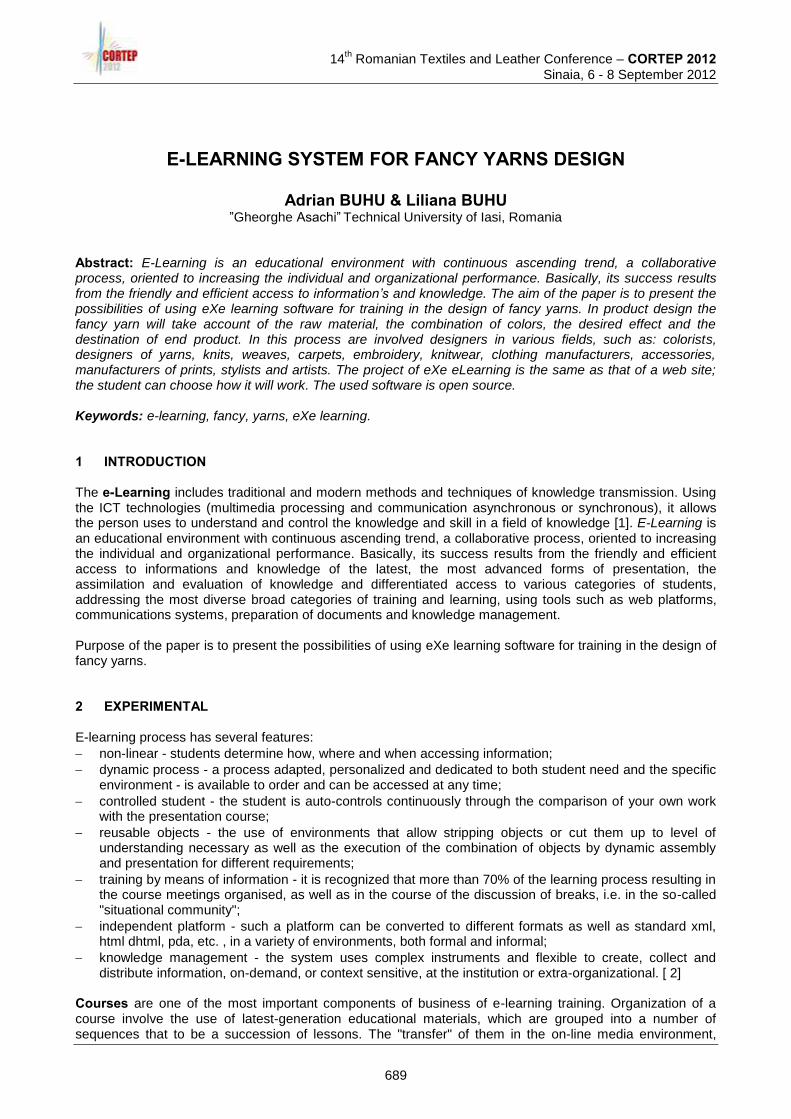
14
th Romanian Textiles and Leather Conference – CORTEP 2012
Sinaia, 6 - 8 September 2012
E-LEARNING SYSTEM FOR FANCY YARNS DESIGN
Adrian BUHU & Liliana BUHU ”Gheorghe Asachi”
Technical University of Iasi, Romania
Abstract: E-Learning is an educational environment with continuous ascending trend, a collaborative process, oriented to increasing the individual and organizational performance. Basically, its success results from the friendly and efficient access to information’s and knowledge. The aim of the paper is to present the possibilities of using eXe learning software for training in the design of fancy yarns. In product design the fancy yarn will take account of the raw material, the combination of colors, the desired effect and the destination of end product. In this process are involved designers in various fields, such as: colorists, designers of yarns, knits, weaves, carpets, embroidery, knitwear, clothing manufacturers, accessories, manufacturers of prints, stylists and artists. The project of eXe eLearning is the same as that of a web site; the student can choose how it will work. The used software is open source. Keywords: e-learning, fancy, yarns, eXe learning. 1 INTRODUCTION The e-Learning includes traditional and modern methods and techniques of knowledge transmission. Using the ICT technologies (multimedia processing and communication asynchronous or synchronous), it allows the person uses to understand and control the knowledge and skill in a field of knowledge [1]. E-Learning is an educational environment with continuous ascending trend, a collaborative process, oriented to increasing the individual and organizational performance. Basically, its success results from the friendly and efficient access to informations and knowledge of the latest, the most advanced forms of presentation, the assimilation and evaluation of knowledge and differentiated access to various categories of students, addressing the most diverse broad categories of training and learning, using tools such as web platforms, communications systems, preparation of documents and knowledge management. Purpose of the paper is to present the possibilities of using eXe learning software for training in the design of fancy yarns. 2 EXPERIMENTAL E-learning process has several features:
non-linear - students determine how, where and when accessing information;
dynamic process - a process adapted, personalized and dedicated to both student need and the specific environment - is available to order and can be accessed at any time;
controlled student - the student is auto-controls continuously through the comparison of your own work with the presentation course;
reusable objects - the use of environments that allow stripping objects or cut them up to level of understanding necessary as well as the execution of the combination of objects by dynamic assembly and presentation for different requirements;
training by means of information - it is recognized that more than 70% of the learning process resulting in the course meetings organised, as well as in the course of the discussion of breaks, i.e. in the so-called "situational community";
independent platform - such a platform can be converted to different formats as well as standard xml, html dhtml, pda, etc. , in a variety of environments, both formal and informal;
knowledge management - the system uses complex instruments and flexible to create, collect and distribute information, on-demand, or context sensitive, at the institution or extra-organizational. [ 2]
Courses are one of the most important components of business of e-learning training. Organization of a course involve the use of latest-generation educational materials, which are grouped into a number of sequences that to be a succession of lessons. The "transfer" of them in the on-line media environment,
689

14th Romanian Textiles and Leather Conference – CORTEP 2012
Sinaia, 6 - 8 September 2012
requires the use of diverse forms of presentation, type simulations, animations and exemplifications of applications. This can be done on different platforms and tools for developing provision of the service of e-learning. Their organization is based on the level of sophistication of technologies of communication used, such as:
learning Management Systems – LMS;
learning Content Management Systems – LCMS;
management of identification and the ownership component digital e-learning that cutting to size, and mode of use lawful;
systems for the management of the database, with the word that it can be shared and managed in the form of subsystems;
communication tools, with the indication that instruments for general use, e.g. Skype could affect the quality of communication; other easy-to-use tools such as blogs have been adopted successfully.
Such a tool is exe learning software. The eXe project developed a freely available Open Source authoring application to assist teachers and academics in the publishing of web content without the need to become proficient in HTML or XML markup. Resources authored in eXe can be exported in IMS Content Package, SCORM 1.2, or IMS Common Cartridge formats or as simple self-contained web pages. eXe grew out of the New Zealand Government Tertiary Education Commission's eCollaboration Fund and was led by the University of Auckland, The Auckland University of Technology, and Tairawhiti Polytechnic. It was later supported by CORE Education, a New Zealand-based not-for-profit educational research and development organization. It has also been greatly assisted by a global group of participants and contributors. [2] 2.1 Overview of eXe Learning eXe (“eLearning XHTML editor”) is free, and easy to download and install on your local computer. It offers a choice of style sheets and is a simple way of creating html pages, and adding pictures or online journal articles to a page. You do not need to use HTML or specialist web authoring programmes, as there is an easy HTML editor or you can paste from Word. There are two stages to using eXe: - create the materials using eXe on your local computer; - export them as web pages to be uploaded into Web Learn. The advantages of eXe are: - it is a collection of tools to create sequences of online learning activities; - activities can be arranged in any order and sequences can be branched; - simple editing dialogue that allows clean paste from word; - it can display equations, images, without needing to use html or web authoring tools; - simple to link to external web sites; - it is easy to create simple mcqs and quizzes using various question types; - choose from a range of available style sheets (appearances); - export your materials for use in Web Learn. eXe can be freely downloaded and it is installed on and runs from your local hard drive (Windows or Linux) [3]. The main eXe screen has three panels: outline, activity and home, figure 1.
Figure 1: The main eXe screen
690

14
th Romanian Textiles and Leather Conference – CORTEP 2012
Sinaia, 6 - 8 September 2012
The ”Outline” represent the structure of course, the ”Home” are zone for authoring tool which is developed by teacher. The ”iDevices” are used for different activities can be designed and build in eXe packages, such as:
case study text entry for description of case study
cloze activity fill in the gaps text
external web site link
free text author enters free text using "wysiwyg" editor
image gallery library of pictures you can upload
image magnifier zoom tool for pictures, similar to “zoomify”
multi-choice create a multiple choice question, correct answer and feedback
multi-select create a multiple-select question, correct answer and feedback
objectives define course aims/objectives
preknowledge establish/provide basic background information
rss newsfeed
reading activity identify set text and questions
reflection promote reflective thinking
scorm quiz automatically marks and scores quiz
true-false question true-false question correct answer and feedback – hand marking
wiki article Imports entire Wikipedia article but no updates 2.2 Fancy yarns design (10 pt, bold) Each textile product is designed and manufactured after a certain project. Design decisions are taken at each level of processing: what fiber will be used in yarns, the yarns will be used in weave, what mass will be weave, in what colors will be produced the yarns or product fabric, what structure will have weave product and what finishes will apply to it. The fancy yarns can be made in deliberately by the introduction of irregularities or intermittent faults along their length. The yarns may be combined as components of a yarn that has appearance and properties of the yarns only be distinguished from the components. Changing appearance a textile product can be made by the introduction of yarns of effect that will affect the touch and its performance. In product design the fancy yarn will take account of the raw material from which it is obtained the product, the combination of colors, the type desired effect and the destination of end product. In this process are involved designers in various fields, such as: colorists which anticipate and provide for future color range, designers of yarns, the knits, weaves, carpets, embroidery, knitwear, clothing manufacturers, accessories, manufacturers of prints, stylists and artists. Training in this field can be achieved through the use of eLearning systems that allow for resume tasks whenever the student needs it. 3 RESULTS Development of means of learning is done by means of a series of activities for learning logically conected between them. For example, you might wish to explain the Objectives of the resource, before testing basic understanding with a Preknowlege test before moving to a Case Study…. ending perhaps with a selfassessment Scorm Quiz. To build up a sequence of activities, figure 2: 1. Select the type of activity you wish to create e.g. Preknowledge; 2. A dialogue appears in the main window; 3. Enter the text; you can copy and paste from Word using the icon on the extreme right of the toolbar; 4. Alternatively, you can paste text from Word via the Text icon to the left of the Word button (vertical arrow); 5. Add or modify the format using the icons in the standard editor toolbar; 6. To save the page click the green arrow at the bottom left of the screen. The image gallery gives you a simple way of uploading pictures which can be reused in different parts of your resource or in different resources. Gallery images are stored on your local computer and a copy will be created and uploaded into WebLearn. Creating image gallery, figure 3, requires the following steps: 1. Select the pen and paper icon on the bottom left of the Image Gallery central panel to edit or upload new pictures; 2. Select “Add Images” from top of central panel to open the Browse dialogue; 3. Select the image file you want to upload from your local drive and select “open”;
691
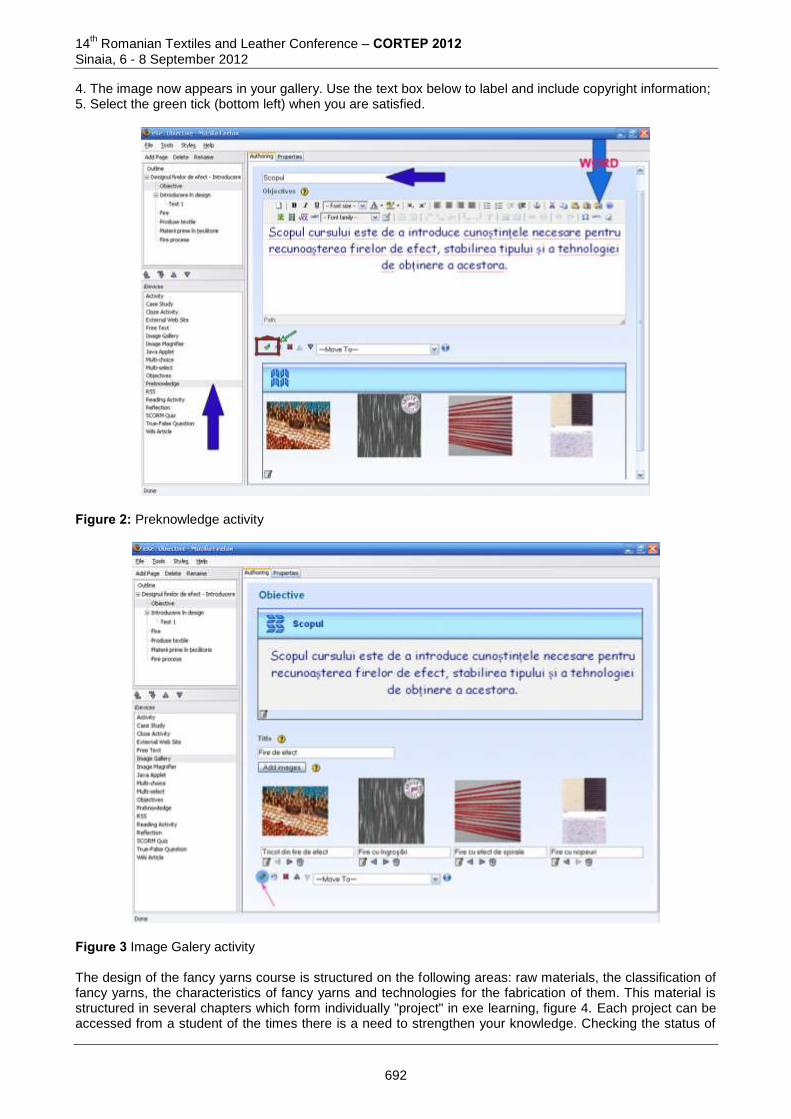
14th Romanian Textiles and Leather Conference – CORTEP 2012
Sinaia, 6 - 8 September 2012
4. The image now appears in your gallery. Use the text box below to label and include copyright information; 5. Select the green tick (bottom left) when you are satisfied.
Figure 2: Preknowledge activity
Figure 3 Image Galery activity The design of the fancy yarns course is structured on the following areas: raw materials, the classification of fancy yarns, the characteristics of fancy yarns and technologies for the fabrication of them. This material is structured in several chapters which form individually "project" in exe learning, figure 4. Each project can be accessed from a student of the times there is a need to strengthen your knowledge. Checking the status of
692

14
th Romanian Textiles and Leather Conference – CORTEP 2012
Sinaia, 6 - 8 September 2012
learning can be done with the aid of verification tests that may be of several types (true or false, tests grid, etc. ).
Figure 4 eXe learning projects Projects can be saved in several file types such as: SCORM 1.2 , IMS Content Package, self-contained folder or zip file for website. These types of file can be upload in elearning platforms used (WebLearn, Moodle, etc.) or it may be loaded on CD’s for use with or without access to the internet, figure 5, due to the fact that it creates a file "index". For the opening index file it is recommended that you use browser Mozilla Firefox which is open source.
Figure 5 Files type from eXe learning projects The project of elearning will be displayed in a easy form to understand for any user that has minimum knowledge of use of the computer, figure 6. Presentation is the same as that of a web site, the student can choose how it will work through the material and will always return to a material above. At the end of each unit of study can be used to enter grid tests to test your knowledge. The disadvantage lies in the fact that these tests will have permanent responses in the same order. To avoid this problem, eXe learning has the possibility to import tests carried out with other types of software (ex: Hotpotatoes), which allow for mixing random response to each time you access the course. Learner's knowledge check can be made in the traditional manner, if it can move to the center in which it is located the teaching staff or, in this case, to send a file with a test grid saved as an .pdf, and a file protected type .xls which is checked when answers to the questions. The professor will receive the file .xls acquiring direct qualifier that can be displayed quickly on a site for free blog, google docs, etc. 4 CONCLUSIONS The e-Learning includes traditional and modern methods and techniques of knowledge transmission. The aim of the paper is to present the possibilities of using eXe learning software for training in the design of fancy yarns. eXe (“eLearning XHTML editor”) is free, and easy to download and install on your local computer. There are two stages to using eXe:
693
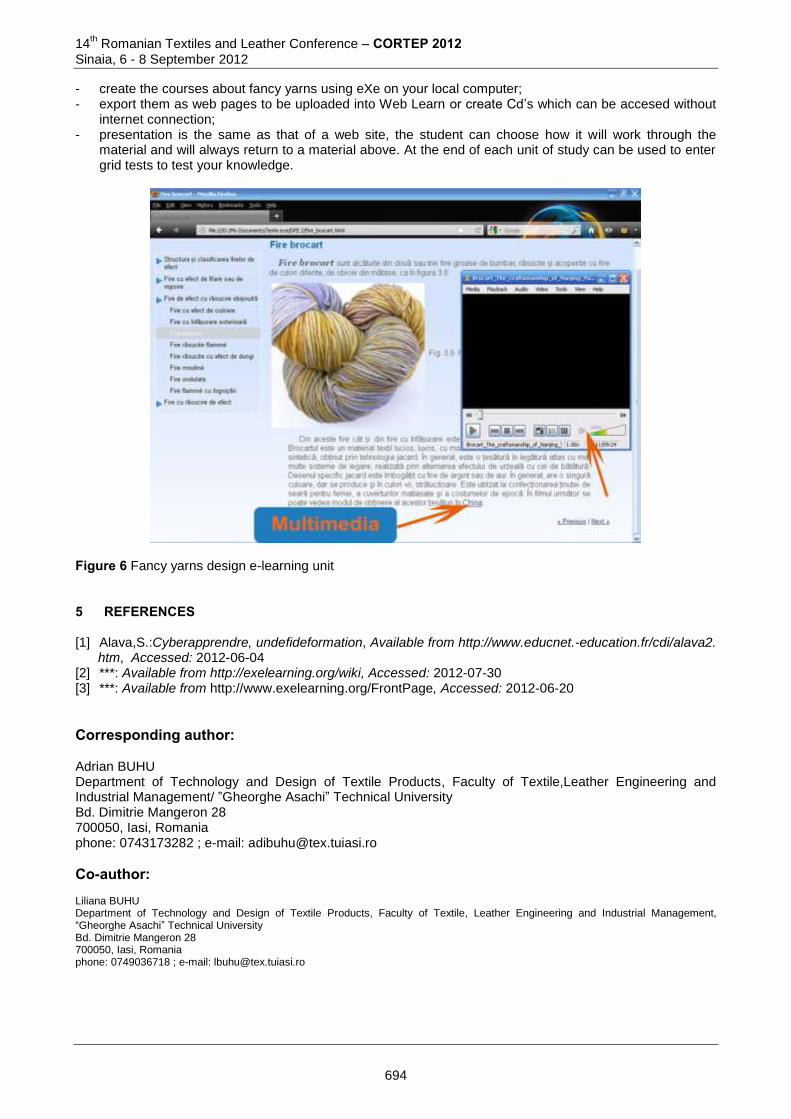
14th Romanian Textiles and Leather Conference – CORTEP 2012
Sinaia, 6 - 8 September 2012
- create the courses about fancy yarns using eXe on your local computer; - export them as web pages to be uploaded into Web Learn or create Cd’s which can be accesed without
internet connection; - presentation is the same as that of a web site, the student can choose how it will work through the
material and will always return to a material above. At the end of each unit of study can be used to enter grid tests to test your knowledge.
Figure 6 Fancy yarns design e-learning unit 5 REFERENCES [1] Alava,S.:Cyberapprendre, undefideformation, Available from http://www.educnet.-education.fr/cdi/alava2.
htm, Accessed: 2012-06-04 [2] ***: Available from http://exelearning.org/wiki, Accessed: 2012-07-30 [3] ***: Available from http://www.exelearning.org/FrontPage, Accessed: 2012-06-20
Corresponding author: Adrian BUHU Department of Technology and Design of Textile Products, Faculty of Textile,Leather Engineering and Industrial Management/ ”Gheorghe Asachi” Technical University Bd. Dimitrie Mangeron 28 700050, Iasi, Romania phone: 0743173282 ; e-mail: [email protected]
Co-author: Liliana BUHU Department of Technology and Design of Textile Products, Faculty of Textile, Leather Engineering and Industrial Management, “Gheorghe Asachi” Technical University Bd. Dimitrie Mangeron 28 700050, Iasi, Romania phone: 0749036718 ; e-mail: [email protected]
694
14
th Romanian Textiles and Leather Conference – CORTEP 2012
Sinaia, 6 - 8 September 2012
ON THE USE OF REFERENCE NOTES FOR KNOWLEDGE CONSOLIDATION
Мariana COJOCARU & Olga SUGAC
Technical University of Moldova
Abstract: The present study is an attempt to implement new forms of didactic material submission in the engineering disciplines teaching. The first step was the analysis of existing modern technologies of information submission in compressed from. It have been compared the advantages and disadvantages, and the limitations of each of the didactic materials visualization technology. As a result, we have chosen reference notes as information submission technology, mainly because of the opportunity to use all the possible types of information submission such as graphics, equations, schemes, figures, etc. As confirmation of the targeted technology implementation, we have proposed the reference notes sheet for one subject from the engineering curriculum. The completed or partially completed reference notes, can serve for training of the students, and for assessment of their knowledge as well. Keywords: knowledge, reference notes, visualization, supporting signs, images. 1. INTRODUCTION In the era of information saturation the problem of knowledge configuration acquires a big importance. In these conditions, "compression" and visualization of learning information is of urgent need. A.P Luria, investigating the cognitive processes, emphasized “the mind that works by means of sight, speculative" [1]. "Visual" thinking is thinking through the visual operations. In the other words, visual images are not an illustration of the author's thoughts, but the final manifestation of the mind. In comparison with the common use of visual means, the work of “visual” thinking is an activity of mind, that makes possible translation from one language of information presentation to another, understanding of relations and connections between its objects. At the end, the thinking is uniform: if the teacher makes active “visual” thinking of his students, thereby influences their thinking in “whole”. An active possession of visual material is possible only when the objects of thinking are clearly explained by means of image. Sometimes the teachers consider that a simple demonstration of image, depicting a defined object, allows the students to immediately pick up the idea. This is not always justified. The teacher should help the perception, but not by words, by structuring the picture. Psychological studies confirm that "perception is not the result of a simple dot transfer of image from the receptors to the brain. Looking at a picture, a person groups some of its parts with others, so the picture, as a whole, is perceived as being something definitely organized "[2]. The form of visualization is a subjective education, and everyone is able to create its own image of the provided information and may not always understand the images offered by the teacher. The American psychologist Rudolf Arnheim, introduced the term of “visual thinking”, and his works initiated the modern researches on the role of imaginative phenomena in cognitive activity. As R. Arnheim correctly noted, „perception and thinking need each other, their functions are mutually complementary: perception, without thinking would be useless, thinking without perception nothing would be reflect about” [2]. Active perception of the signs educational information requires a special organization, considered methods of educational material submission. N. Reznick investigates the features of visual thinking as an example of mathematical disciplines, and emphasizes the following means of visual information presentation:
drawing – the most rigid geometric means of information presentation method;
equation method, though can be attributed to visual form, is little associated with visual representations of the students;
695

14th Romanian Textiles and Leather Conference – CORTEP 2012
Sinaia, 6 - 8 September 2012
signal and visual means, that is, conventional signs, which allow visual perception of the meaning [2].
2. TECHNOLOGIES OF EDUCATIONAL INFORMATION VISUALIZATION, PRINCIPLES OF THE
REFERENCE NOTES DEVELOPMENT "Compression" and visualization of learning information can be achieved by different methodological techniques, and therefore a variety of knowledge presentation models are known. There is a full open space for a creative initiative of teacher and student. In the university system, the following forms of information submission are the most popular: graph model, production model, logical model, semantic network model, cognitive and graphic elements "Tree" and "Building", frame model, summary diagram and abstract scheme, reference notes or list of reference signs, memory card and metaplan. As a rule, graph model, as a visual learning tool is rarely used in the practice. It can be effectively used in introduction or final lectures. Production model represents a set of rules or algorithmic instructions for presentation of the solution procedure. As an option of this model can be offered the AOF maps (action-oriented framework) developed by B.Ts. Badmaev. [2] Logic model is more often used for record of the mathematical axioms and theorems with the use of predicates logic, that allows to reduce the quantity of written-down "signs" in several times. Semantic network model. It is used for disclosure of the concept volume, which characterizes the subject. As an example of semantic network model can serve the formal and logic technique of information blocks of a big scale reflection. Its varieties are graphs, flow charts and terminological nests. Cognitive and graphic elements like "Tree" and "Building" are built on flow charts principle, consisting of components, which are arranged, in the studied theory, in the following sequence: base – core - application. Basic concepts, facts and actions modes are presented in base. Frame model (the frame is a skeleton, a short description of the phenomenon). Usually, the frame consists of several cells, each of which has its own purpose. Examples of frames - tables, matrices, etc. Diagram summary and abstract scheme can be considered as a special case of the frame model. Her author V.M. Kagan is sure, that the perception of images and phenomena depends on the depth of penetration. [3] Memory card developed by teachers B.Deporter and M.Henaki approaches a record form to native work of the brain on information perception and its transfer. The symbols and pictures are entered into the memory card for simplification of its memorization. Memory cards can be recommended for the planning or organization of independent activity. For example, the record of instruction can be carried out before the beginning of the students work practices. [4] Metaplan represents a set of the sign forms (elements) that have a specific purpose. The investigation on the possibility of metaplan use in vocational training belongs to N.E. Erganov. [2] Reference notes or the list of supporting signs The concept of reference notes is connected with the name of the teacher innovator V.F. Shatalov. The reference notes is a model of training material content visualization, built on the special principles, in which, ideas in a studied subject are presented in compressed form, and the graphic means for strengthening of the mnemonic effect are used. This method can be called a qualitatively new stage in the systematization of training material; which does not reject, but supplements the general scheme. This method along with others is based on the psychological characteristics of information perception, because it does not comply with a rigid structure of material presentation. In the usual scheme, information is not coded, and the material is presented in a single phrase or complete definitions. The reference notes strongly differ from the abstract, perhaps, the most detailed one. Making a summary in the traditional way, it is difficult not to give in to temptation to introduce into the abstract more material, to describe in detail each item of the lecture’s plan. The reference notes have to be laconic and concise.
696
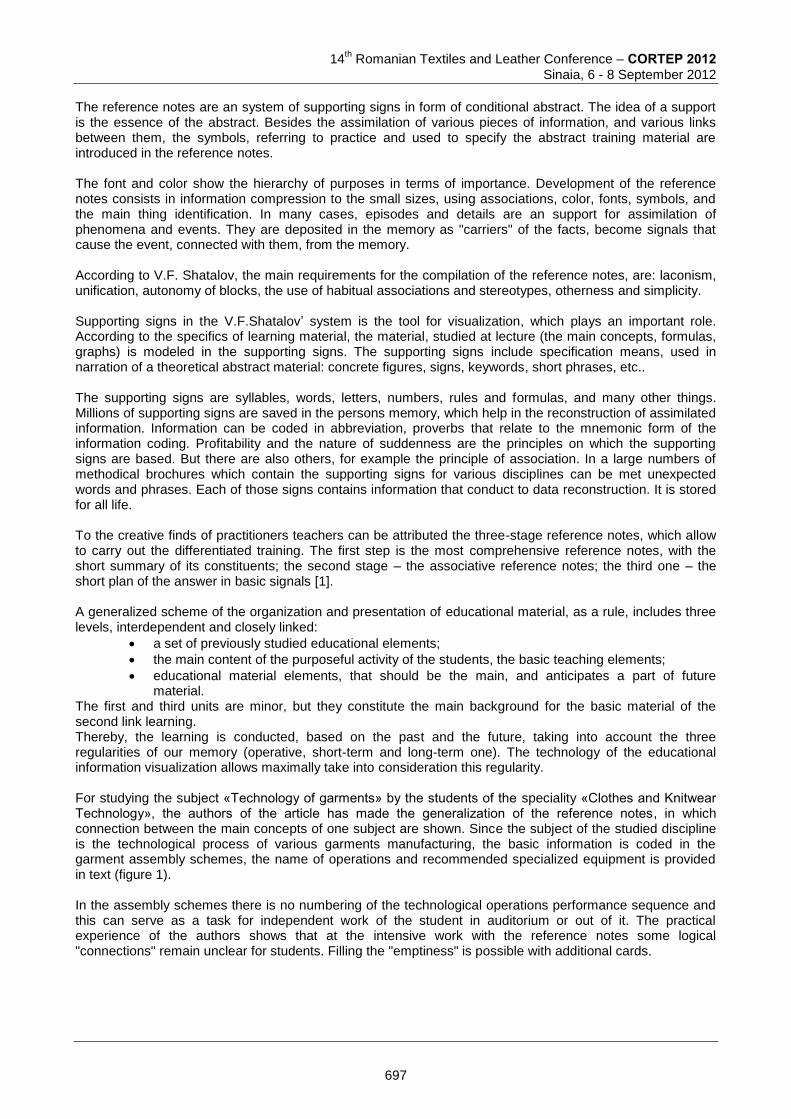
14
th Romanian Textiles and Leather Conference – CORTEP 2012
Sinaia, 6 - 8 September 2012
The reference notes are an system of supporting signs in form of conditional abstract. The idea of a support is the essence of the abstract. Besides the assimilation of various pieces of information, and various links between them, the symbols, referring to practice and used to specify the abstract training material are introduced in the reference notes. The font and color show the hierarchy of purposes in terms of importance. Development of the reference notes consists in information compression to the small sizes, using associations, color, fonts, symbols, and the main thing identification. In many cases, episodes and details are an support for assimilation of phenomena and events. They are deposited in the memory as "carriers" of the facts, become signals that cause the event, connected with them, from the memory. According to V.F. Shatalov, the main requirements for the compilation of the reference notes, are: laconism, unification, autonomy of blocks, the use of habitual associations and stereotypes, otherness and simplicity. Supporting signs in the V.F.Shatalov’ system is the tool for visualization, which plays an important role. According to the specifics of learning material, the material, studied at lecture (the main concepts, formulas, graphs) is modeled in the supporting signs. The supporting signs include specification means, used in narration of a theoretical abstract material: concrete figures, signs, keywords, short phrases, etc.. The supporting signs are syllables, words, letters, numbers, rules and formulas, and many other things. Millions of supporting signs are saved in the persons memory, which help in the reconstruction of assimilated information. Information can be coded in abbreviation, proverbs that relate to the mnemonic form of the information coding. Profitability and the nature of suddenness are the principles on which the supporting signs are based. But there are also others, for example the principle of association. In a large numbers of methodical brochures which contain the supporting signs for various disciplines can be met unexpected words and phrases. Each of those signs contains information that conduct to data reconstruction. It is stored for all life. To the creative finds of practitioners teachers can be attributed the three-stage reference notes, which allow to carry out the differentiated training. The first step is the most comprehensive reference notes, with the short summary of its constituents; the second stage – the associative reference notes; the third one – the short plan of the answer in basic signals [1]. A generalized scheme of the organization and presentation of educational material, as a rule, includes three levels, interdependent and closely linked:
a set of previously studied educational elements;
the main content of the purposeful activity of the students, the basic teaching elements;
educational material elements, that should be the main, and anticipates a part of future material.
The first and third units are minor, but they constitute the main background for the basic material of the second link learning. Thereby, the learning is conducted, based on the past and the future, taking into account the three regularities of our memory (operative, short-term and long-term one). The technology of the educational information visualization allows maximally take into consideration this regularity. For studying the subject «Technology of garments» by the students of the speciality «Clothes and Knitwear Technology», the authors of the article has made the generalization of the reference notes, in which connection between the main concepts of one subject are shown. Since the subject of the studied discipline is the technological process of various garments manufacturing, the basic information is coded in the garment assembly schemes, the name of operations and recommended specialized equipment is provided in text (figure 1). In the assembly schemes there is no numbering of the technological operations performance sequence and this can serve as a task for independent work of the student in auditorium or out of it. The practical experience of the authors shows that at the intensive work with the reference notes some logical "connections" remain unclear for students. Filling the "emptiness" is possible with additional cards.
697
14th Romanian Textiles and Leather Conference – CORTEP 2012
Sinaia, 6 - 8 September 2012
to sew a slide
fastener, (301)
to sew a belt
to a skirt, (2ő301)
to sew a button
on a belt, (304)
to execute a finishing line,
(2ő301)
to sew a buttonhole
on a belt, (407)
to process a pocket,
to close a pocket lining,
(504, 512)to execute a
finishing line , (301)
to hem a skirt
bottom (504, 301)
Skirt manufacturing technology
Figure 1: The reference notes for the subject „Skirt manufacturing technology” 3. CONCLUSION Finally, it is concluded that the training model developed by Shatalov V. F. answers entirely to criteria of manufacturability, conceptuality and systematicity. The practical experience of many teachers speaks about reproduction and viability of this training technology. Conclusions of the authors are that, efficiency of this model is high, because of the better assimilation of educational information in comparison with the traditional models of knowledge presentation. 4. REFERENCES [1] Badmaev B.Ţ.:Psihologhia i metodica usckorennogo obucenia. – M.: Gumanit. izd. ţentr VLADOS,
1998. [2] Reznic N.A.: Tehnologhia vizualinogo mişlenia// Şcolinîe tehnologhii. – 2000. - 4. pp. 127-141. [3] Cagan V.M. Conspect-shema v optimizatii obucenia spetzialinim tehniceschim disciplinam.-Ircutsc Izd-vo
Ircut. Un-ta,- 128 pp. [4] Deporter B.; Henaki M.: Kvantovoe obucenie: Razbudite speaşcevo v vas ghenia! – Mn.: OOO ”Popurri”,
1998. [5] Rudolf Arnheim., Art and Visual Perception: a psychology of the Creative Eye, University of California
Press, 1954. – 485 pp.
698
14
th Romanian Textiles and Leather Conference – CORTEP 2012
Sinaia, 6 - 8 September 2012
Corresponding author Mariana COJOCARU Department of Clothes and Knitwear Technology Faculty: Textile Industry Technical University of Moldova 168, bd. Ştefan cel Mare MD 2004, Chişinău, R.Moldova E-mail: [email protected] Co-author Olga SUGAC Department of Clothes and Knitwear Technology Faculty: Textile Industry Technical University of Moldova 168, bd. Ştefan cel Mare MD 2004, Chişinău, R.Moldova E-mail: [email protected]
699
14
th Romanian Textiles and Leather Conference – CORTEP 2012
Sinaia, 6 - 8 September 2012
PEDAGOGIC TECHNOLOGIES ON ORGANIZATION OF STUDENT REFLEXIVE AND VALUATION ACTIVITIES
Olga SUGAC & Mariana COJOCARU
Technical University of Moldova Abstract: the changed requirements for qualified profile and the competencies level of senior executives today have become the impetus for system reform of the vocational education. Therefore, one of the main objectives of Higher Education should be the development of abilities of students through education and self-education This, in turn, implies the creation of conditions for effective reflexively-evaluation of students. The goal of this research is to analyze modern pedagogic technologies of evaluation of students’ learning activity, discovery and approbation of the most effective forms and methods of control within the professional training of garment manufacture engineers. The priority was given to those forms and methods of control which would help to shift the emphasis from the informational training to meaning-searching, to the formation of students’ cognitive motivation, development of their analytical skills and ability to reflex. Keywords: pedagogic technologies, students’ educational activity, reflection. 1. INTRODUCTION The basic problem of modern education system consists in the contradiction between the round pace of knowledge increment in a modern world and limited opportunities of its digestion by an individual. This forces the pedagogic theory to abandon the absolute educational ideal (fully educated person) and pass to the new ideal – maximum development of human capabilities to self-regulation and self-education. At the same time, the student himself becomes the leading figure in the educational process, acting not as the object but as the subject of learning [1]. The improvement of the quality of students’ professional education in the examined aspect requires a specially organized system of educational and cognitive, administrative, pedagogical, methodical activity of all the subjects of the professional training process, directed at the identification of high performance technologies of professional education and creation of conditions for their expansion (organizational, psychological, pedagogical etc.). One of the directions of pedagogic technologies is the control of learning activity of educational subjects, which, as it is known, does not become for students like as a simple evaluation but has particularly the teaching, educational and developmental functions. 2. INFORMATION Method of control as a complete system consists of different (by function, forms, etc.) structural components. These structural components are:
controls;
its methods and techniques;
organizational forms as an internal organization and external expression of the validation process. Analysis of the educational and methodical literature indicates that the control technologies in different sources as a matter of fact are identical, but their classification and relationship of different authors interpret in its way. The differences in the technologies of training students create alarms some difficulty for young teachers who do not have experience in this field.
Therefore, we believe it is necessary initially to state its understanding of the concepts.
Traditionally provide the following types of control depending on their function in the learning process:
preliminary control that performs diagnostic function;
700
14th Romanian Textiles and Leather Conference – CORTEP 2012
Sinaia, 6 - 8 September 2012
current and total control with dual function: for teachers-provide information about the quality of the selected (current control) or final (final) stages of education, and for students in most cases are an essential cognitive motivation.
Methods and techniques of knowledge control, abilities and skills of students by way of interacting subjects training in the educational process can be classified as follows:
1) verbal; 2) written; 3) graphics; 4) practical; 5) programmed by.
It should be noted that the methods of control is often used in a combined form, i.e. to the real learning process they complement each other. Each method includes all techniques of control, and the same technique can be used in various control methods. Model forms of the internal organization of learning process verification of students activities are:
1) individual; 2) front; 3) group; 4) self-monitoring; 5) controls implicit (in rare cases).
The existing external organizational forms that characterize the external expression of the verification process in the learning process of Higher Education are:
1) protection of laboratory and practical work; 2) seminars; 3) interim appraisal; 4) final exam.
In our view, in the current circumstances, taking into account the requirements for the training of graduates selecting forms and methods of control of knowledge and skills students should give priority to the verification technologies that would shift from information at semantic search training, a motivational learning of individual students, develop their analytical capabilities, resulting in a higher interest to training activities, awareness of the students of the importance of information received, searching for casual relationship and the skill to reflect on. Reflection on the whole is a thought (rational) process to analysis, understanding, and awareness of herself: custom activities, experience, abilities, tasks, appointments, etc. In pedagogy teaching on reflexive actions associated with the theory of L.C. Vygotsky on the relationship of learning with mental development and determine the reflection as self-consciousness in the own work. The reflection is a key pedagogical goal of higher school. In particular, this is because reflection is part of the component of the professional engineer's clothing industry, which involves both assessment and evaluation of production processes at the plant, and self-examination, self-assessment of his own activities as a subject of production. Low capacity for reflection has a negative impact on the professional competence of the future specialist, puts him in a situation of complete dependence on external factors and incentives, appropriate, impacts, and makes it a perfect official saying, unable to take rational decisions in non-standard situations. The essence of modern concepts of a reflexive process training of students is to create conditions in which education is self-education and management. In this case, the problem is solved by means of more effective training of students needs and capacity for self-development, introspect, self-assessment. In the course of properly organized reflection is critical attitude of students to their activities and work colleagues, is the rational for decisions. In the course of properly organized reflection is critical attitude of students to their activities and work colleagues, is the rationale for decisions. In this case, the reflection is the opposite of awareness. This is because if there is realization of integrity situation awareness, reflection, on the contrary, divide this whole, analyses the situation from the perspective of. Thus, the perception is just for reflection and thinking, because it gives an understanding of the overall situation.
701
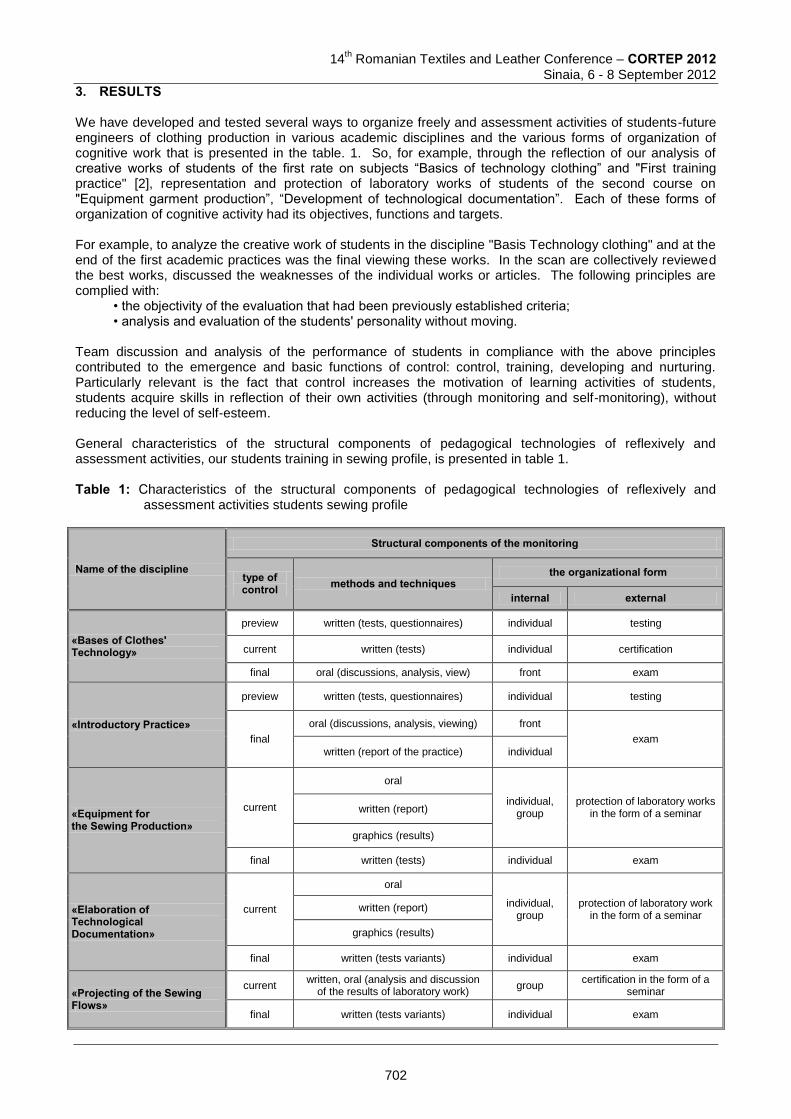
14
th Romanian Textiles and Leather Conference – CORTEP 2012
Sinaia, 6 - 8 September 2012
3. RESULTS We have developed and tested several ways to organize freely and assessment activities of students-future engineers of clothing production in various academic disciplines and the various forms of organization of cognitive work that is presented in the table. 1. So, for example, through the reflection of our analysis of creative works of students of the first rate on subjects “Basics of technology clothing” and "First training practice" [2], representation and protection of laboratory works of students of the second course on "Equipment garment production”, “Development of technological documentation”. Each of these forms of organization of cognitive activity had its objectives, functions and targets. For example, to analyze the creative work of students in the discipline "Basis Technology clothing" and at the end of the first academic practices was the final viewing these works. In the scan are collectively reviewed the best works, discussed the weaknesses of the individual works or articles. The following principles are complied with:
• the objectivity of the evaluation that had been previously established criteria; • analysis and evaluation of the students' personality without moving.
Team discussion and analysis of the performance of students in compliance with the above principles contributed to the emergence and basic functions of control: control, training, developing and nurturing. Particularly relevant is the fact that control increases the motivation of learning activities of students, students acquire skills in reflection of their own activities (through monitoring and self-monitoring), without reducing the level of self-esteem. General characteristics of the structural components of pedagogical technologies of reflexively and assessment activities, our students training in sewing profile, is presented in table 1. Table 1: Сharacteristics of the structural components of pedagogical technologies of reflexively and
assessment activities students sewing profile
Name of the discipline
Structural components of the monitoring
type of control methods and techniques
the organizational form
internal external
«Bases of Clothes' Technology»
preview written (tests, questionnaires) individual testing
current written (tests) individual certification
final oral (discussions, analysis, view) front exam
«Introductory Practice»
preview written (tests, questionnaires) individual testing
final
oral (discussions, analysis, viewing) front
exam
written (report of the practice) individual
«Equipment for the Sewing Production»
current
oral
individual, group
protection of laboratory works in the form of a seminar written (report)
graphics (results)
final written (tests) individual exam
«Elaboration of Technological Documentation»
current
oral
individual, group
protection of laboratory work in the form of a seminar
written (report)
graphics (results)
final written (tests variants) individual exam
«Projecting of the Sewing Flows»
current written, oral (analysis and discussion
of the results of laboratory work) group
certification in the form of a seminar
final written (tests variants) individual exam
702
14th Romanian Textiles and Leather Conference – CORTEP 2012
Sinaia, 6 - 8 September 2012
Analysis of theoretical and applied research on the control of knowledge in education, we have come to the conclusion that to improve the quality of training of specialists and significantly improve the monitoring process can be supported through greater internal personal resources. This is possible when organized properly reflexively-evaluation activity subjects of learning in which students independently have an internal and external control by (or attributed to) and makes the evaluation itself, its activities and those of colleagues, comparing the results with the main and private educational objectives (goals). According to the principle, we have organized and held interim check of knowledge within the second appraisal with the students of the third course "Design of sewing thread” table 1. It has been observed that by the teacher's reflection is a self-diagnostic technology of success and the effectiveness of its pedagogical action, as a means to respond flexibly to any teacher, life situation. 4. CONCLUSIONS Studies have concluded that the higher the level of development of the reflexive-self assessment the student, so it would be better to learn and acquire the ability to act independently in professional self-esteem. Observations showed that in a situation where a student is able to evaluate themselves, their quality, their activities, he can also detect the successes of others and not to exaggerate their shortcomings. However, the adequate self-esteem contributes to not only as individuals but also as an emerging professional future of the organizer or production leader. In addition, it should be noted that the modern and competent organization of the students’ reflexive evaluated activity in various forms allows supporting the learners’ cognitive interest, overcoming the monotony of the academic process, forms the stable positive student motivation for learning activity [2, p.77-78], and encourages the students to persistent systematic training work. In its turn, the formed motivational sphere of students’ personality is the basis for their self-education and self-improvement in the future which will provide the future specialist with the competitive performance on the labor market. 5. REFERENCES: [1] Lavrentiev G.V., Lavrentieva N.B. Innovationnie obuchayuschie tehnologii v professionalinoi podgotovke
specialistov. – Barnaul: Publisher of Altai State University, 2002. – 156 p. [2] Sugac O.V. Pedagogicheskaya model nachalinoi tehnologicheskoi i hudojestvenno-tehnologicheskoi
podgotovki injenerov schveinogo proizvodstva: Thesis......of doctor of philosophy in pedagogics: 13.00.08. – Chişinău, 2008. - 190 p.
Corresponding address: Olga SUGAC Department of Clothes and Knitwear Tehnology Faculty Textile Industry Technical University of Moldova Bd. Stefan cel Mare, 168 MD-2004, Chişinău, Moldova Phone: /+373-22/48-93-12; E-mail: [email protected] Co-author Mariana COJOCARU Department of Clothes and Knitwear Tehnology Faculty Textile Industry Technical University of Moldova Bd. Stefan cel Mare, 168 MD-2004, Chişinău, Moldova Phone: /+373-22/ 31-91-55; E-mail: [email protected]
703
14
th Romanian Textiles and Leather Conference – CORTEP 2012
6 - 8 September 2012, Sinaia, Romania
THE BOOK OF THE TEXTILE ENGINEER
Aristide DODU1, Dorin DAN2 1 Academy of Technical Sciences from Romania
2 “Gheorghe Asachi” Technical University of Iasi, Romania, Faculty of Textiles, Leather and Industrial Management
Abstract: This 4500 pages book, in 3 volumes, is very important for the textile field and was elaborated under the guidance of the General Association of Engineers in Romania (A.G.I.R.). It contains notions, fundamental definitions, schemes, tables, computer formula, diagrams and technical and technological elements.The contents are divided in 12 sections: Section I - Textile raw materials. Classification and properties of fibers from natural and synthetic polymers; Section II - Primary manufacturing of vegetal textile raw materials; Section III - The spinning of textile fibers (equipment, technologies, products etc.), Section IV - The weaving of textile yarns (equipment, technologies, products etc.); Section V - The knitting of textile yarns; Section VI - Technologies of making of non-conventional textiles; Section VII - Making-up of the textile materials (equipment, technologies, products etc.); Section VIII - Textile finishing (water, chemical auxiliaries, due staff, cleaning, bleaching, printing, final finishing etc.); Section IX - Metrology and the technical control of the product quality (methods and devices for chemical and mechanical analyses and tests, inter-phase control); Section X - Installations and general equipment for textile industry (types of constructions, force and lighting electrical systems, thermal installations, plants for air conditioning and end environment amelioration etc.); Section XI - Information organization, management accountancy; Section XII - Statistic elements for production and maintenance of textile products. The Book of the Textile Engineer is expected to be a major support for the activity of the engineers in textile manufacturing, research, design and education, and also for other specialists in different sub-branches of the textile industry, eager to find easier and faster organization, solutions, co-ordination and globally re-technologysation of manufacturing. The contents of the book will also be very helpful for students.
Keywords: spinning, weaving, knitting, making-up of textile materials, textile finishing, textile metrology, equipment for textile industry, maintenance of textile products. Information about: TEXTILE FIBRES: general consideration on structure of textile fibres * general properties of textile fibers * natural fibres * chemical fibres * fibres with bidimentional structure * nonpolymeric fibres * high performance with special destinations. PRIMARY PROCESSING OF COTTON, FLAX AND HEMP: primary processing of cotton * primary processing of flax and hemp. SPINNING: bases of spinning processes * structure and design of yarns * cotton type spinning * wool spinning * bast fibres spinning * silk spinning * sewing thread. WEAVING: yarn winding * twisting fixing and rotosetting * warping * warp sizing * warp waxing * draught * yarns quilling * weaving * bases of fabric designing * types of yarn drawing-in * weaves for simple fabrics * weaves for composed weaves * weaves for jacquard fabrics. KNITTING: general notions * textile yarns preparing for knitting * knitting structures and design * knitting theoretical bases * devices and technologies for knitting production * other technologies for knitting’s production * reshaping elements for some knitting’s. NON-CONVENTIONAL TEXTILES AND OTHER TEXTILE TECHNOLOGIES: nonconventional textiles * other textile technologies. TEXTILE GARMENTS: garments’ characterization and classifying * functions of the clothing products * materials used in textile garments * specific aspects for clothing design * constructive design of clothing items * specific consumption establishing and optimization of the materials utilization * production
704
14th Romanian Textiles and Leather Conference – CORTEP 2012
6 - 8 September 2012, Sinaia, Romania
processes in textile garments * receiving, storage and preparing of materials for cutting * materials boring and cutting * thermo-sticking in textile manufacturing * textile materials sewing * technologies for producing clothing products * nonconventional assembling technologies * humido-thermal treatments * quality in textile industry * sorting * labeling * packing. CHEMICAL TEXTILE TECHNOLOGY: water in textile industry * chemical auxiliaries in textile industry * dyes * cleaning, bleaching and mercerization * wet finishing * dying textile materials * printing textile materials * final finishing * machines for textile materials finishing * treatment of the sewage from textile materials finishing. TEXTILE METROLOGY AND QUALITY TECHNICAL CONTROL: physical and mechanical analyses * metrology conditions specific to textile fabrics trials * climate parameters, methods and apparatus * microscopy methods and techniques in textile metrology * gravimetric methods used in textile study * physical properties of textile materials * mechanical properties of textile materials * automate systems for products and processes control * textile chemical analyses * quality control in mechanical processing technology * quality control in textile chemical finishing. GENERAL TECHNICAL PROBLEMS AND AUXILIARY INSTALATIONS: bases of textile machinery maintenance and repairing * construction elements in the textile industry * electric installations in the textile industry * illumination installations * thermal installations (heating apparatus and elements, energy balance) * ventilation and acclimatization installations * products handling, transport and storage in the textile industry. TECHNICAL AND ECONOMICAL PROBLEMS (ORGANIZATION, MANAGEMENT, MARKETING, INFORMATICS, ACCOUNTABILITY): job management in the textile industry (workplace, production) * management (general, strategic, financial, human resources) * textile products marketing * informatics – instrument in managerial activity * accountancy records. STATISTIC ELEMENTS OF TEXTILE PRODUCTS AND MATERIALS MANUFACTURE AND MENTENANCE: statistic data of production * textile product maintenance * work production elements * work security technique * safeguard and security against fire. References: DODU, A. et. al. Manualul inginerului textilist (The Book of The Textile Engineer) Vol. I. București: Editura
AGIR, 2002, p. 1542. DODU, A. et. al. Manualul inginerului textilist (The Book of The Textile Engineer) Vol. II. Partea A. București,
Editura AGIR, 2003, p. 782. DODU, A. et. al. Manualul inginerului textilist (The Book of The Textile Engineer) Vol. II. Partea B. București,
Editura AGIR, 2003, p. 2091. DODU, A. et. al. Manualul inginerului textilist (The Book of The Textile Engineer) Vol. III. București: Editura
AGIR, 2004, p. 1556. Address of the publisher: Editura AGIR (AGIR Publishing House) Calea Victoriei 118, Sector 1, 010093, Bucuresti Phone: +4021.316.89.92, +4021.316.89.94 (editorial), +021.211.83.50 (distribution) Fax: +4021.312.55.31 E-mail: [email protected]; [email protected] Corresponding address: Aristide DODU Academy of Technical Sciences from Romania Blvd. Dacia nr. 26, Sector 1, Bucharest Phone: +40 21 231 74 88 Fax: +40 21 312 55 31 E-mail: [email protected]
705
Investeşte în oameni ! FONDUL SOCIAL EUROPEAN Programul Operaţional Sectorial Dezvoltarea Resurselor Umane 2007 – 2013 Axa prioritară 2 „Corelarea învăţării pe tot parcursul vieţii cu piaţa muncii” Domeniul major de intervenţie 2.1 „Tranziţia de la şcoală la viaţa activă” Titlul proiectului: De la teorie la PRACTICĂ - PRACTICA Contract POSDRU 90/2.1/S/60423
PRACTICA POSDRU 90/2.1/S/60423
În perioada 2 august 2010 – 1 august 2013, Universitatea Tehnică „Gheorghe Asachi” din
Iaşi, prin Facultatea de Textile – Pielărie şi Management Industrial, în parteneriat cu INCDTP
Bucureşti, ASITEX şi INI, implementeaza proiectul POS-DRU „De la teorie la practică – PRACTICA”. Proiectul este cofinanţat din Fondul Social European prin Programul Operaţional
Sectorial pentru Dezvoltarea Resurselor Umane 2007 – 2013. Valoarea totală a proiectului este de 7.850.840 lei, din care 7.454.111 lei asistenţă financiară nerambursabilă.
La originea ideii pentru proiectul de față stă necesitatea pregătirii forței de muncă
specializate la nevoile reale ale firmelor de profil. Adaptarea la schimbarea mediului competitiv
european cere firmelor flexibilitate și valoare adăugată, scop în care principalele direcții de
acțiune identificate privesc educația, forța de muncă, cercetarea, dezvoltarea și inovarea
(http://ec.europa.eu). Căutarea unor surse noi de construire și menținere a unui avantaj
competitiv durabil conduce la soluții care au în vedere creșterea calității resursei umane printr-o
pregătire practică solidă. Prin generarea de cunoștințe, abilități și aptitudini practice, educația
este cel mai important vector în crearea de competențe ce vizează creativitatea și inițiativa. În
învățământul universitar tehnic combinarea excelenței în studii științifice și tehnice cu
comportament antreprenorial și aptitudini practice trebuie să imprime absolvenților competențe
de natură să le permită absorbția pe piața muncii.
Prin realizarea activităților prevăzute, proiectul rezolvă cerința necesității desfășurării
practicii, în condiții de excelență atât organizatoric cât și din punct de vedere al conținutului.
Faptul că aceste activități sunt incluse în planurile de învățământ, iar pentru anii terminali sunt
prevăzute o excursie de studii și elaborarea unei lucrări de licență apare justificată existența unui
proiect finanțat care să elimine asperitățile existente între centrele universitare și mediul de
producție. Dacă înainte de proiect se manifesta situația jenantă a centrelor universitare de a se
adresa firmelor pentru a permite studenților accesul la liniile de producție, prin atingerea
obiectivului acestui proiect fiecare firmă devine interesată atât material cât și ca beneficiar al
folosirii unor experți bine pregătiți precum și de necesitatea apropierii de centrele universitare
pentru perspectiva dezvoltării ulterioare. Între domeniul industrial și centrele universitare apare o
atmosferă de încredere și colaborare, nerealizată până acum, prin cunoașterea reciprocă a
potențialului științific universitar dată de pregătirea tutorilor și respectiv potențialul real al
întreprinderii.
706
Obiectivul general al proiectului PRACTICA este dezvoltarea aptitudinilor practice, specifice
fabricaţiei, producţiei şi cercetării, pentru studenţii din cadrul învăţământului superior tehnic –
domeniul textile-pielărie.
Obiectivele specifice ale proiecului sunt:
OS1. Organizarea în condiţii corespunzătoare a practicii pentru şapte specializări acreditate din
trei domenii ale ştiinţelor inginereşti, conform structurii Facultăţii de Textile – Pielărie şi
Management Industrial.
OS2. Îmbunătăţirea pregătirii profesionale prin dezvoltarea aptitudinilor practice, pe parcursul a
trei stagii proiectate gradual în corelaţie cu cerinţele pieţei muncii, pentru un număr de 824 de
studenţi (în total 1134 stagii individuale de practică).
OS3. Formarea unui număr de 46 de tutori din cadrul a 29 firme selectate ca parteneri de
practică, ca urmare a încheierii parteneriatelor pe termen lung conform legii nr.258/2007.
OS4. Înfiinţarea unei firme simulate care să integreze activităţi de proiectare, monitorizare a
fabricaţiei, comercializare şi conducere specifice firmelor reale partenere. Includerea practicii în
firma simulată ca activitate didactică obligatorie în planurile de învăţământ a şase specializări
acreditate.
Activităţile proiectului - ANUL III 3.1.Campanie de constientizare a oportunitatilor oferite studentilor privind stagiile de pregatire
practica
3.2.Incheierea parteneriatelor de practica si a conventiilor cadru, formarea grupelor pentru
stagiile de practica
3.3.Planificarea si realizarea achizitiilor de materii prime si echipamente de protectie pentru
desfasurarea practicii
3.4.Participarea sudentilor din anul II la stagii de practica in cadrul atelierelor scoala si a firmei
simulate
3.5.Participarea sudentilor din anul IV la stagii de practica in productie si cercetare, pentru
elaborarea lucrarii de licenta
3.6.Participarea sudentilor din anul III la stagii de practica in cadrul firmelor partenere
3.7.Evaluarea rezultatelor obtinute de studenti in perioada stagiilor de pregatire practica, inclusiv
premierea celor mai bune rezultate
3.8.Schimb de experienta si diseminarea de bune practici privind organizarea practicii studentilor
3.9.Managementul proiectului
Rezultate finale:
1. 824 de studenţi de la șapte specializări.
2. 46 tutori
3. 29 parteneriate
4. 1134 stagii de practică
5. 7 seminarii de instruire a tutorilor
6. 3 workshop-uri organizate
7. 1134 convenţii de practică individuale
8. materiale suport elaborate, editate şi tipărite:
- 3 îndrumare de practică (anii II, III şi IV), multiplicate în min.150 exemplare anual
- 2 caiete de practică (anii II şi III), multiplicate în min.150 exemplare anual
- 1 ghid pentru îndrumarea practicii, adresat tutorilor de practică, multiplicat în
min.50 de exemplare anual.
707
- 1 ghid de bune practici multiplicat în min.200 de exemplare în anul 3 al proiectului.
9. EMPLO – portal al locurilor de muncă
COORDONATOR: Universitatea Tehnică “Gheorghe Asachi ” din Iaşi
Facultatea de Textile – Pielărie şi Management Industrial
Bd. D. Mangeron, nr. 29, 700050-Iaşi
www.tex.tuiasi.ro; www.textilepraxis.ro; [email protected]
MANAGER DE PROIECT: Conf.univ.dr.ing. Carmen Maria LOGHIN Parteneri: Institutul Naţional de Cercetare-Dezvoltare pentru Textile - Pielărie
Asociaţia Absolvenţilor Facultăţii de Textile – Pielărie din Iaşi
Institutul Naţional de Inventică Iaşi
MULŢUMIRI Aceast material a fost realizat cu suportul financiar al proiectului PRACTICA “De la teorie la
practică”, finanţat de către Fondul Social European şi Guvernul României.
708

INDEX OF AUTHORS
ADOLPHE, Dominique 367
AGRAWAL, Pramod 111, 223, 228
AKALIN, M. 781
AKTER, Farzana 770
AMERI DEHABADI, Vahid 462
ANAND, S.C. 717
ANGELOVA, Yordanka 735, 975
ANTCZAK, Emmanuel 211
ANTON, Carmen 683
ARNOLD, Rolf 753
AVADANEI, Manuela 295, 449
AVRAM, Dorin 57, 102, 198, 205, 211
AVRAM, Petronela 223, 228
AZEVEDO, Cláudia 619
BAHNERS, Thomas 476
BALAN, Stela 388, 394, 398
BANG, JuChul 747
BANG, Ju Deuk 747
BARBUTA, Marinela 250
BARITZ, Mihaela Ioana 557, 569
BĂLĂU Mîndru, Iulia 551
BĂLĂU Mîndru, Tudorel 551
BELAKOVA, Dana 334
BEYİT, A. 813
BIBIRE, Cristina 65
BILALIS, Nikolaos 619
BLACHOWICZ, Tomasz 775
BLAGA, Mirela 740, 758, 832, 876, 963
BLUMS, Juris 245
BOȚ-BUDEANU, Ramona 628, 643
BORDEIANU, Demetra Lăcrămioara 147, 153
BOTTERI, Lea 288, 884
BRAHMADEEP 404
BREABAN, Florin 198, 211
BRINKS, Ger 111, 223, 228
BRUNIAUX, Pascal 413, 422
BUCIŞCANU, Ingrid 529, 536, 542, 633
BUDULAN, Costea 179, 314, 758, 819, 851, 926, 963
BUHAI, Crina 758, 963
BUHU, Adrian 689
BUHU, Liliana 689
BURNETT-BOOTHROYD, S. 717
BURR, L. 717
BUSCHMANN, Hans-Jürgen 462
BUTNARU, Gabriela 354
CALIN, Monica Alina 77, 107, 360, 367, 826
CAMPAGNE, Christine 404
CAPMARE, Lavinia 436
CEBAN, Irina 265
CEREMPEI, Angela 500, 506, 515
CHAIB, Rachid 664
CHERIF, Ch. 711
CIOARA, Ioan 192, 250, 271, 468
CIOARA, Lucica 192
CIOBANU, Ana-Ramona 740, 758, 851, 876, 963
CIOBANU, Corina 314, 650, 819
CIOBANU, Luminita 179, 250, 271, 851, 926
CÎRJA, Jana 265, 309
COCHRANE, Cédric 22
COJOCARU, Мariana 695, 700
COMANDAR, Constanta 218
CONSTANDACHE, Ovidiu 506
CONSTANDACHE, Tatiana 515
COSTA, Eduardo 619
COTOROS, Diana 557, 564
1019
COZMÎNCĂ, Irina 669
CREŢU, Meoara 996, 1002
CREŢU, Viorica 88, 94, 859, 868
CRISTEA, Maria Mirabela 433
CURTEZA, Antonela 77, 107, 111, 223, 228, 360, 367, 433, 628, 643, 826
DAN, Dorin 704, 969, 1008, 1013
DANKO, Abramiuc 522
DEFER, Didier 211
DIACONESCU, Rodica 1015
DIESTEL, O. 711
DINCA, Laurentiu 468
DODU, Aristide 704, 969, 1013
DRIŞCU, Mariana 591, 613
DRUMEV, Krasimir 746, 857
DULGHERIU, Ionut 295, 303, 449
DUMITRAS, Catalin 179
DURNA, M. 813
EHRMANN, Andrea 770, 775
ELNASHAR, ElSayed 954
ENE, Alexandra 339
ERTEKİN, Gözde 791, 798
FANGUEIRO, Raul 179, 851, 926
FERRERO, Franco 493
FERRI, Ada 233, 239
FILIPESCU, Elena 374, 442
FILIPESCU, Emilia 374, 442
FLOREA, Adela 667
FOIA, Liliana 233
FRYDRYSIAK, Michał 57
GALENCO, Beatrice Maria 839
GAZIOGLU, D. 719
GEBA, Maria 65
GENOV, Dobrin 746, 856
GHEORGHE, Nicula 468
GHICIUC, Cristina 233
GHITULEASA, Carmen 341, 468
GOMBOC, Lidija 139
GOVARTHANAM, K.K. 717
GRANCARIC, Ana Marija 288, 619, 884
GRECKA, Marianna 245
GRIGORIU, Aurelia 239, 485, 1015
GROSU, Marian-Cătălin 57, 102, 198, 205, 211
GUNESOGLU, Cem 118
GUNESOGLU, Sinem 118
GUTMANN, Jochen Stefan 462, 476
HAMAD, Moez 422
HAN, Seokhun 910
HARNAGEA, Florentina 602, 608
HARNAGEA, Marta-Catalina 598, 602, 608
HARPA, Rodica 166, 185
HELBIG, Reinhard 753
HES, Lubos 46
HORGA, Gheorghe 102, 198, 205, 211
HORGA, Mihaela 198
HOSSU, Ioan 57, 102, 198, 205, 211
HRISTIAN, Liliana 83, 147, 153
HRITCU (SALARIU), Mihaela 233, 239
HUPFER-KEMPKES, K. 45
HUSSAIN, Tanveer 884
HWANG, Young Gu 747
ICHIM, Mariana 639
IONESCU LUCA, Cornelia 579, 585
IONESCU, Irina 303
IONESI, Dorin 179, 436, 924
IROVAN, Marcela 388, 394, 398
İŞGÖREN, E. 781, 813
IVAȘCO, Victoria 265
IVANOV, Ivan 746
JANICKA, J. 790
JEVŠNIK, Simona 946
KADDAR,Taher Rajab 72
KAISER, A. 45
KAPLANGİRAY, Binnaz 118
KAPRALOV, Valerij Viktorovich 728
KAZLACHEVA, Zlatina 382
KELLY, Fern 22
1020
KIM, DoSik 910
KONCAR, Vladan 22
KRZYWINSKI, S. 711
KURCZVEIL, Norbert Cristian 839
KYOSEV, Yordan 920
KYZYMCHUK, Olena 764
LAZOV, Lyubomir 735
LIN, H. 711
LIPSA, Florin 239
LIUTE, Daniela 348, 354
LOGHIN, Carmen 303, 677, 706
LUCA, Gabriel-Petru 659, 664, 669, 673
LUPU, Iuliana Gabriela 147, 153
LUTIC, Liliana 320, 805
LÜTZKENDORF, Renate 139
MACOVEI, Laura 88, 94, 859, 868
MACOVEI, Victoria 388
MAIER, Stelian Sergiu 529, 536, 542, 633
MAIER, Vasilica 529, 536, 542, 533
MARIN, Ema 250, 271
MARMARALI, Arzu 791, 798, 832
MATENCIUC, Cristian Constantin 295
MATUSIAK, Malgorzata 124
MEDOR, Cosmin 468
MEUNIER, Ludivine 22
MIELICKA, E. 790
MIHAI, Aura 569, 575, 598, 619
MIHAI, Carmen 339
MITU, Stan 132, 295, 436, 569, 598
MODENBACH, Werner 932
MOISESCU, Elena 218
MURESAN, Augustin 500, 522, 628, 643
MUREŞAN, Rodica 500, 506, 515
MUSTATA, Adriana 83
MYTILINAIOS, Stylianos 832
NASSER Mohamed, H. 476
NAZIR, Ahsan 884
NEGRU, Daniela 192
NICOLAIOV, Pulferia 303, 677
NICULESCU, Claudia 374
NICULESCU, Marilena 468
ODOBESCU, Rodica 394
OĞLAKCIOĞLU, Nida 791
OLARU, Sabina 374, 442
ONOFREI, Elena 283
OSKAY, Nazan 980
ÖZDEMİR, Fulya 798
ÖZEN, M.S. 813
PANDELEA, Anca 805
PARK, Chan Ho 858
PARK, Shin Woong 747, 858
PARKOVA, Inese 256
PAVARE, Zane 245
PAVKO-CUDEN, Alenka 867
PĂȘTINĂ (COSTEA), Mariana 569
PENCIUC, Mihai 173, 319, 819
PERIOLATTO, Monica 493
PETCU, Ioana 111, 360, 367, 826
PETROVIĆ, Vasilije 158
PINAR, A. 790
PINKERT, Christian 753
PINTILIE, Ecaterina 218
PIROI, Cristina 166, 185
PLUGARU, Violeta 265
POP de POPA, Ioan 969
POPESCU, Crisan 45, 422
POPESCU, Octavian 485
POPESCU, Vasilica 454
POTOP, Georgeta 83, 147, 153
POZZI, Silvia 655
PRUNEANU, Melinda 529, 536, 542, 633
RADU, Cezar-Doru 166, 185, 233, 239
RADULESCU, Razvan 468
RAY, Sadhan Chandra 937
REINERS, Priscilla 920
RENKENS, Wilfried 920
ROMAN, Claudia 1015
RUDOLF, Andreja 946
1021
RYU, Hanyoun 910
ŠAJATOVIĆ, Blaženka Brlobašić 884
SALAUN, Fabien 404
SANCAK, E. 781
SARGHIE, Bogdan 575
SAVA, Costică 639
SCHACHER, Laurence 367
SCHULZ, Ch. 711
SCHÜRING, M. 45
SCOBIOALA CAZAC, Viorica 238
SCRIPCARIU, Luminita 1015
SCRIPCENCO, Angela 265, 278
SEGHEDIN, Neculai Eugen 876
SFILIGOJ SMOLE, Majda 139
SKOKO, Ivana 158
SHIN, YuShik 747
SOLVES, Clara 619
STAMENKOVIĆ, Miodrag 558
STAN, Mihai 341
STANKOVIĆ, Marija 158
STEPANOVIĆ, Jovan 158
STJEPANOVIČ, Zoran 139, 946
STRAZDS, Guntis 334
SUBTIRICA, Adriana 468
SUDIPTA 404
SUGAC, Olga 695, 700
SURDU, Lilioara 468
TAO, Xuyuan 22
TARBUK, Anita 288
TAVMAN, Biret 980
TEDORESCU, Mirela 77, 107, 111, 223, 228, 360, 367, 826
THIELE, Elke 753
THOMASSEY, Sébastien 404, 422
TIŢĂ, Silviu Mihail 683
TOMA, Doina 655
TRIFAN, Geta 271
TRÜMPER, W. 711
TUTUNARU, Irina 388, 394, 398
UDRESCU, Claudia 493
UGBOLUE, Samuel C. 764
UJEVIĆ, Darko 884
ULBRICHT, Mathias 476
ULEA, Eugen 239
URSACHE, Mariana 173, 914
USTA, İ. 781
UŽĀNS, Andis 256
UZUN, M. 781
VALIŠEVSKIS, Aleksandrs 256
VASLUIANU, Ecaterina 454, 650, 819
VASSILIADIS, Savvas 832
VAZ DE CARVALHO, Carlos 619
VERZEA, Ion 659, 664, 669, 673
VIĻUMSONE, Ausma 245, 256
VIRCAN, Ana 436, 449, 926
VISILEANU, Emilia 339, 655, 969
VLAD, Florin 132
VLAD, Luminița 132, 295
VORNICU, Nicoleta 65
VRLJICAK, Zlatko 845
WALAK, A. 790
WEBER, Marcus728, 770, 775, 845, 890, 903
YANG, Charles Q. 36
YILDIRIM OZSOY, N 813
YOON, HyeShin 910
YÜKSEK, M. 781, 813
ZAMAN, Mostafa 890, 903
ZHANG, QJ. 45
ZIĘBA, Janusz 57
ZIEMELE, Inese 334
1022
ORGANIZED BY:”Gheorghe Asachi” Technical University of Iasi Faculty of Textiles-Leather and Industrial Management
CO-ORGANIZERS:Doctoral School of The Faculty of Textiles, Leather and Industrial Management Romanian section of International Federation of Knitting Technologists (IFKT) Alumni Association of Textile&Leather Faculty (ASITEX) General Association of Engineers in Romania (AGIR) National Institute of Inventics, Iaşi
WITH THE SUPPORT OF:National Authority for Scientific Research
www.cortep.tuiasi.ro www.ifkt.ro
9 772285 537007
ISSN 2285-5378
ISSN-L 2285-5378


![[Acronym] Proceedings - UFG](https://static.fdokumen.com/doc/165x107/631430486ebca169bd0abf4b/acronym-proceedings-ufg.jpg)